a comprehensive slagging and fouling prediction tool for coal-fired boilers and its...
TRANSCRIPT
88 (2007) 1035–1043www.elsevier.com/locate/fuproc
Fuel Processing Technology
A comprehensive slagging and fouling prediction tool for coal-firedboilers and its validation/application
Zhanhua Ma a,⁎, Felicia Iman a, Pisi Lu a, Rod Sears a, Lingbu Kong b, A.S. Rokanuzzaman b,Donald P. McCollor b, Steven A. Benson b
a RMT, Inc., 744 Heartland Trail, Madison, WI 53717, United Statesb Energy and Environmental Research Center, The University of North Dakota, 15 North 23rd Street, Grand Forks, ND 58202, United States
Abstract
RMT, Inc., a subsidiary company of Alliant Energy Corporation, and the University of North Dakota Energy and Environmental ResearchCenter (EERC) have developed an ash behavior prediction tool, called AshProSM, to assess slagging and fouling in coal-fired boilers. This toolintegrates boiler computational fluid dynamic (CFD) simulations with ash behavior models including ash formation, transport and deposition, aswell as deposit growth and strength development. AshProSM was applied to a 512-MW tangentially-fired boiler at Wisconsin Power & Light'sColumbia Energy Center to evaluate the localized slagging on furnace walls and fouling in convective pass. The predicted boiler ash depositionpattern is reasonably consistent with that observed on the furnace walls and super heater division panels. The prediction of slag state transition(solid/liquid) through deposit viscosity was verified by the observation in the plant.© 2007 Elsevier B.V. All rights reserved.
Keywords: Slagging; Fouling; Coal-fired boiler
1. Introduction
The ash from coal combustion has been a long-standingproblem for the power generation industry, causing reductionsin thermal efficiency and unit availability and increases inoperating and maintenance costs for coal-fired boilers. Histor-ically, power plant engineers and operators had limited toolsavailable to respond to changes in coal quality in order tominimize ash-related problems.
The ash deposition problem is dependent on fuel composi-tion, boiler design, and operating conditions. In general many ofthe chemical and physical processes involved in ash formationand deposition are understood and this understanding hasassisted many utilities in minimizing ash deposition problems inutility boilers. Many of these processes have been formulatedinto computer codes. For example, computer codes to predictthe particle-size and composition distribution (PSCD) of the ashproduced upon combustion [1] and simplified transport, depo-sition, and growth programs for specific locations in the boiler
⁎ Corresponding author. Tel.: +1 608 662 5126.E-mail address: [email protected] (Z. Ma).
0378-3820/$ - see front matter © 2007 Elsevier B.V. All rights reserved.doi:10.1016/j.fuproc.2007.06.025
[2] have been developed. However, no integration of theseprograms with boiler models to predict the deposit formationand growth in local areas in the boiler and its impact on heattransfer has occurred.
In the past few years, with funding from Alliant Energy,RMT SmartBurn® and the University of North Dakota Energy
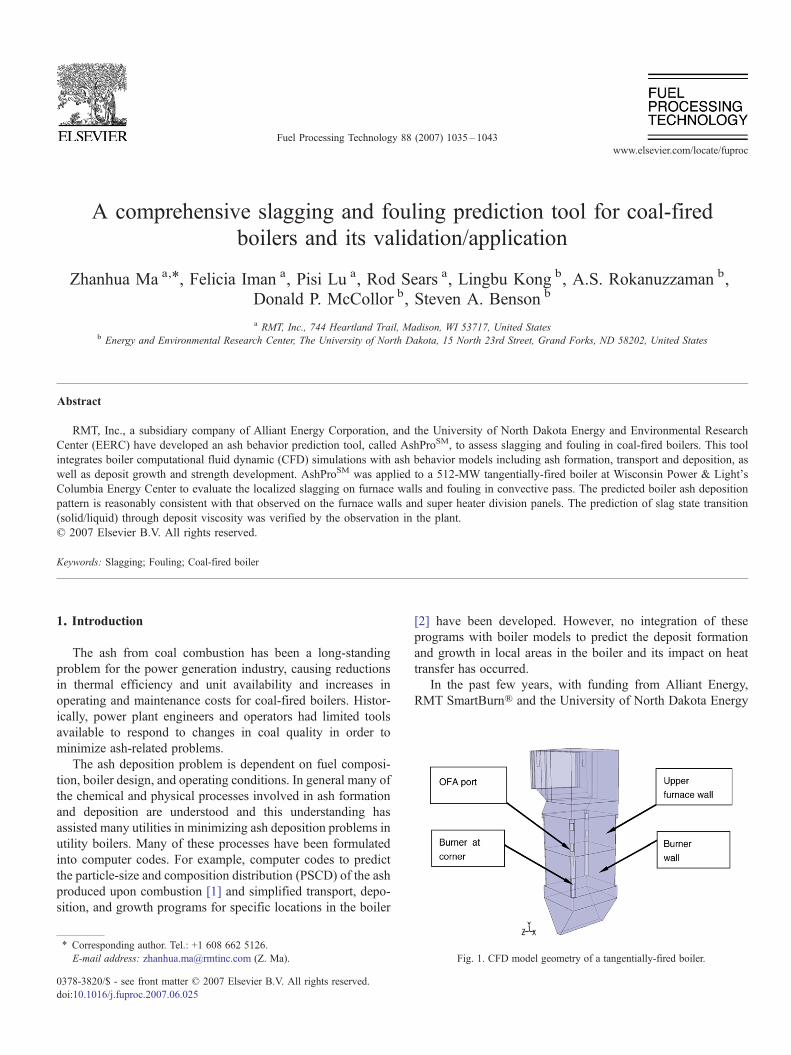
Fig. 1. CFD model geometry of a tangentially-fired boiler.
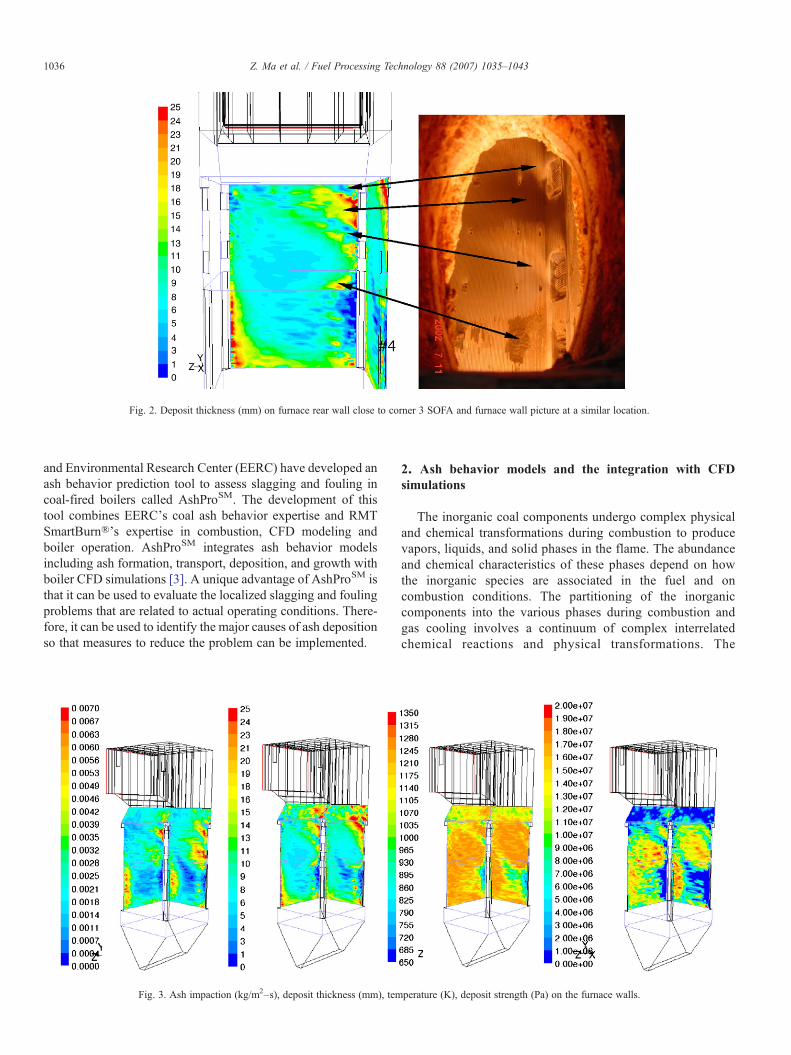
Fig. 2. Deposit thickness (mm) on furnace rear wall close to corner 3 SOFA and furnace wall picture at a similar location.
1036 Z. Ma et al. / Fuel Processing Technology 88 (2007) 1035–1043
and Environmental Research Center (EERC) have developed anash behavior prediction tool to assess slagging and fouling incoal-fired boilers called AshProSM. The development of thistool combines EERC's coal ash behavior expertise and RMTSmartBurn®'s expertise in combustion, CFD modeling andboiler operation. AshProSM integrates ash behavior modelsincluding ash formation, transport, deposition, and growth withboiler CFD simulations [3]. A unique advantage of AshProSM isthat it can be used to evaluate the localized slagging and foulingproblems that are related to actual operating conditions. There-fore, it can be used to identify the major causes of ash depositionso that measures to reduce the problem can be implemented.
Fig. 3. Ash impaction (kg/m2–s), deposit thickness (mm), tem
2. Ash behavior models and the integration with CFDsimulations
The inorganic coal components undergo complex physicaland chemical transformations during combustion to producevapors, liquids, and solid phases in the flame. The abundanceand chemical characteristics of these phases depend on howthe inorganic species are associated in the fuel and oncombustion conditions. The partitioning of the inorganiccomponents into the various phases during combustion andgas cooling involves a continuum of complex interrelatedchemical reactions and physical transformations. The
perature (K), deposit strength (Pa) on the furnace walls.
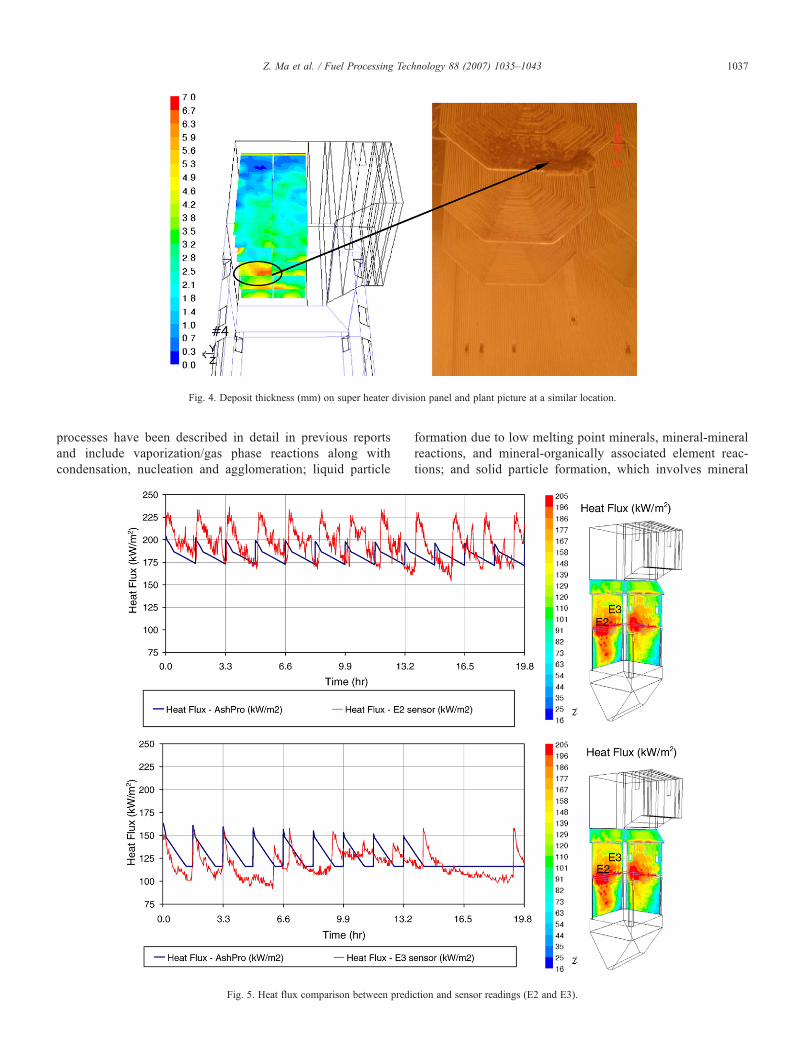
Fig. 4. Deposit thickness (mm) on super heater division panel and plant picture at a similar location.
1037Z. Ma et al. / Fuel Processing Technology 88 (2007) 1035–1043
processes have been described in detail in previous reportsand include vaporization/gas phase reactions along withcondensation, nucleation and agglomeration; liquid particle
Fig. 5. Heat flux comparison between predi
formation due to low melting point minerals, mineral-mineralreactions, and mineral-organically associated element reac-tions; and solid particle formation, which involves mineral
ction and sensor readings (E2 and E3).
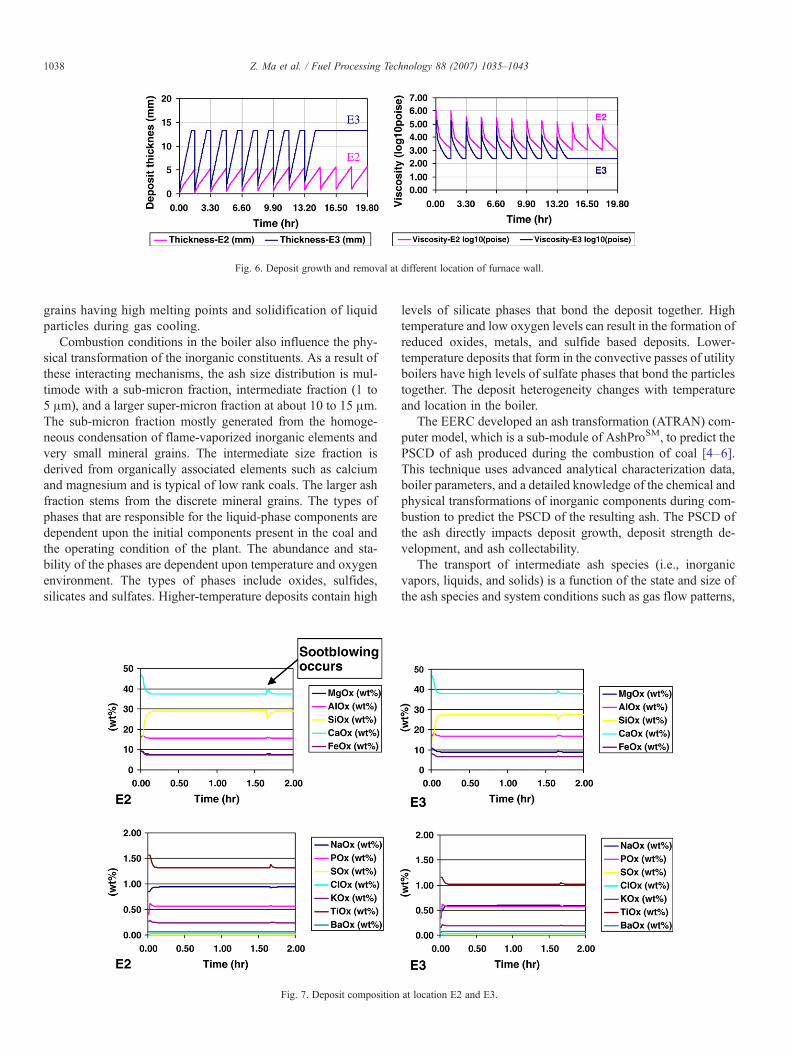
Fig. 6. Deposit growth and removal at different location of furnace wall.
1038 Z. Ma et al. / Fuel Processing Technology 88 (2007) 1035–1043
grains having high melting points and solidification of liquidparticles during gas cooling.
Combustion conditions in the boiler also influence the phy-sical transformation of the inorganic constituents. As a result ofthese interacting mechanisms, the ash size distribution is mul-timode with a sub-micron fraction, intermediate fraction (1 to5 μm), and a larger super-micron fraction at about 10 to 15 μm.The sub-micron fraction mostly generated from the homoge-neous condensation of flame-vaporized inorganic elements andvery small mineral grains. The intermediate size fraction isderived from organically associated elements such as calciumand magnesium and is typical of low rank coals. The larger ashfraction stems from the discrete mineral grains. The types ofphases that are responsible for the liquid-phase components aredependent upon the initial components present in the coal andthe operating condition of the plant. The abundance and sta-bility of the phases are dependent upon temperature and oxygenenvironment. The types of phases include oxides, sulfides,silicates and sulfates. Higher-temperature deposits contain high
Fig. 7. Deposit composition
levels of silicate phases that bond the deposit together. Hightemperature and low oxygen levels can result in the formation ofreduced oxides, metals, and sulfide based deposits. Lower-temperature deposits that form in the convective passes of utilityboilers have high levels of sulfate phases that bond the particlestogether. The deposit heterogeneity changes with temperatureand location in the boiler.
The EERC developed an ash transformation (ATRAN) com-puter model, which is a sub-module of AshProSM, to predict thePSCD of ash produced during the combustion of coal [4–6].This technique uses advanced analytical characterization data,boiler parameters, and a detailed knowledge of the chemical andphysical transformations of inorganic components during com-bustion to predict the PSCD of the resulting ash. The PSCD ofthe ash directly impacts deposit growth, deposit strength de-velopment, and ash collectability.
The transport of intermediate ash species (i.e., inorganicvapors, liquids, and solids) is a function of the state and size ofthe ash species and system conditions such as gas flow patterns,
at location E2 and E3.
1039Z. Ma et al. / Fuel Processing Technology 88 (2007) 1035–1043
gas velocity, and temperature. The primary mode of particletransport to heat-transfer surfaces is inertial impaction. ThePSCD of ash predicted by ATRAN sub-module of AshProSM isincorporated with a boiler CFD model to simulate ash particletransport behavior and to estimate ash impaction rates on boilerheat transfer surfaces.
The combination of the CFD and ATRAN models providepredictions of ash impacting on the furnace walls, the particletemperature and velocity, and PSCD. Upon impaction on theheat-transfer surfaces, ash particles may be captured or rebounddepending on the overall effective stickiness, which is a functionof impacting particle stickiness and existing deposit surfacestickiness. The stickiness of ash particles upon impaction on aheat-transfer surface, defined as the probability of the retention
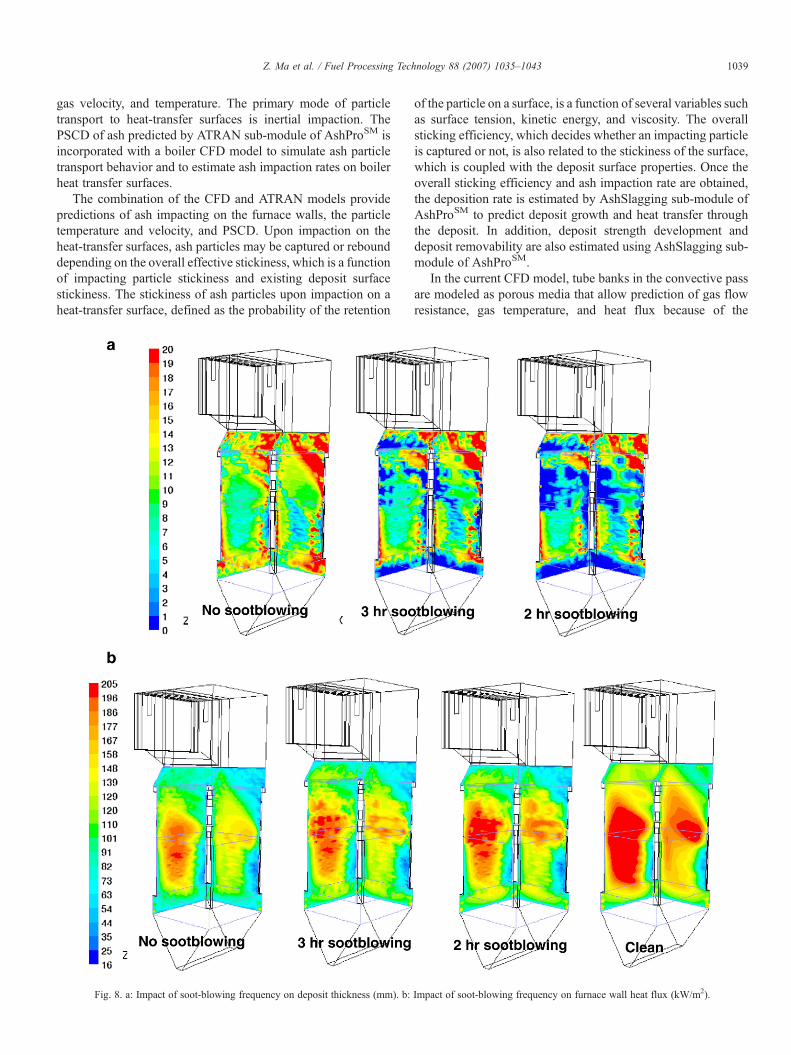
Fig. 8. a: Impact of soot-blowing frequency on deposit thickness (mm). b:
of the particle on a surface, is a function of several variables suchas surface tension, kinetic energy, and viscosity. The overallsticking efficiency, which decides whether an impacting particleis captured or not, is also related to the stickiness of the surface,which is coupled with the deposit surface properties. Once theoverall sticking efficiency and ash impaction rate are obtained,the deposition rate is estimated by AshSlagging sub-module ofAshProSM to predict deposit growth and heat transfer throughthe deposit. In addition, deposit strength development anddeposit removability are also estimated using AshSlagging sub-module of AshProSM.
In the current CFD model, tube banks in the convective passare modeled as porous media that allow prediction of gas flowresistance, gas temperature, and heat flux because of the
Impact of soot-blowing frequency on furnace wall heat flux (kW/m2).
1040 Z. Ma et al. / Fuel Processing Technology 88 (2007) 1035–1043
complex geometry. Therefore, it does not provide detailedinformation about ash particle trajectories in the convective passof the boiler. To predict fouling deposit formation in this region,the CFD model is used to obtain the spatial distribution of ashparticles in a plane at the boiler nose. This information, alongwith gas velocity and temperature, is used by the FOULER sub-module of AshProSM to predict high-and low-temperature foul-ing. FOULER is a mechanistic model developed by the EERCto predict the fouling that occurs in the convective pass of acoal-fired utility boiler.
AshProSM results in localized ash deposition prediction,which is used to guide changes in boiler operations to takecorrective action with various coal feeds to maximize unitavailability, by minimizing ash-related forced outages, and op-timize soot-blowing effectiveness in the boiler to minimizeoperating cost.
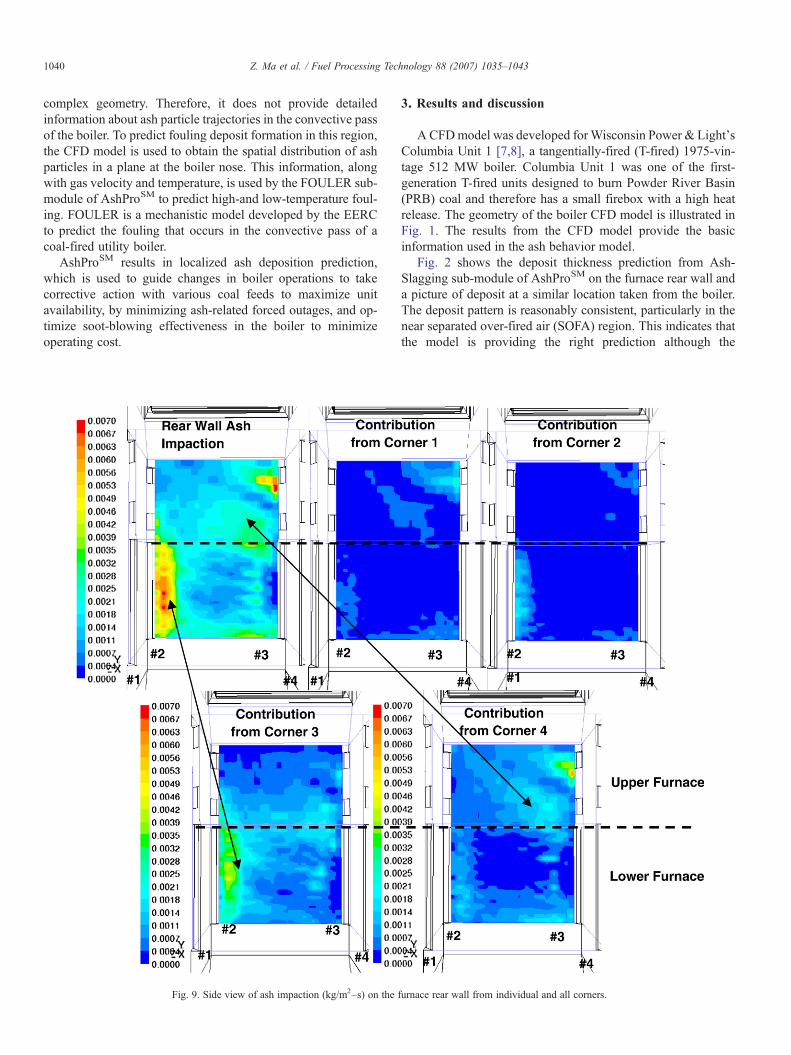
Fig. 9. Side view of ash impaction (kg/m2–s) on the f
3. Results and discussion
ACFDmodel was developed forWisconsin Power & Light'sColumbia Unit 1 [7,8], a tangentially-fired (T-fired) 1975-vin-tage 512 MW boiler. Columbia Unit 1 was one of the first-generation T-fired units designed to burn Powder River Basin(PRB) coal and therefore has a small firebox with a high heatrelease. The geometry of the boiler CFD model is illustrated inFig. 1. The results from the CFD model provide the basicinformation used in the ash behavior model.
Fig. 2 shows the deposit thickness prediction from Ash-Slagging sub-module of AshProSM on the furnace rear wall anda picture of deposit at a similar location taken from the boiler.The deposit pattern is reasonably consistent, particularly in thenear separated over-fired air (SOFA) region. This indicates thatthe model is providing the right prediction although the
urnace rear wall from individual and all corners.
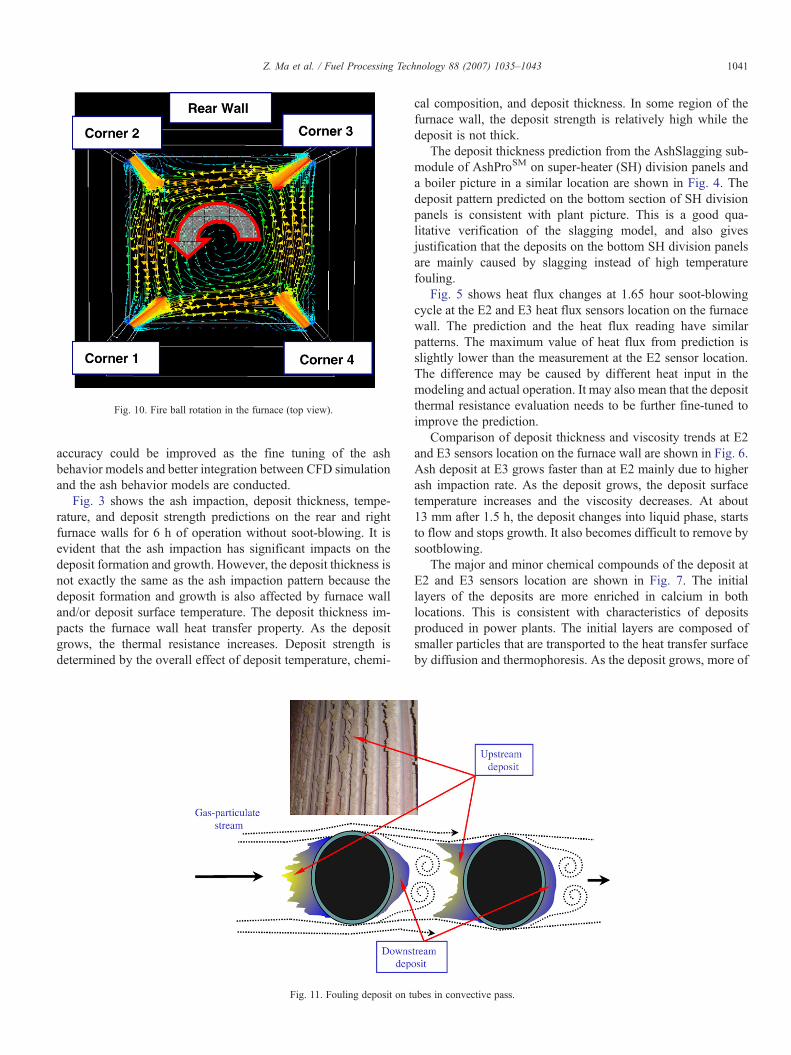
Fig. 10. Fire ball rotation in the furnace (top view).
1041Z. Ma et al. / Fuel Processing Technology 88 (2007) 1035–1043
accuracy could be improved as the fine tuning of the ashbehavior models and better integration between CFD simulationand the ash behavior models are conducted.
Fig. 3 shows the ash impaction, deposit thickness, tempe-rature, and deposit strength predictions on the rear and rightfurnace walls for 6 h of operation without soot-blowing. It isevident that the ash impaction has significant impacts on thedeposit formation and growth. However, the deposit thickness isnot exactly the same as the ash impaction pattern because thedeposit formation and growth is also affected by furnace walland/or deposit surface temperature. The deposit thickness im-pacts the furnace wall heat transfer property. As the depositgrows, the thermal resistance increases. Deposit strength isdetermined by the overall effect of deposit temperature, chemi-
Fig. 11. Fouling deposit on t
cal composition, and deposit thickness. In some region of thefurnace wall, the deposit strength is relatively high while thedeposit is not thick.
The deposit thickness prediction from the AshSlagging sub-module of AshProSM on super-heater (SH) division panels anda boiler picture in a similar location are shown in Fig. 4. Thedeposit pattern predicted on the bottom section of SH divisionpanels is consistent with plant picture. This is a good qua-litative verification of the slagging model, and also givesjustification that the deposits on the bottom SH division panelsare mainly caused by slagging instead of high temperaturefouling.
Fig. 5 shows heat flux changes at 1.65 hour soot-blowingcycle at the E2 and E3 heat flux sensors location on the furnacewall. The prediction and the heat flux reading have similarpatterns. The maximum value of heat flux from prediction isslightly lower than the measurement at the E2 sensor location.The difference may be caused by different heat input in themodeling and actual operation. It may also mean that the depositthermal resistance evaluation needs to be further fine-tuned toimprove the prediction.
Comparison of deposit thickness and viscosity trends at E2and E3 sensors location on the furnace wall are shown in Fig. 6.Ash deposit at E3 grows faster than at E2 mainly due to higherash impaction rate. As the deposit grows, the deposit surfacetemperature increases and the viscosity decreases. At about13 mm after 1.5 h, the deposit changes into liquid phase, startsto flow and stops growth. It also becomes difficult to remove bysootblowing.
The major and minor chemical compounds of the deposit atE2 and E3 sensors location are shown in Fig. 7. The initiallayers of the deposits are more enriched in calcium in bothlocations. This is consistent with characteristics of depositsproduced in power plants. The initial layers are composed ofsmaller particles that are transported to the heat transfer surfaceby diffusion and thermophoresis. As the deposit grows, more of
ubes in convective pass.
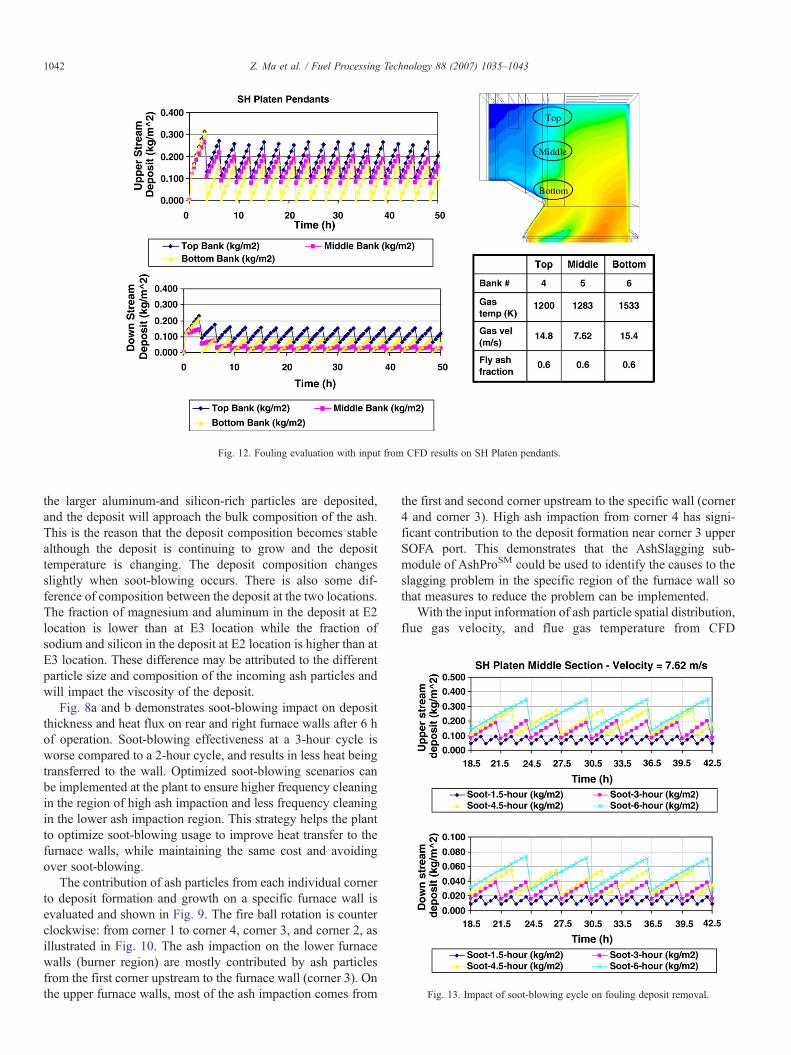
Fig. 12. Fouling evaluation with input from CFD results on SH Platen pendants.
Fig. 13. Impact of soot-blowing cycle on fouling deposit removal.
1042 Z. Ma et al. / Fuel Processing Technology 88 (2007) 1035–1043
the larger aluminum-and silicon-rich particles are deposited,and the deposit will approach the bulk composition of the ash.This is the reason that the deposit composition becomes stablealthough the deposit is continuing to grow and the deposittemperature is changing. The deposit composition changesslightly when soot-blowing occurs. There is also some dif-ference of composition between the deposit at the two locations.The fraction of magnesium and aluminum in the deposit at E2location is lower than at E3 location while the fraction ofsodium and silicon in the deposit at E2 location is higher than atE3 location. These difference may be attributed to the differentparticle size and composition of the incoming ash particles andwill impact the viscosity of the deposit.
Fig. 8a and b demonstrates soot-blowing impact on depositthickness and heat flux on rear and right furnace walls after 6 hof operation. Soot-blowing effectiveness at a 3-hour cycle isworse compared to a 2-hour cycle, and results in less heat beingtransferred to the wall. Optimized soot-blowing scenarios canbe implemented at the plant to ensure higher frequency cleaningin the region of high ash impaction and less frequency cleaningin the lower ash impaction region. This strategy helps the plantto optimize soot-blowing usage to improve heat transfer to thefurnace walls, while maintaining the same cost and avoidingover soot-blowing.
The contribution of ash particles from each individual cornerto deposit formation and growth on a specific furnace wall isevaluated and shown in Fig. 9. The fire ball rotation is counterclockwise: from corner 1 to corner 4, corner 3, and corner 2, asillustrated in Fig. 10. The ash impaction on the lower furnacewalls (burner region) are mostly contributed by ash particlesfrom the first corner upstream to the furnace wall (corner 3). Onthe upper furnace walls, most of the ash impaction comes from
the first and second corner upstream to the specific wall (corner4 and corner 3). High ash impaction from corner 4 has signi-ficant contribution to the deposit formation near corner 3 upperSOFA port. This demonstrates that the AshSlagging sub-module of AshProSM could be used to identify the causes to theslagging problem in the specific region of the furnace wall sothat measures to reduce the problem can be implemented.
With the input information of ash particle spatial distribution,flue gas velocity, and flue gas temperature from CFD
1043Z. Ma et al. / Fuel Processing Technology 88 (2007) 1035–1043
simulations, the FOULER sub-module of AshProSM was usedto predict high-and low-temperature fouling at some specificlocations of convective pass pendants. Fig. 11 depicts thetypical mechanism of upstream and downstream ash deposit onconvective pass pendants as compared to the plant picture of thedeposit.
Fig. 12 indicates that the flue gas temperature at the top andmiddle sections of SH platen bank are much lower than thebottom section, which falls to low temperature fouling category.The high calcium content in the PRB coal used in this unit hassignificant impact on this low temperature fouling. As thetemperature increases, the fouling deposit is much easier toremove due to the decomposition of the sulfate-based deposit.The downstream deposit is less compared to the upstreamdeposit. The lower flue gas velocity in the middle bank sectioncauses less downstream deposit as compared to the top andbottom bank section due to a weaker eddy effect.
The impact of the soot-blowing cycle on the fouling depositremoval in the middle section of SH platen is shown in Fig. 13.As the cleaning frequency decreases (longer soot-blowingperiod), the permanent deposit remaining on the tubes increasesand the soot-blowing effectiveness is deteriorated.
4. Conclusion
The integration of CFD simulations with ash behavior mo-dels enables AshProSM to provide a qualitative and quantitativedescription of the fireside slag formation and deposition pro-cesses within the coal fired boiler. As a result, the prediction toolcan be used to determine the deposit thickness, chemical com-position, physical properties and heat transfer properties in aspecific region of the furnace wall and convective pass. Itprovides the engineer or researcher a powerful tool to assess thecombined impact of ash formation and deposition phenomenaon power plant performance and can be used to assess theimpact of fuel quality, ash properties, fouling, slagging, etc. inthe operation of coal-fired power plants for design and opera-tional purposes. Further efforts are making in improving the
accuracy of the prediction from this tool through fine-tuning ofthe ash behavior models and better integration of CFD simu-lations and the ash behavior models.
Acknowledgements
The Authors gratefully acknowledge financial support fromAlliant Energy Corporation and the information provided by theplant engineers at Columbia Energy Center.
References
[1] S.A. Benson, E.N. Steadman, C.J. Zygarlicke, T.A. Erickson, Ash for-mation, deposition, corrosion, and erosion in conventional boilers, in: L.Baxter, R. DeSollar (Eds.), Applications of Advanced Technology to Ash-Related Problems in Boilers, Plenum Press, New York, 1996, pp. 1–15.
[2] S.A. Benson, E.A. Sondreal, Impact of low-rank coal properties on ad-vanced power systems, Ash Chemistry: Phase Relationships in Ashes,Special Issue of Fuel Process. Technol., 56 (1-2), 1998, pp. 129–142.
[3] E. Vásquez, Z. Ma, S.A. Benson, Advanced Prediction Tools for AshFormation and Deposition in Coal-Fired Boilers, Clearwater, April 18-222004, The Clearwater Coal Conference, Florida, USA.
[4] E.N. Steadman, C.J. Zygarlicke, S.A. Benson, M.L. Jones, A Microanalytical Approach to the Characterization of Coal, Ash, and Deposits,Seminar on Fireside Fouling Problems; ASME Research Comm. on Cor-rosion and Deposits from Combustion Gases: Washington, DC, 1990.
[5] Zygarlicke, C.J. Predicting Ash Behavior in Conventional and AdvancedPower Systems: Putting Models to Work. In Impact of Mineral Impurities inSolid Fuel Combustion; Gupta, R. Ed.; Kluwer Academic/Plenum Publish-ers: New York, 1999; pp 709–722.
[6] L. Yan, R.R. Jensen, J.D. Laumb, S.A. Benson, Predicting ash particle sizeand composition distribution from coal biomass cofiring, Proceedings ofEngineering Foundation Conference, Production in the 21st Century:Impacts of Fuel Quality and Operations, Snowbird, Utah, October 28November 2 2001.
[7] E. Vásquez, R. Sears, Combustion control techniques achieve 0.15 lbs/MMBtu NOx levels without SCR, Power Engineering, vol. 107 (1), January2003, pp. 39–42.
[8] E. Vásquez, F. Mara, D.J. Maas, Z. Ma, K. McQuistan, H. Gadalla, F. Iman,Application of SmartBurnSM Technology for NOx Control in TangentiallyFired Coal Boilers, PowerGen International, December 9-11 2003, PowerGen International Conference, Las Vegas, Nevada USA.