engineering bed models for solid fuel conversion process in grate-fired boilers
TRANSCRIPT
lable at ScienceDirect
Energy 77 (2014) 244e253
Contents lists avai
Energy
journal homepage: www.elsevier .com/locate/energy
Engineering bed models for solid fuel conversion processin grate-fired boilers
M. Costa a, N. Massarotti a, b, V. Indrizzi a, e, *, B. Rajh c, **, C. Yin d, N. Samec c
a Istituto Motori, Consiglio Nazionale delle Ricerche, Viale Marconi 4, 80125 Napoli, Italyb Dipartimento per le Tecnologie (DiT), Universit�a di Napoli “Parthenope”, Centro Direzionale, Isola C4, Napoli, Italyc Faculty of Mechanical Engineering, University of Maribor, 2000 Maribor, Sloveniad Department of Energy Technology, Aalborg University, 9220 Aalborg East, Denmarke School of Metallurgy and Materials, University of Birmingham, Edgbaston, Birmingham B15 2TT, United Kingdom
a r t i c l e i n f o
Article history:Received 10 December 2013Received in revised form4 July 2014Accepted 21 July 2014Available online 13 August 2014
Keywords:Biomass conversionBed modelSolid fuelGrate boiler
* Corresponding author. School of Metallurgy andmingham, Edgbaston, Birmingham B15 2TT, United K** Corresponding author.
E-mail addresses: [email protected], vxi239@[email protected] (B. Rajh).
http://dx.doi.org/10.1016/j.energy.2014.07.0670360-5442/© 2014 Elsevier Ltd. All rights reserved.
a b s t r a c t
A comparison between two numerical models describing the thermo-chemical conversion process of asolid fuel bed in a grate-fired boiler is presented. Both models consider the incoming biomass as sub-jected to drying, pyrolysis, gasification and combustion. In the first approach the biomass bed is treatedas a 0D system, where the thermo-chemical processes are divided in two successive sections: drying andconversion. Phenomenological laws are written to characterize the syngas release as a function of themain governing parameters. The second model is an empirical 1D approach. Temperature, speciesconcentrations and velocity of the syngas provided by the two models are compared. Sensitivity analyseswith respect to the drying agent mass flow rate, the initial moisture content and the composition of thebiomass are performed. The relative error between the mean values of the temperature and velocity ofthe syngas predicted by the two models is equal to about 7%. The application to different types ofbiomass shows that the difference in the predictions increases as the carbon content grows. Thephenomenological model, in fact, generally considers higher conversion rates of this element to volatileswith respect to the analogy model.
© 2014 Elsevier Ltd. All rights reserved.
1. Introduction
The worldwide concern about the limited availability of fossilfuels and global warming mainly due to CO2 emission has spurredinterest in using biomass for energy production. Biomass com-bustion, as an enabled technology to achieve the pressing near-term targets for significant increase of the share of renewable en-ergy sources in energy systems and reduction in CO2 emissions, hasbeen successfully demonstrated in over 200 power plants globally.However, due to the great diversity in biomass resources, effortsstill need to be made to refine the combustion technology in orderto achieve more efficient, cleaner biomass combustionwith greaterfuel flexibility. For instance, biomass combustion may have moresevere pollutant emissions, deposition and corrosion tendency as a
Materials, University of Bir-ingdom.
m.ac.uk (V. Indrizzi), bostjan.
result of the high content of chlorine, sulphur and heavymetals andthe comparatively low ash melting temperature [1e3].
As a tool of analysis, numerical modelling, applicable to differentscales, proves being very powerful. It can eliminate the need toresort to scaling-up of results deriving from lab-scale experiments.This is very significant for studying combustion processes, forwhich scale-up procedures are generally complicated by the stronginteraction between turbulence, reaction kinetics, heat release andradiation [4].
Grate combustion is a well developed technology for burningbiomass fuels with energy recovery, as well as for the thermaltreatment of municipal solid waste in waste-to-energy systems[1,5e7]. In moving grate furnaces, a stack of biomass or waste issupplied on a grate and moves lengthwise along the grate. Sub-jected to the radiation heat transfer from the flame in the freeboardand convective heat transfer from the primary air entering frombeneath the grate, the biomass in the fuel bed will be heated-upand then experience a series of conversion processes (i.e., mois-ture evaporation, devolatilization and pyrolysis, and solid charoxidation) along the grate length, releasing a large amount ofcombustibles in the freeboard. These will undergo combustion due
M. Costa et al. / Energy 77 (2014) 244e253 245
to the supply of a secondary air stream. The fuel bed conversion andfreeboard combustion are two highly interdependent processes in agrate boiler, which have to be appropriately considered in amodelling approach.
For freeboard combustion modelling, 3D (3-dimensional) CFD(computational fluid dynamics) is often performed, in which con-tinuity, momentum, energy and species transport equations inte-grated with appropriate turbulence models, radiation models,combustion models and pollutant formation models are numeri-cally solved, as reported e.g. in Refs. [8e13]. The CFD model of thefreeboard combustion also needs to be coupled with a certain fuelbed conversionmodel: the latter provides the velocity, temperatureand species profile along the grate length on the top of the fuel bedto the former as the grate inlet condition, while the former providesthe incident heat fluxes to the latter.
For fuel bed conversion simulation, very different approachesexist. Following the classification of De Souza Santos [14], theproblem of solid fuel bed conversion may be faced by developingphenomenological models based on the solution of fundamentalequations e such as the laws of thermodynamics and laws of mass,energy, and momentum conservation and constitutive equations eor by analogy (empirical or semi-empirical) models that mimic thebehavior of the fundamental aspect of the process. The phenome-nological models may be further classified on the ground of thelevel of the assumed simplifications, starting from zero dimen-sional time independent schemes (0DeS or 0D steady models)based on the thermo-chemical equilibrium assumption betweenparticipating species at the gasification temperature, to reach 3Ddynamic models (3D-D or 3D dynamic models) accounting for boththe spatial and temporal dependence of the relevant variables. Thehighest level of simplification for solid bed conversion can be foundin themodels of refs. [15e17], while the models in Refs. [18e21] arecharacterized by increased complexity. A comparison betweendifferent simplified approaches can be found in the recent paper byMendiburu et al. [22]. Analogy based analyses are proposed inRefs. [23e27].
In the presentwork, two simplified, engineeringmodels for solidfuel bed conversion, which fall in the two different categories ofphenomenological and analogy models, are presented andcompared. The aim is to define whether the phenomenologicalmodel or the analogy model may be of help in the system optimi-zation for different relative amount offillers (e.g. air-to-fuel ratio), orto furnish a reliable prediction of the syngas composition and pol-lutants concentrations in the flue gases. The first model is a 0D-Smodel, mainly based on mass balance and energy conservationequations, which are solved numerically [18]. The second is a semi-empirical one-dimensionalmodel analogous to theonepresented inRefs. [26], where an experience-based conversion rate for thetreated biomass is assigned as a function of the position on the grate.
The comparison between the two proposedmodels ismadewithreference to the thermal treatment of straw in an 88MWgrate-firedboiler. The actual temperature andmassflowrates of the primaryairand the feeding rate and temperature of the biomass, together withan incident heat power of 1.6MW from the freeboard onto the top ofthe biomass bed, are appropriately considered in both the models.The incident heat power is assumed tobeuniformly distributed overthe entire biomass bed. Then, some model-based sensitivity ana-lyses are performed, by applying both the models to differentbiomass fuels (e.g., woodwaste and refuse derived fuels) of differentcompositions and comparing their predictions.
2. Two-zone zero dimensional steady model
In grate boiler burners, the biomass is fed on a moving grate toform a bed of solid material subjected to thermo-chemical
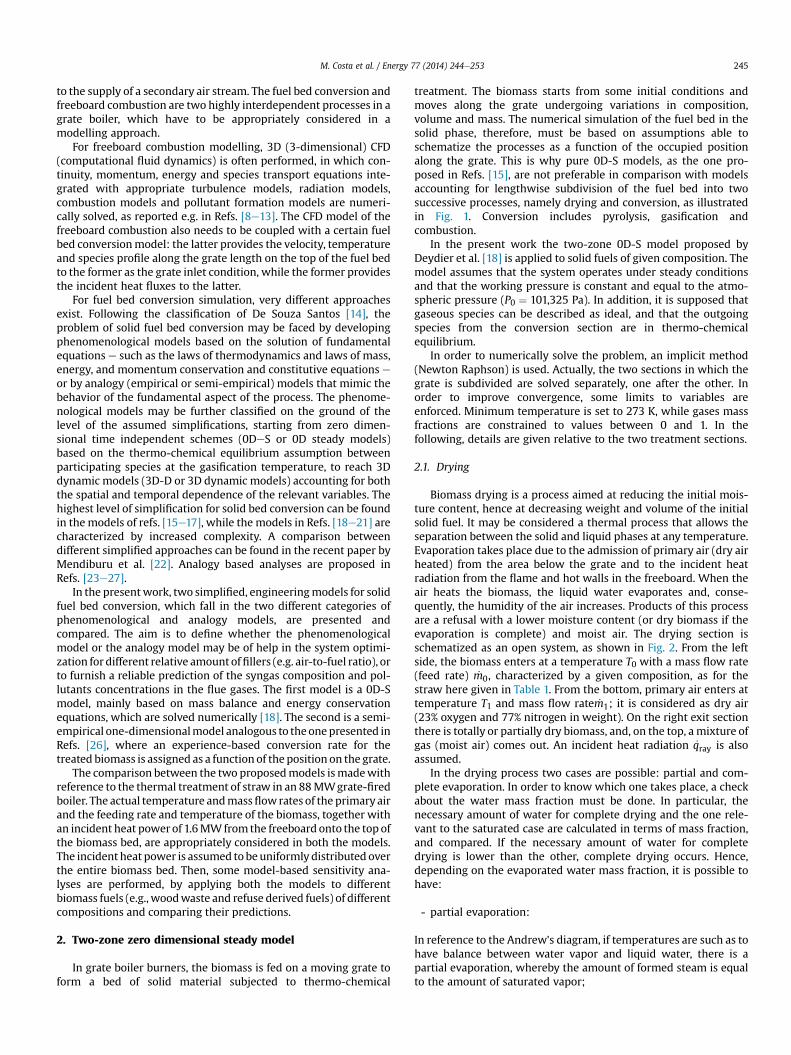
treatment. The biomass starts from some initial conditions andmoves along the grate undergoing variations in composition,volume and mass. The numerical simulation of the fuel bed in thesolid phase, therefore, must be based on assumptions able toschematize the processes as a function of the occupied positionalong the grate. This is why pure 0D-S models, as the one pro-posed in Refs. [15], are not preferable in comparison with modelsaccounting for lengthwise subdivision of the fuel bed into twosuccessive processes, namely drying and conversion, as illustratedin Fig. 1. Conversion includes pyrolysis, gasification andcombustion.
In the present work the two-zone 0D-S model proposed byDeydier et al. [18] is applied to solid fuels of given composition. Themodel assumes that the system operates under steady conditionsand that the working pressure is constant and equal to the atmo-spheric pressure (P0 ¼ 101,325 Pa). In addition, it is supposed thatgaseous species can be described as ideal, and that the outgoingspecies from the conversion section are in thermo-chemicalequilibrium.
In order to numerically solve the problem, an implicit method(Newton Raphson) is used. Actually, the two sections in which thegrate is subdivided are solved separately, one after the other. Inorder to improve convergence, some limits to variables areenforced. Minimum temperature is set to 273 K, while gases massfractions are constrained to values between 0 and 1. In thefollowing, details are given relative to the two treatment sections.
2.1. Drying
Biomass drying is a process aimed at reducing the initial mois-ture content, hence at decreasing weight and volume of the initialsolid fuel. It may be considered a thermal process that allows theseparation between the solid and liquid phases at any temperature.Evaporation takes place due to the admission of primary air (dry airheated) from the area below the grate and to the incident heatradiation from the flame and hot walls in the freeboard. When theair heats the biomass, the liquid water evaporates and, conse-quently, the humidity of the air increases. Products of this processare a refusal with a lower moisture content (or dry biomass if theevaporation is complete) and moist air. The drying section isschematized as an open system, as shown in Fig. 2. From the leftside, the biomass enters at a temperature T0 with a mass flow rate(feed rate) _m0, characterized by a given composition, as for thestraw here given in Table 1. From the bottom, primary air enters attemperature T1 and mass flow rate _m1; it is considered as dry air(23% oxygen and 77% nitrogen in weight). On the right exit sectionthere is totally or partially dry biomass, and, on the top, a mixture ofgas (moist air) comes out. An incident heat radiation _qray is alsoassumed.
In the drying process two cases are possible: partial and com-plete evaporation. In order to know which one takes place, a checkabout the water mass fraction must be done. In particular, thenecessary amount of water for complete drying and the one rele-vant to the saturated case are calculated in terms of mass fraction,and compared. If the necessary amount of water for completedrying is lower than the other, complete drying occurs. Hence,depending on the evaporated water mass fraction, it is possible tohave:
- partial evaporation:
In reference to the Andrew's diagram, if temperatures are such as tohave balance between water vapor and liquid water, there is apartial evaporation, whereby the amount of formed steam is equalto the amount of saturated vapor;
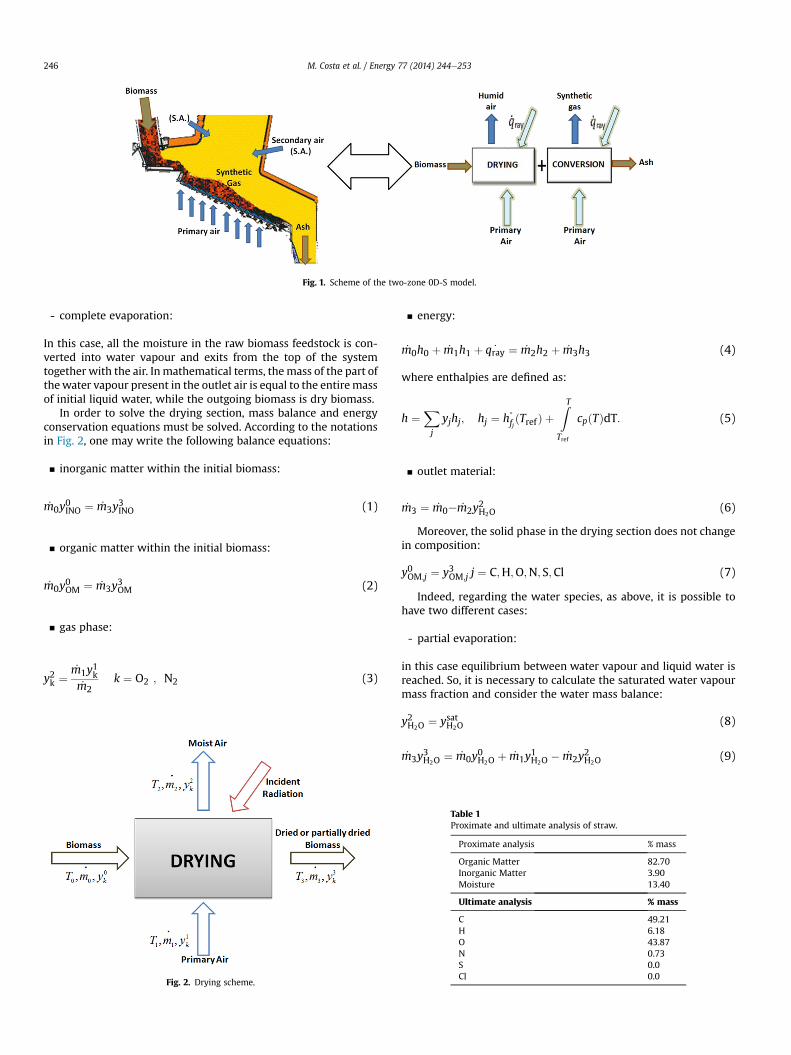
Fig. 1. Scheme of the two-zone 0D-S model.
M. Costa et al. / Energy 77 (2014) 244e253246
- complete evaporation:
In this case, all the moisture in the raw biomass feedstock is con-verted into water vapour and exits from the top of the systemtogether with the air. Inmathematical terms, themass of the part ofthewater vapour present in the outlet air is equal to the entiremassof initial liquid water, while the outgoing biomass is dry biomass.
In order to solve the drying section, mass balance and energyconservation equations must be solved. According to the notationsin Fig. 2, one may write the following balance equations:
▪ inorganic matter within the initial biomass:
_m0y0INO ¼ _m3y
3INO (1)
▪ organic matter within the initial biomass:
_m0y0OM ¼ _m3y
3OM (2)
▪ gas phase:
y2k ¼_m1y1k_m2
k ¼ O2 ; N2 (3)
Fig. 2. Drying scheme.
▪ energy:
_m0h0 þ _m1h1 þ _qray ¼ _m2h2 þ _m3h3 (4)
where enthalpies are defined as:
h ¼Xj
yjhj; hj ¼ h�fjðTref Þ þ
ZT
Tref
cpðTÞdT: (5)
▪ outlet material:
_m3 ¼ _m0e _m2y2H2O (6)
Moreover, the solid phase in the drying section does not changein composition:
y0OM;j ¼ y3OM;j j ¼ C;H;O;N; S;Cl (7)
Indeed, regarding the water species, as above, it is possible tohave two different cases:
- partial evaporation:
in this case equilibrium between water vapour and liquid water isreached. So, it is necessary to calculate the saturated water vapourmass fraction and consider the water mass balance:
y2H2O ¼ ysatH2O (8)
_m3y3H2O ¼ _m0y
0H2O þ _m1y
1H2O � _m2y
2H2O (9)
Table 1Proximate and ultimate analysis of straw.
Proximate analysis % mass
Organic Matter 82.70Inorganic Matter 3.90Moisture 13.40
Ultimate analysis % mass
C 49.21H 6.18O 43.87N 0.73S 0.0Cl 0.0
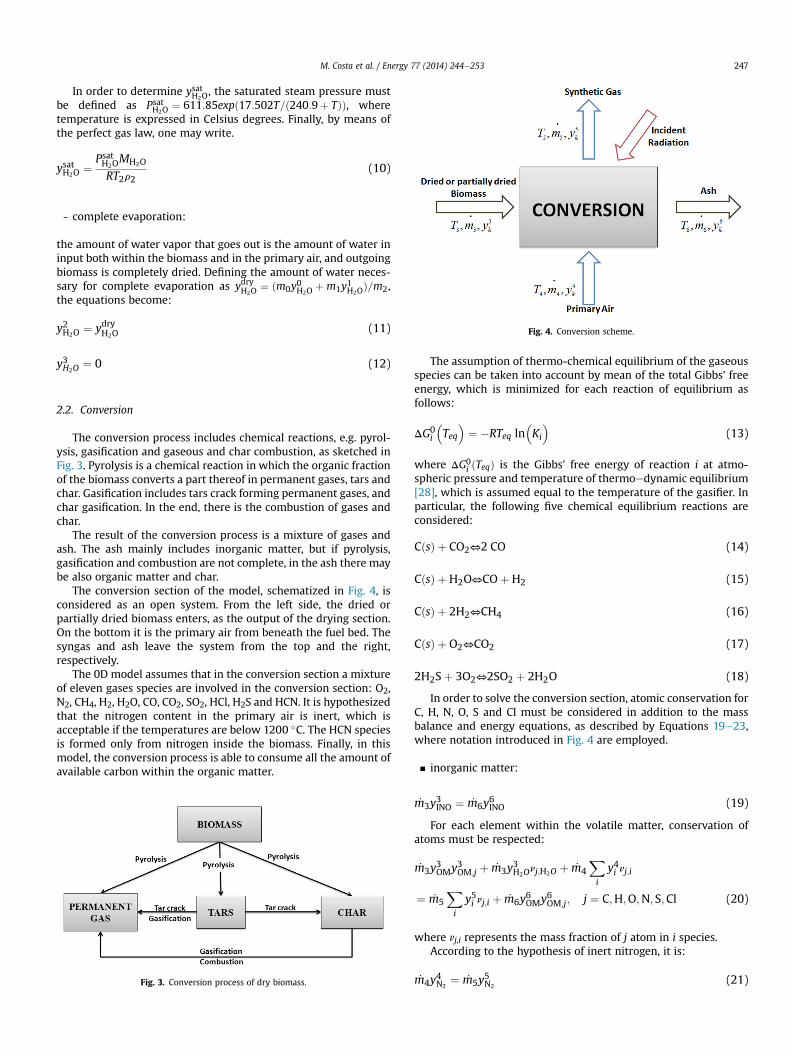
Fig. 4. Conversion scheme.
M. Costa et al. / Energy 77 (2014) 244e253 247
In order to determine ysatH2O, the saturated steam pressure must
be defined as PsatH2O¼ 611:85expð17:502T=ð240:9þ TÞÞ, where
temperature is expressed in Celsius degrees. Finally, by means ofthe perfect gas law, one may write.
ysatH2O ¼ PsatH2OMH2O
RT2r2(10)
- complete evaporation:
the amount of water vapor that goes out is the amount of water ininput both within the biomass and in the primary air, and outgoingbiomass is completely dried. Defining the amount of water neces-sary for complete evaporation as ydryH2O
¼ ðm0y0H2Oþm1y1H2O
Þ=m2,the equations become:
y2H2O ¼ ydryH2O(11)
y3H2O ¼ 0 (12)
2.2. Conversion
The conversion process includes chemical reactions, e.g. pyrol-ysis, gasification and gaseous and char combustion, as sketched inFig. 3. Pyrolysis is a chemical reaction in which the organic fractionof the biomass converts a part thereof in permanent gases, tars andchar. Gasification includes tars crack forming permanent gases, andchar gasification. In the end, there is the combustion of gases andchar.
The result of the conversion process is a mixture of gases andash. The ash mainly includes inorganic matter, but if pyrolysis,gasification and combustion are not complete, in the ash there maybe also organic matter and char.
The conversion section of the model, schematized in Fig. 4, isconsidered as an open system. From the left side, the dried orpartially dried biomass enters, as the output of the drying section.On the bottom it is the primary air from beneath the fuel bed. Thesyngas and ash leave the system from the top and the right,respectively.
The 0D model assumes that in the conversion section a mixtureof eleven gases species are involved in the conversion section: O2,N2, CH4, H2, H2O, CO, CO2, SO2, HCl, H2S and HCN. It is hypothesizedthat the nitrogen content in the primary air is inert, which isacceptable if the temperatures are below 1200 �C. The HCN speciesis formed only from nitrogen inside the biomass. Finally, in thismodel, the conversion process is able to consume all the amount ofavailable carbon within the organic matter.
Fig. 3. Conversion process of dry biomass.
The assumption of thermo-chemical equilibrium of the gaseousspecies can be taken into account by mean of the total Gibbs' freeenergy, which is minimized for each reaction of equilibrium asfollows:
DG0i
�Teq
�¼ �RTeq ln
�Ki
�(13)
where DG0i ðTeqÞ is the Gibbs' free energy of reaction i at atmo-
spheric pressure and temperature of thermoedynamic equilibrium[28], which is assumed equal to the temperature of the gasifier. Inparticular, the following five chemical equilibrium reactions areconsidered:
CðsÞ þ CO2⇔2 CO (14)
CðsÞ þ H2O⇔COþ H2 (15)
CðsÞ þ 2H2⇔CH4 (16)
CðsÞ þ O2⇔CO2 (17)
2H2Sþ 3O2⇔2SO2 þ 2H2O (18)
In order to solve the conversion section, atomic conservation forC, H, N, O, S and Cl must be considered in addition to the massbalance and energy equations, as described by Equations 19e23,where notation introduced in Fig. 4 are employed.
▪ inorganic matter:
_m3y3INO ¼ _m6y
6INO (19)
For each element within the volatile matter, conservation ofatoms must be respected:
_m3y3OMy3OM;j þ _m3y
3H2Onj;H2O þ _m4
Xi
y4i nj;i
¼ _m5Xi
y5i nj;i þ _m6y6OMy6OM;j; j ¼ C;H;O;N; S;Cl (20)
where nj,i represents the mass fraction of j atom in i species.According to the hypothesis of inert nitrogen, it is:
_m4y4N2
¼ _m5y5N2
(21)
M. Costa et al. / Energy 77 (2014) 244e253248
The following conservation equations also hold:
▪ total mass
_m3 þ _m4 ¼ _m5 þ _m6 (22)
▪ energy:
_m3h3 þ _m4h4 þ _qray ¼ _m5h5 þ _m6h6: (23)
Moreover, as previously outlined, it is assumed that.
y6H2O ¼ 0 (24)
y6OM;j ¼ 0; j ¼ H;O;N; S;C (25)
y6OM;C ¼ 1 (26)
The system closure also requires the check on the followingrelationship:
Xi
y5i ¼ 1: i¼O2;N2;CO;CO2;CH4;SO2;H2;H2S;H2O;HCN;HCl
(27)
3. Empirical model
For biomass combustion in a fixed bed, a one-dimensionaltransient heterogeneous model can be developed to predict thevarious conversion processes. This is in principle the same asmodelling of combustion of a single biomass particle exposed to hotambient gas containing oxygen, as demonstrated by Yin et al. [28]and Momeni et al. [29]. Thanks to the relatively small horizontalgradient, the combustion process in a fixed bed can be applied as agood approximation of a moving bed combustion on a travellinggrate, by mapping the distance on the grate with the time elapsedin the transient model via x ¼ us � t, where us is the travelling gratespeed and x is the distance on the grate away from the biomassinlet.
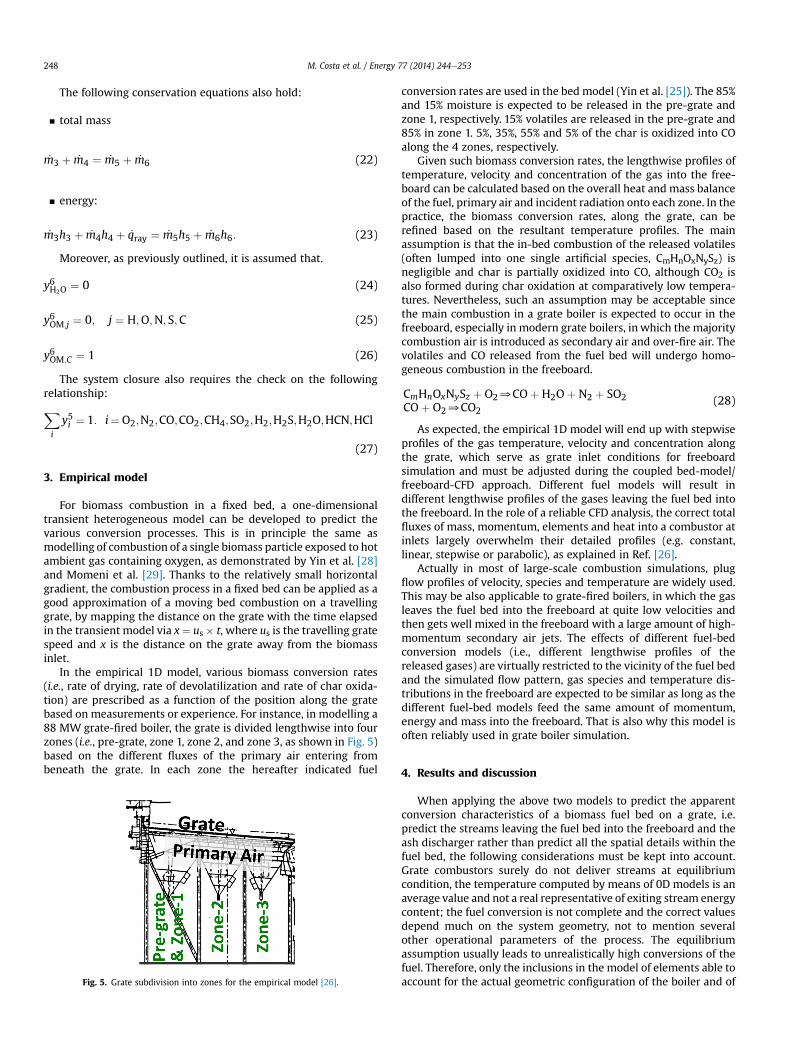
In the empirical 1D model, various biomass conversion rates(i.e., rate of drying, rate of devolatilization and rate of char oxida-tion) are prescribed as a function of the position along the gratebased on measurements or experience. For instance, in modelling a88 MW grate-fired boiler, the grate is divided lengthwise into fourzones (i.e., pre-grate, zone 1, zone 2, and zone 3, as shown in Fig. 5)based on the different fluxes of the primary air entering frombeneath the grate. In each zone the hereafter indicated fuel
Fig. 5. Grate subdivision into zones for the empirical model [26].
conversion rates are used in the bed model (Yin et al. [25]). The 85%and 15% moisture is expected to be released in the pre-grate andzone 1, respectively. 15% volatiles are released in the pre-grate and85% in zone 1. 5%, 35%, 55% and 5% of the char is oxidized into COalong the 4 zones, respectively.
Given such biomass conversion rates, the lengthwise profiles oftemperature, velocity and concentration of the gas into the free-board can be calculated based on the overall heat and mass balanceof the fuel, primary air and incident radiation onto each zone. In thepractice, the biomass conversion rates, along the grate, can berefined based on the resultant temperature profiles. The mainassumption is that the in-bed combustion of the released volatiles(often lumped into one single artificial species, CmHnOxNySz) isnegligible and char is partially oxidized into CO, although CO2 isalso formed during char oxidation at comparatively low tempera-tures. Nevertheless, such an assumption may be acceptable sincethe main combustion in a grate boiler is expected to occur in thefreeboard, especially in modern grate boilers, in which the majoritycombustion air is introduced as secondary air and over-fire air. Thevolatiles and CO released from the fuel bed will undergo homo-geneous combustion in the freeboard.
CmHnOxNySz þ O20COþH2Oþ N2 þ SO2COþ O20CO2
(28)
As expected, the empirical 1D model will end up with stepwiseprofiles of the gas temperature, velocity and concentration alongthe grate, which serve as grate inlet conditions for freeboardsimulation and must be adjusted during the coupled bed-model/freeboard-CFD approach. Different fuel models will result indifferent lengthwise profiles of the gases leaving the fuel bed intothe freeboard. In the role of a reliable CFD analysis, the correct totalfluxes of mass, momentum, elements and heat into a combustor atinlets largely overwhelm their detailed profiles (e.g. constant,linear, stepwise or parabolic), as explained in Ref. [26].
Actually in most of large-scale combustion simulations, plugflow profiles of velocity, species and temperature are widely used.This may be also applicable to grate-fired boilers, in which the gasleaves the fuel bed into the freeboard at quite low velocities andthen gets well mixed in the freeboard with a large amount of high-momentum secondary air jets. The effects of different fuel-bedconversion models (i.e., different lengthwise profiles of thereleased gases) are virtually restricted to the vicinity of the fuel bedand the simulated flow pattern, gas species and temperature dis-tributions in the freeboard are expected to be similar as long as thedifferent fuel-bed models feed the same amount of momentum,energy and mass into the freeboard. That is also why this model isoften reliably used in grate boiler simulation.
4. Results and discussion
When applying the above two models to predict the apparentconversion characteristics of a biomass fuel bed on a grate, i.e.predict the streams leaving the fuel bed into the freeboard and theash discharger rather than predict all the spatial details within thefuel bed, the following considerations must be kept into account.Grate combustors surely do not deliver streams at equilibriumcondition, the temperature computed by means of 0D models is anaverage value and not a real representative of exiting stream energycontent; the fuel conversion is not complete and the correct valuesdepend much on the system geometry, not to mention severalother operational parameters of the process. The equilibriumassumption usually leads to unrealistically high conversions of thefuel. Therefore, only the inclusions in the model of elements able toaccount for the actual geometric configuration of the boiler and of
M. Costa et al. / Energy 77 (2014) 244e253 249
the various time scales of the chemical conversion process wouldallow a better representation of the process. Nevertheless, a 0D-Smodel might provide some initial information and is usually valu-able for further development or control purposes. Analogousreasoning applies for analogy empirical or semi-empirical models.
Another issue that deserves discussion is the need to validatethe fuel bed conversion models on the ground of experimental datacollected just above the fuel bed along the grate length. Indeed, theexperimental characterization of the syngas composition fromgrate-fired boilers during the real operation of a full scale plantintroduces many difficulties due to the strong coupling betweenthe fuel bed conversion and the freeboard conversion and the greatcombustion instabilities inside the fuel bed very commonlyobserved in grate boilers, as demonstrated in Ref. [22]. This de-termines the heating of the boiler walls, with consequent heatpower reaching the fuel bed and promoting its thermal conversion.As a result, no such experimental data are available in the literatureso far. A few efforts can be found, which experimentally charac-terize the gas temperature and species evolution as a function oftime on the top of a small-scale fixed bed of biomass when it issuddenly exposed to an external heat source. However, they are stillvery different from the fuel bed conversion on a travelling grate inan industrial grate boiler, due to, e.g., the very highly inhomoge-neous biomass particle packing in the fuel bed, the very differentmovement of fuel bed, and the non-uniform incident radiation heattransfer and primary air distribution in a real grate boiler. Theexperimental validation of the models presented in the paper,therefore, could be effected only in an indirect way, after properlycoupling them with a CFD simulation of the released syngas com-bustion in the freeboard. This would anyway introduce furtherapproximations, with the consequent impossibility to distinguishthe relative error deriving from the solid phase or the gaseousphase model. For these reasons the present work just aims atcomparing the way the two models describe the thermal conver-sion of some chosen biomasses and to highlight the reason for thedifferences that may arise.
4.1. Comparison between models
The comparison between the twomodels ismadewith referenceto the biomass whose composition is reported in Table 2, thermallytreated in an 88 MW boiler. In order to have consistent results, inagreement with the assumptions of the empirical model, the dryingprocess of the two-zone 0D model is also supposed to mainly occurin thepre-grate zone,which is the14.3%of the total grate length. Thebiomass, which is at room temperature (298 K), enters with a massflow rate of 4.5 kg/s; while the heated primary air, incoming in this
Table 2Composition of wood waste and RDF.
Wood waste
Ultimate analysis %wt (DAF) Proximate analysis %wt (AR)
C 57.09 Fixed carbon 18H 7.42 Volatiles 41.94O 33.29 Water 27.12N 2.20 Ash 12.94
LHV (AR) 11100 kJ/kg
RDF
Ultimate analysis %wt (DAF) Proximate analysis %wt (AR)
C 55.34 Fixed carbon 4.71H 7.51 Volatiles 60.08O 35.73 Water 26.72N 1.42 Ash 8.49
LHV (AR) 13430 kJ/kg
zone, is at 563 K with a mass flow rate of 2.14 kg/s. Indeed, in theconversion section primary air enters at the same temperature, butwith a mass flow rate of 10.02 kg/s. Moreover, regarding the radia-tive contribution, it is considered that there is a net incident heatpower on the top of the bed of 1.6 MW Tables 3-4
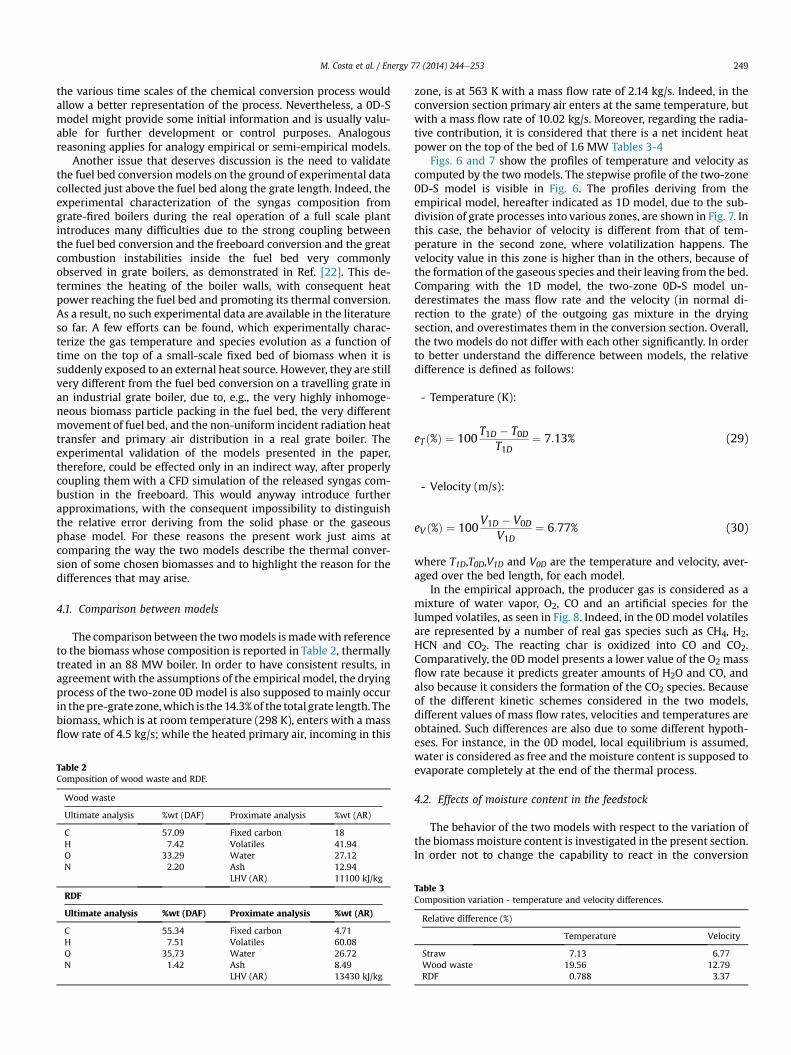
Figs. 6 and 7 show the profiles of temperature and velocity ascomputed by the two models. The stepwise profile of the two-zone0D-S model is visible in Fig. 6. The profiles deriving from theempirical model, hereafter indicated as 1D model, due to the sub-division of grate processes into various zones, are shown in Fig. 7. Inthis case, the behavior of velocity is different from that of tem-perature in the second zone, where volatilization happens. Thevelocity value in this zone is higher than in the others, because ofthe formation of the gaseous species and their leaving from the bed.Comparing with the 1D model, the two-zone 0D-S model un-derestimates the mass flow rate and the velocity (in normal di-rection to the grate) of the outgoing gas mixture in the dryingsection, and overestimates them in the conversion section. Overall,the two models do not differ with each other significantly. In orderto better understand the difference between models, the relativedifference is defined as follows:
- Temperature (K):
eTð%Þ ¼ 100T1D � T0D
T¼ 7:13% (29)
1D
- Velocity (m/s):
eV ð%Þ ¼ 100V1D � V0D
V¼ 6:77% (30)
1D
where T1D,T0D,V1D and V0D are the temperature and velocity, aver-aged over the bed length, for each model.
In the empirical approach, the producer gas is considered as amixture of water vapor, O2, CO and an artificial species for thelumped volatiles, as seen in Fig. 8. Indeed, in the 0D model volatilesare represented by a number of real gas species such as CH4, H2,HCN and CO2. The reacting char is oxidized into CO and CO2.Comparatively, the 0D model presents a lower value of the O2 massflow rate because it predicts greater amounts of H2O and CO, andalso because it considers the formation of the CO2 species. Becauseof the different kinetic schemes considered in the two models,different values of mass flow rates, velocities and temperatures areobtained. Such differences are also due to some different hypoth-eses. For instance, in the 0D model, local equilibrium is assumed,water is considered as free and the moisture content is supposed toevaporate completely at the end of the thermal process.
4.2. Effects of moisture content in the feedstock
The behavior of the two models with respect to the variation ofthe biomass moisture content is investigated in the present section.In order not to change the capability to react in the conversion
Table 3Composition variation - temperature and velocity differences.
Relative difference (%)
Temperature Velocity
Straw 7.13 6.77Wood waste 19.56 12.79RDF 0.788 3.37
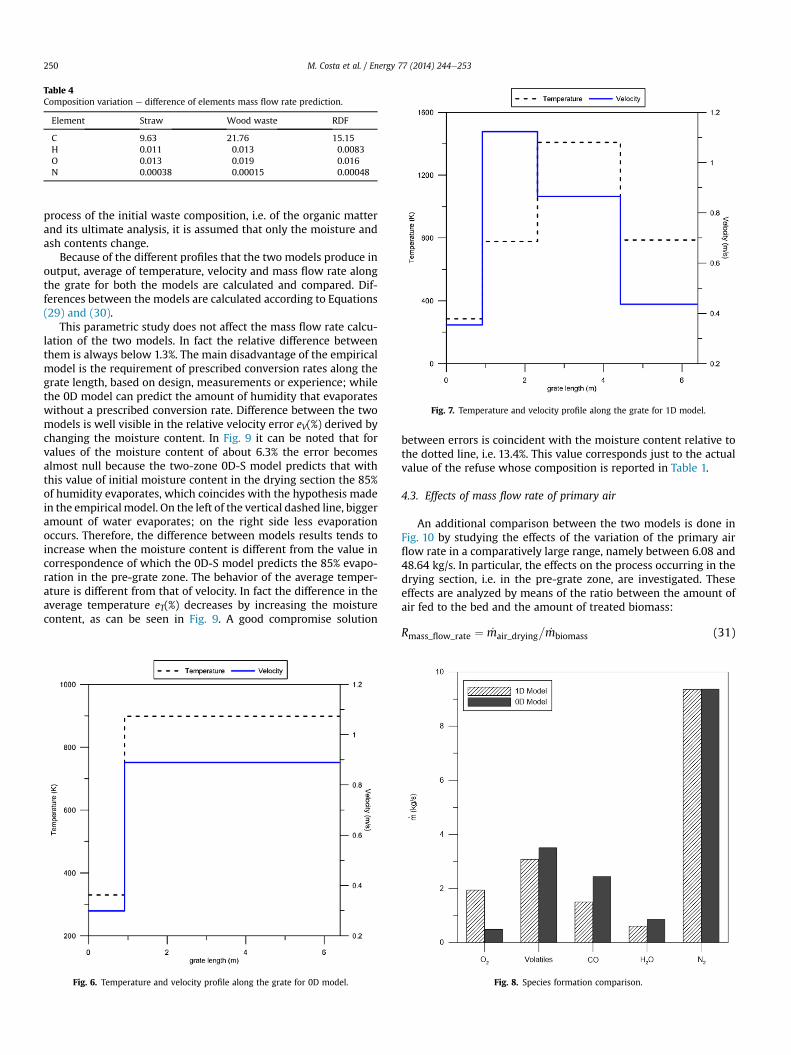
Fig. 7. Temperature and velocity profile along the grate for 1D model.
Table 4Composition variation e difference of elements mass flow rate prediction.
Element Straw Wood waste RDF
C 9.63 21.76 15.15H 0.011 0.013 0.0083O 0.013 0.019 0.016N 0.00038 0.00015 0.00048
M. Costa et al. / Energy 77 (2014) 244e253250
process of the initial waste composition, i.e. of the organic matterand its ultimate analysis, it is assumed that only the moisture andash contents change.
Because of the different profiles that the two models produce inoutput, average of temperature, velocity and mass flow rate alongthe grate for both the models are calculated and compared. Dif-ferences between the models are calculated according to Equations(29) and (30).
This parametric study does not affect the mass flow rate calcu-lation of the two models. In fact the relative difference betweenthem is always below 1.3%. The main disadvantage of the empiricalmodel is the requirement of prescribed conversion rates along thegrate length, based on design, measurements or experience; whilethe 0D model can predict the amount of humidity that evaporateswithout a prescribed conversion rate. Difference between the twomodels is well visible in the relative velocity error eV(%) derived bychanging the moisture content. In Fig. 9 it can be noted that forvalues of the moisture content of about 6.3% the error becomesalmost null because the two-zone 0D-S model predicts that withthis value of initial moisture content in the drying section the 85%of humidity evaporates, which coincides with the hypothesis madein the empiricalmodel. On the left of the vertical dashed line, biggeramount of water evaporates; on the right side less evaporationoccurs. Therefore, the difference between models results tends toincrease when the moisture content is different from the value incorrespondence of which the 0D-S model predicts the 85% evapo-ration in the pre-grate zone. The behavior of the average temper-ature is different from that of velocity. In fact the difference in theaverage temperature eT(%) decreases by increasing the moisturecontent, as can be seen in Fig. 9. A good compromise solution
Fig. 6. Temperature and velocity profile along the grate for 0D model.
between errors is coincident with the moisture content relative tothe dotted line, i.e. 13.4%. This value corresponds just to the actualvalue of the refuse whose composition is reported in Table 1.
4.3. Effects of mass flow rate of primary air
An additional comparison between the two models is done inFig. 10 by studying the effects of the variation of the primary airflow rate in a comparatively large range, namely between 6.08 and48.64 kg/s. In particular, the effects on the process occurring in thedrying section, i.e. in the pre-grate zone, are investigated. Theseeffects are analyzed by means of the ratio between the amount ofair fed to the bed and the amount of treated biomass:
Rmass_flow_rate ¼ _mair_drying�_mbiomass (31)
Fig. 8. Species formation comparison.
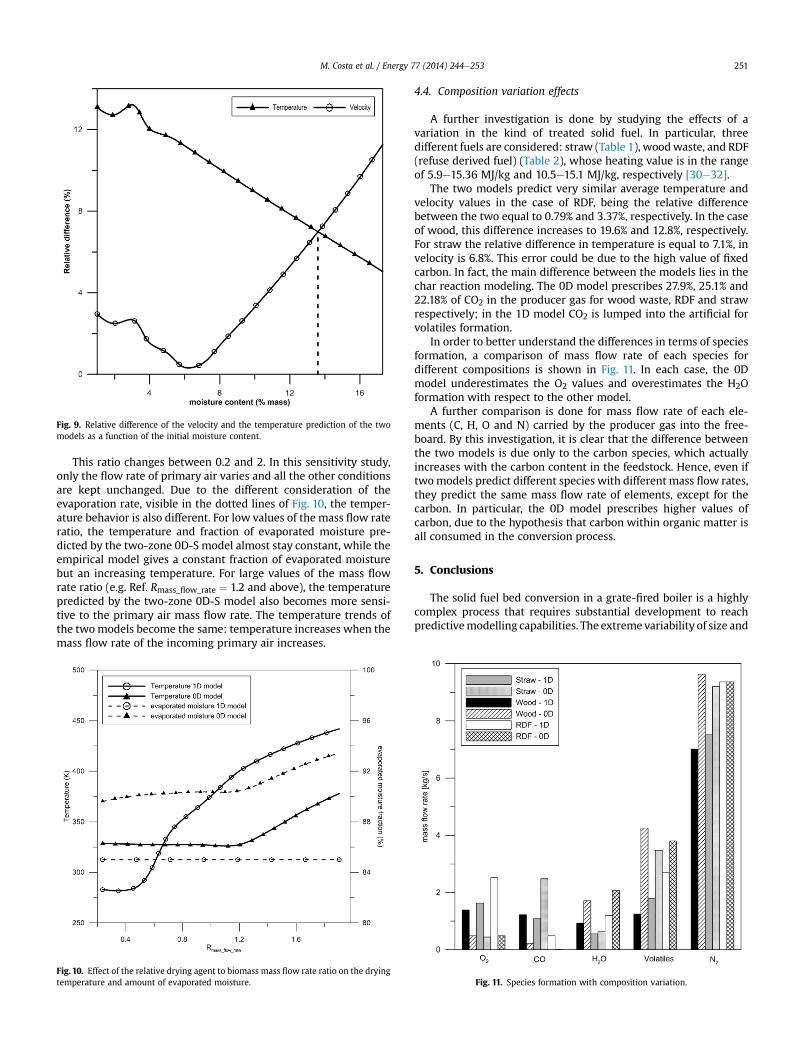
Fig. 9. Relative difference of the velocity and the temperature prediction of the twomodels as a function of the initial moisture content.
M. Costa et al. / Energy 77 (2014) 244e253 251
This ratio changes between 0.2 and 2. In this sensitivity study,only the flow rate of primary air varies and all the other conditionsare kept unchanged. Due to the different consideration of theevaporation rate, visible in the dotted lines of Fig. 10, the temper-ature behavior is also different. For low values of the mass flow rateratio, the temperature and fraction of evaporated moisture pre-dicted by the two-zone 0D-S model almost stay constant, while theempirical model gives a constant fraction of evaporated moisturebut an increasing temperature. For large values of the mass flowrate ratio (e.g. Ref. Rmass_flow_rate ¼ 1.2 and above), the temperaturepredicted by the two-zone 0D-S model also becomes more sensi-tive to the primary air mass flow rate. The temperature trends ofthe twomodels become the same: temperature increases when themass flow rate of the incoming primary air increases.
Fig. 10. Effect of the relative drying agent to biomass mass flow rate ratio on the dryingtemperature and amount of evaporated moisture.
4.4. Composition variation effects
A further investigation is done by studying the effects of avariation in the kind of treated solid fuel. In particular, threedifferent fuels are considered: straw (Table 1), woodwaste, and RDF(refuse derived fuel) (Table 2), whose heating value is in the rangeof 5.9e15.36 MJ/kg and 10.5e15.1 MJ/kg, respectively [30e32].
The two models predict very similar average temperature andvelocity values in the case of RDF, being the relative differencebetween the two equal to 0.79% and 3.37%, respectively. In the caseof wood, this difference increases to 19.6% and 12.8%, respectively.For straw the relative difference in temperature is equal to 7.1%, invelocity is 6.8%. This error could be due to the high value of fixedcarbon. In fact, the main difference between the models lies in thechar reaction modeling. The 0D model prescribes 27.9%, 25.1% and22.18% of CO2 in the producer gas for wood waste, RDF and strawrespectively; in the 1D model CO2 is lumped into the artificial forvolatiles formation.
In order to better understand the differences in terms of speciesformation, a comparison of mass flow rate of each species fordifferent compositions is shown in Fig. 11. In each case, the 0Dmodel underestimates the O2 values and overestimates the H2Oformation with respect to the other model.
A further comparison is done for mass flow rate of each ele-ments (C, H, O and N) carried by the producer gas into the free-board. By this investigation, it is clear that the difference betweenthe two models is due only to the carbon species, which actuallyincreases with the carbon content in the feedstock. Hence, even iftwomodels predict different species with different mass flow rates,they predict the same mass flow rate of elements, except for thecarbon. In particular, the 0D model prescribes higher values ofcarbon, due to the hypothesis that carbon within organic matter isall consumed in the conversion process.
5. Conclusions
The solid fuel bed conversion in a grate-fired boiler is a highlycomplex process that requires substantial development to reachpredictivemodelling capabilities. The extremevariability of size and
Fig. 11. Species formation with composition variation.
M. Costa et al. / Energy 77 (2014) 244e253252
composition of solid fuels, especially biomasses and waste derivedfrom human activities, creates the major difficulties in dealing withthis kind of problems. From the point of view of engineering ap-plications, the correct total fluxes ofmass, momentum, element andheat into a combustor or furnace at various inlets, rather than thedetailed profiles of these parameters at different inlets, play thedominant role in reliable numerical simulations. As a result, evensimplified models may be of practical interest for control purposes.In this study, two different engineering approaches for studying theconversion of a biomass bed on a grate burner are presented andcompared, both of which are characterized by a high order ofsimplification. The first model is a phenomenological numericalapproach, able to predict the formation ofmore chemical species onthe ground of the thermo-chemical equilibrium hypothesis. Thesecondmodel is an empirical approach, solving the piecewisemass,element, energy and momentum balance based on prescribed orexpected biomass conversion rates along the grate length to predictthe lengthwise profile ofmass fractions, velocity and temperature ofthe gasmixture leaving the fuel bed into the freeboard. The incidentradiative heat flux from the freeboard combustion onto the topsurface of the fuel bed is fully considered in both the modellingapproaches due to its great effect on both the drying and conversionprocesses.
Comparison between the two models and model-based sensi-tivity studies are performed, fromwhich the following conclusionscan be drawn.
- Variation of the initial moisture content within the biomassleads to errors of differences in the velocity and temperaturebehaviour predicted by the two models. The best compromisesolution is found being just the case of straw composition forwhich the conversion rates of the empirical model are defined.
- The parametric investigation on the mass flow rate of the pri-mary air explains that there is a value above which the twomodels have the same behaviour in predicting the mean bedtemperature.
- By varying the composition of biomass, it results that the maindifference between the models is only the different treatment ofthe carbon conversion. The phenomenological model generallyoverestimates the conversion rate of this element to volatiles.
In conclusion, for studies in which the main focus lies in theanalysis of the freeboard processes and combustion optimization inthe freeboard region (e.g., secondary air system optimization), suchsimplified bedmodels can be usedwithout substantial error. In fact,both the models give very close results in terms of global mass flowrate, average temperature and velocity of the producer gas, whichmay be implemented into the freeboard combustion CFD model, asgrate inlet boundary conditions.
Nomenclature
SymbolsT temperature (K)Tref reference temperature (K)_m mass flow rate (kg/s)_qray radiative flux (J/s)y mass fractionh enthalpy (J/kg)hf enthalpy of formation (J/kg)Cp heat capacityM molar mass (kg/mol)R gas constant (J/K mol)P pressure (Pa)
r density (kg/m3)DG Gibbs' free energy (J/kg)K equilibrium constanteT relative difference of temperatureeV relative difference of velocityRmass_flow_rate mass flow rate ratioDAF dry and ash free basisAR as received basis
SubscriptsINO inorganic matterOM organic matter
Superscriptssat saturation conditiondry complete drying condition
References
[1] Yin C, Rosendahl L, Kær SK. Grate-firing of biomass for heat and power pro-duction. Prog Energy Combust Sci 2008;34:725e54.
[2] Miles TR, Miles Jr TM, Baxter LL, Jenkis BM, Olden LL. Furnace deposits fromfiring biomass fuels. Biomass Bioenergy 1996;10:125e38.
[3] Venturini P, Borello D, Iossa C, Lentini D, Rispoli F. Modeling of multiphasecombustion and deposit formation in a biomass-fed furnace. Energy 2010;35:3008e21.
[4] Weber R. Scaling characteristics of aerodynamics, heat transfer, and pollutantemissions in industrial flames. In: 26th Int. Symp. Combustion, the combus-tion institute, Pittsburgh, PA; 1996. p. 3343e54.
[5] Markovic M, Bramer EA, Brem G. Experimental investigation of wood com-bustion in a fixed bed with hot air. Waste Manag 2014;34(1):49e62. http://dx.doi.org/10.1016/j.wasman.2013.09.021.
[6] Stehlik P. Up-to-date technologies in waste to energy field. Rev Chem Eng2012;8(4e6).
[7] Van Blijderveen M, Gucho EM, Bram EA, Brem G. Spontaneous ignition ofwood, char and RDF in a lab scale packed bed. Fuel 2010;89(9):2393e404.
[8] Dong W, Blasiak S. CFD modeling of ecotube in coal and waste grate com-bustion. Energy Convers Manag 2001;42:1887e96.
[9] Ryu CK, Choi S. 3-Dimensional Simulation of air mixing in the MSW In-cinerators. Combust Sci Technol 1996;119:155e70.
[10] Castaldi MJ. CFD analysis of NOx formation in waste-to-energy systems usingdetailed kinetic modeling. In: Fourth international symposium on energyfrom biomass and waste,Venice, Italy; 2012.
[11] Costa M, Dell'Isola M, Massarotti N. Numerical analysis of the thermo-fluid-dynamic field in the combustion chamber of an incinerator plant. Energy2009;34:2075e86.
[12] Costa M, Dell'Isola M, Massarotti N. Temperature and residence time of thecombustion products in a waste-to-energy plant. Fuel 2012;102:92e105.
[13] Bauer R, Goelles M, Brunner T, Dourdoumas N, Obernberger I. Modelling ofgrate combustion in a medium scale biomass furnace for control purposes.Biomass Bioenergy 2010;34:417e27.
[14] de Souza-Santos ML. Solid fuels combustion and gasification e modeling,simulation and equipment operation. NewYork, Basel: Marcel Dekker Inc; 2004.
[15] Jarungthammachote S, Dutta A. Thermodynamic equilibrium model and sec-ond law analysis of a downdraft waste gasifier. Energy 2007;32:1600e69.
[16] Vaezi M, Moghiman M, Passandideh-Fard M, Charmchi M. Modelling biomassgasification: a new approach to utilize renewable sources of energy. In: 2008ASME international mechanical engineering congress and exposition, Boston,Massachusetts, USA; 2008.
[17] Cappuccio G, Costa M, Indrizzi V, Massarotti N. Assessment of a 0D-S modelfor waste or biomass gasification. In: Proceedings of the eurasia waste man-agement symposium; 2014. p. 187e94. Istanbul, Turkey.
[18] Deydier A, Marias F, Bernada P, Couture F, Michon U. Equilibrium model for atravelling bed gasifier. Biomass Bioenergy 2011;35:133e45.
[19] Bernada P, Marias F, Deydier A, Couture F, Fourcault A. Modelling of a trav-elling bed waste gasifier. Waste Biomass Valoris 2012;3:333e53.
[20] Shin D, Choi S. The combustion of simulated waste particles in a fixed bed.Combust Flame 2000;121:167e80.
[21] Yang YB, Goh YR, Zakaria R, Nasserzadeh V, Swithenbank J. Mathematicalmodelling of MSW incineration on a travelling bed. Waste Manag 2002;22:369e80.
[22] Mendiburu AZ, Carvalho Jr JA, Coronado CJR. Thermochemical equilibriummodeling of biomass downdraft gasifier: stoichiometric models. Energy2014;66:189e201.
[23] Yin C, Rosendahl L, Kær SK, Clausen S, Hvid SL, Hille T. Mathematical modelingand experimental study of biomass combustion in a thermal 108 MW gratefired boiler. Energy Fuels 2008;22:1380e90.

M. Costa et al. / Energy 77 (2014) 244e253 253
[24] Albrecht BA, Zahirovic S, Bastiaans RJM, van Oijen JA, de Goey LPH.A premixed flamelet-PDF model for biomass combustion in a grate furnace.Energy & Fuels 2008;22(3):1570e80.
[25] G€oerner K, Klasen T. Modelling, simulation and validation of the solid biomasscombustion in different plants. Prog Comput Fluid Dyn 2006;6:225e34.
[26] Yin C, Rosendahl L, Clausen S, Hvid SL. Characterizing and modeling of an 88MW grate-fired boiler burning wheat straw: experience and lessons. Energy2012;41(1):473e82.
[27] Scharler R, Obernberger I, L€angle G, Heinzle J. CFD analysis of air flue gasrecirculation in biomass grate furnaces. In: 1st world conference on biomassfor energy and industry, Sevilla, Spain; 2000.
[28] Yin C, Kær SK, Rosendahl L, Hvid SL. Co-firing straw with coal in a swirl-stabilized dual-feed burner: modeling and experimental validation. Bio-resour Technol 2010;101(11):4169e78.
[29] Momeni M, Yin C, Kær SK, Hvid SL. Comprehensive study of ignition andcombustion of single wooden particles. Energy Fuels 2013;27(2):1061e72.
[30] Francescato V, Antonini E, Zuccoli Bergomi L. Wood fuels handbook: pro-duction, quality requirements, trading. Legnaro (IT): AIEL e Italian Agrifor-estry Energy Association; 2008.
[31] Mrus ST, Prendergast CA. Heating value of refuse derived fuel. In: Nationalwaste processing conference; 1978.
[32] Pohl M, Gebauer K, Beckmann M. Characterization of refuse derived fuels inview of the fuel technical properties. In: 8th European conference on indus-trial furnaces and boilers; 2008.