6>k)l - scholarworks
TRANSCRIPT

GENES INVOLVED IN SINORHIZOBIUM MELILOTI’S
EXOPOLYSACCHARIDE SYNTHESIS PATHWAY AND SYMBIOSIS
A thesis submitted to the faculty of San Francisco State University
in partial fulfillment of the Requirements for
the Degree
Master of Science in
Biology: Cell and Molecular Biology
by
Yasha Rezaeihaghighi
San Francisco, Califonia
April 2015
6>K)L
•

Copyright by Yasha Rezaeihaghighi
2015

CERTIFICATION OF APPROVAL
I certify that I have read “Genes involved in Sinorhizobium melilotVs
exopolysaccharide synthesis pathway and symbiosis” by Yasha Rezaeihaghighi, and
that in my opinion this work meets the criteria for approving a thesis submitted in
partial fulfillment of the requirements for the degree: Master of Science in Biology:
Cell and Molecular Biology at San Francisco State University.
cf&ujjL C c a
Joseph C. Chen
Associate Professor of Biology
Lecturer of Biology
GENES INVOLVED IN SINORHIZOBIUM MELILOTI’S EXOPOLYSACCHARIDE SYNTHESIS PATHWAY AND SYMBIOSIS
Yasha Rezaeihaghighi San Francisco, California
April 2014
The alphaproteobacterium Sinorhizobium meliloti colonizes the roots of host
plants, such as Medicago species, and induces the formation of nodules, where it fixes
molecular nitrogen in exchange for carbon compounds. A previous suppressor
analysis had identified two genes, SMc00067 and SMc03872, involved in the
synthesis of exopolysaccharide-I (EPS-I), critical for symbiosis. A loss-of-function
mutation in either gene resulted in lower production of EPS-I. We used epistasis
analysis to investigate the relationship between SMc00067 and SMc03872 and other
EPS-I synthesis genes (exoY, exoS, exoR and, expR+). I confirmed lower EPS-I levels
in the ASMc00067 and ASMc03872 mutants by direct measurement via anthrone
assays. I also found reduced expression of exoY, encoding an enzyme required for
EPS-I synthesis, in the mutants. We expected the EPS-I under-production to affect the
ability of these two mutant strains to infect and form nodules on alfalfa roots.
ASMc00067 and ASMc03872 mutants, although defective in EPS-I production, did
not show any defects in stimulating nodules compared to the wild type strain. Further
study will uncover the roles of these genes and the regulatory pathways that
influences EPS-I production and symbiosis.
I certify that the Abstract is a correct representation of the content of thisthesi
Joseph C. Chen, Chair, Thesis Committee Date

ACKNOWLEDGEMENTS
I would like to express my appreciation to Dr. Chen who accepted me into his
laboratory and not only taught me techniques in microbiology but also taught me how to
become an independent researcher. I will forever be indebted to Dr. Chen for all of his
support and tireless effort to help me succeed and realize my potential as a scientist. I
also thank my family and friends for their help and support. I want to thank the laboratory
technician Zhenzhong Huang who always helped me prepare for my experiments. I
would also like to thank Jainee Lewis for helping me in many spot assays we performed.
I also thank my committee members, Dr. Jose de la Torre and Dr. Jonathan Knight for
their advice and encouragement.
Collaborative experiments Team members assistedApodJl, ApodJl-2 spot assays and motility assays Jainee LewisMutants interactions with ExoS, ExoY, ExoR, ExpR (calcofluor assays)
Jainee Lewis
First plant assay Zhenzhong HuangSecond plant assay Suling Li, Jainee Lewis,
Zhenzhong Huang
Table of ContentsTable of contents..................................................................................................................... vi
List of Figures....................................................................................................................... viii
List of Tables............................................................................................................................ x
List of Appendices................................................................................................................... xi
BACKGROUND.......................................................................................................................1
Sinorhizobium meliloti as a model organism...................................................................... 1
Significance of exopolysaccharides.....................................................................................4
METHODS.............................................................................................................................. 10
Media and culture................................................................................................................10
Spot assays on various media to detect growth sensitivity of the mutants compared to the wild type......................................................................................................................... 1 1
Calcofluor assays to measure EPS-I production of each strain of S. meliloti at various dilutions................................................................................................................................ 1 2
Motility assays detected any flagellar defect in the strains.............................................. 13
Beta-glucuronidases (GUS) assay to measure expression of EPS-I synthesis genes ....13
<&N3 lysates of EPS-I-related genes were made............................................................... 14
Transductions to introduce desired genes into mutant strains.........................................15
Anthrone assay to measure the total amount of EPS production.....................................16
Symbiosis assay to detect the nodulation ability of deletion strains compared to wild type........................ 18
Making slants...................................................................................................................18
Surface sterilization and germination of Medicago sativa seeds................................ 19
Planting Medicago sativa seeds..................................................................................... 19
RESULTS................................................................................................................................ 21
Characterization of podJ mutants......................................................................................21
\p o d Jl mutant of S. meliloti has a motility defect as well as sensitivity to changes in media composition, but not temperature....................................................................... 2 1
Examining EPS-I production of two mutants, ASMc00067 and ASMc03872............... 24
ASMc00067 and ASMc03872 produce EPS-I at levels comparable to the exoY mutant25
ASMc00067 and ASMc03872 under-produces EPS-I in calcoflour spot assays........26
Quantitative measurement of EPS-I levels in ASMc00067 and ASMc03872 via anthrone assay................................................................................................................. 26
GUS assay measured the expression of EPS-I synthesis genes using the exoY-uidA reporter.............................................................................................................................27
Characterizing ASMc00067 and ASMc03872...................................................................28
exoS masks the under-production phenotype of ASMc00067 and ASMc03872.........29
Epistasis analysis involving exoR with SMc00067 and SMc03872 ............................29
ASMc00067 or ASMc03872 does not affect EPS-II synthesis.................................... 30
Test the nodulation ability of the ASMc00067 and ASMc03872 mutants using plantassays................................................................................................................................... 31
DISCUSSION..........................................................................................................................34
podJ gene in S. meliloti.......................................................................................................34
Properties of ASMc00067 and ASMc03872 in S. meliloti................................................37
ASMc03872 or ASMc00067 produces EPS-I at the same level as exoY mutant............ 39
The exoS gene is antagonistically epistatic to SMc00067 and SMc03872 in the EPS-I production pathway.............................................................................................................40
The gene exoR is antagonistic to SMc00067 and SMc03872 in the EPS-I production pathway................................................................................................................................ 42
EPS-I production pathway in SMc00067 and SMc03872 is not effected by expR .......42
ASMc00067 and ASMc03872 do not show any defect in nodulation..............................44
REFERENCES........................................................................................................................47
FIGURES................................................................................................................................. 56
TABLES.................................................................................................................................. 89
APPENDIX A ..........................................................................................................................95
APPENDIX B ........................................................................................................................ 103
APPENDIX C 119
List of FiguresFigure 1: Tryptone caused the sensitivity of ApodJl to the LBLS media........................ 56
Figure 2: ApodJ2 did not show any sensitivity to different media...................................... 58
Figure 3: The sensitivity of ApodJl to LBLS is not influenced by temperature................ 60
Figure 4: Alterations in EPS-I production reduces ApodJVs sensitivity to LBLS but does not relieve other defects.......................................................................................................... 61
Figure 5: ApodJ2 does not contribute to any detectable phenotypes...................................63
Figure 6 : Loss-of-function mutation in exoY further reduces EPS-I production in the ASMc00067 mutant..................................................................................................................64
Figure 7: Loss-of-function mutation in exoY further reduces EPS-I production in the SMc03872 mutant.................................................................................................................... 65
Figure 8 : The exoS gene is epistatic to SMc00067................................................................6 6
Figure 9: The exoS gene is epistatic to SMc03872................................................................67
Figure 10: The exoR gene is epistatic to SMc00067............................................................ 6 8
Figure 11: The exoR gene is epistatic to SMc03872............................................................ 69
Figure 12: In the different mutants, exoY expressions correlate with EPS-I production levels, as measured via calcofluor fluorescence....................................................................70
Figure 13: In different mutants, exoY expression correlates with EPS-I production, as measured with GUS assay.......................................................................................................71
Figure 14: ASMc00067 and ASMc03872 produce less expolysaccharides than the wild type............................................................................................................................................72
Figure 15: ExpR interacts synergistically with SMc00067.................................................74
Figure 16: The expR interacts synergistically with ASMc03872........................................75
Figure 17: Correcting mutation in the podJ gene not only restored the EPS-I levels, it also relieves any defects seen in the podJ mutants...................................................................... 77
Figure 18: Insertion ofpocLT into the mutant strain ASMc00067 interferes with EPS-I production.................................................................................................................................78
Figure 19: Insertion of podJ* into the deletion strain ASMc03872 interferes with EPS-I formation...................................................................................................................................79
Figure 20: Inserting ASMc00067 in pocLt shows a synergistic interaction between the two genes pertaining to a decrease in EPS-I production levels...........................................80
Figure 21: Inserting ASMc03872 in pocLT shows a synergistic interaction........................81
Figure 22: The mutant strains ASMc00067 and ASMc03872 do not exhibit any defect in nodulation capacity when compared to the wild type...........................................................82
Figure 23: Nodule of plants inoculated with the mutant strains ASMc00067,+6 podJ + ...Q and ASMc03872 and show lower nodule number compared to the wild type strain fourteen days after inoculation............................................................................................... 84
Figure 24: Nodule of plants inoculated with the mutants strains ASMc03872 and ASMc00067 show the same nodule number compared to the wild type and podJ + ...Q twenty one days after inoculation...........................................................................................8 6
Figure 25: The plant assay showed that there is no significant nodule forming defect seen between plants inoculated with mutant strains in comparison to the wild type 28 days after inoculation....................................................................................................................... 8 8

List of Tables
Table 1: All the strains used in this paper are listed in this paper....................................... 89
Table 2: The GUS activities of strain carrying PexoY uidA summary table shows the summarized data...................................................................................................................... 91
Table 3: Data of an Anthron assay done with glucose standard curves..............................92
Table 4: Data of Anthron assays done with a glucose standard curves.............................. 93
Table 5: The summary of the two anthrone assays done......................................................94
x
APPENDIX AList of Appendix
95
ApodJ2 S.meliloti strain behaves like the wild type, showing no sensitivity to media, temperatures and exhibits normal motility....................................................................... 95
Introduction of exoY into /W //elliveates PodTs sensitivity to LBLS bot not deoxycholate........................................................................................................................96
ApodJl-2 S. meliloti strains’ phenotype similarity to ApodJl affirms that ApodJ2 has no role in the defects seen in ApodJ mutants................................................................96
Correcting thepodJmutation in S.meliloti strains relieves the phenotype defect of A podJl................................................................................ 97
Inserting pod J corrected {podJ ...Q) in to either of the deletion strains A SMc03872 or ASMc00067 interferes with EPS-I formation.......................................................... 99
■I-
Inserting SMc03872 and SMc00067 genes into pod J corrected (podJ ...Q) interferes with EPS-I formation....................................................................................100
The gene PodX is antagonistic to SMc00067 and SMc03872 in EPS-I production pathway.......................................................................................................................... 1 0 0
APPENDIX B ........................................................................................................................103
Table IB: The raw data shows the calcoflour fluorescence pertaining to figure 6 ......103
Table 2B: The raw data shows the calcoflour fluorescence pertaining to figure 7......104
Table 3B: The raw data shows the calcoflour fluorescence pertaining to figure 8 ......105
Table 4B: The raw data shows the calcoflour fluorescence pertaining to figure 9......106
Table 5B: The raw data shows the calcoflour fluorescence pertaining to figure 10....107
Table 6 B: The raw data shows the calcoflour fluorescence pertaining to figure 11....109
Table7B: The raw data shows the calcoflour fluorescence pertaining to figure 12......... 110
Table 8 B: The raw data shows the calcoflour fluorescence pertaining to figure 15....112
Table 9B: The raw data shows the calcoflour fluorescence pertaining to figure 16....113
Table 10B: The raw data shows the calcoflour fluorescence pertaining to figure 17...... 114
Tablel IB: The raw data shows the calcoflour fluorescence pertaining to figure 19....... 115
Table 12B: The raw data shows the calcoflour fluorescence pertaining to figure 18...... 116
Table 13B: The raw data shows the calcoflour fluorescence pertaining to figure 20....117
Table 14B: The raw data shows the calcoflour fluorescence pertaining to figure 21....118
APPENDIX C ........................................................................................................................119
Table 1C: Raw plant data assay pertaining to figure 22..................................................... 119
Table 2C: Raw plant data assay pertaining to figure 23.....................................................120
Table 3C: Raw plant data assay pertaining to figure 24....................................................122
Table 4C: Raw plant data assay pertaining to figure 25..................................................... 123

1
BACKGROUND
Sinorhizobium meliloti as a model organism
Sinorhizobium meliloti, a Gram negative alphaproteobacterium, is a useful model
organism for investigating infections as well as molecular signaling. S. meliloti invades
the roots of its symbiotic partners, such as alfalfa (Madicago sativa), where it fixes
atmospheric nitrogen for the host plant in exchange for carbon (Long et al., 1988). As a
symbiont of an agriculturally and economically important plant, S. meliloti reduces the
need for nitrogen fertilizers. S. meliloti enters the roots of legume plants in a manner
similar to pathogenic bacteria invading mammalian cells. This invasion causes the
formation of nodules (growth on the roots of alfalfa) where the bacteria reside (Janczarek,
2011). Studying the interaction between S. meliloti and its host plants will help us learn
more about the regulatory pathways responsible for bacterial invasion of eukaryotic cells.
A complex array of signals allows S. meliloti to enter into a symbiotic relationship
with leguminous plants, resulting in the formation of indeterminate nodules on the roots
of these plants (Wells and Long, 2002). The signaling for symbiosis begins as the legume
releases phenolic compounds called flavonoid (an aromatic compound). Flavonoids, in S.
meliloti, induce NodD transcriptional activators, which bind to the conserved promoter
elements called nod boxes, located upstream of the nodulation genes. Expression of these
genes results in the production of lipochitooligosaccharides called Nod factors. Nod
factors cause a change in the growth of the epidermal root hair, such that they curl around
bacterial cells as a result of an increase in the intercellular calcium levels. Nod factors
2
also invoke the legume to form infection threads inside the root hair. Infection threads are
long, tube-like structures by which the bacteria enter into specific target cells, which lie
on the deeper layer of plant tissue. The bacteria are taken up into inner root cortex cells,
in a host-membrane-bound compartment known as the symbiosome. The bacteria in the
symbiosome then develop into bacteriods that can convert atmospheric nitrogen into
ammonia for the plant in exchange for carbon compounds provided by the plant (Jones et
al., 2007) (Gonzalez and Marketon, 2003) (Jones, 2012).
S. melilotfs ability to enter into a symbiotic relationship with alfalfa and provide
its plant host with nitrogenous compounds is of great agricultural and economic
importance. Alfalfa is the most cultivated forage plant in North America and is the third
largest produced crop after com and soybean (Zhou et al., 2011). Alfalfa is a favored
crop, earning the nickname “queen of forage crops,” because of its high yield, drought
tolerance, and high quality forage. The high value of alfalfa is mostly derived because of
its use for hay production (Zhou et al., 2011).
Alfalfa’s ability to provide its own nitrogen source via a symbiotic relationship
with S. meliloti eliminates the need for nitrogen-supplemented fertilizers. Every year,
production of exogenous fertilizers (nitrogen fertilizers being one of the most produced)
costs billions of dollars and adds a significant amount of pollution into the environment.
These fertilizers not only contaminate freshwater supplies and endanger a variety of
organisms thriving in those environments, they also contribute to the production of
greenhouse gases (Di Lorenzo et al., 2013) (Wan et al., 2012). Fertilizers also contain
toxic chemicals, such as heavy metals, that contaminate the soil and appear in vegetables,
3
fruits, and grains. The nitrogen-fixing ability of S. meliloti for alfalfa solves this problem
naturally, eliminating toxic byproducts. For this reason it is very important to understand
and study the symbiotic relationship between S. meliloti and M. sativa to determine the
genes responsible. By understanding the molecular mechanism underlying this symbiosis,
we can utilize the knowledge to improve the yield of alfalfa and possibly other crops in
the future.
Besides being a symbiont of a major crop, S. meliloti is related to plant pathogens
like Agrobacterium and animal pathogens like Brucella (Galibert et al., 2001). This
genetic relatedness makes S. meliloti a great tool for discovering homologs and pathways
that lead to virulence in pathogenic bacteria. For example A. tumefaciens, a member of
the Rhizobiaceae family, is a plant pathogen that causes crown-gall disease, characterized
by the growth of tumor-like structures between the root and the shoot of plants. S.
meliloti and A. tumefaciens share similar genetic pathways (Pitzschke, 2013). The gene
that encodes for the periplasm protein ExoR was first identified in S. meliloti as part of a
signaling regulatory pathways involved in exopolysaccharide I (EPS-I or succinoglycan)
production. The exoR gene was later discovered to have an ortholog in Agrobacterium. A
disruption in the exoR ortholog in Agrobacterium renders the bacteria unable to attach to
abiotic surfaces as well as plant tissue (Tomlinson et al., 2010).
S. meliloti also shares characteristics with pathogens like Brucella, another group
of Alphaproteobacteria, which can infect both domestic livestock and humans. B. abortus
is one species that can cause abortion in domestic livestock and Malta fever in humans
(He, 2012). For example, B. abortus has a gene, exsA which encodes for an ABC
4
transporter component involved in pathogenesis. The exsA ortholog in S. meliloti encodes
for an exopolysaccharide transporter essential for alfalfa root nodule invasion and
infection (Rosinha et al., 2002) (Galinska and Zagorski, 2013). The more insights we
gain into the genetic and regulatory pathways of S. meliloti, the more useful traits we can
discover about its pathogenic counter-parts.
The model organism S. meliloti provides an opportunity to study an agriculturally
significant symbiont and to gain insight into how conserved genes might function in
related Alphaproteobacteia, including pathogens. In particular, S.meliloti can live both as
a free-living organism and as a symbiont of plants. Thus, we can compare signaling in
different states of the bacteria (Jimenez-Zurdo et al., 2013). We can investigate the genes
contributing to specific physiological processes in the free-living state and then observe
how these genes help or hinder the symbiosis process with the plant host.
Significance of exopolysaccharides
S. meliloti produces exopolysaccharides (EPS) that play an essential part in its cell
invasion process (Sorroche et al., 2012). EPS-I is one of the main components of biofilm
and necessary in cell invasion and nodulation. Because of the pivotal role that EPS play
in cell invasion and infection, understanding the underlying genetic pathways and
mechanisms responsible for EPS production is crucial (Dorken et al., 2012; Leigh et al.,
1985). Uncovering how the pathways are regulated may help us manipulate those
bacterial systems in the future.
S. melilotVs genome has been sequenced and is well studied, making it easier to
identify genes involved in EPS synthesis. S. meliloti possesses the following: one
5
chromosome (3.65 Mb) and two megaplasmids [pSymA (1.35Mb) and pSymB (1.68
Mb)] (Charles and Finan, 1991). Genes related to EPS-I synthesis mostly reside on the
pSymB plasmid. The exo/exs, exp or pss genes are known to be responsible for the
synthesis, modification, polymerization, and export of EPS (Oke and Long, 1999)
(Skorupska et al., 2006).
S. meliloti requires the production of EPS to invade the roots of host plants. S.
meliloti produces five types of polysaccharides: succinoglycan (EPS-I), galactoglucan
(EPS-II), K antigen (a surface polysaccharide), lipopolysaccharides, and cyclic p-glucans
(Fraysse et al., 2003). The first three are considered the main EPSs produced and take
part in essential symbiosis activities, such as extension of the infection thread. EPSs not
only act as signaling molecules, but have also been shown to be part of the infection
thread itself, along with the plant cell wall (Mendis et al., 2013). EPSs also appear to play
a role in down-regulating the plants’ defense responses so that the bacteria is able to enter
the plant roots successfully (Fraysse et al., 2003)(van Workum, 1995). The EPSs are
produced in different concentrations depending on the bacterial environment. The main
type of EPS produced is EPS-I, which is produced under normal conditions; however,
under low phosphate conditions in the soil, EPS-II is produced. EPS-II is not a perfect
substitute, as it will allow the bacterium to infect a smaller variety of plant hosts
(Mendrygal and Gonzalez, 2000).
Succinoglycan (EPS-I) is one of the two acidic exopolysaccharides produced by
S. meliloti which is essential for nodulation. Succinoglycan is composed of
octosasccharide repeating units joined by (3-1,3, (3-1,4, and (3-1,6 glycosidic linkages;

6
each single unit also contains acetyl, pyruvyl, and succinyl groups (Skorupska et al.,
2006). Presence of EPS-I is essential because it is the only symbiotically active EPS
produced in sufficient quantities to stimulate infection thread formation and subsequent
nitrogen fixation. Mutations in the exo genes (required to produce EPS-I) result in S.
meliloti strains that stimulate the growth of small root nodules containing few bacteroids.
Furthermore, these nodules were unable to fix nitrogen (Finan et al., 1985) (Leigh et al.,
1985). This defect was rescued when a small amount of purified EPS-I was added to the
root directly (Djordjevic et al., 1987) (Battisti et al., 1992). Therefore, it was concluded
that EPS-I has an important signaling function but likely not required as a structural part
of the infection thread matrix (Wang et al., 1999) (Urzainqui and Walker, 1992)
(Gonzalez et al., 1998). The production of exopolysaccharides is dependent on a group of
biosynthetic genes predominantly located in a 27-kb cluster on the second symbiotic
mega-plasmid pSymB (Reuber and Walker, 1993) (Reed et al., 1991) (Glucksmann et al.,
1993a) (Glucksmann et al., 1993b). In this paper we have focused mostly on EPS-I and
the genes that directly or indirectly play a role in its synthesis.
Galactoglucan, also known as exopolysaccharide II (EPS-II), is the second class
of polysaccharides. EPS-II is a polymer of disaccharide repeating units composed of an
acetylated glucose and one pyruvylated galactose, which are coupled by a -1,3 and P-1,3
glycosidic bonds (Becker et al., 2002). In the lab strain Rml021, EPS-II is not produced
because of an insertion in the expR genes. This insertion interferes with expR’’s gene
product, a luxR-type transcriptional activator, that is required for EPS-II synthesis
(Pellock et al., 2002) (Becker et al., 2002). Rml021 can produce EPS-II if it is induced
7
(for example, if the expR gene is fixed). Another factor that can influence EPS-II
production is environmental conditions. EPS-II is produced at low levels in S. meliloti,
but increased production of EPS-II is stimulated under low phosphate soil conditions.
EPS-II, however, does not allow invasion of alfalfa nodules (Mendrygal and Gonzalez,
2000). The 30-kb cluster of exp genes necessary for the production of EPS-II is also
located in the second megaplasmid pSymB. These genes are distinct from the genes that
produce EPS-I (Glazebrook and Walker, 1989).
K antigen is only present in certain S. meliloti strains (such as Rm41, a laboratory
strain), and is produced in the absence of both EPS-I and EPS-II. K antigen, similar to
EPS-I and EPS-II, can support infection thread initiation and extension and nodule
development, but not as effectively as either (Pellock et al., 2000)(Sharypova et al.,
2006). The laboratory strain that we use, Rml021, does not produce K antigen.
In this paper we have mostly focused on genes responsible for the production of
EPS-I. In the literature many exo genes have been identified as key players responsible
for the production of EPS-I in S. meliloti (Skorupska et al., 2006). However, there are still
many genes that are involved in EPS-I production but have not been identified or
characterized.
Mutants are very important when studying functions of genes because they
exhibit characteristics or traits different from the wild type, giving us direct clues about
the roles of the mutated genes. Several of the mutants being investigated in this study
were discovered through analysis of a previously identified gene podJl. These genes are
SMc00067, which encodes an outer membrane lipoprotein (IppA), and SMc03872, which

encodes a putative Zn-dependent protease (jspA). I investigated the characteristics of
these novel genes and the role they play in EPS-I formation, nodulation, and interaction
with other EPS genes. I measured the amount of EPS-I production in the two mutants and
the transcriptional level of an EPS-I reporter gene. Using double mutants, I investigated
how the two genes (SMc00067 and SMc03872) interact with other EPS synthesis genes.
To determine if the mutants are disadvantaged in nodulation due to their decreased levels
of EPS-I, I also measured the mutants’ ability to nodulate the roots of alfalfa plants.
The exact genetics and mechanisms of EPS-I formation and how they relate to
EPS-I formation, nodulation, and infection are not known. These mutant studies could
potentially lead to drug discoveries that combat antibiotic-resistant strains of bacteria.
Investigating genes and mechanisms by which bacteria invade eukaryotic cells can help
engineer drugs that prevent the invasion process and reduce bacterial virulence.
Hypothesis: I hypothesized that reduction of EPS-I in the ASMc00067 and
ASMc03872 mutants of S. meliloti hinders the bacterium’s ability to nodulate the roots of
alfalfa; furthermore the gene products of SMc00067 and SMc03872 regulate expression
of genes involved in EPS-I biosynthesis.
8

9

10
METHODS
Media and culture
All strains of S. meliloti used in this study are listed in Table 1. S. meliloti cultures
were grown at 30°C with aeration overnight. S. meliloti cultures were grown in one of the
following liquid growth media: peptone yeast extract (PYE), a rich medium containing 2
g/L Bactopeptone, 1 g/L yeast extract, 0.5mM CaCh. andl mM MgSOWHoO; tryptone
yeast extract (TY) media containing 6 g/L trypton, 3g/L yeast extract, and 3.4 mM
CaCl2*7 H2 0 ; Luria Bertani (LB), a rich media containing 10 g/L tryptone, 5 g/L yeast
extract, and 10 g/L NaCl; M9 + 1 % mannitol, a minimal medium, which contains IX M9
salts (5.8 g/L Na2HP04, 3 g/L KH2P04, 0.5 g/L NaCl, and 1 g/L NH4C1), 1 0 g/L
mannitol, 1 mM MgS04*7H20, and 0.2 mg/mL biotin.
The media used for plating was PYE with 15 g/L Bacto agar, containing one or
more of these antibiotics as needed: 50 or 100 pg/mL neomycin, 250 pg/mL
streptomycin, 25 pg/mL gentamycin, 1 pg/mL tetracycline. Another media used for
plating was LB with 15 g/L Bacto agar containing one or more of these antibiotics as
needed: 250 pg/mL streptomycin, 100 pg/mL kanamycin, and 20 pg/mL gentamycin. LB
plates with 0.1% deoxycholate were also used for strain sensitivity experiments. Luria
Bertani Low Salt (LBLS) media plates were made using the same recipe as LB plates
with the exception of reducing the amount of NaCl from 10 g/L to 1 g/L. In one study,
NaCl in the LB and LBLS plates was substituted with MgS04 at the same osmolality.
The plant assay agar was made with IX BNM in 1 liter which can make 120
tubes, each containing 8.1ml of agar. IX BNM agar was made with 2 mL of 500X BNM
majors (0.5M MgS04*7H20 , 1M KH2P 04, 0.25M MES), 2 mL of 500X BNM minors
(1.9g Na2EDTA«2H20 , 1.4g FeS04*7H20 , 300mg ZnS04*7H20 , 300mg H3B 03, 300mg
MnS04»H20 , 30mg Na2M o04*2H20 , 3mg CuS04, 3mg CoCl2), 2ml of 500X BNM
CaCl2 (0.5M CaCl2*2H20), 13g/L phytoagar with enough 2N KOH to reach a pH of 6.3
(Griffitts and Long, 2008). The tubes were then autoclaved with lids on and left to cool
down for a day before use.
Spot assays on various media to detect growth sensitivity of the mutants compared to the wild type
All the strains were grown overnight (approximately 15 hours) in 5 ml of PYE
media. The Optical Density (OD) of the samples was measured at 600nm (A6oo)- All the
cultures were back-diluted to an A6oo of 0.25 to standardize them. Then the cultures were
put in the shaker at 30°C for 3 hours to reach an A6oo value of approximately 0.5.
Subsequently, each strain was serially diluted by ten-folds six times to produce culture
dilutions fromlO"1 to 10' 6 of the original culture using a 48 well plate. The different
dilutions will help us observe the sensitivity of each strain more clearly at different
bacterial densities. Then 5 pi of each dilution from 1 O' 2 to 1 O' 6 were spotted on different
media plates (PYE, LB, LBLS, and LB+deoxycholate). This aided in pinpointing the
specific ingredient in the media causing the sensitivity phenotype of the mutant strain.
The plates were incubated at 30°C for 3 days and imaged. The sensitivity of the mutant
11
strains to different media was measured in all dilutions from the picture taken under
visible light.
Calcofluor assays to measure EPS-I production of each strain of S.meliloti at various dilutions
Calcofluor directly binds to EPS-I and emits fluorescence under UV light. We
have used that property of calcoflour to indirectly measure the amount of EPS-I that the
bacteria produced (Leigh et al., 1985). In this set of experiments, I used the same
procedure as the spot assay explained in the previous section; however, 1 utilized Luria
Bertani (LB) plates (1% tryptone, 0.5% yeast extract, 1% NaCl, 1.5% Bacto agar) with
0.02% calcofuor and 250 )j,g/mL streptomycin.
The plates were incubated for 3 days and imaged on the third day under UV light
using Kodak 4000R digital imaging system. Fluorescence intensity was measured using
Kodak Molecular Imaging software by manually circling each spot and as well as the
background. The software assigned a net intensity to each spot according to its
fluorescence in the specific plate. The fluorescence of the background was subtracted
from each spot, giving an adjusted net intensity value. Subsequently all the dilutions of
the same strain were summed and labeled as overall average. Dividing the overall
average net intensity of that strain by the overall average net intensity of the wild type
then multiplied by one hundred gives the percentage fluorescence of each strain
compared to the fluorescence of the wild type strain. We used the abbreviation
Fluorescence Compared to the Wild Type (FCWT). The wild type percentage for all sets
performed on different days were calculated and averaged. Then the standard deviations
12

13
between the sets were calculated. The averages of all sets were graphed and the standard
deviation is shown with error bars to give a comparative measurement of EPS-I levels in
the strains. Most graphs are a summary of several plates for a more accurate
representation. Calcofluor fluorescence provides a quanitative EPS-I measurement for
each strain compared in the experiments.
Motility assays detected any flagellar defect in the strains
1.5 (al of the overnight culture was inoculated in four different quadrants of the
motility plates (PYE with 0.25% Bactoagar). The plates were left at 30°C for three days
to grow. The circumference of growth represents S. meliloti's ability to swim away from
the inoculation area using its flagella. Small aggregated growth at the site of inoculation
on the motility agar represents a defect in the motility, and therefore possibly the flagella,
of the bacteria.
Beta-glucuronidases (GUS) assay to measure expression of EPS-I synthesis genes
Overnight cultures of the strains were grown in LB media. The A6oo of the
cultures was taken and the cultures were back diluted to an A6oo value of 0.25. The
cultures were put in the shaker at 30°C for three hours and the A6oo was measured again
to ensure that doubling of the A6oo to 0.5, at which point the cultures are at mid-log phase.
200|nl of culture was aliquot in a 1.7-ml VWR tube (in triplicates for each strain)
and spun for one minute. The supernatant was aspirated at and re-suspended in 0.75ml of
freshly prepared lysis buffer [50 mM sodium phosphate buffer, pH 7.0, 10 mM P-
mercaptoethanol, and 0.1% (v/v) Triton X-100], 100|il of chloroform was then added to
14
each tube, and the tubes were mixed briefly using the vortex mixer. Adding the lysis
buffer and chloroform lysed the cells and released the contents into the solution. The
tubes were then centrifuged briefly to remove any cell debris.
100(il of 10 mM p-nitrophenyl-p-D-glucuronide (PNPG), dissolved in 50 mM
sodium phosphate buffer, was added to the tubes, and the tubes were mixed. As soon as
the last tube was spun; we started the timer and incubated the tubes in 37°C water bath.
In this step the substrate PNPG is cleaved by the GUS produced as the exoY gene is
transcribed. This cleavage of PNPG yields PNP, which is a yellow fluorescent product
The tubes were monitored to detect any color change to yellow, at which point we
stopped the timer and added 400 |il of the stop solution [1M Na2CC>3] to each tube. We
recorded the amount of time it took for each tube to turn color. The sooner the color
changes, the more exoY gene is being transcribed. The tubes were then centrifuged for
five minutes, and the A415 of the supernatants were measured against the control blanks.
The GUS assay activity was then calculated in Miller Units (Miller units=[A4 i5/ (time in
minutes x volume (in mL) x A6oo)]x 1000) (Beck et al., 2008).
<I>N3 lysates of EPS-I-related genes were made
We prepared 5 ml of overnight PYE cultures of the strains and then back-diluted
them to A600 of 0.4 in PYE. The cultures were grown for an additional three hours at
30°C. After three hours of incubation the cultures were measured at the expected A6ooof
0.8. We then proceeded to aliquot 200 |al of each culture and mix it with 10 |_il of seed
ON3, 7.5 (0.1 of 1M CaCb, and 50 jj.1 of 20% glucose in a 1.7-ml tube. The mixture was
15
then incubated at 30°C for 20 minutes to allow the bacteriophage adequate time to infect
the cells. Then we added 3 ml of molten PYE top agar (0.25% Bacto agar in PYE) to the
mixture and swirled and poured on top of a plain PYE plate. After the agar had solidified,
the plates were inverted and left in the incubator at 30°C overnight. The previous step
allowed for the bacateriaphage to lyse the cells and uptake bacterial DNA into their
capsids. A small number of these phages will be carrying the gene of interest that we aim
to introduce into the mutant strains.
The next day we gently scraped off the top agar lawn from the plate and collected
it in a 50 ml conical tube. Next we used 3.5ml of liquid PYE to wash the remaining top
agar, which contained any remaining lysates left on the plate, and added it to the 50 mL
tube. Then we added 100 pi of chloroform to the tube to lyse any residual cells and
mixed. The mixture was incubated overnight at 4°C. The next day the mixture was
centrifuged at 8000 g for 30 minutes in order to separate the agar from the mix. The agar
precipitated at the bottom of the tube, and the supernatant was collected. 1 0 0 pi of
chloroform was added to the supernatant to preserve the lysate for the transduction
experiments.
Transductions to introduce desired genes into mutant strains
5 ml of overnight cultures of the recipient strains were grown for 14-16 hours at
30°C. Then 2.5 mM CaCl2 was added to each to culture to facilitates the adhesion of the
bacteriophage to the bacterial cell. Then we added 100 pi of phage lysate along with 200
pi of the recipient strain culture in an eppendorf tube. We incubated the mixture at 30°C

16
for 2 0 minutes, giving the phage the opportunity to infect the bacterial cell and transfer
the desired gene into the recipient strain. Then 1 ml of PYE+ 10 mM sodium citrate was
added to the eppendorf tube and vortexed to prevent bacteriophage from further infecting
the bacteria.
The tube was then centrifuged for 1 minute at 6000 rpm, and the cell pellet was
saved and the supernatant was aspirated. The pellet was then washed twice by re-
suspending it in 1 ml of plain PYE, centrifuging it for 1 minute at 6000 rpm, and
aspirating the supernatant. The wash step eliminates any remaining phages so that the
surviving bacterial cells are able to grow. The final pellet was re-suspended in 75 pL of
PYE+10 mM sodium citrate, poured on the plate and spread with glass beads. In this step
only the bacteria with the transduced gene which contains an antibiotic resistance cassette
will survive and grow on the plates. This process allowed us to eliminate the bacteria that
have not taken up the desired gene. Next, the plates were left to grow for 3 days at 30°C.
The colonies with least amount of lysis were re-streaked repeatedly until no more lysis
was seen in the colonies. (Martin and Long, 1984)
Anthrone assay to measure the total amount of EPS production
Overnight cultures of the strains were grown in TY medium along with a negative
control that includes only TY medium. In the morning the cultures were back-diluted to
A oo of 0.15 and left to grow for 6 hours in the shaker at 30°C to reach mid-log phase. At
this point the cultures were back-diluted again to reach an A6oo of 0.5. Then we aliquoted
3 mL of each culture into eppendorff tubes and centrifuged the samples for 10 minutes at
24000 ref to obtain a cell pellet. Then the pellet was washed and re-suspended in 3 ml of
M9 + 1% mannitol (a media lacking hexose sugars) and brought to an A6oo of 0.5. At this
point any hexose sugar produced are formed by the bacteria (Jones, 2012).
After the cultures were incubated at 30°C for 24 hours and the A6oo was
measured, 1.4 mL of each culture was harvested and centrifuged for 10 minutes at 4500
ref. All of the exopolysaccharides are in the supernatant. From this point on we made
sure that all plastic-ware and solutions were dust-free, and we filtered all of the solutions
used (water, cetrimide solution, and 10% NaCl). We transferred 1 ml of supernatants to a
new eppendorf tube, added 0 .3 ml of freshly made 1 % cetrimide (dissolved in water) to
each tube, and mixed well via the vortex mixer. The cetrimide causes the EPS present in
the solution to precipitate so we can separate it from other impurities (Leigh et al., 1985).
We centrifuged the solution for 10 minutes at 25000 ref to obtain the EPS pellet.
Next we aspirated the supernatant carefully, and the pellet was re-suspended in
150 | 1 of 10% NaCl (for strains that overproduce EPS-I, 300 |al of NaCl were used). The
tubes are placed in the shaker at 37°C for one hour so that the EPS pellet solubilizes in
the 10% NaCl solution. Then the EPS samples were boiled for five minutes and
centrifuged for 2 minutes at 25000 ref to pellet the insoluble debris. To dilute the
samples, we added 20 | 1 of each EPS solution to 380pl of water and placed them on ice.
We prepared glucose standards of 10, 5, 2.5, 1.25, 0.625 and 0 ng per assay (300 (il) for
normalization.
17
In the fume hood, we added 600 jal of anthrone solution (0.2% anthrone in
concentrated H2SO4) to clean tubes, all of which were kept on ice. Then 300(jl of the
diluted EPS samples were added on top of the anthrone solution slowly. The same
procedure was performed for the standard samples; 300 pi of each glucose standard was
added on top of the 600 |ul of anthrone solution in tubes on ice. Then the solutions were
briefly mixed with vortex mixer and put back on ice immediately. Since the reaction is
exothermic, all the tubes are kept on ice for safety. The H2SO4 dehydrates the
carbohydrates to form furfural which then condenses with anthrone to form a bluish-
green complex. All the tubes (including glucose standards) were boiled for 10 minutes on
the heat block and put back on ice to chill for five minutes. Then the tubes were spun
briefly to homogenize and the contents poured into cuvettes under the hood. The A620 of
all the samples were measured. Using the glucose standard curve we were able to
calculate the amount of EPS (pg/assay) of each sample. (York et al., 1986)(Hansen and
Moller, 1975) The percentage of EPS compare to wild type was calculated by dividing
the amount of EPS-I in each strain by the amount of EPS-I in the wild type. Amount of
EPS per culture OD was calculated by the amount of EPS divided by the OD of the
overnight cultures.
Symbiosis assay to detect the nodulation ability of deletion strains compared to wild type
Making slants
500 ml of 1XBNM agar was made according to the recipe in the material and
methods section. We microwaved the solution to dissolve the agar by bringing it to a boil.
18
Then 8.1 mL of the media was distributed into the 18X150-mm glass test tubes. The
plastic caps were put on the tubes loosely and all the tubes were autoclaved for 30
minutes. After autoclaving, the tubes were tilted and left to solidify to create slants.
Surface sterilization and germination of Medicago sativa seeds
20-30 grams of alfalfa sativa seeds were poured into a 125mL flask. Sufficient
amount of 70% ethanol was poured on the seeds to cover them completely. The flask was
then incubated in the shaker for 20 minutes at room temperature. The ethanol was poured
out, and the seeds were washed with water once. Then, in the chemical hood, 50% Clorox
(made with sterile water) was added to cover the seeds. The seeds were put on the shaker
for another 20 minutes at room temperature. Then the Clorox was poured off and the
seeds were rinsed with sterile water at least four times. This step sterilized the seeds,
removing any bacteria that might already exist on them, as well as helped the seeds
germinate in the next step by providing the acidic environment that weakens the seed
coat. The seeds were imbibed in sterile water for 4-6 hours, while the water was changed
every hour. The water and seeds were poured into a tall petri dish, and the water was
removed using a serological pipet. The lid was placed on the petri dish, and the dish was
inverted and partially sealed with parafilm. Leaving the seeds inverted in the dish helps
the germinated roots to grow straight. The petri dish was left in the incubator at 30°C
overnight in the dark.
Planting Medicago sativa seeds
19
20
After about 20 hours the roots were germinated, and 5mL of sterile water was
added to suspend the seedlings. Using an ethanol sterilized spatula we gently picked up a
healthy seedling and placed it in the agar slant, with the root pointing downward and the
shoot pointing towards the top of the tube. This prevents the shoot from growing into the
agar. The seedlings were placed about 3cm from the top of the tube. We then lightly
place the lids on the tubes without tightening them, and the tubes were left in a growth
chamber at 22°C in a 12/12 hour light-dark cycle for 3 days. Tightening the lid will
prevent the plants from getting the gases they need for respiration and photosynthesis.
The 12/12 hour light-dark cycle will mimic the plants’ natural environment.
To inoculate the seedlings, overnights cultures of the strains were inoculated in
TY medium and grown at 30°C. After 14-16 hours, 2 ml of each strain was centrifuged to
collect cell pellets. Each pellet was re-suspended in 1 ml of water, and the A6ooof the
cultures was measured. This will ensure that we are inoculating all the plants with the
same amount of culture. The cultures were diluted in 4 mL of water to reach an A6oo
value of 0.1. Then using a micropipette 100pL of cultures was poured directly on the root
tips as a controlled procedure to inoculate each plant. The lids were put pack on the tubes
loosely, and the tubes were put back in the growth chamber. Every week the plants were
observed, and their nodules were counted for 4 weeks (7 days, 14 days, 21 days, and 28
days after inoculation) (Pobigaylo et al., 2008)(Griffitts et al., 2008)(Griffitts and Long,
2008).
21
RESULTS
Characterization of podJ mutants
ApodJl mutant of S. meliloti has a motility defect as well as sensitivity to changes in media composition, but not temperature
A previously studied gene in our laboratory, podJ, is known for its role in
regulating cell polarity, ESP production, and growth sensitivity (Fields et al., 2012). To
study these defects in more detail, several types of assays were performed. The mutants
utilized were loss-of-function mutants of either podJl or podJ2. These mutants were
generated by deleting either the first or second open reading frame using a two-step gene
replacement procedure via homologous recombination.
S. meliloti strain with a disruption in the first open reading frame of podJ gene
(podJl) shows a motility defect and sensitivity when grown in LBLS medium. The
deletion of the second open reading frame showed no sensitivity and the same
phenotypes as the wild type (Figure 1 A). To determine what specific ingredient in the
LBLS medium caused the growth sensitivity of the ApodJl mutant, we grew the strains
on several types of media with substitutions for each ingredient present in the standard
LBLS media (Fields et al., 2012). The four strains grown for the spot assay were wild-
type Rml021, a podJl mutant strain {ApodJl), an EPS-I under-producing strain (exoY),
and an EPS-I over-producing strain (exoS). Rml021, exoS, and exoY served as the control
strains because their EPS-I levels were previously measured relative to one another
(Figure 1).
22
In the first part of the experiment, we substituted peptone for tryptone in the
LBLS medium. According to growth on the first two plates in Figure 1 A, when
comparing LBLS against media 1, the sensitivity of the ApodJl mutant strain was
eliminated after replacing tryptone with peptone. The same experiment was performed
with lower concentration of either peptone and tryptone and yeast extract in both types of
media (l/5 th the original concentration). With lower concentrations of nutrients, the
ApodJl sensitivity was not significant (Figure 1 A, last two plates).
The second substitution was changing the salt source in the LBLS media from
NaCl to MgSO/t. As seen in Figure IB, this substitution did not make any visible changes
in the spot assay, as the ApodJl mutant strain showed growth sensitivity in both plates.
In the third part of the experiment, we decreased the amount of peptide source
(tryptone or peptone) and the yeast extract by l/5th of the original LBLS media to
measure their effect on ApodJl growth. When the tryptone was decreased to l/5th of the
concentration of the control LBLS plate in media 4, normal growth of the Jpo<i//was
restored and the growth sensitivity was eliminated (Figure 1C). In contrast, no significant
change in sensitivity was seen when yeast extract was decreased by l / 5 th of the original
LBLS media. Thus, high level of tryptone appears to cause the growth sensitivity the
podJl mutant to LBLS.
We also investigated growth of the ApodJl mutant in the presence of a mild
detergent (deoxycholate) in the medium. The results in Figure 5A showed that in the
presence of deoxycholate, ApodJl grew poorly at all dilutions. The results support the
23
idea that the membrane defect in the ApodJl mutant leads to the sensitivity to
deoxycholate.
To determine any additional factors that can cause the growth sensitivity of
ApodJl in LBLS medium, a range of growth temperatures were tested. The
ApodJl mutant, as well as three control strains [wild-type Rml021, exoY (EPS-I under
producing strain), and exoS (EPS-I over producing strain)], were grown on three different
types of media (LB, LBLS, PYE) at three different temperatures (20°C, 22°C, and 30°C).
The plates placed at 30°C were incubated for 3 days, whereas the plates left at 20°C and
22°C were incubated for 10 days to allow for adequate growth. According to figure 3, the
difference in temperature did not cause any changes to the growth sensitivity of ApodJl
on the LBLS medium, nor did it cause any novel growth sensitivity on PYE or LB
medium. The control strains Rml021, exoY, and exoS grew normally on all plates at the
three temperatures tested.
In order to check the relative amount of EPS-I produced in each strain, a
calcofluor assay was performed. Calcoflour binds to the EPS-I produced by the strains
and fluoresces when observed under UV light. Figure 4 Part A showed a higher level of
EPS-I production in the ApodJl mutant compared to the wild type and exoY strain (EPS-I
under-producing). However, the ApodJl mutant still produces a lower level of EPS-I
compared to the exoS strain (which overproduces EPS-I). Upon transduction of the exoY
loss-of-function mutation into the ApodJl strain, the amount of EPS-I production
decreased significantly, but the growth defect in LBLS medium remained the same. On
the other hand, when the exoS mutation was inserted into the ApodJl mutant, the amount
24
of EPS-I increased, while the sensitivity to LBLS was reduced. The results suggest a link
between EPS-I production and sensitivity to low-salt conditions in LB medium.
Since the excess production of exopolysaccharides have been shown to correlate
with reduced motility, we also performed a motility assay (Cheng and Walker, 1998a).
Plates used for this experiment had a low concentration of agar to facilitate flagellar
movement. The diameter of the growth is the distance the bacteria population travel from
the site of inoculation, which correlates with the bacterium’s motility. As seen in Figure 4
Part B, the wild-type strain has a larger diameter of growth than the ApodJlmutant strain,
indicating a motility defect in the mutant. To determine if this motility defect can be
rescued, either the exoY (normal motility) or exoS (motility defect) mutation was inserted
into the ApodJl strain. The resultant double mutant strains still exhibited the motility
defects (Figure 4 part B). This indicates that the motility does not depend on the level of
EPS-I produced by these strains. Upon correcting the nonsense mutation in the podJ
gene, the strain can produce normal amounts of EPS-I (appendixA).
Examining EPS-I production of two mutants, ASMc00067 and ASMc03872
Through suppressor analysis of the ApodJl mutation, two genes (SMc00067 and
SMc03872) were discovered to contribute to normal levels of EPS-I production (Fields et
al., 2005). The next step was to measure the relative amounts of EPS-I produced by
strains with deletion mutations in these two genes, compared to that of other under
producing strains using the calcofluor assay. Then we utilized an anthrone assay to
measure the total amount of EPS produced by each mutant compared to that of other
strains. Finally, to determine if the gene products affect EPS-I production by influencing
the transcription of exo genes, the GUS reporter assay was used.
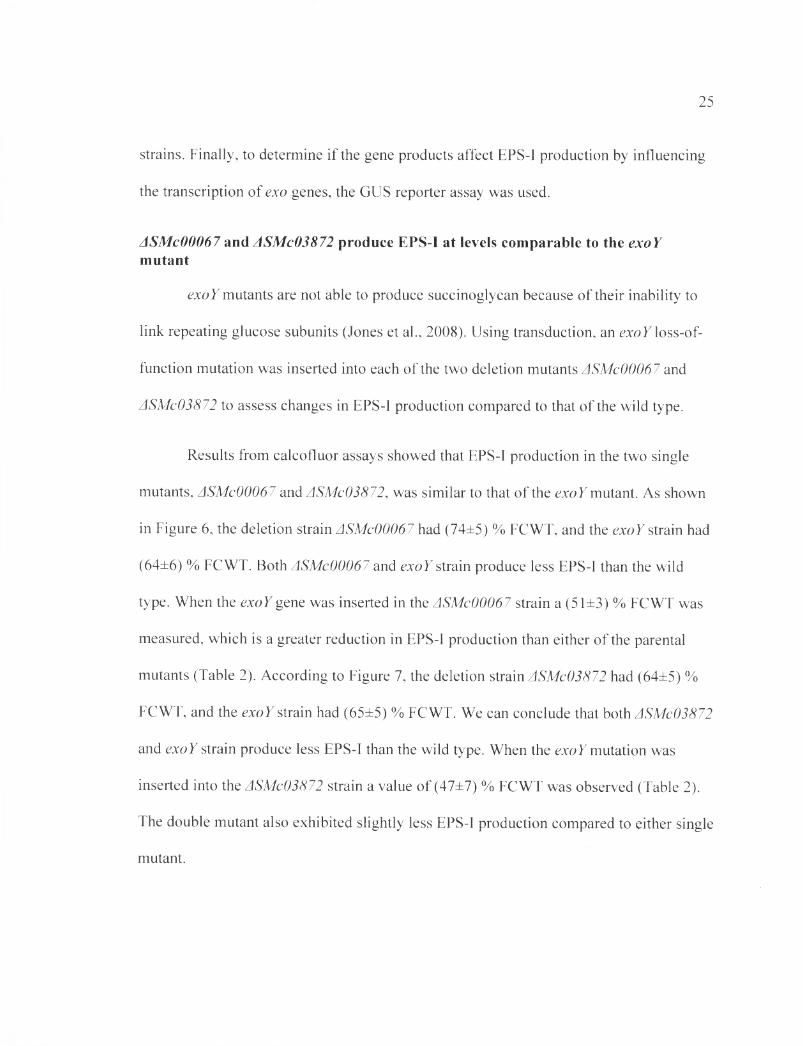
ASMc00067 and ASMc03872 produce EPS-I at levels comparable to the exoY mutant
exoY mutants are not able to produce succinoglycan because of their inability to
link repeating glucose subunits (Jones et al., 2008). Using transduction, an exoY loss-of-
function mutation was inserted into each of the two deletion mutants ASMc00067 and
ASMc03872 to assess changes in EPS-I production compared to that of the wild type.
Results from calcofluor assays showed that EPS-I production in the two single
mutants, ASMc00067 and ASMc03872, was similar to that of the exoY mutant. As shown
in Figure 6 , the deletion strain ASMc00067 had (74±5) % FCWT, and the exo Y strain had
(64±6) % FCWT. Both ASMc00067 and exo Y strain produce less EPS-I than the wild
type. When the exoY gene was inserted in the ASMc00067 strain a (51±3) % FCWT was
measured, which is a greater reduction in EPS-I production than either of the parental
mutants (Table 2). According to Figure 7, the deletion strain ASMc03872 had (64±5) %
FCWT, and the exoY strain had (65±5) % FCWT. We can conclude that both ASMc03872
and exoY strain produce less EPS-I than the wild type. When the exoY mutation was
inserted into the ASMc03872 strain a value of (47±7) % FCWT was observed (Table 2).
The double mutant also exhibited slightly less EPS-I production compared to either single
mutant.
25
26
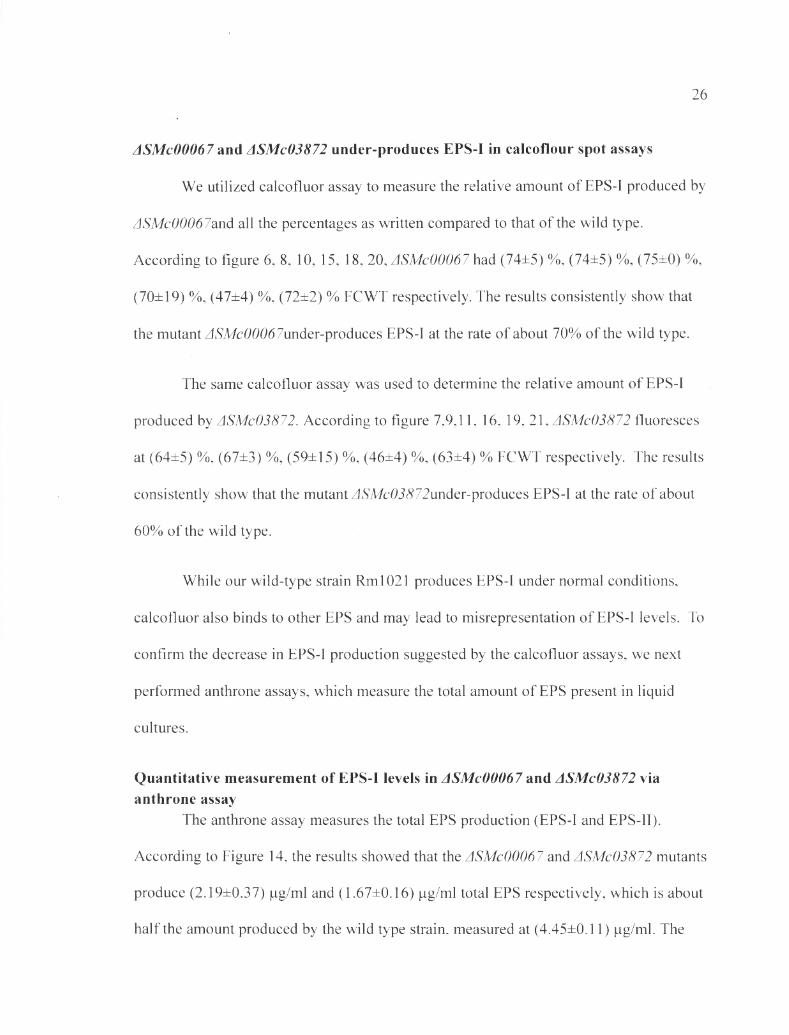
ASMc00067 and ASMc03872 under-produces EPS-I in calcoflour spot assays
We utilized calcofluor assay to measure the relative amount of EPS-I produced by
ASMc00067and all the percentages as written compared to that of the wild type.
According to figure 6 , 8 , 10, 15, 18, 20, ASMc00067 had (74±5) %, (74±5) %, (75±0) %,
(70±19) %, (47±4) %, (72±2) % FCWT respectively. The results consistently show that
the mutant ASMc00067under-produces EPS-I at the rate of about 70% of the wild type.
The same calcofluor assay was used to determine the relative amount of EPS-I
produced by ASMc03872. According to figure 7,9,11, 16, 19, 21, ASMc03872 fluoresces
at (64±5) %, (67±3) %, (59±15) %, (46±4) %, (63±4) % FCWT respectively. The results
consistently show that the mutant zJ.S’A/c05#72under-produces EPS-I at the rate of about
60% of the wild type.
While our wild-type strain Rml021 produces EPS-I under normal conditions,
calcofluor also binds to other EPS and may lead to misrepresentation of EPS-I levels. To
confirm the decrease in EPS-I production suggested by the calcofluor assays, we next
performed anthrone assays, which measure the total amount of EPS present in liquid
cultures.
Quantitative measurement of EPS-I levels in ASMc00067 and ASMc03872 via anthrone assay
The anthrone assay measures the total EPS production (EPS-I and EPS-II).
According to Figure 14, the results showed that the ASMc00067 and ASMc03872 mutants
produce (2.19±0.37) pg/ml and (1.67±0.16) jag/ml total EPS respectively, which is about
half the amount produced by the wild type strain, measured at (4.45±0.11) |ag/ml. The

negative control strain, an exoY mutant, produced very small amounts of EPS, at
(0.15±0.20) pg/ml, and the positive control strain, an exoR mutant, produced very large
amounts of EPS, at (22.24±3.37) pg/ml. The results obtained from the anthrone assays
were qualitatively consistent with the calcafluor results. The raw data and the glucose
curve used to standardize each anthrone assay are shown in Table 3 and 4 and
summarized in Table5.
At this stage of investigating the mutants we concluded that loss-of-function
mutations in SMc00067 and SMc03872 decrease production of EPS-I. Next we wanted to
determine whether these genes are affecting EPS-I production transcriptionally or post-
transcriptionally. To determine the answer we performed GUS reporter assays.
GUS assay measured the expression of EPS-I synthesis genes using the exoY-uidA reporter
To find out if decreased EPS-I production in the mutants resulted from changes in
transcription, we used the exoY-uidA reporter construct, which was inserted into the
strains of interest: A.podJl-2, Rml021, ASMc03872, and ASMc00067. uidA expression
was measured to assess transcription of genes involved in EPS-I production.
In order to validate that EPS-I production in strains carrying the exoY-uidA
construct has stayed intact, calcofluor spot assay was performed (Figure 12). The ApodJl-
2 strain showed (230±3) % FCWT, the ASMc03872 strains showed (60±3) % FCWT, and
the ASMc00067 strain showed (50±1) % FCWT, all similar to levels seen in the parental
strains. The results established that the reporter construct did not interfere with the EPS-I
production pathway in the strains (Figure 12).
27
28
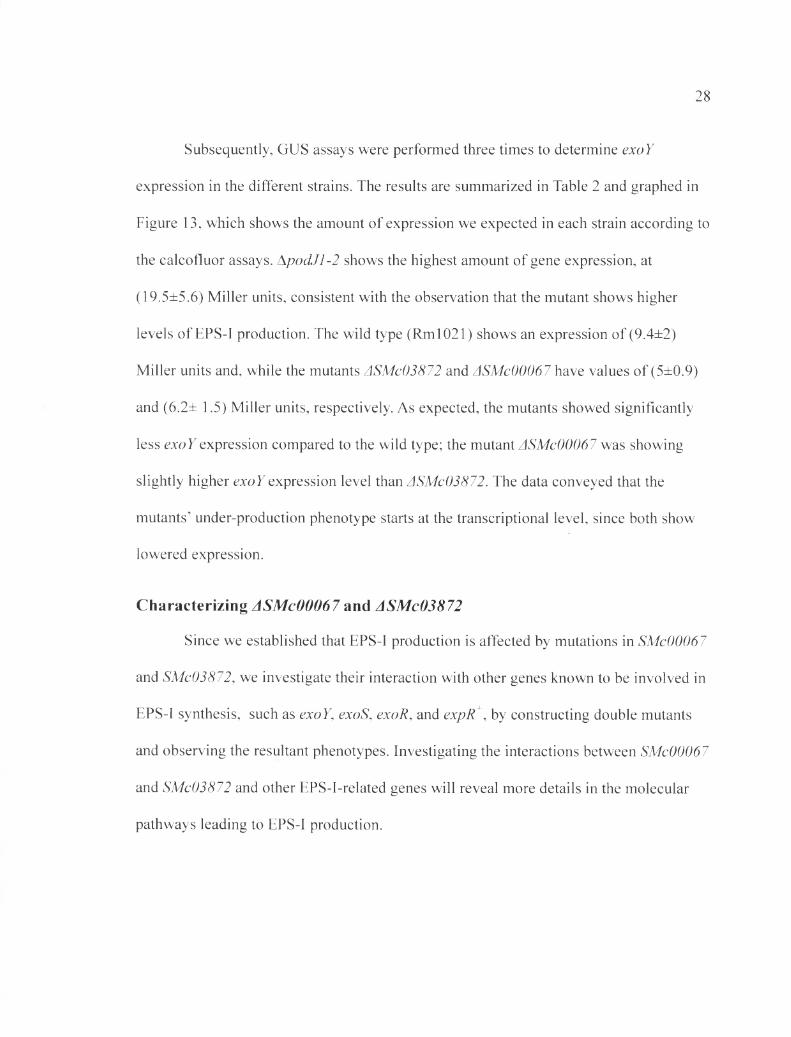
Subsequently, GUS assays were performed three times to determine exoY
expression in the different strains. The results are summarized in Table 2 and graphed in
Figure 13, which shows the amount of expression we expected in each strain according to
the calcofluor assays. ApodJl-2 shows the highest amount of gene expression, at
(19.5±5.6) Miller units, consistent with the observation that the mutant shows higher
levels of EPS-I production. The wild type (Rml021) shows an expression of (9.4±2)
Miller units and, while the mutants ASMc03872 and ASMc00067 have values of (5±0.9)
and (6.2± 1.5) Miller units, respectively. As expected, the mutants showed significantly
less exoY expression compared to the wild type; the mutant ASMc00067 was showing
slightly higher exoY expression level than ASMc03872. The data conveyed that the
mutants’ under-production phenotype starts at the transcriptional level, since both show
lowered expression.
Characterizing ASMc00067 and ASMc03872
Since we established that EPS-I production is affected by mutations in SMc00067
and SMc03872, we investigate their interaction with other genes known to be involved in
EPS-I synthesis, such as exoY, exoS, exoR, and expR \ by constructing double mutants
and observing the resultant phenotypes. Investigating the interactions between SMc00067
and SMc03872 and other EPS-I-related genes will reveal more details in the molecular
pathways leading to EPS-I production.
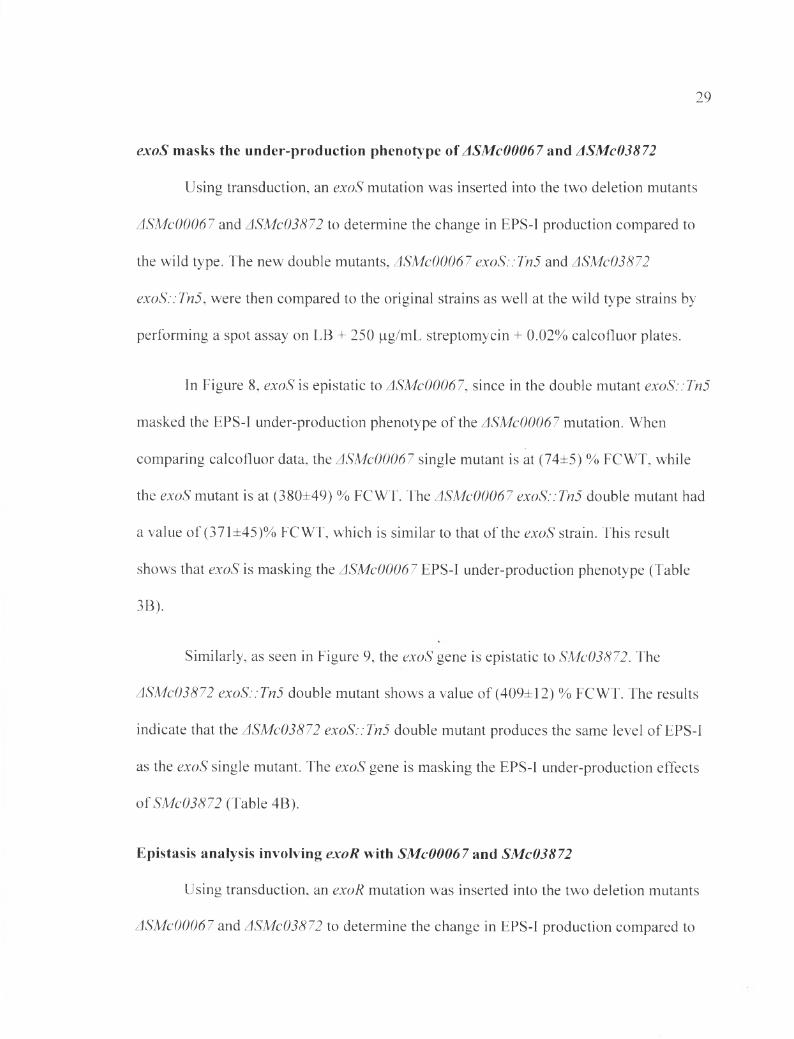
exoS masks the under-production phenotype of ASMc00067 and ASMc03872
Using transduction, an exoS mutation was inserted into the two deletion mutants
ASMc00067 and ASMc03872 to determine the change in EPS-I production compared to
the wild type. The new double mutants, ASMc00067 exoS::Tn5 and ASMc03872
exoS::Tn5, were then compared to the original strains as well at the wild type strains by
performing a spot assay on LB + 250 |_ig/mL streptomycin + 0.02% calcofluor plates.
In Figure 8 , exoS is epistatic to ASMc00067, since in the double mutant exoS::Tn5
masked the EPS-I under-production phenotype of the ASMc00067 mutation. When
comparing calcofluor data, the ASMc00067 single mutant is at (74±5) % FCWT, while
the exoS mutant is at (380±49) % FCWT. The ASMc00067 exoS::Tn5 double mutant had
a value of (371±45)% FCWT, which is similar to that of the exoS strain. This result
shows that exoS is masking the ASMc00067 EPS-I under-production phenotype (Table
3B).
Similarly, as seen in Figure 9, the exoS gene is epistatic to SMc03872. The
ASMc03872 exoS::Tn5 double mutant shows a value of (409±12) % FCWT. The results
indicate that the ASMc03872 exoS::Tn5 double mutant produces the same level of EPS-I
as the exoS single mutant. The exoS gene is masking the EPS-I under-production effects
of SMc03872 (Table 4B).
Epistasis analysis involving exoR with SMc00067 and SMc03872
Using transduction, an exoR mutation was inserted into the two deletion mutants
ASMc00067 and ASMc03872 to determine the change in EPS-I production compared to
29
the wild type. A spot assay was performed utilizing LB media containing 0.2% calcofluor
to determine the relative amount of EPS-I production. The single mutants were compared
to the ASMc00067exoR double mutant as well as the wild type strain.
According to Figure 10, the exoR gene is epistatic to SMc00067. The single
mutant ASMc00067 had (75±0) % FCWT, and the exoR single mutant had (363±20) %
FCWT. SMc00067 is an EPS-I under-producing strain, while exoR is an EPS-I over
producing strain. The ASMc00067 exoR double mutant showed (306±65) % of the wild-
type levels, indicating that the EPS-I under-production effect of ASMc00067 is masked
by the exoR mutation. Therefore, the exoR gene is epistatic to SMc00067 in the EPS-I
production pathway (Table 5B). Similar results were seen for SMc03872 (Figure 11 and
Tabl 6 B).
ASMc00067 or ASMc03872 does not affect EPS-II synthesis
In this experiment expR+, which is responsible for the production of many
enzymes required for EPS-II production (Gonzalez et al., 1996), was inserted into the
mutant strains ASMc00067 and ASMc03872. Results in Figures 15 and 16 show that
neither the SMc00067 or SMc03872 deletion affects the mucoidy phenotype of expR
strains. Nevertheless, the double mutant ASMc00067 expR appears to produce EPS-I at
lower levels compared to either ASMc00067 or expR alone. This result could indicate
that more energy and resources in the bacterial cell is going to EPS-II production instead
of EPS-I (Table 8 B, Table 9B).
30

Test the nodulation ability of the ASMc00067 and ASMc03872 mutants using plantassays
Nodulation assays were performed twice, in which a number of alfalfa plants
grown on agar slants were inoculated with different S. meliloti strains (12 plants were
inoculated with each strain). In the first experiment the nodules were counted once four
weeks after inoculation. In the second plant assay the nodules were counted each week
after inoculation for four weeks (notated as Day After Inoculation (DAI)).
In the first plant assay, the number of nodules was counted after four weeks of
inoculation with the bacteria (28DAI). The total number of nodules from all plants
inoculated with each bacterial strain was as followed: Rml021 induced 6 6 nodules,
ASMc00067 induced 74 nodules, and ASMc03872 induced 70 nodules. The average
number of nodules caused by each strain of bacteria per plant is: 5.5 nodules induced by
the wild type, 6.17 nodules induced by ASMc00067, and 5.83 nodules induced by
ASMc03872. The negative control, with no bacteria inoculated, showed no nodule
growth, and the plants produced small, yellow leaves. Contrary to what we expected,
plants inoculated with the ASMc00067 and ASMc03872 mutants showed no obvious
defect in nodule formation (Table 19 and Figure 22).
In the second plant assay, data was collected at 14, 21, and 28 DAI. In this plant
assay we included thQ podf ...Q strain as well as Rml021, ASMc00067, and ASMc03872,
and the no bacteria control. We recorded results of nodule count, as well as the number of
pink and white nodules at 14, 21, and 27 DAI.
31

The nodule count at 28 DAI and the results are shown in Figure 25 and Table 22.
The average numbers of the plant nodules inoculated with one type of bacteria were as
follows: Rml021 induced 6.33 nodules,podJ+...Q induced 7 nodules, ASMc00067
induced 5.9 nodules and ASMc03872 induced 4.56 nodules. The average numbers of pink
and white nodules per plant stimulated by each S. meliloti strain were as followes:
Rml021 induced (3.3, 3) nodules,podJ+...Q had (4, 3) nodules, ASMc00067 with (4.6,
1.3) nodules, and ASMc03872 had (3, 2) nodules. The plants inoculated with podJ ...Q
had the highest number of nodules per plant. The next highest average number of nodule
belong to the plants inoculated with Rml021, followed by ASMc00067 and ASMc03872,
whose average increased by 1 nodule per plant from the previous week. The strain with
the highest average of pink nodules was ASMc00067, followed by p o d f ...Q, Rml 021,
and ASMc03872.
The two plant assays showed that mutant strains ASMc00067 and ASMc03872 did
not have an obvious defect in stimulating nodule formation. Although the results
indicated that ASMc00067 and ASMc03872 showed less nodule growth at 14 DAI
compared to the wild type and podT , the difference was not dramatic. Furthermore, at 28
DAI, ASMc00067 showed an advantage by stimulating the growth of the most number of
pink nodules. Although the p o d f -inoculated plants have a slight lead in the number of
nodule production, they did not show a great advantage compare to the plants inoculated
with the wild type strain.
32

We used the paired two-sample t-test in order to compare the average numbers of
nodules induced by the wild type Rml021 strain to that induced by ASMc03872 and
ASMc00067. The t-values for the first plant assay are 0.728 for ASMc03872 and 0.230 for
ASMc00067. In order for the data to be significant the t-values should be 2.086 and 2.101,
respectively.
The t-values in the second plant assay are 1.182 for ASMc03872 and 0.243 for
ASMc00067. Again, taking a standard value of 0.05 for the significance level, a table
look-up gives t-values of 3.182 and 2.776. Our t-values are less than these critical values;
so we conclude that the mutations have no significant effect on the number of nodules
produced.
33
34
DISCUSSION
podJ gene in S. meliloti
The podJ gene is a conserved across Rhizobiales, Caulobacterales, and several
Rhodobacterales (Brilli et al., 2010). First identified in C. crescentus, the podJ gene has
been shown to play a role in subcellular organelle localization and polar development.
The homolog of this gene in S. meliloti has been identified through BLAST to be two
adjacent ORFs, SMc02230 and SMc02231, also called podJl and podJ2, respectively.
However, podJ has stayed intact as one ORF in related species such as S. medicae and S.
fredii. Upon further investigation we discovered that a nonsense mutation substituted a
stop codon for a tyrosine codon (TAC to TAA) in the podJ gene in S. meliloti.(Fields et
al., 2012). This nonsense mutation is seen in SU47-derived laboratory strains, such as
RCR2011, Rml021, and Rm2011. Natural isolates of S. meliloti, strains such as AK83,
BL225C, and SMI 1, have a non-interrupted copy of the podJ gene (Galardini et al.,
2011 )(Schneiker-Bekel et al., 2011). This observation indicates that the nonsense
mutation in the podJ gene happened recently in the SU47-derived laboratory strains. The
segmented podJ gene in Rml021, a SU47-derived laboratory strain, was investigated. It
is suspected that the nonsense mutation arose due to multiple passages of the laboratory
strains (Fields et al., 2012).
The function of the first podJl ORF in S. meliloti was investigated using motility
assays and different growth media. Results showed that the ApodJl mutant has a motility
defect when grown on PYE medium, which was confirmed with electron microscopy in
35
our laboratory. The electron microscopy analysis revealed that ApodJl mutants produce
shorter flagella as well as irregularly branched cell morphology. These results indicated
that podJl regulates cellular division as well as motility via the appropriate production of
flagellar components in S. meliloti (Fields et al., 2012).
Motility defects are usually coupled with exopolysaccharide over-production,
leading us to test EPS-I production of the ApodJl mutant using LB plates with 0.02%
calcofluor (Yao et al., 2004) (Wells et al., 2007) (Bahlawane et al., 2008). We compared
the ApodJl and exoS mutant strains, both of which have a motility defect as well as an
EPS-I over-production phenotype (Yao et al., 2004)(Belanger et al., 2009). We also
compared stains with mutations in podJl and exoY; the exoY mutant is characterized by
under-production of EPS-I (Guan et al., 2013). Both the ApodJl and exoS mutant strains
showed a motility defect as well as an EPS-I over- production phenotype. This motility
defect is perhaps regulated by the same proteins whose activation directly or indirectly
affects regulation of exopolysaccharide production. However, more studies are required
for a more detailed answer.
ApodJl showed sensitivity to LBLS media because of the presence of tryptone,
which is an ingredient used in LB media in place of peptone. Tryptone is a pancreatic
digest of casein, a source of free amino acids with some oligopeptides present. Peptone,
however, is enzymatic digest of an animal protein, containing amino acids and
polypeptides.
36
To determine if the sensitivity to LBLS is related to growth rate we grew ApodJl
on PYE, LB, and LBLS at different temperatures. ApodJFs sensitivity is observed at all
temperatures, and no change is seen based on the rate of growth. The insertion of either
the exoS mutation (which leads to EPS-I over-production) partially rescues this
sensitivity to LBLS, suggesting that EPS-I production can affect sensitivity to tryptone
under low-salt conditions.
To test membrane integrity of the ApodJl mutant, we grew the strain on media
containing deoxycholate. Deoxycholate is an ionic detergent that hinders growth of
bacteria with damage to their outer membrane lipopolysaccharide structure (Campbell et
al., 2003). ApodJl showed sensitivity on LB medium containing deoxycholate, and
insertion of either the exoS or exoY mutation did not rescue this sensitivity. This growth
retardation in the presence of deoxycholate suggests a defect in ApodJFs outer
membrane.
The function ofpodJ2 gene in S. meliloti was also investigated via motility assays
and growth sensitivity on different media. The podJ2 deletion mutant displayed the same
phenotype as the wild type strain in all tests. This similarity in phenotype between the
Rml021 wild type and the podJ2 mutant indicates that podJ2 is not expressed or
functional.
podJ has a broad role in cellular organization and function; therefore, we focused
more on specific genes that related to EPS-I synthesis. Two genes we focused on were
SMc03872 and SMc00067, both of which influence EPS-I production. Testing these
37
genes enables us to gather more information about genetic pathway as well as the role
EPS-I plays in cell invasion and nodulation.
Properties of ASMc00067 and ASMc03872 in S. meliloti
ASMc00067 and ASMc03872 improve the growth of ApodJl on LBLS plates as
well as alleviating the over-production of EPS-I (Fields et al., 2012). In addition,
ASMc00067 and ASMc03872 mutants showed an EPS-I under-production phenotype in
the wild type background. This prompted us to perform further epistasis experiments on
these mutants.
The gene SMc00067 codes for an outer membrane lipoprotein. The deletion of
SMc00067 in the wild type strain causes an EPS-I under-production phenotype.
SMc00067 lies downstream of two genes, feuP and feuQ, which are part of a pathway
that affects growth under hypoosmotic conditions. This pathway, which is responsible for
the export of cyclic beta-glucans (another type of polysaccharides produced by
Rhizobiales) seems to be interacting with thepodJ pathways (Griffitts et al., 2008).
The gene SMc03872 codes for a putative Zn-dependent protease. The deletion of
SMc03872 in the wild type background causes an EPS-I under-production effect in S.
meliloti. SMc03872 sits between thiP, a gene that codes for thiamine transporter
membrane protein, and rpoH2, a gene that codes for RNA polymerase factor sigma-32.
An RNA secondary structure can affect gene transcription by sensing the levels of
thiamine tyrophosphate (TPP). TPP, an active form of thiamine, is an essential co-factor
for several important enzymes in carbohydrate and amino acid metabolism; it is needed
by all living organism (Bian et al., 2011). RNA polymerase factor sigma-32 promotes the
attachment of RNA polymerase to the transcription initiation site but is later released.
RNA polymerase factor sigma-32 act as a secondary heat shock sigma factors; the
Rhizobium sigma-32 factor may also be involved in exopolysaccharide production (Liu
et al., 2013). This protease gene is next to transcriptional regulatory genes, suggesting
that it is highly regulated and can be involved in how caseins are digested in the cell as
well as signaling for EPS-I production (Stefanitsi and Garel, 1997).
From previous studies in our laboratory we know that insertion of ASMc03872 in
the ApodJl background showed only a slight decrease in ApodJl's deoxycholate
sensitivity, but it greatly improved the ApodJl mutant’s growth on LBLS media.
Insertion of ASMc00067 in the ApodJl background decreased ApodJl's sensitivity to
deoxycholate significantly. This could indicate that SMc03872 and SMc00067 are
responsible for products that contribute to the integrity of the cell membrane. Although
ASMc03872 decreased the sensitivity o f ApodJl to LBLS, it increased its growth
sensitivity on PYE media. Notably the expressions of both of these genes, SMc00067and
SMc03872, are increased in the tolC mutant, which is characterized by having increased
levels of oxidative stress (Fields et al., 2012). The gene tolC codes for an outer membrane
protein, which is a transport protein responsible for exporting toxins out of bacterial cells
(Santos et al., 2010).
To further study the ASMc00067 and ASMc03872 mutant stains we utilized
epistasis analysis. Epistasis analysis will help us understand the order and the dominance
38
39
of SMc00067 and SMc03872 compared to other EPS-I-related genes. The order of
transcription of genes in a regulatory hierarchy that is governed by a signal can often be
determined by epistasis analysis, in which the phenotype of a double mutant is compared
to the single mutants. The epistatic mutation may be in either the upstream or the
downstream gene, depending on the nature of the two mutations and the type of
regulation. When the regulatory hierarchy satisfies certain conditions, simple rules allow
the position of the epistatic locus in the pathway to be determined without detailed
knowledge of the nature of the mutations, the pathway, or the molecular mechanism of
regulation (Avery and Wasserman, 1992).
ASMc03872 or ASMc00067 produces EPS-I at the same level as exoY mutant
The exoY gene encodes the enzyme galactosyltransferase, which links galactose-
1 -phosphate to an undecaprenal-phosphate carrier and is responsible for the first step of
EPS-I synthesis (Jones et al., 2008). Upstream of exoY lies exoX which codes for a
repressor protein that is a post-transcriptional regulator (Finan et al., 2001). Downstream
of exoY lies exoQ. another exopolysaccharide production gene (Long et al.,
1988)(Gonzalez et al., 1998). Knowing the roles of exoY and its neighboring genes aids
in understanding the regulatory function of genes we are investigating. As discussed
before, exoY mutants are not able to produce succinoglycan because of their inability to
link repeating glucose subunits. As a result of inability to produce EPS-I, exoY mutant
strains are unable to form infection threads and are symbiotically defective (Cheng and
Walker, 1998).
40
To determine if our ASMc00067 and ASMc03872 mutants were under-producing
EPS-I, we compared them to the exoY mutant. The mutants produced EPS-I at the same
level as the exoY mutant. Even the exoY mutant appeared to have some level of EPS-I
production, according to the calcoflour assay, but that could be due to calcoflour binding
to other EPS or carbohydrates.
The exoS gene is antagonistically epistatic to SMc00067 and SMc03872 in the EPS-I production pathway
The gene exoS codes for a histidine kinase, with a periplasmic sensing domain,
flanked by two transmembrane domains, and a cytoplasmic kinase domain. The exoS
gene produces the sensor kinase as a part of a two-component regulatory system. The
other component of the system is the response regulator Chvl. In the presence of a stimuli
the ExoS sensor kinase autophosphorylates, followed by transfer of the phosphate to its
cognate regulator in order to control the transcription of target genes. The ExoS/ChvI
two-component regulatory system positively regulates transcription of EPS-I producing
enzymes, such as ExoY, ExoF, and ExoP (Cheng and Walker, 1998b). Mutant strains
lacking either exoS or chvl were able to stimulate nodule formation, but the nodules were
not able to fix nitrogen (Belanger and Charles, 2013). The exoS or chvl mutants are also
very hard to grow because of the essential roles these genes appear to play in the viability
of the bacteria (Osteras et al., 1995). The ExoS/ChvI pathway is known to regulate EPS-I
production, flagellum synthesis, and metabolism of 20 different types of carbon sources
(Lu and Cheng, 2010).

When an exoS mutation is introduced into the ASMc00067 mutant, the resultant
double mutant exhibited the same EPS-I production level as the exoS parent. This shows
that exoS is masking the phenotype of SMc00067. The data shows EPS-I production of
the exoS mutant to be at 380±49% FCWT and that of ASMc00067 to be at 74±5% FCWT,
with the double mutant at 371±45% FCWT. We can conclude that these genes are
interacting antagonistically. ExoS may act downstream of the SMc00067 gene product in
the regulatory hierarchy.
Similarly, when the exoS mutation is introduced into the ASMc03872 strain, the
double mutant showed the same EPS-I production level as exoS. This indicated that the
genes have an antagonistic epistatic effect, as exoS produces EPS-I at 404±33% FCWT,
ASMc03872 at 67±3% FCWT, and the double mutant at 409±12% FCWT. The masking
effect of the exoS mutation on ASMc03872 suggests that ExoS lies downstream of the
SMc03872 gene product in the regulatory pathway.
exoS is part of a two system regulatory pathways responsible for making enzymes
that stimulate the production of EPS-I. These enzymes could be a part of a negative
feedback loop that inhibits the cell from producing excessive amounts of EPS-I, and
when the inhibition is lifted excessive amounts of EPS-I is produced. When exoS is
inserted into EPS-I under-producing strains, its effect is so strong that it masks the other
mutation.
41
42
The gene exoR is antagonistic to SMc00067 and SMc03872 in the EPS-I production pathway
The gene exoR is known to be involved in regulating many components in the
bacterial cell such as succinoglycan production, flagellum synthesis, biofilm production,
and lipopolysaccharide modifications. The exoR gene produces a 268-amino acid protein
with a conserved signal peptide that targets the protein to the periplasm (Lu et al., 2012).
The ExoR protein suppresses the sensing activities of ExoS, the membrane-bound sensor
of the ExoS/ChvI two-component regulatory system. ExoR protein auto-regulates exoR
expression via its interaction with ExoS/ChvI system. This enables S. meliloti cells to
maintain the levels of exoR expression based on the amount of total ExoR protein (Lu
and Cheng, 2010).
When an exoR mutation is introduced into the ASMc00067 strain, the resultant
double mutant overproduces EPS-I. As the exoR mutant produces EPS-I at 363±20% of
the wild type, ASMc00067 at 75±0%, while the double mutant at 306±65%, there is a
negative epistatic interaction between the genes exoR and SMc00067. The exoR gene
appears to act downstream of SMc00067 in the regulatory pathway. Similar results were
obtained when we investigated the genetic interaction between exoR and SMc03872. A
mutation in exoR appears to mask the under-production of EPS-I in the ASMc03872
mutant.
EPS-I production pathway in SMc00067 and SMc03872 is not effected by expR+
The S. meliloti expR strain is capable of producing EPS-II and using it for
nodulation. Previous studies have shown that in the absence of succinoglycan production,
43
S. meliloti is still able to carry out symbiosis successfully due to the production of
galactoglucan (Mueller and Gonzalez, 2011). Galactoglucan or EPS-II consists of
alternating glucose and galactose residues that are acetylated and pyruvylated,
respectively. The wild type laboratory strain Rml021 only produces EPS-II under low
phosphate conditions because of a mutation in the expR gene; the strain with a functional
expR gene (expR+ strain) is able to produce EPS-II under normal conditions (Sorroche et
al., 2012).
The synthesis of galactoglucan or EPS-II in S. meliloti is regulated by exp genes.
The 23-kb gene cluster is on the SymB plasmid and is separated from the exo/exs cluster
by 200 kb (Becker et al., 1997). As a part of the ExpR/SinI quorum-sensing system,
disruption of expR eliminates the production of EPS-II. This quorum sensing system is
also known to inhibit flagellum production. The system is made out of an A-acyl-
homoserine lactone (AHL) synthase, SinI, and two regulators, SinR and ExpR (LuxR-
type regulators)(Gao et al., 2012). It is thought that the temporal expression of AHL
activates regulators at different concentration. The genes responsible for
exopolysasccharide production are transcribed at lower AHL levels than those genes
responsible for flagellar production (Charoenpanich et al., 2013). expR strains produce
mucoid colonies, a characteristic of EPS-II (Mueller and Gonzalez, 2011). Because of
these characteristics of the expR strain, we decided to investigate the interaction between
the expR gene and our two mutants, ASMc00067 and ASMc03872.
When the expR allele is introduced into the ASMc00067and ASMc03872
mutants, the resultant double mutants still produced EPS-II, as evidenced by the mucoidy
44
phenotype. This could be indicative of the independence of the two pathways that lead to
the production of EPS-II and EPS-I. Since EPS-I is a valuable product to the bacteria, it is
evolutionary advantageous to have multiple independent pathways for EPS production. It
is also advantages to produce different types of EPSs. Independence between EPS-I and
EPS-II formation pathway is essential for survival of the bacteria in different
environmental conditions. If production of EPS-II and EPS-I were controlled by the same
genes, the environmental change such as low phosphate conditions which inhibits EPS-I
production would also inhibit EPS-II production. A lack of EPS production would hinder
symbiosis and therefore the bacteria would be unable to survive in variant environments.
ASMc00067 and ASMc03872 do not show any defect in nodulation
As S. meliloti enters symbiosis with alfalfa, it stimulates the production of
nodules. From previous studies we have determined that the lack of EPS-I formation in
the bacteria can lead to failure to enter symbiosis or cause formation of nodules that
cannot fix nitrogen (Crespo-Rivas et al., 2009) (Cheng and Walker, 1998b). We have
previously determined that the wild type Rml021 strain contain a nonsense mutation in
the podJ gene (Fields et al., 2012). The podJ+ strain and the two mutants strains,
ASMc00067 and ASMc03872, produce less EPS-I than the wild type. To determine how
the variations in EPS-I levels affect nodule production we performed plant assays.
During the plant assay we observed growth of pink and white nodules in
Medicago sativa. Pink nodules represent the more mature stage of nodule growth. The
pink color is due to the presence of a protein called leghemoglobin (similar to
hemoglobin in mammals) which is a nitrogen and oxygen carrier. Leghemoglobin has a
high affinity for oxygen (Km of about 0.0 luM); this allows for oxygen concentration
low enough to allow nitrognase to function but high enough to provide oxygen for
bacterial cell respiration (Naya et al., 2007)(Baudouin et al., 2004).
Variations in the number of nodules stimulated was small, meaning that all the
plants inoculated had about the same number of nodules. Three and four weeks after
inoculation the number and the range of nodules stimulated by the wild type strain stayed
the same. This indicated that the amount of EPS-I production in the wild type signals
increased nodule production in the early stages of incubation and helps to preserve those
nodules afterwards. The average of pink nodules stayed constant throughout the assay.
The plants inoculated with the podX strain showed a constant growth in the
number of nodules for 3 weeks after inoculation. Since the podX strain produced less
EPS-I, we expected a lower number of nodules; however, po& f was the most successful
out of all the strains, by stimulating the highest number of nodules by the end of week
four. The plants inoculated with either ASMc00067 and ASMc03872 are consistent with
the wild type and but lag behind the podLf strain in terms of the number of nodules they
stimulate in the plants.
In the first plant assay we did not observe any obvious different between plants
that were inoculated with the mutant strains ASMc00067 and ASMc03872 versus the wild
type Rml021. The same trend was seen in the second plant assay. And statistical tests
indicated that there is no significant difference between the average numbers of nodules
45

stimulated by the mutant strains versus the wild type. However, we cannot make concrete
conclusions because the plant assay was only performed twice. The correlation between
increased EPS-I production and increased nodule formation has been observed in other
strains of S. meliloti (Jones, 2012); so to support the idea that SMc00067 and SMc03872
may contribute to symbiosis, many more plant assays should be performed.
46
47
REFERENCES
Abdelhady, W., Bayer, A.S., Seidl, K., Moormeier, D.E., Bayles, K.W., Cheung, A., Yeaman, M.R., and Xiong, Y.Q. (2014). Impact of Vancomycin on sarA-Mediated Biofilm Formation: Role in Persistent Endovascular Infections due to Methicillin- Resistant Staphylococcus aureus. J. Infect. Dis.
Bahlawane, C., McIntosh, M., Krol, E., and Becker, A. (2008). Sinorhizobium meliloti regulator MucR couples exopolysaccharide synthesis and motility. Mol. Plant Microbe Interact. 21, 1498-1509.
Battisti, L., Lara, J.C., and Leigh, J.A. (1992). Specific oligosaccharide form of the Rhizobium meliloti exopolysaccharide promotes nodule invasion in alfalfa. Proc. Natl. Acad. Sci. U.S.A. 89, 5625-5629.
Baudouin, E., Frendo, P., Gleuher, M.L., and Puppo, A. (2004). A Medicago sativa haem oxygenase gene is preferentially expressed in root nodules. J. Exp. Bot. 55, 43—47.
Beck, S., Marlow, V.L., Woodall, K., Doerrler, W.T., James, E.K., and Ferguson, G.P. (2008). The Sinorhizobium meliloti MsbA2 protein is essential for the legume symbiosis. Microbiology 154, 1258-1270.
Becker, A., Ruberg, S., Kuster, H., Roxlau, A.A., Keller, M., Ivashina, T., Cheng, H.P., Walker, G.C., and Puhler, A. (1997). The 32-kilobase exp gene cluster of Rhizobium meliloti directing the biosynthesis of galactoglucan: genetic organization and properties of the encoded gene products. J Bacteriol 179,1375-1384.
Becker, A., Ruberg, S., Baumgarth, B., Bertram-Drogatz, P.A., Quester, I., and Puhler, A. (2002). Regulation of succinoglycan and galactoglucan biosynthesis in Sinorhizobium meliloti. J. Mol. Microbiol. Biotechnol. 4, 187-190.
Belanger, L., and Charles, T.C. (2013). Members of the Sinorhizobium meliloti Chvl regulon identified by a DNA binding screen. BMC Microbiol 13, 132.
Belanger, L., Dimmick, K.A., Fleming, J.S., and Charles, T.C. (2009). Null mutations in Sinorhizobium meliloti exoS and chvl demonstrate the importance of this two-component regulatory system for symbiosis. Molecular Microbiology 74, 1223-1237.
Belibasakis, G.N., Thurnheer, T., and Bostanci, N. (2013). Interleukin-8 responses of multi-layer gingival epithelia to subgingival biofilms: role of the “red complex” species. PLoSONE 8, e81581.

48
Bian, J., Shen, H., Tu, Y., Yu, A., and Li, C. (2011). The Riboswiteh Regulates a Thiamine Pyrophosphate ABC Transporter of the Oral Spirochete Treponema denticola v. J Bacteriol 193, 3912-3922.
Brilli, M., Fondi, M., Fani, R., Mengoni, A., Ferri, L., Bazzicalupo, M., and Biondi, E.G. (2010). The diversity and evolution of cell cycle regulation in alpha-proteobacteria: a comparative genomic analysis. BMC Syst Biol 4, 52.
Campbell, G.R.O., Sharypova, L.A., Scheidle, H., Jones, K.M., Niehaus, K., Becker, A., and Walker, G.C. (2003). Striking complexity of lipopolysaccharide defects in a collection of Sinorhizobium meliloti mutants. J. Bacteriol. 185, 3853-3862.
Charles, T.C., and Finan, T.M. (1991). Analysis of a 1600-kilobase Rhizobium meliloti megaplasmid using defined deletions generated in vivo. Genetics 127, 5-20.
Charoenpanich, P., Meyer, S., Becker, A., and McIntosh, M. (2013). Temporal Expression Program of Quorum Sensing-Based Transcription Regulation in Sinorhizobium meliloti. J Bacteriol 195, 3224-3236.
Chen, M., Yu, Q., and Sun, H. (2013). Novel strategies for the prevention and treatment of biofilm related infections. Int J Mol Sci 14, 18488-18501.
Cheng, H.P., and Walker, G.C. (1998a). Succinoglycan production by Rhizobium meliloti is regulated through the ExoS-ChvI two-component regulatory system. J. Bacteriol. 180, 20-26.
Cheng, H.-P., and Walker, G.C. (1998b). Succinoglycan Is Required for Initiation and Elongation of Infection Threads during Nodulation of Alfalfa by Rhizobium meliloti. J Bacteriol 750,5183-5191.
Coutinho, F.H., Silveira, C.B., Pinto, L.H., Salloto, G.R.B., Cardoso, A.M., Martins, O.B., Vieira, R.P., and Clementino, M.M. (2014). Antibiotic Resistance is Widespread in Urban Aquatic Environments of Rio de Janeiro, Brazil. Microb. Ecol.
Crespo-Rivas, J.C., Margaret, I., Hidalgo, A., Buendia-Claveria, A.M., Ollero, F.J., Lopez-Baena, F.J., del Socorro Murdoch, P., Rodriguez-Carvajal, M.A., Soria-Diaz, M.E., Reguera, M., et al. (2009). Sinorhizobium fredii HH103 cgs mutants are unable to nodulate determinate- and indeterminate nodule-forming legumes and overproduce an altered EPS. Mol. Plant Microbe Interact. 22, 575-588.
Desai, M.M., Weissman, D., and Feldman, M.W. (2007). Evolution Can Favor Antagonistic Epistasis. Genetics 777, 1001-1010.
Djordjevic, S.P., Chen, H., Batley, M., Redmond, J.W., and Rolfe, B.G. (1987). Nitrogen fixation ability of exopolysaccharide synthesis mutants of Rhizobium sp. strain NGR234

49
and Rhizobium trifolii is restored by the addition of homologous exopolysaccharides. J. Bacteriol. 169, 53-60.
Dorken, G., Ferguson, G.P., French, C.E., and Poon, W.C.K. (2012). Aggregation by depletion attraction in cultures of bacteria producing exopolysaccharide. J. R. Soc. Interface 9, 3490-3502.
Fields, A.T., Navarrete, C.S., Zare, A.Z., Huang, Z., Mostafavi, M., Lewis, J.C., Rezaeihaghighi, Y., Brezler, B.J., Ray, S., Rizzacasa, A.L., et al. (2012). The conserved polarity factor podJ 1 impacts multiple cell envelope-associated functions in Sinorhizobium meliloti. Mol. Microbiol. 84, 892-920.
Finan, T.M., Hirsch, A.M., Leigh, J.A., Johansen, E., Kuldau, G.A., Deegan, S., Walker, G.C., and Signer, E.R. (1985). Symbiotic mutants of Rhizobium meliloti that uncouple plant from bacterial differentiation. Cell 40, 869-877.
Finan, T.M., Weidner, S., Wong, K., Buhrmester, J., Chain, P., Vorholter, F.J., Hernandez-Lucas, I., Becker, A., Cowie, A., Gouzy, J., et al. (2001). The complete sequence of the 1,683-kb pSymB megaplasmid from the N2-fixing endosymbiont Sinorhizobium meliloti. Proc. Natl. Acad. Sci. U.S.A. 98, 9889-9894.
Fraysse, N., Couderc, F., and Poinsot, V. (2003). Surface polysaccharide involvement in establishing the rhizobium-legume symbiosis. Eur. J. Biochem. 270, 1365-1380.
Galardini, M., Mengoni, A., Brilli, M., Pini, F., Fioravanti, A., Lucas, S., Lapidus, A., Cheng, J.-F., Goodwin, L., Pitluck, S., et al. (2011). Exploring the symbiotic pangenome of the nitrogen-fixing bacterium Sinorhizobium meliloti. BMC Genomics 12, 235.
Galibert, F., Finan, T.M., Long, S.R., Puhler, A., Abola, P., Ampe, F., Barloy-Hubler, F., Barnett, M.J., Becker, A., Boistard, P., et al. (2001). The composite genome of the legume symbiont Sinorhizobium meliloti. Science 293, 668-672.
Galinska, E.M., and Zagorski, J. (2013). Brucellosis in humans—etiology, diagnostics, clinical forms. Ann Agric Environ Med 20, 233-238.
Gao, M., Coggin, A., Yagnik, K., and Teplitski, M. (2012). Role of Specific Quorum- Sensing Signals in the Regulation of Exopolysaccharide II Production within Sinorhizobium meliloti Spreading Colonies. PLoS One 7.
Glazebrook, J., and Walker, G.C. (1989). A novel exopolysaccharide can function in place of the calcofluor-binding exopolysaccharide in nodulation of alfalfa by Rhizobium meliloti. Cell 56, 661-672.
50
Glucksmann, M.A., Reuber, T.L., and Walker, G.C. (1993a). Genes needed for the modification, polymerization, export, and processing of succinoglycan by Rhizobium meliloti: a model for succinoglycan biosynthesis. J Bacteriol 175, 7045-7055.
Glucksmann, M.A., Reuber, T.L., and Walker, G.C. (1993b). Family of glycosyl transferases needed for the synthesis of succinoglycan by Rhizobium meliloti. J. Bacteriol. 175, 7033-7044.
Gonzalez, J.E., and Marketon, M.M. (2003). Quorum sensing in nitrogen-fixing rhizobia. Microbiol. Mol. Biol. Rev. 67, 574-592.
Gonzalez, J.E., Reuhs, B.L., and Walker, G.C. (1996). Low molecular weight EPS II of Rhizobium meliloti allows nodule invasion in Medicago sativa. Proc. Natl. Acad. Sci. U.S.A. 93, 8636-8641.
Gonzalez, J.E., Semino, C.E., Wang, L.X., Castellano-Torres, L.E., and Walker, G.C. (1998). Biosynthetic control of molecular weight in the polymerization of the octasaccharide subunits of succinoglycan, a symbiotically important exopolysaccharide of Rhizobium meliloti. Proc. Natl. Acad. Sci. U.S.A. 95, 13477-13482.
Griffitts, J.S., and Long, S.R. (2008). A symbiotic mutant of Sinorhizobium meliloti reveals a novel genetic pathway involving succinoglycan biosynthetic functions. Mol. Microbiol. 67, 1292-1306.
Griffitts, J.S., Carlyon, R.E., Erickson, J.H., Moulton, J.L., Barnett, M.J., Toman, C.J., and Long, S.R. (2008). A Sinorhizobium meliloti osmosensory two-component system required for cyclic glucan export and symbiosis. Molecular Microbiology 69, 479^490.
Guan, D., Stacey, N., Liu, C., Wen, J., Mysore, K.S., Torres-Jerez, I., Vernie, T., Tadege, M., Zhou, C., Wang, Z., et al. (2013). Rhizobial Infection Is Associated with the Development of Peripheral Vasculature in Nodules of Medicago truncatula. Plant Physiol. 162, 107-115.
Hansen, J., and Moller, I. (1975). Percolation of starch and soluble carbohydrates from plant tissue for quantitative determination with anthrone. Analytical Biochemistry 68, 87-94.
He, Y. (2012). Analyses of Brucella Pathogenesis, Host Immunity, and Vaccine Targets using Systems Biology and Bioinformatics. Front Cell Infect Microbiol 2.
Janczarek, M. (2011). Environmental signals and regulatory pathways that influence exopolysaccharide production in rhizobia. Int J Mol Sci 12, 7898-7933.
51
Jimenez-Zurdo, J.I., Valverde, C., and Becker, A. (2013). Insights into the noncoding RNome of nitrogen-fixing endosymbiotic a-proteobacteria. Mol. Plant Microbe Interact. 26, 160-167.
Jones, K.M. (2012). Increased Production of the Exopolysaccharide Succinoglycan Enhances Sinorhizobium meliloti 1021 Symbiosis with the Host Plant Medicago truncatula. J Bacteriol 194, 4322-4331.
Jones, K.M., Kobayashi, H., Davies, B.W., Taga, M.E., and Walker, G.C. (2007). How rhizobial symbionts invade plants: the Sinorhizobium-Medicago model. Nat. Rev. Microbiol. 5, 619-633.
Jones, K.M., Sharopova, N., Lohar, D.P., Zhang, J.Q., VandenBosch, K.A., and Walker,G.C. (2008). Differential response of the plant Medicago truncatula to its symbiont Sinorhizobium meliloti or an exopolysaccharide-deficient mutant. Proc. Natl. Acad. Sci. U.S.A. 105, 704-709.
Leigh, J.A., Signer, E.R., and Walker, G.C. (1985). Exopolysaccharide-deficient mutants of Rhizobium meliloti that form ineffective nodules. Proc. Natl. Acad. Sci. U.S.A. 82, 6231-6235.
Liu, H., Von Ohlen, T., Cheng, C., Faburay, B„ and Ganta, R.R. (2013). Transcription of Ehrlichia chaffeensis Genes Is Accomplished by RNA Polymerase Holoenzyme Containing either Sigma 32 or Sigma 70. PLoS One 8.
Long, S., Reed, J.W., Himawan, J., and Walker, G.C. (1988). Genetic analysis of a cluster of genes required for synthesis of the calcofluor-binding exopolysaccharide of Rhizobium meliloti. J. Bacteriol. 170, 4239^1248.
Di Lorenzo, T., Di Marzio, W.D., Saenz, M.E., Baratti, M., Dedonno, A.A., Iannucci, A., Cannicci, S., Messana, G., and Galassi, D.M.P. (2013). Sensitivity of hypogean and epigean freshwater copepods to agricultural pollutants. Environ Sci Pollut Res Int.
Lu, H.-Y., and Cheng, H.-P. (2010). Autoregulation of Sinorhizobium meliloti exoR gene expression. Microbiology 156, 2092-2101.
Lu, H.-Y., Luo, L., Yang, M.-H., and Cheng, H.-P. (2012). Sinorhizobium meliloti ExoR Is the Target of Periplasmic Proteolysis. J Bacteriol 194, 4029^1040.
Lunzer, M., Miller, S.P., Felsheim, R., and Dean, A.M. (2005). The biochemical architecture of an ancient adaptive landscape. Science 310, 499-501.
Martin, M.O., and Long, S.R. (1984). Generalized transduction in Rhizobium meliloti. J. Bacteriol. 159, 125-129.

52
Martis, N., Leroy, S., and Blanc, V. (2014). Colistin in multi-drug resistant Pseudomonas aeruginosa blood-stream infections: A narrative review for the clinician. J. Infect.
Mendis, H.C., Queiroux, C., Brewer, T.E., Davis, O.M., Washburn, B.K., and Jones,K.M. (2013). The succinoglycan endoglycanase encoded by exoK is required for efficient symbiosis of Sinorhizobium meliloti 1021 with the host plants Medicago truncatula and Medicago sativa (Alfalfa). Mol. Plant Microbe Interact. 26, 1089-1105.
Mendrygal, K.E., and Gonzalez, J.E. (2000). Environmental regulation of exopolysaccharide production in Sinorhizobium meliloti. J. Bacteriol. 182, 599-606.
Mueller, K., and Gonzalez, J.E. (2011). Complex Regulation of Symbiotic Functions Is Coordinated by MucR and Quorum Sensing in Sinorhizobium meliloti. J Bacteriol 193, 485^196.
Naya, L., Ladrera, R., Ramos, J., Gonzalez, E.M., Arrese-Igor, C., Minchin, F.R., and Becana, M. (2007). The Response of Carbon Metabolism and Antioxidant Defenses of Alfalfa Nodules to Drought Stress and to the Subsequent Recovery of Plants. Plant Physiol. 144, 1104-1114.
Nogales, J., Bemabeu-Roda, L., Cuellar, V., and Soto, M.J. (2012). ExpR Is Not Required for Swarming but Promotes Sliding in Sinorhizobium meliloti. J Bacteriol 194, 2027-2035.
Oke, V., and Long, S.R. (1999). Bacterial genes induced within the nodule during the Rhizobium-legume symbiosis. Mol. Microbiol. 32, 837-849.
Osteras, M., Stanley, J., and Finan, T.M. (1995). Identification of Rhizobium-specific intergenic mosaic elements within an essential two-component regulatory system of Rhizobium species. J Bacteriol 177, 5485-5494.
Ostrowska, K., Strzelczyk, A., Rozalski, A., and Staczek, P. (2013). [Bacterial biofilm as a cause of urinary tract infection—pathogens, methods of prevention and eradication]. Postepy Hig Med Dosw (Online) 6 7 ,1027-1033.
Pellock, B.J., Cheng, H.P., and Walker, G.C. (2000). Alfalfa root nodule invasion efficiency is dependent on Sinorhizobium meliloti polysaccharides. J. Bacteriol. 182, 4310^1318.
Pellock, B.J., Teplitski, M., Boinay, R.P., Bauer, W.D., and Walker, G.C. (2002). A LuxR homolog controls production of symbiotically active extracellular polysaccharide II by Sinorhizobium meliloti. J. Bacteriol. 184, 5067-5076.
Perez, E., Williams, M., Jacob, J.T., Reyes, M.D., Chemetsky Tejedor, S., Steinberg, J.P., Rowe, L., Ganakammal, S.R., Changayil, S., Weil, M.R., et al. (2013). Microbial
53
biofilms on needleless connectors for central venous catheters: a comparison of standard and silver-coated devices collected from patients in an acute care hospital. J. Clin. Microbiol.
Pitzschke, A. (2013). Agrobacterium infection and plant defense—transformation success hangs by a thread. Front Plant Sci 4.
Pobigaylo, N., Szymczak, S., Nattkemper, T.W., and Becker, A. (2008). Identification of genes relevant to symbiosis and competitiveness in Sinorhizobium meliloti using signature-tagged mutants. Mol. Plant Microbe Interact. 21, 219-231.
Reed, J.W., Capage, M., and Walker, G.C. (1991). Rhizobium meliloti exoG and exoJ mutations affect the exoX-exoY system for modulation of exopolysaccharide production. J. Bacteriol. 173, 3776-3788.
Reuber, T.L., and Walker, G.C. (1993). Biosynthesis of succinoglycan, a symbiotically important exopolysaccharide of Rhizobium meliloti. Cell 74, 269-280.
Rosinha, G.M.S., Freitas, D.A., Miyoshi, A., Azevedo, V., Campos, E., Cravero, S.L., Rossetti, O., Splitter, G., and Oliveira, S.C. (2002). Identification and characterization of a Brucella abortus ATP-binding cassette transporter homolog to Rhizobium meliloti ExsA and its role in virulence and protection in mice. Infect. Immun. 70, 5036-5044.
Santos, M.R., Cosme, A.M., Becker, J.D., Medeiros, J.M., Mata, M.F., and Moreira,L.M. (2010). Absence of functional TolC protein causes increased stress response gene expression in Sinorhizobium meliloti. BMC Microbiol 10, 180.
Schneiker-Bekel, S., Wibberg, D., Bekel, T., Blom, J., Linke, B., Neuweger, H., Stiens, M., Vorholter, F.-J., Weidner, S., Goesmann, A., et al. (2011). The complete genome sequence of the dominant Sinorhizobium meliloti field isolate SMI 1 extends the S. meliloti pan-genome. J. Biotechnol. 155, 20-33.
Sharypova, L.A., Chataigne, G., Fraysse, N., Becker, A., and Poinsot, V. (2006). Overproduction and increased molecular weight account for the symbiotic activity of the rkpZ-modified K polysaccharide from Sinorhizobium meliloti Rml021. Glycobiology 1 6 ,1181-1193.
Skorupska, A., Janczarek, M., Marczak, M., Mazur, A., and Krol, J. (2006). Rhizobial exopolysaccharides: genetic control and symbiotic functions. Microb. Cell Fact. 5, 7.
Sorroche, F.G., Spesia, M.B., Zorreguieta, A., and Giordano, W. (2012). A Positive Correlation between Bacterial Autoaggregation and Biofilm Formation in Native Sinorhizobium meliloti Isolates from Argentina. Appl Environ Microbiol 78, 4092—4101.
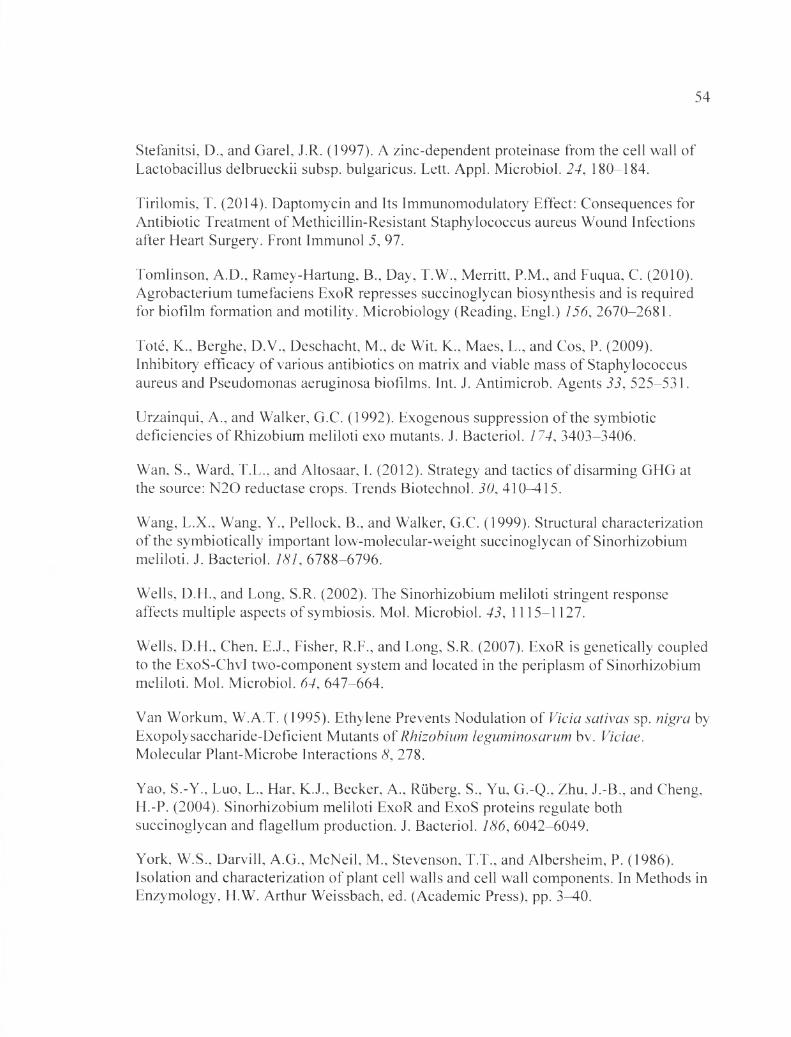
54
Stefanitsi, D., and Garel, J.R. (1997). A zinc-dependent proteinase from the cell wall of Lactobacillus delbrueckii subsp. bulgaricus. Lett. Appl. Microbiol. 24, 180-184.
Tirilomis, T. (2014). Daptomycin and Its Immunomodulatory Effect: Consequences for Antibiotic Treatment of Methicillin-Resistant Staphylococcus aureus Wound Infections after Heart Surgery. Front Immunol 5, 97.
Tomlinson, A.D., Ramey-Hartung, B., Day, T.W., Merritt, P.M., and Fuqua, C. (2010). Agrobacterium tumefaciens ExoR represses succinoglycan biosynthesis and is required for biofilm formation and motility. Microbiology (Reading, Engl.) 156, 2670-2681.
Tote, K., Berghe, D.V., Deschacht, M., de Wit, K., Maes, L., and Cos, P. (2009). Inhibitory efficacy of various antibiotics on matrix and viable mass of Staphylococcus aureus and Pseudomonas aeruginosa biofilms. Int. J. Antimicrob. Agents 33, 525-531.
Urzainqui, A., and Walker, G.C. (1992). Exogenous suppression of the symbiotic deficiencies of Rhizobium meliloti exo mutants. J. Bacteriol. 174, 3403-3406.
Wan, S., Ward, T.L., and Altosaar, I. (2012). Strategy and tactics of disarming GHG at the source: N 20 reductase crops. Trends Biotechnol. 30, 410-415.
Wang, L.X., Wang, Y., Pellock, B., and Walker, G.C. (1999). Structural characterization of the symbiotically important low-molecular-weight succinoglycan of Sinorhizobium meliloti. J. Bacteriol. 181, 6788-6796.
Wells, D.H., and Long, S.R. (2002). The Sinorhizobium meliloti stringent response affects multiple aspects of symbiosis. Mol. Microbiol. 43, 1115-1127.
Wells, D.H., Chen, E.J., Fisher, R.F., and Long, S.R. (2007). ExoR is genetically coupled to the ExoS-ChvI two-component system and located in the periplasm of Sinorhizobium meliloti. Mol. Microbiol. 64, 647-664.
Van Workum, W.A.T. (1995). Ethylene Prevents Nodulation of Vicia sativas sp. nigra by Exopolysaccharide-Deficient Mutants of Rhizobium leguminosarum bv. Viciae.Molecular Plant-Microbe Interactions 8, 278.
Yao, S.-Y., Luo, L., Har, K.J., Becker, A., Ruberg, S., Yu, G.-Q., Zhu, J.-B., and Cheng,H.-P. (2004). Sinorhizobium meliloti ExoR and ExoS proteins regulate both succinoglycan and flagellum production. J. Bacteriol. 186, 6042-6049.
York, W.S., Darvill, A.G., McNeil, M., Stevenson, T.T., and Albersheim, P. (1986). Isolation and characterization of plant cell walls and cell wall components. In Methods in Enzymology, H.W. Arthur Weissbach, ed. (Academic Press), pp. 3-40.

55
Zhou, C., Han, L., Pislariu, C., Nakashima, J., Fu, C., Jiang, Q., Quan, L., Blancaflor, E.B., Tang, Y., Bouton, J.H., et al. (2011). From Model to Crop: Functional Analysis of a STAY-GREEN Gene in the Model Legume Medicago truncatula and Effective Use of the Gene for Alfalfa Improvement. Plant Physiol. 157, 1483-1496.
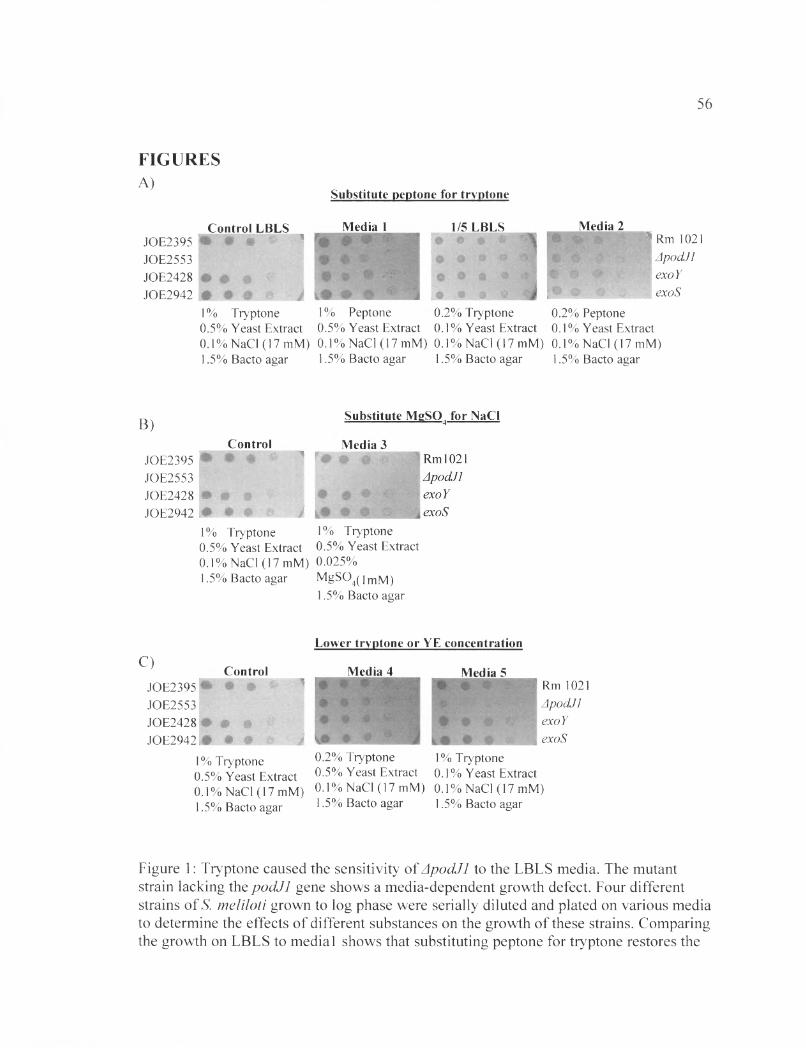
56
FIGURESA)
JOE2395JOE2553JOE2428JOE2942
Control LBLS» • # V '
Substitute peptone for tryptone
Media 1
mu1% Tryptone 0.5% Yeast Extract
Media 21/5 LBLS# m •
m 0
• •0 # 0
1% Peptone 0.2% Tryptone 0.2% Peptone0.5% Yeast Extract 0.1 % Yeast Extract 0.1 % Yeast Extract
0.1% NaCl (17 mM) 0.1% NaCl (17 mM) 0.1% NaCl (17 mM) 0.1% NaCl (17 mM)1.5% Bacto agar 1.5% Bacto agar 1.5% Bacto agar 1 .5% Bacto agar
I Rm 1021 ApocUl exoY exoS
B)Control
JOE2395 H i iJOE2553JOE2428 • m 9 «' ■JOE2942 • • • 6 •" i
1% Tryptone0.5% Yeast Extract 0.1% NaCl (17 mM) 1.5% Bacto agar
Substitute MgSQ4 for NaCl
Media 3
1% Tryptone 0.5% Yeast Extract 0.025% MgS04(]mM)1.5% Bacto agar
C) ControlJOE2395 • • •JOE2553JOE2428 • •JOE2942 • • • a ■ J
1% Tryptone 0.5% Yeast Extract 0.1% NaCl (17 mM) 1.5% Bacto agar
Lower tryptone or YE concentration
Media 4 Media 5
0.2% Tryptone 0.5% Yeast Extract 0.1% NaCl (17 mM) 1.5% Bacto agar
Rm 1021 ApodJl exoY exoS
1% Tryptone 0.1% Yeast Extract 0.1% NaCl (17 mM) 1.5% Bacto agar
Figure 1: Tryptone caused the sensitivity of J podJl to the LBLS media. The mutant strain lacking the podJl gene shows a media-dependent growth defect. Four different strains of S. meliloti grown to log phase were serially diluted and plated on various media to determine the effects of different substances on the growth of these strains. Comparing the growth on LBLS to medial shows that substituting peptone for tryptone restores the
57
growth of the ApodJl strains. When 1/5 LBLS and media 2 are compared, the results show that at lower concentrations of tryptone and peptone, the sensitivity effect is not significant. When LBLS and media 3 are compared, the results show that substituting MgSC>4 for NaCl does not cause any significant difference in growth. When LBLS is compared to media 4, the decrease in the amount of tryptone restores the growth of the ApodJl strain. According to the comparison between LBLS and media 5, the decrease in yeast extract concentration does not relieve the growth effect of the ApodJl strain. The sensitivity of the ApodJl strain to the LBLS media appears to be due to the presence of tryptone.
58
Substitute peptone for tryptone
A)Control LBLS Media 1
1% Tryptone 0.5% Yeast Extract
Media 2JOE2395 • • •JOE2422 • • • . :•JOE2428 i • eJOE2942 hm * « i
0.2 % Peptone
Rm 1021ApodJ2exoYexoS
1 % Peptone0.5% Yeast Extract 0.1 % Yeast Extract
0.1% NaCl (17 mM) 0.1% NaCl (17mM) 0.1% NaCl (17 mM) 1.5% Bacto agar 1 .5% Bacto agar 1.5% Bacto agar
B)
JOE2395 % JOE2422 m JOE2428 JOE2942 yp
1%
Control LBLS• * ®• •• f &« • iTryptone
0.5% Yeast Extract
Substitute MgSO for NaCl
Media 3Rm 1021ApodJ2exoYexoS
Tryptone Yeast Extract
0.1% NaCl (17 mM) 0.025% MgS04 1.5% Bacto agar ] .50/,, B act0 agar
C)
Lower tryptone or YE concentration
Control LBLS
JOE2395 •JOE2422 9 •JOE2428JOE2942 v « i O
1% Tryptone 0.5% Yeast Extract 0.1% NaCl (17 mM) 1.5% Bacto agar
Media 4 Media 5Rml021ApodJ2exoYexoS
0 .2 % Tryptone 1 % Tryptone 0.5 % Y east Extract 0.1 % Yeast Extract 0.1% NaCl (17mM) 0.1% NaCl (17mM) 1.5% Bacto agar 1.5% Bacto agar
Figure 2: ApodJ2 did not show any sensitivity to different media. The same variety of media as in figure 1 is tested. In this experiment the strain being tested has a deletion of

59
the podJ2 gene instead of the previously studied podJl. No significant difference is seen in the growth of the ApodJ2 strain in different media.
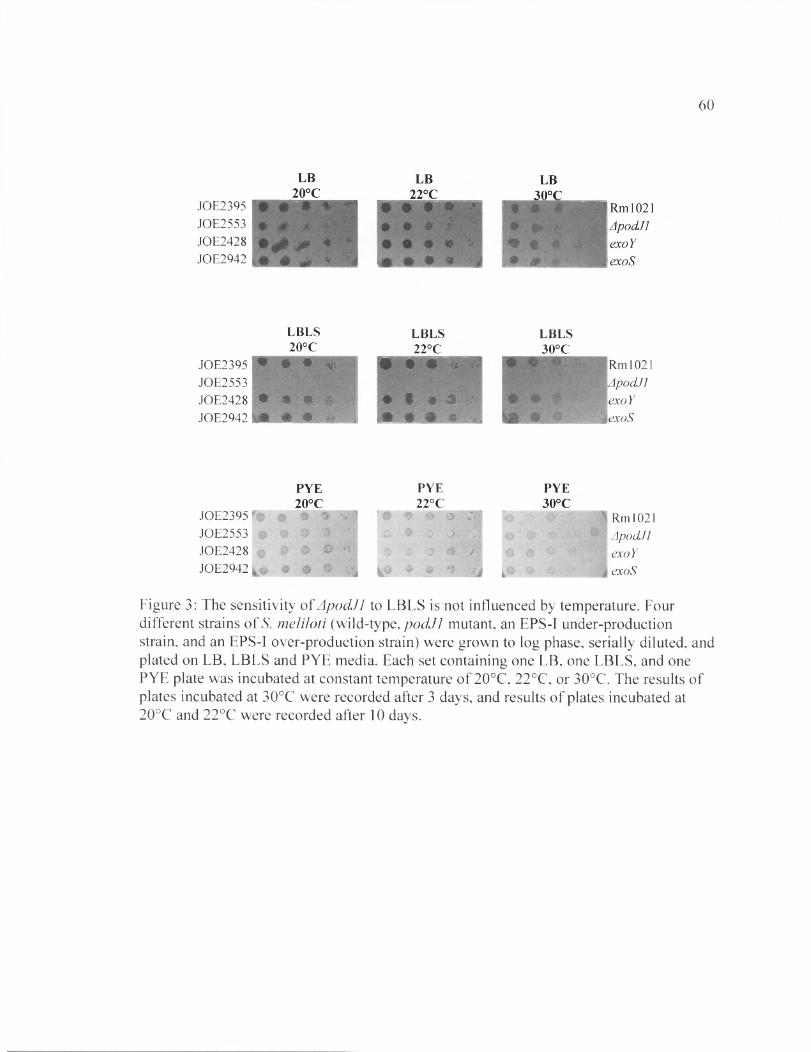
60
JOE2395JOE2553JOE2428JOE2942
LBLS LBLS20°C 22°C
JOE2395 • • • tit • m m m *JOE2553JOE2428 m m m $ • • m dJOE2942 m m m • • • 0
LBLS30°C
Rml021ApodJlexoYexoS
JOE2395 JOE2553 JOE2428 JOE2942 k ci
PYE22°C
# % © C.- t 0m m a vm m m © ,
t a o $ a -.>i
Rm 1021ApodJlexoYexoS
Figure 3: The sensitivity of ApodJl to LBLS is not influenced by temperature. Four different strains of S', meliloti (wild-type, podJl mutant, an EPS-I under-production strain, and an EPS-I over-production strain) were grown to log phase, serially diluted, and plated on LB, LBLS and PYE media. Each set containing one LB, one LBLS, and one PYE plate was incubated at constant temperature of 20°C, 22°C, or 30°C. The results of plates incubated at 30°C were recorded after 3 days, and results of plates incubated at 20°C and 22°C were recorded after 10 days.
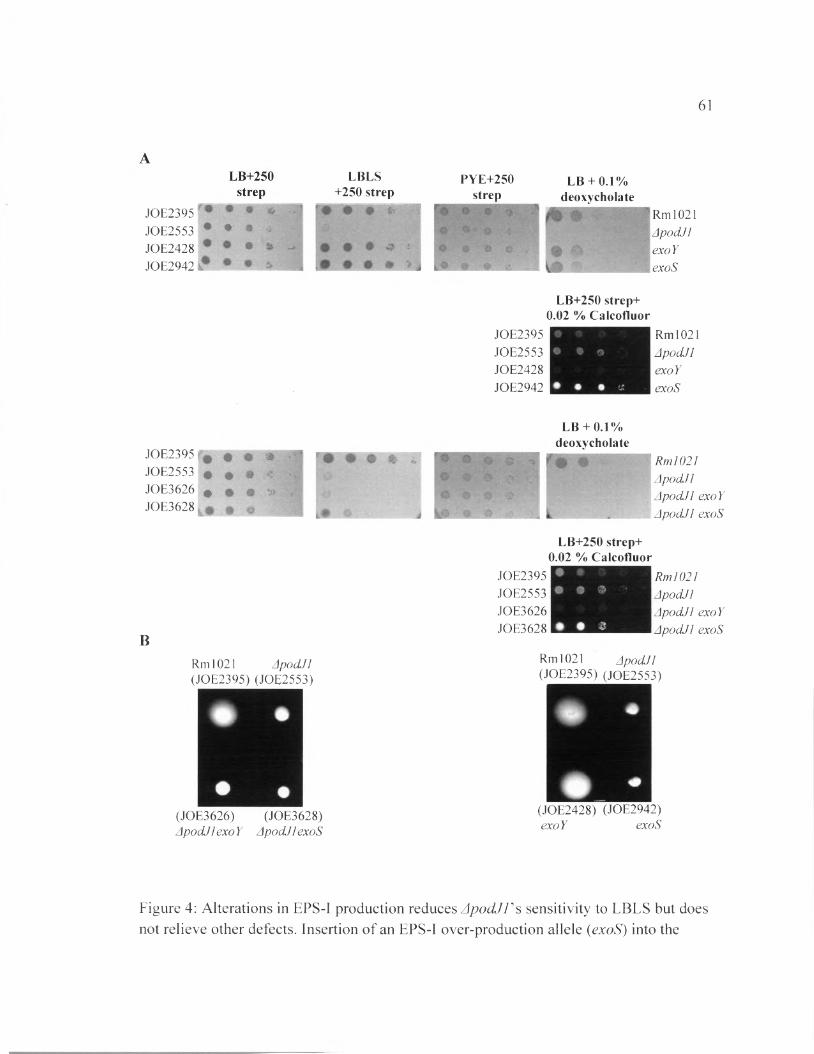
61
LBLS +250 strep
JOE2395JOE2553JOE2428JOE2942
PYE+250strep
L B + 0.1% deoxycholate
Rm 1021ApodJlexoYexoS
LB+250 strep+ 0.02 % Calcofluor
JOE2395JOE2553JOE2428JOE2942
Rm 1021ApodJlexoYexoS
JOE2395 JOE2553 JOE3626 # JOE3628
L B + 0.1% deoxycholate
Rml021 ApodJl ApodJl exoY ApodJl exoS
LB+250 strep+ 0.02 % Calcofluor
B
JOE2395JOE2553JOE3626JOE3628
Rml021 ApodJl ApodJl exoY ApodJl exoS
Rml021 ApodJl (JOE2395) (JOE2553)
Rm 1021 ApodJl(JOE2395) (JOE2553)
(JOE3626) (JOE3628)ApodJl exoY ApodJl exoS
(JOE2428) (JOE2942)exoY exoS
Figure 4: Alterations in EPS-I production reduces ApodJFs sensitivity to LBLS but does not relieve other defects. Insertion of an EPS-I over-production allele (exoS) into the

62
ApodJl strain suppresses sensitivity to LBLS. (A) Six different strains of S. meliloti (wild type, podJl mutant strain, an EPS-I under-producing strain (exoY), an EPS-I overproducing strain (exoS), a double mutant strain with podJl and exoY mutations, and a double mutant strain with podJl and exoS mutations) were serially diluted. The cultures were plated on LB, LBLS, PYE, LB containing 0.1% deoxycholate, and LB containing 0.02% calcofluor media. The pictures of the calcofluor plates were taken using exposure to UV light. The single exoY and exoS mutants and the double mutants (ApodJl exoY and ApodJl exoS) show correspondingly similar levels of EPS-I production; however, the ApodJl exoY double mutant shows sensitivity to LBLS while the ApodJl exoS double mutant shows a minor rescuing effect. (B) The motility of each strain was tested by comparing the diameter of growth in an inoculated PYE motility plate. The results were recorded after three days of incubation at 30 °C. The wild-type and exoY strains showed normal motility. The two double mutants (ApodJ exoY and ApodJ exoS) did not show any improvements in their motility compare to the ApodJlparent.

63
A)
JOE2395JOE2553JOE3684JOE3687
*
LB+250strep
LBLS +250 strep
PYE+250strep
L B + 0.1% deoxycholate
Rm 1021ApodJl ApodJ2 ApodJl-2
LB+250 strep+0.02 % Calcofluor
JOE2395 | | V H | Rm 102 JOE2553JOE3684 ApodJ2JOE3687 m jC B E K K i A p o d Jl-2
B) Rml021 ApodJl (JOE2395) (JOE2553)
(JOE3685) (JOE3689)ApodJl ApodJ 1-2
Figure 5: ApodJ2 does not contribute to any detectable phenotypes. According to the results, ApodJl-2 has the same phenotype as ApodJl in that they are both sensitive todeoxycholate and LBLS media and have motility defects. A) Four strains of S. meliloti(wild type, a podJl mutant strain, a podJ2 mutant strain, and a mutant with deletion of both podJl and podJl) were serially diluted and plated on LB, LBLS, PYE, LB with 0.1% deoxycholate and LB with 0.02% calcofluor media. The podJ2 mutant behaved similarly to the wild type. (B) The strains were inoculated into motility plates (in duplicates) and left for three days to grow. The wild type and the strain with the podJ2 deletion are similar in their flagellar motility, whereas podJl and the podJl-2 mutant show a motility defect. The podJ2 deletion did not contribute to the sensitivity and the motility defect of the ApodJl-2 strain.
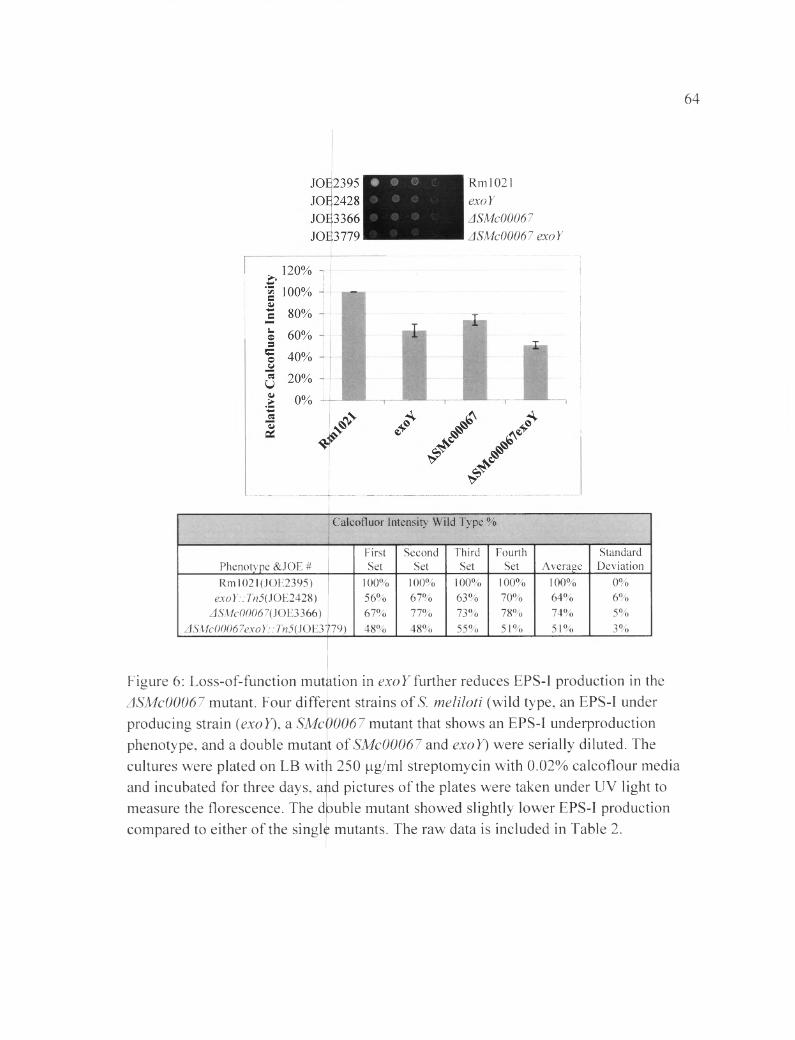
64
Rm 1021exoYASMc00067 ASMc00067 exoY
II
I
Calcofluor Intensity Wild Type %
Phenotype &JOE #FirstSet
SecondSet
ThirdSet
FourthSet Average
StandardDeviation
Rml021(JC)E2395) exoY:: Tn5(JOE2428)
ASMcOO()67(]OE3366) ASMc()0067exoY::Tn5(JOE3'H9)
100%56%67%48%
100%67%11%48%
100%63%73%55%
100%70%78%51%
100%64%74%51%
0%6%5%3%
Figure 6: Loss-of-function mutation in exoY further reduces EPS-I production in the ASMc00067 mutant. Four diffe rent strains of S. meliloti (wild type, an EPS-I under producing strain (exoY), a SMc00067 mutant that shows an EPS-I underproduction phenotype, and a double mutant of SMc00067 and exoY) were serially diluted. The cultures were plated on LB wit 1 250 |_ig/ml streptomycin with 0.02% calcoflour media and incubated for three days, and pictures of the plates were taken under UV light to measure the florescence. The double mutant showed slightly lower EPS-I production compared to either of the single mutants. The raw data is included in Table 2.

65
JOE2395JOE2428JOE3249JOE3781
Rml021exoYASMc03872 ASMc03872 exoY
Calcofluor Intensity Wild Type %
Phenotype &JOE #FirstSet
SecondSet
ThirdSet
FourthSet Average
StandardDeviation
Rml021(JC)E2395) 100% 100% 100% 100% 100% 0%
exoY:: 7h5(JOE2428) 65% 72% 60% 64% 65% 5%
ASMc03872( JOE3249) 70% 60% 60% 66% 64% 5%
A SMc03872exo Y:: Tn5( JOE3781) 57% 46% 41% 46% 47% 1%
Figure 7: Loss-of-function mutation in exoY further reduces EPS-I production in the SMc03872 mutant. Four different strains of S. meliloti (wild type, an EPS-I underproducing strain {exoY), a mutant SMc03872 strain that shows an EPS-I under-production phenotype, and a double mutant of SMc03872 and exoY) were serially diluted. The cultures were plated on LB with 250 |xg/ml streptomycin with 0.02% calcoflour media and incubated for three days, and pictures of the plates were taken under UV light to measure the florescence level. The raw data is included in Table 3.

66
JOE2395JOE2942JOE3366JOE378Q
Rm 1021exoSASMc00067 ASMc00067 exoS
^ 500% •r 450% | 400% = 350%
300% 250% 200% 150% 100% 50%
0%
L .©35=ow
.2
V
Calcofluor Intensity Wild Type %First Second Third Fourth Standard
Phenotype &JOE # Set Set Set Set Average Deviation
Rml021(JC)E2395) 100% 100% 100% 100% 100% 0%
exoS:: Tn5{iOE2942) 351% 453% 360% 357% 380% 49%
ASMc00067( JOE3366) 70% 76% 70% 79% 74% 5%
ASMc00067exoS:: 7>z5(JOE3780) 319% 417% 349% 397% 371% 45%
Figure 8: The exoS gene is epistatic to SMc00067. Four different strains of S. meliloti (wild type, an EPS-I over-producing strain (exoS), a SMc00067 mutant that shows an EPS-I underproduction phenotype, and a double mutant of SMc00067 and exoS) were serially diluted. The cultures were plated on LB with 250 |ag/ml streptomycin with 0.02% calcoflour media, incubated for three days, and pictures of the plates were taken under UV light to measure the florescence levels. The results indicate that the introduction of the mutant exoS allele reverses the under-production of EPS-I in the SMc00067 mutant, indicating that the mutant trait is masked by exoS allele. The raw data is presented in table 4.

67
JOE2395JOE2942 evaVJOE3249 m ^ H j . v i / c O j r :JOE3782 D C ^ S ^ H ASMc03872 exoS
500%S 450% c 400%| 350%- 300% o 250% c 200% s 150%15 100%
50% \> o%JSQJ
Calcofluor Intensity Wild Type %
Phenotype &JOE #FirstSet
SecondSet
ThirdSet
FourthSet Average
StandardDeviation
Rml021(JC)E2395) 100% 100% 100% 100% 100% 0%
exoS::Tn5(JOE2942) 436% 429% 378% 375% 404% 33%
ASMc03872(iOE3249) 63% 68% 66% 71% 67% 3%
A SMc03872exoS:: r«5(JOE3782) 417% 419% 408% 392% 409% 12%
Figure 9: The exoS gene is epistatic to SMc03872. Four different strains of S. meliloti (wild type, an EPS-I over-producing strain (exoS), a SMc03872 mutant that shows an EPS-I under-production phenotype, and a double mutant of SMc03872 and exoS) were serially diluted. The cultures were plated on LB with 250 |ig/ml streptomycin with 0.02% calcoflour media and incubated for three days, and pictures of the plates were taken under UV light to measure the florescence level. The results indicate that the introduction of the mutant exoS allele reverses the under-production of EPS-I in the SMc03872 mutant, indicating that the mutant trait is masked by the exoS allele. SMc03872 is upstream of exoS because exoS is dominating the phenotype. The raw data is presented in table 5.
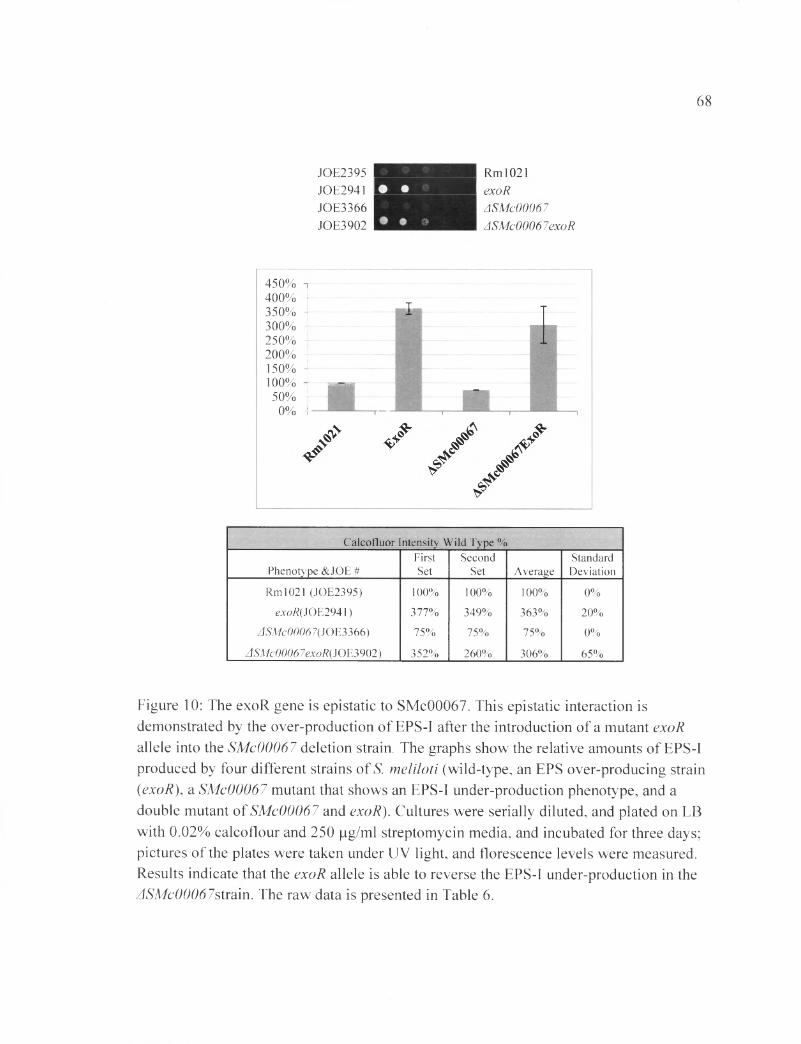
68
JOE2395 Rm 1JOE2941 S U H exoR JOE3366 ASMcO()()67JOE39Q2 ASMc00067exoR
450%400% -j350% ] I300% -250% -200% -150% -100% m h h 50% -0% -i T----
Calcofluor Intensity Wild Type %
Phenotype &JOE #FirstSet
SecondSet Average
StandardDeviation
Rm 1021 (JOE2395) 100% 100% 100% 0%
exoR( JOE2941) 377% 349% 363% 20%
ASMc00067( JOE3366) 75% 75% 75% 0%
ASMc00067exoR(]QE3902) 352% 260% 306% 65%
Figure 10: The exoR gene is epistatie to SMe00067. This epistatic interaction is demonstrated by the over-production of EPS-I after the introduction of a mutant exoR allele into the SMc00067 deletion strain. The graphs show the relative amounts of EPS-I produced by four different strains of S. meliloti (wild-type, an EPS over-producing strain (exoR), a SMc00067 mutant that shows an EPS-I under-production phenotype, and a double mutant of SMc00067 and exoR). Cultures were serially diluted, and plated on LB with 0.02% calcoflour and 250 (ig/ml streptomycin media, and incubated for three days; pictures of the plates were taken under UV light, and florescence levels were measured. Results indicate that the exoR allele is able to reverse the EPS-I under-production in the ASMc00067siraxn. The raw data is presented in Table 6.

69
JOE2395JOE2941JOE3249JOE39Q3
. 450% -] * 400% - 5 350%= 300%S 250% H £ 200%2 150%(3 ioo%5! 50% -! o%<uQ*
Rm 1021exoRASMc03872 ASMc03872 exoR
& & J*
Calcofluor Intensity Wild Type %
Phenotype &JOE #FirstSet
SecondSet Average
StandardDeviation
Rm 1021 (JOE2395) 100% 100% 100% 0%
exaR(JOE2941) 391% 339% 365% 37%
ASMc03872{ JOE3249) 69% 48% 59% 15%
ASMc03872exoR{ JQE3903) 392% 303% 347% 63%
Figure 11: The exoR gene is epistatic to SMc03872. This epistatic interaction is demonstrated by the over-production of EPS-I after the introduction of a mutant exoR allele into the SMc03872 deletion strain. The graphs show the relative amounts of EPS-I produced by four different strains of S. meliloti (wild type, an EPS-I over-producing strain (exoR), a SMc00067 mutant that shows an EPS-I underproduction phenotype, and a double mutant of SMc00067 and exoR). Cultures were serially diluted, plated on LB with 0.02% calcoflour and 250 pg/ml streptomycin media, and incubated for three days; pictures of the plates were taken under UV light, and florescence levels were measured. Results indicate that the exoR allele is able to reverse the EPS-I underproduction in the ASMc03872 strain. The raw data is presented in Table 6.
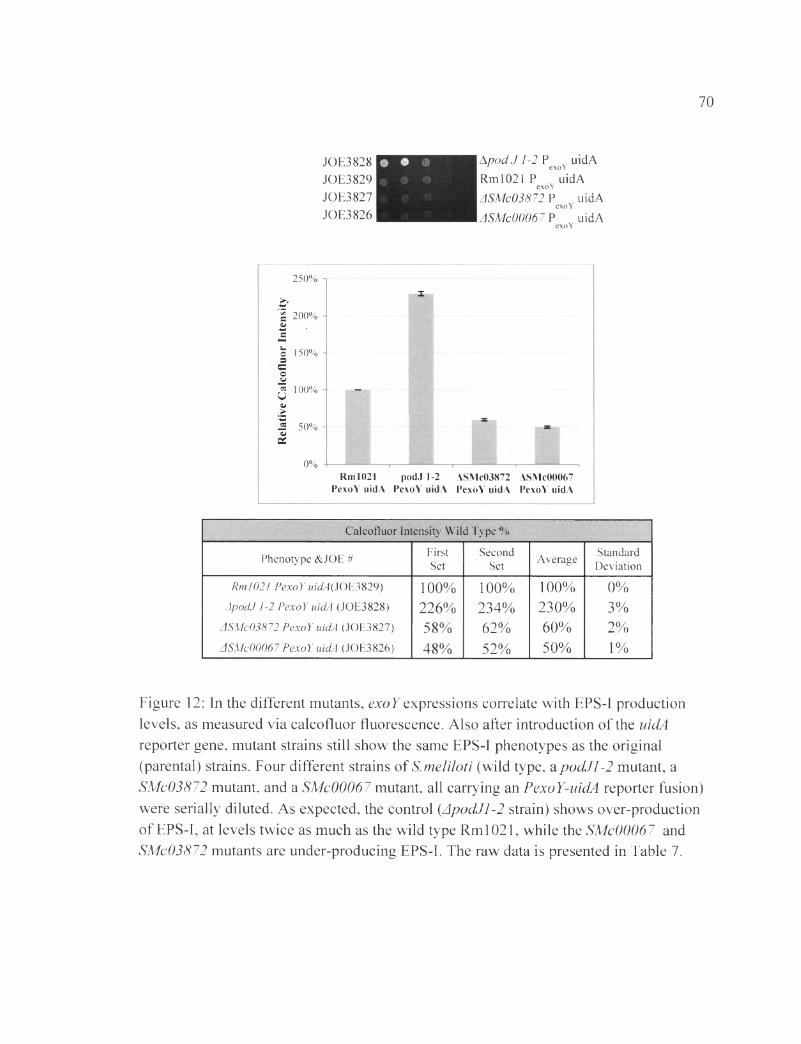
70
JOE3828JOE3829JOE3827JOE3826
Apod J 1-2 P „ uidAr exoY
Rml021 P uidAexoY
ASMc03872 P uidAexoY
ASMc00067 P uidAexoY
250%
i 200%
s
o 150%
« 100%
50%
0%Rm 1021 podJ 1-2 ASMc03872 ASMc00067
PexoY uidA PexoY uidA PexoY uidA PexoY uidA
Calcofluor Intensity Wild Type %
Phenotype &JOE # FirstSet
SecondSet Average Standard
Deviation
Rml021 PexoY uidA( JOE3829) 100% 100% 100% 0%ApodJ 1-2 PexoY uidA (JOE3828) 226% 234% 230% 3%
ASMc03872 PexoY uidA (JOE3827) 58% 62% 60% 2%ASMc00067 PexoY uidA (JOE3826) 48% 52% 50% 1%
Figure 12: In the different mutants, exoY expressions correlate with EPS-I production levels, as measured via calcofluor fluorescence. Also after introduction of the uidA reporter gene, mutant strains still show the same EPS-I phenotypes as the original (parental) strains. Four different strains of S. meliloti (wild type, a podJl-2 mutant, a SMc03872 mutant, and a SMc00067 mutant, all carrying an PexoY-uidA reporter fusion) were serially diluted. As expected, the control (ApodJl-2 strain) shows over-production of EPS-I, at levels twice as much as the wild type Rml021, while the SMc00067 and SMc03872 mutants are under-producing EPS-I. The raw data is presented in Table 7.
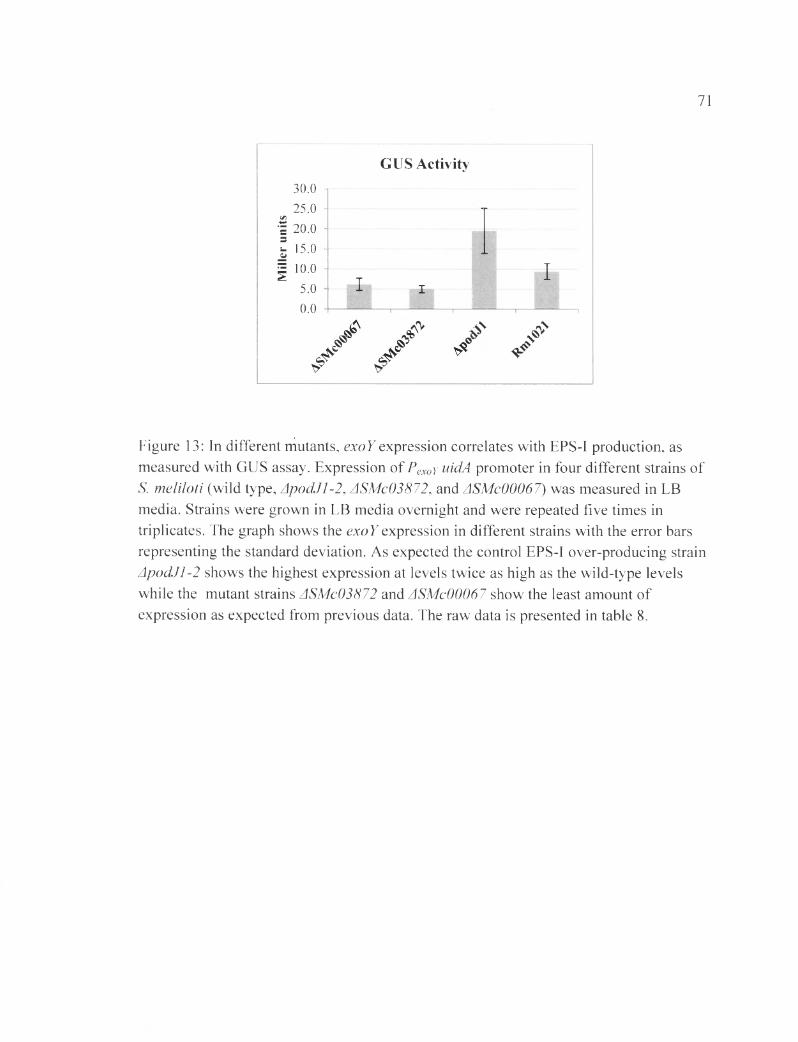
71
30.0 -25.0 -!*1
•I 20.0 -
I 15.0 -I 10.0 -
5.0 -fi n
GUS Activity
1 1 1 1u.u
4&
1 II i 1J - >>s s* s
/ ^V
Figure 13: In different mutants, exoYexpression correlates with EPS-I production, as measured with GUS assay. Expression of Pexoy uidA promoter in four different strains of S. meliloti (wild type, ApodJl-2, ASMc03872, and ASMc00067) was measured in LB media. Strains were grown in LB media overnight and were repeated five times in triplicates. The graph shows the exoY expression in different strains with the error bars representing the standard deviation. As expected the control EPS-I over-producing strain ApodJl-2 shows the highest expression at levels twice as high as the wild-type levels while the mutant strains ASMc03872 and ASMc00067 show the least amount of expression as expected from previous data. The raw data is presented in table 8.

72
A)
B)
strains (June31,2012) Amount of EPS
(jig/assay)
(July 13,2012) Amount of EPS
(Hg/assay)
Average amount of
EPS (ng/assay)
StandardDeviation
Rm 1021(JOE2395) 4.53 7.13 5.83 1.84
SMc00067( JOE3366) 2.98 5.41 4.19 1.72
SMc03872{ JOE3249) 2.68 4.66 3.67 1.40
exoy(JOE2428) 1.19 0.54 0.86 0.46
£xo/?(JOE2941) 9.42 16.51 12.97 5.01
Figure 14: ASMc00067 and ASMc03872 produce less expolysaccharides than the wild type. Anthrone assay confirms that when measuring the EPS levels quantitatively,
73
ASMc00067 and ASMc03872 still show lower EPS levels compared to the control strains; these measurements are consistent with previous results. Anthrone assay measures the amount of total saccharide moiety (EPS-I and EPS-II) in S. meliloti by forming product that reacts with anthrone to produce a fluorescent color. We then estimate the total amount of carbohydrates (EPS-I and EPS-II) using the absorbance of the solution against a standard glucose control curve generated via measuring the fluorescence of samples containing 0, 0.625, 125, 2.5, 5, 10 |LXg of glucose per assay. The deletion strains (ASMc00067 and ASMc03872) produced more EPS than the EPS-I under-producing strain (exoY), however, they produced more EPS than both the over-producing strain (exoR) and the wild type strains. The raw data is presented in table 14 and 15.

74
JOE2395 rKjKJKBB Rm 1021 JOE3366 }^ ^ ^ ^ ^ ^ ^ A S M c 0 0 0 6 7 JOE3877 | 9 9 ^ ^ H e x / 7 / ? (EPS-II) JOE3915 B B H expR ASMc00067
^ 120%
I 100%
| 80%| 60%| 40%U 20%•I 0%
Calcofluor Intensity Wild Type %
Phenotype &JOE #FirstSet
First Set Duplicate
SecondSet
SecondSet
DuplicateThird
SetThird Set Duplicate
FourthSet
FourthSet
Duplicate AverageStandardDeviation
Rml021 (JOE2395) 100% 100% 100% 100% 100% 100% 100% 100% 100% 0%
ASMc00067{ JOE3366) 55% 48% 85% 93% 57% 55% 83% 88% 70% 19%
exp/r(JOE3877) 63% 66% 79% 82% 67% 67% 67% 76% 71% 7%
expR ASMc00067 (JOE3916& JOE
3915) 40% 41% 65% 62% 41% 35% 53% 50% 48% 11%
Figure 15: ExpR^ interacts synergistically with SMc00067. The expR has a synergistic interaction with SMc00067 demonstrated by the decrease in EPS-I production, as the SMc00067 deletion is introduced into expR+. The four following strains of S. meliloti were serially diluted: (wild type, an EPS-II over-producing strain (exoR), a mutant strain (ASMc00067) that shows an EPS-I under-production phenotype, a double mutant of
SMc00067 and ExpR (EPS-II)). Cultures were plated on LB media containing 0.02% calcoflour and 250 ng/ml streptomycin media, and incubated for three days; pictures of the plates were taken under UV light and florescence levels were measured. Inserting the deletion SMc00067 in to the expR shows a decrease in EPS-I production. The raw data is presented in table 11.
I I I !
cSS*
J '
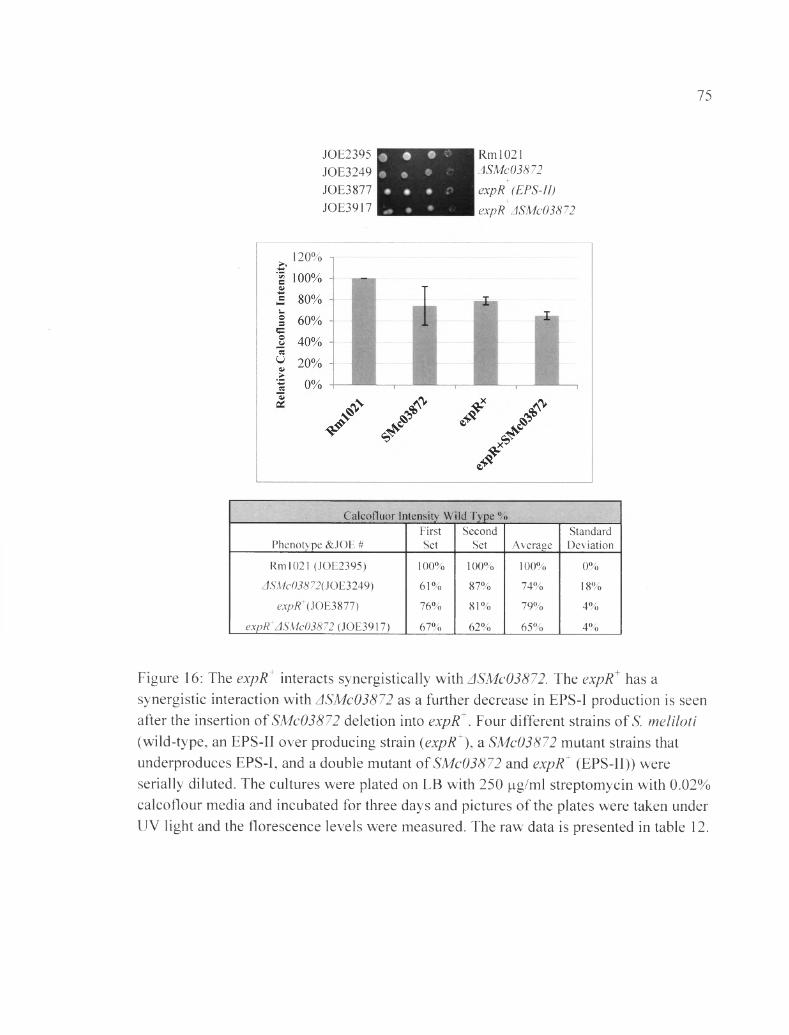
75
JOE2395JOE3249JOE3877JOE3917
Rm 1021ASMc03872expR (EPS-II) expR ASMc03872
120% i
Calcofluor Intensity Wild Type %
Phenotype &JOE #FirstSet
SecondSet Average
StandardDeviation
Rm 1021 (JOE2395) 100% 100% 100% 0%
ASMc03872( JOE3249) 61% 87% 74% 18%
e x p R (JOE3877) 76% 81% 79% 4%
expR ASMc03872 (JOE3917) 67% 62% 65% 4%
Figure 16: The expR interacts synergistically with ASMc03872. The expR has a synergistic interaction with ASMc03872 as a further decrease in EPS-I production is seen after the insertion of SMc03872 deletion into expR . Four different strains of S. meliloti (wild-type, an EPS-II over producing strain (expR+), a SMc03872 mutant strains that underproduces EPS-I, and a double mutant of SMc03872 and expR+ (EPS-II)) were serially diluted. The cultures were plated on LB with 250 |ig/ml streptomycin with 0.02% calcoflour media and incubated for three days and pictures of the plates were taken under UV light and the florescence levels were measured. The raw data is presented in table 12.
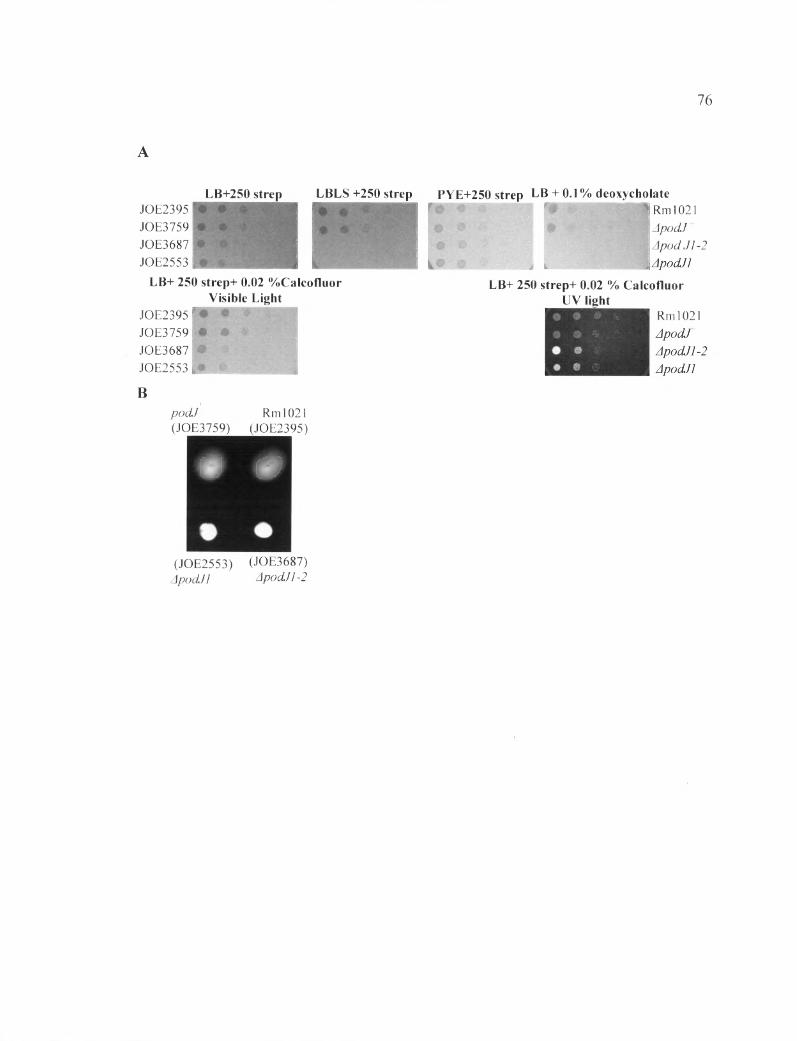
76
LB+250 strep LBLS +250 strepJOE2395 JOE3759 JOE3687 JOE2553
LB+ 250 strep+ 0.02 %Calcofluor Visible Light
JOE2395 “JOE3759 JOE3687 JOE2553
PYE+250 strep LB + 0.1 % deoxycholateRml021ApodJ
i A podJ 1-2\ApodJlLB+ 250 strep+ 0.02 % Calcofluor
UV lightRml021
ApodJ
Apoddl-2ApodJlBpodJ Rml021(JOE3759) (JOE2395)
# #
(JOE2553) (JOE3687)ApodJl ApodJ 1-2

77
250%
1 200% -jS
o 150% -j5=o« 100%0>
020% ™ - ■ ™ ■
Rml021 podJ+ ApodJl-2 ApodJl
Calcofluor Intensity Wild Type %
Phenotype &JOE #FirstSet
SecondSet
ThirdSet
FourthSet Average
StDev
Rml021 (JOE2395)
/?o<i/+(JOE3759)
ApodJl-2 (JOE3687)
ApodJl OOE2553)
100%
92%
171%
153%
100%
84%
190%
145%
100%
81%
180%
151%
100%
90%
188%
172%
100%
87%
182%
155%
0%
5%
9%
11%
Figure 17: Correcting mutation in the podJ gene not only restored the EPS-I levels, it also relieves any defects seen in the podJ mutants. (A) Four strains of S. meliloti (wild type, a podJ mutation corrected strain (pocLT), a podJl-2 mutant (ApodJl-2), and a podJl mutant (ApodJl)) were serially diluted. The strains were plated on LB, LBLS, PYE, LBLS with 0.1% deoxycholate and LBLS with 0.02% calcofluor media. After three days of incubation the pictures of the plates were taken under UV light, and fluoresces levels were measured. The p o d f strain does not show sensitivity to LBLS media and deoxycholate. The resulting phenotypes of podT resemble that of the wild type, whereas both ApodJl and ApodJl-2 are still sensitive to both LBLS and deoxycholate.(B) Correction of the podJ gene also restored the wild type motility. The strains were plated on motility plates (in duplicates) and incubated for three days. The fluorescence levels were measured and graphed. The data from four calcofluor plates were measured and combined in the graph. The raw data is presented in table 13.
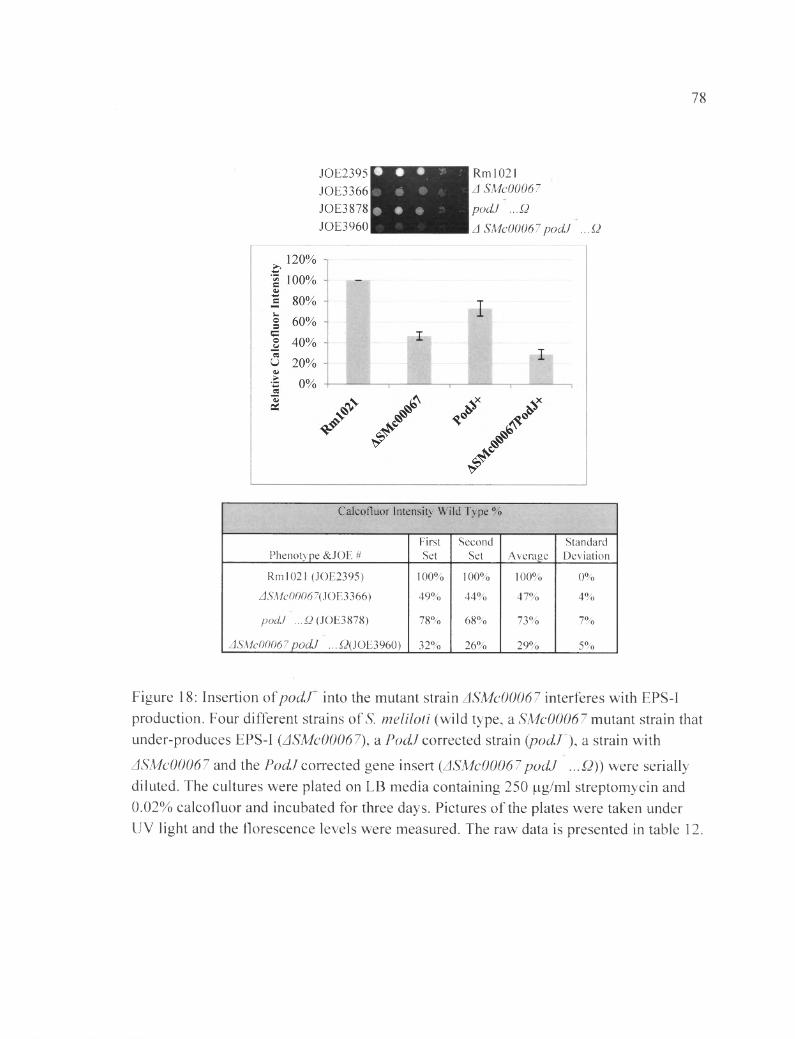
78
• • •m # • % # • #
JOE2395JOE3366JOE3878JOE396Q
Rml021zJ SMc00067podJ ...QA SMc00067podJ ...Q
Calcofluor Intensity Wild Type %
First Second StandardPhenotype &JOE # Set Set Average Deviation
Rml021 (JOE2395) 100% 100% 100% 0%
ASMc00067( JOE3366) 49% 44% 47% 4%
podJ ...Q (JOE3878) 78% 68% 73% 7%
ASM c00067podJ ...X2(JOE3960) 32% 26% 29% 5%
Figure 18: Insertion of podJ into the mutant strain ASMc00067 interferes with EPS-I production. Four different strains of S. meliloti (wild type, a SMc00067 mutant strain that under-produces EPS-I (ASMc00067), a PodJ corrected strain (pod/'), a strain with
-t-
ASMc00067 and the PodJ corrected gene insert (ASMc00067podJ ...Q)) were serially diluted. The cultures were plated on LB media containing 250 (ig/ml streptomycin and 0.02% calcofluor and incubated for three days. Pictures of the plates were taken under UV light and the florescence levels were measured. The raw data is presented in table 12.

79
JOE2395JOE3249JOE3878JOE39581
Rml021A SMc03872podJ ...QA SMc03872 podJ ...Q
Calcofluor Intensity Wild Type %
Phenotype &JOE #FirstSet
SecondSet Average
StandardDeviation
Rml021 (JOE2395) 100% 100% 100% 0%
ASMc03872( JOE3249) 43% 49% 46% 4%
podJ+...Q ( JOE3878) 67% 71% 69% 3%
ASMc03872podJ+...Q (JOE3958) 22% 26% 24% 3%
Figure 19: Insertion of podJ" into the deletion strain ASMc03872 interferes with EPS-I formation. Four different strains of S. meliloti (wild-type, a SMc03872 mutant that shows an EPS-I underproduction phenotype (dSMc03872), a strain with the PodJ mutation corrected (podT), a SMc03872 mutant strain with the PodJ mutation corrected gene
insert (ASMc03872podJ ...Q), were serially diluted. The cultures were plated on LB media containing 250 fig/nil streptomycin and 0.02% calcofluor, and incubated for three days; pictures of the plates were taken under UV light and the florescence levels were measured. The raw data is presented in table 13.
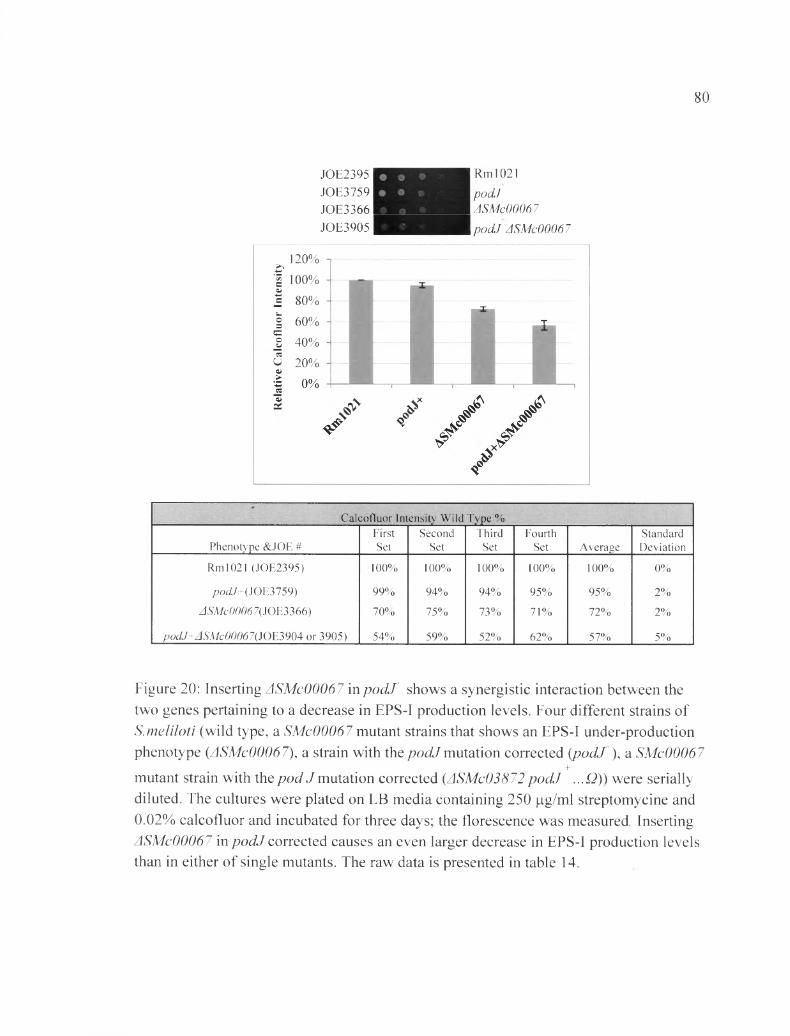
80
JOE2395 Rm 1021JOE3759 pod)JOE3366 ASMc00067JOE3905 H H H H I podJ ASMc00067
^ 120%
1 100%
| 80%1 60%1 40%3 20%
oc
Calcofluor Intensity Wild Type %
Phenotype &JOE #FirstSet
SecondSet
ThirdSet
FourthSet Average
StandardDeviation
Rml021 (JOE2395) 100% 100% 100% 100% 100% 0%
/?o<i/+(JOE3759) 99% 94% 94% 95% 95% 2%
ASMc00067( JOE3366) 70% 75% 73% 71% 72% 2%
podJ+ASMc00067(JQE3904 or 3905) 54% 59% 52% 62% 57% 5%
Figure 20: Inserting ASMc00067 inp o d f shows a synergistic interaction between the two genes pertaining to a decrease in EPS-I production levels. Four different strains of S.meliloti (wild type, a SMc00067 mutant strains that shows an EPS-I under-production phenotype (ASMc00067), a strain with the podJ mutation corrected (pocLT), a SMc00067
mutant strain with the pod J mutation corrected (ASMc03872 podJ ...£?)) were serially diluted. The cultures were plated on LB media containing 250 [ig/ml streptomycine and 0.02% calcofluor and incubated for three days; the florescence was measured. Inserting ASMc00067 in podJ corrected causes an even larger decrease in EPS-I production levels than in either of single mutants. The raw data is presented in table 14.
I I I !No ' / *
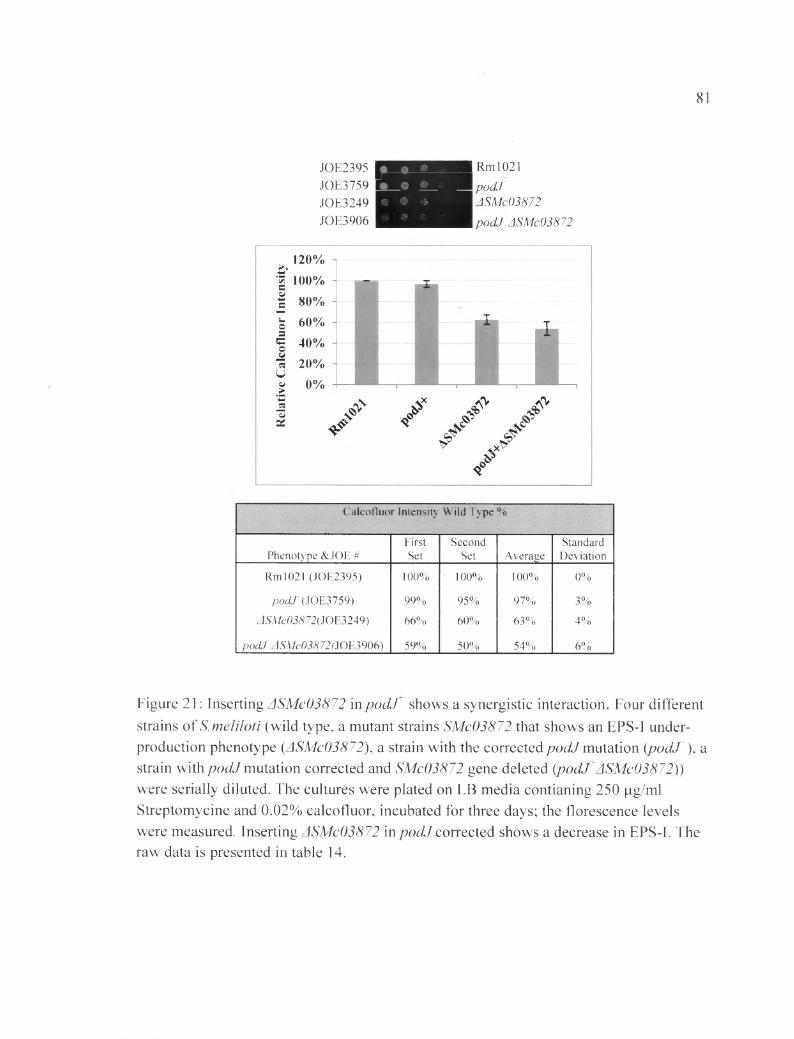
81
JOE2395 Rm 1021JOE3759 r 9 ^ S ^ M Po d I JOE3249 E S S ^ ^ I JSM c03H~2
JOE39Q6 H H H H podJ ASMc03872
^ 120% • | 100% | 80% i 60%I 40%« 20% U« 0% *Z3 -5 "S c£
Calcofluor Intensity Wild Type %
First Second StandardPhenotype &JOE # Set Set Average Deviation
Rml021 (JOE2395) 100% 100% 100% 0%
pocLT (JOE3759) 99% 95% 97% 3%
ASMc03872( JOE3249) 66% 60% 63% 4%
p o d f ASMc03872(JQE3906) 59% 50% 54% 6%
Figure 21: Inserting ASMc03872 in podJ shows a synergistic interaction. Four different strains of S.meliloti (wild type, a mutant strains SMc03872 that shows an EPS-I underproduction phenotype (ASMc03872), a strain with the corrected podJ mutation {podX), a strain with podJ mutation corrected and SMc03872 gene deleted (podJ' ASMc03872)) were serially diluted. The cultures were plated on LB media contianing 250 |xg/ml Streptomycine and 0.02% calcofluor, incubated for three days; the florescence levels were measured. Inserting ASMc03872 in podJ corrected shows a decrease in EPS-I. The raw data is presented in table 14.
I I I !S S
/ / &
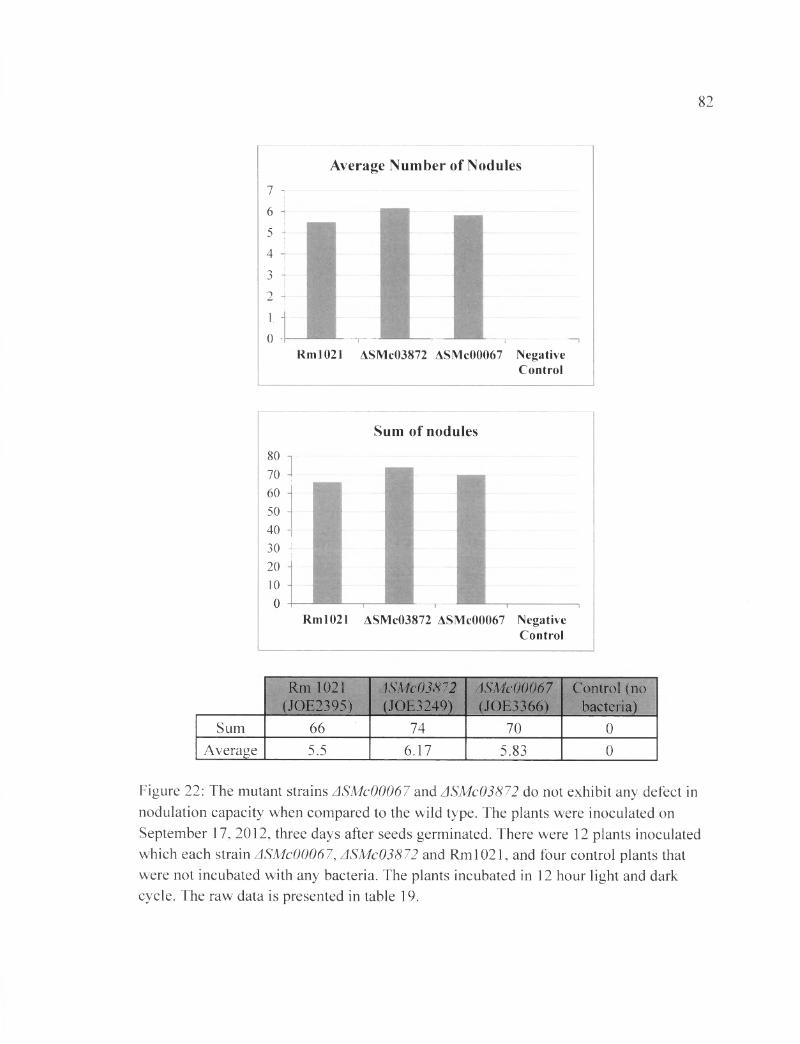
82
Average Number of Nodules7 -1
6
5 - 4
3 - 2 -
10 + " 1— T---------- ------------------
Rm 1021 ASMc03872 ASMc00067 NegativeControl
Sum of nodules80
70 I H H60 ' '50 ■40 -30 j20 ■10
Rml021 ASMc03872 ASMc00067 NegativeControl
Rm 1021 (JOE2395)
ASMc03872(JOE3249)
ASMc00067(JOE3366)
Control (no bacteria)
Sum 66 74 70 0Average 5.5 6.17 5.83 0
Figure 22: The mutant strains ASMc00067 and ASMc03872 do not exhibit any defect in nodulation capacity when compared to the wild type. The plants were inoculated on September 17, 2012, three days after seeds germinated. There were 12 plants inoculated which each strain ASMc00067, ASMc03872 and Rml021, and four control plants that were not incubated with any bacteria. The plants incubated in 12 hour light and dark cycle. The raw data is presented in table 19.
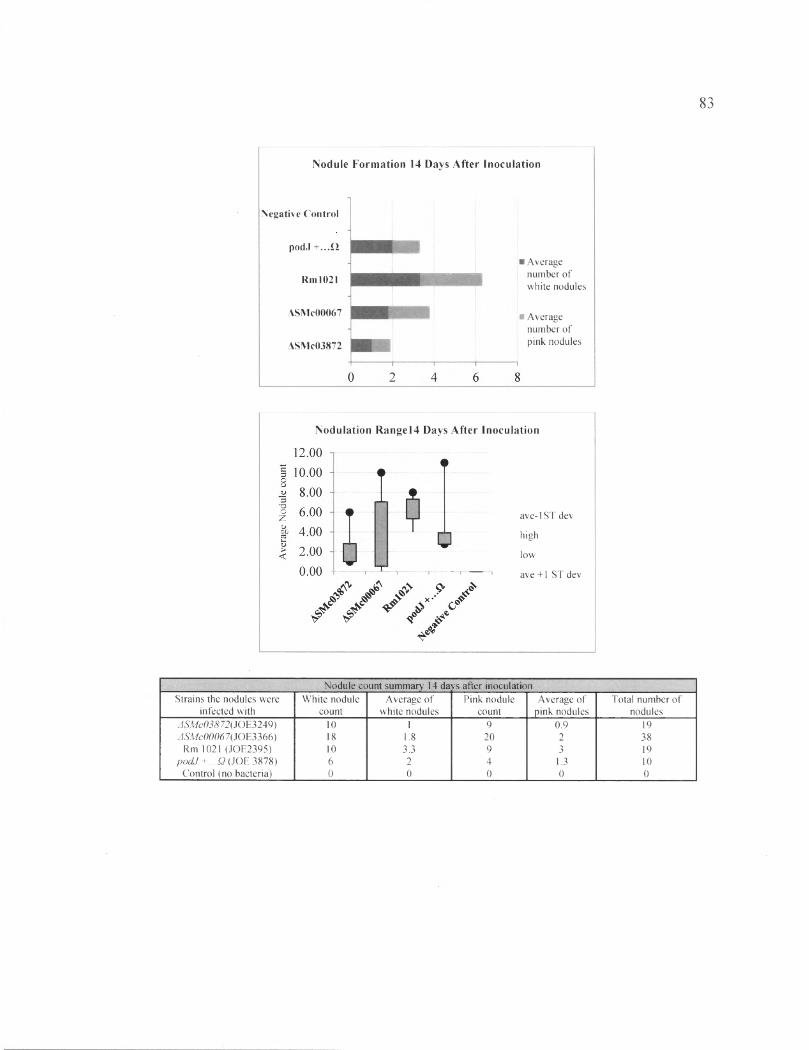
83
N odule F o rm a tio n 14 Days A fte r Ino cu la tio n
Negative Control
podJ + ...Q
Rm l021
ASMc00067
ASMc03872
i Average number of white nodules
i Average number of pink nodules
N od u la tio n R a n g e l4 Days A fte r In o cu la tion
*ooZ<DCJj
ave-lST dev
high
low
ave +1 ST dev
Nodule count summary 14 da'ys after inoculationStrains the nodules were White nodule Average of Pink nodule Average of Total number of
infected with count white nodules count pink nodules nodulesASMc03872{iOE2>2A9) 10 1 9 0.9 19ASMc00067{ JOE3366) 18 1.8 2 0 2 38
Rm 1021 (JOE2395) 10 3.3 9 3 19podJ + ...Q (JOE 3878) 6 2 4 1.3 10
Control (no bacteria) 0 0 0 0 0
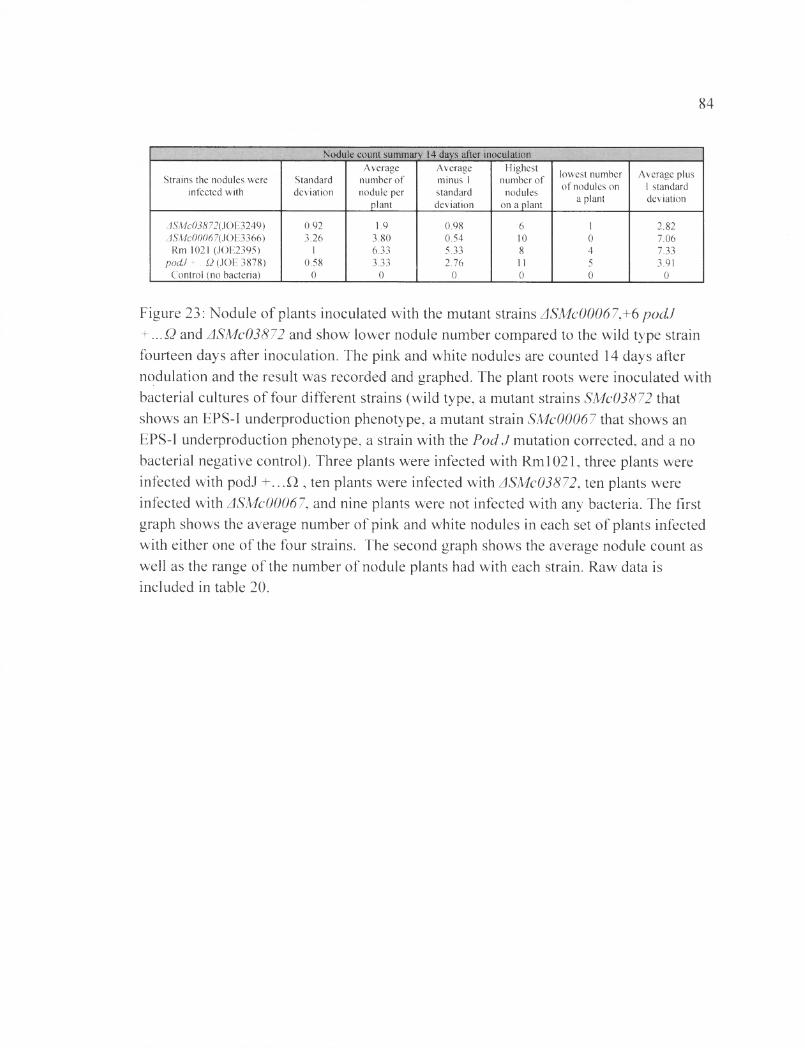
84
Nodule count summary 14 days after inoculation
Strains the nodules were infected with
Standarddeviation
Average number of nodule per
plant
Average minus 1 standard deviation
Highest number of
nodules on a plant
lowest number o f nodules on
a plant
Average plus 1 standard deviation
ASMc03872(JOE3249) 0.92 1.9 0.98 6 1 2.82ASMc00067{ JOE3366) 3.26 3.80 0.54 10 0 7.06
Rm 1021 (JOE2395) 1 6.33 5.33 8 4 7.33podJ +...Q (JOE 3878) 0.58 3.33 2.76 11 5 3.91
Control (no bacteria) 0 0 0 0 0 0
Figure 23: Nodule of plants inoculated with the mutant strains ASMc00067,+6 podJ + ...Q and ASMc03872 and show lower nodule number compared to the wild type strain fourteen days after inoculation. The pink and white nodules are counted 14 days after nodulation and the result was recorded and graphed. The plant roots were inoculated with bacterial cultures of four different strains (wild type, a mutant strains SMc03872 that shows an EPS-I underproduction phenotype, a mutant strain SMc00067 that shows an EPS-I underproduction phenotype, a strain with the Pod J mutation corrected, and a no bacterial negative control). Three plants were infected with Rml021, three plants were infected with podJ +...£2, ten plants were infected with ASMc03872, ten plants were infected with ASMc00067, and nine plants were not infected with any bacteria. The first graph shows the average number of pink and white nodules in each set of plants infected with either one of the four strains. The second graph shows the average nodule count as well as the range of the number of nodule plants had with each strain. Raw data is included in table 20.

85
N odule F o rm a tio n 21 Days A fte r Ino cu la tio n
Negative Control
ASMc00067
ASMe03872
i Average number of white nodules
i Average number of pink nodules
N o d u la tion R ange 21 Days A fte r In ocu la tion
ave-lST dev
high
low
ave +1 ST dev
Nodule count summary 21 days after inoculationStrains the nodules were White nodule Average of Pink nodule Average of Total number
infected with count white nodules count pink nodules of nodulesASMc03872 (JOE3249) 2 0 2 14 1.4 34ASMc00067 (JOE3366) 15 1.5 34 3.4 49
Rm 1021 (JOE2395) 10 3.3 8 2.7 18podJ + ...Q (JOE 3878) 9 3 12 4 21
Control (no bacteria) 0 0 0 0 0
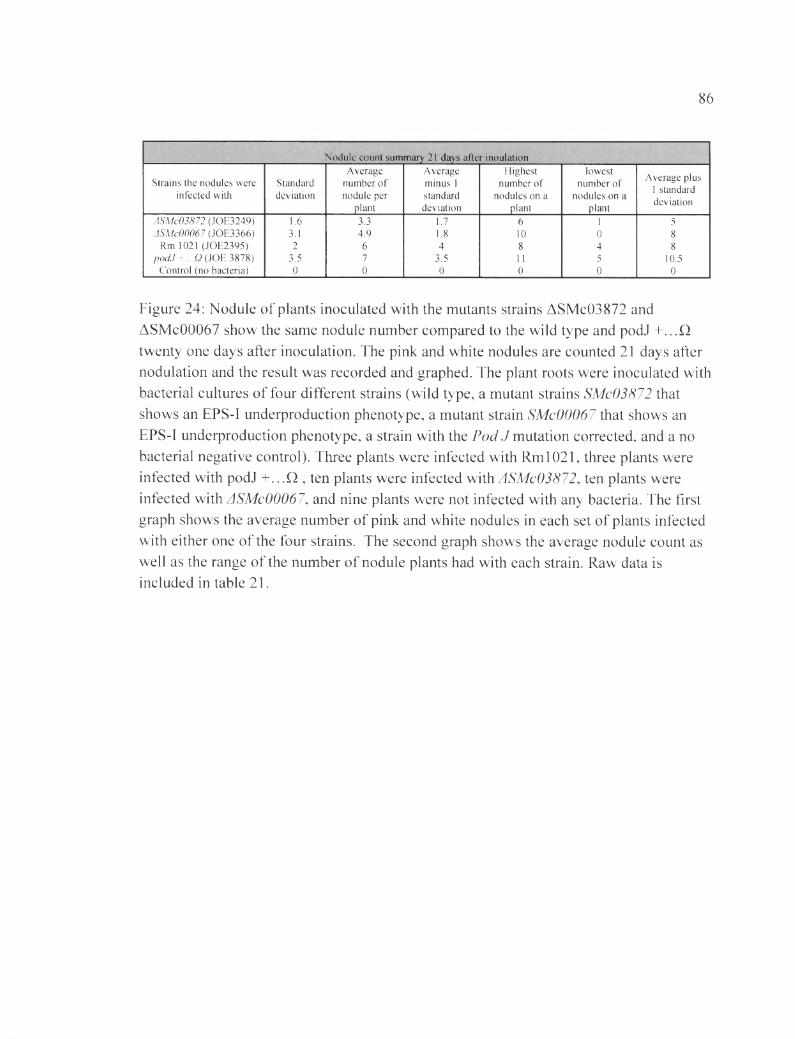
86
Nodule count summary 21 days after inoulationAverage Average Highest lowest Average plus
1 standard deviation
Strains the nodules were Standard number of minus 1 number of number ofinfected with deviation nodule per
plantstandarddeviation
nodules on a plant
nodules on a plant
ASMc03872 (JOE3249) 1.6 3.3 1.7 6 1 5ASMc00067 (JOE3366) 3.1 4.9 1.8 10 0 8
Rm 1021 (JOE2395) 2 6 4 8 4 8podJ +...Q (JOE 3878) 3.5 7 3.5 11 5 10.5
Control (no bacteria) 0 0 0 0 0 0
Figure 24: Nodule of plants inoculated with the mutants strains ASMc03872 and ASMc00067 show the same nodule number compared to the wild type and podJ +...D twenty one days after inoculation. The pink and white nodules are counted 21 days after nodulation and the result was recorded and graphed. The plant roots were inoculated with bacterial cultures of four different strains (wild type, a mutant strains SMc03872 that shows an EPS-1 underproduction phenotype, a mutant strain SMc00067 that shows an EPS-I underproduction phenotype, a strain with the Pod J mutation corrected, and a no bacterial negative control). Three plants were infected with Rml021, three plants were infected with podJ + ...f2 , ten plants were infected with ASMc03872, ten plants were infected with ASMc00067, and nine plants were not infected with any bacteria. The first graph shows the average number of pink and white nodules in each set of plants infected with either one of the four strains. The second graph shows the average nodule count as well as the range of the number of nodule plants had with each strain. Raw data is included in table 21.
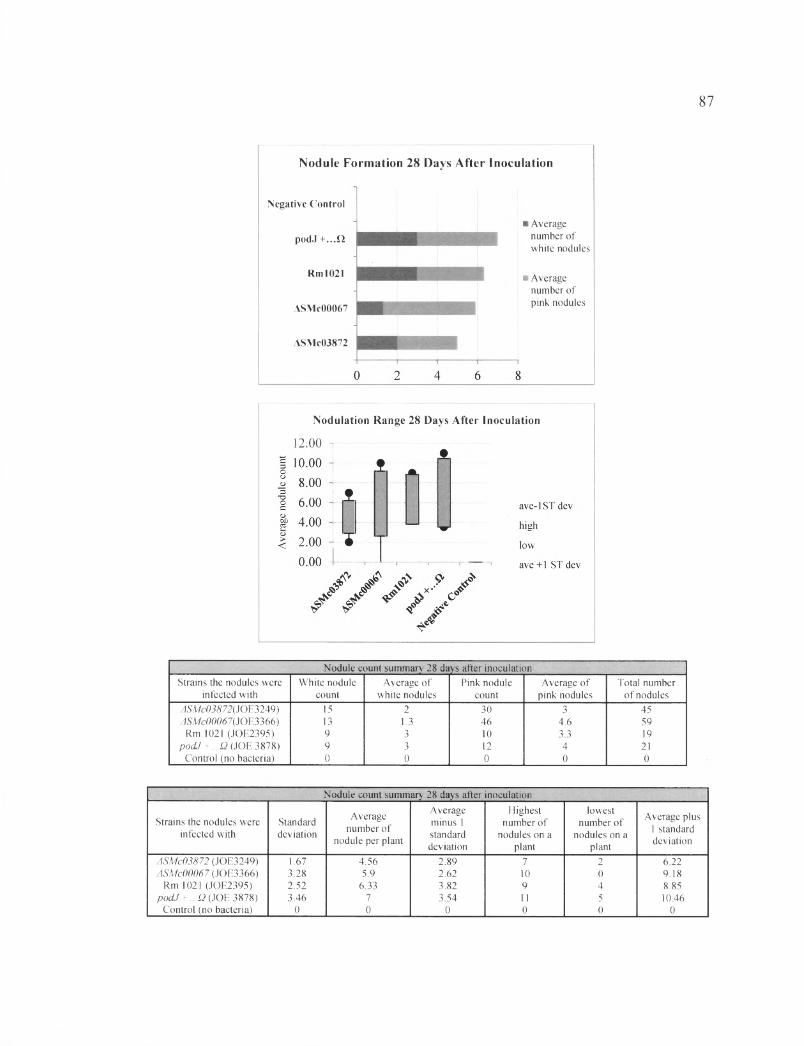
87
Nodule Formation 28 Days After Inoculation
Negative Control
podJ +...12
Rml021
ASMc00067
ASMc03872
N odula tion R ange 28 Days A fte r In o cu la tio n
12.00 i
Nodule count summary 28 days after inoculationStrains the nodules were White nodule Average of Pink nodule Average of Total number
infected with count white nodules count pink nodules of nodulesASMc03872{iOE?>249) 15 2 30 3 45ASMc00067( JOE3366) 13 1.3 46 4.6 59
Rm 1021 (JOE2395) 9 3 10 3.3 19podJ +... Q (JOE 3878) 9 3 12 4 21
Control (no bacteria) 0 0 0 0 0
Nodule count summary 28 days after inoculation
Strains the nodules were infected with
Standarddeviation
Average number of
nodule per plant
Average minus 1 standard deviation
Highest number of
nodules on a plant
lowest number of
nodules on a plant
Average plus 1 standard deviation
ASMc03872 (JOE3249) 1.67 4.56 2.89 7 2 6 .2 2ASMc00067 (JOE3366) 3.28 5.9 2.62 10 0 9.18
Rm 1021 (JOE2395) 2.52 6.33 3.82 9 4 8.85podJ +... Q (JOE 3878) 3.46 7 3.54 11 5 10.46
Control (no bacteria) 0 0 0 0 0 0
i Average number of white nodules
i Average number of pink nodules

88
Figure 25: The plant assay showed that there is no significant nodule forming defect seen between plants inoculated with mutant strains in comparison to the wild type 28 days after inoculation. The pink and white nodules are counted 28 days after nodulation and the result was recorded and graphed. The plant roots were inoculated with bacterial cultures of four different strains (wild type, a mutant strains SMc03872 that shows an EPS-I underproduction phenotype, a mutant strain SMc00067 that shows an EPS-I underproduction phenotype, a strain with the Pod J mutation corrected, and a no bacterial negative control). Three plants were infected with Rml021, three plants were infected with podJ + ...f2 , ten plants were infected with ASMc03872, ten plants were infected with ASMc00067, and nine plants were not infected with any bacteria. The first graph shows the average number of pink and white nodules in each set of plants infected with either one of the four strains. The second graph shows the average nodule count as well as the range of the number of nodule plants had with each strain. Raw data is included in table 22 .

89
TABLES
Table 1: All the strains used in this paper are listed in this paper.
Strain Genotype Construct ReferencesJOE2395 (Rm 1021)
nSU47 derivative Sm (progenitor o f strains listed below)
Obtained from Dr. Long laboratory at Stanford
(Meade et al., 1982)
JOE2553 Rm 1021 (ApodJl) JOE 2532 (In frame deletion ofSMc2230)
(Fields et al 2 0 1 2 )
JOE2428 Rm 1021 exoY ::Tn5, StrepR, NeoR Obtained from Dr. Long laboratory at Stanford
(Zhan et al., 1990)
JOE2942 Rml021 exoS96::Tn5 StrepR,N eoR Obtained from Dr. Long laboratory at Stanford
(Doherty et al., 1988)
JOE2422 Rm\02\SMc02231 ::pJC359, StrepR, NeoR
Triparental mating of Rm 1021, JOELS980, and JOE2397, isolate# 2 -1
This study
JOE3626 Rml021 SMc02230exoY::Tn5, NeoR JOE 2553 x<DN3(JOE2428), isolates#4-2
(Zhan et al., 1990)
JOE3628 Rml021 ASMc02230exoS96::Tn5, StrepR, NeoR
JOE 2553 x<DN3(JOE2942), isolates#5-l
(Doherty et al., 1988)
JOE3687 Rm 102 \ASMc02230- SMc02231(ApodJl -2), StrepR
Triparental mating of Rm 1021, JOE 1008, and JOE3645, isolate# 4-2
(Doherty et al., 1988)
JOE3759 Rml021 SMc02230-l corrected (ApodJ ), StrepR
SMc02230 with its codon corrected from TAA to TAC
(Fields et al 2 0 1 2 )
JOE3779 Rm 1021 ASMc00067 exoY:: Tn5, StrepR, NeoR
JOE 3366 x<DN3(JOE2428), isolates#3-2
This study
JOE3781 Rm 1021 ASMc03872 exoY::7t\5, StrepR, NeoR
JOE 3249 xd>N3(JOE2428), isolates#5-l
This study
JOE3780 Rm 1021 ASMc00067 exoS96:: Tn5, StrepR, NeoR
JOE 3366 x(DN3(JOE2942), isolates#4-2
This study
JOE3782 Rm 1021 ASMc03872 exoS96::Tn5, StrepR, NeoR
JOE 3249 xd>N3(JOE2942), isolates#6-l
This study
JOE3828 R m \02 \A P odJ?exoY
uidA(SMb20946: :pEC340), StrepR, NeoR
Triparental mating of JOE3687, JOEIOO8 , and JOE3787, isolate# 3-3
This study
JOE3829 Rml021 P uidAexoY
(SMb20946::pEC340), StrepR, NeoR
Triparental mating of Rm 1021, JOE 1008, and JOE3787, isolate# 4-3
This study
JOE3827 Rm 1021 ASMc03872 P uidAexoY
(SMb20946::pEC340), StrepR, NeoRTriparental mating of SMc03249, JOE 1008, and JOE3787, isolate# 2-2
This study
JOE3826 Rm 1021 ASMc00067 P „ uidAexoY
(SMb20946::pEC340), StrepR, NeoRTriparental mating of SMc00067, JOE 1008, and JOE3787, isolate# 1-2
This study

90
JOE2941 Rm \Q2\exoR95\CYnS , StrepR, NeoR Obtained from Dr. Long laboratory at Stanford
(Doherty et a l , 1988)
JOE3902 Rm 1021 ASMc00067ExoR95 ::Tn5, StrepR, NeoR
JOE 3366 x<DN3(JOE2941), isolates#2 -l
This study
JOE3903 Rm 1021 SMc03872 ExoR95 ::Tn5, StrepR, NeoR
JOE 3249 xd>N3(JOE2941), isolates#6-3
This study
JOE3878 Rml021 podJ ...Q, StrepR, SpecR, Gents
Sucrose counter selection of JOE 3855, isolates#5-l
This study
JOE3958 Rm 1021 A SMc03872podJ ...Q , StrepR, SpecR
JOE 3249 xd>N3(JOE3878), isolates#3-3
This study
JOE3960 Rm 1021 A SMc00067podJ ...Q , StrepR, SpecR
JOE 3366 x<DN3(JOE3878), isolates#4-3
This study
JOE3906 Rm 1021 pod) ...Cl A SMc03872::Tn5- 110(134), StrepR, NeoR
JOE 3759 x<DN3(CSN134), isolates#7-l
This study
JOE3905 Rm \02\podJ ...CIA SMc00067::Tn5- 110(016), StrepR, NeoR
JOE 3759 x(DN3(CSN016), isolates#6-4
This study
JOE3877 Rm8530 ( expR ), Strep JOE 3877 (Pellock et a l 2 0 0 2 )
JOE3917 Rm8530 SMc03872::Tn5-110 (134), StrepR, NeoR (expR +SMc03872)
JOE3877xO>N3(CSN134),isolates#3-l
This study
JOE3915 Rm8530 SMc00067::Tn5-l 10 (015), StrepR, NeoR (expR +SMc03872)
JOE3877xON3(CSNO 15), isolates# ! -1
This study
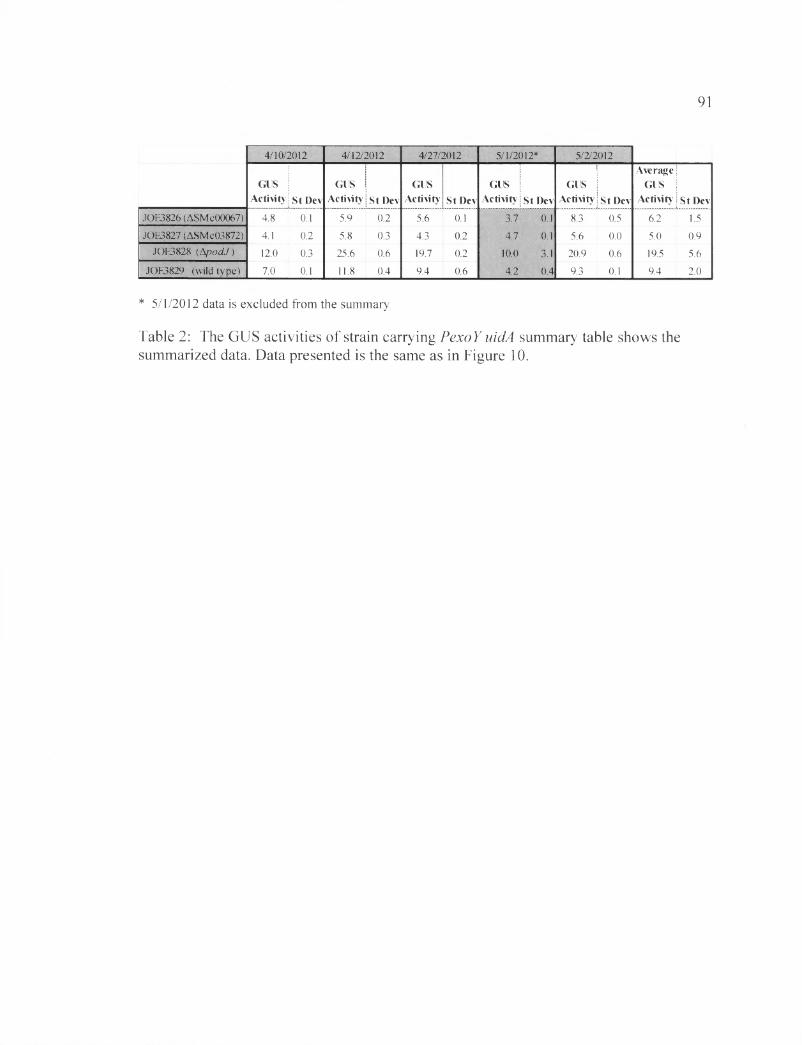
91
4/10/2012 4/12/2012 4/27/2012 5/1/2012* 5/2/2012
GUSActivity St Dev
GUSActivity St Dev
GUSActivity St Dev
GUS | Activity! St Dev
GUSActivity St Dev
AverageGUS
Activity St Dev
JOE3826 (ASMc00067) 4.8 0.1 5.9 0 .2 5.6 0.1 3.7 0.1 8.3 0.5 6.2 1.5
JOE3827 (ASMc03872) 4.1 0.2 5.8 0.3 4.3 0 .2 4.7 0.1 5.6 0.0 5.0 0.9JOE3828 (Apo d J) 12.0 0.3 25.6 0 .6 19.7 0.2 10.0 3.1 20.9 0 .6 19.5 5.6
JOE3829 (wild type) 7.0 0.1 11.8 0.4 9.4 0 .6 4.2 0.4 9.3 0.1 9.4 2 .0
* 5/1/2012 data is excluded from the summary
Table 2: The GUS activities of strain carrying PexoY uidA summary table shows the summarized data. Data presented is the same as in Figure 10.
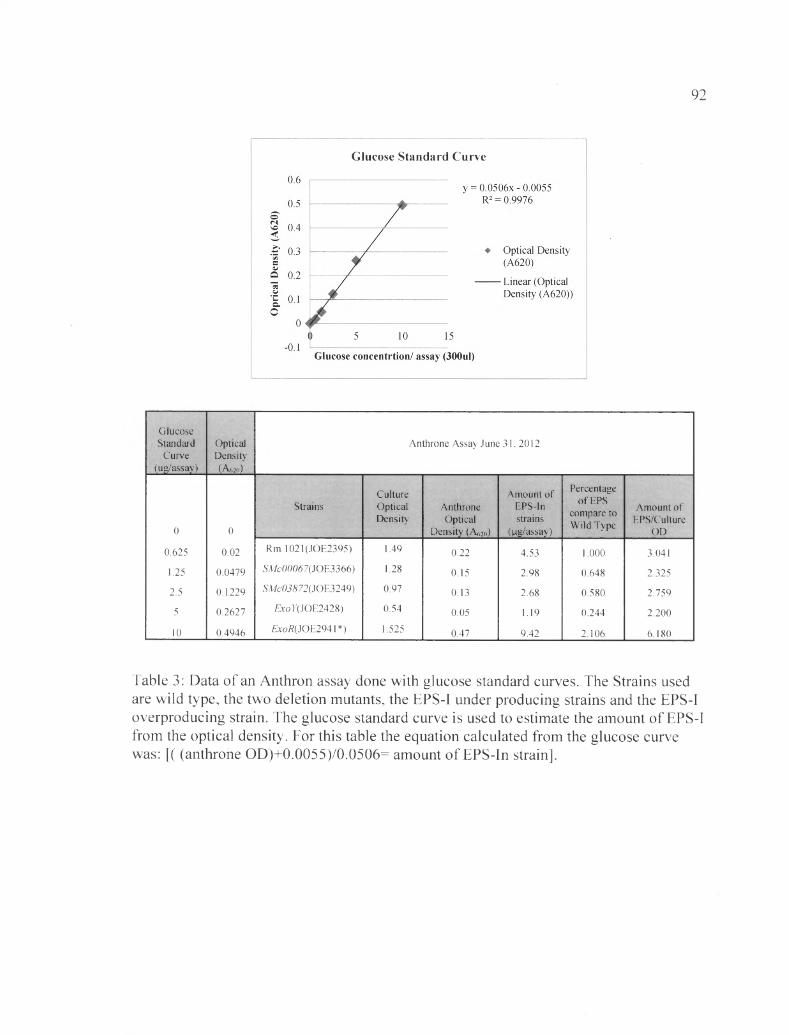
92
Glucose Standard Curve
GlucoseStandard
Curve(ug/assay)
OpticalDensity(A620)
Anthrone Assay June 31, 2012
0 0
StrainsCultureOpticalDensity
Anthrone Optical
Density (A^o)
Amount of EPS-ln strains
(Ug/assay)
Percentage of EPS
compare to Wild Type
Amount of EPS/Culture
OD
0.625 0 .0 2 Rm 1021(JOE2395) 1.49 0 .2 2 4.53 1 .000 3.041
1.25 0.0479 SMc00067{ JOE3366) 1.28 0.15 2.98 0.648 2.325
2.5 0.1229 SMc03872{ JOE3249) 0.97 0.13 2 .6 8 0.580 2.759
5 0.2627 £xrc>y(JOE2428) 0.54 0.05 1.19 0.244 2 .2 0 0
10 0.4946 £mft(JOE2941*) 1.525 0.47 9.42 2.106 6.180
Table 3: Data of an Anthron assay done with glucose standard curves. The Strains used are wild type, the two deletion mutants, the EPS-I under producing strains and the EPS-I overproducing strain. The glucose standard curve is used to estimate the amount of EPS-I from the optical density. For this table the equation calculated from the glucose curve was: [ ( (anthrone C)D)+0.0055)/0.0506= amount of EPS-In strain].
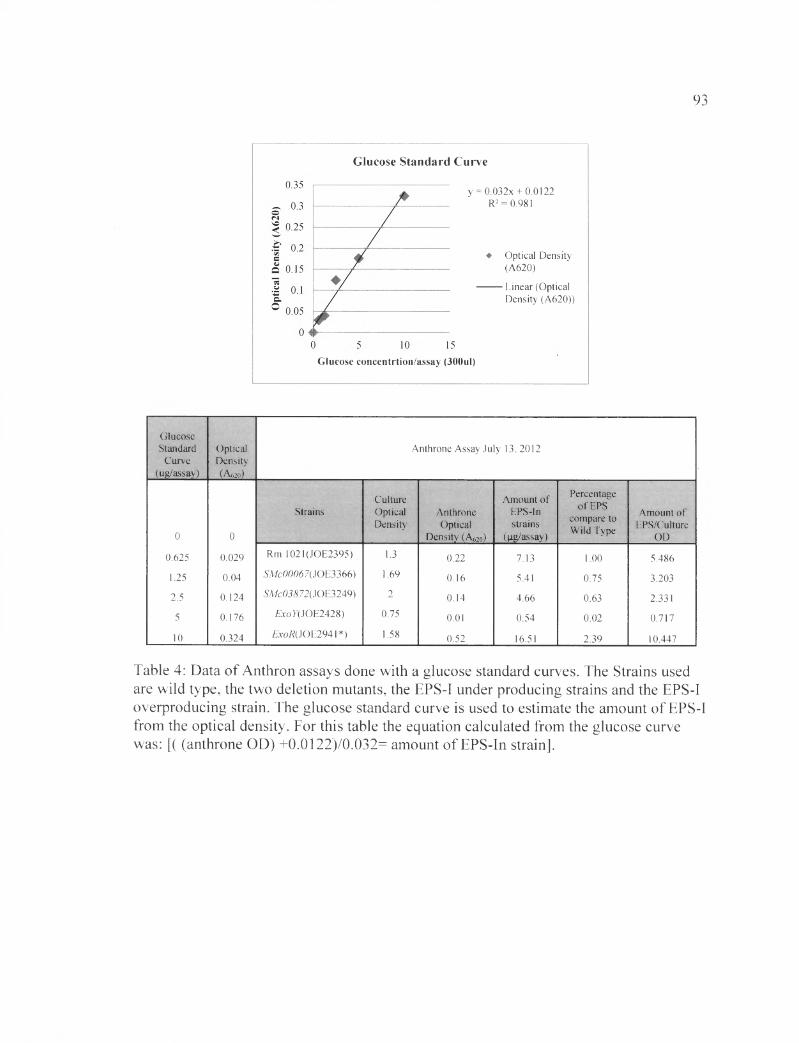
93
Glucose Standard Curve
y = 0.032x + 0.0122 R2 = 0.981
Optical Density (A620)
- Linear (Optical Density (A620))
Glucose concentrtion/assay (300ul)
GlucoseStandard
Curve(ug/assay)
OpticalDensity(A62o)
Anthrone Assay July 13, 2012
0 0
StrainsCultureOpticalDensity
Anthrone Optical
Density (A^o)
Amount of EPS-In strains
(Ug/assay)
Percentage of EPS
compare to Wild Type
Amount of EPS/Culture
OD
0.625 0.029 Rm 1021(JOE2395) 1.3 0 .2 2 7.13 1.00 5.486
1.25 0.04 SMc00067(SOE3366) 1.69 0.16 5.41 0.75 3.203
2.5 0.124 SMc03872{iOE32A9) 2 0.14 4.66 0.63 2.331
5 0.176 ExoY( JOE2428) 0.75 0.01 0.54 0 .0 2 0.717
10 0.324 ExoR( JOE2941*) 1.58 0.52 16.51 2.39 10.447
Table 4: Data of Anthron assays done with a glucose standard curves. The Strains used are wild type, the two deletion mutants, the EPS-I under producing strains and the EPS-I overproducing strain. The glucose standard curve is used to estimate the amount of EPS-I from the optical density. For this table the equation calculated from the glucose curve was: [ ( (anthrone OD) +0.0122)/0.032= amount of EPS-In strain].

94
strains(June31, 2012) Amount o f EPS
(jag/assay)
(July 13,2012) Amount of EPS
(Hg/assay)
Average amount of
EPS (Hg/assay)
StandardDeviation
Rm 1021(JC)E2395) 4.53 7.13 5.83 1.84
SMc00067{ JOE3366) 2.98 5.41 4.19 1.72
SMc03872( JOE3249) 2 .6 8 4.66 3.67 1.40
e*or(JOE2428) 1.19 0.54 0 .8 6 0.46
ExoR(iOE294\) 9.42 16.51 12.97 5.01
Table 5: The summary of the two anthrone assays done. The average and the Standard deviation of the two sets have been calculated.
95
APPENDIX A
ApodJ2 S.meliloti strain behaves like the wild type, showing no sensitivity to media, temperatures and exhibits normal motility
To determine if podJ2 gene contributes to the LBLS sensitivity phenotypes seen
in the podJ strain, we performed spot assays with different substitutes for ingredients in
the LBLS media. After making a mutant strain podJ2 by removing the second open
reading frame of the podJ gene (ApodJ2), this mutant’s sensitivity was tested. The results
showed that the deletion mutant ApodJ2 unlike ApodJl d\d not show any sensitivity when
grown in the LBLS control media nor did it show any sensitivity to any substitution
ingredients in the modified LBLS media. As seen in figure 2 substituting peptone for
tryptone (part A), changing the salt from NaCl to MgSC>4 (part B) or changing the
concentration of tryptone or yeast extract (part C) did not affect the growth of ApocU2
mutant. In this experiment ApodJ2's phenotype was similar to that of the wild type. We
investigated the sensitivity of ApodJ2 mutant to deoxycholate to determine any parallels
with ApodJl. Results in Figure 5 part A showed that ApodJ2 mutant similar to the wild
type strain does not exhibit growth sensitivity in the presence of deoxycholate in its
growth media. This indicates that podJ2 gene does not play a role in production and the
maintenance of the cell integrity.
To discover any motility defect in ApodJ2 we utilized a motility test on soft agar.
In figure 5 part B we can observed that the mutant strain ApodJ2 has a large diameter of
growth similar to that of the wild type. Since ApodJl and ApodJl-2 strains showed a
motility defect (evident by the smaller growth diameter) we concluded that podJ2does
not play any role in the motility defect seen in the podJ strain.

96
We then investigated the EPS-I production ability of ApodJ2 strain by growing the
strain on LB media containing calcofluor. The results in figure 5 part A indicate that the
wild type strain and ApodJ2 strain produce EPS-I at similar levels. In this figure we can
also observe that ApodJ2 strain produces less EPS-I than either of the mutants ApodJl or
ApodJl-2.
Introduction of exoY into Porf/Zelliveates PodT s sensitivity to LBLS bot not deoxycholate
Introduction of exoY into the PodJX background completely eliminates the
sensitivity to LBLS but not to deoxycholate. This indicates that the absence of exoY is
causing a decrease in the production of galactosyltransferase in the cell and hence
decreasing the levels of EPS-I production. When the APodJV s carbohydrates over
consumption phenotype is alleviated, APodJV s tolerance to tryptone increases compares
to that of peptone. However, since the levels of EPS-I in the double mutant APodJl exoY
are still higher than that of exoY, we can conclude that there are other genes in APodJl
that can stimulate the production of galactosyltransferase. Since the deletion of exoY is
unable to rescue the motility defect or deoxycholate sensitivity seen in APodJl we can
conclude that the gene exoY is not involved in membrane integrity or flagellar structure.
ApodJl-2 S. meliloti strains’ phenotype similarity to ApodJl affirms that ApodJ2 has no role in the defects seen in ApodJ mutants
We investigated the sensitivity of ApodJl -2 mutant in deoxycholate to determine
the combinatory effect of ApodJ land ApodJ2 on the strain’s sensitivity. As shown in
Figure 5 part A the mutant strain ApodJl-2 is sensitive to deoxycholate in its growth

97
media just as previously seen with ApodJl. Since ApodJ2 did not show any sensitivity to
deoxycholate, it is logical to conclude that the absence ofpodJl gene is responsible for
the overall sensitivity phenotype of ApodJl-2.
To detect any motility defect present in ApodJl-2 strain, we performed a motility
test. In Figure 5 part B we can observe that the mutant ApodJl-2 similar to ApodJl has a
small diameter of growth, however, the previously tested ApodJ2 exhibited a large
diameter of growth (Figure 5 part A). The results indicated that podJl and not
ApodJ2gem is responsible for the motility defect of ApodJl-2.
We then investigated the EPS-I production ability of ApodJl-2 to determine the
presence of any defects. The results in figure 17 indicated that ApodJl-2 similar to have a
(182±9) % FCWT which is similar to that o f ApodJl at (155±11) % FCWT. EPS-I
production of ApodJl-2 is twice as high as that of the wild type (Table 14). ApodJl-2
exhibits the same EPS-I phenotype as ApodJl indicating that the podJl gem is
responsible for the EPS-I defect.
Correcting the podJ mutation in S.meliloti strains relieves the phenotype defect ofApodJl
To determine with certainty that these phenotypic defects seen in ApodJ are
caused by podJ and not another mutation, same assays were performed with the ApodJ
mutation corrected. To correct the podJ mutation the stop codon between the two open
reading frames podJl and podJ2 were remove. We performed a spot assay where we
compared the sensitivity of ApodJl and ApodJ 1-2 to podX (where podJ mutation is
corrected) in LBLS media. According to figure 17 the sensitivity to LBLS media seen in
98
both ApodJl and ApodJl-2 is completely eliminated in the podX strain. The podJ'
exhibits the same phenotype as the wild type strain.
To determine if the deoxycholate sensitivity seen in the ApodJl was due the
mutation we grewp o d f on LB containing 0.1 % deoxycholate plate. According to figure
17 the sensitivity to deoxycholate is eliminated in pocLt. The amount of growth in the
podT observed was comparable to that of the wild type strain, indicating that the
nonsense mutation in ApodJl is also responsible for the deoxycholate sensitivity.
The p odT strain’s motility was investigated utilizing motility soft agar in figure
17 part B. The p odT strain has a large diameter of growth similar to that of the wild type
strain. This indicates that the podT strain has normal motility and therefore exhibits no
flagellar defect. The podT strain has a bigger diameter of growth compared to either
ApodJ lor ApodJ 1-2 strains (two strains that have a motility defect and a smaller diameter
of growth).
Correcting the ApodJ strain’s nonsense mutation relieves the EPS-I over
production phenotype in this strain. In figure 17, ApodJl and ApodJl-2 strain flouresced
at (155±11) % and (182±9) % FCWT while podT fluoresced at (87±5) % FCWT. The
wild type and the pocLT strain are similar in the amount of EPS-I they produce. The
mutation in the podJl gene in boihApodJ 1 and ApodJl-2 strains caused the over
production EPS-I.
As a side note, in figure 18 and 19 podT ...Q produces EPS-I levels at (73±7) %
and (69±3) % FCWT while in Figure 20 and 21 p o d f produces (95±2) % and (97±3) %
FCWT. The difference in EPS-I production between the two pocLt strains is due to the Cl
cassette that possibly interfered with the EPS-I genetic pathway in thep o d f ...Q.
+Inserting pod /corrected (podJ ...O) in to either of the deletion strains J SMc03872 or ASMc00067 interferes with EPS-I formation
-f-As shown in figure 18 the florescence levels of podJ ...Cl strain was (73±7) % of
the wild type and the florescence levels of ASMc00067 was (47±4) % of the wild type.
*4“Both strains ASMc00067 and podJ ...Cl show an under-production of EPS-I compared to
the wild type. The double mutant ASMc00067podf fluoresced at (29±5) % of the wild
type which is a significant reduction compared to the EPS-I production of either of the
+mutant strains ASMc00067 or podJ ...Cl. This significant reduction in EPS-I formation in
the double mutant indicates an interruption in the EPS-I formation pathway (Table 15).
+According to Figure 19 insertion of podJ ...Q gene into ASMc03872 strain caused
interference in EPS-I production. The strain podJ ...Q fluoresces at (69±3) % of the wild
type and ASMc03872 fluoresces at (46±4) % of the wild type. The double mutant
+ASMc03872podJ ...Q fluorescences at (24±3) % of the wild type which is a greater
+under-production than either of the single mutant ASMc038 72 or the podJ ...Cl strain.
-f-This result suggests that insertion of the podJ ...Q causes an interference in the EPS-I
production pathway in each of the mutant strains ASMc00067 or ASMc()3872(rYab\z 16).
99

100
Inserting SMc03872 and SMc00067 genes into pod J corrected (podJ* ...Cl) interferes with EPS-I formation.
In this experiment either the SMc00067 or the SMc03872 gene is inserted into
+ + podJ ...Q {podJ corrected) strain. In figure 20 the brightness of podJ ...Q strain was
(95±2) % FCWT and ASMc00067 strain was (72±2) % FCWT. The ASMc00067 and the
podJ ...Q strains showed an under-production of EPS-I compared to the wild type. The
double mutant pocLP ASMc00067 showed (57±5) % FCWT. The insertion of either
SMc00067 or SMc03872 gene into podJ ...Q causes an interference in the EPS-I
production pathway resulting in a greater under-production of EPS-I in the double mutant
than either of the single mutants. (Tablel7).
The gene Pod'J* is antagonistic to SMc00067 and SMc03872 in EPS-I production pathway
After correcting this mutation in the p o d f (PodJ corrected) strain we observed
that the EPS production decreased from 100% in Rm 1021 to 87% inp o d X . We tested
the interaction of podX with the two mutants ASMc00067 and ASMc03872 in the EPS-I
production pathway. We tested this interaction once by inserting the po& T gene into the
mutant backgrounds ASMc00067 and ASMc03872 and a second time by inserting the
genes SMc00067 and SMc03872 into the pocLT background.
As the EPS-I under-producing podX gene is inserted into ASMc00067, a double
mutant is produced that has lower EPS-I levels than either of the strain. The p o d t and
ASMc00067strain produces EPS-I at 73±3% and 47±4% of the wild type with the double
mutant producing EPS-I at 29±5% of the wild type. Inserting the p o d f gene into the
ASMc00067, interferes with ASMc00067,s EPS-I production. The two genes
SMc00067and p o d f contributes to a greater EPS-I underproduction in the double mutant.
Then we looked at the interaction between these two genes by putting the
SMc00067m to p o d f background. The p o d f and SMc00067 produced EPS-I at 95±2%
and 72±2% of the wild type with the double mutant at 57±5%EPS-I production of the
wild type. The double mutant reveals a synergistic interaction between the genes as they
contribute to a higher EPS-I underproduction phenotype.
We repeated the experiment with the p o d f gene inserted into ASMc03872 strain.
The double mutant showed a decreased EPS-I production compared to either of the
mutants alone. In this spot assay p o d f and ASMc03872 produced EPS-I at 69±3% and
46±4% of the wild type, whereas the double mutant produced EPS-I at 24±3% of the wild
type. This shows that the insertion of p o d f interferes with ASMc03872,s EPS-I
production pathway. The two genes p o d f and ASMc03872 contribute to a greater under
production phenotype.
ASMc00067 into p o d f produced 63±4% and 97±3% EPS-I compared to that of
the wild type. The double mutant was measured at 54±6% EPS-I production of the wild
type. The genes SMc00067 into p o d f work synergistically with each other in the EPS-I
production pathway.
101
The gene SMc()0067which codes for outer membrane lipoprotein (IppA) work on
different pathways in EPS-I production than the podJ gene. The same interaction is seen
between podJ gene and SMc03872 which codes for a putative Zn dependent protease
(pspA). The insertion of podJ gene into either ASMc00067or ASMc03872 interferes with
EPS-I production.
+According to Figure 21 insertion of SMc03872 gene into podJ ...Cl strain causes
interference in EPS-I production. The podJ ...Q shows a (97±3) % FCWT and
ASMc03872 shows a (63±4) % FCWT. The double mutant ASMc03872podJ ...Cl shows
a (54±6) % FCWT. This indicates that the double mutant has a greater under-production
of EPS-I than either of the single mutant ASMc03872 or the podJ ...Cl strain, therefore
-f-the gene SMc03872 is interrupting the EPS-I production of podJ ...Cl strain (Table 18).
102
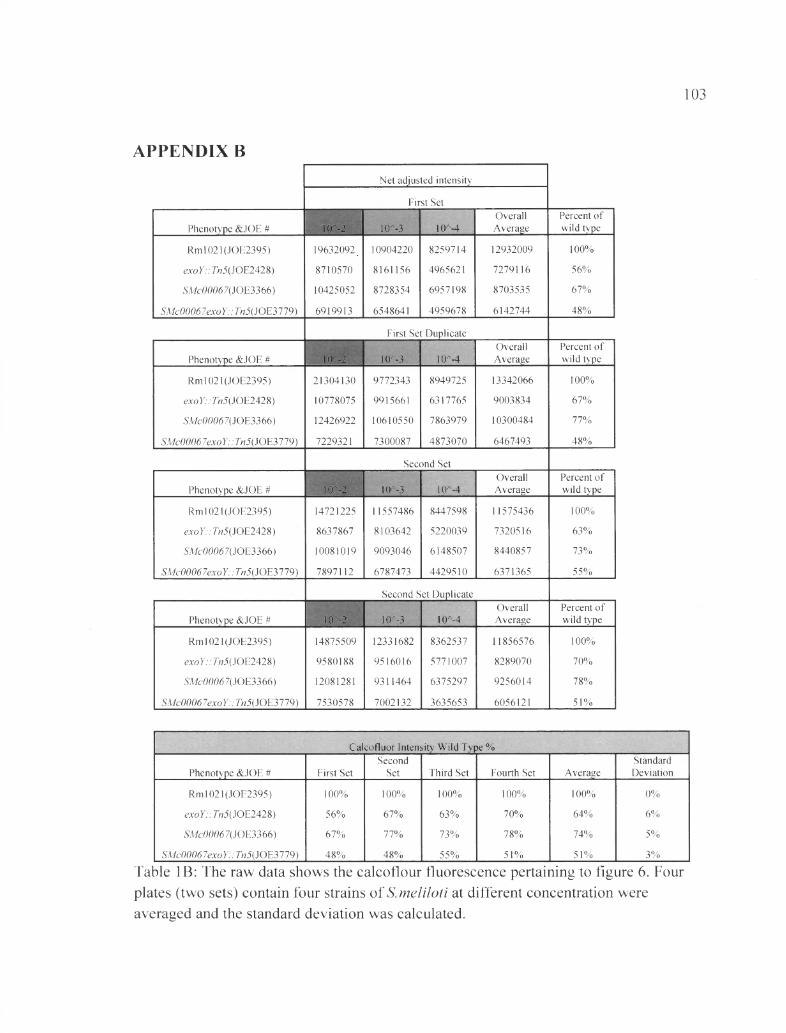
103
APPENDIX BNet adjusted intensity
First Set
Phenotype &JOE # 10A~2 10A-3 10A-4OverallAverage
Percent of wild type
Rml 021 (J0E2395) 19632092 10904220 8259714 12932009 1 00%
exo Y:: 7«5( JOE2428) 8710570 8161156 4965621 7279116 56%
SMc00067( J OE3366) 10425052 8728354 6957198 8703535 67%
SMc00067exo Y:: T«5(JOE3779) 6919913 6548641 4959678 6142744 48%
First Set Duplicate
Phenotype &JOE # 10A-2 10A-3 10A-4OverallAverage
Percent of wild type
Rml 021 (JOE2395) 21304130 9772343 8949725 13342066 1 00%
exoY:: 7«J(JOE2428) 10778075 9915661 6317765 9003834 67%
SMc00067{ JOE3366) 12426922 10610550 7863979 10300484 11%
SMc00067exo Y:: 7k5(JOE3779) 7229321 7300087 4873070 6467493 48%
Second Set
Phenotype &JOE # 1 0 ^ 2 10A-3 10A-4OverallAverage
Percent of wild type
Rml 021 (JOE2395) 14721225 11557486 8447598 11575436 100%
exoY:: 7>?5(JOE2428) 8637867 8103642 5220039 7320516 63%
SMc00067( JOE3366) 10081019 9093046 6148507 8440857 73%
SMc00067exoY::Tn5( JOE3779) 7897112 6787473 4429510 6371365 55%
Second Set Duplicate
Phenotype &JOE # i r -2 10A-3 10A-4OverallAverage
Percent of wild type
Rml 021 (JOE2395) 14875509 12331682 8362537 11856576 1 0 0%
exoY::Tn5( JOE2428) 9580188 9516016 5771007 8289070 70%
,WdWtf<57(JOE3366) 12081281 9311464 6375297 9256014 78%
SMc00067exo Y:: 7>?5( JOE3 779) 7530578 7002132 3635653 6056121 51%
Calcofluor Intensity Wild Type %
Phenotype &JOE # First SetSecond
Set Third Set Fourth Set AverageStandardDeviation
Rml021(JOE2395) 1 00% 1 00% 1 00% 100% 100% 0 %
exoY:: 7«5(JOE2428) 56% 67% 63% 70% 64% 6 %
SMc00067( JOE3366) 67% 77% 73% 78% 74% 5%
SMc00067exo Y:: 7>?5(JOE3779) 48% 48% 55% 51% 51% 3%
Table IB: The raw data shows the calcoflour fluorescence pertaining to figure 6. Fourplates (two sets) contain four strains of S. meliloti at different concentration wereaveraged and the standard deviation was calculated.

104
Net adjusted intensity
First Set
Phenotype &JOE # 10A-2 10A-3 10A-4 Overall AveragePercent of wild type
Rml021(JC)E2395) 18510625 10606151 8558422 12558399 100%
exoY:: 7>?5(JOE2428) 10260098 8606141 5734813 8200351 65%
SMc03872{ JOE3249) 10357262 9373174 6472884 8734440 70%
SMc03872exoY::Tn5(JOE31&\) 8445581 7568869 5322263 7112238 57%
First Set Duplicate
Phenotype &JOE # 10A-2 10A-3 10A-4 Overall AveragePercent of wild type
Rm 1021 (JOE2395) 19243596 12192082 9475348 13637009 100%
exoY:: 7«5(JOE2428) 11120584 10321743 7850359 9764229 72%
SMc03872{ JOE3249) 7181027 9909081 7452251 8180786 60%
SMc03872exoY::Tn5(JC>E378l) 7087200 7054512 4698889 6280200 46%
Second Set
Phenotype &JOE # 10A-2 10A-3 10A-4 Overall AveragePercent of wild type
Rml021(JOE2395) 13169947 10721399 8297451 10729599 100%
exoY:: 7>?5(JOE2428) 6816606 7306934 5146026 6423189 60%
SMc03872{ JOE3249) 5581239 8163162 5442654 6395685 60%
SMc038 72exo Y:: Tn5( JOE3781) 5714897 4238356 3096072 4349775 41%
Second Set Duplicate
Phenotype &JOE # 10A-2 10A-3 10A-4 Overall AveragePercent of wild type
Rml021(JC)E2395) 14874411 12025794 8149591 11683265 100%
exoY::Tn5( JOE2428) 8602648 8848586 5146578 7532604 64%
SMc03872{ JOE3249) 9358728 8560040 5339854 7752874 6 6 %
SMc03872exo Y:: Tn5( JOE3781) 6079513 6535235 3484335 5366361 46%
Calcofluor Intensity Wild Type %
Phenotype &JOE # First SetSecond
Set Third Set Fourth Set AverageStandardDeviation
Rml021(JOE2395) 100% 1 00% 1 00% 1 00% 1 0 0% 0 %
exo Y:: 7>i5( JOE2428) 65% 12% 60% 64% 65% 5%
SMc03872( JOE3249) 70% 60% 60% 6 6 % 64% 5%
SMc03872exoY:: 7k5(JOE3781) 57% 46% 41% 46% 47% 7%
Table 2B: The raw data shows the calcoflour fluorescence pertaining to figure 7. Fourplates (two sets) contain four strains of S. meliloti at different concentration wereaveraged and the standard deviation was calculated.
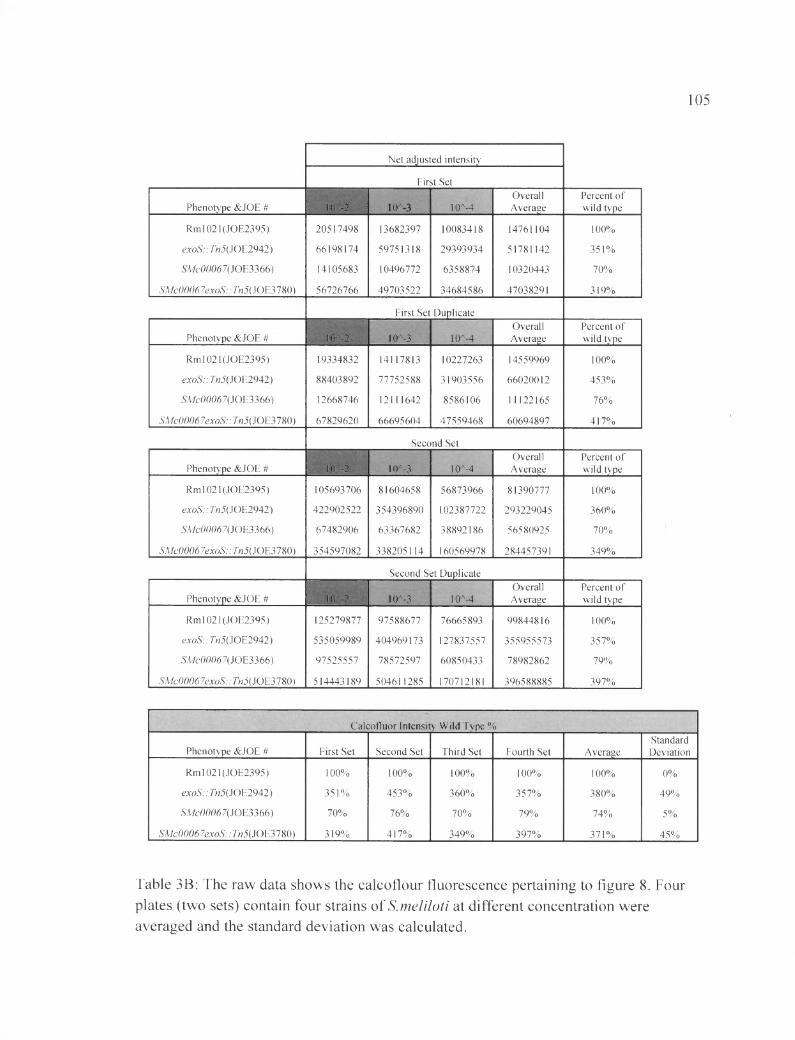
105
Net adjusted intensity
First Set
Phenotype &JOE # 10**2 © > 10A-4OverallAverage
Percent of wild type
Rml021(JOE2395) 20517498 13682397 10083418 14761104 100%
exoS:: 7w5(JOE2942) 66198174 59751318 29393934 51781142 351%
SMc00067( JOE3366) 14105683 10496772 6358874 10320443 70%
SMc00067exoS:: 7«5(JOE3780) 56726766 49703522 34684586 47038291 319%
First Set Duplicate
Phenotype &JOE # 10**2 10A-3 10A-4OverallAverage
Percent of wild type
Rm 1021 (JOE2395) 19334832 14117813 10227263 14559969 1 00%
exoS:: 7>?5(JOE2942) 88403892 77752588 31903556 66020012 453%
SMc00067(JOE3366) 12668746 12111642 8586106 11122165 76%
SMc00067exoS:: Tn5( JOE3780) 67829620 66695604 47559468 60694897 417%
Second Set
Phenotype &JOE # 10A-2 10A-3 10A-4OverallAverage
Percent of wild type
Rml021(JOE2395) 105693706 81604658 56873966 81390777 100%
exoS:: 7«5(JOE2942) 422902522 354396890 102387722 293229045 360%
SMc00067( JOE3366) 67482906 63367682 38892186 56580925 70%
SMc00067exoS:: Tn5{ JOE3780) 354597082 338205114 160569978 284457391 349%
Second Set Duplicate
Phenotype &JOE # 10A-2 10A-3 10A-4OverallAverage
Percent of wild type
Rml021(JOE2395) 125279877 97588677 76665893 99844816 100%
exoS:: 7)?5(JOE2942) 535059989 404969173 127837557 355955573 357%
SA/c00067(JOE3366) 97525557 78572597 60850433 78982862 79%
SMc00067exoS:: 7«5(JOE3780) 514443189 504611285 170712181 396588885 397%
Calcofluor Intensity Wild Type %
Phenotype &JOE # First Set Second Set Third Set Fourth Set AverageStandardDeviation
Rml021(JOE2395) 100% 10 0 % 1 00% 100% 100% 0 %
exoS:: 7«5(JOE2942) 351% 453% 360% 357% 380% 49%
SMc00067{ JOE3366) 70% 76% 70% 79% 74% 5%
SMc00067exoS:: 7>?5(JOE3780) 319% 417% 349% 397% 371% 45%
Table 3B: The raw data shows the calcoflour fluorescence pertaining to figure 8. Fourplates (two sets) contain four strains of S.meliloti at different concentration wereaveraged and the standard deviation was calculated.
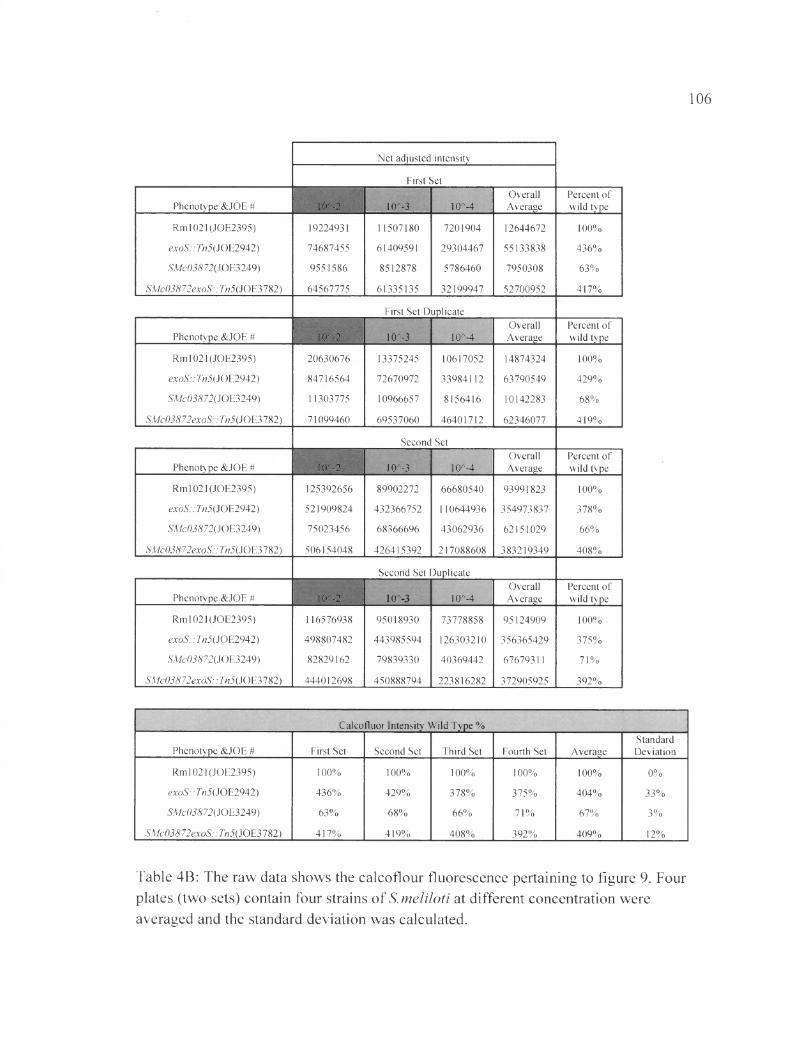
106
Net adjusted intensity
First Set
Phenotype &JOE # 1 0 ^ 2 10A-3 10MOverallAverage
Percent of wild type
Rm 1021 (JOE2395) 19224931 11507180 7201904 12644672 1 00%
exoS:: 7«5(JOE2942) 74687455 61409591 29304467 55133838 436%
SMc03872(JC)E3249) 9551586 8512878 5786460 7950308 63%
SMc03872exoS:: 7>?5(JOE3782) 64567775 61335135 32199947 52700952 417%
First Set Duplicate
Phenotype &JOE # 10A-2 10A-3 10A-4OverallAverage
Percent of wild type
Rml021(JC>E2395) 20630676 13375245 10617052 14874324 100%
exoS:: 7>?5(JOE2942) 84716564 72670972 33984112 63790549 429%
SMc03872( JOE3249) 11303775 10966657 8156416 10142283 6 8 %
SMc03872exoS:: 7k5(JOE3782) 71099460 69537060 46401712 62346077 419%
Second Set
Phenotype &JOE # 10A-2 10A-3 10A-4OverallAverage
Percent of wild type
Rm 1021 (JOE2395) 125392656 89902272 66680540 93991823 100%
exoS:: 7k5(JOE2942) 521909824 432366752 110644936 354973837 378%
SMc03872( JOE3249) 75023456 68366696 43062936 62151029 6 6 %
SMc03872exoS::Tn5(30E3in) 506154048 426415392 217088608 383219349 408%
Second Set Duplicate
Phenotype &JOE # 1 (^ -2 © > lO'MOverallAverage
Percent of wild type
Rml021(JC)E2395) 116576938 95018930 73778858 95124909 100%
exoS:: 7>?5( JOE2942) 498807482 443985594 126303210 356365429 375%
SMc03872( JOE3249) 82829162 79839330 40369442 67679311 71%
Wc03<S72exaS::7>?5(JOE3782) 444012698 450888794 223816282 372905925 392%
Calcofluor Intensity Wild Type %
Phenotype &JOE # First Set Second Set Third Set Fourth Set AverageStandardDeviation
Rml021(JOE2395) 1 0 0% 1 00% 1 00% 1 00% 100% 0 %
exoS:: Tn5( JOE2942) 436% 429% 378% 375% 404% 33%
SMc03872()OE3249) 63% 6 8 % 6 6 % 71% 67% 3%
SMc03872exoS:: 7«5( JOE3 782) 417% 419% 408% 392% 409% 12%
Table 4B: The raw data shows the calcoflour fluorescence pertaining to figure 9. Fourplates (two sets) contain four strains of S.meliloti at different concentration wereaveraged and the standard deviation was calculated.
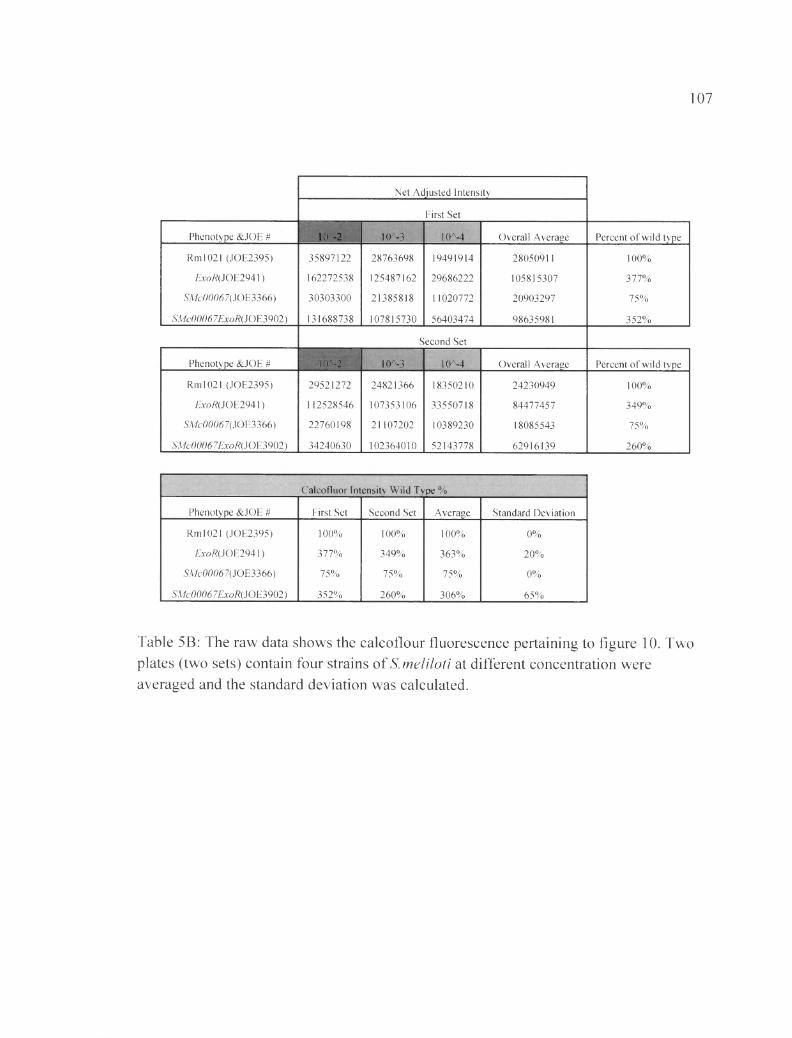
107
Net Adjusted Intensity
First Set
Phenotype &JOE #
<©
10A»3 10A-4 Overall Average Percent of wild type
Rml021 (JOE2395) 35897122 28763698 19491914 28050911 1 00%
Em/?(JOE2941) 162272538 125487162 29686222 105815307 377%
SMc00067{ JOE3366) 30303300 21385818 11020772 20903297 75%
SMc00067ExoR( JOE3902) 131688738 107815730 56403474 98635981 352%
Second Set
Phenotype &JOE # 10A-2 10^3 10A-4 Overall Average Percent of wild type
Rml021 (JOE2395) 29521272 24821366 18350210 24230949 1 00%
£mft(JOE2941) 112528546 107353106 33550718 84477457 349%
SMc00067( JOE3366) 22760198 21107202 10389230 18085543 75%
SMc00067ExoR( JOE39Q2) 34240630 102364010 52143778 62916139 260%
Calcofluor Intensity Wild Type %
Phenotype &JOE # First Set Second Set Average Standard Deviation
Rml021 (JOE2395) 1 00% 1 00% 1 0 0% 0 %
ExoK(JOE2941) 377% 349% 363% 2 0 %
SMc00067{ JOE3366) 75% 75% 75% 0 %
SMc00067ExoR( JOE3902) 352% 260% 306% 65%
Table 5B: The raw data shows the calcoflour fluorescence pertaining to figure 10. Twoplates (two sets) contain four strains of S.meliloti at different concentration wereaveraged and the standard deviation was calculated.
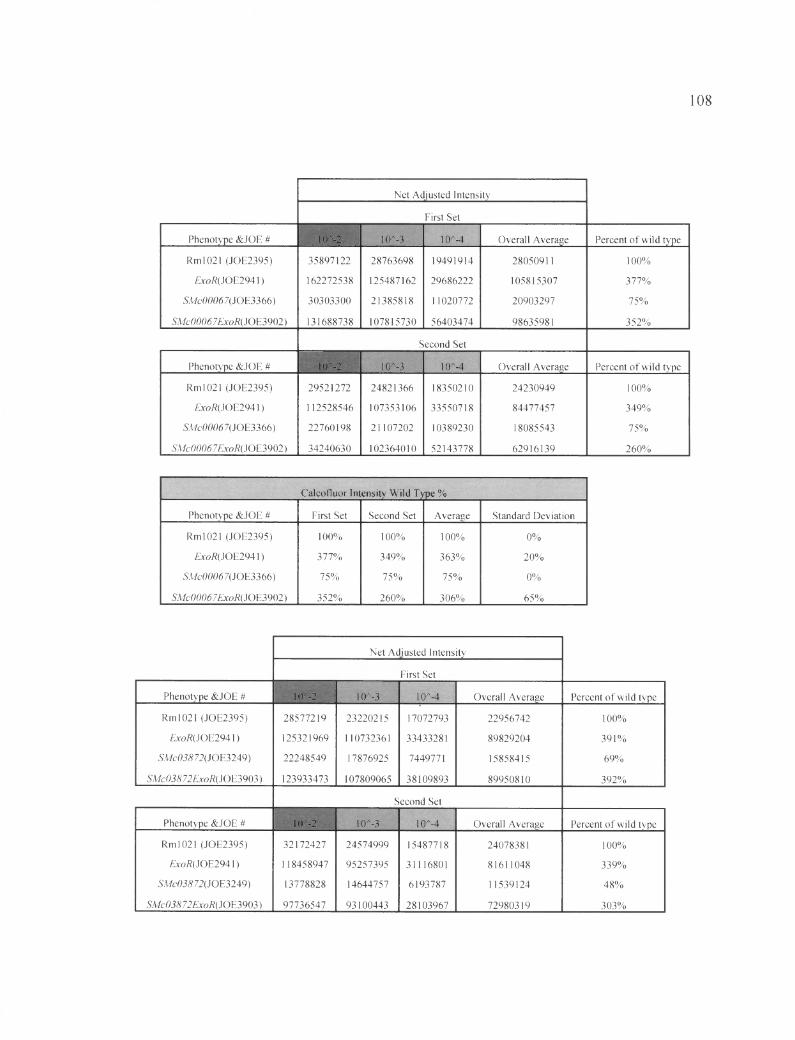
108
Net Adjusted Intensity
First Set
Phenotype &JOE # 10A-2 10^3 10M Overall Average Percent of wild type
Rml021 (JOE2395) 35897122 28763698 19491914 28050911 1 00%
ExoR{iOE294\) 162272538 125487162 29686222 105815307 377%
SMc00067{ JOE3366) 30303300 21385818 11020772 20903297 75%
SMc00067ExoRQOE3902) 131688738 107815730 56403474 98635981 352%
Second Set
Phenotype &JOE # 10A-2 lO M 10A-4 Overall Average Percent of wild type
Rml021 (JOE2395) 29521272 24821366 18350210 24230949 100%
ExoR(iOE294\) 112528546 107353106 33550718 84477457 349%
SMc00067( JOE3366) 22760198 21107202 10389230 18085543 75%
SMc00067ExoR(iOE3902) 34240630 102364010 52143778 62916139 260%
Calcofluor Intensity Wild Type %
Phenotype &JOE # First Set Second Set Average Standard Deviation
Rml021 (JOE2395) 100% 100% 1 00% 0 %
ExoR()OE294\) 377% 349% 363% 2 0 %
SMc00067{ JOE3366) 75% 75% 75% 0 %
SMc00067ExoR( JOE3902) 352% 260% 306% 65%
Net Adjusted Intensity
First Set
Phenotype &JOE # 10A-2 10A-3 10A-4 Overall Average Percent of wild type
Rml021 (JOE2395) 28577219 23220215 17072793 22956742 100%
ExoR( JOE2941) 125321969 110732361 33433281 89829204 391%
SMc03872( JOE3249) 22248549 17876925 7449771 15858415 69%
SMc03872ExoR{ JOE3903) 123933473 107809065 38109893 89950810 392%
Second Set
Phenotype &JOE # 10A-2 10A-3 10A-4 Overall Average Percent of wild type
Rml021 (JOE2395) 32172427 24574999 15487718 24078381 100%
ExoR(SOE294\) 118458947 95257395 31116801 81611048 339%
SMc03872( JOE3249) 13778828 14644757 6193787 11539124 48%
SMc03872ExoR(50E3903) 97736547 93100443 28103967 72980319 303%

109
Calcofluor Intensity Wild Type %
Phenotype &JOE # First Set Second Set Average Standard Deviation
Rml021 (JOE2395) 100% 100% 100% 0 %
ExoR( JOE2941) 391% 339% 365% 37%
SMc03872( JOE3249) 69% 48% 59% 15%
SMc03872ExoR( JQE3903) 392% 303% 347% 63%
Table 6B: The raw data shows the calcoflour fluorescence pertaining to figure 11. Two plates (two sets) contain four strains of S. meliloti at different concentration were averaged and the standard deviation was calculated.

110
Net Adjusted Intensity
First Set
Phenotype &JOE # 10A-2 10A~3 10A-4 Overall Average Percent of wild type
Rml021 PexoY uidA( JOE3829) 17677814 12897865 9873478 13483052.33 100%
ApodJ 1-2 PexoY uidA (JOE3828) 32488098 37930550 19741174 30053274 223%
ASMc03872 PexoY uidA (JOE3827) 8448280 8793758 5638500 7626846 57%
ASMc00067 PexoY uidA (JOE3826) 5679709 7570886 5255441 6168679 46%
Second Set
Phenotype &JOE # 10A-2 10A-3 10A-4 Overall Average Percent of wild type
Rml021 PexoY uidA{ JOE3829) 14122105 12733723 10285957 12380595 100%
ApodJ 1-2 PexoY uidA (JOE3828) 33667365 3 7 4 7 7 9 4 9 17259565 29468293 238%
ASMc03872 PexoY uidA (JOE3827) 8242169 8821950 6074540 7712886 62%
ASMc00067 PexoY uidA (JOE3826) 6911160 6750071 5467451 6376227 52%
Calcofluor Intensity Wild Type %
Phenotype &JOE # First Set Second Set Average Standard Deviation
Rml021 PexoY uidA( JOE3829) 100% 100% 100% 0 %
ApodJ 1-2 PexoY uidA (JOE3828) 226% 234% 230% 3%
ASMc03872 PexoY uidA (JOE3827) 58% 62% 60% 2 %
ASMc00067 PexoY uidA (JOE3826) 48% 52% 50% 1%
Table7B: The raw data shows the calcoflour fluorescence pertaining to figure 12. Twoplates (two sets) contain four strains of S. meliloti at different concentration wereaveraged and the standard deviation was calculated.
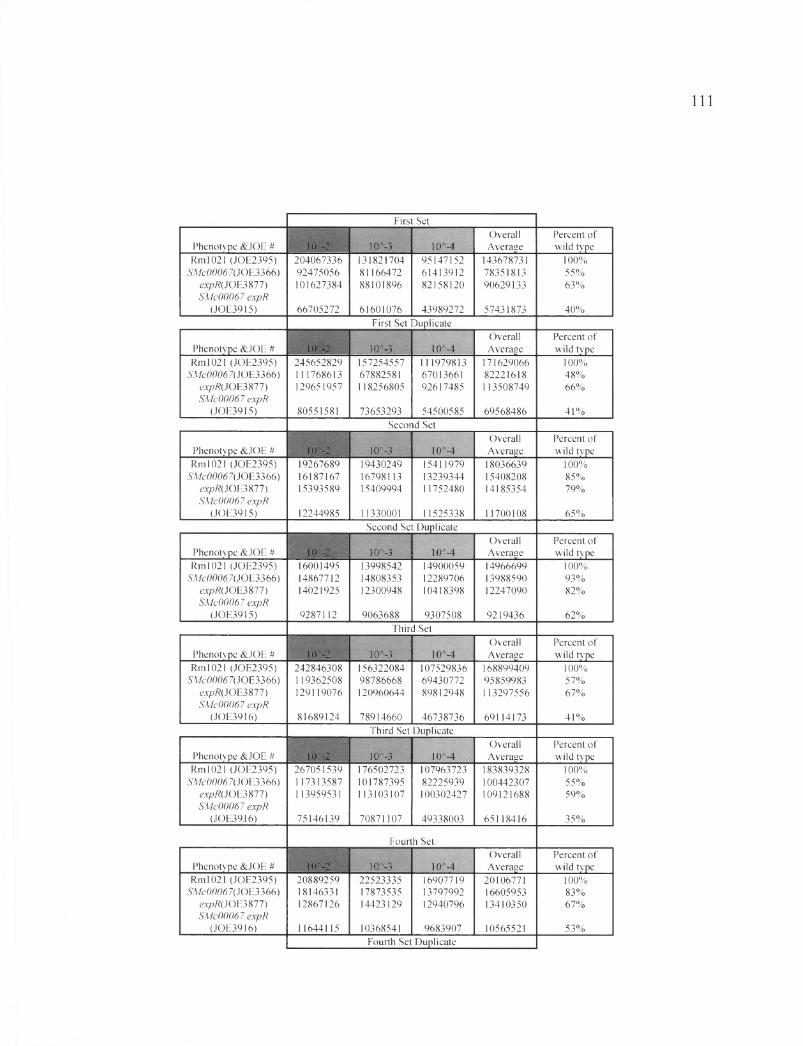
First SetOverall Percent of
Phenotype &JOE # 1 0 A-2 10A-3 10A-4 Average wild typeRml 021 (JOE2395) 204067336 131821704 95147152 143678731 1 00%
SMc00067(JOE3366) 92475056 81166472 61413912 78351813 55%expR{JOE3877) 101627384 88101896 82158120 90629133 63%SMc00067 expR
(JOE3915) 66705272 61601076 43989272 57431873 40%First Set Duplicate
Overall Percent ofPhenotype &JOE # 10**2 10A-3 10A-4 Average wild typeRml 021 (JOE2395) 245652829 157254557 111979813 171629066 1 0 0%
SMc00067( JOE3366) 111768613 67882581 67013661 82221618 48%expR()OE3877) 129651957 118256805 92617485 113508749 6 6 %SMc00067 expR
(JOE3915) 80551581 73653293 54500585 69568486 41%Second Set
Overall Percent ofPhenotype &JOE # 10A-2 10A-3 10A-4 Average wild typeRml 021 (JOE2395) 19267689 19430249 15411979 18036639 100%
SMc00067( JOE3366) 16187167 16798113 13239344 15408208 85%expR{JOE3S77) 15393589 15409994 11752480 14185354 79%SMc00067 expR
(JOE3915) 12244985 11330001 11525338 11700108 65%Second Set Duplicate
Overall Percent ofPhenotype &JOE # 10A«2 10A-3 10A-4 Average wild typeRml 021 (JOE2395) 16001495 13998542 14900059 14966699 1 00%
SMc00067{ JOE3366) 14867712 14808353 12289706 13988590 93%expR(JOE3&77) 14021925 12300948 10418398 12247090 82%SMc00067 expR
(JOE3915) 9287112 9063688 9307508 9219436 62%Third Set
Overall Percent ofPhenotype &JOE # 10A-2 10A-3 10A-4 Average wild typeRml 021 (JOE2395) 242846308 156322084 107529836 168899409 100%
SMc00067( JOE3366) 119362508 98786668 69430772 95859983 57%expR()OE3&77) 129119076 120960644 89812948 113297556 67%SMc00067 expR
(JOE3916) 81689124 78914660 46738736 69114173 41%Third Set Duplicate
Overall Percent ofPhenotype &JOE # 1 0 A-2 10A-3 10A-4 Average wild typeRml 021 (JOE2395) 267051539 176502723 107963723 183839328 100%
SMc00067(]C)E3366) 117313587 101787395 82225939 100442307 55%expR( JOE3877) 113959531 113103107 100302427 109121688 59%SMc00067 expR
(JOE3916) 75146139 70871107 49338003 65118416 35%
Fourth SetOverall Percent of
Phenotype &JOE # 10A-2 10A-3 10A-4 Average wild typeRml 021 (JOE2395) 20889259 22523335 16907719 20106771 1 00%
SMc00067(JOE3366) 18146331 17873535 13797992 16605953 83%expR(]OE3S77) 12867126 14423129 12940796 13410350 67%SMc00067 expR
(JOE3916) 11644115 10368541 9683907 10565521 53%Fourth Set Duplicate
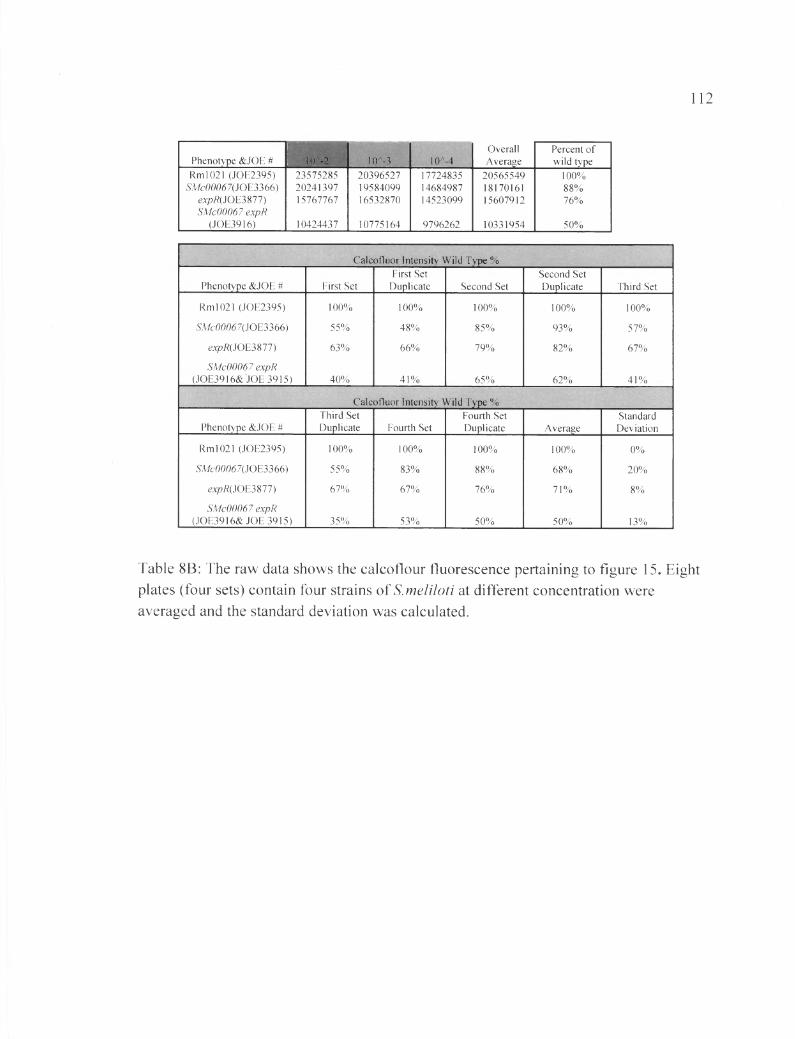
112
Phenotype &JOE # 1 0 ^ 2 10A-3 10A-4OverallAverage
Percent of wild type
Rml021 (JOE2395) 23575285 20396527 17724835 20565549 100%SMc00067( JOE3366) 20241397 19584099 14684987 18170161 8 8 %
expR( JOE3877) 15767767 16532870 14523099 15607912 76%SMc00067 expR
(JOE3916) 10424437 10775164 9796262 10331954 50%
Calcofluor Intensity Wild Type %
Phenotype &JOE # First SetFirst Set
Duplicate Second SetSecond Set Duplicate Third Set
Rml021 (JOE2395) 1 00% 1 00% 100% 100% 1 00%
SMc00067{ JOE3366) 55% 48% 85% 93% 57%
ej^fl(JOE3877) 63% 6 6 % 79% 82% 67%
SMc00067 expR (JOE3916& JOE 3915) 40% 41% 65% 62% 41%
Calcofluor Intensity Wild Type %
Phenotype &JOE #Third Set Duplicate Fourth Set
Fourth Set Duplicate Average
StandardDeviation
Rml021 (JOE2395) 1 00% 100% 100% 100% 0 %
SMc00067{ JOE3366) 55% 83% 8 8 % 6 8 % 2 0 %
expR( JOE3877) 67% 67% 76% 71% 8%
SMc00067 expR (JOE3916& JOE 3915) 35% 53% 50% 50% 13%
Table 8B: The raw data shows the calcoflour fluorescence pertaining to figure 15. Eight plates (four sets) contain four strains of S.meliloti at different concentration were averaged and the standard deviation was calculated.
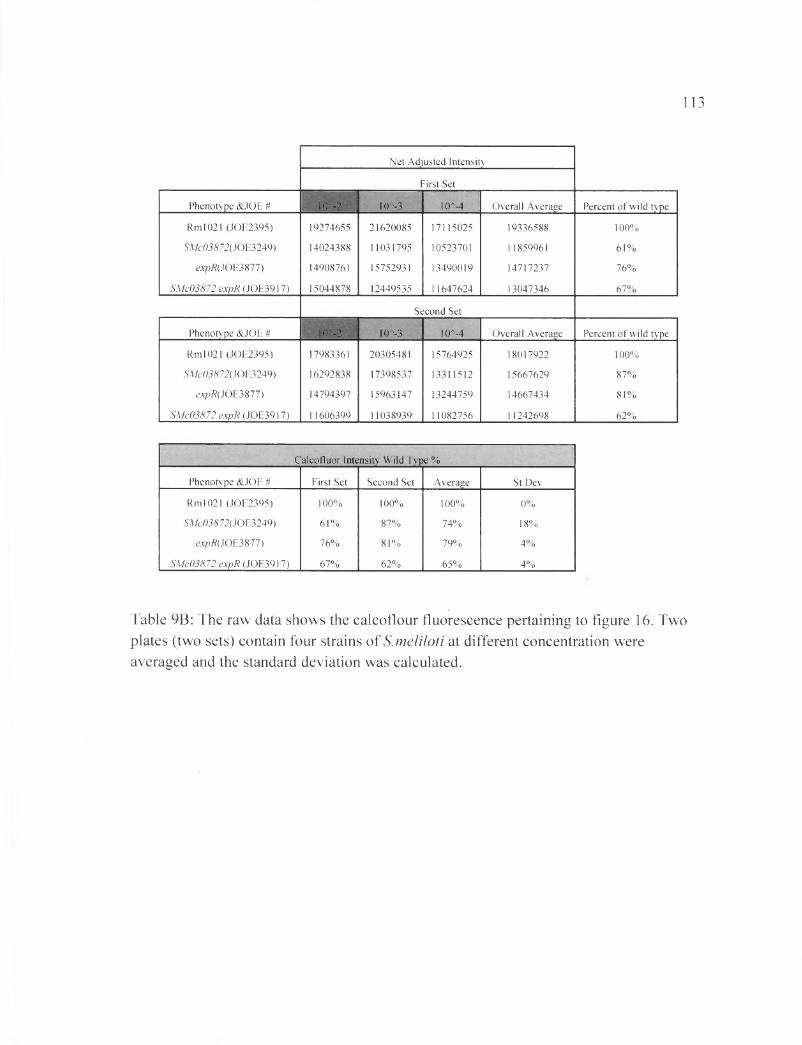
113
Net Adjusted Intensity
First Set
Phenotype &JOE # 1 0 A-2 10A-3 1 0M Overall Average Percent of wild type
Rml021 (JOE2395) 19274655 21620085 17115025 19336588 1 00%
SMc03872( JOE3249) 14024388 11031795 10523701 11859961 61%
expR( JOE3877) 14908761 15752931 13490019 14717237 76%
SMc03872 expR (JOE3917) 15044878 12449535 11647624 13047346 67%
Second Set
Phenotype &JOE # 1 0 ^ 2 10A-3 10A-4 Overall Average Percent of wild type
Rml021 (JOE2395) 17983361 20305481 15764925 18017922 1 00%
SMc03872(J OE3249) 16292838 17398537 13311512 15667629 87%
expR{ JOE3877) 14794397 15963147 13244759 14667434 81%
SMc03872 expR (JOE3917) 11606399 11038939 11082756 11242698 62%
Calcofluor Intensity Wild Type %
Phenotype &JOE # First Set Second Set Average St Dev
Rml021 (JOE2395) 100% 100% 100% 0 %
SMc03872( JOE3249) 61% 87% 74% 18%
expR(iOE3&77) 76% 81% 79% 4%
SMc03872 expR (JOE3917) 67% 62% 65% 4%
Table 9B: The raw data shows the calcoflour fluorescence pertaining to figure 16. Twoplates (two sets) contain four strains of S. meliloti at different concentration wereaveraged and the standard deviation was calculated.

114
Net adjusted intensity
Set A
Phenotype &JOE # 10N 2 10A-3 10A-4 Overall Average Percent of wild type
Rml021 (JOE2395) 80742575 72785831 41711103 65079836 100%
PodJ (JOE3759) 86429279 63050415 30397991 59959228 92%
APodJ 1-2 (JOE3687) 183891111 127299271 22800021 111330134 171%
APodJl( JOE2553) 165796951 108706679 24184527 99562719 153%
Set B
Phenotype &JOE # K r -2
<o
10A-4 Overall Average Percent of wild type
Rml021 (JOE2395) 73336800 55783852 34216680 54445777 1 00%
PodS (JOE3759) 61081456 53154072 22305260 45513596 84%
APodJ 1-2 (JOE3687) 197422704 96203408 16951318 103525810 190%
APodJl{ JOE2553) 117164760 92936824 26905288 79002291 145%
SetC
Phenotype &JOE # 10A-2 10A-3 o > Overall Average Percent of wild type
Rml021 (JOE2395) 24425741 14609534 12186487 17073921 100%
PodJ (JOE3759) 18070055 12257106 11374848 13900670 81%
APodJ 1-2 (JOE3687) 32269869 35210597 24750385 30743617 180%
APodJl{ JOE2553) 25586979 27711145 24281765 25859963 151%
Set D
Phenotype &JOE # 10A-2 10A-3 10A-4 Overall Average Percent of wild type
Rml021 (JOE2395) 21906102 13907760 11971566 15928476 100%
PodJ (JOE3759) 18524406 13091718 11177242 14264455 90%
APodJ 1-2 (JOE3687) 33006170 33434274 23211590 29884011 188%
APodJl{ JOE2553) 27058366 30184494 24833850 27358903 172%
Calcofluor Intensity Wild Type %
Phenotype &JOE # First Set Second Set Third Set Fourth Set AverageStandardDeviation
Rml021 (JOE2395) 100% 1 0 0% 100% 100% 100% 0 %
PodJ ()OE3159) 92% 84% 81% 90% 87% 5%
APodJ 1-2 (JOE3687) 171% 190% 180% 188% 182% 9%
APodJ l(JOE2553) 153% 145% 151% 172% 155% 11%
Table 10B: The raw data shows the calcoflour fluorescence pertaining to figure 17. Fourplates (four sets) contain four strains of S. meliloti at different concentration wereaveraged and the standard deviation was calculated.
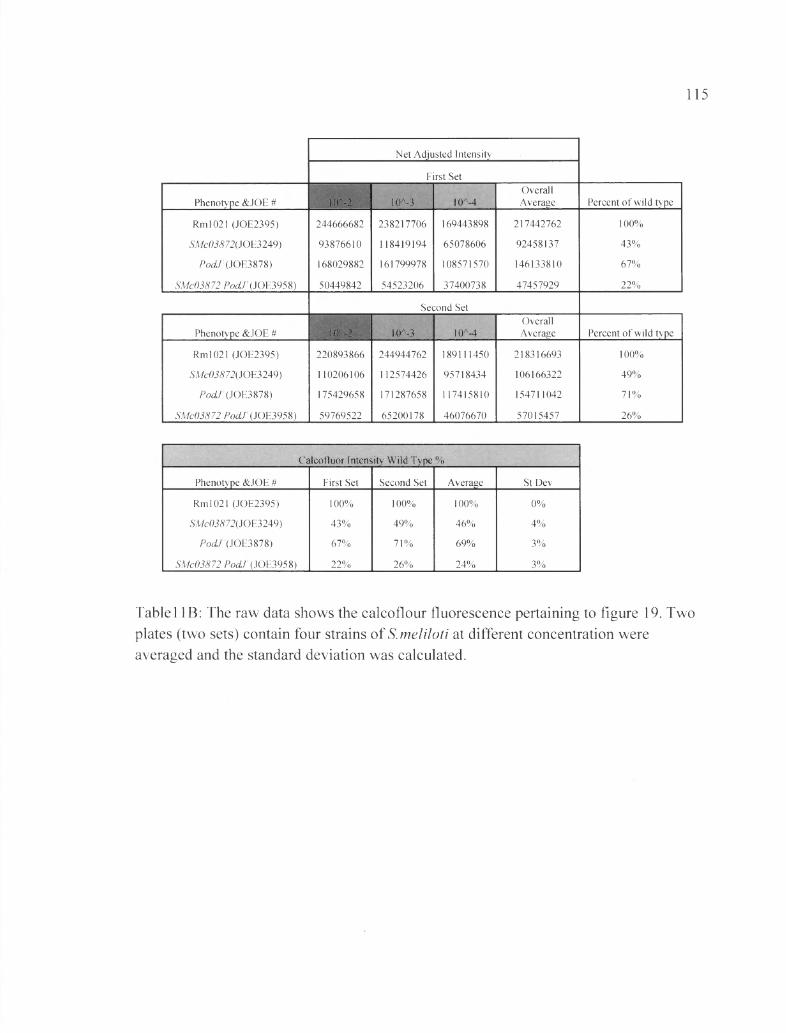
115
Net Adjusted Intensity
First Set
Phenotype &JOE # 10**2 10A-3 10**4OverallAverage Percent of wild type
Rml021 (JOE2395) 244666682 238217706 169443898 217442762 100%
SMc03 5 72( J OE3249) 93876610 118419194 65078606 92458137 43%
PodT (JOE3878) 168029882 161799978 108571570 146133810 67%
SMc03872 PodJ (JOE3958) 50449842 54523206 37400738 47457929 2 2 %
Second Set
Phenotype &JOE # 10**2 10*-3 10**4OverallAverage Percent of wild type
Rml021 (JOE2395) 220893866 244944762 189111450 218316693 1 00%
SMc03872{ JOE3249) 110206106 112574426 95718434 106166322 49%
Podir(JOE3878) 175429658 171287658 117415810 154711042 71%
SMc03872 PodJ (JOE3958) 59769522 65200178 46076670 57015457 26%
Calcofluor Intensity Wild Type %
Phenotype &JOE # First Set Second Set Average St Dev
Rml021 (JOE2395) 100% 1 00% 100% 0 %
SMc03872{ JOE3249) 43% 49% 46% 4%
P o d J (JOE3878) 67% 71% 69% 3%
SMc03872 PodJ (JOE3958) 2 2 % 26% 24% 3%
Tablel IB: The raw data shows the calcoflour fluorescence pertaining to figure 19. Twoplates (two sets) contain four strains of S. meliloti at different concentration wereaveraged and the standard deviation was calculated.
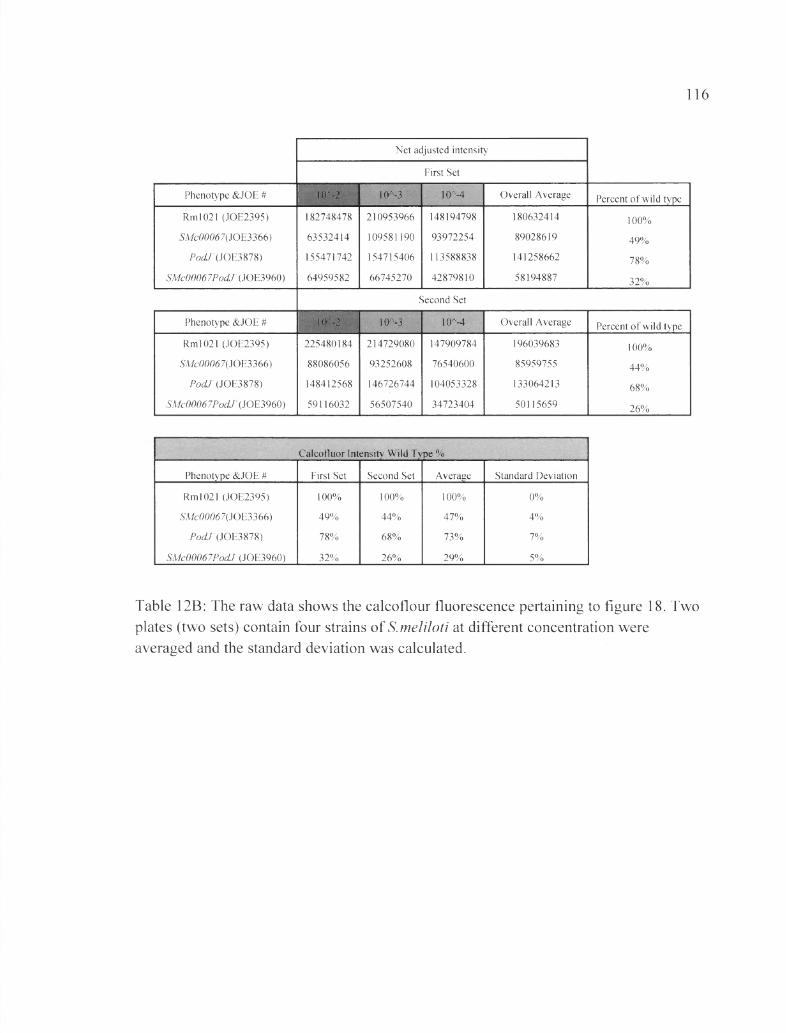
116
Net adjusted intensity
First Set
Phenotype &JOE # 10A-2 10^3 10A-4 Overall Average Percent of wild type
Rml021 (JOE2395) 182748478 210953966 148194798 180632414 100%
SMc00067{ JOE3366) 63532414 109581190 93972254 89028619 49%PodT (JOE3878) 155471742 154715406 113588838 141258662 78%
SMc00067PocLT (JOE3960) 64959582 66745270 42879810 58194887 32%
Second Set
Phenotype &JOE # i r -2 10A-3 10A-4 Overall Average Percent of wild type
Rml021 (JOE2395) 225480184 214729080 147909784 196039683 100%SMc00067{ JOE3366) 88086056 93252608 76540600 85959755 44%
PodT( JOE3878) 148412568 146726744 104053328 133064213 6 8 %
SMe00067PodJ (JQE3960) 59116032 56507540 34723404 50115659 26%
Calcofluor Intensity Wild Type %
Phenotype &JOE # First Set Second Set Average Standard Deviation
Rml021 (JOE2395) 1 0 0% 100% 100% 0 %
SMc00067{ JOE3366) 49% 44% 47% 4%
PodT (JOE3878) 78% 6 8 % 73% 1%
SMc00067PodT (JOE3960) 32% 26% 29% 5%
Table 12B: The raw data shows the calcoflour fluorescence pertaining to figure 18. Two plates (two sets) contain four strains of S. meliloti at different concentration were averaged and the standard deviation was calculated.
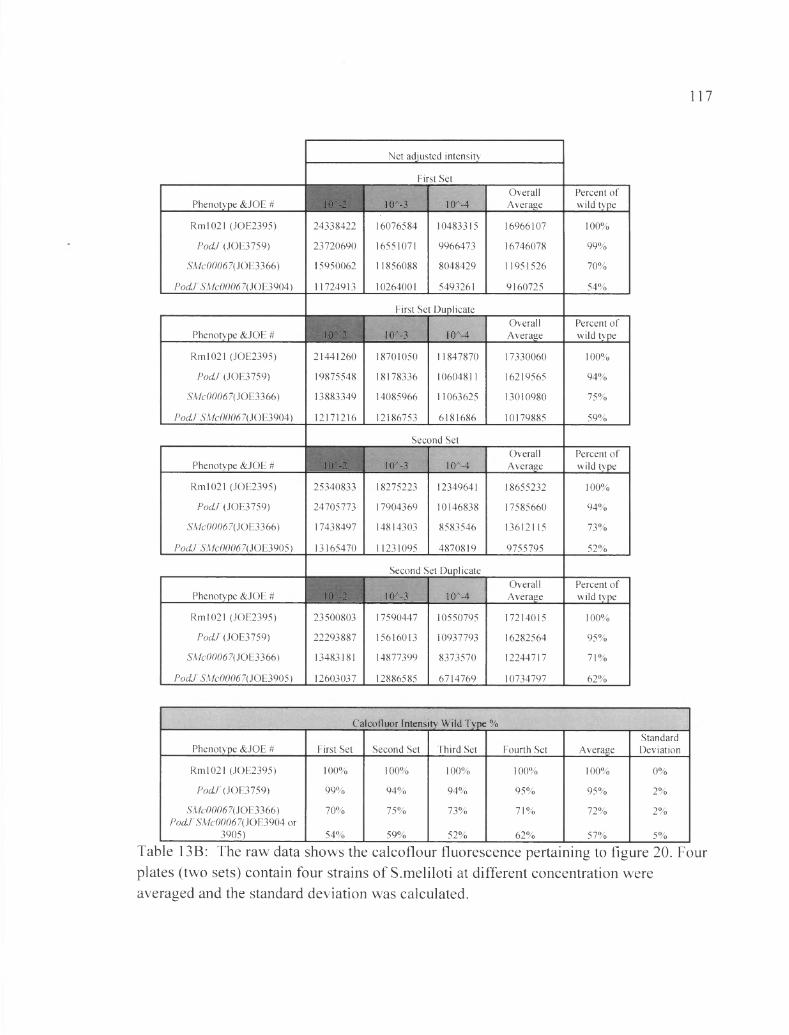
117
Net adjusted intensity
First Set
Phenotype &JOE # i r -2 10A-3 10A-4OverallAverage
Percent of wild type
Rml021 (JOE2395) 24338422 16076584 10483315 16966107 100%
PocLT (JOE3759) 23720690 16551071 9966473 16746078 99%
SMc00067{ JOE3366) 15950062 11856088 8048429 11951526 70%
PodJ SMc00067(JOE3904) 11724913 10264001 5493261 9160725 54%
First Set Duplicate
Phenotype &JOE # 10A-2 10A-3 10A-4OverallAverage
Percent of wild type
Rml021 (JOE2395) 21441260 18701050 11847870 17330060 1 00%
PodT (JOE3759) 19875548 18178336 10604811 16219565 94%
SMc00067{ JOE3366) 13883349 14085966 11063625 13010980 75%
PodJ SMc00067(JOE3904) 12171216 12186753 6181686 10179885 59%
Second Set
Phenotype &JOE # 1 0 ^ 2 10A-3 10A-4OverallAverage
Percent of wild type
Rml021 (JOE2395) 25340833 18275223 12349641 18655232 100%
PodT (JOE3759) 24705773 17904369 10146838 17585660 94%
SMc00067(JOE3366) 17438497 14814303 8583546 13612115 73%
PodJ SMc00067UC>E3905) 13165470 11231095 4870819 9755795 52%
Second Set Duplicate
Phenotype &JOE # 1 0 ^ 2 10A-3 10A-4OverallAverage
Percent of wild type
Rml021 (JOE2395) 23500803 17590447 10550795 17214015 100%
PodLT(JOE3759) 22293887 15616013 10937793 16282564 95%
SMc00067( JOE3366) 13483181 14877399 8373570 12244717 71%
PodJ SMc00067(JQE3905) 12603037 12886585 6714769 10734797 62%
Calcofluor Intensity Wild Type %
Phenotype &JOE # First Set Second Set Third Set Fourth Set AverageStandardDeviation
Rml021 (JOE2395) 100% 100% 1 0 0% 100% 100% 0 %
PodJ (JOE3759) 99% 94% 94% 95% 95% 2 %
SMc0006700E3366) 70% 75% 73% 71% 72% 2 %PodJ SMc00067{JOE3904 or
3905) 54% 59% 52% 62% 57% 5%
Table 13B: The raw data shows the calcoflour fluorescence pertaining to figure 20. Fourplates (two sets) contain four strains of S.meliloti at different concentration wereaveraged and the standard deviation was calculated.
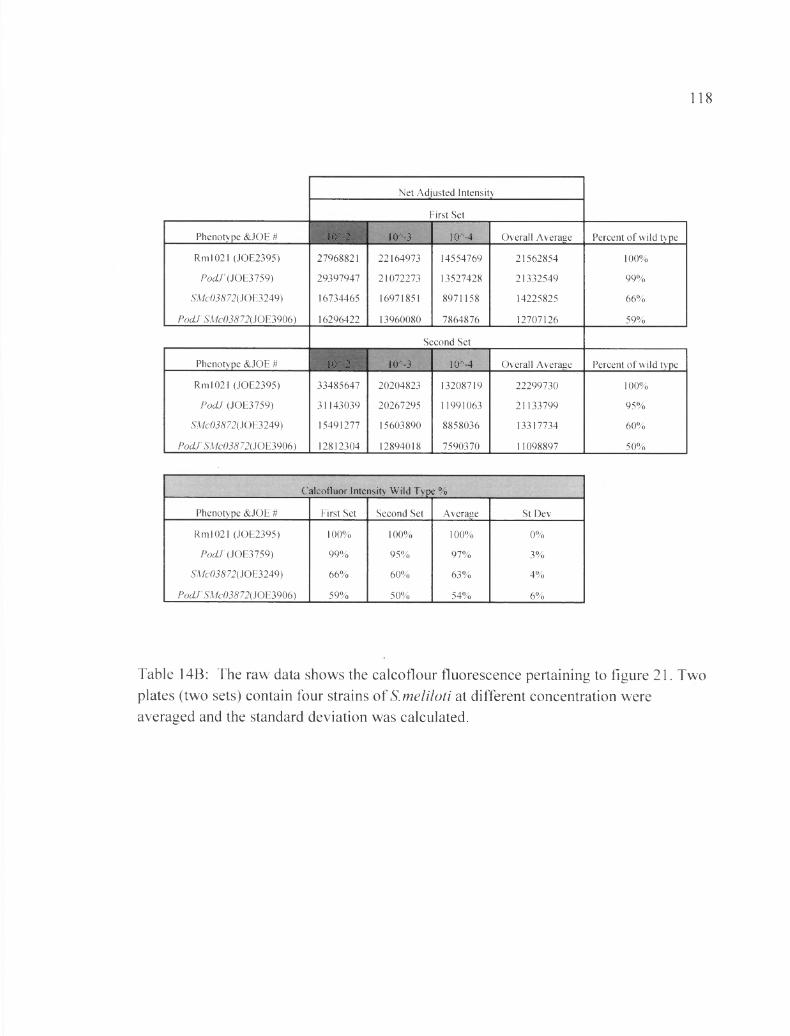
118
Net Adjusted Intensity
First Set
Phenotype &JOE # 10A-2 lO M 10A-4 Overall Average Percent of wild type
Rml021 (JOE2395) 27968821 22164973 14554769 21562854 100%
/ W (JOE3759) 29397947 21072273 13527428 21332549 99%
SMc03872(}OE3249) 16734465 16971851 8971158 14225825 6 6 %
PodJ SMc03872( JOE3906) 16296422 13960080 7864876 12707126 59%
Second Set
Phenotype &JOE # 10A-2 10A-3 10A-4 Overall Average Percent of wild type
Rm1021 (JOE2395) 33485647 20204823 13208719 22299730 100%
P odJ (JOE3759) 31143039 20267295 11991063 21133799 95%
SMc03872(50E3249) 15491277 15603890 8858036 13317734 60%
PodJ SMc038 72(JQE3906) 12812304 12894018 7590370 11098897 50%
Calcofluor Intensity Wild Type %
Phenotype &JOE # First Set Second Set Average St Dev
Rml021 (JOE2395) 1 00% 1 00% 100% 0 %
P odJ (JOE3759) 99% 95% 97% 3%
SMc03872( JOE3249) 6 6 % 60% 63% 4%
PodJ SMc03872{JOE3906) 59% 50% 54% 6 %
Table 14B: The raw data shows the calcoflour fluorescence pertaining to figure 21. Two plates (two sets) contain four strains of S.meliloti at different concentration were averaged and the standard deviation was calculated.
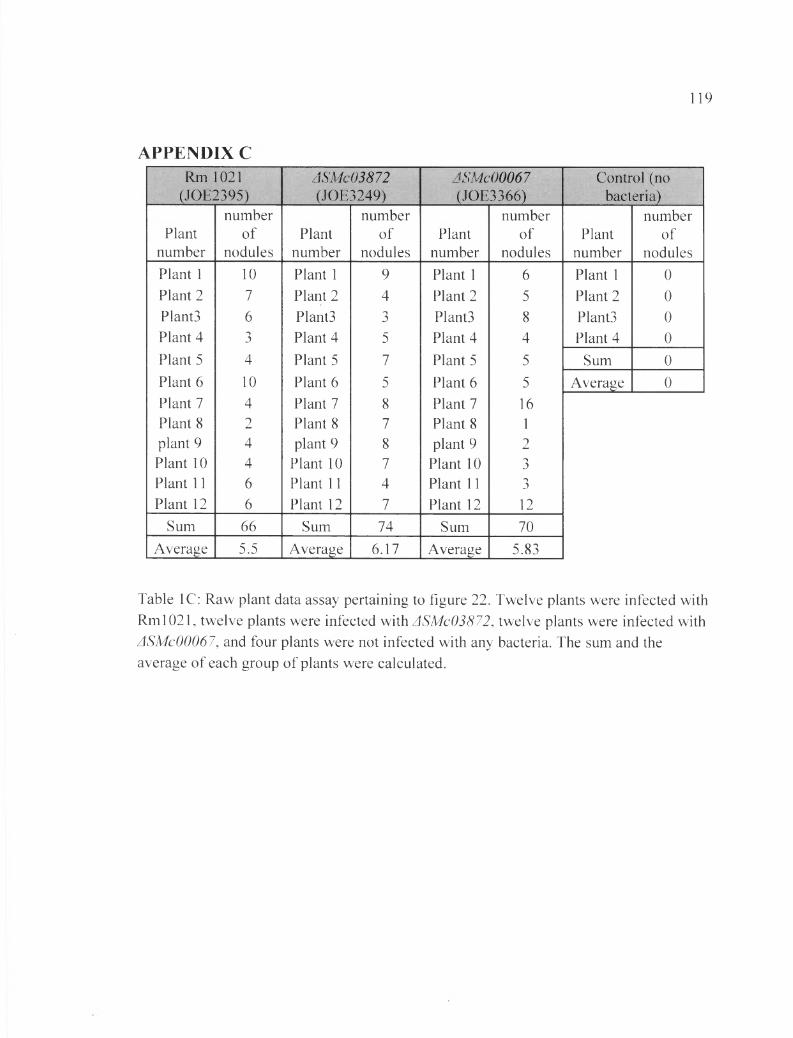
119
APPENDIX CRm 1021 ASMc03872 ASMc00067 Control (no
(JOE2395) (JOE3249) (JOE3366) bacteria)number number number number
Plant of Plant of Plant of Plant ofnumber nodules number nodules number nodules number nodulesPlant 1 10 Plant 1 9 Plant 1 6 Plant 1 0Plant 2 7 Plant 2 4 Plant 2 5 Plant 2 0Plant3 6 Plant3 3 Plant3 8 Plant3 0Plant 4 3 Plant 4 5 Plant 4 4 Plant 4 0Plant 5 4 Plant 5 7 Plant 5 5 Sum 0Plant 6 10 Plant 6 5 Plant 6 5 Average 0Plant 7 4 Plant 7 8 Plant 7 16Plant 8 2 Plant 8 7 Plant 8 1plant 9 4 plant 9 8 plant 9 2Plant 10 4 Plant 10 7 Plant 10 3Plant 11 6 Plant 11 4 Plant 11 3Plant 12 6 Plant 12 7 Plant 12 12
Sum 66 Sum 74 Sum 70Average 5.5 Average 6.17 Average 5.83
Table 1C: Raw plant data assay pertaining to figure 22. Twelve plants were infected with Rml021, twelve plants were infected with ASMc03872, twelve plants were infected with ASMc00067, and four plants were not infected with any bacteria. The sum and the average of each group of plants were calculated.
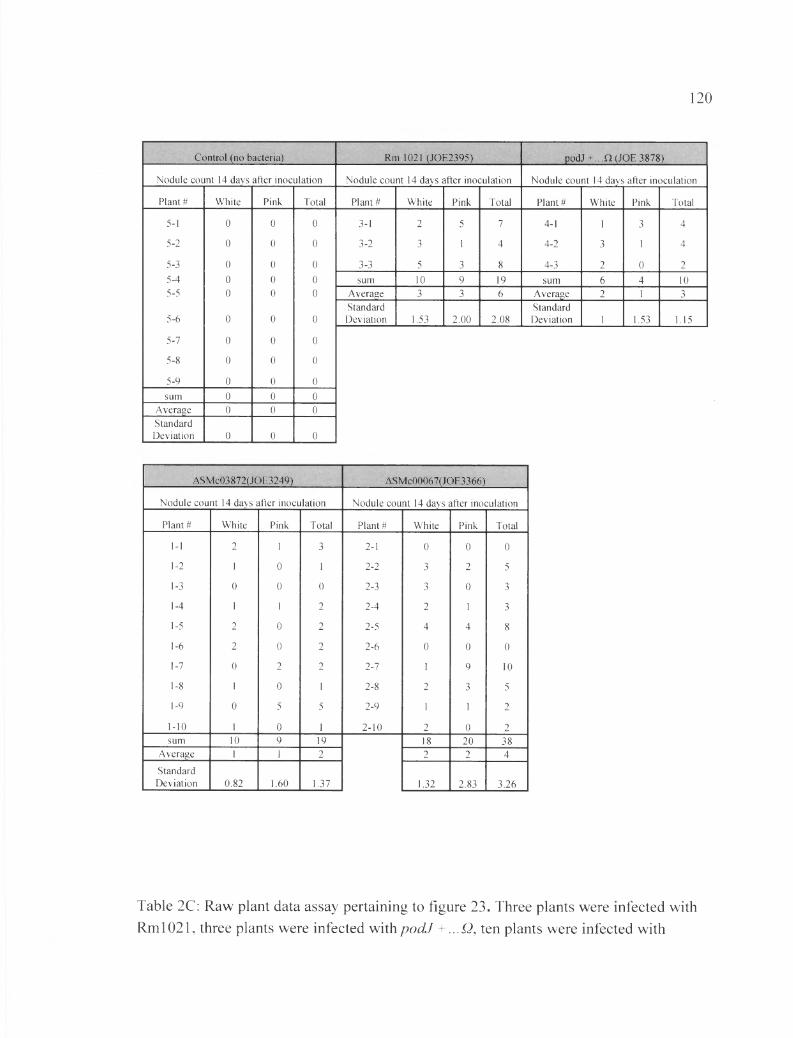
120
Control (no bacteria) Rm 1021 (JOE2395) podJ+...£} (JOE 3878)
Nodule count 14 days after inoculation Nodule count 14 days after inoculation Nodule count 14 days after inoculation
Plant# White Pink Total Plant # White Pink Total Plant # White Pink Total
5-1 0 0 0 3-1 2 5 7 4-1 1 3 4
5-2 0 0 0 3-2 3 1 4 4-2 3 1 4
5-3 0 0 0 3-3 5 3 8 4-3 2 0 2
5-4 0 0 0 sum 10 9 19 sum 6 4 105-5 0 0 0 Average 3 3 6 Average 2 1 3
5-6 0 0 0StandardDeviation 1.53 2 .0 0 2.08
StandardDeviation 1 1.53 1.15
5-7 0 0 0
5-8 0 0 0
5-9 0 0 0
sum 0 0 0
Average 0 0 0
StandardDeviation 0 0 0
ASMc03872(JOE3249) ASMc00067(JOE3366)
Nodule count 14 days after inoculation Nodule count 14 days after inoculation
Plant# White Pink Total Plant # White Pink Total
1-1 2 1 3 2-1 0 0 0
1-2 1 0 1 2 -2 3 2 5
1-3 0 0 0 2-3 3 0 3
1-4 1 1 2 2-4 2 1 3
1-5 2 0 2 2-5 4 4 8
1-6 2 0 2 2 -6 0 0 0
1-7 0 2 2 2-7 1 9 10
1-8 1 0 1 2 -8 2 3 5
1-9 0 5 5 2-9 1 1 2
1-10 1 0 1 2 -1 0 2 0 2sum 10 9 19 18 2 0 38
Average 1 1 2 2 2 4StandardDeviation 0.82 1.60 1.37 1.32 2.83 3.26
Table 2C: Raw plant data assay pertaining to figure 23. Three plants were infected with Rml021, three plants were infected with podJ +... Q, ten plants were infected with

121
ASMc03872, ten plants were infected with ASMc00067, and nine plants were not infected with any bacteria. The pink and the white nodules were counted after fourteen days. The sum and the average of each group of plants were calculated. The standard deviation was also calculated for each set.
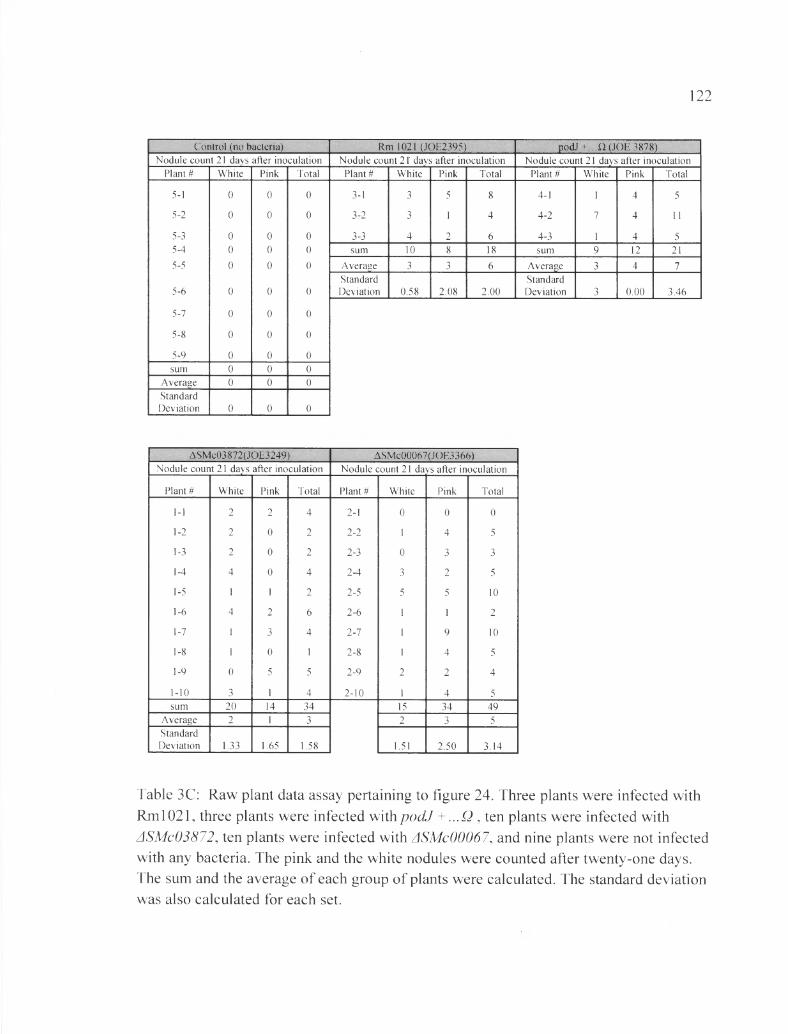
122
Control (no bacteria) Rm 1021 (JOE2395) podJ + ...Q (JOE 3878)Nodule count 21 days after inoculation Nodule count 21 days after inoculation Nodule count 21 daysi after inoculation
Plant# White Pink Total Plant # White Pink Total Plant # White Pink Total
5-1 0 0 0 3-1 3 5 8 4-1 1 4 5
5-2 0 0 0 3-2 3 1 4 4-2 7 4 11
5-3 0 0 0 3-3 4 2 6 4-3 1 4 55-4 0 0 0 sum 10 8 18 sum 9 12 21
5-5 0 0 0 Average 3 3 6 Average 3 4 7
5-6 0 0 0StandardDeviation 0.58 2.08 2 .0 0
StandardDeviation 3 0 .0 0 3.46
5-7 0 0 0
5-8 0 0 0
5-9 0 0 0
sum 0 0 0
Average 0 0 0
StandardDeviation 0 0 0
ASMc03872(JOE3249) ASMc00067(JOE3366)Nodule count 21 days after inoculation Nodule count 21 days after inoculation
Plant # White Pink Total Plant # White Pink Total
1-1 2 2 4 2-1 0 0 0
1-2 2 0 2 2 -2 1 4 5
1-3 2 0 2 2-3 0 3 3
1-4 4 0 4 2-4 3 2 5
1-5 1 1 2 2-5 5 5 10
1-6 4 2 6 2 -6 1 1 2
1-7 1 3 4 2-7 1 9 10
1-8 1 0 1 2 -8 1 4 5
1-9 0 5 5 2-9 2 2 4
1 -10 3 1 4 2 -1 0 1 4 5sum 2 0 14 34 15 34 49
Average 2 1 3 2 3 5StandardDeviation 1.33 1.65 1.58 1.51 2.50 3.14
Table 3C: Raw plant data assay pertaining to figure 24. Three plants were infected with Rml 021, three plants were infected with podJ + ...Q , ten plants were infected with ASMc03872, ten plants were infected with ASMc00067, and nine plants were not infected with any bacteria. The pink and the white nodules were counted after twenty-one days. The sum and the average of each group of plants were calculated. The standard deviation was also calculated for each set.
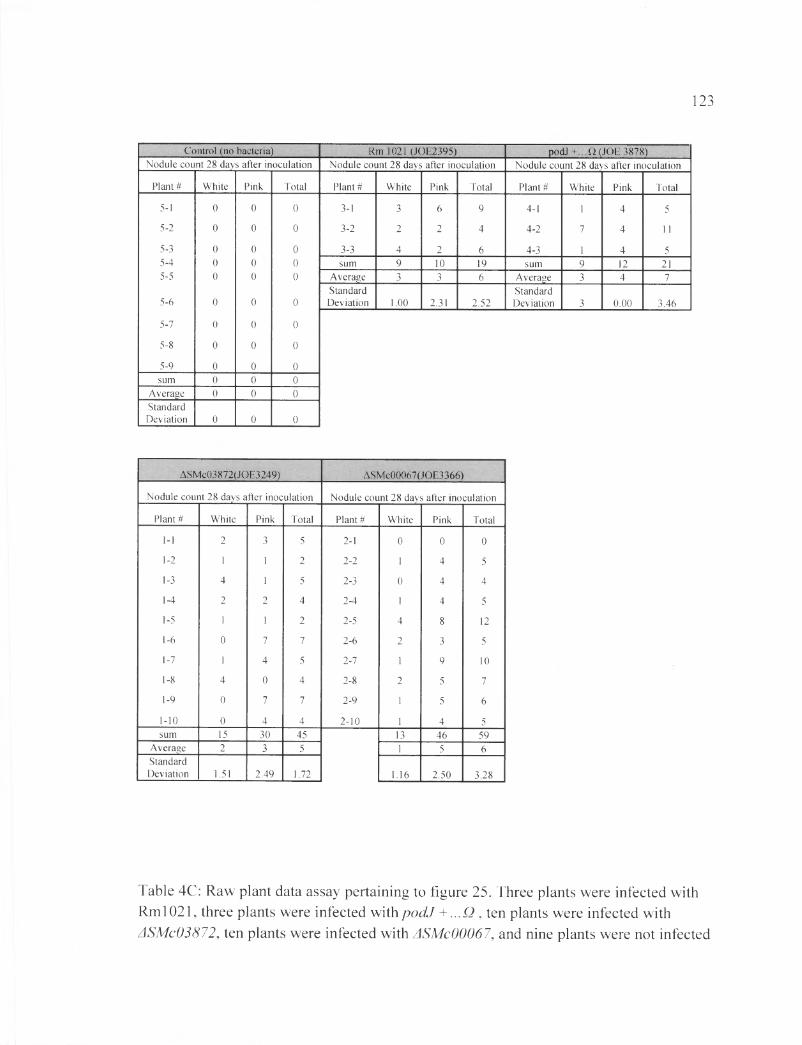
123
Control (no bacteria) Rm 1021 (JOE2395) p o d J+ ...0 (JOE 3878)Nodule count 28 days after inoculation Nodule count 28 days after inoculation Nodule count 28 da>fs after inoculation
Plant# White Pink Total Plant# White Pink Total Plant# White Pink Total
5-1 0 0 0 3-1 3 6 9 4-1 1 4 5
5-2 0 0 0 3-2 2 2 4 4-2 7 4 11
5-3 0 0 0 3-3 4 2 6 4-3 1 4 55-4 0 0 0 sum 9 10 19 sum 9 12 215-5 0 0 0 Average 3 3 6 Average 3 4 7
5-6 0 0 0StandardDeviation 1 .00 2.31 2.52
StandardDeviation 3 0 .0 0 3.46
5-7 0 0 0
5-8 0 0 0
5-9 0 0 0sum 0 0 0
Average 0 0 0StandardDeviation 0 0 0
ASMc03872(JOE3249) ASMc00067(JOE3366)
Nodule count 28 days after inoculation Nodule count 28 days after inoculation
Plant # White Pink Total Plant # White Pink Total
1-1 2 3 5 2-1 0 0 0
1-2 1 1 2 2 -2 1 4 5
1-3 4 1 5 2-3 0 4 4
1-4 2 2 4 2-4 1 4 5
1-5 1 1 2 2-5 4 8 12
1-6 0 7 7 2 -6 2 3 5
1-7 1 4 5 2-7 1 9 10
1-8 4 0 4 2 -8 2 5 7
1-9 0 7 7 2-9 1 5 6
1-10 0 4 4 2 -1 0 1 4 5sum 15 30 45 13 46 59
Average 2 3 5 1 5 6StandardDeviation 1.51 2.49 1.72 1.16 2.50 3.28
Table 4C: Raw plant data assay pertaining to figure 25. Three plants were infected with Rml021, three plants were infected with podJ + ...Q , ten plants were infected with ASMc03872, ten plants were infected with ASMc00067, and nine plants were not infected

124
with any bacteria. The pink and the white nodules were counted after twenty-eight days. The sum and the average of each group of plants were calculated. The standard deviation was also calculated for each set.