58th swst international convention june 7-12, 2015
TRANSCRIPT
Proceedings of the 58th International Convention of
Society of Wood Science and Technology
June 7-12, 2015 - Grand Teton National Park, Jackson, Wyoming, USA
1
58th SWST International Convention
June 7-12, 2015
Jackson Lake Lodge
Grand Teton National Park
Jackson, Wyoming, USA
Convention Theme: Renewable
Materials and the Bio-Economy
Edited by: H. Michael Barnes and Victoria L. Herian
Overall General Co-Chair: Eric Hansen, Oregon State
University, USA
Proceedings of the 58th International Convention of
Society of Wood Science and Technology
June 7-12, 2015 - Grand Teton National Park, Jackson, Wyoming, USA
2
Table of Contents
Biomass Chemistry for a Greener Environment
Session Moderator: Elisha Ncube, Copperbelt University, Zambia
Jing Luo, Beijing Forestry University, China
Soybean Meal-based Adhesive Enhanced by a Commercial Epoxy Resin and a Post Heat Treated
Process............................................................................................................................. .................... 15
Junming Xu, West Virginia University, USA
Fractionation of the Liquefied Lignocellulosic Biomass for the Production of Platform Chemicals......24
Elisha Ncube, Copperbelt University, Zambia
Concentrations of Heavy Metals in Eucalyptus and Pinus Wood Sawdust and Smoke..........................25
Weixing Gan, Guangxi University, China
Synthesis and Characterization of Sucrose-Melamine-Formaldehyde Adhesives..................................26
Yuxiang Huang, Beijing Forestry University, China.................................................................27
Preparation and Characterization of Activated Carbon Fibers from Liquefied Wood by KOH Activation
Design for Environment: Use of Renewable Materials
Session Moderator: Andreja Kutnar, University of Primorska, Slovenia
Philipp Sommerhuber, Thünen Institute of Wood Research, Germany
Environmental Product Design of Wood-Plastic Composites ...............................................................42
Bruce Lippke, University of Washington, USA
Carbon Policy Failures and the Opportunity for Better Uses of Wood ....................................................50
Richard Bergman, US Forest Products Laboratory, USA
Life-Cycle Inventory Analysis of Laminated Veneer Lumber Production in the United States ............61
Dick Sandberg, Luleå University of Technology, Sweden
Modification, Product Properties, and Environmental Impacts in Thermal Wood Processing................71
Pablo Crespell, FPInnovations, Canada
Tall Buildings – An Approach to Modelling Economic, Carbon, and Employment Effects …………..82
Wood-based Green Fuels and Chemicals
Session Moderator: Patricia Townsend, Washington State University, USA
Kevin Zobrist, Washington State University, USA
Beyond Biofuels: Shifting from Hardwood-based Transportation Fuels to Biochemicals .....................84
Michel Delmas, University of Toulouse, France
Wood Residues as Feedstock for the 3G CIMV Biorefinery.................................................................85
Armando McDonald, University of Idaho, USA
Development of a New Nanocatalyst for Upgrading Wood Pyrolysis Bio-oil to Green Fuels ..............86
Reza Hosseinpour, Islamic Azad University, Iran
Hydrothermal Processing Effects on Bioethanol Production from Lignocellulosic Material..................87
Sun Joseph Chang, Louisiana State University, USA
An Economic Analysis of Bagasse as a Bio-fuel Feedstock ……………………………………………………88
Proceedings of the 58th International Convention of
Society of Wood Science and Technology
June 7-12, 2015 - Grand Teton National Park, Jackson, Wyoming, USA
3
Biomass Energy: Innovations, Economic Realities, and Public Perception
Session Moderator: Nikki Brown, Pennsylvania State University, USA
Omar Espinoza, University of Minnesota, USA
Overcoming Barriers to Biomass Cogeneration in the U.S. Wood Products Industry............................89
Jeremy Withers, Virginia Technological University, USA.........................................................97
Internal and External Barriers Impacting Non-food Lignocellulosic Biofuel Projects in the United States
Changlei Xia, University of North Texas, USA
Self-Activation Process for Biomass Based Activated Carbon ............................................................98
Robert Rice, University of Maine, USA
Loss-on-Ignition Testing of Wood Ash................................................................................................105
Annika Hyytiä, University of Helsinki, Finland
Sustainable Development – International Framework – Overview and Analysis in the Context of Forests
and Forest Products ............................................................................................................................. 106
Early Stage Researcher Full Oral Slot (8 minutes)
Session Moderators: David DeVallance, West Virginia University, USA and Tobias Keplinger, ETH
Zurich, Switzerland
Claire Monot, Grenoble INP-Pagora, France
Development of a Sulfur-free Delignification Process for Softwood Biorefineries .............................107
Lawrence Aguda, Forestry Research Institute of Nigeria, Nigeria
Effectiveness of Gliricidia Sepium Heart Wood Extractives as Preservative Against Termite Attack.116
Lufei Li, Beijing Forestry University, China
Activated Carbon Monolith Derived from Bio-char ............................................................................125
Mubarak Adesina, Idaho State University, USA
Reliability Analysis of Wood Floor Vibrations Considering Sheathing Discontinuities ........................126
Peter Kessels Dadzie, Kumasi Polytechnic, Ghana
Predicting Bending Properties of Stem and Branch Wood of a Tropical Hardwood Species from
Density and Moisture Content .............................................................................................................135
Thanh Huynh, Oregon State University, USA
Modern Building Systems’ 28’ x 64’ Modular Structure: SAP 2000 Wind Load Analysis
Oluwafemi Oluwadare, University of Ibadan, Nigeria
Potential of Seed Oil of Hildegardia Barteri (mast.) Kosterm for Biodiesel Production .....................145
Kojo Afrifah, Kwame Nkrumah University of Science and Technology, Ghana
Assessment of Factors Affecting the Quality of Sliced Veneer from Four Timber Species ................146
Jussi Ruponen, Aalto University, Finland
Moisture Stability of Post-manufacture Thermally Modified Welded Birch (Betula pendula L.)
Wood ...................................................................................................................................................155
Proceedings of the 58th International Convention of
Society of Wood Science and Technology
June 7-12, 2015 - Grand Teton National Park, Jackson, Wyoming, USA
4
Early Stage Researcher Full Oral Slot (8 minutes)
Session Moderators: Dick Sandberg, Luleå University of Technology, Sweden and Bonnie Yang,
Mississippi State University, USA
Massih Nilforoushan, University of Utah, USA
Dimensional Optimization of Beetle Kill Pine Interlocking Cross Laminated Timber (ICLT). ............156
Xuehua Wang, Nanjing Forestry University, China
Shearing Behavior of SIP Wall Shelled with Bamboo Scrimber Panel .............................................157
Richard Bergman, US Forest Products Laboratory, USA
Life-Cycle Inventory Analysis of I-joist Production in the United States ...........................................165
Paige McKinley, Oregon State University, USA
Multi-scale Investigation of Adhesive Bond Durability ......................................................................176
Jimmy Thomas, The Rubber Board, India
3D Visualisation of Spiral Grain and Compression Wood in Pinus Radiata with Fluorescence and Circular
Polarised Light Imaging ............................................................................................................................177
Patrick Dixon, Massachusetts Institute of Technology, USA
Micro-compression of Solid Bamboo Fibers ......................................................................................186
Payam Hooshmand, Sharif University of Technology, Iran
Energy Use and Sensitivity Analysis of Energy Inputs for Canola Production (Brassica napus L.)
in Iran .........................................................................................................................................................187
Johann Trischler, Linnæus University, Sweden
Particleboards Made out of Reed Canary Grass Glued with an Acrylic Adhesive ..............................188
Kunqian Zhang, University of British Columbia, Canada
Low Density Moso Bamboo Surface OSB ........................................................................................197
Early Stage Researcher Speed Slot (3 minutes)
Session Moderator: Michael Burnard, University of Primorska, Slovenia
Mesut Uysal, Purdue University, USA Determining Tension and Compression Strength and Basic Manufacturing Feasibility of CNC Router-
cut Joints ........................................................................................................................................ ....206
Zhengbin He, Beijing Forestry University, China
Heat and Mass Transfer during Ultrasound-Assisted Vacuum .............................................................207
Luyi Chen, University of Minnesota, USA
Comparative Life Cycle Analysis of Fossil and Bio-based PET Bottles ................................................218
Bonnie Yang, Mississippi State University, USA
Development of Industrial Laminated Bridge Planks from Southern Pine Lumber .............................228
Kyle Sullivan, Oregon State University, USA Effect of Cross-Laminated Timber Floor Deaphragm Orientation on Shear Stiffness and Strength ....229
Cagatay Tasdemir, Purdue University, USA
Trends in U.S. Furniture Trade ...........................................................................................................................230
Proceedings of the 58th International Convention of
Society of Wood Science and Technology
June 7-12, 2015 - Grand Teton National Park, Jackson, Wyoming, USA
5
Shupin Luo, Beijing Forestry University, China
Investigation of Lignin as Additive on the Properties of Wood Flour/Polypropylene Composites .....231
Zachary Miller, North Carolina State University, USA .................................................................240
Influence of Lignin Modification on Microfibril Angle in Young Transgenic Black Cottonwood Trees
Mesut Uysal, Purdue University, USA
Increasing Service Life of Wooden Chairs .........................................................................................241
Jaromir Milch, Mendel University in Brno, Czech Republic
Analysis of Mechanical Behavior of All-wooden Dowel Joint Using FEM and DIC ........................242
Hamed Olayiwola, University of Ibadan, Nigeria
Effects of Cement Strength Grade and Particle Content on the Compressive Strength of Bamboo-
cement Composites ............................................................................................................................. 250
Daniel Way, Oregon State University, USA
Manufacturing and Mechanical Characterization of a 3D Molded Core Strand Panel ..........................259
Jinxue Jiang, Washington State University, USA
Multi-technique Characterization of Douglas-fir Cell Wall Deconstruction during Mechanical Milling
Pretreatment ...............................................................................................................................................260
Adeyinka Adesope, University of Ibadan, Nigeria
Preparation of Strips from Bambusa Vulgaris Schrad Culms from Recycled Scaffold for Intermediate
Raw Materials Production ...................................................................................................................272
Kendall Conroy, Oregon State University, USA
Gender Diversity Impacts on Firm Performance in Forest Sector Firms .............................................281
Stephen Tekpetey, Forestry Research Institute of Ghana, Ghana .........................................282
Investigating the Surface Quality of Tropical Hardwood Species: A Case of Khaya ivorensis from Ghana
Poster Session
Session Moderator: Frederick Kamke, Oregon State University, USA
Kojo Afrifah, Kwame Nkrumah University of Science and Technology, Ghana
Alstonia boonei for Pulp and Paper Production ……………………………………………………………….283
Martin Brabec, Mendel University in Brno, Czech Republic
Identification of the “Non-standard” Deformation Behaviour of European Beech and Norway Spruce
during the Compression Loading ………………………………………………………………….......290
Nikki Brown, Pennsylvania State University, USA
Dynamic Mechanical Analysis of Different Wood Species ......................................................................300
Nikki Brown, Pennsylvania State University, USA
Fuel Bricks from Lignin and Coal Fines ……………………………………………………………..301
Daniel Burnett, Surface Measurement Systems, USA
Characterizing Restoration Materials for Historic Buildings Using the Dynamic Vapor Sorption
Technique ..................................................................................................................... ......................302
Kristian Bysheim, Norwegian Institute of Wood Technology, Norway
How Wood Influences Well-being in Indoor Environments: Building Materials, Well-being and
Perception of the Indoor Environment ………………………………………………………………...303
Proceedings of the 58th International Convention of
Society of Wood Science and Technology
June 7-12, 2015 - Grand Teton National Park, Jackson, Wyoming, USA
6
Zeki Candan, Istanbul University, Turkey
Anatomical Structures of Thermally Compressed Paulownia (Paulownia spp.) Wood ......................304
Zeki Candan, Istanbul University, Turkey
Dynamic Mechanical Thermal Analysis (DMTA) of Hybrid Biocomposites …………………………305
Zeki Candan, Istanbul University, Turkey
Thermal Conductivity of Structural Plywood Panels Affected by Some Manufacturing Parameters and
Aging Process ……………………………………………………………………………………….312
Hong Chen, Nanjing Forestry University, China
The Effect of Alkaline Treatment on Tensile Properties of Single Bamboo Fiber …………………...320
Terry Conners, University of Kentucky, USA
Restoring the Mayflower II ………………………………………………………………………….321
Peter Kessels Dadzie, Kumasi Polytechnic, Ghana
Furniture and Lumber Exports in Ghana: A Comparative Study of Some Market Trends …………….329
Wayan Darmawan, Bogor Agricultural University, Indonesia
Natural Weathering Performances of Outdoor Ultraviolet Finishing Systems on Tropical Fast Growing
Woods ................................................................................................................................................ 339
David DeVallance, West Virginia University, USA
Influence of Inherent Yellow-poplar Characteristics on Adhesion Properties Needed for Cross-laminated
Timber Panels ……………………………………………………………………………………………347
Tuncer Dilik, Istanbul University, Turkey
Global Trends in Furniture Production and Trade and the Turkish Furniture Industry.............................348
Arya Ebrahimpour, Idaho State University, USA
Serviceability Sensitivity Analysis of Wood Floors Using OpenSees ………………………………357
Emine Seda Erdinler, Istanbul University, Turkey
Impact-Deformation Relation of Surface Treated Wood Material ......................................................366
Omar Espinoza, Virginia Tech, USA
The U.S. Hardwood Supply Chain ……………………………………………………………………...374
Les Groom, USDA Forest Service Southern Station, USA
Effect of Silviculture on Loblolly Pine as Bioenergy Feedstock ........................................................375
Hongmei Gu, U.S. Forest Products Laboratory, USA
Life-cycle GHG Emissions of Electricity from Syngas Produced by Pyrolyzing Woody Biomass ....376
Andi Hermawan, Kyushu University, Japan
Viscoelastic Creep Behavior of Surface and Inner Layer of Sugi and Hinoki Boxed-heart Timber under
Various Temperatures ................................................................................................................................390
Olav Hoibo, Norwegian University of Life Sciences, Norway
Preferences for Materials in City Buildings: Does Region of Origin Matter? ……………………….399
Payam Hooshmand, Sharif University of Technology, Iran
Modeling and Design of a Disk-Type Furrow Opener’s Coulter (Its Mechanical Analysis and Study for
No-till Machinery) (Combination and Bertini) ...................................................................................400
Proceedings of the 58th International Convention of
Society of Wood Science and Technology
June 7-12, 2015 - Grand Teton National Park, Jackson, Wyoming, USA
7
Payam Hooshmand, Sharif University of Technology, Iran
Optimization of Energy Required and Energy Analysis for Rice Production Using Data Envelopment
Analysis Approach …………………………………………………………………………………...401
Thanh Huynh, Oregon State University, USA
Lateral Load Path Analysis: Practical Modeling Methods for Light-Frame Structures .......................402
Tobias Keplinger, ETH Zurich, Switzerland
Versatile Strategies for the Modification and Functionalization of the Wood Structure ……………..403
Namhun Kim, Kangwon National University, Korea
Natural Durability of Yellow-hearted Red Pine (Hwangjangmok) ………………………………......404
Kucuk Huseyin Koc, Istanbul University, Turkey
Effect of CNC Application Parameters on Wooden Surface Quality .................................................410
Andreja Kutnar, University of Primorska, Slovenia
COST Action FP1407 - Understanding Wood Modification through an Integrated Scientific and
Environmental Impact Approach ........................................................................................................418
Andreja Kutnar, University of Primorska, Slovenia Sustainability, Environmental Impact and LCA in Build Environment in Slovenia and Sweden ….....426 Andreja Kutnar, University of Primorska, Slovenia Sustainable Built Environment in Canada and Europe ……………………………………………………427 Clevan Lamason, University of New Brunswick, Canada Examination of Water Phase Transitions in Black Spruce by Magnetic Resonance and Magnetic Resonance Imaging …………………………………………………………………………………….428
Bruce Lippke, University of Washington, USA
Carbon Policy Failures and the Opportunity for Better Uses of Wood ..................................................429
Joseph Loferski, Virginia Tech, USA Investigation of Hardwood Cross-laminated Timber Design …………………………………………..431 Jing Luo, Beijing Forestry University, China Cellulose Nano-whiskers Dispersing Performance in Non-polar Materials .............................................432
Byrne Miyamoto, Oregon State University, USA Durability Assessment of Bamboo Slats ……………………………………………………………….433
Jun Mu, Beijing Forestry University, China
The Effect of Urea-formaldehyde Resin Adhesive on the Pyrolysis Mechanism of Poplar Particleboard
with DAEM ........................................................................................................................................434
Lech Muszynski, Oregon State University, USA CLT Served Any Way You Want It: An Overview of 19 Plants Toured in 2012-2014 ……………………443
Dodi Nandika, Bogor Agricultural University, Indonesia
Characteristics of Densified Sengon Wood (Paraserianthes falcataria (L) Nielsen) by Compregnation
Process ………………………………………………………………………………………………444 Robert Okwori, Federal University of Technology, Nigeria Local Production of Particle Board Using Ficus (SPP) Wood and Epoxy Resin Adhesive ………..445
Gladys Quartey, Takoradi Polytechnic, Ghana
The Relationship between Fibre Characteristics and Strength Properties of Three Lesser Utilized
Ghanaian Hardwood Species ..............................................................................................................455
Proceedings of the 58th International Convention of
Society of Wood Science and Technology
June 7-12, 2015 - Grand Teton National Park, Jackson, Wyoming, USA
8
Henry Quesada-Pineda, Virginia Tech, USA Assessing Geographic Information Systems (GIS) Use in Marketing Applications: A Case of Study in the Wood Products Industry ……………………………………………………………………….456
Tobias Schauerte, Linnaeus University, Sweden
Firm Performance in the Swedish Industry for Off-Site Produced Wooden Single-Family Houses ...457
Tobias Schauerte, Linnaeus University, Sweden From Single-Family Houses to Multi-Family Houses – Resistance to Change and Perceived Hinders.458
Tobias Schauerte, Linnaeus University, Sweden
Owning or Renting? Investigating Consumer Perceptions on Different Apartment Types in Wooden
Multistory Houses in Sweden .............................................................................................................459
Katherine Semple, University of British Columbia, Canada
Hybrid Oriented Strand Boards made from Moso Bamboo (Phyllostachys pubescens Mazel) and Aspen
(Populus tremuloides Michx.): Bamboo Surfaces, Aspen Core ……………………………………...460
Shasha Song, Beijing Forestry University, China
Effects of Different Types of Housing Environment on Physiological Response ................................471
Stephen Tekpetey, Forestry Research Institute of Ghana, Ghana
Bamboo for Furniture and Housing in Ghana: The Certification and Standard Issues …………………472
Patricia Townsend, Washington State University, USA
Identifying Stakeholder Interests and Concerns in the New Hardwood-based Bioeconomy................473
Johann Trischler, Linnaeus University, Sweden
Impacts on the Wood Properties under Changing Conditions of Environment and Industry ………...474
Mesut Uysal, Purdue University, USA
Comparing Load Caring Capacity of Different Joinery Systems for Remanufacturing of Wooden
Furniture and Recycling its Parts ........................................................................................................482
Mesut Uysal, Purdue University, USA
Manufacturing Feasibility and Load Caring Capacity of CNC-Joinery Systems …………………….483
Hui Wan, Mississippi State University, USA
Impact of Different Recycling Methods on Reconstituted Panel Performance ...................................484
Guizhou Wang, North Carolina State University, USA
Compressive Failure Characterization of Embossed and TAD Features in Paper Towel ……………..485
Jingxin Wang, West Virginia University, USA
Effects of Densification on Sugar Extraction from Woody Biomass ..................................................486
Junming Xu, Chinese Academy of Forestry, China
Fractionation of the Liquefied Lignocellulosic Biomass for the Production of Platform Chemicals …487
Songlin Yi, Beijing Forestry University, China .............................................................................................488
Effects of Frequency and Processing Time on the Drying of Ultrasound-Assisted Impregnated Wood
Lili Yu, International Centre for Bamboo and Rattan, China
Effects of Boron-Containing Flame Retardants on the Flame Resistance of Bamboo Filament ……..494
Derong Zhang, Beijing Forestry University, China
Effect on Wood Mechanical Characteristics of Chinese Fir with High Temperature Drying Process ..503
Proceedings of the 58th International Convention of
Society of Wood Science and Technology
June 7-12, 2015 - Grand Teton National Park, Jackson, Wyoming, USA
9
Student Poster Competition
Session Moderator: Frederick Kamke, Oregon State University, USA
Adeyinka Adesope, University of Ibadan, Nigeria
Preparation of Strips from Bambusa Vulgaris Schrad Culms from Recycled Scaffold for Intermediate
Raw Materials Production ..................................................................................................................508
Lawrence Aguda, Forestry Reserach Institute of Nigeria, Nigeria
Effectiveness of Gliricidia Sepium Heart Wood Extractives as Preservative against Termite Attack..510
Luyi Chen, University of Minnesota, USA
Comparative Life Cycle Analysis of Fossil and Bio-based PET Bottles ……………………………511
Kendall Conroy, Oregon State University, USA
Gender Diversity Impacts on Firm Performance in Forest Sector Firms .............................................512
Charles Edmunds, North Carolina State University, USA
Fungal Pretreatment Method Optimization for Small Wood Samples Degraded by Ceriporiopsis
Subvermispora ………………………………………………………………………………………………….513
Changle Jiang, West Virginia University, USA
Synthesis of TEMPO Cellulose Nanofibrils stabilized Copper Nanoparticles and its Release from
Antimicrobial Polyvinyl Alcohol Film ...............................................................................................514
Jinxue Jiang, Washington State University, USA
Multi-technique Characterization of Douglas-fir Cell Wall Deconstruction during Mechanical Milling
Pretreatment ……………………………………………………………………………………………515
Arif Caglar Konukcu, Mississippi State University, USA
Optimization Study on Yield of CNC Cutting Wood-based Composite Panels for Upholstery Furniture
Frames ................................................................................................................................................516
Clevan Lamason, University of New Brunswick, Canada
Water States in Black Spruce and Aspen during Drying Studied by Time-Domain Magnetic Resonance
Devices ………………………………………………………………………………………………….517
Luyi Li, University of Washington, USA
The Effects of Soil Parent Material and Nitrogen Fertilization on Tree Growth and Wood Quality of
Douglas-fir in the Pacific Northwest ..................................................................................................518
Paige McKinley, Oregon State University, USA
Multi-scale Investigation of Adhesive Bond Durability ……………………………………………...527
Massih Nilforoushan, University of Utah, USA Dimensional Optimization of Beetle Kill Pine Interlocking Cross Laminated Timber (ICLT) ............528
Hamed Olayiwola, University of Ibadan, Nigeria
Effects of Cement Strength Grade and Particle Content on the Compressive Strength of Bamboo-cement
Composites ……………………………………………………………………………………………...529
Jussi Ruponen, Aalto University, Finland ………………………………………………………………….531
Moisture Stability of Post-manufacture Thermally Modified Welded Birch (Betula pendula L.) Wood
Kyle Sullivan, Oregon State University, USA
Effect of Cross-laminated Timber Floor Deaphragm Orientation on Shear Stiffness and Strength …..532
Proceedings of the 58th International Convention of
Society of Wood Science and Technology
June 7-12, 2015 - Grand Teton National Park, Jackson, Wyoming, USA
10
Cagatay Tasdemir, Purdue University, USA
Current Trends in Furniture Trade ......................................................................................................................533
Daniel Way, Oregon State University, USA
Manufacturing and Mechanical Characterization of a 3D Molded Core Strand Panel ………………...534
Changlei Xia, University of North Texas, USA
Self-Activation Process for Biomass Based Activated Carbon ..........................................................535
Tuhua Zhong, West Virginia University, USA
Hybrids of TEMPO Nanofibrillated Cellulose and Copper Nanoparticles Embedded in Polyvinyl
Alcohol Films for Antimicrobial Applications …………………………………………………………536
Nano to Macro Scale Wooden Composites
Session Moderator: Levente Dénes, University of West Hungary, Hungary
Armando McDonald, University of Idaho, USA
Grafted a-cellulose - poly(3-hydroxybutyrate-co-3-hydroxyvalerate) Biocomposites ......................537
Changle Jiang, West Virginia University, USA
Synthesis of TEMPO Cellulose Nanofibrils Stabilized Copper Nanoparticles and its Release from
Antimicrobial Polyvinyl Alcohol Film................................................................................................538
Levente Dénes, University of West Hungary, Hungary
Hierarchical PLA Structures Used for Wooden Sandwich Panel’s Core Fortification .......................544
Todd Shupe, Louisiana State University, USA
Development of Wood Fiber-Polypropylene Laminates with Layer-By-Layer Assembly of Kraft Pulp
Hand-Sheets and Polypropylene Films ...............................................................................................545
Blake Larkin, Oregon State University, USA
Effective Adhesive Systems and Optimal Bonding Parameters for Hybrid CLT …………………….546
Nano to Macro Scale Wooden Composites
Session Moderator: Levente Dénes, University of West Hungary, Hungary
Frederick Kamke, Oregon State University, USA
Micro X-Ray Computed Tomography Study of Adhesive Bonds in Wood ..........................................547
Bryan Dick, North Carolina State University, USA
Continued Research into Fire Performance of Varying Adhesives in CLT Panels Constructed from
Southern Yellow Pine .........................................................................................................................548
Pamela Rebolledo-Valenzuela, Université Laval, Canada
Gas Permeability and Porosity of Fiberboard Mats as a Function of Density .....................................549
Min Niu, Fujian Agriculture and Forestry University, China
Pyrolysis of Si-Al Compounds and Plant Fiber in Burned Ultra-low Density Fiberboard ..................558
Xiaomei Liu, Mississippi State University, USA
Characterization of Polymerization of Isocyanate Resin and Phenolic Resins of Different Molecular
Weights. Part I: Morphology and Structure Analysis ..........................................................................567
Timber Physics from 1 µm to 10 µm
Session Moderator: Samuel Zelinka, US Forest Products Laboratory, USA
Proceedings of the 58th International Convention of
Society of Wood Science and Technology
June 7-12, 2015 - Grand Teton National Park, Jackson, Wyoming, USA
11
Samuel Zelinka, US Forest Products Laboratory, USA
Subcellular Electrical Measurements as a Function of Wood Moisture Content ....................................568
Oliver Vay, Wood K Plus, Austria
Thermal Conduction Behavior of Wood at Macroscopic and at Cell Wall Level ...............................577
Hong-jian Zhang, Southwest Forestry University, China
Mechanism and Regularity of Bending Creep Behavior of Solid Wood Beam in Varying Humidity..587
Guizhou Wang, North Carolina State University, USA
Moisture and Heat Transfer in Cross Laminated Timber .........................................................................597
Petr Cermak, Mendel University in Brno, Czech Republic ...................................................598
Analysis of Dimensional Stability of Thermally Modified Wood Affected by Wetting-Drying Cycles
Novel Techniques for a New Era of Wood Construction
Session Moderator: Arijit Sinha, Oregon State University, USA
Jerome Johnson, University of Wisconsin-Stout, USA
Analysis and Development of Green Roof Structures .........................................................................607
Robert M. Knudson, FPInnovations, C a n a d a
Wood Solutions to Satisfy Energy Codes in Building Construction ...................................................617
Zahra Ghorbani, University of Utah, USA
Easy Assembly Systems: Integration of Post-Tensioned Heavy Timber and Smart Architecture in
Construction Practices ........................................................................................................................618
Arijit Sinha, Oregon State University, USA
Design and Performance of Steel Energy Dissipators to be Used in Cross-Laminated Timber Self-
Centering Systems ............................................................................................................................. .628
Kristopher Walker, Oregon State University, USA
Use of Virtual Visual Sensors in Obtaining Natural Frequencies of Timber Structures .......................629
Treatments and Durability
Session Moderator: Dodi Nandika, Bogor Agricultural University, Indonesia
Paul Frederik Laleicke, Oregon State University, USA
Non-Destructive Detection and Monitoring of Durability Issues in Full-Scale Wall Envelopes under
Accelerated Weathering ......................................................................................................................630
David Bueche, Hoover Treated Wood Products, USA
What is Fire-Retardant-Treated Wood? .............................................................................................631
Charles Edmunds, North Carolina State University, USA
Fungal Pretreatment of Genetically Modified Black Cottonwood - Merging Novel Low-input Fungal
Pretreatment with Next-generation Lignocellulosic Feedstocks .........................................................640
Roger Rowell, University of Wisconsin, USA ..........................................................................641
Understanding Decay Resistance, Dimensional Stability and Strength Changes in Acetylated Wood
H. Michael Barnes, Mississippi State University, USA
Effect of Preservative Treatment on I-joist Bending Stiffness ………………………………………652
Proceedings of the 58th International Convention of
Society of Wood Science and Technology
June 7-12, 2015 - Grand Teton National Park, Jackson, Wyoming, USA
12
Wood Quality and Improvement
Session Moderator: Wayan Darmawan, Bogor Agricultural University, Indonesia
Qi-Lan Fu, Université Laval, Canada
Optimization of Thermo-hygromechanical Densification Process of Sugar Maple Wood ....................653
Per Otto Flæte, Norwegian Institute of Wood Technology, Norway
Non-destructive Pre-harvest Measurement of Diameter Profiles of Standing Mature Pine Trees by
Terrestrial Laser Scanning (TLS) .......................................................................................................662
Brian Bond, Virginia Tech
USA Properties of Plantation Grown KOA …………………………………………………………………...668
Wayan Darmawan, Bogor Agricultural University, Indonesia
Wear Characteristics of Multilayer Coated Cutting Tools in Milling Wood and Wood-Based
Composites ............................................................................................................................. ............669
Victor Grubii, Luleå Tekniska Universitet, Sweden
Influence of Wetting Processes on Surface Quality during Scots Pine Planing ……………………...678
Fiber Properties Chain: From Cell Wall to End Products
Session Moderator: Jean-Michel Leban, INRA, France
Jean-Michel Leban, INRA, France
Assessing Timber MOE&MOR in the Forest Resources: What we have learned during the Last Twenty
Years ...............................................................................................................................................................687
Patrick Dixon, Massachusetts Institute of Technology, USA
Bending Properties of Clear Bamboo Culm Material from Three Species ..........................................688
Milan Sernek, University of Ljubljana, Slovenia
Tannin-based Foams from the Bark of Coniferous Species ................................................................. 689
Dietrich Buck, Luleå University of Technology, Sweden
Comparison of Cost, Sustainabi cology for Different Solid Wood Panel.............................................690
Zachary Miller, North Carolina State University, USA
Anatomical, Physical and Mechanical Properties of Transgenic Loblolly Pine ……………………...691
Tuhua Zhong, West Virginia University, USA
Hybrids of TEMPO Nanofibrillated Cellulose and Copper Nanoparticles Embedded in Polyvinyl
Alcohol Films for Antimicrobial Applications ....................................................................................692
Bonnie Yang, Mississippi State University, USA
Comparison of Nondestructive Testing Methods for Evaluating No.2 Southern Pine Lumber: Bending
Stiffness ............................................................................................................................. .................699
Bambang Suryoatmono, Parahyangan Catholic University, Indonesia
Distortion Energy Criterion for Estimating Dowel Bearing Strength of Timber Member Loaded at
Angle ............................................................................................................................. .....................700
Kate Semple, University of British Columbia, Canada
Comparison of Stranding and Strand Quality of Two Giant Timber Bamboo Species; Moso (Phyllostachys
pubescens Mazel) and Guadua (Guadua angustifolia Kunth) Using a CAE 6/36 Disk Flaker …………..708
Proceedings of the 58th International Convention of
Society of Wood Science and Technology
June 7-12, 2015 - Grand Teton National Park, Jackson, Wyoming, USA
13
Justin Crouse, University of Maine, USA ......................................................................................718
Temperature and Humidity Dependent Mechanical Performance of Nanocellulose and its Composites
IUFRO 5.10 Forest Products and Communities
Session Moderator: Rajat Panwar, University of British Columbia, Canada
Rajat Panwar, University of British Columbia, Canada
Business Management Research in the Forestry Sector: Past, Present and Future Directions ..............719
Anne Toppinen, University of Helsinki, Finland
Challenges in Communicating Forest Industry Sustainability to the General Public: Results from a Four-
country Comparison in Europe ............................................................................................................720
Jianping Sun, Guangxi University, China
Study on 1/f Features of Wood Texture Changes Based on Spectrum Analysis....................................728
Matti Stendahl, Swedish University of Agricultural Sciences, Sweden
Operations Management, Cooperation and Negotiation in the Wood Supply Chain – The Relationship
Between Sawmills and Sawlog Suppliers ...........................................................................................729
E. M. (Ted) Bilek, USDA Forest Products Laboratory, USA
Nanocellulose Market Volume Projections: A Derived Demand Analysis …………………………..730
Henry Quesada-Pineda, Virginia Tech, USA
A Demand-pricing Management Approach to Add Value in the U.S. Hardwood Industry ..................731
Kristian Bysheim, Norwegian Institute of Wood Technology, Norway
Comparing Health, Emotional Well-being and Indoor Environment in Solid Wood and Brick Built
Student Housing ..................................................................................................................................732
Magnus Larsson, Swedish University of Agricultural Sciences, Sweden
Mapping of Wood Supply Chains, a Case Study .....................................................................................733
Michael Burnard, University of Primorska, Slovenia
Comparative Analysis of European Forest Sector Production 2008–2013 ...........................................734
Eini Lowell, Pacific Northwest Research Station, USA
Market Appeal of Hawaiian Koa Wood Product Characteristics: A Consumer Preference Study …..743
Jaana Korhonen, University of Helsinki, Finland
To Own Forest or Not? Vertical Integration in Pulp and Paper Sector ................................................752
Liina Häyrinen, University of Helsinki, Finland
Exploring the Future Use of Forests in Finland: Perspectives from Sustainability Oriented Forest
Owners ............................................................................................................................. ...................753
Ed Pepke, Dovetail Partners, France
Impacts of Policies to Eliminate Illegal Timber Trade ...............................................................................754
Tobias Schauerte, Linnaeus University, Sweden
Lean Thinking for Improving the Production and Material Flow: Increasing the Capacity and
Profitability of a Swedish Wooden Single-Family House Producer ...................................................775
Wei-Yew Chang, University of British Columbia, Canada
Matching Market Signals to the Canadian Wood Products Value Chain: A Disaggregated Trade Flow
Analysis ............................................................................................................................. .................784
Proceedings of the 58th International Convention of
Society of Wood Science and Technology
June 7-12, 2015 - Grand Teton National Park, Jackson, Wyoming, USA
14
David DeVallance, West Virginia University, USA
Hotspot Markets and Specifier Perception for Wood-Based Materials in Appalachian LEED Building
Projects ...............................................................................................................................................785
Iris Montague, USDA Forest Service, USA ...................................................................................786
The Forest Products in a Digital Age: The Use and Effectiveness of Social Media as a Marketing Tool
Manja Kitek Kuzman, University of Ljubljana, Slovenia
Demographic Changes and Challenges in the Woodworking Industry .....................................................787
Arsenio Ella, Forest Products Research and Development Institute,
Philippines
Almaciga Resin and Wild Honey the Backbone of Indigenous Peoples in Palawan,
the Philippines ....................................................................................................................................788

Proceedings of the 58th International Convention of
Society of Wood Science and Technology
June 7-12, 2015 - Grand Teton National Park, Jackson, Wyoming, USA
15
Biomass Chemistry for a Greener Environment Session Moderator: Elisha Ncube, Copperbelt University, Zambia
Improving Water Resistance of Soybean Meal-Based
Adhesive by a Polyepoxide and Post Heat Treated Process
Jing Luo, Qiang Gao*, Jianzhang Li*
MOE Key Laboratory of Wooden Material Science and Application, Beijing
Key Laboratory of Lignocellulosic Chemistry, MOE Engineering Research
Centre of Forestry Biomass Materials and Bioenergy, Beijing Forestry
University, Beijing, China
Contact information: MOE Key Laboratory of Wooden Material Science and
Application, Beijing Forestry University, Beijing 100083, China.
[email protected], +8615510155899
*Corresponding author: [email protected], +8601062336912,
[email protected], +8601062338083
Abstract
The aim of this study was to improve the water resistance of the soybean meal-based bio-
adhesive with a 5, 5 dimethyl hydantoin polyepoxide (DMHP). The DMHP could react with
active groups on protein molecule to form a cross-linking network, which improved the water
resistance of the resulting adhesive. In addition, adding DMHP increased wettability of the
adhesive, improved the cross-linking degree of the cured adhesive, and created a smooth
surface with less holes and cracks to prevent moisture intruding, which further enhanced the
water resistance of the adhesive. Incorporating 13 wt% DMHP effectively improved the
water resistance of the adhesive by 182.9% to 1.16 MPa, which met interior use plywood
requirement. At the same time we examined the effects of four different heat treatment
processes on plywood bonded with the adhesive. The surface and core layer wet shear
strength improved by 56.3% and 102.3%, respectively, with 4 min low pressure heat
treatment. Heat treatment could also improve the water resistance of the adhesive by
improving the cross-linking density of the adhesive layer in plywood and releasing its interior
force, according to a vertical density profile analysis. Therefore, 8 h oven drying heat
treatment at 120°C, the surface and core layer wet shear strength improved by 60.0% and
175.0%, respectively.
Keywords: Soybean meal-based bio-adhesive; 5, 5 dimethyl hydantoin polyepoxide;
Plywood; Water resistance; Heat treatment
Proceedings of the 58th International Convention of
Society of Wood Science and Technology
June 7-12, 2015 - Grand Teton National Park, Jackson, Wyoming, USA
16
1. Introduction
With the increasing concerns over environmental threats and sustainable development,
deployment of biodegradable and renewable biomass for the production of wood adhesives is
not only inevitable but also responsive to suppressing the impact caused by formaldehyde-
based adhesives (Sellers, 2001). Soy protein has been used as a wood adhesive for centuries
because of its low cost and environmental friendliness (Kumar et al., 2002). However, soy
protein-based bio-adhesives have disadvantages which limited their application, i.e., low
bond strength and poor water resistance (Orr, 2007). Therefore, there is an urgent need to
improve the water resistance of soy protein-based adhesive.
2. Materials and Methods
2.1 Materials
Soybean meal was obtained from Xiangchi Grain and Oil Company in Shandong Province of
China, and then milled to 250 mesh flour (SM). Components of the soybean meal flour were
tested as follows: 46.8% soy protein, 5.86% moisture, 6.46% ash, and 0.56% fat.
Polyacrylamide (PAM), sodium dodecyl sulfate (SDS), epichlorohydrin (ECH), sodium
hydroxide (NaOH) were obtained from Tianjin Chemical Reagent Co.. The 5, 5 dimethyl
hydantoin (DMH) was obtain from Tianjin institute of synthetic materials industry. Poplar
veneer (40 × 40 × 1.5 cm, 8% of moisture content) was provided from Hebei Province of
China.
2.2 Preparation of the different adhesives
For the SM adhesive, soybean meal flour (28 g) was added into deionized water (72 g) and
stirred for 10 min at 20 oC.
For the SM/PAM adhesive, soybean meal flour (28 g) was added to a polyacrylamide
solution (72 g, 0.01%) and stirred for 10 min at 20 oC.
For the SM/PAM/SDS adhesive, sodium dodecyl Sulfate (1 g) was added into the SM/PAM
adhesive and further stirred for 10 min at 20 oC.
For the SM/PAM/SDS/DMHP adhesive, various amounts of the DMHP were added to the
SM/PAM/SDS adhesive and further stirred for 10 min at 20 oC. Additions of the DMHP were
5%, 9%, 13%, 17%, respectively.
2.3 Preparation of the plywood sample
Three-ply plywood samples were prepared under the following conditions: 180 g/m2 glue
spreading for a single surface, 70 s/mm hot pressing time, 120 °C hot pressing temperature,
and 1.0 MPa hot pressing pressure (Luo et al., 2014). After hot pressing, the plywood
samples were stored under ambient conditions for at least 12 h before testing.
Proceedings of the 58th International Convention of
Society of Wood Science and Technology
June 7-12, 2015 - Grand Teton National Park, Jackson, Wyoming, USA
17
Five-ply plywood samples were made under the following conditions: 180 g/m2 glue
spreading for a single surface, 120°C hot pressing temperature, and 1.0 MPa hot pressing
pressure. After hot pressing, the plywood samples were stored under ambient conditions for 8
h before testing.
2.4 Heat treatment
HT2: After hot pressing at 60 s/mm hot press time with 1.0 MPa pressure, then the pressure
decreased to 0.1-0.2 MPa and kept for 2, 4, 6, 8, and 10 min, respectively. The hot press and
heat treatment process were finished in one time press.
HT4: After hot pressing for 60 s/mm hot press time, the five-ply plywood was taken out and
placed in an oven at 120°C for 4, 8, 12, 16, and 20 h, respectively.
3. Results and Discussion
3.1. Water resistance measurement
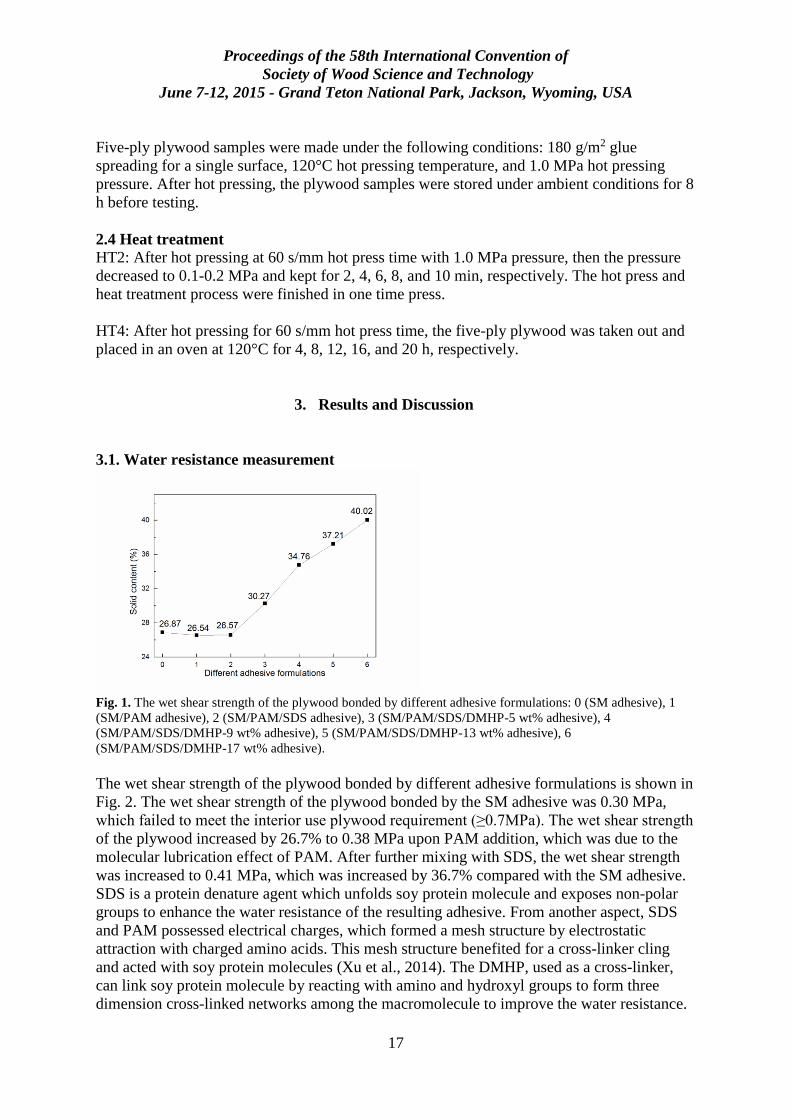
Fig. 1. The wet shear strength of the plywood bonded by different adhesive formulations: 0 (SM adhesive), 1
(SM/PAM adhesive), 2 (SM/PAM/SDS adhesive), 3 (SM/PAM/SDS/DMHP-5 wt% adhesive), 4
(SM/PAM/SDS/DMHP-9 wt% adhesive), 5 (SM/PAM/SDS/DMHP-13 wt% adhesive), 6
(SM/PAM/SDS/DMHP-17 wt% adhesive).
The wet shear strength of the plywood bonded by different adhesive formulations is shown in
Fig. 2. The wet shear strength of the plywood bonded by the SM adhesive was 0.30 MPa,
which failed to meet the interior use plywood requirement (≥0.7MPa). The wet shear strength
of the plywood increased by 26.7% to 0.38 MPa upon PAM addition, which was due to the
molecular lubrication effect of PAM. After further mixing with SDS, the wet shear strength
was increased to 0.41 MPa, which was increased by 36.7% compared with the SM adhesive.
SDS is a protein denature agent which unfolds soy protein molecule and exposes non-polar
groups to enhance the water resistance of the resulting adhesive. From another aspect, SDS
and PAM possessed electrical charges, which formed a mesh structure by electrostatic
attraction with charged amino acids. This mesh structure benefited for a cross-linker cling
and acted with soy protein molecules (Xu et al., 2014). The DMHP, used as a cross-linker,
can link soy protein molecule by reacting with amino and hydroxyl groups to form three
dimension cross-linked networks among the macromolecule to improve the water resistance.
Proceedings of the 58th International Convention of
Society of Wood Science and Technology
June 7-12, 2015 - Grand Teton National Park, Jackson, Wyoming, USA
18
The wet shear strength increased significantly upon 5 wt% DMHP additions, which was
increased by 56.1% to 0.64 MPa compared with the SM/PAM/SDS adhesive. The wet shear
strength of the plywood with addition of 9 wt% DMHP was 0.76MPa, which met the interior
use panel requirement. However, from the standard deviation at formulation 4, the wet shear
strength of the plywood specimens cannot be guaranteed over 0.70 MPa. As shown in Fig. 3,
the wet shear strength of the plywood bonded with the adhesive upon 13 wt% DMHP
additions increased by 52.6% and reached a maximum value of 1.16 MPa. By increasing the
DMHP content to 17 wt%, the bond strength decreased to 0.69 MPa and could not meet the
interior use plywood requirement (0.7 MPa). This was probably due to the over-low physical
viscosity, which resulted in the adhesive over penetrating into the veneer. Therefore, based
the above discussing, the optimum addition of the DMHP was selected at 13 wt% and the
resulting adhesive was further characterized.
3.2. FTIR spectroscopic analysis
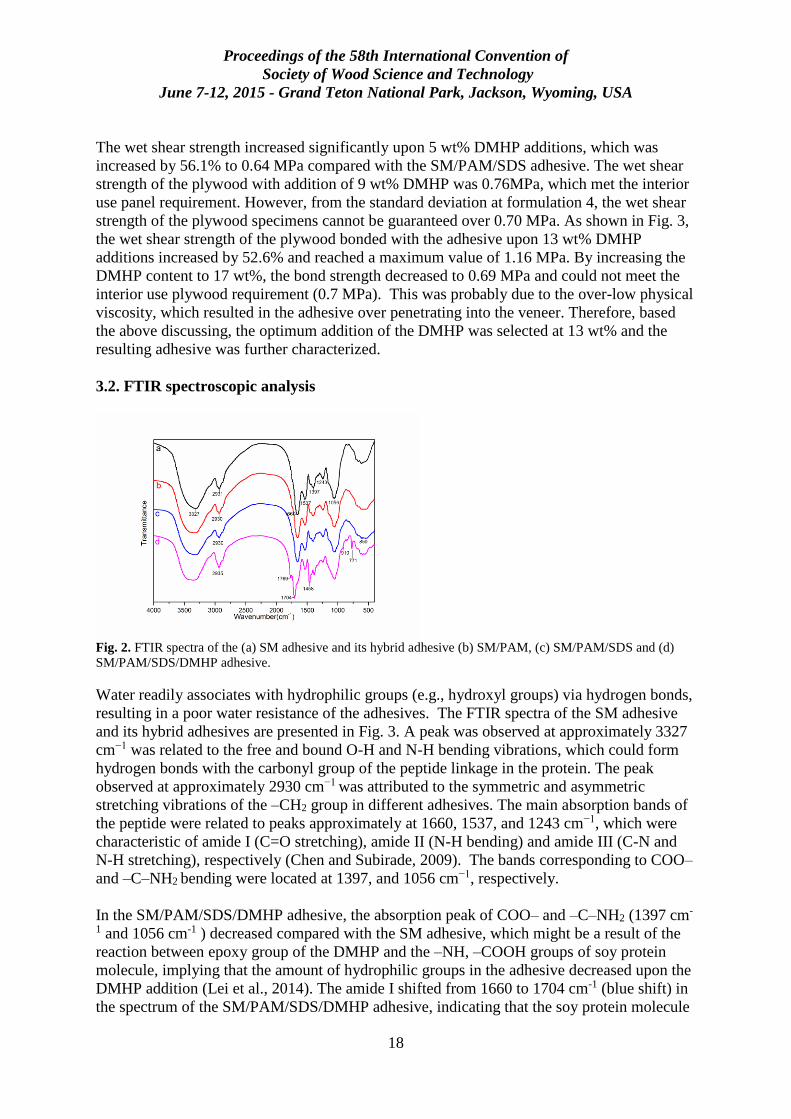
Fig. 2. FTIR spectra of the (a) SM adhesive and its hybrid adhesive (b) SM/PAM, (c) SM/PAM/SDS and (d)
SM/PAM/SDS/DMHP adhesive.
Water readily associates with hydrophilic groups (e.g., hydroxyl groups) via hydrogen bonds,
resulting in a poor water resistance of the adhesives. The FTIR spectra of the SM adhesive
and its hybrid adhesives are presented in Fig. 3. A peak was observed at approximately 3327
cm−1 was related to the free and bound O-H and N-H bending vibrations, which could form
hydrogen bonds with the carbonyl group of the peptide linkage in the protein. The peak
observed at approximately 2930 cm−1 was attributed to the symmetric and asymmetric
stretching vibrations of the –CH2 group in different adhesives. The main absorption bands of
the peptide were related to peaks approximately at 1660, 1537, and 1243 cm−1, which were
characteristic of amide I (C=O stretching), amide II (N-H bending) and amide III (C-N and
N-H stretching), respectively (Chen and Subirade, 2009). The bands corresponding to COO–
and –C–NH2 bending were located at 1397, and 1056 cm−1, respectively.
In the SM/PAM/SDS/DMHP adhesive, the absorption peak of COO– and –C–NH2 (1397 cm-
1 and 1056 cm-1 ) decreased compared with the SM adhesive, which might be a result of the
reaction between epoxy group of the DMHP and the –NH, –COOH groups of soy protein
molecule, implying that the amount of hydrophilic groups in the adhesive decreased upon the
DMHP addition (Lei et al., 2014). The amide I shifted from 1660 to 1704 cm-1 (blue shift) in
the spectrum of the SM/PAM/SDS/DMHP adhesive, indicating that the soy protein molecule
Proceedings of the 58th International Convention of
Society of Wood Science and Technology
June 7-12, 2015 - Grand Teton National Park, Jackson, Wyoming, USA
19
had less random loose state in the SM/PAM/SDS/DMHP adhesive than that in the SM
adhesive. A new peak appeared at 1769 cm-1, which attributed to the stretching vibrations of
the ester carbonyl bond. This band indicated that the formation of the ester linkage between
the epoxy group and the hydroxyl group of soy protein (Schramm and Rinderer, 2006). The
absorption peak at 910 cm-1 was assigned to the free epoxy group skeleton vibration (Yu,
1988). After incorporated the DMHP, there would be a strong absorption peak at 910 cm-1.
But in the Fig. 3, it exhibited a minor one (910 cm-1) and even became neglectable in the
spectrum of the SM/PAM/SDS/DMHP adhesive formulation, indicating that epoxy group of
the resin reacted with active hydrogen on –OH and –NH2 groups in the protein molecules
during the curing process by a ring-opening reaction (Park et al., 2013). In addition, the peak
at 910 cm-1 also showed the good dispersibility of the DMHP in a water soluble adhesive
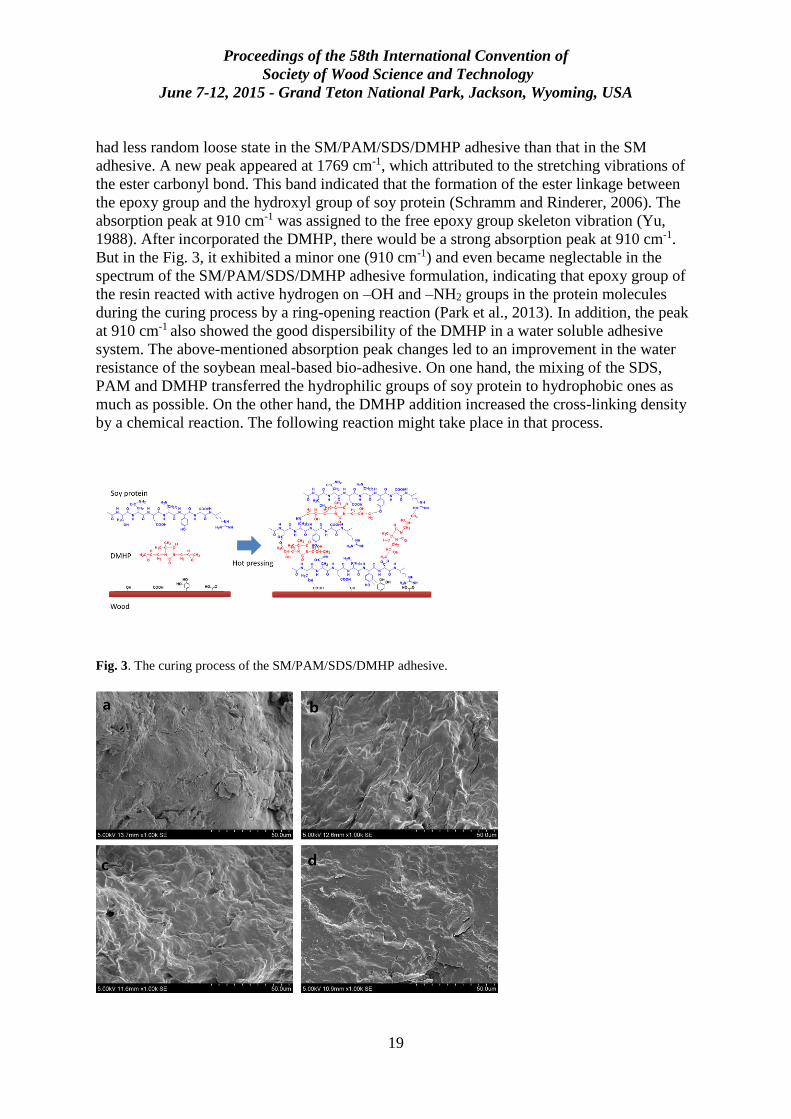
system. The above-mentioned absorption peak changes led to an improvement in the water
resistance of the soybean meal-based bio-adhesive. On one hand, the mixing of the SDS,
PAM and DMHP transferred the hydrophilic groups of soy protein to hydrophobic ones as
much as possible. On the other hand, the DMHP addition increased the cross-linking density
by a chemical reaction. The following reaction might take place in that process.
Fig. 3. The curing process of the SM/PAM/SDS/DMHP adhesive.
Proceedings of the 58th International Convention of
Society of Wood Science and Technology
June 7-12, 2015 - Grand Teton National Park, Jackson, Wyoming, USA
20
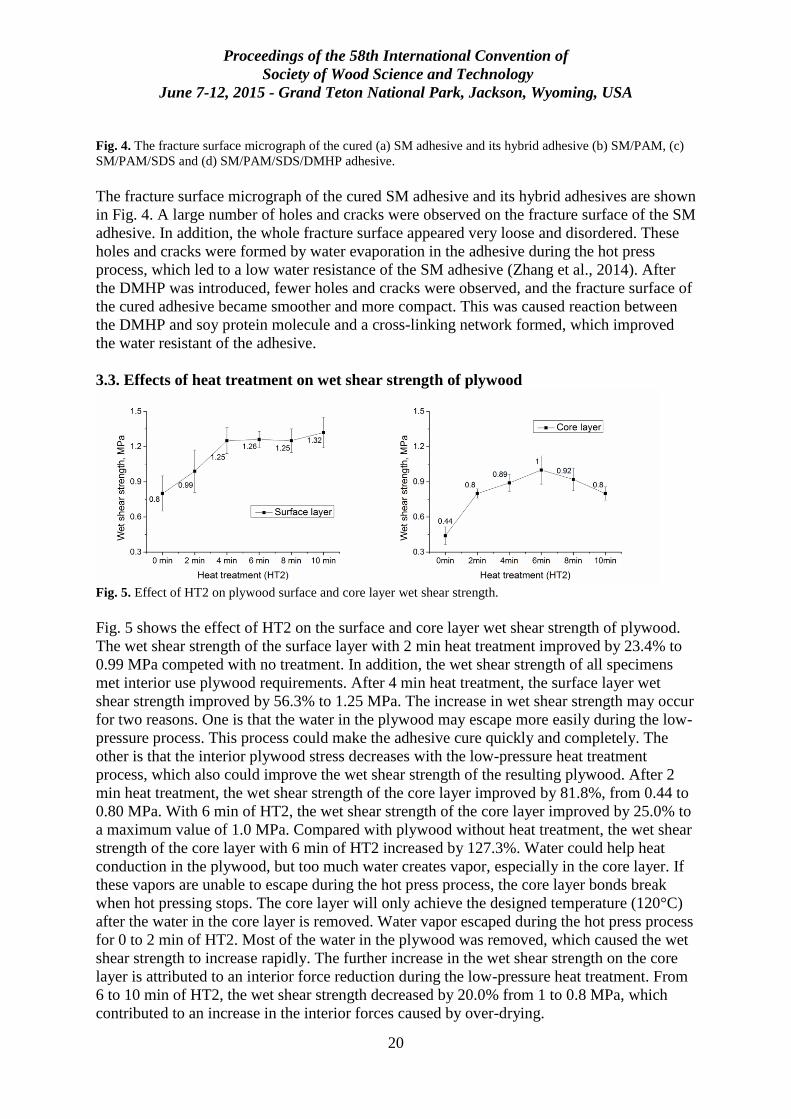
Fig. 4. The fracture surface micrograph of the cured (a) SM adhesive and its hybrid adhesive (b) SM/PAM, (c)
SM/PAM/SDS and (d) SM/PAM/SDS/DMHP adhesive.
The fracture surface micrograph of the cured SM adhesive and its hybrid adhesives are shown
in Fig. 4. A large number of holes and cracks were observed on the fracture surface of the SM
adhesive. In addition, the whole fracture surface appeared very loose and disordered. These
holes and cracks were formed by water evaporation in the adhesive during the hot press
process, which led to a low water resistance of the SM adhesive (Zhang et al., 2014). After
the DMHP was introduced, fewer holes and cracks were observed, and the fracture surface of
the cured adhesive became smoother and more compact. This was caused reaction between
the DMHP and soy protein molecule and a cross-linking network formed, which improved
the water resistant of the adhesive.
3.3. Effects of heat treatment on wet shear strength of plywood
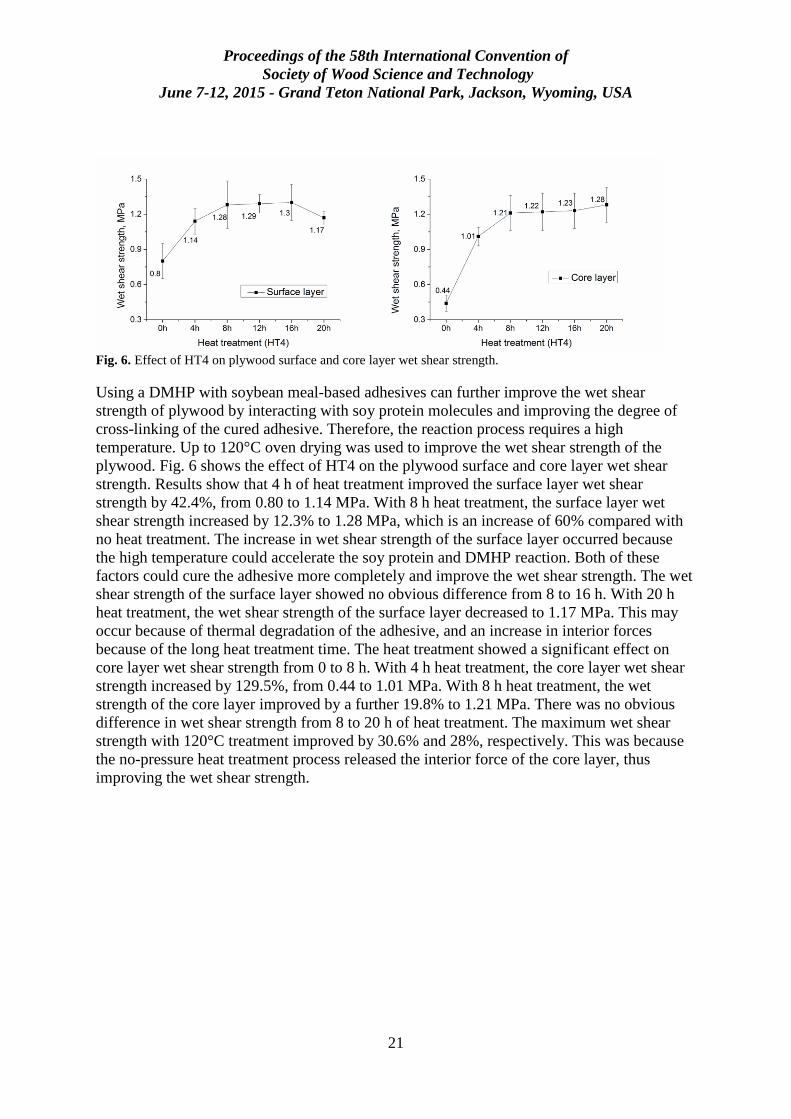
Fig. 5. Effect of HT2 on plywood surface and core layer wet shear strength.
Fig. 5 shows the effect of HT2 on the surface and core layer wet shear strength of plywood.
The wet shear strength of the surface layer with 2 min heat treatment improved by 23.4% to
0.99 MPa competed with no treatment. In addition, the wet shear strength of all specimens
met interior use plywood requirements. After 4 min heat treatment, the surface layer wet
shear strength improved by 56.3% to 1.25 MPa. The increase in wet shear strength may occur
for two reasons. One is that the water in the plywood may escape more easily during the low-
pressure process. This process could make the adhesive cure quickly and completely. The
other is that the interior plywood stress decreases with the low-pressure heat treatment
process, which also could improve the wet shear strength of the resulting plywood. After 2
min heat treatment, the wet shear strength of the core layer improved by 81.8%, from 0.44 to
0.80 MPa. With 6 min of HT2, the wet shear strength of the core layer improved by 25.0% to
a maximum value of 1.0 MPa. Compared with plywood without heat treatment, the wet shear
strength of the core layer with 6 min of HT2 increased by 127.3%. Water could help heat
conduction in the plywood, but too much water creates vapor, especially in the core layer. If
these vapors are unable to escape during the hot press process, the core layer bonds break
when hot pressing stops. The core layer will only achieve the designed temperature (120°C)
after the water in the core layer is removed. Water vapor escaped during the hot press process
for 0 to 2 min of HT2. Most of the water in the plywood was removed, which caused the wet
shear strength to increase rapidly. The further increase in the wet shear strength on the core
layer is attributed to an interior force reduction during the low-pressure heat treatment. From
6 to 10 min of HT2, the wet shear strength decreased by 20.0% from 1 to 0.8 MPa, which
contributed to an increase in the interior forces caused by over-drying.
Proceedings of the 58th International Convention of
Society of Wood Science and Technology
June 7-12, 2015 - Grand Teton National Park, Jackson, Wyoming, USA
21
Fig. 6. Effect of HT4 on plywood surface and core layer wet shear strength.
Using a DMHP with soybean meal-based adhesives can further improve the wet shear
strength of plywood by interacting with soy protein molecules and improving the degree of
cross-linking of the cured adhesive. Therefore, the reaction process requires a high
temperature. Up to 120°C oven drying was used to improve the wet shear strength of the
plywood. Fig. 6 shows the effect of HT4 on the plywood surface and core layer wet shear
strength. Results show that 4 h of heat treatment improved the surface layer wet shear
strength by 42.4%, from 0.80 to 1.14 MPa. With 8 h heat treatment, the surface layer wet
shear strength increased by 12.3% to 1.28 MPa, which is an increase of 60% compared with
no heat treatment. The increase in wet shear strength of the surface layer occurred because
the high temperature could accelerate the soy protein and DMHP reaction. Both of these
factors could cure the adhesive more completely and improve the wet shear strength. The wet
shear strength of the surface layer showed no obvious difference from 8 to 16 h. With 20 h
heat treatment, the wet shear strength of the surface layer decreased to 1.17 MPa. This may
occur because of thermal degradation of the adhesive, and an increase in interior forces
because of the long heat treatment time. The heat treatment showed a significant effect on
core layer wet shear strength from 0 to 8 h. With 4 h heat treatment, the core layer wet shear
strength increased by 129.5%, from 0.44 to 1.01 MPa. With 8 h heat treatment, the wet
strength of the core layer improved by a further 19.8% to 1.21 MPa. There was no obvious
difference in wet shear strength from 8 to 20 h of heat treatment. The maximum wet shear
strength with 120°C treatment improved by 30.6% and 28%, respectively. This was because
the no-pressure heat treatment process released the interior force of the core layer, thus
improving the wet shear strength.
Proceedings of the 58th International Convention of
Society of Wood Science and Technology
June 7-12, 2015 - Grand Teton National Park, Jackson, Wyoming, USA
22
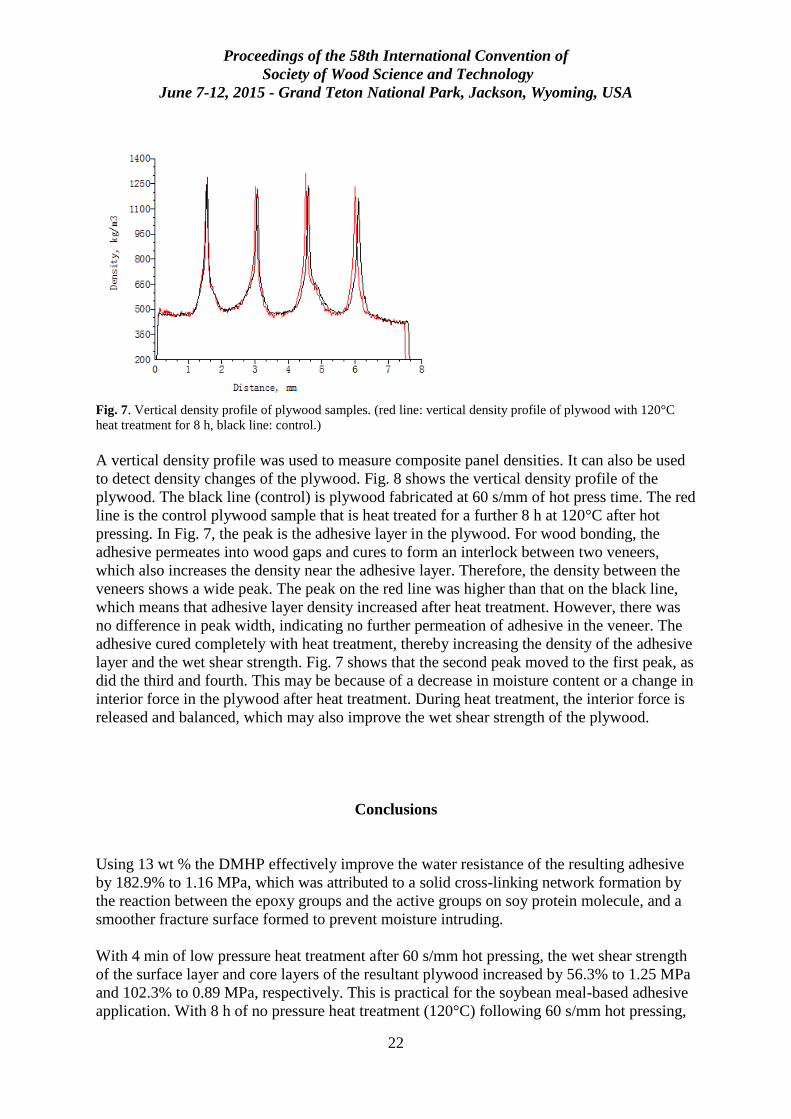
Fig. 7. Vertical density profile of plywood samples. (red line: vertical density profile of plywood with 120°C
heat treatment for 8 h, black line: control.)
A vertical density profile was used to measure composite panel densities. It can also be used
to detect density changes of the plywood. Fig. 8 shows the vertical density profile of the
plywood. The black line (control) is plywood fabricated at 60 s/mm of hot press time. The red
line is the control plywood sample that is heat treated for a further 8 h at 120°C after hot
pressing. In Fig. 7, the peak is the adhesive layer in the plywood. For wood bonding, the
adhesive permeates into wood gaps and cures to form an interlock between two veneers,
which also increases the density near the adhesive layer. Therefore, the density between the
veneers shows a wide peak. The peak on the red line was higher than that on the black line,
which means that adhesive layer density increased after heat treatment. However, there was
no difference in peak width, indicating no further permeation of adhesive in the veneer. The
adhesive cured completely with heat treatment, thereby increasing the density of the adhesive
layer and the wet shear strength. Fig. 7 shows that the second peak moved to the first peak, as
did the third and fourth. This may be because of a decrease in moisture content or a change in
interior force in the plywood after heat treatment. During heat treatment, the interior force is
released and balanced, which may also improve the wet shear strength of the plywood.
Conclusions
Using 13 wt % the DMHP effectively improve the water resistance of the resulting adhesive
by 182.9% to 1.16 MPa, which was attributed to a solid cross-linking network formation by
the reaction between the epoxy groups and the active groups on soy protein molecule, and a
smoother fracture surface formed to prevent moisture intruding.
With 4 min of low pressure heat treatment after 60 s/mm hot pressing, the wet shear strength
of the surface layer and core layers of the resultant plywood increased by 56.3% to 1.25 MPa
and 102.3% to 0.89 MPa, respectively. This is practical for the soybean meal-based adhesive
application. With 8 h of no pressure heat treatment (120°C) following 60 s/mm hot pressing,
Proceedings of the 58th International Convention of
Society of Wood Science and Technology
June 7-12, 2015 - Grand Teton National Park, Jackson, Wyoming, USA
23
the wet shear strength of the surface and core layers of the resultant plywood increased by
60.0% to 1.28 MPa and 175.0% to 1.21 MPa, respectively. The results of the vertical density
profile show that the density of the adhesive layer increased and that the interior forces in the
plywood may be released and balanced during the heat treatment process, thereby improving
wet shear strength.
References
Chen, L., Subirade, M., 2009. Elaboration and Characterization of Soy/Zein Protein
Microspheres for Controlled Nutraceutical Delivery. Biomacromolecules 10, 3327-3334.
Kumar, R., Choudhary, V., Mishra, S., Varma, I., Mattiason, B., 2002. Adhesives and plastics
based on soy protein products. Ind Crops Prod 16, 155-172.
Lei, H., Du, G., Wu, Z., Xi, X., Dong, Z., 2014. Cross-linked soy-based wood adhesives for
plywood. Int. J. Adhes. Adhes. 50, 199-203.
Luo, J., Luo, J., Gao, Q., Li, J., 2014. Effects of heat treatment on wet shear strength of
plywood bonded with soybean meal-based adhesive. Ind Crops Prod.
Orr, L., 2007. Wood Adhesives–A Market Opportunity Study. Omni Tech International, Ltd.,
Midland, MI.
Park, C.H., Lee, S.W., Park, J.W., Kim, H.J., 2013. Preparation and characterization of dual
curable adhesives containing epoxy and acrylate functionalities. React. Funct. Polym. 73,
641-646.
Schramm, C., Rinderer, B., 2006. Application of polycarboxylic acids to cotton fabrics under
mild curing conditions. Cell Chem. Technol. 40, 799-804.
Sellers, T.J., 2001. Wood adhesive innovations and applications in North America. Forest
Prod. J. 51, 12-22.
Xu, H., Luo, J., Gao, Q., Zhang, S., Li, J., 2014. Improved water resistance of soybean meal-
based adhesive with SDS and PAM. BioResources 9, 4667-4678.
Yu, L., 1988. Solitons & polarons in conducting polymers. World Scientific.
Zhang, Y.H., Zhu, W.Q., Lu, Y., Gao, Z.H., Gu, J.Y., 2014. Nano-scale blocking mechanism
of MMT and its effects on the properties of polyisocyanate-modified soybean protein
adhesive. Ind Crops Prod 57, 35-42.
Proceedings of the 58th International Convention of
Society of Wood Science and Technology
June 7-12, 2015 - Grand Teton National Park, Jackson, Wyoming, USA
24
Fractionation of the Liquefied Lignocellulosic Biomass for
the Production of Platform Chemicals
Junming Xu, [email protected]
Xinfeng XIE,
Jingxin WANG,
Jianchun JIANG,
West Virginia University, 372 Gilmore Street, Morgantown, WV 26506
USA
Abstract
A facile and sustainable process was designed to intrigue a degradation reaction of biomass
and produce biopolyols and phenolic compounds. Liquefaction of lignocellulosic materials
was conducted in methanol at temperature of 180 ℃ for 15 minutes with the conversion of
raw materials at about 75.0%. It was found that a majority of those hydrophobic phenolics
could be separated from aqueous solution. The phenolic products that extracted from the
aqueous phase were mainly composed of phenolic derivatives such as 2-methoxy-4-propyl-
phenol and 4-hydroxy-3-methoxy-benzoic acid methyl ester. The aqueous solution was then
distilled under vacuum to remove the water and formed a viscous liquid product named
biopolyol. As evidenced by GC-MS, the biopolyols mainly contain methyl sugar derivatives,
including methyl β-d-mannofuranoside, methyl α-D-Galactopyranoside, methyl α-D-
Glucopyranoside and methyl β-D-Glucopyranoside. The production rate of phenolics and
multi hydroxyl compounds (including glycerol and sugar derivatives) in phenolic products
and biopolyols is 66.75% and 84.69%, respectively.
Proceedings of the 58th International Convention of
Society of Wood Science and Technology
June 7-12, 2015 - Grand Teton National Park, Jackson, Wyoming, USA
25
Concentrations of heavy metals in Eucalyptus and Pinus
wood sawdust and smoke, Copperbelt province, Zambia
Ncube, [email protected]
Benjamin Phiri, [email protected]
Copperbelt University, P O Box 21692, Jambo drive, Riverside, Kitwe
Zambia
Abstract
Heavy metals assimilated by trees or adsorbed by sawdust from polluted air poses a health
hazard. The amount of heavy metals in Eucalyptus and Pinus sawdust was evaluated to
establish whether sawdust use for energy and surface amendments was safe. Wood sawdust
and smoke from a burning test were analyzed for heavy metals by atomic adsorption
spectrophotometetry. The heavy metal concentrations in Eucalyptus sawdust were 11.5-61.1
mg Pb/kg, 3.3-7.9 mg Cd/kg, 4.9-56.9 mg Cr/kg and 20.2-43.4 mg Ni/kg while that in Pinus
sawdust were 17.1-32.8 mg Pb/kg, 5.1-8.6 mg Cd/kg, 9.9-28.2 mg Cr/kg and 18.7-67.4 mg
Ni/kg. The concentrations of chromium and cadmium in both wood types from Kitwe
exceeded the limit, and so the sawdust was deemed unsuitable for surface applications. This
was the same for nickel in Pinus sawdust. The study showed that sawdust from both wood
types was not safe for mulching, composting and animal bedding. The annual exposure limits
of 0.2 μg Cr/m3, 180 μg Ni/m3 and 0.2 μg Cd/m3 set by the World Health Organization were
not exceeded by the smoke from both wood types. This suggested that combustion emissions
embedded on large particulate matter from Eucalyptus and Pinus sawdust which has been in
storage for about two years in conditions found in Kitwe is unlikely to have adverse short-
term health effects associated with heavy metals.
Proceedings of the 58th International Convention of
Society of Wood Science and Technology
June 7-12, 2015 - Grand Teton National Park, Jackson, Wyoming, USA
26
Synthesis and Characterization of Sucrose-Melamine-
Formaldehyde Adhesives
Weixing Gan, [email protected]
Yifu Zhang,
Haibing Yang,
Licheng Pan,
Zhoufeng Huang,
Guangxi University, Wood Science Department , 100 University Road,
Nanning, Guangxi
Abstract
Due to the limitation of the petroleum resources and the unstable fossil fuel prices, there is
more demand on the development of bio-based adhesives synthesized from the renewable
bio-resources. Sucrose, rich in hydroxyl groups, is a class of renewable and biodegradable
biomaterials which can be used as a substitute for the synthetic polymers like lactose. In this
work, sucrose–melamine-formaldehyde (SMF) resin was synthesized in a base condition. The
shelf-life of the SMF resin was determined by a method of viscosity measurement. It was
found that the shelf-life of SMF resin was increased as the sucrose content was increased.
The effect of sucrose content on the bonding strength, formaldehyde emission of SMF
bonded plywood were studied, and a sucrose to melamine mole ratio of 0.6:1 was
determined. Fourier Transform-Infrared Spectroscopy (FT-IR) and Mass Spectrum (MS)
were employed to analyze the chemical structure of the SMF resin. The spectrogram of FT-
IR and MS revealed the structures of sucrose, melamine and formaldehyde in the SMF. The
chemical reaction of SMF resins occurred between the three primary hydroxyl groups of
sugarcane and the hydroxymethyl of melamine.
Proceedings of the 58th International Convention of
Society of Wood Science and Technology
June 7-12, 2015 - Grand Teton National Park, Jackson, Wyoming, USA
27
Preparation and Characterization of Activated Carbon
Fibers from Liquefied Wood by KOH Activation
Yuxiang Huang, Guangjie Zhao 0F
College of Materials Science and Technology, Beijing Forestry University,
Tsinghua East Road 35, Haidian 100083, Beijing, China
Abstract
Activated carbon fibers (ACFs) have been prepared from liquefied wood by chemical
activation with KOH, with a particular focus on the effect of KOH/fiber ratio in term of
porous texture and surface chemistry. ACFs based on steam activation served as a blank for
comparison. The properties of the ACFs were investigated by scanning electron microscope
(SEM), X-ray diffraction (XRD), and nitrogen adsorption/desorption, FTIR spectroscopy,
and X-ray photoelectron spectroscopy (XPS). The results show that the KOH-activated ACFs
have rougher surfaces and more amorphous structure compared with the blank. The pore
development was significant when the KOH/fiber ratio reached 3, and achieved a maximum
Brunauer-Emmett-Teller (BET) surface area of 1371 m2 g-1 and total pore volume of 0.777
cm3 g-1, of which 45.3% belong to mesopores with diameters of 2-4 nm, while the blank
activated at the same temperature had a BET surface of 1250 m2 g-1 and total pore volume of
0.644 cm3 g-1, which are mainly micropores. The surface functional groups are closely
associated with the KOH/fiber ratios. KOH-activated ACFs with KOH/fiber ratio of 3 have
more oxygenated surface functional groups (C-O, C=O, -COOH) than the blank.
Key words: activated carbon fibers (ACFs); liquefied wood; KOH activation; microstructure;
surface properties
1. Introduction
Activated carbon fibers (ACFs), as a new type of activated carbon, have unique
characteristics compared with granular or powdered activated carbons due to their abundantly
developed pore structure and special surface reactivity. They have been widely applied in
many fields as a result, such as adsorption and separation, electronic materials, catalyst
support, and the storage of natural gas[1]. ACFs are currently prepared from polyacrylonitrile
(PAN), pitch or phenolic resin fibers. Since environmental protection and resource
conservation have attracted more and more attention in recent years, biomass resources such
Correspondence to: Guangjie Zhao; E-mail: [email protected]. Tel/Fax: 86 010 62338358.
Proceedings of the 58th International Convention of
Society of Wood Science and Technology
June 7-12, 2015 - Grand Teton National Park, Jackson, Wyoming, USA
28
as bamboo[2], jute[3] and cotton waste[4] become popular as alternatives to petrochemical
resources.
Wood, being a main component of biomass containing abundant cellulose and lignin[5], has
been utilized as well in the preparation of wood-based ACFs by liquefaction with phenol.
This way did not require the separation of chemical components in wood, giving a higher
wood utilization ratio than other methods[6-7]. Lately, ACFs have been successively made
from liquefied Chinese fir sawdust[8] and poplar bark[9] by physical activation with steam.
Although the obtained ACFs had high specific surface area, their yield was relatively low and
most of them were microporous with very narrow pore size distribution (PSDs). On the other
hand, ACFs prepared by steam activation had very high C content, thereby possessing less
oxygen-containing surface functionalities. In turn, previous literature has shown that
chemical activation with KOH can widen the PSDs[10] and introduce oxygen-containing
surface groups[11]. To date, one of the most extended utilization of activated carbon
materials is electric double layer capacitors (EDLCs) [12]. From the point of view of this
application not only the wide PSDs and more mesopores over high SSA are required [13], but
the surface chemistry especially the O functionalities also has a significant effect on the
capacity of EDLCs on account of their enhancement in pseudocapacitance[14]. Hence, it can
be expected that chemical activation with KOH of liquefied wood-based fibers could deliver
ACFs with added mesoporosity and surface chemical properties that may be advantageous for
application in EDLCs.
The aim of this work was to control the porosity and surface chemical properties of Wliq
based ACFs. To this end, ACFs should be prepared by KOH activation and the KOH/fiber
ratio should be investigated in terms of the ACFs’ porous structure and surface chemistry.
The results will be compared with those obtained from ACFs based on steam activation
(blank). The surface morphology of the prepared ACFs will be observed by SEM and XRD.
The pore structure will be evaluated by N2 adsorption/desorption. FTIR spectroscopy and X-
ray photo-electron spectroscopy (XPS) should contribute to the characterization of the
materials.
2. Experimental
2.1 Preparation of ACFs
Chinese fir (Cunninghamia lanceolata) was firstly ground and screened to particle size of 60-
80 meshes for use in the experiments. The mixture of wood flour, phenols and H3PO4 at a
mess ratio of 1:5:0.4 was heated in an oil bath at 160℃ for 2.5 hours with continuous stirring
to obtain liquefied wood. After the liquefaction, 5 wt% (based on the weight of liquefied
solution) hexamethylenetetramine as synthetic agent was added to the liquefied wood to
prepare the spinning solution by heating the mixture from room temperature up to 170 ℃ in
40 minutes. The spun filaments were prepared by melt-spinning at 120℃ with a laboratory
spinning apparatus. When the spinning was over, the resultant fibers were cured by soaking
in a solution with HCHO and HCl (1:1 by volume) as the main components at 90 ℃ for 2
hours and then washed with distilled water and finally dried at 80℃ for 4 hours to obtain the
precursor fibers. 20 g of the resultant precursors were then carbonized in a horizontal
transparent tube furnace (Y02PB, Thermcraftinc U.S.A) at 500°C in N2 flow for 1 h
Proceedings of the 58th International Convention of
Society of Wood Science and Technology
June 7-12, 2015 - Grand Teton National Park, Jackson, Wyoming, USA
29
carbonization. The carbonization yield (CY) was calculated by the weight ratio of the
resultant carbon fibers (CFs) to precursor fibers.
About 6 g of CFs were put in the tube furnace after impregnation with KOH at KOH/fiber
ratios of 1, 2 and 3 (w/w). About 2 g of each CFs was carbonized by heating the mixtures
under N2 flow (200 cm3 min-1) at a heating rate of 4°C min-1. The activation temperature was
850°C and the holding time was 1 h. The obtained ACFs were washed with distilled water
until neutral pH and dried at 103±2°C. The KOH-activated ACFs are labeled as ACF-1, -2,
and -3, where the numbers represent the impregnation ratios KOH/fiber as indicated above.
The activation yield (AY) was calculated by the weight ratio of ACFs to CFs, thereby the
total yield was obtained by multiplying AY by CY.
For comparison, steam activation was also conducted, where 2 g of CFs were similarly heated
from r.t. to 850°C and were held at this temperature for 1 h by introducing a steam flow and
then cooled down to r.t. These products are labeled as ACF-S or simply as the blank.
2.2 Characterization of ACFs
Surface morphology
Surface morphology of the ACFs was examined with a scanning electron microscope (SEM,
S-3400N, Hitach Company in Japan). Before observation, the samples were metalized with a
thin layer of Pt.
XRD analysis
X-ray diffraction (SHIMADZU, XRD-6000) measurements were conducted with an X-ray
diffractometer using CuKa radiation (wavelength 0.154nm) at 40 kV and 30 mA. The
scanning rate was 2°/min with a scanning step of 0.02° from 5° to 60° (2θ).
Nitrogen adsorption measurement
Surface area and porosity of the ACFs were evaluated by N2 adsorption-desorption isotherm
measured at -196 ℃ by a surface area analyzer and a pore size analyzer: Autosorb-iQ. Before
analysis, the samples were degassed at 300℃ for 3 h. The SSA (SBET) was calculated by the
Brunauer–Emmett–Teller (BET) method using N2 adsorption isotherm data[15]. The total
pore volume (Vtot) was evaluated by converting the amount of N2 adsorbed at a relative
pressure of 0.995 to the volume of liquid adsorbate. The micropore area (Smicro) and
micropore volume (Vmicro) were obtained by t-plot method[16]. PSDs were calculated using
the Density Functional Theory (DFT) method[17], which based on calculated adsorption
isotherms for pores of different sizes.
FTIR analysis
The chemical groups of the ACFs were examined using pressed potassium bromide (KBr)
pellets containing 5% of samples by Fourier transform infrared spectrum analysis
spectrometer (FTIR, BRUKER Tensor 27, German) in the scanning range of 4000-500 cm-1.
The samples were pulverized (100 mesh) and mixed with KBr before being pressed into a
disk.
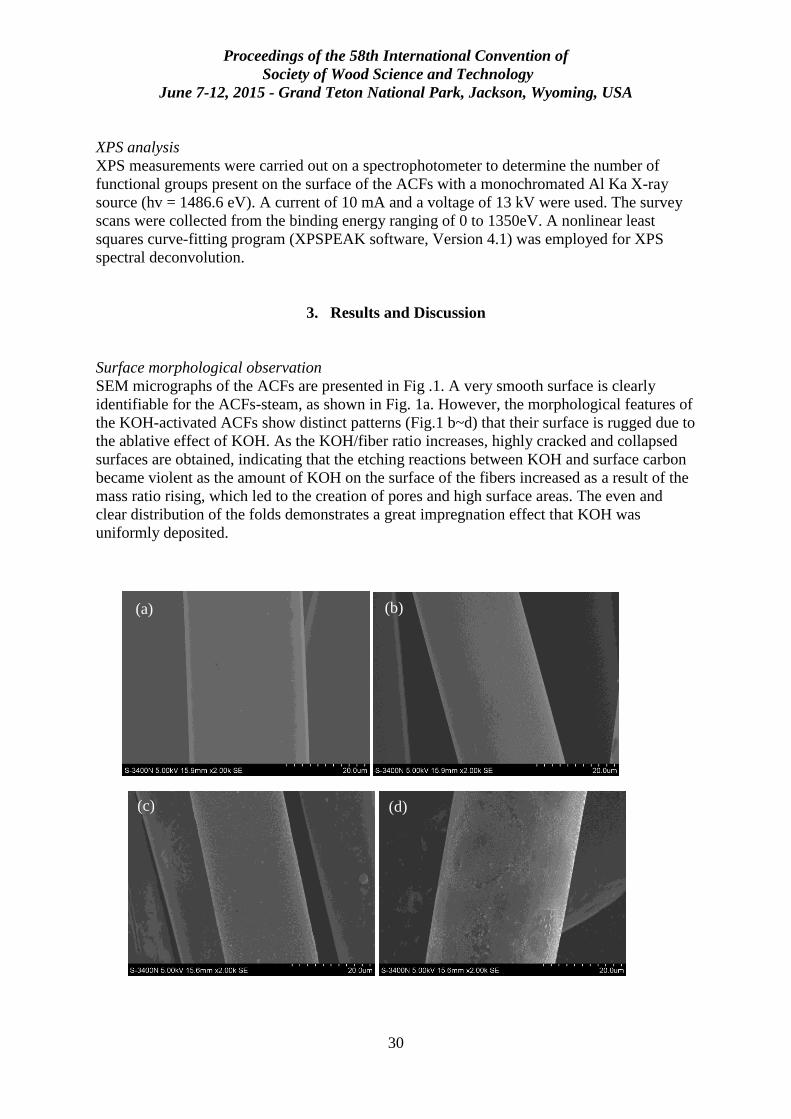
Proceedings of the 58th International Convention of
Society of Wood Science and Technology
June 7-12, 2015 - Grand Teton National Park, Jackson, Wyoming, USA
30
XPS analysis
XPS measurements were carried out on a spectrophotometer to determine the number of
functional groups present on the surface of the ACFs with a monochromated Al Ka X-ray
source (hv = 1486.6 eV). A current of 10 mA and a voltage of 13 kV were used. The survey
scans were collected from the binding energy ranging of 0 to 1350eV. A nonlinear least
squares curve-fitting program (XPSPEAK software, Version 4.1) was employed for XPS
spectral deconvolution.
3. Results and Discussion
Surface morphological observation
SEM micrographs of the ACFs are presented in Fig .1. A very smooth surface is clearly
identifiable for the ACFs-steam, as shown in Fig. 1a. However, the morphological features of
the KOH-activated ACFs show distinct patterns (Fig.1 b~d) that their surface is rugged due to
the ablative effect of KOH. As the KOH/fiber ratio increases, highly cracked and collapsed
surfaces are obtained, indicating that the etching reactions between KOH and surface carbon
became violent as the amount of KOH on the surface of the fibers increased as a result of the
mass ratio rising, which led to the creation of pores and high surface areas. The even and
clear distribution of the folds demonstrates a great impregnation effect that KOH was
uniformly deposited.
(d) (c)
(a) (b)
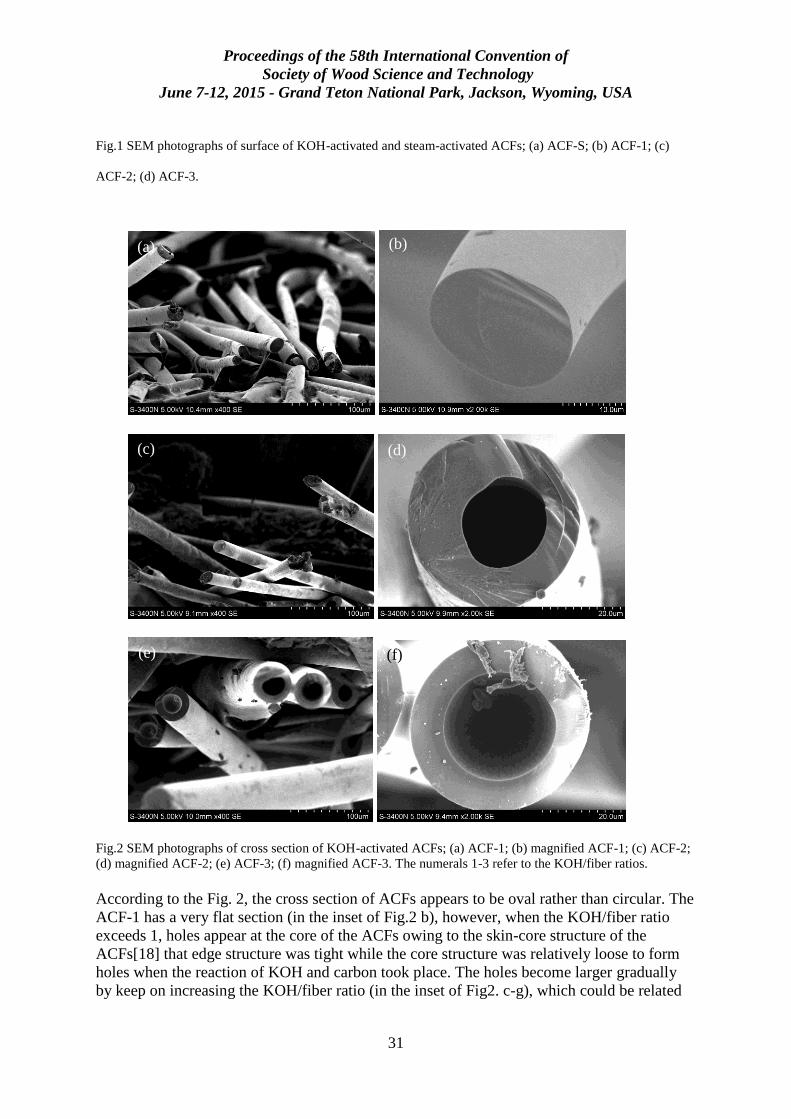
Proceedings of the 58th International Convention of
Society of Wood Science and Technology
June 7-12, 2015 - Grand Teton National Park, Jackson, Wyoming, USA
31
Fig.1 SEM photographs of surface of KOH-activated and steam-activated ACFs; (a) ACF-S; (b) ACF-1; (c)
ACF-2; (d) ACF-3.
Fig.2 SEM photographs of cross section of KOH-activated ACFs; (a) ACF-1; (b) magnified ACF-1; (c) ACF-2;
(d) magnified ACF-2; (e) ACF-3; (f) magnified ACF-3. The numerals 1-3 refer to the KOH/fiber ratios.
According to the Fig. 2, the cross section of ACFs appears to be oval rather than circular. The
ACF-1 has a very flat section (in the inset of Fig.2 b), however, when the KOH/fiber ratio
exceeds 1, holes appear at the core of the ACFs owing to the skin-core structure of the
ACFs[18] that edge structure was tight while the core structure was relatively loose to form
holes when the reaction of KOH and carbon took place. The holes become larger gradually
by keep on increasing the KOH/fiber ratio (in the inset of Fig2. c-g), which could be related
(f)
(d)
(b)
(e)
(c)
(a)
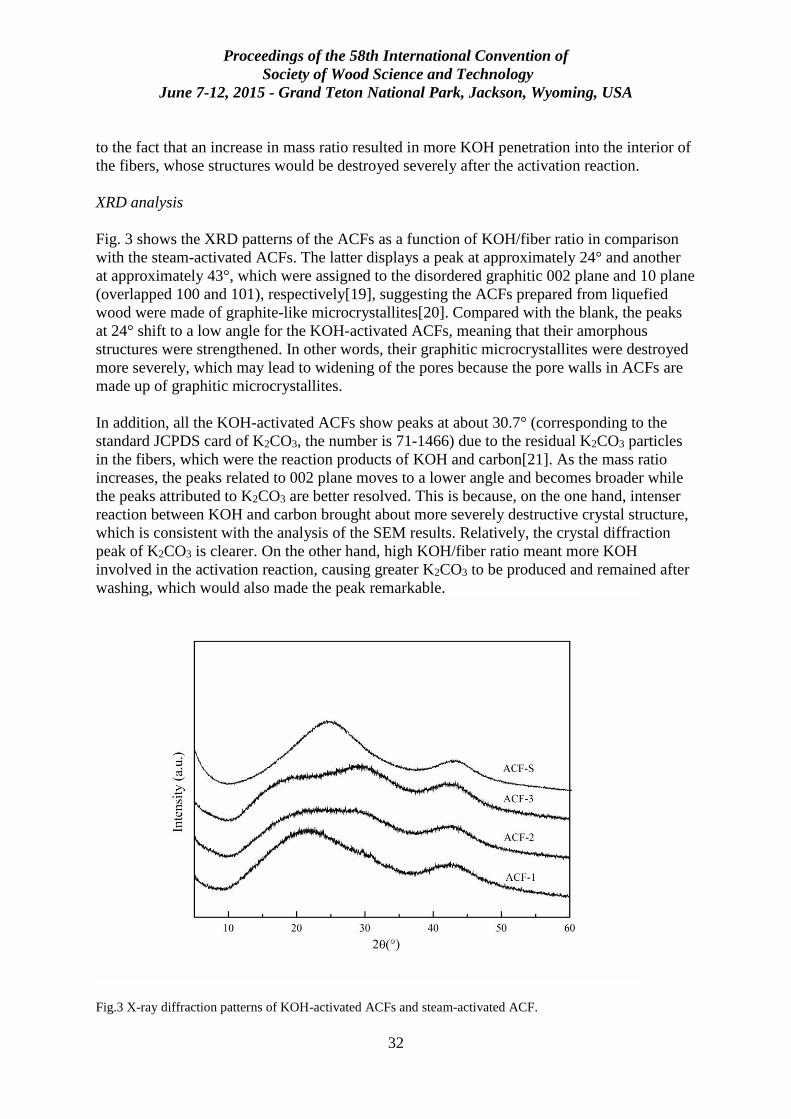
Proceedings of the 58th International Convention of
Society of Wood Science and Technology
June 7-12, 2015 - Grand Teton National Park, Jackson, Wyoming, USA
32
to the fact that an increase in mass ratio resulted in more KOH penetration into the interior of
the fibers, whose structures would be destroyed severely after the activation reaction.
XRD analysis
Fig. 3 shows the XRD patterns of the ACFs as a function of KOH/fiber ratio in comparison
with the steam-activated ACFs. The latter displays a peak at approximately 24° and another
at approximately 43°, which were assigned to the disordered graphitic 002 plane and 10 plane
(overlapped 100 and 101), respectively[19], suggesting the ACFs prepared from liquefied
wood were made of graphite-like microcrystallites[20]. Compared with the blank, the peaks
at 24° shift to a low angle for the KOH-activated ACFs, meaning that their amorphous
structures were strengthened. In other words, their graphitic microcrystallites were destroyed
more severely, which may lead to widening of the pores because the pore walls in ACFs are
made up of graphitic microcrystallites.
In addition, all the KOH-activated ACFs show peaks at about 30.7° (corresponding to the
standard JCPDS card of K2CO3, the number is 71-1466) due to the residual K2CO3 particles
in the fibers, which were the reaction products of KOH and carbon[21]. As the mass ratio
increases, the peaks related to 002 plane moves to a lower angle and becomes broader while
the peaks attributed to K2CO3 are better resolved. This is because, on the one hand, intenser
reaction between KOH and carbon brought about more severely destructive crystal structure,
which is consistent with the analysis of the SEM results. Relatively, the crystal diffraction
peak of K2CO3 is clearer. On the other hand, high KOH/fiber ratio meant more KOH
involved in the activation reaction, causing greater K2CO3 to be produced and remained after
washing, which would also made the peak remarkable.
Fig.3 X-ray diffraction patterns of KOH-activated ACFs and steam-activated ACF.
Proceedings of the 58th International Convention of
Society of Wood Science and Technology
June 7-12, 2015 - Grand Teton National Park, Jackson, Wyoming, USA
33
N2 adsorption/desorption isotherm
Fig. 4 shows the adsorption/desorption isotherms of N2 for the ACFs. In the blank, the
volume adsorbed increases quickly with increasing pressure at low pressure ranges but levels
off when the relative pressure is above 0.1. This means that the isotherms belong to type I
according to the IUPAC classification[22], where microporous adsorption is the prominent
adsorption. As for the KOH-activated ACFs, however, the volume absorbed maintains an
upward trend when the relative pressure exceeds 0.1, especially for the ACF-1 and ACF-2.
It’s worth noting that adsorption/desorption hysteresis can be found in the isotherms of the
KOH-activated ACFs, while no hysteresis for the steam-activated ACFs. These results could
probably be related to the difference in mesopores between the KOH-activated ACFs and the
blank.
Pore properties of all the ACFs including SBET, Smic, Smeso, Vtot, and yield are listed in Table 1.
SBET and Vtot of the KOH-activated ACFs gradually increase with increasing KOH/fiber ratio
while the yield decreases correspondingly. However, the Smeso of ACF-2 reaches the
maximum of 525m2/g and then reduces with increasing KOH/fiber ratios, while the Smic
keeps highly increasing, most likely because of the limited availability of KOH when KOH is
attached on the surface, thus the activation only took place on the surface of the fibers and
there was little generation of metallic K which can intercalate into carbon lattices of the
carbon matrix to further develop the porosity[23]. With the prolongation of the activation,
micropores were gradually enlarged to mesopores[24]. When the mass ratio exceeded 2,
KOH was enough to penetrate into the interior of the fibers. On the one hand, the etching of
the carbon framework was conducted from outer to inner and the metallic K generated by the
redox reactions between various KOH and carbon further developed the micropores by
efficiently intercalating into the carbon lattices. Moreover, the continuous activation on the
surface would further etch the previously generated mesopores and even cause them to
collapse so their quantities began to reduce. SBET, Smicro and Smeso of steam-activated ACFs
are 1240 m2/g, 969m2/g and 281m2/g respectively, which are slightly less than those of ACF-
3. However, the ACF-3 has a higher yield obviously and the ratio of mesopore volume to
total pore volume is 45.3% while that of the ACFs-steam is only 9.3%, demonstrating ACFs
by steam activation were mainly microporous and ACFs by KOH activation had abundant
mesopores.
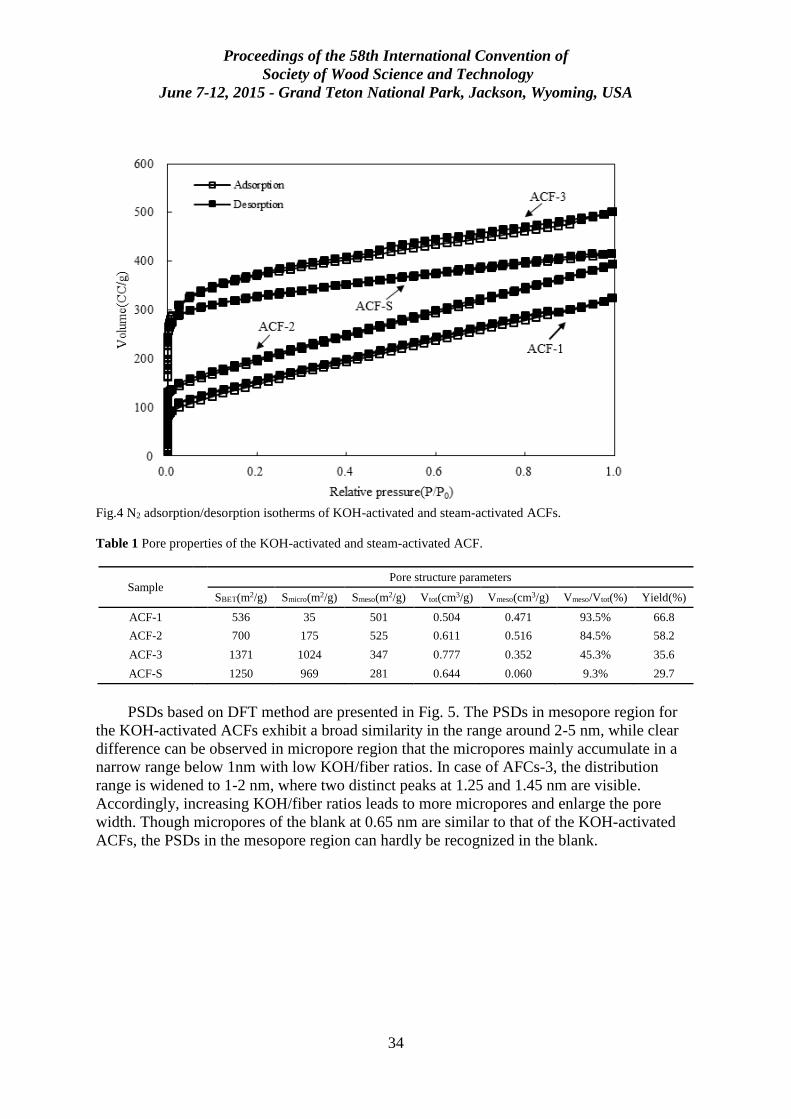
Proceedings of the 58th International Convention of
Society of Wood Science and Technology
June 7-12, 2015 - Grand Teton National Park, Jackson, Wyoming, USA
34
Fig.4 N2 adsorption/desorption isotherms of KOH-activated and steam-activated ACFs.
Table 1 Pore properties of the KOH-activated and steam-activated ACF.
Sample Pore structure parameters
SBET(m2/g) Smicro(m2/g) Smeso(m2/g) Vtot(cm3/g) Vmeso(cm3/g) Vmeso/Vtot(%) Yield(%)
ACF-1 536 35 501 0.504 0.471 93.5% 66.8
ACF-2 700 175 525 0.611 0.516 84.5% 58.2
ACF-3 1371 1024 347 0.777 0.352 45.3% 35.6
ACF-S 1250 969 281 0.644 0.060 9.3% 29.7
PSDs based on DFT method are presented in Fig. 5. The PSDs in mesopore region for
the KOH-activated ACFs exhibit a broad similarity in the range around 2-5 nm, while clear
difference can be observed in micropore region that the micropores mainly accumulate in a
narrow range below 1nm with low KOH/fiber ratios. In case of AFCs-3, the distribution
range is widened to 1-2 nm, where two distinct peaks at 1.25 and 1.45 nm are visible.
Accordingly, increasing KOH/fiber ratios leads to more micropores and enlarge the pore
width. Though micropores of the blank at 0.65 nm are similar to that of the KOH-activated
ACFs, the PSDs in the mesopore region can hardly be recognized in the blank.
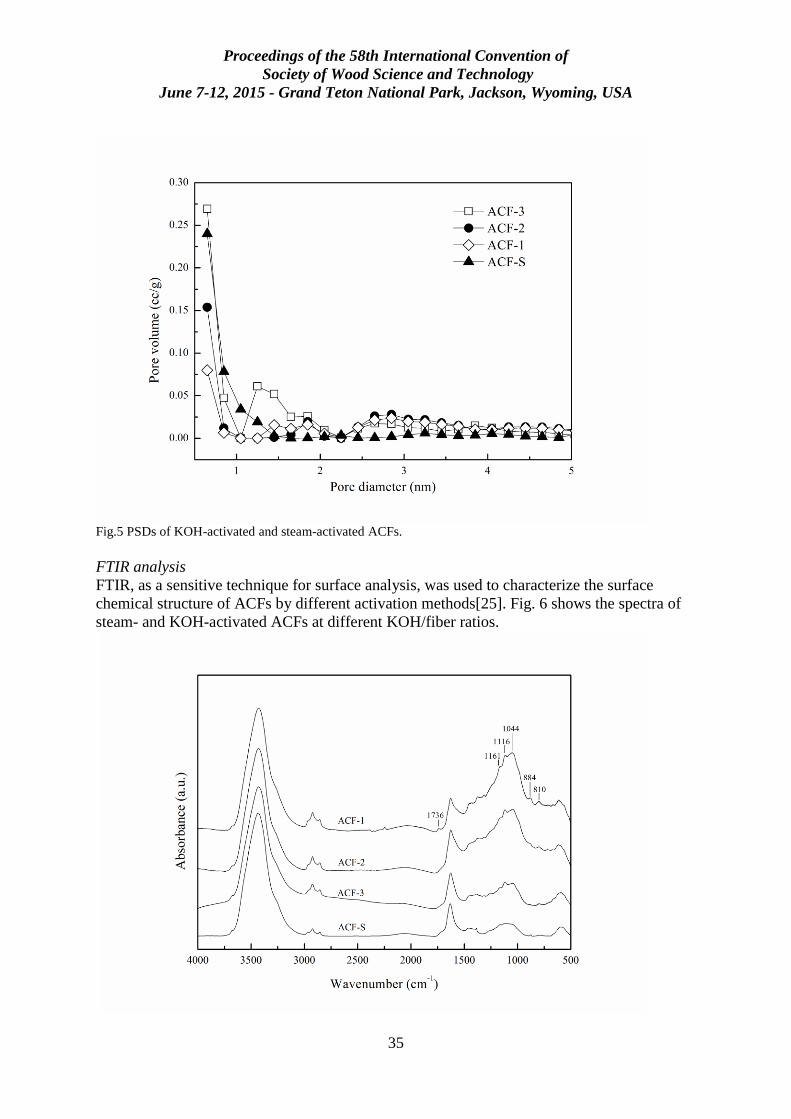
Proceedings of the 58th International Convention of
Society of Wood Science and Technology
June 7-12, 2015 - Grand Teton National Park, Jackson, Wyoming, USA
35
Fig.5 PSDs of KOH-activated and steam-activated ACFs.
FTIR analysis
FTIR, as a sensitive technique for surface analysis, was used to characterize the surface
chemical structure of ACFs by different activation methods[25]. Fig. 6 shows the spectra of
steam- and KOH-activated ACFs at different KOH/fiber ratios.
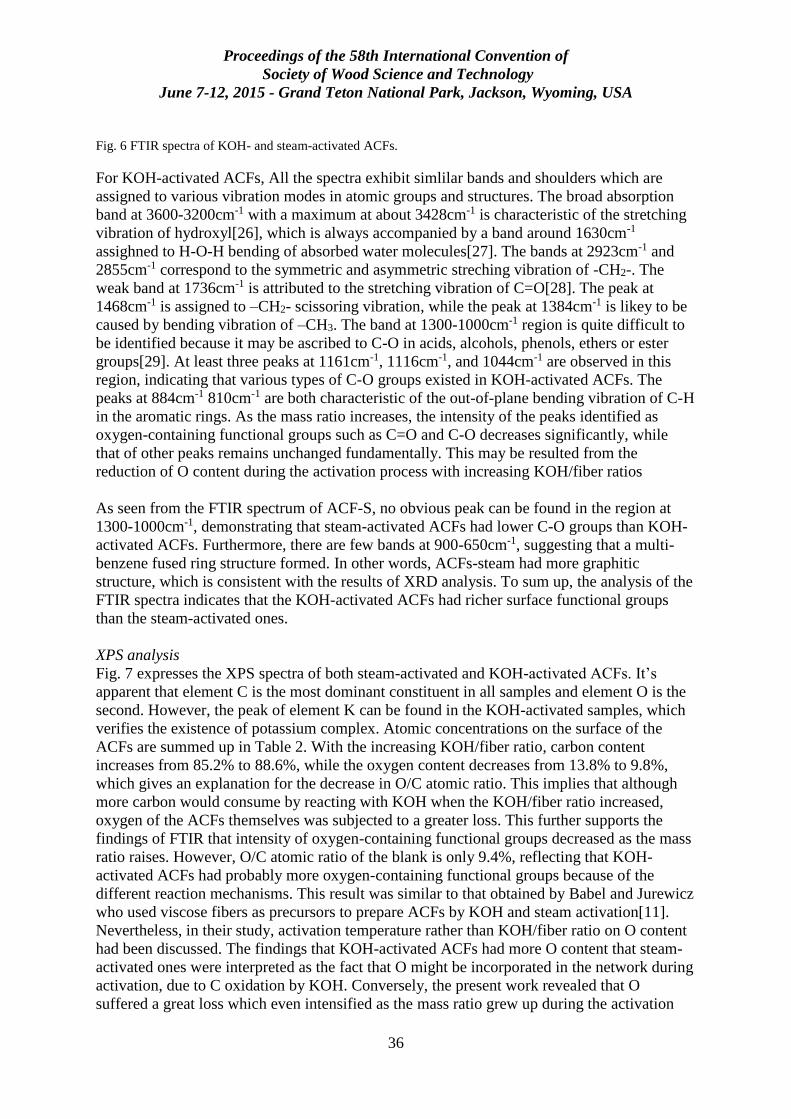
Proceedings of the 58th International Convention of
Society of Wood Science and Technology
June 7-12, 2015 - Grand Teton National Park, Jackson, Wyoming, USA
36
Fig. 6 FTIR spectra of KOH- and steam-activated ACFs.
For KOH-activated ACFs, All the spectra exhibit simlilar bands and shoulders which are
assigned to various vibration modes in atomic groups and structures. The broad absorption
band at 3600-3200cm-1 with a maximum at about 3428cm-1 is characteristic of the stretching
vibration of hydroxyl[26], which is always accompanied by a band around 1630cm-1
assighned to H-O-H bending of absorbed water molecules[27]. The bands at 2923cm-1 and
2855cm-1 correspond to the symmetric and asymmetric streching vibration of -CH2-. The
weak band at 1736cm-1 is attributed to the stretching vibration of C=O[28]. The peak at
1468cm-1 is assigned to –CH2- scissoring vibration, while the peak at 1384cm-1 is likey to be
caused by bending vibration of –CH3. The band at 1300-1000cm-1 region is quite difficult to
be identified because it may be ascribed to C-O in acids, alcohols, phenols, ethers or ester
groups[29]. At least three peaks at 1161cm-1, 1116cm-1, and 1044cm-1 are observed in this
region, indicating that various types of C-O groups existed in KOH-activated ACFs. The
peaks at 884cm-1 810cm-1 are both characteristic of the out-of-plane bending vibration of C-H
in the aromatic rings. As the mass ratio increases, the intensity of the peaks identified as
oxygen-containing functional groups such as C=O and C-O decreases significantly, while
that of other peaks remains unchanged fundamentally. This may be resulted from the
reduction of O content during the activation process with increasing KOH/fiber ratios
As seen from the FTIR spectrum of ACF-S, no obvious peak can be found in the region at
1300-1000cm-1, demonstrating that steam-activated ACFs had lower C-O groups than KOH-
activated ACFs. Furthermore, there are few bands at 900-650cm-1, suggesting that a multi-
benzene fused ring structure formed. In other words, ACFs-steam had more graphitic
structure, which is consistent with the results of XRD analysis. To sum up, the analysis of the
FTIR spectra indicates that the KOH-activated ACFs had richer surface functional groups
than the steam-activated ones.
XPS analysis
Fig. 7 expresses the XPS spectra of both steam-activated and KOH-activated ACFs. It’s
apparent that element C is the most dominant constituent in all samples and element O is the
second. However, the peak of element K can be found in the KOH-activated samples, which
verifies the existence of potassium complex. Atomic concentrations on the surface of the
ACFs are summed up in Table 2. With the increasing KOH/fiber ratio, carbon content
increases from 85.2% to 88.6%, while the oxygen content decreases from 13.8% to 9.8%,
which gives an explanation for the decrease in O/C atomic ratio. This implies that although
more carbon would consume by reacting with KOH when the KOH/fiber ratio increased,
oxygen of the ACFs themselves was subjected to a greater loss. This further supports the
findings of FTIR that intensity of oxygen-containing functional groups decreased as the mass
ratio raises. However, O/C atomic ratio of the blank is only 9.4%, reflecting that KOH-
activated ACFs had probably more oxygen-containing functional groups because of the
different reaction mechanisms. This result was similar to that obtained by Babel and Jurewicz
who used viscose fibers as precursors to prepare ACFs by KOH and steam activation[11].
Nevertheless, in their study, activation temperature rather than KOH/fiber ratio on O content
had been discussed. The findings that KOH-activated ACFs had more O content that steam-
activated ones were interpreted as the fact that O might be incorporated in the network during
activation, due to C oxidation by KOH. Conversely, the present work revealed that O
suffered a great loss which even intensified as the mass ratio grew up during the activation
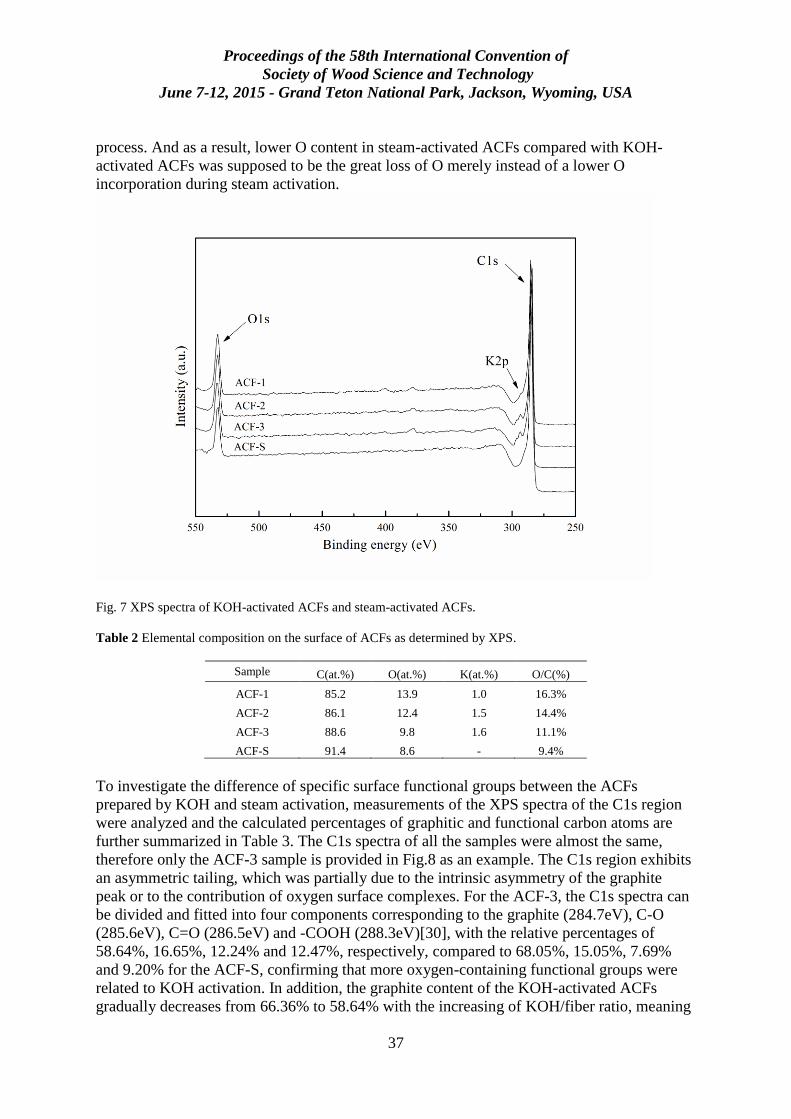
Proceedings of the 58th International Convention of
Society of Wood Science and Technology
June 7-12, 2015 - Grand Teton National Park, Jackson, Wyoming, USA
37
process. And as a result, lower O content in steam-activated ACFs compared with KOH-
activated ACFs was supposed to be the great loss of O merely instead of a lower O
incorporation during steam activation.
Fig. 7 XPS spectra of KOH-activated ACFs and steam-activated ACFs.
Table 2 Elemental composition on the surface of ACFs as determined by XPS.
Sample C(at.%) O(at.%) K(at.%) O/C(%)
ACF-1 85.2 13.9 1.0 16.3%
ACF-2 86.1 12.4 1.5 14.4%
ACF-3 88.6 9.8 1.6 11.1%
ACF-S 91.4 8.6 - 9.4%
To investigate the difference of specific surface functional groups between the ACFs
prepared by KOH and steam activation, measurements of the XPS spectra of the C1s region
were analyzed and the calculated percentages of graphitic and functional carbon atoms are
further summarized in Table 3. The C1s spectra of all the samples were almost the same,
therefore only the ACF-3 sample is provided in Fig.8 as an example. The C1s region exhibits
an asymmetric tailing, which was partially due to the intrinsic asymmetry of the graphite
peak or to the contribution of oxygen surface complexes. For the ACF-3, the C1s spectra can
be divided and fitted into four components corresponding to the graphite (284.7eV), C-O
(285.6eV), C=O (286.5eV) and -COOH (288.3eV)[30], with the relative percentages of
58.64%, 16.65%, 12.24% and 12.47%, respectively, compared to 68.05%, 15.05%, 7.69%
and 9.20% for the ACF-S, confirming that more oxygen-containing functional groups were
related to KOH activation. In addition, the graphite content of the KOH-activated ACFs
gradually decreases from 66.36% to 58.64% with the increasing of KOH/fiber ratio, meaning
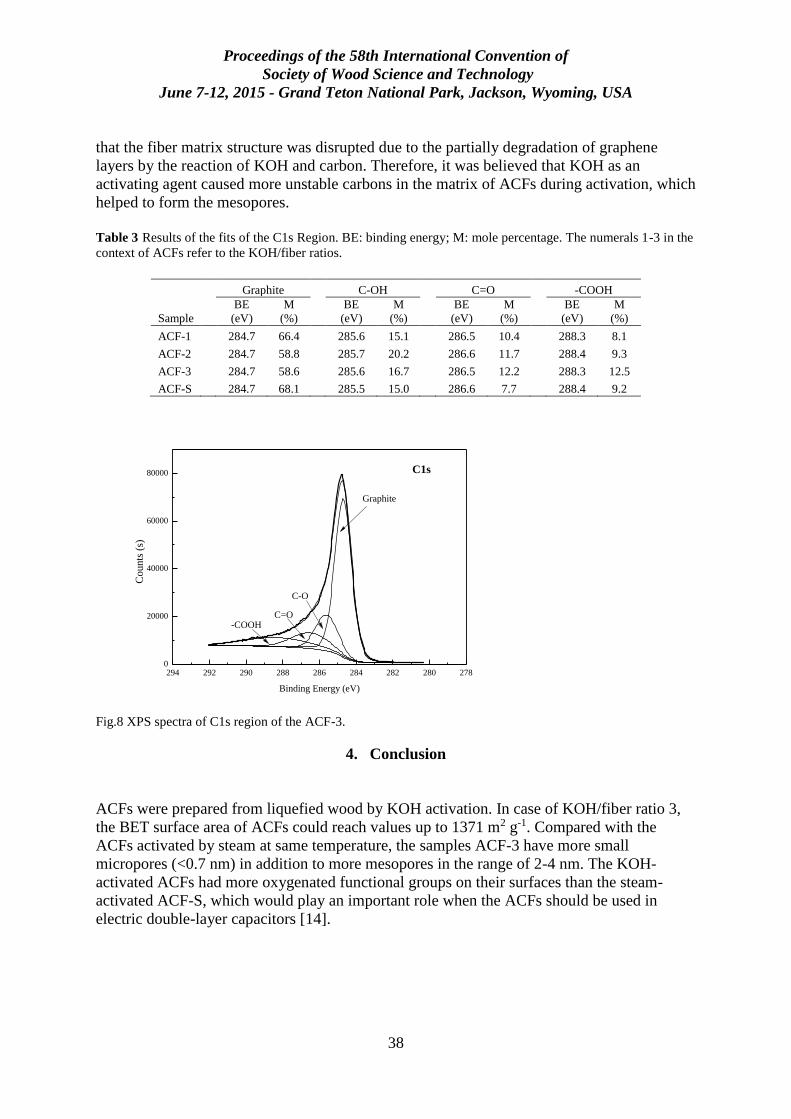
Proceedings of the 58th International Convention of
Society of Wood Science and Technology
June 7-12, 2015 - Grand Teton National Park, Jackson, Wyoming, USA
38
that the fiber matrix structure was disrupted due to the partially degradation of graphene
layers by the reaction of KOH and carbon. Therefore, it was believed that KOH as an
activating agent caused more unstable carbons in the matrix of ACFs during activation, which
helped to form the mesopores.
Table 3 Results of the fits of the C1s Region. BE: binding energy; M: mole percentage. The numerals 1-3 in the
context of ACFs refer to the KOH/fiber ratios.
Sample
Graphite C-OH C=O -COOH
BE
(eV)
M
(%)
BE
(eV)
M
(%)
BE
(eV)
M
(%)
BE
(eV)
M
(%)
ACF-1 284.7 66.4 285.6 15.1 286.5 10.4 288.3 8.1
ACF-2 284.7 58.8 285.7 20.2 286.6 11.7 288.4 9.3
ACF-3 284.7 58.6 285.6 16.7 286.5 12.2 288.3 12.5
ACF-S 284.7 68.1 285.5 15.0 286.6 7.7 288.4 9.2
294 292 290 288 286 284 282 280 2780
20000
40000
60000
80000 C1s
-COOHC=O
C-O
Graphite
Counts
(s)
Binding Energy (eV)
Fig.8 XPS spectra of C1s region of the ACF-3.
4. Conclusion
ACFs were prepared from liquefied wood by KOH activation. In case of KOH/fiber ratio 3,
the BET surface area of ACFs could reach values up to 1371 m2 g-1. Compared with the
ACFs activated by steam at same temperature, the samples ACF-3 have more small
micropores (<0.7 nm) in addition to more mesopores in the range of 2-4 nm. The KOH-
activated ACFs had more oxygenated functional groups on their surfaces than the steam-
activated ACF-S, which would play an important role when the ACFs should be used in
electric double-layer capacitors [14].
Proceedings of the 58th International Convention of
Society of Wood Science and Technology
June 7-12, 2015 - Grand Teton National Park, Jackson, Wyoming, USA
39
Acknowledgement
The research was financially supported by Specialized Research Fund for the Doctoral
Program of Higher Education (No. 20130014130001).
References
[1] M. Suzuki, Activated carbon fiber: Fundamentals and applications, Carbon. 32(1994)
577-586.
[2] D. Li, X. Ma, X. Liu, Preparation and characterization of nano-TiO2 loaded bamboo-
based activated carbon fibers by H2O Activation, Bioresources. 9(2014) 602-12.
[3] N.H. Phan, S. Rio, C. Faur, L. Le Coq, P. Le Cloirec, T.H. Nguyen, Production of fibrous
activated carbons from natural cellulose (jute, coconut) fibers for water treatment
applications, Carbon. 44(2006) 2569-77.
[4] J. Zheng, Q. Zhao, Z. Ye, Preparation and characterization of activated carbon fiber
(ACF) from cotton woven waste, Appl Surf Sci. 299(2014) 86-91.
[5] M.J. John, R.D. Anandjiwala, Recent developments in chemical modification and
characterization of natural fiber-reinforced composites, Polym Composite. 29(2008) 187-207.
[6] M.H. Alma, M.A. Basturk, Liquefaction of grapevine cane (Vitis vinisera L.) waste and
its application to phenol–formaldehyde type adhesive, Ind Crop Prod. 24(2006) 136-171.
[7] S. Pu, N. Shiraishi, Liquefaction of Wood without a Catalyst I - Time course of wood
liquefaction with phenols and effects of wood /phenol ratios, Mokuzai Gakkaishi 39(1993)
446-452.
[8] W. Liu, G. Zhao, Effect of temperature and time on microstructure and surface functional
groups of activated carbon fibers prepared from liquefied wood, BioResources. 4(2012)
5552-5267.
[9] J. Zhang, W. Zhang, Preparation and characterization of activated carbon fibers from
liquefied poplar bark, Mater Lett. 112(2013) 26-28.
[10] Ruiz-Fernández, M., Alexandre-Franco, M., Fernández-González, C., Gómez-Serrano,
V., Development of activated carbon from vine shoots by physical and chemical activation
methods. Some insight into activation mechanisms, Adsorption 17(2011), 621-629.
[11] K. Babel, K. Jurewicz, KOH activated carbon fabrics as supercapacitor material, Journal
of Physics and Chemistry of Solids. 65(2004) 275-280.
Proceedings of the 58th International Convention of
Society of Wood Science and Technology
June 7-12, 2015 - Grand Teton National Park, Jackson, Wyoming, USA
40
[12] A. Castro-Muñiz, F. Suárez-García, A. Martínez-Alonso, J.M.D. Tascón, Activated
carbon fibers with a high content of surface functional groups by phosphoric acid activation
of PPTA, J Colloid Interf Sci 361(2011), 307-315.
[13] X. Ma, F. Zhang, J. Zhu, Preparation of highly developed mesoporous activated carbon
fiber from liquefied wood using wood charcoal as additive and its adsorption of methylene
blue from solution, Bioresource Technol. 164(2014) 1-6.
[14] H. Oda, A. Yamashita, S. Minoura, M. Okamoto, T. Morimoto, Modification of the
oxygen-containing functional group on activated carbon fiber in electrodes of an electric
double-layer capacitor, J Power Sources 158(2006), 1510-1516. [15] S. Brunauer, P.H. Emmett, E. Teller, Adsorption of gases in multimolecular layers, J Am
Chem Soc. 60(1938) 309-319.
[16] J.H. de Boer, B.C. Lippens, B.G. Linsen, J.C.P. Broekhoff, A. van den Heuvel, T.J.
Osinga, The t-curve of multimolecular N2-adsorption, J Colloid Interf Sci. 21(1966) 405-414.
[17] C. Lastoskie, K.E. Gubbins, N. Quirke, Pore size distribution analysis of microporous
carbons: a density functional theory approach, The Journal of Physical Chemistry. 97(1993)
4786-4796.
[18] X. Ma, H. Yang, L. Yu, Y. Chen, Y. Li, Preparation, Surface and Pore Structure of High
Surface Area Activated Carbon Fibers from Bamboo by Steam Activation, Materials. (2014)
4431-4441.
[19] Z. Ryu, H. Rong, J. Zheng, M. Wang, B. Zhang, Microstructure and chemical analysis of
PAN-based activated carbon fibers prepared by different activation methods, Carbon.
40(2002) 1131-1150.
[20] L. Wang, X. Wang, B. Zou, X. Ma, Y. Qu, C. Rong, Y. Li, Y. Su, Z. Wang, Preparation
of carbon black from rice husk by hydrolysis, carbonization and pyrolysis, Bioresource
Technol. 102(2011) 8220-24.
[21] D.W. McKee, Gasification of graphite in carbon dioxide and water vapor—the catalytic
effects of alkali metal salts, Carbon. 20(1982) 59-66.
[22] Q. Qian, M. Machida, H. Tatsumoto, Preparation of activated carbons from cattle-
manure compost by zinc chloride activation, Bioresource Technol. 98(2007) 353-360.
[23] E. Raymundo-Piñero, D. Cazorla-Amorós, A. Linares-Solano, S. Delpeux, E.
Frackowiak, K. Szostak, F. Béguin, High surface area carbon nanotubes prepared by
chemical activation, Carbon.40(2002) 1614-1617.
[24] X. Dai, X. Liu, L. Qian, Z. Yan, J. Zhang, A novel method to synthesize super-activated
carbon for natural gas adsorptive storage, J Porous Mater. 13(2006) 399-405.
Proceedings of the 58th International Convention of
Society of Wood Science and Technology
June 7-12, 2015 - Grand Teton National Park, Jackson, Wyoming, USA
41
[25] S. Shin, J. Jang, S.H. Yoon, I. Mochida, A study on the effect of heat treatment on
functional groups of pitch based activated carbon fiber using FTIR, Carbon 35(1997) 1739-
1743.
[26] J. Xu, L. Chen, H. Qu, Y. Jiao, J. X. Preparation and characterization of activated carbon
from reedy grass leaves by chemical activation with H3PO4, Appl. Surf. Sci. 320(2014) 674-
680.
[27] P. Sathya, G. Velraj, S. Meyvel, Fourier transform infrared spectroscopic study of
ancient brick samples from Salavankuppam Region, Tamilnadu, India, Advances in Applied
Science Research, 3(2012) 776-779.
[28] X.D. Ma, F. Ouyang, Adsorption properties of biomass-based activation carbon prepared
with spent coffee grounds and pomelo skin by phosphoric acid activation, Appl. Surf. Sci.
280(2013) 1-7.
[29] M. Benadjemia, L. Millière, L. Reinert, N. Benderdouche, Preparation, characterization
and methylene blue adsorption of phosphoric acid activated carbons from globe artichoke
leaves, Fuel Process. Technol. 92(2011) 1203-1212.
[30] I.V. Pavlidis, T. Vorhaben, T. Tsoufis, P. Rudolf, U.T. Bornscheuer, D. Gournis, H.
Stamatis, Development of effective nanobiocatalytic systems through the immobilization of
hydrolases on functionalized carbon-based nanomaterials, Bioresource Technol. 115(2012)
164-171.
Proceedings of the 58th International Convention of
Society of Wood Science and Technology
June 7-12, 2015 - Grand Teton National Park, Jackson, Wyoming, USA
42
Design for Environment: Use of Renewable
Materials Session Moderator: Andreja Kutnar, University of Primorska,
Slovenia
Environmental Product Design of
Wood-Plastic Composites
Philipp F. Sommerhuber
Research Associate, Thünen Institute of Wood Research, Hamburg, Germany
Abstract
The European bio-economy is promoting wood for products and energy use in our society.
Resource efficiency has become an important issue for the harvested timber products industry
through increasing prices of wood particles and market competition. Production and use of
wood-plastic composites (WPC) are projected to increase, alongside with a decreased
availability of suitable wood particles. This conflict leads to considerations of using
alternative resources, like secondary resources from the waste stream. Mechanical properties
of WPC made from virgin and recycled high-density polyethylene (HDPE), virgin spruce and
recycled wood are investigated. Flexural properties are not affected by the use of recycled
content and are comparable to WPC made from virgin content. Impact strength of recycled
composites is lower. A ratio of 30% recycled wood particles with 70% recycled HDPE and
3% maleic anhydride polyolefin (MaPE) is a promising WPC mixture in terms of resource
efficiency when compared to the mechanical properties of virgin WPC.
Keywords
Wood-Plastic Composite; cascade use; circular economy; waste valorization; recycled wood
and plastics; mechanical properties
Proceedings of the 58th International Convention of
Society of Wood Science and Technology
June 7-12, 2015 - Grand Teton National Park, Jackson, Wyoming, USA
43
Introduction
Wood resources are facing a strong competition between material and energy utilization
through the promotion of wood-based products and an increased share of renewable biomass
for the provision of energy in Europe. In Germany, 35% (25.4 Mio m³) of harvested wood
were directly used as energy carrier in 2011. The biggest share is used in households for
heating (Junker et al. 2014, Seintsch and Weimar 2012). Based on market information of
waste wood trade in Germany from Mantau et al. (2012), 78.3% of the waste wood is
energetically used and 21% is used materially. Landfill is almost negligible (0.5%) due to the
ban of organic waste on landfills fixed by the European Waste Framework Directive
2008/98/EC (European Commission 2008) and its implementation in Germany.
Post-consumer wood has become an important secondary raw material, i.e. for the
particleboard industry. However, through the lack of a sophisticated material cascade chain in
our society, more waste wood is burned than materially used. This issue has led to an increase
in prices of wooden co-products and waste wood and has already negatively affected the
economy of the wood panel industry.
About 30% of this energetically used waste wood can be classified as AI-AII according to the
German Recycled Wood Directive AltholzV (AltholzV 2012). This classified waste wood
could have been used as a raw material for wood-based products first, instead of being
directly burned as an energy carrier. This leads to loosing valuable resources.
These secondary wood resources could have been used in Wood-Plastic Composites (WPC)
products. On a global perspective, Europe is the third largest producer of WPC. The
predominant thermoplastic polymers used for WPC are Polyethylene (PE) and Polypropylene
(PP) – each polymers comprise a share of 37% – and Polyvinylchloride (PVC) with a share of
26% (Eder 2013). These resources are mostly derived from virgin fossil-based hydrocarbon
sources, what implies significant environmental impacts.
This article focuses on the utilization of potential secondary resources for WPC. Research has
been conducted by Kamdem et al. (2004). The authors compared mechanical properties of
WPC made from chromated copper arsenate (CCA) treated wood particles blended with
virgin and recycled high-density polyethylene (HDPE). Chaharmahali et al. (2008) studied
the possibility of producing wood-plastic panels using a melt blend/hot press method from
medium-density fiberboard and particleboard with 60 – 80% wood content as filler with
recycled HDPE from milk bottles. Shalbafan et al. (2013) demonstrated flat pressed WPCs
produced from residues of light-weight foam core particleboards which consisted of wood
particles (with cured urea-formaldehyde resin) and expanded polystyrene.
These articles state that WPC can be produced from recycled resources but a broader
perspective on the availability and price situation of the resources is missing. The aim of this
research project is to develop a methodology for evaluating the use of resources for WPC,
considering technical, economic, environmental and social aspects, and for contributing to an
environmental product design of WPC. The first step is to identify alternative resources for
WPC on a macro-economic level and to evaluate differences of mechanical properties of
WPC produced from virgin and recycled resources. In the next step, Life Cycle Assessment
(LCA) of WPC from virgin and recycled content will be conducted with a focus on
mechanical properties. Multi Criteria Analysis (MCA) evaluates the different resource
Proceedings of the 58th International Convention of
Society of Wood Science and Technology
June 7-12, 2015 - Grand Teton National Park, Jackson, Wyoming, USA
44
alternatives based on their mechanical behavior, economic and socio-technical aspects in
WPC. In this paper, first results of the mechanical properties of virgin and recycled content
WPC are presented.
Materials & Methods
Materials
Virgin wood (spruce – Picea abies) and recycled wood are mixed in various fractions with
virgin and recycled HDPE by adding Maleic anhydride polyolefin (MaPE).
Wood. The recycled wood was provided by a local recycling company in Hamburg,
Germany, in October 2014 and is predominantly composed of used transport pallets and some
post-consumer derived timber products. The waste wood category can be classified as A II
according to the German Recycled Wood Directive (AltholzV 2012), although
contaminations were not tested specifically. The transport pallets were chipped at the
recycling site to a particle size of < 200 mm. The moisture content was calculated to 33% at
delivery at the lab.
Kiln dried virgin spruce was chosen for the comparison. The dimension of the board was
2000 x 165 x 30 mm³ with an average density of 430 kg/m³ (Rüter and Diederichs 2012). The
moisture content was estimated to 10 – 15%.
Plastics. The recycled HDPE granulate was provided by INTERSEROH Dienstleistungs GmbH,
a recycling company which collects and recycles post-consumer packaging waste, besides other
services. It is a licensed party of Dual System, which is the take-back system of sales packaging
in Germany. According to the data sheet of ALBA recythen® HD 2, the recycled plastic is a
mixture of various types of polyethylene with a predominant HDPE content. It can be used
for injection molding and extrusion. The melt flow index (190/5) is 2 g/10min according to
DIN ISO 1133 and the density is 940 kg/m³ according to DIN EN ISO 1183.
Virgin HDPE was chosen because of the mass flow index (MFI) properties of ALBA
recythen® HD 2. Virgin HDPE is derived from a company situated in Saudi Arabia and has a
MFI of 1.8 g/10min according to ISO 1133 and a density of 952 kg/m³ according to ISO
1183.
Additives. MaPE was used as the coupling agent. It has a MFI of 2 g/10 min and a density of
890 kg/m³, both specifications according to ISO 1133.
Experimental design is presented in Table 1. Wood and plastic content of the WPC formulas
are calculated on the basis of 97% (100% WPC – 3% MaPE).
Wood content 0% 30% 60%
Specimen
A
rPE
0/100
B
pPE
0/100
C
rWPC
30/70
D
pWPC
30/70
E
rWPC
60/30
F
pWPC
60/30
Proceedings of the 58th International Convention of
Society of Wood Science and Technology
June 7-12, 2015 - Grand Teton National Park, Jackson, Wyoming, USA
45
Waste wood A I-II - - 29% - 58% -
ALBA recythen® HD 2 100% - 68% - 39% -
Virgin spruce - - - 29% - 58%
Virgin HDPE - 100% - 68% - 39%
MaPE - - 3% 3% 3% 3%
Table 1. Experimental design. r… indicates recycling content; p… indicates virgin content.
Methods
Experimental Processing. The recycled wood had to be manually sorted for nails and cut in
two steps from < 200 mm to < 100 mm by a counter blade cutter to get a homogenous
particle size distribution for the drying process. The waste wood chips were dried at 80°C for
30 min. until 4% equilibrium moisture content was reached. Moisture content of the dried
wood chips was measured to 5.6% after 24h at 103°C.
The virgin wooden boards were sawn to smaller sticks and cut using the same counter blade
cutter to < 100 mm. No sorting and drying was needed. The waste wood chips and virgin
wood chips were milled with 1 mm mesh size in a Retsch laboratory mill. Moisture content of
9% for the virgin wood was measured after 24h at 103°C.
Virgin and recycled HDPE and MaPE were obtained as directly usable for compounding. The
wood particles had to be oven-dried for 24h at 103°C to be compoundable with the plastic
particles and MaPE in a laboratory internal mixer named HAAKE Reomix 3000 OS. The
material was fed manually and compounded with tangential counter-rotating twin-screw
extruder geometries. The process temperature was 170°C for 15 minutes compounding
duration. After the WPC mixtures were cooled down, they were milled in the Retsch
laboratory mill with 8 mm mesh size.
The milled WPC granulates were pressed to flat panels in a metal frame sized
250 x 170 x 4 mm³ using a Siempelkamp computerized hydraulic heating press. The process
temperature was 180°C.
Characterization. The specimens were conditioned in 20°C/65% atmosphere until constant
mass < 0.1% after 24h was reached and tested in the same conditions. Rod-shaped specimens
(80 x 10 x 4 mm³) were used for all tests. Flexural test was conducted according to DIN EN
ISO 178. Charpy impact test (acU) was conducted according to DIN EN ISO 179-1 edgewise
for flat pressed panel conditions (1eUb).
Results and Discussion
Mechanical characterization
Results of material characterization are presented in Table 2.
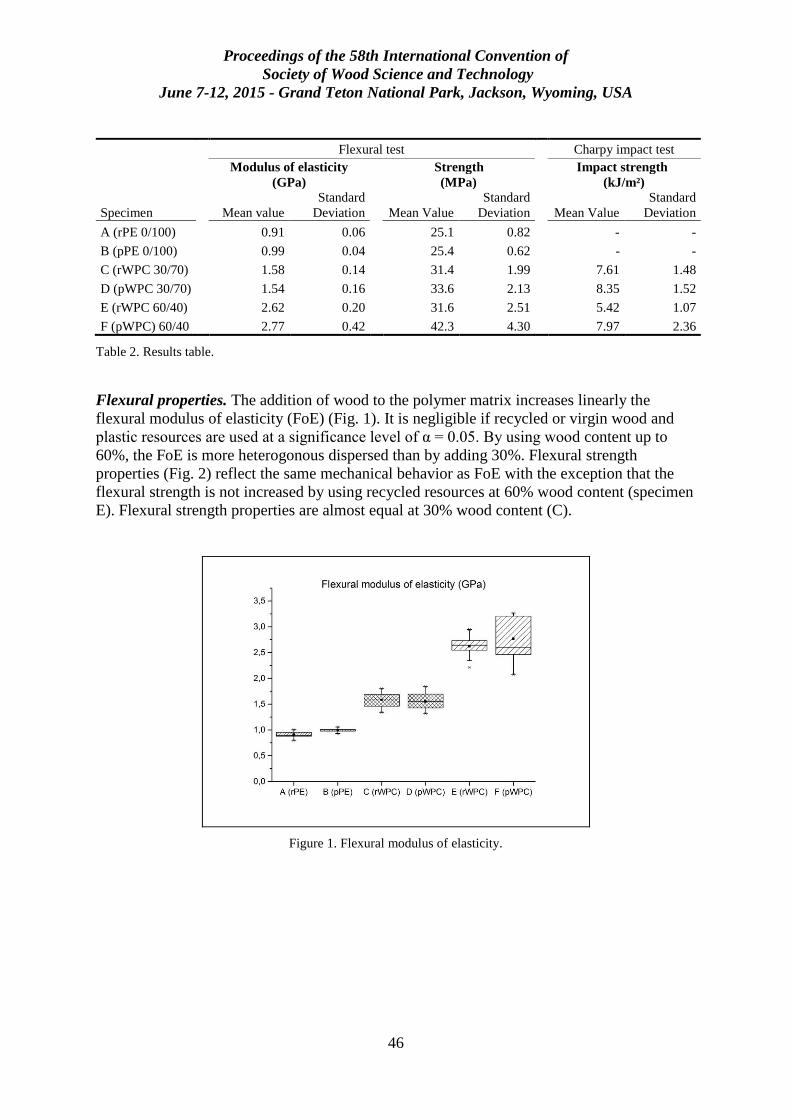
Proceedings of the 58th International Convention of
Society of Wood Science and Technology
June 7-12, 2015 - Grand Teton National Park, Jackson, Wyoming, USA
46
Flexural test
Charpy impact test
Modulus of elasticity
(GPa)
Strength
(MPa)
Impact strength
(kJ/m²)
Specimen Mean value
Standard
Deviation
Mean Value
Standard
Deviation
Mean Value
Standard
Deviation
A (rPE 0/100) 0.91 0.06 25.1 0.82 - -
B (pPE 0/100) 0.99 0.04 25.4 0.62 - -
C (rWPC 30/70) 1.58 0.14 31.4 1.99 7.61 1.48
D (pWPC 30/70) 1.54 0.16 33.6 2.13 8.35 1.52
E (rWPC 60/40) 2.62 0.20 31.6 2.51 5.42 1.07
F (pWPC) 60/40 2.77 0.42 42.3 4.30 7.97 2.36
Table 2. Results table.
Flexural properties. The addition of wood to the polymer matrix increases linearly the
flexural modulus of elasticity (FoE) (Fig. 1). It is negligible if recycled or virgin wood and
plastic resources are used at a significance level of α = 0.05. By using wood content up to
60%, the FoE is more heterogonous dispersed than by adding 30%. Flexural strength
properties (Fig. 2) reflect the same mechanical behavior as FoE with the exception that the
flexural strength is not increased by using recycled resources at 60% wood content (specimen
E). Flexural strength properties are almost equal at 30% wood content (C).
Figure 1. Flexural modulus of elasticity.
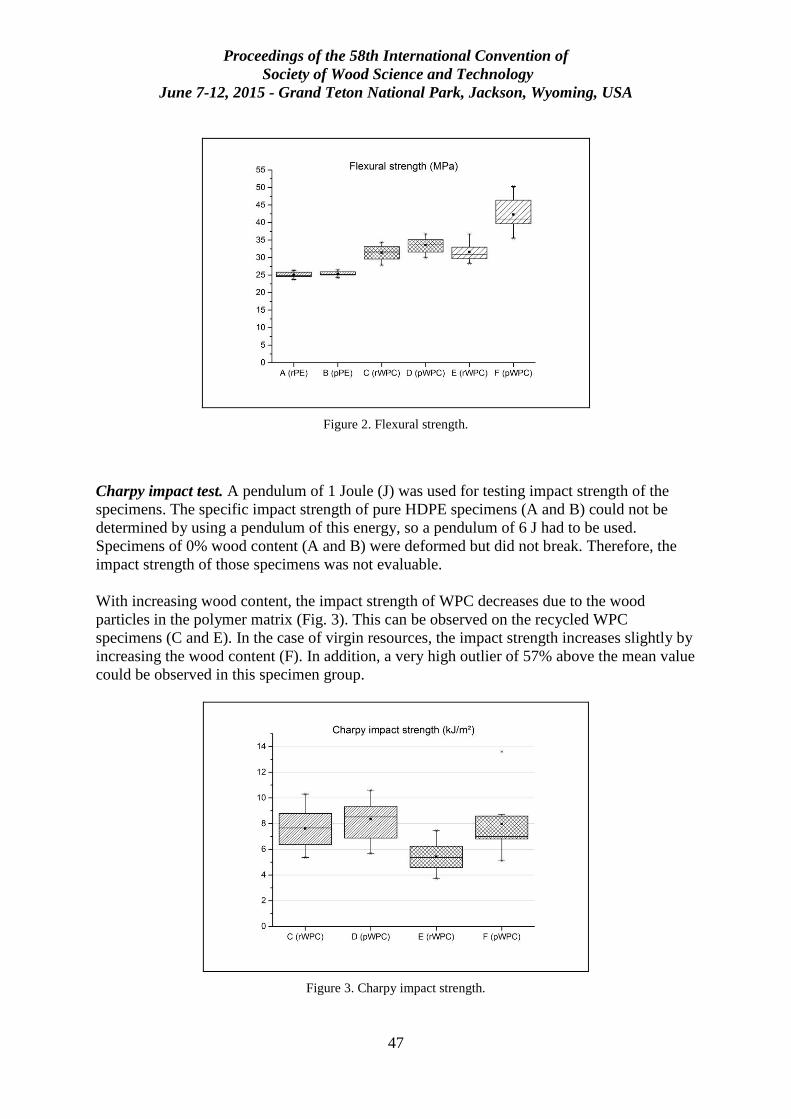
Proceedings of the 58th International Convention of
Society of Wood Science and Technology
June 7-12, 2015 - Grand Teton National Park, Jackson, Wyoming, USA
47
Figure 2. Flexural strength.
Charpy impact test. A pendulum of 1 Joule (J) was used for testing impact strength of the
specimens. The specific impact strength of pure HDPE specimens (A and B) could not be
determined by using a pendulum of this energy, so a pendulum of 6 J had to be used.
Specimens of 0% wood content (A and B) were deformed but did not break. Therefore, the
impact strength of those specimens was not evaluable.
With increasing wood content, the impact strength of WPC decreases due to the wood
particles in the polymer matrix (Fig. 3). This can be observed on the recycled WPC
specimens (C and E). In the case of virgin resources, the impact strength increases slightly by
increasing the wood content (F). In addition, a very high outlier of 57% above the mean value
could be observed in this specimen group.
Figure 3. Charpy impact strength.
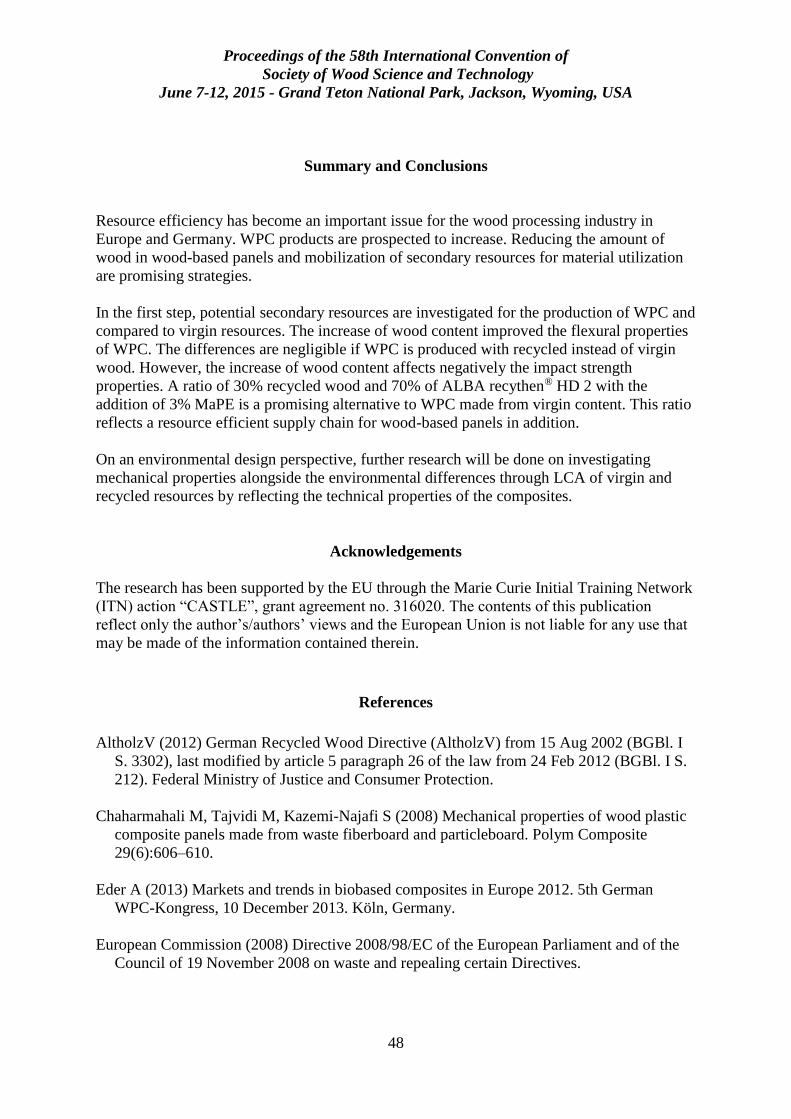
Proceedings of the 58th International Convention of
Society of Wood Science and Technology
June 7-12, 2015 - Grand Teton National Park, Jackson, Wyoming, USA
48
Summary and Conclusions
Resource efficiency has become an important issue for the wood processing industry in
Europe and Germany. WPC products are prospected to increase. Reducing the amount of
wood in wood-based panels and mobilization of secondary resources for material utilization
are promising strategies.
In the first step, potential secondary resources are investigated for the production of WPC and
compared to virgin resources. The increase of wood content improved the flexural properties
of WPC. The differences are negligible if WPC is produced with recycled instead of virgin
wood. However, the increase of wood content affects negatively the impact strength
properties. A ratio of 30% recycled wood and 70% of ALBA recythen® HD 2 with the
addition of 3% MaPE is a promising alternative to WPC made from virgin content. This ratio
reflects a resource efficient supply chain for wood-based panels in addition.
On an environmental design perspective, further research will be done on investigating
mechanical properties alongside the environmental differences through LCA of virgin and
recycled resources by reflecting the technical properties of the composites.
Acknowledgements
The research has been supported by the EU through the Marie Curie Initial Training Network
(ITN) action “CASTLE”, grant agreement no. 316020. The contents of this publication
reflect only the author’s/authors’ views and the European Union is not liable for any use that
may be made of the information contained therein.
References
AltholzV (2012) German Recycled Wood Directive (AltholzV) from 15 Aug 2002 (BGBl. I
S. 3302), last modified by article 5 paragraph 26 of the law from 24 Feb 2012 (BGBl. I S.
212). Federal Ministry of Justice and Consumer Protection.
Chaharmahali M, Tajvidi M, Kazemi-Najafi S (2008) Mechanical properties of wood plastic
composite panels made from waste fiberboard and particleboard. Polym Composite
29(6):606–610.
Eder A (2013) Markets and trends in biobased composites in Europe 2012. 5th German
WPC-Kongress, 10 December 2013. Köln, Germany.
European Commission (2008) Directive 2008/98/EC of the European Parliament and of the
Council of 19 November 2008 on waste and repealing certain Directives.
Proceedings of the 58th International Convention of
Society of Wood Science and Technology
June 7-12, 2015 - Grand Teton National Park, Jackson, Wyoming, USA
49
Junker F, Haß M, Hubold G, Kreins P, Salamon P, Seintsch B (2014) Potenziale einer
biobasierten Wirtschaft. Thünen Institute, Braunschweig. 35 pp. In German with summary
in English.
Kamdem P, Jiang H, Cui W, Freed J, Matuana LM (2004) Properties of wood plastic
composites made of recycled HDPE and wood flour from CCA-treated wood removed
from service. Compos Part A-APPL S 35(3):347–355.
Mantau U, Weimar H, Kloock T (2012) Standorte der Holzwirtschaft -
Holzrohstoffmonitoring. Altholz im Entsorgungsmarkt - Aufkommens- und
Vertriebsstruktur 2010. Universität Hamburg, Zentrum Holzwirtschaft; Johann Heinrich
von Thünen-Institut, Hamburg. 65 pp.
Rüter S, Diederichs S (2012) Ökobilanz-Basisdaten für Bauprodukte aus Holz. Johann
Heinrich von Thünen-Institut; Universität Hamburg, Zentrum Holzwirtschaft, Hamburg.
316 pp. In German with summary in English.
Seintsch B, Weimar H (2012) Actual sitation and future perspectives for supply and demand
for hardwood in Germany in N Róbert and A Teischinger, eds The 5th conference on
hardwood research and utilization in Europe. 6-7 September, Sopron, Hungary.
Shalbafan A, Benthien JT, Welling J, Barbu MC (2013) Flat pressed wood plastic composites
made of milled foam core particleboard residues. Holz Roh Werkst 71(6):805–813.
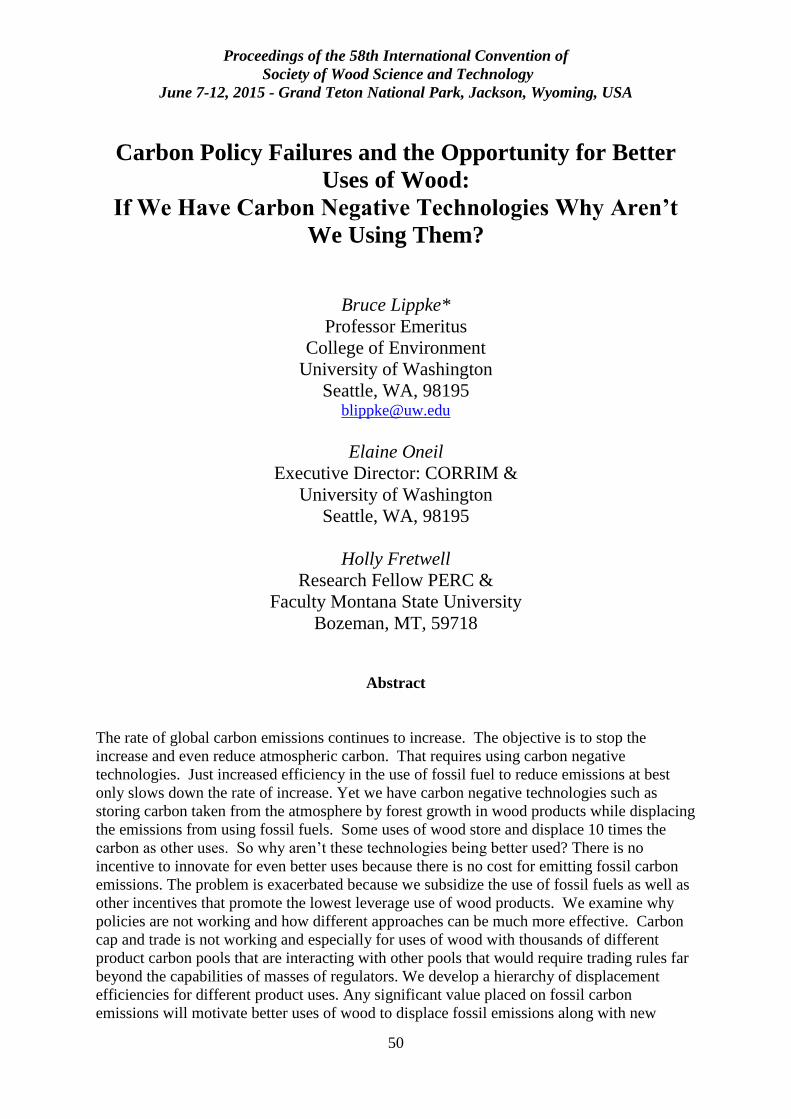
Proceedings of the 58th International Convention of
Society of Wood Science and Technology
June 7-12, 2015 - Grand Teton National Park, Jackson, Wyoming, USA
50
Carbon Policy Failures and the Opportunity for Better
Uses of Wood:
If We Have Carbon Negative Technologies Why Aren’t
We Using Them?
Bruce Lippke*
Professor Emeritus
College of Environment
University of Washington
Seattle, WA, 98195 [email protected]
Elaine Oneil
Executive Director: CORRIM &
University of Washington
Seattle, WA, 98195
Holly Fretwell
Research Fellow PERC &
Faculty Montana State University
Bozeman, MT, 59718
Abstract
The rate of global carbon emissions continues to increase. The objective is to stop the
increase and even reduce atmospheric carbon. That requires using carbon negative
technologies. Just increased efficiency in the use of fossil fuel to reduce emissions at best
only slows down the rate of increase. Yet we have carbon negative technologies such as
storing carbon taken from the atmosphere by forest growth in wood products while displacing
the emissions from using fossil fuels. Some uses of wood store and displace 10 times the
carbon as other uses. So why aren’t these technologies being better used? There is no
incentive to innovate for even better uses because there is no cost for emitting fossil carbon
emissions. The problem is exacerbated because we subsidize the use of fossil fuels as well as
other incentives that promote the lowest leverage use of wood products. We examine why
policies are not working and how different approaches can be much more effective. Carbon
cap and trade is not working and especially for uses of wood with thousands of different
product carbon pools that are interacting with other pools that would require trading rules far
beyond the capabilities of masses of regulators. We develop a hierarchy of displacement
efficiencies for different product uses. Any significant value placed on fossil carbon
emissions will motivate better uses of wood to displace fossil emissions along with new
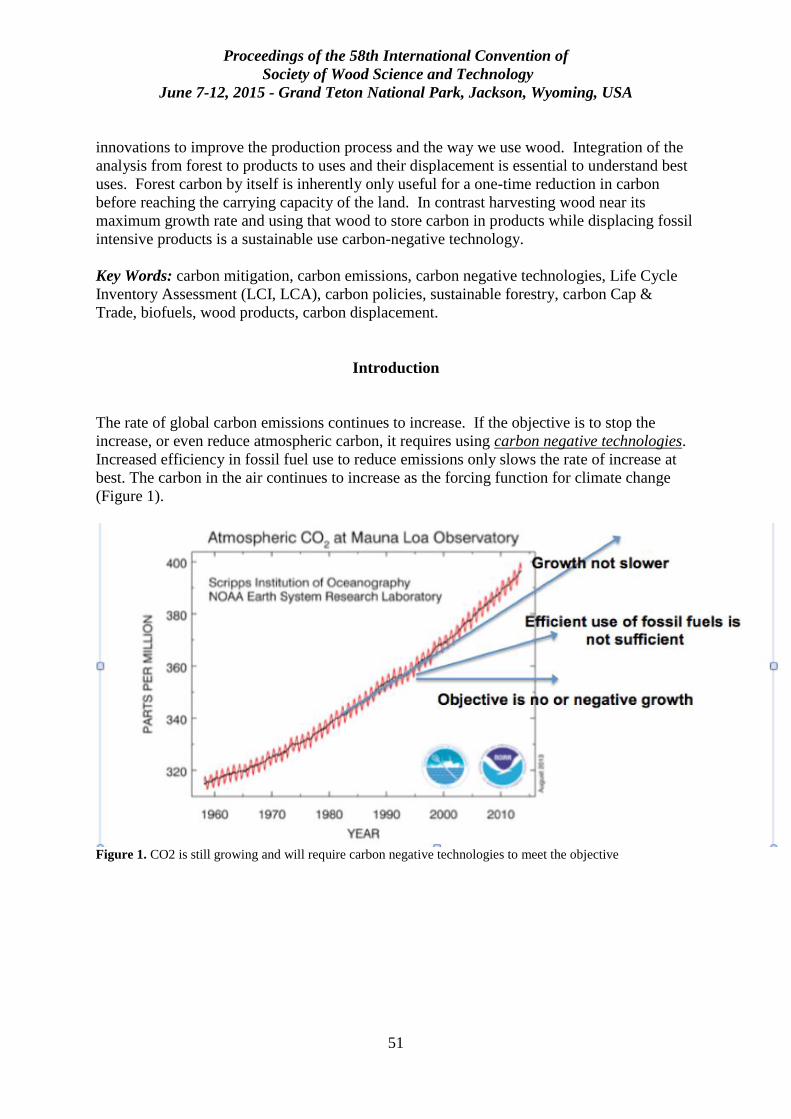
Proceedings of the 58th International Convention of
Society of Wood Science and Technology
June 7-12, 2015 - Grand Teton National Park, Jackson, Wyoming, USA
51
innovations to improve the production process and the way we use wood. Integration of the
analysis from forest to products to uses and their displacement is essential to understand best
uses. Forest carbon by itself is inherently only useful for a one-time reduction in carbon
before reaching the carrying capacity of the land. In contrast harvesting wood near its
maximum growth rate and using that wood to store carbon in products while displacing fossil
intensive products is a sustainable use carbon-negative technology.
Key Words: carbon mitigation, carbon emissions, carbon negative technologies, Life Cycle
Inventory Assessment (LCI, LCA), carbon policies, sustainable forestry, carbon Cap &
Trade, biofuels, wood products, carbon displacement.
Introduction
The rate of global carbon emissions continues to increase. If the objective is to stop the
increase, or even reduce atmospheric carbon, it requires using carbon negative technologies.
Increased efficiency in fossil fuel use to reduce emissions only slows the rate of increase at
best. The carbon in the air continues to increase as the forcing function for climate change
(Figure 1).
Figure 1. CO2 is still growing and will require carbon negative technologies to meet the objective
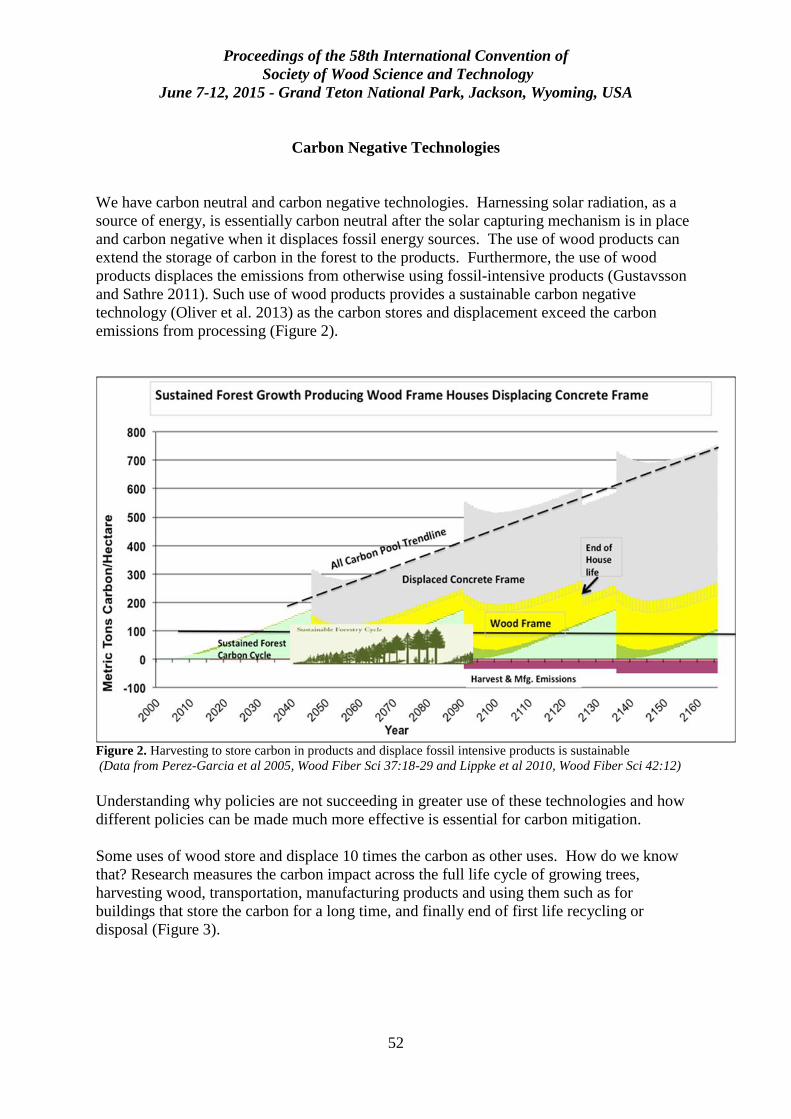
Proceedings of the 58th International Convention of
Society of Wood Science and Technology
June 7-12, 2015 - Grand Teton National Park, Jackson, Wyoming, USA
52
Carbon Negative Technologies
We have carbon neutral and carbon negative technologies. Harnessing solar radiation, as a
source of energy, is essentially carbon neutral after the solar capturing mechanism is in place
and carbon negative when it displaces fossil energy sources. The use of wood products can
extend the storage of carbon in the forest to the products. Furthermore, the use of wood
products displaces the emissions from otherwise using fossil-intensive products (Gustavsson
and Sathre 2011). Such use of wood products provides a sustainable carbon negative
technology (Oliver et al. 2013) as the carbon stores and displacement exceed the carbon
emissions from processing (Figure 2).
Figure 2. Harvesting to store carbon in products and displace fossil intensive products is sustainable
(Data from Perez-Garcia et al 2005, Wood Fiber Sci 37:18-29 and Lippke et al 2010, Wood Fiber Sci 42:12)
Understanding why policies are not succeeding in greater use of these technologies and how
different policies can be made much more effective is essential for carbon mitigation.
Some uses of wood store and displace 10 times the carbon as other uses. How do we know
that? Research measures the carbon impact across the full life cycle of growing trees,
harvesting wood, transportation, manufacturing products and using them such as for
buildings that store the carbon for a long time, and finally end of first life recycling or
disposal (Figure 3).
Proceedings of the 58th International Convention of
Society of Wood Science and Technology
June 7-12, 2015 - Grand Teton National Park, Jackson, Wyoming, USA
53
Figure 3. Life Cycle Inventories – ‘cradle to grave’ (adopted from Perez-Garcia et al 2005)
CORRIM 1F
1 (the Consortium for Research on Renewable Industrial Products) used forest
inventory data from the USFS Forest Inventory Analysis, collected primary survey data on all
the life cycle inputs (resources & energy) for producing mills for each major wood species
and product as well as all the outputs (products, co-products, water and air emissions, waste)
to generate a full life cycle impact analysis of inputs and outputs across all stages of
processing from cradle to grave. It enables the comparison of each wood use to non-wood
alternatives such as wood products versus steel; wood frame versus concrete framing; wood
versus glass, plastic, or metal tables and chairs (and many more products); each with different
efficiencies in displacing carbon emissions.
Policy Failures
Why aren’t carbon technologies in high demand? Under current policies there is no incentive
to select better ways to mitigate carbon emissions. There is no cost penalty for producing
fossil emissions into the atmosphere. The attempts to provide incentives for better uses of the
wood do not consider the hierarchy in efficiency for displacing carbon by each different use
of the wood (Figure 4). Similarly, there is no motive to innovate for even better products,
designs, and uses.
1 CORRIM is organized as a not for profit research corporation, a consortium of 19 Research Organizations (mostly
universities) developing life cycle information on all wood uses. Funding has been provided largely by USFS and DOE
research grants and private donors. www.CORRIM.org
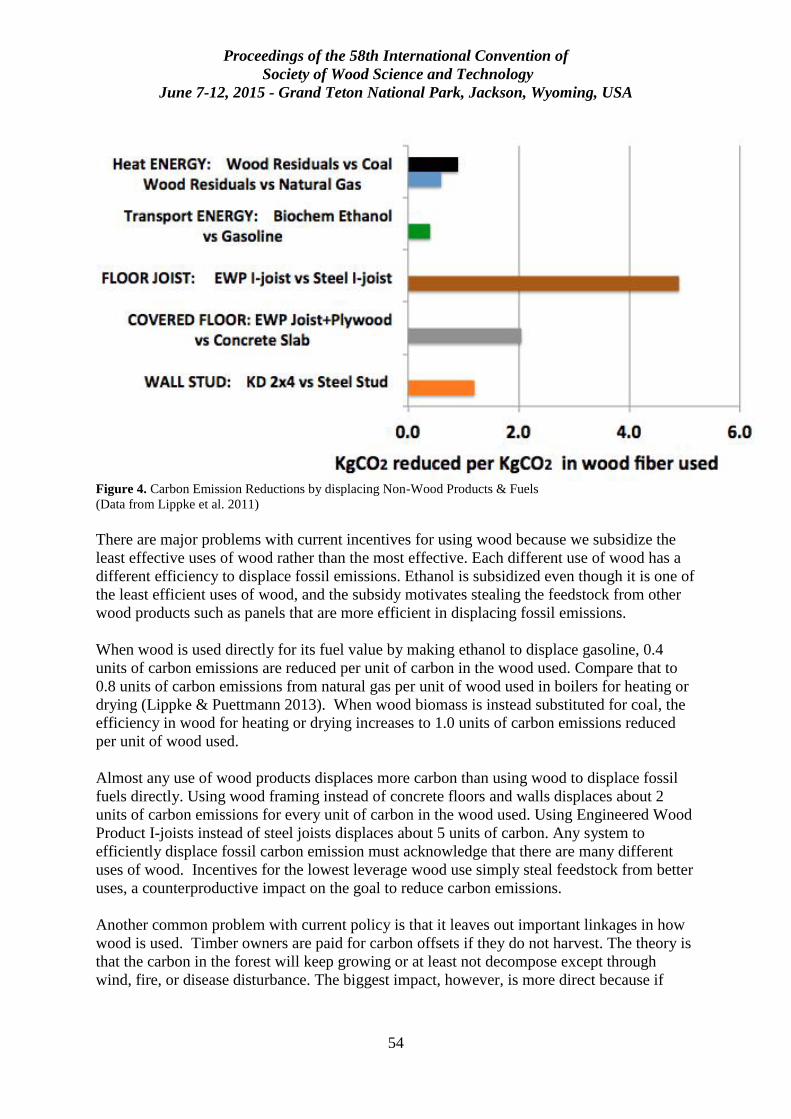
Proceedings of the 58th International Convention of
Society of Wood Science and Technology
June 7-12, 2015 - Grand Teton National Park, Jackson, Wyoming, USA
54
Figure 4. Carbon Emission Reductions by displacing Non-Wood Products & Fuels
(Data from Lippke et al. 2011)
There are major problems with current incentives for using wood because we subsidize the
least effective uses of wood rather than the most effective. Each different use of wood has a
different efficiency to displace fossil emissions. Ethanol is subsidized even though it is one of
the least efficient uses of wood, and the subsidy motivates stealing the feedstock from other
wood products such as panels that are more efficient in displacing fossil emissions.
When wood is used directly for its fuel value by making ethanol to displace gasoline, 0.4
units of carbon emissions are reduced per unit of carbon in the wood used. Compare that to
0.8 units of carbon emissions from natural gas per unit of wood used in boilers for heating or
drying (Lippke & Puettmann 2013). When wood biomass is instead substituted for coal, the
efficiency in wood for heating or drying increases to 1.0 units of carbon emissions reduced
per unit of wood used.
Almost any use of wood products displaces more carbon than using wood to displace fossil
fuels directly. Using wood framing instead of concrete floors and walls displaces about 2
units of carbon emissions for every unit of carbon in the wood used. Using Engineered Wood
Product I-joists instead of steel joists displaces about 5 units of carbon. Any system to
efficiently displace fossil carbon emission must acknowledge that there are many different
uses of wood. Incentives for the lowest leverage wood use simply steal feedstock from better
uses, a counterproductive impact on the goal to reduce carbon emissions.
Another common problem with current policy is that it leaves out important linkages in how
wood is used. Timber owners are paid for carbon offsets if they do not harvest. The theory is
that the carbon in the forest will keep growing or at least not decompose except through
wind, fire, or disease disturbance. The biggest impact, however, is more direct because if
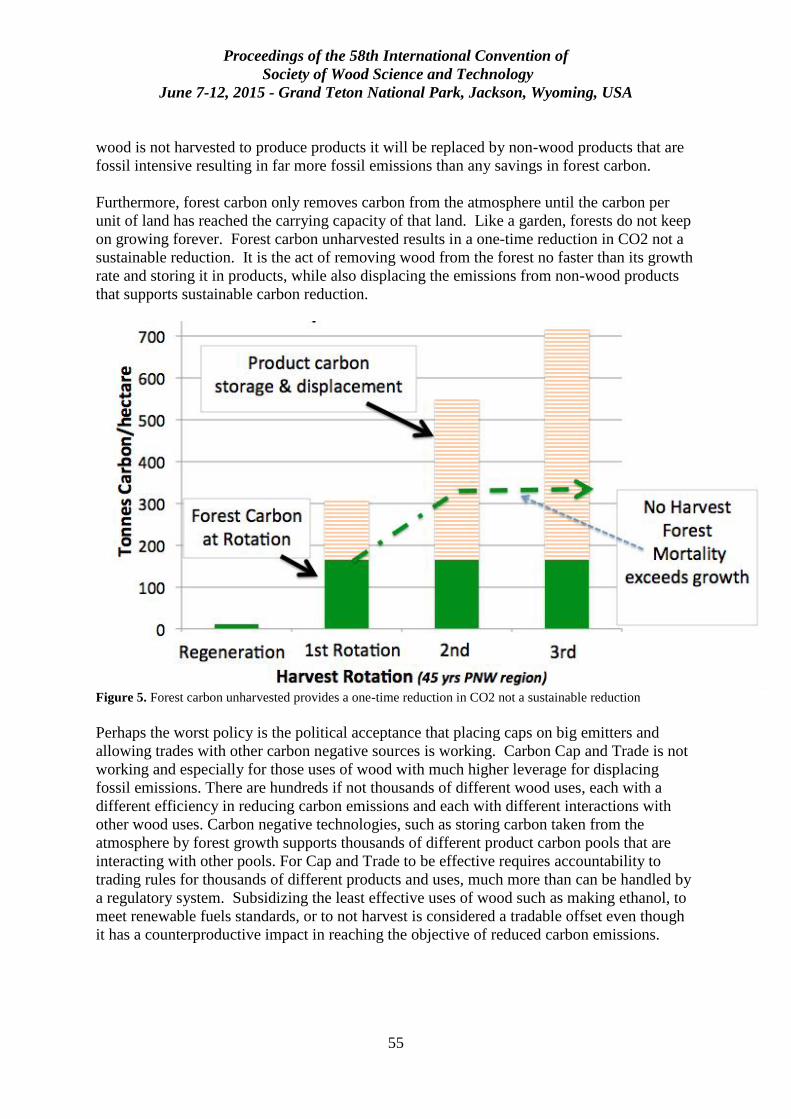
Proceedings of the 58th International Convention of
Society of Wood Science and Technology
June 7-12, 2015 - Grand Teton National Park, Jackson, Wyoming, USA
55
wood is not harvested to produce products it will be replaced by non-wood products that are
fossil intensive resulting in far more fossil emissions than any savings in forest carbon.
Furthermore, forest carbon only removes carbon from the atmosphere until the carbon per
unit of land has reached the carrying capacity of that land. Like a garden, forests do not keep
on growing forever. Forest carbon unharvested results in a one-time reduction in CO2 not a
sustainable reduction. It is the act of removing wood from the forest no faster than its growth
rate and storing it in products, while also displacing the emissions from non-wood products
that supports sustainable carbon reduction.
Figure 5. Forest carbon unharvested provides a one-time reduction in CO2 not a sustainable reduction
Perhaps the worst policy is the political acceptance that placing caps on big emitters and
allowing trades with other carbon negative sources is working. Carbon Cap and Trade is not
working and especially for those uses of wood with much higher leverage for displacing
fossil emissions. There are hundreds if not thousands of different wood uses, each with a
different efficiency in reducing carbon emissions and each with different interactions with
other wood uses. Carbon negative technologies, such as storing carbon taken from the
atmosphere by forest growth supports thousands of different product carbon pools that are
interacting with other pools. For Cap and Trade to be effective requires accountability to
trading rules for thousands of different products and uses, much more than can be handled by
a regulatory system. Subsidizing the least effective uses of wood such as making ethanol, to
meet renewable fuels standards, or to not harvest is considered a tradable offset even though
it has a counterproductive impact in reaching the objective of reduced carbon emissions.
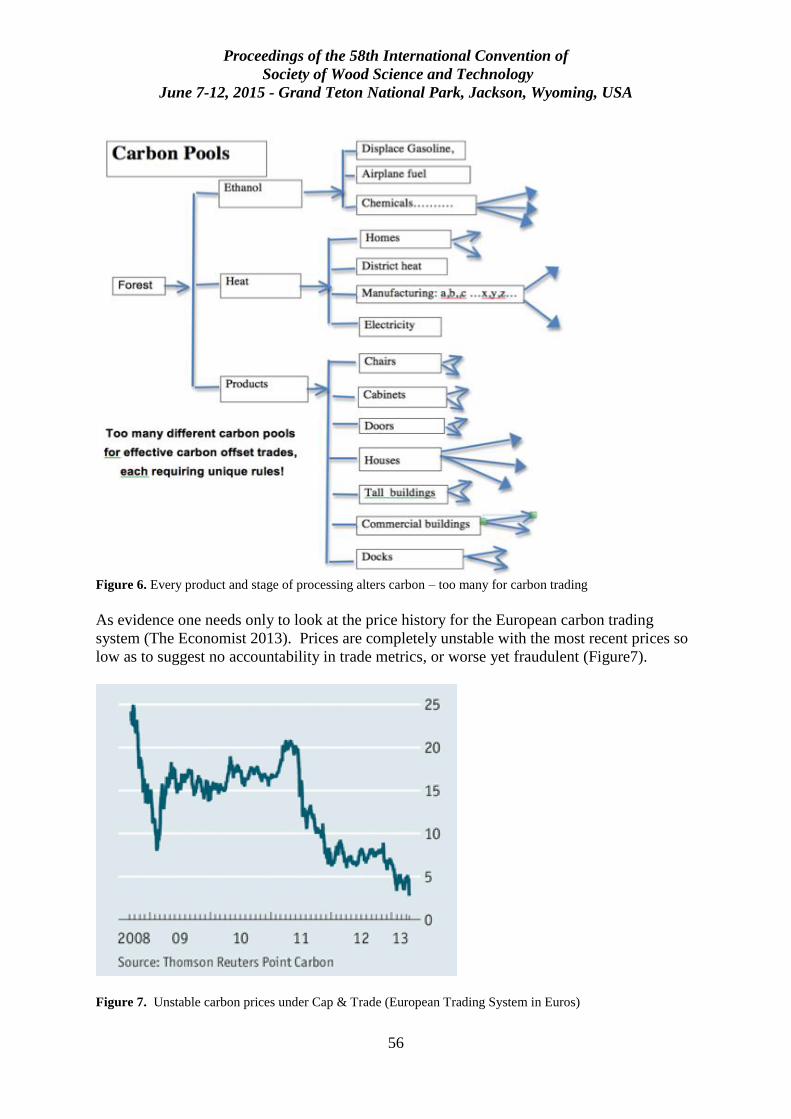
Proceedings of the 58th International Convention of
Society of Wood Science and Technology
June 7-12, 2015 - Grand Teton National Park, Jackson, Wyoming, USA
56
Figure 6. Every product and stage of processing alters carbon – too many for carbon trading
As evidence one needs only to look at the price history for the European carbon trading
system (The Economist 2013). Prices are completely unstable with the most recent prices so
low as to suggest no accountability in trade metrics, or worse yet fraudulent (Figure7).
Figure 7. Unstable carbon prices under Cap & Trade (European Trading System in Euros)
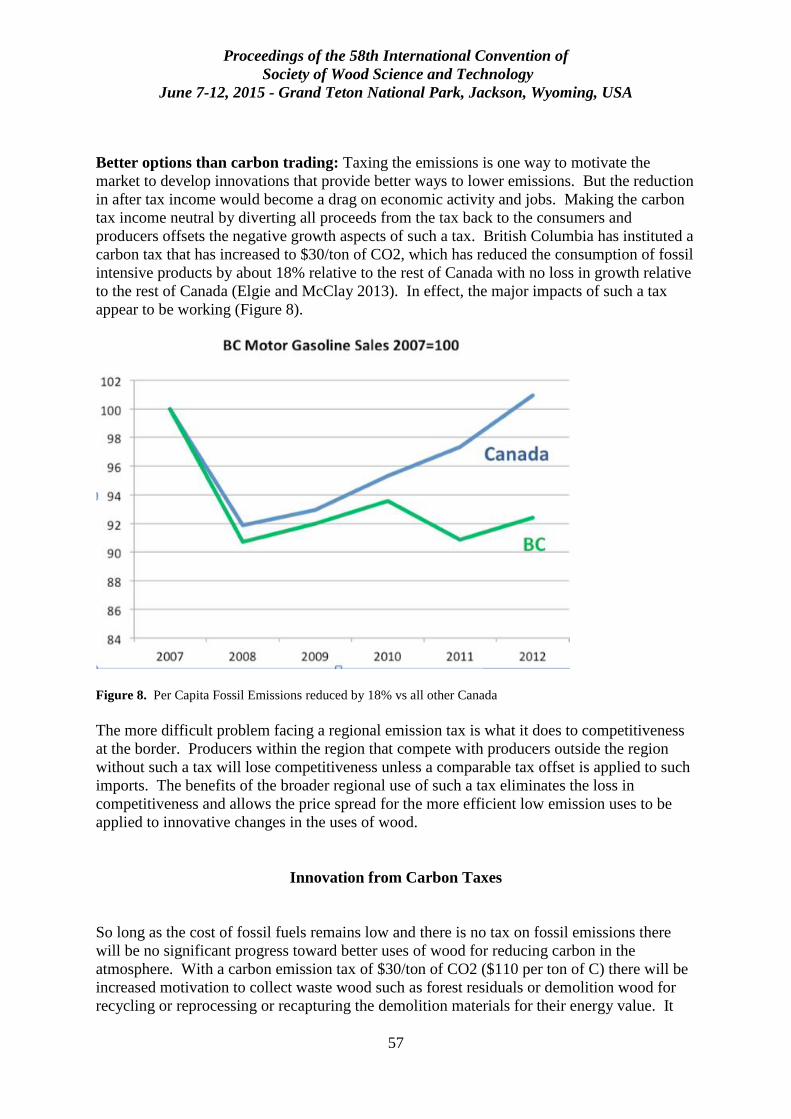
Proceedings of the 58th International Convention of
Society of Wood Science and Technology
June 7-12, 2015 - Grand Teton National Park, Jackson, Wyoming, USA
57
Better options than carbon trading: Taxing the emissions is one way to motivate the
market to develop innovations that provide better ways to lower emissions. But the reduction
in after tax income would become a drag on economic activity and jobs. Making the carbon
tax income neutral by diverting all proceeds from the tax back to the consumers and
producers offsets the negative growth aspects of such a tax. British Columbia has instituted a
carbon tax that has increased to $30/ton of CO2, which has reduced the consumption of fossil
intensive products by about 18% relative to the rest of Canada with no loss in growth relative
to the rest of Canada (Elgie and McClay 2013). In effect, the major impacts of such a tax
appear to be working (Figure 8).
Figure 8. Per Capita Fossil Emissions reduced by 18% vs all other Canada
The more difficult problem facing a regional emission tax is what it does to competitiveness
at the border. Producers within the region that compete with producers outside the region
without such a tax will lose competitiveness unless a comparable tax offset is applied to such
imports. The benefits of the broader regional use of such a tax eliminates the loss in
competitiveness and allows the price spread for the more efficient low emission uses to be
applied to innovative changes in the uses of wood.
Innovation from Carbon Taxes
So long as the cost of fossil fuels remains low and there is no tax on fossil emissions there
will be no significant progress toward better uses of wood for reducing carbon in the
atmosphere. With a carbon emission tax of $30/ton of CO2 ($110 per ton of C) there will be
increased motivation to collect waste wood such as forest residuals or demolition wood for
recycling or reprocessing or recapturing the demolition materials for their energy value. It
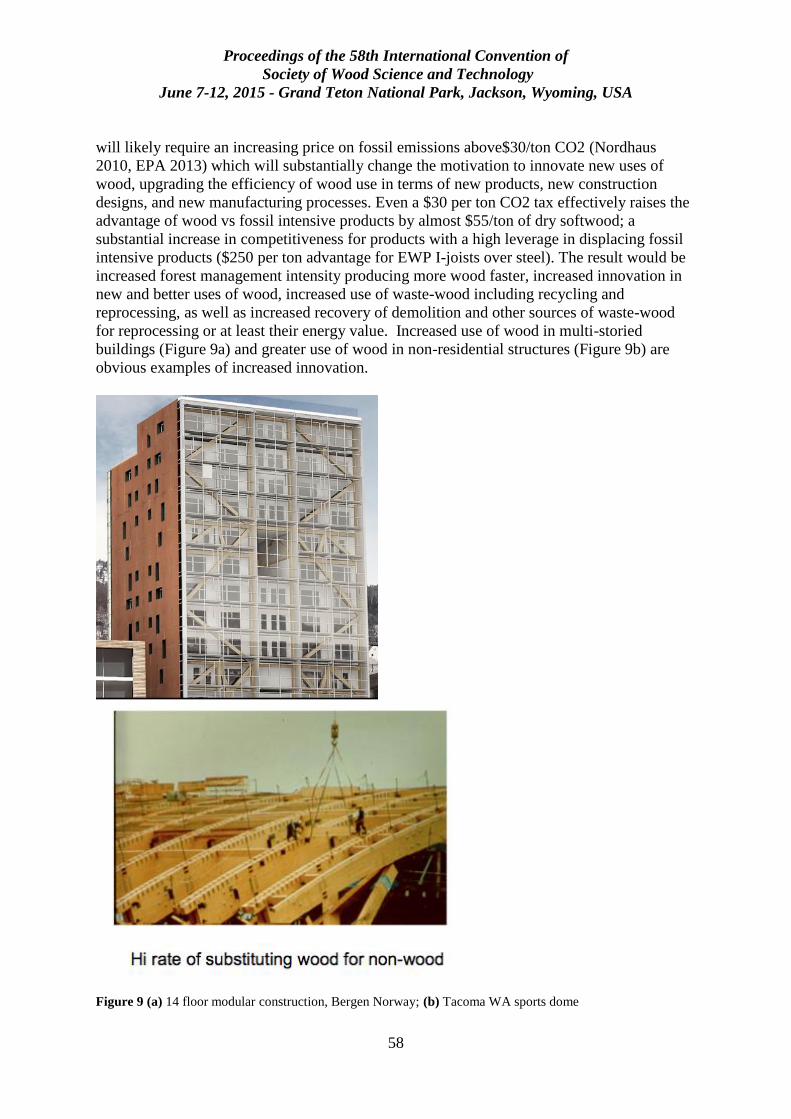
Proceedings of the 58th International Convention of
Society of Wood Science and Technology
June 7-12, 2015 - Grand Teton National Park, Jackson, Wyoming, USA
58
will likely require an increasing price on fossil emissions above$30/ton CO2 (Nordhaus
2010, EPA 2013) which will substantially change the motivation to innovate new uses of
wood, upgrading the efficiency of wood use in terms of new products, new construction
designs, and new manufacturing processes. Even a $30 per ton CO2 tax effectively raises the
advantage of wood vs fossil intensive products by almost $55/ton of dry softwood; a
substantial increase in competitiveness for products with a high leverage in displacing fossil
intensive products ($250 per ton advantage for EWP I-joists over steel). The result would be
increased forest management intensity producing more wood faster, increased innovation in
new and better uses of wood, increased use of waste-wood including recycling and
reprocessing, as well as increased recovery of demolition and other sources of waste-wood
for reprocessing or at least their energy value. Increased use of wood in multi-storied
buildings (Figure 9a) and greater use of wood in non-residential structures (Figure 9b) are
obvious examples of increased innovation.
Figure 9 (a) 14 floor modular construction, Bergen Norway; (b) Tacoma WA sports dome
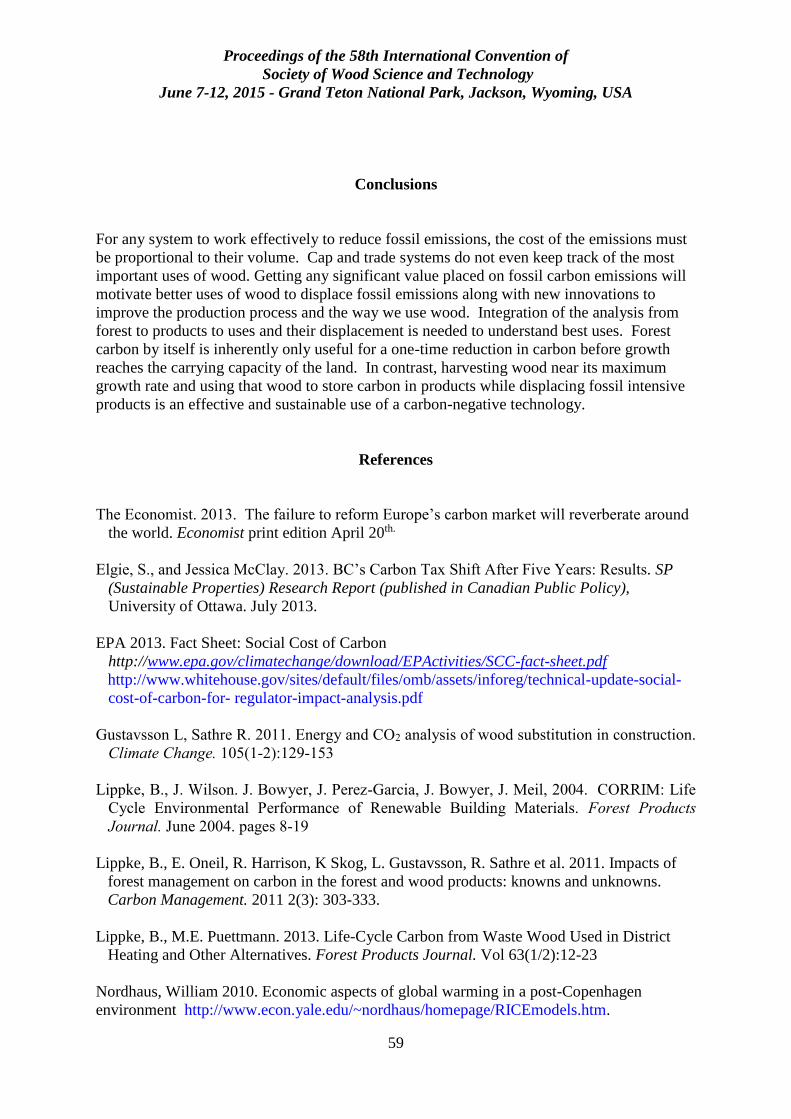
Proceedings of the 58th International Convention of
Society of Wood Science and Technology
June 7-12, 2015 - Grand Teton National Park, Jackson, Wyoming, USA
59
Conclusions
For any system to work effectively to reduce fossil emissions, the cost of the emissions must
be proportional to their volume. Cap and trade systems do not even keep track of the most
important uses of wood. Getting any significant value placed on fossil carbon emissions will
motivate better uses of wood to displace fossil emissions along with new innovations to
improve the production process and the way we use wood. Integration of the analysis from
forest to products to uses and their displacement is needed to understand best uses. Forest
carbon by itself is inherently only useful for a one-time reduction in carbon before growth
reaches the carrying capacity of the land. In contrast, harvesting wood near its maximum
growth rate and using that wood to store carbon in products while displacing fossil intensive
products is an effective and sustainable use of a carbon-negative technology.
References
The Economist. 2013. The failure to reform Europe’s carbon market will reverberate around
the world. Economist print edition April 20th.
Elgie, S., and Jessica McClay. 2013. BC’s Carbon Tax Shift After Five Years: Results. SP
(Sustainable Properties) Research Report (published in Canadian Public Policy),
University of Ottawa. July 2013.
EPA 2013. Fact Sheet: Social Cost of Carbon
http://www.epa.gov/climatechange/download/EPActivities/SCC-fact-sheet.pdf
http://www.whitehouse.gov/sites/default/files/omb/assets/inforeg/technical-update-social-
cost-of-carbon-for- regulator-impact-analysis.pdf
Gustavsson L, Sathre R. 2011. Energy and CO2 analysis of wood substitution in construction.
Climate Change. 105(1-2):129-153
Lippke, B., J. Wilson. J. Bowyer, J. Perez-Garcia, J. Bowyer, J. Meil, 2004. CORRIM: Life
Cycle Environmental Performance of Renewable Building Materials. Forest Products
Journal. June 2004. pages 8-19
Lippke, B., E. Oneil, R. Harrison, K Skog, L. Gustavsson, R. Sathre et al. 2011. Impacts of
forest management on carbon in the forest and wood products: knowns and unknowns.
Carbon Management. 2011 2(3): 303-333.
Lippke, B., M.E. Puettmann. 2013. Life-Cycle Carbon from Waste Wood Used in District
Heating and Other Alternatives. Forest Products Journal. Vol 63(1/2):12-23
Nordhaus, William 2010. Economic aspects of global warming in a post-Copenhagen
environment http://www.econ.yale.edu/~nordhaus/homepage/RICEmodels.htm.
Proceedings of the 58th International Convention of
Society of Wood Science and Technology
June 7-12, 2015 - Grand Teton National Park, Jackson, Wyoming, USA
60
Oliver C.D., N.T. Nassar, B.R. Lippke, and J.B. McCarter. 2013. Carbon, fossil fuel, and
biodiversity mitigation with wood and forests. Journal of Sustainable Forestry. 33:3:248-
275
Perez-Garcia J, B Lippke, D Briggs, J Wilson, J Bowyer, J Meil. 2005a. The environmental
performance of renewable building materials in the context of residential construction.
Wood Fiber Sci 37(1):3–17.
Perez-Garcia, J, B Lippke, J Comnick and C Manriquez. 2005b. An assessment of carbon
pools, storage, and products market substitution using life-cycle analysis results. Wood and
Fiber Sci Vol37, December 2005: 140-148.
Sathre, R., J. O’Connor. 2010. Meta-analysis of greenhouse gas displacement factors of wood
product substitution. Environ. Sci Policy 13:104-114
Proceedings of the 58th International Convention of
Society of Wood Science and Technology
June 7-12, 2015 - Grand Teton National Park, Jackson, Wyoming, USA
61
Life-Cycle Inventory Analysis of Laminated Veneer
Lumber Production in the United States
Richard D. Bergman 1*
1 Research Forest Product Technologist, U.S. Forest Service Forest Products
Laboratory, Madison, Wisconsin, USA
* Corresponding author [email protected]
Abstract
Documenting the environmental performance of building products is becoming increasingly
common. Developing environmental product declarations (EPDs) based on life-cycle
assessment (LCA) data is one way to provide scientific documentation. Many U.S. structural
wood products have LCA-based “eco-labels” using the ISO standard. However, the standard
requires underlying life-cycle inventory (LCI) data to be of recent age. This study updates the
gate-to-gate manufacturing LCI data for laminated veneer lumber (LVL) for Pacific
Northwestern (PNW) and for southeastern (SE) United States. Modeling the primary industry
data per 1.0 m3 of LVL through LCI analysis provides the inputs and outputs from veneer
logs to LVL starting at the forest landing. For PNW and SE, cumulative mass-allocated
energy consumption associated with manufacturing 1.0 m3 of LVL was found to be 5.64 and
6.87 GJ/m3, respectively, with about 25% of the primary energy derived from wood residues.
Emission data produced through modeling found that estimated biomass and fossil CO2
emissions in kg/m3 were 127 and 139 for the PNW and 108 and 169 for the SE. One m3
(~535 OD kg wood potion) of LVL stores about 980 kg CO2 equivalents. The amount of
carbon stored in LVL thus exceeds total CO2 emissions during manufacturing by about
350%. This study provides the necessary gate-to-gate LVL manufacturing LCI data for the
cradle-to-gate LCA to develop an updated EPD.
Keywords: environmental product declaration, life-cycle inventory, laminated veneer lumber,
life-cycle analysis, LCA, wood.
Introduction
Documenting the environmental performance of building products is becoming widespread
because green building programs and concerns that some green-marketing claims are
misleading (i.e., green-washing). Developing environmental product declarations (EPDs) for
building products is one way to provide scientific documentation and to counter green-
washing (Bergman and Taylor 2011). Life-cycle inventory (LCI) data are the underlying data
for subsequent development of life-cycle assessments (LCAs) and EPDs. EPDs are similar to
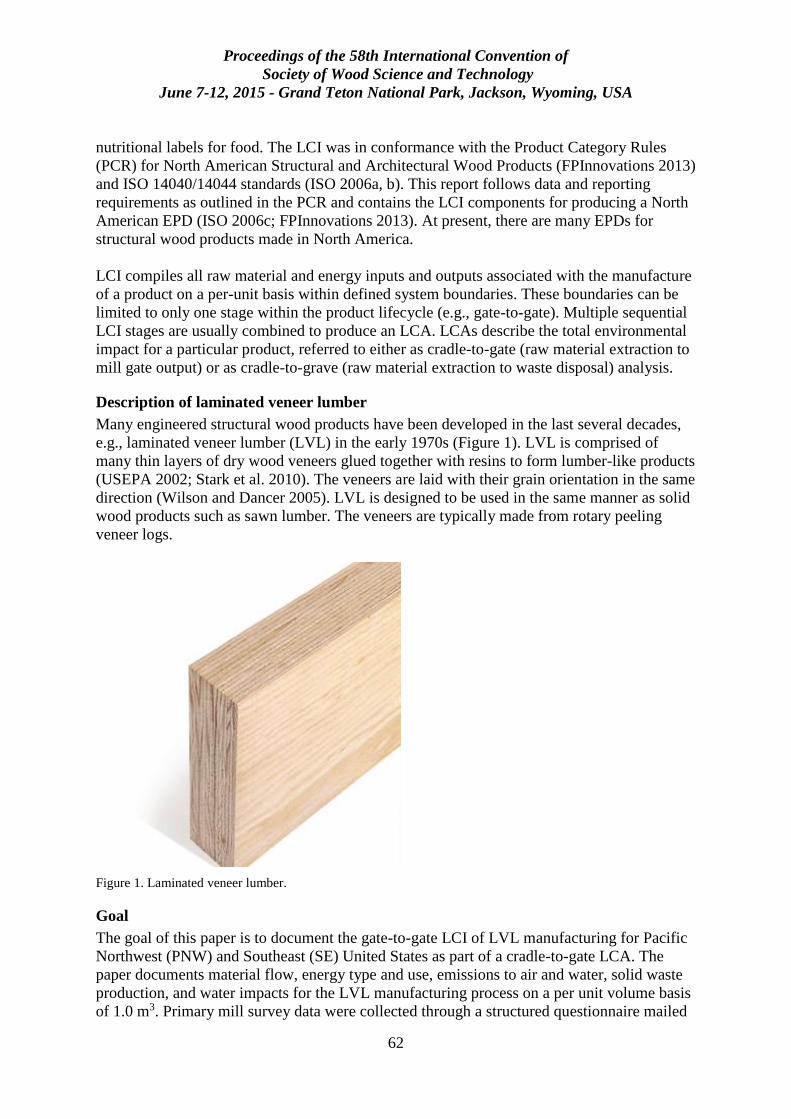
Proceedings of the 58th International Convention of
Society of Wood Science and Technology
June 7-12, 2015 - Grand Teton National Park, Jackson, Wyoming, USA
62
nutritional labels for food. The LCI was in conformance with the Product Category Rules
(PCR) for North American Structural and Architectural Wood Products (FPInnovations 2013)
and ISO 14040/14044 standards (ISO 2006a, b). This report follows data and reporting
requirements as outlined in the PCR and contains the LCI components for producing a North
American EPD (ISO 2006c; FPInnovations 2013). At present, there are many EPDs for
structural wood products made in North America.
LCI compiles all raw material and energy inputs and outputs associated with the manufacture
of a product on a per-unit basis within defined system boundaries. These boundaries can be
limited to only one stage within the product lifecycle (e.g., gate-to-gate). Multiple sequential
LCI stages are usually combined to produce an LCA. LCAs describe the total environmental
impact for a particular product, referred to either as cradle-to-gate (raw material extraction to
mill gate output) or as cradle-to-grave (raw material extraction to waste disposal) analysis.
Description of laminated veneer lumber
Many engineered structural wood products have been developed in the last several decades,
e.g., laminated veneer lumber (LVL) in the early 1970s (Figure 1). LVL is comprised of
many thin layers of dry wood veneers glued together with resins to form lumber-like products
(USEPA 2002; Stark et al. 2010). The veneers are laid with their grain orientation in the same
direction (Wilson and Dancer 2005). LVL is designed to be used in the same manner as solid
wood products such as sawn lumber. The veneers are typically made from rotary peeling
veneer logs.
Figure 1. Laminated veneer lumber.
Goal
The goal of this paper is to document the gate-to-gate LCI of LVL manufacturing for Pacific
Northwest (PNW) and Southeast (SE) United States as part of a cradle-to-gate LCA. The
paper documents material flow, energy type and use, emissions to air and water, solid waste
production, and water impacts for the LVL manufacturing process on a per unit volume basis
of 1.0 m3. Primary mill survey data were collected through a structured questionnaire mailed
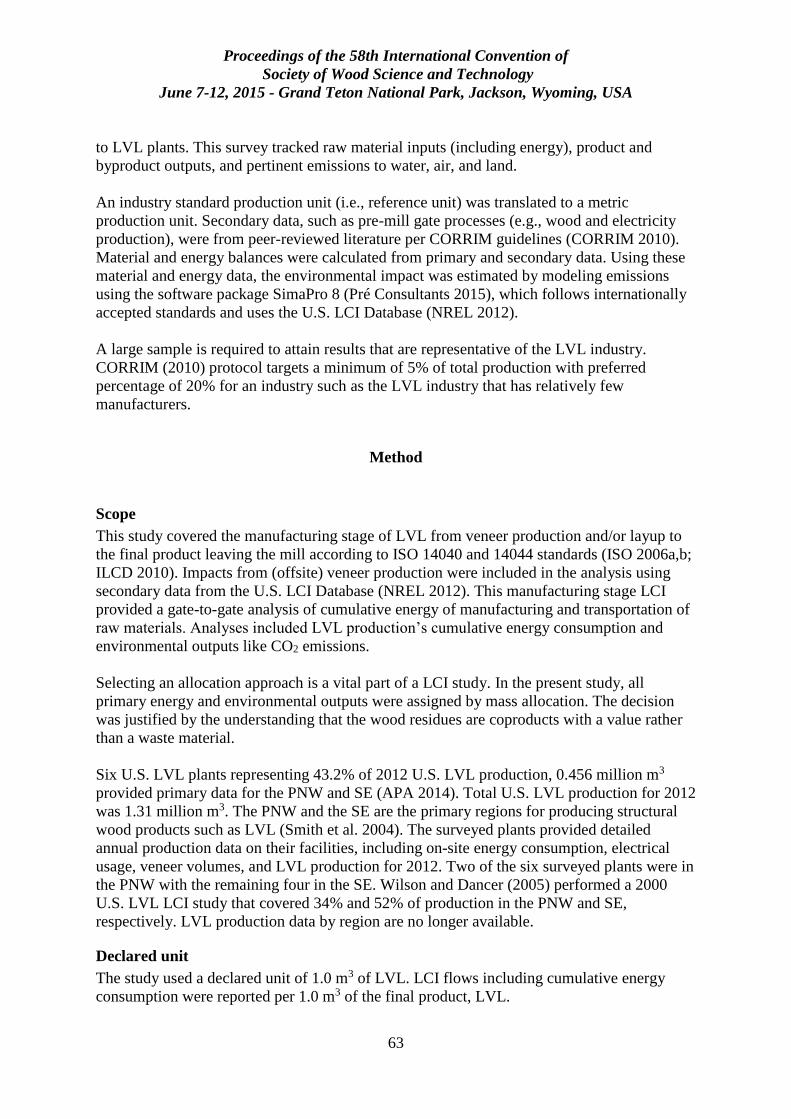
Proceedings of the 58th International Convention of
Society of Wood Science and Technology
June 7-12, 2015 - Grand Teton National Park, Jackson, Wyoming, USA
63
to LVL plants. This survey tracked raw material inputs (including energy), product and
byproduct outputs, and pertinent emissions to water, air, and land.
An industry standard production unit (i.e., reference unit) was translated to a metric
production unit. Secondary data, such as pre-mill gate processes (e.g., wood and electricity
production), were from peer-reviewed literature per CORRIM guidelines (CORRIM 2010).
Material and energy balances were calculated from primary and secondary data. Using these
material and energy data, the environmental impact was estimated by modeling emissions
using the software package SimaPro 8 (Pré Consultants 2015), which follows internationally
accepted standards and uses the U.S. LCI Database (NREL 2012).
A large sample is required to attain results that are representative of the LVL industry.
CORRIM (2010) protocol targets a minimum of 5% of total production with preferred
percentage of 20% for an industry such as the LVL industry that has relatively few
manufacturers.
Method
Scope
This study covered the manufacturing stage of LVL from veneer production and/or layup to
the final product leaving the mill according to ISO 14040 and 14044 standards (ISO 2006a,b;
ILCD 2010). Impacts from (offsite) veneer production were included in the analysis using
secondary data from the U.S. LCI Database (NREL 2012). This manufacturing stage LCI
provided a gate-to-gate analysis of cumulative energy of manufacturing and transportation of
raw materials. Analyses included LVL production’s cumulative energy consumption and
environmental outputs like CO2 emissions.
Selecting an allocation approach is a vital part of a LCI study. In the present study, all
primary energy and environmental outputs were assigned by mass allocation. The decision
was justified by the understanding that the wood residues are coproducts with a value rather
than a waste material.
Six U.S. LVL plants representing 43.2% of 2012 U.S. LVL production, 0.456 million m3
provided primary data for the PNW and SE (APA 2014). Total U.S. LVL production for 2012
was 1.31 million m3. The PNW and the SE are the primary regions for producing structural
wood products such as LVL (Smith et al. 2004). The surveyed plants provided detailed
annual production data on their facilities, including on-site energy consumption, electrical
usage, veneer volumes, and LVL production for 2012. Two of the six surveyed plants were in
the PNW with the remaining four in the SE. Wilson and Dancer (2005) performed a 2000
U.S. LVL LCI study that covered 34% and 52% of production in the PNW and SE,
respectively. LVL production data by region are no longer available.
Declared unit
The study used a declared unit of 1.0 m3 of LVL. LCI flows including cumulative energy
consumption were reported per 1.0 m3 of the final product, LVL.
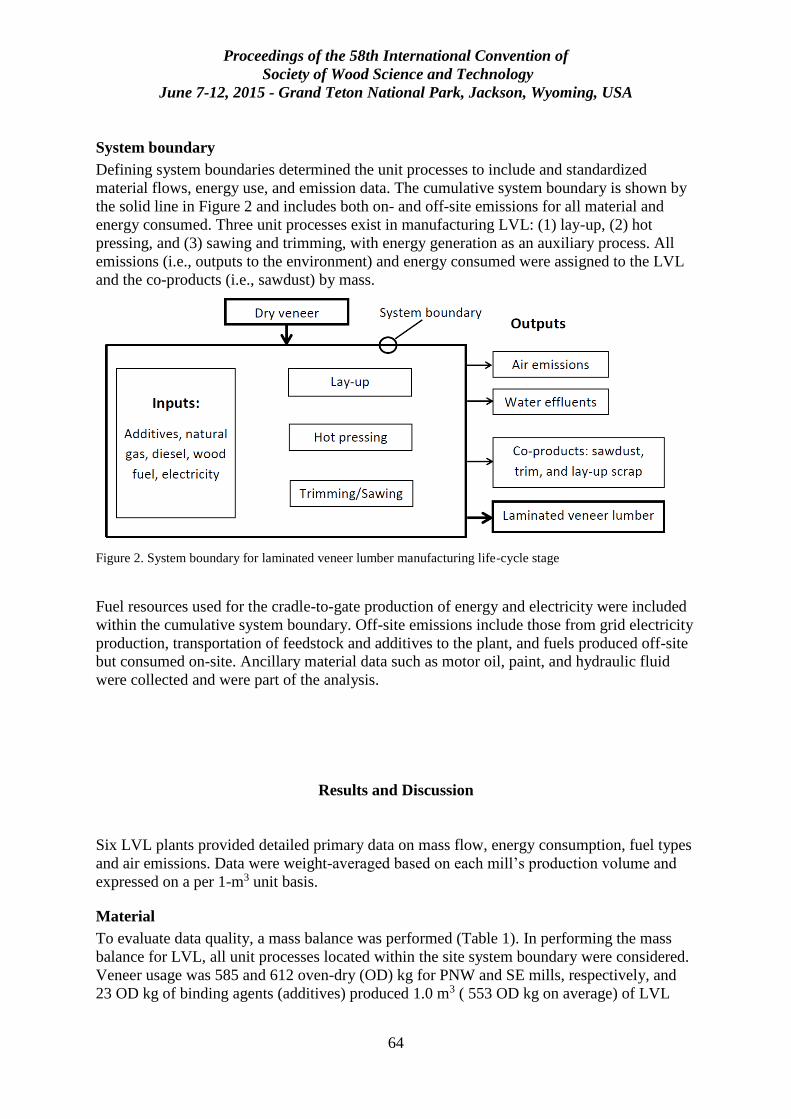
Proceedings of the 58th International Convention of
Society of Wood Science and Technology
June 7-12, 2015 - Grand Teton National Park, Jackson, Wyoming, USA
64
System boundary Defining system boundaries determined the unit processes to include and standardized
material flows, energy use, and emission data. The cumulative system boundary is shown by
the solid line in Figure 2 and includes both on- and off-site emissions for all material and
energy consumed. Three unit processes exist in manufacturing LVL: (1) lay-up, (2) hot
pressing, and (3) sawing and trimming, with energy generation as an auxiliary process. All
emissions (i.e., outputs to the environment) and energy consumed were assigned to the LVL
and the co-products (i.e., sawdust) by mass.
Figure 2. System boundary for laminated veneer lumber manufacturing life-cycle stage
Fuel resources used for the cradle-to-gate production of energy and electricity were included
within the cumulative system boundary. Off-site emissions include those from grid electricity
production, transportation of feedstock and additives to the plant, and fuels produced off-site
but consumed on-site. Ancillary material data such as motor oil, paint, and hydraulic fluid
were collected and were part of the analysis.
Results and Discussion
Six LVL plants provided detailed primary data on mass flow, energy consumption, fuel types
and air emissions. Data were weight-averaged based on each mill’s production volume and
expressed on a per 1-m3 unit basis.
Material
To evaluate data quality, a mass balance was performed (Table 1). In performing the mass
balance for LVL, all unit processes located within the site system boundary were considered.
Veneer usage was 585 and 612 oven-dry (OD) kg for PNW and SE mills, respectively, and
23 OD kg of binding agents (additives) produced 1.0 m3 ( 553 OD kg on average) of LVL
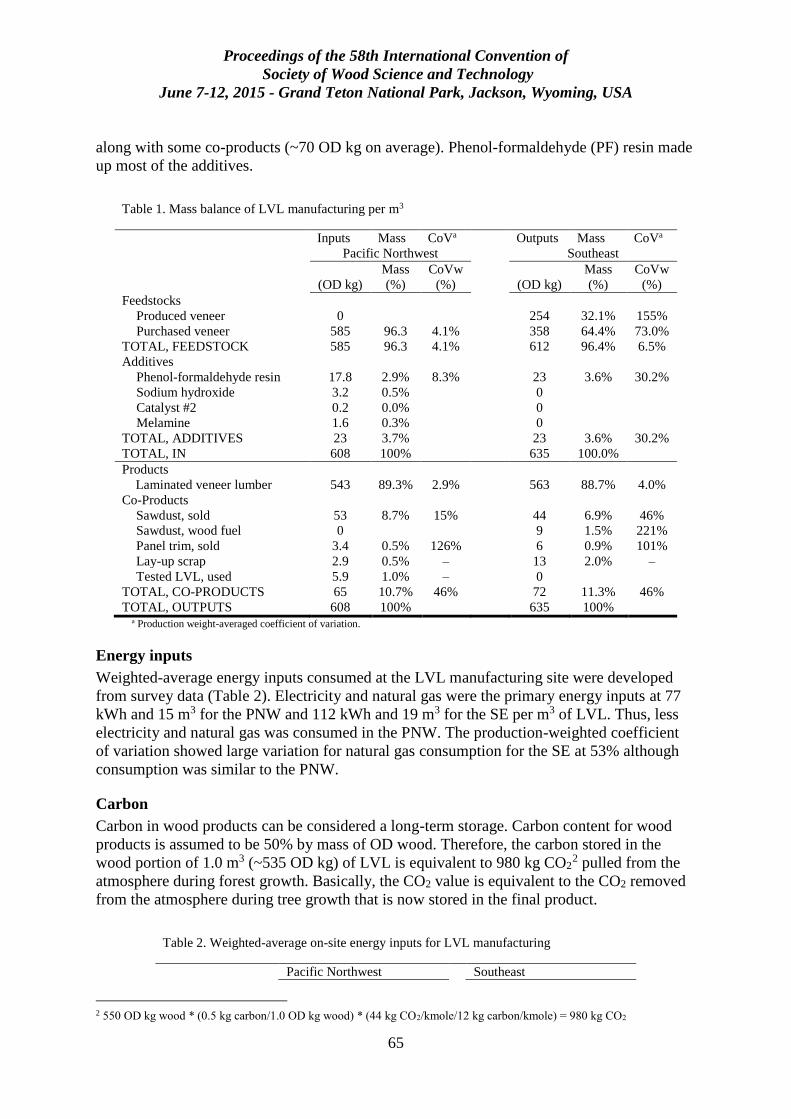
Proceedings of the 58th International Convention of
Society of Wood Science and Technology
June 7-12, 2015 - Grand Teton National Park, Jackson, Wyoming, USA
65
along with some co-products (~70 OD kg on average). Phenol-formaldehyde (PF) resin made
up most of the additives.
Table 1. Mass balance of LVL manufacturing per m3
Inputs Mass CoVa
Outputs Mass CoVa
Pacific Northwest Southeast
(OD kg)
Mass
(%)
CoVw
(%)
(OD kg)
Mass
(%)
CoVw
(%)
Feedstocks
Produced veneer 0
254 32.1% 155%
Purchased veneer 585 96.3 4.1% 358 64.4% 73.0%
TOTAL, FEEDSTOCK 585 96.3 4.1% 612 96.4% 6.5%
Additives
Phenol-formaldehyde resin 17.8 2.9% 8.3%
23 3.6% 30.2%
Sodium hydroxide 3.2 0.5%
0
Catalyst #2 0.2 0.0% 0
Melamine 1.6 0.3% 0
TOTAL, ADDITIVES 23 3.7% 23 3.6% 30.2%
TOTAL, IN 608 100% 635 100.0%
Products
Laminated veneer lumber 543 89.3% 2.9% 563 88.7% 4.0%
Co-Products
Sawdust, sold 53 8.7% 15%
44 6.9% 46%
Sawdust, wood fuel 0 9 1.5% 221%
Panel trim, sold 3.4 0.5% 126%
6 0.9% 101%
Lay-up scrap 2.9 0.5% –
13 2.0% –
Tested LVL, used 5.9 1.0% –
0
TOTAL, CO-PRODUCTS 65 10.7% 46%
72 11.3% 46%
TOTAL, OUTPUTS 608 100%
635 100%
a Production weight-averaged coefficient of variation.
Energy inputs
Weighted-average energy inputs consumed at the LVL manufacturing site were developed
from survey data (Table 2). Electricity and natural gas were the primary energy inputs at 77
kWh and 15 m3 for the PNW and 112 kWh and 19 m3 for the SE per m3 of LVL. Thus, less
electricity and natural gas was consumed in the PNW. The production-weighted coefficient
of variation showed large variation for natural gas consumption for the SE at 53% although
consumption was similar to the PNW.
Carbon
Carbon in wood products can be considered a long-term storage. Carbon content for wood
products is assumed to be 50% by mass of OD wood. Therefore, the carbon stored in the
wood portion of 1.0 m3 (~535 OD kg) of LVL is equivalent to 980 kg CO2 2F
2 pulled from the
atmosphere during forest growth. Basically, the CO2 value is equivalent to the CO2 removed
from the atmosphere during tree growth that is now stored in the final product.
Table 2. Weighted-average on-site energy inputs for LVL manufacturing
Pacific Northwest Southeast
2 550 OD kg wood * (0.5 kg carbon/1.0 OD kg wood) * (44 kg CO2/kmole/12 kg carbon/kmole) = 980 kg CO2
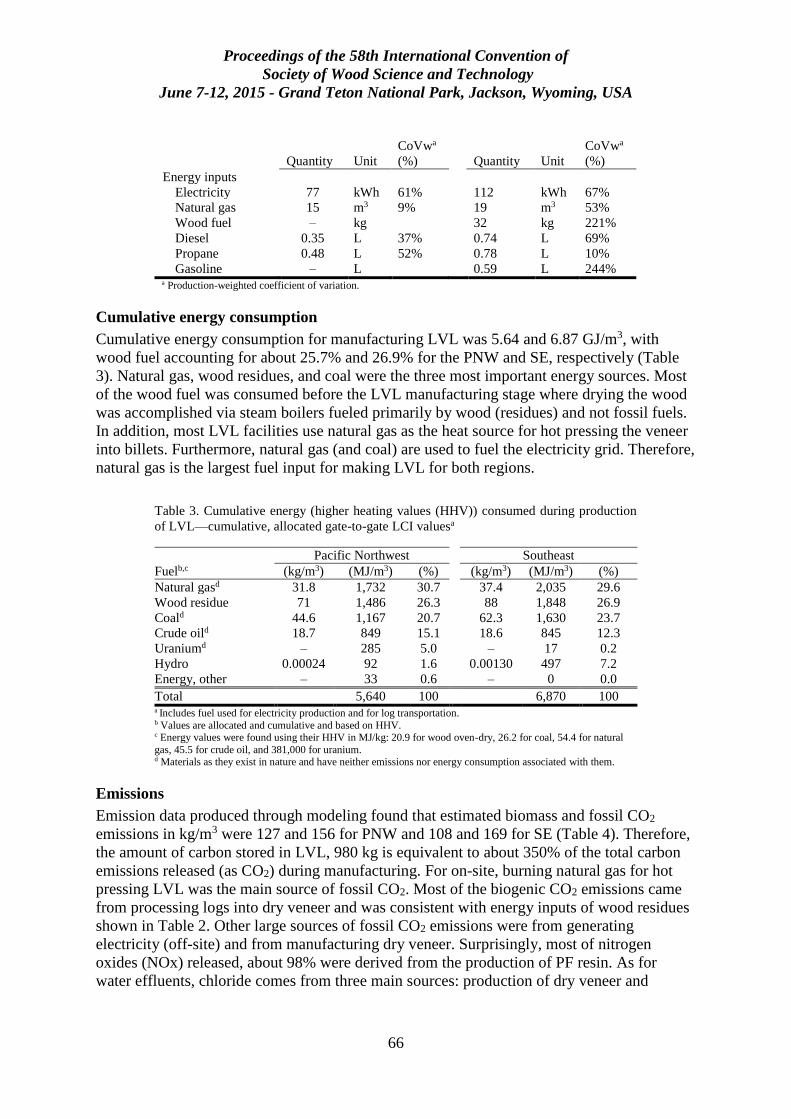
Proceedings of the 58th International Convention of
Society of Wood Science and Technology
June 7-12, 2015 - Grand Teton National Park, Jackson, Wyoming, USA
66
Quantity Unit
CoVwa
(%)
Quantity Unit
CoVwa
(%)
Energy inputs
Electricity 77 kWh 61% 112 kWh 67%
Natural gas 15 m3 9% 19 m3 53%
Wood fuel – kg 32 kg 221%
Diesel 0.35 L 37% 0.74 L 69%
Propane 0.48 L 52% 0.78 L 10%
Gasoline – L 0.59 L 244% a Production-weighted coefficient of variation.
Cumulative energy consumption
Cumulative energy consumption for manufacturing LVL was 5.64 and 6.87 GJ/m3, with
wood fuel accounting for about 25.7% and 26.9% for the PNW and SE, respectively (Table
3). Natural gas, wood residues, and coal were the three most important energy sources. Most
of the wood fuel was consumed before the LVL manufacturing stage where drying the wood
was accomplished via steam boilers fueled primarily by wood (residues) and not fossil fuels.
In addition, most LVL facilities use natural gas as the heat source for hot pressing the veneer
into billets. Furthermore, natural gas (and coal) are used to fuel the electricity grid. Therefore,
natural gas is the largest fuel input for making LVL for both regions.
Table 3. Cumulative energy (higher heating values (HHV)) consumed during production
of LVL—cumulative, allocated gate-to-gate LCI valuesa
Fuelb,c
Pacific Northwest Southeast
(kg/m3) (MJ/m3) (%) (kg/m3) (MJ/m3) (%)
Natural gasd 31.8 1,732 30.7 37.4 2,035 29.6
Wood residue 71 1,486 26.3 88 1,848 26.9
Coald 44.6 1,167 20.7 62.3 1,630 23.7
Crude oild 18.7 849 15.1 18.6 845 12.3
Uraniumd – 285 5.0 – 17 0.2
Hydro 0.00024 92 1.6 0.00130 497 7.2
Energy, other – 33 0.6 – 0 0.0
Total 5,640 100 6,870 100 a Includes fuel used for electricity production and for log transportation. b Values are allocated and cumulative and based on HHV. c Energy values were found using their HHV in MJ/kg: 20.9 for wood oven-dry, 26.2 for coal, 54.4 for natural
gas, 45.5 for crude oil, and 381,000 for uranium. d Materials as they exist in nature and have neither emissions nor energy consumption associated with them.
Emissions
Emission data produced through modeling found that estimated biomass and fossil CO2
emissions in kg/m3 were 127 and 156 for PNW and 108 and 169 for SE (Table 4). Therefore,
the amount of carbon stored in LVL, 980 kg is equivalent to about 350% of the total carbon
emissions released (as CO2) during manufacturing. For on-site, burning natural gas for hot
pressing LVL was the main source of fossil CO2. Most of the biogenic CO2 emissions came
from processing logs into dry veneer and was consistent with energy inputs of wood residues
shown in Table 2. Other large sources of fossil CO2 emissions were from generating
electricity (off-site) and from manufacturing dry veneer. Surprisingly, most of nitrogen
oxides (NOx) released, about 98% were derived from the production of PF resin. As for
water effluents, chloride comes from three main sources: production of dry veneer and
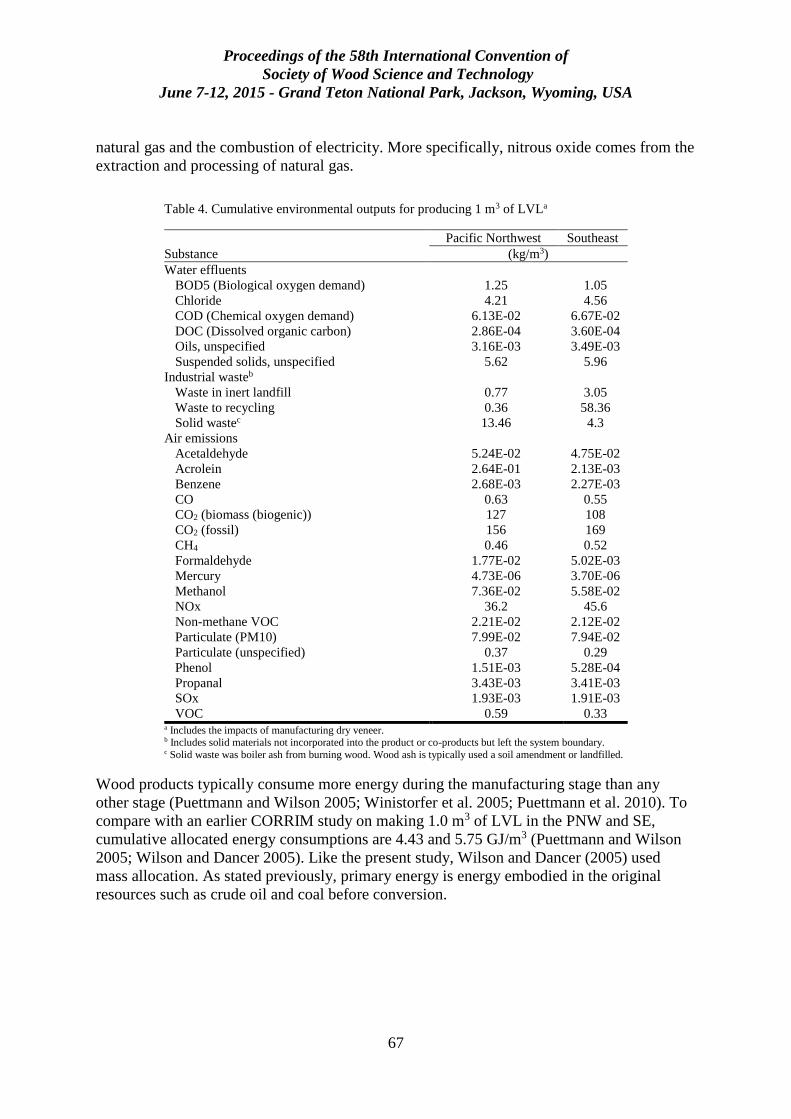
Proceedings of the 58th International Convention of
Society of Wood Science and Technology
June 7-12, 2015 - Grand Teton National Park, Jackson, Wyoming, USA
67
natural gas and the combustion of electricity. More specifically, nitrous oxide comes from the
extraction and processing of natural gas.
Table 4. Cumulative environmental outputs for producing 1 m3 of LVLa
Substance
Pacific Northwest Southeast
(kg/m3)
Water effluents
BOD5 (Biological oxygen demand) 1.25 1.05
Chloride 4.21 4.56
COD (Chemical oxygen demand) 6.13E-02 6.67E-02
DOC (Dissolved organic carbon) 2.86E-04 3.60E-04
Oils, unspecified 3.16E-03 3.49E-03
Suspended solids, unspecified 5.62 5.96
Industrial wasteb
Waste in inert landfill 0.77 3.05
Waste to recycling 0.36 58.36
Solid wastec 13.46 4.3
Air emissions
Acetaldehyde 5.24E-02 4.75E-02
Acrolein 2.64E-01 2.13E-03
Benzene 2.68E-03 2.27E-03
CO 0.63 0.55
CO2 (biomass (biogenic)) 127 108
CO2 (fossil) 156 169
CH4 0.46 0.52
Formaldehyde 1.77E-02 5.02E-03
Mercury 4.73E-06 3.70E-06
Methanol 7.36E-02 5.58E-02
NOx 36.2 45.6
Non-methane VOC 2.21E-02 2.12E-02
Particulate (PM10) 7.99E-02 7.94E-02
Particulate (unspecified) 0.37 0.29
Phenol 1.51E-03 5.28E-04
Propanal 3.43E-03 3.41E-03
SOx 1.93E-03 1.91E-03
VOC 0.59 0.33 a Includes the impacts of manufacturing dry veneer. b Includes solid materials not incorporated into the product or co-products but left the system boundary. c Solid waste was boiler ash from burning wood. Wood ash is typically used a soil amendment or landfilled.
Wood products typically consume more energy during the manufacturing stage than any
other stage (Puettmann and Wilson 2005; Winistorfer et al. 2005; Puettmann et al. 2010). To
compare with an earlier CORRIM study on making 1.0 m3 of LVL in the PNW and SE,
cumulative allocated energy consumptions are 4.43 and 5.75 GJ/m3 (Puettmann and Wilson
2005; Wilson and Dancer 2005). Like the present study, Wilson and Dancer (2005) used
mass allocation. As stated previously, primary energy is energy embodied in the original
resources such as crude oil and coal before conversion.
Proceedings of the 58th International Convention of
Society of Wood Science and Technology
June 7-12, 2015 - Grand Teton National Park, Jackson, Wyoming, USA
68
Conclusions
EPDs present life-cycle data in a concise and consistent format to enable industry to
communicate with customers. This study provides the underlying gate-to-gate LCI data for
updating the North American LVL EPD. Future efforts will work on incorporating the LCI
data into a cradle-to-gate LCA and then eventually into an EPD for LVL.
Structural wood products such as LVL used in building construction can store carbon for long
periods, which is typically greater or far greater than the carbon dioxide emissions released
during manufacturing (Puettmann and Wilson 2005; Bergman and Bowe 2010; Puettmann et
al. 2010). The amount of carbon stored in LVL if allowed to decay is equivalent to about
350% of the total carbon dioxide emissions released during manufacturing.
Acknowledgments
I gratefully acknowledge funding for this project was through a cooperative agreement
between the USDA Forest Service Forest Products Laboratory and the Consortium for
Research on Renewable Industrial Materials (13-CO-11111137-014). In addition, I appreciate
the reviews provided by Scott Bowe (University of Wisconsin), Indroneil Ganguly
(University of Washington), and Adam Taylor (University of Tennessee-Knoxville).
References
APA (2014) Engineered wood statistics: Third quarter 2014. APA—The Engineered Wood
Association. Tacoma, WA. 9 p.
Bergman RD, Bowe SA (2010) Environmental impact of manufacturing softwood lumber in
northeastern and north central United States. Wood Fiber Sci 42 (CORRIM Special
Issue):67–78.
Bergman RD, Taylor A (2011) Environmental product declarations of wood products—An
application of life cycle information about forest products. Forest Prod J 61(3):192–201.
CORRIM (2010) Research guidelines for life-cycle inventories. Consortium for Research on
Renewable Industrial Materials (CORRIM), Inc., University of Washington, Seattle, WA. 40
p.
FPInnovations (2013) Product Category Rule (PCR): For preparing an Environmental
Product Declaration (EPD) for North American Structural and Architectural Wood Products.
UN CPC 31. NAICS 21. 17 pp. https://fpinnovations.ca/ResearchProgram/environment-
sustainability/epd-program/Documents/wood-products-pcr-version-v1.1-may-2013-lastest-
version.pdf. (March 30, 2015).
Proceedings of the 58th International Convention of
Society of Wood Science and Technology
June 7-12, 2015 - Grand Teton National Park, Jackson, Wyoming, USA
69
ILCD (2010) International Reference Life Cycle Data System (ILCD) Handbook - General
guide for Life Cycle Assessment—Detailed guidance. EUR 24708 EN. European
Commission–Joint Research Centre–Institute for Environment and Sustainability.
Luxembourg. Publications Office of the European Union. 417 p.
ISO (2006a) Environmental management—life-cycle assessment—principles and framework.
ISO 14040. International Organization for Standardization, Geneva, Switzerland. 20 p.
ISO (2006b) Environmental management—life-cycle assessment—requirements and
guidelines. ISO 14044. International Organization for Standardization, Geneva, Switzerland.
46 p.
ISO (2006c) Environmental labels and declarations—Type III environmental declarations—
Principles and procedures. ISO 14025. International Organization for Standardization,
Geneva, Switzerland. 25 p.
NREL (2012) Life-cycle inventory database project. National Renewable Energy Laboratory.
https://www.lcacommons.gov/nrel/search. (accessed March 3, 2015).
PRé Consultants (2015) SimaPro 8 Life-Cycle assessment software package. Amersfoort,
The Netherlands. http://www.pre-sustainability.com/simapro/. (accessed February 27. 2015).
Puettmann ME, Wilson, JB (2005) Life-cycle analysis of wood products: Cradle-to-gate LCI
of residential wood building materials. Wood Fiber Sci 37 (Special Issue):18–29.
Puettmann ME, Bergman RD, Hubbard SS, Johnson L, Lippke B, Wagner F (2010) Cradle-
to-gate life-cycle inventories of US wood products production—CORRIM Phase I and Phase
II Products. Wood Fiber Sci 42 (CORRIM Special Issue):15–28.
Stark NM, Cai Zi, Carll C. (2010) Wood-based composite materials: Panel products, glued-
laminated timber, structural composite lumber, and wood–nonwood composite materials. In:
Wood handbook—wood as an engineering material. Gen Tech Rep FPL–GTR–113.
Madison, WI: U.S. Department of Agriculture, Forest Service, Forest Products Laboratory.
pp. 11-1–11-28.
Smith WB, Miles PD, Vissage JS, Pugh SA (2004) Forest resources of the United States,
2002. Gen Tech Rep NC-241. USDA For Serv North Central Research Station, St. Paul, MN.
137 p.
USEPA (2002) AP 42 Section 10.9 Engineered wood products manufacturing. United States
Environmental Protection Agency. pp. 10.9-1–24.
http://www.epa.gov/ttnchie1/ap42/ch10/final/c10s09.pdf (accessed March 3, 2015)
Wilson JB, Dancer ER (2005) Gate-to-gate life-cycle inventory of laminated veneer lumber
production. Wood Fiber Sci 37 (Special Issue):114–127.

Proceedings of the 58th International Convention of
Society of Wood Science and Technology
June 7-12, 2015 - Grand Teton National Park, Jackson, Wyoming, USA
70
Winistorfer P, Chen Z, Lippke B, Stevens N (2005) Energy consumption and greenhouse gas
emissions related to use, maintenance, and disposal of a residential structure. Wood Fiber Sci
37 (Special Issue):128–139.
Proceedings of the 58th International Convention of
Society of Wood Science and Technology
June 7-12, 2015 - Grand Teton National Park, Jackson, Wyoming, USA
71
Modification, Product Properties, and Environmental
Impacts in Thermal Wood Processing
Dick Sandberg1 - Andreja Kutnar2
1 Professor, Luleå University of Technology, Wood Science and Engineering
SE-931 87 SKELLEFTEÅ, Sweden
2 Assistant Professor, University of Primorska, SI-6000 KOPER, Slovenia
Abstract
The world’s political and economic decisions are increasingly determined by resource and
energy scarcity and by climate change. In these circumstances, a balance must be achieved
between economics, ecology and social welfare, which was put forward at the end of the 20th
century and has been irrevocably linked to forestry ever since. It is essential that the forest
sector is placed at the centre of the developing bio-based economy. The value of the forest for
mankind and the environment is irrefutable, and the value of the multitude of products made
of wood is of great importance, socially, economically and environmentally. Over the last
fifty years, sawn timber in particular has largely disappeared from many technological
applications diminishing its contribution to sustainability in the one area where it could be
most significant: as a substitute for energy-intensive materials (e.g., in the built environment).
However, there is currently a resurgence of interest in timber products due to the
environmental benefits they provide, a phenomenon that other industrial sectors are well
aware of. This paper discusses the role of thermal wood processing in a sustainability of
resource utilization context and what thermal wood processing should achieve to contribute to
the European low-carbon economy.
Keywords: EPD, LCA, low-carbon bio-economy, PCR, sustainability
Introduction
Forest-based industries are continually developing advanced processes, materials and wood-
based solutions to meet evolving demands and increase competitiveness. One of the emerging
treatments involves the combined use of temperature and moisture, where force can be
applied, so that one speaks of thermo-hydro (TH) and thermo-hydro-mechanical (THM)
processes. Figure 1 show a simplified synoptic diagram of the most common TH and THM
processes based on what is achieved through the process. Thermal wood processing (thermal
treatment) involves temperatures between 100 and 300°C and can have two distinctly
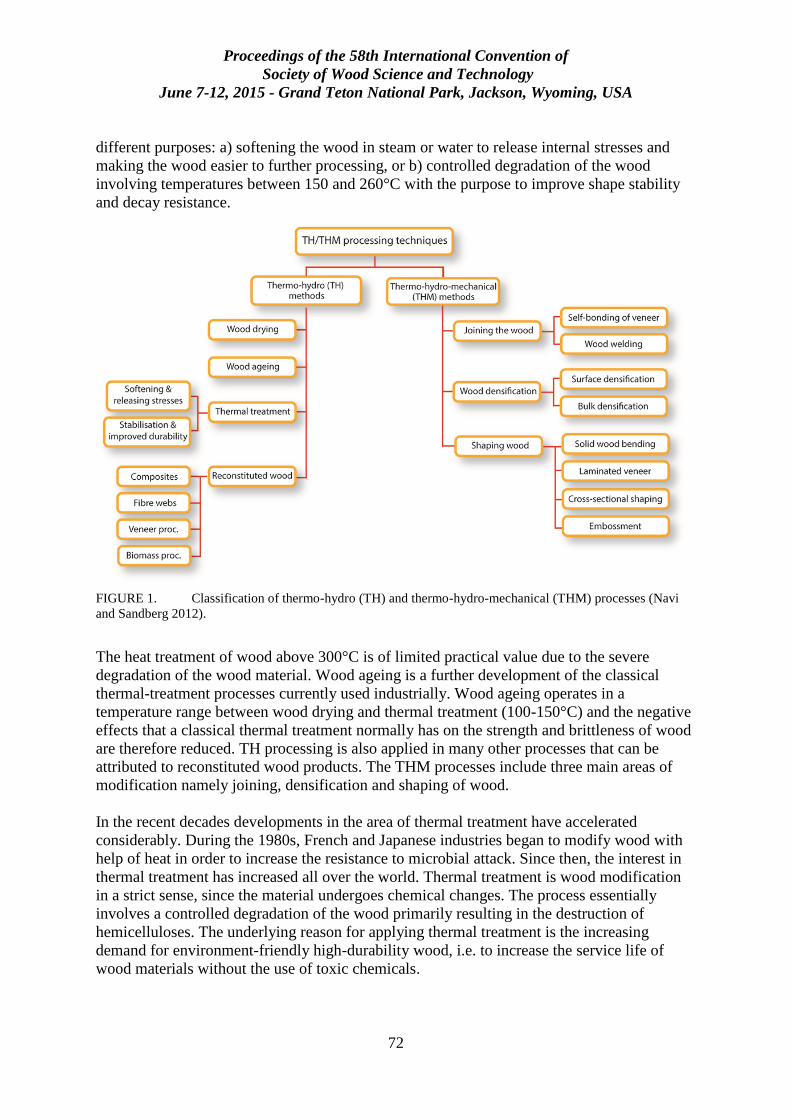
Proceedings of the 58th International Convention of
Society of Wood Science and Technology
June 7-12, 2015 - Grand Teton National Park, Jackson, Wyoming, USA
72
different purposes: a) softening the wood in steam or water to release internal stresses and
making the wood easier to further processing, or b) controlled degradation of the wood
involving temperatures between 150 and 260°C with the purpose to improve shape stability
and decay resistance.
FIGURE 1. Classification of thermo-hydro (TH) and thermo-hydro-mechanical (THM) processes (Navi
and Sandberg 2012).
The heat treatment of wood above 300°C is of limited practical value due to the severe
degradation of the wood material. Wood ageing is a further development of the classical
thermal-treatment processes currently used industrially. Wood ageing operates in a
temperature range between wood drying and thermal treatment (100-150°C) and the negative
effects that a classical thermal treatment normally has on the strength and brittleness of wood
are therefore reduced. TH processing is also applied in many other processes that can be
attributed to reconstituted wood products. The THM processes include three main areas of
modification namely joining, densification and shaping of wood.
In the recent decades developments in the area of thermal treatment have accelerated
considerably. During the 1980s, French and Japanese industries began to modify wood with
help of heat in order to increase the resistance to microbial attack. Since then, the interest in
thermal treatment has increased all over the world. Thermal treatment is wood modification
in a strict sense, since the material undergoes chemical changes. The process essentially
involves a controlled degradation of the wood primarily resulting in the destruction of
hemicelluloses. The underlying reason for applying thermal treatment is the increasing
demand for environment-friendly high-durability wood, i.e. to increase the service life of
wood materials without the use of toxic chemicals.
Proceedings of the 58th International Convention of
Society of Wood Science and Technology
June 7-12, 2015 - Grand Teton National Park, Jackson, Wyoming, USA
73
The purpose of this paper is to present the role of thermal wood processing in a sustainability
of resource utilization context and what thermal wood processing should achieve to contribute
to the European low-carbon economy.
BioEconomy in Europe
For many years to come, the world’s political and economic decisions will be determined by
resource and energy scarcity and by climate change as a topic related to the consumption of
fossil energy. In these circumstances, a balance has to be achieved between economics,
ecology and social welfare that can be summed up as sustainability, which was put forward at
the end of the 20th century and has been inseparably linked to forestry ever since.
The forest sector and wood-based industries are challenged by this change and feel that it is
important to participate in the sustainability debate. This is for obvious reasons, as they
themselves first put forward the concept of sustainability that is nowadays related to the
global economy. Indeed, nobody questions the value of the forest for mankind and the
environment, and nobody questions the value of the multitude of products made of wood.
Wood, and especially sawn timber, has during the last fifty years to a large extent
disappeared from technological applications (Radkau 2007) so that its contribution to
sustainability fails to appear in the one area where it would be most significant, as a substitute
for energy-intensive materials.
Wood is in volume the most important renewable material resource (Rowell 2002). The
utilization of wood in all aspects of human existence appears to be the most effective way to
optimize the use of resources and to reduce the environmental impact associated with
mankind's activities. However, as timber possesses good but not outstanding properties, this is
not an easy thing to achieve, and in view of the new materials emerging it becomes noticeably
more difficult. The only properties it has that reign supreme are ecological fitness and, possibly,
a low cost.
In the European Union (EU) measures are being discussed in economics and science that seek
to improve the sustainability of resource utilization. European Policy is affecting and, indeed,
directing current research, development and marketing in the EU. The main policies having a
direct impact on the forest-based sector are the EU Sustainable Development Strategy “SDS”
(European Commission 2009), which was published in 2006, and revised in 2009, the EU
Roadmap 2050 (European Commission 2011), and the recycling society directive “Directive
2008/98/EC” (European Parliament Council 2008). The forest-based sector can considerably
contribute to the European Commission’s ambitious CO2 emissions reduction goal of 80%
reduction by 2050, i.e. Roadmap 2050, with innovative production technologies, reduced
energy consumption, increased wood products recycling, and the reuse and refining of side-
streams.
The need to reduce the whole-life energy consumption of buildings has highlighted the role that
wood can play in construction. When buildings have net zero energy consumption, a major part
of their overall environmental burden consists of their embodied energy and the associated
greenhouse gas emissions. Compared with other construction materials the energy needed to
Proceedings of the 58th International Convention of
Society of Wood Science and Technology
June 7-12, 2015 - Grand Teton National Park, Jackson, Wyoming, USA
74
convert a tree into the final product is significantly lower, resulting in wood products having a
low embodied energy.
It is vital that wood can be used effectively through the whole value chain, from forest
management and multiple uses of forest resources through new wood and fiber-based materials
and processing technologies to new end-use concepts. The fossil fuel consumption, potential
contributions to the greenhouse effect and quantities of solid waste tend to be minor for wood
products compared to competing products (Werner and Richter 2007). Impregnated wood
products tend to be more critical than comparative products with respect to toxicological effects
and/or photo-generated smog, depending on the type of preservative. Unfortunately, the
number of Life Cycle Assessment (LCA) studies of wood–based composites and modified
wood is relatively limited, they are geographically specific, and utilize of a variety of databases
and impact assessment protocols. The aim of the “carbon economy” is to mitigate climate
change and promote sustainable development in Europe by reducing energy consumption,
pollution and emissions while increasing performance.
As a consequence of increased competition from traditional and new industries based on
renewable resources, the forest resources must be considered to be limited. There are forecasts
showing that, already in 2020, the European consumption of wood can be as large as the total
European combined forest growth increment (Jonsson et al. 2011). According to the
Communication “Innovating for Sustainable Growth: A Bio-economy for Europe” Europe
needs radically change its production, consumption, processing, storage, recycling and
disposal of resources. Thus, bio-economy is considered as one of the key elements for smart
and green growth in Europe. The Strategic Research and Innovation Agenda for 2020 of the
Forest-based Sector and the Horizons - Vision 2030 for the European Forest-based Sector see
this sector as a key actor and enabler of the bio-based society.
Thermal Processing of Wood
Thermal treatments of wood have been investigated for many years and are now
commercialized. In the beginning of the twentieth century, the use of heat and moisture in
wood processing came into focus, and it was observed that wood dried at a high temperature
changes colour, and has a greater dimensional stability and a lower hygroscopicity (Tiemann
1915; Koehler and Pillow 1925). After the First World War, comprehensive studies were
made of the effect of the kiln drying temperature on the strength of wood for the aviation
industry in the United States (Wilson 1920). Systematic research on how to improve wood
properties by thermal treatment has been made of the US-based group around Alfred Stamm
in the 1940th, and in Germany by Burmester (1973). The exact method of treatment can have
a significant effect on the properties of the modified wood, and the most important process
variables are: the treatment atmosphere, the choice of closed or open system, the choice of
wet or dry systems, the use of a catalyst, the wood species, the time and temperature of
treatment, and the dimensions of the material. Table 1 shows the processing conditions for
the some well-known thermal processes in Europe.
One of the first commercial thermal-treatment units in Europe was based on Burmesters work
and started in Germany around 1980, but was never industrialized in a great scale (Giebler
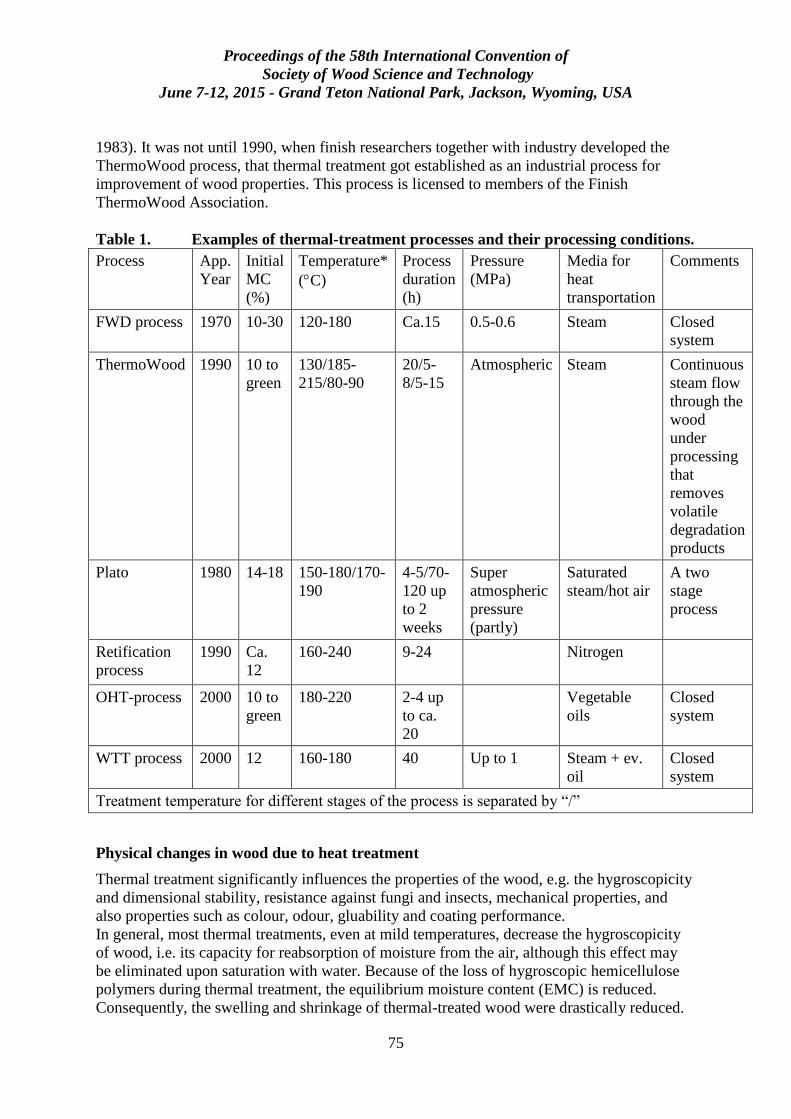
Proceedings of the 58th International Convention of
Society of Wood Science and Technology
June 7-12, 2015 - Grand Teton National Park, Jackson, Wyoming, USA
75
1983). It was not until 1990, when finish researchers together with industry developed the
ThermoWood process, that thermal treatment got established as an industrial process for
improvement of wood properties. This process is licensed to members of the Finish
ThermoWood Association.
Table 1. Examples of thermal-treatment processes and their processing conditions.
Process App.
Year
Initial
MC
(%)
Temperature*
(C)
Process
duration
(h)
Pressure
(MPa)
Media for
heat
transportation
Comments
FWD process 1970 10-30 120-180 Ca.15 0.5-0.6 Steam Closed
system
ThermoWood 1990 10 to
green
130/185-
215/80-90
20/5-
8/5-15
Atmospheric Steam Continuous
steam flow
through the
wood
under
processing
that
removes
volatile
degradation
products
Plato 1980 14-18 150-180/170-
190
4-5/70-
120 up
to 2
weeks
Super
atmospheric
pressure
(partly)
Saturated
steam/hot air
A two
stage
process
Retification
process
1990
Ca.
12
160-240 9-24 Nitrogen
OHT-process 2000 10 to
green
180-220 2-4 up
to ca.
20
Vegetable
oils
Closed
system
WTT process 2000 12 160-180 40 Up to 1 Steam + ev.
oil
Closed
system
Treatment temperature for different stages of the process is separated by “/”
Physical changes in wood due to heat treatment
Thermal treatment significantly influences the properties of the wood, e.g. the hygroscopicity
and dimensional stability, resistance against fungi and insects, mechanical properties, and
also properties such as colour, odour, gluability and coating performance.
In general, most thermal treatments, even at mild temperatures, decrease the hygroscopicity
of wood, i.e. its capacity for reabsorption of moisture from the air, although this effect may
be eliminated upon saturation with water. Because of the loss of hygroscopic hemicellulose
polymers during thermal treatment, the equilibrium moisture content (EMC) is reduced.
Consequently, the swelling and shrinkage of thermal-treated wood were drastically reduced.
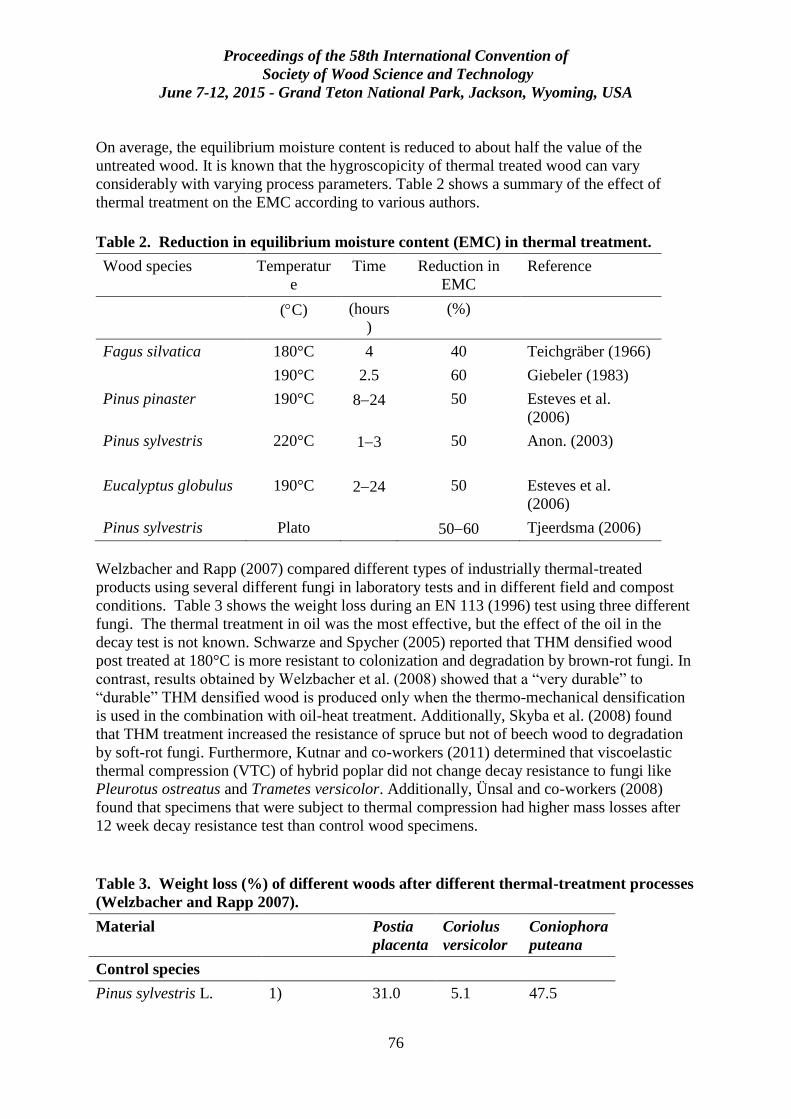
Proceedings of the 58th International Convention of
Society of Wood Science and Technology
June 7-12, 2015 - Grand Teton National Park, Jackson, Wyoming, USA
76
On average, the equilibrium moisture content is reduced to about half the value of the
untreated wood. It is known that the hygroscopicity of thermal treated wood can vary
considerably with varying process parameters. Table 2 shows a summary of the effect of
thermal treatment on the EMC according to various authors.
Table 2. Reduction in equilibrium moisture content (EMC) in thermal treatment.
Wood species Temperatur
e
Time Reduction in
EMC
Reference
(C) (hours
)
(%)
Fagus silvatica 180°C 4 40 Teichgräber (1966)
190°C 2.5 60 Giebeler (1983)
Pinus pinaster 190°C 824 50 Esteves et al.
(2006)
Pinus sylvestris 220°C
13 50 Anon. (2003)
Eucalyptus globulus 190°C 224 50 Esteves et al.
(2006)
Pinus sylvestris Plato 5060 Tjeerdsma (2006)
Welzbacher and Rapp (2007) compared different types of industrially thermal-treated
products using several different fungi in laboratory tests and in different field and compost
conditions. Table 3 shows the weight loss during an EN 113 (1996) test using three different
fungi. The thermal treatment in oil was the most effective, but the effect of the oil in the
decay test is not known. Schwarze and Spycher (2005) reported that THM densified wood
post treated at 180°C is more resistant to colonization and degradation by brown-rot fungi. In
contrast, results obtained by Welzbacher et al. (2008) showed that a “very durable” to
“durable” THM densified wood is produced only when the thermo-mechanical densification
is used in the combination with oil-heat treatment. Additionally, Skyba et al. (2008) found
that THM treatment increased the resistance of spruce but not of beech wood to degradation
by soft-rot fungi. Furthermore, Kutnar and co-workers (2011) determined that viscoelastic
thermal compression (VTC) of hybrid poplar did not change decay resistance to fungi like
Pleurotus ostreatus and Trametes versicolor. Additionally, Ünsal and co-workers (2008)
found that specimens that were subject to thermal compression had higher mass losses after
12 week decay resistance test than control wood specimens.
Table 3. Weight loss (%) of different woods after different thermal-treatment processes
(Welzbacher and Rapp 2007).
Material Postia
placenta
Coriolus
versicolor
Coniophora
puteana
Control species
Pinus sylvestris L. 1) 31.0 5.1 47.5
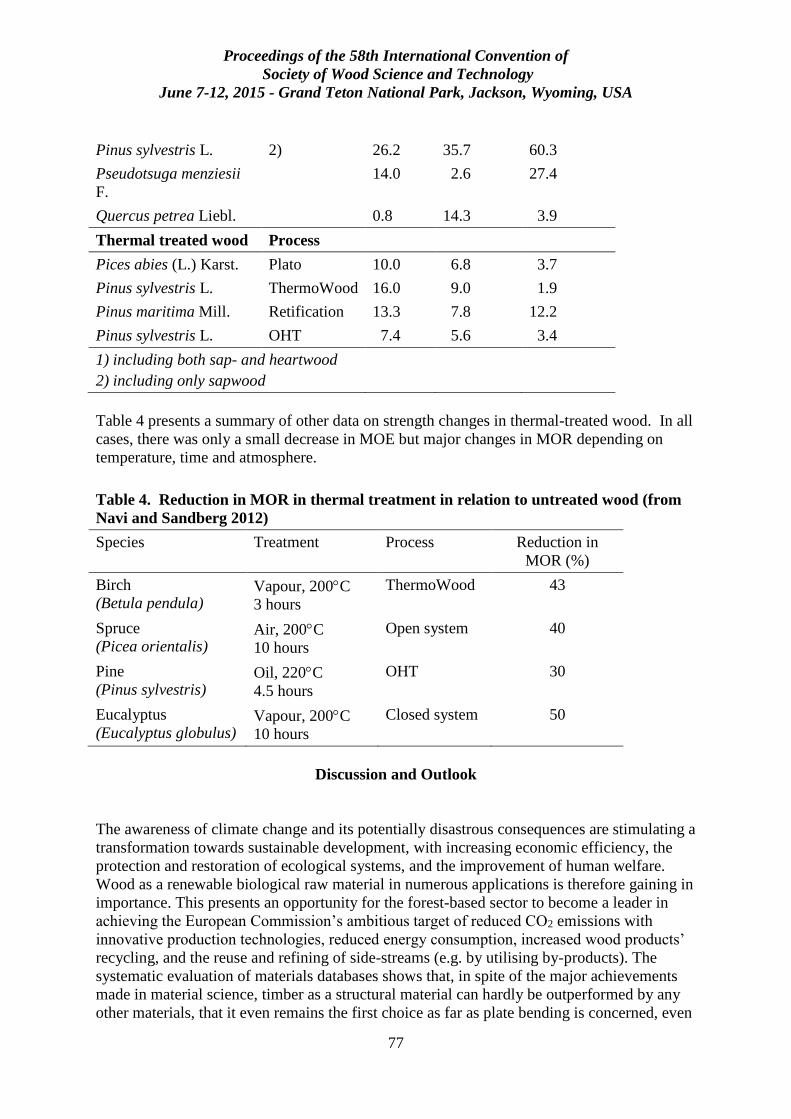
Proceedings of the 58th International Convention of
Society of Wood Science and Technology
June 7-12, 2015 - Grand Teton National Park, Jackson, Wyoming, USA
77
Pinus sylvestris L. 2) 26.2 35.7 60.3
Pseudotsuga menziesii
F.
14.0 2.6 27.4
Quercus petrea Liebl. 0.8 14.3 3.9
Thermal treated wood Process
Pices abies (L.) Karst. Plato 10.0 6.8 3.7
Pinus sylvestris L. ThermoWood 16.0 9.0 1.9
Pinus maritima Mill. Retification 13.3 7.8 12.2
Pinus sylvestris L. OHT 7.4 5.6 3.4
1) including both sap- and heartwood
2) including only sapwood
Table 4 presents a summary of other data on strength changes in thermal-treated wood. In all
cases, there was only a small decrease in MOE but major changes in MOR depending on
temperature, time and atmosphere.
Table 4. Reduction in MOR in thermal treatment in relation to untreated wood (from
Navi and Sandberg 2012)
Species Treatment Process Reduction in
MOR (%)
Birch
(Betula pendula) Vapour, 200C
3 hours
ThermoWood 43
Spruce
(Picea orientalis) Air, 200C
10 hours
Open system 40
Pine
(Pinus sylvestris) Oil, 220C
4.5 hours
OHT 30
Eucalyptus
(Eucalyptus globulus) Vapour, 200C
10 hours
Closed system 50
Discussion and Outlook
The awareness of climate change and its potentially disastrous consequences are stimulating a
transformation towards sustainable development, with increasing economic efficiency, the
protection and restoration of ecological systems, and the improvement of human welfare.
Wood as a renewable biological raw material in numerous applications is therefore gaining in
importance. This presents an opportunity for the forest-based sector to become a leader in
achieving the European Commission’s ambitious target of reduced CO2 emissions with
innovative production technologies, reduced energy consumption, increased wood products’
recycling, and the reuse and refining of side-streams (e.g. by utilising by-products). The
systematic evaluation of materials databases shows that, in spite of the major achievements
made in material science, timber as a structural material can hardly be outperformed by any
other materials, that it even remains the first choice as far as plate bending is concerned, even

Proceedings of the 58th International Convention of
Society of Wood Science and Technology
June 7-12, 2015 - Grand Teton National Park, Jackson, Wyoming, USA
78
outperforming carbon fibre composites, and that it is undisputedly unrivalled in terms of cost
and environmental performance. These results show that timber is a high-performance
material for structures, playing an essential role in construction and light weight design.
Several of the species used by industry have deficiencies related to poor resistance to
biological degradation and low shape stability that earlier could be reduced by e.g.
preservation with more or less toxic substances that today is forbidden to use. Consequently,
there has been a renewed interest in developing thermal processes in recent years.
Energy and material are inseparable. In this context it should be recalled that the first energy
transition took place in the industrial revolution and that the unlimited, cheap coal available
also brought about a material transition towards iron and steel. Today’s energy transition is
the reverse: It is at the expense of energy-intensive materials and would progress more
quickly if savings on materials could be made or materials containing little embodied energy
were be used. Forestry and the wood refining industry are stated to be capable of contributing
considerably more to sustainable development if they managed to regain lost ground in
technology. The forest can then contribute to environmental protection and sustainability in
two ways: on the one hand, by extracting and retaining carbon from the atmosphere and at the
same time limiting land erosion and, on the other hand, by replacing energy-intensive
materials and construction techniques with innovative products. This would have the greatest
impact.
Thermal processing will be implemented to improve the intrinsic properties of wood and to
obtain the form and functionality desired by architects, designers and engineers. High
performance at low weight and low price creates a considerable market potential for thermal
treated timber products that can replace energy-intensive materials and methods of
construction, and reveal a great potential in construction, architecture, light weight
construction, and furniture manufacture. Different modification processes and parameters
yield modified wood with different properties suitable for a variety of product lines.
However, they also have different environmental impacts, which are consequently transferred
into the materials and final products. Interactive assessment of process parameters,
product properties, and environmental impacts should be used to aid development of
innovative modification processes and manufacturing technologies. Recycling, up-cycling,
the cradle to cradle (C2C) paradigm, and end-of-life disposal options need to be integrated in
a fully developed industrial ecology for modified wood processes. New advances in wood-
based material processing should support and promote efficient product reuse, recycling
and end-of-life use, and pave the way to a low-carbon economy.
The low-carbon economy aims to mitigate climate change and promote sustainable
development in Europe, by reducing energy consumption, pollution and emissions while
increasing performance. Therefore, research into thermally based timber processing and the
resultant products must place more emphasis on the interactive assessment of process
parameters, developed product properties, and environmental impacts. Energy consumption
contributes considerably to the environmental impact of thermally treated wood. However,
the improved properties during the use phase might reduce the environmental impact of the
thermally based timber processing. To achieve sustainable development, certain criteria
within a framework of economic, environmental and social systems must also be followed. It
is important to note that the effective use of wood throughout its whole value chain from
forest management, through multiple use cycles, and end-of-life disposal can lead to a truly
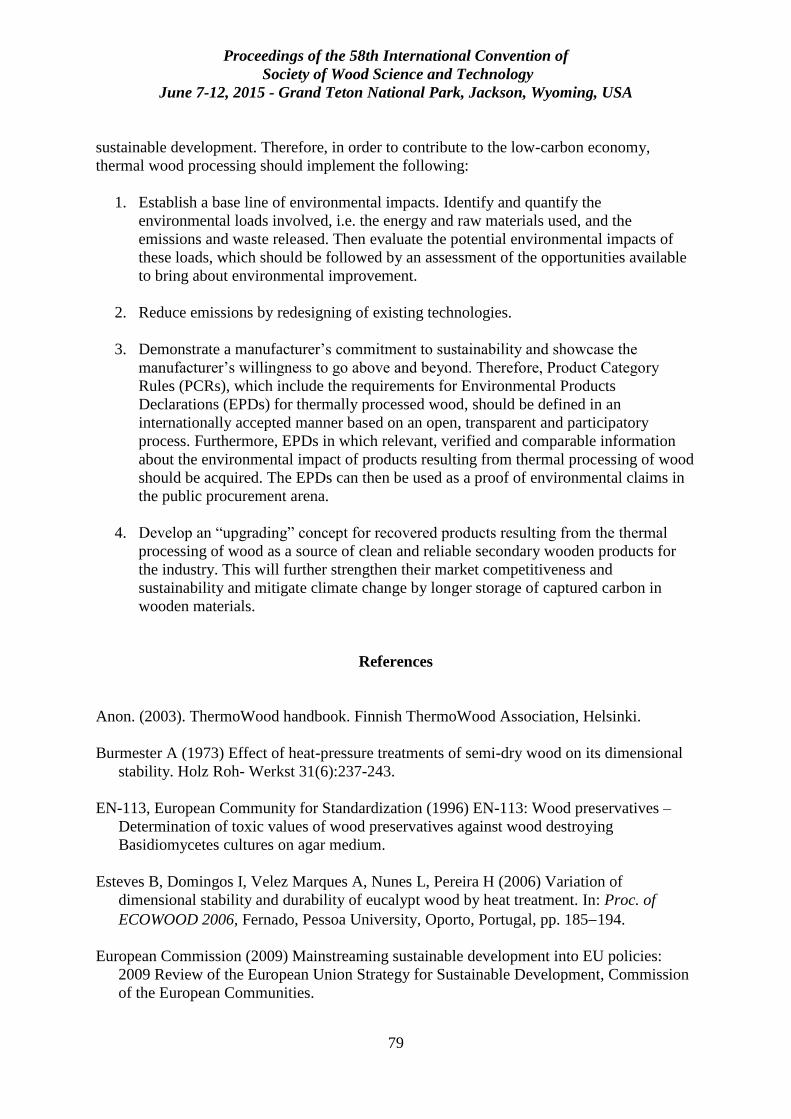
Proceedings of the 58th International Convention of
Society of Wood Science and Technology
June 7-12, 2015 - Grand Teton National Park, Jackson, Wyoming, USA
79
sustainable development. Therefore, in order to contribute to the low-carbon economy,
thermal wood processing should implement the following:
1. Establish a base line of environmental impacts. Identify and quantify the
environmental loads involved, i.e. the energy and raw materials used, and the
emissions and waste released. Then evaluate the potential environmental impacts of
these loads, which should be followed by an assessment of the opportunities available
to bring about environmental improvement.
2. Reduce emissions by redesigning of existing technologies.
3. Demonstrate a manufacturer’s commitment to sustainability and showcase the
manufacturer’s willingness to go above and beyond. Therefore, Product Category
Rules (PCRs), which include the requirements for Environmental Products
Declarations (EPDs) for thermally processed wood, should be defined in an
internationally accepted manner based on an open, transparent and participatory
process. Furthermore, EPDs in which relevant, verified and comparable information
about the environmental impact of products resulting from thermal processing of wood
should be acquired. The EPDs can then be used as a proof of environmental claims in
the public procurement arena.
4. Develop an “upgrading” concept for recovered products resulting from the thermal
processing of wood as a source of clean and reliable secondary wooden products for
the industry. This will further strengthen their market competitiveness and
sustainability and mitigate climate change by longer storage of captured carbon in
wooden materials.
References
Anon. (2003). ThermoWood handbook. Finnish ThermoWood Association, Helsinki.
Burmester A (1973) Effect of heat-pressure treatments of semi-dry wood on its dimensional
stability. Holz Roh- Werkst 31(6):237-243.
EN-113, European Community for Standardization (1996) EN-113: Wood preservatives –
Determination of toxic values of wood preservatives against wood destroying
Basidiomycetes cultures on agar medium.
Esteves B, Domingos I, Velez Marques A, Nunes L, Pereira H (2006) Variation of
dimensional stability and durability of eucalypt wood by heat treatment. In: Proc. of
ECOWOOD 2006, Fernado, Pessoa University, Oporto, Portugal, pp. 185194.
European Commission (2009) Mainstreaming sustainable development into EU policies:
2009 Review of the European Union Strategy for Sustainable Development, Commission
of the European Communities.
Proceedings of the 58th International Convention of
Society of Wood Science and Technology
June 7-12, 2015 - Grand Teton National Park, Jackson, Wyoming, USA
80
European Commission (2011) A roadmap for moving to a competitive low carbon economy
in 2050. Communication. Brussels: European Commission European Commission.
http://eur-
lex.europa.eu/LexUriServ/LexUriServ.do?uri=CELEX:52011DC0112:EN:NOT.
European Parliament Council (2008) Directive 2008/98/EC of the European Parliament and
of the Council of 19 November 2008 on waste and repealing certain Directives. Directive.
Brussels: European Parliament. http://eurlex.europa.eu
/LexUriServ/LexUriServ.do?uri=CELEX:32008L0098:EN:NOT.
Giebler E (1983) Dimensionsstabilisierung von Holz durch eine Feuchte/Wärme/Druck-
Behandlung (Dimensional stabilization of wood by moisture-heat-pressure-treatment).
Holz Roh- Werkst 41(3):87-94.
Jonsson R, Egnell G, Baudin A. (2011) Swedish Forest Sector Outlook Study. United
Nations, Geneva. http://www.unece.org/fileadmin/DAM/timber/publications/DP-
58_hi_res.pdf, [March, 18 2014].
Koehler A, Pillow MY (1925) Effect of high temperatures on the mode of fracture of a
softwood. Southern Lumberman 121:219-221.
Kutnar A, Humar M, Kamke FA, Šernek M (2011) Fungal decay of viscoelastic thermal
compressed (VTC) wood. Holz Roh- Werkst 69(2): 325-328.
Navi P, Sandberg D (2012) Thermo-hydro-mechanical processing of wood. EPFL Press,
Lausanne, Switzerland, 376 pp.
Radkau J (2007) Holz – Wie ein Naturstoff Geschichte schreibt, (Wood - how a natural
material writes history.) Oekom Verlag, München.
Rowell RM (2002) Sustainable composites from natural resources. In: High performance
structures and composites. C.A. Brebbia and W.P. de Wilde (Eds.). WIT Press, Boston,
MA, pp. 183–192.
Skyba O, Niemz P, Schwarze FWMR (2008) Degradation of thermo-hygro-mechanically
(THM)-densified wood by soft-rot fungi. Holzforschung, 62(3): 277-283.
Schwarze FWMR, Spycher M (2005) Resistance of thermo-hygro-mechanically densified
wood to colonisation and degradation by brown-rot fungi. Holzforschung 59:358-363.
Teichgräber R (1966) Beitrag zur Kenntnis der Eigenschaftsänderungen des Holzes beim
Dämpfen. (On the alteration of the properties of wood during steaming). Holz Roh-
Werkst, 24(11):548-551.
Tiemann HD (1915) The effect of different methods of drying on the strength of wood.
Lumber World Review, 28:19-20.
Proceedings of the 58th International Convention of
Society of Wood Science and Technology
June 7-12, 2015 - Grand Teton National Park, Jackson, Wyoming, USA
81
Tjeerdsma BF (2006) Heat treatment of wood – thermal modification. SHR Timber
Research, Wageningen, The Netherlands.
Ünsal O, Kartal SN, Candan Z, Arango R, Clausen CA, Green F (2008) Preliminary
investigation of biological resistance. Water absorption and swelling of thermally
compressed pine wood panels. IRG/WP; 08-40396. Stockholm, IRG Secretariat, 11 p.
Welzbacher CR, Rapp A (2007) Durability of thermally modified timber from industrial-
scale processes in different use classes: Results from laboratory and field tests. Wood
Material Science and Engineering, 2(1):414.
Welzbacher CR, Wehsener J, Rapp AO, Haller P (2008) Thermo-mechanical densification
combined with thermal modification of Norway spruce (Picea abies Karst) in industrial
scale – dimensional stability and durability aspects. Holz Roh- Werkst 66: 39-49.
Werner F, Richter K (2007) Wood building products in comparative LCA. A literature
review. Int. J. LCA 12(7):470–479.
Wilson TRC (1920) The effect of kiln drying on the strength of airplane woods. National
Advisory Committee for Aeronautics, Washington DC, Report No. 68.
Proceedings of the 58th International Convention of
Society of Wood Science and Technology
June 7-12, 2015 - Grand Teton National Park, Jackson, Wyoming, USA
82
Tall Buildings – An Approach to Modeling Economic,
Carbon, and Employment Effects
Pablo J. Crespell1
1 Senior Scientist, Business Analysis –
FPInnovations. 2665 East Mall, Vancouver, Canada V6T 1Z4
Abstract
Trends continue to gear towards higher shares of mid- and high-rise construction, especially
for apartments. There is much interest in pursuing this trend as a way to ensure further levels
of penetration of wood-based systems. Europe has a lead over North America but a wealth of
knowledge has been created over the last years and recent code changes may be the final
steps needed to allow the inroad of wood into this market.
The proposed methodology relies on actual and conceptual buildings to calculate wood use
factors for several building systems, including light wood frame, mass timbers and hybrid
(beams, elevated slabs). A lower limit (low factor) and upper limit (high factor) bound is
assigned to each story class based on feasibility by building system. For instance CLT is only
used up to 15 stories. Past that point only post & beam and/or hybrid systems are used.
Similarly, a central wood core is assumed for all non-platform frame solutions up to 20
stories to provide resistance to lateral forces. Over twenty stories a concrete central core is
assumed.
Wood use factors (ft3/sqft) are multiplied by the respective floor areas by story class to
estimate potential demand for wood (lower and upper limit by story class). Alternatively
these volumes can be inputted into any of the available carbon calculators to estimate
sequestered CO2 equivalent and/or the associated avoided GHG emissions by replacing non-
wood buildings with a higher carbon footprint.
Building code limitations are not considered in the assessment of the maximum opportunity
or size of the market. The actual opportunity for wood buildings will be dependent on:
building systems, configurations, location, building code limits and market penetration.
Reasonable levels of market penetration should consider current shares of wood by end-use
and height class. For instance wood platform frame has over 50% share in the mid-rise class
(5-7 stories). So it may be reasonable to simulate an additional 20% for the lower limit and a
total no higher than 25-30% for the upper limit (mass timbers).

Proceedings of the 58th International Convention of
Society of Wood Science and Technology
June 7-12, 2015 - Grand Teton National Park, Jackson, Wyoming, USA
83
It is assumed that the lumber stock required to produce the needed engineered wood products
is already available, therefore we propose quantifying the associated labor without including
primary transformation. By estimating total demand of wood and average size of plants it is
possible to estimate employment opportunities associated to the construction of tall wood
buildings in North America. Such trend is expected to have enormous economic multipliers
in the design and construction community and the associated trades.
Keywords: Tall wood buildings, wood use, nonresidential construction, residential
construction, carbon economy, employment.
Acknowledgements
Forestry Investment Initiative
NRCAN
Wood Works BC
FPInnovations
Proceedings of the 58th International Convention of
Society of Wood Science and Technology
June 7-12, 2015 - Grand Teton National Park, Jackson, Wyoming, USA
84
Wood-based Green Fuels and Chemicals Session Moderator: Patricia Townsend, Washington State University,
USA
Beyond Biofuels: Shifting from Hardwood-Based
Transportation fuels to Biochemicals
Kevin Zobrist, [email protected]
Patricia Townsend, [email protected]
Nora Haider, [email protected]
Marina Heppenstall, [email protected]
Orion Lekos, [email protected]
Washington State University, 600 128th St SE, Everett, WA 98208
Abstract
Advanced Hardwood Biofuels Northwest (AHB) is a Pacific Northwest-based, USDA-funded
Project that is looking at hybrid poplar as a feedstock for renewable biofuels. Since this effort
began, there have been profound changes in the bioenergy industry. Greater availability of
domestic sources of petroleum and natural gas are contributing to lower fossil fuel prices.
Future political support for renewable fuels is uncertain. Given these factors, poplar-based
biofuels cannot compete economically with conventional fossil fuels in the near-term. The
loss of expected near-term economic opportunities for both biorefinery operators and poplar
growers to produce poplar-based biofuels has required significant changes in the scope and
focus of the AHB project. In this presentation, we will discuss how we have responded to the
changing bioeconomy by shifting our end product focus from liquid transportation fuels to an
alternative product line of high-value biochemical such as acetic acid, ethylene, and ethanol.
We will discuss potential economic opportunities for these biochemicals in the Pacific
Northwest, the potential for poplar-based biochemical production in other regions, and the
role of biochemical in establishing a foundation for future poplar-based fuel production. We
will also discuss how we have shifted our Extension outreach efforts to focus on broader
bioenergy themes and poplar production practices to better prepare the region for future
biofuel opportunities.
Proceedings of the 58th International Convention of
Society of Wood Science and Technology
June 7-12, 2015 - Grand Teton National Park, Jackson, Wyoming, USA
85
Wood Residues as Feedstock for the 3G CIMV Biorefinery
Michel Delmas, [email protected]
Bouchra Benjelloun Mlayah, [email protected]
CIMV/ University of Toulouse, 6 allee des Amazones, 34432, Toulouse cedex 4
Abstract
Forestry and logging industries generate a lot of lignocellulosic residues like agriculture with:
corn, wheat, rice, barley straws, sugarcane bagasse. This huge quantity of feedstock has been
considered by people engaged since 20 years in the development of the 2G biofuels industry.
There is not today a great interest for wood residues. This is due probably by the fact that the
2G biorefinery focus only on glucose to produce bioethanol in poor economic conditions
requiring high subsidies. We are pleased to present here our 3G biorefinery which works with
all kind of lignocellulosic residues, including timber, mainly hardwood. We shall develop
here how biolignin™, cellulose and hemicelluloses and others compounds of wood are
separated for industrial purpose. Glucose and xylose are produced without degradation with
high purity and quantitative yields what opens the way to a 3G biofuels production, very
profitable without subsidy. Cimv (www.cimv.fr ) operates a pilot plant (2T/day of feedstock)
since 6 years. We have during this time collect the requiring data for the demo and
commercial plant construction and the validation of our products with our industrial partners
in Europe. A part of these is public due to the final report of the European research program
on biorefinery: Biocore (www.biocore-europe.org ). The demo and commercial plants
development in Europe and USA will be presented
Proceedings of the 58th International Convention of
Society of Wood Science and Technology
June 7-12, 2015 - Grand Teton National Park, Jackson, Wyoming, USA
86
Development of a New Nanocatalyst for Upgrading Wood
Pyrolysis Bio-Oil to Green Fuels
Armando McDonald, [email protected]
Yinglei Han, [email protected]
David McIlroy, [email protected]
University of Idaho, 875 Perimeter Drive, MSC1132, Moscow, ID 83844
Abstract
In order to reduce the greenhouse gas (GHG) emissions, woody biomass derived fuels have
become an alternative to fossil fuels. Fast pyrolysis is a process can convert the woody
biomass to a crude bio-oil which contains anhydro-sugars, alcohols, ketones, aldehydes,
carboxylic acids and phenolics. Nevertheless, some of these compounds contribute to bio-oil
shelf life instability and difficulty in refining. The bio-oil can be catalytically upgraded by a
hydrodeoxygenation (HDO) treatment to stable hydrocarbons which can be refined into
various fuel grades (such as gasoline and jet fuel). Therefore, developing new catalysts with
enhanced performance and lowering costs for upgrading bio-oils is required. This study aims
at developing and evaluating nickel (Ni) and ruthenium (Ru) decorated SiO2 nanosprings
(Ni-NS and Ru-NS) as HDO catalysts for upgrading pyrolysis bio-oils. The Ni-NS, and
conventional catalysts were characterized by H2-temperature program reduction (H2-TPR),
transmission electron microscopy (TEM) and X-ray diffraction (XRD). Phenol was used as a
representative model compound of bio-oil and used for catalyst optimization. The reactions
were performed in a stirred reactor at 300oC at 4000 psi H2 pressure. The phenol and bio-oil
HDO reaction products were characterized by GC-MS for volatile products and ESI-MS for
oligomeric products. The results show that the Ru-NS based catalysts showed excellent
conversion yields into hydrocarbons with good catalyst stability
Proceedings of the 58th International Convention of
Society of Wood Science and Technology
June 7-12, 2015 - Grand Teton National Park, Jackson, Wyoming, USA
87
Hydrothermal Processing Effects on Bioethanol
Production from Lignocellulosic Material
Reza Hosseinpour, [email protected]
Pedram Fatehi, [email protected]
Islamic Azad University, No. 19 Asadi Aly North, Satari Highway Noor SQ,
Tehran
Abstract
The development of products derived from biomass is emerging as an important force
component for economic development in the world. Rising oil prices and uncertainty over the
security of existing fossil reserves, combined with concerns over global climate change, have
created the need for new transportation fuels and for the manufacture of bioproducts to
substitute for fossil-based materials. The concept of a biorefinery that integrates processes
and technologies for biomass conversion demands an efficient utilization of all components.
Hydrothermal processing is a potential clean technology to convert raw materials such as
lignocellulosic materials into bioethanol and high added-value chemicals. In this technology,
water at high temperatures and pressures is applied for hydrolysis, extraction and structural
modification of materials. This paper is focused on providing an updated overview on the
fundamentals of hydrothermal processing and its modelling, as well as separation and
applications of the main components of lignocellulosic materials into bioethanol.
Proceedings of the 58th International Convention of
Society of Wood Science and Technology
June 7-12, 2015 - Grand Teton National Park, Jackson, Wyoming, USA
88
An Economic Analysis of Bagasse as a Bio-fuel Feedstock
Sun Joseph Chang, [email protected]
Louisiana State University Agricultural Center, School of Renewable Natural
Resources, Baton Rouge, LA 70803
Abstract
Every year the sugar mills in Louisiana produce about 1 million green tons of bagasse with
505 moisture content as a by-product of sugar production. Over the years, it has been
considered as a source of raw materials for pulp production and bagasse board production.
With the current drive for bio-energy, this paper examines the feasibility of using such
material as a competitor with wood for bio-energy production. More importantly, this paper
examines the feasibility of using bagasse as the feedstock for biofuel - ethanol production.
The results of the analyses suggest that when natural gas, the key competitor of biofuel, is
expensive, bagasse is too valuable to the sugar mills to be sold as the feedstock of biofuel.
On the other hand, when natural gas is inexpensive, sugar mills must pay the biofuel plants to
take bagasse as the feed stock. Not surprisingly, sugar mills rationally choose to burn
bagasse to power their plants.
Proceedings of the 58th International Convention of
Society of Wood Science and Technology
June 7-12, 2015 - Grand Teton National Park, Jackson, Wyoming, USA
89
Biomass Energy: Innovations, Economic Realities, and
Public Perception Session Moderator: Nikki Brown, Pennsylvania State University, USA
Overcoming Barriers to Biomass Cogeneration in the U.S.
Wood Production Industry
Omar Espinoza. 1* – Maria Fernanda Laguarda Mallo2 – Mariah Weitzenkamp3
– Urs Buehlmann4
1 Assistant Professor, Department of Bioproducts and Biosystems Engineering –
University of Minnesota. St. Paul, MN 55108
* Corresponding author
[email protected] 2,3 Graduate Student and Student, Department of Bioproducts and Biosystems
Engineering – University of Minnesota. St. Paul, MN 55108 4 Associate Professor, Department of Sustainable Biomaterials – Virignia Tech.
Blacksburg, VA 24061
Abstract
Cogeneration, also known as Combined Heat and Power (CHP), is the simultaneous
generation of electric and thermal energy from the same fuel source. Some of cogeneration’s
proven benefits are much higher efficiencies than conventional power generation and its
ability to facilitate distributed energy and lower energy costs. However, only a small number
of wood products manufacturers have adopted this technology. In this research project,
drivers, perceptions and barriers for cogeneration were investigated to gain understanding on
the reasons for the low adoption of this technology among wood products manufacturers.
Interviews to experts and a non-probability, target survey of non-adopters was carried out to
identify operational characteristics, perceptions about benefits of cogeneration and barriers to
its implementation Findings show that economies of scale and coincidence between thermal
and electric loads are some of the major factors for cogeneration feasibility. Main barriers
identified are the initial investment and complexity, companies’ return on investment
requirements, utility tariff policies, and inadequate policies and incentives. Another major
finding is a lack of awareness and knowledge about cogeneration, presenting organizations
that support the industry with an opportunity to provide education and outreach to these
industries.
Keywords: forest products industry, cogeneration, combined heat and power
Proceedings of the 58th International Convention of
Society of Wood Science and Technology
June 7-12, 2015 - Grand Teton National Park, Jackson, Wyoming, USA
90
Introduction
The U.S. wood products industry has faced many difficulties and significant downsizing
during the last decade. Adding to this challenging environment has been the steady increase
in energy prices (EIA, 2014; American Hardwood Export Council, 2006). The increased
energy costs clearly threaten profitability and indicate a need to reduce energy expenditures.
Another important development has been the increase in concerns about energy
independence, climate change, and environmental sustainability. There has been a global
push to increase the share of energy generated from renewable sources, since these types of
fuels produce relatively low levels of greenhouse emissions. In the U.S., 29 states have now
renewable energy portfolio standards and nine have renewable energy goals (DSIRE, 2014).
These goals invariably consider a mix of renewable energy sources such as solar, wind,
hydropower, geothermal, biomass. Among the latter, woody biomass has been gaining
attention for its environmental advantages over fossil fuels: it is abundant, renewable, it has
low carbon emissions, low metals and sulfur, and produces minimal amounts of ash
(Bergman & Zerbe`, 2004; Bowyer et al., 2011). Additionally, wood biomass has cost
advantages over other energy sources (EIA, 2014).
Cogeneration can be defined as the simultaneous generation of thermal and electrical energy
from the same energy source (EPA, 2014c). Cogeneration plants typically have efficiencies
that double those of conventional power plants. Within the U.S. wood products industry,
cogeneration has the potential to cover a considerable part of its energy needs from wood
residues. However, relatively few companies in the industry have adopted cogeneration
technology. Possible reasons for this lack of widespread adoption are: high initial investment,
not enough steam pressure generated on-site, low fossil fuel cost (i.e., natural gas), among
others (Lamb, 2008). Moreover, there is a lack of current information about the benefits and
drawbacks of cogeneration applied to the wood products industry. Research is needed to
develop a sound, detailed scientific analysis to help understand the potential benefits of
cogeneration operations for the wood products industry, and the major factors for technical
and economic feasibility. Outcomes will facilitate decision making by companies interested
in the technology.
The goal of this research project was to evaluate wood biomass-based cogeneration
technologies for U.S. wood products manufacturers, and identify barriers to their adoption.
The specific objectives were to: (1) investigate the status of biomass-based cogeneration in
the wood products industry, (2) identify perceived and actual barriers to adoption of
cogeneration, and (3) investigate economical and technical conditions under which
cogeneration could become a viable option for wood products manufacturers.
Proceedings of the 58th International Convention of
Society of Wood Science and Technology
June 7-12, 2015 - Grand Teton National Park, Jackson, Wyoming, USA
91
Methods
To accomplish the study’s objectives, a combination of literature review, expert and industry
interviews, and a target survey of wood products manufacturers was used to accomplish the
study’s objectives. A detailed explanation of methods follows.
Interviews
After an extensive literature review, interviews with cogeneration experts and industry
representatives were conducted to identify and learn about the critical topics of cogeneration
as it applies to the wood products industry. A list of potential interviewees including,
technology experts, industry adopters and non-adopters, was compiled. Topics included in the
interviews were: (1) conditions/drivers for cogeneration, (2) barriers to cogeneration, (3) role
of policies, and (4) the interviewee’s outlook for cogeneration. The interviews were recorded,
transcribed and then coded for analysis. Organization and analysis of the responses were
carried out using Microsoft Excel spreadsheet software.
Target Survey of Non-Adopters
Using as major input the expert and industry interviews, a targeted web-based survey of U.S.
wood products manufacturers was conducted. The targeted sampling approach used is a non-
probability strategy, where the researchers do not have certainty of whether all potential
respondents have the same chance of selection (Rea, 2005), thus generalizations from the
results cannot be made to the entire population of interest. The reasons for selecting this
sampling strategy were related to time and resource limitations, and availability of lists of
current and valid e-mail addresses.
Sample Development
A sample of companies in the population of interest (NAICS codes 321: Wood Products, and
337: Furniture and Related Products) was developed using the Wood2Energy database
(Wood2Energy, 2014). This database contains several fields, which can be used to sort
companies. A list of 946 companies was compiled and used for the survey. Efforts were made
to try to have a sample that reflects the regional distribution of the industry.
Questionnaire Development
The Tailored Design Method’s recommendations by Dillman were followed (Dillman 2009)
to design and conduct the survey. The survey instrument was developed in three steps: (1) A
list of topics and initial draft were created based on results from interviews to experts
conducted during the first stage of the research. The platform used for the web-based survey
was Qualtrics survey software (Qualtrics, 2014). (2) The questionnaire was subject to review
by four industry and experts and feedback was used to create a new and improved version.
(3) A survey pre-test was conducted among a sample of 103 companies randomly selected
from the distribution list. Changes were made based on response patterns and feedback
received. A final version of the questionnaire was then ready for its final distribution.
Proceedings of the 58th International Convention of
Society of Wood Science and Technology
June 7-12, 2015 - Grand Teton National Park, Jackson, Wyoming, USA
92
Results and Discussion
Expert and Industry Interviews
Experts and industry representatives were interviewed during spring and summer of 2014.
The major findings from the analysis are presented in this section.
Drivers for Cogeneration
Energy costs: The most common response, when asked about the motivations and drivers
for cogeneration, was the increasing costs of energy.
Growing energy needs: All the companies interviewed for this study mentioned “growing
energy needs,” especially thermal energy, as a major driver for considering cogeneration.
Wood residue utilization: Interviewees also mentioned the need for more profitable
outlets for their wood residues as a major driver to consider cogeneration.
Environmental driver: Of all the drivers mentioned during the interviews, environmental
considerations did not seem to be regarded as a major motivation, especially for
manufacturers. One manufacturer indicated that, purchasing electricity from a utility that
in turn obtains a considerable part of its energy from wind, allowed the company to meet
its environmental goals without resorting to cogeneration.
Factors for Cogeneration
Scale of operation: This was a common theme in the interviews. Responses suggest that
economies of scale make cogeneration more or less feasible for wood products
manufacturers.
Match between electric/thermal loads: According to our interviewees, along with
economies of scale, a good coincidence between electric and thermal load was mentioned
as one of the most important factors for economic feasibility of cogeneration. The
importance of strategy for system design was also mentioned.
Low seasonal variability in thermal loads: Cogeneration operations need constant thermal
loads throughout the year to be economically feasible.
Location (relative to utilities and fuel): Due to the low energy density of wood biomass,
location relative to the fuel is especially important for bioenergy operations. Location
relative to utilities is also an important factor.
Age of thermal equipment: Companies that need considerable upgrading of their thermal
equipment (boiler, steam lines) for the implementation of cogeneration may find it
financially challenging to engage in such investment.
Spark spread: Spark spread is the difference (in $ per kWh) between the price of
delivered electric energy and the cost of generating power with a cogeneration system
(EPA, 2014a). This metric was seen as an important consideration for the economic
feasibility of a cogeneration project and the design strategy to be used.
Proceedings of the 58th International Convention of
Society of Wood Science and Technology
June 7-12, 2015 - Grand Teton National Park, Jackson, Wyoming, USA
93
Barriers to Cogeneration
Initial investment: Economies of scale are important for the initial investment required for
a cogeneration plant. For some operations, an important component of the initial
investment is the acquisition of emissions control equipment.
Company hurdle rate and required payback period: Although experts mentioned that, in
general, cogeneration projects have relatively short payback periods, companies
sometimes require even shorter payback period to consider implementing a project.
Complexity of operation and maintenance. All of the adopters interviewed coincided that
there is a need to hire personnel with specific qualifications to run and maintain the
cogeneration facility.
Adequate markets for wood residues: While looking for better utilization of wood
residues was a major driver for considering cogeneration, having more profitable outlets
for them can also be a barrier.
Tariff policies by utilities and inadequate power purchase agreement: Since most
cogeneration projects are designed to meet thermal loads, there is usually a discrepancy
between a manufacturing facility’s load and the cogeneration output, thus companies need
to negotiate power purchasing agreements with utilities.
Emissions regulations and permitting issues: Adopters interviewed for this study
mentioned that for small operations emissions regulations are usually not a big hurdle, but
as the size of the operation increases, emissions requirements become more stringent.
Inadequate policies/incentives: The Environmental Protection Agency lists 349 policies
related to cogeneration in its Cogeneration Policies and Incentives database (EPA, 2013).
Some of our interviewees noted that the incentives from PURPA ("Public Utility
Regulatory Policies Act of 1978 (PURPA)," 1978), which in large part facilitated
important increases in cogeneration capacity, were rolled back with the passage of the
Energy Policy Act of 2005 ("Energy Policy Act of 2005," 2005), mostly affecting the
utilities’ power buying obligations.
Lack of education/awareness: Lastly, several interviewees mentioned that there is a lack
of awareness and education about cogeneration technologies.
Survey of Wood Products Manufacturers
The survey was conducted in the summer of 2014, with one initial distribution and two
reminders, lasting four weeks in total. The initial distribution list contained 946 companies.
Accounting for bounced emails, surveys not fully completed and four companies that
declined to participate, the adjusted response rate was of 8%. Given the sampling method
used and the low response rate, it is important to state that the conclusions listed here apply
only to the facilities that responded to the survey.
Most respondent were primary manufacturers (sawmills), architectural millwork
manufacturers, wood components producers, and dimension lumber and planer mills.
Companies in 30 U.S. states answered the survey, from which most indicated to be located in
the Eastern U.S.
Familiarity with Cogeneration and Company Status Regarding Cogeneration
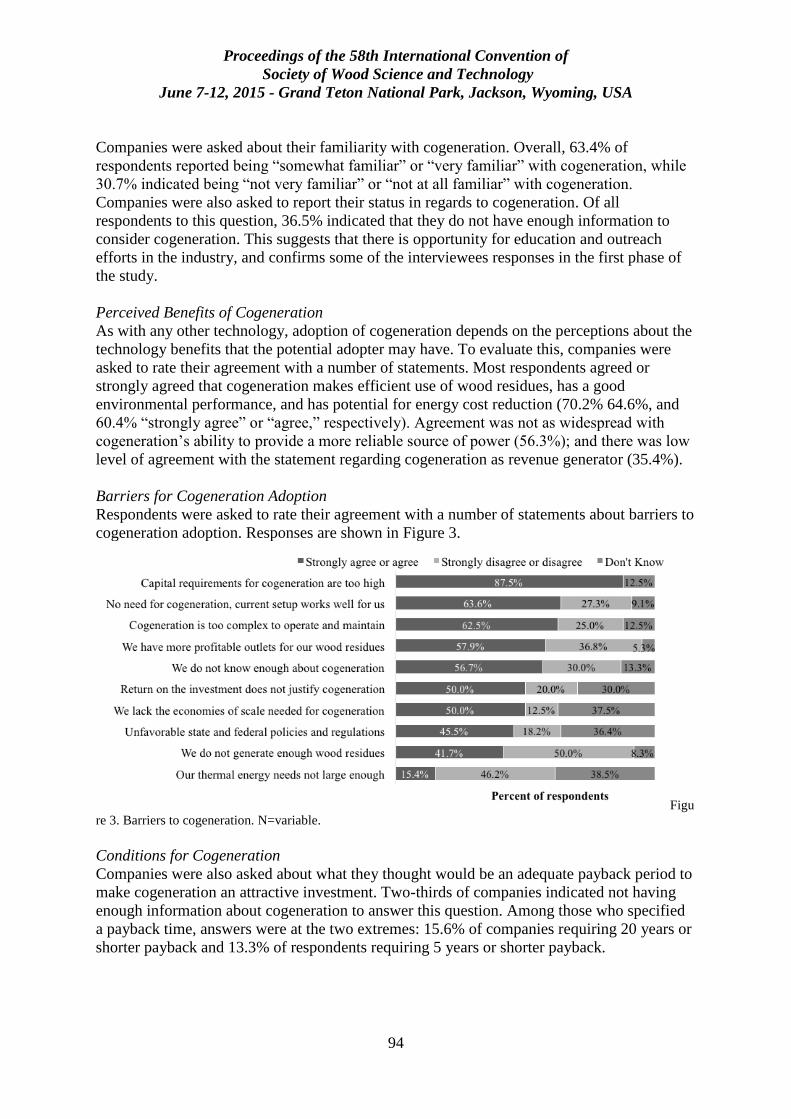
Proceedings of the 58th International Convention of
Society of Wood Science and Technology
June 7-12, 2015 - Grand Teton National Park, Jackson, Wyoming, USA
94
Companies were asked about their familiarity with cogeneration. Overall, 63.4% of
respondents reported being “somewhat familiar” or “very familiar” with cogeneration, while
30.7% indicated being “not very familiar” or “not at all familiar” with cogeneration.
Companies were also asked to report their status in regards to cogeneration. Of all
respondents to this question, 36.5% indicated that they do not have enough information to
consider cogeneration. This suggests that there is opportunity for education and outreach
efforts in the industry, and confirms some of the interviewees responses in the first phase of
the study.
Perceived Benefits of Cogeneration
As with any other technology, adoption of cogeneration depends on the perceptions about the
technology benefits that the potential adopter may have. To evaluate this, companies were
asked to rate their agreement with a number of statements. Most respondents agreed or
strongly agreed that cogeneration makes efficient use of wood residues, has a good
environmental performance, and has potential for energy cost reduction (70.2% 64.6%, and
60.4% “strongly agree” or “agree,” respectively). Agreement was not as widespread with
cogeneration’s ability to provide a more reliable source of power (56.3%); and there was low
level of agreement with the statement regarding cogeneration as revenue generator (35.4%).
Barriers for Cogeneration Adoption
Respondents were asked to rate their agreement with a number of statements about barriers to
cogeneration adoption. Responses are shown in Figure 3.
Figu
re 3. Barriers to cogeneration. N=variable.
Conditions for Cogeneration
Companies were also asked about what they thought would be an adequate payback period to
make cogeneration an attractive investment. Two-thirds of companies indicated not having
enough information about cogeneration to answer this question. Among those who specified
a payback time, answers were at the two extremes: 15.6% of companies requiring 20 years or
shorter payback and 13.3% of respondents requiring 5 years or shorter payback.
Proceedings of the 58th International Convention of
Society of Wood Science and Technology
June 7-12, 2015 - Grand Teton National Park, Jackson, Wyoming, USA
95
Summary and Conclusions
Research was conducted to understand the drivers, factors, and barriers to cogeneration
adoption in the wood products industry Major findings from this study are listed below.
From interviews with experts, it was found that the major drivers (in order of importance)
for cogeneration implementation are: reduction of energy costs, growing energy needs by
companies and desire to more effectively utilize wood residues.
Among the most important factors considered when thinking about a cogeneration
investment were: scale of the operation, good coincidence between electric and thermal
loads and having a low seasonal variability in thermal loads.
Most important barriers mentioned were: large investment required, companies’ return of
investment requirements, complexity of operating and maintaining a cogeneration unit,
more profitable markets for wood residues, and lack of awareness about cogeneration
among industries.
Most survey respondents indicated being somewhat or very familiar with cogeneration
(63.4%) while 30.7% were not very or not at all familiar with cogeneration. More than a
third (36.5%) of respondents said they lack the information necessary to consider
cogeneration.
Among the perceived benefits from cogeneration were: efficient use of wood residues,
environmental performance, and potential for cost reduction.
Most important barriers perceived were: the capital requirements, followed by complexity
of operation and maintenance.
Answers seemed to indicate a lack of knowledge and awareness about cogeneration. This
represents an opportunity to provide education and outreach. The authors consider that
further research is needed on feasibility of wood biomass cogeneration, including case studies
of successful (and not so successful) implementations that could inform companies interested
in cogeneration.
References
Alreck P L, Settle R B (2004) The survey research handbook. McGraw-Hill/Irwin,
Boston, MA. 3rd Ed. Vol. xxv. 463 pp.
American Hardwood Export Council (2006) Understanding the North American
Hardwood Industry: An Overview. Date accessed: April 22, 2008. http://www.ahec-
europe.org/
Bergman R, Zerbe J (2004) Primer on Wood Biomass for Energy. Date accessed: June
2013. http://www.dof.virginia.gov/mgt/resources/pub-usda-fs-primer-on-wood-biomass-for-
energy.pdf
Bowyer J, Bratkovich S, Frank M, Fernholz K, Howe J, Stai S (2011) Managing Forests
for Carbon Mitigation. Dovetail Partners, Inc., Minneapolis, MN. 16 pp.
Proceedings of the 58th International Convention of
Society of Wood Science and Technology
June 7-12, 2015 - Grand Teton National Park, Jackson, Wyoming, USA
96
Dillman D A (2009) Internet, mail, and mixed-mode surveys : the tailored design method
Wiley & Sons. Hoboken, N.J. 3rd Ed. Vol. xii. 499 pp.
DSIRE (2014) Database of State Incentives for Renewables & Efficiency (DSIRE). ,
http://www.dsireusa.org/ (October 3, 2014)
EIA (2014) Energy Information Administration. http://www.eia.gov/ (September 26,
2014)
Energy Policy Act of 2005 (2005).
EPA (2013) Database of CHP Policies and Incentives (dCHPP).
http://www.epa.gov/chp/policies/database.html (February 9, 2013)
EPA (2014c) Combined Heat and Power Partnership - Basic Information.
http://www.epa.gov/chp/basic/index.html (October 3, 2014)
Lamb F (2008, April 29, 2008). [Electronic mail communication].
Public Utility Regulatory Policies Act of 1978 (PURPA), H.R. 4018 C.F.R. (1978).
Qualtrics (2014) Qualtrics [computer software] Qualtrics, LLC. Provo, Utah
http://www.qualtrics.com/
Rea L M (2005) Designing and conducting survey research : a comprehensive guide.
Jossey-Bass. 3rd Ed. Vol. xvi, San Francisco, CA. 283 pp.
Wood2Energy (2014) Wood to Energy User Facility Database (Database). University of
Tennessee Center for Renewable Carbon. Date accessed: July 2014.
http://www.wood2energy.org
Acknowledgements
The author would like to acknowledge Dennis Becker, Ben Wallace, and Keith Landin for
their help during the questionnaire development. Special thanks to the Office of the Vice
President for Research, University of Minnesota, for providing financial support for this
research. Lastly, we would like to acknowledge the companies that participated in this study,
and who kindly provided their input and time.
Proceedings of the 58th International Convention of
Society of Wood Science and Technology
June 7-12, 2015 - Grand Teton National Park, Jackson, Wyoming, USA
97
Internal and External Barriers Impacting Non-food
Lignocellulosic Biofuel Projects in the United States
Jeremy Withers, [email protected]
Quesada Henry, [email protected]
Robert Smith, [email protected]
Virginia Tech, Brooks Center (0503), 1650 Research Center Dr., Blacksburg
Virginia 24061
Abstract
This research identifies drivers and barriers impacting non-food cellulosic biofuel projects.
Exploratory research on secondary sources was conducted. Different qualitative and
quantitative tools were used to organize, classify and code the relevant data found. First phase
results indicated that since the 2005 U.S. Epact, 54 known non-food cellulosic biofuel
projects have attempted to reach economies of scale. Examined projects were classified by;
company, type, location, current status, feedstock. Figures were created to display project
status and percent within each category; pilot, demonstration, or commercial. Then the
projects were mapped by dividing by the U.S. map vertical median and overlaying the five
categories of; shutdown, cancelled, planning, under construction, operating. Of those, an
average of 2/3 have shutdown, mothballed, or stalled in pilot and demonstration level status.
Few have reached the full potential of biofuel production economies of scale. Results also
indicated that little information is publicly known about factors determining project
sustainability. This led to conducting an assessment of U.S. non-food based cellulosic bio-
refinery projects that could be identified, and the factors affecting a sustainable undertaking.
During a second phase, this research will conduct interviews, focus groups, and industry
visits to collect information from primary sources in order to better understand the internal
and external factors impacting these projects.
Proceedings of the 58th International Convention of
Society of Wood Science and Technology
June 7-12, 2015 - Grand Teton National Park, Jackson, Wyoming, USA
98
Self-Activation Process for Biomass Based Activated
Carbon
Changlei Xia 1 – Sheldon Q. Shi 2*
1 PhD Candidate, Department of Mechanical and Energy Engineering,
University of North Texas, Denton, TX 76203, USA.
2 Associate Professor, Department of Mechanical and Energy Engineering,
University of North Texas, Denton, TX 76203, USA.
* Corresponding Author
Abstract
Self-activation takes the advantages of the gases emitted from the pyrolysis process of
biomass to activate the converted carbon, so that a high performance activated carbon is
obtained. Different biomass types were used for the self-activation processes into activated
carbon, including kenaf bast fiber, kenaf core, sugarcane bagasse, sugarcane leaf, coconut
fiber, peanut shell, and sawdust. A linear relationship was shown between the BET surface
area (SABET) and the yield (ln(SABET) and yield) for the self-activation process. The study
also showed that a yield of 9.0% gave the highest surface area by gram kenaf core (115.3 m2
per gram kenaf core), and the yields between 5.5%-13.8% produced a surface area per gram
kenaf core that higher than 90% of the maximum.
Keywords: Self-activation, activated carbon, biomass, kenaf core
Introduction
Activated carbon is a crude form of graphite with a random or amorphous structure, which is
highly porous with large internal surface area. Activated carbon may exhibit a broad range of
pore sizes from visible cracks or crevices to slits of molecular dimensions. Generally,
activated carbon has a surface area of higher than 500 m2/g as determined by the gas
adsorption technique. In the adsorption analysis, non-polar gases, e.g. N2, CO2, Ar, CH4, etc.,
are used, and the N2 adsorption at 77 K is widely used (Mohan and Pittman Jr, 2006).
The use of carbon can be traced back to ancient times. The earliest known use of carbon in
the form of wood chars (charcoal) was in 3750 BC by the Egyptians and Sumerians
(Inglezakis and Poulopoulos, 2006). However, activated carbon was first produced on an
industrial scale was in early twentieth century. The major development of the activated
carbon was in Europe. In the early stage of development of activated carbon, they were only
Proceedings of the 58th International Convention of
Society of Wood Science and Technology
June 7-12, 2015 - Grand Teton National Park, Jackson, Wyoming, USA
99
available in the form of powdered activated carbon (PAC). Recently, many of the types of
activated carbon, e.g. granular activated carbon (GAC), pelletized activated carbon, etc. have
been developed. The Swedish chemist von Ostreijko obtained two patents, in 1900 and 1901,
covering the basic concepts of chemical and physical/thermal activation of carbon, with metal
chlorides and with carbon dioxide and steam, respectively (Sontheimer et al., 1988). In 1909,
a plant named ‘Chemische Werke’ was built to manufacture, for the first time on a
commercial scale, the PAC Eponit® from wood, adopting von Ostrejko’s gasification
approach (Dabrowski, 1999).
Activation methods can be divided into two categories: 1) physical/thermal activation and 2)
chemical activation. The physical/thermal activation uses a mild oxidizing gas, e.g. CO2,
water steam, etc., to eliminate the bulk of the volatile matters, followed by partial gasification
with thermal treatment. This method develops materials with higher porosity and more
surface area. The chemical activations are chemicals employed methods to increase the
surface area. Prior to activation, the raw materials are impregnated with certain chemicals.
Then, the chemicals loaded raw materials are processed by the activation steps (may combine
with carbonization).
The self-activation process of biomass described in this research takes advantages of the
gases emitted from the biomass during the carbonization process to serve as the activation
agent, so that the carbonization and activation are combined into one step (Shi and Xia,
2014). Compared to the conventional activated carbon manufacturing, the processing cost
using the self-activation is reduced, since no activating gas or chemical is used. In addition,
the self-activation process is more environmentally friendly. The exhausting gases (mainly
CO and H2) can be used as fuel or as feedstock for methanol production with further
synthesis.
In this study, we investigated the self-activation process, the relationship between yield and
BET surface area, and the best yield for the highest total surface area per gram kenaf core.
Materials and Methods
Materials. Kenaf core was obtained from Biotech Mills Inc., USA, with sizes of 3–30 meshes according
to the US standard sieve series and moisture content of 11.7% based on the ASTM D4442
standard. Other biomass, including kenaf bast fiber, sugarcane bagasse, sugarcane leaf,
coconut fiber, peanut shell, and sawdust, were used as received.
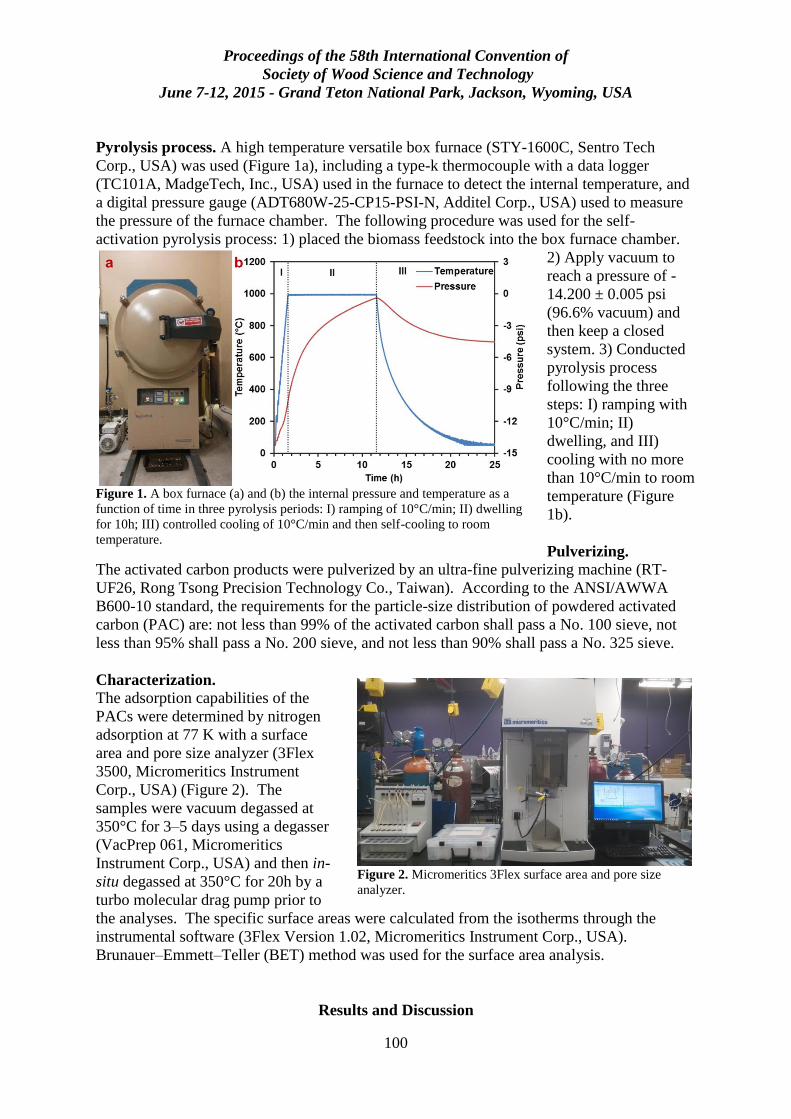
Proceedings of the 58th International Convention of
Society of Wood Science and Technology
June 7-12, 2015 - Grand Teton National Park, Jackson, Wyoming, USA
100
Pyrolysis process. A high temperature versatile box furnace (STY-1600C, Sentro Tech
Corp., USA) was used (Figure 1a), including a type-k thermocouple with a data logger
(TC101A, MadgeTech, Inc., USA) used in the furnace to detect the internal temperature, and
a digital pressure gauge (ADT680W-25-CP15-PSI-N, Additel Corp., USA) used to measure
the pressure of the furnace chamber. The following procedure was used for the self-
activation pyrolysis process: 1) placed the biomass feedstock into the box furnace chamber.
2) Apply vacuum to
reach a pressure of -
14.200 ± 0.005 psi
(96.6% vacuum) and
then keep a closed
system. 3) Conducted
pyrolysis process
following the three
steps: I) ramping with
10°C/min; II)
dwelling, and III)
cooling with no more
than 10°C/min to room
temperature (Figure
1b).
Pulverizing. The activated carbon products were pulverized by an ultra-fine pulverizing machine (RT-
UF26, Rong Tsong Precision Technology Co., Taiwan). According to the ANSI/AWWA
B600-10 standard, the requirements for the particle-size distribution of powdered activated
carbon (PAC) are: not less than 99% of the activated carbon shall pass a No. 100 sieve, not
less than 95% shall pass a No. 200 sieve, and not less than 90% shall pass a No. 325 sieve.
Characterization. The adsorption capabilities of the
PACs were determined by nitrogen
adsorption at 77 K with a surface
area and pore size analyzer (3Flex
3500, Micromeritics Instrument
Corp., USA) (Figure 2). The
samples were vacuum degassed at
350°C for 3–5 days using a degasser
(VacPrep 061, Micromeritics
Instrument Corp., USA) and then in-
situ degassed at 350°C for 20h by a
turbo molecular drag pump prior to
the analyses. The specific surface areas were calculated from the isotherms through the
instrumental software (3Flex Version 1.02, Micromeritics Instrument Corp., USA).
Brunauer–Emmett–Teller (BET) method was used for the surface area analysis.
Results and Discussion
Figure 1. A box furnace (a) and (b) the internal pressure and temperature as a
function of time in three pyrolysis periods: I) ramping of 10°C/min; II) dwelling
for 10h; III) controlled cooling of 10°C/min and then self-cooling to room
temperature.
Figure 2. Micromeritics 3Flex surface area and pore size
analyzer.
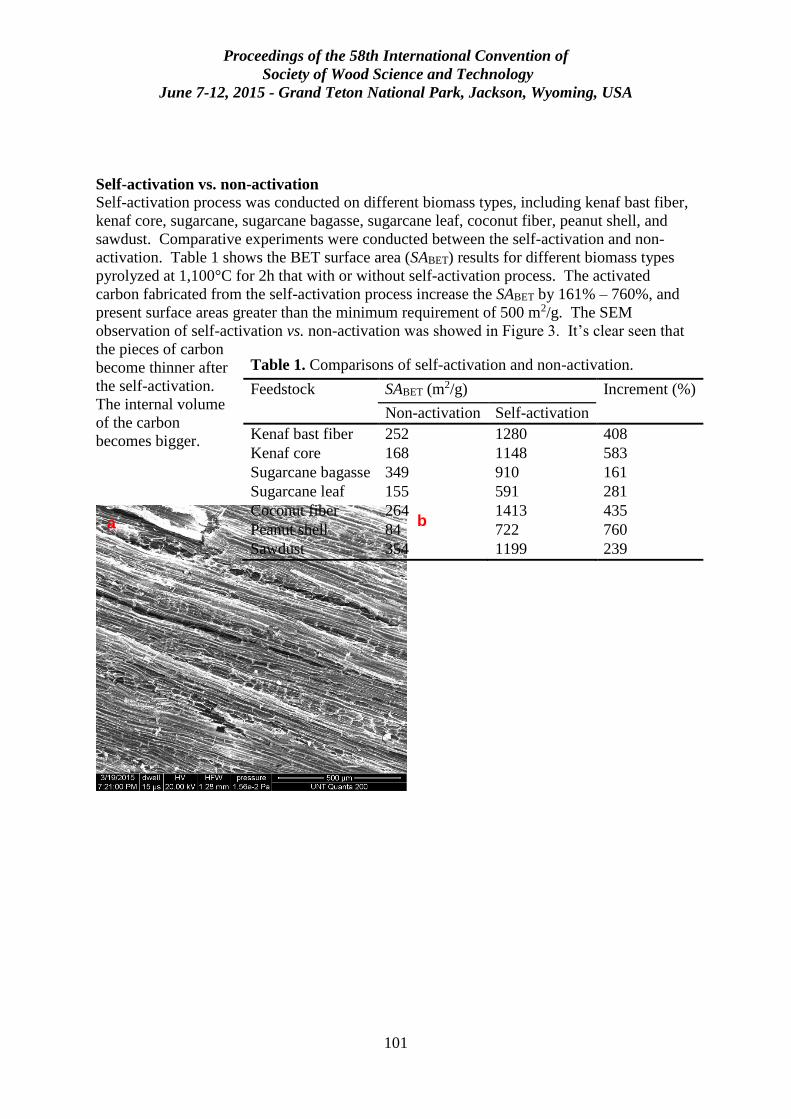
Proceedings of the 58th International Convention of
Society of Wood Science and Technology
June 7-12, 2015 - Grand Teton National Park, Jackson, Wyoming, USA
101
Self-activation vs. non-activation
Self-activation process was conducted on different biomass types, including kenaf bast fiber,
kenaf core, sugarcane, sugarcane bagasse, sugarcane leaf, coconut fiber, peanut shell, and
sawdust. Comparative experiments were conducted between the self-activation and non-
activation. Table 1 shows the BET surface area (SABET) results for different biomass types
pyrolyzed at 1,100°C for 2h that with or without self-activation process. The activated
carbon fabricated from the self-activation process increase the SABET by 161% – 760%, and
present surface areas greater than the minimum requirement of 500 m2/g. The SEM
observation of self-activation vs. non-activation was showed in Figure 3. It’s clear seen that
the pieces of carbon
become thinner after
the self-activation.
The internal volume
of the carbon
becomes bigger.
Table 1. Comparisons of self-activation and non-activation.
Feedstock SABET (m2/g) Increment (%)
Non-activation Self-activation
Kenaf bast fiber 252 1280 408
Kenaf core 168 1148 583
Sugarcane bagasse 349 910 161
Sugarcane leaf 155 591 281
Coconut fiber 264 1413 435
Peanut shell 84 722 760
Sawdust 354 1199 239
a b
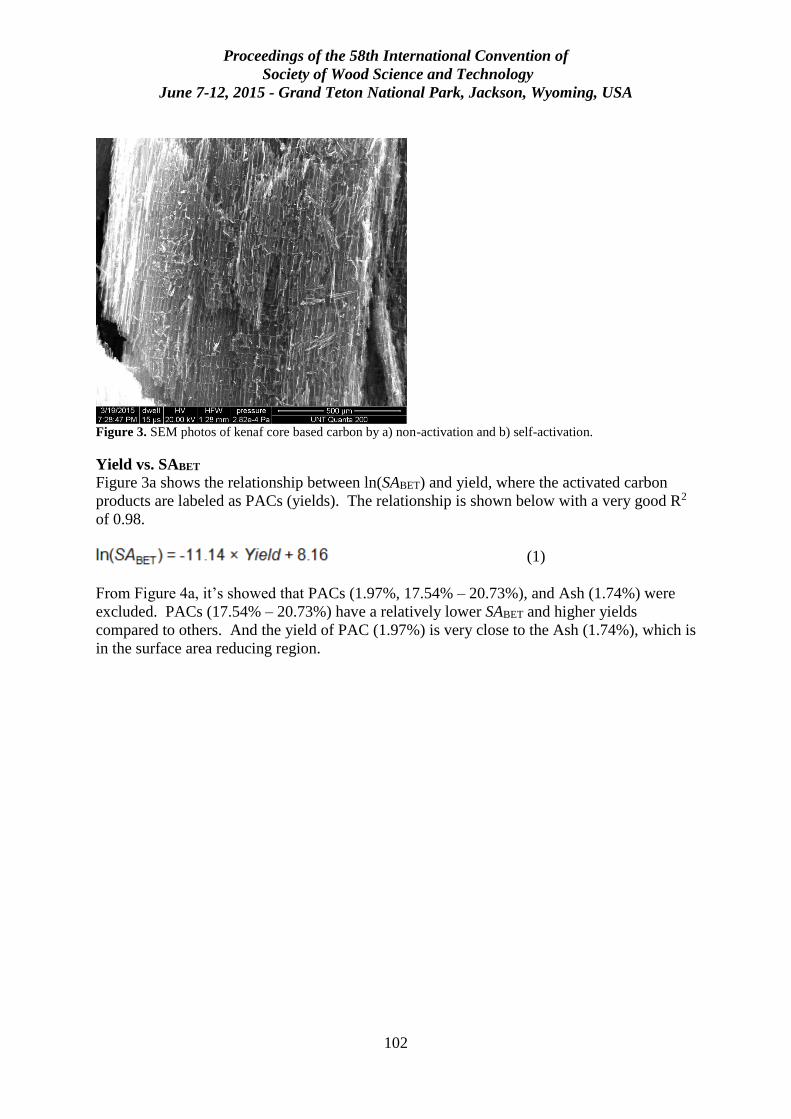
Proceedings of the 58th International Convention of
Society of Wood Science and Technology
June 7-12, 2015 - Grand Teton National Park, Jackson, Wyoming, USA
102
Figure 3. SEM photos of kenaf core based carbon by a) non-activation and b) self-activation.
Yield vs. SABET
Figure 3a shows the relationship between ln(SABET) and yield, where the activated carbon
products are labeled as PACs (yields). The relationship is shown below with a very good R2
of 0.98.
(1)
From Figure 4a, it’s showed that PACs (1.97%, 17.54% – 20.73%), and Ash (1.74%) were
excluded. PACs (17.54% – 20.73%) have a relatively lower SABET and higher yields
compared to others. And the yield of PAC (1.97%) is very close to the Ash (1.74%), which is
in the surface area reducing region.
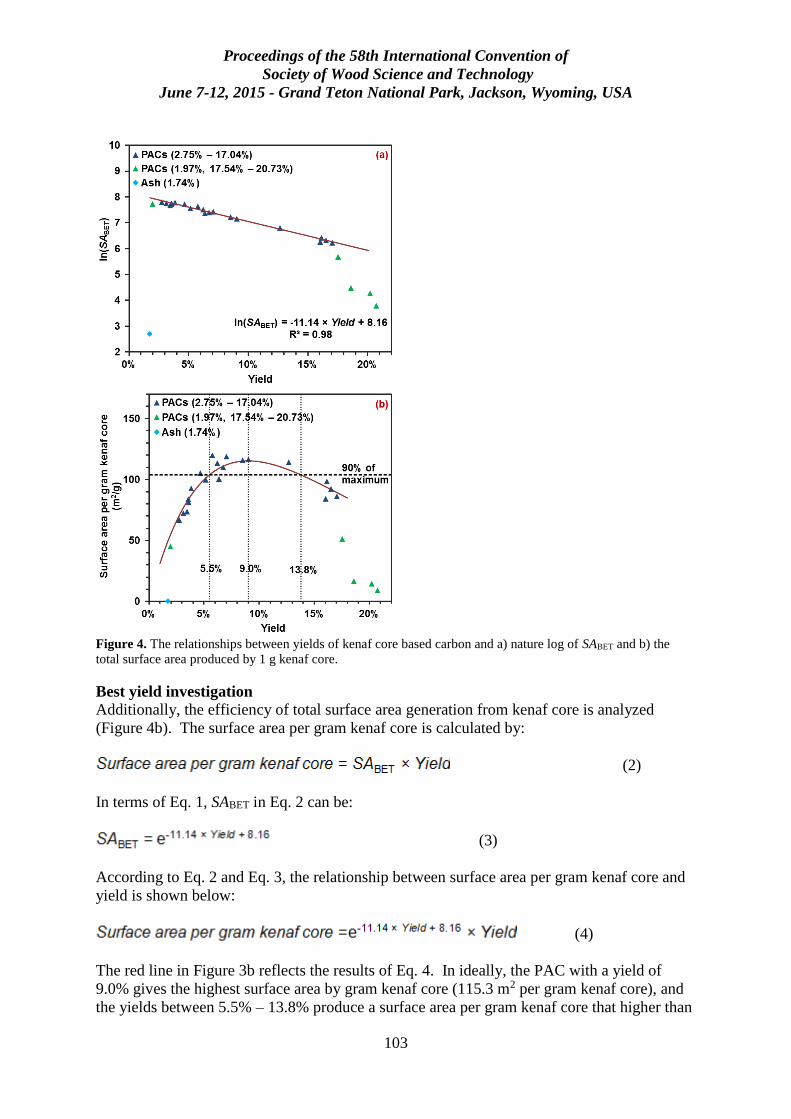
Proceedings of the 58th International Convention of
Society of Wood Science and Technology
June 7-12, 2015 - Grand Teton National Park, Jackson, Wyoming, USA
103
Figure 4. The relationships between yields of kenaf core based carbon and a) nature log of SABET and b) the
total surface area produced by 1 g kenaf core.
Best yield investigation
Additionally, the efficiency of total surface area generation from kenaf core is analyzed
(Figure 4b). The surface area per gram kenaf core is calculated by:
(2)
In terms of Eq. 1, SABET in Eq. 2 can be:
(3)
According to Eq. 2 and Eq. 3, the relationship between surface area per gram kenaf core and
yield is shown below:
(4)
The red line in Figure 3b reflects the results of Eq. 4. In ideally, the PAC with a yield of
9.0% gives the highest surface area by gram kenaf core (115.3 m2 per gram kenaf core), and
the yields between 5.5% – 13.8% produce a surface area per gram kenaf core that higher than
Proceedings of the 58th International Convention of
Society of Wood Science and Technology
June 7-12, 2015 - Grand Teton National Park, Jackson, Wyoming, USA
104
90% of the maximum (103.8 m2 per gram kenaf core). It provides a guide of taking the full
advantage of kenaf core to making high total surface area by controlling the yields.
Conclusions
Self-activation is an effective activation process for activated carbon from biomass. The
activated carbons were successfully produced without any additional activating gases or
chemicals. The comparisons of self-activation and non-activation showed that the surface
area of produced carbon can be dramatically increased. The relationships between yields and
surface area (SABET) was investigated to have a lineal fitting between ln(SABET) and yields. In
additional, the study of effective of kenaf core for producing highest total surface area
showed that the yield of 9.0% received a maximum surface area per using gram kenaf core,
and the yields between 5.5% and 13.8% were recommended for more than 90% of
effectiveness.
Acknowledgements
This research was supported by National Science Foundation (NSF) CMMI 1247008. We
acknowledge Dr. Liping Cai (Mechanical & Energy Engineering, University of North Texas).
References
Dabrowski, A., 1999. Adsorption-its development and application for practical purposes,
Studies in Surface Science and Catalysis 123, 3-28.
Inglezakis, V.J., Poulopoulos S.G. 2006. Adsorption, ion exchange and catalysis: Design of
operations and environmental applications. Elsevier Science & Technology.
Mohan, D., Pittman Jr, C.U., 2006. Activated carbons and low cost adsorbents for
remediation of tri-and hexavalent chromium from water, Journal of hazardous materials 137,
762-811.
Shi, S.Q., Xia, C., 2014. Porositization process of carbon or carbonaceous materials, U.S.
Patent Application 14/211,357.
Sontheimer, H., J. Crittenden, and R.S. Summers. 1988. Activated Carbon for Water
Treatment, 2nd ed, Forschungstelle Engler-Bunte-Institute, Universität Karlsruhe, Karlsruhe,
Germany.
Proceedings of the 58th International Convention of
Society of Wood Science and Technology
June 7-12, 2015 - Grand Teton National Park, Jackson, Wyoming, USA
105
Loss-on-Ignition Testing of Wood Ash
Robert Rice, [email protected]
J. Leah Jones, [email protected]
University of Maine, 119 Nutting Hall, , Orono, Maine 04469
Abstract
Loss on ignition (LOI) tests are used for determining the mass loss from solid combustion
residues and ash that have been heated to prescribed temperatures. The mass loss can be
from carbon, sulfur, potassium, sodium and other elements that volatilize and contribute to
thermal energy or, possibly, to deleterious effects, such as sinter. When applied to coal and
coke combustion, it is believed that the mass loss from the ash can be an estimate of the
amount of carbon remaining in the residue. If substantial organic or inorganic carbon is found
in the ash during the test, it is a clear indicator of combustion efficiency for a particular
combustion system. Although loss on ignition testing is commonly applied to coal and coke,
we have modified the testing protocols to better reflect elemental losses from wood ash. The
details of testing along with an analysis of the chemistry changes that occur at various
temperatures will be presented. The method appears to have substantial practical and
theoretical use for the analysis of the bioenergy based combustion processes
Proceedings of the 58th International Convention of
Society of Wood Science and Technology
June 7-12, 2015 - Grand Teton National Park, Jackson, Wyoming, USA
106
Sustainable Development – International Framework –
Overview and Analysis in the Context of Forests and
Forest Products
Annika Hyytiä, [email protected]
University of Helsinki, Metsätieteiden laitos PL 27 , Voudintie 11, 00014
Helsingin Yliopisto
Abstract
Forests are a resource for Bio-based Economy. Strategies, technologies, policies and
collaboration are important tools within the forest sector. Bio-based Economy is a challenge
and a concept in a wider scope in the Green Economy. The goal is in combining the
environmental goal with economic growth and in preventing dependency in fossil energy,
poverty and ecosystem decrease to develop economic growth and employment with
sustainable goals. There is international co-operation within the green initiatives. The
investments and innovations are in a way to the sustained growth and give new opportunities.
Proceedings of the 58th International Convention of
Society of Wood Science and Technology
June 7-12, 2015 - Grand Teton National Park, Jackson, Wyoming, USA
107
Early Stage Researcher Full Oral Slot (8 minutes) Session Moderators: David DeVallance, West Virginia University,
USA and Tobias Keplinger, ETH Zurich, Switzerland
Development of a Sulfur-Free Delignification Process for
Softwood Biorefineries
Claire Monot 1* - Christine Chirat 2
1 PhD Student, Université Grenoble Alpes, Laboratory of Pulp and Paper
Science and Graphic Arts (LGP2) – CNRS – Agefpi, F-38000 Grenoble,
FRANCE.
* Corresponding author
[email protected] 2 Associate Professor, Université Grenoble Alpes, Laboratory of Pulp and Paper
Science and Graphic Arts (LGP2) – CNRS – Agefpi, F-38000 Grenoble,
FRANCE.
Abstract
Nowadays, several pulp and paper biorefinery projects are under development. Particularly,
the use of an autohydrolysis step prior to the production of cellulose fibers by wood
delignification (cooking) is proposed to extract hemicelluloses. These could be a source of
sugars, oligomers and polymers to produce bioproducts, biofuels and biomaterials. After
cooking, the major part of lignin ends up in the effluent, the black liquor, which is currently
burnt to recover the cooking reagents and to produce energy. Its gasification could produce
more energy, however, traditional kraft cooking uses sulfur, which might be problematic in
gasification processes. This is why sulfur-free cooking is studied, although it is usually less
efficient than kraft cooking. Our study shows that autohydrolysis could improve the
production of cellulosic fibers, by facilitating cooking as well as further oxygen
delignification and bleaching, while using a sulfur-free process. Different types of cooking
(kraft, soda, and soda/anthraquinone) on autohydrolysed and control softwood chips are
compared. Autohydrolysis enables to apply a sulfur-free cooking on softwood chips, which is
more difficult on control wood chips. Their kappa numbers (proportional to the lignin
content) are lower than the ones of kraft pulp. Furthermore, the delignification during oxygen
stage is better for those types of pulps.
Keywords: Prehydrolysis, sulfur-free cooking, pulp and paper biorefinery, anthraquinone,
soda cooking, oxygen delignification
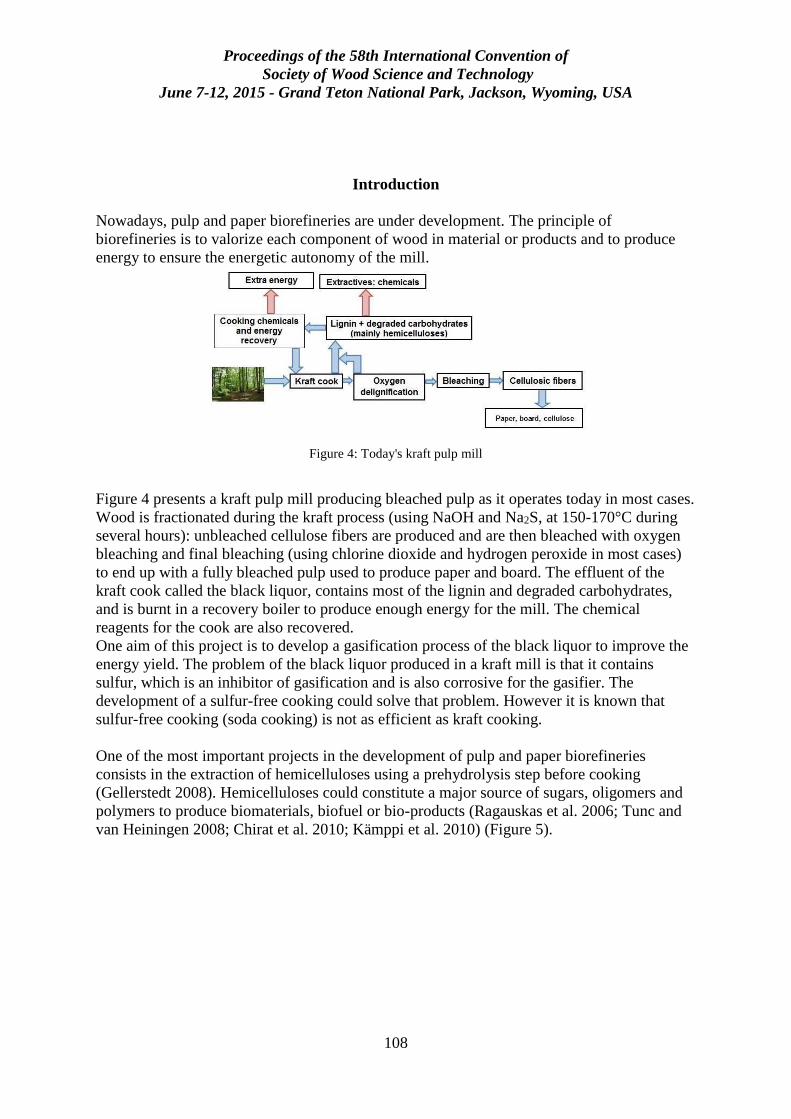
Proceedings of the 58th International Convention of
Society of Wood Science and Technology
June 7-12, 2015 - Grand Teton National Park, Jackson, Wyoming, USA
108
Introduction
Nowadays, pulp and paper biorefineries are under development. The principle of
biorefineries is to valorize each component of wood in material or products and to produce
energy to ensure the energetic autonomy of the mill.
Figure 4: Today's kraft pulp mill
Figure 4 presents a kraft pulp mill producing bleached pulp as it operates today in most cases.
Wood is fractionated during the kraft process (using NaOH and Na2S, at 150-170°C during
several hours): unbleached cellulose fibers are produced and are then bleached with oxygen
bleaching and final bleaching (using chlorine dioxide and hydrogen peroxide in most cases)
to end up with a fully bleached pulp used to produce paper and board. The effluent of the
kraft cook called the black liquor, contains most of the lignin and degraded carbohydrates,
and is burnt in a recovery boiler to produce enough energy for the mill. The chemical
reagents for the cook are also recovered.
One aim of this project is to develop a gasification process of the black liquor to improve the
energy yield. The problem of the black liquor produced in a kraft mill is that it contains
sulfur, which is an inhibitor of gasification and is also corrosive for the gasifier. The
development of a sulfur-free cooking could solve that problem. However it is known that
sulfur-free cooking (soda cooking) is not as efficient as kraft cooking.
One of the most important projects in the development of pulp and paper biorefineries
consists in the extraction of hemicelluloses using a prehydrolysis step before cooking
(Gellerstedt 2008). Hemicelluloses could constitute a major source of sugars, oligomers and
polymers to produce biomaterials, biofuel or bio-products (Ragauskas et al. 2006; Tunc and
van Heiningen 2008; Chirat et al. 2010; Kämppi et al. 2010) (Figure 5).
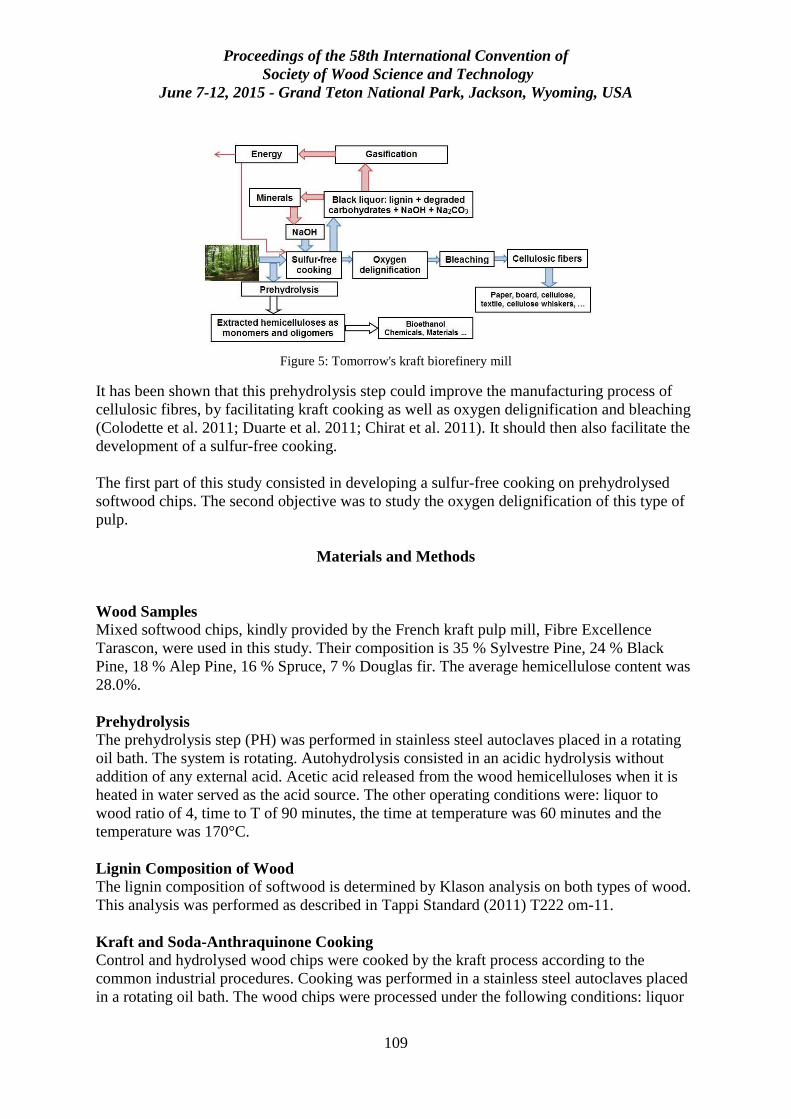
Proceedings of the 58th International Convention of
Society of Wood Science and Technology
June 7-12, 2015 - Grand Teton National Park, Jackson, Wyoming, USA
109
Figure 5: Tomorrow's kraft biorefinery mill
It has been shown that this prehydrolysis step could improve the manufacturing process of
cellulosic fibres, by facilitating kraft cooking as well as oxygen delignification and bleaching
(Colodette et al. 2011; Duarte et al. 2011; Chirat et al. 2011). It should then also facilitate the
development of a sulfur-free cooking.
The first part of this study consisted in developing a sulfur-free cooking on prehydrolysed
softwood chips. The second objective was to study the oxygen delignification of this type of
pulp.
Materials and Methods
Wood Samples
Mixed softwood chips, kindly provided by the French kraft pulp mill, Fibre Excellence
Tarascon, were used in this study. Their composition is 35 % Sylvestre Pine, 24 % Black
Pine, 18 % Alep Pine, 16 % Spruce, 7 % Douglas fir. The average hemicellulose content was
28.0%.
Prehydrolysis
The prehydrolysis step (PH) was performed in stainless steel autoclaves placed in a rotating
oil bath. The system is rotating. Autohydrolysis consisted in an acidic hydrolysis without
addition of any external acid. Acetic acid released from the wood hemicelluloses when it is
heated in water served as the acid source. The other operating conditions were: liquor to
wood ratio of 4, time to T of 90 minutes, the time at temperature was 60 minutes and the
temperature was 170°C.
Lignin Composition of Wood
The lignin composition of softwood is determined by Klason analysis on both types of wood.
This analysis was performed as described in Tappi Standard (2011) T222 om-11.
Kraft and Soda-Anthraquinone Cooking
Control and hydrolysed wood chips were cooked by the kraft process according to the
common industrial procedures. Cooking was performed in a stainless steel autoclaves placed
in a rotating oil bath. The wood chips were processed under the following conditions: liquor
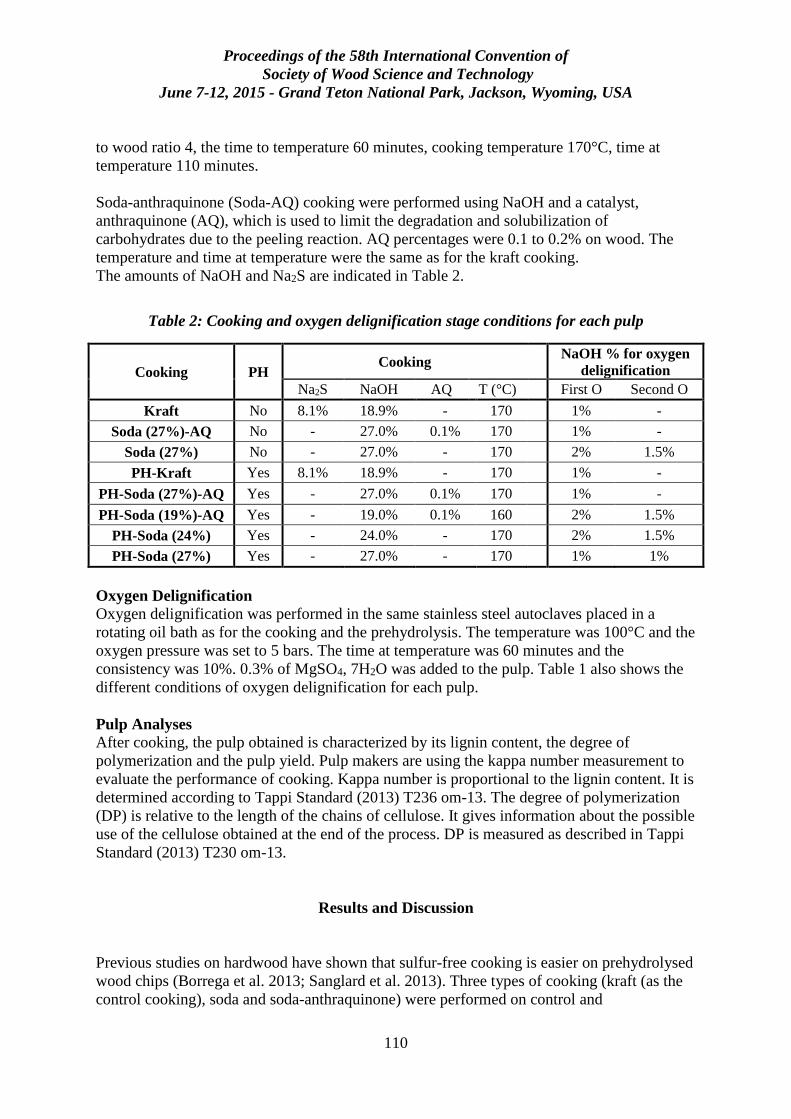
Proceedings of the 58th International Convention of
Society of Wood Science and Technology
June 7-12, 2015 - Grand Teton National Park, Jackson, Wyoming, USA
110
to wood ratio 4, the time to temperature 60 minutes, cooking temperature 170°C, time at
temperature 110 minutes.
Soda-anthraquinone (Soda-AQ) cooking were performed using NaOH and a catalyst,
anthraquinone (AQ), which is used to limit the degradation and solubilization of
carbohydrates due to the peeling reaction. AQ percentages were 0.1 to 0.2% on wood. The
temperature and time at temperature were the same as for the kraft cooking.
The amounts of NaOH and Na2S are indicated in Table 2.
Table 2: Cooking and oxygen delignification stage conditions for each pulp
Cooking PH Cooking
NaOH % for oxygen
delignification
Na2S NaOH AQ T (°C)
First O Second O
Kraft No 8.1% 18.9% - 170
1% -
Soda (27%)-AQ No - 27.0% 0.1% 170
1% -
Soda (27%) No - 27.0% - 170 2% 1.5%
PH-Kraft Yes 8.1% 18.9% - 170
1% -
PH-Soda (27%)-AQ Yes - 27.0% 0.1% 170
1% -
PH-Soda (19%)-AQ Yes - 19.0% 0.1% 160
2% 1.5%
PH-Soda (24%) Yes - 24.0% - 170 2% 1.5%
PH-Soda (27%) Yes - 27.0% - 170
1% 1%
Oxygen Delignification
Oxygen delignification was performed in the same stainless steel autoclaves placed in a
rotating oil bath as for the cooking and the prehydrolysis. The temperature was 100°C and the
oxygen pressure was set to 5 bars. The time at temperature was 60 minutes and the
consistency was 10%. 0.3% of MgSO4, 7H2O was added to the pulp. Table 1 also shows the
different conditions of oxygen delignification for each pulp.
Pulp Analyses
After cooking, the pulp obtained is characterized by its lignin content, the degree of
polymerization and the pulp yield. Pulp makers are using the kappa number measurement to
evaluate the performance of cooking. Kappa number is proportional to the lignin content. It is
determined according to Tappi Standard (2013) T236 om-13. The degree of polymerization
(DP) is relative to the length of the chains of cellulose. It gives information about the possible
use of the cellulose obtained at the end of the process. DP is measured as described in Tappi
Standard (2013) T230 om-13.
Results and Discussion
Previous studies on hardwood have shown that sulfur-free cooking is easier on prehydrolysed
wood chips (Borrega et al. 2013; Sanglard et al. 2013). Three types of cooking (kraft (as the
control cooking), soda and soda-anthraquinone) were performed on control and
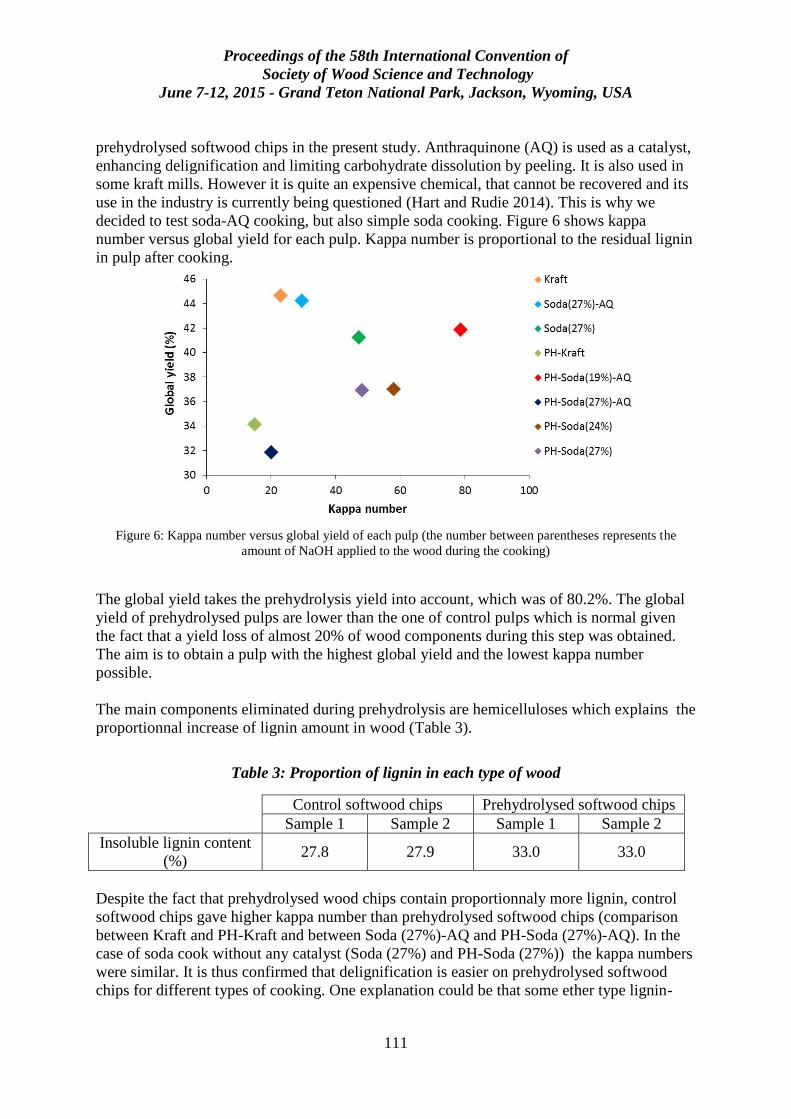
Proceedings of the 58th International Convention of
Society of Wood Science and Technology
June 7-12, 2015 - Grand Teton National Park, Jackson, Wyoming, USA
111
prehydrolysed softwood chips in the present study. Anthraquinone (AQ) is used as a catalyst,
enhancing delignification and limiting carbohydrate dissolution by peeling. It is also used in
some kraft mills. However it is quite an expensive chemical, that cannot be recovered and its
use in the industry is currently being questioned (Hart and Rudie 2014). This is why we
decided to test soda-AQ cooking, but also simple soda cooking. Figure 6 shows kappa
number versus global yield for each pulp. Kappa number is proportional to the residual lignin
in pulp after cooking.
Figure 6: Kappa number versus global yield of each pulp (the number between parentheses represents the
amount of NaOH applied to the wood during the cooking)
The global yield takes the prehydrolysis yield into account, which was of 80.2%. The global
yield of prehydrolysed pulps are lower than the one of control pulps which is normal given
the fact that a yield loss of almost 20% of wood components during this step was obtained.
The aim is to obtain a pulp with the highest global yield and the lowest kappa number
possible.
The main components eliminated during prehydrolysis are hemicelluloses which explains the
proportionnal increase of lignin amount in wood (Table 3).
Table 3: Proportion of lignin in each type of wood
Control softwood chips Prehydrolysed softwood chips
Sample 1 Sample 2 Sample 1 Sample 2
Insoluble lignin content
(%) 27.8 27.9 33.0 33.0
Despite the fact that prehydrolysed wood chips contain proportionnaly more lignin, control
softwood chips gave higher kappa number than prehydrolysed softwood chips (comparison
between Kraft and PH-Kraft and between Soda (27%)-AQ and PH-Soda (27%)-AQ). In the
case of soda cook without any catalyst (Soda (27%) and PH-Soda (27%)) the kappa numbers
were similar. It is thus confirmed that delignification is easier on prehydrolysed softwood
chips for different types of cooking. One explanation could be that some ether type lignin-
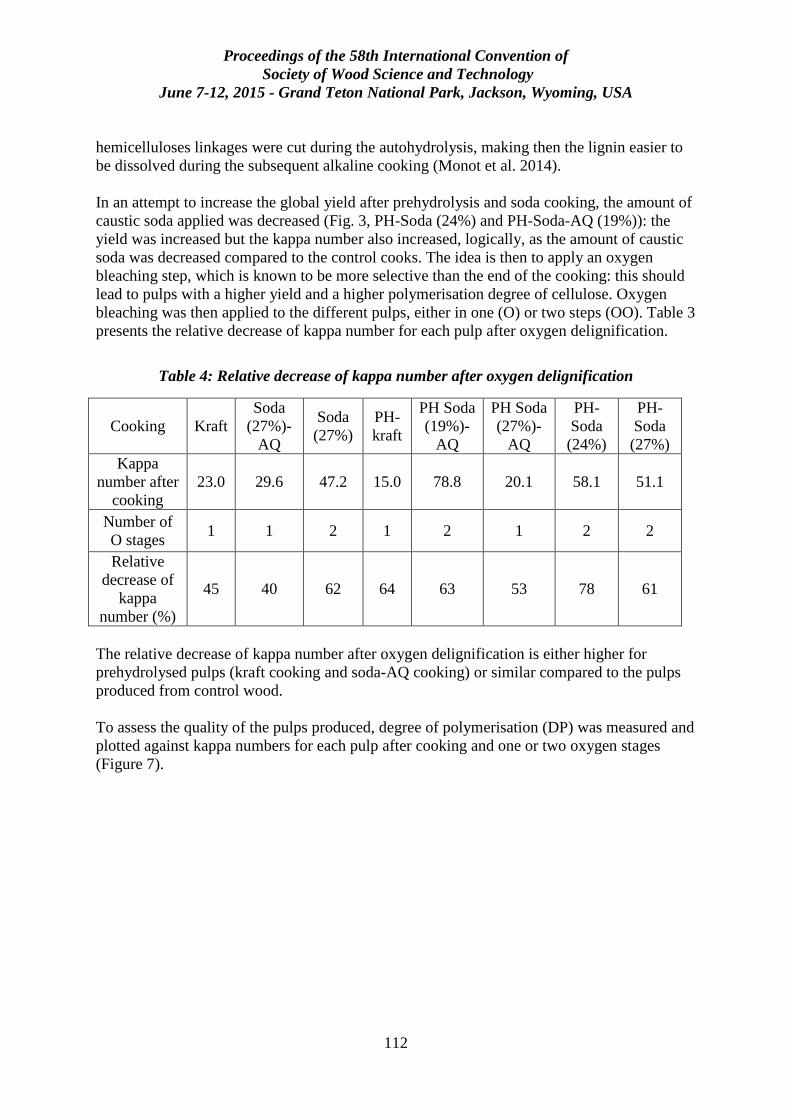
Proceedings of the 58th International Convention of
Society of Wood Science and Technology
June 7-12, 2015 - Grand Teton National Park, Jackson, Wyoming, USA
112
hemicelluloses linkages were cut during the autohydrolysis, making then the lignin easier to
be dissolved during the subsequent alkaline cooking (Monot et al. 2014).
In an attempt to increase the global yield after prehydrolysis and soda cooking, the amount of
caustic soda applied was decreased (Fig. 3, PH-Soda (24%) and PH-Soda-AQ (19%)): the
yield was increased but the kappa number also increased, logically, as the amount of caustic
soda was decreased compared to the control cooks. The idea is then to apply an oxygen
bleaching step, which is known to be more selective than the end of the cooking: this should
lead to pulps with a higher yield and a higher polymerisation degree of cellulose. Oxygen
bleaching was then applied to the different pulps, either in one (O) or two steps (OO). Table 3
presents the relative decrease of kappa number for each pulp after oxygen delignification.
Table 4: Relative decrease of kappa number after oxygen delignification
Cooking Kraft
Soda
(27%)-
AQ
Soda
(27%)
PH-
kraft
PH Soda
(19%)-
AQ
PH Soda
(27%)-
AQ
PH-
Soda
(24%)
PH-
Soda
(27%)
Kappa
number after
cooking
23.0 29.6 47.2 15.0 78.8 20.1 58.1 51.1
Number of
O stages 1 1 2 1 2 1 2 2
Relative
decrease of
kappa
number (%)
45 40 62 64 63 53 78 61
The relative decrease of kappa number after oxygen delignification is either higher for
prehydrolysed pulps (kraft cooking and soda-AQ cooking) or similar compared to the pulps
produced from control wood.
To assess the quality of the pulps produced, degree of polymerisation (DP) was measured and
plotted against kappa numbers for each pulp after cooking and one or two oxygen stages
(Figure 7).
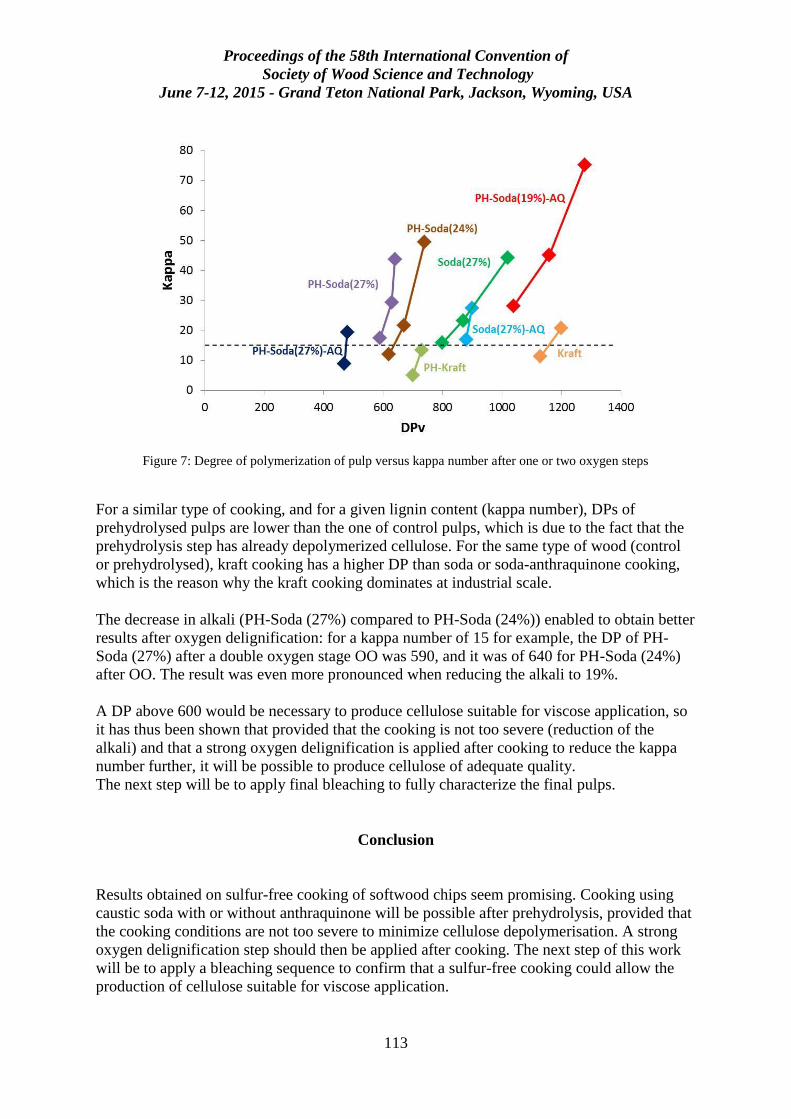
Proceedings of the 58th International Convention of
Society of Wood Science and Technology
June 7-12, 2015 - Grand Teton National Park, Jackson, Wyoming, USA
113
Figure 7: Degree of polymerization of pulp versus kappa number after one or two oxygen steps
For a similar type of cooking, and for a given lignin content (kappa number), DPs of
prehydrolysed pulps are lower than the one of control pulps, which is due to the fact that the
prehydrolysis step has already depolymerized cellulose. For the same type of wood (control
or prehydrolysed), kraft cooking has a higher DP than soda or soda-anthraquinone cooking,
which is the reason why the kraft cooking dominates at industrial scale.
The decrease in alkali (PH-Soda (27%) compared to PH-Soda (24%)) enabled to obtain better
results after oxygen delignification: for a kappa number of 15 for example, the DP of PH-
Soda (27%) after a double oxygen stage OO was 590, and it was of 640 for PH-Soda (24%)
after OO. The result was even more pronounced when reducing the alkali to 19%.
A DP above 600 would be necessary to produce cellulose suitable for viscose application, so
it has thus been shown that provided that the cooking is not too severe (reduction of the
alkali) and that a strong oxygen delignification is applied after cooking to reduce the kappa
number further, it will be possible to produce cellulose of adequate quality.
The next step will be to apply final bleaching to fully characterize the final pulps.
Conclusion
Results obtained on sulfur-free cooking of softwood chips seem promising. Cooking using
caustic soda with or without anthraquinone will be possible after prehydrolysis, provided that
the cooking conditions are not too severe to minimize cellulose depolymerisation. A strong
oxygen delignification step should then be applied after cooking. The next step of this work
will be to apply a bleaching sequence to confirm that a sulfur-free cooking could allow the
production of cellulose suitable for viscose application.
Proceedings of the 58th International Convention of
Society of Wood Science and Technology
June 7-12, 2015 - Grand Teton National Park, Jackson, Wyoming, USA
114
Acknowledgments
Authors would like to thank Institut Carnot-Energie du Futur for the funding of this study.
References
Borrega M, Tolonen LK, Bardot F, et al (2013) Potential of hot water extraction of birch
wood to produce high-purity dissolving pulp after alkaline pulping. Bioresour Technol
135:665–671. doi: 10.1016/j.biortech.2012.11.107
Chirat C, Boiron L, Lachenal D (2011) Bleaching ability of pre-hydrolyzed pulps in the
context of a biorefinery mill. Pages 12-18 in Proceedings of the International Pulp Bleaching
Conference, Tappi, Portland, USA.
Chirat C, Lachenal D, Dufresne A (2010) Biorefinery in a Kraft Pulp Mill: From Bioethanol
to Cellulose Nanocrystals. Cellul Chem Technol 44:59–64.
Colodette JL, Longue D, Pedrazzi C, et al (2011) Pulpability and Bleachability of Xylan-
Depleted Eucalyptus Wood Chips. Ind Eng Chem Res 50:1847–1852. doi:
10.1021/ie101799y
Duarte GV, Ramarao BV, Amidon TE, Ferreira PT (2011) Effect of Hot Water Extraction on
Hardwood Kraft Pulp fibers (Acer saccharum, Sugar Maple). Ind Eng Chem Res 50:9949–
9959. doi: 10.1021/ie200639u
Gellerstedt G (2008) Biorefinery solutions – The future of the forest based industry. Pages 1-
4 in Proceedings of the European Workshop on Lignocellulosics and Pulp, Stockholm,
Sweden.
Hart P, Rudie A (2014) Anthraquinone - A Review of the Rise and Fall of a Pulping Catalyst.
Proceedings of the TAPPI PEERS Conference. TAPPI Press, Tacoma, WA.
Kämppi R, Hörhammer H, Leponiemi A, van Heiningen A (2010) Pre-extraction and PSAQ
pulping of Siberian larch | NPPRJ. Nord PulpPaper 25:243–248.
Monot C, Evangelista B, Chirat C (2014) Relationship between lignin-carbohydrate
complexes (LCC) from chips and pulps and their delignification and bleaching ability. Pages
259-265 in Proceedings of the International Pulp Bleaching Conference, Grenoble, France.
Ragauskas AJ, Nagy M, Kim DH, et al (2006) From wood to fuels: Integrating biofuels and
pulp production. Ind Biotechnol 2:55–65. doi: 10.1089/ind.2006.2.55
Sanglard M, Chirat C, Jarman B, Lachenal D (2013) Biorefinery in a pulp mill: simultaneous
production of cellulosic fibers from Eucalyptus globulus by soda-anthraquinone cooking and
surface-active agents. Holzforschung 67:481–488.
Tappi Standard (2011) T 222 Om-11. Acid-insoluble lignin in wood and pulp. Technical
Association of the Pulp and Paper Industry.

Proceedings of the 58th International Convention of
Society of Wood Science and Technology
June 7-12, 2015 - Grand Teton National Park, Jackson, Wyoming, USA
115
Tappi Standard (2013) T 236 Om-13. Kappa number of pulp. Technical Association of the
Pulp and Paper Industry.
Tappi Standard (2013) T 230 Om-13. Viscosity of pulp (capillary viscometer method).
Technical Association of the Pulp and Paper Industry.
Tunc MS, van Heiningen ARP (2008) Hydrothermal dissolution of mixed southern
hardwoods. Holzforschung 62:539–545. doi: 10.1515/HF.2008.100
Proceedings of the 58th International Convention of
Society of Wood Science and Technology
June 7-12, 2015 - Grand Teton National Park, Jackson, Wyoming, USA
116
Effectiveness of Gliricidia Sepium Heart Wood Extractives
as Preservatives Against Termite Attack
AGUDA L. O1*., AJAYI B2., Owoyemi J3. Adejoba O.R4 and Areo O.S5. 1 Researcher, Department of Forest Products Development and Utilization,
Forestry Research Institute of Nigeria, P.M.B. 5054, Ibadan, Oyo State, Nigeria. 2 Professor, Head of Department of Forestry and Wood Tech., Federal
University of Technology Akure, P.M.B. 704, Akure, Ondo state, Nigeria. 3 Doctor, Senior Lecturer, Department of Forestry and Wood Tech., Federal
University of Technology Akure, P.M.B. 704, Akure, Ondo state, Nigeria. 4Doctor, Assistant Director, Head of Department of Forest Products
Development and Utilization, Forestry Research Institute of Nigeria, P.M.B.
5054, Ibadan, Oyo State, Nigeria. 5Researcher, Department of Forest Products Development and Utilization,
Forestry Research Institute of Nigeria, P.M.B. 5054, Ibadan, Oyo State, Nigeria. *E-Mail: [email protected]. Phone No: +2348038724979
Abstract
Resistance of most wood species against termite attack is mainly as a result of their
extractives components. The chemical compositions of extractives from matured Gliricidia
sepium that are known to be very resistant against termite attack were studied to assess their
role as wood preservatives. Ethanol-toluene and distilled water were used in the extraction of
these compounds from the heartwood of this species. Chemical analysis of the extracts was
done using Gas Chromatography-Mass Spectrometry (GC-MS) after derivatization using N,O
bis (trimethyl silyl) acetamide.. More than One hundred and forty five compounds were
identified from both extracts. Fatty acids, hydrocarbons, sterols, sterol ketones, phenolics,
sterol esters and waxes were the main groups of compounds identified. The extracts obtained
were used to treat four wood species that are known to be susceptible to termites attack.
Treated samples were taken to a termitarium for a period of twelve weeks. It was observed
that wood extracts used as preservatives improved the resistance of these susceptible wood
species to termite attack more than 60% compared to the controls and also it was observed
that removal of extractives decreased resistance of the durable samples significantly. It can be
concluded that wood extractives contribute greatly to the protection of less durable wood
against termite attack.
Keywords: Wood Extractives, bio-preservatives, termitarium, subterranean termites,
Susceptible.
Proceedings of the 58th International Convention of
Society of Wood Science and Technology
June 7-12, 2015 - Grand Teton National Park, Jackson, Wyoming, USA
117
Introduction
Wood is a natural organic material that consists mainly of two groups of organic compounds:
carbohydrates (hemicelluloses and cellulose) and phenols (lignin), which correspond to (65-
75%) and (20-30%), respectively (Pettersen 1984). The wood is also constituted of minor
amounts of extraneous materials, mostly in the form of organic extractives (usually 4–10%)
and inorganic minerals (ash), mainly calcium, potassium, and magnesium, besides manganese
and silica. Wood as a natural lingo-fibrous material produced by tree has been one of the
earliest structural materials discovered by man. It is made from countless elongated hollow
cells closely packed and joined end-to-end or overlapping. The cells are of different kinds
and have special functions in the growing trees. As a result; its properties are subjected to
wide variations brought about by the Physiology of trees and environmental factors affecting
its growth.
Wood being a biological material is readily degraded by bacteria, fungi and termites (Walker,
1993; Schultz and Nicholas, 2002a). However, some wood species are resistant to these
degrading agents while others are very susceptible to deterioration (Kityo and Plumptre,
1997). Natural resistance is the inherent ability of some wood species to resist the attack of
bio-deteriorating agents without treatment with chemical preservatives (Owoyemi et.al,
2014). The natural resistance exhibited by some species is the resultant effect of the presence
of extractives in the heartwood region. Milton, 1995 revealed that the sapwood of all known
tree species is very susceptible to decay, regardless of any natural resistance of the
heartwood. Unless sapwood is entirely removed or impregnated with preservatives, decay is
likely to occur even in durable species (Adam, et. Al, 2002).
The term ‘natural durability’ therefore refers to the degree of resistance of untreated wood to
bio-deteriorating agents. The natural durability of wood can only be appreciated through
adequate knowledge of physiological processes of tree growth. As trees get older and larger,
the storage cells in the center at the bottom begin to die resulting to a gradual transformation
of the sapwood region to heartwood. Trees with more toxic natural chemicals deposited
during the transformation have very durable heartwood that is highly resistant while some
may be moderately resistant than others. Those that are susceptible must be treated with
preservative chemicals to increase their service life.
The most common of these preservatives has been chromated copper arsenate (CCA)
(Lebow, 2010). These synthetic chemicals are expensive and often harmful to the workers
and the environment. Worse still, these preservatives are not readily degraded to harmless
products and are not easy to detoxify. The copper based preservatives are also poor inhibitors
of mould (Arango et al., 2005) and are very costly. The dangers posed to wood treatment
workers by most of the conventional proprietary wood preservatives, in addition to
environmental degradation are becoming a matter of major concern worldwide (Barnes,
1992). Therefore, their application needs careful supervision to avoid polluting the
environment.
Proceedings of the 58th International Convention of
Society of Wood Science and Technology
June 7-12, 2015 - Grand Teton National Park, Jackson, Wyoming, USA
118
In the recent times, the attention of researchers have been drawn to the problem of
environmental pollutions, particularly contamination of soil and water resources is considered
as a major risk for human communities throughout the world (Mohsen et. al., 2011). Increase
in the awareness on the negative impacts of these chemicals particularly on human health and
environment has made this preservative unsuitable. Biological extracts are formulated from
plants parts- such as fruits, leaves, seeds, bark, roots and so on. Research into the use of bio-
extract has revealed that some bio-preservatives can serve as alternatives wood preservatives
to the conventional ones. They are less expensive, readily available and environmentally
friendly unlike the conventional preservative chemicals (Lebow, 2010; O’Callahan, 2012;
Neemtreefarms, 2007; Burkill, 1985).
There are wood species that are naturally resistant to bio-deterioration agents. The resistance
is mainly due to the accumulation of extractives in the heartwood some of which are decay
inhibitors (Kityo and Plumptre, 1997). It is these extractives which render the heartwood
poisonous to wood destroying organisms. Haygreen and Bowyer (1996) and Milton (1995)
noted that the chemical composition and amount of extractives in wood is highly variable
within and between tree species and can range from 2-15 % of wood weight.
Studies have shown that injecting wood extractives of durable species into non-durable
specimen increases the wood samples’ durability. It is therefore, pertinent to harness
knowledge on the potent heartwood extractives of durable timbers for the development of
environmental friendly wood protecting chemicals. Such intentions and pursuits not only
have the ultimate aim of sustainable production of naturally durable species on the earth, but
are also, reflective of growing concerns on the environmental impact of traditional wood
preservatives. There is great potential in the use of extractives as natural preservatives, as
many components of extractives are toxic to micro-organisms, imparting decay resistance to
wood.
Gliricidia sepium is a leguminous tree and belongs to the family Fabaceae. Gliricidia, which
originated in Central America, is used in many tropical and sub-tropical countries as live
fencing. That is, it is planted along the side of fields, and the trunks are used as fence posts.
During the dry season, when much of the forage is gone, the tree limbs are cut and the foliage
is offered to livestock. It is an exotic species introduced into Nigeria as a source of fuelwood.
However, its use has been mainly for fodder, life-fencing, manure and shades (Glover, 1989,
Stewart and Simons, 1996). It can grow to a height of 15m if not pollarded, tolerate dry
season and fire and can be propagated easily from seeds and branches (Lavini, 1996; Simons
1996). It has a distinctly dark brown heartwood and yellowish band of sapwood which could
be mistakenly for Milicia excelsa, Afzelia africana planks.
The heartwood is resistant, very hard and heavy, strong, coarse-textured, within irregular
grain. It seasons well and takes high polish (Elevitch and Francis, 2006). Oluwadare et al
(2007) reports on the utilization potential of Gliricidia sepium revealed that the wood
Gliricidia sepium is of high density and with strength superior to other hardwood species.
Proceedings of the 58th International Convention of
Society of Wood Science and Technology
June 7-12, 2015 - Grand Teton National Park, Jackson, Wyoming, USA
119
Materials and Methods
The heartwood of matured trees of Gliricidia sepium will be selected for this study based on
its known natural durability. Two matured trees of the Gliricidia sepium were obtained from
Forestry Research Institute of Nigeria (FRIN) staff quarters Ibadan, Nigeria. The wood
specimen was divided into three groups; the first group was the sawdust of heartwood of
G.sepium obtained during conversion of the wood species using circular saw. G.sepium
extractives were obtained using distilled water and ethanol-toluene as solvents. The second
group of twenty test samples (unground) of 20 x 20 x 60mm in dimension. The extractive in
this group of wood blocks was extracted using distilled water and ethanol-toluene to obtain
wood free from extractives. The leached wood samples were exposed to termites attack to
test for the resistance of leached G.sepium to termites. This is to test for the effect of
extractives on natural durability of G. sepium. The third group consisting ten samples of 20 x
20 x 60mm was used as controls for comparison. These samples were exposed to termite
attack directly without treatment. The extraction was done using Soxlet extractors in the
wood chemistry laboratory at Forest Products Development and Utilization Department in
FRIN. The extracts obtained using ethanol-toluene was concentrated using Rotary Evaporator
in the same department while the extracts from distilled water were used without
concentration. Chemical composition of the extracts was done using Gas Chromatography-
Mass Spectrometry (GC-MS) at Federal University of Technology Akure Central laboratory
in Ondo State, Nigeria.
The sapwood of Brachystegia eurycoma, Ceiba pentandra, Triplochyton scleroxylon and
Nesogordonia papaverifera were selected for this study because they are susceptible to
deterioration. The wood species were cut into small test specimens of 20mm x 20mm x
60mm in accordance to ASTM D1413 (2003). One hundred and sixty (160) test blocks were
dried for both species and labeled A1- 40 for Brachystegia eurycoma, B1- 40 for Ceiba
pentandra, T1- 40 for Triplochyton scleroxylon and N1- 40 for Nesogordonia papaverifera.
Each sample was labeled for ease of future identification. Five samples of 20 x 20 x 60mm
were selected from A1-40, B1-40, T1-40 and N1-40 respectively. The samples were prepared
for test by drying and sterilizing them in the oven for 18 hours at 103°C and weighed (W1),
the weight was recorded as initial dry weight for each of the blocks. This was used in the
determination of the density of the wood and in the calculation of the percentage rate of
absorption of the wood species. These samples were treated with a solution of 100ml of the
extract from ethanol-toluene into 900ml of distilled water, 300ml of the same extract into
700ml of distilled water, pure solution of ethanol-toluene extract, 500ml of extract from
distilled water in 500ml of distilled water, pure distilled water extract and CCA respectively.
After the cold dipping preservatives treatment for 72hrs, the test samples were weighed (W2),
the weight was recorded and the percentage of absorption (AR) and retention of the
preservative (kg/m3) were calculated using `equation (1)
100W
W-W AR
1
12 ------------------------------------------------- (1)
The treated samples and the controls were oven dried at 60o
C for 48hrs, until a constant
weight was achieved. The specimens were relabeled for easy identification, conditioned to
equilibrium moisture content and weighed to determine their initial weight (W3) before
Proceedings of the 58th International Convention of
Society of Wood Science and Technology
June 7-12, 2015 - Grand Teton National Park, Jackson, Wyoming, USA
120
exposed to termite attack in an active termitarium in the staff quarter of FRIN, Ibadan Oyo
State, Nigeria for 12weeks. The effect of extractives on natural durability was tested by
exposing G. sepium whose extracts had been removed to the same termite attack. Weekly
visual assessment according to ASTM 2003 was carried out to determine the rate of attack
and observations was noted. When is 12 weeks, the experiment was terminated and samples
were removed, cleaned and oven dry for 18 hours at 600C. After conditioning to equilibrium
moisture content (EMC), samples were again cleaned of all soil and weigh to determine their
final weight (W4). The percentage weight loss for individual test pieces was determined using
equation;
100W
W-W WL
3
34 ----------------------------------------------------- (2)
Where: WL = Weight loss
W3 = weight of samples after treatment but before exposure to termites.
W4 = weight of samples after exposure to termites.
The data collected was computed and analyzed using 4 x 7 factorial experiments in
Completely Randomized Design. Mean found to differ significantly was separated using
Duncan Multiple Range Test.
Results and Discussions
Identification of compounds in wood extractives
Chemical analysis of the extracts using GC-MS revealed different individual components.
More than One hundred and forty compounds were identified. Hydrocarbons, fatty acids,
sterols, sterol esters, waxes and sterol ketones were the major groups of compounds detected
and identified. Other compounds included phenolics and ethers. The main compounds
detected included sitosterol, stigmasterol, squalene, pentadecanoic acid ester, linoleic acid,
palmitic acid, heptadecanoic acid, decane, pentacosane oleic acid while the unique ones
included 2-(3,7-dimtheyl-octa-2,6 dienyl) 1,4 dimethoxy benezene. 1-octadecanol, 1-
tridecanol, hexacosane, squalene, pentacosane, 9 octadecanoic acid, heptadecanoic acid,
palmitic acid, sitosterol, stigmasterol, vanillin, tetradecanone and docosanoic acid while the
unique ones included benzestrol, dibutyl phthalate and diethyl phthalate as shown in table 1.
Field exposure to termites
Effect of treatment of less durable species with wood extractives
Weekly visual observation was conducted and the samples were rated as specified in ASTM
D 3345-74 standards and a gravimetric method was used to assess weight loss due to termite
damage after 12 weeks and the termites attack on the samples was rated 7 which indicate a
moderate attack penetration within the first 6 weeks after which was rated 4 for the rest of the
exposure duration because the samples were heavily attacked thereby leading to about 30 –
40% of the wood cross-section being eaten up by the termites. The average weight loss for
Brachystegia eurycoma, Ceiba pentandra, Triplochyton scleroxylon and Nesogordonia
papaverifera treated with CCA (a well-known effective wood preservative) were only 4.89,
4.94, 11.59 and 9 percent respectively after twelve weeks of exposure to termite attack. On
the other hand, the untreated control samples have average weight loss of 66.07, 86.33, 65.77
and 65.29 percent respectively and 6.72, 14.15, 16.74 and 14.00 percent respectively were the
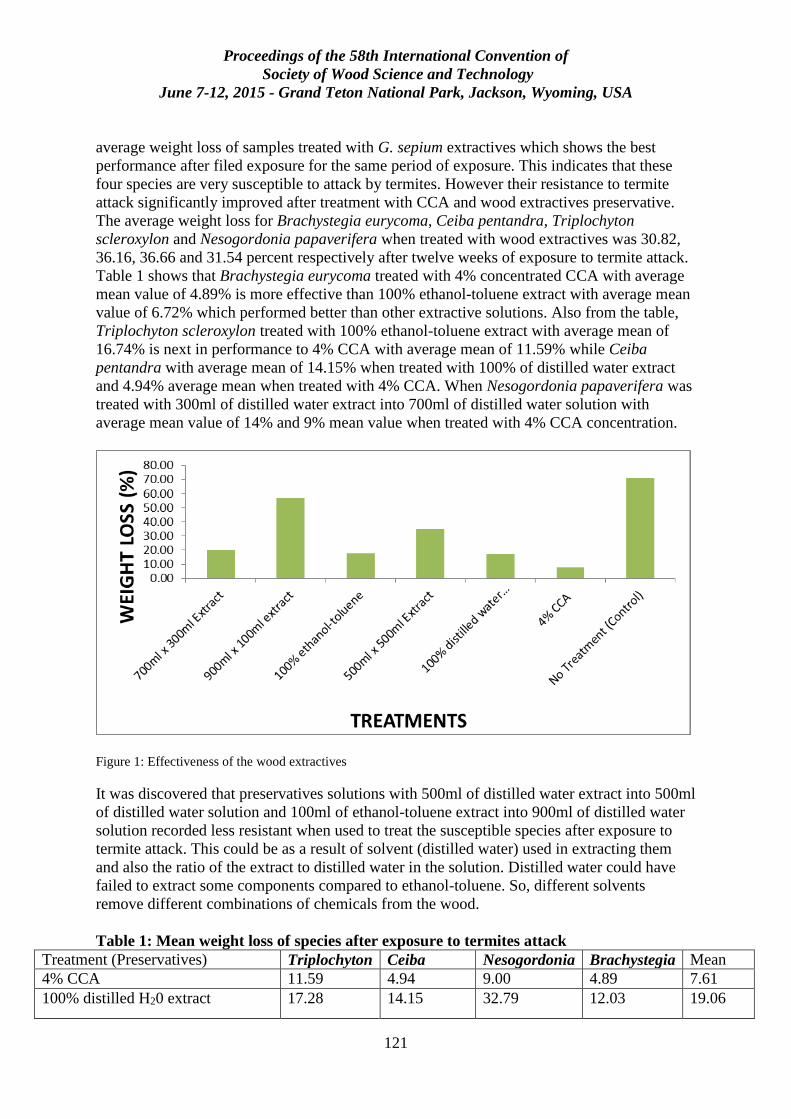
Proceedings of the 58th International Convention of
Society of Wood Science and Technology
June 7-12, 2015 - Grand Teton National Park, Jackson, Wyoming, USA
121
average weight loss of samples treated with G. sepium extractives which shows the best
performance after filed exposure for the same period of exposure. This indicates that these
four species are very susceptible to attack by termites. However their resistance to termite
attack significantly improved after treatment with CCA and wood extractives preservative.
The average weight loss for Brachystegia eurycoma, Ceiba pentandra, Triplochyton
scleroxylon and Nesogordonia papaverifera when treated with wood extractives was 30.82,
36.16, 36.66 and 31.54 percent respectively after twelve weeks of exposure to termite attack.
Table 1 shows that Brachystegia eurycoma treated with 4% concentrated CCA with average
mean value of 4.89% is more effective than 100% ethanol-toluene extract with average mean
value of 6.72% which performed better than other extractive solutions. Also from the table,
Triplochyton scleroxylon treated with 100% ethanol-toluene extract with average mean of
16.74% is next in performance to 4% CCA with average mean of 11.59% while Ceiba
pentandra with average mean of 14.15% when treated with 100% of distilled water extract
and 4.94% average mean when treated with 4% CCA. When Nesogordonia papaverifera was
treated with 300ml of distilled water extract into 700ml of distilled water solution with
average mean value of 14% and 9% mean value when treated with 4% CCA concentration.
Figure 1: Effectiveness of the wood extractives
It was discovered that preservatives solutions with 500ml of distilled water extract into 500ml
of distilled water solution and 100ml of ethanol-toluene extract into 900ml of distilled water
solution recorded less resistant when used to treat the susceptible species after exposure to
termite attack. This could be as a result of solvent (distilled water) used in extracting them
and also the ratio of the extract to distilled water in the solution. Distilled water could have
failed to extract some components compared to ethanol-toluene. So, different solvents
remove different combinations of chemicals from the wood.
Table 1: Mean weight loss of species after exposure to termites attack
Treatment (Preservatives) Triplochyton Ceiba Nesogordonia Brachystegia Mean
4% CCA 11.59 4.94 9.00 4.89 7.61
100% distilled H20 extract 17.28 14.15 32.79 12.03 19.06
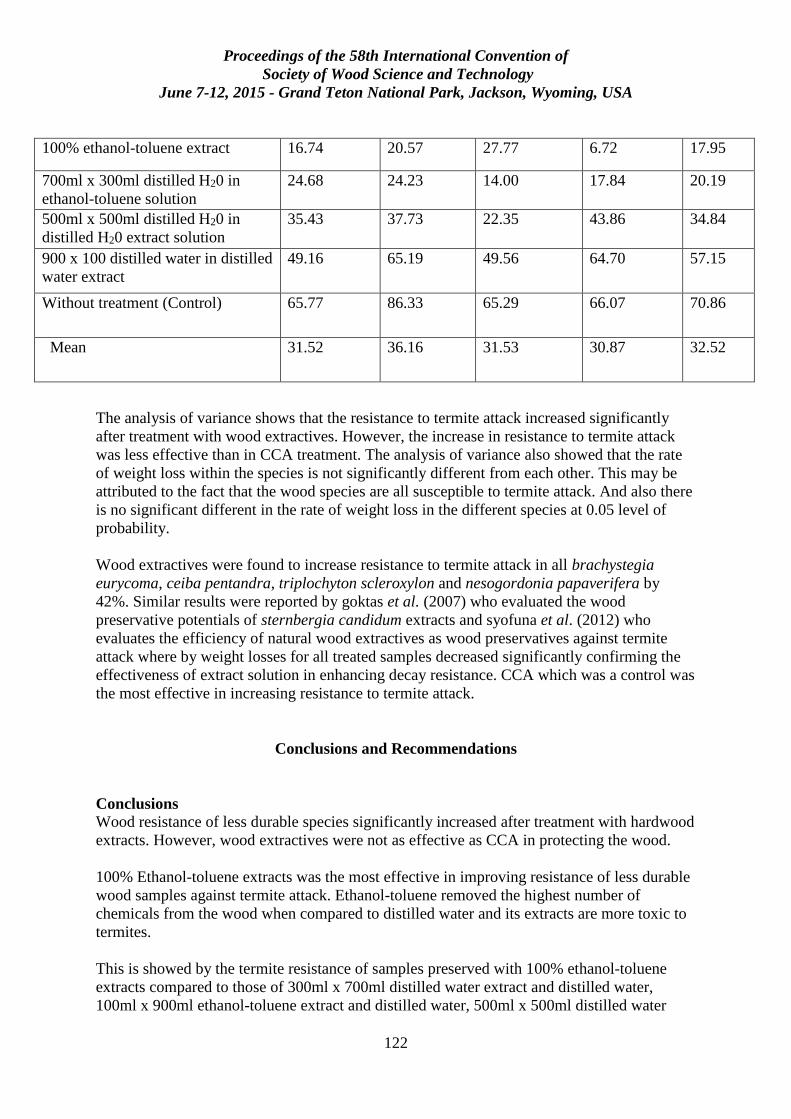
Proceedings of the 58th International Convention of
Society of Wood Science and Technology
June 7-12, 2015 - Grand Teton National Park, Jackson, Wyoming, USA
122
100% ethanol-toluene extract 16.74 20.57 27.77 6.72 17.95
700ml x 300ml distilled H20 in
ethanol-toluene solution
24.68 24.23 14.00 17.84
20.19
500ml x 500ml distilled H20 in
distilled H20 extract solution
35.43 37.73 22.35 43.86 34.84
900 x 100 distilled water in distilled
water extract
49.16 65.19 49.56 64.70 57.15
Without treatment (Control) 65.77 86.33 65.29 66.07 70.86
Mean 31.52 36.16 31.53 30.87 32.52
The analysis of variance shows that the resistance to termite attack increased significantly
after treatment with wood extractives. However, the increase in resistance to termite attack
was less effective than in CCA treatment. The analysis of variance also showed that the rate
of weight loss within the species is not significantly different from each other. This may be
attributed to the fact that the wood species are all susceptible to termite attack. And also there
is no significant different in the rate of weight loss in the different species at 0.05 level of
probability.
Wood extractives were found to increase resistance to termite attack in all brachystegia
eurycoma, ceiba pentandra, triplochyton scleroxylon and nesogordonia papaverifera by
42%. Similar results were reported by goktas et al. (2007) who evaluated the wood
preservative potentials of sternbergia candidum extracts and syofuna et al. (2012) who
evaluates the efficiency of natural wood extractives as wood preservatives against termite
attack where by weight losses for all treated samples decreased significantly confirming the
effectiveness of extract solution in enhancing decay resistance. CCA which was a control was
the most effective in increasing resistance to termite attack.
Conclusions and Recommendations
Conclusions
Wood resistance of less durable species significantly increased after treatment with hardwood
extracts. However, wood extractives were not as effective as CCA in protecting the wood.
100% Ethanol-toluene extracts was the most effective in improving resistance of less durable
wood samples against termite attack. Ethanol-toluene removed the highest number of
chemicals from the wood when compared to distilled water and its extracts are more toxic to
termites.
This is showed by the termite resistance of samples preserved with 100% ethanol-toluene
extracts compared to those of 300ml x 700ml distilled water extract and distilled water,
100ml x 900ml ethanol-toluene extract and distilled water, 500ml x 500ml distilled water
Proceedings of the 58th International Convention of
Society of Wood Science and Technology
June 7-12, 2015 - Grand Teton National Park, Jackson, Wyoming, USA
123
extract and distilled water and finally 100% of distilled water extract which is the next to
100% ethanol-toluene extract in improving resistance of less durable species to termite
attack. This is further revealed by the high number of chemical components identified in the
extracts obtained from the different woods using ethanol-toluene and distilled water.
Gliricidia sepium durability reduced after removal of its extractives but not significantly. It
was concluded that extractives embedded in the cell walls were not readily removed by
extraction.
There was also a tendency for treated less durable wood species to be consumed more by
subterranean termites than the durable species whose extracts were removed. This was
attributed to the fact that the introduced wood extractives could not ‘enter’ the cell wall but
remained within the cell lumens. It was also concluded that density is another factor that
enhances durability of this specie.
References
Adegeye, A. O., Ogunsanwo, O. Y. and Olajuyigbe, S. O. (2009). Antifungal Activities of
Heart Wood Extract (HWE) of Teak Tectona grandis Against Two White Rots in
Woods of Gmelina arborea and Triplochiton scleroxylon. Academic Journal of Plant
Sciences 2 (4): 279-285, 2009
Amienyo. C. A and Ataga. A. E (2007). Use of Indigenous Plant Extracts for the Protection
of Mechanically Injured Sweet Potato (Ipomoea batatus) tubers. Scientific Research
and Essay Vol. 2(5), pp.167-170
Arango. A. R, Green, F. I., Hintz, K. , Lebow, P. K and Miller, B. R. (2005). Natural
Durability of Tropical and Native Woods against Termite damage by Reticulutermers
Flavipes. USDA. Forest service. International Biodeterioration and Biodegradation
Vol 57(2006): pp 146-150
Asamoah, A., Atta-Boateng, A., Frimpong-Mensah, K. and Antwi-Boasiako, C. (2011).
Efficacy of extractives from parts of Ghanaian pawpaw, avocado and neem on the
durability of alstonia. African Journal of Environmental Science and Technology Vol.
5(2), pp. 131-135.
Balaban., M. (2004). Identification of the Main Phenolic Compounds in Wood of Ceratonia
siliqua by GC-MC. Phytochemical Analysis 15, 385-388.
Bultman, J. D and Southwell, C. R (1976). Natural Resistance of Tropical American woods
to Terrestrial Wood destroying Organisms. Biotropica. V ol 8, No.2, pp71-95.
Femi-Ola T. O. and Aderibigbe E. Y. (2008). Studies on the Effect of Some Wood Extracts
on Growth and Cellulase Production by Strains of Bacillus subtilis. Asian Journal of
Plant Sciences, Volume 7, Issue 4: 421-423
Goktas O., Mammandov. R., Duru. E. M., Ozen. E., Colak. M. A. and Yilmaz. F. (2007).
Introduction and Evaluation of the Wood Preservative potentials of the Poisonous
Proceedings of the 58th International Convention of
Society of Wood Science and Technology
June 7-12, 2015 - Grand Teton National Park, Jackson, Wyoming, USA
124
Sternbergia canadidum extracts. African Journal of Biotechnology, Vol. 6 (8) pp.
982-986.
Milton, F. T. (1995). The Preservation of Wood. A self study manual for wood treaters.
Minnesota extension service. University of Minnesota Collage of Natural resources.
Onuorah E.O. (2000). The Wood Preservative Potentials of Heartwood extracts of Milicia
excela and Erthrophleum suaveolens. Bioresource Technology 75:171-173.
Owoyemi J. M.*, Olaniran O. S. (2014). Natural resistance of ten selected Nigerian wood
species to subterranean termites attack. International Journal of Biological Sciences
and Applications 2014; 1(2): 35-39
Peralta R.C.G, Menezes E. B, Carvalho A. G, Menezes E. L. A (2003). Feeding Preferences
of Subterranean Termites for Forest Species associated or not to Wood Decaying
Fungi. Floresta e Ambiente Vol. 10, No 2 pp 58-63.
Peralta, R. C. G, Menezes, E. B, Carvalho A. G, Menezes E. L. A (2004). Wood
Consumption rates of Forest Species by Subterranean Termites (isoptera) under Field
Conditions. Revista Arvore Vol. 28, No 2 pp 283-289.
Pereria D. M., Valentao P., Pereira J. A and Andrade P. B. (2009). Phenolics: From
Chemistry to Biology. Molecules 14, 2202-2211.
Roll. D. (2003). Wood Preservation Category 4b, Commercial Wood Preservation Study
Guide, Ohio Department of Agriculture. Publication for Pesticide Regulation 08/03
Schultz, T.P. and Nicholas, D.D. (2002b). Naturally durable heartwood: evidence for a
proposed dual defensive function of the extractives. Phytochemistry 54, 47-52
Silverio F. O ., Barbosa L. C. A., Maltha.C. R. A., Silvestre.A. J. D., Veloso. D. P. and
Gomide.J .L . (2007). Characterization of Lipophilic Wood Extractives from Clones
of Eucalyptus Urograndis cultivate in Brazil. Bioresource 2(2) 157-168.
Syofuna A., A.Y. Banana1, G. Nakabonge (2012). Efficiency of Natural Wood Extractives as
Wood Preservatives against Termite Attack. Maderas. Ciencia y tecnología, 14(2): 155-163.
Proceedings of the 58th International Convention of
Society of Wood Science and Technology
June 7-12, 2015 - Grand Teton National Park, Jackson, Wyoming, USA
125
Activated Carbon Monolith Derived From Bio-char
Lufei Li, [email protected]
Wenliang Wang, [email protected]
Liping Cai, [email protected]
Sheldon Shi, [email protected]
Jianmin Chang, [email protected]
Beijing Forestry University, Haidian District, Beijing 100083
Abstract
Activated carbon monoliths were fabricated using powered bio-char as a raw material and
bio-oil phenol-formaldehyde (PF) resin as a binder. The effect of the preparation condition on
the physical and mechanical properties (compressive strength, bulk density, iodine adsorption
value) of the resultant form was investigated. Using scanning electron microscopy (SEM) and
N2 adsorption, the microstructure characteristics and adsorption performance under different
conditions were observed. The results showed that the binder ratio and molding pressure had
a significant effect on the pore size distribution and mechanical strength of activated carbon
monoliths. It was found that an increase in the binder ratio would reduce the specific surface
areas and strengthened the compressive strength of the carbon. The activated carbon
monoliths prepared from the high molding pressures exhibited lower specific surface areas
and total pore volume and higher compressive strength than those of the activated carbon
monoliths prepared from low molding pressures. The optimum conditions to obtain the
highest properties were the 30% content of the PF resin binder and 20 MPa of the molding
pressure.

Proceedings of the 58th International Convention of
Society of Wood Science and Technology
June 7-12, 2015 - Grand Teton National Park, Jackson, Wyoming, USA
126
Reliability Analysis of Wood Floor Vibrations Considering
Sheathing Discontinuities
Mubarak Adesina1* and Arya Ebrahimpour2
1 Graduate Student, Department of Civil and Environmental Engineering, Idaho
State University, Pocatello ID, USA.
*Corresponding author
2 Professor, Department of Civil and Environmental Engineering, Idaho State
University, Pocatello ID, USA.
Abstract
Reliability analysis of wood floor vibrations under occupant induced loads is presented. The
project adopts the finite element analysis approach using the Opensees simulation framework
with Microsoft Excel used as the user interface. The Opensees results are imported into the
user interface and compared against multiple vibration perception criteria. Analyses included
the effect of sheathing continuity on the floor response. Extensive literature search was
performed to obtain the relevant statistical data on sawn lumber joists. An automatic process
was developed in which based on appropriate probability distribution functions, Excel
interface simulated random values for the parameters considered. Limit state functions are
developed based on the current vibration perception criteria. A combination of random and
deterministic parameters is used in the limit state equations. Using Monte Carlo simulation,
reliability index values were obtained for two floor systems of same dimensions. The first
floor had discontinuous sheathing and the other had continuous sheathing. Results are
discussed, followed by summary and conclusions. The results show a large range of
reliability index values for the vibration serviceability criteria considered in this study.
Keywords: Reliability analysis, limit state, reliability index, wood floors, sawn lumber, wood
floor sheathing, vibrations, OpenSees, finite element analysis.
Introduction
The prevalent use of wood floor systems has made it important to understand their behavior
when subjected to occupant induced vibrations. A number of researchers have developed
deterministic relations to quantify the vibration acceptability of floors under human-induced
activities. Generally, the dynamic response of a wood floor system is a complex problem.
Proceedings of the 58th International Convention of
Society of Wood Science and Technology
June 7-12, 2015 - Grand Teton National Park, Jackson, Wyoming, USA
127
Each joist has a different modulus of elasticity and connections between joists and sheathing
are non-rigid (Foschi and Gupta 1987). Also, the sheathing has significantly different
properties compared to the joist properties. A reliability analysis will provide insight into the
effect of uncertainties in material and geometric properties.
This research project has two goals: (1) to compare the reliability index values of current
vibration acceptability criteria, and (2) to study the effect of sheathing continuity on structural
reliability. The criteria used consider the natural frequency of the floor, the static deflection,
and the root-mean-square value of response acceleration.
Review of Literature
Structural vibrations arise from normal human activity, operation of mechanical equipment
within buildings, external traffic or wind storms and earthquakes. Methods of structural
analysis and design are growing more refined, the systems are better integrated and use of
high strength construction material is now common.
Serviceability requirements in current standards and specification which are little more than
rules of thumb based on experience with traditional construction often are not sufficient for
minimizing objectionable motion in modern structures (Ellingwood and Talin 1984). Detailed
loading and resistance criteria have been developed for the ultimate or safety related limit
states. However, serviceability requirements will determine the degree to which limit states
design will lead to feasible and economical structure.
Numerous studies have been conducted in attempts to relate levels of floor vibration to
human discomfort or tolerance levels. Specific findings in these studies are not always
consistent due to diverse methods and purposes in the course of conducting the experiment or
modeling the floor systems.
Ellingwood and Talin (1984) found that vibration is more likely to be a problem when caused
by a single person walking than by a group of people. They concluded that a single person
walking on the floor provides an appropriate dynamic model for developing serviceability
criteria. A research by Foschi and Gupta (1987) used the finite strip method to study floor
vibration induced by footfall impact loading. It was observed that the dynamic response
analysis of wood floor was quite challenging due to variation in individual joist modulus of
elasticity and connection between joists and sheathing are non-rigid. Similarly, Folz and
Foschi (1991) used the finite-strip method for analyzing the dynamic response of very
flexible floors. Humans were idealized as lumped oscillators that included masses, springs
and dashpots in the vertical direction. They assumed that nails exhibit linear load-slip
characteristics, allowing slip parallel to the joist, slip perpendicular to the joist and rotational
slip.
The British standard (Guide to evaluation, 1992) states the general guidance on how to assess
floor vibrations and how to predict human response to vibrations. Basic requirement for floor
vibration assessment is that it must cover all important parameters affecting human response.
The parameters include amplitude, damping and frequency of vibration. Frequency weighted
Proceedings of the 58th International Convention of
Society of Wood Science and Technology
June 7-12, 2015 - Grand Teton National Park, Jackson, Wyoming, USA
128
root mean square acceleration of vibration caused by a footfall impact satisfies this
requirement (Chui 1986). Humans tend to tolerate higher vibration magnitude at higher
frequencies than lower frequencies; thus, the calculated root-mean-square acceleration is
frequency weighted. International Standards Organization states only frequencies between 8
and 80 Hz should be included scaled by a factor equal to 8/fo, where fo is the floor
fundamental natural frequency in Hertz (Hz). Smith and Chui (1988) introduced a design
criterion based on the requirement that fundamental frequency of vibration for the floor be
greater than 8 Hz and that the root mean square acceleration value for the first one-second of
vibration be less than 0.45 m/s2.
OpenSees Program and Excel Interface
Finite element modeling software can be a powerful tool for Engineers in all fields, but
without proper calibration, comparison to real-world scenarios, and verification, finite
element modeling software cannot be considered reliable. OpenSees, an open source software
created and maintained by University of California, Berkeley, has not undergone the level of
verification that is attained through the commercialization process. OpenSees does, however,
receive constant verification at an academic level through ongoing peer-review and has even
been adopted by the Pacific Earthquake Engineering Research Center.
The Excel user interface was designed to facilitate the use of OpenSees in estimation of
vibration and deflection serviceability properties of wood floor systems. The interface allows
the user to input values for various floor system properties which are then ported into
OpenSees. Results from the OpenSees program are imported into the user interface and
compared against multiple acceptance criteria which have been established by researchers to
determine fitness of the floor system.
The synchrony between OpenSees and MS Excel was designed by Harvey Burch (2013) to
examine the vibration analysis of wood floors considering sheathing discontinuities. His
findings were measured against available thresholds published by previous researchers in the
area of wood floor vibration. To ascertain if the program was working correctly, he verified it
with an experimental result obtained by John Wolfe, a previous student.
Burch’s program is a very useful tool as it is able to simulate various floor sizes, specify
joists and sheathing sizes. It requires no knowledge of OpenSees, suitable for what-if
situations including reliability analysis. When used for reliability analyses, the program can
be modified to take advantage of Excel statistical functions.
Reliability Analysis of Wood Floor
The reliability analysis of a simple residential wood floor using regular lumber joist is
presented. The floor is measured against set thresholds to derive the limit state equations to
yield the reliability index (β), a measure of serviceability reliability. Table 1 gives the floor
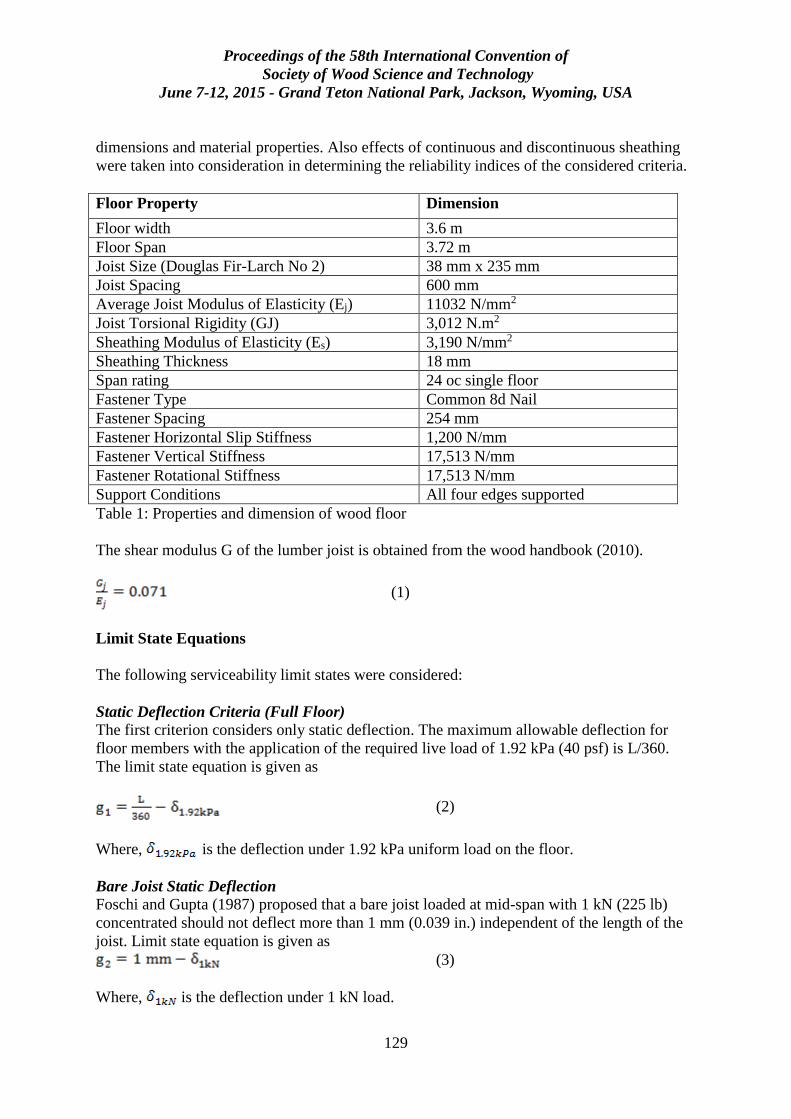
Proceedings of the 58th International Convention of
Society of Wood Science and Technology
June 7-12, 2015 - Grand Teton National Park, Jackson, Wyoming, USA
129
dimensions and material properties. Also effects of continuous and discontinuous sheathing
were taken into consideration in determining the reliability indices of the considered criteria.
Floor Property Dimension
Floor width 3.6 m
Floor Span 3.72 m
Joist Size (Douglas Fir-Larch No 2) 38 mm x 235 mm
Joist Spacing 600 mm
Average Joist Modulus of Elasticity (Ej) 11032 N/mm2
Joist Torsional Rigidity (GJ) 3,012 N.m2
Sheathing Modulus of Elasticity (Es) 3,190 N/mm2
Sheathing Thickness 18 mm
Span rating 24 oc single floor
Fastener Type Common 8d Nail
Fastener Spacing 254 mm
Fastener Horizontal Slip Stiffness 1,200 N/mm
Fastener Vertical Stiffness 17,513 N/mm
Fastener Rotational Stiffness 17,513 N/mm
Support Conditions All four edges supported
Table 1: Properties and dimension of wood floor
The shear modulus G of the lumber joist is obtained from the wood handbook (2010).
(1)
Limit State Equations
The following serviceability limit states were considered:
Static Deflection Criteria (Full Floor)
The first criterion considers only static deflection. The maximum allowable deflection for
floor members with the application of the required live load of 1.92 kPa (40 psf) is L/360.
The limit state equation is given as
(2)
Where, is the deflection under 1.92 kPa uniform load on the floor.
Bare Joist Static Deflection
Foschi and Gupta (1987) proposed that a bare joist loaded at mid-span with 1 kN (225 lb)
concentrated should not deflect more than 1 mm (0.039 in.) independent of the length of the
joist. Limit state equation is given as
(3)
Where, is the deflection under 1 kN load.
Proceedings of the 58th International Convention of
Society of Wood Science and Technology
June 7-12, 2015 - Grand Teton National Park, Jackson, Wyoming, USA
130
Natural Frequency Criterion
In an effort to find a method of predicting acceptability of a floor during the design phase,
Dolan, et al. (1999) created a vibration-limiting criterion that does not require any knowledge
of the damping associated with a floor system. Their criterion is based solely on the
calculated or predicted natural frequency of a floor system. The natural frequency of an
unoccupied floor system must be higher than 15 Hz to be considered acceptable. Also, for an
occupied floor system, the natural frequency must be higher than 14 Hz. The occupancy loads
considered in the analysis of Dolan et al. range from 96 Pa (2 psf) to 192 Pa (4 psf). The limit
state for an unoccupied floor system is
(4)
Where, is the unoccupied floor natural frequency. The limit state for an occupied floor
system is
(5)
Where, is the occupied floor natural frequency.
Lin J. Hu Criterion
The criterion developed by Hu deals with a combination of natural frequency and static
displacement. The criterion is designed for measurements on unoccupied floors without
partitions, finishing, and furniture. The static deflection is measured after application of a 1
kN (225 lb.) load at mid-span of the entire floor system. Thus, the limit state equation is
(6)
Where, is the unoccupied floor natural frequency, - deflection under 1 kN load.
Smith and Chui Root Mean Square Acceleration Criterion
This criterion includes limitations on the natural frequency of the floor system as well as the
root-mean-square (RMS) acceleration for a one second period of time. Smith and Chui state
that the range of frequencies to which humans are most sensitive in terms of floor vibrations
is from 4 to 8 Hz. In order to avoid excessive vibrations in this range, the natural frequency of
the floor system must be greater than 8 Hz. Also, based on experimental work of Chui, an
acceptable limit for the frequency-weighted root-mean-square acceleration should be less
than 0.45 m/s2 or 0.046g.
The limit state is given as
(7)
Where, is the frequency weighted RMS acceleration of the floor.
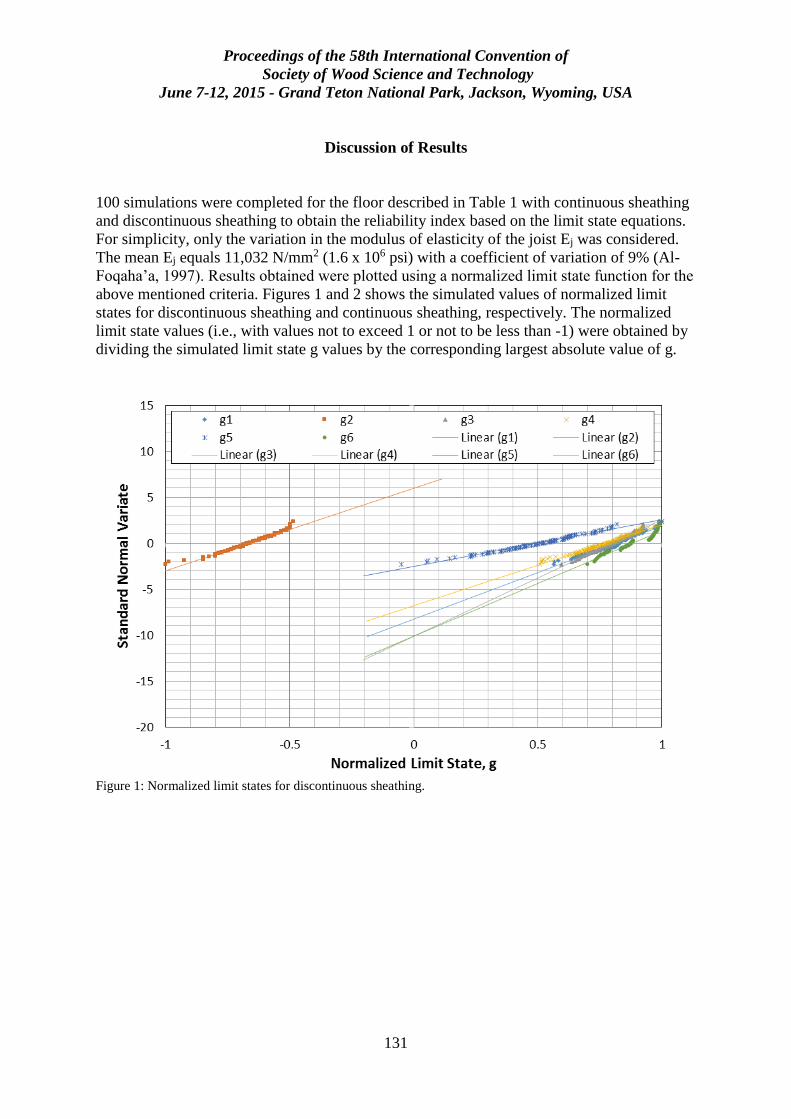
Proceedings of the 58th International Convention of
Society of Wood Science and Technology
June 7-12, 2015 - Grand Teton National Park, Jackson, Wyoming, USA
131
Discussion of Results
100 simulations were completed for the floor described in Table 1 with continuous sheathing
and discontinuous sheathing to obtain the reliability index based on the limit state equations.
For simplicity, only the variation in the modulus of elasticity of the joist Ej was considered.
The mean Ej equals 11,032 N/mm2 (1.6 x 10⁶ psi) with a coefficient of variation of 9% (Al-
Foqaha’a, 1997). Results obtained were plotted using a normalized limit state function for the
above mentioned criteria. Figures 1 and 2 shows the simulated values of normalized limit
states for discontinuous sheathing and continuous sheathing, respectively. The normalized
limit state values (i.e., with values not to exceed 1 or not to be less than -1) were obtained by
dividing the simulated limit state g values by the corresponding largest absolute value of g.
Figure 1: Normalized limit states for discontinuous sheathing.
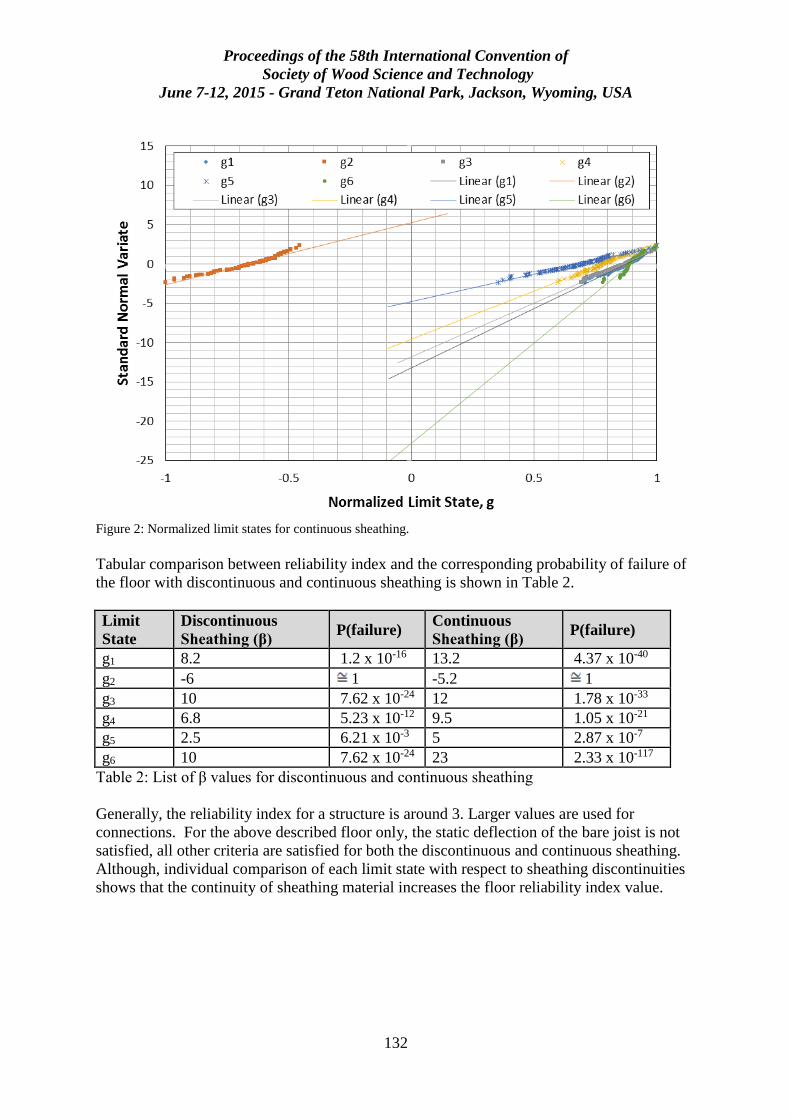
Proceedings of the 58th International Convention of
Society of Wood Science and Technology
June 7-12, 2015 - Grand Teton National Park, Jackson, Wyoming, USA
132
Figure 2: Normalized limit states for continuous sheathing.
Tabular comparison between reliability index and the corresponding probability of failure of
the floor with discontinuous and continuous sheathing is shown in Table 2.
Limit
State
Discontinuous
Sheathing (β) P(failure)
Continuous
Sheathing (β) P(failure)
g1 8.2 1.2 x 10⁻¹⁶ 13.2 4.37 x 10-40
g2 -6 1 -5.2 1
g3 10 7.62 x 10⁻²⁴ 12 1.78 x 10⁻³³
g4 6.8 5.23 x 10⁻¹² 9.5 1.05 x 10⁻²¹
g5 2.5 6.21 x 10⁻³ 5 2.87 x 10⁻⁷
g6 10 7.62 x 10⁻²⁴ 23 2.33 x 10-117
Table 2: List of β values for discontinuous and continuous sheathing
Generally, the reliability index for a structure is around 3. Larger values are used for
connections. For the above described floor only, the static deflection of the bare joist is not
satisfied, all other criteria are satisfied for both the discontinuous and continuous sheathing.
Although, individual comparison of each limit state with respect to sheathing discontinuities
shows that the continuity of sheathing material increases the floor reliability index value.
Proceedings of the 58th International Convention of
Society of Wood Science and Technology
June 7-12, 2015 - Grand Teton National Park, Jackson, Wyoming, USA
133
Conclusion
Structural reliability considers the likelihood of structure reaching its limit state. The above
results clearly show a large range of reliability index values for the serviceability criteria
considered in this work. Amongst all criteria considered, the floor did not meet the Foschi
and Gupta 1kN bare joist deflection requirement irrespective of the sheathing condition.
However, comparison between reliability index values of same criterion with respect to
sheathing shows continuous sheathing to have a higher reliability index over discontinuous
sheathing. This means that for realistic wood floor vibration reliability analyses, sheathing
discontinuities should not be ignored.
References
Al-Foqaha’a, A. A. (1997). Design criterion for wood floor vibrations via finite element and
reliability analyses. Ph.D Dissertation, Washington State University, Pullman, Washington.
Burch H.R. (2013) Finite element vibration analysis of wood floors considering sheathing
discontinuities. MS thesis, Idaho State University, Pocatello. ID. 254 pp.
Chui, Y.H. (1986) Vibrational performance of timber floors and the related human
discomfort criteria. Journal of the Institute of Wood Science. 10(5): 183-188
Dolan, J.D., et al (1999) Preventing annoying wood floor vibrations. J. Structural
Engineering. 125(1): 19-24
Ellingwood, B. and Talin, A. (1984) Structural Serviceability: Floor vibrations. J. Structural
Engineering, ASCE 110(2): 401-418
Folz, B., and Foschi, R.O (1991) Coupled vibrational response of floor systems with
occupants. J. Engineering Mechanics, ASCE 117(4): 872-892
Foschi, R.O., and Gupta, A. (1987) Reliability of floors under impact vibration. Canadian J.
Civil Engrg. 14(5): 683-689
Guide to evaluation of human exposure to vibration in buildings (1992). British Standard
Institution, London.
Hu, Lin J. (1997) Design guide for wood-framed floor systems. Canadian Forest Service No.
32.
Smith, I., and Chui, Y.H. (1988) Design of lightweight wooden floors to avoid human
discomfort. Canadian J. Civil Engrg. 15(2): 254-262

Proceedings of the 58th International Convention of
Society of Wood Science and Technology
June 7-12, 2015 - Grand Teton National Park, Jackson, Wyoming, USA
134
Wood Handbook: Wood as an engineering material (2010) Forest product laboratory, United
States Dept. of Agriculture forest service, Madison, WI.
Proceedings of the 58th International Convention of
Society of Wood Science and Technology
June 7-12, 2015 - Grand Teton National Park, Jackson, Wyoming, USA
135
Predicting Bending Properties of Stem and Branch Wood
of a Tropical Hardwood Species from Density and
Moisture Content
Peter Kessels Dadzie 1* - Martin Amoah 2
1 Lecturer, Interior Architecture and Furniture Production Department,
Kumasi Polytechnic, Box 854, Kumasi, Ghana.
*Corresponding author
[email protected]; [email protected]
2Senior Lecturer and Dean, Faculty of Technical Education, University of
Education Winneba, Kumasi Campus, Kumasi, Ghana.
Abstract
Branchwood is being explored as supplements to stemwood in wood products manufacturing
and bending properties are among those properties needed for wood for structural and
nonstructural applications. However, non destructive methods are being adopted in
determining wood properties, and wood density and moisture contents are some variables that
can be applied. This study used density and moisture content to predict the MOE and MOR
of branch and stem wood of Entandrophragma cylindricum (sapele) tested at two moisture
levels (10±4%MC and 17±3MC). Density was determined in accordance with ISO 3131-
1975. Bending properties determinations followed BS 373-1957 and using INSTRON TCM
Machine with crosshead speed of 6.6mm/min. Results generally indicated that at each
moisture level, branchwood had higher density than their stemwood counterparts. Generally
at MOE and MOR at 10±4%MC were higher than at 17±3%MC but at 10±4%MC MOE and
MOR of stemwood were higher than their branchwood counterparts. Whereas MC was found
to have significant effect (P < 0.05), wood type and their interactions did not have significant
effect on MOE and MOR of stem and branch wood. Moreover the predictive powers of MC
and density as combined predictive variable for the bending properties were higher for
branchwood than stemwood at both MC levels. It was concluded that for the species,
branchwood had higher density than stemwood, and moisture content and density combined
could predict MOE and MOR of both stem and branch wood of the species from 54.2% to
94.0% level of accuracy.
Keywords: Stem and branch wood, Bending properties of wood, Hardwood density,
Entandropharagma cylindricum, Wood density and moisture relations.
Introduction
Proceedings of the 58th International Convention of
Society of Wood Science and Technology
June 7-12, 2015 - Grand Teton National Park, Jackson, Wyoming, USA
136
Among the reasons usually given for the non-extraction of timber from the crown area of
tress is the lack of knowledge on the wood quality, including density and mechanical
properties (Ayarkwa, 1998). Mechanical strength, especially bending strength is of much
importance in measuring the stiffness (MOE) and the maximum load (MOR) of beams
(Haygreeen & Bowyer, 1996; Tsoumis, 1991; Forest Products Laboratory, 2010). Furniture
items like chairs and tables have parts that act like beams (e.g. seat slats, backrest slats,
armrest, side rails and table tops) and are therefore subjected to bending stresses when loaded
(Walton, 1974).
It is reported that decline in wood resource or forests influences a rise in the awareness of
efficient use of wood and finger-jointing of wood for many lumber products (Gene, 2010).
However, one step towards efficient wood utilization is the adaption of the whole tree
utilization concept that advocate for the use of wood residues like branches and off-cuts
(Haygreen and Bowyer 1996). Considering the rate of decline/depletion of Ghana’s forest
and their consequential effects on the economy and environment, forest depletion has become
one major challenge facing the wood related entrepreneurs and the industries and has also
resulted in a major rise in interest in wood residue utilization (Ministry of Lands and Natural
Resources –MLNR, 2012). As a result of the alarming depletion rate (2%p.a) of forests in
Ghana, the contribution of the forestry sector to national GDP has declined from 8% a decade
ago to a current level of 4% in 2011 (MLNR, 2012). This state of affairs, among others, have
caused some wood processing industries to either fold-up or not operating at full capacity due
to lack of raw materials. What is most disturbing, in this turn of events, is the drastic
extinction of the premium and commercial timber species which are used for furniture and
other interior products. In the estimation of the International Institute for Environment and
Development (IIED), the supplies of the traditional (premium and commercial) timber
species such as Entandrophragma cylindricum (Sapele), among others, could fall by a further
50% within five years (Acquah & Whyte, 1998).
Due to the foreseen much threat of wood raw material extinction on the future of wood and
construction industries, researchers are exploring the use of tree branches as supplements to
tree stems. But studies on branchwoods have covered physical and mechanical
properties/qualities as well as the workability of some Ghanaian hardwoods. Okai (2002)
studied some physical and mechanical properties of Terminalia ivorensis (emire) and
Anigeria robusta (asanfena), while Amoah et. al. (2012) have researched into the mechanical
and physical characteristics of branchwood and rootwood of emire and Milicia excelsa
(iroko/odum). Again Okine (2003), has also worked on the workability of emire and asanfena
and has even used some to produce some furniture. However, there are no available studies
on the natural durability qualities of branchwood of the “redwood species” especially Sapele.
Meanwhile Sapele tree has branches of about 25% of its extracted log volume which could be
used as alternative or supplement to stemwood in new value-added products, like garden
furniture, provided that their properties, specific to the intended application, are known
(Dadzie 2013; Gurau et. al., 2008) and bending properties are some of such properties. This
study therefore seek to assess: 1) the variations in density of stem and branch wood of sapele
at 2 moisture levels, 2) the bending strength properties between stem and branch woods at 2
moisture levels, and 3) use moisture levels and density to predict bending properties of stem
and branch woods of sapele.
Proceedings of the 58th International Convention of
Society of Wood Science and Technology
June 7-12, 2015 - Grand Teton National Park, Jackson, Wyoming, USA
137
Materials and Methods
Samples collection and preparation
Four branch logs with diameters ranging from 26 cm to 48 cm and lengths from 1.5 m to 2 m
were extracted for the study. A total of two branch and stem logs were extracted from a tree
each from two natural forest reserves within two ecological zones of Ghana. Because samples
were from natural forests the ages of the trees were unknown. However, the average diameter
at breast height (dbh) was 120cm. All two reserves are concessions of Logs and Lumber
Limited (LLL)- a timber processing firm in Kumasi, Ghana, and used for this study. Both
through-and-through and quarter sawn methods were used for the conversion of the logs to
lumber, using the same vertical bandmills that are being used for the conversion of logs in the
factory. After the conversion, both branch and stem boards were re-sawn and crosscut into
dimensions of 25 mm x 60 mm x 420 mm and grouped according to the two trees and the two
reserves from which they were obtained and hence obtaining 4groups each (i.e. 1species x 2
trees x 2 reserves) for stem and branch woods. Clear heartwoods free of knots, fuzzy grains
and any other visible defects were then sampled from each group. The stem and branch
woods were regrouped into two each while ensuring that each group had samples of each tree
and each reserve. One group each of the stem and branch wood was conditioned in the air-
drying shed of LLL to average MC of 17±3% at same temperature and relative humidity used
by the company to air-dry wood, whereas the other one group each were kiln-dried in the
factory’s kilns to average MC of 10±4% (average MC used for kiln-dried lumber products).
After each drying process, 32 samples were finally prepared for stem and branch wood
groups within each MC level in accordance with BS 373-1957 specifications for bending test.
Data Collection and Analysis
Wood density and bending properties
For each stem and branch wood group within each MC level, 30 samples were tested for
density according to ISO 3131, whereas their modulus of elasticity (MOE) and modulus of
rupture (MOR) were tested by a three-point flexural test in an INSTRON TCM universal
testing machine model 4482 with crosshead speed of 6.6 mm/min. The INSTRON had a
computerized data acquisition system that captured all relvant information on the test and test
samples. Moisture contents of all tested samples were measured with moisture meter (model
MO210 designed to measure MC of wood up to 44% as specified by the manufacturers) and
which was found to have accuracy of ±2% upon validation with oven-dry method using 20
samples drawn from the stem and branch wood sample groups {i.e. (5 stem samples x 2 MC
levels) + 5 branchwood samples x 2 MC levels) = 20 samples}. Determining MCs in wood
properties studies with moisture meters has been acceptably used by some researchers,
including Beaulieu et al (1987), Ayarkwa et al (2000), and Amoah et al (2012). Analysis of
variance (ANOVA) and regression analysis were used to analyze the data obtained from both
density and bending property tests using SPSS 17.0 version.
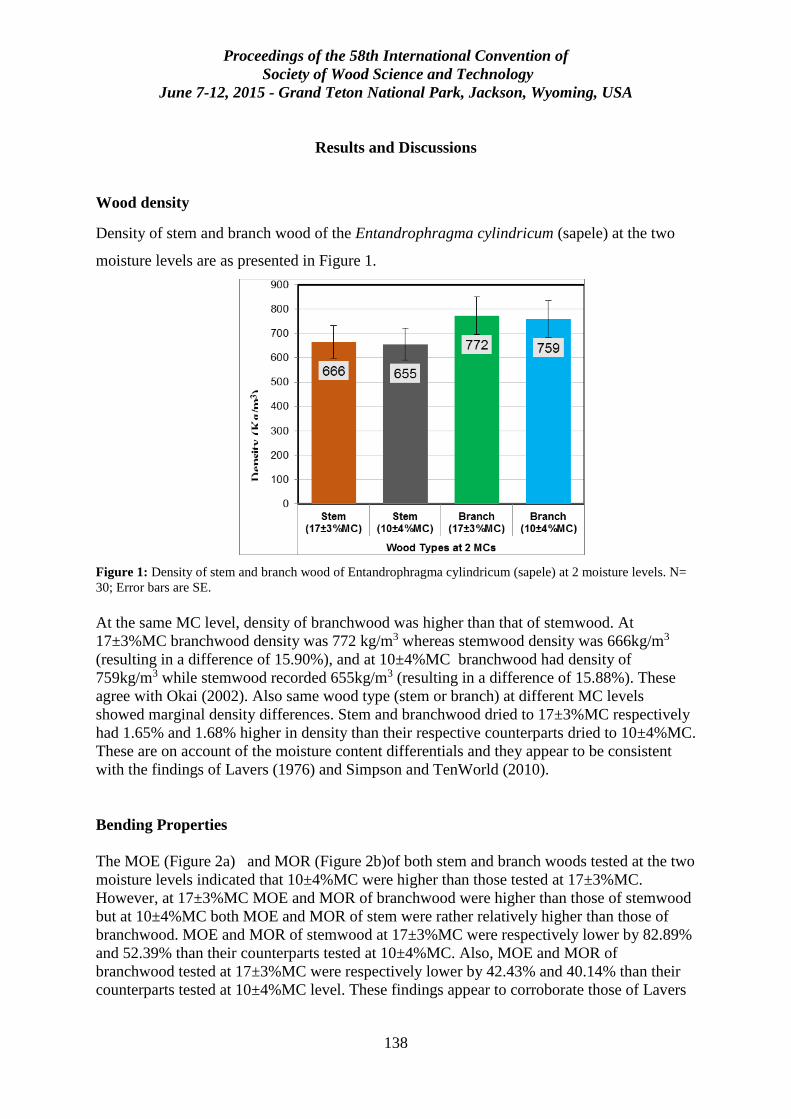
Proceedings of the 58th International Convention of
Society of Wood Science and Technology
June 7-12, 2015 - Grand Teton National Park, Jackson, Wyoming, USA
138
Results and Discussions
Wood density
Density of stem and branch wood of the Entandrophragma cylindricum (sapele) at the two
moisture levels are as presented in Figure 1.
Figure 1: Density of stem and branch wood of Entandrophragma cylindricum (sapele) at 2 moisture levels. N=
30; Error bars are SE.
At the same MC level, density of branchwood was higher than that of stemwood. At
17±3%MC branchwood density was 772 kg/m3 whereas stemwood density was 666kg/m3
(resulting in a difference of 15.90%), and at 10±4%MC branchwood had density of
759kg/m3 while stemwood recorded 655kg/m3 (resulting in a difference of 15.88%). These
agree with Okai (2002). Also same wood type (stem or branch) at different MC levels
showed marginal density differences. Stem and branchwood dried to 17±3%MC respectively
had 1.65% and 1.68% higher in density than their respective counterparts dried to 10±4%MC.
These are on account of the moisture content differentials and they appear to be consistent
with the findings of Lavers (1976) and Simpson and TenWorld (2010).
Bending Properties
The MOE (Figure 2a) and MOR (Figure 2b)of both stem and branch woods tested at the two
moisture levels indicated that 10±4%MC were higher than those tested at 17±3%MC.
However, at 17±3%MC MOE and MOR of branchwood were higher than those of stemwood
but at 10±4%MC both MOE and MOR of stem were rather relatively higher than those of
branchwood. MOE and MOR of stemwood at 17±3%MC were respectively lower by 82.89%
and 52.39% than their counterparts tested at 10±4%MC. Also, MOE and MOR of
branchwood tested at 17±3%MC were respectively lower by 42.43% and 40.14% than their
counterparts tested at 10±4%MC level. These findings appear to corroborate those of Lavers
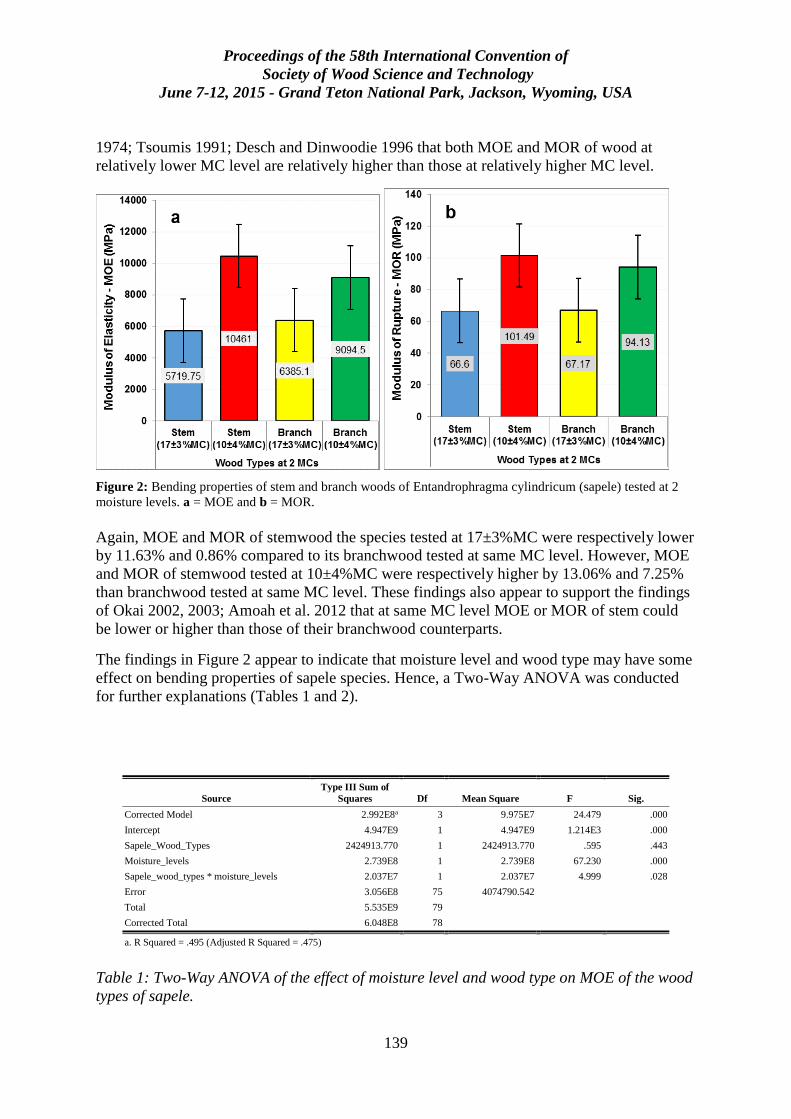
Proceedings of the 58th International Convention of
Society of Wood Science and Technology
June 7-12, 2015 - Grand Teton National Park, Jackson, Wyoming, USA
139
1974; Tsoumis 1991; Desch and Dinwoodie 1996 that both MOE and MOR of wood at
relatively lower MC level are relatively higher than those at relatively higher MC level.
Figure 2: Bending properties of stem and branch woods of Entandrophragma cylindricum (sapele) tested at 2
moisture levels. a = MOE and b = MOR.
Again, MOE and MOR of stemwood the species tested at 17±3%MC were respectively lower
by 11.63% and 0.86% compared to its branchwood tested at same MC level. However, MOE
and MOR of stemwood tested at 10±4%MC were respectively higher by 13.06% and 7.25%
than branchwood tested at same MC level. These findings also appear to support the findings
of Okai 2002, 2003; Amoah et al. 2012 that at same MC level MOE or MOR of stem could
be lower or higher than those of their branchwood counterparts.
The findings in Figure 2 appear to indicate that moisture level and wood type may have some
effect on bending properties of sapele species. Hence, a Two-Way ANOVA was conducted
for further explanations (Tables 1 and 2).
Table 1: Two-Way ANOVA of the effect of moisture level and wood type on MOE of the wood
types of sapele.
Source
Type III Sum of
Squares Df Mean Square F Sig.
Corrected Model 2.992E8a 3 9.975E7 24.479 .000
Intercept 4.947E9 1 4.947E9 1.214E3 .000
Sapele_Wood_Types 2424913.770 1 2424913.770 .595 .443
Moisture_levels 2.739E8 1 2.739E8 67.230 .000
Sapele_wood_types * moisture_levels 2.037E7 1 2.037E7 4.999 .028
Error 3.056E8 75 4074790.542
Total 5.535E9 79
Corrected Total 6.048E8 78
a. R Squared = .495 (Adjusted R Squared = .475)
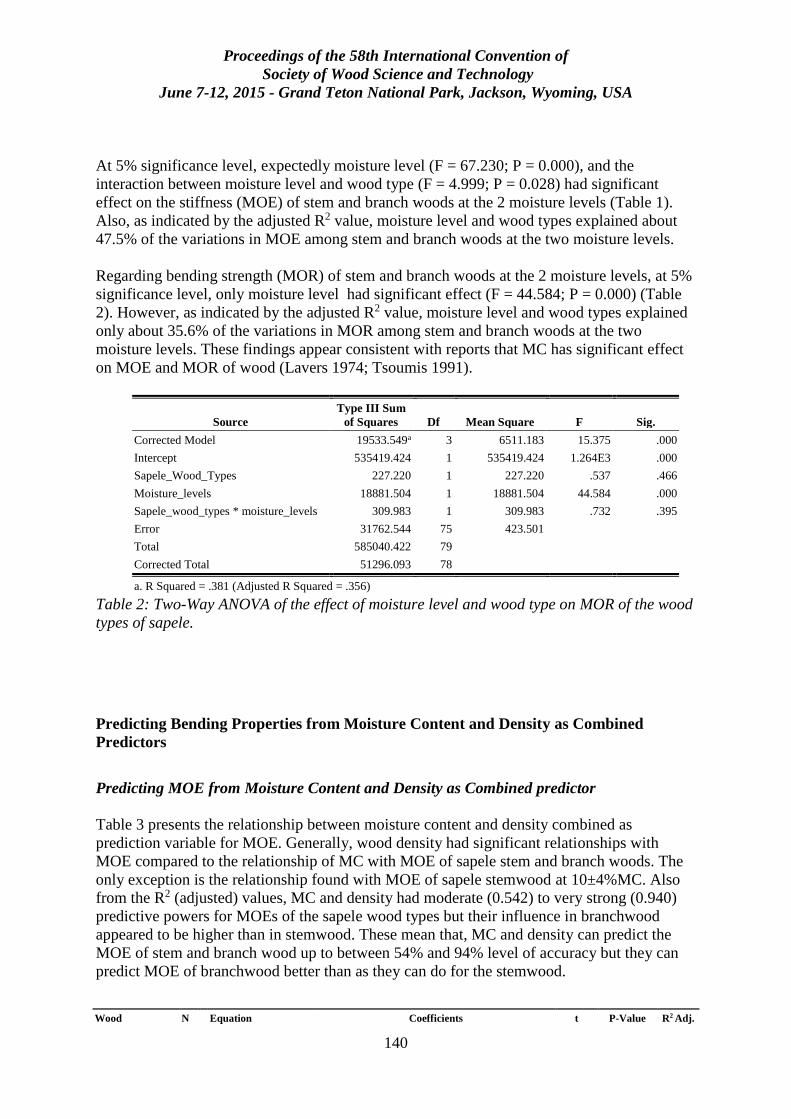
Proceedings of the 58th International Convention of
Society of Wood Science and Technology
June 7-12, 2015 - Grand Teton National Park, Jackson, Wyoming, USA
140
At 5% significance level, expectedly moisture level (F = 67.230; P = 0.000), and the
interaction between moisture level and wood type (F = 4.999; P = 0.028) had significant
effect on the stiffness (MOE) of stem and branch woods at the 2 moisture levels (Table 1).
Also, as indicated by the adjusted R2 value, moisture level and wood types explained about
47.5% of the variations in MOE among stem and branch woods at the two moisture levels.
Regarding bending strength (MOR) of stem and branch woods at the 2 moisture levels, at 5%
significance level, only moisture level had significant effect (F = 44.584; P = 0.000) (Table
2). However, as indicated by the adjusted R2 value, moisture level and wood types explained
only about 35.6% of the variations in MOR among stem and branch woods at the two
moisture levels. These findings appear consistent with reports that MC has significant effect
on MOE and MOR of wood (Lavers 1974; Tsoumis 1991).
Source
Type III Sum
of Squares Df Mean Square F Sig.
Corrected Model 19533.549a 3 6511.183 15.375 .000
Intercept 535419.424 1 535419.424 1.264E3 .000
Sapele_Wood_Types 227.220 1 227.220 .537 .466
Moisture_levels 18881.504 1 18881.504 44.584 .000
Sapele_wood_types * moisture_levels 309.983 1 309.983 .732 .395
Error 31762.544 75 423.501
Total 585040.422 79
Corrected Total 51296.093 78
a. R Squared = .381 (Adjusted R Squared = .356)
Table 2: Two-Way ANOVA of the effect of moisture level and wood type on MOR of the wood
types of sapele.
Predicting Bending Properties from Moisture Content and Density as Combined
Predictors
Predicting MOE from Moisture Content and Density as Combined predictor
Table 3 presents the relationship between moisture content and density combined as
prediction variable for MOE. Generally, wood density had significant relationships with
MOE compared to the relationship of MC with MOE of sapele stem and branch woods. The
only exception is the relationship found with MOE of sapele stemwood at 10±4%MC. Also
from the R2 (adjusted) values, MC and density had moderate (0.542) to very strong (0.940)
predictive powers for MOEs of the sapele wood types but their influence in branchwood
appeared to be higher than in stemwood. These mean that, MC and density can predict the
MOE of stem and branch wood up to between 54% and 94% level of accuracy but they can
predict MOE of branchwood better than as they can do for the stemwood.
Wood
Species/Type &
MC
N Equation Coefficients t P-Value R2 Adj.
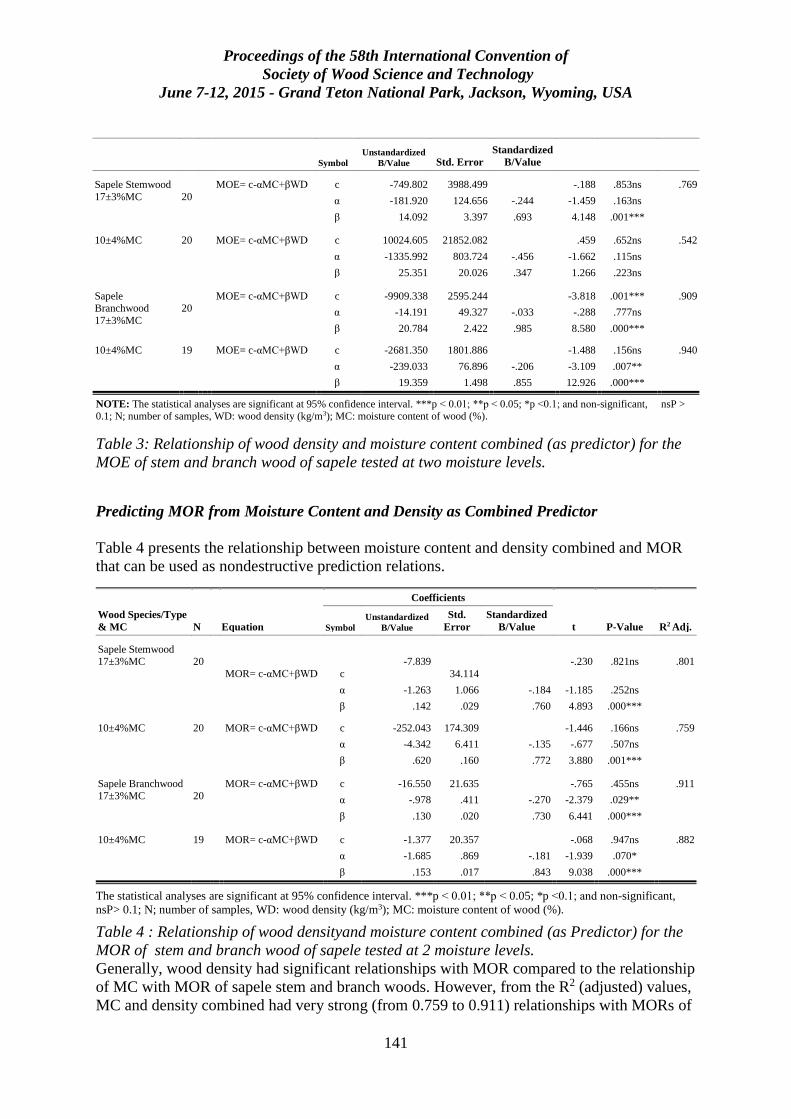
Proceedings of the 58th International Convention of
Society of Wood Science and Technology
June 7-12, 2015 - Grand Teton National Park, Jackson, Wyoming, USA
141
NOTE: The statistical analyses are significant at 95% confidence interval. ***p ˂ 0.01; **p ˂ 0.05; *p ˂0.1; and non-significant, nsP > 0.1; N; number of samples, WD: wood density (kg/m3); MC: moisture content of wood (%).
Table 3: Relationship of wood density and moisture content combined (as predictor) for the
MOE of stem and branch wood of sapele tested at two moisture levels.
Predicting MOR from Moisture Content and Density as Combined Predictor
Table 4 presents the relationship between moisture content and density combined and MOR
that can be used as nondestructive prediction relations.
Wood Species/Type
& MC N Equation
Coefficients
t P-Value R2 Adj. Symbol
Unstandardized
B/Value
Std.
Error
Standardized
B/Value
Sapele Stemwood 17±3%MC
20
MOR= c-αMC+βWD c
-7.839
34.114
-.230 .821ns .801
α -1.263 1.066 -.184 -1.185 .252ns
β .142 .029 .760 4.893 .000***
10±4%MC 20 MOR= c-αMC+βWD c -252.043 174.309 -1.446 .166ns .759
α -4.342 6.411 -.135 -.677 .507ns
β .620 .160 .772 3.880 .001***
Sapele Branchwood 17±3%MC
20
MOR= c-αMC+βWD c -16.550 21.635 -.765 .455ns .911
α -.978 .411 -.270 -2.379 .029**
β .130 .020 .730 6.441 .000***
10±4%MC 19 MOR= c-αMC+βWD c -1.377 20.357 -.068 .947ns .882
α -1.685 .869 -.181 -1.939 .070*
β .153 .017 .843 9.038 .000***
The statistical analyses are significant at 95% confidence interval. ***p ˂ 0.01; **p ˂ 0.05; *p ˂0.1; and non-significant,
nsP> 0.1; N; number of samples, WD: wood density (kg/m3); MC: moisture content of wood (%).
Table 4 : Relationship of wood densityand moisture content combined (as Predictor) for the
MOR of stem and branch wood of sapele tested at 2 moisture levels.
Generally, wood density had significant relationships with MOR compared to the relationship
of MC with MOR of sapele stem and branch woods. However, from the R2 (adjusted) values,
MC and density combined had very strong (from 0.759 to 0.911) relationships with MORs of
Symbol
Unstandardized
B/Value Std. Error
Standardized
B/Value
Sapele Stemwood
17±3%MC
20
MOE= c-αMC+βWD c -749.802 3988.499 -.188 .853ns .769
α -181.920 124.656 -.244 -1.459 .163ns
β 14.092 3.397 .693 4.148 .001***
10±4%MC 20 MOE= c-αMC+βWD c 10024.605 21852.082 .459 .652ns .542
α -1335.992 803.724 -.456 -1.662 .115ns
β 25.351 20.026 .347 1.266 .223ns
Sapele Branchwood
17±3%MC
20
MOE= c-αMC+βWD c -9909.338 2595.244 -3.818 .001*** .909
α -14.191 49.327 -.033 -.288 .777ns
β 20.784 2.422 .985 8.580 .000***
10±4%MC 19 MOE= c-αMC+βWD c -2681.350 1801.886 -1.488 .156ns .940
α -239.033 76.896 -.206 -3.109 .007**
β 19.359 1.498 .855 12.926 .000***
Proceedings of the 58th International Convention of
Society of Wood Science and Technology
June 7-12, 2015 - Grand Teton National Park, Jackson, Wyoming, USA
142
stem and branch woods of sapele but, as it occurred for the MOEs, the influence of MC and
wood density combined appeared higher in branchwood than in stemwood (Table 4). These
mean that, MC and density can predict the MOR of stem and branch wood up to between
75.9% and 91% accuracy but they can predict MOR of branchwood better than stemwood.
Conclusions and Recommendations
Based on the results the following conclusions were drawn;
1. Branchwood of sapele had higher density than its stemwood counterpart. However
both stem and branch wood density increased with increase in moisture level.
2. Generally, bending properties of stemwood of sapele are relatively higher than those
of its branchwood counterparts. Moisture content had significant effect on the
variation in both MOE and MOR of sapele stem and branch woods.
3. Moisture content (MC) and wood density (WD) had moderate to strong relationship
with MOE and MOR of both stem and branch woods of sapele. Subsequently, MC
and WD combined can predict the bending properties of the wood types up to
accuracies between 54% and 94%. However, the predictive strength of MC and WD
appeared higher in branchwood than stemwood.
4. From the predictive strength of MC and WD as combined variables for MOE and
MOR, the variables could be used nondestructively to predict the bending strength
properties of stem and branch wood of sapele.
References
AFORNET- African Forest Research Network (2000) Wood Based Industries in Sub-Saharan
Africa. www.afornet.org, (16 August 2005).
Alexander Rose Ltd. (2005) Fine quality traditional garden furniture, Alexander Rose Ltd,
West Sussex. U.K.. 25pp.
Capito, Eugene (Hon.) (1993) Situation of African Forestry Policy. ATO, Information
Bulletin No. 2 (1994) SGIT Impremerie de Louis, Gabon. pp.10-12.
Dadzie P.K (2013) The Potential Contribution of Branchwood Quantity, Left after Logging
Operations, Towards Reducing Depletion Rate and Preserving Ghana’s Forest Ecosystem,
America Journal of Agriculture and Forestry, Vol. 1 No.2. PP. 32-39.
http://www.sciencepublishinggroup.com/j/ajaf
Dadzie P K, Amoah M, Tekpetey S L (2014) Preliminary assessment of wealth creation in
wood products’ business in Ghana: The perspective of lumber and furniture production and
implications for entrepreneurship, International Journal of Business and Economic Research,
Proceedings of the 58th International Convention of
Society of Wood Science and Technology
June 7-12, 2015 - Grand Teton National Park, Jackson, Wyoming, USA
143
3(6): 243-249. doi: 10.11648/j.ijber.20140306.15.
http://www.sciencepublishinggroup.com/j/ijber (20 December 2014)
Dadzie P K, Frimpong-Mensah K (2011) Value addition to wood resources, the case of
Garden furniture production and export in Ghana; A case study of a local firm,
conference paper presented at the 65th international convention of the Forest Products
Society, 19th -21st June 2011, Portland, Oregon. U.S.A.
http://www.slideshare.net/julielang/session-8-ic2011dadzie (20 December 2014).
Doomson O, Vlosky R P (2007) A strategic overview of the forest sector in Ghana, Louisiana
Forest Products Development Centre working paper #81, School of Renewable Natural
Resources, Lousiana State University of Agricultural Centre, Baton Rouge. U.S.A. 17pp.
ITTO (International Timber Trade Organization) (2011) tropical timber market reports in;
Bandara W A R T W, Vlosky R P (2012) An analysis of the U.S wood products import
sector: prospects for tropical wood products exporters, Journal of Tropical Forestry and
Environment 2 (02) 49-62.
Ratnasingam J (1998) The South-East Asian furniture industry siege, Southern African Wood
and Timber Times 24 (1) 68-72.
The Ghanaian Times of January 23, 2015; www.ghanaiantimes.com.gh/. (3 February 2015)
TIDD.- Timber Industries Development Division (2001) Exporters performance/moving
species/direction of trade-lumber (KD) and furniture parts; wood products export report,
December, Data Processing Section, Takoradi. Ghana. 33pp.
TIDD (2002) Exporters performance/moving species/direction of trade-lumber (KD) and
furniture parts; wood products export report, December, data processing section, Takoradi.
Ghana. 36pp.
TIDD (2003) Exporters performance/moving species/direction of trade-lumber (KD) and
furniture parts; wood products export report, December, data processing section, Takoradi.
Ghana. 36pp.
TIDD (2004) Exporters performance/moving species/direction of trade-lumber (KD) and
furniture parts; wood products export report, December, data processing section, Takoradi.
Ghana. 42pp.
TIDD (2005a) The first 30 out of 126 exporters of all wood products, Jan-Feb 2005. wood
products’export report for February 2005, data processing section of TIDD, Takoradi, Ghana.
32 pp.
TIDD (2005b) Exporters performance/moving species/direction of trade-lumber (KD),
flooring and furniture parts. report on export of wood products for December 2005, data
processing section of TIDD, Takoradi, Ghana. 54 pp.
TIDD (2006) Exporters performance/moving species/direction of trade-lumber (KD) and
furniture parts; wood products export report, December, data processing section, Takoradi.
Ghana. 36 pp..
TIDD (2007) Exporters performance/moving species/direction of trade-lumber (KD) and
furniture parts; wood products export report, December, data processing section, Takoradi.
Ghana. 31pp..

Proceedings of the 58th International Convention of
Society of Wood Science and Technology
June 7-12, 2015 - Grand Teton National Park, Jackson, Wyoming, USA
144
TIDD. (2008). exporters performance/moving species/direction of trade-lumber (KD) and
furniture parts; wood products export report, December, data processing section, Takoradi.
Ghana. 41 pp.
Waters M M (1970) Woodwork - A course for first exanimations, R & R Clark, Ltd. London.
Great Britain. 136 pp.
Proceedings of the 58th International Convention of
Society of Wood Science and Technology
June 7-12, 2015 - Grand Teton National Park, Jackson, Wyoming, USA
145
Potential of Seed Oil of Hildegardia Barteri (mast.)
Kosterm for Biodiesel Production
Abiodun Oluwafemi Oluwadare, [email protected]
Adenike Adeniyi, [email protected]
University of Ibadan, Department of Forest Resources Management, , Ibadan
Abstract
This study analysed seed oil of H. barteri as a source of biofuel. Mature fruits of H. barteri
were collected from two mother trees and dehulled, oven and sun-dried and milled.
Mechanical extractor and solvent extraction (N-Hexane) was used to obtain oil and analysed
for presence of C, H, O, S, N, Pb, Cd, Ni, and Co; physicochemical properties, proximate
analysis, calorific value and spectra analysis using FTIR. Oil yields ranged from 23.15-
30.53% for mechanical and solvent methods. Moisture, crude protein and ash contents were
1.03-2.0, 1.02-1.79 and 0.05-0.12% respectively. Specific gravity, cloud point, conradson
carbon, acid value and iodine values ranged from 0.83-0.85, 7.4-8.30C, 0.16-0.27%, 31.85-
33.95 mgKOH and 57.3-61.8 respectively while C, O, H, N and S contents were generally
higher in oil obtained by mechanical extraction. The Pb level was least (0.007%) in solvent
extracted oil and highest (0.023%) in sun-dried mechanically extracted oil. Iodine values of
solvent and mechanically extracted samples were 61.85 and 58.6 respectively. Calorific value
of sun-dried solvent extracted oil was slightly higher (36,140kj/kg) than the oven-dried
(35,690kj/kg).Identified functional groups were alcohol, esters, alkynes and alkanes. Results
obtained showed promising indication that the seed oil of Hildegardia barteri could be used
for production of biodiesel.
Proceedings of the 58th International Convention of
Society of Wood Science and Technology
June 7-12, 2015 - Grand Teton National Park, Jackson, Wyoming, USA
146
Assessment of Factors Affecting the Quality of Sliced
Veneer from Four Timber Species
Kojo Afrifah A.1* – Kwasi F. Mensah2
1Lecturer, Department of Wood Science & Technology
Faculty of Renewable Natural Resource
Kwame Nkrumah University of Science and Technology, Kumasi, Ghana.
*Corresponding author
[email protected] 2Associate Professor, Department of Wood Science & Technology
Faculty of Renewable Natural Resource
Kwame Nkrumah University of Science and Technology, Kumasi, Ghana.
Abstract
The size and quality of timber for processing have reduced in recent times due to declining
forest resource base. The most important price determinant of processed timber products
however is the quality which is influenced by the raw material and other factors. This study
therefore focused on assessing the factors that affect the quality of sliced veneer from
Pterygota macrocarpa, Aningeria species, Khaya species and Antiaris toxicaria in an
industrial setting in order to mitigate them. The study observed 17 defects as the commonest
factors affecting the quality of sliced veneer from these species. These quality reducing
factors were categorized as natural, material handling, and processing defects. Observations
revealed that handling and processing defects could be reduced with the right production
techniques. By contrast the effects of natural defects could not be eliminated but could be
minimized with quality raw material with low inherent defects.
Keywords: Species, Defects, Sliced Veneer, Timber, Log, Flitch
Introduction
The production of veneer in Ghana is on the ascendancy due to the Government promoting
the establishment of more timber industries. In 1990 – 1995 for instance there was an
increase of about 29000 m3 of veneer exported from the country (MFL 1996). Additionally,
the increase in demand for veneer products such as plywood, laminated veneer lumber etc.
locally mean higher requirements for both sliced and rotary veneer.
Proceedings of the 58th International Convention of
Society of Wood Science and Technology
June 7-12, 2015 - Grand Teton National Park, Jackson, Wyoming, USA
147
For the forest resource of Ghana to support the increases in demand for wood for various uses
on sustainable basis, the supplies should be utilized efficiently to minimize waste and
increase or improve recovery. Increase in recovery will ensure higher revenue from a unit
volume of raw material (Afrifah and Mensah 2014). However, the most important price
determinant is the quality or grade of the veneer. Thus a unit volume of sliced veneer of the
same species but different in quality will attract different prices.
From the forgone reasoning, it is therefore necessary to conduct studies into the
manufacturing processes of sliced veneer, a highly exported veneer from the country to find
out how best the quality could be improved.
Four wood species were selected for this research based on their prevalent use for the
production of sliced veneer exported in large quantities from Ghana (FPIB 1995). The species
were Pterygota macrocarpa, Aningeria species, Khaya species and Antiaris toxicaria. They
were assessed for factors influencing the quality of the sliced veneers produced from them.
Materials and Methods
The study was conducted at Logs and Lumber Limited (LLL), Kumasi – Ghana, a company
that produces large quantities of veneer for export and plywood manufacture. The quality
assessment was based on defects considered in the grading rules for grading sliced veneer in
Ghana by the Timber Industry Development Division (TIDD) of the Forestry Commission.
The defects were categorized as defects and characteristics inherent in wood, discolouration,
other growth features, imperfections caused by wood destroying fungi, manufacturing
defects, grain defects and defects due to borers.
Ten flitches selected at random for each species were studied. For each flitch ten sheets were
randomly picked for observation. A total of hundred sheets were studied for each species.
The defects were further classified as countable and uncountable. Countable defects were
graded according to the number and size of the defects as follows:
1. Defects with diameters between 1 and 20 mm.
1 to 5 of the defect - 1
6 to 10 of the defect - 2
11 and up of the defect -3
2. Defects with diameters greater than 21 mm.
1 to 3 of the defect - 1
4 to 6 of the defect - 2
7 and up of the defect - 3
The countable defects included knot, dead knot, mineral deposits, knife marks, shelling,
pressure-bar marks, borer hole and inbark.
Uncountable defects were also scored according to the extent to which the defect covers the
sheet (i.e. intensity) as follows:
1 to 20% of the sheet covered with the defect as 1
Proceedings of the 58th International Convention of
Society of Wood Science and Technology
June 7-12, 2015 - Grand Teton National Park, Jackson, Wyoming, USA
148
21 to 40% of the sheet covered with the defect as 2
And more than 41% of the sheet covered with the defect was scored 3.
Some of these defects are angle grain, irregular grain, resin streak, sap stain, chemical stain,
cracks/checks, coarse fiber, splits, buckling, blue-black stain, rot and blue stain.
The veneer sheets were inspected after drying at the drier to ensure that all the defects were
present in order to determine their effect on the yield of the studied species. Normally, at the
final processing stage (i.e. cutting to size and bundling) attempts were made to remove
defects from defective sheets consequently the yield of veneer was reduced.
Results and Discussions
Grain defects
Grain defects found in the four species studied are presented in Table 1. They included angle
grain and irregular grain. Angle grain occurred in all the species. This was because all the
flitches studied were quarter sliced, therefore the expected orientation of the fibers in the
veneer should have been in the general direction of the longer edge. Where possible portions
of the sheets were clipped off to reduce the angle grain defect. Irregular grain defect only
occurred in Pterygota macrocarpa, and Khaya species. This defect occurred mostly in the
regions of the sheets where large knots and bumps caused deviation of the grains. Grain
defects occurring at the end and edges of the sheets were clipped off reducing yield.
In grading, all types of grain patterns are accepted, but undesirable pattern downgrades the
veneer (FPIB 1991).
Table 1 Classification of the grain defects in the veneer sheets of Aningeria species,
Antiaris toxicaria, Pterygota macrocarpa and Khaya species
Species Defect % of the sheets with
defect
% of the sheets with
grade
1 2 3
Aningeria Angle grain 56 (4.27) 94.64 5.36
Antiaris Angle grain 20 (2.53) 100
African Pterygota Angle grain
Irregular grain
51 (2.38)
19 (1.77)
100
100
African Mahogany Angle grain
Irregular grain
88 (2.96)
40. (1.78)
100
100
The values in parentheses are the standard deviations.
Defects and characteristics inherent in the wood
Table 2 shows the proportion of dead knots and knots found in the studied veneer sheets for
the four species. Anigeria species and Pterygota macrocarpa recorded the highest whilst
Khaya species recorded the least (Table 2). The knots in Khaya species were observed in only
one flitch as was the dead knots observed in Aningeria spp.
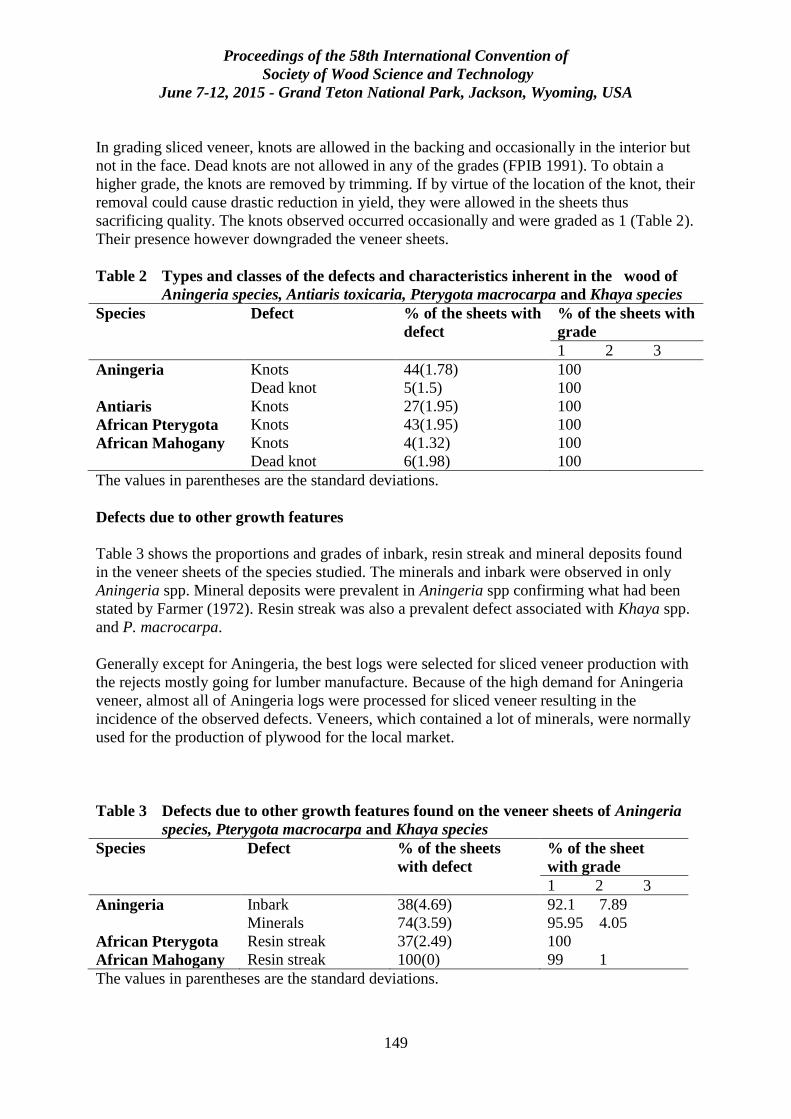
Proceedings of the 58th International Convention of
Society of Wood Science and Technology
June 7-12, 2015 - Grand Teton National Park, Jackson, Wyoming, USA
149
In grading sliced veneer, knots are allowed in the backing and occasionally in the interior but
not in the face. Dead knots are not allowed in any of the grades (FPIB 1991). To obtain a
higher grade, the knots are removed by trimming. If by virtue of the location of the knot, their
removal could cause drastic reduction in yield, they were allowed in the sheets thus
sacrificing quality. The knots observed occurred occasionally and were graded as 1 (Table 2).
Their presence however downgraded the veneer sheets.
Table 2 Types and classes of the defects and characteristics inherent in the wood of
Aningeria species, Antiaris toxicaria, Pterygota macrocarpa and Khaya species
Species Defect % of the sheets with
defect
% of the sheets with
grade
1 2 3
Aningeria Knots
Dead knot
44(1.78)
5(1.5)
100
100
Antiaris Knots 27(1.95) 100
African Pterygota Knots 43(1.95) 100
African Mahogany Knots
Dead knot
4(1.32)
6(1.98)
100
100
The values in parentheses are the standard deviations.
Defects due to other growth features
Table 3 shows the proportions and grades of inbark, resin streak and mineral deposits found
in the veneer sheets of the species studied. The minerals and inbark were observed in only
Aningeria spp. Mineral deposits were prevalent in Aningeria spp confirming what had been
stated by Farmer (1972). Resin streak was also a prevalent defect associated with Khaya spp.
and P. macrocarpa.
Generally except for Aningeria, the best logs were selected for sliced veneer production with
the rejects mostly going for lumber manufacture. Because of the high demand for Aningeria
veneer, almost all of Aningeria logs were processed for sliced veneer resulting in the
incidence of the observed defects. Veneers, which contained a lot of minerals, were normally
used for the production of plywood for the local market.
Table 3 Defects due to other growth features found on the veneer sheets of Aningeria
species, Pterygota macrocarpa and Khaya species
Species Defect % of the sheets
with defect
% of the sheet
with grade
1 2 3
Aningeria Inbark
Minerals
38(4.69)
74(3.59)
92.1 7.89
95.95 4.05
African Pterygota Resin streak 37(2.49) 100
African Mahogany Resin streak 100(0) 99 1
The values in parentheses are the standard deviations.
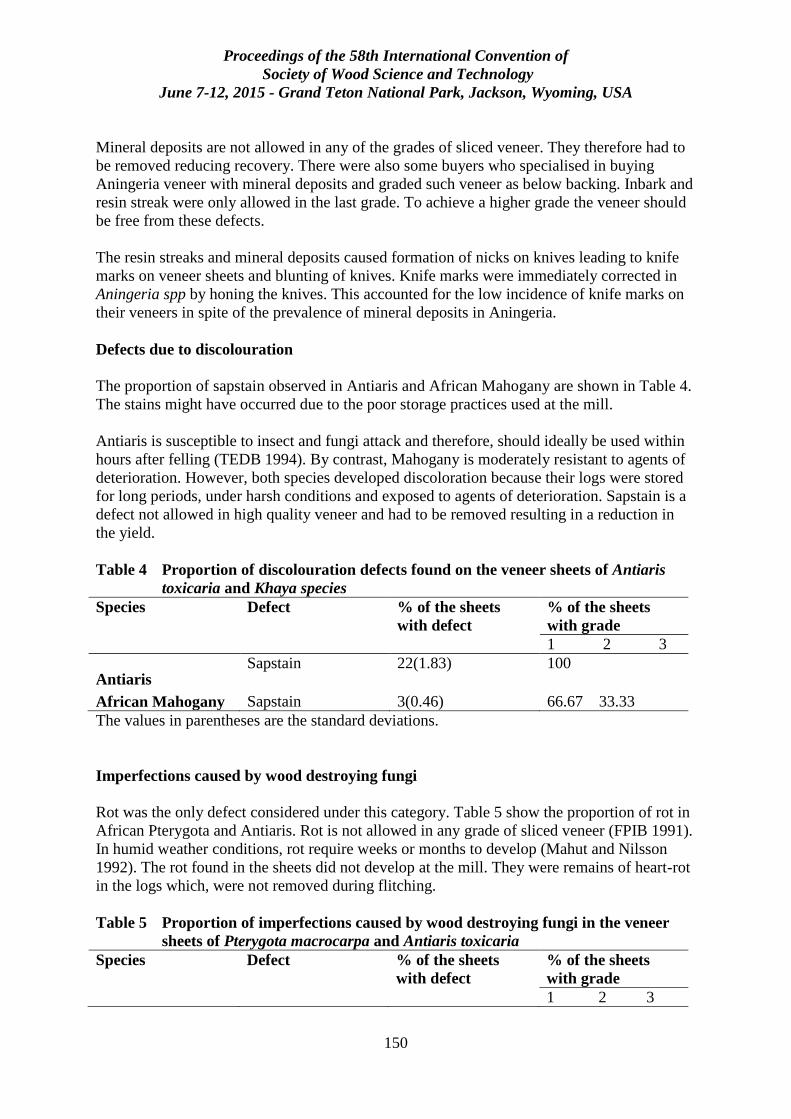
Proceedings of the 58th International Convention of
Society of Wood Science and Technology
June 7-12, 2015 - Grand Teton National Park, Jackson, Wyoming, USA
150
Mineral deposits are not allowed in any of the grades of sliced veneer. They therefore had to
be removed reducing recovery. There were also some buyers who specialised in buying
Aningeria veneer with mineral deposits and graded such veneer as below backing. Inbark and
resin streak were only allowed in the last grade. To achieve a higher grade the veneer should
be free from these defects.
The resin streaks and mineral deposits caused formation of nicks on knives leading to knife
marks on veneer sheets and blunting of knives. Knife marks were immediately corrected in
Aningeria spp by honing the knives. This accounted for the low incidence of knife marks on
their veneers in spite of the prevalence of mineral deposits in Aningeria.
Defects due to discolouration
The proportion of sapstain observed in Antiaris and African Mahogany are shown in Table 4.
The stains might have occurred due to the poor storage practices used at the mill.
Antiaris is susceptible to insect and fungi attack and therefore, should ideally be used within
hours after felling (TEDB 1994). By contrast, Mahogany is moderately resistant to agents of
deterioration. However, both species developed discoloration because their logs were stored
for long periods, under harsh conditions and exposed to agents of deterioration. Sapstain is a
defect not allowed in high quality veneer and had to be removed resulting in a reduction in
the yield.
Table 4 Proportion of discolouration defects found on the veneer sheets of Antiaris
toxicaria and Khaya species
Species Defect % of the sheets
with defect
% of the sheets
with grade
1 2 3
1BAntiaris Sapstain 22(1.83) 100
African Mahogany Sapstain 3(0.46) 66.67 33.33
The values in parentheses are the standard deviations.
Imperfections caused by wood destroying fungi
Rot was the only defect considered under this category. Table 5 show the proportion of rot in
African Pterygota and Antiaris. Rot is not allowed in any grade of sliced veneer (FPIB 1991).
In humid weather conditions, rot require weeks or months to develop (Mahut and Nilsson
1992). The rot found in the sheets did not develop at the mill. They were remains of heart-rot
in the logs which, were not removed during flitching.
Table 5 Proportion of imperfections caused by wood destroying fungi in the veneer
sheets of Pterygota macrocarpa and Antiaris toxicaria
Species Defect % of the sheets
with defect
% of the sheets
with grade
1 2 3
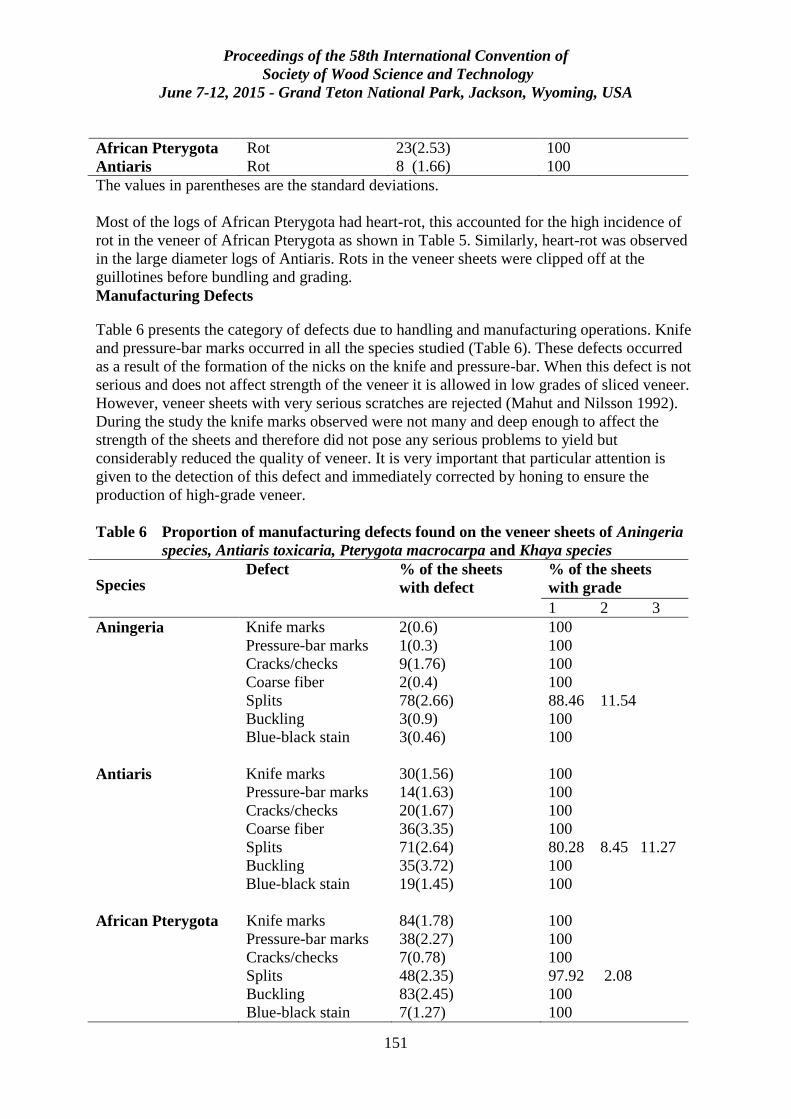
Proceedings of the 58th International Convention of
Society of Wood Science and Technology
June 7-12, 2015 - Grand Teton National Park, Jackson, Wyoming, USA
151
African Pterygota Rot 23(2.53) 100
Antiaris Rot 8 (1.66) 100
The values in parentheses are the standard deviations.
Most of the logs of African Pterygota had heart-rot, this accounted for the high incidence of
rot in the veneer of African Pterygota as shown in Table 5. Similarly, heart-rot was observed
in the large diameter logs of Antiaris. Rots in the veneer sheets were clipped off at the
guillotines before bundling and grading.
Manufacturing Defects
Table 6 presents the category of defects due to handling and manufacturing operations. Knife
and pressure-bar marks occurred in all the species studied (Table 6). These defects occurred
as a result of the formation of the nicks on the knife and pressure-bar. When this defect is not
serious and does not affect strength of the veneer it is allowed in low grades of sliced veneer.
However, veneer sheets with very serious scratches are rejected (Mahut and Nilsson 1992).
During the study the knife marks observed were not many and deep enough to affect the
strength of the sheets and therefore did not pose any serious problems to yield but
considerably reduced the quality of veneer. It is very important that particular attention is
given to the detection of this defect and immediately corrected by honing to ensure the
production of high-grade veneer.
Table 6 Proportion of manufacturing defects found on the veneer sheets of Aningeria
species, Antiaris toxicaria, Pterygota macrocarpa and Khaya species
2BSpecies Defect % of the sheets
with defect
% of the sheets
with grade
1 2 3
Aningeria Knife marks
Pressure-bar marks
Cracks/checks
Coarse fiber
Splits
Buckling
Blue-black stain
2(0.6)
1(0.3)
9(1.76)
2(0.4)
78(2.66)
3(0.9)
3(0.46)
100
100
100
100
88.46 11.54
100
100
Antiaris Knife marks
Pressure-bar marks
Cracks/checks
Coarse fiber
Splits
Buckling
Blue-black stain
30(1.56)
14(1.63)
20(1.67)
36(3.35)
71(2.64)
35(3.72)
19(1.45)
100
100
100
100
80.28 8.45 11.27
100
100
African Pterygota Knife marks
Pressure-bar marks
Cracks/checks
Splits
Buckling
Blue-black stain
84(1.78)
38(2.27)
7(0.78)
48(2.35)
83(2.45)
7(1.27)
100
100
100
97.92 2.08
100
100
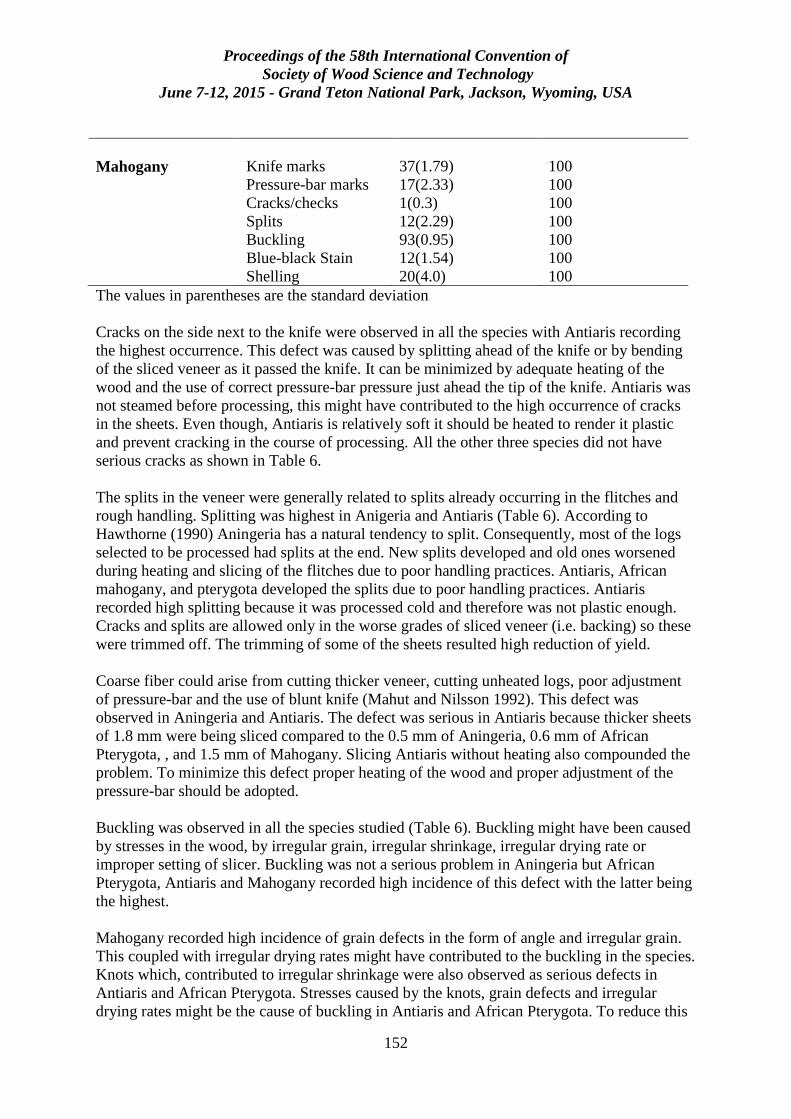
Proceedings of the 58th International Convention of
Society of Wood Science and Technology
June 7-12, 2015 - Grand Teton National Park, Jackson, Wyoming, USA
152
Mahogany Knife marks
Pressure-bar marks
Cracks/checks
Splits
Buckling
Blue-black Stain
Shelling
37(1.79)
17(2.33)
1(0.3)
12(2.29)
93(0.95)
12(1.54)
20(4.0)
100
100
100
100
100
100
100
The values in parentheses are the standard deviation
Cracks on the side next to the knife were observed in all the species with Antiaris recording
the highest occurrence. This defect was caused by splitting ahead of the knife or by bending
of the sliced veneer as it passed the knife. It can be minimized by adequate heating of the
wood and the use of correct pressure-bar pressure just ahead the tip of the knife. Antiaris was
not steamed before processing, this might have contributed to the high occurrence of cracks
in the sheets. Even though, Antiaris is relatively soft it should be heated to render it plastic
and prevent cracking in the course of processing. All the other three species did not have
serious cracks as shown in Table 6.
The splits in the veneer were generally related to splits already occurring in the flitches and
rough handling. Splitting was highest in Anigeria and Antiaris (Table 6). According to
Hawthorne (1990) Aningeria has a natural tendency to split. Consequently, most of the logs
selected to be processed had splits at the end. New splits developed and old ones worsened
during heating and slicing of the flitches due to poor handling practices. Antiaris, African
mahogany, and pterygota developed the splits due to poor handling practices. Antiaris
recorded high splitting because it was processed cold and therefore was not plastic enough.
Cracks and splits are allowed only in the worse grades of sliced veneer (i.e. backing) so these
were trimmed off. The trimming of some of the sheets resulted high reduction of yield.
Coarse fiber could arise from cutting thicker veneer, cutting unheated logs, poor adjustment
of pressure-bar and the use of blunt knife (Mahut and Nilsson 1992). This defect was
observed in Aningeria and Antiaris. The defect was serious in Antiaris because thicker sheets
of 1.8 mm were being sliced compared to the 0.5 mm of Aningeria, 0.6 mm of African
Pterygota, , and 1.5 mm of Mahogany. Slicing Antiaris without heating also compounded the
problem. To minimize this defect proper heating of the wood and proper adjustment of the
pressure-bar should be adopted.
Buckling was observed in all the species studied (Table 6). Buckling might have been caused
by stresses in the wood, by irregular grain, irregular shrinkage, irregular drying rate or
improper setting of slicer. Buckling was not a serious problem in Aningeria but African
Pterygota, Antiaris and Mahogany recorded high incidence of this defect with the latter being
the highest.
Mahogany recorded high incidence of grain defects in the form of angle and irregular grain.
This coupled with irregular drying rates might have contributed to the buckling in the species.
Knots which, contributed to irregular shrinkage were also observed as serious defects in
Antiaris and African Pterygota. Stresses caused by the knots, grain defects and irregular
drying rates might be the cause of buckling in Antiaris and African Pterygota. To reduce this
Proceedings of the 58th International Convention of
Society of Wood Science and Technology
June 7-12, 2015 - Grand Teton National Park, Jackson, Wyoming, USA
153
defect proper drying schedules should be adopted to dry the veneer to uniform moisture
contents and maximum restraint should be used to hold the veneer flat when drying.
Blue-black stain was caused by the condensation of water on the knife and pressure-bar,
which on contact with the wood containing tannins reacted to form a blue-black stain that
stained the veneers. This defect imparts an unpleasant colour to the veneer and therefore
should be controlled by cleaning and lacquering of the knife and pressure-bar.
Shelling was observed in Mahogany. The defect may be caused by overheating of the wood,
too much pressure-bar pressure, too sharp a pressure-bar or dull knife (Mahut and Nilsson
1992). Observations revealed that steaming of flitches was not based on any proper schedule.
For this reason the cause of this defect could not be easily ascertained. Shelling is not allowed
in the high grades of sliced veneer. The portions with the defect were trimmed off reducing
the yield.
Conclusions
This study assessed the factors affecting the quality of sliced veneer of Aningeria spp,
Antiaris toxicaria, Pterygota macrocarpa, and Khaya spp in a factory setting.
The quality of produced sliced veneer were generally low due to the presence of preventable
or manufacturing defects such as sapstain, knife marks, buckling, cracks, checks, splits, etc.
The use of poor quality logs also resulted in veneer sheets with unpreventable natural defects
such as knots, irregular grain, heart rot, etc. Implementation of proper processing techniques
such as appropriate storage, heating, selection of good quality logs, proper handling practices,
and etc. will mitigate the prevalence of defects and improve quality of sliced veneer and
yield.
References
Afrifah KA, Mensah KF (2014) Assessment of the Effect of Log Diameter and Inherent
Characteristics of Four Timber Species on the Yield of Sliced Veneer. Global Advanced
Research Journal of Physical and Applied Sciences Vol. 3(2) pp. 017-024.
Farmer RH (1972) Handbook of hardwoods. Second ed. Department of Environmental
Building Research Establishment, London. Pp22-91.
FPIB (1991) Decorative Veneer Grading Rules for Ghana. Forest Products Inspection
Bureau, Takoradi, Ghana. 15pp.
FPIB (1995) Welcome to forest Products Inspection Bureau (FPIB). Fourth ed. Forest
Products Inspection Bureau, Takoradi. 57pp.

Proceedings of the 58th International Convention of
Society of Wood Science and Technology
June 7-12, 2015 - Grand Teton National Park, Jackson, Wyoming, USA
154
Hawthorne WD (1990) Field guide to the forest trees of Ghana. Chatham: Natural resources
institute for the overseas development administration, London, Ghana forestry series 1.
278pp.
Kollmann FFP, Kuenzi EW, Stamn UA (1975) Principles of wood Science and Technology.
Springer-Velag, New York. 703pp.
Mahut J, Nilsson KG (1992) Decorative Veneer and Plywood Production. Technical
University, Zvolen. 129pp.
MLF (1996) Forestry development master plan, 1996 – 2020. Ministry of Lands and Forestry,
Accra, Ghana. 24pp.
TEDB (1994) The tropical timbers of Ghana. Timber Export Development Board, Takoradi,
Ghana. 87pp.
Proceedings of the 58th International Convention of
Society of Wood Science and Technology
June 7-12, 2015 - Grand Teton National Park, Jackson, Wyoming, USA
155
Moisture Stability of Post-manufacture Thermally
Modified Welded Birch (Betula pendula L.) Wood
Jussi Ruponen, [email protected]
Aalto University, Tekniikantie 3, Vuorimiehentie 1, Espoo FI-00076
Abstract
Welding of wood provides strong wood-to-wood bonding without adhesives. However, the
bonds suffer from delamination when exposed to moist conditions. Therefore, this work
studies if the delamination tendency of linear-friction welded wood bonds in birch (Betula
pendula L.) could be reduced by post-manufacture thermal modification. According to the
hypotheses, firstly, the bond line in birch wood has unsatisfactory water resistance and poor
bond strength in moist conditions. Secondly, water resistance, or wet strength, could be
maintained above certain level through thermal modification, yet below the level of non-
modified welded wood, when immersed in water. The work included linear-friction welding
of birch, thermal modification (at 200°C for 3 h and 5 h) under superheated steam in
atmospheric pressure, determination of anti-swelling efficiency (ASE), internal bond (IB)
strength testing, and water immersion to observe delamination behavior. Thermal
modification improved the dimensional stability, resulting ASE values ranging from 25.9% to
38.0%. The IB strength in dry condition decreased as the thermal modification, yet yielding a
value closer to wet. During water immersion, the non-modified specimens suffered from
delamination more compared to thermally modified. Results indicate thermal modification
could be applied to stabilize the welded bond lines, but the process needs optimization, for
instance, to insure scalability and to minimize the loss in strength properties.
Proceedings of the 58th International Convention of
Society of Wood Science and Technology
June 7-12, 2015 - Grand Teton National Park, Jackson, Wyoming, USA
156
Early Stage Researcher Full Oral Slot (8 minutes) Session Moderators: Dick Sandberg, Luleå University of Technology,
Sweden and Bonnie Yang, Mississippi State University, USA
Dimensional Optimization of Beetle Kill Pine Interlocking
Cross Laminated Timber (ICLT).
Massih Nilforoushan Hamedani, [email protected]
Ryan Smith, [email protected]
Ben Hagenhofer-Daniell, [email protected]
University of Utah, 375 S. 1530 E. RM 236 , Salt Lake City, UT 84112
Abstract
Moisture content is a critical factor for dimensional stability in engineered wood products.
This paper focuses on one such product: Interlocking Cross Laminated Timber fabricated
with beetle killed pine from the intermountain west. This research engages in supply chain
mapping, and the co-relational assessment of drying techniques that can lower moisture
content to a consistent level for dimensional stability and performance of the product. The
research will ultimately suggest a drying regime in-line with existing supply chains that is
optimized for economy, schedule, and repeatability. While the focus is on a regionally
specific timber resource and engineered timber product, the lessons learned should be
applicable to engineered solid timber products generally. This research will also establish a
framework for evaluating the management of moisture content in timber resources beyond
beetle killed pine. In order to assess the drying phases in current supply chains, different
intermountain supply chain strategies have been studied based on information from local
sawmills and logging companies. Different approaches to dry solid timber products based on
determined supply chains have been evaluated to develop efficient supply chain options to
increase the opportunities for further commercialization of ICLT and other solid timber
products in the USA.
Proceedings of the 58th International Convention of
Society of Wood Science and Technology
June 7-12, 2015 - Grand Teton National Park, Jackson, Wyoming, USA
157
Shearing Behavior of SIP Wall Shelled with Bamboo
Scrimber Panel
Xuehua Wang1,3
Assistant professor, Email: [email protected]
Xiaohuan Wang2
Associate professor, Email: [email protected]
Zhihui Wu1*-
Professor, Email: [email protected]
Benhua Fei3*
Professor, Email: [email protected]
1 Nanjing Forestry University 2 Beijing Forestry Machinery Research Institute of the State Forestry
Administration 3 International Centre for Bamboo and Rattan
* Corresponding Author
Abstract
Shearing behavior of Structural Insulated Panel (SIP) wall, which was consisted of styrofoam
core board, shell panel of bamboo scrimber and frame of Spruce-Pine-Fir (SPF) dimension
lumber, was tested under monotonic and cyclic loads in this study. The results showed that
SIP wall failed at similar positions under two loading modes, while more seriously
destruction occurred under cyclic than monotonic load. There was a linear relationship
between load and displacement at the initial loading stage, which indicated wall worked
under elastic state; at later loading stage, bearing capacity and rigidity were reduced as result
of wall slip. Shearing strength was 20.0 kN·m-1, 15.8 kN·m-1 respectively under monotonic
and cyclic loads, which met the requirement of GB 50005 - 2003. Energy consumption of the
SIP wall covered with bamboo scrimber was 11556.6 J·m-1.
Key words: bamboo scrimber panel, SIP wall, monotonic and cyclic loading, shearing
behavior
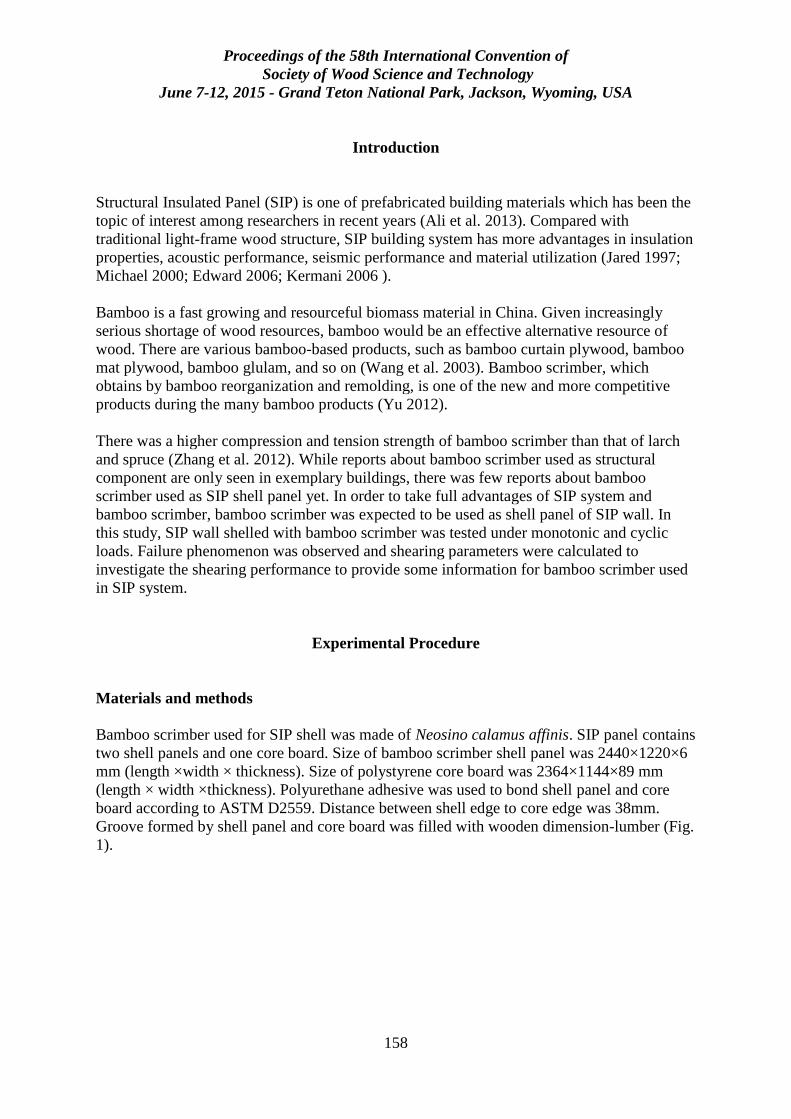
Proceedings of the 58th International Convention of
Society of Wood Science and Technology
June 7-12, 2015 - Grand Teton National Park, Jackson, Wyoming, USA
158
Introduction
Structural Insulated Panel (SIP) is one of prefabricated building materials which has been the
topic of interest among researchers in recent years (Ali et al. 2013). Compared with
traditional light-frame wood structure, SIP building system has more advantages in insulation
properties, acoustic performance, seismic performance and material utilization (Jared 1997;
Michael 2000; Edward 2006; Kermani 2006 ).
Bamboo is a fast growing and resourceful biomass material in China. Given increasingly
serious shortage of wood resources, bamboo would be an effective alternative resource of
wood. There are various bamboo-based products, such as bamboo curtain plywood, bamboo
mat plywood, bamboo glulam, and so on (Wang et al. 2003). Bamboo scrimber, which
obtains by bamboo reorganization and remolding, is one of the new and more competitive
products during the many bamboo products (Yu 2012).
There was a higher compression and tension strength of bamboo scrimber than that of larch
and spruce (Zhang et al. 2012). While reports about bamboo scrimber used as structural
component are only seen in exemplary buildings, there was few reports about bamboo
scrimber used as SIP shell panel yet. In order to take full advantages of SIP system and
bamboo scrimber, bamboo scrimber was expected to be used as shell panel of SIP wall. In
this study, SIP wall shelled with bamboo scrimber was tested under monotonic and cyclic
loads. Failure phenomenon was observed and shearing parameters were calculated to
investigate the shearing performance to provide some information for bamboo scrimber used
in SIP system.
Experimental Procedure
Materials and methods
Bamboo scrimber used for SIP shell was made of Neosino calamus affinis. SIP panel contains
two shell panels and one core board. Size of bamboo scrimber shell panel was 2440×1220×6
mm (length ×width × thickness). Size of polystyrene core board was 2364×1144×89 mm
(length × width ×thickness). Polyurethane adhesive was used to bond shell panel and core
board according to ASTM D2559. Distance between shell edge to core edge was 38mm.
Groove formed by shell panel and core board was filled with wooden dimension-lumber (Fig.
1).
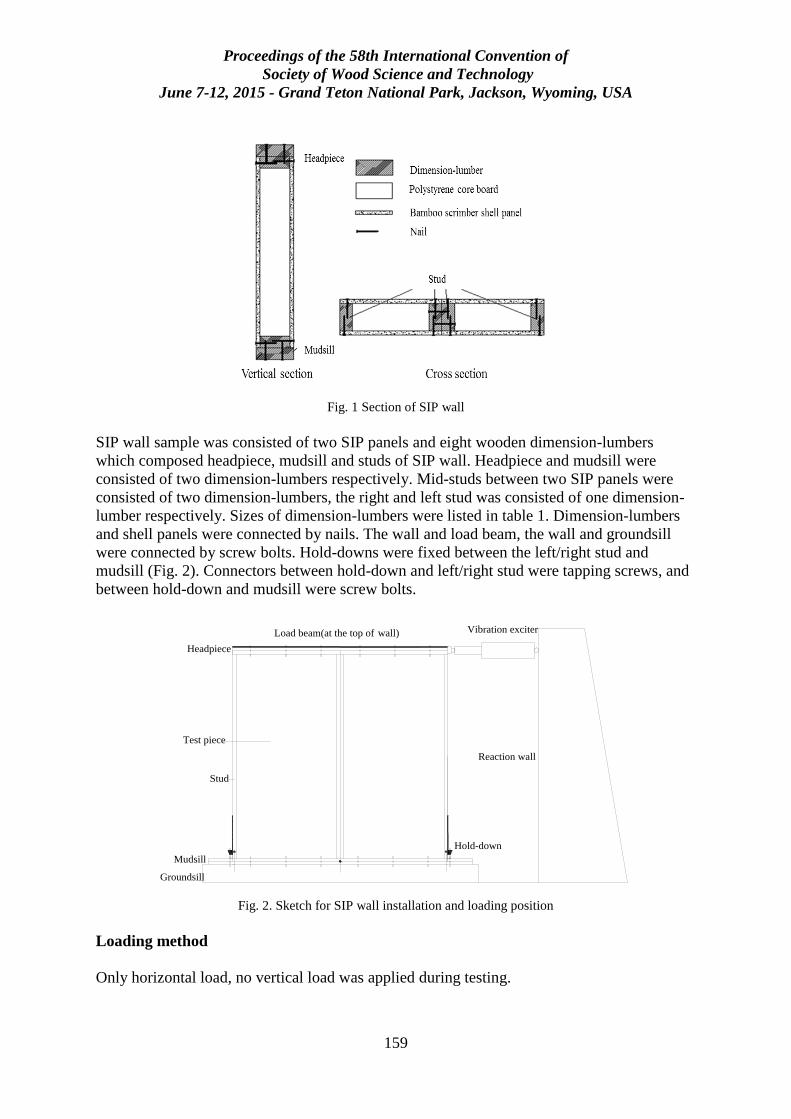
Proceedings of the 58th International Convention of
Society of Wood Science and Technology
June 7-12, 2015 - Grand Teton National Park, Jackson, Wyoming, USA
159
Fig. 1 Section of SIP wall
SIP wall sample was consisted of two SIP panels and eight wooden dimension-lumbers
which composed headpiece, mudsill and studs of SIP wall. Headpiece and mudsill were
consisted of two dimension-lumbers respectively. Mid-studs between two SIP panels were
consisted of two dimension-lumbers, the right and left stud was consisted of one dimension-
lumber respectively. Sizes of dimension-lumbers were listed in table 1. Dimension-lumbers
and shell panels were connected by nails. The wall and load beam, the wall and groundsill
were connected by screw bolts. Hold-downs were fixed between the left/right stud and
mudsill (Fig. 2). Connectors between hold-down and left/right stud were tapping screws, and
between hold-down and mudsill were screw bolts.
Vibration exciter
Reaction wall
Load beam(at the top of wall)
Headpiece
Test piece
Stud
Groundsill
Mudsill
Hold-down
Fig. 2. Sketch for SIP wall installation and loading position
Loading method
Only horizontal load, no vertical load was applied during testing.
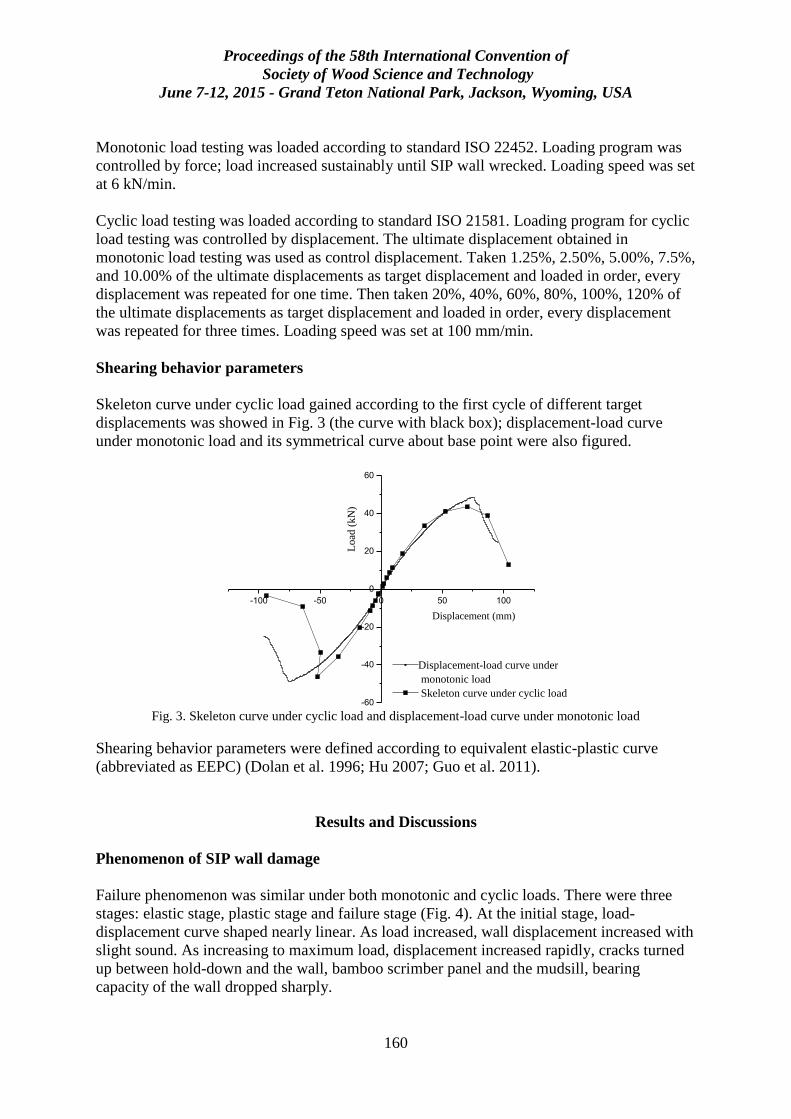
Proceedings of the 58th International Convention of
Society of Wood Science and Technology
June 7-12, 2015 - Grand Teton National Park, Jackson, Wyoming, USA
160
Monotonic load testing was loaded according to standard ISO 22452. Loading program was
controlled by force; load increased sustainably until SIP wall wrecked. Loading speed was set
at 6 kN/min.
Cyclic load testing was loaded according to standard ISO 21581. Loading program for cyclic
load testing was controlled by displacement. The ultimate displacement obtained in
monotonic load testing was used as control displacement. Taken 1.25%, 2.50%, 5.00%, 7.5%,
and 10.00% of the ultimate displacements as target displacement and loaded in order, every
displacement was repeated for one time. Then taken 20%, 40%, 60%, 80%, 100%, 120% of
the ultimate displacements as target displacement and loaded in order, every displacement
was repeated for three times. Loading speed was set at 100 mm/min.
Shearing behavior parameters
Skeleton curve under cyclic load gained according to the first cycle of different target
displacements was showed in Fig. 3 (the curve with black box); displacement-load curve
under monotonic load and its symmetrical curve about base point were also figured.
-100 -50 0 50 100
-60
-40
-20
0
20
40
60
Load
(kN
)
Displacement (mm)
Displacement-load curve under
monotonic load
Skeleton curve under cyclic load
Fig. 3. Skeleton curve under cyclic load and displacement-load curve under monotonic load
Shearing behavior parameters were defined according to equivalent elastic-plastic curve
(abbreviated as EEPC) (Dolan et al. 1996; Hu 2007; Guo et al. 2011).
Results and Discussions
Phenomenon of SIP wall damage
Failure phenomenon was similar under both monotonic and cyclic loads. There were three
stages: elastic stage, plastic stage and failure stage (Fig. 4). At the initial stage, load-
displacement curve shaped nearly linear. As load increased, wall displacement increased with
slight sound. As increasing to maximum load, displacement increased rapidly, cracks turned
up between hold-down and the wall, bamboo scrimber panel and the mudsill, bearing
capacity of the wall dropped sharply.
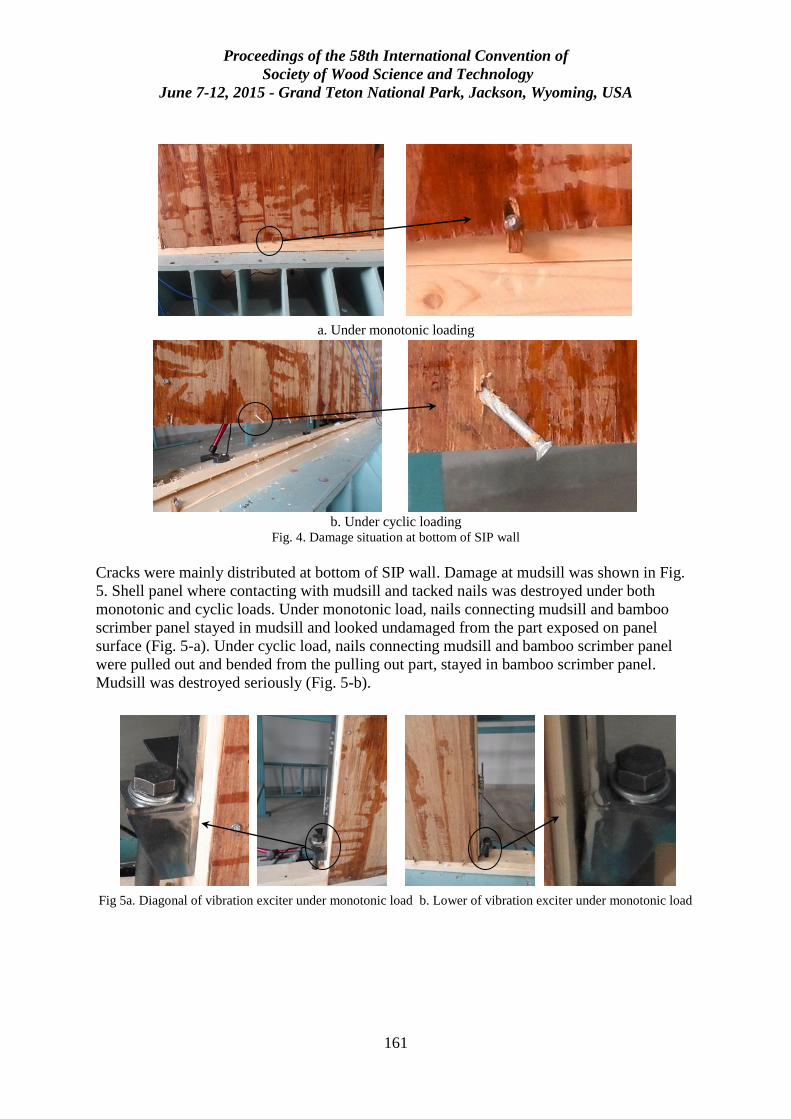
Proceedings of the 58th International Convention of
Society of Wood Science and Technology
June 7-12, 2015 - Grand Teton National Park, Jackson, Wyoming, USA
161
a. Under monotonic loading
b. Under cyclic loading
Fig. 4. Damage situation at bottom of SIP wall
Cracks were mainly distributed at bottom of SIP wall. Damage at mudsill was shown in Fig.
5. Shell panel where contacting with mudsill and tacked nails was destroyed under both
monotonic and cyclic loads. Under monotonic load, nails connecting mudsill and bamboo
scrimber panel stayed in mudsill and looked undamaged from the part exposed on panel
surface (Fig. 5-a). Under cyclic load, nails connecting mudsill and bamboo scrimber panel
were pulled out and bended from the pulling out part, stayed in bamboo scrimber panel.
Mudsill was destroyed seriously (Fig. 5-b).
Fig 5a. Diagonal of vibration exciter under monotonic load b. Lower of vibration exciter under monotonic load
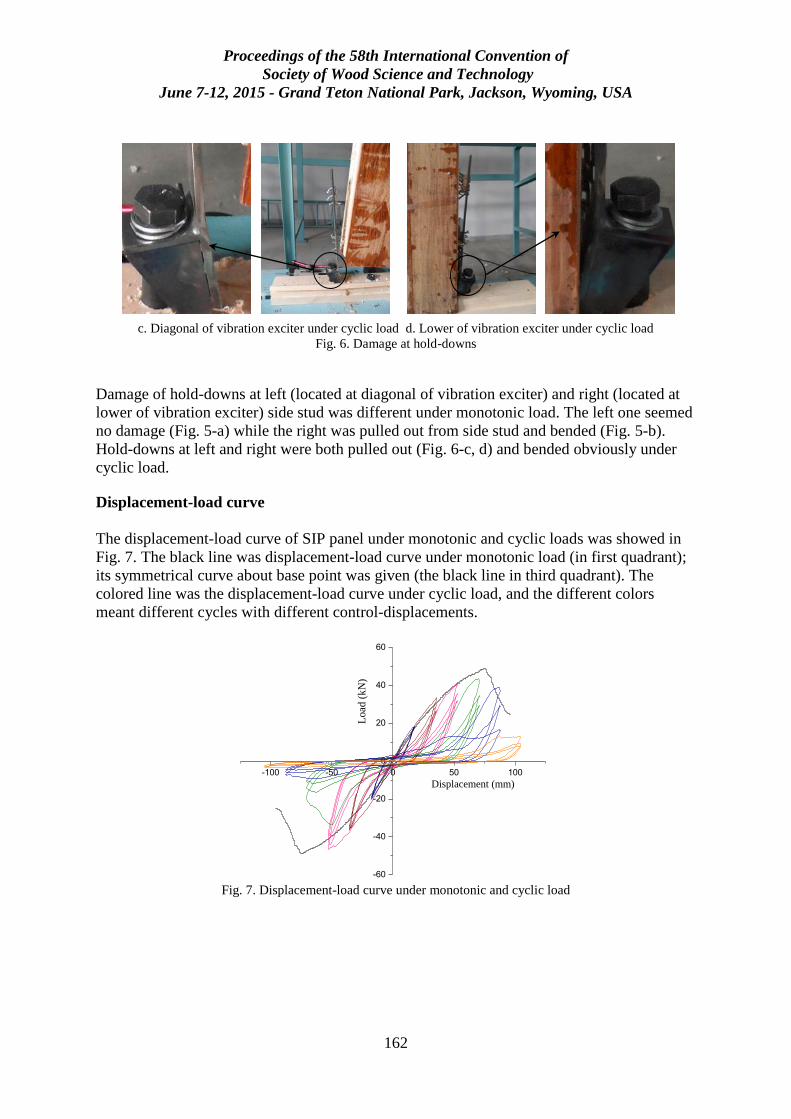
Proceedings of the 58th International Convention of
Society of Wood Science and Technology
June 7-12, 2015 - Grand Teton National Park, Jackson, Wyoming, USA
162
c. Diagonal of vibration exciter under cyclic load d. Lower of vibration exciter under cyclic load
Fig. 6. Damage at hold-downs
Damage of hold-downs at left (located at diagonal of vibration exciter) and right (located at
lower of vibration exciter) side stud was different under monotonic load. The left one seemed
no damage (Fig. 5-a) while the right was pulled out from side stud and bended (Fig. 5-b).
Hold-downs at left and right were both pulled out (Fig. 6-c, d) and bended obviously under
cyclic load.
Displacement-load curve
The displacement-load curve of SIP panel under monotonic and cyclic loads was showed in
Fig. 7. The black line was displacement-load curve under monotonic load (in first quadrant);
its symmetrical curve about base point was given (the black line in third quadrant). The
colored line was the displacement-load curve under cyclic load, and the different colors
meant different cycles with different control-displacements.
-100 -50 0 50 100
-60
-40
-20
0
20
40
60
Load
(kN
)
Displacement (mm)
Fig. 7. Displacement-load curve under monotonic and cyclic load
Proceedings of the 58th International Convention of
Society of Wood Science and Technology
June 7-12, 2015 - Grand Teton National Park, Jackson, Wyoming, USA
163
Conclusions
Failures were mainly occured at bottom of wall. Under monotonic load, nails stayed in
mudsill, looked undamaged from the part exposed on panel surface. Shell panel and mudsill
was slightly damaged. Hold-down lower vibration exciter turned bended. Under cyclic load,
nails were forced out and bended at the pulling out part, stayed in bamboo scrimber panel.
Mudsill was destroyed seriously. Hold-downs at left and right were both bending
deformation.
Displacement-load curve was almost linear at initial loading stage both under monotonic and
cyclic loads. Area enclosed by hysteresis loop was small. Rheostriction phenomenon was
obvious form the displacement- load curve. Wall members were damaged as repeated
loading, and further lessened strength, load capacity and stiffness. At grades with different
target displacement, hysteresis loop turned from S-shape to Z-shape as the displacement
increased, wall slip effect appeared.
Ultimate load, shearing strength, ultimate displacement and elastic stiffness of the SIP wall
shelled with 6 mm bamboo scrimber were 48.8 kN, 20.0 kN·m-1, 82.5 mm, 971.1 kN·m-1
under monotonic load, and 44.9 kN, 17.8 kN·m-1, 63.7 mm, 1140.7 kN·m-1 under cyclic load.
Energy dissipation under cyclic load was 11556.6 44.9 kN.
References
ASTM (2004) D 2559-2004. Standard Specification for Adhesives for Structural Laminated Wood
Products for Use under Exterior (Wet Use) Exposure Conditions, West Conshohocken, PA 19428-2959.
ASTM (2006) E564-06, Standard Practice for Static Load Test for Shear Resistance of Framed Walls for
Buildings, West Conshohocken, PA 19428-2959.
Kermani A, Hairstans R (2006) Racking performance of structural insulated panels. Journal of structural
Engineering, 132(11): 1806-1812.
Panjehpour M, Ali AAA, Voo YL (2013) Structural Insulated Panels: Past, Present, and Future. Journal of
Engineering, Project, and Production Management, 3(1): 2-8.
GB (2003) 50005-2003, Code for design of timber structures, Beijing, PA 100000.
Dolan JD, Johnson AC (1996) Cyclic tests of long shear walls with openings. Virginia Polytechnic
Institute and State University, Timber Engineering Report No. TE-1996-002. Blacksburg, Virginia:
VPISU. 39 pp.
Du Min, XIE Bao-yuan, FEI Ben-hua, WANG Xiao-huan, LIU Yan (2013) Shear Performance of Wood-
Frame Shear Walls Made of Domestic Material. Journal of Building Materials 16(3): 487-490 (in
Chinese).
Du Min, Xie Baoyuan, Fei Benhua, Wang Xiaohuan, Liu Yan (2012) Shear performance of wood-frame
shear walls with cross brace. Chinese Journal of Applied Mechanics 29(3): 314-320 (in Chinese).

Proceedings of the 58th International Convention of
Society of Wood Science and Technology
June 7-12, 2015 - Grand Teton National Park, Jackson, Wyoming, USA
164
Edward L Keith, P E (2006) Standardization testing of structural insulated panels (SIPs) for the structural
insulated panel association, Gig Harbor, Washington. APA Report No. T2006P-33 for the Engineered
Wood Association, Tacoma, WA. 40 pp.
Guo H, Hao J, Li F (2011) Cyclic test of simi-rigid composite steel frame with diagonally stiffened steel
plate shear walls. Journal of Earthquake Engineering and Engineering Vibration, 31(1): 54-60.
Hu Guoxi (2007) Study about lateral force resisting performance of irregular wooden shear wall. MS
thesis, Tongji University, Shanghai, 84 pp (in Chinese).
ISO (2011) 22452-2011, Timber structures - Structural insulated panel walls - Test methods, Geneva, Case
postale 56﹒CH-1211.
ISO (2010) 21581, Timber structures - Static and cyclic lateral load test methods for shear walls, Geneva,
Case postale 56﹒CH-1211.
Jared Bernard Jamison (1997). Monotonic and cyclic performance of structurally insulated panel shear
walls. MS thesis, Faculty of the Virginia polytechnic institute and state university, Virginia, 177 pp.
Liu Yan, Ni Chun, Lu Wensheng, Lu Xilin, Zhou Dingguo (2008) Effect of variable upper stiffness on the
performance of wood shear walls. China Civil Engineering Journal, 41(11):63-70 (in Chinese).
Morley, M. (2000). Building with structural insulated panels (Sips): strength and energy efficiency through
structural panel construction. Taunton Press, 192 pp.
Shim KB, Park MJ, Hwang KH, Park JS, Park MJ(2010) Shear performance of hybrid post and beam wall
system with structural insulation panel (SIP). Mokchae Konghak 38(5): 405-413.
Wang Zhao-hui, Jiang Ze-hui (2003) Status on standards for bamboo-based panels and its prospect. World
Bamboo and Rattan, 1(3):5-10 (in Chinese).
Yu Wen-ji (2012). Current Status and Future Development of Bamboo Scrimber Industry in China. China
Wood Industry, 26(1):11-14 (in Chinese).
ZHANG Jun-zhen, REN Hai-qing, ZHONG Yong, ZHAO Rong-jun (2012). Analysis of compressive and
tensile mechanical properties. Journal of Nanjing Forestry University (Natural Sciences) 36(4):107-111 (in
Chinese).
Proceedings of the 58th International Convention of
Society of Wood Science and Technology
June 7-12, 2015 - Grand Teton National Park, Jackson, Wyoming, USA
165
Life-Cycle Inventory Analysis
of I-joist Production in the United States
Richard D. Bergman 1*
1 Research Forest Product Technologist
U.S. Forest Service Forest Products Laboratory, Madison, Wisconsin, USA
* Corresponding author
Abstract
Documenting the environmental performance of building products is becoming increasingly
common. Creating environmental product declarations (EPDs) based on life-cycle assessment
(LCA) data is one approach to provide scientific documentation of the products’
environmental performance. Many U.S. structural wood products have LCA-based “eco-
labels” developed under the ISO standard 14025. In this study, the standard dictates
underlying life-cycle inventory (LCI) data to be used reflect current practices in the industry.
Therefore, gate-to-gate manufacturing LCI data for I-joist must be developed to construct
updated cradle-to-gate LCAs for southeastern (SE) and for Pacific Northwestern (PNW)
regions of the United States. Modeling the production weighted-average primary industry
data per 1.0 km of I-joists with an assumed average depth of 4.8 cm through LCI analysis
provides cumulative energy consumption and environmental outputs. For PNW and SE,
cumulative mass allocated energy consumption associated with manufacturing 1.0 km of I-
joist was found to be 65.7 and 71.0 GJ/km, respectively, with about 30% of the primary
energy provided from wood residues. Emission data produced through modeling found that
estimated biomass and fossil CO2 emissions in kg/km were, respectively, 1,774 and 1,969 for
the PNW and 1,808 and 2,042 for the SE. One km (5,240 oven-dry kg wood portion, on
average) of I-joist stores about 9,610 kg CO2 equivalents. The amount of carbon stored in I-
joists thus exceeds total CO2 emissions during manufacturing by about 200%. From this
study, the gate-to-gate I-joist manufacturing LCI data can now be incorporated into the
cradle-to-gate LCAs to develop an updated EPD.
Keywords: environmental product declaration, life-cycle inventory, I-joists, life-cycle
analysis, LCA, wood, structural composite lumber
Proceedings of the 58th International Convention of
Society of Wood Science and Technology
June 7-12, 2015 - Grand Teton National Park, Jackson, Wyoming, USA
166
Introduction
Documenting the environmental performance of building products is becoming widespread
because green building programs and concerns that some green-marketing claims are
misleading (i.e., green-washing). Developing environmental product declarations (EPDs) for
building products is one way to provide scientific documentation and to counter green-
washing (Bergman and Taylor 2011). In addition, EPDs are increasingly being required in
green building rating systems and building codes. Life-cycle inventory (LCI) data are the
underlying data for subsequent development of life-cycle assessments (LCAs) and EPDs.
EPDs are similar to nutritional labels for food. The LCI was in conformance with the Product
Category Rules (PCR) for North American Structural and Architectural Wood Products
(FPInnovations 2013) and ISO 14040/14044 standards (ISO 2006a, b). This report follows
data and reporting requirements as outlined in the PCR and contains the LCI components for
producing a North American EPD (ISO 2006c; FPInnovations 2013).
LCI compiles all raw material and energy inputs and environmental outputs associated with
the manufacture of a product on a per-unit basis within carefully defined system boundaries.
These boundaries can be limited to only one stage within the product lifecycle (e.g., gate-to-
gate). Multiple sequential LCI stages are usually combined in an LCA. LCAs describe the
total environmental impact for a particular product, referred to either as cradle-to-gate (raw
material extraction to mill gate output) or as cradle-to-grave (raw material extraction to waste
disposal) analysis.
Description of I-joists
Many engineered structural wood products have been developed in the last several decades,
eg, I-joists (Fig 1). An I-joist is comprised of a web made from structural wood panel, mostly
oriented strandboard (OSB) and some plywood. The web is glued between two flanges made
from solid-sawn or finger-jointed lumber, but mostly laminated veneer lumber (LVL)
(USEPA 2002; Wilson and Dancer 2005; Stark et al. 2010; ASTM 2013). I-joists have an “I”
shape form and are measured in linear feet in the United States. Production values and study
results were reported per linear km with an assumed average depth of 4.8 cm. I-joist depth
varies notably, but large quantities of I-joists made in the United States have a depth of 4.8
cm. These engineered structural wood products are designed to be used in the same manner
as solid wood products such as sawn lumber but with different properties.
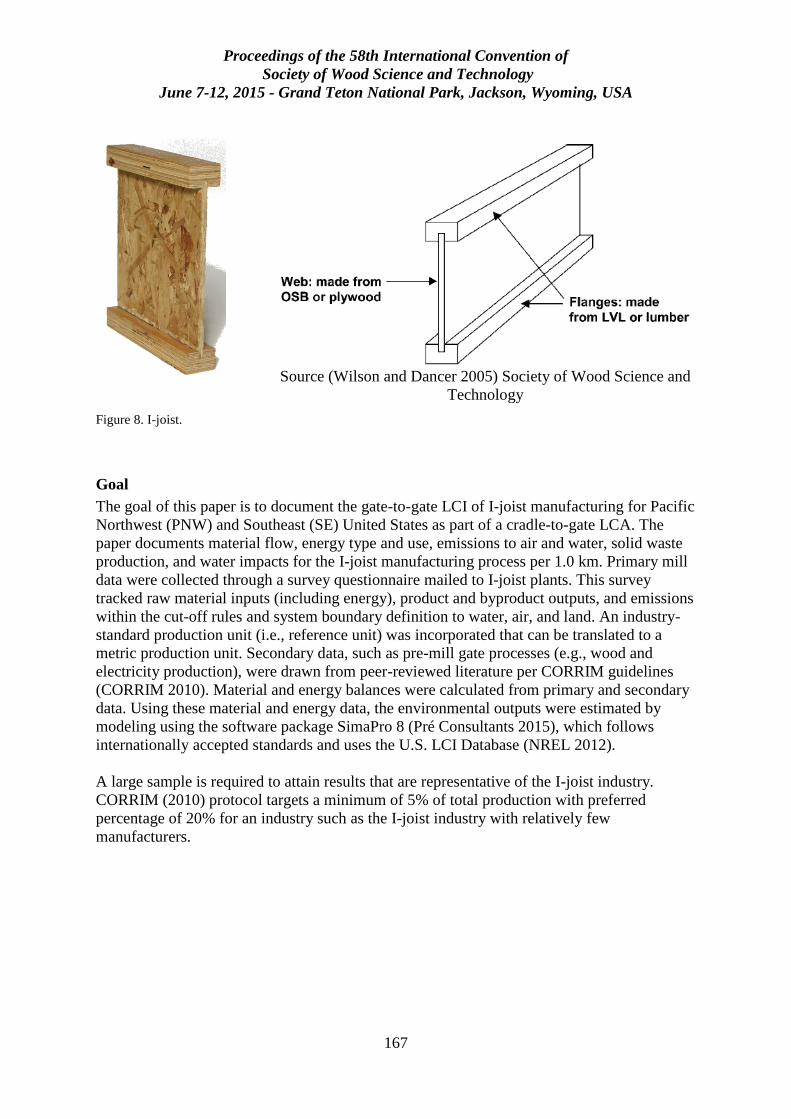
Proceedings of the 58th International Convention of
Society of Wood Science and Technology
June 7-12, 2015 - Grand Teton National Park, Jackson, Wyoming, USA
167
Source (Wilson and Dancer 2005) Society of Wood Science and
Technology
Figure 8. I-joist.
Goal
The goal of this paper is to document the gate-to-gate LCI of I-joist manufacturing for Pacific
Northwest (PNW) and Southeast (SE) United States as part of a cradle-to-gate LCA. The
paper documents material flow, energy type and use, emissions to air and water, solid waste
production, and water impacts for the I-joist manufacturing process per 1.0 km. Primary mill
data were collected through a survey questionnaire mailed to I-joist plants. This survey
tracked raw material inputs (including energy), product and byproduct outputs, and emissions
within the cut-off rules and system boundary definition to water, air, and land. An industry-
standard production unit (i.e., reference unit) was incorporated that can be translated to a
metric production unit. Secondary data, such as pre-mill gate processes (e.g., wood and
electricity production), were drawn from peer-reviewed literature per CORRIM guidelines
(CORRIM 2010). Material and energy balances were calculated from primary and secondary
data. Using these material and energy data, the environmental outputs were estimated by
modeling using the software package SimaPro 8 (Pré Consultants 2015), which follows
internationally accepted standards and uses the U.S. LCI Database (NREL 2012).
A large sample is required to attain results that are representative of the I-joist industry.
CORRIM (2010) protocol targets a minimum of 5% of total production with preferred
percentage of 20% for an industry such as the I-joist industry with relatively few
manufacturers.
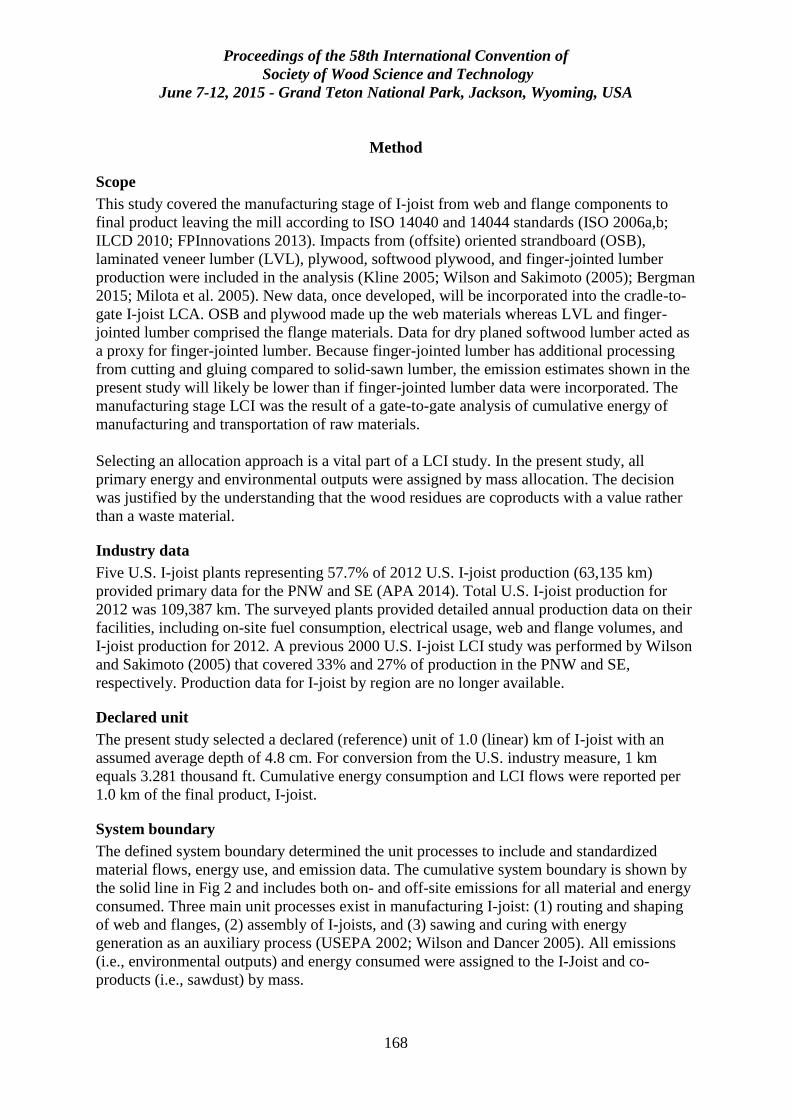
Proceedings of the 58th International Convention of
Society of Wood Science and Technology
June 7-12, 2015 - Grand Teton National Park, Jackson, Wyoming, USA
168
Method
Scope
This study covered the manufacturing stage of I-joist from web and flange components to
final product leaving the mill according to ISO 14040 and 14044 standards (ISO 2006a,b;
ILCD 2010; FPInnovations 2013). Impacts from (offsite) oriented strandboard (OSB),
laminated veneer lumber (LVL), plywood, softwood plywood, and finger-jointed lumber
production were included in the analysis (Kline 2005; Wilson and Sakimoto (2005); Bergman
2015; Milota et al. 2005). New data, once developed, will be incorporated into the cradle-to-
gate I-joist LCA. OSB and plywood made up the web materials whereas LVL and finger-
jointed lumber comprised the flange materials. Data for dry planed softwood lumber acted as
a proxy for finger-jointed lumber. Because finger-jointed lumber has additional processing
from cutting and gluing compared to solid-sawn lumber, the emission estimates shown in the
present study will likely be lower than if finger-jointed lumber data were incorporated. The
manufacturing stage LCI was the result of a gate-to-gate analysis of cumulative energy of
manufacturing and transportation of raw materials.
Selecting an allocation approach is a vital part of a LCI study. In the present study, all
primary energy and environmental outputs were assigned by mass allocation. The decision
was justified by the understanding that the wood residues are coproducts with a value rather
than a waste material.
Industry data
Five U.S. I-joist plants representing 57.7% of 2012 U.S. I-joist production (63,135 km)
provided primary data for the PNW and SE (APA 2014). Total U.S. I-joist production for
2012 was 109,387 km. The surveyed plants provided detailed annual production data on their
facilities, including on-site fuel consumption, electrical usage, web and flange volumes, and
I-joist production for 2012. A previous 2000 U.S. I-joist LCI study was performed by Wilson
and Sakimoto (2005) that covered 33% and 27% of production in the PNW and SE,
respectively. Production data for I-joist by region are no longer available.
Declared unit
The present study selected a declared (reference) unit of 1.0 (linear) km of I-joist with an
assumed average depth of 4.8 cm. For conversion from the U.S. industry measure, 1 km
equals 3.281 thousand ft. Cumulative energy consumption and LCI flows were reported per
1.0 km of the final product, I-joist.
System boundary
The defined system boundary determined the unit processes to include and standardized
material flows, energy use, and emission data. The cumulative system boundary is shown by
the solid line in Fig 2 and includes both on- and off-site emissions for all material and energy
consumed. Three main unit processes exist in manufacturing I-joist: (1) routing and shaping
of web and flanges, (2) assembly of I-joists, and (3) sawing and curing with energy
generation as an auxiliary process (USEPA 2002; Wilson and Dancer 2005). All emissions
(i.e., environmental outputs) and energy consumed were assigned to the I-Joist and co-
products (i.e., sawdust) by mass.
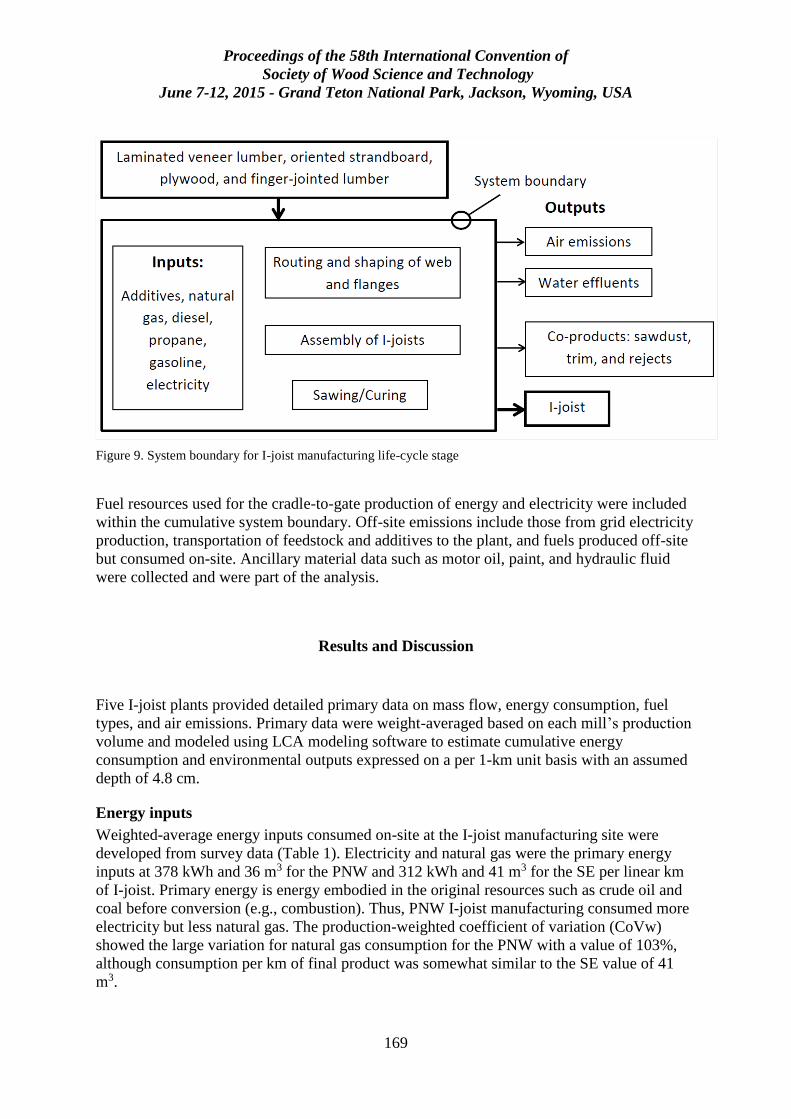
Proceedings of the 58th International Convention of
Society of Wood Science and Technology
June 7-12, 2015 - Grand Teton National Park, Jackson, Wyoming, USA
169
Figure 9. System boundary for I-joist manufacturing life-cycle stage
Fuel resources used for the cradle-to-gate production of energy and electricity were included
within the cumulative system boundary. Off-site emissions include those from grid electricity
production, transportation of feedstock and additives to the plant, and fuels produced off-site
but consumed on-site. Ancillary material data such as motor oil, paint, and hydraulic fluid
were collected and were part of the analysis.
Results and Discussion
Five I-joist plants provided detailed primary data on mass flow, energy consumption, fuel
types, and air emissions. Primary data were weight-averaged based on each mill’s production
volume and modeled using LCA modeling software to estimate cumulative energy
consumption and environmental outputs expressed on a per 1-km unit basis with an assumed
depth of 4.8 cm.
Energy inputs
Weighted-average energy inputs consumed on-site at the I-joist manufacturing site were
developed from survey data (Table 1). Electricity and natural gas were the primary energy
inputs at 378 kWh and 36 m3 for the PNW and 312 kWh and 41 m3 for the SE per linear km
of I-joist. Primary energy is energy embodied in the original resources such as crude oil and
coal before conversion (e.g., combustion). Thus, PNW I-joist manufacturing consumed more
electricity but less natural gas. The production-weighted coefficient of variation (CoVw)
showed the large variation for natural gas consumption for the PNW with a value of 103%,
although consumption per km of final product was somewhat similar to the SE value of 41
m3.
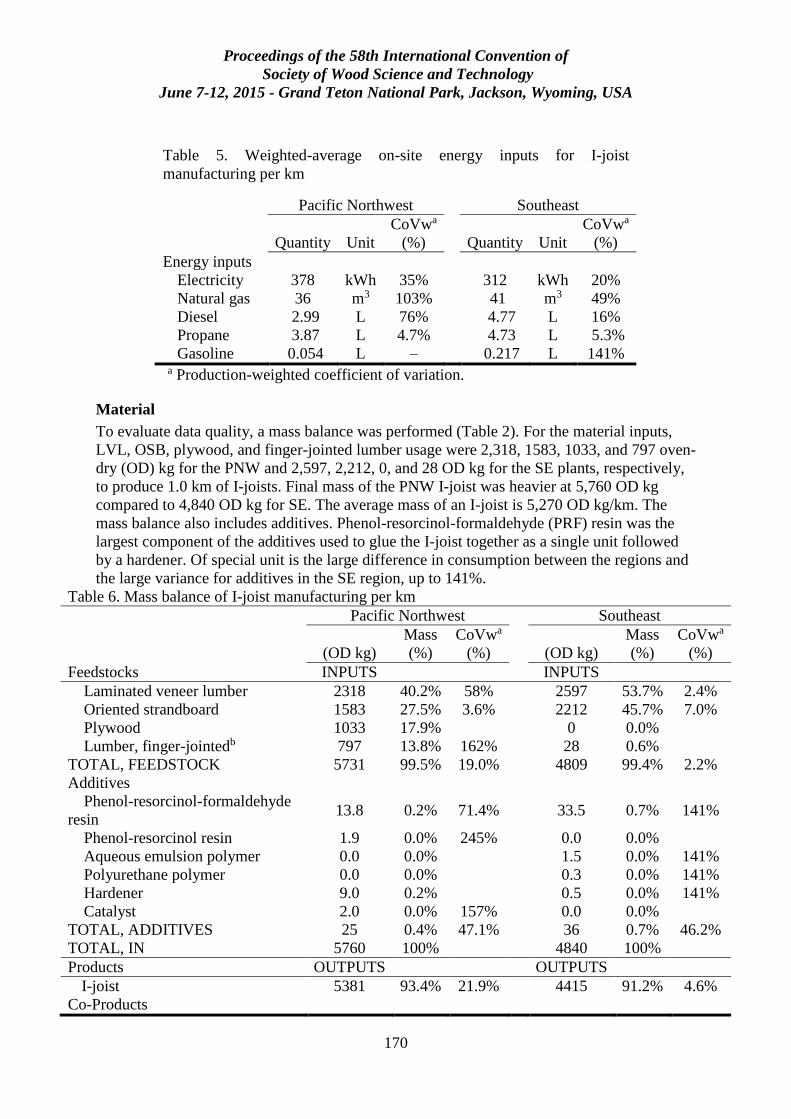
Proceedings of the 58th International Convention of
Society of Wood Science and Technology
June 7-12, 2015 - Grand Teton National Park, Jackson, Wyoming, USA
170
Table 5. Weighted-average on-site energy inputs for I-joist
manufacturing per km
Pacific Northwest Southeast
Quantity Unit
CoVwa
(%)
Quantity Unit
CoVwa
(%)
Energy inputs
Electricity 378 kWh 35% 312 kWh 20%
Natural gas 36 m3 103% 41 m3 49%
Diesel 2.99 L 76% 4.77 L 16%
Propane 3.87 L 4.7% 4.73 L 5.3%
Gasoline 0.054 L – 0.217 L 141% a Production-weighted coefficient of variation.
Material
To evaluate data quality, a mass balance was performed (Table 2). For the material inputs,
LVL, OSB, plywood, and finger-jointed lumber usage were 2,318, 1583, 1033, and 797 oven-
dry (OD) kg for the PNW and 2,597, 2,212, 0, and 28 OD kg for the SE plants, respectively,
to produce 1.0 km of I-joists. Final mass of the PNW I-joist was heavier at 5,760 OD kg
compared to 4,840 OD kg for SE. The average mass of an I-joist is 5,270 OD kg/km. The
mass balance also includes additives. Phenol-resorcinol-formaldehyde (PRF) resin was the
largest component of the additives used to glue the I-joist together as a single unit followed
by a hardener. Of special unit is the large difference in consumption between the regions and
the large variance for additives in the SE region, up to 141%.
Table 6. Mass balance of I-joist manufacturing per km
Pacific Northwest Southeast
(OD kg)
Mass
(%)
CoVwa
(%)
(OD kg)
Mass
(%)
CoVwa
(%)
Feedstocks INPUTS
INPUTS
Laminated veneer lumber 2318 40.2% 58% 2597 53.7% 2.4%
Oriented strandboard 1583 27.5% 3.6% 2212 45.7% 7.0%
Plywood 1033 17.9% 0 0.0%
Lumber, finger-jointedb 797 13.8% 162% 28 0.6%
TOTAL, FEEDSTOCK 5731 99.5% 19.0% 4809 99.4% 2.2%
Additives
Phenol-resorcinol-formaldehyde
resin 13.8 0.2% 71.4%
33.5 0.7% 141%
Phenol-resorcinol resin 1.9 0.0% 245% 0.0 0.0%
Aqueous emulsion polymer 0.0 0.0% 1.5 0.0% 141%
Polyurethane polymer 0.0 0.0%
0.3 0.0% 141%
Hardener 9.0 0.2% 0.5 0.0% 141%
Catalyst 2.0 0.0% 157% 0.0 0.0%
TOTAL, ADDITIVES 25 0.4% 47.1% 36 0.7% 46.2%
TOTAL, IN 5760 100% 4840 100%
Products OUTPUTS
OUTPUTS
I-joist 5381 93.4% 21.9% 4415 91.2% 4.6%
Co-Products
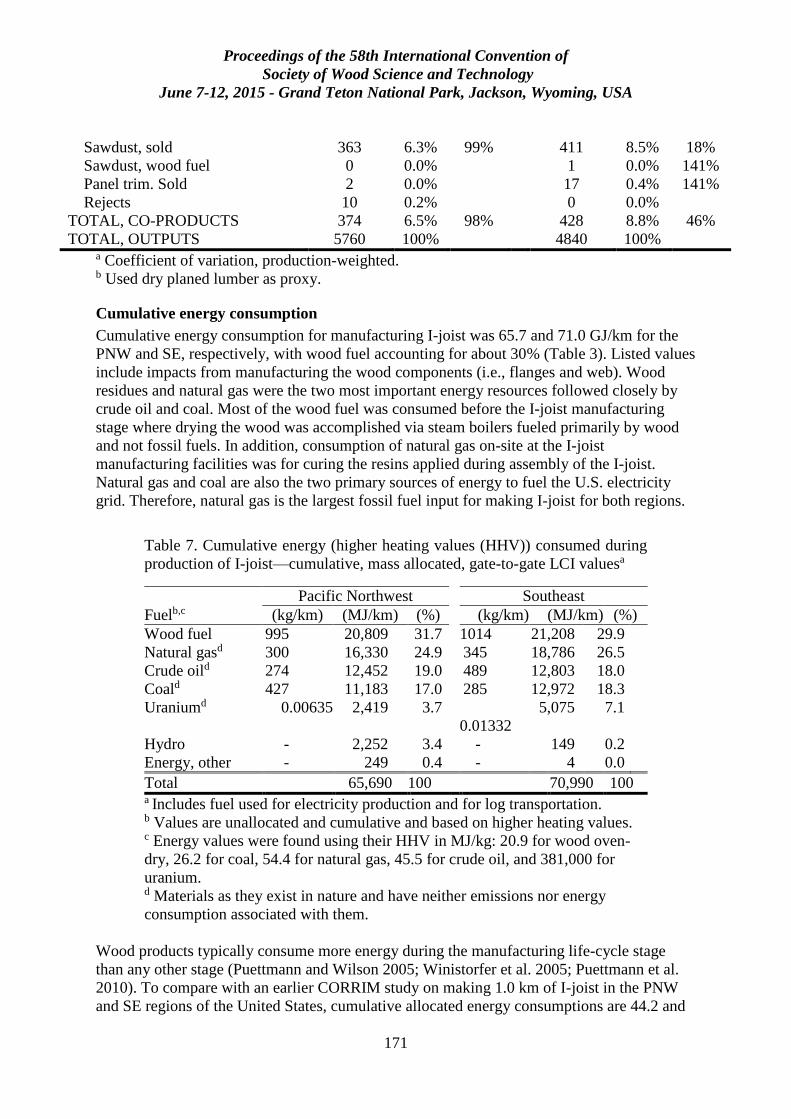
Proceedings of the 58th International Convention of
Society of Wood Science and Technology
June 7-12, 2015 - Grand Teton National Park, Jackson, Wyoming, USA
171
Sawdust, sold 363 6.3% 99% 411 8.5% 18%
Sawdust, wood fuel 0 0.0% 1 0.0% 141%
Panel trim. Sold 2 0.0% 17 0.4% 141%
Rejects 10 0.2% 0 0.0%
TOTAL, CO-PRODUCTS 374 6.5% 98% 428 8.8% 46%
TOTAL, OUTPUTS 5760 100% 4840 100%
a Coefficient of variation, production-weighted. b Used dry planed lumber as proxy.
Cumulative energy consumption
Cumulative energy consumption for manufacturing I-joist was 65.7 and 71.0 GJ/km for the
PNW and SE, respectively, with wood fuel accounting for about 30% (Table 3). Listed values
include impacts from manufacturing the wood components (i.e., flanges and web). Wood
residues and natural gas were the two most important energy resources followed closely by
crude oil and coal. Most of the wood fuel was consumed before the I-joist manufacturing
stage where drying the wood was accomplished via steam boilers fueled primarily by wood
and not fossil fuels. In addition, consumption of natural gas on-site at the I-joist
manufacturing facilities was for curing the resins applied during assembly of the I-joist.
Natural gas and coal are also the two primary sources of energy to fuel the U.S. electricity
grid. Therefore, natural gas is the largest fossil fuel input for making I-joist for both regions.
Table 7. Cumulative energy (higher heating values (HHV)) consumed during
production of I-joist—cumulative, mass allocated, gate-to-gate LCI valuesa
Fuelb,c
Pacific Northwest Southeast
(kg/km) (MJ/km) (%) (kg/km) (MJ/km) (%)
Wood fuel 995 20,809 31.7 1014 21,208 29.9
Natural gasd 300 16,330 24.9 345 18,786 26.5
Crude oild 274 12,452 19.0 489 12,803 18.0
Coald 427 11,183 17.0 285 12,972 18.3
Uraniumd 0.00635 2,419 3.7
0.01332
5,075 7.1
Hydro - 2,252 3.4 - 149 0.2
Energy, other - 249 0.4 - 4 0.0
Total 65,690 100 70,990 100 a Includes fuel used for electricity production and for log transportation. b Values are unallocated and cumulative and based on higher heating values. c Energy values were found using their HHV in MJ/kg: 20.9 for wood oven-
dry, 26.2 for coal, 54.4 for natural gas, 45.5 for crude oil, and 381,000 for
uranium. d Materials as they exist in nature and have neither emissions nor energy
consumption associated with them.
Wood products typically consume more energy during the manufacturing life-cycle stage
than any other stage (Puettmann and Wilson 2005; Winistorfer et al. 2005; Puettmann et al.
2010). To compare with an earlier CORRIM study on making 1.0 km of I-joist in the PNW
and SE regions of the United States, cumulative allocated energy consumptions are 44.2 and
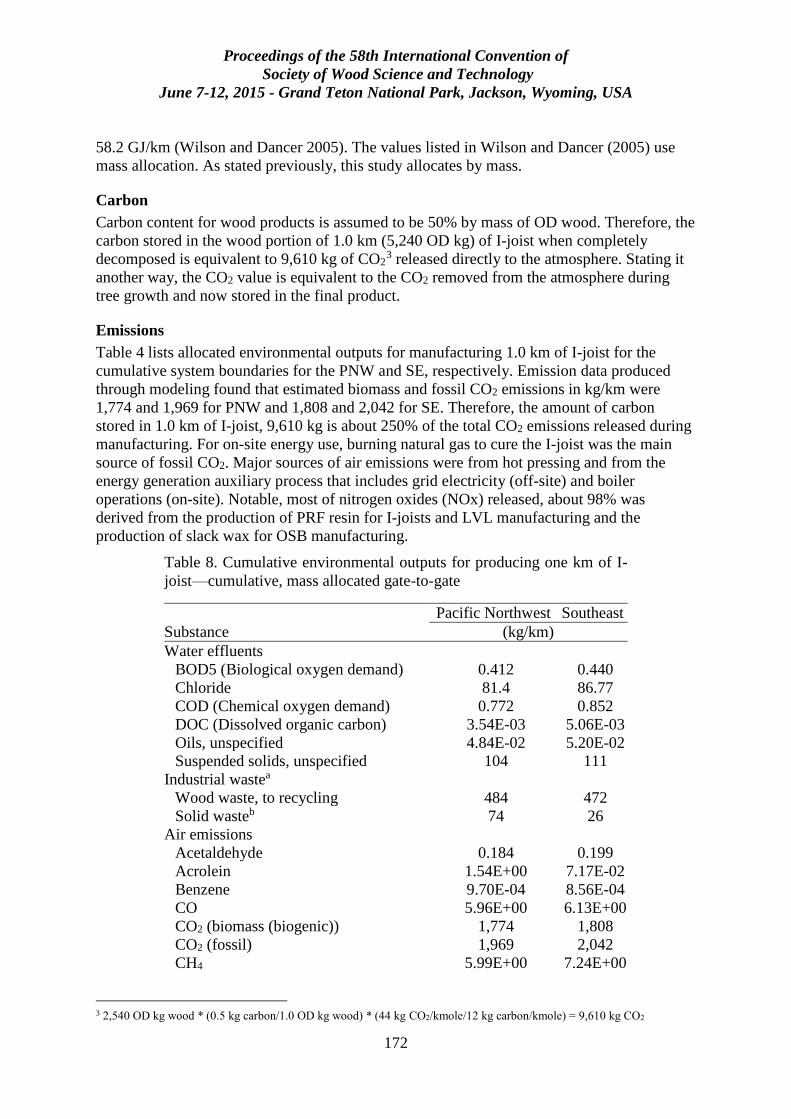
Proceedings of the 58th International Convention of
Society of Wood Science and Technology
June 7-12, 2015 - Grand Teton National Park, Jackson, Wyoming, USA
172
58.2 GJ/km (Wilson and Dancer 2005). The values listed in Wilson and Dancer (2005) use
mass allocation. As stated previously, this study allocates by mass.
Carbon
Carbon content for wood products is assumed to be 50% by mass of OD wood. Therefore, the
carbon stored in the wood portion of 1.0 km (5,240 OD kg) of I-joist when completely
decomposed is equivalent to 9,610 kg of CO2 3F
3 released directly to the atmosphere. Stating it
another way, the CO2 value is equivalent to the CO2 removed from the atmosphere during
tree growth and now stored in the final product.
Emissions
Table 4 lists allocated environmental outputs for manufacturing 1.0 km of I-joist for the
cumulative system boundaries for the PNW and SE, respectively. Emission data produced
through modeling found that estimated biomass and fossil CO2 emissions in kg/km were
1,774 and 1,969 for PNW and 1,808 and 2,042 for SE. Therefore, the amount of carbon
stored in 1.0 km of I-joist, 9,610 kg is about 250% of the total CO2 emissions released during
manufacturing. For on-site energy use, burning natural gas to cure the I-joist was the main
source of fossil CO2. Major sources of air emissions were from hot pressing and from the
energy generation auxiliary process that includes grid electricity (off-site) and boiler
operations (on-site). Notable, most of nitrogen oxides (NOx) released, about 98% was
derived from the production of PRF resin for I-joists and LVL manufacturing and the
production of slack wax for OSB manufacturing.
Table 8. Cumulative environmental outputs for producing one km of I-
joist—cumulative, mass allocated gate-to-gate
Substance
Pacific Northwest Southeast
(kg/km)
Water effluents
BOD5 (Biological oxygen demand) 0.412 0.440
Chloride 81.4 86.77
COD (Chemical oxygen demand) 0.772 0.852
DOC (Dissolved organic carbon) 3.54E-03 5.06E-03
Oils, unspecified 4.84E-02 5.20E-02
Suspended solids, unspecified 104 111
Industrial wastea
Wood waste, to recycling 484 472
Solid wasteb 74 26
Air emissions
Acetaldehyde 0.184 0.199
Acrolein 1.54E+00 7.17E-02
Benzene 9.70E-04 8.56E-04
CO 5.96E+00 6.13E+00
CO2 (biomass (biogenic)) 1,774 1,808
CO2 (fossil) 1,969 2,042
CH4 5.99E+00 7.24E+00
3 2,540 OD kg wood * (0.5 kg carbon/1.0 OD kg wood) * (44 kg CO2/kmole/12 kg carbon/kmole) = 9,610 kg CO2
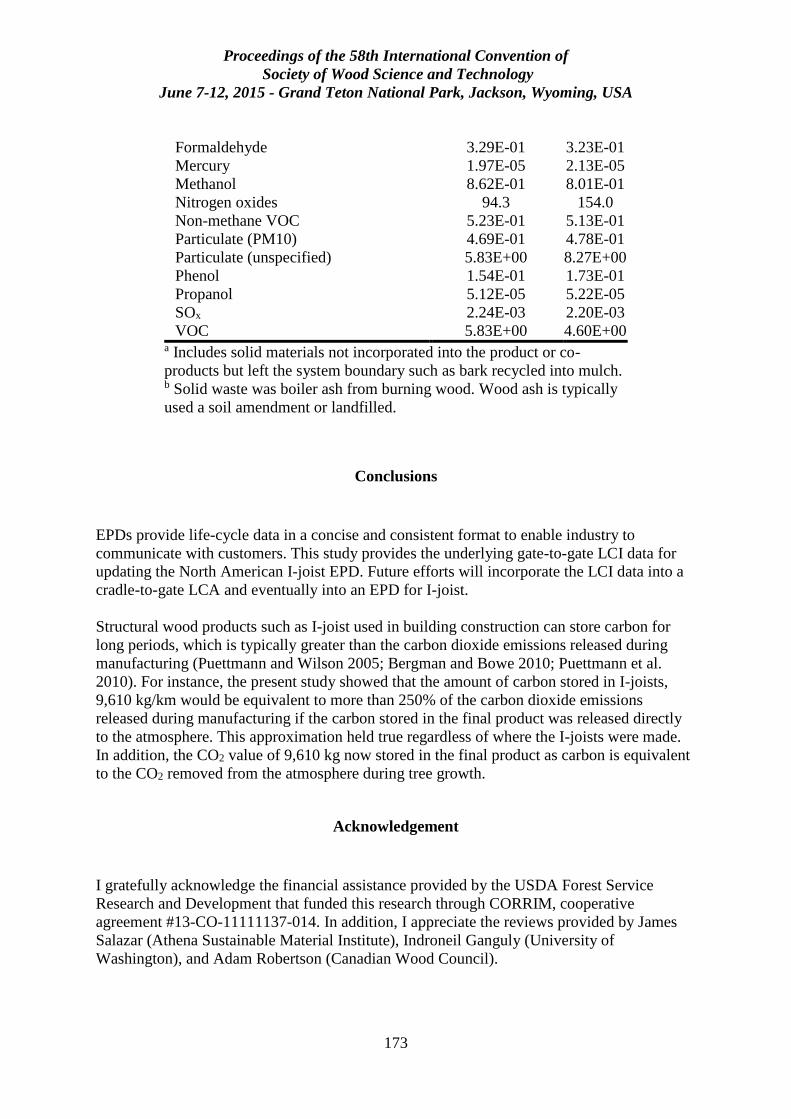
Proceedings of the 58th International Convention of
Society of Wood Science and Technology
June 7-12, 2015 - Grand Teton National Park, Jackson, Wyoming, USA
173
Formaldehyde 3.29E-01 3.23E-01
Mercury 1.97E-05 2.13E-05
Methanol 8.62E-01 8.01E-01
Nitrogen oxides 94.3 154.0
Non-methane VOC 5.23E-01 5.13E-01
Particulate (PM10) 4.69E-01 4.78E-01
Particulate (unspecified) 5.83E+00 8.27E+00
Phenol 1.54E-01 1.73E-01
Propanol 5.12E-05 5.22E-05
SOx 2.24E-03 2.20E-03
VOC 5.83E+00 4.60E+00 a Includes solid materials not incorporated into the product or co-
products but left the system boundary such as bark recycled into mulch. b Solid waste was boiler ash from burning wood. Wood ash is typically
used a soil amendment or landfilled.
Conclusions
EPDs provide life-cycle data in a concise and consistent format to enable industry to
communicate with customers. This study provides the underlying gate-to-gate LCI data for
updating the North American I-joist EPD. Future efforts will incorporate the LCI data into a
cradle-to-gate LCA and eventually into an EPD for I-joist.
Structural wood products such as I-joist used in building construction can store carbon for
long periods, which is typically greater than the carbon dioxide emissions released during
manufacturing (Puettmann and Wilson 2005; Bergman and Bowe 2010; Puettmann et al.
2010). For instance, the present study showed that the amount of carbon stored in I-joists,
9,610 kg/km would be equivalent to more than 250% of the carbon dioxide emissions
released during manufacturing if the carbon stored in the final product was released directly
to the atmosphere. This approximation held true regardless of where the I-joists were made.
In addition, the CO2 value of 9,610 kg now stored in the final product as carbon is equivalent
to the CO2 removed from the atmosphere during tree growth.
Acknowledgement
I gratefully acknowledge the financial assistance provided by the USDA Forest Service
Research and Development that funded this research through CORRIM, cooperative
agreement #13-CO-11111137-014. In addition, I appreciate the reviews provided by James
Salazar (Athena Sustainable Material Institute), Indroneil Ganguly (University of
Washington), and Adam Robertson (Canadian Wood Council).
Proceedings of the 58th International Convention of
Society of Wood Science and Technology
June 7-12, 2015 - Grand Teton National Park, Jackson, Wyoming, USA
174
References
APA (2014) Engineered wood statistics: Third quarter 2014. APA—The Engineered Wood
Association. Tacoma, WA. 9 p.
ASTM (2013) Standard specification for establishing and monitoring structural capacities of
prefabricated wood I-joists. ASTM International. West Conshohocken, PA. 33 pp.
Bergman RD, Bowe SA (2010) Environmental impact of manufacturing softwood lumber in
northeastern and north central United States. Wood Fiber Sci 42 (CORRIM Special
Issue):67-78.
Bergman RD, Taylor A (2011) Environmental product declarations of wood products—An
application of life cycle information about forest products. Forest Prod J 61(3):192–201.
Bergman RD (2015) Life-cycle inventory analysis of laminated veneer lumber production in
the United States. In: Proceedings, Society of Wood Science and Technology 58th
International Convention. June 7-12, 2015. Jackson Hole, Wyoming. (In press).
CORRIM (2010) Research guidelines for life-cycle inventories. Consortium for Research on
Renewable Industrial Materials (CORRIM), Inc., University of Washington, Seattle, WA. 40
pp.
FPInnovations. (2013) Product Category Rule (PCR): For preparing an Environmental
Product
Declaration (EPD) for North American Structural and Architectural Wood Products. UN CPC
31. NAICS 21. 17 pp. https://fpinnovations.ca/ResearchProgram/environment-
sustainability/epd-program/Documents/wood-products-pcr-version-v1.1-may-2013-lastest-
version.pdf. (22 April 2015).
ILCD (2010) International Reference Life Cycle Data System (ILCD) Handbook - General
guide for Life Cycle Assessment—Detailed guidance. EUR 24708 EN. European
Commission–Joint Research Centre–Institute for Environment and Sustainability.
Luxembourg. Publications Office of the European Union. 417 pp.
ISO (2006a) Environmental management—life-cycle assessment—principles and framework.
ISO 14040. International Organization for Standardization, Geneva, Switzerland. 20 pp.
ISO (2006b) Environmental management—life-cycle assessment—requirements and
guidelines. ISO 14044. International Organization for Standardization, Geneva, Switzerland.
46 pp.
ISO (2006c) Environmental labels and declarations—Type III environmental declarations—
Principles and procedures. ISO 14025. International Organization for Standardization,
Geneva, Switzerland. 25 pp.
Proceedings of the 58th International Convention of
Society of Wood Science and Technology
June 7-12, 2015 - Grand Teton National Park, Jackson, Wyoming, USA
175
Kline ED (2005) Gate-to-gate life-cycle inventory of oriented strandboard production. Wood
and Fiber Sci 37(CORRIM Special Issue):74–84.
Milota MR, West CD, Hartley ID (2005) Gate-to-gate life-cycle inventory of softwood
lumber production. Wood Fiber Sci 42(Special Issue):47–57.
NREL (2012) Life-cycle inventory database project. National Renewable Energy Laboratory.
https://www.lcacommons.gov/nrel/search. (22 April 2015).
PRé Consultants (2015) SimaPro 8 Life-cycle assessment software package. Amersfoort, The
Netherlands. http://www.pre-sustainability.com/simapro/. (22 April 2015).
Puettmann ME, Wilson, JB (2005) Life-cycle analysis of wood products: Cradle-to-gate LCI
of residential wood building materials. Wood Fiber Sci 37 (Special Issue):18–29.
Puettmann ME, Bergman RD, Hubbard SS, Johnson L, Lippke B, Wagner F (2010) Cradle-
to-gate life-cycle inventories of US wood products production—CORRIM Phase I and Phase
II Products. Wood Fiber Sci 42 (CORRIM Special Issue):15–28
Stark NM, Cai Zi, Carll C. (2010) Wood-based composite materials: Panel products, glued-
laminated timber, structural composite lumber, and wood–nonwood composite materials. In:
Wood handbook—wood as an engineering material. Gen Techn Rep FPL–GTR–113. USDA
For Serv Forest Products Laboratory, Madison, WI. pp. 11-1–11–28.
USEPA (2002) AP 42 Section 10.9 Engineered wood products manufacturing. United States
Environmental Protection Agency. pp. 10.9-1–24.
http://www.epa.gov/ttnchie1/ap42/ch10/final/c10s09.pdf. (22 April 2015)
Wilson JB, Sakimoto ET (2005) Gate-to-gate life-cycle inventory of softwood plywood
production. Wood Fiber Sci 37 (Special Issue):58–73.
Wilson JB, Dancer ER (2005) Gate-to-gate life-cycle inventory of I-joist production. Wood
Fiber Sci 37 (Special Issue):114–127.
Winistorfer P, Chen Z, Lippke B, Stevens N (2005) Energy consumption and greenhouse gas
emissions related to use, maintenance, and disposal of a residential structure. Wood Fiber Sci
37 (Special Issue):128–139.
Proceedings of the 58th International Convention of
Society of Wood Science and Technology
June 7-12, 2015 - Grand Teton National Park, Jackson, Wyoming, USA
176
Multi-scale Investigation of Adhesive Bond Durability
Paige McKinley, [email protected]
Oregon State University, 119 Richardson Hall , Wood Science and Engineering,
Corvallis, OR 97331
Abstract
Moisture durability is essential for wood composite products, especially those used in
building construction, where products are prone to weathering. The main focus of this
research is to determine if adhesive penetration into the cell wall has a positive influence on
bond durability. This study uses bonded Douglas-fir test specimens (6mmx14 mmx64 mm),
varying in bonded surface cell type (earlywood vs. latewood), bonded surface orientation
(longitudinal vs. tangential), and adhesive type. The adhesives of interest are a low and high
molecular weight phenol-formaldehyde, along with a pre-polymeric diphenylmethane
diiscoyanate. Half of each type of test specimen undergoes accelerated weathering and the
rest remain dry. All samples are mechanically tested in lap shear. The maximum load is
recorded along with the stress and strain around the bondline, using Digital Image Correlation
(DIC). Smaller samples (2mmx2mmx10mm) are cut from the same previously tested samples
and then scanned at the Advanced Photon Source using micro X-ray Computed Tomography
(XCT). All adhesive types were previously tagged with iodine to increase contrast during
scans. This technique gives high resolution (1.3µm²/voxel), 3D images for which cell wall
penetration can be analyzed at both the micrometer and nanometer scale. The mechanical test
results, DIC results, and XCT images of the weathered vs. dry samples will be compared and
used to quantitatively measure the effects of moisture on the bondline.
Proceedings of the 58th International Convention of
Society of Wood Science and Technology
June 7-12, 2015 - Grand Teton National Park, Jackson, Wyoming, USA
177
3D Visualisation of Spiral Grain and Compression Wood
in Pinus Radiata with Fluorescence and Circular Polarised
Light Imaging
Jimmy Thomas1,2,†- David A. Collings2
1Wood Technologist & Laboratory Manager
Central Wood Testing Laboratory,
The Rubber Board, INDIA
Senior Lecturer, 2School of Biological Sciences, University of Canterbury,
Christchurch, NEW ZEALAND
† Corresponding author & Society of Wood Science & Technology member
To visualise the development of spiral grain in young pine trees, a novel technique was
developed that is based on tracking the orientation of axial resin canals. 60 µm-thick
complete serial transverse sections covering a stem length of nearly 10 mm were imaged at
high resolution with a professional flatbed scanner using circular-polarised transmitted light.
Lignin autofluorescence from compression wood in these sections was also imaged with a
stereo-fluorescence microscope, using blue excitation and green fluorescence. Images were
aligned and canals detected with ImageJ macros. A series of image processing steps were
applied to the image stack and only resin canals were identified as black dots in the resultant
image stack which was used to generate a 3D view of spiral grain using a plug-in ‘3D
Viewer’ in ImageJ. The 3D visualisation showed the organisation of resin canals and spiral
grain inside the wood. 3D reconstruction to show the compression wood was made from
overlays of the fluorescence and the scanner images. Imaging confirmed the rapid onset of
spiral grain, with a near vertical adjacent to the pith reorienting to a strong left-handed spiral
within the first year of growth. There were fewer canals in the compression wood which
appeared to be straighter than the twisted canals found elsewhere. This new method provides
new insights in to our understanding on the formation of spiral grain and compression wood
and a possible link between their occurrence.
Keywords: circular polarised light, compression wood, radiata pine, resin canals, spiral
grain, 3D visualisation
Proceedings of the 58th International Convention of
Society of Wood Science and Technology
June 7-12, 2015 - Grand Teton National Park, Jackson, Wyoming, USA
178
Introduction
Spiral grain and compression wood in radiata pine
Presence of spiral grain and compression wood in radiata pine trees is common and these
wood quality issues devalue the wood due to reduction in strength of sawn timber (Cown et
al., 1991) and have negative effect on the surface smoothness (Sepúlveda, 2001) which may
result in the downgrading in quality and the rejection of large proportions of sawn boards
(Johansson et al., 2001). Majority of drying problems in Pinus radiata are related to twist
which is related to both diameter and spiral grain Cown et al. (1996). (Tarvainen, 2005)
estimated the annual loss caused by distortion due to spiral grain in dried timber in Europe to
nearly €1 billion. Compression wood however believed to be contributed to the formation of
warping. Their occurrence and influence on wood properties have been well documented and
reviewed(Thomas and Collings, 2014). However, their inter-relationship in radiata pine and
other species is only rarely been investigated and not understood. In this study resin canals,
which are formed from the same cambial initials as the tracheids and align with the grain,
were used as a proxy to demonstrate the grain changes. The new imaging and 3D
visualisation techniques provide a better diagnostic tool to understand the real-time grain
orientation at various positions inside the stem and the link between spiral grain and
compression wood
Materials and Methods
Novel imaging approach
One year old radiata pine trees, up to 10 mm in diameter, were cut with a sliding microtome
(HM400, Microm, Walldorf, Germany) to produce complete transverse sections (60 µm). The
sections were carefully transferred to a microscope slide after washing in distilled water and
mounted in glycerol. Imaging of these sections was done with a professional flatbed scanner
(Epson Perfection V700 Photo) at 2400 dpi and in 24 bit colour, and saved as TIFF images.
For this, slides were placed on a sheet of linear polarising film (polariser) (catalogue number
NT38-491, Edmund Optics, Singapore) on the scanner bed and a second sheet of linear
polarising film oriented at right angles (analyser) to the polariser to create linear polarised
light (Fig. 1a) (Arpin et al., 2002). Two sheets of quarter wave-retarder films (catalogue
number NT27-344, Edmund Optics) were added to the optical path on either side of the
microscope slides, and at an angle of 450 to the linear polarising sheets. This meant that the
wood sections were imaged with circularly polarised light (Fig. 1a) (Higgins, 2010). Lignin
autofluorescence from compression wood was imaged in these transverse sections with a
Leica DFC 310 FX digital camera connected to a stereo-fluorescence microscope (model MZ
10F Fluo, Leica Microsystems, Heerbrugg, Switzerland), using blue excitation and green
fluorescence under constant imaging conditions.
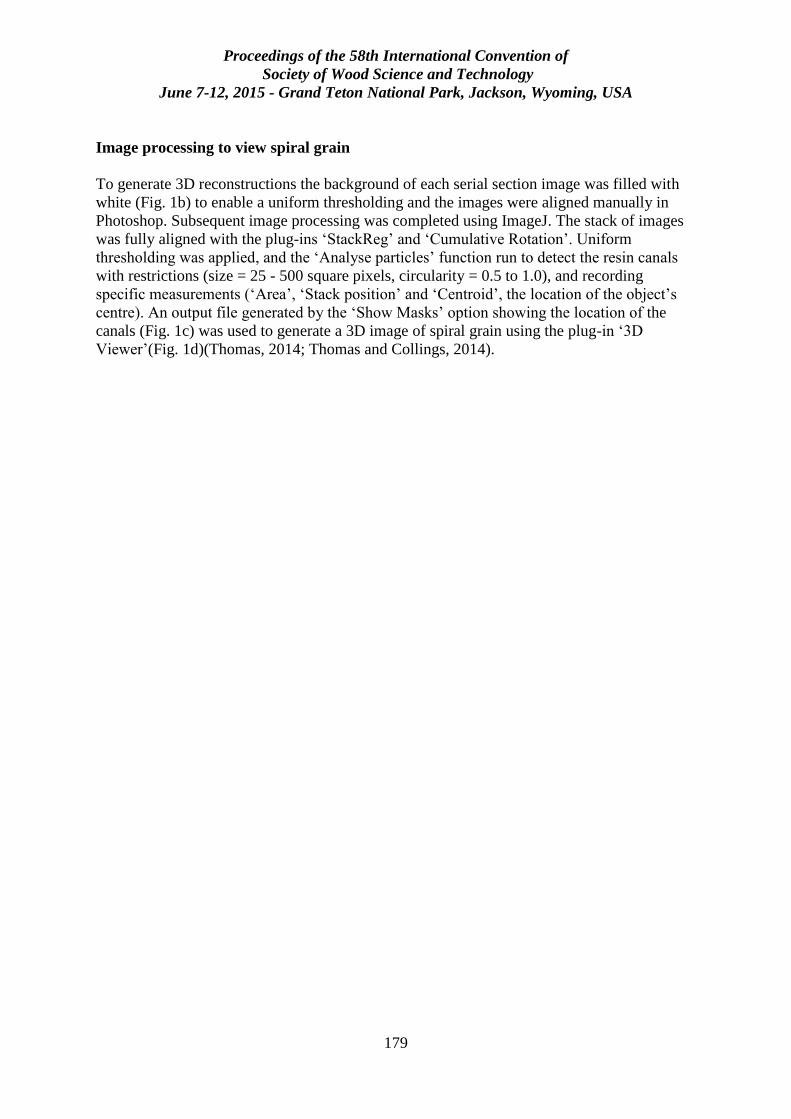
Proceedings of the 58th International Convention of
Society of Wood Science and Technology
June 7-12, 2015 - Grand Teton National Park, Jackson, Wyoming, USA
179
Image processing to view spiral grain
To generate 3D reconstructions the background of each serial section image was filled with
white (Fig. 1b) to enable a uniform thresholding and the images were aligned manually in
Photoshop. Subsequent image processing was completed using ImageJ. The stack of images
was fully aligned with the plug-ins ‘StackReg’ and ‘Cumulative Rotation’. Uniform
thresholding was applied, and the ‘Analyse particles’ function run to detect the resin canals
with restrictions (size = 25 - 500 square pixels, circularity = 0.5 to 1.0), and recording
specific measurements (‘Area’, ‘Stack position’ and ‘Centroid’, the location of the object’s
centre). An output file generated by the ‘Show Masks’ option showing the location of the
canals (Fig. 1c) was used to generate a 3D image of spiral grain using the plug-in ‘3D
Viewer’(Fig. 1d)(Thomas, 2014; Thomas and Collings, 2014).
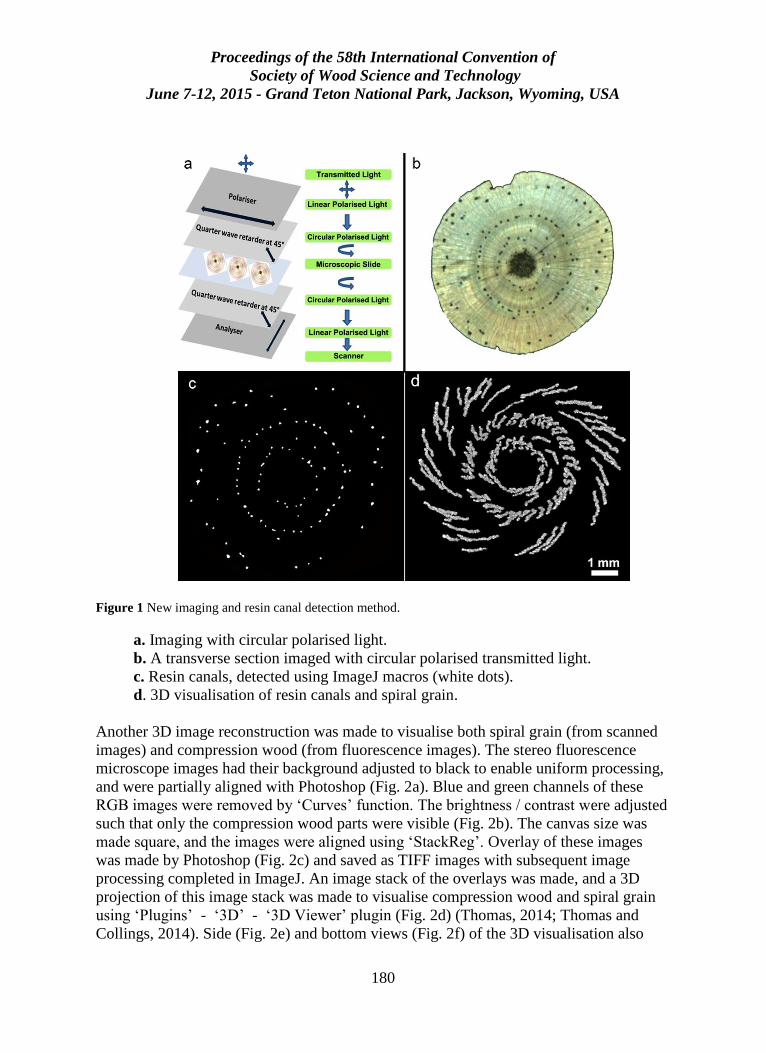
Proceedings of the 58th International Convention of
Society of Wood Science and Technology
June 7-12, 2015 - Grand Teton National Park, Jackson, Wyoming, USA
180
Figure 1 New imaging and resin canal detection method.
a. Imaging with circular polarised light.
b. A transverse section imaged with circular polarised transmitted light.
c. Resin canals, detected using ImageJ macros (white dots).
d. 3D visualisation of resin canals and spiral grain.
Another 3D image reconstruction was made to visualise both spiral grain (from scanned
images) and compression wood (from fluorescence images). The stereo fluorescence
microscope images had their background adjusted to black to enable uniform processing,
and were partially aligned with Photoshop (Fig. 2a). Blue and green channels of these
RGB images were removed by ‘Curves’ function. The brightness / contrast were adjusted
such that only the compression wood parts were visible (Fig. 2b). The canvas size was
made square, and the images were aligned using ‘StackReg’. Overlay of these images
was made by Photoshop (Fig. 2c) and saved as TIFF images with subsequent image
processing completed in ImageJ. An image stack of the overlays was made, and a 3D
projection of this image stack was made to visualise compression wood and spiral grain
using ‘Plugins’ - ‘3D’ - ‘3D Viewer’ plugin (Fig. 2d) (Thomas, 2014; Thomas and
Collings, 2014). Side (Fig. 2e) and bottom views (Fig. 2f) of the 3D visualisation also

Proceedings of the 58th International Convention of
Society of Wood Science and Technology
June 7-12, 2015 - Grand Teton National Park, Jackson, Wyoming, USA
181
clearly showed the organisation of compression wood and spiral grain in transverse
section.
Proceedings of the 58th International Convention of
Society of Wood Science and Technology
June 7-12, 2015 - Grand Teton National Park, Jackson, Wyoming, USA
182
Figure 2 3D visualisation of the link between compression wood and spiral grain.
a. Fluorescence microscope image of the transverse section.
b. Compression wood segregated by thresholding.
c. Overlay stack of fluorescence images (a) whose blue and green channels were
removed and corresponding scanner images in which resin canals were detected.
d. 3D visualisation of compression wood and spiral grain.
e. Side view of compression wood and spiral grain
f. Bottom view of compression wood and spiral grain.
Proceedings of the 58th International Convention of
Society of Wood Science and Technology
June 7-12, 2015 - Grand Teton National Park, Jackson, Wyoming, USA
183
Results and Discussion
Imaging stem transverse sections with a flatbed scanner
The new imaging technique, using a combination of the polariser (Arpin et al., 2002) and
quarter wave-retarder film (Foster, 1997; Higgins, 2010), is a novel approach to create
high-quality images suitable for any modern image analysis programme (Thomas, 2014;
Thomas and Collings, 2014). It is an easy and economic way of replicating polarised light
microscopy and is particularly useful for imaging large areas which is difficult with
conventional microscopy. Circular polarised light has previously been suggested as a way
to overcome image asymmetries such as Maltese cross effect (Higgins, 2010). However
the use of circular polarised light with automatic image analysis is novel and this new
imaging technique is simple to create, convenient to operate and provides better quality
images. Moreover this new method is quick and easy to operate, and gives reproducible
results.
3-dimensional image reconstructions and analysis of grain orientation
3D reconstruction of the circular polarised light images revealed the organisation of resin
canals. The canals were arranged in concentric bands around the pith with the canals
nearest to the pith nearly straight and those in the outer regions twisted leftwards (Fig.
1d). However there were fewer canals in the compression wood region and these were
straighter than the twisted canals (Fig. 2d). This is consistent with Cown et al. (2003)
who observed few or no canals in radiata pine compression wood. As the resin canals
follow the tracheids in radiata pine, this twisting of the resin canals demonstrated the
rapid and early onset of left-handed spiral grain in radiata pine trees, a pattern that is
typical of pines.
The unknown link between compression wood and spiral grain
Fluorescence imaging demonstrated its capability to detect compression wood in wood
cross section images. 3D reconstruction of serial sections collected over 4.5 mm revealed
that the pattern of compression wood looked similar at different depths (Fig. 2d). By
combining the polarised light and the stereo-fluorescence microscope images, both
compression wood and spiral grain were visible for the first time. The low number of
resin canals and their relatively straight orientation in compression wood areas are
suggesting a possible link between the formation of compression wood and spiral grain in
radiata pine. It is obvious that researchers have looked at the incidence of compression
wood and spiral grain separately, and have made only very limited effort on approaching
these issues together (Thomas, 2014). In this study, visualisation of the internal structure
Proceedings of the 58th International Convention of
Society of Wood Science and Technology
June 7-12, 2015 - Grand Teton National Park, Jackson, Wyoming, USA
184
of full cross section of young pine tree stems was successfully made for the first time.
The orientation of the resin canals has shown the grain deviation along the length of the
stem and hence this 3D reconstruction technique would give a great opportunity to study
the generation and progression of spiral grain and compression wood in wood. Moreover
this study is the first attempt to look at grain across an entire stem but considering events
at a cellular level.
Acknowledgements
JT gratefully acknowledges funding for his PhD scholarship generously provided by
Scion Ltd, Rotorua, New Zealand during this work.
References
Arpin TL, Mallol C, Goldberg P. Short Contribution: A new method of analyzing and
documenting micromorphological thin sections using flatbed scanners:
Applications in geoarchaeological studies. Geoarchaeology: An International
Journal (2002) 17:305-313.
Cown DJ, Haslett AN, Kimberley MO, McConchie DL. The influence of wood quality
on lumber drying distortion. Annals of Forestry Science (1996) 53:1177-1188.
Cown DJ, Ilic J, Butterfield B. Compression wood in New Zealand radiata pine (2003).
Wood Quality Initiative Report No. STA 3, Rotorua, New Zealand.
Cown DJ, Young GD, Kimberley MO. Spiral grain patterns in plantation-grown Pinus
radiata. New Zealand Journal of Forestry Science (1991) 21:206-216.
Higgins MD. Imaging birefringent minerals without extinction using circularly polarised
light. The Canadian Mineralogist (2010) 48:231-235.
Johansson M, Perstorper M, Kliger R, Johansson G. Distortion of Norway spruce timber
Part 2. Modelling twist. Holz als Roh- und Werkstoff (2001) 59:155-162.
Sepúlveda P. Measurement of spiral grain with computed tomography. Journal of Wood
Science (2001) 47:289-293.
Tarvainen V. Measures for improving quality and shape stability of sawn softwood
timber during drying and under service conditions - Best practice manual to
improve straightness of sawn timber. (2005) VTT Publications Otamedia Oy,
Espoo, Finland.

Proceedings of the 58th International Convention of
Society of Wood Science and Technology
June 7-12, 2015 - Grand Teton National Park, Jackson, Wyoming, USA
185
Thomas J. An investigation on the formation and occurrence of spiral grain and
compression wood in radiata pine (Pinus radiata D. Don.). (2014) PhD Thesis,
School of Biological Sciences, University of Canterbury, Christchurch, New
Zealand.
Thomas J, Collings DA. Novel imaging and 3D rendering techniques to visualise spiral
grain in Pinus radiata. In: 57th International Convention of Society of Wood
Science and Technology, Barnes HM, Herian VL, eds. Technical University in
Zvolen, Zvolen, SLOVAKIA. Society of Wood Science and Technology, USA
(2014) 984-992.
Proceedings of the 58th International Convention of
Society of Wood Science and Technology
June 7-12, 2015 - Grand Teton National Park, Jackson, Wyoming, USA
186
Micro-compression of Solid Bamboo Fibers
Patrick Dixon, [email protected]
Lorna Gibson, [email protected]
Massachusetts Institute of Technology, 77 Massachusetts Avenue, Building
8-032, Cambridge, MA 02139
Abstract
Advances in micro- and nano-mechanical methods now allow for a direct measurement
of the mechanical properties of plant cell walls. One emerging technique is micro-
compression, in which micro-scale pillars are machined and compressed using a micro-
mechanical tester. Although this method has been initially employed on wood, it has yet
to be exploited for analysis of other plant materials such as bamboo. Bamboo has a fiber-
reinforced structure, consisting of vascular bundles with vessels surrounded by dense
longitudinal, sclerenchymatous fibers, embedded in a matrix of parenchyma cells. The
fiber properties can serve as an effective estimate of the solid cell wall properties. In this
study, micro-pillars are fabricated from high density fibers areas of Moso bamboo
(Phyllostachys pubescens Mazel). Micro-pillars, 25 µm in diameter, with aspect ratios
from 2 to 3, are created with a focused ion beam. The pillars are loaded in compression
using a nano-indenter with a flat-end 80 µm diameter punch. Our initial results on micro-
pillars compressed at a rate of 4 mN/s, give a compressive strength of 331.8 ± 31.0 MPa
(mean ± standard deviation). For comparison, literature values for micro-pillar
compression strengths of wood fiber cell wall lie in the range of 100 to 200 MPa. Further
work is establishing if this difference is due to experimental conditions (e.g. loading rate
control, loading rate) or truly points to the underlying reason for the extraordinary
strength of bamboo itself.
Proceedings of the 58th International Convention of
Society of Wood Science and Technology
June 7-12, 2015 - Grand Teton National Park, Jackson, Wyoming, USA
187
Energy Use and Sensitivity Analysis of Energy Inputs
ror Canola Production (Brassica Napus L.) in Iran
Payam Hooshmand, [email protected]
Adel Ranji, [email protected]
Hamid Khakrah, [email protected]
Sohrab Chandaz, [email protected]
Milad Hosseinpoor, [email protected]
Sharif University of Technology, Azadi St, , Tehran
Abstract
The objectives of this study were to determine the energy consumption and evaluation of
inputs sensitivity for Canola production (Brassica napus L.) in Mazandaran province,
Iran. The sensitivity of energy inputs was estimated using the marginal physical
productivity (MPP) method and partial regression coefficients on Canola yield. Data were
collected from 62 Canola farms in September 2012. The sample volume was determined
by random sampling method. The results revealed that total energy input for Canola
production was 29531 MJ ha-1; the non-renewable energy shared about 99 % while the
renewable energy did 1 %. Energy use efficiency, energy productivity, and net energy
were 1.53, 0.07 kg MJ-1, and∼15753 MJ ha-1, respectively. Econometric model
evaluation showed that seed energy was the most significant input which affects the
output level. Sensitivity analysis indicates that with an additional use of 1MJ of each of
the seed, Toxin and machinery energy would lead to an increase in yield by 35.618,
1.031and 0.271 kg, respectively. Also, the MPP of human labor energy was calculated to
be -16.886 implying that the use of human labor energy is in excess for canola
production, causing an environmental risk problem in the region.
Proceedings of the 58th International Convention of
Society of Wood Science and Technology
June 7-12, 2015 - Grand Teton National Park, Jackson, Wyoming, USA
188
Particleboards from Reed Canary Grass
Johann Trischler1* and Dick Sandberg2
1 PhD student, Department of Forestry and Wood Technology - Linnæus
University, SE-351 95 Växjö, Sweden
* Corresponding author
[email protected] 2 Professor, Department of Engineering Sciences and Mathematics - Luleå
University of Technology, SE-931 87 Skellefteå
Abstract
Particleboards are an important base for furniture production and interior use, and the
production process is in general optimized for wood as the main raw material.
Monocotyledons such as reed canary grass (Phalaris arundinacea L.) are an interesting
raw-material resource for particleboards, especially since monocotyledons are less
suitable than most wood species for thermal energy recovery and pulp and papermaking.
In this work, the use of reed canary grass for single-layer particleboards was studied. A
surface treatment with paper during pressing or a paper coating after pressing were also
tested as a way to increase their mechanical properties. A waterborne acryl-based
adhesive was used, and this allowed the reed canary grass to be used without any
additional pre-treatment. The boards were tested according to the EN 312 standard. The
results showed that the boards did not fulfil the requirements of the standard regarding
mechanical properties and thickness swelling but that a surface treatment gave a
considerable improvement in the mechanical properties. The low mechanical
performance of the boards is due to problems related to the production process, where it
appears that acrylic adhesive is not favourable for grass-based panel production.
Keywords: Acrylic adhesive, Mechanical properties, Monocotyledons, Panels, Surface
treatment.
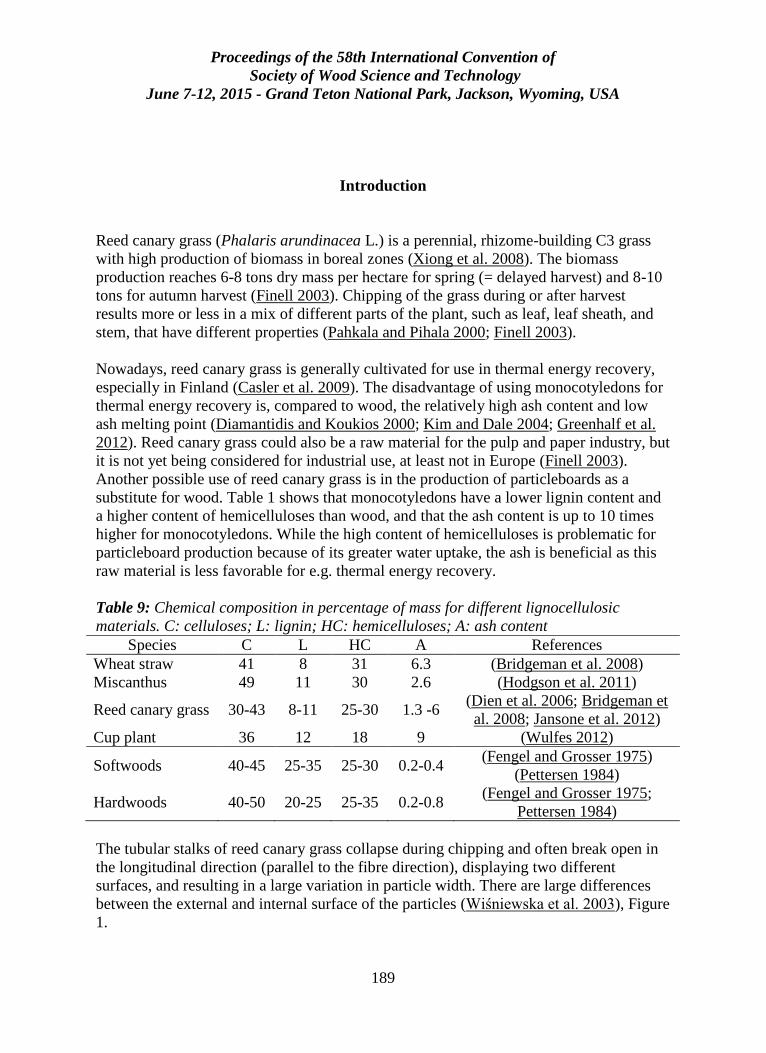
Proceedings of the 58th International Convention of
Society of Wood Science and Technology
June 7-12, 2015 - Grand Teton National Park, Jackson, Wyoming, USA
189
Introduction
Reed canary grass (Phalaris arundinacea L.) is a perennial, rhizome-building C3 grass
with high production of biomass in boreal zones (Xiong et al. 2008). The biomass
production reaches 6-8 tons dry mass per hectare for spring (= delayed harvest) and 8-10
tons for autumn harvest (Finell 2003). Chipping of the grass during or after harvest
results more or less in a mix of different parts of the plant, such as leaf, leaf sheath, and
stem, that have different properties (Pahkala and Pihala 2000; Finell 2003).
Nowadays, reed canary grass is generally cultivated for use in thermal energy recovery,
especially in Finland (Casler et al. 2009). The disadvantage of using monocotyledons for
thermal energy recovery is, compared to wood, the relatively high ash content and low
ash melting point (Diamantidis and Koukios 2000; Kim and Dale 2004; Greenhalf et al.
2012). Reed canary grass could also be a raw material for the pulp and paper industry, but
it is not yet being considered for industrial use, at least not in Europe (Finell 2003).
Another possible use of reed canary grass is in the production of particleboards as a
substitute for wood. Table 1 shows that monocotyledons have a lower lignin content and
a higher content of hemicelluloses than wood, and that the ash content is up to 10 times
higher for monocotyledons. While the high content of hemicelluloses is problematic for
particleboard production because of its greater water uptake, the ash is beneficial as this
raw material is less favorable for e.g. thermal energy recovery.
Table 9: Chemical composition in percentage of mass for different lignocellulosic
materials. C: celluloses; L: lignin; HC: hemicelluloses; A: ash content
Species C L HC A References
Wheat straw 41 8 31 6.3 (Bridgeman et al. 2008)
Miscanthus 49 11 30 2.6 (Hodgson et al. 2011)
Reed canary grass 30-43 8-11 25-30 1.3 -6 (Dien et al. 2006; Bridgeman et
al. 2008; Jansone et al. 2012)
Cup plant 36 12 18 9 (Wulfes 2012)
Softwoods 40-45 25-35 25-30 0.2-0.4 (Fengel and Grosser 1975)
(Pettersen 1984)
Hardwoods 40-50 20-25 25-35 0.2-0.8 (Fengel and Grosser 1975;
Pettersen 1984)
The tubular stalks of reed canary grass collapse during chipping and often break open in
the longitudinal direction (parallel to the fibre direction), displaying two different
surfaces, and resulting in a large variation in particle width. There are large differences
between the external and internal surface of the particles (Wiśniewska et al. 2003), Figure
1.
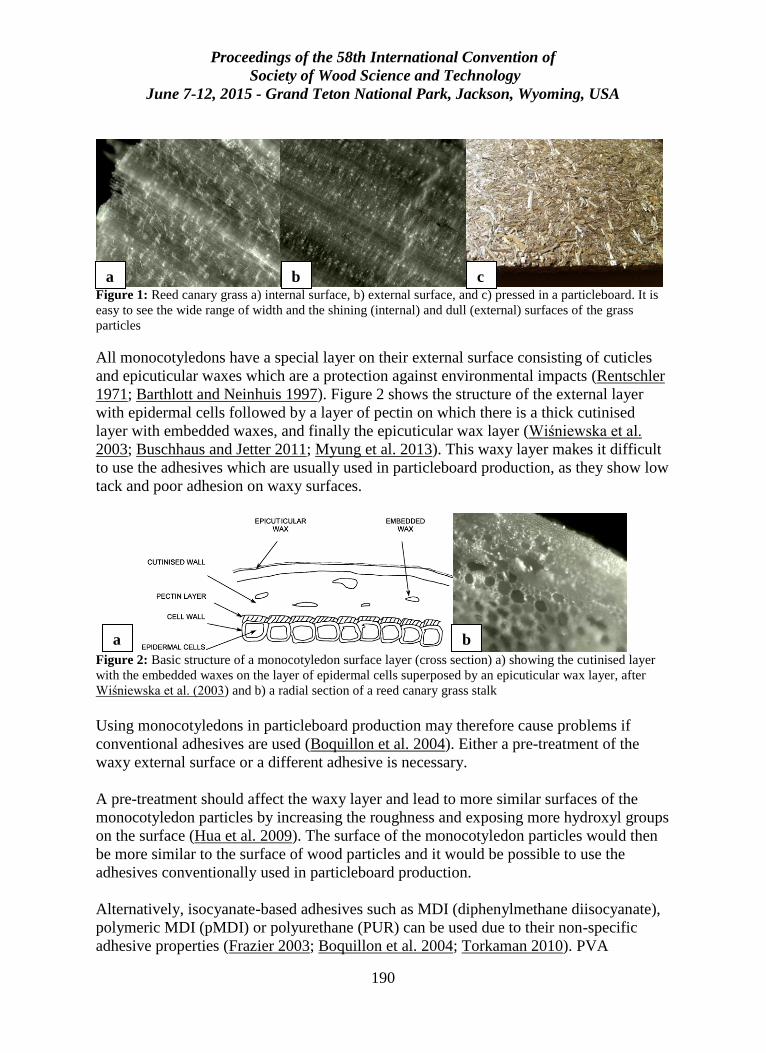
Proceedings of the 58th International Convention of
Society of Wood Science and Technology
June 7-12, 2015 - Grand Teton National Park, Jackson, Wyoming, USA
190
Figure 1: Reed canary grass a) internal surface, b) external surface, and c) pressed in a particleboard. It is
easy to see the wide range of width and the shining (internal) and dull (external) surfaces of the grass
particles
All monocotyledons have a special layer on their external surface consisting of cuticles
and epicuticular waxes which are a protection against environmental impacts (Rentschler
1971; Barthlott and Neinhuis 1997). Figure 2 shows the structure of the external layer
with epidermal cells followed by a layer of pectin on which there is a thick cutinised
layer with embedded waxes, and finally the epicuticular wax layer (Wiśniewska et al.
2003; Buschhaus and Jetter 2011; Myung et al. 2013). This waxy layer makes it difficult
to use the adhesives which are usually used in particleboard production, as they show low
tack and poor adhesion on waxy surfaces.
Figure 2: Basic structure of a monocotyledon surface layer (cross section) a) showing the cutinised layer
with the embedded waxes on the layer of epidermal cells superposed by an epicuticular wax layer, after
Wiśniewska et al. (2003) and b) a radial section of a reed canary grass stalk
Using monocotyledons in particleboard production may therefore cause problems if
conventional adhesives are used (Boquillon et al. 2004). Either a pre-treatment of the
waxy external surface or a different adhesive is necessary.
A pre-treatment should affect the waxy layer and lead to more similar surfaces of the
monocotyledon particles by increasing the roughness and exposing more hydroxyl groups
on the surface (Hua et al. 2009). The surface of the monocotyledon particles would then
be more similar to the surface of wood particles and it would be possible to use the
adhesives conventionally used in particleboard production.
Alternatively, isocyanate-based adhesives such as MDI (diphenylmethane diisocyanate),
polymeric MDI (pMDI) or polyurethane (PUR) can be used due to their non-specific
adhesive properties (Frazier 2003; Boquillon et al. 2004; Torkaman 2010). PVA
c a b
a b
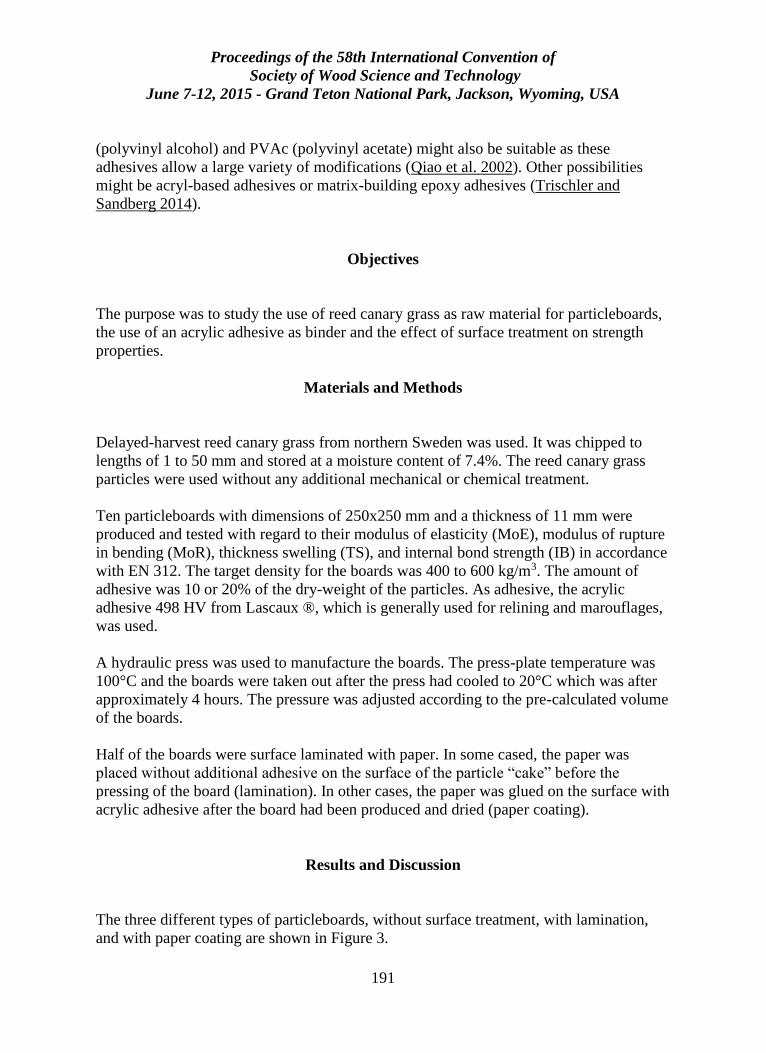
Proceedings of the 58th International Convention of
Society of Wood Science and Technology
June 7-12, 2015 - Grand Teton National Park, Jackson, Wyoming, USA
191
(polyvinyl alcohol) and PVAc (polyvinyl acetate) might also be suitable as these
adhesives allow a large variety of modifications (Qiao et al. 2002). Other possibilities
might be acryl-based adhesives or matrix-building epoxy adhesives (Trischler and
Sandberg 2014).
Objectives
The purpose was to study the use of reed canary grass as raw material for particleboards,
the use of an acrylic adhesive as binder and the effect of surface treatment on strength
properties.
Materials and Methods
Delayed-harvest reed canary grass from northern Sweden was used. It was chipped to
lengths of 1 to 50 mm and stored at a moisture content of 7.4%. The reed canary grass
particles were used without any additional mechanical or chemical treatment.
Ten particleboards with dimensions of 250x250 mm and a thickness of 11 mm were
produced and tested with regard to their modulus of elasticity (MoE), modulus of rupture
in bending (MoR), thickness swelling (TS), and internal bond strength (IB) in accordance
with EN 312. The target density for the boards was 400 to 600 kg/m3. The amount of
adhesive was 10 or 20% of the dry-weight of the particles. As adhesive, the acrylic
adhesive 498 HV from Lascaux ®, which is generally used for relining and marouflages,
was used.
A hydraulic press was used to manufacture the boards. The press-plate temperature was
100°C and the boards were taken out after the press had cooled to 20°C which was after
approximately 4 hours. The pressure was adjusted according to the pre-calculated volume
of the boards.
Half of the boards were surface laminated with paper. In some cased, the paper was
placed without additional adhesive on the surface of the particle “cake” before the
pressing of the board (lamination). In other cases, the paper was glued on the surface with
acrylic adhesive after the board had been produced and dried (paper coating).
Results and Discussion
The three different types of particleboards, without surface treatment, with lamination,
and with paper coating are shown in Figure 3.
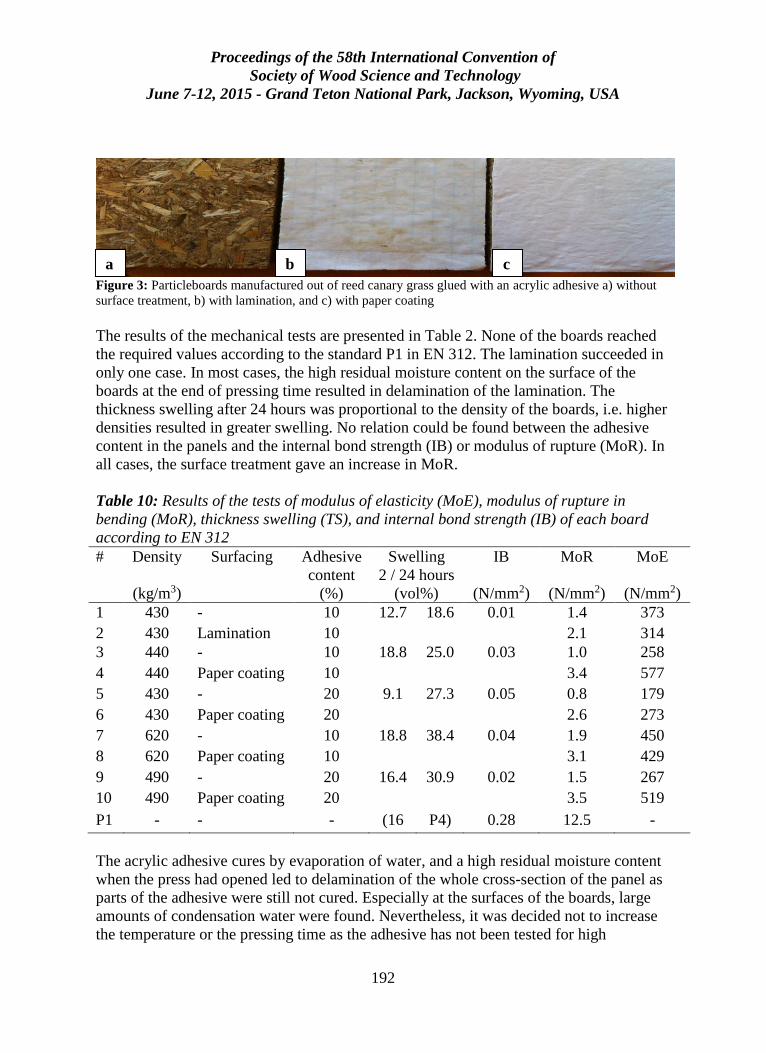
Proceedings of the 58th International Convention of
Society of Wood Science and Technology
June 7-12, 2015 - Grand Teton National Park, Jackson, Wyoming, USA
192
Figure 3: Particleboards manufactured out of reed canary grass glued with an acrylic adhesive a) without
surface treatment, b) with lamination, and c) with paper coating
The results of the mechanical tests are presented in Table 2. None of the boards reached
the required values according to the standard P1 in EN 312. The lamination succeeded in
only one case. In most cases, the high residual moisture content on the surface of the
boards at the end of pressing time resulted in delamination of the lamination. The
thickness swelling after 24 hours was proportional to the density of the boards, i.e. higher
densities resulted in greater swelling. No relation could be found between the adhesive
content in the panels and the internal bond strength (IB) or modulus of rupture (MoR). In
all cases, the surface treatment gave an increase in MoR.
Table 10: Results of the tests of modulus of elasticity (MoE), modulus of rupture in
bending (MoR), thickness swelling (TS), and internal bond strength (IB) of each board
according to EN 312
# Density
(kg/m3)
Surfacing Adhesive
content
(%)
Swelling
2 / 24 hours
(vol%)
IB
(N/mm2)
MoR
(N/mm2)
MoE
(N/mm2)
1 430 - 10 12.7 18.6 0.01 1.4 373
2 430 Lamination 10 2.1 314
3 440 - 10 18.8 25.0 0.03 1.0 258
4 440 Paper coating 10 3.4 577
5 430 - 20 9.1 27.3 0.05 0.8 179
6 430 Paper coating 20 2.6 273
7 620 - 10 18.8 38.4 0.04 1.9 450
8 620 Paper coating 10 3.1 429
9 490 - 20 16.4 30.9 0.02 1.5 267
10 490 Paper coating 20 3.5 519
P1 - - - (16 P4) 0.28 12.5 -
The acrylic adhesive cures by evaporation of water, and a high residual moisture content
when the press had opened led to delamination of the whole cross-section of the panel as
parts of the adhesive were still not cured. Especially at the surfaces of the boards, large
amounts of condensation water were found. Nevertheless, it was decided not to increase
the temperature or the pressing time as the adhesive has not been tested for high
a b c
c
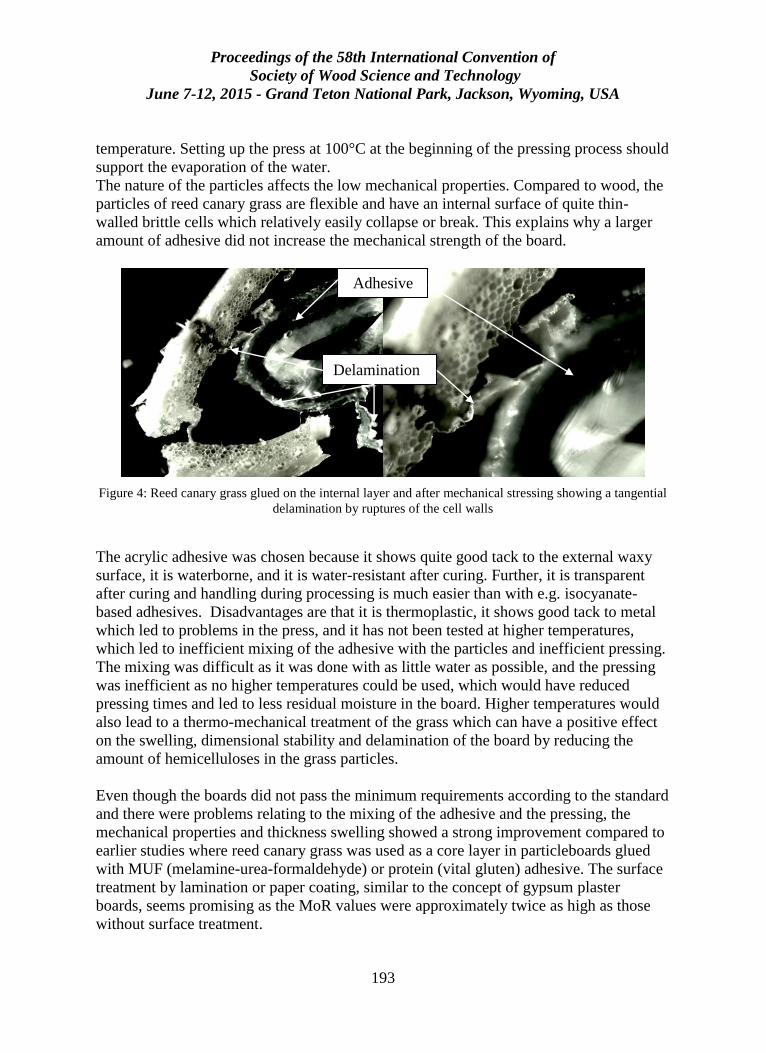
Proceedings of the 58th International Convention of
Society of Wood Science and Technology
June 7-12, 2015 - Grand Teton National Park, Jackson, Wyoming, USA
193
temperature. Setting up the press at 100°C at the beginning of the pressing process should
support the evaporation of the water.
The nature of the particles affects the low mechanical properties. Compared to wood, the
particles of reed canary grass are flexible and have an internal surface of quite thin-
walled brittle cells which relatively easily collapse or break. This explains why a larger
amount of adhesive did not increase the mechanical strength of the board.
Figure 4: Reed canary grass glued on the internal layer and after mechanical stressing showing a tangential
delamination by ruptures of the cell walls
The acrylic adhesive was chosen because it shows quite good tack to the external waxy
surface, it is waterborne, and it is water-resistant after curing. Further, it is transparent
after curing and handling during processing is much easier than with e.g. isocyanate-
based adhesives. Disadvantages are that it is thermoplastic, it shows good tack to metal
which led to problems in the press, and it has not been tested at higher temperatures,
which led to inefficient mixing of the adhesive with the particles and inefficient pressing.
The mixing was difficult as it was done with as little water as possible, and the pressing
was inefficient as no higher temperatures could be used, which would have reduced
pressing times and led to less residual moisture in the board. Higher temperatures would
also lead to a thermo-mechanical treatment of the grass which can have a positive effect
on the swelling, dimensional stability and delamination of the board by reducing the
amount of hemicelluloses in the grass particles.
Even though the boards did not pass the minimum requirements according to the standard
and there were problems relating to the mixing of the adhesive and the pressing, the
mechanical properties and thickness swelling showed a strong improvement compared to
earlier studies where reed canary grass was used as a core layer in particleboards glued
with MUF (melamine-urea-formaldehyde) or protein (vital gluten) adhesive. The surface
treatment by lamination or paper coating, similar to the concept of gypsum plaster
boards, seems promising as the MoR values were approximately twice as high as those
without surface treatment.
Adhesive
Delamination
Proceedings of the 58th International Convention of
Society of Wood Science and Technology
June 7-12, 2015 - Grand Teton National Park, Jackson, Wyoming, USA
194
The problems relating to the efficiency of the pressing process and the curing of the
acrylic adhesive mean that this type of adhesive is not interesting for grass-based panel
production. An enzymatic pre-treatment of the particles under anaerobic conditions might
be more promising. Such a treatment would not only lead to a reduction in fines and
possibly eliminate the thin-walled, easy destructible cells, but it would also remove the
waxy layer and decrease the silica content (Hua et al. 2009; Shen et al. 2011).
Conventional adhesives such as MUF then give acceptable results.
Conclusions
Particleboards were manufactured out of reed canary grass (Phalaris arundinacea L.)
glued with an acrylic adhesive. On some of the boards a surface treatment in the form of
lamination or paper coating was applied. The boards were tested according to the
standard EN 312. None of the boards met the minimum requirements with regard to
mechanical properties, due not only to problems relating to the production process of the
boards but probably also to the low density and the nature of the grass particles. Due the
problems with the adhesive during the production process, acrylic adhesive cannot be
recommended for the production of grass-based particleboards. A surface liner was
shown to improve the mechanical properties of the boards, and lamination during the
pressing was an especially promising way of strengthening this kind of panel.
References
Barthlott, W., and Neinhuis, C. 1997. Purity of the sacred lotus, or escape from
contamination in biological surfaces. Planta 202(1): 1-8.
Boquillon, N., Elbez, G., and Schönfeld, U. 2004. Properties of wheat straw
particleboards bounded with different types of resin. Journal of Wood Science
50(3): 230-235.
Bridgeman, T.G., Jones, J.M., Shield, I., and Williams, P.T. 2008. Torrefaction of reed
canary grass, wheat straw and willow to enhance solid fuel qualities and
combustion properties. Fuel 87(6): 844-856.
Buschhaus, C., and Jetter, R. 2011. Composition differences between epicuticular and
intracuticular wax substructures: How do plants seal their epidermal surfaces?
Journal of Experimental Botany 62(3): 841-853.
Proceedings of the 58th International Convention of
Society of Wood Science and Technology
June 7-12, 2015 - Grand Teton National Park, Jackson, Wyoming, USA
195
Casler, M., Cherney, J., and Brummer, E.C. 2009. Biomass yield of naturalized
populations and cultivars of reed canary grass. BioEnergy Research 2(3): 165-
173.
Diamantidis, N.D., and Koukios, E.G. 2000. Agricultural crops and residues as
feedstocks for non-food products in Western Europe. Industrial Crops and
Products 11(2–3): 97-106.
Dien, B.S., Jung, H.-J.G., Vogel, K.P., Casler, M.D., Lamb, J.F.S., Iten, L., Mitchell,
R.B., and Sarath, G. 2006. Chemical composition and response to dilute-acid
pretreatment and enzymatic saccharification of alfalfa, reed canarygrass, and
switchgrass. Biomass and Bioenergy 30(10): 880-891.
Fengel, D., and Grosser, D. 1975. Chemische Zusammensetzung von Nadel- und
Laubhölzern. Holz als Roh- und Werkstoff 33(1): 32-34.
Finell, M. 2003. The use of reed canary grass (Phalaris arundinacea) as a short fibre raw
material for the pulp- and paper industry, Umeå, Sweden: Swedish University of
Agricultural Sciences.
Frazier, C.E. 2003. Isocyanate Wood Binders In: Handbook of Adhesive Technology,
Revised and Expanded, A. Pizzi and K.L. Mittal, eds. 2003. New York, NY:
Taylor & Francis (Marcel Dekker Inc.).
Greenhalf, C.E., Nowakowski, D.J., Bridgwater, A.V., Titiloye, J., Yates, N., Riche, A.,
and Shield, I. 2012. Thermochemical characterisation of straws and high yielding
perennial grasses. Industrial Crops and Products 36(1): 449-459.
Hodgson, E.M., Nowakowski, D.J., Shield, I., Riche, A., Bridgwater, A.V., Clifton-
Brown, J.C., and Donnison, I.S. 2011. Variation in miscanthus chemical
composition and implications for conversion by pyrolysis and thermo-chemical
bio-refining for fuels and chemicals. Bioresource Technology 102(3): 3411-3418.
Hua, J., Yang, Z., and Xuefei, W. 2009. Effect of lipases on the surface properties of
wheat straw. Industrial Crops & Products 30(2): 304-310.
Jansone, B., Rancane, S., Berzins, P., and Stesele, V. 2012. Reed canary grass (Phalaris
arundinacea L.) in natural biocenosis of Latvia, research experiments and
production fields. In: International Scientific Conference: Renewable Energy and
Energy Efficiency, Jelgava (Latvia), 28-30 May 2012, J. Latvia University of
Agriculture, ed. 2012. Jelgava, Latvia: Latvia University of Agriculture: 61-65.
Kim, S., and Dale, B.E. 2004. Global potential bioethanol production from wasted crops
and crop residues. Biomass and Bioenergy 26(4): 361-375.
Proceedings of the 58th International Convention of
Society of Wood Science and Technology
June 7-12, 2015 - Grand Teton National Park, Jackson, Wyoming, USA
196
Myung, K., Parobek, A.P., Godbey, J.A., Bowling, A.J., and Pence, H.E. 2013.
Interaction of organic solvents with the epicuticular wax layer of wheat leaves.
Journal of Agricultural and Food Chemistry 61(37): 8737-8742.
Pahkala, K., and Pihala, M. 2000. Different plant parts as raw material for fuel and pulp
production. Industrial Crops and Products 11(2–3): 119-128.
Pettersen, R.C. 1984. The chemical composition of wood. In: The chemistry of solid
wood. Advances in chemistry series 207, R.M. Rowell, ed. 1984. Washington
DC: American Chemical Society 57-126.
Qiao, L., Coveny, P.K., and Easteal, A.J. 2002. Modifications of poly(vinyl alcohol) for
use in poly(vinyl acetate) emulsion wood adhesives. Pigment and Resin
Technology 31(2): 88-95.
Rentschler, I. 1971. Die Wasserbenetzbarkeit von Blattoberflächen und ihre
submikroskopische Wachsstruktur. Planta 96(2): 119-135.
Shen, J.-h., Liu, Z.-m., Li, J., and Niu, J. 2011. Wettability changes of wheat straw
treated with chemicals and enzymes. Journal of Forestry Research 22(1): 107-110.
Torkaman, J. 2010. Improvement of Bondability in Rice Husk Particleboard Made With
Sodium Silicate Ancona, Italy: Taylor & Francis/Balkema.
Trischler, J., and Sandberg, D. 2014. Monocotyledons in particleboard production :
Adhesives, additives, and surface modification of reed canary grass.
BioResources 9(3): 3919-3938.
Wiśniewska, S.K., Nalaskowski, J., Witka-Jeżewska, E., Hupka, J., and Miller, J.D. 2003.
Surface properties of barley straw. Colloids and Surfaces B: Biointerfaces 29(2–
3): 131-142.
Wulfes, R. 2012. Alternativen zu Mais – praktische Erfahrungen mit Produktion und
Verarbeitung neuer Substrate –. Praxis der Biomassenutzung,
Kompetenzzentrum_Biomassenutzung, ed., FH Kiel, FB Agrarwirtschaft,
Rendsburg/Osterrönfeld.
Xiong, S., Lötjönen, T., and Knuuttila, K. 2008. Energiproduktion från rörflen: Handbok
för el och värmeproduktion (Energy conversion with reed canary grass: a guide
for electricity and heat production), Umeå, Sweden: Swedish University of
Agricultures, Unit of Biomass Technology and Chemistry.
Proceedings of the 58th International Convention of
Society of Wood Science and Technology
June 7-12, 2015 - Grand Teton National Park, Jackson, Wyoming, USA
197
Tailoring the Addition of Moso Strands to Enhance the
Properties of OSB but Reducing Board Density
Polo K. Zhang 1 – Kate E. Semple2 - Greg D. Smith3*
1 M.Sc. Student, Department of Wood Science, Faculty of Forestry,
University of British Columbia, Vancouver BC, Canada.
[email protected] 2 Research Scientist, Department of Wood Science, Faculty of Forestry,
University of British Columbia, Vancouver BC, Canada.
[email protected] 3 Associate Professor, Department of Wood Science, Faculty of Forestry,
University of British Columbia, Vancouver BC, Canada.
* Corresponding author
Abstract
Moso bamboo (Phyllostachys pubescens Mazel) has great potential for improving the
properties of wood-based strand composite building materials. In previous work we have
shown that replacement of aspen surface strands with Moso bamboo strands significantly
improves the strength and water resistance of oriented strand board (OSB) of the same
density made from Aspen. However due to the greater density of bamboo, composite
product density is an issue for development of building materials from bamboo. The aim
of this work is to produce a low density bamboo–surface OSB that still meets CSA-
O437.0 (2011) requirements for OSB. Three sets of six three-layer OSB were made with
Moso bamboo strands in the surfaces and Aspen strands in the core. Board types are 1)
MM: 50% bamboo (surfaces)/50% Aspen (core), target density = 760 kg/m3, 2) MH:
25% bamboo (surface)/75% Aspen (core), target density = 720 kg/m3, and 3) ML: same
composition as Type 2, but pressed to a target density of 640 kg/m3. Measured board
strength properties include internal bond (IB), flexural properties (modulus of rupture, -
MOR; and modulus of elasticity, -MOE), and water resistance (% thickness swell, TS;
and % water absorption, WA). ML were fabricated to lowest density for structural
products specified in CSA-O437.0 (2011). It was also the lowest in mechanical properties
and the water resistance, but still met CSA-O437 minimum properties. This bamboo-
substituted OSB therefore has good potential as a substitute for conventional wood OSB
of similar density.
Proceedings of the 58th International Convention of
Society of Wood Science and Technology
June 7-12, 2015 - Grand Teton National Park, Jackson, Wyoming, USA
198
Keywords: Moso bamboo, OSB, density, mechanical properties, CSA-O437.0, structural
materials
Introduction
Bamboo (Poaceae/Graminaceae) is a fast growing giant grass and can have better
toughness and orientation properties than wood owing to its unique microscopic structure
and chemical composition (Li 2004). Among over one thousand species of bamboo
(Austin and Ueda 1971), Moso (Phyllostachys pubescens Mazel) is one of the few
commercially used species. Lee et al. (1996) has proved the manufacture of strand boards
from Moso bamboo is technically feasible. Although both physical and mechanical
properties of bamboo oriented strand boards could meet industry-level standards (Lee et
al.1996), the density of bamboo composites is often too high to be a practical direct
substitute for commodity OSB manufactured from wood. However, the great
concentration of vascular bundles makes the bamboo denser (Ghavami 2005). On the
other hand, the strength of bamboo depends largely on the number of the vascular
bundles (Lo et al. 2008). In our previous work (Semple et al. 2015) mixed Moso bamboo
and Aspen (Populus tremuloides Michx.) wood strands together to produce a 3-layer
Moso surfaces/Aspen core OSB with a density around 740 kg/m3. However, according to
CSA O437.0 (2011), the required density for OSB panels should be around 640 kg/m3.
The main objective of this study is to fabricate lower density Moso-Aspen hybrid OSBs
which meet the CSA-O437.0 requirements for mechanical properties and water
resistance.
Materials and Methods
Culm feedstock: 20 poles of 5-inch (12.7 cm) diameter Chinese Moso culm stock in 8
foot lengths were purchased from Canada’s Bamboo World, located in Chilliwack, BC,
who import Moso culms from Zhejiang Province in China. The Moso culms had an
average diameter of 101.7 mm with an average weight of 6.6 kg. After cross-cutting, the
volume of small specimens cut from the culms was measured using the water
displacement method. With an average moisture content at 19.25±1.1%, the oven dry
density of the culm is 744.8±21.4 kg/m³.
Stranding: Pre-saturated culm pieces measuring 130 mm long were converted to strands
using a laboratory disk strander (CAE 6/36 single-blade disk) built by Carmanah Desigh
and Manufacturing, Vancouver, BC. Disk rotational speed was set at 734 RPM, and knife
projection was set at 0.675mm to give an average target strand thickness of 0.65 mm.
Counter knife angle was 45° with a hydraulic piston-driven feed buffer rate of 0.37
m/min. Sheet metal shims measuring 0.002 inch in thickness are used to make tiny
changes in the knife protrusion from its original block. A magnetic mounted dial gauge
was used to measure the knife protrusion. From preliminary stranding trials (Smola 2013,
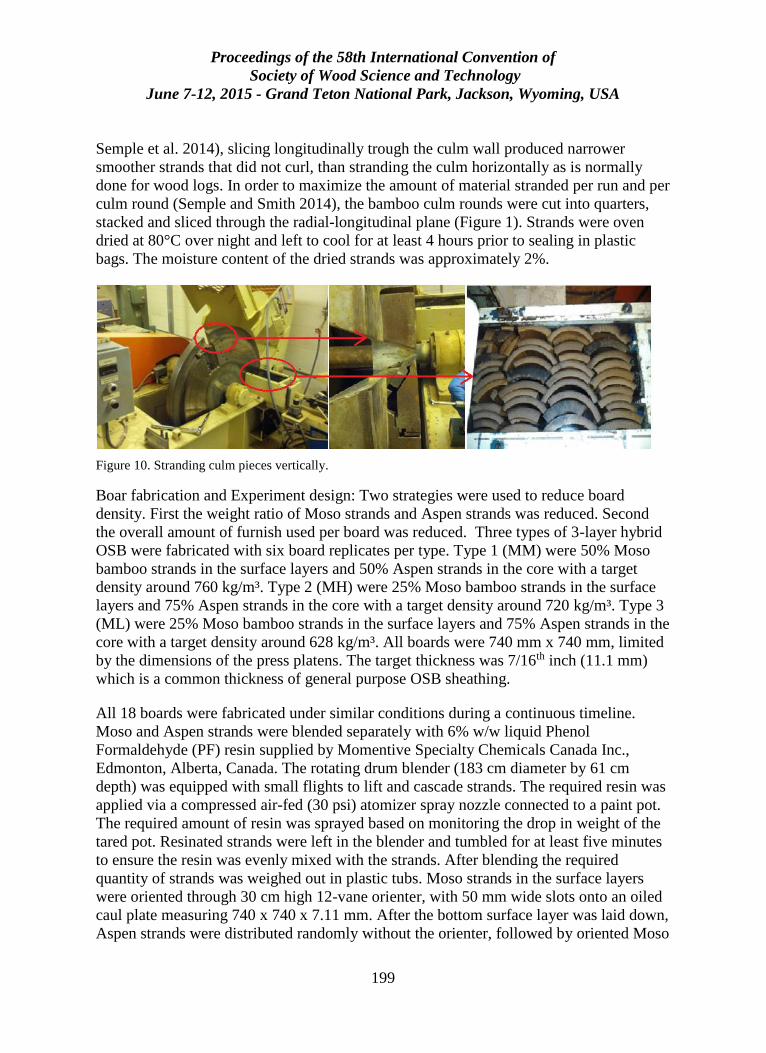
Proceedings of the 58th International Convention of
Society of Wood Science and Technology
June 7-12, 2015 - Grand Teton National Park, Jackson, Wyoming, USA
199
Semple et al. 2014), slicing longitudinally trough the culm wall produced narrower
smoother strands that did not curl, than stranding the culm horizontally as is normally
done for wood logs. In order to maximize the amount of material stranded per run and per
culm round (Semple and Smith 2014), the bamboo culm rounds were cut into quarters,
stacked and sliced through the radial-longitudinal plane (Figure 1). Strands were oven
dried at 80°C over night and left to cool for at least 4 hours prior to sealing in plastic
bags. The moisture content of the dried strands was approximately 2%.
Figure 10. Stranding culm pieces vertically.
Boar fabrication and Experiment design: Two strategies were used to reduce board
density. First the weight ratio of Moso strands and Aspen strands was reduced. Second
the overall amount of furnish used per board was reduced. Three types of 3-layer hybrid
OSB were fabricated with six board replicates per type. Type 1 (MM) were 50% Moso
bamboo strands in the surface layers and 50% Aspen strands in the core with a target
density around 760 kg/m³. Type 2 (MH) were 25% Moso bamboo strands in the surface
layers and 75% Aspen strands in the core with a target density around 720 kg/m³. Type 3
(ML) were 25% Moso bamboo strands in the surface layers and 75% Aspen strands in the
core with a target density around 628 kg/m³. All boards were 740 mm x 740 mm, limited
by the dimensions of the press platens. The target thickness was 7/16th inch (11.1 mm)
which is a common thickness of general purpose OSB sheathing.
All 18 boards were fabricated under similar conditions during a continuous timeline.
Moso and Aspen strands were blended separately with 6% w/w liquid Phenol
Formaldehyde (PF) resin supplied by Momentive Specialty Chemicals Canada Inc.,
Edmonton, Alberta, Canada. The rotating drum blender (183 cm diameter by 61 cm
depth) was equipped with small flights to lift and cascade strands. The required resin was
applied via a compressed air-fed (30 psi) atomizer spray nozzle connected to a paint pot.
The required amount of resin was sprayed based on monitoring the drop in weight of the
tared pot. Resinated strands were left in the blender and tumbled for at least five minutes
to ensure the resin was evenly mixed with the strands. After blending the required
quantity of strands was weighed out in plastic tubs. Moso strands in the surface layers
were oriented through 30 cm high 12-vane orienter, with 50 mm wide slots onto an oiled
caul plate measuring 740 x 740 x 7.11 mm. After the bottom surface layer was laid down,
Aspen strands were distributed randomly without the orienter, followed by oriented Moso
Proceedings of the 58th International Convention of
Society of Wood Science and Technology
June 7-12, 2015 - Grand Teton National Park, Jackson, Wyoming, USA
200
strands on the top surface. The mat was flattened with a plywood sheet and covered with
a second oiled caul plate. The whole assembly was hot pressed at 150 °C for 15 minutes.
During this process, maximum mat compaction pressure was 5.8 MPa for about 14
minutes. After pressing the board was removed, cooled, weighed and labeled with back
RH(right hand) corner of press, board number (1-6) and Type (MM, MH or ML).
Specimen cutting: to reduce the influence of possible variability in temperature in the hot
press platens, three different cutting patterns were used (two boards per type cut using
each pattern) to redistribute the test specimens relative to location in press. In all the
patterns, 30 IB specimens (51 x 51 mm) were located in different zones on the board.
Four bending test specimens (290 x 76 mm) were located with two parallel-to-strands and
two perpendicular-to-strands direction pieces for each board. One thickness swelling test
specimen (152 x 152 mm) was cut per board. After cutting, each test specimen was
labeled with board type, board (replicate) number, and test piece (observation) number.
All specimens were conditioned at a relative humidity of 65±2% and a temperature of 20
± 2°C to a constant average MC of 2% in accordance with ASTM D1037 (2012).
Specimens were kept in the conditioning room till the weight change during 24hrs was
less than 2%.
Results and Discussion
All results were analyzed using single-factor ANOVA (i.e. board type) in JMP 10 (SAS
Institute, Inc. 2012), using the 5% probability level. Means were compared for all pairs of
means using the Tukey-Kramer HSD evaluation. Board density and thickness were
derived from measurements IB specimens and are given in Table 1. In CSA-O437.0
(2011), O-2 class OSB is recognized as being structurally equivalent to plywood when
used as roof, wall and floor sheathing. Thus our results are compared to the requirements
for O-2 class to determine whether low density bamboo hybrid OSB may be qualified to
substitute for structural wood OSB.
Thickness and density: Due to the spring back of the board after the pressure was
released after press opening, board thickness exceeded the target thickness of 11.1 mm by
an average of 0.42 mm. Between the three board types, the differences in average
thickness was statistically significant (p<0.0001). 50% w/w Moso hybrid boards (MM)
showed the greatest springback, while 25% w/w Moso hybrid low density boards (ML)
showed the lowest (Table 1). Note that the levels in the table not connected by same letter
are significantly different (same meaning for all the tables following). Most board types
were slightly higher in density than the target pressing density, despite the spring-back:
MM boards exceeded the target density of 760 kg/m3 by 0.60%; MH exceeded its target
of 720 kg/m3 by 1.15%; and ML exceeded its target of 628 kg/m3 by 1.08%.
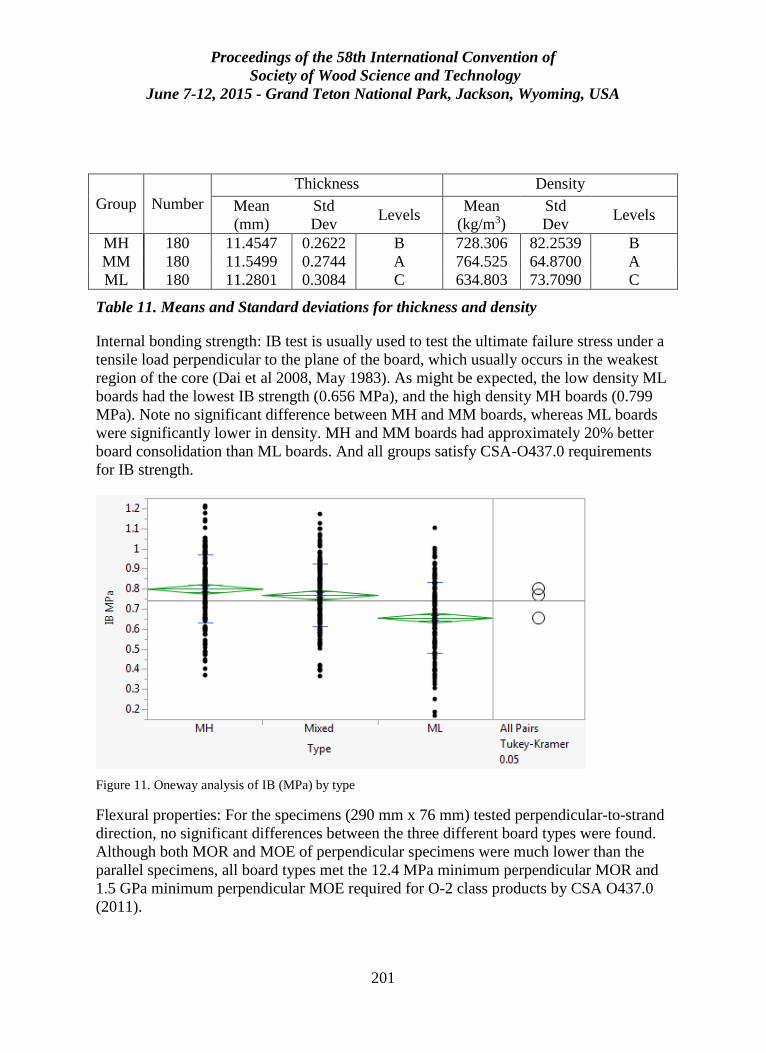
Proceedings of the 58th International Convention of
Society of Wood Science and Technology
June 7-12, 2015 - Grand Teton National Park, Jackson, Wyoming, USA
201
Group Number
Thickness Density
Mean
(mm)
Std
Dev Levels
Mean
(kg/m3)
Std
Dev Levels
MH 180 11.4547 0.2622 B 728.306 82.2539 B
MM 180 11.5499 0.2744 A 764.525 64.8700 A
ML 180 11.2801 0.3084 C 634.803 73.7090 C
Table 11. Means and Standard deviations for thickness and density
Internal bonding strength: IB test is usually used to test the ultimate failure stress under a
tensile load perpendicular to the plane of the board, which usually occurs in the weakest
region of the core (Dai et al 2008, May 1983). As might be expected, the low density ML
boards had the lowest IB strength (0.656 MPa), and the high density MH boards (0.799
MPa). Note no significant difference between MH and MM boards, whereas ML boards
were significantly lower in density. MH and MM boards had approximately 20% better
board consolidation than ML boards. And all groups satisfy CSA-O437.0 requirements
for IB strength.
Figure 11. Oneway analysis of IB (MPa) by type
Flexural properties: For the specimens (290 mm x 76 mm) tested perpendicular-to-strand
direction, no significant differences between the three different board types were found.
Although both MOR and MOE of perpendicular specimens were much lower than the
parallel specimens, all board types met the 12.4 MPa minimum perpendicular MOR and
1.5 GPa minimum perpendicular MOE required for O-2 class products by CSA O437.0
(2011).
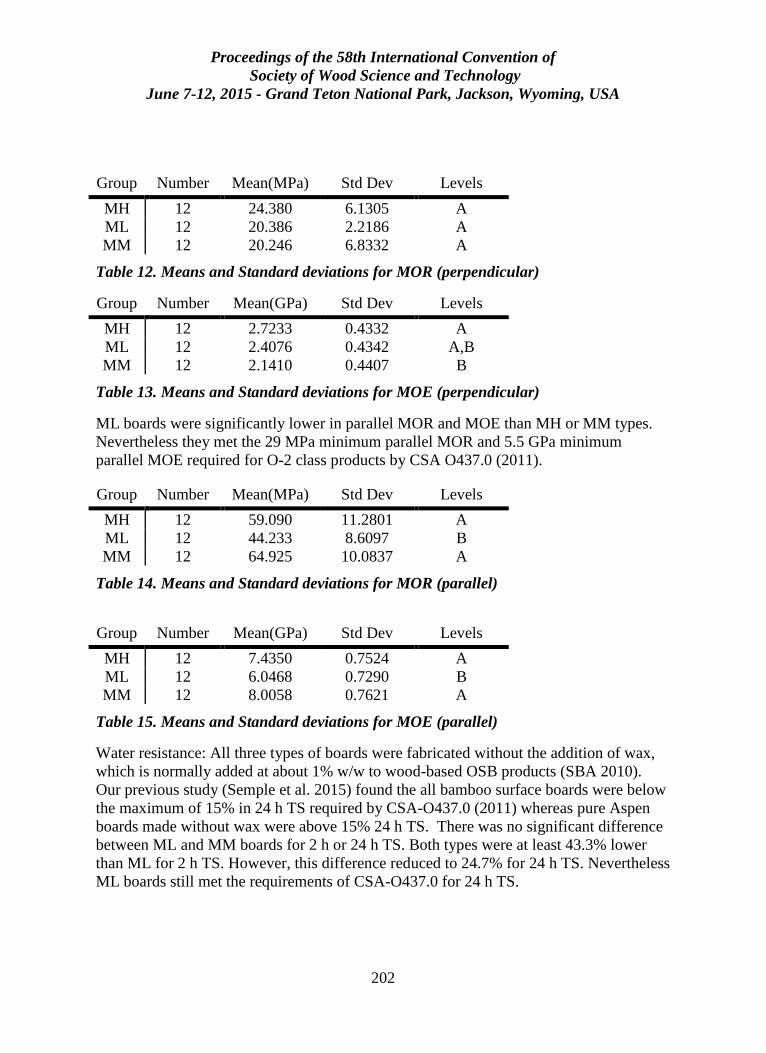
Proceedings of the 58th International Convention of
Society of Wood Science and Technology
June 7-12, 2015 - Grand Teton National Park, Jackson, Wyoming, USA
202
Group Number Mean(MPa) Std Dev Levels
MH 12 24.380 6.1305 A
ML 12 20.386 2.2186 A
MM 12 20.246 6.8332 A
Table 12. Means and Standard deviations for MOR (perpendicular)
Group Number Mean(GPa) Std Dev Levels
MH 12 2.7233 0.4332 A
ML 12 2.4076 0.4342 A,B
MM 12 2.1410 0.4407 B
Table 13. Means and Standard deviations for MOE (perpendicular)
ML boards were significantly lower in parallel MOR and MOE than MH or MM types.
Nevertheless they met the 29 MPa minimum parallel MOR and 5.5 GPa minimum
parallel MOE required for O-2 class products by CSA O437.0 (2011).
Group Number Mean(MPa) Std Dev Levels
MH 12 59.090 11.2801 A
ML 12 44.233 8.6097 B
MM 12 64.925 10.0837 A
Table 14. Means and Standard deviations for MOR (parallel)
Group Number Mean(GPa) Std Dev Levels
MH 12 7.4350 0.7524 A
ML 12 6.0468 0.7290 B
MM 12 8.0058 0.7621 A
Table 15. Means and Standard deviations for MOE (parallel)
Water resistance: All three types of boards were fabricated without the addition of wax,
which is normally added at about 1% w/w to wood-based OSB products (SBA 2010).
Our previous study (Semple et al. 2015) found the all bamboo surface boards were below
the maximum of 15% in 24 h TS required by CSA-O437.0 (2011) whereas pure Aspen
boards made without wax were above 15% 24 h TS. There was no significant difference
between ML and MM boards for 2 h or 24 h TS. Both types were at least 43.3% lower
than ML for 2 h TS. However, this difference reduced to 24.7% for 24 h TS. Nevertheless
ML boards still met the requirements of CSA-O437.0 for 24 h TS.
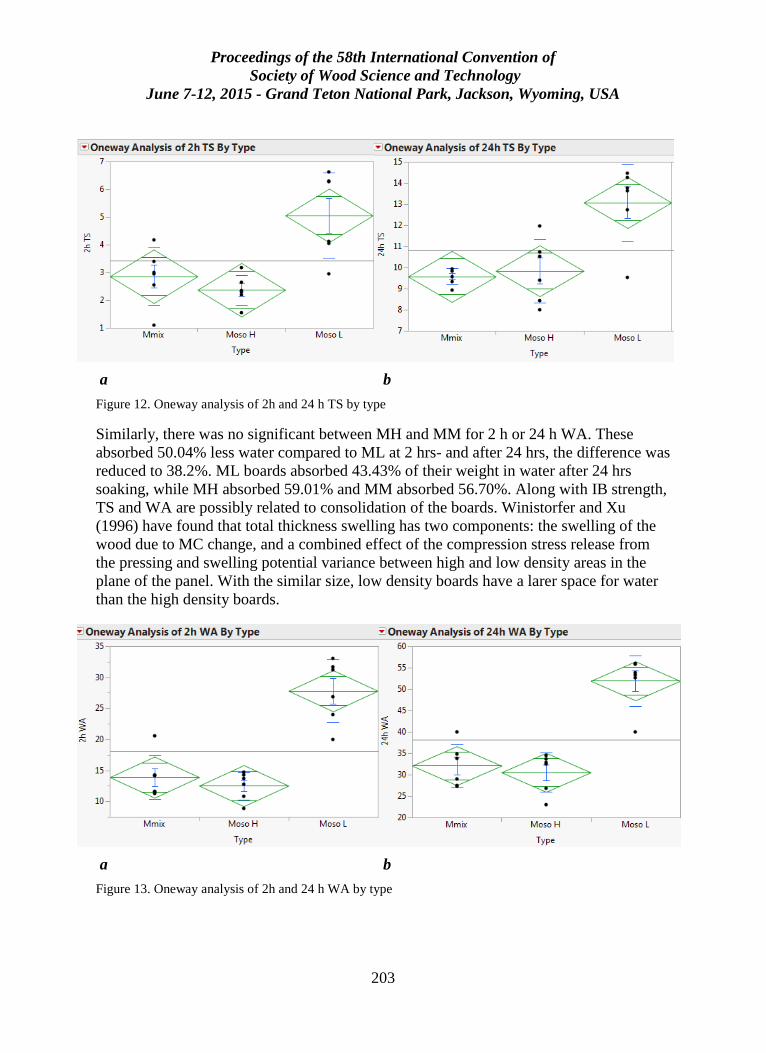
Proceedings of the 58th International Convention of
Society of Wood Science and Technology
June 7-12, 2015 - Grand Teton National Park, Jackson, Wyoming, USA
203
a b
Figure 12. Oneway analysis of 2h and 24 h TS by type
Similarly, there was no significant between MH and MM for 2 h or 24 h WA. These
absorbed 50.04% less water compared to ML at 2 hrs- and after 24 hrs, the difference was
reduced to 38.2%. ML boards absorbed 43.43% of their weight in water after 24 hrs
soaking, while MH absorbed 59.01% and MM absorbed 56.70%. Along with IB strength,
TS and WA are possibly related to consolidation of the boards. Winistorfer and Xu
(1996) have found that total thickness swelling has two components: the swelling of the
wood due to MC change, and a combined effect of the compression stress release from
the pressing and swelling potential variance between high and low density areas in the
plane of the panel. With the similar size, low density boards have a larer space for water
than the high density boards.
a b
Figure 13. Oneway analysis of 2h and 24 h WA by type
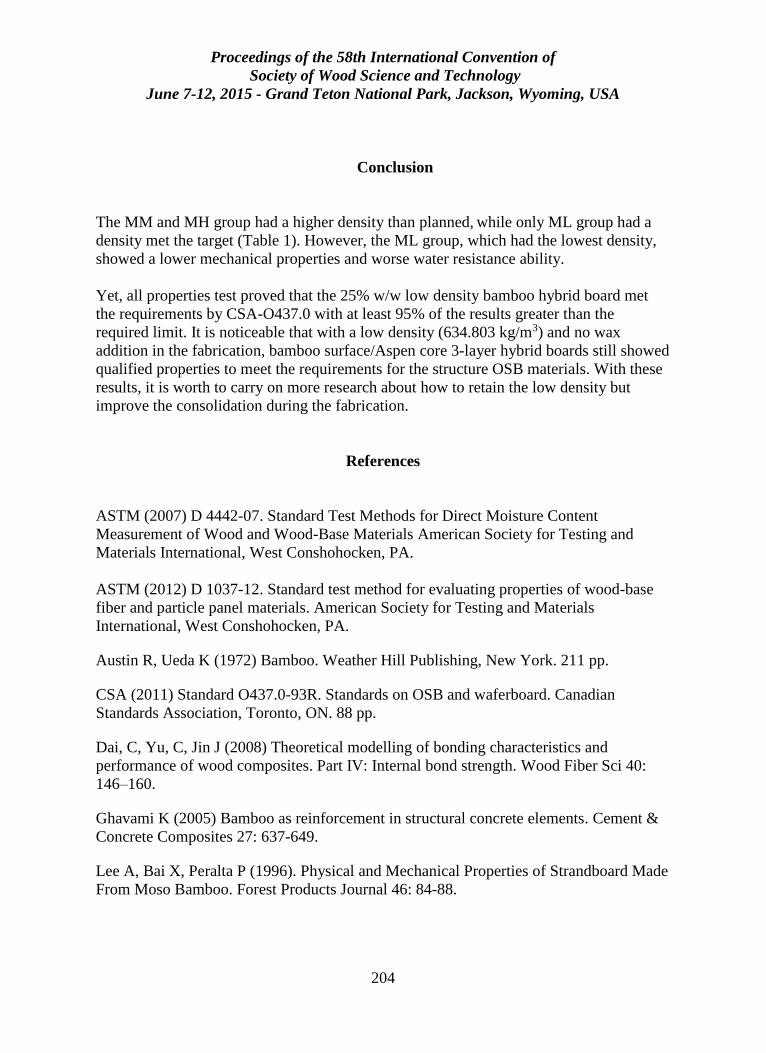
Proceedings of the 58th International Convention of
Society of Wood Science and Technology
June 7-12, 2015 - Grand Teton National Park, Jackson, Wyoming, USA
204
Conclusion
The MM and MH group had a higher density than planned, while only ML group had a
density met the target (Table 1). However, the ML group, which had the lowest density,
showed a lower mechanical properties and worse water resistance ability.
Yet, all properties test proved that the 25% w/w low density bamboo hybrid board met
the requirements by CSA-O437.0 with at least 95% of the results greater than the
required limit. It is noticeable that with a low density (634.803 kg/m3) and no wax
addition in the fabrication, bamboo surface/Aspen core 3-layer hybrid boards still showed
qualified properties to meet the requirements for the structure OSB materials. With these
results, it is worth to carry on more research about how to retain the low density but
improve the consolidation during the fabrication.
References
ASTM (2007) D 4442-07. Standard Test Methods for Direct Moisture Content
Measurement of Wood and Wood-Base Materials American Society for Testing and
Materials International, West Conshohocken, PA.
ASTM (2012) D 1037-12. Standard test method for evaluating properties of wood-base
fiber and particle panel materials. American Society for Testing and Materials
International, West Conshohocken, PA.
Austin R, Ueda K (1972) Bamboo. Weather Hill Publishing, New York. 211 pp.
CSA (2011) Standard O437.0-93R. Standards on OSB and waferboard. Canadian
Standards Association, Toronto, ON. 88 pp.
Dai, C, Yu, C, Jin J (2008) Theoretical modelling of bonding characteristics and
performance of wood composites. Part IV: Internal bond strength. Wood Fiber Sci 40:
146–160.
Ghavami K (2005) Bamboo as reinforcement in structural concrete elements. Cement &
Concrete Composites 27: 637-649.
Lee A, Bai X, Peralta P (1996). Physical and Mechanical Properties of Strandboard Made
From Moso Bamboo. Forest Products Journal 46: 84-88.
Proceedings of the 58th International Convention of
Society of Wood Science and Technology
June 7-12, 2015 - Grand Teton National Park, Jackson, Wyoming, USA
205
Li X (2004) Physical, Chemical, and Mechanical Properties of Bamboo and Its
Utilization Potential for Fiberboard Manufacturing Anatomical. Doctoral thesis, Beijing
Forestry University, Beijing, PRC. 68 pp.
Lo T, Cui H, Tang, P, Leung H (2008). Strength Analysis of Bamboo by Microscopic
Investigation of Bamboo Fibre. Construction and Building Materials 22: 1532-1535.
May HA (1983) Relationship between properties, raw materials, and the density profile
of particleboard. Part 4: effects of density differences and raw materials on the tensile
strength perpendicular to the boards plane and the shear strength, . Holz als Roh-und
Werkstoff 41: 271–275.
SAS Institute, Inc. (2012) JMP Version 10: Discovering JMP. SAS Institute Inc., Cary,
NC. 154 pp
Semple KE, Smith GD (2014). Theoretical Models For Bamboo Strand Width
Distribution. Pages 401-408 in Proceedings of the 3rd International Conf. on Processing
Technologies for Forest and Bio-based Products Industries (PTF BPI 2014), 24-26
September 2014, Kuchl/Salzburg, Austria.
Semple KE, Smola M, Hoffman J, Smith GD (2014). Optimising the stranding of Moso
bamboo (Phyllostachys pubescens Mazel) culms using a CAE 6/36 disk flaker. Pages 257
- 269 in M Barnes and V Herian (eds) Proceedings of the 57th International Convention of
Society of Wood Science and Technology, 23-27 June, 2014, Zvolen, Slovakia.
Semple KE, Zhang PK, Smola M, Smith GD (2015) Uni-layer and three-layer Oriented
Strand Boards made from mixtures of Moso bamboo (Phyllostachys pubescens Mazel)
and Aspen (Populus tremuloides Michx.) strands. European Journal of Wood and Wood
Products, accepted in 2015.
Smola M (2013). Producing Structural Elements from Moso Bamboo Culms.
Unpublished Thesis.Fachhochscheule Rosenheim University, Rosenheim, German.
SBA – Structural Board Association (2010). Binders and waxes in OSB. Technical
Bulletin. http://osbguide.tecotested.com/pdfs/en/tb114.pdf. (January 2013).
Winistorfer PM, Xu W (1996) Layer water absorption of medium density fiberboard and
oriented strandboard. Forest Products Journal, 46(6), 69-72
Proceedings of the 58th International Convention of
Society of Wood Science and Technology
June 7-12, 2015 - Grand Teton National Park, Jackson, Wyoming, USA
206
Early Stage Researcher Speed Slot (3 minutes) Session Moderator: Michael Burnard, University of Primorska,
Slovenia
Determining Tension and Compression Strength and
Basic Manufacturing Feasibility of CNC Router-cut
Joints
Mesut Uysal, [email protected]
Cagatay Tasdemir, [email protected]
Eva Haviarova, [email protected]
Rado Gazo, [email protected]
Purdue University, 2491 Sycamore Ln., Apt 5, West Lafayette, IN 47906
Abstract
Joinery systems produced using advanced CNC equipment increasingly popular in wood
products, could be manufactured faster, more accurately, requiring lower labor costs.
These joints are used mainly in products made of engineered materials, processed by
CNC machinery. The specific joint construction has self-locking character and variable
strength related to manufacturing tolerance and joint design. In this respect, seven types
of joints were evaluated for strength and manufacturing capacity. To understand better
manufacturing feasibility of each joint type, calculation of material yield and processing
time were determined. Yield percentages were calculated for samples and used to
evaluate the manufacturing efficiency of CNC process for production of these joints.
Moreover, recorded CNC manufacturing times for each sample have been averaged
within its corresponding experimental group and employed to compare the burden
created during the production of each joint in terms of efficient use of labor and machine
time. Manufactured joint samples were then tested for strength in tensions and
compression. Results of strength tests were compared to other CNC-made and also to
traditional joint types. The results of this study are expected to provide information for
furniture industry utilizing CNC manufacturing by providing a better understanding of
manufacturing feasibility and strength capacity of different joint types.
Proceedings of the 58th International Convention of
Society of Wood Science and Technology
June 7-12, 2015 - Grand Teton National Park, Jackson, Wyoming, USA
207
Heat and Mass Transfer during Ultrasound-Assisted
Vacuum Drying of Wood
Z.B. He*, Z.J. Zhao, Y. Zhang, Z.Y. Wang, S.L. Yi
Beijing Key Laboratory of Wood Science and Engineering
College of Material Science and Technology
Beijing Forestry University
Beijing, 100083, P.R. China
E-mail: [email protected]
Abstract
Wood ultrasound drying is a kind of innovative approaches. In this paper, poplar with the
dimensions of 450mm by 100mm by 40mm was taken as experimental material. The
drying process was done under the conditions that the drying medium temperature was
60°C, the absolute pressure was 0.02 MPa, the ultrasound power was 100 W and the
frequency was 20 kHz. The moisture distribution inner wood and water diffusion
coefficient were studied, and the model among wood moisture content variation, drying
time and water diffusion coefficient was established. Results indicated that the moisture
gradient increases along with the increase of drying time during the drying process, free
water and bound water are dried simultaneously when wood moisture content above the
fiber saturation point; Wood moisture decreases almost linearly when moisture above the
fiber saturation point while the descending rate decreases when the moisture content
below the fiber saturation point. The water diffusion coefficient decreases along with the
increase of drying time and increases exponentially along with the increase of moisture
content. The moisture diffusion coefficient is 2.89×10⁻⁴cm2.s-1 at the initial drying stage,
it is 3.02×10⁻⁶cm2.s-1 when the moisture content when the moisture content at the fiber
saturation point, and it is 2.27×10⁻⁷cm2.s-1 when the moisture content is 10%; The
equation between the water diffusion coefficient and the moisture content was established
and it could be used to predict the water diffusion coefficient during ultrasound-assited
vacuum drying.
Key words: ultrasound; water distribution; water diffusion coefficient; vacuum drying
Proceedings of the 58th International Convention of
Society of Wood Science and Technology
June 7-12, 2015 - Grand Teton National Park, Jackson, Wyoming, USA
208
Introduction
All kinds of woods, which are the main raw materials in furniture, building and
woodworking industry, must be dried after deforestation (Zhang et al. 2005). Thus, wood
drying is one of the most important steps in wood product manufacturing. The drying
process consumes roughly 40% to 70% of the total energy in the entire wood products
manufacturing process (Zhang and Liu 2006). Compared with the traditional drying
methods, wood vacuum drying has many advantages. For example, it could significantly
shorten the drying time (particularly when the moisture content is below the wood fiber
saturation point), it could increase suitability for drying large dimensions of timber, it has
less risk of discoloration, and it has good energy efficiency (Ressel 1999; Welling 1994).
However, vacuum drying methods are not suitable for timber with high initial moisture
contents (Welling 1994), and surface checking and internal checking can be significant
problems with wood vacuum drying, especially when the drying temperature is high; this
is because of insufficient moisture movement from the center of the wood samples to the
surface during the vacuum drying process which can cause steep moisture gradients from
the core to wood surface layers, which could lead to checking (Kanagawa and Yasujima
1993; Avramidis et al. 1994). Therefore, exploring energy efficient new technologies for
low temperature vacuum drying and improving product quality is an important goal in
development of new drying technologies.
Ultrasound is an efficient non-thermal alternative to increasing the drying rate without
significantly heating up the material (Cohen and Yang 1995). When ultrasound power is
applied in liquid media, ultrasound waves cause rapid series of alternative compressions
and expansions, in a way similar to a sponge when it is squeezed and released repeatedly.
Also, ultrasound produces cavitation, which is beneficial for the removal of moisture that
is strongly attached to the solid. Micro-deformation of porous solid materials, caused by
ultrasonic waves, is likely responsible for the creation of microscopic channels that
enhance diffusion and increase convective mass transfer (Fuente-Blanco et al. 2006;
Gallego-Juárez et al. 1999; Soria and Villamiel 2010; Tarleton 1992).
In recent years, ultrasound has been implemented as an alternative method for drying,
and the results have shown that ultrasound can greatly reduce the overall processing time
(Aversa et al. 2011; Mothibe et al. 2011), increase the mass transfer rate (Cárcel et al.
2011; García-Pérez et al. 2011; Zhao and Chen 2011), and increase the effective water
diffusivity (Bantle and Eikevik 2011). However, no reports so far have addressed the
mass transfer during the ultrasound-vacuum combined drying process. In this work,
poplar (Populus spp.), which is one kind of fast growing wood and planted in large area
in China, was taken as material and the drying time and the water diffusion coefficient
was studied during the ultrasound-assited vacuum drying process..
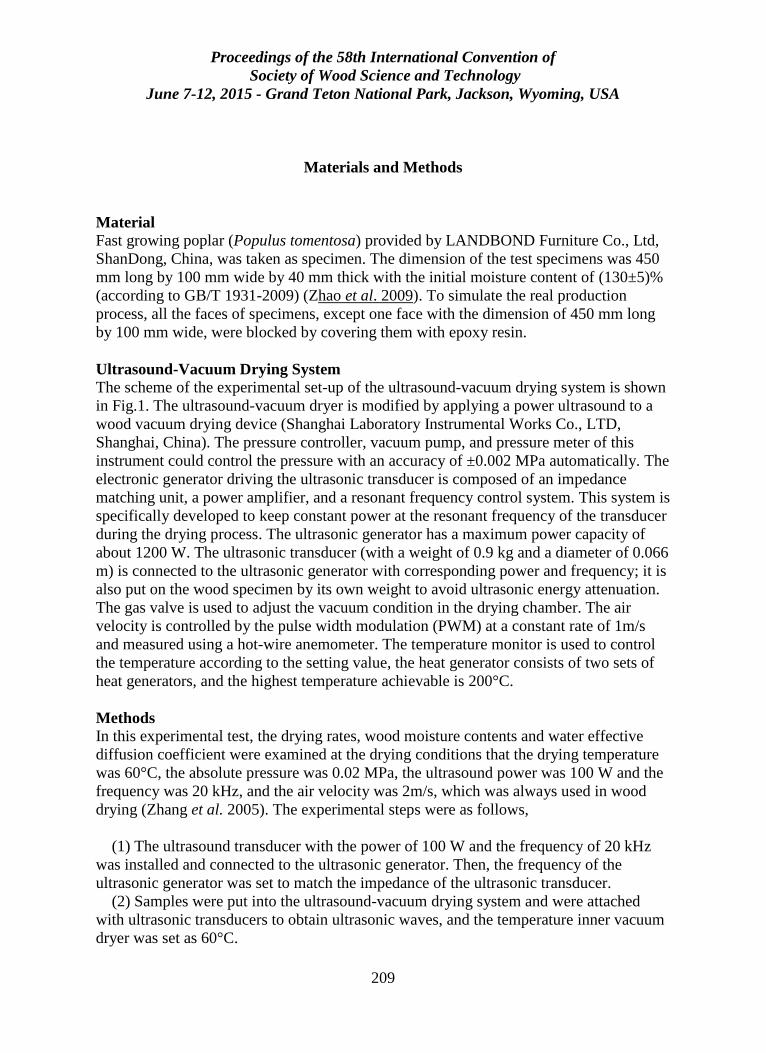
Proceedings of the 58th International Convention of
Society of Wood Science and Technology
June 7-12, 2015 - Grand Teton National Park, Jackson, Wyoming, USA
209
Materials and Methods
Material
Fast growing poplar (Populus tomentosa) provided by LANDBOND Furniture Co., Ltd,
ShanDong, China, was taken as specimen. The dimension of the test specimens was 450
mm long by 100 mm wide by 40 mm thick with the initial moisture content of (130±5)%
(according to GB/T 1931-2009) (Zhao et al. 2009). To simulate the real production
process, all the faces of specimens, except one face with the dimension of 450 mm long
by 100 mm wide, were blocked by covering them with epoxy resin.
Ultrasound-Vacuum Drying System
The scheme of the experimental set-up of the ultrasound-vacuum drying system is shown
in Fig.1. The ultrasound-vacuum dryer is modified by applying a power ultrasound to a
wood vacuum drying device (Shanghai Laboratory Instrumental Works Co., LTD,
Shanghai, China). The pressure controller, vacuum pump, and pressure meter of this
instrument could control the pressure with an accuracy of ±0.002 MPa automatically. The
electronic generator driving the ultrasonic transducer is composed of an impedance
matching unit, a power amplifier, and a resonant frequency control system. This system is
specifically developed to keep constant power at the resonant frequency of the transducer
during the drying process. The ultrasonic generator has a maximum power capacity of
about 1200 W. The ultrasonic transducer (with a weight of 0.9 kg and a diameter of 0.066
m) is connected to the ultrasonic generator with corresponding power and frequency; it is
also put on the wood specimen by its own weight to avoid ultrasonic energy attenuation.
The gas valve is used to adjust the vacuum condition in the drying chamber. The air
velocity is controlled by the pulse width modulation (PWM) at a constant rate of 1m/s
and measured using a hot-wire anemometer. The temperature monitor is used to control
the temperature according to the setting value, the heat generator consists of two sets of
heat generators, and the highest temperature achievable is 200°C.
Methods In this experimental test, the drying rates, wood moisture contents and water effective
diffusion coefficient were examined at the drying conditions that the drying temperature
was 60°C, the absolute pressure was 0.02 MPa, the ultrasound power was 100 W and the
frequency was 20 kHz, and the air velocity was 2m/s, which was always used in wood
drying (Zhang et al. 2005). The experimental steps were as follows,
(1) The ultrasound transducer with the power of 100 W and the frequency of 20 kHz
was installed and connected to the ultrasonic generator. Then, the frequency of the
ultrasonic generator was set to match the impedance of the ultrasonic transducer.
(2) Samples were put into the ultrasound-vacuum drying system and were attached
with ultrasonic transducers to obtain ultrasonic waves, and the temperature inner vacuum
dryer was set as 60°C.
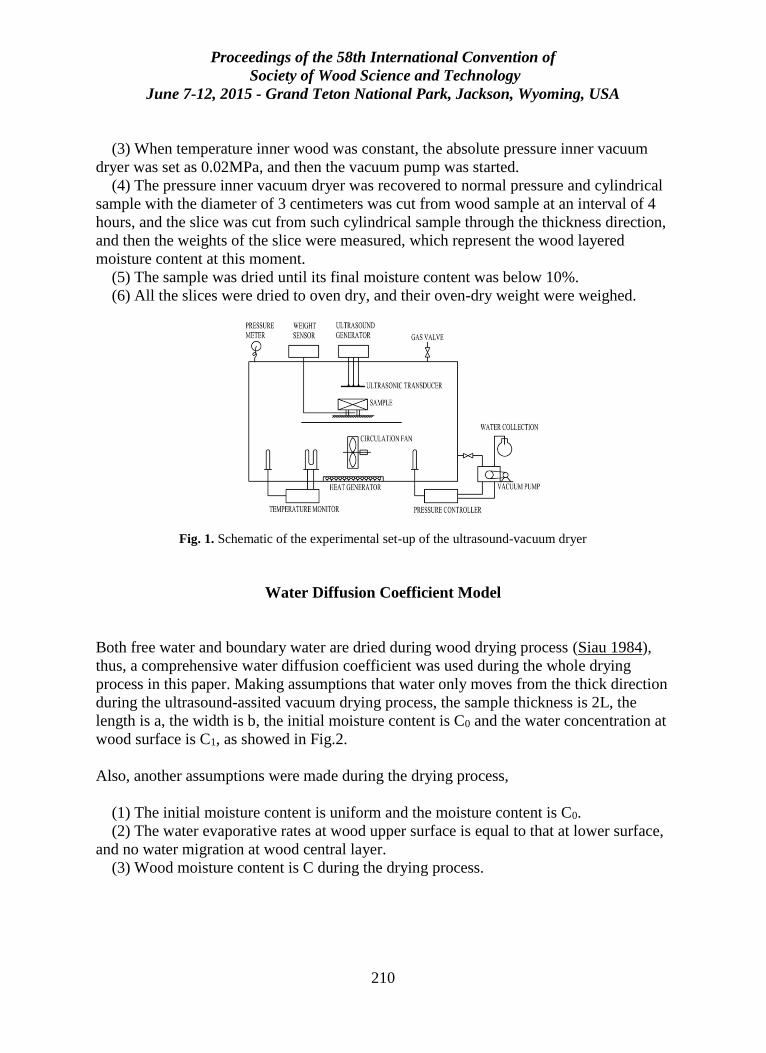
Proceedings of the 58th International Convention of
Society of Wood Science and Technology
June 7-12, 2015 - Grand Teton National Park, Jackson, Wyoming, USA
210
(3) When temperature inner wood was constant, the absolute pressure inner vacuum
dryer was set as 0.02MPa, and then the vacuum pump was started.
(4) The pressure inner vacuum dryer was recovered to normal pressure and cylindrical
sample with the diameter of 3 centimeters was cut from wood sample at an interval of 4
hours, and the slice was cut from such cylindrical sample through the thickness direction,
and then the weights of the slice were measured, which represent the wood layered
moisture content at this moment.
(5) The sample was dried until its final moisture content was below 10%.
(6) All the slices were dried to oven dry, and their oven-dry weight were weighed.
Fig. 1. Schematic of the experimental set-up of the ultrasound-vacuum dryer
Water Diffusion Coefficient Model
Both free water and boundary water are dried during wood drying process (Siau 1984),
thus, a comprehensive water diffusion coefficient was used during the whole drying
process in this paper. Making assumptions that water only moves from the thick direction
during the ultrasound-assited vacuum drying process, the sample thickness is 2L, the
length is a, the width is b, the initial moisture content is C0 and the water concentration at
wood surface is C1, as showed in Fig.2.
Also, another assumptions were made during the drying process,
(1) The initial moisture content is uniform and the moisture content is C0.
(2) The water evaporative rates at wood upper surface is equal to that at lower surface,
and no water migration at wood central layer.
(3) Wood moisture content is C during the drying process.
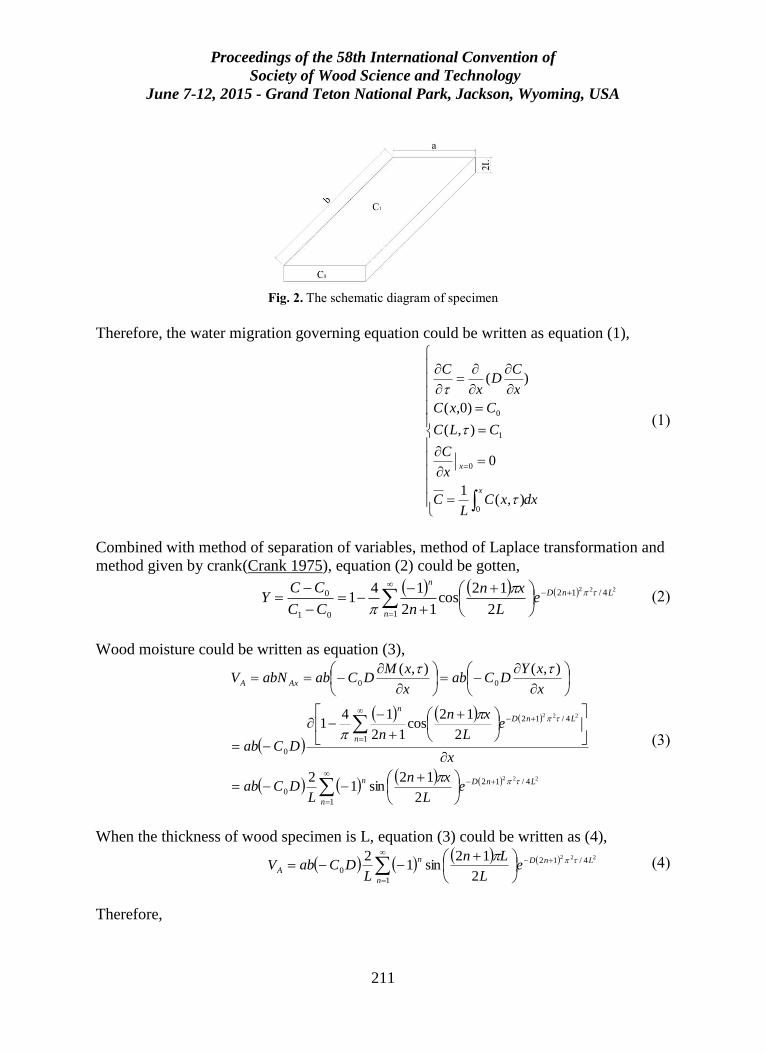
Proceedings of the 58th International Convention of
Society of Wood Science and Technology
June 7-12, 2015 - Grand Teton National Park, Jackson, Wyoming, USA
211
Fig. 2. The schematic diagram of specimen
Therefore, the water migration governing equation could be written as equation (1),
dxxCL
C
x
C
CLC
CxC
x
CD
x
C
x
x
0
0
1
0
),(1
0
),(
)0,(
)(
(1)
Combined with method of separation of variables, method of Laplace transformation and
method given by crank(Crank 1975), equation (2) could be gotten,
2224/12
101
0
2
12cos
12
141 LnD
n
n
eL
xn
nCC
CCY
(2)
Wood moisture could be written as equation (3),
222
222
4/12
1
0
4/12
1
0
00
2
12sin1
2
2
12cos
12
141
),(),(
LnD
n
n
LnD
n
n
AxA
eL
xn
LDCab
x
eL
xn
nDCab
x
xYDCab
x
xMDCababNV
(3)
When the thickness of wood specimen is L, equation (3) could be written as (4),
222
4/12
1
02
12sin1
2 LnD
n
n
A eL
Ln
LDCabV
(4)
Therefore,
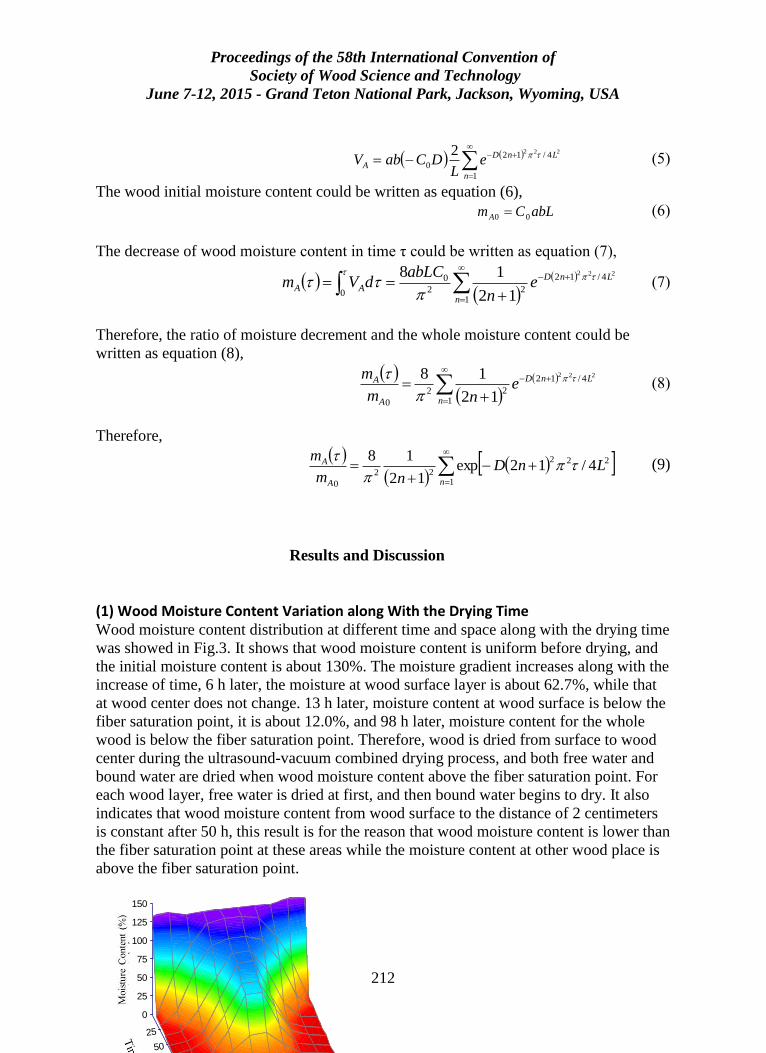
Proceedings of the 58th International Convention of
Society of Wood Science and Technology
June 7-12, 2015 - Grand Teton National Park, Jackson, Wyoming, USA
212
1
4/12
0
2222
n
LnD
A eL
DCabV (5)
The wood initial moisture content could be written as equation (6),
abLCmA 00 (6)
The decrease of wood moisture content in time τ could be written as equation (7),
01
4/12
22
0222
12
18
n
LnD
AA en
abLCdVm (7)
Therefore, the ratio of moisture decrement and the whole moisture content could be
written as equation (8),
1
4/12
22
0
222
12
18
n
LnD
A
A enm
m
(8)
Therefore,
1
222
22
0
4/12exp12
18
nA
A LnDnm
m
(9)
Results and Discussion
(1) Wood Moisture Content Variation along With the Drying Time Wood moisture content distribution at different time and space along with the drying time
was showed in Fig.3. It shows that wood moisture content is uniform before drying, and
the initial moisture content is about 130%. The moisture gradient increases along with the
increase of time, 6 h later, the moisture at wood surface layer is about 62.7%, while that
at wood center does not change. 13 h later, moisture content at wood surface is below the
fiber saturation point, it is about 12.0%, and 98 h later, moisture content for the whole
wood is below the fiber saturation point. Therefore, wood is dried from surface to wood
center during the ultrasound-vacuum combined drying process, and both free water and
bound water are dried when wood moisture content above the fiber saturation point. For
each wood layer, free water is dried at first, and then bound water begins to dry. It also
indicates that wood moisture content from wood surface to the distance of 2 centimeters
is constant after 50 h, this result is for the reason that wood moisture content is lower than
the fiber saturation point at these areas while the moisture content at other wood place is
above the fiber saturation point.
4 3 2 1 0 -1
-2
-3
距离 (cm)
125
100
75
50
25
时间
(h)
0
0
25
25
50
50
75
75
100
100
125
125
150
150
含水率
(%
)
含水率
(%
)
含水率三维图最后.txt, X , Y , Z
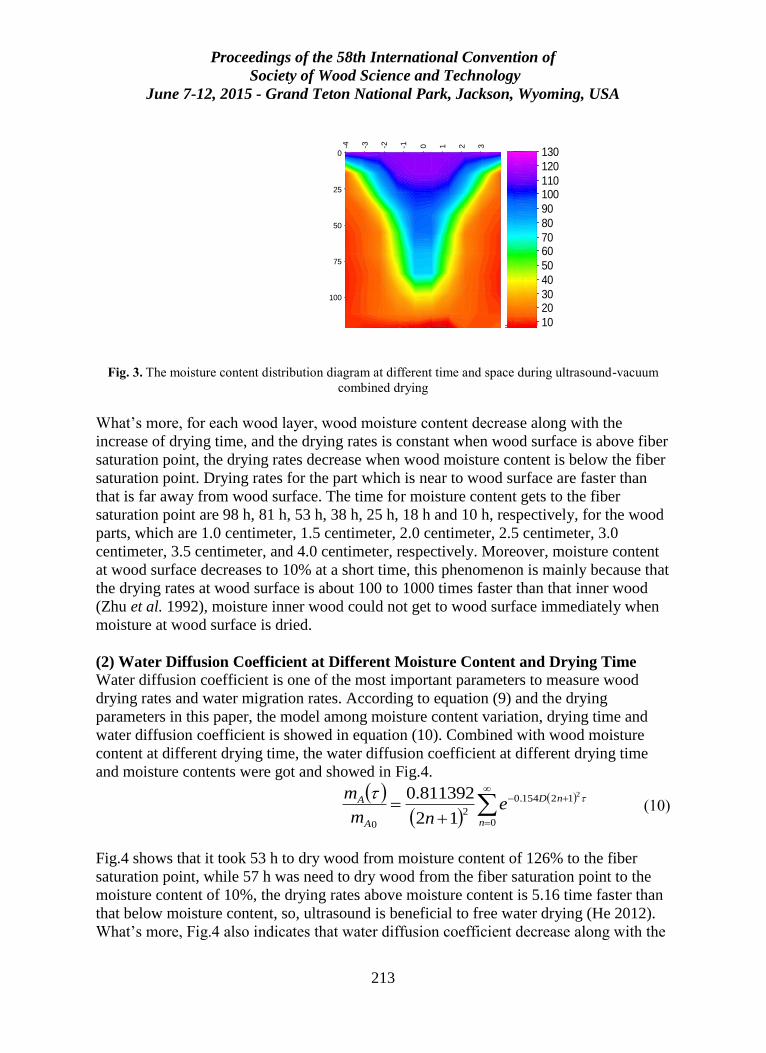
Proceedings of the 58th International Convention of
Society of Wood Science and Technology
June 7-12, 2015 - Grand Teton National Park, Jackson, Wyoming, USA
213
-4 -3 -2 -1 0 1 2 3
0
25
50
75
100
含水率三维图最后.txt, X , Y , Z
43210-1-2-3
0 0
10 10
20 2030 30
40 40
50 50
60 6070 70
80 80
90 90
100 100110 110
120 120
130 130
含水率三维图最后.txt, X , Y , Z
Fig. 3. The moisture content distribution diagram at different time and space during ultrasound-vacuum
combined drying
What’s more, for each wood layer, wood moisture content decrease along with the
increase of drying time, and the drying rates is constant when wood surface is above fiber
saturation point, the drying rates decrease when wood moisture content is below the fiber
saturation point. Drying rates for the part which is near to wood surface are faster than
that is far away from wood surface. The time for moisture content gets to the fiber
saturation point are 98 h, 81 h, 53 h, 38 h, 25 h, 18 h and 10 h, respectively, for the wood
parts, which are 1.0 centimeter, 1.5 centimeter, 2.0 centimeter, 2.5 centimeter, 3.0
centimeter, 3.5 centimeter, and 4.0 centimeter, respectively. Moreover, moisture content
at wood surface decreases to 10% at a short time, this phenomenon is mainly because that
the drying rates at wood surface is about 100 to 1000 times faster than that inner wood
(Zhu et al. 1992), moisture inner wood could not get to wood surface immediately when
moisture at wood surface is dried.
(2) Water Diffusion Coefficient at Different Moisture Content and Drying Time
Water diffusion coefficient is one of the most important parameters to measure wood
drying rates and water migration rates. According to equation (9) and the drying
parameters in this paper, the model among moisture content variation, drying time and
water diffusion coefficient is showed in equation (10). Combined with wood moisture
content at different drying time, the water diffusion coefficient at different drying time
and moisture contents were got and showed in Fig.4.
0
120.154
2
0
2
12
0.811392
n
nD
A
A enm
m (10)
Fig.4 shows that it took 53 h to dry wood from moisture content of 126% to the fiber
saturation point, while 57 h was need to dry wood from the fiber saturation point to the
moisture content of 10%, the drying rates above moisture content is 5.16 time faster than
that below moisture content, so, ultrasound is beneficial to free water drying (He 2012).
What’s more, Fig.4 also indicates that water diffusion coefficient decrease along with the
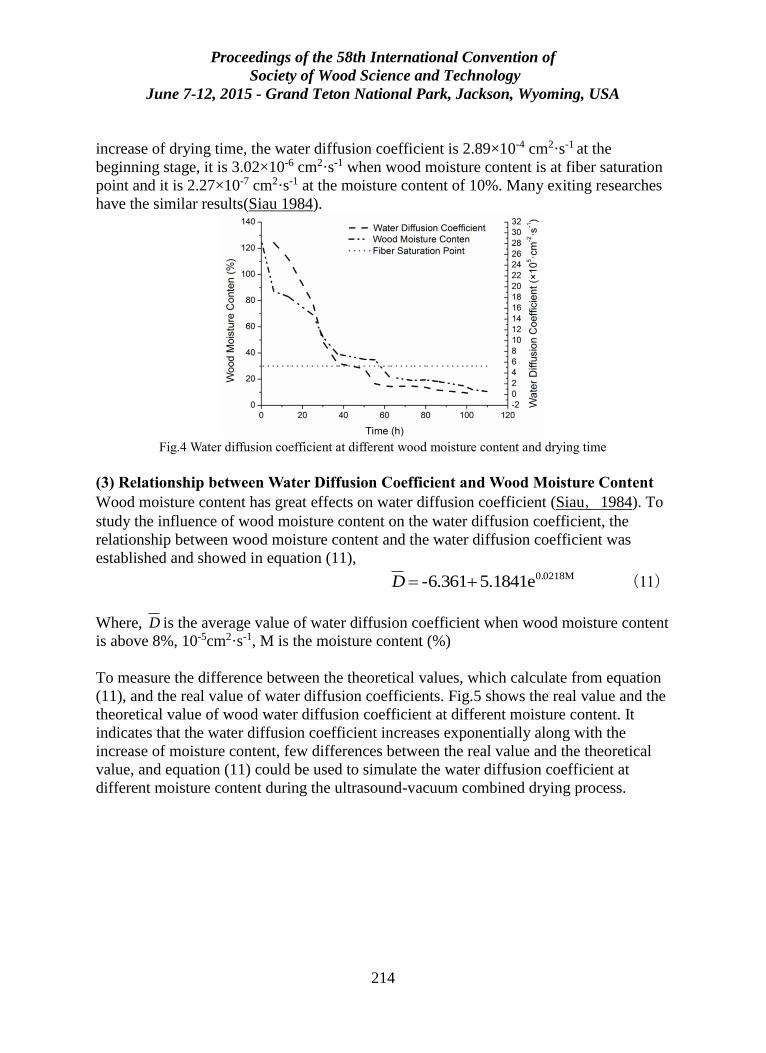
Proceedings of the 58th International Convention of
Society of Wood Science and Technology
June 7-12, 2015 - Grand Teton National Park, Jackson, Wyoming, USA
214
increase of drying time, the water diffusion coefficient is 2.89×10⁻⁴ cm2·s-1 at the
beginning stage, it is 3.02×10⁻⁶ cm2·s-1 when wood moisture content is at fiber saturation
point and it is 2.27×10⁻⁷ cm2·s-1 at the moisture content of 10%. Many exiting researches
have the similar results(Siau 1984).
Fig.4 Water diffusion coefficient at different wood moisture content and drying time
(3) Relationship between Water Diffusion Coefficient and Wood Moisture Content
Wood moisture content has great effects on water diffusion coefficient (Siau,1984). To
study the influence of wood moisture content on the water diffusion coefficient, the
relationship between wood moisture content and the water diffusion coefficient was
established and showed in equation (11), 0.0218M5.1841e-6.361D (11)
Where, D is the average value of water diffusion coefficient when wood moisture content
is above 8%, 10-5cm2·s-1, M is the moisture content (%)
To measure the difference between the theoretical values, which calculate from equation
(11), and the real value of water diffusion coefficients. Fig.5 shows the real value and the
theoretical value of wood water diffusion coefficient at different moisture content. It
indicates that the water diffusion coefficient increases exponentially along with the
increase of moisture content, few differences between the real value and the theoretical
value, and equation (11) could be used to simulate the water diffusion coefficient at
different moisture content during the ultrasound-vacuum combined drying process.
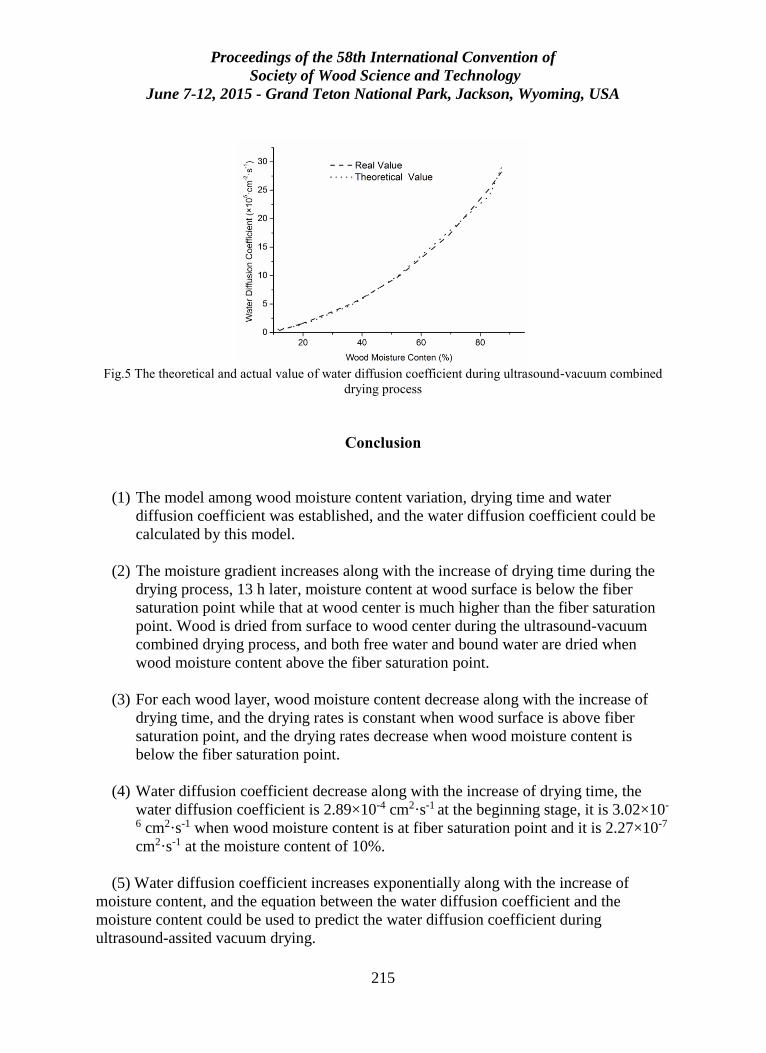
Proceedings of the 58th International Convention of
Society of Wood Science and Technology
June 7-12, 2015 - Grand Teton National Park, Jackson, Wyoming, USA
215
Fig.5 The theoretical and actual value of water diffusion coefficient during ultrasound-vacuum combined
drying process
Conclusion
(1) The model among wood moisture content variation, drying time and water
diffusion coefficient was established, and the water diffusion coefficient could be
calculated by this model.
(2) The moisture gradient increases along with the increase of drying time during the
drying process, 13 h later, moisture content at wood surface is below the fiber
saturation point while that at wood center is much higher than the fiber saturation
point. Wood is dried from surface to wood center during the ultrasound-vacuum
combined drying process, and both free water and bound water are dried when
wood moisture content above the fiber saturation point.
(3) For each wood layer, wood moisture content decrease along with the increase of
drying time, and the drying rates is constant when wood surface is above fiber
saturation point, and the drying rates decrease when wood moisture content is
below the fiber saturation point.
(4) Water diffusion coefficient decrease along with the increase of drying time, the
water diffusion coefficient is 2.89×10⁻⁴ cm2·s-1 at the beginning stage, it is 3.02×10-
6 cm2·s-1 when wood moisture content is at fiber saturation point and it is 2.27×10⁻⁷
cm2·s-1 at the moisture content of 10%.
(5) Water diffusion coefficient increases exponentially along with the increase of
moisture content, and the equation between the water diffusion coefficient and the
moisture content could be used to predict the water diffusion coefficient during
ultrasound-assited vacuum drying.
Proceedings of the 58th International Convention of
Society of Wood Science and Technology
June 7-12, 2015 - Grand Teton National Park, Jackson, Wyoming, USA
216
Acknowledgments
This paper was supported by “the Fundamental Research Funds for the Central
University (NO. BLX2014-41)” and “The National Science Foundation of China-Study
on the Moisture Migration Mechanism during Ultrasonic-Assisted Wood Vacuum
Superheated Steam Drying (31270604)”.
Reference
Aversa, M., Van der Voort, A. J., De Heij, W., Tournois, B., and Curcio, S. (2011). An
experimental analysis of acoustic drying of carrots: evaluation of heat transfer
coefficients in different drying conditions, Dry Technol. 29, 239-244.
Avramidis, S., Liu, M., and Neilson, B. J. (1994). Radio-frequency/vacuum drying of
softwoods: Drying of thick western red cedar with constant electrode voltage, Forest Prod
J. 44(1), 41-47.
Bantle, M., and Eikevik, T. M. (2011). Parametric study of high-intensity ultrasound in
the atmospheric freeze drying of peas, Dry Technol. 29, 1230-1239.
Cárcel, J. A., Garcia-Perez, J. V., Riera, E., and Mulet. A. (2011). Improvement of
convective drying of carrot by applying power ultrasound-influence of mass load density,
Dry Technol. 29, 174-182.
Cohen, J. S., and Yang, T. C. S. (1995). Progress in food dehydration, Trends Food Sci.
Tech. 6(1), 20-25.
Crank, J. (1975), The mathematics of diffusion, second ed. Claredon press, oxford.
Fuente-Blanco, S., Sarabia, E. R. F., Acosta-Aparicio, V. M., Blanco-Blanco, A., and
Gallego-Juárez, J. A. (2006). Food drying process by power ultrasound, Ultrasonics
Sonochem. 44, 523-527.
Gallego-Juárez, J. A., Rodríguez-Corral, G., Gálvez-Moraleda, J. C., and Yang, T. S.
(1999). A new high intensity ultrasonic technology for food dehydration, Dry Technol.
17, 597-608.
García-Pérez, J. V., Ozuna, C., Ortuño, C., Cárcel, J. A., and Mulet, A. (2011). Modeling
ultrasonically assisted convective drying of eggplant, Dry Technol. 29, 1499-1509.
Proceedings of the 58th International Convention of
Society of Wood Science and Technology
June 7-12, 2015 - Grand Teton National Park, Jackson, Wyoming, USA
217
He, Z. B., Yang, F., Yi, S. L., and Gao, J. M. (2012). Effect of ultrasound pretreatment on
vacuum drying of Chinese catalpa wood, Dry Technol. 30(15), 1750-1755.
Kanagawa, Y., and Yasujima, M. (1993). Effect of heat sources on drying time in
vacuum drying of wood, Vacuum Drying of Wood'93, 292, Slovakia.
Mothibe, K. J., Zhang, M., Nsor-atindana, J., and Wang, Y. C. (2011). Use of ultrasound
pretreatment in drying of fruits: Drying rates, quality attributes, and shelf life extension,
Dry Technol. 29, 1611-1621.
Ressel, J.B. (1999). State of the art for vacuum drying in the wood working industry, cost
action E15, workshop’. Edinburgh, UK.
Siau, J. F. (1984). Transport Process in Wood. Springer-Verlag, New York.
Soria, A. C., and Villamiel, M. (2010). Effect of ultrasound on the technological
properties and bioactivity of food: a review, Trends Food Sci. Tech. 21, 323-331.
Tarleton, E.S. (1992). The role of field-assisted techniques in solid/liquid separation,
Filtration Separation 3, 246-253.
Welling, J. (1994). Superheated steam vacuum drying of timber-range of application and
advantages, The 4th IUFRO international wood drying conference. Rotorua, 460-461.
Zhao, F., and Chen, Z. Q. (2011). Numerical study on moisture transfer in ultrasound-
assisted convective drying process of sludge, Dry Technol. 29, 1404-1415.
Zhang, B.G., and Liu, D.Y. (2006). Exploring a new developing way of wood drying
technology in China, China Forest Prod. Ind. 33(4), 3-6.
Zhang, B. G., Gao, J. M., Yi, S. L., and Zhou, Y. D. (2005). Applied wood drying,
Chemical Industry Press, Beijing.
Zhao, R.J., Fei, B.H., Lv, J.X., Yu, H.Q., Huang, R.F., Zhao, Y.Q., Huang, A.M., Cui,
Y.Z. (2009) Wood moisture content measuring method.Wood-determination of moisture
content for physical and mechanical test, MOD, CN-GB, GB/T 1931–2009.
Zhu Z.X. (1992). Wood Drying. China Forestry Publishing, Beijing.
Proceedings of the 58th International Convention of
Society of Wood Science and Technology
June 7-12, 2015 - Grand Teton National Park, Jackson, Wyoming, USA
218
Comparative Life Cycle Analysis of Fossil and
Bio-based PET Bottles
Luyi Chen 1 – Rylie E.O. Pelton2 – Timothy M. Smith3
1 Graduate Research Assistant, Department of Bioproducts and Biosystems
Engineering – University of Minnesota, Saint Paul MN, USA.
[email protected] 2 Graduate Research Assistant, Department of Bioproducts and Biosystems
Engineering – University of Minnesota, Saint Paul MN, USA.
[email protected] 3 Associate Professor, Department of Bioproducts and Biosystems
Engineering – University of Minnesota, Saint Paul MN, USA.
Abstract
Both biofuels and bio-plastics are often regarded as sustainable solutions to current
environmental problems such as climate change, fossil depletion and fine particulates
emissions. However, both have been criticized for being economically costly, competing
with other societally beneficial goods such as food, and offering limited environmental
benefits compared to their fossil counterparts. Biorefinery, proposed as a sustainable
counterpart to fossil refinery, provides the possibility of lowering production costs by
producing and selling value-added co-products. This study provides a comparative
environmental life cycle analysis for 100% bio-based PET bottles produced in a multi-
output biorefinery system, versus fully fossil-based and partially fossil-based PET bottles.
Results indicate that with consideration of displacement credits, some fully bio-based
PET bottles have overall better environmental performance than any other scenarios.
Results were found to be sensitive to data quality and allocation method. The study
served as a building block for comprehensive analysis of optimized biorefineries.
Keywords
Comparative Life Cycle Assessment, Bio-PET, Bioplastics, Avoided Impacts,
Biorefinery
Proceedings of the 58th International Convention of
Society of Wood Science and Technology
June 7-12, 2015 - Grand Teton National Park, Jackson, Wyoming, USA
219
Introduction
Growing concerns about fossil fuel depletion and global warming have driven scholars to
seek for sustainable alternatives for crude oil refinery products. To address those issues,
the biofuels and biochemicals were proposed as a solution. They were developed from
non-food crops, agricultural residues and forest residues such as corn stover, wheat straw,
switchgrass and woody biomass (Hsu et al., 2010a). However, the environmental
excellence of a spectrum of bioproducts has yet to be decided (Borrion, McManus, &
Hammond, 2012). To establish a both environmentally viable business mode for biomass
based products, a novel manufacturing process co-producing biofuels and biochemicals
has been proposed. Research have suggested that co-producing biofuels and biochemical
would increase the economical viability of bioproducts industry (Cherubini, 2010). So
far, nearly all bio-PET available only replace the petrochemical ethylene glycol with bio-
ethylene glycol generated from corn or sugarcane ethanol, leaving PTA still coming from
fossil resources. The aim of this study is to conduct a comparative Life Cycle Analysis
for the traditional fossil-based PET bottle, partially bio-based PET bottles, and the
aforementioned completely biomass derived PET bottles.
Materials & Methods
This study applied the Life Cycle Assessment (LCA) methodology, which is used for
estimation and evaluation of environmental impacts attributable to the life cycle of a
product (ISO, 2006; Rebitzer et al., 2004). Consider the data availability of pilot and
demonstration biorefinery facilities, a traditional attributional life cycle assessment
(aLCA) model was applied with sensitivity analysis of weak points in the system. The
goal of this study is to quantify and compare environmental impacts of PET bottles
produced through traditional fossil refinery facilities and through biomass processing
facilities in the context of the United States, using a cradle-to-factory-gate approach.
Regarding the production of PET bottles, the two chemical precursors, purified
terephthalate acid (PTA) and ethylene glycol (EG), are synthesized separately. In the
traditional production of PET, PTA is produced from fossil refineries, whereas EG is
produced from natural gas refineries. On the other hand, bio-based versions of PTA and
EG can be produced from a variety of biomass materials, the environmental impacts of
which are explored in different scenarios presented in Table 1. Softwood forest residues
and corn stover were chosen as raw materials for bio-based purified terephthalic acid.
Weighted average fuel consumption for forest regeneration, thining and harvesting
operations was summarized by Puetmann et al. (Puettmann, Oneil, Milota, & Johnson,
2012).Upon harvesting, the woody biomass transportation scenario for equipment and
distances was documented by Ganguly et al. (Ganguly, Eastin, Bowers, Huisenga, &
Pierobon, 2014). Fig. 1 illustrates the system boundary of the study.
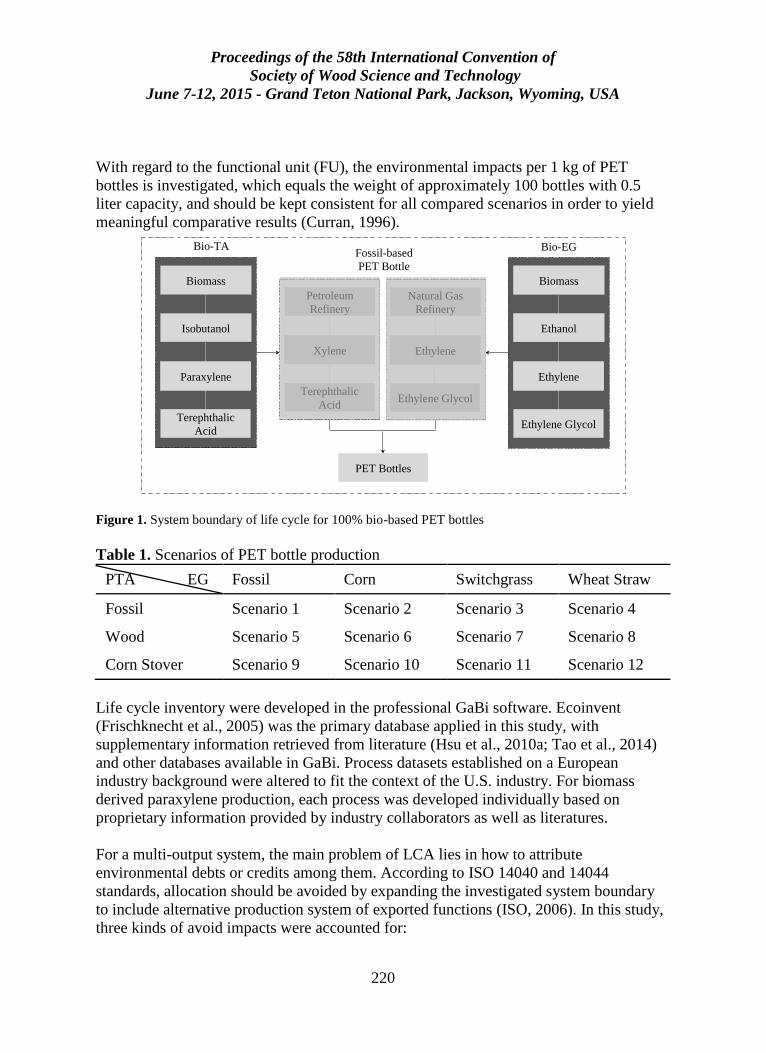
Proceedings of the 58th International Convention of
Society of Wood Science and Technology
June 7-12, 2015 - Grand Teton National Park, Jackson, Wyoming, USA
220
With regard to the functional unit (FU), the environmental impacts per 1 kg of PET
bottles is investigated, which equals the weight of approximately 100 bottles with 0.5
liter capacity, and should be kept consistent for all compared scenarios in order to yield
meaningful comparative results (Curran, 1996).
Petroleum
Refinery
Xylene
PET Bottles
Terephthalic
Acid
Natural Gas
Refinery
Ethylene
Ethylene Glycol
Fossil-based
PET Bottle
Bio-TA
Isobutanol
Paraxylene
Terephthalic
Acid
Biomass
Ethanol
Ethylene
Ethylene Glycol
Biomass
Bio-EG
Figure 1. System boundary of life cycle for 100% bio-based PET bottles
Table 1. Scenarios of PET bottle production
PTA EG Fossil Corn Switchgrass Wheat Straw
Fossil Scenario 1 Scenario 2 Scenario 3 Scenario 4
Wood Scenario 5 Scenario 6 Scenario 7 Scenario 8
Corn Stover Scenario 9 Scenario 10 Scenario 11 Scenario 12
Life cycle inventory were developed in the professional GaBi software. Ecoinvent
(Frischknecht et al., 2005) was the primary database applied in this study, with
supplementary information retrieved from literature (Hsu et al., 2010a; Tao et al., 2014)
and other databases available in GaBi. Process datasets established on a European
industry background were altered to fit the context of the U.S. industry. For biomass
derived paraxylene production, each process was developed individually based on
proprietary information provided by industry collaborators as well as literatures.
For a multi-output system, the main problem of LCA lies in how to attribute
environmental debts or credits among them. According to ISO 14040 and 14044
standards, allocation should be avoided by expanding the investigated system boundary
to include alternative production system of exported functions (ISO, 2006). In this study,
three kinds of avoid impacts were accounted for:
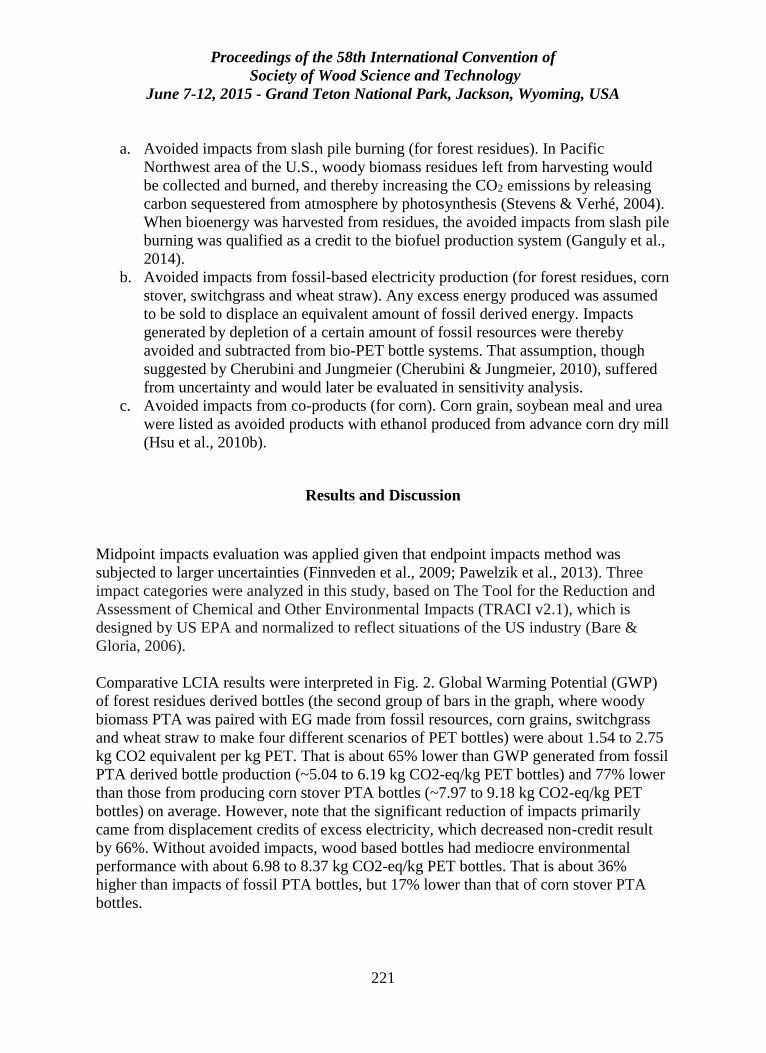
Proceedings of the 58th International Convention of
Society of Wood Science and Technology
June 7-12, 2015 - Grand Teton National Park, Jackson, Wyoming, USA
221
a. Avoided impacts from slash pile burning (for forest residues). In Pacific
Northwest area of the U.S., woody biomass residues left from harvesting would
be collected and burned, and thereby increasing the CO2 emissions by releasing
carbon sequestered from atmosphere by photosynthesis (Stevens & Verhé, 2004).
When bioenergy was harvested from residues, the avoided impacts from slash pile
burning was qualified as a credit to the biofuel production system (Ganguly et al.,
2014).
b. Avoided impacts from fossil-based electricity production (for forest residues, corn
stover, switchgrass and wheat straw). Any excess energy produced was assumed
to be sold to displace an equivalent amount of fossil derived energy. Impacts
generated by depletion of a certain amount of fossil resources were thereby
avoided and subtracted from bio-PET bottle systems. That assumption, though
suggested by Cherubini and Jungmeier (Cherubini & Jungmeier, 2010), suffered
from uncertainty and would later be evaluated in sensitivity analysis.
c. Avoided impacts from co-products (for corn). Corn grain, soybean meal and urea
were listed as avoided products with ethanol produced from advance corn dry mill
(Hsu et al., 2010b).
Results and Discussion
Midpoint impacts evaluation was applied given that endpoint impacts method was
subjected to larger uncertainties (Finnveden et al., 2009; Pawelzik et al., 2013). Three
impact categories were analyzed in this study, based on The Tool for the Reduction and
Assessment of Chemical and Other Environmental Impacts (TRACI v2.1), which is
designed by US EPA and normalized to reflect situations of the US industry (Bare &
Gloria, 2006).
Comparative LCIA results were interpreted in Fig. 2. Global Warming Potential (GWP)
of forest residues derived bottles (the second group of bars in the graph, where woody
biomass PTA was paired with EG made from fossil resources, corn grains, switchgrass
and wheat straw to make four different scenarios of PET bottles) were about 1.54 to 2.75
kg CO2 equivalent per kg PET. That is about 65% lower than GWP generated from fossil
PTA derived bottle production (~5.04 to 6.19 kg CO2-eq/kg PET bottles) and 77% lower
than those from producing corn stover PTA bottles (~7.97 to 9.18 kg CO2-eq/kg PET
bottles) on average. However, note that the significant reduction of impacts primarily
came from displacement credits of excess electricity, which decreased non-credit result
by 66%. Without avoided impacts, wood based bottles had mediocre environmental
performance with about 6.98 to 8.37 kg CO2-eq/kg PET bottles. That is about 36%
higher than impacts of fossil PTA bottles, but 17% lower than that of corn stover PTA
bottles.
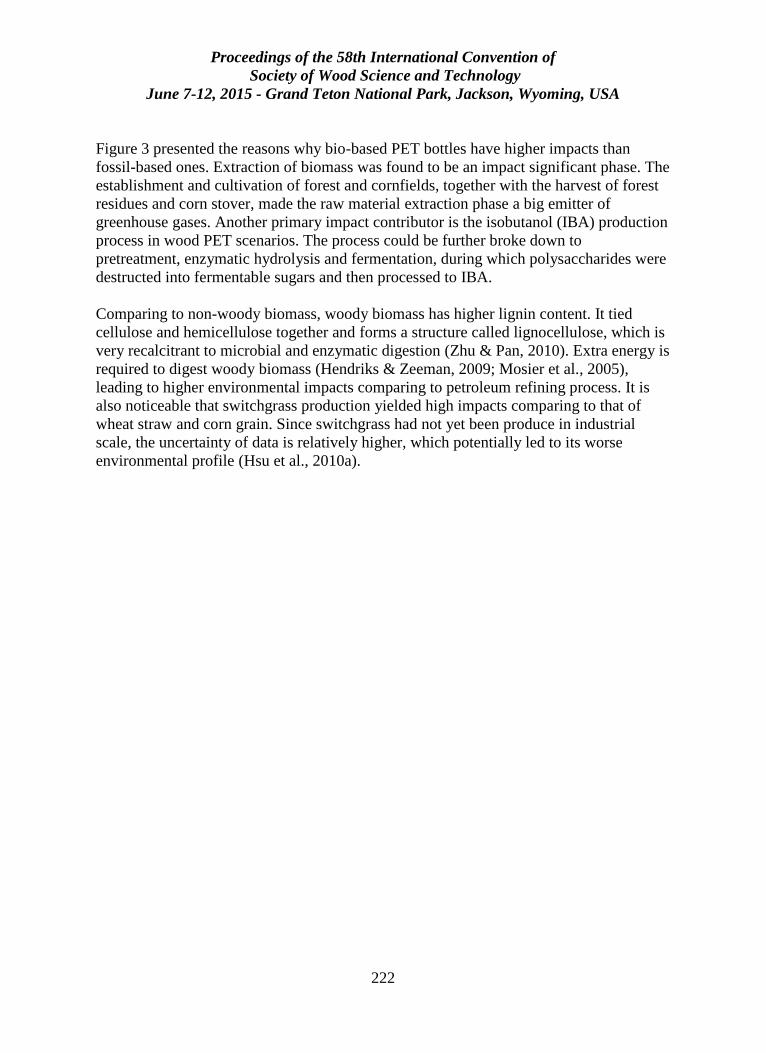
Proceedings of the 58th International Convention of
Society of Wood Science and Technology
June 7-12, 2015 - Grand Teton National Park, Jackson, Wyoming, USA
222
Figure 3 presented the reasons why bio-based PET bottles have higher impacts than
fossil-based ones. Extraction of biomass was found to be an impact significant phase. The
establishment and cultivation of forest and cornfields, together with the harvest of forest
residues and corn stover, made the raw material extraction phase a big emitter of
greenhouse gases. Another primary impact contributor is the isobutanol (IBA) production
process in wood PET scenarios. The process could be further broke down to
pretreatment, enzymatic hydrolysis and fermentation, during which polysaccharides were
destructed into fermentable sugars and then processed to IBA.
Comparing to non-woody biomass, woody biomass has higher lignin content. It tied
cellulose and hemicellulose together and forms a structure called lignocellulose, which is
very recalcitrant to microbial and enzymatic digestion (Zhu & Pan, 2010). Extra energy is
required to digest woody biomass (Hendriks & Zeeman, 2009; Mosier et al., 2005),
leading to higher environmental impacts comparing to petroleum refining process. It is
also noticeable that switchgrass production yielded high impacts comparing to that of
wheat straw and corn grain. Since switchgrass had not yet been produce in industrial
scale, the uncertainty of data is relatively higher, which potentially led to its worse
environmental profile (Hsu et al., 2010a).
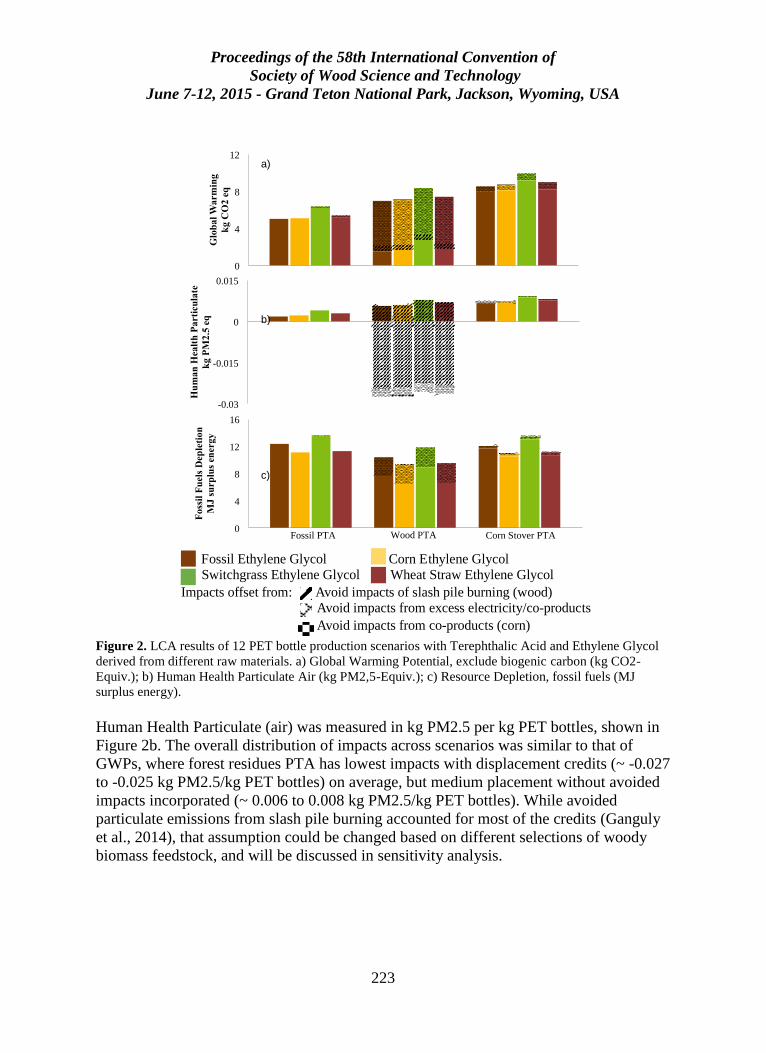
Proceedings of the 58th International Convention of
Society of Wood Science and Technology
June 7-12, 2015 - Grand Teton National Park, Jackson, Wyoming, USA
223
0
4
8
12
Glo
ba
l W
arm
ing
kg
CO
2 e
q
-0.03
-0.015
0
0.015
Hu
ma
n H
ealt
h P
art
icu
late
kg P
M2
.5 e
q
0
4
8
12
16
Fo
ssil
Fu
els
Dep
leti
on
MJ s
urp
lus
ener
gy
Fossil PTA Wood PTA Corn Stover PTA
Fossil Ethylene Glycol Corn Ethylene Glycol Switchgrass Ethylene Glycol Wheat Straw Ethylene Glycol
Impacts offset from: Avoid impacts of slash pile burning (wood) Avoid impacts from excess electricity/co-products
Avoid impacts from co-products (corn)
Figure 2. LCA results of 12 PET bottle production scenarios with Terephthalic Acid and Ethylene Glycol
derived from different raw materials. a) Global Warming Potential, exclude biogenic carbon (kg CO2-
Equiv.); b) Human Health Particulate Air (kg PM2,5-Equiv.); c) Resource Depletion, fossil fuels (MJ
surplus energy).
Human Health Particulate (air) was measured in kg PM2.5 per kg PET bottles, shown in
Figure 2b. The overall distribution of impacts across scenarios was similar to that of
GWPs, where forest residues PTA has lowest impacts with displacement credits (~ -0.027
to -0.025 kg PM2.5/kg PET bottles) on average, but medium placement without avoided
impacts incorporated (~ 0.006 to 0.008 kg PM2.5/kg PET bottles). While avoided
particulate emissions from slash pile burning accounted for most of the credits (Ganguly
et al., 2014), that assumption could be changed based on different selections of woody
biomass feedstock, and will be discussed in sensitivity analysis.
a)
b)
c)
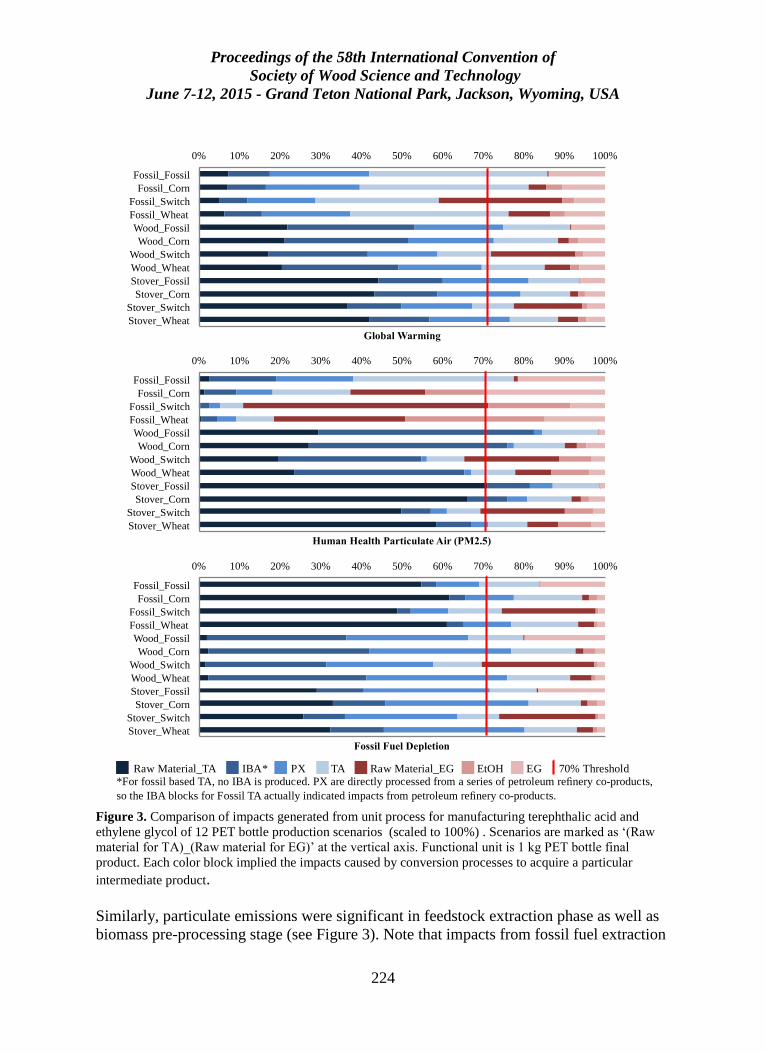
Proceedings of the 58th International Convention of
Society of Wood Science and Technology
June 7-12, 2015 - Grand Teton National Park, Jackson, Wyoming, USA
224
0% 10% 20% 30% 40% 50% 60% 70% 80% 90% 100%
Fossil_Fossil
Fossil_Corn
Fossil_Switch
Fossil_Wheat
Wood_Fossil
Wood_Corn
Wood_Switch
Wood_Wheat
Stover_Fossil
Stover_Corn
Stover_Switch
Stover_Wheat
Human Health Particulate Air (PM2.5)
0% 10% 20% 30% 40% 50% 60% 70% 80% 90% 100%
Fossil_Fossil
Fossil_Corn
Fossil_Switch
Fossil_Wheat
Wood_Fossil
Wood_Corn
Wood_Switch
Wood_Wheat
Stover_Fossil
Stover_Corn
Stover_Switch
Stover_Wheat
Fossil Fuel Depletion
0% 10% 20% 30% 40% 50% 60% 70% 80% 90% 100%
Fossil_Fossil
Fossil_Corn
Fossil_Switch
Fossil_Wheat
Wood_Fossil
Wood_Corn
Wood_Switch
Wood_Wheat
Stover_Fossil
Stover_Corn
Stover_Switch
Stover_Wheat
Global Warming
Raw Material_TA IBA* PX TA Raw Material_EG EtOH EG 70% Threshold*For fossil based TA, no IBA is produced. PX are directly processed from a series of petroleum refinery co-products,
so the IBA blocks for Fossil TA actually indicated impacts from petroleum refinery co-products.
Figure 3. Comparison of impacts generated from unit process for manufacturing terephthalic acid and
ethylene glycol of 12 PET bottle production scenarios (scaled to 100%) . Scenarios are marked as ‘(Raw
material for TA)_(Raw material for EG)’ at the vertical axis. Functional unit is 1 kg PET bottle final
product. Each color block implied the impacts caused by conversion processes to acquire a particular
intermediate product.
Similarly, particulate emissions were significant in feedstock extraction phase as well as
biomass pre-processing stage (see Figure 3). Note that impacts from fossil fuel extraction
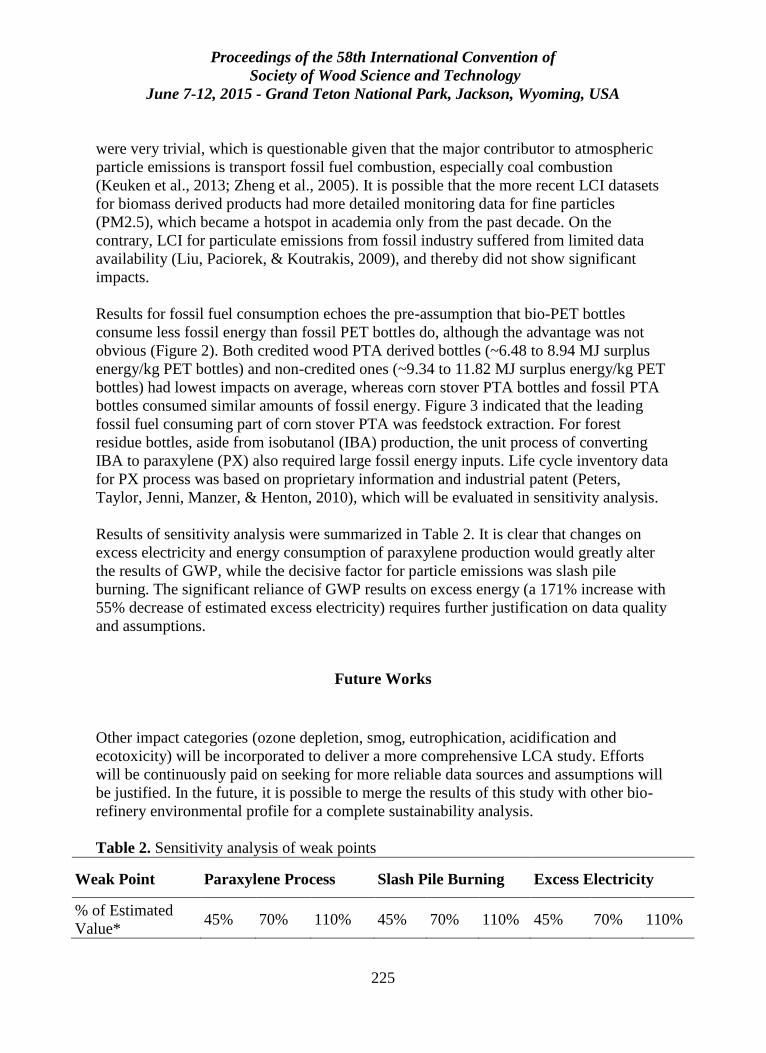
Proceedings of the 58th International Convention of
Society of Wood Science and Technology
June 7-12, 2015 - Grand Teton National Park, Jackson, Wyoming, USA
225
were very trivial, which is questionable given that the major contributor to atmospheric
particle emissions is transport fossil fuel combustion, especially coal combustion
(Keuken et al., 2013; Zheng et al., 2005). It is possible that the more recent LCI datasets
for biomass derived products had more detailed monitoring data for fine particles
(PM2.5), which became a hotspot in academia only from the past decade. On the
contrary, LCI for particulate emissions from fossil industry suffered from limited data
availability (Liu, Paciorek, & Koutrakis, 2009), and thereby did not show significant
impacts.
Results for fossil fuel consumption echoes the pre-assumption that bio-PET bottles
consume less fossil energy than fossil PET bottles do, although the advantage was not
obvious (Figure 2). Both credited wood PTA derived bottles (~6.48 to 8.94 MJ surplus
energy/kg PET bottles) and non-credited ones (~9.34 to 11.82 MJ surplus energy/kg PET
bottles) had lowest impacts on average, whereas corn stover PTA bottles and fossil PTA
bottles consumed similar amounts of fossil energy. Figure 3 indicated that the leading
fossil fuel consuming part of corn stover PTA was feedstock extraction. For forest
residue bottles, aside from isobutanol (IBA) production, the unit process of converting
IBA to paraxylene (PX) also required large fossil energy inputs. Life cycle inventory data
for PX process was based on proprietary information and industrial patent (Peters,
Taylor, Jenni, Manzer, & Henton, 2010), which will be evaluated in sensitivity analysis.
Results of sensitivity analysis were summarized in Table 2. It is clear that changes on
excess electricity and energy consumption of paraxylene production would greatly alter
the results of GWP, while the decisive factor for particle emissions was slash pile
burning. The significant reliance of GWP results on excess energy (a 171% increase with
55% decrease of estimated excess electricity) requires further justification on data quality
and assumptions.
Future Works
Other impact categories (ozone depletion, smog, eutrophication, acidification and
ecotoxicity) will be incorporated to deliver a more comprehensive LCA study. Efforts
will be continuously paid on seeking for more reliable data sources and assumptions will
be justified. In the future, it is possible to merge the results of this study with other bio-
refinery environmental profile for a complete sustainability analysis.
Table 2. Sensitivity analysis of weak points
Weak Point Paraxylene Process Slash Pile Burning Excess Electricity
% of Estimated
Value* 45% 70% 110% 45% 70% 110% 45% 70% 110%
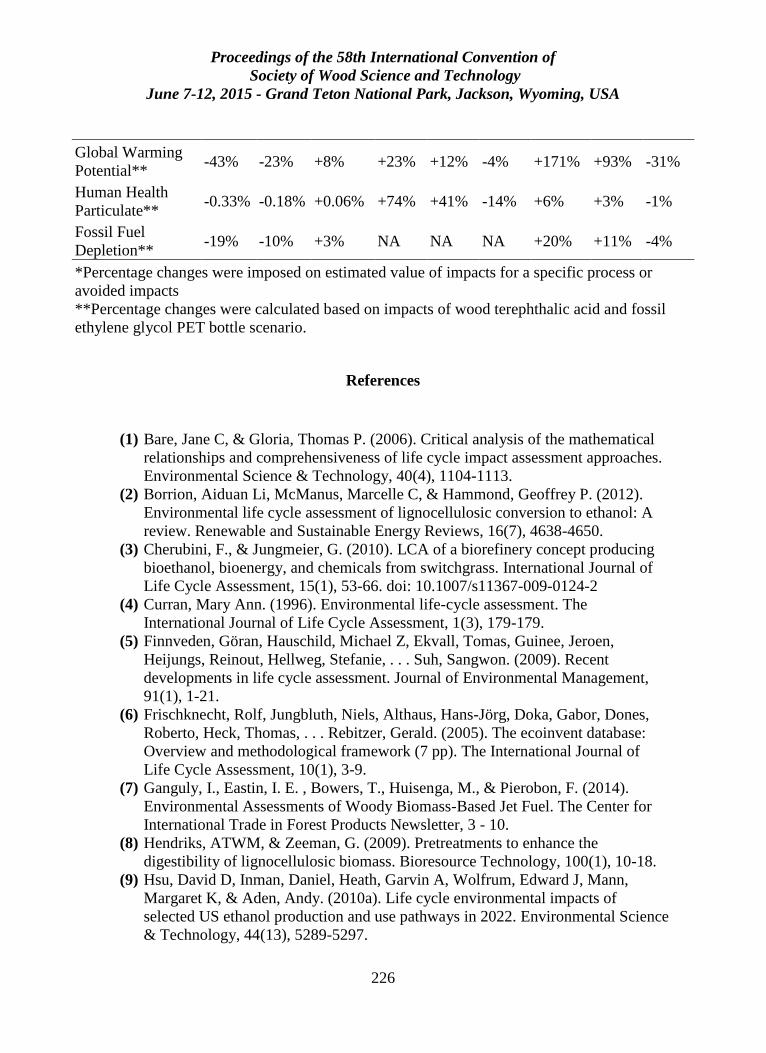
Proceedings of the 58th International Convention of
Society of Wood Science and Technology
June 7-12, 2015 - Grand Teton National Park, Jackson, Wyoming, USA
226
Global Warming
Potential** -43% -23% +8% +23% +12% -4% +171% +93% -31%
Human Health
Particulate** -0.33% -0.18% +0.06% +74% +41% -14% +6% +3% -1%
Fossil Fuel
Depletion** -19% -10% +3% NA NA NA +20% +11% -4%
*Percentage changes were imposed on estimated value of impacts for a specific process or
avoided impacts
**Percentage changes were calculated based on impacts of wood terephthalic acid and fossil
ethylene glycol PET bottle scenario.
References
(1) Bare, Jane C, & Gloria, Thomas P. (2006). Critical analysis of the mathematical
relationships and comprehensiveness of life cycle impact assessment approaches.
Environmental Science & Technology, 40(4), 1104-1113.
(2) Borrion, Aiduan Li, McManus, Marcelle C, & Hammond, Geoffrey P. (2012).
Environmental life cycle assessment of lignocellulosic conversion to ethanol: A
review. Renewable and Sustainable Energy Reviews, 16(7), 4638-4650.
(3) Cherubini, F., & Jungmeier, G. (2010). LCA of a biorefinery concept producing
bioethanol, bioenergy, and chemicals from switchgrass. International Journal of
Life Cycle Assessment, 15(1), 53-66. doi: 10.1007/s11367-009-0124-2
(4) Curran, Mary Ann. (1996). Environmental life-cycle assessment. The
International Journal of Life Cycle Assessment, 1(3), 179-179.
(5) Finnveden, Göran, Hauschild, Michael Z, Ekvall, Tomas, Guinee, Jeroen,
Heijungs, Reinout, Hellweg, Stefanie, . . . Suh, Sangwon. (2009). Recent
developments in life cycle assessment. Journal of Environmental Management,
91(1), 1-21.
(6) Frischknecht, Rolf, Jungbluth, Niels, Althaus, Hans-Jörg, Doka, Gabor, Dones,
Roberto, Heck, Thomas, . . . Rebitzer, Gerald. (2005). The ecoinvent database:
Overview and methodological framework (7 pp). The International Journal of
Life Cycle Assessment, 10(1), 3-9.
(7) Ganguly, I., Eastin, I. E. , Bowers, T., Huisenga, M., & Pierobon, F. (2014).
Environmental Assessments of Woody Biomass-Based Jet Fuel. The Center for
International Trade in Forest Products Newsletter, 3 - 10.
(8) Hendriks, ATWM, & Zeeman, G. (2009). Pretreatments to enhance the
digestibility of lignocellulosic biomass. Bioresource Technology, 100(1), 10-18.
(9) Hsu, David D, Inman, Daniel, Heath, Garvin A, Wolfrum, Edward J, Mann,
Margaret K, & Aden, Andy. (2010a). Life cycle environmental impacts of
selected US ethanol production and use pathways in 2022. Environmental Science
& Technology, 44(13), 5289-5297.
Proceedings of the 58th International Convention of
Society of Wood Science and Technology
June 7-12, 2015 - Grand Teton National Park, Jackson, Wyoming, USA
227
(10) Hsu, David D, Inman, Daniel, Heath, Garvin A, Wolfrum, Edward J,
Mann, Margaret K, & Aden, Andy. (2010b). Support Information:
(11) Life cycle environmental impacts of selected US ethanol production and
use pathways in 2022. Environmental Science & Technology, 44(13), 5289-5297.
(12) ISO, ISO14040. (2006). 14040: Environmental Management–Life Cycle
Assessment–Principles and Framework. London: British Standards Institution.
(13) Keuken, MP, Moerman, M, Voogt, M, Blom, M, Weijers, EP, Röckmann,
T, & Dusek, U. (2013). Source contributions to PM 2.5 and PM 10 at an urban
background and a street location. Atmospheric Environment, 71, 26-35.
(14) Liu, Yang, Paciorek, Christopher Joseph, & Koutrakis, Petros. (2009).
Estimating regional spatial and temporal variability of PM2. 5 concentrations
using satellite data, meteorology, and land use information.
(15) Mosier, Nathan, Wyman, Charles, Dale, Bruce, Elander, Richard, Lee,
YY, Holtzapple, Mark, & Ladisch, Michael. (2005). Features of promising
technologies for pretreatment of lignocellulosic biomass. Bioresource
Technology, 96(6), 673-686.
(16) Pawelzik, P, Carus, M, Hotchkiss, J, Narayan, R, Selke, S, Wellisch, M, . .
. Patel, MK. (2013). Critical aspects in the life cycle assessment (LCA) of bio-
based materials–Reviewing methodologies and deriving recommendations.
Resources, Conservation and Recycling, 73, 211-228.
(17) Peters, Matthew W, Taylor, Joshua D, Jenni, Madeline, Manzer, Leo E, &
Henton, David E. (2010). Integrated process to selectively convert renewable
isobutanol to p-xylene: Google Patents.
(18) Puettmann, ME, Oneil, E, Milota, MR, & Johnson, LR. (2012). Cradle to
Gate Life Cycle Assessment of Softwood Lumber Production from the Pacific
Northwest. CORRIM Report Update.
(19) Rebitzer, G., Ekvall, T., Frischknecht, R., Hunkeler, D., Norris, G.,
Rydberg, T., . . . Pennington, D. W. (2004). Life cycle assessment part 1:
framework, goal and scope definition, inventory analysis, and applications.
Environ Int, 30(5), 701-720. doi: 10.1016/j.envint.2003.11.005
(20) Stevens, Christian, & Verhé, Roland. (2004). Renewable bioresources:
scope and modification for non-food applications: John Wiley & Sons.
(21) Tao, Ling, Tan, Eric C. D., McCormick, Robert, Zhang, Min, Aden, Andy,
He, Xin, & Zigler, Bradley T. (2014). Techno-economic analysis and life-cycle
assessment of cellulosic isobutanol and comparison with cellulosic ethanol and n-
butanol. Biofuels, Bioproducts and Biorefining, 8(1), 30-48. doi:
10.1002/bbb.1431
(22) Zheng, Mei, Salmon, Lynn G, Schauer, James J, Zeng, Limin, Kiang, CS,
Zhang, Yuanhang, & Cass, Glen R. (2005). Seasonal trends in PM2. 5 source
contributions in Beijing, China. Atmospheric Environment, 39(22), 3967-3976.
(23) Zhu, JY, & Pan, XJ. (2010). Woody biomass pretreatment for cellulosic
ethanol production: technology and energy consumption evaluation. Bioresource
Technology, 101(13), 4992-5002.
Proceedings of the 58th International Convention of
Society of Wood Science and Technology
June 7-12, 2015 - Grand Teton National Park, Jackson, Wyoming, USA
228
Development of Industrial Laminated Bridge Planks
from Southern Pine Lumber
Bonnie Yang, [email protected]
Rubin Shmulsky, [email protected]
Dan Seale, [email protected]
Mississippi State University, Box 9820, Mississippi State, MS 39762
Abstract
Industrial southern pine laminated planks were proposed, manufactured and tested. This
process sought to both develop high value construction bridge timbers and to improve the
performance and utilization of low grade pine lumber. The laminated planks were made
from No.3 grade southern pine dimension lumber with the cross section of 38 × 184
mm2, and the variable lengths of 2.45, 3.06, 3.68, 4.29, 4.90 m. Southern pine lumber
was assembled with nonstructural square endjoints. Waterproof polyurethane adhesive
was used to face-laminate the lumber into 192 mm × 319 mm × 4.29 m laminated planks.
The planks were destructively tested in plank orientation by static bending. Beams were
loaded by third-point configuration as specified in ASTM 5456. Modulus of rupture
(MOR) and modulus of elasticity (MOE) were evaluated; bending design values for
uniform load situations were also developed from the test results. The product of this
research has applicability as member stock for bolt-laminating into construction bridges
and mats.
Proceedings of the 58th International Convention of
Society of Wood Science and Technology
June 7-12, 2015 - Grand Teton National Park, Jackson, Wyoming, USA
229
Effect of Cross-Laminated Timber Floor Diaphragm
Orientation on Shear Stiffness and Strength
Kyle Sullivan
CCE School and WSE Department, Oregon State University
Abstract
Cross-‐laminated timber (CLT) brings the forest industry to new heights with its
ability to build taller wooden structures. Wood buildings in the US have
typically and historically been light-‐ frame wood construction under five
stories. CLT provides the structural strengths and stiffnesses to potentially
replace steel and reinforced concrete in more environmentally sustainable
structural systems for mid-‐rise and possibly high-‐rise buildings. The “Toward
Taller Wood Buildings” national symposium (November, 2014, Chicago, IL)
brought together a group of leaders, firms, and organizations that are already
deeply involved with the development of CLT in the US.
Two researchers who attended the symposium had a significant impact on the
proposed direction of the research. Doug Rammer, Research General Engineer at
the US Forest Service, and John van de Lindt, Professor at Colorado State
University, both feel strongly that looking at how CLT floor diaphragms transfer
lateral loads would lead to design provisions in the National Design Specification for
Wood Construction and the IBC. CLT floor diaphragms experience lateral loading
along both their strong and weak axes depending on the direction of earthquake
ground motions or wind loadings and on the orientation of the panels. We will
determine how lateral loads parallel to either axes are transferred through the
diaphragm due to different strengths and stiffnesses in the two directions. The goal
is also to develop preliminary estimates of design values for shear strength and
stiffness based on ASTM E455, so that structural engineers will be able to
confidently use CLT in lateral-‐force-‐resisting systems.
Proceedings of the 58th International Convention of
Society of Wood Science and Technology
June 7-12, 2015 - Grand Teton National Park, Jackson, Wyoming, USA
230
Trends in U.S Furniture Trade
Cagatay Tasdemir, [email protected]
Rado Gazo, [email protected]
Purdue University, 2491 Sycamore Ln., Apt 6 , West Lafayette, IN 47906
Abstract
The US and global economy has experienced both a downturn and a recovery over the
last decade. The objective of this study is to analyze trends in imports and exports of
furniture in the US over this period of time. We evaluate top ten furniture exporting
countries in terms of value and principal products. Main competitive strategies of
countries exporting furniture to the U.S. are identified and briefly explained within the
scope of this study by observing the changes in the values of last five years data. Taiwan
was one of the most important furniture exporters to the US until 1994, when the country
started to lose its power in the market due to the technological improvements made in
other Asian countries. Decreasing trend of Taiwan export values continued in last ten
years while Vietnam increased its share of the U.S. furniture market. Since 2004, China
was the most important source of imported wood furniture and accounts for over 48.5%
of total imports volume.
Overall, low-cost structure, government support and advanced technologies in Asia have
provided the Asian countries with competitive advantage over their European and
American competitors. Hence, lower price of imported products has been the main
influential and decisive factor for furniture consumers in U.S. and set the benchmark for
manufacturers in terms of competitive advantages.
Proceedings of the 58th International Convention of
Society of Wood Science and Technology
June 7-12, 2015 - Grand Teton National Park, Jackson, Wyoming, USA
231
Effect of Lignin as Additive on the Properties of Wood
Flour/Polypropylene Composites
Shupin Luo1 –Jinzhen Cao2*
1 PhD Candidate, MOE Key Laboratory of Wooden Material Science and
Application, Beijing Forestry University, Beijing, China.
2 Professor, MOE Key Laboratory of Wooden Material Science and
Application, Beijing Forestry University, Beijing, China.
* Corresponding author
Abstract
This study was designed to investigate the effect of soda lignin incorporation on the
physical, mechanical, and thermal properties of wood flour /polypropylene composites.
Varying contents (1, 2, 4, and 8 wt%) of lignin was added to wood flour and
polypropylene by direct mixing, then the composites were prepared by two-screw
extrusion and compression molding. The performance of composites were evaluated via
water absorption testing and mechanical testing. Results showed that lignin incorporation
reduced the water absorption rates. Flexural properties and impact strength increased
when 1 or 2 wt% of lignin was added; while these properties slightly decreased when
lignin addition increased to 4 or 8 wt%. Dynamic mechanical analysis and Scanning
electron micrographs also indicated improved interfacial bonding between wood flour
and polypropylene by 1 and 2 wt% lignin addition.
Keywords: wood, lignin, mechanical properties, interfacial bonding
Proceedings of the 58th International Convention of Society of Wood Science and Technology
June 7-12, 2015 – Grand Teton National Park, Jackson, Wyoming, USA
232
1. Introduction
Natural fiber reinforced polymer composites, as an important branch in the field of
composite materials, have been intensively investigated in recent decades. Compared
with conventional synthetic fibers like glass and carbon, natural fibers have several
advantages. They are low cost, highly available and renewable, low density, high specific
strength and biodegradable [1]. However, one of the main problems with using natural
fibers as reinforcement is the poor compatibility between the inherently polar fibers and
non-polar polymer matrices. The incompatibility caused ineffective stress transfer
throughout the interface, resulting in low performance of composites. This means that the
reinforcement potential of natural fibers cannot be exploited to the full extent, especially
for short fibers and particles[2]. However, with the rising environmental concerns and
depletion of petro-chemical resources currently, it is desirable to reduce the chemical
input, energy cost and wastes during the production. An alternative to these methods are
the use of natural materials as additives in the composites.
Lignin is the second most abundant biopolymer on our planet after cellulose, and it is one
of the three main components found in the cell wall of natural lignocellulosic
materials[3]. Large quantities of lignin are yearly available from numerous pulping
processes such as paper and biorefinery industries. Most of them is burnt to produce
energy although they can offer many other added value uses. Only approximately 2% of
the lignin from pulp and paper industry has been commercialized [4,5]. The chemical
structure of lignin is complex, largely depending on the origin, separation and
fragmentation processes[6].
Some researchers incorporated commercial lignin into composites to ascertain if it was
beneficial to the properties. Graupner[7] applied kraft lignin powder of eucalyptus as
natural adhesion promoter in cotton fiber-PLA composites, resulting in improved tensile
properties while decreased impact properties. Acha et al.[8] investigated the feasibility of
using a commercial kraft lignin as a compatibilizer for jute fabric-PP composites, but
found the improvement only obtained from impact behavior. Wood et al. [9] found the
addition of 5 wt% Kraft lignin to hemp-epoxy composites generated a significant rise in
the impact strength; both flexural and tensile modulus showed an increase when lignin
was added up to 2.5 wt%. Previous studies on lignin as additive in natural fiber/polymer
composites showed various results. Besides, there has been few studies about the lignin
addition in WF/PP composite.
In this context, we applied the commercial soda lignin from alkaline pulping as additive
in wood flour/PP composite, in order to ascertain if this kind of lignin was beneficial to
the mechanical and physical properties of composites.
2. Materials and Methods
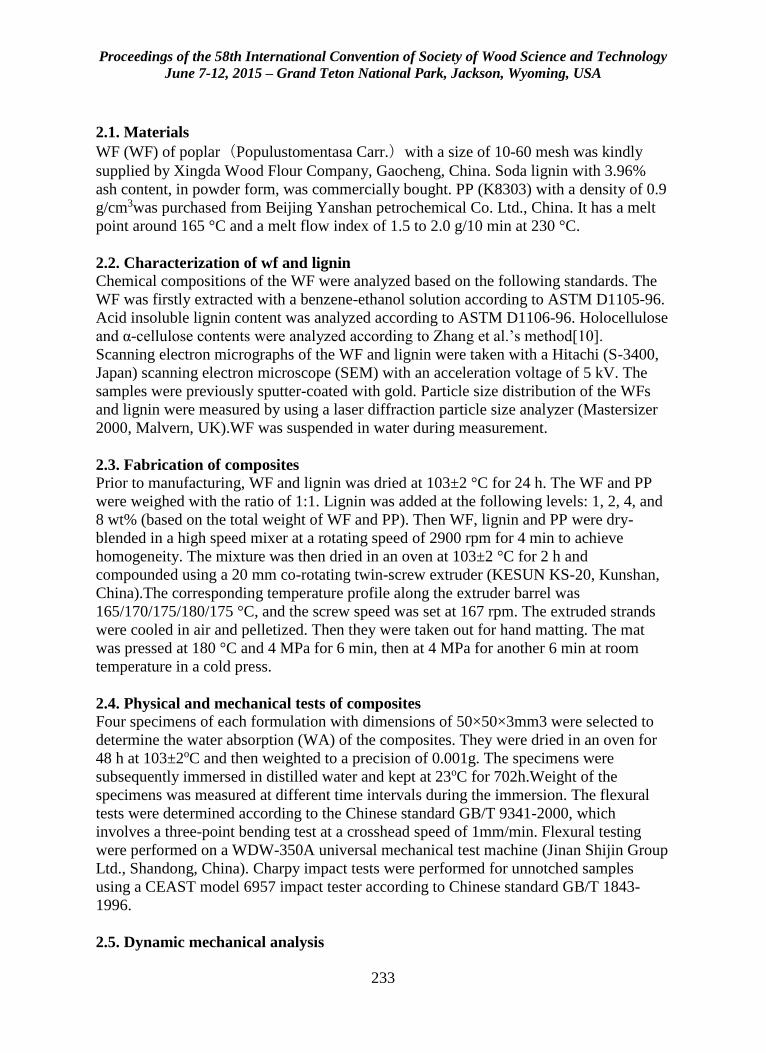
Proceedings of the 58th International Convention of Society of Wood Science and Technology
June 7-12, 2015 – Grand Teton National Park, Jackson, Wyoming, USA
233
2.1. Materials
WF (WF) of poplar(Populustomentasa Carr.)with a size of 10-60 mesh was kindly
supplied by Xingda Wood Flour Company, Gaocheng, China. Soda lignin with 3.96%
ash content, in powder form, was commercially bought. PP (K8303) with a density of 0.9
g/cm3was purchased from Beijing Yanshan petrochemical Co. Ltd., China. It has a melt
point around 165 °C and a melt flow index of 1.5 to 2.0 g/10 min at 230 °C.
2.2. Characterization of wf and lignin
Chemical compositions of the WF were analyzed based on the following standards. The
WF was firstly extracted with a benzene-ethanol solution according to ASTM D1105-96.
Acid insoluble lignin content was analyzed according to ASTM D1106-96. Holocellulose
and α-cellulose contents were analyzed according to Zhang et al.’s method[10].
Scanning electron micrographs of the WF and lignin were taken with a Hitachi (S-3400,
Japan) scanning electron microscope (SEM) with an acceleration voltage of 5 kV. The
samples were previously sputter-coated with gold. Particle size distribution of the WFs
and lignin were measured by using a laser diffraction particle size analyzer (Mastersizer
2000, Malvern, UK).WF was suspended in water during measurement.
2.3. Fabrication of composites
Prior to manufacturing, WF and lignin was dried at 103±2 °C for 24 h. The WF and PP
were weighed with the ratio of 1:1. Lignin was added at the following levels: 1, 2, 4, and
8 wt% (based on the total weight of WF and PP). Then WF, lignin and PP were dry-
blended in a high speed mixer at a rotating speed of 2900 rpm for 4 min to achieve
homogeneity. The mixture was then dried in an oven at 103±2 °C for 2 h and
compounded using a 20 mm co-rotating twin-screw extruder (KESUN KS-20, Kunshan,
China).The corresponding temperature profile along the extruder barrel was
165/170/175/180/175 °C, and the screw speed was set at 167 rpm. The extruded strands
were cooled in air and pelletized. Then they were taken out for hand matting. The mat
was pressed at 180 °C and 4 MPa for 6 min, then at 4 MPa for another 6 min at room
temperature in a cold press.
2.4. Physical and mechanical tests of composites
Four specimens of each formulation with dimensions of 50×50×3mm3 were selected to
determine the water absorption (WA) of the composites. They were dried in an oven for
48 h at 103±2oC and then weighted to a precision of 0.001g. The specimens were
subsequently immersed in distilled water and kept at 23oC for 702h.Weight of the
specimens was measured at different time intervals during the immersion. The flexural
tests were determined according to the Chinese standard GB/T 9341-2000, which
involves a three-point bending test at a crosshead speed of 1mm/min. Flexural testing
were performed on a WDW-350A universal mechanical test machine (Jinan Shijin Group
Ltd., Shandong, China). Charpy impact tests were performed for unnotched samples
using a CEAST model 6957 impact tester according to Chinese standard GB/T 1843-
1996.
2.5. Dynamic mechanical analysis
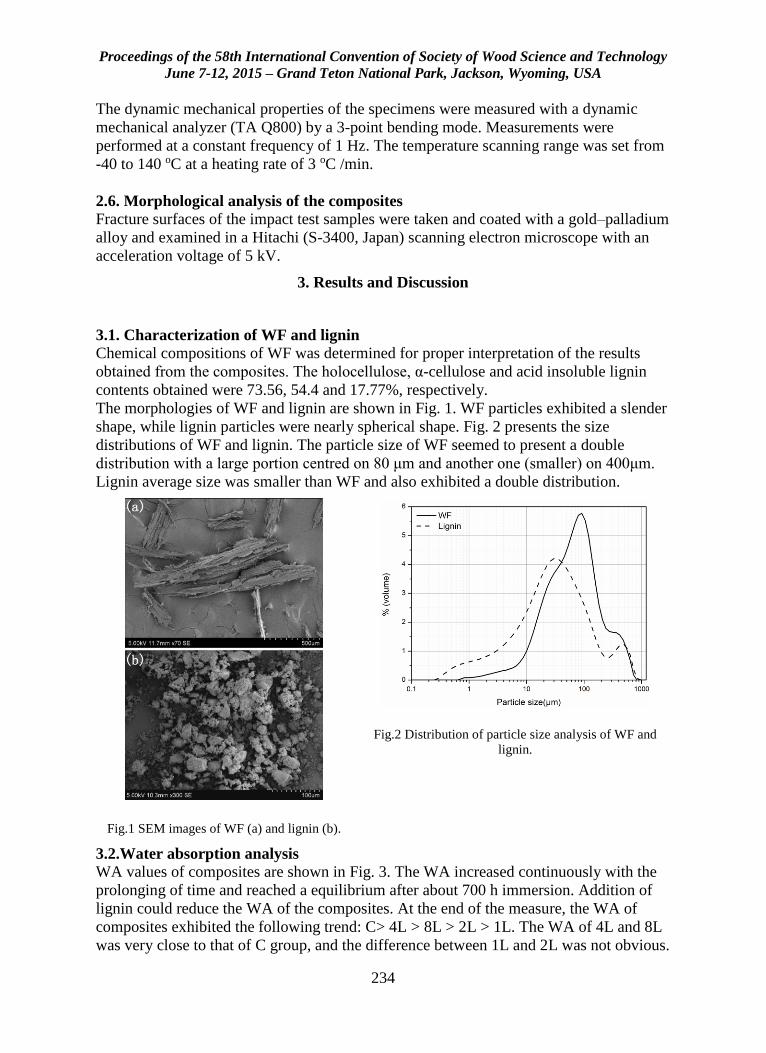
Proceedings of the 58th International Convention of Society of Wood Science and Technology
June 7-12, 2015 – Grand Teton National Park, Jackson, Wyoming, USA
234
The dynamic mechanical properties of the specimens were measured with a dynamic
mechanical analyzer (TA Q800) by a 3-point bending mode. Measurements were
performed at a constant frequency of 1 Hz. The temperature scanning range was set from
-40 to 140 oC at a heating rate of 3 oC /min.
2.6. Morphological analysis of the composites
Fracture surfaces of the impact test samples were taken and coated with a gold–palladium
alloy and examined in a Hitachi (S-3400, Japan) scanning electron microscope with an
acceleration voltage of 5 kV.
3. Results and Discussion
3.1. Characterization of WF and lignin
Chemical compositions of WF was determined for proper interpretation of the results
obtained from the composites. The holocellulose, α-cellulose and acid insoluble lignin
contents obtained were 73.56, 54.4 and 17.77%, respectively.
The morphologies of WF and lignin are shown in Fig. 1. WF particles exhibited a slender
shape, while lignin particles were nearly spherical shape. Fig. 2 presents the size
distributions of WF and lignin. The particle size of WF seemed to present a double
distribution with a large portion centred on 80 μm and another one (smaller) on 400μm.
Lignin average size was smaller than WF and also exhibited a double distribution.
Fig.2 Distribution of particle size analysis of WF and
lignin.
Fig.1 SEM images of WF (a) and lignin (b).
3.2.Water absorption analysis
WA values of composites are shown in Fig. 3. The WA increased continuously with the
prolonging of time and reached a equilibrium after about 700 h immersion. Addition of
lignin could reduce the WA of the composites. At the end of the measure, the WA of
composites exhibited the following trend: C> 4L > 8L > 2L > 1L. The WA of 4L and 8L
was very close to that of C group, and the difference between 1L and 2L was not obvious.
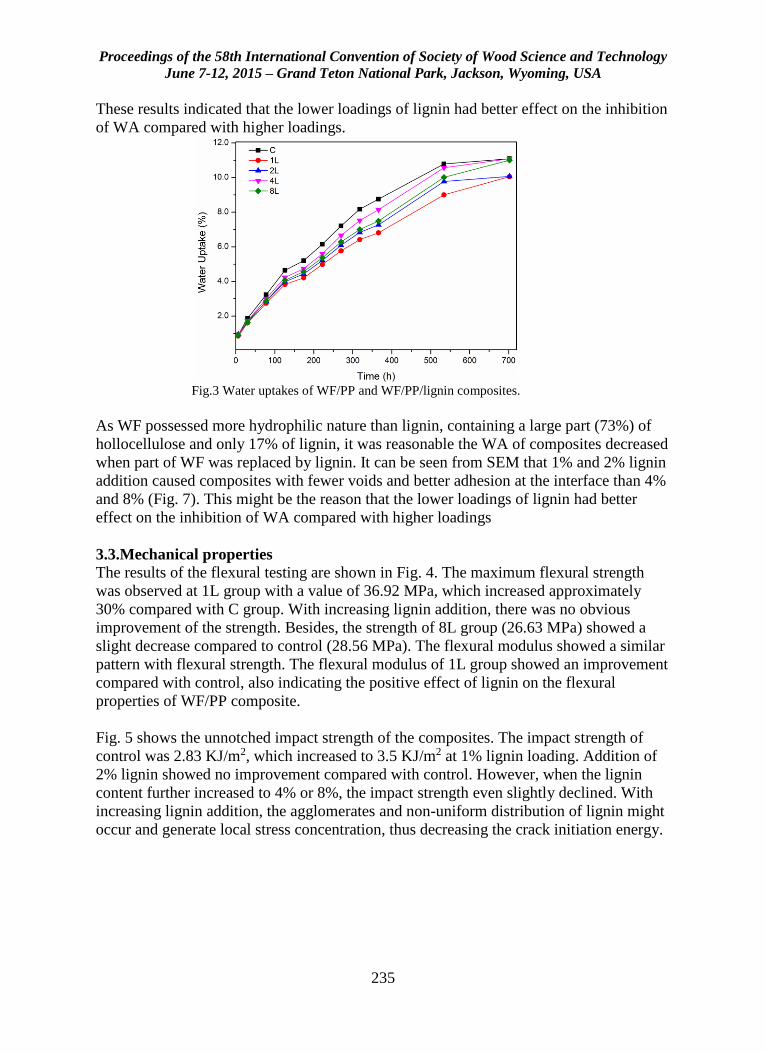
Proceedings of the 58th International Convention of Society of Wood Science and Technology
June 7-12, 2015 – Grand Teton National Park, Jackson, Wyoming, USA
235
These results indicated that the lower loadings of lignin had better effect on the inhibition
of WA compared with higher loadings.
Fig.3 Water uptakes of WF/PP and WF/PP/lignin composites.
As WF possessed more hydrophilic nature than lignin, containing a large part (73%) of
hollocellulose and only 17% of lignin, it was reasonable the WA of composites decreased
when part of WF was replaced by lignin. It can be seen from SEM that 1% and 2% lignin
addition caused composites with fewer voids and better adhesion at the interface than 4%
and 8% (Fig. 7). This might be the reason that the lower loadings of lignin had better
effect on the inhibition of WA compared with higher loadings
3.3.Mechanical properties The results of the flexural testing are shown in Fig. 4. The maximum flexural strength
was observed at 1L group with a value of 36.92 MPa, which increased approximately
30% compared with C group. With increasing lignin addition, there was no obvious
improvement of the strength. Besides, the strength of 8L group (26.63 MPa) showed a
slight decrease compared to control (28.56 MPa). The flexural modulus showed a similar
pattern with flexural strength. The flexural modulus of 1L group showed an improvement
compared with control, also indicating the positive effect of lignin on the flexural
properties of WF/PP composite.
Fig. 5 shows the unnotched impact strength of the composites. The impact strength of
control was 2.83 KJ/m2, which increased to 3.5 KJ/m2 at 1% lignin loading. Addition of
2% lignin showed no improvement compared with control. However, when the lignin
content further increased to 4% or 8%, the impact strength even slightly declined. With
increasing lignin addition, the agglomerates and non-uniform distribution of lignin might
occur and generate local stress concentration, thus decreasing the crack initiation energy.
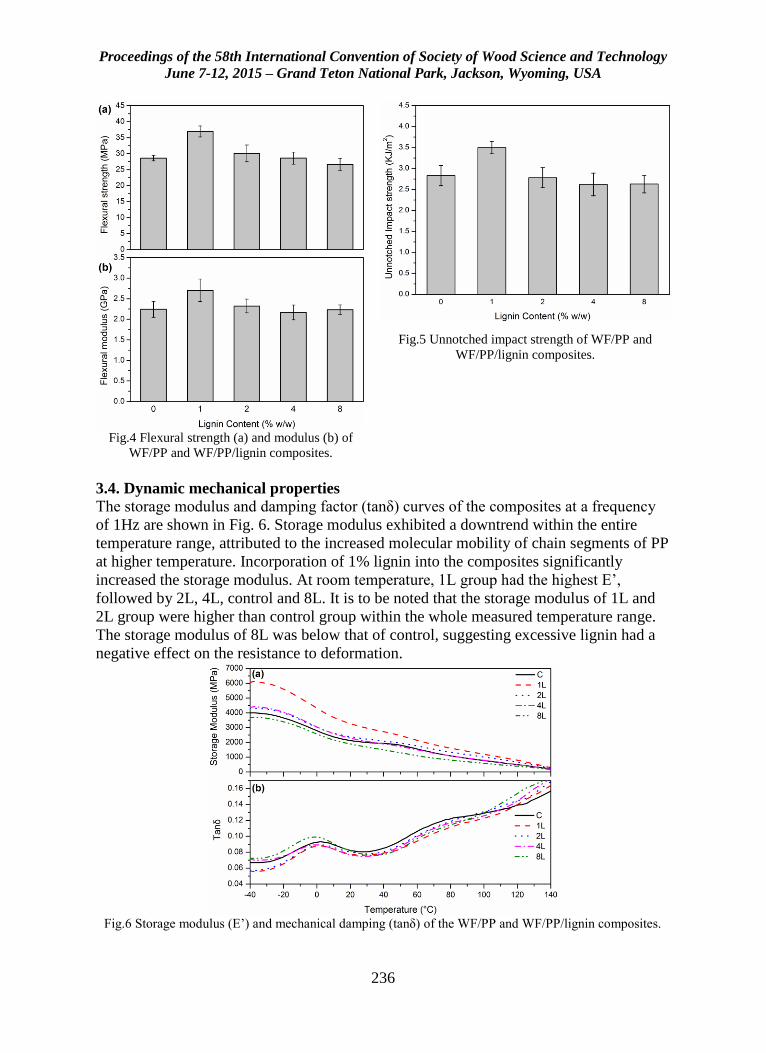
Proceedings of the 58th International Convention of Society of Wood Science and Technology
June 7-12, 2015 – Grand Teton National Park, Jackson, Wyoming, USA
236
Fig.5 Unnotched impact strength of WF/PP and
WF/PP/lignin composites.
Fig.4 Flexural strength (a) and modulus (b) of
WF/PP and WF/PP/lignin composites.
3.4. Dynamic mechanical properties
The storage modulus and damping factor (tanδ) curves of the composites at a frequency
of 1Hz are shown in Fig. 6. Storage modulus exhibited a downtrend within the entire
temperature range, attributed to the increased molecular mobility of chain segments of PP
at higher temperature. Incorporation of 1% lignin into the composites significantly
increased the storage modulus. At room temperature, 1L group had the highest E’,
followed by 2L, 4L, control and 8L. It is to be noted that the storage modulus of 1L and
2L group were higher than control group within the whole measured temperature range.
The storage modulus of 8L was below that of control, suggesting excessive lignin had a
negative effect on the resistance to deformation.
Fig.6 Storage modulus (E’) and mechanical damping (tanδ) of the WF/PP and WF/PP/lignin composites.
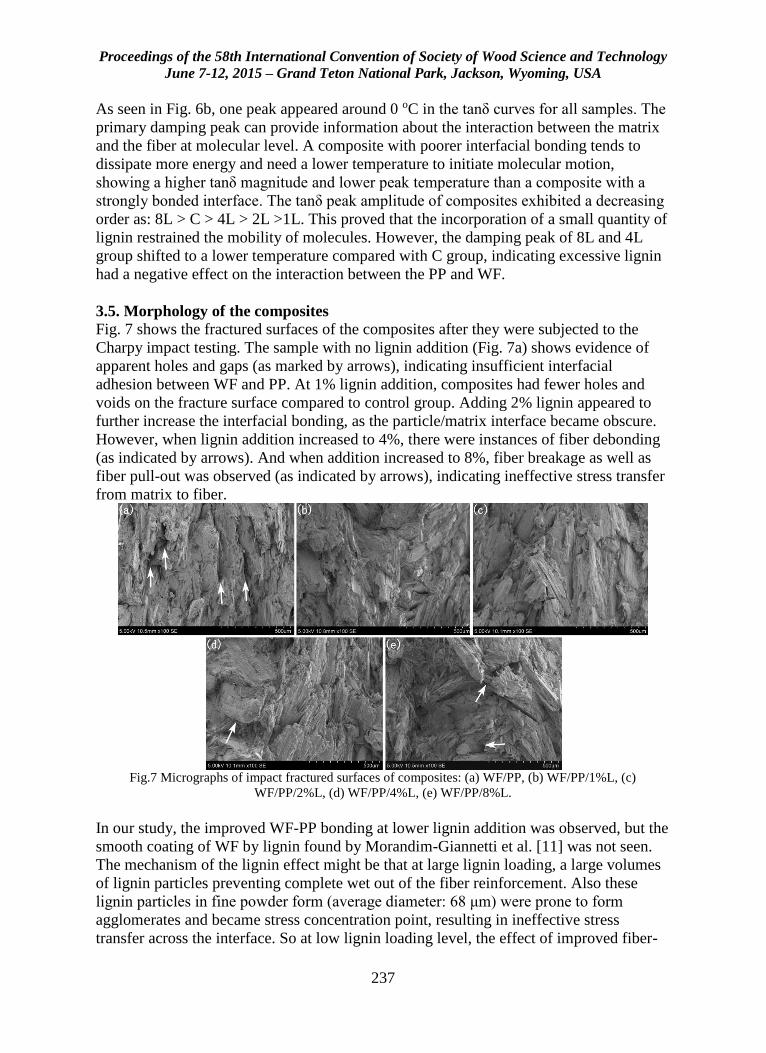
Proceedings of the 58th International Convention of Society of Wood Science and Technology
June 7-12, 2015 – Grand Teton National Park, Jackson, Wyoming, USA
237
As seen in Fig. 6b, one peak appeared around 0 oC in the tanδ curves for all samples. The
primary damping peak can provide information about the interaction between the matrix
and the fiber at molecular level. A composite with poorer interfacial bonding tends to
dissipate more energy and need a lower temperature to initiate molecular motion,
showing a higher tanδ magnitude and lower peak temperature than a composite with a
strongly bonded interface. The tanδ peak amplitude of composites exhibited a decreasing
order as: 8L > C > 4L > 2L >1L. This proved that the incorporation of a small quantity of
lignin restrained the mobility of molecules. However, the damping peak of 8L and 4L
group shifted to a lower temperature compared with C group, indicating excessive lignin
had a negative effect on the interaction between the PP and WF.
3.5. Morphology of the composites
Fig. 7 shows the fractured surfaces of the composites after they were subjected to the
Charpy impact testing. The sample with no lignin addition (Fig. 7a) shows evidence of
apparent holes and gaps (as marked by arrows), indicating insufficient interfacial
adhesion between WF and PP. At 1% lignin addition, composites had fewer holes and
voids on the fracture surface compared to control group. Adding 2% lignin appeared to
further increase the interfacial bonding, as the particle/matrix interface became obscure.
However, when lignin addition increased to 4%, there were instances of fiber debonding
(as indicated by arrows). And when addition increased to 8%, fiber breakage as well as
fiber pull-out was observed (as indicated by arrows), indicating ineffective stress transfer
from matrix to fiber.
Fig.7 Micrographs of impact fractured surfaces of composites: (a) WF/PP, (b) WF/PP/1%L, (c)
WF/PP/2%L, (d) WF/PP/4%L, (e) WF/PP/8%L.
In our study, the improved WF-PP bonding at lower lignin addition was observed, but the
smooth coating of WF by lignin found by Morandim-Giannetti et al. [11] was not seen.
The mechanism of the lignin effect might be that at large lignin loading, a large volumes
of lignin particles preventing complete wet out of the fiber reinforcement. Also these
lignin particles in fine powder form (average diameter: 68 μm) were prone to form
agglomerates and became stress concentration point, resulting in ineffective stress
transfer across the interface. So at low lignin loading level, the effect of improved fiber-
Proceedings of the 58th International Convention of Society of Wood Science and Technology
June 7-12, 2015 – Grand Teton National Park, Jackson, Wyoming, USA
238
matrix interaction dominated; at high lignin loading level, the domination of improved
interaction was replaced by negative effect of lignin aggregation. Besides, there was the
possibility that the active groups of lignin were not highly effective, since it was used as
received.
4. Conclusion
WF/PP composites were fabricated with incorporating varying amounts of soda lignin.
Compared to control sample, addition of lignin to WF/PP composites resulted in reduced
water absorption. Incorporation of a small quantity of lignin was shown to be beneficial
towards improving the flexural properties and impact strength of the composites,
although these properties remained unchanged or even reduced when lignin was added up
to 4 and 8 wt%. DMA and SEM analysis also indicated that fiber-matrix adhesion could
be improved at appropriate dosage. But the improvement was not enough to remarkably
improve the physical and mechanical behavior of WF/PP composites, probably due to the
aggregation of lignin particles and low reactivity with WF.
Acknowledgements
This study is financially supported by Fundamental Research Funds for the Central
Universities in China (No. TD2011-14).
References
[1] Wambua P, Ivens J, Verpoest I (2003) Natural fibres: can they replace glass in fibre
reinforced plastics? Compos Sci Technol 63(9):1259-64.
[2] Sobczak L, Brueggemann O, Putz RF (2013) Polyolefin composites with natural
fibers and wood-modification of the fiber/filler-matrix interaction. J Appl Polym Sci
127(1):1-17.
[3] Thakur VK, Thakur MK, Raghavan P, Kessler MR (2014) Progress in Green Polymer
Composites from Lignin for Multifunctional Applications: A Review. ACS Sustainable
Chem Eng 2(5):1072-92.
[4] Gosselink RJA, de Jong E, Guran B, Abacherli A (2004) Co-ordination network for
lignin-standardisation, production and applications adapted to market requirements
(EURO LIGNIN). Ind Crop Prod 20(2):121-9.
Proceedings of the 58th International Convention of Society of Wood Science and Technology
June 7-12, 2015 – Grand Teton National Park, Jackson, Wyoming, USA
239
[5] Laurichesse S, Averous L. Chemical modification of lignins: Towards biobased
polymers. Prog Polym Sci 2014;39(7):1266-90.
[6] Chakar FS, Ragauskas AJ. Review of current and future softwood kraft lignin process
chemistry. Ind Crop Prod 2004;20(2):131-41.
[7] Graupner N (2008) Application of lignin as natural adhesion promoter in cotton fibre-
reinforced poly(lactic acid) (PLA) composites. J Mater Sci 43(15):5222-9.
[8] Acha BA, Marcovich NE, Reboredo MM (2009) Lignin in jute fabric-polypropylene
composites. J Appl Polym Sci 113(3):1480-7.
[9] Wood BM, Coles SR, Maggs S, Meredith J, Kirwan K (2011) Use of lignin as a
compatibiliser in hemp/epoxy composites. Compos Sci Technol 71(16):1804-10.
[10] Zhang H, Pang H, Shi J, Fu T, Liao B (2012) Investigation of liquefied wood
residues based on cellulose, hemicellulose, and lignin. J Appl Polym Sci 123(2):850-6.
[11] Morandim-Giannetti AA, Agnelli JAM, Lanças BZ, Magnabosco R, Casarin SA,
Bettini SHP (2012) Lignin as additive in polypropylene/coir composites: Thermal,
mechanical and morphological properties. Carbohyd Polym 87(4):2563-8.
Proceedings of the 58th International Convention of Society of Wood Science and Technology
June 7-12, 2015 – Grand Teton National Park, Jackson, Wyoming, USA
240
Influence of Lignin Modification on Microfibril Angle
in Young Transgenic Black Cottonwood Trees
Zachary Miller, [email protected]
Vincent Chiang, [email protected]
Ilona Peszlen, [email protected]
Perry Peralta, [email protected]
North Carolina State University, 3911 Greenleaf Street, Raleigh, NC 27695
Abstract
Primary and secondary cell walls of plants contain a scaffold of cellulose microfibrils
embedded in a hemicellulose and lignin matrix. Microfibril angle (MFA) refers to the
angle between the long axis of the cell and the direction of helical windings of cellulose
microfibrils in the secondary cell wall of fibers and tracheids. Wood in which the MFA is
large has a low Young’s modulus and not suitable for high-grade lumber, reducing its
value as a raw material. This problem was not too serious in the past when trees were
allowed to reach maturity before being harvested, however, the increase in demand for
pulp and wood products is driving the forest industry towards short-rotation cropping of
fast-growing species like Populus hybrids. In this study, genetically modified six-month-
old black cottonwood (Populus trichocarpa) clones with modifications to genes located in
the lignin biosynthesis pathway were investigated. Black cottonwood was chosen because
of its sequenced genome, ease of propagation, fast growth and economic importance.
Black cottonwood trees were propagated by rooted cuttings and grown in the Forest
Biotechnology greenhouse at NCSU for approximately 6 months. These trees represent a
wildtype for control and groups that received different genetic modifications based on the
steps in the lignin biosynthesis pathway. The MFA was measured from bark-to-bark in
samples using an X-ray diffraction technique. Significant variation in MFA from pith to
bark was observed.
Proceedings of the 58th International Convention of Society of Wood Science and Technology
June 7-12, 2015 – Grand Teton National Park, Jackson, Wyoming, USA
241
Increasing Service Life of Wooden Chairs
Mesut Uysal, [email protected]
Eva Haviarova, [email protected]
Carl Albert Eckelman, [email protected]
Purdue University, 2491 Sycamore Ln., Apt 5, West Lafayette, IN 47906
Abstract
The goal of the study was to obtain background information concerning the effect of joint
construction on the durability, reparability and parts reuse of wooded chair frames. Tests
were conducted with simple chair frames with seven different types of joints grouped into
two joinery systems. Namely, a) mechanical joinery – screw joints, bed bolts with dowel
nut joints, pinned round mortise and tenon, and pinned rectangular mortise and tenon
joints, and b) permanent (glued) joinery – dowel joints, glued round mortise and tenon,
and glued rectangular mortise and tenon joints. Front to back load test was conducted to
determine chair strength performance (moment capacity). Chair durability, reparability,
and parts reusability were also evaluated. Mechanical joints were found to be the easiest
to repair and resulted in largest reuse of parts. Glued round and rectangular mortise and
tenon joints, however, provided high levels of strength which would potentially increase
product service life (contributing to long lasting, more sustainable product). Joints
constructed with large screws or lag screws produced about the same moment capacity as
glued round and rectangular mortise and tenon joints. Screw joints are conceivably well
suited for simple on-site repair of broken furniture with the advantage that broken
furniture does not need to be disassembled prior to repair.
Proceedings of the 58th International Convention of Society of Wood Science and Technology
June 7-12, 2015 – Grand Teton National Park, Jackson, Wyoming, USA
242
Analysis of Mechanical Behavior of All-Wooden Joint
Using FEM and DIC
Jaromír Milch1* – Jan Tippner1 – Václav Sebera1 – Martin Brabec1
1 Department of Wood Science, Faculty of Forestry and Wood Technology,
Mendel University in Brno. Zemědělská 3, 613 00 Brno.
* Corresponding author
Abstract
The preservation of original material during reconstruction of valuable historical timber
constructions results in higher attention on all-wooden joints that are necessary to
implement into the trusses. This paper investigates a mechanical behavior of all-wooden
joint with dowel connection using numerical modelling and full-field strain measurement.
Numerical simulations of joints employ finite element analysis (FEA) in ANSYS
software. Wood is considered as fully orthotropic elasto-plastic material (Norway spruce
and European beech). Experimental testing employing optical evaluation of deformations
based on optical methods based on digital image correlation (DIC) was used for
verification of numerical models. During the measurements in testing machine, the area
of interest focused on members of joints using the stereovision system. The first part of
work dealt with assembling of fundamental anisotropic elasto-plastic material in simple
finite-element (FE) 3D models and its verification. Sensitivity analysis was used for
finding optimal characteristic of the material models, e.g. yield stress, tangent moduli.
Subsequently, the verified anisotropic elasto-plastic material models were implemented
into the simulation of whole 3D solid joints. The second part of work focused on a
verification of the 3D numerical models using experimental data (displacements and
forces). Last, an application of the verified anisotropic elasto-plastic material model of
joints into complex structural analysis of truss will be demonstrated.
Keywords: bilinear isotropic hardening, digital image correlation, dowel-type joints,
elasto-plastic, finite element method.
Proceedings of the 58th International Convention of Society of Wood Science and Technology
June 7-12, 2015 – Grand Teton National Park, Jackson, Wyoming, USA
243
Introduction
The assessment of historical timber monuments is currently paid a big attention from
structural, architectural and safety point of view during restoration of damaged timber
elements or connections in the structure (Abruzzese 2009). The missing information
about global mechanical behavior of complex connections in the timber structures are
reasons for evaluation of mechanical response when loaded using sophisticated methods.
The numerical approaches based on finite element method (FEM) are one of several
appropriate methods for virtual assessment and prediction of possible (points of fault) in
the material, in the complex wood structure eventually. Many studies about construction
joints with wooden dowels were investigated (Hill 1950, Kessel and Augustin 1996,
Bulleit et al. 1999, Santos et al. 2009, etc.). Nowadays, considering the increasing interest
about all-wooden joints with dowel connection many studies were performed by using
approaches FEA and DIC for predict of mechanical behavior (Oudjene and Khelifa 2009,
Dias et al. 2010, etc.). FEM may simplify the optimization of the timber connections
according to various parameters in comparison with the experimental testing. Therefore,
the numerical modeling is usually undertaken as an approach to study of timber
connection in complex structures (Chen et al. 2003).
Wood is an anisotropic material, but under a certain set of conditions is usually
considered as an elastic fully orthotropic material in the numerical analyses. However,
this model is insufficient for prediction of ultimate strength in wood behavior (Moses and
Prion 2002). Orthotropic plasticity theory based on Hill's formulation with hardening is
utilized in describing the non-linear behavior up to and beyond the point of ultimate
wood strength. The non-linear constitutive behavior of the wood strands is defined by
four basic constitutive regimes: elastic, elasto-plastic and post-failure brittle or post-
failure ductile (Clouston and Lam 2002). Therefore, the numerical simulations using
elasto-plastic material model with hardening are more accurate and suitable for prediction
of the mechanical behavior of other material, the wood eventually. Further, this model
reflects a more realistic idea about the global behavior of numerical models of wood in
comparison with experimental tests (Sohouli et al. 2011). Owing to crushing of wood
cells and separation of the fibres, the stress-strain behavior is non-linear in the
compression, meanwhile the tension and shear exhibit the linear stress-strain behavior
until brittle failure occurs. The finding a suitable material model for the wood will allow
to predicting “more realistic” behavior of the wooden elements under various loading
conditions in numerous applications of structural engineering such as the connections
behaviour, etc. (Moses and Prion 2002).
Materials and Methods
Experimental test
All tested joints were prepared from Norway spruce (Picea abies L. Karst.) with wooden
dowels (nominal diameter d = 8 mm) that were made of European beech (Fagus sylvatica
L.). Wood members of joints were cut parallel to grain with length and in the tangential
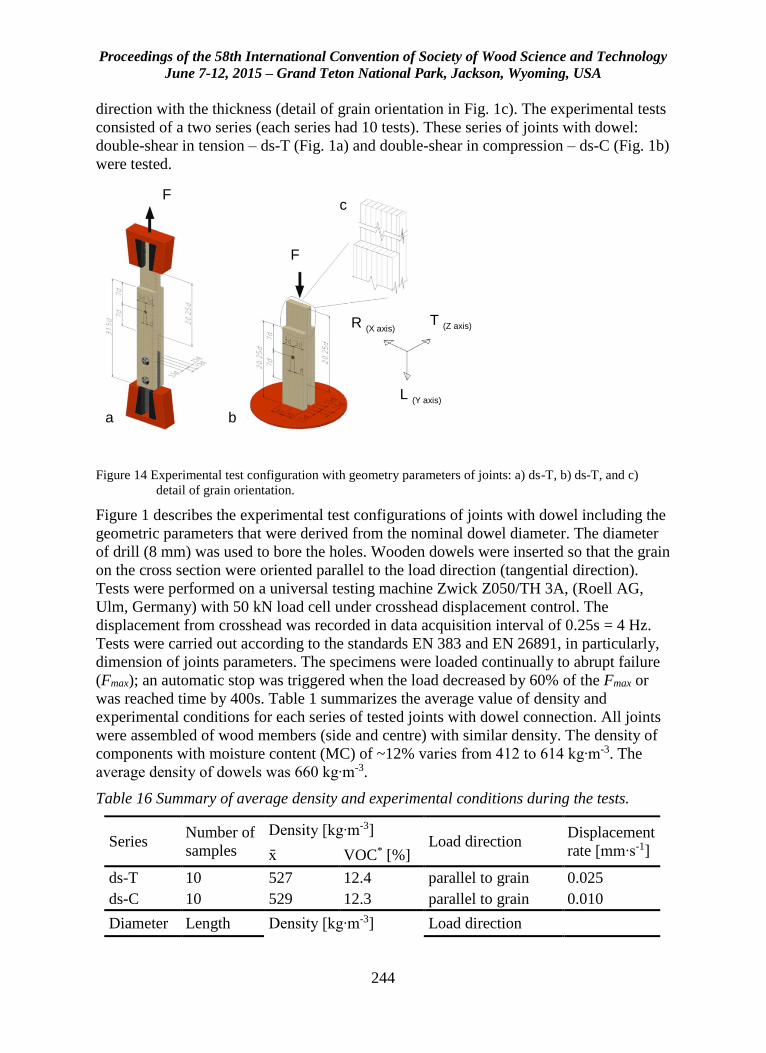
Proceedings of the 58th International Convention of Society of Wood Science and Technology
June 7-12, 2015 – Grand Teton National Park, Jackson, Wyoming, USA
244
direction with the thickness (detail of grain orientation in Fig. 1c). The experimental tests
consisted of a two series (each series had 10 tests). These series of joints with dowel:
double-shear in tension – ds-T (Fig. 1a) and double-shear in compression – ds-C (Fig. 1b)
were tested.
Figure 14 Experimental test configuration with geometry parameters of joints: a) ds-T, b) ds-T, and c)
detail of grain orientation.
Figure 1 describes the experimental test configurations of joints with dowel including the
geometric parameters that were derived from the nominal dowel diameter. The diameter
of drill (8 mm) was used to bore the holes. Wooden dowels were inserted so that the grain
on the cross section were oriented parallel to the load direction (tangential direction).
Tests were performed on a universal testing machine Zwick Z050/TH 3A, (Roell AG,
Ulm, Germany) with 50 kN load cell under crosshead displacement control. The
displacement from crosshead was recorded in data acquisition interval of 0.25s = 4 Hz.
Tests were carried out according to the standards EN 383 and EN 26891, in particularly,
dimension of joints parameters. The specimens were loaded continually to abrupt failure
(Fmax); an automatic stop was triggered when the load decreased by 60% of the Fmax or
was reached time by 400s. Table 1 summarizes the average value of density and
experimental conditions for each series of tested joints with dowel connection. All joints
were assembled of wood members (side and centre) with similar density. The density of
components with moisture content (MC) of ~12% varies from 412 to 614 kg∙m-3. The
average density of dowels was 660 kg∙m-3.
Table 16 Summary of average density and experimental conditions during the tests.
Series Number of
samples
Density [kg∙m-3] Load direction
Displacement
rate [mm∙s-1] x VOC* [%]
ds-T 10 527 12.4 parallel to grain 0.025
ds-C 10 529 12.3 parallel to grain 0.010
Diameter Length Density [kg∙m-3] Load direction
a b
c F
F
L (Y axis)
T (Z axis) R (X axis)
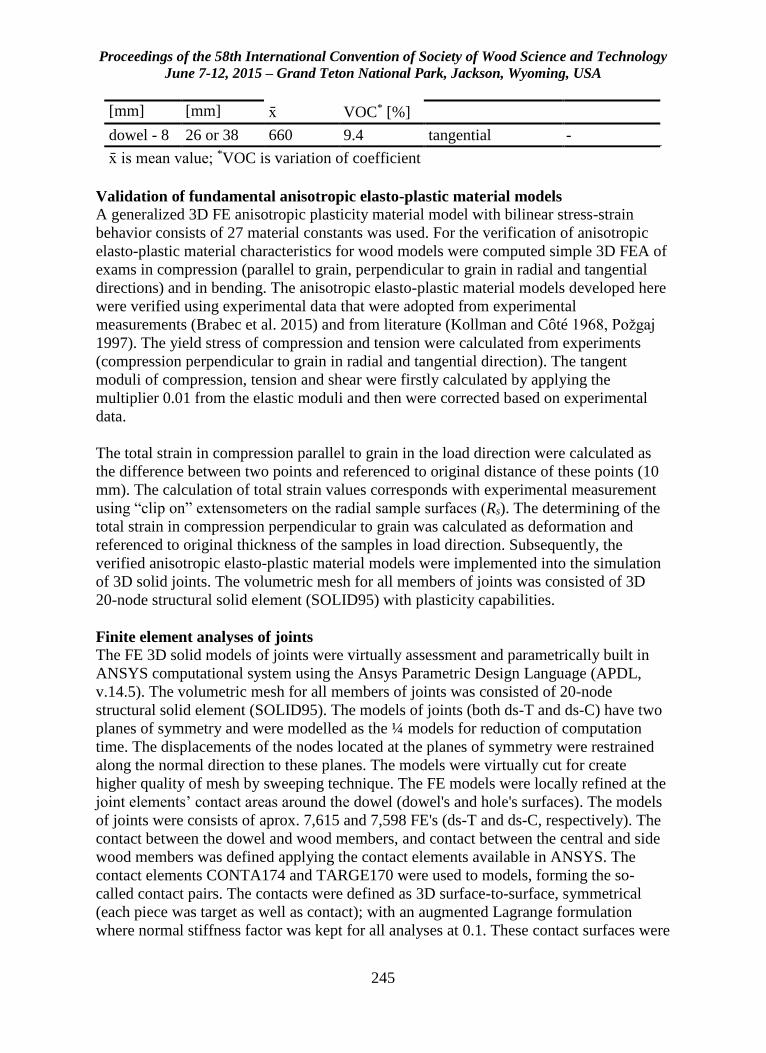
Proceedings of the 58th International Convention of Society of Wood Science and Technology
June 7-12, 2015 – Grand Teton National Park, Jackson, Wyoming, USA
245
[mm] [mm] x VOC* [%]
dowel - 8 26 or 38 660 9.4 tangential -
x is mean value; *VOC is variation of coefficient
Validation of fundamental anisotropic elasto-plastic material models
A generalized 3D FE anisotropic plasticity material model with bilinear stress-strain
behavior consists of 27 material constants was used. For the verification of anisotropic
elasto-plastic material characteristics for wood models were computed simple 3D FEA of
exams in compression (parallel to grain, perpendicular to grain in radial and tangential
directions) and in bending. The anisotropic elasto-plastic material models developed here
were verified using experimental data that were adopted from experimental
measurements (Brabec et al. 2015) and from literature (Kollman and Côté 1968, Požgaj
1997). The yield stress of compression and tension were calculated from experiments
(compression perpendicular to grain in radial and tangential direction). The tangent
moduli of compression, tension and shear were firstly calculated by applying the
multiplier 0.01 from the elastic moduli and then were corrected based on experimental
data.
The total strain in compression parallel to grain in the load direction were calculated as
the difference between two points and referenced to original distance of these points (10
mm). The calculation of total strain values corresponds with experimental measurement
using “clip on” extensometers on the radial sample surfaces (Rs). The determining of the
total strain in compression perpendicular to grain was calculated as deformation and
referenced to original thickness of the samples in load direction. Subsequently, the
verified anisotropic elasto-plastic material models were implemented into the simulation
of 3D solid joints. The volumetric mesh for all members of joints was consisted of 3D
20-node structural solid element (SOLID95) with plasticity capabilities.
Finite element analyses of joints
The FE 3D solid models of joints were virtually assessment and parametrically built in
ANSYS computational system using the Ansys Parametric Design Language (APDL,
v.14.5). The volumetric mesh for all members of joints was consisted of 20-node
structural solid element (SOLID95). The models of joints (both ds-T and ds-C) have two
planes of symmetry and were modelled as the ¼ models for reduction of computation
time. The displacements of the nodes located at the planes of symmetry were restrained
along the normal direction to these planes. The models were virtually cut for create
higher quality of mesh by sweeping technique. The FE models were locally refined at the
joint elements’ contact areas around the dowel (dowel's and hole's surfaces). The models
of joints were consists of aprox. 7,615 and 7,598 FE's (ds-T and ds-C, respectively). The
contact between the dowel and wood members, and contact between the central and side
wood members was defined applying the contact elements available in ANSYS. The
contact elements CONTA174 and TARGE170 were used to models, forming the so-
called contact pairs. The contacts were defined as 3D surface-to-surface, symmetrical
(each piece was target as well as contact); with an augmented Lagrange formulation
where normal stiffness factor was kept for all analyses at 0.1. These contact surfaces were
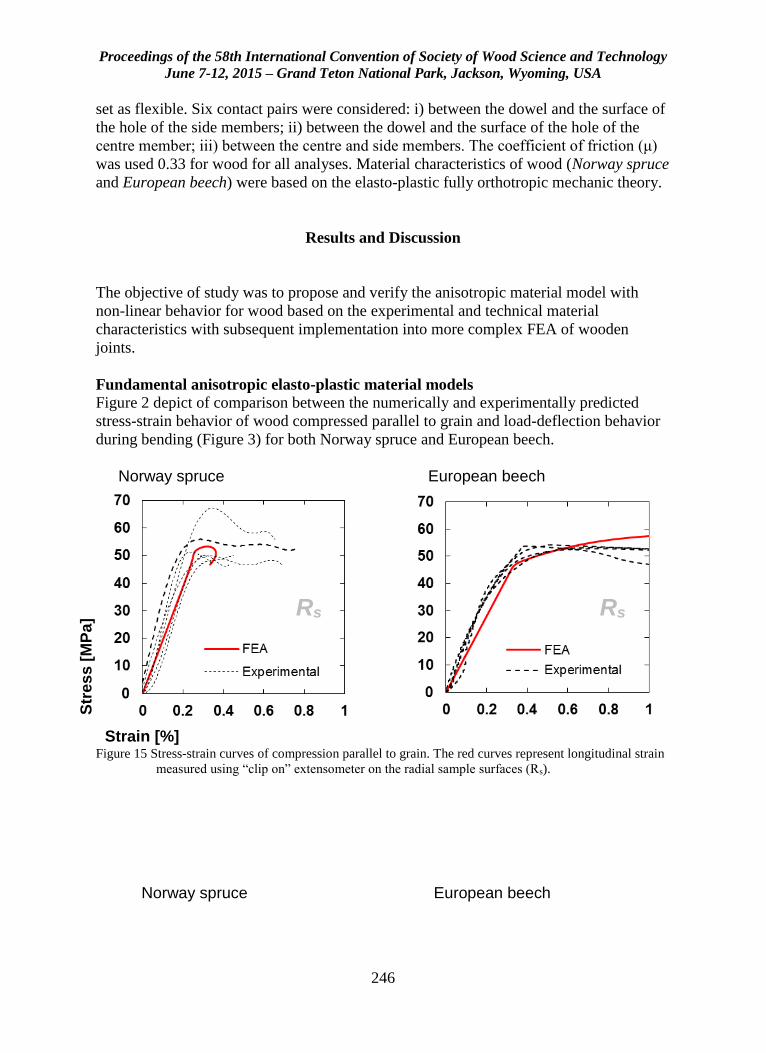
Proceedings of the 58th International Convention of Society of Wood Science and Technology
June 7-12, 2015 – Grand Teton National Park, Jackson, Wyoming, USA
246
set as flexible. Six contact pairs were considered: i) between the dowel and the surface of
the hole of the side members; ii) between the dowel and the surface of the hole of the
centre member; iii) between the centre and side members. The coefficient of friction (μ)
was used 0.33 for wood for all analyses. Material characteristics of wood (Norway spruce
and European beech) were based on the elasto-plastic fully orthotropic mechanic theory.
Results and Discussion
The objective of study was to propose and verify the anisotropic material model with
non-linear behavior for wood based on the experimental and technical material
characteristics with subsequent implementation into more complex FEA of wooden
joints.
Fundamental anisotropic elasto-plastic material models
Figure 2 depict of comparison between the numerically and experimentally predicted
stress-strain behavior of wood compressed parallel to grain and load-deflection behavior
during bending (Figure 3) for both Norway spruce and European beech.
Norway spruce European beech
Str
es
s [
MP
a]
Strain [%]
Figure 15 Stress-strain curves of compression parallel to grain. The red curves represent longitudinal strain
measured using “clip on” extensometer on the radial sample surfaces (Rs).
Norway spruce European beech
Rs Rs
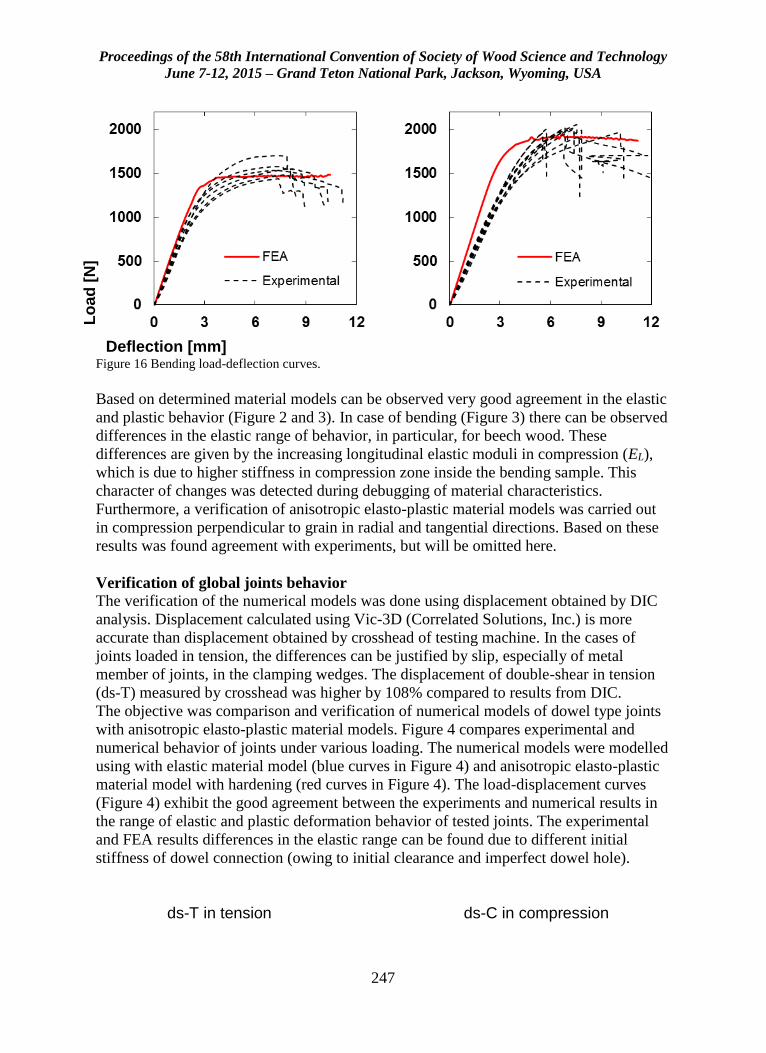
Proceedings of the 58th International Convention of Society of Wood Science and Technology
June 7-12, 2015 – Grand Teton National Park, Jackson, Wyoming, USA
247
Lo
ad
[N
]
Deflection [mm] Figure 16 Bending load-deflection curves.
Based on determined material models can be observed very good agreement in the elastic
and plastic behavior (Figure 2 and 3). In case of bending (Figure 3) there can be observed
differences in the elastic range of behavior, in particular, for beech wood. These
differences are given by the increasing longitudinal elastic moduli in compression (EL),
which is due to higher stiffness in compression zone inside the bending sample. This
character of changes was detected during debugging of material characteristics.
Furthermore, a verification of anisotropic elasto-plastic material models was carried out
in compression perpendicular to grain in radial and tangential directions. Based on these
results was found agreement with experiments, but will be omitted here.
Verification of global joints behavior
The verification of the numerical models was done using displacement obtained by DIC
analysis. Displacement calculated using Vic-3D (Correlated Solutions, Inc.) is more
accurate than displacement obtained by crosshead of testing machine. In the cases of
joints loaded in tension, the differences can be justified by slip, especially of metal
member of joints, in the clamping wedges. The displacement of double-shear in tension
(ds-T) measured by crosshead was higher by 108% compared to results from DIC.
The objective was comparison and verification of numerical models of dowel type joints
with anisotropic elasto-plastic material models. Figure 4 compares experimental and
numerical behavior of joints under various loading. The numerical models were modelled
using with elastic material model (blue curves in Figure 4) and anisotropic elasto-plastic
material model with hardening (red curves in Figure 4). The load-displacement curves
(Figure 4) exhibit the good agreement between the experiments and numerical results in
the range of elastic and plastic deformation behavior of tested joints. The experimental
and FEA results differences in the elastic range can be found due to different initial
stiffness of dowel connection (owing to initial clearance and imperfect dowel hole).
ds-T in tension ds-C in compression
Proceedings of the 58th International Convention of Society of Wood Science and Technology
June 7-12, 2015 – Grand Teton National Park, Jackson, Wyoming, USA
248
La
od
[N
]
Displacement [mm] Figure 17 Comparison between experimental and numerical solution of load-displacement curves; left: ds-
T; right ds-C.
Conclusion
The paper presents numerical-experimental approaches of anisotropic wood behavior
during loading. The devised fundamental anisotropic elasto-plastic material models for
both Norway spruce and European beech were verified based on the experimental results
and sensitivity analyses of material characteristics of wood (changes of yield stress,
tangent moduli etc.). The new anisotropic elasto-plastic material models for wood include
fully orthotropic elasticity, anisotropic plasticity with hardening for the non-linear
behavior of wood in compression and bending allowing the prediction of wood ultimate
strength. The stress-strain behavior of FEA showed very good agreement with
experimental multilinear curves for both anisotropic elasto-plastic material models. The
numerical curves for all exams showed gradual elasto-plastic transitions which are
similar with experimental stress-strain curves. Further, the verified fundamental
anisotropic material models were implemented into the solver of more complex FEA of
joints. These material models were compared and verified on the basis of experimental
load-displacement behavior of tested double-shear joints under various load (compression
and tension). The mechanical responds of numerical joints models showed good
agreement with experimental behavior of wooden joints.
Acknowledgements
This paper was funded by the grant no. 21/2015 of Internal Grant Agency of Faculty of
Forestry and Wood Technology at Mendel University in Brno and Ministry of Education,
Youth and Sports of the Czech Republic (grant no. 6215648902) and by the project
NAKI “Design and Assessment of Timber Joints of Historical Structures” reg. No,
DF12P01OVV004, provided by the Ministry of Culture of the Czech Republic.
Proceedings of the 58th International Convention of Society of Wood Science and Technology
June 7-12, 2015 – Grand Teton National Park, Jackson, Wyoming, USA
249
References
[1] Abruzzese D, Miccoli L, and Yuan J (2009) Mechanical behavior of leaning
masonry Huzhu Pagoda, J Cult Herit 10:480–486.
[2] Brabec M, Tippner J, Sebera V, Milch J, Rademacher P (2015) Standard and non-
standard deformation behaviour of European beech and Norway spruce during
compression. Holzforschung. Online – 2015-01-23, vol. 0, issue 0, s. -. DOI:
10.1515/hf-2014-0231.
[3] Bulleit WM, Sandberg LB, Drewek MW, and O'Bryant TL (1999) Behavior and
modeling of wood-pegged timber frames. J Struct Eng 125(1):3–9.
[4] Chen CJ, Lee TL, and Jeng DS (2003) Finite element modeling for the mechanical
behavior of dowel-type timber joints. Comput Struct 81(30):2731–2738.
[5] Clouston PL, and Lam F (2002) A stochastic plasticity approach to strength
modeling of strand-based wood composites. Compos Sci Technol 62(10):1381–
1395.
[6] Dias AMPG, Van de Kuilen JW, Cruz HMP, and Lopes SMR (2010) Numerical
Modeling of the Load-Deformation Behavior of Doweled Softwood and Hardwood
Joints. Wood Fiber Sci 42(4):480–489.
[7] Hill R (1950) The Mathematical Theory of Plasticity, The Oxford Engineering
Science Series, Oxford, pp. 97–114.
[8] Kessel MH, Augustin R (1996) Load behavior of connections with pegs II. Timber
Framing. Journal of the Timber Framers Guild (39):8–10.
[9] Kollman FFP, Côté WA (1968) Principles of wood science and technology: solid
wood. Allen & Unwin.
[10] Moses DM, and Prion, HG (2002) Anisotropic plasticity and failure prediction in
wood composites. Research Report. University of British Columbia, Canada.
[11] Oudjene M, and Khelifa M (2009) Elasto-plastic constitutive law for wood
behaviour under compressive loadings. Constr Build Mater 23(11):3359–3366.
[12] Požgaj A, Chovanec D, Kurjatko S, and Babiak M (1997) Štruktůra a vlastnosti
dreva. Priroda, Bratislava. (in Slovak)
[13] Santos CL, De Jesus AM, Morais JJ, and Lousada JL (2009) Quasi-static
mechanical behaviour of a double-shear single dowel wood connection. Constr
Build Mater 23(1):171–182.
[14] Sohouli AR, Goudarzi AM, and Alashti RA (2011) Finite Element Analysis of
Elastic-Plastic Contact Mechanic Considering the Effect of Contact Geometry and
Material Properties. Journal of Surface Engineered Materials and Advanced
Technology 1(03):125–129.
Proceedings of the 58th International Convention of Society of Wood Science and Technology
June 7-12, 2015 – Grand Teton National Park, Jackson, Wyoming, USA
250
Effects of Cement Strength Grade and Particle Content
on the Compressive Strength of Bamboo-Cement
Composites
Olayiwola H.O1*, Adesope A.S2, Adefisan O.O3
1Postgrad, Department of Agricultural and Environmental Engineering,
Wood Products Engineering Unit, University of Ibadan, Nigeria *Corresponding author:
[email protected] 2Research Officer, Forestry Research Institute of Nigeria,
Forest Product Development and Utilization Unit 3Senior Lecturer, Department of Agricultural and Environmental
Engineering, Wood Products Engineering Unit, University of Ibadan,
Nigeria
Abstract
Escalating cost of conventional building materials and rapid population growth has led to
acute shortage of housing units in developing nations; hence, the need for alternative low-
cost and durable building materials. This study determined the influence of cement grade,
particle content and chemical additive on the compressive strength of bamboo-cement
composites.
Laboratory type 35mm-thick (cube) cement-bonded composites were made from particles
derived from bamboo (Bambusa vulgaris). The proportion of cement, sand, stone-dust
was done by weight in a nominal mix of 1:2:4. The particle content was substituted based
on sand proportion. Two levels of the production variables were employed in the
production. These are chemical additive (0% and 3%), particle content (10% and 20%),
particle size (850µm and 1.18mm) and cement strength grade (32,5R and 42,5R).
Composites encapsulated with 42,5R cement had better strength from 1.16 to 3.02
N/mm2 and 1.65 to 4.76 N/mm2 at 0% and 3% chemical additive respectively. There was
an inverse relationship between the particle content and compressive strength for both
cement types and particle sizes.
The results indicated that composites produced with cement grade 42,5R at 3%CaCl2,
10% particle content and 1.18mm particle size have higher compressive strength than
those produced with cement grade 35,5R.
Proceedings of the 58th International Convention of Society of Wood Science and Technology
June 7-12, 2015 – Grand Teton National Park, Jackson, Wyoming, USA
251
Keywords; Low-cost building material, bamboo-cement composites, cement grade,
particle content and compressive strength
Introduction
Shelter is undoubtedly one of the most important requirements for human survival. This
is why provision of rural housing and low-cost housing units top the list of government
agenda in the developing nations. However, the use of conventional building materials
are costly and highly energy intensive (Bharath et al; 2014). This has incapacitated the
efforts of both governments and NGOs alike.The answer to the challenges of housing in
the developing worlds lies in the encouragement of community participation in housing
construction, small scale production of building components, use of non-skilled labour in
the production and materials that are cheap and readily available.
Natural fibre composites are excellent low-cost alternative building materials that are
claimed to offer environmental advantages such as reduced dependence on
energy/material sources, lower pollutant emissions, lower greenhouse gas emission and
enhanced energy recovery (Syed et al 2011). They have been reported to exhibit better
electrical resistance, good thermal insulation and acoustic properties (Syed et al 2011;
Manza et al 2010), high ductility and great crack resistance (Ali et al 2010). These render
them well suited for use in structures exposed to cyclical and extreme live loads (Tsung-
Chin Hou et at 2005; Ali et al 2010). Their superior tensile strength (Baruah and Talukdar
2007), ductility and crack resistance and ability to be moulded into any shape make them
well sought-after materials in various engineering applications. Another positive side is
the fact that the method of production can be adapted to suit the available local
technology.
Natural fibres such as sisal, jute, coir, wood, kenaf, bamboo, rattan, baggasse, oil palm
fibre have all been proved to be good reinforcement in thermoset, thermoplastic and
cement matrices (Joseph et al .1996; Sreekala et al. 1997; Geethamma et al.1998; Badejo.
1988; Olorunnisola. 2005; Omoniyi. 2009). This work sought to find out the influence of
strength grade of two commercially available cement types in Nigeria, on the
compressive strength of bamboo reinforced cement composite- a prospective alternative
low-cost building material.
Bamboo
Bamboo is a fast-growing minor forest product which is cheap and widely available.
About 75 genera and 1250 species of this renewable resource grow in different parts of
the world (Sattar 1995). The available species in Nigeria are bambusa vulgaris, Its role
in poverty alleviation and economic development has been well studied. Bamboo
products are excellent material for low-cost housing components
Bamboo possesses excellent strength properties, especially tensile strength. Most of these
properties depend on the species and the climatic conditions under which they grow (
Proceedings of the 58th International Convention of Society of Wood Science and Technology
June 7-12, 2015 – Grand Teton National Park, Jackson, Wyoming, USA
252
Sekhar and Gulati 1973). Strength varies along the culm height. Compressive strength
increases with height while bending strength has the inverse trend (Kabir et al
1991;1993). These properties are expected to be carried over into composites when
bamboo particles are mixed with cement.
Cement
Cements are made in a variety of compositions for a wide variety of uses. ASTM C150
defines Portland cement as “hydraulic cement(cement that not only hardens by reacting
with water but also forms a water-resistant product) produced by pulverizing clinkers
consisting essentially of hydraulic calcium silicates, usually containing one or more of
the forms of calcium suphate as an inter ground addition.” The low cost and widespread
availability of the limestone, shales, and other naturally occurring materials make
Portland cement one of the lowest cost materials widely used over the last century
throughout the world.
Two brands of Ordinary Portland cement are common and popular in Nigerian markets.
These brands have strength grades of 32,5R and 42,5R and carry the following tags
respectively: CEM II/B-L 32.5N and CEM II/A-L42.5R.
Materials and Methods
Bamboo culms used in this study were procured within the University of Ibadan, Nigeria.
Matured green culms were cut into pieces of average length of 4ft. and then air-dried to
ensure breakdown of sugar and other extractives that could inhibit bonding with cement.
The dried culms were then sliced and chipped with cutlass into average dimension of 1in.
by 3in. to ensure easy milling. The chips were milled into flakes with hammer mill and
screened into fines and particle sizes of 600µm, 850µm and 1.18mm.
The proportion of cement, sand, stone-dust was done by weight in a nominal mix of
1:2:4. A pre-determined quantity of cement, sand and stone-dust based on this
formulation ratio was mixed with suitable amount of bamboo particles substituted at 10%
and 20% of sand proportion in dry state until a homogenous mixture was achieved. This
mixture was then blended with required quantity of water calculated using Equation 1,
developed by Simatupang (1979), until a desired workability and consistency was
attained. Two levels of CaCl2 (0% and 3%) based on cement proportion was employed.
This was dissolved in the water used for blending.
Where:
= water required to blend the mixtures in (litres)
= weight of cement based on the formulation (kg)
= moisture content of wood at time of use (%)
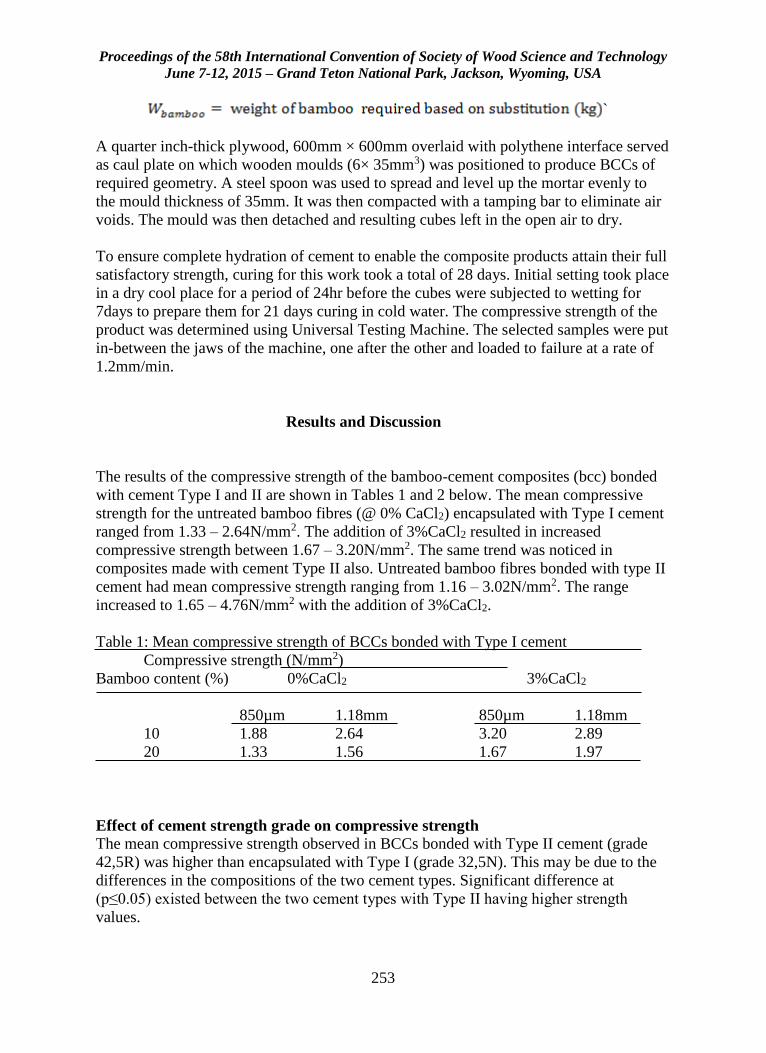
Proceedings of the 58th International Convention of Society of Wood Science and Technology
June 7-12, 2015 – Grand Teton National Park, Jackson, Wyoming, USA
253
`
A quarter inch-thick plywood, 600mm × 600mm overlaid with polythene interface served
as caul plate on which wooden moulds (6× 35mm3) was positioned to produce BCCs of
required geometry. A steel spoon was used to spread and level up the mortar evenly to
the mould thickness of 35mm. It was then compacted with a tamping bar to eliminate air
voids. The mould was then detached and resulting cubes left in the open air to dry.
To ensure complete hydration of cement to enable the composite products attain their full
satisfactory strength, curing for this work took a total of 28 days. Initial setting took place
in a dry cool place for a period of 24hr before the cubes were subjected to wetting for
7days to prepare them for 21 days curing in cold water. The compressive strength of the
product was determined using Universal Testing Machine. The selected samples were put
in-between the jaws of the machine, one after the other and loaded to failure at a rate of
1.2mm/min.
Results and Discussion
The results of the compressive strength of the bamboo-cement composites (bcc) bonded
with cement Type I and II are shown in Tables 1 and 2 below. The mean compressive
strength for the untreated bamboo fibres (@ 0% CaCl2) encapsulated with Type I cement
ranged from 1.33 – 2.64N/mm2. The addition of 3%CaCl2 resulted in increased
compressive strength between 1.67 – 3.20N/mm2. The same trend was noticed in
composites made with cement Type II also. Untreated bamboo fibres bonded with type II
cement had mean compressive strength ranging from 1.16 – 3.02N/mm2. The range
increased to 1.65 – 4.76N/mm2 with the addition of 3%CaCl2.
Table 1: Mean compressive strength of BCCs bonded with Type I cement
Compressive strength (N/mm2)
Bamboo content (%) 0%CaCl2 3%CaCl2
850µm 1.18mm 850µm 1.18mm
10 1.88 2.64 3.20 2.89
20 1.33 1.56 1.67 1.97
Effect of cement strength grade on compressive strength
The mean compressive strength observed in BCCs bonded with Type II cement (grade
42,5R) was higher than encapsulated with Type I (grade 32,5N). This may be due to the
differences in the compositions of the two cement types. Significant difference at
(p≤0.05) existed between the two cement types with Type II having higher strength
values.
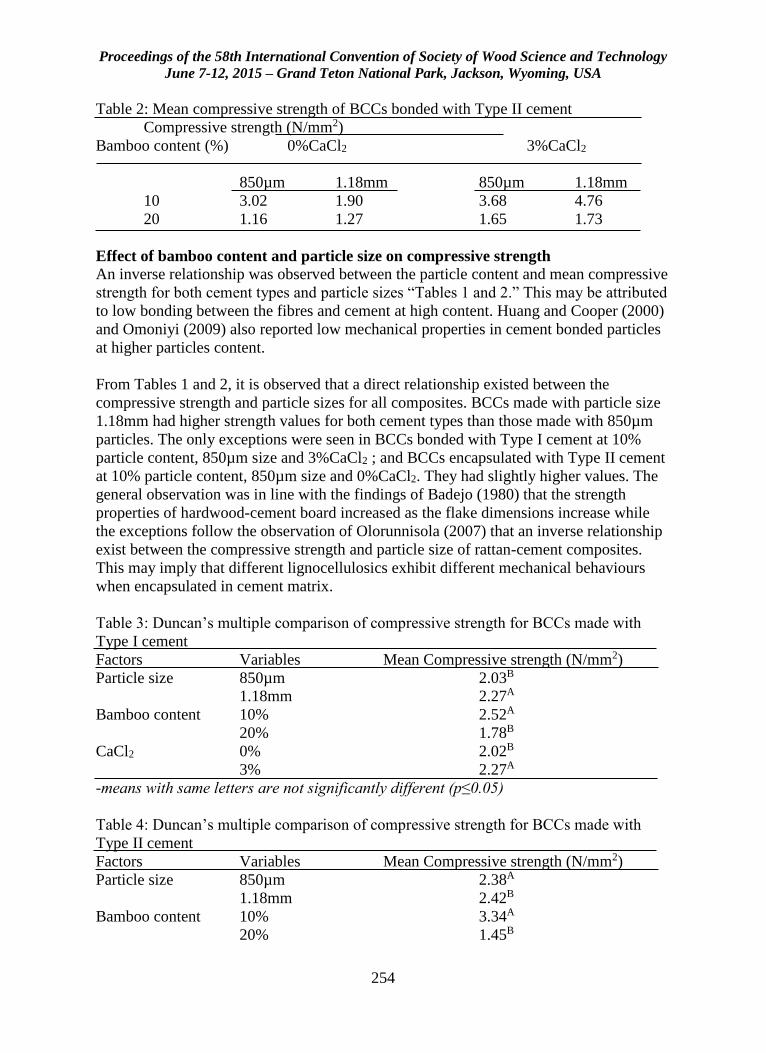
Proceedings of the 58th International Convention of Society of Wood Science and Technology
June 7-12, 2015 – Grand Teton National Park, Jackson, Wyoming, USA
254
Table 2: Mean compressive strength of BCCs bonded with Type II cement
Compressive strength (N/mm2)
Bamboo content (%) 0%CaCl2 3%CaCl2
850µm 1.18mm 850µm 1.18mm
10 3.02 1.90 3.68 4.76
20 1.16 1.27 1.65 1.73
Effect of bamboo content and particle size on compressive strength
An inverse relationship was observed between the particle content and mean compressive
strength for both cement types and particle sizes “Tables 1 and 2.” This may be attributed
to low bonding between the fibres and cement at high content. Huang and Cooper (2000)
and Omoniyi (2009) also reported low mechanical properties in cement bonded particles
at higher particles content.
From Tables 1 and 2, it is observed that a direct relationship existed between the
compressive strength and particle sizes for all composites. BCCs made with particle size
1.18mm had higher strength values for both cement types than those made with 850µm
particles. The only exceptions were seen in BCCs bonded with Type I cement at 10%
particle content, 850µm size and 3%CaCl2 ; and BCCs encapsulated with Type II cement
at 10% particle content, 850µm size and 0%CaCl2. They had slightly higher values. The
general observation was in line with the findings of Badejo (1980) that the strength
properties of hardwood-cement board increased as the flake dimensions increase while
the exceptions follow the observation of Olorunnisola (2007) that an inverse relationship
exist between the compressive strength and particle size of rattan-cement composites.
This may imply that different lignocellulosics exhibit different mechanical behaviours
when encapsulated in cement matrix.
Table 3: Duncan’s multiple comparison of compressive strength for BCCs made with
Type I cement
Factors Variables Mean Compressive strength (N/mm2)
Particle size 850µm 2.03B
1.18mm 2.27A
Bamboo content 10% 2.52A
20% 1.78B
CaCl2 0% 2.02B
3% 2.27A
-means with same letters are not significantly different (p≤0.05)
Table 4: Duncan’s multiple comparison of compressive strength for BCCs made with
Type II cement
Factors Variables Mean Compressive strength (N/mm2)
Particle size 850µm 2.38A
1.18mm 2.42B
Bamboo content 10% 3.34A
20% 1.45B
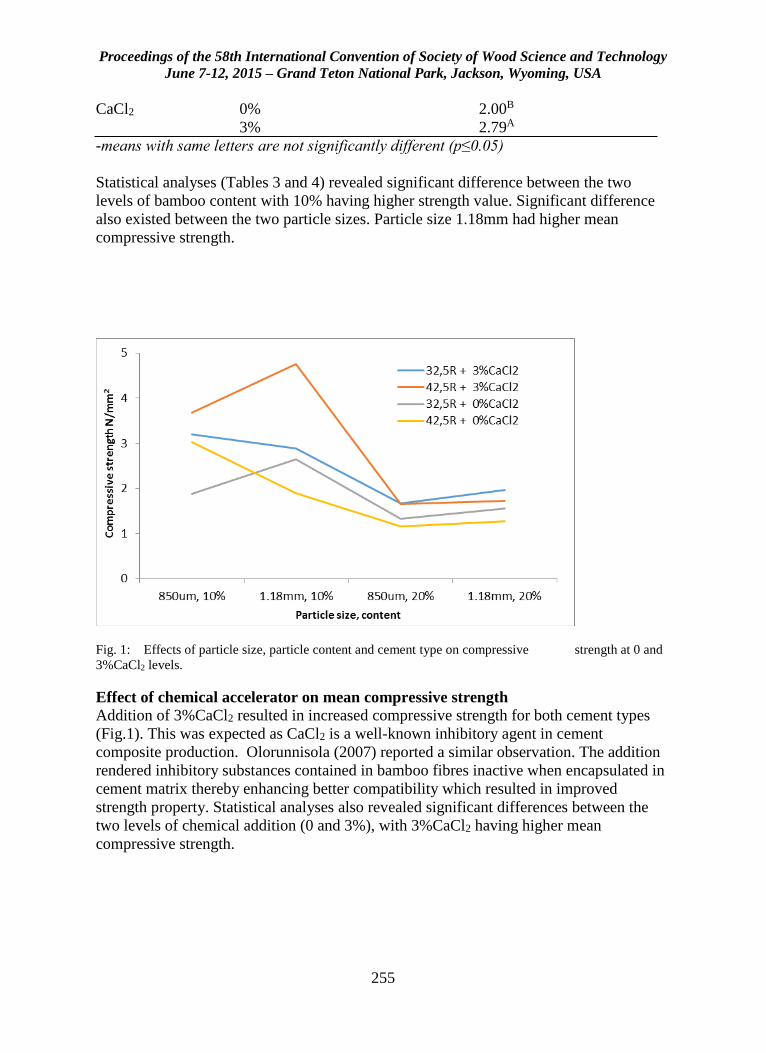
Proceedings of the 58th International Convention of Society of Wood Science and Technology
June 7-12, 2015 – Grand Teton National Park, Jackson, Wyoming, USA
255
CaCl2 0% 2.00B
3% 2.79A
-means with same letters are not significantly different (p≤0.05)
Statistical analyses (Tables 3 and 4) revealed significant difference between the two
levels of bamboo content with 10% having higher strength value. Significant difference
also existed between the two particle sizes. Particle size 1.18mm had higher mean
compressive strength.
Fig. 1: Effects of particle size, particle content and cement type on compressive strength at 0 and
3%CaCl2 levels.
Effect of chemical accelerator on mean compressive strength
Addition of 3%CaCl2 resulted in increased compressive strength for both cement types
(Fig.1). This was expected as CaCl2 is a well-known inhibitory agent in cement
composite production. Olorunnisola (2007) reported a similar observation. The addition
rendered inhibitory substances contained in bamboo fibres inactive when encapsulated in
cement matrix thereby enhancing better compatibility which resulted in improved
strength property. Statistical analyses also revealed significant differences between the
two levels of chemical addition (0 and 3%), with 3%CaCl2 having higher mean
compressive strength.
Proceedings of the 58th International Convention of Society of Wood Science and Technology
June 7-12, 2015 – Grand Teton National Park, Jackson, Wyoming, USA
256
Conclusion
Based on the data collected and their statistical analyses, the following conclusions are
drawn:
i. The compressive strength of bamboo-cement composites are affected by the
strength grade of the Portland cement used in the production. 42,5R graded
cement produced composites of higher strength values.
ii. Particle size and particle content exhibited an inverse and a direct relationship
with compressive strength respectively.
iii. Addition of 3%CaCl2 improved the compressive strength of the bamboo-cement
composites.
iv. Bamboo-cement composites produced with cement grade 42,5R at 3%CaCl2, 10%
particle content and 1.18mm particle size have higher compressive strength than
those produced with cement grade 35,5R.
References
Ali, M., Liu, A.,Sou, H. and Chouw N. 2010. Effect of fibre content on dynamic
properties of coir fibre reinforced concrete beams. NZSEE Conference, 2010.
Paper Id: 44.
ASTM C150-86. 1990. Standard Specification for Portland Cement. Annual book of
ASTM Standards 4.02:89-93.
Badejo, S.O. 1988. Effect of flake geometry on properties of cement-bonded
particleboard from mixed tropical hardwoods. Wood Science and Technology
22(4):357-370
Baruah, P., and Talukdar, S. 2007. A comparative study of compressive, flexural, tensile
and shear strength of concrete with fibres of different origins. Indian Concrete Journal,
81(7):17-24
Bharath B, Maheshwar RL, Juberahmed P and Rahul RP (2014): “ Studies on
stabilised adobe blocks”. International Journal of Research in Engineering and
Technology, IJRET. Vol: 03 special issue: 06. Pp 259-264.
Geethamma, V.G., Mathew, K.T., Lakshmnarayanan, R. and Thomas, S. 1998.
Composite of short coir fibers and natural rubber: effect of chemical
modification, loading and orientation of fiber. Polymer, 39:1483
Joseph, K., Thomas, S. and Pavithran, C. 1996. Effect of chemical treatment on the
tensile properties of short sisal fibre-reinforced polyethylene composites.
Polymer, 37:5139^15
Proceedings of the 58th International Convention of Society of Wood Science and Technology
June 7-12, 2015 – Grand Teton National Park, Jackson, Wyoming, USA
257
Kabir, M.F., Bhattacharjee, D.K., and Sattar, M.A. 1991. Physical and mechanical
properties of four bamboo species. Bangladesh Journal of Forest Science,
20(1&2), 31-36
Kabir, M.F., Bhattacharjee, D.K., and Sattar, M.A. 1993. Effects of age and height on
strength properties of dendrocalamus logispaths. Bamboo Information Centre,
India. Bulletin 3(1), 11-15
Mahzan, S., Zaidi, A.M., Ahmad, Arsat N., Hatta, M.N.M, Ghazali, M.I. 2010. Study
on sound absorption properties of coconut coir fibre composite with added
recycled rubber. International Journal of Integrated Engineering, Vol. 2, No. 1.
Pp. 29-34.
Olorunnisola, A.O. 2005. Dimensional stability of cement-bonded composite boards
made from rattan cane particles. Journal of Bamboo and Rattan, Vol.4(2):173-
182
Omoniyi, T.E. 2009. Development and evaluation of bagasse-reinforced cement
composite roofing sheets. Ph.D Thesis submitted to the Department of
Agricultural and Environmental Engineering, University of Ibadan.
Sattar, M.A. 1995. Traditional bamboo housing in Asia: Present status and future
prospects. Proceedings of the Vth International Bamboo Workshop and the
IVth International Bamboo Congress, Ubud, Bali, Indonesia. 19-22 June, 1995.
Sekhar, A.C and Gulati, A.S. 1973. A note on the physical and mechanical properties
of Dendrocalamus strictus from different localities. Van Vigyan: 11(314),
17-22
Simatupang, M.H. 1979. The Water Requirement of Manufactured Cement-bonded
Particleboard. Hole Roh-Werkst. 37;373-382
Sreekala, M.S., Kumaran, M.G. and Thomas, S. 1997. Oil palm fibers: morphology,
chemical composition, surface modification and mechanical properties. Journal
Applied Polymer Science, 66:8-821
Syed A.H, Pandurangadu V. and Palanikuamr K. 2011. Mechanical properties of green
coconut fiber reinforced HDPE polymer composite. International Journal of
Engineering Science and Technology (IJEST), Vol. 3. No. 11. Pp.7942-7952
Tsung-Chin Hou, Jerome P.L. 2005. Monitoring strain in ECC using wireless sensors.
Proceeding of the International Conference on Fracture (ICFXI), Turin, Italy,
March 20-25, 2005

Proceedings of the 58th International Convention of Society of Wood Science and Technology
June 7-12, 2015 – Grand Teton National Park, Jackson, Wyoming, USA
258
Verma, D., Gope, P.C., Shandilya, A., Gupta, A., Maheshwari, M.K. 2013. Coir fibre
reinforcement and application in polymer composites: a review. Journal of
Material and Environmental Science. 4(2) (2013) 263-276
Proceedings of the 58th International Convention of Society of Wood Science and Technology
June 7-12, 2015 – Grand Teton National Park, Jackson, Wyoming, USA
259
Manufacturing and Mechanical Characterization of a
3D Molded Core Strand Panel
Daniel Way
Oregon State University, Corvallis, OR
Abstract
Three dimensionally (3D) molded core panels consist of two components: A core that is
molded in a repeating structure that contains hollow areas and skins which make up the
outer portion of the panel. These panels have been of interest to the wood composites
community because of their ability to utilize low value materials, but have yet to enter the
building construction materials market due to challenges in meeting necessary
mechanical requirements for structural use.
The design of 3D molded core panels is unique compared to commercially available
wood composite panels in that they behave more like a beam with the core acting as a
load transfer mechanism between the high strength skins. Air space in the hollow core
provides additional insulation but can also be designed to allow passage of hot air from
attic spaces. Air space also lowers the thickness to weight ratio meaning that panels of
greater depth may be produced without hindering jobsite handling. Unlike their solid
composite panel counterparts, the two part core and skin system generally results in non-
catastrophic failures.
This study investigates the use of wood strands for forming a molded core on the premise
that wood strands typically have favorable mechanical properties opposed to their fiber
and particle counterparts. Cores were molded using furnish typical of oriented strand
board (OSB) and a proprietary core mold supplied by our industrial partner and
commercially available OSB as skin material. Panels were tested for key mechanical
properties to determine their adequacy for use as a structural sheathing material.
Keywords: 3D molded core panel, strand composites, structural sheathing, sandwich
panels
Proceedings of the 58th International Convention of Society of Wood Science and Technology
June 7-12, 2015 – Grand Teton National Park, Jackson, Wyoming, USA
260
Multi-technique Characterization of Douglas-fir Cell
Wall Deconstruction during Mechanical Milling
Pretreatment
Jinxue Jiang 1 – Jinwu Wang2 - Michael P. Wolcott3*
1 Graduate student, Composite Materials & Engineering Center, Washington
State University, Pullman WA, USA 2 Research assistant professor, Composite Materials & Engineering Center,
Washington State University, Pullman WA, USA 3 Professor, Composite Materials & Engineering Center, Washington State
University, Pullman WA, USA.
* Corresponding author [email protected]
Abstract
Overcoming recalcitrance of the wood cell wall to enzymatic degradation is believed to
being crucial for effective biological conversion of polysaccharides to fermentable
sugars. Mechanical milling has long been used to overcome the native structure barriers
of cell wall for producing milled wood lignin. This process imparts macro/micro/nano
morphological and physicochemical alternations that contribute to increased accessibility
of cellulose without removal of chemical compositions. Multi-technique characterization
of Douglas-fir cell wall disruption during mechanical milling were conducted using
electronic microscopy (SEM, TEM), confocal laser scanning microscopy (CLSM),
atomic force microscopy (AFM), and X-ray diffraction (XRD). Collectively, these
techniques elucidate the evolution of cell wall changes. We propose that coincident with
the particle size reduction of the wood material during the milling process includes tissue
disintegration, cell wall fragmentation, disordering of layered cell wall fragment, and
aggregation of disordered cell wall fragments. As evidenced by LSCM, the constituent
cell wall polymers are redistributed following the ultrastructural disruption from the
mechanical milling. XRD results demonstrated the amorphization of the semicrystalline
polymers. Micro/nano porous structures were visualized by 3D-TEM tomography. The
surface and ultrastructure alternation of cell wall contribute to enhancement of enzymatic
digestibility by 4-14 folds over that of untreated cell walls depending on degree of
milling pretreatment.
Key words: bioconversion, mechanical milling pretreatment, visualization, cell wall
ultrastructure, accessible void Introduction
Proceedings of the 58th International Convention of Society of Wood Science and Technology
June 7-12, 2015 – Grand Teton National Park, Jackson, Wyoming, USA
261
Considerable interest has been emerged in converting sustainable lignocellulosic biomass
into fossil fuel alternatives toward a diverse and economically viable renewable energy
portfolio. The major challenge facing industrial-scale conversion of lignocellulosic
biomass into biofuels are presented by the complex hetero matrix structure, which greatly
impede chemical and microbial deconstruction of plant cell wall polysaccharides
(Chiaramonti et al., 2012). Therefore, a pretreatment is recognized necessary to overcome
the robust multi-scale recalcitrance and produce substrate highly susceptible to enzyme
action for maximizing intermediate fermentable sugars release. Over the past decades,
great efforts have been devoted on various thermochemical strategies, while the presence
of chemicals and various solvents result in corrosion of processing equipment, formation
of inhibitors to down stream process, and disposal/or recycle of the waste effluent, are
responsible for the high cost and environmental impact of unsuccessful
biorefinary(Barakat et al., 2014a, 2014b).
Mechanical milling pretreatment offers an attractive alternative to address these
deficiencies and has a promising potential for implementation as a small scale facility,
distributed sugar depot, to produce fermentable sugars. This process profoundly imparts
multiple length scale structural alternations (i.e. tissue, cellular and molecular levels) by
disrupting supramolecular cross-links of cellulose-hemicellulose-lignin matrix without
removal of chemical compositions. Therefore, the versatile mechanical milling has
recently attracted renascent interest in pretreatment arena for lignocellulose valorization
due to its effectiveness to a variety of feedstock as well as great advantage of simple and
green chemistry process(Takahashi et al., 2013). Particle size and cellulose crystallinity
are the mostly characterized factors, which are correlated well with the improved
enzymatic digestibility(Hoeger et al., 2013; Zakaria et al., 2014). The particle size
reduction is believed to improve heat and mass transfer efficiency and increase enzyme
accessibility with the increased specific surface area. It has been suggested that
amorphogenesis of the highly ordered and tightly packed crystalline cellulose microfibrils
also benefit in more hydrolytic enzyme accessible to cellulose substrate(Arantes and
Saddler, 2010). Though such phenomenon description and elucidating deduction help to
basically characterize milled biomass substrates, a comprehensive understanding of the
ultrastructure change and redistribution of cell wall components would provide insight
into fundamental mechanism of mechanical deconstruction of native cell wall
recalcitrance and generating substrates susceptible to enzyme saccharification.
Microscopy methodologies help to determine the hierarchical architecture of plant cell
wall as well as the macromolecular level distribution of components. Consequently, a
variety of microscopy tools have been employed to probe the structure of plant cell wall
with multi-scale resolution as well as the effectiveness of pretreatment on unlocking cell
wall for cost effective biofuel production(Chundawat et al., 2011). However, there is
currently no systematic, multi-scale, and integrated approach for comprehensive
understanding of anatomical properties, such as visualization the morphological
alternation and chemical composition distribution of cell wall correlating to the degree of
mechanical milling wood. In the present study, we investigated the evolution of wood
Proceedings of the 58th International Convention of Society of Wood Science and Technology
June 7-12, 2015 – Grand Teton National Park, Jackson, Wyoming, USA
262
cell wall deconstruction with multi-scale visualization and characterization to provide
insight into fundamental mechanism of mechanical milling and native biomass
recalcitrance.
2. Materials and methods
2.1 Material
Douglas-fir (Pseudotsuga menziesii) wood chips were obtained from Vaagen Brothers
Lumber Inc. (Colville, WA). The original wood chips were passed through vibrating
screen with an inch aperture and retained by No.4 mesh screen, and the screened chip had
geometric mean diameter of 10.36mm. The screened wood chips were pre-ground into
particles by a hammer mill fitted with a 1/8-inch screen, and stored at a conditioned room
before using.
2.2 Mechanical milling pretreatment
Mechanical milling pretreatment of wood was conducted with a high-energy vibratory
ring & puck mill (Standard mill, Rocklab Pty Ltd, New Zealand). The mill chamber had
an inner diameter of 128 mm and height of 43 mm. The grinding mediums were a ring
(inner diameter of 78mm, outside diameter of 100mm, and height of 41mm) and a puck
(diameter of 52mm and height of 41 mm). Both milling chamber and grinding mediums
were made of tungsten carbide. The sample (10 g) with moisture content of 5wt % (oven
dry base) were loaded into the milling chamber and milling time was varied from 2-12
minutes at room temperature. The milling time chosen was dependent on our previous
experiments about mechanical milling pretreatment of Douglas-fir with the same ring &
puck mill.
2.3 Cellulose crystallinity index
X-ray diffractograms of the milled wood particles were obtained by a powder x-ray
diffractometer (Rigaku, Miniflex 600, Japan) using Cu Kα (λ=0.154 nm) radiation
generated at 40 kV and 15 mA. The instrument scanning range 2θ was from 10 to 40°
with scanning rate of 1°/min. The relative degree of cellulose crystallinity, in terms of
crystallinity index (CrI), was estimated as the height ratio between the intensity of
crystalline peak and total intensity as described by Segal method(Segal et al., 1959.).
2.4 Scanning electron microscopy (SEM)
SEM imaging of samples were acquired typically at 20 kV accelerating voltage using FEI
Quanta 200F, field emission gun with high vacuum ETD detectors (FEI Company,
Hillsboro, Oregon, USA). Samples were mounted on aluminum stubs using carbon tape
and sputter coated with 8 nm of gold for good conductivity prior to imaging.
2.5 Atomic force microscopy (AFM)
AFM imaging was conducted using a Dimension Nanoscope 3100 Scanning Probe
Microscope (Digital Instruments) with a Nanoscope IIIa controller. Both amplitude and
Proceedings of the 58th International Convention of Society of Wood Science and Technology
June 7-12, 2015 – Grand Teton National Park, Jackson, Wyoming, USA
263
phase images were collected simultaneously in tapping mode (in air) with an OTESPA7,
etched silicon probe with a nominal frequency of 275 kHz and a nominal spring constant
of 40 N/m. RMS roughness factors were estimated after image flattening and lane fitting
of the height images using the software that came with the instrument.
2.6 Sample preparation for microtomy
Wood samples were processed using microwave electronic microscopy processing.
Briefly, samples were fixed in 3% gluteraldehyde buffered in 0.05M Pipes buffer (Sigma,
St Louis, MO) with 100% power of microwave. Dehydration was conducted in graded
ethanol series for 40 seconds under microwave each (30%, 50%, 60%, 70%, 80%, 90%,
and 3×100% ethanol). Samples were infiltrated with Spurr’s low viscosity resin and
incubated overnight at room temperature in a hood with increasing concentration of the
resin (30%, 50%, 3×100% resin, diluted in isopropanol). Samples were then transferred
to 1.5 mL microcentrifuge tubes with fresh Spurr’s resin and then the resin was
polymerized overnight in an oven with temperature of 70 °C. Spurr’s resin embedded
samples were sectioned to ~70-120nm using Leica Reichert Ultracut R microtome (Leica,
Wetzlar, Germany). Glass knives were used to trim the block surface, and then a Diatome
diamond knife was used to get the ultrathin sections.
2.7 Confocal laser scanning microscopy (CLSM)
Semi-thin (200 -500nm) sectioned samples were positioned on glass microscope slides
and stained with saturated HPLC-grade acridine orange (AO; 3, 6-bis (dimethylamino)
acridine hydrochloride, Sigma-Aldrich, St. Louis, MO) for 1 hour at room
temperature(Yu et al., 2014). The images of stained samples were captured using a Leica
TCS SP8 confocal scanning laser microscopy with a 20× dry objective lens. A white laser
at λ=500 nm was used as the excitation light source. Flouorescence emission between
λ=515 and 540 nm was collected as the green channel and emissions above λ=590 nm
were collected as the red channel. Stacks of confocal optical sections were taken through
the z-depth of the observed sections. Image analysis was performed using LAS AF Lite
imaging analysis software. The images appear green in color were rich in carbohydrate
and areas that are red in color are rich in lignin. When AO interacts with carbohydrates, it
remains in a monomeric form that fluoresces and emits light primarily in the green region
of the visible light spectrum. However, when AO interacts with the aromatic π electrons
of lignin, the electron density of the molecule changes in such a way that causes other
AO molecules to aggregate and this causes a fluorescence emission shift from green to
red light spectrum.
2.8 Transmission electron microscopy (TEM) and 3D-TEM-tomography
The ultrathin sections were collected on Formvar coated copper or nickel slot grids (SPI
Supplies, West Chester, PA). Grids were post-stained for 10 min with 1% aqueous
KMnO4 to selectively stain for lignin. Images were captured with a 4 megapixel Gatan
UltraScan 4K Eagle camera (Gatan, Pleasanton, CA) on a FEI Tecnai G2 20 Twin 200kV
LaB6 TEM (FEI, Hilsboro, OR). Tomgrams were created by capturing dual-axis ±50-
60°tilt series images. Tomograms were constructed using an R-weighted back projection
algorithm within the Inspect 3D software (FEI, Hilsboro, OR). Single-axis tomograms
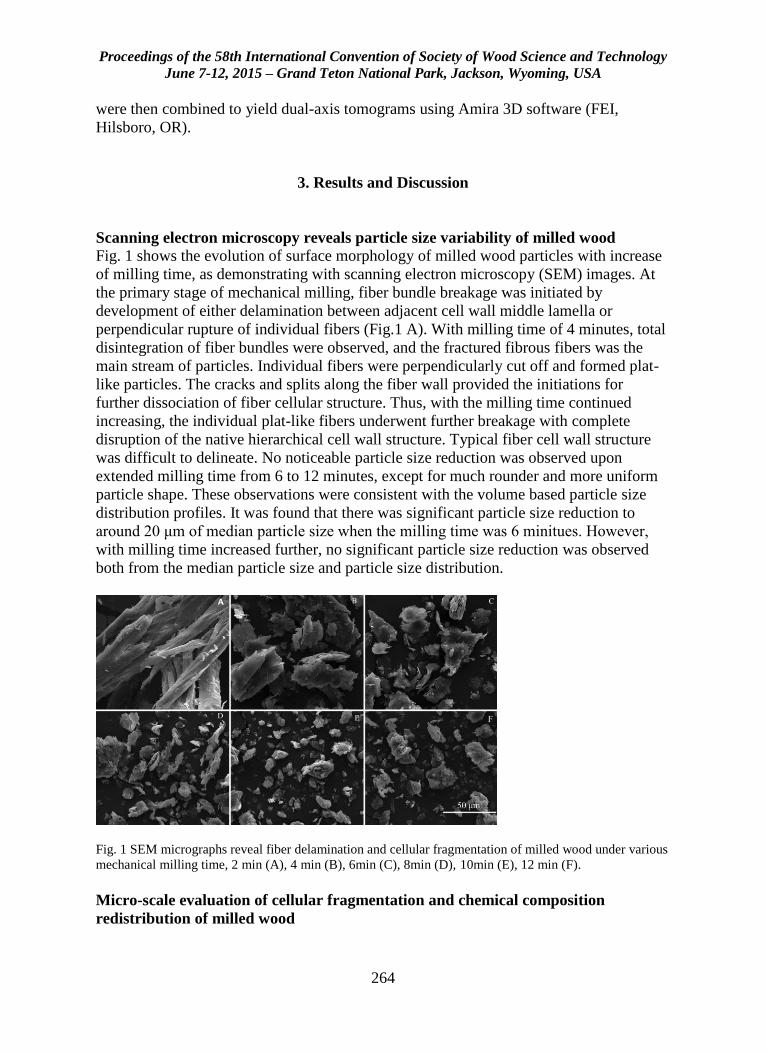
Proceedings of the 58th International Convention of Society of Wood Science and Technology
June 7-12, 2015 – Grand Teton National Park, Jackson, Wyoming, USA
264
were then combined to yield dual-axis tomograms using Amira 3D software (FEI,
Hilsboro, OR).
3. Results and Discussion
Scanning electron microscopy reveals particle size variability of milled wood
Fig. 1 shows the evolution of surface morphology of milled wood particles with increase
of milling time, as demonstrating with scanning electron microscopy (SEM) images. At
the primary stage of mechanical milling, fiber bundle breakage was initiated by
development of either delamination between adjacent cell wall middle lamella or
perpendicular rupture of individual fibers (Fig.1 A). With milling time of 4 minutes, total
disintegration of fiber bundles were observed, and the fractured fibrous fibers was the
main stream of particles. Individual fibers were perpendicularly cut off and formed plat-
like particles. The cracks and splits along the fiber wall provided the initiations for
further dissociation of fiber cellular structure. Thus, with the milling time continued
increasing, the individual plat-like fibers underwent further breakage with complete
disruption of the native hierarchical cell wall structure. Typical fiber cell wall structure
was difficult to delineate. No noticeable particle size reduction was observed upon
extended milling time from 6 to 12 minutes, except for much rounder and more uniform
particle shape. These observations were consistent with the volume based particle size
distribution profiles. It was found that there was significant particle size reduction to
around 20 μm of median particle size when the milling time was 6 minitues. However,
with milling time increased further, no significant particle size reduction was observed
both from the median particle size and particle size distribution.
Fig. 1 SEM micrographs reveal fiber delamination and cellular fragmentation of milled wood under various
mechanical milling time, 2 min (A), 4 min (B), 6min (C), 8min (D), 10min (E), 12 min (F).
Micro-scale evaluation of cellular fragmentation and chemical composition
redistribution of milled wood
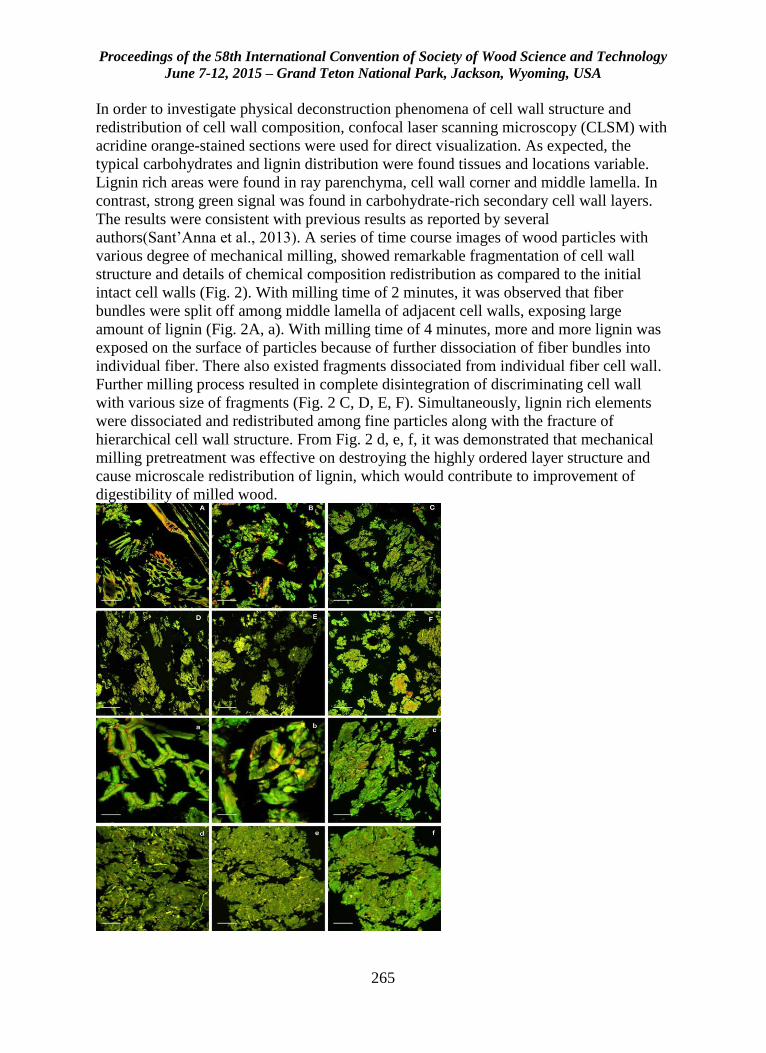
Proceedings of the 58th International Convention of Society of Wood Science and Technology
June 7-12, 2015 – Grand Teton National Park, Jackson, Wyoming, USA
265
In order to investigate physical deconstruction phenomena of cell wall structure and
redistribution of cell wall composition, confocal laser scanning microscopy (CLSM) with
acridine orange-stained sections were used for direct visualization. As expected, the
typical carbohydrates and lignin distribution were found tissues and locations variable.
Lignin rich areas were found in ray parenchyma, cell wall corner and middle lamella. In
contrast, strong green signal was found in carbohydrate-rich secondary cell wall layers.
The results were consistent with previous results as reported by several
authors(Sant’Anna et al., 2013). A series of time course images of wood particles with
various degree of mechanical milling, showed remarkable fragmentation of cell wall
structure and details of chemical composition redistribution as compared to the initial
intact cell walls (Fig. 2). With milling time of 2 minutes, it was observed that fiber
bundles were split off among middle lamella of adjacent cell walls, exposing large
amount of lignin (Fig. 2A, a). With milling time of 4 minutes, more and more lignin was
exposed on the surface of particles because of further dissociation of fiber bundles into
individual fiber. There also existed fragments dissociated from individual fiber cell wall.
Further milling process resulted in complete disintegration of discriminating cell wall
with various size of fragments (Fig. 2 C, D, E, F). Simultaneously, lignin rich elements
were dissociated and redistributed among fine particles along with the fracture of
hierarchical cell wall structure. From Fig. 2 d, e, f, it was demonstrated that mechanical
milling pretreatment was effective on destroying the highly ordered layer structure and
cause microscale redistribution of lignin, which would contribute to improvement of
digestibility of milled wood.
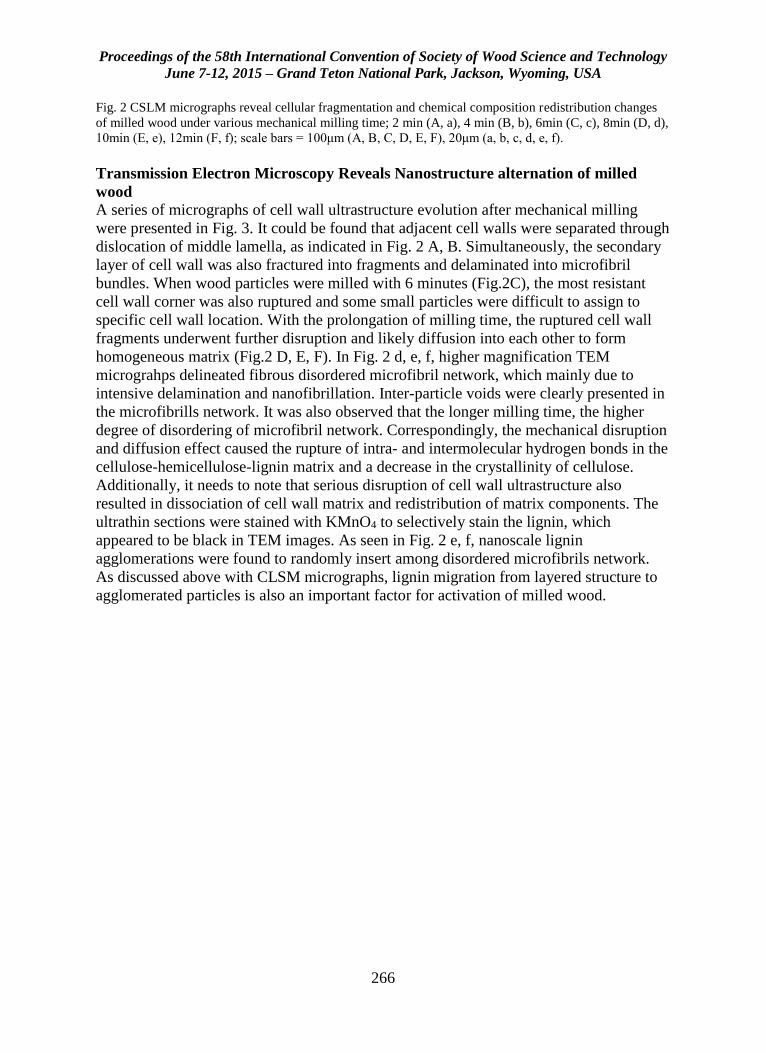
Proceedings of the 58th International Convention of Society of Wood Science and Technology
June 7-12, 2015 – Grand Teton National Park, Jackson, Wyoming, USA
266
Fig. 2 CSLM micrographs reveal cellular fragmentation and chemical composition redistribution changes
of milled wood under various mechanical milling time; 2 min (A, a), 4 min (B, b), 6min (C, c), 8min (D, d),
10min (E, e), 12min (F, f); scale bars = 100μm (A, B, C, D, E, F), 20μm (a, b, c, d, e, f).
Transmission Electron Microscopy Reveals Nanostructure alternation of milled
wood
A series of micrographs of cell wall ultrastructure evolution after mechanical milling
were presented in Fig. 3. It could be found that adjacent cell walls were separated through
dislocation of middle lamella, as indicated in Fig. 2 A, B. Simultaneously, the secondary
layer of cell wall was also fractured into fragments and delaminated into microfibril
bundles. When wood particles were milled with 6 minutes (Fig.2C), the most resistant
cell wall corner was also ruptured and some small particles were difficult to assign to
specific cell wall location. With the prolongation of milling time, the ruptured cell wall
fragments underwent further disruption and likely diffusion into each other to form
homogeneous matrix (Fig.2 D, E, F). In Fig. 2 d, e, f, higher magnification TEM
micrograhps delineated fibrous disordered microfibril network, which mainly due to
intensive delamination and nanofibrillation. Inter-particle voids were clearly presented in
the microfibrills network. It was also observed that the longer milling time, the higher
degree of disordering of microfibril network. Correspondingly, the mechanical disruption
and diffusion effect caused the rupture of intra- and intermolecular hydrogen bonds in the
cellulose-hemicellulose-lignin matrix and a decrease in the crystallinity of cellulose.
Additionally, it needs to note that serious disruption of cell wall ultrastructure also
resulted in dissociation of cell wall matrix and redistribution of matrix components. The
ultrathin sections were stained with KMnO4 to selectively stain the lignin, which
appeared to be black in TEM images. As seen in Fig. 2 e, f, nanoscale lignin
agglomerations were found to randomly insert among disordered microfibrils network.
As discussed above with CLSM micrographs, lignin migration from layered structure to
agglomerated particles is also an important factor for activation of milled wood.
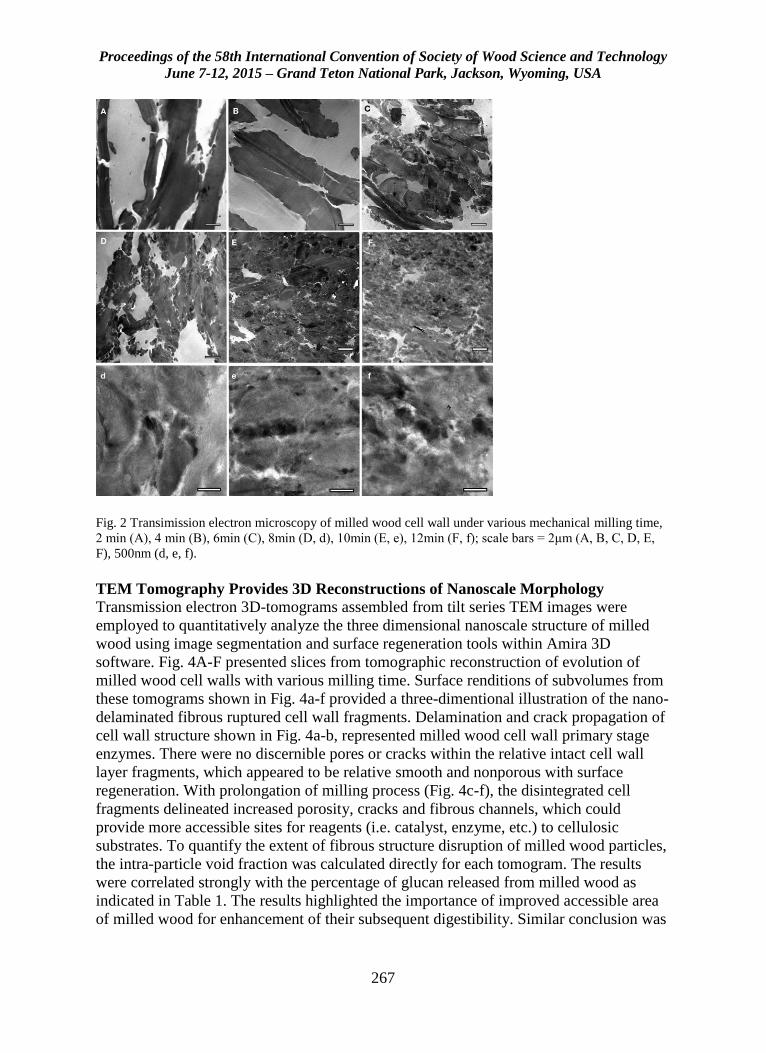
Proceedings of the 58th International Convention of Society of Wood Science and Technology
June 7-12, 2015 – Grand Teton National Park, Jackson, Wyoming, USA
267
Fig. 2 Transimission electron microscopy of milled wood cell wall under various mechanical milling time,
2 min (A), 4 min (B), 6min (C), 8min (D, d), 10min (E, e), 12min (F, f); scale bars = 2μm (A, B, C, D, E,
F), 500nm (d, e, f).
TEM Tomography Provides 3D Reconstructions of Nanoscale Morphology
Transmission electron 3D-tomograms assembled from tilt series TEM images were
employed to quantitatively analyze the three dimensional nanoscale structure of milled
wood using image segmentation and surface regeneration tools within Amira 3D
software. Fig. 4A-F presented slices from tomographic reconstruction of evolution of
milled wood cell walls with various milling time. Surface renditions of subvolumes from
these tomograms shown in Fig. 4a-f provided a three-dimentional illustration of the nano-
delaminated fibrous ruptured cell wall fragments. Delamination and crack propagation of
cell wall structure shown in Fig. 4a-b, represented milled wood cell wall primary stage
enzymes. There were no discernible pores or cracks within the relative intact cell wall
layer fragments, which appeared to be relative smooth and nonporous with surface
regeneration. With prolongation of milling process (Fig. 4c-f), the disintegrated cell
fragments delineated increased porosity, cracks and fibrous channels, which could
provide more accessible sites for reagents (i.e. catalyst, enzyme, etc.) to cellulosic
substrates. To quantify the extent of fibrous structure disruption of milled wood particles,
the intra-particle void fraction was calculated directly for each tomogram. The results
were correlated strongly with the percentage of glucan released from milled wood as
indicated in Table 1. The results highlighted the importance of improved accessible area
of milled wood for enhancement of their subsequent digestibility. Similar conclusion was
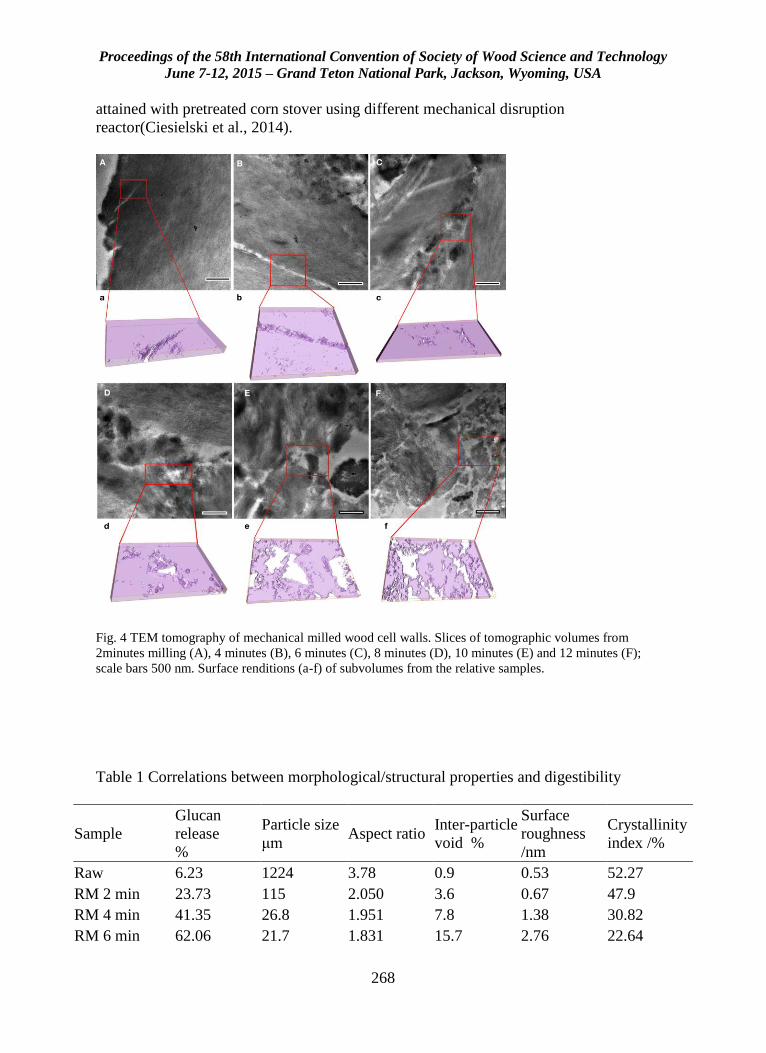
Proceedings of the 58th International Convention of Society of Wood Science and Technology
June 7-12, 2015 – Grand Teton National Park, Jackson, Wyoming, USA
268
attained with pretreated corn stover using different mechanical disruption
reactor(Ciesielski et al., 2014).
Fig. 4 TEM tomography of mechanical milled wood cell walls. Slices of tomographic volumes from
2minutes milling (A), 4 minutes (B), 6 minutes (C), 8 minutes (D), 10 minutes (E) and 12 minutes (F);
scale bars 500 nm. Surface renditions (a-f) of subvolumes from the relative samples.
Table 1 Correlations between morphological/structural properties and digestibility
Sample
Glucan
release
%
Particle size
μm Aspect ratio
Inter-particle
void %
Surface
roughness
/nm
Crystallinity
index /%
Raw 6.23 1224 3.78 0.9 0.53 52.27
RM 2 min 23.73 115 2.050 3.6 0.67 47.9
RM 4 min 41.35 26.8 1.951 7.8 1.38 30.82
RM 6 min 62.06 21.7 1.831 15.7 2.76 22.64
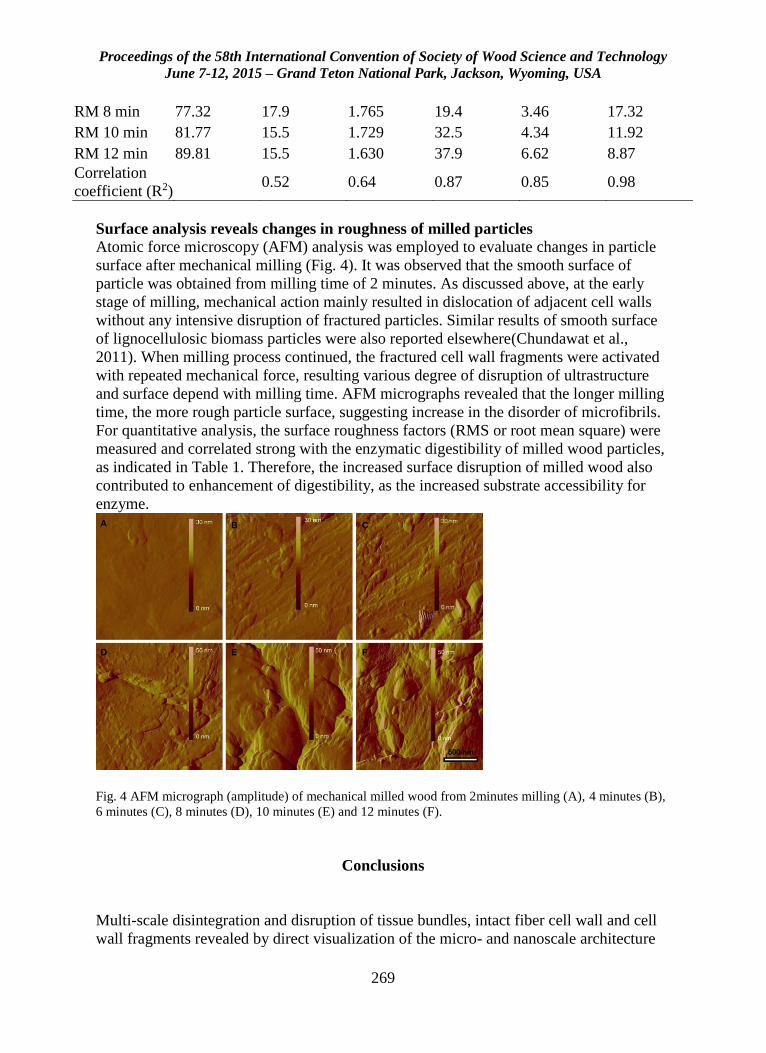
Proceedings of the 58th International Convention of Society of Wood Science and Technology
June 7-12, 2015 – Grand Teton National Park, Jackson, Wyoming, USA
269
RM 8 min 77.32 17.9 1.765 19.4 3.46 17.32
RM 10 min 81.77 15.5 1.729 32.5 4.34 11.92
RM 12 min 89.81 15.5 1.630 37.9 6.62 8.87
Correlation
coefficient (R2) 0.52 0.64 0.87 0.85 0.98
Surface analysis reveals changes in roughness of milled particles
Atomic force microscopy (AFM) analysis was employed to evaluate changes in particle
surface after mechanical milling (Fig. 4). It was observed that the smooth surface of
particle was obtained from milling time of 2 minutes. As discussed above, at the early
stage of milling, mechanical action mainly resulted in dislocation of adjacent cell walls
without any intensive disruption of fractured particles. Similar results of smooth surface
of lignocellulosic biomass particles were also reported elsewhere(Chundawat et al.,
2011). When milling process continued, the fractured cell wall fragments were activated
with repeated mechanical force, resulting various degree of disruption of ultrastructure
and surface depend with milling time. AFM micrographs revealed that the longer milling
time, the more rough particle surface, suggesting increase in the disorder of microfibrils.
For quantitative analysis, the surface roughness factors (RMS or root mean square) were
measured and correlated strong with the enzymatic digestibility of milled wood particles,
as indicated in Table 1. Therefore, the increased surface disruption of milled wood also
contributed to enhancement of digestibility, as the increased substrate accessibility for
enzyme.
Fig. 4 AFM micrograph (amplitude) of mechanical milled wood from 2minutes milling (A), 4 minutes (B),
6 minutes (C), 8 minutes (D), 10 minutes (E) and 12 minutes (F).
Conclusions
Multi-scale disintegration and disruption of tissue bundles, intact fiber cell wall and cell
wall fragments revealed by direct visualization of the micro- and nanoscale architecture
Proceedings of the 58th International Convention of Society of Wood Science and Technology
June 7-12, 2015 – Grand Teton National Park, Jackson, Wyoming, USA
270
alteration in accessibility explains the increased enzyme susceptibility of milled wood.
We proposed that enhanced degree of cell wall deconstruction was collectively achieved
by particle size reduction, nanofibrillation of layered microfibrils and redistribution of
chemical composition during mechanical milling process. The surface and ultrastructure
alternation of cell wall contribute to enhancement of enzymatic digestibility by 4-14 folds
over that of untreated cell walls depending on degree of milling pretreatment.
Acknowledgement
This research is supported by USDA National Institute of Food and Agriculture
Coordinated Agricultural Research. The authours would also like to acknowledge the
help of scanning electronic microscopy analysis from Franceschi Microscopy & Imaging
Center (FMIC) at Washington State Univeristy, Pullman.
References
Arantes, V., Saddler, J.N., 2010. Access to cellulose limits the efficiency of enzymatic
hydrolysis: the role of amorphogenesis. Biotechnol Biofuels 3.
Barakat, A., Chuetor, S., Monlau, F., Solhy, A., Rouau, X., 2014a. Eco-friendly dry
chemo-mechanical pretreatments of lignocellulosic biomass: Impact on energy and yield
of the enzymatic hydrolysis. Appl. Energy 113, 97–105.
doi:10.1016/j.apenergy.2013.07.015
Barakat, A., Mayer-Laigle, C., Solhy, A., Arancon, R.A.D., de Vries, H., Luque, R.,
2014b. Mechanical pretreatments of lignocellulosic biomass: towards facile and
environmentally sound technologies for biofuels production. RSC Adv 4, 48109–48127.
doi:10.1039/C4RA07568D
Chiaramonti, D., Prussi, M., Ferrero, S., Oriani, L., Ottonello, P., Torre, P., Cherchi, F.,
2012. Review of pretreatment processes for lignocellulosic ethanol production, and
development of an innovative method. Biomass Bioenergy 46, 25–35.
doi:10.1016/j.biombioe.2012.04.020
Chundawat, S.P.S., Donohoe, B.S., da Costa Sousa, L., Elder, T., Agarwal, U.P., Lu, F.,
Ralph, J., Himmel, M.E., Balan, V., Dale, B.E., 2011. Multi-scale visualization and
characterization of lignocellulosic plant cell wall deconstruction during thermochemical
pretreatment. Energy Environ. Sci. 4, 973. doi:10.1039/c0ee00574f
Proceedings of the 58th International Convention of Society of Wood Science and Technology
June 7-12, 2015 – Grand Teton National Park, Jackson, Wyoming, USA
271
Ciesielski, P.N., Wang, W., Chen, X., Vinzant, T.B., Tucker, M.P., Decker, S.R.,
Himmel, M.E., Johnson, D.K., Donohoe, B.S., 2014. Effect of mechanical disruption on
the effectiveness of three reactors used for dilute acid pretreatment of corn stover Part 2:
morphological and structural substrate analysis. Biotechnol. Biofuels 7, 1–12.
Hoeger, I.C., Nair, S.S., Ragauskas, A.J., Deng, Y., Rojas, O.J., Zhu, J.Y., 2013.
Mechanical deconstruction of lignocellulose cell walls and their enzymatic
saccharification. Cellulose 20, 807–818. doi:10.1007/s10570-013-9867-9
Sant’Anna, C., Costa, L.T., Abud, Y., Biancatto, L., Miguens, F.C., de Souza, W., 2013.
Sugarcane cell wall structure and lignin distribution investigated by confocal and electron
microscopy: Cell Wall Ultrastructure and Lignin Localization In Sugarcane. Microsc.
Res. Tech. 76, 829–834. doi:10.1002/jemt.22235
Segal, L., Creely, J.J., Martin Jr, A.E., n.d. An Empirical Method for Estimating the
Degree of Crystallinity of Native Cellulose Using the X-Ray Diffractometer. Text. Res. J.
Takahashi, T., Ito, K., Ito, A., Enda, Y., Gochi, M., Mori, H., Kobayashi, J., 2013.
Tandem-ring mill pulverization benefits for enzymatic saccharification of biomass.
Renew. Energy. doi:10.1016/j.renene.2013.07.046
Yu, Z., Gwak, K.-S., Treasure, T., Jameel, H., Chang, H., Park, S., 2014. Effect of Lignin
Chemistry on the Enzymatic Hydrolysis of Woody Biomass. ChemSusChem 7, 1942–
1950. doi:10.1002/cssc.201400042
Zakaria, M.R., Fujimoto, S., Hirata, S., Hassan, M.A., 2014. Ball Milling Pretreatment of
Oil Palm Biomass for Enhancing Enzymatic Hydrolysis. Appl. Biochem. Biotechnol.
doi:10.1007/s12010-014-0964-5
Proceedings of the 58th International Convention of Society of Wood Science and Technology
June 7-12, 2015 – Grand Teton National Park, Jackson, Wyoming, USA
272
Preparation of Strips from Bambusa Vulgaris Schrad
Culms from Recycled Scaffold for Intermediate Raw
Materials Production
Adesope A.S 1* - Adewole N.A 2 - Olayiwola H.O 3- Adejoba O.R1
1*Researcher, Forestry Research Institute of Nigeria, Forest Products
Development and utilization Dept
* Corresponding author
2Senior Lecturer. Ph.D, Department of Agric and Environmental Engrg,
University of Ibadan.
3Postgrad, Department of Agric and Environmental Engrg, University of
Ibadan.
Abstract
In Nigeria, the main use of bamboo that attracts money is its use as scaffold and the
massive number of bamboo used as scaffold always ended up as waste. But there are
possibilities of recovering useful bamboo culms for the production of intermediate
products like laminates among others particularly for semi-structural and non-structural
purposes. The major constraint of using these recovered culms is the form in which
bamboo occurs naturally (round). It is for this reason that this study is aimed at preparing
strips from recovered bamboo culms to produce value added products. This study sourced
and revealed the characteristics of bamboo reclaimed from scaffold use. From a total of
298 culms used as scaffold, only about 65% was good for re-use while others constituted
a waste. The study was able to improvise treatment vat for the bamboo strips to enhance
its durability. Intermediate products like bamboo wall clock, bamboo ply and bamboo
boards were produced through lamination process. This study revealed the possibility of
re-using bamboo from scaffold and was able to produce useful raw material and
intermediate products from recovered bamboo waste.
Key-words: Bamboo culms, Scaffold, Intermediate Products, Bamboo Strips
Proceedings of the 58th International Convention of Society of Wood Science and Technology
June 7-12, 2015 – Grand Teton National Park, Jackson, Wyoming, USA
273
Introduction
On account of the enforcement of our natural forest protection project in Nigeria, wood is
becoming increasingly scarce. The realization that bamboo is the most potentially
important non-timber resource and fast-growing woody biomass has evoked keen interest
in the processing, preservation, utilization and the promotion of bamboo as an alternative
to wood (Janssen, 2000). Its use as top grade building material and availability makes
bamboo material always sought for in the field of construction. Its high valued utilization
not only promotes the economic development, but also reduces pressure on our forest
resources and protects the environment when used as wood substitute.
It has tremendous economic potential with its significant applications and innovative
products. Also, its wide availability offers great opportunities to the micro, small and
medium scale enterprises (Markus, 2008). Since the bamboo resource is widely available
across the rural domains and industrial effort requires a lot of labour, bamboo has a great
potential to offer job opportunity and income source to the rural masses. This can
ultimately lead to the sustainable development of rural dwellers and hence contributing
significantly to the economy (Sornai V, 2003; Suresh Moktan, 2007).
There are inherent variations in the bamboo culm features that limit its direct use for
many valuable applications in round form (INBAR, 2006). Bamboo has hollow and come
naturally with wall thickness which is not appreciable as compared with that of solid
wood, hence the need for lamination to actualize its full potentials. Bamboo laminates
have been of immense advantage because of the flexibility of standard sizes for use in the
production of small to large structure (Pokhrel, 2008). Several other products have been
made from bamboo laminates including furniture parts and novel items that are
aesthetically pleasing. Despite the growing popularity of bamboo to meet several
demands, it requires some level of technology and machinery for its processing before it
can realize its full potential in meeting the demand (Janssen, 2000; Van, 2010).
African countries are yet to fully optimize the potentials of this valuable forest resource.
In the case of Nigeria, the use of bamboo attracts commercial value in its use in
construction industry for scaffold as observed by Adewole and Olayiwola (2011). After
use as scaffold it becomes partially dried, and ended up as waste. Inadequate
technological capacity and lack of processing facilities are major challenges to
developing utilization schedule for the numerous bamboo resources and recovered
bamboo from construction industries in Nigeria.
It is possible to create intermediate raw material from bamboo recovered from scaffold
use in producing items that can be used interior decoration in building. The focus of this
study is to explore ways of maximizing the potentials of bamboo resource through
preparation of strips from Bambusa vulgaris Schrad culm for use in the production of
intermediate raw materials.
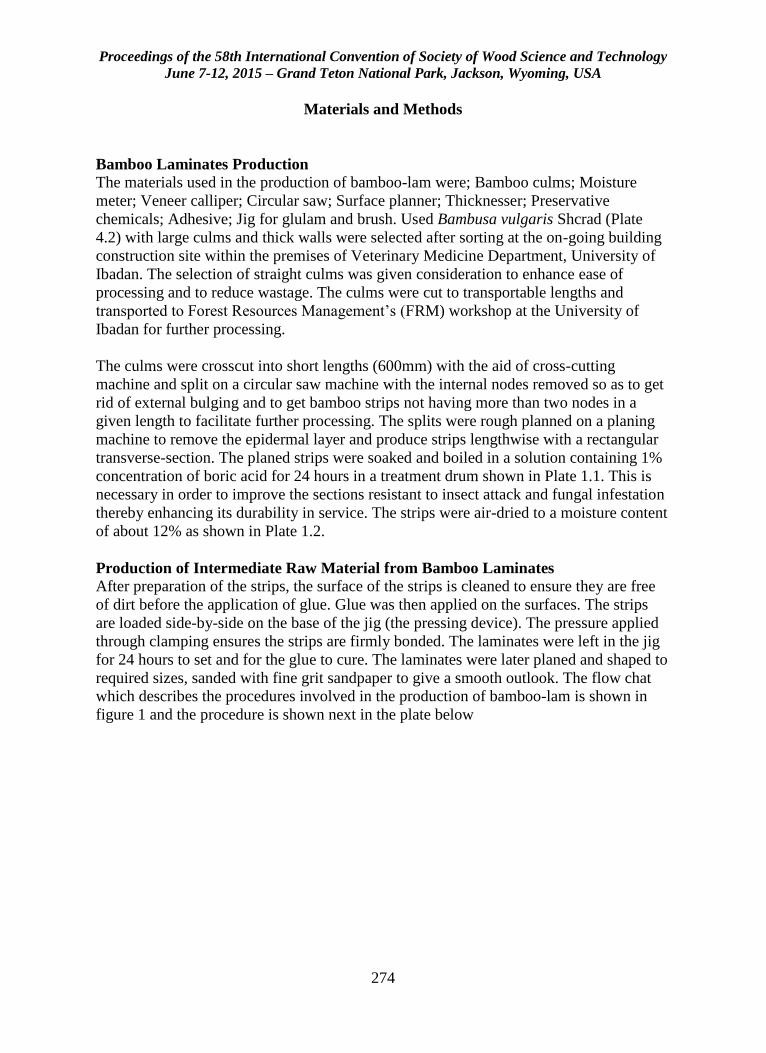
Proceedings of the 58th International Convention of Society of Wood Science and Technology
June 7-12, 2015 – Grand Teton National Park, Jackson, Wyoming, USA
274
Materials and Methods
Bamboo Laminates Production
The materials used in the production of bamboo-lam were; Bamboo culms; Moisture
meter; Veneer calliper; Circular saw; Surface planner; Thicknesser; Preservative
chemicals; Adhesive; Jig for glulam and brush. Used Bambusa vulgaris Shcrad (Plate
4.2) with large culms and thick walls were selected after sorting at the on-going building
construction site within the premises of Veterinary Medicine Department, University of
Ibadan. The selection of straight culms was given consideration to enhance ease of
processing and to reduce wastage. The culms were cut to transportable lengths and
transported to Forest Resources Management’s (FRM) workshop at the University of
Ibadan for further processing.
The culms were crosscut into short lengths (600mm) with the aid of cross-cutting
machine and split on a circular saw machine with the internal nodes removed so as to get
rid of external bulging and to get bamboo strips not having more than two nodes in a
given length to facilitate further processing. The splits were rough planned on a planing
machine to remove the epidermal layer and produce strips lengthwise with a rectangular
transverse-section. The planed strips were soaked and boiled in a solution containing 1%
concentration of boric acid for 24 hours in a treatment drum shown in Plate 1.1. This is
necessary in order to improve the sections resistant to insect attack and fungal infestation
thereby enhancing its durability in service. The strips were air-dried to a moisture content
of about 12% as shown in Plate 1.2.
Production of Intermediate Raw Material from Bamboo Laminates
After preparation of the strips, the surface of the strips is cleaned to ensure they are free
of dirt before the application of glue. Glue was then applied on the surfaces. The strips
are loaded side-by-side on the base of the jig (the pressing device). The pressure applied
through clamping ensures the strips are firmly bonded. The laminates were left in the jig
for 24 hours to set and for the glue to cure. The laminates were later planed and shaped to
required sizes, sanded with fine grit sandpaper to give a smooth outlook. The flow chat
which describes the procedures involved in the production of bamboo-lam is shown in
figure 1 and the procedure is shown next in the plate below
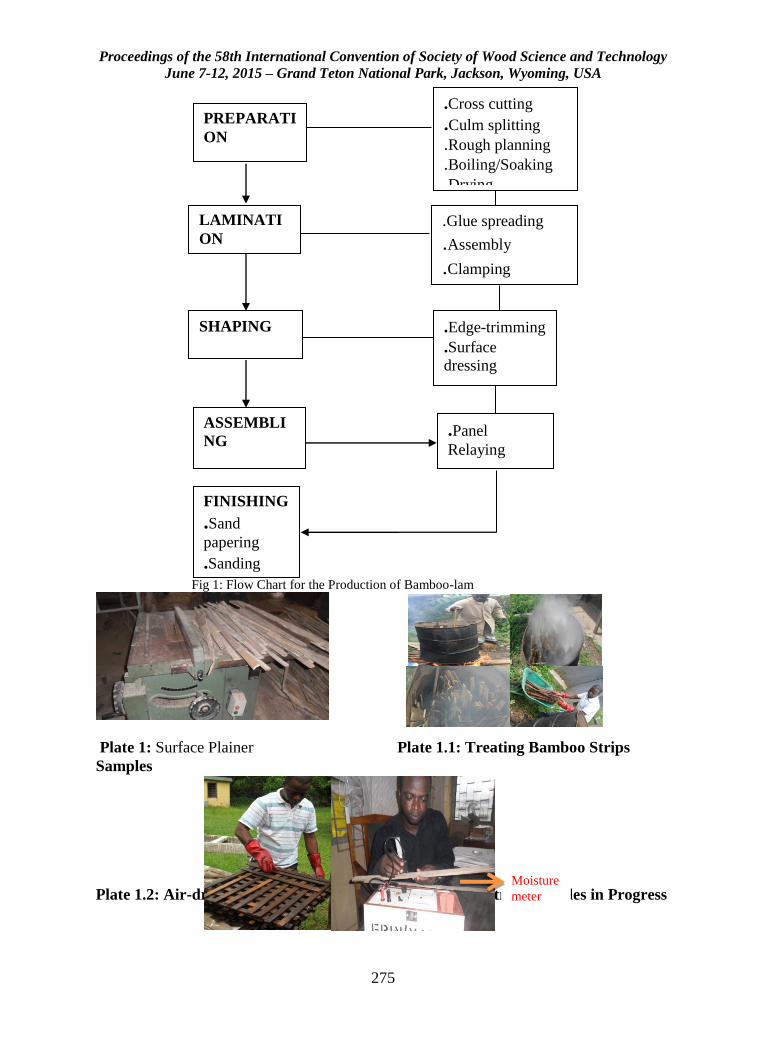
Proceedings of the 58th International Convention of Society of Wood Science and Technology
June 7-12, 2015 – Grand Teton National Park, Jackson, Wyoming, USA
275
Fig 1: Flow Chart for the Production of Bamboo-lam
Plate 1: Surface Plainer Plate 1.1: Treating Bamboo Strips
Samples
Plate 1.2: Air-drying and monitoring the MC of Bamboo Strips Samples in Progress
.Cross cutting
.Culm splitting
.Rough planning
.Boiling/Soaking
.Drying
LAMINATI
ON
.Glue spreading
.Assembly
.Clamping
SHAPING
ASSEMBLI
NG
.Edge-trimming
.Surface
dressing
.Panel
Relaying
FINISHING
.Sand
papering
.Sanding
sealing
PREPARATI
ON
Moisture
meter
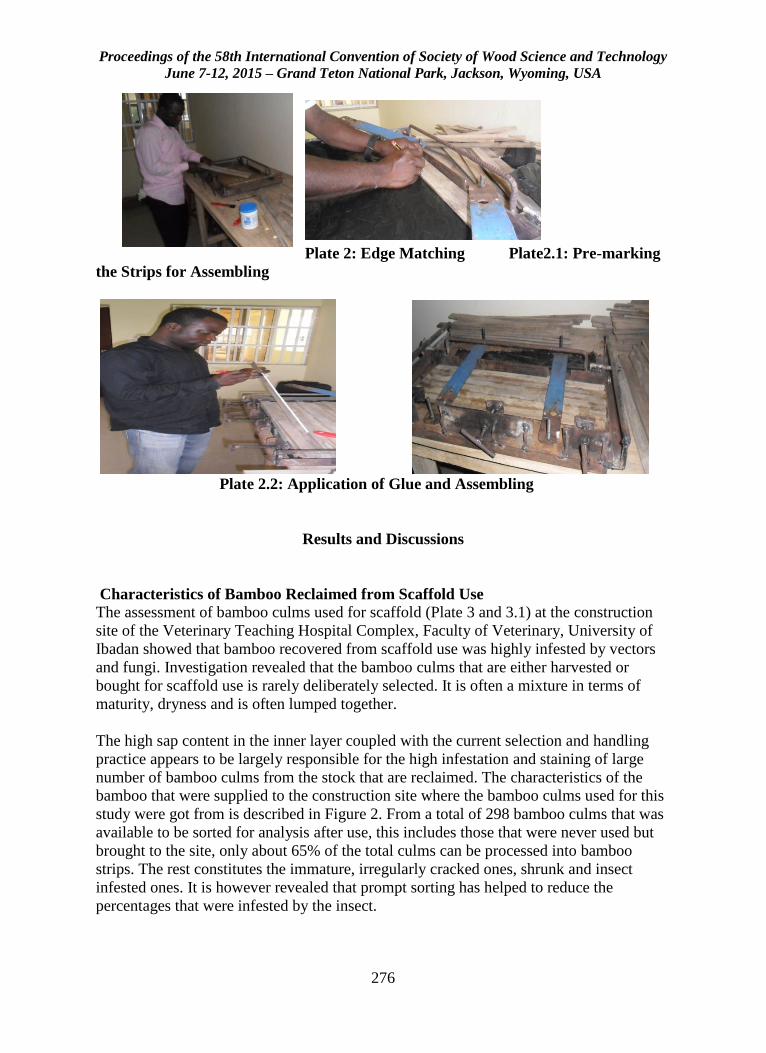
Proceedings of the 58th International Convention of Society of Wood Science and Technology
June 7-12, 2015 – Grand Teton National Park, Jackson, Wyoming, USA
276
Plate 2: Edge Matching Plate2.1: Pre-marking
the Strips for Assembling
Plate 2.2: Application of Glue and Assembling
Results and Discussions
Characteristics of Bamboo Reclaimed from Scaffold Use
The assessment of bamboo culms used for scaffold (Plate 3 and 3.1) at the construction
site of the Veterinary Teaching Hospital Complex, Faculty of Veterinary, University of
Ibadan showed that bamboo recovered from scaffold use was highly infested by vectors
and fungi. Investigation revealed that the bamboo culms that are either harvested or
bought for scaffold use is rarely deliberately selected. It is often a mixture in terms of
maturity, dryness and is often lumped together.
The high sap content in the inner layer coupled with the current selection and handling
practice appears to be largely responsible for the high infestation and staining of large
number of bamboo culms from the stock that are reclaimed. The characteristics of the
bamboo that were supplied to the construction site where the bamboo culms used for this
study were got from is described in Figure 2. From a total of 298 bamboo culms that was
available to be sorted for analysis after use, this includes those that were never used but
brought to the site, only about 65% of the total culms can be processed into bamboo
strips. The rest constitutes the immature, irregularly cracked ones, shrunk and insect
infested ones. It is however revealed that prompt sorting has helped to reduce the
percentages that were infested by the insect.
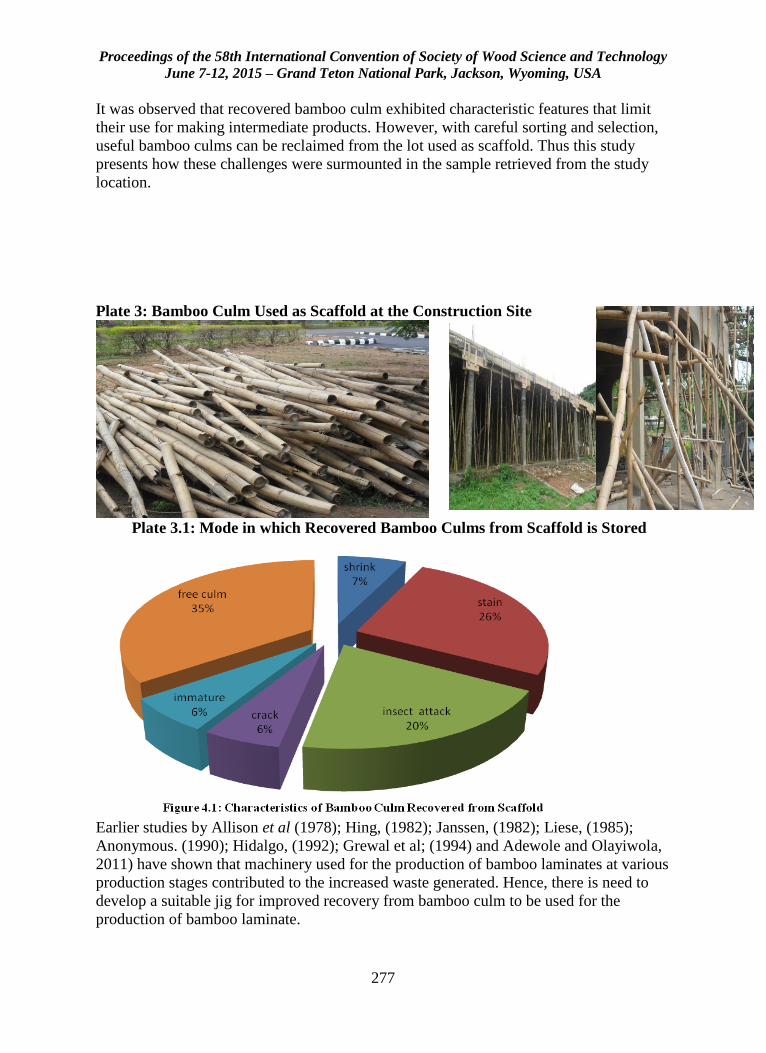
Proceedings of the 58th International Convention of Society of Wood Science and Technology
June 7-12, 2015 – Grand Teton National Park, Jackson, Wyoming, USA
277
It was observed that recovered bamboo culm exhibited characteristic features that limit
their use for making intermediate products. However, with careful sorting and selection,
useful bamboo culms can be reclaimed from the lot used as scaffold. Thus this study
presents how these challenges were surmounted in the sample retrieved from the study
location.
Plate 3: Bamboo Culm Used as Scaffold at the Construction Site
Plate 3.1: Mode in which Recovered Bamboo Culms from Scaffold is Stored
Earlier studies by Allison et al (1978); Hing, (1982); Janssen, (1982); Liese, (1985);
Anonymous. (1990); Hidalgo, (1992); Grewal et al; (1994) and Adewole and Olayiwola,
2011) have shown that machinery used for the production of bamboo laminates at various
production stages contributed to the increased waste generated. Hence, there is need to
develop a suitable jig for improved recovery from bamboo culm to be used for the
production of bamboo laminate.
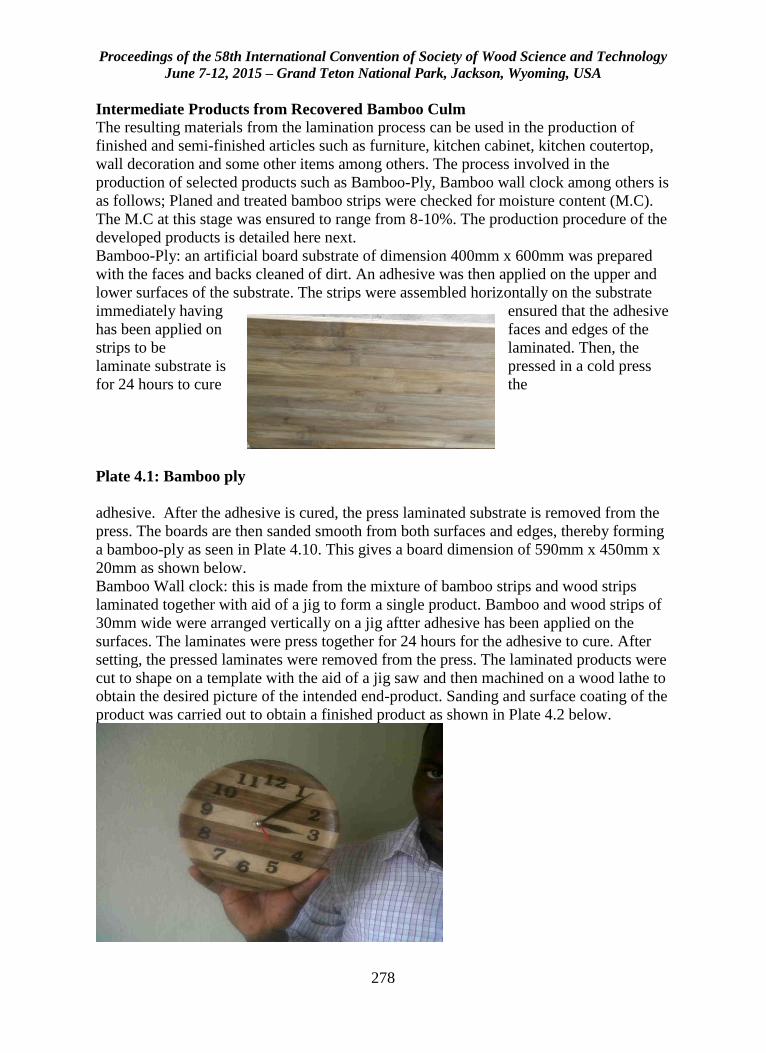
Proceedings of the 58th International Convention of Society of Wood Science and Technology
June 7-12, 2015 – Grand Teton National Park, Jackson, Wyoming, USA
278
Intermediate Products from Recovered Bamboo Culm
The resulting materials from the lamination process can be used in the production of
finished and semi-finished articles such as furniture, kitchen cabinet, kitchen coutertop,
wall decoration and some other items among others. The process involved in the
production of selected products such as Bamboo-Ply, Bamboo wall clock among others is
as follows; Planed and treated bamboo strips were checked for moisture content (M.C).
The M.C at this stage was ensured to range from 8-10%. The production procedure of the
developed products is detailed here next.
Bamboo-Ply: an artificial board substrate of dimension 400mm x 600mm was prepared
with the faces and backs cleaned of dirt. An adhesive was then applied on the upper and
lower surfaces of the substrate. The strips were assembled horizontally on the substrate
immediately having ensured that the adhesive
has been applied on faces and edges of the
strips to be laminated. Then, the
laminate substrate is pressed in a cold press
for 24 hours to cure the
Plate 4.1: Bamboo ply
adhesive. After the adhesive is cured, the press laminated substrate is removed from the
press. The boards are then sanded smooth from both surfaces and edges, thereby forming
a bamboo-ply as seen in Plate 4.10. This gives a board dimension of 590mm x 450mm x
20mm as shown below.
Bamboo Wall clock: this is made from the mixture of bamboo strips and wood strips
laminated together with aid of a jig to form a single product. Bamboo and wood strips of
30mm wide were arranged vertically on a jig aftter adhesive has been applied on the
surfaces. The laminates were press together for 24 hours for the adhesive to cure. After
setting, the pressed laminates were removed from the press. The laminated products were
cut to shape on a template with the aid of a jig saw and then machined on a wood lathe to
obtain the desired picture of the intended end-product. Sanding and surface coating of the
product was carried out to obtain a finished product as shown in Plate 4.2 below.
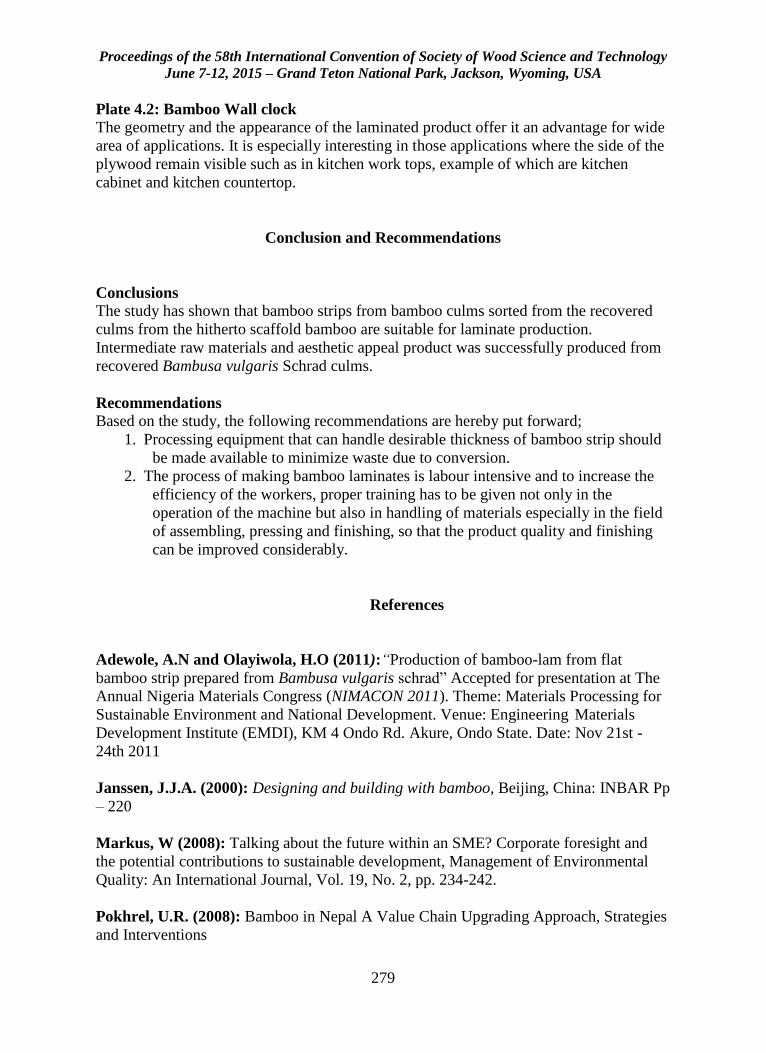
Proceedings of the 58th International Convention of Society of Wood Science and Technology
June 7-12, 2015 – Grand Teton National Park, Jackson, Wyoming, USA
279
Plate 4.2: Bamboo Wall clock
The geometry and the appearance of the laminated product offer it an advantage for wide
area of applications. It is especially interesting in those applications where the side of the
plywood remain visible such as in kitchen work tops, example of which are kitchen
cabinet and kitchen countertop.
Conclusion and Recommendations
Conclusions
The study has shown that bamboo strips from bamboo culms sorted from the recovered
culms from the hitherto scaffold bamboo are suitable for laminate production.
Intermediate raw materials and aesthetic appeal product was successfully produced from
recovered Bambusa vulgaris Schrad culms.
Recommendations
Based on the study, the following recommendations are hereby put forward;
1. Processing equipment that can handle desirable thickness of bamboo strip should
be made available to minimize waste due to conversion.
2. The process of making bamboo laminates is labour intensive and to increase the
efficiency of the workers, proper training has to be given not only in the
operation of the machine but also in handling of materials especially in the field
of assembling, pressing and finishing, so that the product quality and finishing
can be improved considerably.
References
Adewole, A.N and Olayiwola, H.O (2011):“Production of bamboo-lam from flat
bamboo strip prepared from Bambusa vulgaris schrad” Accepted for presentation at The
Annual Nigeria Materials Congress (NIMACON 2011). Theme: Materials Processing for
Sustainable Environment and National Development. Venue: Engineering Materials
Development Institute (EMDI), KM 4 Ondo Rd. Akure, Ondo State. Date: Nov 21st -
24th 2011
Janssen, J.J.A. (2000): Designing and building with bamboo, Beijing, China: INBAR Pp
– 220
Markus, W (2008): Talking about the future within an SME? Corporate foresight and
the potential contributions to sustainable development, Management of Environmental
Quality: An International Journal, Vol. 19, No. 2, pp. 234-242.
Pokhrel, U.R. (2008): Bamboo in Nepal A Value Chain Upgrading Approach, Strategies
and Interventions

Proceedings of the 58th International Convention of Society of Wood Science and Technology
June 7-12, 2015 – Grand Teton National Park, Jackson, Wyoming, USA
280
Sorna, V.G and Mohini S., (2003): "Bamboo Composites--for sustainable rural
development", Journal of Rural Technology, Vol. 1(1), pp. 6-10
Suresh, M (2007): Development of Small and Medium Enterprises In Bhutan: Analysing
Constraints To Growth, South Asian Survey, Vol. 14 (2), pp. 251-282.
Van, H (2010): Method for manufacturing Bamboo-mats and Use thereof. Patent
Application Publication. Feb, 4, 2010. Pp. 1-4.
Proceedings of the 58th International Convention of Society of Wood Science and Technology
June 7-12, 2015 – Grand Teton National Park, Jackson, Wyoming, USA
281
Gender Diversity Impacts on Firm Performance in
Forest Sector Firms
Kendall Conroy
Oregon State University, Corvallis, OR
Abstract
The forest industry is predicted to lose a large percentage of its employees due to
retirement in the coming decade. The industry also tends to lack diversity in its
workforce, which makes this is an ideal time to move towards greater diversity. While
many companies in the sector recognize the need for a more diverse workforce and have
strategies in place to encourage diversity, there is little academic work evaluating the
performance of such strategies. The existing research shows that greater diversity leads
to increased creativity, openness to change, and innovation, all of which can contribute
to increased financial performance. However, there is no information specific to forest
sector firms. For that reason, we investigate the relationship between gender diversity
and financial performance of large forest sector firms. We use the
PricewaterhouseCoopers global 100 pulp, paper and packaging companies database and
select those companies from Europe, North America and Oceania. Our data consists of
the gender ratio of each of the 67 company’s boards of directors and corporate executive
teams. Preliminary regression analyses indicate a strong connection between greater
female representation and firm performance. Consistent findings would provide further
incentive for forest sector firms to strive for higher diversity in their workforces.
Proceedings of the 58th International Convention of Society of Wood Science and Technology
June 7-12, 2015 – Grand Teton National Park, Jackson, Wyoming, USA
282
Investigating the Surface Quality of Tropical Hardwood
Species: A Case of Khaya ivorensis from Ghana.
Stephen Tekpetey, [email protected]
Forestry Research Institute of Ghana, Box 63 KNUST, Kumasi
Abstract
Tropical hardwood species are important commercial tree species for decorative veneer,
cabinet work,canoe and boat construction. Surface quality of solid wood products is an
important property which influence manufacturing such as strength of adhesive and
finishing. Hence surface characterization and assessment of commercial hardwood
species like Khaya ivorensis is relevant. There are, however, limited studies and
information on the surface quality assessment of tropical African hardwood species such
as Khaya ivorensis. In this study, surface roughness of plantation grown and naturally
grown Khaya ivorensis harvested from Pra-Anum Forest reserve, Ghana were evaluated
using the stylus profilometer. The assessment was made at three different height levels:
Butt, middle and top portions. The average roughness (Ra), mean peak to valley height
(Rz), core roughness depth (Rk), reduced peak height (Rpk), reduced valley depth (Rvk),
total height of roughness (Rt), maximum surface roughness (Rmax) and maximum depth
of roughness motif (Rx) were estimated on the tangential surfaces. Based on the results of
statistical analysis, roughness parameters varied significantly at different portions of
wood samples at p= 0.05 in both plantation and natural mahogany samples. Results also
revealed that roughness parameters/values for plantation samples were relatively lower
than the natural samples indicating smoother surfaces than natural ones.
Proceedings of the 58th International Convention of Society of Wood Science and Technology
June 7-12, 2015 – Grand Teton National Park, Jackson, Wyoming, USA
283
Poster Session and Student Poster Competition Moderator: Frederick Kamke, Oregon State University,
USA
Assessment of the Physical and Fiber Characteristics of
Alstonia boonei for Pulp and Paper Production
Enoch ADJEI MENSAH 1 - Kojo Agyapong AFRIFAH 2*
1 Department of Wood Science & Technology
Faculty of Renewable Natural Resource
Kwame Nkrumah University of Science and Technology, Kumasi, Ghana.
+233-54-228-1936
[email protected] 2 Department of Wood Science and Technology,
Faculty of Renewable Natural Resources
Kwame Nkrumah University of Science and Technology, Kumasi, Ghana,
+233-24-077-0941 Fax: +233-3220-60375
*Corresponding author
Abstract
Timber resources have dwindled in the last few decades, resulting in the reduction of
quality traditional wood species for the production of pulp and paper. This study
therefore assessed the physical and fiber characteristics along the bole of Alstonia boonei
an abundant lesser utilized timber species in order to ascertain its viability as an
alternative material for pulp and paper production. The studied parameters were basic
density, fiber length, fiber diameter, lumen diameter, cell wall thickness, flexibility ratio,
slenderness ratio and runkel ratio. The results showed significant differences in basic
density, fiber length, fiber diameter, lumen diameter and cell wall thickness between the
butt, middle and top portions of the bole. Flexibility ratio, slenderness ratio, and runkel
ratio were also significantly different for the various portions of the bole. The highest
basic density (315 kg/m3), fiber length (1421μm), flexibility ratio (68.5%), and runkel
ratio (0.509) were recorded in the butt whereas the top had the lowest basic density (236
kg/m3), fiber length (1185μm), flexibility ratio (61.4%), and runkel ratio (0.705). These
ratings conform to the standards required for timbers used for pulp and paper production.
Proceedings of the 58th International Convention of Society of Wood Science and Technology
June 7-12, 2015 – Grand Teton National Park, Jackson, Wyoming, USA
284
Thus, A. boonei was found to be suitable for pulp and paper production with the butt
region offering the best biomass.
Key words: Biomass, Density, Fiber, Pulp, Paper, Species
Introduction
Paper is a versatile commodity that contributes to the growth and development of every
country. The level of development of a country could be related to its paper consumption
trends (Darkwa 1996). In recent times the global consumption of paper has been
estimated to be around 400 million tons per annum and about 7.2 billion trees are felled
to satisfy this need for purposes of writing, printing, wrapping, communication, education
and packaging (Green tips 2010). This high demand for paper and its products is also
observed in most developing countries such as Ghana. With the dwindling stands of
traditional timber species, supply of paper to meet the increasing demand would require
alternative sustainable raw materials to supplement the existing ones.
Wood quality affects the quality of pulp and ultimately the manufactured paper (Newel
1953). Thus most Softwood timbers are preferred over hardwoods because they have a
preponderance of tracheid that reputedly produce strong paper. Nonetheless, Newel
(1953) reported that hardwood pulps could have strength equal to or even greater than
those from softwood. Therefore, it would be beneficial to assess the pulping
characteristics of some lesser utilized hardwood species, including Alstonia boonei to
augment the pulp form softwoods.
A. boonei, from the family Apocynaceae, is a pioneer tree very common on old farms and
in swampy forest from Senegal through Ethiopia to Congo (Hawthorne and Gyakari
2006). This species provides firewood. As timber, its sapwood which is not
differentiated from the heartwood, is very wide, up to 200 mm, soft, and light in weight
when dried. The wood is nearly yellowish-white when freshly cut, the timber darkens on
exposure. It has a low lustre and no characteristic odour or taste. The wood is also liable
to staining. It works easily with hand and machine tools, but because of its softness, it is
essential to use tools with sharp cutting edges. The wood can be glued, stained and
polished satisfactorily. The well-known Asante stools of Ghana are made from it. It
contains latex which gives an inferior resinous coagulate, and has been used to adulterate
better rubbers (Orwa 2009).
The major determinants of the quality of any given pulp from a plant are its fiber length
and chemical properties (Omotoso and Ogunsile 2009). Review of literature shows no
documented information on these parameters for A. boonei despite the fact that this
species is abundant. This study therefore, focused on analyzing the basic density and
fibre characteristics of A. boonei in order to ascertain its potential for pulp and paper
making.
Proceedings of the 58th International Convention of Society of Wood Science and Technology
June 7-12, 2015 – Grand Teton National Park, Jackson, Wyoming, USA
285
Materials and Methods
Sample collection
A. boonei was collected from the demonstration farm of Faculty of Renewable Natural
Resources, Kwame Nkrumah University of Science and Technology (KNUST), Kumasi -
Ghana. The height of the tree was recorded and subsequently divided into butt, middle
and top portions for sample collection and analysis.
Sample preparation
Basic density
Test samples were prepared to the dimensions of 20×20×20 mm according to TAPPI 258
om-11 (2011). A total of 54 samples were studied, with 18 samples each for the butt,
middle and top portions. Dimensions of the samples were measured in the radial,
tangential and longitudinal directions and weighed before soaking in water for 24 h.
Volume of saturated samples and wet weight were determined after 24 h. The samples
were then oven-dried at 103±2oC. Dried weights and dimensions of the samples were
measured and the basic density of A. boonei determined using Equation 1.
Maceration
Match-stick sized wood samples were taken from the top, middle and butt portions of the
wood and placed in labelled test tubes. The samples were flooded with a mixture of
Hydrogen Peroxide and Glacial Acetic Acid (1:1 v/v) in the test tubes and incubated at
65oC for 6 days. The fully macerated samples were then observed under microscope.
Determination of fiber dimensions and anatomical ratios
Slides of macerated wood were prepared and mounted. Images of the fibers were
captured at a scale of ×200µm with a microscope that had a computer attachment using
Micron (USB2) software. Determination of fiber length (FL), cell wall thickness (CWT),
lumen diameter (LD) and fibre diameter (FD) was done on selected straight fibers using
ImageJ software.
Determined fibre dimensions were used to calculate slenderness ratio (SR), runkel ratio
(RR) and flexibility ratio (FR) as shown in Equations (3) to (5);
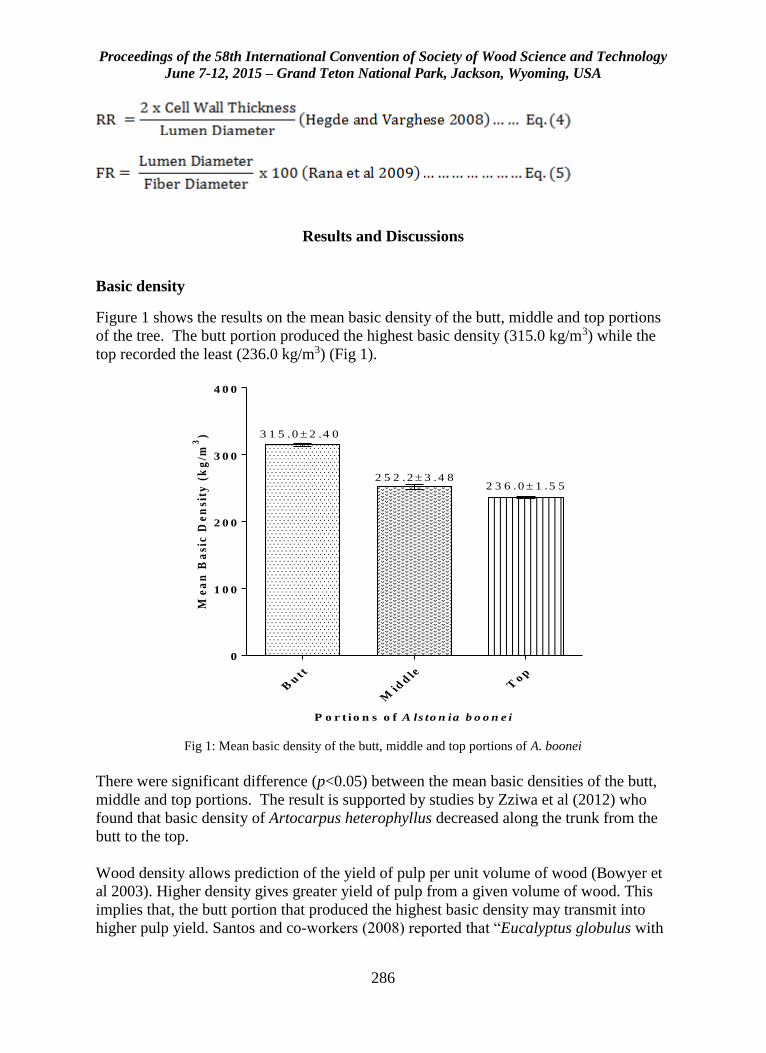
Proceedings of the 58th International Convention of Society of Wood Science and Technology
June 7-12, 2015 – Grand Teton National Park, Jackson, Wyoming, USA
286
Results and Discussions
Basic density
Figure 1 shows the results on the mean basic density of the butt, middle and top portions
of the tree. The butt portion produced the highest basic density (315.0 kg/m3) while the
top recorded the least (236.0 kg/m3) (Fig 1).
Bu
tt
Mid
dle
To p
0
1 0 0
2 0 0
3 0 0
4 0 0
P o r t io n s o f A ls to n ia b o o n e i
Me
an
Ba
sic
De
ns
ity
(k
g/m
3) 3 1 5 .0 2 .4 0
2 5 2 .2 3 .4 82 3 6 .0 1 .5 5
Fig 1: Mean basic density of the butt, middle and top portions of A. boonei
There were significant difference (p<0.05) between the mean basic densities of the butt,
middle and top portions. The result is supported by studies by Zziwa et al (2012) who
found that basic density of Artocarpus heterophyllus decreased along the trunk from the
butt to the top.
Wood density allows prediction of the yield of pulp per unit volume of wood (Bowyer et
al 2003). Higher density gives greater yield of pulp from a given volume of wood. This
implies that, the butt portion that produced the highest basic density may transmit into
higher pulp yield. Santos and co-workers (2008) reported that “Eucalyptus globulus with
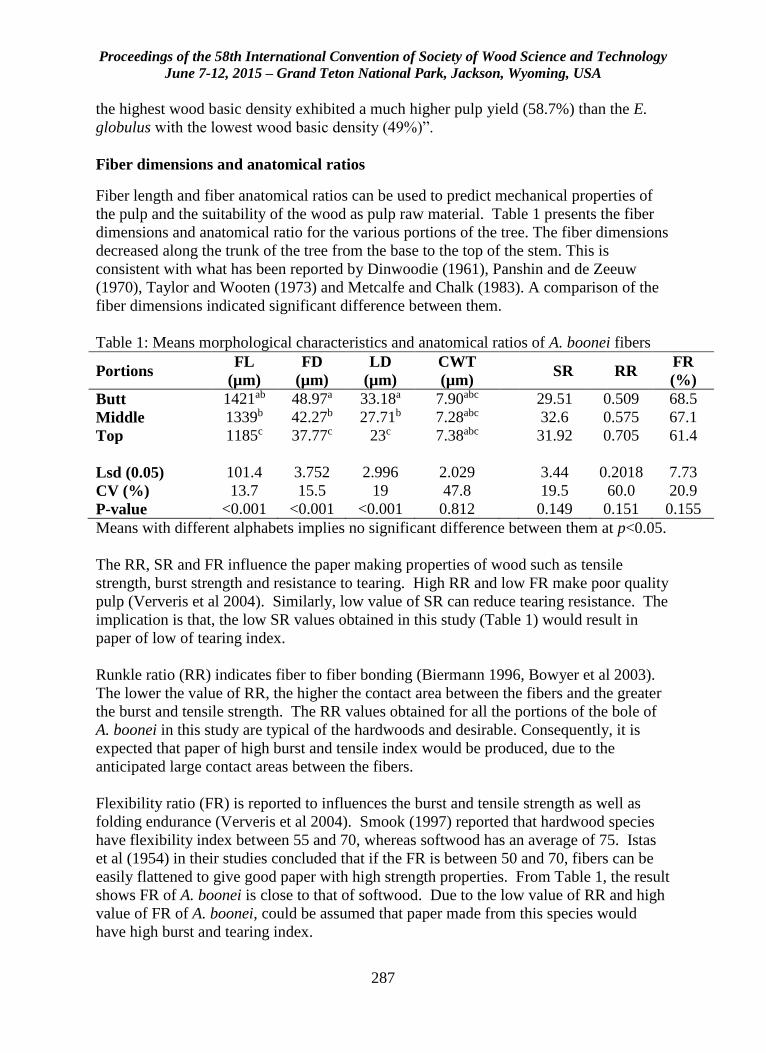
Proceedings of the 58th International Convention of Society of Wood Science and Technology
June 7-12, 2015 – Grand Teton National Park, Jackson, Wyoming, USA
287
the highest wood basic density exhibited a much higher pulp yield (58.7%) than the E.
globulus with the lowest wood basic density (49%)”.
Fiber dimensions and anatomical ratios
Fiber length and fiber anatomical ratios can be used to predict mechanical properties of
the pulp and the suitability of the wood as pulp raw material. Table 1 presents the fiber
dimensions and anatomical ratio for the various portions of the tree. The fiber dimensions
decreased along the trunk of the tree from the base to the top of the stem. This is
consistent with what has been reported by Dinwoodie (1961), Panshin and de Zeeuw
(1970), Taylor and Wooten (1973) and Metcalfe and Chalk (1983). A comparison of the
fiber dimensions indicated significant difference between them.
Table 1: Means morphological characteristics and anatomical ratios of A. boonei fibers
Portions FL
(µm)
FD
(µm)
LD
(µm)
CWT
(µm) SR RR
FR
(%)
Butt 1421ab 48.97a 33.18a 7.90abc 29.51 0.509 68.5
Middle 1339b 42.27b 27.71b 7.28abc 32.6 0.575 67.1
Top 1185c 37.77c 23c 7.38abc 31.92 0.705 61.4
Lsd (0.05) 101.4 3.752 2.996 2.029 3.44 0.2018 7.73
CV (%) 13.7 15.5 19 47.8 19.5 60.0 20.9
P-value <0.001 <0.001 <0.001 0.812 0.149 0.151 0.155
Means with different alphabets implies no significant difference between them at p<0.05.
The RR, SR and FR influence the paper making properties of wood such as tensile
strength, burst strength and resistance to tearing. High RR and low FR make poor quality
pulp (Ververis et al 2004). Similarly, low value of SR can reduce tearing resistance. The
implication is that, the low SR values obtained in this study (Table 1) would result in
paper of low of tearing index.
Runkle ratio (RR) indicates fiber to fiber bonding (Biermann 1996, Bowyer et al 2003).
The lower the value of RR, the higher the contact area between the fibers and the greater
the burst and tensile strength. The RR values obtained for all the portions of the bole of
A. boonei in this study are typical of the hardwoods and desirable. Consequently, it is
expected that paper of high burst and tensile index would be produced, due to the
anticipated large contact areas between the fibers.
Flexibility ratio (FR) is reported to influences the burst and tensile strength as well as
folding endurance (Ververis et al 2004). Smook (1997) reported that hardwood species
have flexibility index between 55 and 70, whereas softwood has an average of 75. Istas
et al (1954) in their studies concluded that if the FR is between 50 and 70, fibers can be
easily flattened to give good paper with high strength properties. From Table 1, the result
shows FR of A. boonei is close to that of softwood. Due to the low value of RR and high
value of FR of A. boonei, could be assumed that paper made from this species would
have high burst and tearing index.
Proceedings of the 58th International Convention of Society of Wood Science and Technology
June 7-12, 2015 – Grand Teton National Park, Jackson, Wyoming, USA
288
Conclusion
This study was conducted to analyse the basic density and fiber characteristics of the
Alstonia boonei to identify its suitability for pulp and paper making.
The wood of A. boonei throughout this research has proven to have desirable potentials
for quality pulp and paper production. Notwithstanding its low SR, the wood has
desirable RR and FR to produce good paper with high strength properties. The mean
fiber length, wall thickness, fiber diameter and lumen diameter of the wood of A. boonei
meet the requirements for good pulp and paper production.
The butt portion of A. boonei was found to be denser and possessed the best fiber
properties. This implies that the butt portion can yield higher pulp and would be the best
portion for the pulp and paper industry.
References
Biermann CJ (1996) Hand Book of Pulping and Paper Making. Second Edition.
California: Academic Press.
Bowyer JL, Haygreen JG, Schmulsky R (2003) Forest Products and Wood Science: An
Introduction. Fourth edition. Iowa State Press.
Darkwa NA (1996) Pulp imports and consumption patterns in Ghana. Ghana Journal of
forestry, Vol. 3, pp 55-60.
Dinwoodie JM (1961) Tracheid and fibre length in timber: A Review of Literature
Forestry. 34: 73-118.
Green tips (2010) Paper Consumption Statistics.
http://www.greenhomedesign.co.uk/paper-consumption-statistics-scary/. (15April 2014).
Hawthorne WD, Gyakari N (2006) Photo Guide for the Forest Trees of Ghana. A tree-
spotters field guide for identifying the largest trees. Oxford, UK. pp 96-97.
Hegde RK, Varghese M (2008) Genetic analysis of wood traits in Eucalyptus
camaldulensis. J. Tree. Sci. 27:1-13.
Istas JR, Heremans R, Roekelboom EL (1954) General Characteristics of Wood,
Hardwood of Congo Belge in relationship with their utilization in industry paper pulp.
Detailed Study of Some species. Gembloux: INEAC. Technical Series, No. 43.
Metcalfe CR, Chalk L (1983) Anatomy of the Dicotyledons. Vol. II. Clarendon Press.
Oxford, UK.
Proceedings of the 58th International Convention of Society of Wood Science and Technology
June 7-12, 2015 – Grand Teton National Park, Jackson, Wyoming, USA
289
Newel JS (1953) Pulping. In: Pulp and Paper Manufacture. 3rd ed. McGraw-Hill book
Company Inc. USA. Vol. 3. pp 896-898.
Omotoso MA, Ogunsile BO (2009) Assessment of and potash production as options for
management of wood waste. http://www.ncsu.edu. (18 October 2013).
Orwa C, Mutua A, Kindt R, Jamnadass R, Anthony S (2009) Agroforestree Database: a
tree reference and selection guide version 4.0. World Agroforestry Centre, Kenya.
Panshin AJ, de Zeeuw C (1980) Text Book of Wood Technology, Volume I. McGraw
Hill, New York.
Rana R, Langenfeld-Heyser R, Finkeldey R, Polle A (2009) Functional anatomy of five
endangered tropical timber wood species of the family Dipterocarpaceae. Trees. 23:512-
529.
Santos A, Anjos O, Simoes R, Amaral ME, Vaz A (2008) Effect of Eucalyptus globulus
wood density on papermaking potential. Tappi Journal. pp. 25-32.
Smook GA (1997) Handbook for Pulp & Paper Technologists. Vancouver: Angus Wilde
Publications.
TAPPI (2011) T258 om-11. Basic Density of Wood and Pulp, In: Tappi Test Methods.
Technical Association of the Pulp and Paper Industry, Atlanta, GA.
Taylor FW, Wooten TE (1973) Wood Property Variation of Mississippi delta hardwoods.
Wood Fibre Sci 5: 2-13.
Ververis C, Georghiou K, Christodoulakis N, Santas P, Santas R (2004) Fibre
dimensions, lignin and cellulose content of various plant materials and their suitability for
paper production. Industrial Crops and Products 19(3): 245–254.
Zziwa A, Mugambwa R, Kizito S, Sseremba OE, Syofuna A (2012) Basic density,
modulus of elasticity and modulus of rapture of Artocarpus heterophyllus. Uganda
Journal of Agricultural Sciences, Uganda 13(1): 15-23.
Acknowledgements
We thank various people for their contribution to this project: Mr. Douglas Amoah, for
his valuable technical support on this project; Mr. Kwadwo Boakye Boadu, for his
assistance on the use of the software; Dr. Emmanuel Ebanyele and Mr. Govina, staff of
Forest Research Institute of Ghana (FORIG), for their help in collecting the data on fiber
dimensions and all the technicians who helped in handling the instruments.
Proceedings of the 58th International Convention of Society of Wood Science and Technology
June 7-12, 2015 – Grand Teton National Park, Jackson, Wyoming, USA
290
Identification of the “Non-standard” Deformation
Behaviour of European Beech and Norway Spruce
During the Compression Loading
Martin 1* – Jan Tippner 1 – Václav Sebera 1
Jaromír Milch 1 – Peter Rademacher 1
1 Department of Wood Science, Faculty of Forestry and Wood Technology,
Mendel University in Brno, Zemědělská 3, 613 00, Brno, Czech Republic
* Corresponding author
Abstract
The purpose of paper was to analyze a negative increment of strain in the load direction
observed in range of a plastic deformation during the compression parallel to the grain.
The strain data for its description were obtained with use of different samples' lengths by
means of two approaches: a) “clip on” extensometers and b) full-field optical technique
based on digital image correlation (DIC). The samples were cut from the European beech
(Fagus sylvatica L.) and Norway spruce (Picea abies L. Karst.) as clear special
orthotropic blocks with a cross section radial (R) × tangential (T) = 20 × 20 mm2 and the
different lengths (h = 30, 40, 50 and 60 mm). Based on the strain analysis, it can be
concluded that the deformation field consists of three sub-regions with different
stiffnesses. The failure of less stiff zones located near the compression plates during
loading reduced compression deformation of the stiffer middle zone to minimum or even
leads to its expansion. The negative strain phenomenon of spruce and beech wood was
most frequently occurred when h was 60 mm and 30 mm, respectively. The three-zone
heterogeneity of deformation field induced a sharp difference of the displacement and
strain (correlatively stiffness) when measured by mentioned approaches at various sample
surface areas. Therefore, it should be of concern when wood is loaded in such mode.
Key words: compression test; damage zone; digital image correlation; strain; wood
Proceedings of the 58th International Convention of Society of Wood Science and Technology
June 7-12, 2015 – Grand Teton National Park, Jackson, Wyoming, USA
291
Introduction
Wood anisotropy is often reduced to orthotropy, which makes the determination of
reliable wood elastic constants easier, especially by using special orthotropic samples
(Bodig and Jayne 1993). However, such samples do not exhibit the homogeneous
deformation fields when loaded uniaxially because of wood’s heterogeneity and problems
of the representative volume element (RVE) determined by sample dimensions (Bodig
and Goodmann 1973). In order to comprehensively explore the strain field heterogeneity
the digital image correlation (DIC) is usually applied (Peters and Ranson 1982; Sutton et
al. 2000).
When the wood samples are compressing parallel to grain, the strain field heterogeneity
relates to the strain concentration in an area often called “damage zone” located near the
compression plates (Choi et al. 1991; Zink et al. 1995; Dahl and Malo 2009). The zone
between them is called “middle zone”. Xavier et al. (2012) investigated the influence of
the damage zones on the apparent Young’s modulus (E), which they obtained from the
displacement of the movable compression plate. The authors proposed the analytical
model of sample as a series of three springs, in which two less stiff ones represent the
damage zones and the stiff one is for the middle zone. The damage zones decrease the
apparent E, meanwhile the friction that arises between the sample and the compression
plates has a contrary effect. However, the damage zones have a much higher effect than
the friction. Both phenomena become more crucial as the sample length decreases.
Meanwhile, Bertolini et al. (2012) reported that the sample length in a range of 150–250
mm does not influence the E significantly when extensometers are used for
measurements. An increase of the sample cross section near the compression plates
causes lower strain magnitudes in the damage zones which results in higher apparent E.
In this context, a dog-bone shape sample was investigated by André et al. (2013). The
friction effects induce also the “barrel” deformation mode of the sample (Xavier et al.
2012). The “barrel”, “buckling” or “shear” deformation modes complicate the
determination of a passive strain needed for calculation the Poisson’s ratios. The
conditions for the maximal “homogeneous” deformation mode were proposed by
Benabou (2008, 2010).
The motivation of this study is the decrease of strain as the load increases, i.e. a negative
increment of strain in the loading direction (εL), which was detected by the extensometers
during the compression of Norway spruce parallel to grain. The samples of European
beech seldom exhibited described “non-standard” behaviour as well. In order to underlay
our hypothesis, an analytical model of Xavier et al. (2012) introduced above was
employed. It is hypothesized that, the negative increment of strain stems from the
expansion of the middle stiffer spring in a series of three springs allowed by the failure
of the two springs representing the less stiff damage zones within a sample. The
objectives of this study are to elaborate this problem and to provide data for its
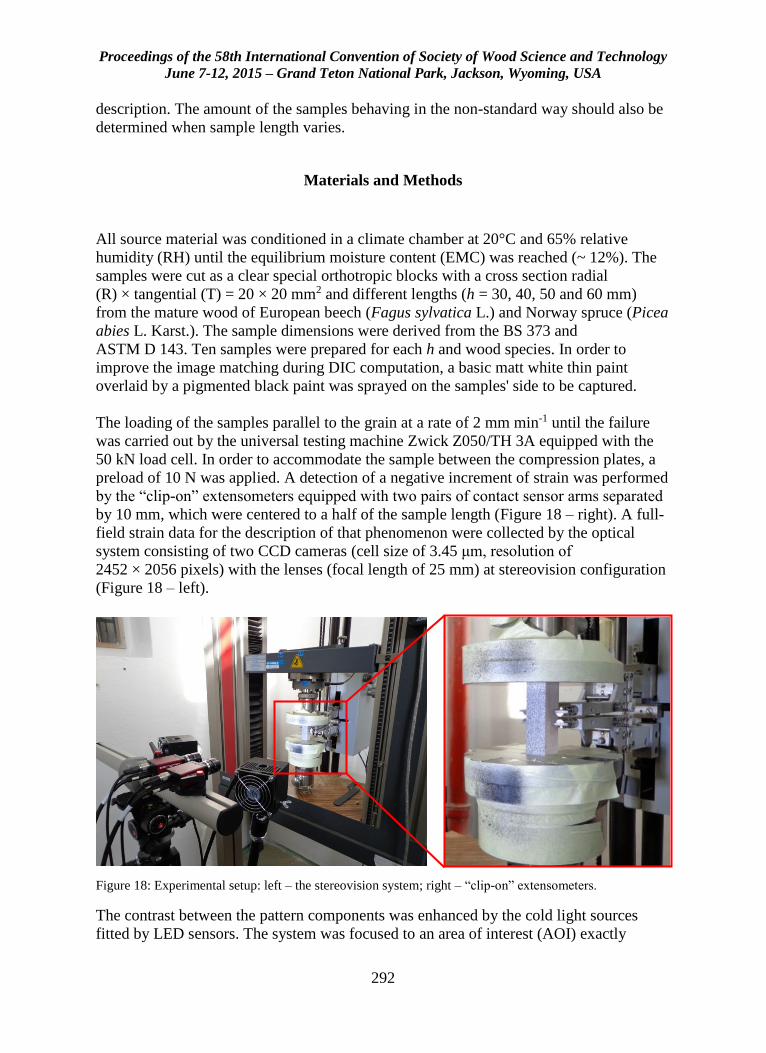
Proceedings of the 58th International Convention of Society of Wood Science and Technology
June 7-12, 2015 – Grand Teton National Park, Jackson, Wyoming, USA
292
description. The amount of the samples behaving in the non-standard way should also be
determined when sample length varies.
Materials and Methods
All source material was conditioned in a climate chamber at 20°C and 65% relative
humidity (RH) until the equilibrium moisture content (EMC) was reached (~ 12%). The
samples were cut as a clear special orthotropic blocks with a cross section radial
(R) × tangential (T) = 20 × 20 mm2 and different lengths (h = 30, 40, 50 and 60 mm)
from the mature wood of European beech (Fagus sylvatica L.) and Norway spruce (Picea
abies L. Karst.). The sample dimensions were derived from the BS 373 and
ASTM D 143. Ten samples were prepared for each h and wood species. In order to
improve the image matching during DIC computation, a basic matt white thin paint
overlaid by a pigmented black paint was sprayed on the samples' side to be captured.
The loading of the samples parallel to the grain at a rate of 2 mm min-1 until the failure
was carried out by the universal testing machine Zwick Z050/TH 3A equipped with the
50 kN load cell. In order to accommodate the sample between the compression plates, a
preload of 10 N was applied. A detection of a negative increment of strain was performed
by the “clip-on” extensometers equipped with two pairs of contact sensor arms separated
by 10 mm, which were centered to a half of the sample length (Figure 18 – right). A full-
field strain data for the description of that phenomenon were collected by the optical
system consisting of two CCD cameras (cell size of 3.45 μm, resolution of
2452 × 2056 pixels) with the lenses (focal length of 25 mm) at stereovision configuration
(Figure 18 – left).
Figure 18: Experimental setup: left – the stereovision system; right – “clip-on” extensometers.
The contrast between the pattern components was enhanced by the cold light sources
fitted by LED sensors. The system was focused to an area of interest (AOI) exactly
Proceedings of the 58th International Convention of Society of Wood Science and Technology
June 7-12, 2015 – Grand Teton National Park, Jackson, Wyoming, USA
293
covering the patterned samples' surface and calibrated with help of the calibration images
of a grid with 5.5 mm spacing at various geometric orientations. The appropriate
measurement accuracy was adjusted by capturing the deformed sample surfaces with a
scale of 12.5 px mm-1. The calibrated system was placed in such a way that the centre of
a captured area corresponded with the AOI centre.
Owing to the induced quasi-static loading rate, all experimental data such as the images,
displacement and force was synchronically recorded with an acquisition interval of 0.25 s
by a hardware trigger device. The calculation of the strain fields from the partial
derivatives of the displacement using Lagrange notation was carried out in Vic-3D
v. 2012 (Correlated Solutions Inc.). In order to obtain the appropriate spatial resolution of
the measurement, the strains were calculated locally based on the lowest possible
displacement field of 3 × 3 points and strain filter size of 5 × 5 points. A subset size of
25 × 25 pixels and subset step of 5 pixels were chosen based on the pre-study examining
the optimal ratio between the density of the computed points (6 points mm-2) and the
efficiency of recognition the speckle pattern. The average accuracy of strain in the load
direction equal to 89 micro strains was estimated with help of the noise detected on the
five images while any loading force was not applying.
Results and Discussion
Strain field characterization
A full-field strain analysis proved the three sub-regions of a typical field of strain in the
loading direction (εL) during compression (Figure 19). The deformation sub-regions are
clearly distinguishable only across the sample length (h) which is in agreement with the
observations made by André et al. (2013), Xavier et al. (2012), Benabou (2008), and Zink
et al. (1995).
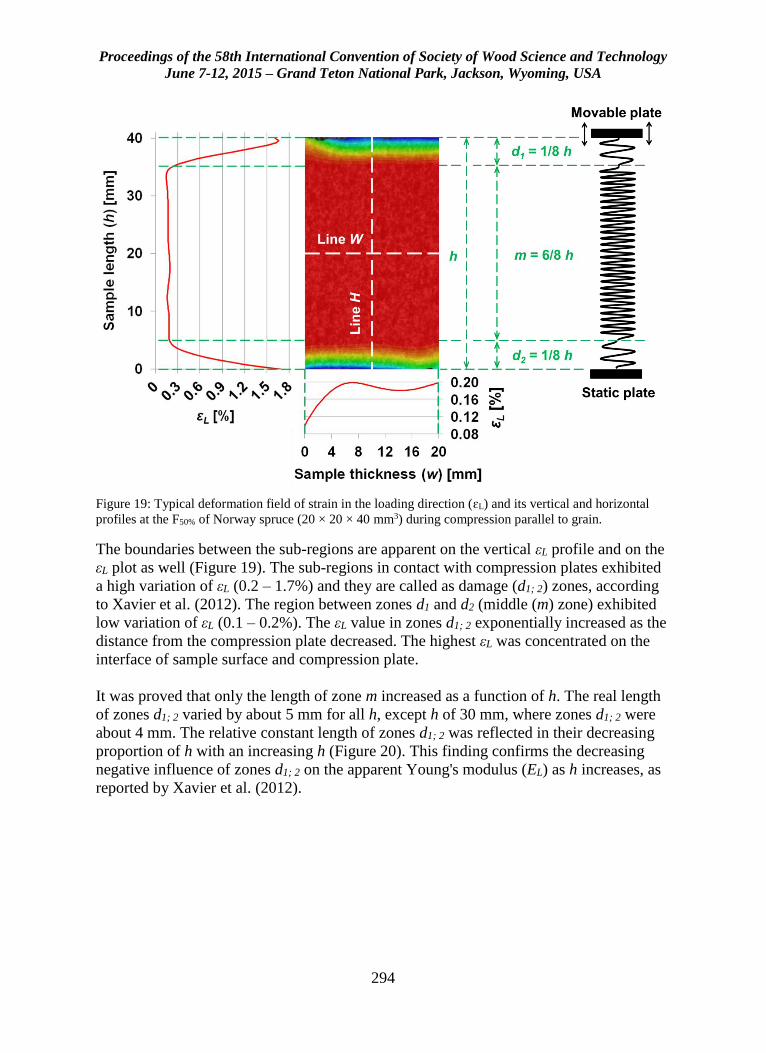
Proceedings of the 58th International Convention of Society of Wood Science and Technology
June 7-12, 2015 – Grand Teton National Park, Jackson, Wyoming, USA
294
Figure 19: Typical deformation field of strain in the loading direction (ɛL) and its vertical and horizontal
profiles at the F50% of Norway spruce (20 × 20 × 40 mm3) during compression parallel to grain.
The boundaries between the sub-regions are apparent on the vertical εL profile and on the
εL plot as well (Figure 19). The sub-regions in contact with compression plates exhibited
a high variation of εL (0.2 – 1.7%) and they are called as damage (d1; 2) zones, according
to Xavier et al. (2012). The region between zones d1 and d2 (middle (m) zone) exhibited
low variation of εL (0.1 – 0.2%). The εL value in zones d1; 2 exponentially increased as the
distance from the compression plate decreased. The highest εL was concentrated on the
interface of sample surface and compression plate.
It was proved that only the length of zone m increased as a function of h. The real length
of zones d1; 2 varied by about 5 mm for all h, except h of 30 mm, where zones d1; 2 were
about 4 mm. The relative constant length of zones d1; 2 was reflected in their decreasing
proportion of h with an increasing h (Figure 20). This finding confirms the decreasing
negative influence of zones d1; 2 on the apparent Young's modulus (EL) as h increases, as
reported by Xavier et al. (2012).
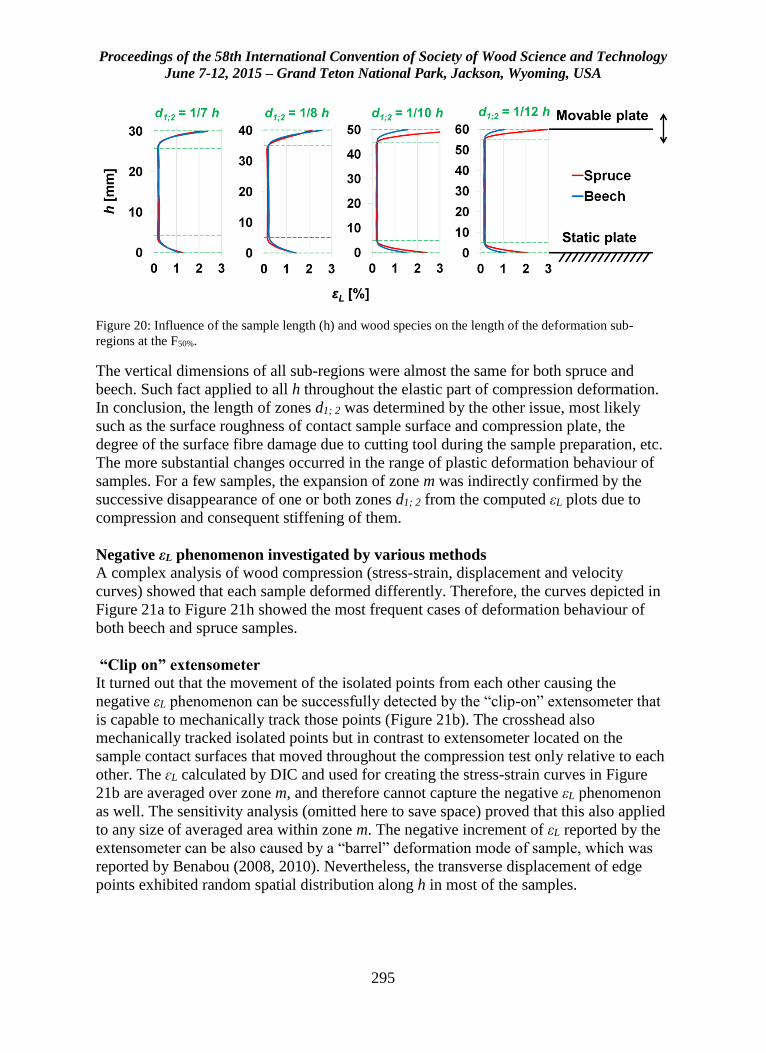
Proceedings of the 58th International Convention of Society of Wood Science and Technology
June 7-12, 2015 – Grand Teton National Park, Jackson, Wyoming, USA
295
Figure 20: Influence of the sample length (h) and wood species on the length of the deformation sub-
regions at the F50%.
The vertical dimensions of all sub-regions were almost the same for both spruce and
beech. Such fact applied to all h throughout the elastic part of compression deformation.
In conclusion, the length of zones d1; 2 was determined by the other issue, most likely
such as the surface roughness of contact sample surface and compression plate, the
degree of the surface fibre damage due to cutting tool during the sample preparation, etc.
The more substantial changes occurred in the range of plastic deformation behaviour of
samples. For a few samples, the expansion of zone m was indirectly confirmed by the
successive disappearance of one or both zones d1; 2 from the computed εL plots due to
compression and consequent stiffening of them.
Negative εL phenomenon investigated by various methods
A complex analysis of wood compression (stress-strain, displacement and velocity
curves) showed that each sample deformed differently. Therefore, the curves depicted in
Figure 21a to Figure 21h showed the most frequent cases of deformation behaviour of
both beech and spruce samples.
“Clip on” extensometer
It turned out that the movement of the isolated points from each other causing the
negative εL phenomenon can be successfully detected by the “clip-on” extensometer that
is capable to mechanically track those points (Figure 21b). The crosshead also
mechanically tracked isolated points but in contrast to extensometer located on the
sample contact surfaces that moved throughout the compression test only relative to each
other. The ɛL calculated by DIC and used for creating the stress-strain curves in Figure
21b are averaged over zone m, and therefore cannot capture the negative εL phenomenon
as well. The sensitivity analysis (omitted here to save space) proved that this also applied
to any size of averaged area within zone m. The negative increment of εL reported by the
extensometer can be also caused by a “barrel” deformation mode of sample, which was
reported by Benabou (2008, 2010). Nevertheless, the transverse displacement of edge
points exhibited random spatial distribution along h in most of the samples.
Proceedings of the 58th International Convention of Society of Wood Science and Technology
June 7-12, 2015 – Grand Teton National Park, Jackson, Wyoming, USA
296
Videoextensometer analyses
In order to better describe the negative εL phenomenon with help of the full-field data, the
isolated points spaced with a constant initial distance (l0) = 3 mm along h were virtually
tracked. A higher εL within the zones d1; 2 and consequently their earlier collapse
compared with zone m allowing the negative increment of εL was revealed (Figure 21d),
which was in the contrast to samples behaving in the standard way (Figure 21c). In the
second step, the isolated points symmetrically spaced with respect to the horizontal axis
of AOI along h with the increasing l0 were tracked. The curves (Figure 21e and Figure
21f) display the development of the difference (∆l) between l0 and the actual distance (la)
of the tracked points. Within the last section of the curve’s courses it is possible to see the
sharp increase of ∆l attributable to an abrupt stiffness decrease in a plastic deformation
range. However, such increase was reduced by the expansion of zone m when the
samples exhibited negative εL phenomenon (Figure 21f). The shear crack plane
originating in zone m within the samples behaving in the standard way had a similar
effect but to a lesser degree (Figure 21e).
Velocity analysis
The negative εL phenomenon was also observable within the velocity of displacements in
the loading direction obtained based on the full-field displacement data. The maximum
velocity was observed where samples came into the contact with the movable
compression plate. As the distance from that plate increased, the velocity decreased and
its minimum equal to zero reached on the other contact zone at the static compression
plate. However, this finding was not true throughout the compression test for samples
exhibiting negative increment of εL (Figure 21h). It was proved by a higher velocity of
point no. 3 compared with point no. 2 during the short time interval, in which the
negative εL phenomenon was commonly measured by the extensometer.
Percentage of samples behaving in the non-standard way
The percentage of the negative εL phenomenon (Pn) was at its minimum when the h was
50 mm for both wood species, meanwhile the maximum was observed when h was
60 mm (Pn = 70%) for spruce and 30 mm (Pn = 10%) beech. These differences may be
related to the failure modes of spruce and beech when compressed parallel to the grain.
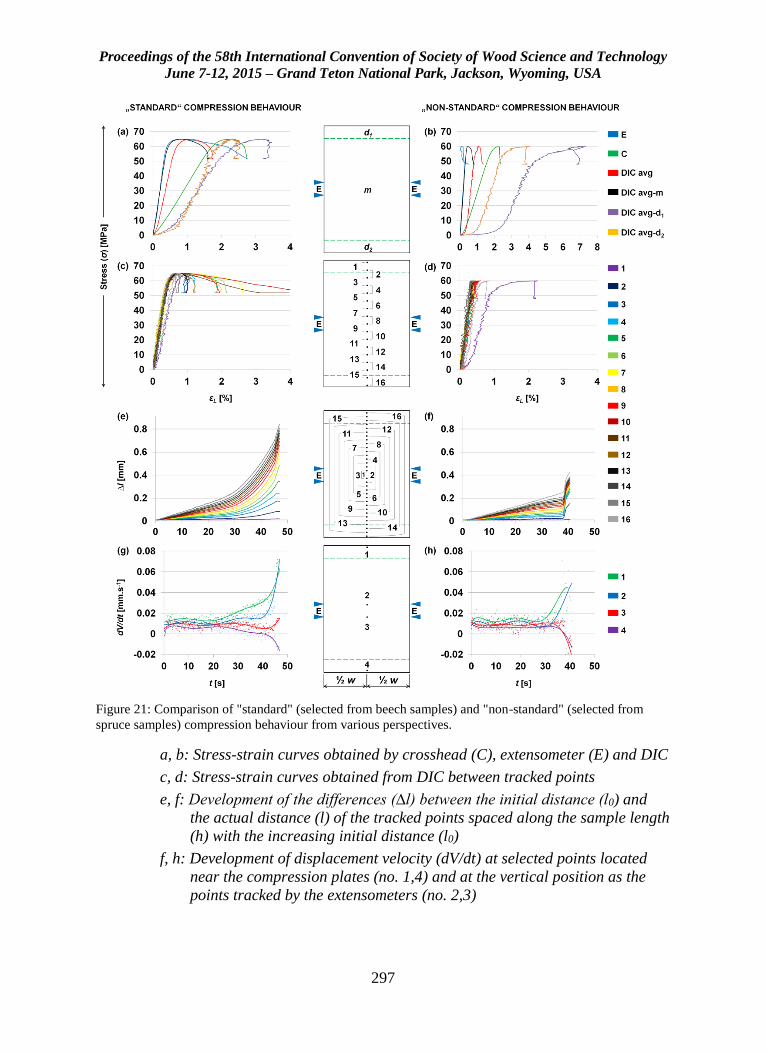
Proceedings of the 58th International Convention of Society of Wood Science and Technology
June 7-12, 2015 – Grand Teton National Park, Jackson, Wyoming, USA
297
Figure 21: Comparison of "standard" (selected from beech samples) and "non-standard" (selected from
spruce samples) compression behaviour from various perspectives.
a, b: Stress-strain curves obtained by crosshead (C), extensometer (E) and DIC
c, d: Stress-strain curves obtained from DIC between tracked points
e, f: Development of the differences (∆l) between the initial distance (l0) and
the actual distance (l) of the tracked points spaced along the sample length
(h) with the increasing initial distance (l0)
f, h: Development of displacement velocity (dV/dt) at selected points located
near the compression plates (no. 1,4) and at the vertical position as the
points tracked by the extensometers (no. 2,3)
Proceedings of the 58th International Convention of Society of Wood Science and Technology
June 7-12, 2015 – Grand Teton National Park, Jackson, Wyoming, USA
298
Summary and Conclusions
This paper describes the negative increment of strain in the loading direction during the
compression of Norway spruce (Picea abies, L. Karst) and European beech (Fagus
sylvatica, L.) parallel to grain. We found that the deformation field of the samples
consisted of two less stiff damage zones near the compression plates and one stiffer zone
located between them. The full-field deformation analysis revealed that the negative
increment of strain results in an expansion of the middle zone. We also found that the
negative strain phenomenon occurred 7-10 times more often within the spruce than
within the beech. The findings of this study can be helpful for the identification of
weaknesses of standard compression tests, especially in the choice of the sample length
and surface area for the deformation measurement.
Acknowledgements
This work was funded by the of Internal Grant Agency of Faculty of Forestry and Wood
Technology at Mendel University in Brno (Grant No. 17/2015) and Ministry of
Education, Youth and Sports of the Czech Republic (Grant No. 6215648902) and by the
European Social Fund and the state budget of the Czech Republic, project "The
Establishment of an International Research Team for the Development of New Wood-
based Materials" Reg. No. CZ.1.07/2.3.00/20.0269.
References
André A, Kliger R, Olsson R (2013) Compression failure mechanism in small-scale wood
specimens reinforced with CFRP: An experimental study. Construction and Buildings
Materials 41:790-800.
ASTM D143 (1994) Standard test methods for small clear specimens of timber.
American Society for Testing and Materials, Philadelphia, PA, USA.
Benabou L (2008) Kink band formation in wood species under compressive loading.
Experimental Mechanics 48(5):647-656.
Benabou L (2010) Predictions of compressive strength and kink band orientation for
wood species. Mechanics of Materials 42(3):335-343.
Bertolini MS, Silva DAL, Souza AM, Calil C, Lahr FAR (2012) Influência do
Comprimento de Corpos-de-prova na Obtenção do Módulo de Elasticidade Ec0. Floresta
e Ambiente 19(2):179-183.
Proceedings of the 58th International Convention of Society of Wood Science and Technology
June 7-12, 2015 – Grand Teton National Park, Jackson, Wyoming, USA
299
Bodig J, Goodman JR (1973) Prediction of elastic parameters for wood. Wood Science
and Technology 5(4):249-264.
Bodig J, Jayne BA (1993) Mechanics of wood and wood composites. Malabar: Krieger
Publish. Company.
BS 373 (1957) Methods of testing small clear specimens of timber. British Standard
Institution, London.
Dahl KB, Malo KA (2009) Planar Strain Measurements on Wood Specimens.
Experimental of Mechanics 49(4):575-586.
Choi D, Thorpe JL, Hanna RB (1991) Image analysis to measure strain in wood and
paper. Wood Science and Technology 25(4):251-262.
Peters WH, Ranson WF (1982) Digital Imaging Techniques In Experimental Stress
Analysis. Optical Engineering 21(3):213-227.
Sutton MA, Mcneill SR, Helm JD, Chao YJ (2000) Advances in two-dimensional and
three-dimensional computer vision. Photomechanics 77:323-372.
Xavier J, De Jesus AMP, Morais JJL, Pinto JMT (2012) Stereovision measurements on
evaluating the modulus of elasticity of wood by compression tests parallel to the grain.
Construction and Buildings Materials 26(1):207-215.
Zink AG, Davidson RW, Hanna RB (1995) Strain measurement in wood using a digital
image correlation technique. Wood and Fiber Science 27(4):346-359.
Proceedings of the 58th International Convention of Society of Wood Science and Technology
June 7-12, 2015 – Grand Teton National Park, Jackson, Wyoming, USA
300
Dynamic Mechanical Analysis of Different Wood
Species
Nicole Brown, [email protected]
Timothy Gruver, [email protected]
Alex Storm, [email protected]
Pennsylvania State University, 209 Agricultural Engineering Bldg,
University Park, PA 16802
Abstract
This work explores results of dynamic mechanical analysis of several wood species,
including aspen (Populus grandidenta), yellow-poplar (Liriodendron tulipifera), and
southern yellow pine (Pinus spp.). Results suggested that at least one significant
relaxation occurred in each species at different temperatures above 40C; for pine, two
relaxations were observed. The energies associated with the relaxations are generally
consistent with glass transitions. In this presentation we will discuss how these findings
relate to the literature, and how we can further understand the underlying mechanism for
the behavior.
Proceedings of the 58th International Convention of Society of Wood Science and Technology
June 7-12, 2015 – Grand Teton National Park, Jackson, Wyoming, USA
301
Fuel Bricks from Lignin and Coal Fines
Nicole Brown, [email protected]
Leidy Peña Duque, [email protected]
Curtis Frantz, [email protected]
Sridhar Komarneni, [email protected]
Fred Cannon, [email protected]
Pennsylvania State University, 209 Agricultural Engineering Bldg, ,
University Park, PA 16802
Abstract
In this presentation, we will discuss the preparation of fuel bricks made from two key
industrial wastes: lignin and coal fines. We will discuss how these bricks are a better
environmental solution than coke, the main fuel source at metalcasting foundries. Our
presentation will describe how the chemistry and morphology of the bricks change
following different pyrolytic exposures; solid state NMR data suggests polyaromatic
domains form from the lignin fraction, while SEM data indicates the formation of silicon
carbide nanowires. Four tons of these bricks were successfully produced and piloted at
each of two foundries, where up to 25% of the coke feed was replaced over a period of
two days. The latest efforts to implement the technology will be discussed, as will our
efforts to use lignin for other products.
Proceedings of the 58th International Convention of Society of Wood Science and Technology
June 7-12, 2015 – Grand Teton National Park, Jackson, Wyoming, USA
302
Characterizing Restoration Materials for Historic Buildings
Using the Dynamic Vapor Sorption Technique
Manaswini Acharya, Majid Naderi, Daniel Burnett and Jurgen Dienstmaier
Surface Measurement Systems Ltd.
Abstract
The moisture sorption properties are critical factors to building materials such as timber,
bricks, stones, cement, mortar and fiber. Moisture damage brought upon building
materials is significant in affecting and limiting the life of the building. In this context,
investigating the moisture ingress properties of used building materials in a heritage
structure is particularly important for selecting the restoration materials needed to carry
out repairs and remedial measures. Proper selection of compatible repair materials is a
core principle in conservation science and engineering of historical heritage structures. It
is commonly accepted that compatibility of mechanical and physical properties is
important (i.e. strength, thermal expansion capacity and porosity). However, moisture
storage capacity has not been yet acknowledged as one of the parameters that should be
considered when selecting repair/restoration materials. When compatible materials with
near identical moisture holding capacity and thermal expansion properties are used it is
likely that the combination will act well against hydration and humidification.
In this study, Dynamic Vapor Sorption (DVS) studies have been performed on building
materials from Abbey Mill - an 18th century, grade II listed building (Tewkesbury, UK).
Moisture sorption kinetics and isotherms were determined on wood, mortar, and brick
samples. Comparisons in total sorption capacity and sorption/desorption hysteresis were
used as a measure for selecting appropriate replacement/repair materials.
Proceedings of the 58th International Convention of Society of Wood Science and Technology
June 7-12, 2015 – Grand Teton National Park, Jackson, Wyoming, USA
303
How Wood Influences Well-being in Indoor
Environments: Building Materials, Well-being and
Perception of the Indoor Environment
Kristian Bysheim, [email protected]
Anders Nyrud, [email protected]
Norwegian Institute of Wood Technology, Po Box 113, Blinder, , Oslo 0314
Abstract
Focus groups were carried out in several European countries to gain insight in how
regular people view the correlation between building materials and the perception of
indoor environment. The focus groups were carried out among regular people and
bulding industry professionals. The participants discussed topics regarding choice of
building materials, well-being in built environments, natural matierals, sustainability, and
cleanability of building materials.
Preliminary analysis of the results indicate cultural differences being an important factor
influencing perception of the built environment. Practical experience was also an
important. Men tended to be more pragmatic regarding ethical and environmental issues,
relying more on public approval and informatino from the distributor. Women tended to
have a more active approach regarding the environment and other ethical issues.
Proceedings of the 58th International Convention of Society of Wood Science and Technology
June 7-12, 2015 – Grand Teton National Park, Jackson, Wyoming, USA
304
Anatomical Structures of Thermally Compressed
Paulownia (Paulownia spp.) Wood
Ayse Dilek Dogu1* – Kamile Tirak Hizal2 – Davut Bakir3 – Fatma Digdem
Tuncer1 – Zeki Candan1 – Oner Unsal1
1 Department of Forest Products Engineering, Faculty of Foresty,
Istanbul University, Sariyer, Istanbul, TURKEY 2 Department of Forest Products Engineering, Faculty of Foresty,
Duzce University, Duzce, TURKEY 3 Department of Forest Products Engineering, Faculty of Foresty,
Artvin Coruh University, Artvin, TURKEY
* Corresponding author
Abstract
Various thermal modification techniques are used to improve some properties of wood
materials which are getting more and more important. Thermal compression method is
one of thermal modification techniques. In this study, the effects of thermal compression
method on anatomical features of paulownia wood by microscopic methods were studied.
Paulownia wood panels with dimensions of 150 mm by 500 mm by 18 mm were hot-
pressed using a laboratory hot press at a temperature of either 150°C or 170°C and
pressure of 1 MPa for 45 min. Anatomical investigations were also performed for
untreated wood samples for comparison. All microscopic studies were carried out
visually only on cross sections, radial sections, and tangential sections. Possible cracks,
collapse, buckling, degradations, fractures, and ruptures on vessel walls, ray parenchyma
cells, fibers, axial parenchymas, and pits were investigated.
Keywords: Thermal compression method; Paulownia wood; Anatomical features.
Proceedings of the 58th International Convention of Society of Wood Science and Technology
June 7-12, 2015 – Grand Teton National Park, Jackson, Wyoming, USA
305
Dynamic Mechanical Thermal Analysis (DMTA) of
Hybrid Biocomposites
Zeki Candan1* – Ahmed H. Hassanin2 – Ali Kilic3
1 Department of Forest Products Engineering, Faculty of Foresty,
Istanbul University, Sariyer, Istanbul, TURKEY 2 Department of Textile Engineering, Alexandria University,
Alexandria, EGYPT 3 Temag Labs, Faculty of Textile Technology and Design,
Istanbul Technical University, Istanbul, TURKEY
* Corresponding author
Abstract
The main objective of this work was to evaluate dynamic mechanical thermal
characteristics of hybrid biocomposites. Jute and glass fiber woven fabrics were used as
reinforcement elements while unsaturated polyester resin was used as polymer matrix.
Storage modulus, loss modulus, and tan delta values of the hybrid biocomposites were
determined to evaluate DMTA performance. The results obtained in this study revealed
that the storage modulus, loss modulus, and tan delta values of the hybrid biocomposites
were affected by the reinforcement. The findings showed that the glass fiber
reinforcement had a positive effect on the storage modulus values of the hybrid
biocomposites. It could be concluded that the hybrid biocomposites having enhanced
performance could be used as a novel green composite material for automotive,
construction, and marine industry.
Keywords: Dynamic mechanical thermal analysis (DMTA); Hybrid biocomposites;
Glass fiber; Jute; Polyester; Biomaterials
Introduction
In the last quarter of the previous century, due to the increasing of environmental
consciousness, intensified efforts are being made to reduce the dependence on petroleum
based materials. This led to grow the focusing on developing, discovering, creating and
innovating eco-friendly, renewable, sustainable and bio-based materials (1) (2) (3). These
materials eventually have to introduce several advantages such as low density, high
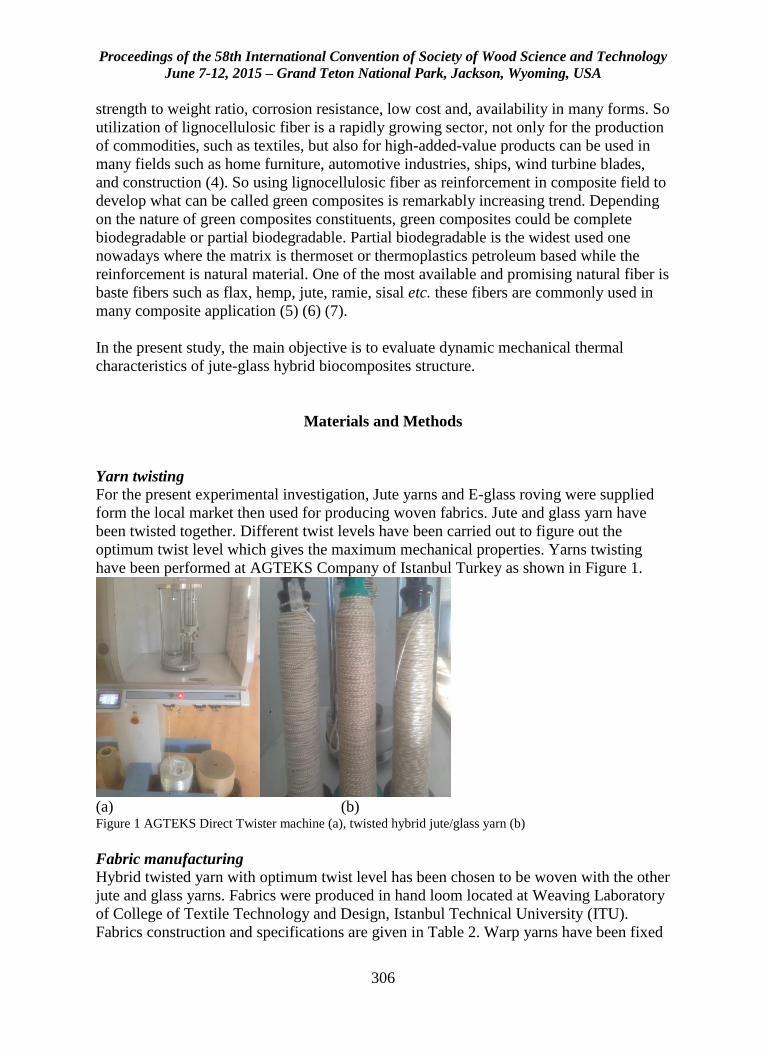
Proceedings of the 58th International Convention of Society of Wood Science and Technology
June 7-12, 2015 – Grand Teton National Park, Jackson, Wyoming, USA
306
strength to weight ratio, corrosion resistance, low cost and, availability in many forms. So
utilization of lignocellulosic fiber is a rapidly growing sector, not only for the production
of commodities, such as textiles, but also for high-added-value products can be used in
many fields such as home furniture, automotive industries, ships, wind turbine blades,
and construction (4). So using lignocellulosic fiber as reinforcement in composite field to
develop what can be called green composites is remarkably increasing trend. Depending
on the nature of green composites constituents, green composites could be complete
biodegradable or partial biodegradable. Partial biodegradable is the widest used one
nowadays where the matrix is thermoset or thermoplastics petroleum based while the
reinforcement is natural material. One of the most available and promising natural fiber is
baste fibers such as flax, hemp, jute, ramie, sisal etc. these fibers are commonly used in
many composite application (5) (6) (7).
In the present study, the main objective is to evaluate dynamic mechanical thermal
characteristics of jute-glass hybrid biocomposites structure.
Materials and Methods
Yarn twisting
For the present experimental investigation, Jute yarns and E-glass roving were supplied
form the local market then used for producing woven fabrics. Jute and glass yarn have
been twisted together. Different twist levels have been carried out to figure out the
optimum twist level which gives the maximum mechanical properties. Yarns twisting
have been performed at AGTEKS Company of Istanbul Turkey as shown in Figure 1.
(a) (b) Figure 1 AGTEKS Direct Twister machine (a), twisted hybrid jute/glass yarn (b)
Fabric manufacturing
Hybrid twisted yarn with optimum twist level has been chosen to be woven with the other
jute and glass yarns. Fabrics were produced in hand loom located at Weaving Laboratory
of College of Textile Technology and Design, Istanbul Technical University (ITU).
Fabrics construction and specifications are given in Table 2. Warp yarns have been fixed
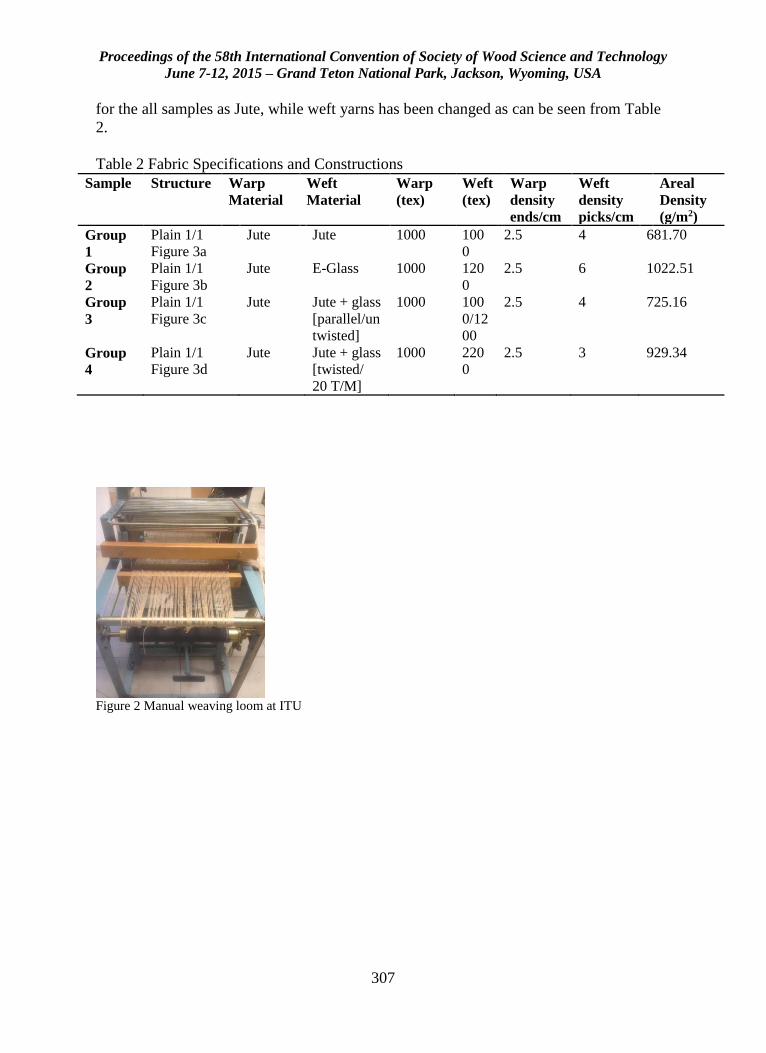
Proceedings of the 58th International Convention of Society of Wood Science and Technology
June 7-12, 2015 – Grand Teton National Park, Jackson, Wyoming, USA
307
for the all samples as Jute, while weft yarns has been changed as can be seen from Table
2.
Table 2 Fabric Specifications and Constructions
Sample Structure Warp
Material
Weft
Material
Warp
(tex)
Weft
(tex)
Warp
density
ends/cm
Weft
density
picks/cm
Areal
Density
(g/m2)
Group
1
Plain 1/1
Figure 3a
Jute Jute 1000 100
0
2.5 4 681.70
Group
2
Plain 1/1
Figure 3b
Jute E-Glass 1000 120
0
2.5 6 1022.51
Group
3
Plain 1/1
Figure 3c
Jute Jute + glass
[parallel/un
twisted]
1000 100
0/12
00
2.5 4 725.16
Group
4
Plain 1/1
Figure 3d
Jute Jute + glass
[twisted/
20 T/M]
1000 220
0
2.5 3 929.34
Figure 2 Manual weaving loom at ITU
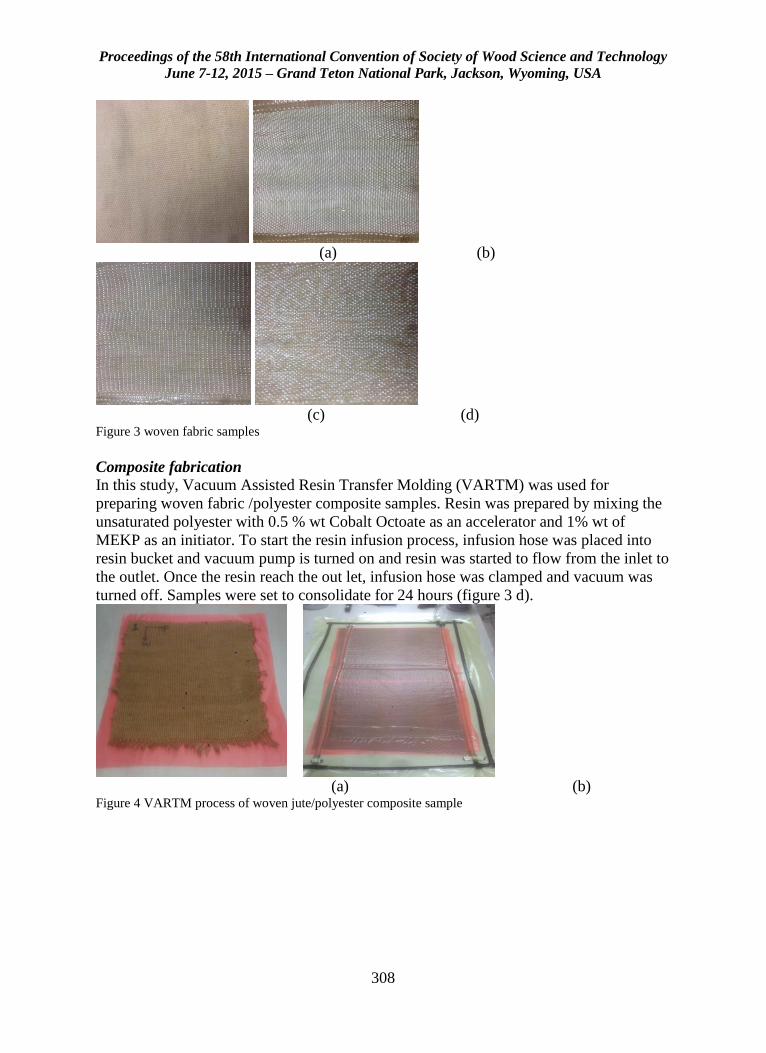
Proceedings of the 58th International Convention of Society of Wood Science and Technology
June 7-12, 2015 – Grand Teton National Park, Jackson, Wyoming, USA
308
(a) (b)
(c) (d) Figure 3 woven fabric samples
Composite fabrication
In this study, Vacuum Assisted Resin Transfer Molding (VARTM) was used for
preparing woven fabric /polyester composite samples. Resin was prepared by mixing the
unsaturated polyester with 0.5 % wt Cobalt Octoate as an accelerator and 1% wt of
MEKP as an initiator. To start the resin infusion process, infusion hose was placed into
resin bucket and vacuum pump is turned on and resin was started to flow from the inlet to
the outlet. Once the resin reach the out let, infusion hose was clamped and vacuum was
turned off. Samples were set to consolidate for 24 hours (figure 3 d).
(a) (b) Figure 4 VARTM process of woven jute/polyester composite sample
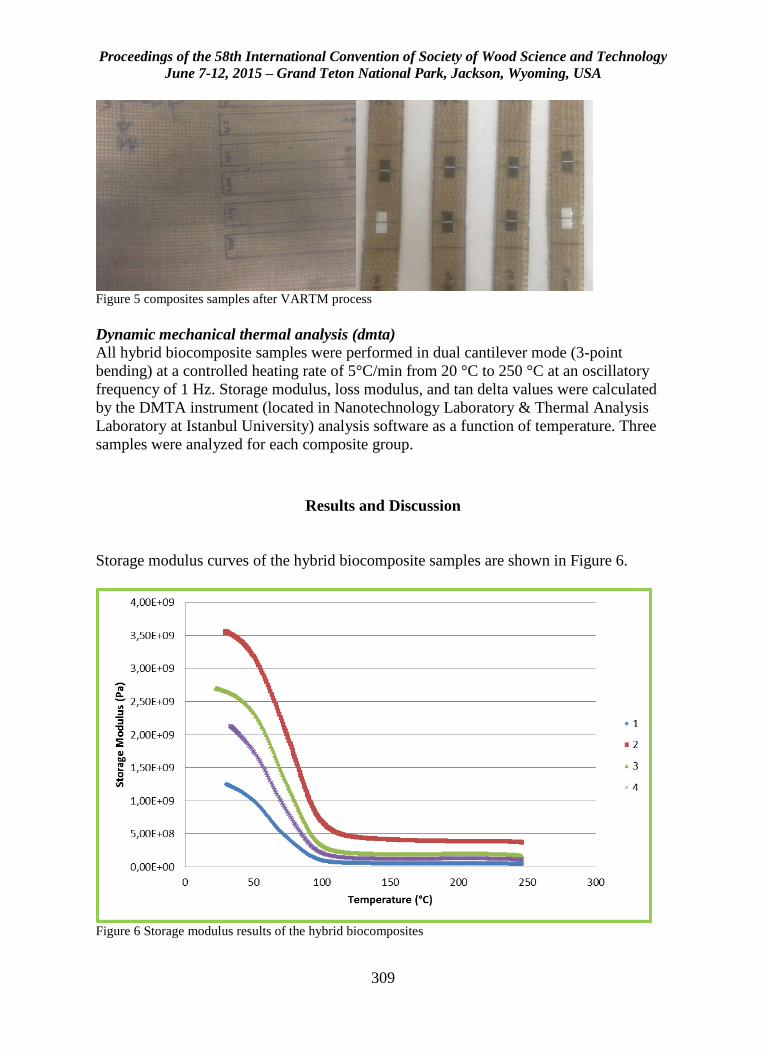
Proceedings of the 58th International Convention of Society of Wood Science and Technology
June 7-12, 2015 – Grand Teton National Park, Jackson, Wyoming, USA
309
Figure 5 composites samples after VARTM process
Dynamic mechanical thermal analysis (dmta)
All hybrid biocomposite samples were performed in dual cantilever mode (3-point
bending) at a controlled heating rate of 5°C/min from 20 °C to 250 °C at an oscillatory
frequency of 1 Hz. Storage modulus, loss modulus, and tan delta values were calculated
by the DMTA instrument (located in Nanotechnology Laboratory & Thermal Analysis
Laboratory at Istanbul University) analysis software as a function of temperature. Three
samples were analyzed for each composite group.
Results and Discussion
Storage modulus curves of the hybrid biocomposite samples are shown in Figure 6.
Figure 6 Storage modulus results of the hybrid biocomposites
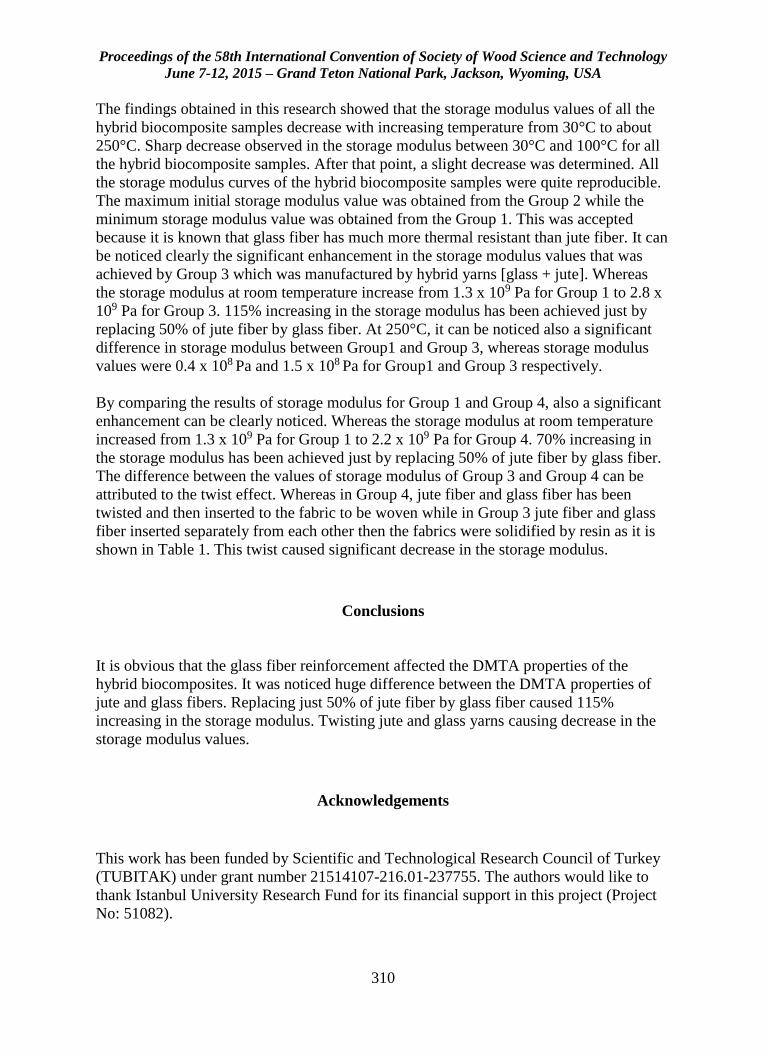
Proceedings of the 58th International Convention of Society of Wood Science and Technology
June 7-12, 2015 – Grand Teton National Park, Jackson, Wyoming, USA
310
The findings obtained in this research showed that the storage modulus values of all the
hybrid biocomposite samples decrease with increasing temperature from 30°C to about
250°C. Sharp decrease observed in the storage modulus between 30°C and 100°C for all
the hybrid biocomposite samples. After that point, a slight decrease was determined. All
the storage modulus curves of the hybrid biocomposite samples were quite reproducible.
The maximum initial storage modulus value was obtained from the Group 2 while the
minimum storage modulus value was obtained from the Group 1. This was accepted
because it is known that glass fiber has much more thermal resistant than jute fiber. It can
be noticed clearly the significant enhancement in the storage modulus values that was
achieved by Group 3 which was manufactured by hybrid yarns [glass + jute]. Whereas
the storage modulus at room temperature increase from 1.3 x 10⁹ Pa for Group 1 to 2.8 x
109 Pa for Group 3. 115% increasing in the storage modulus has been achieved just by
replacing 50% of jute fiber by glass fiber. At 250°C, it can be noticed also a significant
difference in storage modulus between Group1 and Group 3, whereas storage modulus
values were 0.4 x 10⁸ Pa and 1.5 x 10⁸ Pa for Group1 and Group 3 respectively.
By comparing the results of storage modulus for Group 1 and Group 4, also a significant
enhancement can be clearly noticed. Whereas the storage modulus at room temperature
increased from 1.3 x 10⁹ Pa for Group 1 to 2.2 x 10⁹ Pa for Group 4. 70% increasing in
the storage modulus has been achieved just by replacing 50% of jute fiber by glass fiber.
The difference between the values of storage modulus of Group 3 and Group 4 can be
attributed to the twist effect. Whereas in Group 4, jute fiber and glass fiber has been
twisted and then inserted to the fabric to be woven while in Group 3 jute fiber and glass
fiber inserted separately from each other then the fabrics were solidified by resin as it is
shown in Table 1. This twist caused significant decrease in the storage modulus.
Conclusions
It is obvious that the glass fiber reinforcement affected the DMTA properties of the
hybrid biocomposites. It was noticed huge difference between the DMTA properties of
jute and glass fibers. Replacing just 50% of jute fiber by glass fiber caused 115%
increasing in the storage modulus. Twisting jute and glass yarns causing decrease in the
storage modulus values.
Acknowledgements
This work has been funded by Scientific and Technological Research Council of Turkey
(TUBITAK) under grant number 21514107-216.01-237755. The authors would like to
thank Istanbul University Research Fund for its financial support in this project (Project
No: 51082).
Proceedings of the 58th International Convention of Society of Wood Science and Technology
June 7-12, 2015 – Grand Teton National Park, Jackson, Wyoming, USA
311
References
1. Ashori, Alireza. Wood–plastic composites as promising green-composites for
automotive industries. Bioresource Technology. 2008, Vol. 99, pp. 4661–4667.
2. Shah, Darshil U. Developing plant fibre composites for structural applications by
optimising composite parameters: a critical review. Journal of Material Science.
2013, Vol. 48, pp. 6083–6107.
3. Zhou, Yonghui, et al. Lignocellulosic fibre mediated rubber composites: An
overview. Composites Part B. 2015, Vol. 76, pp. 180-191.
4. Cristaldi, Giuseppe, et al. Composites Based on Natural Fibre Fabrics. [book
auth.] Polona Dobnik Dubrovski. Woven Fabric Engineering. Rijeka : InTech,
2010.
5. Zhu, Jinchun, et al. Recent Development of Flax Fibres and Their Reinforced
Composites Based on Different Polymeric Matrices. Materials. 2013, Vol. 6, pp.
5171-5198.
6. Ku, H, et al. A review on the tensile properties of natural fiber reinforced
polymer composites. Composites: Part B. 2011, Vol. 42, 4, pp. 856–873.
7. La Mantia, F.P. and Morreale, M. Green composites: A brief review.
Composites: Part A. 2011, Vol. 42, 6, pp. 579–588.
Proceedings of the 58th International Convention of Society of Wood Science and Technology
June 7-12, 2015 – Grand Teton National Park, Jackson, Wyoming, USA
312
Thermal Conductivity of Structural Plywood Panels
Affected by Some Manufacturing Parameters and
Aging Process
Cenk Demirkir1* – Gursel Colakoglu1 – Semra Colak1
Ismail Aydin1 – Zeki Candan2
1 Department of Forest Products Engineering, Faculty of Foresty,
Karadeniz Technical University, Trabzon TURKEY. 2 Department of Forest Products Engineering, Faculty of Foresty,
Istanbul University, Sariyer, Istanbul, TURKEY.
* Corresponding author
Abstract
Wood and wooden structure materials have been used in house, school, and office
construction throughout the world. Wood composite materials are superior to other
building materials in terms of thermal conductivity due to its porous structure. Thermal
conductivity is one of the most important properties of composite panels used in
construction. It was essential to determine the effect of aging process on the panel
properties of used in structural applications. This study evaluates thermal conductivity of
scots pine and black pine plywood panels manufactured from rotary cut veneers dried at
three different temperatures: 110°C, 140°C, and 160°C. Phenol formaldehyde (PF) and
melamine urea formaldehyde (MUF) adhesives were used for plywood panel
manufacturing. The panels were exposed to aging process according to ASTM C 481-99
standard. The panels with five plies and 10 mm thickness were manufactured for each
group. Thermal conductivity values of the plywood panels were determined. The thermal
conductivity of the panels decreased with increasing the drying temperature. It was also
found that the thermal conductivity of the panels decreased after the aging process.
Keywords: Thermal conductivity; Aging process; Structural plywood panels
Proceedings of the 58th International Convention of Society of Wood Science and Technology
June 7-12, 2015 – Grand Teton National Park, Jackson, Wyoming, USA
313
Introduction
Wood and wooden structure materials have been used in house, school and office
construction in many countries. Wood framed buildings are composed of framing studs
or joists, sheathing materials (plywood, (OSB) oriented strand board), and fasteners
(nails, screws) (Yan 1992). The most common materials used as sheathing are plywood
and OSB (Breyer et al. 2003). Wood composite material is superior to other building
materials in terms of thermal conductivity due to its porous structure (Gu and Zink-Sarp
2005; Krüger and Adriazola 2010). Plywood panels have well-balanced thermal
insulation and warmth keeping properties (steady and non-steady-states), which is
important for insulation performance in that they maintained temperature and relax
severe temperature changes in residences exposed to diurnal and seasonal temperature
changes (Kawasaki and Kawai 2006).
In plywood production, veneer drying is a different thermal process affecting veneer
quality for bonding, durability and physical and mechanical properties of panels. The
purpose of veneer drying is to reduce its moisture content to a suitable range for gluing.
Mostly applied drying temperatures are between 90 - 160°C as called normal in plywood
industry. Using high drying temperatures reduce the veneer drying time and increase the
capacity. Reduction in drying time and energy consumption offers a great potential for
economic benefit to the wood industries (Aydın and Colakoglu 2005). However, drying
at very low moisture levels and at very high temperatures or at moderate temperatures for
prolonged periods inactivates the veneer surfaces, causing poor wetting of veneer and
hence poor bonding (Frihart and Hunt 2010). Drying temperature influences both
physical and chemical surface properties of veneer and hence its thermal conductivity
characteristics. However, the number of studies about the thermal conductivity of
plywood panels related to the different drying temperatures was not enough level.
Sustaining to durability of wood-based panels is one of the most important features for
structural products used in construction of houses (Norita et al. 2008). It is known that
wood is deteriorated when it is exposed to outdoor conditions. Xie et al. (2005) stated
that weathering of wood is caused by various factors such as solar radiation, heat,
atmospheric pollutants and micro-organisms. Several studies have been researched about
sustaining durability of wood and wood composite materials (Karlsson et al. 1996;
Menezzi et al. 2008). The durability or moisture resistance of structural panels (plywood,
OSB) is usually determined by standardized aging test methods that include various
cycles of cold or hot water immersion, boiling, steaming, freezing, and drying (Norita et
al. 2008). Variation of moisture content in wood can cause cracks and loss of mechanical
and physical properties of wood. It has been thought that thermal conductivity could be
affected by variation of moisture content in wood and wood based materials by
weathering. It was stated that thermal conductivity of wood and wood composite
materials such as plywood, OSB, medium density fiberboard (MDF), and particleboard
has varied according to wood specie, direction of wood fiber, ratio of early and late
wood, thickness of composite materials, density, moisture content, resin type and
additives, temperature, and flow direction of heat in several studies (Bader at al. 2007;
Proceedings of the 58th International Convention of Society of Wood Science and Technology
June 7-12, 2015 – Grand Teton National Park, Jackson, Wyoming, USA
314
Sonderegger and Niemz 2009; Kol et al. 2008). But there are few studies the effect of
aging factors in using place on thermal conductivity of wood composite materials. In this
study, it was studied that the effect of aging process and some manufacturing factors such
as wood species, drying temperatures of veneer, adhesive types on the thermal
conductivity of structural plywood panels.
Materials and Methods
Scots pine (Pinus slyvestris) and black pine (Pinus nigra) were used as wood species in
this study. Densities of Scots pine and black pine (Pinus nigra) were 0.48 gr/cm3 and
0.56 gr/cm3, respectively. Logs for veneer manufacturing with an average diameter at
breast height of 40 cm were obtained from Sinop, located at the most northern point of
the Black Sea Region of Turkey. A rotary peeler with a maximum horizontal holding
capacity of 80 cm was used for veneer manufacturing. The logs were steamed before the
peeling process, and then veneer sheets with dimensions of 55 cm by 55 cm by 2 mm
were clipped. The vertical opening was 0.5 mm and horizontal opening was 85% of the
veneer thickness in the veneer manufacturing process. After rotary peeling, veneers were
dried until moisture content of them reach to 4-6 % at three different temperatures:
110°C, 140°C, and 160 °C in a veneer dryer.
Five-ply-plywood panels with 10 mm thick were manufactured using PF glue resin with
47% solid content and MUF with 55% solid content. MUF resin solution used in the
manufacturing was composed of 100 parts of MUF resin by weight, 30 parts of wheat
flour by weight, and 10 parts of 15 % concentrated NH4Cl by weight. Veneer sheets were
conditioned to approximately 5-7% moisture content in a conditioning chamber before
gluing. The glue was applied at a rate of 160 g/m2 to the single surface of veneer using a
four-roller spreader. Two replicate plywood panels were manufactured from each group.
The experimental design of the panels is shown in Table 1.
Table 1. Experimental design
Glue Type
Veneer Drying
Temperature
(°C)
Wood Species
Scots Pine Black Pine
110
140
160
A1
A2
A3
C1
C2
C3
PF
110
140
160
A4
A5
A6
C4
C5
C6
MUF
A quick thermal conductivity meter based on ASTM C 1113-99 (2009) hot-wire method
was used. QTM 500 device, a product of Kyoto Electronics Manufacturing, Japan, was
used for thermal conductivity measurement with PD-11 probe.
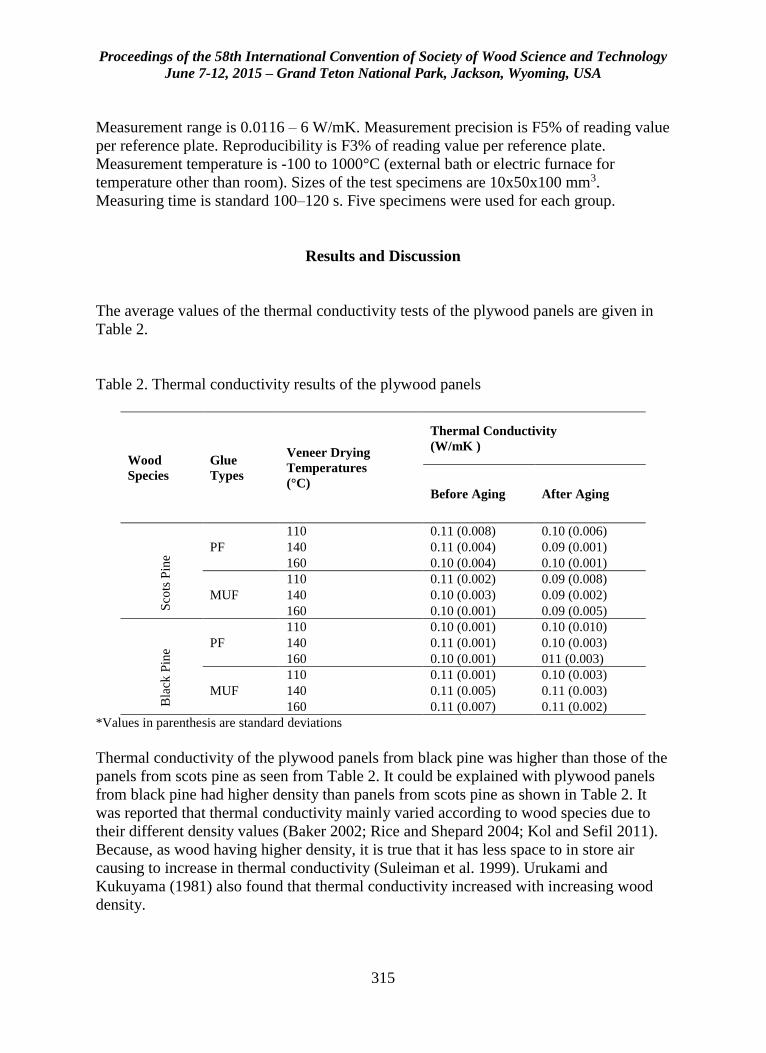
Proceedings of the 58th International Convention of Society of Wood Science and Technology
June 7-12, 2015 – Grand Teton National Park, Jackson, Wyoming, USA
315
Measurement range is 0.0116 – 6 W/mK. Measurement precision is F5% of reading value
per reference plate. Reproducibility is F3% of reading value per reference plate.
Measurement temperature is -100 to 1000°C (external bath or electric furnace for
temperature other than room). Sizes of the test specimens are 10x50x100 mm3.
Measuring time is standard 100–120 s. Five specimens were used for each group.
Results and Discussion
The average values of the thermal conductivity tests of the plywood panels are given in
Table 2.
Table 2. Thermal conductivity results of the plywood panels
Wood
Species
Glue
Types
Veneer Drying
Temperatures
(°C)
Thermal Conductivity
(W/mK )
Before Aging After Aging
Sco
ts P
ine PF
110 0.11 (0.008) 0.10 (0.006)
140 0.11 (0.004) 0.09 (0.001)
160 0.10 (0.004) 0.10 (0.001)
MUF
110 0.11 (0.002) 0.09 (0.008)
140 0.10 (0.003) 0.09 (0.002)
160 0.10 (0.001) 0.09 (0.005)
Bla
ck P
ine
PF
110 0.10 (0.001) 0.10 (0.010)
140 0.11 (0.001) 0.10 (0.003)
160 0.10 (0.001) 011 (0.003)
MUF
110 0.11 (0.001) 0.10 (0.003)
140 0.11 (0.005) 0.11 (0.003)
160 0.11 (0.007) 0.11 (0.002)
*Values in parenthesis are standard deviations
Thermal conductivity of the plywood panels from black pine was higher than those of the
panels from scots pine as seen from Table 2. It could be explained with plywood panels
from black pine had higher density than panels from scots pine as shown in Table 2. It
was reported that thermal conductivity mainly varied according to wood species due to
their different density values (Baker 2002; Rice and Shepard 2004; Kol and Sefil 2011).
Because, as wood having higher density, it is true that it has less space to in store air
causing to increase in thermal conductivity (Suleiman et al. 1999). Urukami and
Kukuyama (1981) also found that thermal conductivity increased with increasing wood
density.
Proceedings of the 58th International Convention of Society of Wood Science and Technology
June 7-12, 2015 – Grand Teton National Park, Jackson, Wyoming, USA
316
In this study, in general, thermal conductivity of scots pine panels decreased with
increasing the veneer drying temperature, except for plywood manufactured with PF resin
and veneers dried at 140°C and 160°C when thermal conductivity actually increased. The
results of Student Newman-Keuls also proved that there was no significant difference
between thermal conductivity of panels from veneers dried at 140°C and 160°C with
respect to drying temperature with 0,001 error probabilities. This situation can be
explained with decreasing in density of the plywood panels with increasing the veneer
drying temperature.
According to the Newman-Keuls results with 0,001 error probabilities, in general,
thermal conductivity values of test panels decreased with aging process. Considering the
aging process steps, moisture content of the panels might have not reached the values
they had before aging process because of hysteresis even if they were exposed to the
conditions defined the concerning standard (Ors and Keskin 2001). Therefore, decreasing
in the thermal conductivity after aging process may be due to decreasing the moisture
content of the panels.
Conclusions
One of the most important properties of composite panels used in construction is thermal
conductivity. It is essential to determine the effect of aging process on the properties of
panels used in structural applications. In this study, the effect of some manufacturing
factors and aging process on thermal conductivity of plywood panels was determined. It
was concluded from the study that the effect of veneer drying temperatures and aging
process on the thermal conductivity of test panels were significant.
Acknowledgements
The authors acknowledge the financial support of the Scientific and Technological
Research Council of Turkey (TÜBİTAK).
References
APA (1998) Structural Adhesives for Plywood-Lumber Assemblies, Technical Note,
Number Y391 C.
APA (2011) The Engineered Wood Association PS 2-10 Performance Standard for
Wood-Based Structural-Use Panels. Form No. S350F/Revised June 2011/0400.
Proceedings of the 58th International Convention of Society of Wood Science and Technology
June 7-12, 2015 – Grand Teton National Park, Jackson, Wyoming, USA
317
ASTM C 481-99 (2005) Standard Test Method for Laboratory Aging of Sandwich
Constructions, United States.
ASTM C 1113/M 1113-09 (2009) Standard Test Method for Thermal Conductivity of
Refractories by Hot Wire (Platinum Resistance Thermometer Technique). 2009, United
States, March.
Aydin I (2004a) Effects of Some Manufacturing Conditions on Wettability and Bonding
of Veneers Obtained from Various Wood Species. PhD Thesis. Karadeniz Technical
University, Faculty of Forestry, Natural and Applied Sciences Institute, Trabzon, Turkey.
Aydın I (2004b) Surface Inactivation in Veneer Drying Process and Its Effects on
Bonding Strength. Artvin Coruh University Journal of Forestry Faculty 1-2: 1-8.
Aydin I, Colakoglu G (2005a) Formaldehyde Emission, Surface Roughness, and Some
Properties of Plywood as Function of Veneer Drying Temperature. Dry Technol 23:
1107-117.
Bader H, Niemz P, Sonderegger W (2007) Untersuchungen Zum Einfluss Des
Plattenaufbaus Auf Ausgew¨Ahlte Eigenschaften Von Assivholzplatten. Holz Roh
Werkst 65(3): 173–181.
Baker WA (2002) Wood Structural Panels, Chapter Two. APA Engineered Wood
Handbook, Thomas G. Williamson, ISBN: 0-07-136029-8, page: 2.1-2.9.
Breyer DE, Fridley KJ, Pollock DG, Cobeen KE (2003) Design of Wood Structures –
ASD: Fifth Edition. USA , New York.
Çolak S, Aydın İ, Demirkır C, Çolakoğlu G (2004) Some Technological Properties of
Laminated Veneer Lumber Manufactured from Pine (Pinus sylvestris L.) Veneers with
Melamine Added – UF Resins. Turkish Journal of Agricultural Forestry 28: 109-113.
EWPA (2010) Engineered Wood Products Association of Australasia, Structural
Plywood & LVL Design Manual.
Gu HM and Zink-Sharp A (2005) Geometric Model for Softwood Transverse Thermal
Conductivity. Part I. Wood Fiber Sci 37(4): 699-711.
He G, Yu C, Dai C (2007) Theoretical Modeling of Bonding Characteristics and
Performance of Wood Composites. Part III. Bonding Strength Between Two Wood
Elements. Wood Fiber Sci 39(4): 566-577.
Kamke FA, Kultikova E, Lenth CA (1996) OSB Properties As Affected By Resin
Distribution. Pages 147– 154 in The Fourth International Panel and Engineered- Wood
Technology Conference & Exposition, Atlanta, GA.
Proceedings of the 58th International Convention of Society of Wood Science and Technology
June 7-12, 2015 – Grand Teton National Park, Jackson, Wyoming, USA
318
Karlsson POA, McNatt JD, Verrill SP (1996) Vacuum-Pressure Soak Plus Oven-Dry As
An Accelerated-Aging Test For Wood-Based Panel Products. Forest Prod J 46: 84–88.
Kawasaki T and Kawai S (2006) Thermal Insulation Properties of Wood-Based
Sandwich panel for use as structural insulated walls and floors. J Wood Sci 52: 75-83.
Kol HS, Özçifçi A, Altun S (2008) Effect of Some Chemicals on Thermal Conductivity
of Laminated Veneer Lumbers Manufactured with Urea formaldehyde and Phenol
formaldehyde Adhesives. Kastamonu University Journal of Forestry Faculty 8(2): 125-
130.
Kol HS and Sefil Y (2011) The Thermal Conductivity of Fir and Beech Wood Heat
Treated at 170, 180, 190, 200 and 212°C. J Appl Polym Sci 121: 2473-2480.
Krüger EL and Adriazola M (2010) Thermal Analysis of Wood-Based Test Cells. Constr
Build Mater 24(6): 999-1007.
Menezzi CHS, Souza RQ, Thompson RM, Teixeira DE, Okino YA, Da Costa AF (2008)
Properties After Weathering And Decay Resistance Of Thermally Modified Wood
Structural Board. Int Biodeter Biodegr 62(4): 448-454.
Norita H, Kojima Y, Suzuki S (2008) The Aging Effects Of Water Immersion Treatments
In Wet-Bending For Standardized Testing Of Wood Panels. J Wood Sci 54: 121-127.
Örs Y, and Keskin H (2001) Knowledge of Wood Materials (in Turkish). Atlas
Publishing, ISBN: 975-6574-01-1, Turkey.
Pizzi A (1983) Wood Adhesives; Chemistry and Technology. Vol.1., Marcel Dekker,
New York.
Rice RW and Shepard R (2004) The Thermal Conductivity of Plantation Grown White
Pine (Pinus strobus) and Red Pine (Pinus resinosa) at Two Moisture Content Levels.
Forest Prod J 54(1): 92-94.
Sonderegger W and Niemz P (2009) Thermal Conductivity and Water Vapor
Transmission Properties of Wood Based Materials. Eur J Woo Woo Pro 67: 313-321.
Suleiman BM, Larfeldt J, Leckner B, Gustavsson M (1999) Thermal Conductivity and
Diffusivity of Wood. Wood Sci Technol 33(6): 465–473.
Tan H (2011) Some Technological Properties of LVL and Plywood Produced from Logs
of Spruce and Fir Growing in Distinct Regions, PhD Thesis. Karadeniz Technical
University, Faculty of Forestry, Natural and Applied Sciences Institute, Trabzon, Turkey.
Urukami H and Kukuyama M (1981) The Influence Of Specific Gravity On Thermal
Conductivity And Diffusivity Of Wood. Wood Sci Technol 33: 465-473.
Proceedings of the 58th International Convention of Society of Wood Science and Technology
June 7-12, 2015 – Grand Teton National Park, Jackson, Wyoming, USA
319
Vick CB (1999) Adhesive Bonding of Wood Materials, Wood handbook – Wood as An
Engineered Material Chapter 9. FPL-GTR-113.Department of Agriculture. Forest
Service. Forest Product Laboratory, Madison, U.S.
Xie Y, Krause A, Mai C, Militz H, Richter K, Urban K, Evans PD (2005) Weathering of
wood modified with the N-methylol compound 1,3-dimethylol-4,5-
dihydroxyethyleneurea. Polym Degrad Stabil 89: 189-199.
Yan CC (1992) The reliability analysis of wood diaphragms under wind loading, PhD.,
Washington State University, Department of Civil and Environmental Engineering,
Washington.
Youngquist JA, Myers GC, Murmanis LL (1987) Resin Distribution In Hardwood:
Evaluated By Internal Bond Strength And Fluorescence Microscopy. Wood Fiber Sci
19(2): 215–224.
Proceedings of the 58th International Convention of Society of Wood Science and Technology
June 7-12, 2015 – Grand Teton National Park, Jackson, Wyoming, USA
320
The Effect of Alkaline Treatment on Tensile Properties
of Single Bamboo Fiber
Hong Chen1,2†, Benhua Fei2*†
1College of Furniture and Industrial Design, Nanjing Forest University,
Nanjing, 210037, China 2 International Centre for Bamboo and Rattan, Beijing, 100102, China
* Corresponding author: [email protected]
† SWST member
Abstract
The objective of this study was to investigate effect of alkaline treatment on the
morphology of cellulose microfibril aggregates and tensile properties. Single bamboo
fibers were treated by alkaline solution at five concentrations (6%, 8%, 10%, 15% and
25%) at room temperature for 2 hours. The morphology of cellulose microfibril
aggregates were observed with AFM, and the tensile strength, tensile modulus and
elongation at break were investigated. The results revealed that alkaline treatment
affected the structure of cellulose microfibril aggregates and tensile properties
significantly. Tinny pores appeared between cellulose microfibril aggregates in bamboo
cell wall when treated by alkaline solution with concentration of 10% or more. Both the
tensile strength and tensile modulus of single bamboo fiber decreased when treated with
6%, 8%, 10% alkaline solution, respectively. While when the concentration of alkaline
solution increased to 15% and 25%, tensile modulus decreased sharply, but tensile
strength changed little. The elongations at break were similar when the fiber treated by
alkaline solution with concentration of 6% and 8%, respectively. When the concentration
increased to 10%, the elongation began to increase obviously which increased sharply
when the concentration went up to 15% and 25%. Besides, the fracture forms of bamboo
cell wall were different with different alkali treatments. The fracture forms of fibers
treated by 6% and 8% alkali solution liked the brush which represented tenacity. When
the concentration increased to 10%, the fracture forms were like teeth, while the forms
were orderly when the concentration increased to 15% and 25% which indicated the
frangibility of fibers.
Proceedings of the 58th International Convention of Society of Wood Science and Technology
June 7-12, 2015 – Grand Teton National Park, Jackson, Wyoming, USA
321
Restoring the Mayflower II
Terry Conners1†*
1 Associate Extension Professor, Department of Forestry, University of
Kentucky, Lexington, KY 40546-0073, USA
†* SWST member, Corresponding author
E-mail: [email protected]
Abstract
The Mayflower II is a recreation of the ship that brought the Pilgrims to America in 1620,
and it was given to the American people by the United Kingdom in 1957 as an expression
of goodwill to celebrate our countries’ alliance in WW II. After 60 years, however, the
constant exposure to salt water and humidity, and the interaction of its iron fasteners with
the English white oak that was used in the ship’s construction have caused significant
deterioration of the ship’s planking and frame. Locating large high-quality white oak
trees for repairs and restoration has been difficult, as most large white oaks are bucked
and sold for more conventional products such as sawtimber, staves or veneer. This
project has received a lot of favorable press aimed at the general public, and could be
used to make the public more aware of forest management.
KEYWORDS: Forest management, white oak, Mayflower II, wooden ships
Introduction
The Mayflower II is a recreation of the original ship that sailed with the Pilgrims from
England to Plymouth, Massachusetts in 1620. The original ship was lost long ago (though
pieces of it may be incorporated into a barn in Jordans, Buckinghamshire, England), but a
near-replica was constructed in England in the mid-1950s and given to the people of the
United States as a token of the alliance that bound the U.S. and the United Kingdom
during WW II. Owned and operated by Plimoth Plantation, a living history recreation of
Plymouth as it was in 1627, the ship is docked at the Plymouth waterfront during tourist
season (April through November), after which time it is towed to Fairhaven Shipyard on
the south of Cape Cod for the winter. While at Fairhaven in 2013 the Mayflower II was
inspected by the U.S. Coast Guard for seaworthiness. This is normally done on a biannual
basis during the winter months, but that year the USCG removed the copper sheathing at
the waterline (used to protect the hull from floating ice) and did a more thorough
inspection. What they discovered wasn’t encouraging: about sixty white oak planks
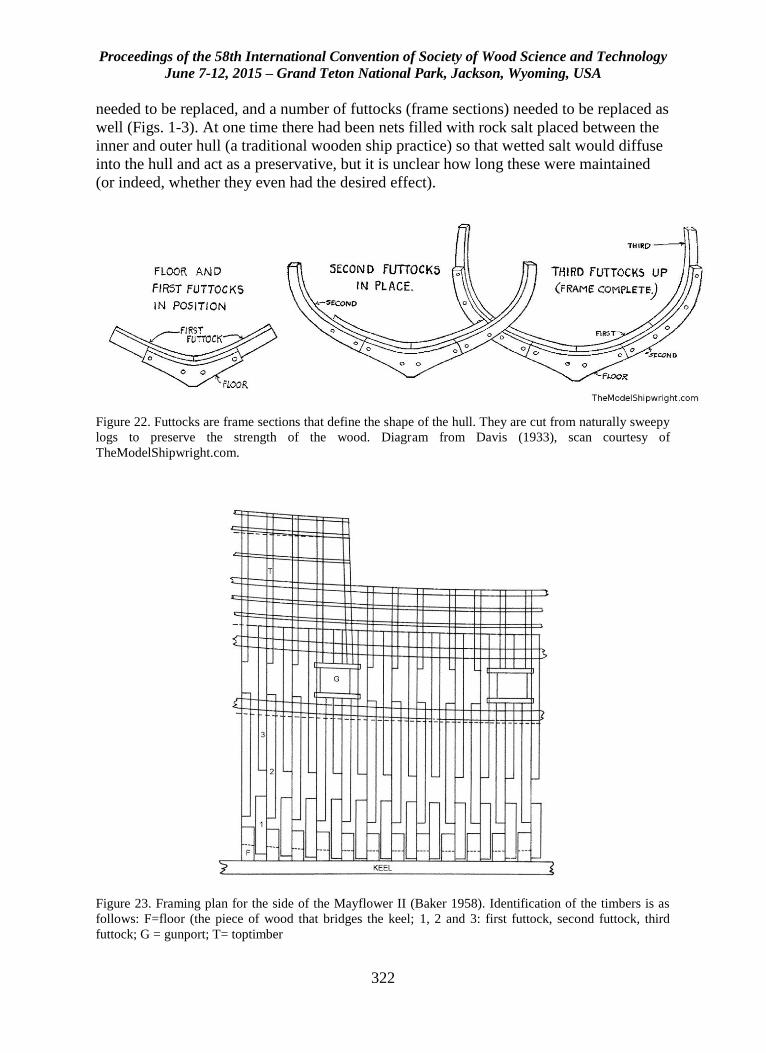
Proceedings of the 58th International Convention of Society of Wood Science and Technology
June 7-12, 2015 – Grand Teton National Park, Jackson, Wyoming, USA
322
needed to be replaced, and a number of futtocks (frame sections) needed to be replaced as
well (Figs. 1-3). At one time there had been nets filled with rock salt placed between the
inner and outer hull (a traditional wooden ship practice) so that wetted salt would diffuse
into the hull and act as a preservative, but it is unclear how long these were maintained
(or indeed, whether they even had the desired effect).
Figure 22. Futtocks are frame sections that define the shape of the hull. They are cut from naturally sweepy
logs to preserve the strength of the wood. Diagram from Davis (1933), scan courtesy of
TheModelShipwright.com.
Figure 23. Framing plan for the side of the Mayflower II (Baker 1958). Identification of the timbers is as
follows: F=floor (the piece of wood that bridges the keel; 1, 2 and 3: first futtock, second futtock, third
futtock; G = gunport; T= toptimber
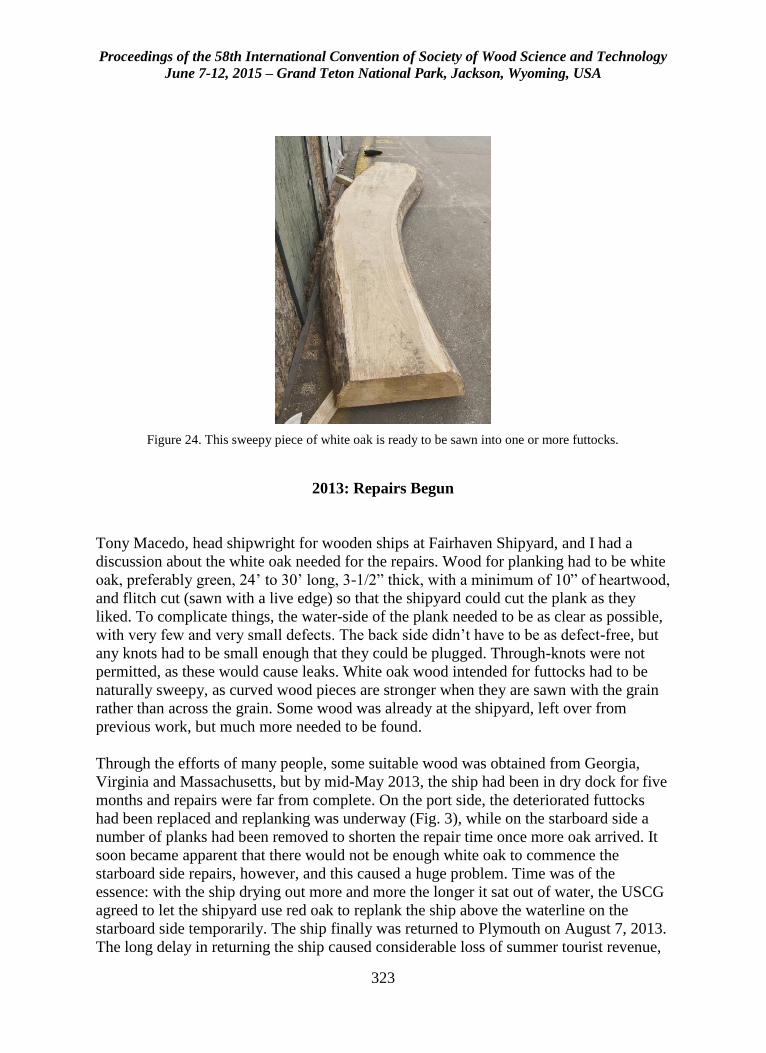
Proceedings of the 58th International Convention of Society of Wood Science and Technology
June 7-12, 2015 – Grand Teton National Park, Jackson, Wyoming, USA
323
Figure 24. This sweepy piece of white oak is ready to be sawn into one or more futtocks.
2013: Repairs Begun
Tony Macedo, head shipwright for wooden ships at Fairhaven Shipyard, and I had a
discussion about the white oak needed for the repairs. Wood for planking had to be white
oak, preferably green, 24’ to 30’ long, 3-1/2” thick, with a minimum of 10” of heartwood,
and flitch cut (sawn with a live edge) so that the shipyard could cut the plank as they
liked. To complicate things, the water-side of the plank needed to be as clear as possible,
with very few and very small defects. The back side didn’t have to be as defect-free, but
any knots had to be small enough that they could be plugged. Through-knots were not
permitted, as these would cause leaks. White oak wood intended for futtocks had to be
naturally sweepy, as curved wood pieces are stronger when they are sawn with the grain
rather than across the grain. Some wood was already at the shipyard, left over from
previous work, but much more needed to be found.
Through the efforts of many people, some suitable wood was obtained from Georgia,
Virginia and Massachusetts, but by mid-May 2013, the ship had been in dry dock for five
months and repairs were far from complete. On the port side, the deteriorated futtocks
had been replaced and replanking was underway (Fig. 3), while on the starboard side a
number of planks had been removed to shorten the repair time once more oak arrived. It
soon became apparent that there would not be enough white oak to commence the
starboard side repairs, however, and this caused a huge problem. Time was of the
essence: with the ship drying out more and more the longer it sat out of water, the USCG
agreed to let the shipyard use red oak to replank the ship above the waterline on the
starboard side temporarily. The ship finally was returned to Plymouth on August 7, 2013.
The long delay in returning the ship caused considerable loss of summer tourist revenue,
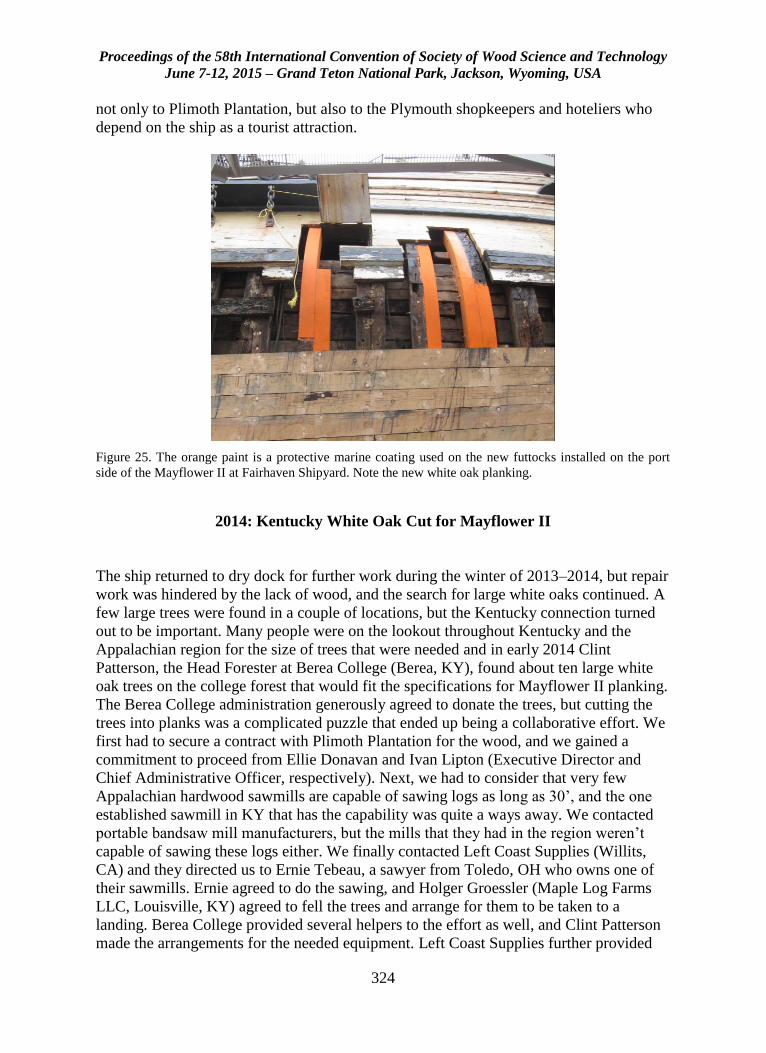
Proceedings of the 58th International Convention of Society of Wood Science and Technology
June 7-12, 2015 – Grand Teton National Park, Jackson, Wyoming, USA
324
not only to Plimoth Plantation, but also to the Plymouth shopkeepers and hoteliers who
depend on the ship as a tourist attraction.
Figure 25. The orange paint is a protective marine coating used on the new futtocks installed on the port
side of the Mayflower II at Fairhaven Shipyard. Note the new white oak planking.
2014: Kentucky White Oak Cut for Mayflower II
The ship returned to dry dock for further work during the winter of 2013–2014, but repair
work was hindered by the lack of wood, and the search for large white oaks continued. A
few large trees were found in a couple of locations, but the Kentucky connection turned
out to be important. Many people were on the lookout throughout Kentucky and the
Appalachian region for the size of trees that were needed and in early 2014 Clint
Patterson, the Head Forester at Berea College (Berea, KY), found about ten large white
oak trees on the college forest that would fit the specifications for Mayflower II planking.
The Berea College administration generously agreed to donate the trees, but cutting the
trees into planks was a complicated puzzle that ended up being a collaborative effort. We
first had to secure a contract with Plimoth Plantation for the wood, and we gained a
commitment to proceed from Ellie Donavan and Ivan Lipton (Executive Director and
Chief Administrative Officer, respectively). Next, we had to consider that very few
Appalachian hardwood sawmills are capable of sawing logs as long as 30’, and the one
established sawmill in KY that has the capability was quite a ways away. We contacted
portable bandsaw mill manufacturers, but the mills that they had in the region weren’t
capable of sawing these logs either. We finally contacted Left Coast Supplies (Willits,
CA) and they directed us to Ernie Tebeau, a sawyer from Toledo, OH who owns one of
their sawmills. Ernie agreed to do the sawing, and Holger Groessler (Maple Log Farms
LLC, Louisville, KY) agreed to fell the trees and arrange for them to be taken to a
landing. Berea College provided several helpers to the effort as well, and Clint Patterson
made the arrangements for the needed equipment. Left Coast Supplies further provided
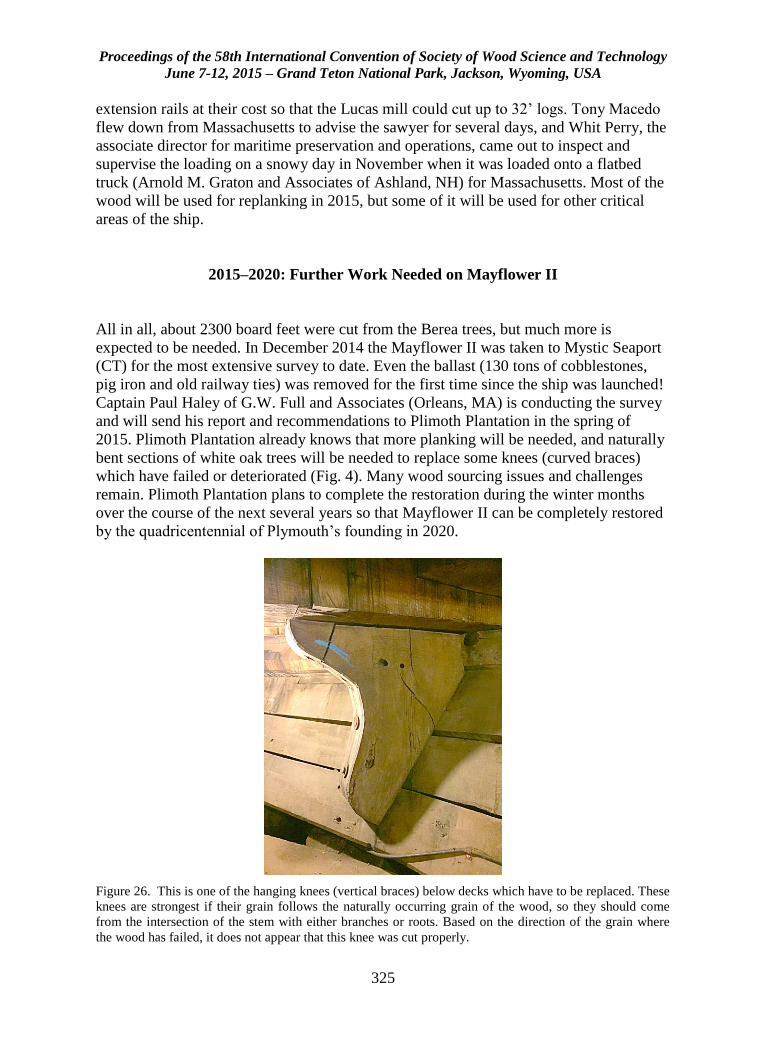
Proceedings of the 58th International Convention of Society of Wood Science and Technology
June 7-12, 2015 – Grand Teton National Park, Jackson, Wyoming, USA
325
extension rails at their cost so that the Lucas mill could cut up to 32’ logs. Tony Macedo
flew down from Massachusetts to advise the sawyer for several days, and Whit Perry, the
associate director for maritime preservation and operations, came out to inspect and
supervise the loading on a snowy day in November when it was loaded onto a flatbed
truck (Arnold M. Graton and Associates of Ashland, NH) for Massachusetts. Most of the
wood will be used for replanking in 2015, but some of it will be used for other critical
areas of the ship.
2015–2020: Further Work Needed on Mayflower II
All in all, about 2300 board feet were cut from the Berea trees, but much more is
expected to be needed. In December 2014 the Mayflower II was taken to Mystic Seaport
(CT) for the most extensive survey to date. Even the ballast (130 tons of cobblestones,
pig iron and old railway ties) was removed for the first time since the ship was launched!
Captain Paul Haley of G.W. Full and Associates (Orleans, MA) is conducting the survey
and will send his report and recommendations to Plimoth Plantation in the spring of
2015. Plimoth Plantation already knows that more planking will be needed, and naturally
bent sections of white oak trees will be needed to replace some knees (curved braces)
which have failed or deteriorated (Fig. 4). Many wood sourcing issues and challenges
remain. Plimoth Plantation plans to complete the restoration during the winter months
over the course of the next several years so that Mayflower II can be completely restored
by the quadricentennial of Plymouth’s founding in 2020.
Figure 26. This is one of the hanging knees (vertical braces) below decks which have to be replaced. These
knees are strongest if their grain follows the naturally occurring grain of the wood, so they should come
from the intersection of the stem with either branches or roots. Based on the direction of the grain where
the wood has failed, it does not appear that this knee was cut properly.
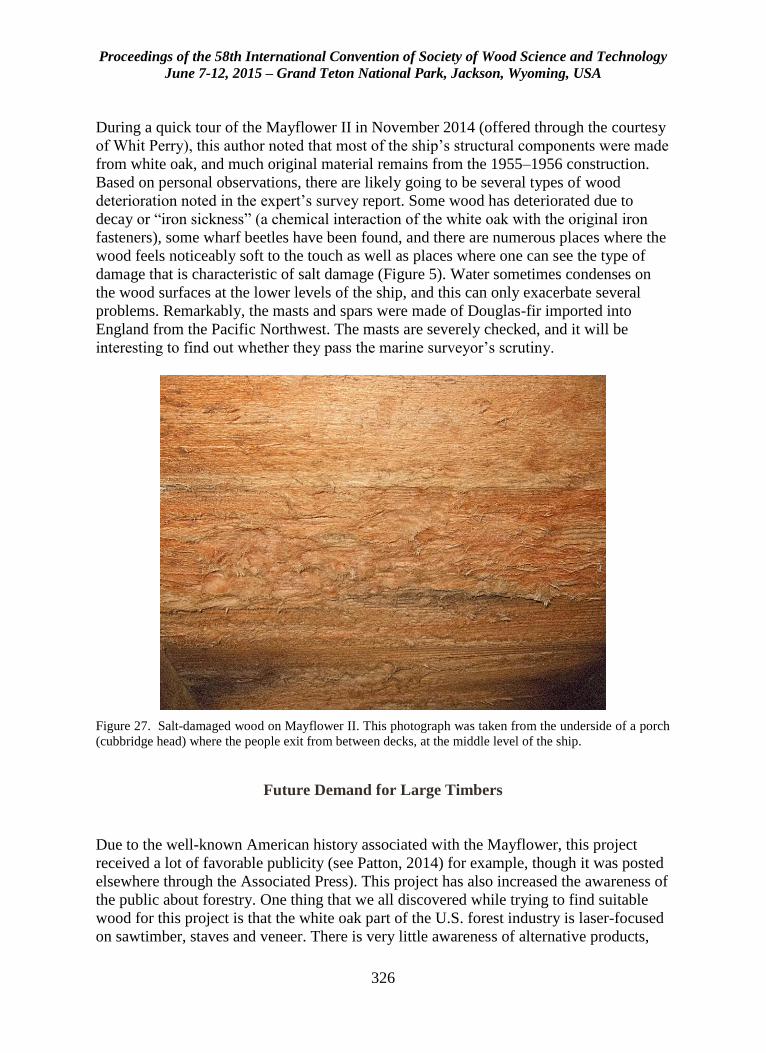
Proceedings of the 58th International Convention of Society of Wood Science and Technology
June 7-12, 2015 – Grand Teton National Park, Jackson, Wyoming, USA
326
During a quick tour of the Mayflower II in November 2014 (offered through the courtesy
of Whit Perry), this author noted that most of the ship’s structural components were made
from white oak, and much original material remains from the 1955–1956 construction.
Based on personal observations, there are likely going to be several types of wood
deterioration noted in the expert’s survey report. Some wood has deteriorated due to
decay or “iron sickness” (a chemical interaction of the white oak with the original iron
fasteners), some wharf beetles have been found, and there are numerous places where the
wood feels noticeably soft to the touch as well as places where one can see the type of
damage that is characteristic of salt damage (Figure 5). Water sometimes condenses on
the wood surfaces at the lower levels of the ship, and this can only exacerbate several
problems. Remarkably, the masts and spars were made of Douglas-fir imported into
England from the Pacific Northwest. The masts are severely checked, and it will be
interesting to find out whether they pass the marine surveyor’s scrutiny.
Figure 27. Salt-damaged wood on Mayflower II. This photograph was taken from the underside of a porch
(cubbridge head) where the people exit from between decks, at the middle level of the ship.
Future Demand for Large Timbers
Due to the well-known American history associated with the Mayflower, this project
received a lot of favorable publicity (see Patton, 2014) for example, though it was posted
elsewhere through the Associated Press). This project has also increased the awareness of
the public about forestry. One thing that we all discovered while trying to find suitable
wood for this project is that the white oak part of the U.S. forest industry is laser-focused
on sawtimber, staves and veneer. There is very little awareness of alternative products,
Proceedings of the 58th International Convention of Society of Wood Science and Technology
June 7-12, 2015 – Grand Teton National Park, Jackson, Wyoming, USA
327
and there is very little awareness of the needs of the wooden ship building industry. This
isn’t surprising, but it marks a huge change from the forest planning exercised by our
forebears. For example, there are forests in in the Tronçais region in France that were
deliberately planted with white oaks for shipbuilding in the late 1600s (Bouchard
Cooperages 2015). The English had similar concerns, e.g., as recognized by the 1542
Statute of Woods or Act for the Preservation of Woods (Thirgood 1971). With the
interest in historic preservation and reenactment, there is still a need today for timbers to
restore wooden ships. Besides the Mayflower II there are well-known survivors such as
the whaler Charles W. Morgan (Mystic Seaport, CT) and the USS Constitution (“Old
Ironsides”) (Charlestown Navy Yard, Massachusetts); there are even newly-built ships
such as the San Salvador, a replica of the flagship of the explorer Juan Rodríguez
Cabrillo (berthed in San Diego, CA) and l’Hermione, a recreation of the ship on which
Lafayette sailed to America in 1780 (berthed in Rochefort, France). All of these wooden
ships will need continual upkeep and wood replacement. The large timbers needed for
these ships are valuable, and the forest industry might do well to use the opportunity
provided by these charismatic projects to talk about the importance of forest management
to the general populace – and to grow larger white oak trees, with suitable signage to give
the landowner (or National Forest) bragging rights for the next couple of hundred years!
References
Baker, William A. The New Mayflower. Her Design and Construction. Barre, MA: Barre
Gazette, 1958. 164 pp., plus blueprints.
Bouchard Cooperages (2015). Forest Origin Comparison.
http://www.bouchardcooperages.com/usa/news/forest_origin.html
Davis, Charles G. (1933). The Built-Up Ship Model. Publication Number 25 , Marine
Research Society, Salem, Massachusetts. 206 pp.
Patton, J. (2014) Old oak trees from Berea provide timber for Mayflower II repair.
Published on many websites because the story was distributed by the Associated Press,
but the original was published here:
http://www.kentucky.com/2014/12/25/3611291/special-wood-from-berea-college.html.
Thirgood, J.V. (1971). The historical significance of oak. In: Oak Symposium
Proceedings. U.S. Department of Agriculture, Forest Service, Northeastern Forest
Experiment Station: Upper Darby, PA. pp. 1–18.

Proceedings of the 58th International Convention of Society of Wood Science and Technology
June 7-12, 2015 – Grand Teton National Park, Jackson, Wyoming, USA
328
Acknowledgements
The author gratefully acknowledges the work of the many people and groups mentioned
in this article. It has truly been a group effort to get even this much accomplished! Holger
Groessler, Clint Patterson and his staff and Ernie Tebeau did most of the organizing and
all of the work, and it took them several weeks to do it. I also want to give special thanks
to my father, Tom Conners, who alerted me to this problem, and to Berea College and
Whit Perry, Ellie Donavan and Ivan Lipton of Plimoth Plantation.
Proceedings of the 58th International Convention of Society of Wood Science and Technology
June 7-12, 2015 – Grand Teton National Park, Jackson, Wyoming, USA
329
Furniture and Lumber Exports from Ghana: A
Comparative Study of Some Market Trends
Peter Kessels Dadzie 1
1 Lecturer, Interior Architecture and Furniture Production Department,
Kumasi Polytechnic, Box 854, Kumasi, Ghana.
[email protected]; [email protected]
Abstract
Adding value to the dwindling timber resources in Ghana before export is an issue of
much concern. However, it appears that wood products manufacturing firms in Ghana
continue to produce and export lumber which have lower value relative to garden
furniture. This study assessed values of wood species when used for garden furniture and
kiln-dried (KD) lumber, and the destination and product type effect on these values. The
study covered an eight year period (2001 to 2008). Reports on wood products export
were reviewed to obtain data for analyses. Findings were that values/m3 of all wood
species were higher when used for garden furniture than when used to produce lumber for
exports. Among the 15 most requested species for garden furniture, Pericopsis elata
(afromosia) had the highest value for furniture (€3,308.844) and lumber (€869.00)
whereas Terminalia ivorensis (emire) had the least furniture value (€1,336.936) while
Pycnanthus angolensis (otie) had the least lumber value (€263.10). Generally, both
products registered a decreasing trend in export volumes but lumber prices/m3
appreciated whereas furniture prices fell. Sweden and U.S. A respectively offered the
highest (€17,891.80) and lowest (€254.097) mean garden furniture value, while Cyprus
and France respectively offered the highest (€644.80) and lowest (€314.97) lumber value.
Direction of trade and product type had significant effect (p<0.01) on values of the
products and they explained 92.3% of the variations. Conclusions were that the best
destination for furniture export is Sweden and that for lumber is Cyprus. Based on
monetary values, it was recommended that garden furniture production for exports should
be encouraged than lumber, and furniture export to Sweden could yield higher values/m3.
Key words: Furniture and lumber exports, Timber products from Ghana, Value addition
to wood, Ghana’s wood trading partners.
Proceedings of the 58th International Convention of Society of Wood Science and Technology
June 7-12, 2015 – Grand Teton National Park, Jackson, Wyoming, USA
330
Introduction
Ghana’s forest sector is a major contributor to the national economy. It is reported that
the sector, which is dominated by timber industries, accounts for about 11% of the total
export earnings of the country (Ghanaian Times 2015). The timber industry manufacture
products like lumber, furniture parts, plywood, glulam etc for exports and these
contribute about 6% to the Gross Domestic Product (GDP) and employ labour force of
over 75,000 people, while providing direct livelihood to about two million people in total
(Ghanaian Times 2015).
Furniture parts, which are one of Ghana’s forest products for exports, is mainly garden
furniture (Alexander Rose Ltd 2005). Such furniture are mostly used in open places
where they are partly or wholly exposed to the weather and as such they are primarily
produced from relatively durable and weather resistant wood species like iroko/odum
(Milicia excelsa), mahogany (Khaya spp.), teak (Tectona grandis), utile
(Entandrophragma utile), albizia (Albizia ferrugenia) etc. either alone or in combination
with some metal components (Plow and heart 2006; TIDD 2003). In Ghana, 26 wood
species have been identified as being used for the production of various garden furniture
parts for exports (Dadzie et al 2014). However, wood has been the most favorite material
for garden furniture globally due to its desirable attributes such as: easy to work on with
both hand and machine tools; ability to be fastened satisfactorily with adhesive, nails and
screws; natural beauty from variations in figure and colour that blends; and resistance to
rust and corrosion (Ratnasingam 1998; Waters 1970). These same wood species in
addition to others are being exploited for lumber production for exports and local
consumption.
In the export market however, furniture parts have much higher value per unit volume
than lumber. Trade statistics revealed that, while a cubic meter of kiln-dried lumber was
€377.172, air-dried was €315.133 and overland was €68.578, the value of garden
furniture parts stood at €1,677.850 per m3 (TIDD 2005a). These show value differences
between furniture and air-dried lumber per m3 to be €1,362.717 (432.43%) and that
between furniture and kiln-dried lumber to be €1,300.717 (344.85%). Additionally,
individual wood species, when converted to garden furniture for exports could register
appreciably higher values than when exported in the lumber forms. For instance, kiln-
dried lumber of Mahogany (Khaya Spp.) and its furniture values registered an increase of
200.07%, whiles Odum (Milicia excelsa) recorded a value increase of 178.10% (TIDD,
2005a). However, studies on market trends such as price variations over a considerable
period of time, among importing countries/buyers and among wood species especially in
relation to lumber or furniture produced in Ghana appear limited or unavailable.
This study therefore assessed the trend of; 1) Average value/m3 for K.D lumber and
garden furniture of the various wood species desired for garden furniture exports. 2)
Average volume and value/m3 of K.D lumber and garden furniture exports from Ghana
over a period
Proceedings of the 58th International Convention of Society of Wood Science and Technology
June 7-12, 2015 – Grand Teton National Park, Jackson, Wyoming, USA
331
3) Average value/m3 of K.D lumber and garden furniture offered by importers of the two
products from Ghana and 4) whether or not direction of trade and product type has
significant effect on the value/m3 of lumber and garden furniture.
Materials and Methods
Data collection
Average Value/m3 (Free-on-Board FOB) and Volume (m3) of Kiln-Dried Lumber and
Garden Furniture exported from 2001 to 2008.
The average FOB values/m3 of each specific wood species used for both garden furniture
and kiln-dried lumber production were extracted from TIDD’s export reports on wood
products (TIDD 2001; 2002; 2003; 2004; 2005; 2006; 2007;2008). These average values
were obtained by dividing each product’s cumulative values by their respective
cumulative volumes exported in each year. The mean of each wood species for either
lumber or furniture for the 8 years were used as the average value of each species for the
period. In estimating the average values/m3of garden furniture and lumber, in general, the
general cumulative values were also divided by their respective general cumulative
volumes of each of the products exported in each year.
Average Value/M3 of Kiln-Dried Lumber and Garden Furniture among Importers of the
Two Products from Ghana.
The average FOB values/m3 of garden furniture in general (i.e. without considering
specific wood species) imported by each country were first extracted from TIDD’s export
reports on wood products for the period of study (i.e. 8 years). This was done by dividing
their cumulative values by their respective cumulative volumes for each year from 2001
to 2008. The mean for the 8 years was used as the average purchased value/m3 offered for
the product in that country. After obtaining all the countries that import furniture products
from Ghana, their kiln-dried lumber imports were also traced and their average values/m3
for each year subsequently determined as was done in the case of garden furniture. All
these estimates were done without considering any specific species but the products in
general (i.e. kiln-dried lumber and garden furniture).
Data analyses
Data obtained on volumes and values of garden furniture exports across species, years
and importing countries were analysed using Microsoft Excel 2003 and 2007 to
determine their trends. SPSS 17.0 was also used to perform a Two-Way ANOVA to
determine the influence of direction of trade and product type on the variations in
values/m3 of kiln-dried lumber and garden furniture in general (not for specific species).
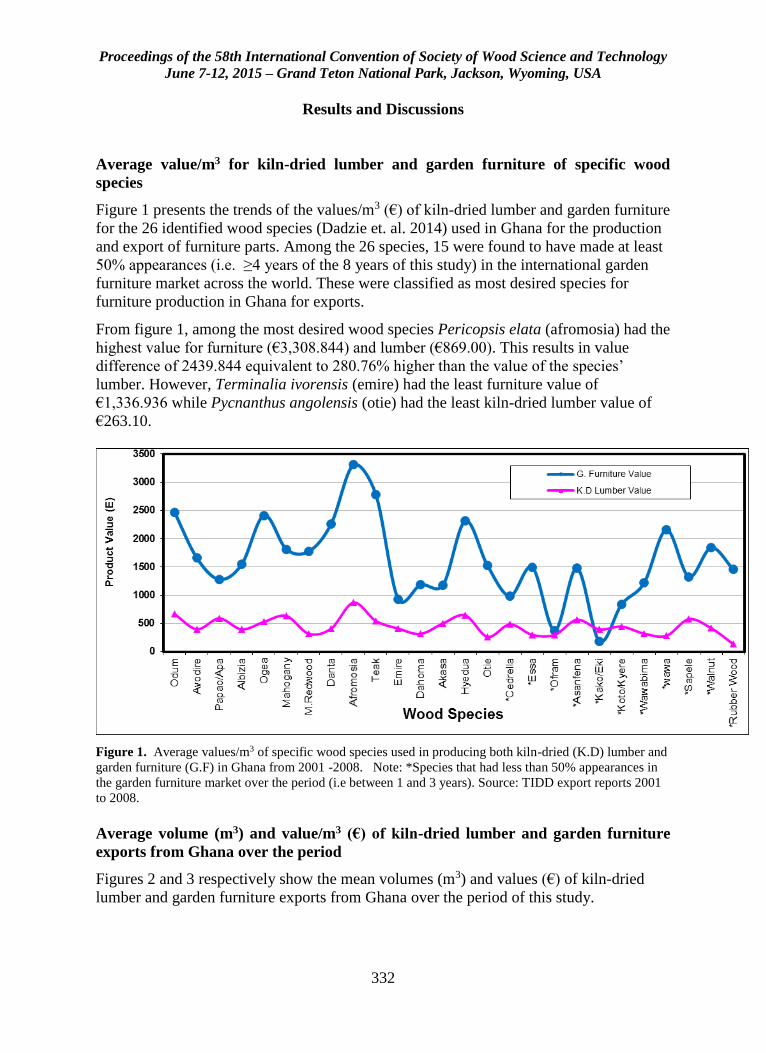
Proceedings of the 58th International Convention of Society of Wood Science and Technology
June 7-12, 2015 – Grand Teton National Park, Jackson, Wyoming, USA
332
Results and Discussions
Average value/m3 for kiln-dried lumber and garden furniture of specific wood
species
Figure 1 presents the trends of the values/m3 (€) of kiln-dried lumber and garden furniture
for the 26 identified wood species (Dadzie et. al. 2014) used in Ghana for the production
and export of furniture parts. Among the 26 species, 15 were found to have made at least
50% appearances (i.e. ≥4 years of the 8 years of this study) in the international garden
furniture market across the world. These were classified as most desired species for
furniture production in Ghana for exports.
From figure 1, among the most desired wood species Pericopsis elata (afromosia) had the
highest value for furniture (€3,308.844) and lumber (€869.00). This results in value
difference of 2439.844 equivalent to 280.76% higher than the value of the species’
lumber. However, Terminalia ivorensis (emire) had the least furniture value of
€1,336.936 while Pycnanthus angolensis (otie) had the least kiln-dried lumber value of
€263.10.
Figure 1. Average values/m3 of specific wood species used in producing both kiln-dried (K.D) lumber and
garden furniture (G.F) in Ghana from 2001 -2008. Note: *Species that had less than 50% appearances in
the garden furniture market over the period (i.e between 1 and 3 years). Source: TIDD export reports 2001
to 2008.
Average volume (m3) and value/m3 (€) of kiln-dried lumber and garden furniture
exports from Ghana over the period
Figures 2 and 3 respectively show the mean volumes (m3) and values (€) of kiln-dried
lumber and garden furniture exports from Ghana over the period of this study.
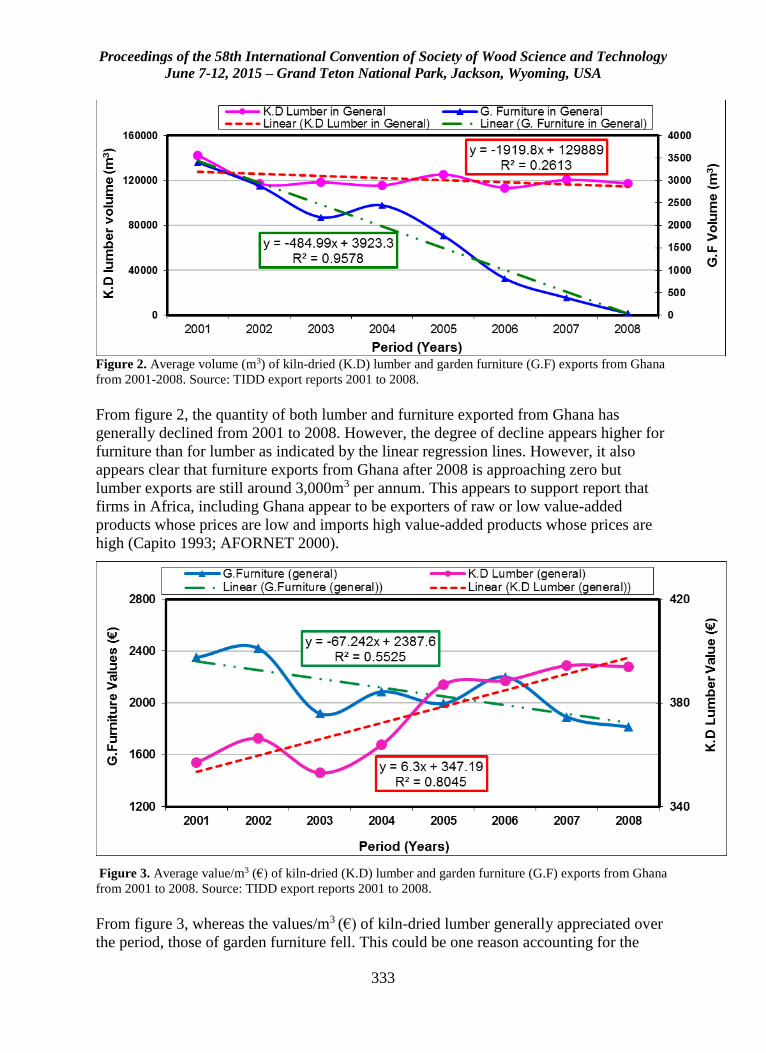
Proceedings of the 58th International Convention of Society of Wood Science and Technology
June 7-12, 2015 – Grand Teton National Park, Jackson, Wyoming, USA
333
Figure 2. Average volume (m3) of kiln-dried (K.D) lumber and garden furniture (G.F) exports from Ghana
from 2001-2008. Source: TIDD export reports 2001 to 2008.
From figure 2, the quantity of both lumber and furniture exported from Ghana has
generally declined from 2001 to 2008. However, the degree of decline appears higher for
furniture than for lumber as indicated by the linear regression lines. However, it also
appears clear that furniture exports from Ghana after 2008 is approaching zero but
lumber exports are still around 3,000m3 per annum. This appears to support report that
firms in Africa, including Ghana appear to be exporters of raw or low value-added
products whose prices are low and imports high value-added products whose prices are
high (Capito 1993; AFORNET 2000).
Figure 3. Average value/m3 (€) of kiln-dried (K.D) lumber and garden furniture (G.F) exports from Ghana
from 2001 to 2008. Source: TIDD export reports 2001 to 2008.
From figure 3, whereas the values/m3 (€) of kiln-dried lumber generally appreciated over
the period, those of garden furniture fell. This could be one reason accounting for the
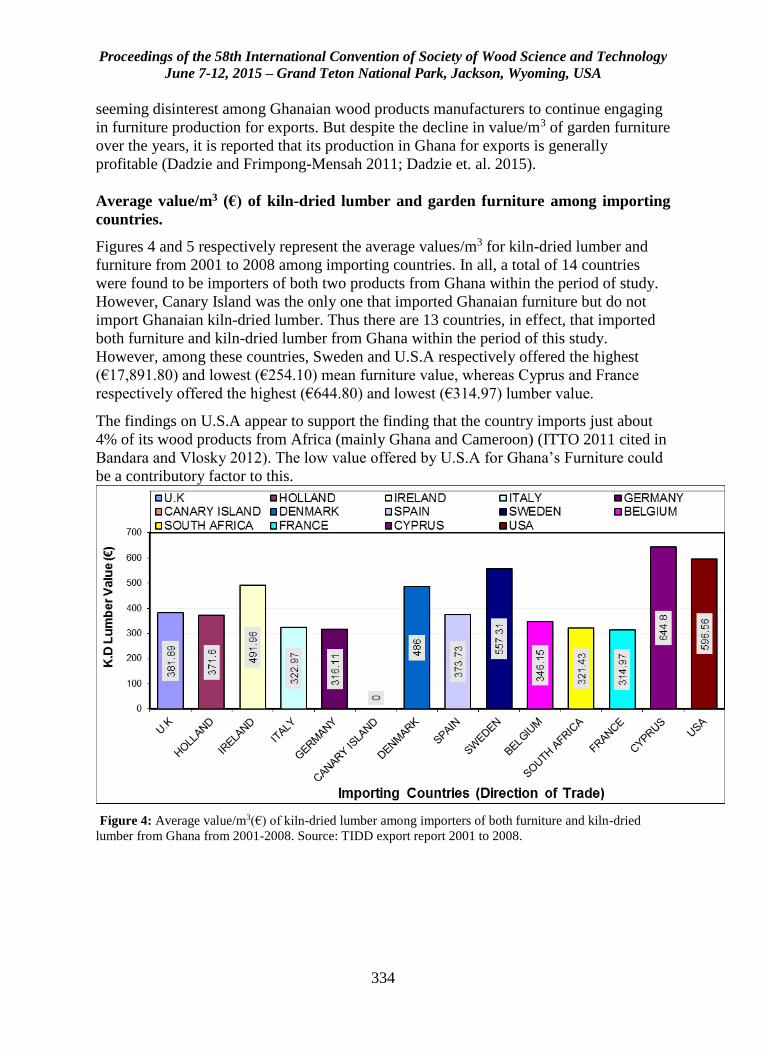
Proceedings of the 58th International Convention of Society of Wood Science and Technology
June 7-12, 2015 – Grand Teton National Park, Jackson, Wyoming, USA
334
seeming disinterest among Ghanaian wood products manufacturers to continue engaging
in furniture production for exports. But despite the decline in value/m3 of garden furniture
over the years, it is reported that its production in Ghana for exports is generally
profitable (Dadzie and Frimpong-Mensah 2011; Dadzie et. al. 2015).
Average value/m3 (€) of kiln-dried lumber and garden furniture among importing
countries.
Figures 4 and 5 respectively represent the average values/m3 for kiln-dried lumber and
furniture from 2001 to 2008 among importing countries. In all, a total of 14 countries
were found to be importers of both two products from Ghana within the period of study.
However, Canary Island was the only one that imported Ghanaian furniture but do not
import Ghanaian kiln-dried lumber. Thus there are 13 countries, in effect, that imported
both furniture and kiln-dried lumber from Ghana within the period of this study.
However, among these countries, Sweden and U.S.A respectively offered the highest
(€17,891.80) and lowest (€254.10) mean furniture value, whereas Cyprus and France
respectively offered the highest (€644.80) and lowest (€314.97) lumber value.
The findings on U.S.A appear to support the finding that the country imports just about
4% of its wood products from Africa (mainly Ghana and Cameroon) (ITTO 2011 cited in
Bandara and Vlosky 2012). The low value offered by U.S.A for Ghana’s Furniture could
be a contributory factor to this.
Figure 4: Average value/m3(€) of kiln-dried lumber among importers of both furniture and kiln-dried
lumber from Ghana from 2001-2008. Source: TIDD export report 2001 to 2008.
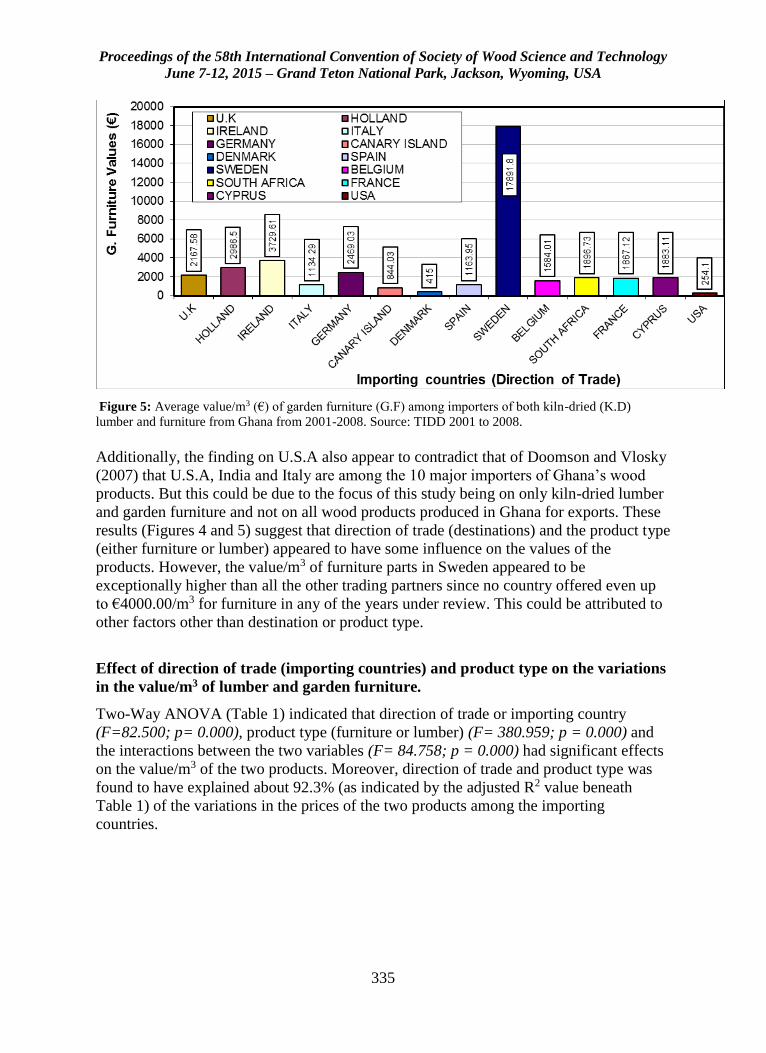
Proceedings of the 58th International Convention of Society of Wood Science and Technology
June 7-12, 2015 – Grand Teton National Park, Jackson, Wyoming, USA
335
Figure 5: Average value/m3 (€) of garden furniture (G.F) among importers of both kiln-dried (K.D)
lumber and furniture from Ghana from 2001-2008. Source: TIDD 2001 to 2008.
Additionally, the finding on U.S.A also appear to contradict that of Doomson and Vlosky
(2007) that U.S.A, India and Italy are among the 10 major importers of Ghana’s wood
products. But this could be due to the focus of this study being on only kiln-dried lumber
and garden furniture and not on all wood products produced in Ghana for exports. These
results (Figures 4 and 5) suggest that direction of trade (destinations) and the product type
(either furniture or lumber) appeared to have some influence on the values of the
products. However, the value/m3 of furniture parts in Sweden appeared to be
exceptionally higher than all the other trading partners since no country offered even up
to €4000.00/m3 for furniture in any of the years under review. This could be attributed to
other factors other than destination or product type.
Effect of direction of trade (importing countries) and product type on the variations
in the value/m3 of lumber and garden furniture.
Two-Way ANOVA (Table 1) indicated that direction of trade or importing country
(F=82.500; p= 0.000), product type (furniture or lumber) (F= 380.959; p = 0.000) and
the interactions between the two variables (F= 84.758; p = 0.000) had significant effects
on the value/m3 of the two products. Moreover, direction of trade and product type was
found to have explained about 92.3% (as indicated by the adjusted R2 value beneath
Table 1) of the variations in the prices of the two products among the importing
countries.
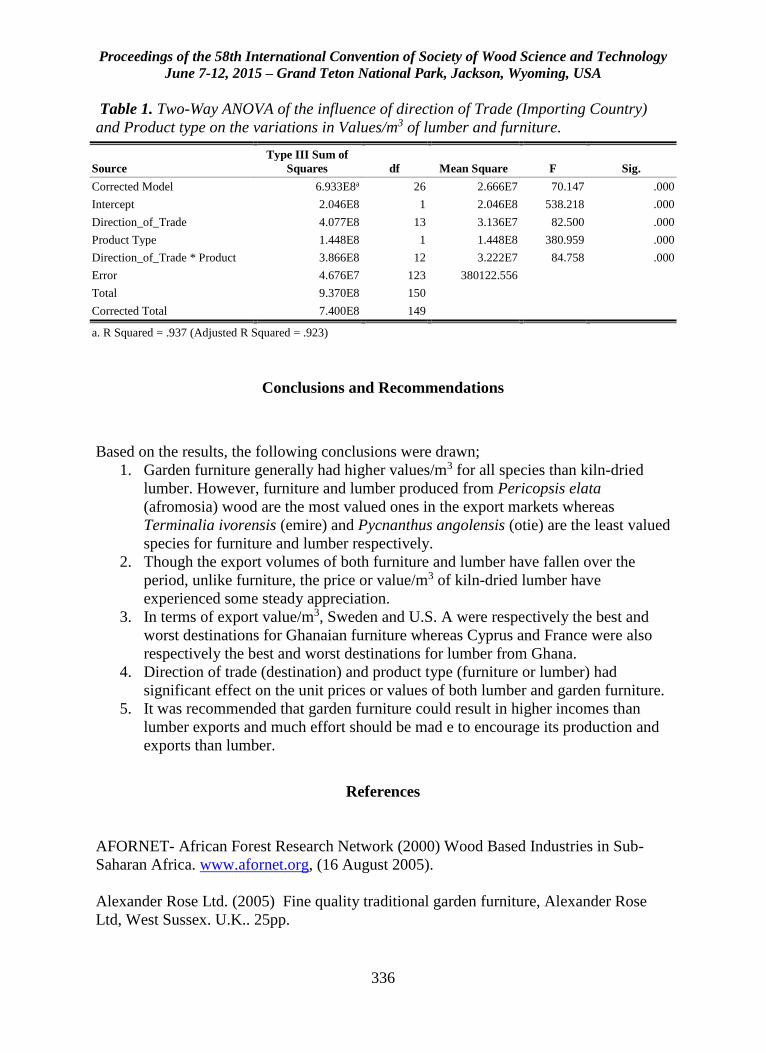
Proceedings of the 58th International Convention of Society of Wood Science and Technology
June 7-12, 2015 – Grand Teton National Park, Jackson, Wyoming, USA
336
Table 1. Two-Way ANOVA of the influence of direction of Trade (Importing Country)
and Product type on the variations in Values/m3 of lumber and furniture.
Conclusions and Recommendations
Based on the results, the following conclusions were drawn;
1. Garden furniture generally had higher values/m3 for all species than kiln-dried
lumber. However, furniture and lumber produced from Pericopsis elata
(afromosia) wood are the most valued ones in the export markets whereas
Terminalia ivorensis (emire) and Pycnanthus angolensis (otie) are the least valued
species for furniture and lumber respectively.
2. Though the export volumes of both furniture and lumber have fallen over the
period, unlike furniture, the price or value/m3 of kiln-dried lumber have
experienced some steady appreciation.
3. In terms of export value/m3, Sweden and U.S. A were respectively the best and
worst destinations for Ghanaian furniture whereas Cyprus and France were also
respectively the best and worst destinations for lumber from Ghana.
4. Direction of trade (destination) and product type (furniture or lumber) had
significant effect on the unit prices or values of both lumber and garden furniture.
5. It was recommended that garden furniture could result in higher incomes than
lumber exports and much effort should be mad e to encourage its production and
exports than lumber.
References
AFORNET- African Forest Research Network (2000) Wood Based Industries in Sub-
Saharan Africa. www.afornet.org, (16 August 2005).
Alexander Rose Ltd. (2005) Fine quality traditional garden furniture, Alexander Rose
Ltd, West Sussex. U.K.. 25pp.
Source
Type III Sum of
Squares df Mean Square F Sig.
Corrected Model 6.933E8a 26 2.666E7 70.147 .000
Intercept 2.046E8 1 2.046E8 538.218 .000
Direction_of_Trade 4.077E8 13 3.136E7 82.500 .000
Product Type 1.448E8 1 1.448E8 380.959 .000
Direction_of_Trade * Product 3.866E8 12 3.222E7 84.758 .000
Error 4.676E7 123 380122.556
Total 9.370E8 150
Corrected Total 7.400E8 149
a. R Squared = .937 (Adjusted R Squared = .923)
Proceedings of the 58th International Convention of Society of Wood Science and Technology
June 7-12, 2015 – Grand Teton National Park, Jackson, Wyoming, USA
337
Capito, Eugene (Hon.) (1993) Situation of African Forestry Policy. ATO, Information
Bulletin No. 2 (1994) SGIT Impremerie de Louis, Gabon. pp.10-12.
Dadzie P. K, Frimpong-Mensah K, Amoah M, & Boampong E (2015) Scenario Analysis
of Profits in Further Processing Lumber to Furniture in Ghana for Export: A Case Study
of a Local Firm, International Journal of Business and Economic Research, 4(2): 55-66.
doi:10.11648/j.ijber.20150402.15 http://www.sciencepublishinggroup.com/j/ijber
(20 March 2015)
Dadzie P K, Amoah M, Tekpetey S L (2014) Preliminary assessment of wealth creation
in wood products’ business in Ghana: The perspective of lumber and furniture production
and implications for entrepreneurship, International Journal of Business and Economic
Research, 3(6): 243-249. doi: 10.11648/j.ijber.20140306.15.
http://www.sciencepublishinggroup.com/j/ijber (20 December 2014)
Dadzie P K, Frimpong-Mensah K (2011) Value addition to wood resources, the case of
garden,furniture production and export in Ghana; A case study of a local firm, conference
paper presented at the 65th international convention of the Forest Products Society, 19th -
21st June 2011, Portland, Oregon. U.S.A. http://www.slideshare.net/julielang/session-8-
ic2011dadzie (20 December 2014).
Doomson O, Vlosky R P (2007) A strategic overview of the forest sector in Ghana,
Louisiana Forest Products Development Centre working paper #81, School of Renewable
Natural Resources, Lousiana State University of Agricultural Centre, Baton Rouge.
U.S.A. 17pp.
ITTO (International Timber Trade Organization) (2011) tropical timber market reports in;
Bandara W A R T W, Vlosky R P (2012) An analysis of the U.S wood products import
sector: prospects for tropical wood products exporters, Journal of Tropical Forestry and
Environment 2 (02) 49-62.
Plow, and Heart Inc. (2006). Furniture Buying Guide. www.plowhearth.com/ Outlet
Store. Asp. (Accessed April 2006).
Ratnasingam J (1998) The South-East Asian furniture industry siege, Southern African
Wood and Timber Times 24 (1) 68-72.
The Ghanaian Times of January 23, 2015; www.ghanaiantimes.com.gh/. (3 February
2015).
TIDD.- Timber Industries Development Division (2001) Exporters performance/moving
species/direction of trade-lumber (KD) and furniture parts; wood products export report,
December, Data Processing Section, Takoradi. Ghana. 33pp.
Proceedings of the 58th International Convention of Society of Wood Science and Technology
June 7-12, 2015 – Grand Teton National Park, Jackson, Wyoming, USA
338
TIDD (2002) Exporters performance/moving species/direction of trade-lumber (KD) and
furniture parts; wood products export report, December, data processing section,
Takoradi. Ghana. 36pp.
TIDD (2003) Exporters performance/moving species/direction of trade-lumber (KD) and
furniture parts; wood products export report, December, data processing section,
Takoradi. Ghana. 36pp.
TIDD (2004) Exporters performance/moving species/direction of trade-lumber (KD) and
furniture parts; wood products export report, December, data processing section,
Takoradi. Ghana. 42pp.
TIDD (2005a) The first 30 out of 126 exporters of all wood products, jan-feb 2005.
wood products’export report for February 2005, data processing section of TIDD,
Takoradi, Ghana. 32 pp.
TIDD (2005b) Exporters performance/moving species/direction of trade-lumber (KD),
flooring and furniture parts. Report on export of wood products for December 2005, data
processing section of TIDD, Takoradi, Ghana. 54 pp.
TIDD (2006) Exporters performance/moving species/direction of trade-lumber (KD) and
furniture parts; wood products export report, December, data processing section,
Takoradi. Ghana. 36 pp.
TIDD (2007) Exporters performance/moving species/direction of trade-lumber (KD) and
furniture parts; wood products export report, December, data processing section,
Takoradi. Ghana. 31pp.
TIDD. (2008). exporters performance/moving species/direction of trade-lumber (KD) and
furniture parts; wood products export report, December, data processing section,
Takoradi. Ghana. 41 pp.
Waters M M (1970) Woodwork - A course for first exanimations, R & R Clark, Ltd.
London. Great Britain. 136 pp.
Proceedings of the 58th International Convention of Society of Wood Science and Technology
June 7-12, 2015 – Grand Teton National Park, Jackson, Wyoming, USA
339
Natural Weathering Performance of Exterior UV
Coating on
Fast Growing Tropical Woods
Wayan Darmawan(1), Dodi Nandika(1), Rita Kartikasari(2),
Helgadara(2), Douglas Gardner(3), Barbara Ozarska(4)
(1)Prof., Department of Forest Products, Faculty of Forestry,
Bogor Agricultural University (IPB), Bogor (16680), Indonesia.
Phone +62-251-8621285, Fax. +62-251-8621256
E-mail : [email protected]
* (Corresponding author) (2)Research Assistant, Department of Forest Products, Faculty of Forestry,
Bogor Agricultural University (IPB), Bogor (16680), Indonesia. (3) Professor, the University of Maine, USA
(4)Associate Professor, the University of Melbourne, Australia
Abstract
Wood products exposed outdoor could be weathered, especially in the tropical region
with high in sun light intensity, rain intensity, and relative humidity. An effort that could
be done to protect and enhance wood performance is finishing. The purpose of this
research is to understand the durability of finishing layer of the finished wood exposed
outdoor. The effects of surface condition of boards (planed and unplaned), sawing pattern
(quarter sawn and plain sawn), and two water based wood finishes (Sayerlack and Ultran
Politur P-03 UV) were studied.
The experimental results showed that finishing layer of pine was the lowest in durability.
The results also indicated that durability of finishing layer depicted by flat sawn boards
were lower than that of the quarter sawn board. The finishing layer was considered to
provide a good protection to the surfaces of board against failures. The presence of
failure due to microbial disfigurement and checking on the surfaces of the finished
samples (in average) were 15% and 18% consecutively. On the other hand, the
percentages of failure were observed to be 60% due to microbial disfigurement and 20 %
due to checking for the unfinished wood. Comparing the two exterior water-based wood
finishes used in this experiment, it was found that the two water based coating provided
almost the same protection against microbial disfigurement and cracking.
Proceedings of the 58th International Convention of Society of Wood Science and Technology
June 7-12, 2015 – Grand Teton National Park, Jackson, Wyoming, USA
340
Keywoord : Weathering, UV coating, tropical woods, checking, microbial disfigurement
Introduction
Wood is subject to degradation by biological (bacteria, fungi, and insect), mechanical,
chemical, climatic, and thermal factors. Weathering is a general term used to define a
slow degradation of wood materials exposed to the weather. Degradation mechanism
depends on the type of wood material, but the cause is a combination of the factors. It is a
well-known fact that the shorter wave lengths of the solar spectrum having higher photon
energies are more deeply absorbed into polymeric materials such as wood, and the
structure of chemical bonding within the cell wall is adversely influenced. The
weathering initially causes the color of the wood surface to change, followed by the
occurrence of surface checking and increased roughness of the samples. The
discoloration of the surface is a direct indication of the chemical modification in the cell
wall due to weathering. Most of the time, weathered wood would have a more
pronounced yellow color than unexposed wood as a result of the modification of lignin
and hemicelluloses. Such discoloration in the cell wall is influenced by photochemical
reactions leading to the degradation of wood constituents, mainly lignin. A major part of
solubilized lignin during degradation is washed out by rain. However, fiber-rich cellulose
with a higher resistance against ultraviolet light degradation remains in the cell wall
without significant modification and results in the wood acquiring a whitish to gray color
(Feist and Hon 1984; Rowell and Barbour 1988).
Wood products, used for the outermost barrier to the weather are often wood siding,
windows, decks, roofs, and garden furniture). If these wood products are to achieve a
long service life, the weathering process and wood finishing (coating) treatments to retard
this degradation should be understood. Surface coating of woods for exterior has two
basic functions. One is to give an aesthetically acceptable surface appearance and color.
The other is to provide protection against wood degradation by microbiological,
chemical, physical or mechanical attack. For decorative purposes, the coating layer
should be durable and retain its gloss and color for longer period of time, and either be
unchanged by solar radiation. For protective purposes, the coating should be durable and
retain its physical properties as long as possible in order to extend the interval between
maintenance. These protective properties play an important role in the selection of proper
coating materials for supreme durability. Assessment of these protective properties of
coatings is a great importance. The durability of a coated exterior wood surface depends
on its ability to resist the degradation processes that act on the coating and the wood
substrate.
Wood products used under outdoor environmental conditions should be finished using
different types of coatings with the purpose of protection so that the overall service life of
the wood product is extended. Two basic types of treatment or coating methods are
Proceedings of the 58th International Convention of Society of Wood Science and Technology
June 7-12, 2015 – Grand Teton National Park, Jackson, Wyoming, USA
341
commonly used to enhance resistance of wood surfaces against weathering. The first
method is the applications of water repellents, and preservatives to protect wood against
moisture and microbial activity. The second method is the application of wood finishes
to the surface in the form of thin layers with limited penetration. In recent development,
both water repellent, preservative treatment and finishing have been investigated for
enhancing weathering resistance of wood (Williams 2005; Jacques 2000; Nejad and
Cooper 2011).
Research works have investigated the application of inorganic chemicals to the surface of
wood, including copper ethanolamine (Cu-MEA) to enhance its resistance against
weathering (Zhang et al. 2009). It is determined that a Cu-MEA treatment delays the
degradation of lignin due to weathering. It is also reported that the discoloration of wood
decreases with increasing concentration of copper in the chemical (Williams 2005).
According to findings of a past study, photo-stabilization of wood using chromated
copper arsenate (CCA), ammonium copper quat (ACQ1900), linseed oil results in the
decrease in delignification, and copper tebuconazole (CA-B) results in a reduction in
wood discoloration (Temiz et al. 2007; Nejad and Cooper 2011). Treatment of solid
wood with a melamine based resin is considered for possible protection of wood products
against weathering, without changing their natural appearance (Hansmann et al. 2006).
However, it has some limitation due to the formaldehyde emission. Another method is
the application of clear-coats, which is the easiest and most common method for
protecting wood against weathering degradation. Coating wood with water-borne
transparent acrylic finishes is not very effective against photo-discoloration. However,
wood products coated with semi-transparent acrylic is found effective against photo-
degradation, which might be due to having a pigment content restricting transmittance of
UV light to the wood surface (Schaller and Rogez 2007; Allen et al. 2002; Deka and
Petric 2008). Therefore, it is important to reduce the light energy reaching the wood
surface with use of a coating to prevent its photo-degradation.
Recently, organic and inorganic UV light absorbers have received great attention in
transparent wood coatings because of their excellent properties as UV light blockers.
Application of epoxidized triazine UV absorbers to wooden surfaces has realized
increased photostability of surfaces with performance improvements (Kiguchi et al. 2001;
Ozgenc et al. 2012). Though, there is no significant difference between acrylic clear-
coats containing the organic and inorganic UV absorbers for stabilizing wood color and
protecting the quality of the surface, however after exposure of the coated wood to
weathering, the color stabilization and quality of both the acrylic clear-coat surfaces
showed better quality than that of the control samples (Ozgenc et al. 2010; Schaller et al.
2008).
The previous results indicate that visible and UV radiation inevitably impacts the wooden
surface when transparent varnishes are employed, even in the presence of various UV
absorbers or free-radical scavengers in such coatings. The visible and UV radiation
photodegrade the lignin in the wooden surface beneath the coating, leading to
delamination and subsequent catastrophic coating failure due to the continued action of
sun, rain, and biological factors. This coating failure leads to checking and cracking on
Proceedings of the 58th International Convention of Society of Wood Science and Technology
June 7-12, 2015 – Grand Teton National Park, Jackson, Wyoming, USA
342
the wood surfaces. Checking may increase the uptake of water, thus accelerating the
degradation on wood surfaces. Decay fungi, and mildew fungi often flourish when
excessive water is present. Moisture also encourages the growth of lichens and other
microorganisms that discolor the wood surface. Therefore, it is important to stabilize
wooden surfaces prior to the application of transparent coatings to increase the exterior
performance of clear coatings. This was the concept underlying our attempt to enhance
exterior performance of clear coatings through stabilization of wood surfaces.
Since the main causes of wood surface degradation are UV irradiation, moisture uptake,
and fungal activity, the approach taken in an attempt to enhance the weathering
performance of clear-coated boards was pretreatment the surfaces of wooden boards and
then apply clear coatings. Water repellent and water repellent preservative pretreatment
were applied in this study. The clear coatings applied to the exposure surface of the
pretreated boards were either UV acrylic and alkyd varnish. The clear-coated boards were
exposed to exterior for 1 year. The purpose of this research work was to investigate the
performance characteristics of UV clear coatings on fast growing woods under extended
(3 years) natural weathering exposure.
Materials and Methods
Specimens preparation
Sample trees were obtained from a plantation forest planted by government at the West
and East Java, Indonesia. Fast growing pine (Pinus merkusii) and teak (Tectona grandis)
and slow growing teak (Tectona grandis) of 3 trees each were selected from the
plantation site as representative specimens. The sample trees having straight stems, and
with free external defects were chosen with the intent of minimizing tree-to-tree
variation. The characteristics of the sample trees are shown in Table 1. After felling, the
trees were cross cut in length of 2.0 m from the bottom part of the tree stem. The sample
logs were kept cold, and maintained in the green condition, and they were transported to
the wood workshop for preparation of test specimens. The sample logs were band sawed
in flat cutting pattern to produce flat sawn (radial) and quarter sawn (tangential) flitches
in thickness of 25 mm. The flitches were edged, and the boards produced were seasoned
at 25 oC and relative humidity of 80% until moisture content of about 15% was reached.
The boards were planed and cross cut to produce panels of 20 x 150 x 300 mm for
specimens of natural weathering tests. Selection of 32 panels completely heartwood of
each species for the test was done carefully to keep the defects free panels.
Coatings application
An industrial water-based coating was chosen. Ultran lasur transparent coating,
representing a range of coating properties was used in the test set-up. Different
wood/coating systems, consisting of a combination of wood substrate and coating, were
included in this research. For each wood/coating system four replicates were produced
resulting in 32 wood samples. The coating was professionally applied by brushing. All
of the specimens were lightly wiped to remove any excess solution from their surface and
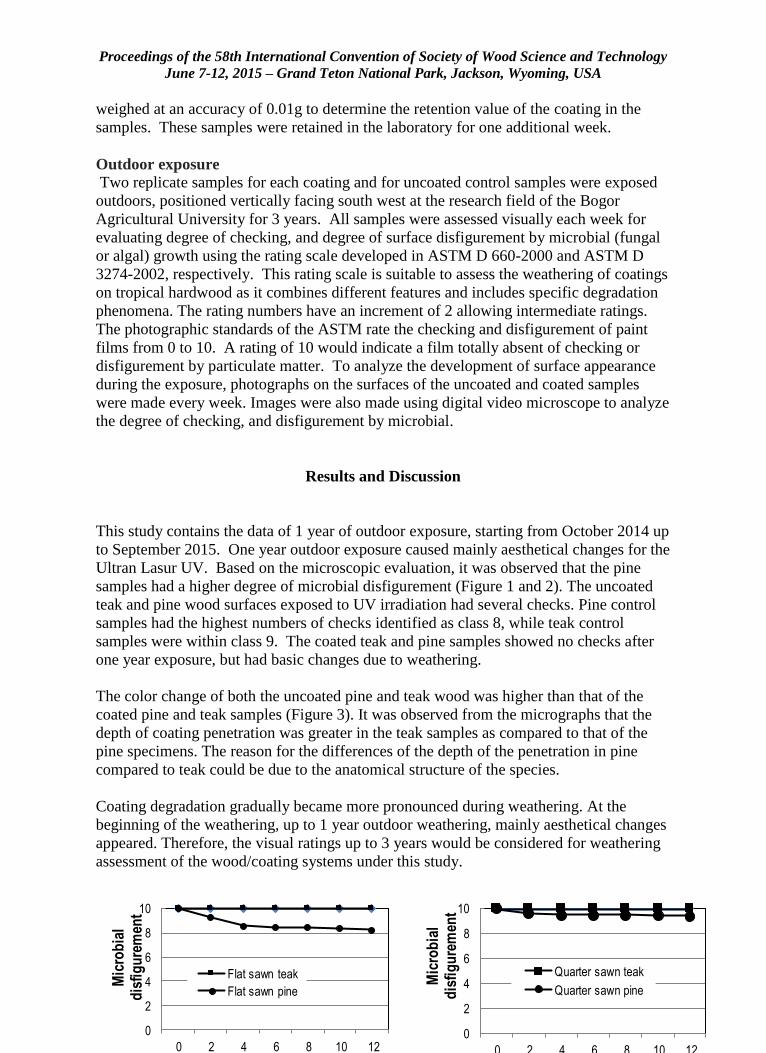
Proceedings of the 58th International Convention of Society of Wood Science and Technology
June 7-12, 2015 – Grand Teton National Park, Jackson, Wyoming, USA
343
weighed at an accuracy of 0.01g to determine the retention value of the coating in the
samples. These samples were retained in the laboratory for one additional week.
Outdoor exposure
Two replicate samples for each coating and for uncoated control samples were exposed
outdoors, positioned vertically facing south west at the research field of the Bogor
Agricultural University for 3 years. All samples were assessed visually each week for
evaluating degree of checking, and degree of surface disfigurement by microbial (fungal
or algal) growth using the rating scale developed in ASTM D 660-2000 and ASTM D
3274-2002, respectively. This rating scale is suitable to assess the weathering of coatings
on tropical hardwood as it combines different features and includes specific degradation
phenomena. The rating numbers have an increment of 2 allowing intermediate ratings.
The photographic standards of the ASTM rate the checking and disfigurement of paint
films from 0 to 10. A rating of 10 would indicate a film totally absent of checking or
disfigurement by particulate matter. To analyze the development of surface appearance
during the exposure, photographs on the surfaces of the uncoated and coated samples
were made every week. Images were also made using digital video microscope to analyze
the degree of checking, and disfigurement by microbial.
Results and Discussion
This study contains the data of 1 year of outdoor exposure, starting from October 2014 up
to September 2015. One year outdoor exposure caused mainly aesthetical changes for the
Ultran Lasur UV. Based on the microscopic evaluation, it was observed that the pine
samples had a higher degree of microbial disfigurement (Figure 1 and 2). The uncoated
teak and pine wood surfaces exposed to UV irradiation had several checks. Pine control
samples had the highest numbers of checks identified as class 8, while teak control
samples were within class 9. The coated teak and pine samples showed no checks after
one year exposure, but had basic changes due to weathering.
The color change of both the uncoated pine and teak wood was higher than that of the
coated pine and teak samples (Figure 3). It was observed from the micrographs that the
depth of coating penetration was greater in the teak samples as compared to that of the
pine specimens. The reason for the differences of the depth of the penetration in pine
compared to teak could be due to the anatomical structure of the species.
Coating degradation gradually became more pronounced during weathering. At the
beginning of the weathering, up to 1 year outdoor weathering, mainly aesthetical changes
appeared. Therefore, the visual ratings up to 3 years would be considered for weathering
assessment of the wood/coating systems under this study.
0
2
4
6
8
10
0 2 4 6 8 10 12
Mic
rob
ial
dis
fig
ure
men
t
Period of exposure (month)
Flat sawn teak
Flat sawn pine
0
2
4
6
8
10
0 2 4 6 8 10 12
Mic
rob
ial
dis
fig
ure
men
t
Period of exposure (month)
Quarter sawn teak
Quarter sawn pine
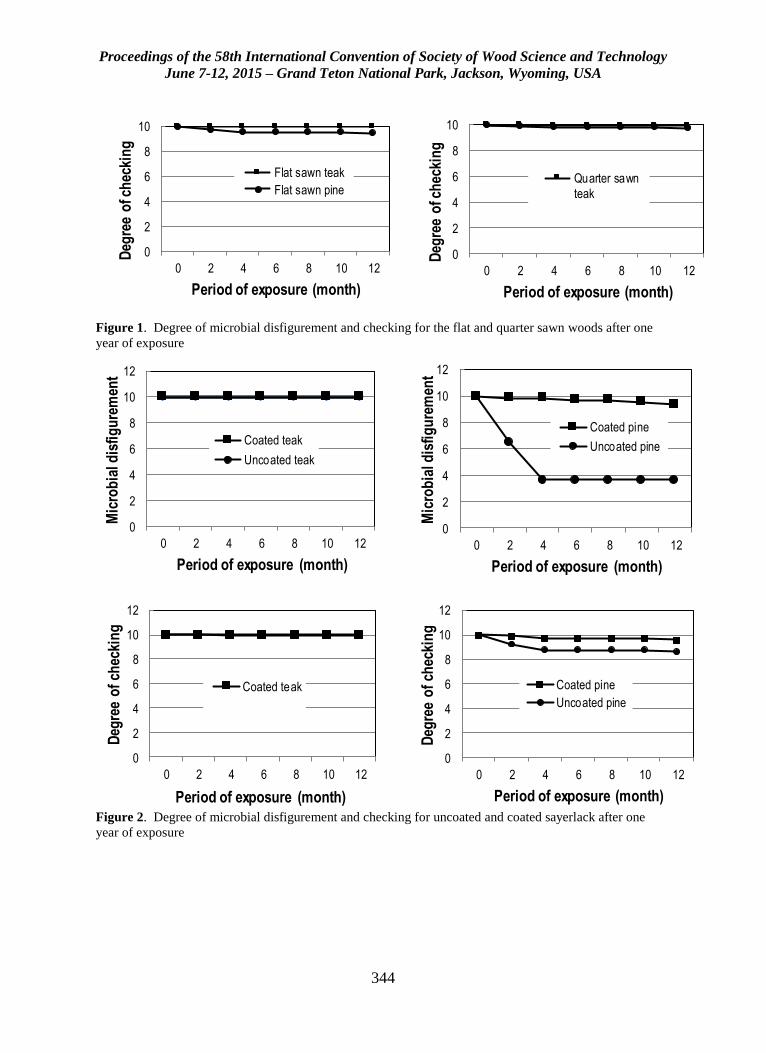
Proceedings of the 58th International Convention of Society of Wood Science and Technology
June 7-12, 2015 – Grand Teton National Park, Jackson, Wyoming, USA
344
Figure 1. Degree of microbial disfigurement and checking for the flat and quarter sawn woods after one
year of exposure
Figure 2. Degree of microbial disfigurement and checking for uncoated and coated sayerlack after one
year of exposure
0
2
4
6
8
10
0 2 4 6 8 10 12
Deg
ree
of c
hec
kin
g
Period of exposure (month)
Flat sawn teak
Flat sawn pine
0
2
4
6
8
10
0 2 4 6 8 10 12
Deg
ree
of c
hec
kin
g
Period of exposure (month)
Quarter sawn
teak
0
2
4
6
8
10
12
0 2 4 6 8 10 12
Mic
rob
ial d
isfi
gu
rem
ent
Period of exposure (month)
Coated teak
Uncoated teak
0
2
4
6
8
10
12
0 2 4 6 8 10 12
Mic
rob
ial d
isfi
gu
rem
ent
Period of exposure (month)
Coated pine
Uncoated pine
0
2
4
6
8
10
12
0 2 4 6 8 10 12
Deg
ree
of
chec
kin
g
Period of exposure (month)
Coated teak
0
2
4
6
8
10
12
0 2 4 6 8 10 12
Deg
ree
of
chec
kin
g
Period of exposure (month)
Coated pine
Uncoated pine
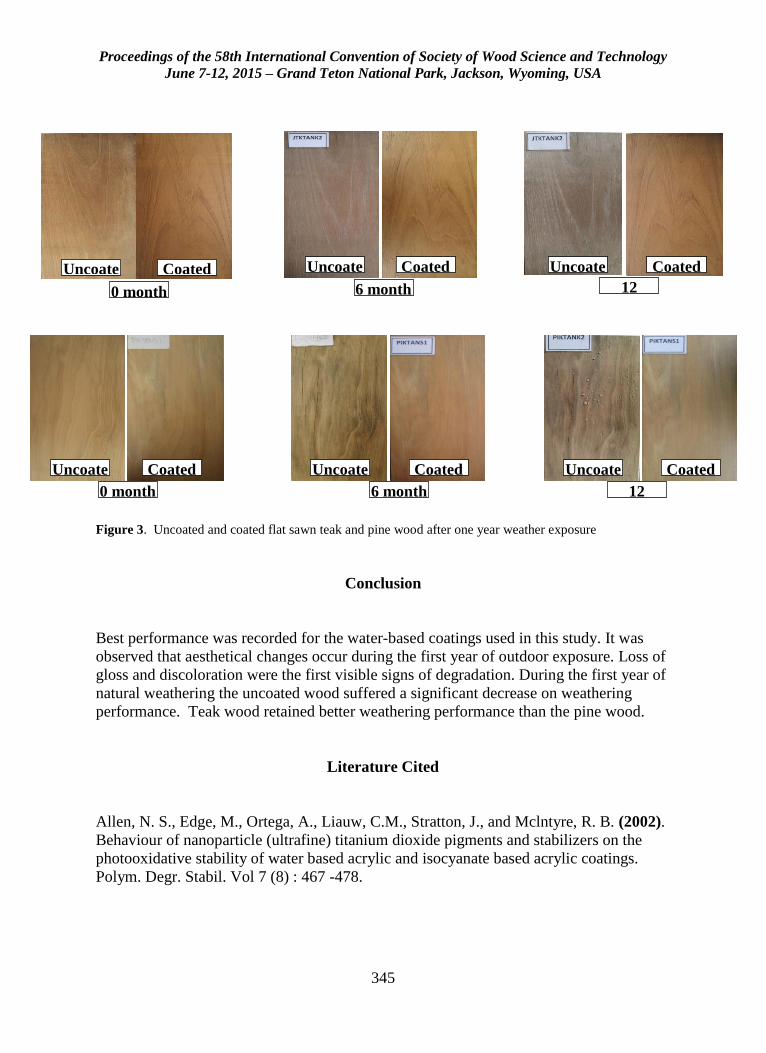
Proceedings of the 58th International Convention of Society of Wood Science and Technology
June 7-12, 2015 – Grand Teton National Park, Jackson, Wyoming, USA
345
Figure 3. Uncoated and coated flat sawn teak and pine wood after one year weather exposure
Conclusion
Best performance was recorded for the water-based coatings used in this study. It was
observed that aesthetical changes occur during the first year of outdoor exposure. Loss of
gloss and discoloration were the first visible signs of degradation. During the first year of
natural weathering the uncoated wood suffered a significant decrease on weathering
performance. Teak wood retained better weathering performance than the pine wood.
Literature Cited
Allen, N. S., Edge, M., Ortega, A., Liauw, C.M., Stratton, J., and Mclntyre, R. B. (2002).
Behaviour of nanoparticle (ultrafine) titanium dioxide pigments and stabilizers on the
photooxidative stability of water based acrylic and isocyanate based acrylic coatings.
Polym. Degr. Stabil. Vol 7 (8) : 467 -478.
0 month 6 month 12
month
Uncoate
d
Coated Uncoate
d
Coated Uncoate
d
Coated
Uncoate
d
Coated Uncoate
d
Coated Uncoate
d
Coated
0 month 6 month 12
month
Proceedings of the 58th International Convention of Society of Wood Science and Technology
June 7-12, 2015 – Grand Teton National Park, Jackson, Wyoming, USA
346
Deka M., and Petrid M. (2008). Photo-degradation of water bome acrylic coated modified
and non-modified wood during artihcial light exposure, BioResources Vol. 3 (2) : 346-
362
Feist W. C., and Hon D. N. S. (1984). Chemistry of weathering and protection, In:
Rowell, R. M. (ed.) The Chemistry of Solid Wood, Advances in Chemistry Series No.
207, American Chemical Society, Washington, DC, USA, Chapter 11, pp. 401-451.
Hansmann C., Deka M., Wimmer R., and Gindl W. (2006). Artificial weathering of wood
surfaces modified by melamine formaldehyde resins, Holz Roh Werkst. 64 (3) :168-203
Jacques L. F. E. (2000). Accelerated and outdoor/natural exposure testing of coatings.
Prog. Polym. Sci., Vol. 25 (9) : 1337 -1362.
Kiguchi M., Evans P. D., Ekstedt J., Williams R. S., Kataoka Y. (2001). Improvement
of the Durability of Clear Coatings by Grafting of UV-Absorbers on to Wood. Surf. Coat.
Int. Part B: Coat. Trans., Vol. 84 (4) : 263–270 (2001)
Nejad M., and Cooper P. (2011). Exterior wood coating : Performance of
semitransparent stains on preservative treated wood. J. Coat. Technol. Res., Vol 8 (4) :
449-458
Ozgenc O., Hiziroglu S., and Yildiz U. C. (2012). Weathering properties of wood
species treated with different coating applications. BioResources Vol 7 (4) : 4875-4888
Rowell, M., and Barbour, R. J. (1988). Archaeological wood: Properties, chemistry and
preservation," In: Proceedings of 196th meeting of the American Chemical Society,
Washington, Chapter 11.
Schaller C., and Rogez D. (2007). New approaches in wood coating stabilization, J. Coat.
Technol. Res. Vol. 4 (4) : 401-409
Schaller C., Rogez D., and Braig A. (2008). Hydroxyphenyl-s-triazines: Advanced
multipurpose UV-absorbers for coatings, J. Coat. Technol. Res. Vol. 5 (1) : 25-31.
Temiz, A., Terziev, N., Eikenes; M., and Hafren , J. (2007). Effect of accelerated
weathering on surface chemistry of modified wood, Appl. Surf. Sci. Vol. 253 (12) : 5355-
5362.
Williams, R.S. (2005). Handbook of wood chemistry and wood composites, In :
Weathering of Wood, Forest Service, Forest Products Laboratory, USDA, Chapter 7.
Zhang, J., Kandem, D. P., and Temiz, A. (2009). Weathering of copper-amine treated
wood, Appl. Surf. Sci., Vol. 256 (3) : 842-846.
Proceedings of the 58th International Convention of Society of Wood Science and Technology
June 7-12, 2015 – Grand Teton National Park, Jackson, Wyoming, USA
347
Influence of Inherent Yellow-Poplar Characteristics on
Adhesion Properties Needed for Cross-Laminated
Timber Panels
David DeVallance, [email protected]
Daniel Hovanec, [email protected]
West Virginia University, PO Box 6125, Division of Forestry & Natural
Resources, Morgantown, WV 26506
Abstract
Low-grade hardwood timber is an abundant resource in the Eastern United States.
Hardwood timber species are not currently approved for manufacturing cross-laminated
timber (CLT) panels under the ANSI/APA PRG-320, Standard for Performance-Rated
Cross-Laminated Timber. However, many low-value, low-grade Appalachian hardwoods
could be used for producing CLT products once the necessary research is performed.
Specifically, it is necessary to determine which controllable factors affect adhesive bond
quality, as the use of hardwoods in a bonding assembly can results in poor bond quality.
For example, a greater presence of extractives can interfere with available bonding sites
on the wood surface, and higher density can negatively affect bond quality as the
dimensional changes resultant of moisture absorption and loss can create stress on the
bond line. The objective of this research was to determine the characteristics of yellow-
poplar lumber that affect adhesive bond quality for use in cross-laminated timbers
(CLTs). Twelve different treatments were applied to yellow-poplar lumber to examine
the interactions and main effects of adherend thickness, lamination orientation, and
orthotropic orientation (saw pattern). Bond strength and durability was determined using
shear-block and cyclic delamination tests. Results related to the inherent yellow-poplar
characteristics that result in the best adhesion properties will be presented and compared
to industrial-accepted softwood controls.
Proceedings of the 58th International Convention of Society of Wood Science and Technology
June 7-12, 2015 – Grand Teton National Park, Jackson, Wyoming, USA
348
Global Trends in Furniture Production and Trade and
the Turkish Furniture Industry
Tuncer Dilik 1* – K. Hüseyin Koç2 – E. Seda Erdinler3–Emel Öztürk4
1 Associate Professor, Department of Forest Industrial Engineering, Faculty
of Forestry, Istanbul University, 34473,Istanbul, TURKEY.
* Corresponding author
[email protected] 2 Professor Dr., Department of Forest Industrial Engineering, Faculty of
Forestry, Istanbul University, 34473, Istanbul, TURKEY.
[email protected] 3 Assistant Professor, Department of Forest Industrial Engineering, Faculty
of Forestry, Istanbul University, 34473, Istanbul, TURKEY.
[email protected] 4 Research Assistant Dr., Department of Forest Industrial Engineering,
Faculty of Forestry, Istanbul University, 34473, Istanbul, TURKEY.
Abstract
New trends and their reflections show themselves also in furniture production and trade.
The close relationship of furniture with fashion causes easier exposure of the trends in
various fields from furniture design to production technology, procurement methods to
renewal and changing interval. The study analyzes the impact of global furniture trends
on the industries. For this purpose, status of the Turkish furniture industry, which has
gained a fast development process, is being examined in terms of production capacity and
trade volume, and it is tried to determine the impact of trends on development strategies.
The priorities for ensuring sustainability in development are also discussed. In 2012, the
global furniture production has been realized as US$ 450 billion, it’s been clearly
understood from the export figure of US$ 160 billion and import figure of US$ 154
billion that the international trade increases gradually. As mainly the first 25 countries in
the list perform the global furniture trade, it can be said that 70 countries have an active
role in the industry with roughly 200 companies. Although Turkey has more than 1%
share in the global furniture production with its total production capacity and although
new technologies and modern business practices have become common, it is possible to
tell that the impact of global furniture trends is on top of the reasons why the market
share is not at the desired level and there is no Turkish furniture image in the world yet.
Proceedings of the 58th International Convention of Society of Wood Science and Technology
June 7-12, 2015 – Grand Teton National Park, Jackson, Wyoming, USA
349
Keywords: Turkish furniture industry, Global furniture trends, Furniture foreign trade,
furniture production in Turkey, furniture export of Turkey, furniture import of Turkey.
Introduction
Trends and reflections rapidly developing with the impact of the globalization
experienced in every area today also show themselves in furniture production and trade.
Exposures arising from the trends are more apparent in the furniture industry compared to
the other industries. The close relationship of furniture with fashion causes the impact of
the trends to be seen easier in various areas from design to production technology of
furniture, procurement methods to renewal and changing intervals. On the other hand, the
developing technology and business administration practices oblige following up the
trends [Kurtoglu and Dilik 2014]. The study analyzes the impacts of the trends developed
in the world on the furniture industry. For this purpose, the status, production capacity
and the trade volume of the Turkish furniture industry, which has gained a quick
development process, are examined and the impact of the trends on development
strategies is assessed. In addition to this, the priorities for ensuring sustainability in
development and the trends are discussed.
When the development of the global furniture production during the last ten years is
examined, it's seen that the production volume and its share in the international trade
have grown apace. This can be seen from the export figure of 160 billion dollars and
import figure of 154 billion dollars within the international trade part of the global
furniture production of approximately 450 billion dollars, according to 2012 Turkish
Statistical Institute (TUIK) and Trademap data. As the furniture industry is among the top
five fastest growing industries of the country, it can easily be seen that this development
in the world is also available in the Turkish furniture industry. Furthermore, the furniture
industry appears on top of the industries with positive foreign trade balance while it
continues to grow. With an estimated furniture production value of 11,6 billion liras,
Turkey has a market share of more than two percent in the global furniture production.
But this market share is not at the desired level considering the existing technological
infrastructure of the industry [Trademap 2012, TUIK 2014, Turkey Furniture Products
Assembly Industry Report 2013, Anonymous, 2012]. On the other hand, the Turkish
furniture industry quickly discovers the new technologies and modern operational
practices in the world and aims to increase its market share in the global furniture
production. It can be argued that the impact of the global furniture trends is on top of the
reasons why no Turkish furniture image is established and the desired level of
development is obtained in the world yet. However, the Turkish furniture industry
appears to have a remarkable effort in catching and discovering the trends in line with the
developments in the world. As a matter of fact, it hosts trend works and innovation
exhibitions (like ZOW on March 19-22, 2015 in Istanbul, Turkey Innovation Week on
December 4-6, 2014 in Istanbul etc.) featuring the international furniture trends, which
are held in the important centers of the furniture world during the recent years [DTM
2012, Imm Cologne 2014].
Proceedings of the 58th International Convention of Society of Wood Science and Technology
June 7-12, 2015 – Grand Teton National Park, Jackson, Wyoming, USA
350
Materials and Methods
This study, using literature research and an observation based method, the impacts and
reflections of the global trends in the field of furniture and decoration on the Turkish
furniture industry are analyzed. For this purpose, the Industrial Commodity Statistics
generated by the UNSD (United Nations Statistics Division), as well as national or
international industry reports and market researches related to the furniture industry are
used as a data source. With the data obtained within this scope, the development of the
Turkish furniture industry in terms of production and foreign trade volume in line with
the strategic targets, as well as the development status of the furniture industry in the
world and in Turkey have been analyzed with production and foreign trade values. In
addition to this, the status of the global trends and properties in furniture in the Turkish
furniture industry has been discussed with sub-sector and product based assessments.
Results and Discussion
Place of furniture industry in the global economy and its development
The furniture industry is one of the most important economic industries in the world with
a production value of 450 billion dollars in average together with primary and secondary
components. Although half of this furniture produced is sold and consumed within the
own production region, it's seen that a significant part (176 billion dollars) is sold outside
the production region, in other words is subject to foreign trade. The global furniture
industry features a significant number in terms of employment. The industry expands its
area each passing day with an employment of 260.000 people, as well as with the
furniture produced in the entire world [Trademap2012, Imm Cologne 2014]. In parallel
to the economical and technological development, the furniture industry also strives for
development and change against the changing demand levels and quantities. For this
purpose, organizations and exhibitions with strategic themes, which were organized with
a limited amount before, are now organized in great numbers in various countries.
Through these exhibitions, both the furniture produced is evaluated in terms of design,
diversity, innovation etc., and information related to the status of the industry is provided
about the trends in every field from design to production, sales and marketing to after-
sales service. Italy, hosting 10 of average 60 international exhibitions organized every
year throughout the world, is on top of the exhibition organizations. Italy is followed by
China organizing 9 exhibitions every year and Germany organizing 6 exhibitions every
year [Gaggenau 2015, UNcomtrade, 2012]. Turkey strives for enabling its activities in
this industry with 2 international and 4 national exhibitions organized every year.
Considering the global furniture production data for the last five years, it's seen that
China directs the industry in various aspects. As it can be seen from Table 1, only China
produces one fourth (25%) of the furniture produced in the entire world. China is
followed by the USA (15%), Italy (8%) and Germany (7%) [Trademap, 2012, CSIL 2011,
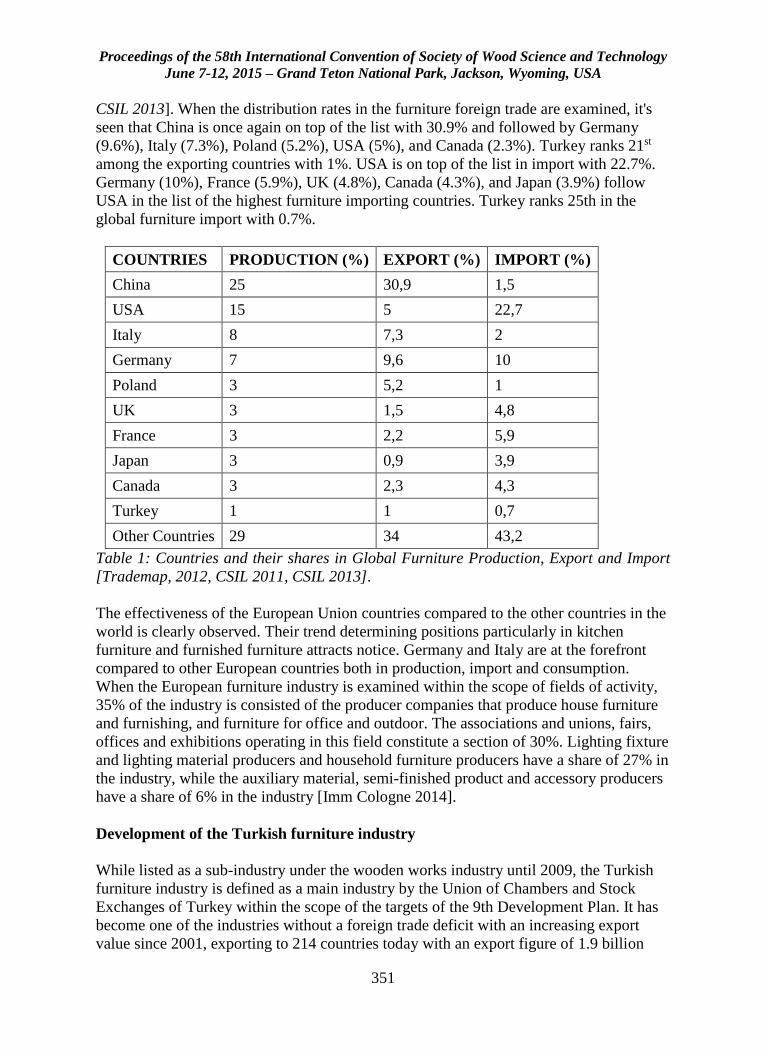
Proceedings of the 58th International Convention of Society of Wood Science and Technology
June 7-12, 2015 – Grand Teton National Park, Jackson, Wyoming, USA
351
CSIL 2013]. When the distribution rates in the furniture foreign trade are examined, it's
seen that China is once again on top of the list with 30.9% and followed by Germany
(9.6%), Italy (7.3%), Poland (5.2%), USA (5%), and Canada (2.3%). Turkey ranks 21st
among the exporting countries with 1%. USA is on top of the list in import with 22.7%.
Germany (10%), France (5.9%), UK (4.8%), Canada (4.3%), and Japan (3.9%) follow
USA in the list of the highest furniture importing countries. Turkey ranks 25th in the
global furniture import with 0.7%.
COUNTRIES PRODUCTION (%) EXPORT (%) IMPORT (%)
China 25 30,9 1,5
USA 15 5 22,7
Italy 8 7,3 2
Germany 7 9,6 10
Poland 3 5,2 1
UK 3 1,5 4,8
France 3 2,2 5,9
Japan 3 0,9 3,9
Canada 3 2,3 4,3
Turkey 1 1 0,7
Other Countries 29 34 43,2
Table 1: Countries and their shares in Global Furniture Production, Export and Import
[Trademap, 2012, CSIL 2011, CSIL 2013].
The effectiveness of the European Union countries compared to the other countries in the
world is clearly observed. Their trend determining positions particularly in kitchen
furniture and furnished furniture attracts notice. Germany and Italy are at the forefront
compared to other European countries both in production, import and consumption.
When the European furniture industry is examined within the scope of fields of activity,
35% of the industry is consisted of the producer companies that produce house furniture
and furnishing, and furniture for office and outdoor. The associations and unions, fairs,
offices and exhibitions operating in this field constitute a section of 30%. Lighting fixture
and lighting material producers and household furniture producers have a share of 27% in
the industry, while the auxiliary material, semi-finished product and accessory producers
have a share of 6% in the industry [Imm Cologne 2014].
Development of the Turkish furniture industry
While listed as a sub-industry under the wooden works industry until 2009, the Turkish
furniture industry is defined as a main industry by the Union of Chambers and Stock
Exchanges of Turkey within the scope of the targets of the 9th Development Plan. It has
become one of the industries without a foreign trade deficit with an increasing export
value since 2001, exporting to 214 countries today with an export figure of 1.9 billion
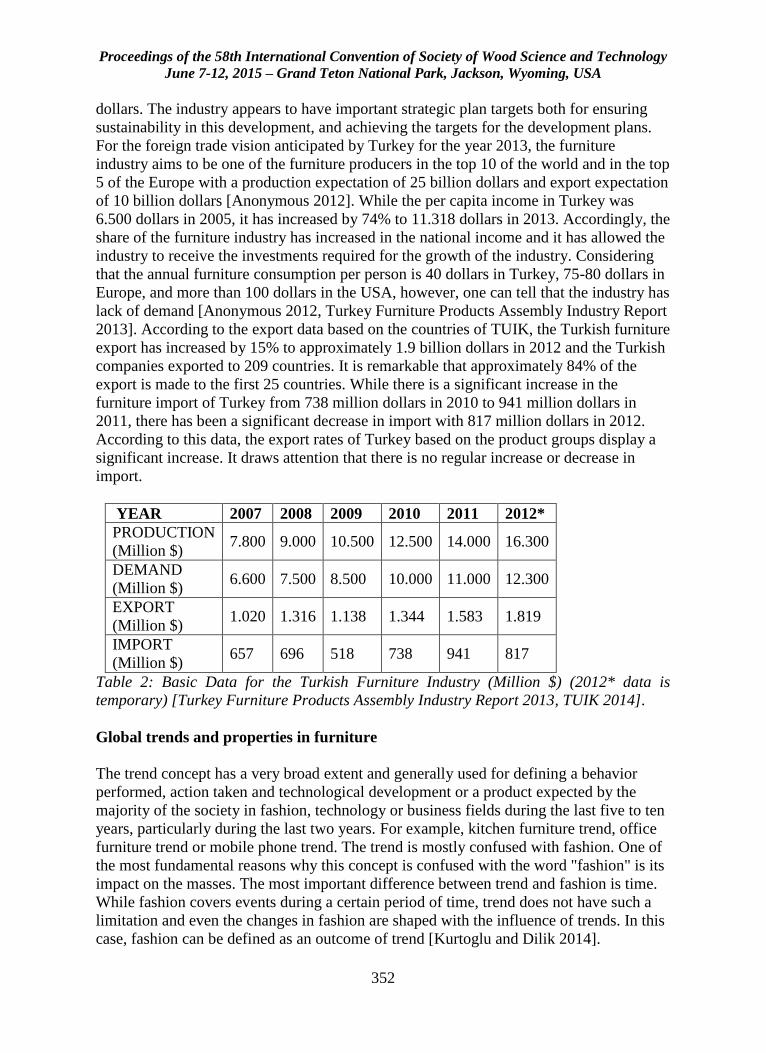
Proceedings of the 58th International Convention of Society of Wood Science and Technology
June 7-12, 2015 – Grand Teton National Park, Jackson, Wyoming, USA
352
dollars. The industry appears to have important strategic plan targets both for ensuring
sustainability in this development, and achieving the targets for the development plans.
For the foreign trade vision anticipated by Turkey for the year 2013, the furniture
industry aims to be one of the furniture producers in the top 10 of the world and in the top
5 of the Europe with a production expectation of 25 billion dollars and export expectation
of 10 billion dollars [Anonymous 2012]. While the per capita income in Turkey was
6.500 dollars in 2005, it has increased by 74% to 11.318 dollars in 2013. Accordingly, the
share of the furniture industry has increased in the national income and it has allowed the
industry to receive the investments required for the growth of the industry. Considering
that the annual furniture consumption per person is 40 dollars in Turkey, 75-80 dollars in
Europe, and more than 100 dollars in the USA, however, one can tell that the industry has
lack of demand [Anonymous 2012, Turkey Furniture Products Assembly Industry Report
2013]. According to the export data based on the countries of TUIK, the Turkish furniture
export has increased by 15% to approximately 1.9 billion dollars in 2012 and the Turkish
companies exported to 209 countries. It is remarkable that approximately 84% of the
export is made to the first 25 countries. While there is a significant increase in the
furniture import of Turkey from 738 million dollars in 2010 to 941 million dollars in
2011, there has been a significant decrease in import with 817 million dollars in 2012.
According to this data, the export rates of Turkey based on the product groups display a
significant increase. It draws attention that there is no regular increase or decrease in
import.
YEAR 2007 2008 2009 2010 2011 2012*
PRODUCTION
(Million $) 7.800 9.000 10.500 12.500 14.000 16.300
DEMAND
(Million $) 6.600 7.500 8.500 10.000 11.000 12.300
EXPORT
(Million $) 1.020 1.316 1.138 1.344 1.583 1.819
IMPORT
(Million $) 657 696 518 738 941 817
Table 2: Basic Data for the Turkish Furniture Industry (Million $) (2012* data is
temporary) [Turkey Furniture Products Assembly Industry Report 2013, TUIK 2014].
Global trends and properties in furniture
The trend concept has a very broad extent and generally used for defining a behavior
performed, action taken and technological development or a product expected by the
majority of the society in fashion, technology or business fields during the last five to ten
years, particularly during the last two years. For example, kitchen furniture trend, office
furniture trend or mobile phone trend. The trend is mostly confused with fashion. One of
the most fundamental reasons why this concept is confused with the word "fashion" is its
impact on the masses. The most important difference between trend and fashion is time.
While fashion covers events during a certain period of time, trend does not have such a
limitation and even the changes in fashion are shaped with the influence of trends. In this
case, fashion can be defined as an outcome of trend [Kurtoglu and Dilik 2014].
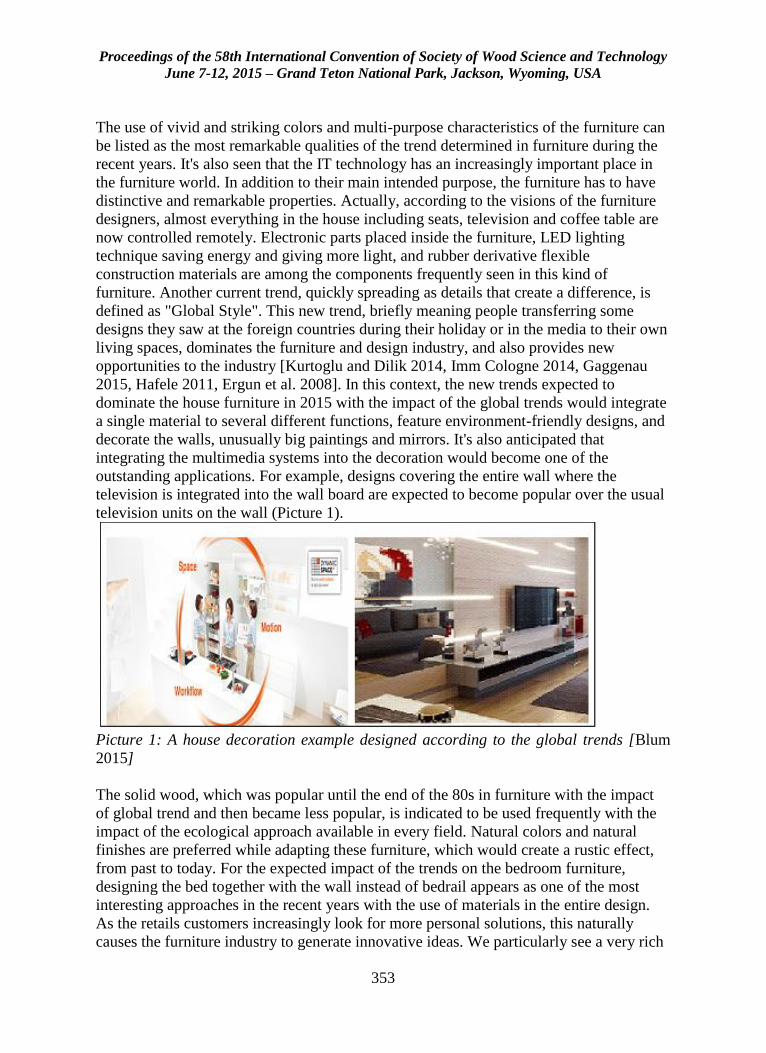
Proceedings of the 58th International Convention of Society of Wood Science and Technology
June 7-12, 2015 – Grand Teton National Park, Jackson, Wyoming, USA
353
The use of vivid and striking colors and multi-purpose characteristics of the furniture can
be listed as the most remarkable qualities of the trend determined in furniture during the
recent years. It's also seen that the IT technology has an increasingly important place in
the furniture world. In addition to their main intended purpose, the furniture has to have
distinctive and remarkable properties. Actually, according to the visions of the furniture
designers, almost everything in the house including seats, television and coffee table are
now controlled remotely. Electronic parts placed inside the furniture, LED lighting
technique saving energy and giving more light, and rubber derivative flexible
construction materials are among the components frequently seen in this kind of
furniture. Another current trend, quickly spreading as details that create a difference, is
defined as "Global Style". This new trend, briefly meaning people transferring some
designs they saw at the foreign countries during their holiday or in the media to their own
living spaces, dominates the furniture and design industry, and also provides new
opportunities to the industry [Kurtoglu and Dilik 2014, Imm Cologne 2014, Gaggenau
2015, Hafele 2011, Ergun et al. 2008]. In this context, the new trends expected to
dominate the house furniture in 2015 with the impact of the global trends would integrate
a single material to several different functions, feature environment-friendly designs, and
decorate the walls, unusually big paintings and mirrors. It's also anticipated that
integrating the multimedia systems into the decoration would become one of the
outstanding applications. For example, designs covering the entire wall where the
television is integrated into the wall board are expected to become popular over the usual
television units on the wall (Picture 1).
Picture 1: A house decoration example designed according to the global trends [Blum
2015]
The solid wood, which was popular until the end of the 80s in furniture with the impact
of global trend and then became less popular, is indicated to be used frequently with the
impact of the ecological approach available in every field. Natural colors and natural
finishes are preferred while adapting these furniture, which would create a rustic effect,
from past to today. For the expected impact of the trends on the bedroom furniture,
designing the bed together with the wall instead of bedrail appears as one of the most
interesting approaches in the recent years with the use of materials in the entire design.
As the retails customers increasingly look for more personal solutions, this naturally
causes the furniture industry to generate innovative ideas. We particularly see a very rich
Proceedings of the 58th International Convention of Society of Wood Science and Technology
June 7-12, 2015 – Grand Teton National Park, Jackson, Wyoming, USA
354
product variety for the kitchens. The collections now feature units with surface materials
furnished with brand new patterns, as well as multisite and multiscope placement of Hi-
Tech combining ease of use with energy efficiency. The life trends of the year 2014
indicate units with more flexibility and "smarter" functions, integrating modern flat
screen televisions with interior architecture. For example, the target of the German
kitchen industry appears applying these ideas, while determining good work flow,
sufficient storage area and high movement comfort as three fundamental principles of a
practical kitchen. Shortening the intervals between the purchases with easy replacement
of the units when the designs become old fashioned also provides an advantage for the
kitchen industry. As the new houses are mostly small and tight, they do not have a
sufficient storage area. Therefore, several possible solutions such as better use of height
and depth in the kitchens, where storage is required too much, are being developed
[BLUM 2015, Gijs 2013]. About the impact of the global trends on the materials used in
furniture; the effort on adapting the light materials, the indispensable material for the
planes, ships and automobiles, into every field continues with full pace for a long time.
However, it's been found out that this trend does not apply too much in the furniture
industry, other than the exception of IKEA using light materials in high quantities. To
date, the "lightness" factor did not trigger any industrial shift compelling the development
of a new production technology. But this situation is expected to change with the
furniture where materials with internal spaces, perfectly hiding the cables and connectors
of lighting, home entertainment systems and electronic remote controls, are used. On the
other hand, it's seen that the digital printing techniques, triggering innovation in every
field with laser cut sidebands, are in forefront of the furniture industry with unlimited
opportunities. But it's found out that this situation exposes the furniture industry to these
questions: Who will carry out the printing job in the future? Decorators? Panel
producers? Or furniture producers? Considering that all of them are investing to digital
printing presses, one can say that the situation becomes increasingly unclear.
Summary and Conclusions
In our era where the needs such as quality and functionality stand out, the impact of
global trends on the development of the furniture industry is clearly evident. The Turkish
furniture industry has set the target of being the 10th biggest furniture producer in the
world and 5th biggest furniture producer in Europe for the year 2023, 100th anniversary
of the establishment of the Republic of Turkey. As in the development of the global
furniture industry, following and anticipating the global trends appears to be important
for the Turkish furniture industry in achieving the targeted development.
As a result, the impacts of the global trends observed on the development of the furniture
industry can be summarized as follows:
Emerging and spreading of modern electro-furniture equipped with technology as
a requirement of the modern life.
Reflection of smart house and green building on furniture. The increase in the
importance of recycling and furniture wastes.
Proceedings of the 58th International Convention of Society of Wood Science and Technology
June 7-12, 2015 – Grand Teton National Park, Jackson, Wyoming, USA
355
Seeing smart furniture and environment-friendly furniture applications more.
Quick increase of the human- and environment-friendly, light, functional, easily
portable, modular furniture, which increase the life quality and provide ease of
use in line with the urbanization and increasing housing understanding, in the
global market.
Suppliers attending to the design process more, stakeholders with specialties in
different fields focusing more on joint design management works (furniture,
electronic, IT technology, accessory etc.).
Quicker development of advanced design skill, brand power, after-sales service
quality effectiveness as the fields leading the growth in the industry.
Developments in the fields of packing, packaging and transporting fields to
increase the international action, facilitating the shipment of the products to
distant regions, reducing the sales costs.
Quickly increasing the use of dirt and stain free fabrics, leathers, environment-
friendly sponges, paints and varnishes as a result of the reflections of nano-
technology applications in the material.
References
Anonymous, 2012 Furniture Industry Report 2012/1 Science, Industry and Technology
Ministry of Turkey, Directorate General of Industry, Ankara, Turkey, 2012.
BLUM, 2015 http://www.blum.com/tr/tr/03/10/ (23.02.2015).
CSIL, 2011 World Furniture Outlook 2010/2011 Annual Percentage Changes (Global
Furniture Trade (Annual Trend)), Milan, Italy.
CSIL, 2013 World Furniture Outlook, 12th edition of the Seminar organized by CSIL,
Wednesday, April 10, 2013, FIERA MILANO-RHO CONGRESS CENTRE. Italy.
DTM, 2012 Furniture import & export data. The Undersecretariat of Foreign Trade of
Turkey, Ankara.
Ergun O, Koc K H, Erdinler E S, 2008 Ecologic Design and Turkish Furniture Industry.
Furniture Decoration Magazine, Issue 87, 460-474, November-December 2008, Istanbul.
Gaggenau, 2015 http://www.gaggenau-press.com/TR/tr/press-
releases.html?PHPSESSID=2vq69fu8mqlbm8irpblbejud35(27.01.2015).
Gijs van W, 2013 The Innovation Expedition, BIS Publishers, Amsterdam. ISBN:978-
605-4789-07-8, TIM- Turkish Exporters' Assembly, December 2014, Istanbul.
Hafele, 2011 http://www.hafele.com.tr/documents/HTR_HAFELE_TREND_2011,
(24.12.2014).
Imm Cologne 2014 Final report. http://news.imm-cologne.com/2013/01/final-report-
imm-cologne-livingkitchen-2013/#more-484 (13.02.2015).
Proceedings of the 58th International Convention of Society of Wood Science and Technology
June 7-12, 2015 – Grand Teton National Park, Jackson, Wyoming, USA
356
Kurtoglu A, Dilik T, 2014 Furniture Industry Coursebook Notes, Istanbul University,
Faculty of Forestry, Department of Forest Industrial Engineering, Istanbul, Turkey,
2014.
Trademap, 2012 International Trade Center, Trade Statistics, Exports 2001-2011
International Trade in Goods Statistics by Product Group. List of exporters for the
selected products 9401- 9404
TUIK, 2014 The Turkish Statistical Institute Database Annual Industrial Products
Statistics. Ankara.
Turkey Furniture Products Assembly Industry Report 2013, ISBN: 978-605-137-339-3,
TOBB Publication No: 2014/212 , Ankara, Turkey.
UNcomtrade, 2012 United Nations Commodity Trade Statistics Database.
http://comtrade.un.org/db/default.aspx (11.02.2015).
Acknowledgement
This study is supported by Scientific Research Projects Coordination Unit of Istanbul
University with project no. UDP-51869.
Proceedings of the 58th International Convention of Society of Wood Science and Technology
June 7-12, 2015 – Grand Teton National Park, Jackson, Wyoming, USA
357
Serviceability Sensitivity Analysis of Wood Floors Using
OpenSees
Harvey Burch1, Samuel Sanchez2, Arya Ebrahimpour3*
1 Structural Engineer, Engineering System Solutions, 4943 N 29th E, Suite
A
Idaho Falls ID, USA
[email protected] 2 Graduate Student, Dept. of Civil and Environmental Engineering,
Idaho State University, Pocatello ID, USA
[email protected] 3 Professor, Dept. of Civil and Environmental Engineering
Idaho State University, Pocatello ID, USA
*Corresponding author
Abstract
This paper reviews several design criteria for preventing unacceptable wood floor
vibrations and presents the results of a sensitivity analysis on static and dynamic
responses of wood floor systems under occupant-induced loads. To accomplish this task,
a user interface for the OpenSees finite element analysis program was developed. The
interface was created in Microsoft Excel and allows user input for various floor system
properties which are used as input into OpenSees. Results from the OpenSees program
are imported into the user interface and compared against multiple acceptance criteria
which have been established by researchers to determine fitness of the floor system. It
was determined that a system with a 1.92 kPa (40 psf) uniform load modeled as a floor
with one continuous piece of sheathing covering the entire floor system produced
deflections which averaged 32 percent to a maximum of 45 percent lower than a floor
system modeled with jointed sheathing. For a 1 kN (225 lb) force applied at the center of
the floor, floors with jointed sheathing had an average of 12 percent and a maximum of
15 percent larger displacements compared to the floors with continuous sheathing. Floors
with jointed sheathing had an average of 8 percent and a maximum of 12 percent lower
unoccupied natural frequencies compared to the floors with continuous sheathing. Floors
with jointed sheathing had an average of 10 percent and a maximum of 13 percent lower
occupied natural frequencies compared to the floors with continuous sheathing. Floors
with jointed sheathing also achieved an average of 17 percent and a maximum of 38
percent larger frequency-weighted one-second root-mean-square acceleration values
compared to the floors with continuous sheathing. The results show that great care must
Proceedings of the 58th International Convention of Society of Wood Science and Technology
June 7-12, 2015 – Grand Teton National Park, Jackson, Wyoming, USA
358
be taken when simplifying the sheathing setup on a floor model since the results of the
model create the illusion of better serviceability performance than actual installed floors
will achieve.
Keywords: sensitivity analysis, wood floors, engineered joists, vibrations, OpenSees,
finite element analysis, spreadsheet.
Introduction
Annoying floor vibrations in wood floor construction has become a major issue that
needs to be considered at the time of design. The widespread use of engineered wood I-
joist systems have allowed for longer spans and lighter construction. This advancement
has come with many benefits but also with the increase of the vibrational response of
floor systems. Footfall impact has been the most common source of annoying vibrations
for wood floors. Over the years the design recommendation to limit deflection produced
by a uniformly distributed static load of 1.9 kN/m2 (40 psf) has been span/360. But, this
requirement is insufficient in avoiding excessive vibrations. Researchers have presented
other design criteria that limit vibrations in wood floors. However, some of the criteria
need intensive calculations that require knowledge of structural dynamics.
The criteria studied were those of the International Building Code, Foschi and Gupta
(1987), Onysko et al. (2001), Dolan et al. (1999), Lin J. Hu (2007), and Smith and Chui
(1988). The first three criteria deal with static deflection. The International Building Code
requires that the maximum allowable deflection for floor members with an applied live
load be less than or equal to span/360. Foschi and Gupta’s criterion requires that a “bare”
joist loaded at the center with a concentrated load of 1 kN (225 lb) have a 1 mm (0.04 in.)
or smaller defection. This deflection is found using Eq. (1).
(1)
Onysko, et al. propose a criterion that limits floor vibration more accurately than the
standard span/360. They proposed that to limit floor vibrations the following should be
used:
a) for spans beyond approximately 3.0 m and 5.5 m
b) for span between 5.5 m and approximately 9.9 m
c) for spans beyond approximately 9.9 m
d) for spans under approximately 3.0 m
e) for all spans
Where, = floor system deflection in mm under 1 kN (225 lb), L = span length in m, and
= the maximum deflection of a floor member under the action of a uniformly
distributed load of 1.9 kN/m2 (40 psf).
Proceedings of the 58th International Convention of Society of Wood Science and Technology
June 7-12, 2015 – Grand Teton National Park, Jackson, Wyoming, USA
359
The next three criteria predict acceptability of a floor by calculating the natural frequency
of a floor system. Dolan, et al. provided a simple method of estimating the natural
frequency. Their criterion proposes that the natural frequency be calculated using the
following equation:
(2)
Where, g = acceleration of gravity; E = joist modulus of elasticity; I = moment of inertia
of joist alone; W = weight of floor system supported by joist; and L = span length.
Based on results of 180 floors tested the acceptability criterion states that for a floor to be
adequate, the natural frequency of an unoccupied floor must be higher than 15 Hz, and 14
Hz for an occupied floor.
Hu’s criterion deals with a combination of natural frequency and static displacement.
This criterion was validated with a database of 160 floors. The floors were rated by
occupants as to their vibration acceptability. Hu stated that the allowed deflection can be
determined using the following equation:
(3)
Where, f = natural frequency (Hz); d = deflection (mm). The static deflection is measured
after a load of 1-kN (225 lb) is applied at mid-span.
The last criterion is that proposed by Smith and Chui. Smith and Chui’s research focuses
on providing a method to predict the dynamic behavior of light-weight wood-joist floors.
These floors are semi-rigid and are attached to wood based sheathing. Their method
allows the user to predict the natural frequencies and the one-second root-mean-square
acceleration under a simplified force function. Since humans are more sensitive to
vibrations with natural frequencies between 4-8 Hz, Smith and Chui require that a floor
system must have a natural frequency greater than 8 Hz. In addition, the criterion
specifies that the frequency-weighted root-mean-square (rms) acceleration experienced
by the observer must not exceed a threshold value. This value is a result of the heel-drop
test impact where acceptable root-mean-square acceleration must be less than 0.45 m/s2.
Smith and Chui propose the following equation to estimate the floor natural:
(4)
Where, fo = fundamental natural frequency; a = floor span; b = floor width; c = joist
width; d = joist depth; h = sheathing thickness; Ej = modulus of elasticity of joist; Ij =
area moment of inertia of joist; n = number of joist; ρs = density of sheathing; ρj = density
of joist.
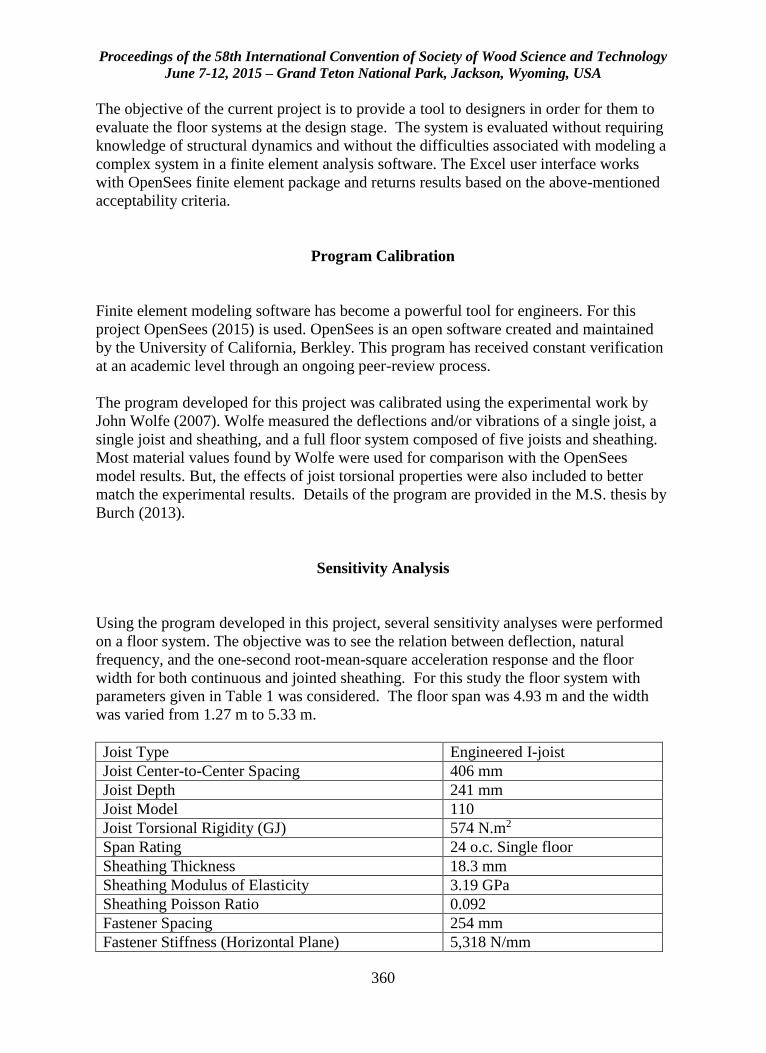
Proceedings of the 58th International Convention of Society of Wood Science and Technology
June 7-12, 2015 – Grand Teton National Park, Jackson, Wyoming, USA
360
The objective of the current project is to provide a tool to designers in order for them to
evaluate the floor systems at the design stage. The system is evaluated without requiring
knowledge of structural dynamics and without the difficulties associated with modeling a
complex system in a finite element analysis software. The Excel user interface works
with OpenSees finite element package and returns results based on the above-mentioned
acceptability criteria.
Program Calibration
Finite element modeling software has become a powerful tool for engineers. For this
project OpenSees (2015) is used. OpenSees is an open software created and maintained
by the University of California, Berkley. This program has received constant verification
at an academic level through an ongoing peer-review process.
The program developed for this project was calibrated using the experimental work by
John Wolfe (2007). Wolfe measured the deflections and/or vibrations of a single joist, a
single joist and sheathing, and a full floor system composed of five joists and sheathing.
Most material values found by Wolfe were used for comparison with the OpenSees
model results. But, the effects of joist torsional properties were also included to better
match the experimental results. Details of the program are provided in the M.S. thesis by
Burch (2013).
Sensitivity Analysis
Using the program developed in this project, several sensitivity analyses were performed
on a floor system. The objective was to see the relation between deflection, natural
frequency, and the one-second root-mean-square acceleration response and the floor
width for both continuous and jointed sheathing. For this study the floor system with
parameters given in Table 1 was considered. The floor span was 4.93 m and the width
was varied from 1.27 m to 5.33 m.
Joist Type Engineered I-joist
Joist Center-to-Center Spacing 406 mm
Joist Depth 241 mm
Joist Model 110
Joist Torsional Rigidity (GJ) 574 N.m2
Span Rating 24 o.c. Single floor
Sheathing Thickness 18.3 mm
Sheathing Modulus of Elasticity 3.19 GPa
Sheathing Poisson Ratio 0.092
Fastener Spacing 254 mm
Fastener Stiffness (Horizontal Plane) 5,318 N/mm
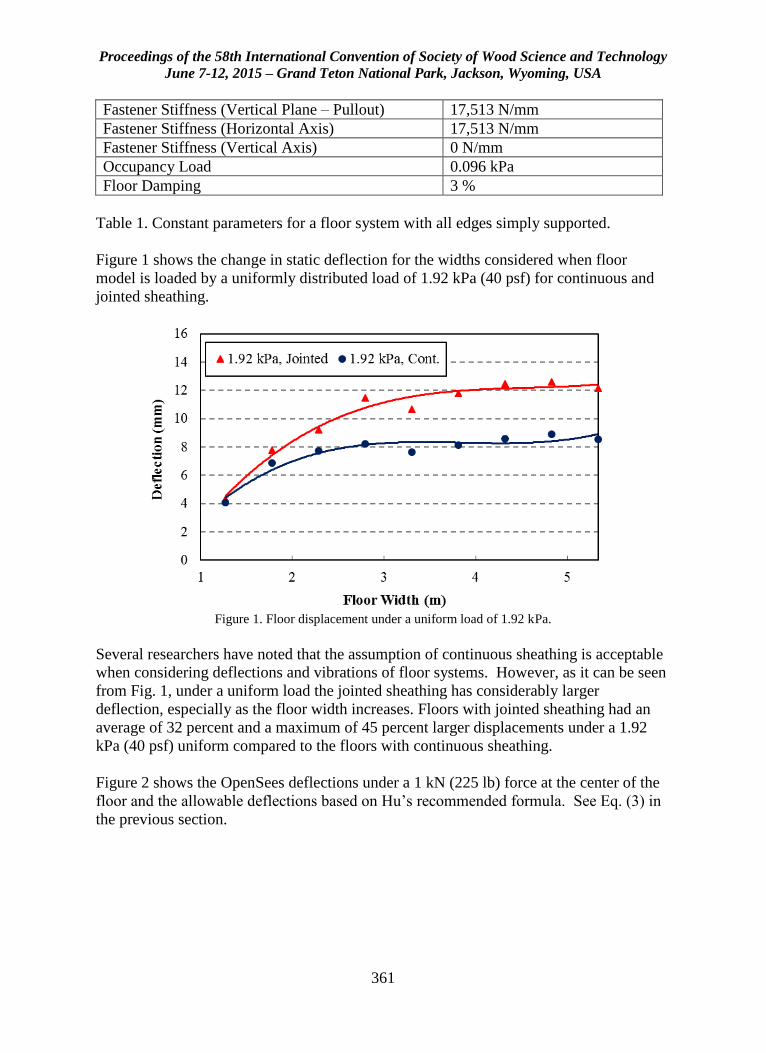
Proceedings of the 58th International Convention of Society of Wood Science and Technology
June 7-12, 2015 – Grand Teton National Park, Jackson, Wyoming, USA
361
Fastener Stiffness (Vertical Plane – Pullout) 17,513 N/mm
Fastener Stiffness (Horizontal Axis) 17,513 N/mm
Fastener Stiffness (Vertical Axis) 0 N/mm
Occupancy Load 0.096 kPa
Floor Damping 3 %
Table 1. Constant parameters for a floor system with all edges simply supported.
Figure 1 shows the change in static deflection for the widths considered when floor
model is loaded by a uniformly distributed load of 1.92 kPa (40 psf) for continuous and
jointed sheathing.
Figure 1. Floor displacement under a uniform load of 1.92 kPa.
Several researchers have noted that the assumption of continuous sheathing is acceptable
when considering deflections and vibrations of floor systems. However, as it can be seen
from Fig. 1, under a uniform load the jointed sheathing has considerably larger
deflection, especially as the floor width increases. Floors with jointed sheathing had an
average of 32 percent and a maximum of 45 percent larger displacements under a 1.92
kPa (40 psf) uniform compared to the floors with continuous sheathing.
Figure 2 shows the OpenSees deflections under a 1 kN (225 lb) force at the center of the
floor and the allowable deflections based on Hu’s recommended formula. See Eq. (3) in
the previous section.
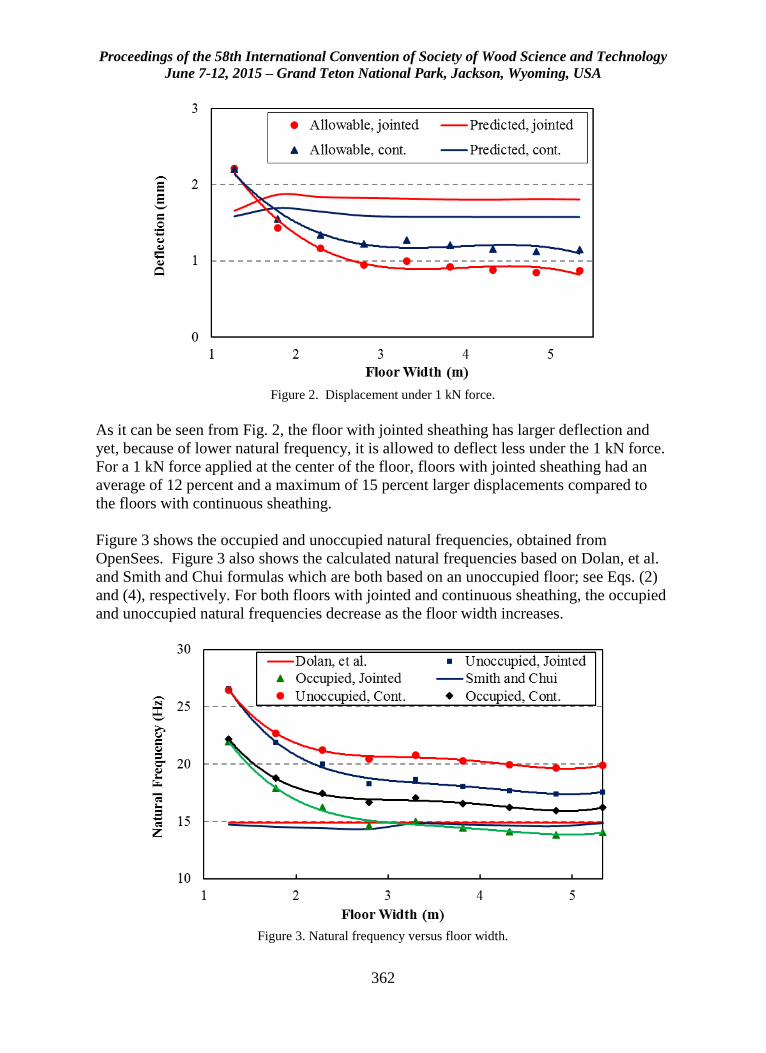
Proceedings of the 58th International Convention of Society of Wood Science and Technology
June 7-12, 2015 – Grand Teton National Park, Jackson, Wyoming, USA
362
Figure 2. Displacement under 1 kN force.
As it can be seen from Fig. 2, the floor with jointed sheathing has larger deflection and
yet, because of lower natural frequency, it is allowed to deflect less under the 1 kN force.
For a 1 kN force applied at the center of the floor, floors with jointed sheathing had an
average of 12 percent and a maximum of 15 percent larger displacements compared to
the floors with continuous sheathing.
Figure 3 shows the occupied and unoccupied natural frequencies, obtained from
OpenSees. Figure 3 also shows the calculated natural frequencies based on Dolan, et al.
and Smith and Chui formulas which are both based on an unoccupied floor; see Eqs. (2)
and (4), respectively. For both floors with jointed and continuous sheathing, the occupied
and unoccupied natural frequencies decrease as the floor width increases.
Figure 3. Natural frequency versus floor width.
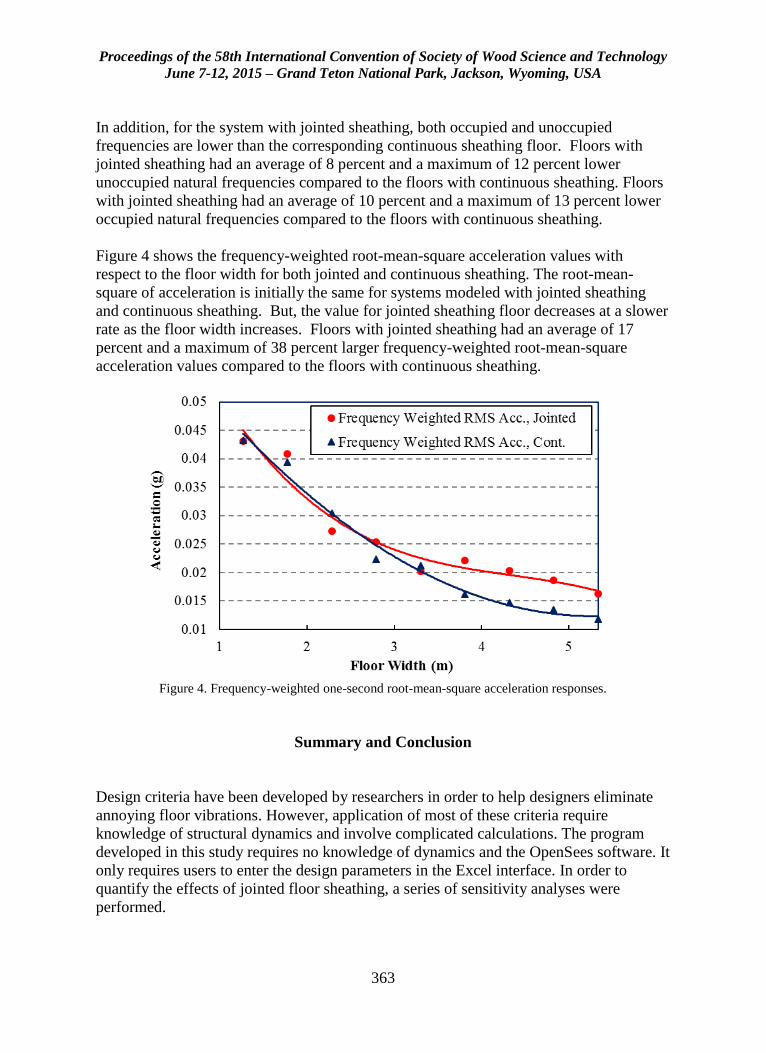
Proceedings of the 58th International Convention of Society of Wood Science and Technology
June 7-12, 2015 – Grand Teton National Park, Jackson, Wyoming, USA
363
In addition, for the system with jointed sheathing, both occupied and unoccupied
frequencies are lower than the corresponding continuous sheathing floor. Floors with
jointed sheathing had an average of 8 percent and a maximum of 12 percent lower
unoccupied natural frequencies compared to the floors with continuous sheathing. Floors
with jointed sheathing had an average of 10 percent and a maximum of 13 percent lower
occupied natural frequencies compared to the floors with continuous sheathing.
Figure 4 shows the frequency-weighted root-mean-square acceleration values with
respect to the floor width for both jointed and continuous sheathing. The root-mean-
square of acceleration is initially the same for systems modeled with jointed sheathing
and continuous sheathing. But, the value for jointed sheathing floor decreases at a slower
rate as the floor width increases. Floors with jointed sheathing had an average of 17
percent and a maximum of 38 percent larger frequency-weighted root-mean-square
acceleration values compared to the floors with continuous sheathing.
Figure 4. Frequency-weighted one-second root-mean-square acceleration responses.
Summary and Conclusion
Design criteria have been developed by researchers in order to help designers eliminate
annoying floor vibrations. However, application of most of these criteria require
knowledge of structural dynamics and involve complicated calculations. The program
developed in this study requires no knowledge of dynamics and the OpenSees software. It
only requires users to enter the design parameters in the Excel interface. In order to
quantify the effects of jointed floor sheathing, a series of sensitivity analyses were
performed.
Proceedings of the 58th International Convention of Society of Wood Science and Technology
June 7-12, 2015 – Grand Teton National Park, Jackson, Wyoming, USA
364
Floors modeled with continuous sheathing had lower displacement values than the floors
modeled with jointed sheathing. For a 1.92 kPa (40 psf) uniform load, floors with jointed
sheathing had an average of 32 percent to a maximum of 45 percent larger displacement
than floors with continuous sheathing. For a 1 kN (225 lb) force applied at the center of
the floor, floors with jointed sheathing had an average of 12 percent and a maximum of
15 percent lager displacements compared to floors with continuous sheathing.
For unoccupied floors, floors with jointed sheathing had an average of 8 percent and
maximum of 12 percent lower natural frequencies compared to the floors with continuous
sheathing. Percentage decreased as the width of the floor increased. Floors with jointed
sheathing had an average of 10 percent and a maximum of 13 percent lower occupied
natural frequencies compared to the floors with continuous sheathing. For one-second
root-mean square acceleration values, floors with jointed sheathing had an average of 17
percent and a maximum of 38 percent larger root-mean-square acceleration values
compared to floors with continuous sheathing.
It can be concluded that modeling floor systems with once piece of continuous sheathing
will give less conservative values than the actual values. In order to obtain more accurate
results, floor systems should be modeled with jointed sheathing. Therefore, the program
developed in this project is a useful tool as it allows users to examine the changes in
displacement, natural frequencies, and root-mean-square accelerations with different
system parameters, including the option of jointed sheathing.
References
Burch H R (2013) Finite Element Vibration Analysis of Wood Floors Considering
Sheathing Discontinuities. MS thesis, Idaho State University, Pocatello, ID. 254 pp.
Dolan J D, Murray T M, Johnson J R, Runte D, and Shue B C (1999) Preventing
Annoying Wood Floor Vibrations. J. Structural Engineering. 125(1): 19-24
Foschi R O, Gupta A (1987) Reliability of floors under impact vibration. Can. J. Civ.
Engrg Ottawa 14: 683-689.
Hu L J (2007) Design Guide for Wood-Framed Floor Systems. Canadian Forest Service
No. 32: 1-60.
ICC (2012) 333-335. International Building Code, Washington DC.
OpenSees (2015). http://opensees.berkeley.edu/OpenSees/home/about.php (12 Feb.
2015).
Onysko D M, Hu L J, Jones ED, Di LB (2001) Serviceability design of residential wood
framed floors in Canada. Can. J. Civ. Engrg Ottawa: 1-8.

Proceedings of the 58th International Convention of Society of Wood Science and Technology
June 7-12, 2015 – Grand Teton National Park, Jackson, Wyoming, USA
365
Smith I, Chui Y H (1988) Design of light-weight wooden floors to avoid human
discomfort. Can. J. Civ. Engrg Ottawa 15: 254-262.
Wolfe J M (2007) Development of experimental data base for finite element vibration
analysis of floor systems with rotated engineering wood I-Joist. MS thesis, Idaho State
University, Pocatello, ID. 296 pp.
Proceedings of the 58th International Convention of Society of Wood Science and Technology
June 7-12, 2015 – Grand Teton National Park, Jackson, Wyoming, USA
366
Impact-Deformation Relation of Surface Treated Wood
Material
E.Seda ERDINLER1*- K.Hüseyin KOÇ2 -Tuncer DİLİK3 - Ender HAZIR4
1 Assistant Professor, Faculty of Forestry, Department of Forest Industry
Engineering, Istanbul University 34473 Istanbul – Turkey
* Corresponding author
[email protected] 2 Professor Dr., Faculty of Forestry, Department of Forest Industry
Engineering, Istanbul University, 34473 Istanbul – Turkey
[email protected] 3 Associated Professor, Faculty of Forestry, Department of Forest Industry
Engineering, Istanbul University, 34473 Istanbul – Turkey
[email protected] 4 Research Assistant, Faculty of Forestry, Department of Forest Industry
Engineering, Istanbul University, 34473 Istanbul – Turkey
Abstract
Wood and wood based material is used in various areas. Wood material is exposed to
many external effects as it is used for furniture. Impact and drops have negative
influence on these materials. Surface treatment is effective on wood material’s
durability. This may change due to layers of paint and the property of the paint used on
the material. In this study, it’s aimed to determine the differences by investigating the
deformations occurring on wooden materials with various surface treatments due to
impact and fall. MDF, intensively used in the furniture industry, was used. The impact-
deformation relationship of the surfaces applied with wooden material, processed with
surface treatment, together with cellulosic and polyurethane paint on various number of
layer were examined. For surface hardness; impact tester was used for determining the
effect of sudden impacts. Pendulum hardness tester was used to determine the layer
hardness of the surfaces. Statistical assessment was performed for determining and
revealing the impacts. At result of the study, for coating hardness, polyurethane paint
provided better results in applications made with three layers, while cellulosic paint
provided better results in applications with four layers, and cellulosic paint provided
better results with five layers. Five-layer cellulosic application and three-layer
polyurethane application provided similar results. Parameters effecting durability due to
impact on different surface treatments and improvement of utilization quality have been
determined which would be a base for a more effective application.
Proceedings of the 58th International Convention of Society of Wood Science and Technology
June 7-12, 2015 – Grand Teton National Park, Jackson, Wyoming, USA
367
Keywords: A. Wood material, B. Surface treatment, C. Impact, D. Deformation, E. Coating
Introduction
Wood is a material with an increasing importance in its use. It is one of the materials that
the manufacturers have always used for centuries. Its characteristics and superiorities
including the manufacturing stage play an important role in preferring the wood material.
The economic life of the wood material should be prolonged and it should be used more
effectively as it a valuable material. Protective surface treatments and impregnation
applications are among the important procedures applied for prolonging the economic life
of the wood material according to the place it is used for. Impregnation is the application
related to the protection created by impregnating the chemical preservatives applied to
the wooden material, used under atmospheric conditions, by the material. Protective
surface treatments have a positive impact on the appearance of the product and also
protect the material against external factors.
There are several studies related to different specifications of wood, and such studies still
continue. In addition to light resistance and aging, the study carried out by Baysal (2011)
examines the surface hardness performance in polyurethane varnish and alkyd based
synthetic varnish applied to Fagus Orientalis wood impregnated with CCB. It's been
stated that there is an increase in surface hardness in the samples varnished after CCB,
and that an increase in surface hardening is observed on beech material as the
concentration of CCB was increased.
In the study of Atar et al. (2004), it's been determined that bleaching agents reduce the
surface hardness, and the surface hardness of the wood material did not affect the
finishing varnish layer hardness.
In his study, Sönmez (1989) stated that the type of tree was not influential in the hardness
of varnish layers, but the true impact depended on the type of varnish.
Çakıcıer et al. (2011) determined that surface hardness was very less in varnished
samples after thermal treatment compared to the samples without varnish. They have
stated that surface hardness value decreased with the increase in temperature and time.
The same study also determined that the scraping resistance of the samples with thermal
treatment was very lower than the ones without treatment.
In the study they examined the impact of boric acid solution on the hardness of water
based varnish layer, Budakçı et al. (2009) suggested using beech material in the furniture
and decoration components that were desired to have higher hardness value with the use
of water based varnish, and 5% boric acid modification should be performed in the rate of
30% inside the water based varnish.

Proceedings of the 58th International Convention of Society of Wood Science and Technology
June 7-12, 2015 – Grand Teton National Park, Jackson, Wyoming, USA
368
Oblak et al. (2006) stated that surface treatment statements should be analyzed in detail in
order to completely reveal the physical, mechanical and chemical properties. As the
surface treatment systems give different results with various application methods, it is
important to determine the best method.
Similarly, Pavlic et al. (2004) stated that the systems should be tested and the best system
should be selected according to the result of these tests in order to obtain a high quality
surface treatment result. Resistance to impact is one of these test methods. It is used for
determining the damages to be caused by the impacts during the use of impact test.
Impact tests evaluate the effects of accidental contact damage that may occur during use.
They are usually carried out by the direct evaluation of the effect of a falling object,
phere or dart of specified shape and hardness, onto the tested surface form different
heights. During impact on coated surfaces, the deformation of the substrate can be
relevant, significantly affecting the final results. It is of importance that the coating film
is flexible enough to withstand, to a certain extent, the stretching at the fringes of the
deformation without any cracking or cleavage.
Hardness can be defined as the ability of a coating film to resist indentation or
penetration by a solid object. Hardness is also related to the dying state of the coating
depending on solvents retention and, for chemical drying coatings, on the cross-linking
effectiveness. The efficiency of the drying systems is then fundamental to achieve an
adequate hardness. ISO 1522 is a damping method used to assess the hardness of a dry
film of paint, varnish or related product by measuring how it reduces the oscillation
amplitude of a pendulum (Bulian and Graystone 2009).
Persoz pendulum is used for this research as seen in Figure 1.
Figure 1. Pendulum Hardness Tester (TQC,2015)
The expectations from the wood surfaces vary according to the aim of their user.
Resistance of the surface against wearing with different effects or maintaining its current
structure against the impacts are among the important properties looked for, including the
hardness value of the surface treatment material in several areas of use.
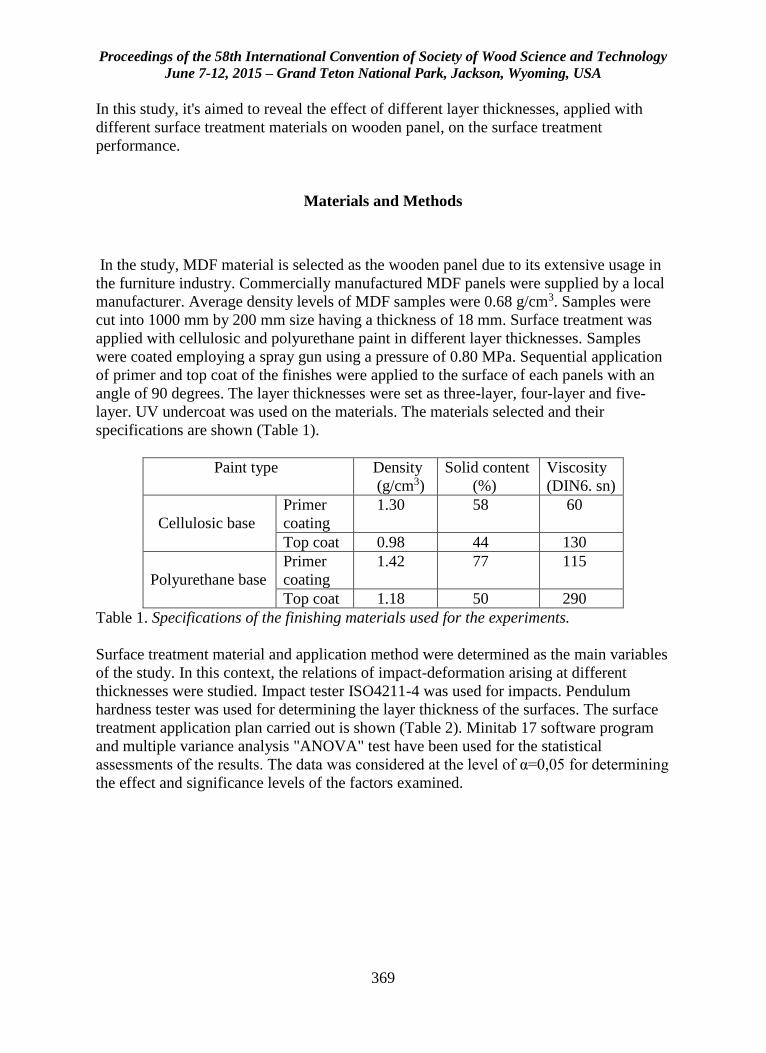
Proceedings of the 58th International Convention of Society of Wood Science and Technology
June 7-12, 2015 – Grand Teton National Park, Jackson, Wyoming, USA
369
In this study, it's aimed to reveal the effect of different layer thicknesses, applied with
different surface treatment materials on wooden panel, on the surface treatment
performance.
Materials and Methods
In the study, MDF material is selected as the wooden panel due to its extensive usage in
the furniture industry. Commercially manufactured MDF panels were supplied by a local
manufacturer. Average density levels of MDF samples were 0.68 g/cm3. Samples were
cut into 1000 mm by 200 mm size having a thickness of 18 mm. Surface treatment was
applied with cellulosic and polyurethane paint in different layer thicknesses. Samples
were coated employing a spray gun using a pressure of 0.80 MPa. Sequential application
of primer and top coat of the finishes were applied to the surface of each panels with an
angle of 90 degrees. The layer thicknesses were set as three-layer, four-layer and five-
layer. UV undercoat was used on the materials. The materials selected and their
specifications are shown (Table 1).
Paint type Density
(g/cm3)
Solid content
(%)
Viscosity
(DIN6. sn)
Cellulosic base
Primer
coating
1.30 58 60
Top coat 0.98 44 130
Polyurethane base
Primer
coating
1.42 77 115
Top coat 1.18 50 290
Table 1. Specifications of the finishing materials used for the experiments.
Surface treatment material and application method were determined as the main variables
of the study. In this context, the relations of impact-deformation arising at different
thicknesses were studied. Impact tester ISO4211-4 was used for impacts. Pendulum
hardness tester was used for determining the layer thickness of the surfaces. The surface
treatment application plan carried out is shown (Table 2). Minitab 17 software program
and multiple variance analysis "ANOVA" test have been used for the statistical
assessments of the results. The data was considered at the level of α=0,05 for determining
the effect and significance levels of the factors examined.
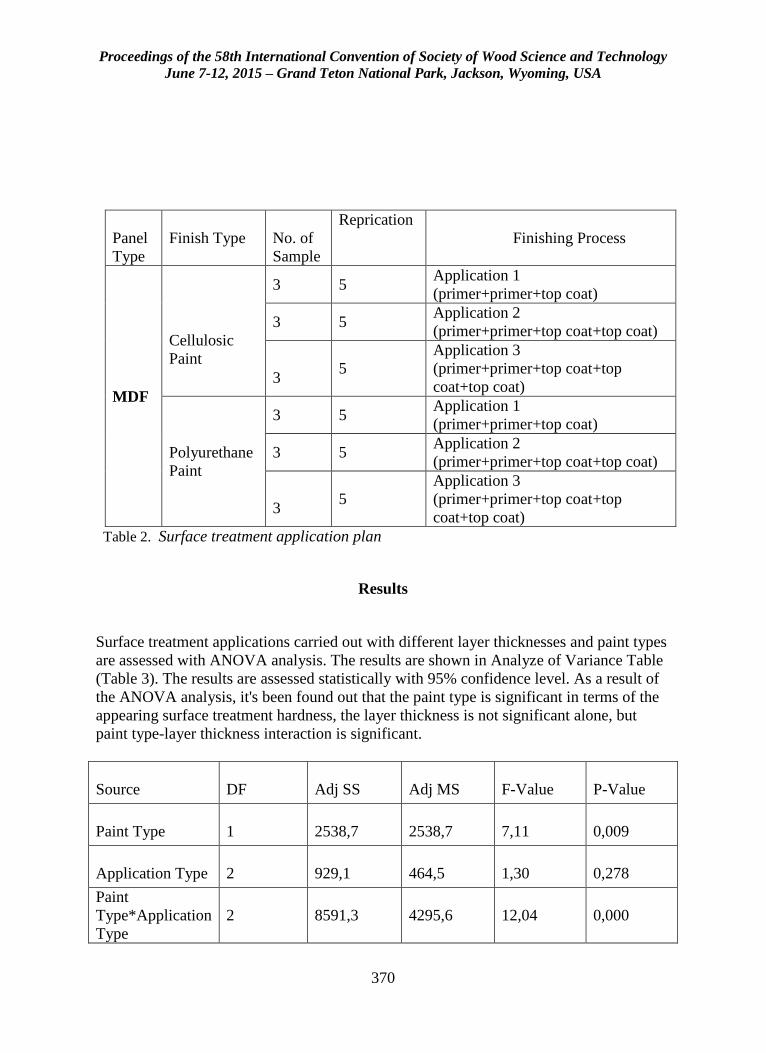
Proceedings of the 58th International Convention of Society of Wood Science and Technology
June 7-12, 2015 – Grand Teton National Park, Jackson, Wyoming, USA
370
Panel
Type
Finish Type
No. of
Sample
0BReprication
Finishing Process
MDF
Cellulosic
Paint
3 5 Application 1
(primer+primer+top coat)
3 5 Application 2
(primer+primer+top coat+top coat)
3 5
Application 3
(primer+primer+top coat+top
coat+top coat)
Polyurethane
Paint
3 5 Application 1
(primer+primer+top coat)
3 5 Application 2
(primer+primer+top coat+top coat)
3 5
Application 3
(primer+primer+top coat+top
coat+top coat)
Table 2. Surface treatment application plan
Results
Surface treatment applications carried out with different layer thicknesses and paint types
are assessed with ANOVA analysis. The results are shown in Analyze of Variance Table
(Table 3). The results are assessed statistically with 95% confidence level. As a result of
the ANOVA analysis, it's been found out that the paint type is significant in terms of the
appearing surface treatment hardness, the layer thickness is not significant alone, but
paint type-layer thickness interaction is significant.
Source
DF
Adj SS
Adj MS
F-Value
P-Value
Paint Type
1
2538,7
2538,7
7,11
0,009
Application Type
2
929,1
464,5
1,30
0,278
Paint
Type*Application
Type
2
8591,3
4295,6
12,04
0,000
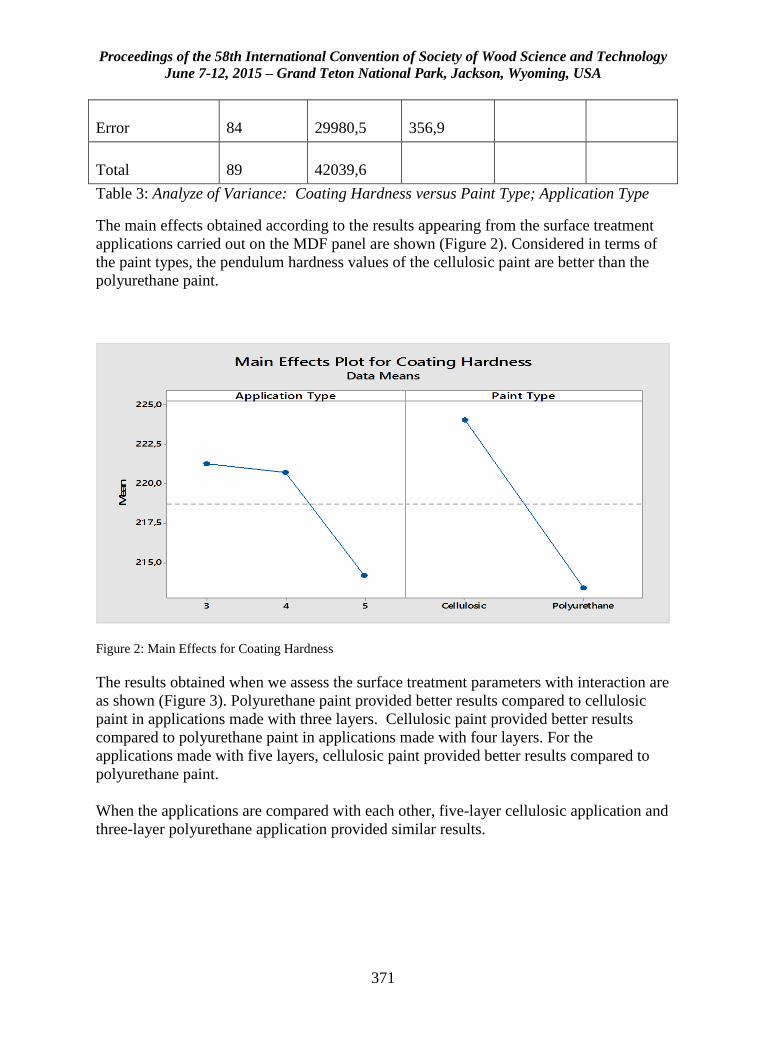
Proceedings of the 58th International Convention of Society of Wood Science and Technology
June 7-12, 2015 – Grand Teton National Park, Jackson, Wyoming, USA
371
Error
84
29980,5
356,9
Total
89
42039,6
Table 3: Analyze of Variance: Coating Hardness versus Paint Type; Application Type
The main effects obtained according to the results appearing from the surface treatment
applications carried out on the MDF panel are shown (Figure 2). Considered in terms of
the paint types, the pendulum hardness values of the cellulosic paint are better than the
polyurethane paint.
Figure 2: Main Effects for Coating Hardness
The results obtained when we assess the surface treatment parameters with interaction are
as shown (Figure 3). Polyurethane paint provided better results compared to cellulosic
paint in applications made with three layers. Cellulosic paint provided better results
compared to polyurethane paint in applications made with four layers. For the
applications made with five layers, cellulosic paint provided better results compared to
polyurethane paint.
When the applications are compared with each other, five-layer cellulosic application and
three-layer polyurethane application provided similar results.
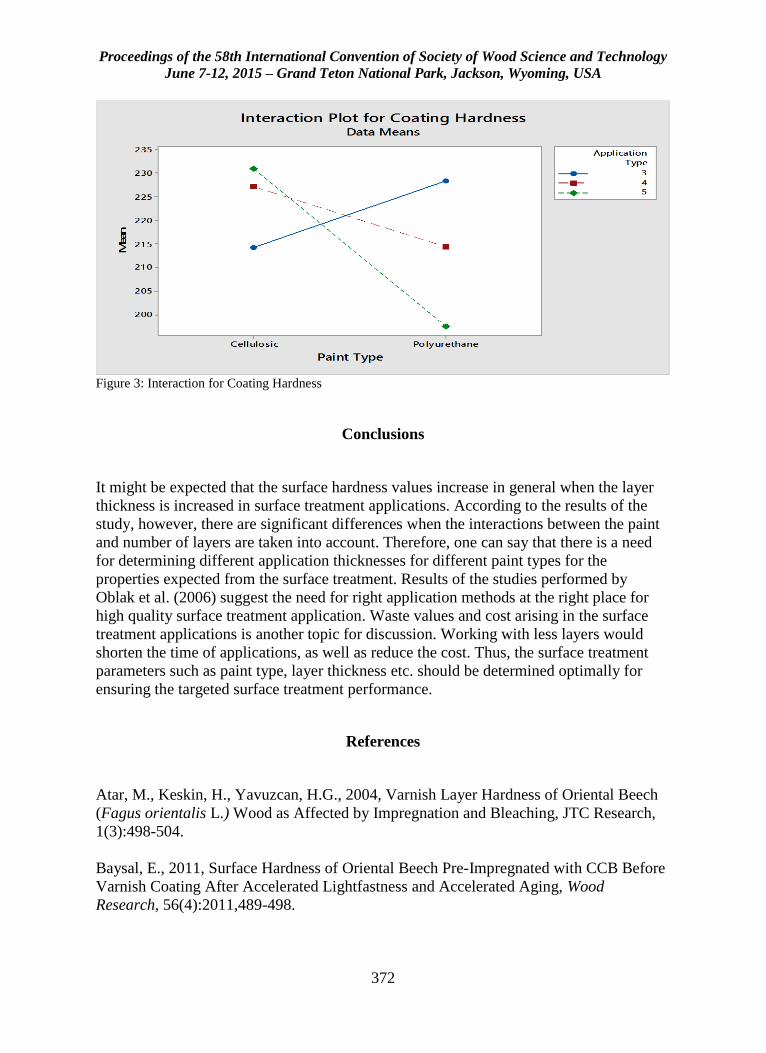
Proceedings of the 58th International Convention of Society of Wood Science and Technology
June 7-12, 2015 – Grand Teton National Park, Jackson, Wyoming, USA
372
Figure 3: Interaction for Coating Hardness
Conclusions
It might be expected that the surface hardness values increase in general when the layer
thickness is increased in surface treatment applications. According to the results of the
study, however, there are significant differences when the interactions between the paint
and number of layers are taken into account. Therefore, one can say that there is a need
for determining different application thicknesses for different paint types for the
properties expected from the surface treatment. Results of the studies performed by
Oblak et al. (2006) suggest the need for right application methods at the right place for
high quality surface treatment application. Waste values and cost arising in the surface
treatment applications is another topic for discussion. Working with less layers would
shorten the time of applications, as well as reduce the cost. Thus, the surface treatment
parameters such as paint type, layer thickness etc. should be determined optimally for
ensuring the targeted surface treatment performance.
References
Atar, M., Keskin, H., Yavuzcan, H.G., 2004, Varnish Layer Hardness of Oriental Beech
(Fagus orientalis L.) Wood as Affected by Impregnation and Bleaching, JTC Research,
1(3):498-504.
Baysal, E., 2011, Surface Hardness of Oriental Beech Pre-Impregnated with CCB Before
Varnish Coating After Accelerated Lightfastness and Accelerated Aging, Wood
Research, 56(4):2011,489-498.
Proceedings of the 58th International Convention of Society of Wood Science and Technology
June 7-12, 2015 – Grand Teton National Park, Jackson, Wyoming, USA
373
Budakci, M., Uysal, B., Esen, R., 2009, The effect of Boric Acid Modification on the
Hardness Value of Water-Based Varnish, 5th International Advanced Technologies
Symposium, 13-15,may, Karabuk, Turkey.
Bulian F, Graystone JA, 2009, Industrial Wood Coatings. Oxford, UK: Elsevier
Publications.
Cakicier,N., Korkut,S. , Korkut Sevim, D., 2011, Varnish Layer Hardness, Scratch
Resistance and Glossiness of Various Wood Species as Affected by Heat Treatment,
BioResorces, 6(2), 1648-1658.
Oblak L, Krıcej B, Lipuscek I (2006) The Comparison of The coating Systems According
to the Basis Criteria. Wood Research 51(4):77-86
Pavlic M, Kricej B, Tomazic M, Petric M () Selection of Proper Methods For Evaluation
of Finished Interior Surface Quality. Copenhagen:COST E-18
Sonmez, A., Budakci, M., Yakin,,M. ,2004, Effect of Application Methods on the
Hardness Gloss and Adhesion Strength of Waterborne Varnish Coating on the Wooden
Surface, Journal of Polytechnic,(7)3, 229-235.
TQC (2015), http://www.tqc.eu/rsrc/artikel_downloads/pendulum-hardness-tester-
sp0500-d44.pdf [10.04.2015]
Acknowledgement
This study is supported by Scientific Research Projects Coordination Unit of Istanbul
University with project no. UDP-46844.
Proceedings of the 58th International Convention of Society of Wood Science and Technology
June 7-12, 2015 – Grand Teton National Park, Jackson, Wyoming, USA
374
The U.S. Hardwood Supply Chain
Urs Buehlmann, [email protected]
Omar Espinoza, [email protected]
Abstract
This paper presents an overview of the U.S. hardwood value chain from harvest to
lumber. Focus is given to log trade, sawmill log procurement, lumber production, and
lumber distribution. This paper uses six earlier publications that individually describe
segments of the U.S. hardwood markets to investigate effects of a changing customer
base throughout the supply chain. Special focus is given on the role of intermediaries
such as log and lumber brokers as these market participants have received scant attention
from researchers so far.
Proceedings of the 58th International Convention of Society of Wood Science and Technology
June 7-12, 2015 – Grand Teton National Park, Jackson, Wyoming, USA
375
Effect of Silviculture on Loblolly Pine as Bioenergy
Feedstock
Les Groom, [email protected]
Thomas Elder, [email protected]
Don Bragg, [email protected]
Anurag Mandalika, [email protected]
Jerry Spivey, [email protected]
USDA Southern Research Station, 2500 Shreveport Hwy, Pineville, LA
71360
Abstract
Woody biomass is a broadly defined term that encompasses a wide variety of feedstocks
ranging from clear bolewood to logging residues. However, the physical, chemical, and
thermochemical properties can vary greatly depending on the origin and type of woody
biomass feedstock. Furthermore, the majority of woody biomass to liquid transportation
fuels plants under construction or being developed use a thermochemical conversion
platform with a synthesis gas serving as an intermediate. This presentation will focus on
the physical, thermal, and chemical composition of loblolly pine (Pinus taeda) grown
under a variety of silvicultural regimes. In addition to the findings from laboratory
analysis of physical, chemical, and thermochemical characterization of loblolly pine
samples, results will also be shown for subsequent conversion to synthesis gas in a pilot-
scale gasification unit. Efficacious conversion of the various woody biomass feedstocks
into commercial liquid transportation fuels will be discussed based on the analyses
presented.
Proceedings of the 58th International Convention of Society of Wood Science and Technology
June 7-12, 2015 – Grand Teton National Park, Jackson, Wyoming, USA
376
Life-Cycle GHG Emissions of Electricity from Syngas
Produced by Pyrolyzing Woody Biomass
Hongmei Gu, Ph.D1*
Richard Bergman, Ph.D1
1U.S. Forest Service Forest Products Laboratory
Madison, Wisconsin, USA
*Corresponding author
Abstract
Low-value residues from forest restoration activities in the western United States
intended to mitigate effects from wildfire, climate change, and pests and disease need a
sustainable market to improve the economic viability of treatment. Converting biomass
into bioenergy is a potential solution. Life-cycle assessment (LCA) as a sustainable
metric tool can assess the impact of new bioenergy systems. Using the internationally
accepted LCA method, this study evaluated the syngas electricity produced via a
distributed-scale biomass pyrolysis system called the Tucker Renewable Natural Gas
(RNG) system (pyrolysis system developed by Tucker Engineering Associates, Locust,
NC). This system converts woody biomass in a high temperature and extremely low
oxygen environment to a medium-energy synthesis gas (syngas) that is burned to
generate electricity. The pyrolysis process also produces biochar as a byproduct and low-
energy (unused) syngas as a waste. Results from the life-cycle impact assessment include
an estimate of the global warming (GW) impact from the cradle-to-grave production of
syngas for electricity. It showed a notably lower GW impact value (0.142 kg CO2-eq
/kWh) compared to electricity generated from bituminous coal (1.08 kg CO2-eq /kWh)
and conventional natural gas (0.72 kg CO2-eq /kWh), when the carbon sequestration
benefit from the biochar byproduct is included. In addition, the evaluation of the GW
impact for Tucker syngas electricity showed the highest GHG emissions came from
burning propane to maintain the endothermic reaction in the Tucker RNG unit. Using the
previously unused low-energy (waste) syngas to supplement propane use would further
reduce GHG emissions (ie fossil CO2) associated with syngas electricity by 20%.
Keywords: Bioenergy, life-cycle assessment, GHG emission, syngas electricity, woody
biomass.
Proceedings of the 58th International Convention of Society of Wood Science and Technology
June 7-12, 2015 – Grand Teton National Park, Jackson, Wyoming, USA
377
Introduction
Restoration treatments on western U.S. forests produced large quantities of woody
biomass that can be used as feedstock for production of biofuels and other bioproducts.
Producing bioenergy and bioproducts from such forest thinning or timber harvest
byproducts would contribute to achieving broad national energy objectives, including the
nation’s energy security and reduction of greenhouse gas emissions from fossil fuels.
The U.S. Department of Energy and the U.S. Department of Agriculture are both strongly
committed to expanding the role of biomass as an energy source and envision a 30%
replacement of the current U.S. petroleum consumption with biofuels by 2030 (Perlack et
al 2005). Biomass fuels and products are one way to reduce the need for oil and gasoline
imports while supporting the growth of agriculture, forestry, and rural economies. Also,
expanding biofuels and bioproducts production from biomass has the potential to reduce
net greenhouse gas (GHG) emissions and improve local economies and energy security.
The 2007 Energy Independence and Security Act (EISA) sets aggressive goals for
moving biofuels into the marketplace to reduce the nation’s dependence on foreign
sources of energy and reduce GHG emissions by increasing the supply of renewable fuels
from 4 billion gallons in 2006 to 36 billion by 2022 with 16 billion gallons cellulosic
biofuel (EISA 2007). Schnepf and Yacobucci (2013) define cellulosic biofuel as
renewable fuel derived from any cellulose, hemicellulose, or lignin sources that has life-
cycle GHGs at least 60% less than the baseline life-cycle GHGs from gasoline or diesel
as transportation fuel. Life-cycle assessment (LCA) is the pre-eminent and internationally
accepted method for categorizing life-cycle GHGs.
LCA as a science-based tool is useful in assessing the claim that expanding bioenergy
production from woody biomass has the potential to reduce net GHG emissions.
Information provided by this analytical tool is essential for policy makers to make
evidence-based judgments on expanding renewable energy production. LCA considers
direct and related processes, flows of raw materials and intermediate inputs, waste, and
other material and energy outputs associated with the entire product chain or system.
Broadly, LCA can assess new products, new processes, or new technologies in an
analytically thorough and environmentally holistic manner to guide more robust
deployment decisions. LCA can calculate GHG and other emissions over a part or all of
the whole life cycle of a product. One huge benefit is that LCA provides sustainability
metrics for comparing competing products.
For our study, we applied LCA to the electricity generated from the synthesis gas
(syngas) produced by a distributed-scale advanced biomass pyrolysis system, which will
be referred to in this paper as the Tucker (developed by Tucker Engineer Associate,
Locust, NC) renewable natural gas (RNG) unit. This study is part of a larger USDA
project developing and evaluating the Tucker RNG unit that could generate bioenergy
and bioproducts for higher value markets. The Tucker RNG unit uses high temperature
conversion (>750 °C) in an extremely low oxygen environment to convert the feedstock
from forest thinning and mill residues into the syngas that can be used for heat and
electricity and into biochar for soil amendment or as a precursor in the manufacturing of
Proceedings of the 58th International Convention of Society of Wood Science and Technology
June 7-12, 2015 – Grand Teton National Park, Jackson, Wyoming, USA
378
activated carbon and other industrial carbon products. Syngas-generated electricity is
intended to substitute a portion (marginal part) of grid electricity generated from fossil
fuels, most commonly natural gas and coal. The system was specifically designed to
generate a high-quality biochar to become activated carbon and not as a soil amendment
which sells at a lower price. However, LCA can focus on life-cycle stages that may not
be considered once a process becomes commercialized but still in the development phase
to evaluate what-if scenarios. In the present study, the what-if scenario was burning
syngas to generate electricity with the biochar as a byproduct.
In this paper, LCA will estimate the GHG emission performance from the Tucker RNG
technology in reference to established electricity technologies including fossil fuels. This
is the first study to evaluate the production of syngas electricity from a distributed-scale
thermochemical conversion system in the United States. We will answer the question of
how much GHG emissions in kg CO2-eq can be reduced by substituting fossil fuel
electricity with forest residue-derived syngas electricity. Applying LCA can help to
compare the processes or technologies for energy and environmental benefits and identify
the hotspots (highest points) for energy consumption and GHG emissions.
Methods
The goal of this study was to estimate the GW impact of the electricity generated from
the syngas produced by Tucker RNG unit with biomass residue as the feedstock and
compare the results to a fossil fuel reference. To achieve this goal, the life-cycle
inventory (LCI) for syngas electricity from cradle-to-grave including processes of raw
material extraction, transportation, feedstock processing, pyrolysis conversion, and
syngas electricity generation was modeled and conformed to the ISO 14040 and 14044
standards (ISO 2006a,b). LCI needs to be built before the impact analysis can be done.
LCI is the data collection portion of a LCA. It tracks and quantifies inputs and outputs of
a system including detailed resources, raw material, and energy flows.
Primary data were collected from a one-hour continuous run of the Tucker RNG unit for
the pyrolysis converting process. The feedstock was wood chips processed from under-
utilized small-diameter logs extracted from National Forests with a mix of conifer species
dominated by lodgepole pine (Pinus contorta), Douglas fir (Pseudotsuga menziesii), and
ponderosa pine (P. ponderosa). Before feeding into the Tucker RNG unit, the chips were
dried to less than 10% moisture content (MC) to improve the performance in Tucker
RNG unit. The LCI model was constructed in three parts 1) upstream model, including
forest management, thinning material extraction, transportation, and feedstock
processing; 2) pyrolysis thermal conversion model; 3) downstream model, including the
generation of electricity from the primary product syngas and application of biochar as
byproduct.
The focus of this study and the conversion technology is on syngas generation and
burning to generate electricity. Therefore, the primary product from the Tucker RNG unit
Proceedings of the 58th International Convention of Society of Wood Science and Technology
June 7-12, 2015 – Grand Teton National Park, Jackson, Wyoming, USA
379
is considered to be syngas, while biochar from the system is considered a byproduct. The
environmental burdens were assigned 100% to the syngas as the product of interest. Since
biochar is considered as byproduct in this study, it will not take any environmental
burden from the LCA output, but its role for long-term carbon storage in the soil will be
analyzed for carbon sequestration benefits in the LCA for syngas electricity
environmental impacts. Secondary data were drawn from peer-reviewed literature
according to CORRIM guidelines (CORRIM 2010). With the material and energy inputs
and reported emissions, the cradle-to-grave LCI model for the Tucker RNG syngas
electricity was built in SimaPro 8 to estimate the environmental outputs and cumulated
energy consumption (PRé Consultants 2015). Within the SimaPro software, the inventory
data were compiled into the impact category indicator of interest, global warming (GW).
Scope
This study covers the cradle-to-grave LCA of electricity generated from syngas produced
by pyrolyzing woody biomass. LCI data for producing syngas from the Tucker RNG
pyrolysis unit was already constructed by Bergman and Gu (2014) and was incorporated
into the model. In addition to the LCA on syngas electricity from this study, data from
LCI databases for electricity generated from other sources, such as coal, natural gas, and
biomass were drawn and analyzed for a comparative partial LCA to examine the
marginal effects on electricity grid. The electricity grid is comprised of many regions
comprised of various energy sources (USEPA 2014a). The USEPA has broken the U.S.
electricity grid into “eGrids” (USEPA 2014a).The eGrid system from the Northwest
(NWPP) region included in the comparison to syngas electricity is referred to as NWPP.
The eGrid NWPP is representative of year 2008 mix of fuels used for utility electricity
generation in the northwestern United States. Fuels include coal, biomass, petroleum,
geothermal, natural gas, nuclear, hydroelectric, wind, and other energy sources. NWPP
electricity grid covers area including Washington, Oregon, Idaho, Utah, most of
Montana, Wyoming, Nevada, and northern parts of California, Arizona, and New
Mexico. It is intended that the Tucker RNG syngas provide marginal electricity for the
grid because of its distributed-scale size.
Functional unit
Functional unit is the reference unit used to quantify the environmental performance of a
product system. It is also a reference related to the inputs and outputs. Because the goal
of this research is to compare the GHG performance of electricity generated from Tucker
RNG syngas to that of electricity generated from other source, the functional unit is
defined as production of 1 kWh of electricity. Material flows, energy use, and emission
data are standardized based on this functional unit within the system boundaries
described in the following section.
Unit processes
To do the life cycle impact assessment (LCIA), the syngas electricity system was built
from unit processes. LCI databases contain large lists of unit processes. In the product
system, starting from the functional unit, related processes are called on and built into the
process tree with inputs and outputs matched to the delivery of the functional unit. For
Proceedings of the 58th International Convention of Society of Wood Science and Technology
June 7-12, 2015 – Grand Teton National Park, Jackson, Wyoming, USA
380
the reference fossil fuel chains, the GHG performance was calculated using data from the
USLCI Database (NREL 2012).
Processes for the upstream model of forest management and log extraction in the USLCI
Database were used (NREL 2012). Chip processing was modeled with the specific
operational data collected as part of this study. Then the pyrolysis conversion process was
modeled using Tucker RNG unit specific operation data collected on the system for a 1-
hour continuous run. The downstream electricity generation process was modified for
Tucker syngas from the USLCI natural gas electricity generation process.
The mainstream model of this study was thermochemical conversion with the Tucker
RNG unit. As mentioned previously, Bergman and Gu (2014) provided a detailed
analysis of the Tucker RNG unit itself.
The process for electricity generation from the Tucker RNG syngas is similar to the
process for natural gas electricity. Electricity is produced from burning the Tucker RNG
syngas in a commercial 1.6 MWe Caterpillar generator derated to 1.2 MWe because the
syngas has relatively low energy density compared to natural gas. Using wood, the
Tucker RNG unit must produce about two times the volume of syngas to generate the
same electricity as natural gas. The higher heating value (HHV) of the produced syngas is
19.5 MJ/m3, one half of the natural gas HHV at 38.3 MJ/m3. The main components by
mass of the syngas are carbon monoxide (55.5%), carbon dioxide (20.1%), and methane
(9.2%).
Compiling process data
Starting with the functional unit of 1 kWh electricity generated, fuels and equipment use,
and transportation requirements were compiled in the SimaPro model to quantify the
GHG emissions to the environment. The model then relates them to the 100-y GW
impact according to the Tool for the Reduction and Assessment of Chemical and Other
Environmental Impacts (TRACI) method (IPCC 2007; Bare 2011). TRACI 2.1 method is
now incorporated in SimaPro software, version 8.
System boundary
Defining the system boundary selects the unit processes to be included in the system.
Based on our goal to determine the environmental impacts of syngas electricity, we drew
our system boundary to include the upstream of material handling, main conversion
process with the Tucker RNG unit, and the downstream electricity product production.
Figure 1 shows the system boundary defined for this cradle-to-grave LCA study. The
Tucker thermochemical process includes feedstock conveyance, active reacting, passive
reacting, condensing, tar cracking, cooling, collecting, and storing. The cumulative
system boundary includes both on- and off-site emissions for all material and energy
consumed. Fuel and electricity use for the upstream feedstock processing and Tucker
pyrolysis converting process were included in the cumulative boundary (solid line) to
calculate the total emissions. The on-site emissions include the processes within the
dotted line (Fig 1). The off-site emissions include the grid electricity production,
transportation, and fuels produced off-site but consumed onsite.
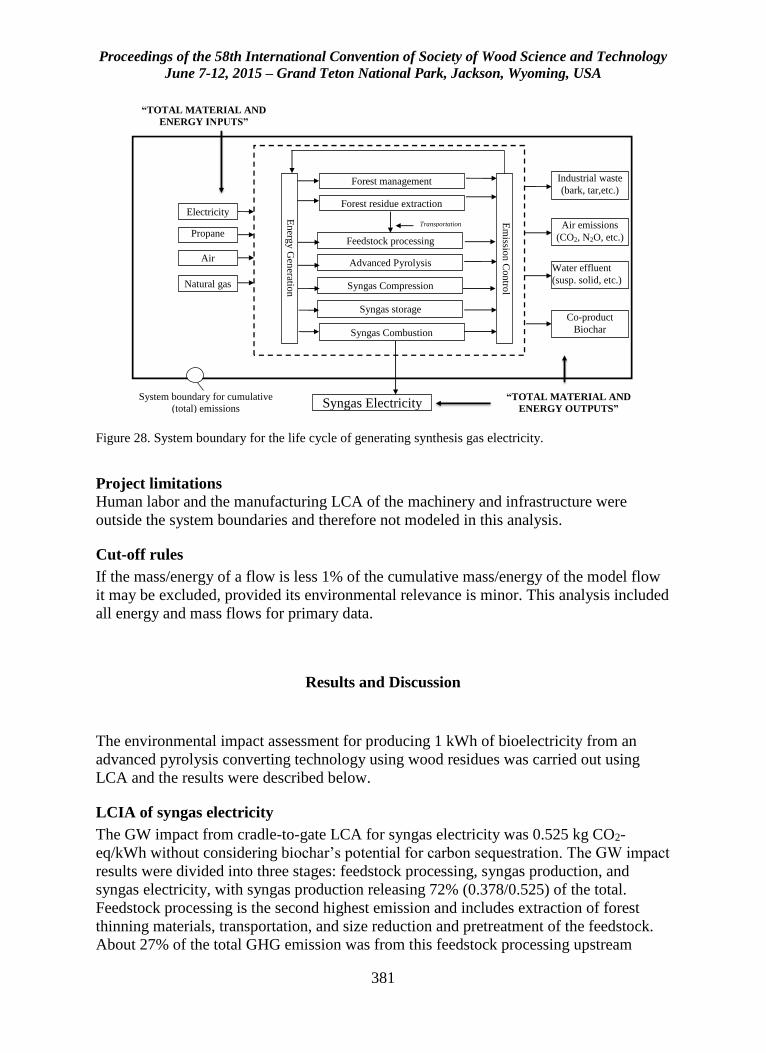
Proceedings of the 58th International Convention of Society of Wood Science and Technology
June 7-12, 2015 – Grand Teton National Park, Jackson, Wyoming, USA
381
Feedstock processing
Em
ission C
ontro
l
Energ
y G
eneratio
n
Syngas Electricity
Electricity
Propane
Air
“TOTAL MATERIAL AND
ENERGY INPUTS”
System boundary for cumulative
(total) emissions
Forest residue extraction
“TOTAL MATERIAL AND
ENERGY OUTPUTS”
Advanced Pyrolysis
Syngas Compression
Syngas storage
Natural gas
Forest management Industrial waste
(bark, tar,etc.)
Air emissions
(CO2, N2O, etc.)
Co-product
Biochar Syngas Combustion
Water effluent
(susp. solid, etc.)
Transportation
Figure 28. System boundary for the life cycle of generating synthesis gas electricity.
Project limitations
Human labor and the manufacturing LCA of the machinery and infrastructure were
outside the system boundaries and therefore not modeled in this analysis.
Cut-off rules
If the mass/energy of a flow is less 1% of the cumulative mass/energy of the model flow
it may be excluded, provided its environmental relevance is minor. This analysis included
all energy and mass flows for primary data.
Results and Discussion
The environmental impact assessment for producing 1 kWh of bioelectricity from an
advanced pyrolysis converting technology using wood residues was carried out using
LCA and the results were described below.
LCIA of syngas electricity
The GW impact from cradle-to-gate LCA for syngas electricity was 0.525 kg CO2-
eq/kWh without considering biochar’s potential for carbon sequestration. The GW impact
results were divided into three stages: feedstock processing, syngas production, and
syngas electricity, with syngas production releasing 72% (0.378/0.525) of the total.
Feedstock processing is the second highest emission and includes extraction of forest
thinning materials, transportation, and size reduction and pretreatment of the feedstock.
About 27% of the total GHG emission was from this feedstock processing upstream
Proceedings of the 58th International Convention of Society of Wood Science and Technology
June 7-12, 2015 – Grand Teton National Park, Jackson, Wyoming, USA
382
stage, which leaves only 1% of GHG emission associated with the syngas electricity
generation process. The GW impacts were summarized from fossil CO2, CH4 (mainly
fossil), and N2O emissions. The fossil CO2 emissions for the three stages calculated by
SimaPro were 0.002, 0.334, and 0.095 kg/kWh, for syngas electricity generation, Tucker
RNG gas, and feedstock processing, respectively. The fossil CH4 emissions for the three
stages were 1.23E-5, 0.0002, and 9.4E-5 kg/kWh, with N2O emissions broken into 1.07E-
5, 1.23E-7, and 3.55E-7 kg/kWh. N2O emissions were much smaller in quantity but have
a much larger GW impact by mass than fossil CO2 (IPCC 2007).
In terms of the type of energy consumed in each of the three stages, more renewable
biomass energy is consumed in the feedstock processing stage than both the syngas
producing and electricity generation stage because it uses biomass heating for feedstock
drying and some processing. CO2 emissions from burning woody biomass are not
considered in estimating the GW impact because the woody biomass consumption is
equal to tree regrowth for a given period. Feedstock drying and processing took place at a
sawmill with a wood boiler producing process heat for drying. The endothermic reaction
of the Tucker RNG unit was sustained by propane combustion; therefore, pyrolysis
conversion was identified as the major fossil fuel energy consumption (ie environmental
hot spot) for the whole system. For a comparison, Steubing (2011) reports a GW impact
of 0.103 kg CO2-eq/kWh for a Swiss case where the syngas is primarily composed of
CH4 and very little fossil fuel (ie gas) is consumed in the production of syngas unlike the
Tucker RNG unit (Steubing et al 2011).
Carbon sequestration effect from biochar
In this analysis, biochar was produced from Tucker RNG unit as a byproduct, thus taking
no environmental burden from the process. However, in the case of biochar, the resultant
product is highly stable and recalcitrant, with high carbon content, so that decomposition
is delayed for hundreds to thousands of years, beyond current GHG accounting time
frames (Cowie et al 2013). Thus, it is important to model this delay in emissions to
demonstrate the direct climate change impacts from biochar in the system. As mentioned
previously, all environmental burdens were assigned to syngas electricity because biochar
was designated as a byproduct.
Biochar is characterized by stable aromatic C structures, low bulk density, and high ash
content. The stable storage of biochar in soils represents a long-term removal of
atmospheric C; ie C sequestration (Sohi et al 2010). There are two types of carbon
movements. The movement of C from one reservoir in the ecosystem to another is called
carbon accumulation. The movement of C from atmosphere into a reservoir is called
carbon sequestration. According to IPCC (2007), carbon sequestration can be defined as
the uptake of C-containing substances, and in particular CO2, into another reservoir with
a longer residence time.
If the biochar produced from the Tucker RNG unit as a byproduct is intended to be
applied as a soil amendment, the benefit of C sequestration to slow or even reverse the
increase in atmospheric concentration of CO2 may apply to the GHG emission
accounting. From the material ultimate chemical analysis, biochar from forest thinning
Proceedings of the 58th International Convention of Society of Wood Science and Technology
June 7-12, 2015 – Grand Teton National Park, Jackson, Wyoming, USA
383
residue has a fixed carbon content as high as 90% on a dry weight basis. Based on Wang
et al (2014), we calculated a Carbon Stable Factor for the biochar generated from the
Tucker RNG unit of 85%. With this, the total C in the biochar produced as a byproduct
for generating 1 kWh syngas electricity can be calculated and converted to CO2-
equivalent weight, as a reduction in the total GHG emission accounting for the entire
process. The sequestration of the biochar C directly reduces the GW impact as shown in
Fig 1. However, transportation of biochar, biochar spreading, and soil management
practices and their associated environmental impacts were not included in this study. The
GHG emissions from burning fossil fuels from these activities would likely reduce the
benefits of applying biochar as a soil amendment (Gaunt and Lehmann 2008).
Comparing GHG emissions of syngas electricity to other electricity technologies
LCA for coal electricity, natural gas electricity, direct biomass combustion electricity,
and the Northwest eGrid profile electricity were performed in the SimaPro software with
the data from the built-in USLCI Database. Figure 2 shows the results of GHG emission
data summarized from LCA. For 1 kWh electricity generated from the Tucker syngas
converted from forest residue chips the GHG emissions were estimated to be 0.525 kg
CO2-eq/kWh without taking biochar carbon sequestration into consideration. This is close
to the total GHG emission from the eGrid for Northwest region (0.499 kg CO2-eq/kWh).
However, coal and natural gas electricity has a substantially higher value than our studied
syngas electricity (1.079 kg CO2-eq/kWh and 0.72 kg CO2-eq/kWh, respectively).
Electricity generated from biomass direct combustion has a lower GW impact (0.087 kg
CO2-eq/kWh) because of less fossil fuel consumption and neutral impact to the
environment from biogenic CO2 emission, which is the major emission from the Tucker
RNG unit technology. When including biochar carbon sequestration effect, the GHG
emission value for our studied syngas electricity was reduced by more than 70% to 0.142
kg CO2-eq. Thus, a notable influence was discovered from carbon sequestration by the
byproduct biochar when included and should be emphasized in future analysis for
biobased renewable electricity-generating technologies.
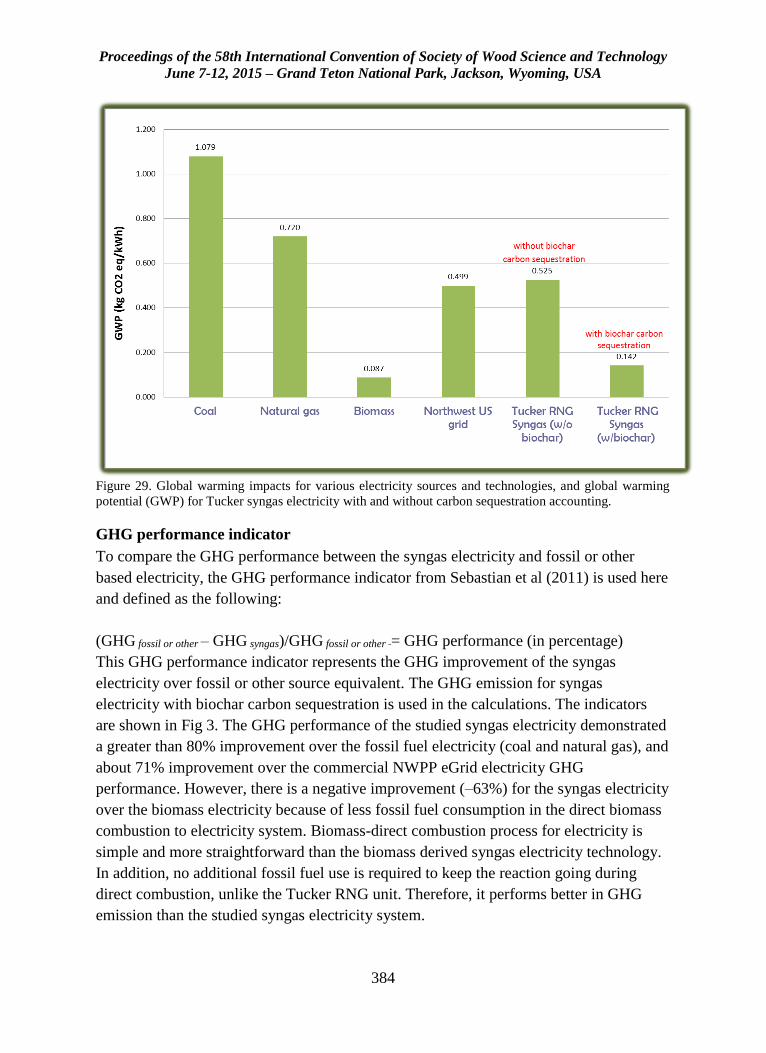
Proceedings of the 58th International Convention of Society of Wood Science and Technology
June 7-12, 2015 – Grand Teton National Park, Jackson, Wyoming, USA
384
Figure 29. Global warming impacts for various electricity sources and technologies, and global warming
potential (GWP) for Tucker syngas electricity with and without carbon sequestration accounting.
GHG performance indicator
To compare the GHG performance between the syngas electricity and fossil or other
based electricity, the GHG performance indicator from Sebastian et al (2011) is used here
and defined as the following:
(GHG fossil or other – GHG syngas)/GHG fossil or other = GHG performance (in percentage)
This GHG performance indicator represents the GHG improvement of the syngas
electricity over fossil or other source equivalent. The GHG emission for syngas
electricity with biochar carbon sequestration is used in the calculations. The indicators
are shown in Fig 3. The GHG performance of the studied syngas electricity demonstrated
a greater than 80% improvement over the fossil fuel electricity (coal and natural gas), and
about 71% improvement over the commercial NWPP eGrid electricity GHG
performance. However, there is a negative improvement (–63%) for the syngas electricity
over the biomass electricity because of less fossil fuel consumption in the direct biomass
combustion to electricity system. Biomass-direct combustion process for electricity is
simple and more straightforward than the biomass derived syngas electricity technology.
In addition, no additional fossil fuel use is required to keep the reaction going during
direct combustion, unlike the Tucker RNG unit. Therefore, it performs better in GHG
emission than the studied syngas electricity system.
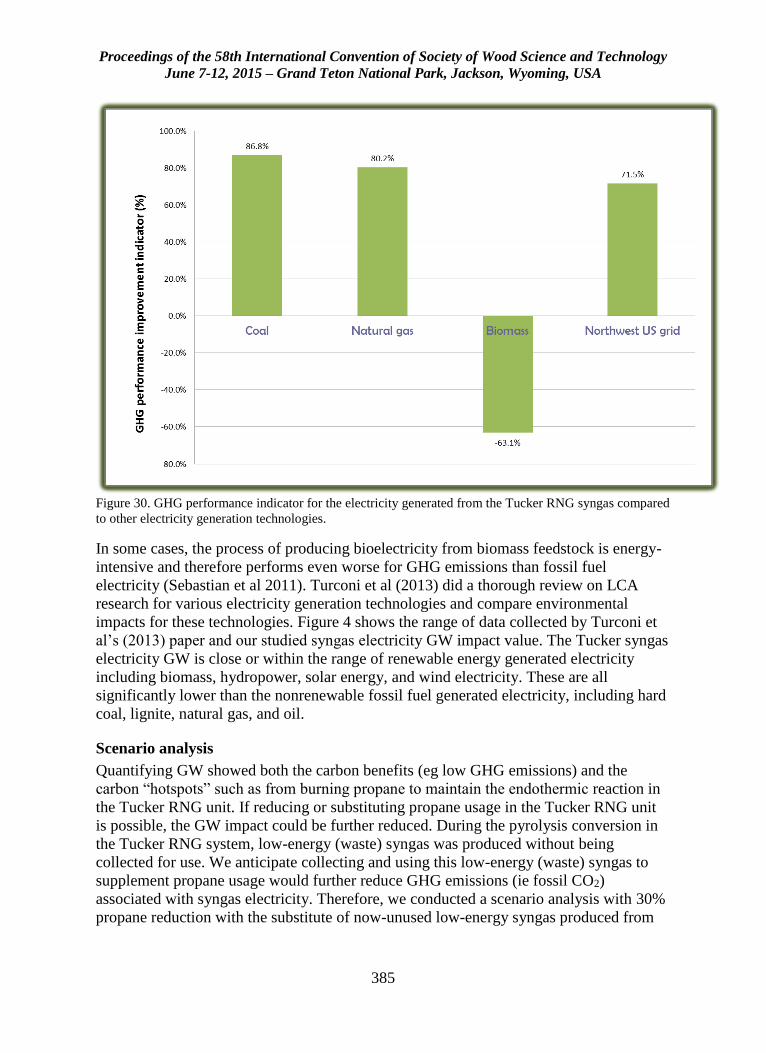
Proceedings of the 58th International Convention of Society of Wood Science and Technology
June 7-12, 2015 – Grand Teton National Park, Jackson, Wyoming, USA
385
Figure 30. GHG performance indicator for the electricity generated from the Tucker RNG syngas compared
to other electricity generation technologies.
In some cases, the process of producing bioelectricity from biomass feedstock is energy-
intensive and therefore performs even worse for GHG emissions than fossil fuel
electricity (Sebastian et al 2011). Turconi et al (2013) did a thorough review on LCA
research for various electricity generation technologies and compare environmental
impacts for these technologies. Figure 4 shows the range of data collected by Turconi et
al’s (2013) paper and our studied syngas electricity GW impact value. The Tucker syngas
electricity GW is close or within the range of renewable energy generated electricity
including biomass, hydropower, solar energy, and wind electricity. These are all
significantly lower than the nonrenewable fossil fuel generated electricity, including hard
coal, lignite, natural gas, and oil.
Scenario analysis
Quantifying GW showed both the carbon benefits (eg low GHG emissions) and the
carbon “hotspots” such as from burning propane to maintain the endothermic reaction in
the Tucker RNG unit. If reducing or substituting propane usage in the Tucker RNG unit
is possible, the GW impact could be further reduced. During the pyrolysis conversion in
the Tucker RNG system, low-energy (waste) syngas was produced without being
collected for use. We anticipate collecting and using this low-energy (waste) syngas to
supplement propane usage would further reduce GHG emissions (ie fossil CO2)
associated with syngas electricity. Therefore, we conducted a scenario analysis with 30%
propane reduction with the substitute of now-unused low-energy syngas produced from
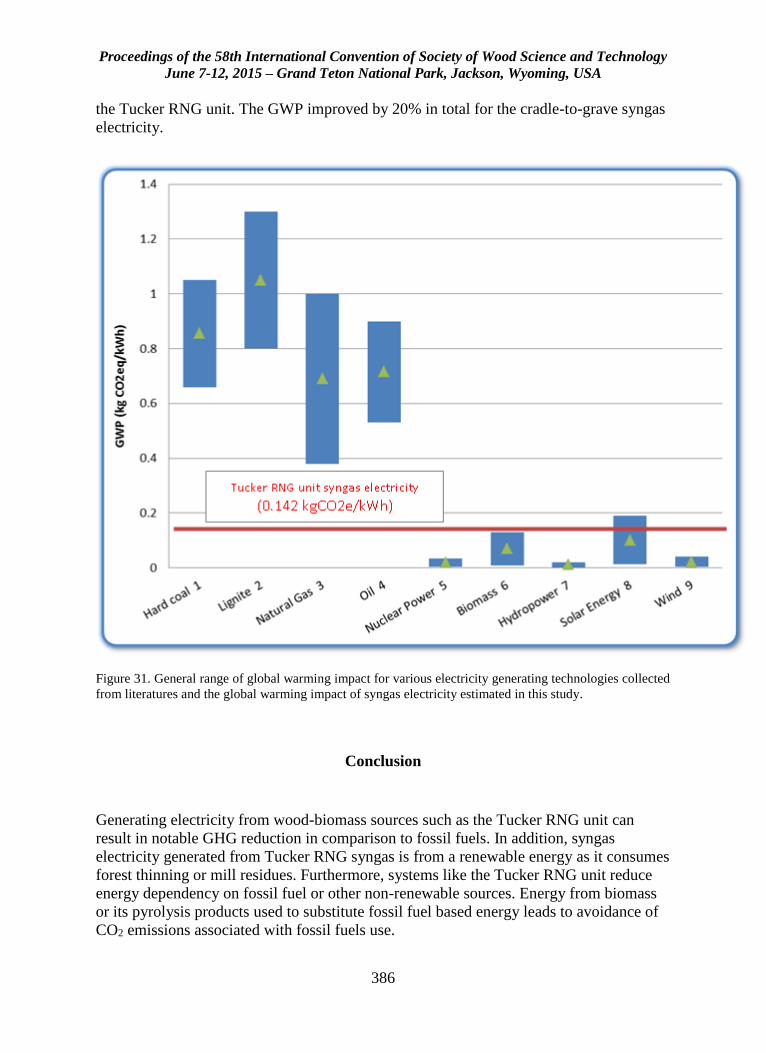
Proceedings of the 58th International Convention of Society of Wood Science and Technology
June 7-12, 2015 – Grand Teton National Park, Jackson, Wyoming, USA
386
the Tucker RNG unit. The GWP improved by 20% in total for the cradle-to-grave syngas
electricity.
Figure 31. General range of global warming impact for various electricity generating technologies collected
from literatures and the global warming impact of syngas electricity estimated in this study.
Conclusion
Generating electricity from wood-biomass sources such as the Tucker RNG unit can
result in notable GHG reduction in comparison to fossil fuels. In addition, syngas
electricity generated from Tucker RNG syngas is from a renewable energy as it consumes
forest thinning or mill residues. Furthermore, systems like the Tucker RNG unit reduce
energy dependency on fossil fuel or other non-renewable sources. Energy from biomass
or its pyrolysis products used to substitute fossil fuel based energy leads to avoidance of
CO2 emissions associated with fossil fuels use.
Proceedings of the 58th International Convention of Society of Wood Science and Technology
June 7-12, 2015 – Grand Teton National Park, Jackson, Wyoming, USA
387
Sequestering biochar when produced as a byproduct from thermochemical conversion
processes such as the Tucker RNG unit can lower the GHG emissions associated with
generating electricity. This occurs because the carbon stored in the biochar equates to
CO2 removed from the atmosphere because of its long-term stability.
The sum of these two effects associated with syngas electricity of using woody biomass
as a feedstock and sequestering biochar lowers the GW impact (ie GHG emissions)
substantially. It is known that electricity from burning fossil fuels is the main contributor
to the GW impact (Hertwich et al 2013); thus, the consumption of biomass (directly
combusted or indirectly derived) for bioelectricity is assumed as carbon neutral. Carbon
neutrality for the biomass burned to generate electricity continues to be questioned
(USEPA 2014b). Regardless, GHG emissions are generated that impact GW because the
entire life cycle of the biomass is assessed so there are fossil CO2 emissions in the
cultivation, harvesting, processing, and transportation processes. The present study
tracked these GHG emissions including fossil CO2 and thus was included in our analysis.
One additional point was added for wood harvested from sustainably managed forests.
By doing so, substantial C benefits are gained by avoiding CH4 emissions related to
burning or natural decomposition of forest thinning residues but instead converting them
into biomass-based electricity.
Future works for the broader project details utilizing the biochar as a co-product instead
of a byproduct and then evaluating the additional life cycle of producing activated C. The
reason is that biochar as activated C has a higher market value than as a soil amendment.
However, it takes processing in tightly controlled environments such as the Tucker RNG
unit to generate the physical properties required, which means additional energy and
materials to make it so.
Acknowledgment
We thank Richard Tucker and David Barbee (Tucker Engineering Associates) for
technical assistance. In addition, the authors especially thank Mark Knaebe (USDA
Forest Service Forest Products Laboratory), Nathaniel Anderson (USDA Forest Service
Rocky Mountain Research Station) and Prakash Nepal (U.S. Forest Service, Forestry
Sciences Laboratory in Research Trainable Park, NC) for their peer review of this paper.
We gratefully acknowledge financial assistance for this research project provided by the
U.S. Department of Agriculture (USDA) National Institute of Food and Agriculture
Biomass Research and Development Initiative (BRDI) award no. 2011-10006-30357.
BRDI is a joint effort between the USDA and the U.S. Department of Energy.
Proceedings of the 58th International Convention of Society of Wood Science and Technology
June 7-12, 2015 – Grand Teton National Park, Jackson, Wyoming, USA
388
References
Bare, J (2011) TRACI 2.0: the tool for the reduction and assessment of chemical and
other environmental impacts 2.0. Clean Technologies and Environmental Policy, 13(5).
Bergman RD, Gu H (2014) Life-cycle inventory analysis of bio-products from a modular
advanced biomass pyrolysis system. In: Proceedings, Society of Wood Science and
Technology 57th International Convention. June 23-27, 2014. Zvolen, Slovakia: 405–415.
Cowie AL, Cowie AJ (2013) Case Study - Rural Climate Solutions (University of New
England/ NSW Department of Primary Industries) Life cycle assessment of greenhouse
gas mitigation benefits of biochar. http://www.ieabioenergy-
task38.org/publications/T38_Biochar_case_study.pdf. (28 April 2015). CORRIM (2010)
Research guidelines for life-cycle inventories. Consortium for Research on Renewable
Industrial Materials. University of Washington, Seattle. 40 p.
EISA (2007) Legal Reference—Energy Independence and Security Act of 2007. GPO
(Government Printing Office). Gaunt J Lehmann J (2008) Energy balance and emissions
associated with biochar sequestration and pyrolysis bioenergy production. College of
Agriculture and Life Sciences, Cornell University. Environmental Science & Technology
42: 4152–4158.
Hertwich, E.G., Gibon, T., Bouman, E.A., Arvesen, A., Suh, S., Heath, G.A., Bergesen,
J.D., Ramirez, A., Vega, M.I., and L. Shi. (2013) Integraed life-cycle assessment of
electricity-supply scenarios confirms global environmental benefit of low-carbon
technologies. PNAS special feature.
http://www.pnas.org/cgi/doi/10.1073/pnas.1312753111. Pp. 6. (28 April 2015)
IPCC (2007) The physical scientific basis. Contribution of working group to the fourth
assessment report of the intergovernmental panel on climate change, edited by S.
Solomon et al, Cambridge Univ. Press, New York.
ISO (2006a) Environmental management—life-cycle assessment—principles and
framework. ISO 14040. International Organization for Standardization, Geneva,
Switzerland. 20 pp.
ISO (2006b) Environmental management—life-cycle assessment—requirements and
guidelines. ISO 14044. International Organization for Standardization, Geneva,
Switzerland. 46 pp.
NREL (2012) Life-cycle inventory database project. National Renewable Energy
Laboratory. https://www.lcacommons.gov/nrel/search. (accessed March 3, 2015).
Perlack PD, Wright LL, Turhollow AF, Graham RL, Stokes RJ, Erbach DC (2005)
Biomass as feedstock for a bioenergy and bioproducts industry: The technical feasibility
of a billion-ton: Annual supply. April 2005. A joint study sponsored by U.S. Department
of Energy and the U.S. Department of Agriculture.
http://www1.eere.energy.gov/bioenergy/pdfs/final_billionton_vision_report2.pdf (28
April 2015)
PRé Consultants (2015) Life-Cycle assessment software package SimaPro 8 Update
Instructions. Stationsplein 121, 3818 LE Amersfoort, The Netherlands. http://www.pre-
sustainability.com/ (28 April 2015).
Proceedings of the 58th International Convention of Society of Wood Science and Technology
June 7-12, 2015 – Grand Teton National Park, Jackson, Wyoming, USA
389
Schnepf R, Yacobucci BD (2013) Renewable fuel standard: overview and issues.
Congressional Research Service Report for Congress no. 7-5700
https://www.fas.org/sgp/crs/misc/R40155.pdf (28 April 2015).
Sebastian F, Royo J Gomez, M (2011) Cofiring versus biomass-fired power plants: GHG
(Greenhouse Gases) emissions savings comparison by means of LCA (Life Cycle
Assessment) methodology. Energy 36: 2029-2037.
Sohi SP, Krull E, Lopez-Capel E, Bol R (2010) Chapter 2 – A review of biochar and its
use and function in soil. Advances in Agronomy 105:47–82.
Steubing B (2011) Analysis of the availability of bioenergy and assessment of its optimal
use from an environmental perspective. PhD dissertation, École polytechnique fédérale
de Lausanne, Lausanne, Switzerland. 181 pp.
Steubing B, Zah R, Ludwig C (2011) Life cycle assessment of SNG from wood for
heating, electricity, and transportation. Biomass Bioenerg 35(7):2950–2960.
Turconi R, Boldrin A, Astrup T (2013) Life cycle assessment of electricity generation
technologies: Overview, comparability and limitations. Renewable and Sustainable
Energy Reviews 28: 555–565. USEPA (2014a) eGRID 9th edition version 1.0: Year 2010
summary tables. United States Environmental Protection Agency. Washington, D.C. 13
p. http://www.epa.gov/cleanenergy/documents/egridzips/eGRID_9th_edition_V1-
0_year_2010_Summary_Tables.pdf (27 March 2015).
USEPA (2014b) Carbon dioxide emissions associated with bioenergy and other biogenic
sources. United States Environmental Protection Agency. Washington, D.C.
http://www.epa.gov/climatechange/ghgemissions/biogenic-emissions.html (28 April
2015).
Wang Z, Dunn JB, Han J, Wang MQ (2014) Effects of co-produced biochar on life cycle
greenhouse gas emissions of pyrolysis-derived renewable fuels. Biofuels and Bioprod
Bioref. 8:189–204.
Proceedings of the 58th International Convention of Society of Wood Science and Technology
June 7-12, 2015 – Grand Teton National Park, Jackson, Wyoming, USA
390
Viscoelastic Creep Behavior of Surface and Inner Layer
of Sugi and Hinoki Boxed-Heart Timber under Various
Temperatures
Andi Hermawan 1* – Noboru Fujimoto2
1 JSPS Postdoctoral Fellow, Department of Sustainable Bioresource Science,
Laboratory of Wood Material Technology, Kyushu University, Fukuoka,
Japan
* Corresponding author
[email protected] 2 Associate Professor, Department of Sustainable Bioresource Science,
Laboratory of Wood Material Technology, Kyushu University, Fukuoka,
Japan
Abstract
This study was conducted to investigate the rheological behavior of Sugi and Hinoki
boxed-heart timber at constant moisture content (MC) by using cantilever creep test. The
focus of the study was on the effect of temperature on viscoelastic creep behavior of
surface and inner layer specimen of Sugi and Hinoki boxed-heart timber. Surface and
inner layer specimen of the timber with dimension of 75 mm in length, 25 mm in width, 3
mm in thickness and with an effective span of 40 mm was rigidly clamped at its fixed-
end. Cantilever creep test of the specimen was conducted at temperature of 20, 65, 80 and
95°C with equilibrium moisture content (EMC) about 12%. A load of 20% from rupture
load of the specimen at each temperature was applied at its free-end and strain gauges
were bonded at fourth span (10 mm) on its upper and bottom faces. Loading and
unloading duration was set for 300 and 180 min, respectively. Four-element burger model
was used to model creep properties of the timber. It was found that temperature had
significant effects on the creep properties of the timber. Creep compliance of surface and
inner layer specimen of both Sugi and Hinoki boxed-heart timber tended to increase as
temperature increased. Creep compliance of surface layer specimen of Sugi boxed-heart
timber was larger than that of Hinoki boxed-heart timber at each temperature. However,
creep compliance of inner layer specimen of Sugi and Hinoki boxed-heart timber was
almost the same.
Keywords: Sugi, Hinoki, boxed-heart timber, viscoelastic creep, burger model, parameter
identification
Proceedings of the 58th International Convention of Society of Wood Science and Technology
June 7-12, 2015 – Grand Teton National Park, Jackson, Wyoming, USA
391
Introduction
Sugi (Cryptomeria japonica) and Hinoki (Chamaecyparis obtusa) are the most important
commercial wood species in Japan. Generally, thinned Sugi and Hinoki trees are sawn
into boxed-heart timber and used for structural purposes in Japanese traditional post-and-
beam construction. In Japan, timber for structural purposes should be dried to the
moisture content (MC) lower than 20% to prevent dimensional change in the future
because of moisture fluctuation. However, to achieve high-quality dried boxed-heart
timber is very difficult because surface checks often occur during drying the timber due
to obvious anisotropic shrinkage.
In Japan, various pretreatments and drying methods have been developed to achieve a
higher-quality dried boxed-heart timber with fewer surface checks as well as reduce its
drying time (Ishiguri et al. 2001, Kobayashi et al. 2003). It was reported that high-
temperature and low-humidity (HT-LH) pre-treatment is effective in preventing surface
checks of Sugi boxed-heart timber (Katagiri et al. 2007). It is thought that during HT-LH
pre-treatment, green Sugi boxed-heart timber was exposed to the dry heat at a
temperature more than 100°C. Under this circumstances, thermal softening occurred at
surface layer of the timber and contributed to the effective relaxation of tensile stress;
thus a large drying set formed at the surface layer of the timber and resulting less surface
check occurrence. On the other hand, it was reported also that excessive temperature and
time of the pre-treatment conditions would give negative effect to the timber in term of
internal check occurrence. However, an accurate understanding on the mechanism of
HT-LH pretreatment affect checks occurrence of the timber is still unclear.
Very little research have been conducted to better understand the mechanism of HT-LH
pretreatment on checks prevention of boxed-heart timber. Over a decade ago, rheological
approach has been proposed to clarify the effect of temperature on checks development
during drying of Sugi boxed-heart timber (Fujimoto et al. 2001). Tensile creep behavior
of surface layer and compressive creep behavior of inner layer of the timber were
investigated under various temperatures. Although tensile and compressive creep test is
close analogy with the mechanical behavior of the timber during drying, however, in this
experiment, tensile and compressive creep tests were conducted separately with different
sample size and shape. On the other hand, Moutee et al. (2009) have developed cantilever
creep test to model creep behavior of wood during drying. This test is simple and much
closer analogy with the mechanical behavior of wood during drying because a cantilever
beam when subjected to a load at its free-end, tension and compression stress occur on its
upper and bottom faces, respectively at the same time.
This study was conducted as a part of effort to better understand the mechanism of HT-
LH pretreatment on surface check prevention of Sugi and Hinoki boxed-heart timber. We
believed that respond of the timber especially surface and inner layer of the timber on
temperature and MC change under applied stress contributed to the checking occurrence
of the timber. Therefore, in this study we investigated rheological behavior of the timber
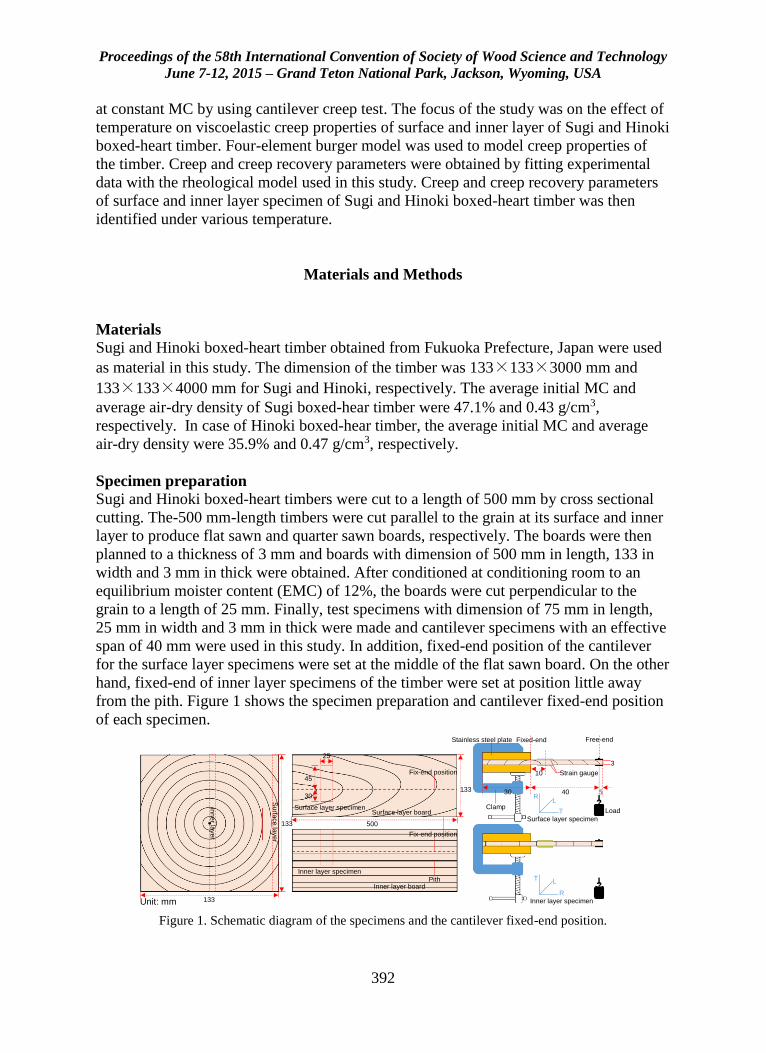
Proceedings of the 58th International Convention of Society of Wood Science and Technology
June 7-12, 2015 – Grand Teton National Park, Jackson, Wyoming, USA
392
at constant MC by using cantilever creep test. The focus of the study was on the effect of
temperature on viscoelastic creep properties of surface and inner layer of Sugi and Hinoki
boxed-heart timber. Four-element burger model was used to model creep properties of
the timber. Creep and creep recovery parameters were obtained by fitting experimental
data with the rheological model used in this study. Creep and creep recovery parameters
of surface and inner layer specimen of Sugi and Hinoki boxed-heart timber was then
identified under various temperature.
Materials and Methods
Materials
Sugi and Hinoki boxed-heart timber obtained from Fukuoka Prefecture, Japan were used
as material in this study. The dimension of the timber was 133×133×3000 mm and
133×133×4000 mm for Sugi and Hinoki, respectively. The average initial MC and
average air-dry density of Sugi boxed-hear timber were 47.1% and 0.43 g/cm3,
respectively. In case of Hinoki boxed-hear timber, the average initial MC and average
air-dry density were 35.9% and 0.47 g/cm3, respectively.
Specimen preparation
Sugi and Hinoki boxed-heart timbers were cut to a length of 500 mm by cross sectional
cutting. The-500 mm-length timbers were cut parallel to the grain at its surface and inner
layer to produce flat sawn and quarter sawn boards, respectively. The boards were then
planned to a thickness of 3 mm and boards with dimension of 500 mm in length, 133 in
width and 3 mm in thick were obtained. After conditioned at conditioning room to an
equilibrium moister content (EMC) of 12%, the boards were cut perpendicular to the
grain to a length of 25 mm. Finally, test specimens with dimension of 75 mm in length,
25 mm in width and 3 mm in thick were made and cantilever specimens with an effective
span of 40 mm were used in this study. In addition, fixed-end position of the cantilever
for the surface layer specimens were set at the middle of the flat sawn board. On the other
hand, fixed-end of inner layer specimens of the timber were set at position little away
from the pith. Figure 1 shows the specimen preparation and cantilever fixed-end position
of each specimen.
Figure 1. Schematic diagram of the specimens and the cantilever fixed-end position.
Strain gauge10
40
3
Load
Free-end
Surface layer specimen
Stainless steel plate
Clamp
30 5
L
T
R
T L
R
Fix-end position
Inner layer specimenPith
Inner layer specimen
133
133
Su
rface
laye
r
Inn
er la
ye
r
45
30
25
133
Fix-end position
Surface layer specimenSurface layer board
Inner layer board
500
Fixed-end
Unit: mm
?
?
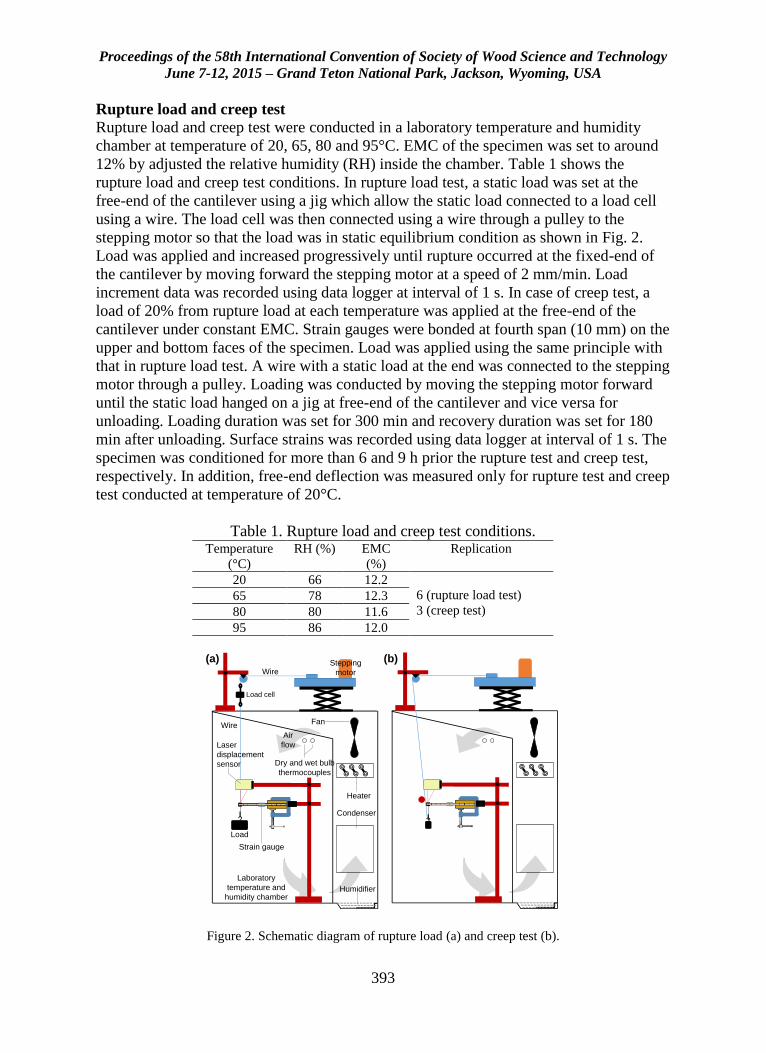
Proceedings of the 58th International Convention of Society of Wood Science and Technology
June 7-12, 2015 – Grand Teton National Park, Jackson, Wyoming, USA
393
Rupture load and creep test
Rupture load and creep test were conducted in a laboratory temperature and humidity
chamber at temperature of 20, 65, 80 and 95°C. EMC of the specimen was set to around
12% by adjusted the relative humidity (RH) inside the chamber. Table 1 shows the
rupture load and creep test conditions. In rupture load test, a static load was set at the
free-end of the cantilever using a jig which allow the static load connected to a load cell
using a wire. The load cell was then connected using a wire through a pulley to the
stepping motor so that the load was in static equilibrium condition as shown in Fig. 2.
Load was applied and increased progressively until rupture occurred at the fixed-end of
the cantilever by moving forward the stepping motor at a speed of 2 mm/min. Load
increment data was recorded using data logger at interval of 1 s. In case of creep test, a
load of 20% from rupture load at each temperature was applied at the free-end of the
cantilever under constant EMC. Strain gauges were bonded at fourth span (10 mm) on the
upper and bottom faces of the specimen. Load was applied using the same principle with
that in rupture load test. A wire with a static load at the end was connected to the stepping
motor through a pulley. Loading was conducted by moving the stepping motor forward
until the static load hanged on a jig at free-end of the cantilever and vice versa for
unloading. Loading duration was set for 300 min and recovery duration was set for 180
min after unloading. Surface strains was recorded using data logger at interval of 1 s. The
specimen was conditioned for more than 6 and 9 h prior the rupture test and creep test,
respectively. In addition, free-end deflection was measured only for rupture test and creep
test conducted at temperature of 20°C.
Table 1. Rupture load and creep test conditions. Temperature
(°C)
RH (%) EMC
(%)
Replication
20 66 12.2
6 (rupture load test)
3 (creep test) 65 78 12.3
80 80 11.6
95 86 12.0
Figure 2. Schematic diagram of rupture load (a) and creep test (b).
Fan
Dry and wet bulb
thermocouples
Heater
Condenser
Humidifier
Air
flow
Laboratory
temperature and
humidity chamber
Wire
Laser
displacement
sensor
Wire
Strain gauge
Stepping
motor
Load
Load cell
? ?
(a) (b)
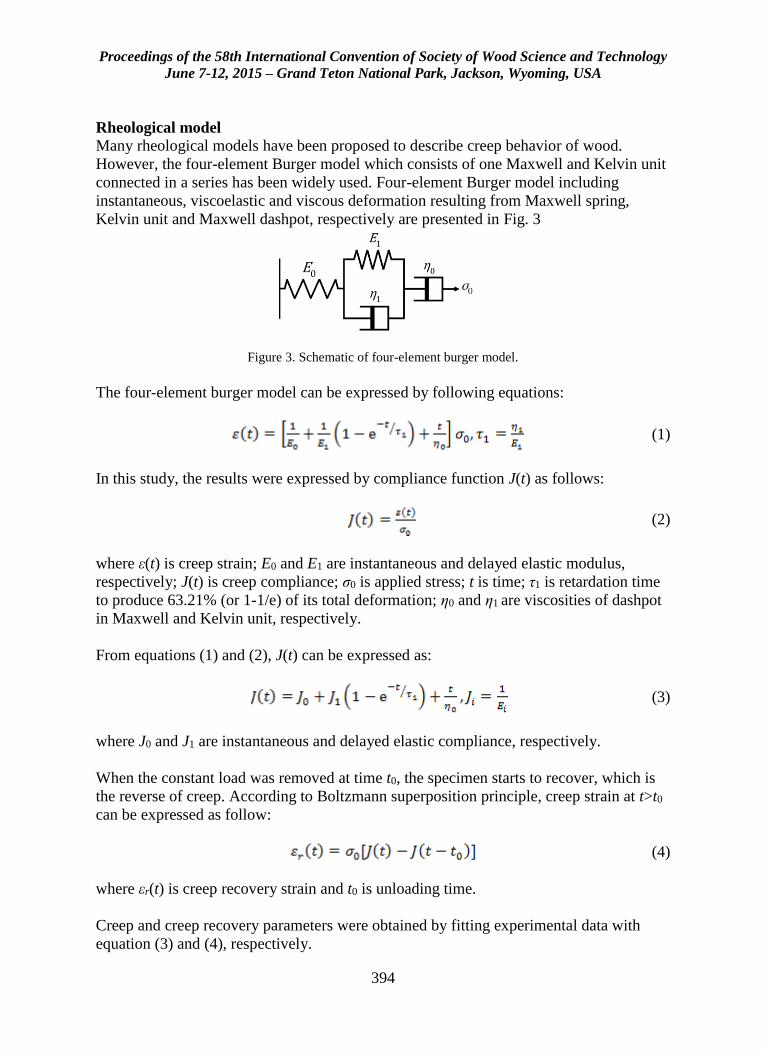
Proceedings of the 58th International Convention of Society of Wood Science and Technology
June 7-12, 2015 – Grand Teton National Park, Jackson, Wyoming, USA
394
Rheological model
Many rheological models have been proposed to describe creep behavior of wood.
However, the four-element Burger model which consists of one Maxwell and Kelvin unit
connected in a series has been widely used. Four-element Burger model including
instantaneous, viscoelastic and viscous deformation resulting from Maxwell spring,
Kelvin unit and Maxwell dashpot, respectively are presented in Fig. 3
Figure 3. Schematic of four-element burger model.
The four-element burger model can be expressed by following equations:
(1)
In this study, the results were expressed by compliance function J(t) as follows:
(2)
where ε(t) is creep strain; E0 and E1 are instantaneous and delayed elastic modulus,
respectively; J(t) is creep compliance; σ0 is applied stress; t is time; τ1 is retardation time
to produce 63.21% (or 1-1/e) of its total deformation; η0 and η1 are viscosities of dashpot
in Maxwell and Kelvin unit, respectively.
From equations (1) and (2), J(t) can be expressed as:
(3)
where J0 and J1 are instantaneous and delayed elastic compliance, respectively.
When the constant load was removed at time t0, the specimen starts to recover, which is
the reverse of creep. According to Boltzmann superposition principle, creep strain at t>t0
can be expressed as follow:
(4)
where εr(t) is creep recovery strain and t0 is unloading time.
Creep and creep recovery parameters were obtained by fitting experimental data with
equation (3) and (4), respectively.
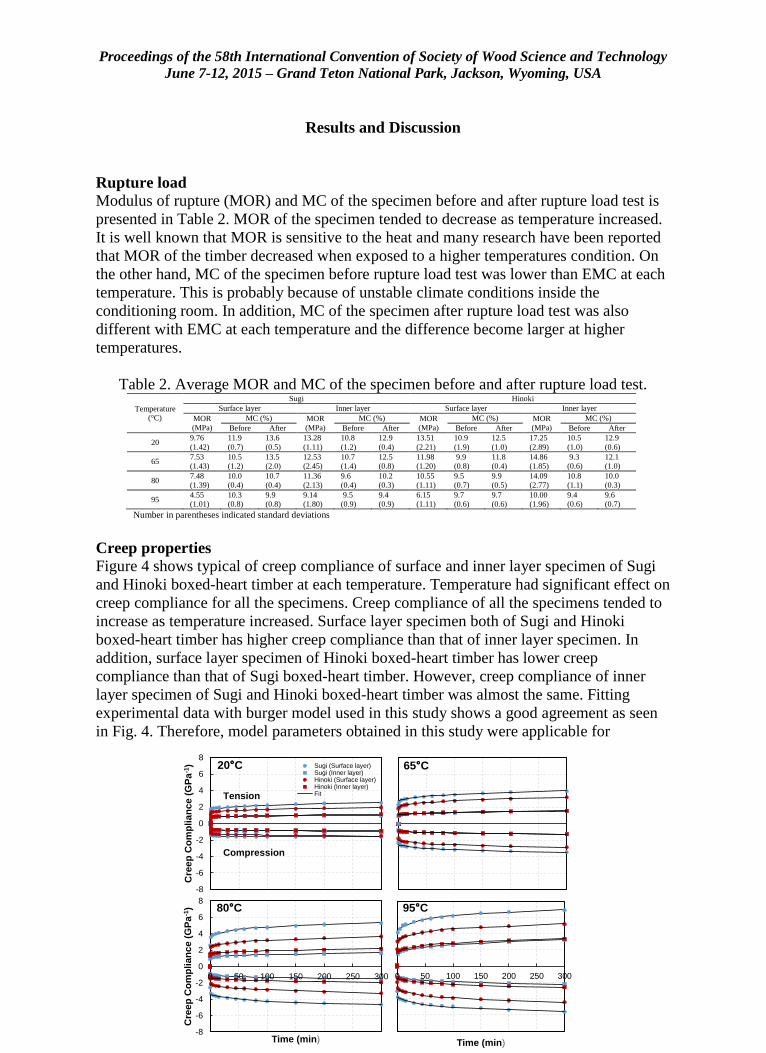
Proceedings of the 58th International Convention of Society of Wood Science and Technology
June 7-12, 2015 – Grand Teton National Park, Jackson, Wyoming, USA
395
Results and Discussion
Rupture load
Modulus of rupture (MOR) and MC of the specimen before and after rupture load test is
presented in Table 2. MOR of the specimen tended to decrease as temperature increased.
It is well known that MOR is sensitive to the heat and many research have been reported
that MOR of the timber decreased when exposed to a higher temperatures condition. On
the other hand, MC of the specimen before rupture load test was lower than EMC at each
temperature. This is probably because of unstable climate conditions inside the
conditioning room. In addition, MC of the specimen after rupture load test was also
different with EMC at each temperature and the difference become larger at higher
temperatures.
Table 2. Average MOR and MC of the specimen before and after rupture load test.
Temperature
(°C)
Sugi Hinoki
Surface layer Inner layer Surface layer Inner layer
MOR
(MPa)
MC (%) MOR
(MPa)
MC (%) MOR
(MPa)
MC (%) MOR
(MPa)
MC (%)
Before After Before After Before After Before After
20 9.76
(1.42)
11.9
(0.7)
13.6
(0.5)
13.28
(1.11)
10.8
(1.2)
12.9
(0.4)
13.51
(2.21)
10.9
(1.9)
12.5
(1.0)
17.25
(2.89)
10.5
(1.0)
12.9
(0.6)
65 7.53
(1.43)
10.5
(1.2)
13.5
(2.0)
12.53
(2.45)
10.7
(1.4)
12.5
(0.8)
11.98
(1.20)
9.9
(0.8)
11.8
(0.4)
14.86
(1.85)
9.3
(0.6)
12.1
(1.0)
80 7.48
(1.39)
10.0
(0.4)
10.7
(0.4)
11.36
(2.13)
9.6
(0.4)
10.2
(0.3)
10.55
(1.11)
9.5
(0.7)
9.9
(0.5)
14.09
(2.77)
10.8
(1.1)
10.0
(0.3)
95 4.55
(1.01)
10.3
(0.8)
9.9
(0.8)
9.14
(1.80)
9.5
(0.9)
9.4
(0.9)
6.15
(1.11)
9.7
(0.6)
9.7
(0.6)
10.00
(1.96)
9.4
(0.6)
9.6
(0.7)
Number in parentheses indicated standard deviations
Creep properties
Figure 4 shows typical of creep compliance of surface and inner layer specimen of Sugi
and Hinoki boxed-heart timber at each temperature. Temperature had significant effect on
creep compliance for all the specimens. Creep compliance of all the specimens tended to
increase as temperature increased. Surface layer specimen both of Sugi and Hinoki
boxed-heart timber has higher creep compliance than that of inner layer specimen. In
addition, surface layer specimen of Hinoki boxed-heart timber has lower creep
compliance than that of Sugi boxed-heart timber. However, creep compliance of inner
layer specimen of Sugi and Hinoki boxed-heart timber was almost the same. Fitting
experimental data with burger model used in this study shows a good agreement as seen
in Fig. 4. Therefore, model parameters obtained in this study were applicable for
-8
-6
-4
-2
0
2
4
6
8
Cre
ep
Co
mp
lian
ce (
GP
a-1
)
Time (min)
65°C
-8
-6
-4
-2
0
2
4
6
8
Cre
ep
Co
mp
lia
nc
e (
GP
a-1
)
Time (min)
Sugi (Surface layer)Sugi (Inner layer)Hinoki (Surface layer)Hinoki (Inner layer)Fit
-8
-6
-4
-2
0
2
4
6
8
0 50 100 150 200 250 300
Cre
ep
Co
mp
lian
ce (
GP
a-1
)
Time (min)-8
-6
-4
-2
0
2
4
6
8
0 50 100 150 200 250 300
Cre
ep
Co
mp
lia
nc
e (
GP
a-1
)
Time (min)
20°C
80°C 95°C
Tension
Compression
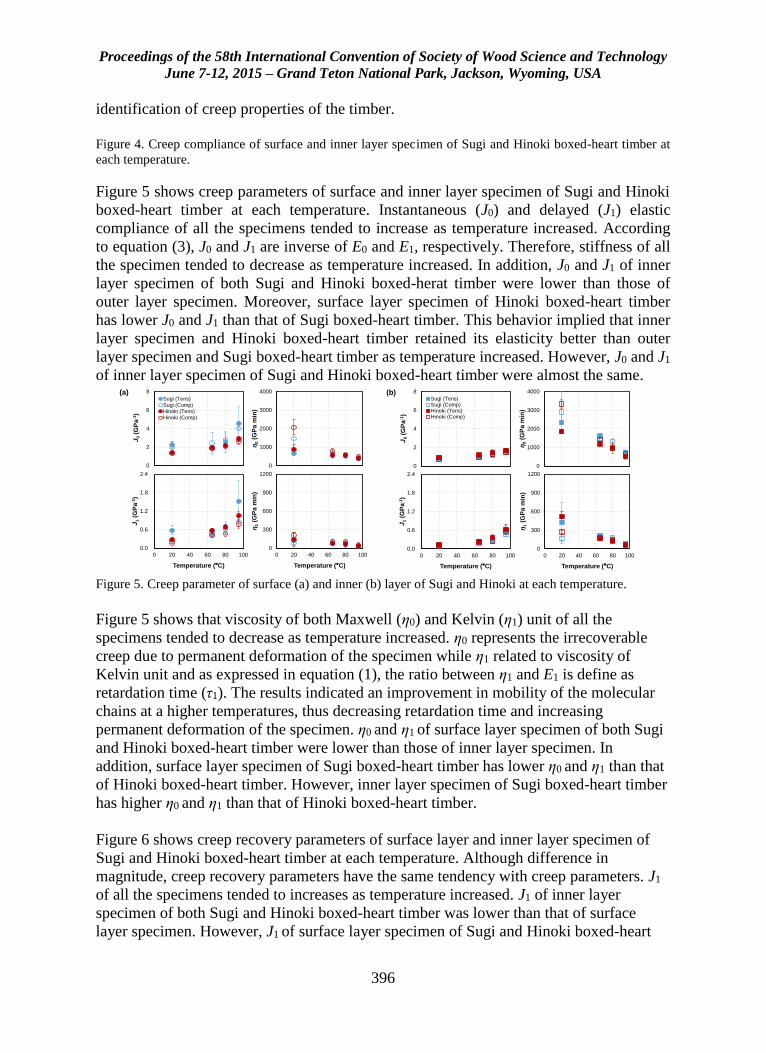
Proceedings of the 58th International Convention of Society of Wood Science and Technology
June 7-12, 2015 – Grand Teton National Park, Jackson, Wyoming, USA
396
identification of creep properties of the timber.
Figure 4. Creep compliance of surface and inner layer specimen of Sugi and Hinoki boxed-heart timber at
each temperature.
Figure 5 shows creep parameters of surface and inner layer specimen of Sugi and Hinoki
boxed-heart timber at each temperature. Instantaneous (J0) and delayed (J1) elastic
compliance of all the specimens tended to increase as temperature increased. According
to equation (3), J0 and J1 are inverse of E0 and E1, respectively. Therefore, stiffness of all
the specimen tended to decrease as temperature increased. In addition, J0 and J1 of inner
layer specimen of both Sugi and Hinoki boxed-herat timber were lower than those of
outer layer specimen. Moreover, surface layer specimen of Hinoki boxed-heart timber
has lower J0 and J1 than that of Sugi boxed-heart timber. This behavior implied that inner
layer specimen and Hinoki boxed-heart timber retained its elasticity better than outer
layer specimen and Sugi boxed-heart timber as temperature increased. However, J0 and J1
of inner layer specimen of Sugi and Hinoki boxed-heart timber were almost the same.
Figure 5. Creep parameter of surface (a) and inner (b) layer of Sugi and Hinoki at each temperature.
Figure 5 shows that viscosity of both Maxwell (η0) and Kelvin (η1) unit of all the
specimens tended to decrease as temperature increased. η0 represents the irrecoverable
creep due to permanent deformation of the specimen while η1 related to viscosity of
Kelvin unit and as expressed in equation (1), the ratio between η1 and E1 is define as
retardation time (τ1). The results indicated an improvement in mobility of the molecular
chains at a higher temperatures, thus decreasing retardation time and increasing
permanent deformation of the specimen. η0 and η1 of surface layer specimen of both Sugi
and Hinoki boxed-heart timber were lower than those of inner layer specimen. In
addition, surface layer specimen of Sugi boxed-heart timber has lower η0 and η1 than that
of Hinoki boxed-heart timber. However, inner layer specimen of Sugi boxed-heart timber
has higher η0 and η1 than that of Hinoki boxed-heart timber.
Figure 6 shows creep recovery parameters of surface layer and inner layer specimen of
Sugi and Hinoki boxed-heart timber at each temperature. Although difference in
magnitude, creep recovery parameters have the same tendency with creep parameters. J1
of all the specimens tended to increases as temperature increased. J1 of inner layer
specimen of both Sugi and Hinoki boxed-heart timber was lower than that of surface
layer specimen. However, J1 of surface layer specimen of Sugi and Hinoki boxed-heart
0
2
4
6
8
0 20 40 60 80 100
J0
(GP
a-1
)
Temperature (°C)
Sugi (Tens)
Sugi (Comp)
Hinoki (Tens)
Hinoki (Comp)
0
1000
2000
3000
4000
0 20 40 60 80 100
η0
(GP
a m
in)
Temperature (°C)
0.0
0.6
1.2
1.8
2.4
0 20 40 60 80 100
J1
(GP
a-1
)
Temperature (°C)
0
300
600
900
1200
0 20 40 60 80 100
η1
(GP
a m
in)
Temperature (°C)
0
2
4
6
8
0 20 40 60 80 100
J0
(GP
a-1
)
Temperature (°C)
Sugi (Tens)Sugi (Comp)Hinoki (Tens)Hinoki (Comp)
0
1000
2000
3000
4000
0 20 40 60 80 100
η0
(GP
a m
in)
Temperature (°C)
0.0
0.6
1.2
1.8
2.4
0 20 40 60 80 100
J1
(GP
a-1
)
Temperature (°C)
0
300
600
900
1200
0 20 40 60 80 100
η1
(GP
a m
in)
Temperature (°C)
(a) (b)
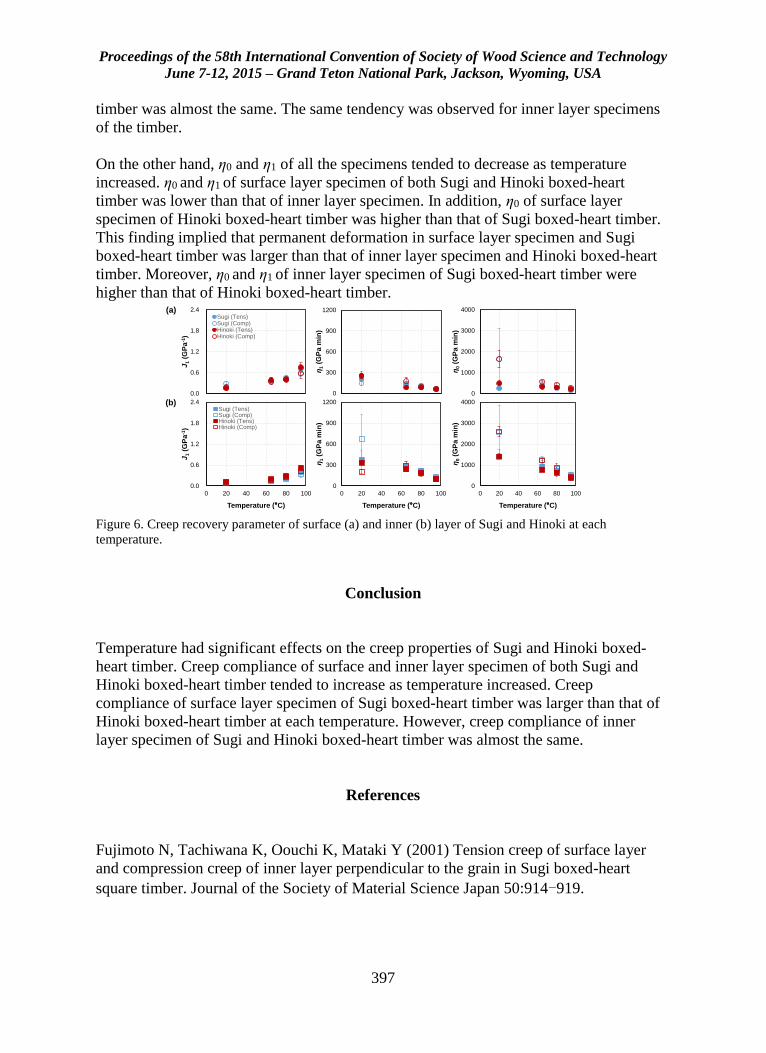
Proceedings of the 58th International Convention of Society of Wood Science and Technology
June 7-12, 2015 – Grand Teton National Park, Jackson, Wyoming, USA
397
timber was almost the same. The same tendency was observed for inner layer specimens
of the timber.
On the other hand, η0 and η1 of all the specimens tended to decrease as temperature
increased. η0 and η1 of surface layer specimen of both Sugi and Hinoki boxed-heart
timber was lower than that of inner layer specimen. In addition, η0 of surface layer
specimen of Hinoki boxed-heart timber was higher than that of Sugi boxed-heart timber.
This finding implied that permanent deformation in surface layer specimen and Sugi
boxed-heart timber was larger than that of inner layer specimen and Hinoki boxed-heart
timber. Moreover, η0 and η1 of inner layer specimen of Sugi boxed-heart timber were
higher than that of Hinoki boxed-heart timber.
Figure 6. Creep recovery parameter of surface (a) and inner (b) layer of Sugi and Hinoki at each
temperature.
Conclusion
Temperature had significant effects on the creep properties of Sugi and Hinoki boxed-
heart timber. Creep compliance of surface and inner layer specimen of both Sugi and
Hinoki boxed-heart timber tended to increase as temperature increased. Creep
compliance of surface layer specimen of Sugi boxed-heart timber was larger than that of
Hinoki boxed-heart timber at each temperature. However, creep compliance of inner
layer specimen of Sugi and Hinoki boxed-heart timber was almost the same.
References
Fujimoto N, Tachiwana K, Oouchi K, Mataki Y (2001) Tension creep of surface layer
and compression creep of inner layer perpendicular to the grain in Sugi boxed-heart
square timber. Journal of the Society of Material Science Japan 50:914-919.
0.0
0.6
1.2
1.8
2.4
0 20 40 60 80 100
J1
(GP
a-1
)
Temperature (°C)
Sugi (Tens)Sugi (Comp)Hinoki (Tens)Hinoki (Comp)
(a)
0
300
600
900
1200
0 20 40 60 80 100
η1
(GP
a m
in)
Temperature (°C)
0
1000
2000
3000
4000
0 20 40 60 80 100
η0
(GP
a m
in)
Temperature (°C)
0
1000
2000
3000
4000
0 20 40 60 80 100
η0
(GP
a m
in)
Temperature (°C)
0
300
600
900
1200
0 20 40 60 80 100
η1
(GP
a m
in)
Temperature (°C)
0.0
0.6
1.2
1.8
2.4
0 20 40 60 80 100
J1
(GP
a-1
)
Temperature (°C)
Sugi (Tens)Sugi (Comp)Hinoki (Tens)Hinoki (Comp)
(b)
Proceedings of the 58th International Convention of Society of Wood Science and Technology
June 7-12, 2015 – Grand Teton National Park, Jackson, Wyoming, USA
398
Ishiguri F, Andoh M, Yokota S, Yoshizawa N (2001) Effect of smoke heating on
moisture content, surface checking and dynamic Young’s modulus of Sugi (Cryptomeria
japonica) boxed-heart timber. Mokuzaigakkaishi 47:350-357.
Katagiri Y, Fujimoto N, Murase Y (2007) Effect of the treatment temperature on the
surface drying set of Sugi boxed-heart square timber. Drying Technology 25:507-510.
Kobayashi I, Kuroda N, Hisida T, Takahashi Y (2003) Superheated steam pre-treatment
for the drying process of boxed-heart timber from Sugi (Cryptomeria japonica D. Don).
Wood Industry 58:258-263.
Moutee M, Fortin Y, Laghdir A (2010) Cantilever experimental setup for rheological
parameter identification in relation to wood drying. Wood Science and Technology
44:31-49.
Proceedings of the 58th International Convention of Society of Wood Science and Technology
June 7-12, 2015 – Grand Teton National Park, Jackson, Wyoming, USA
399
Preferences for Materials in City Buildings, Does
Region of Origin Matter?
Olav Hoibo, [email protected]
Eric Hansen, [email protected]
Erlend Nybakk, [email protected]
Norwegian University of Life Sciences, Box 5003, , Aas, NO-1432
Abstract
A fast-growing global population, increasing urbanization, and a focus on sustainable
development brings into focus the housing sector and material use. Since carbon footprint
is important for the environmental impact of buildings, wood based housing may be an
attractive and sustainable option. Data in this study consists of responses from
immigrants and native Norwegians. Norway is a country where wood has traditionally
been a major building material in one and two story residential buildings (78% market
share). The study revealed significant differences in preferences between building
materials, and that the most preferred materials often were the same as the most common
materials used in city buildings. Small differences were found between immigrants and
native Norwegians. Still the difference in preference between types of materials was not
consistent across different groups of people. Differences due to divergent attitudes, like
concerns about material choice in general and where they wanted to live were found. The
respondents that preferred city living preferred to a greater extent the commonly used city
materials, like concrete and steel for structural use, compared to respondents that did not
prefer city living. For cladding materials, stained or painted wood was one of the most
preferred cladding materials even though it is not common on city buildings. Stone/bricks
was the most preferred cladding.
Proceedings of the 58th International Convention of Society of Wood Science and Technology
June 7-12, 2015 – Grand Teton National Park, Jackson, Wyoming, USA
400
Modeling and Design of a Disk-Type Furrow Opener’s
Coulter (Its Mechanical Analysis and Study for No-Till
Machinery)
(Combination and Bertini)
Payam Hooshmand, [email protected]
Jalaladdin Ghezavati, [email protected]
adel Ranji, [email protected]
Milad Hosseinpoor, [email protected]
Sharif University of Technology, Azadi St, , Tehran
Abstract
No-till practices play an important role in decreasing production costs, increasing soil
organic matter content, improving soil structure and removing unwanted environmental
impacts. However, due to a lack of access to proper machinery for direct seeding in
unplowed lands, such practices have failed to produce successful results since they are
incapable of providing sufficient contact between soil and seeds. This step can finally
lead to the promotion of this practice in the potential areas. The total actual forces
imposed to a furrow opener in practice are multiple times larger than a design’s total.
There are a number of factors contributing to this phenomenon including unknown
environmental factors in soil, existence of fine and coarse gravels, and also different
partial, unpredictable loads produced on impact with the soil. Empirically and practically,
as well as based on results from agricultural projects on no-till machinery in Iranian arid
and semi-arid regions, disk coulters of a furrow opener set sustain heavy damages during
no-till farming. On the other hand, several parameters can influence the soil; as a result,
the safety factor was also increased to improve the furrow opener’s resistance against
rocks, unknown soil factors, etc. Finally, the coulter’s stress was determined using the
von Mises criterion. The result showed that the minimum coulter stress was 1985.5Pa
throughout the plane and its maximum belonged to the holes inside the hub with
1.0819*107 Pa.
Proceedings of the 58th International Convention of Society of Wood Science and Technology
June 7-12, 2015 – Grand Teton National Park, Jackson, Wyoming, USA
401
Optimization of Energy Required and Energy Analysis
for Rice Production Using Data Envelopment Analysis
Approach
Payam Hooshmand, [email protected]
Adel Ranji, [email protected]
Hamed Rajabzadeh, [email protected]
Hamid Atari, [email protected]
Milad Hosseinpoor, [email protected]
Sharif University of Technology, Azadi St, , Tehran
Abstract
The objective of this study was the application of non-parametric method of data
envelopment analysis (DEA) to analyze the efficiency of farmers, discriminate efficient
farmers from inefficient ones and to identify wasteful uses of energy for rice production
in Mazandaran province, Iran. This method was used based on seven energy inputs
including human labor, machinery, diesel fuel, fertilizers, biocide, Irrigation and seed
energy and three output of rice( yield, straw and husk). Technical, pure technical, scale
and cross efficiencies were calculated using CCR and BCC models for farmers. From this
study the following results were obtained: from the total of 72 farmers, considered for the
analysis, 9.7 % and 22.2 % were found to be technically and pure technically efficient,
respectively. The average values of technical, pure technical and scale efficiency scores
of farmers were found to be 0.78, 0.95 and 0.82, respectively. The energy saving target
ratio for rice production was calculated as 7.47 %, indicating that by following the
recommendations resulted from this study, about 4.57 GJ ha−1 of total input energy
could be saved while holding the constant level of rice yield. The comparative results of
energy indices revealed that by optimization of energy consumption, energy efficiency,
energy productivity and net energy with respect to the actual energy use can be increased
by 7.46 %, 7.46 % and 5.54 %, respectively.
Proceedings of the 58th International Convention of Society of Wood Science and Technology
June 7-12, 2015 – Grand Teton National Park, Jackson, Wyoming, USA
402
Practical Modeling of Lateral Load Paths in Light-
Frame Classroom Structure
Thanh Huynh, [email protected]
Thomas Miller, [email protected]
Rakesh Gupta, [email protected]
Michael Lewis, [email protected]
Oregon State University, WSE Department, Richardson Hall, Corvallis, OR,
97331
Abstract
The objective of this study is to use a validated modeling method to investigate lateral
load paths and system behavior in an actual light-frame wood structure. The modeling
methods were validated against full-scale tests on sub-assemblies and an L-shaped house
by previous researchers. A model of a modular classroom structure is used to investigate
the effects of stiffness distribution, torsion and uplift on system behavior and lateral load
paths. ASCE 7-10 main lateral force resisting system and components and cladding wind
loads are applied. The analysis is done for a series of foundation types. The modifications
in the foundation change the locations where the structure is securely connected to the
foundation, and therefore have significant effects on how the load will be distributed
throughout the structure. Thousands of classrooms such as these are used throughout the
United States. Consequently, accurate modeling techniques to validate the performance
of these structures is integral to attesting that these structures are safe for occupancy
under their designed loads.
Proceedings of the 58th International Convention of Society of Wood Science and Technology
June 7-12, 2015 – Grand Teton National Park, Jackson, Wyoming, USA
403
Versatile Strategies for the Modification and
Functionalization of the Wood Structure
Tobias Keplinger, [email protected]
Etienne Cabane, [email protected]
Jana Segmehl, [email protected]
Ingo Burgert, [email protected]
ETH Zurich, Institute for Building Materials, Wood Materials Science,
Stefano-Franscini-Platz 3, Zürich 8093
Abstract
Wood has been used for thousands of years as a building material due to its superior
properties such as high mechanical strength in view of its light weight. This is explained
by the unique hierarchical structure. Additionally the porous structure offers potential for
utilization in new application fields e.g. in membrane technologies or the wood inherent
cellulose scaffold can be used for the development of new materials with a broad
property profile. The development of such materials requires specific chemical
modifications of the wood structure.
We report on a procedure which offers the possibility to insert new functionalities and to
control the spatial distribution of the modifying substance in the wood structure. For the
controlled spatial in-situ polymerization of monomers within the wood structure a
modular 2 step process is presented. In addition we studied delignification procedures on
bulk wood samples to obtain a cellulose scaffold while keeping the integrity of the
hierarchical anisotropic structure intact. We then investigated the insertion of
nanoparticles and polymeric components in order to implement new properties and
functions. For both approaches it is important to visualize the chemical changes with high
resolution in order to understand the modification at the cell wall level. For this purpose
especially Raman spectroscopy in combination with multivariate data analysis is applied,
yielding topo-chemical images with high chemical/spatial resolution.
Proceedings of the 58th International Convention of Society of Wood Science and Technology
June 7-12, 2015 – Grand Teton National Park, Jackson, Wyoming, USA
404
Natural Durability of Yellow-hearted Red Pine
(Hwangjangmok)
Aehee Lee1 - Namhun Kim2* - Jaehyuk Jang3 - Sewhi Park4
1Master student, Division of Forest Materials Science & Engineering,
Kangwon National University, Republic of Korea. [email protected]
2Professor, Division of Forest Materials Science & Engineering,
Kangwon National University, Republic of Korea.
*Corresponding author
[email protected] 3Researcher, Division of Forest Materials Science & Engineering,
Kangwon National University, Republic of Korea. [email protected]
4Master student, Division of Forest Materials Science & Engineering,
Kangwon National University, Republic of Korea. [email protected]
Abstract
This study was carried out to investigate natural durability of Yellow-hearted red pine
(YHRP, Pinus densiflora for. erecta Uyeki) grown in Korea. Anti-fungal and anti-termite
properties at indoor conditions and color change at outdoor conditions were examined.
Weight loss of the heartwood in YHRP after fungi test and termite was lower than that of
the sapwood in YHRP. Furthermore, the highest mortality of termite was obtained from
the heartwood of YHRP. Color indexes such as L*(brightness), a*(green-red), b*(cyan-
yellow) decreased with time and then level off in all samples after 30 days of exposure
time.
Keywords: Yellow-hearted red pine (YHRP), Red pine(RP), heartwood, annual ring,
natural durability.
Introduction
YHRP (Pinus densiflora for. erecta Uyeki(Uyeki 1928)) with high ratio of yellow
heartwood and extremely narrow ring width is one of the Korean red-pine species.
Usually, it has longer life than one hundred year and ranged infrequently in some limited
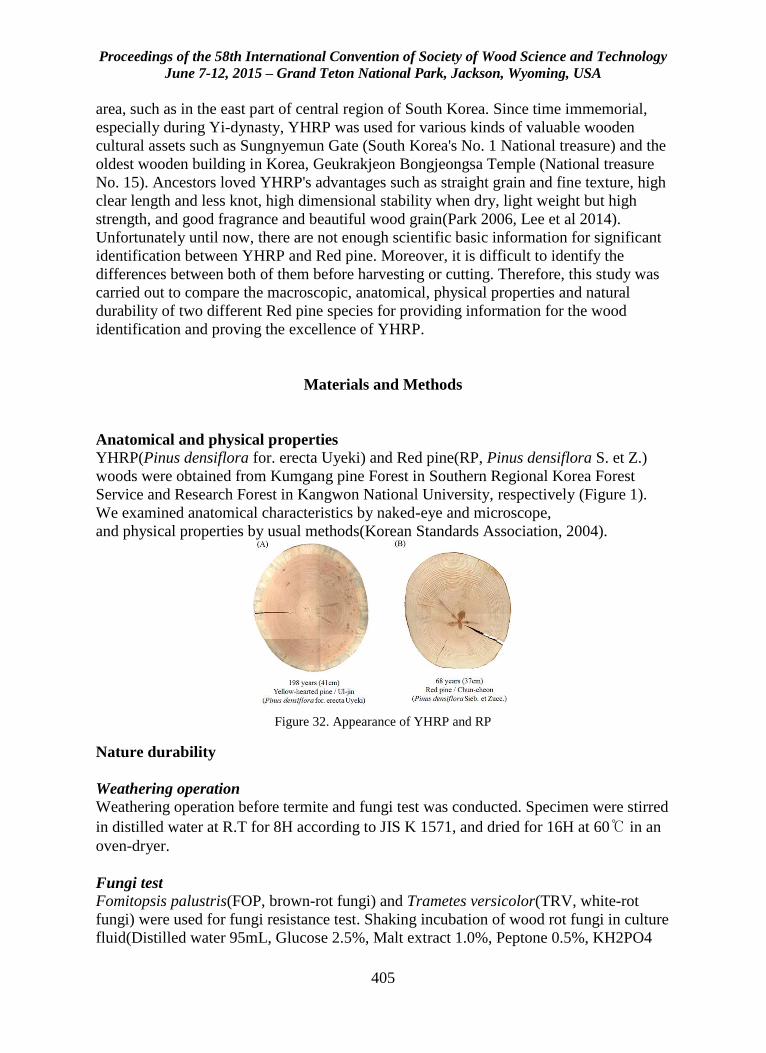
Proceedings of the 58th International Convention of Society of Wood Science and Technology
June 7-12, 2015 – Grand Teton National Park, Jackson, Wyoming, USA
405
area, such as in the east part of central region of South Korea. Since time immemorial,
especially during Yi-dynasty, YHRP was used for various kinds of valuable wooden
cultural assets such as Sungnyemun Gate (South Korea's No. 1 National treasure) and the
oldest wooden building in Korea, Geukrakjeon Bongjeongsa Temple (National treasure
No. 15). Ancestors loved YHRP's advantages such as straight grain and fine texture, high
clear length and less knot, high dimensional stability when dry, light weight but high
strength, and good fragrance and beautiful wood grain(Park 2006, Lee et al 2014).
Unfortunately until now, there are not enough scientific basic information for significant
identification between YHRP and Red pine. Moreover, it is difficult to identify the
differences between both of them before harvesting or cutting. Therefore, this study was
carried out to compare the macroscopic, anatomical, physical properties and natural
durability of two different Red pine species for providing information for the wood
identification and proving the excellence of YHRP.
Materials and Methods
Anatomical and physical properties
YHRP(Pinus densiflora for. erecta Uyeki) and Red pine(RP, Pinus densiflora S. et Z.)
woods were obtained from Kumgang pine Forest in Southern Regional Korea Forest
Service and Research Forest in Kangwon National University, respectively (Figure 1).
We examined anatomical characteristics by naked-eye and microscope,
and physical properties by usual methods(Korean Standards Association, 2004).
Figure 32. Appearance of YHRP and RP
Nature durability
Weathering operation
Weathering operation before termite and fungi test was conducted. Specimen were stirred
in distilled water at R.T for 8H according to JIS K 1571, and dried for 16H at 60℃ in an
oven-dryer.
Fungi test
Fomitopsis palustris(FOP, brown-rot fungi) and Trametes versicolor(TRV, white-rot
fungi) were used for fungi resistance test. Shaking incubation of wood rot fungi in culture
fluid(Distilled water 95mL, Glucose 2.5%, Malt extract 1.0%, Peptone 0.5%, KH2PO4
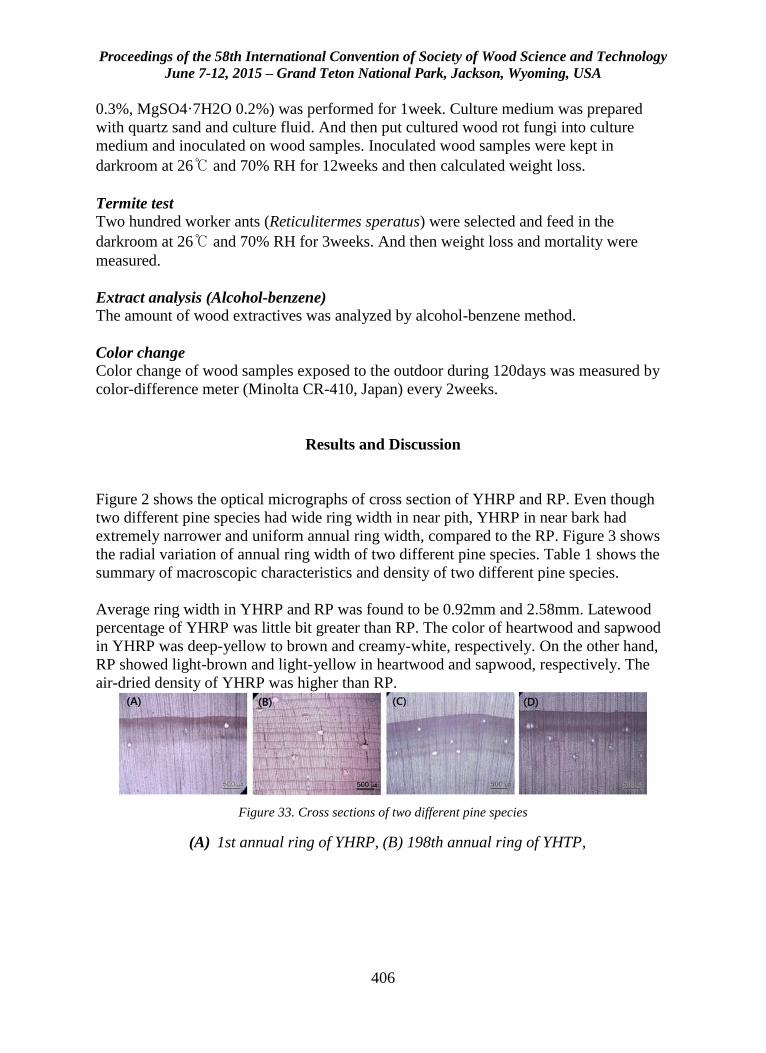
Proceedings of the 58th International Convention of Society of Wood Science and Technology
June 7-12, 2015 – Grand Teton National Park, Jackson, Wyoming, USA
406
0.3%, MgSO4·7H2O 0.2%) was performed for 1week. Culture medium was prepared
with quartz sand and culture fluid. And then put cultured wood rot fungi into culture
medium and inoculated on wood samples. Inoculated wood samples were kept in
darkroom at 26℃ and 70% RH for 12weeks and then calculated weight loss.
Termite test
Two hundred worker ants (Reticulitermes speratus) were selected and feed in the
darkroom at 26℃ and 70% RH for 3weeks. And then weight loss and mortality were
measured.
Extract analysis (Alcohol-benzene)
The amount of wood extractives was analyzed by alcohol-benzene method.
Color change
Color change of wood samples exposed to the outdoor during 120days was measured by
color-difference meter (Minolta CR-410, Japan) every 2weeks.
Results and Discussion
Figure 2 shows the optical micrographs of cross section of YHRP and RP. Even though
two different pine species had wide ring width in near pith, YHRP in near bark had
extremely narrower and uniform annual ring width, compared to the RP. Figure 3 shows
the radial variation of annual ring width of two different pine species. Table 1 shows the
summary of macroscopic characteristics and density of two different pine species.
Average ring width in YHRP and RP was found to be 0.92mm and 2.58mm. Latewood
percentage of YHRP was little bit greater than RP. The color of heartwood and sapwood
in YHRP was deep-yellow to brown and creamy-white, respectively. On the other hand,
RP showed light-brown and light-yellow in heartwood and sapwood, respectively. The
air-dried density of YHRP was higher than RP.
Figure 33. Cross sections of two different pine species
(A) 1st annual ring of YHRP, (B) 198th annual ring of YHTP,
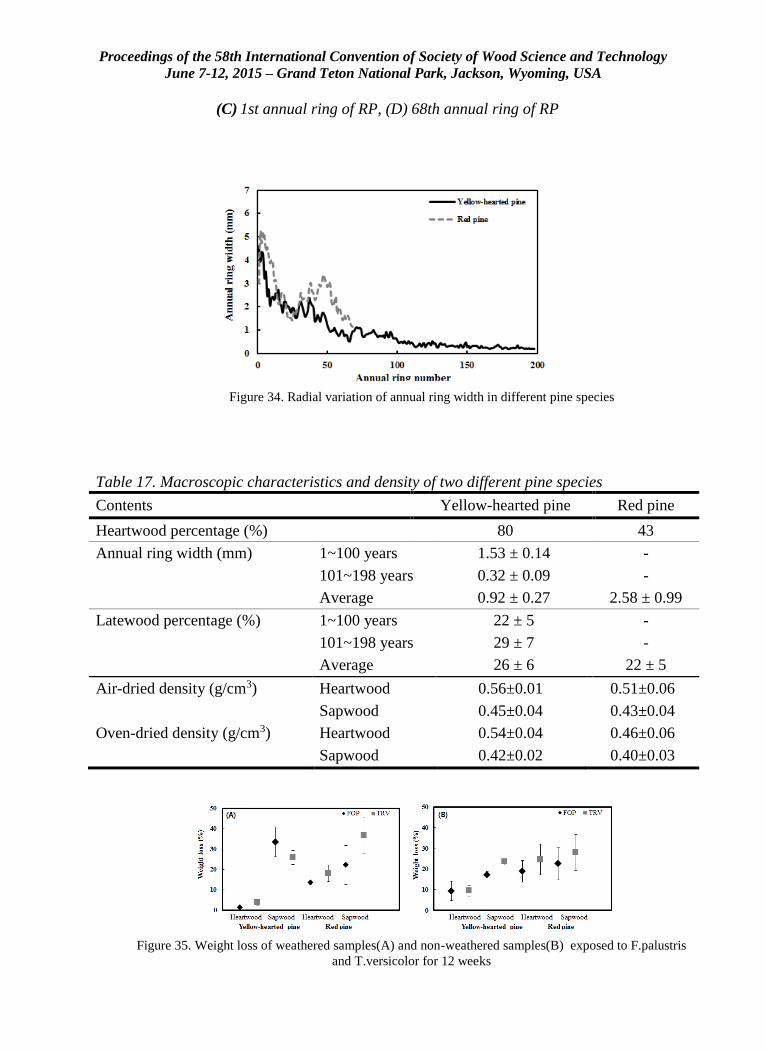
Proceedings of the 58th International Convention of Society of Wood Science and Technology
June 7-12, 2015 – Grand Teton National Park, Jackson, Wyoming, USA
407
(C) 1st annual ring of RP, (D) 68th annual ring of RP
Table 17. Macroscopic characteristics and density of two different pine species Contents Yellow-hearted pine Red pine
Heartwood percentage (%) 80 43
Annual ring width (mm) 1~100 years 1.53 ± 0.14 -
101~198 years 0.32 ± 0.09 -
Average 0.92 ± 0.27 2.58 ± 0.99
Latewood percentage (%) 1~100 years 22 ± 5 -
101~198 years 29 ± 7 -
Average 26 ± 6 22 ± 5
Air-dried density (g/cm3) Heartwood 0.56±0.01 0.51±0.06
Sapwood 0.45±0.04 0.43±0.04
Oven-dried density (g/cm3) Heartwood 0.54±0.04 0.46±0.06
Sapwood 0.42±0.02 0.40±0.03
Figure 34. Radial variation of annual ring width in different pine species
Figure 35. Weight loss of weathered samples(A) and non-weathered samples(B) exposed to F.palustris
and T.versicolor for 12 weeks
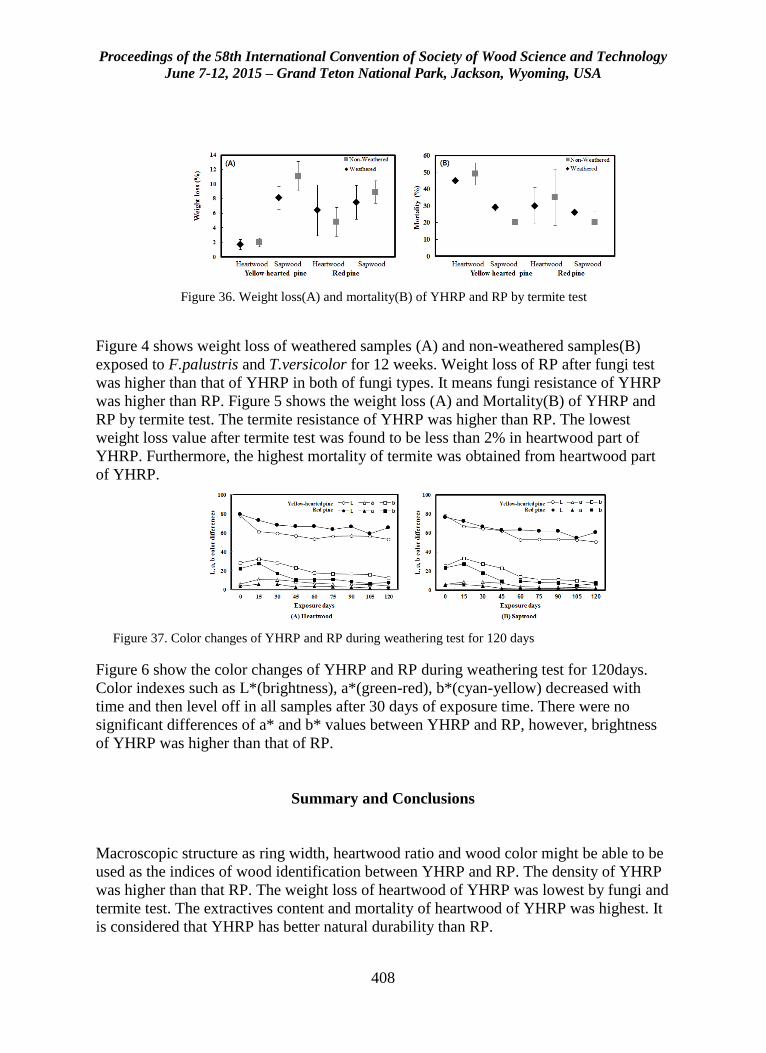
Proceedings of the 58th International Convention of Society of Wood Science and Technology
June 7-12, 2015 – Grand Teton National Park, Jackson, Wyoming, USA
408
Figure 4 shows weight loss of weathered samples (A) and non-weathered samples(B)
exposed to F.palustris and T.versicolor for 12 weeks. Weight loss of RP after fungi test
was higher than that of YHRP in both of fungi types. It means fungi resistance of YHRP
was higher than RP. Figure 5 shows the weight loss (A) and Mortality(B) of YHRP and
RP by termite test. The termite resistance of YHRP was higher than RP. The lowest
weight loss value after termite test was found to be less than 2% in heartwood part of
YHRP. Furthermore, the highest mortality of termite was obtained from heartwood part
of YHRP.
Figure 6 show the color changes of YHRP and RP during weathering test for 120days.
Color indexes such as L*(brightness), a*(green-red), b*(cyan-yellow) decreased with
time and then level off in all samples after 30 days of exposure time. There were no
significant differences of a* and b* values between YHRP and RP, however, brightness
of YHRP was higher than that of RP.
Summary and Conclusions
Macroscopic structure as ring width, heartwood ratio and wood color might be able to be
used as the indices of wood identification between YHRP and RP. The density of YHRP
was higher than that RP. The weight loss of heartwood of YHRP was lowest by fungi and
termite test. The extractives content and mortality of heartwood of YHRP was highest. It
is considered that YHRP has better natural durability than RP.
Figure 36. Weight loss(A) and mortality(B) of YHRP and RP by termite test
Figure 37. Color changes of YHRP and RP during weathering test for 120 days
Proceedings of the 58th International Convention of Society of Wood Science and Technology
June 7-12, 2015 – Grand Teton National Park, Jackson, Wyoming, USA
409
References
[1] Uyeki H. (1928) On the physiognomy of Pinus densiflora growing in Korea and
silicultural treatment for its improvement. Bulletin of Agriculture and Forestry
College of Suwon pp.263.
[2] Park BW (2006) Pine and Hwangjangmok. Forestry Cooperative Federation. National
Forestry Cooperative Federation 486: 28-33.
[3] Lee AH, Jang JH, Park BH, Kim NH (2014) Anatomical Characteristics of Yellow-
hearted Pine (Pinus densiflora for. erecta Uyeki). Journal of Forest Science 30(1) :
56-61
[4] Korean Standards association (2004) KS F 2198
Acknowledgement
This research was supported by Basic Science Research Program through the National
Research Foundation of Korea (NRF) funded by the Ministry of Education
(2012R1A1A2009637).
Proceedings of the 58th International Convention of Society of Wood Science and Technology
June 7-12, 2015 – Grand Teton National Park, Jackson, Wyoming, USA
410
Effect of CNC Application Parameters on Wooden
Surface Quality
K.Hüseyin Koç1* –E.Seda Erdinler2 –Ender Hazır3 – Emel Öztürk4
1 Professor Dr., Faculty of Forestry, Department of Forest Industry
Engineering, Istanbul University, 34473, İstanbul, TURKEY.
* Corresponding author
[email protected] 2 Assistant Professor, Faculty of Forestry, Department of Forest Industry
Engineering, Istanbul University, 34473, İstanbul, TURKEY.
[email protected] 3Research Assistant, Faculty of Forestry, Department of Forest Industry
Engineering, Istanbul University, 34473, İstanbul, TURKEY.
[email protected] 4 Research Assistant Dr., Faculty of Forestry, Department of Forest Industry
Engineering, Istanbul University, 34473, İstanbul, TURKEY.
Abstract
Wood and wooden material are the materials that have increasing industrial importance
with their wide usage area and comfort. Requirement for new data has occurred to
determine the parameters and user expectations as advanced technology applications such
as CNC machinery get to be used more in wood processing industry. Although wood is
an easier material to process with respect to metal etc. its heterogeneous structure and
variables due to process conditions make processing more complex. Research is on the
effect of process parameters by CNC router on surface treatment quality. Two tree
species and one wooden panel with intensive use in the furniture industry are selected for
the study. The tree species are Beech and Ayous, and the wooden panel is MDF panel.
The procedure parameters Spindle speed (rpm) and Feed rate (m/minute) are taken as
variable, and the others are taken as fixed.
This study analyzes the impact of procedure parameters through CNC router on the
surface treatment quality. In the analysis, cutter spindle speed, progress speed, cutting
depth parameters and wooden material are taken as variable parameters. A two factorial
experimental design is used. According to the results of the analysis, the surface
structure significantly changes according to the material structure in CNC process. The
surface structure becomes smoother as the spindle speed increases, and the surface
structure gets worse as the feed rate is increased and a rougher structure appears.
Proceedings of the 58th International Convention of Society of Wood Science and Technology
June 7-12, 2015 – Grand Teton National Park, Jackson, Wyoming, USA
411
Keywords: A. CNC, B. Wood processing, C. Surface quality, D. Wood material, E.
Surface roughness
Introduction
The majority of the problems arising the fields of use of the wooden materials is related
to the failure in determining appropriate procedure parameters. The procedure speed
varying from 0 to 60 meters per minute or processing thickness varying from 0 to 30 mm
per minute and very variable speeds and other procedure parameters may have a wide
range. Determining these parameters accurately is directly related with the expectation on
the surface quality of the wooden material. It's been stated that applying CAD-CAM
systems, which is based on CNC machinery, increases the efficiency up to 2,5 times
[Kurtoglu et al. 1997, Kurtoglu et al. 1999].
The works on determining and defining the parameters for processing wooden material in
CNC machinery increase by leaps. In a study, it's been suggested that the surface
roughness has changed significantly depending to the parameters as a result of milling the
material surfaces in CNC machinery and that these parameters can be defined with a
suitable mathematical model [Nas et al.2012].
CNC applications become more popular in the forest industry. For example, 75% of the
imported wood processing machines in Turkey are consisted of CNC machinery.
Accurate selection and efficient use of CNC machinery depends of determining the
procedure parameters [Aciyapamoglu 2013]. Procedure parameters in wood processing
with CNC affect the surface quality [Karagoz 2010]. In addition to accurately
determining the tool route and cutter movements in increasing the process efficiency, the
structure of the cutter tool also directly affects the surface structure [Bozdogan 2012].
However, optimizing the process according to the expectation from the surface of the
wooden material also brings some challenges. For this purpose, the sensor selection and
surface estimations are studied in a study. The study states that it is possible to estimate
the cutting depth with a regression analysis and artificial neural network as a result of low
speed measurement procedures on the Paper Birch wood, and suggests a modeling for
this purpose [Iskra and Hernandez, 2012]. In another study, it's been stated that the
procedure time can be reduced by 54% in an optimization carried out with a fuzzy logic.
The study particularly dwells on the feasible option of defining the relationship for the
surface quality between the cutting force and the cutting direction [Gawronski 2013,
Bajıc et al. 2008].
The readiness of the wood before use affects the expectations from the surface. The
roughness values of a heat treated material is found out to be higher in radial directions
with CNC process, and ideal application values differed for different tree species. It's
been stated that the surface roughness after CNC process decreases when the heat
Proceedings of the 58th International Convention of Society of Wood Science and Technology
June 7-12, 2015 – Grand Teton National Park, Jackson, Wyoming, USA
412
treatment temperature increases, but this does not apply for all cutting directions
[Karagoz et al. 2011].
For the milling of beech wood with CNC, it's been found out that the cutting angle, feed
rate and fiber direction affect the surface roughness, and cutting width does not have any
impact on the surface roughness despite the increase in the sound intensity [Karagoz
2010, Karagoz et al.2011]
It's been stated that C++ and graphical interactive technologies can be used for increasing
the efficiency and improving the quality in processing the wood with CNC [Lajie et al.
2011]. A study shows that the expectations related to the aging applications on wooden
surfaces can be simulated with CNC machinery [Weg et al 2012].
It's been stated that cutting depth and cutting angle does not have an impact on surface
roughness in processing the wood, but spindle speed and feed rate have an impact on
surface roughness. The general information indicates that the roughness values would
reduce when operated with lower feed rate and higher spindle speed [Rawangwong et al.
2011].
The cutting force is modeled with response surface method and box-behnken design and
experiments methodology by using an experimental design in edge milling application on
MDF [Norazmein et al. 2012].
In the CNC wood milling carried out on alder, a genetic algorithm was used and
optimization results were obtained in a shorter time by optimizing it with CAM software
[Krimpenis et al.2014].
Materials and Methods
Materials: Two tree species and one wooden panel with intensive use in the furniture
industry are selected for the study. The tree species are Beech and Ayous, and the
wooden panel is MDF panel. The samples are prepared as three samples with the
dimension of 200 mm x 95 mm x 18 mm for each procedure parameter (Figure 1).
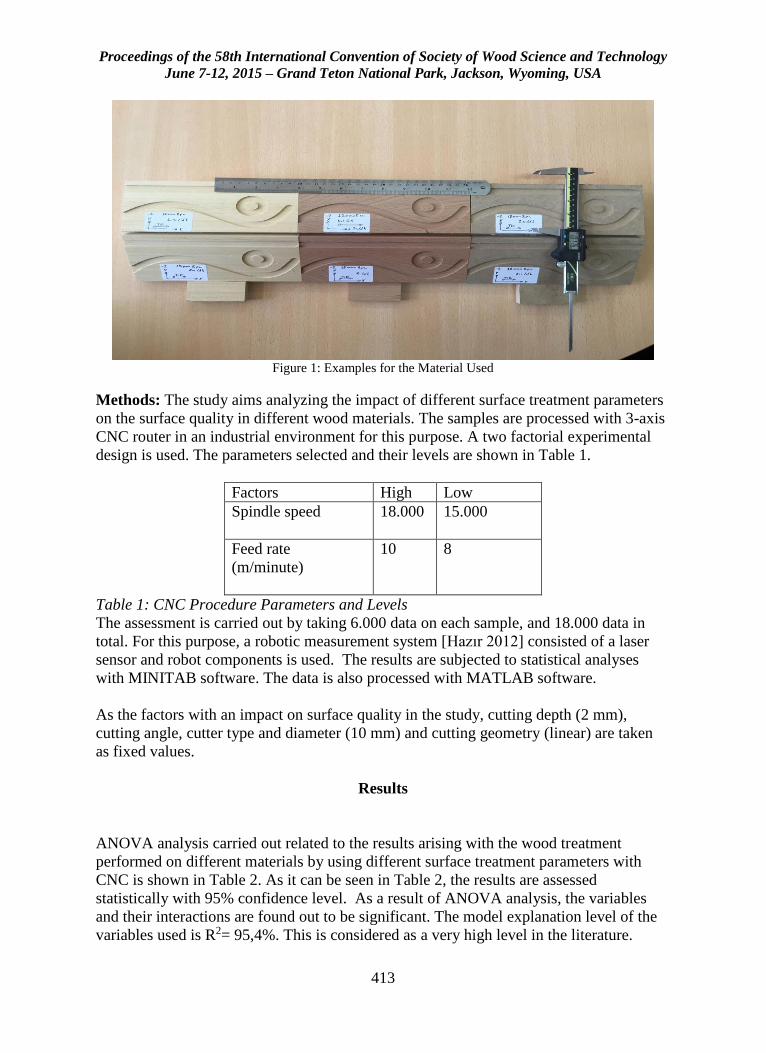
Proceedings of the 58th International Convention of Society of Wood Science and Technology
June 7-12, 2015 – Grand Teton National Park, Jackson, Wyoming, USA
413
Figure 1: Examples for the Material Used
Methods: The study aims analyzing the impact of different surface treatment parameters
on the surface quality in different wood materials. The samples are processed with 3-axis
CNC router in an industrial environment for this purpose. A two factorial experimental
design is used. The parameters selected and their levels are shown in Table 1.
Factors High Low
Spindle speed
18.000 15.000
Feed rate
(m/minute)
10 8
Table 1: CNC Procedure Parameters and Levels
The assessment is carried out by taking 6.000 data on each sample, and 18.000 data in
total. For this purpose, a robotic measurement system [Hazır 2012] consisted of a laser
sensor and robot components is used. The results are subjected to statistical analyses
with MINITAB software. The data is also processed with MATLAB software.
As the factors with an impact on surface quality in the study, cutting depth (2 mm),
cutting angle, cutter type and diameter (10 mm) and cutting geometry (linear) are taken
as fixed values.
Results
ANOVA analysis carried out related to the results arising with the wood treatment
performed on different materials by using different surface treatment parameters with
CNC is shown in Table 2. As it can be seen in Table 2, the results are assessed
statistically with 95% confidence level. As a result of ANOVA analysis, the variables
and their interactions are found out to be significant. The model explanation level of the
variables used is R2= 95,4%. This is considered as a very high level in the literature.
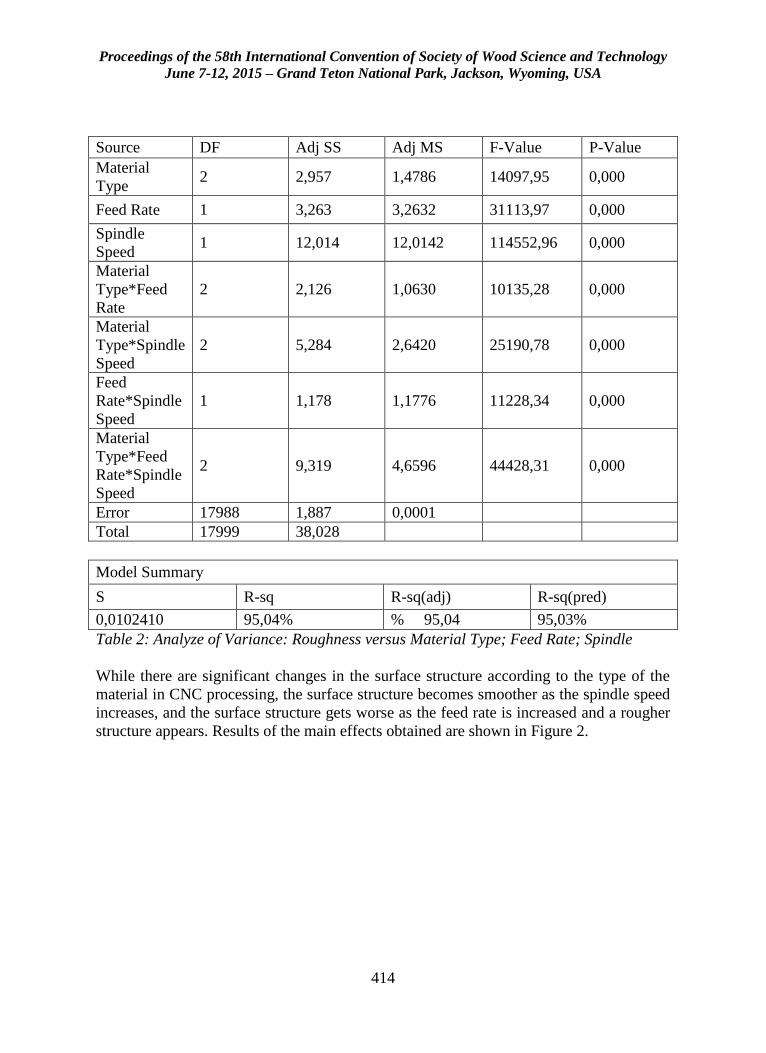
Proceedings of the 58th International Convention of Society of Wood Science and Technology
June 7-12, 2015 – Grand Teton National Park, Jackson, Wyoming, USA
414
Source DF Adj SS Adj MS F-Value P-Value
Material
Type 2 2,957 1,4786 14097,95 0,000
Feed Rate 1 3,263 3,2632 31113,97 0,000
Spindle
Speed 1 12,014 12,0142 114552,96 0,000
Material
Type*Feed
Rate
2 2,126 1,0630 10135,28 0,000
Material
Type*Spindle
Speed
2 5,284 2,6420 25190,78 0,000
Feed
Rate*Spindle
Speed
1 1,178 1,1776 11228,34 0,000
Material
Type*Feed
Rate*Spindle
Speed
2 9,319 4,6596 44428,31 0,000
Error 17988 1,887 0,0001
Total 17999 38,028
Model Summary
S R-sq R-sq(adj) R-sq(pred)
0,0102410 95,04% % 95,04 95,03%
Table 2: Analyze of Variance: Roughness versus Material Type; Feed Rate; Spindle
While there are significant changes in the surface structure according to the type of the
material in CNC processing, the surface structure becomes smoother as the spindle speed
increases, and the surface structure gets worse as the feed rate is increased and a rougher
structure appears. Results of the main effects obtained are shown in Figure 2.
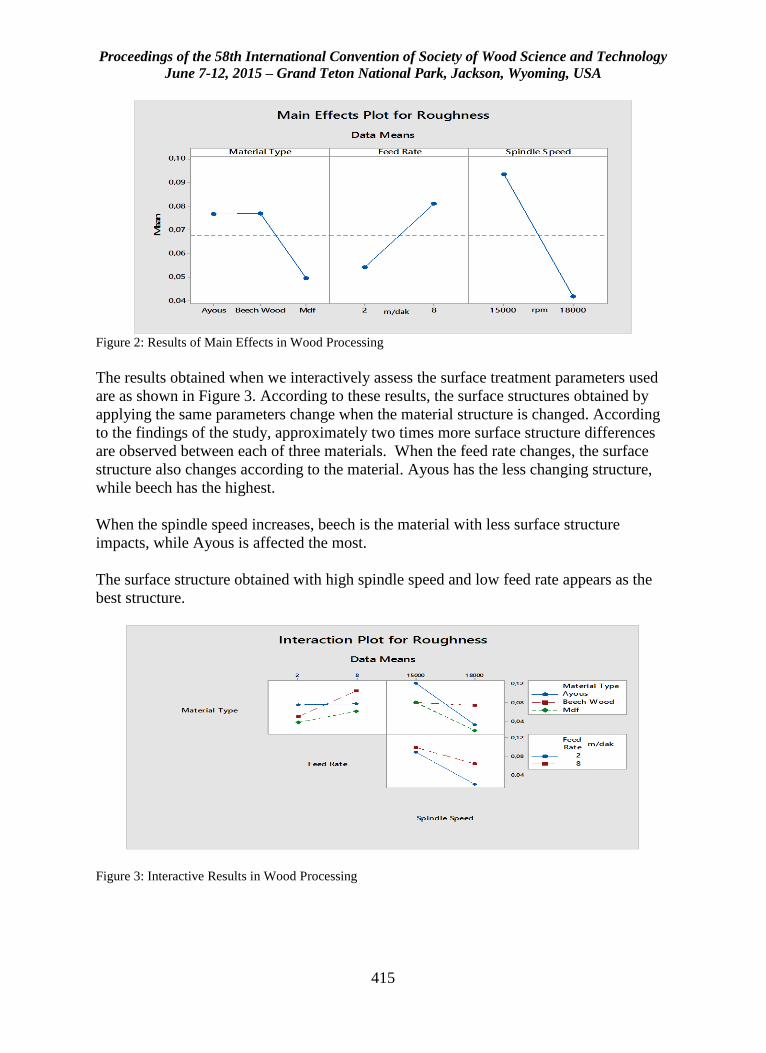
Proceedings of the 58th International Convention of Society of Wood Science and Technology
June 7-12, 2015 – Grand Teton National Park, Jackson, Wyoming, USA
415
Figure 2: Results of Main Effects in Wood Processing
The results obtained when we interactively assess the surface treatment parameters used
are as shown in Figure 3. According to these results, the surface structures obtained by
applying the same parameters change when the material structure is changed. According
to the findings of the study, approximately two times more surface structure differences
are observed between each of three materials. When the feed rate changes, the surface
structure also changes according to the material. Ayous has the less changing structure,
while beech has the highest.
When the spindle speed increases, beech is the material with less surface structure
impacts, while Ayous is affected the most.
The surface structure obtained with high spindle speed and low feed rate appears as the
best structure.
Figure 3: Interactive Results in Wood Processing
Proceedings of the 58th International Convention of Society of Wood Science and Technology
June 7-12, 2015 – Grand Teton National Park, Jackson, Wyoming, USA
416
Conclusions
Surface structure in wood processing depends on to several factors. Material type,
material structure, method for preparing the material to processing, feed rate, spindle
speed, cutting angle, cutting depth (2 mm), cutter type, cutter diameter, cutting geometry
(linear, curvilinear etc.) are basic factors that are effective on the surface quality.
Assessing the surface structure generally based on surface roughness is a commonly used
method. However, the limited number of data obtained and the limited number of actions
in curvilinear surface structures necessitated the search for new measurements. In this
study, the measurement is carried out by using a 2D laser displacement sensor. The
results conform with the literature in general, but the results may differ when the
interactions between the parameters are taken into account. It is an important field of
argument to accurately determine the interaction between the parameters in processing
with CNC.
References
Aciyapamoglu M, 2013 Multi Criteria Selection at CNC Wood Working Machinery.
Istanbul Technical University, Graduate School of Science Engineering and Technology,
MSc. Thesis
Bajıc D, Lela B, Zıvkovic D, 2008 Modeling of Machined Surface Roughness and
Optimization of Cutting Parameters in Face Milling. Metalurgia 47(4):331-334.
Bozdogan M 2012 The Investigation Of Effects of Cutting Parameters and Cutting Tool
Path of Surface Quality in CNC Milling Process. Marmara University, Institute of Pure
and Applied Sciences, Mechanical Education Unit, MSc. Thesis
Gawronski T, 2013 Optimization of CNC Routing Operations of Wooden Furniture
Parts. Int J Adv Manuf Technol (2013)67:2259-2267-DOI-10.1007/s00170-012-4647-5.
Hazir E, 2012 A Modeling Study on Evaluating the Quality of Wooden Surface. MSc.
Thesis, Istanbul University Institute of Science, Istanbul, TURKEY
Iskra P, Tanaka C, 2005 The Influence of Wood Fiber Direction, Feed Rate and Cutting
Width on Sound Intensity During Routing. Holz Als Roh-Und Werkstoff. 63(3),167-172.
Iskra P, Hernandez R, 2012 Toward a Process Monitoring of CNC Wood Router.Sensor
Selection and Surface Roughness Prediction. Wood Sci Technol 46:115-128-DOI
10.1007/s00226-010-0378-7.
Karagoz U, 2010 Investigation of Machining Parameters on The Surface Quality in CNC
Routing Wood and Wood-Based Materials, Suleyman Demirel University, Graduate
School of Natural and Applied Sciences, MSc. Thesis
Proceedings of the 58th International Convention of Society of Wood Science and Technology
June 7-12, 2015 – Grand Teton National Park, Jackson, Wyoming, USA
417
Karagöz U, Akyıldız M H, Isleyen O, 2011 Effect of Heat Treatment on Surface
Roughness of Thermal Wood Machined by CNC, PRO LIGNO, Vol. 7, No.4, p. 50-58,
ISSN 2069-7430
Krimpenis A A, Fountas N A, Tantziouras T, Vaxevanidis N M, 2014 Optimizing CNC
Wood Milling Operations with The Use of Genetic Algorithms on CAM Software. Wood
Material Science&Engineering, 2014, DOI 10.1080/17480272.2014.961959.
Kurtoglu A, Koc K H, Oner U, 1999, Edge Banding Application with CNC Machines and
its Comparison with Conventional Machine. Furniture & Decoration Magazine,28,10-17.
Kurtoglu A, Koc K H, Oner U,1997, CAD-CAM Systems, CNC Machines and Turkish
Furniture Industry, Machine-Metal Technology. 6(66), 114-120.
Lajie W U, Qiangbo Y E, Lijuan Y A O, Ruiwen H, Jing W, 2011 The Data Processing
System of CNC Wood-Working Milling Machine. Second International Conference on
Dijital Manufacturing &Automation, 2011 IEEE, DOI 10.1109/ıcdma.2011.306
Nas E, Samtas G, Demir H, 2012 Mathematical Modelling of Parameters Effecting
Surface Roughness via CNC Routers. Pamukkale University, Journal of Engineering
Sciences 18(1), 47-59.
Norazmein AR, Safian S, Sudin I, 2012 Mathematical Modeling of Cutting Force in
Milling of Medium Density Fibreboard Using Response Surface Method. Advanced
Materials Research 445(2012) 51-55.
Rawangwong S, Chatthong J, Rodjananugoon F, 2011 The Study of Proper Conditions
in Face Coconut Wood by CNC Milling Machine,Proceedings of the 2011 IEE ICQR,
978-1-4577-0628-8/11.
Weg W, Chaun H, Xiang L, Feng M, Zang S, 2012 Antique Wood Flooring on the
Feasibility Study for CNC Machining. International Conference on Biobase Material
Science and Engineering, 978-1-4673-2383-3/12,2012 IEEE.
Acknowledgement
This study is supported by Scientific Research Projects Coordination Unit of Istanbul
University with project no. UDP-46844.
Proceedings of the 58th International Convention of Society of Wood Science and Technology
June 7-12, 2015 – Grand Teton National Park, Jackson, Wyoming, USA
418
COST Action FP1407 - Understanding Wood
Modification through an Integrated Scientific and
Environmental Impact Approach
Andreja Kutnar1
1Assistant Professor, Andrej Marušič Institute, Faculty of Mathematics,
Natural Sciences and Information Technologies, University of Primorska,
Koper, Slovania.
Abstract
Though many aspects of wood modification (chemical, thermal, impregnation) treatments
are known, the fundamental influence of the process on product performance, the
environment, and end of life scenarios remain unknown. To contribute to the low-carbon
economy and sustainable development, it is essential to integrate interactive assessment
of process parameters, developed product properties, and environmental impacts.
Therefore, a group of researchers proposed a new COST Action FP1407 “Understanding
wood modification through an integrated scientific and environmental impact approach”,
which was selected for funding in November 2014. The main objective of the Action
FP1407 is to characterize the relationship between wood modification processing,
product properties, and the associated environmental impacts in order to maximize
sustainability and minimize environmental impacts. The Action will provide the critical
mass of Europe-wide knowledge needed to achieve the future developments in the field.
The networking, multi-disciplinary, exchange of knowledge, and scientific excellence, as
well as the expertise of industrial members, will enable comprehensive research and
development of modification processing and products design with emphasis on their
environmental impacts. This presentation will briefly introduce the mechanism COST
(European Cooperation in Science and Technology) and the key research areas, work
plan and secondary objectives of this Action FP1407.
Keywords: Modification, processing, LCA, EPD, cascading
Proceedings of the 58th International Convention of Society of Wood Science and Technology
June 7-12, 2015 – Grand Teton National Park, Jackson, Wyoming, USA
419
Introduction
The Europeans Cooperation in Science and Technology (COST) is the longest-running
European framework supporting trans-national cooperation among researchers, engineers
and scholars across Europe. It was established in 1971 and covers 35 European member
countries. Until 2015 it was structured into nine science and technology domains among
which it is also Forest Products (FP) domain (for more details, see
http://www.cost.esf.org/about_cost). New organization in place from 2015 has a single
Scientific Committee, by which COST is aiming at guaranteeing a fully open and bottom-
up approach.
COST provides funds for coordination of research through COST actions, while research
remains funded on a national level. COST actions are thus networking activities based on
predominantly nationally funded research projects on a research topic. There is a great
emphasis on gender balance and inclusion of young scientists, as well as membership of
researchers from COST Inclusiveness countries. It also allows all interested scientists
from countries who sign the Memorandum of Understanding (MoU) to join the activities
of the Action.
In the last call of past COST structure the COST Action FP1407 Understanding wood
modification through an integrated scientific and environmental impact approach
(ModWoodLife) was selected for funding. Its MoU is available on
http://w3.cost.eu/fileadmin/domain_files/FPS/Action_FP1407/mou/FP1407-e.pdf. The
Action started in March 2015 and will last until April 2019. The main aim of the Action
is to characterize the relationship between modification processing, product properties,
and the associated environmental impacts. This includes the development and
optimization of modified processing and quantification of the impacts of emerging
treatment technologies compared to traditional processing and alternative materials to
maximize sustainability and minimize environmental impacts. The Action will provide
the critical mass of Europe-wide knowledge needed to achieve the future developments in
the wood modification processing with integrating assessment of process parameters,
developed product properties, and environmental impacts.
The Action has members from 23 European countries (Figure 1) and 6 COST
collaboration countries (Ukraine, Tunisia, USA, Canada, New Zealand, and Chile), while
additional 3 expressed the intention to sign the MoU.
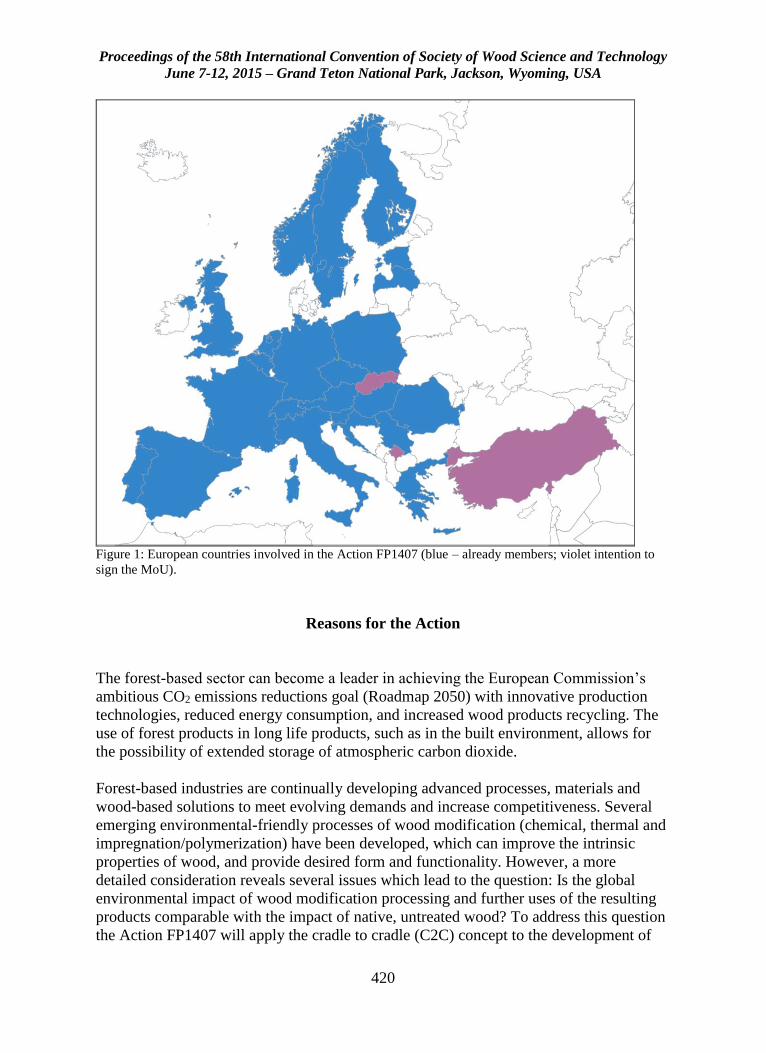
Proceedings of the 58th International Convention of Society of Wood Science and Technology
June 7-12, 2015 – Grand Teton National Park, Jackson, Wyoming, USA
420
Figure 1: European countries involved in the Action FP1407 (blue – already members; violet intention to
sign the MoU).
Reasons for the Action
The forest-based sector can become a leader in achieving the European Commission’s
ambitious CO2 emissions reductions goal (Roadmap 2050) with innovative production
technologies, reduced energy consumption, and increased wood products recycling. The
use of forest products in long life products, such as in the built environment, allows for
the possibility of extended storage of atmospheric carbon dioxide.
Forest-based industries are continually developing advanced processes, materials and
wood-based solutions to meet evolving demands and increase competitiveness. Several
emerging environmental-friendly processes of wood modification (chemical, thermal and
impregnation/polymerization) have been developed, which can improve the intrinsic
properties of wood, and provide desired form and functionality. However, a more
detailed consideration reveals several issues which lead to the question: Is the global
environmental impact of wood modification processing and further uses of the resulting
products comparable with the impact of native, untreated wood? To address this question
the Action FP1407 will apply the cradle to cradle (C2C) concept to the development of
Proceedings of the 58th International Convention of Society of Wood Science and Technology
June 7-12, 2015 – Grand Teton National Park, Jackson, Wyoming, USA
421
products based on wood modification processes. This paradigm values new advanced
wood-based materials with improved intrinsic properties that promote efficient product
reuse, recycling and end-of-life use, and pave the way to a low-carbon economy.
Different modification processes, with possible variations in their parameters, yield
modified wood with different properties, thusly enabling the creation of different product
lines. However, they also have different environmental impacts, which are consequently
transferred into materials, elements, and final products. Interactive assessment of process
parameters, product properties, and environmental impact should be used to aid
development of innovative modification processes and manufacturing technologies,
existing and planned, which embrace the cradle to cradle paradigm. Recycling, up-
cycling and end-of-life disposal options need to be integrated in a fully developed
industrial ecology. Intelligent material reuse and up-cycling concepts could reduce the
amount of waste destined for landfills or down-cycling. But in order to develop and/or
optimize wood modification processing to minimize environmental impacts, much more
information must be gathered about relevant process factors. This includes the
development of chain of custody procedures throughout the entire life cycle.
Research into wood modification processing and the resultant products must place more
emphasis on the interactive assessment of process parameters, developed product
properties, and environmental impacts. Energy consumption contributes considerably to
the environmental impact of modified wood. However, the improved properties during
the use phase might reduce the environmental impact of the modified wood product
overall. It is important to note that the effective use of wood throughout its whole value
chain from forest management, through multiple use cycles, and end-of-life disposal can
lead to truly sustainable development. Therefore, in order to contribute to the low-carbon
economy, wood modification should implement: Establish baseline environmental
impacts (Identify and quantify the environmental loads involved. Evaluate the potential
environmental impacts of these loads followed by an assessment of the opportunities
available to bring about environmental improvement); Demonstrate a manufacturer’s
commitment to sustainability and showcase the manufacturer’s willingness to go above
and beyond; (Product Category Rules (PCRs) should be defined in an internationally
accepted manner based on an open, transparent and participatory process. EPDs should
be acquired); Develop an “upgrading” concept for recovered products resulting from
modified wood as a source of clean and reliable secondary wooden products for the
industry that enable extended storage of captured carbon in wooden materials; Establish
procedures for chain of custody value chain management for the whole life (tracking
stored sequestered atmospheric carbon in timber products).
Organization of the Action
The Action FP1407 has 4 Working Groups (WG) that address the relevant key areas
described in the MoU (http://www.cost.eu/COST_Actions/fps/Actions/FP1407):

Proceedings of the 58th International Convention of Society of Wood Science and Technology
June 7-12, 2015 – Grand Teton National Park, Jackson, Wyoming, USA
422
WG1: Product Category Rules - Objectives: To develop product category rules for
modified wood based on the scientific and industrial state-of-the-art of commercialized
and developing modified wood products and technologies. Evaluation of current PCRs
and adoption where appropriate.
Working Group 2: Life Cycle Assessments - Objectives: To perform objective
environmental impact assessments of commercial modification processes and incorporate
environmental impact assessments into wood modification processing and product
development, including recycling and upgrading at the end of service life.
Working Group 3: Environmental products declarations - Objectives: To develop
environmental product declarations based on WG1 and WG2 and force a harmonization
of various national EPDs in the field of wood modification.
Working Group 4: Integration, dissemination and exploitation - Objectives: To
ensure dissemination, evaluation, and exploitation of the Action’s results together with
establishing a strong network with the relevant industrial stakeholders.
The general organization (Figure 2) of the Action is as defined in organizational features
common for all COST Actions "Rules and Procedures for Implementing COST Actions".
The Action Chair, Vice Chair and WG Leaders together with the rest of Management
Committee (MC) are in charge of the coordination, implementation and management of
the Action. The Working Group (WG) Leaders report to the Action Chair and to the
Management Committee (MC). The Action benefits from elected individuals serving on
the MC and the Steering Committee (SC). The SC is comprised of the Chair and Vice-
Chair of the Action, the Leaders and Vice-leaders of the Working Groups, a nominated
manager for Short Term Scientific Missions. Given the direct relevance to commercial
applications, industrial involvement is promoted through direct involvement within the
MC/SC as a result of the creation of a dedicated industrial sub-committee, the Special
Exploitation Committee (SEC). The SEC (comprised of industrial partners) promotes
dissemination and commercialization of acquired knowledge.
Figure 2: Management structure
Proceedings of the 58th International Convention of Society of Wood Science and Technology
June 7-12, 2015 – Grand Teton National Park, Jackson, Wyoming, USA
423
Goals of the 1st Grant Period
The Action FP1407 defined 5 main goals of the 1st Grant Period (June 2015 – May 2016):
- Deliver state of the art of generic Life Cycle Assessments and Environmental
Products Declarations of wood products in different Member States
- Perform systematic comparison of modification processes including their
technical characteristics and environmental performance
- Deliver state of the art of life cycle analysis of different commercial modification
processes (“cradle to gate” and “cradle to grave”) and examine scenarios for the
service life and end of life of wood products
- Explore possibilities to prepare a joint book to be suggested for publishing in
Springer Series "Environmental Footprints and Eco-design of Products and
Processes”.
- Recruit industrial stakeholders to take part in a Special exploitation committee of
the Action FP1407, which will promote dissemination and commercialization of
knowledge acquired in Action FP1407.
Action created a Mendeley group, which is available on
http://www.mendeley.com/groups/6789831/cost-action-fp1407-modwoodlife/, where a
state of the art of the Action will be built.
Networking tools
The networking activities within the COST Action FP1407 include scientific and
administrative meetings, short-term scientific missions and organization of training
schools. Networking will yield the aims and objectives of the Action FP1407 by:
- Making connections, facilitating collaboration and building enduring, mutually
beneficial inter and intra disciplinary relationships between individuals,
institutions and companies;
- Creating transnational, innovative interdisciplinary excellence to enhance the
research and innovation performance of the sector;
- Facilitate collaboration between industry, SMEs, stakeholder associations,
research organizations, leading-edge scientists from the wider range of disciplines
covering wood materials, chemistry, construction, biology, polymer,
environmental, and other relevant fields who will bring their broad expertise to
this Action and enable the aims and objectives of this Action;
- Scientific excellence, interdisciplinary research and development leading to
innovative and higher-value uses of renewable materials for technical
applications;
- Training and development for professionals as well as under- and post-graduate
students in COST countries, where special emphasis is given to exchange
knowledge, especially between COST countries that traditionally have high levels
Proceedings of the 58th International Convention of Society of Wood Science and Technology
June 7-12, 2015 – Grand Teton National Park, Jackson, Wyoming, USA
424
of participation to those who do not, like COST Inclusiveness countries and
COST Near Neighboring countries.
-
These activities of the Action FP1407 will be enabled through Working Group meetings,
Short Term Scientific Missions, Interaction with and visits to innovative companies,
Training Schools for Early Stage Researchers, International seminars, and Workshops.
Impact of the Action
Networking, open discussion, planning and collaboration within the Action will provide
the most productive, most proficient and most enduring tactic to build relationships
among researcher from COST countries, COST Inclusiveness countries and COST Near
Neighboring countries working on the topics of this Action and therefore leading to a
positive transformation of the wood-based sector. Furthermore, strong emphasis on
involvement of Early Stage Researchers and gender balance will have an impact on the
future development of the sector in COST countries. High levels of participation will be
encouraged to ensure these objectives are met, through the use of inclusive measures at
meetings.
The expected scientific impacts will be the results of coordination and streamlining of
profound scientific investigations on the basics of wood modification processing and
modified wood, which will be used in industry for improvement and optimization of
existing technologies and development of new modification processes, as well as
development of Product Category Rules and life cycle models for modified wood.
Besides the networking and collaboration based on current projects in the COST
countries, this Action will result in new international and interdisciplinary project
proposals, as well as the development of new standards.
Conclusion
The main aim and objectives of the Action FP1407 is to advance the research in the field
of wood modification to allow significant contributions to the goals of European and
global resource efficiency and a low carbon economy. These goals will be met by
implementing excellent research in the area of wood modification, properties of modified
wood, and environmental impacts. The interactive assessment of process parameters,
product properties and environmental impacts performed in this Action will build on the
previous scientific and technical research in environmental assessment and wood
modification. The Action FP1407 will bring together knowledge, expertise, and
infrastructure to achieve the Action’s aim. Current knowledge will be upgraded and
known challenges overcome. The goals of sustainable development to increase economic
efficiency, protect, and restore ecological systems and improve human well-being, or a
combination of the three are expected to lead to new concepts, products, and processes
Proceedings of the 58th International Convention of Society of Wood Science and Technology
June 7-12, 2015 – Grand Teton National Park, Jackson, Wyoming, USA
425
optimizing the multiple utilization/recycling of forest-based resources. Life cycle
analysis, industrial ecology and the cradle-to-cradle concepts will be used as key tools
also in economic developments leading to new business opportunities through innovative
products with properties optimized to the end use requirements and the sustainable use of
resources. It is emphasized that this work has to also extend to unmodified timber
products, since baseline comparisons have to be made. This greatly extends the range and
impact of the Action beyond the wood modification industries. Furthermore, the
networking, multi-disciplinary collaboration, exchange of knowledge, and scientific
excellence, as well as the expertise of industrial members, will lead to following indirect
impacts:
- Low performing countries learning from advanced countries;
- Partners will become better equipped to seek competitive funding in national and
international environment;
- Improved research and innovation culture of participants, especially SMEs;
- Participants write joint proposals for competitive funding and investment in
RD&I within these;
- Dissemination activities enhance attitudes towards and perceived value of
research and innovation in the general public and industry;
- Scientific discoveries, industrial developments and innovation achievements;
- Contributions to four “Europe 2020” flagship initiatives through innovation,
resource efficiency, globalized industrial promotion and job creation.
Acknowledgments
The author would like to acknowledge the WoodWisdom-Net+ and the Ministry of
Education, Science and Sport of Republic of Slovenia for financial support of the project
CaReWood and W3B. Furthermore, the author would like to acknowledge the Slovenian
Research Agency for financial support within the frame of the project Z4-5520.
More Information
COST Action FP1407 web page: http://costfp1407.iam.upr.si/en/
Proceedings of the 58th International Convention of Society of Wood Science and Technology
June 7-12, 2015 – Grand Teton National Park, Jackson, Wyoming, USA
426
Sustainability, Environmental Impact and LCA in
Build Environment in Slovenia and Sweden
Andreja Kutnar, [email protected]
Dick Sandberg, [email protected]
University of Primorska, Andrej Marušič Institute, Muzejski trg 2, SI-6000
KOPER
Abstract
Forestry and forest-related industries have become more focused on the major challenges
of the future, especially climate change and resource depletion. The forest-based sector
can become a leader in achieving the European Commission’s ambitious target of
reducing CO2 emissions with innovative production technologies, reduced energy
consumption, increased wood products recycling, and reuse. Apart from these undoubted
environmental benefits, the use of forest products in long life products, such as built
environment applications, allows for the possibility of extended storage of atmospheric
carbon dioxide. Despite many sustainable and green building activities in recent years
there is a lot of room for expansion and improvement in this area. In fact, a shift towards
new building paradigms is just beginning. These paradigms shift the standard from
minimal and zero environmental impact, towards positive impacts for both the
environment and society.
In this paper the Slovenian and Swedish case is presented in relation to the current
European and regional developments in the increased use of wood as a construction
material for the future. Furthermore, the role of building and living with wood in
sustainable development together with the topic of green buildings movements and the
current trends of creating healthy living environments are introduced.
Proceedings of the 58th International Convention of Society of Wood Science and Technology
June 7-12, 2015 – Grand Teton National Park, Jackson, Wyoming, USA
427
Sustainable Built Environment in Canada and Europe
Alberto Cayuela, [email protected]
Angelique Pilon, [email protected]
Andreja Kutnar, [email protected]
University of Primorska, Andrej Marušič Institute, Muzejski trg 2, SI-6000
KOPER
Abstract
Global political and economic decisions are increasingly determined by resource and
energy availability and by climate change imperatives. Increasingly, balancing economic,
ecological and social welfare objectives has become a key goal of development in many
jurisdictions in Europe and North America. Because of their low embodied energy, their
ability to displace carbon emissions and store atmospheric carbon, bio-based materials
supplied through sustainable forest practices are becoming a cost-effective solution for
urban sustainability. Concurrently, the focus on minimizing the impacts of development
is shifting toward the idea that development can bring about net positive benefits to the
environment and society. Despite the steady growth of green buildings in recent years
and the transformative effect on the building industry of rating systems such as LEED
and BREEAM, there still exists significant potential for increased adoption of sustainable
practices by large sectors within the building industry. This presentation will introduce
living laboratories (user-centred ecosystems that integrate research and systematic
innovation processes within public-private-civil society partnerships) as catalyzers for
sustainability in the built environment and describe the role that bio-based materials play.
It will contrast European and Canadian case studies of projects focusing on wood and
bio-based materials as integral elements of a sustainable built environment.
Proceedings of the 58th International Convention of Society of Wood Science and Technology
June 7-12, 2015 – Grand Teton National Park, Jackson, Wyoming, USA
428
Magnetic Resonance Investigation of Freezing and
Thawing of Black Spruce Wood
Clevan Lamason1, Bryce MacMillan2, Bruce Balcom2, Brigitte Leblon1, and
Zarin Pirouz3
1Faculty of Forestry and Environmental Management, University of New
Brunswick (UNB), NB, CANADA
([email protected]) 2Magnetic Resonance Imaging Center, Department of Physics, UNB, NB,
CANADA 3Faculty of Forestry and Environmental Management, UNB, NB, CANADA
4Scientist, FPInnovations, Vancouver, CANADA
Abstract
This study examines the phase transitions of water in black spruce (Picea mariana Mill.)
sapwood by unilateral magnetic resonance and magnetic resonance imaging. The goal is
to observe and understand the behavior of water below 0°C in wood. The species studied
presented one abrupt phase change that occurred around -3°C, which was attributed to the
phase transition of free water. A more diffuse change occurred below -60°C which was
attributed to a phase transition of bound water. A recently developed portable unilateral
magnetic resonance instrument is demonstrated as a powerful tool in the study of water in
wood. This portable magnet employed a bulk spin-spin relaxation time measurement that
quantifies observable bound and free water in wood. Imaging is employed to verify the
unilateral magnetic resonance results and to better understand realistic freeze/thaw
behavior of log samples in the field. A ring boundary behavior during the thawing
process was observed and likewise there are differences in the thawing behaviors of
heartwood and sapwood samples.
Proceedings of the 58th International Convention of Society of Wood Science and Technology
June 7-12, 2015 – Grand Teton National Park, Jackson, Wyoming, USA
429
Carbon Policy Failures and the Opportunity for Better
Uses of Wood:
If We Have Carbon Negative Technologies Why Aren’t
We Using Them?
Bruce Lippke*
Professor Emeritus
College of Environment
University of Washington
Seattle, WA, 98195 [email protected]
Elaine Oneil
Executive Director: CORRIM &
University of Washington
Seattle, WA, 98195
Holly Fretwell
Research Fellow PERC &
Faculty Montana State University
Bozeman, MT, 59718
Abstract
The rate of global carbon emissions continues to increase. The objective is to stop the
increase and even reduce atmospheric carbon. That requires using carbon negative
technologies. Just increased efficiency in the use of fossil fuel to reduce emissions at best
only slows down the rate of increase. Yet we have carbon negative technologies such as
storing carbon taken from the atmosphere by forest growth in wood products while
displacing the emissions from using fossil fuels. Some uses of wood store and displace
10 times the carbon as other uses. So why aren’t these technologies being better used?
There is no incentive to innovate for even better uses because there is no cost for emitting
fossil carbon emissions. The problem is exacerbated because we subsidize the use of
fossil fuels as well as other incentives that promote the lowest leverage use of wood
products. We examine why policies are not working and how different approaches can
be much more effective. Carbon cap and trade is not working and especially for uses of
wood with thousands of different product carbon pools that are interacting with other
Proceedings of the 58th International Convention of Society of Wood Science and Technology
June 7-12, 2015 – Grand Teton National Park, Jackson, Wyoming, USA
430
pools that would require trading rules far beyond the capabilities of masses of regulators.
We develop a hierarchy of displacement efficiencies for different product uses. Any
significant value placed on fossil carbon emissions will motivate better uses of wood to
displace fossil emissions along with new innovations to improve the production process
and the way we use wood. Integration of the analysis from forest to products to uses and
their displacement is essential to understand best uses. Forest carbon by itself is
inherently only useful for a one-time reduction in carbon before reaching the carrying
capacity of the land. In contrast harvesting wood near its maximum growth rate and
using that wood to store carbon in products while displacing fossil intensive products is a
sustainable use carbon-negative technology.
Key Words: carbon mitigation, carbon emissions, carbon negative technologies, Life
Cycle Inventory Assessment (LCI, LCA), carbon policies, sustainable forestry, carbon
Cap & Trade, biofuels, wood products, carbon displacement.
Proceedings of the 58th International Convention of Society of Wood Science and Technology
June 7-12, 2015 – Grand Teton National Park, Jackson, Wyoming, USA
431
Investigation of Hardwood Cross-Laminated Timber
Design
Joseph , [email protected]
Khris Beagley, [email protected]
Dan Hindman, [email protected]
John Bouldin, [email protected]
Virginia Tech, 1650 Research Center Dr., Brooks Forest Products Center,
Blacksburg, VA 24061-0503
Abstract
The objective of this paper is to investigate the feasibility of using various design
methods for predicting the mechanical properties of hardwood cross laminated timber
(CLT). A program was developed to compute the predicted stiffness properties using
four different mechanics based methods: (1) the Shear Analogy Method, (2) the Gamma
Method, (3) the k-Method and (4) classical transformed section analysis. The project
compared predicted stiffness values to experimentally measured parameters. Yellow-
poplar (Liriodendron tulipifera) lumber was used to create hardwood CLT beams that
were non-destructively tested in bending in both flatwise and edgewise orientations with
the face grains arranged either parallel or perpendicular to the span. Upon completion of
non-destructive testing, the hardwood CLT beams were tested to failure in bending in
either a flatwise or edgewise orientation. The tests emulated practical loading conditions
and the experimental data collected was compared to analytically calculated deflections.
The Modulus of Rupture (MOR) was calculated from each beam and used to determine
the feasibility of utilizing CLT within each loading configuration. The experimental
MOR was compared to predicted values.
The results support the conclusion that both the stiffness and strength of hardwood CLT
can be predicted using the same design methods that were developed for softwood
species. This finding opens the possibility of using hardwoods in CLT production.
Proceedings of the 58th International Convention of Society of Wood Science and Technology
June 7-12, 2015 – Grand Teton National Park, Jackson, Wyoming, USA
432
Cellulose Nano-Whiskers Dispersing Performance in
Non-Polar Materials
Jing Luo, [email protected]
Gao Qiang, [email protected]
Jianzhang Li, [email protected]
Sheldon Shi, [email protected]
Beijing Forestry University, No.35 Qinghua East Road , Haidian District,
Beijing 100083
Abstract
As a renewable functional materials, cellulose nano-whiskers(CNWs) were widely
investigated in wood industry. The higher the cellulose content, the higher the percentage
of the crystalline component, CNWs can present a higher mechanical property. CNWs
are crystalline cellulose sticks with numbers of hydroxyl groups on their surface. Those
hydroxyl groups can form hydrogen bond with water molecules, so that the CNWs could
easily disperse in water or other polar solutions. Therefore, CNWs have been used to
reinforce urea formaldehyde resin, soy protein-based adhesive, polyvinyl alcohol film in
wood industry because of its water solubility. However, CNWs are difficult to be
dispersed in non-polar liquid to form a stable and uniform solution, which has limited it
applications. In this research, CNWs were first fabricated using acidolysis method. Then,
CNWs was washed and dispersed into n-hexane or acetone by a physical method. The
hybrid solution was introduced and dispersed into non-polar liquids in a high
temperature, such as ethylene-co-vinyl acetate (EVA), polyvinyl chloride, and poly
ethylene. The effect of the incorporation of cellulose nano-whiskers on tensile strength,
modulus of rupture (MOR), light transmittance performance, cross section characteristic,
thermostability of non-polar materials were investigated. Preliminary experiments
showed CNWs was successfully dispersed into EVA and the MOR of the EVA was
improved by at lest 20%
Proceedings of the 58th International Convention of Society of Wood Science and Technology
June 7-12, 2015 – Grand Teton National Park, Jackson, Wyoming, USA
433
Durability Assessment of Bamboo Slats
Arijit Sinha, [email protected]
Byrne Miyamoto, [email protected]
Jeff Morrell, [email protected]
Oregon State University, 234 Richardson Hall, , Corvallis, OR 97331
Abstract
Bamboo is the most rapidly growing renewable material. In the western world,
acceptance of bamboo has been limited to commodity products. Bamboo composites such
as laminated bamboo lumber (LBL) can be used structurally in buildings, but a major
challenge that limits acceptance of LBL is concern about long term performance under
different climatic conditions. Bamboo culms are known to degrade rapidly after harvest
when improperly processed. While LBL components are generally rapidly processed and
often treated to provide long term protection, there are few data on the field performance
of these materials. In this report, bamboo slats, which are the building blocks of LBL,
along with Douglas-fir heartwood and hybrid poplar were exposed outdoors in a Ground
Proximity test near Corvallis, OR. Douglas-fir is moderately durable while hybrid poplar
has little resistance to biological degradation. The site has a Mediterranean climate with
wet mild winters and dry summers and moderate above ground decay risk. Material
properties and the degree of biological damage were assessed monthly over a 20 months.
Flexural properties were increasingly variable with time for all three materials and the
specimens began to experience stain and mold damage. No evidence of visible decay was
noted. The results will be discussed in relation to the potential for using bamboo
components where periodic wetting is possible and identify approaches for improving the
durability of these materials.
Proceedings of the 58th International Convention of Society of Wood Science and Technology
June 7-12, 2015 – Grand Teton National Park, Jackson, Wyoming, USA
434
The Effect of Urea-Formaldehyde Resin Adhesive on
ohe Pyrolysis Mechanism of Poplar Particle Board with
DAEM
Mu Jun1*, Zhang Yu1, Yu Zhiming1, Zhang Derong1, Zhang Yang1
1 Associate Professor, MOE Key Laboratory of wooden Material Science
and Application, Beijing Forestry University, Beijing, China.
* Corresponding author
[email protected] 1 Graduate student, College of Material Science and Technology – Beijing
Forestry University, Beijing, China.
[email protected] 1 Professor, MOE Key Laboratory of wooden Material Science and
Application, Beijing Forestry University, Beijing, China.
[email protected] 1 Associate Professor, MOE Key Laboratory of wooden Material Science
and Application, Beijing Forestry University, Beijing, China
[email protected] 1 Assitant Professor, MOE Key Laboratory of wooden Material Science and
Application, Beijing Forestry University, Beijing, China
Abstract
In order to study the effect of urea-formaldehyde resin adhesive(UF) on the pyrolysis
process of wood composites, the pyrolysis-related weight loss process of UF resin
adhesive, poplar wood and poplar particle board was compared with temperature
programming thermogravimetry analysis to test the adaptability of a DAEM (distributed
activation energy model) to their kinetic analysis. With the Miura integration method, the
activation energy distribution and the values of the frequency factor can be directly
obtained from three weight loss curves at temperature rise of 5℃/min, 20℃/min and
50℃/min, requiring no prior assumption of the activation energy distribution of pyrolysis
and the frequency factor assuming at a fixed value. The results obtained show that the
activation energy of UF was higher than that of poplar and poplar particle board at the
same conversion rate. The variation of activation energy curves was similar for the poplar
and the poplar particle board. UF resin promoted the thermo degradation of poplar and
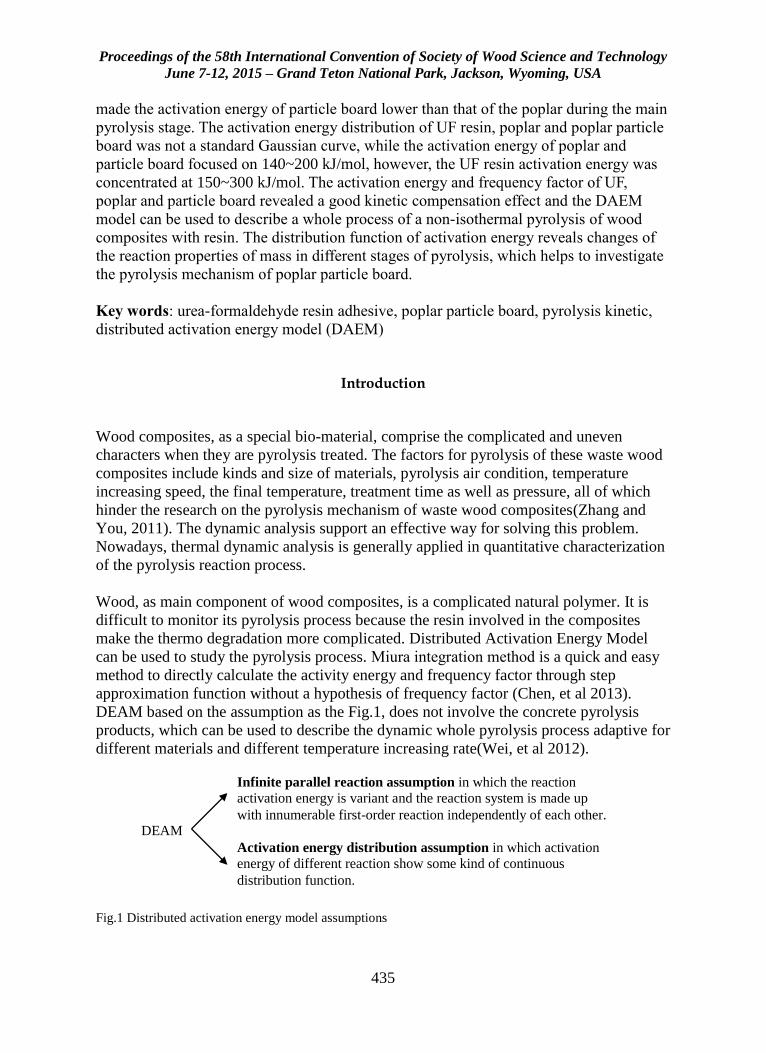
Proceedings of the 58th International Convention of Society of Wood Science and Technology
June 7-12, 2015 – Grand Teton National Park, Jackson, Wyoming, USA
435
made the activation energy of particle board lower than that of the poplar during the main
pyrolysis stage. The activation energy distribution of UF resin, poplar and poplar particle
board was not a standard Gaussian curve, while the activation energy of poplar and
particle board focused on 140~200 kJ/mol, however, the UF resin activation energy was
concentrated at 150~300 kJ/mol. The activation energy and frequency factor of UF,
poplar and particle board revealed a good kinetic compensation effect and the DAEM
model can be used to describe a whole process of a non-isothermal pyrolysis of wood
composites with resin. The distribution function of activation energy reveals changes of
the reaction properties of mass in different stages of pyrolysis, which helps to investigate
the pyrolysis mechanism of poplar particle board.
Key words: urea-formaldehyde resin adhesive, poplar particle board, pyrolysis kinetic,
distributed activation energy model (DAEM)
Introduction
Wood composites, as a special bio-material, comprise the complicated and uneven
characters when they are pyrolysis treated. The factors for pyrolysis of these waste wood
composites include kinds and size of materials, pyrolysis air condition, temperature
increasing speed, the final temperature, treatment time as well as pressure, all of which
hinder the research on the pyrolysis mechanism of waste wood composites(Zhang and
You, 2011). The dynamic analysis support an effective way for solving this problem.
Nowadays, thermal dynamic analysis is generally applied in quantitative characterization
of the pyrolysis reaction process.
Wood, as main component of wood composites, is a complicated natural polymer. It is
difficult to monitor its pyrolysis process because the resin involved in the composites
make the thermo degradation more complicated. Distributed Activation Energy Model
can be used to study the pyrolysis process. Miura integration method is a quick and easy
method to directly calculate the activity energy and frequency factor through step
approximation function without a hypothesis of frequency factor (Chen, et al 2013).
DEAM based on the assumption as the Fig.1, does not involve the concrete pyrolysis
products, which can be used to describe the dynamic whole pyrolysis process adaptive for
different materials and different temperature increasing rate(Wei, et al 2012).
Fig.1 Distributed activation energy model assumptions
Infinite parallel reaction assumption in which the reaction
activation energy is variant and the reaction system is made up
with innumerable first-order reaction independently of each other. DEAM
Activation energy distribution assumption in which activation
energy of different reaction show some kind of continuous
distribution function.
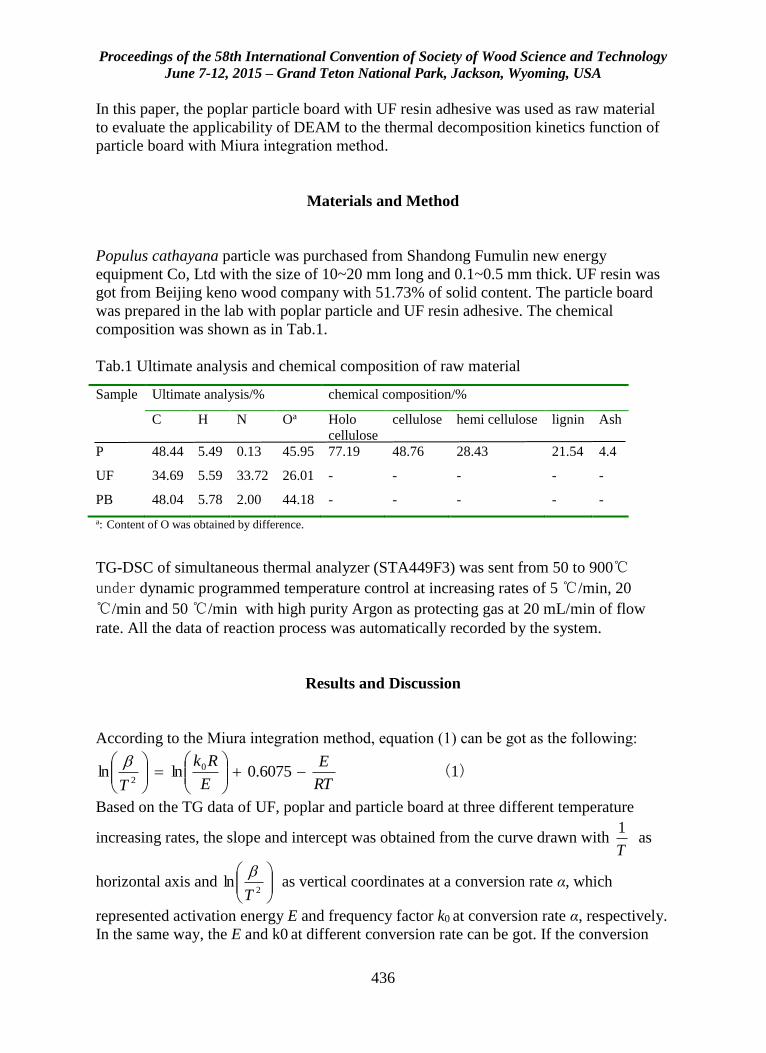
Proceedings of the 58th International Convention of Society of Wood Science and Technology
June 7-12, 2015 – Grand Teton National Park, Jackson, Wyoming, USA
436
In this paper, the poplar particle board with UF resin adhesive was used as raw material
to evaluate the applicability of DEAM to the thermal decomposition kinetics function of
particle board with Miura integration method.
Materials and Method
Populus cathayana particle was purchased from Shandong Fumulin new energy
equipment Co, Ltd with the size of 10~20 mm long and 0.1~0.5 mm thick. UF resin was
got from Beijing keno wood company with 51.73% of solid content. The particle board
was prepared in the lab with poplar particle and UF resin adhesive. The chemical
composition was shown as in Tab.1.
Tab.1 Ultimate analysis and chemical composition of raw material
Sample Ultimate analysis/% chemical composition/%
C H N Oa Holo
cellulose
cellulose hemi cellulose lignin Ash
P 48.44 5.49 0.13 45.95 77.19 48.76 28.43 21.54 4.4
UF 34.69 5.59 33.72 26.01 - - - - -
PB 48.04 5.78 2.00 44.18 - - - - -
a: Content of O was obtained by difference.
TG-DSC of simultaneous thermal analyzer (STA449F3) was sent from 50 to 900℃
under dynamic programmed temperature control at increasing rates of 5 ℃/min, 20
℃/min and 50 ℃/min with high purity Argon as protecting gas at 20 mL/min of flow
rate. All the data of reaction process was automatically recorded by the system.
Results and Discussion
According to the Miura integration method, equation (1) can be got as the following:
RT
E
E
Rk
T
0.6075lnln 0
2
(1)
Based on the TG data of UF, poplar and particle board at three different temperature
increasing rates, the slope and intercept was obtained from the curve drawn with T
1
as
horizontal axis and
2
lnT
as vertical coordinates at a conversion rate α, which
represented activation energy E and frequency factor k0 at conversion rate α, respectively.
In the same way, the E and k0 at different conversion rate can be got. If the conversion
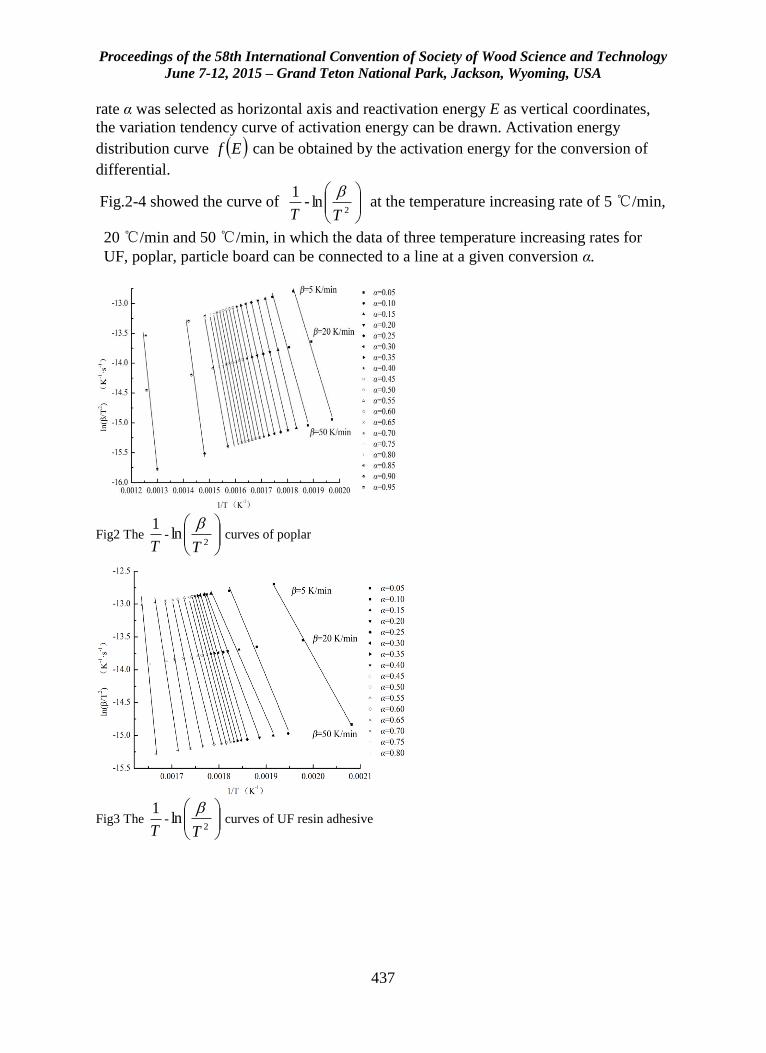
Proceedings of the 58th International Convention of Society of Wood Science and Technology
June 7-12, 2015 – Grand Teton National Park, Jackson, Wyoming, USA
437
rate α was selected as horizontal axis and reactivation energy E as vertical coordinates,
the variation tendency curve of activation energy can be drawn. Activation energy
distribution curve Ef can be obtained by the activation energy for the conversion of
differential.
Fig.2-4 showed the curve of T
1-
2
lnT
at the temperature increasing rate of 5 ℃/min,
20 ℃/min and 50 ℃/min, in which the data of three temperature increasing rates for
UF, poplar, particle board can be connected to a line at a given conversion α.
Fig2 The T
1-
2
lnT
curves of poplar
Fig3 The T
1-
2
lnT
curves of UF resin adhesive
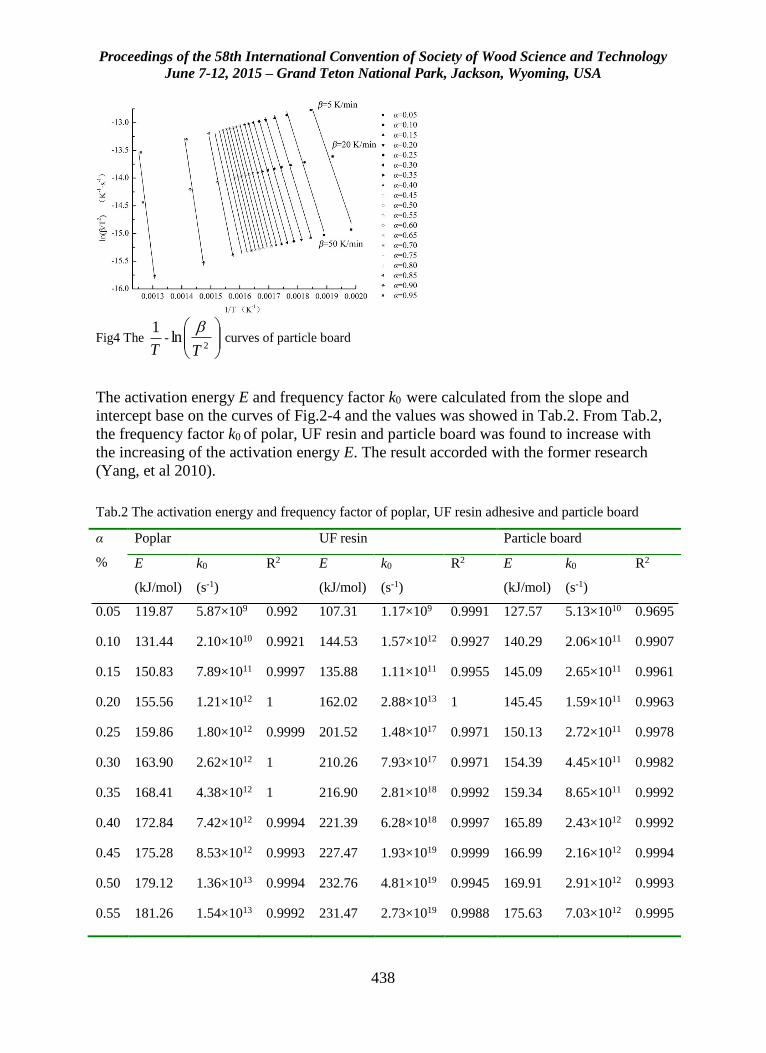
Proceedings of the 58th International Convention of Society of Wood Science and Technology
June 7-12, 2015 – Grand Teton National Park, Jackson, Wyoming, USA
438
Fig4 The T
1-
2
lnT
curves of particle board
The activation energy E and frequency factor k0 were calculated from the slope and
intercept base on the curves of Fig.2-4 and the values was showed in Tab.2. From Tab.2,
the frequency factor k0 of polar, UF resin and particle board was found to increase with
the increasing of the activation energy E. The result accorded with the former research
(Yang, et al 2010).
Tab.2 The activation energy and frequency factor of poplar, UF resin adhesive and particle board
α
%
Poplar UF resin Particle board
E
(kJ/mol)
k0
(s-1)
R2 E
(kJ/mol)
k0
(s-1)
R2 E
(kJ/mol)
k0
(s-1)
R2
0.05 119.87 5.87×10⁹ 0.992 107.31 1.17×10⁹ 0.9991 127.57 5.13×10¹⁰ 0.9695
0.10 131.44 2.10×10¹⁰ 0.9921 144.53 1.57×10¹² 0.9927 140.29 2.06×10¹¹ 0.9907
0.15 150.83 7.89×10¹¹ 0.9997 135.88 1.11×10¹¹ 0.9955 145.09 2.65×10¹¹ 0.9961
0.20 155.56 1.21×10¹² 1 162.02 2.88×10¹³ 1 145.45 1.59×10¹¹ 0.9963
0.25 159.86 1.80×10¹² 0.9999 201.52 1.48×10¹⁷ 0.9971 150.13 2.72×10¹¹ 0.9978
0.30 163.90 2.62×10¹² 1 210.26 7.93×10¹⁷ 0.9971 154.39 4.45×10¹¹ 0.9982
0.35 168.41 4.38×10¹² 1 216.90 2.81×10¹⁸ 0.9992 159.34 8.65×10¹¹ 0.9992
0.40 172.84 7.42×10¹² 0.9994 221.39 6.28×10¹⁸ 0.9997 165.89 2.43×10¹² 0.9992
0.45 175.28 8.53×10¹² 0.9993 227.47 1.93×10¹⁹ 0.9999 166.99 2.16×10¹² 0.9994
0.50 179.12 1.36×10¹³ 0.9994 232.76 4.81×10¹⁹ 0.9945 169.91 2.91×10¹² 0.9993
0.55 181.26 1.54×10¹³ 0.9992 231.47 2.73×10¹⁹ 0.9988 175.63 7.03×10¹² 0.9995
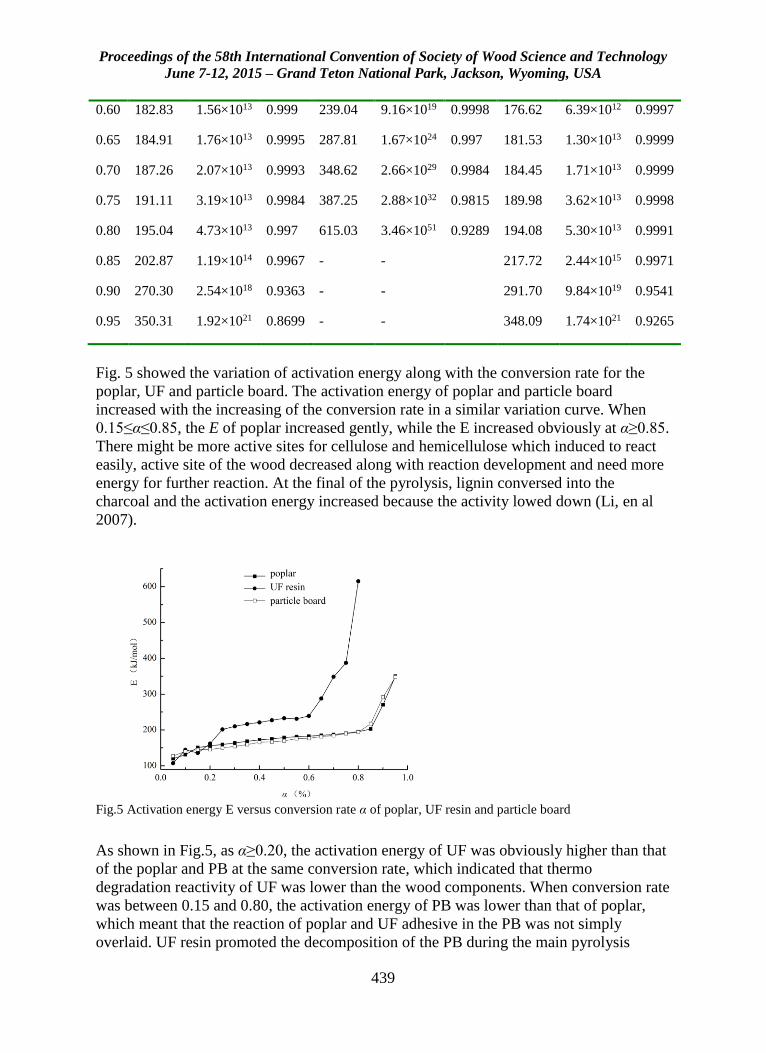
Proceedings of the 58th International Convention of Society of Wood Science and Technology
June 7-12, 2015 – Grand Teton National Park, Jackson, Wyoming, USA
439
0.60 182.83 1.56×10¹³ 0.999 239.04 9.16×10¹⁹ 0.9998 176.62 6.39×10¹² 0.9997
0.65 184.91 1.76×10¹³ 0.9995 287.81 1.67×1024 0.997 181.53 1.30×10¹³ 0.9999
0.70 187.26 2.07×10¹³ 0.9993 348.62 2.66×1029 0.9984 184.45 1.71×10¹³ 0.9999
0.75 191.11 3.19×10¹³ 0.9984 387.25 2.88×1032 0.9815 189.98 3.62×10¹³ 0.9998
0.80 195.04 4.73×10¹³ 0.997 615.03 3.46×1051 0.9289 194.08 5.30×10¹³ 0.9991
0.85 202.87 1.19×10¹⁴ 0.9967 - - 217.72 2.44×10¹⁵ 0.9971
0.90 270.30 2.54×10¹⁸ 0.9363 - - 291.70 9.84×10¹⁹ 0.9541
0.95 350.31 1.92×10²¹ 0.8699 - - 348.09 1.74×10²¹ 0.9265
Fig. 5 showed the variation of activation energy along with the conversion rate for the
poplar, UF and particle board. The activation energy of poplar and particle board
increased with the increasing of the conversion rate in a similar variation curve. When
0.15≤α≤0.85, the E of poplar increased gently, while the E increased obviously at α≥0.85.
There might be more active sites for cellulose and hemicellulose which induced to react
easily, active site of the wood decreased along with reaction development and need more
energy for further reaction. At the final of the pyrolysis, lignin conversed into the
charcoal and the activation energy increased because the activity lowed down (Li, en al
2007).
Fig.5 Activation energy E versus conversion rate α of poplar, UF resin and particle board
As shown in Fig.5, as α≥0.20, the activation energy of UF was obviously higher than that
of the poplar and PB at the same conversion rate, which indicated that thermo
degradation reactivity of UF was lower than the wood components. When conversion rate
was between 0.15 and 0.80, the activation energy of PB was lower than that of poplar,
which meant that the reaction of poplar and UF adhesive in the PB was not simply
overlaid. UF resin promoted the decomposition of the PB during the main pyrolysis
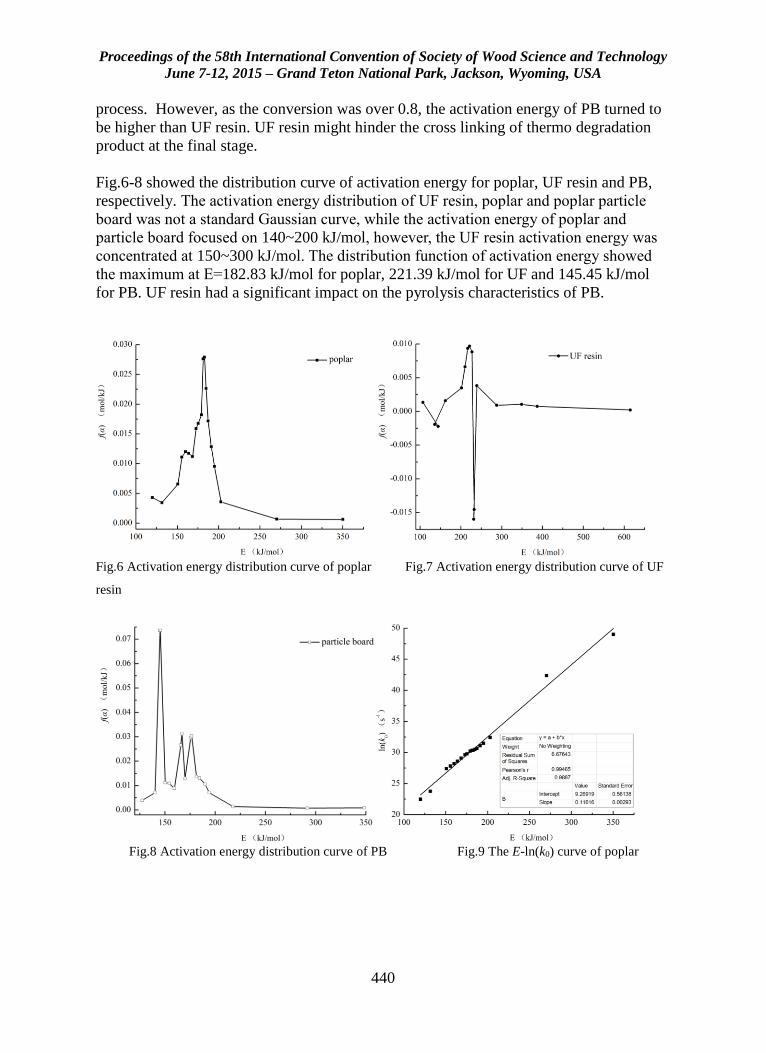
Proceedings of the 58th International Convention of Society of Wood Science and Technology
June 7-12, 2015 – Grand Teton National Park, Jackson, Wyoming, USA
440
process. However, as the conversion was over 0.8, the activation energy of PB turned to
be higher than UF resin. UF resin might hinder the cross linking of thermo degradation
product at the final stage.
Fig.6-8 showed the distribution curve of activation energy for poplar, UF resin and PB,
respectively. The activation energy distribution of UF resin, poplar and poplar particle
board was not a standard Gaussian curve, while the activation energy of poplar and
particle board focused on 140~200 kJ/mol, however, the UF resin activation energy was
concentrated at 150~300 kJ/mol. The distribution function of activation energy showed
the maximum at E=182.83 kJ/mol for poplar, 221.39 kJ/mol for UF and 145.45 kJ/mol
for PB. UF resin had a significant impact on the pyrolysis characteristics of PB.
Fig.6 Activation energy distribution curve of poplar Fig.7 Activation energy distribution curve of UF
resin
Fig.8 Activation energy distribution curve of PB Fig.9 The E-ln(k0) curve of poplar
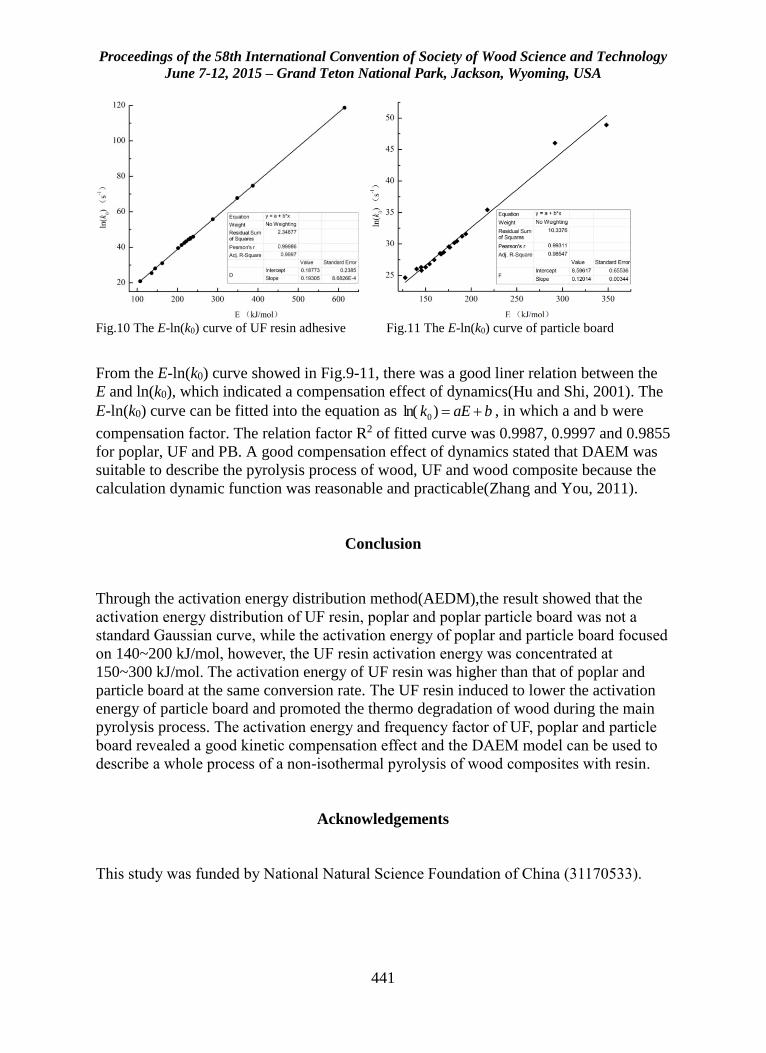
Proceedings of the 58th International Convention of Society of Wood Science and Technology
June 7-12, 2015 – Grand Teton National Park, Jackson, Wyoming, USA
441
Fig.10 The E-ln(k0) curve of UF resin adhesive Fig.11 The E-ln(k0) curve of particle board
From the E-ln(k0) curve showed in Fig.9-11, there was a good liner relation between the
E and ln(k0), which indicated a compensation effect of dynamics(Hu and Shi, 2001). The
E-ln(k0) curve can be fitted into the equation as baEk )ln( 0 , in which a and b were
compensation factor. The relation factor R2 of fitted curve was 0.9987, 0.9997 and 0.9855
for poplar, UF and PB. A good compensation effect of dynamics stated that DAEM was
suitable to describe the pyrolysis process of wood, UF and wood composite because the
calculation dynamic function was reasonable and practicable(Zhang and You, 2011).
Conclusion
Through the activation energy distribution method(AEDM),the result showed that the
activation energy distribution of UF resin, poplar and poplar particle board was not a
standard Gaussian curve, while the activation energy of poplar and particle board focused
on 140~200 kJ/mol, however, the UF resin activation energy was concentrated at
150~300 kJ/mol. The activation energy of UF resin was higher than that of poplar and
particle board at the same conversion rate. The UF resin induced to lower the activation
energy of particle board and promoted the thermo degradation of wood during the main
pyrolysis process. The activation energy and frequency factor of UF, poplar and particle
board revealed a good kinetic compensation effect and the DAEM model can be used to
describe a whole process of a non-isothermal pyrolysis of wood composites with resin.
Acknowledgements
This study was funded by National Natural Science Foundation of China (31170533).
Proceedings of the 58th International Convention of Society of Wood Science and Technology
June 7-12, 2015 – Grand Teton National Park, Jackson, Wyoming, USA
442
Reference
Chen YX, Gan YP, Chang N (2013) The effect of Fe2O3 on the kinetic parameters of the
Yulin coal pyrolysis. J. Xi’an Univ. of Arch. Tech. (Natural Science Edition) 44(5): 736-
739. In Chinese with abstract in English.
Hu ZR, Shi QZ (2001) Thermal analysis kinetics. Science Press, Beijing.
Li SF, Fang MX, Shu LF, et al(2006) Pyrolysis and combustion mechanism of wood with
distribution activation energy model. J. of Combustion Sci. and Tech. 12(6): 535-539.
Wei ZG, Huang YQ, Yin XL, et al (2012) Kinetics study on activating corncob
hydrolysis residues char pyrolysis by ZnCl. Renewable Energy Resources 30(1): 62-66.
Yang JB, Zhang YW, Cai NS (2010) A comparison of a single reaction model with a
distributed activation energy one based on coal pyrolysis kinetics. J. of Engineering for
Thermal Energy & Power 25(3): 301-305.
Zhang K, You CF (2011) Research on the parallel reaction Kinetic Model of lignite
pyrolysis. Proceedings of the CSEE 31(17): 26-31.
Proceedings of the 58th International Convention of Society of Wood Science and Technology
June 7-12, 2015 – Grand Teton National Park, Jackson, Wyoming, USA
443
CLT Served Any Way You Want It: n Overview of 19
Plants Toured in 2012-2014. Abridged
Lech Muszynski, [email protected]
Oregon State University, 119 Richardson Hall, Corvallis, OR 97331
Abstract
Cross-laminated timber, or CLT, is a massive structural composite panel product usually
consisting of 3 to 9 layers of dimensional timber (lamellas) arranged perpendicular to
each other, much like layers of veneer in plywood, and can be used as prefabricated wall,
floor and roofing elements in residential, public and commercial structures. This is not
merely a new engineered composite panel product but an entirely new building
technology revolutionizing the use of timber in construction. The CLT manufacturing
process and the technology of erecting prefabricated houses based on this product has
been developed in Europe over the last 16 years despite lack of the product standard. The
output capacity of the industry worldwide has been growing exponentially. The organic
development of the industry resulted in a surprising diversity in the manufacturing
processes, products and market strategies. The author will present a brief overview of the
profiles of 19 CLT manufacturing plants toured between 2012-14
Proceedings of the 58th International Convention of Society of Wood Science and Technology
June 7-12, 2015 – Grand Teton National Park, Jackson, Wyoming, USA
444
Characteristics of Densified Sengon Wood
(Paraserianthes falcataria (L) Nielsen) by
Compregnation Process
Dodi Nandika, [email protected]
Bogor Agricultural University, Kampus IPB Darmaga, Bogor 16680
Abstract
Sengon (Paraserianthes falcataria (L) Nielsen). is a fast-growing tree species that widely
planted in Indonesia. Low quality of the sengon wood mainly related to the strength and
durability led to its limited use. A study was conducted to evaluate the effect of chitosan
impregnation followed by thermal compression on the characteristics of densified sengon
wood. Chitosan concentration used in this study was 0.5%. and compression level applied
was 50%. Sengon boards was compressed under three different temperature (150°C.
170°C. and 190°C). The results of study showed that compregnation process improved its
physical. mechanical properties. and its resistance against subterranean termite. Density
of densified boards was 80.7 % larger than that of uncompregnated boards. The
hardness. MOE. and MOR were investigated to be 54.6%. 53.2%. and 52.77%.
respectively larger than the uncompregnated wood. In addition. the chitosan impregnated
on the sengon wood could decrease spring back of the densified boards significantly. The
optimum temperature for impregnation as well as compression process of the boards were
100°C and 150°C respectively.
Proceedings of the 58th International Convention of Society of Wood Science and Technology
June 7-12, 2015 – Grand Teton National Park, Jackson, Wyoming, USA
445
Local Production of Particle Board Using Ficus (SPP)
Wood and Epoxy Resin Adhesive
Robert Ogbanje Okwori PhD & Adeogun Idris Olawale
Corresponding author: [email protected], Tel: +2348060966524
Department of Industrial and Technology education,
Federal University of Technology,
Minna, Nigeria
Abstract
Wood is utilized for providing shelter for man. Particle board (pb) was produced using
ficus wood waste, epoxy resin adhesive, hardener (ammonium chloride), mould, hot
presser, and intron testing machine. The wood was naturally seasoned and had 4%
moisture content. The production of Pb was carried out using manual lay up technique.
The Pb consisted of 20wt% of wood saw dust and 80wt% of epoxy resin. The mix was
stirred manually. The cast of each Pb was cured under the load of 50kg for 24 hours
before removing from the mould. The cast of each pb was post cured in the air for 24
hours after from removing the mould. The test result of mechanical properties given as
follows: MOR values at the density of 700 kg/m3 at 25 °C and at the density of 800
kg/m3 at 25 and 40 °C, the IB values at the density of 600 kg/m3 at 40 °C and at the
density of 800 kg/m3 at 55 °C. The SHP values had the test result according to the set
standard except with the density of 600 kg/m3 at 40 and 55 °C. The density at 600kg/m3
yields less MOE than at 700kg/m3 at 800kg/m3 respectively. The pb was finally treated
with preservative. The pb is durable, resistant to insect and termites attack and it is
affordable since is locally produced. Based on the above traits, it is recommended for
cabinet makers and upholsterers for use.
Key words: Ficus wood, Particle board, Epoxy resin, Adhesive
Introduction
The demand for particle board and plywood has recently increased tremendously in
Nigeria especially for domestic and industrial use. Particle board is a man made board
produced from wood particles, such as wood chips, wood shavings or wood saw dust
with the application of adhesive and press together. Particleboard is cheaper, denser and
more uniform than solid wood. Particle board is cheap in price when compared to
Proceedings of the 58th International Convention of Society of Wood Science and Technology
June 7-12, 2015 – Grand Teton National Park, Jackson, Wyoming, USA
446
plywood. Particle board is used for cabinet making and upholstered work. It can also be
used for partitioning of walls, platform for chairs and stair treads. I can be combined with
other materials to be used as inlaying and over laying for decorative purposes.
The strength and durability of particle board is a function of the mechanical
characteristics of the component materials. Analysis of the mechanical characteristics is
the investigation of the materials behaviour when subjected to loads. Material reactions
under loads are the stress and strain generated within the materials and usually results in
deformation.
A sufficient knowledge of the mechanical behaviour of wood enables a safe design for
the materials service life. However, being a biological material like timber, it is subjected
to greater variability and complexity due to various conditions as moisture. Wood is an
orthotropic material which means it has particular mechanical characteristics in the three
directions: longitudinal, radial and tangential (Youngquist, Myers & Muehl, 1993).
Particle boards are made from a wide range of materials such as fibers obtained from
trees. It provides uniform and predictable in-service performance largely as a
consequence of standards used to monitor and control their manufacture. The mechanical
characteristics of particle board depends upon a variety of factors. This includes wood
species, the type of adhesive used to bind the wood elements together, geometry of the
wood elements (fibers, flakes, strands, particles, veneer, lumber) and density of the final
product (Cai & Winandy,2006).
Model building codes in the United States stipulate that man made boards used for
structural applications such as subflooring and sheathing must meet the requirements of
certain U.S. Department of Commerce standards. Voluntary Product Standard PS 1–07
for construction and industrial plywood (NIST, 2007) and Performance Standard PS 2–04
for wood-based structural-use panels (NIST, 2004). It spells out the rules for
manufacturing plywood (Halloran, 1980, APA, 1981). Particle boards are used for a
number of structural and nonstructural applications. It is used for both interior and
exterior construction in a house, furniture, flooring, paneling, partitioning, wall, ceiling
panels and support structures in buildings and so on. Knowledge of the mechanical
characteristics of these products is important to enhance its utilization.
Through out the world, sellers reported that the demand for wood composite products
has increased substantially. Man made board as an alternative to solid wood has reduced
the high demand for solid wood. The use of non-timber resources, wood wastes and
agricultural residues are ways of saving solid wood. In order to overcome the wood
shortage and to meet the future demand of wood products, studies have been conducted
to utilize non-wood materials, agricultural residues, fast growing tree, low-grade wood
species and underutilized wood species in the forest industry as raw material components
for wood-based composite production in several countries. In developing countries most
of these residues are mostly ploughed into the soil or burnt in the field, however, these
residues can be used to produce particle board and medium density fiber board.
(Youngquist, Myers & Muehi, 1993).
Proceedings of the 58th International Convention of Society of Wood Science and Technology
June 7-12, 2015 – Grand Teton National Park, Jackson, Wyoming, USA
447
Statement of the Problem
The continuous increase in the cost of natural wood in Nigeria today has been a problem
and this brought about other alternative wood materials (man-made board) that can serve
as substitute for those materials that are scarce and expensive such as solid wood and
metal. It is observed that particle boards imported are expensive therefore, woodworkers
find it to afford. The researchers also observed that some particleboards produced do not
meet the minimum mechanical property requirements specified (NIST, 2007). The
mechanical properties of particleboard are indication of quality and suitability for use. In
most cases the testing methods listed in the specific standards for determining these
properties require sophisticated equipment. In fact, results are normally obtained several
hours or even several days after the manufacture of the board (Cook & Harten, 2000).
Aim and Objectives of the Study
The aim of this study is to produce a single layer particle board locally using ficus (SPP)
wood saw dust and epoxy resin adhesive. The objectives of the study include to:
1. Produce a single layer particle board using ficus (SPP) wood saw dust.
2. Determine the mechanical characteristics of ficus particle board.
Research Question
The following question was formulated to guide the study.
1. What are the procedures for producing ficus particle board?
2. What are mechanical characteristics of ficus particle board?
Materials and Methods
Materials used and methods of manufacturing particle board and the experimental
procedures for the mechanical characterization is discussed in this section.
Research Design
Experimental research design was adopted for the study. Wood saw dust was collected
and used for the production of the particle board. Specimens of suitable dimension were
used for mechanical testing. It was aimed at testing the mechanical characteristics of the
particleboard.
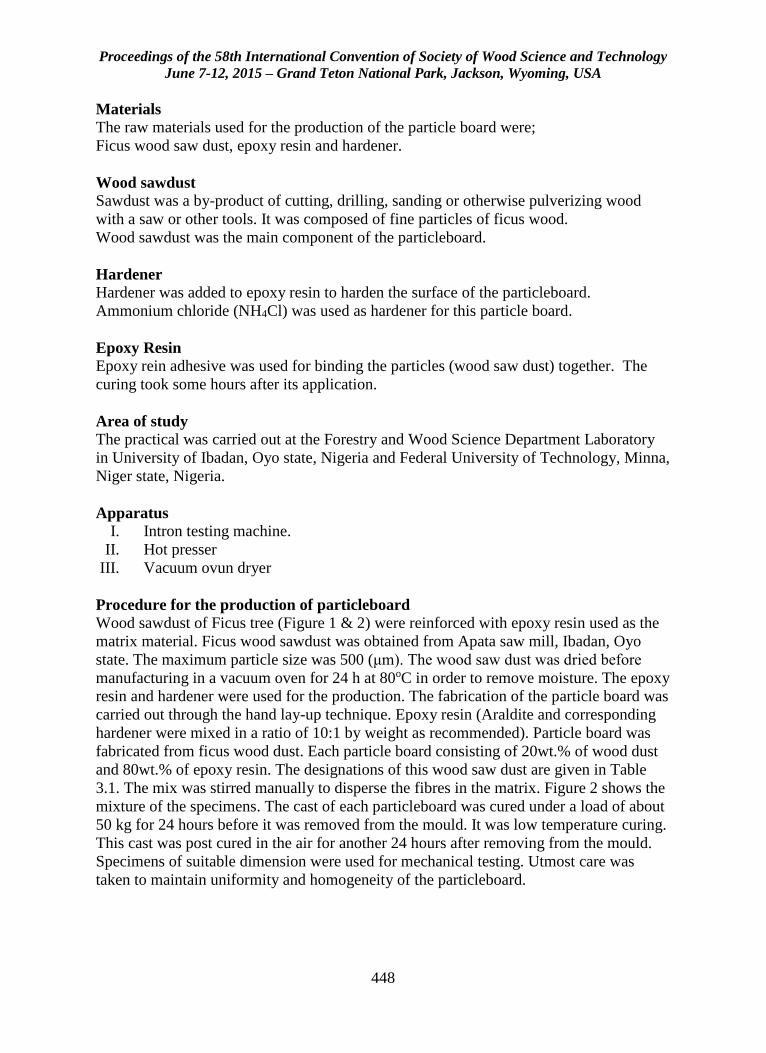
Proceedings of the 58th International Convention of Society of Wood Science and Technology
June 7-12, 2015 – Grand Teton National Park, Jackson, Wyoming, USA
448
Materials
The raw materials used for the production of the particle board were;
Ficus wood saw dust, epoxy resin and hardener.
Wood sawdust
Sawdust was a by-product of cutting, drilling, sanding or otherwise pulverizing wood
with a saw or other tools. It was composed of fine particles of ficus wood.
Wood sawdust was the main component of the particleboard.
Hardener
Hardener was added to epoxy resin to harden the surface of the particleboard.
Ammonium chloride (NH4Cl) was used as hardener for this particle board.
Epoxy Resin
Epoxy rein adhesive was used for binding the particles (wood saw dust) together. The
curing took some hours after its application.
Area of study
The practical was carried out at the Forestry and Wood Science Department Laboratory
in University of Ibadan, Oyo state, Nigeria and Federal University of Technology, Minna,
Niger state, Nigeria.
Apparatus
I. Intron testing machine.
II. Hot presser
III. Vacuum ovun dryer
Procedure for the production of particleboard Wood sawdust of Ficus tree (Figure 1 & 2) were reinforced with epoxy resin used as the
matrix material. Ficus wood sawdust was obtained from Apata saw mill, Ibadan, Oyo
state. The maximum particle size was 500 (μm). The wood saw dust was dried before
manufacturing in a vacuum oven for 24 h at 80oC in order to remove moisture. The epoxy
resin and hardener were used for the production. The fabrication of the particle board was
carried out through the hand lay-up technique. Epoxy resin (Araldite and corresponding
hardener were mixed in a ratio of 10:1 by weight as recommended). Particle board was
fabricated from ficus wood dust. Each particle board consisting of 20wt.% of wood dust
and 80wt.% of epoxy resin. The designations of this wood saw dust are given in Table
3.1. The mix was stirred manually to disperse the fibres in the matrix. Figure 2 shows the
mixture of the specimens. The cast of each particleboard was cured under a load of about
50 kg for 24 hours before it was removed from the mould. It was low temperature curing.
This cast was post cured in the air for another 24 hours after removing from the mould.
Specimens of suitable dimension were used for mechanical testing. Utmost care was
taken to maintain uniformity and homogeneity of the particleboard.
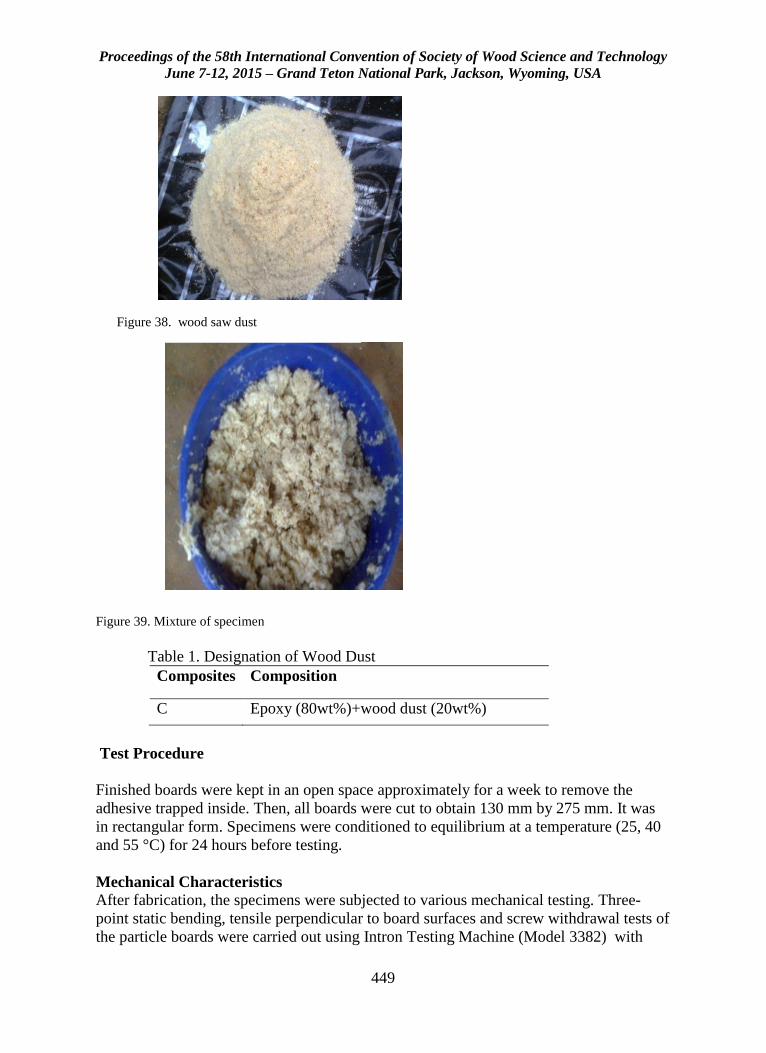
Proceedings of the 58th International Convention of Society of Wood Science and Technology
June 7-12, 2015 – Grand Teton National Park, Jackson, Wyoming, USA
449
Figure 39. Mixture of specimen
Table 1. Designation of Wood Dust
Composites Composition
C Epoxy (80wt%)+wood dust (20wt%)
Test Procedure
Finished boards were kept in an open space approximately for a week to remove the
adhesive trapped inside. Then, all boards were cut to obtain 130 mm by 275 mm. It was
in rectangular form. Specimens were conditioned to equilibrium at a temperature (25, 40
and 55 °C) for 24 hours before testing.
Mechanical Characteristics
After fabrication, the specimens were subjected to various mechanical testing. Three-
point static bending, tensile perpendicular to board surfaces and screw withdrawal tests of
the particle boards were carried out using Intron Testing Machine (Model 3382) with
Figure 38. wood saw dust
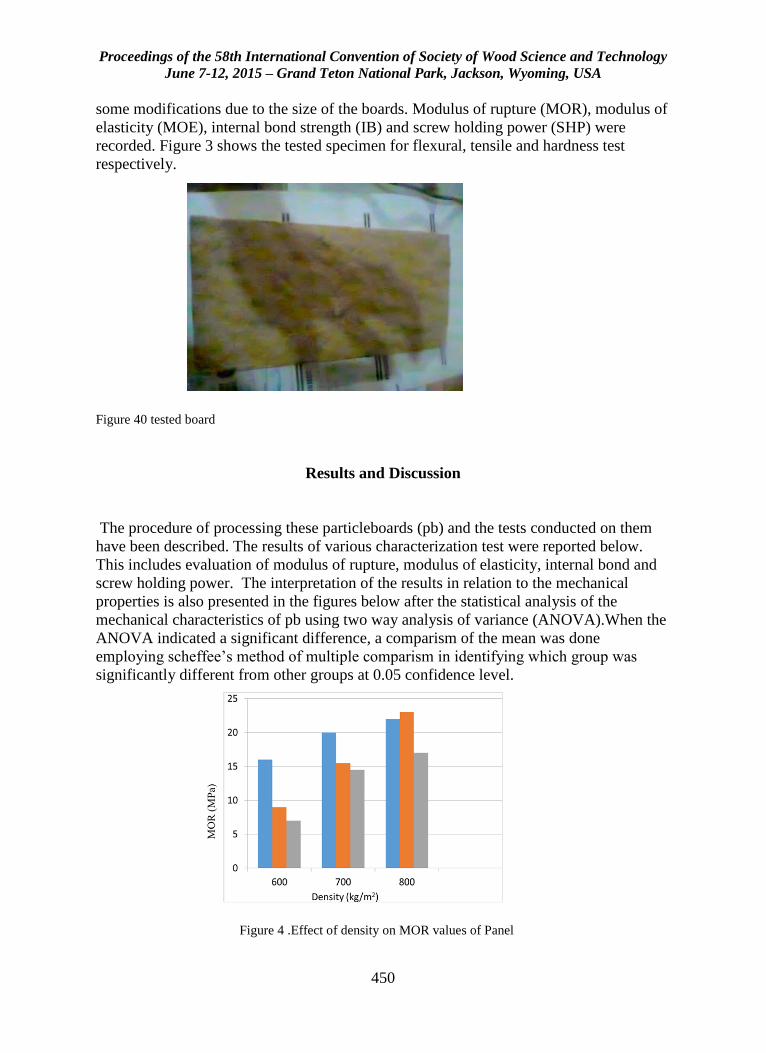
Proceedings of the 58th International Convention of Society of Wood Science and Technology
June 7-12, 2015 – Grand Teton National Park, Jackson, Wyoming, USA
450
some modifications due to the size of the boards. Modulus of rupture (MOR), modulus of
elasticity (MOE), internal bond strength (IB) and screw holding power (SHP) were
recorded. Figure 3 shows the tested specimen for flexural, tensile and hardness test
respectively.
Figure 40 tested board
Results and Discussion
The procedure of processing these particleboards (pb) and the tests conducted on them
have been described. The results of various characterization test were reported below.
This includes evaluation of modulus of rupture, modulus of elasticity, internal bond and
screw holding power. The interpretation of the results in relation to the mechanical
properties is also presented in the figures below after the statistical analysis of the
mechanical characteristics of pb using two way analysis of variance (ANOVA).When the
ANOVA indicated a significant difference, a comparism of the mean was done
employing scheffee’s method of multiple comparism in identifying which group was
significantly different from other groups at 0.05 confidence level.
Figure 4 .Effect of density on MOR values of Panel
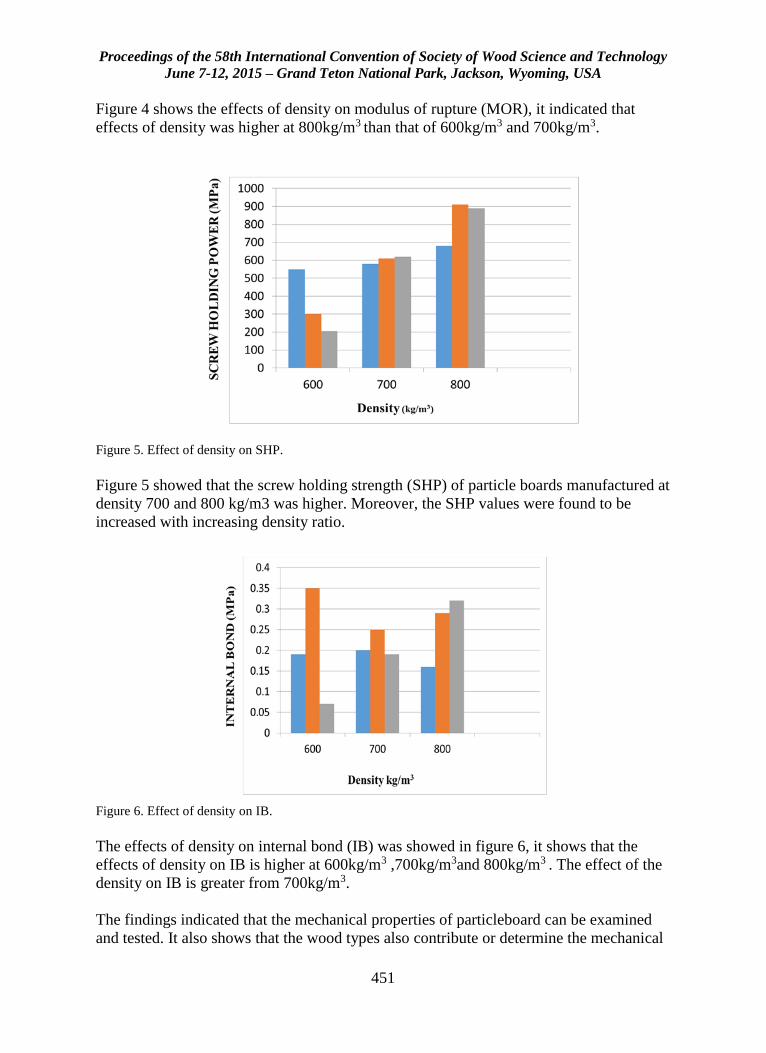
Proceedings of the 58th International Convention of Society of Wood Science and Technology
June 7-12, 2015 – Grand Teton National Park, Jackson, Wyoming, USA
451
Figure 4 shows the effects of density on modulus of rupture (MOR), it indicated that
effects of density was higher at 800kg/m3 than that of 600kg/m3 and 700kg/m3.
Figure 5. Effect of density on SHP.
Figure 5 showed that the screw holding strength (SHP) of particle boards manufactured at
density 700 and 800 kg/m3 was higher. Moreover, the SHP values were found to be
increased with increasing density ratio.
Figure 6. Effect of density on IB.
The effects of density on internal bond (IB) was showed in figure 6, it shows that the
effects of density on IB is higher at 600kg/m3 ,700kg/m3and 800kg/m3 . The effect of the
density on IB is greater from 700kg/m3.
The findings indicated that the mechanical properties of particleboard can be examined
and tested. It also shows that the wood types also contribute or determine the mechanical
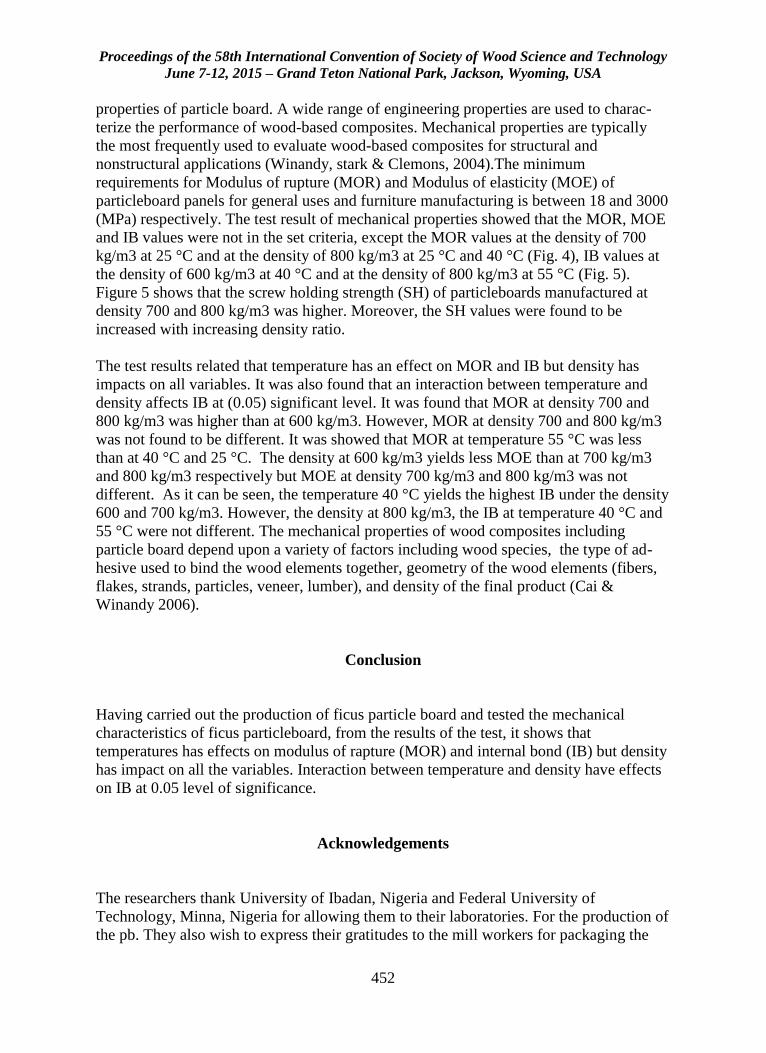
Proceedings of the 58th International Convention of Society of Wood Science and Technology
June 7-12, 2015 – Grand Teton National Park, Jackson, Wyoming, USA
452
properties of particle board. A wide range of engineering properties are used to charac-
terize the performance of wood-based composites. Mechanical properties are typically
the most frequently used to evaluate wood-based composites for structural and
nonstructural applications (Winandy, stark & Clemons, 2004).The minimum
requirements for Modulus of rupture (MOR) and Modulus of elasticity (MOE) of
particleboard panels for general uses and furniture manufacturing is between 18 and 3000
(MPa) respectively. The test result of mechanical properties showed that the MOR, MOE
and IB values were not in the set criteria, except the MOR values at the density of 700
kg/m3 at 25 °C and at the density of 800 kg/m3 at 25 °C and 40 °C (Fig. 4), IB values at
the density of 600 kg/m3 at 40 °C and at the density of 800 kg/m3 at 55 °C (Fig. 5).
Figure 5 shows that the screw holding strength (SH) of particleboards manufactured at
density 700 and 800 kg/m3 was higher. Moreover, the SH values were found to be
increased with increasing density ratio.
The test results related that temperature has an effect on MOR and IB but density has
impacts on all variables. It was also found that an interaction between temperature and
density affects IB at (0.05) significant level. It was found that MOR at density 700 and
800 kg/m3 was higher than at 600 kg/m3. However, MOR at density 700 and 800 kg/m3
was not found to be different. It was showed that MOR at temperature 55 °C was less
than at 40 °C and 25 °C. The density at 600 kg/m3 yields less MOE than at 700 kg/m3
and 800 kg/m3 respectively but MOE at density 700 kg/m3 and 800 kg/m3 was not
different. As it can be seen, the temperature 40 °C yields the highest IB under the density
600 and 700 kg/m3. However, the density at 800 kg/m3, the IB at temperature 40 °C and
55 °C were not different. The mechanical properties of wood composites including
particle board depend upon a variety of factors including wood species, the type of ad-
hesive used to bind the wood elements together, geometry of the wood elements (fibers,
flakes, strands, particles, veneer, lumber), and density of the final product (Cai &
Winandy 2006).
Conclusion
Having carried out the production of ficus particle board and tested the mechanical
characteristics of ficus particleboard, from the results of the test, it shows that
temperatures has effects on modulus of rapture (MOR) and internal bond (IB) but density
has impact on all the variables. Interaction between temperature and density have effects
on IB at 0.05 level of significance.
Acknowledgements
The researchers thank University of Ibadan, Nigeria and Federal University of
Technology, Minna, Nigeria for allowing them to their laboratories. For the production of
the pb. They also wish to express their gratitudes to the mill workers for packaging the
Proceedings of the 58th International Convention of Society of Wood Science and Technology
June 7-12, 2015 – Grand Teton National Park, Jackson, Wyoming, USA
453
ficus saw dust used for the fabrication of the pb. The efforts of the computer operator are
highly appreciated for typing this manuscript.
Recommendations
The following are recommended based on the study:
1. When producing particle board, temperature should be considered so that the
quality will not be affected since it has effect on MOR and IB.
2. Local production of particleboards should be encouraged by government since
there are different species of trees in Nigeria and to reduce importation of such
boards.
3. Wood workers in the saw mills should be educated using mass media to preserve
wood dust for the production of particleboards e.t.c, instead of disposing them in
the environment which causes environmental pollution.
4. Educational institutions offering woodwork technology should procure equipment
that are essential for particle board production. This will encourage local
production of particleboard by students and other woodworkers.
References
Cai, Z.; Muehl, J.H.& Winandy, J.E (2006). Effects of panel density and mat moisture
content on processing medium density fiberboard. Forest product Journal. 56(10), 20–
25.
Cook, T. & Harten, w. (2000). Lignocellulosic – Plastic Composites from Recycled
Materials. American Chemical Society, 107, (40).
CPA. (1999). Particleboard standard. ANSI A 208.1-1999. Leesburg, VA: composite
panel Association.
NIST. (2007). Voluntary product standard PS 1–07. Construction and industrial plywood.
National Institute of Standards and Technology. Gaithersburg, MD: U.S. Department of
Commerce.
Halloran, M.R. (1980). The performance approach to acceptance of building products.
In: Proceedings of 14th Washinton state university particleboard symposium. Pullman,
Pp.
77-84.
Winandy, J.E., N. M. Stark, & C. M. Clemons.(2004) .Consideration In Recycling Of
Wood-Plastic Composites. 5th Global Wood and Natural Fiber Composites Symposium.
Kassel- Germany.

Proceedings of the 58th International Convention of Society of Wood Science and Technology
June 7-12, 2015 – Grand Teton National Park, Jackson, Wyoming, USA
454
Youngquist, J.A.; Myers, G.E.; Muehl, J.M.( 1993). Composites from recycled wood and
plastics. U.S. Environmental Protection Agency, Project IAG DW12934608–2. Madison,
WI: U.S. Department of Agriculture, Forest Service, Forest Products Laboratory. 3 p.
Proceedings of the 58th International Convention of Society of Wood Science and Technology
June 7-12, 2015 – Grand Teton National Park, Jackson, Wyoming, USA
455
The Relationship Between Fibre Characteristics and
Strength Properties of Three Lesser Utilized Ghanaian
Hardwood Species.
Gladys Quartey, [email protected]
Stephen Terpetey, [email protected]
Takoradi Polytechnic, P. O. Box TD 372, , Takoradi, Western Region
Abstract
Wood exists as concentric bands of cells oriented for specific function and as softwood
and hardwood. Hardwood fibers are generally shorter (1-1.5mm) than softwood fibers
(3.5mm). Three hardwood species, Albizia ferruginea, Blighia sapida, and Sterculia
rhinopetala were selected for anatomical investigations and mechanical strength tests.
Maceration was done and structural size samples were tested for their mechanical
properties according to EN 408 (2003). Results revealed that Sterculia rhinopetala had a
bending strength of 61.4 N/mm2 at a moisture content of 29 % with an average density of
0.899 g/cm3. Albizia ferruginea had lowest bending strength of 50 N/mm2 at a lower
average density of 0.740 g/cm3. Fiber lengths were measured using Leica DMLM light
microscope with a Leica DFC 320 digital camera. Photomicrographs were then analyzed
with Leica IM 1000 Version 4.0 Release 132. Sterculia rhinopetala had thick longest
fibers with a fiber length ranging between 1479-1899µm. Albizia ferruginea had
relatively short fibers which ranged from 1196 – 1274 µm. Whilst Blighia sapida had a
fiber length of between 1127 – 1303 µm. This brings to the fore the fact that Sterculia
rhinopetala with thick long fibers has a high bending strength whilst Albizia ferruginea
with relatively short fibers has low bending strength.
Proceedings of the 58th International Convention of Society of Wood Science and Technology
June 7-12, 2015 – Grand Teton National Park, Jackson, Wyoming, USA
456
Assessing Geographic Information Systems (GIS) Use
in Marketing Applications: A Case of Study in the
Wood Products Industry
Henry Quesada-Pineda, [email protected]
Melissa Brenes-Bastos, [email protected]
Robert Smith, [email protected]
Virginia Tech, 1650 Research Tech Drive, Blacksburg, VA 24061
Abstract
Geographical Information Systems (GIS) is a worldwide growing technology, however it
is not yet completely accepted. Of all of the business processes in an organization,
marketing is perhaps one of the natural fitting-processes to apply GIS. Even though there
is recent research regarding applications of GIS in the wood products industry, those
applications are mostly related to biomass mapping and logistics issues. Little research
has been conducted on the utilization of GIS as part of the marketing strategic plan in this
industry. Thus, the main goal of this project is to understand GIS uses on marketing
application in the wood products industry, specifically in the marketing mix strategic
plan. The approach of this research consisted of the collection and analysis of data from
secondary and primary wood products industries in the state of Virginia. A relational
database was developed to organize the information and to create an industry directory
for secondary wood products industries. Secondly, clustering techniques were used to test
if wood products companies cluster around certain geographical regions. Confirmation of
the clustering led to the construction of a GIS application to map wood products
industries. Finally, guidelines were developed to describe how to use GIS in the
marketing process of wood products firms.
Proceedings of the 58th International Convention of Society of Wood Science and Technology
June 7-12, 2015 – Grand Teton National Park, Jackson, Wyoming, USA
457
Firm Performance in the Swedish Industry for Off-Site
Produced Wooden Single-Family Houses
Tobias Schauerte, [email protected]
Fredrik Lindblad, [email protected]
Linnaeus University, Lückligsplats 1, Växjö 35195
Abstract
In the last years, the Swedish market for wooden single-family houses was characterized
by an enormous downfall. Within five years, from 2007 to 2012, the number of produced
wooden single-family houses declined from 12 100 to 4 800 units per year, equaling
60%. Yet, firms in the industry seem not to adjust their businesses or costs consequently,
since the costs per m2 housing area increased by almost 20%. Looking back to 2001,
costs even increased by ca 66%. These numbers supposably point on serious problems
related to the firms’ overall performances. Thus, the aim of this study is to map and
analyze the overall performance of the firms producing wooden single-family houses in
Sweden.
For 51 firms, balance sheets from 2010 to 2013 were collected and analyzed. Results
show for example that the average turnover per firm decreased by ca 20%, whilst the
average profit per employee in the industry increased by 75%. The relationship between
these two numbers can be seen as mainly caused by the continuously rising housing
prices due to severe national housing shortage. Further, looking at the operational risk of
the firms, it can be seen that firms have a different sensitivity for short-term economic
fluctuations and need to adjust their business activities accordingly.
Proceedings of the 58th International Convention of Society of Wood Science and Technology
June 7-12, 2015 – Grand Teton National Park, Jackson, Wyoming, USA
458
From Single-Family Houses to Multi-Family Houses -
Resistance to Change and Perceived Hinders
Tobias Schauerte, [email protected]
Fredrik Lindblad, [email protected]
Marie Johansson, [email protected]
Linnaeus University, Lückligsplats 1, , Växjö 35195
Abstract
In the past decades, housing shortage in Sweden has accumulated to a level that has led to
acute problems for many people in general, and combined with continuously rising
housing prices, problems especially occur for younger people with relatively low income.
On the market for single-family houses, where wood dominates with 85 – 90 % of market
share, firms struggle with a low order intake and currently compete with very low
margins, if any. Only few of these firms produce multi-family houses as well, even
though production facilities often allow for that. One way to tackle the existing housing
shortage could be to get more actors from the single-family house industry to produce
multi-family houses. This would trigger competition, improve product quality and utilize
economies of scale due to product relatedness, e.g. for prefabricated walls. In that way,
profitability and the firms’ margins could be improved.
This study is aiming at exploring potential hinders for Swedish firms producing wooden
single-family houses to build multi-family houses. This will be done by deep interviews
with decision makers in those firms and, based on that, a follow-up survey-study
covering all listed firms in that industry segment. The results may show that resistance to
change and perceived hinders mainly are related to management issues, lack of
knowledge about the new segment and constructional requirements, firm size, risk taking
or ownership model.
Proceedings of the 58th International Convention of Society of Wood Science and Technology
June 7-12, 2015 – Grand Teton National Park, Jackson, Wyoming, USA
459
Owning or Renting? Investigating Consumer
Perceptions on Different Apartment Types in Wooden
Multistory Houses in Sweden.
Tobias Schauerte, [email protected]
Anders Ingwald, [email protected]
Linnaeus University, Lückligsplats 1, Växjö 35195
Abstract
In Sweden, housing shortage has become a serious problem. To overcome that shortage
reasonably, the amount of new housing units per year should be around 60 000. However,
not more than 25 000 housing units per year have been finalized the past years. As wood
is regarded as a very suitable construction material to helping to overcome the shortage,
an increase of wooden multistory houses on the market is expected in the near future.
At the same time, discussions take place about an appropriate distribution of apartment
types, i.e. rental apartments vs. condominiums. In Sweden, ca 25% of all apartments are
rental apartments and ca 15% condominiums. More rental apartments are demanded from
the publics, whilst firms on the construction market are very well aware of the higher
profitability of condominiums. Yet, since prices for condominiums increased a lot in the
past years, the attractiveness of condominiums seems only to be recognized from the
seller part.
This study is aiming at investigating the perceptions of consumers on condominiums and
rental apartments in wooden multistory houses. Thereby, we learn to understand how
consumers link their personal values and needs to housing and different types of
products’ attributes; a crucial part of strategic segmenting of markets. Results show that
there is a significant difference in consumers’ perceptions on the type of apartments and
that decisive arguments for consumers are linked to costs, security and quality of life.
Proceedings of the 58th International Convention of Society of Wood Science and Technology
June 7-12, 2015 – Grand Teton National Park, Jackson, Wyoming, USA
460
Hybrid Oriented Strand Boards from Moso Bamboo
(Phyllostachys pubescens Mazel) and Aspen (Populus
tremuloides Michx.): Bamboo Surfaces, Aspen Core
Kate E Semple1, Polo K Zhang2, Gregory D Smith3*
1Research Scientist, 2Graduate Research Assistant, and 3Associate Professor
*Corresponding author 1,2,3Department of Wood Science-Composites Group, University of British
Columbia, 2900-2424 Main Mall, Vancouver, BC, Canada, V6T 1Z4.
[email protected], [email protected], [email protected].
Abstract
Five sets of six 3-layer strandboards were made in three configurations, (1) Moso
bamboo in the surface and core layers, (2) Moso bamboo in the surface and Aspen in the
core, and (3) Aspen in the surface and core layers. For the configurations containing
bamboo strands in the surface layers, there were two sub groups: (a) all strands contain a
node in the middle, and (b) strands are node free (internode). All 30 boards were
comprised of 50% w/w surface furnish and 50% core furnish and fabricated to 737 mm x
737 mm x 11.1 mm. Standard mechanical (thickness, density, surface and core density)
and strength properties (internal bond, flexure, lateral nail withdrawal resistance), and
water resistance (2h and 24h thickness swell and water absorption) were assessed.
Complete replacement of the Aspen in the surface layers with internode bamboo strands
resulted in over 45% greater bending strength. Panels made with bamboo face layers met
CSA O437.0 (1993) minimum requirement for water resistance without the need for wax
addition, presumably because no densification of the surface material was observed. Due
to high variance in nail resistance, effects of board type and core composition were not
statistically significant, but values exceeded CSA O437.0 minimum requirements. Moso
surface boards were low in stiffness which is consistent with unadulterated Moso bamboo
tissue being high in bending strength and fracture toughness but low in specific stiffness.
The presence of nodes in the bamboo strands significantly reduced the strength properties
of boards, a problem which could be mitigated by minimising the frequency of nodes in
the strands, particularly those used in the surface layers.
Proceedings of the 58th International Convention of Society of Wood Science and Technology
June 7-12, 2015 – Grand Teton National Park, Jackson, Wyoming, USA
461
Keywords: Moso Bamboo, Aspen, Strands, Oriented Strand Board, Mechanical
Properties.
Introduction
Used in a smart way in combination with commodity wood-based construction products,
bamboo has the potential to significantly reduce costs and the carbon footprint of the
construction industry in rapidly developing countries throughout the tropics and sub-
tropics where bamboo is grown (Dagilis 1999, de Flander and Rovers 2010). Bamboo has
some excellent material properties (for example tensile strength and fracture toughness)
compared with wood but despite this relatively little progress has been made in
developing and commercializing modern, engineered composite building materials from
bamboo (Cai and Winnandy 2005, de Flander and Rovers 2010). Compared with most of
the conventional bamboo panel products currently in production, the OSB process
represents one of the best opportunities for automation, property control and consistency,
mass production, and resin efficiency in manufacture of bamboo-based building
materials, with minimal waste.
Intensive stand management makes bamboo culms and products costly to manufacturers
and consumers and it is therefore logical to combine it with lower cost and grade wood
resources for conversion into building products. Construction-grade OSB is made up of a
three-layer mat with highly densified, uni-directionally oriented strands in the surface
layers to enhance product strength and stiffness, and usually randomly oriented smaller
strands and fines in the core to facilitate the release of core gas pressure and utilise finer
material where it has less effect on board strength properties. Short cycle clonal Aspen
(in this case Populus x euramericana cv. San Martine) has been widely cultivated in
China for land reclamation and wood production for over 30 years (Su 2003), and the
wood is very well suited for OSB production (Zhao 1990). Since the mid-1970’s China
has been developing and promoting the use of OSB as a renewable construction material
to reduce demand for traditional bricks (Hua and Zhou 1996). By 2013 there were 104
OSB mills in China, the largest, Hubei Baoyuan Wood Industry Co. Ltd, having an
annual output of 220, 000 m3 (Anon 2013). The OSB manufacturing process has been
adapted to bamboo in China (Fu 2007a,b; Anon. 2012), but economic production of
products has been hampered by technical issues mainly associated with efficiently
converting the culms to strands (Grossenbacher 2012).
The objective of this work is to produce a hybrid strandboard building product from
bamboo and wood, locating the stronger, tougher bamboo strands in the surface layers of
OSB and the weaker but more compactible aspen strands and fines in the core layer.
Considerable attention has been focussed elsewhere on taking advantage of the high
tensile strength of the fibre-rich outer zone of Moso bamboo culms in combination with
lower density, lower grade woods to produce other kinds of high strength, low density
hybrid composites. Examples include solid or hollow beams that place milled bamboo
strips with the fibre-rich zone near the cortex on the top and bottom surfaces, i.e., the
flanges, and solid or laminated strand lumber poplar as the web (Amino 2003, Lee et al.
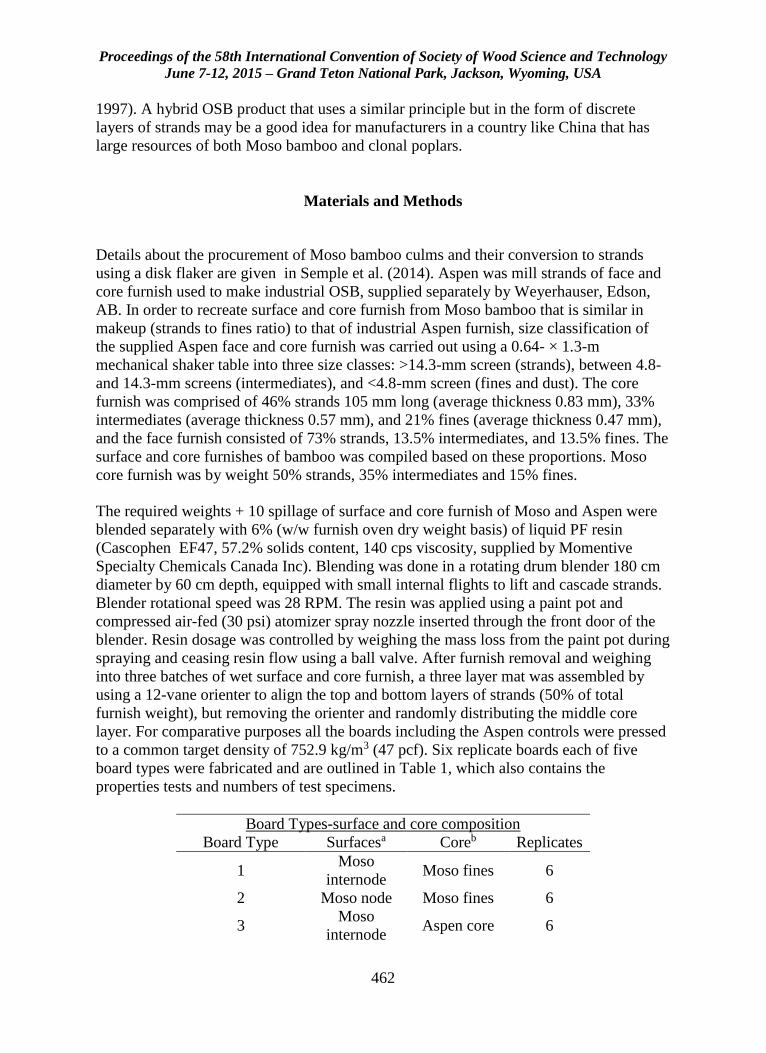
Proceedings of the 58th International Convention of Society of Wood Science and Technology
June 7-12, 2015 – Grand Teton National Park, Jackson, Wyoming, USA
462
1997). A hybrid OSB product that uses a similar principle but in the form of discrete
layers of strands may be a good idea for manufacturers in a country like China that has
large resources of both Moso bamboo and clonal poplars.
Materials and Methods
Details about the procurement of Moso bamboo culms and their conversion to strands
using a disk flaker are given in Semple et al. (2014). Aspen was mill strands of face and
core furnish used to make industrial OSB, supplied separately by Weyerhauser, Edson,
AB. In order to recreate surface and core furnish from Moso bamboo that is similar in
makeup (strands to fines ratio) to that of industrial Aspen furnish, size classification of
the supplied Aspen face and core furnish was carried out using a 0.64- × 1.3-m
mechanical shaker table into three size classes: >14.3-mm screen (strands), between 4.8-
and 14.3-mm screens (intermediates), and <4.8-mm screen (fines and dust). The core
furnish was comprised of 46% strands 105 mm long (average thickness 0.83 mm), 33%
intermediates (average thickness 0.57 mm), and 21% fines (average thickness 0.47 mm),
and the face furnish consisted of 73% strands, 13.5% intermediates, and 13.5% fines. The
surface and core furnishes of bamboo was compiled based on these proportions. Moso
core furnish was by weight 50% strands, 35% intermediates and 15% fines.
The required weights + 10 spillage of surface and core furnish of Moso and Aspen were
blended separately with 6% (w/w furnish oven dry weight basis) of liquid PF resin
(Cascophen EF47, 57.2% solids content, 140 cps viscosity, supplied by Momentive
Specialty Chemicals Canada Inc). Blending was done in a rotating drum blender 180 cm
diameter by 60 cm depth, equipped with small internal flights to lift and cascade strands.
Blender rotational speed was 28 RPM. The resin was applied using a paint pot and
compressed air-fed (30 psi) atomizer spray nozzle inserted through the front door of the
blender. Resin dosage was controlled by weighing the mass loss from the paint pot during
spraying and ceasing resin flow using a ball valve. After furnish removal and weighing
into three batches of wet surface and core furnish, a three layer mat was assembled by
using a 12-vane orienter to align the top and bottom layers of strands (50% of total
furnish weight), but removing the orienter and randomly distributing the middle core
layer. For comparative purposes all the boards including the Aspen controls were pressed
to a common target density of 752.9 kg/m3 (47 pcf). Six replicate boards each of five
board types were fabricated and are outlined in Table 1, which also contains the
properties tests and numbers of test specimens.
Board Types-surface and core composition
Board Type Surfacesa Coreb Replicates
1 Moso
internode Moso fines 6
2 Moso node Moso fines 6
3 Moso
internode Aspen core 6
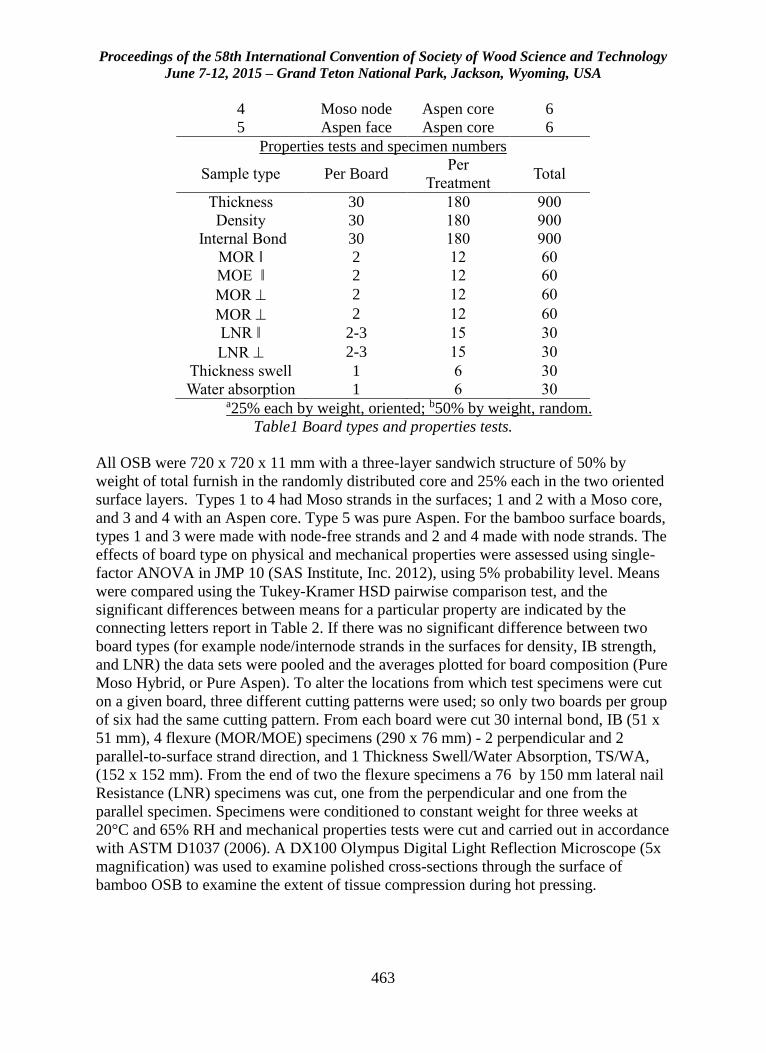
Proceedings of the 58th International Convention of Society of Wood Science and Technology
June 7-12, 2015 – Grand Teton National Park, Jackson, Wyoming, USA
463
4 Moso node Aspen core 6
5 Aspen face Aspen core 6
Properties tests and specimen numbers
Sample type Per Board Per
Treatment Total
Thickness 30 180 900
Density 30 180 900
Internal Bond 30 180 900
MOR ǁ 2 12 60
MOE ǁ 2 12 60
MOR 2 12 60
MOR 2 12 60
LNR ǁ 2-3 15 30
LNR 2-3 15 30
Thickness swell 1 6 30
Water absorption 1 6 30 a25% each by weight, oriented; b50% by weight, random.
Table1 Board types and properties tests.
All OSB were 720 x 720 x 11 mm with a three-layer sandwich structure of 50% by
weight of total furnish in the randomly distributed core and 25% each in the two oriented
surface layers. Types 1 to 4 had Moso strands in the surfaces; 1 and 2 with a Moso core,
and 3 and 4 with an Aspen core. Type 5 was pure Aspen. For the bamboo surface boards,
types 1 and 3 were made with node-free strands and 2 and 4 made with node strands. The
effects of board type on physical and mechanical properties were assessed using single-
factor ANOVA in JMP 10 (SAS Institute, Inc. 2012), using 5% probability level. Means
were compared using the Tukey-Kramer HSD pairwise comparison test, and the
significant differences between means for a particular property are indicated by the
connecting letters report in Table 2. If there was no significant difference between two
board types (for example node/internode strands in the surfaces for density, IB strength,
and LNR) the data sets were pooled and the averages plotted for board composition (Pure
Moso Hybrid, or Pure Aspen). To alter the locations from which test specimens were cut
on a given board, three different cutting patterns were used; so only two boards per group
of six had the same cutting pattern. From each board were cut 30 internal bond, IB (51 x
51 mm), 4 flexure (MOR/MOE) specimens (290 x 76 mm) - 2 perpendicular and 2
parallel-to-surface strand direction, and 1 Thickness Swell/Water Absorption, TS/WA,
(152 x 152 mm). From the end of two the flexure specimens a 76 by 150 mm lateral nail
Resistance (LNR) specimens was cut, one from the perpendicular and one from the
parallel specimen. Specimens were conditioned to constant weight for three weeks at
20°C and 65% RH and mechanical properties tests were cut and carried out in accordance
with ASTM D1037 (2006). A DX100 Olympus Digital Light Reflection Microscope (5x
magnification) was used to examine polished cross-sections through the surface of
bamboo OSB to examine the extent of tissue compression during hot pressing.
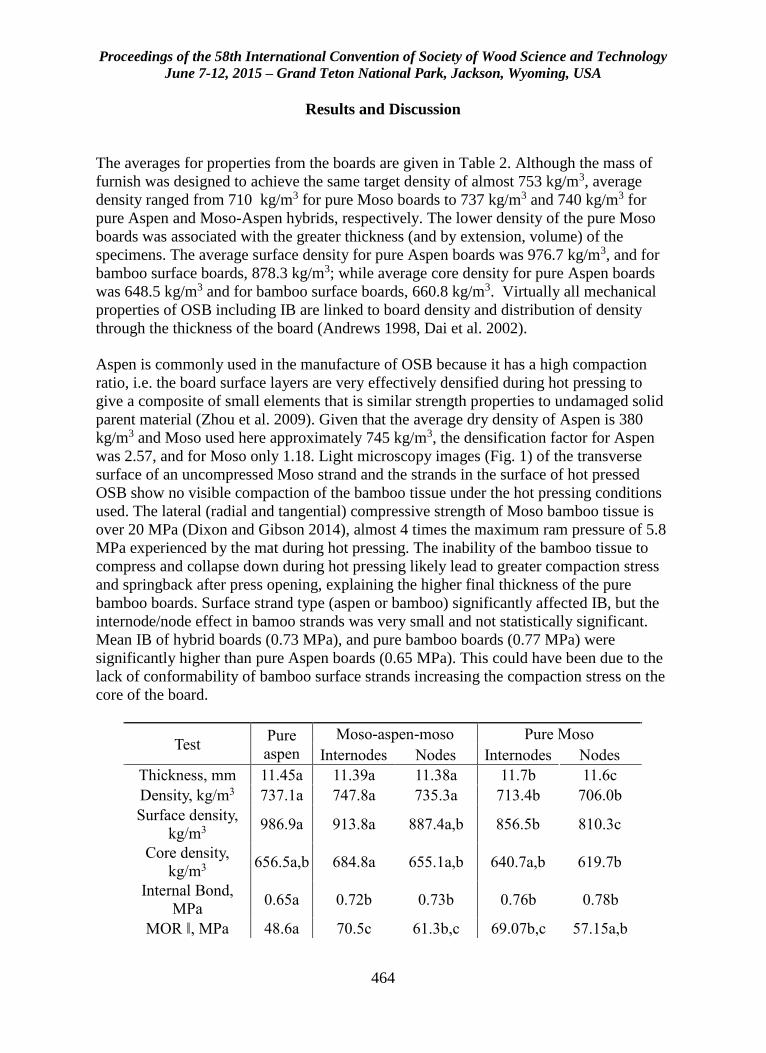
Proceedings of the 58th International Convention of Society of Wood Science and Technology
June 7-12, 2015 – Grand Teton National Park, Jackson, Wyoming, USA
464
Results and Discussion
The averages for properties from the boards are given in Table 2. Although the mass of
furnish was designed to achieve the same target density of almost 753 kg/m3, average
density ranged from 710 kg/m3 for pure Moso boards to 737 kg/m3 and 740 kg/m3 for
pure Aspen and Moso-Aspen hybrids, respectively. The lower density of the pure Moso
boards was associated with the greater thickness (and by extension, volume) of the
specimens. The average surface density for pure Aspen boards was 976.7 kg/m3, and for
bamboo surface boards, 878.3 kg/m3; while average core density for pure Aspen boards
was 648.5 kg/m3 and for bamboo surface boards, 660.8 kg/m3. Virtually all mechanical
properties of OSB including IB are linked to board density and distribution of density
through the thickness of the board (Andrews 1998, Dai et al. 2002).
Aspen is commonly used in the manufacture of OSB because it has a high compaction
ratio, i.e. the board surface layers are very effectively densified during hot pressing to
give a composite of small elements that is similar strength properties to undamaged solid
parent material (Zhou et al. 2009). Given that the average dry density of Aspen is 380
kg/m3 and Moso used here approximately 745 kg/m3, the densification factor for Aspen
was 2.57, and for Moso only 1.18. Light microscopy images (Fig. 1) of the transverse
surface of an uncompressed Moso strand and the strands in the surface of hot pressed
OSB show no visible compaction of the bamboo tissue under the hot pressing conditions
used. The lateral (radial and tangential) compressive strength of Moso bamboo tissue is
over 20 MPa (Dixon and Gibson 2014), almost 4 times the maximum ram pressure of 5.8
MPa experienced by the mat during hot pressing. The inability of the bamboo tissue to
compress and collapse down during hot pressing likely lead to greater compaction stress
and springback after press opening, explaining the higher final thickness of the pure
bamboo boards. Surface strand type (aspen or bamboo) significantly affected IB, but the
internode/node effect in bamoo strands was very small and not statistically significant.
Mean IB of hybrid boards (0.73 MPa), and pure bamboo boards (0.77 MPa) were
significantly higher than pure Aspen boards (0.65 MPa). This could have been due to the
lack of conformability of bamboo surface strands increasing the compaction stress on the
core of the board.
Test Pure
aspen
Moso-aspen-moso Pure Moso
Internodes Nodes Internodes Nodes
Thickness, mm 11.45a 11.39a 11.38a 11.7b 11.6c
Density, kg/m3 737.1a 747.8a 735.3a 713.4b 706.0b
Surface density,
kg/m3 986.9a 913.8a 887.4a,b 856.5b 810.3c
Core density,
kg/m3 656.5a,b 684.8a 655.1a,b 640.7a,b 619.7b
Internal Bond,
MPa 0.65a 0.72b 0.73b 0.76b 0.78b
MOR ǁ, MPa 48.6a 70.5c 61.3b,c 69.07b,c 57.15a,b
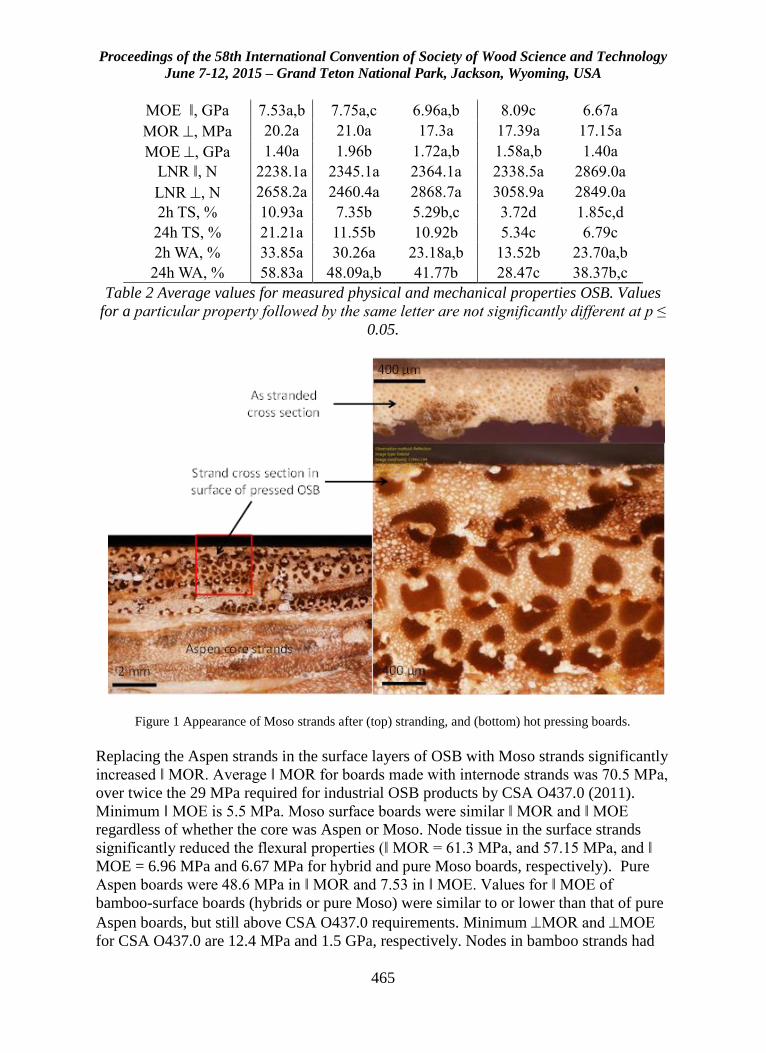
Proceedings of the 58th International Convention of Society of Wood Science and Technology
June 7-12, 2015 – Grand Teton National Park, Jackson, Wyoming, USA
465
MOE ǁ, GPa 7.53a,b 7.75a,c 6.96a,b 8.09c 6.67a
MOR , MPa 20.2a 21.0a 17.3a 17.39a 17.15a
MOE , GPa 1.40a 1.96b 1.72a,b 1.58a,b 1.40a
LNR ǁ, N 2238.1a 2345.1a 2364.1a 2338.5a 2869.0a
LNR , N 2658.2a 2460.4a 2868.7a 3058.9a 2849.0a
2h TS, % 10.93a 7.35b 5.29b,c 3.72d 1.85c,d
24h TS, % 21.21a 11.55b 10.92b 5.34c 6.79c
2h WA, % 33.85a 30.26a 23.18a,b 13.52b 23.70a,b
24h WA, % 58.83a 48.09a,b 41.77b 28.47c 38.37b,c
Table 2 Average values for measured physical and mechanical properties OSB. Values
for a particular property followed by the same letter are not significantly different at p ≤
0.05.
Figure 1 Appearance of Moso strands after (top) stranding, and (bottom) hot pressing boards.
Replacing the Aspen strands in the surface layers of OSB with Moso strands significantly
increased ǁ MOR. Average ǁ MOR for boards made with internode strands was 70.5 MPa,
over twice the 29 MPa required for industrial OSB products by CSA O437.0 (2011).
Minimum ǁ MOE is 5.5 MPa. Moso surface boards were similar ǁ MOR and ǁ MOE
regardless of whether the core was Aspen or Moso. Node tissue in the surface strands
significantly reduced the flexural properties (ǁ MOR = 61.3 MPa, and 57.15 MPa, and ǁ
MOE = 6.96 MPa and 6.67 MPa for hybrid and pure Moso boards, respectively). Pure
Aspen boards were 48.6 MPa in ǁ MOR and 7.53 in ǁ MOE. Values for ǁ MOE of
bamboo-surface boards (hybrids or pure Moso) were similar to or lower than that of pure
Aspen boards, but still above CSA O437.0 requirements. Minimum MOR and MOE
for CSA O437.0 are 12.4 MPa and 1.5 GPa, respectively. Nodes in bamboo strands had
Proceedings of the 58th International Convention of Society of Wood Science and Technology
June 7-12, 2015 – Grand Teton National Park, Jackson, Wyoming, USA
466
no effect on MOR and MOE. For boards with Aspen core the MOE values for
bamboo-surface boards (1.72 GPa for internode and 1.96 GPa for node strands) were
significantly higher than Aspen surfaces (1.40 GPa). The mean values of MOE for pure
Moso boards were 1.58 GPa (internode) and 1.40 GPa (node), which are at or below the
CSA O437.0 minimum requirements for MOE of OSB. Removing the influence of
surface strand orientation, the flexural properties perpendicular to surface strand direction
could be linked to the greater degree of compaction and densification observed in the
core of boards made with bamboo strand surfaces. The resistance of the bamboo tissue
softening and compaction during hot pressing means compaction stress from the platens
is transferred through to the aspen core layer, which, in the case of the internode surface
strands, was significantly higher in density than the pure aspen boards. Overall poor
consolidation of the boards with noded strands meant the effect was not as apparent in
this case.
When analysed as an aggregate model containing all 10 groups there was no statistically
significant difference in ǁ or LNR between any of the groups. COV values were
between 25% and 35% indicating a high degree of variability in the LNR values within
each group. The averages for LNR in all board types and strand orientations exceeded
the CSA O437.0 minimum OSB of 70 x board thickness in N (i.e. 770 N for an average
board thickness of 11.5 mm). It was observed however that lowest LNR values were for
pure Aspen panels with stress parallel to surface strand direction (2238 N) and highest
values were for pure bamboo boards (above 2800 N) suggesting that the bamboo tissue
may be more resistant to localized damage from lateral stress on embedded nails. Of the
numerous studies that have fabricated OSB from bamboo none provide any comparative
data on LNR. Similar LNR tests done by Suzuki (2000) on 12-mm-thick OSB made from
Sugi (Cryptomeria japonica) ranged 1600 N to 2300 N, for board densities ranging from
670 kg/m3 to 720 kg/m3, values which are slightly lower than ours. A significant finding was that placing bamboo strands in the surface of OSB made
without the necessary emulsified wax addition significantly reduces the 24 h thickness
swelling and water absorption compared with boards containing pure Aspen. There were
no differences in 24 h thickness swell and water absorption between boards made with
internode or node strands in the surfaces. Note that after two hours soaking, the
differences between Aspen and bamboo boards were not statistically significant, however
the Aspen boards continued to absorb a greater amount of water, almost 60% of their
initial weight, and swell more over the next 22 h. On the other hand, bamboo surface
boards only absorbed an average of 45% of their initial weight in water. Average TS after
24 h for Aspen boards was 21.2% (exceeding the 15% maximum required for OSB in
CSA O437.0 (2011), while the average for boards with bamboo surfaces was just 11.2%.
Without wax addition thickness swelling in OSB is high due to the high degree of
densification of the strands (Andrews 1998, Wolcott et al. 1990, Blomberg et al. 2006). A
combination of lack of tissue compression and higher levels of naturally hydrophobic
substances such as silica in the bamboo strands (Leise 1998) likely contributed to the
much greater dimensional stability of the bamboo OSB.
Proceedings of the 58th International Convention of Society of Wood Science and Technology
June 7-12, 2015 – Grand Teton National Park, Jackson, Wyoming, USA
467
It is relevant to try to compare our results for pure boards with Moso OSB made by other
researchers using a similar resin type and dosage. Maximum physical and mechanical
properties of 6% PF-bonded boards made without additives or wax by Zhang et al. (2007)
were 45 MPa in ǁMOR, 5.5 GPa in ǁMOE, 0.55 MPa in IB, 12% TS, for boards with a
density of 752 kg/m3, figures that are not very different from ours. They found properties
were reduced in boards compressed to a lower density. PF-bonded 11- mm-thick Moso
bamboo OSB made by Lee et al. (1996) were 737 kg/m3 in density, 37 MPa in ǁMOR and
6 GPa in ǁMOE, and 0.43 MPa in IB. 12-mm-thick PF bonded randomly aligned strand
boards from Moso made by Sumardi et al. (2006) were 32 MPa in MOR, 3.7 GPa in
MOE and 0.26 MPa in IB if compressed to a density of 730 kg/m3. Another study on
bamboo OSB by Fu (2007b) found that the following strand and board fabrication
parameters led to optimum board properties: strand dimensions 110-120 mm in length, 9-
15 mm in width and 0.6-0.8 mm in thickness; if using PF resin 6-8% solids content by
oven dry bamboo strands is recommended; and pressing at 160°C platen temperature, 2.5
MPa pressure, with a pressing time of 70 s per mm of board thickness. Maximum board
properties attained by Fu (2007b) were 36 MPa in ǁMOR, 5.3 GPa in ǁMOE, 0.40 MPa in
IB. Information on board density or thickness swell/water absorption figures was not
given.
The specific strength and stiffness of building materials (i.e. strength to weight ratio) is a
key requirement for products handled manually on building sites. From our results the
ǁMOE of bamboo surface OSB was not higher than that of pure Aspen OSB, when
manufactured to a common density of 740 kg/m3. Due to the high parent material density
of bamboo, board densities here were high compared with commercial OSB commonly
made from Aspen, which is usually between about 575 and 600 kg/m3, but still exceeds
the CSA O437.0 minimum parallel MOE of 5.5 MPa. Sumardi et al. (2006) found that
MOR and MOE of pure Moso OSB were below about 7 MPa and 1.3 GPa respectively if
board density was below 600 kg/m3; these properties only increased with density once
compaction ratio exceeded 1, i.e. densified to above the mean parent tissue density of 600
kg/m3 for bamboo. Typical Douglas Fir plywood has even higher strength properties than
OSB but is only 520 kg/m3 in density and so for bamboo-based structural boards to be
commercially viable they should have a density and properties that are at least
comparable to or better than conventional wood-based building materials.
Further work should focus on why nodes in strands have such an adverse effect on board
quality and find practical ways to mitigate the effect of nodes so that these do not need to
be removed prior to stranding. Reducing the density of bamboo-Aspen OSB is also a
priority; it may be possible to retain the beneficial effects of bamboo on board properties
but reduce the ratio of bamboo strands in the surface layers, and achieve a reduction in
overall board density.
Proceedings of the 58th International Convention of Society of Wood Science and Technology
June 7-12, 2015 – Grand Teton National Park, Jackson, Wyoming, USA
468
Acknowledgements
This study was funded through an NSERC (National Science and Engineering Research
Council) G8 Tri-Council grant. The authors gratefully acknowledge Mr John Hoffman,
Forest Products Innovations (Western Division), for access to boil tank facilities and
operation of the disk strander, and Mr Rick Fodor, Carmanah Design and Engineering,
Inc., Surrey, BC for training and advice on setup and operation of the disk strander.
Thank you very much also to Mr Jason Hutzkal, Momentive Specialty Chemicals, Inc,
Edmonton, AB for supplying PF resin.
References
Amino Y (2003) Conception and feasibility of bamboo-precocious wood composite beams.
Journal of Bamboo and Rattan 2(3): 261-279.
Andrews CK (1998) The influence of furnish moisture content and press closure rate on the
formation of the vertical density profile in oriented strand board: relating the vertical
density profile to bending properties, dimensional stability and bond performance. MSc
Thesis, The University of Tennessee, Knoxville, TN.
Anon (2012) Aiming for domination. Wood Based Panels International Online,18 June
2012. http://www.wbpionline.com/features/aiming-for-domination/. Accessed 10 April
2013.
Anon (2013) OSB demand in China predicted to grow; new board capacities to appear in
China and India. Global Trends Review, 24 May 2013.
ASTM (2006) Standard test method for evaluating properties of wood-base fiber and
particle panel materials-D 1037-06a. American Society for Testing and Materials
International, West Conshohocken, PA, 30 pp.
Blomberg J, Persson B, Bexell U (2006) Effects of semi-isotropic densification on anatomy
and cell shape recovery on soaking. Holzforshung 60(3): 322-331.
Cai Z, Winandy JE (2005) Opportunity and development of bio-based composites. In: Proc.
International Workshop on Pre-fabricated bamboo panel module housing, Nov. 24-25,
2005, Beijing, China.
CSA (2011) Standards on OSB and waferboard-O437.0-93R. Canadian Standards
Association, Toronto, ON, 88 pp.
Dagilis TD (1999) Bamboo Composite Materials for Low-Cost Housing. PhD Thesis,
Department of Civil Engineering, Queens University, Kingston, ON, 229 pp.
Proceedings of the 58th International Convention of Society of Wood Science and Technology
June 7-12, 2015 – Grand Teton National Park, Jackson, Wyoming, USA
469
Dai CP, Mei C, Korai H (2002) Density and property relationships of wood strand
composites. Proc 6th Pacific Rim Bio-Based Composites Symposium, Nov. 10-13,
Portland, Oregon, pp. 458-466.
De Flander K, Rovers R (2009) One laminated bamboo-frame house per hectare per year.
Constr & Bldg Mat 23(1): 210-2.
Dixon PG, Gibson LJ (2014) The structure and mechanics of Moso bamboo material. J Roy
Soc Interface 11: 20140321. http://dx.doi.org/10.1098/rsif.2014.0321.
Fu W (2007a) Bamboo-A Potential Resource of Raw Material for OSB in China. China
Forest Products Industry, 34: 21-24.
Fu W (2007b) A Study on Flaking Technique and Manufacture of Bamboo OSB. PhD
Dissertation, Northeast Forestry University, Harbin, China, 86 pp.
Grossenbacher M (2012) Industrielle Herstellung von Bambus-OSB: Ein
Erfahrungsbericht. In: 2nd Bieler Holzwerkstoff-Workshop, 28-29 November 2012, Biel,
Switzerland.
Hua Y, Zhou D (1996) The development of oriented strand board in China. In H. Kajita
and K. Tsunoda (eds) Proc 3rd Pacific Rim Bio-Based Composites Symposium, Dec 2-5,
1996, Kyoto, Japan, pp 64-71.
Lee AWC, Xuesong B, Peralta P (1996) Physical and mechanical properties of strandboard
made from Moso bamboo. For Prod J 46(11/12): 84-88.
Lee AWC, Bai X, Bangi AP (1997) Flexural properties of bamboo-reinforced Southern
pine OSB beams. For Prod J 47(6): 74-78.
Semple KE, Smola M, Hoffman J, Smith GD (2014) Optimising the stranding of Moso
bamboo (Phyllostachys pubescens Mazel) culms using a CAE 6/36 disk flaker.
Proceedings, 57th International Convention SWST, M Barnes, V Herian (eds), June 23-
27, 2014, Zvolen, Slovakia, pp. 257-269.
Su X, Zhang B, Huang Q, Huang L, Zhang X (2003) Advances in tree genetic engineering
in China. Proc XII World Forestry Congress, September 21-28, 2003, Quebec City,
Quebec.
Sumardi I, Suzuki S, Ono K (2006) Some important properties of strandboard
manufactured from bamboo. For Prod J 56(6): 59-63.
Suzuki S (2000) Effects of strand length and orientation of strength properties of OSB
made from Japanese cedar. World Congress on Timber Engineering (WCTE) Vol. 1.3.8,
July 31-August 3 2000, Whistler, BC, 8 pp.
Proceedings of the 58th International Convention of Society of Wood Science and Technology
June 7-12, 2015 – Grand Teton National Park, Jackson, Wyoming, USA
470
Wolcott MP, Kamke FA, Dillard DA (1990) Fundamentals of flakeboard manufacture:
Viscoelastic behavior of the wood component. Wood Fiber Sci 22(4):345-361.
Zhang H, Du F, Zhang F, Liao Z, Ye X, Zheng Z, Wang W (2007) Research and
development of production technology of bamboo waferboard and oriented strand board
based on biological characteristics and timber adaptability. J Bamboo Res 26(2): 43-48.
Zhou C, Smith GD, Dai C (2009) Characterizing hydro-thermal compression behavior of
Aspen wood strands. Holzforschung 63(5):609 -617.
Zhou D (1990) A study of oriented structural board made from hybrid poplar - Physical and
mechanical properties of OSB. Holz Roh- Werkst. 48(7-8): 293–296.
Proceedings of the 58th International Convention of Society of Wood Science and Technology
June 7-12, 2015 – Grand Teton National Park, Jackson, Wyoming, USA
471
Effects of Different Types of Housing Environment on
Physiological Response
Shasha Song, [email protected]
Fei Benhua
Beijing Forestry University, No.35 Qinghua East Road , Haidian District,
Beijing 100083
Abstract
The aim of the present study was to promote the quality of living environment, working
environment and create a healthy living environment through advocating the low carbon
building and the green building. Physiological environment assessment of wood
construction based on examined the physiological environment index of the participants
in three different structure types of housing environment with CAPTIV synchronous test.
The results of MANOVA revealed a significant main effect for log, glulam, reinforced
concrete three different structures types of housing environment with skin temperature,
ECG, respiration. In comparison, the influence of the physiological environment factors
in log structure and glulam structure housing are better than the reinforced concrete
structure housing, which is beneficial to the health of habitant. Participants are interested
in the log structure and glulam structure housing environment, because the feeling of joy
and comfortable. In this study, it provides the theoretical support and reference with the
wooden constructure building living environment for the future of scientific and efficient
use of product design, application.
Proceedings of the 58th International Convention of Society of Wood Science and Technology
June 7-12, 2015 – Grand Teton National Park, Jackson, Wyoming, USA
472
Bamboo for Furniture and Housing in Ghana: The
Certification and Standard Issues.
Stephen Tekpetey, [email protected]
Emmanuel Appiah-Kubi, [email protected]
Francis Owusu, [email protected]
Charles Essien, [email protected]
Forestry Research Institute of Ghana, Box 63 KNUST, Kumasi
Abstract
Bamboo resources continue to gain greater recognition as a suitable construction
material. With the rapid development of the global economy and constant increase in
human population, the demand for green products like engineered-bamboo product (e-
bamboo) will increase. In Ghana, engineered bamboo may soon become a more popular
material for making housing components and furniture. In order to ensure the quality of
e-bamboo products in Ghana and other emerging economies, manufacturing standards
and certification will be vital for consumers' satisfaction and enhancement of
international trade. This paper interrogates the issues around certification and standards
for bamboo product for housing and furniture in Ghana. It further highlights the steps,
challenges and concerted efforts required in the national standardization process of e-
bamboo products in Ghana. It was recommended that a technical committee and testing
laboratories for e-bamboo manufacture and bamboo products respectively should be set-
up to boost confidence in the use e-bamboo for construction in Ghana and other countries
where the resource abound.
Proceedings of the 58th International Convention of Society of Wood Science and Technology
June 7-12, 2015 – Grand Teton National Park, Jackson, Wyoming, USA
473
Identifying Stakeholder Interests and Concerns in the
New Hardwood-based Bioeconomy
Patricia Townsend, [email protected]
Nora Haider, [email protected]
Marina Heppenstall, [email protected]
Stanely Asah, [email protected]
Kevin Zobrist, [email protected]
Washington State University, 728 134th St SW , Suite 213, Everett, WA
98204
Abstract
Across the United States, bioeconomy initiatives are paving the way for homegrown
energy and biochemicals using sustainable and renewable biomass. In the Pacific
Northwest, our project, Advanced Hardwood Biofuels Northwest (AHB), is researching
and developing a supply chain using sustainably-grown poplar to support the bioeconomy
by producing biochemicals and biofuels. For AHB and other bioeconomy initiatives to be
successful, the concerns and interests of stakeholders across the supply chain must be
addressed. As part of our outreach efforts, the AHB Extension Team has identified
stakeholders essential for the success of hardwood bioeconomy. To further understand
how we can support stakeholder needs, we are surveying three stakeholder groups:
Extension professionals, environmental professionals, and landowners. Our goal is to
understand the perceptions and concerns of these professionals and landowners regarding
biofuels, the bioeconomy, and poplar as a feedstock. These assessments will assist us in
determining how to best inform stakeholders on issues relevant to these new industries
and use their input in addressing barriers to industry development. We will show how the
initial survey results are being used to guide Extension and outreach activities that will
assist in educating concerned stakeholders and landowners in supporting the emerging
bioeconomy. We will share our experience in producing outreach materials and events
tailored for these diverse stakeholders.
Proceedings of the 58th International Convention of Society of Wood Science and Technology
June 7-12, 2015 – Grand Teton National Park, Jackson, Wyoming, USA
474
Impacts on the Wood Properties under Changing
Conditions of Environment and Industry
Johann Trischler1* - Dick Sandberg2 – Thomas Thörnqvist3
1 PhD student, Department of Forestry and Wood Technology - Linnæus
University, SE-351 95 Växjö, Sweden
* Corresponding author
[email protected] 2 Professor, Department of Engineering Sciences and Mathematics - Luleå
University of Technology, SE-931 87 Skellefteå 3 Professor, Department of Forestry and Wood Technology - Linnæus
University, SE-351 95 Växjö, Sweden
Abstract
Besides the traditional uses of wood in the construction, pulp- and papermaking and
furniture industries, the energy recovery industry based on renewable resources such as
wood has been growing strongly during recent years. Shortages in the supply affect the
price of the raw material, and this affects its supply and leads to an oscillating raw
material price because of permanently changing supply and demand. Forestry as the
supplier of wood is trying to provide the most beneficial mix of raw materials to meet the
market conditions.
In this study, parameters related to silvicultural operations which influence the wood as
raw material for sawn timber are studied. By defining a strategic cube, it was possible to
illustrate the impact of the different parameters on the type of available raw material. The
method provides estimates of changes in the mix of raw materials caused by changing
parameters. The results show that besides the climate conditions the demands of the
different wood-using industries have a strong impact on the quality and quantity of
available raw material. Climate change and innovation or trends in the construction and
furniture industries, for example, influence silvicultural management, and this affects the
raw material mix.
Keywords: Silvicultural operations, Timber production, Wood properties.
Proceedings of the 58th International Convention of Society of Wood Science and Technology
June 7-12, 2015 – Grand Teton National Park, Jackson, Wyoming, USA
475
Introduction
According to different scenarios published in the Forest Sector Outlook Study presented
by FAO, the consumption of wood in Europe can become as large as Europe’s total forest
growth increment (Jonsson et al. 2011). For industries using wood as raw material, the
increasing demand for this raw material leads to increasing competition. The promotion
of wood for renewable energy, the preservation of biological diversity, and wood as a
sustainable raw material in general may even tighten this effect.
Wood, like all other resources, is available only in limited amounts. A change in the
demand within the wood-using industry affects not only the competitors within this
industry but also forestry, which is the producer and main supplier of wood (Trømborg
and Solberg 2010; Abt et al. 2012). The magnitude of such an impact depends on the shift
in the levels of demand and supply. According to Schwarzbauer and Stern (2010),
forestry and sawmills would profit from the greater demand and higher prices of wood
for energy purposes while the wood-based panel industry and the pulp and paper industry
would suffer. Nevertheless, sawmills might also be affected negatively if increasing
prices make it more profitable for forest owners to provide wood for energy purposes in
short rotation cycles than wood for timber in long cycles. The history of forest usage
shows that using wood for energy purpose once had such a strong effect on the forests
that the term “sustainability” had to be created (von Carlowitz 2013).
It is possible to increase the biomass production and to influence the wood properties in a
positive way through selection of species and breeding (Hakmount 1948; Grattapaglia
and Resende 2011). Plant properties which can be influenced are the volume and form of
the stem, the crown shape, the wood properties such as density and fibre characteristics,
the resin composition, and the biotic and abiotic resistance (Namkoong et al. 1980). The
wood properties such as density, microfibril angle, fibre length, juvenile wood and knots,
can further be influenced by silvicultural operations such as spacing, thinnings or
stocking, pruning and fertilisation (Zobel 1992; Hart 2010).
An increased annual production of wood per area allows earlier harvests, as the required
diameters are reached within a shorter time. The rate of growth of different species can be
influenced by the availability of water and nutrients and by the temperature (Calder 1992;
Soares and Almeida 2001; Stape et al. 2004) with conifers having in general higher
growth rates under cool climate conditions than deciduous trees (Way and Oren 2010). If
the work of Nylinder and Hägglund (1954) is considered in combination with that of
Bergh et al. (1999), it can be supposed that temperature also has an indirect impact on the
growth rate by influencing the mineralisation processes which in turn have an impact on
the amount of available nutrients. For Norway spruce in Sweden, it was found that not
only the width of the annual rings but also the amount of latewood and the mean fibre
length decreased with increasing latitude. It was also shown that not only very wide but
also very narrow annual rings lead to a decrease in wood density because of the greater
amount of latewood with thicker cell walls (Nylinder and Hägglund 1954; Larson 1969;
Thörnqvist 1993; Grahn et al. 1995).

Proceedings of the 58th International Convention of Society of Wood Science and Technology
June 7-12, 2015 – Grand Teton National Park, Jackson, Wyoming, USA
476
Support of the growth rate of trees would lead to shorter harvesting cycles for required
diameters. A negative effect reducing the harvesting cycles is the amount of juvenile
wood, which differs from the mature wood especially in anatomical and physico-
mechanical properties such as shrinking behaviour, lower wood density and shrinkage
(Fight et al. 1989; Jozsa and Brix 1989; Kennedy 1995; Bao et al. 2001). These
differences in wood properties can have a negative impact on the mechanical properties
and quality of semi-finished products (Senft et al. 1985). For Norway spruce, for
example, such fast-grown wood with a lower content of intermediate and mature wood is
graded as having a lower quality at comparable diameters (Kyrkjeeide et al. 1994) and
the lower density leads to lower values of the modulus of elasticity in bending (Eikenes
and Lackner 1990).
Objectives
The purpose of this study was to illustrate different impacts of silvicultural operations
including the effect of changes in silvicultural operations on the quality and quantity of
wood raw material.
Materials and Methods
To illustrate the properties of wood as raw material for sawn timber under changing
silvicultural operations the strategic cube developed by Steinmann and Schreyögg (2005)
was used. For this method it was necessary to assume that intense silvicultural
management leads to only one specific assortment of wood for which the output is
maximized. This method illustrates also how climate conditions and silvicultural
operations influence the properties and the amount of the wood as raw material and how
future changes in wood quality and quantity would influence the wood-using industry.
Results and Discussion
The sides of the strategic cube (Figure 1) are defined by the rotation cycle, type of
cultivation such as plantations or second growth forests, and the intensity of silvicultural
operations such as intense thinnings, fertilisation and irrigation.
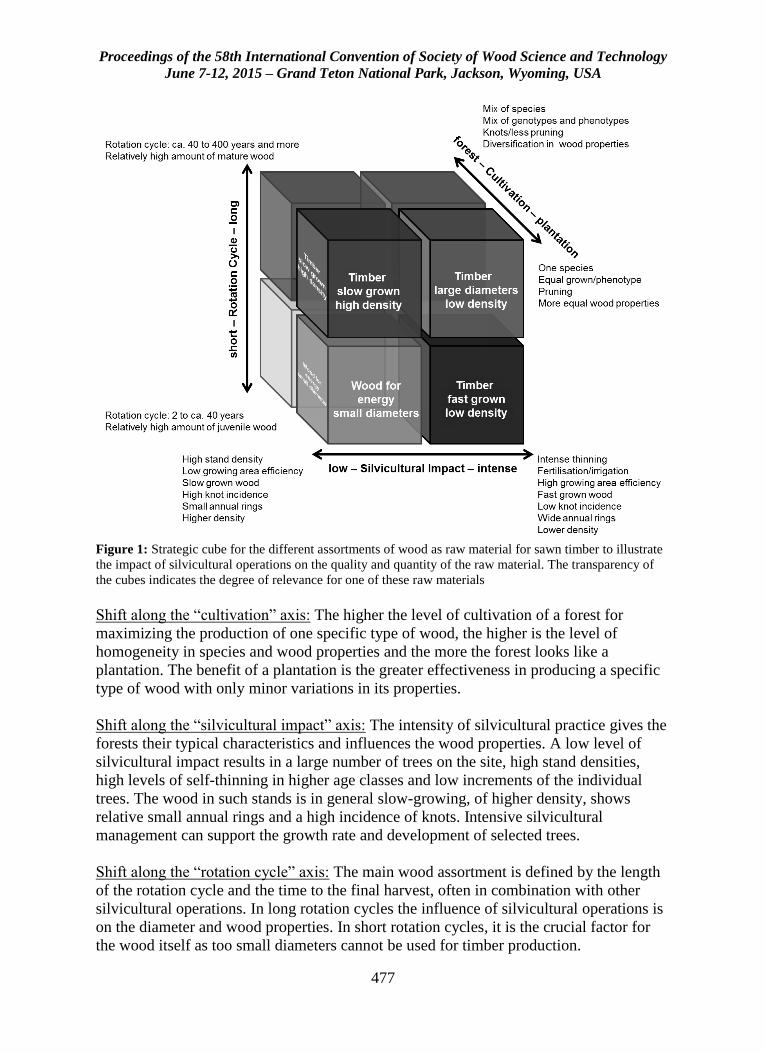
Proceedings of the 58th International Convention of Society of Wood Science and Technology
June 7-12, 2015 – Grand Teton National Park, Jackson, Wyoming, USA
477
Figure 1: Strategic cube for the different assortments of wood as raw material for sawn timber to illustrate
the impact of silvicultural operations on the quality and quantity of the raw material. The transparency of
the cubes indicates the degree of relevance for one of these raw materials
Shift along the “cultivation” axis: The higher the level of cultivation of a forest for
maximizing the production of one specific type of wood, the higher is the level of
homogeneity in species and wood properties and the more the forest looks like a
plantation. The benefit of a plantation is the greater effectiveness in producing a specific
type of wood with only minor variations in its properties.
Shift along the “silvicultural impact” axis: The intensity of silvicultural practice gives the
forests their typical characteristics and influences the wood properties. A low level of
silvicultural impact results in a large number of trees on the site, high stand densities,
high levels of self-thinning in higher age classes and low increments of the individual
trees. The wood in such stands is in general slow-growing, of higher density, shows
relative small annual rings and a high incidence of knots. Intensive silvicultural
management can support the growth rate and development of selected trees.
Shift along the “rotation cycle” axis: The main wood assortment is defined by the length
of the rotation cycle and the time to the final harvest, often in combination with other
silvicultural operations. In long rotation cycles the influence of silvicultural operations is
on the diameter and wood properties. In short rotation cycles, it is the crucial factor for
the wood itself as too small diameters cannot be used for timber production.
Proceedings of the 58th International Convention of Society of Wood Science and Technology
June 7-12, 2015 – Grand Teton National Park, Jackson, Wyoming, USA
478
Deduction: The manner of cultivation has an impact on the diversity of species, their
genotype and phenotype, and silviculture can therefore react in various ways to the
demands of the market. Besides the quantity, the quality of the wood can also be
controlled. Intensive thinning in the early stages of the forest stand can reduce the
rotation cycle, as the trees left on the site have a higher increment. Fertilisation, in
combination with a very short rotation cycle, leads to high productivity of the stand over
a short time period in the case of short rotation coppice. Higher stand densities and longer
rotation cycles can increase the percentage of mature wood and the density of the stem.
This method also indicates about how changing demands in the wood-using industry are
changing the raw material mix of the forests and the forest type by silvicultural
operations, and how this leads to a new raw material mix which in turn influences the
wood-using industry. An increasing demand for one type of raw material on the market
leads to increasing competition for the raw material which further stimulates additional
supply, if possible, and this again affects the competitors, resulting in a new balance of
supply and demand for the raw materials. Using the strategic cube, it becomes obvious
that only one of the wood raw materials can be produced on a given site at one time when
the production is maximized.
In general, advantageous wood properties and high growth rates of the species are
appreciated. Faster growth in the young age classes combined with high stocking rates
leads to a lower incidence of knots and earlier self-pruning which has a positive effect on
the uniformity of wood properties. The lower wood density and the higher content of
juvenile wood resulting from intensive thinning combined with a possible reduction in
rotation time are critical for the timber production and related industries. While the wood-
based panel production might compensate for these disadvantages by varying the density
in the cross section of the board and specific adhesives, the pulp and paper industry might
suffer from fibres with poor properties and the construction industry from sawn timber of
lower quality.
Conclusions
In this study, the impact of climate, species and silvicultural operations on the quantity
and quality of wood as raw material have been considered. It has been shown that these
factors lead to different grades of wood with regard to wood properties. As forestry is the
producer and main supplier of wood as raw material, it is strongly influenced by the shifts
in supply and demand on the wood market.
Even if this concept is strongly simplified as it is based on the theory that each type of
forest provides only one main type of raw material, it is shown that silvicultural
operations have an impact on the quality and quantity of wood available on the market.
Nevertheless, timber forests, for example, provide a mix of raw materials suitable for
different purposes, and this has to be considered in a model illustrating the impact of
silvicultural operations on the type of raw material.
Proceedings of the 58th International Convention of Society of Wood Science and Technology
June 7-12, 2015 – Grand Teton National Park, Jackson, Wyoming, USA
479
References
Abt, K.L., Abt, R.C., and Galik, C. 2012. Effect of bioenergy demands and supply
response on markets, carbon, and land use. Forest Science 58(5): 523-539.
Bao, F.C., Jiang, Z.H., Jiang, X.M., Lu, X.X., Luo, X.Q., and Zhang, S.Y. 2001.
Differences in wood properties between juvenile wood and mature wood in 10
species grown in China. Wood Science and Technology 35(4): 363-375.
Bergh, J., Linder, S., Lundmark, T., and Elfving, B. 1999. The effect of water and
nutrient availability on the productivity of Norway spruce in northern and
southern Sweden. Forest Ecology and Management 119(1–3): 51-62.
Calder, I.R. 1992. A model of transpiration and growth of Eucalyptus plantation in water-
limited conditions. Journal of Hydrology 130(1–4): 1-15.
Eikenes, B., and Lackner, R. 1990. Plantation grown Norway spruce (Picea abies (L.)
Karst.) - Strength properties and grading of structural size timber. In: XIX World
Congress: Montréal, Canada, 5-11/8/1990, I.U.o.F.R. Organizations, ed. 1990.
Saint John, CA: Canadian IUFRO World Congress Organizing Committee: 12.
Fight, R.D., Fahey, T.D., and Briggs, D.G. 1989. Growing Douglas-fir for a “quality”
market. Pacific Northwest Research Station, Forestry Sciences Laboratory,
Portland, OR, [Unpublished document].
Grahn, T., Kubulnieks, E., and Lundqvist, S.-O. 1995. Vedråvarans egenskapsspridning.
Fokus: Massa- och papperstillverkning. STFI Stockholm, Stockholm, Sweden.
Grattapaglia, D., and Resende, M.V. 2011. Genomic selection in forest tree breeding.
Tree Genetics & Genomes 7(2): 241-255.
Hakmount, G.A. 1948. Forest-tree breeding. Economic Botany 2(3): 284-305.
Hart, J.F. 2010. A review of the effects of silviculture on wood quality. University of
British Columbia, Faculty of Forestry, Vancouver, Canada,
http://circle.ubc.ca/bitstream/handle/2429/30037/HartJamesFoster_WOOD_493_
Graduating_Essay_2009.pdf?sequence=1, [September, 16 2014].
Jonsson, R., Egnell, G., and Baudin, A. 2011. Swedish forest sector outlook study. United
Nations, Geneva, Switzerland,
http://www.unece.org/fileadmin/DAM/timber/publications/DP-58_hi_res.pdf,
[March, 18 2014].
Proceedings of the 58th International Convention of Society of Wood Science and Technology
June 7-12, 2015 – Grand Teton National Park, Jackson, Wyoming, USA
480
Jozsa, L.A., and Brix, H. 1989. The effects of fertilization and thinning on wood quality
of a 24-year-old Douglas-fir stand. Canadian Journal of Forest Research 19(9):
1137-1145.
Kennedy, R.W. 1995. Coniferous wood quality in the future: concerns and strategies.
Wood Science and Technology 29(5): 321-338.
Kyrkjeeide, P.A., Lindström, H., and Thörnqvist, T. 1994. Konstruktionsvirke från grov
gran: deformation och kvalitet hos reglar/ Building timber from large-dimension
spruce - deformation and quality in wall studies -, Uppsala, Sweden: Sveriges
lantbruksuniversitet.
Larson, P.R. 1969. Wood formation and the concept of wood quality, New Haven, CT:
Yale University.
Namkoong, G., Barnes, R.D., and Burle, J. 1980. Screening for yield in forest tree
breeding. Commonwealth Forestry Review 59(1): 61-68.
Nylinder, P., and Hägglund, E. 1954. Ståndorts- och trädegenskapers inverkan på utbyte
och kvalitet vid framställning av sulfitmassa av gran /The influence of stand and
tree properties on yield and quality of sulphite pulp of Swedish spruce (Picea
excelsa). skogsforskningsinstitut, Stockholm, Sweden,
http://pub.epsilon.slu.se/9980/1/medd_statens_skogsforskningsinst_044_11.pdf, [June, 08
2014].
Schwarzbauer, P., and Stern, T. 2010. Energy vs. material: Economic impacts of a
“wood-for-energy scenario” on the forest-based sector in Austria — A simulation
approach. Forest Policy and Economics 12(1): 31-38.
Senft, J.F., Bendtsen, B.A., and Galligan, W.L. 1985. Weak wood: fast-grown trees make
problem lumber. Journal of Forestry 83(8): 476-484.
Soares, J.V., and Almeida, A.C. 2001. Modeling the water balance and soil water fluxes
in a fast growing Eucalyptus plantation in Brazil. Journal of Hydrology 253(1–4):
130-147.
Stape, J.L., Binkley, D., Ryan, M.G., and do Nascimento Gomes, A. 2004. Water use,
water limitation, and water use efficiency in a Eucalyptus plantation. BOSQUE
25(2): 35-41.
Steinmann, H., and Schreyögg, G. 2005. Management. Grundlagen der
Unternehmensführung. Konzepte - Funktionen - Fallstudien, Wiesbaden,
Germany: Gabler Verlag.
Proceedings of the 58th International Convention of Society of Wood Science and Technology
June 7-12, 2015 – Grand Teton National Park, Jackson, Wyoming, USA
481
Thörnqvist, T. 1993. Att utnyttja vedegenskaperna vid virkets förädling. In: Marknaden
rår - skogen står, G. Lönner, ed. 1993. Umeå, Sweden: Sveriges
lantbruksuniversitet: 107-119.
Trømborg, E., and Solberg, B. 2010. Forest sector impacts of the increased use of wood
in energy production in Norway. Forest Policy and Economics 12(1): 39-47.
Way, D.A., and Oren, R. 2010. Differential responses to changes in growth temperature
between trees from different functional groups and biomes: a review and
synthesis of data. Tree Physiology 30(6): 669-688.
von Carlowitz, H.C. 2013. Sylvicultura oeconomica oder haußwirthliche Nachricht und
naturmäßige Anweisung zur wilden Baum-Zucht, München, Germany: oekom
Verlag GmbH.
Zobel, B. 1992. Silvicultural effects on wood properties. North Carolina State University,
Piracicaba, Brazil,
http://www.ipef.br/PUBLICACOES/international/nr02/cap05.pdf, [September, 16
2014].
Proceedings of the 58th International Convention of Society of Wood Science and Technology
June 7-12, 2015 – Grand Teton National Park, Jackson, Wyoming, USA
482
Comparing Load Caring Capacity of Different Joinery
Systems for Remanufacturing of Wooden Furniture and
Recycling its Parts
Mesut UYSAL1, Eva Haviarova2, Carl A. Eckelman3
1 Graduate Student, Forestry and Natural Resources in Purdue University,
47906 2 Assoc. Professor, Forestry and Natural Resources in Purdue University,
47906 3 Professor, Forestry and Natural Resources in Purdue University, 47906
Abstract
The goal of the study was to obtain background information concerning the effect of joint
construction on the durability, reparability and parts reuse of wooded chair frames. Tests
were conducted with simple chair frames with seven different types of joints grouped into
two joinery systems. Namely, a) mechanical joinery – screw joints, bed bolts with dowel
nut joints, pinned round mortise and tenon, and pinned rectangular mortise and tenon
joints, and b) permanent (glued) joinery – dowel joints, glued round mortise and tenon,
and glued rectangular mortise and tenon joints. Front to back load test was conducted to
determine chair strength performance (moment capacity). Chair durability, reparability,
and parts reusability were also evaluated.
Mechanical joints were found to be the easiest to repair and resulted in largest reuse of
parts. Glued round and rectangular mortise and tenon joints, however, provided high
levels of strength which would potentially increase product service life (contributing to
long lasting, more sustainable product). Joints constructed with large screws or lag
screws produced about the same moment capacity as glued round and rectangular mortise
and tenon joints. Screw joints are conceivably well suited for simple on-site repair of
broken furniture with the advantage that broken furniture does not need to be
disassembled prior to repair.
Key Words: Joints, Wooden chairs, Furniture, Reusing, Remanufacturing, Recycling and
Cyclic load test
Proceedings of the 58th International Convention of Society of Wood Science and Technology
June 7-12, 2015 – Grand Teton National Park, Jackson, Wyoming, USA
483
Manufacturing Feasibility and Load Caring Capacity of
CNC-Joinery Systems
Mesut Uysal1, Cagatay Tasdemir1, Eva Haviarova2 and Rado Gazo3
1 Graduate Student, Forestry and Natural Resources in Purdue University,
47906 2 Assoc. Professor, Forestry and Natural Resources in Purdue University,
47906 3 Professor, Forestry and Natural Resources in Purdue University, 47906
Abstract
Joinery systems produced using advanced CNC equipment increasingly popular in wood
products, could be manufactured faster, more accurately, requiring lower labor costs.
These joints are used mainly in products made of engineered materials, processed by
CNC machinery. The specific joint construction has self-locking character and variable
strength related to manufacturing tolerance and joint design. In this respect, seven types
of joints were evaluated for strength and manufacturing capacity. To understand better
manufacturing feasibility of each joint type, calculation of material yield and processing
time were determined. Yield percentages were calculated for samples and used to
evaluate the manufacturing efficiency of CNC process for production of these joints.
Moreover, recorded CNC manufacturing times for each sample have been averaged
within its corresponding experimental group and employed to compare the burden
created during the production of each joint in terms of efficient use of labor and machine
time. Manufactured joint samples were then tested for strength in tensions and
compression. Results of strength tests were compared to other CNC-made and also to
traditional joint types. The results of this study are expected to provide information for
furniture industry utilizing CNC manufacturing by providing a better understanding of
manufacturing feasibility and strength capacity of different joint types.
Keywords: CNC, Joints, Yield, Strength Design.
Proceedings of the 58th International Convention of Society of Wood Science and Technology
June 7-12, 2015 – Grand Teton National Park, Jackson, Wyoming, USA
484
Impact of Different Recycling Methods on
Reconstituted Panel Performance
Hui Wan, [email protected]
Xiangming Wang, [email protected]
Xioamei Liu, Mississippi State University
FPInnovations, Canada
Abstract
This paper presents the test results of panels with fibers come from different recycling
methods: chemical impregnation together with thermal treatment, steam explosion, and
hammer milling. It shows that different recycling methods affected the performance of
panels made with recycled fibers. The main reason is that pH of recycled fibers changed a
lot after the recycling processes.
Proceedings of the 58th International Convention of Society of Wood Science and Technology
June 7-12, 2015 – Grand Teton National Park, Jackson, Wyoming, USA
485
Compressive Failure Characterization of Embossed and
TAD Features in Paper Towel
Guizhou Wang, [email protected]
Steven Keller, [email protected]
North Carolina State University, 2820 Faucette Dr., Raleigh, NC 27695
Abstract
The end use properties, including absorptivity, flexibility, softness, strength and others, of
soft hygienic products such as tissues, napkins and towels, stem from the bulky fibrous
structures. Features like creping, through air drying (TAD) patterning and embossing are
intentionally used to bulk the structure and while maintaining strength between different
layers. The goal of this research study was to measure and characterize a much lower
range of compressive responses of towel which influence its end use properties
mentioned above. The focus was on recording the compressive response curves that show
the yield stress, limiting web thickness at 80 kPa and the Young’s Modulus, characteristic
of the collapse of TAD patterning and embossments found in paper towel samples. A
modified micro compression instrument was developed to optimize the load sensitivity.
The compressive responses with sensitivity to 1.0 kPa where specimen were compressed
between a 2.37 mm diameter probe and a backing plate. The mass of the fibrous web
within the test region was also determined so that apparent structural density could be
accounted for. Video imaging of the web compression and collapse event was recorded to
enhance the interpretation the compressive behaviors of the different towels. The results
showed that conventional wet pressing embossment had a greater yield stress and
Young’s Modulus, while through air drying pattern had a larger web limiting thickness.
Proceedings of the 58th International Convention of Society of Wood Science and Technology
June 7-12, 2015 – Grand Teton National Park, Jackson, Wyoming, USA
486
Effects of Densification on Sugar Extraction from
Woody Biomass
Amy Falcon, [email protected]
Jingxin Wang, [email protected]
Abstract
Densified biomass is an ideal feedstock for biofuels because it can be stored for great
lengths of time, is resistant to degradation over time, and can be transported more
economically than chips or ground biomass. We tested whether densified material
(pellets) could be used to produce the same quantity and quality sugars as ground wood.
If the need for mechanical pretreatment is eliminated, then the time and energy necessary
to pretreat the biomass at sugar facilities is greatly reduced. The effects of densification
of biomass on sugar extraction was analyzed using three genotypes of hybrid willow
biomass: Belleville SV1 Rep 1, Bellville SX61 Rep 2 and Belleville Owasco 99207-018
Rep 2 collected from Cornell University. Pelleted biomass was pretreated with hot water
and urea, filtered, and a Nelson-Somogyi assay was used to determine the reducing sugar
content of the liquid fraction of the biomass as an indication of total sugar content. The
National Renewable Energy Laboratory, Laboratory Analytical Procedures (LAP) for the
determination of structural carbohydrates and lignin were performed on the solid fraction,
and the extracted sugars were quantified and qualified. Our preliminary results showed
that pelleting the biomass had no observable effect on the extraction of sugar from woody
biomass, thus allowing pellets and ground biomass to be used interchangeably for the
removal of sugars from woody biomass for biofuels and bioproducts.
Proceedings of the 58th International Convention of Society of Wood Science and Technology
June 7-12, 2015 – Grand Teton National Park, Jackson, Wyoming, USA
487
Fractionation of the Liquefied Lignocellulosic Biomass for
the Production of Platform Chemicals
Junming XUa, Xinfeng XIEb, Jingxin WANGb, *Jianchun JIANGa
a Institute of Chemical Industry of Forestry Products, CAF; Key Lab. of
Biomass Energy and Material, Jiangsu Province; National Engineering Lab.
for Biomass Chemical Utilization; Key and Lab. on Forest Chemical
Engineering, SFA, Nanjing 210042 China. b Division of Forestry and Natural Resources, West Virginia University,
Morgantown, WV 26506
Abstract
A facile and sustainable process was designed to intrigue a degradation reaction of
biomass and produce biopolyols and phenolic compounds. Liquefaction of lignocellulosic
materials was conducted in methanol at temperature of 180 ℃ for 15 minutes with the
conversion of raw materials at about 75.0%. It was found that a majority of those
hydrophobic phenolics could be separated from aqueous solution. The phenolic products
that extracted from the aqueous phase were mainly composed of phenolic derivatives
such as 2-methoxy-4-propyl-phenol and 4-hydroxy-3-methoxy-benzoic acid methyl ester.
The aqueous solution was then distilled under vacuum to remove the water and formed a
viscous liquid product named biopolyol. As evidenced by GC-MS, the biopolyols mainly
contain methyl sugar derivatives, including methyl β-d-mannofuranoside, methyl α-D-
Galactopyranoside, methyl α-D-Glucopyranoside and methyl β-D-Glucopyranoside. The
production rate of phenolics and multi hydroxyl compounds (including glycerol and
sugar derivatives) in phenolic products and biopolyols is 66.75% and 84.69%,
respectively.
Proceedings of the 58th International Convention of Society of Wood Science and Technology
June 7-12, 2015 – Grand Teton National Park, Jackson, Wyoming, USA
488
Effects of Frequency and Processing Time on the
Drying Course of Ultrasound-assisted Impregnated
Wood
Zijian Zhao Lv Huan Zhengbin He Songlin Yi*
Beijing Forestry University, China, 100083
Abstract
Impregnating wood assisted with ultrasound could promote the impregnation efficiency
by improving the permeability and thus affect the subsequent drying course. Poplar
lumber and phenolic resin were applied to investigate the influence of ultrasound-assisted
impregnation on the wood drying process. The ultrasonic frequency and processing time
were analyzed and correlated. The results indicated that average drying speed of
impregnated group was slower than the control one throughout the whole course,
especially below the fiber saturation point. At the earlier drying stage, the drying speed
presented a decreasing tendency along with the increasing ultrasonic time when the
frequency remained constant; while with the same processing time, a contrary trend was
detected with the enlarging frequency. The frequency and time had irregular effect on the
average speed at the later drying course. These findings could be applied to the
impregnated wood drying industry to seek balance between the ultrasound-assisted
performance and the following drying effectiveness.
Key words: wood drying, ultrasound, impregnation, frequency and time
Introduction
Impregnation modification is a kind of wood function-improving method. During the
impregnating course, chemical additives are forced into the wood with special technology
generally including two patterns— vacuum-press impregnation and atmospheric pressure
impregnation (Luo, 2000). Impregnating at vacuum-press environment depends on
certain equipment involving stirred tank, liquid accumulator, impregnating pot, vacuum
pump, pressure pump and necessary controlling system. Although achieving higher
impregnating depth and weight gain, this technology demands large capital, high power
and complicated operation. Despite the weaker performance compared to the vacuum-
press, impregnating at ordinary pressure needs simple device, small fund, low energy and
Proceedings of the 58th International Convention of Society of Wood Science and Technology
June 7-12, 2015 – Grand Teton National Park, Jackson, Wyoming, USA
489
convenient handling (Li, 2005, Feng, 2006). Consequently, it is of great significance for
the power reduction of wood manufacture to improve the impregnating performance at
atmospheric pressure.
When ultrasound propagates in liquid media, there always appears cavitation
phenomenon, generating numerous cavitation bubbles which immediately collapse and
generate momentary high temperature and high pressure and strong local shock waves
and microjets (Li, et al, 2006, He, et al, 2012, Gallego-Juarez, 1999, Muralidhara, et al,
1985, Mason, Peters, 2002). Based on this phenomenon, Li (Li, et al, 2006) demonstrates
that when wood is impregnated assisted with ultrasound, the cavitation may cause
pressure on the surface, promoting the modifier permeate into the wood. The previous
studies of the author indicate that ultrasound-assisted impregnation at the ordinary
pressure depends on the wood initial moisture content. When the content is around the
green timber, the ultrasound could achieve a larger assistance, leading to a better
impregnating performance. In addition, the impregnated wood needs to be dried only
once, which is benefit to the decrease of energy and production cycle.
Wood drying is an important process during the producing course, however, there are few
reports concerning the dewatering of the impregnated timber, particularly the ultrasound-
assisted impregnated wood. This study focuses on the effects of frequency and processing
time on the drying course of ultrasound-assisted impregnated wood, providing theoretical
basis for the production practice.
Materials and Methods
Fast-growing poplar was obtained from Guangdong Landbond Furniture Co. Ltd in
Guangdong Province, China. Poplar sapwood blocks with dimensions of
20mm×20mm×20mm (L×T×R) were prepared from defect free wood and with initial
moisture content 150%~170%. The block samples were divided into 7 groups—A, B, C,
D, E, F and G—with 30 replicates per group. The subsequent processing conditions of
these groups are shown in Table.1, respectively.
Tab.1 processing condition of every group
A B C D E F G
Frequency 28kHz 28kHz 28kHz 40kHz 40kHz 40kHz --
Processing
time 20min 40min 60min 20min 40min 60min --
The impregnation was carried out in ultrasonic cleaning machine with an aqueous
solution of 23% low molecular weight phenolic resin provided by Beijing Dynea
Chemical Industry Co. Ltd in Beijing Province, China. After the impregnation finished,
the impregnated specimens and the control ones were dried for 10h in the air and 9h at
70±2℃ and finally at103±2℃ until constant weight.
Proceedings of the 58th International Convention of Society of Wood Science and Technology
June 7-12, 2015 – Grand Teton National Park, Jackson, Wyoming, USA
490
Before the impregnation, the initial weight of every sample was first recorded, then after
the air-seasoning, the weight of samples was measured. During the 9h drying course at
70±2℃, the specimen weight was written down every 3h. When the weight of specimens
became constant, they were finally recorded. The moisture content throughout the whole
course and the final weight gain of every sample were calculated based on the measured
data. The result of every group was the average of the 30 replicates.
Firstly, the initial moisture content of group G was determined according to equation (1),
30
1 5
500 %100
i Gi
GiGi
m
mmMC (1)
where 0MC is the initial moisture content of group G, Gim0 and Gim5 is the initial and final
weight of every sample of group G. This 0MC was taken as the initial moisture of every
block specimen. Secondly, according to 0MC and the initial weight of the specimens of
group A to F, the oven-dry weight of these specimens could be calculated with equation
(2),
0
0
1 MC
mmod
(2)
where 0m and odm is the initial and oven-dry weight of these specimens of group A to F.
Finally, the moisture content throughout the whole course and the ultimate weight gain of
every group could be determined according to the above measured and calculated data.
Results and Discussion
Effects of frequency and processing time on the drying speed
The drying speed of group A to G at different period throughout the whole drying course
is presented in Table 2.
Tab.2 Drying Speed at Different Period
A B C D E F G
0~13h %/h 9.66 8.76 7.86 9.32 9.05 8.98 8.98
13~19h %/h 4.69 6.71 7.80 5.46 4.65 4.75 7.88
0~19h %/h 8.09 8.11 7.84 8.10 7.66 7.65 8.63
The speed of most impregnated groups is slower compared to that of control group G,
especially at the period of 13h to 19h. In addition, the drying speed of the experimental
groups differs from each other, indicating that the ultrasonic frequency and processing
time have comprehensive effects on the dewatering speed of impregnated samples. In the
previous 13h dewatering stage, when the treating time remains constant, in general, the
higher is the frequency the faster is the drying course and the faster speed of the two
frequency is not below that of the control group. While with the same frequency, the
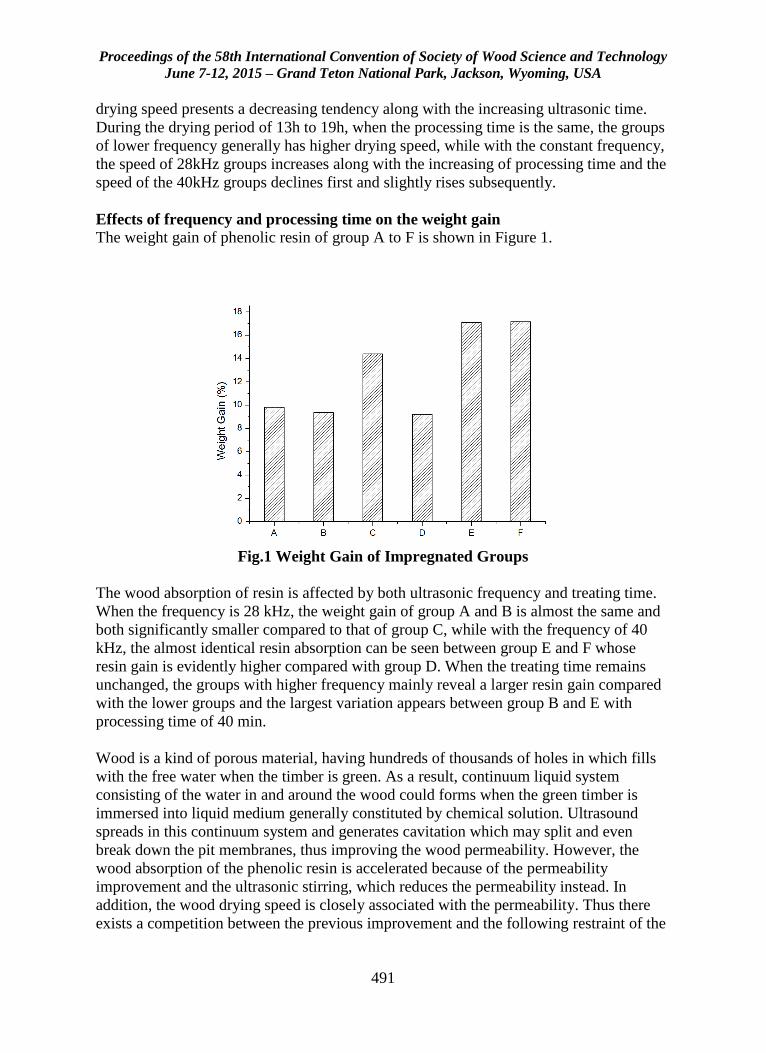
Proceedings of the 58th International Convention of Society of Wood Science and Technology
June 7-12, 2015 – Grand Teton National Park, Jackson, Wyoming, USA
491
drying speed presents a decreasing tendency along with the increasing ultrasonic time.
During the drying period of 13h to 19h, when the processing time is the same, the groups
of lower frequency generally has higher drying speed, while with the constant frequency,
the speed of 28kHz groups increases along with the increasing of processing time and the
speed of the 40kHz groups declines first and slightly rises subsequently.
Effects of frequency and processing time on the weight gain
The weight gain of phenolic resin of group A to F is shown in Figure 1.
Fig.1 Weight Gain of Impregnated Groups
The wood absorption of resin is affected by both ultrasonic frequency and treating time.
When the frequency is 28 kHz, the weight gain of group A and B is almost the same and
both significantly smaller compared to that of group C, while with the frequency of 40
kHz, the almost identical resin absorption can be seen between group E and F whose
resin gain is evidently higher compared with group D. When the treating time remains
unchanged, the groups with higher frequency mainly reveal a larger resin gain compared
with the lower groups and the largest variation appears between group B and E with
processing time of 40 min.
Wood is a kind of porous material, having hundreds of thousands of holes in which fills
with the free water when the timber is green. As a result, continuum liquid system
consisting of the water in and around the wood could forms when the green timber is
immersed into liquid medium generally constituted by chemical solution. Ultrasound
spreads in this continuum system and generates cavitation which may split and even
break down the pit membranes, thus improving the wood permeability. However, the
wood absorption of the phenolic resin is accelerated because of the permeability
improvement and the ultrasonic stirring, which reduces the permeability instead. In
addition, the wood drying speed is closely associated with the permeability. Thus there
exists a competition between the previous improvement and the following restraint of the
Proceedings of the 58th International Convention of Society of Wood Science and Technology
June 7-12, 2015 – Grand Teton National Park, Jackson, Wyoming, USA
492
permeability, which comprehensively affected by the ultrasonic frequency and the
processing time.
Normally, the permeability only influences the dewatering course of the free water which
corresponds to the drying stage of the preceding 13h in this paper. The course of 13h to
19h could be seen as the dewatering of the bound water since the wood moisture content
at 16h is already below the fiber saturation point.
The similar weight gain of group A, B and D indicates the identical restraint to
permeability while the different drying speed of these groups reveals the various
promotion. That is to say, the promoting effect of group A is the strongest while group B
is the weakest because of the same tendency of their drying speed. However, the speed of
both group A and D is larger than that of control group G, showing that the accelerating
influence of A and D is stronger than their inhibiting effect. These analyses could be
absolutely applied to the other groups. As a result, it could be concluded that with
constant frequency, the shorter is the processing time the stronger and faster is the
improving effect and the drying speed while the treating time remains unchanged, the
lower is the frequency the higher is the possibility that the promoting effect is weaker,
particularly with longer processing time.
With regard to the dewatering of bound water, the variation of drying speed between the
groups may be attributed to the following. Firstly, the more is the resin gain the higher
and slower is the dewatering resistance and drying speed. Secondly, the adulteration of
some free water removal into the bound water drying course on this study condition
makes it more complicated to identify the influence factor of bound water drying speed.
Conclusion
(1)Ultrasonic frequency and processing time comprehensively affect the drying course of
impregnated wood whose dewatering speed is slower than that of the control group
throughout the whole course, especially the bound water dewatering stage.
(2)In the previous 13h dewatering stage, when the treating time remains constant, in
general, the higher is the frequency the faster is the drying course. While with the same
frequency, the drying speed presents a decreasing tendency along with the increasing
ultrasonic time.
(3)During the drying period of 13h to 19h, when the processing time is the same, the
groups with lower frequency generally have higher drying speed, while with the constant
frequency, the speed of 28 kHz groups increases and that of the 40kHz groups declines
first and slightly rises subsequently along with the increasing of processing time.
(4)With constant frequency, the shorter is the processing time the stronger is the
permeability improving effect while with the same treating time, the lower is the
frequency the higher is the possibility that the permeability promoting effect is weaker,
especially with longer processing time.
Proceedings of the 58th International Convention of Society of Wood Science and Technology
June 7-12, 2015 – Grand Teton National Park, Jackson, Wyoming, USA
493
REFERENCES
FengNuo (2006) Ultrasound Handbook. Nanjing University Press, Nanjing. 90pp.
Gallego-Juarez J A, Rodriguez-Corral G, Gálvez Moraleda J C, et al. (1999) A new high-
intensity ultrasonic technology for food dehydration. Drying Technology 17(3): 597-608.
HeZhengbin, GuoYuehong, et al (2012) Preliminary study of wood ultrasound-vacuum
combined drying dynamics. Journal of Beijing Forestry University (34)2:133-136.
LiXiaodong (2005) Soaking Treatment of Wood Flame-proof and New Technology.
Liaoning Chemical Industry 34(10):439-442.
LiXiaodong, HaoWanxin, QiXiangyang (2006) Application of Ultrasonic Wave in
Soaking Methods of Wood Treated with Fire Retardant. Fujian Forestry Science and
Technology, 33(1):64-66,79.
LuoJieshu (2000) A General Discussion on Flame Retardant Treatment of Wood. China
Forest Products Industry 27(2):7-9.
Mason, T. J., & Peters, D. (2002). Practical sonochemistry: Power ultrasound uses and
applications. Woodhead Publishing.
Muralidhara H S, Ensminger D, Putnam A. (1985) Acoustic dewatering and drying (low
and high frequency): State of the art review. Drying Technology 3(4): 529-566.
Proceedings of the 58th International Convention of Society of Wood Science and Technology
June 7-12, 2015 – Grand Teton National Park, Jackson, Wyoming, USA
494
Effects of Boron-Containing Fire Retardants on the
Fire Resistance of Bamboo Filament
Lili Yu1,2 –Xianmiao Liu1 - Fuqing Qiu3–Haiqing Ren 4 - Benhua Fei1*
1,2 Ph. D, International Center for Bamboo and Rattan, Beijing 100102,
China; Tianjin University of Science and Technology, Department of wood
science and technology; Tianjin, 300222, China.
[email protected] 1 Associate Professor, International Center for Bamboo and Rattan, Beijing
100102, China; 3 Senior Engineer, Hubei Chufeng bamboo CO. LTD, Wuhan 430000,
Hubei, China. 4 Professor, Research Institute of Wood Industry, Chinese Academy of
Forestry, Beijing 100091, China; 1 Professor, International Center for Bamboo and Rattan, Beijing 100102,
China;
* Corresponding author
Abstract
As one of the indoor decoration materials, bamboo filament should be treated with the
flame retardants for safe use. The effects of different treatment conditions on the retention
of boron-containing flame retardants (boric acid: borax=1:1 ) in the bamboo filament
have been investigated by the analysis of orthogonal and single factor tests in this study.
Furthermore, the effects of boron-containing flame retardants on the combustibility of
bamboo filament have been evaluated by Cone analysis. The results showed that the
boring loading in the treated bamboo filament would increase distinctly as the treatment
duration, temperature or solution concentration increased. Compared to the untreated and
UV treated bamboo filaments, heat release reduced obviously in the treated bamboo
filament with higher boron loading, heat rates were only 50 % and 30 % of untreated
bamboo filament and UV bamboo filament, the total amount of the heat release were
reduced by 39.7% and 56.5 %, respectively. During the combustion process, boron-
containing flame retardants have excellent smoke suppression efficacy, and the total
smoke release were reduced by 86.1 % and 91.1 %, respectively. Moreover, boron-
containing flame retardants would promote the carbon residue production of the treated
bamboo filament and reduce the mass loss during the fire.
Keywords: bamboo filament, boric acid; borax, heat release, smoke release
Proceedings of the 58th International Convention of Society of Wood Science and Technology
June 7-12, 2015 – Grand Teton National Park, Jackson, Wyoming, USA
495
Introduction
Bamboo as a renewable and natural material of biological origin has been an essential
material for human survival in the countries lack of timber resources, such as China.
Compared to wood, bamboo has many advantages. For example, it has shorter growth
period, higher production and mechanical strength, better dimensional stability, special
visual enjoyment etc (Zhao et al. 2010). Nowadays, the idea material has several major
features including environmental safety, natural, reused and low - carbon, bamboo just
meet these demands. As the result, bamboo based material has been used much more
widely in China and other regions (Yang et al. 2007, Zhang 2011, Lei et al. 2004). Among
of them, bamboo filament not only has the special features of bamboo superior to other
decorative material, but also has its own characteristics, such as the excellent flexibility and
the smaller thickness, which make it curved arbitrarily and formed flexible and various
shapes. The designers can express their thoughts and feelings directly and sufficiently.
Moreover, as the indoor decorative material, bamboo filament material can be applied
quickly, removed conveniently easily, recycled and reused easily, and is very
environmental and natural. Therefore, bamboo filament is beginning to be applied into
indoor decorative field to replace the traditional indoor decorative material, such as paint
and wallpaper (Song et al. 2014), and has achieved favorable effects on decoration and
beautifies the living environment.
However, bamboo based material burns easily when exposed to heat and air or strong heat
radiation (Yang et al. 2014). Fire safety is an important concern in all types of
constructions. Bamboo filament is exceptionally important in this regard, because its fire
resistance is much poorer than wood based material. One of the reasons is the difference in
their chemical compositions. The content of extracts are rather higher in the bamboo than
in the wood, which results in the significant difference in the pyrolysis process (Uysal and
Ozciftci 2004, Terzi et al. 2011, Blasi et al. 2007), and the poorer fire resistance of bamboo
filament. The other reason is the thinner and smaller unit of bamboo filament. Some
researches showed that the greater the material section, the greater the specific heat
capacity, which needs more energy to reach the fire point; The greater the material section,
the smaller the thermal expansion capacity, which means the internal stress caused by heat
is also smaller; The surface of the materials with greater section is easier to form the
charring layer, which could stop oxygen supply and consume a lot of heat; Also, the greater
the material section, the lower the thermal conductivity.
However, the research on the bamboo based materials treated with boron based fire
retardant are rather too few because of their lower loading and poor leaching performance,
the aim of this study was to clarify the effects of immersed conditions (duration,
temperature, solution concentration) on the drug loading and combustion performance, and
the objective of the work reported here was to provide useful fire retardant treatment
information for bamboo filament used as an indoor material.
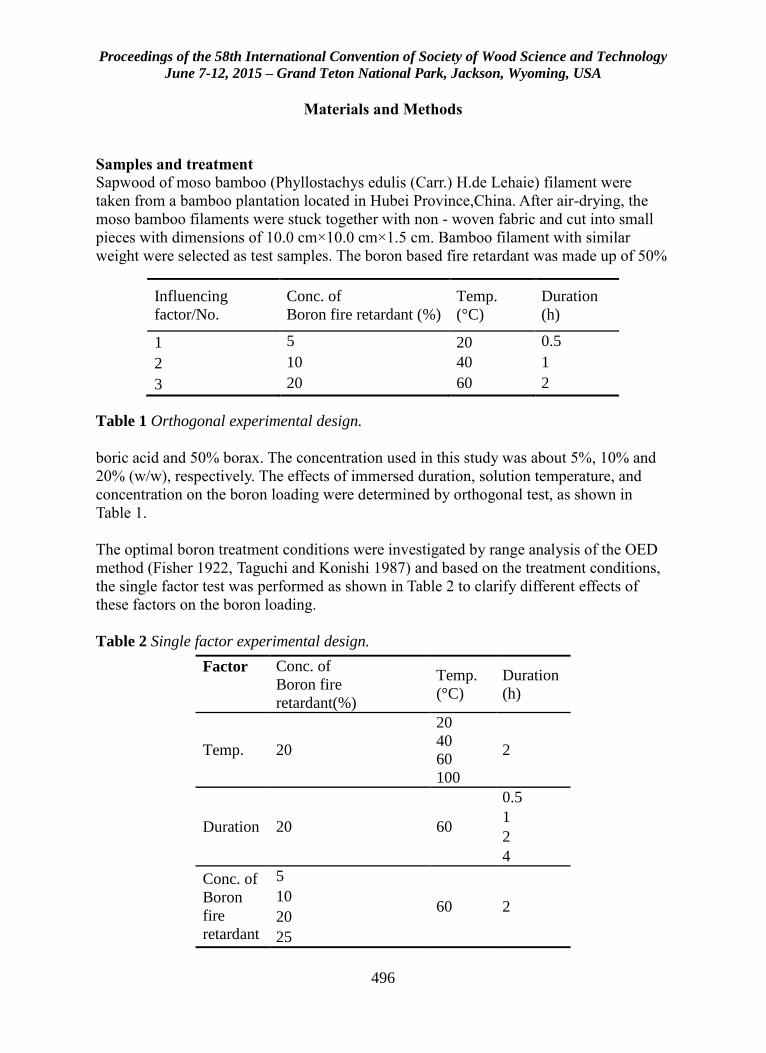
Proceedings of the 58th International Convention of Society of Wood Science and Technology
June 7-12, 2015 – Grand Teton National Park, Jackson, Wyoming, USA
496
Materials and Methods
Samples and treatment
Sapwood of moso bamboo (Phyllostachys edulis (Carr.) H.de Lehaie) filament were
taken from a bamboo plantation located in Hubei Province,China. After air-drying, the
moso bamboo filaments were stuck together with non - woven fabric and cut into small
pieces with dimensions of 10.0 cm×10.0 cm×1.5 cm. Bamboo filament with similar
weight were selected as test samples. The boron based fire retardant was made up of 50%
Table 1 Orthogonal experimental design.
boric acid and 50% borax. The concentration used in this study was about 5%, 10% and
20% (w/w), respectively. The effects of immersed duration, solution temperature, and
concentration on the boron loading were determined by orthogonal test, as shown in
Table 1.
The optimal boron treatment conditions were investigated by range analysis of the OED
method (Fisher 1922, Taguchi and Konishi 1987) and based on the treatment conditions,
the single factor test was performed as shown in Table 2 to clarify different effects of
these factors on the boron loading.
Table 2 Single factor experimental design.
Influencing
factor/No.
Conc. of
Boron fire retardant (%)
Temp.
(°C)
Duration
(h)
1 5 20 0.5
2 10 40 1
3 20 60 2
Factor Conc. of
Boron fire
retardant(%)
Temp.
(°C)
Duration
(h)
Temp. 20
20
40
60
100
2
Duration 20 60
0.5
1
2
4
Conc. of
Boron
fire
retardant
5
60 2 10
20
25
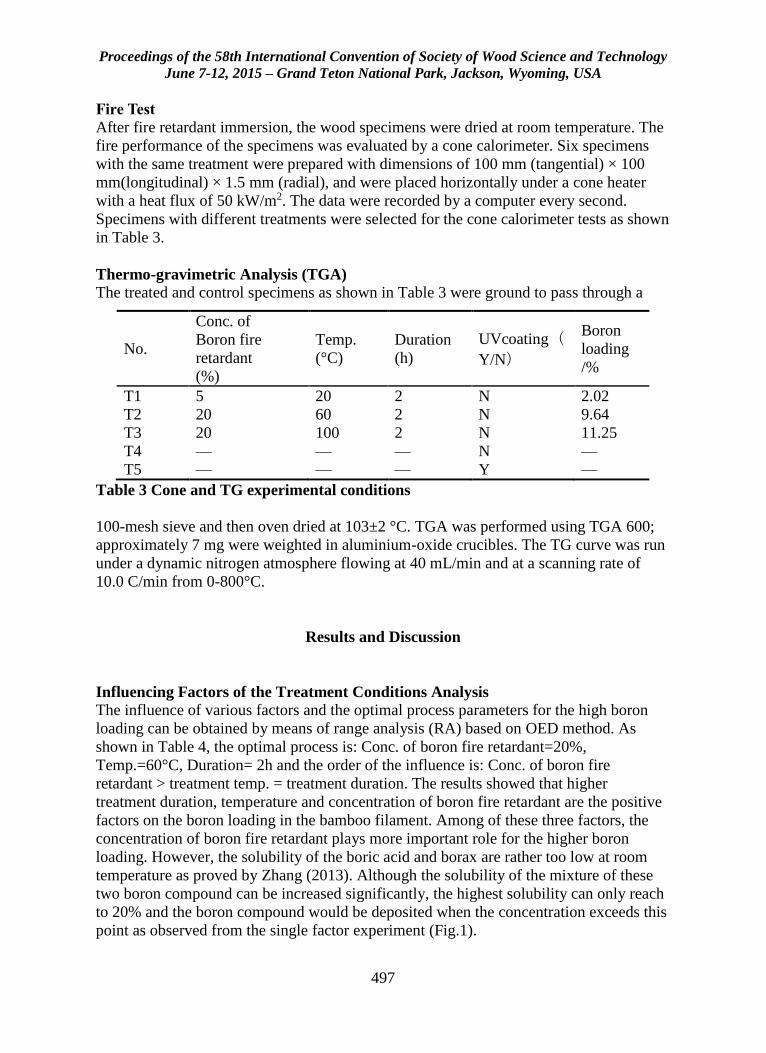
Proceedings of the 58th International Convention of Society of Wood Science and Technology
June 7-12, 2015 – Grand Teton National Park, Jackson, Wyoming, USA
497
Fire Test
After fire retardant immersion, the wood specimens were dried at room temperature. The
fire performance of the specimens was evaluated by a cone calorimeter. Six specimens
with the same treatment were prepared with dimensions of 100 mm (tangential) × 100
mm(longitudinal) × 1.5 mm (radial), and were placed horizontally under a cone heater
with a heat flux of 50 kW/m2. The data were recorded by a computer every second.
Specimens with different treatments were selected for the cone calorimeter tests as shown
in Table 3.
Thermo-gravimetric Analysis (TGA)
The treated and control specimens as shown in Table 3 were ground to pass through a
Table 3 Cone and TG experimental conditions
100-mesh sieve and then oven dried at 103±2 °C. TGA was performed using TGA 600;
approximately 7 mg were weighted in aluminium-oxide crucibles. The TG curve was run
under a dynamic nitrogen atmosphere flowing at 40 mL/min and at a scanning rate of
10.0 C/min from 0-800°C.
Results and Discussion
Influencing Factors of the Treatment Conditions Analysis
The influence of various factors and the optimal process parameters for the high boron
loading can be obtained by means of range analysis (RA) based on OED method. As
shown in Table 4, the optimal process is: Conc. of boron fire retardant=20%,
Temp.=60°C, Duration= 2h and the order of the influence is: Conc. of boron fire
retardant > treatment temp. = treatment duration. The results showed that higher
treatment duration, temperature and concentration of boron fire retardant are the positive
factors on the boron loading in the bamboo filament. Among of these three factors, the
concentration of boron fire retardant plays more important role for the higher boron
loading. However, the solubility of the boric acid and borax are rather too low at room
temperature as proved by Zhang (2013). Although the solubility of the mixture of these
two boron compound can be increased significantly, the highest solubility can only reach
to 20% and the boron compound would be deposited when the concentration exceeds this
point as observed from the single factor experiment (Fig.1).
No.
Conc. of
Boron fire
retardant
(%)
Temp.
(°C)
Duration
(h)
UVcoating(
Y/N)
Boron
loading
/%
T1 5 20 2 N 2.02
T2 20 60 2 N 9.64
T3 20 100 2 N 11.25
T4 — — — N —
T5 — — — Y —
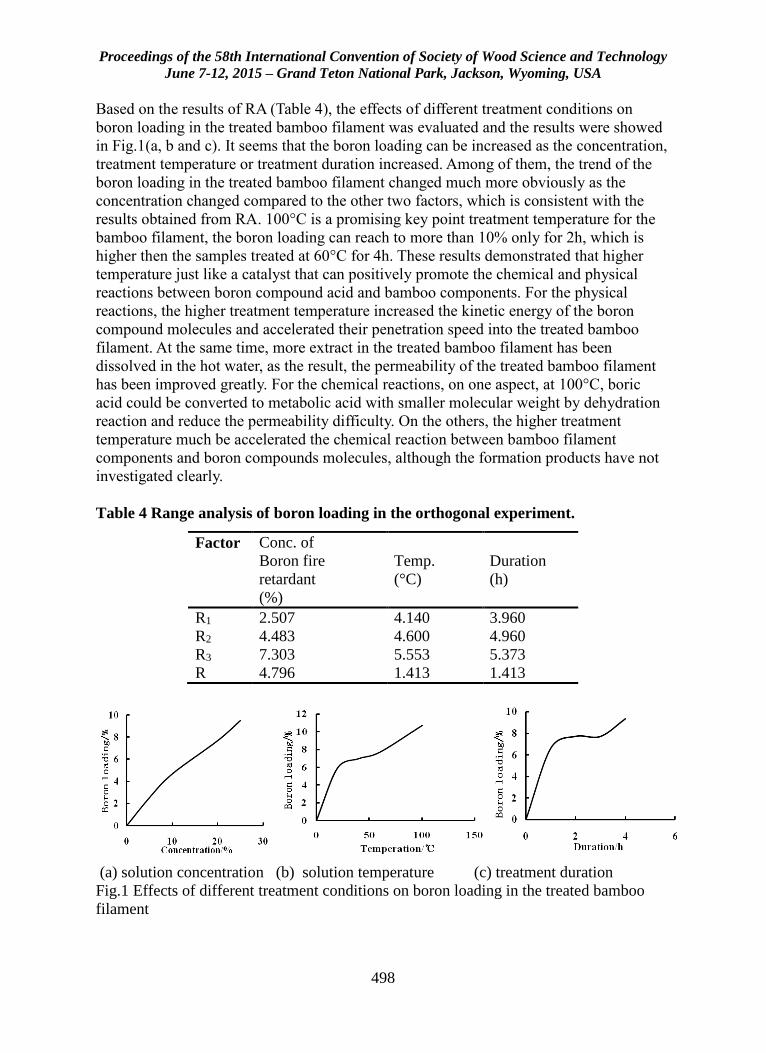
Proceedings of the 58th International Convention of Society of Wood Science and Technology
June 7-12, 2015 – Grand Teton National Park, Jackson, Wyoming, USA
498
Based on the results of RA (Table 4), the effects of different treatment conditions on
boron loading in the treated bamboo filament was evaluated and the results were showed
in Fig.1(a, b and c). It seems that the boron loading can be increased as the concentration,
treatment temperature or treatment duration increased. Among of them, the trend of the
boron loading in the treated bamboo filament changed much more obviously as the
concentration changed compared to the other two factors, which is consistent with the
results obtained from RA. 100°C is a promising key point treatment temperature for the
bamboo filament, the boron loading can reach to more than 10% only for 2h, which is
higher then the samples treated at 60°C for 4h. These results demonstrated that higher
temperature just like a catalyst that can positively promote the chemical and physical
reactions between boron compound acid and bamboo components. For the physical
reactions, the higher treatment temperature increased the kinetic energy of the boron
compound molecules and accelerated their penetration speed into the treated bamboo
filament. At the same time, more extract in the treated bamboo filament has been
dissolved in the hot water, as the result, the permeability of the treated bamboo filament
has been improved greatly. For the chemical reactions, on one aspect, at 100°C, boric
acid could be converted to metabolic acid with smaller molecular weight by dehydration
reaction and reduce the permeability difficulty. On the others, the higher treatment
temperature much be accelerated the chemical reaction between bamboo filament
components and boron compounds molecules, although the formation products have not
investigated clearly.
Table 4 Range analysis of boron loading in the orthogonal experiment.
(a) solution concentration (b) solution temperature (c) treatment duration
Fig.1 Effects of different treatment conditions on boron loading in the treated bamboo
filament
Factor Conc. of
Boron fire
retardant
(%)
Temp.
(°C)
Duration
(h)
R1 2.507 4.140 3.960
R2 4.483 4.600 4.960
R3 7.303 5.553 5.373
R 4.796 1.413 1.413
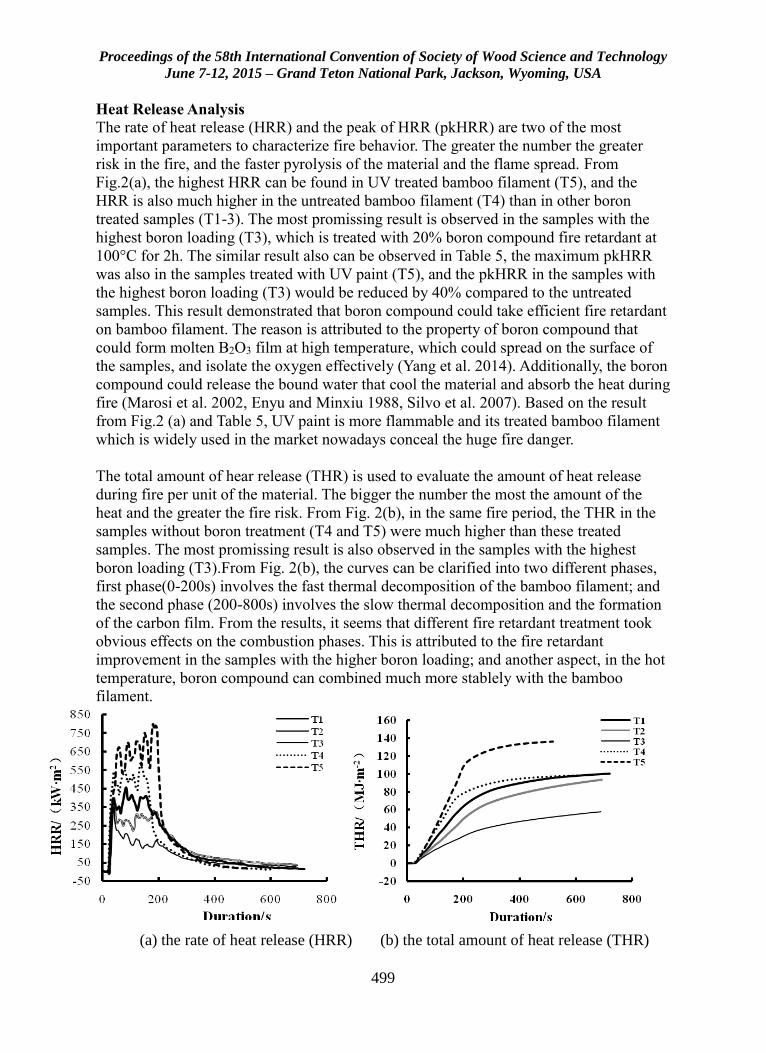
Proceedings of the 58th International Convention of Society of Wood Science and Technology
June 7-12, 2015 – Grand Teton National Park, Jackson, Wyoming, USA
499
Heat Release Analysis
The rate of heat release (HRR) and the peak of HRR (pkHRR) are two of the most
important parameters to characterize fire behavior. The greater the number the greater
risk in the fire, and the faster pyrolysis of the material and the flame spread. From
Fig.2(a), the highest HRR can be found in UV treated bamboo filament (T5), and the
HRR is also much higher in the untreated bamboo filament (T4) than in other boron
treated samples (T1-3). The most promissing result is observed in the samples with the
highest boron loading (T3), which is treated with 20% boron compound fire retardant at
100°C for 2h. The similar result also can be observed in Table 5, the maximum pkHRR
was also in the samples treated with UV paint (T5), and the pkHRR in the samples with
the highest boron loading (T3) would be reduced by 40% compared to the untreated
samples. This result demonstrated that boron compound could take efficient fire retardant
on bamboo filament. The reason is attributed to the property of boron compound that
could form molten B2O3 film at high temperature, which could spread on the surface of
the samples, and isolate the oxygen effectively (Yang et al. 2014). Additionally, the boron
compound could release the bound water that cool the material and absorb the heat during
fire (Marosi et al. 2002, Enyu and Minxiu 1988, Silvo et al. 2007). Based on the result
from Fig.2 (a) and Table 5, UV paint is more flammable and its treated bamboo filament
which is widely used in the market nowadays conceal the huge fire danger.
The total amount of hear release (THR) is used to evaluate the amount of heat release
during fire per unit of the material. The bigger the number the most the amount of the
heat and the greater the fire risk. From Fig. 2(b), in the same fire period, the THR in the
samples without boron treatment (T4 and T5) were much higher than these treated
samples. The most promissing result is also observed in the samples with the highest
boron loading (T3).From Fig. 2(b), the curves can be clarified into two different phases,
first phase(0-200s) involves the fast thermal decomposition of the bamboo filament; and
the second phase (200-800s) involves the slow thermal decomposition and the formation
of the carbon film. From the results, it seems that different fire retardant treatment took
obvious effects on the combustion phases. This is attributed to the fire retardant
improvement in the samples with the higher boron loading; and another aspect, in the hot
temperature, boron compound can combined much more stablely with the bamboo
filament.
(a) the rate of heat release (HRR) (b) the total amount of heat release (THR)
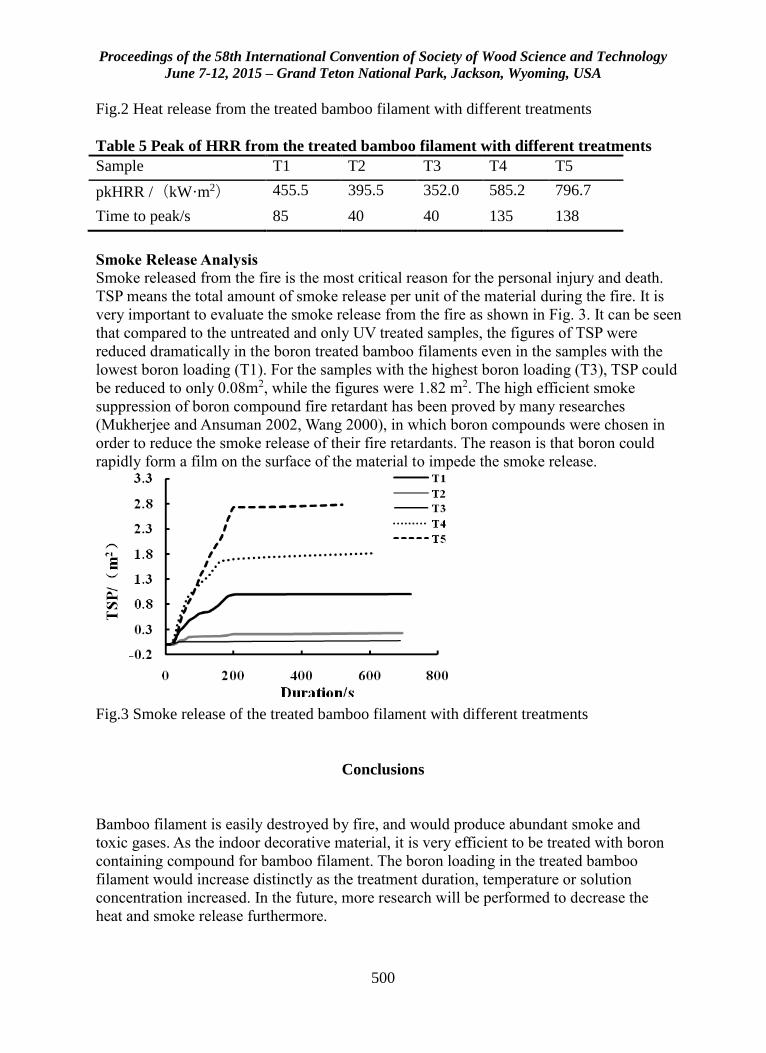
Proceedings of the 58th International Convention of Society of Wood Science and Technology
June 7-12, 2015 – Grand Teton National Park, Jackson, Wyoming, USA
500
Fig.2 Heat release from the treated bamboo filament with different treatments
Table 5 Peak of HRR from the treated bamboo filament with different treatments
Sample T1 T2 T3 T4 T5
pkHRR /(kW·m2) 455.5 395.5 352.0 585.2 796.7
Time to peak/s 85 40 40 135 138
Smoke Release Analysis
Smoke released from the fire is the most critical reason for the personal injury and death.
TSP means the total amount of smoke release per unit of the material during the fire. It is
very important to evaluate the smoke release from the fire as shown in Fig. 3. It can be seen
that compared to the untreated and only UV treated samples, the figures of TSP were
reduced dramatically in the boron treated bamboo filaments even in the samples with the
lowest boron loading (T1). For the samples with the highest boron loading (T3), TSP could
be reduced to only 0.08m2, while the figures were 1.82 m2. The high efficient smoke
suppression of boron compound fire retardant has been proved by many researches
(Mukherjee and Ansuman 2002, Wang 2000), in which boron compounds were chosen in
order to reduce the smoke release of their fire retardants. The reason is that boron could
rapidly form a film on the surface of the material to impede the smoke release.
Fig.3 Smoke release of the treated bamboo filament with different treatments
Conclusions
Bamboo filament is easily destroyed by fire, and would produce abundant smoke and
toxic gases. As the indoor decorative material, it is very efficient to be treated with boron
containing compound for bamboo filament. The boron loading in the treated bamboo
filament would increase distinctly as the treatment duration, temperature or solution
concentration increased. In the future, more research will be performed to decrease the
heat and smoke release furthermore.
Proceedings of the 58th International Convention of Society of Wood Science and Technology
June 7-12, 2015 – Grand Teton National Park, Jackson, Wyoming, USA
501
References
AWPA (2006) Book of standards. American Wood Protection Association, Birmingham,
AL, USA.
Baugh PJ, Hinojosa O, Arthur JC and Mares T (1968) ESR spectra of copper complexes
of cellulose. J. Appl. Poly. Sci 18:249-265.
Bergervoet AJ, Marcinko JL, Walcheski PJ (1997) Fixation process for heat-fixable
preservative treated wood. Appl. No.: 609087.
Zhao N, Lei D, Wu L (2010) Cultural and functional support in designing of bamboo
products. Journal of Bamboo Research, 29(2):52-58.
Yang H, Chen G, Wang X (2007) Bamboo furniture and ecological design. Journal of
Zhengzhou University of Light Industry, 8(4):73-75.
Zhang Y (2011) The research on artistic design-expression of the native bamboo. Master
thesis, Hunan, China.
Lei D, Wu L, Chen D, et al. (2004) The modern furniture with raw bamboo:A blend of
tradition form and modern aesthetics. Word Bamboo and Raton, 2(4):41-43.
Song S, Yang F, Sun Z, et al. (2014) The sliced bamboo winding technology and processing
technology. China Forest Products Industry, 41(3):34-36.
Yang Y, Wu Y, Qing Y, et al. (2014) Effect of typical boron compounds on the thermal
degradation and combustion properties of phyllostachys pubescen. Hunan Forestry
Technology, 16(4):51-55.
Uysal B, Ozciftci A (2004) The effects of impregnation chemicals on combustion
properties of laminated wood material. Combustion Science and Technology, 176
(1):117-133.
Terzi E, Kartal SN, Robert HW, et al. (2011) Fire performance and decay resistance of solid
wood and plywood treated with quaternary ammonia compounds and common fire
retardants. European Journal of Wood Products, 69:41-51.
Blasi CD, Branca C, Galgano A (2007) Flame retarding of wood by impregnation with
boric acid-pyrolysis products and char oxida-tion rates. Polymer Degradation and
Stability, 92: 752-764.
Fisher RA (1922) On the mathematical foundations of theoretical statistics. Philosophical
Transactions of the Royal Society, A. 222: 309-368.

Proceedings of the 58th International Convention of Society of Wood Science and Technology
June 7-12, 2015 – Grand Teton National Park, Jackson, Wyoming, USA
502
Taguchi G, Konishi S (1987) Taguchi methods orthogonal arrays and linear graphs: tools
for quality engineering. American.
Zhang H (2013) Research progress of modificated zinc borate. Rubber and Science and
Technology, 39:9-13.
Marosi G, Ma´rton A, Anna P, et al. (2002) Ceramic precursor in flame retardant systems.
Polym Degrad Stab., 77:259–65.
Enyu X, Minxiu Z (1988) Flame retardant science and application. 1sted. Beijing: National
Defence Industry Press; 1988.
Silvo H, Majda SS, Karin SK, et al. (2007) Flame retardant activity of SiO2-coated
regenerated cellulose fibres. Polym Degrad Stab., 92:1957–65.
Mukherjee GN, Ansuman D (2002) Mixed ligand complex formation of Fe with boric acid
and typical N-donor multidentate ligands. Proc Indian Acad Sci (Chem Sci), 114(3):163–
174.
Wang QW (2000) FRW fire retardant for wood. PhD dissertation, Northeast Forestry
University, Harbin, China.
Proceedings of the 58th International Convention of Society of Wood Science and Technology
June 7-12, 2015 – Grand Teton National Park, Jackson, Wyoming, USA
503
Effect on Wood Mechanical Characteristics of
Chinese Fur with High Temperature Drying Process
Derong Zhang, Xiaojuan Jin, Wei Pang
College of Materials Science and Technology, Beijing Forestry University,
Beijing 100083, P R. China
Abstract
In order to improve the elasticity of table tennis racket bottom board through thermal
treatment, in this research the effect of the drying temperature(130-190℃)and drying
time on the character of Chinese fir(Cunninghamia lanceolata)were investigated,
which indicated that dynamic modulus of elasticity and dynamic modulus of shearing
show well relevance. The pulling force on wood, dynamic modulus of elasticity, static
modulus of elasticity, dynamic modulus of shearing and storage modulus were all
influenced by the drying treatment at high temperature, as well as the effect on dynamic
modulus of shearing was stronger than that on dynamic modulus of elasticity. Besides,
drying temperature had greatly affected the character of Chinese fir, but drying time
caused little impact.
Keywords: drying temperature, drying time, dynamic modulus of elasticity, static
modulus of elasticity, modulus of shearing, storage modulus.
Introduction
Wood is widely applied in the table tennis racket bottom board because of its low weight
and good elasticity. A suitable table tennis racket can help athletes achieve good scores;
however, used as the racket bottom board of table tennis, the same species wood with the
same texture and the similar character cannot meet the demand of different athletes. It is a
good method to improve the elasticity of table tennis racket bottom board by drying
treatment at high-temperature to meet different athletes’ demand.
The performance of tennis racquet depends on its wood features, while the striking force,
resilience quality and feeling of the racquet are all affected by the dynamic mechanical
properties of wood such as the storage modulus and loss modulus et al. Consequently, it
has a great significance to investigate the relationship between wood’s characteristics and
properties of hitting. Meanwhile, different athletes have different requirements for the
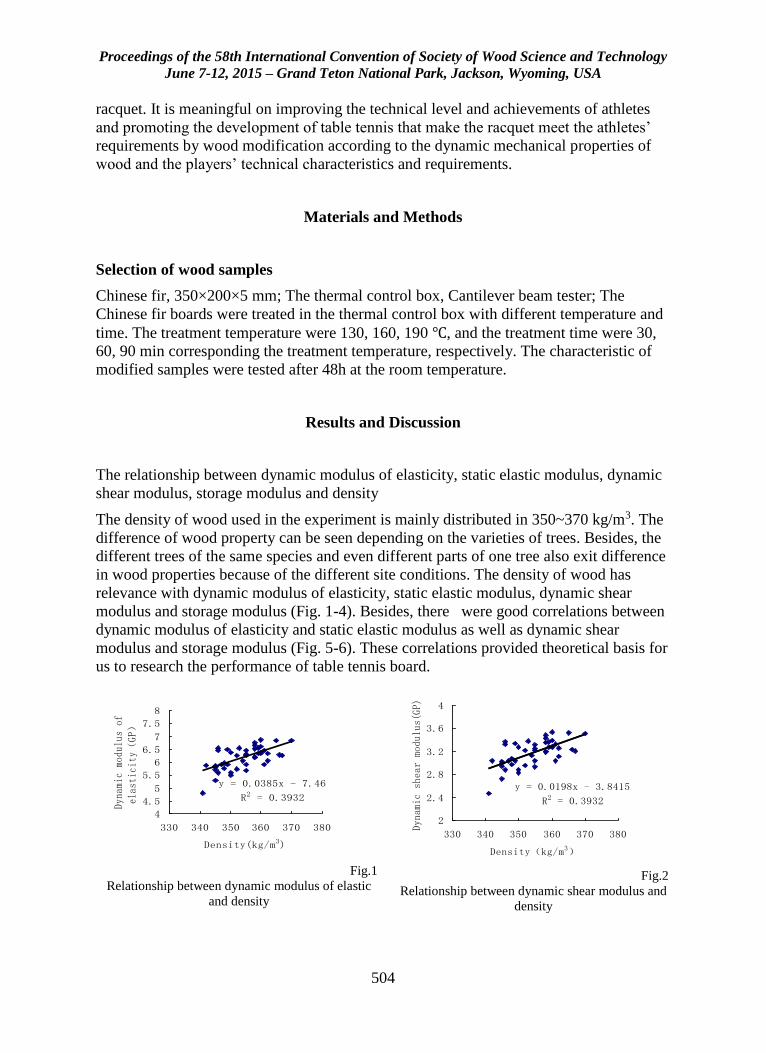
Proceedings of the 58th International Convention of Society of Wood Science and Technology
June 7-12, 2015 – Grand Teton National Park, Jackson, Wyoming, USA
504
racquet. It is meaningful on improving the technical level and achievements of athletes
and promoting the development of table tennis that make the racquet meet the athletes’
requirements by wood modification according to the dynamic mechanical properties of
wood and the players’ technical characteristics and requirements.
Materials and Methods
Selection of wood samples
Chinese fir, 350×200×5 mm; The thermal control box, Cantilever beam tester; The
Chinese fir boards were treated in the thermal control box with different temperature and
time. The treatment temperature were 130, 160, 190 ℃, and the treatment time were 30,
60, 90 min corresponding the treatment temperature, respectively. The characteristic of
modified samples were tested after 48h at the room temperature.
Results and Discussion
The relationship between dynamic modulus of elasticity, static elastic modulus, dynamic
shear modulus, storage modulus and density
The density of wood used in the experiment is mainly distributed in 350~370 kg/m3. The
difference of wood property can be seen depending on the varieties of trees. Besides, the
different trees of the same species and even different parts of one tree also exit difference
in wood properties because of the different site conditions. The density of wood has
relevance with dynamic modulus of elasticity, static elastic modulus, dynamic shear
modulus and storage modulus (Fig. 1-4). Besides, there were good correlations between
dynamic modulus of elasticity and static elastic modulus as well as dynamic shear
modulus and storage modulus (Fig. 5-6). These correlations provided theoretical basis for
us to research the performance of table tennis board.
y = 0.0385x - 7.46
R2 = 0.3932
4
4.5
5
5.5
6
6.5
7
7.5
8
330 340 350 360 370 380
Density(kg/m3)
Dyna
mic
modu
lus
ofel
asti
city
(GP
)
Fig.1
Relationship between dynamic modulus of elastic
and density
y = 0.0198x - 3.8415
R2 = 0.3932
2
2.4
2.8
3.2
3.6
4
330 340 350 360 370 380
Density(kg/m3)
Dyna
mic
shea
r mo
dulu
s(GP
)
Fig.2
Relationship between dynamic shear modulus and
density
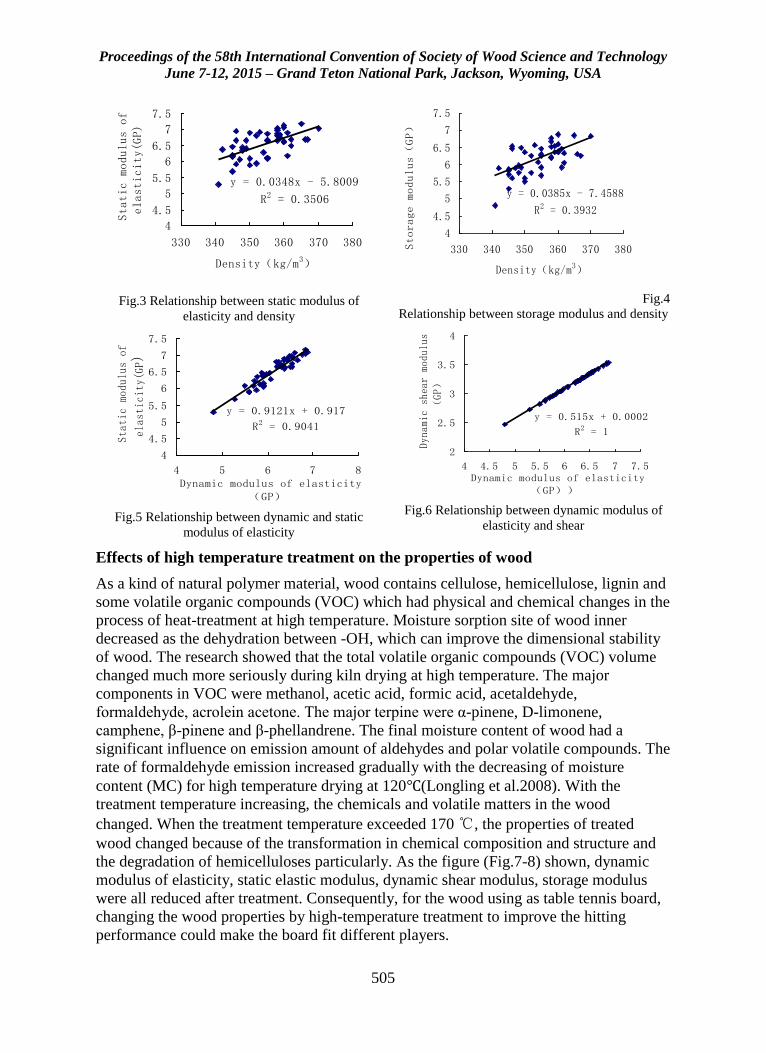
Proceedings of the 58th International Convention of Society of Wood Science and Technology
June 7-12, 2015 – Grand Teton National Park, Jackson, Wyoming, USA
505
y = 0.0348x - 5.8009
R2 = 0.3506
4
4.5
5
5.5
6
6.5
7
7.5
330 340 350 360 370 380
Density(kg/m3)
Static modulus of
elasticity(GP)
Fig.3 Relationship between static modulus of
elasticity and density
y = 0.0385x - 7.4588
R2 = 0.3932
4
4.5
5
5.5
6
6.5
7
7.5
330 340 350 360 370 380
Density(kg/m3)
Storage modulus(GP)
Fig.4
Relationship between storage modulus and density
y = 0.9121x + 0.917
R2 = 0.9041
4
4.5
5
5.5
6
6.5
7
7.5
4 5 6 7 8 Dynamic modulus of elasticity
(GP)
Sta
tic
modu
lus
of
elas
tici
ty(G
P)
Fig.5 Relationship between dynamic and static
modulus of elasticity
y = 0.515x + 0.0002
R2 = 1
2
2.5
3
3.5
4
4 4.5 5 5.5 6 6.5 7 7.5 Dynamic modulus of elasticity
(GP))
Dyn
amic
she
ar m
odul
us(GP
)
Fig.6 Relationship between dynamic modulus of
elasticity and shear
Effects of high temperature treatment on the properties of wood
As a kind of natural polymer material, wood contains cellulose, hemicellulose, lignin and
some volatile organic compounds (VOC) which had physical and chemical changes in the
process of heat-treatment at high temperature. Moisture sorption site of wood inner
decreased as the dehydration between -OH, which can improve the dimensional stability
of wood. The research showed that the total volatile organic compounds (VOC) volume
changed much more seriously during kiln drying at high temperature. The major
components in VOC were methanol, acetic acid, formic acid, acetaldehyde,
formaldehyde, acrolein acetone. The major terpine were α-pinene, D-limonene,
camphene, β-pinene and β-phellandrene. The final moisture content of wood had a
significant influence on emission amount of aldehydes and polar volatile compounds. The
rate of formaldehyde emission increased gradually with the decreasing of moisture
content (MC) for high temperature drying at 120℃(Longling et al.2008). With the
treatment temperature increasing, the chemicals and volatile matters in the wood
changed. When the treatment temperature exceeded 170 ℃, the properties of treated
wood changed because of the transformation in chemical composition and structure and
the degradation of hemicelluloses particularly. As the figure (Fig.7-8) shown, dynamic
modulus of elasticity, static elastic modulus, dynamic shear modulus, storage modulus
were all reduced after treatment. Consequently, for the wood using as table tennis board,
changing the wood properties by high-temperature treatment to improve the hitting
performance could make the board fit different players.
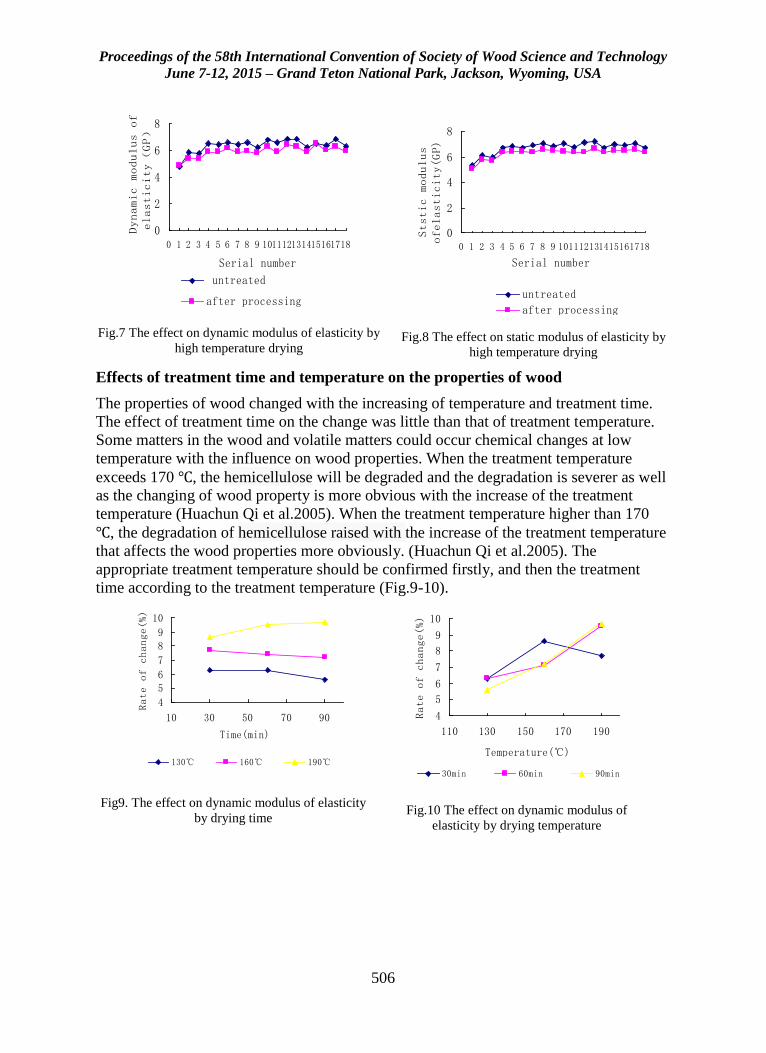
Proceedings of the 58th International Convention of Society of Wood Science and Technology
June 7-12, 2015 – Grand Teton National Park, Jackson, Wyoming, USA
506
0
2
4
6
8
0 1 2 3 4 5 6 7 8 9 101112131415161718
Serial number
Dynamic modulus of
elasticity(GP)
untreated
after processing
Fig.7 The effect on dynamic modulus of elasticity by
high temperature drying
0
2
4
6
8
0 1 2 3 4 5 6 7 8 9 101112131415161718
Serial number
Ststic modulus
ofelasticity(GP)
untreated
after processing
Fig.8 The effect on static modulus of elasticity by
high temperature drying
Effects of treatment time and temperature on the properties of wood
The properties of wood changed with the increasing of temperature and treatment time.
The effect of treatment time on the change was little than that of treatment temperature.
Some matters in the wood and volatile matters could occur chemical changes at low
temperature with the influence on wood properties. When the treatment temperature
exceeds 170 ℃, the hemicellulose will be degraded and the degradation is severer as well
as the changing of wood property is more obvious with the increase of the treatment
temperature (Huachun Qi et al.2005). When the treatment temperature higher than 170
℃, the degradation of hemicellulose raised with the increase of the treatment temperature
that affects the wood properties more obviously. (Huachun Qi et al.2005). The
appropriate treatment temperature should be confirmed firstly, and then the treatment
time according to the treatment temperature (Fig.9-10).
4
56
7
89
10
10 30 50 70 90
Time(min)
Rate of change(%)
130℃ 160℃ 190℃
Fig9. The effect on dynamic modulus of elasticity
by drying time
4
5
6
7
8
9
10
110 130 150 170 190
Temperature(℃)
Rate of change(%)
30min 60min 90min
Fig.10 The effect on dynamic modulus of
elasticity by drying temperature
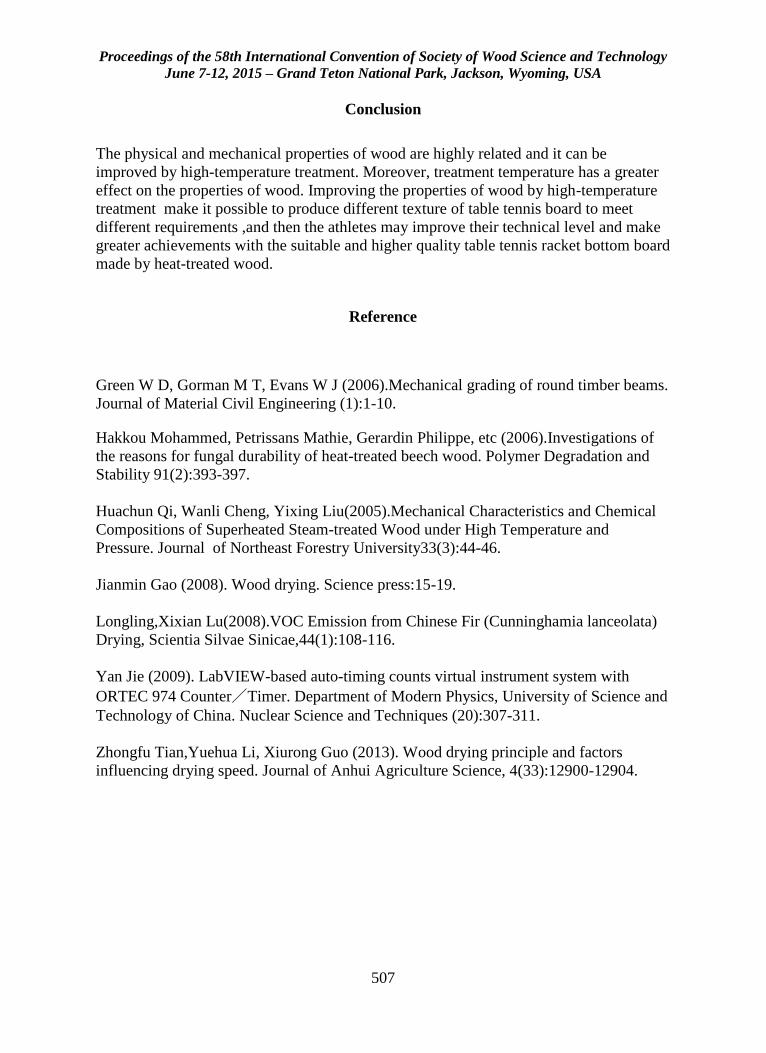
Proceedings of the 58th International Convention of Society of Wood Science and Technology
June 7-12, 2015 – Grand Teton National Park, Jackson, Wyoming, USA
507
Conclusion
The physical and mechanical properties of wood are highly related and it can be
improved by high-temperature treatment. Moreover, treatment temperature has a greater
effect on the properties of wood. Improving the properties of wood by high-temperature
treatment make it possible to produce different texture of table tennis board to meet
different requirements ,and then the athletes may improve their technical level and make
greater achievements with the suitable and higher quality table tennis racket bottom board
made by heat-treated wood.
Reference
Green W D, Gorman M T, Evans W J (2006).Mechanical grading of round timber beams.
Journal of Material Civil Engineering (1):1-10.
Hakkou Mohammed, Petrissans Mathie, Gerardin Philippe, etc (2006).Investigations of
the reasons for fungal durability of heat-treated beech wood. Polymer Degradation and
Stability 91(2):393-397.
Huachun Qi, Wanli Cheng, Yixing Liu(2005).Mechanical Characteristics and Chemical
Compositions of Superheated Steam-treated Wood under High Temperature and
Pressure. Journal of Northeast Forestry University33(3):44-46.
Jianmin Gao (2008). Wood drying. Science press:15-19.
Longling,Xixian Lu(2008).VOC Emission from Chinese Fir (Cunninghamia lanceolata)
Drying, Scientia Silvae Sinicae,44(1):108-116.
Yan Jie (2009). LabVIEW-based auto-timing counts virtual instrument system with
ORTEC 974 Counter/Timer. Department of Modern Physics, University of Science and
Technology of China. Nuclear Science and Techniques (20):307-311.
Zhongfu Tian,Yuehua Li, Xiurong Guo (2013). Wood drying principle and factors
influencing drying speed. Journal of Anhui Agriculture Science, 4(33):12900-12904.
Proceedings of the 58th International Convention of Society of Wood Science and Technology
June 7-12, 2015 – Grand Teton National Park, Jackson, Wyoming, USA
508
Student Poster Competition Moderator: Frederick Kamke, Oregon State University,
USA
Preparation of Strips from Bambusa Vulgaris Schrad
Culms from Recycled Scaffold for Intermediate Raw
Materials Production
Adesope A.S 1* - Adewole N.A 2 - Olayiwola H.O 3- Adejoba O.R1
1*Researcher, Forestry Research Institute of Nigeria, Forest Products
Development and utilization Dept
* Corresponding author
2Senior Lecturer. Ph.D, Department of Agric and Environmental Engrg,
University of Ibadan.
3Postgrad, Department of Agric and Environmental Engrg, University of
Ibadan.
Abstract
In Nigeria, the main use of bamboo that attracts money is its use as scaffold and the
massive number of bamboo used as scaffold always ended up as waste. But there are
possibilities of recovering useful bamboo culms for the production of intermediate
products like laminates among others particularly for semi-structural and non-structural
purposes. The major constraint of using these recovered culms is the form in which
bamboo occurs naturally (round). It is for this reason that this study is aimed at preparing
strips from recovered bamboo culms to produce value added products. This study sourced
and revealed the characteristics of bamboo reclaimed from scaffold use. From a total of
298 culms used as scaffold, only about 65% was good for re-use while others constituted
a waste. The study was able to improvise treatment vat for the bamboo strips to enhance
its durability. Intermediate products like bamboo wall clock, bamboo ply and bamboo
boards were produced through lamination process. This study revealed the possibility of

Proceedings of the 58th International Convention of Society of Wood Science and Technology
June 7-12, 2015 – Grand Teton National Park, Jackson, Wyoming, USA
509
re-using bamboo from scaffold and was able to produce useful raw material and
intermediate products from recovered bamboo waste.
Key-words: Bamboo culms, Scaffold, Intermediate Products, Bamboo Strips
Proceedings of the 58th International Convention of Society of Wood Science and Technology
June 7-12, 2015 – Grand Teton National Park, Jackson, Wyoming, USA
510
Effectiveness of Gliricidia Sepium Heart Wood
Extractives as Preservatives Against Termite Attack
AGUDA L. O1*., AJAYI B2., Owoyemi J3. Adejoba O.R4 and Areo O.S5. 1 Researcher, Department of Forest Products Development and Utilization,
Forestry Research Institute of Nigeria, P.M.B. 5054, Ibadan, Oyo State,
Nigeria. 2 Professor, Head of Department of Forestry and Wood Tech., Federal
University of Technology Akure, P.M.B. 704, Akure, Ondo state, Nigeria. 3 Doctor, Senior Lecturer, Department of Forestry and Wood Tech., Federal
University of Technology Akure, P.M.B. 704, Akure, Ondo state, Nigeria. 4Doctor, Assistant Director, Head of Department of Forest Products
Development and Utilization, Forestry Research Institute of Nigeria, P.M.B.
5054, Ibadan, Oyo State, Nigeria. 5Researcher, Department of Forest Products Development and Utilization,
Forestry Research Institute of Nigeria, P.M.B. 5054, Ibadan, Oyo State,
Nigeria. *E-Mail: [email protected]. Phone No: +2348038724979
Abstract
Resistance of most wood species against termite attack is mainly as a result of their
extractives components. The chemical compositions of extractives from matured
Gliricidia sepium that are known to be very resistant against termite attack were studied
to assess their role as wood preservatives. Ethanol-toluene and distilled water were used
in the extraction of these compounds from the heartwood of this species. Chemical
analysis of the extracts was done using Gas Chromatography-Mass Spectrometry (GC-
MS) after derivatization using N,O bis (trimethyl silyl) acetamide.. More than One
hundred and forty five compounds were identified from both extracts. Fatty acids,
hydrocarbons, sterols, sterol ketones, phenolics, sterol esters and waxes were the main
groups of compounds identified. The extracts obtained were used to treat four wood
species that are known to be susceptible to termites attack. Treated samples were taken to
a termitarium for a period of twelve weeks. It was observed that wood extracts used as
preservatives improved the resistance of these susceptible wood species to termite attack
more than 60% compared to the controls and also it was observed that removal of
extractives decreased resistance of the durable samples significantly. It can be concluded
that wood extractives contribute greatly to the protection of less durable wood against
termite attack.
Keywords: Wood Extractives, bio-preservatives, termitarium, subterranean termites,
Susceptible.
Proceedings of the 58th International Convention of Society of Wood Science and Technology
June 7-12, 2015 – Grand Teton National Park, Jackson, Wyoming, USA
511
Comparative Life Cycle Analysis of PET Bottles
Produced from Different Raw Materials
Luyi Chen, [email protected]
Rylie Pelton, [email protected]
Timothy Smith, [email protected]
University of Minnesota Twin Cities, 1954 Buford Avenue, , St. Paul, MN
55108
Abstract
Growing concerns about fossil fuel depletion and global warming have driven scholars to
seek sustainable substitutes for petroleum products. Generating energy and materials
from biomass is no longer a novel approach, but how to extract economically profitable
products from lignocellulosic biomass is still under debate, due to the high cost and
technology barrier of breaking down ligno-cellulose fiber into simple sugars. Co-
products, such as activated carbon and lignosulfonates, were studied to maximize the
sustainability of the biorefinery industry. This work focuses on one value-added co-
product, woody-biomass based PET bottles used in the soft drink industry. Study results
contribute to market value/environmental impact analysis of the parameterized co-
products model. In this study Life Cycle Analysis (LCA) was performed to investigate
the environmental impacts of diverting a small portion of isobutanol from a projected
bio-jet fuel production system to paraxylene, and further processing it to wood-based
PET bottles. A comparative assessment was done for: 1), different industrial data; 2),
different allocation methods; 3), different types of biomass.
Proceedings of the 58th International Convention of Society of Wood Science and Technology
June 7-12, 2015 – Grand Teton National Park, Jackson, Wyoming, USA
512
Gender Diversity Impacts on Firm Performance in
Forest Sector Firms
Kendall Conroy
Oregon State University, Corvallis, OR
Abstract
The forest industry is predicted to lose a large percentage of its employees due to
retirement in the coming decade. The industry also tends to lack diversity in its
workforce, which makes this is an ideal time to move towards greater diversity. While
many companies in the sector recognize the need for a more diverse workforce and have
strategies in place to encourage diversity, there is little academic work evaluating the
performance of such strategies. The existing research shows that greater diversity leads
to increased creativity, openness to change, and innovation, all of which can contribute
to increased financial performance. However, there is no information specific to forest
sector firms. For that reason, we investigate the relationship between gender diversity
and financial performance of large forest sector firms. We use the
PricewaterhouseCoopers global 100 pulp, paper and packaging companies database and
select those companies from Europe, North America and Oceania. Our data consists of
the gender ratio of each of the 67 company’s boards of directors and corporate executive
teams. Preliminary regression analyses indicate a strong connection between greater
female representation and firm performance. Consistent findings would provide further
incentive for forest sector firms to strive for higher diversity in their workforces.
Proceedings of the 58th International Convention of Society of Wood Science and Technology
June 7-12, 2015 – Grand Teton National Park, Jackson, Wyoming, USA
513
Fungal Pretreatment Method Optimization for Small
Wood Samples Degraded by Ceriporiopsis
Subvermispora
Charles Edmunds, [email protected]
Vincent Chiang, [email protected]
Richard Giles, [email protected]
Ilona Peszlen, [email protected]
Perry Peralta, [email protected]
North Carolina State University, 2820 Faucette Blvd, Raleigh, NC 27695
Abstract
Fungal pretreatment on genetically modified wood samples holds tremendous promise for
a low-cost and environmentally-friendly method of increasing the reactivity of
lignocellulosic biomass prior to bio-ethanol and bio-chemical conversion. One
drawback of research in this area is the frequent requirement of testing young
greenhouse-grown wood specimens. There is a lack of knowledge concerning the
optimal technique for fungal pretreatment of small specimens from transgenic wood.
This project explores testing different methods for fungal inoculation and incubation to
study the utilization of a white-rot wood degrading fungus (Ceriporiopsis subvermispora)
as a means to increase biomass reactivity. Sweetgum (Liquidambar styraciflua) wood is
used as a representative fast growing hardwood species to develop methods that will be
used for future testing of genetically modified Populus trichocarpa. Several variables
regarding the inoculation and incubation of small hardwood (Liquidambar styraciflua)
specimens were tested in order to optimize the procedure, as measured by a sufficient
amount of biomass degradation (% weight loss) and low variation between replicates.
The variables tested include: inoculation medium (liquid mycelium slurry or pre-
colonized malt agar extract), wood particle size (ground 40-mesh vs. cylindrical stem
shape); and incubation container (20 ml vial vs. large Petri dish). The results from this
study are of great utility to fungal pretreatment research.
Proceedings of the 58th International Convention of Society of Wood Science and Technology
June 7-12, 2015 – Grand Teton National Park, Jackson, Wyoming, USA
514
Effect of TEMPO Nanofibrillated Cellulose Content on
Copper Release from Antimicrobial Polyvinyl Alcohol
Films
Changle Jiang 1 – Gloria S. Oporto2* – Tuhua Zhong1 – Jacek Jaczynski3
1 PhD student, Division of Forestry and Natural Resources,
West Virginia University, Morgantown WV, USA 2 Assistant Professor, Division of Forestry and Natural Resources,
West Virginia University, Morgantown WV, USA
* Corresponding author
[email protected] 3 Associate Professor, Division of Animal and Nutrition Science,
West Virginia University, Morgantown WV, USA
Abstract
The long-term goal of our research is to develop a novel antimicrobial film with
controlled release of the active agent. In this work, copper nanoparticles (CuNPs) were
synthesized on TEMPO nanofibrillated cellulose (TNFC) using a chemical reduction
method. Polyvinyl alcohol (PVA) composite films were prepared by incorporating this
TNFC-CuNPs hybrid material into the PVA matrices using a solvent casting process.
Copper release from the final films was determined using Inductively Coupled Plasma
Optical Emission Spectroscopy (ICP-OES). The final PVA/TNFC-CuNPs films with
different TNFC concentration were investigated for copper release rate. The
antimicrobial properties of PVA/TNFC-CuNPs film was conducted against
nonpathogenic Escherichia coli (E. coli). The copper release measurement show that the
release rate drops when TNFC concentration increases.
Keywords: TEMPO nanofibrillated cellulose, copper nanoparticles, copper release,
antimicrobial films.
Proceedings of the 58th International Convention of Society of Wood Science and Technology
June 7-12, 2015 – Grand Teton National Park, Jackson, Wyoming, USA
515
Multi-technique Characterization of Douglas-fir Cell
Wall Deconstruction during Mechanical Milling
Pretreatment
Jinxue Jiang 1 – Jinwu Wang2 - Michael P. Wolcott3*
1 Graduate student, Composite Materials & Engineering Center, Washington
State University, Pullman WA, USA 2 Research assistant professor, Composite Materials & Engineering Center,
Washington State University, Pullman WA, USA 3 Professor, Composite Materials & Engineering Center, Washington State
University, Pullman WA, USA.
* Corresponding author [email protected]
Abstract
Overcoming recalcitrance of the wood cell wall to enzymatic degradation is believed to
being crucial for effective biological conversion of polysaccharides to fermentable
sugars. Mechanical milling has long been used to overcome the native structure barriers
of cell wall for producing milled wood lignin. This process imparts macro/micro/nano
morphological and physicochemical alternations that contribute to increased accessibility
of cellulose without removal of chemical compositions. Multi-technique characterization
of Douglas-fir cell wall disruption during mechanical milling were conducted using
electronic microscopy (SEM, TEM), confocal laser scanning microscopy (CLSM),
atomic force microscopy (AFM), and X-ray diffraction (XRD). Collectively, these
techniques elucidate the evolution of cell wall changes. We propose that coincident with
the particle size reduction of the wood material during the milling process includes tissue
disintegration, cell wall fragmentation, disordering of layered cell wall fragment, and
aggregation of disordered cell wall fragments. As evidenced by LSCM, the constituent
cell wall polymers are redistributed following the ultrastructural disruption from the
mechanical milling. XRD results demonstrated the amorphization of the semicrystalline
polymers. Micro/nano porous structures were visualized by 3D-TEM tomography. The
surface and ultrastructure alternation of cell wall contribute to enhancement of enzymatic
digestibility by 4-14 folds over that of untreated cell walls depending on degree of
milling pretreatment.
Key words: bioconversion, mechanical milling pretreatment, visualization, cell wall
ultrastructure, accessible void
Proceedings of the 58th International Convention of Society of Wood Science and Technology
June 7-12, 2015 – Grand Teton National Park, Jackson, Wyoming, USA
516
Optimization Study on Yield of CNC Cutting Wood-
based Composite Panels for Upholstery Furniture
Frames
Arif Caglar Konukcu, [email protected]
Jilei Zhang, [email protected]
Mississippi State University, Department of Sustainable Bioproducts , 201
Locksley Way, Starkville, MS 39759
Abstract
In today’s competitive world, many furniture manufacturers are improving the efficiency
of their process, eliminating unnecessary costs, and improving quality by using wood-
based composite panels in their frames. Upholstery furniture frames, today, are made by
using over 70 percent wood-based composite panels. Material utilization becomes the
most important area of improvement. Many furniture manufacturers have realized
increased design and production efficiencies using wood-based panel products as their
frame stocks together with CNC technology, but they are continuously looking for
alternatives for improvement of their bottom line such as cutting yield optimization. In
this case study, effects of full panel size of wood-based composites, number of frames
cut, and frame part shape and size on the cutting yield of a upholstery company were
evaluated using computer simulation software with optimization capacity. Results
indicated that the cutting yield is affected by full panel sizes and number of frames cut.
Curve-shaped and small size parts can also lower the material cutting yield. The current
company cutting yield of 79.80% can be improved up to the range of 80 to 84% through
optimization of considering full panel size, number of frames cuts, etc.
Proceedings of the 58th International Convention of Society of Wood Science and Technology
June 7-12, 2015 – Grand Teton National Park, Jackson, Wyoming, USA
517
Water States in Black Spruce and Aspen during Drying
Studied by Time-Domain Magnetic Resonance
Devices
Clevan Lamason1, Bryce MacMillan2, Bruce Balcom2, Brigitte Leblon1, and Zarin Pirouz3
1Faculty of Forestry and Environmental Management, University of New
Brunswick (UNB), NB, CANADA
([email protected]) 2Magnetic Resonance Imaging Center, Department of Physics, UNB, NB,
CANADA 3Faculty of Forestry and Environmental Management, UNB, NB, CANADA
4Scientist, FPInnovations, Vancouver, CANADA
Abstract
In this study, water content in black spruce (Picea mariana Mill.) and aspen (Populus
tremuloides Michx.) sapwood samples was investigated with time-domain magnetic
resonance (MR). Time-domain MR measurements easily distinguish water in different
environments in wood according to the spin-spin relaxation time and provide quantitative
information on water content. The MR techniques employed can distinguish and quantify
the individual signal components. Both black spruce and aspen have two signal
components at moisture contents above the fiber saturation point. These two signal
components correspond to motionally restricted water, often referred to as bound water,
and unrestricted, or free water. Bound water content is constant above 40% moisture
content. No signal from free water was detected at or below 20% moisture content in
either species. We also demonstrate the use of a recently developed portable unilateral
magnet that can be employed as a powerful tool in the study and measurement of water
content in wood.
Proceedings of the 58th International Convention of Society of Wood Science and Technology
June 7-12, 2015 – Grand Teton National Park, Jackson, Wyoming, USA
518
Evaluate Soil Parent Material and Nitrogen
Fertilization Impact on Whole Tree Wood Quality of
Douglas-fir in the Pacific Northwest
Luyi Li, Eric C. Turnblom*
School of Environmental and Forest Sciences, College of the Environment,
University of Washington, Seattle WA, USA.
*Corresponding author
Abstract
The influence of two soil parent material types and a nitrogen fertilization treatment (224
kg N ha-1) on Douglas-fir (Pseudotsuga menziesii (Mirb.) plantation wood quality along
the whole tree trunk was studied in western Oregon. Four aspects regarding wood quality
were assessed and analyzed, (1) tree sonic acoustic velocity, (2) log resonance acoustic
velocity, (3) specific gravity, and (4) latewood percentage. Higher quality wood can be
found in the segment from stump to the live crown base. A variety of fertilization effects
upon wood quality attributes were detected. A strong correlation (R2 = 0.92) between tree
sonic acoustic velocity and log resonance acoustic velocity was observed, and tree sonic
acoustic velocity was 8% higher than log resonance acoustic velocity.
Key words: Douglas-fir, wood quality, soil parent material, nondestructive evaluation,
specific gravity, latewood percentage
Introduction
Costal Douglas-fir (Pseudotsuga menziesii (Mirb.) Franco) is the predominant plantation
species native to the western Pacific Northwest. Douglas-fir is widely valued as an
important tree species in forest management because of its high volume timber
production and the rapid growth rates on established stands. In addition, it is a premium
timber resource for structural applications and its appearance is appreciated in both
domestic and international markets. Nitrogen is consistently the most limiting factor to
the growth of forests in the Pacific Northwest as well as the rest of the world (Hanson
and Weltzin 2000, LeBauer and Treseder 2008). Decades of observations in the Pacific
Northwest in detecting soil nitrogen and tree growth response to fertilization practices
indicate that soil nitrogen tends to be limiting, and is therefore predictive of inherent
forest productivity (Littke et al. 2011). Fertilization practices have been developed to
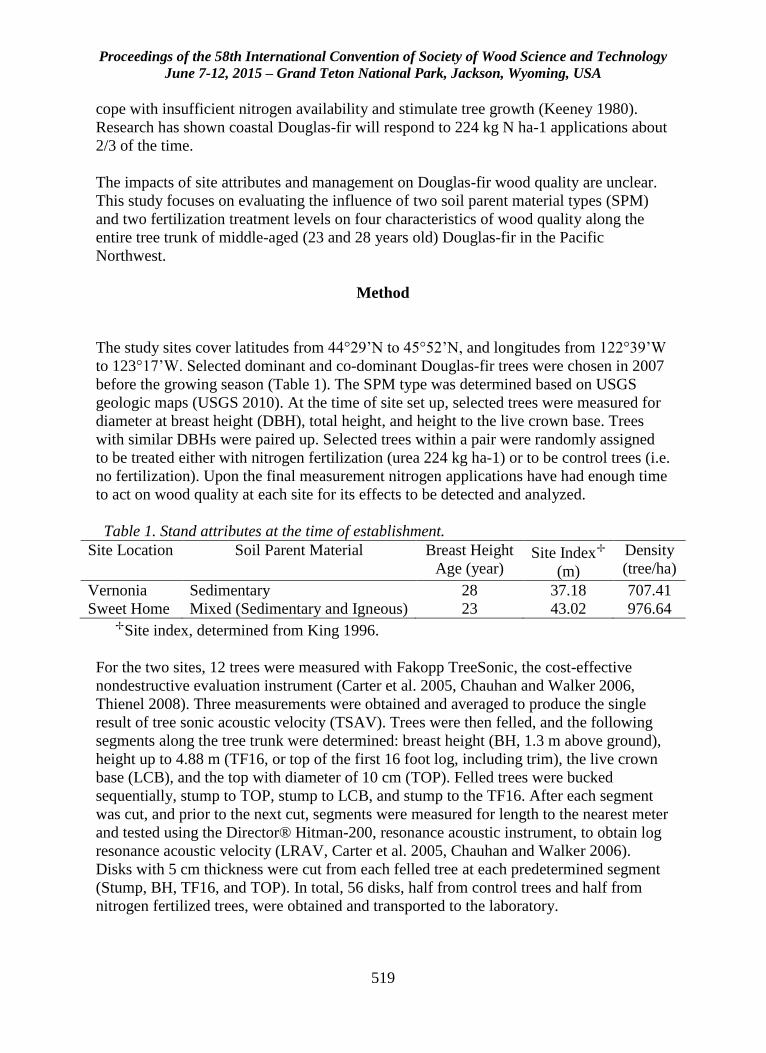
Proceedings of the 58th International Convention of Society of Wood Science and Technology
June 7-12, 2015 – Grand Teton National Park, Jackson, Wyoming, USA
519
cope with insufficient nitrogen availability and stimulate tree growth (Keeney 1980).
Research has shown coastal Douglas-fir will respond to 224 kg N ha-1 applications about
2/3 of the time.
The impacts of site attributes and management on Douglas-fir wood quality are unclear.
This study focuses on evaluating the influence of two soil parent material types (SPM)
and two fertilization treatment levels on four characteristics of wood quality along the
entire tree trunk of middle-aged (23 and 28 years old) Douglas-fir in the Pacific
Northwest.
Method
The study sites cover latitudes from 44°29’N to 45°52’N, and longitudes from 122°39’W
to 123°17’W. Selected dominant and co-dominant Douglas-fir trees were chosen in 2007
before the growing season (Table 1). The SPM type was determined based on USGS
geologic maps (USGS 2010). At the time of site set up, selected trees were measured for
diameter at breast height (DBH), total height, and height to the live crown base. Trees
with similar DBHs were paired up. Selected trees within a pair were randomly assigned
to be treated either with nitrogen fertilization (urea 224 kg ha-1) or to be control trees (i.e.
no fertilization). Upon the final measurement nitrogen applications have had enough time
to act on wood quality at each site for its effects to be detected and analyzed.
Table 1. Stand attributes at the time of establishment.
Site Location Soil Parent Material Breast Height
Age (year) Site Index✢
(m)
Density
(tree/ha)
Vernonia Sedimentary 28 37.18 707.41
Sweet Home Mixed (Sedimentary and Igneous) 23 43.02 976.64 ✢Site index, determined from King 1996.
For the two sites, 12 trees were measured with Fakopp TreeSonic, the cost-effective
nondestructive evaluation instrument (Carter et al. 2005, Chauhan and Walker 2006,
Thienel 2008). Three measurements were obtained and averaged to produce the single
result of tree sonic acoustic velocity (TSAV). Trees were then felled, and the following
segments along the tree trunk were determined: breast height (BH, 1.3 m above ground),
height up to 4.88 m (TF16, or top of the first 16 foot log, including trim), the live crown
base (LCB), and the top with diameter of 10 cm (TOP). Felled trees were bucked
sequentially, stump to TOP, stump to LCB, and stump to the TF16. After each segment
was cut, and prior to the next cut, segments were measured for length to the nearest meter
and tested using the Director® Hitman-200, resonance acoustic instrument, to obtain log
resonance acoustic velocity (LRAV, Carter et al. 2005, Chauhan and Walker 2006).
Disks with 5 cm thickness were cut from each felled tree at each predetermined segment
(Stump, BH, TF16, and TOP). In total, 56 disks, half from control trees and half from
nitrogen fertilized trees, were obtained and transported to the laboratory.
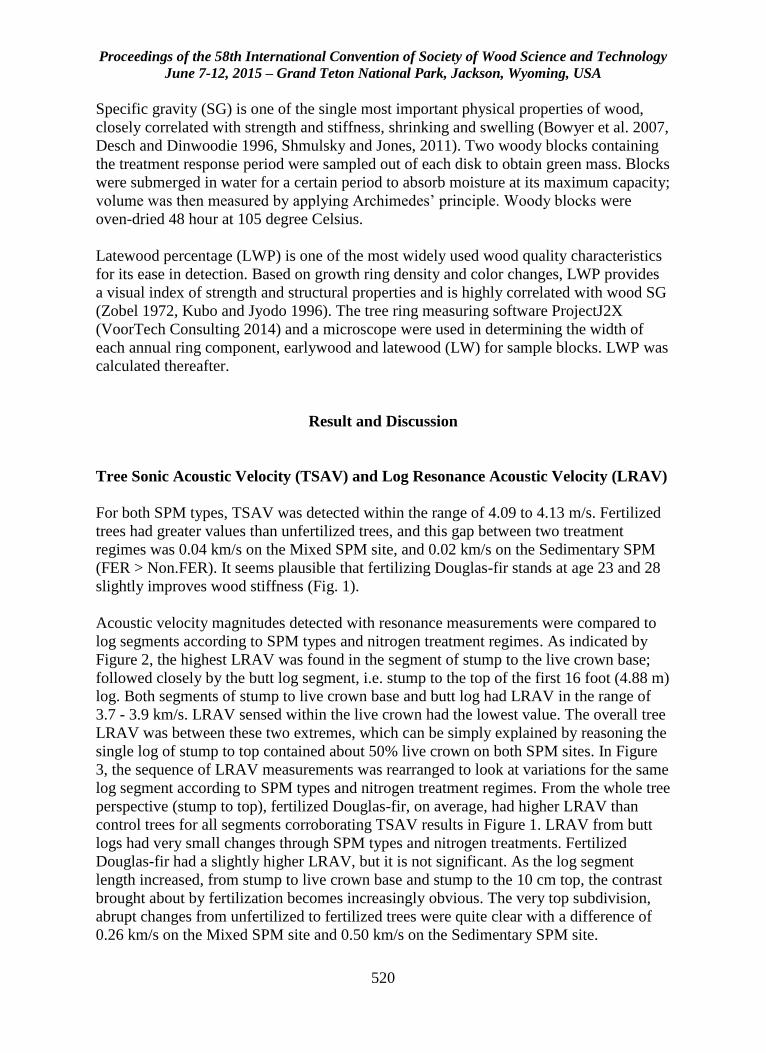
Proceedings of the 58th International Convention of Society of Wood Science and Technology
June 7-12, 2015 – Grand Teton National Park, Jackson, Wyoming, USA
520
Specific gravity (SG) is one of the single most important physical properties of wood,
closely correlated with strength and stiffness, shrinking and swelling (Bowyer et al. 2007,
Desch and Dinwoodie 1996, Shmulsky and Jones, 2011). Two woody blocks containing
the treatment response period were sampled out of each disk to obtain green mass. Blocks
were submerged in water for a certain period to absorb moisture at its maximum capacity;
volume was then measured by applying Archimedes’ principle. Woody blocks were
oven-dried 48 hour at 105 degree Celsius.
Latewood percentage (LWP) is one of the most widely used wood quality characteristics
for its ease in detection. Based on growth ring density and color changes, LWP provides
a visual index of strength and structural properties and is highly correlated with wood SG
(Zobel 1972, Kubo and Jyodo 1996). The tree ring measuring software ProjectJ2X
(VoorTech Consulting 2014) and a microscope were used in determining the width of
each annual ring component, earlywood and latewood (LW) for sample blocks. LWP was
calculated thereafter.
Result and Discussion
Tree Sonic Acoustic Velocity (TSAV) and Log Resonance Acoustic Velocity (LRAV)
For both SPM types, TSAV was detected within the range of 4.09 to 4.13 m/s. Fertilized
trees had greater values than unfertilized trees, and this gap between two treatment
regimes was 0.04 km/s on the Mixed SPM site, and 0.02 km/s on the Sedimentary SPM
(FER > Non.FER). It seems plausible that fertilizing Douglas-fir stands at age 23 and 28
slightly improves wood stiffness (Fig. 1).
Acoustic velocity magnitudes detected with resonance measurements were compared to
log segments according to SPM types and nitrogen treatment regimes. As indicated by
Figure 2, the highest LRAV was found in the segment of stump to the live crown base;
followed closely by the butt log segment, i.e. stump to the top of the first 16 foot (4.88 m)
log. Both segments of stump to live crown base and butt log had LRAV in the range of
3.7 - 3.9 km/s. LRAV sensed within the live crown had the lowest value. The overall tree
LRAV was between these two extremes, which can be simply explained by reasoning the
single log of stump to top contained about 50% live crown on both SPM sites. In Figure
3, the sequence of LRAV measurements was rearranged to look at variations for the same
log segment according to SPM types and nitrogen treatment regimes. From the whole tree
perspective (stump to top), fertilized Douglas-fir, on average, had higher LRAV than
control trees for all segments corroborating TSAV results in Figure 1. LRAV from butt
logs had very small changes through SPM types and nitrogen treatments. Fertilized
Douglas-fir had a slightly higher LRAV, but it is not significant. As the log segment
length increased, from stump to live crown base and stump to the 10 cm top, the contrast
brought about by fertilization becomes increasingly obvious. The very top subdivision,
abrupt changes from unfertilized to fertilized trees were quite clear with a difference of
0.26 km/s on the Mixed SPM site and 0.50 km/s on the Sedimentary SPM site.
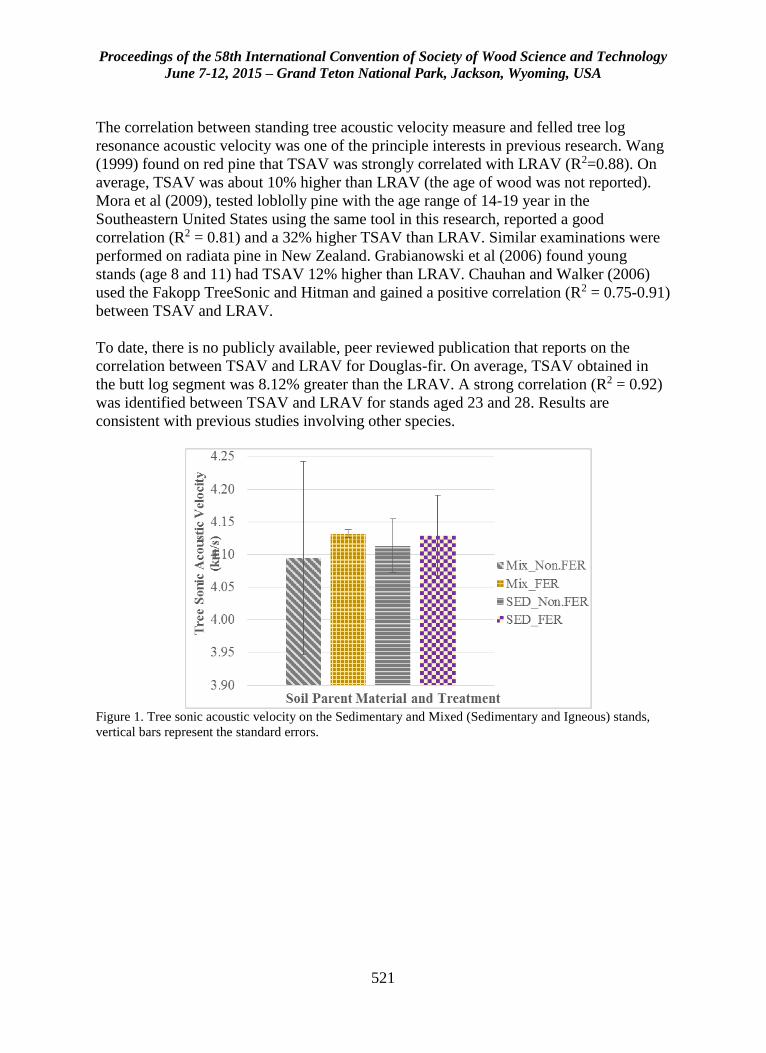
Proceedings of the 58th International Convention of Society of Wood Science and Technology
June 7-12, 2015 – Grand Teton National Park, Jackson, Wyoming, USA
521
The correlation between standing tree acoustic velocity measure and felled tree log
resonance acoustic velocity was one of the principle interests in previous research. Wang
(1999) found on red pine that TSAV was strongly correlated with LRAV (R2=0.88). On
average, TSAV was about 10% higher than LRAV (the age of wood was not reported).
Mora et al (2009), tested loblolly pine with the age range of 14-19 year in the
Southeastern United States using the same tool in this research, reported a good
correlation (R2 = 0.81) and a 32% higher TSAV than LRAV. Similar examinations were
performed on radiata pine in New Zealand. Grabianowski et al (2006) found young
stands (age 8 and 11) had TSAV 12% higher than LRAV. Chauhan and Walker (2006)
used the Fakopp TreeSonic and Hitman and gained a positive correlation (R2 = 0.75-0.91)
between TSAV and LRAV.
To date, there is no publicly available, peer reviewed publication that reports on the
correlation between TSAV and LRAV for Douglas-fir. On average, TSAV obtained in
the butt log segment was 8.12% greater than the LRAV. A strong correlation (R2 = 0.92)
was identified between TSAV and LRAV for stands aged 23 and 28. Results are
consistent with previous studies involving other species.
Figure 1. Tree sonic acoustic velocity on the Sedimentary and Mixed (Sedimentary and Igneous) stands,
vertical bars represent the standard errors.
Proceedings of the 58th International Convention of Society of Wood Science and Technology
June 7-12, 2015 – Grand Teton National Park, Jackson, Wyoming, USA
522
Figure 2. Log resonance acoustic velocity sorted by log position with the combination of soil parent material
and fertilization regimes, vertical bars represent the standard errors.
Figure 3. Log resonance acoustic velocity for Soil Parent Material and fertilization treatment combinations
according to log position, vertical bars represent the standard errors.
Specific Gravity (SG) and Latewood Percentage (LWP)
Specific gravity, and latewood percentage for the treated period were measured through
wood blocks obtained from 56 disks from sample trees.
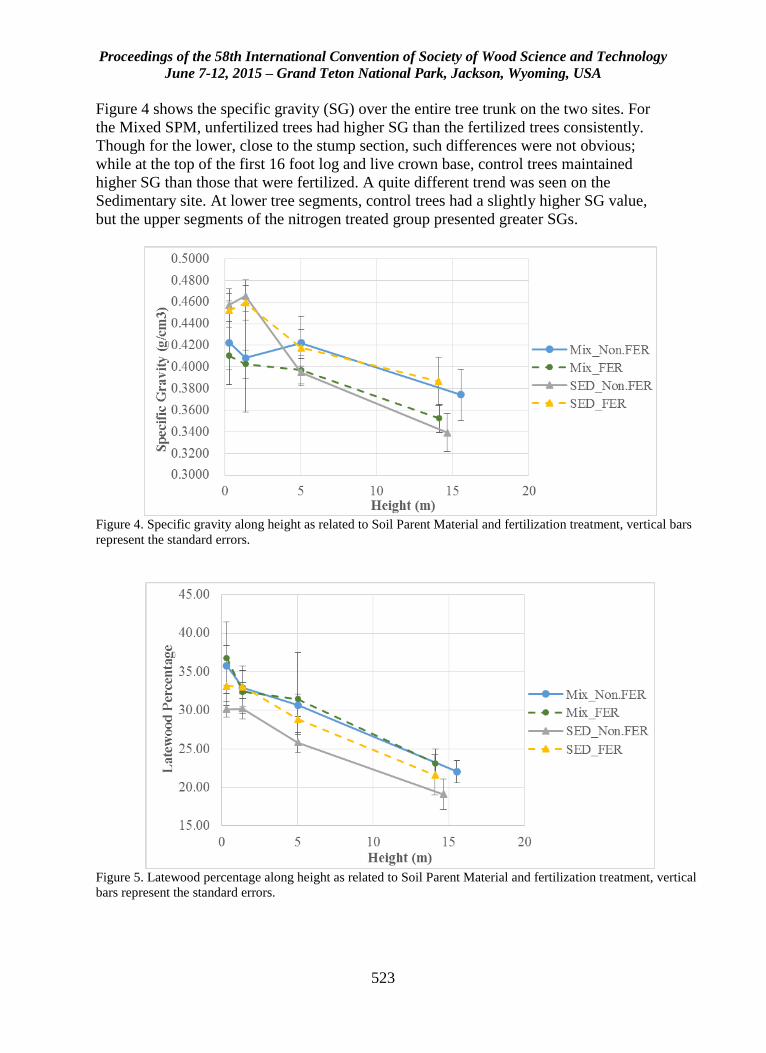
Proceedings of the 58th International Convention of Society of Wood Science and Technology
June 7-12, 2015 – Grand Teton National Park, Jackson, Wyoming, USA
523
Figure 4 shows the specific gravity (SG) over the entire tree trunk on the two sites. For
the Mixed SPM, unfertilized trees had higher SG than the fertilized trees consistently.
Though for the lower, close to the stump section, such differences were not obvious;
while at the top of the first 16 foot log and live crown base, control trees maintained
higher SG than those that were fertilized. A quite different trend was seen on the
Sedimentary site. At lower tree segments, control trees had a slightly higher SG value,
but the upper segments of the nitrogen treated group presented greater SGs.
Figure 4. Specific gravity along height as related to Soil Parent Material and fertilization treatment, vertical bars
represent the standard errors.
Figure 5. Latewood percentage along height as related to Soil Parent Material and fertilization treatment, vertical
bars represent the standard errors.
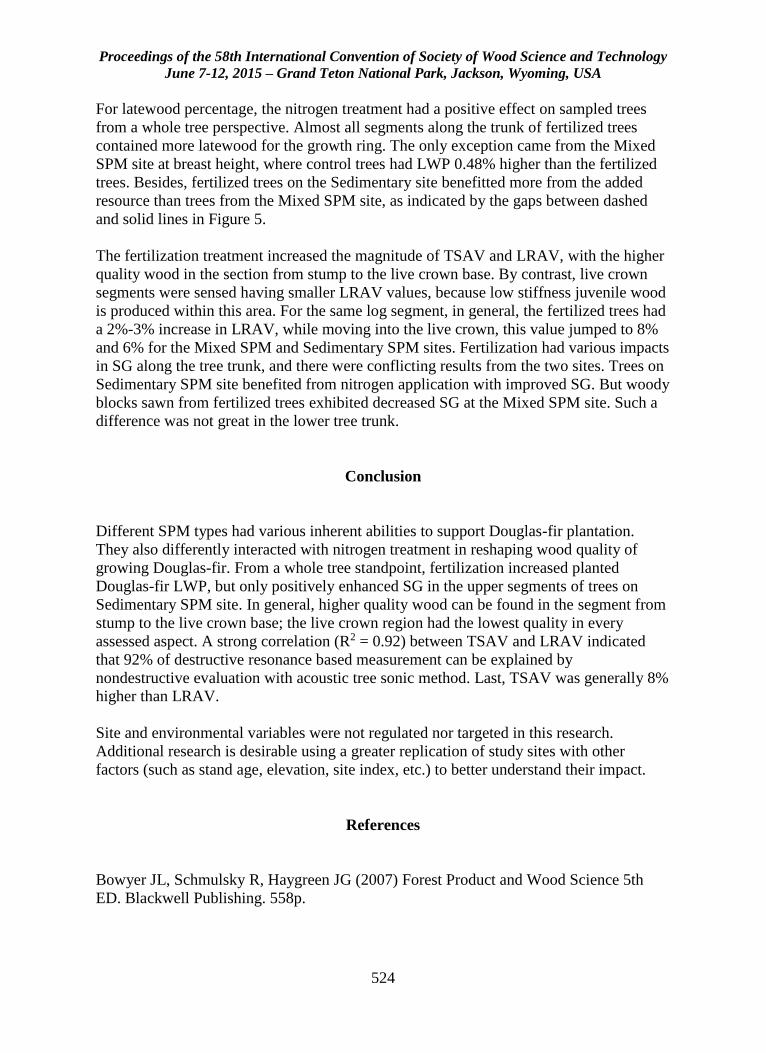
Proceedings of the 58th International Convention of Society of Wood Science and Technology
June 7-12, 2015 – Grand Teton National Park, Jackson, Wyoming, USA
524
For latewood percentage, the nitrogen treatment had a positive effect on sampled trees
from a whole tree perspective. Almost all segments along the trunk of fertilized trees
contained more latewood for the growth ring. The only exception came from the Mixed
SPM site at breast height, where control trees had LWP 0.48% higher than the fertilized
trees. Besides, fertilized trees on the Sedimentary site benefitted more from the added
resource than trees from the Mixed SPM site, as indicated by the gaps between dashed
and solid lines in Figure 5.
The fertilization treatment increased the magnitude of TSAV and LRAV, with the higher
quality wood in the section from stump to the live crown base. By contrast, live crown
segments were sensed having smaller LRAV values, because low stiffness juvenile wood
is produced within this area. For the same log segment, in general, the fertilized trees had
a 2%-3% increase in LRAV, while moving into the live crown, this value jumped to 8%
and 6% for the Mixed SPM and Sedimentary SPM sites. Fertilization had various impacts
in SG along the tree trunk, and there were conflicting results from the two sites. Trees on
Sedimentary SPM site benefited from nitrogen application with improved SG. But woody
blocks sawn from fertilized trees exhibited decreased SG at the Mixed SPM site. Such a
difference was not great in the lower tree trunk.
Conclusion
Different SPM types had various inherent abilities to support Douglas-fir plantation.
They also differently interacted with nitrogen treatment in reshaping wood quality of
growing Douglas-fir. From a whole tree standpoint, fertilization increased planted
Douglas-fir LWP, but only positively enhanced SG in the upper segments of trees on
Sedimentary SPM site. In general, higher quality wood can be found in the segment from
stump to the live crown base; the live crown region had the lowest quality in every
assessed aspect. A strong correlation (R2 = 0.92) between TSAV and LRAV indicated
that 92% of destructive resonance based measurement can be explained by
nondestructive evaluation with acoustic tree sonic method. Last, TSAV was generally 8%
higher than LRAV.
Site and environmental variables were not regulated nor targeted in this research.
Additional research is desirable using a greater replication of study sites with other
factors (such as stand age, elevation, site index, etc.) to better understand their impact.
References
Bowyer JL, Schmulsky R, Haygreen JG (2007) Forest Product and Wood Science 5th
ED. Blackwell Publishing. 558p.
Proceedings of the 58th International Convention of Society of Wood Science and Technology
June 7-12, 2015 – Grand Teton National Park, Jackson, Wyoming, USA
525
Carter P, Briggs D, Ross RJ, Wang X (2005) Acoustic testing to enhance western forest
values and meet customer wood quality needs. PNW-GTR-642. IN: Harrington, C.A.,
Schoenholtz, S.H. (eds.). Productivity of western forests: A forest products focus. USDA
Forest Service, Pacific Northwest Research Station, Portland, pp 121-129.
Chauhan SS, Walker JCF (2006) Variation in acoustic velocity and density with age, and
their interrelationships in radiata pine. Forest Ecology and Management. 229: 388-394.
Desch HE, Dinwoodie JM (1996) Timber: structure, properties, conversion and use. 7th
ED. Macmillan Press LTD., London. 306p.
Grabianowski M, Manley B, Walker JCF (2006) Acoustic measurements on standing
trees, logs and green lumber. Wood Science and Technology. 40: 205-216.
Hanson PJ, Weltzin JF (2000) Drought disturbance from climate change: response of
United States forests. The Science of the Total Environment. 262 (2000) 205-220.
Keeney DR (1980) Prediction of soil nitrogen availability in forest ecosystems: a
literature review. Forest Science. 26: 159-171.
King JE (1966) Site index curves for Douglas-fir in the Pacific Northwest. Weyerhaeuser
Forestry Paper, No. 8, Weyerhaeuser Co., Forestry Research Center, Centralia, WA.
Kubo T, Jyodo S (1996) Characteristics of the annual ring structure related to wood
density variation in sugi (Cryptomerica japonica). Mokuzai Gakkaishi, 42: 1156-1162.
LeBauer DS, Treseder KK (2008) Nitrogen limitation of net primary productivity in
terrestrial ecosystems is globally distributed. Ecology. 89: 371-379.
Littke KM, Harrison RB, Briggs DG, Grider AR (2011) Understanding soil nutrients and
characteristics in the Pacific Northwest through parent material origin and soil nutrient
regimes. Canadian Journal of Forest Research. Vol.41: 2001-2008.
Mora CR, Schimleck LR, Isik F, Mahon JM Jr, Clark III, A, Daniels RF (2009)
Relationships between acoustic variables and different measures of stiffness in standing
Pinus taeda trees. Canadian Journal of Forest Research 39: 1421-1429.
Shmulsky R, Jones PD (2011) Forest Products and Wood Science. 6th ED. 576p.
Thienel GAC (2008) Nondestructive evaluation of wood quality in standing Douglas-fir
trees in western Washington and western Oregon. Master thesis. College of Forest
Resources, University of Washington, Seattle, WA.
The National Geological Map Database. 2010. U.S. Geological Survey:
http://ngmdb.usgs.gov/ngmdb/ngmdb_home.html

Proceedings of the 58th International Convention of Society of Wood Science and Technology
June 7-12, 2015 – Grand Teton National Park, Jackson, Wyoming, USA
526
Wang X (1999) Stress wave-based nondestructive evaluation (NDE) methods for wood
quality of standing trees. Doctor dissertation. School of Forest Resources and
Environmental Science, Michigan Technological University, Houghton, MI.
Zobel BJ (1972) Three rings-per-inch dense southern pine-can it be developed. Journal of
Forestry. 70: 333-335.
Acknowledgement
The authors would like to thank Bob Gonyea, Bert Hasselberg, Randy Collier, Kim
Littke, Monica Seeley and Armin Farahmandnia for their great assistance. Special thanks
to the Stand Management Cooperative, Center for Intensive Planted-forest Silviculture,
and USDA Forest Service PNW Research Station for resource support.
Proceedings of the 58th International Convention of Society of Wood Science and Technology
June 7-12, 2015 – Grand Teton National Park, Jackson, Wyoming, USA
527
Multi-scale Investigation of Adhesive Bond Durability
Paige McKinley, [email protected]
Oregon State University, 119 Richardson Hall , Wood Science and
Engineering, Corvallis, OR 97331
Abstract
Moisture durability is essential for wood composite products, especially those used in
building construction, where products are prone to weathering. The main focus of this
research is to determine if adhesive penetration into the cell wall has a positive influence
on bond durability. This study uses bonded Douglas-fir test specimens (6mmx14 mmx64
mm), varying in bonded surface cell type (earlywood vs. latewood), bonded surface
orientation (longitudinal vs. tangential), and adhesive type. The adhesives of interest are a
low and high molecular weight phenol-formaldehyde, along with a pre-polymeric
diphenylmethane diiscoyanate. Half of each type of test specimen undergoes accelerated
weathering and the rest remain dry. All samples are mechanically tested in lap shear. The
maximum load is recorded along with the stress and strain around the bondline, using
Digital Image Correlation (DIC). Smaller samples (2mmx2mmx10mm) are cut from the
same previously tested samples and then scanned at the Advanced Photon Source using
micro X-ray Computed Tomography (XCT). All adhesive types were previously tagged
with iodine to increase contrast during scans. This technique gives high resolution
(1.3µm²/voxel), 3D images for which cell wall penetration can be analyzed at both the
micrometer and nanometer scale. The mechanical test results, DIC results, and XCT
images of the weathered vs. dry samples will be compared and used to quantitatively
measure the effects of moisture on the bondline.
Proceedings of the 58th International Convention of Society of Wood Science and Technology
June 7-12, 2015 – Grand Teton National Park, Jackson, Wyoming, USA
528
Dimensional Optimization of Beetle Kill Pine
Interlocking Cross Laminated Timber (ICLT).
Massih Nilforoushan Hamedani, [email protected]
Ryan Smith, [email protected]
Ben Hagenhofer-Daniell, [email protected]
University of Utah, 375 S. 1530 E. RM 236 , Salt Lake City, UT 84112
Abstract
Moisture content is a critical factor for dimensional stability in engineered wood
products. This paper focuses on one such product: Interlocking Cross Laminated Timber
fabricated with beetle killed pine from the intermountain west. This research engages in
supply chain mapping, and the co-relational assessment of drying techniques that can
lower moisture content to a consistent level for dimensional stability and performance of
the product. The research will ultimately suggest a drying regime in-line with existing
supply chains that is optimized for economy, schedule, and repeatability. While the focus
is on a regionally specific timber resource and engineered timber product, the lessons
learned should be applicable to engineered solid timber products generally. This research
will also establish a framework for evaluating the management of moisture content in
timber resources beyond beetle killed pine. In order to assess the drying phases in current
supply chains, different intermountain supply chain strategies have been studied based on
information from local sawmills and logging companies. Different approaches to dry
solid timber products based on determined supply chains have been evaluated to develop
efficient supply chain options to increase the opportunities for further commercialization
of ICLT and other solid timber products in the USA.

Proceedings of the 58th International Convention of Society of Wood Science and Technology
June 7-12, 2015 – Grand Teton National Park, Jackson, Wyoming, USA
529
Effects of Cement Strength Grade and Particle Content
on the Compressive Strength of Bamboo-Cement
Composites
Olayiwola H.O1*, Adesope A.S2, Adefisan O.O3
1Postgrad, Department of Agricultural and Environmental Engineering,
Wood Products Engineering Unit, University of Ibadan, Nigeria *Corresponding author:
[email protected] 2Research Officer, Forestry Research Institute of Nigeria,
Forest Product Development and Utilization Unit 3Senior Lecturer, Department of Agricultural and Environmental
Engineering, Wood Products Engineering Unit, University of Ibadan,
Nigeria
Abstract
Escalating cost of conventional building materials and rapid population growth has led to
acute shortage of housing units in developing nations; hence, the need for alternative low-
cost and durable building materials. This study determined the influence of cement grade,
particle content and chemical additive on the compressive strength of bamboo-cement
composites.
Laboratory type 35mm-thick (cube) cement-bonded composites were made from particles
derived from bamboo (Bambusa vulgaris). The proportion of cement, sand, stone-dust
was done by weight in a nominal mix of 1:2:4. The particle content was substituted based
on sand proportion. Two levels of the production variables were employed in the
production. These are chemical additive (0% and 3%), particle content (10% and 20%),
particle size (850µm and 1.18mm) and cement strength grade (32,5R and 42,5R).
Composites encapsulated with 42,5R cement had better strength from 1.16 to 3.02
N/mm2 and 1.65 to 4.76 N/mm2 at 0% and 3% chemical additive respectively. There was
an inverse relationship between the particle content and compressive strength for both
cement types and particle sizes.
The results indicated that composites produced with cement grade 42,5R at 3%CaCl2,
10% particle content and 1.18mm particle size have higher compressive strength than
those produced with cement grade 35,5R.

Proceedings of the 58th International Convention of Society of Wood Science and Technology
June 7-12, 2015 – Grand Teton National Park, Jackson, Wyoming, USA
530
Keywords; Low-cost building material, bamboo-cement composites, cement grade,
particle content and compressive strength
Proceedings of the 58th International Convention of Society of Wood Science and Technology
June 7-12, 2015 – Grand Teton National Park, Jackson, Wyoming, USA
531
Moisture Stability of Post-manufacture Thermally
Modified Welded Birch (Betula pendula L.) Wood
Jussi Ruponen, [email protected]
Aalto University, Tekniikantie 3, Vuorimiehentie 1, Espoo FI-00076
Abstract
Welding of wood provides strong wood-to-wood bonding without adhesives. However,
the bonds suffer from delamination when exposed to moist conditions. Therefore, this
work studies if the delamination tendency of linear-friction welded wood bonds in birch
(Betula pendula L.) could be reduced by post-manufacture thermal modification.
According to the hypotheses, firstly, the bond line in birch wood has unsatisfactory water
resistance and poor bond strength in moist conditions. Secondly, water resistance, or wet
strength, could be maintained above certain level through thermal modification, yet
below the level of non-modified welded wood, when immersed in water. The work
included linear-friction welding of birch, thermal modification (at 200°C for 3 h and 5 h)
under superheated steam in atmospheric pressure, determination of anti-swelling
efficiency (ASE), internal bond (IB) strength testing, and water immersion to observe
delamination behavior. Thermal modification improved the dimensional stability,
resulting ASE values ranging from 25.9% to 38.0%. The IB strength in dry condition
decreased as the thermal modification, yet yielding a value closer to wet. During water
immersion, the non-modified specimens suffered from delamination more compared to
thermally modified. Results indicate thermal modification could be applied to stabilize
the welded bond lines, but the process needs optimization, for instance, to insure
scalability and to minimize the loss in strength properties.
Proceedings of the 58th International Convention of Society of Wood Science and Technology
June 7-12, 2015 – Grand Teton National Park, Jackson, Wyoming, USA
532
Effect of Cross-Laminated Timber Floor Diaphragm
Orientation on Shear Stiffness and Strength
Kyle Sullivan
CCE School and WSE Department, Oregon State University
Abstract
Cross-‐laminated timber (CLT) brings the forest industry to new heights with its
ability to build taller wooden structures. Wood buildings in the US have
typically and historically been light-‐ frame wood construction under five
stories. CLT provides the structural strengths and stiffnesses to potentially
replace steel and reinforced concrete in more environmentally sustainable
structural systems for mid-‐rise and possibly high-‐rise buildings. The “Toward
Taller Wood Buildings” national symposium (November, 2014, Chicago, IL)
brought together a group of leaders, firms, and organizations that are already
deeply involved with the development of CLT in the US.
Two researchers who attended the symposium had a significant impact on the
proposed direction of the research. Doug Rammer, Research General Engineer at
the US Forest Service, and John van de Lindt, Professor at Colorado State
University, both feel strongly that looking at how CLT floor diaphragms transfer
lateral loads would lead to design provisions in the National Design Specification for
Wood Construction and the IBC. CLT floor diaphragms experience lateral loading
along both their strong and weak axes depending on the direction of earthquake
ground motions or wind loadings and on the orientation of the panels. We will
determine how lateral loads parallel to either axes are transferred through the
diaphragm due to different strengths and stiffnesses in the two directions. The goal
is also to develop preliminary estimates of design values for shear strength and
stiffness based on ASTM E455, so that structural engineers will be able to
confidently use CLT in lateral-‐force-‐resisting systems.

Proceedings of the 58th International Convention of Society of Wood Science and Technology
June 7-12, 2015 – Grand Teton National Park, Jackson, Wyoming, USA
533
Trends in U.S Furniture Trade
Cagatay Tasdemir, [email protected]
Rado Gazo, [email protected]
Purdue University, 2491 Sycamore Ln., Apt 6, West Lafayette, IN 47906
Abstract
The US and global economy has experienced both a downturn and a recovery over the
last decade. The objective of this study is to analyze trends in imports and exports of
furniture in the US over this period of time. We evaluate top ten furniture exporting
countries in terms of value and principal products. Main competitive strategies of
countries exporting furniture to the U.S. are identified and briefly explained within the
scope of this study by observing the changes in the values of last five years data. Taiwan
was one of the most important furniture exporters to the US until 1994, when the country
started to lose its power in the market due to the technological improvements made in
other Asian countries. Decreasing trend of Taiwan export values continued in last ten
years while Vietnam increased its share of the U.S. furniture market. Since 2004, China
was the most important source of imported wood furniture and accounts for over 48.5%
of total imports volume.
Overall, low-cost structure, government support and advanced technologies in Asia have
provided the Asian countries with competitive advantage over their European and
American competitors. Hence, lower price of imported products has been the main
influential and decisive factor for furniture consumers in U.S. and set the benchmark for
manufacturers in terms of competitive advantages
Proceedings of the 58th International Convention of Society of Wood Science and Technology
June 7-12, 2015 – Grand Teton National Park, Jackson, Wyoming, USA
534
Manufacturing and Mechanical Characterization of a
3D Molded Core Strand Panel
Daniel Way
Oregon State University, Corvallis, OR
Abstract
Three dimensionally (3D) molded core panels consist of two components: A core that is
molded in a repeating structure that contains hollow areas and skins which make up the
outer portion of the panel. These panels have been of interest to the wood composites
community because of their ability to utilize low value materials, but have yet to enter the
building construction materials market due to challenges in meeting necessary
mechanical requirements for structural use.
The design of 3D molded core panels is unique compared to commercially available
wood composite panels in that they behave more like a beam with the core acting as a
load transfer mechanism between the high strength skins. Air space in the hollow core
provides additional insulation but can also be designed to allow passage of hot air from
attic spaces. Air space also lowers the thickness to weight ratio meaning that panels of
greater depth may be produced without hindering jobsite handling. Unlike their solid
composite panel counterparts, the two part core and skin system generally results in non-
catastrophic failures.
This study investigates the use of wood strands for forming a molded core on the premise
that wood strands typically have favorable mechanical properties opposed to their fiber
and particle counterparts. Cores were molded using furnish typical of oriented strand
board (OSB) and a proprietary core mold supplied by our industrial partner and
commercially available OSB as skin material. Panels were tested for key mechanical
properties to determine their adequacy for use as a structural sheathing material.
Keywords: 3D molded core panel, strand composites, structural sheathing, sandwich
panels
Proceedings of the 58th International Convention of Society of Wood Science and Technology
June 7-12, 2015 – Grand Teton National Park, Jackson, Wyoming, USA
535
Self-Activation Process for Biomass Based Activated
Carbon
Changlei Xia 1 – Sheldon Q. Shi 2*
1 PhD Candidate, Department of Mechanical and Energy Engineering,
University of North Texas, Denton, TX 76203, USA.
2 Associate Professor, Department of Mechanical and Energy Engineering,
University of North Texas, Denton, TX 76203, USA.
* Corresponding Author
Abstract
Self-activation takes the advantages of the gases emitted from the pyrolysis process of
biomass to activate the converted carbon, so that a high performance activated carbon is
obtained. Different biomass types were used for the self-activation processes into
activated carbon, including kenaf bast fiber, kenaf core, sugarcane bagasse, sugarcane
leaf, coconut fiber, peanut shell, and sawdust. A linear relationship was shown between
the BET surface area (SABET) and the yield (ln(SABET) and yield) for the self-activation
process. The study also showed that a yield of 9.0% gave the highest surface area by
gram kenaf core (115.3 m2 per gram kenaf core), and the yields between 5.5%-13.8%
produced a surface area per gram kenaf core that higher than 90% of the maximum.
Keywords: Self-activation, activated carbon, biomass, kenaf core
Proceedings of the 58th International Convention of Society of Wood Science and Technology
June 7-12, 2015 – Grand Teton National Park, Jackson, Wyoming, USA
536
Hybrid Cellulose-Copper Nanoparticles Embedded in
Polyvinyl Alcohol for Antimicrobial Applications
Tuhua Zhong1 - Gloria S. Oporto2* - Jacek Jaczynski3 - Changle Jiang1
1 PhD student, Division of Forestry and Natural Resources,
West Virginia University, Morgantown, WV 26506.
2 Assistant Professor, Division of Forestry and Natural Resources,
West Virginia University, Morgantown, WV 26506.
* Corresponding author
3 Associate Professor, Division of Animal and Nutritional Sciences,
West Virginia University, Morgantown, WV 26506.
Abstract. Copper nanoparticles on TEMPO nanofibrillated cellulose (TNFC) and on
carboxymethyl cellulose (CMC) templates were successfully synthesized. Polyvinyl
alcohol (PVA) films embedded with the resulting hybrids of cellulose-copper
nanoparticles were prepared by solvent casting method. Antimicrobial testing
demonstrated that both PVA composite films have excellent antimicrobial properties
against E.coli DH 5Approximately 90% less cellulosic material was required when
using TNFC as template compared to CMC template to get similar films antimicrobial
performance. The maximum thermal decomposition temperature of the films increased
18 and 25 when TNFC-copper nanoparticles and CMC-copper nanoparticles were
incorporated into the films. Likely, compared to pure PVA, the storage modulus at 48
resulted enhanced up to 164% and 217% after the incorporation of the hybrid materials.
The results shows that both hybrid cellulose-copper nanoparticles materials have
potentiality to be used as advanced antimicrobial and reinforcing materials for
thermoplastic composite applications.
Keywords: TEMPO nanofibrillated cellulose, Carboxymethyl cellulose, Polyvinyl
alcohol, copper nanoparticles, antimicrobial properties, reinforcement material.
Proceedings of the 58th International Convention of Society of Wood Science and Technology
June 7-12, 2015 – Grand Teton National Park, Jackson, Wyoming, USA
537
Nano to Macro Scale Wooden Composites Session Moderator: Levente Dénes, University of West Hungary,
Hungary
Grafted Α-Cellulose - Poly(3-Hydroxybutyrate-Co-3-
Hydroxyvalerate) Biocomposites
Armando McDonald, [email protected]
Wei Liqing, [email protected]
University of Idaho, 875 Perimeter Drive , MSC1132, Moscow, ID 83844
Abstract
In this study, a green biocomposite from the bacterial bioplastic, poly(3-hydroxybutyrate-
co-3-hydroxyvalerate) (PHBV), and α-cellulose fibers was prepared. The α-cellulose
fibers were isolated from at-risk intermountain lodgepole pine wood by successive
removing of extractives, lignin and hemicellulose. Grafting of PHBV onto cellulose was
carried out by reactive extrusion using dicumyl peroxide free radical initiation at 175°C.
The biocomposites were characterized by scanning electron microscopy (SEM) and
dynamic mechanical analysis (DMA) and showed good interfacial bonding and
compatibility between the two phases. The crystallinity of PHBV and cellulose in the
biocomposite were reduced as determined by X-ray diffraction (XRD), differential
scanning calorimetry (DSC) and Fourier transform infrared spectroscopy (FTIR)
analyses. The mechanical properties of the biocomposites were improved by cross-
linking due to better stress transfer between the two interphases as compared to the blend
control composite without adding peroxide. This inline process offers an effective
approach to improve biocomposite materials by reactive extrusion.
Proceedings of the 58th International Convention of Society of Wood Science and Technology
June 7-12, 2015 – Grand Teton National Park, Jackson, Wyoming, USA
538
Effect of TEMPO Nanofibrillated Cellulose Content on
Copper Release from Antimicrobial Polyvinyl Alcohol
Films
Changle Jiang 1 – Gloria S. Oporto2* – Tuhua Zhong1 – Jacek Jaczynski3
1 PhD student, Division of Forestry and Natural Resources,
West Virginia University, Morgantown WV, USA 2 Assistant Professor, Division of Forestry and Natural Resources,
West Virginia University, Morgantown WV, USA
* Corresponding author
[email protected] 3 Associate Professor, Division of Animal and Nutrition Science,
West Virginia University, Morgantown WV, USA
Abstract
The long-term goal of our research is to develop a novel antimicrobial film with
controlled release of the active agent. In this work, copper nanoparticles (CuNPs) were
synthesized on TEMPO nanofibrillated cellulose (TNFC) using a chemical reduction
method. Polyvinyl alcohol (PVA) composite films were prepared by incorporating this
TNFC-CuNPs hybrid material into the PVA matrices using a solvent casting process.
Copper release from the final films was determined using Inductively Coupled Plasma
Optical Emission Spectroscopy (ICP-OES). The final PVA/TNFC-CuNPs films with
different TNFC concentration were investigated for copper release rate. The
antimicrobial properties of PVA/TNFC-CuNPs film was conducted against
nonpathogenic Escherichia coli (E. coli). The copper release measurement show that the
release rate drops when TNFC concentration increases.
Keywords: TEMPO nanofibrillated cellulose, copper nanoparticles, copper release,
antimicrobial films.
Introduction
Copper is considered a broad spectrum antimicrobial agent capable of inhibiting bacteria
(Jia et al 2012; Ruparelia et al 2008) and fungi (Cioffi et al 2005). Currently, there is a
growing interest to synthesize copper nanoparticles (CuNPs) due to their higher specific
area and improved antimicrobial performance (Usman et al 2013; Palza 2015). Although,
there are many ways to get nanoscale copper, synthesizing it on a biopolymer became
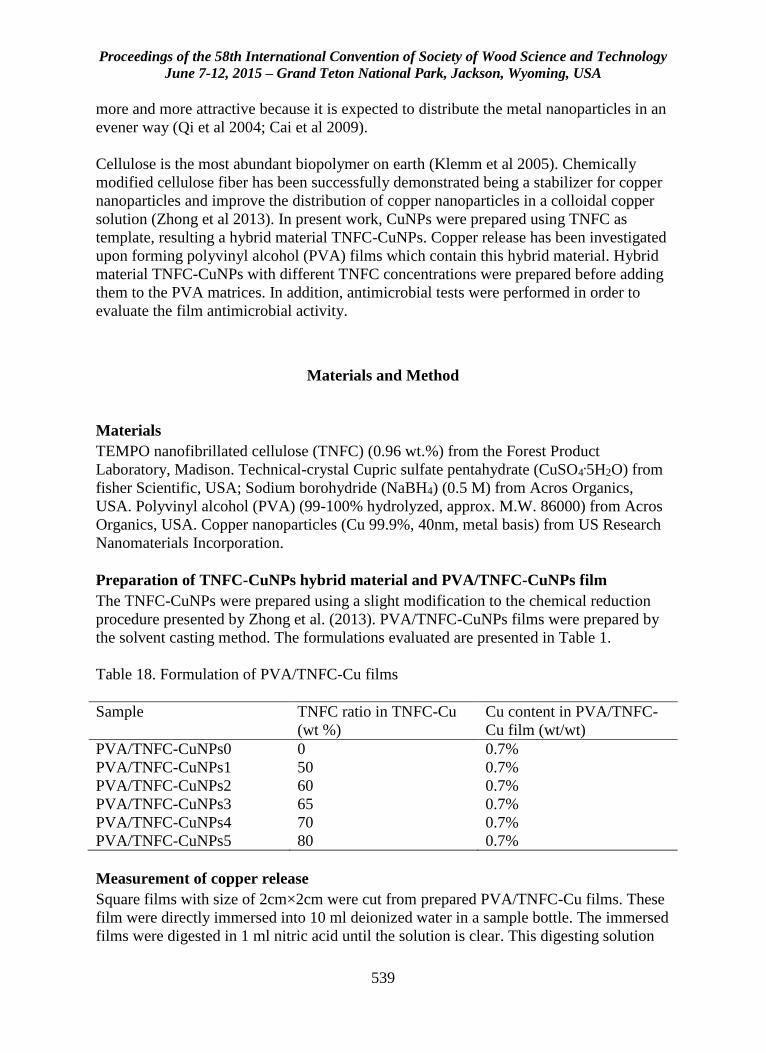
Proceedings of the 58th International Convention of Society of Wood Science and Technology
June 7-12, 2015 – Grand Teton National Park, Jackson, Wyoming, USA
539
more and more attractive because it is expected to distribute the metal nanoparticles in an
evener way (Qi et al 2004; Cai et al 2009).
Cellulose is the most abundant biopolymer on earth (Klemm et al 2005). Chemically
modified cellulose fiber has been successfully demonstrated being a stabilizer for copper
nanoparticles and improve the distribution of copper nanoparticles in a colloidal copper
solution (Zhong et al 2013). In present work, CuNPs were prepared using TNFC as
template, resulting a hybrid material TNFC-CuNPs. Copper release has been investigated
upon forming polyvinyl alcohol (PVA) films which contain this hybrid material. Hybrid
material TNFC-CuNPs with different TNFC concentrations were prepared before adding
them to the PVA matrices. In addition, antimicrobial tests were performed in order to
evaluate the film antimicrobial activity.
Materials and Method
Materials
TEMPO nanofibrillated cellulose (TNFC) (0.96 wt.%) from the Forest Product
Laboratory, Madison. Technical-crystal Cupric sulfate pentahydrate (CuSO4.5H2O) from
fisher Scientific, USA; Sodium borohydride (NaBH4) (0.5 M) from Acros Organics,
USA. Polyvinyl alcohol (PVA) (99-100% hydrolyzed, approx. M.W. 86000) from Acros
Organics, USA. Copper nanoparticles (Cu 99.9%, 40nm, metal basis) from US Research
Nanomaterials Incorporation.
Preparation of TNFC-CuNPs hybrid material and PVA/TNFC-CuNPs film
The TNFC-CuNPs were prepared using a slight modification to the chemical reduction
procedure presented by Zhong et al. (2013). PVA/TNFC-CuNPs films were prepared by
the solvent casting method. The formulations evaluated are presented in Table 1.
Table 18. Formulation of PVA/TNFC-Cu films
Sample TNFC ratio in TNFC-Cu
(wt %)
Cu content in PVA/TNFC-
Cu film (wt/wt)
PVA/TNFC-CuNPs0 0 0.7%
PVA/TNFC-CuNPs1 50 0.7%
PVA/TNFC-CuNPs2 60 0.7%
PVA/TNFC-CuNPs3 65 0.7%
PVA/TNFC-CuNPs4 70 0.7%
PVA/TNFC-CuNPs5 80 0.7%
Measurement of copper release
Square films with size of 2cm×2cm were cut from prepared PVA/TNFC-Cu films. These
film were directly immersed into 10 ml deionized water in a sample bottle. The immersed
films were digested in 1 ml nitric acid until the solution is clear. This digesting solution
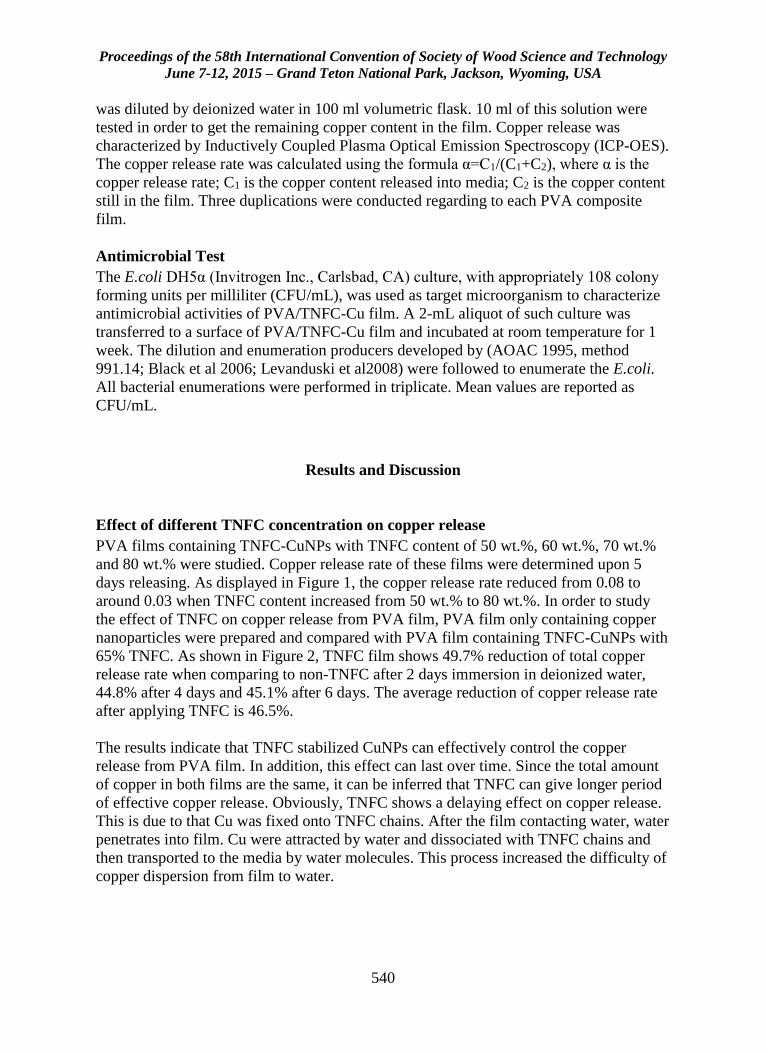
Proceedings of the 58th International Convention of Society of Wood Science and Technology
June 7-12, 2015 – Grand Teton National Park, Jackson, Wyoming, USA
540
was diluted by deionized water in 100 ml volumetric flask. 10 ml of this solution were
tested in order to get the remaining copper content in the film. Copper release was
characterized by Inductively Coupled Plasma Optical Emission Spectroscopy (ICP-OES).
The copper release rate was calculated using the formula α=C1/(C1+C2), where α is the
copper release rate; C1 is the copper content released into media; C2 is the copper content
still in the film. Three duplications were conducted regarding to each PVA composite
film.
Antimicrobial Test
The E.coli DH5α (Invitrogen Inc., Carlsbad, CA) culture, with appropriately 108 colony
forming units per milliliter (CFU/mL), was used as target microorganism to characterize
antimicrobial activities of PVA/TNFC-Cu film. A 2-mL aliquot of such culture was
transferred to a surface of PVA/TNFC-Cu film and incubated at room temperature for 1
week. The dilution and enumeration producers developed by (AOAC 1995, method
991.14; Black et al 2006; Levanduski et al2008) were followed to enumerate the E.coli.
All bacterial enumerations were performed in triplicate. Mean values are reported as
CFU/mL.
Results and Discussion
Effect of different TNFC concentration on copper release
PVA films containing TNFC-CuNPs with TNFC content of 50 wt.%, 60 wt.%, 70 wt.%
and 80 wt.% were studied. Copper release rate of these films were determined upon 5
days releasing. As displayed in Figure 1, the copper release rate reduced from 0.08 to
around 0.03 when TNFC content increased from 50 wt.% to 80 wt.%. In order to study
the effect of TNFC on copper release from PVA film, PVA film only containing copper
nanoparticles were prepared and compared with PVA film containing TNFC-CuNPs with
65% TNFC. As shown in Figure 2, TNFC film shows 49.7% reduction of total copper
release rate when comparing to non-TNFC after 2 days immersion in deionized water,
44.8% after 4 days and 45.1% after 6 days. The average reduction of copper release rate
after applying TNFC is 46.5%.
The results indicate that TNFC stabilized CuNPs can effectively control the copper
release from PVA film. In addition, this effect can last over time. Since the total amount
of copper in both films are the same, it can be inferred that TNFC can give longer period
of effective copper release. Obviously, TNFC shows a delaying effect on copper release.
This is due to that Cu was fixed onto TNFC chains. After the film contacting water, water
penetrates into film. Cu were attracted by water and dissociated with TNFC chains and
then transported to the media by water molecules. This process increased the difficulty of
copper dispersion from film to water.
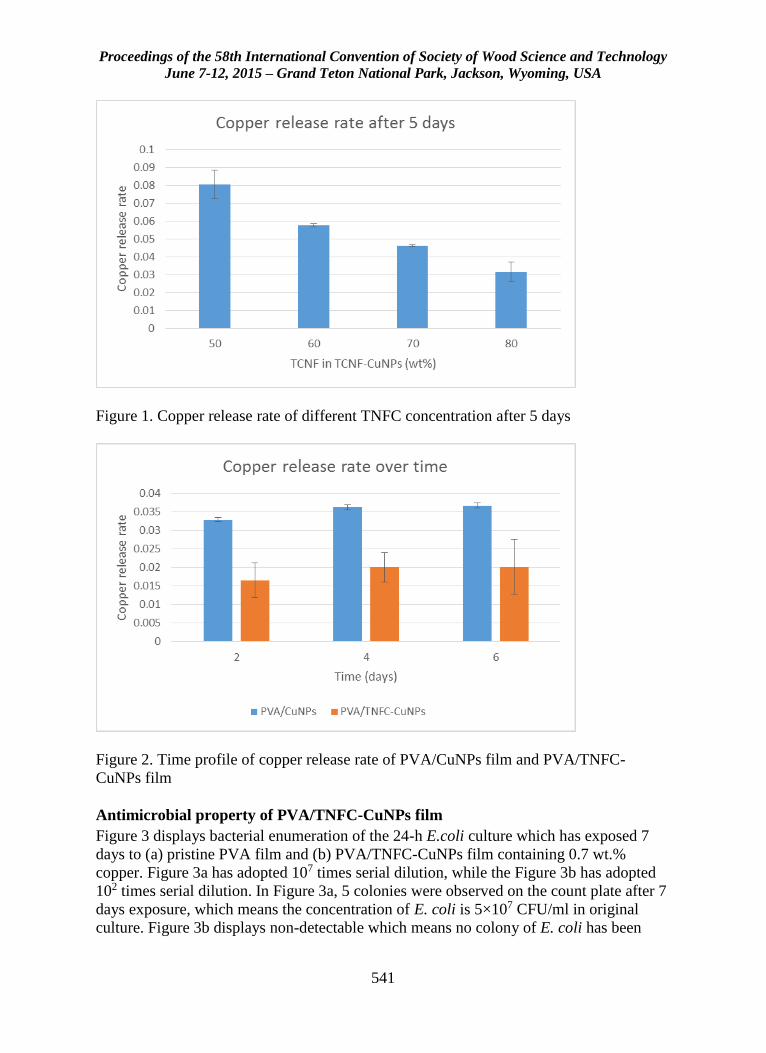
Proceedings of the 58th International Convention of Society of Wood Science and Technology
June 7-12, 2015 – Grand Teton National Park, Jackson, Wyoming, USA
541
Figure 1. Copper release rate of different TNFC concentration after 5 days
Figure 2. Time profile of copper release rate of PVA/CuNPs film and PVA/TNFC-
CuNPs film
Antimicrobial property of PVA/TNFC-CuNPs film
Figure 3 displays bacterial enumeration of the 24-h E.coli culture which has exposed 7
days to (a) pristine PVA film and (b) PVA/TNFC-CuNPs film containing 0.7 wt.%
copper. Figure 3a has adopted 107 times serial dilution, while the Figure 3b has adopted
102 times serial dilution. In Figure 3a, 5 colonies were observed on the count plate after 7
days exposure, which means the concentration of E. coli is 5×10⁷ CFU/ml in original
culture. Figure 3b displays non-detectable which means no colony of E. coli has been
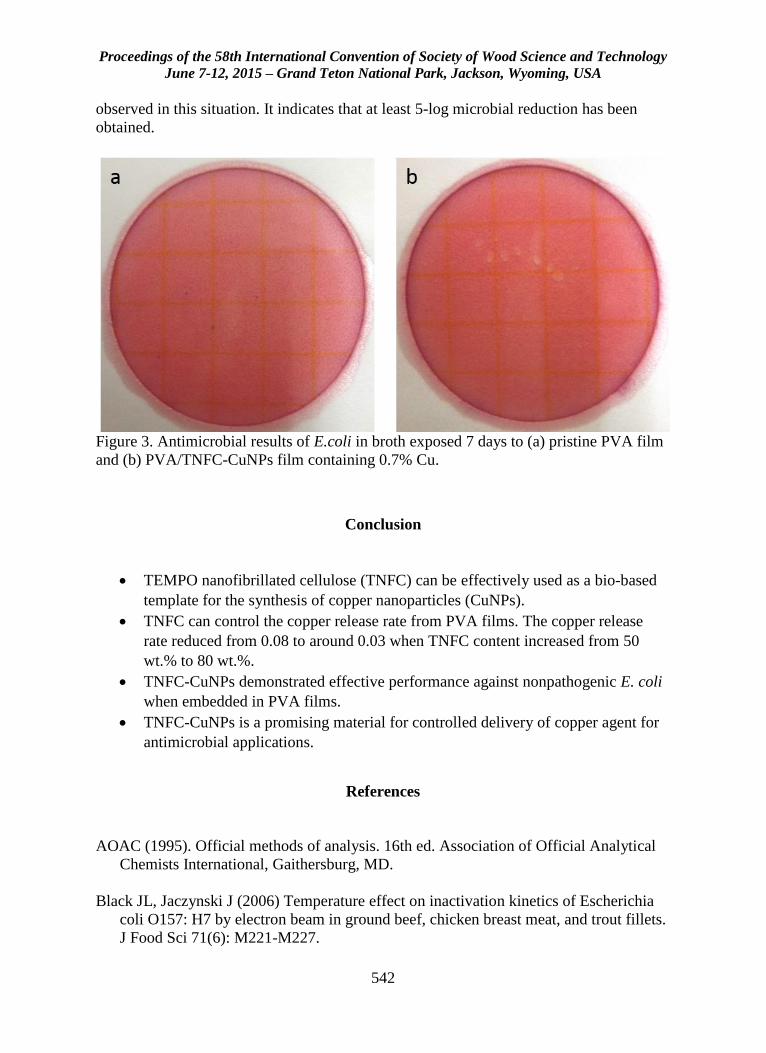
Proceedings of the 58th International Convention of Society of Wood Science and Technology
June 7-12, 2015 – Grand Teton National Park, Jackson, Wyoming, USA
542
observed in this situation. It indicates that at least 5-log microbial reduction has been
obtained.
Figure 3. Antimicrobial results of E.coli in broth exposed 7 days to (a) pristine PVA film
and (b) PVA/TNFC-CuNPs film containing 0.7% Cu.
Conclusion
TEMPO nanofibrillated cellulose (TNFC) can be effectively used as a bio-based
template for the synthesis of copper nanoparticles (CuNPs).
TNFC can control the copper release rate from PVA films. The copper release
rate reduced from 0.08 to around 0.03 when TNFC content increased from 50
wt.% to 80 wt.%.
TNFC-CuNPs demonstrated effective performance against nonpathogenic E. coli
when embedded in PVA films.
TNFC-CuNPs is a promising material for controlled delivery of copper agent for
antimicrobial applications.
References
AOAC (1995). Official methods of analysis. 16th ed. Association of Official Analytical
Chemists International, Gaithersburg, MD.
Black JL, Jaczynski J (2006) Temperature effect on inactivation kinetics of Escherichia
coli O157: H7 by electron beam in ground beef, chicken breast meat, and trout fillets.
J Food Sci 71(6): M221-M227.
Proceedings of the 58th International Convention of Society of Wood Science and Technology
June 7-12, 2015 – Grand Teton National Park, Jackson, Wyoming, USA
543
Levanduski L, Jaczynski J (2008) Increased resistance of Escherichia coli O157: H7 to
electron beam following repetitive irradiation at sub-lethal doses. Int J Food
Microbiol 121(3): 328-334.
Cioffi N, Torsi L, Ditaranto N, Tantillo G, Ghibelli L, Sabbatini L, Bleve-Zacheo T,
D'Alessio M, Zambonin PG, Traversa E (2005) Copper nanoparticle/polymer
composites with antifungal and bacteriostatic properties. Chem Mater 17 (21): 5255–
5262
Cai J, Kimura S, Wada M, Kuga S (2009) Nanoporous cellulose as metal nanoparticles
support. Biomacromolecules 10 (1): 87–94
Palza H (2015) Antimicrobial Polymers with Metal Nanoparticles. Int. J Mol Sci 16:
2099-2116
Isogai A, Saito T, Fukuzumi H (2011) TEMPO-oxidized cellulose nanofibers. Nanoscale
3: 71-85
Jia B, Mei Y, Cheng L, Zhou J, Zhang L (2012) Preparation of copper nanoparticles
coated cellulose films with antibacterial properties through one-step reduction. ACS
Appl Mater Inter 4 (6): 2897–2902
Klemm D, Heublein B, Fink HP, Bohn A (2005) Cellulose: fascinating biopolymer and
sustainable raw material. Angew Chem Int Ed 44: 3358 – 3393
Qi L, Xu Z, Jiang X, Hu C and Zou X (2004) Preparation and antibacterial activity of
chitosan nanoparticles. Carbohydr Polym 339 (16): 2693–2700
Ruparelia JP, Chatterjee AK, Duttagupta SP, Mukherji S (2008) Strain specificity in
antimicrobial activity of silver and copper nanoparticles. Acta Biomater 4 (3): 707–
716
Usman MS, Zowalaty MEE, Shameli K, Zainuddin N, Salama M, Ibrahim NA (2013)
Synthesis, characterization, and antimicrobial properties of copper nanoparticles. Int J
Nanomed 8: 4467–4479
Wang MS, Jiang F, Hsieh YL and Nitin N (2014) Nanofibrillated celluloseimprove
dispersibility and stability of silver nanoparticles and induce production of bacterial
extracellular polysaccharides. J. Mater Chem B 2: 6226-6235
Zhong T, Oporto GS, Jaczynski J, Tesfai AT, Armstrong J (2013) Antimicrobial
properties of the hybrid copper nanoparticles-carboxymethyl cellulose. Wood Fiber
Sci 45(2): 215-222
Proceedings of the 58th International Convention of Society of Wood Science and Technology
June 7-12, 2015 – Grand Teton National Park, Jackson, Wyoming, USA
544
Hierarchical PLA Structures Used for Wooden
Sandwich Panel’s Core Fortification
Levente Dénes, [email protected]
University of West Hungary, 4 Bajcsy Zs. St., Charles Simonyi Faculty of
Engineering, Wood Science and Applied Arts, 9400 Sopron
Abstract
Hierarchical structures as organized assemblies of units are capable to confer unique
properties to a structure via optimization over a large range of length scales. The
architecture of cellulose chains in wood, cellular structure in an avian wing bone or in the
human trabecular bone provides excellent examples of this. The ability to design and
fabricate synthetic structures with similar characteristics would lead to components with
remarkable properties for example outstanding strength and stiffness could be combined
with excellent fracture toughness. Research studies on hierarchical and fractal geometries
has shown that the scaling of material required for stability against loading can be altered
by changing the hierarchical order of a structure. With the increased use of novel
fabrication methods, a material’s architecture can be controlled over an ever increasing
set of length scales. Manipulation of a material’s properties can then be achieved by
design parameters settings. This paper details the design, manufacture and testing of
regular hierarchical structures made of polylactic acid (PLA) rods. The structures were
manufactured using the Fuse Deposition type rapid prototyping technology. A number of
uni-axial compression tests were carried out to assess the effect of different geometries
and rod sizes on sandwich panels’ performance. Analytical estimates for the strength and
stiffness are compared with the numerical simulations and experimental results
Proceedings of the 58th International Convention of Society of Wood Science and Technology
June 7-12, 2015 – Grand Teton National Park, Jackson, Wyoming, USA
545
Development of Wood Fiber-Polypropylene Laminates
with Layer-By-Layer Assembly of Kraft Pulp Hand-
Sheets and Polypropylene Films
Todd Shupe, [email protected]
Chung Hse, [email protected]
Louisiana State University, Louisiana Forest Products Development Center,
Baton Rouge, LA 70803
Abstract
This study examined the effects of polypropylene (PP) film thickness, hand-sheet fiber
content (FC) in layer, and weight ratio of total fiber content (TFC) on tensile properties
and dimensional stability of wood-plastic laminates. Wet-formed Kraft pulp hand-sheets
were interleaved with polypropylene films to fabricate laminates of 1/8 in. thick.
Experimental results showed that laminates of 0.75-mil film yielded better tensile
strength (MORt) than those of 2.25-mil, due to better interpenetration of plastic, as
evidenced in SEM observation. The effect of TFC and film thickness on percent
elongation at break (ELONG) were not consistent at two higher TFC levels; however,
TFC=50 showed the lowest ELONG at all film thickness levels. The interaction between
TFC and film thickness had a varying effect on MOEt. At 0.75-mil, better interfacial
adhesion in thin hand-sheets contributed to the increase of MOEt with TFC. At 2.25-mil,
constitutive hand-sheets were too thick for plastic penetration and poor interfacial
adhesion contributed to the reverse relationship in MOEt with nominal fiber content
(NOMFC). With proper control of film thickness, wood fiber-polypropylene laminated
with fiber loading as high as 70% can be fabricated with favorable mechanical properties.
Proceedings of the 58th International Convention of Society of Wood Science and Technology
June 7-12, 2015 – Grand Teton National Park, Jackson, Wyoming, USA
546
Effective Adhesive Systems and Optimal Bonding
Parameters for Hybrid CLT
Blake Larkin, [email protected]
Lech Muszyński, [email protected]
Arijit Sinha, arijit [email protected]
Andre Barbosa, andre.barbosa
Rakesh Gupta, [email protected];
Oregon State University, 119 Richardson Hall, Corvallis, OR 97331
Abstract
The objective of this project is to determine effective adhesive systems and bonding
parameters (adhesive spread rates and bonding pressures) for the hybrid Cross laminated
timber (CLT) combinations. The Hybrid CLT combinations include both structural grade
lumber and underutilized, low-grade lumber. For a reference species, we selected
structural-grade beetle-killed pine (BKP), since lodgepole pine is a member of the US-
SPF group closely related to the European species commonly used for CLT construction.
The structural-grade, local species will be represented by Douglas-fir (DF), while the
low-grade species will be represented by stud-grade BKP, DF, and Western Hemlock.
The two adhesive systems investigated are: PUR, an adhesive currently used by the CLT
industry that will serve as a reference, and phenol-resorcinol formaldehyde (PRF), a cold
setting adhesive commonly used by the engineered wood products industry in North
America that will represent a potential domestic alternative. The variables will include
species combinations (6), adhesive types (2), clamping pressures (3), and, in some cases,
spread rates (3), with repetition of 10 specimens per combination
Proceedings of the 58th International Convention of Society of Wood Science and Technology
June 7-12, 2015 – Grand Teton National Park, Jackson, Wyoming, USA
547
Micro X-Ray Computed Tomography Study of
Adhesive Bonds in Wood
Fred Kamke, [email protected]
John Nairn, [email protected]
Arijit Sinha, [email protected]
Paige McKinley, [email protected]
Daniel Ching, [email protected]
Oregon State University, 119 Richardson Hall, Corvallis, OR 97331
Abstract
Micro x-Ray computed tomography (XCT) is an emerging technology that has found
many applications in biology and the study of materials. Although synchrotron-based
XCT is still considered the best in regard to spatial resolution, scanning speed, and signal
to noise ratio, point source XCT devices are now very capable of producing excellent
tomography data with sub-micron resolution. The equipment is expensive, access to a
synchrotron device is limited, and the technique generates large quantity of data for
analysis. Several groups around the world have adapted XCT to the study of wood. This
presentation will provide an overview of micro XCT research at Oregon State University,
with a particular focus on adhesive bonds in wood. The research includes study of:
anatomical features of several important wood species, penetration of three adhesive
types into wood, moisture effects on bonding, and mechanical performance of bonds
during XCT scanning.
Proceedings of the 58th International Convention of Society of Wood Science and Technology
June 7-12, 2015 – Grand Teton National Park, Jackson, Wyoming, USA
548
Continued Research into Fire Performance of Varying
Adhesives in CLT Panels Constructed from Southern
Yellow Pine
Bryan Dick, Perry Peralta, Miklos Horvath, Phil Mitchell, Ilona Peszlen,
Weichiang Pang, Scott Schiff, Robert White
Abstract
Cross-Laminated Timber (CLT) is a construction system that has continued to gain
popularity as a “green” alternative to traditional concrete and steel construction . A
collaborative CLT project involving NC State, Clemson University, and the US Forest
Products Laboratory was initiated to foster the use of southern pine in the manufacture of
CLT panels. Fire tests following PS-1 procedures have been conducted to evaluate the
fire performance of emulsion polymer isocyanate, 2 types of polyurethane, phenol
resorcinol formaldehyde, and melamine formaldehyde adhesives. Since originally
presenting the baseline research at SWST in 2014, the research team has furthered the
research into the subject and has obtained informative data about the fire resistance of
multiple adhesives that may be used in production. Results from the fire performance
testing have been evaluated by both non-destructive and destructive means in an attempt
to consistently evaluate and quantify the response of the adhesive to the laboratory scale
and full scale fire performance tests. Product performance data will feed into efforts to
gain building code approval and eventual public acceptance of southern pine CLT.
Preliminary results indicate that there are substantial differences in the type of adhesive
used for CLT production with southern yellow pine, to the extent that some adhesives
may be deemed inappropriate for CLT production in SYP by the research team. This
presentation provides an in depth look at the CLT fire testing performance project results
so far.
Proceedings of the 58th International Convention of Society of Wood Science and Technology
June 7-12, 2015 – Grand Teton National Park, Jackson, Wyoming, USA
549
Gas Permeability and Porosity of Fiberboard Mats as a
Function of Density
Pamela Rebolledo V. 1 – Alain Cloutier2* – Martin Claude Yemele3
1 PhD candidate, Centre de recherche sur les matériaux renouvelables
(CRMR), Département des sciences du bois et de la forêt, Université Laval,
2425 rue de la Terrasse, Québec, QC, Canada, G1V 0A6.
[email protected] 2 Professor and director, Centre de recherche sur les matériaux renouvelables
(CRMR), Université Laval, 2425 rue de la Terrasse,
Québec, QC, Canada, G1V 0A6.
* Corresponding author
[email protected] 3Industry Advisor, Direction de la modernisation de l’industrie des produits
forestiers, Ministère des forêts, de la faune et des parcs,
5700, 4e avenue Ouest, bureau A-202,
Québec, QC, Canada, G1H 6R1.
Abstract
The properties and structure of fiberboard mats including density depend on the level of
densification. The relationship between gas permeability, porosity and density needs to
be investigated because these properties determine the mechanisms of heat and mass
transfer in the mat as well as its rheology during the hot pressing process. Gas
permeability determines the rate of convective heat transfer and is highly dependent on
mat porosity which is changing during the hot pressing process. Mat porosity also
impacts the mechanical behavior of the fiber assembly during consolidation. The aim of
this study is to characterize the relationship between mat porosity, gas permeability and
density. Panels of 560 x 460 x 16 mm without vertical density profiles were produced in
a 862 x 862 mm laboratory hot press. Gas permeability was measured with an in-house
built apparatus. Porosity was measured by X-ray microtomography, mercury porosimetry
and thin microtomed section image analysis. The porosimetry measured by X-ray
microtomography and image analysis have shown similar porosity results of about 55%
void volume. Mercury porosimetry has shown a lower porosity of about 31% void
volume. This difference may be due to the tortuosity of the porous network. Permeability
measurement has shown slip flow. Cross-plane intrinsic permeability results were
between 3.6 x 10⁻¹⁴ and 7.2 x 10⁻¹⁴ m2 for panel densities between 808 and 910 kg m-3, in
Proceedings of the 58th International Convention of Society of Wood Science and Technology
June 7-12, 2015 – Grand Teton National Park, Jackson, Wyoming, USA
550
agreement with values published for fiberboards in other studies in the same range of
density.
Keywords: wood fiber mats, image analysis, X-ray microtomography, mercury
porosimetry, hot pressing modeling
Introduction
Medium density fiberboard (MDF) is made from fiber, adhesive, wax and void spaces.
This system changes with time and space during hot pressing when consolidation
progresses. The void space or porosity in the mat is reduced, the steam flow capacity or
permeability of the mat decreases and its density increases. Gas permeability and porosity
of the mat are fundamental properties because they are involved in the processes of heat
and mass transfer by convection and conduction occurring during hot pressing (Dai and
Yu 2004, Thömen et al. 2006, Kavazović et al. 2012).
The porosity of the mat is directly related to its microstructure. The porous system inside
the mat is determined by the morphology of fibers and the consolidation level. With
small size particles and low densities, the porosity of the material is relatively
homogeneous. Particle size could have an effect on the mechanical behavior of mat
because porosity is higher in areas with larger particles (Tran, 2012) and there are larger
deformations in high porosity locations of the mat (Sackey and Smith, 2010). This latter
study showed that for a high efficiency of compaction during pressing, it is necessary to
mix small and large fibers. Previous works on the modeling of void formation in OSB
have shown that inter-fiber and intra-fiber voids exhibit different behavior (Dai et al.
2005). Benthien et al. (2014) and NguehoYemele et al. (2008) found that particle size has
an effect on panel mechanical performance. Nonetheless, experimental studies about
microstructural characterization of thermal insulation of wood-based panels with X-ray
micro-tomography have highlighted that during the compression process the decrease of
inter-fiber porosity has a greater effect on the decrease of the total volume than the intra-
fiber porosity (Delisée et al. 2008).
Permeability is defined by the ease with which fluids are transported through a porous
material under the influence of a pressure gradient (Siau 1984). The most practical way to
measure permeability in both solid wood and composite materials is by using air because
there are no problems due to the clogging of the pores that occurs when using liquids
(Comstock 1968). Gas permeability can be written as (Siau 1984):
(1)
where:
kg* : apparent gas permeability (m3
gas m-1
wood s-1 Pa-1)
Q : volumetric gas flow rate (m3gas s
-1)
L : length in the flow direction (mwood)
P : pressure at which Q is measured (Pa)
A : cross-sectional area of the specimen (m2wood)
ΔP : pressure differential across the specimen (Pa)
Proceedings of the 58th International Convention of Society of Wood Science and Technology
June 7-12, 2015 – Grand Teton National Park, Jackson, Wyoming, USA
551
: average pressure across the specimen (Pa)
The apparent permeability ( ) must be corrected for slip flow. This corresponds to the
intersect of the straight line of the graph against 1/ with the y axis. It corresponds to
the gas permeability corrected for slip flow (kg). The intrinsic permeability corresponding
to the permeability independent of the fluid can be calculated as:
(2)
where
K : intrinsic permeability ( )
: gas permeability corrected for slip flow ( )
: viscosity of the fluid ( )
Gas permeability is a parameter determined by the structure of the porous material. It
plays an important role because it controls the mechanisms of heat and mass transfer
inside the mat during hot pressing. Because the mat is made of particles of variable size
and shape and due to the presence of a density profile across thickness, mat gas
permeability is generally not isotropic (Bolton and Humphrey 1994). The in-plane
permeability coefficient Kpxy (for gas flow perpendicular to the axis of mat compression)
impacts heat and moisture transfer rate from the core to the edges of the mat. The cross-
sectional permeability coefficient Kpz (for gas flow parallel to the axis of mat
compression) impacts heat and moisture transfer from press platens to mat core. Many
studies have shown that the in-plane permeability of the mat is higher than the cross-
sectional permeability of the mat apparently due to the tendency of the fibers to lay in a
direction parallel to the press platens thus facilitating steam flow in the plane of the mat.
(Hata et al. 1993, von Haas 1998, Haselein 1998, Thömen et al. 2006). Mat permeability
impacts panel densification during hot-pressing and is a necessary input for hot pressing
simulation. A few studies demonstrated that fiber mat permeability is dependent on mat
structure and density level. However, the effect of particle morphology is not clear yet
(Thömen and Klueppel 2008, Belley 2009, Tran 2012). Nevertheless, a combined effect
of particle morphology and mat density on permeability can be expected (Bolton and
Humphrey 1994).
Previous work has shown that the relationship between permeability and density is
logarithmic (Hata 1993, Bolton and Humphrey 1994, Haselein 1998, von Haas 1998,
Garcia and Cloutier 2005, Belley 2009). Von Haas (1998) and Haselein (1998) proposed
the following equation for in-plane permeability coefficient and cross-plane permeability
coefficient (Kpxy and Kpz respectively) as a function of density:
(3)
where a, b and c are regression coefficients depending on flow direction and kg m-3 is
the density. Belley (2009) proposed a third degree polynomial relationship for intrinsic
transverse permeability of wood fiber mats (in m2):
(4)
During hot-pressing, both permeability and porosity change with time because density
increases due to consolidation. These two properties are sensitive parameters in models
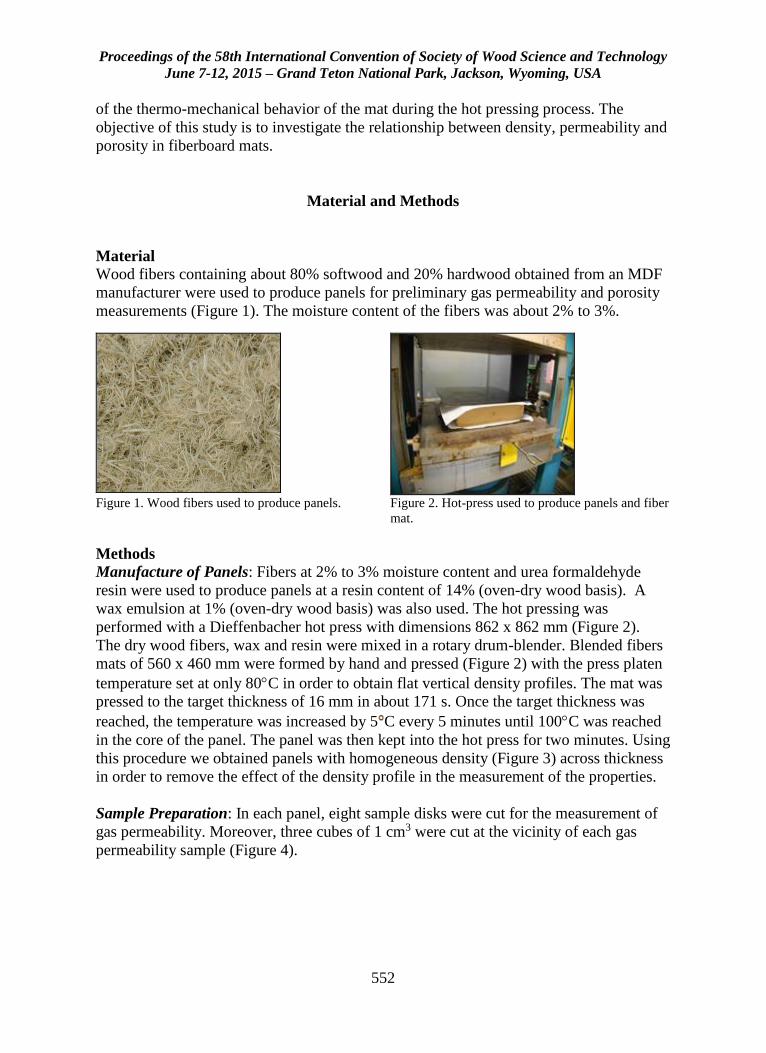
Proceedings of the 58th International Convention of Society of Wood Science and Technology
June 7-12, 2015 – Grand Teton National Park, Jackson, Wyoming, USA
552
of the thermo-mechanical behavior of the mat during the hot pressing process. The
objective of this study is to investigate the relationship between density, permeability and
porosity in fiberboard mats.
Material and Methods
Material
Wood fibers containing about 80% softwood and 20% hardwood obtained from an MDF
manufacturer were used to produce panels for preliminary gas permeability and porosity
measurements (Figure 1). The moisture content of the fibers was about 2% to 3%.
Methods
Manufacture of Panels: Fibers at 2% to 3% moisture content and urea formaldehyde
resin were used to produce panels at a resin content of 14% (oven-dry wood basis). A
wax emulsion at 1% (oven-dry wood basis) was also used. The hot pressing was
performed with a Dieffenbacher hot press with dimensions 862 x 862 mm (Figure 2).
The dry wood fibers, wax and resin were mixed in a rotary drum-blender. Blended fibers
mats of 560 x 460 mm were formed by hand and pressed (Figure 2) with the press platen
temperature set at only 80C in order to obtain flat vertical density profiles. The mat was
pressed to the target thickness of 16 mm in about 171 s. Once the target thickness was
reached, the temperature was increased by 5 C every 5 minutes until 100C was reached
in the core of the panel. The panel was then kept into the hot press for two minutes. Using
this procedure we obtained panels with homogeneous density (Figure 3) across thickness
in order to remove the effect of the density profile in the measurement of the properties.
Sample Preparation: In each panel, eight sample disks were cut for the measurement of
gas permeability. Moreover, three cubes of 1 cm3 were cut at the vicinity of each gas
permeability sample (Figure 4).
Figure 1. Wood fibers used to produce panels. Figure 2. Hot-press used to produce panels and fiber
mat.
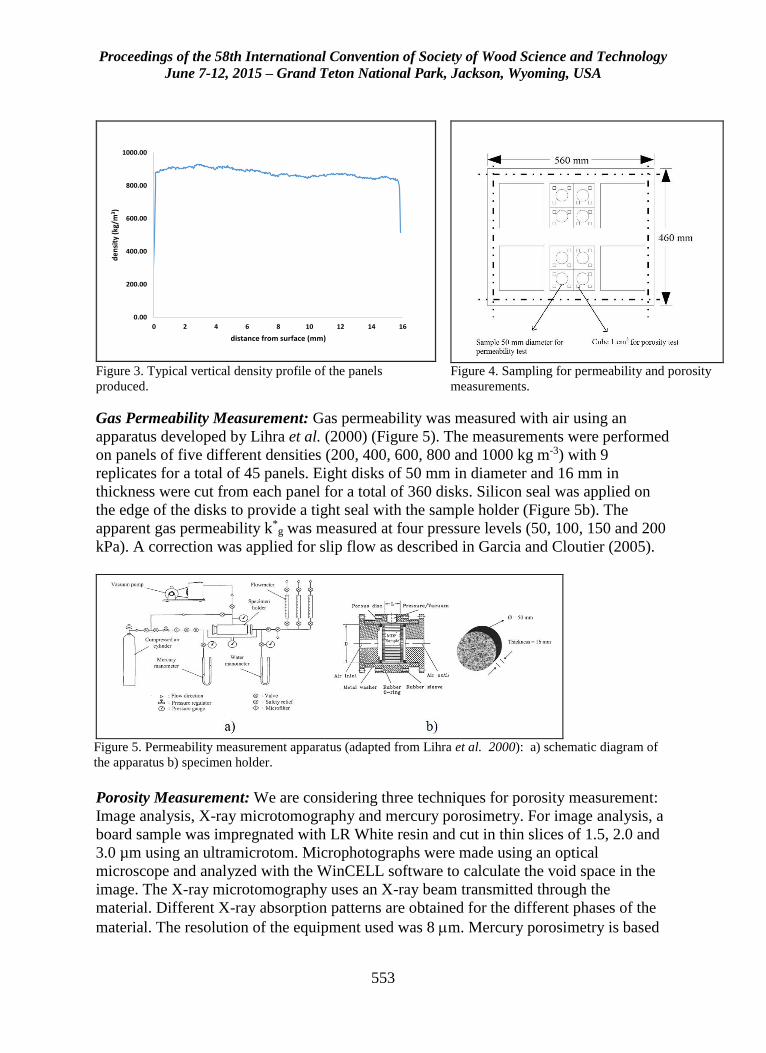
Proceedings of the 58th International Convention of Society of Wood Science and Technology
June 7-12, 2015 – Grand Teton National Park, Jackson, Wyoming, USA
553
Gas Permeability Measurement: Gas permeability was measured with air using an
apparatus developed by Lihra et al. (2000) (Figure 5). The measurements were performed
on panels of five different densities (200, 400, 600, 800 and 1000 kg m-3) with 9
replicates for a total of 45 panels. Eight disks of 50 mm in diameter and 16 mm in
thickness were cut from each panel for a total of 360 disks. Silicon seal was applied on
the edge of the disks to provide a tight seal with the sample holder (Figure 5b). The
apparent gas permeability k*g was measured at four pressure levels (50, 100, 150 and 200
kPa). A correction was applied for slip flow as described in Garcia and Cloutier (2005).
Figure 5. Permeability measurement apparatus (adapted from Lihra et al. 2000): a) schematic diagram of
the apparatus b) specimen holder.
Porosity Measurement: We are considering three techniques for porosity measurement:
Image analysis, X-ray microtomography and mercury porosimetry. For image analysis, a
board sample was impregnated with LR White resin and cut in thin slices of 1.5, 2.0 and
3.0 µm using an ultramicrotom. Microphotographs were made using an optical
microscope and analyzed with the WinCELL software to calculate the void space in the
image. The X-ray microtomography uses an X-ray beam transmitted through the
material. Different X-ray absorption patterns are obtained for the different phases of the
material. The resolution of the equipment used was 8 m. Mercury porosimetry is based
0.00
200.00
400.00
600.00
800.00
1000.00
0 2 4 6 8 10 12 14 16
den
sity
(kg
/m3 )
distance from surface (mm)
Figure 3. Typical vertical density profile of the panels
produced.
Figure 4. Sampling for permeability and porosity
measurements.
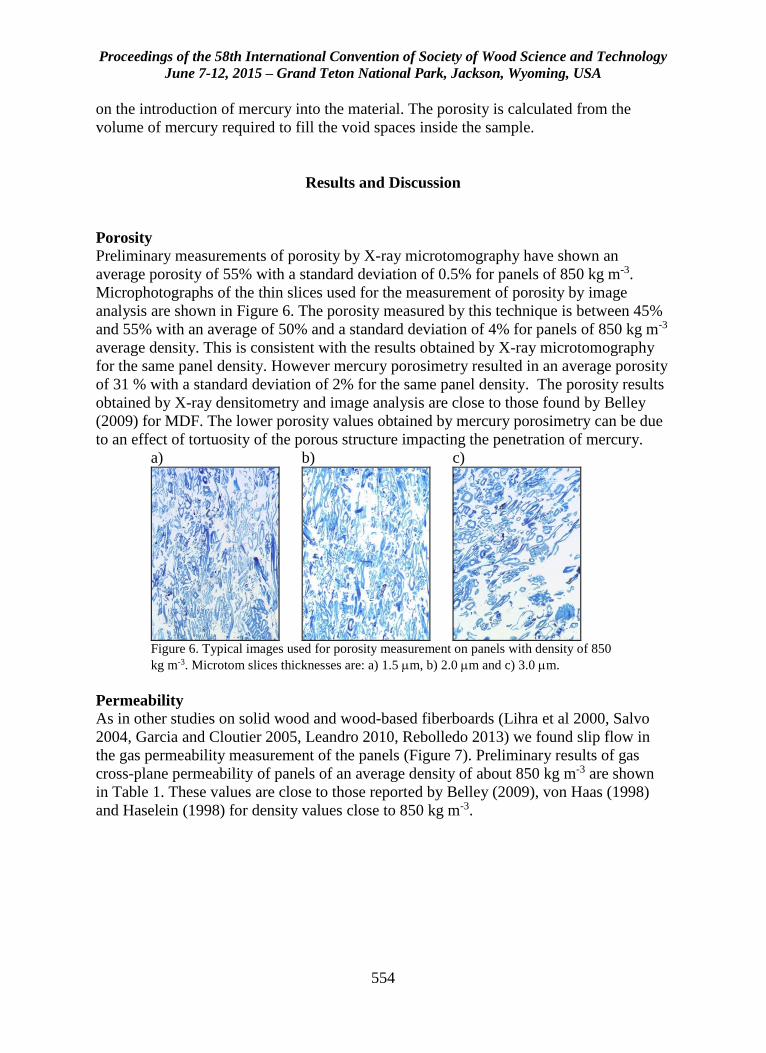
Proceedings of the 58th International Convention of Society of Wood Science and Technology
June 7-12, 2015 – Grand Teton National Park, Jackson, Wyoming, USA
554
on the introduction of mercury into the material. The porosity is calculated from the
volume of mercury required to fill the void spaces inside the sample.
Results and Discussion
Porosity
Preliminary measurements of porosity by X-ray microtomography have shown an
average porosity of 55% with a standard deviation of 0.5% for panels of 850 kg m-3.
Microphotographs of the thin slices used for the measurement of porosity by image
analysis are shown in Figure 6. The porosity measured by this technique is between 45%
and 55% with an average of 50% and a standard deviation of 4% for panels of 850 kg m-3
average density. This is consistent with the results obtained by X-ray microtomography
for the same panel density. However mercury porosimetry resulted in an average porosity
of 31 % with a standard deviation of 2% for the same panel density. The porosity results
obtained by X-ray densitometry and image analysis are close to those found by Belley
(2009) for MDF. The lower porosity values obtained by mercury porosimetry can be due
to an effect of tortuosity of the porous structure impacting the penetration of mercury.
a) b) c)
Figure 6. Typical images used for porosity measurement on panels with density of 850
kg m-3. Microtom slices thicknesses are: a) 1.5 m, b) 2.0 m and c) 3.0 m.
Permeability
As in other studies on solid wood and wood-based fiberboards (Lihra et al 2000, Salvo
2004, Garcia and Cloutier 2005, Leandro 2010, Rebolledo 2013) we found slip flow in
the gas permeability measurement of the panels (Figure 7). Preliminary results of gas
cross-plane permeability of panels of an average density of about 850 kg m-3 are shown
in Table 1. These values are close to those reported by Belley (2009), von Haas (1998)
and Haselein (1998) for density values close to 850 kg m-3.
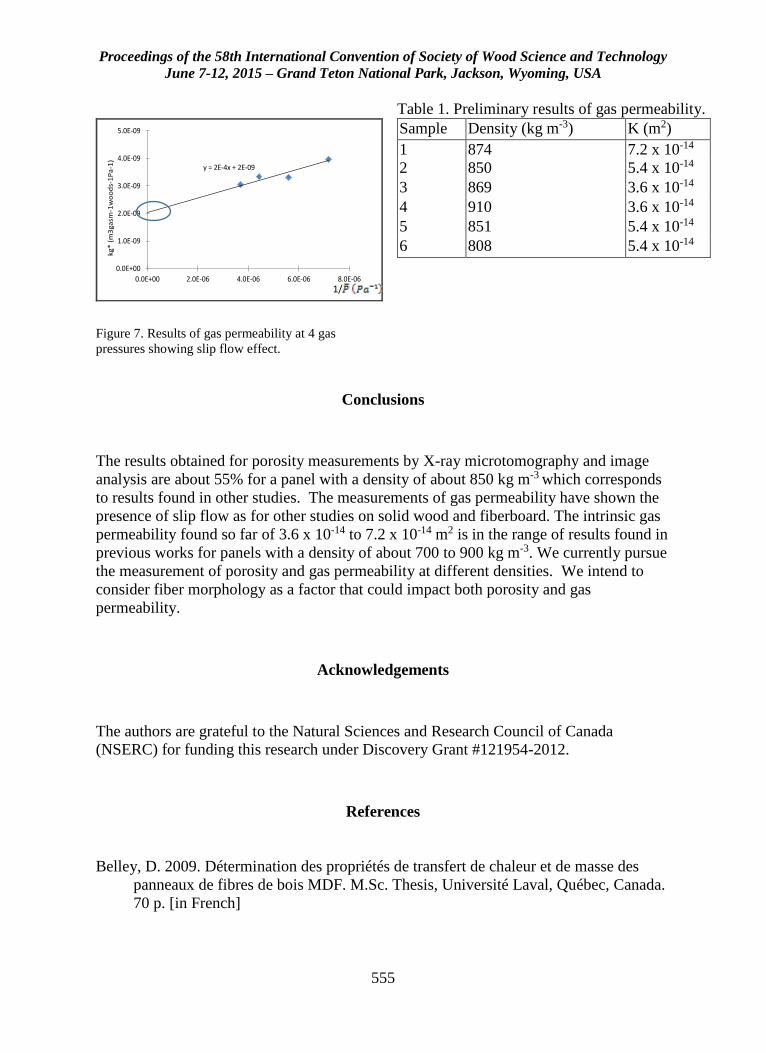
Proceedings of the 58th International Convention of Society of Wood Science and Technology
June 7-12, 2015 – Grand Teton National Park, Jackson, Wyoming, USA
555
Conclusions
The results obtained for porosity measurements by X-ray microtomography and image
analysis are about 55% for a panel with a density of about 850 kg m-3 which corresponds
to results found in other studies. The measurements of gas permeability have shown the
presence of slip flow as for other studies on solid wood and fiberboard. The intrinsic gas
permeability found so far of 3.6 x 10⁻¹⁴ to 7.2 x 10⁻¹⁴ m2 is in the range of results found in
previous works for panels with a density of about 700 to 900 kg m-3. We currently pursue
the measurement of porosity and gas permeability at different densities. We intend to
consider fiber morphology as a factor that could impact both porosity and gas
permeability.
Acknowledgements
The authors are grateful to the Natural Sciences and Research Council of Canada
(NSERC) for funding this research under Discovery Grant #121954-2012.
References
Belley, D. 2009. Détermination des propriétés de transfert de chaleur et de masse des
panneaux de fibres de bois MDF. M.Sc. Thesis, Université Laval, Québec, Canada.
70 p. [in French]
Table 1. Preliminary results of gas permeability.
y = 2E-4x + 2E-09
0.0E+00
1.0E-09
2.0E-09
3.0E-09
4.0E-09
5.0E-09
0.0E+00 2.0E-06 4.0E-06 6.0E-06 8.0E-06
kg*
(m
3g
asm
-1w
oo
ds-
1P
a-1
)
Sample Density (kg m-3) K (m2)
1 874 7.2 x 10⁻¹⁴
2 850 5.4 x 10⁻¹⁴
3 869 3.6 x 10⁻¹⁴
4 910 3.6 x 10⁻¹⁴
5 851 5.4 x 10⁻¹⁴
6 808 5.4 x 10⁻¹⁴
Figure 7. Results of gas permeability at 4 gas
pressures showing slip flow effect.
1/
Proceedings of the 58th International Convention of Society of Wood Science and Technology
June 7-12, 2015 – Grand Teton National Park, Jackson, Wyoming, USA
556
Benthien, J. T., Bähnisch, C., Heldner, S., Ohlmeyer, M. 2014. Effect of fiber size
distribution on medium-density fiberboard properties caused by varied steaming
time and temperature of defribation process. Wood Fiber Sci. 46(2): 175-185.
Bolton, A. J., Humphrey. P. E. 1994. The permeability of wood-based composite
materials. Holzforschung 48: 95–100.
Comstock, G. L. 1968. Relationship between permeability of green and dry Eastern
hemlock. For. Prod. J. 18: 20-23.
Dai, C., Yu, C., 2004. Heat and mass transfer in wood composite panels during hot-
pressing: Part 1 A Physical-mathematical model. Wood Fiber Sci. 36(4):585-597.
Dai, C., Yu, C., Zhou, X. 2005. Heat and mass transfer in wood composite panels during
hot-pressing: Part 1I Modeling void formation and mat permeability. Wood Fiber
Sci. 37(2): 242-257.
Delisée, C., Badel, E., Lux, J., Malvestio, J. 2008. Caractérisation microstructurale 3D et
densification locale d`isolants fibreux cellulosiques sollicites en compression.
XXVI Rencontres universitaires de génie civil. Nancy, France. June 4-6. 8 p. [in
French]
Garcia, R.A. Cloutier, A. 2005. Characterisation of heat and mass transfert in the mat
during hot pressing of MDF panels. Wood Fiber Sci. 37 (1): 23-41.
Haselein, C.R. 1998. Numerical simulation of pressing wood-fiber composites. PhD
Thesis, Oregon State Univ. Corvalis, U.S.A. 244 p.
Hata, T., S. Kawai, T. Ebihara, and H. Sasaki. 1993. Production of particleboards with a
steam-injection press V. Effects of particle geometry on temperature behaviors in
particle mats and on air permeabilities of boards. Mokuzai Gakkaishi 39(2):161–
168.
Kavazović, Z., Deteix, J., Fortin, A., Cloutier, A. 2012. Numerical modeling of the
medium-density fiberboard hot pressing process. Part 2. Coupled mechanical and
heat and mass transfer models. . Wood Fiber Sci. 44(2): 243-262.
Leandro, L 2010. Propiedades de familias de Eucalyptus nitens relacionadas con el
secado. (In Spanish). Tesis de Doctorado en Ciencias e Industrias de la Madera.
Depto. Ingeniería en Maderas, Facultad de Ingeniería, Universidad del Bío-Bío,
Concepciòn, Chile. 126 p. [in Spanish]
Lihra T. Cloutier A, Zhang S-Y. 2000. Longitudinal and transverse permeability of
balsam fir wetwood and normal heartwood. Wood Fiber Sci. 32(2): 64-178.
Proceedings of the 58th International Convention of Society of Wood Science and Technology
June 7-12, 2015 – Grand Teton National Park, Jackson, Wyoming, USA
557
Ngueho Yemele, M.C., Cloutier, A., Diouf, P. N., Koubaa, A., Blanchet, P., Stevanovic,
T. 2008. Physical and mechanical properties of particleboard made from extracted
black spruce and trembling aspen bark. Forest Prod. J. 58(10): 38-46.
Rebolledo, P. 2013. Interrelación entre las propiedades anatómicas y físicas con la
permeabilidad gaseosa y estudio de la difusión del agua en Eucalyptus nitens. Tesis
Magister en ciencia y tecnologia de la madera. Departamento de Ingeniería en
Maderas. Facultad de Ingeniería, Universidad del Bío-Bío. Concepción, Chile. 157
p. [in Spanish]
Siau, F. 1984. Transport process in wood. Springer-Verlag. New York, U.S.A. 245 p.
Sackey, E., Smith, G. 2010. Characterizing macro-voids of uncompressed mats and
finished particleboard panels using response surface methodology and X-ray CT.
Holzforschung 64(1): 343–352.
Salvo, L. 2004. Relación de la estructura anatómica con la permeabilidad y tasa de
secado de la madera de Pinus radiata D.Don. Tesis Magister en ciencia y tecnologia
de la madera. Departamento Ingeniería en Maderas. Facultad de Ingeniería,
Universidad del Bío-Bío. Concepción, Chile. 79 p. [in Spanish]
Tran, T. N. H. 2012. Study de compression behavior of wood-based fiberboard:
characterization from non-destructive image techniques. PhD. Thesis, Université de
Bordeaux, Bordeaux, France. 223 p.
Thömen, H., Klueppel, A. 2008. An investigation on the permeability of different wood
furnish materials. Holzforschung 62(1): 215-222.
Thömen, H., Haselein, C.R., Humphrey, P.E. 2006. Modeling the physical process
relevant during hot pressing of wood-based composites. Part 2. Rheology. Holz als
Roh-und Werkstoff 64: 125- 133.
Von Haas, G. 1998. Investigation of the hot pressing of wood composite-mats under
special consideration of the compression behaviour, the permeability, the
temperature conductivity and sorption-speed. Ph.D. Thesis Hamburg University,
Germany. 264 p. [in German]
Proceedings of the 58th International Convention of Society of Wood Science and Technology
June 7-12, 2015 – Grand Teton National Park, Jackson, Wyoming, USA
558
Pyrolysis of Si-Al compounds and Fibers in Burned
Ultra-low Density Fiberboards
Min Niu1 – Xiaodong (Alice) Wang2 – Olle Hagman3– Olov Karlsson4 –
Yongqun Xie5*
1 Lecture (also a Postdoc. at LTU in Skellefteå), Division of Wood Science
and Technology, College of Materials Engineering, Fujian Agriculture and
Forestry University,
350002, Fuzhou, Fujian, China
[email protected], [email protected] 2 Assistant Professor, Division of Wood Science and Engineering,
Department of Engineering Sciences and Mathmatics,
Luleå University of Technology,
93162, Skellefteå, Sweden
[email protected] 3 Professor, Division of Wood Science and Engineering, Department of
Engineering Sciences and Mathmatics,
Luleå University of Technology,
93162, Skellefteå, Sweden
[email protected] 4 Associate Professor, Division of Wood Science and Engineering,
Department of Engineering Sciences and Mathmatics,
Luleå University of Technology,
93162, Skellefteå, Sweden
[email protected] 5 Professor, Division of Wood Science and Technology, College of
Materials Engineering, Fujian Agriculture and Forestry University,
350002, Fuzhou, Fujian, China
* Corresponding author
Abstract
Si-Al compounds significantly decreases release amount of heat, smoke and off-gases
during combustion of ultra-low density fiberboards (ULDFs). Under the protection of Si-
Al compounds, whether plant fiber (the matrix of ULDFs) was burned up at high
temperature is the purpose of this study. Pyrolysis of Si-Al compounds themselves will
be also analyzed in this paper. SEM with an EDS, XRD and FTIR was used to
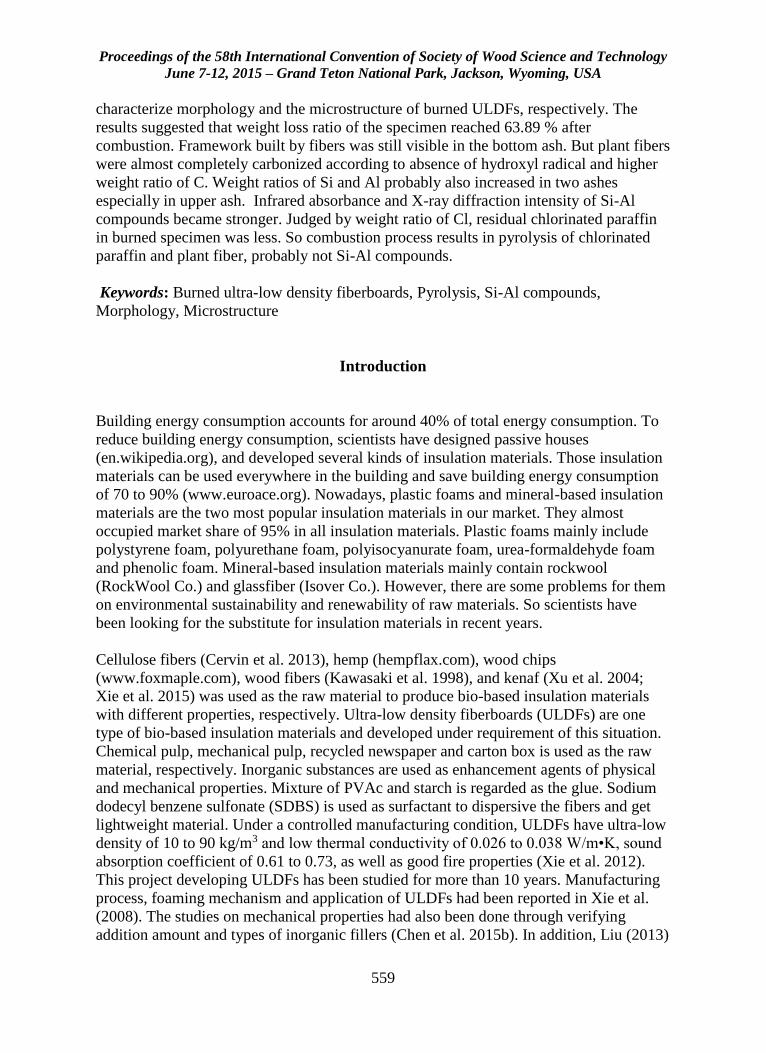
Proceedings of the 58th International Convention of Society of Wood Science and Technology
June 7-12, 2015 – Grand Teton National Park, Jackson, Wyoming, USA
559
characterize morphology and the microstructure of burned ULDFs, respectively. The
results suggested that weight loss ratio of the specimen reached 63.89 % after
combustion. Framework built by fibers was still visible in the bottom ash. But plant fibers
were almost completely carbonized according to absence of hydroxyl radical and higher
weight ratio of C. Weight ratios of Si and Al probably also increased in two ashes
especially in upper ash. Infrared absorbance and X-ray diffraction intensity of Si-Al
compounds became stronger. Judged by weight ratio of Cl, residual chlorinated paraffin
in burned specimen was less. So combustion process results in pyrolysis of chlorinated
paraffin and plant fiber, probably not Si-Al compounds.
Keywords: Burned ultra-low density fiberboards, Pyrolysis, Si-Al compounds,
Morphology, Microstructure
Introduction
Building energy consumption accounts for around 40% of total energy consumption. To
reduce building energy consumption, scientists have designed passive houses
(en.wikipedia.org), and developed several kinds of insulation materials. Those insulation
materials can be used everywhere in the building and save building energy consumption
of 70 to 90% (www.euroace.org). Nowadays, plastic foams and mineral-based insulation
materials are the two most popular insulation materials in our market. They almost
occupied market share of 95% in all insulation materials. Plastic foams mainly include
polystyrene foam, polyurethane foam, polyisocyanurate foam, urea-formaldehyde foam
and phenolic foam. Mineral-based insulation materials mainly contain rockwool
(RockWool Co.) and glassfiber (Isover Co.). However, there are some problems for them
on environmental sustainability and renewability of raw materials. So scientists have
been looking for the substitute for insulation materials in recent years.
Cellulose fibers (Cervin et al. 2013), hemp (hempflax.com), wood chips
(www.foxmaple.com), wood fibers (Kawasaki et al. 1998), and kenaf (Xu et al. 2004;
Xie et al. 2015) was used as the raw material to produce bio-based insulation materials
with different properties, respectively. Ultra-low density fiberboards (ULDFs) are one
type of bio-based insulation materials and developed under requirement of this situation.
Chemical pulp, mechanical pulp, recycled newspaper and carton box is used as the raw
material, respectively. Inorganic substances are used as enhancement agents of physical
and mechanical properties. Mixture of PVAc and starch is regarded as the glue. Sodium
dodecyl benzene sulfonate (SDBS) is used as surfactant to dispersive the fibers and get
lightweight material. Under a controlled manufacturing condition, ULDFs have ultra-low
density of 10 to 90 kg/m3 and low thermal conductivity of 0.026 to 0.038 W/m•K, sound
absorption coefficient of 0.61 to 0.73, as well as good fire properties (Xie et al. 2012).
This project developing ULDFs has been studied for more than 10 years. Manufacturing
process, foaming mechanism and application of ULDFs had been reported in Xie et al.
(2008). The studies on mechanical properties had also been done through verifying
addition amount and types of inorganic fillers (Chen et al. 2015b). In addition, Liu (2013)
Proceedings of the 58th International Convention of Society of Wood Science and Technology
June 7-12, 2015 – Grand Teton National Park, Jackson, Wyoming, USA
560
has studied fire properties of ULDFs in his doctoral thesis, and indicated chlorinated
paraffin and Si-Al compounds had a synergistic effect on fire resistance. Under the
synergistic effect, the released amount of heat, smoke and off-gases such as CO and CO2
significantly decreased.
However, past studies mainly concentrated on changes of processing parameters and
improvement of physical and mechanical properties. Fire resistance mechanism of plant
fiber or cellulose fiber under the synergistic effect of Si-Al compounds and chlorinated
paraffin has been not yet reported. So the goal of this paper is to provide a foundation to
further understand improvement mechanism of fire properties of ULDFs. In this paper,
the morphology and microstructure of unburned and burned ULDFs will be analyzed by
applying a SEM-EDS, XRD and FTIR.
Materials and Methods
Materials Waste newspaper (collected in China) was used as raw material to prepare ULDFs. 500
and 900 mL Si-Al compounds, as the two levels, were added into the foaming system and
mixed together with fibers to improve the fire properties of ULDFs. Manufacturing
process of ULDFs was described in previous study (Niu et al. 2014). ULDFs were burned
by Cone Calarimeter (FTT Co., England) at 780 oC in accordance with ISO 5660-1/2002.
Then fly ash (upper ash) caused by complete combustion and bottom ash caused by
incomplete combustion were obtained. The two types of ash along with unburned ULDFs
were used as the specimens for next characterization.
Morphology
A scanning electron microscope (SEM, Jeol JSM-6460) with an energy dispersive
spectroscopy (EDS, Oxford Instruments) was used to display micromorphology of the
specimens, distribution and weight ratios of main elements, but not including fly ash with
500 mL Si-Al compounds (labelled 1-fly ash). The mapping was performed using an
acceleration voltage of 25 kV, a current of 8 μA, and a working distance of 12 mm.
Because JSM-6460 was broken in our office, 1-fly ash was tested by an extreme high
resolution scanning electron microscope (XHR-SEM, FEI Magellan-400) with an EDS
(equipped with X-Max 80 silicon drift detector) under the conditions: acceleration
voltage of 10 kV, a current of 0.2 nA, and a working distance of 5.1 mm.
Crystallization
An X-ray diffractometer (XRD, PANalytical Empyrean with a PIXcel3D detector) was
employed to identify crystalline substances with the conditions: 2θ range of 5 to 60o, a
voltage of 45 kV and current of 40 mA, and Cu LFF HR X-ray tube.
Proceedings of the 58th International Convention of Society of Wood Science and Technology
June 7-12, 2015 – Grand Teton National Park, Jackson, Wyoming, USA
561
Functional groups
Infrared spectroscopy (IR, IFS 66V/S, Bruker) was used to determine the change in
functional groups at room temperature of 22 oC, over a spectral range of 400 to 4000 cm-
1.
Results and Discussion
Morphology of burned ULDFs by a cone calorimeter
Morphology of burned specimens and elemental distribution of C, O, Al and Si, are
shown in Figure 1.
Fig. 1 Micromorphology and element distribution of fly ash and bottom ash from SEM-EDS (Jeol JSM-
6460), except for 1-fly ash that was tested by FEI Magellan-400. 1-500 mL Si-Al compounds; 2- 900 mL
Si-Al compounds.
2-Fly ash
2-Bottom ash
C O
Al
Si
C
A
l
S
i
KPb
Proceedings of the 58th International Convention of Society of Wood Science and Technology
June 7-12, 2015 – Grand Teton National Park, Jackson, Wyoming, USA
562
From Fig. 1, fly ashes were fragmented, lamellar and lightweight; bottom ashes were
integral, reticular and similar to the original structure of fibers. The element C in fly
ashes especially in 1-fly ash with less Si-Al compounds was almost invisible. This was
possibly because it reacted with O in the air and mainly generated the gas CO2 on the
surface of specimens, while the C in bottom ashes was visible and well-regulated. It was
still retained in the fibers after combustion. Judged by weight loss of 62 to 71% (Niu et
al. 2014) and brittleness of burned samples, fibers from bottom ashes were carbonized,
and their molecular structure was destroyed, even if bottom ash had more Si-Al
compounds. But if without fire retardants, ULDFs as porous ultra-low density materials
will transform into fly ashes of 100% or less bottom ashes left after combustion. So
carbonization of ULDFs was attributed to Si-Al compounds. On the other hand, glue,
AKD and surfactant as other sources of C, all were decomposed into oxides of carbon
and hydroxides when they suffered from high temperature. Morphology of O was more
similar to the morphology of Si and Al. This suggested it existed in the form of the oxides
of Si and Al, and the structures of Si and Al oxides were stable at high temperature of
780 oC. According to the sources of Si and Al, the two types of oxides were from
hydrolysis products of Si-Al compounds charged into acidic foaming mixture. Compared
with Si, Al spots were bigger and more concentrated especially in EDS profiles of bottom
ashes. It was perhaps caused by agglomeration of Al oxides or Si-Al oxides (Al2O3-SiO2)
(Chen et al. 2015a). Weight ratio of the elements is listed in Table 1.
Table 1 Weight ratios of main elements in ULDFs before and after combustion
Elements
Weight ratio (%)
1-Fly Ash 1-Bottom
Ash
1-Before
Combustion 2-Fly Ash
2-Bottom
Ash
2-Before
Combustion
C — 55.52 8.21 — 43.19 6.16
O 59.93 29.48 52.43 52.11 38.09 57.57
Al 23.85 8.35 11.04 20.09 7.77 14.95
Si 12.79 4.81 4.33 22.92 9.78 6.75
Cl 0.29 0.59 22.16 0.98 0.32 13.52
Total 96.87 98.75 98.17 96.10 99.15 98.95
1-500 mL Si-Al compounds; 2-900 mL Si-Al compounds. “—” means no data given.
C, O, Al, Si and Cl were five main elements in ULDFs. The sum of their weight ratio was
more than 96% in total weight ratio of all elements. Combustion brought several elements
significant changes. After combustion, weight ratio of Cl sharply decreased less than 1%,
and C almost disappeared in fly ash and was up to the maximum in bottom ash. Weight
ratios of Si and Al in bottom ashes were apparently lower than those of fly ashes.
Actually, weight ratios of Si and Al will not be changed too much because Si-Al
compounds have good high-temperature resistance and stable chemical structure (Liu
2010, Lu et al. 2008), Here, the decreases of their weight ratios were mainly caused by
the increases of other elements. When Si-Al compounds increased from 500 to 900 mL,
weight ratio of Si increased and Al decreased, especially for fly ash. But the sum of Si
and Al probably increased in the two ashes with the increase of Si-Al compounds in spite
of the effects of other elements.
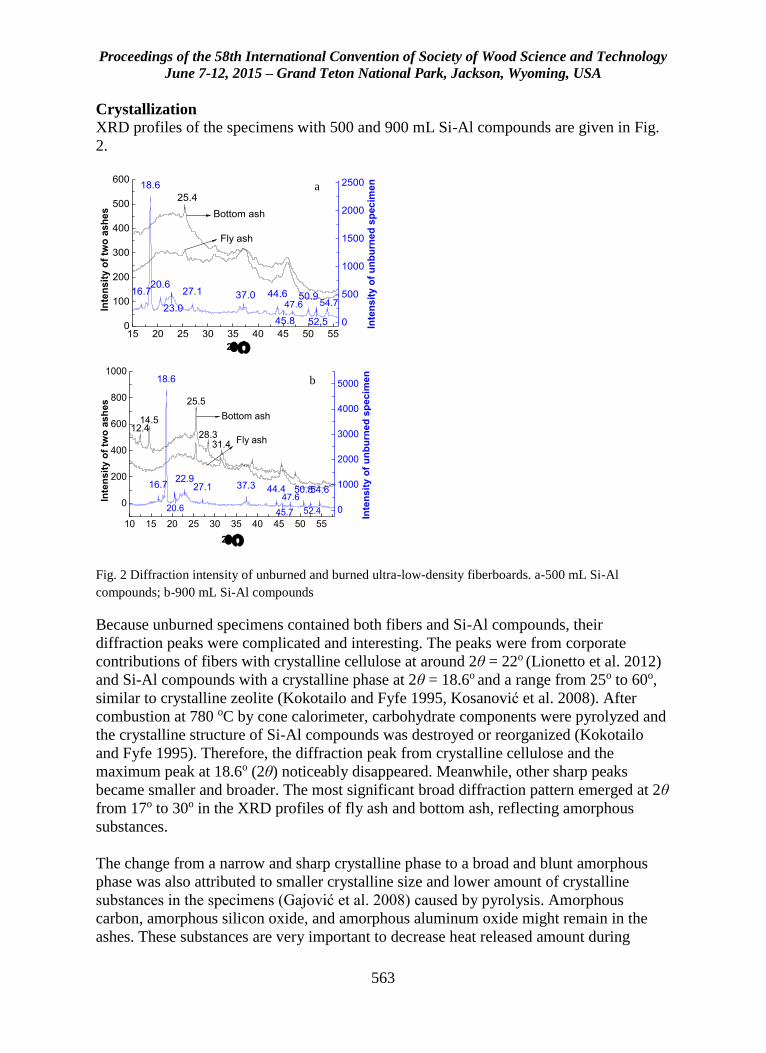
Proceedings of the 58th International Convention of Society of Wood Science and Technology
June 7-12, 2015 – Grand Teton National Park, Jackson, Wyoming, USA
563
Crystallization
XRD profiles of the specimens with 500 and 900 mL Si-Al compounds are given in Fig.
2.
Fig. 2 Diffraction intensity of unburned and burned ultra-low-density fiberboards. a-500 mL Si-Al
compounds; b-900 mL Si-Al compounds
Because unburned specimens contained both fibers and Si-Al compounds, their
diffraction peaks were complicated and interesting. The peaks were from corporate
contributions of fibers with crystalline cellulose at around 2θ = 22o (Lionetto et al. 2012)
and Si-Al compounds with a crystalline phase at 2θ = 18.6o and a range from 25o to 60o,
similar to crystalline zeolite (Kokotailo and Fyfe 1995, Kosanović et al. 2008). After
combustion at 780 oC by cone calorimeter, carbohydrate components were pyrolyzed and
the crystalline structure of Si-Al compounds was destroyed or reorganized (Kokotailo
and Fyfe 1995). Therefore, the diffraction peak from crystalline cellulose and the
maximum peak at 18.6o (2θ) noticeably disappeared. Meanwhile, other sharp peaks
became smaller and broader. The most significant broad diffraction pattern emerged at 2θ
from 17o to 30o in the XRD profiles of fly ash and bottom ash, reflecting amorphous
substances.
The change from a narrow and sharp crystalline phase to a broad and blunt amorphous
phase was also attributed to smaller crystalline size and lower amount of crystalline
substances in the specimens (Gajović et al. 2008) caused by pyrolysis. Amorphous
carbon, amorphous silicon oxide, and amorphous aluminum oxide might remain in the
ashes. These substances are very important to decrease heat released amount during
15 20 25 30 35 40 45 50 550
100
200
300
400
500
600
0
500
1000
1500
2000
2500
16.7
18.6
20.627.1 44.6 50.9
54.747.6
Inte
nsit
y o
f u
nb
urn
ed
sp
ecim
en
Inte
nsit
y o
f tw
o a
sh
es
2
25.4
2-a
Bottom ash
Fly ash
23.0
37.0
45.8 52.5
a
10 15 20 25 30 35 40 45 50 55
0
1000
2000
3000
4000
5000
0
200
400
600
800
1000
16.7
18.6
22.927.1 37.3 44.4 50.854.6
12.414.5
25.5
28.331.4
20.6 52.4
2
45.7
Bottom ash
Fly ash
2-b
47.6
Inte
ns
ity
of
un
bu
rne
d s
pe
cim
en
Inte
ns
ity
of
two
as
he
s
b
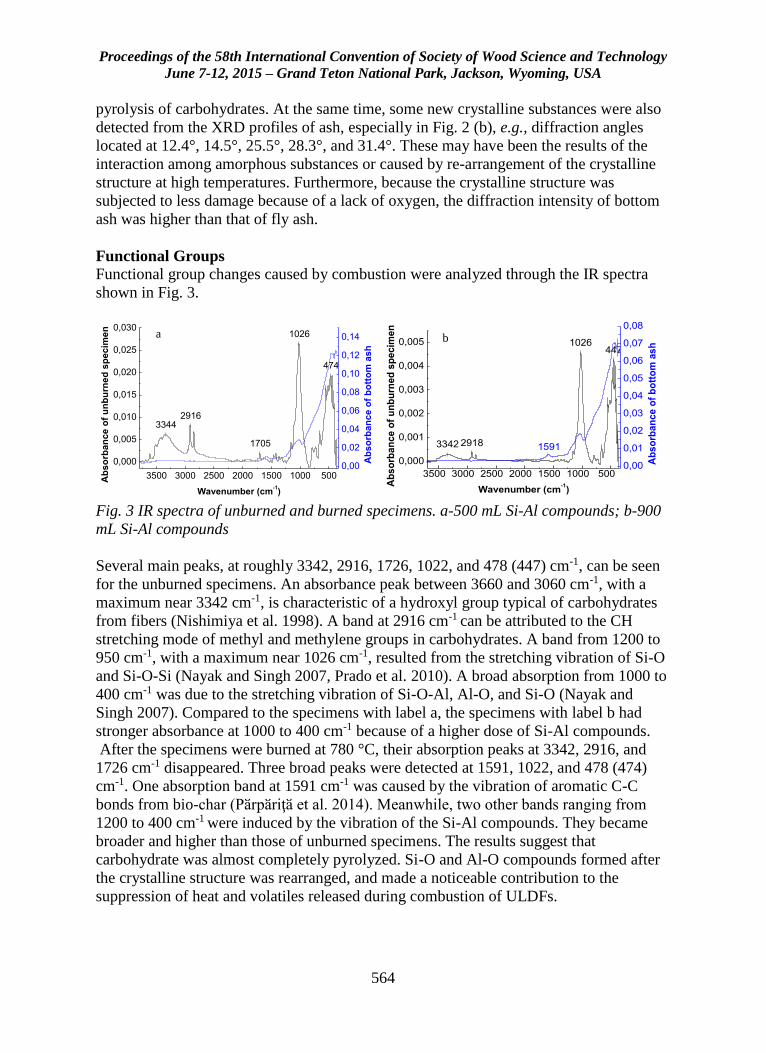
Proceedings of the 58th International Convention of Society of Wood Science and Technology
June 7-12, 2015 – Grand Teton National Park, Jackson, Wyoming, USA
564
pyrolysis of carbohydrates. At the same time, some new crystalline substances were also
detected from the XRD profiles of ash, especially in Fig. 2 (b), e.g., diffraction angles
located at 12.4°, 14.5°, 25.5°, 28.3°, and 31.4°. These may have been the results of the
interaction among amorphous substances or caused by re-arrangement of the crystalline
structure at high temperatures. Furthermore, because the crystalline structure was
subjected to less damage because of a lack of oxygen, the diffraction intensity of bottom
ash was higher than that of fly ash.
Functional Groups
Functional group changes caused by combustion were analyzed through the IR spectra
shown in Fig. 3.
Fig. 3 IR spectra of unburned and burned specimens. a-500 mL Si-Al compounds; b-900
mL Si-Al compounds
Several main peaks, at roughly 3342, 2916, 1726, 1022, and 478 (447) cm-1, can be seen
for the unburned specimens. An absorbance peak between 3660 and 3060 cm-1, with a
maximum near 3342 cm-1, is characteristic of a hydroxyl group typical of carbohydrates
from fibers (Nishimiya et al. 1998). A band at 2916 cm-1 can be attributed to the CH
stretching mode of methyl and methylene groups in carbohydrates. A band from 1200 to
950 cm-1, with a maximum near 1026 cm-1, resulted from the stretching vibration of Si-O
and Si-O-Si (Nayak and Singh 2007, Prado et al. 2010). A broad absorption from 1000 to
400 cm-1 was due to the stretching vibration of Si-O-Al, Al-O, and Si-O (Nayak and
Singh 2007). Compared to the specimens with label a, the specimens with label b had
stronger absorbance at 1000 to 400 cm-1 because of a higher dose of Si-Al compounds.
After the specimens were burned at 780 °C, their absorption peaks at 3342, 2916, and
1726 cm-1 disappeared. Three broad peaks were detected at 1591, 1022, and 478 (474)
cm-1. One absorption band at 1591 cm-1 was caused by the vibration of aromatic C-C
bonds from bio-char (Pӑrpӑriţӑ et al. 2014). Meanwhile, two other bands ranging from
1200 to 400 cm-1 were induced by the vibration of the Si-Al compounds. They became
broader and higher than those of unburned specimens. The results suggest that
carbohydrate was almost completely pyrolyzed. Si-O and Al-O compounds formed after
the crystalline structure was rearranged, and made a noticeable contribution to the
suppression of heat and volatiles released during combustion of ULDFs.
33442916
1705
1026
474
3500 3000 2500 2000 1500 1000 500
0,000
0,005
0,010
0,015
0,020
0,025
0,030
Wavenumber (cm-1)
Ab
so
rban
ce o
f u
nb
urn
ed
sp
ecim
en 2-a
0,00
0,02
0,04
0,06
0,08
0,10
0,12
0,14
Ab
so
rban
ce o
f b
ott
om
ash
a
3342 2918
1026447
3500 3000 2500 2000 1500 1000 500
0,000
0,001
0,002
0,003
0,004
0,005
Wavenumber (cm-1)
Ab
so
rba
nc
e o
f u
nb
urn
ed
sp
ec
ime
n
2-b
1591
0,00
0,01
0,02
0,03
0,04
0,05
0,06
0,07
0,08
Ab
so
rba
nc
e o
f b
ott
om
ash
b
Proceedings of the 58th International Convention of Society of Wood Science and Technology
June 7-12, 2015 – Grand Teton National Park, Jackson, Wyoming, USA
565
Conclusions
Fibers, chlorinated paraffin, AKD, glue and surfactant are pyrolyzed to volatile Cl
compounds like HCl, volatile C oxides (CO, CO2) and lightweight C in bottom ashes
after combustion. More Si-Al compounds still exist in the ashes in the form of amorphous
oxides of Si and Al, even suffering from high temperature.
Acknowledgments
The authors are grateful for the support of ÅForsk in Stockholm, Grant. No. 239124.
References
Cervin NT, Andersson L, Sing Ng JB, et al. (2013). Lightweight and strong cellulose
materials made from aqueous foams stabilized by nanofibrillated cellulose.
Biomacromolecules 14(2): 503-511.
Chen TJ, Niu M, Xie YQ, et al. (2015a). Modification of ultra-low density fiberboards by
an inorganic film formed by Si-Al deposition and their mechanical properties.
BioResources 10(1): 538-547.
Chen TJ, Niu M, Wu ZZ, et al. (2015b). Effect of silica sol content on thermostability
and mechanical properties of ultra-low density fiberboards. BioResources 10(1):1519-
1527.
Gajović A, Gracin D, Djerdj I, et al. (2008). Nanostructure of thin silicon films by
combining HRTEM, XRD and Raman spectroscopy measurements and the implication to
the optical properties. Applied Surface Science 254(9): 2748-2754.
Kawasaki T, Zhang M, Kawai S (1998). Manufacture and properties of ultra-low-density
fiberboard. Journal of Wood Science 44(5): 354-360.
Kokotailo GT, Fyfe CA (1995). Zeolite structure analysis with powder X-ray diffraction
and solid-state NMR techniques. The Rigaku Journal 12(1): 3-10.
Kosanović C, Bosnar S, Subotić B, et al. (2008). Study of the microstructure of
amorphous aluminosilicate gel before and after its hydrothermal treatment. Microporous
and Mesoporous Materials 110(2-3): 177-185.
Lionetto F, Sole DR, Cannoletta D, et al. (2012). Monitoring wood degradation during
weathering by cellulose crystallinity. Materials 5(10): 1910-1922.
Proceedings of the 58th International Convention of Society of Wood Science and Technology
June 7-12, 2015 – Grand Teton National Park, Jackson, Wyoming, USA
566
Liu CH (2010). Wood fire retardant-Sodium silicate. Education in Chemistry 32(12): 71-
72. (http://www.cnki.com.cn/Article/CJFDTotal-HXJX201012030.htm)
Liu JH (2013). Fire Retardant Properties and Mechanism of Ultra-Low Density Wood
Fiber-Based Material, Ph.D. dissertation, Fujian Agriculture and Forestry University,
China.
Nayak SP, Singh BK (2007). Instrumental characterization of clay by XRF, XRD and
FTIR. Bulletin of Materials Science 30(3): 235-238.
Nishimiya K, Hata T, Imamura Y, et al. (1998). Analysis of chemical structure of wood
charcoal by X-ray photo electron spectroscopy. Journal of Wood Science 44(1): 56-61.
Niu M, Hagman O, Wang XD, et al. (2014). Effect of Si-Al compounds on fire properties
of ultra-low density fiberboard. BioResources 9(2): 2415-2430.
Pӑrpӑriţӑ E, Brebu M, Uddin M, et al.(2014). Pyrolysis behaviors of various biomasses.
Polymer Degradation and Stability 100(2): 1-9.
Prado L, Sriyal M, Ghislandi M, et al. (2010). Surface modification of alumina
nanoparticles with silane coupling agents. Journal of the Brazilian Chemical Society
21(12): 2238-2245.
Xie YQ, Chen, Y, Wei QH (2008). Study on forming a truss-like reticular structure made
from nature fiber under the effect of liquid frothing. Journal of Fujian College of Forestry
28(3): 299-303.
Xie YQ, Liu JH, Lin M, et al. (2012). Reinforcement of plant fiber-based ultra low
density material with sodium silicate. Journal of Beijing Forestry University 34(1): 115-
118.
Xie YQ, Wei W, Wei QH, et al. (2015). A preparation method of insulation cotton using
kenaf bark. Chinese patent CN103274637.
Xu JY, Sugawara R, Widyorini R, et al. (2004). Manufacture and properties of low-
density binderless particleboard from kenaf core. Journal of Wood Science 50(1): 62-67.
Proceedings of the 58th International Convention of Society of Wood Science and Technology
June 7-12, 2015 – Grand Teton National Park, Jackson, Wyoming, USA
567
Characterization of Polymerization of Isocyanate Resin
and Phenolic Resins of Different Molecular Weights.
Part I: Morphology and Structure Analysis
XM Liu, Yan Luo, X.F. Zhang, H. Wan
Department of Sustainable Bioproducts
Mississippi State University
Mississippi State, MS 39762-9820
E-mail: [email protected]
Abstract
The reaction of isocyanate resin and phenol-formaldehyde (PF) resins with different
molecular weights was characterized by infrared spectroscopy (FTIR), scanning electron
microscopy (SEM), X-ray diffraction (XRD), thermos gravimetric Analysis (TGA). FTIR
and TG/DTG results showed that higher molecular weights of PF resins can not only
promote the reaction of MDI and PF co-polymer system, but also result in the best
thermal property of co-polymer. XRD results showed that the higher the molecular
weight, the better the crystal structure would be. This kind of co-polymer system
provides a great way to recycle isocyanate based polyurethane wastes and has the
potential to improve the thermal resistance property of phenolic resins.
Proceedings of the 58th International Convention of Society of Wood Science and Technology
June 7-12, 2015 – Grand Teton National Park, Jackson, Wyoming, USA
568
Timber Physics from 1 µm to 10 m Session Moderator: Samuel Zelinka, US Forest Products
Laboratory, USA
Subcellular Electrical Measurements as a Function of
Wood Moisture Content
Samuel L. Zelinka 1* – José L. Colon Quintana2 – Samuel V. Glass3
Joseph E. Jakes3 – Alex C. Wiedenhoeft5
1 Project Leader, Building and Fire Sciences, USDA Forest Service, Forest
Products Laboratory, Madison, WI, USA
* Corresponding author
2 Student, University of Puerto Rico Mayaguez, Mayaguez, Puerto Rico
3 Research Physical Scientist, Building and Fire Sciences, USDA Forest
Service, Forest Products Laboratory, Madison, WI, USA
4 Research Materials Engineer, Forest Biopolymers Science and
Engineering, USDA Forest Service, Forest Products Laboratory, Madison,
WI, USA
5 Research Botanist, Center for Wood Anatomy Research, USDA Forest
Service, Forest Products Laboratory, Madison, WI, USA
Abstract
Recent work has highlighted the importance of movement of chemicals and ions through
the wood cell wall. Movement depends strongly on moisture content and is necessary for
structural damage mechanisms such as fastener corrosion and wood decay. Here, we
present the first measurements of electrical resistance at the subcellular level as a
function of wood moisture content by using a 1µm diameter probe. Measurements were
taken with the probe contacting the S2 layer and the compound corner middle lamella of
the cell wall within the latewood, and the compound corner middle lamella in the
Proceedings of the 58th International Convention of Society of Wood Science and Technology
June 7-12, 2015 – Grand Teton National Park, Jackson, Wyoming, USA
569
earlywood. The resistance decreased with increasing relative humidity in all locations.
The resistance decreased more rapidly with relative humidity in the S2 layer than in the
middle lamella. These results give insight into how some moisture-dependent wood
properties affecting ion movement may be partitioned across cell wall layers.
Keywords: wood-moisture relations, electrical properties of wood, timber physics,
percolation theory, wood damage mechanisms
Introduction
Wood-moisture relations have long been studied using electrical measurements at the
macroscopic level (Stamm 1929). Recently, Zelinka et al. (2008) proposed a new
mechanism for electrical conduction in wood based upon percolation theory. The theory
describes the rapid increase in conductivity of wood as a function of moisture content
(MC) between roughly 15-30% moisture content in terms of a percolating network
through which ion movement occurs. One key feature of the model is that there is a
percolation threshold, the MC at which the percolating network first forms and below
which ionic conduction cannot occur. Above the percolation threshold, the conductivity
increases with a power-law behavior. Because the percolation threshold represents the
lower bound for ionic conduction, it also represents the moisture content below which
wood damage mechanisms that rely on ion transport cannot occur (Jakes et al. 2013).
Jakes et al. (2013) developed a model for chemical movement in cell walls that is
consistent with the percolation model for ionic conduction. In this model chemical
movement occurs in regions of the cell where the hemicelluloses have softened through a
moisture induced glass transition. Under dry conditions, the hemicelluloses in wood have
a glass transition between 150 and 220°C, however, the glass transition temperature
decreases with moisture content and eventually crosses room temperature when in
equilibrium with a relative humidity (RH) of somewhere between 60% to 80% RH
(Cousins 1976, 1978; Kelley et al. 1987; Olsson and Salmen 2004). Above the glass
transition temperature, the hemicellulose backbones twist and bend facilitating movement
of ions and other chemicals between energetically favorable sites. Just below the
percolation threshold, some of the hemicelluloses have adsorbed enough moisture to
soften at room temperature. As the relative humidity increases, the number and size of
softened regions grows until there is a continuous pathway of softened regions through
which chemicals and ions can have long range diffusion.
The percolation model developed by Zelinka et al. was based upon macroscale
measurements of the electrical conductivity and implicitly treats the wood material as
homogenous. The transport mechanism proposed by Jakes et al. depends upon a
moisture induced glass transition occurring in the hemicelluloses. This theory suggests
that there are likely differences in the threshold moisture content for moisture transport
between different regions in the cell wall. For instance, the secondary cell wall contains
cellulose microfibrils, amorphous cellulose, hemicelluloses, and lignin, where
hemicelluloses are preferentially oriented along the microfibrils (Hafren et al. 2000;
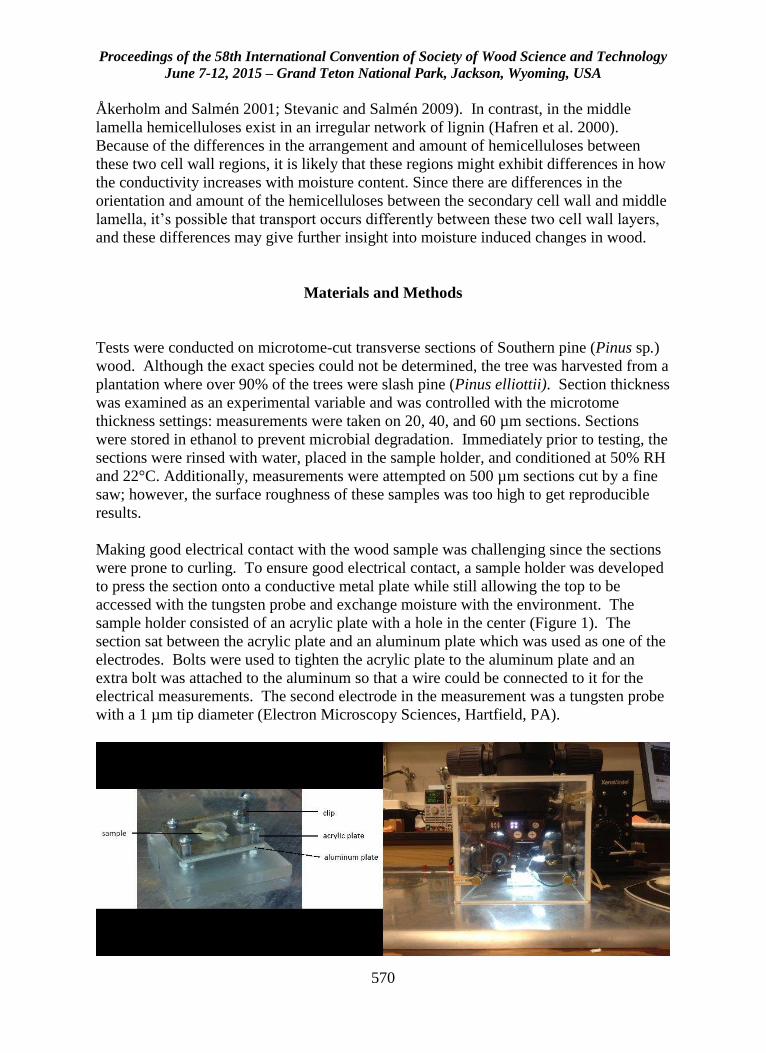
Proceedings of the 58th International Convention of Society of Wood Science and Technology
June 7-12, 2015 – Grand Teton National Park, Jackson, Wyoming, USA
570
Åkerholm and Salmén 2001; Stevanic and Salmén 2009). In contrast, in the middle
lamella hemicelluloses exist in an irregular network of lignin (Hafren et al. 2000).
Because of the differences in the arrangement and amount of hemicelluloses between
these two cell wall regions, it is likely that these regions might exhibit differences in how
the conductivity increases with moisture content. Since there are differences in the
orientation and amount of the hemicelluloses between the secondary cell wall and middle
lamella, it’s possible that transport occurs differently between these two cell wall layers,
and these differences may give further insight into moisture induced changes in wood.
Materials and Methods
Tests were conducted on microtome-cut transverse sections of Southern pine (Pinus sp.)
wood. Although the exact species could not be determined, the tree was harvested from a
plantation where over 90% of the trees were slash pine (Pinus elliottii). Section thickness
was examined as an experimental variable and was controlled with the microtome
thickness settings: measurements were taken on 20, 40, and 60 µm sections. Sections
were stored in ethanol to prevent microbial degradation. Immediately prior to testing, the
sections were rinsed with water, placed in the sample holder, and conditioned at 50% RH
and 22°C. Additionally, measurements were attempted on 500 µm sections cut by a fine
saw; however, the surface roughness of these samples was too high to get reproducible
results.
Making good electrical contact with the wood sample was challenging since the sections
were prone to curling. To ensure good electrical contact, a sample holder was developed
to press the section onto a conductive metal plate while still allowing the top to be
accessed with the tungsten probe and exchange moisture with the environment. The
sample holder consisted of an acrylic plate with a hole in the center (Figure 1). The
section sat between the acrylic plate and an aluminum plate which was used as one of the
electrodes. Bolts were used to tighten the acrylic plate to the aluminum plate and an
extra bolt was attached to the aluminum so that a wire could be connected to it for the
electrical measurements. The second electrode in the measurement was a tungsten probe
with a 1 µm tip diameter (Electron Microscopy Sciences, Hartfield, PA).
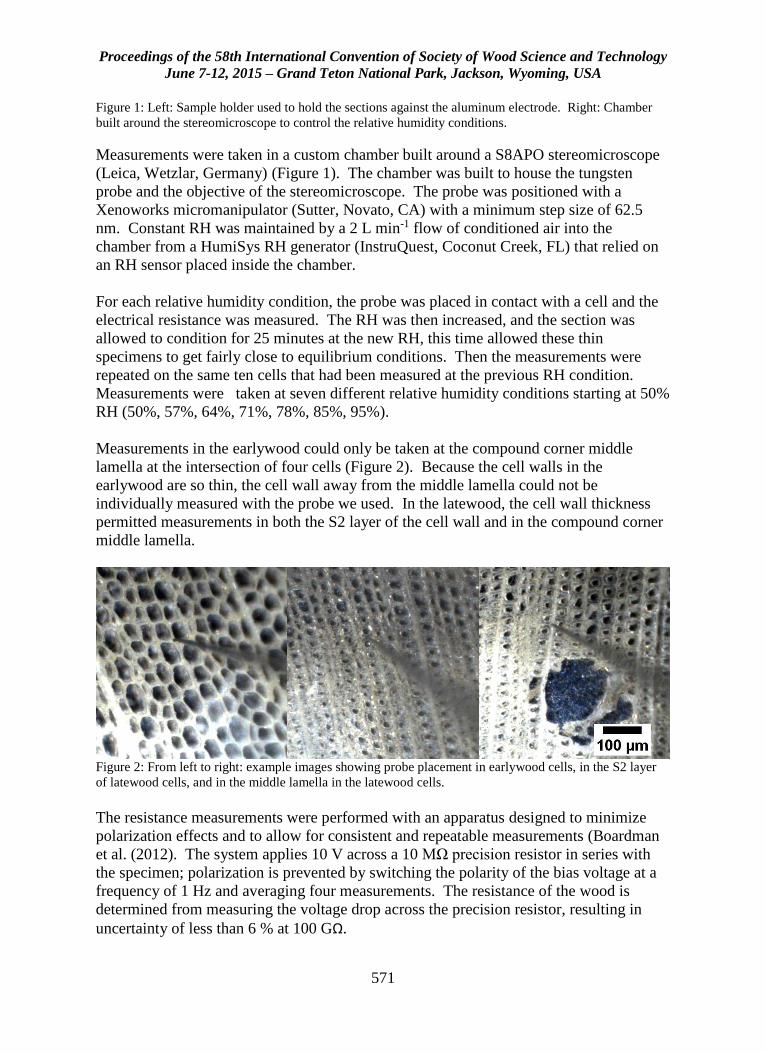
Proceedings of the 58th International Convention of Society of Wood Science and Technology
June 7-12, 2015 – Grand Teton National Park, Jackson, Wyoming, USA
571
Figure 1: Left: Sample holder used to hold the sections against the aluminum electrode. Right: Chamber
built around the stereomicroscope to control the relative humidity conditions.
Measurements were taken in a custom chamber built around a S8APO stereomicroscope
(Leica, Wetzlar, Germany) (Figure 1). The chamber was built to house the tungsten
probe and the objective of the stereomicroscope. The probe was positioned with a
Xenoworks micromanipulator (Sutter, Novato, CA) with a minimum step size of 62.5
nm. Constant RH was maintained by a 2 L min-1 flow of conditioned air into the
chamber from a HumiSys RH generator (InstruQuest, Coconut Creek, FL) that relied on
an RH sensor placed inside the chamber.
For each relative humidity condition, the probe was placed in contact with a cell and the
electrical resistance was measured. The RH was then increased, and the section was
allowed to condition for 25 minutes at the new RH, this time allowed these thin
specimens to get fairly close to equilibrium conditions. Then the measurements were
repeated on the same ten cells that had been measured at the previous RH condition.
Measurements were taken at seven different relative humidity conditions starting at 50%
RH (50%, 57%, 64%, 71%, 78%, 85%, 95%).
Measurements in the earlywood could only be taken at the compound corner middle
lamella at the intersection of four cells (Figure 2). Because the cell walls in the
earlywood are so thin, the cell wall away from the middle lamella could not be
individually measured with the probe we used. In the latewood, the cell wall thickness
permitted measurements in both the S2 layer of the cell wall and in the compound corner
middle lamella.
Figure 2: From left to right: example images showing probe placement in earlywood cells, in the S2 layer
of latewood cells, and in the middle lamella in the latewood cells.
The resistance measurements were performed with an apparatus designed to minimize
polarization effects and to allow for consistent and repeatable measurements (Boardman
et al. (2012). The system applies 10 V across a 10 MΩ precision resistor in series with
the specimen; polarization is prevented by switching the polarity of the bias voltage at a
frequency of 1 Hz and averaging four measurements. The resistance of the wood is
determined from measuring the voltage drop across the precision resistor, resulting in
uncertainty of less than 6 % at 100 GΩ.
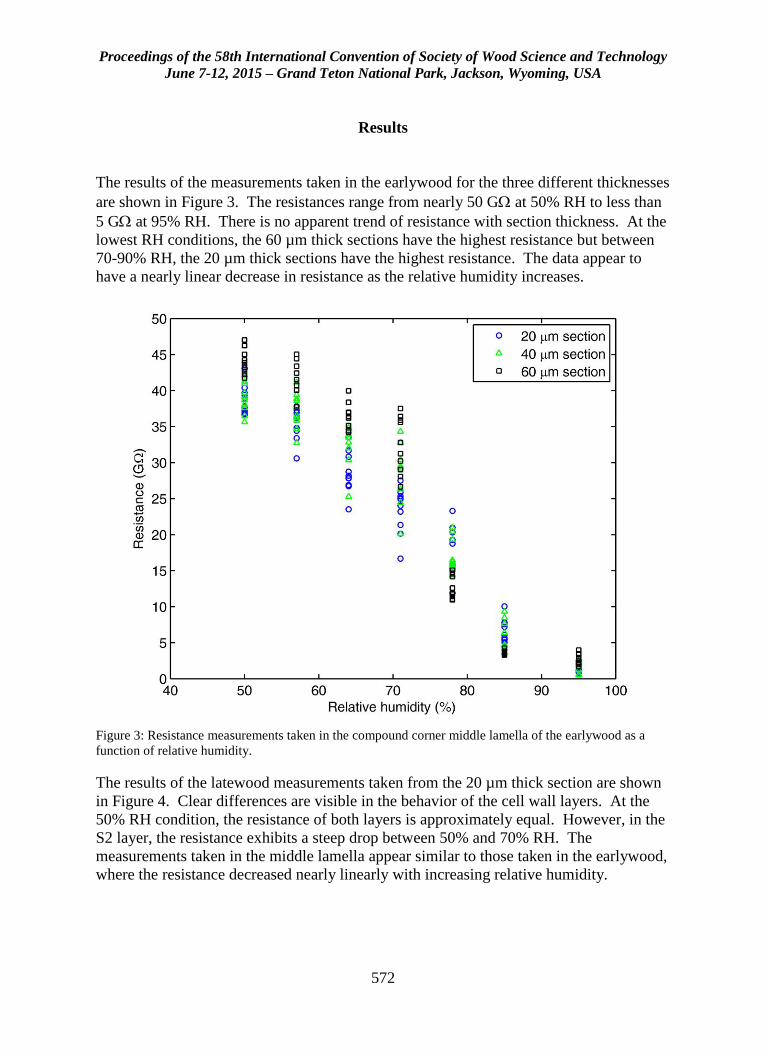
Proceedings of the 58th International Convention of Society of Wood Science and Technology
June 7-12, 2015 – Grand Teton National Park, Jackson, Wyoming, USA
572
Results
The results of the measurements taken in the earlywood for the three different thicknesses
are shown in Figure 3. The resistances range from nearly 50 G at 50% RH to less than
5 G at 95% RH. There is no apparent trend of resistance with section thickness. At the
lowest RH conditions, the 60 µm thick sections have the highest resistance but between
70-90% RH, the 20 µm thick sections have the highest resistance. The data appear to
have a nearly linear decrease in resistance as the relative humidity increases.
Figure 3: Resistance measurements taken in the compound corner middle lamella of the earlywood as a
function of relative humidity.
The results of the latewood measurements taken from the 20 µm thick section are shown
in Figure 4. Clear differences are visible in the behavior of the cell wall layers. At the
50% RH condition, the resistance of both layers is approximately equal. However, in the
S2 layer, the resistance exhibits a steep drop between 50% and 70% RH. The
measurements taken in the middle lamella appear similar to those taken in the earlywood,
where the resistance decreased nearly linearly with increasing relative humidity.
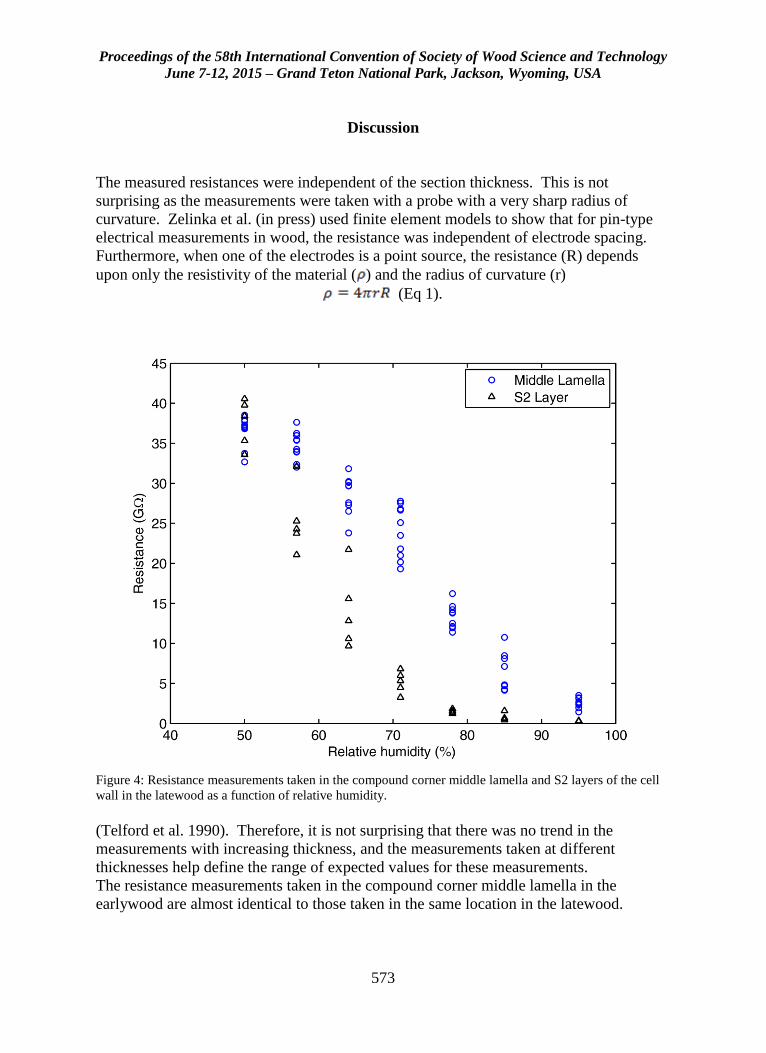
Proceedings of the 58th International Convention of Society of Wood Science and Technology
June 7-12, 2015 – Grand Teton National Park, Jackson, Wyoming, USA
573
Discussion
The measured resistances were independent of the section thickness. This is not
surprising as the measurements were taken with a probe with a very sharp radius of
curvature. Zelinka et al. (in press) used finite element models to show that for pin-type
electrical measurements in wood, the resistance was independent of electrode spacing.
Furthermore, when one of the electrodes is a point source, the resistance (R) depends
upon only the resistivity of the material ( ) and the radius of curvature (r)
(Eq 1).
Figure 4: Resistance measurements taken in the compound corner middle lamella and S2 layers of the cell
wall in the latewood as a function of relative humidity.
(Telford et al. 1990). Therefore, it is not surprising that there was no trend in the
measurements with increasing thickness, and the measurements taken at different
thicknesses help define the range of expected values for these measurements.
The resistance measurements taken in the compound corner middle lamella in the
earlywood are almost identical to those taken in the same location in the latewood.

Proceedings of the 58th International Convention of Society of Wood Science and Technology
June 7-12, 2015 – Grand Teton National Park, Jackson, Wyoming, USA
574
It is worthwhile to compare these data to those collected at the macroscale. Traditionally,
electrical measurements in wood have plotted conductivity (σ, the reciprocal of the
resistivity) as a function of the wood moisture content. Using Eq. 1, the conductivity
ranges from 10-6 -1m-1 at 50% RH for both the S2 and middle lamella to 10-4 -1m-1 and
5·10-5 -1m-1 at 95% RH for the S2 layer and the middle lamella, respectively. From
sorption measurements previously taken on material from the same parent board (Zelinka
et al. 2014), these RH conditions correspond with wood moisture contents of 7.8% and
22.4% MC, respectively. The macroscopic measurements of Stamm (1929) used to
develop the percolation model ranged from 10-7 -1m-1 at 9% MC to 4·10-5 -1m-1 at
22% MC; and are within an order of magnitude of the range of values found at the
subcellular level. Furthermore, the relative change in the resistivity of the macroscopic
measurements is similar to the relative change in resistivity of the measurements taken in
the S2 layer.
The increase in conductivity with moisture content is important as it is a way to measure
the mobility of ions at different moisture contents. Jakes et al. (2013) hypothesized that
several wood damage mechanisms require chemical diffusion within the cell wall and
that a better understanding of the diffusion of ions and other chemicals through the cell
wall may lead to new ways of protecting wood from moisture-induced damage. In these
measurements, it appears that there are clear differences in conductivity between the S2
layer and the middle lamella, and that movement increases more rapidly in the S2 layer
than in the middle lamella as wood moisture content increases.
These measurements may give insight into where a percolating network first occurs in
wood and how it may be related to mechanical softening. Specifically, the conductivity
increases most rapidly in the S2 layer where the hemicelluloses are more regularly
oriented, whereas in the middle lamella, there does not appear to be a sharp increase in
the conductivity with moisture content. If a rapid increase in conductivity is indeed
controlled by the hemicelluloses passing through a moisture induced glass transition, then
these measurements suggest that the moisture content at which the glass transition occurs
is different in the S2 layer and middle lamella and that the S2 layer is the first to soften.
These measurements suggest treatments that preferentially affect the S2 layer may be
more beneficial in reducing chemical movement in wood at moisture contents below fiber
saturation, thereby protecting wood from moisture-induced damage.
Conclusions
Electrical resistance was measured across microtomed wood sections as a function of
relative humidity using a 1 µm diameter probe contacting the secondary cell wall and
compound corner middle lamella of southern pine. Several conclusions can be drawn
from these measurements:
The measured resistances were independent of section thickness between 20-60
µm. A smooth, microtomed surface was necessary to make good electrical
contact and obtain reproducible results.
Proceedings of the 58th International Convention of Society of Wood Science and Technology
June 7-12, 2015 – Grand Teton National Park, Jackson, Wyoming, USA
575
Measurements could only be taken in the compound corner middle lamella in the
earlywood. Measurements taken in the earlywood in the middle lamella were
almost identical to those taken in the latewood in the middle lamella.
The resistance decreased as the relative humidity of the chamber increased. The
resistance of the S2 layer decreased more rapidly than the middle lamella.
Acknowledgements
Funding for J.L.C.Q. was provided through the Summer Research Experience for
Undergraduates (SURE) program as administered by the University of Wisconsin,
Madison. The authors acknowledge experimental assistance of Keith Bourne and the
contributions of David Eustice of the Forest Products Laboratory machine shop.
References
Åkerholm M, Salmén L (2001) Interactions between wood polymers studied by dynamic
FT-IR spectroscopy. Polymer 42(3):963-969.
Boardman C, Glass SV, Carll CG (2012) Moisture meter calibrations for untreated and
ACQ-treated southern yellow pine lumber and plywood. Journal of Testing and
Evaluation 40(1):1.
Cousins W (1976) Elastic modulus of lignin as related to moisture content. Wood Science
and Technology 10(1):9-17.
Cousins W (1978) Young's modulus of hemicellulose as related to moisture content.
Wood Science and Technology 12(3):161-167.
Hafren J, Fujino T, Itoh T, Westermark U, Terashima N (2000) Ultrastructural changes in
the compound middle lamella of Pinus thunbergii during lignification and lignin
removal. Holzforschung 54(3):234-240.
Jakes JE, Plaza N, Stone DS, Hunt CG, Glass SV, Zelinka SL (2013) Mechanism of
transport through wood cell wall polymers. Journal of Forest Products and
Industries 2(6):10-13.
Kelley SS, Rials TG, Glasser WG (1987) Relaxation behaviour of the amorphous
components of wood. Journal of Materials Science 22(2):617-624.
Olsson A-m, Salmen L (2004) The softening behavior of hemicelluloses related to
moisture. In: ACS symposium series: Washington, DC; American Chemical
Society; 1999.

Proceedings of the 58th International Convention of Society of Wood Science and Technology
June 7-12, 2015 – Grand Teton National Park, Jackson, Wyoming, USA
576
Stamm AJ (1929) The fiber-saturation point of wood as obtained from electrical
conductivity measurements. Industrial and Engineering Chemistry, Analytical
Edition 1(2):94-97.
Stevanic JS, Salmén L (2009) Orientation of the wood polymers in the cell wall of spruce
wood fibres. Holzforschung 63(5):497-503.
Telford WM, Geldard LP, Sheriff RE (1990) Chapter 8. Resistivity Methods. In:
Applied geophysics. Cambridge: Cambridge University Press.
Zelinka S, Glass S, Stone D (2008) A Percolation Model for Electrical Conduction in
Wood with Implications for Wood-Water Relations. Wood and Fiber Science
40(4):544-552.
Zelinka SL, Glass SV, Boardman CR, Derome D (2014) Moisture storage and transport
properties of preservative treated and untreated southern pine wood. Wood
Material Science & Engineering:1-11.
Zelinka SL, Wiedenhoeft AC, Glass SV, Ruffinatto F (in press) Anatomically-informed
mesoscale impedance specotroscopy in souther pine and the electric field
distribution for pin-type electric moisture meters. Wood Material Science and
Engineering.
Proceedings of the 58th International Convention of Society of Wood Science and Technology
June 7-12, 2015 – Grand Teton National Park, Jackson, Wyoming, USA
577
Thermal Conduction Behavior of Wood at Macroscopic
and at Cell Wall Level
Oliver Vay 1* – Michael Obersriebnig 2 – Karin de Borst 3 – Wolfgang
Gindl-Altmutter 4
1 Senior Researcher, Wood K plus – Competence Centre for Wood
Composites and Wood Chemistry, Linz, Austria.
* Corresponding author
[email protected] 2 Junior Researcher, Institute of Wood Technology and Renewable
Materials, BOKU – University of Natural Ressources and Life Sciences,
Vienna, Austria. 3 Professor, School of Engineering, University of Glasgow, Scotland.
4 Professor, Institute of Wood Technology and Renewable Materials, BOKU
– University of Natural Ressources and Life Sciences, Vienna, Austria.
Abstract
For an orthotropic material, the thermal conductivity in arbitrary directions follows from
the conductivities in the principal material directions by rotation of the thermal
conductivity tensor. Thus, if wood behaves othotropically, three analytical relations
describe the thermal conductivity of wood between the principal anatomical directions
depending on the rotation angle. Experiments were made at macroscopic level to prove if
these functions hold for wood. Experimental data for thermal conductivity at angles to the
grain were compared with values predicted from the conductivities in the principal
anatomical directions using the relations for rotation of the thermal conductivity tensor.
Excellent agreement between the experimental data and the theoretical curve was
obtained. It is concluded that thermal conductivity of wood at angles to the principal
anatomical directions can be described by transformation equations derived by the
respective rotation of the thermal conductivity tensor.
At cell wall level, thermal conduction behavior was studied by means of scanning
thermal microscopy. As a result of the deviating substructures of the cell wall layers, in
particular the orientation of cellulose microfibrils, variations in thermal conductivity are
observed. The assumption of high anisotropy of the thermal conductivity of crystalline
cellulose, having a comparable higher conductivity in parallel to the orientation of the
cellulose chains, explains well the observed behavior.
Keywords: Anatomical direction, Grain angle, Scanning thermal microscopy, Thermal
conductivity, Wood cell wall
Proceedings of the 58th International Convention of Society of Wood Science and Technology
June 7-12, 2015 – Grand Teton National Park, Jackson, Wyoming, USA
578
Introduction
Due to the morphological structure wood exhibits a distinctive anisotropic material
behavior. The anisotropy of thermal conductivity, as an important property in the field of
building physics as well as for timber processing like wood drying and wood
modification processes is discussed by several authors (e.g. Griffiths and Kaye 1923;
Schneider and Engelhardt 1977; Bučar and Straže 2008, Sonderegger et al. 2011).
Thermal conductivity at the macroscopic level is usually determined by means of a
steady-state hot-plate method.
The heat transport property of wood along the grain is approximately 2–3 times as high
as transverse to the grain, while differences between radial and tangential thermal
conductivities are less pronounced. The higher conductivity along the grain compared to
transverse conductivities can be explained by a higher conductivity of the cell wall in
longitudinal direction of the cell and the orientation of the cells in the stem. As a result,
for hardwoods with a high amount of ray cells, which are forming pathways for the heat
transport in radial direction, the radial thermal conductivity is significant higher
compared to tangential thermal conductivity while for softwood with a small amount of
ray cells there is almost no difference between tangential and radial conductivities
(Rowley 1933, Waangard 1940; Kühlmann 1962).
The anisotropic material behavior can be expressed by the following structure of the
thermal conductivity tensor K (Frandsen 2005; Eitelberger and Hofstetter 2011)
(1)
with λL as longitudinal thermal conductivity, λR the radial thermal conductivity and λT the
tangential thermal conductivity.
Thus, assuming reference axis coincide with the principal material axis, off-axis thermal
conductivities can be implemented by the respective rotation of the conductivity tensor K.
If wood behaves othotropically, three analytical relations describe the thermal
conductivity of wood between the principal anatomical directions depending on the
rotation angle (Vay et al. 2015).
An objective of the present study was to show the validity of these functions and, thus, to
show orthotropic symmetry of the thermal conduction behavior of wood. Experimental
verification was done in the longitudinal – radial plane. Thus, the respective relation
describing the thermal conductivity can be implemented by rotation of the conductivity
tensor K (equation 1) in the x1-x2 plane, about the x3 axis, by an angle α from the x1
towards the x2 axis. Transformed thermal conductivity is given by:
T
R
L
K
00
00
00
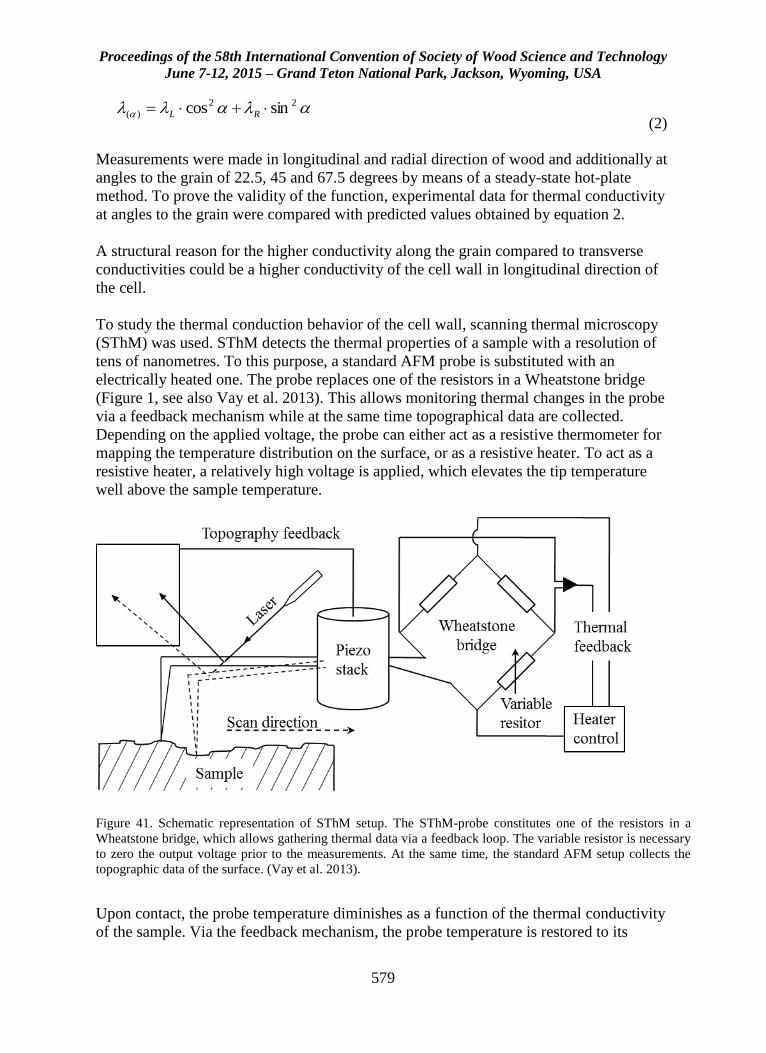
Proceedings of the 58th International Convention of Society of Wood Science and Technology
June 7-12, 2015 – Grand Teton National Park, Jackson, Wyoming, USA
579
(2)
Measurements were made in longitudinal and radial direction of wood and additionally at
angles to the grain of 22.5, 45 and 67.5 degrees by means of a steady-state hot-plate
method. To prove the validity of the function, experimental data for thermal conductivity
at angles to the grain were compared with predicted values obtained by equation 2.
A structural reason for the higher conductivity along the grain compared to transverse
conductivities could be a higher conductivity of the cell wall in longitudinal direction of
the cell.
To study the thermal conduction behavior of the cell wall, scanning thermal microscopy
(SThM) was used. SThM detects the thermal properties of a sample with a resolution of
tens of nanometres. To this purpose, a standard AFM probe is substituted with an
electrically heated one. The probe replaces one of the resistors in a Wheatstone bridge
(Figure 1, see also Vay et al. 2013). This allows monitoring thermal changes in the probe
via a feedback mechanism while at the same time topographical data are collected.
Depending on the applied voltage, the probe can either act as a resistive thermometer for
mapping the temperature distribution on the surface, or as a resistive heater. To act as a
resistive heater, a relatively high voltage is applied, which elevates the tip temperature
well above the sample temperature.
Wood is generally disintegrated Materials & Methods
Upon contact, the probe temperature diminishes as a function of the thermal conductivity
of the sample. Via the feedback mechanism, the probe temperature is restored to its
Figure 41. Schematic representation of SThM setup. The SThM-probe constitutes one of the resistors in a
Wheatstone bridge, which allows gathering thermal data via a feedback loop. The variable resistor is necessary
to zero the output voltage prior to the measurements. At the same time, the standard AFM setup collects the
topographic data of the surface. (Vay et al. 2013).
22
)( sincos RL
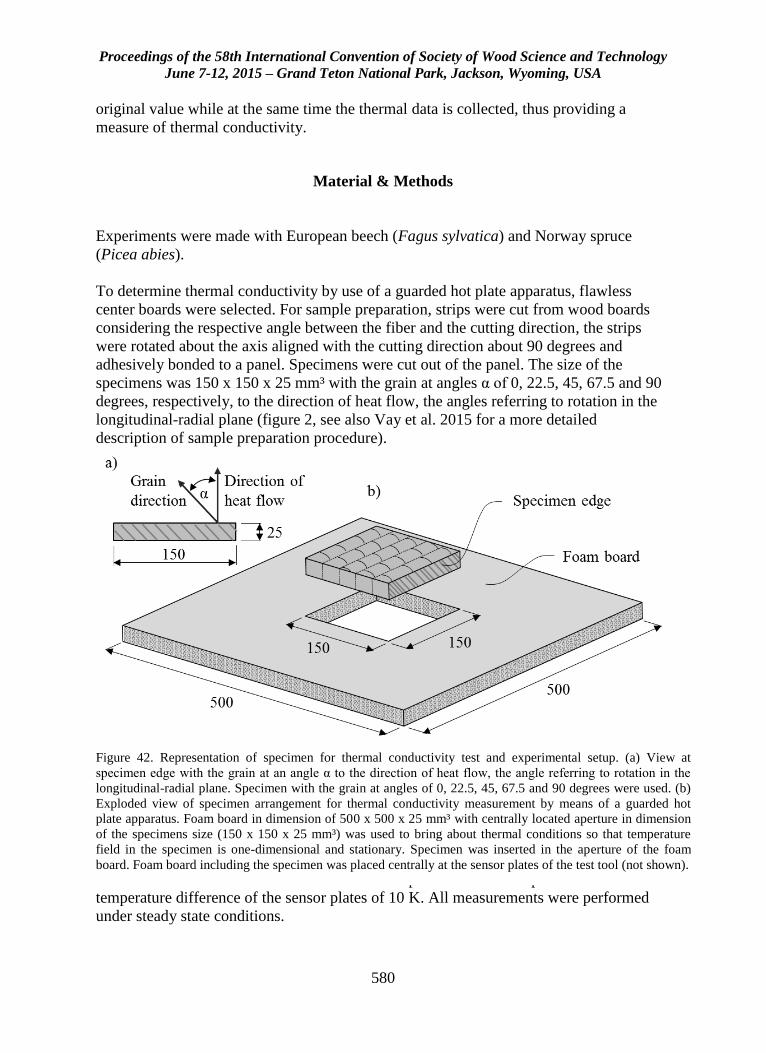
Proceedings of the 58th International Convention of Society of Wood Science and Technology
June 7-12, 2015 – Grand Teton National Park, Jackson, Wyoming, USA
580
original value while at the same time the thermal data is collected, thus providing a
measure of thermal conductivity.
Material & Methods
Experiments were made with European beech (Fagus sylvatica) and Norway spruce
(Picea abies).
To determine thermal conductivity by use of a guarded hot plate apparatus, flawless
center boards were selected. For sample preparation, strips were cut from wood boards
considering the respective angle between the fiber and the cutting direction, the strips
were rotated about the axis aligned with the cutting direction about 90 degrees and
adhesively bonded to a panel. Specimens were cut out of the panel. The size of the
specimens was 150 x 150 x 25 mm³ with the grain at angles α of 0, 22.5, 45, 67.5 and 90
degrees, respectively, to the direction of heat flow, the angles referring to rotation in the
longitudinal-radial plane (figure 2, see also Vay et al. 2015 for a more detailed
description of sample preparation procedure).
Wood is generally disintegrated
Materials & Methods
Thermal conductivities were tested for mean temperature of the sample of 10°C at a
temperature difference of the sensor plates of 10 K. All measurements were performed
under steady state conditions.
Figure 42. Representation of specimen for thermal conductivity test and experimental setup. (a) View at
specimen edge with the grain at an angle α to the direction of heat flow, the angle referring to rotation in the
longitudinal-radial plane. Specimen with the grain at angles of 0, 22.5, 45, 67.5 and 90 degrees were used. (b)
Exploded view of specimen arrangement for thermal conductivity measurement by means of a guarded hot
plate apparatus. Foam board in dimension of 500 x 500 x 25 mm³ with centrally located aperture in dimension
of the specimens size (150 x 150 x 25 mm³) was used to bring about thermal conditions so that temperature
field in the specimen is one-dimensional and stationary. Specimen was inserted in the aperture of the foam
board. Foam board including the specimen was placed centrally at the sensor plates of the test tool (not shown).

Proceedings of the 58th International Convention of Society of Wood Science and Technology
June 7-12, 2015 – Grand Teton National Park, Jackson, Wyoming, USA
581
18 specimens each with the grain at angles of 0, 22.5, 45 and 67.5 degrees, respectively
and 9 specimens with the grain at an angle of 90 degrees were tested. Thermal
conductivity tests were made according to the method given in ISO 8302. Test instrument
was single-specimen guarded hot plate apparatus (Lambda Meter EP 500, Lambda
Messtechnik, Dresden, Germany). For measurement, the specimen was inserted in an
aperture located right in the center of a foam board (Plastazote LD 29, Zotefoam,
England), which is needed to bring about thermal conditions so that temperature field in
the specimen is one-dimensional and stationary. Foam as adjacent outer material will be
not considered for the test result (figure 2). Measurements were made with mean sample
temperature of 10°C at a temperature difference of the sensor plates of 10K. All
measurements were performed under steady state conditions.
To analyse the influence of grain orientation, measured thermal conductivity values were
standardised on mean density of all specimens at angles to the grain. Experimental points
as the mean values of standardised data at angles to the grain of 0, 22.5, 45, 67.5 and 90
degrees are compared with predicted values obtained by equation 2. Therefore, equation
2 was used as the model for a least squares fit of the experimental points.
To study the conductivity of the cell wall along and transverse to the grain, small cubes
of both wood species were prepared and smoothed with an ultra-microtome (Leica). Test
instrument was a Bruker Dimension Icon (Bruker, Santa Barbara, CA, US) equipped with
a standard SThM probe of the same manufacturer (VITA-DM-GLA 1, nominal tip radius
<100 nm). For all scans a heating voltage of 2 V at a scan rate of 0.3 Hz with constant
gain factors was applied and the scan size was 6 μm * 6 μm (see also Vay et al. 2013).
Results & Discussion
Figure 3 shows experimental data at angles to the grain and the respective curve fit for
European beech and Norway spruce.
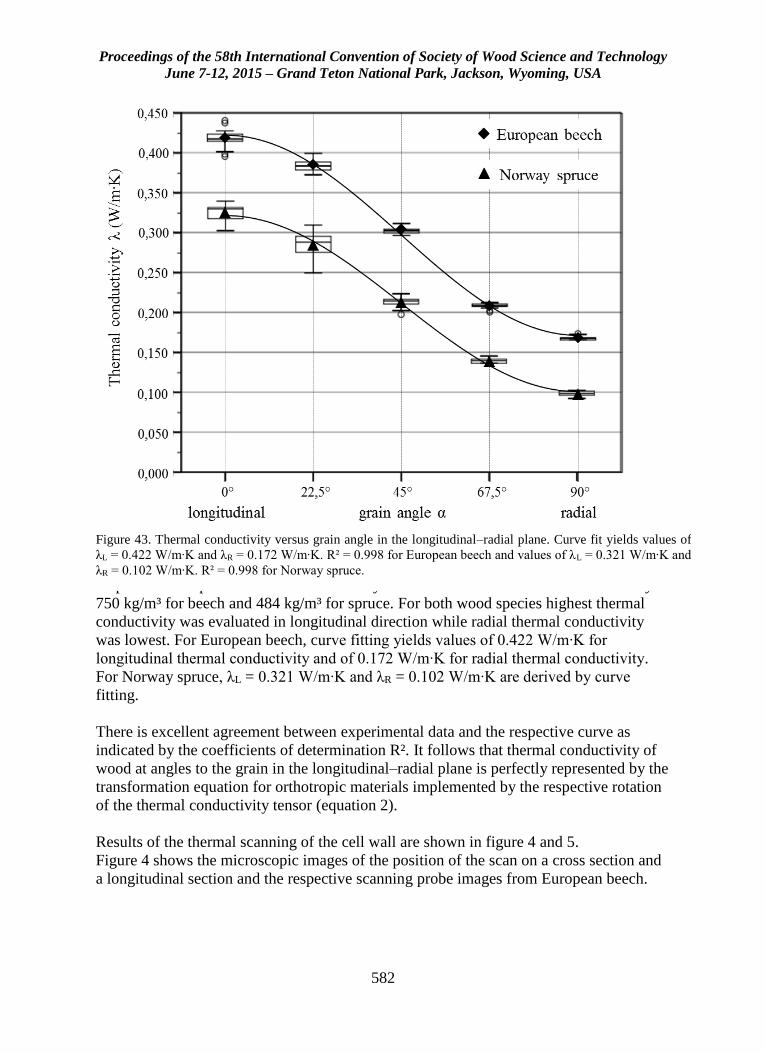
Proceedings of the 58th International Convention of Society of Wood Science and Technology
June 7-12, 2015 – Grand Teton National Park, Jackson, Wyoming, USA
582
Moisture content at guarded hot plate test was approximately 11 per cent for beech and
12 per cent for spruce. Thermal conductivity values were standardised on mean density of
750 kg/m³ for beech and 484 kg/m³ for spruce. For both wood species highest thermal
conductivity was evaluated in longitudinal direction while radial thermal conductivity
was lowest. For European beech, curve fitting yields values of 0.422 W/m∙K for
longitudinal thermal conductivity and of 0.172 W/m∙K for radial thermal conductivity.
For Norway spruce, λL = 0.321 W/m∙K and λR = 0.102 W/m∙K are derived by curve
fitting.
There is excellent agreement between experimental data and the respective curve as
indicated by the coefficients of determination R². It follows that thermal conductivity of
wood at angles to the grain in the longitudinal–radial plane is perfectly represented by the
transformation equation for orthotropic materials implemented by the respective rotation
of the thermal conductivity tensor (equation 2).
Results of the thermal scanning of the cell wall are shown in figure 4 and 5.
Figure 4 shows the microscopic images of the position of the scan on a cross section and
a longitudinal section and the respective scanning probe images from European beech.
Figure 43. Thermal conductivity versus grain angle in the longitudinal–radial plane. Curve fit yields values of
λL = 0.422 W/m∙K and λR = 0.172 W/m∙K. R² = 0.998 for European beech and values of λL = 0.321 W/m∙K and
λR = 0.102 W/m∙K. R² = 0.998 for Norway spruce.
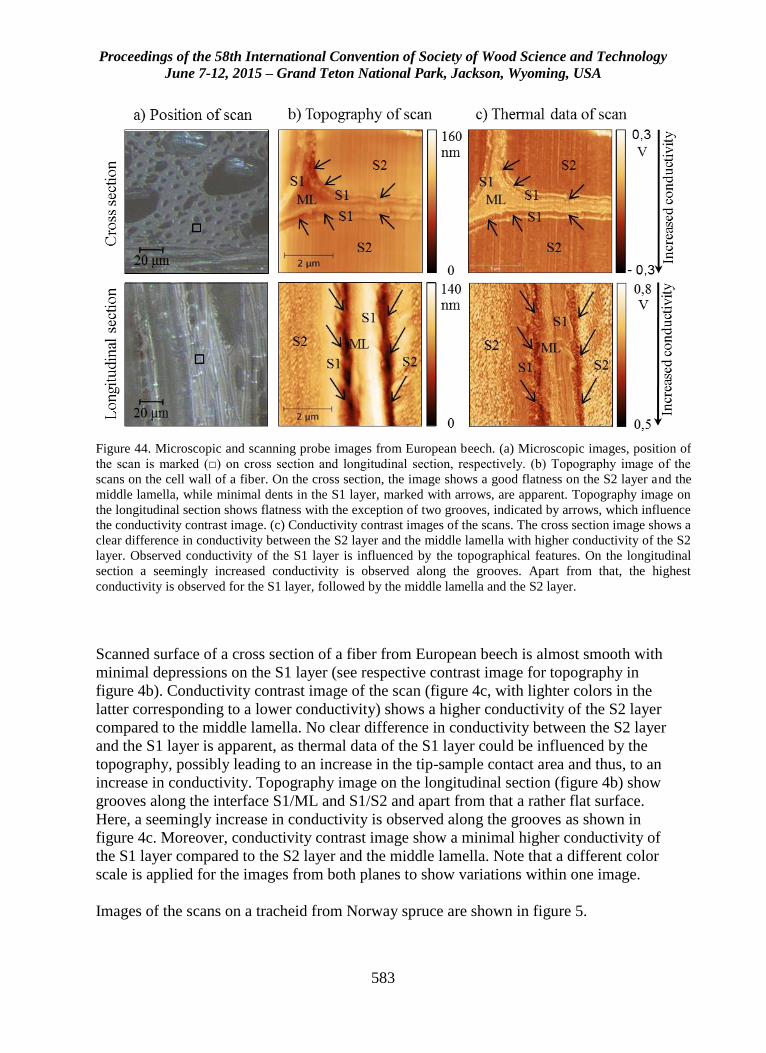
Proceedings of the 58th International Convention of Society of Wood Science and Technology
June 7-12, 2015 – Grand Teton National Park, Jackson, Wyoming, USA
583
Scanned surface of a cross section of a fiber from European beech is almost smooth with
minimal depressions on the S1 layer (see respective contrast image for topography in
figure 4b). Conductivity contrast image of the scan (figure 4c, with lighter colors in the
latter corresponding to a lower conductivity) shows a higher conductivity of the S2 layer
compared to the middle lamella. No clear difference in conductivity between the S2 layer
and the S1 layer is apparent, as thermal data of the S1 layer could be influenced by the
topography, possibly leading to an increase in the tip-sample contact area and thus, to an
increase in conductivity. Topography image on the longitudinal section (figure 4b) show
grooves along the interface S1/ML and S1/S2 and apart from that a rather flat surface.
Here, a seemingly increase in conductivity is observed along the grooves as shown in
figure 4c. Moreover, conductivity contrast image show a minimal higher conductivity of
the S1 layer compared to the S2 layer and the middle lamella. Note that a different color
scale is applied for the images from both planes to show variations within one image.
Images of the scans on a tracheid from Norway spruce are shown in figure 5.
Figure 44. Microscopic and scanning probe images from European beech. (a) Microscopic images, position of
the scan is marked (□) on cross section and longitudinal section, respectively. (b) Topography image of the
scans on the cell wall of a fiber. On the cross section, the image shows a good flatness on the S2 layer and the
middle lamella, while minimal dents in the S1 layer, marked with arrows, are apparent. Topography image on
the longitudinal section shows flatness with the exception of two grooves, indicated by arrows, which influence
the conductivity contrast image. (c) Conductivity contrast images of the scans. The cross section image shows a
clear difference in conductivity between the S2 layer and the middle lamella with higher conductivity of the S2
layer. Observed conductivity of the S1 layer is influenced by the topographical features. On the longitudinal
section a seemingly increased conductivity is observed along the grooves. Apart from that, the highest
conductivity is observed for the S1 layer, followed by the middle lamella and the S2 layer.

Proceedings of the 58th International Convention of Society of Wood Science and Technology
June 7-12, 2015 – Grand Teton National Park, Jackson, Wyoming, USA
584
As visible in the topography images of the cross section scan and the longitudinal section
scan, respectively (figure 5b), the collected thermal data (figure 5c) is less influenced by
topographical features compared to the scan on a fiber of European beech (see figure 4).
Variations in conductivity (see figure 5c) which are seemingly caused by variations in
topography are marked with arrows. Apart from that, the cross section scan on the cell
wall of the tracheid of Norway spruce (figure 5c) reveals a higher conductivity of the S2
layer compared to the S1 layer and the middle lamella. The S1 layer and middle lamella
show approximately the same conductivity.
In contrast, the respective image from the longitudinal section scan shows highest
conductivity of the S1 layer, followed by the S2 layer and the middle lamella.
The assumption of anisotropic thermal behavior of crystalline cellulose, with significant
higher thermal conductivity along the cellulose chains compared to conductivity normal
to the chains as well as the conductivity of the other cell wall materials could explain the
conductivity contrast images. Almost vertically oriented cellulose fibrils increase the
conductivity of the cell wall layer, as visible for the S2 layer in the cross section as well
as for the S1 layer on the image of a longitudinal section scan.
Figure 45. Microscopic and scanning probe images from Norway spruce. (a) Microscopic images, position of
the scan on the cell wall of a tracheid are marked (□) on cross section and longitudinal section, respectively. (b)
Topography images on the cross section as well as on the longitudinal section show overall good flatness with
the exception of one groove in each image, marked with the arrows along one interface S1/S2. (c) Conductivity
contrast images from the same scans. Apart from effects of topographical features (arrows) on the observed
conductivity, on the cross section image, the S2 layers shows the greatest conductivity, followed by the middle
lamella and the S1 layer while contrary on the image on the longitudinal section the S1 layer shows higher
conductivity than the S2 layer and the middle lamella.
Proceedings of the 58th International Convention of Society of Wood Science and Technology
June 7-12, 2015 – Grand Teton National Park, Jackson, Wyoming, USA
585
Summary & Conclusions
The guarded hot plate experiment showed that thermal conductivity of wood between two
principal anatomical directions are perfectly represented by the theoretical curve derived
from the respective rotation of the thermal conductivity tensor. It follows that wood
shows orthotropic symmetry regarding the thermal conduction behavior. It is concluded
that thermal conductivity of wood in arbitrary directions can be calculated by this
method.
The SThM experiment images thermal conductivity of the wood cell wall. The results
show differences in conductivity between the individual cell wall layers. In cross
sections, the S2 layer shows a higher conductivity compared to the S1 layer and the
middle lamella. In contrast, in longitudinal sections thermal conductivity of the S1 layer
is apparently higher than conductivity of the S2 layer and the middle lamella. The
observed conduction behavior could be attributed to a clear higher conductivity of
cellulose along the cellulose chains compared to the conductivity of cellulose normal to
the cellulose chains as well as to hemicelluloses and lignin, respectively.
References
Bučar B., Straže A. (2008): Determination of the thermal conductivity of wood by the hot
plate method: The influence of morphological properties of fir wood (Abies alba Mill.) to
the contact thermal resistance. Holzforschung, 62: 362-367.
Eitelberger J., Hofstetter K. (2011): Prediction of transport properties of wood below the
fiber saturation point – A multiscale homogenization approach and its experimental
validation Part 1: Thermal conductivity. Composites Science and Technology, 71: 134-
144.
Griffiths E., Kaye G. (1923): The measurement of thermal conductivity. Proc Roy Soc
Lond Ser A, 104 (724): 71-98.
ISO 8302 (1991): Thermal insulation – Determination of steady-state thermal resistance
and related properties – Guarded hot plate apparatus.
Kühlmann G. (1962): Untersuchung der thermischen Eigenschaft von Holz und
Spanplatten in Abhängigkeit von Feuchtigkeit und Temperatur im hygroskopischen
Bereich. Holz Roh Werkst 20(7): 259-270.
Schneider A., Engelhardt F. (1977): Vergleichende Untersuchungen über die
Wärmeleitfähigkeit von Holzspan- und Rindenplatten. Holz als Roh- und Werkstoff,
35(7): 273-278.

Proceedings of the 58th International Convention of Society of Wood Science and Technology
June 7-12, 2015 – Grand Teton National Park, Jackson, Wyoming, USA
586
Sonderegger W., Hering S., Niemz P. (2011): Thermal behaviour of Norway spruce and
European beech in and between the principal anatomical directions. Holzforschung 65:
369-375.
Vay O., Obersriebnig M., Müller U., Konnerth J., Gindl-Altmutter W. (2013): Studying
thermal conductivity of wood at cell wall level by scanning thermal microscopy (SThM).
Holzforschung 67 (2): 155-159.
Vay O., De Borst K., Hansmann C., Teischinger A., Müller U. (2015): Thermal
conductivity of wood at angles to the principal anatomical directions. Wood Science and
Technology. DOI 10.1007/s00226-015-0716-x.
Wangaard F. (1940): Transverse heat conductivity of wood. Heating Piping Air
Condition 12: 459-464.
Proceedings of the 58th International Convention of Society of Wood Science and Technology
June 7-12, 2015 – Grand Teton National Park, Jackson, Wyoming, USA
587
Mechanism and Regularity of Bending Creep Behavior
of Solid Wood Beam in Varying Humidity 4F
*
Hong Jian Zhang1*, Ying Hei Chui2
Chun Lei Dong, Yu Xiang Huang and Tong Li
1 Professor, Faculty of Material Science and Technology
Southwest Forestry University, Kunming, China *Corresponding author
[email protected] 2 Professor, Wood Science and Technology Centre
University of New Brunswick, Fredericton, Canada
Abstract
In order to make the mechanism and regularity clear of the creep behavior of the solid
wood beam in varying humidity (V-creep), a series of experiments were carefully done
with the sample from poplar and sets of the accurately controllable system of temperature
and humidity and the on line detecting system of the deformation. Results from the
analyses indicated that: it was the mechanism of “Stress coupling - loading – Moisture
content – Varying mutual actions” that regulated the behavior of the bending V-creep,
in which the stress coupling was aroused by the hygro-stresses including swelling stress
and shrinking stress excited by adsorption or desorption, whose varying state could be
represented by the difference of stepping moisture content (±D), and the loading stress; 2)
the inner mechanism of the essentially negative creep in absorbing (ad-creep) was that a
part of the compressive deformation and bucked and crumbed fibre under compression
were transferred by the swelling - loading stress coupling into compression recovery,
stretching of the fibre and then tensile deformation; the inner mechanism of the positive
creep in desorbing (de-creep), whose deflection might huge, was that a part of the tensile
deformation was transferred by the shrinking - loading stress coupling into tensile
recovery, compressive deformation and fibre bulking and crumbling; 3) the appearing
orientation, either negative or positive, of ad-creep including that of the first ad-creep,
and the quantity of all kinds deflections occurred during V-creep were determined by ±D,
loading, moisture content and their varying mutual actions; 4) the mechanism of the
absolute deflection of the negative ad-creep becoming larger and larger and almost
*
Supported by the National Nature Science Fund of China, 31170534
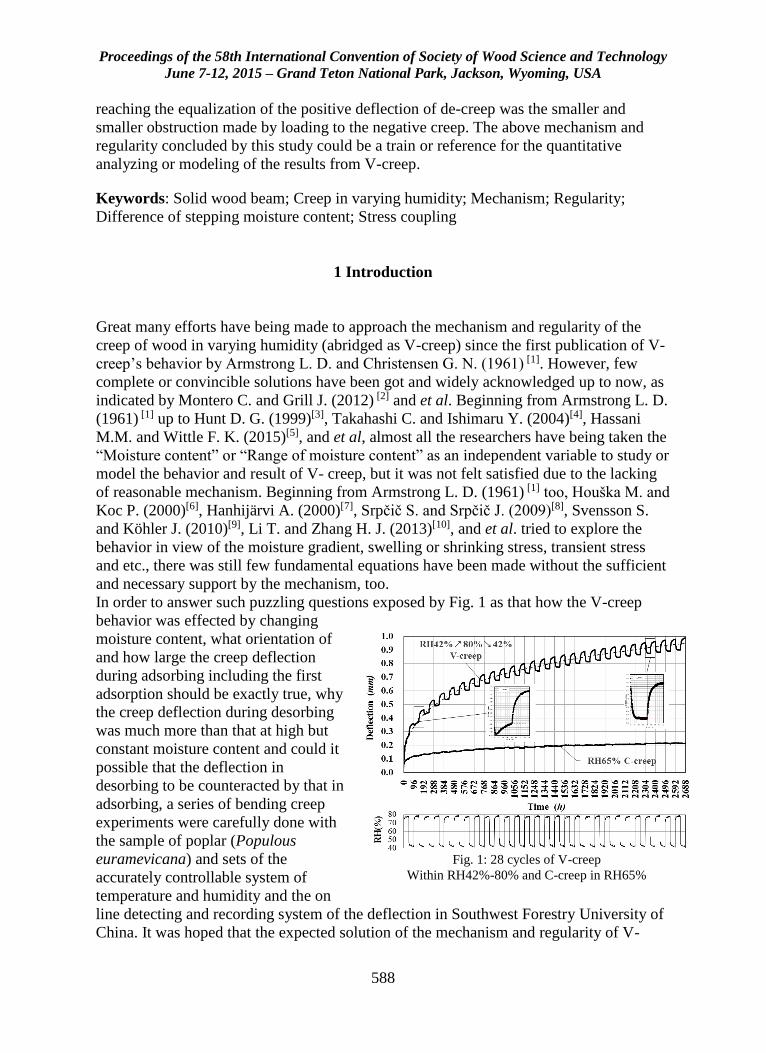
Proceedings of the 58th International Convention of Society of Wood Science and Technology
June 7-12, 2015 – Grand Teton National Park, Jackson, Wyoming, USA
588
reaching the equalization of the positive deflection of de-creep was the smaller and
smaller obstruction made by loading to the negative creep. The above mechanism and
regularity concluded by this study could be a train or reference for the quantitative
analyzing or modeling of the results from V-creep.
Keywords: Solid wood beam; Creep in varying humidity; Mechanism; Regularity;
Difference of stepping moisture content; Stress coupling
1 Introduction
Great many efforts have being made to approach the mechanism and regularity of the
creep of wood in varying humidity (abridged as V-creep) since the first publication of V-
creep’s behavior by Armstrong L. D. and Christensen G. N. (1961) [1]. However, few
complete or convincible solutions have been got and widely acknowledged up to now, as
indicated by Montero C. and Grill J. (2012) [2] and et al. Beginning from Armstrong L. D.
(1961) [1] up to Hunt D. G. (1999)[3], Takahashi C. and Ishimaru Y. (2004)[4], Hassani
M.M. and Wittle F. K. (2015)[5], and et al, almost all the researchers have being taken the
“Moisture content” or “Range of moisture content” as an independent variable to study or
model the behavior and result of V- creep, but it was not felt satisfied due to the lacking
of reasonable mechanism. Beginning from Armstrong L. D. (1961) [1] too, Houška M. and
Koc P. (2000)[6], Hanhijärvi A. (2000)[7], Srpčič S. and Srpčič J. (2009)[8], Svensson S.
and Köhler J. (2010)[9], Li T. and Zhang H. J. (2013)[10], and et al. tried to explore the
behavior in view of the moisture gradient, swelling or shrinking stress, transient stress
and etc., there was still few fundamental equations have been made without the sufficient
and necessary support by the mechanism, too.
In order to answer such puzzling questions exposed by Fig. 1 as that how the V-creep
behavior was effected by changing
moisture content, what orientation of
and how large the creep deflection
during adsorbing including the first
adsorption should be exactly true, why
the creep deflection during desorbing
was much more than that at high but
constant moisture content and could it
possible that the deflection in
desorbing to be counteracted by that in
adsorbing, a series of bending creep
experiments were carefully done with
the sample of poplar (Populous
euramevicana) and sets of the
accurately controllable system of
temperature and humidity and the on
line detecting and recording system of the deflection in Southwest Forestry University of
China. It was hoped that the expected solution of the mechanism and regularity of V-
Fig. 1: 28 cycles of V-creep
Within RH42%-80% and C-creep in RH65%
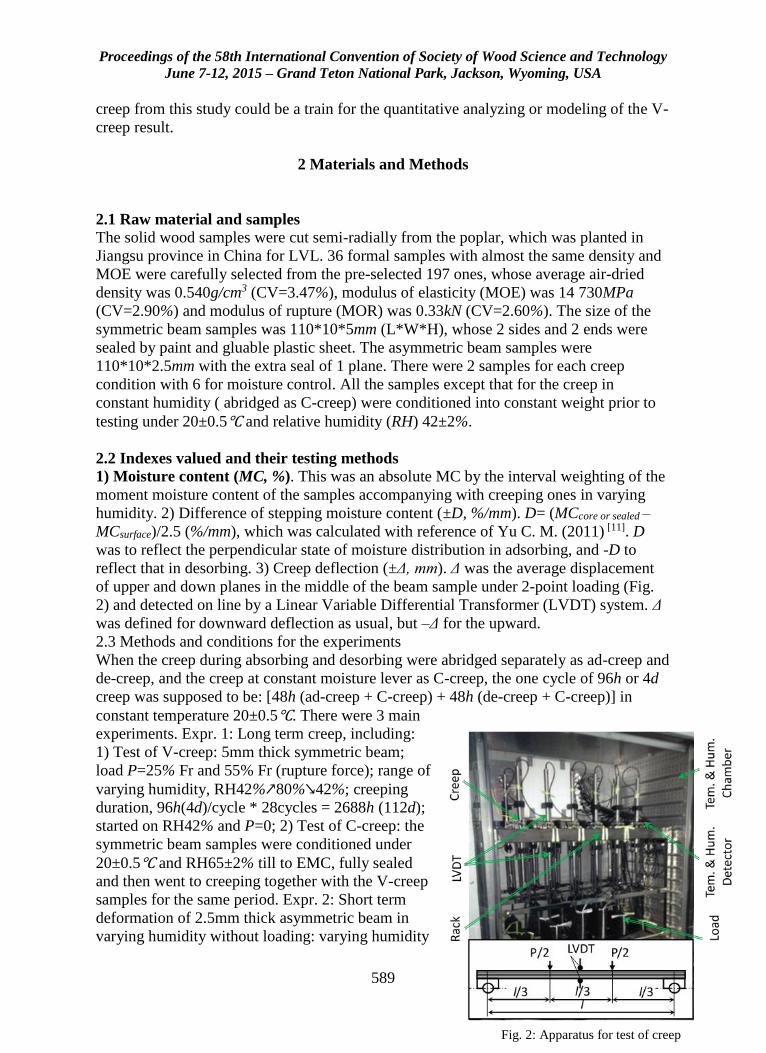
Proceedings of the 58th International Convention of Society of Wood Science and Technology
June 7-12, 2015 – Grand Teton National Park, Jackson, Wyoming, USA
589
creep from this study could be a train for the quantitative analyzing or modeling of the V-
creep result.
2 Materials and Methods
2.1 Raw material and samples
The solid wood samples were cut semi-radially from the poplar, which was planted in
Jiangsu province in China for LVL. 36 formal samples with almost the same density and
MOE were carefully selected from the pre-selected 197 ones, whose average air-dried
density was 0.540g/cm3 (CV=3.47%), modulus of elasticity (MOE) was 14 730MPa
(CV=2.90%) and modulus of rupture (MOR) was 0.33kN (CV=2.60%). The size of the
symmetric beam samples was 110*10*5mm (L*W*H), whose 2 sides and 2 ends were
sealed by paint and gluable plastic sheet. The asymmetric beam samples were
110*10*2.5mm with the extra seal of 1 plane. There were 2 samples for each creep
condition with 6 for moisture control. All the samples except that for the creep in
constant humidity ( abridged as C-creep) were conditioned into constant weight prior to
testing under 20±0.5℃ and relative humidity (RH) 42±2%.
2.2 Indexes valued and their testing methods
1) Moisture content (MC, %). This was an absolute MC by the interval weighting of the
moment moisture content of the samples accompanying with creeping ones in varying
humidity. 2) Difference of stepping moisture content (±D, %/mm). D= (MCcore or sealed –
MCsurface)/2.5 (%/mm), which was calculated with reference of Yu C. M. (2011) [11]. D
was to reflect the perpendicular state of moisture distribution in adsorbing, and -D to
reflect that in desorbing. 3) Creep deflection (±Δ, mm). Δ was the average displacement
of upper and down planes in the middle of the beam sample under 2-point loading (Fig.
2) and detected on line by a Linear Variable Differential Transformer (LVDT) system. Δ
was defined for downward deflection as usual, but –Δ for the upward.
2.3 Methods and conditions for the experiments
When the creep during absorbing and desorbing were abridged separately as ad-creep and
de-creep, and the creep at constant moisture lever as C-creep, the one cycle of 96h or 4d
creep was supposed to be: [48h (ad-creep + C-creep) + 48h (de-creep + C-creep)] in
constant temperature 20±0.5℃. There were 3 main
experiments. Expr. 1: Long term creep, including:
1) Test of V-creep: 5mm thick symmetric beam;
load P=25% Fr and 55% Fr (rupture force); range of
varying humidity, RH42%↗80%↘42%; creeping
duration, 96h(4d)/cycle * 28cycles = 2688h (112d);
started on RH42% and P=0; 2) Test of C-creep: the
symmetric beam samples were conditioned under
20±0.5℃ and RH65±2% till to EMC, fully sealed
and then went to creeping together with the V-creep
samples for the same period. Expr. 2: Short term
deformation of 2.5mm thick asymmetric beam in
varying humidity without loading: varying humidity
Fig. 2: Apparatus for test of creep
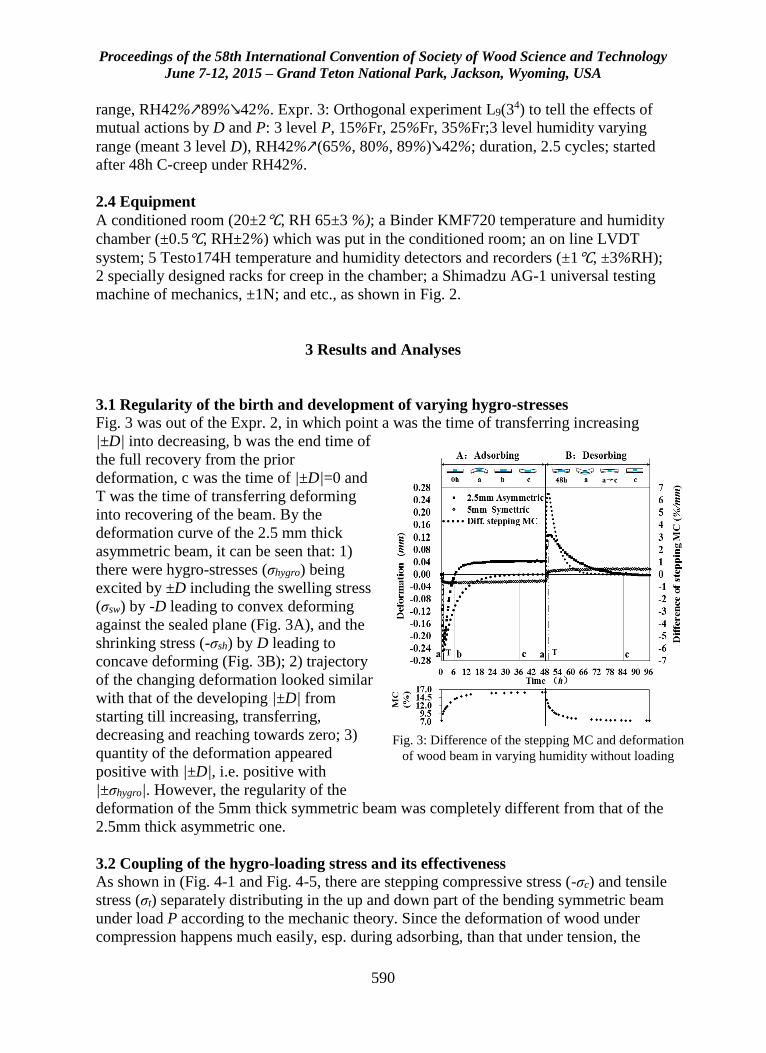
Proceedings of the 58th International Convention of Society of Wood Science and Technology
June 7-12, 2015 – Grand Teton National Park, Jackson, Wyoming, USA
590
range, RH42%↗89%↘42%. Expr. 3: Orthogonal experiment L9(34) to tell the effects of
mutual actions by D and P: 3 level P, 15%Fr, 25%Fr, 35%Fr;3 level humidity varying
range (meant 3 level D), RH42%↗(65%, 80%, 89%)↘42%; duration, 2.5 cycles; started
after 48h C-creep under RH42%.
2.4 Equipment
A conditioned room (20±2℃, RH 65±3 %); a Binder KMF720 temperature and humidity
chamber (±0.5℃, RH±2%) which was put in the conditioned room; an on line LVDT
system; 5 Testo174H temperature and humidity detectors and recorders (±1℃, ±3%RH);
2 specially designed racks for creep in the chamber; a Shimadzu AG-1 universal testing
machine of mechanics, ±1N; and etc., as shown in Fig. 2.
3 Results and Analyses
3.1 Regularity of the birth and development of varying hygro-stresses
Fig. 3 was out of the Expr. 2, in which point a was the time of transferring increasing
|±D| into decreasing, b was the end time of
the full recovery from the prior
deformation, c was the time of |±D|=0 and
T was the time of transferring deforming
into recovering of the beam. By the
deformation curve of the 2.5 mm thick
asymmetric beam, it can be seen that: 1)
there were hygro-stresses (σhygro) being
excited by ±D including the swelling stress
(σsw) by -D leading to convex deforming
against the sealed plane (Fig. 3A), and the
shrinking stress (-σsh) by D leading to
concave deforming (Fig. 3B); 2) trajectory
of the changing deformation looked similar
with that of the developing |±D| from
starting till increasing, transferring,
decreasing and reaching towards zero; 3)
quantity of the deformation appeared
positive with |±D|, i.e. positive with
|±σhygro|. However, the regularity of the
deformation of the 5mm thick symmetric beam was completely different from that of the
2.5mm thick asymmetric one.
3.2 Coupling of the hygro-loading stress and its effectiveness
As shown in (Fig. 4-1 and Fig. 4-5, there are stepping compressive stress (-σc) and tensile
stress (σt) separately distributing in the up and down part of the bending symmetric beam
under load P according to the mechanic theory. Since the deformation of wood under
compression happens much easily, esp. during adsorbing, than that under tension, the
Fig. 3: Difference of the stepping MC and deformation
of wood beam in varying humidity without loading
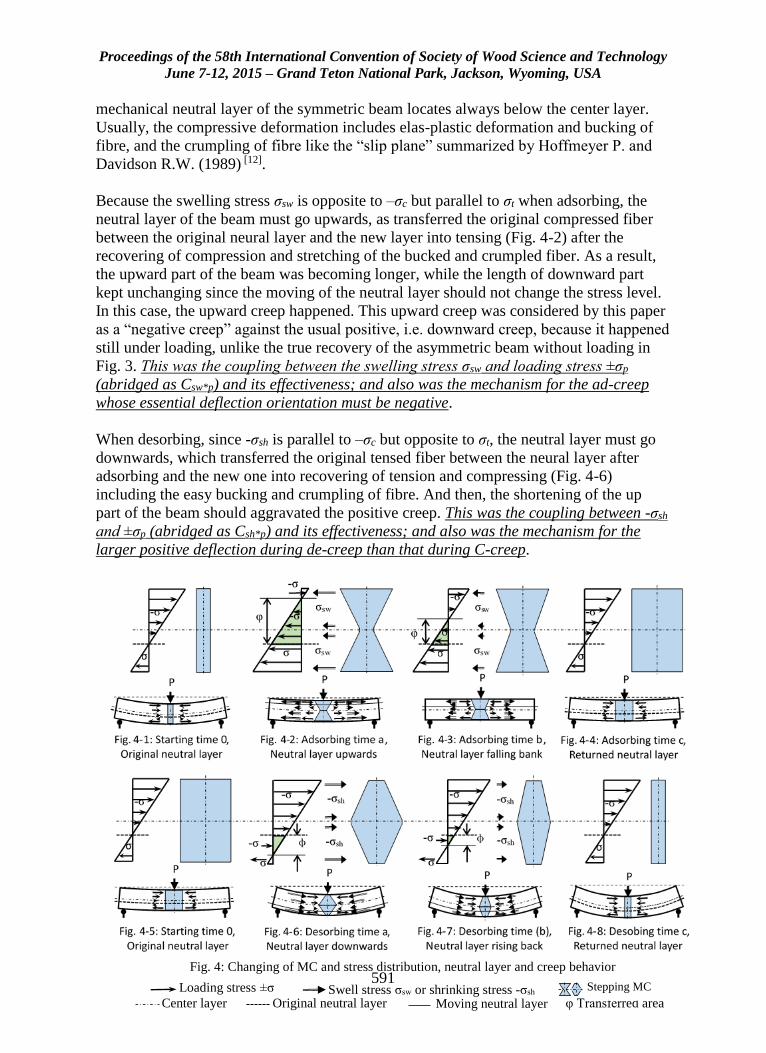
Proceedings of the 58th International Convention of Society of Wood Science and Technology
June 7-12, 2015 – Grand Teton National Park, Jackson, Wyoming, USA
591
mechanical neutral layer of the symmetric beam locates always below the center layer.
Usually, the compressive deformation includes elas-plastic deformation and bucking of
fibre, and the crumpling of fibre like the “slip plane” summarized by Hoffmeyer P. and
Davidson R.W. (1989) [12].
Because the swelling stress σsw is opposite to –σc but parallel to σt when adsorbing, the
neutral layer of the beam must go upwards, as transferred the original compressed fiber
between the original neural layer and the new layer into tensing (Fig. 4-2) after the
recovering of compression and stretching of the bucked and crumpled fiber. As a result,
the upward part of the beam was becoming longer, while the length of downward part
kept unchanging since the moving of the neutral layer should not change the stress level.
In this case, the upward creep happened. This upward creep was considered by this paper
as a “negative creep” against the usual positive, i.e. downward creep, because it happened
still under loading, unlike the true recovery of the asymmetric beam without loading in
Fig. 3. This was the coupling between the swelling stress σsw and loading stress ±σp
(abridged as Csw*p) and its effectiveness; and also was the mechanism for the ad-creep
whose essential deflection orientation must be negative.
When desorbing, since -σsh is parallel to –σc but opposite to σt, the neutral layer must go
downwards, which transferred the original tensed fiber between the neural layer after
adsorbing and the new one into recovering of tension and compressing (Fig. 4-6)
including the easy bucking and crumpling of fibre. And then, the shortening of the up
part of the beam should aggravated the positive creep. This was the coupling between -σsh
and ±σp (abridged as Csh*p) and its effectiveness; and also was the mechanism for the
larger positive deflection during de-creep than that during C-creep.
Fig. 4: Changing of MC and stress distribution, neutral layer and creep behavior
Center layer Original neutral layer Moving neutral layer φ Transferred area Swell stress σsw or shrinking stress -σsh
Loading stress ±σ Stepping MC
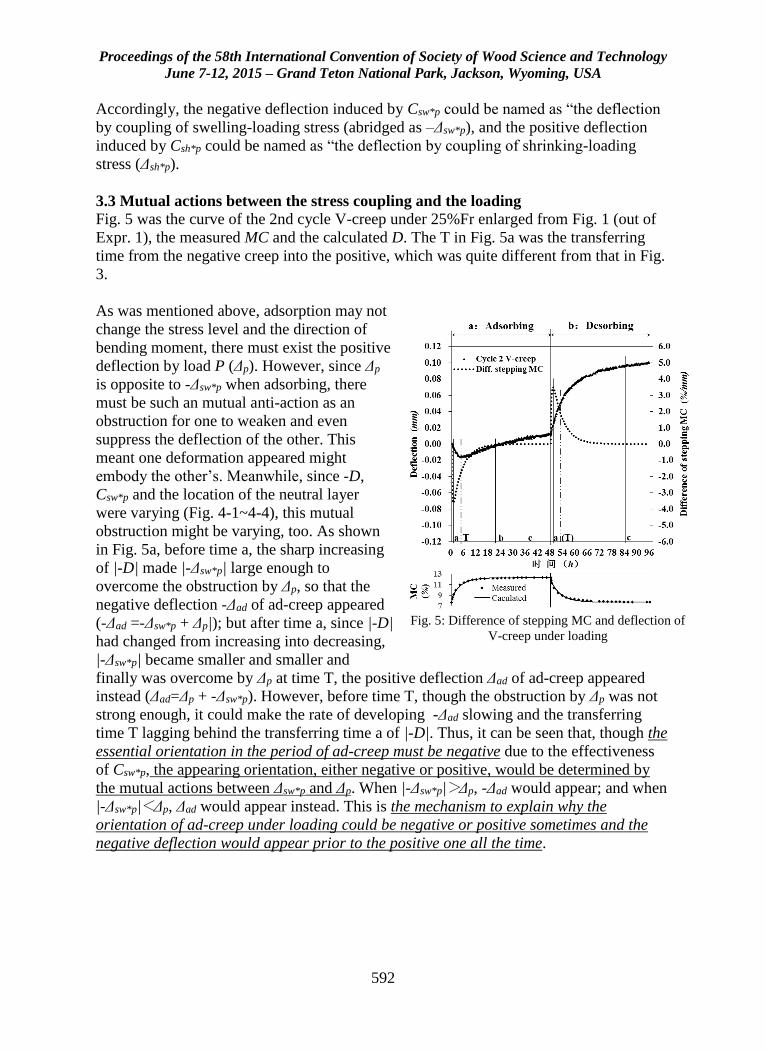
Proceedings of the 58th International Convention of Society of Wood Science and Technology
June 7-12, 2015 – Grand Teton National Park, Jackson, Wyoming, USA
592
Accordingly, the negative deflection induced by Csw*p could be named as “the deflection
by coupling of swelling-loading stress (abridged as –Δsw*p), and the positive deflection
induced by Csh*p could be named as “the deflection by coupling of shrinking-loading
stress (Δsh*p).
3.3 Mutual actions between the stress coupling and the loading
Fig. 5 was the curve of the 2nd cycle V-creep under 25%Fr enlarged from Fig. 1 (out of
Expr. 1), the measured MC and the calculated D. The T in Fig. 5a was the transferring
time from the negative creep into the positive, which was quite different from that in Fig.
3.
As was mentioned above, adsorption may not
change the stress level and the direction of
bending moment, there must exist the positive
deflection by load P (Δp). However, since Δp
is opposite to -Δsw*p when adsorbing, there
must be such an mutual anti-action as an
obstruction for one to weaken and even
suppress the deflection of the other. This
meant one deformation appeared might
embody the other’s. Meanwhile, since -D,
Csw*p and the location of the neutral layer
were varying (Fig. 4-1~4-4), this mutual
obstruction might be varying, too. As shown
in Fig. 5a, before time a, the sharp increasing
of |-D| made |-Δsw*p| large enough to
overcome the obstruction by Δp, so that the
negative deflection -Δad of ad-creep appeared
(-Δad =-Δsw*p + Δp|); but after time a, since |-D|
had changed from increasing into decreasing,
|-Δsw*p| became smaller and smaller and
finally was overcome by Δp at time T, the positive deflection Δad of ad-creep appeared
instead (Δad=Δp + -Δsw*p). However, before time T, though the obstruction by Δp was not
strong enough, it could make the rate of developing -Δad slowing and the transferring
time T lagging behind the transferring time a of |-D|. Thus, it can be seen that, though the
essential orientation in the period of ad-creep must be negative due to the effectiveness
of Csw*p, the appearing orientation, either negative or positive, would be determined by
the mutual actions between Δsw*p and Δp. When |-Δsw*p|>Δp, -Δad would appear; and when
|-Δsw*p|<Δp, Δad would appear instead. This is the mechanism to explain why the
orientation of ad-creep under loading could be negative or positive sometimes and the
negative deflection would appear prior to the positive one all the time.
Fig. 5: Difference of stepping MC and deflection of
V-creep under loading
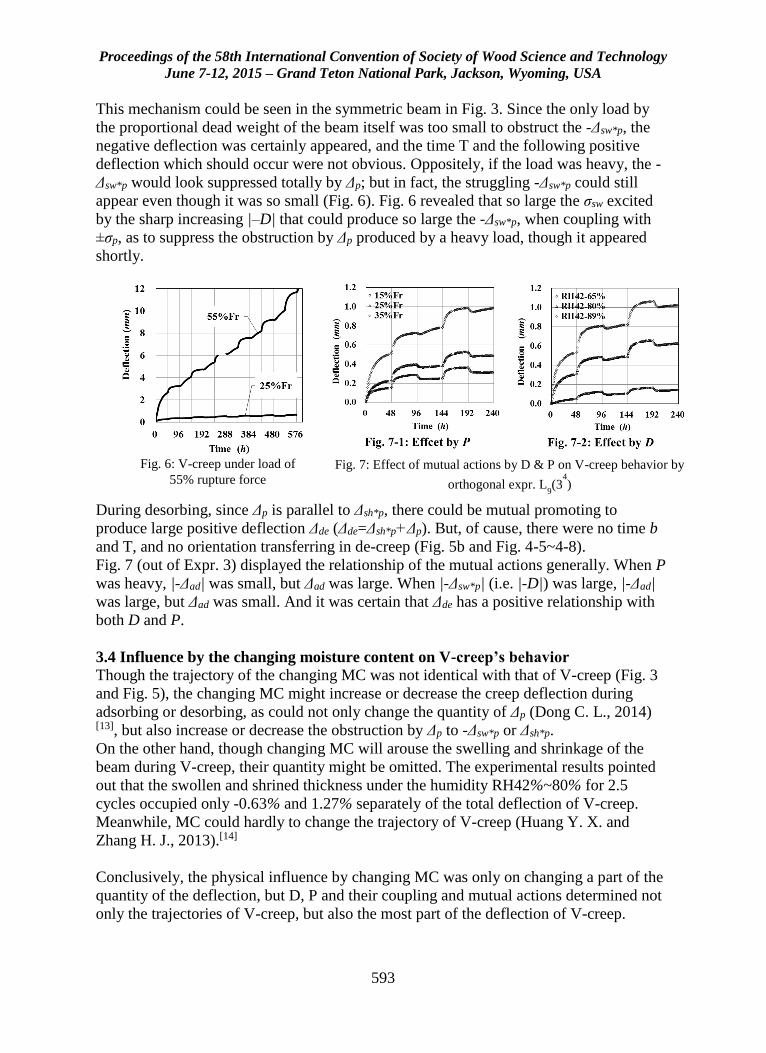
Proceedings of the 58th International Convention of Society of Wood Science and Technology
June 7-12, 2015 – Grand Teton National Park, Jackson, Wyoming, USA
593
This mechanism could be seen in the symmetric beam in Fig. 3. Since the only load by
the proportional dead weight of the beam itself was too small to obstruct the -Δsw*p, the
negative deflection was certainly appeared, and the time T and the following positive
deflection which should occur were not obvious. Oppositely, if the load was heavy, the -
Δsw*p would look suppressed totally by Δp; but in fact, the struggling -Δsw*p could still
appear even though it was so small (Fig. 6). Fig. 6 revealed that so large the σsw excited
by the sharp increasing |–D| that could produce so large the -Δsw*p, when coupling with
±σp, as to suppress the obstruction by Δp produced by a heavy load, though it appeared
shortly.
During desorbing, since Δp is parallel to Δsh*p, there could be mutual promoting to
produce large positive deflection Δde (Δde=Δsh*p+Δp). But, of cause, there were no time b
and T, and no orientation transferring in de-creep (Fig. 5b and Fig. 4-5~4-8).
Fig. 7 (out of Expr. 3) displayed the relationship of the mutual actions generally. When P
was heavy, |-Δad| was small, but Δad was large. When |-Δsw*p| (i.e. |-D|) was large, |-Δad|
was large, but Δad was small. And it was certain that Δde has a positive relationship with
both D and P.
3.4 Influence by the changing moisture content on V-creep’s behavior
Though the trajectory of the changing MC was not identical with that of V-creep (Fig. 3
and Fig. 5), the changing MC might increase or decrease the creep deflection during
adsorbing or desorbing, as could not only change the quantity of Δp (Dong C. L., 2014)
[13], but also increase or decrease the obstruction by Δp to -Δsw*p or Δsh*p.
On the other hand, though changing MC will arouse the swelling and shrinkage of the
beam during V-creep, their quantity might be omitted. The experimental results pointed
out that the swollen and shrined thickness under the humidity RH42%~80% for 2.5
cycles occupied only -0.63% and 1.27% separately of the total deflection of V-creep.
Meanwhile, MC could hardly to change the trajectory of V-creep (Huang Y. X. and
Zhang H. J., 2013).[14]
Conclusively, the physical influence by changing MC was only on changing a part of the
quantity of the deflection, but D, P and their coupling and mutual actions determined not
only the trajectories of V-creep, but also the most part of the deflection of V-creep.
Fig. 6: V-creep under load of
55% rupture force Fig. 7: Effect of mutual actions by D & P on V-creep behavior by
orthogonal expr. L9(3
4)
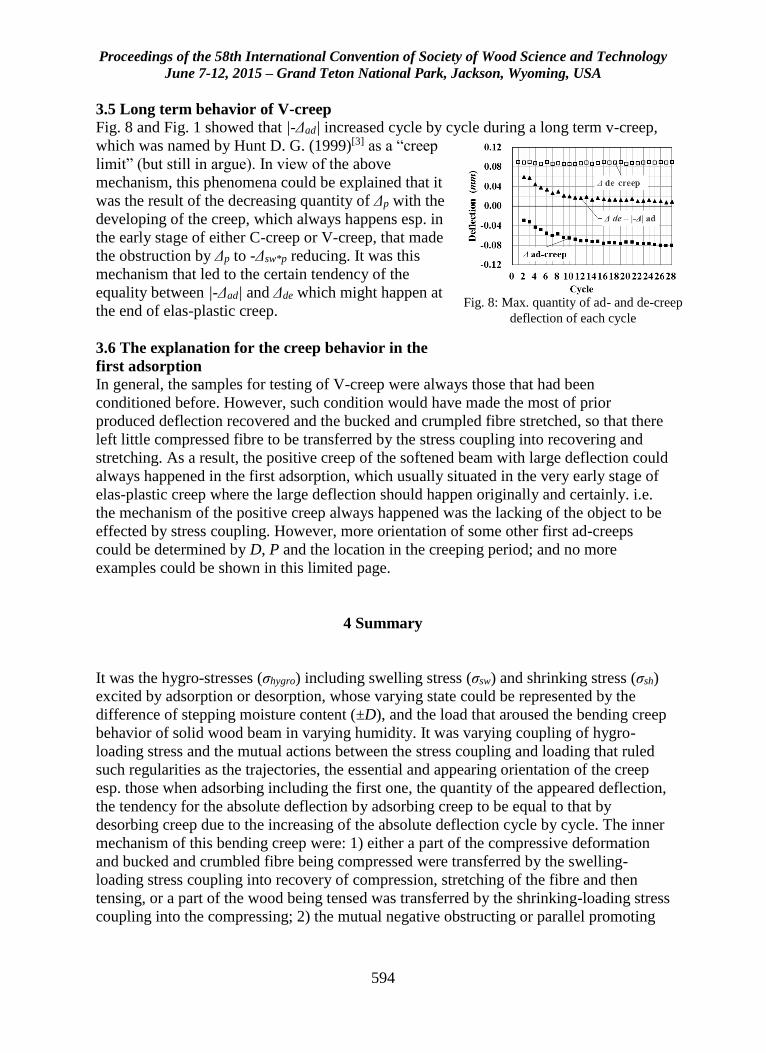
Proceedings of the 58th International Convention of Society of Wood Science and Technology
June 7-12, 2015 – Grand Teton National Park, Jackson, Wyoming, USA
594
3.5 Long term behavior of V-creep Fig. 8 and Fig. 1 showed that |-Δad| increased cycle by cycle during a long term v-creep,
which was named by Hunt D. G. (1999)[3] as a “creep
limit” (but still in argue). In view of the above
mechanism, this phenomena could be explained that it
was the result of the decreasing quantity of Δp with the
developing of the creep, which always happens esp. in
the early stage of either C-creep or V-creep, that made
the obstruction by Δp to -Δsw*p reducing. It was this
mechanism that led to the certain tendency of the
equality between |-Δad| and Δde which might happen at
the end of elas-plastic creep.
3.6 The explanation for the creep behavior in the
first adsorption
In general, the samples for testing of V-creep were always those that had been
conditioned before. However, such condition would have made the most of prior
produced deflection recovered and the bucked and crumpled fibre stretched, so that there
left little compressed fibre to be transferred by the stress coupling into recovering and
stretching. As a result, the positive creep of the softened beam with large deflection could
always happened in the first adsorption, which usually situated in the very early stage of
elas-plastic creep where the large deflection should happen originally and certainly. i.e.
the mechanism of the positive creep always happened was the lacking of the object to be
effected by stress coupling. However, more orientation of some other first ad-creeps
could be determined by D, P and the location in the creeping period; and no more
examples could be shown in this limited page.
4 Summary
It was the hygro-stresses (σhygro) including swelling stress (σsw) and shrinking stress (σsh)
excited by adsorption or desorption, whose varying state could be represented by the
difference of stepping moisture content (±D), and the load that aroused the bending creep
behavior of solid wood beam in varying humidity. It was varying coupling of hygro-
loading stress and the mutual actions between the stress coupling and loading that ruled
such regularities as the trajectories, the essential and appearing orientation of the creep
esp. those when adsorbing including the first one, the quantity of the appeared deflection,
the tendency for the absolute deflection by adsorbing creep to be equal to that by
desorbing creep due to the increasing of the absolute deflection cycle by cycle. The inner
mechanism of this bending creep were: 1) either a part of the compressive deformation
and bucked and crumbled fibre being compressed were transferred by the swelling-
loading stress coupling into recovery of compression, stretching of the fibre and then
tensing, or a part of the wood being tensed was transferred by the shrinking-loading stress
coupling into the compressing; 2) the mutual negative obstructing or parallel promoting
Fig. 8: Max. quantity of ad- and de-creep
deflection of each cycle
Proceedings of the 58th International Convention of Society of Wood Science and Technology
June 7-12, 2015 – Grand Teton National Park, Jackson, Wyoming, USA
595
created by both the stress coupling and loading which were affected by the changing
moisture content.
Acknowledgments
Sincere thanks to all the supporters and helpers for this study.
References
[1] Armstrong L. D. and Christensen G. N. (1961) Influence of moisture changes on
deformation of wood under stress [J]. Nature, 191(4791): 869-870.
[2] Montero C., Gril J. et al. (2012) Influence of hygromechanical history on the
longitudinal mechanosorptive creep of wood [J]. Holzforschung, 66: 757-764.
[3] Hunt D. G. (1999) A unified approach to creep of wood [C]. Proc. R. Soc. Lond. The
royal society, 455: 4077-4095.
[4] Takahashi C. Ishimaru Y., et al. (2004) The creep of wood destabilized by change in
moisture content: Part 1: The creep behavior of wood during and immediately after
adsorption [J]. Holzforschung, 58: 261-267.
[5] Hassani M. M., Wittle F. K., et al. (2015) Rheological model for wood [J]. Comput.
methods appl. mech. engrg., 283: 1032-1060.
[6] Houška M., Koc P. (2000) Sorptive stress estimation: An important key to the
mechano-sorptive effect in wood [J]. Mechanics of time-dependent materials, 4: 81-
98.
[7] Hanhijärvi A. (2000) Advances in the knowledge of the influence of moisture
changes on the long-term mechanical performance of timber structures [J]. Materials
and Structures, 33: 43-49.
[8] Srpčič S., Srpčič S., et al. (2009) Mechanical analysis of glulam beams exposed to
changing humidity [J].Wood Sci Technology, 43: 9-22.
[9] Svensson S., Köhler J. (2010) Including moisture induced stresses in the safety
format of timber structure [C]. World conference on timber engineering (WCTE).
[10] Li T., Zhang H. J., et al. (2013) Static bending creep of solid wood beam under
different moisture conditions [J]. Journal of southwest forestry university, 33(6): 82-
85.
Proceedings of the 58th International Convention of Society of Wood Science and Technology
June 7-12, 2015 – Grand Teton National Park, Jackson, Wyoming, USA
596
[11] Yu C. M. Numerical analysis of heat and mass transfer for porous materials: A
theory of drying [M]. Beijing: Tsing Hua University Press, 2011.
[12] Hoffmeyer P., Davidson R. W. (1989) Mechano-sorptive creep mechanism of wood
in compression and bending [J]. Wood sci. technol., 23:215-217
[13] Dong C. L. Quantitative analysis and design for bending modulus of elasticity of
wood beams with gradient moisture content [D]. Ph.D. thesis (supervised by Zhang
H.J. and Liu Y.X.). Hrbin, Northeast Forestry University, 2014.
[14] Huang Y. X., Zhang H. J., et al. (2013) Creep of wood beams and its relationship
with hygroscopic expansion in varying humidity. China wood industry, 27(3):9-
12,24.
Proceedings of the 58th International Convention of Society of Wood Science and Technology
June 7-12, 2015 – Grand Teton National Park, Jackson, Wyoming, USA
597
Moisture and Heat Transfer in Cross Laminated
Timber
Guizhou Wang, [email protected]
Perry Peralta, [email protected]
Phil Mitchell, [email protected]
North Carolina State University, 2820 Faucette Dr., Raleigh, NC 27695
Abstract
Due to the advantages such as superior fire, seismic, acoustic and thermal performance,
excellent strength and stiffness properties and light weight, cross laminated timber (CLT)
has been widely utilized in Europe and expected to have the potential to replace concrete,
steel and masonry in low and middle rise residential and commercial constructions since
its introduction in Switzerland in 1970s. Plenty of works have been conducted with
regard to its design strategy, mechanical strength, fire resistance and other properties,
while there are only limited studies of its diffusion properties, especially when
considering the adhesive layers applied in the CLT panel. The goal of this study was to
characterize the overall and adhesive layer’s diffusion coefficient of moisture and heat
transfer in 3-layer southern pine CLT panels. The influences of four commonly used
adhesives, phenol formaldehyde resin (PFR), polyurethane (PU), emulsion polymer
isocyanate (EPI) and melamine formaldehyde (MF), on the diffusion process had been
studied here using the diffusion cup method. Nuclear Magnetic Resonance (NMR) was
utilize to measure the moisture content dynamically and non-destructively in CLT panels
with higher spatial resolution and lower system error. Diffusion coefficient was
calculated based on the diffusion resistance model and inverse method.
Proceedings of the 58th International Convention of Society of Wood Science and Technology
June 7-12, 2015 – Grand Teton National Park, Jackson, Wyoming, USA
598
Analysis of Dimensional Stability of Thermally
Modified Wood Affected by Wetting-Drying Cycles
Čermák, P. 1* – Rautkari, L. 2 – Rademacher, P. 3
1 Postdoctoral Researcher, Department of Wood Science, Mendel University
in Brno, Zemedelska 3, 613 00, Brno, Czech Republic.
* Corresponding author
[email protected] 2 Assistant Professor, Department of Forest Products Technology, Aalto
University, Tekniikantie 3, 164 00, Espoo, Finland.
[email protected] 3 Research Director, Department of Wood Science, Mendel University in
Brno, Zemedelska 3, 613 00, Brno, Czech Republic.
Abstract
The dimensional stability of thermally modified wood exposed to several wetting-drying
cycles was analyzed. Specimens of dimensions 15×15 ×15 mm3 were thermally modified
at 180 and 200 °C. The mass loss and chemical composition of the wood were
determined in order to evaluate the effect and degree of modification. Afterwards, the
radial, tangential, and volumetric swelling, anti-swelling efficiency and mass loss due to
wetting-drying cycles were determined and compared. The specimen’s mass tended to
decrease with each additional rewetting cycle. Additional extractives that were formed
via thermal decomposition leached out during wetting cycles. Thermal modification
positively affected the dimensional stability of all investigated species. The wood’s
swelling was reduced, a result attributed to hemicellulose degradation. Dimensional
stability was improved by 24 to 30% following mild treatment and by 26 to 54%
following more severe treatment. When specimens were exposed to six consecutive
rewetting cycles, the swelling of the modified wood increased, whereas it slightly
decreased for the control (hornification). The effective dimensional stability of thermally
modified wood was reduced by 34 and 28.4% for beech, 47 and 19.6% for poplar, and
19.3 and 24.5% for spruce compared to the initial anti-swelling efficiency following the
first wetting cycle.
Keywords: Thermal modification; Anti-swelling efficiency; Dimensional stability;
Wetting-drying cycle; Chemical composition; Shape stability; Heat treatment
Proceedings of the 58th International Convention of Society of Wood Science and Technology
June 7-12, 2015 – Grand Teton National Park, Jackson, Wyoming, USA
599
Introduction
Wood is a biodegradable, dimensionally unstable material. These fundamental properties
of wood can cause problems when using certain wood products. Wood that is subjected
to outdoor conditions, or even to humidity changes indoors, shrinks and swells, causing
issues. Several common wood modification techniques are applied to fundamentally
change the properties of wood (its bio-durability, dimensional stability, and others).
Thermal modification of wood has long been recognized as a potential method to
improve the natural properties of the wood and has been one of the most successful
methods of modification for many years (Viitanen et al. 1994; Viitaniemi et al. 1997;
Militz 2002; Hill 2006 and 2011; Čermák et al. 2014).
Heating wood to a relatively high temperature (160 to 260 °C) results in degradation
associated with chemical changes in its structure (Esteves and Pereira 2009). If the
process is controlled carefully, the properties obtained following thermal modification
can be tailored for further use of the wood in specific applications. One of the most
important characteristics of thermally modified wood is a decrease in its equilibrium
moisture content (EMC) and, consequently, greater dimensional stability. Such reduction
in the EMC has already been reported by Tiemann (1920), who showed that drying at
high temperatures decreased the EMC of wood, inhibiting swelling and shrinking. The
principal driver of the enhanced dimensional stability and reduced water absorption is
likely a reduction in the number of hydroxyl groups of the hemicelluloses, as well as
decreased accessibility of water molecules to cellulose hydroxyl groups due to the
increase in cellulose crystallinity and cross-linking in lignin (Weiland and Guyonnet
2003; Hakkou et al. 2005). According to Militz (2002) and Tjeerdsma (1998), the
dimensional stability of wood depends on the species, conditions of use, and the
anatomical direction. Yildiz (2002) reported that the ASE reached 50% for beech wood
treated at 200 °C. Tjeerdsma (1998) and Sailer et al. (2000) reported ASE values of about
40% for spruce and pine. Similar results were presented by Militz (2002) and Giebeler
(1983), in which the ASE was determined to be 35 to 40% for pine and beech and 50%
for poplar. Sailer et al. (2000) and Esteves et al. (2008) stated that the dimensional
stability was greater in the tangential direction (by about 2.5%).
Nearly all of the thermally modified timber commercially available today is used for
outdoor applications (i.e., cladding, decking, flooring, garden furniture, and others).
These products are commonly exposed to cyclic moisture conditions during seasonal
changes and the issue of dimensional stability of modified wood in these types of
environments is of fundamental importance. Unfortunately, studies of the dimensional
stability of thermally modified wood exposed to cyclic moisture conditions are scarce.
The present study is therefore focused on the basic analysis of the dimensional stability of
modified wood as affected by several wetting-drying cycles. The present study was
conducted in order to evaluate material performance in such conditions.
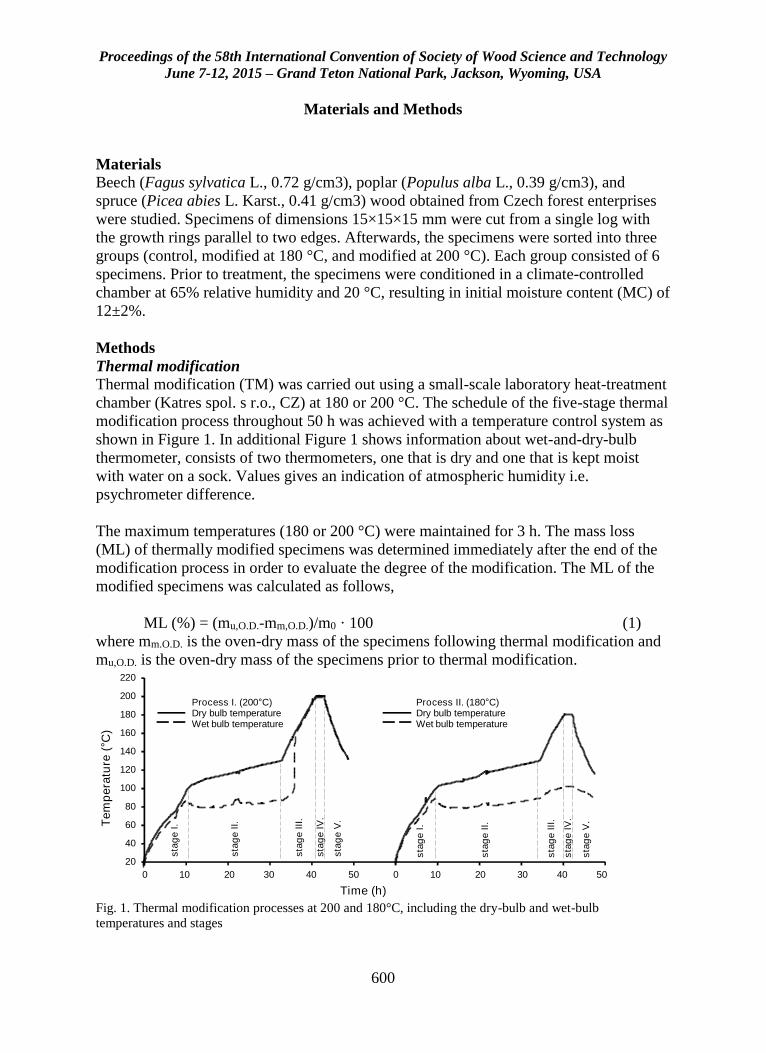
Proceedings of the 58th International Convention of Society of Wood Science and Technology
June 7-12, 2015 – Grand Teton National Park, Jackson, Wyoming, USA
600
Materials and Methods
Materials Beech (Fagus sylvatica L., 0.72 g/cm3), poplar (Populus alba L., 0.39 g/cm3), and
spruce (Picea abies L. Karst., 0.41 g/cm3) wood obtained from Czech forest enterprises
were studied. Specimens of dimensions 15×15×15 mm were cut from a single log with
the growth rings parallel to two edges. Afterwards, the specimens were sorted into three
groups (control, modified at 180 °C, and modified at 200 °C). Each group consisted of 6
specimens. Prior to treatment, the specimens were conditioned in a climate-controlled
chamber at 65% relative humidity and 20 °C, resulting in initial moisture content (MC) of
12±2%.
Methods
Thermal modification Thermal modification (TM) was carried out using a small-scale laboratory heat-treatment
chamber (Katres spol. s r.o., CZ) at 180 or 200 °C. The schedule of the five-stage thermal
modification process throughout 50 h was achieved with a temperature control system as
shown in Figure 1. In additional Figure 1 shows information about wet-and-dry-bulb
thermometer, consists of two thermometers, one that is dry and one that is kept moist
with water on a sock. Values gives an indication of atmospheric humidity i.e.
psychrometer difference.
The maximum temperatures (180 or 200 °C) were maintained for 3 h. The mass loss
(ML) of thermally modified specimens was determined immediately after the end of the
modification process in order to evaluate the degree of the modification. The ML of the
modified specimens was calculated as follows,
ML (%) = (mu,O.D.-mm,O.D.)/m0 · 100 (1)
where mm.O.D. is the oven-dry mass of the specimens following thermal modification and
mu,O.D. is the oven-dry mass of the specimens prior to thermal modification.
20
40
60
80
100
120
140
160
180
200
220
Te
mp
era
ture
(°C
)
Time (h)
0 10 20 30 40 50 0 10 20 30 40 50
sta
ge
I.
sta
ge
II.
sta
ge
III
.
sta
ge
IV
.
sta
ge
V.
sta
ge
I.
sta
ge
II.
sta
ge
III
.
sta
ge
IV
.
sta
ge
V.
Process I. (200°C)Dry bulb temperatureWet bulb temperature
Process II. (180°C)Dry bulb temperatureWet bulb temperature
Fig. 1. Thermal modification processes at 200 and 180°C, including the dry-bulb and wet-bulb
temperatures and stages
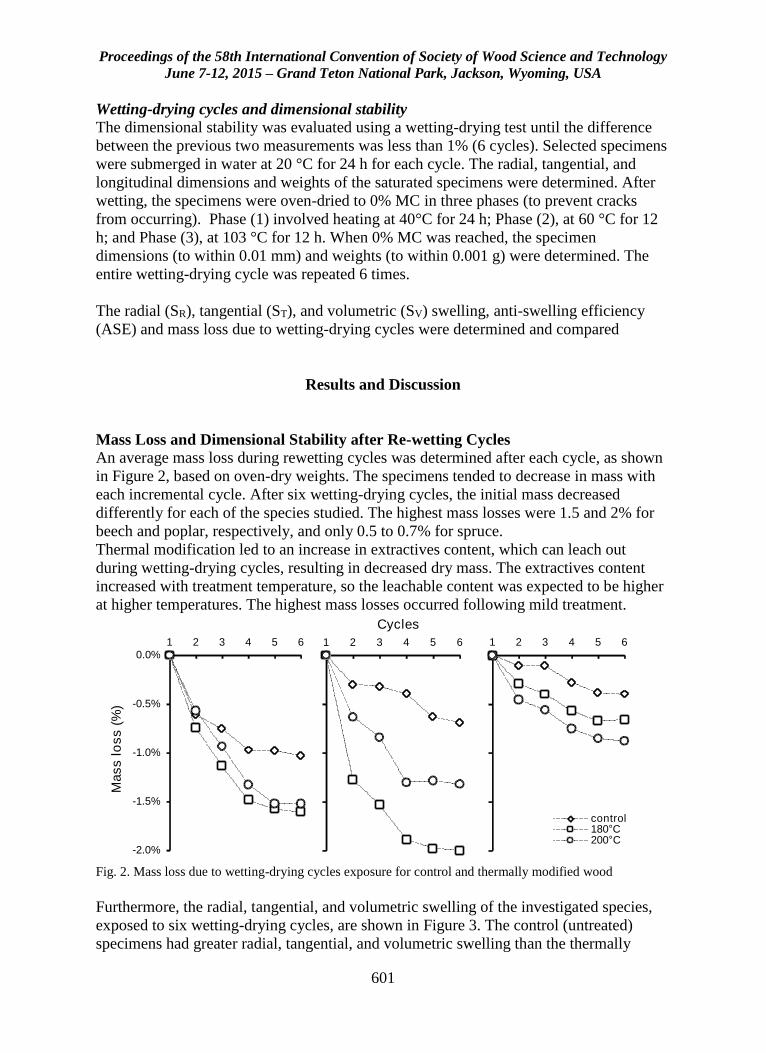
Proceedings of the 58th International Convention of Society of Wood Science and Technology
June 7-12, 2015 – Grand Teton National Park, Jackson, Wyoming, USA
601
Wetting-drying cycles and dimensional stability
The dimensional stability was evaluated using a wetting-drying test until the difference
between the previous two measurements was less than 1% (6 cycles). Selected specimens
were submerged in water at 20 °C for 24 h for each cycle. The radial, tangential, and
longitudinal dimensions and weights of the saturated specimens were determined. After
wetting, the specimens were oven-dried to 0% MC in three phases (to prevent cracks
from occurring). Phase (1) involved heating at 40°C for 24 h; Phase (2), at 60 °C for 12
h; and Phase (3), at 103 °C for 12 h. When 0% MC was reached, the specimen
dimensions (to within 0.01 mm) and weights (to within 0.001 g) were determined. The
entire wetting-drying cycle was repeated 6 times.
The radial (SR), tangential (ST), and volumetric (SV) swelling, anti-swelling efficiency
(ASE) and mass loss due to wetting-drying cycles were determined and compared
Results and Discussion
Mass Loss and Dimensional Stability after Re-wetting Cycles
An average mass loss during rewetting cycles was determined after each cycle, as shown
in Figure 2, based on oven-dry weights. The specimens tended to decrease in mass with
each incremental cycle. After six wetting-drying cycles, the initial mass decreased
differently for each of the species studied. The highest mass losses were 1.5 and 2% for
beech and poplar, respectively, and only 0.5 to 0.7% for spruce.
Thermal modification led to an increase in extractives content, which can leach out
during wetting-drying cycles, resulting in decreased dry mass. The extractives content
increased with treatment temperature, so the leachable content was expected to be higher
at higher temperatures. The highest mass losses occurred following mild treatment.
-2.0%
-1.5%
-1.0%
-0.5%
0.0%1 2 3 4 5 6
Ma
ss
los
s (
%)
1 2 3 4 5 6
Cycles
1 2 3 4 5 6
control180°C200°C
Fig. 2. Mass loss due to wetting-drying cycles exposure for control and thermally modified wood
Furthermore, the radial, tangential, and volumetric swelling of the investigated species,
exposed to six wetting-drying cycles, are shown in Figure 3. The control (untreated)
specimens had greater radial, tangential, and volumetric swelling than the thermally
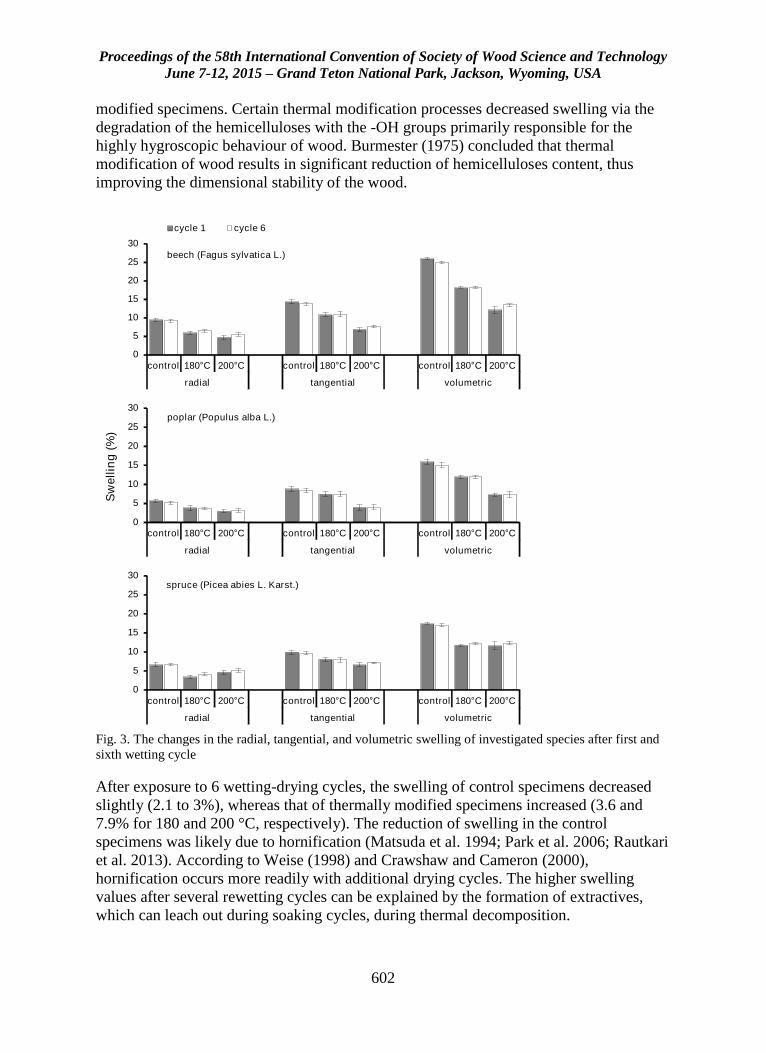
Proceedings of the 58th International Convention of Society of Wood Science and Technology
June 7-12, 2015 – Grand Teton National Park, Jackson, Wyoming, USA
602
modified specimens. Certain thermal modification processes decreased swelling via the
degradation of the hemicelluloses with the -OH groups primarily responsible for the
highly hygroscopic behaviour of wood. Burmester (1975) concluded that thermal
modification of wood results in significant reduction of hemicelluloses content, thus
improving the dimensional stability of the wood.
0
5
10
15
20
25
30
control 180°C 200°C control 180°C 200°C control 180°C 200°C
radial tangential volumetric
cycle 1 cycle 6
beech (Fagus sylvatica L.)
0
5
10
15
20
25
30
control 180°C 200°C control 180°C 200°C control 180°C 200°C
radial tangential volumetric
Sw
ellin
g (
%)
poplar (Populus alba L.)
0
5
10
15
20
25
30
control 180°C 200°C control 180°C 200°C control 180°C 200°C
radial tangential volumetric
spruce (Picea abies L. Karst.)
Fig. 3. The changes in the radial, tangential, and volumetric swelling of investigated species after first and
sixth wetting cycle
After exposure to 6 wetting-drying cycles, the swelling of control specimens decreased
slightly (2.1 to 3%), whereas that of thermally modified specimens increased (3.6 and
7.9% for 180 and 200 °C, respectively). The reduction of swelling in the control
specimens was likely due to hornification (Matsuda et al. 1994; Park et al. 2006; Rautkari
et al. 2013). According to Weise (1998) and Crawshaw and Cameron (2000),
hornification occurs more readily with additional drying cycles. The higher swelling
values after several rewetting cycles can be explained by the formation of extractives,
which can leach out during soaking cycles, during thermal decomposition.
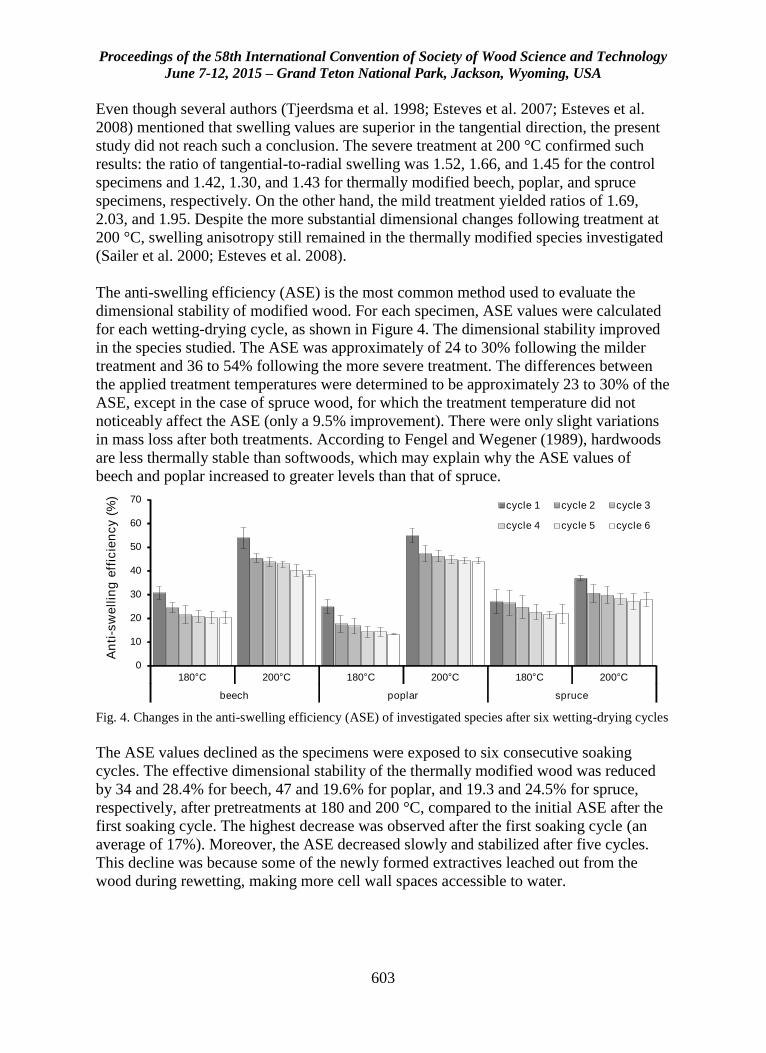
Proceedings of the 58th International Convention of Society of Wood Science and Technology
June 7-12, 2015 – Grand Teton National Park, Jackson, Wyoming, USA
603
Even though several authors (Tjeerdsma et al. 1998; Esteves et al. 2007; Esteves et al.
2008) mentioned that swelling values are superior in the tangential direction, the present
study did not reach such a conclusion. The severe treatment at 200 °C confirmed such
results: the ratio of tangential-to-radial swelling was 1.52, 1.66, and 1.45 for the control
specimens and 1.42, 1.30, and 1.43 for thermally modified beech, poplar, and spruce
specimens, respectively. On the other hand, the mild treatment yielded ratios of 1.69,
2.03, and 1.95. Despite the more substantial dimensional changes following treatment at
200 °C, swelling anisotropy still remained in the thermally modified species investigated
(Sailer et al. 2000; Esteves et al. 2008).
The anti-swelling efficiency (ASE) is the most common method used to evaluate the
dimensional stability of modified wood. For each specimen, ASE values were calculated
for each wetting-drying cycle, as shown in Figure 4. The dimensional stability improved
in the species studied. The ASE was approximately of 24 to 30% following the milder
treatment and 36 to 54% following the more severe treatment. The differences between
the applied treatment temperatures were determined to be approximately 23 to 30% of the
ASE, except in the case of spruce wood, for which the treatment temperature did not
noticeably affect the ASE (only a 9.5% improvement). There were only slight variations
in mass loss after both treatments. According to Fengel and Wegener (1989), hardwoods
are less thermally stable than softwoods, which may explain why the ASE values of
beech and poplar increased to greater levels than that of spruce.
0
10
20
30
40
50
60
70
180°C 200°C 180°C 200°C 180°C 200°C
beech poplar spruce
An
ti-s
we
llin
g e
ffic
ien
cy (
%)
cycle 1 cycle 2 cycle 3
cycle 4 cycle 5 cycle 6
Fig. 4. Changes in the anti-swelling efficiency (ASE) of investigated species after six wetting-drying cycles
The ASE values declined as the specimens were exposed to six consecutive soaking
cycles. The effective dimensional stability of the thermally modified wood was reduced
by 34 and 28.4% for beech, 47 and 19.6% for poplar, and 19.3 and 24.5% for spruce,
respectively, after pretreatments at 180 and 200 °C, compared to the initial ASE after the
first soaking cycle. The highest decrease was observed after the first soaking cycle (an
average of 17%). Moreover, the ASE decreased slowly and stabilized after five cycles.
This decline was because some of the newly formed extractives leached out from the
wood during rewetting, making more cell wall spaces accessible to water.
Proceedings of the 58th International Convention of Society of Wood Science and Technology
June 7-12, 2015 – Grand Teton National Park, Jackson, Wyoming, USA
604
Conclusions
Thermal modification led to significant chemical changes, resulting in 2.8 to 10.4% of
mass loss (species depended). Hemicelluloses were the most degraded wood component,
while amount of extractives increased. Thermal modification significantly improved the
dimensional stability of the wood. The radial, tangential, and volumetric swelling of
modified wood decreased, resulting in 24 to 30% ASE following mild treatment (180 °C)
and 36 to 54% following severe treatment (200 °C). When specimens were exposed to
several rewetting cycles, the initial dimensional stability of the thermally modified wood
was reduced by 34 and 28.4% for beech, 47 and 19.6% for poplar, and 19.3 and 24.5%
for spruce for 180 °C and 200 °C respectively. Dimensional stability reduction following
numerous soaking cycles can be partly attributed to the formation of leachable extractives
within the thermally modified wood as a result of thermal degradation. This leaching
rendered new regions within the cell wall accessible to water molecules. The control
specimens underwent lesser swelling during rewetting cycles, which is likely due to
hornification. This resulted in a reduction of -OH group accessibility after repeated
soaking cycles. Although some of the phenomena observed in this study were explained,
more detailed analysis of the -OH group accessibility of thermally modified wood
exposed to cyclic conditioning should be done in the future.
Acknowledgements
This work was supported by the OP Education for Competitiveness European Social
Fund and the state budget of the Czech Republic CZ.1.07/2.3.00/30.0031 Postdocs in
Technical and Economical Sciences at MENDELU
References
Burmester, A. (1975). “Zur Dimensionsstabilisierung von Holz,” Holz Roh-Werkst 33(9), 333-
335. DOI: 10.1007/BF02612789
Čermák, P., Horáček, P., and Rademacher, P. (2014). “Measured temperature and moisture
profiles during thermal modification of beech (Fagus sylvatica L.) and spruce (Picea abies L.
Karst.) wood,” Holzforschung 68(2), 175-183. DOI:10.1515/hf-2013-0047
Crawshaw, J., and Cameron, R. E. (2000). “A small angle X-ray scattering study of pore structure
in Tencel® cellulose fibres and the effects of physical treatments,” Polymer 41(12), 4691-
4698.
Esteves, B., Domingos, I., and Pereira, H. (2008). “Pine wood modification by heat treatment in
air,” BioResources 3(1), 142-154.
Proceedings of the 58th International Convention of Society of Wood Science and Technology
June 7-12, 2015 – Grand Teton National Park, Jackson, Wyoming, USA
605
Esteves, B., and Pereira, H. (2009). “Wood modification by heat treatment: a review,”
BioResources 4(1), 370-404.
Fengel, D., and Wegener, G. (1989). Wood: Chemistry, Ultrastructure, Reactions, Walter de
Gruyter.
Giebeler, E. (1983). “Dimensionsstabilisierung von Holz durch eine Feuchte/Wärme/ Druck-
Behandlung,” Holz Roh-Werkst. 41, 87-94.
Hakkou, M., Pétrissans, M., Zoulalian, A., and Gérardin, P. (2005). “Investigation of wood
wettability changes during heat treatment on the basis of chemical analysis,” Polym. Degrad.
Stab. 89(1), 1-5. DOI:10.1016/j.polymdegradstab.2004.10.017
Hill, C. (2006). Wood Modification: Chemical, Thermal and Other Processes, Wiley Series in:
Renewable Resources, John Wiley & Sons.
Hill, C. (2011). “Wood modification: An update,” BioResources 6(2), 918-919.
Matsuda, Y., Isogai, A., and Onabe, F. (1994). “Effects of thermal and hydrothermal treatments
on the reswelling capabilities of pulps and paper sheets,” Journal Pulp Pap. Sci. 20, 323-327.
Militz, H. (2002). “Heat treatment of wood: European processes and their background,” in:
Proceedings of conference on “Enhancing the durability of lumber and engineered wood
products”, February 11-13, Kissimmee, Orlando.
Park, S., Venditti, R. A., Jameel, H., and Pawlak, J. J. (2006). “Changes in pore size distribution
during the drying of cellulose fibers as measured by differential scanning calorimetry,”
Carbohyd. Polym. 66(1), 97-103.
Rapp, A., and Sailer, M. (2004). “Oil heat treatment of wood in Germany - State of the art.
Review on heat treatment of wood,” Cost Action E 22, Proceeding of Special Seminar Held
in Antibes, February 2004, France, 47-62.
Rautkari, L., Hill, C. Curling, S., Jalaludin, Z., and Ormondroyd, G. (2013). “What is the role of
the accessibility of wood hydroxyl groups in controlling moisture content?” J. Mater. Sci.
48(18), 6352-6356.
Sailer, M., Rapp, A., and Leithoff, H. (2000). “Improved resistance of Scots pine and spruce by
application of an oil-heat treatment,” in: International Research Group Wood Pre, Section 4-
Processes, NºIRG/WP 00-40162.
Sinner, M., and Puls, J. (1978). “Non-corrosive dye reagent for detection of reducing sugars in
borate complex ion-exchange chromatography,” J. Chromatogr. A. 156(1), 197-204.
Sinner, M., Simatupang, H., and Dietrichs, H. (1975). “Automatic quantitative analysis of wood
carbohydrates by borate complexation chromatography,” Wood Sci. Technol. 9(4), 307-322.
Tiemann, H. (1920). “Effect of different methods of drying on the strength and hygroscopicity of
wood,” in: The Kiln Drying of Lumber, 3rd Ed., Chap. 11, J. P. Lippincott Co.
Proceedings of the 58th International Convention of Society of Wood Science and Technology
June 7-12, 2015 – Grand Teton National Park, Jackson, Wyoming, USA
606
Tjeerdsma, B., Boonstra, M., and Militz, H. (1998). “Thermal modification of nondurable wood
species. Part 2. Improved wood properties of thermally treated wood,” International Research
Group on Wood Pre., Document no. IRG/WP 98- 40124.
Viitanen, H., Jamsa, S., Paajanen, L., Nurmi, A., and Viitaniemi, P. (1994). “The effect of heat
treatment on the properties of spruce – A preliminary report,” International Research Group
on Wood Preservation. Document No. IRG/WP 94-40032.
Viitaniemi, P., Jämsä, S., and Viitanen, H. (1997). “Method for improving biodegradation
resistance and dimensional stability of cellulosic products,” United States Patent N° 5678324
(US005678324).
Weiland, J., and Guyonnet, R. (2003). “Study of chemical modifications and fungi degradation of
thermally modified wood using DRIFT spectroscopy,” Holz Roh-Werkst 61(3), 216-220.
Weiland, J. J., and Guyonnet, R. (2003). “Study of chemical modifications and fungi degradation
of thermally modified wood using DRIFT spectroscopy,” Holz Roh-Werkst 61(3), 216-220.
Weise, U. (1998). “Hornification: mechanisms and terminology,” Paperi ja Puu 80(2), 110-115.
Yildiz, S. (2002). “Effects of heat treatment on water repellence and anti-swelling efficiency of
beech wood,” In: International Research Group Wood Pre, Section 4- Processes, NºIRG/WP
02-40223.
Zaman, A., Alen, R., and Kotilainen, R. (2000). “Thermal behavior of Scots pine (Pinus
sylvestris) and silver birch (Betula pendula) at 200-230°C,” Wood Fiber Sci. 32(2), 138-143.
Proceedings of the 58th International Convention of Society of Wood Science and Technology
June 7-12, 2015 – Grand Teton National Park, Jackson, Wyoming, USA
607
Analysis and Development of Green Roof Structures
Jerome E. Johnson
Professor, Engineering and Technology Department,
University of Wisconsin-Stout, Menomonie, WI USA.
Abstract
Green roofs, living roofs, and vegetative roofs are all synonymous with Norwegian
torvtak, which translates to turf roof. The Scandinavian torvtak dwellings implemented
two layers of turf (bottom layer green side down and top layer green side up) placed over
multiple layers of birch bark. While some traditional torvtak construction methods are
still used today, contemporary methods utilize membranes made of various synthetic
materials. The depth of growth mediums delineates the difference between “extensive”
and “intensive” green roof structures. Extensive roofs are usually less than 15 cm deep;
intensive roofs range from 15-60cm. Vegetation for extensive roofs have typically been
made of succulents, which tend to be drought resistant but do not add to the biodiversity
of the roof. Alternatives such as native prairie grasses and mosses are investigated for
their resilience and added-value. Costs for roofing materials and installation range from
$110 to $134 per m2 more for extensive green roofs compared to a conventional black
roof made of Ethylene Propylene Diene Monomer. Vegetative roofs have a higher rate of
evapotranspiration than conventional roofs made of impervious materials, thus reducing
the temperature near the roof and the energy consumption for cooling a structure in the
summer months. Experimental construction models initially showed effectiveness of the
membrane, growth medium, and vegetation, as well as attractiveness to birds.
Keywords: vegetative roof, green roof, membrane
Introduction
Initial investigations into green roof structures by the researcher occurred while traveling
throughout Norway in 2011 for a sabbatical visit. Throughout the countryside, vegetative
roofs were seen on many residences, storehouses, and commercial structures. While tile
and rock replaced sod as the dominate roof covering in the 19th and 20th centuries,
romantics have revived the older tradition.
Proceedings of the 58th International Convention of Society of Wood Science and Technology
June 7-12, 2015 – Grand Teton National Park, Jackson, Wyoming, USA
608
Classroom research related to green roof structures was directed by the researcher for
undergraduate students in the fall semester of 2014. Students were expected to review the
literature and standards for vernacular architecture and contemporary installations,
calculate loads, evaluate various growing substrate, drainage, water proofing membranes
and plant materials, and develop well-crafted, purposeful prototypes in order to conduct
longitudinal tests. This research established a foundation for on-going investigation into
the construction methods for various vegetative roofs.
Materials and Methods
During the Middle Ages and Renaissance, green roofs were used by royalty, especially in
castles to provide insulation and retention of heat in the winter months. Long before this
time, Norwegians had begun to use soil on their roofs and had found that planting green
material such as grass and small shrubs would hold the soil in place and provide adequate
insulation during the winter season. The earliest settlers of the Faroe Islands, who landed
from Scandinavia in about 400AD, took this technology with them, creating a key part of
the islands’ distinctive architectural vernacular (Wilson, 2014). Brennan (2010) indicated
that a traditional Scandinavian sod roof was built with sloping wood boards, overlaid
with several layers of birch bark, and then covered with two layers of sod. The birch bark
acted as a water- and soil-resistant layer, lasting an average of 30 years before needing to
be replaced. The bottom layer of sod was installed grass-side-down, allowing the wilted
grass to act as a drainage layer. The second layer of sod was installed green-side-up, and
thus allowed the roots to eventually permeate the bottom layer to create one solid
structure. The combined thickness of the two layers was approximately 15cm.
Maihaugen in Lillehammer, Norway is an open air museum with 200 old and new
buildings, exhibitions, and authentic crafts (Maihaugen, 2015). Volunteers continue the
tradition of roofing many of the buildings using birch bark and sod.
Membranes
Birch bark was used as the waterproofing membrane in Scandinavia since it was readily
available and the bark was easily stripped from the trunk in spring or early summer. Care
was exercised with the lengthwise incision so only the outer bark was pried loose.
Removing the phloem would cause the tree to die, but removing the outer bark would
leave only a scar. The sheets of bark were stored flat under pressure to prevent curling.
The bark was laid white side down directly onto the roof boards without any means of
fastening. The coarseness of the outer bark helped it adhere to the roof boards through
friction. The inner brown side of the bark is smooth and impervious to water, thus it was
placed facing up (Hennessey, 2007). Bark sheets were laid from the eaves upward,
overlapping like shingles, and straddling the ridge. Six to eight layers of birch bark were
considered adequate. The first layers projected about 8 cm along the eaves, where they
curved down around the edge of the outer board to form a throating suitable for
mitigating fast runoff. Methods in the latter 20th century of Norwegian storehouses
included construction of log structures with board decking and a plastic, dimpled
Proceedings of the 58th International Convention of Society of Wood Science and Technology
June 7-12, 2015 – Grand Teton National Park, Jackson, Wyoming, USA
609
drainage sheet that also served as a weatherproofing membrane and root barrier
(Stugaard, 2015).
The weather-protection membranes used in contemporary installations in the United
States may contain chemically organic materials such as bitumen or asphalt, which is the
case with built-up roofs and some fluid-applied membranes. A root-protection barrier is
necessary as the roots of the growing medium penetrate the organic bitumen.
Polyethylene sheeting has been used for this purpose. A more robust membrane,
promoted by Firestone Building Products, is Ethylene Propylene Diene Monomer
(EPDM) (Firestone, 2015a). This single-ply, synthetic rubber roofing membrane has been
used extensively for commercial flat roof installations due to its durability, flexibility,
cost, and ultra violet light (UV) resistance. In non-vegetative installations, however, the
traditional color of black has raised the sunlight and heat absorption of the roof.
Thermoplastic polyolefin (TPO), or polyvinyl chloride (PVC), which are white, have
been installed to help cool buildings by reflecting the sunlight. A multi-ply EPDM, which
is black on the underside and white on the top, has also gain acceptance. TPO and PVC,
like all polymers, are subject to UV and heat degradation and PVC leaches toxins. PVC
plasticizers, which are required to make the material flexible, can break down by
attracting mold or microbes, causing it to revert to its original solid state (Mendoza,
2015). For green roof installations, 60 mil EPDM has been recommended by professional
installers (Biermeier, 2015) as it is made from inorganic material and cannot be broken
down by bacteria. It must be adhered to the roof structure with a low volatile organic
compound adhesive. The drawback to using EPDM, though, is that the common seam
adhesion product is petroleum based bitumen adhesive. Another narrow sheet of EPDM
is usually placed over each seam, therefore making it more difficult for roots to penetrate
the membrane. Firestone also offers a polyurethane-based pourable adhesive, Sealer S-
10, which contains no organic material.
Drainage
Aggregate was used as a drainage layer on roof pitches less than 2/12. Contemporary
installation use a geotextile mat for separating the growing medium from the drainage
area. Most mats are made from polypropylene or a polypropylene/acrylic blend. Some
retain water at a storage capacity of 6 l/m2 (0.15 gal/ft2). This material was ideal for use
on extensive roofs with slopes from 1:12 to 3:12. Other drainage methods include 1"
thick waffled plastic sheet made of recycled polypropylene. The waffles, or dimples, rest
on the membrane so the upper side of the sheet stores 7 l/m2 water (0.17 gal/ft2) and the
lower space serves as a high-volume drainage passageway (Conservation Technology,
2015). Aggregate is not required under the waffled sheets and thus a significant reduction
in dead load is achieved. The geosynthetic waffled sheet drain should have polypropylene
non-woven separation fabric on its top side.
Growth Medium Since 1995, the German professional association Forschungsgesellschaft Landschaftsbau
Landschaftsentwicklung (FLL) (English: The Landscaping and Landscape Development
and Research Society) has highly researched various areas concerning green roof design,
including the "Vegetation Support Course” (FLL, 2002). Green roofs have usually been
Proceedings of the 58th International Convention of Society of Wood Science and Technology
June 7-12, 2015 – Grand Teton National Park, Jackson, Wyoming, USA
610
categorized as either “extensive” or “intensive” roofs. The terms have been used to
describe the depth of growing medium. Extensive roof generally have between 7.5cm and
15cm of medium. Intensive roofs are >15cm deep. The United States General Service
Administration classifies four types of green roofs commonly found around the world.
These are: single-course and multi-course extensive, semi-intensive and intensive. They
vary in terms of the type of plant grown, their need for irrigation, the type of drainage
layer used to carry away excess water, and the composition of the growth medium, or the
soil in which the plants are grown (GSA, 2011). It is common practice to use the term
extensive to describe green roofs that are very thin and will only support hardy, drought-
resistant vegetation such as sedums, herbs, and perennials. Intensive is used to describe
green roofs that are thick enough to support a wider range of vegetation including
grasses, shrubs, and small trees.
While the primary considerations for substrate composition are largely concerned with
sustaining plant growth, the allowable weight of the green roof system can often govern
the composition and thickness of the substrate. This is especially pertinent for retrofit
applications (Claridge, 2012). Typical extensive green roof growing media is comprised
of 70% (by volume) 4–10 mm pumice, 10% 1–3 mm zeolite, and 20% organic matter at
a 100-mm depth is recommended minimum to maintain plants without irrigation
(excluding drought conditions) and minimize weeds while preventing runoff from storms
with less than 25 mm of rainfall (Fassman et al., 2012).
Inclusion of polyacrymide gel into the growing material of crushed waste red brick 2-
5mm in size and 20% organic material (composted garden waste mixed with conifer bark
mulch),was suggested by Young, et. al. (2014) as a means to retain water, and thus
increase root biomass and shoot growth. Plant biomass was substantially increased when
green waste compost was used in higher concentration of the organic matter component
instead of bark. These factors affected the evapotranspiration rates of the vegetative roofs
under study. A higher rate of evapotranspiration led to greater cooling effect. Young
(2014) cautioned, though, that when designing green roof substrate to promote greater
plant growth in order to increase cooling from evapotranspiration, there may be a
negative effect that higher evapotranspiration rates have upon the substrate water
reservoir during times of drought. If this is depleted too quickly, leading to water stress
and stomatal closure, plants no longer transpire at the same rate, mortality may occur and
the net cooling effect of the green roof could be reduced.
Vegetation The most prominent vegetative cover for green roof structures has been succulents
including sempervivums, sedums, sempervivum arachnoideum and jovibarbas. Succulent
plants have evolved special water-storage tissues in thickened or swollen leaves, stems or
roots as an adaptation to the arid climates of deserts and semi-deserts. Many of these
habitats are associated with high day-time temperatures and special mechanisms have
evolved to collect and conserve the limited moisture that is available. Examples of leaf
succulents include aloe, haworthia, and sempervivum. Stem succulents, which have
fleshy stems and contain water storage cells overlaid by photosynthetic tissue include
Proceedings of the 58th International Convention of Society of Wood Science and Technology
June 7-12, 2015 – Grand Teton National Park, Jackson, Wyoming, USA
611
most cacti, euphorbia, and obesa. Root succulents have swollen fleshy roots that store
water underground and have stems and leaves that are often deciduous and shed during
prolonged dry seasons. These include calibanus hookeri, fockea capensis, and pterocactus
kunzei (Simply Succulents, 2015).
While sedums and other succulents are drought, heat, and wind tolerant, Kraf (2013)
suggested that one of the plant’s biggest failings is that it does not encourage biodiversity
of plant species on the roof. Low-diversity mix of Sedum species often focused on
ornament and minimized the potential for wider environmental benefits. Biodiversity is a
measure of the variety of plants and animals in an area. Green roofs provide new habitat
for beneficial plants and animals in helping to increase biodiversity. Increased
biodiversity can help ecosystems continue to function even when they are disturbed by
development or in other ways.
The GSA (2011) reported that prairie grassland was one of the few specific landscapes
that have been recreated successfully on green roofs in North America. Extensive green
roofs can mimic dry meadow grassland through their minimal supply of nutrients, quick
drainage and sun exposure. Importantly, western short-grass prairies, like green roofs,
have functionally shallow growing medium depths and restricted root space because
annual precipitation rarely permeates deeply (Sutton, et. al. 2012). Gill et al. (2002) found
root production in the short-grass prairie greatest in the top 20 centimeters of soil. Coffin
and Lauenroth (1991) noted that the majority of blue grama (Bouteloua gracilis) roots
grew within five centimeters of the soil surface and no deeper than ten centimeters.
Skabelund (2011) observed some hairy grama (Bouteloua hirsuta), sideoats grama
(Bouteloua curtipendula), and little bluestem (Schizachyrium scoparium) did not
completely brown out on the west side of the Kansas State University Seaton Hall Green
Roof even though they were not supplemented with water during July-October 2011.
Mosses have been found to survive quite well as a plant type for shallow growing
medium, extensive green roofs. They require little soil and virtually no maintenance once
they have been established. Mosses grow quickly and are cost-effective to install. They
don't produce flowers and don't have actual roots that draw up any nutrients or water.
Mosses have minute ducts that open when moistened and become dormant with the lack
of moisture and then become active when moistened. Mosses do have chlorophyll and do
photosynthesize regardless of the temperature, hence they remain green in color even in
winter (Dwyer, 2009). The majority of mosses prefer no direct sunlight and prefer an
acidic soil (pH between 5.0 and 5.5), which is why they are often found under and near
pinus species. As they have no true roots, mosses will grow on logs, rocks and even on
concrete or clay planters. This is accomplished by rhizoids that attach the gametophyte to
the substratum and facilitate the absorption of minerals and water (Britannica, 2015).
While the literature asserted that the primary role of rhizoids is in attachment to the
substrate, the rhizoids of the endohydric moss Polytrichum have been shown to take up
water from the substrate, though the importance of this route of water uptake is probably
minor compared with uptake across aerial surfaces of the plant (Jones et. al., 2012). Many
types of mosses will tolerate sun, however, all mosses do require humidity to thrive.
Proceedings of the 58th International Convention of Society of Wood Science and Technology
June 7-12, 2015 – Grand Teton National Park, Jackson, Wyoming, USA
612
Structure The dead load of a green roof assembly is based on the saturated soil weight and
determined on a project-specific basis, because growth medium composition varies from
job to job. ASTM E2397 is the established standard procedure for determining the dead
and live loads associated with green roof systems. Roofmeadow® green roofs engineered
to be both lightweight and efficient, generally weigh about 4,746 kg/m2 (6.75 pounds per
square foot) for each 2.54cm (1 inch) of media depth. Thus, the saturated weight of a 7.6
cm (3-inch) deep system is about 14,060 kg/m2 (20 pounds per square foot), including a
mature plant cover. Mid-range, 12.7 cm (5-inch), systems weigh approximately 166
kg/m2 (34 pounds per square foot) and are compatible with wood or steel decks
(Roofmeadow, 2015). Heavier intensive green roofs generally require a concrete
supporting deck. The modular Firestone SkyScape Vegetative Roof System under full
wet conditions. Maximum system weight after installation is slightly less at 156.2 kg/m2
(32lbs/sqft) (Firestone, 2015b).
If people are not meant to walk on the roof then it is considered a landscaped roof and
should be designed for a live load of 97.65kg/m2 (20lbs/sqft). If people access the roof
then it is a garden and designed for a live load of 488.2 kg/m2 (100lbs/sqft). For more in-
depth information, the ASTM (Standards E2397 and E2399) has published specific
protocols for determining the weight and dead load of green roofs.
Extensive roof designs may be installed on roofs that are pitched to a maximum of 3/12
(3 units of rise per 12 units of run). While the rafters or trusses, ceiling joists, and wall
studs of the superstructure for sloped roofs should be sized according to job-specific
conditions, crucial components to the roof structure are the peat holder, commonly
referred to as eave beam, and peat holder hooks or jacks (Norwegian:torvholdstokk og
Torvholderkroker). The jacks are usually forged or bent steel at 90 degrees and are
fastened directly to the roof deck and the outside of the eave beam. The membrane is
placed over the jacks. A small gap between the eave beam and the membrane, equal in
thickness to that of the jack minus the membrane thickness, is sufficient for water
drainage under the beam. Typical Norwegian installations used gutter hooks
(takrennekroker) to hang a birch log beneath the eave. This log slowed the water flow
from underneath the beam. The logs were often slanted in one direction to direct the flow
as well. Modern installations utilize various gutters.
Results
Experimental models were created to assess membrane, growing mediums, water runoff,
and vegetative effectiveness. The researcher produced a stabbur (store house) for later
use as a bird feeder. Construction details included redwood post and beam construction,
¼” exterior grade plywood roof sheathing, GAF StormGuard® self‐adhering ice and
water shield, sand and gravel substrate, and Dicranium flagellare and Dicranella
heteromalla moss for vegetation. While the ice and water shield is a bitumen-based
product, it was anticipated that the rhizoids would not penetrate during the feeders life
Proceedings of the 58th International Convention of Society of Wood Science and Technology
June 7-12, 2015 – Grand Teton National Park, Jackson, Wyoming, USA
613
expectancy. Most all of the moss continued to grow through the first winter into the
spring. Bare spots were a result of birds disrupting the moss before it had a substantial
hold on the substrate. Leaks were not detected below the plywood deck.
Students developed an experimental model with rafters, eave beam, and spacers all
constructed of redwood. On the peak of the roof acrylic was used for observation of the
various layers. Ice and water shield was used on half of the structure as a membrane and
birch bark was used on the other half. On top of the membrane boards were secured to
the fascia boards with ½” holes drilled every six inches to act as a spacer for water to be
able to flow under the growing medium. Gravel was placed on top of the membrane and
held in place by the eave beam and spacers. A polypropylene sheet was placed above the
gravel and organic growing matter with assorted seed was placed above the separation
mat. The seed had not germinated at the time of writing and leaks had not been detected.
At the time of writing a shed with a 2/12 slope was being structurally retrofitted to
accommodate an extensive roof. Additional rafters, ceiling joists and studs were spaced
between the existing members. The oriented-strand-board (OSB) roof sheathing was
replaced with 19mm (3/4”) exterior grade plywood. New fascia was added and the eave
beam was installed. The membrane of EPDM was adhered to the roof deck and fascia.
There were no seams as the width of the EPDM extended from eave to ridge to eave.
Polypropylene drainage mats were purchased and are awaiting installation. Growing
medium and vegetation are to be transplanted from on-site.
Conclusions
One of the most significant benefits of a vegetative roof is extending the number of years
typically needed before a roof must be replaced, as compared with conventional black
rubber, asphalt shingle, and white roofs (GSA 2011). This is due to a green roof’s
vegetation layer and growing medium protect the roofing membrane from damaging UV
radiation and from fluctuations in temperature extremes. Temperature fluctuations cause
daily expansion and contraction in the membrane, wearing it out over time. The GSA
(2011) study puts the average life expectancy of a green roof at 40 years versus 17 years
for a black roof. The lifetimes of green roofs are difficult to predict because some do not
need to be replaced even more than 50 years after installation.
Green roof installation costs per unit area decrease as size increases. The installed cost
premium for multi-course extensive green roofs ranged from $110 to $134 per m2
($10.30 to $12.50 per square foot) more compared to a conventional black roof. The
installed cost premium for semi-intensive green roofs ranged from $174 to $212 per m2
($16.20 to $19.70 per square foot) more compared to a conventional, black roof. Annual
maintenance for a green roof is typically higher than for a black roof, by $2.26 to $3.33
per m2 ($0.21 to $0.31 per square foot) (GSA, 2011).
Proceedings of the 58th International Convention of Society of Wood Science and Technology
June 7-12, 2015 – Grand Teton National Park, Jackson, Wyoming, USA
614
During the summer, green roofs have a higher rate of evapotranspiration than
conventional roofs made of impervious materials, creating a cooling effect on and around
buildings. In both summer and winter, green roofs have an insulating effect on buildings,
reducing peak heating and cooling demands in hot and cold seasons. This makes a
smaller contribution to energy savings than the evapotranspiration effect.
Variations in growing medium can affect the ability of a green roof to promote
biodiversity. Deeper growing medium provides a potential habitat for a greater number of
plants and animals because of its increased ability to hold water and nutrients and its
ability to accommodate plants with deeper roots. The shallow growth medium commonly
used in extensive green roofs is less effective, as it intensifies the already extreme rooftop
environment.
Intensive roofs require a professional roofing contractor, professional engineer, a large
crew, and extensive material handling equipment for proper and lawful installation. The
results of this research suggest that individual home owners can begin their own green
roofs by starting with small bird feeders, pergolas, outhouses, and sheds, and then
evaluate the aesthetic qualities and membrane effectiveness, before considering adding a
green roof to a dwelling.
Structural wood components must be sized appropriately for extensive roof systems. If
extensive green roofs become more prevalent on outbuildings, store houses, and even
bird houses, there may be an increased demand for substantially larger framing, skeletal,
and trim members.
The type of vegetation used is the most important factor in a green roof’s ability to
encourage biodiversity. Intensive roofs typically support a greater diversity of rare spider
and bird species than extensive roofs, which are generally visited by more common bird
species. Both types of roof attract a similar number of insect species (GSA, 2011). As
succulents are most commonly used for extensive roofs and are quite ornamental, but do
not contribute to the biodiversity of the roof system, additional research must be made in
the United States into which native prairie grasses with small root depth and which
mosses are most tolerant of threatening roof conditions and contribute to the biodiversity
on extensive roofs.
Through proper planting schemes, the aesthetic value of structures with green roofs
(Norwegian: Torvtak) can be greatly enhanced. Vegetative roofs can create exciting,
visual and olfactory effects, which are intrinsic to human health and happiness.
References
Biermeier M (2015) TEK Roofing Company, Inc., Eau Claire, WI, Personal
Communication.
Proceedings of the 58th International Convention of Society of Wood Science and Technology
June 7-12, 2015 – Grand Teton National Park, Jackson, Wyoming, USA
615
Brennan A (2010) Green Building, old school: Scandinavian sod
http://www.justmeans.com/blogs/green-building-old-school-scandinavian-sod.
(2 November 1998).
Britannica (2015) http://www.britannica.com/EBchecked/topic/501471/rhizoid . (1 April
2015).
Claridge N, Edwards L (2012) Green Roof Technology – Research, Design and
Implementation of a Green Roof at The University Of Canterbury. University of
Canterbury Sustainability Office and the Department of Civil and Natural Resources
Engineering
http://www.sustain.canterbury.ac.nz/summer/Green_Roof_Technology.pdf . (31 March
2015).
Coffin D, Lauenroth W (1991) Effects of Competition on Spatial Distribution of Roots of
blue grama, Bouteloua gracilis . Journal of Range Management 44:68–71.
Conservation Technology (2015) Green Roof Components
http://www.conservationtechnology.com/greenroof_components.html . (31 March 2015).
Dwyer M (2009) Moss Gardening: A Low-Maintenance Option for Shade
http://www.gardensmart.tv/?p=articles&title=Moss_Gardening. (11 December 2014).
Fassman E, Simcock R (2012) Moisture Measurements as Performance Criteria for
Extensive Living Roof Substrates. Journal of Environ. Engineering, 138(8), 841–851.
FLL (2002) Guideline for the Planning, Execution and Upkeep of Green Roof Sites,
Forschungsgesellschaft Landschaftsentwicklung Landschaftsbau .
Firestone (2015a) EPDM Roofing Systems, Firestone Building Products
http://firestonebpco.com/roofing/epdm-roofing-systems/ . (1 April 2015).
Firestone (2015b) Skyscape™ Vegetative Roof Systems: Design & Installation Guide,
Firestone Building Products. http://firestonebpco.com/assets/2014/07/skyscape-design-
and-installation-guide.pdf . (1 April 2015).
Gill R, Burke I, Lauenroth W, Milchunas D (2002). Longevity and Turnover of Roots in
the Shortgrass Steppe: Influence of Diameter and Depth”. Plant Ecology 159:241.
GSA (2011) The Benefits and Challenges of Green Roofs on Public and Commercial
Buildings: A Report of the United States General Services Administration.
http://www.gsa.gov/portal/mediaId/158783/fileName/The_Benefits_and_Challenges_of_
Green_Roofs_on_Public_and_Commercial_Buildings.action . (9 March 2015).
Proceedings of the 58th International Convention of Society of Wood Science and Technology
June 7-12, 2015 – Grand Teton National Park, Jackson, Wyoming, USA
616
Hennessey T (2007) Entirely by hand ... From the ground up. Penobscot River
Restoration Trust, http://www.penobscotriver.org/content/4060/birch-bark-canoe . (27
March 2015).
Jones V, Dolan L (2012) The evolution of root hairs and rhizoids. Annals of Botany, 110
(2):205-212 http://aob.oxfordjournals.org/content/early/2012/06/23/aob.mcs136.full . (12
April 2015).
Kraft A (2013) Why Manhattan's Green Roofs Don't Work--and How to Fix Them
Scientific American, a division of Nature America, Inc.
http://www.scientificamerican.com/article/why-manhattans-green-roofs-dont-work-how-
to-fix-them/ . (31 March 2015).
Mendoza (2014) TPO: Getting Better With Age, TPO product manager, Firestone
Building Products http://firestonebpco.com/content/uploads/2012/07/FINAL-2014-TPO-
Technical-Paper.pdf . (4 April 2015).
Roofmeadow (2015) Details & Specs, Roofmeadow, Inc. Philadelphia, PA
http://www.roofmeadow.com/details-specs-services/details-specs/ . (10 April 2015).
Simply Succulents (2015) Simply Succulents Nursery, Cable, WI
https://www.simplysucculents.com/ . (10 March 2015).
Skabelund, L. 2011. Observations on the Kansas State University Seaton Hall Green
Roof. Personal Communication.
Stugaard K (2015) Observations on the construction of the Stabbur in Hedalen, Norway
Personal Communication.
Sutton R, Harrington J, Skabelund L, MacDonagh P, Coffman R, Koch G (2012) Prairie-
Based Green Roofs: Literature, Templates, and Analogs, Journal of Green Building. 7 (1)
https://agronomy.unl.edu/c/document_library/get_file?p_l_id=4128278&folderId=51143
39&name=DLFE-65734.pdf . (10 April 2015).
Wilson M (2014) Why a rooftop garden makes environmental and economic sense.
House and Home. http://www.ft.com/cms/s/0/76672710-5dd9-11e4-b7a2-
00144feabdc0.html#axzz3XQTpnl5E (15 April 2015).
Young T, Cameron D, Sorrill J, Edwards T, Phoenix G, (2014) Importance of different
components of green roof substrate on plant growth and physiological performance.
Urban Forestry & Urban Greening, 13, (3) 507–516.
Proceedings of the 58th International Convention of Society of Wood Science and Technology
June 7-12, 2015 – Grand Teton National Park, Jackson, Wyoming, USA
617
Wood Solutions to Satisfy Energy Codes in Building
Construction
Robert M. Knudson, [email protected]
Jieying Wang, [email protected]
Jean-Frederic Grandmont, [email protected]
FPInnovations, 2665 East Mall, Vancouver BC V6T 1Z4
Abstract
Buildings account for approximately 40% of energy use in most developed countries. In
North America, the requirements for new buildings constructed after 2012 are expected
to yield approximately 30% increases in energy efficiency. Targets will continue to ramp
upward into the future. Developing wood-based solutions to meet the changing energy
codes is an opportunity for the forest industry. FPInnovations, in collaboration with
numerous partners, is working actively to meet these challenges. FPInnovations
responded to the rapidly changing energy efficiency requirements for buildings across
Canada and the United States by publishing guides to extend the building industry’s
existing design and construction practices. New wood-based insulation materials are also
being investigated. An assessment of European dry process wood fibre insulation
products for manufacture and use in North America has been carried out. Other research
is exploring a new process for manufacturing rigid insulation products from pulp fiber.
FPInnovations has been working on development of multi-functional, wood-based panel
systems combining both structural and thermal insulation attributes. Short term work has
focused on fabricating multi-functional panels from existing products. Longer term work
will evolve to explore entirely new panel and other engineered wood products. To be
successful, any new wood or wood-based products must function as part of building
systems and at the same time be cost competitive.
Proceedings of the 58th International Convention of Society of Wood Science and Technology
June 7-12, 2015 – Grand Teton National Park, Jackson, Wyoming, USA
618
Easy Assembly Systems- Integration of Post-Tensioned
Heavy Timber and Smart Architecture in Construction
Practices
Zahra Ghorbani 1, Ben Hagenhofer-Daniell 2, Ryan E Smith3
1 Research Assistant, College of Architecture + Planning, School of
Architecture, University of Utah, SLC UT,USA
[email protected] 2 Research Assistant Professor, College of Architecture + Planning, School
of Architecture, University of Utah, SLC UT, USA 3 Associate Professor, College of Architecture + Planning, School of
Architecture, University of Utah, SLC UT, USA
Abstract
Digital modeling and manufacturing techniques in timber construction have matured in
recent years. This computation has increased the potential for geometrically complex
forms. Despite this advances, assembly methods for wood structures remain cumbersome
with too much inefficiency in cost, materials, and scheduling. The environmental benefits
of wood as a sustainable building material are well documented, yet sub-trades are often
unfamiliar with heavy timber construction.
This project develops a new and easy method of Timber Assembly System. This Timber
Assembly System (TAS) will be established through the confluence of two primary
domains of research: 1) Structural system development including post-tensioned timber
system development and assessment of wood properties and behavior. 2) Geometric
system development including smart geometry, sequencing, and joinery detailing.
This project utilizes techniques from masonry and concrete construction, applied to the
planar frame, wall, roof and floor systems in buildings, to presents new and innovative
possibilities for timber assemblies. This system relies on smart geometry, the tendon to
material location, and smart joinery. Furthermore, the structural system enables the use of
demolition waste wood, small diameter logs, and beetle killed pine. This intelligent
system of assembly will reduce labor and material costs while increasing the demand for
timber specified in building construction.
Key Words: Easy Assembly of architecture, Post – Tension Timber, Smart Architecture,
Digital Fabrication, Assembly System for Wood Building Material, Integration of
Architecture and Structure and construction, Bio structural morphology.
Proceedings of the 58th International Convention of Society of Wood Science and Technology
June 7-12, 2015 – Grand Teton National Park, Jackson, Wyoming, USA
619
Introduction
The increasing power of parametric modeling for a possibility of geometrically complex
forms and digital fabrication in line with built environment are a milestone in the world
of architecture and engineering. Design engineering has been developed as an interactive
medium for collaboration between architects and structural engineers to innovate
effective, sustainable method of construction. Thanks to design engineering, inefficiency
in construction, the negative impact of site construction activities on the environment,
cost of construction and schedule can be moderated. This approach leads to study on
assembly system that is even recommended by National Research Council (NRC) to
exploit the greatest potential, and advance the competitiveness and productivity of the
U.S. construction industry in the next 20 years. (National Academies Press, 2009)
Theory of Easy Assembly System (EAS) with smart components through the post-
tensioned structure can provide a new vision of flexible method to build complex
geometries, and control construction issues. This research offers more controlled
conditions, fewer job-sites environmental impacts, compressed project schedules, and
reduce construction waste material. It focuses on how wood members could be assembled
by post-tension or compression forces depending on its geometries. In the other words, it
tries to create innovative architectural and structural techniques to build an immense
structure efficiently depending on the eco-friendly material. In order to Integration of
Post-Tensioned and Smart Architecture in wood structure, structure and smart geometries
must be simultaneously considered.
Structure
Traditional Cordwood House and Log Construction are interesting a precedent to shape
the foundation of this research, but it is matured by Post-Tensioned Laminated Veneer
Lumber technology. Log building can be defined as stacking the logs horizontally to
make walls. There are two different types of log house;
Handcrafted: Handcrafted homes were usually built of large logs and chinking to
fill and seal the spaces between logs. Skills of handcrafted can guarantee the
quality of the structure. The cost for this sort of log house is almost high.
Manufactured or machine milled: it is based on shaped and milled logs that make
more opportunity to build a house with different types of profile, including
interlocking tongues and grooves in the length of the logs and precise corner
notches.
The point is finding proper notching technique for a corner of log in both types of log
house to join member together accurately. The stability of the house is just related to the
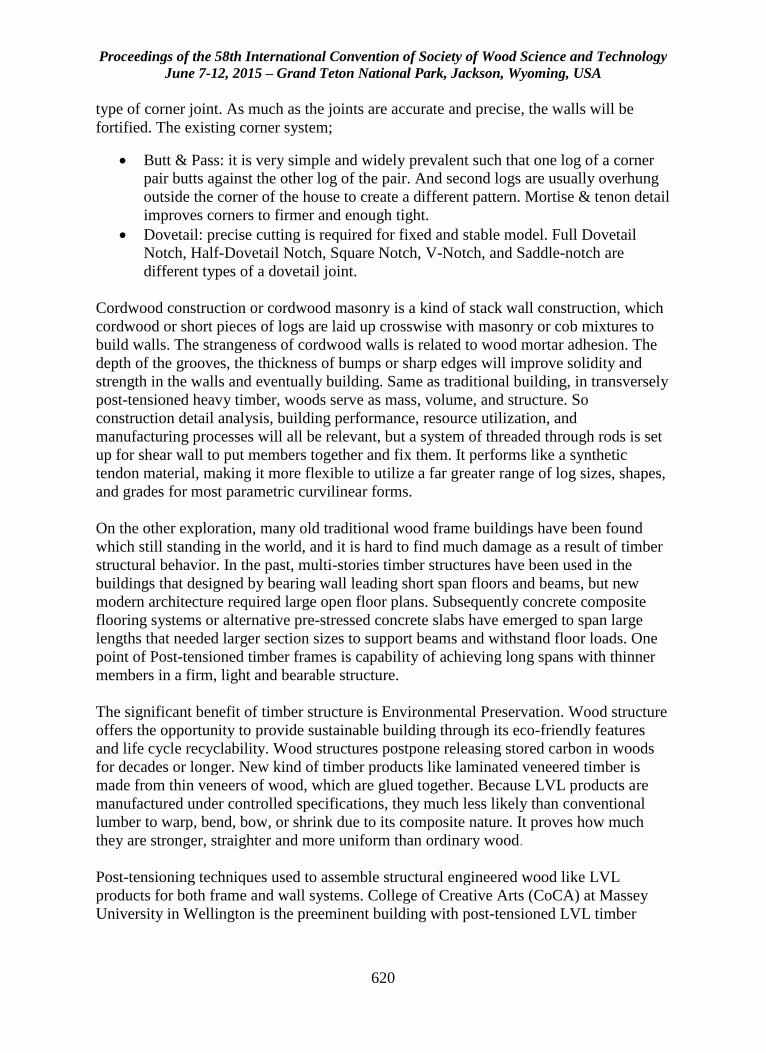
Proceedings of the 58th International Convention of Society of Wood Science and Technology
June 7-12, 2015 – Grand Teton National Park, Jackson, Wyoming, USA
620
type of corner joint. As much as the joints are accurate and precise, the walls will be
fortified. The existing corner system;
Butt & Pass: it is very simple and widely prevalent such that one log of a corner
pair butts against the other log of the pair. And second logs are usually overhung
outside the corner of the house to create a different pattern. Mortise & tenon detail
improves corners to firmer and enough tight.
Dovetail: precise cutting is required for fixed and stable model. Full Dovetail
Notch, Half-Dovetail Notch, Square Notch, V-Notch, and Saddle-notch are
different types of a dovetail joint.
Cordwood construction or cordwood masonry is a kind of stack wall construction, which
cordwood or short pieces of logs are laid up crosswise with masonry or cob mixtures to
build walls. The strangeness of cordwood walls is related to wood mortar adhesion. The
depth of the grooves, the thickness of bumps or sharp edges will improve solidity and
strength in the walls and eventually building. Same as traditional building, in transversely
post-tensioned heavy timber, woods serve as mass, volume, and structure. So
construction detail analysis, building performance, resource utilization, and
manufacturing processes will all be relevant, but a system of threaded through rods is set
up for shear wall to put members together and fix them. It performs like a synthetic
tendon material, making it more flexible to utilize a far greater range of log sizes, shapes,
and grades for most parametric curvilinear forms.
On the other exploration, many old traditional wood frame buildings have been found
which still standing in the world, and it is hard to find much damage as a result of timber
structural behavior. In the past, multi-stories timber structures have been used in the
buildings that designed by bearing wall leading short span floors and beams, but new
modern architecture required large open floor plans. Subsequently concrete composite
flooring systems or alternative pre-stressed concrete slabs have emerged to span large
lengths that needed larger section sizes to support beams and withstand floor loads. One
point of Post-tensioned timber frames is capability of achieving long spans with thinner
members in a firm, light and bearable structure.
The significant benefit of timber structure is Environmental Preservation. Wood structure
offers the opportunity to provide sustainable building through its eco-friendly features
and life cycle recyclability. Wood structures postpone releasing stored carbon in woods
for decades or longer. New kind of timber products like laminated veneered timber is
made from thin veneers of wood, which are glued together. Because LVL products are
manufactured under controlled specifications, they much less likely than conventional
lumber to warp, bend, bow, or shrink due to its composite nature. It proves how much
they are stronger, straighter and more uniform than ordinary wood.
Post-tensioning techniques used to assemble structural engineered wood like LVL
products for both frame and wall systems. College of Creative Arts (CoCA) at Massey
University in Wellington is the preeminent building with post-tensioned LVL timber
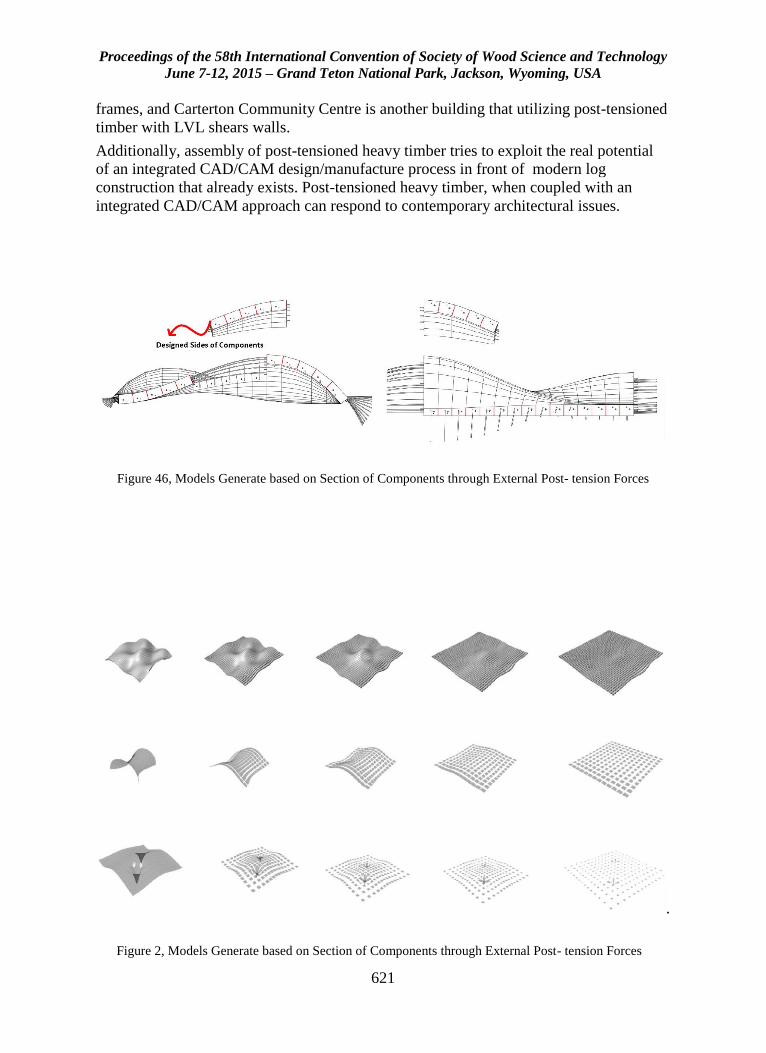
Proceedings of the 58th International Convention of Society of Wood Science and Technology
June 7-12, 2015 – Grand Teton National Park, Jackson, Wyoming, USA
621
frames, and Carterton Community Centre is another building that utilizing post-tensioned
timber with LVL shears walls.
Additionally, assembly of post-tensioned heavy timber tries to exploit the real potential
of an integrated CAD/CAM design/manufacture process in front of modern log
construction that already exists. Post-tensioned heavy timber, when coupled with an
integrated CAD/CAM approach can respond to contemporary architectural issues.
Figure 46, Models Generate based on Section of Components through External Post- tension Forces
.
Figure 2, Models Generate based on Section of Components through External Post- tension Forces
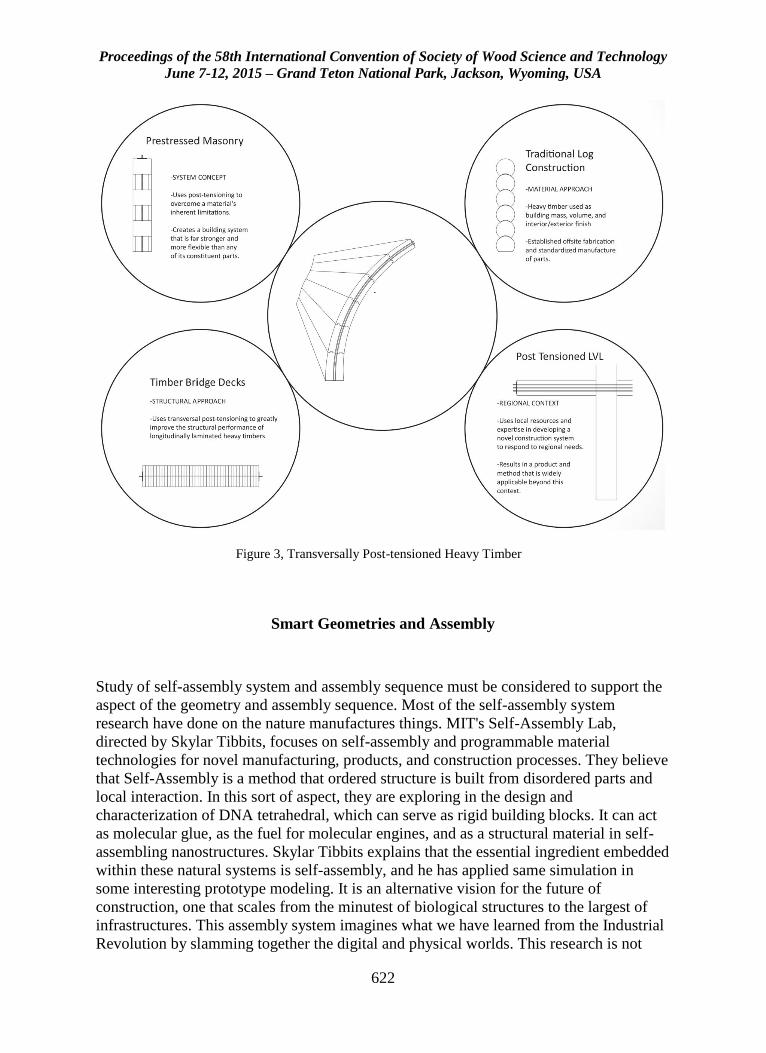
Proceedings of the 58th International Convention of Society of Wood Science and Technology
June 7-12, 2015 – Grand Teton National Park, Jackson, Wyoming, USA
622
Smart Geometries and Assembly
Study of self-assembly system and assembly sequence must be considered to support the
aspect of the geometry and assembly sequence. Most of the self-assembly system
research have done on the nature manufactures things. MIT's Self-Assembly Lab,
directed by Skylar Tibbits, focuses on self-assembly and programmable material
technologies for novel manufacturing, products, and construction processes. They believe
that Self-Assembly is a method that ordered structure is built from disordered parts and
local interaction. In this sort of aspect, they are exploring in the design and
characterization of DNA tetrahedral, which can serve as rigid building blocks. It can act
as molecular glue, as the fuel for molecular engines, and as a structural material in self-
assembling nanostructures. Skylar Tibbits explains that the essential ingredient embedded
within these natural systems is self-assembly, and he has applied same simulation in
some interesting prototype modeling. It is an alternative vision for the future of
construction, one that scales from the minutest of biological structures to the largest of
infrastructures. This assembly system imagines what we have learned from the Industrial
Revolution by slamming together the digital and physical worlds. This research is not
Figure 3, Transversally Post-tensioned Heavy Timber
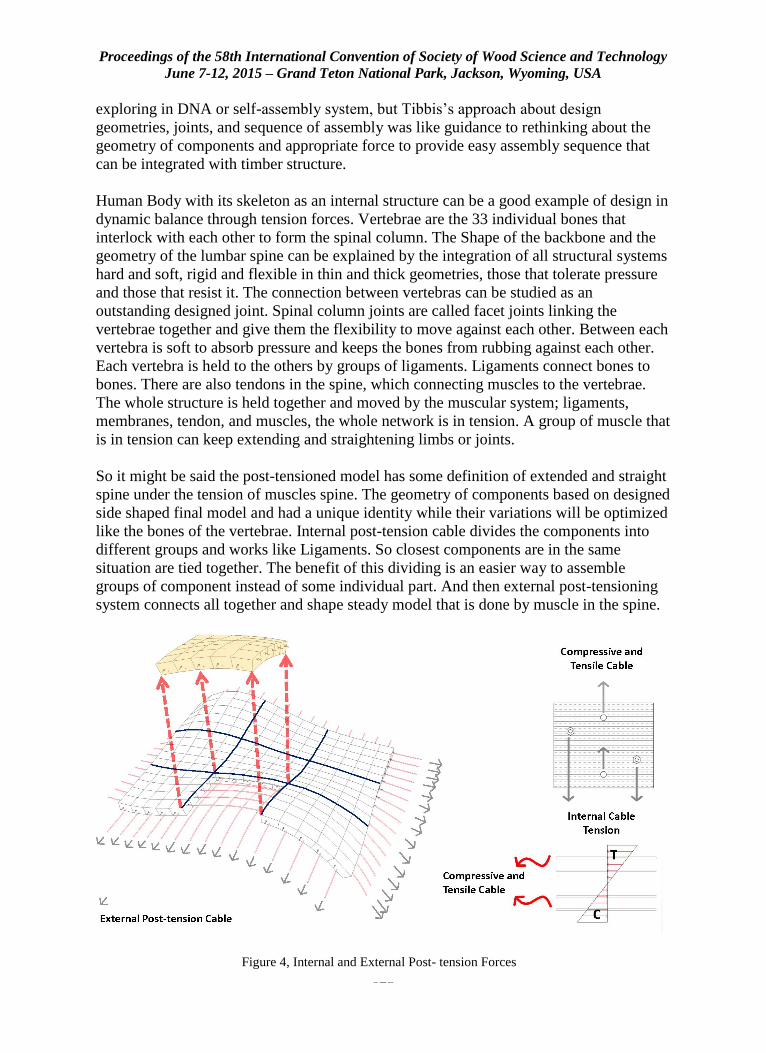
Proceedings of the 58th International Convention of Society of Wood Science and Technology
June 7-12, 2015 – Grand Teton National Park, Jackson, Wyoming, USA
623
exploring in DNA or self-assembly system, but Tibbis’s approach about design
geometries, joints, and sequence of assembly was like guidance to rethinking about the
geometry of components and appropriate force to provide easy assembly sequence that
can be integrated with timber structure.
Human Body with its skeleton as an internal structure can be a good example of design in
dynamic balance through tension forces. Vertebrae are the 33 individual bones that
interlock with each other to form the spinal column. The Shape of the backbone and the
geometry of the lumbar spine can be explained by the integration of all structural systems
hard and soft, rigid and flexible in thin and thick geometries, those that tolerate pressure
and those that resist it. The connection between vertebras can be studied as an
outstanding designed joint. Spinal column joints are called facet joints linking the
vertebrae together and give them the flexibility to move against each other. Between each
vertebra is soft to absorb pressure and keeps the bones from rubbing against each other.
Each vertebra is held to the others by groups of ligaments. Ligaments connect bones to
bones. There are also tendons in the spine, which connecting muscles to the vertebrae.
The whole structure is held together and moved by the muscular system; ligaments,
membranes, tendon, and muscles, the whole network is in tension. A group of muscle that
is in tension can keep extending and straightening limbs or joints.
So it might be said the post-tensioned model has some definition of extended and straight
spine under the tension of muscles spine. The geometry of components based on designed
side shaped final model and had a unique identity while their variations will be optimized
like the bones of the vertebrae. Internal post-tension cable divides the components into
different groups and works like Ligaments. So closest components are in the same
situation are tied together. The benefit of this dividing is an easier way to assemble
groups of component instead of some individual part. And then external post-tensioning
system connects all together and shape steady model that is done by muscle in the spine.
Figure 4, Internal and External Post- tension Forces
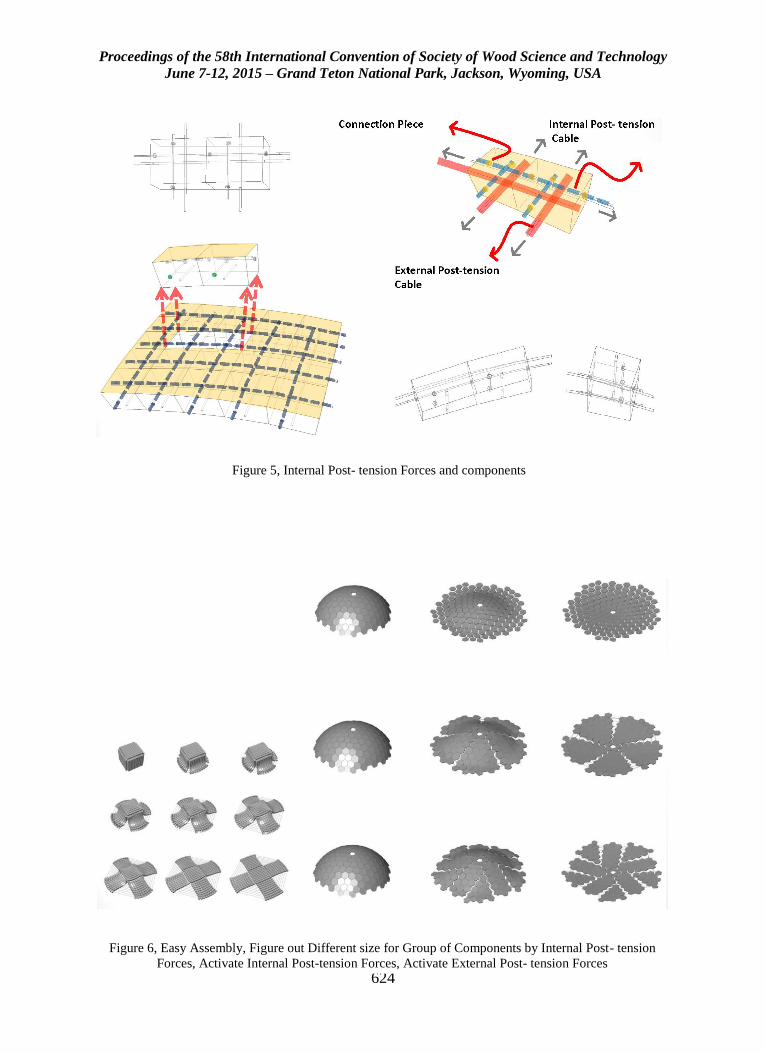
Proceedings of the 58th International Convention of Society of Wood Science and Technology
June 7-12, 2015 – Grand Teton National Park, Jackson, Wyoming, USA
624
Figure 5, Internal Post- tension Forces and components
Figure 6, Easy Assembly, Figure out Different size for Group of Components by Internal Post- tension
Forces, Activate Internal Post-tension Forces, Activate External Post- tension Forces

Proceedings of the 58th International Convention of Society of Wood Science and Technology
June 7-12, 2015 – Grand Teton National Park, Jackson, Wyoming, USA
625
Design Challenge
The important point of the digital design- fabrication is providing more accuracy in the
design model, details, and manufacturing.
In case of elements to be connected to each other, any geometry can be corrected.
The tolerances of production in construction are controlled accurately.
To design components, the points and surfaces where connections are made have to be
adaptable and have to be designed in an easy assembly way. The detail of connections
has to be accurately characterized, and the geometry and physical properties of all parts
have to be well defined. It allows classifying components to optimize the different types.
The best approach is to set a few basic parts and determine all other components by
means of those few basic parts. Finding differentiation of these elements has to be done
to group them only according to a specific principle and unnecessary differentiation is
also avoided. Therefore, families of components can be assembled in an easier and faster
sequence with similar tools.
It is possible to add a specifically designed element into the connection zone to assemble
complex structures with minimum types of the group while having different connection
elements. Moreover, it must be tried to control the number of element connections, and
non-parallel the connection work. Since these flexible technologies have emerged, it is
possible to assemble complex structures prior to the start of the construction work. Thus,
by bringing the pre-assembled parts of the site, the huge cost of positioning, adjusting and
fixing of small parts is diminished. On the other words, model optimization provides a
low cost and quick construction with low environmental impact. So, in digital fabrication,
components are designed clearly, simply and precisely. Then, Proper assembly sequence
in one direction is considered to provide the easiest alignment instead of several
orientations. It leads to finding minimum issues over handling, orientation and
identification.
This paper has been written based on the basic idea that is under study and design. To
reach our goal, applying this system in real construction, we must carefully monitor our
methodology.
Phase 1
Develop baseline structural performance criteria. Review existing log
construction ICC code and previous empirical log wall research to determine what
will constitute equivalent performance in a fully post-tensioned system utilizing
regionally sourced beetle kill pine.
Work with forestry, manufactured log home builders, and advanced timber
fabricators to determine the range log lengths and thicknesses, as well as any
geometric limitations. This would be based on the timber harvested, but more on
the specific capabilities of timber milling and machining equipment and
processes.
Outline a digital workflow from design through to manufacture. Work through
issues of interoperability. Determine what work is best done at what stage of
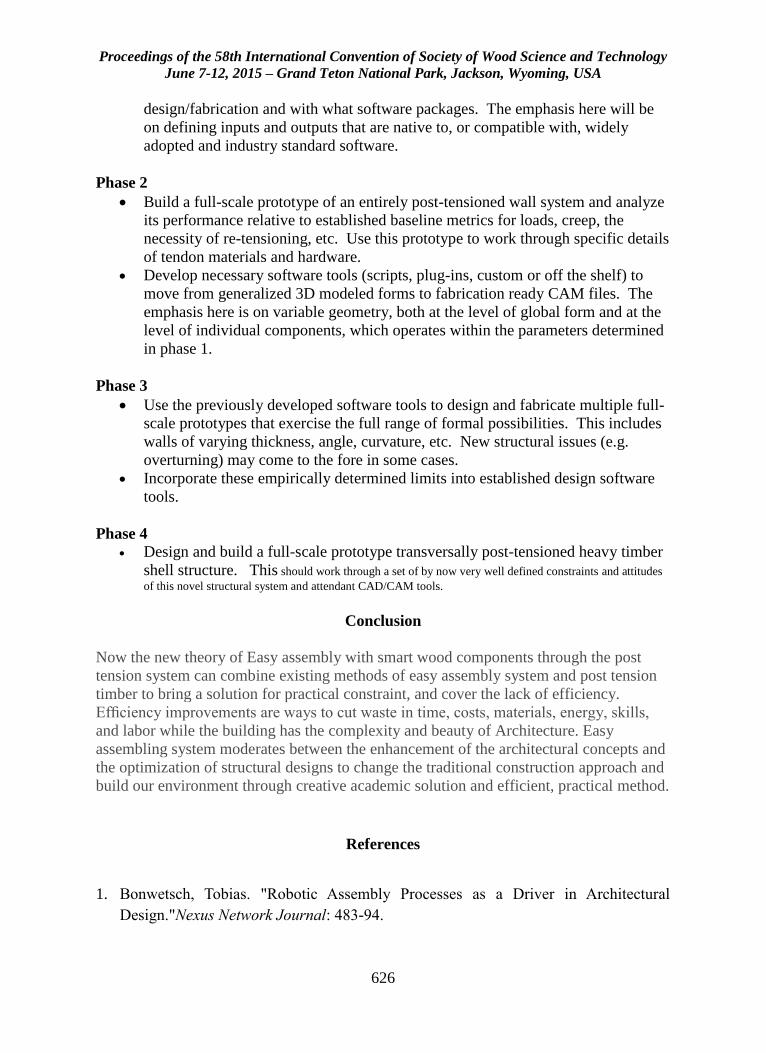
Proceedings of the 58th International Convention of Society of Wood Science and Technology
June 7-12, 2015 – Grand Teton National Park, Jackson, Wyoming, USA
626
design/fabrication and with what software packages. The emphasis here will be
on defining inputs and outputs that are native to, or compatible with, widely
adopted and industry standard software.
Phase 2
Build a full-scale prototype of an entirely post-tensioned wall system and analyze
its performance relative to established baseline metrics for loads, creep, the
necessity of re-tensioning, etc. Use this prototype to work through specific details
of tendon materials and hardware.
Develop necessary software tools (scripts, plug-ins, custom or off the shelf) to
move from generalized 3D modeled forms to fabrication ready CAM files. The
emphasis here is on variable geometry, both at the level of global form and at the
level of individual components, which operates within the parameters determined
in phase 1.
Phase 3
Use the previously developed software tools to design and fabricate multiple full-
scale prototypes that exercise the full range of formal possibilities. This includes
walls of varying thickness, angle, curvature, etc. New structural issues (e.g.
overturning) may come to the fore in some cases.
Incorporate these empirically determined limits into established design software
tools.
Phase 4
Design and build a full-scale prototype transversally post-tensioned heavy timber
shell structure. This should work through a set of by now very well defined constraints and attitudes
of this novel structural system and attendant CAD/CAM tools.
Conclusion
Now the new theory of Easy assembly with smart wood components through the post
tension system can combine existing methods of easy assembly system and post tension
timber to bring a solution for practical constraint, and cover the lack of efficiency.
Efficiency improvements are ways to cut waste in time, costs, materials, energy, skills,
and labor while the building has the complexity and beauty of Architecture. Easy
assembling system moderates between the enhancement of the architectural concepts and
the optimization of structural designs to change the traditional construction approach and
build our environment through creative academic solution and efficient, practical method.
References
1. Bonwetsch, Tobias. "Robotic Assembly Processes as a Driver in Architectural
Design."Nexus Network Journal: 483-94.

Proceedings of the 58th International Convention of Society of Wood Science and Technology
June 7-12, 2015 – Grand Teton National Park, Jackson, Wyoming, USA
627
2. Enns, Jonathan. "Intelligent Wood Assemblies: Incorporating Found Geometry and
Natural Material Complexity." Architectural Design: 116-21.
3. Graham, D.A. Carradine, D.M. Bender, D.A. Dolan, J.D. (2010) “Performance of Log
Shear Walls Subjected to Monotonic and Reverse-Cyclic Loading”. Journal of
Structural Engineering 136(1):37-45
4. Mora, Rodrigo, Claude Bédard, and Hugues Rivard. "A Geometric Modelling
Framework for Conceptual Structural Design from Early Digital Architectural
Models." Advanced Engineering Informatics: 254-70.
5. National Academies Press (2009) Advancing the Competitiveness and Efficiency of
the U.S, Construction Industry. Washington, D.C.
6. Oxman, Rivka. "Informed Tectonics in Material-based Design." Design Studies: 427-
55.
7. Roy, Robert L (1980) Cordwood Masonry Houses: A Practical Guide for the Owner-
builder. New York, Sterling.
8. Roy, Robert L. Stoneview (2008) How to Build an Eco-friendly Little Guesthouse.
Gabriola: New Society Publishers
9. space lab by kohki hiranuma architect & associates - designboom | architecture &
design magazine (designboom architecture design magazine space lab by kohki
hiranuma architect associates Comments)
10. Sarti, F., Palermo, A., Pampanin, S. (2012) “Simplified Design Procedures for Post-
Tensioned Seismic Resistant Timber Walls.” Proceedings 15th WCEE, Lisbon.
11. Seismic design: engineering wood | ArchitectureAU,
http://architectureau.com/articles/seismic-design-engineering-wood/ (accessed April
16, 2015).
12. Tibbits, Skylar(2012) "Design to Self-Assembly." Architectural Design: 68-73.
13. Zhang, J.y., M. Ohsaki, and Y. Kanno. "A Direct Approach to Design of Geometry
and Forces of Tensegrity Systems." International Journal of Solids and Structures:
2260-278.
14. Anatomy of the Spine: vertebrae, sacroiliac joints, cervical ..,
http://www.allaboutbackandneckpain.com/understand/anatomy.asp (accessed April
16, 2015).
Proceedings of the 58th International Convention of Society of Wood Science and Technology
June 7-12, 2015 – Grand Teton National Park, Jackson, Wyoming, USA
628
Design and Performance of Steel Energy Dissipators to
be used in Cross-Laminated Timber Self-Centering
Systems
Arijit Sinha, [email protected]
Andre Barbosa, [email protected]
Anthonie Kramer, [email protected]
Oregon State University, 234 Richardson Hall, , Corvallis, OR 97331
Abstract
A new alternative energy dissipation solution to be used with cross-laminated timber
(CLT) self-centering walls is presented. CLT could potentially be used for high-rise
construction. The development of high performance seismic design solutions is necessary
to encourage innovative structures. The objective of this study is to investigate a
connection system that is easy to install and replace (structural fuse), which is designed to
be used with a self-centering CLT rocking wall. The proposed energy dissipators are
fabricated following concepts used in developing steel Buckling Restrained Braces,
having a milled portion which is designed to yield and is enclosed within a grouted steel
pipe. The connection system is investigated experimentally through a unique test
sequence of displacement controlled cycles based on a modified version of the test
method developed by the American Concrete Institute to facilitate development of special
precast systems. Digital Image Correlation was used to analyze strain behavior of the
milled portion, as well as track movement of the panels during quasi-static uniaxial and
cyclic testing. The results show the energy dissipation properties of the connection
system. Damage was focused primarily in the energy dissipators, with negligible
deformation and damage to the CLT panels and connections. These tests demonstrate the
ability of these systems to be used as a viable energy dissipating solution in self-centering
rocking or hybrid systems.
Proceedings of the 58th International Convention of Society of Wood Science and Technology
June 7-12, 2015 – Grand Teton National Park, Jackson, Wyoming, USA
629
Use of Virtual Visual Sensors in Obtaining Natural
Frequencies of Timber Structures
Kristopher Walker, [email protected]
Thomas Miller, [email protected]
Rakesh Gupta, [email protected]
Oregon State University, 900 SE Centerpointe Dr., Apt A303, Corvallis, OR
97333
Abstract
Many nondestructive methods of structural health monitoring are subjective in nature and
largely based on visual observations of damage. Most current methods of objective data
collection are limited to localized damage on the structure, rather than global response.
Recent research involves the use of commercially available digital video cameras, or
virtual visual sensors, to obtain structural dynamic behavior. This project focuses on the
determination of natural vibration frequencies by monitoring the intensity value of a
single pixel coordinate over the course of a few seconds of video of structural vibration
and applying a fast Fourier transform to extract signal frequencies. Natural frequencies
are used to calculate stiffness properties of materials and structural systems. The focus
here is primarily on the application of the virtual visual sensor technique to timber
structures. Experimentation focuses on verification of the method to extract vibrational
frequencies in various scenarios, using naturally occurring color gradients in wood
structures to achieve this analysis. Applications are made to in-use structures such as a
US Forest Service pedestrian bridge to examine the potential usefulness of the technique
to objectively infer structural health. Preliminary results show high accuracy in
determining vibrational frequencies, and good use of naturally occurring color gradients
in both lab and field tests.
Proceedings of the 58th International Convention of Society of Wood Science and Technology
June 7-12, 2015 – Grand Teton National Park, Jackson, Wyoming, USA
630
Treatments and Durability Session Moderator: Dodi Nandika, Bogor Agricultural University,
Indonesia
Non-Destructive Detection and Monitoring of
Durability Issues in Full-Scale Wall Envelopes under
Accelerated Weathering
Paul Frederik Laleicke, [email protected]
Fred Kamke, [email protected]
Oregon State University, 119 Richardson Hall, Corvallis, OR 97331
Abstract
Many wood composites are known to poorly resist the effects of moisture and
temperature extremes over time. Long-term experiments on small specimens are required
to evaluate the durability and weather resistance of wood composites. Duration of testing
and efforts to assess the performance of wood composites in full scale assemblies
constrain the development of new products and applications. Accelerated weathering
technologies have the potential to shorten the process of time-dependent effects of natural
weather exposure and can be applied to simulate regional weather characteristic. The
multi-chamber modular environmental conditioning (MCMEC) system at Oregon State
University is capable of exposing full-scale wall elements to specific patterns of
temperature, moisture and ultraviolet-radiation. Degradation and excessive shrinking and
swelling alter the interfacial boundaries, a critical performance factor. Non-destructive
approaches to detect and monitor weather related chemical and structural changes of the
interfacial boundaries are acousto-ultrasonics and dielectric analysis. Based on the data
and findings multi-scale models that allow the prediction of wood composite specific and
climate related deterioration and alteration phenomena shall be developed.
The outcome of this study can drastically shorten the process of durability testing and
clear the way for the development and placement of new wood composites.
Proceedings of the 58th International Convention of Society of Wood Science and Technology
June 7-12, 2015 – Grand Teton National Park, Jackson, Wyoming, USA
631
What is Fire-Retardant-Treated Wood?
David G. Bueche. 1*
1 Marketing Representative, Hoover Treated Wood Products,
Thomson, GA, USA.
* Corresponding author
Introduction
August 2013, marked the 120th anniversary of the granting of US Patent 502,867 to Lina
Schuler for a ‘Fireproofing Compound.’ Max Bachert, widely acknowledged as the
father of the fire-retardant-treated wood (FRTW) industry, started pressure treating wood
with Schuler’s formula at the Electric Fireproofed Wood Company in New York during
the early 1890’s. The first commercial use of FRTW in buildings was reportedly made in
1895. From that time until the beginning of World War II, the industry was more or less
localized in the New York – New Jersey area. The tremendous military demand for
FRTW during the war expanded production nationwide.
Interest and demand for FRTW began to grow after the war as the insurance underwriting
industry started rating FRTW equivalent to steel for fire insurance nationally. This was
the result of tests conducted to emulate and evaluate the cause of the Hydra-Matic plant
fire. These full scale tests changed the perception of fire performance of building
materials by demonstrating to insurance underwriters and building and fire officials that
no building material was immune to fire damage. The outcome was the promulgation of
provisions for FRTW for use in lieu of noncombustible materials in the model codes.
As the success and demand for FRTW has grown, so have the number of products which
would like to be regarded as FRTW. This paper will serve as an aid, answering the
question “What is fire-retardant-treated wood?”
Fire, Treatment and Performance
Fire has been described as uncontrolled combustion. Combustion is defined as “a self-
sustained, high-temperature oxidation reaction.” Note that combustion does not require
flames to be present. Non-flaming combustion includes glowing and smoldering
combustion. The overall effect of combustion is an exothermic reaction. Reaction rates
increase with increasing temperature, so the energy given off in an exothermic reaction
can increase the reaction rate, resulting in the release of even more energy (heat).
Proceedings of the 58th International Convention of Society of Wood Science and Technology
June 7-12, 2015 – Grand Teton National Park, Jackson, Wyoming, USA
632
The primary effect of heat on solid fuel is to decompose or pyrolyze the solid mass into
molecules simple enough to combine directly with oxygen in a flame. Pyrolysis is the
chemical degradation of a substance by the action of heat. The gases and vapors
generated diffuse into the surrounding air, and can form a flammable mixture that can
ignite and burn. Pyrolysis does not signify ignition which is the initiation of combustion.
While most solids must be pyrolyzed to burn, exceptions are the chemical elements.
Since, by definition, an element is the simplest chemical substance, it cannot be broken
down further. Charcoal is mostly carbon with smaller proportion of hydrogen and other
elements. Elements including charcoal burn primarily by glowing combustion. In this
type of combustion, chemical reactions occur directly at the surface, resulting in a glow.
Combustion in the absence of flame is referred to as either glowing or smoldering,
depending on whether or not light is emitted. Continuous glowing is a property allowing
a product to glow after the fire exposure has been removed. Smoldering refers to fire
development in a product caused as the result of a long-term, low intensity heat exposure.
Flaming occurs earlier than glowing, progresses more rapidly, and is mainly responsible
for the rapid spread of fire. Glowing assists in maintaining the production of flames and
is the main factor contributing to the resistance of fire to extinction. Smoldering is the
heart of the fire hazard problem due to its potential for transition to flaming combustion.
There usually is a clear distinction between materials which may char under the influence
of the ignition source, but which do not propagate further (non-progressive combustion)
and those where smoldering develops in extent and spreads (progressive combustion).
How Wood Burns
As wood is heated, its temperature rises steadily according to the amount of heat applied
to the wood and its own specific heat. At approximately 100º C, there is a pause in the
temperature rise due to the rapid evaporation of the free water in the wood. Once the
water has evaporated, the temperature rises steadily and a gradual chemical change
begins, resulting in the decomposition of wood into volatile and solid constituents. This
change is slight at first and below 200º C is indicated by a slight darkening of the wood.
Around 270 to 300º C, however, the action becomes very rapid, and because it is
exothermic, the temperature rise accelerates causing the pyrolysis of wood. This process
results in burnable gases such as methane, volatile liquids such as methanol in the form of
vapors, combustible oils and resins, and a great deal of water vapor, ultimately leaving
behind a charred residue, which is primarily carbon or charcoal.
When exposed to the air and a small ignition source, the vapors ignite and the wood
begins to burn with the familiar flaming. This flaming liberates considerable quantities
of heat so that continued distillation may be independent of the external heat source, and
the fire begins to spread. The burning gases continue to heat the charcoal, and when the
flame retreats it exposes the charcoal and the air, causing it to ignite and glow, furthering
the release of large quantities of heat.
Proceedings of the 58th International Convention of Society of Wood Science and Technology
June 7-12, 2015 – Grand Teton National Park, Jackson, Wyoming, USA
633
Wood cannot ignite unless it has pyrolyzed. This can be demonstrated by heating a small
stick of wood. It has to discolor and turn dark before ignition is possible; however, the
converse is not necessarily true. A piece of wood which has pyrolyzed so much as to turn
into a black char may still never reach the right conditions for ignition. The process of
combustion of charcoal, the solid phase in the pyrolysis products of wood, is essentially
independent of the process of flaming combustion of the gaseous and liquid phases. At
temperatures of approximately 230° C, wood can be reduced to charcoal without either
flame or glow; between 230° and 465° C, wood chars and then is consumed by glow
without flame; above 465° C, wood flames until the evolution of volatile combustibles
ceases, and then glows until the charcoal is consumed.
Once heat is obtained from the burning wood, combustion may proceed without the
addition of supplemental heat. Combustion is the mechanism of the transfer of the heat
from the burning material to preheat the unburnt material which determines at what rate,
if at all, the spread of burning will proceed. Wood by nature has a low thermal
conductivity, which means the surface of a piece of wood can be heated until it bursts
into flame, but there is a limiting rate at which the heat can be transferred to the interior
of the wood. If the source of external heat is removed, the rate at which heat is radiated
and conducted from the flame through the char to the unburnt wood is dependent on local
exposure of the wood in the vicinity of the flame. Only a portion of the flame is
transmitted back to the wood, and if this portion is insufficient to heat enough wood to
maintain the supply of flammable vapors, flaming will gradually die down.
The burning of wood can occur in a primary mode, where visible flames are present from
the combustion of flammable gasses, or in a secondary mode, where flames are absent.
Flameless combustion is referred to as glowing or smoldering, depending on if light is
emitted. Smoldering combustion may occur in the charred area or consume the entire
specimen, proceeding as a front in the solid state rather than a flame in the gas phase.
Fire-Retardants
Wood cannot be treated so that it will be unaffected by heat; however, it can be treated so
that it will not flame or glow, but merely char under the influence of heat, and therefore
not assist the spread of fire. As the action is a chemical one, intimate contact of the fire
retardants with the wood is necessary; meaning the wood must be impregnated.
Given flaming combustion and glowing combustion occur at different times and by
distinctly different mechanisms, they may be expected to differ in the means by which
they are controlled. Treatments may prevent flaming but fail to retard glow and vice
versa. They must, therefore, be considered separately and are broadly classified as either
flame retardants or smoldering retardants. Flame retardants refer to chemicals added so
that the treated material will not support flaming combustion after the igniting flame is
removed. Smoldering retardants refer to chemicals which effectively prevent smoldering
combustion, which occurs after the igniting flame is removed.
Effective treatments influence the decomposition of wood under heat, increasing the yield
of water and solid charcoal at the expense of the volatile hydrocarbons responsible for
Proceedings of the 58th International Convention of Society of Wood Science and Technology
June 7-12, 2015 – Grand Teton National Park, Jackson, Wyoming, USA
634
flame. In fact, the yield of flammable volatiles is insufficient to give combustible
mixtures in air and fire-retardant-treated wood consequently does not flame. Moreover,
retardants raise the temperature at which the decomposition becomes exothermic. In
addition, the denser charcoal is so modified that it will not glow under normal conditions.
Various tests (ASTM 1993; ASTM 2007) consistently demonstrate that FRTW will be
self-extinguishing of both flaming and glowing once the primary source of heat and fire
is removed or exhausted. FRTW alone will not continue to burn unaided.
Performance of Materials in Fire
All building materials have their own peculiar properties when exposed to conditions of
severe heat: wood burns, metals melt, and concrete crumbles. Heavy timber members
burn slowly because of their size and can be exposed to a prolonged fire and still support
their load. In the case of smaller members, structural failure is gradual as cross sectional
areas are reduced in size.
Metal building materials are not combustible, yet they are subject to collapse in the early
stages of a fire. As temperatures rise, steel loses strength rapidly and begins to weaken
between 320º and 425º C. It does not take long to reach these moderate temperatures in a
fire. Additionally, steel readily expands under the influence of heat. Often, this
expansion pulls the building walls, floors, and roof down without warning.
At one time, roof assemblies were assumed to be fire safe if the deck and supports were
constructed of metal, particularly when the fire hazard of the building’s contents were
considered low to moderate. This type of roof construction was classed as “non-
combustible” even though the vapor barrier, insulation and roofing were combustible.
These assumptions were challenged on August 12, 1953, when a flash fire at the General
Motors Hydra-Matic Transmission Plant in Livonia, MI, swept with lightning speed
through the entire factory. The fire started at the floor level. The heat from the fire rose
to the underside of the roof, heating the steel deck. The roofing materials began
pyrolyzing, releasing combustible vapors that flowed under the roof covering entering the
building through the seams in the steel deck. These vapors ignited and, within half an
hour, began propagating an intense fire under the roof deck and inside the building. In
only a few minutes, this 34-acre building, constructed entirely of noncombustible
materials, collapsed completely, destroying both the building, and all of its contents.
By contrast, only 2 years later in the summer of 1955, a fire started in an exhaust duct of
a plywood mill in Tillamook, OR. The fire swept both upward and downward over the
roofing material on the outside of the building, stimulated by a strong wind (Anon 1956).
This structure was one of the 17 large wood hangars constructed during World War II by
the US Navy to house blimps used to patrol both coasts against attack by submarines.
These 1,000 feet long, 170 feet high, by 296 feet wide structures were constructed of
FRTW heavy timber wood arch trusses (Anon 1943; Smith 1944).
Altogether, this fire burned over 40,000 square feet of roofing, or about one-tenth of the
roof area. Approximately 3,000 square feet of 2-inch roof planking was charred through,
Proceedings of the 58th International Convention of Society of Wood Science and Technology
June 7-12, 2015 – Grand Teton National Park, Jackson, Wyoming, USA
635
and eventually about 15,000 square feet of the planking was replaced. No structural
damage occurred to the rafters, purlins, bracing, or other parts, despite the fact that the
flames swept through a charred hole in the roof (Anon 1956).
Realizing they weren't protected against major loss, even though noncombustible
construction materials cannot burn, many fire insurance companies sought a performance
standard for all types of materials. Companies supporting Factory Mutual Engineering
Services asked for full-scale testing of materials.
Full-Scale Testing
Beginning in 1953, Factory Mutual Engineering Division (FMED 1955) developed what
is referred to as the ‘White House’ test, a full-scale procedure developed to replicate the
disastrous Hydra-Matic fire. Engineers designed the test to determine why the fire
progressed so quickly below the roof assembly that had a noncombustible surface.
Original testing evaluated similar, if not identical, materials to the Hydra-Matic building.
The test structure was a 100 feet long by 20 feet wide, and subjected the exposed
underside of a roof construction to a standard ignition source duplicating the ASTM E119
time temperature curve in the first 20 feet of the structure. The edges of the roof were
sealed tightly to prevent pyrolysis vapors from venting prematurely. This made it
possible to replicate a real-world fire exposure for most large commercial and industrial
buildings, revealing more information about how fires grow and propagate.
The fire tests were divided into two parallel tests using identical test samples each time.
A full-scale test was made to provide information indicative of the performance of the
flat steel roof deck construction with various combustible materials on the upper surface.
The principle purposes of this test were to determine the extent these combustible
materials contributed to the spread of the fire, the smoke inside the building, and the
building collapse. These large scale tests used a structure designed and constructed to be
representative of a portion of a steel frame metal roof deck type of building incorporating
the extent of restraint of structural members as in actual buildings. Tests (Thompson and
Cousins 1959) were also made with identical samples in the small-scale FM Construction
Material Calorimeter in order to correlate full-scale tests with the small-scale tests.
Based on the performance of fire retardant treated wood in the Tillamook fire, Thomson
(1957) conducted a full-scale test at Factory Mutual Engineering to determine if “fire
retardant type” lumber on the large roof deck structure would qualify as Class I. Class I,
by definition, is a metal roof deck construction with no greater rate of heat contribution
within a building than would be obtained from a deck consisting of plain vegetable fiber
insulation, mechanically fastened to a steel deck, with no asphalt or other combustible
adhesive between. Constructions of greater heat contribution are considered as Class II
and generally require protection by automatic sprinklers.
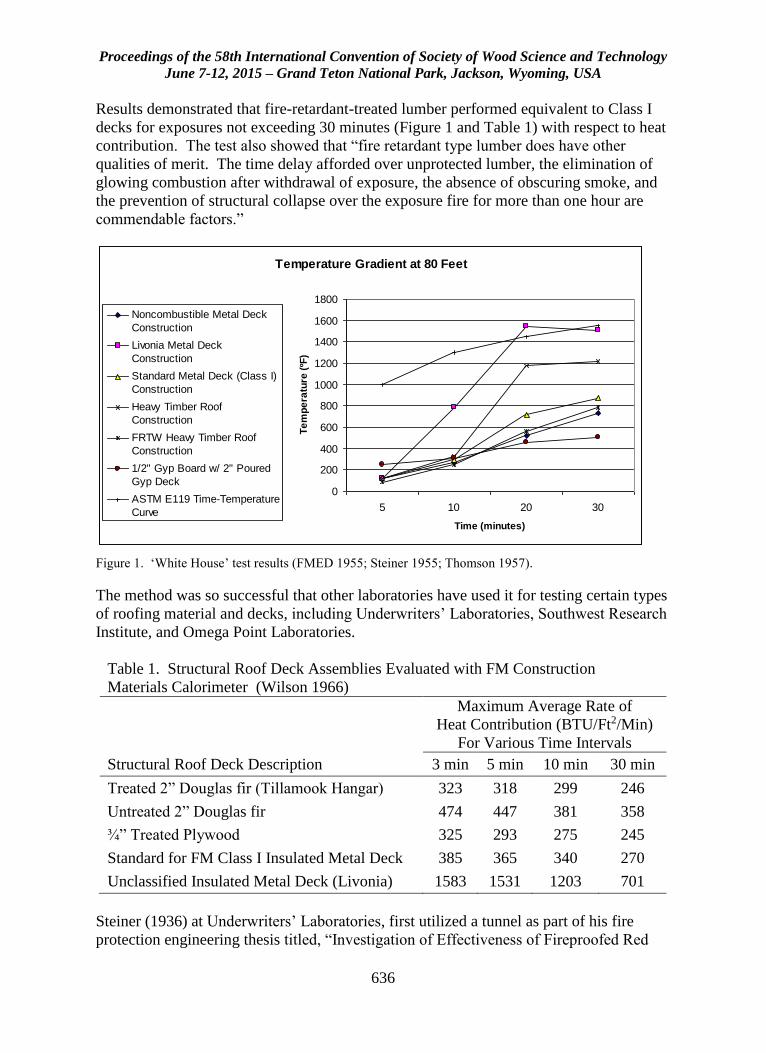
Proceedings of the 58th International Convention of Society of Wood Science and Technology
June 7-12, 2015 – Grand Teton National Park, Jackson, Wyoming, USA
636
Results demonstrated that fire-retardant-treated lumber performed equivalent to Class I
decks for exposures not exceeding 30 minutes (Figure 1 and Table 1) with respect to heat
contribution. The test also showed that “fire retardant type lumber does have other
qualities of merit. The time delay afforded over unprotected lumber, the elimination of
glowing combustion after withdrawal of exposure, the absence of obscuring smoke, and
the prevention of structural collapse over the exposure fire for more than one hour are
commendable factors.”
Figure 1. ‘White House’ test results (FMED 1955; Steiner 1955; Thomson 1957).
The method was so successful that other laboratories have used it for testing certain types
of roofing material and decks, including Underwriters’ Laboratories, Southwest Research
Institute, and Omega Point Laboratories.
Table 1. Structural Roof Deck Assemblies Evaluated with FM Construction
Materials Calorimeter (Wilson 1966)
Maximum Average Rate of
Heat Contribution (BTU/Ft2/Min)
For Various Time Intervals
Structural Roof Deck Description 3 min 5 min 10 min 30 min
Treated 2” Douglas fir (Tillamook Hangar) 323 318 299 246
Untreated 2” Douglas fir 474 447 381 358
¾” Treated Plywood 325 293 275 245
Standard for FM Class I Insulated Metal Deck 385 365 340 270
Unclassified Insulated Metal Deck (Livonia) 1583 1531 1203 701
Steiner (1936) at Underwriters’ Laboratories, first utilized a tunnel as part of his fire
protection engineering thesis titled, “Investigation of Effectiveness of Fireproofed Red
Temperature Gradient at 80 Feet
0
200
400
600
800
1000
1200
1400
1600
1800
5 10 20 30
Time (minutes)
Te
mp
era
ture
(ºF
)Noncombustible Metal Deck
Construction
Livonia Metal Deck
Construction
Standard Metal Deck (Class I)
Construction
Heavy Timber Roof
Construction
FRTW Heavy Timber Roof
Construction
1/2" Gyp Board w/ 2" Poured
Gyp Deck
ASTM E119 Time-Temperature
Curve
Proceedings of the 58th International Convention of Society of Wood Science and Technology
June 7-12, 2015 – Grand Teton National Park, Jackson, Wyoming, USA
637
Oak and Maple Lumber.” Later Steiner (1943; 1944) adapted his tunnel for measuring
and classifying the fire hazard of building materials including the classification of
chemically impregnated lumber and plywood to reduce fire hazard. This tunnel has
become the best known and most widely used large-scale test for classifying the burning
characteristics of building materials with a 10 minute test duration (ASTM 2015).
Steiner (1955), again at Underwriters’ Laboratories, utilized the full-scale ‘White House’
test structure to evaluate roof deck constructions. Steiner found that the results of tests in
the full-scale structure conducted at UL, in addition to the full-scale tests conducted at
Factory Mutual, correlated well with performance in the tunnel. As a result, UL began
listing ‘Fire Investigated,’ UL’s version of Class I roof constructions, in 1957 using the
Steiner Tunnel. Two of the first listings were for chemically impregnated wood, i.e.
NM501 for ¾ in. fire-retardant-treated plywood roof decks and NM502 for 1 inch fire-
retardant treated lumber roof decks. The test method was later standardized and
published by Underwriters’ Laboratories as UL 1256 (2013) and ULC S126 (2014).
These tests at Underwriters’ and Associated Factory Mutual Laboratories conducted for
their affiliated fire insurance organizations assisted in setting insurance rates for the use
of wood in construction. At the request of several insurance rating bureaus, UL wrote a
performance standard for FRTW with required test method and conditions of acceptance.
It covers wood products that are impregnated (filled or permeated thoroughly) by either
pressure treating after the product has been manufactured or mixing intimately with the
wood during manufacture of the product as discussed by McDonald (1970).
This new performance standard for FRTW prompted the testing of two full-scale ‘White
House, tests in 1963 to validate performance of ¾ inch fire-retardant-treated plywood and
1 inch fire-retardant-treated lumber roof decks in the 20-ft wide by100-ft long test
structure (Malcomson 1964). Performance in the full-scale ‘White House’ test once
again substantiated the results in the tunnel, and as a result, the 30-minute ASTM E84
test is now referenced for FRTW in all the current model building codes. This increase in
exposure to 30 minutes for FRTW in the ASTM E84 apparatus and labeling by UL
(Malcomson and Bono 1967), enabled it to be differentiated from other building
materials that obtain only a ‘flame spread rating’ in the 10 minute test.
Summary
For more than 120 years the wood preserving industry has produced wood pressure
impregnated with fire retardant salts to enhance its performance in fire. FRTW does not
support combustion and there is no significant glowing after flames are removed. Also,
fire-retardant treatments substantially reduce the combustion rate of wood while limiting
flame spread. One of the most important aspects to remember is this: Pressure
impregnated fire-retardant-treated plywood was developed as an alternative to metal roof
decks and has demonstrated equivalency to steel in fire tests based on fire experience
under actual fire conditions; it is given comparable insurance rates, and FRTW roof
Proceedings of the 58th International Convention of Society of Wood Science and Technology
June 7-12, 2015 – Grand Teton National Park, Jackson, Wyoming, USA
638
systems are suitable for the same uses. Conversely, products which claim to be the same
as fire-retardant-treated plywood have not been tested in the full scale test and their
performance has not been evaluated in comparison to the Fire Classified unprotected
metal deck.
References
Anon (1943) Fireproof lumber construction by U.S. Navy (1943). Wood Preserving
News, May, 54-57.
Anon (1956) Everybody said: ‘There she goes!’ But she didn’t. Wood Preserving News,
May, 6-9.
ASTM (1993) E60-80 Test method for combustible properties of treated wood by the crib
test. American Society for Testing and Materials, West Conshohocken, PA.
ASTM (2007) E69-02 Standard test method for combustible properties of treated wood
by the fire-tube apparatus. American Society for Testing and Materials, West
Conshohocken, PA.
ASTM (2014) E119-14 Standard test methods for fire tests of building construction and
materials. American Society for Testing and Materials, West Conshohocken, PA.
ASTM (2015) E84-15 Standard test method for surface burning characteristics of
building materials. American Society for Testing and Materials, West Conshohocken,
PA.
FMED (1955) Insulated metal roof deck fire tests. Factory Mutual Engineering Division,
Associated Factory Mutual Fire Insurance Companies, Norwood, MA.
McDonald CE (1970) Fire retardant hardwood plywood. Wood Preserving News, April,
6- 9, 12, 14 & 15.
Malcomson RW (1964) Report on roof deck construction NM-501 (File R4859,
Assignment 63K3955). Underwriters’ Laboratories, Chicago, IL.
Malcomson RW Bono JA (1967) Underwriters’ Laboratories, Inc. Issues new labels for
FRTW. Wood Preserving News, September, 24-25 & 27.
Smith WH (1944) Fireproofed wood for airship hangars. Proceedings of the American
Wood Preservers Association, 40, 17-24.
Steiner AJ (1936) Investigation of effectiveness of fireproofed red oak and maple lumber.
MS Thesis, Armour Institute of Technology, Chicago, IL.
Proceedings of the 58th International Convention of Society of Wood Science and Technology
June 7-12, 2015 – Grand Teton National Park, Jackson, Wyoming, USA
639
Steiner AJ (1943) Report on fire hazard classification of Douglas fir and southern yellow
pine impregnated with chromated zinc chloride (CZC) (Retardant 2755, Application
No. 41C1373). Underwriters’ Laboratories, Chicago, IL.
Steiner, A. J. (1944) Fire hazard classification of building materials. UL Bulletin of
Research Number 32. Underwriters’ Laboratories, Chicago, IL.
Steiner AJ (1955) Summary of comparative fire performance of two types of roof deck
constructions (File R3796, Assignment 54C6305). Underwriters’ Laboratories,
Chicago, IL..
Thompson NJ (1957) Examination of Protexol fire retardant lumber on 100 ft x 20 ft test
structure (Laboratory Report No. 13159-924). Norwood, MA: Factory Mutual
Engineering Division Factory Mutual Laboratories.
Thompson NJ Cousins EW (1959) The FM construction materials calorimeter. NFPA
Quarterly, 52(3), 186-192.
UL (2013) 1256 Standard for fire test of roof deck constructions. UL, Northbrook, IL.
ULC (2014) S126 Standard method of test for fire spread under roof-deck assemblies.
Underwriters’ Laboratories of Canada, Toronto, Ontario Canada.
Wilson JA (1966) Fire retardant treated lumber and the FM construction materials
calorimeter. Proceedings of the American Wood Preservers Association, 62, 205-212.
Proceedings of the 58th International Convention of Society of Wood Science and Technology
June 7-12, 2015 – Grand Teton National Park, Jackson, Wyoming, USA
640
Fungal Pretreatment of Genetically Modified Black
Cottonwood - Merging Novel Low-Input Fungal
Pretreatment with Next-Generation Lignocellulosic
Feedstocks
Charles Edmunds, [email protected]
Vincent Chiang, [email protected]
Ratna Sharma-Shivappa, [email protected]
Perry Peralta, [email protected]
Ilona Peszlen, impeszle
North Carolina State University, 2820 Faucette Blvd, Raleigh, NC 27695
Abstract
Rising demands for liquid fuels and the finite supply of petroleum resources drives
research for biofuels and biochemicals. Pretreatment steps are required to open the
structure of lignocellulosic biomass and reduce its recalcitrance prior to further
processing. Fungal pretreatment has the potential to become a low-cost and
environmentally-friendly method of pretreatment that can displace current pretreatment
methods which utilize high temperatures, harsh chemical, and high energy input. Under
investigation is wood specimens from the species Populus trichocarpa which have
undergone several modification to individual and groups of genes regulating lignin
biosynthesis, yielding wood with unique properties. Little is known about how genetic
modifications to the lignin biosynthetic pathway will influence fungal degradation.
Wood with reduced or altered lignin could enhance the effectiveness of fungal
pretreatment and benefit the biofuels/biochemicals and pulping industries by reducing
chemical and energy requirements, thus increasing processing efficiency and decreasing
the environmental impact. In this study, genetically modified P. trichocarpa was
subjected to the white-rot fungus Ceriporiopsis subvermispora for 30 days. After the
pretreatment period, the weight loss, changes to cell wall carbohydrates, lignin content
and structure, and enzymatic hydrolysis were measured.
Proceedings of the 58th International Convention of Society of Wood Science and Technology
June 7-12, 2015 – Grand Teton National Park, Jackson, Wyoming, USA
641
Understanding Decay Resistance, Dimensional Stability
and Strength Changes Acetylated Wood
Roger M. Rowell
Professor Emeritus, University of Wisconsin, Madison, WI, USA and Guest Professor, EcoBuild, Stockholm, Sweden [email protected]
Abstract
The reaction of wood with acetic anhydride has been studies since the late 1920’s. The
acetylated wood is known to have greatly reduces hygroscopicity,improved dimensional
stability and decay resistance due to the esterification of the accessible hydroxyl groups
in the cell wall polymers. The bonded acetyl reduce hydrogen bonding with water and
bulk the cell wall back to its original green volume. Both the sorption of primary and
secondary water are reduced. Dimensional stability is not 100% since the water molecule
is smaller than the acetyl group so water can access hydroxyl sites even when the wood is
fully acetylated. The equilibrium moisture content is reduced in a linear relationship to
the level of acetyl content. This means that the reduction in moisture content is not
dependent on where the acetylation reaction takes place in the cell wall. The reduction of
moisture sorption reduces the sorption and desorption of environmental gasses such as
formaldehyde. There is a greater difference in the sorption-desorption isotherm
(hysteresis) in acetylated wood as compared to non-acetylated wood. This may be due to
the increased time it takes for moisture to sorb into the acetylated cell wall. Resistance to
fungal attack increases as the level of acetylation increases. The level of acetyl needed to
stop white-rot fungal attack (7 – 10%) is much lower than that needed to stop brown-rot
fungal attack (17 – 19%). The mechanism of brown-rot fungal attack is not completely
understood but it may be that the cell wall moisture content is too low at high levels of
acetylation to support fungal growth so the initial colonization does not take place. The
increase in fungal resistance, however, is not linear with the increase in acetyl content
indicating that fungal resistance is due to more than one type of hydroxyl substitution.
Strength properties are not significantly changed in acetylated wood and acetylation
results in greatly improved wet strength and wet stiffness properties. Wet stiffness in
non-acetylated wood is greatly reduced due to the low Tg of the cell wall hemicelluloses.
Key Words: Acetylation, acetyl content, brown-rot fungus, white-rot fungus,
equilibrium moisture content, sorption isotherm, dimensional stability, sugar analysis, Tg,
wet and dry strength and stiffness, wood.
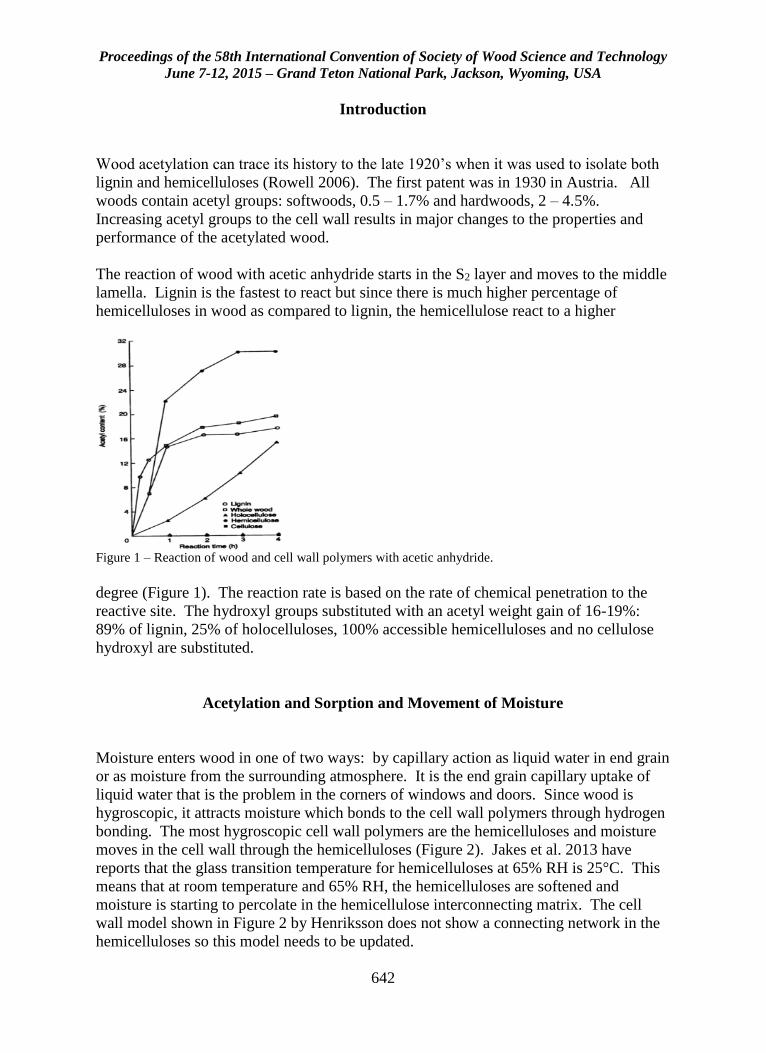
Proceedings of the 58th International Convention of Society of Wood Science and Technology
June 7-12, 2015 – Grand Teton National Park, Jackson, Wyoming, USA
642
Introduction
Wood acetylation can trace its history to the late 1920’s when it was used to isolate both
lignin and hemicelluloses (Rowell 2006). The first patent was in 1930 in Austria. All
woods contain acetyl groups: softwoods, 0.5 – 1.7% and hardwoods, 2 – 4.5%.
Increasing acetyl groups to the cell wall results in major changes to the properties and
performance of the acetylated wood.
The reaction of wood with acetic anhydride starts in the S2 layer and moves to the middle
lamella. Lignin is the fastest to react but since there is much higher percentage of
hemicelluloses in wood as compared to lignin, the hemicellulose react to a higher
Figure 1 – Reaction of wood and cell wall polymers with acetic anhydride.
degree (Figure 1). The reaction rate is based on the rate of chemical penetration to the
reactive site. The hydroxyl groups substituted with an acetyl weight gain of 16-19%:
89% of lignin, 25% of holocelluloses, 100% accessible hemicelluloses and no cellulose
hydroxyl are substituted.
Acetylation and Sorption and Movement of Moisture
Moisture enters wood in one of two ways: by capillary action as liquid water in end grain
or as moisture from the surrounding atmosphere. It is the end grain capillary uptake of
liquid water that is the problem in the corners of windows and doors. Since wood is
hygroscopic, it attracts moisture which bonds to the cell wall polymers through hydrogen
bonding. The most hygroscopic cell wall polymers are the hemicelluloses and moisture
moves in the cell wall through the hemicelluloses (Figure 2). Jakes et al. 2013 have
reports that the glass transition temperature for hemicelluloses at 65% RH is 25°C. This
means that at room temperature and 65% RH, the hemicelluloses are softened and
moisture is starting to percolate in the hemicellulose interconnecting matrix. The cell
wall model shown in Figure 2 by Henriksson does not show a connecting network in the
hemicelluloses so this model needs to be updated.
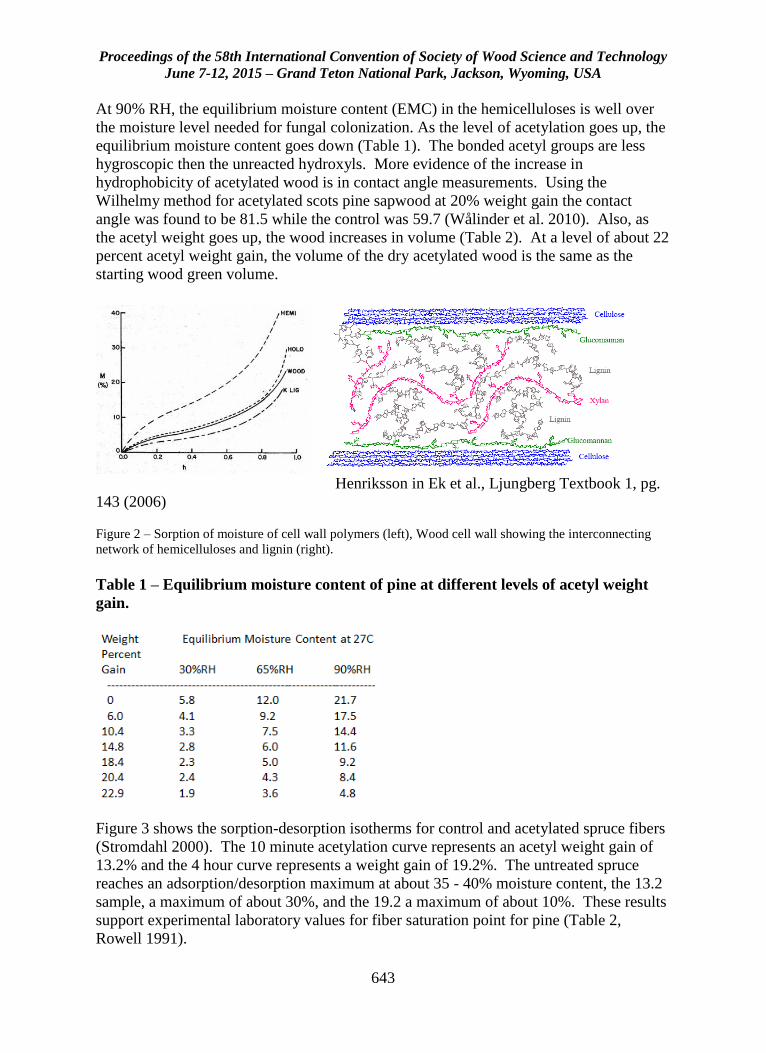
Proceedings of the 58th International Convention of Society of Wood Science and Technology
June 7-12, 2015 – Grand Teton National Park, Jackson, Wyoming, USA
643
At 90% RH, the equilibrium moisture content (EMC) in the hemicelluloses is well over
the moisture level needed for fungal colonization. As the level of acetylation goes up, the
equilibrium moisture content goes down (Table 1). The bonded acetyl groups are less
hygroscopic then the unreacted hydroxyls. More evidence of the increase in
hydrophobicity of acetylated wood is in contact angle measurements. Using the
Wilhelmy method for acetylated scots pine sapwood at 20% weight gain the contact
angle was found to be 81.5 while the control was 59.7 (Wålinder et al. 2010). Also, as
the acetyl weight goes up, the wood increases in volume (Table 2). At a level of about 22
percent acetyl weight gain, the volume of the dry acetylated wood is the same as the
starting wood green volume.
Henriksson in Ek et al., Ljungberg Textbook 1, pg.
143 (2006)
Figure 2 – Sorption of moisture of cell wall polymers (left), Wood cell wall showing the interconnecting
network of hemicelluloses and lignin (right).
Table 1 – Equilibrium moisture content of pine at different levels of acetyl weight
gain.
Figure 3 shows the sorption-desorption isotherms for control and acetylated spruce fibers
(Stromdahl 2000). The 10 minute acetylation curve represents an acetyl weight gain of
13.2% and the 4 hour curve represents a weight gain of 19.2%. The untreated spruce
reaches an adsorption/desorption maximum at about 35 - 40% moisture content, the 13.2
sample, a maximum of about 30%, and the 19.2 a maximum of about 10%. These results
support experimental laboratory values for fiber saturation point for pine (Table 2,
Rowell 1991).
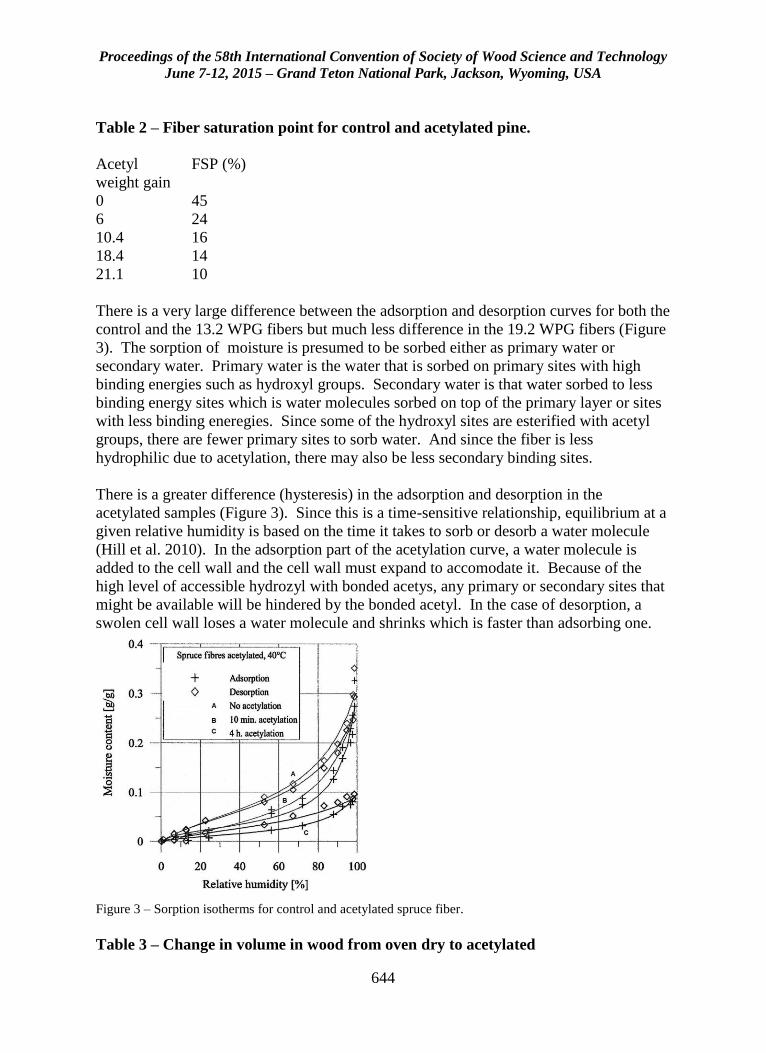
Proceedings of the 58th International Convention of Society of Wood Science and Technology
June 7-12, 2015 – Grand Teton National Park, Jackson, Wyoming, USA
644
Table 2 – Fiber saturation point for control and acetylated pine.
Acetyl FSP (%)
weight gain
0 45
6 24
10.4 16
18.4 14
21.1 10
There is a very large difference between the adsorption and desorption curves for both the
control and the 13.2 WPG fibers but much less difference in the 19.2 WPG fibers (Figure
3). The sorption of moisture is presumed to be sorbed either as primary water or
secondary water. Primary water is the water that is sorbed on primary sites with high
binding energies such as hydroxyl groups. Secondary water is that water sorbed to less
binding energy sites which is water molecules sorbed on top of the primary layer or sites
with less binding eneregies. Since some of the hydroxyl sites are esterified with acetyl
groups, there are fewer primary sites to sorb water. And since the fiber is less
hydrophilic due to acetylation, there may also be less secondary binding sites.
There is a greater difference (hysteresis) in the adsorption and desorption in the
acetylated samples (Figure 3). Since this is a time-sensitive relationship, equilibrium at a
given relative humidity is based on the time it takes to sorb or desorb a water molecule
(Hill et al. 2010). In the adsorption part of the acetylation curve, a water molecule is
added to the cell wall and the cell wall must expand to accomodate it. Because of the
high level of accessible hydrozyl with bonded acetys, any primary or secondary sites that
might be available will be hindered by the bonded acetyl. In the case of desorption, a
swolen cell wall loses a water molecule and shrinks which is faster than adsorbing one.
Figure 3 – Sorption isotherms for control and acetylated spruce fiber.
Table 3 – Change in volume in wood from oven dry to acetylated
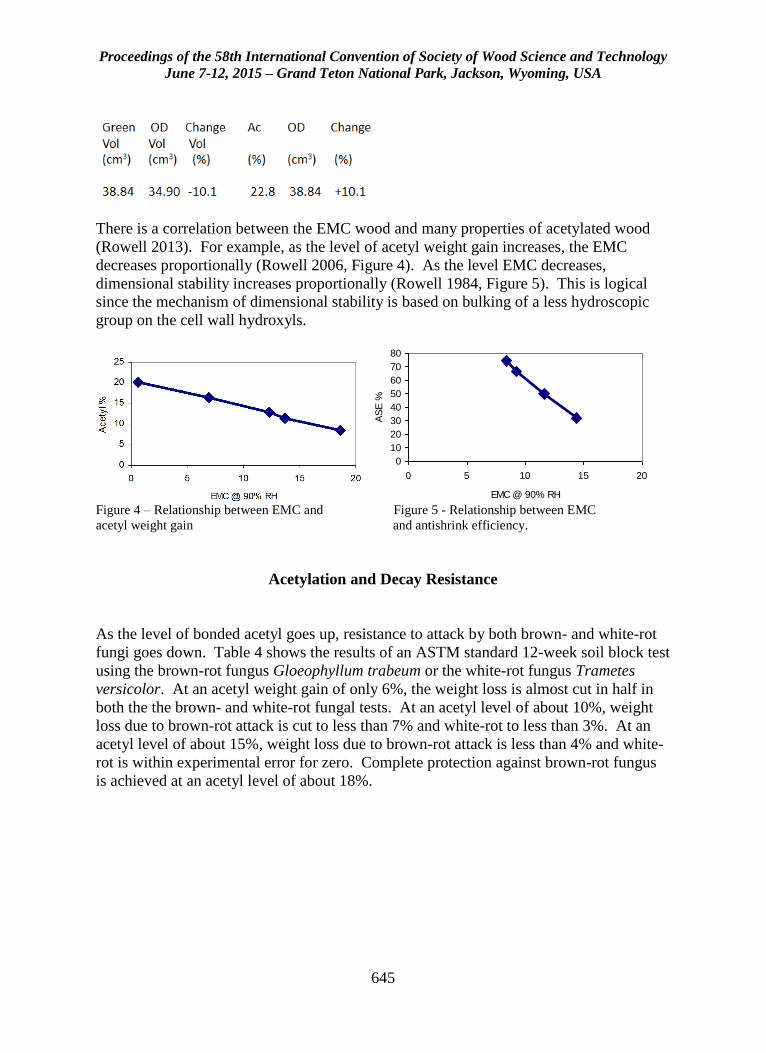
Proceedings of the 58th International Convention of Society of Wood Science and Technology
June 7-12, 2015 – Grand Teton National Park, Jackson, Wyoming, USA
645
There is a correlation between the EMC wood and many properties of acetylated wood
(Rowell 2013). For example, as the level of acetyl weight gain increases, the EMC
decreases proportionally (Rowell 2006, Figure 4). As the level EMC decreases,
dimensional stability increases proportionally (Rowell 1984, Figure 5). This is logical
since the mechanism of dimensional stability is based on bulking of a less hydroscopic
group on the cell wall hydroxyls.
0
10
20
30
40
50
60
70
80
0 5 10 15 20
EMC @ 90% RH
AS
E %
Figure 4 – Relationship between EMC and Figure 5 - Relationship between EMC
acetyl weight gain and antishrink efficiency.
Acetylation and Decay Resistance
As the level of bonded acetyl goes up, resistance to attack by both brown- and white-rot
fungi goes down. Table 4 shows the results of an ASTM standard 12-week soil block test
using the brown-rot fungus Gloeophyllum trabeum or the white-rot fungus Trametes
versicolor. At an acetyl weight gain of only 6%, the weight loss is almost cut in half in
both the the brown- and white-rot fungal tests. At an acetyl level of about 10%, weight
loss due to brown-rot attack is cut to less than 7% and white-rot to less than 3%. At an
acetyl level of about 15%, weight loss due to brown-rot attack is less than 4% and white-
rot is within experimental error for zero. Complete protection against brown-rot fungus
is achieved at an acetyl level of about 18%.
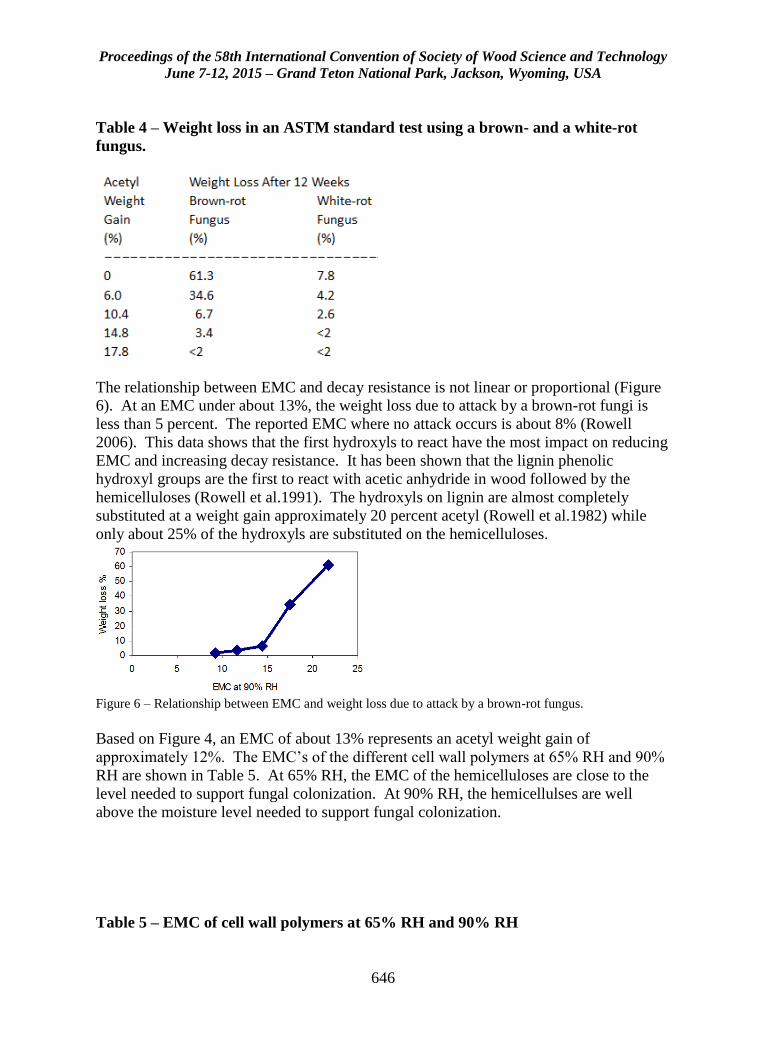
Proceedings of the 58th International Convention of Society of Wood Science and Technology
June 7-12, 2015 – Grand Teton National Park, Jackson, Wyoming, USA
646
Table 4 – Weight loss in an ASTM standard test using a brown- and a white-rot
fungus.
The relationship between EMC and decay resistance is not linear or proportional (Figure
6). At an EMC under about 13%, the weight loss due to attack by a brown-rot fungi is
less than 5 percent. The reported EMC where no attack occurs is about 8% (Rowell
2006). This data shows that the first hydroxyls to react have the most impact on reducing
EMC and increasing decay resistance. It has been shown that the lignin phenolic
hydroxyl groups are the first to react with acetic anhydride in wood followed by the
hemicelluloses (Rowell et al.1991). The hydroxyls on lignin are almost completely
substituted at a weight gain approximately 20 percent acetyl (Rowell et al.1982) while
only about 25% of the hydroxyls are substituted on the hemicelluloses.
Figure 6 – Relationship between EMC and weight loss due to attack by a brown-rot fungus.
Based on Figure 4, an EMC of about 13% represents an acetyl weight gain of
approximately 12%. The EMC’s of the different cell wall polymers at 65% RH and 90%
RH are shown in Table 5. At 65% RH, the EMC of the hemicelluloses are close to the
level needed to support fungal colonization. At 90% RH, the hemicellulses are well
above the moisture level needed to support fungal colonization.
Table 5 – EMC of cell wall polymers at 65% RH and 90% RH
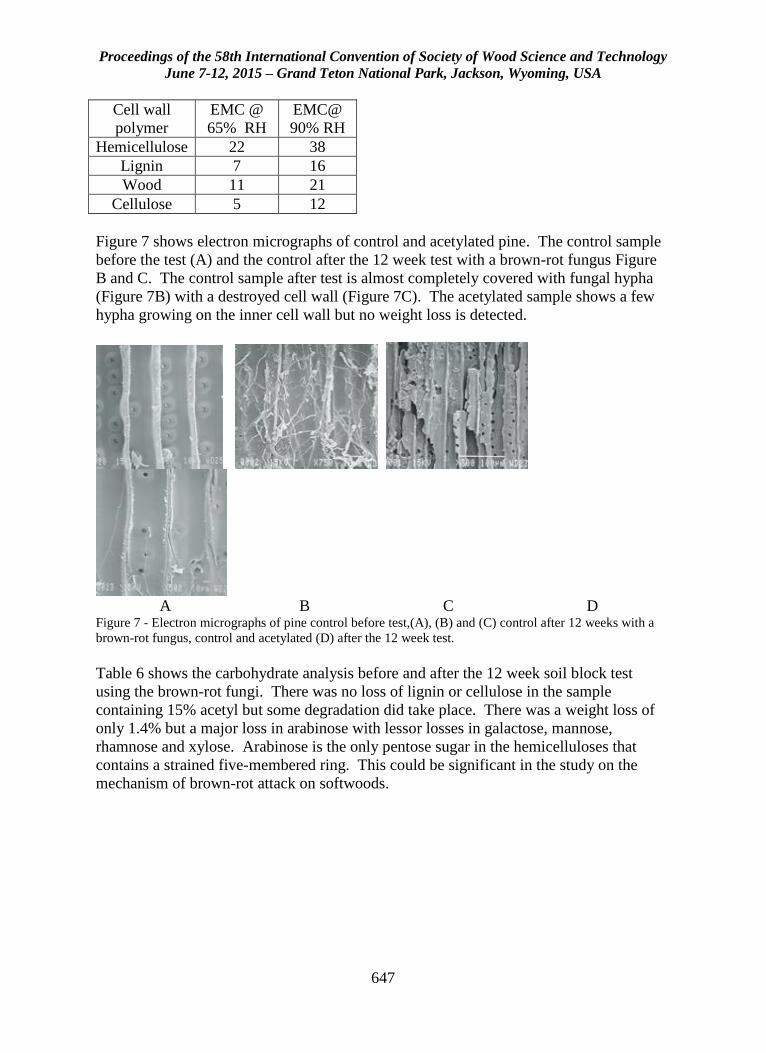
Proceedings of the 58th International Convention of Society of Wood Science and Technology
June 7-12, 2015 – Grand Teton National Park, Jackson, Wyoming, USA
647
Cell wall
polymer
EMC @
65% RH
EMC@
90% RH
Hemicellulose 22 38
Lignin 7 16
Wood 11 21
Cellulose 5 12
Figure 7 shows electron micrographs of control and acetylated pine. The control sample
before the test (A) and the control after the 12 week test with a brown-rot fungus Figure
B and C. The control sample after test is almost completely covered with fungal hypha
(Figure 7B) with a destroyed cell wall (Figure 7C). The acetylated sample shows a few
hypha growing on the inner cell wall but no weight loss is detected.
A B C D Figure 7 - Electron micrographs of pine control before test,(A), (B) and (C) control after 12 weeks with a
brown-rot fungus, control and acetylated (D) after the 12 week test.
Table 6 shows the carbohydrate analysis before and after the 12 week soil block test
using the brown-rot fungi. There was no loss of lignin or cellulose in the sample
containing 15% acetyl but some degradation did take place. There was a weight loss of
only 1.4% but a major loss in arabinose with lessor losses in galactose, mannose,
rhamnose and xylose. Arabinose is the only pentose sugar in the hemicelluloses that
contains a strained five-membered ring. This could be significant in the study on the
mechanism of brown-rot attack on softwoods.
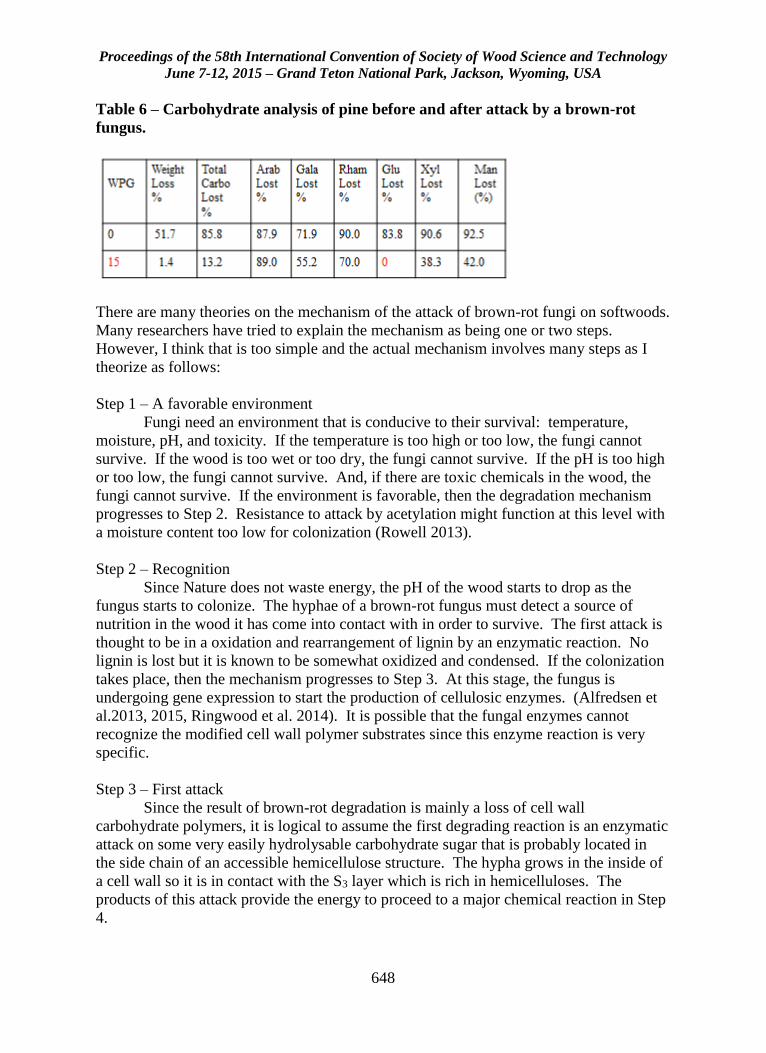
Proceedings of the 58th International Convention of Society of Wood Science and Technology
June 7-12, 2015 – Grand Teton National Park, Jackson, Wyoming, USA
648
Table 6 – Carbohydrate analysis of pine before and after attack by a brown-rot
fungus.
There are many theories on the mechanism of the attack of brown-rot fungi on softwoods.
Many researchers have tried to explain the mechanism as being one or two steps.
However, I think that is too simple and the actual mechanism involves many steps as I
theorize as follows:
Step 1 – A favorable environment
Fungi need an environment that is conducive to their survival: temperature,
moisture, pH, and toxicity. If the temperature is too high or too low, the fungi cannot
survive. If the wood is too wet or too dry, the fungi cannot survive. If the pH is too high
or too low, the fungi cannot survive. And, if there are toxic chemicals in the wood, the
fungi cannot survive. If the environment is favorable, then the degradation mechanism
progresses to Step 2. Resistance to attack by acetylation might function at this level with
a moisture content too low for colonization (Rowell 2013).
Step 2 – Recognition
Since Nature does not waste energy, the pH of the wood starts to drop as the
fungus starts to colonize. The hyphae of a brown-rot fungus must detect a source of
nutrition in the wood it has come into contact with in order to survive. The first attack is
thought to be in a oxidation and rearrangement of lignin by an enzymatic reaction. No
lignin is lost but it is known to be somewhat oxidized and condensed. If the colonization
takes place, then the mechanism progresses to Step 3. At this stage, the fungus is
undergoing gene expression to start the production of cellulosic enzymes. (Alfredsen et
al.2013, 2015, Ringwood et al. 2014). It is possible that the fungal enzymes cannot
recognize the modified cell wall polymer substrates since this enzyme reaction is very
specific.
Step 3 – First attack
Since the result of brown-rot degradation is mainly a loss of cell wall
carbohydrate polymers, it is logical to assume the first degrading reaction is an enzymatic
attack on some very easily hydrolysable carbohydrate sugar that is probably located in
the side chain of an accessible hemicellulose structure. The hypha grows in the inside of
a cell wall so it is in contact with the S3 layer which is rich in hemicelluloses. The
products of this attack provide the energy to proceed to a major chemical reaction in Step
4.
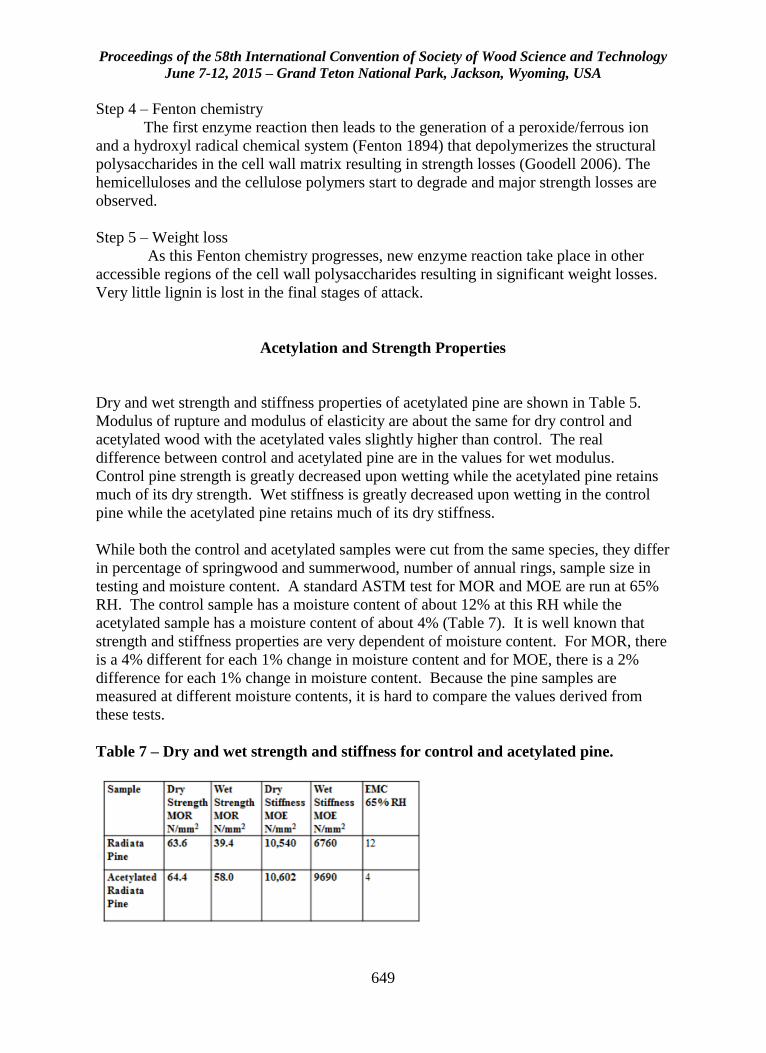
Proceedings of the 58th International Convention of Society of Wood Science and Technology
June 7-12, 2015 – Grand Teton National Park, Jackson, Wyoming, USA
649
Step 4 – Fenton chemistry
The first enzyme reaction then leads to the generation of a peroxide/ferrous ion
and a hydroxyl radical chemical system (Fenton 1894) that depolymerizes the structural
polysaccharides in the cell wall matrix resulting in strength losses (Goodell 2006). The
hemicelluloses and the cellulose polymers start to degrade and major strength losses are
observed.
Step 5 – Weight loss
As this Fenton chemistry progresses, new enzyme reaction take place in other
accessible regions of the cell wall polysaccharides resulting in significant weight losses.
Very little lignin is lost in the final stages of attack.
Acetylation and Strength Properties
Dry and wet strength and stiffness properties of acetylated pine are shown in Table 5.
Modulus of rupture and modulus of elasticity are about the same for dry control and
acetylated wood with the acetylated vales slightly higher than control. The real
difference between control and acetylated pine are in the values for wet modulus.
Control pine strength is greatly decreased upon wetting while the acetylated pine retains
much of its dry strength. Wet stiffness is greatly decreased upon wetting in the control
pine while the acetylated pine retains much of its dry stiffness.
While both the control and acetylated samples were cut from the same species, they differ
in percentage of springwood and summerwood, number of annual rings, sample size in
testing and moisture content. A standard ASTM test for MOR and MOE are run at 65%
RH. The control sample has a moisture content of about 12% at this RH while the
acetylated sample has a moisture content of about 4% (Table 7). It is well known that
strength and stiffness properties are very dependent of moisture content. For MOR, there
is a 4% different for each 1% change in moisture content and for MOE, there is a 2%
difference for each 1% change in moisture content. Because the pine samples are
measured at different moisture contents, it is hard to compare the values derived from
these tests.
Table 7 – Dry and wet strength and stiffness for control and acetylated pine.
Proceedings of the 58th International Convention of Society of Wood Science and Technology
June 7-12, 2015 – Grand Teton National Park, Jackson, Wyoming, USA
650
Conclusions
Wood acetylated to approximately 20% acetyl weight gain show a large reduction in cell
wall moisture content due to the bonding of a much less hygroscopic acetyl group
replacing a hydroxyl group. The increase in dimensional stability is due to the cell wall
bulking of the dry bonded acetyl groups and bulking the cell wall back to its original
green volume. Since the elastic limit of the cell is not exceeded during the acetylation
process, no cell was structural damage is done. The mechanism of decay resistance of
acetylated wood is not clear but several possible mechanisms have been suggested. It
may be that the cell wall polymers have such a low moisture content, the first specific
enzyme reaction does not take place. A water molecule is necessary at a glyosidic bond
for it to be hydrolyzed. There is very difference in dry strength and stillness in both
control and acetylated pine, however, there are major differences in wet strength and
stiffness with the acetylated pine retaining much of its dry strength and stiffness. The
difference in moisture content of the test specimens under the test conditions make it
difficult to compare the test values
References
Alfredsen, G., Flæte, P. O. and Militz, H. (2013). Decay resistance of acetic anhydride
modified wood – a review. Int. Wood Prod. J., 4, 137–43.
Alfredsen, G., Ringman, R., Pilga, A. and Fossdal, C.G. (2015). New insight regarding
mode of action of brown rot decay of modified wood based on DNA and gene expression
studies: a review. International Wood Products Journal 6 (1) 5-7.
Fenton, H. J. H. (1894). Oxidation of tartaric acid in the presence of iron.
J. Chem. Soc. Trans., 65, pp.899–911.
Goodell, B., Daniel, G., Jellison, J. and Qian, Y. (2006). Iron-reducing capacity of low
molecular-weight compounds produced in wood by fungi. Holzforschung, 60, pp.630–36.
Hill, C.A.S., Norton, A.J. and Newman, G. (2010). The water vapour sorption properties
of Sitka spruce determined using a dynamic vapour sorption apparatus. Wood Sci and
Tech. 44: 497-514.
Jakes, J.E., Plaza, N., Stone, D.S., Hunt, C.G., Glass, S.V. and Zeliinka, S.L. (2013).
Mechanism of transport through wood cell wall polymers. K. Forest products and
industries, 2(6) 10-13.
Ringman, R., Pilgard, A. and Richter, K. (2014). Effect of wood modification on gene
expression during incipient Postia placenta decay. Int. Biodeter. Biodegr., 86, 86–91.
Proceedings of the 58th International Convention of Society of Wood Science and Technology
June 7-12, 2015 – Grand Teton National Park, Jackson, Wyoming, USA
651
Rowell, R.M. (1982). Distribution of reacted chemicals in southern pine modified with
acetic anhydride, Wood Sci. 15(2): 172-182.
Rowell, R.M. (Ed.). (1984). The Chemistry of Solid Wood. Advances in Chemistry
Series 207, American Chemical Society, Washington DC, USA.
Rowell, R. M. (1991). Chemical modification of wood, Handbook on Wood and
Cellulosic Materials, Hon, D. N.-S., and Shiraishi, N.,eds., Marcel Dekker, Inc., New
York, NY, Chapter 15, 703-756.
Rowell, R.M. (2006). Acetylation of wood: A journey from analytical technique to
commercial reality, Forest Products Journal, 56(9): 4-12.
Rowell, R.M. (2013). Moisture properties, Handbook of wood chemistry and wood
composites, Second Edition, Rowell, R.M., Ed, CRC Press, Boca Raton, FL, Chapter 4,
75-98.
Rowell, R. M., Simonson, R. Hess, S., Plackett, D.V., Cronshaw, D. and Dunningham,
E.( 1991). Acetyl distribution in acetylated whole wood and reactivity of isolated wood
cell wall components to acetic anhydride. Wood and Fiber Sci. 26(1): 11-18.
Stromdahl, K. (2000). Water sorption in wood and plant fibers, PhD thesis, The
Technical University of Demark, Department of Structural Engineering and Materials,
Copenhagen, Denmark.
Wålinder, M., Segerholm, K., Larsson-Brelid, P., and Westin, M. (2010). Liquids and
coatings wettability and penetrability of acetylated scots pine sapwood. In: Proceedings
5th European Conference on Wood Modification, Riga, Latvia, 381-388.
Proceedings of the 58th International Convention of Society of Wood Science and Technology
June 7-12, 2015 – Grand Teton National Park, Jackson, Wyoming, USA
652
Effect of Preservative Treatment on I-joist Bending
Stiffness
H. Michael Barnes, [email protected]
MG Sanders, [email protected]
GB Lindsey, [email protected]
Mississippi State University, Box 9820, Department of Sustainable
Bioproducts, Mississippi State, MS 39762-9820
Abstract
A series of I-joists were treated with a new preservative system and tested full-sized in
bending. Statistical analysis indicated that no changes in the bending stiffness were
attributable to the treatment. This indicates that no change is design values are needed
for treated I-joists.
Proceedings of the 58th International Convention of Society of Wood Science and Technology
June 7-12, 2015 – Grand Teton National Park, Jackson, Wyoming, USA
653
Wood Quality and Improvement Session Moderator: Wayan Darmawan, Bogor Agricultural
University, Indonesia
Optimization of the Thermo-Hygromechanical
Densification Process of Sugar Maple Wood
Qi Lan Fu1 – Alain Cloutier 2* – Aziz Laghdir3
1 PhD candidate, Centre de recherche sur les matériaux renouvelables
(CRMR), Département des sciences du bois et de la forêt, Université Laval,
2425 rue de la Terrasse, Québec, QC, Canada, G1V 0A6.
[email protected] 2 Professor and director, Centre de recherche sur les matériaux renouvelables
(CRMR), Département des sciences du bois et de la forêt, Université Laval,
2425 rue de la Terrasse, Québec, QC, Canada, G1V 0A6.
* Corresponding author
[email protected] 3 Research scientist and co-director, Service de recherche et d’expertise en
transformation des produits forestiers (Serex), 25 Armand-Sinclair, porte 5,
Amqui, QC, Canada, G5J 1K3.
Abstract
Densified wood is a promising engineered wood product, especially for heavy-duty
applications. However process temperature, steaming, and duration impact the
characteristics of densified wood. The objective of the current study was to optimize
thermo-hygromechanical (THM) densification process temperature and duration for sugar
maple wood. The response variables studied were compression set recovery and
hardness. The THM densification process was performed at three different temperatures
(180°C, 200°C, 220°C), densification times (450 s, 900 s, 1350 s) and post-treatment
times (900 s, 1350 s, 1800 s). The response surface methodology was used to analyze the
impact of the parameters studied. The effect of temperature on wood density through the
thickness was also determined. The results suggest that the density of densified samples
across the thickness was above two times that of the control and was fairly constant but
Proceedings of the 58th International Convention of Society of Wood Science and Technology
June 7-12, 2015 – Grand Teton National Park, Jackson, Wyoming, USA
654
decreased sharply near the surface. Density did not increase proportionally with
temperature. Wood densified at 200°C reached the maximum density and the higher
surface to core density gradient. A higher weight loss occurred at 220°C, resulting in a
significant decrease in density and hardness of wood. On the other hand, almost no
compression set recovery was observed for sugar maple densified at 220°C.
Keywords: Density, hardness, compression set recovery, response surface
methodology.
Introduction
Wood densification is a modification method, aiming at compressing wood to obtain a
higher density material. It has been known since 1900, when the first patented
densification process appeared (Kollman et al 1975). It is well known that most
mechanical properties of wood are proportional to its density. The main purpose of
densification is to enhance wood density, hence to improve its mechanical performance
and commercial value.
Compression set recovery (CSR) is an important issue in wood densification and has
been studied rather extensively (Laine et al 2013; Ito et al 1998; Popescu et al 2014;
Kutnar and Kamke 2012 a), because it is an indication of its dimensional stability and
defines its potential end-uses. The release of elastic strain energy stored in amorphous
and semi-crystalline cellulose and microfibrils is considered as the main reason to cause
the set recovery (Laine et al 2013). Three fundamental mechanisms were proposed to
prevent set-recovery (Norimoto et al 1993): Relaxation of internal stresses, formation of
cross-linkages between matrix components, and isolation of wood polymers under the
effect of moisture and heat to prevent re-softening. Navi and Heger (2004) reported that
the hemicelluloses hydrolysis occurring during the thermo-hygromechanical (THM)
densification process have an important role to relax wood internal stresses. In the
presence of heat and steam, the hemicelluloses which are the least stable to withstand
heat among the three major components of wood, degrade and the bonds connecting the
molecules of the matrix can be broken and reformed. In addition, thermal degradation of
the hemicelluloses reduces the hygroscopicity of wood and weakens the connection
between microfibrils and lignin (Navi and Heger 2004), providing additional void space
to rearrange the microfibrils and release the internal stresses (Inoue et al 1993).
The objective of this study was to investigate the effects of THM densification
temperature and time on the compression set recovery and hardness of densified wood.
The impacts of temperature and treatment time on the density profile of densified wood
were also investigated. The overall objective of this larger initiative was to optimize the
THM densification process for sugar maple wood to obtain high quality densified wood
products.
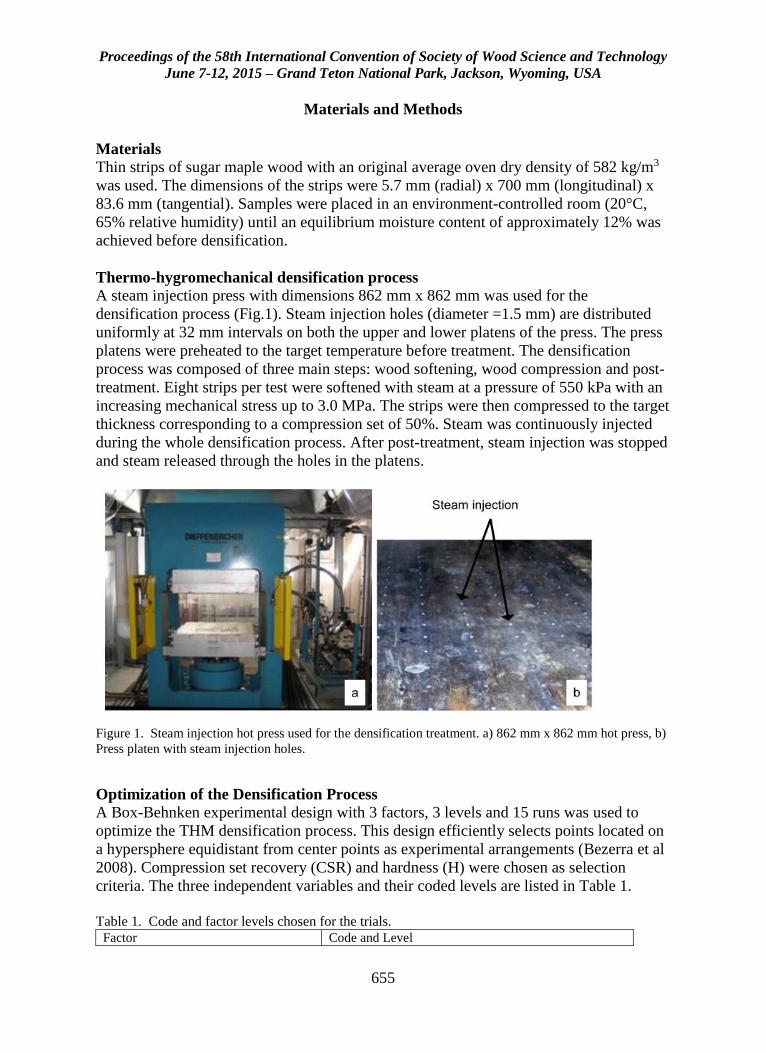
Proceedings of the 58th International Convention of Society of Wood Science and Technology
June 7-12, 2015 – Grand Teton National Park, Jackson, Wyoming, USA
655
Materials and Methods
Materials
Thin strips of sugar maple wood with an original average oven dry density of 582 kg/m3
was used. The dimensions of the strips were 5.7 mm (radial) x 700 mm (longitudinal) x
83.6 mm (tangential). Samples were placed in an environment-controlled room (20°C,
65% relative humidity) until an equilibrium moisture content of approximately 12% was
achieved before densification.
Thermo-hygromechanical densification process
A steam injection press with dimensions 862 mm x 862 mm was used for the
densification process (Fig.1). Steam injection holes (diameter =1.5 mm) are distributed
uniformly at 32 mm intervals on both the upper and lower platens of the press. The press
platens were preheated to the target temperature before treatment. The densification
process was composed of three main steps: wood softening, wood compression and post-
treatment. Eight strips per test were softened with steam at a pressure of 550 kPa with an
increasing mechanical stress up to 3.0 MPa. The strips were then compressed to the target
thickness corresponding to a compression set of 50%. Steam was continuously injected
during the whole densification process. After post-treatment, steam injection was stopped
and steam released through the holes in the platens.
Figure 1. Steam injection hot press used for the densification treatment. a) 862 mm x 862 mm hot press, b)
Press platen with steam injection holes.
Optimization of the Densification Process
A Box-Behnken experimental design with 3 factors, 3 levels and 15 runs was used to
optimize the THM densification process. This design efficiently selects points located on
a hypersphere equidistant from center points as experimental arrangements (Bezerra et al
2008). Compression set recovery (CSR) and hardness (H) were chosen as selection
criteria. The three independent variables and their coded levels are listed in Table 1.
Table 1. Code and factor levels chosen for the trials.
Factor Code and Level
Proceedings of the 58th International Convention of Society of Wood Science and Technology
June 7-12, 2015 – Grand Teton National Park, Jackson, Wyoming, USA
656
-1 0 +1 Temperature (°C) 180 200 220 Densification time (s) 450 900 1350 Post-treatment time (s) 900 1350 1800
Properties Determination
Brinell Hardness
Brinell hardness tests were conducted according to the European standard EN 1534
(2000).
Compression Set Recovery
After densification, specimens (50 mm longitudinal x 50 mm tangential) were first dried
in an oven to determine oven-dry thickness before swelling. Then oven-dried samples
were immersed into water at room temperature for 24 h and oven-dried again for 24 h.
The compression set recovery TC (%) was calculated as follows:
TC= [(Ts-To) / (Tu-To)] x 100
Where Ts is the oven-dry thickness after swelling (mm), To is the oven-dry thickness
before swelling (mm) and Tu is the initial oven-dry uncompressed thickness (mm).
Density Profile
The density profiles of control (not densified) and densified samples at 180°C, 190°C and
200°C, respectively were measured using an X-ray densitometer (Quintek Measurements
Systems model QDP-01X) at intervals of 0.02 mm through the thickness.
Results and Discussion
Compression set recovery and hardness
Average compression set recovery and hardness obtained for each treatment are
presented in Table 2. The CSR of densified samples was in the range of 1.1% to 19.2%.
The maximum value of CSR was approximately 17 times that of the minimum CSR. The
hardness of densified samples varied from 25.2 N/mm2 to 51.4 N/mm2. The maximum
value of hardness was approximately twice as much as the minimum value. Furthermore,
lower CSR values and higher hardness values were not obtained under the same
experimental conditions. Therefore, it is necessary to analyze the effects of process
parameters on CSR and hardness and further optimize the densification process to obtain
high quality products. In this study, relatively higher hardness values and lower
compression set recovery values were obtained simultaneously for treatments No. 11, 12
and 15.
Table 2. Average compression set recovery and hardness obtained for the treatments applied
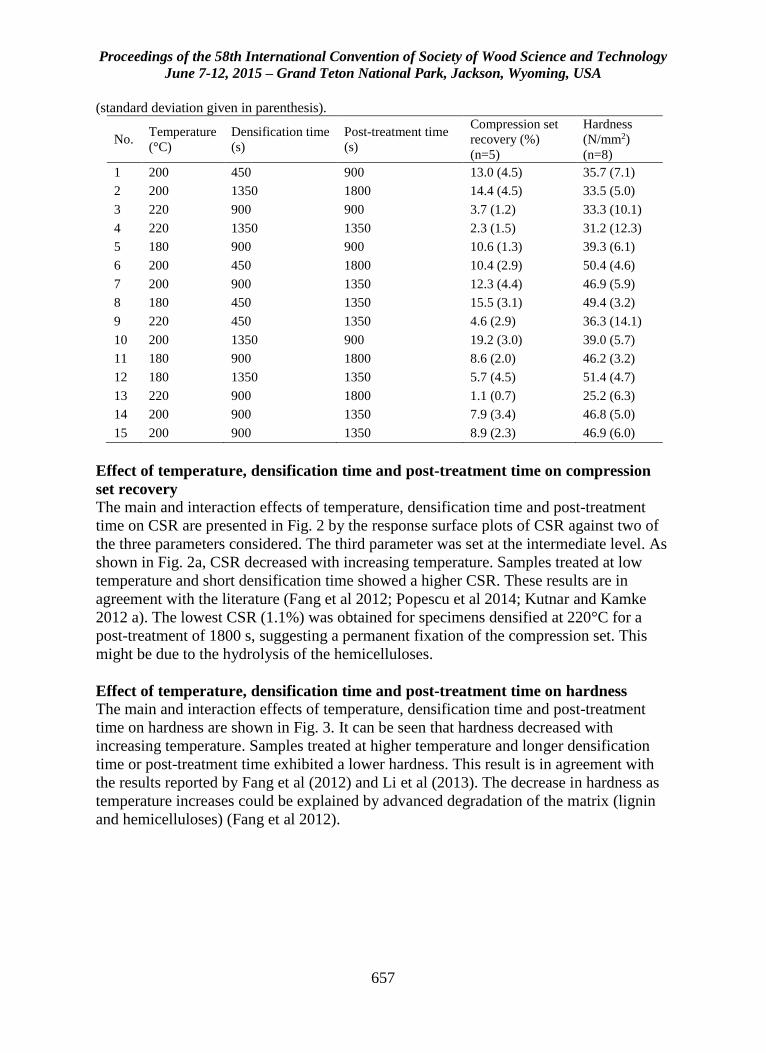
Proceedings of the 58th International Convention of Society of Wood Science and Technology
June 7-12, 2015 – Grand Teton National Park, Jackson, Wyoming, USA
657
(standard deviation given in parenthesis).
No. Temperature
(°C) Densification time
(s) Post-treatment time
(s)
Compression set
recovery (%)
(n=5)
Hardness (N/mm2)
(n=8) 1 200 450 900 13.0 (4.5) 35.7 (7.1)
2 200 1350 1800 14.4 (4.5) 33.5 (5.0)
3 220 900 900 3.7 (1.2) 33.3 (10.1)
4 220 1350 1350 2.3 (1.5) 31.2 (12.3)
5 180 900 900 10.6 (1.3) 39.3 (6.1)
6 200 450 1800 10.4 (2.9) 50.4 (4.6)
7 200 900 1350 12.3 (4.4) 46.9 (5.9)
8 180 450 1350 15.5 (3.1) 49.4 (3.2)
9 220 450 1350 4.6 (2.9) 36.3 (14.1)
10 200 1350 900 19.2 (3.0) 39.0 (5.7)
11 180 900 1800 8.6 (2.0) 46.2 (3.2)
12 180 1350 1350 5.7 (4.5) 51.4 (4.7)
13 220 900 1800 1.1 (0.7) 25.2 (6.3)
14 200 900 1350 7.9 (3.4) 46.8 (5.0)
15 200 900 1350 8.9 (2.3) 46.9 (6.0)
Effect of temperature, densification time and post-treatment time on compression
set recovery The main and interaction effects of temperature, densification time and post-treatment
time on CSR are presented in Fig. 2 by the response surface plots of CSR against two of
the three parameters considered. The third parameter was set at the intermediate level. As
shown in Fig. 2a, CSR decreased with increasing temperature. Samples treated at low
temperature and short densification time showed a higher CSR. These results are in
agreement with the literature (Fang et al 2012; Popescu et al 2014; Kutnar and Kamke
2012 a). The lowest CSR (1.1%) was obtained for specimens densified at 220°C for a
post-treatment of 1800 s, suggesting a permanent fixation of the compression set. This
might be due to the hydrolysis of the hemicelluloses.
Effect of temperature, densification time and post-treatment time on hardness
The main and interaction effects of temperature, densification time and post-treatment
time on hardness are shown in Fig. 3. It can be seen that hardness decreased with
increasing temperature. Samples treated at higher temperature and longer densification
time or post-treatment time exhibited a lower hardness. This result is in agreement with
the results reported by Fang et al (2012) and Li et al (2013). The decrease in hardness as
temperature increases could be explained by advanced degradation of the matrix (lignin
and hemicelluloses) (Fang et al 2012).
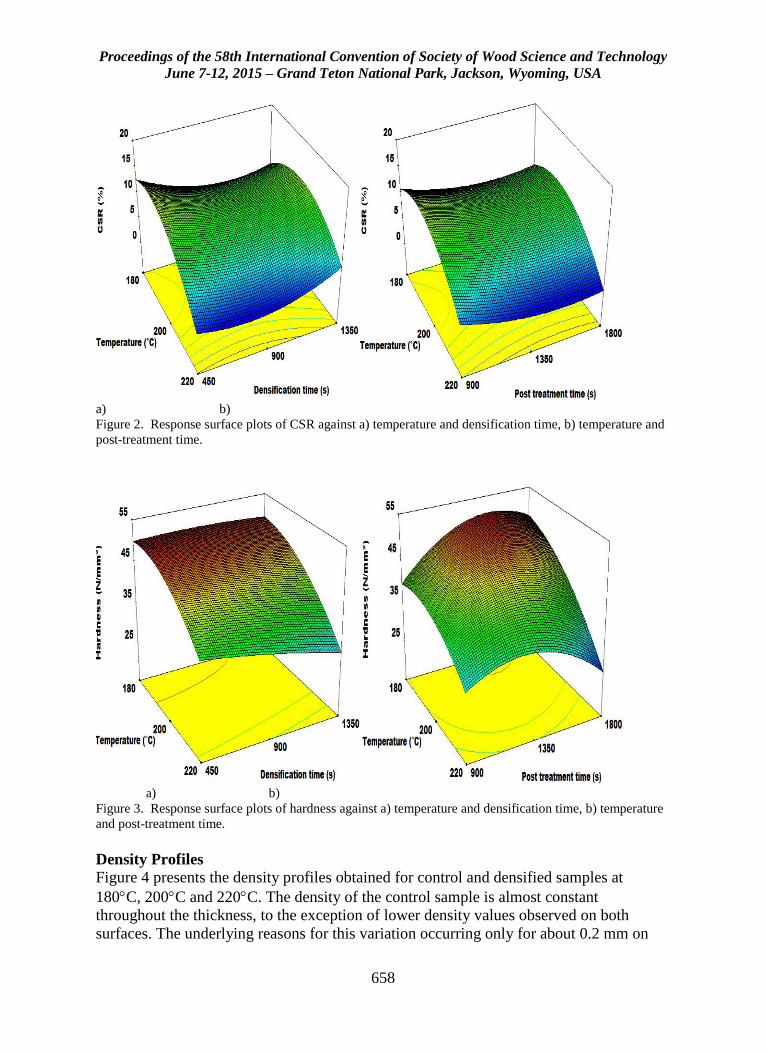
Proceedings of the 58th International Convention of Society of Wood Science and Technology
June 7-12, 2015 – Grand Teton National Park, Jackson, Wyoming, USA
658
a) b)
Figure 2. Response surface plots of CSR against a) temperature and densification time, b) temperature and
post-treatment time.
a) b)
Figure 3. Response surface plots of hardness against a) temperature and densification time, b) temperature
and post-treatment time.
Density Profiles
Figure 4 presents the density profiles obtained for control and densified samples at
180C, 200C and 220C. The density of the control sample is almost constant
throughout the thickness, to the exception of lower density values observed on both
surfaces. The underlying reasons for this variation occurring only for about 0.2 mm on
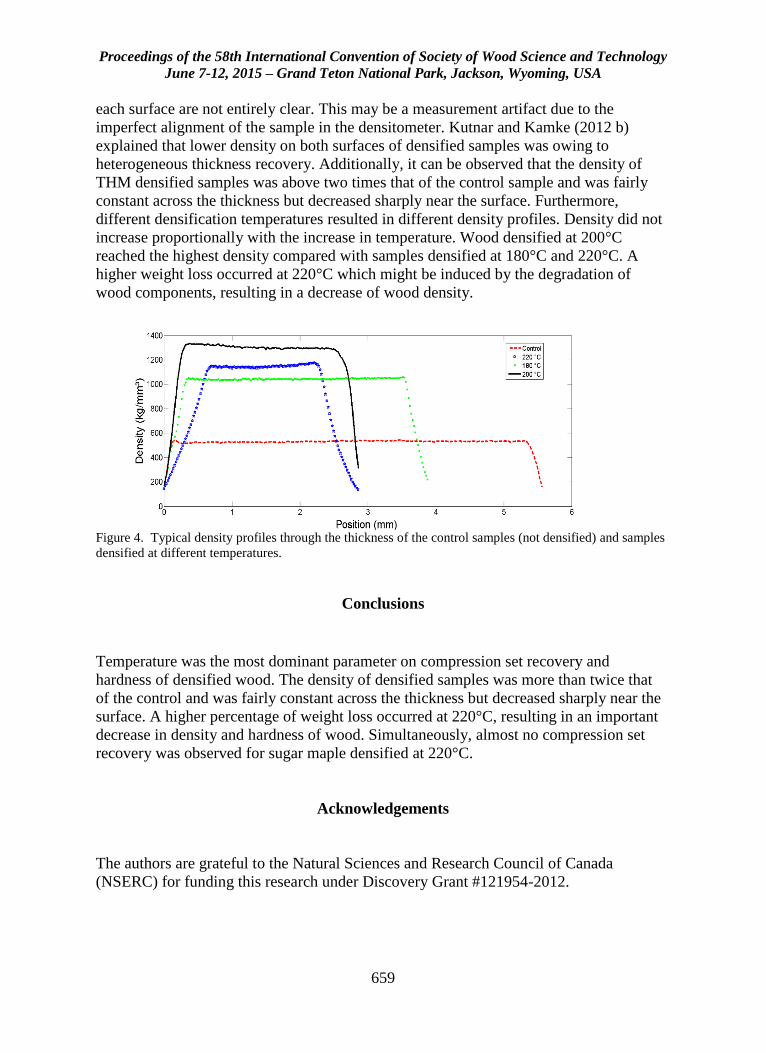
Proceedings of the 58th International Convention of Society of Wood Science and Technology
June 7-12, 2015 – Grand Teton National Park, Jackson, Wyoming, USA
659
each surface are not entirely clear. This may be a measurement artifact due to the
imperfect alignment of the sample in the densitometer. Kutnar and Kamke (2012 b)
explained that lower density on both surfaces of densified samples was owing to
heterogeneous thickness recovery. Additionally, it can be observed that the density of
THM densified samples was above two times that of the control sample and was fairly
constant across the thickness but decreased sharply near the surface. Furthermore,
different densification temperatures resulted in different density profiles. Density did not
increase proportionally with the increase in temperature. Wood densified at 200°C
reached the highest density compared with samples densified at 180°C and 220°C. A
higher weight loss occurred at 220°C which might be induced by the degradation of
wood components, resulting in a decrease of wood density.
Figure 4. Typical density profiles through the thickness of the control samples (not densified) and samples
densified at different temperatures.
Conclusions
Temperature was the most dominant parameter on compression set recovery and
hardness of densified wood. The density of densified samples was more than twice that
of the control and was fairly constant across the thickness but decreased sharply near the
surface. A higher percentage of weight loss occurred at 220°C, resulting in an important
decrease in density and hardness of wood. Simultaneously, almost no compression set
recovery was observed for sugar maple densified at 220°C.
Acknowledgements
The authors are grateful to the Natural Sciences and Research Council of Canada
(NSERC) for funding this research under Discovery Grant #121954-2012.
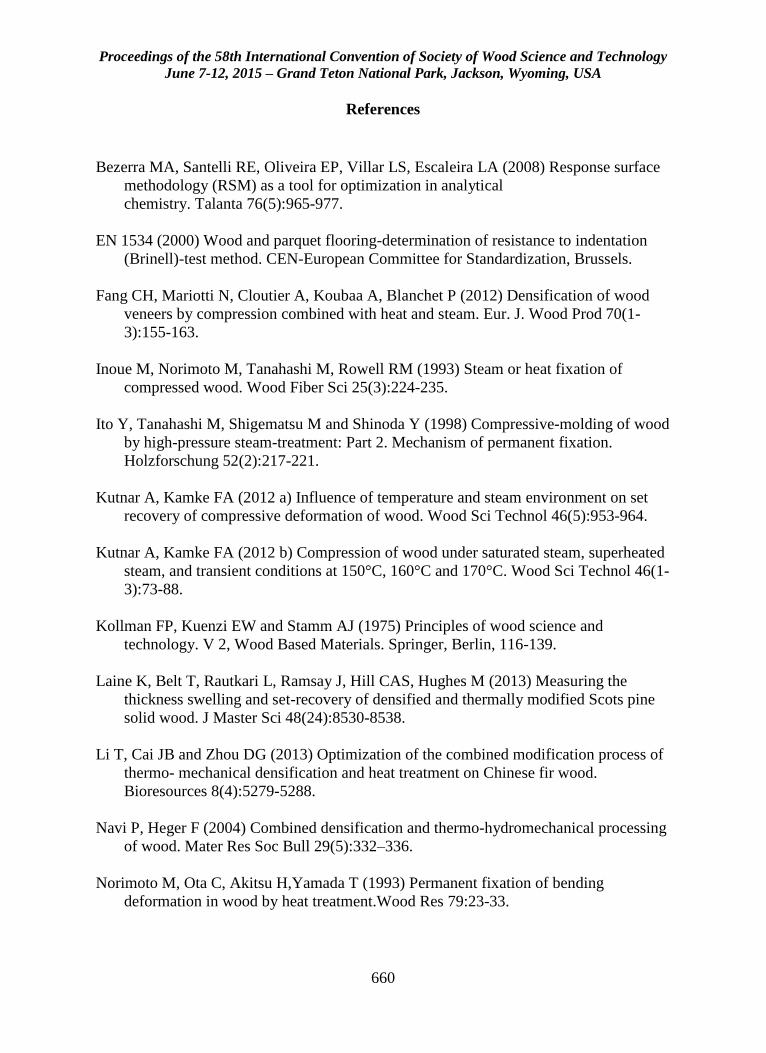
Proceedings of the 58th International Convention of Society of Wood Science and Technology
June 7-12, 2015 – Grand Teton National Park, Jackson, Wyoming, USA
660
References
Bezerra MA, Santelli RE, Oliveira EP, Villar LS, Escaleira LA (2008) Response surface
methodology (RSM) as a tool for optimization in analytical
chemistry. Talanta 76(5):965-977.
EN 1534 (2000) Wood and parquet flooring-determination of resistance to indentation
(Brinell)-test method. CEN-European Committee for Standardization, Brussels.
Fang CH, Mariotti N, Cloutier A, Koubaa A, Blanchet P (2012) Densification of wood
veneers by compression combined with heat and steam. Eur. J. Wood Prod 70(1-
3):155-163.
Inoue M, Norimoto M, Tanahashi M, Rowell RM (1993) Steam or heat fixation of
compressed wood. Wood Fiber Sci 25(3):224-235.
Ito Y, Tanahashi M, Shigematsu M and Shinoda Y (1998) Compressive-molding of wood
by high-pressure steam-treatment: Part 2. Mechanism of permanent fixation.
Holzforschung 52(2):217-221.
Kutnar A, Kamke FA (2012 a) Influence of temperature and steam environment on set
recovery of compressive deformation of wood. Wood Sci Technol 46(5):953-964.
Kutnar A, Kamke FA (2012 b) Compression of wood under saturated steam, superheated
steam, and transient conditions at 150°C, 160°C and 170°C. Wood Sci Technol 46(1-
3):73-88.
Kollman FP, Kuenzi EW and Stamm AJ (1975) Principles of wood science and
technology. V 2, Wood Based Materials. Springer, Berlin, 116-139.
Laine K, Belt T, Rautkari L, Ramsay J, Hill CAS, Hughes M (2013) Measuring the
thickness swelling and set-recovery of densified and thermally modified Scots pine
solid wood. J Master Sci 48(24):8530-8538.
Li T, Cai JB and Zhou DG (2013) Optimization of the combined modification process of
thermo- mechanical densification and heat treatment on Chinese fir wood.
Bioresources 8(4):5279-5288.
Navi P, Heger F (2004) Combined densification and thermo-hydromechanical processing
of wood. Mater Res Soc Bull 29(5):332–336.
Norimoto M, Ota C, Akitsu H,Yamada T (1993) Permanent fixation of bending
deformation in wood by heat treatment.Wood Res 79:23-33.

Proceedings of the 58th International Convention of Society of Wood Science and Technology
June 7-12, 2015 – Grand Teton National Park, Jackson, Wyoming, USA
661
Popescu MC, Lisa G, Navi P, Froidevaux J, Popescu CM (2014) Evaluation of the
thermal stablility and set recovery of thermo-hydro-mechanically treated lime (Tilia
cordata) wood. Wood Sci Technol 48(1):85-97.
Proceedings of the 58th International Convention of Society of Wood Science and Technology
June 7-12, 2015 – Grand Teton National Park, Jackson, Wyoming, USA
662
Non-Destructive Pre-Harvest Measurement of Diameter
Profiles of Standing Mature Pine Trees by Terrestrial
Laser Scanning (TLS)
Per Otto Flæte 1*
1 Senior researcher, Norwegian Institute of Wood Technology - PO Box 113
Blindern - NO-0314 Oslo - Norway.
* Corresponding author
Abstract
The conversion of forest resources to solid wood products is a chain of closely related
activities. Decisions taken at one stage will have consequences for the following ones. At
an early stage, the bucking operation occurs. Tree bucking performed by harvesters in
cut-to-length harvesting systems is an important part of the forestry supply chain. Modern
harvesters are equipped with tools to measure stem dimensions (diameter, length) and to
predict the stem profile during processing. If the stem diameter profiles of the trees in a
stand are available prior to harvesting, this information can be utilized for tailoring log
supply. The information can be used for allocating logs from specific stands to different
purchasers and by using the stem profiles for optimal bucking of the trees.
This paper discusses Terrestrial Laser Scanning (TLS) as potential technique for non-
destructive prediction of diameter profiles of standing mature Scots pine trees. TLS has
been developed to capture detailed and highly accurate information relating to an object’s
dimensions, spatial positioning, texture and colour in both two and three dimensions. It is
now a widely used technology in architectural, engineering and industrial measurement
applications, for example to digitize the external surface of buildings and archaeological
sites. For forest monitoring purposes, the use of TLS is in an early stage. The reported
results are based on measurements of Scots pines scanned with TLS in Norway.
Keywords: Terrestrial laser scanning, diameter, stem profiles, Scots pin
Introduction
Terrestrial laser scanning (TLS) has been developed to capture detailed and highly
accurate information relating to an object’s dimensions, spatial positioning, texture and
colour in both two and three dimensions. It is now a widely used technology in
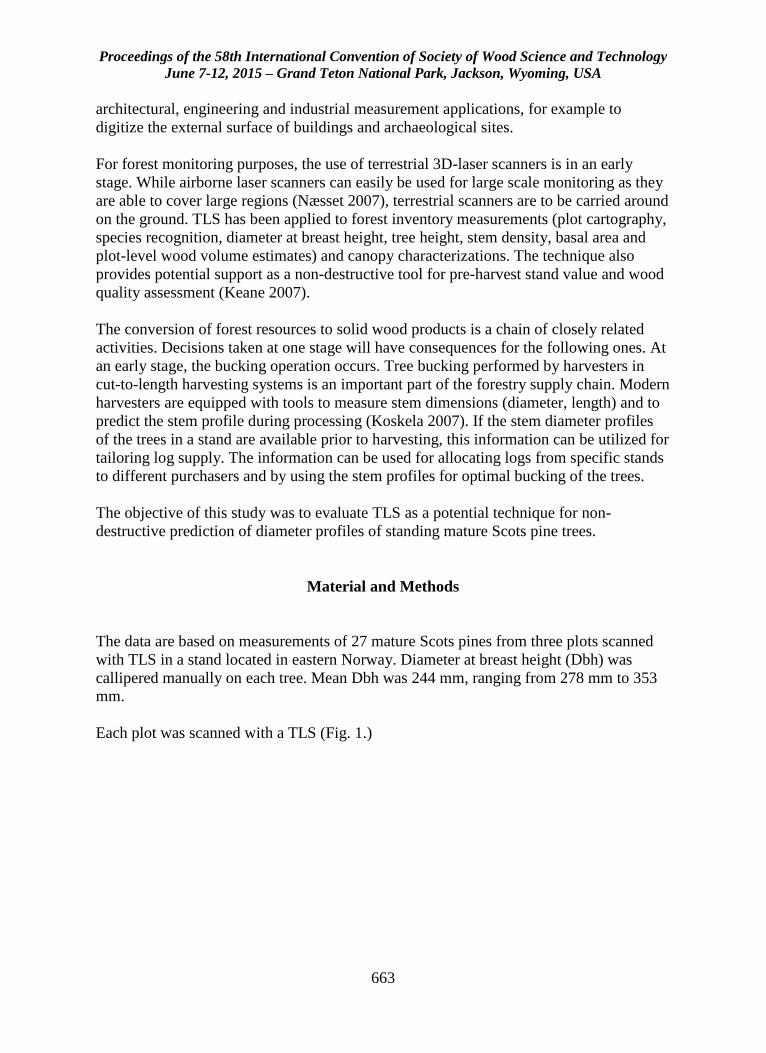
Proceedings of the 58th International Convention of Society of Wood Science and Technology
June 7-12, 2015 – Grand Teton National Park, Jackson, Wyoming, USA
663
architectural, engineering and industrial measurement applications, for example to
digitize the external surface of buildings and archaeological sites.
For forest monitoring purposes, the use of terrestrial 3D-laser scanners is in an early
stage. While airborne laser scanners can easily be used for large scale monitoring as they
are able to cover large regions (Næsset 2007), terrestrial scanners are to be carried around
on the ground. TLS has been applied to forest inventory measurements (plot cartography,
species recognition, diameter at breast height, tree height, stem density, basal area and
plot-level wood volume estimates) and canopy characterizations. The technique also
provides potential support as a non-destructive tool for pre-harvest stand value and wood
quality assessment (Keane 2007).
The conversion of forest resources to solid wood products is a chain of closely related
activities. Decisions taken at one stage will have consequences for the following ones. At
an early stage, the bucking operation occurs. Tree bucking performed by harvesters in
cut-to-length harvesting systems is an important part of the forestry supply chain. Modern
harvesters are equipped with tools to measure stem dimensions (diameter, length) and to
predict the stem profile during processing (Koskela 2007). If the stem diameter profiles
of the trees in a stand are available prior to harvesting, this information can be utilized for
tailoring log supply. The information can be used for allocating logs from specific stands
to different purchasers and by using the stem profiles for optimal bucking of the trees.
The objective of this study was to evaluate TLS as a potential technique for non-
destructive prediction of diameter profiles of standing mature Scots pine trees.
Material and Methods
The data are based on measurements of 27 mature Scots pines from three plots scanned
with TLS in a stand located in eastern Norway. Diameter at breast height (Dbh) was
callipered manually on each tree. Mean Dbh was 244 mm, ranging from 278 mm to 353
mm.
Each plot was scanned with a TLS (Fig. 1.)
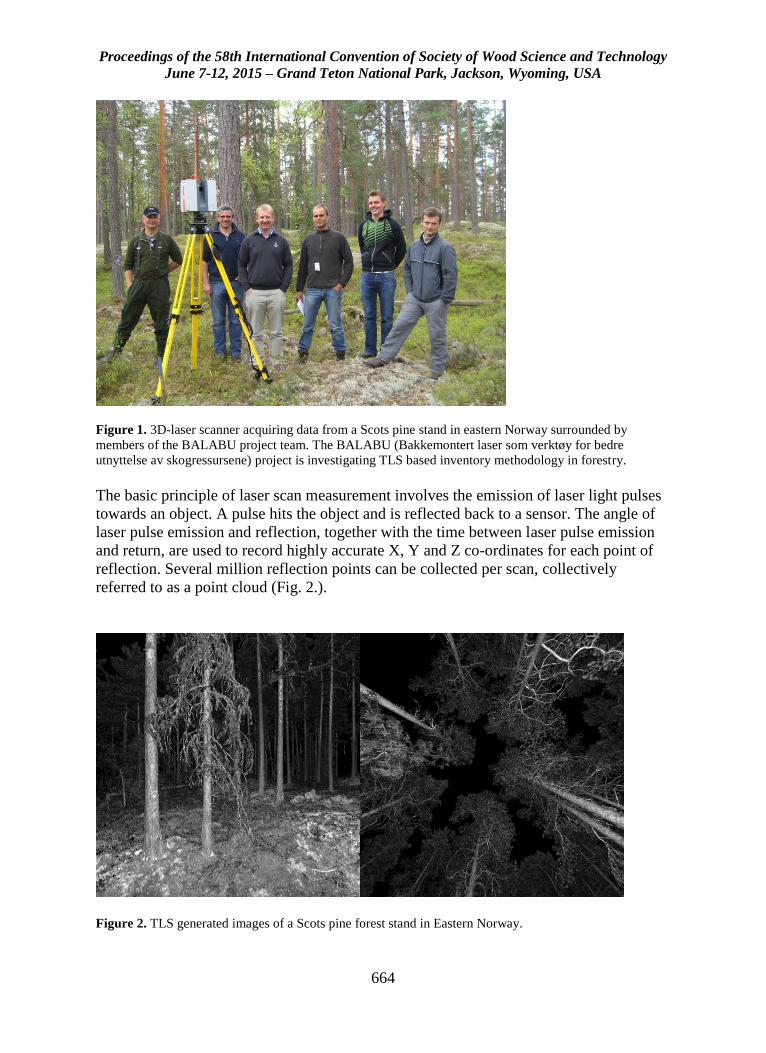
Proceedings of the 58th International Convention of Society of Wood Science and Technology
June 7-12, 2015 – Grand Teton National Park, Jackson, Wyoming, USA
664
Figure 1. 3D-laser scanner acquiring data from a Scots pine stand in eastern Norway surrounded by
members of the BALABU project team. The BALABU (Bakkemontert laser som verktøy for bedre
utnyttelse av skogressursene) project is investigating TLS based inventory methodology in forestry.
The basic principle of laser scan measurement involves the emission of laser light pulses
towards an object. A pulse hits the object and is reflected back to a sensor. The angle of
laser pulse emission and reflection, together with the time between laser pulse emission
and return, are used to record highly accurate X, Y and Z co-ordinates for each point of
reflection. Several million reflection points can be collected per scan, collectively
referred to as a point cloud (Fig. 2.).
Figure 2. TLS generated images of a Scots pine forest stand in Eastern Norway.
Proceedings of the 58th International Convention of Society of Wood Science and Technology
June 7-12, 2015 – Grand Teton National Park, Jackson, Wyoming, USA
665
The TLS data were processed by Treemetrics Ltd., Cork, Ireland (project partner in the
BALABU project) and converted to StanForD stem files. A stem file comprises stem
diameters recorded in 10 cm intervals from the base towards the top for a tree. This is the
same file format as used in harvesters.
The pine trees were harvested by a single grip harvester and the stem files produced by
the harvester were collected. Modern harvesters are equipped with tools to measure stem
dimensions (diameter, length) and to predict the stem profile during processing. This
information is part of the bucking control system of a harvester.
To evaluate the potential of using TLS for producing diameter profiles of standing trees
the TLS based data were compared with the manually callipered diameters on each tree
and with the diameters measured along each stem by the harvester.
Results and Discussion
Diameter at breast height (Dbh) Data for measured Dbh are shown in Table 1. Dbh measured by conventional caliper was
used as a measure of the true Dbh (reference). The difference between reference Dbh and
corresponding Dbh measured by harvester or by TLS was on average 2 mm for both
methods. However, the higher standard deviation for the difference calculated for the
TLS based Dbh estimates indicate a poorer accuracy compared with the harvester.
Table 1. Diameter at breast height (Dbh) measured by conventional calliper (reference),
by harvester and by TLS. Statistics for the difference between reference and harvester
and between reference and TLS are shown in right column. N = 27
Dbh (mm) Difference
Reference (R) Harvester (H) TLS R - H R - TLS
Mean 244 242 246 2 -2
St. dev. 45 49 55 11 19
Min 178 151 150 -20 -51
Max 353 355 390 50 50
Stem diameter profiles
The stem diameter profiles of the 27 pine trees comprised 3 871-diameter recordings in
total (in 10 cm steps along the stem of each tree from base to upper cross cut made by the
harvester). The stem diameter profiles of two of the trees are displayed in Fig. 3.
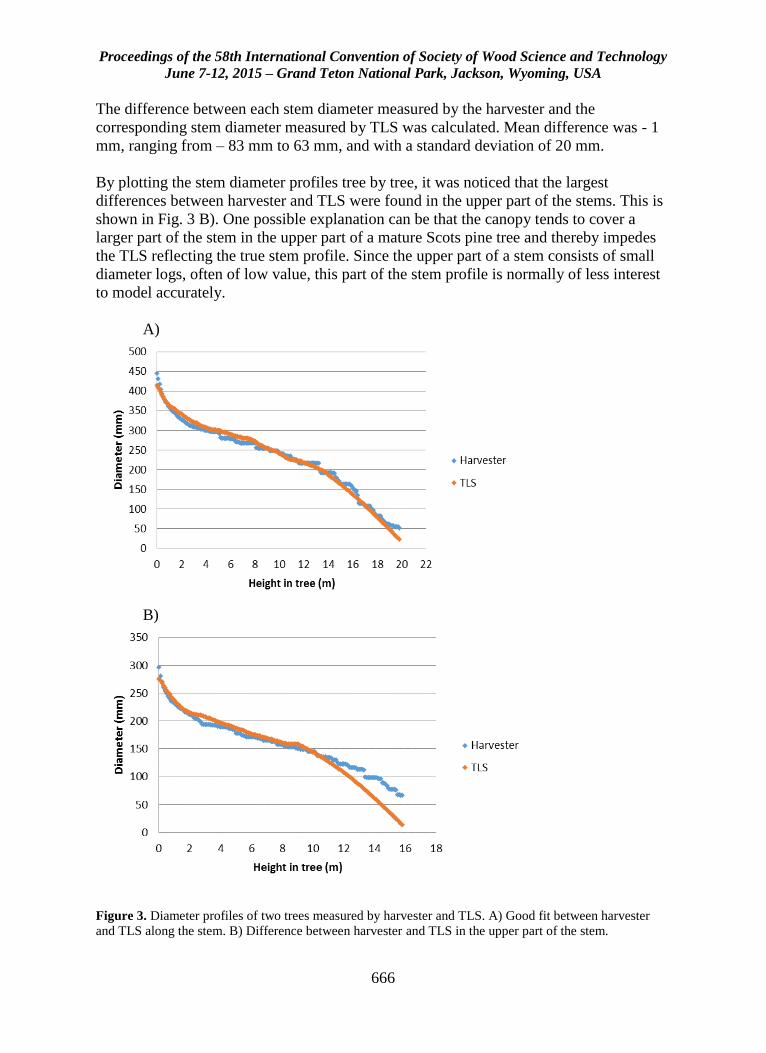
Proceedings of the 58th International Convention of Society of Wood Science and Technology
June 7-12, 2015 – Grand Teton National Park, Jackson, Wyoming, USA
666
The difference between each stem diameter measured by the harvester and the
corresponding stem diameter measured by TLS was calculated. Mean difference was - 1
mm, ranging from – 83 mm to 63 mm, and with a standard deviation of 20 mm.
By plotting the stem diameter profiles tree by tree, it was noticed that the largest
differences between harvester and TLS were found in the upper part of the stems. This is
shown in Fig. 3 B). One possible explanation can be that the canopy tends to cover a
larger part of the stem in the upper part of a mature Scots pine tree and thereby impedes
the TLS reflecting the true stem profile. Since the upper part of a stem consists of small
diameter logs, often of low value, this part of the stem profile is normally of less interest
to model accurately.
A)
B)
Figure 3. Diameter profiles of two trees measured by harvester and TLS. A) Good fit between harvester
and TLS along the stem. B) Difference between harvester and TLS in the upper part of the stem.
Proceedings of the 58th International Convention of Society of Wood Science and Technology
June 7-12, 2015 – Grand Teton National Park, Jackson, Wyoming, USA
667
Conclusion
This study shows that the stem diameter profiles of standing mature Scots pine can be
non-destructive predicted by means of TLS. This can be a useful tool in pre-harvest
bucking simulations for optimal utilization of the wood resources. The accuracy of the
predictions should be explored more in detail based on a larger material than used in the
present study.
References
Keane, E (2007) The potential of terrestrial laser scanning technology in pre-harvest
timber measurement operations. COFORD connects. Harvesting/Transportation No. 7. 4
pp.
Koskela, L (2007) Contributions to Statistical Aspects of Computerized Forest
Harvesting. Academic dissertation. Acta Universitatis Tamperensis 1237. University of
Tampere, Department of Mathematics, Statistics and Philosophy, Finland. ISBN 978-
951-6982-4.
Næsset, E (2007) Airborne laser scanning as a method in operational forest inventory:
Status of accuracy assessments accomplished in Scandinavia. Scandinavian Journal of
Forest Research 22: 433-442.
Proceedings of the 58th International Convention of Society of Wood Science and Technology
June 7-12, 2015 – Grand Teton National Park, Jackson, Wyoming, USA
668
Properties of Plantation Grown KOA
Brian Bond, [email protected]
Ian Wilton, [email protected]
Nick Dudley, [email protected]
Virginia Tech, 1650 Research Center Dr, Blacksburg, VA 24061
Abstract
Acacia koa (koa), endemic to Hawaii, is used in furniture, cabinetry, musical instruments,
and a wide variety of other decorative and craft products. It is sold for average prices of
5.00 - $15.00 U.S. per board foot. Premium instrument grade Koa with vertical grain and
heavy figured material can sell for over $100 U.S. per board foot. No harvesting of koa is
currently permitted on state owned land in Hawaii and sources of koa are diminishing.
Koa has been identified as adaptable to plantation management and planted koa could
theoretically become a substitute source. Presently little is known about the properties of
plantation-grown koa. The research presented describes several wood properties, (color,
specific gravity, hardness, heartwood/sapwood ratios and anatomical structure) of
Hawaiian plantation-grown koa and compares them to published data from natural grown
material.
Proceedings of the 58th International Convention of Society of Wood Science and Technology
June 7-12, 2015 – Grand Teton National Park, Jackson, Wyoming, USA
669
Wear Characteristics of Newly Coated Cutting Tools in
Milling Wood and Wood-Based Composites
Wayan DARMAWAN(1), Dodi NANDIKA(1), Fauzan FAHRUSSIAM(2)
Hiroshi USUKI(3), Masahiro YOSHINOBU(3), Shuhou KOSEKI(4)
(1) Professor at Bogor Agricultural University, Indonesia /
(2) Research Assistance at Bogor Agricultural University,
Indonesia/[email protected]
(3) Professor at Shimane University, Japan/[email protected]
(4) Hitachi Tool Engineering Ltd.Japan
Abstract
This article presents the characteristics of wear on the clearance face of newly multilayer-
coated K10 cutting tools when milling mersawa wood and particleboard. The K10 cutting
tools were coated with monolayer titanium aluminum nitride (TiAlN), multilayer
TiAlN/titanium silicon nitride (TiSiN), and TiAlN/titanium boron nitride (TiBN).
Mersawa wood with density of 0.80 g/cm3 and particleboard with a density of 0.61 g/cm3
were cut using the coated tools and uncoated K10. Cutting tests were performed at a high
cutting speed of 17 m/s and a feed rate of 0.1 mm/rev to investigate the wear
characteristics on the clearance face of these coated tools. Experimental results showed
that the coated tools experienced a smaller amount of wear than the uncoated tool when
milling the mersawa and particleboard. The best coating was multilayer TiAlN/TiBN.
The high hardness, low coefficient of friction, high resistance to oxidation, and high
resistance to delamination wear of the multilayer-coated TiAlN/TiBN tool indicate a very
promising applicability of this coating for high-speed cutting of abrasive woods and
wood based materials.
Keywords : particleboard, abrasive wood, silica, multilayer coated tools, clearance wear
Introduction
Recently, the use of abrasive wood (wood with high silica) and wood-based material has
been known for building construction and decorative purposes. In the secondary wood
manufacturing industry, where the abrasive wood and wood-based material are machined
extensively, tool wear would be an important economic parameter. Therefore,
investigating wear characteristics will lead to making better choices of cutting tool
materials used to cut the abrasive wood and the wood-based material.
Proceedings of the 58th International Convention of Society of Wood Science and Technology
June 7-12, 2015 – Grand Teton National Park, Jackson, Wyoming, USA
670
Machining of the abrasive materials causes cutting tools to wear out much faster than
machining of solid woods. Rapid dulling of steel cutting edge of blades, saw teeth, or
other knives when machining abrasive materials is a well-known phenomenon. The use
of tungsten carbide tools for cutting particleboard has been limited because of the
relatively high rate of wear caused by high-temperature oxidation and abrasion (Sheikh-
Ahmad and Bailey 1999, Darmawan et. al 2012). Thus, an effort to coat the surfaces of
the carbide cutting tool with newly hard materials has been made to increase the wear
resistance of the carbide tool.
In a previous study (Salje and Stuehmeier 1988, Darmawan et. al 2001), K10 tungsten
carbide inserts were coated with TiN and TiC films by the chemical vapor deposition
method and then used for cutting particleboard. Those authors noted that the TiN coating
brought no advantages in the milling of particleboard; in other words, the edge life
attained or the total tool paths were not longer than those attained using uncoated cutting
edges. The TiC-coated tungsten carbide tools were also reported to show large edge
fractures after a short time of operation. In a study by Sheikh-Ahmad and Stewart (1995),
K grades of tungsten carbide tools were coated with TiN, TiN/TiCN, and TiAlN by the
physical vapor deposition (PVD) method for continuous milling of particleboard, and
those authors noted that a slight improvement in wear resistance was provided by
coatings that were synthesized to carbide grade with fine grain size (0.8 μm) and low
cobalt content (3%). In contrast, coatings applied to carbide grade with higher cobalt
content and coarse grain size decreased the wear resistance of the tools. The primary
failure mode for the PVD coatings tested in that work was chipping of coatings on the
rake face. This was caused by inadequate adhesion of coating over the tool surfaces
because of improper substrate and coating combination.
In a study by Fuch and Raatz (1997), TiN, Titanium Aluminum Oxide Nitride TiAlON,
and TiC coatings were synthesized on the surface of tungsten carbide (93.5% Tungsten
Carbide WC, 5% Co, 1.5% Tantalum Carbide and Niobium Carbide (TaC/NbC)) by
plasma-assisted chemical vapor deposition for milling laminated particleboard. Those
authors noted that TiN- and TiAlON-coated carbide tools did not provide any
improvement in wear resistance compared with the uncoated carbide tool and that the
TiC-coated carbide tool provided only a slight improvement. Darmawan et al. (2001)
reported that the wear of TiN, CrN, CrC, TiCN, and TiAlN coatings when cutting wood-
chip cement board resulted from delamination of the coating film at both low- and high-
cutting speeds. Among the coatings tested in that study, TiAlN exhibited the lowest
occurrence of delamination. For high-speed cutting, delamination of these coating films
was caused by oxidation, which was accelerated by an increase in cutting temperature.
The findings of the studies discussed above indicate that the monolayer coatings did not
provide significant improvement in the cutting tool life for high-speed cutting of wood-
based materials. Therefore, ongoing research is proposed to achieve better performance
of the coated carbide tools when cutting these materials. Multilayer coatings would be a
promising technique to improve the performance of monolayer coatings. Therefore,
TiAlN coating, which is high in hardness, good in oxidation resistance, and better in wear
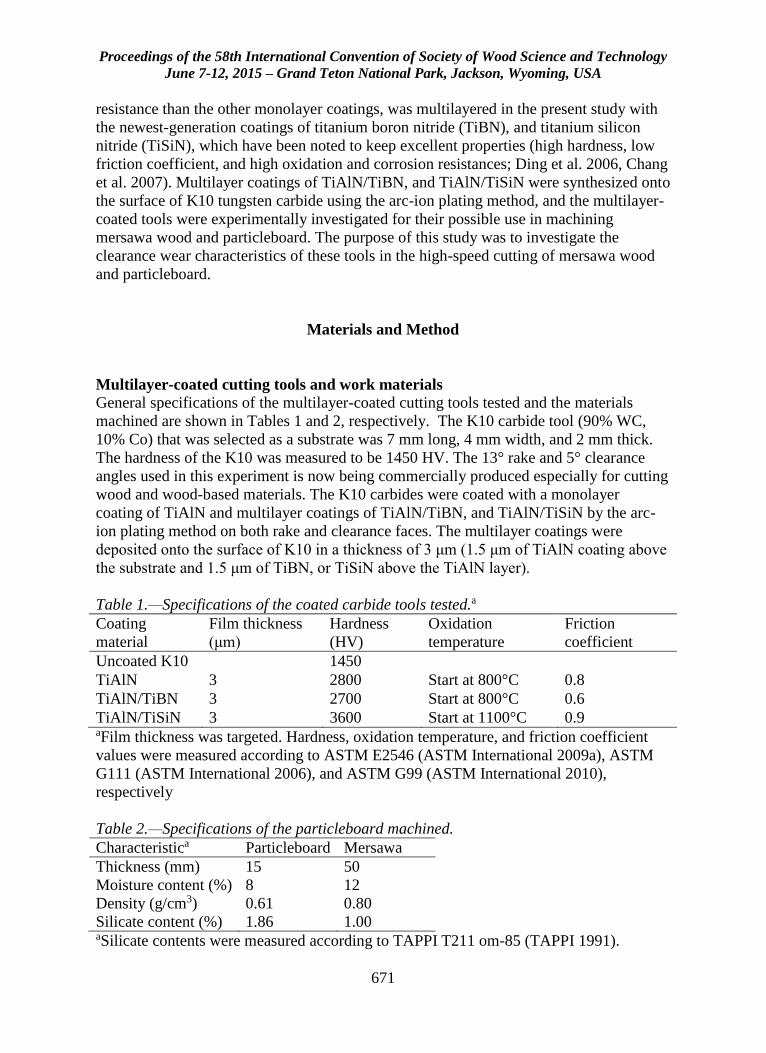
Proceedings of the 58th International Convention of Society of Wood Science and Technology
June 7-12, 2015 – Grand Teton National Park, Jackson, Wyoming, USA
671
resistance than the other monolayer coatings, was multilayered in the present study with
the newest-generation coatings of titanium boron nitride (TiBN), and titanium silicon
nitride (TiSiN), which have been noted to keep excellent properties (high hardness, low
friction coefficient, and high oxidation and corrosion resistances; Ding et al. 2006, Chang
et al. 2007). Multilayer coatings of TiAlN/TiBN, and TiAlN/TiSiN were synthesized onto
the surface of K10 tungsten carbide using the arc-ion plating method, and the multilayer-
coated tools were experimentally investigated for their possible use in machining
mersawa wood and particleboard. The purpose of this study was to investigate the
clearance wear characteristics of these tools in the high-speed cutting of mersawa wood
and particleboard.
Materials and Method
Multilayer-coated cutting tools and work materials
General specifications of the multilayer-coated cutting tools tested and the materials
machined are shown in Tables 1 and 2, respectively. The K10 carbide tool (90% WC,
10% Co) that was selected as a substrate was 7 mm long, 4 mm width, and 2 mm thick.
The hardness of the K10 was measured to be 1450 HV. The 13° rake and 5° clearance
angles used in this experiment is now being commercially produced especially for cutting
wood and wood-based materials. The K10 carbides were coated with a monolayer
coating of TiAlN and multilayer coatings of TiAlN/TiBN, and TiAlN/TiSiN by the arc-
ion plating method on both rake and clearance faces. The multilayer coatings were
deposited onto the surface of K10 in a thickness of 3 μm (1.5 μm of TiAlN coating above
the substrate and 1.5 μm of TiBN, or TiSiN above the TiAlN layer).
Table 1.—Specifications of the coated carbide tools tested.a
Coating
material
Film thickness
(μm)
Hardness
(HV)
Oxidation
temperature
Friction
coefficient
Uncoated K10 1450
TiAlN 3 2800 Start at 800°C 0.8
TiAlN/TiBN 3 2700 Start at 800°C 0.6
TiAlN/TiSiN 3 3600 Start at 1100°C 0.9 aFilm thickness was targeted. Hardness, oxidation temperature, and friction coefficient
values were measured according to ASTM E2546 (ASTM International 2009a), ASTM
G111 (ASTM International 2006), and ASTM G99 (ASTM International 2010),
respectively
Table 2.—Specifications of the particleboard machined.
Characteristica Particleboard Mersawa
Thickness (mm) 15 50
Moisture content (%) 8 12
Density (g/cm3) 0.61 0.80
Silicate content (%) 1.86 1.00 aSilicate contents were measured according to TAPPI T211 om-85 (TAPPI 1991).
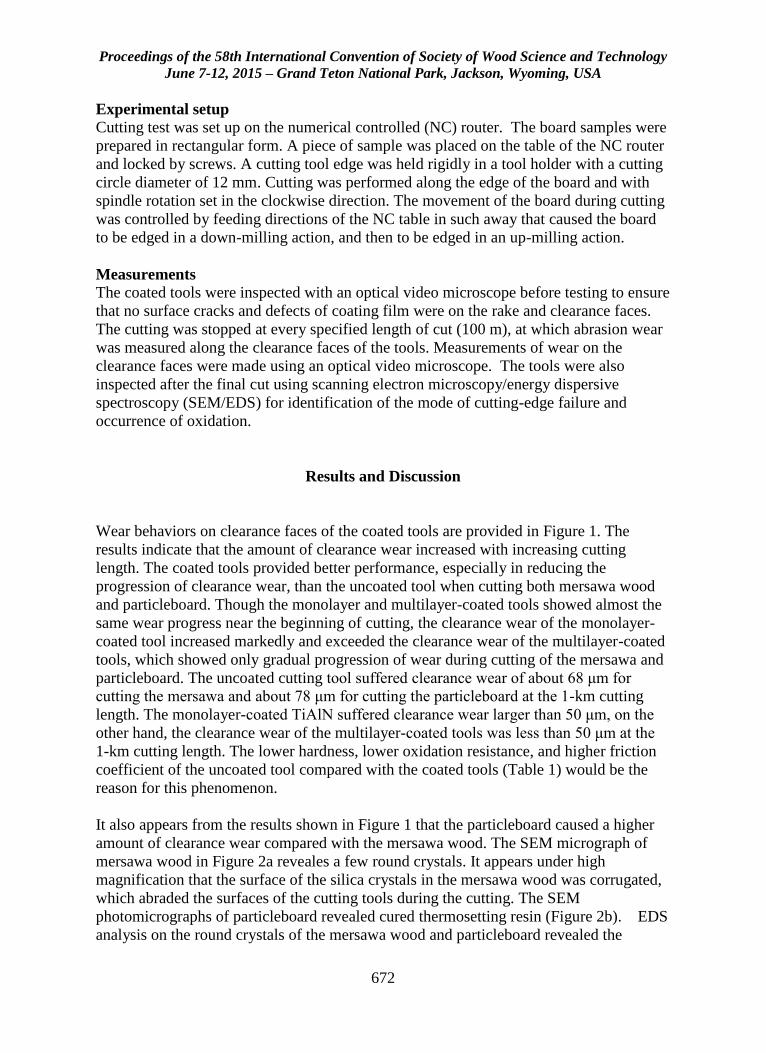
Proceedings of the 58th International Convention of Society of Wood Science and Technology
June 7-12, 2015 – Grand Teton National Park, Jackson, Wyoming, USA
672
Experimental setup
Cutting test was set up on the numerical controlled (NC) router. The board samples were
prepared in rectangular form. A piece of sample was placed on the table of the NC router
and locked by screws. A cutting tool edge was held rigidly in a tool holder with a cutting
circle diameter of 12 mm. Cutting was performed along the edge of the board and with
spindle rotation set in the clockwise direction. The movement of the board during cutting
was controlled by feeding directions of the NC table in such away that caused the board
to be edged in a down-milling action, and then to be edged in an up-milling action.
Measurements
The coated tools were inspected with an optical video microscope before testing to ensure
that no surface cracks and defects of coating film were on the rake and clearance faces.
The cutting was stopped at every specified length of cut (100 m), at which abrasion wear
was measured along the clearance faces of the tools. Measurements of wear on the
clearance faces were made using an optical video microscope. The tools were also
inspected after the final cut using scanning electron microscopy/energy dispersive
spectroscopy (SEM/EDS) for identification of the mode of cutting-edge failure and
occurrence of oxidation.
Results and Discussion
Wear behaviors on clearance faces of the coated tools are provided in Figure 1. The
results indicate that the amount of clearance wear increased with increasing cutting
length. The coated tools provided better performance, especially in reducing the
progression of clearance wear, than the uncoated tool when cutting both mersawa wood
and particleboard. Though the monolayer and multilayer-coated tools showed almost the
same wear progress near the beginning of cutting, the clearance wear of the monolayer-
coated tool increased markedly and exceeded the clearance wear of the multilayer-coated
tools, which showed only gradual progression of wear during cutting of the mersawa and
particleboard. The uncoated cutting tool suffered clearance wear of about 68 μm for
cutting the mersawa and about 78 μm for cutting the particleboard at the 1-km cutting
length. The monolayer-coated TiAlN suffered clearance wear larger than 50 μm, on the
other hand, the clearance wear of the multilayer-coated tools was less than 50 μm at the
1-km cutting length. The lower hardness, lower oxidation resistance, and higher friction
coefficient of the uncoated tool compared with the coated tools (Table 1) would be the
reason for this phenomenon.
It also appears from the results shown in Figure 1 that the particleboard caused a higher
amount of clearance wear compared with the mersawa wood. The SEM micrograph of
mersawa wood in Figure 2a reveales a few round crystals. It appears under high
magnification that the surface of the silica crystals in the mersawa wood was corrugated,
which abraded the surfaces of the cutting tools during the cutting. The SEM
photomicrographs of particleboard revealed cured thermosetting resin (Figure 2b). EDS
analysis on the round crystals of the mersawa wood and particleboard revealed the
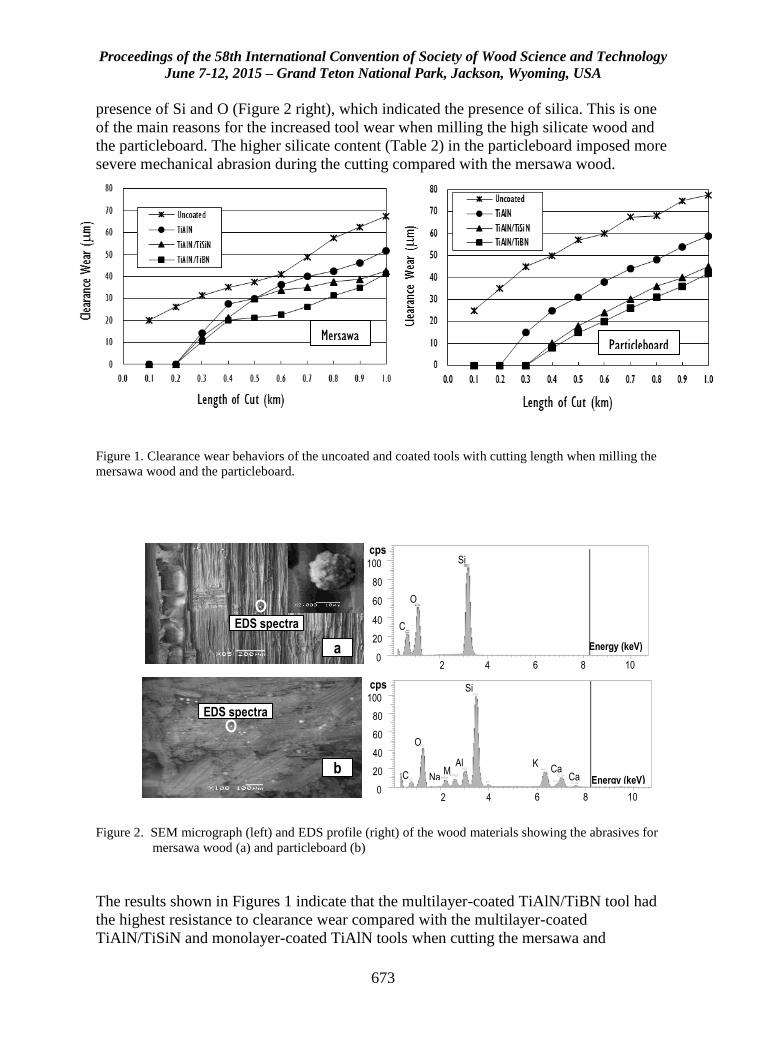
Proceedings of the 58th International Convention of Society of Wood Science and Technology
June 7-12, 2015 – Grand Teton National Park, Jackson, Wyoming, USA
673
presence of Si and O (Figure 2 right), which indicated the presence of silica. This is one
of the main reasons for the increased tool wear when milling the high silicate wood and
the particleboard. The higher silicate content (Table 2) in the particleboard imposed more
severe mechanical abrasion during the cutting compared with the mersawa wood.
Figure 1. Clearance wear behaviors of the uncoated and coated tools with cutting length when milling the
mersawa wood and the particleboard.
Figure 2. SEM micrograph (left) and EDS profile (right) of the wood materials showing the abrasives for
mersawa wood (a) and particleboard (b)
The results shown in Figures 1 indicate that the multilayer-coated TiAlN/TiBN tool had
the highest resistance to clearance wear compared with the multilayer-coated
TiAlN/TiSiN and monolayer-coated TiAlN tools when cutting the mersawa and
Particleboard Mersawa
2 4 6 8 10
Energy (keV) 0
20
40
60
80
100
cps Si
K
Ca
Al
Na Mg
O
C Ca
2 4 6 8 10
Energy (keV) 0
20
40
60
80
100
cps Si
O
C
EDS spectra
b
EDS spectra
a
EDS spectra
a
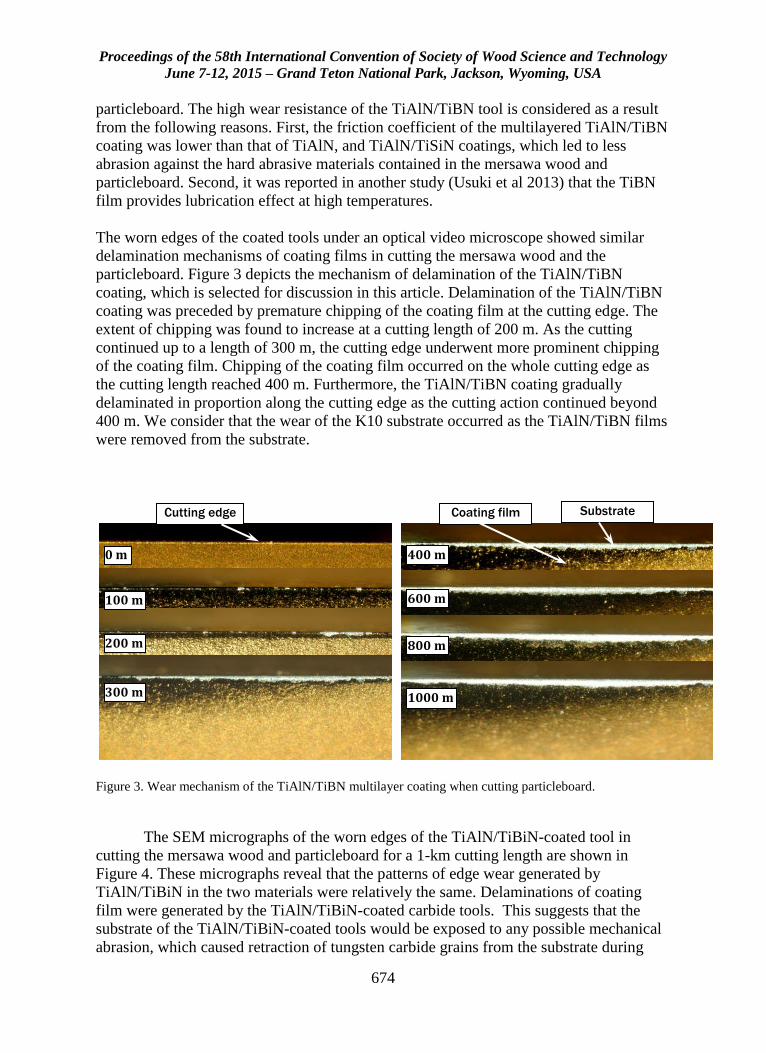
Proceedings of the 58th International Convention of Society of Wood Science and Technology
June 7-12, 2015 – Grand Teton National Park, Jackson, Wyoming, USA
674
particleboard. The high wear resistance of the TiAlN/TiBN tool is considered as a result
from the following reasons. First, the friction coefficient of the multilayered TiAlN/TiBN
coating was lower than that of TiAlN, and TiAlN/TiSiN coatings, which led to less
abrasion against the hard abrasive materials contained in the mersawa wood and
particleboard. Second, it was reported in another study (Usuki et al 2013) that the TiBN
film provides lubrication effect at high temperatures.
The worn edges of the coated tools under an optical video microscope showed similar
delamination mechanisms of coating films in cutting the mersawa wood and the
particleboard. Figure 3 depicts the mechanism of delamination of the TiAlN/TiBN
coating, which is selected for discussion in this article. Delamination of the TiAlN/TiBN
coating was preceded by premature chipping of the coating film at the cutting edge. The
extent of chipping was found to increase at a cutting length of 200 m. As the cutting
continued up to a length of 300 m, the cutting edge underwent more prominent chipping
of the coating film. Chipping of the coating film occurred on the whole cutting edge as
the cutting length reached 400 m. Furthermore, the TiAlN/TiBN coating gradually
delaminated in proportion along the cutting edge as the cutting action continued beyond
400 m. We consider that the wear of the K10 substrate occurred as the TiAlN/TiBN films
were removed from the substrate.
Figure 3. Wear mechanism of the TiAlN/TiBN multilayer coating when cutting particleboard.
The SEM micrographs of the worn edges of the TiAlN/TiBiN-coated tool in
cutting the mersawa wood and particleboard for a 1-km cutting length are shown in
Figure 4. These micrographs reveal that the patterns of edge wear generated by
TiAlN/TiBiN in the two materials were relatively the same. Delaminations of coating
film were generated by the TiAlN/TiBiN-coated carbide tools. This suggests that the
substrate of the TiAlN/TiBiN-coated tools would be exposed to any possible mechanical
abrasion, which caused retraction of tungsten carbide grains from the substrate during
0 m
100 m
200 m
300 m
400 m
600 m
800 m
1000 m
Cutting edge Coating film Substrate
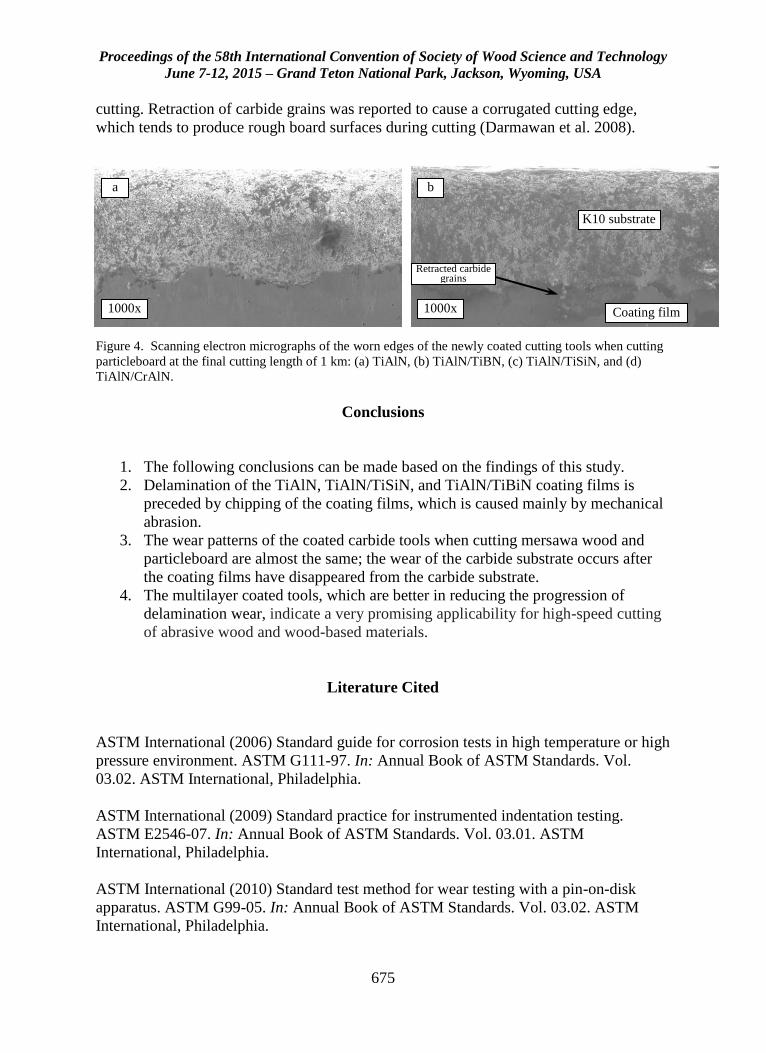
Proceedings of the 58th International Convention of Society of Wood Science and Technology
June 7-12, 2015 – Grand Teton National Park, Jackson, Wyoming, USA
675
cutting. Retraction of carbide grains was reported to cause a corrugated cutting edge,
which tends to produce rough board surfaces during cutting (Darmawan et al. 2008).
Figure 4. Scanning electron micrographs of the worn edges of the newly coated cutting tools when cutting
particleboard at the final cutting length of 1 km: (a) TiAlN, (b) TiAlN/TiBN, (c) TiAlN/TiSiN, and (d)
TiAlN/CrAlN.
Conclusions
1. The following conclusions can be made based on the findings of this study.
2. Delamination of the TiAlN, TiAlN/TiSiN, and TiAlN/TiBiN coating films is
preceded by chipping of the coating films, which is caused mainly by mechanical
abrasion.
3. The wear patterns of the coated carbide tools when cutting mersawa wood and
particleboard are almost the same; the wear of the carbide substrate occurs after
the coating films have disappeared from the carbide substrate.
4. The multilayer coated tools, which are better in reducing the progression of
delamination wear, indicate a very promising applicability for high-speed cutting
of abrasive wood and wood-based materials.
Literature Cited
ASTM International (2006) Standard guide for corrosion tests in high temperature or high
pressure environment. ASTM G111-97. In: Annual Book of ASTM Standards. Vol.
03.02. ASTM International, Philadelphia.
ASTM International (2009) Standard practice for instrumented indentation testing.
ASTM E2546-07. In: Annual Book of ASTM Standards. Vol. 03.01. ASTM
International, Philadelphia.
ASTM International (2010) Standard test method for wear testing with a pin-on-disk
apparatus. ASTM G99-05. In: Annual Book of ASTM Standards. Vol. 03.02. ASTM
International, Philadelphia.
1000x
a
K10 substrate
1000x
b
Coating film
Retracted carbide grains
Proceedings of the 58th International Convention of Society of Wood Science and Technology
June 7-12, 2015 – Grand Teton National Park, Jackson, Wyoming, USA
676
Banh T L, Phan QT, and Nguyen DB (2004) Wear mechanisms of PVD coated HSS end-
mills used to machine 1045 hardened steel. Adv. Technol. Mater. Mater. Process.
6(2):244–249.
Chang CL, Chen WC, Tsai PC, Ho WY, and Wang DY (2007) Characteristics and
performance of TiSiN/TiAlN multilayer coatings synthesized by cathodic arc plasma
evaporation. Surf. Coat. Technol. 202(7):987–992.
Darmawan W, Tanaka C, Usuki H, Ohtani T (2001) Performance of coated carbide tools
when grooving wood-based materials : Effect of work materials and coating materials on
the wear resistance of coated carbide tools. J. Wood Science. Vol. 47 (2) : 94 - 101
Darmawan W, Rahayu I, Nandika D, Marchal R (2012) The Importance of Extractives
and Abrasives in Wood Materials on the Wearing of Wood Cutting Tools. Journal of
BioResources. Vol 7 (4) : 4715 – 4729
Ding XZ, Tan ALK, Zeng XT, Wang C, Yue T, and Sun CQ (2006) Corrosion resistance
of CrAlN and TiAlN coatings deposited by lateral rotating cathode arc. Thin Solid Films
516:987–992.
Fuch I and Raatz C (1997) Study of wear behavior of specially coated (CVD, PACVD)
cemented carbide tools while milling of wood-based materials. In: Proceedings of the
13th International Wood Machining Seminar. University of British Columbia,
Vancouver, B.C., Canada, June 17-19, pp 709–715.
Salje E and Stuehmeier W (1988) Milling particleboard with high hard cutting materials.
In: Proceedings of the Ninth International Wood Machining Seminar. University of
California Forest Products Laboratory, Richmond, California, October 10-12, pp 211–
228.
Sheikh-Ahmad JY and Bailey JA (1999) High-temperature wear of cemented tungsten
carbide tools while machining particleboard and fiberboard. J. Wood Sci. 45(6):445–455.
Sheikh-Ahmad JY and Stewart JS (1995) Performance of different PVD coated tungsten
carbide tools in the continuous machining of particleboard. In: Proceedings of the 12th
International Wood Machining Seminar. Kyoto University, Kyoto, Japan, October 2 – 4,
pp 282–291.
Stewart HA (1992) High-temperature halogenation of tungsten carbide cobalt tool
material when machining medium density fiberboard. Forest Prod. J. 42(10):27–31.
TAPPI (1991) TAPPI Test Methods: Ash in Wood and Pulp (T211 om-85), Vol. 1.
TAPPI Press, Atlanta.
Usuki H, Uehara K, Isaka M, and Kubota K (2013) Machining of Inconel 718 with
Lubricant-Coated Tool. Int. J. of Automation Technology, 7 (3) : 306-312

Proceedings of the 58th International Convention of Society of Wood Science and Technology
June 7-12, 2015 – Grand Teton National Park, Jackson, Wyoming, USA
677
Acknowledgments
The authors thank the Directorate of Research and Community Service of the Ministry of
Research and Technology for the Republic of Indonesia for the research grant, and
Hitachi Tool Engineering Ltd. Japan for preparing the coated cutting tools
Proceedings of the 58th International Convention of Society of Wood Science and Technology
June 7-12, 2015 – Grand Teton National Park, Jackson, Wyoming, USA
678
Influence of Wetting on Surface Quality during Scots Pine
Planing
Victor Grubîi 1* – Micael Öhman 2 – Mats Ekevad 3
1 Master student Luleå University of Technology, Skellefteå, Sweden
* Corresponding author
[email protected] 2 Lecturer Luleå University of Technology, Skellefteå, Sweden
[email protected] 3 Professor Luleå University of Technology, Skellefteå, Sweden
Abstract
Planing of timber in the sawmill industry are decisive for the quality of the final products.
An important issue represents the torn grain defect while planing dried Scots pine timber.
The defect is characterized by a splintered wood surface occurring usually around knots,
where the fibers orientation is nearly perpendicular to the cutting direction.
The aim of this study was to establish how wood wetting processes influenced the
occurrence of planing defects, especially the torn grain defect. For surface quality
characterization, 120 surfaces were analyzed when dry and wet planing using a
qualitative method and graded based on ASTM D1666-11 standard procedures. Due to
its limitations, a separate quantitative assessment method was proposed for application
and compared with the qualitative method. The quantitative assessment was based on a
mechanical measurement of the torn grain parameters and grading classes based on
quantification of the qualitative assessment grades.
Both assessment methods showed slight improvements in surface quality assessment after
the wetting processes mainly because of positive impact of wetting on planing of the
disturbances zones in wood. Results have shown that with increasing of the wetting time
there is an increase in moisture penetration depth too which affects negatively the surface
quality after planing. Overall, the qualitative assessment tends to be more accurate for
general surface quality assessment while the quantitative method has the main focus on
torn grain defect characterization.
Key words: torn grain, fuzzy grain, surface quality, planing defects, moisture content
Proceedings of the 58th International Convention of Society of Wood Science and Technology
June 7-12, 2015 – Grand Teton National Park, Jackson, Wyoming, USA
679
1. Introduction
During wood machining and especially during planing, surface defects may occur. The
possibility of the wood to be integrated in finished products like furniture depends on the
degree of the defects. Accordingly, methods to reduce defects on wood surface are in
much demand.
The present study is focused on torn grain occurrence while planing kiln dried Scots pine
(Pinus sylvestris L.) wood. The defect is characterized by a splintered wood surface
where small particles have been broken or lifted from the surface. This happens when the
knives are working against the grain, usually around knots (Davim, 2011). The main
factor in torn grain occurrence, the grain orientation, was confirmed by Goli et al. (2008)
which refers to different chips types formation by cutting at different grain angles, worst
chip formation being represented by cutting at 90o grain orientation with increased depth
of cut. A specific cause for torn grain occurrence represents the typically increased timber
feed speeds in modern sawmill lines, 50-150 m/min (Jackson et al. 2006).
Another reason for torn grain occurrence which makes the problem statement of the
current study, is the material low moisture content, 6-8%, at which the material could be
too brittle and sudden changes in the grain orientation cause the surface fibers avulsion –
torn grain defect. On the other hand, if the material has too high moisture content, other
defects of planing might occur (Davim 2011 such as fuzzy and raised grain. Fuzzy grain
is characterized by a group of fibers that have not been cleanly cut and still remains
lifted. Raised grain is a defect that appears afterwards the planing process and occurs
because of density variation in the growth rings where denser latewood cells compress
the lower density earlywood cells that will expand to their original shape because of
moisture variations after planing. These defects occur because of improper machining
conditions like worn knives, insufficient clearance angle, excessive pressure on the
feeding rolls and/or high moisture content of wood, 20% or more (Davim, 2011).
According to Aguilera and Martin (2001), the most important input parameters in the
planing process are the wood species, grain orientation, cutting depth, feed rate and
cutting speed. According to Dinwoodie (2000), increasing moisture content from zero up
to fiber saturation point, result in a linear loss in stiffness, further increase in moisture
content having no influence in stiffness.
The aim of this study, is to ascertain if a wetting process can reduce torn grain and
improve the quality of the wood surface.
In order to characterize wood surface quality there are several methods such as:
Mechanical contact (Kirsch et al. 1999), Artificial vision (Garrido et al. 2007), Pneumatic
(Mothe 1985), Friction (Davim 2011) and Visio-Touch (Triboulot 1984) but due to wood
anisotropy none of them seems to be perfectly suitable (Davim 2011), each one having its
advantages and disadvantages (Lemaster 1995). In both planing industry and for clients,
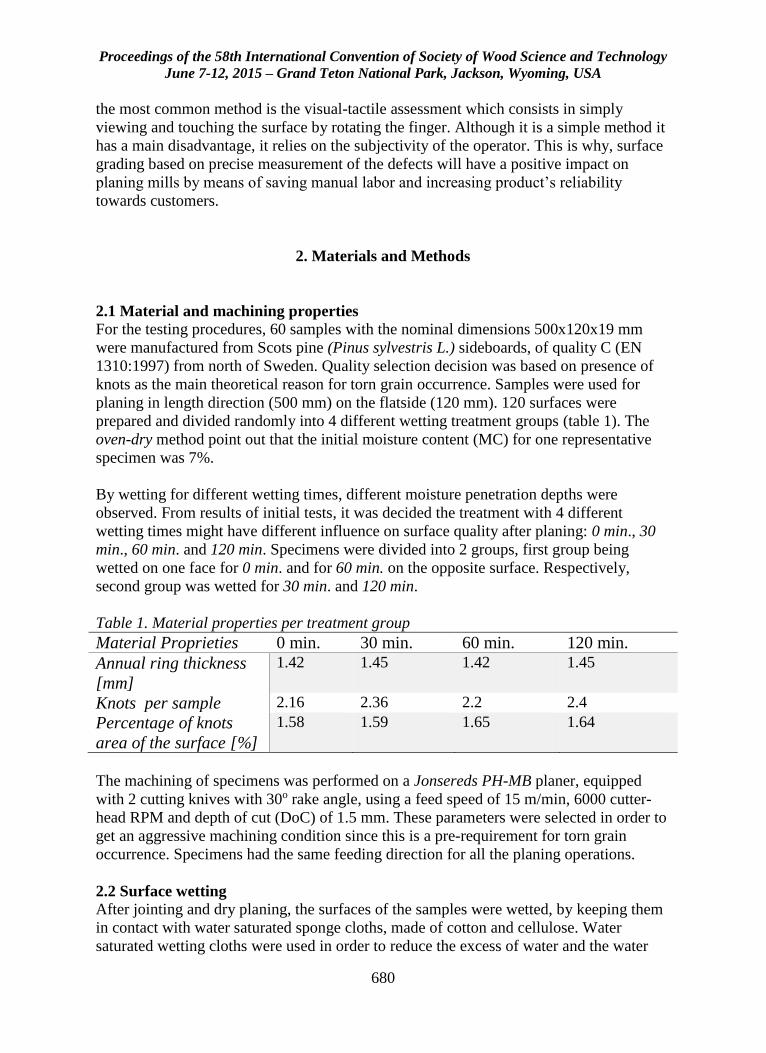
Proceedings of the 58th International Convention of Society of Wood Science and Technology
June 7-12, 2015 – Grand Teton National Park, Jackson, Wyoming, USA
680
the most common method is the visual-tactile assessment which consists in simply
viewing and touching the surface by rotating the finger. Although it is a simple method it
has a main disadvantage, it relies on the subjectivity of the operator. This is why, surface
grading based on precise measurement of the defects will have a positive impact on
planing mills by means of saving manual labor and increasing product’s reliability
towards customers.
2. Materials and Methods
2.1 Material and machining properties
For the testing procedures, 60 samples with the nominal dimensions 500x120x19 mm
were manufactured from Scots pine (Pinus sylvestris L.) sideboards, of quality C (EN
1310:1997) from north of Sweden. Quality selection decision was based on presence of
knots as the main theoretical reason for torn grain occurrence. Samples were used for
planing in length direction (500 mm) on the flatside (120 mm). 120 surfaces were
prepared and divided randomly into 4 different wetting treatment groups (table 1). The
oven-dry method point out that the initial moisture content (MC) for one representative
specimen was 7%.
By wetting for different wetting times, different moisture penetration depths were
observed. From results of initial tests, it was decided the treatment with 4 different
wetting times might have different influence on surface quality after planing: 0 min., 30
min., 60 min. and 120 min. Specimens were divided into 2 groups, first group being
wetted on one face for 0 min. and for 60 min. on the opposite surface. Respectively,
second group was wetted for 30 min. and 120 min.
Table 1. Material properties per treatment group
Material Proprieties 0 min. 30 min. 60 min. 120 min.
Annual ring thickness
[mm]
1.42 1.45 1.42 1.45
Knots per sample 2.16 2.36 2.2 2.4
Percentage of knots
area of the surface [%]
1.58 1.59 1.65 1.64
The machining of specimens was performed on a Jonsereds PH-MB planer, equipped
with 2 cutting knives with 30o rake angle, using a feed speed of 15 m/min, 6000 cutter-
head RPM and depth of cut (DoC) of 1.5 mm. These parameters were selected in order to
get an aggressive machining condition since this is a pre-requirement for torn grain
occurrence. Specimens had the same feeding direction for all the planing operations.
2.2 Surface wetting
After jointing and dry planing, the surfaces of the samples were wetted, by keeping them
in contact with water saturated sponge cloths, made of cotton and cellulose. Water
saturated wetting cloths were used in order to reduce the excess of water and the water
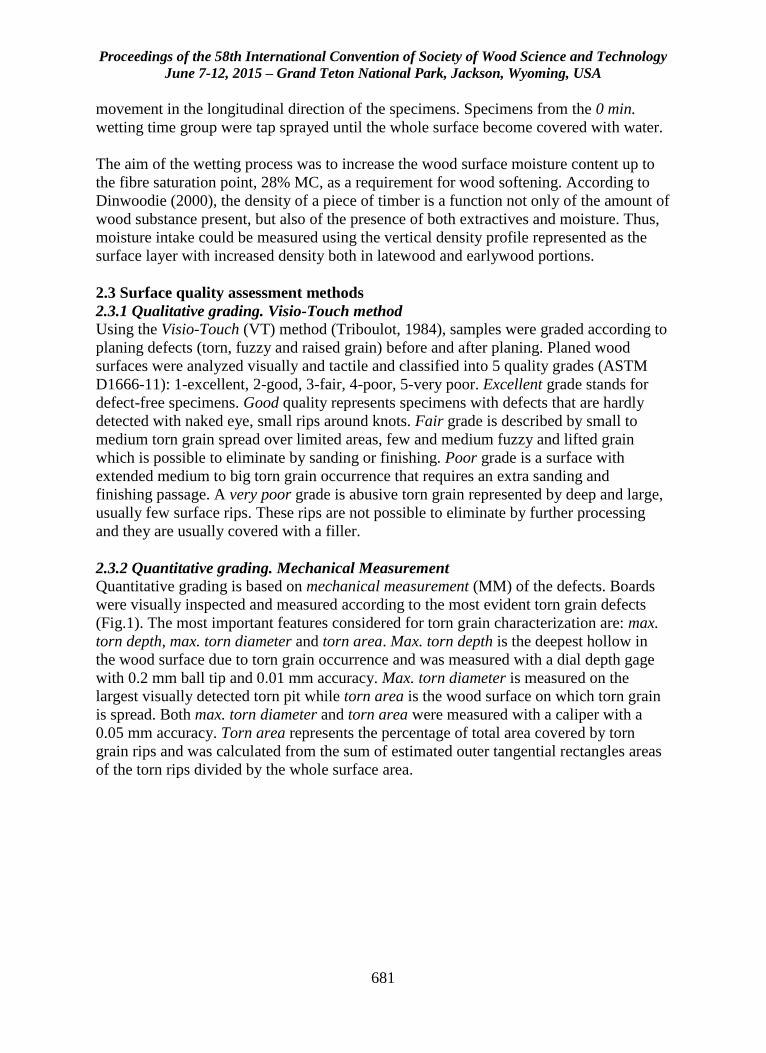
Proceedings of the 58th International Convention of Society of Wood Science and Technology
June 7-12, 2015 – Grand Teton National Park, Jackson, Wyoming, USA
681
movement in the longitudinal direction of the specimens. Specimens from the 0 min.
wetting time group were tap sprayed until the whole surface become covered with water.
The aim of the wetting process was to increase the wood surface moisture content up to
the fibre saturation point, 28% MC, as a requirement for wood softening. According to
Dinwoodie (2000), the density of a piece of timber is a function not only of the amount of
wood substance present, but also of the presence of both extractives and moisture. Thus,
moisture intake could be measured using the vertical density profile represented as the
surface layer with increased density both in latewood and earlywood portions.
2.3 Surface quality assessment methods
2.3.1 Qualitative grading. Visio-Touch method
Using the Visio-Touch (VT) method (Triboulot, 1984), samples were graded according to
planing defects (torn, fuzzy and raised grain) before and after planing. Planed wood
surfaces were analyzed visually and tactile and classified into 5 quality grades (ASTM
D1666-11): 1-excellent, 2-good, 3-fair, 4-poor, 5-very poor. Excellent grade stands for
defect-free specimens. Good quality represents specimens with defects that are hardly
detected with naked eye, small rips around knots. Fair grade is described by small to
medium torn grain spread over limited areas, few and medium fuzzy and lifted grain
which is possible to eliminate by sanding or finishing. Poor grade is a surface with
extended medium to big torn grain occurrence that requires an extra sanding and
finishing passage. A very poor grade is abusive torn grain represented by deep and large,
usually few surface rips. These rips are not possible to eliminate by further processing
and they are usually covered with a filler.
2.3.2 Quantitative grading. Mechanical Measurement
Quantitative grading is based on mechanical measurement (MM) of the defects. Boards
were visually inspected and measured according to the most evident torn grain defects
(Fig.1). The most important features considered for torn grain characterization are: max.
torn depth, max. torn diameter and torn area. Max. torn depth is the deepest hollow in
the wood surface due to torn grain occurrence and was measured with a dial depth gage
with 0.2 mm ball tip and 0.01 mm accuracy. Max. torn diameter is measured on the
largest visually detected torn pit while torn area is the wood surface on which torn grain
is spread. Both max. torn diameter and torn area were measured with a caliper with a
0.05 mm accuracy. Torn area represents the percentage of total area covered by torn
grain rips and was calculated from the sum of estimated outer tangential rectangles areas
of the torn rips divided by the whole surface area.
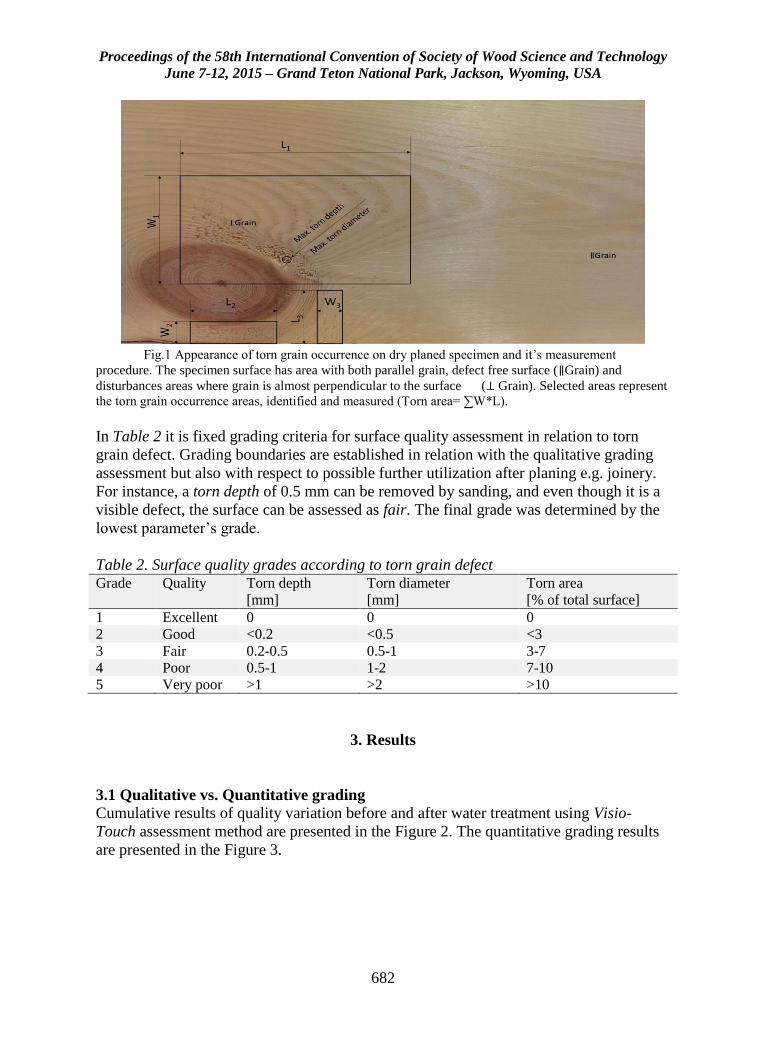
Proceedings of the 58th International Convention of Society of Wood Science and Technology
June 7-12, 2015 – Grand Teton National Park, Jackson, Wyoming, USA
682
Fig.1 Appearance of torn grain occurrence on dry planed specimen and it’s measurement
procedure. The specimen surface has area with both parallel grain, defect free surface (∥Grain) and
disturbances areas where grain is almost perpendicular to the surface (⊥ Grain). Selected areas represent
the torn grain occurrence areas, identified and measured (Torn area= ∑W*L).
In Table 2 it is fixed grading criteria for surface quality assessment in relation to torn
grain defect. Grading boundaries are established in relation with the qualitative grading
assessment but also with respect to possible further utilization after planing e.g. joinery.
For instance, a torn depth of 0.5 mm can be removed by sanding, and even though it is a
visible defect, the surface can be assessed as fair. The final grade was determined by the
lowest parameter’s grade.
Table 2. Surface quality grades according to torn grain defect Grade Quality Torn depth
[mm]
Torn diameter
[mm]
Torn area
[% of total surface]
1 Excellent 0 0 0
2 Good <0.2 <0.5 <3
3 Fair 0.2-0.5 0.5-1 3-7
4 Poor 0.5-1 1-2 7-10
5 Very poor >1 >2 >10
3. Results
3.1 Qualitative vs. Quantitative grading Cumulative results of quality variation before and after water treatment using Visio-
Touch assessment method are presented in the Figure 2. The quantitative grading results
are presented in the Figure 3.
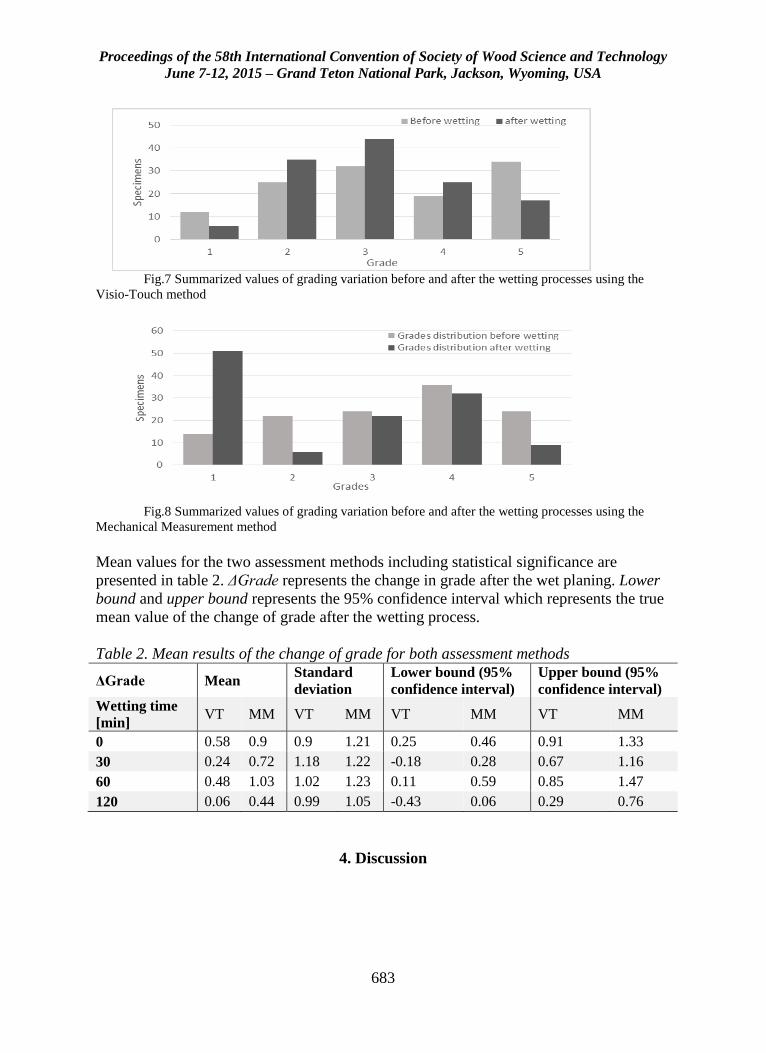
Proceedings of the 58th International Convention of Society of Wood Science and Technology
June 7-12, 2015 – Grand Teton National Park, Jackson, Wyoming, USA
683
Fig.7 Summarized values of grading variation before and after the wetting processes using the
Visio-Touch method
Fig.8 Summarized values of grading variation before and after the wetting processes using the
Mechanical Measurement method
Mean values for the two assessment methods including statistical significance are
presented in table 2. ΔGrade represents the change in grade after the wet planing. Lower
bound and upper bound represents the 95% confidence interval which represents the true
mean value of the change of grade after the wetting process.
Table 2. Mean results of the change of grade for both assessment methods
ΔGrade Mean Standard
deviation
Lower bound (95%
confidence interval)
Upper bound (95%
confidence interval)
Wetting time
[min] VT MM VT MM VT MM VT MM
0 0.58 0.9 0.9 1.21 0.25 0.46 0.91 1.33
30 0.24 0.72 1.18 1.22 -0.18 0.28 0.67 1.16
60 0.48 1.03 1.02 1.23 0.11 0.59 0.85 1.47
120 0.06 0.44 0.99 1.05 -0.43 0.06 0.29 0.76
4. Discussion
Proceedings of the 58th International Convention of Society of Wood Science and Technology
June 7-12, 2015 – Grand Teton National Park, Jackson, Wyoming, USA
684
4.1 Qualitative grading
Mean results of the qualitative grading using the Visio-Touch method show slight
improvements for 0 min. and 60 min. wetting time groups while for 30 min. and 120 min.
wetting time the differences after treatment were not significant. The reason is not only
because of torn grain occurrence but also due to other defects created when planing wood
with increased moisture content e.g. fuzzy grain or lifted grain. A general behavior after
planing of a wetted surface in relation to defects zones being that the torn occurrence will
be substituted by the fuzzy or lifted grain defect which is essentially not a destruction of
the surface but rather a deficient processing which can be removed in further processing
stages e.g. by sanding and finishing.
The most positive results have been registered with the 0 min. wetting time, with water
spraying of the specimens which can be assessed as very positive with respect to
implementation into production. A general behavior of surface quality after wetting
processes will be that the number of 1st and the 5th graded surfaces will be significantly
reduced while “middle” grades will be uniformly increased, Fig.2. The conclusion is that
the method should be used only for the lowest grade surfaces.
4.2 Quantitative grading
Differently from qualitative assessment, the results of the Mechanical measurement
method reflect only the changes in surface quality according to torn grain occurrence.
Respectively, the results show slightly more significant improvements in surface quality.
All the wetting classes proved to have positive impact on torn grain occurrence, the true
mean values of grading parameters changes being positive. Hence, there is no significant
difference in parameters change between wetting times, but there is a small tendency
towards decreasing quality with increased wetting time.
Surprisingly, the best results with the Mechanical Measurement method were obtained
with 60 min. wetting time, the mean increase in surface quality of about 1 grade unit
proofing the positive effect of wood wetting in torn grain reduction. Similarly positive
impact could be observed on the other side of the same specimens, wetted for 0 min. It
can be concluded that the raw material features parameter has a more important impact
on surface quality modification than the wetting time itself.
Cumulative results of grades variation showed different behavior from qualitative
assessment in terms that the mean increase in surface quality is due to increase of 1st
graded specimens by 364% (Fig.3), the rest of grades frequency was lowered. This
indicates that in many cases the torn grain defect was eliminated or reduced to
insignificant sizes.
An interesting feature of the torn grain occurrence is that it happened always where grain
angle was not parallel to the surface and it was latewood portions where the torn grain
occurred. This indicates that denser material – latewood fibers, due to thicker cell walls,
need a much higher cutting force and it will produce fiber avulsion. Also, presence of
reaction wood close to the knots due to external stresses increases the difference between
cutting forces.
Proceedings of the 58th International Convention of Society of Wood Science and Technology
June 7-12, 2015 – Grand Teton National Park, Jackson, Wyoming, USA
685
5. Conclusions
The wetting process proofed to have slightly positive impact on surface quality when
planing Scots pine wood. Softening of the wood surface layer hindered the ripping of
fibers from surface, the torn grain defect. The disturbances zones, characteristic with torn
grain occurrence, after wet planing gathered a more „wooly” surface due to lifted fibers,
fuzzy grain defect. For particular uses, the fuzzy grain defect can be easier to „fix” by
further processes e.g. sanding and finishing. Wood wetting for short periods of time
appeared to be the most suitable for surface quality increase due to loss in cell walls
stiffness in top layers but also, keeping rather low, suitable moisture content in the
detachment zones.
The current study covered two grading methods for surface quality in relationship to torn
grain occurrence. Especially of interest for planing mills might be the quantitative
method which allows measurement and classification of the defects based on distinct
criteria. It can be said that despite the good correlation between the two methods, there is
need for completion of the mechanical measurement method from the fuzzy/raised grain
defect assessment perspective.
As a preliminary hypothetical study, current work was focused on torn grain
classification and identification of wetting processes influences on the surface quality of
wood. Future studies should be focused in detailed studies of the wood properties in the
disturbances zones and their surface quality behavior using different machining
properties.
References
1. Aguilera A.; Martin P. 2001. Machining qualification of solid wood of Fagus silvatica L.
And Picea excesa L.: cutting forces, power requirements and surface roughness. Holz als
Roh- und Werkstoff, vol. 59, no.6, pp. 483-488.
2. ASTM D1666-11. Standard Test Methods for Conducting Machining Tests of Wood and
Wood-Base Materials, ASTM International, West Conshohocken, PA, 2011
3. Davim J. P., 2011. Wood Machining. ISTE Ltd., London, UK
4. Dinwoodie JM., 2000. Timber; its nature and behavior. Second edition, Taylor&Francis,
Abingdom, UK
5. EN 1310:1997. Round and sawn timber – Method of measurement of features. European
standard.
6. Garrido N., Martins J., Carvalho L.H., Mendes J.G., Costa C.2007. Method of sawing
conditions on the quality of particleboard edges. Proceedings of the 18th International
Wood Machining Seminar, p.247-255, Vancouver, Canada.
7. Goli, G.; Fioravanti M.; Marchal R.; Uzielli L.; Busoni S. 2009. Up-milling and down-
milling wood with different grain orientations – the cutting forces behavior, Eur. J. Wood
Prod. (2010) 68:385-395.
Proceedings of the 58th International Convention of Society of Wood Science and Technology
June 7-12, 2015 – Grand Teton National Park, Jackson, Wyoming, USA
686
8. Jackson M.R.; Hynek P.; Parkin R.M. 2007. On planing machine engineering
characteristics and machined timber surface quality. Mechatronics Research Centre,
Loughborough University, Loughborough, Leicestershire, UK. ImecE Vol.221 Part E: J.
Process Mechanical Engineering.
9. Krish J., Csiha C. 1999. Analyzing wood surface roughness using an S3P perthometer
and computer based data processing. Proceedings of the 13th Sesja Naukowa Badania dla
Meblarstwa, Poland, p. 145-154.
10. Lemaster R.L. 1995.The use of an optical profilometer to monitor product quality in
wood and wood-based products. Proceedings of the Forest Products Society, p.33-42,
Madison, WI.
11. Mothe F., “Essai de comparaison de 3 méthodes de classement de surface bois massif
pour leur rugosité; méthodes pneumatique et sensorielle”, Annales des Sciences
Forestieres, col.42, no.4, p.435-452, 1985.
12. Triboulot P (1984). Réflexion sur les surfaces et mesures des états de surfaces du bois.
Annales des Sciences Forestière,vol.41, no.3, p.335-354,
13. Wyeth D.J.; Goli G.; Atkins A.G. 2009. Fracture toughness, chip types and the mechanics
of cutting wood. A review COST Action E35 2004-2008: Wood machining –
micromechanics and fracture. Holzforschung, Vol.63, pp. 168-180.
Acknowledgements
The first author wants to thank Åforsk foundation for financial support provided in order
to present the project results at the International Convention of SWST to be held in Jun 7-
12 2015 in Jackson, US (ref. nr 15-277).
Proceedings of the 58th International Convention of Society of Wood Science and Technology
June 7-12, 2015 – Grand Teton National Park, Jackson, Wyoming, USA
687
Fiber Properties Chain: From Cell Wall to
End Products Session Moderator: Jean-Michel Leban, INRA, France
Assessing Timber MOE&MOR in the Forest Resources:
What We Have Learnt During the Last Twenty Years
Jean-Michel Leban, [email protected]
INRA, 4 rue Giradet, Nancy 54000
Abstract
MOE, MOR and to a lesser extend wood density, are the main wood properties used by
engineers and architects for the dimensioning of wooden structures.
For a given construction market, it is possible to estimate the amount of timber that is
necessary for fulfilling the consumer demand. The question that arises is therefore» how
to produce the right raw material for the end users requirements?”
The recent development of non destructive testing technologies permits the low cost
measurement of timber MOE-MOR at the stand level in forests, and at the sawmill before
and after log conversion in boards and battens. During the same period scientists have
produced models that permit to simulate the variations of the timber properties by
quantifying the different sources of variability. In this paper we will review the main
results published during the last twenty years by considering the different studied tree
species and the geographic areas covered. After the identification of the patterns and
trends for the studies of the timber MOE-MOR and wood density variations, an attempt
will be made for (i) evaluating if today, forest managers know how to produce the right
raw material for the construction market and (ii) identifying the new research questions
that need now to be answered in the assessment of the timber properties from the present
and future forest resources.
Proceedings of the 58th International Convention of Society of Wood Science and Technology
June 7-12, 2015 – Grand Teton National Park, Jackson, Wyoming, USA
688
Bending Properties of Clear Bamboo Culm Material
from Three Species
Patrick Dixon, [email protected]
Arfa Aijazi, [email protected]
Sally Lin, [email protected]
Stephanie Chen, [email protected]
Peter Augusciak, [email protected]
Massachusetts Institute of Technology, 77 Massachusetts Avenue, Building
8-032, Cambridge, MA 02139
Abstract
Bamboo is a renewable, lingo-cellulosic resource, being studied for use as sustainable
construction material. The woody nature and size of timber bamboos, make them
appropriate for the fabrication of structural products, analogous to wood products. Here,
we compare the bending properties (modulus of elasticity, MOE, and modulus of rupture,
MOR) and the microstructure of three species of timber bamboo: Phyllostachys
pubescens, referred to as Moso; Guadua angustifolia, referred to as Guadua; and
Bambusa stenostachya, referred to as Tre Gai. Bamboo has a fiber-reinforced structure,
consisting of vascular bundles embedded in parenchyma cells. The vascular bundle
volume fraction increases radially (inside to outside of the culm wall) and longitudinally
(up the height of the culm), giving a structure of varying density. Bend specimens are cut
from different positions in culm materials to assess the effect of density on the axial
MOE and MOR. Initial results show similar MOR-density relationships for all three
species, with MORs between 50 MPa to 250 MPa. However, the MOE of the Guadua is
higher than the other species’ at a given density. The MOE and MOR are related to
microstructural models accounting for the varying fiber volume fraction. The
understanding of the differences among these species determined here will allow for
more informed selection of raw material for bamboo structural products. Sixth author:
Lorna Gibson [email protected]
Proceedings of the 58th International Convention of Society of Wood Science and Technology
June 7-12, 2015 – Grand Teton National Park, Jackson, Wyoming, USA
689
Tannin-Based Foams from the Bark of Coniferous
Species
Milan Sernek, [email protected]
Matjaž Čop, [email protected]
Antonio Pizzi, [email protected]
Marie-Pierre Laborie, [email protected]
University of Ljubljana, 101 Jamnikarjeva, 1000 Ljubljana
Abstract
The use of renewable resources has a positive impact on the conservation of nature, and
thus represents an important aspect of sustainability. The development of new bio-based
tannin foams could make a significant contribution to the more efficient use of forest
biomass resources. The objectives of this study was to characterize the curing kinetics of
tannin-based foams by means of differential scanning calorimetry (DSC), as well as also
to determine the influence of the individual components used to make up the foam on the
latter’s density, the structure of its pores, homogeneity, and compression strength, as well
as on the compression modulus of the foam. DSC revealed that increased amounts of
tannin slowed down the curing, whereas increased amounts of the catalyst accelerated the
curing reaction. The advanced isoconversional method appears to be an appropriate
model for the characterization of the curing kinetics of tannin-based foams. The
investigation of the foam properties revealed that the amount of cross-linker affected
homogeneity, and that the surfactant defined the foam morphology. Partial replacement
of pine tannin with spruce tannin led to a decreased compression strength and
compression modulus of the foam, but an increased proportion of the closed structure. It
was found that the main factor of the foaming reaction was the amount of polyphenols
present in the tannin extract.
Proceedings of the 58th International Convention of Society of Wood Science and Technology
June 7-12, 2015 – Grand Teton National Park, Jackson, Wyoming, USA
690
Comparison of Cost, Sustainability and Ecology for
Different Solid Wood Panels
Dietrich Buck, [email protected]
Xiaodong (Alice) Wang, [email protected]
Olle Hagman, [email protected]
Anders Gustafsson, [email protected]
Luleå University of Technology, Forskargatan 1, , Skellefteå 93155
Abstract
Wood is considered as a pure ‘‘sustainable’’ and ‘‘renewable’’ material. The increasing
use of wood for construction can have a positive impact on the sustainability of
constructions. There are various techniques to join solid wood into prefabricated panels
for construction. However, comparative market and economy studies are missing. In this
paper, the following techniques for the production of solid wood panels are compared:
Laminating, Nailing, Stapling, Screwing, Stress laminating, Doweling, Dovetailing and
Wood welding. The production costs, durability and ecological consideration have been
presented. This study is based on literatures and the reviews of 27 companies in 6
countries. The study shows that the techniques of solid wood construction are very
different. Cross Laminated Timber (CLT) scores the highest in terms of cost and
durability. For ecological fact, dovetailing is the best. Taking into account both durability
and ecological considerations, doweling is the best. These alternatives give some freedom
of choice regarding the visibility of surfaces and the efficient use of lower qualities of
timber. CLT is the most cost-effective, not patented and well-established option in the
market; the development of more health-friendly adhesives is still going on. Current
researches demonstrate an alternative: Wood welding. From the ecological point of view,
panels made exclusively of wood; no chemicals or no non-renewable resources are used.
Proceedings of the 58th International Convention of Society of Wood Science and Technology
June 7-12, 2015 – Grand Teton National Park, Jackson, Wyoming, USA
691
Anatomical, Physical and Mechanical Properties of
Transgenic Loblolly Pine
Zachary Miller, [email protected]
Ilona Peszlen, [email protected]
Perry Peralta, [email protected]
North Carolina State University, 3911 Greenleaf Street, Raleigh, NC 27695
Abstract
The forest industry is moving toward fast-grown plantation timber to keep up with raw
material needs and to reduce costs. Trees are being harvested at a younger age, producing
wood with a larger portion of juvenile wood, knots and reaction wood, corresponding
declines in modulus of elasticity (MOE) and modulus of rupture (MOR), and stability
issues associated with the shrinking and swelling differential between juvenile and
mature wood. The tree improvement industry utilizes good silvicultural methods along
with genetic manipulation and subsequent selection of elite clones as powerful tools with
the ultimate goal of enhancing tree growth while maintaining or increasing wood quality.
Wood anatomy and physical properties are major factors in the selection process. The
objectives of this study were to analyze mechanical, physical and anatomical properties
of these transgenics and compare them to the control. This investigation consisted of 55
sample trees from two control groups and three transgenic groups modified for increased
density. One elite transgenic group exhibited higher density and mechanical properties
and showed thicker tracheid walls with smaller diameter compared with the control.
Proceedings of the 58th International Convention of Society of Wood Science and Technology
June 7-12, 2015 – Grand Teton National Park, Jackson, Wyoming, USA
692
Hybrids of TEMPO Nanofibrillated Cellulose and
Copper Nanoparticles Embedded in Polyvinyl Alcohol
for Antimicrobial Applications
Tuhua Zhong1 - Gloria S. Oporto2* - Jacek Jaczynski3 - Changle Jiang1
1 PhD student, Division of Forestry and Natural Resources,
West Virginia University, Morgantown, WV 26506.
2 Assistant Professor, Division of Forestry and Natural Resources,
West Virginia University, Morgantown, WV 26506.
* Corresponding author
3 Associate Professor, Division of Animal and Nutritional Sciences,
West Virginia University, Morgantown, WV 26506.
Abstract
Copper nanoparticles on TEMPO nanofibrillated cellulose (TNFC) and on
carboxymethyl cellulose (CMC) templates were successfully synthesized. Polyvinyl
alcohol (PVA) films embedded with the resulting hybrids of cellulose-copper
nanoparticles were prepared by solvent casting method. Antimicrobial testing
demonstrated that both PVA composite films have excellent antimicrobial properties
against E.coli DH 5Approximately 90% less cellulosic material was required when
using TNFC as template compared to CMC template to get similar films antimicrobial
performance. The maximum thermal decomposition temperature of the films increased
18 and 25 when TNFC-copper nanoparticles and CMC-copper nanoparticles were
incorporated into the films. Likely, compared to pure PVA, the storage modulus at 48
resulted enhanced up to 164% and 217% after the incorporation of the hybrid materials.
The results shows that both hybrid cellulose-copper nanoparticles materials have
potentiality to be used as advanced antimicrobial and reinforcing materials for
thermoplastic composite applications.
Keywords: TEMPO nanofibrillated cellulose, Carboxymethyl cellulose, Polyvinyl
alcohol, copper nanoparticles, antimicrobial properties, reinforcement material.
Proceedings of the 58th International Convention of Society of Wood Science and Technology
June 7-12, 2015 – Grand Teton National Park, Jackson, Wyoming, USA
693
Introduction
Cellulosic micro- and nanomaterials have been effectively used to improve mechanical
properties of several thermoplastic resins (Chakraborty et al 2006; Lee et al 2009; Liu et
al 2014). The feasibility to improve also the antimicrobial properties of those films will
open novel opportunities of applications that range from packing, medical, safety, etc.
Copper has been used as antimicrobial agent since antiquity; metallic copper and copper
oxides have demonstrated effective antimicrobial activities against a broad spectrum of
microorganisms, fungi and viruses (Borkow and Gabbay 2009). In contrast to the low
sensitivity of human tissue to copper (Hostynek and Maibach 2004), prokaryotes (ie,
bacteria) are extremely susceptible to copper. There are a growing number of researches
on the synthesis of metallic nanoparticles using cellulose as a stabilizer and nanoreactor
(Padalkar et al 2010; Zhong et al 2013). However, little knowledge is reported on the
effects of this type of hybrid cellulose-copper nanoparticles materials on thermoplastic
resins and films.
The main objective of this work consisted on to evaluate the antimicrobial performance,
thermal and mechanical properties of polyvinyl alcohol films after the incorporation of
hybrid materials composed of carboxylate cellulose and copper nanoparticles. Because of
their unique properties, such as light weight, high strength, biodegradability,
biocompatibility and carboxylic group availability, carboxymethyl cellulose (CMC) and
2,2,6,6-tetramethylpiperidine-1-oxyl radical (TEMPO) nanofibrillated cellulose were
chosen as template to attach copper nanoparticles.
Materials and Methods
Preparation of the hybrid TNFC-copper nanoparticles
Hybrid TNFC-copper nanoparticles was prepared by introducing copper nanoparticles on
TNFC substrate by the chemical reduction of cupric ions (Zhong et al. 2013 modified
procedure).
Preparation of the hybrid CMC-copper nanoparticles
The general procedure used for the preparation of the hybrid CMC-copper nanoparticles
has been described previously (Zhong et al 2013).
Preparation of PVA/TNFC-copper nanoparticles and PVA/CMC-copper
nanoparticles films
Polyvinyl alcohol (99-100% hydrolyzed, approx. M.W. 86000; Sigma Aldrich, St. Louis,
MO)/TNFC-copper nanoparticle and PVA/CMC-copper nanoparticles films were
prepared by solvent casting method described by Cheng et al (2007). The components of
the films are presented in Table 1. Control films of PVA/TNFC and PVA/CMC were also
prepared.
Proceedings of the 58th International Convention of Society of Wood Science and Technology
June 7-12, 2015 – Grand Teton National Park, Jackson, Wyoming, USA
694
Table 1. Weight percentage (wt%) of main element to the total weight of PVA, cellulose
and copper.
Sample Code PVA (wt%) Cellulose (wt%) Copper (wt%)
PVA/TNFC-Cu0.6 98.3 1.1 0.6
PVA/CMC-Cu0.6 90.4 9.0 0.6
PVA/TNFC 98.9 1.1 ---
PVA/CMC 90.9 9.1 ---
Transmission Electron Microscopy (TEM)
The morphology and particle size of copper nanoparticles on TNFC substrate were
observed by JEOL TEM-2100 instrument (Tokyo, Japan) operating at 120 kV, the
observation of CMC-copper nanoparticles were operated at 200 kV. TEM samples were
typically prepared by dropping the hybrid TNFC-copper nanoparticles and CMC-copper
nanoparticles solutions on a 200 mesh nickel grid coated with a carbon film.
Antimicrobial activities of PVA/TNFC-Cu and PVA/CMC-Cu films
The E.coli 108
colony-forming units per milliliter (CFU/mL), was used as targeted microorganism to test
antimicrobial activities of PVA/TNFC-Cu and PVA/CMC-Cu films. A 2-mL aliquot of
such culture was transferred to a surface of PVA/TNFC-Cu0.6 and PVA/CMC-Cu0.6
films and incubated at room temperature for 1 wk. The dilution and enumeration
producers developed by (AOAC 1995, method 991.14; Black and Jaczynski 2006;
Levanduski and Jaczynski 2008) were followed to enumerate the E.coli. All bacterial
enumerations were performed in triplicate. Mean values are reported as CFU/mL.
Thermo-gravimetric analyzer (TGA) characterization
The thermal performance of pure PVA and its nanocomposite films was determined by
TA Q50 thermo-gravimetric analyzer (New Castle, USA), with temperature ramp-up rate
of 10 /min while being purged with nitrogen at a flow rate of 20 mL/min. The sample
weight was chosen between 3 mg and 4 mg for all of the samples tested.
Dynamic Mechanical Analysis (DMA)
Samples of 38 mm 15 mm 0.35 mm for DMA analysis were prepared. Dynamic
mechanical analysis was conducted in a tension-film mode on a TA Q800 DMA
instrument (New Castle, USA), temperature scans were run from 30 to 150 at a
heating rate of 2 /min with a frequency of 1 Hz and amplitude 30 m.
Results and Discussion
Characterization of hybrid TNFC-copper nanoparticles and CMC-copper
nanoparticles
The transmission electron micrographs of hybrid TNFC-copper nanoparticles and CMC-
copper nanoparticles are presented in Fig 1. Copper nanoparticles reveal spherical
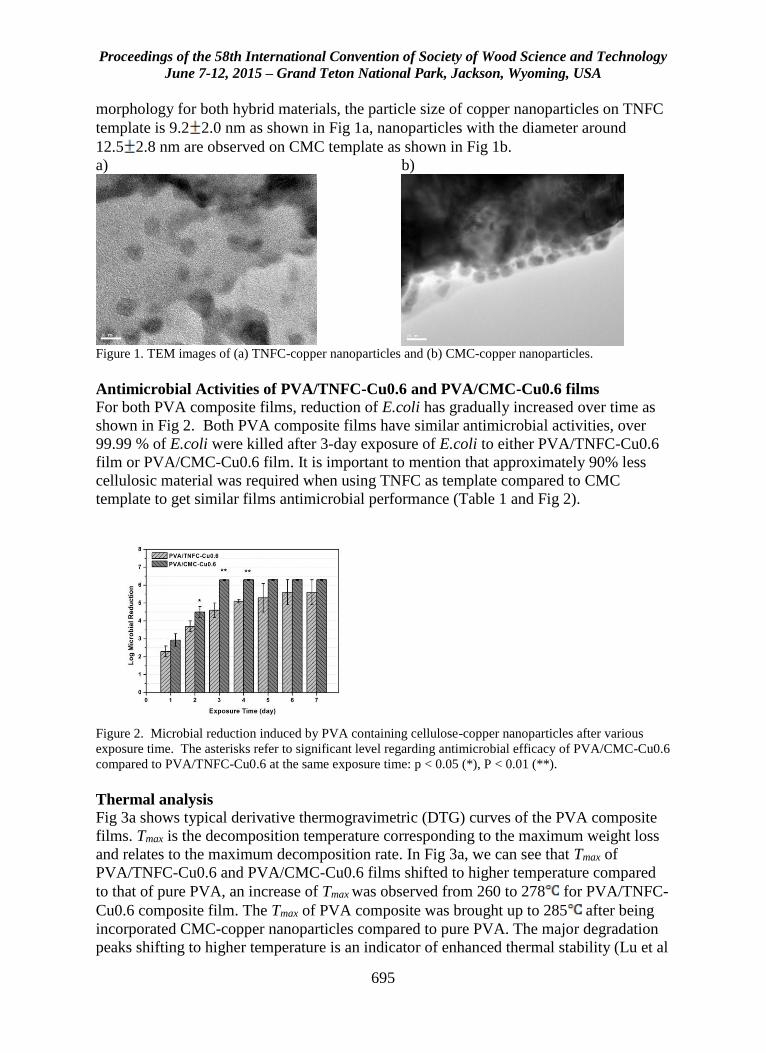
Proceedings of the 58th International Convention of Society of Wood Science and Technology
June 7-12, 2015 – Grand Teton National Park, Jackson, Wyoming, USA
695
morphology for both hybrid materials, the particle size of copper nanoparticles on TNFC
template is 9.2 2.0 nm as shown in Fig 1a, nanoparticles with the diameter around
12.5 2.8 nm are observed on CMC template as shown in Fig 1b.
a) b)
Figure 1. TEM images of (a) TNFC-copper nanoparticles and (b) CMC-copper nanoparticles.
Antimicrobial Activities of PVA/TNFC-Cu0.6 and PVA/CMC-Cu0.6 films
For both PVA composite films, reduction of E.coli has gradually increased over time as
shown in Fig 2. Both PVA composite films have similar antimicrobial activities, over
99.99 % of E.coli were killed after 3-day exposure of E.coli to either PVA/TNFC-Cu0.6
film or PVA/CMC-Cu0.6 film. It is important to mention that approximately 90% less
cellulosic material was required when using TNFC as template compared to CMC
template to get similar films antimicrobial performance (Table 1 and Fig 2).
Figure 2. Microbial reduction induced by PVA containing cellulose-copper nanoparticles after various
exposure time. The asterisks refer to significant level regarding antimicrobial efficacy of PVA/CMC-Cu0.6
compared to PVA/TNFC-Cu0.6 at the same exposure time: p < 0.05 (*), P < 0.01 (**).
Thermal analysis
Fig 3a shows typical derivative thermogravimetric (DTG) curves of the PVA composite
films. Tmax is the decomposition temperature corresponding to the maximum weight loss
and relates to the maximum decomposition rate. In Fig 3a, we can see that Tmax of
PVA/TNFC-Cu0.6 and PVA/CMC-Cu0.6 films shifted to higher temperature compared
to that of pure PVA, an increase of Tmax was observed from 260 to 278 for PVA/TNFC-
Cu0.6 composite film. The Tmax of PVA composite was brought up to 285 after being
incorporated CMC-copper nanoparticles compared to pure PVA. The major degradation
peaks shifting to higher temperature is an indicator of enhanced thermal stability (Lu et al
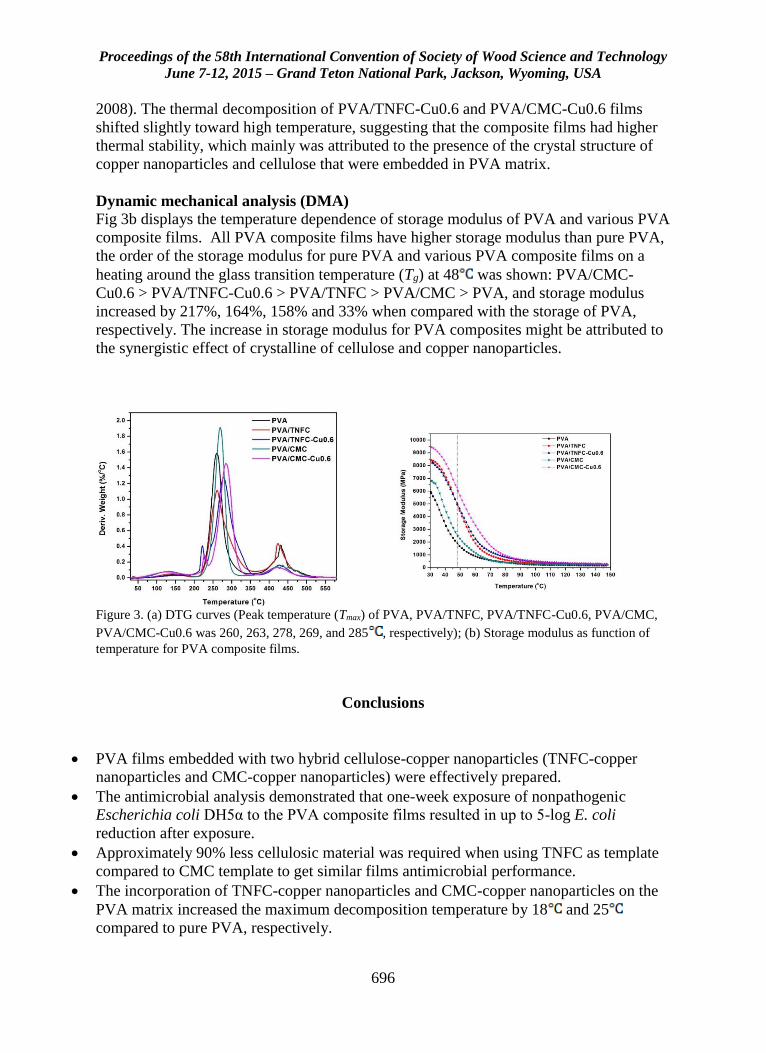
Proceedings of the 58th International Convention of Society of Wood Science and Technology
June 7-12, 2015 – Grand Teton National Park, Jackson, Wyoming, USA
696
2008). The thermal decomposition of PVA/TNFC-Cu0.6 and PVA/CMC-Cu0.6 films
shifted slightly toward high temperature, suggesting that the composite films had higher
thermal stability, which mainly was attributed to the presence of the crystal structure of
copper nanoparticles and cellulose that were embedded in PVA matrix.
Dynamic mechanical analysis (DMA) Fig 3b displays the temperature dependence of storage modulus of PVA and various PVA
composite films. All PVA composite films have higher storage modulus than pure PVA,
the order of the storage modulus for pure PVA and various PVA composite films on a
heating around the glass transition temperature (Tg) at 48 was shown: PVA/CMC-
Cu0.6 > PVA/TNFC-Cu0.6 > PVA/TNFC > PVA/CMC > PVA, and storage modulus
increased by 217%, 164%, 158% and 33% when compared with the storage of PVA,
respectively. The increase in storage modulus for PVA composites might be attributed to
the synergistic effect of crystalline of cellulose and copper nanoparticles.
a) b)
Figure 3. (a) DTG curves (Peak temperature (Tmax) of PVA, PVA/TNFC, PVA/TNFC-Cu0.6, PVA/CMC,
PVA/CMC-Cu0.6 was 260, 263, 278, 269, and 285 , respectively); (b) Storage modulus as function of
temperature for PVA composite films.
Conclusions
PVA films embedded with two hybrid cellulose-copper nanoparticles (TNFC-copper
nanoparticles and CMC-copper nanoparticles) were effectively prepared.
The antimicrobial analysis demonstrated that one-week exposure of nonpathogenic
Escherichia coli DH5α to the PVA composite films resulted in up to 5-log E. coli
reduction after exposure.
Approximately 90% less cellulosic material was required when using TNFC as template
compared to CMC template to get similar films antimicrobial performance.
The incorporation of TNFC-copper nanoparticles and CMC-copper nanoparticles on the
PVA matrix increased the maximum decomposition temperature by 18 and 25
compared to pure PVA, respectively.
Proceedings of the 58th International Convention of Society of Wood Science and Technology
June 7-12, 2015 – Grand Teton National Park, Jackson, Wyoming, USA
697
The storage modulus of the PVA composite films at 48 increased up to 164% and
217% with the incorporation of TNFC-copper nanoparticles and CMC-copper
nanoparticles, respectively.
Acknowledgements
Funding for this work was provided by NIFA-McStennis WVA00098 “Efficient
utilization of biomass for biopolymers in central Appalachia” and NIFA-USDA
Grant/Contract No. 2013-34638-21481 “Development of novel hybrid cellulose
nanocomposite film with potent biocide properties utilizing low quality Appalachian
hardwoods”.
References
AOAC (1995). Official methods of analysis. 16th ed. Association of Official Analytical
Chemists International, Gaithersburg, MD.
Black JL, Jaczynski J (2006) Temperature effect on inactivation kinetics of Escherichia coli
O157: H7 by electron beam in ground beef, chicken breast meat, and trout fillets. J Food
Sci 71(6): M221-M227.
Borkow G, Gabbay J (2009) Copper, an ancient remedy returning to fight microbial, fungal
and viral infections. Current Chemical Biology 3(3):272-278.
Chakraborty A, Sain M, Kortschot M (2006) Reinforcing potential of wood pulp-derived
microfibres in a PVA matrix. Holzforschung 60(1):53-58.
Cheng Q, Wang S, Rials TG, Lee SH (2007) Physical and mechanical properties of polyvinyl
alcohol and polypropylene composite materials reinforced with fibril aggregates isolated
from regenerated cellulose fibers. Cellulose 14(6):593-602.
Lee SY, Mohan DJ, Kang IA, Doh GH, Lee S, Han SO (2009) Nanocellulose reinforced
PVA composite films: effects of acid treatment and filler loading. Fiber Polym 10(1):77-
82.
Levanduski L, Jaczynski J (2008) Increased resistance of Escherichia coli O157: H7 to
electron beam following repetitive irradiation at sub-lethal doses. Int J Food Microbiol
121(3):328-334.
Liu D, Sun X, Tian H, Maiti S, Ma Z (2013) Effects of cellulose nanofibrils on the structure
and properties on PVA nanocomposites. Cellulose 20(6):2981-2989.

Proceedings of the 58th International Convention of Society of Wood Science and Technology
June 7-12, 2015 – Grand Teton National Park, Jackson, Wyoming, USA
698
Lu J, Wang T, Drzal LT (2008) Preparation and properties of microfibrillated cellulose
polyvinyl alcohol composite materials. Composites Part A 39(5):738-746.
Hostynek JJ, Maibach HI (2004) Copper hypersensitivity: dermatologic aspects*. Dermatol
Ther 17(4):328-333.
Padalkar S, Capadona JR, Rowan SJ, Weder C, Won YH, Stanciu LA, Moon RJ (2010).
Natural biopolymers: novel templates for the synthesis of nanostructures. Langmuir
26(11):8497-8502.
Zhong T, Oporto GS, Jaczynski J, Tesfai AT, Armstrong J (2013) Antimicrobial properties
of the hybrid copper nanoparticles-carboxymethyl cellulose. Wood Fiber Sci 45(2):215-
222.
Proceedings of the 58th International Convention of Society of Wood Science and Technology
June 7-12, 2015 – Grand Teton National Park, Jackson, Wyoming, USA
699
Comparison Study of Nondestructive Testing Methods
in Visual Grade No.2 Southern Pine Lumber: Bending
Stiffness
Bonnie Yang, [email protected]
Dan Seale, [email protected]
Rubin Shmulsky, [email protected]
Mississippi State University, Box 9820, Mississippi State, MS 39762
Abstract
Bending stiffness (modulus of elasticity, or E) is one of the main indicators in structural
lumber stress grading systems. Due to a relatively high amount of variability in
contemporary sawn lumber, it is important that nondestructive evaluation technology is
developed and employed to better discern potentially high E value pieces from potentially
low E value pieces. The research described herein is from a field test of various
nondestructive technologies (machine stress rating, transverse vibration and longitudinal
stress wave techniques) applied to visually graded No. 2 southern pine lumber. A total of
343 pieces of 2 × 6, 2 × 8, 2 × 10, and 2 × 12 SP lumber were evaluated nondestructively
with four commercial tools; static bending E values were then obtained by four-point
bending tests. For each of the nondestructive techniques, results are correlated to static
bending E. In all cases, the non-destructive techniques successfully predicted E for all
lumber sizes, with linear regression R2 values ranging from 0.56 to 0.87. Based on these
research findings, further testing and analysis related to strength performance seems
appropriate.
Proceedings of the 58th International Convention of Society of Wood Science and Technology
June 7-12, 2015 – Grand Teton National Park, Jackson, Wyoming, USA
700
Distortion Energy Criterion for Estimating
Dowel Bearing Strength of Timber Member
Loaded at Angle
Bambang Suryoatmono 1* – Johannes Adhijoso Tjondro2 - Lie Ting Hwe3 -
Clemen3
1 Professor, Department of Civil Engineering – Parahyangan Catholic
University, Jalan Ciumbuleuit 94, Bandung 40141, Indonesia.
* Corresponding author
[email protected] [email protected]
2 Associate Professor, Departament of Civil Engineering – Parahyangan
Catholic University, Jalan Ciumbuleuit 94, Bandung 40141, Indonesia.
3 Former Student at Departament of Civil Engineering – Parahyangan
Catholic University, Jalan Ciumbuleuit 94, Bandung 40141, Indonesia.
Abstract
To estimate the strength of a mechanical timber member connection loaded at an angle,
one of the important properties is the dowel bearing strength of the member. Hankinson-
type formulas have long been used to predict wood mechanical properties at an angle to
the grain, including dowel bearing strength. The most recent wood specification in the
USA (ANSI/AWC National Design Specification 2015) is one of the specifications that
use Hankinson’s type formulas. In this paper, distortion energy criterion (DEC) is used
and an alternative equation to the Hankinson’s formula is introduced. To verify the
formula, dowel bearing tests on two sets of specimens were conducted. The first set of
specimens had bolts of various diameter. Wood of various specific gravity in the
hardwood category were loaded at an angle of 0o, 30o, 45o, 60o, and 90o to the grain. The
second set of specimens were similar to the first set except that the mechanical fastener
was lag screw of various diameter. The tests were conducted according to ASTM D5764-
97a. It can be concluded that the proposed alternative equation based on distortion energy
criterion (DEC) is better than the Hankinson’s formula. This is due to the shear strength
of the wood that is not considered in the Hankinson’s formula.
Keywords: dowel bearing strength at an angle, distortion energy criterion (DEC),
Hankinson’s formula, hardwood, bolt, lag screw.
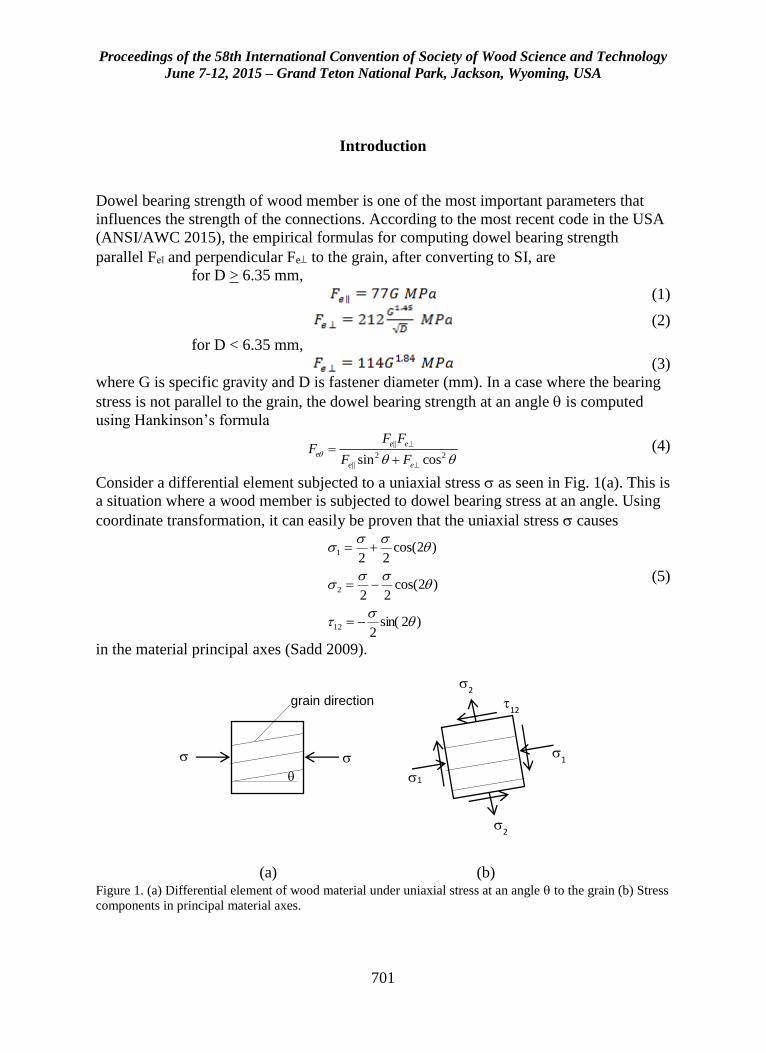
Proceedings of the 58th International Convention of Society of Wood Science and Technology
June 7-12, 2015 – Grand Teton National Park, Jackson, Wyoming, USA
701
Introduction
Dowel bearing strength of wood member is one of the most important parameters that
influences the strength of the connections. According to the most recent code in the USA
(ANSI/AWC 2015), the empirical formulas for computing dowel bearing strength
parallel Feǁ and perpendicular Fe to the grain, after converting to SI, are
for D > 6.35 mm,
(1)
(2)
for D < 6.35 mm,
(3)
where G is specific gravity and D is fastener diameter (mm). In a case where the bearing
stress is not parallel to the grain, the dowel bearing strength at an angle is computed
using Hankinson’s formula
||
2 2
|| sin cos
e e
e
e e
F FF
F F
(4)
Consider a differential element subjected to a uniaxial stress as seen in Fig. 1(a). This is
a situation where a wood member is subjected to dowel bearing stress at an angle. Using
coordinate transformation, it can easily be proven that the uniaxial stress causes
)2sin(2
)2cos(22
)2cos(22
12
2
1
(5)
in the material principal axes (Sadd 2009).
(a) (b)
Figure 1. (a) Differential element of wood material under uniaxial stress at an angle to the grain (b) Stress
components in principal material axes.
grain direction
12
2
2
1
1
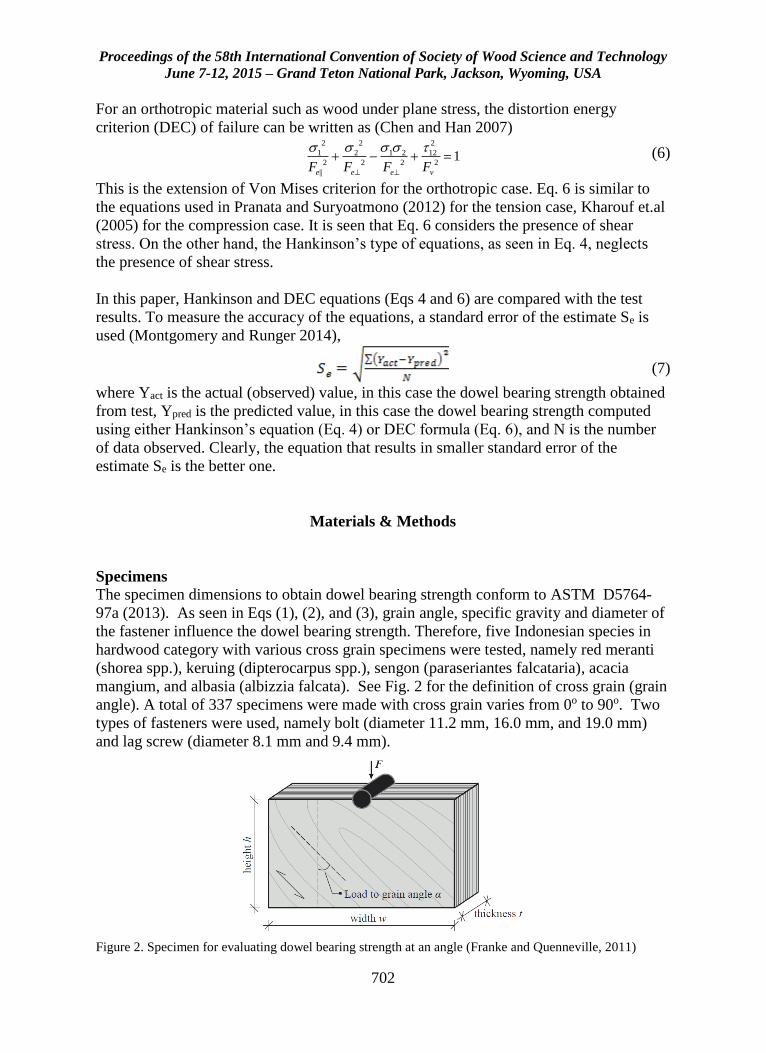
Proceedings of the 58th International Convention of Society of Wood Science and Technology
June 7-12, 2015 – Grand Teton National Park, Jackson, Wyoming, USA
702
For an orthotropic material such as wood under plane stress, the distortion energy
criterion (DEC) of failure can be written as (Chen and Han 2007)
2 2 2
1 2 1 2 12
2 2 2 2
||
1e e e vF F F F
(6)
This is the extension of Von Mises criterion for the orthotropic case. Eq. 6 is similar to
the equations used in Pranata and Suryoatmono (2012) for the tension case, Kharouf et.al
(2005) for the compression case. It is seen that Eq. 6 considers the presence of shear
stress. On the other hand, the Hankinson’s type of equations, as seen in Eq. 4, neglects
the presence of shear stress.
In this paper, Hankinson and DEC equations (Eqs 4 and 6) are compared with the test
results. To measure the accuracy of the equations, a standard error of the estimate Se is
used (Montgomery and Runger 2014),
(7)
where Yact is the actual (observed) value, in this case the dowel bearing strength obtained
from test, Ypred is the predicted value, in this case the dowel bearing strength computed
using either Hankinson’s equation (Eq. 4) or DEC formula (Eq. 6), and N is the number
of data observed. Clearly, the equation that results in smaller standard error of the
estimate Se is the better one.
Materials & Methods
Specimens
The specimen dimensions to obtain dowel bearing strength conform to ASTM D5764-
97a (2013). As seen in Eqs (1), (2), and (3), grain angle, specific gravity and diameter of
the fastener influence the dowel bearing strength. Therefore, five Indonesian species in
hardwood category with various cross grain specimens were tested, namely red meranti
(shorea spp.), keruing (dipterocarpus spp.), sengon (paraseriantes falcataria), acacia
mangium, and albasia (albizzia falcata). See Fig. 2 for the definition of cross grain (grain
angle). A total of 337 specimens were made with cross grain varies from 0o to 90o. Two
types of fasteners were used, namely bolt (diameter 11.2 mm, 16.0 mm, and 19.0 mm)
and lag screw (diameter 8.1 mm and 9.4 mm).
Figure 2. Specimen for evaluating dowel bearing strength at an angle (Franke and Quenneville, 2011)
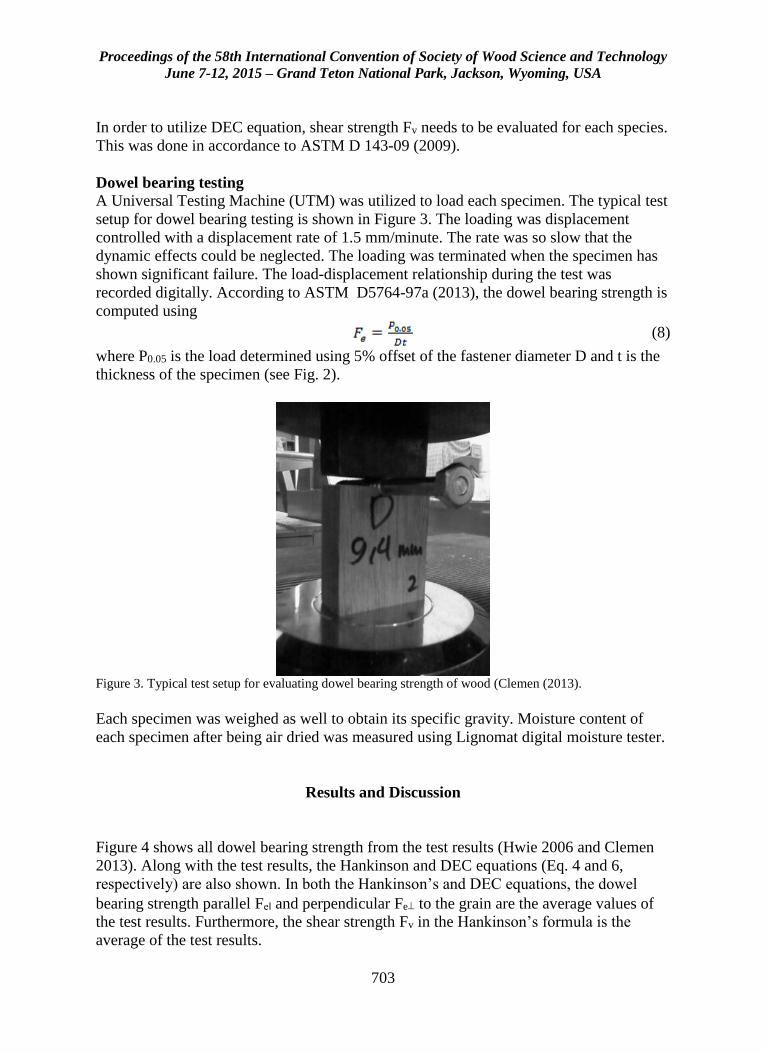
Proceedings of the 58th International Convention of Society of Wood Science and Technology
June 7-12, 2015 – Grand Teton National Park, Jackson, Wyoming, USA
703
In order to utilize DEC equation, shear strength Fv needs to be evaluated for each species.
This was done in accordance to ASTM D 143-09 (2009).
Dowel bearing testing
A Universal Testing Machine (UTM) was utilized to load each specimen. The typical test
setup for dowel bearing testing is shown in Figure 3. The loading was displacement
controlled with a displacement rate of 1.5 mm/minute. The rate was so slow that the
dynamic effects could be neglected. The loading was terminated when the specimen has
shown significant failure. The load-displacement relationship during the test was
recorded digitally. According to ASTM D5764-97a (2013), the dowel bearing strength is
computed using
(8)
where P0.05 is the load determined using 5% offset of the fastener diameter D and t is the
thickness of the specimen (see Fig. 2).
Figure 3. Typical test setup for evaluating dowel bearing strength of wood (Clemen (2013).
Each specimen was weighed as well to obtain its specific gravity. Moisture content of
each specimen after being air dried was measured using Lignomat digital moisture tester.
Results and Discussion
Figure 4 shows all dowel bearing strength from the test results (Hwie 2006 and Clemen
2013). Along with the test results, the Hankinson and DEC equations (Eq. 4 and 6,
respectively) are also shown. In both the Hankinson’s and DEC equations, the dowel
bearing strength parallel Feǁ and perpendicular Fe to the grain are the average values of
the test results. Furthermore, the shear strength Fv in the Hankinson’s formula is the
average of the test results.
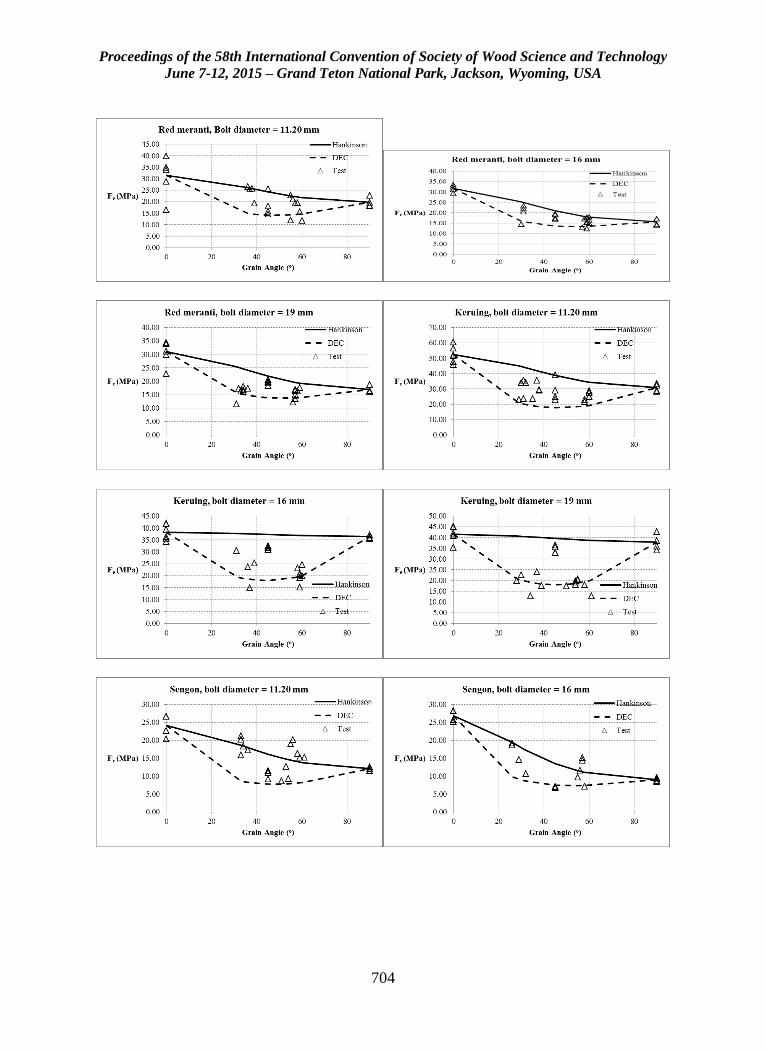
Proceedings of the 58th International Convention of Society of Wood Science and Technology
June 7-12, 2015 – Grand Teton National Park, Jackson, Wyoming, USA
704
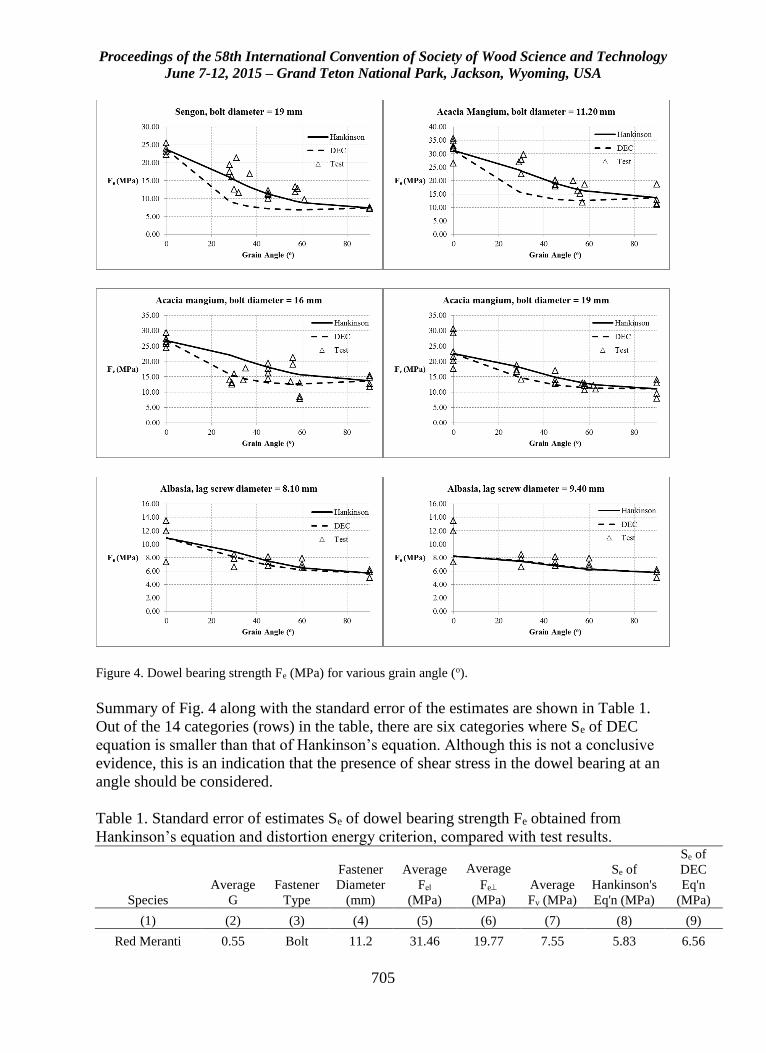
Proceedings of the 58th International Convention of Society of Wood Science and Technology
June 7-12, 2015 – Grand Teton National Park, Jackson, Wyoming, USA
705
Figure 4. Dowel bearing strength Fe (MPa) for various grain angle (o).
Summary of Fig. 4 along with the standard error of the estimates are shown in Table 1.
Out of the 14 categories (rows) in the table, there are six categories where Se of DEC
equation is smaller than that of Hankinson’s equation. Although this is not a conclusive
evidence, this is an indication that the presence of shear stress in the dowel bearing at an
angle should be considered.
Table 1. Standard error of estimates Se of dowel bearing strength Fe obtained from
Hankinson’s equation and distortion energy criterion, compared with test results.
Species
Average
G
Fastener
Type
Fastener
Diameter
(mm)
Average
Feǁ
(MPa)
Average
Fe
(MPa)
Average
Fv (MPa)
Se of
Hankinson's
Eq'n (MPa)
Se of
DEC
Eq'n
(MPa)
(1) (2) (3) (4) (5) (6) (7) (8) (9)
Red Meranti 0.55 Bolt 11.2 31.46 19.77 7.55 5.83 6.56
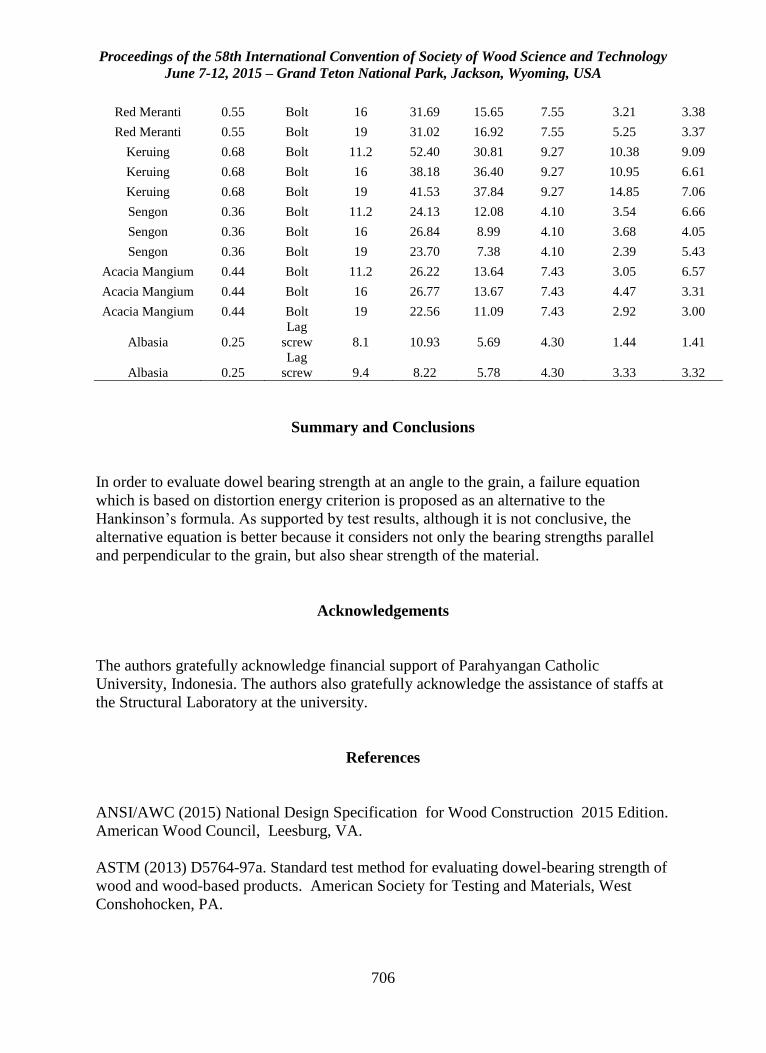
Proceedings of the 58th International Convention of Society of Wood Science and Technology
June 7-12, 2015 – Grand Teton National Park, Jackson, Wyoming, USA
706
Red Meranti 0.55 Bolt 16 31.69 15.65 7.55 3.21 3.38
Red Meranti 0.55 Bolt 19 31.02 16.92 7.55 5.25 3.37
Keruing 0.68 Bolt 11.2 52.40 30.81 9.27 10.38 9.09
Keruing 0.68 Bolt 16 38.18 36.40 9.27 10.95 6.61
Keruing 0.68 Bolt 19 41.53 37.84 9.27 14.85 7.06
Sengon 0.36 Bolt 11.2 24.13 12.08 4.10 3.54 6.66
Sengon 0.36 Bolt 16 26.84 8.99 4.10 3.68 4.05
Sengon 0.36 Bolt 19 23.70 7.38 4.10 2.39 5.43
Acacia Mangium 0.44 Bolt 11.2 26.22 13.64 7.43 3.05 6.57
Acacia Mangium 0.44 Bolt 16 26.77 13.67 7.43 4.47 3.31
Acacia Mangium 0.44 Bolt 19 22.56 11.09 7.43 2.92 3.00
Albasia 0.25
Lag
screw 8.1 10.93 5.69 4.30 1.44 1.41
Albasia 0.25
Lag
screw 9.4 8.22 5.78 4.30 3.33 3.32
Summary and Conclusions
In order to evaluate dowel bearing strength at an angle to the grain, a failure equation
which is based on distortion energy criterion is proposed as an alternative to the
Hankinson’s formula. As supported by test results, although it is not conclusive, the
alternative equation is better because it considers not only the bearing strengths parallel
and perpendicular to the grain, but also shear strength of the material.
Acknowledgements
The authors gratefully acknowledge financial support of Parahyangan Catholic
University, Indonesia. The authors also gratefully acknowledge the assistance of staffs at
the Structural Laboratory at the university.
References
ANSI/AWC (2015) National Design Specification for Wood Construction 2015 Edition.
American Wood Council, Leesburg, VA.
ASTM (2013) D5764-97a. Standard test method for evaluating dowel-bearing strength of
wood and wood-based products. American Society for Testing and Materials, West
Conshohocken, PA.
Proceedings of the 58th International Convention of Society of Wood Science and Technology
June 7-12, 2015 – Grand Teton National Park, Jackson, Wyoming, USA
707
ASTM (2009) D 143-09. Standard methods for testing small clear specimens of timber.
American Society for Testing and Materials, West Conshohocken, PA.
Chen WF, Han DJ (2007) Plasticity for structural engineers. Ross Publishing.
Lauderdale, FL. 606 pp.
Clemen (2013) Experimental study on dowel bearing strength of lag screw on Indonesian
wood members. Undergraduate thesis, Parahyangan Catholic University, Bandung,
Indonesia. 91 pp.
Franke S and Quenneville P (2011). Bolted and dowelled connections in Radiata pine and
laminated veneer lumber using the European yield mode. Australian Journal of Structural
Engineering 13(1) :13-24.
Hwie LT (2006) Experimental study on dowel bearing strength of bolt loaded at an angle.
Undergraduate thesis, Parahyangan Catholic University, Bandung, Indonesia. 156 pp.
Kharouf N, et.al.(2005) Postelastic behavior of single- and double-bolt timber
connections. Journal of Structural Engineering 13(1):188-196.
Montgomery DC, Runger GC (2014) Applied statistics and probability for engineers,
Sixth edition. McGraw-Hill, New York. 811 pp.
Sadd MH (2009) Elasticity theory, applications, and numerics, 2nd ed. Elsevier Inc,
Burlington, MA. 536 pp.
Suryoatmono B, Pranata YA (2012) An alternative to Hankinson’s formula for uniaxial
tension at an angle to the grain. Pages 217-222 in Pierre Quenneville in Proc World
Conference onTimber Engineering, 15-19 July 2012, Auckland, New Zealand.
Proceedings of the 58th International Convention of Society of Wood Science and Technology
June 7-12, 2015 – Grand Teton National Park, Jackson, Wyoming, USA
708
Comparison of Stranding and Strand Quality of Moso
(Phyllostachys pubescens Mazel) and Guadua (Guadua
angustifolia Kunth) Using a CAE 6/36 Disk Flaker.
Kate E Semple1, Polo K Zhang2, Gregory D Smith3*
*Corresponding author 1Research Scientist, 2Graduate Research Assistant, and 3Associate Professor,
1,2,3Department of Wood Science-Composites Group, University of British
Columbia, 2900-2424 Main Mall, Vancouver, BC, Canada, V6T 1Z4. Email:
[email protected], [email protected], [email protected].
Abstract
High tensile strength make giant timber bamboos such as Moso and Guadua are
potentially suited to the production of engineered strand-based structural composite
building materials. Using the right slicing technology and tooling, conversion to strands
utilizes a much higher proportion of the culm than the conventional milled, dried strips
currently used to fabricate laminated bamboo lumber and boards. It also incorporates the
fibre-rich, strongest portion of the culm located at the outer cortex into the composite.
Previous studies have found Moso bamboo produces good quality strand-based
composites but there is very little information available on strand production, especially
from Guadua. Here we compare Moso and Guadua pole characteristics and re-saturation
behavior likely to affect strand outcomes, as well as strand size classification and their
thickness and width distributions from stranding re-saturated Moso and Guadua quartered
culm pieces using a CAE 6/36 single-blade disk flaker. Strand slicing and quality was
significantly better for Moso than Guadua, even though Guadua has a larger culm wall
and fewer nodes. Setting the blade to cut 0.65 mm thick strands, the frequency
distribution of strand thickness for Moso was similar to that found in industrial Aspen
mill strands, whereas the thickness distribution was shifted upwards in Guadua due to the
propensity for splitting rather than clean slicing. Only 5% of bulk Guadua strands has a
smooth sliced surface on both sides, compared with 25% of Moso strands and over 60%
of Aspen mill strands. Splitting was caused by the much larger fibre bundles present in
Guadua. Node tissue in the culm wall is denser and disrupts its structure, resulting in
greater damage and strand breakage; the much larger zone of node tissue in Guadua
created a major problem with strand breakage.
Key words: Bamboo; Processing; Disk flaker; Furnish Quality; Surface Roughness;
Oriented Strand Board
Proceedings of the 58th International Convention of Society of Wood Science and Technology
June 7-12, 2015 – Grand Teton National Park, Jackson, Wyoming, USA
709
Introduction
Bamboo is one of the fastest growing renewable woody biomass plants and also one of
the world’s most widely used building materials. Over one billion people globally live in
a mostly primitive dwelling built from bamboo (De Flander and Rovers 2009). Due to
deforestation bamboo is emerging as a significant non-wood forest resource to replace
wood in construction and other uses where it grows native across the tropical and sub-
tropical belt of Asia, Africa and Latin America (Leise 1998). Raw bamboo rounds are
unsuitable for modern wood-based construction systems due to longitudinal splitting and
flaws, high variation in geometry and mechanical properties both within and across culms
which prohibits conformation to the narrow range of properties required for composites
used in construction of large, modern structures (Van der Lugt et al. 2003, Correal and
Ramirez 2010, Harries et al. 2012). A wide range of reconstituted lumber and panel
products has been developed over decades to overcome the natural variability in wood
logs to produce building products with the required uniformity and controlled properties
(Stark et al. 2010). Yet despite the plethora of laminated bamboo-based composites
developed in recent years, relatively little attention has focused on developing similar
kinds of modern engineered composite building products from bamboo that would foster
modern housing construction from this resource (De Flander and Rovers 2009). OSB is
one product which lends itself to automated, economically efficient production and with
the appropriate adaptations most wood composite processing technologies can be
extended to bamboo. Commercial development of bamboo OSB for housing construction
in China is thwarted by a lack of efficient, automated technology for converting culm
stock to strands and very few published experiences converting bamboo culms to strands.
The aim of this study is provide technical information on converting bamboo culms to
strands and compare strand size and quality outcomes between two commercially
important bamboos, Moso and Guadua.
Materials and Methods
Culm procurement and characterization
Twenty poles of 5-inch diameter Chinese-gown Moso culms (mean diam. = 101.7 mm)
in 8 foot lengths were purchased from Canada’s Bamboo World, located in Chilliwack,
BC, Canada, which imports seasoned and fumigated (methyl bromide) bamboo poles
from Zhejiang Province, China, harvested at four years of age. Ten 19-ft long Guadua
culms (mean diameter = 103.7 mm) came from Koolbamboo, Miami, FL ex Columbia
and Panama harvested at between 4 and 6 years of age. Node frequency (number per m
length of culm), internode length, wall thickness and basic density of wall and node tissue
were measured. Each pole was marked into 17 to 19 130-mm-long sections,
approximately half of which were node free, and the other half containing a node in or
near the middle. This meant some small sections of culm were cut and discarded. Each
pole was then cut lengthwise into four quarters, and each quarter then cross cut into the
pre-marked 130 mm sections. After cross cutting, the noded and internode sections were
kept in separate bins ready for re-saturation and stranding. The node plates from both
Proceedings of the 58th International Convention of Society of Wood Science and Technology
June 7-12, 2015 – Grand Teton National Park, Jackson, Wyoming, USA
710
species had to be removed prior to re-saturation and stranding; this was done with a
hammer in the case of Moso, but in the case of Guadua the node plates were very thick
and tough requiring manual removal with a Dremel saw and sanding down the remaining
thick portion till flush with the inner wall. This was to enable the pieces to be stacked into
the feed drawer of the stranding machine.
Stranding
Details on the flaker equipment and methodology for effectively re-saturating the
seasoned bamboo culm tissue to facilitate stranding, and the development of the most
effective operating parameters for Moso bamboo are given in Semple et al. (2014). The
theoretical basis for maximizing the production of bulk strands from bamboo culm
rounds can be found in Semple and Smith (2014). Optimal strand numbers and quality
outcomes (total strands per round, average thickness, thickness and width distributions,
and surface smoothness were obtained when fully saturated culm pieces were quartered,
and stranded vertically at 734 RPM with a knife protrusion of 0.726 mm (nominal strand
thickness = 0.65 mm), corresponding feed rate of 7.95 mm/s. Disposable knives were
Udderholm Sleipner heat tempered cold work tool steel (HRc 58). Slicing the culm tissue
parallel to the fiber direction resulted in a more consistent strand thickness distribution
with 85% of strands falling within the thickness range of 0.25 to 0.75 mm. Strand
recovery (number of strands per culm round) was increased by over 50% if the culm
rounds were converted to quarters and stacked in the feed drawer (Semple and Smith
2014). This slicing configuration also confines the waxy outer cortex layer to one thin
edge of each strand. These stranding parameters were used to produce bulk strands from
both Moso and Guadua for comparative purposes and for subsequent OSB fabrication.
The bulk strands were distributed into large wire baskets and dried down to approx. 4%
MC in a walk-in oven over night at a temperature of 85°C. The dried strands were bagged
and screened to remove fines and dust on a 56 cm x 117 cm vibrating sieve machine
fitted with three screen sizes; 14.3 mm (collects large face strands), 7.8 mm (collects
intermediate strands and fragments) and 3.2 mm (collects fines). The material collected
on each sieve was bagged separately and weighed to give the weight proportions out of
the total weight of bulk strands.
Strand sampling and measurement, strand surface roughness The full sized stands retained on the 14.3 mm screen were sampled for representative
strand thickness and width properties, and surface characteristics. Strand thickness and
width at mid-length of a randomly sampled batch of 250 strands each of Moso and
Guadua were measured using digital calipers and compared with the same measurements
made on 250 industrial Aspen mill strands (face furnish) supplied by the Weyerhauser
OSB mill in Edson, AB. Assessment of strands surface quality was done in two ways.
First a combination of visual and tactile assessment of each measured strand as made as
to whether each strand fell into one of three surface roughness groupings: (1) rough on
both sides, (2) smooth on one side and rough on the other, or (3) smooth on both sides.
Laser surface topography scanning (Lundberg and Porankiewicz 1995, Hu and Afzal
2005) of examples of the ‘rough’ and ‘smooth’ surfaces of each type of tissue (Aspen,
Moso, Guadua strands, and ‘smooth’ reference surface of Moso sliced cabinet makers
veneer) was carried out using a LaserScan LT (Solaris, San Francisco, USA) laser surface
Proceedings of the 58th International Convention of Society of Wood Science and Technology
June 7-12, 2015 – Grand Teton National Park, Jackson, Wyoming, USA
711
profilometer fitted with a Keyence K2000 Series LK-031 sensor head. Profile data was
mapped and analyzed using Solar Map Universal 3.2 software. Each scan was 10 mm x
10 mm in area, with a sampling increment of 1 µm in the x-direction (i.e. across the
grain). The average roughness profile was compiled from a total of 50 cross-grain scans
taken at increments of 200 µm along the grain (y-direction), a process that took
approximately 20 minutes per scan. Reported variables included average roughness (Ra)
and average maximum roughness (Rz). Ra is the arithmetic average of all the absolute
values for peak height and valley depth from center line, and Rz is the average of the five
highest in magnitude peak height and valley depths.
[eqn 1]
[eqn 2]
where Rpi and Rvi are the ith highest peak and lowest valley, respectively.
A DX100 Olympus Digital Light Reflection Microscope (5x magnification) was used to
examine the sliced transverse cross-sections through the culm wall of Moso and Guadua
tissue to visually compare the morphology of the vascular bundles.
Results and Discussion
Pole characteristics and resaturation MC
Average basic density of Moso was 436 kg/m3 (internode) and 532 kg/m3 (node plates),
an increase of 22% in density for node plates. Average basic density of Guadua was 526
kg/m3 (internode) and 581 kg/m3 (node plates), an increase in 14% in density of node
plates. Node plates were significantly thicker in Guadua (7.4 mm) than Moso (2.7 mm),
and much tougher to remove manually. Guadua poles were also slightly greater in
average diameter and wall thickness; (103.7 mm and 12 mm, respectively) than Moso
(101.7 mm and 10.9 mm, respectively). The frequency of nodes was less for Guadua (3.3
nodes per m of culm) than Moso (3.8 per m), and spaced further apart (average internode
length 30.7 cm compared with 24 cm for Moso). Soaking in cold water for 24 h was
insufficient to resaturate either species - Moso tissue was 38.6%, and 38.4% for Guadua;
whereas the MC of pieces boiled then steeped in cold water for a further 18 h was 128%
for Moso and 114% for Guadua. After 96 h the boiled/steeped Moso pieces reached
142.7% MC, but only 114.4% for Guadua, indicating a lower maximum water holding
capacity. Fresh Moso culm stock harvested and stranded by Lee et al. (1994) was 137%
MC suggesting full tissue resaturation was reached with the boil/steep method.
Strand size classifications
The proportions of complete strands (remaining on top of the large 14.3 mm screen) was
higher for Moso (75.5% for internodes and 67.8% for noded strands) than Guadua
(65.4% for internode and 59.4% for noded). The proportion of the stranded material
broken up into smaller pieces that fell through large screen was higher for Guadua
(34.7% for internode and 40.6% for noded strands) reflecting greater damage and
fragmentation of strands during slicing this type of bamboo. Many of the Guadua strands
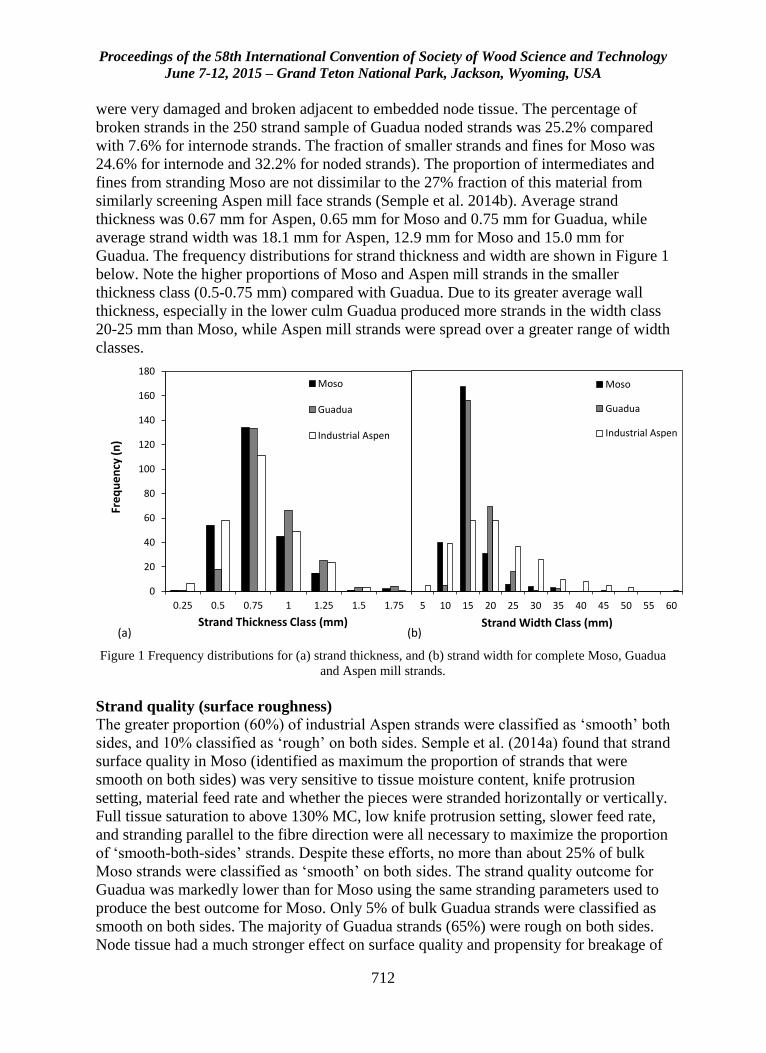
Proceedings of the 58th International Convention of Society of Wood Science and Technology
June 7-12, 2015 – Grand Teton National Park, Jackson, Wyoming, USA
712
were very damaged and broken adjacent to embedded node tissue. The percentage of
broken strands in the 250 strand sample of Guadua noded strands was 25.2% compared
with 7.6% for internode strands. The fraction of smaller strands and fines for Moso was
24.6% for internode and 32.2% for noded strands). The proportion of intermediates and
fines from stranding Moso are not dissimilar to the 27% fraction of this material from
similarly screening Aspen mill face strands (Semple et al. 2014b). Average strand
thickness was 0.67 mm for Aspen, 0.65 mm for Moso and 0.75 mm for Guadua, while
average strand width was 18.1 mm for Aspen, 12.9 mm for Moso and 15.0 mm for
Guadua. The frequency distributions for strand thickness and width are shown in Figure 1
below. Note the higher proportions of Moso and Aspen mill strands in the smaller
thickness class (0.5-0.75 mm) compared with Guadua. Due to its greater average wall
thickness, especially in the lower culm Guadua produced more strands in the width class
20-25 mm than Moso, while Aspen mill strands were spread over a greater range of width
classes.
5 10 15 20 25 30 35 40 45 50 55 60
Strand Width Class (mm)
Moso
Guadua
Industrial Aspen
0
20
40
60
80
100
120
140
160
180
0.25 0.5 0.75 1 1.25 1.5 1.75
Fre
qu
en
cy (
n)
Strand Thickness Class (mm)
Moso
Guadua
Industrial Aspen
(a) (b)
Figure 1 Frequency distributions for (a) strand thickness, and (b) strand width for complete Moso, Guadua
and Aspen mill strands.
Strand quality (surface roughness)
The greater proportion (60%) of industrial Aspen strands were classified as ‘smooth’ both
sides, and 10% classified as ‘rough’ on both sides. Semple et al. (2014a) found that strand
surface quality in Moso (identified as maximum the proportion of strands that were
smooth on both sides) was very sensitive to tissue moisture content, knife protrusion
setting, material feed rate and whether the pieces were stranded horizontally or vertically.
Full tissue saturation to above 130% MC, low knife protrusion setting, slower feed rate,
and stranding parallel to the fibre direction were all necessary to maximize the proportion
of ‘smooth-both-sides’ strands. Despite these efforts, no more than about 25% of bulk
Moso strands were classified as ‘smooth’ on both sides. The strand quality outcome for
Guadua was markedly lower than for Moso using the same stranding parameters used to
produce the best outcome for Moso. Only 5% of bulk Guadua strands were classified as
smooth on both sides. The majority of Guadua strands (65%) were rough on both sides.
Node tissue had a much stronger effect on surface quality and propensity for breakage of
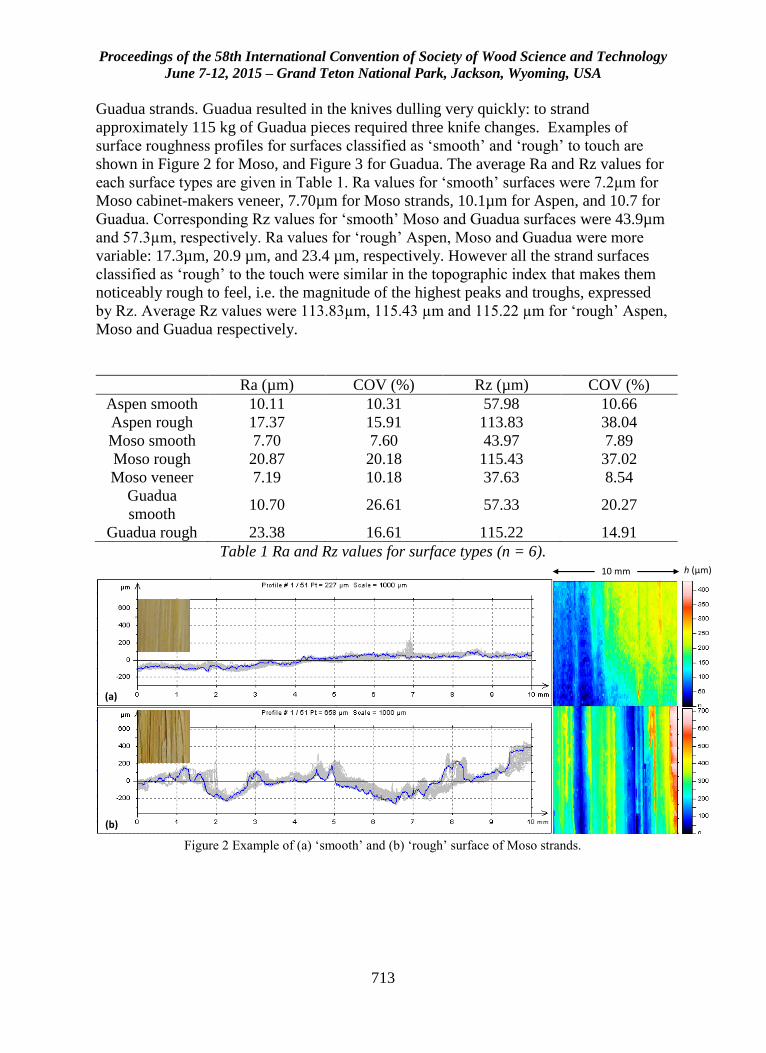
Proceedings of the 58th International Convention of Society of Wood Science and Technology
June 7-12, 2015 – Grand Teton National Park, Jackson, Wyoming, USA
713
Guadua strands. Guadua resulted in the knives dulling very quickly: to strand
approximately 115 kg of Guadua pieces required three knife changes. Examples of
surface roughness profiles for surfaces classified as ‘smooth’ and ‘rough’ to touch are
shown in Figure 2 for Moso, and Figure 3 for Guadua. The average Ra and Rz values for
each surface types are given in Table 1. Ra values for ‘smooth’ surfaces were 7.2µm for
Moso cabinet-makers veneer, 7.70µm for Moso strands, 10.1µm for Aspen, and 10.7 for
Guadua. Corresponding Rz values for ‘smooth’ Moso and Guadua surfaces were 43.9µm
and 57.3µm, respectively. Ra values for ‘rough’ Aspen, Moso and Guadua were more
variable: 17.3µm, 20.9 µm, and 23.4 µm, respectively. However all the strand surfaces
classified as ‘rough’ to the touch were similar in the topographic index that makes them
noticeably rough to feel, i.e. the magnitude of the highest peaks and troughs, expressed
by Rz. Average Rz values were 113.83µm, 115.43 µm and 115.22 µm for ‘rough’ Aspen,
Moso and Guadua respectively.
Ra (µm) COV (%) Rz (µm) COV (%)
Aspen smooth 10.11 10.31 57.98 10.66
Aspen rough 17.37 15.91 113.83 38.04
Moso smooth 7.70 7.60 43.97 7.89
Moso rough 20.87 20.18 115.43 37.02
Moso veneer 7.19 10.18 37.63 8.54
Guadua
smooth 10.70 26.61 57.33 20.27
Guadua rough 23.38 16.61 115.22 14.91
Table 1 Ra and Rz values for surface types (n = 6).
(a)
(b)
10 mm h (µm)
Figure 2 Example of (a) ‘smooth’ and (b) ‘rough’ surface of Moso strands.
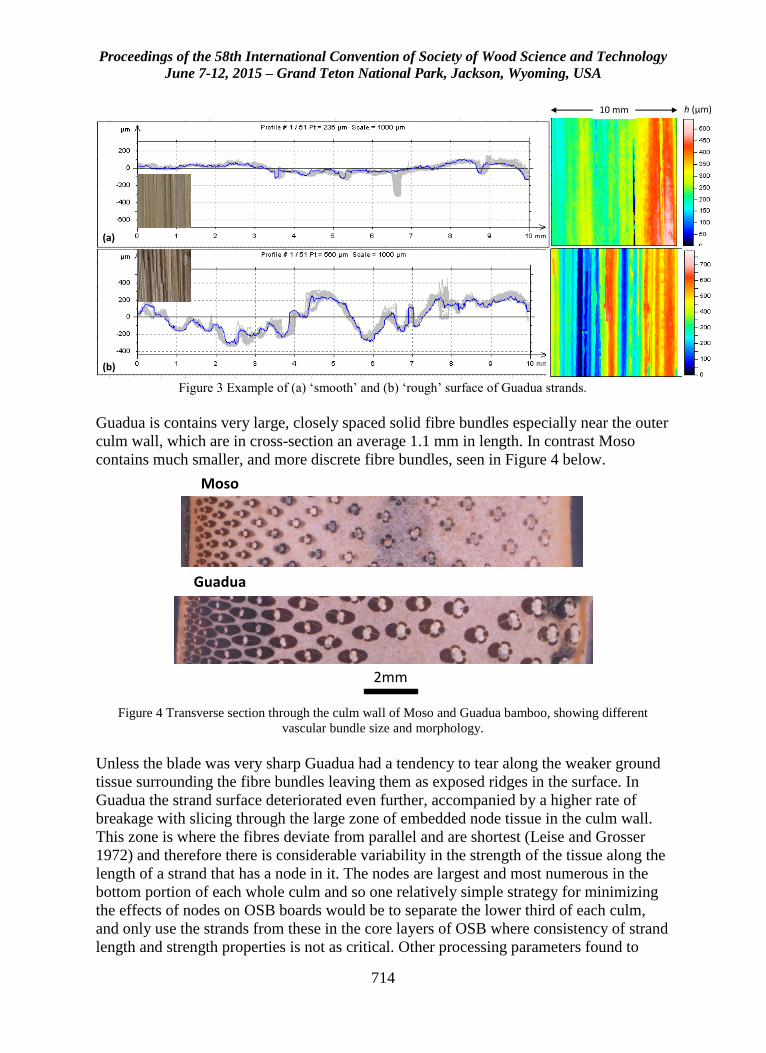
Proceedings of the 58th International Convention of Society of Wood Science and Technology
June 7-12, 2015 – Grand Teton National Park, Jackson, Wyoming, USA
714
(b)
10 mm h (µm)
(a)
Figure 3 Example of (a) ‘smooth’ and (b) ‘rough’ surface of Guadua strands.
Guadua is contains very large, closely spaced solid fibre bundles especially near the outer
culm wall, which are in cross-section an average 1.1 mm in length. In contrast Moso
contains much smaller, and more discrete fibre bundles, seen in Figure 4 below.
Moso
Guadua
2mm
Figure 4 Transverse section through the culm wall of Moso and Guadua bamboo, showing different
vascular bundle size and morphology.
Unless the blade was very sharp Guadua had a tendency to tear along the weaker ground
tissue surrounding the fibre bundles leaving them as exposed ridges in the surface. In
Guadua the strand surface deteriorated even further, accompanied by a higher rate of
breakage with slicing through the large zone of embedded node tissue in the culm wall.
This zone is where the fibres deviate from parallel and are shortest (Leise and Grosser
1972) and therefore there is considerable variability in the strength of the tissue along the
length of a strand that has a node in it. The nodes are largest and most numerous in the
bottom portion of each whole culm and so one relatively simple strategy for minimizing
the effects of nodes on OSB boards would be to separate the lower third of each culm,
and only use the strands from these in the core layers of OSB where consistency of strand
length and strength properties is not as critical. Other processing parameters found to
Proceedings of the 58th International Convention of Society of Wood Science and Technology
June 7-12, 2015 – Grand Teton National Park, Jackson, Wyoming, USA
715
impinge on strand quality in the case of dense, difficult-to-strand hardwoods include
slower cutting speed and lower knife angle (De Vallance et al. 2012), and further
adjustment of these may improve strand quality from Guadua.
Conclusions
Due to its lower density and smaller, more discrete fibre bundles Moso was less wearing
on strander knife blades and strand quality was much higher than Guadua. The proportion
of whole strands was 75% for Moso and 65% for Guadua, with many Guadua strands
tending to break adjacent to the node tissue. Average strand thickness and coefficient of
variation (0.65 mm and 37.7% COV) for Moso was very close to that found in Aspen
mill strands (0.67 mm and 35.7% COV). Due to the constrained wall thickness of
bamboo culms average Moso strand width was around 13 mm compared with 18 mm for
sampled industrial Aspen strands. In contrast Guadua strands were an average of 0.75
mm in thickness, 31.3% COV; and 15.0 mm in width, 27.3% COV; in keeping with its
greater average wall thickness. The mean surface roughness index (Ra) for ‘smooth’
Moso strands was 7.7µm, and 20.9µm for ‘rough’ strands, and 10.7µm and 23.4µm for
‘smooth’ and ‘rough’ Guadua strands, respectively. The maximum roughness index (Rz)
for the roughest strand surfaces was similar across tissue types, Moso, Guadua and
Aspen, at approx. 115 µm. In contrast to Moso, much further work is needed to find a
more effective method of removing Guadua nodes prior to processing and improving the
strand quality before the species could be considered suitable for OSB manufacture.
Acknowledgements
This study was funded through an NSERC (National Science and Engineering Research
Council) G8 Tri-Council grant. The authors gratefully acknowledge the following
personnel at Forest Products Innovations (Western Division): Mr John Hoffman for
access to boil tank facilities and operation of the disk flaker, and Dr Zarin Pirouz and Mr
John White for access to laser surface profilometry equipment.
References
Correal JF, Ramirez F (2010) Adhesive bond performance in glue line shear and bending
for glued laminated Guadua bamboo. J. Trop. For. Sci. 22(4): 433-439.
Dagilis TD (1999) Bamboo composite materials for low cost housing. PhD thesis,
Department of Civil Engineering, Queens University, Kingston, ON, 248 pp.
Proceedings of the 58th International Convention of Society of Wood Science and Technology
June 7-12, 2015 – Grand Teton National Park, Jackson, Wyoming, USA
716
De Flander K, Rovers R (2009) One laminated bamboo-frame house per hectare per year.
Construction and Building Materials 23(1): 210-2
De Vallance DB, Gray JD, Grushecky ST (2012) Improving strand quality of upland oaks
for use in oriented strand board. Proceedings, 18th Central Hardwoods Forest
Conference, G Miller et al. (eds), 26-28 March 2012, West Virginia University,
Morgantown, WV. USDA Forest Service Northern Research Station GTR-NRS-P-
117: 284-291.
Harries K, Sharma B, Richard M (2012) Structural use of full culm bamboo: the path to
standardization. Int J Arch, Eng & Constr 1(2): 66-75.
Hu C, Afzal MT (2005) Automatic measurement of wood surface roughness by laser
imaging. Part 1: Development of laser imaging system. Forest Products Journal 55(12):
158-163.
Liese W (1998) The anatomy of bamboo culms. INBAR Technical Report 18,
International Network for Bamboo and Rattan, Beijing, pp. 175-191.
Liese W, Grosser D (1972) On the variability of fiber length of bamboo. Holzforschung
26: 202-211.
Lundberg IA, Porankiewicz S (1995) Studies of non-contact methods for roughness
measurements on wood surfaces. Holz als Roh- und Werkstoff 53(5): 309-314.
Semple KE, Smola M, Hoffman J, Smith GD (2014a) ‘Optimising the stranding of Moso
bamboo (Phyllostachys pubescens Mazel) culms using a CAE 6/36 disk flaker. In M
Barnes and V Herian (eds) Proceedings of the 57th International Convention of Society
of Wood Science and Technology, June 23-27, 2014, Zvolen, Slovakia, pp. 257-269.
Semple KE, Xian D, Smith GD (2014b) Reinforced core particleboard for improved
screw-holding ability. Wood Fiber Sci 46(1): 48-64.
Semple KE, Smith GD (2014) Theoretical models for bamboo strand recovery and width
distribution. Proceedings, Processing Technologies for the Forest and Biobased
Products Industries-PTF BPI 2014, A Petutschnigg, MC Barbu (eds), 24-26 September
2014, Salzburg University of Applied Sciences, Kuchl, Austria, pp. 401-408.
Stark N, Cai Z, C Carll (2010) Chapter 11 Wood-Based composite materials, in Wood
Hand Book: Wood as an Engineering Material, FPL General Technical Report FPL-
GTR-190, USDA Forest Products Laboratory, Madison, Wisconsin, 509 pp.
Van Der Lugt P, Van Der Dobbelsteen A, Abrahams R (2003) Bamboo as a building
material alternative for Western Europe? A study of the environmental performance
costs and bottlenecks of the use of bamboo (products) in Western Europe. J. Bamboo
and Rattan 2(3): 205-223.

Proceedings of the 58th International Convention of Society of Wood Science and Technology
June 7-12, 2015 – Grand Teton National Park, Jackson, Wyoming, USA
717
Proceedings of the 58th International Convention of Society of Wood Science and Technology
June 7-12, 2015 – Grand Teton National Park, Jackson, Wyoming, USA
718
Temperature and Humidity Dependent Mechanical
Performance of Nanocellulose and its Composites
Mehdi Tajvidi, [email protected]
Justin Crouse, <[email protected]
Douglas Gardner, [email protected]
Douglas Bousfield, [email protected]
William Gramlich, [email protected]
Abstract
The two main forms of cellulose nanomaterials namely, cellulose nanocrystals (CNC)
and cellulose nanofibrils (CNF) are known as high strength, high stiffness renewable
nanomaterials of the future. Current information on the mechanical performance of these
fibers and their composites confirms such understanding. However, these interesting
nanomaterials are hydrophilic and viscoelastic in nature and their mechanical properties
are highly temperature and moisture dependent. The problem exacerbates when the
polymer matrix used in the formulation is also temperature and humidity sensitive.
Therefore, there is a need to understand the mechanical and viscoelastic performance of
these materials and their composites under service conditions where either or both
humidity and temperature are variable. For this purpose, pure films of CNC and CNF as
well as their composites with poly vinyl alcohol (PVA) at various concentrations were
produced by solution casting. An environmentally controlled dynamic mechanical
analyzer (DMA) was used to obtain stress/strain curves at various temperatures and
relative humidities. Dynamic mechanical tests were also carried out under different
temperature and humidity regimens to establish basic material behavior under service
condition. The fundamental behavior of CNF and CNC films and their composites as
affected by temperature and relative humidity will be presented and discussed.
Proceedings of the 58th International Convention of Society of Wood Science and Technology
June 7-12, 2015 – Grand Teton National Park, Jackson, Wyoming, USA
719
IUFRO 5.10 Forest Products and Communities Session Moderator: Paul Dargusch, University of Queensland,
Australia
Business Management Research in the Forestry Sector:
Past, Present and Future Directions
Rajat Panwar, [email protected]
University of British Columbia, 2424 Main Mall, , Vancouver, BC V6T 1Z4
Abstract
Insofar the forest sector is at a cross-road, business and management scholars in the forest
sector have an unprecedented responsibility to address difficult questions that may, at
times, involve even explicating why or why not should the forest industry exist. Is
globalization of industry a fundamental reason for a number of environmental concerns
surrounding us? Could the sub-sectors that developed due to a growth in the bio-economy
domain co-exist with the traditional forest industry as spin-offs or would they emerge as
the next stage of evolution of an industry.
The forest sector provides a fertile ground for addressing a number of such fundamental
questions that have not been considered before in strategy, management, and industry
evolution literatures. And indeed forest sector business scholars are better positioned to
take lead. How can the current forest sector scholarship take the leap from merely
replicating the studies conducted by business school researchers in a forestry context to
leveraging the much-professed uniqueness of the forestry in order to contribute to our
fundamental knowledge about business and the environment?
Proceedings of the 58th International Convention of Society of Wood Science and Technology
June 7-12, 2015 – Grand Teton National Park, Jackson, Wyoming, USA
720
Challenges in Communicating Forest Industry
Sustainability to the General Public:
Results from a Four-Country Comparison in Europe
Toppinen, A.*1, Korhonen, E.1, Lähtinen, K.1, Ranacher, L.2, Werner, A. 2,
Stern, T. 2 and Kutnar, A.
1 University of Helsinki, Department of Forest Sciences, Latokartanonkaari
7, FI-00014, Helsinki, Finland
* Corresponding author [email protected] 2 Market Analysis and Innovation Research Team, Kompetenzzentrum Holz
(Wood K plus), Feistmantelstraße 4, A-1180 Vienna, Austria 3 University of Primorska Faculty of Mathematics, Natural Sciences and
Information Technologies, Glagojaška 8, SI-6000 Koper, Slovenia,
Abstract
Despite increasing global awareness of environmental issues, little is known regarding
how different segments of the European forest industry communicate their sustainability
efforts to the general public. Communication is an important tool in maintaining
legitimacy and acceptability of company operations, and public expectations are found to
be high. Consequently, some key empirical questions emerge such as what is the core
content and what challenges exist in forest related communication? This study applies a
qualitative content analysis in four forestry-rich European countries (Austria, Finland,
Germany, Slovenia). Online communication of 61 companies and 19 industry
associations were qualitatively analysed with a focus on eight “core topics of interest”
(TOIs) identified as a results from an international stakeholder feedback process. Our
results also show high conformity in communication across countries. The most
frequently communicated TOI was Forest and the economy particularly within large
companies (28 %) and bioenergy producers (30%); Added Value of wood (AVA, 34%)
within family businesses and SMEs, and on Forests and global warming (FGW, 22%)
within associations. Characteristically, current content focuses on supplying facts or
referring to certificates or standards, and lacks feedback mechanisms, pointing towards
areas of future development in the forest sector communication.
Introduction
Overall, forests are a rich source of ecological, economic and social benefits. As a
material, wood is used for various purposes, such as construction material, energy carrier,

Proceedings of the 58th International Convention of Society of Wood Science and Technology
June 7-12, 2015 – Grand Teton National Park, Jackson, Wyoming, USA
721
boards, paper, cellulose, fibres and chemicals. Co-products of the wood processing
industries are an important raw material for further processing. Chips from sawmilling
can be used directly on site, for energy production or pellets, or are sold to a company
using the fibers for subordinated processing like pulp or panel production. This reuse of
the raw material thus increases the overall wood availability on the market (Steirer,
2005). Even though a lot of by-products are used, there is still room for improvement to
further increase efficiency of wood use (Windsperger, 2010). In addition, there is a need
for forest sector to renew its product and service portfolio, which calls for increased
attention to enhancing added value via intangible product attributes and putting efforts to
new forest and wood-based innovations (Hetemäki, 2014). However, the final market
demand is determined by consumer acceptance and based on competition between
alternative products and services. These are examples of issues that we would like to
investigate in this analysis from the forest sector communication perspective.
In the previous studies, public expectations regarding transparency and responsible
business conduct of the natural resource based sectors are found to be high (e.g.,
Ranängen and Zobalt 2014). Communication is an important tool in maintaining
legitimacy and acceptability of organizations. When covering sustainability
communication in forest products industry, previous studies have mainly been focusing
on sustainability reporting (Vidal and Kozak 2008). However, after spread of
digitalization the importance of sustainability-related online communication has
increased, especially among forest companies and associations. Consequently, an
empirical question emerges as “What is the core content in forest related communication
when using different dimensions of sustainability as a lens?”
As an analytic lens, eight “topics of interest” (TOIs) were chosen based on written
stakeholder feedback and final discussion in a stakeholder workshop (Helsinki
22.9.2014). The topics were chosen to be both of interest for stakeholders from the forest-
based sector and also to cover a clear societal relevance towards a bio-based and
sustainable economy. They are identified as follows (with acronyms used in the text and
figure captions):
1. Wood based innovations (WBI)
2. Multifunctional forestry and forest ecosystem services (FES)
3. Forest conservation by [forest management and] production (CBP)
4. Forests and global warming (FGW)
5. Forests and economy (FEC)
6. Added value of wood (AVA)
7. Building with wood (BWW)
8. Efficient use of wood (EUW)
Our point of departure is that the three-dimensional concept of sustainability
(environmental, social and economic) can be implemented at four hierarchical levels, i.e.
as societal, sectoral, corporate and product (or service) level (see Figure 1).

Proceedings of the 58th International Convention of Society of Wood Science and Technology
June 7-12, 2015 – Grand Teton National Park, Jackson, Wyoming, USA
722
Firstly, societal level sustainability, as a more extensive level of the sustainability
concept, includes strategic decisions, regulations and operations related to sustainable
development in a global scale. The societal level has a high impact on other three levels
as carried through the implementation of national and international regulations and
commitments, which create limitations and incentives for society, governments,
companies, organizations and individuals.
Secondly, the main focus of sectoral level sustainability, which is a lesser used concept
according to Draper (2006), is to maintain or enhance the current legitimacy or solid
reputation of a sector in sustainability related matters with the aim to improve
competitiveness in relation to other sectors. Thus, the success of improving sustainability
performance requires collaboration with other companies, organizations and value-chain
members in the same sector.
Thirdly, the sustainability in corporate level encompasses communicating the current
state and goals of corporate social responsibility, as mentioned above.
Fourthly, the product level sustainability is primarily concerned with consumers’
perceptions on environmental and social sustainability of products, which has been
affected by corporate strategic decisions-making process. Based on e.g. Toppinen et al.
(2013) for Finnish consumers of wood products, the safety aspect and health impacts of a
product are emphasized. In addition we hypothesize based on workshop discussions that
sustainability of forest based ecosystem services, including provisioning of wood based
products (Räty et al., 2014), to customers is of potential relevance at this level.
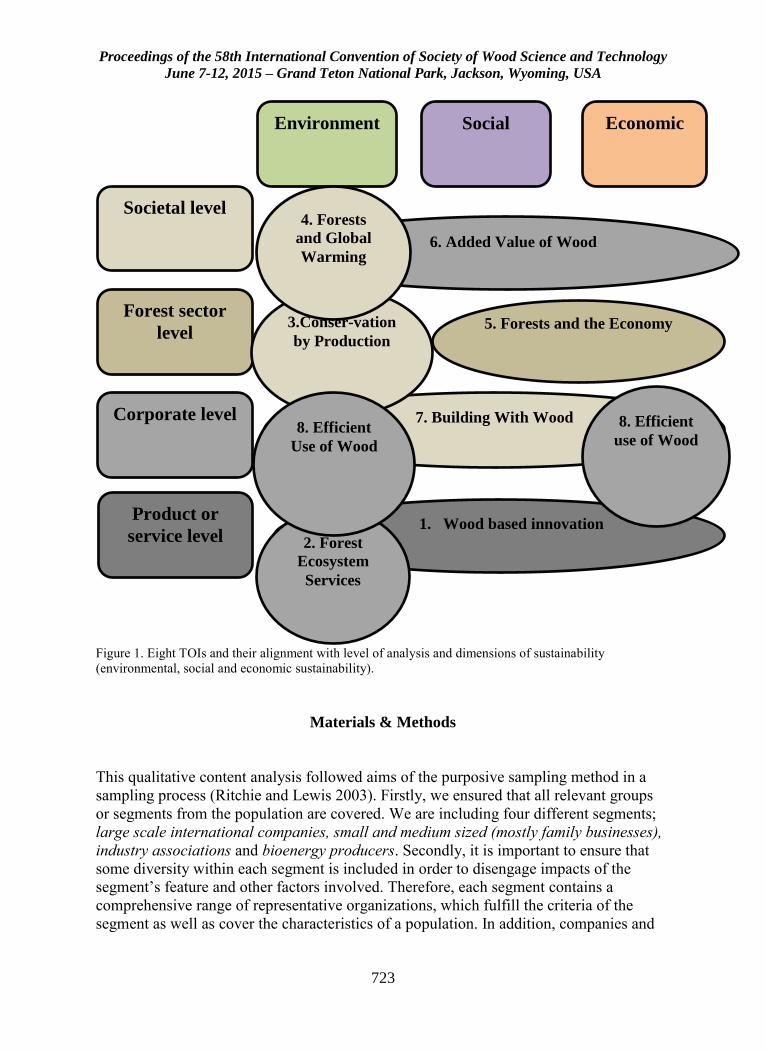
Proceedings of the 58th International Convention of Society of Wood Science and Technology
June 7-12, 2015 – Grand Teton National Park, Jackson, Wyoming, USA
723
Figure 1. Eight TOIs and their alignment with level of analysis and dimensions of sustainability
(environmental, social and economic sustainability).
Materials & Methods
This qualitative content analysis followed aims of the purposive sampling method in a
sampling process (Ritchie and Lewis 2003). Firstly, we ensured that all relevant groups
or segments from the population are covered. We are including four different segments;
large scale international companies, small and medium sized (mostly family businesses),
industry associations and bioenergy producers. Secondly, it is important to ensure that
some diversity within each segment is included in order to disengage impacts of the
segment’s feature and other factors involved. Therefore, each segment contains a
comprehensive range of representative organizations, which fulfill the criteria of the
segment as well as cover the characteristics of a population. In addition, companies and
7. Building With Wood
Societal level
Forest sector
level
Corporate level
Product or
service level 1. Wood based innovation
5. Forests and the Economy
6. Added Value of Wood
Environment Social Economic
8. Efficient
use of Wood
3.Conser-vation
by Production
4. Forests
and Global
Warming
2. Forest
Ecosystem
Services
8. Efficient
Use of Wood
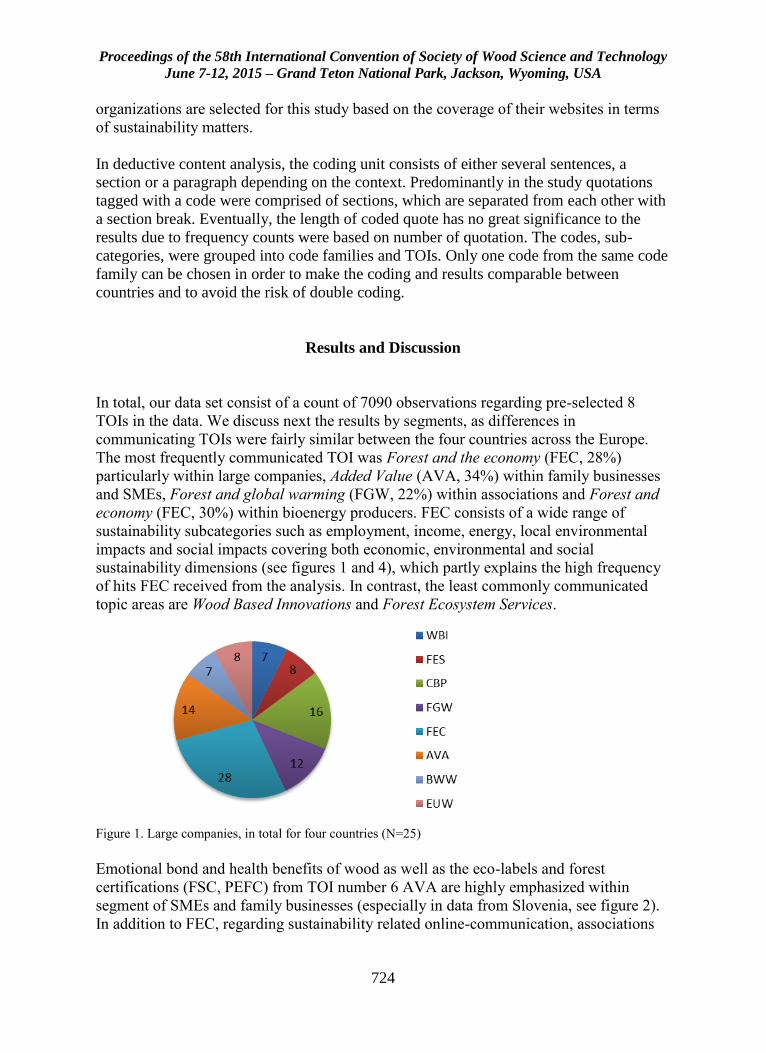
Proceedings of the 58th International Convention of Society of Wood Science and Technology
June 7-12, 2015 – Grand Teton National Park, Jackson, Wyoming, USA
724
organizations are selected for this study based on the coverage of their websites in terms
of sustainability matters.
In deductive content analysis, the coding unit consists of either several sentences, a
section or a paragraph depending on the context. Predominantly in the study quotations
tagged with a code were comprised of sections, which are separated from each other with
a section break. Eventually, the length of coded quote has no great significance to the
results due to frequency counts were based on number of quotation. The codes, sub-
categories, were grouped into code families and TOIs. Only one code from the same code
family can be chosen in order to make the coding and results comparable between
countries and to avoid the risk of double coding.
Results and Discussion
In total, our data set consist of a count of 7090 observations regarding pre-selected 8
TOIs in the data. We discuss next the results by segments, as differences in
communicating TOIs were fairly similar between the four countries across the Europe.
The most frequently communicated TOI was Forest and the economy (FEC, 28%)
particularly within large companies, Added Value (AVA, 34%) within family businesses
and SMEs, Forest and global warming (FGW, 22%) within associations and Forest and
economy (FEC, 30%) within bioenergy producers. FEC consists of a wide range of
sustainability subcategories such as employment, income, energy, local environmental
impacts and social impacts covering both economic, environmental and social
sustainability dimensions (see figures 1 and 4), which partly explains the high frequency
of hits FEC received from the analysis. In contrast, the least commonly communicated
topic areas are Wood Based Innovations and Forest Ecosystem Services.
Figure 1. Large companies, in total for four countries (N=25)
Emotional bond and health benefits of wood as well as the eco-labels and forest
certifications (FSC, PEFC) from TOI number 6 AVA are highly emphasized within
segment of SMEs and family businesses (especially in data from Slovenia, see figure 2).
In addition to FEC, regarding sustainability related online-communication, associations
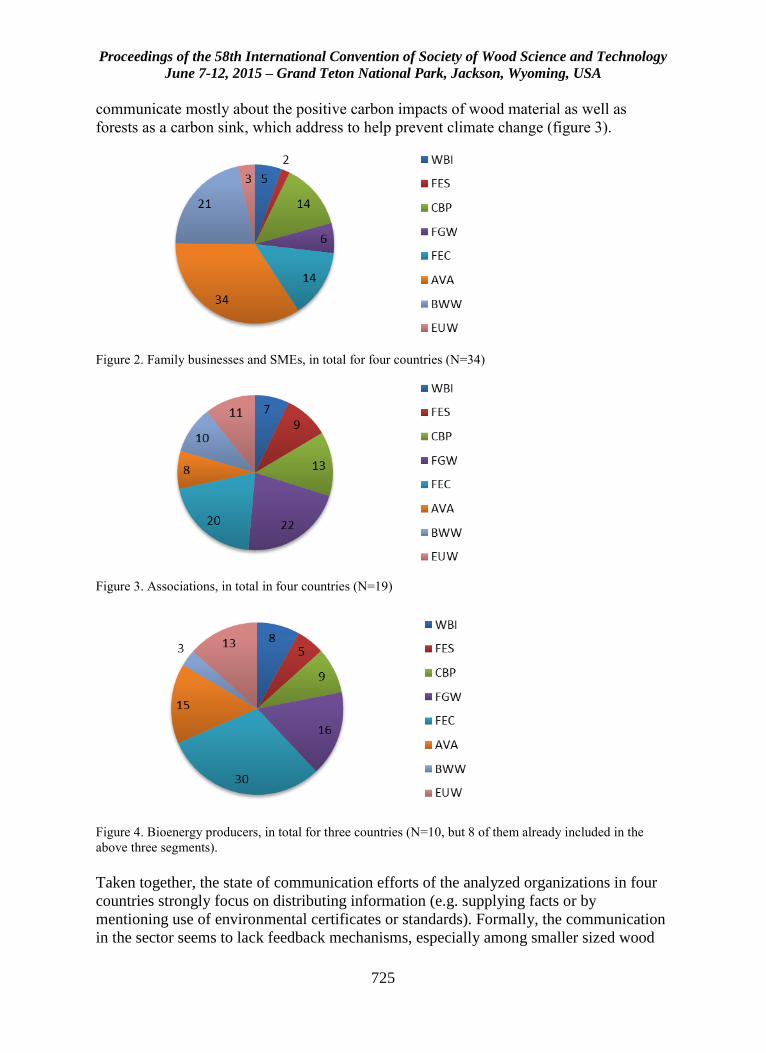
Proceedings of the 58th International Convention of Society of Wood Science and Technology
June 7-12, 2015 – Grand Teton National Park, Jackson, Wyoming, USA
725
communicate mostly about the positive carbon impacts of wood material as well as
forests as a carbon sink, which address to help prevent climate change (figure 3).
Figure 2. Family businesses and SMEs, in total for four countries (N=34)
Figure 3. Associations, in total in four countries (N=19)
Figure 4. Bioenergy producers, in total for three countries (N=10, but 8 of them already included in the
above three segments).
Taken together, the state of communication efforts of the analyzed organizations in four
countries strongly focus on distributing information (e.g. supplying facts or by
mentioning use of environmental certificates or standards). Formally, the communication
in the sector seems to lack feedback mechanisms, especially among smaller sized wood

Proceedings of the 58th International Convention of Society of Wood Science and Technology
June 7-12, 2015 – Grand Teton National Park, Jackson, Wyoming, USA
726
companies. Furthermore, stakeholder expectations about tailored communication were
rarely expressed in explicit terms, making the evaluation of the effectiveness of
communication difficult.
Summary and Concluding Remarks
The share of eight pre-selected topics for total data indicates dominance of Forest and the
economy (FEC). As the second most frequently communicated the TOI is Added value of
Wood (AVA), despite that its dominance was due mainly to heavy emphasis on this in
Slovenian sample. In contrast, among the TOIs, the two future-oriented topics, i.e. WBI
of Wood-based innovations and FES Forest ecosystem services deserved the least weight
in the data. Furthermore, stakeholder expectations about tailored communication were
rarely expressed in explicit terms, making the evaluation of the communication
effectiveness difficult. In addition, the communication efforts of sample organizations
heavily focused on distributing information (e.g. supplying facts or by mentioning use of
environmental certificates or standards), and lacked feedback mechanisms with targeted
stakeholders, especially among the smaller sized wood companies.
In comparison to the corporate level results focusing on sustainability reports by globally
leading pulp and paper companies, Vidal and Kozak (2008) found that sustainable forest
management was on average the most commonly reported topic. In addition, in Vidal and
Kozak (2008) larger sized companies were found to report on a wider range of activities
than smaller sized firms, whereas it was not possible to draw such a conclusion from our
sample. However, sustainability reporting may be more suitable for communicating with
regulators and auditors whereas general communication towards a wide range of
stakeholder groups, such as consumers, would require clearer messages that also appeal
to the emotional side (see e.g. Joutsenvirta 2009). Such issues would seem to include e.g.
forest sector contribution to solving global sustainability challenges or emphasizing
safety and health benefits of wood material at individual or societal level.
As a final note, communicators in the forest sector should critically examine their
efficacy of communicating in all topic issue areas. For example, is all the economic
performance and value added related communication worth it, or should some of it be
replaced by other less represented categories? The answers to these questions will be
searched for in the surveys and experimental research performed in the frame of this
Wood Wisdom Net (W3B) project.
Acknowledgements
Financial support from ERANET WoodWisdom Net W3B partners and financers is
gratefully acknowledged. Work of Slovenian author was supported by the Ministry of
education, science and sport.
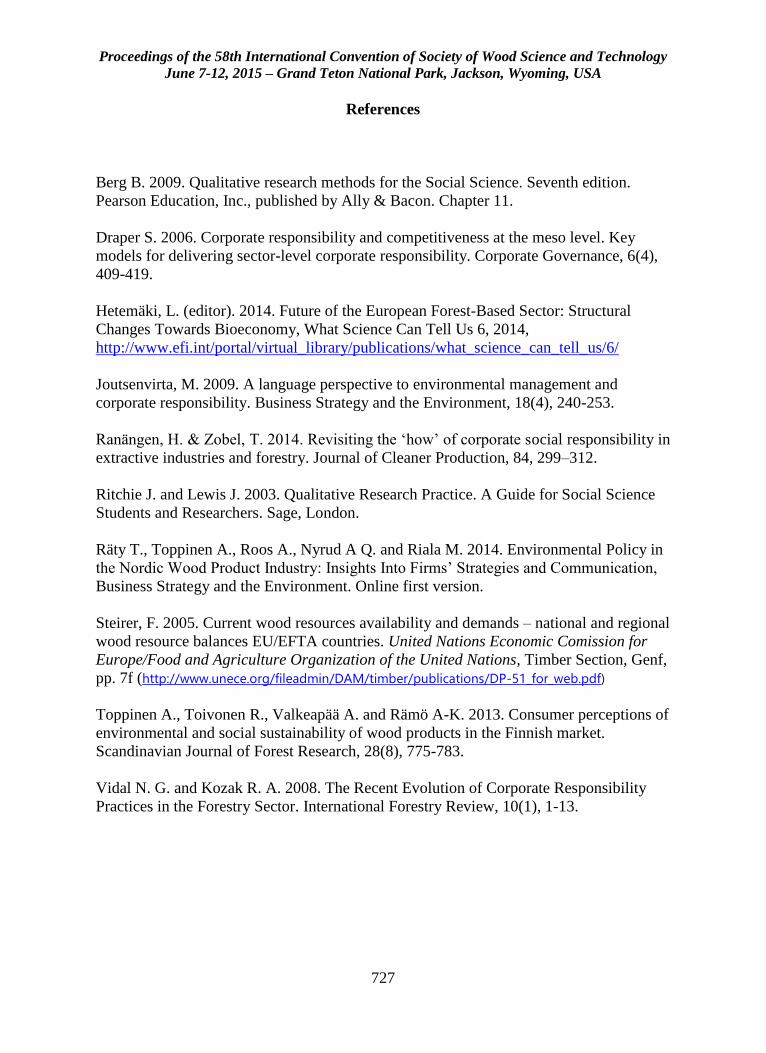
Proceedings of the 58th International Convention of Society of Wood Science and Technology
June 7-12, 2015 – Grand Teton National Park, Jackson, Wyoming, USA
727
References
Berg B. 2009. Qualitative research methods for the Social Science. Seventh edition.
Pearson Education, Inc., published by Ally & Bacon. Chapter 11.
Draper S. 2006. Corporate responsibility and competitiveness at the meso level. Key
models for delivering sector-level corporate responsibility. Corporate Governance, 6(4),
409-419.
Hetemäki, L. (editor). 2014. Future of the European Forest-Based Sector: Structural
Changes Towards Bioeconomy, What Science Can Tell Us 6, 2014,
http://www.efi.int/portal/virtual_library/publications/what_science_can_tell_us/6/
Joutsenvirta, M. 2009. A language perspective to environmental management and
corporate responsibility. Business Strategy and the Environment, 18(4), 240-253.
Ranängen, H. & Zobel, T. 2014. Revisiting the ‘how’ of corporate social responsibility in
extractive industries and forestry. Journal of Cleaner Production, 84, 299–312.
Ritchie J. and Lewis J. 2003. Qualitative Research Practice. A Guide for Social Science
Students and Researchers. Sage, London.
Räty T., Toppinen A., Roos A., Nyrud A Q. and Riala M. 2014. Environmental Policy in
the Nordic Wood Product Industry: Insights Into Firms’ Strategies and Communication,
Business Strategy and the Environment. Online first version.
Steirer, F. 2005. Current wood resources availability and demands – national and regional
wood resource balances EU/EFTA countries. United Nations Economic Comission for
Europe/Food and Agriculture Organization of the United Nations, Timber Section, Genf,
pp. 7f (http://www.unece.org/fileadmin/DAM/timber/publications/DP-51_for_web.pdf)
Toppinen A., Toivonen R., Valkeapää A. and Rämö A-K. 2013. Consumer perceptions of
environmental and social sustainability of wood products in the Finnish market.
Scandinavian Journal of Forest Research, 28(8), 775-783.
Vidal N. G. and Kozak R. A. 2008. The Recent Evolution of Corporate Responsibility
Practices in the Forestry Sector. International Forestry Review, 10(1), 1-13.
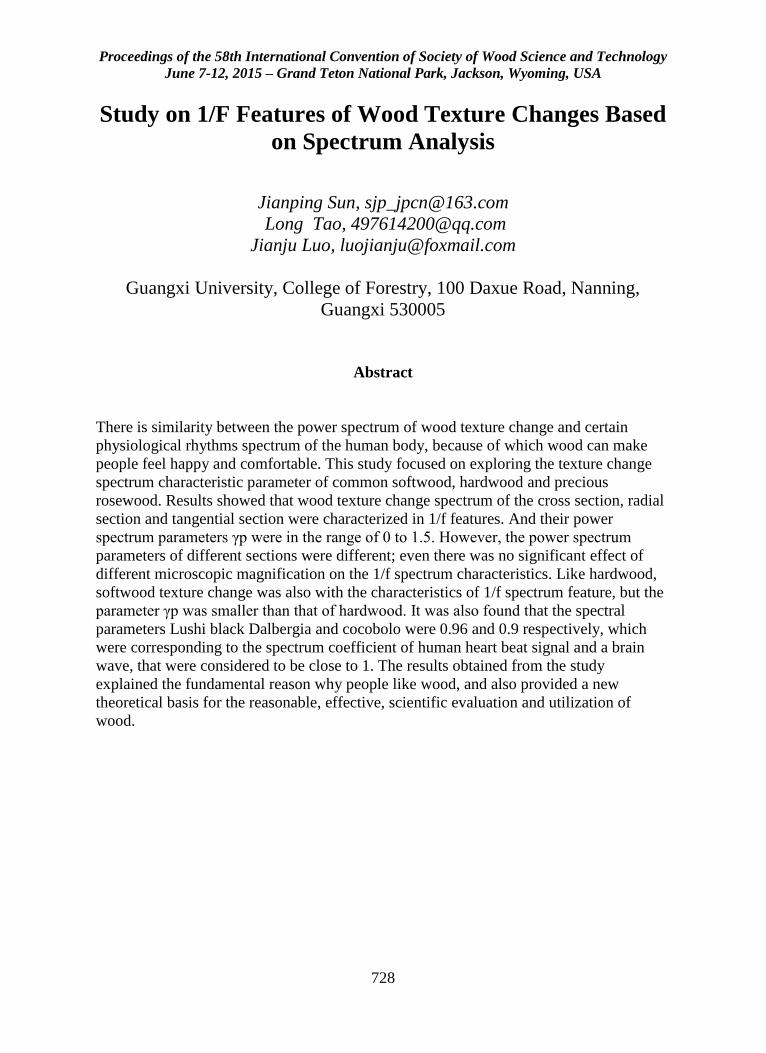
Proceedings of the 58th International Convention of Society of Wood Science and Technology
June 7-12, 2015 – Grand Teton National Park, Jackson, Wyoming, USA
728
Study on 1/F Features of Wood Texture Changes Based
on Spectrum Analysis
Jianping Sun, [email protected]
Long Tao, [email protected]
Jianju Luo, [email protected]
Guangxi University, College of Forestry, 100 Daxue Road, Nanning,
Guangxi 530005
Abstract
There is similarity between the power spectrum of wood texture change and certain
physiological rhythms spectrum of the human body, because of which wood can make
people feel happy and comfortable. This study focused on exploring the texture change
spectrum characteristic parameter of common softwood, hardwood and precious
rosewood. Results showed that wood texture change spectrum of the cross section, radial
section and tangential section were characterized in 1/f features. And their power
spectrum parameters γp were in the range of 0 to 1.5. However, the power spectrum
parameters of different sections were different; even there was no significant effect of
different microscopic magnification on the 1/f spectrum characteristics. Like hardwood,
softwood texture change was also with the characteristics of 1/f spectrum feature, but the
parameter γp was smaller than that of hardwood. It was also found that the spectral
parameters Lushi black Dalbergia and cocobolo were 0.96 and 0.9 respectively, which
were corresponding to the spectrum coefficient of human heart beat signal and a brain
wave, that were considered to be close to 1. The results obtained from the study
explained the fundamental reason why people like wood, and also provided a new
theoretical basis for the reasonable, effective, scientific evaluation and utilization of
wood.
Proceedings of the 58th International Convention of Society of Wood Science and Technology
June 7-12, 2015 – Grand Teton National Park, Jackson, Wyoming, USA
729
Operations Management, Cooperation and Negotiation
in the Wood Supply Chain – The Relationship Between
Sawmills snd Sawlog Suppliers
Matti Stendahl, [email protected]
Emanuel Erlandsson, [email protected]
Swedish University of Agricultural Sciences, Department of Forest
Products, PO Box 7008, SE-75007 UPPSALA
Abstract
Recent decades’ development of technology in forest inventory, harvesting, logistics, and
sawmilling have created new possibilities for better integration of sawmills’ and sawlog
suppliers’ operations. This could largely increase value creation in the wood supply
chain. However, industry practitioners indicate that integration still is at a fairly basic
level and that the full potential of available technology is not used. The literature does not
provide much information about the relationship between sawmills and sawlog suppliers
and the reasons for this incongruity are therefore not well known. This study investigates
the relationship between sawmills and sawlog suppliers in four Swedish cases. Semi-
structured individual interviews and focus group discussions with respondents from a
cross-functional sample in each case provided deep insights into operations management,
cooperation and negotiation involved in the relationship. Function modeling (IDEF0) was
used to map actors, activities and information flows in the negotiation process. The study
indicates that managing social relationships is equally important as managing technology
in the management of the wood supply chain.
Proceedings of the 58th International Convention of Society of Wood Science and Technology
June 7-12, 2015 – Grand Teton National Park, Jackson, Wyoming, USA
730
Nanocellulose Market Volume Projections: A Derived
Demand Analysis
E.M. (Ted) Bilek, [email protected]
John Cowie, John Cowie <[email protected]>
Jo Anne Shatkin, Jo Anne Shatkin <[email protected]>
Theodore Wegner, [email protected]
USDA Forest Products Laboratory, One Gifford Pinchot Drive, Madison,
WI 53726
Abstract
Nanotechnology has enormous promise to bring about fundamental changes and
significant benefit to society and to the forest products industry. This study creates a
methodology to estimate the potential volume of nanocellulose that will be used in
diverse products and markets in the United States. Published data sources are used to
identify research that cites the utility of nanocellulose for particular applications. Eleven
potentially high-volume applications are identified along with twelve low-volume
applications. In addition, three identified novel applications are considered to be
potentially promising, but not developed enough to make nanocellulose market demand
projections. Volume projections are made by estimating nanocellulose market
penetrations into representative end-product markets. Middle market-penetration
estimates are bracketed by both high and low estimates to establish a plausible volume
range for nanocellulose demand. When summed, the annual market potential in high-
volume applications in the U.S. is approximately 12 million tonnes of nanocellulose with
nearly half coming from the combined packaging and paper industries. This estimate is
based on current markets and our middle market-penetration estimates. The spread
around this middle point is quite wide, ranging from around 45 percent less to around 55
percent more, reflecting the early stage of the technology development

Proceedings of the 58th International Convention of Society of Wood Science and Technology
June 7-12, 2015 – Grand Teton National Park, Jackson, Wyoming, USA
731
A Demand-pricing Management Approach to Add
Value in the U.S. Hardwood Industry
Henry Quesada-Pineda
Virginia Tech, USA
Abstract
It is a common practice for companies to determine their prices based on cost plus a
profit markup and or market prices. The hardwood lumber industry usually works in a
similar way. The problem with these approaches is that they are usually based on
arbitrary decisions and do not account for the risk of either setting prices to high and
therefore losing demand, or too low and leaving money on the table. The goal of this
study is to test a demand-pricing methodology based on mathematical modeling, that
have proved to be successful in increasing profits in other industries, and that may also be
valuable in the hardwood lumber industry. There is a particular interested in exporting
firms because it is considered that they have to deal with more challenges and
complexities at the time of determining prices than those whose focus remain only on the
domestic market. In this study, researchers analyzed historic sales data in order to
determine optimum pricing values for each product in each geographic region, which will
serve the sales and marketing groups in negotiating with customers abroad. It was
observed that in specific circumstances, the suggested approach, which is based on
statistical modeling and mathematical optimization may lead to higher profits than the
traditional pricing method.
Proceedings of the 58th International Convention of Society of Wood Science and Technology
June 7-12, 2015 – Grand Teton National Park, Jackson, Wyoming, USA
732
Comparing Health, Emotional Wellbeing and Indoor
Environment in Solid Wood and Brick Built Student
Housing
Kristian Bysheim, [email protected]
Maren Grønseth, [email protected]
Norwegian Institute of Wood Technology, Po Box 113, Blinder, , Oslo 0314
Abstract
Indoor environment in student housing in solid wood built in the years 2013-2014 were
compared with the indoor environment in student residences in brick and concrete
construction with non-load bearing timber frame walls built in the years 1964-1975. A
survey that measured subjective environmental factors, health problems related to indoor
environment and emotional well-being were distributed to residents by email during the
fall of 2014. The survey was based on Ørebro model and Russel's circumplex model of
Affect. The questionnaire was distributed via email to 990 students twice to measure any
changes in indoor environments and emotional wellbeing. The response rate was 42
percent. Temperature and humidity were measured using sensors in the apartments during
the same period. Results from Örebro model showed fewer registered complaints among
residents of solid wood construction for most environmental factors and symptoms. This
was true for both the first and second measurement. Analysis of variance of the factors
that measured emotional well-being showed a significant relationship between residence
and experience of well-being for several of the self-reported factors
Proceedings of the 58th International Convention of Society of Wood Science and Technology
June 7-12, 2015 – Grand Teton National Park, Jackson, Wyoming, USA
733
Mapping of Wood Supply Chains, a Case Study.
Magnus Larsson, [email protected]
Anders Roos, [email protected]
Matti Stendahl, [email protected]
SLU, Forest Products, PO Box 7008, SE-7500 07 Uppsala
Abstract
The aim of the study is to suggest and test a model for mapping the structure and
processes and assessing the performance in wood based supply chains. This will describe
the performance of the whole supply chain and enable managers to achieve cost effective,
customer responsive and resilient product flows. The work includes mapping supply
chains (forest-sawmill-customer) and factors that impact the production and flow. This
proceeds to identify methods to manage and improve the supply chains. The work is
based on qualitative case-studies and comprises the following sub-studies:
1.Mapping of a wood-based SC from raw material production to the customer. 2.Analysis
of the conditions and restrictions for achieving an enhanced wood based SC in terms of
cost efficiency, customer value and flexibility. 3.Development of performance indicators,
models for assessment of efficient resource management, customer value and risk
management (uncertainties). A suggested mapping framework draws on the works by
Lambert & Cooper, used by Haartveit et al. The mapping is supplemented with
qualitative studies, in which costs appearing from sub optimized activities, as well as
value creation potential, are detected and defined. The result is intended to be used as a
base for decisions on strategy and desired performance by the SC management in charge.
Proceedings of the 58th International Convention of Society of Wood Science and Technology
June 7-12, 2015 – Grand Teton National Park, Jackson, Wyoming, USA
734
Comparative Analysis of the European Forest Sector
Production 2008-2013
Michael D. Burnard1,2* – Monika Cerinšek2 – Andreja Kutnar1,3– Boris
Horvat1,2
1 Andrej Marušič Insitute, University of Primorska, Koper, Slovenia
2 Abelium R&D, d.o.o., Ljubljana, Slovenia 3 Faculty of Mathematics, Natural Sciences and Information Technology
*Corresponding author
Abstract
Wood is available in many forms and is present in many products available on the
market. In order to analyse Europe’s forest sector production, detailed production
quantities and values along with labor force data from 2008-2013 made available by the
European Commission and the Food and Agriculture Organization of the United Nations
were examined with hierarchical clustering using Ward’s method. The production data
(the Eurostat “Prodcom” dataset) is derived from annual surveys and covers
approximately 4000 manufactured products, 205 of which are forest sector products.
Labour force data includes employed persons and hours worked in four broad categories
including forestry and logging, the manufacture of wood and wood products, the
manufacture of paper and paper products, and furniture manufacturing. By using this data
it is possible to identify the strengths and weaknesses in forest sector production in many
European countries. Furthermore, this analysis provides an opportunity to identify
possible areas of expansion for specific countries. This paper will provide an overview of
the methods and results from performing the analysis. The combination of labour force
and production data will provide an estimate of the relative efficiency of the forest
products sector (and sub sectors) in European countries.
Keywords: clustering, Ward’s method, policy, industrial development
Introduction
Europe has identified the need to transform their economy into a socially responsible and
biobased economy in order to achieve sustainable growth. The EU polices that directly

Proceedings of the 58th International Convention of Society of Wood Science and Technology
June 7-12, 2015 – Grand Teton National Park, Jackson, Wyoming, USA
735
impact the forest sector include the EU Sustainable Development Strategy (European
Commission 2009), the EU Roadmap 2020 (European Commission 2011) and the
recycling society directives (European Parliament 2008), amongst others. The European
Forest Technology Platform (FTP) is working to position the forest sector as key actors
throughout this transition (FTP 2013a, FTP 2013b). As countries and regions across
Europe develop and update their smart specialization strategies to focus their innovation
efforts, they will seek as much information as they can about relating to market trends in
a wide range of areas, including the forest sector. Similarly, businesses and researchers
seeking to both follow and shape the market continually search for new information
about the forest sector’s performance. In each situation, both new and established
methods for examining, understanding and making predictions about the market are
needed.
In this exploratory study we apply Ward’s clustering method on three separate aspects of
the forest sector (categorized production quantities, roundwood production, and labour)
to look for models of growth and expansion for Slovenia’s forest sector. Our clustering
method will group countries together that manufacture similar sets of products, that
produce similar quantities of roundwood, and that have similarly segmented forest
products labor statistics (all relative to their total).
Objective
Our objective is to determine which countries Slovenia may emulate or learn lessons
from by examining the successful countries that fall in the same cluster as Slovenia.
Similarly, successful countries that fall outside of Slovenia’s clusters may also provide
insights for reinvigorating the countries forest sector.
Materials and Methods
Data sources and quality
The data analysed in this project comes from three sources. First, the production data is
derived from the Eurostat Prodcom database (Eurostat, 2015). We analysed a subset of
this dataset that reflects 205 products closely related to the forest products sector. These
205 products were grouped by their 4-digit NACE2 codes and resulted in production
quantities for 26 categories of products (Table 1). Additionally, the roundwood
production data was retrieved from the Food and Agriculture Organization of the United
Nations (FAO) forestry production and trade database for six categories of roundwood
(FAO, 2015). Labour statistics were derived from the Eurostat employment database and
include four categories of forest sector related jobs. It should be noted that these data
include estimates and missing data (which may be missing because survey respondents
chose to keep them confidential). We know, for example, that Austria produces a
significant amount of particleboard, however the quantity is missing from the Prodcom
data.
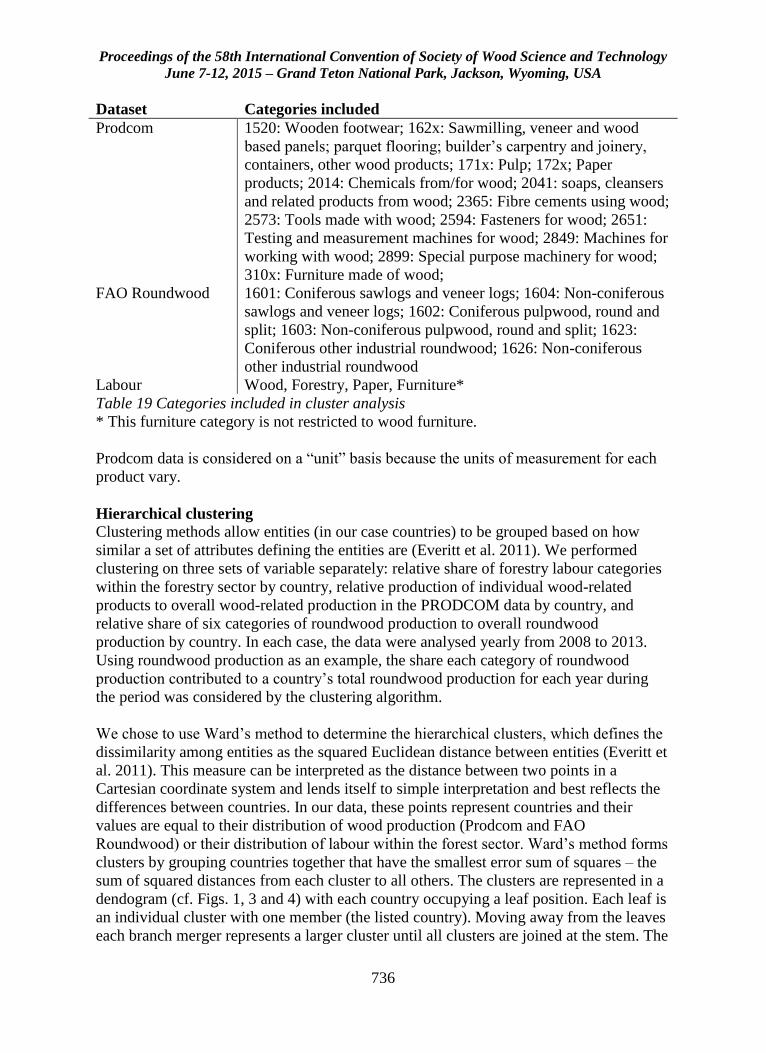
Proceedings of the 58th International Convention of Society of Wood Science and Technology
June 7-12, 2015 – Grand Teton National Park, Jackson, Wyoming, USA
736
Dataset Categories included
Prodcom 1520: Wooden footwear; 162x: Sawmilling, veneer and wood
based panels; parquet flooring; builder’s carpentry and joinery,
containers, other wood products; 171x: Pulp; 172x; Paper
products; 2014: Chemicals from/for wood; 2041: soaps, cleansers
and related products from wood; 2365: Fibre cements using wood;
2573: Tools made with wood; 2594: Fasteners for wood; 2651:
Testing and measurement machines for wood; 2849: Machines for
working with wood; 2899: Special purpose machinery for wood;
310x: Furniture made of wood;
FAO Roundwood 1601: Coniferous sawlogs and veneer logs; 1604: Non-coniferous
sawlogs and veneer logs; 1602: Coniferous pulpwood, round and
split; 1603: Non-coniferous pulpwood, round and split; 1623:
Coniferous other industrial roundwood; 1626: Non-coniferous
other industrial roundwood
Labour Wood, Forestry, Paper, Furniture*
Table 19 Categories included in cluster analysis
* This furniture category is not restricted to wood furniture.
Prodcom data is considered on a “unit” basis because the units of measurement for each
product vary.
Hierarchical clustering
Clustering methods allow entities (in our case countries) to be grouped based on how
similar a set of attributes defining the entities are (Everitt et al. 2011). We performed
clustering on three sets of variable separately: relative share of forestry labour categories
within the forestry sector by country, relative production of individual wood-related
products to overall wood-related production in the PRODCOM data by country, and
relative share of six categories of roundwood production to overall roundwood
production by country. In each case, the data were analysed yearly from 2008 to 2013.
Using roundwood production as an example, the share each category of roundwood
production contributed to a country’s total roundwood production for each year during
the period was considered by the clustering algorithm.
We chose to use Ward’s method to determine the hierarchical clusters, which defines the
dissimilarity among entities as the squared Euclidean distance between entities (Everitt et
al. 2011). This measure can be interpreted as the distance between two points in a
Cartesian coordinate system and lends itself to simple interpretation and best reflects the
differences between countries. In our data, these points represent countries and their
values are equal to their distribution of wood production (Prodcom and FAO
Roundwood) or their distribution of labour within the forest sector. Ward’s method forms
clusters by grouping countries together that have the smallest error sum of squares – the
sum of squared distances from each cluster to all others. The clusters are represented in a
dendogram (cf. Figs. 1, 3 and 4) with each country occupying a leaf position. Each leaf is
an individual cluster with one member (the listed country). Moving away from the leaves
each branch merger represents a larger cluster until all clusters are joined at the stem. The
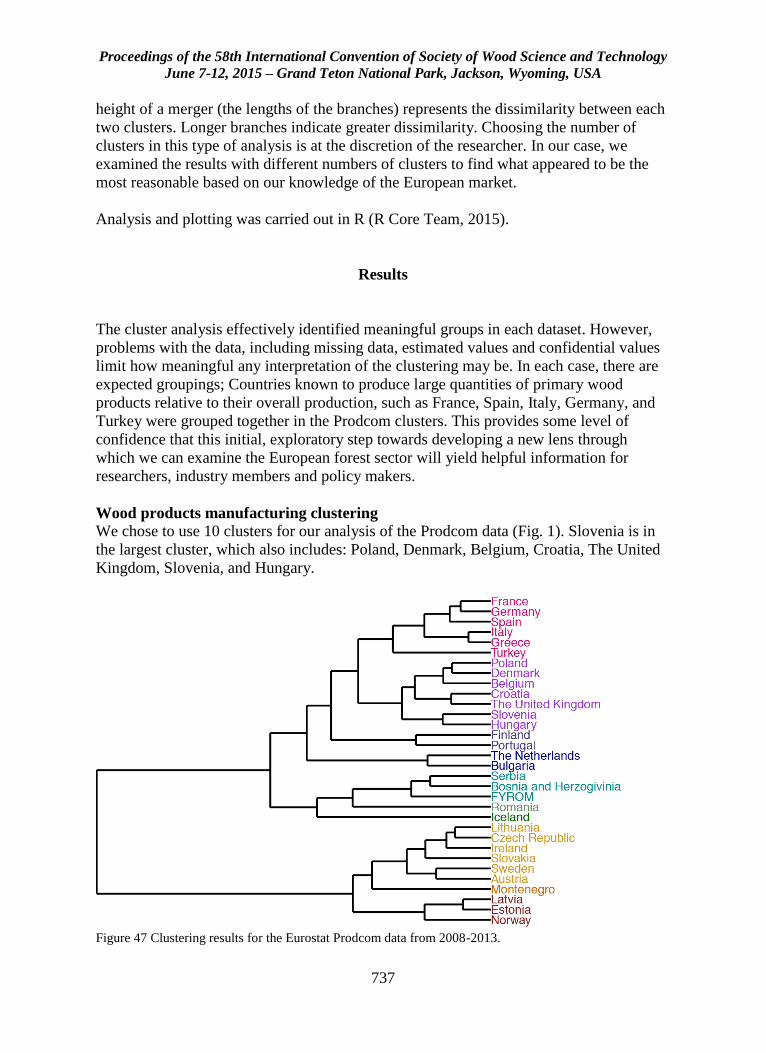
Proceedings of the 58th International Convention of Society of Wood Science and Technology
June 7-12, 2015 – Grand Teton National Park, Jackson, Wyoming, USA
737
height of a merger (the lengths of the branches) represents the dissimilarity between each
two clusters. Longer branches indicate greater dissimilarity. Choosing the number of
clusters in this type of analysis is at the discretion of the researcher. In our case, we
examined the results with different numbers of clusters to find what appeared to be the
most reasonable based on our knowledge of the European market.
Analysis and plotting was carried out in R (R Core Team, 2015).
Results
The cluster analysis effectively identified meaningful groups in each dataset. However,
problems with the data, including missing data, estimated values and confidential values
limit how meaningful any interpretation of the clustering may be. In each case, there are
expected groupings; Countries known to produce large quantities of primary wood
products relative to their overall production, such as France, Spain, Italy, Germany, and
Turkey were grouped together in the Prodcom clusters. This provides some level of
confidence that this initial, exploratory step towards developing a new lens through
which we can examine the European forest sector will yield helpful information for
researchers, industry members and policy makers.
Wood products manufacturing clustering
We chose to use 10 clusters for our analysis of the Prodcom data (Fig. 1). Slovenia is in
the largest cluster, which also includes: Poland, Denmark, Belgium, Croatia, The United
Kingdom, Slovenia, and Hungary.
Figure 47 Clustering results for the Eurostat Prodcom data from 2008-2013.
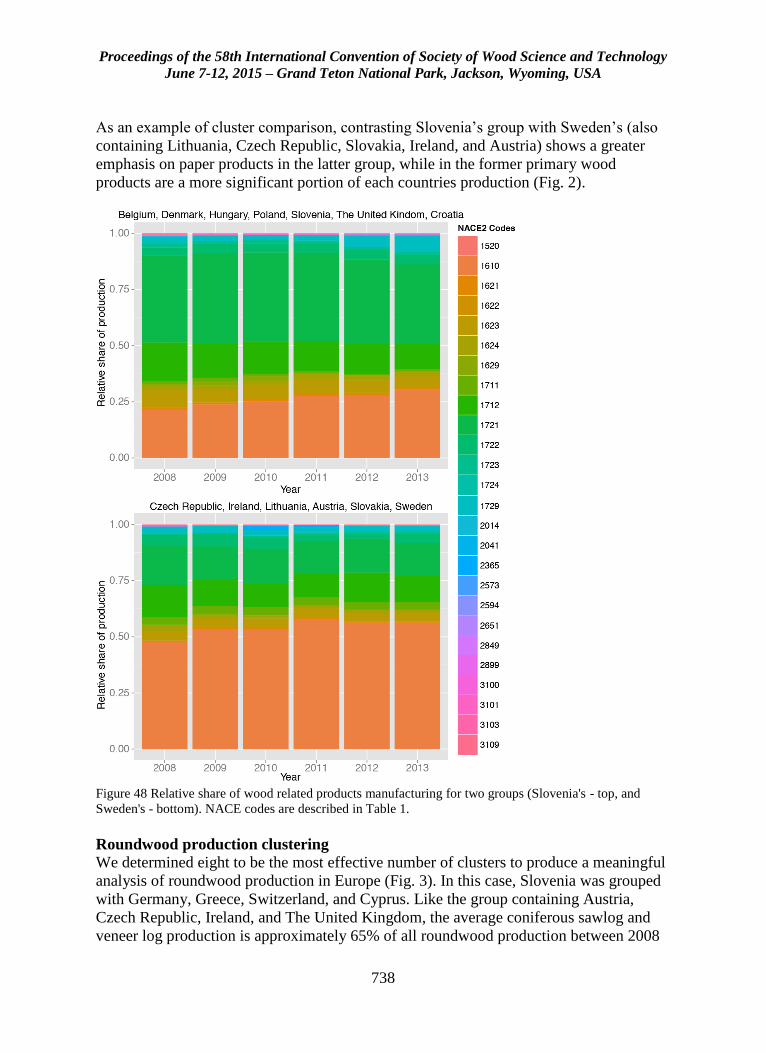
Proceedings of the 58th International Convention of Society of Wood Science and Technology
June 7-12, 2015 – Grand Teton National Park, Jackson, Wyoming, USA
738
As an example of cluster comparison, contrasting Slovenia’s group with Sweden’s (also
containing Lithuania, Czech Republic, Slovakia, Ireland, and Austria) shows a greater
emphasis on paper products in the latter group, while in the former primary wood
products are a more significant portion of each countries production (Fig. 2).
Figure 48 Relative share of wood related products manufacturing for two groups (Slovenia's - top, and
Sweden's - bottom). NACE codes are described in Table 1.
Roundwood production clustering
We determined eight to be the most effective number of clusters to produce a meaningful
analysis of roundwood production in Europe (Fig. 3). In this case, Slovenia was grouped
with Germany, Greece, Switzerland, and Cyprus. Like the group containing Austria,
Czech Republic, Ireland, and The United Kingdom, the average coniferous sawlog and
veneer log production is approximately 65% of all roundwood production between 2008
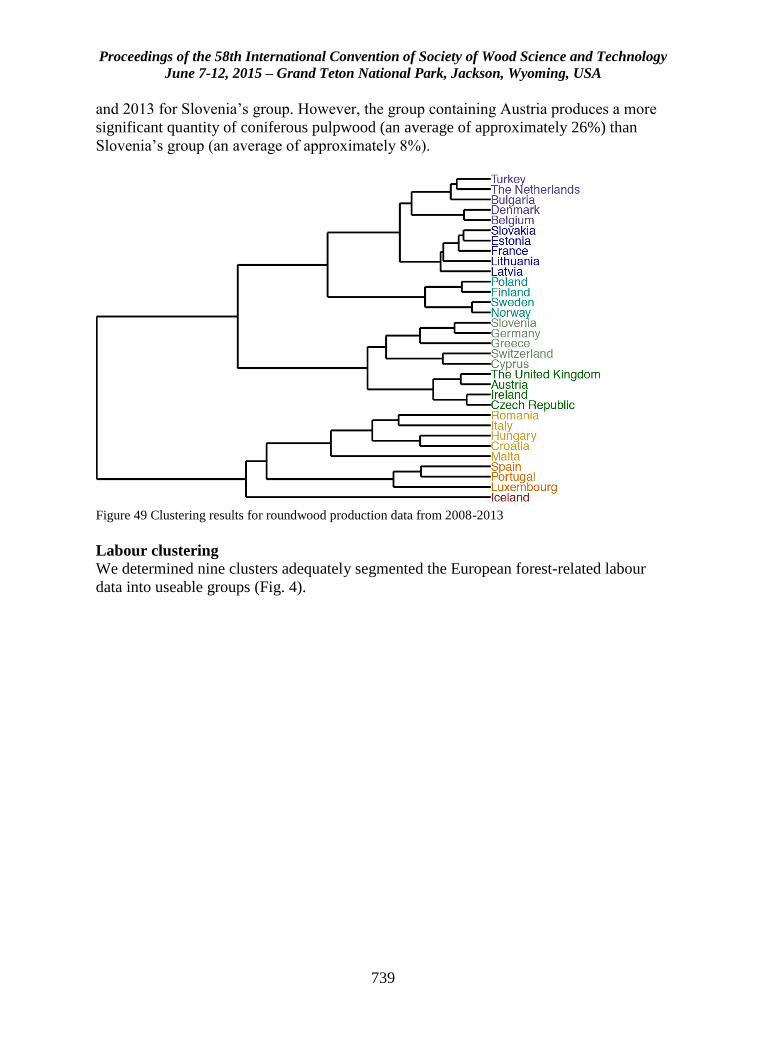
Proceedings of the 58th International Convention of Society of Wood Science and Technology
June 7-12, 2015 – Grand Teton National Park, Jackson, Wyoming, USA
739
and 2013 for Slovenia’s group. However, the group containing Austria produces a more
significant quantity of coniferous pulpwood (an average of approximately 26%) than
Slovenia’s group (an average of approximately 8%).
Figure 49 Clustering results for roundwood production data from 2008-2013
Labour clustering
We determined nine clusters adequately segmented the European forest-related labour
data into useable groups (Fig. 4).
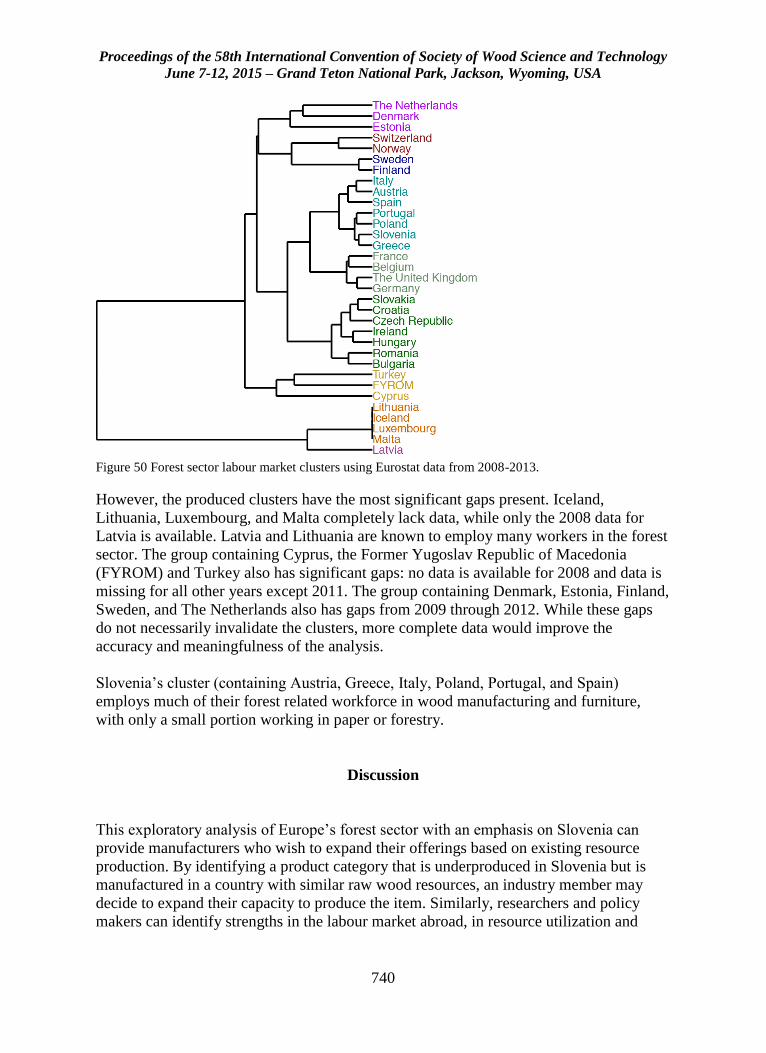
Proceedings of the 58th International Convention of Society of Wood Science and Technology
June 7-12, 2015 – Grand Teton National Park, Jackson, Wyoming, USA
740
Figure 50 Forest sector labour market clusters using Eurostat data from 2008-2013.
However, the produced clusters have the most significant gaps present. Iceland,
Lithuania, Luxembourg, and Malta completely lack data, while only the 2008 data for
Latvia is available. Latvia and Lithuania are known to employ many workers in the forest
sector. The group containing Cyprus, the Former Yugoslav Republic of Macedonia
(FYROM) and Turkey also has significant gaps: no data is available for 2008 and data is
missing for all other years except 2011. The group containing Denmark, Estonia, Finland,
Sweden, and The Netherlands also has gaps from 2009 through 2012. While these gaps
do not necessarily invalidate the clusters, more complete data would improve the
accuracy and meaningfulness of the analysis.
Slovenia’s cluster (containing Austria, Greece, Italy, Poland, Portugal, and Spain)
employs much of their forest related workforce in wood manufacturing and furniture,
with only a small portion working in paper or forestry.
Discussion
This exploratory analysis of Europe’s forest sector with an emphasis on Slovenia can
provide manufacturers who wish to expand their offerings based on existing resource
production. By identifying a product category that is underproduced in Slovenia but is
manufactured in a country with similar raw wood resources, an industry member may
decide to expand their capacity to produce the item. Similarly, researchers and policy
makers can identify strengths in the labour market abroad, in resource utilization and
Proceedings of the 58th International Convention of Society of Wood Science and Technology
June 7-12, 2015 – Grand Teton National Park, Jackson, Wyoming, USA
741
production to focus innovation and provide incentives for smart expansion within the
industry.
Slovenia may not produce the raw quantities of products and roundwood, and does not
employ the raw number of employees in the sector as larger countries but it uses it’s
resources similarly to countries with very successful forest sectors. However, there is
always room to improve, expand, or to reign in production in the wrong areas. This type
of cluster analysis is a useful early step in determining where these opportunities lie.
Conclusion
Clustering methods provide researchers, industry members and policy makers with a
relatively easy to understand introduction point to a large amount of data. Although the
quality of the data will greatly impact the level of confidence the analysts should have in
their conclusions, cluster analysis provides many advantages, especially for exploratory
research. In our example of the forest sector, a Slovenian researcher may determine that a
product category is produced to great effect in another country and may conduct research
to help drive innovation related to that product category at home. Furthermore, these
results are derived from interdisciplinary research activities and demonstrate the type of
collaborative work needed to continue moving the forest sector forward.
References
Eurostat (2015a) Eurostat Employment Database (lfsa_egan22d, v3.0.3.3-20150102-
5511-PROD_EUROBASE) http://ec.europa.eu/eurostat/web/lfs/data/database (8 Jan
2015)
Eurostat (2015a) Eurostat Prodcom Database (DS_066342, v3.0.3.3-20150102-5511-
PROD_EUROBASE) http://ec.europa.eu/eurostat/web/prodcom/data/database (8 Jan
2015)
European Commission, 2009. Mainstreaming sustainable development into EU policies:
2009 Review of the European Union Strategy for Sustainable Development.
Communication. Brussels: European Commission European Commission. http://eur-
lex.europa.eu/LexUriServ/LexUriServ.do?uri=CELEX:52009DC0400:EN:NOT. (15 Sept
2013).
European Commission (2011) A Roadmap for moving to a competitive low carbon
economy in 2050. Communication. Brussels: European Commission European
Commission. http://eur-
lex.europa.eu/LexUriServ/LexUriServ.do?uri=CELEX:52011DC0112:EN:NOT. (15 Sept
2013)
Proceedings of the 58th International Convention of Society of Wood Science and Technology
June 7-12, 2015 – Grand Teton National Park, Jackson, Wyoming, USA
742
European Parliament (2008) Directive 2008/98/EC of the European Parliament and of the
Council of 19 November 2008 on waste and repealing certain Directives. Directive.
Brussels: European Parliament http://eur-
lex.europa.eu/LexUriServ/LexUriServ.do?uri=CELEX:32008L0098:EN:NOT. (15 Sept
2013)
Everitt BS, Landau S, Leese M, and Stahl D (2011) Cluster Analysis, 5th Edition. John
Wiley & Sons, Ltd. West Sussex. 287 pp.
Food and Agriculture Organization of the United Nations, Rome, Italy. FAOSTAT.
Forestry (Collection). (http://data.fao.org/ref/4d0e8c4f-abb6-43e0-902f-
a1b522a32f09.html?version=1.0 (9 Feb 2015)
Forest Technology Platform (2013a) Horizons – Vision 2030 for the European Forest-
based sector.
http://www.forestplatform.org/files/FTP_Vision_revision/FTP_Vision_final_Feb_2013.p
df (15 April 2015)
Forest Technology Platform (2013b) Strategic Research and Innovation Agenda for 2020.
http://www.forestplatform.org/files/SRA_revision/Renewed_SRA_for_2020.pdf (15
April 2015)
R Core Team (2015). R: A language and environment for statistical computing. R
Foundation for Statistical Computing. Version 3.0.1.1. Vienna, Austria. URL
http://www.R-project.org/.
Acknowledgments
The authors would like to acknowledge the WoodWisdom-Net+ and the Ministry of
Education, Science and Sport of Republic of Slovenia for financial support of the project
CaReWood. Furthermore, the authors would like to acknowledge the Slovenian Research
Agency for financial support within the frame of the project P1-0294.
Proceedings of the 58th International Convention of Society of Wood Science and Technology
June 7-12, 2015 – Grand Teton National Park, Jackson, Wyoming, USA
743
Market Appeal of Hawaiian Koa Wood Product
Characteristics: A Consumer Preference Study
Eini C. Lowell1*– Katherine Wilson2 – J.B. Friday 2 – Jan Wiedenbeck3 –
Catherine Chan2
1 Research Scientist, USDA Forest Service Pacific Northwest Research
Station, Portland OR, USA.* Corresponding author
[email protected] 2 Graduate Student, Extension Specialist, Professor, College of Tropical
Agricultural and Human Resources, University of Hawai'i at Manoa,
Honolulu, HI. USA.
[email protected], [email protected], [email protected] 3 Research Scientist, USDA Forest Service Northern Research Station,
Princeton WV. USA.
Abstract
Acacia koa is an endemic Hawaiian tree species whose wood is prized globally. Today,
most woodworkers use koa wood from dead and dying old-growth trees. Wood from
young-growth koa is thought to be less appealing to consumers because of its lighter
color and lack of figure. A conjoint choice experiment was conducted to evaluate
consumer preference of these koa characteristics and their willingness-to-pay. This
experiment randomly combined different attributes: colors, figure, and prices and used
six identically shaped bowls (an item likely to be purchased by Hawaiian residents and
visitors) from which respondents selected their preference. The survey was conducted at
Hawaii’s Woodshow (129 respondents) to canvass consumers likely to be familiar with
koa. Results were analyzed using latent class analysis software that separates respondents
into distinct classes based upon preferences. The results identified three classes of
respondents. Class 1 (32% of respondents) showed significant preference for lower prices
and curly figure but not for color. Class 2 (42% of respondents) significantly preferred
curly figure and medium or light colored koa bowls. Class 3 (27% of respondents)
significantly preferred lower prices, medium color, and bowls with no curly figure. Koa
woodworkers can use these results to design and create pieces for different market
groups. Through substitution of young-growth koa for the decreasing supply of old-
growth wood, the legacy of koa wood can be sustained.
Key words: Acacia koa, conjoint choice, Hawai'i, consumer preferences, willingness-to-
pay, old-growth, young-growth
Proceedings of the 58th International Convention of Society of Wood Science and Technology
June 7-12, 2015 – Grand Teton National Park, Jackson, Wyoming, USA
744
Introductiom
Beauty is in the eye of the beholder. This especially holds true when considering wood
products. Variation in wood characteristics such as color and figure make each piece
unique. The appeal of one piece of furniture or household item made from wood over
another is personal. While differences in consumer preference can vary by geographic
location, Acacia koa is especially prized both in the Hawaiian Islands and globally. Its
reputation comes primarily from pieces crafted from old-growth trees.
Many woodworkers and craftspeople in Hawai'i prefer to work with old-growth koa as
their raw material for its color and figure (e.g., curl). This resource is dwindling in supply
with limited amounts available in the foreseeable future. The koa wood being used now
comes from dead and dying trees. Little data are available on second-growth koa wood
properties and much anecdotal information as to its inferiority for woodworking is
common. The ability to market products made from young-growth koa will promote
active management in young-growth stands. Research conducted on genetic variation in
wood quality, including color and grain, was reported by Simmons et al. (1991). Work by
Dudley and Yamasaki (2000) found indications that figure may be under genetic control.
Sun et al. (1996) recommended that more attention be paid to selection and silviculture in
koa reforestation programs. Results point to the ability of land managers to select and
manage for characteristics that match consumer preferences.
Color and figure have been identified as key attributes in creating and marketing koa
products. In fact, it is thought that just the name koa has market recognition and creates
desirability. Yet a lack of ability by consumers to identify wood species was documented
by Bowe and Bumgardner (2004) and Bumgardner et al. (2007). Consumer preference
research on other species has found other attributes that resonate with buyers. Secondary
manufacturers using Eastern white pine (Pinus strobus L.) found that lumber quality and
region of origin had the largest influence on purchasing decisions (Alderman et al. 2007).
Consumers were willing to pay more for an end table made in Alaska over one
manufactured in China (Donovan and Nicholls 2003). Along with name recognition and
origin are appearance attributes such as color and figure. Bumgardner and Bowe (2002)
found that consumers thought darker color woods reflected higher value than lighter color
woods and the lighter color was perceived to be less expensive. In studying character-
marked furniture made from red alder (Alnus rubra), Bumgardner et al. (2009) found a
disconnect between retailer and consumer cues on willingness-to-pay. These past
research studies suggest that there are opportunities for marketing koa products from both
young- and old-growth trees.
Conjoint choice analysis is a technique that has the ability to determine how certain
product attributes affect whether a consumer is likely to purchase an item and also
quantify its significance (Green and Srinivasan 1978). This means of analysis in
preference research is widely used for consumer and industrial goods (Green and
Srinivasan 1990). Lihra et al. (2012) found that price drove decision when buying
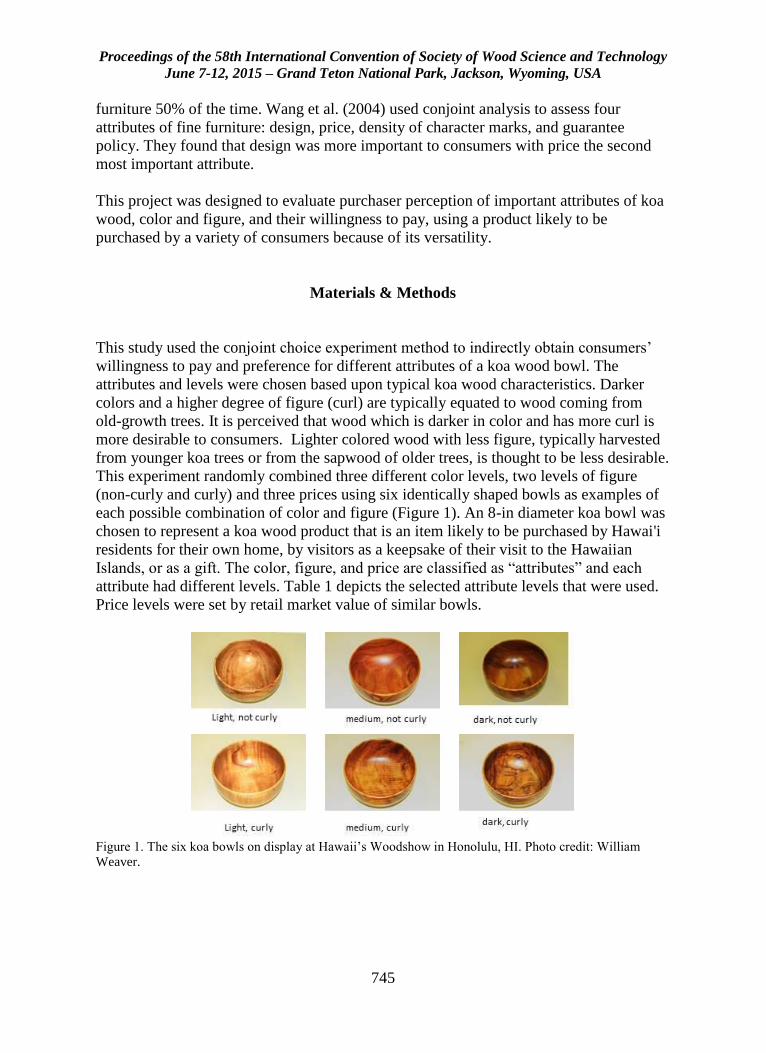
Proceedings of the 58th International Convention of Society of Wood Science and Technology
June 7-12, 2015 – Grand Teton National Park, Jackson, Wyoming, USA
745
furniture 50% of the time. Wang et al. (2004) used conjoint analysis to assess four
attributes of fine furniture: design, price, density of character marks, and guarantee
policy. They found that design was more important to consumers with price the second
most important attribute.
This project was designed to evaluate purchaser perception of important attributes of koa
wood, color and figure, and their willingness to pay, using a product likely to be
purchased by a variety of consumers because of its versatility.
Materials & Methods
This study used the conjoint choice experiment method to indirectly obtain consumers’
willingness to pay and preference for different attributes of a koa wood bowl. The
attributes and levels were chosen based upon typical koa wood characteristics. Darker
colors and a higher degree of figure (curl) are typically equated to wood coming from
old-growth trees. It is perceived that wood which is darker in color and has more curl is
more desirable to consumers. Lighter colored wood with less figure, typically harvested
from younger koa trees or from the sapwood of older trees, is thought to be less desirable.
This experiment randomly combined three different color levels, two levels of figure
(non-curly and curly) and three prices using six identically shaped bowls as examples of
each possible combination of color and figure (Figure 1). An 8-in diameter koa bowl was
chosen to represent a koa wood product that is an item likely to be purchased by Hawai'i
residents for their own home, by visitors as a keepsake of their visit to the Hawaiian
Islands, or as a gift. The color, figure, and price are classified as “attributes” and each
attribute had different levels. Table 1 depicts the selected attribute levels that were used.
Price levels were set by retail market value of similar bowls.
Figure 1. The six koa bowls on display at Hawaii’s Woodshow in Honolulu, HI. Photo credit: William
Weaver.
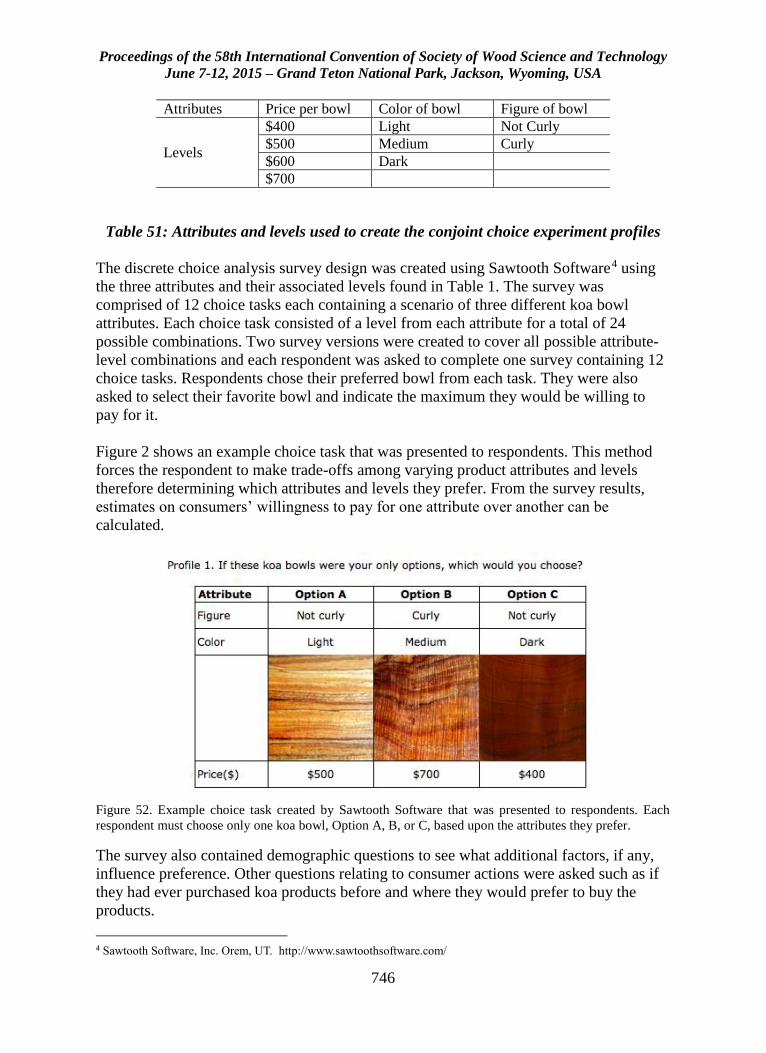
Proceedings of the 58th International Convention of Society of Wood Science and Technology
June 7-12, 2015 – Grand Teton National Park, Jackson, Wyoming, USA
746
Attributes Price per bowl Color of bowl Figure of bowl
Levels
$400 Light Not Curly
$500 Medium Curly
$600 Dark
$700
Table 51: Attributes and levels used to create the conjoint choice experiment profiles
The discrete choice analysis survey design was created using Sawtooth Software 5 F
4 using
the three attributes and their associated levels found in Table 1. The survey was
comprised of 12 choice tasks each containing a scenario of three different koa bowl
attributes. Each choice task consisted of a level from each attribute for a total of 24
possible combinations. Two survey versions were created to cover all possible attribute-
level combinations and each respondent was asked to complete one survey containing 12
choice tasks. Respondents chose their preferred bowl from each task. They were also
asked to select their favorite bowl and indicate the maximum they would be willing to
pay for it.
Figure 2 shows an example choice task that was presented to respondents. This method
forces the respondent to make trade-offs among varying product attributes and levels
therefore determining which attributes and levels they prefer. From the survey results,
estimates on consumers’ willingness to pay for one attribute over another can be
calculated.
Figure 52. Example choice task created by Sawtooth Software that was presented to respondents. Each
respondent must choose only one koa bowl, Option A, B, or C, based upon the attributes they prefer.
The survey also contained demographic questions to see what additional factors, if any,
influence preference. Other questions relating to consumer actions were asked such as if
they had ever purchased koa products before and where they would prefer to buy the
products.
4 Sawtooth Software, Inc. Orem, UT. http://www.sawtoothsoftware.com/
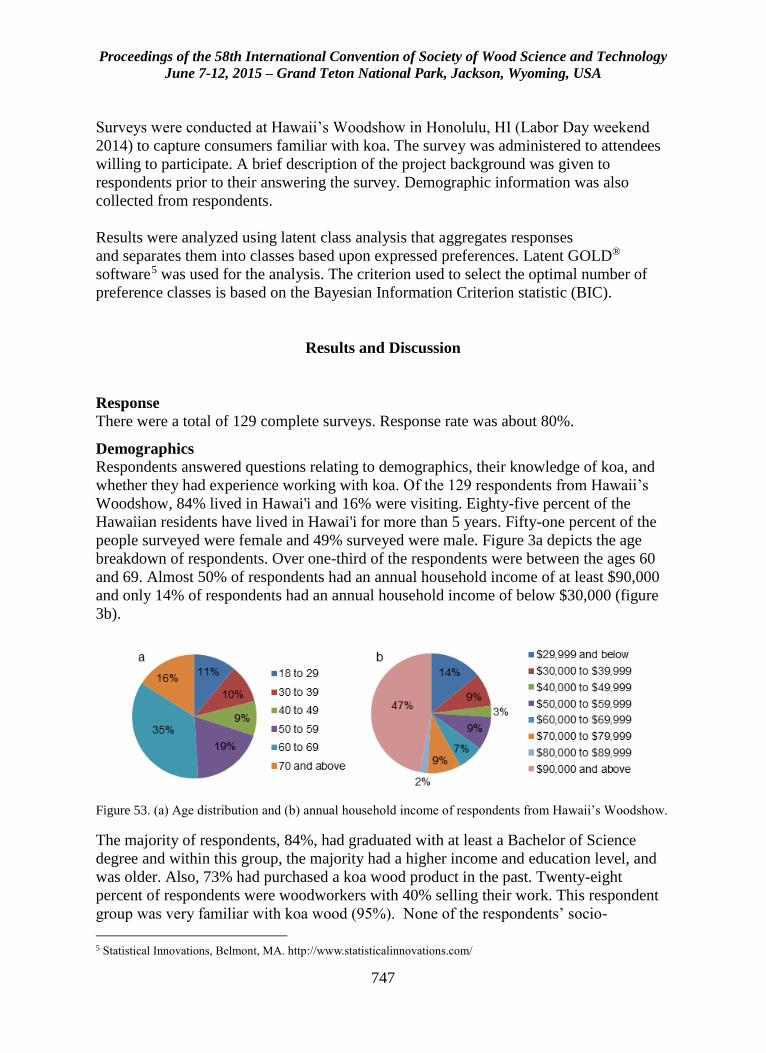
Proceedings of the 58th International Convention of Society of Wood Science and Technology
June 7-12, 2015 – Grand Teton National Park, Jackson, Wyoming, USA
747
Surveys were conducted at Hawaii’s Woodshow in Honolulu, HI (Labor Day weekend
2014) to capture consumers familiar with koa. The survey was administered to attendees
willing to participate. A brief description of the project background was given to
respondents prior to their answering the survey. Demographic information was also
collected from respondents.
Results were analyzed using latent class analysis that aggregates responses
and separates them into classes based upon expressed preferences. Latent GOLD®
software6 F
5 was used for the analysis. The criterion used to select the optimal number of
preference classes is based on the Bayesian Information Criterion statistic (BIC).
Results and Discussion
Response
There were a total of 129 complete surveys. Response rate was about 80%.
Demographics
Respondents answered questions relating to demographics, their knowledge of koa, and
whether they had experience working with koa. Of the 129 respondents from Hawaii’s
Woodshow, 84% lived in Hawai'i and 16% were visiting. Eighty-five percent of the
Hawaiian residents have lived in Hawai'i for more than 5 years. Fifty-one percent of the
people surveyed were female and 49% surveyed were male. Figure 3a depicts the age
breakdown of respondents. Over one-third of the respondents were between the ages 60
and 69. Almost 50% of respondents had an annual household income of at least $90,000
and only 14% of respondents had an annual household income of below $30,000 (figure
3b).
Figure 53. (a) Age distribution and (b) annual household income of respondents from Hawaii’s Woodshow.
The majority of respondents, 84%, had graduated with at least a Bachelor of Science
degree and within this group, the majority had a higher income and education level, and
was older. Also, 73% had purchased a koa wood product in the past. Twenty-eight
percent of respondents were woodworkers with 40% selling their work. This respondent
group was very familiar with koa wood (95%). None of the respondents’ socio-
5 Statistical Innovations, Belmont, MA. http://www.statisticalinnovations.com/
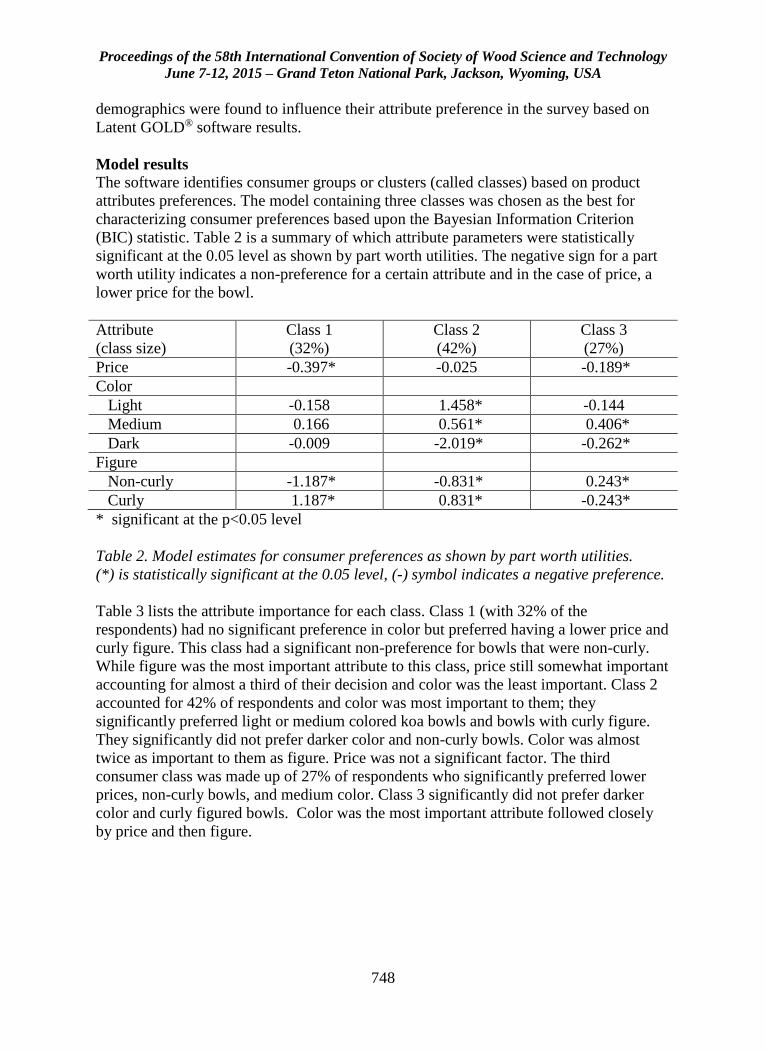
Proceedings of the 58th International Convention of Society of Wood Science and Technology
June 7-12, 2015 – Grand Teton National Park, Jackson, Wyoming, USA
748
demographics were found to influence their attribute preference in the survey based on
Latent GOLD® software results.
Model results
The software identifies consumer groups or clusters (called classes) based on product
attributes preferences. The model containing three classes was chosen as the best for
characterizing consumer preferences based upon the Bayesian Information Criterion
(BIC) statistic. Table 2 is a summary of which attribute parameters were statistically
significant at the 0.05 level as shown by part worth utilities. The negative sign for a part
worth utility indicates a non-preference for a certain attribute and in the case of price, a
lower price for the bowl.
Attribute
(class size)
Class 1
(32%)
Class 2
(42%)
Class 3
(27%)
Price -0.397* -0.025 -0.189*
Color
Light -0.158 1.458* -0.144
Medium 0.166 0.561* 0.406*
Dark -0.009 -2.019* -0.262*
Figure
Non-curly -1.187* -0.831* 0.243*
Curly 1.187* 0.831* -0.243*
* significant at the p<0.05 level
Table 2. Model estimates for consumer preferences as shown by part worth utilities.
(*) is statistically significant at the 0.05 level, (-) symbol indicates a negative preference.
Table 3 lists the attribute importance for each class. Class 1 (with 32% of the
respondents) had no significant preference in color but preferred having a lower price and
curly figure. This class had a significant non-preference for bowls that were non-curly.
While figure was the most important attribute to this class, price still somewhat important
accounting for almost a third of their decision and color was the least important. Class 2
accounted for 42% of respondents and color was most important to them; they
significantly preferred light or medium colored koa bowls and bowls with curly figure.
They significantly did not prefer darker color and non-curly bowls. Color was almost
twice as important to them as figure. Price was not a significant factor. The third
consumer class was made up of 27% of respondents who significantly preferred lower
prices, non-curly bowls, and medium color. Class 3 significantly did not prefer darker
color and curly figured bowls. Color was the most important attribute followed closely
by price and then figure.
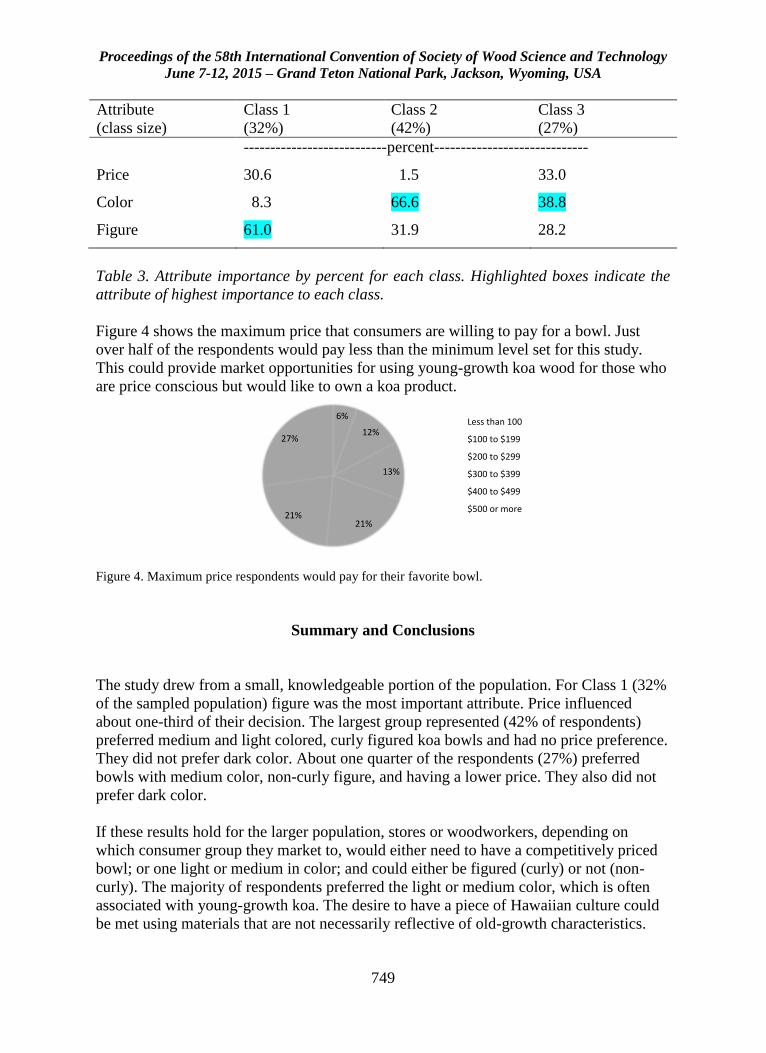
Proceedings of the 58th International Convention of Society of Wood Science and Technology
June 7-12, 2015 – Grand Teton National Park, Jackson, Wyoming, USA
749
Attribute
(class size)
Class 1
(32%)
Class 2
(42%)
Class 3
(27%)
---------------------------percent-----------------------------
Price 30.6 1.5 33.0
Color 8.3 66.6 38.8
Figure 61.0 31.9 28.2
Table 3. Attribute importance by percent for each class. Highlighted boxes indicate the
attribute of highest importance to each class.
Figure 4 shows the maximum price that consumers are willing to pay for a bowl. Just
over half of the respondents would pay less than the minimum level set for this study.
This could provide market opportunities for using young-growth koa wood for those who
are price conscious but would like to own a koa product.
6%
12%
13%
21%21%
27%
MaximumPriceRespondentswouldPayfortheirFavoriteKoaBowl
Lessthan100
$100to$199
$200to$299
$300to$399
$400to$499
$500ormore
Figure 4. Maximum price respondents would pay for their favorite bowl.
Summary and Conclusions
The study drew from a small, knowledgeable portion of the population. For Class 1 (32%
of the sampled population) figure was the most important attribute. Price influenced
about one-third of their decision. The largest group represented (42% of respondents)
preferred medium and light colored, curly figured koa bowls and had no price preference.
They did not prefer dark color. About one quarter of the respondents (27%) preferred
bowls with medium color, non-curly figure, and having a lower price. They also did not
prefer dark color.
If these results hold for the larger population, stores or woodworkers, depending on
which consumer group they market to, would either need to have a competitively priced
bowl; or one light or medium in color; and could either be figured (curly) or not (non-
curly). The majority of respondents preferred the light or medium color, which is often
associated with young-growth koa. The desire to have a piece of Hawaiian culture could
be met using materials that are not necessarily reflective of old-growth characteristics.
Proceedings of the 58th International Convention of Society of Wood Science and Technology
June 7-12, 2015 – Grand Teton National Park, Jackson, Wyoming, USA
750
These results have implications for koa silviculture and harvesting regimes and suggest a
change in the paradigm that consumers only want darker wood with either curly or non-
curly figure. It appears young-growth koa can be a viable resource option for the
manufacture of certain types of koa products (in this case bowls) and there will be
consumers to purchase these products.
Koa woodworkers can use these results to design and create pieces for market segments
that occupy a similar market niche to these small koa bowls. Through substitution of
young-growth koa for the decreasing supply of old-growth wood, the legacy of koa wood
can be sustained.
Acknowledgements
The authors would like to thank the Hawai'i Forest Industry Association for allowing us
to conduct our survey during their annual Woodshow. We appreciate the assistance of
Cassie Zhang and Nicole Evans, graduate students, University of Hawai'i, who aided in
conducting the surveys and/or analyzing the data. The bowls were turned by Timothy
Allen Shafto.
References
Alderman D, Smith R, Bowe S (2007) Eastern white pine secondary manufacturers:
Consumption, markets, and marketing. For Prod J 57(10): 28-35.
Bowe S, Bumgardner M (2004) Species selection in secondary wood products:
perspectives from different consumers. Wood Fiber Sci 36(3): 319–328.
Bumgardner MS, Bowe SA (2002) Species selection in secondary wood products:
Implications for product design and promotion. Wood and Fiber Sci. 34(3): 408-418.
Bumgardner M, Nicholls D, Barber V (2009) Character-marked furniture made from red
alder harvested in southeast Alaska: product perspectives from consumers and retailers.
Can J For Res 39(12): 2450-2459.
Bumgardner M, Nicholls D, Donovan G (2007) Effects of species information and
furniture price on consumer preferences for selected woods. Wood and Fiber Sci 39(1):
71-81.
Donovan GH, Nicholls DL (2003) Estimating consumer willingness to pay a price
premium for Alaska secondary wood products. Res. Pap. PNW-RP-553. Portland, OR:
U.S. Department of Agriculture, Forest Service, Pacific Northwest Research Station. 7 p.
Dudley NS, Yamasaki J (2000) A Guide to Determining Wood Properties of Acacia koa.
HARC Forestry Report 3.
Proceedings of the 58th International Convention of Society of Wood Science and Technology
June 7-12, 2015 – Grand Teton National Park, Jackson, Wyoming, USA
751
Green PE, Srinivasan V (1978) Conjoint analysis in consumer research: issues and
outlook. J Consumer Res: 103-123.
Green PE, Srinivasan V (1990) Conjoint analysis in marketing: new developments with
implications for research and practice. The J Marketing: 3-19.
Lihra T, Buehlmann U, Graf R (2012) Customer preferences for customized household
furniture. J For Econ 18(2): 94-112.
Simmons P, Winkle E, Conkle T, Willers K, Glover N (1991) Genetic variation of koa.
In: Improvement of Acacia koa: Resource documents. J.L. Brewbaker, N. Glover, and E.
Moore (eds). U.S. Forest Service Institute of Pacific Islands Forestry, State of Hawaii
Department of Land and Natural Resource, and Nitrogen Fixing Tree Association,
Honolulu, Hawai’i.
Sun W, Brewbaker JL, Austin MT (1996) Genetic variation of Acacia koa seed, seedling,
and early growth traits. Pages 33-38 in DO Evans and L. Ferentinos, eds. Koa: a decade
of growth. Proceedings of the Hawaii Forest Industry Association Annual Symposium.
Honolulu, HI.
Wang Q, Shi G, Chan-Halbrendt C (2004) Market potential for fine furniture
manufactured from low-grade hardwood: Evidence form a conjoint analysis in the
northeastern United States. For Prod J 54(5): 19-25.
Proceedings of the 58th International Convention of Society of Wood Science and Technology
June 7-12, 2015 – Grand Teton National Park, Jackson, Wyoming, USA
752
To Own Forest or Not? Vertical Integration in Pulp and
Paper Sector
Jaana Korhonen, [email protected]
Yijing Zhang, [email protected]
University of Helsinki, Department of Forestry, Pl 27, 00014 Helsinki
Abstract
Vertical integration in forest industry refers to firms that provide large portion of wood
from their own or controlled forests. Access to resources and competition for cost
effective acquisition of industrial raw material are some of the main concerns and
advantages for globalized forestry corporations. However, quantitative studies in this
topic are still lacking especially at the global scale. This analysis is based on the logistic
regression analysis on dichotomous variable whether company owns forest land or not.
Data is based on sample of 99 forest companies reported in TOP 100 A Global Forests,
Paper & Packaging Industry Survey, and the information provided with regards to
corporate forest holdings and corporate financial performance available in corporate
sustainability and other reports for year 2012. In results, we see that decision on vertical
integration is significantly affected by the firm size, profitability, and product
diversification of the company. The influence of location and other relevant factors of
firm performance are discussed to the extents that the data allows.
Proceedings of the 58th International Convention of Society of Wood Science and Technology
June 7-12, 2015 – Grand Teton National Park, Jackson, Wyoming, USA
753
Exploring the Future Use Oo Forests in Finland:
Perspectives from Sustainability Oriented Forest
Owners
Liina Häyrinen, [email protected]
Osmo Mattila, [email protected]
Sami Berghäll, [email protected]
Markus Närhi,
Anne Toppinen, [email protected]
University of Helsinki, P.O. Box 27, (Latokartanonkaari 7), Helsinki FI-
00014
Abstract
The objective of the study was to explore the views of sustainability oriented non-
industrial private forest owners (NIPFs) on the future use of forests in Finland. Findings
from the qualitative analysis based on 4 focus group discussions from 17 NIPFs show
that generally NIPFs have a strong emotional attachment towards forests and are
interested in more diversified opportunities of forest use in the future beyond dominant
raw-material driven mindset. They also presented a lot of insight for enhancing intangible
value creation based on forest ecosystem services. Even though groups of forest owners
also recognized factors that inhibit the more diversified development of the forest-based
products and services, they saw the overall future of forests in bringing welfare to society
as positive. They identified unused possibilities in e.g. peer-to-peer learning via
organized forest owner forums and cross-sectoral co-operation between forestry and
nature-based tourism. Finally, results elaborated the high diversity between four groups
in NIPF associations to forest use and their inherent service and information needs, which
can be considered as a challenge for current service organizations. However, further
research is needed beyond these findings to generalize them, as well as to study the
business potential in sustainable lifestyle aspects of forestry.
Proceedings of the 58th International Convention of Society of Wood Science and Technology
June 7-12, 2015 – Grand Teton National Park, Jackson, Wyoming, USA
754
Impacts of Policies to Eliminate Illegal Timber Trade
Ed Pepke1 – Jim Bowyer2 – Steve Bratkovich3 – Kathryn Fernholz4 – Matt
Frank5 – Harry Groot6 – Jeff Howe7
1 Associate, Forest Products Marketing and Policies, Dovetail Partners,
Minneapolis, MN, USA, [email protected] 2 Director of Responsible Materials, Dovetail Partners, Minneapolis, MN,
USA, [email protected] 3 Project Manager for Recycling and Reuse, Dovetail Partners, Minneapolis,
MN, USA, [email protected] 4 Executive Director, Dovetail Partners, Minneapolis, MN, USA,
[email protected] 5 Program and Research Associate, Dovetail Partners, Minneapolis, MN,
USA, [email protected] 6 Associate, Dovetail Partners, Minneapolis, MN, USA,
[email protected] 7 Founder and Chairman, Dovetail Partners, Minneapolis, MN, USA,
Abstract
Recognizing the multiple and exorbitant costs of illegal timber trade, governments and
trade associations are increasingly implementing policies to ensure the legality of imports
and exports. When illegal timber trade stems from illegal logging it has tremendous
additional social, economic and environmental consequences—stopping the illegal trade
reduces demand for illegally logged timber. The establishment of policies started in the
United States (Lacey Act Amendment), then Europe (European Union Timber
Regulation), Australia and some other countries, including China. These policies have
had positive impacts, e.g. through the successes of wood and paper trade associations in
sensitizing the wood chain to the effects of illegal logging and timber trade. Systems for
the certification of sustainable timber management made improvements to meet the
policies’ demands for due diligence. However, at least initially, they have not directly
raised demand for timber, including that for tropical timber, on which some government
policies are focused. This paper and its presentation will include up-to-date analysis of
market effects of the policies’ implementation.
Keywords
Illegal timber trade, illegal logging, trade policy, Lacey Act, EU Timber Regulation,
Australia Illegal Logging Act,

Proceedings of the 58th International Convention of Society of Wood Science and Technology
June 7-12, 2015 – Grand Teton National Park, Jackson, Wyoming, USA
755
Executive Summary
Illegal timber trade stemming from illegal logging has tremendous social, economic and
environmental consequences. Illegal logging negates the intent of sustainable forest
management, often causing or leading to forest degradation and deforestation—outcomes
that can devastate forest dependent communities. Such activity is also linked to habitat
destruction and species extinction. In addition, illegal logging results in huge losses in
assets on, and revenues from, public lands, as well as losses in taxes and royalties within
developing countries. The global trade in illegally harvested timber is highly lucrative
and comparable to the production value of illegal drugs. Recognizing the multiple and
exorbitant costs of illegal timber trade, governments and trade associations are
increasingly implementing policies to ensure the legality of imports and exports.
Establishment of policies aimed at stemming international trade in illegally logged timber
started in the United States (Lacey Act Amendment) in 2008, followed soon thereafter by
Europe (European Union Timber Regulation), Australia and other countries including
China. These policies have had positive impacts, in part by sensitizing players in wood
and paper supply chains to the effects of illegal logging and timber trade, and also by
bringing the force of law specific to timber trade regulation. But without wider
participation of governments in the effort to stem the flow of illegal timber, the actions of
the United States, European Union, and others are likely to be ineffective. The reality is
that if only legal timber goes to Australia, the European Union and the United States,
illegal timber will simply flow to innumerable ports where customs agents are
inadequately equipped to stop the illegal trade.
Systems for certification of sustainable timber management have laid the groundwork for
verification of proof of legality from forest to consumer. The policies to prevent the trade
of illegal timber have not yet increased sufficient consumer confidence to raise the
demand for wood, including tropical timber. In fact, attention to illegal logging that
policy discussions stimulated has led to several unintended consequences. Substitution of
temperate species for tropical species has occurred, and worse from the standpoint of the
forest sector, substitution of non-wood products for wood.
Introduction
Illegal logging refers to harvesting, transporting, processing, buying or selling timber and
timber products in contradiction with national laws. The laws referred to are not only the
laws regulating harvest, but may also cover laws regulating access to resources, land
tenure, forest management, environmental protection, labor, community welfare, trade
and export procedures and also taxes, duties and fees related to timber harvesting and
timber trade. Illegal timber trade is the import and export of either illegally logged
timber, or if the timber was legally harvested, then of timber linked to some other
violation of law during the sequence of processing and trade until the final consumer.
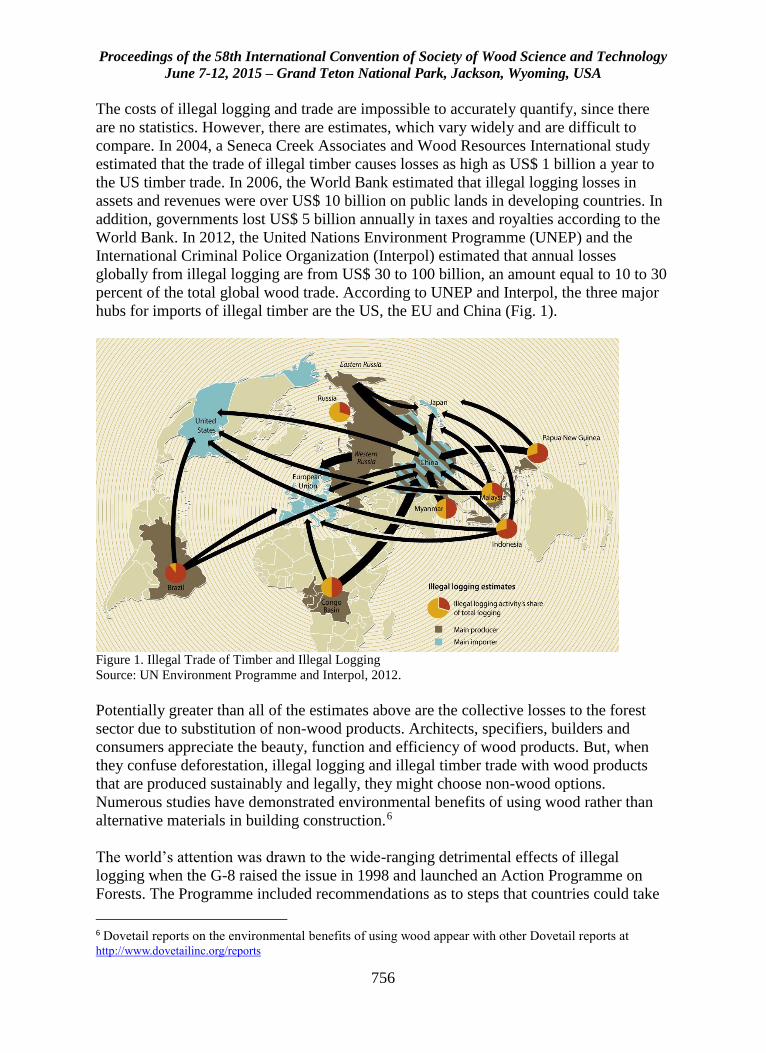
Proceedings of the 58th International Convention of Society of Wood Science and Technology
June 7-12, 2015 – Grand Teton National Park, Jackson, Wyoming, USA
756
The costs of illegal logging and trade are impossible to accurately quantify, since there
are no statistics. However, there are estimates, which vary widely and are difficult to
compare. In 2004, a Seneca Creek Associates and Wood Resources International study
estimated that the trade of illegal timber causes losses as high as US$ 1 billion a year to
the US timber trade. In 2006, the World Bank estimated that illegal logging losses in
assets and revenues were over US$ 10 billion on public lands in developing countries. In
addition, governments lost US$ 5 billion annually in taxes and royalties according to the
World Bank. In 2012, the United Nations Environment Programme (UNEP) and the
International Criminal Police Organization (Interpol) estimated that annual losses
globally from illegal logging are from US$ 30 to 100 billion, an amount equal to 10 to 30
percent of the total global wood trade. According to UNEP and Interpol, the three major
hubs for imports of illegal timber are the US, the EU and China (Fig. 1).
Figure 1. Illegal Trade of Timber and Illegal Logging
Source: UN Environment Programme and Interpol, 2012.
Potentially greater than all of the estimates above are the collective losses to the forest
sector due to substitution of non-wood products. Architects, specifiers, builders and
consumers appreciate the beauty, function and efficiency of wood products. But, when
they confuse deforestation, illegal logging and illegal timber trade with wood products
that are produced sustainably and legally, they might choose non-wood options.
Numerous studies have demonstrated environmental benefits of using wood rather than
alternative materials in building construction. 7F
6
The world’s attention was drawn to the wide-ranging detrimental effects of illegal
logging when the G-8 raised the issue in 1998 and launched an Action Programme on
Forests. The Programme included recommendations as to steps that countries could take
6 Dovetail reports on the environmental benefits of using wood appear with other Dovetail reports at http://www.dovetailinc.org/reports
Proceedings of the 58th International Convention of Society of Wood Science and Technology
June 7-12, 2015 – Grand Teton National Park, Jackson, Wyoming, USA
757
to eliminate illegal logging. In 2005, the G-8 Environment and Development Ministerial
Conference prepared a plan of action, subsequently adopted by G-8 leaders, for reducing
illegal logging activity and trade of illegally sourced timber.
The first regional Forest Law Enforcement and Governance (FLEG) conference was held
in 2001 in Indonesia and resulted in the Bali Declaration, where participating countries
committed to strengthening bilateral, regional and multilateral collaboration.
Collaboration is recognized as key to fighting illegality in international trade.
In 2003, the European Union (EU) initiated the Forest Law Enforcement Governance and
Trade (FLEGT) Action Plan. The key difference from previous processes is the “T” for
trade, which puts teeth into the plan. Without tackling the trade aspect, from which illegal
logging gains revenues, other parts of the previous plan were weaker. Elimination of
demand for illegal timber in international trade is just one aspect of the FLEGT Action
Plan. FLEGT goes far beyond policies of individual countries, as it acknowledges shared
responsibility between exporters and importers. The cornerstone of the plan is Voluntary
Partnership Agreements (VPAs) with tropical timber producing and exporting countries.
The VPAs include bilateral processes to establish legislation and its enforcement. As of
early 2015, 15 countries had initiated or were implementing VPAs, with another 11
considering participation in them. VPA countries are to produce FLEGT-licensed timber
for export to the EU and other destinations, of which the first shipments are forecast for
2016.
A 2004 UN Economic Commission for Europe meeting found that all countries in its
region of Europe, North America and the Commonwealth of Independent States have
some degree of illegal logging; however, illegality ranges from negligible to considerable
(from less than 1 percent to in excess of 35 percent of legal wood volume harvested). The
greatest illegal logging occurs in countries suffering from inadequate laws and
enforcement. Illegal logging negates the intent of sustainable forest management, often
causing or leading to forest degradation and deforestation.
Illegally harvested logs and wood products too often enter into international trade. The
majority of illegal harvests are fuelwood for local use in cooking and heating, often
tolerated due to poverty and lack of alternative energy sources. However, the more
valuable species and sizes are exported.
Interpol states, “Illegal logging and the international trade in illegally harvested timber is
a serious, international organized crime responsible for habitat destruction, species
extinction and climate change. National legislation in many countries, and numerous
international mechanisms, such as the European Union Action Plan named FLEGT and
REDD+, the United Nations Collaborative Programme, are diligently working to ensure
forest sustainability and manage carbon emissions. The trade in illegally harvested timber
is highly lucrative and comparable to the production value of illegal drugs.
Environmental criminals are often also involved in acts of corruption, smuggling and
violence, with their activities leading to loss of tax revenue, political upheaval and post-
Proceedings of the 58th International Convention of Society of Wood Science and Technology
June 7-12, 2015 – Grand Teton National Park, Jackson, Wyoming, USA
758
conflict instability. Without strong, coordinated law enforcement, criminals will exploit
these invaluable natural resources.”
According to Interpol, the consequences of illegal logging on the legal timber trade
include an evasion of costs along the supply chain (e.g. taxes, licenses, permits,
exploitation of cheap labor, illegal traders’ operations, etc.). This results in global price
suppression of 7 to 16 percent, meaning that law-abiding timber industry firms are denied
US$ 30 billion annually in lost income (ETTF, 2015). Interpol works together through its
190-country members and with organizations such as UNEP, against illegal timber trade.
Interpol handles a wide range of illegal trade concerns, including transportation of waste
(e.g., dumping of e-waste) 8F
7, wildlife trade9F
8, ivory sales 10F
9, pharmaceutical crime 11F
10, and
stolen goods. 12F
11 In recent years, there has also been growing concern about illegal oil
trade13F
12 and the diamond trade. 14F
13 Efforts to address illegal logging have parallels with
many other international trade concerns.
Policies to Eliminate Illegal Timber Trade
Current policies aimed at eliminating the illegal trade of wood and wood products range
from specific timber-related laws to weaker public procurement policies. The US, EU and
Australia lead with legislation against illegal wood trade, including penalties. Other
countries, such as Japan, have policies to promote the import and purchase of legal wood.
Yet another tier of countries, such as China, are enacting timber-linked legislation, for
which the severity of penalty for violation is not yet known. While most countries have
laws against illegal trade of products in general, most lack the specificity to tackle illegal
trade of timber products.
US Lacey Act Amendment (LAA)
In 2008, the US Lacey Act of 1900 was amended to include timber and timber products.
It became the premier legislation against illegal logging through banning imports of
illegal timber and timber products. The LAA imposes uniform requirements throughout
the US wood supply chain (timber importers, traders, processors, middlemen, wholesalers
and retailers). The amendment resulted from a broad consensus between the timber
industry, environmental organizations and the US government – all parties agreed that the
law would benefit the legal timber trade.
The LAA prohibits any person from importing, exporting, selling, receiving, acquiring or
purchasing any plant or plant product (e.g. wood or paper product), knowing that it was
7 http://www.solidwastemag.com/recycling/interpol-cracks-down-on-illegal-e-waste-trade/1002753151/ 8 http://voices.nationalgeographic.com/2012/07/26/4000-people-arrested-during-interpols-operation-cage-that-targeted-
the-illegal-trade-in-birds/ 9 http://www.huffingtonpost.com/2012/07/26/interpol-operation-worthy_n_1696166.html 10 http://www.interpol.int/Crime-areas/Pharmaceutical-crime 11 http://www.insightcrime.org/news-briefs/interpol-highlights-potential-profits-of-transnational-cell-phone-trade 12 http://www.brookings.edu/research/interviews/2014/09/27-isis-oil-funds-terror-alkhatteeb 13 http://money.howstuffworks.com/african-diamond-trade2.htm

Proceedings of the 58th International Convention of Society of Wood Science and Technology
June 7-12, 2015 – Grand Teton National Park, Jackson, Wyoming, USA
759
taken, possessed, transported or sold in violation of existing laws or regulations. The Act
extends to operators abroad with the possibility for prosecuting non-US citizens. The
LAA also prohibits false labeling of goods.
The LAA suggests that companies which trade, use and/or market timber apply “due
care” to ensure compliance. This is different than EU and Australian legislation, where
there are specific requirements for a “due diligence” system (explained below). Due care
is a concept developed in the US legal system that means the degree of care that a
reasonably prudent person would exercise under the circumstances. Therefore, it
recognizes varying degrees of knowledge among different operators.
The Act has clear, progressive penalties. The severity of LAA penalties and sanctions
vary according to an offender’s awareness of the illegality of a given action. The value of
the goods also affects the severity of punishment. Sanctions and penalties range from
small fines and possible forfeiture of the goods, to a felony level fine of US$ 500,000 (or
twice the maximum gain or loss from the transaction), a possible prison sentence of up to
five years, and forfeiture of the goods. The amount of the fine is determined based on the
type of operator, with larger corporations facing the highest penalties. 15F
14
European Union Timber Regulation (EUTR)
The EUTR is a regulatory act adopted by the EU in 2010 that prohibits placing illegal
timber on the EU market. It entered fully into law in March 2013. The regulation requires
“operators” (the companies that first place timber on the EU market, i.e. importers) to
exercise due diligence to ensure that the timber is completely legal.
According to the EUTR, the three key elements of a due diligence system are:
Information: The operator must have access to information describing the timber
and timber products, country of harvest, species, quantity, details of the supplier,
and information on compliance with national legislation.
Risk assessment: The operator should assess the risk of illegal timber in the
supply chain involved based on the information identified above and taking into
account criteria set out in the regulation.
Risk mitigation: When the assessment shows that there is a risk of illegal timber
in the supply chain that risk can be mitigated by requiring additional information
and verification from the supplier.
If the information in the three elements above is not sufficient to assess legality, then
operators must request additional information or impose additional measures (e.g.
certification of sustainable and legal forest management, third party verification of
legality, and/or documentation of the harvest site, licensing, transport, processing, etc.).
Companies may create and maintain their own due diligence systems or outsource to a
monitoring organization (MO) that is officially recognized by the European Commission.
Trade associations, some of which are also MOs, play an important role for small and
14 For additional discussion of the Lacey Act, see the Dovetail Report, “Understanding the Lacey Act”
available at: http://www.dovetailinc.org/report_pdfs/2013/dovetaillaceyact1113_0.pdf
Proceedings of the 58th International Convention of Society of Wood Science and Technology
June 7-12, 2015 – Grand Teton National Park, Jackson, Wyoming, USA
760
medium-sized enterprises. The MOs are either designated as national or EU-wide. As of
April 2015, the European Commission had officially recognized nine MOs. The lack of
sufficient MOs has hindered advancement of the EUTR.
In contrast to the LAA, which encompasses a wide variety of plant products as mentioned
in the previous section, the EUTR covers main timber products, but excludes some others
(e.g. recycled products, printed paper and bamboo). Similar to the LAA, the EUTR can
be revised, and other products can subsequently be added. As with the LAA, the EUTR
applies to both domestically produced and imported timber products; this not only allows
it to coincide with World Trade Organization requirements, but also allows it to apply to
illegal timber produced within the EU.
Another difference from the LAA is that the EUTR is less broad. The LAA extends to
activities outside of the US and beyond the initial importing. But, the EUTR stops with
the initial importer - it only prohibits operators from placing illicit timber or timber
products on the EU market and it requires those first-time operators to be able to
demonstrate the legality of timber. In contrast, the LAA applies throughout the supply
and processing chain, and all entities must be able to show at any time that their timber
products are legal.
The EUTR obliges EU member states to determine penalties for failing to comply with
the regulation. In contrast, the LAA includes a list of penalties and sanctions. The EUTR
requires that the penalties be “effective, proportionate and dissuasive.” EU trade
associations frequently express concern that EU countries will not have equivalent
enforcement, thus allowing illegal timber to enter where weaker enforcement exists.
Under the EUTR, each of the 28 EU states has nominated one or two “Competent
Authorities.” Competent Authorities are responsible for setting penalties and
enforcement. They also oversee MOs operating within their country.
Australia Illegal Logging Prohibition Act
Australia’s Illegal Logging Prohibition Act of 2012 promotes the trade of legally logged
timber and timber products. According to a 2005 study by JP Management Consulting for
the Australian Government, Australia is a significant importer of wood products (AUD$
4.4 billion in 2014) of which up to AUD$ 400 million come from sources with some risk
of being illegally logged. As stated on the webpage16F
15 associated with the Act, Australia
needs this legislation “... as a responsible member of the global community. It is in
Australia’s interests to protect plants and animals and the environment, promote
sustainable forest management and reduce the depletion of exhaustible natural resources
that are threatened by illegal logging. As a producer of timber products, it is in our
interest to promote the trade in legally logged timber. By strengthening our laws, we are
making Australia a less attractive destination for cheap illegal timber and timber products
that can undercut legitimate Australian businesses. We are also strengthening our
reputation in domestic and international markets.”
15 www.daff.gov.au/forestry/policies/illegal-logging

Proceedings of the 58th International Convention of Society of Wood Science and Technology
June 7-12, 2015 – Grand Teton National Park, Jackson, Wyoming, USA
761
The Act considers “intentionally, knowingly or recklessly” importing or processing
illegally logged timber a criminal offense. In order to be in accordance with World Trade
Organization rules, like the EUTR, the Australian Act covers timber harvested nationally
and internationally. The legislation only places requirements on Australian businesses,
and importers are required to practice and prove due diligence. Australian businesses
must practice due diligence “to assess and manage the risk that the timber or timber
products they are importing for processing has been illegally logged.” The Australian Act
is designed to complement EUTR and LAA.
Other Countries’ Similar and Evolving Legislation
Illegal trade is illegal everywhere by definition. But there is always the question of
specificity and enforcement of laws, i.e. the degree of enforcement that can be
determined by the will to enforce and the related level of corruption, and often the
capability of enforcement. Few countries have timber-specific trade laws such as those
presented above.
Some governments – national, regional and local – have procurement regulations that
pertain specifically to timber; often these specify that timber must be certified as
originating from sustainably managed forests. Sometimes they go further, as for example
in Japanese legislation, which specifically address illegal timber trade. The Japanese
Government introduced a Green Purchasing Law in 2006 to ensure that domestic
companies import legal and sustainably produced timber products. Japanese importers
voluntarily certify, according to various methods, the legality and sustainability of wood
and wood products (Goho-wood, 2015). Due to their voluntary nature, Japanese rules are
viewed as weaker than those of the US, EU and Australia.
Despite progress in addressing illegal logging, illegal trade channels continue to operate
in some parts of the world. China, for example, commonly imports illegal timber, often
softwood from Russia, and too often tropical timber. The necessity to prove legality for
export markets in Australia, the EU and the US has raised the consciousness of the
Chinese timber trade and the government. Following enactment of the LAA and
preceding the EUTR coming into force, trade associations informed their members that
export customers would demand proof of legality for their due care and due diligence
systems. Nevertheless, according to an expert familiar with the situation in China, the
impact on business practices due to the LAA and EUTR has been quite limited due to
weak and uncoordinated enforcement by the authorities.
China is in the process of developing a legal verification policy. Currently, it is in an
experimental stage and not yet implemented. Although some local industry associations
have started to introduce their own verification programs, they lack resources, credibility,
and transparency needed for wide acceptance by the marketplace, especially in
international markets.
Proceedings of the 58th International Convention of Society of Wood Science and Technology
June 7-12, 2015 – Grand Teton National Park, Jackson, Wyoming, USA
762
Comparison of LAA, EUTR and Australia’s laws
The EUTR is part of a larger FLEGT Action Plan, which aims to eliminate illegality in
the wood trade by attacking supply and demand. On the supply side, the EU has VPAs
with tropical timber producing and exporting countries. These agreements are designed to
improve legislation and enforcement in the VPA countries. FLEGT-licensed timber will
be automatically accepted under the EUTR.
The requirements for timber traders in Australia, EU and the US are similar. The major
difference is the process by which traders adhere to the laws. The EU and Australian laws
use a prescriptive approach, under which compliance means that the traders and operators
must meet the specific requirements of the regulation. By contrast, under the LAA, which
is a fact-based law, the individual company alone is responsible for compliance. A table
comparing the LAA and the EUTR appears in the annex. The EUTR automatically
accepts as legal any timber accompanied by a FLEGT license (expected in 2016) or
CITES (Convention on International Trade in Endangered Species of Wild Fauna and
Flora) permit. None of the systems accept certification of sustainable forest management
as sufficient proof of legality.
Why Certification Alone is Not Sufficient to Ensure Legality
In order for any forest to be certified as sustainably managed, one of the first tenets is
legality. This includes legality in land ownership, harvesting rights, employment of forest
workers, and so on. But the European Commission, which is responsible for running the
EU program, including the EUTR, states that certification alone is not enough to prove
legality. Why? Because even if all of the above-mentioned conditions were legal, when
logs leave the forest, illegality could occur that would not be identified through
certification of the forestland or the tracking of such material.
For example, various aspects of transportation from the log landing to the domestic or
overseas buyer may be illegal (e.g. unlicensed drivers, unregistered or illegal vehicles or
loads exceeding weight limits). Similarly, illegal activity can occur in conjunction with
processing logs, resulting lumber or their value-added products (e.g. undocumented
workers or illegal working conditions). Defining illegality in this way makes it difficult
for any importing company to be certain of legality. How is a company to know, for
instance, that the wood they bought was completely legal from stump until they took
possession? One solution available to large enterprises is development of a completely
integrated production and distribution system, starting at the forest and continuing
through sale of products. One international company that tries to do this is IKEA, and
although they often do not own the processing subsidiaries, they have extensive controls
in place to ensure legality of their suppliers.
Certification systems have modified their standards to better address the needs for
proving legality of due diligence systems. Although the US and EU governments do not
Proceedings of the 58th International Convention of Society of Wood Science and Technology
June 7-12, 2015 – Grand Teton National Park, Jackson, Wyoming, USA
763
recognize privately certified timber as automatically complying with the law, companies
can use certification as a mainstay in their due diligence or due care systems.
For example, according to the Programme for the Endorsement of Forest Certification
(PEFC), “the 2013 PEFC Chain of Custody certification has been updated to offer an
efficient mechanism for companies to demonstrate alignment with EUTR requirements.
The PEFC Due Diligence System (DDS), which is integral to PEFC chain-of-custody,
mirrors the EUTR requirements. The main difference between the PEFC DDS and the
EUTR is that the PEFC DDS goes further than the EUTR:
the PEFC DDS applies to all products and not to only a selection of product
groups that the EUTR covers, and
the PEFC DDS is compulsory for every stage of the chain, and not only for the
first placer on the EU market as required by the EUTR.”
It is important to note that the European Commission has never said that certification is
not sufficient to prove legality, but simply that certification is not actual proof of legality.
In fact, the European Commission clearly recognizes certification as evidenced by its
language regarding the EU timber regulation: “In practice, operators may rate credibly
certified or legally verified products as negligible risk of being illegal, i.e. suitable for
placing on the market with no further risk mitigation measures”
(http://ec.europa.eu/environment/eutr2013/faq/index_en.htm).
There are a number of potential issues that have kept the European Commission from
accepting certification as proof of legality – potentially most important is that, different
from CITES and FLEGT, certification is a private mechanism. PEFC strongly believes,
however, that the European Commission needs to find ways and means to recognize the
role of certification, especially since certification goes beyond legality, also promoting
sustainable management. As noted by PEFC, the more companies that obtain PEFC
chain-of-custody, the more the demand for sustainably sourced material will increase,
and the more it will be possible to effectively promote sustainable forest management
certification in Asia, Africa and Latin America.
The Forest Stewardship Council (FSC), the other main global certification system, also
recognizes the importance of aligning with due diligence systems’ needs. According to
FSC, “In support of the EUTR (and the US and Australia laws), FSC took measures to
accommodate compliance by its certificate holders. It elaborated further its definition of
legality, it incorporated trade and customs laws into the chain-of-custody requirements
and it ensured that where the FSC definition of ‘reclaimed material’ is in line with the
concept of ‘waste’ in the EUTR, where due diligence is applied. In a separate decision
(‘Advice Note’) it obliged certificate holders to cooperate in collecting the necessary
information about origin, species and legality documents on request of the clients.”
Proceedings of the 58th International Convention of Society of Wood Science and Technology
June 7-12, 2015 – Grand Teton National Park, Jackson, Wyoming, USA
764
Impact to Date on the Timber Trade
Policies to eliminate the trade of illegal timber have had direct, intended impacts, as well
as unintended consequences. The following impacts are described below:
Raising awareness of illegal logging and trade
Establishment of due diligence systems by traders and industry
Confiscation of illegal timber and penalties for possession
Substitution of temperate timber for tropical timber and non-wood for wood.
Awareness of the existence of illegal logging and trade
The political processes cited above, and the major legislation in the US and EU, have
raised awareness of the existence of illegal logging and its associated trade. Not only are
the forest sector and environmental community aware, but also a much broader audience
is now concerned about potential devastation and how forests will be regenerated and
subsequently managed.
There is increasing awareness that the best way to foster sustainable forest management
is to recognize and capture value from responsible periodic harvests of wood and non-
wood products. When forests’ greatest value is for their wood and non-wood products, on
a sustained yield basis, only then will forests remain forests. Otherwise, if the value of the
land that forests occupy is greater for agricultural crops, grazing, mining or urbanization,
then land conversion for these purposes can be expected.
One of the most rewarding aspects of the EUTR and the LAA has been the support for
these policies by the timber industry. Wood and paper associations and their members
have voiced their beliefs that through the elimination of illegality, the legal timber trade
will benefit. Some trade associations made members establish due diligence systems as a
requirement for membership. Since illegal timber undermines profits of legal timber, it is
in the trade’s best interest to support legal wood. But beyond that, having confidence in
the sustainable and legal source of wood products means potentially higher demand by
users and buyers.
Due diligence systems
The necessity for US and EU companies to establish or ameliorate their due care or due
diligence systems has also increased awareness of the risks of imports from various
countries and regions within countries. Importing certified forest products gives better
level of risk minimization than non-certified forest products. When sufficient certified
products of a desired species are not available, importers need to seek alternative sources
of verification of legality from suppliers.
Confiscation, court cases
The LAA, like many US laws, got additional clarification from courts’ interpretations.
The first case to draw widespread attention was against Gibson Guitar Corporation for
the import of illegal ebony from Madagascar in 2009. In 2011, Gibson had a second
Proceedings of the 58th International Convention of Society of Wood Science and Technology
June 7-12, 2015 – Grand Teton National Park, Jackson, Wyoming, USA
765
seizure by US Government authorities of ebony and rosewood imported from India. In
both cases Gibson claimed that products were improperly classified, and as finished
products were legally exported. In August 2012, Gibson settled the case with the US
government by paying a US$ 300,000 fine, a US$ 50,000 community payment, and
forfeiting the seized rosewood and ebony, which was valued at over US$ 300,000.
While the EUTR is newer than the LAA, it too has seen cases brought against importers
that not only have raised consciousness of the law, but also further defined its extent. One
of the first cases resulted from NGO whistleblowers (Greenpeace) calling attention to
illegal logs shipped from Brazil to the Antwerp, Belgium port. The containers were
impounded by the Belgium Competent Authority, Santé Publique, Sécurité de la Chaîne
Alimentaire et Environnement (SPF), awaiting proof of legality. The timber was
produced and exported by a Brazilian company, Rainbow, which was the focus of an
investigation by Greenpeace that showed some of its timber was illegal; this was
confirmed by the Brazilian authorities which have fined Rainbow multiple times. The
European Timber Trade Federation (ETTF) reported in January 2015 that SPF released
the containers following adequate proof of legality; however, the importing companies
cancelled further contracts with Rainbow.
In February 2015 the UK National Measurement Office (NMO), which is the UK
Competent Authority for the EUTR, investigated Chinese plywood imports. It found that
only one of sixteen UK companies fully met their EUTR due diligence obligations.
Specifically the companies were informed that they must take further steps in their due
diligence systems to minimize the risk of importing illegal material through product and
species identification testing. Although these 16 companies were small- to medium-sized
enterprises, and accounted for only 10 percent of the UK plywood imports from China,
the NMO stated that this sample was an indication that the problem was widespread
among UK importers. Some of the plywood had poplar core, which was presumably
domestically produced, and is currently a challenge to guarantee legality due to the lack
of comprehensive chain-of-custody in China. The NMO Enforcement Project Manager,
Mr. Michael Worrell told the Timber Trade Journal (TTJ), “Fundamentally what the
report highlights is that a composite product, coming from half way around the world,
with a complex chain of custody and containing tropical timber represents a higher level
of risk in terms of complying with the legislation and that the material it contains is what
the documents say. It may contain one thing one day and something else the next” (TTJ,
2015).
The NMO ordered correction under the threat of sanctions and prosecution. Of added
interest was the NMO’s intention to work with other EU countries’ Competent
Authorities on high risk wood products and countries (ETTF, 2015). Of further interest
was the response by the UK Timber Trade Federation, which commended the NMO for
its investigation, saying that, “the EUTR is a regulation that is being taken seriously by
the UK government and that it [the government] wishes to continue playing a leading role
in driving illegal timber out of its supply chains.” The Federation stated that the challenge
is primarily one of procedures and process, and that this development helps address the
detail required in due diligence systems. Indeed, a common complaint is that the
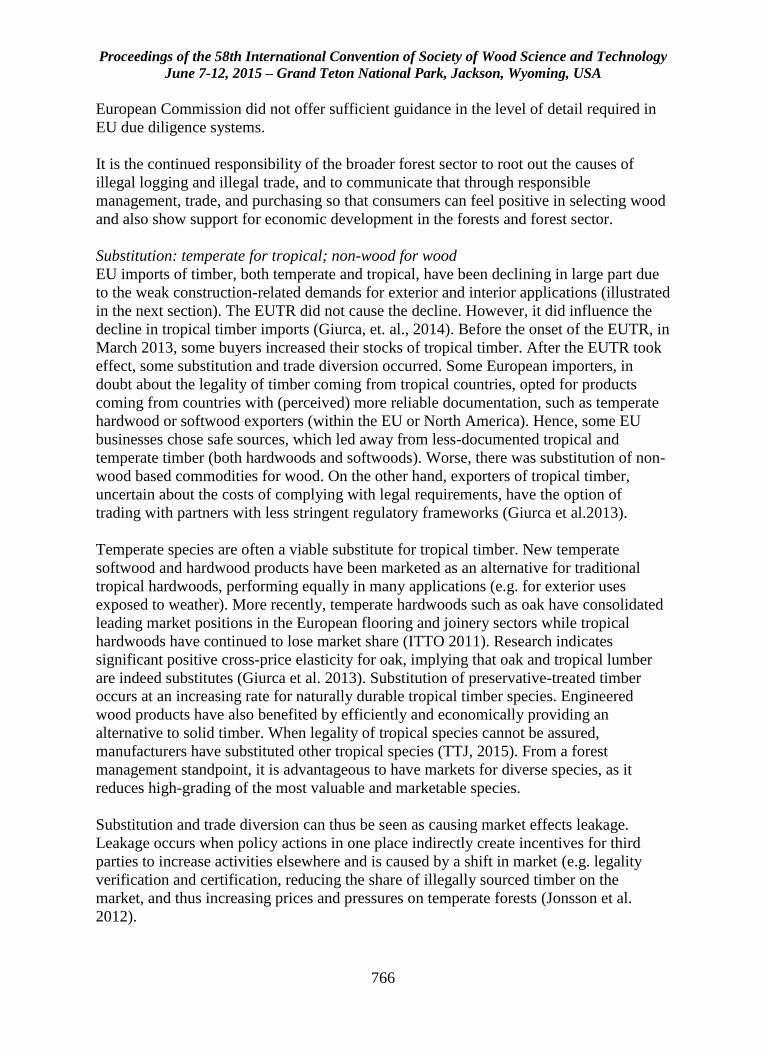
Proceedings of the 58th International Convention of Society of Wood Science and Technology
June 7-12, 2015 – Grand Teton National Park, Jackson, Wyoming, USA
766
European Commission did not offer sufficient guidance in the level of detail required in
EU due diligence systems.
It is the continued responsibility of the broader forest sector to root out the causes of
illegal logging and illegal trade, and to communicate that through responsible
management, trade, and purchasing so that consumers can feel positive in selecting wood
and also show support for economic development in the forests and forest sector.
Substitution: temperate for tropical; non-wood for wood
EU imports of timber, both temperate and tropical, have been declining in large part due
to the weak construction-related demands for exterior and interior applications (illustrated
in the next section). The EUTR did not cause the decline. However, it did influence the
decline in tropical timber imports (Giurca, et. al., 2014). Before the onset of the EUTR, in
March 2013, some buyers increased their stocks of tropical timber. After the EUTR took
effect, some substitution and trade diversion occurred. Some European importers, in
doubt about the legality of timber coming from tropical countries, opted for products
coming from countries with (perceived) more reliable documentation, such as temperate
hardwood or softwood exporters (within the EU or North America). Hence, some EU
businesses chose safe sources, which led away from less-documented tropical and
temperate timber (both hardwoods and softwoods). Worse, there was substitution of non-
wood based commodities for wood. On the other hand, exporters of tropical timber,
uncertain about the costs of complying with legal requirements, have the option of
trading with partners with less stringent regulatory frameworks (Giurca et al.2013).
Temperate species are often a viable substitute for tropical timber. New temperate
softwood and hardwood products have been marketed as an alternative for traditional
tropical hardwoods, performing equally in many applications (e.g. for exterior uses
exposed to weather). More recently, temperate hardwoods such as oak have consolidated
leading market positions in the European flooring and joinery sectors while tropical
hardwoods have continued to lose market share (ITTO 2011). Research indicates
significant positive cross-price elasticity for oak, implying that oak and tropical lumber
are indeed substitutes (Giurca et al. 2013). Substitution of preservative-treated timber
occurs at an increasing rate for naturally durable tropical timber species. Engineered
wood products have also benefited by efficiently and economically providing an
alternative to solid timber. When legality of tropical species cannot be assured,
manufacturers have substituted other tropical species (TTJ, 2015). From a forest
management standpoint, it is advantageous to have markets for diverse species, as it
reduces high-grading of the most valuable and marketable species.
Substitution and trade diversion can thus be seen as causing market effects leakage.
Leakage occurs when policy actions in one place indirectly create incentives for third
parties to increase activities elsewhere and is caused by a shift in market (e.g. legality
verification and certification, reducing the share of illegally sourced timber on the
market, and thus increasing prices and pressures on temperate forests (Jonsson et al.
2012).
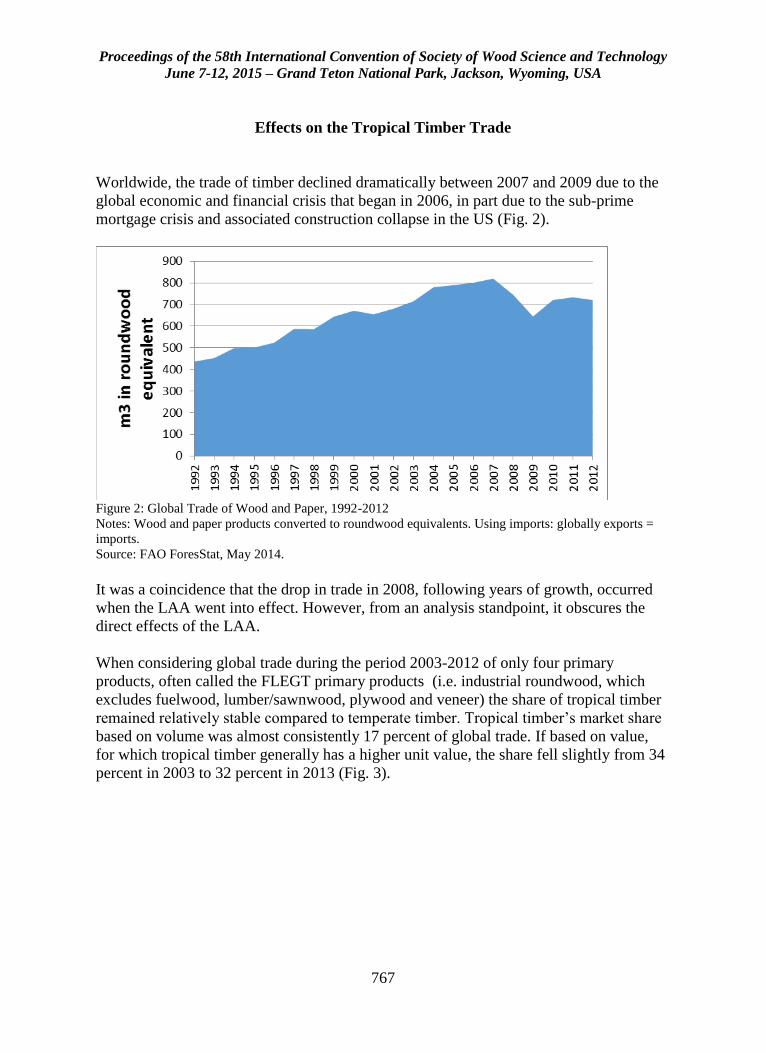
Proceedings of the 58th International Convention of Society of Wood Science and Technology
June 7-12, 2015 – Grand Teton National Park, Jackson, Wyoming, USA
767
Effects on the Tropical Timber Trade
Worldwide, the trade of timber declined dramatically between 2007 and 2009 due to the
global economic and financial crisis that began in 2006, in part due to the sub-prime
mortgage crisis and associated construction collapse in the US (Fig. 2).
Figure 2: Global Trade of Wood and Paper, 1992-2012
Notes: Wood and paper products converted to roundwood equivalents. Using imports: globally exports =
imports.
Source: FAO ForesStat, May 2014.
It was a coincidence that the drop in trade in 2008, following years of growth, occurred
when the LAA went into effect. However, from an analysis standpoint, it obscures the
direct effects of the LAA.
When considering global trade during the period 2003-2012 of only four primary
products, often called the FLEGT primary products (i.e. industrial roundwood, which
excludes fuelwood, lumber/sawnwood, plywood and veneer) the share of tropical timber
remained relatively stable compared to temperate timber. Tropical timber’s market share
based on volume was almost consistently 17 percent of global trade. If based on value,
for which tropical timber generally has a higher unit value, the share fell slightly from 34
percent in 2003 to 32 percent in 2013 (Fig. 3).
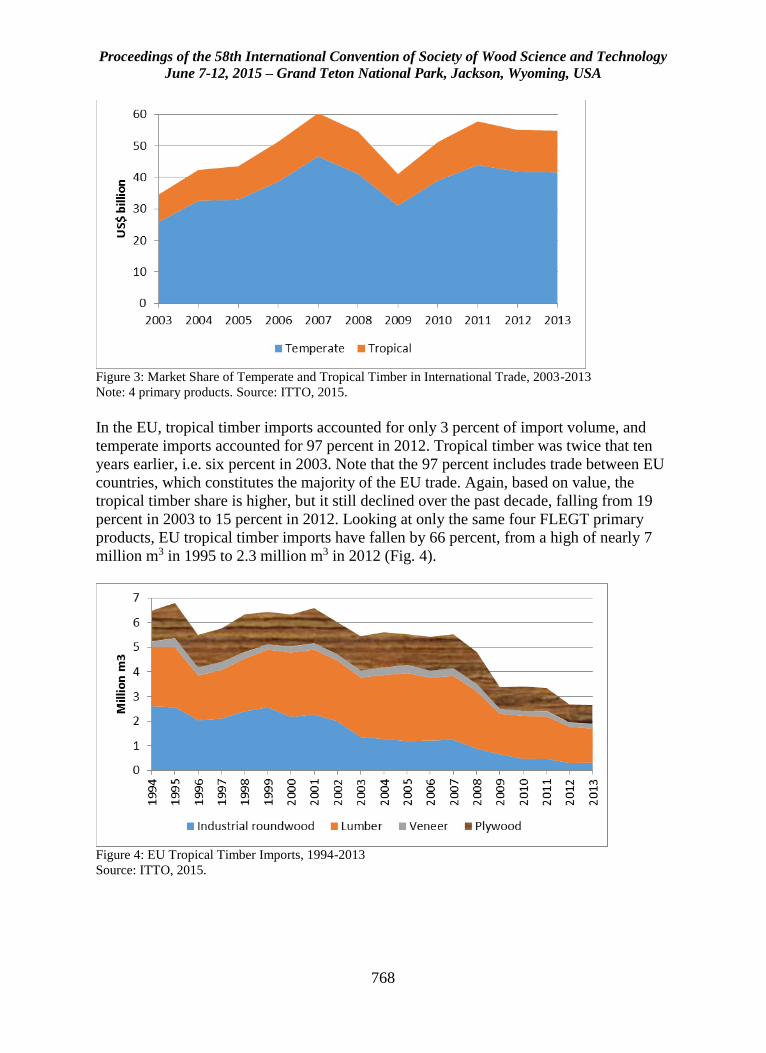
Proceedings of the 58th International Convention of Society of Wood Science and Technology
June 7-12, 2015 – Grand Teton National Park, Jackson, Wyoming, USA
768
Figure 3: Market Share of Temperate and Tropical Timber in International Trade, 2003-2013
Note: 4 primary products. Source: ITTO, 2015.
In the EU, tropical timber imports accounted for only 3 percent of import volume, and
temperate imports accounted for 97 percent in 2012. Tropical timber was twice that ten
years earlier, i.e. six percent in 2003. Note that the 97 percent includes trade between EU
countries, which constitutes the majority of the EU trade. Again, based on value, the
tropical timber share is higher, but it still declined over the past decade, falling from 19
percent in 2003 to 15 percent in 2012. Looking at only the same four FLEGT primary
products, EU tropical timber imports have fallen by 66 percent, from a high of nearly 7
million m3 in 1995 to 2.3 million m3 in 2012 (Fig. 4).
Figure 4: EU Tropical Timber Imports, 1994-2013
Source: ITTO, 2015.
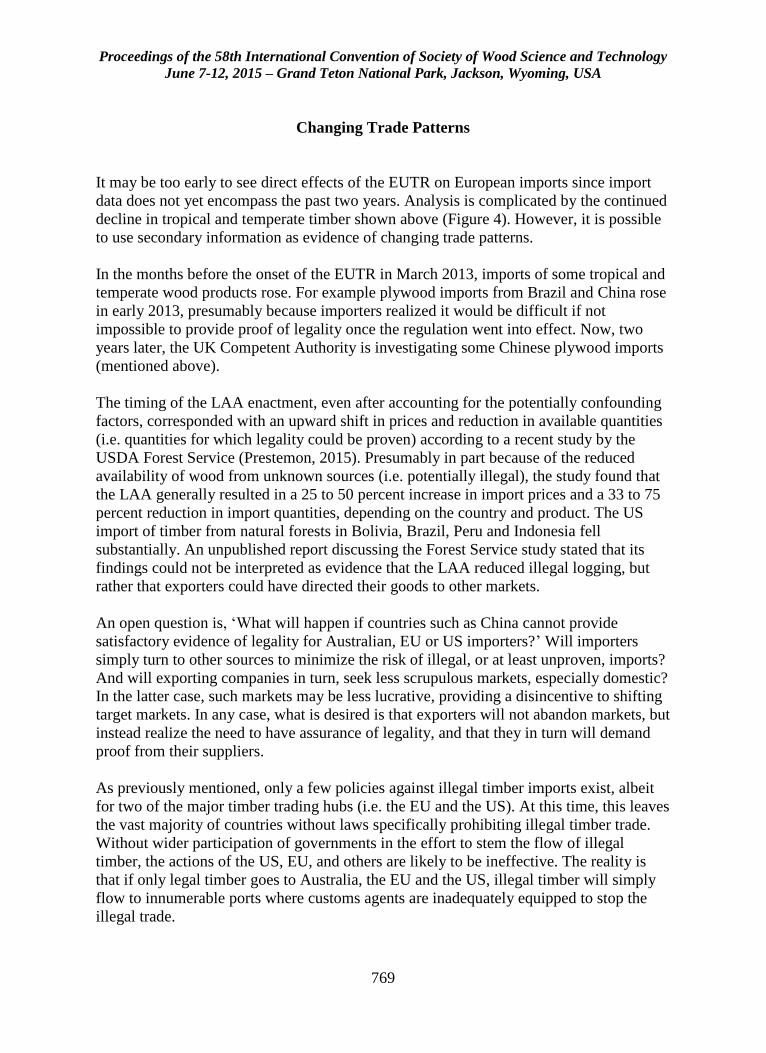
Proceedings of the 58th International Convention of Society of Wood Science and Technology
June 7-12, 2015 – Grand Teton National Park, Jackson, Wyoming, USA
769
Changing Trade Patterns
It may be too early to see direct effects of the EUTR on European imports since import
data does not yet encompass the past two years. Analysis is complicated by the continued
decline in tropical and temperate timber shown above (Figure 4). However, it is possible
to use secondary information as evidence of changing trade patterns.
In the months before the onset of the EUTR in March 2013, imports of some tropical and
temperate wood products rose. For example plywood imports from Brazil and China rose
in early 2013, presumably because importers realized it would be difficult if not
impossible to provide proof of legality once the regulation went into effect. Now, two
years later, the UK Competent Authority is investigating some Chinese plywood imports
(mentioned above).
The timing of the LAA enactment, even after accounting for the potentially confounding
factors, corresponded with an upward shift in prices and reduction in available quantities
(i.e. quantities for which legality could be proven) according to a recent study by the
USDA Forest Service (Prestemon, 2015). Presumably in part because of the reduced
availability of wood from unknown sources (i.e. potentially illegal), the study found that
the LAA generally resulted in a 25 to 50 percent increase in import prices and a 33 to 75
percent reduction in import quantities, depending on the country and product. The US
import of timber from natural forests in Bolivia, Brazil, Peru and Indonesia fell
substantially. An unpublished report discussing the Forest Service study stated that its
findings could not be interpreted as evidence that the LAA reduced illegal logging, but
rather that exporters could have directed their goods to other markets.
An open question is, ‘What will happen if countries such as China cannot provide
satisfactory evidence of legality for Australian, EU or US importers?’ Will importers
simply turn to other sources to minimize the risk of illegal, or at least unproven, imports?
And will exporting companies in turn, seek less scrupulous markets, especially domestic?
In the latter case, such markets may be less lucrative, providing a disincentive to shifting
target markets. In any case, what is desired is that exporters will not abandon markets, but
instead realize the need to have assurance of legality, and that they in turn will demand
proof from their suppliers.
As previously mentioned, only a few policies against illegal timber imports exist, albeit
for two of the major timber trading hubs (i.e. the EU and the US). At this time, this leaves
the vast majority of countries without laws specifically prohibiting illegal timber trade.
Without wider participation of governments in the effort to stem the flow of illegal
timber, the actions of the US, EU, and others are likely to be ineffective. The reality is
that if only legal timber goes to Australia, the EU and the US, illegal timber will simply
flow to innumerable ports where customs agents are inadequately equipped to stop the
illegal trade.
Proceedings of the 58th International Convention of Society of Wood Science and Technology
June 7-12, 2015 – Grand Teton National Park, Jackson, Wyoming, USA
770
What is Needed to Further Reduce Illegal Trade
Reducing illegal logging and the illegal trade of wood is not easy, and cannot be done
unilaterally. More countries need to establish collaboration and uniform legislation that
specifically aims at eliminating the illegal timber trade. The LAA is a unilateral measure,
aimed at the demand side (US imports) in comparison to the EUTR that establishes
bilateral (or multi-lateral considering the 26 EU states) regulations aimed at both the
demand side (EU imports) and supply side (VPA exports). In all of the policies cited
above, the goal is to reduce incentives for illegal logging and illegal trade.
Legislation alone is not enough—it must be accompanied by sufficient enforcement
throughout the timber supply chain. Customs agents at the exporting and importing ends
of the chain need to be sufficiently trained to know different wood products and species.
There must also be enough customs agents with sufficient time available to inspect
containers of logs, lumber, plywood and a host of other timber products.
More research is needed to quantify the magnitude of the problem relating to lack of
statistics on illegal logging/trade, including both benchmarking the current situation and
monitoring change. Only with sufficient information can policies be judged to be either
efficient or in need of modification. While accurate and detailed statistics on illegal
timber trade may never be available, research on various indicators enables estimations
and monitoring trends.
Illegal trade affects many diverse products and sectors – including e-waste, wildlife,
endangered species, oil, diamonds, and others. Policies and actions taken to address one
form of illegal trade can provide valuable lessons to other sectors facing related
challenges. Building on the LAA, efforts to combat illegal logging and the illegal trade of
wood in US markets were informed by previous efforts related to wildlife trade.
Emerging new understandings from innovative policies to address illegal logging can and
should be applied to other trade concerns with the shared objective that responsible trade
is a necessary common theme throughout supply chains. Needs for widespread
legislation, enforcement, research, and monitoring are not limited to the trade in forest
products.
Conclusion
Government policies, backed by the legal timber trade, are tackling the disastrous effects
of illegal logging and the trade of illegal timber products. These effects are far-reaching,
from loss of forests and their many attributes to undermining the revenues of
governments and profits of forest sector companies. Worse is confusion about illegality
in timber, and the potential choice of less environmentally sound, non-wood substitutes.
When managed sustainably, forests can produce a renewable supply of wood and non-
wood products. Through effective, enforced policies to eradicate illegal logging and
Proceedings of the 58th International Convention of Society of Wood Science and Technology
June 7-12, 2015 – Grand Teton National Park, Jackson, Wyoming, USA
771
illegal trade, confidence can be restored in wood products, while enhancing profitability
of the forest sector. An important benefit of both outcomes is that the value of forests, as
forests, is enhanced, increasing the likelihood of retention of forested areas even in the
face of competitive pressures for conversion to agriculture or other land uses.
References
Australian Government. Illegal Logging Prohibition Act 2012. (2012)
www.daff.gov.au/forestry/policies/illegal-logging. Accessed 22 January 2015.
Environmental Investigation Agency (EIA). (2012) The US Lacey Act: Tackling the
illegal trade in timber, plants and wood products. Funding for implementation in 2012.
http://eia-global.org/images/uploads/The_U.S_Lacey_Act.pdf.
EIA. (2011) EIA statement regarding 24 August 2011 Gibson Guitars raid by US Fish &
Wildlife Service. http://eia-global.org/news-media/eia-statement-regarding-24-august-
2011-gibson-guitars-raid-by-us-fish-wildl. 2011. Accessed 23 February 2015
European Commission. Independent evaluation of the implementation of the EU Action
Plan on Forest Law Enforcement Governance and Trade. (2014) Unpublished overview
of evaluation.
European Forest Institute. Literature review: United States Lacey Act Amendment and
the European Union Timber Regulation – Focus on their communications. (2012)
Unpublished report.
European Timber Trade Federation (ETTF). ETTF news. (2015) Winter 2014/15.
www.ettf.info. Accessed 23 February 2015.
ETTF. (2015) Probe uncovers EUTR failings in UK Chinese plywood importing.
http://www.ettf.info/node/161. Accessed 23 February 2015.
EU. (2015) Competent authorities.
http://ec.europa.eu/environment/forests/pdf/list_competent_authorities_eutr.pdf.
Accessed 11 February 2015.
EU Timber Regulation. (2013) http://eur-
lex.europa.eu/LexUriServ/LexUriServ.do?uri=OJ:L:2010:295:0023:0034:EN:PDF.
European Union. (2003) FLEGT Action Plan. http://eur-
lex.europa.eu/LexUriServ/LexUriServ.do?uri=COM:2003:0251:FIN:EN:PDF.
EU. (2013) EU Timber Regulation.
http://ec.europa.eu/environment/forests/timber_regulation.htm
EU. (2015) Monitoring organizations.
http://ec.europa.eu/environment/forests/pdf/mos.pdf. Accessed 11 February 2015.
Florian D., Masiero M., Mavsar R., Pettenella D. (2012) How to support the
implementation of due diligence systems through the EU Rural Development
Programme: problems and potentials. L’Italia Forestale e Montana 67(2): 191–201. doi:
10.4129/ifm.2012.
Proceedings of the 58th International Convention of Society of Wood Science and Technology
June 7-12, 2015 – Grand Teton National Park, Jackson, Wyoming, USA
772
FSC. Personal communication on 16 February 2015. (2015) FSC website concerning
compliance with due diligence systems at https://ic.fsc.org/timber-legality.492.htm.
Giurca, A., Jonsson, R., Lovric, M. and Pepke, E. (2014) EUTR impact on international
timber markets. In proceedings for Joint Society of Wood Science and Technology,
Wood Structure and Properties and European Hardwood Conference.
http://www.swst.org/meetings/AM14/pdfs/proceedings.pdf. 2014.
Goho-wood. (2015) Law concerning the promotion of the procurement of eco-friendly
goods and services by the state and other entities. Japan. https://www.goho-
wood.jp/world/outline/doc/101126_leaflet.pdf. Accessed 23 February 2015.
Greenpeace. Logging in the Amazon. (2005)
http://www.greenpeace.org/international/en/campaigns/forests/amazon/logging-in-the-
amazon.
Interpol. (2015) Project Leaf. http://www.interpol.int/Crime-areas/Environmental-
crime/Projects/Project-Leaf. Accessed 17 February 2015.
Jonsson, R., Giurca, A. Masiero, M., Pepke, E., Pettenella, D. Prestemon, J., Winkel, G.
(2015) Assessement of the EU Timber Regulation and FLEGT Action Plan. EFI Think
Forest Policy Brief. http://www.efi.int/files/attachments/thinkforest/efi_thinkforest-
brief_eutr.pdf
Jonsson, R., Mbongo, W., Felton, A., Boman, M. (2012) Leakage Implications for
European Timber Markets from Reducing Deforestation in Developing Countries.
Forests. 3:736-744
JP Management Consulting (Asia Pacific) Pty Ltd. (2005) Overview of illegal logging: A
report prepared for the Australian Government. Unpublished.
Oliver, Rupert. (2014) EUTR introduced just as EU economy hits bottom. ETTF News.
2014.
PEFC. (2015) Personal communication on 16 February 2015. PEFC website:
www.pefc.org
Pepke, Ed, J. Bowyer, S. Bratkovich, K. Fernholz, M. Frank, H. Groot, J. Howe. (2015)
Impacts of policies to eliminate illegal timber trade. Dovetail Partners Inc.
http://www.dovetailinc.org/reports/Impacts+of+Policies+to+Eliminate+Illegal+Timber+
Trade_n679?prefix=%2Freports. 2015.
Prestemon J.P. (2015) The impacts of the Lacey Act Amendment of 2008 on US
hardwood lumber and hardwood plywood imports. Forest Policy and Economics 50: 31–
44. http://www.illegal-logging.info/sites/default/files/ja_2014_prestemon_002.pdf.
Seneca Creek Associates, LLC and Wood Resources International, LLC. (2004) Illegal
logging and global wood markets: The competitive impacts on the US wood products
industry. 2004.
Timber Trade Journal (TTJ). (2015) NMO bears its teeth in Chinese plywood
enforcement action. February.
TTJ. (2015) Hardwood health. February.

Proceedings of the 58th International Convention of Society of Wood Science and Technology
June 7-12, 2015 – Grand Teton National Park, Jackson, Wyoming, USA
773
UNECE/FAO. (2004) Illegal logging and trade of illegally-derived forest products in the
UNECE region.http://www.unece.org/fileadmin/DAM/timber/docs/sem/2004-
1/summarynote.pdf. 2004.
UK Timber Trade Federation. TTF response to NMO report on Chinese plywood. Issued
23 February 2015.
UN Environment Programme and Interpol. (2012) Green carbon, black trade: Illegal
logging, tax fraud and laundering in the world’s tropical forests.
http://dev.grida.no/logging/layout/RRAlogging_english.pdf.
World Bank. (2006) Strengthening Forest Law Enforcement and Governance. Report N.
36638-GLB. http://www-
wds.worldbank.org/external/default/WDSContentServer/WDSP/IB/2006/09/05/00016001
6_20060905125450/Rendered/PDF/366380REVISED010Forest0Law01PUBLIC1.pdf.
2006
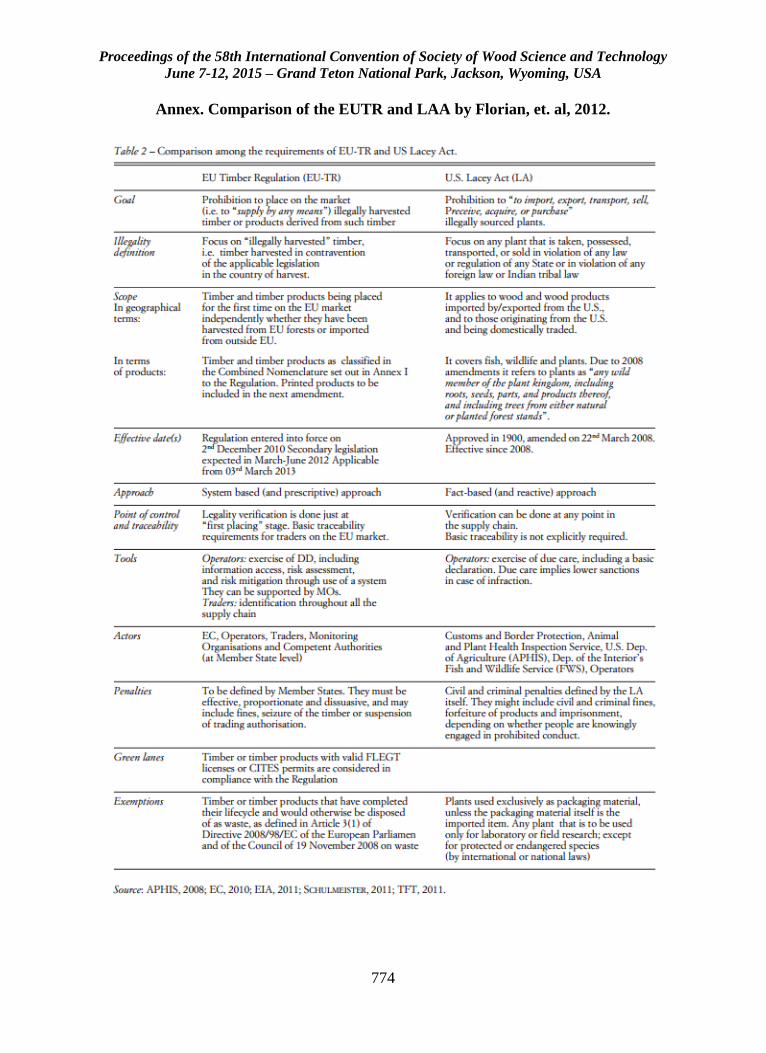
Proceedings of the 58th International Convention of Society of Wood Science and Technology
June 7-12, 2015 – Grand Teton National Park, Jackson, Wyoming, USA
774
Annex. Comparison of the EUTR and LAA by Florian, et. al, 2012.
Proceedings of the 58th International Convention of Society of Wood Science and Technology
June 7-12, 2015 – Grand Teton National Park, Jackson, Wyoming, USA
775
Improving Production Efficiency to Increase the
Capacity and Profitability of a Swedish Wooden Single-
Family House Producer
Tobias Schauerte1* – Victor Svensson2 – Simon Allhorn2
1 Assistant professor Industrial Engineering and Marketing, Faculty of
Technology, Department of Mechanical Engineering – Linnaeus University,
Växjö, Sweden.
* Corresponding author
[email protected] 2 Industrial Engineer, Faculty of Technology, Department of Mechanical
Engineering – Linnaeus University, Växjö, Sweden.
Abstract
After the economic downfall and declining orders for wooden single-family houses in the
past, order quantities on the Swedish market are turning upwards again. Yet, production
costs for the firms are too high, often due to an inefficient production with too long lead-
times. Further, a lot of capital is tied up in stock, leading to a relatively low rate of
inventory turnover. Many firms face such production-related bottlenecks that affect
profitability in a negative way. At the same time, firms want to increase their production
capacity since the market is gaining strength.
In this study, principles and methods of the LEAN production philosophy were applied
on a case firm, where the value stream was mapped to explore bottlenecks in the
production of a wooden single-family house and to calculate production efficiency. By
means of the DuPont scheme for economic analysis, the firm's return on assets was
analyzed.
Data reveal how stock utilization, production and material flow, capacity and
consequently return on capital are affected by a suboptimal facility planning. Changes in
the current facility layout are suggested and measurements performed to exploit the direct
effects of such changes and show their potential.
Results show that with the suggested changes, stock could be reduced by 37 %, value-
adding space increased by 13 % and production capacity by 50 %. By implementing the
Proceedings of the 58th International Convention of Society of Wood Science and Technology
June 7-12, 2015 – Grand Teton National Park, Jackson, Wyoming, USA
776
suggestions, production efficiency could increase between 10.3 % and 230 % and the
firms return on assets could improve from 2.5 % to 37.8 %, which corresponds to an
increase of profitability by around 1 506 %.
Keywords: Wooden Single-Family Houses, Lean Production, Production Efficiency,
Value Stream Mapping, Production and Material Flow, Return on Assets
Introduction
Background
Todays’ competitive business environment places high requirements on the different
industries. In that context, the Swedish industry for prefabricated wooden single-family
houses is no exception. Since the industry structure is characterized by a high degree of
perfect competition, the products, here single-family houses, are highly substitutional in
the eye of the consumer and firms mainly compete by prices. (Schauerte et al., 2014).
Nevertheless, production costs per m2 increased by more than 60 % from 2001 to 2013
(SCB, 2015a), which is highly disproportional compared to the consumer price index that
increased by 15 % in the same period (SCB, 2015b). This unbalanced development could
be explained by different rationales, like e.g. a sales downfall by ca 70 % from 2007 to
2012 due to the economic crisis (Schauerte et al., 2013) or rising direct costs for material
or salaries. Yet, as various researchers indicate (a.o. Brege et al., 2004; Eliasson, 2014;
Eliasson and Sandberg, 2015; Jonsson and Rudberg, 2014; Meiling et al., 2012), actual
ways of working and production facilities do not correspond to the current state of
development compared to other industries. Many firms in the Swedish industry for
prefabricated wooden single-family houses are lacking behind in efficiency and
production development.
Working more efficient and reducing production costs could be achieved by several
means. According to Pullan et al. (2013), LEAN production offers a number of tools that
could help to improve production flow by reducing lead-times, semi-finished products or
downsizing stocks and minimizing waste (Sandberg and Bildsten, 2011). This could lead
to a decrease of tied up capital and an improvement in the rate of turnover, production
efficiency and consequently profitability. Such development would allow for better
resource utilization and can free production capacity (Pullan et al., 2013). As mentioned
above, the sales quantity on the market declined by ca 70 % from 2007 to 2012, from
12 000 to 4 800 units. However, since 2012, the number of produced houses is raising. In
2014, 7 000 units were produced and for 2015, the Swedish national trade and employers’
association of the wood processing and furniture industry forecasted 9 000 units to be
produced (TMF, 2014; 2015). As the market is gaining strength, firms in the industry
have to adjust their overall strategic conduct to meet that growing demand. Considering
the above described situation on production efficiency, especially production related
adjustments should be made to successfully be part of the positive market development.
Proceedings of the 58th International Convention of Society of Wood Science and Technology
June 7-12, 2015 – Grand Teton National Park, Jackson, Wyoming, USA
777
The case firm and research question of this study The case firm, which wants to stay anonymous due to a high degree of competition in its
industry, prefabricates semi-finished modules for wooden single-family houses, row
houses and multi-family houses up to 4 floors. Elements are produced off-site and
assembled on-site. At the time of the study, the firm employed 16 people and had a
production capacity equaling ca 40 single-family houses per year. Yet, this quantity
varies depending of the type of house to be produced. Production takes place in a rented
factory building that offers no possibility to expand production facilities by extending the
existing building. As the demand for the case firm’s products steadily increases, it could
sell or market approximately 50 % more than actually can be produced today. Thus, the
management of the firm decided to map possibilities how to improve and develop its
production strategy and facility planning, in order to expand the production capacity.
Therefore, the research question of this study is as follows:
How can production efficiency be improved to free production capacity for a firm
producing wooden single-family houses?
Lean Thinking and Value Stream Mapping
LEAN is a philosophy originating from Toyota Production System (TPS), aiming at
shaping a firm’s production in a way that utilizes resources as efficient as possible. One
important part of this is constituted by the reduction of waste. By analyzing customer
demand, value-adding processes and activities can be identified. According to TPS, all
other activities should be eliminated, or reduced as much as possible, in order to reach
higher production and value stream efficiency (Liker, 2004).
Value streams include all activities needed to process materials and parts into the finished
product. Mapping a value stream, data on e.g. lead time, value adding time, set-up times,
stock levels, staffing, delivery frequencies and available capacities have to be gathered.
In order to improve a product’s value stream efficiency, the existing stream needs to be
analyzed, starting with the material- and information flow at the dispatch point of the
finished product, i.e. the end of the value stream. This, since delivery frequency is
directly linked to quantity of demand and should determine the production and
throughput rate. Mapping the value stream then continues upstream and as much relevant
primary data as possible should be gathered on the different steps in the process. After
mapping the whole process, a desired future state has to be created, depending on the
strategic intend of the individual firm (Rother, 2009). In the current study, the case firm
was aiming at increasing production capacity by 50 %.
The description above is a simplified depiction of mapping a value stream. Since a
detailed description of all steps, including all other related and used methods and theories
in this study, would exceed the scope of this paper, the authors refer the interested reader
to Allhorn and Svensson (2014). Further, this study is limited to the investigation of
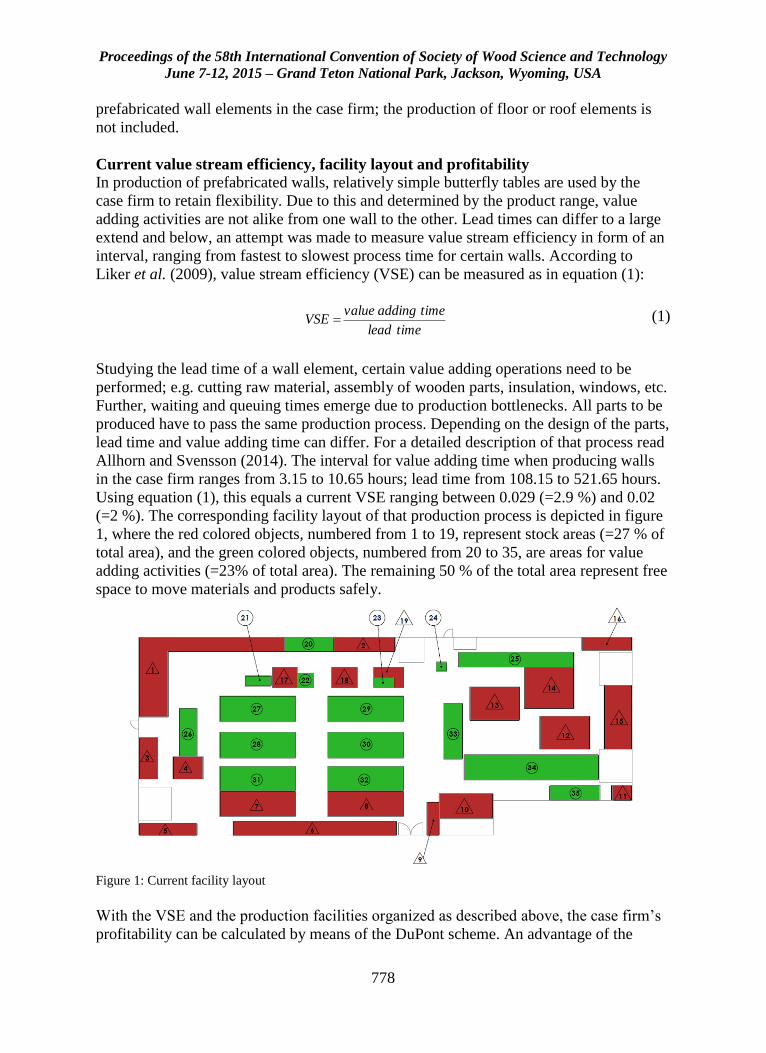
Proceedings of the 58th International Convention of Society of Wood Science and Technology
June 7-12, 2015 – Grand Teton National Park, Jackson, Wyoming, USA
778
prefabricated wall elements in the case firm; the production of floor or roof elements is
not included.
Current value stream efficiency, facility layout and profitability
In production of prefabricated walls, relatively simple butterfly tables are used by the
case firm to retain flexibility. Due to this and determined by the product range, value
adding activities are not alike from one wall to the other. Lead times can differ to a large
extend and below, an attempt was made to measure value stream efficiency in form of an
interval, ranging from fastest to slowest process time for certain walls. According to
Liker et al. (2009), value stream efficiency (VSE) can be measured as in equation (1):
timelead
timeaddingvalueVSE (1)
Studying the lead time of a wall element, certain value adding operations need to be
performed; e.g. cutting raw material, assembly of wooden parts, insulation, windows, etc.
Further, waiting and queuing times emerge due to production bottlenecks. All parts to be
produced have to pass the same production process. Depending on the design of the parts,
lead time and value adding time can differ. For a detailed description of that process read
Allhorn and Svensson (2014). The interval for value adding time when producing walls
in the case firm ranges from 3.15 to 10.65 hours; lead time from 108.15 to 521.65 hours.
Using equation (1), this equals a current VSE ranging between 0.029 (=2.9 %) and 0.02
(=2 %). The corresponding facility layout of that production process is depicted in figure
1, where the red colored objects, numbered from 1 to 19, represent stock areas (=27 % of
total area), and the green colored objects, numbered from 20 to 35, are areas for value
adding activities (=23% of total area). The remaining 50 % of the total area represent free
space to move materials and products safely.
Figure 1: Current facility layout
With the VSE and the production facilities organized as described above, the case firm’s
profitability can be calculated by means of the DuPont scheme. An advantage of the
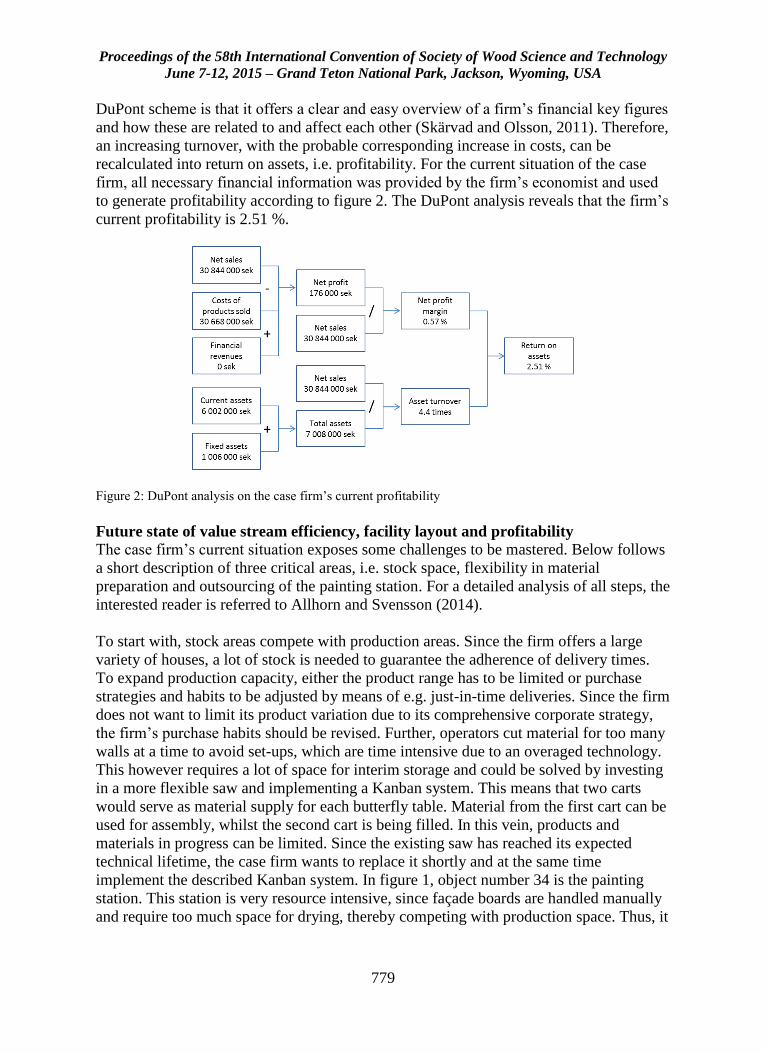
Proceedings of the 58th International Convention of Society of Wood Science and Technology
June 7-12, 2015 – Grand Teton National Park, Jackson, Wyoming, USA
779
DuPont scheme is that it offers a clear and easy overview of a firm’s financial key figures
and how these are related to and affect each other (Skärvad and Olsson, 2011). Therefore,
an increasing turnover, with the probable corresponding increase in costs, can be
recalculated into return on assets, i.e. profitability. For the current situation of the case
firm, all necessary financial information was provided by the firm’s economist and used
to generate profitability according to figure 2. The DuPont analysis reveals that the firm’s
current profitability is 2.51 %.
Figure 2: DuPont analysis on the case firm’s current profitability
Future state of value stream efficiency, facility layout and profitability
The case firm’s current situation exposes some challenges to be mastered. Below follows
a short description of three critical areas, i.e. stock space, flexibility in material
preparation and outsourcing of the painting station. For a detailed analysis of all steps, the
interested reader is referred to Allhorn and Svensson (2014).
To start with, stock areas compete with production areas. Since the firm offers a large
variety of houses, a lot of stock is needed to guarantee the adherence of delivery times.
To expand production capacity, either the product range has to be limited or purchase
strategies and habits to be adjusted by means of e.g. just-in-time deliveries. Since the firm
does not want to limit its product variation due to its comprehensive corporate strategy,
the firm’s purchase habits should be revised. Further, operators cut material for too many
walls at a time to avoid set-ups, which are time intensive due to an overaged technology.
This however requires a lot of space for interim storage and could be solved by investing
in a more flexible saw and implementing a Kanban system. This means that two carts
would serve as material supply for each butterfly table. Material from the first cart can be
used for assembly, whilst the second cart is being filled. In this vein, products and
materials in progress can be limited. Since the existing saw has reached its expected
technical lifetime, the case firm wants to replace it shortly and at the same time
implement the described Kanban system. In figure 1, object number 34 is the painting
station. This station is very resource intensive, since façade boards are handled manually
and require too much space for drying, thereby competing with production space. Thus, it
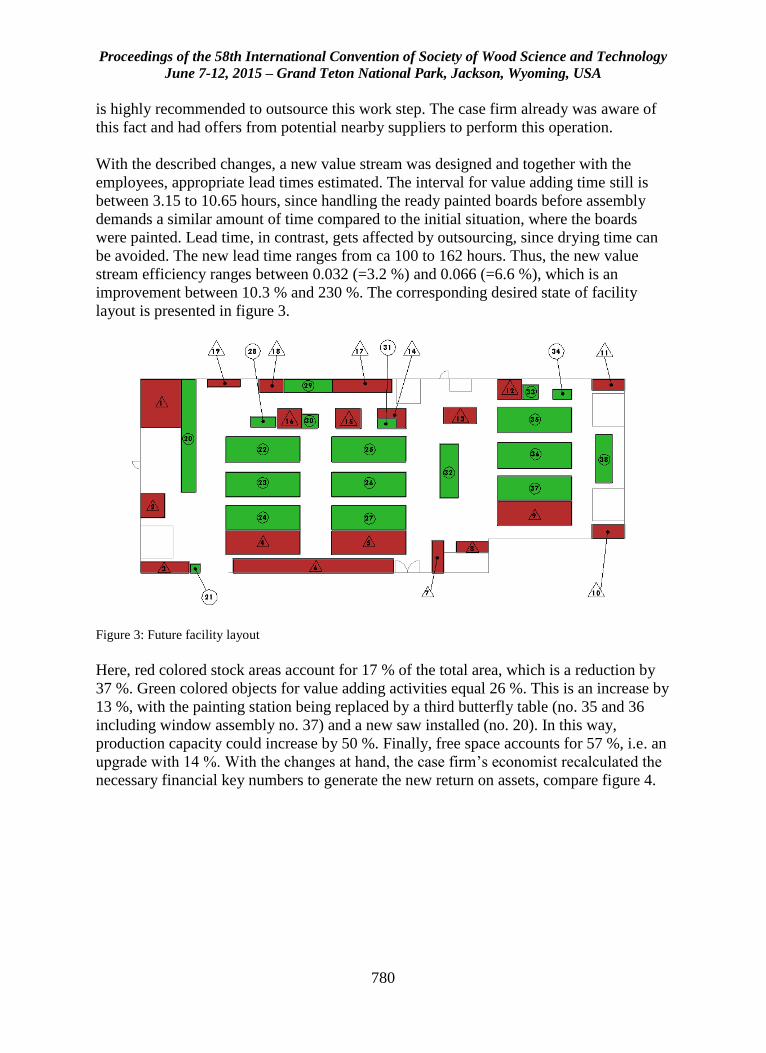
Proceedings of the 58th International Convention of Society of Wood Science and Technology
June 7-12, 2015 – Grand Teton National Park, Jackson, Wyoming, USA
780
is highly recommended to outsource this work step. The case firm already was aware of
this fact and had offers from potential nearby suppliers to perform this operation.
With the described changes, a new value stream was designed and together with the
employees, appropriate lead times estimated. The interval for value adding time still is
between 3.15 to 10.65 hours, since handling the ready painted boards before assembly
demands a similar amount of time compared to the initial situation, where the boards
were painted. Lead time, in contrast, gets affected by outsourcing, since drying time can
be avoided. The new lead time ranges from ca 100 to 162 hours. Thus, the new value
stream efficiency ranges between 0.032 (=3.2 %) and 0.066 (=6.6 %), which is an
improvement between 10.3 % and 230 %. The corresponding desired state of facility
layout is presented in figure 3.
Figure 3: Future facility layout
Here, red colored stock areas account for 17 % of the total area, which is a reduction by
37 %. Green colored objects for value adding activities equal 26 %. This is an increase by
13 %, with the painting station being replaced by a third butterfly table (no. 35 and 36
including window assembly no. 37) and a new saw installed (no. 20). In this way,
production capacity could increase by 50 %. Finally, free space accounts for 57 %, i.e. an
upgrade with 14 %. With the changes at hand, the case firm’s economist recalculated the
necessary financial key numbers to generate the new return on assets, compare figure 4.
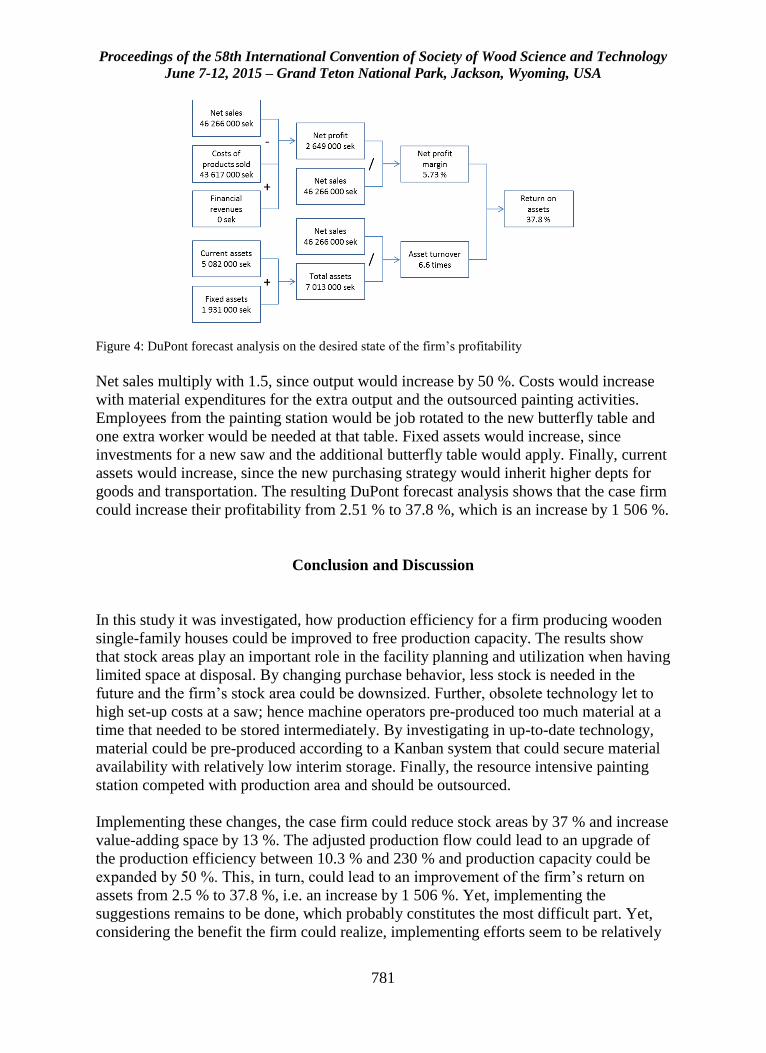
Proceedings of the 58th International Convention of Society of Wood Science and Technology
June 7-12, 2015 – Grand Teton National Park, Jackson, Wyoming, USA
781
Figure 4: DuPont forecast analysis on the desired state of the firm’s profitability
Net sales multiply with 1.5, since output would increase by 50 %. Costs would increase
with material expenditures for the extra output and the outsourced painting activities.
Employees from the painting station would be job rotated to the new butterfly table and
one extra worker would be needed at that table. Fixed assets would increase, since
investments for a new saw and the additional butterfly table would apply. Finally, current
assets would increase, since the new purchasing strategy would inherit higher depts for
goods and transportation. The resulting DuPont forecast analysis shows that the case firm
could increase their profitability from 2.51 % to 37.8 %, which is an increase by 1 506 %.
Conclusion and Discussion
In this study it was investigated, how production efficiency for a firm producing wooden
single-family houses could be improved to free production capacity. The results show
that stock areas play an important role in the facility planning and utilization when having
limited space at disposal. By changing purchase behavior, less stock is needed in the
future and the firm’s stock area could be downsized. Further, obsolete technology let to
high set-up costs at a saw; hence machine operators pre-produced too much material at a
time that needed to be stored intermediately. By investigating in up-to-date technology,
material could be pre-produced according to a Kanban system that could secure material
availability with relatively low interim storage. Finally, the resource intensive painting
station competed with production area and should be outsourced.
Implementing these changes, the case firm could reduce stock areas by 37 % and increase
value-adding space by 13 %. The adjusted production flow could lead to an upgrade of
the production efficiency between 10.3 % and 230 % and production capacity could be
expanded by 50 %. This, in turn, could lead to an improvement of the firm’s return on
assets from 2.5 % to 37.8 %, i.e. an increase by 1 506 %. Yet, implementing the
suggestions remains to be done, which probably constitutes the most difficult part. Yet,
considering the benefit the firm could realize, implementing efforts seem to be relatively

Proceedings of the 58th International Convention of Society of Wood Science and Technology
June 7-12, 2015 – Grand Teton National Park, Jackson, Wyoming, USA
782
accomplishable. However, follow up efforts should be made to evaluate whether or not
implementation succeeded with the calculated numbers above. Since production
efficiency is regarded as relatively low in this industry, additional firms could be
investigated to see, if industry common production issues exist and could be worked
upon.
References
Allhorn S and Svensson V (2014) Capacity expansion in a manufacturing firm. Bachelor
thesis in Ind Org and Econ, Dep of Mech Eng, Faculty of Techn, Linnaeus Univ, 79 pp.
Brege S, Johansson H-E, Pihlqvist B (2004) Trämanufaktur – det systembrytande
innovationssystemet [Wood manufactury – the system-breaking innovationsytem].
VINNOVA analysis 2004:02, ISBN 91-785084-08-5. In Swedish.
Eliasson L (2014) Some aspects on quality requirements of wood f or use in the industrial
manufacture of single-family houses. PhD thesis no. 174/2014, ISBN 978-91-87427-88-
6, Dep of For and Wood Techn, Faculty of Techn, Linnaeus Univ.
Eliasson L, Sandberg D (2015) A case-study of single-family timber housing in Sweden
and its wood material processing cost. Wood Mat Sc & Eng, ISSN 1748-0272, in press.
Jonsson H and Rudberg M (2014) Classification of production systems for industrialized
building: a production strategy perspective. Constr Manag and Econ, 32:53-69.
Liker J K (2004) The Toyota Way: 14 Management Principles from the World's Greatest
Manufacturer. New York: McGraw Hill.
Meiling J, Backlund F, Johnsson H (2012) Managing for continous improvement in off-
site construction. Eng, Constr and Archit Manag, 19(2):141-158.
Pullan T, Bhasi, M and Madhu, G (2013) Decision support tool for lean product and
process development. Prod Planning & Contr, 24:449-464.
Rother M (2009) Toyota Kata: Managing People for Improvement, Adaptiveness and
Superior Results. New York: McGraw Hill.
Sandberg E and Bildsten L (2011). Coordination and waste in industrialised housing.
Constr Innov, 11(1):77-91.
SCB (2015a) Total production costs for constructed single-family houses. Online at:
http://www.statistikdatabasen.scb.se/pxweb/sv/ssd/START__BO__BO0201__BO0201C/
KostnaderPerAreorSM2/table/tableViewLayout1/?rxid=391c81a8-fdd5-4d12-8e13-
705ede2ab3eb. (26 March 2015). In Swedish.
Proceedings of the 58th International Convention of Society of Wood Science and Technology
June 7-12, 2015 – Grand Teton National Park, Jackson, Wyoming, USA
783
SCB (2015b) Consumer price index. Online at: http://www.scb.se/sv_/Hitta-
statistik/Statistik-efter-amne/Priser-och-
konsumtion/Konsumentprisindex/Konsumentprisindex-
KPI/33772/33779/Konsumentprisindex-KPI/272151/. (26 March 2015). In Swedish.
Schauerte T, Johansson J and Gustafsson Å (2013) From Customer Values to Production
Requirements – Improving the Quality of Wooden Houses. Pro Ligno, 9(4):780-787.
Schauerte T, Lindblad F and Johansson J (2014) Industry Structure and Risk Positions for
Wooden Single-Family House Firms in Sweden: Evaluating their Potential to Enter the
Multi-Family House Segment. In For Prod Soc and World Conf on Tim Engin joint proc,
10-14 August 2014, Québec City, Canada.
Skärvad P-H and Olsson J (2011) Företagsekonomi 100 [Business economics 100].
Malmö: Liber.
TMF (2014) Wooden house barometer. December 2014. Online at:
http://www.tmf.se/statistik/statistiska_publikationer/trahusbarometern. (26 March 2015).
In Swedish.
TMF (2015) Wooden house barometer. March 2015. Online at:
http://www.tmf.se/statistik/statistiska_publikationer/trahusbarometern. (26 March 2015).
In Swedish.
Proceedings of the 58th International Convention of Society of Wood Science and Technology
June 7-12, 2015 – Grand Teton National Park, Jackson, Wyoming, USA
784
Matching Market Signals to the Canadian Wood
Products Value Chain: A Disaggregated Trade Flow
Analysis
Wei-Yew Chang, [email protected]
Chris Gaston, [email protected]
University of British Columbia, 4025-2424 Main Mall, , Vancouver, BC
V6T 1Z4
Abstract
Forest sector economic models have frequently used by researchers to analyze potential
impacts of various policies or forest products market shocks. Most studies, however,
typically used aggregated product groups and assumed that each commodity (e.g., logs,
lumber, etc.) under investigation was viewed by the consumer as a homogeneous good,
which implies that there are no price differences between product grades, sizes, and
species. For example, Scots pine lumber from Russia is assumed to be a perfect substitute
for old-growth yellow cedar from Canada; however, there is more than a ten-fold price
difference between these products. In this study, we develop a dynamic global forest
products trade model that considers forest products heterogeneity to examine the
competitiveness of Canadian softwood logs and lumber products on the world markets.
Factors that may affect global forest products markets such as the mountain pine beetle
infestation in western Canada, Russia’s log export tariff and WTO accession, the
recovery of American housing starts, and the high economic growth in China are
simulated to project future global softwood logs and lumber trade flows. Results of this
study will not only shed light on the future competitiveness of forest products by region
and type but also provide strong market signals for both forest managers and the forest-
products industry to link back to the upstream forest products value chain.
Proceedings of the 58th International Convention of Society of Wood Science and Technology
June 7-12, 2015 – Grand Teton National Park, Jackson, Wyoming, USA
785
Hotspot Markets and Specifier Perception for Wood-
Based Materials in Appalachian LEED Building
Projects
David DeVallance, [email protected]
Gregory Estep, [email protected]
Shawn Grushecky, [email protected]
West Virginia University, PO Box 6125, Division of Forestry & Natural
Resources, Morgantown, WV 26506
Abstract
A growth in green building projects within the Appalachian Region of the United States
has increased the potential for wood product use. The overall objective of this research
was to identify factors that influenced the use of wood products in commercial LEED
projects within the Appalachian Region. Through purposeful sampling methods, the
study determined wood-based product perceptions of material specifiers that prescribed
the use of building materials in the projects. Using spatial analysis techniques, two major
geographic areas in the Appalachian Region (surrounding Pittsburgh, PA and Greenville,
SC) were identified where wood products have been awarded points towards LEED
building certification. Results indicated that material specifiers generally had a positive
perception towards wood-based building materials and felt wood offers the
environmental and physical attributes needed in green building practices. Specifiers also
felt that the main barrier to wood use in commercial green building projects lie in the
building type and building code restrictions. However, optimism exists for specifiers in
the form of building code acceptance to new and innovative wood-based materials like
Cross Laminated Timbers (CLTs). The results of the research are expected to help
improve the marketing techniques of wood product manufacturers by indicating the
perceptions of those specifying the material used for LEED commercial projects within
Hotspot market areas of the Appalachian Region.

Proceedings of the 58th International Convention of Society of Wood Science and Technology
June 7-12, 2015 – Grand Teton National Park, Jackson, Wyoming, USA
786
The Forest Products in a Digital Age: The Use and
Effectiveness of Social Media as a Marketing Tool
Iris Montague, [email protected]
Kathryn Arano-Gazal, [email protected]
Jan Wiedenbeck, [email protected]
Rajendra Poudel, [email protected]
USDA Forest Service, 201 Lincoln Green, Starkville, MS 35759
Abstract
The use of social media as a marketing tool has increased significantly in the recent
years. While a number of studies regarding the use of social media among Fortune 500
companies and other industries have been conducted, very limited information is
available regarding social media use among the U.S. forest products industry. A mail
survey was conducted in 2013 to investigate the use social media as a marketing tool and
to examine the factors affecting the use of social media in the U.S. forest products
industry. Results show that close to 58 percent of respondents currently use some form of
social media. Social media adoption was influenced by company age, net sales revenue,
product type, the use of online marketing, perceived importance of e-commerce and
website quality. About 94 percent of the respondents thought that social media is an
effective tool for marketing. While no major concerns were expressed regarding the use
of social media there was some concern on generating the return on investment to cover
the costs associated with social media use. The information collected from this study can
be used in assisting the forest products industry in understanding the social media
marketing world and developing an effective social media marketing strategy.
Proceedings of the 58th International Convention of Society of Wood Science and Technology
June 7-12, 2015 – Grand Teton National Park, Jackson, Wyoming, USA
787
Demographic Changes and Challenges in the
Woodworking Industry
Manja Kitek Kuzman, [email protected]
University of Ljubljana, Biotechnical Faculty Department of Wood Science
and Technology, Jamnikarjeva 101 1000 , Ljubljana
Abstract
The woodworking industry is a major employer in many of the Member States of the
European Union. It provides jobs to nearly 3 million people in the EU27. The companies
within the woodworking industry are mostly small and medium-sized enterprises, with
only a few large groups. The woodworking industry, being an important employer in the
European Union, faces an enormous challenge in these difficult times of economic crisis.
Despite an unemployment rate that has never been higher in the EU, the woodworking
industries have difficulties of finding skilled workers and attract them to work in a
woodworking company, also the sector is not seen as an attractive sector.
The public tends to imagine jobs in the industry as manual, repetitive and unskilled,
poorly paid and without any great career prospects. Young people in particular are put off
as they see no scope for exercising their creativity. The woodworking industry is being
faced with a relatively ‘old’ work force. Over the coming years, many workers will reach
the retirement age and will leave the sector. Some of the best practices will be presented.
Also the Slovenian Initiatives for societal perceptions of the forest-based sector and its
products towards a sustainable society will be discussed.
Proceedings of the 58th International Convention of Society of Wood Science and Technology
June 7-12, 2015 – Grand Teton National Park, Jackson, Wyoming, USA
788
Almaciga Resin and Willd Honey the Backbone of
Indigenous Peoples in Palawan, the Philippines
Arsenio Ella, [email protected]
EMMANUEL DOMINGO
FLORENA SAMIANO
Forest Products Research and Development Institute, FPRDI-DOST, 7456
Sta. Rita, San Antonio, Los Banos, Laguna 4030
Abstract
Almaciga (Agathis philippinensis Warb.) source of almaciga resin grow naturally in
almost all of the Philippine forests and mountains like in Palawan. For a period of 10
years (2003-2012) an average of 202,400 kg of Manila copal valued at US$ 188,900 were
exported to France, Germany, etc. They are known for their superior quality for the
manufacture of varnish, lacquer and paint. Palawan tappers who are mostly Indigenous
People (IPs) practice the unscrupulous harvesting methods, e.g., deep tapping, over
tapping and frequently rechipping. The situation has prompted FPRDI to improve the
traditional methods in order to sustain productivity and save the remaining almaciga
trees. Gathering of wild honey in Palawan has been an integral part of IPs existence
suffice it to say it is part of their culture and rituals. As an enterprise, it is a very viable
activity at the level of the gatherer. The technology offers low capital input, high returns
per unit of time spent and low technical requirement needed by the gatherer. An
investigation was carried out to determine IPs methods of gathering, trading and
marketing for these 2 important non-timber forest products (NTFPs).