58th~innesot~nutritiqri''corif efence&
TRANSCRIPT
-. •' ~
[.'·'·. •',"
. ,.. - '-
. 4.
.. .,,. - -~
·• Q ·:,' . :~3.; ;-~;. ::·-' ·.~t ·:··~ ·,
. uN'1_vERSITY OF MINNESorA' : . ,:;. -.
• , J•
.-··
' . ,i'• ....
. 58th~innesot~Nutritiqri''Corif efence&. ... (2>· · · · .· <8A.S;F .. Teqhn~c.~L-$yll1pos·1uni
. . ' . " . ' •' ,-~ . .' -.... . :___ . " . ... ': ~ - . . . . . .
''• · ·. Septem,ber22=-;24, 1997 • ·13Iooqrlngtoµ,)v1inriesot._a· · ·
,.~ ... ~ ;, {
,''·{~ ,· ;'t°• "- ~ ' ... . { ~ '
• w :-..i ~
. ' .......
'.'. /
·.: .
~' ... f:' .~ '. .. ' f :--:..,~ 'w ' f •
~ ' ' '
\ ·\ .. ·: ....
r'.;.:\·t:·;· ·: _,-·· ~~~ .:. '-'-."
11, l '
c
":··:-.:~;f -
58th Minnesota Nutrition Conference &
BASF Technical Symposium
Sponsored by University of Minnesota
Luncheon Sponsors: Diamond V Mills, Cedar Rapids, IA Pfizer Animal Health, Lee's Summit, MO
Refreshment & Continental Breakfast Sponsors: Alltech, Inc. Chr. Hansen BioSystems Land O'Lakes Feed Division Laporte Biochem International Northwest Feed Manufacturers Association. Protiva, A Unit of Monsanto Company
Conference Sponsors: University of Minnesota
-University of Minnesota Extension Service -Department of Animal Science -College of Veterinary Medicine
American Feed Manufacturers Association Northwest Agri-Dealers Association
Bloomington, Minnesota September 22-24, 1997
Next year's dates: September 21-23, 1998
Acknowledgments
Fifty-eighth Minnesota Nutrition Conference proceedings edited and assembled by Lee Johnston, Gerald Wagner and Leon Meger.
MONDAY, SEPTEMBER 22, 1997
BASF Technical Symposium P.M. 1:00 Introduction -Ted Anderson 1:10 Antioxidant Nutrients and Reproduction in Dairy Cattle -James Miller 1:50 Update on Vitamin E and Selenium for Dairy Cow Immunity and Udder Health - William Weiss 2:30 Nutrient Requirements for the High Lean Pig -Tim Stahly 3:10 Refreshment Break - Sponsored by BASF 3:30 A Review of the Use of Natuphos Phytase in Growing-Finishing Swine Diets - Darrell Knabe 4:10 A Review of the Use ofNatuphos Phytase in Broiler, Layer and Turkey Diets - Fraulene McKnight 4:50 Effect of Removing Vitamins and Minerals from Finisher Diets on Performance and Meat Quality of
Broiler Chickens and Swine - David Baker 5:30 Reception - Sponsored by BASF
11
r I
l
! I y ( I
I [ I -' I
I
J
I ! I
I
!
J
1 l
TUESDAY, SEPTEMBER 23, 1997 58th Minnesota Nutrition Conference
Ruminant
8:00 Continental Breakfast - Sponsored A.M. Moderator - Rich Everson
8:30 Energy Values of Feeds Based on Nutrient Analysis - William Weiss 9:00 Dry Matter Intake as Affected by Cow Groupings and Behavior - Rick Grant 9:30 Manure Scoring and Nutrient Factors Affecting Manure - Charles Stallings
10:00 Refreshment Break - Sponsored 10:30 Defining Nutritional Profitability for Dairy Farms - Maurice Eastridge 1 I :00 Further Studies on Milk Yield and Diseases in Dairy Cows - Yrjo Grohn I I :30 Speaker Panel Questions/ Answers 12:00 Guest Speaker: Abel Ponce de Leon
I 2: 1 5 Luncheon sponsored by Diamond V Mills
P.M. Moderator - Alfredo DiC.ostanzo 1 :30 Practical Applications of the New NRC Requirements for Feedlot Cattle -
Fred Owens 2:00
·2:30 3:00 3:30 4:00 5:00 5:30 6:30
Tailoring Feedlot Nutrition and Management Programs to Cattle Type and Origin -Don Boggs Refreshment Break - Sponsored Matching Nutrition to Cow Type - David Lalman Supplemental Nutrition of Pastured Beef Cows - John Hall Speaker Panel Questions/Answers Adjourn NFMA Social Hour NFMA Dinner - Featuring the Entertainment of Wy Spano & D.J. Leary Tickets available from University of Minnesota, $29 in advance or at the door.
111
.:;~ - - - -t•~.tw'f
...
"''
WEDNESDAY, SEPTEMBER 24, 1997 58th Minnesota Nutrition Conference
8:00 Continental Breakfast - Sponsored A.M. Moderator - John Goihl
Swine
8:30 Increasing the Accuracy of Feeding Programs for Growing-Finishing Pigs -Jim Pettigrew
9:00 Effects of Pelleting and Expanding on Nutrient Utilization and Pig Performance -Joe Hancock
9:30 Refreshment Break - Sponsored 10:00 New Animal Protein Products for Use in Starter Diets - Dean Zimmerman 10:30 Impact of Environmental Factors and Disease on Animal Performance -
Michael Spurlock 11 :00 Speaker Panel Questions/ Answers 11 :30 Guest Speaker: Mike Martin
11 :45 Luncheon sponsored by Pfizer Animal Health
Poultry
P.M. Moderator - Keith Turner 1:00 Stress and Nutrition Interactions: Emphasis on Vitamin C - Jeff McKee 1:30 Recent Research on Threonine Needs of Poultry - Turkey and Broiler Studies -
Mike Kidd 2:00 Refreshment Break - Sponsored 2:30 NIR - Utility and Applications - Dan Dyer 3:00 Feeding Animal By-Products to Poultry - Virgil Stangeland 3:30 Speaker Panel Questions/ Answers 4:00 Adjourn
IV
58th Minnesota Nutrition Conference
Conference Committee
+ Wendel Carlson, Department of Animal Science + Hugh Chester-Jones, Southern Experiment Station + Craig Coon, Department of Animal Science
Larry Dunn, George.A. Hormell & Co. Richard Everson, Cenex Land O'Lakes Ag Services
•!• John Goihl, Agri-Nutrition Services, Inc. + Jerry Hawton, Department of Animal Science
Jim Hedges, Hubbard Milling Company Dale Hill, Independent Consultant
•!•+Lee Johnston, West Central Experiment Station Duane Klaustermeier, Quali-Tech Products, Inc.
+ James Linn, Department of Animal Science Russ Martin, Domain, Inc.
+ Sally Noll, Department of Animal Science Tom Oelberg, Monsanto Company
+ Bill Olson, College of Veterinary Medicine + Jerry Olson, College of Veterinary Medicine + Donald Otterby, Department of Animal Science
Doug Pamp, Vitaplus + James Pettigrew, Department of Animal Science
Michael Schmoll, Kindstrom-Schmoll, Inc. La Verne M. Schugel, Zinpro Corp.
+ Jerry Shurson, Department of Animal Science Virgil Stangeland, Stangeland Feed Consulting, Inc.
+ Marshall Stem, Department of Animal Science Andrew Thulin, Cargill, Inc. John Tracy, Tracy Animal Nutrition
+ Gerald Wagner, Extension Special Programs + Paul Waibel, Department of Animal Science
•!• Conference Co-chairs + University of Minnesota
v
Technical Symposium and Conference Speakers
David Baker, comparative nutritionist who has published extensively in the areas of proteinamino acid nutrition, trace mineral and phosphorus utilization, and vitamin bioavailability. At the University of Illinois, he holds professorial appointments in Animal Sciences, Nutritional Sciences and Internal Medicine.
Don Boggs, received B.S. from University of Illinois, M.S. from Kansas State University and Ph.D. from Michigan State University. He became Extension Beef Specialist at South Dakota State University in Brookings in 1988 and is active in Integrated Resource Management and is on the Board of Directors of the Beef Improvement Federation.
Daniel Dyer, received B.A. from Kansas State University and M.S. and Ph.D. from University of Arkansas. He is a Com Product Development Manager of DuPont Quality Grains in Des Moines, Iowa. He is responsible for application testing of new com biotech products for animal feed, food and industrial products.
Maurice Eastridge, received B .S. from Eastern Kentucky University, M.S. in Dairy Management and Ph.D. in Dairy Nutrition from Purdue University. He is assistant professor in Animal Science at The Ohio State University. He conducts educational programs on the feeding of dairy cattle and research on fat and fiber sources.
Rick Grant, received B.S. from Cornell University and Ph.D. from Purdue University. He is associate professor of Dairy Nutrition at University of Nebraska. He conducts research ia dairy nutrition and is extension dairy specialist in nutrition and feeding management.
Yrjo Grohn, received B.V.M., D.V.M. and Ph.D. from College of Veterinary Medicine, Helsinki, Finland, and M.S., M.P.V.M. from Univerisity of California, Davis. He is associate professor of Epidemiology at Cornell University teaching epidemiology and researching epidemiology and genetic analysis of production diseases in dairy cattle.
John Hall, received B.S. and M.S. from Univeristy of Georgia, Athens, and Ph.D. from University of Kentucky, Lexington. He is an assistant professor in the Dept. of Animal & Poultry Science at Virginia Tech. Previously served as Animal Scientist at the University of MinnesotaNorth Central Experiment Station.
Joe Hancock, received B.S. and M.S. from Texas Tech University and Ph.D. from University of Nebraska. He is associate professor at Kansas State University teaching and advising undergraduate and graduate students and conducting research. His research activities center on factors that limit nutrient utilization in weanling pigs and processing techniques to maximize nutritional value of diets for finishing pigs and sows.
Michael Kidd, received B.S.A. and M.S. from University of Arkansas and Ph.D. from North Carolina State University. He is Research Manager with Nutri-Quest, Inc., responsible for basic and applied research to promote and develop amino acid nutrition of poultry.
VI

I
I I.
f r l I l
! s I l ity
l I \
I I
~g
I i
pr I
,I
I ·I
I 'I I ... ~ I 1 I
! i '!Y l 1-
l I n \ I I I I I 1}
1. 11c
I
~(!~ ·~~~
Technical Symposium and Conference Speakers
Darrell Knabe, received B.S. from West Texas State University, Canyon, M.S. and Ph.D. from Texas A&M University, College Station. He is professor of Animal Science at Texas A&M University, College Station, conducting swine research relating to: N and P excretion, amino acid availability in feed & reproductive efficiency.
David Lalman, received B.S. from Kansas State University, M.S. from Montana State University and Ph.D. from University of Missouri. He is assistant professor and Extension Beef Cattle Specialist with Oklahoma State University conducting statewide educational programs in cow-calf production and research on nutrition and management.
Michael V. Martin, is Acting Vice President for Agricultural Policy, Dean, College of_ Agricultural, Food, and Environmental Sciences, Professor, Applied Economics, University of Minnesota. His professional interests are agricultural policy, trade and rural development.
Jeff McKee, received M.S. from and is Ph.D. candidate at University of Illinois, UrbanaChampaign. He researches the effects and alleviation of multiple concurrent stressors on broiler chickens and effects of vitamin Con energy conversion and thermal energy balance of broilers.
W. Fraulene McKnight, received M.S. in Poultry Science and Ph.D. in Poultry Nutrition from Louisiana State University. He joined BASF in 1984 and is responsible for technical support and research coordination in the Southeastern United States.
James Miller, received B.S. from Berry College, M.S. and Ph.D. from University of Georgia. He is professor of Animal Science at The University of Tennessee in Knoxville. His research interests include antioxidants in dairy cattle, udder edema, milk fever, placental retention, and grass tetany.
Fredric Owens, received B.S. and Ph.D. from University of Minnesota, St. Paul. He is Sarkeys Distinguished Professor of Animal Science at Oklahoma State University with responsibilities of teaching graduate courses and conducting ruminant nutrition research.
James Pettigrew, received B.S. from Southern Illinois University, M.S. from Iowa State and Ph.D. from University of Illinois. He is professor of Animal Science at the University of Minnesota engaged in teaching and swine nutrition research since 1980.
F. Abel Ponce de Leon, is Professor and Head in the Department of Animal Science, College of Agricultural, Food, and Environmental Sciences. His research and teaching expertise emphasizes genetics, biotechnology, genome mapping and genome variation.
Michael Spurlock, received B.S., M.S. and Ph.D. from University of Missouri. He is manager of swine research for Purina Mills, Inc., and responsible for basic research directed at mechanisms that limit growth as a consequence of infection and environmental stressors.
Vll
- - -
th
Technical Symposium and Conference Speakers
Tim Stahly, received B.S. and M.S. from South Dakota State University and Ph.D. from University of Nebraska. He is professor of Animal Sciences at Iowa State University. He conducts research in the areas of monogastric nutrition, growth physiology and computer simulation modeling.
Charles Stallings, received B.S. from Eastern Kentucky Univerisity, M.S. and Ph.D. from Michigan State University. He is professor and extension Dairy Scientist in Nutrition at Virginia Tech, working as dairy nutritionist, extension project leader and is forage testing lab director.
Virgil Stangeland, received B.S. and M.S. from South Dakota State University. He is selfemployed with Stangeland Feed Consulting, Inc., working as a consulting nutritionist; developing agriculture ventures and adding value to renewable resources.
William Weiss, received B.S. and M.S. from Purdue University and Ph.D. from Ohio State University. He is associate professor at Ohio State University. He conducts research on cow nutrition and health, feed evaluation and forage utilization. Extension duties include teaching applied dairy nutrition short courses and consulting with farmers.
Dean Zimmerman, received B.S. from Iowa State College and Ph.D. from Iowa State Univerisity. He is professor of Animal Nutrition at Iowa State University and is responsible for swine nutrition and management research, teaching swine nutrition and managing the research farm. •
Vlll
! ia I I 'I
l 11
I I 'I
I i ' I t If
l ' I l
---·µa -
\.
Speaker
James Miller
William Weiss
Tim Stahly
Darrell Knabe
Fraulene McKnight
David Baker
William Weiss
Rick Grant
Charles Stallings
Maurice Eastridge
YrjoGrohn
Fred Owens
Don Boggs
David Lalman
John Hall
Jim Pettigrew
Joe Hancock
Dean Zimmerman
Michael Spurlock
Jeff McKee
Mike Kidd
Dan Dyer
Virgil Stangeland
Table of Contents *
Title
Antioxidant Nutrients and Reproduction in Dairy Cattle
Update on Vitamin E and Selenium for Dairy Cow Immunity and Udder Health
Nutrient Requirements for the High Lean Pig
A Review of the Use of Natuphos Phytase in Growing-Finishing Swine Diets
A Review of the Use of Natuphos Phytase in Broiler, Layer and Turkey Diets
Effect of Removing Vitamins and Minerals from Finisher Diets on Performance and Meat Quality of Broiler Chickens and Swine
Energy Values of Feeds Based on Nutrient Analysis
Dry Matter Intake as Affected by Cow Groupings and Behavior
Manure Scoring and Nutrient Factors Affecting Manure
Defining Nutritional Profitability for Dairy Farms
Further Studies on Milk Yield and Diseases in Dairy Cows
Practical Applications of the New NRC Requirements for Feedlot Cattle
Tailoring Feedlot Nutrition and Management Programs to Cattle Type and Origin
Matching Nutrition and Cow Type
Supplemental Nutrition of Pastured Beef Cows
Increasing the Accuracy of Feeding Programs for Growing-Finishing Pigs
Effects of Pelleting and Expanding on Nutrient Utilization and Pig Performance
New Animal Protein Products for Use in Starter Diets
Impact of Environmental Factors and Disease on Animal Performance
Stress and Nutrition Interactions: Emphasis on Vitamin C
Recent Research on Threonine Needs of Poultry - Turkey and Broiler Studies
NIR - Utility and Applications
Feeding Animal By-Products to Poultry
* Papers appear in the order of presentation at the 58th Minnesota Nutrition Conference & BASF Technical Symposium held September 22-24, 1997.
lX
Page
1
23
33
43
61
77
83
93
105
113
123
1~7
147
157
167
181
185
205
211
227
243
263
275
i,f~~ - - - ~- - -~
t l'·· """ !
Would you like to order this proceedings?
You may copy this form, complete the required information, and mail the completed form with your payment to the addresss at the bottom of this page. Prices honored for up to one year after the conference, while supplies last. Thank you for your order.
PROCEEDINGS ORDER FORM 98-9303
Minnesota Nutrition Conference Please, one person per form, copy as needed.
Name as desired on mailing label (Type or Print clearly)
Organization ---------------
Address ----------------
Cicy ------------------
State _____ Zip __________ _
Phone
Fax#
D Please mail 1997 proceedings to above address, free
shipping in the USA: __ copies @ $22 each = $ __ _
Total Fees:$ _______ _
0 Check enclosed payable to University of Minnesota
Charge my: DMasterCard 0Visa DDiscover
Account Number ____ ! ___ _
Expiration Date --------------
Signature (Required)-------------
Send this completed order form and payment to:
Registrar - Minnesota Nutrition Conference Extension Special Programs, Univ. of MN PO Box 64780 St. Paul MN 55164-0780
x
I
! r /,
! I 1 ! I II
I i !.
'i
r
ANTIOXIDANT NUTRIENTS AND REPRODUCTION IN DAIRY CATTLE
J. K. Miller, M. H. Campbell, L. Motjope, and P. F. Cunningham Animal Science Department, University of Tennessee, Knoxville, TN and F. C. Madsen, Suidae Technology,
Greensburg, IN
ABSTRACT
Reactive oxygen metabolites (ROM) are generated faster than they can be safely neutralized when prooxidative metabolites exceed antioxidant defense mechanisms. Increasing evidence suggests this condition makes health problems such as udder edema, retained fetal membranes (RFM) and suboptimal reproduction in dairy cows more likely. Nutrients essential for manufacture or structure of known components of defense against ROM include vitamin E, Cu, Mg, Mn, Zn, vitamin A, p-carotene, and adequate energy and protein. Some essential elements (notably Fe and Cu) can also generate ROM under some circumstances. In comparisons with periparturient dairy cows, excess Fe increased saturation of Fe-binding proteins which in turn was associated with increased incidence of RFM. Multiparous cows had more completely saturated Fe-binding proteins and higher incidence of RFM than primiparous heifers. Prepartum supplementation with vitamin E reduced severity of udder edema and estrus was detected sooner when either vitamin E or Zn were supplemented. Effects of vitamin E on udder edema and first detected estrus were more pronounced when Fe was not excessive whereas Zn was more effective on udder edema when Fe was excessive. Vitamin E and Zn appear to compliment each other so adequate amounts of both should be beneficial.
INTRODUCTION
Increasing interest in vitamin E and other antioxidants in recent years has resulted from accumulating evidence for their roles in delaying or preventing numerous diseases in humans and animals (Gutteridge and Halliwell, 1994). Increasing evidence links reactive oxygen metabolites (ROM) with disorders in dairy cattle including milk fever, RFM, udder edema, mastitis, and suboptimal reproductive performance (Miller et al., 1993). Reactive oxygen metabolites are a normal product of energy metabolism but an excess of prooxidants or an inadequacy of antioxidants can upset the balance between their production and safe disposal.
Iron is a potential prooxidant of concern because of its ability to catalyze production of harmful free radicals (Gutteridge and Halliwell, 1994). It is not unusual for Fe in feed to exceed established requirements of dairy cows (NRC, 1989) by ten-fold (Miller and Madsen, 1992). Vitamin E is considered to be the most important lipid soluble antioxidant in membranes (Machlin and Bendich, 1987) and blood plasma (Halliwell and Gutteridge, 1990). Zinc, which can displace catalytic Fe at sensitive sites (Bettger,
d,E:~ -- - - - - -l·~~:t'j
m.
1993; Bray and Bettger, 1990; Casciola-Rosen et al., 1997) should compliment vitamin E as an antioxidant.
Both vitamin E and Zn appear to be most critical near calving when they reach their lowest concentrations in blood plasma (Goff and Stabel, 1990). The periparturient period is especially critical for health of dairy cows. Udder edema, RFM, and suboptimal reproduction all reduce profits for producers. If oxidative stress is a contributing factor,, protection against these disorders depends on orchestration of factors which influence· ROM prevention, quenching, chain breaking, and inhibition of site specific damage from catalytic metals such as Fe·2
.
Our purpose here is to discuss origin and propagation of reactive forms of oxygen, conditions which contribute to their increased production, possible effects on health and performance of dairy cattle, and efficacy of supplemental vitamin E and Zn in combating oxidative stress. Research with periparturient dairy cows has been presented as examples.
SOURCES, CONSEQUENCES, AND PROTECTION AGAINST ROM
Origin, Propagation, and Effects of ROM
Superoxide and hydrogen peroxide. Animals do not use energy in feed directly for maintenance and productive purposes but first convert it to ATP which releases energy • as needed. The process could be compared with bank deposits or withdrawals with ATP as the energy currency (Gutteridge and Halliwell, 1994 ). Energy released as electrons derived from the tricarboxylic acid cycle are transferred down a chain of enzymes in animal cells generates ATP during oxidative phosphorylation. Spent electrons reaching the end of the chain are combined with oxygen to completely reduce it to water. Air-breathing organisms have achieved great energetic efficiency by using oxygen to accept electrons in this manner but an estimated 2-5% of the electrons may escape from intermediate carriers in the chain (Levine and Kidd, 1989). These partially reduce oxygen to the initial ROM, superoxide (02-, Figure 1, Table 1 ).
Another significant source of 0 2- is the cytochrome P-450 enzymes (Gutteridge and • Halliwell, 1994) which can be classified into two broad categories according to whether physiological (endogenous) or foreign (xenobiolic) substances are metabolized (Waterman et al., 1986). Other oxidative enzymes and spontaneous nonenzymatic oxidation of biological molecules produce additional 0 2-. Any condition which elevates metabolic rate or activity of oxidative enzymes could increase number of electrons transferred and amount of oxygen consumed. High milk production or excessive exposure·to aflatoxins for example, could thus increase generation of 0 2-. A variety of organic molecules can also be activated by sunlight or other radiant energy to generate 02-.
2
l. .
i1tam1n i I
I . 1eir i it ~ptimal actor, ~ence I ge from I 1.
1 fn, 11th and ~bating I I, r ~
I
t I ' ' l I y for rnergy vi th i s 1· ~f
1·
'reduce ~ . using !s may lartially I
lnd lhether \ f: 1tic !vates l ns f ' jety of
~nerate
t ·t I ! j
Superoxide is further reduced to hydrogen peroxide (HOOH, Figure 1, Table 1 ). Both 0 2- and HOOH are unavoidable products of normal metabolic processes and are not always harmful if properly metabolized. They are involved physiologically in chemistry of several enzymes and prostaglandins and are used by phagocytic cells to kill bacteria (Halliwell, 1987; Levine and Kidd, 1985). Reactivity of 0 2- and HOOH, by themselves; is insufficient to initiate peroxidative chains so damage by them is thought to result from their conversion into more reactive oxidants (Gutteridge and Halliwell, 1994 ).
Contribution of Fe to oxidative problems. Although Fe is essential for life, its ability" to transfer single electrons in controlled biological reactions also gives it a pivotal role in harmful oxidative reactions (Gutteridge and Halliwell, 1994). Iron normally is complexed in specific molecules which keep it away from 0 2- and HOOH to prevent their conversion into more reactive forms. Release of catalytic Fe becomes more likely under conditions of dietary imbalance, trauma, or stress often accompanying calving (Madsen et al., 1990) or when safe binding sites are more saturated (Gutteridge and Quinlan, 1993)."'A potential problem is created when 0 2• and HOOH come into close proximity with catalytic transition elements such as Fe.
Superoxide reduces Fe+3 to Fe+2 which in turn splits HOOH into a hydroxy ion plus the extremely reactive hydroxyl radical (•OH, figure 1). Two distinct types of damage can be caused by •OH depending on where it is generated (Gutteridge and Halliwell, 1994). When •OH is produced in blood plasma or elsewhere in the free pool, it may become the focal point of peroxidative chains which can spread to cellular and subcellular membranes. If Fe is nonspecifically associated with an important molecule such as DNA or an enzyme, however, it may catalyze •OH which damages the molecule at' the site where Fe is located (Bettger, 1993).
Additional reactions by which decompartmentalized Fe could create more reactive ROM include acceleration of oxidative Maillard reactions (Dills, 1993) and decomposition of lipid peroxides to alkoxyl or peroxyl radicals capable of initiating additional peroxidative chains (Halliwell, 1987). The potential for reactions between decompartmentalized Fe, 0 2·, HOOH, •OH, organic molecules, and their oxidized products is great. Once the process has been initiated, ROM tend to propagate in expanding chain reactions (Levine and Kidd, 1985).
Oxidative stress and disease. Levine and Kidd (1985) have suggested four stages through which adaptation to oxidative stress progresses to chronic disease. In the first stage, the individual is healthy and able to cope with oxidative stress. Chronic deficiency of antioxidant nutrients or exposure to prooxidants introduces the second stage in which the individual adapts depending upon availability of sufficient antioxidant factors. As continued oxidative stress depletes antioxidants, the individual enters the third stage in which cell components are subjected to oxidative damage. Protection of target organs against ROM at the cost of antioxidant defense to other systems impairs absorption so antioxidant nutrients become even more limiting. This introduces stage four by establishing a vicious cycle in which rate of deterioration of antioxidant defense
3
-11S•"';..... - - --.. ~ \\ ""'
,.
continually exceeds rate of recovery. At this stage, oxidative stress has progressed to established disease.
Defense Against ROM
Antioxidant defense mechanisms. Animals are protected against ROM and their toxic products by a remarkably efficient antioxidant system (figure 1, table 1 ). To an extent, this system is compartmentalized, relying heavily on metal complexing proteins and antioxidant molecules extracellularly whereas antioxidant enzymes predominate intracellularly (Gutteridge and Halliwell, 1994). At least five levels of mechanisms operate in concert, including protective (levels 1-3), chain-breaking (level 4) and toxic product removal (level 5) mechanisms. These mechanisms are listed below. ·
Level 1. Enzymes convert 0 2• an'1 HOOH into forms which do not react with catalytic Fe. Conversion of 0 2• to HOOH is accelerated by superoxide dismutase (SOD). Hydrogen peroxide, in turn, is broken down to water by glutathione peroxidase (GSH-Px). Glutathione peroxidase as well as catalase also convert organic hydroperoxides into less harmful forms.
Level 2. Iron is oxidized to less reactive forms and safely complexed away from catalytic reactions which produce more reactive oxidants. Ceruloplasmin maintains Fe in the less reactive Fe+3 form which can be compartmented by transferrin and lactoferrin. This inhibits Fe catalyzed peroxide decomposition or initiation of •OH
"" production. Certain endogenous materials such as creatinine (Glazer, 1988) also bind metals and prevent indiscriminate coordination of proteins by Cu+1 and possibly Fe+~. which can initiate •OH and oxidize the protein.
Level 3. Important molecules may be protected against catalytic Fe by zn+2 which has an outer electron makeup similar to Fe+2 but is not involved in electron transfer (Casciola-Rosen et al., 1997). Lower Zn concentrations in tissues of Zn deficient rats have been accompanied by elevated Fe concentrations and increased oxidative damage (Oteiza et al., 1995). This could result from a mass action effect in which Fe moves into a "vacuum" caused by a change in ionic equilibria due to Zn deficiency. ~
Conversely, increased Zn relative to Fe could shift the equilibrium in the other direction (Miller et al., 1996). Zinc might then protect against decompartmentalized Fe by masking labile sulfur groups and competing for molecular binding sites (Bray and Bettger, 1990). Zinc functions as an antioxidant only at specific sites, however (Bettger, 1993) and does not interrupt peroxidative chains.
Level 4. Despite protective antioxidants, some ROM and catalytic Fe may escape to initiate peroxidative chains. These chains are terminated by a variety of antioxidant molecules. Protein, primarily albumin, may account for up to half of total peroxyl radical quenching capacity of blood plasma (Wayner et al., 1987). Other radical quenchers include lipid soluble vitamin E, ubiquinone, ~-carotene, and retinoic acid as well as
4
LJ
~ ~
~ II
I
i ~ ~ I ~ I
j I
I
I I \ a to
I 1.
r toxic 1 ent, td ! l . )XIC
'
s Fe
I bind I +2 3
has
·ats
l :Fe l r· iction
~ttger,
I l do I ~1t 3dical I TS I s
water soluble ascorbate, phenolics, and urate (Gutteridge and Halliwell, 1994; Machlin and Bendich, 1987). Vitamin E stabilizes ROM by giving up an electron but can be restored to the reduced form by interaction with ascorbate at membrane-cytosol interfaces (Chan, 1993; Wilson, 1987). This interaction not only permits repair of membrane-bound oxidized vitamin Eby ascorbate but also enables vitamin E to protect both water- and lipid-soluble cell constituents against oxidative damage (Ibrahim et al., 1997).
When insufficient vitamin E is available, however, glutathione-S-transferases conjugate ROM with glutathione (GSH) (Golden and Ramdath, 1987). Glutathione is consumed rather than merely oxidized by this process, so relatively more reducing equivalents are required when GSH, rather than vitamin E, serves as a chain breaker. Physiological or tissue oxidative stress can affect metabolic flux differently depending on which chain breaker is used to terminate the process. In addition to regenerating vitamin E, ascorbate can act directly as a water soluble antioxidant (Wilson, 1987).
Level 5. A fifth level of antioxidant defense involves aldehyde dehydrogenases which oxidize cytotoxic aldehydes produced when peroxidized lipids decompose. Xanthine dehydrogenase is an example which catalyzes, but is not specific to conversion of xanthine, NAO+, and H20 to urate and NADH (Commission on Biochemical Nomenclature, 1972). As an additional benefit, xanthine dehydrogenase helps keep Fe in the less reactive oxidized form (Emery, 1991 ), thereby conserving reducing equivalents, GSH, vitamin E, and other chain breaking antioxidants.
Maintenance of antioxidant defense through nutrition. Several essential nutrients, (Sies, 1985; Slater et al., 1987) are involved in manufacture or structure of known components of antioxidant defense. Vitamin A for immune function, vitamin E and pcarotene as chain-breaking antioxidants, Cu, Zn, and Mn for SOD, Se for GSH-Px, Fe for catalase, Fe and Mo for xanthine dehydrogenase, Zn to displace catalytic Fe, and Mg and Zn to stabilize membranes and maintain cellular integrity must be supplied by the diet. Most feedstuffs are likely to contain insufficient Cu, Mg, Mn, Se, and Zn relative to Fe (NRC, 1989). Mo can depress absorpU.on and utilization of Cu contributing to decompartmentalization and accumulation of Fe in the liver with resulting oxidative stress. For these reasons supplementation with Fe may be inadvisable and Mo content of the diet should be monitored even though both are essential elements. Vitamin E, vitamin A, and p-carotene contents of hay and silage decrease progressively with storage so importance of supplementation with these nutrients has increased with widespread dependence on stored feeds.
Endogenous production of transferrin, lactoferrin, ceruloplasmin, serum albumin, creatinine, antioxidant enzymes, and GSH is dependent on absorbed amino acids. An adequate supply of amino acids is dependent in turn on adequate amounts and appropriate balance of rumen degradable (nitrogen and sulfur) and escape protein with energy (Butler and Smith, 1989; Ferguson and Chalupa, 1989). If research with rats is
5
,'€:% - - -- --- - -~
~1·~~-r~"
"",
r· '' !
applicable to ruminants, protein deficiency can depress production of GSH (Hum et al., 1992) and activity of antioxidant enzymes as well as elevate lipid peroxidation (Huang and Fwu, 1993). Since GSH is used in detoxification pathways, exposure of cows to xenobiotics may deplete GSH even further. Compromised vitamin E status in protein deficient rats (Hung and Shaw, 1994) may result from increased consumption by free radical reactio'ns. Also of endogenous origin are ubiquinone and ascorbate but the diet must provide carbohydrates in adequate amounts and balance to supply rumen fatty acids and rumen escape protein.
RESEARCH WITH DAIRY COWS
Antioxidant Nutrients, Prooxidants, Periparturient Disorders, and Reproduction
During 7 yr we have investigated effects of vitamin E supplemented during the dry period on health in more than 640 observations (many of the cows were used more than one year). Each year half of the cows were each supplemented daily for 6 wk before calving with 1000 IU of vitamin E. Excess dietary Fe was also fed to 401 of the cows in a factorial arrangement with vitamin E in five of the years. In two years, 224 cows were given all combinations of supplemental vitamin E, Zn, and Fe in a 2x2x2 factorial arrangement. Daily amounts of supplements included 1000 IU of vitamin E, 80 · ppm of Zn (half from Zn methionine and half from Zn S04), and 1200 ppm of Fe (from Fe S04•7H20). Placentas not shed within 12 h after calving were considered as retained. Udder floor area of primiparous heifers was measured before and after the
~
evening milking during the first week after calving. Below average decrease in udder floor area accompanying removal of milk was considered indicative of edema. . . Strengths of associations between antioxidant nutrient supplements and incidences of periparturient disorders were calculated as odds ratios (Fletcher et al., 1988).
Retained fetal membranes. Inadequacies of vitamin E or Zn are only two of many possible contributing causes to increased incidence of RFM. Increased likelihood of RFM following dystocia or birth of twins is well known (Lewis, 1997). Results from 7 yr comparing incidence of RFM in cows unsupplemented or supplemented with vitamin E and excluding cases of RFM preceded by dystocia or twins are in Table 2. In these comparisons, a reduced incidence of RFM when vitamin E was supplemented was statistically significant (P<.05) in 3 yr, a tendency (P=.08) in 2 yr, and without statistical significance in 2 yr. When the comparison included a total of 602 cows accumulated over 7 yr, however, the reduction of RFM by vitamin E was highly significant (P<.0001).
Only 2 yr are available for comparing effects of supplemental Zn on RFM. Incidence of RFM tended to be lower (P=.08) when supplemental Zn was fed in only one of the years (Table 2). Our experience with vitamin E suggests type two errors are likely in comparisons of RFM which may have many unaccounted for causes in addition to treatment effects and emphasizes the need for large numbers of cows. Incidence of RFM (Table 3) did not appear to be directly increased by addition to the diet of an amount of Fe equivalent to 1200 mg per kg of dry matter consumed.
6
I r t al., t mg b lin be ;diet lty 1.
on
r lthe
~ 2 ~
E, 80 bm \ ! . )e
(er
t of
~f I
iJ yr I. E ~In :>
r )
hi cal I ad I !001 ). :::e of I
~in I
iof
.·~::::..~ .... ~·:::£',,
l191P--~
Udder edema. Heifers supplemented with vitamin E for 6 wk before calving were only 34% as likely as unsupplemented heifers to develop above average udder edema in a 3-yr comparison with a total of 158 heifers (Table 4). Statistical significance was not achieved with the relatively small number of heifers in two of the years but the larger number of observations accumulated over 3 yr was highly significant (P<.001). As in the case with RFM, large numbers ,of animals are needed to demonstrate effects of vitamin E on udder edema. Also as with RFM, supplemental vitamin E may be beneficial if dietary vitamin E is marginal and some other nutrient is not more limiting.
In Table 5, effects of vitamin E or Zn on severity of egema were determined separately for groups of heifers receiving or not receiving excess dietary Fe. When Fe was not excessive, heifers receiving supplemental vitamin E were only 22% as likely to have edema more severe than averag~ than heifers not given vitamin E. Supplemental Zn did not appear to reduce severity of udder edema when Fe was not excessive. In contrast, when Fe was excessive, vitamin E was ineffective in reducing severity of udder edema but heifers given supplemental Zn were only 17% as likely as unsupplemented heifers to have above average severity of udder edema. When effects of supplemental vitamin E or Zn were compared regardless of Fe intake, severity of udder edema was reduced by vitamin E but not by Zn.
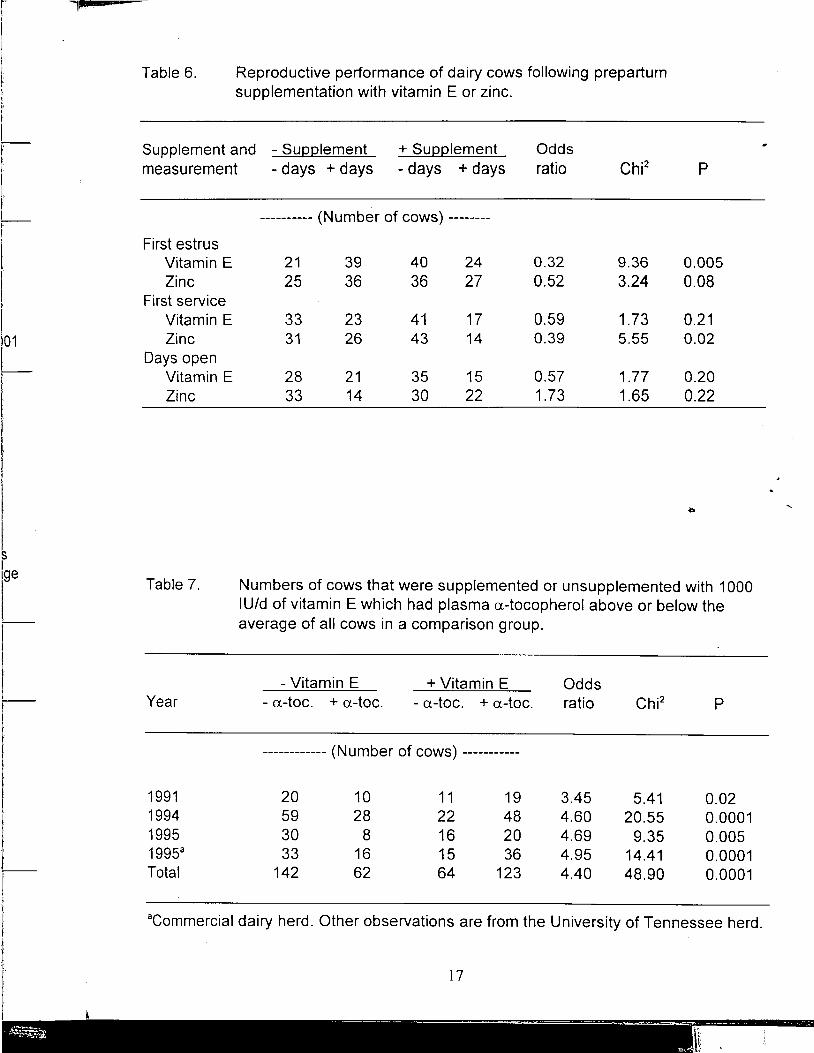
Reproduction following prepartum supplementation with vitamin E or Zn. Supplementation with vitamin E or Zn was discontinued at calving but residual effects on reproductive performance were evident during the subsequent lactation. The period from calving to first detected estrus was shortened when cows had received · supplemental vitamin E prepartum (Table 6). Cows that had received vitamin E were over three times more likely (P<.005) to exhibit first estrus sooner than unsupplemented cows. There was a tendency (P=.08) for estrus to be detected sooner when Zn had been supplemented. Days to first service appeared to be reduced by supplementation with Zn but not vitamin E. Neither vitamin E nor Zn appeared to reduce days open. These results are undoubtedly influenced by the policy at the University of Tennessee to delay breeding until at least 60 d postpartum. Effects of prepartum supplementation with vitamin E or Zn on days to first service and days open would have bee·n more likely if the mandatory waiting period had been reduced from 60 to 45 d.
Harmful effects of ROM appear to result both directly from perioxidative damage to important lipids and macromolecules and indirectly from changes in cellular membranes and components which can cause abnormal metabolism. One of the most important roles for vitamin E may be protection of components of normal metabolism related to reproductive processes. Steroid hormones are synthesized from cholesterol through a series of steps catalyzed by individual enzymes. Vitamin Eis concentrated in microsomes of steroid hormone producing tissues where it protects highly sensitive steroidogenic cytochrome P-450 enzymes from lipid peroxidation (Staats et al., 1984; Takayanagi et al., 1986). Enzymes specific P-450 appear to differ in their vulnerability
7
""

to ROM attack with 17 a-hydroxylase being one of the most susceptible (Takayanagi et al. 1986). Deficiency of a-hydroxylase impairs synthesis of androgens and estrogens but increases plasma concentrations of corticosterone in a recognized human congenital defect (Yanase et al., 1991).
We have measured corticosterone (which is synthesized independently of 17 ahydroxylase) and 17 p-estradiol (synthesis of which is dependent on 17 a-hydroxylase) in plasma from 112 periparturient cow~ (Miller et al., 1993). Fifty-nine cows with RFM, udder edema, below averag~ plasma fast-acting antioxidants (FAA, a measure of the ability of plasma to quench peroxy radicals generated in vitro) or some combination were classified as under "oxidative stress". Fifty-three cows without RFM or udder edema and with above average plasma FAA were considered apparently normal. Within cow corticosterone to 17 p-estradiol ratios in plasma obtained near parturition averaged 12.2 for stressed and 5.5 for apparently normal cows (P<.06). A higher concentration of corticosterone in relation to 17 p-estradiol when cows presented some indication of oxidative stresses is consistent with our hypothesis that oxidative changes could alter steroidogenesis through selective damage to steroidogenic enzymes.
Indices of Oxidative Status as Related to Treatment and to Periparturient Disorders
Large numbers of cows are required to determine treatment effects on observations such as RFM (Table 2). For this reason, some readily determined biochemical.i.. measurement which can be closely related to these health disorders may provide a more sensitive assessment of antioxidant efficacy than presence or absence of the·' disorder. Measurements with potential value include plasma fast-acting antioxidants (FAA), plasma a-tocopherol, plasma Zn and serum unsaturated iron-binding capacity (UIBC).
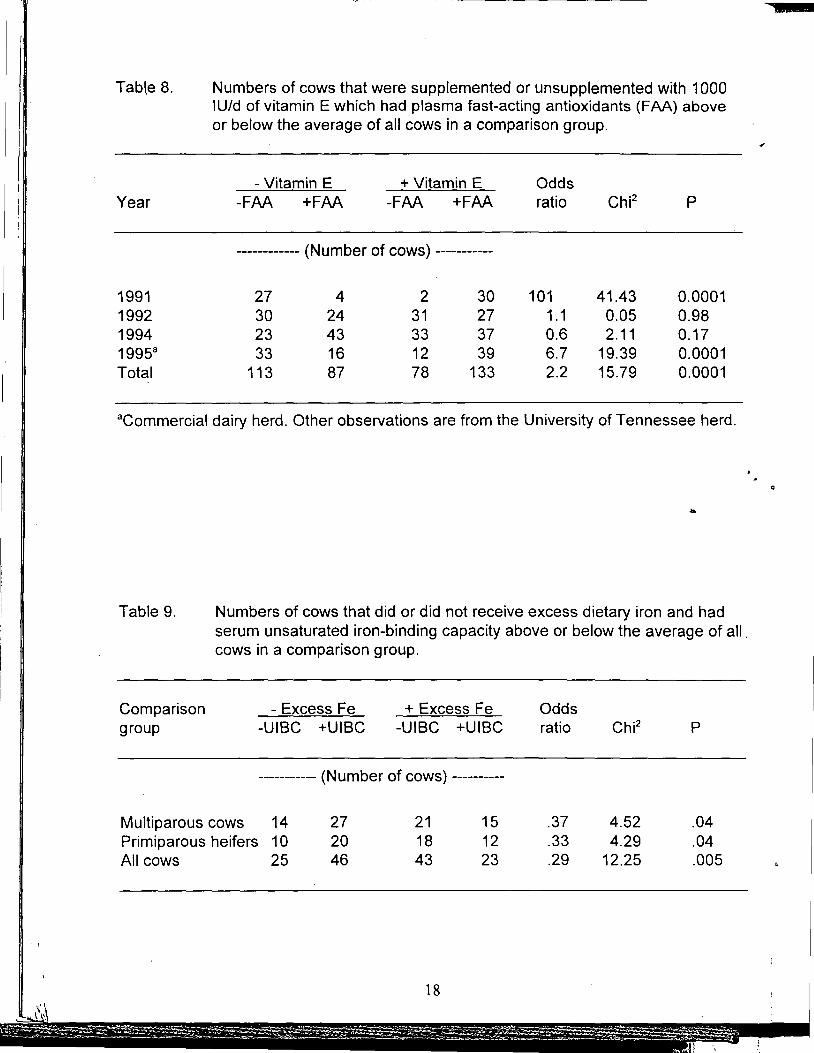
Indices of oxidative status as influenced by vitamin E, Zn, or excess Fe. Fastacting antioxidants measure the ability of blood plasma to protect a target molecule (Phycoerythrin) against peroxyl radicals generated in vitro (Glazer, 1988). The fastactirig fraction remaining afte~ precipitation of proteins owes its antioxidant activity primarily to a-tocopherol, ascorbate, bilirubin, and urate. Numbers of cows supplemented or unsupplemented with vitamin E which had plasma FAA or atocopherol above or below the averages of all cows are in Tables 7 and 8. One hundred and eighty-seven cows supplemented with vitamin E were over four times more likely than 204 unsupplemented cows to have plasma a-tocopherol higher than the 391 cow average (Table 7). The relationship between supplemental vitamin E and plasma FAA, however, was more variable. Plasma FAA was increased by vitamin E supplementation in only 2 out of 4 yr the measurement was made (Table 8) but the increase for the 4-yr total was statistically significant. Plasma Zn was not influenced by supplemental Zn.
I I •
iag1 et ~ns 1f
( 1·
~lase) I
\FM. \the I Dn I r I
I.. :ion :,
some anges
I ins 1 [ !a I re nts I 3City
I ;t-~le I st-1
r iundred !ikely 11 cow 1FAA, fntation l 1e 4-yr
f" . f
Unsaturated iron-binding capacity measures availability of sites in serum capable of binding additional Fe. Release Qf catalytic Fe becomes more likely when safe binding sites are more saturated by presence of excess Fe (Gutteridge and Quinlan, 1993). This is important because Fe not specifically and safely bound can catalyze damaging free-radical reactions (Gutteridge ~nd Halliwell, 1994). Sixty-six cows fed excess Fe were almost three times more likely than 71 cows not receiving excess Fe to have UIBC below the average of all"'137 cows (Table 9). In other words, excess Fe decreased the capacity of blood plasma to bind additional Fe. When multiparous cows and primiparous heifers were considered separately, excess Fe was associated with lower UIBC in either parity.
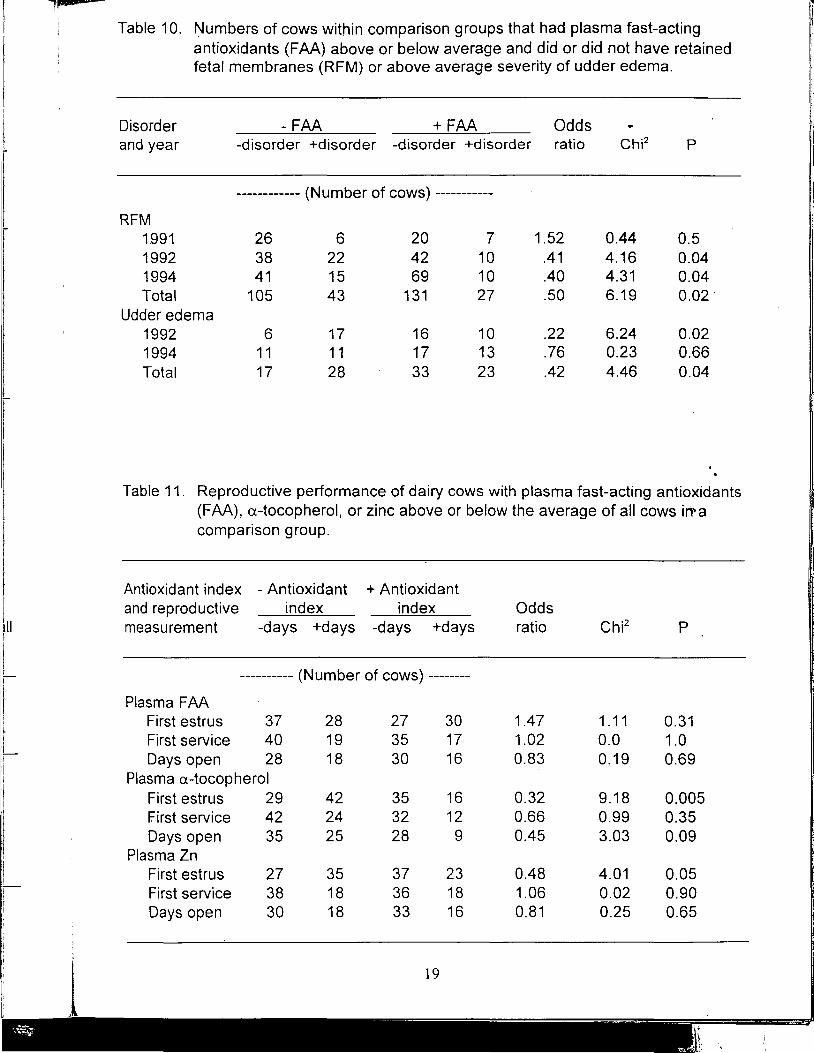
Relationships between indices of oxidative status and periparturient disorders. Odds ratios (Fletcher et al., 1988) were calculated to determine whether below average antioxidant status is a risk factor for increased incidences of periparturient disorders. Incidences of RFM and severity of udder as related to plasma FAA are in Table 10. When cows were divided into two groups according to whether plasma FAA was above or below the average of all cows, those in the below average group were twice as likely to have RFM in 2 of 3 yr. Heifers with below average FAA had more severe udder edema in 1 of 2 yr. Plasma FAA measured near parturition did not appear to be related to days to first detected estrus, days to first service or days open (Table 11 ).
Cows with above average plasma tocopherol tended (P=.08) to have a lower incidence of RFM, were less likely to develop udder edema (Table 12), exhibited estrus sooner . ~
after calving, and tended (P=.09) to have less days open (Table 11) than cows below average in this measurement. Although plasma Zn did not appear to be related to incidence of RFM, severity of udder edema was less (Table 13) and estrus was detected sooner (Table 11) when plasma Zn was above average. As might be expected with a voluntary 60 d waiting period before breeding, there were no apparent relationships between plasma a-tocopherol or Zn and days to first service (Table 11 ).
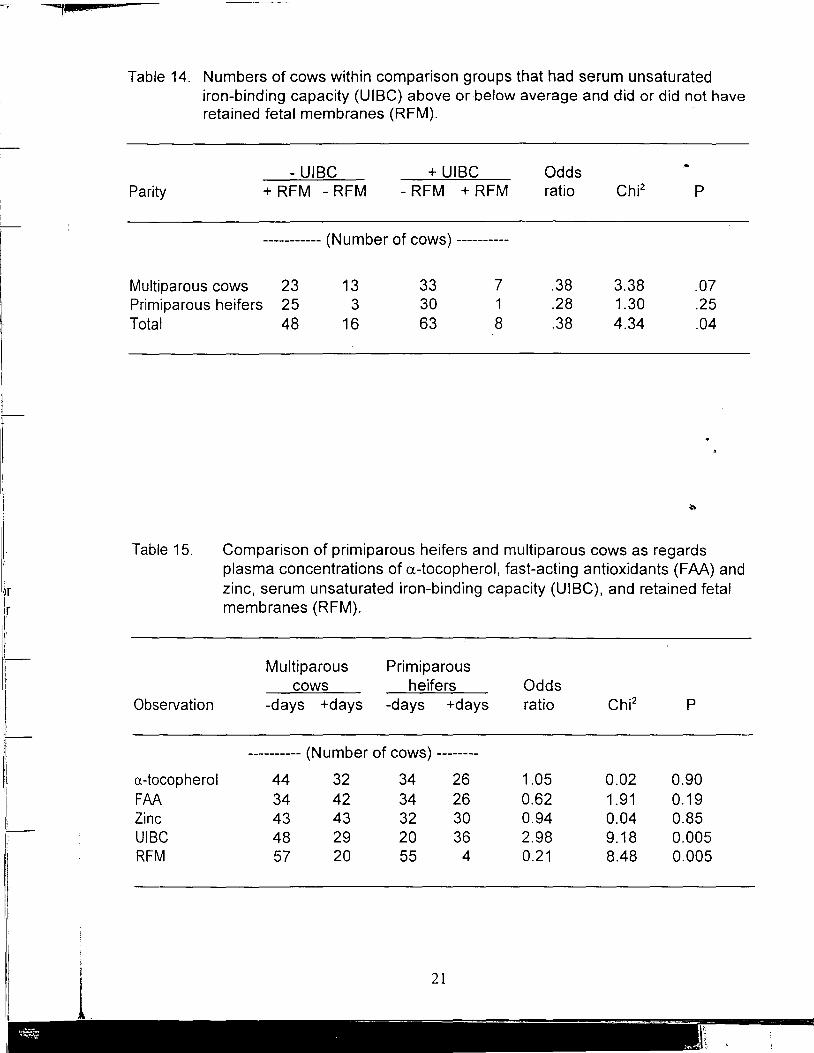
Incidence of RFM did not appear to be directly increased by addition to the diet of Fe equivalent to 1200 mg per kg of dry matter consumed. However, cows fed excess Fe were almost three times more likely than unsupplemented cows to have below average UIBC (Table 9). Cows with below average UIBC, in turn, were over twice as likely to have RFM as cows with above average UIBC (Table 14). Differences between multiparous cows and primiparous heifers undoubtedly contributed to these results. When the relationship between UIBC and RFM was determined separately by parity, increased incidence of RFM when UIBC was below average was only a tendency (P=.07) in cows alone and nonsignificant in heifers alone (Table 14). Lower UIBC in mature cows than in heifers (Table 15) may result from greater accumulation of Fe over a longer time. It is interesting that mature cows also have a higher incidence of RFM than heifers. Excess Fe intake can thus be related indirectly with increased incidence of RFM through lower UIBC. Cows and heifers did not differ in plasma concentrations of a-tocopherol, FAA, or Zn (Table 15) .
9
'~~:..~~~) - ~ _!~'-1"::."
\\. I'
""'· ~ .
I
IMPLICATIONS
When considered over several years, incidences of peripartu(ient disorders such as RFM and udder edema appear to be greater when antioxidant status of dairy cows is below average as indicated by plasma FAA and a-tocopherol. Both indices of antioxidant status can be increased by supplementation with vitaniin E which also decreases incidences of RFM and udder edema. Some inconsistencies were evident, however, form year to year. From a chemist's viewpoint, free radical reactions are recognized as totally random events. Unlike many more predictable biochemical reactions, free radicals are not controlled closely either enzymatically or kinetically. To this unpredictability should be added small physiological differences from year to year due to temperature, rainfall, changing feed etc.
Differing responses to vitamin E or Zn depending on whether or not Fe was excessive suggest involvement of different mechanisms. Casciola-Rosen et al. (1997) have presented evidence that carboxylate side chains on acidic residues of large molecules such as enzymes act as nonspecific metal binding sites. If the bound metal is redoxactive as is Fe, it can induce •OH production at the binding site and fragment the molecule. This type of damage differs from damage initiated by •OH generated in the free pool in that it is not prevented by •OH scavengers such as vitamin E. Sitespecifically damaged molecules may initiate chain reactions which can be terminated by vitamin E but the initial molecule is still damaged. Prevention of site-specific damage _ ... therefore would depend upon prevention of •OH generation at the site. Likelibood of site-specific damage is reduced when potential binding sites are either unoccupi~~ by redox active metals or are occupied by a_ metal incapable of supporting •OH production such as Zn. In this case, vitamin E can terminate •OH generated in the free pool against which Zn is ineffective. Vitamin E and Zn thus compliment each other in antioxicant functions.
Modern management may expose dairy cows to excessive prooxidants and antioxidant requirements may be higher than generally recognized. Vitamin E contents of hay and silage decrease progressively with storage, and long term feeding of stored feeds without access to green forage can reduce vitamin E status of dairy cows (Schingoethe et al., 1978). The importance of vitamin E supplementation for dairy cows has thus increased with widespread dependence on stored feeds. Intakes of other antioxidant nutrients sufficient to control ROM balance effectively may also exceed amounts contained in average feedstuffs. Although additional vitamin E may partially compensate for inadequacies of other antioxidant nutrients under some conditions, supplementation with all known nutrients required for antioxidant defense in adequate and balanced amounts would be beneficial.
It is generally recognized that modern livestock production as we know it would be difficult without supplementing antioxidant nutrients. It is ironic that we tend to treat our
10
s
1t,
ro f
[ ls I he r 1e
~ b r Y ~
~ 1· oy 't' '.1on
ant nd
jthe 1
.ft \ [:
l 1te
our r
'i
J
•.;;;~
lF
domestic animals better than ourselves in this respect. Antioxidant supplementation in human nutrition is often discouraged as unnecessary and possibly even harmful (Herbert, 1994; 1996). This is despite the fact that many of the nutrients removed during processing of foods intended for human consumption are added to byproducts fed to livestock. ·
RECOMMENDATIONS
Protein and energy supplied in optimum and balanced amounts for maximum milk production should also meet amino acid and energy requirements for Fe complexing agents and other endogenously produced antioxidants. These nutrients should not be neglected for the dry cow, however, because of the increased likelihood of oxidative stress near calving. Potential prooxidants including aflatoxins, pesticides, heat damaged feed, and excessive Fe and Mo should be avoided as much as possible. Finally, vitamin and mineral supplements are needed. Based on present knowledge for dairy cows and under average conditions, 0.3 ppm Se, 20 ppm Cu, 60 ppm each of Zn and Mn, and .25% Mg in dietary OM plus 1000 IU/d of vitamin E for dry cows or 500 IU/d for lactating cows appear to be adequate. Some adjustment of these nutrients may be necessary depending on environment, diet, disease, and other factors.
LITERATURE CITED
Bray, T. M. and W. J. Bettger. 1990. The physiological role of zinc as an antioxidant. ~
Free Radical Biol. Med. 8:281-291. Butler, W. R. and R. D. Smith. 1989. Interrelationships between energy balance and
postpartum reproductive function in dairy cattle. J. Dairy Sci. 72:767-785. Casciola-Rosen, L., F. Wrigley, and A. Rosen. 1997. Scleroderma autoantigens are
uniquely fragmented by metal-catalyzed oxidation reactions: Implications for pathogenesis. J. Exp. Med. 185:71-79.
Chan, A. C. 1993. Pa.rtners in defense, vitamin E and vitamin C. Can. J. Physiol. Pharmacol. 71 :725-731.
Commission on Biochemical Nomenclature. 1972. Enzyme nomenclature. Elsevier Sci. Publ. Co., Amsterdam, Neth.
Dills, W. L., Jr. 1993. Protein fructosylation: fructose and the Maillard Reaction. Am. J. Clin. Nutr. 58(Suppl. 1):779S-787S.
Emery, T. F. 1991. Iron and Your Health: Facts and Fallacies. 116 pages. CRC Press, Inc. Boca Ratan, FL.
Ferguson, J. D. and W. Chalupa. 1989. Impact of protein nutrition on reproduction in dairy cows. J. Dairy Sci. 72:746-766.
Fletcher, R.H., S. W. Fletcher, and E. H. Wagner. 1988. Clinical Epidemiology. 2nd ed. Williams and Wilkins, Baltimore, MD.
Glazer, A. N. 1988. Fluorescence-based assay for reactive oxygen species. A protective role for creatinine. Fed. Am. Soc. Exp. Biol. J. 2:2487-2491.
11
""
Goff, J. P. and J. R. Stabel. 1990. Decreased plasma retinal, a-tocopherol and zinc concentration during the periparturient period. Effect of milk fever. J. Dairy Sci. 73:3195-3199.
Golden, M.H.N. and D. Ramdath. 1987. Free radicals in the pathogenesis of Kwashiorkor. Proc. Nutr. Soc. 46:53-68.
Gutteridge, J.M.C. and B. Halliwell. 1994. Antioxidants in Nutrition, Health, and Disease. 143 pages. Oxford University Press, Oxford, UK.
Gutteridge, J.M.C. and G. J. Quinlan. 1993. Antioxidant protection against organic and inorganic oxygen radicals by normal human plasma: the important role for ironbinding and iron-oxidizing proteins. Biochem. Biophys. Acta 1156:144-150.
Halliwell, B. 1987. Oxidants and human disease: some new concepts. Fed. Am. Soc. Exp. Biol. J. 1 :358-364:
Halliwell, B. and J.M.C. Gutteridge. 1990. Role of free radicals and catalytic metal ions in human disease: An overview. Pages 1-85 in: Methods of Enzynology 1868. Academic Press, San Diego, CA.
Herbert, V. 1994. The antioxidant myth. Am. J. Clin. Nutr. 60:157-158. Herbert, V. 1996. Prooxidant effects of antioxidant vitamins. Introduction. J. Nutr.
126: 1197S-1200S. Huang, C.-J. and M.-L. Fwu. 1993. Degree of protein deficiency affects the extent of the
depression of the antioxidative enzyme activities and the enhancement of tissue lipid peroxidation in rats. J. Nutr. 123:803-810.
Huang, C.-J. and H.-M. Shaw. 1994. Tissue vitamin E status is compromised by dietary protein insufficiency in young growing rats. J. Nutr. 124:571-579. ~
Hum, S., K. G. Koski, and L. J. Hoffer. 1992. Varied protein intake alters glutathione ;: metabolism in rats. J. Nutr. 122:2010-2018.
Ibrahim, W., U.-S. Lee, C.-C. Yeh, J. Szabo, G. Bruckner, and C. K. Chow. 1997. Oxidative stress and antioxidant status in mouse liver: effects of dietary lipid, vitamin E and iron. J. Nutr. 127:1401-1406.
Levine, S. A. and P. M. Kidd. 1985. Antioxidant Adaptation. Its Role in Free Radical Pathology. 367 pages. Biocurrents Div., Allergy Research Group, San Leandro, CA.
Lewis, G. S. 1997. Symposium: health Problems of the Prepartum Cow. Uterine Health and Disorders. J. Dairy Sci. 80:984-994.
Machlin, L. J. and A. Bendich. 1987. Free radical tissue damage: protective role of antioxidant nutrients. Fed. Am. Soc. Exp. Biol. J. 1 :441-445.
Madsen, F. C., R. E. Rompala, and J. K. Miller. 1990. Effect of disease on the metabolism of essential trace elements: A role for dietary coordination
. complexes. Feed Management 41 (7):20-23. Miller, J. K. and F. C., Madsen. 1992. Trace Minerals. Pages 287-296 in: Large Dairy
Herd Management. H. H. Van Horn and C. J. Wilcox, eds. American Dairy Science Association, Champaign, IL.
Miller, J. K., E. Brzezinska-Slebodzinska, and F. C. Madsen. 1993. Oxidative stress, antioxidants, and animal function. J. Dairy Sci. 76:2812-2821.
12
r i
I I
I )C I Sci.
1and
ron-
bc. ions
BB.
.of the issue
ietary
I ne
tl I
!al hdro,
lea Ith
f
Miller, J. K., F. C. Madsen, R. A. Holwerda, and M. H. Campbell. 1996. Zinc may protect periparturient dairy cattle against excessive dietary iron. Feedstuffs 68(2D): 12-14.
National Research Council. 1989. Nutrient Requirements of Dairy Cattle. 157 pages. National Academy Press, Washington, DC.
Oteiza, P. I., K. L. Olin, C. G. Fraga, and C. L. Keen. 1995. Zinc deficiency causes oxidative damage to proteins, lipids, and DNA in rat testes. J. Nutr. 125:823-829.
Schingoethe, D. J., J. G. Parsen, F. C. Ludens, W. L. Tucker, and H.J. Shave. 1978. Vitamin E status of dairy cows fed stored feeds continuously or pastured during summer. J. Dairy Sci. 61:1582-1589.
Sies, H. 1985. Ed. Oxidative Stress. 507 pages. Academic Press, Orlando, FL. Slater, T. F., K. H. Cheesman, J. J. Davies, K. Proudfoot, and W. Kim. 1987. Free
radical mechanisms in relation to tissue injury. Proc. Nutr. Soc. 46: 1-12. Statts, D. A., D. P. Lohr, and H. D. Colby. 1988. Effects of tocopherol depletion on the
regional differences in adrenal microsomal lipid peroxidation and steroid metabolism. Endocrinology 123:975-980.
Takayanagi, R., K. I. Kato, and H. lbayoski. 1986. Relative inactivation of steroidogenic enzyme activities of in vitro vitamin E-depleted human adrenal microsomes by lipid peroxidation. Endocrinology 119:464-469. .
Waterman, W.R., M. E. John, and E. R. Simpson. 1986. Regulation of synthesis and activity of cytochrome P-450 enzymes in physiological pathways. Pages 349-386 ·· in: Cytochrome P-450. Structure, mechanism and Biochemistry. P. R. Ortiz de Montellano, ed. Plenium Press, New York, NY. ~
Wayner, D.D.M., G. W. Burton, K. V. Ingold, L.R.C. Barclay, and S. J. Lake. 1987. The relative contributions of vitamin E, urate, ascorbate and proteins to the total peroxyl radical trapping antioxidant activity of human blood plasma. Biochem. Biophys. Acta 924:408-419.
Wilson, R. L. 1987. Vitamin, selenium, zinc and cooper interactions in free radical protection against ill-placed iron. Proc. Nutr. Soc. 46:27-34.
Yanase, T., E. R. Simpson, and M. R. Waterman. 1991. 17a-hydroxylase/17,20-lyase deficiency: from clinical investigation to molecular definition. Endocrine Rev. 12:91-108. .
13
-·~f.~ - ~
""
. '
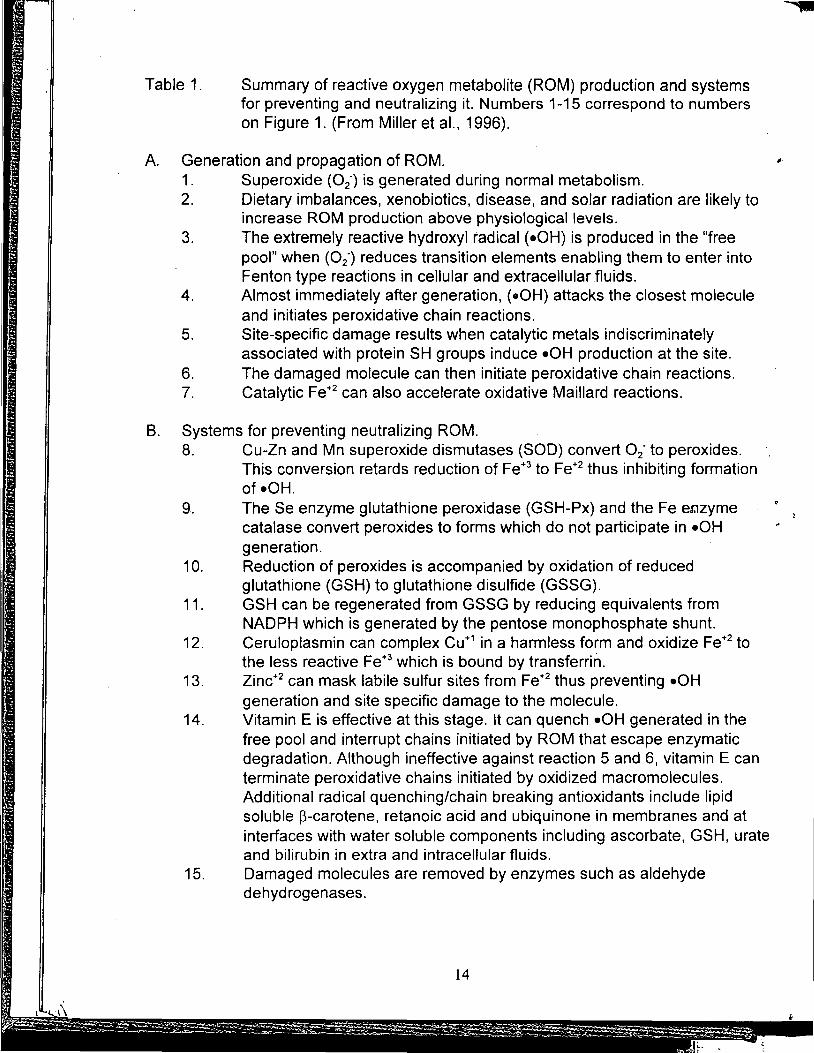
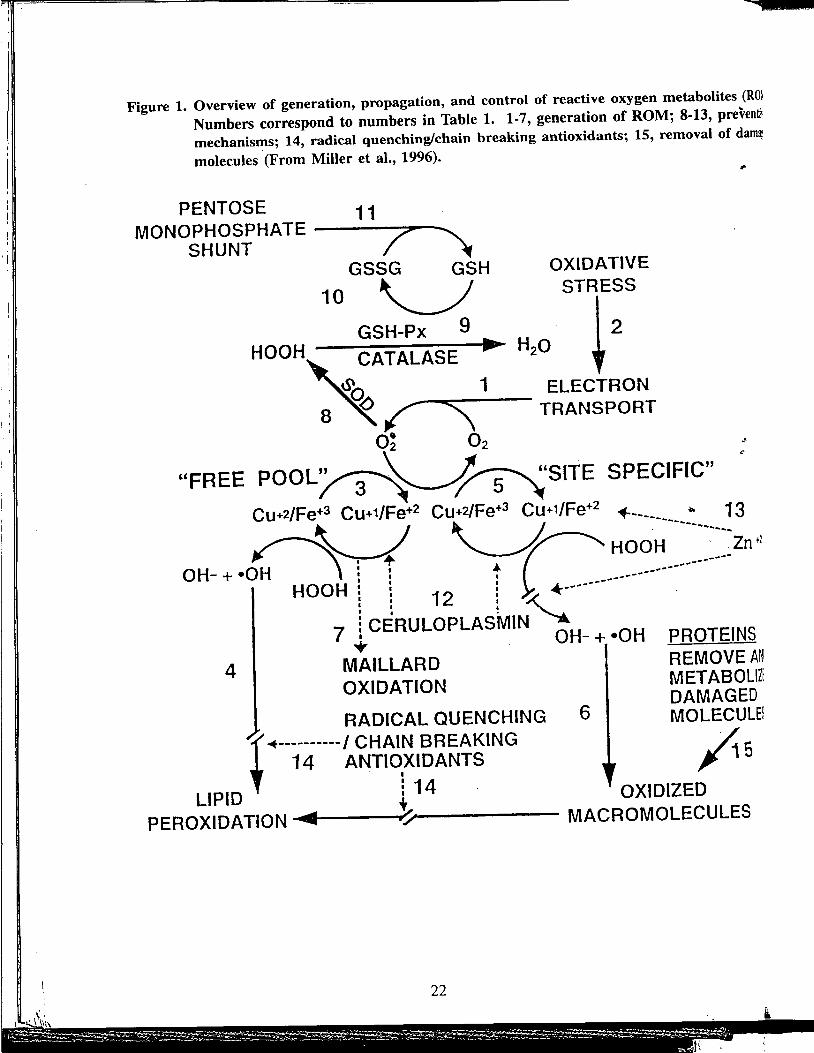
Table 1. Summary of reactive oxygen metabolite (ROM) production and systems for preventing and neutralizing it. Numbers 1-15 correspond to numbers on Figure 1. (From Miller et al., 1996).
A. Generation and propagation of ROM. 1. Superoxide (02·) is generated during normal metabolism. 2. Dietary imbalances, xenobiotics, disease, and solar radiation are likely to
increase ROM production above physiological levels. 3. The extremely reactive hydroxyl radical (•OH) is produced in the "free
pool" when (02·) reduces transition elements enabling them to enter into Fenton type reactions in cellular and extracellular fluids.
4. Almost immediately after generation, (•OH) attacks the closest molecule and initiates peroxidative chain reactions.
5. Site-specific damage results when catalytic metals indiscriminately associated with protein SH groups induce •OH production at the site.
6. The damaged molecule can then initiate peroxidative chain reactions. 7. Catalytic Fe+2 can also accelerate oxidative Maillard reactions.
B. Systems for preventing neutralizing ROM. 8. Cu-Zn and Mn superoxide dismutases (SOD) convert 0 2• to peroxides.
This conversion retards reduction of Fe+3 to Fe+2 thus inhibiting formation of •OH.
9. The Se enzyme glutathione peroxidase (GSH-Px) and the Fe e.r.izyme catalase convert peroxides to forms which do not participate in •OH generation.
10. Reduction of peroxides is accompanied by oxidation of reduced glutathione (GSH) to glutathione disulfide (GSSG).
11. GSH can be regenerated from GSSG by reducing equivalents from NADPH which is generated by the pentose monophosphate shunt.
12. Ceruloplasmin can complex Cu+1 in a harmless form and oxidize Fe+2 to the less reactive Fe+3 which is bound by transferrin.
13. Zinc+2 can mask labile sulfur sites from Fe+2 thus preventing •OH generation and site specific damage to the molecule.
14. Vitamin E is effective at this stage. It can quench •OH generated in the free pool and interrupt chains initiated by ROM that escape enzymatic degradation. Although ineffective against reaction 5 and 6, vitamin E can terminate peroxidative chains initiated by oxidized macromolecules. Additional radical quenching/chain breaking antioxidants include lipid soluble p-carotene, retanoic acid and ubiquinone in membranes and at interfaces with water soluble components including ascorbate, GSH, urate and bilirubin in extra and intracellular fluids.
15. Damaged molecules are removed by enzymes such as aldehyde dehydrogenases.
14
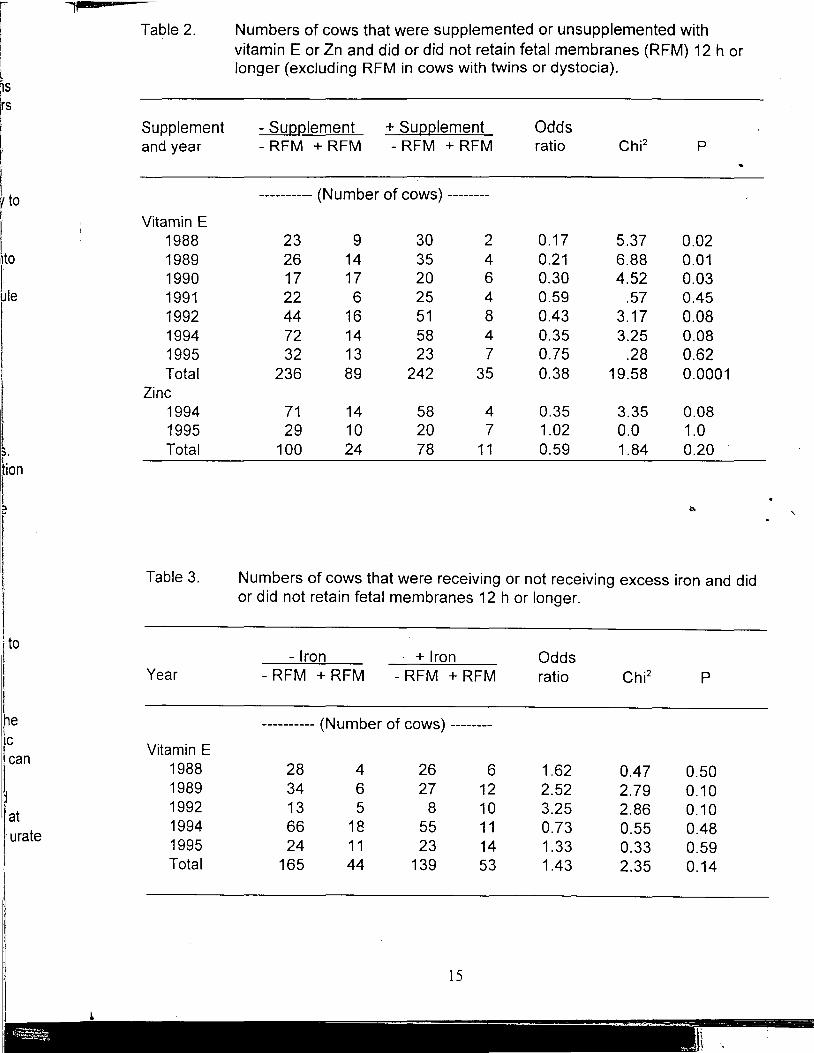
Table 3. Numbers of cows that were receiving or not receiving excess iron and did or did not retain fetal membranes 12 h or longer.
!to - Iron · +Iron Odds
Year - RFM + RFM - RFM + RFM ratio Chi2 p
he ---------- (Number of cows) --------I
ic Vitamin E
lean
~ 1988 28 4 26 6 1.62 0.47 0.50 1989 34 6 27 12 2.52 2.79 0.10
I at 1992 13 5 8 10 3.25 2.86 0.10
·urate 1994 66 18 55 11 0.73 0.55 0.48
I 1995 24 11 23 14 1.33 0.33 0.59 :1 Total 165 44 139 53 1.43 2.35 0.14
15
- --- - - - --~~~~')
l"n.
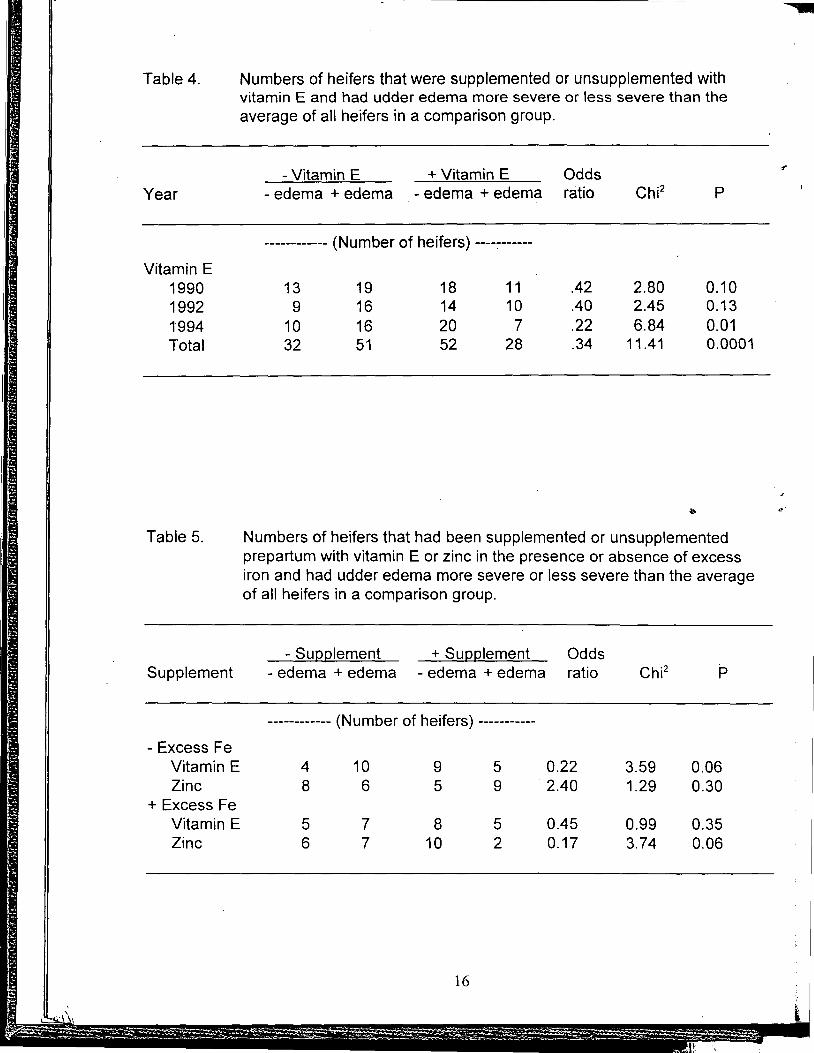
Table 4.
Year
Vitamin E 1990 1992 1"994 Total
Table 5.
Supplement
- Excess Fe Vitamin E Zinc
+Excess Fe Vitamin E Zinc
Numbers of heifers that were supplemented or unsupplemented with vitamin E and had udder edema more severe or less severe than the average of all heifers in a comparison group.
-Vitamin E +Vitamin E Odds - edema + edema - edema + edema ratio Chi2 p
------------ (Number of heifers) -----------
13 19 18 11 .42 2.80 0.10 9 16 14 10 .40 2.45 0.13
10 16 20 7 .22 6.84 0.01 32 51 52 28 .34 11.41 0.0001
Numbers of heifers that had been supplemented or unsupplemented prepartum with vitamin E or zinc in the presence or absence of excess iron and had udder edema more severe or less severe than the average of all heifers in a comparison group.
- Sugglement + SUQQlement Odds - edema + edema - edema + edema ratio Chi2 p
------------ (Number of heifers) -----------
4 10 9 5 0.22 3.59 0.06 8 6 5 9 2.40 1.29 0.30
5 7 8 5 0.45 0.99 0.35 6 7 10 2 0.17 3.74 0.06
16
,
s I 1ge
I_
~t~~~
Table 7. Numbers of cows that were supplemented or unsupplemented with 1000 IU/d of vitamin E which had plasma a-tocopherol above or below the average of all cows in a comparison group.
17
• ,,
I: "" . .
'1· ---~--------------
Tabl.e 8.
Year
1991 1992 1994 1995a Total
Numbers of cows that were supplemented or unsupplemented with 1000 IU/d of vitamin E which had plasma fast-acting antioxidants (FAA) above or below the average of all cows in a comparison group.
-Vitamin E +Vitamin E Odds -FAA +FAA -FAA +FAA ratio Chi2 p
------------ (Number of cows) -----------
27 4 2 30 101 41.43 0.0001 30 24 31 27 1.1 0.05 0.98 23 43 33 37 0.6 2.11 0.17 33 16 12 39 6.7 19.39 0.0001
113 87 78 133 2.2 15.79 0.0001
acommercial dairy herd. Other observations are from the University of Tennessee herd.
Table 9.
Comparison group
Numbers of cows that did or did not receive excess dietary iron and had serum unsaturated iron-binding capacity above or below the average of all. cows in a comparison group.
- Excess Fe +Excess Fe Odds -UIBC +UIBC -UIBC +UIBC ratio Chi2 p
----------- (Number of cows) ----------
Multiparous cows 14 27 21 15 .37 4.52 .04 Primiparous heifers 10 20 18 12 .33 4.29 .04 All cows 25 46 43 23 .29 12.25 .005
18
~
l
1 ·.~~
Table 10. Numbers of cows within comparison groups that had plasma fast-acting antioxidants (FAA) above or below average and did or did not have retained fetal membranes (RFM) or above average severity of udder edema.
Disorder - FAA +FAA Odds and year -disorder +disorder -disorder +disorder ratio Chi2 p
------------ (Number of cows) -----------
RFM 1.991 26 6 20 7 1.52 0.44 0.5 1992 38 22 42 10 .41 4.16 0.04 1994 41 15 69 10 .40 4.31 0.04 Total 105 43 131 27 .50 6.19 0.02.
Udder edema 1992 6 17 16 10 .22 6.24 0.02 1994 11 11 17 13 .76 0.23 0.66 Total 17 28 33 23 .42 4.46 0.04
Table 11. Reproductive performance of dairy cows with plasma fast-acting antioxidants (FAA), a-tocopherol, or zinc above or below the average of all cows ill' a comparison group.
Antioxidant index - Antioxidant + Antioxidant and reproductive index index Odds measurement -days +days -days +days ratio Chi2 p
---------- (Number of cows) --------
Plasma FAA First estrus 37 28 27 30 1.47 1.11 0.31 First service 40 19 35 17 1.02 0.0 1.0 Days open 28 18 30 16 0.83 0.19 0.69
Plasma a-tocopherol First estrus 29 42 35 16 0.32 9.18 0.005 First service 42 24 32 12 0.66 0.99 0.35 Days open 35 25 28 9 0.45 3.03 0.09
Plasma Zn First estrus 27 35 37 23 0.48 4.01 0.05 First service 38 18 36 18 1.06 0.02 0.90 Days open 30 18 33 16 0.81 0.25 0.65
19
- --
"' . 11·
\ ,.
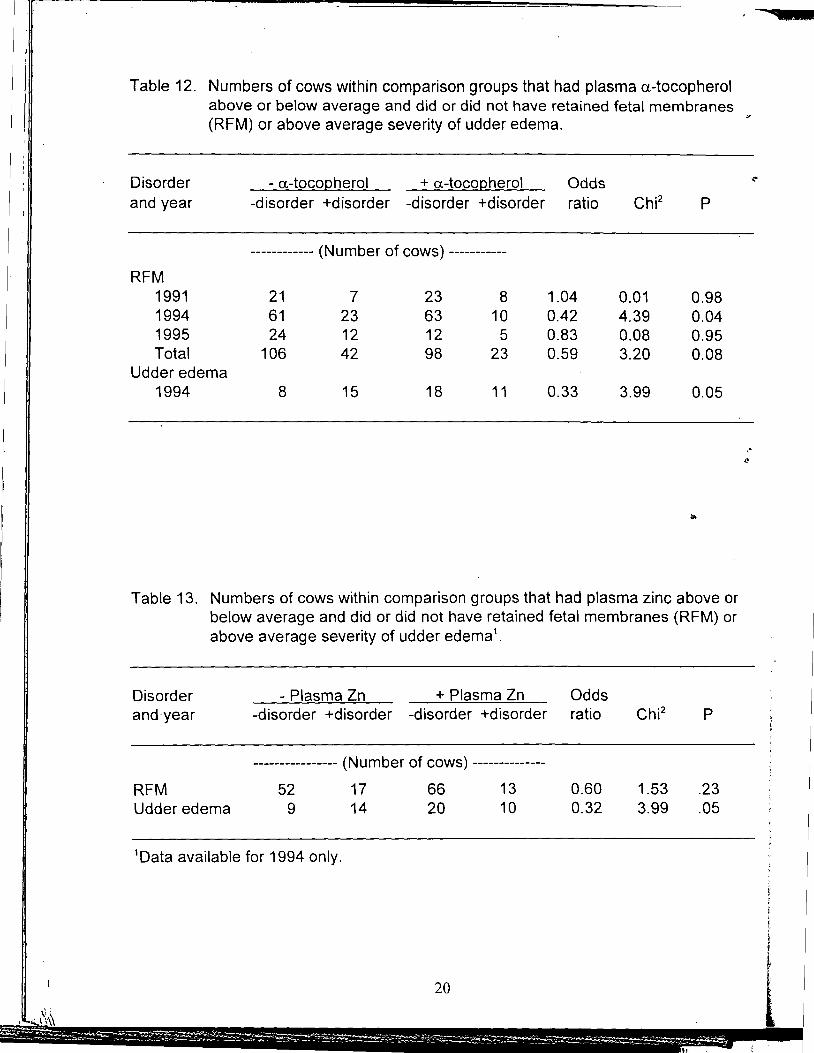
Table 12. Numbers of cows within comparison groups that had plasma a-tocopherol above or below average and did or did not have retained fetal membranes (RFM) or above average severity of udder edema.
Disorder - a-tocogherol + a-tocogherol Odds and year -disorder +disorder -disorder +disorder ratio Chi2 p
------------ (Number of cows) -----------
RFM 1991 21 7 23 8 1.04 0.01 0.98 1994 61 23 63 10 0.42 4.39 0.04 1995 24 12 12 5 0.83 0.08 0.95 Total 106 42 98 23 0.59 3.20 0.08
Udder edema 1994 8 15 18 11 0.33 3.99 0.05
Table 13. Numbers of cows within comparison groups that had plasma zinc above or below average and did or did not have retained fetal membranes (RFM) or above average severity of udder edema 1 .
Disorder - Plasma Zn +Plasma Zn and·year -disorder +disorder -disorder +disorder
---------------- (Number of cows) --------------
RFM 52 17 66 13 Udder edema 9 14 20 10
1 Data available for 1994 only.
20
Odds ratio
0.60 0.32
Chi2
1.53 3.99
p
.23
.05
<!'
! l
l _I -
)f l 1r l I_.'
,!,-1
II It Ii ii ~ I Ii 1-1
I I
,-.... --~-~~--·---
! '
1
Table 14. Numbers of cows within comparison groups that had serum unsaturated iron-binding capacity (UIBC) above or below average and did or did not have retained fetal membranes (RFM).
- UIBC + UIBC Odds ,.
Parity + RFM -RFM - RFM + RFM ratio Chi2 p
----------- (Number of cows) ----------
Multiparous cows 23 13 33 7 .38 3.38 .07 Primiparous heifers 25 3 30 1 .28 1.30 .25 Total 48 16 63 8 .38 4.34 .04
Table 15. Comparison of primiparous heifers and multiparous cows as regards plasma concentrations of a-tocopherol, fast-acting antioxidants (FAA) and zinc, serum unsaturated iron-binding capacity (UIBC), and retained fetal membranes (RFM).
Multiparous Primiparous cows heifers Odds
Observation -days +days -days +days ratio Chi2 p
---------- (Number of cows) --------
a-tocopherol 44 32 34 26 1.05 0.02 0.90 FAA 34 42 34 26 0.62 1.91 0.19 Zinc 43 43 32 30 0.94 0.04 0.85 UIBC 48 29 20 36 2.98 9.18 0.005 RFM 57 20 55 4 0.21 8.48 0.005
21
- ~ - --
·:~~ . \
I.
' "'· ~- ~
I
I
! I , I !
i
I'
' ' \;
l Iii\\
Figure 1. Overview of generation, propagation, and control of reactive oxygen metabolites (Rm Numbers correspond to numbers in Table 1. 1-7, generation of ROM; 8-13, preventil' mechanisms; 14, radical quenching/chain breaking antioxidants; 15, removal of dam~ molecules (From Miller et al., 1996). ..
PENTOSE 11 MONOPHOSPHATE ---/--""""'
SHUNT / ~ GSSG GSH OXIDATIVE
10 ~ STRESS
GSH-Px 9 i 2
HOOH'U'~ATALASE ~ H20ELECTRON
8 ~~ '\ TRANSPORT
o~ 02
"FREE POOL~~~SITE SPECIFIC" •
Cu+2/Fe+3 Cu+1/Fe+2 Cu+2/Fe+3 Cu+1/Fe+2 ~----- • 13
n~ "-AC HOO~-------~--~zn·1 I ~ ---
OH- + •O : : t ------------------HOOH : I : L-------
4
: : 12 : ~ ~ . 7 i C~RULOPLASMIN '--..
• OH-+•OH
MAILLARD OXIDATION
PROTEINS REMOVE A~~ METABOLIZi DAMAGED
RADICAL QUENCHING 6 MOLECULE~
14 ANTIOXIDANTS ' I i
~----------1 CHAIN BREAKING /1"' S
LIPID t 14 . OXIDIZED PEROXIDATION ........ ------·'/r------ MACROMOLECULES
22
r l,
I , Dlites (R 0 M) I • I, preventive h of damag~ 1.
"
13
[~~Zn +2
!TEINS lOVE AND .iABOLIZE nAGED LECULES
l(\s
tLES
·~f~~~
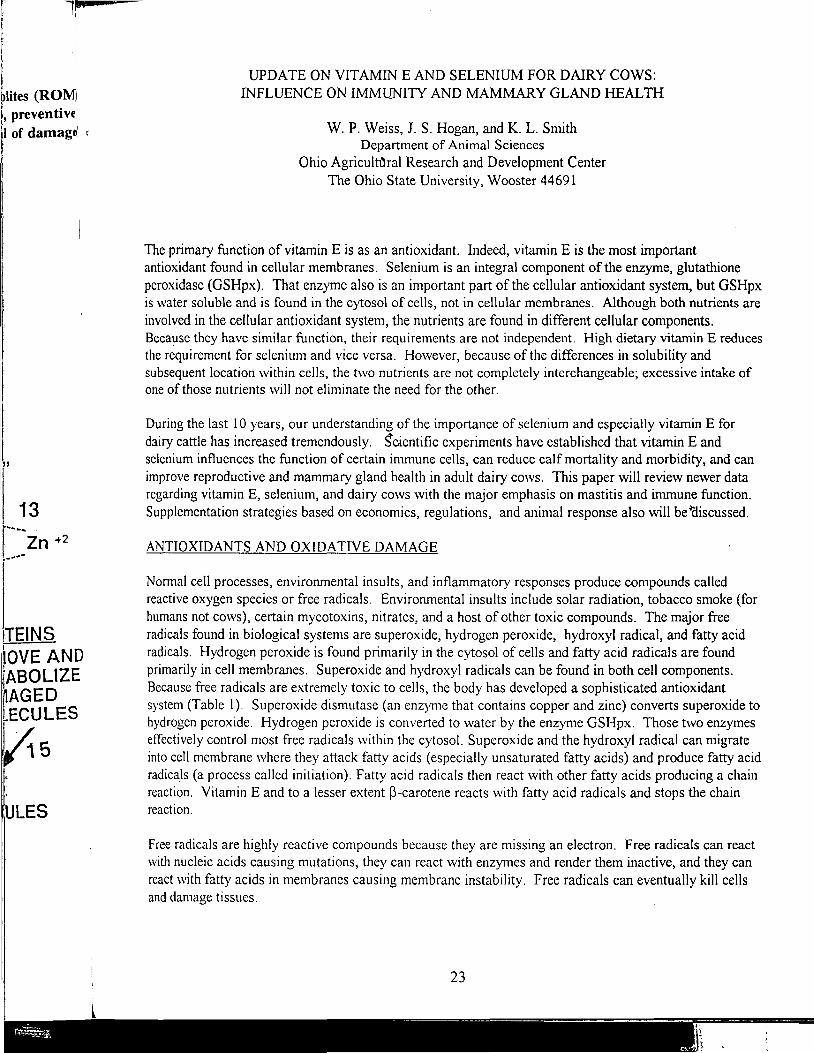
UPDATE ON VITAMIN E AND SELENIUM FOR DAIRY COWS: INFLUENCE ON IMMUNITY AND MAMMARY GLAND HEAL TH
W. P. Weiss, J. S. Hogan, and K. L. Smith Department of Animal Sciences
Ohio Agricultl!ral Research and Development Center The Ohio State University, Wooster 44691
The primary function of vitamin E is as an antioxidant. Indeed, vitamin E is the most important antioxidant found in cellular membranes. Selenium is an integral component of the enzyme, glutathione peroxidase (GSHpx). That enzyme also is an important part of the cellular antioxidant system, but GSHpx is water soluble and is found in the cytosol of cells, not in cellular membranes. Although both nutrients are involved in the cellular antioxidant system, the nutrients are found in different cellular components. Because they have similar function, their requirements are not independent. High dietary vitamin E reduces the requirement for selenium and vice versa. However, because of the differences in solubility and subsequent location within cells, the two nutrients are not completely interchangeable; excessive intake of one of those nutrients will not eliminate the need for the other.
During the last 10 years, our understanding of the importance of selenium and especially vitamin E for dairy cattle has increased tremendously. S'cientific experiments have established that vitamin E and selenium influences the function of certain immune cells, can reduce calf mortality and morbidity, and can improve reproductive and manunary gland health in adult dairy cows. This paper will review newer data regarding vitamin E, selenium, and dairy cows with the major emphasis on mastitis and immune function. Supplementation strategies based on economics, regulations, and animal response also will be-ic!iscussed.
ANTIOXIDANTS AND OXIDATIVE DAMAGE
Normal cell processes, environmental insults, and inflammatory responses produce compounds called reactive oxygen species or free radicals. Environmental insults include solar radiation, tobacco smoke (for humans not cows), certain mycotoxins, nitrates, and a host of other toxic compounds. The major free radicals found in biological systems are superoxide, hydrogen peroxide, hydroxyl radical, and fatty acid radicals. Hydrogen peroxide is found primarily in the cytosol of cells and fatty acid radicals are found primarily in cell membranes. Superoxide and hydroxyl radicals can be found in both cell components . Because free radicals are extremely toxic to cells, the body has developed a sophisticated antioxidant system (Table 1 ). Su peroxide dismutase (an enzyme that contains copper and zinc) converts superoxide to hydrogen peroxide. Hydrogen peroxide is converted to water by the enzyme GSHpx. Those two enzymes effectively control most free radicals within the cytosol. Superoxide and the hydroxyl radical can migrate into cell membrane where they attack fatty acids (especially unsaturated fatty acids) and produce fatty acid radicals (a process called initiation). Fatty acid radicals then react with other fatty acids producing a chain reaction. Vitamin E and to a lesser extent P-carotene reacts with fatty acid radicals and stops the chain reaction.
Free radicals are highly reactive compounds because they are missing an electron. Free radicals can react with nucleic acids causing mutations, they can react with enzymes and render them inactive, and they can react with fatty acids in membranes causing membrane instability. Free radicals can eventually kill cells and damage tissues.
23
~~
.,,,.,o11
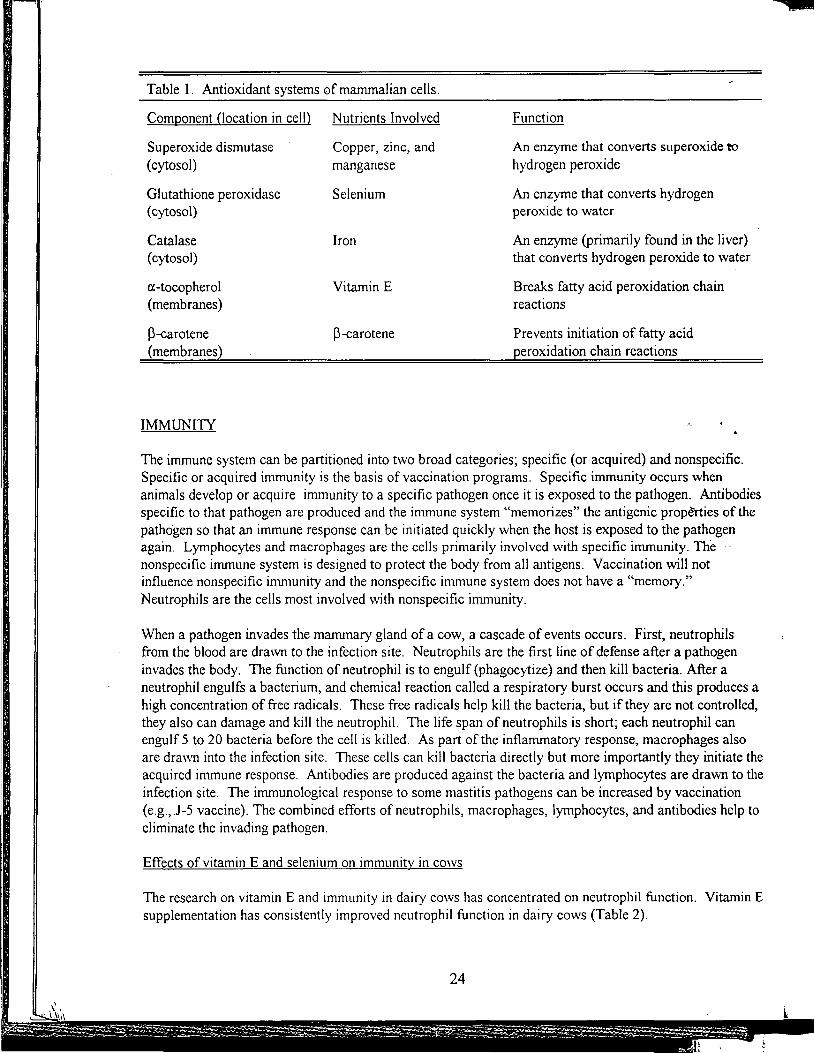
Table I. Antioxidant systems of mammalian cells.
Component (location in cell)
Superoxide dismutase (cytosol)
Glutathione peroxidase (cytosol)
Catalase (cytosol)
a-tocopherol (membranes)
P-carotene (membranes)
IMMUNITY
Nutrients Involved
Copper, zinc, and manganese
Selenium
Iron
Vitamin E
P-carotene
Function
An enzyme that converts superoxide to hydrogen peroxide
An enzyme that converts hydrogen peroxide to water
An enzyme (primarily found in the liver) that converts hydrogen peroxide to water
Breaks fatty acid peroxidation .chain reactions
Prevents initiation of fatty acid peroxidation chain reactions
The immune system can be partitioned into two broad categories; specific (or acquired) and nonspecific. Specific or acquired immunity is the basis of vaccination programs. Specific immunity occurs when animals develop or acquire immunity to a specific pathogen once it is exposed to the pathogen. Antibodies specific to that pathogen are produced and the immune system "memorizes" the antigenic prope"rties of the pathogen so that an immune response can be initiated quickly when the host is exposed to the pathogen again. Lymphocytes and macrophages are the cells primarily involved with specific immunity. The nonspecific immune system is designed to protect the body from all antigens. Vaccination will not influence nonspecific immunity and the nonspecific immune system does not have a "memory." Neutrophils are the cells most involved with nonspecific immunity.
When a pathogen invades the mammary gland of a cow, a cascade of events occurs. First, neutrophils from the blood are drawn to the infection site. Neutrophils are the first line of defense after a pathogen invades the body. The function ofneutrophil is to engulf (phagocytize) and then kill bacteria. After a neutrophil engulfs a bacterium, and chemical reaction called a respiratory burst occurs and this produces a high concentration of free radicals. These free radicals help kill the bacteria, but if they are not controlled, they also can damage and kill the neutrophil. The life span of neutrophils is short; each neutrophil can engulf 5 to 20 bacteria before the cell is killed. As part of the inflammatory response, macrophages also are drawn into the infection site. These cells can kill bacteria directly but more importantly they initiate the acquired immune response. Antibodies are produced against the bacteria and lymphocytes are drawn to the infection site. The immunological response to some mastitis pathogens can be increased by vaccination (e.g.,J-5 vaccine). The combined efforts ofneutrophils, macrophages, lymphocytes, and antibodies help to eliminate the invading pathogen.
Effects of vitamin E and selenium on immunity in cows
The research on vitamin E and immunity in dairy cows has concentrated on neutrophil function. Vitamin E supplementation has consistently improved neutrophil function in dairy cows (Table 2).
24
r l 1·
l -·-!-i i-i D
:er) I tter
I-
ic.
lodies I if the ~ n
s l
In ices a
tiled, ,11 l so I ate the I to the :bn :ielp to
i.min E
,,.;:___ '11'~!...~,..~
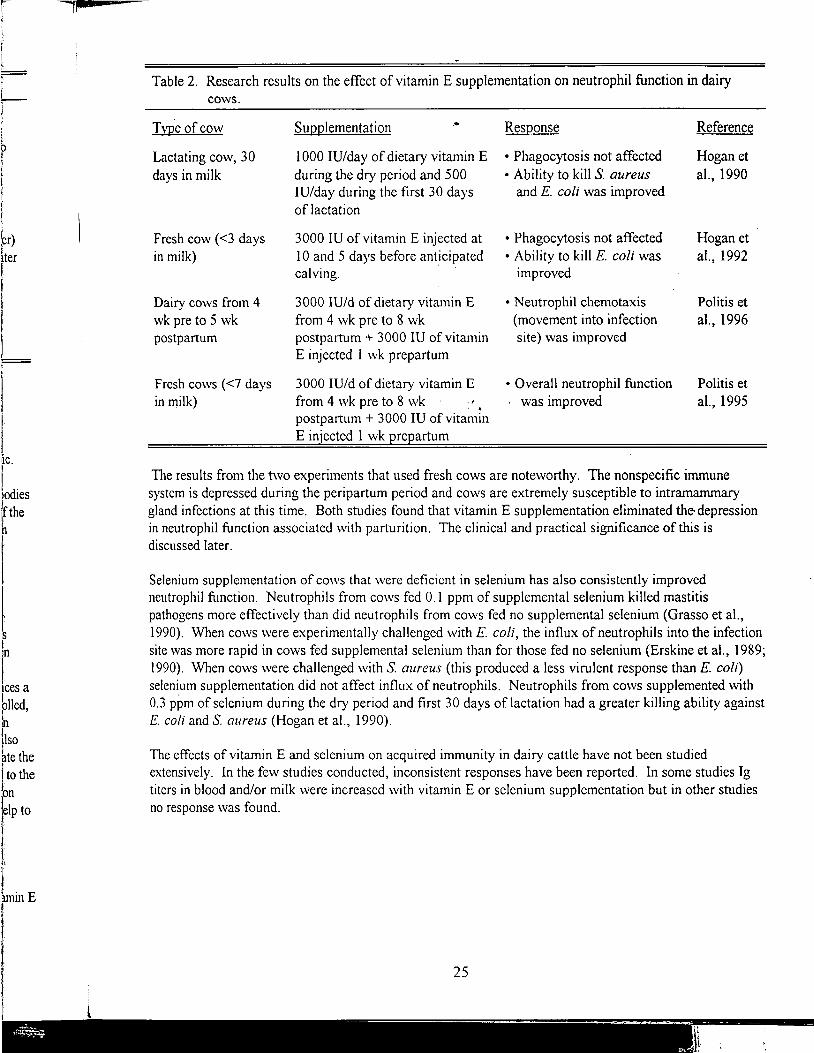
Table 2. Research results on the effect of vitamin E supplementation on neutrophil function in dairy cows.
Typ.eofcow
Lactating cow, 30 days in milk
Fresh cow (<3 days in milk)
Dairy cows from 4 wk pre to 5 wk postpartum
Fresh cows (<7 days in milk)
Supplementation .•
I 000 JU/day of dietary vitamin E during the dry period and 500 IV/day during the first 30 days of lactation
3000 IU of vitamin E injected at IO and 5 days before anticipated calving. · ·
3000 IU/d of dietary vitamin E from 4 wk pre to 8 wk postpartum+ 3000 IU of vitamin E injected I wk prepartum
3000 IU/d of dietary vitamin E from 4 wk pre to 8 wk postpartum+ 3000 IU of vitamin E injected 1 wk prepartum
Response
• Phagocytosis not affected • Ability to kill S. aureus
and E. coli was improved
• Phagocytosis not affected • Ability to kill E. coli was
improved
• Neutrophil chemotaxis (movement into infection site) was improved
• Overall neutrophil function . was improved
Reference
Hogan et
al., 1990
Hogan et al., 1992
Politis et
al., 1996
Politis et
al., 1995
The results from the two experiments that used fresh cows are noteworthy. The nonspecific immune system is depressed during the peripartum period and cows are extremely susceptible to intramammary gland infections at this time. Both studies found that vitamin E supplementation eliminated the· depression in neutrophil function associated \Vith parturition. The clinical and practical significance of this is discussed later.
Selenium supplementation of cows that were deficient in selenium has also consistently improved ncutrophil function. Neutrophils from cows fed 0.1 ppm of supplemental selenium killed mastitis pathogens more effectively than did ncutrophils from cows fed no supplemental selenium (Grasso et al., 1990). When cows were experimentally challenged with E. coli, the influx of neutrophils into the infection site was more rapid in cmvs fed supplemental selenium than for those fed no selenium (Erskine et al., 1989; 1990). When cows were challenged with S. aureus (this produced a less virulent response than E. coli) selenium supplementation did not affect influx of neutrophils. Neutrophils from cows supplemented with 0.3 ppm of selenium during the dry period and first 30 days of lactation had a greater killing ability against E. coli and S. aureus (Hogan et al., 1990).
The effects of vitamin E and selenium on acquired immunity in dairy cattle have not been studied extensively. In the few studies conducted, inconsistent responses have been reported. In some studies lg titers in blood and/or milk were increased with vitamin E or selenium supplementation but in other studies no response was found.
25
- -
"'.

VITAMIN E, SELENIUM, AND MAMMARY GLAND HEAL TH
Mastitis is an extremely prevalent and costly disease. Surveys have found that in well-managed dairy .., herds, approximately 50 cases of clinical mastitis can be expected per 100 cows annually. Each case of clinical mastitis costs between $100 and $140 (Hoblet et al., 1991). Those costs include veterinary and drug costs, lost production, and dumped milk. For a well-managed herd of 100 cows, clinical mastitis would cost about $6,000 per year. The cost of subclinical mastitis is more difficult to quantify but most experts agree that subclinical mastitis costs the average dairy farmer more than does clinical mastitis. The total cost of mastitis (lost production and treatment costs) is estimated to be $150 to $200/cow per year or about $17 ,500 annually for an average 100 cow herd.
Smith et al. (1984) were the first to report that supplemental vitamin E and selenium reduced clinical mastitis. That study was conducted in Ohio (the soil has very low concentrations of selenium) and used dry cows fed hay-based diets (should be very low in vitamin E). Cows were either injected with a placebo or 50 mg of selenium at 21 days before calving and were fed either 0 or 1000 IU/day of supplemental vitamin E (dl-a-tocopheryl acetate). Selenium without supplemental vitamin E reduced the incidence and duration of clinical mastitis, but the largest response was caused by vitamin E with or without selenium. A subsequent study compared mammary gland health of cows fed no supplemental selenium or vitamin E with that of cows fed diets with 0 .1 ppm of supplemental selenium and 1000 JU/day of supplemen4tl vitamin E during the dry period and 0.3 ppm of supplemental selenium and approximately 700 IU of · supplemental vitamin E during lactation (Smith, 1986). Selenium and vitamin E supplementation reduced mammary gland infections by 42% and reduced clinical mastitis by 32%. The largest response was found during the first 3 months of lactation (Figure I).
U) 35 ctl .2
30 - Control - Supplemented c: 0 - 25 0 ... C1)
20 .c E :I 15 c: C1)
.~ 10 -ctl :I 5 E :I 0 0
30 60 90 150 210 305
Days in milk
Figure 1. The cumulative number of cases of clinical mastitis at various stages of lactation for cows fed no supplemental vitamin E and selenium or fed supplemental vitamin E and selenium (Smith, 1986).
26
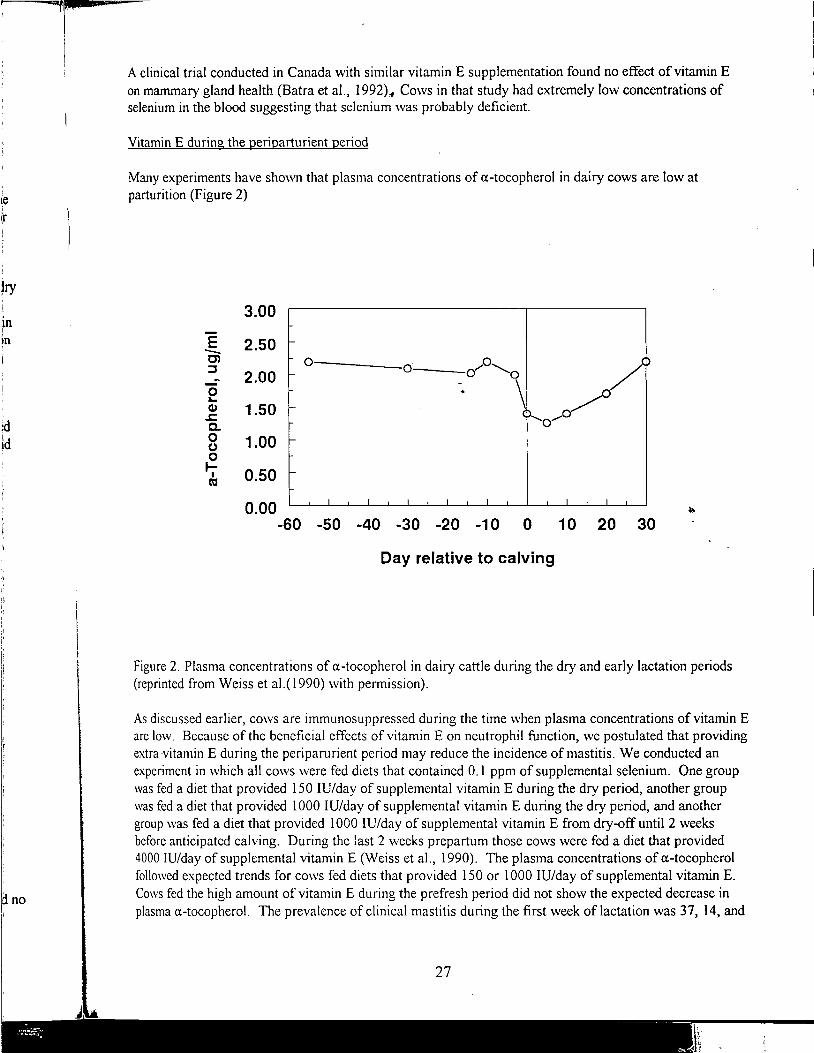
-if"
m I
In
Xi id
I~
d no
·~~:..s:.'
A clinical trial conducted in Canada with similar vitamin E supplementation found no effect of vitamin E on mammary gland health (Batra et al., 1992),. Cows in that study had extremely low concentrations of selenium in the blood suggesting that selenium was probably deficient.
Vitamin E during the perioarturient period
Many experiments have shown that plasma concentrations of a-tocopherol in dairy cows are low at parturition (Figure 2)
3.00
E 2.50 -C) 0 ,P. .... ......_ :J 0 2.00 0 0 - \ 0
. / "-Q) 1.50 ~ ....._ ,.....o a. 0 0 1.00 0 0 I-
0.50 I ca
0.00 ~
-60 -50 -40 -30 -20 -10 0 10 20 30
Day relative to calving
Figure 2. Plasma concentrations of a-tocopherol in dairy cattle during the dry and early lactation periods (reprinted from Weiss et al.(1990) with permission).
As discussed earlier, cows are immunosuppressed during the time when plasma concentrations of vitamin E are low. Because of the beneficial effects of vitamin E on neutrophil function, we postulated that providing extra vitamin E during the periparurient period may reduce the incidence of mastitis. We conducted an experiment in which all cows were fed diets that contained 0.1 ppm of supplemental selenium. One group was fed a diet that provided 150 IV/day of supplemental vitamin E during the dry period, another group was fed a diet that provided 1000 IV/day of supplemental vitamin E during the dry period, and another group was fed a diet that provided 1000 IV/day of supplemental vitamin E from dry-off until 2 weeks before anticipated calving. During the last 2 weeks prepartum those cows were fed a diet that provided 4000 JU/day of supplemental vitamin E (Weiss et al., 1990). The plasma concentrations of a-tocopherol followed expected trends for cows fed diets that provided 150 or 1000 IV/day of supplemental vitamin E. Cows fed the high amount of vitamin E during the prefresh period did not show the expected decrease in plasma cx-toeopherol. The prevalence of clinical mastitis during the first week of lactation was 37, 14, and
27
------------
""·
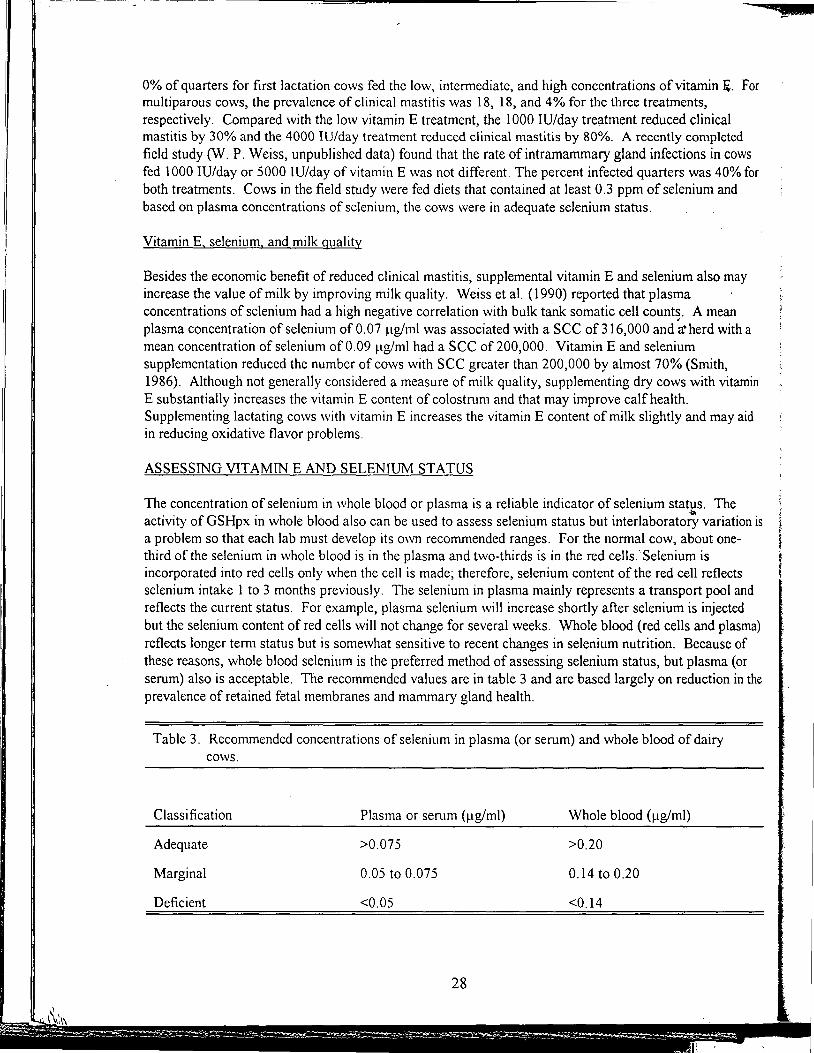
0% of quarters for first lactation cows fed the low, intermediate, and high concentrations of vitamin ~. For multiparous cows, the prevalence of clinical mastitis was 18, 18, and 4 % for the three treatments, respectively. Compared with the low vitamin E treatment, the 1000 IU/day treatment reduced clinical mastitis by 30% and the 4000 IU/day treatment reduced clinical mastitis by 80%. A recently completed field study (W. P. Weiss, unpublished data) found that the rate of intramammary gland infections in cows fed 1000 IU/day or 5000 IU/day of vitamin E was not different. The percent infected quarters was 40% for both treatments. Cows in the field study were fed diets that contained at least 0.3 ppm of selenium and based on plasma concentrations of selenium, the cows were in adequate selenium status.
Vitamin E. selenium. and milk quality
Besides the economic benefit of reduced clinical mastitis, supplemental vitamin E and selenium also may increase the value of milk by improving milk quality. Weiss et al. (1990) reported that plasma concentrations of selenium had a high negative correlation with bulk tank somatic cell count~. A mean plasma concentration of selenium of 0.07 ~1g/ml was associated with a SCC of 316,000 and a· herd with a mean concentration of selenium of 0.09 µg/ml had a SCC of 200,000. Vitamin E and selenium supplementation reduced the number of cows with SCC greater than 200,000 by almost 70% (Smith, 1986). Although not generally considered a measure of milk quality, supplementing dry cows with vitamin E substantially increases the vitamin E content of colostrum and that may improve calf health. Supplementing lactating cows with vitamin E increases the vitamin E content of milk slightly and may aid in reducing oxidative flavor problems.
ASSESSING VITAMIN E AND SELENIUM STATUS
The concentration of selenium in whole blood or plasma is a reliable indicator of selenium status. The -i.
activity of GSHpx in whole blood also can be used to assess selenium status but interlaboratory variation is a problem so that each lab must develop its own recommended ranges. For the normal cow, about onethird of the selenium in whole blood is in the plasma and two-thirds is in the red cells. Selenium is incorporated into red cells only when the cell is made; therefore, selenium content of the red cell reflects selenium intake 1 to 3 months previously. The selenium in plasma mainly represents a transport pool and reflects the current status. For example, plasma selenium will increase shortly after selenium is injected but the selenium content of red cells will not change for several weeks. Whole blood (red cells and plasma) reflects longer term status but is somewhat sensitive to recent changes in selenium nutrition. Because of these reasons, whole blood selenium is the preferred method of assessing selenium status, but plasma (or serum) also is acceptable. The recommended values are in table 3 and are based largely on reduction in the prevalence of retained fetal membranes and mammary gland health.
Table 3. Recommended concentrations of selenium in plasma (or serum) and whole blood of dairy cows.
Classification
Adequate
Marginal
Deficient
Plasma or serum (µg/ml)
>0.075
0.05 to 0.075
<0.05
28
Whole blood (µg/ml)
>0.20
0.14 to 0.20
<0.14
r-----1
f For
~ \ IWS } fi 1o or l
\ f
t l
iy l I
ih a l I i . amm
laid
1 I I
l r. . t1on 1s I
r-i :ts 1and i 'ed 1 isma) 1lof :1 ;(or ~in the :(
1l_ 1·-. -
J 11
11
ij-
11
rl 1-1 -
I)
I_!
·-1
I
I
f
I
1
Much recent research has focused on using plasma concentrations of cx:-tocopherol to assess the vitamin E status of cows. We have found that when plasma concentrations of cx:-tocopherol in cows at parturition was less than 3 µg/ml, the probability of having clinical mastitis during the first week of lactation was 9
times greater than when plasma concentrations were greater than 3 µg/ml. In another experiment we found that neutrophil function was maximized when plasma concentration of a:-tocopherol were at least 3.5
µg/ml. Based on these data, we reconunend that cows at calving have ct-tocopherol concentrations in their plasma of at least 3 to 3 .5 µg/ml. The concentrations of cx:-tocopherol and lipids in plasma are correlated (high plasma lipids= high cx:-tocopherol). Because of that correlation, that recommendation is not reliable for cows at other stages of lactation.
RECOMMENDATIONS
Selenium
Essentially all dairy animals raised in the Midwestern US should be fed the maximum allowable amount of supplemental selenium (current FDA regulation is 0.3 ppm). The costs associated with that strategy is small. Potential benefits include reduced prevalence of retained fetal membranes (estimated cost of$100 to $120/case), reduced clinical mastitis (estimated cost $120/case), and reduced sec (potential quality bonuses for milk). Diets fed to animals at all stages of life (calves, heifers, and lactating and dry cows) should be supplemented with 0.3 ppm of Se. Often heifers are not supplemented properly and are in marginal selenium status when they calve. Sodium selenite and sodium selenate are the two approved sources of supplemental selenium for animal diets. Limited data suggests that the selenate may have a higher bioavailability than selenite. In most situations, feeding 0.3 ppm provides adequate selenium, but occasionally that amount is not adequate. Certain conditions (high sulfate in the feed or water, excessive dietary copper, zinc, or iron, and diets with very high or very low concentrations of calcium) reduce the availability of selenium or increase its requirement. In these situations, collect some blood samples and assess the selenium status. If animals are deficient and the maximum legal amount of selenium is being fed, consider injections of selenium. Good results have been obtained when 50 mg of selenium was injected into Holstein cows approximately 3 weeks prepartum.
Vitamin E
Most concentrate feeds contain very little vitamin E. Raw soybeans can be a good source of vitamin E, but roasting destroys most of the vitamin E. Fresh green forage is an excellent source of vitamin E and may contain more than 100 IU/Ib. of dry matter. After forage is cut, the concentration of vitamin E in the plants decreases rapidly. Most wilted silages have less than 30% the vitamin E found in fresh plants. Hay that was cured quickly, may contain about 20% of the vitamin E found in fresh plants, but if the curing period was extended, hay may have very little or no vitamin E. A typical Midwestern type diet (com silage, alfalfa silage, alfalfa hay, com grain and soybean meal) for lactating and dry cows typically exceeds the current NRC recommendation for vitamin E (7 JU/lb. of DM). However, numerous research studies have shown that the NRC recommendation for vitamin E is inadequate to maintain good mammary gland health. Based on current data, we recommend that all dry cows not consuming fresh forage be fed 1000 IU/day of supplemental vitamin E. If the diet is at least 50% fresh forage (pasture), supplemental vitamin Eis probably not necessary. We think that lactating cows should be fed about 500 IU/day of supplemental vitamin E when fed stored forages. If cows are consuming at least 25% of their diet as pasture, supplemental vitamin E is probably not needed. When cows were in marginal selenium status, very positive results were obtained when dry cows within 2 weeks of calving were fed 4000 IU/day of supplemental vitamin E. No positive results were found when high levels of vitamin E were fed to peripartum cows that were adequate in selenium. If adequate blood concentrations of selenium cannot be
29
If
ii
-. ~.;...~~
1\ . "'
obtained because of interfering compounds, extra vitamin E supplementation during the perip~rtum period may be beneficial. Based on vitamin E prices in Ohio, feeding 1000 IU/day of vitamin E for 60 days and feeding 500 IU/day for 305 days will cost about $7 to $8 per cow per 365 days (about 2cents per cowday). The benefit associated with that program can be calculated based on the expected decrease in clinical mastitis (30%), a normal incidence rate of clinical mastitis in well-managed herds that have controlled contagious mastitis (50 cases/100 cows/365 days) and on the average cost of clinical mastitis ($120). For a 100 cow herd the potential benefit of this supplementation program is $1800 while the cost is $750. That benefit includes only clinical mastitis; the potential of reduced retained fetal membranes, reduced sec and potentially improved calf health are not considered. The practice of feeding supplemental vitamin E at the rates of 1000 IU/day to dry cows and 500 IU/day to lactating cows can be justified based on economics. The practice offeeding 4000 IU/day during the prefresh period (approximate cost of $3/cow for 14 days) should be considered carefully. We recommend that practice only when selenium status is marginal and when clinical mastitis at calving is a problem.
SUMMARY
Supplemental vitamin E and selenium improves immune function of dairy cattle, especially during the peripartum period. An inadequate intake of selenium and vitamin E is related with an increased incidence of retained fetal membranes, mammary gland infections, and clinical mastitis. Feeding diets with 0.3 ppm of supplemental selenium to all classes of cattle and feeding 1000 IU/day of supplemental vitamin E to dry cows and springing heifers and 500 IU/day to lactating cows improves immunity and reduces the incidence of clinical mastitis and reduces SCC. Selenium status of cows can be evaluated based on blood concentrations. Evaluation of the vitamin E status of cows is more difficult, but plasma concentrations of a-tocopherol in cows at parturition appear to have clinical value.
LITERATURE CITED
Batra, T. R., M. Hidiroglou, and M. W. Smith. 1992. Effect of vitamin Eon incidence of mastitis in dairy cattle. Can. J. Anim. Sci. 67:775-788.
Erskine, R. J., R. J. Eberhart, P. J. Grasso, and R. W. Scholz. 1989. Induction of E. coli mastitis in cows fed selenium-deficient or selenium-adequate diets. Am. J. Vet. Res. 50:2093-2099.
Erskine, R. J., R. J. Eberhart, and R. W. Scholz. 1990. Experimentally induced S. aureus mastitis in elenium-deficient or selenium-supplemented cows. Am. J. Vet. Res. 51: 1107-1111.
Grasso, P., R. w. Scholz, R. J. Erskine, and R. J. Eberhart. 1990. Phagocytosis, bactericidal activity, and oxidative metbolism of mammary neutrophils from dairy cows fed selenium-adequate and seleniumdeficient diets. Am. J. Vet. Res. 51:269-277.
Hoblet, K. H., G.D. Schnitkey, D. Arbaugh, and K. L. Smith. 1991. Economic losses associated with episodes of clinical mastitis in nine low somatic cell count herds. J. Am. Vet. Med. Assoc. 199: 190-196.
Hogan, J. S., K. L. Smith, W. P. Weiss, D. A. Todhunter, and W. L. Shockey. 1990. Relationships among vitamin E, selenium, and bovine blood neutrophils. J. Dairy Sci. 73:2372-2378.
Hogan, J. S. W. P. Weiss, D. A. Todhunter, K. L. Smith, and P. s. Schoenberger. 1992. Bovine blood neutrophil responses to parenteral vitamin E. J. Dairy Sci. 75:399-405.
30
i
!ce 1 pm ldry l :nee
l i'of I
I l. ury ! I
fws i I
::!;.~
I
t
Politis, I., M. Hidiroglou, T. R. Batra, J. A. Gilmore, R. C. Gorewit, and H. Scherf. 1995. Effects of vitamin Eon immune function of dairy cows. Am. J. Vet. Rec. 56:179-184.
Politis, I., N. Hidiroglou, J. H. White, J. a. Gilmore, S. N. Williams, H. Scherf, and M. Frigg. 1996. Effects of vitamin E on mammary and blood leukocyte function with emphasis on chemotaxis in periparturient dairy cows. Am. J. Vet. Res. 468-471.
Smith, K. L. 1986. Vitamin E-Enhancement of immune response and effects on mastitis in dairy cows. Animal Nutr. Events, Roche Symp. Hoffmann-La Roche, Basie Switzerland.
Smith, K. L., J. H. Harrison, D. D. Hancock, D. A. Todhunter, and H. R. Conrad. 1984. Effect of vitamin E and selenium supplementation on incidence of clinica~ mastitis and duration of clinical symptoms. J. Dairy Sci. 67:1293-1300
Weiss, W. P., J. S. Hogan, K. L. Smith, and K. H. Hoblet. 1990. Relationships among selenium, vitamin E, and mammary gland health in commercial dairy herds. J. Dairy Sci. 73:381-390.
Weiss, W. P., J. S. Hogan, D. A. Todhunter, and K. L. Smith. 1997. Effect of vitamin E supplementation in diets with a low concentration of selenium on mammary gland health of dairy cows. J. Dairy Sci. (in press).
31
-- - - ----=--
,,,.,.

Notes
(This page intentionally blank. )
32
I !
I
J ... ~ .~~
NUTRIENT NEEDS OF HIGH LEAN PIGS
Tim S. Stahly Professor
Department of Animal Science Iowa State University
-· The nutrient needs of pigs are dependent on the type of the biological processes occurring in the pig and the rates at which the processes are being expressed. High lean genetic strains of pigs normally exhibit greater body maintenance processes and proteinaceous tissue (i.e., muscle, bone, visceral organs) growth, but lower rates of fatty tissue accretion. These patterns of tissue growth result in body gains higher in protein, macrominerals, and water but lower in fat and energy content. The higher water and lower energy content of gain in high lean pig results in less feed and feed energy being required per unit of body weight gain compared with moderate lean pigs. Similarly, voluntary energy intake is less, even though body weight gains are equal to or greater than moderate lean pigs.
The greater productivity of high lean pigs reared in high health herds are even more striking when compared with the expected performance of pigs on which the 1988 NRC nutrient requirements for swine are based (Table 1). In this comparison, high lean pigs (barrows only) fed from 11to22, 22 to 44, 44 to 110, and 110 to 242 pounds, respectively, required .74, .83, .91, and .85 pounds less feed per pound of body weight gain than those assumed in thei.NRC (1988). Furthermore, their daily gains were .46, .51, .56, and .17 pounds greater in the respective four stages of growth.
Vitamins
The high rates of proteinaceous tissue growth in high lean strains cause these animals to have a greater dietary need_ for the nutrients required to fuel these processes. Vitamins, particularly B vitamins, are key elements in proteinaceous tissue growth via their role in energy and protein metabolism. In recent work at our research station, the dietary needs of pigs with a high lean growth capacity for a group of five B vitamins were evaluated. The five test vitamins (niacin, pantothenic acid, riboflavin, B 12 , and folic acid) were chosen because they are involved in fueling proteinaceous tissue accretion. All other vitamins were provided at 600% of the NRC (1988) estimated requirement.
Pigs with both a high and moderate genetic capacity for lean growth were evaluated. All pigs were reared via a MEW scheme to minimize the level of chronic immune system activation in the pigs, thus allowing maximum accretion of proteinaceous tissue to occur. High lean pigs fed from 20 to 62 pounds responded linearly to increasing dietary concentrations of the five test vitamins up to 4 70% of the NRC ( 1988) estimated need for 11- to 22-pound pigs (Table 2). In moderate lean pigs, daily gains and efficiency of feed utilization were maximized by dietary B
33
~~~~~~~~-
"'..<! I\ .
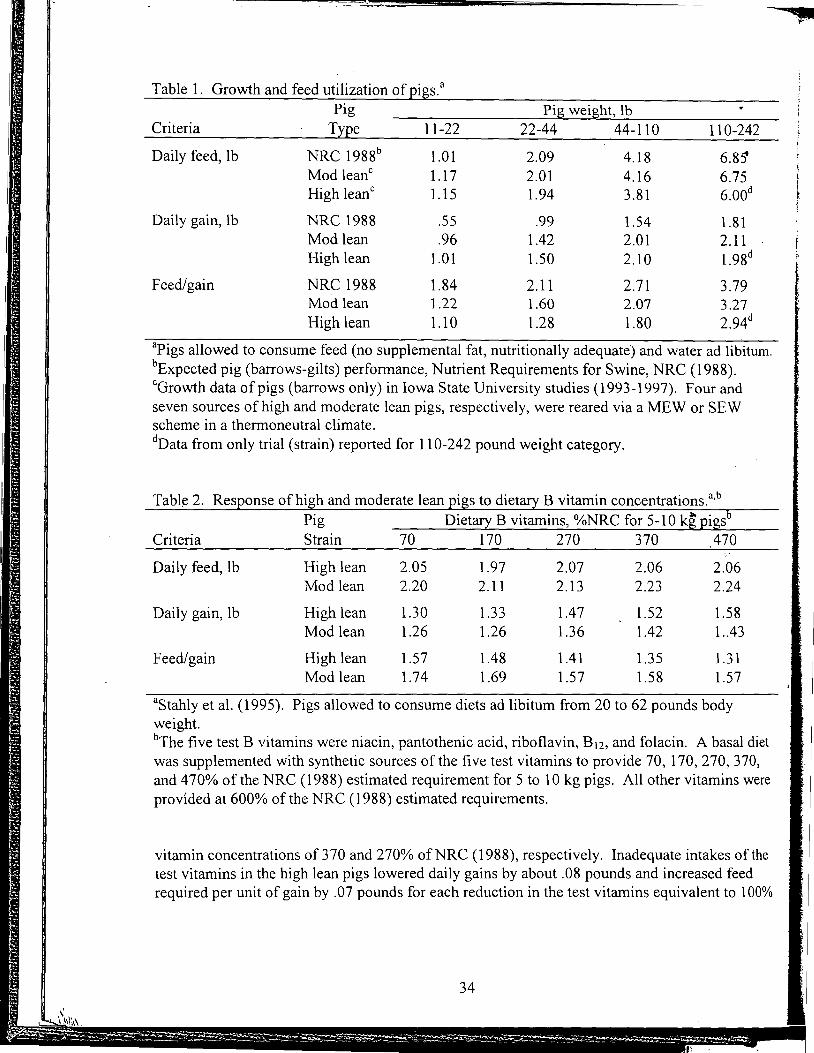
Table 1. Growth and feed utilization of pigs. a
Pig Pig weight, lb Criteria TYPe 11-22 22-44 44-110 110-242
Daily feed, lb NRC 1988b 1.01 2.09 4.18 6.8~ Mod leanc 1.17 2.01 4.16 6.75 High leanc 1.15 1.94 3.81 6.00d
Daily gain, lb NRC 1988 .55 .99 1.54 1.81 Mod lean .96 1.42 2.01 2.11 High lean 1.01 1.50 2.10 1.98d
Feed/gain NRC 1988 1.84 2.11 2.71 3.79 Mod lean 1.22 1.60 2.07 3.27 High lean 1.10 1.28 1.80 2.94d
3Pigs allowed to consume feed (no supplemental fat, nutritionally adequate) and water ad libitum. bExpected pig (barrows-gilts) performance, Nutrient Requirements for Swine, NRC (1988). cGrowth data of pigs (barrows only) in Iowa State University studies (1993-1997). Four and seven sources of high and moderate lean pigs, respectively, were reared via a MEW or SEW scheme in a thermoneutral climate. dData from only trial (strain) reported for 110-242 pound weight category.
Tabl~ 2. Response of high and moderate lean pigs to dietary B vitamin concentrations.a,b Dietary B vitamins, %NRC for 5-10 kg pigs6 Pig
Criteria Strain 70 170 270 370 470
Daily feed, lb High lean 2.05 1.97 2.07 2.06 2.06 Mod lean 2.20 2.11 2.13 2.23 2.24
Daily gain, lb High lean 1.30 1.33 1.47 1.52 1.58 Mod lean 1.26 1.26 1.36 1.42 1 . .43
Feed/gain High lean 1.57 1.48 1.41 1.35 1.31 Mod lean 1.74 1.69 1.57 1.58 1.57
3 Stahly et al. (1995). Pigs allowed to consume diets ad libitum from 20 to 62 pounds body weight. bThe five test B vitamins were niacin, pantothenic acid, riboflavin, B 12, and folacin. A basal diet was supplemented with synthetic sources of the five test vitamins to provide 70, 170, 270, 370, and 4 70% of the NRC ( 1988) estimated requirement for 5 to 10 kg pigs. All other vitamins were provided at 600% of the NRC (1988) estimated requirements.
vitamin concentrations of 370 and 270% ofNRC (1988), respectively. Inadequate intakes of the test vitamins in the high lean pigs lowered daily gains by about .08 pounds and increased feed required per unit of gain by .07 pounds for each reduction in the test vitamins equivalent to 100%
34
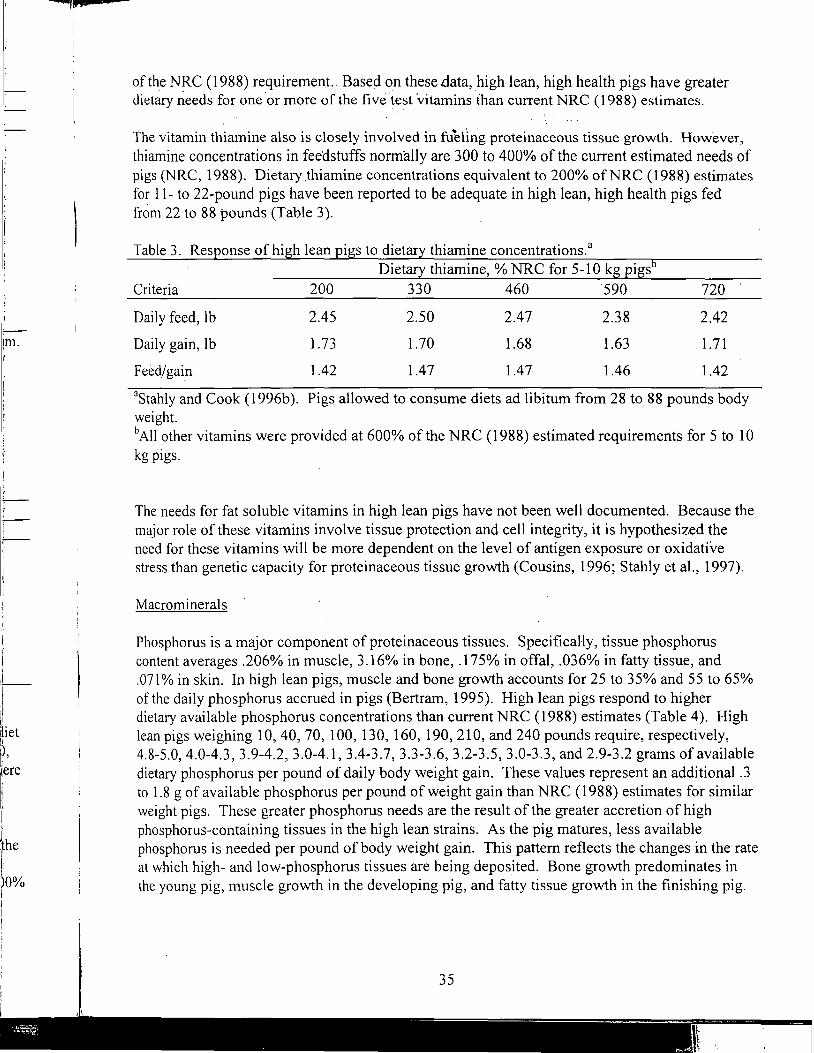
·_, -
-I -
lffi.
t
,_I_ r _1_
,_i_
I '1 1,
iii et ii 1),
~ere
ll
II t'he l 11
11°% Ii I
I
of the NRC (1988) requirement.. Based on these.data, high lean, high health pigs have greater dietary needs for one ·or more of the five test vitamins than current NRC (1988) estimates.
The vitamin thiamine also is closely involved in fueling proteinaceous tissue growth. However, thiamine concentrations in feedstuffs normally are 300 to 400% of the current estimated needs of pigs (NRC, 1988). Dietary .thiamine concentrations equivalent to 200% of NRC (1988) estimates for 11- to 22-pound pigs have been reported to be adequate in high lean, high health pigs fed from 22 to 88 pounds (Table 3).
Table 3. Response of high lean pigs to dietary thiamine concentrations. a
Dietary thiamine, % NRC for 5-10 kg pigs6
Criteria 200 330 460 590 720
Daily feed, lb
Daily gain, lb
Feed/gain
2.45
1.73
1.42
2.50
1.70
1.47
2.47
1.68
1.47
2.38
1.63
1.46
2.42
1. 71
1.42
3Stahly and Cook (1996b ). Pigs allowed to consume diets ad libitum from 28 to 88 pounds body weight. b All other vitamins were provided at 600% of the NRC (1988) estimated requirements for 5 to 10 kg pigs.
The needs for fat soluble vitamins in high lean pigs have not been well documented. Because the major role of these vitamins involve tissue protection and cell integrity, it is hypothesized the need for these vitamins will be more dependent on the level of antigen exposure or oxidative stress than genetic capacity for proteinaceous tissue growth (Cousins, 1996; Stahly et al., 1997).
Macro minerals
Phosphorus is a major component of proteinaceous tissues. Specifically, tissue phosphorus content averages .206% in muscle, 3 .16% in bone, .175% in offal, .036% in fatty tissue, and .071 % in skin. In high lean pigs, muscle and bone growth accounts for 25 to 35% and 55 to 65% of the daily phosphorus accrued in pigs (Bertram, 1995). High lean pigs respond to higher dietary available phosphorus concentrations than current NRC (1988) estimates (Table 4). High lean pigs weighing 10, 40, 70, 100, 130, 160, 190, 210, and 240 pounds require, respectively, 4.8-5.0, 4.0-4.3, 3.9-4.2, 3.0-4.1, 3.4-3.7, 3.3-3.6, 3.2-3.5, 3.0-3.3, and 2.9-3.2 grams of available dietary phosphorus per pound of daily body weight gain. These values represent an additional .3 to 1.8 g of available phosphorus per pound of weight gain than NRC ( 1988) estimates for similar weight pigs. These greater phosphorus needs are the result of the greater accretion of high phosphorus-containing tissues in the high lean strains. As the pig matures, less available phosphorus is needed per pound of body weight gain. This pattern reflects the changes in the rate at which high- and low-phosphorus tissues are being deposited. Bone growth predominates in the young pig, muscle growth in the developing pig, and fatty tissue growth in the finishing pig.
35
'~ . ii, '
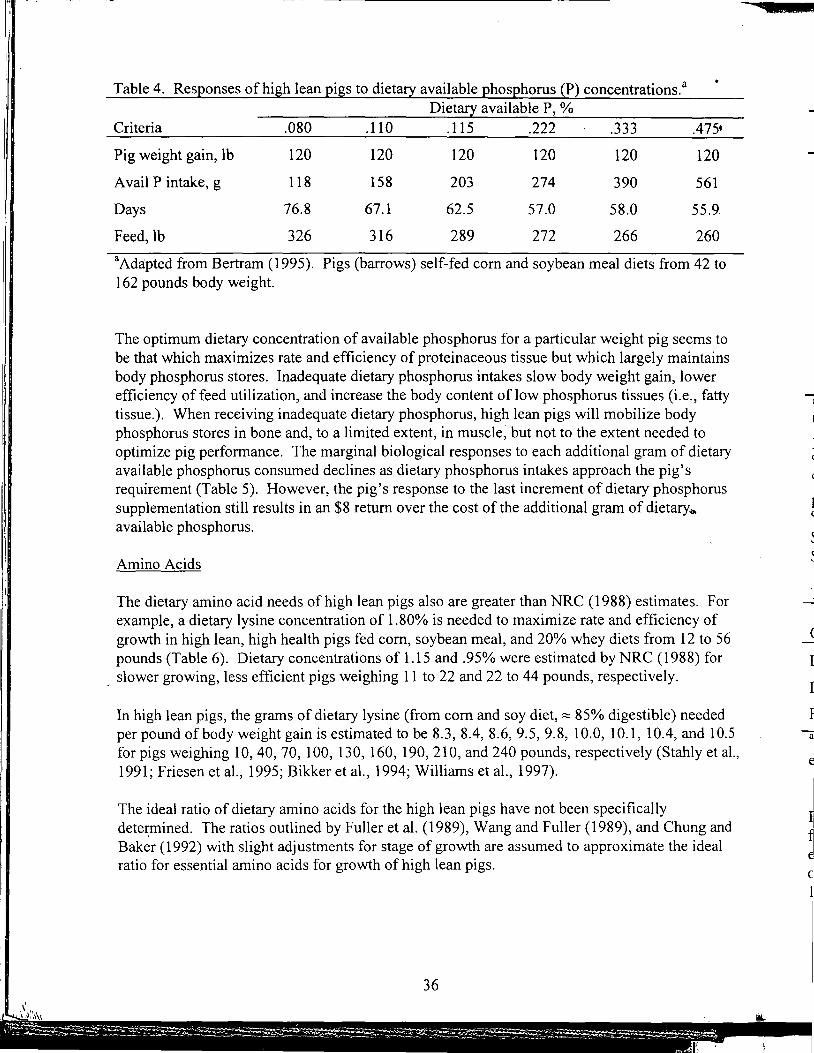
"'
Table 4. Responses of high lean pigs to dietary available phosphorus (P) concentrations.a Dietary available P, %
Criteria .080 .110 .115 .222 .333
Pig weight gain, lb 120 120 120 120 120
Avail P intake, g
Days
Feed, lb
118
76.8
326
158
67.1
316
203
62.5
289
274
57.0
272
390
58.0
266
.475•
120
561
55.9
260
aAda:pted from Bertram (1995). Pigs (barrows) self-fed com and soybean meal diets from 42 to 162 pounds body weight.
The optimum dietary concentration of available phosphorus for a particular weight pig seems to be that which maximizes rate and efficiency of proteinaceous tissue but which largely maintains body phosphorus stores. Inadequate dietary phosphorus intakes slow body weight gain, lower efficiency of feed utilization, and increase the body content of low phosphorus tissues (i.e., fatty tissue.). When receiving inadequate dietary phosphorus, high lean pigs will mobilize body phosphorus stores in bone and, to a limited extent, in muscle, but not to the extent needed to optimize pig performance. The marginal biological responses to each additional gram of dietary available phosphorus consumed declines as dietary phosphorus intakes approach the pig's requirement (Table 5). However, the pig's response to the last increment of dietary phosphorus supplementation still results in an $8 return over the cost of the additional gram of dietary~ available phosphorus.
Amino Acids
The dietary amino acid needs of high lean pigs also are greater than NRC (1988) estimates. For example, a dietary lysine concentration of 1.80% is needed to maximize rate and efficiency of growth in high lean, high health pigs fed com, soybean meal, and 20% whey diets from 12 to 56 pounds (Table 6). Dietary concentrations of 1.15 and .95% were estimated by NRC (1988) for
_ slower growing, less efficient pigs weighing 11 to 22 and 22 to 44 pounds, respectively.
In high lean pigs, the grams of dietary lysine (from com and soy diet, ~ 85% digestible) needed per pound of body weight gain is estimated to be 8.3, 8.4, 8.6, 9.5, 9.8, 10.0, 10.1, 10.4, and 10.5 for pigs weighing 10, 40, 70, 100, 130, 160, 190, 210, and 240 pounds, respectively (Stahly et al., 1991; Friesen et al., 1995; Bikker et al., 1994; Williams et al., 1997).
The ideal ratio of dietary amino acids for the high lean pigs have not been specifically determined. The ratios outlined by Fuller et al. (1989), Wang and Fuller (1989), and Chung and Baker (1992) with slight adjustments for stage of growth are assumed to approximate the ideal ratio for essential amino acids for growth of high lean pigs.
36
~ 1
i 1
a , ]
1 , s
I s
~ 1 1 ~
I
E I
l G
E I
~ G
1
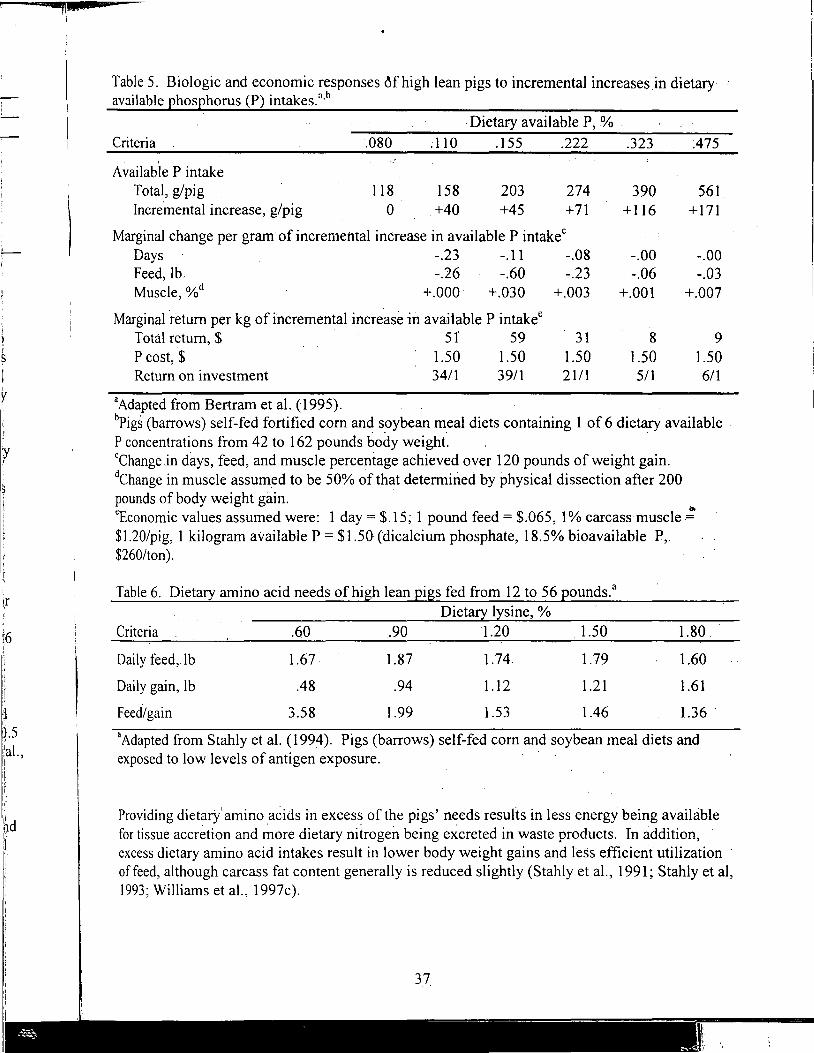
9
-: -
Table 5. Biologic and economic responses Mhigh lean pigs to incremental increases in dietary available phosphorus (P) intakes. a,b
·Dietary available P, % . Criteria .080 :110 .155 .222 .323 :475
Available P intake Total, g/pig 118 158 203 274 390 561 Incre.mental increase, g/pig 0 . +40 +45 + 71 +116 +171
Marginal change per gram of incremental increase in available P intakec Days -.23 -.11 -.08 -.00 -.00 Feed, lb. -.26 -.60 -.23 -.06 -.03 Muscle, o/od +.000 +.030 +.003 +.001 +.007
Marginal return per kg of incremental increase in available P intakee Total return,$ . 5 t 59 31 8 9 P cost, $ 1.50 1.50 1.50 1.50 1.50 Return on investment 3411 3911 21/1 511 611
a Adapted from Bertram et al. (1995). , bPigs (barrows) self-fed fortified com and s_oybean meal diets containing 1 of 6 dietary available . P concentrations from 42 to 162 pounds body weight. cChange.in days, feed, and muscle percentage achieved over 120 pounds of weight gain. dChange in muscle assumed to be 50% of that determined by physical dissection after 200 pounds of body weight gain. eEconomic values assumed were: 1 day= $.15; 1 pound feed= $.065, 1 % carcass muscle-~ $1.20/pig, I kilogram available P = $1.50 (dicalcium phosphate, 18.5% bioavailable P,. $260/ton).
Table 6. Dietary amino acid needs of high lean pigs fed from 12 to 56 pounds: a
Dietary lysine, % Criteria .60 .90 1.20 . 1.50
Daily feed,. lb
Daily gain, lb
1.67.
.48
1.87
.94
1.74
1.12
1.79
1.21
1.80
1.60
1.61
Feed/gain 3.58 1.99 1.53 1.46 1.36
aAdapted from Stahly et al. (1994). Pigs (barrows) self-fed com and soybean meal diets and exposed to low levels of antigen exposure. -
Providing dietary' amino acids in excess of the pigs' needs results in less energy being available for tissue accretion and ~ore dietary nitrogen being excreted in waste products. In addition, excess dietary amino acid intakes result in lower body weight gains and less efficient utilization · offeed, although carcass fat content generally is reduced slightly (Stahly et al., 1991; Stahly et al, 1993; Williams et al., l 997c).
37.
~~~~~~~~~~~~~~~
,SJ .
""
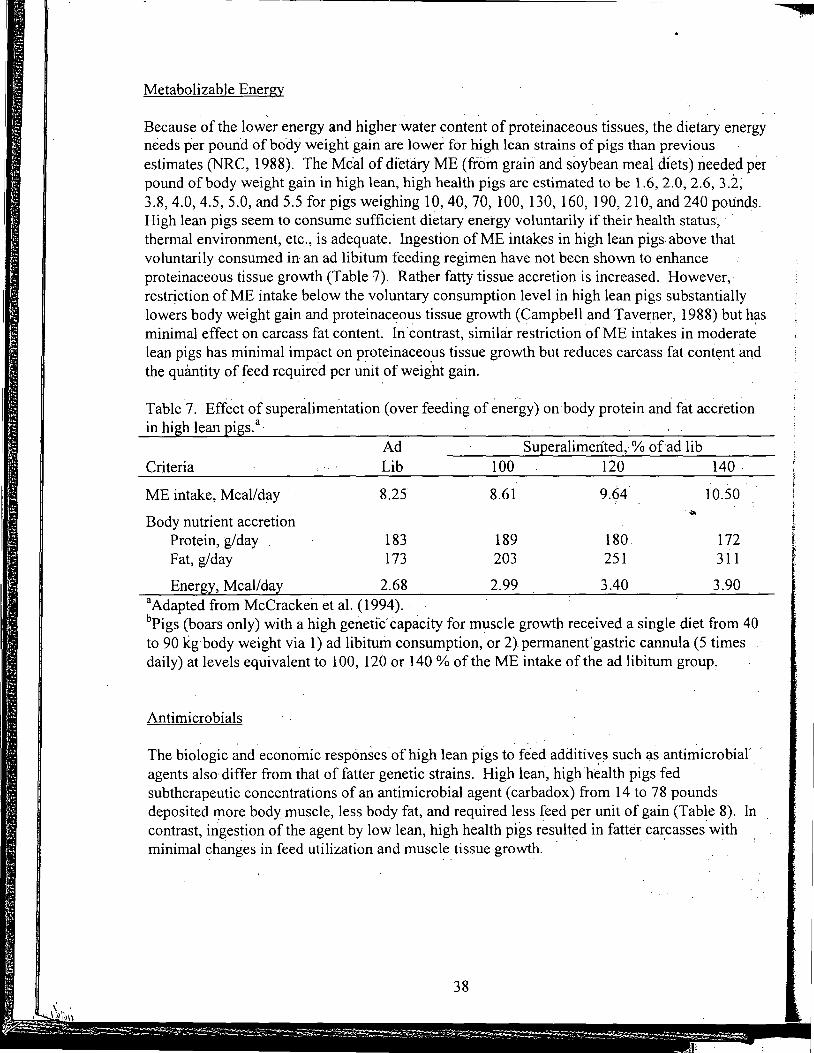
Metabolizable Energy
Because of the lower energy and higher water content of proteinaceous tissues, the dietary energy needs p"er pound of body weight gain are lower for high lean strains of pigs than previous estimates (NRC, 1988). The Meal of dietary ME (fioin grain and soybean meal diets) needed per pound of body weight gain in high lean, high health pigs are estimated to be 1.6, 2.0, 2.6, 3.2; 3.8, 4.0, 4.5, 5.0, and 5.5 for pigs weighing 10, 40, 70, 100, 130, 160, 190, 210, and 240 polinds. High lean pigs seem to consume sufficient dietary energy voluntarily if their health status, · · thermal environment, etc., is adequate. Ingestion of ME intakes in high lean pigs. above that voluntarily consumed in an ad libitum feeding regimen have not been shown to enhance proteinaceous tissue growth (Table 7). Rather fatty tissue accretion is increased. However,· restriction of ME intake below the voluntary consumption level in high lean pigs substantially lowers body weight gain and proteinaceous tissue growth (Campbell and Taverner, 1988) but h~s minimal effect on carcass fat content. In contrast, similar restriction of ME intakes in moderate lean pigs has minimal impact on proteinaceous tissue growth but reduces carcass fat contt:;nt and the quantity of feed required per unit of weight gain. ·
...
Table 7. Effect of superalimentation (over feeding of energy) on body protein and fat accretion in high lean pigs. a.
Criteria
ME intake, Meal/day
Body nutrient accretion
Ad Lib
8.25
Protein, g/day 183 Fat, g/day 173
100
8.61
189 203
Superalimerited, % of ad lib 120 140
9.64. 10.50 .lo,
180 172 251 311
Energy, Meal/day 2.68 2.99 3.40 3.90 3Adapted from McCracken et al. (1994). bPigs (boars only) with a high genetic· capacity for muscle growth received a single diet from 40 to 90 kg body weight via 1) ad libitum consumption, or 2} permanent' gastric cannula (5 times daily) at levels equivalent to 100, 120 or 140 % of the ME intake of the ad libitum group~
Antimicrobials
The biologic ~d economic responses.of high lean pi.gs t~ f~ed additiv~? such as antimicrobiar agents also differ from that of fatter genetic strains. High lean, high health pigs fed subtherapeutic concentrations of an antimicrobial agent ( carbadox) from 14 to 78 pounds deposited more body muscle, less body fat, and required l_ess feed per unit of gain (Tab~e 8). In contrast, ingestion of the agent by low lean, high health pigs resulted in fatter carcasses with minimal changes in feed utilization and muscle tissue growth. · · · ·
38
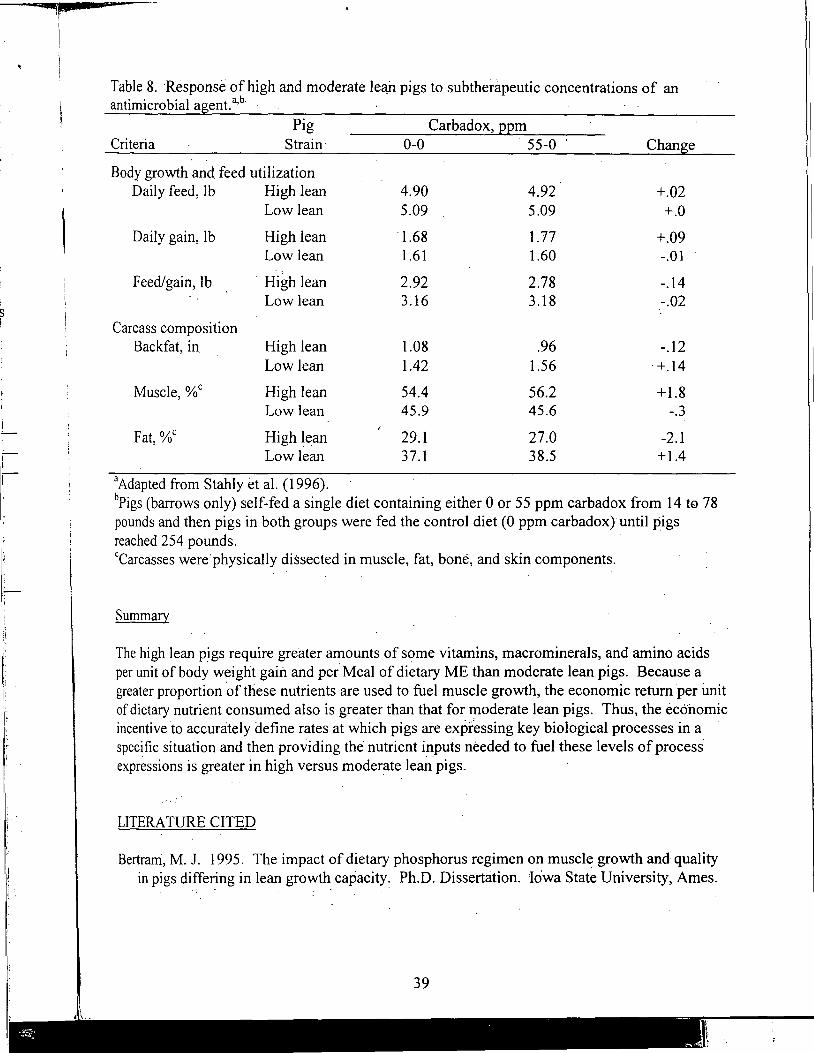
s I
I
' -[
i _, -'l '
! . !
l I !
Table 8. Response of high and moderate lean pigs to subtherapeutic concentrations of an . . b' l ab antJm1cro ia agent. ' ·
Pig Carbadox, QQm Criteria Strain· 0-0 55-0 Change
Body growth and feed utilization Daily feed, lb High lean 4.90 4.92 +.02
Low lean 5.09 5.09 +.O
Daily gain, lb High lean · 1.68 1.77 +.09 Low lean 1.61 1.60 -.01
Feed/gain, lb High lean 2.92 2.78 -.14 Low lean 3.16 3.18 -.02
Carcass composition Backfat, in High lean 1.08 .96 -.12
Low lean 1.42 1.56 +.14
Muscle, %c High lean 54.4 56.2 +1.8 Low lean 45.9 45.6 -.3
Fat, %c High lean 29.1 27.0 -2.1 Low lean 37.1 38.5 +1.4
3Adapted from Stahly et al. (1996). hPigs (barrows only) self-fed a single diet containing either 0 or 55 ppm carbadox from 14 t0 78 pounds and then pigs in both groups were fed the control diet (0 ppm carbadox}until pigs reached 254 pounds. cCarcasses were.physically dissected in muscle, fat, bone, and skin components.
Summary
The high lean pigs require greater amounts of some vitamins, macrominerals, and amino acids . .
per unit of body weight gain and per Meal of dietary ME than moderate lean pigs. Because a greater proportion of these nutrients are used to fuel muscle growth, the economic return per ilnit of dietary nutrient consumed also is greater than that for ITioderate lean pigs. Thus, the economic incentive to accurately define rates at which pigs are expressing key biological processes in a specific situation and then providing the nutrient inputs needed to fuel these levels of process expressions is greater in high versus moderate lean pigs.
LITERATURE CITED
Bertrarri, M. J. 1995. The impact of dietary phosphorus regimen on muscle growth and quality in pigs differ_ing in lean growth capacity: Ph.D. Dissertation. IOwa State University, Ames.
39
~ :I~ ..
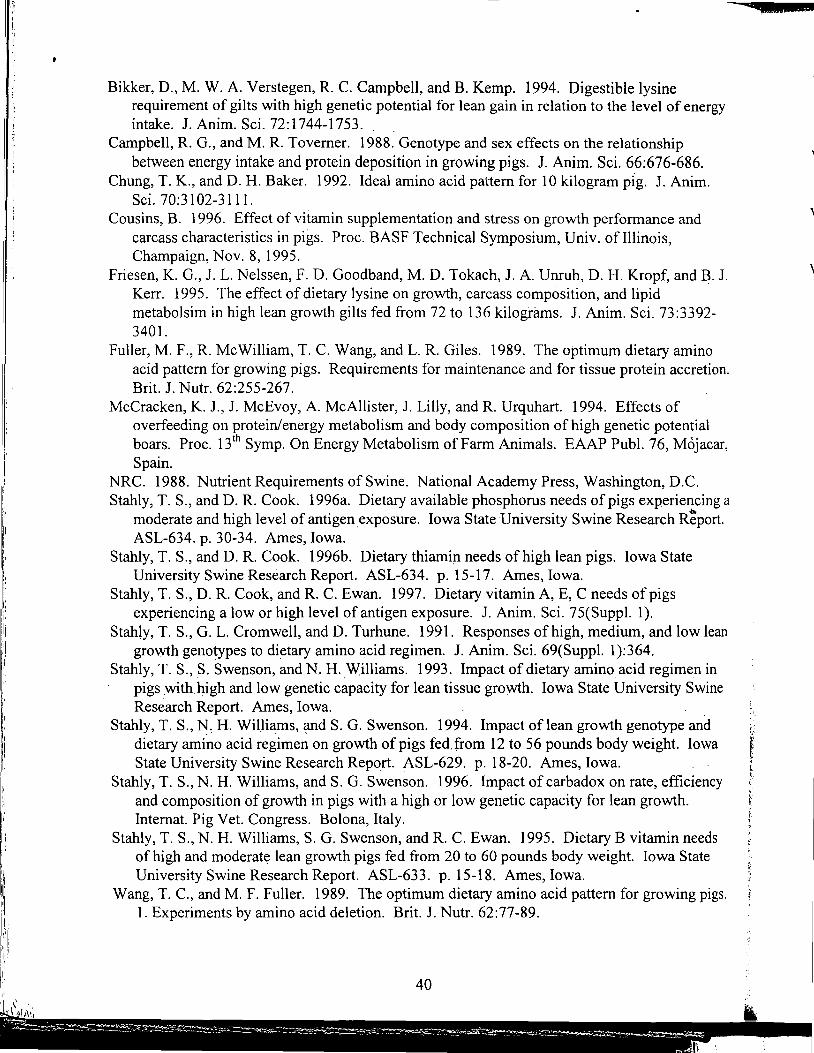
I .I ,, I
~ I ·11 I'
i'l I
:·1 l'' I .,
Bil(ker, D., M. W. A. Verstegen, R. C. Campbell, and B. Kemp. 1994. Digestible lysine requirement of gilts with high genetic potential for lean gain in relation to the level of energy intake. J. Anim. Sci. 72:1744-1753.
Campbell, R. G., and M. R. Toverner. 1988. Genotype and sex effects on the relationship between energy intake and protein deposition in growing pigs. J. Anim. Sci. 66:676-686.
Chung, T. K., and D. H. Baker. 1992. Ideal amino acid pattern for 10 kilogram pig. J. Anim. Sci. 70:3102-3111.
Cousins, B. 1996. Effect of vitamin supplementation and stress on growth performance and carcass characteristics in pigs. Proc. BASF Technical Symposium, Univ. of Illinois, Champaign, Nov. 8, 1995.
Friesen, K. G., J. L. Nelssen, F. D. Goodband, M. D. Tokach, J. A. Unruh, D. H. Kropf, and B. J. Kerr. 1995. The effect of dietary lysine on growth, carcass composition, and lipid metabolsim in high lean growth gilts fed from 72 to 136 kilograms. J. Anim. Sci. 73:3392-3401.
Fuller, M. F., R. McWilliam, T. C. Wang, and L. R. Giles. 1989. The optimum dietary amino acid pattern for growing pigs. Requirements for maintenance and for tissue protein accretion. Brit. J. Nutr. 62:255-267.
McCracken, K. J., J. McEvoy, A. McAllister, J. Lilly, and R. Urquhart. 1994. Effects of overfeeding on protein/energy metabolism and body composition of high genetic potential boars. Proc. 13th Syrup. On Energy Metabolism of Farm Animals. EAAP Publ. 76, Mojacar, Spain.
NRC. 1988. Nutrient Requirements of Swine. National Academy Press, Washington, D.C. Stahly, T. S., and D. R. Cook. 1996a. Dietary available phosphorus needs of pigs experiencing a
moderate and high level of antigen exposure . .Iowa State University Swine Research R~port. ASL-634. p. 30-34. Ames, Iowa.
Stahly, T. S., and D.R. Cook. 1996b. Dietary thiamin needs of high lean pigs. Iowa State University Swine Research Report. ASL-634. p. 15-17. Ames, Iowa.
Stahly, T. S., D.R. Cook, and R. C. Ewan. 1997. Dietary vitamin A, E, C needs of pigs experiencing a low or high level of antigen exposure. J. Anim. Sci. 75(Suppl. 1 ).
Stahly, T. S., G. L. Cromwell, and D. Turhune. 1991. Responses of high, medium, and low lean growth genotypes to dietary amino acid regimen. J. Anim. Sci. 69(Suppl. 1):364.
Stahly, T. S., S. Swenson, and N. H"Williams. 1993. Impact of dietary amino acid regimen in pigs _with high and low genetic capacity for lean tissue growth. Iowa State University Swine Research Report. Ames, Iowa.
Stahly, T. S., ~~ H. Willi<~ms, (llld S. G. Swenson. 1994. Impact of lean growth genotype and dietary amino acid regimen on growth of pigs fedJrom 12 to 56 pounds body weight. Iowa State University Swine Research Report. ASL-629. p. 18-20. Ames, Iowa.
Stahly, T. S., N. H. Williams, and S. G. Swenson. 1996. Impact of carbadox on rate, efficiency and composition of growth in pigs with a high or low genetic capacity for lean growth. Internat. Pig Vet. Congress. Bolona, Italy.
Stahly, T. S., N. H. Williams, S. G. Swenson, and R. C. Ewan. 1995. Dietary B vitamin needs of high and moderate lean growth pigs fed from 20 to 60 pounds body weight. Iowa State University Swine Research Report. ASL-633. p. 15-18. Ames, Iowa.
Wang, T. C., and M. F. Fuller. 1989. The optimum dietary amino acid pattern for growing pigs. 1. Experiments by amino acid deletion. Brit. J. Nutr. 62:77-89.
''·
J.
. on. I
;ar, i I ' I i ~g a )ft. ;
\ean
:in :1 :•ine Ii Ii. :I Id Ii wa
It pcy
~ds :te II
Ii. IP1gs.
9*2·
Williams, N. H., T. S. Stahly, and D.R. Zimmerman. 1995. Influence of immune system activation on the digestibility, retention, and excretion of dietary protein (nitrogen) in growing pigs. Iowa State University Swine Research Report ASL-633. p. 19-22. Ames, Iowa.
Williams, N. H., T. S. Stahly, and D. R. Zimmerman. 1997a. Effect of chronic immune system activation on the rate, efficiency, and composition of growth, partial efficiency of lysine and energy utilization, and lysine needs of pigs fed from 6 to 27 kg. J. Anim. Sci. 75:(accepted).
Williams, N. H., T. S. Stahly, and D.R. Zimmerman. l 997b. Effect of chronic immune system activation on body nitrogen retention, partial efficiency of lysine utilization, and lysine needs of pigs. J. Anim. Sci. 75:(accepted).
Williams, N. H., T. S. Stahly, and D.R. Zimmerman. l 997c. Effect of level of immune system activation on the growth and dietary lysine needs of pigs fed from 6 to l 12 kg. J. Anim. Sci. 75:(accepted) .
41
Notes
( This page intentionally blank. )
INl
Phj ma the PaE thel nea ha~ of a
I
en! pro
De1 are detE
I
al. ~
Carl Ben surf part 199
The
swi~ Brid pro diet<! knoJ of p~ ~groj 1norg requ
This digei excri
I 11 I
I 42 11
11\~ ~
11 1•1, ..
...;;.:"'':"" • 4 ........... ~
A REVIEW OF THE USE OF NATUPHos® PHYTASE
IN GROWING-FINISHING SWINE DIETS
INTRODUCTION
Dr. Darrell A. Knabe and Patrick O'Quinn Texas A&M University
College Station, TX
Phytate is a natural component of plant seeds and is known to bind intrinsic minerals making them partially or totally indigestible by the nonruminant. About two-thirds of the total P in cereal grains and oilseed meals is in the form of phytate (Eeckhout and Paepe, 1994). ·The breakdown of phytate to release P and other bound minerals is by the action of the enzyme phytase. The mucosol activity of phytase in the pig is negligible (Pointillart, 1988) and most gains, oilseed meals, and grain by'"products have low phytase levels (Eeckhout and Paepe, 1994) resulting in a substantial amount of dietary P being excreted in the manure. Phosphorus excretions by swinecan be an environmental pollutant and are of particular concern in densely populated swine production areas such as the U. S. corn Belt, eastern North Carolina, Taiwan, China, Denmark, and the Netherlands (Honeyman, 1993) or where land and water supplies are limited (Cromwell and Coffey, 1991 ). Phosphorus, and not N, is the primary ~ determinant of safe land application rates of swine manure. For example, Mueller et al. (1994) reported a large build-up of P when Bermuda grass pasture in eastern North Carolina was fertilized with swine lagoon effluent to meet the N requirements of Bermuda grass. Whereas. N and nitrogenous compounds are potential pollutants of surface and groundwater, phosphates are not very soluble in water and adhere to soil particles thus posing an environmental concern .through soil erosion (Honeyman, 1993).
The use of microbially derived phytase to reduce inorganic P supplementation of swine diets and thus, lessen environmental P loading is .a current focus·of research. Bridges et al., (1995) estimated that the amount of P excreted from a swine operation producing 10,000 pigs annually may be reduced by up to 3,000 kg through the use of dietary manipulation and phytase supplementation. Phytase supplementation is known to be effective in liberating phytate P in swine diets. The optimum inclusion rate of phytase is dependent upon the type of diet fed, the response criteria involved (growth versus bone strength for example) and the relative cost of phytase and inorganic P. Increased governmental regulation of P disposal may make phytase a required diet ingredient in the future.
This review will focus on the effects of supplemental microbial phytase on nutrient digestibility and performance of growing-finishing pigs. The .impact of phytase on P excretions will be greatest for growing-finishing pigs because they consume 70 to 80%
43
-- --~---
,..,,,, \\ '
of all feed in a farrow-to-finish operation, and because they respond to lower dietary concentration of phytase than the young pig (Kemme et al., 1997b).
The. majority of research trials reported in this review used Natuphos ®as the source of
phytase, but some of the earlier work used other sources. An extensive compilation of research reports encompassing all classes of pigs, poultry and fish is given in "Phytase in Animal Nutrition and Waste Management" published by BASF Corporation, Mount Olive, NJ.
NUTRIENT DIGESTIBILITY
..
Research trials evaluating the effects of phytase on apparent total tract digestibilities of P, Ca, and N are summarized in Table 1. Within an experiment, the diets with or without supplemental phytase had identical ingredient content with the exception of different amounts of supplemental Ca, in some experiments. In most instances, diets contained no inorganic P or very low levels of inorganic P.
The. most striking conclusion from Table 1 is that phytase supplementation consistently improves the digestibility of P. Of the 58 comparisons of diets with and without phytase supplementation, the average improvement in P digestibility was 17 percentage units. This equates to a 53% increase in apparent digestibility of phosphorus and an increase of .06% digestible P, assuming a diet contains .35% total phosphorus ft,om organic sources.
Of the 27 experiments summarized in Table 1, 15 used grain (predominantly corn)soybean meal based diets, 10 used Dutch-type diets (barley, peas, tapioca and other grain by-products), one was based on sorghum and canola meal, and one was based on sucrose and soybean meal. The increase in digestibility of P from phytase supplementation is dependent on diet composition, in that phytate varies among ingredients, and efficacy of phytase is affected by nutrient concentrations, notably Ca content (Table 3). The average improvement in P digestibility of grain-SBM based
- diets was 16 percentage units (range of 6 to 30) compared to 21 percentage units (range 10 to 29) for Dutch diets.
The response in P digestibility is also dose dependent as shown in Figure 1 which compares the level of added microbial phytase to the improvement of P digestibility measured in percentage units. The relationship between phytase level and improvements in P digestibility cannot be quantified from this crude comparison. Jongbloed et al. (1996b) determined the effect of increasing phytase on digestibility of P in a typical Dutch diet and a similar diet containing about 50% corn and soybean meal. The improvement in P digestibility was curvilinear (Figure 2) with the lowest levels of phytase causing the greatest increases in P digestibility. For example, the first addition of 200 FTU/kg to the corn-SBM type diet improved P digestibility 19 percentage units; an additional 200 FTU/kg caused a further improvement of only 4
44
I
l
i i I
i 1 (
of
)f
I
pf
itly ise ~s.
t
! of
percentage units. These data suggest that the greatest cost benefit from phytase additions will occur at additions of 500 FTU or less.
Phytase supplementation also improves digestibility of Ca but the effect is less consistent and the response is smaller than that found for P. Of the 44 comparisons in Table 1, the average improvement in Ca digestibility was 6 percentage units (49' versus 55% digestibility) with a range of -3 to 30 percentage units. The improvements in digestibility were statistically signi~icant in only_about one-half of the comparisons. Jongbloed et al. (1996c) regressed improvements in digestible Ca and P content due to phytase addition and concluded that an increase in digestible P content of 1 g/kg was associated with an increase in digestible Ca content of .55 (± .19) g/kg. This increase in digestible Ca content along with the adverse effect of excess Ga on P utilization suggests that phytase supplemented diets should have less total Ca than similar, nonsupplemented diets.
Less consistent, and of lower magnitude, is the effect of phytase on digestibility of protein/amino acids, and trace minerals. Of the 12 comparisons in Table 1, total tract N digestibility was improved by an average of only 1 percentage unit. Due to bacterial degradation and synthesis of protein in the large intestine, protein and amino acid digestibility are best evaluated at the.ileum of pigs. Mroz et al. (1994) and Jongbloed et al. (1996a) reported improvements in apparent ilea! digestibilities of some, but not all, amino acids due to phytase supplementations of 800 or 900 FTU/kg, respectively. The increases, however, were small, averaging two percentage units. O'Quinn et al. (1997) found no improvement in ilea! N digestibility or N balance from suppleme'nting . 300 or 500 FTU/kg in diets of finishing pigs. In a summary by Jongbloed et al. (199,6b); the mean percentag~ unit improvement in total tract digestibility of N (n = 17) and organic matter (ri = 12) were 0.9 and 0.2, respectively. Improvements in digestibility and retention of Cu and Zn due to supplementation of phytase in diets of young pigs have been reported (Adeola et al., 1995, Adeola et al. 1996, Pallauf and Rimbach, 1996). Although these responses are not large, they do suggest the possibility for reduced inorganic supplementation of the elements.
PIG PERFORMANCE AND CARCASS MERIT
The amount of phytase needed in the diets of growing-finishing pigs will ultimately depend upon the biological traits that are to be optimized. For terminal-cross gilts and barrows, growth performance and carcass merit are the traits of economic importance; for replacement gilts and developing boars, growth performance and bone development are the important traits. Less dietary Ca and P are needed for optimum performance and carcass merit than for bone mineralization, so less phytase will be needed to optimize performance than bone traits.
Table 2 summarizes 11 experiments that evaluated phytase in diets of growing and/or finishing pigs. Responses in daily gain, feed efficiency, and bone traits are expressed as a percentage of the positive control diets which either met or exceeded the Ca and
45
P requirements suggested by NRC (1988). This method was chosen to more easily evaluate the relative effectiveness of increasing levels of dietary phytase.
In all experiments, the addition of phytase to the negative control diets resulted in improved performance and increased bone strength. The degree of response varied . rather widely among trials, in large part due to the degree of inadequacy of the ' negative control diets compared to the positive control diet; for example, in the experiments of O'Quinn et al. (1997) and Harper et al. (1997), gain/feed was essentially equal for pigs fed the positive and negative control diets leaving little chance for improvement from phytase additions.
In experiments evaluating multiple levels of phytase additions, the phytase level resulting in performance equal to that of the positive control were: 167 (Harper et al.,'' 1997); 250 (Harper et al., 1997); 300 (O'Quinn et al., 1997); 400 (Veum et al., 1994); 400 (Veum et al., 1995); and 500 (Liu et al., 1997b). Phytase levels causing bone strengths equal to the positive controls were: 300 (O'Quinn et al., 1997); 333 (Harper et al., 1997); 400 (Veum et al., 1994); 500 (Liu et al., 1997b); 600 (Veum et al., 1995); and 1,000 (Cromwell et al., 1995).
In the experiments of Veum et al. (1996a) and Cromwell et al. (1995) feeding up to 1,000 or 830 FTU/kg, respectively, did not result in performance on bone strength equal to that of the positive control. Feeding up to 1,000 FTU/kg, in the experiment of Cromwell et al. (1995) did not maximize performance, but did maximize bone strength. The reasons for this lack of response to phytase are unknown. Wide Ca : P ratios in low-P diets have been shown to lower P digestibility, performance, and bone strength in pigs fed low-P, phytase supplemented diets (Table 3). In the experiments of · Cromwell et al. (1995) the Ca : P ratio of the low-P diets approached 2.0, whereas the 1
Ca : P ratio of the other experiments summarized in Table 2 ranged from 1 : 1 to 1.5 : 1. l !
The effect of low-P, phytase supplemented diets on carcass leanness, quality scores, t taste panel scores, and composition of lean has been evaluated in three expe,riments ~ (O'Quinn et al., 1997; Harper et al., 1997; and Liu et al., 1997a). Carcass traits were l; neither improved nor worsened by the addition or deletion of phytase to a low-P diet.
REDUCTIONS IN P EXCRETIONS
Use· of phytase to replace inorganic P supplementation will undoubtedly reduce P excretions and reduce the land area needed for environmentally responsible disposal of manure. The amount of reduction will depend upon the level of dietary P fed prior to using phytase and the level of phytase added. In a summary of 25 studies, Kornegay (as cited by Harper et al., 1997) estimated that the use of 500 FTU/kg would reduce fecal P excretions by 30%. This level of reduction would result in a net savings of about $.64 in manure disposal cost per pig marketed based on a model proposed by Bosch et al. (1996) in which manure is stored in lagoons and the effluent is used to
46
8 I I I
' I
of ~th. I
:)th I
he I
,[: 1 .
>Sal x to ray
by
irrigate crops. Manure disposal costs are real and should be considered when determining the economics of using phytase.
PHYTASE EQUIVALENCY VALUES
Table 4 lists the dietary phytase concentration estimated to provide an amount of P equal to that provided by 1 g of inorganic P/kg diet (.1 % in diet). The estimates by Harper et al. (1997) are equivalents averaged for several criteria including bone strength. Examining the results of the experiments on which these values are based suggests that performance and carcass traits can be maximized at levels below those shown in the table. Specifically, performance and carcass merit were similar for pigs fed the positive control diets and pigs fed 250 or 167 FTU/kg in the two experiments of Harper et al. (1997). In the finishing trial of O'Quinn et al. (1997) performance arid carcass merit were equal between pigs fed the positive control diets and pigs fed 300 FTU/kg.
SUMMARY
Microbial phytase consistently improves .the digestibility of P in plant-based diets. Digestibilities of Ca, Cu and Zn are also improved by phytase supplementation but the increase is smaller and less consistent than that for phosphorus. Advantages in N and organic matter digestibility from phytase supplementation are negligible. Diets • supplemented with phytase should not contain excessive Ca. Excess Ca reduces _the effectiveness of phytase; a 1 :1 to 1.2:1 Ca:total ratio is preferred.
Diets of growing-finishing pigs destined for slaughter need very little, if any, inorganic P supplementation if adequate phytase is pr9vided in the diet. Phytase supplementation in the range of 200 to 400 FTU/kg of diets should optimize performance and carcass merit.
47
It :11 .
~r.--~-~---------
' . '
, I
I :
LITERATURE CITED
Adeola, 0. 1996. Effect of supplemental phytase on trace mineral availability for swine. In: M. B. Coelho and E.T. Kornegay (Ed.) Phytase in Animal Nutrition and Waste Management, p. 435-449. BASF Corp., Mt. Olive, NJ.
Adeola, 0., B. V. Lawrence, A. L. Sutton and T. R. Cline. 1995. Phytase-induced changes in mineral utilization in zinc-supplemented diets for pigs. J. Anim. Sci. 1995. 3384-3391.
Bollinger, D. W., J. Liu, K. Zyla, D. R. Ledoux, and T. L. Veum. 1995. Microbial phytase · supplementation of a canola-grain sorghum diet and phosphorus utilization by
growing pigs. J. Anim. Sci., 73 (Suppl. 1 ):188 (Abstr.). Bosch, D., M. Zhu, and E. T. Kornegay. 1996. The potential impact of microbial
phytase on swine and poultry manure disposal costs in the United States. In: M. B. Coelho and E. T. Kornegay (Ed.) Phytase in Animal Nutrition and Waste Management, p. 621-638. BASF Corp., Mt. Olive, NJ.
Bridges, T. C., L. W. Turner, G. L. Cromwell, and J. L. Pierce. 1995. Modeling the effects of diet formulation on nitrogen and phosphorus excretion in swine waste. Appl. Eng. in Agric. 11 (5):731.
Bruce, J. A. M., F. Sundst0I. 1995. The effect of microbial phytase in diets for pigs on apparent ileal and fecal digestibility, pH and flow of digesta measurements in growing pigs fed a high-fibre diet. Can. J. Anim. Sci. 75:121-127.
Cromwell, G. L. and R. D. Coffey. 1991. Phosphorus - a key essential nutrient, yet a possible major pollutant - its central role in animal nutrition. In: T. P. Lyo~s (Ed.) Biotechnology in the Feed Industry. p 133. Alltech Tech. Publ., Nicholasville, KY.
Cromwell, G. L., R. D. Coffey, G. R. Parker, H. J. Monegue, and J. H. Randolph. 1995. Efficacy of a recombinant-derived phytase in improving the bioavailability of phosphorus in corn-soybean meal diets for pigs. J. Anim. Sci. 73:2000-2008.
Eeckhout, W. and M. de Paepe. 1994. Total phosphorus, phytate-phosphoru·s and phytase activity in plant feedstuffs. Anim. Feed Sci., and Tech. 47:19.
Han, Y. M., F. Yang, A. G. Zhou, E. R. Miller, P. K. Ku, M. G. Hogberg, and X. G. Lei. 1997. Supplemental phytase of microbial and cereal sources improve dietary phytate phosphorus utilization by pigs from weaning through finishing. J. Anim. Sci. 75:1017-1025.
Harper, A. F., E.T. Kornegay, and T. C. Schell. 1997. Phytase supplementation of low phosphorus growing-finishing pig diets improves performance, phosphorus digestibility and bone mineralization, and reduces phosphorus excretion. J. Anim. Sci. (in press).
Honeyman, M.S. 1993. Environment-friendly swine feed formulation to reduce nitrogen and phosphorus excretion. Am. J. Alt. Agric. 8(3):128.
Jongbloed, A. W., P.A. Kemme, and J. Mroz. 1996b. Effectiveness of Natuphos® phytase in improving the bioavailabilities of phosphorus and other nutrients for growing-finishing pigs. In: M. B. Coelho and E. T. Kornegay (Ed.) Phytase in Animal Nutrition and Waste Management, p. 259-274. BASF Corp., Mt. Olive, NJ.
.I
;e ;
~.
>r
-
. $7
Jongbloed, A. W., P.A. Kemme, and Z. Mroz. 1996a. Effect of microbial phytase on apparent ileal digestibilities of nitrogen and amino acids in pig diets. In: M. B. Coelho and E. T. Kornegay (Ed.) Phytase in Animal Nutrition and Waste Management, p. 477-484. BASF Corp., Mt. Olive, NJ.
Jongbloed, A. W., P.A. Kemme, and Z. Mroz. 1996c. Influence of dietary calcium levels on the effectiveness of Natuphos® phytase for swine. In: M. B. Coelho and E. T. Kornegay (Ed.) Phytase in Animal Nutrition and Waste Management, p. 393-400. BASF Corp., Mt. Olive, NJ.
Jongbloed, A. W., Z. Mroz, and P.A. Kemme. 1992. The effect of supplementary Aspergil/us niger phytase in diets of pigs on concentration and apparent digestibility of dry matter, total phosphorus, and phytic acid in different sections of the alimentary tract. J. Anim . Sci. 70: 1159-1168.
Jongbloed, A. W., Z. Mroz, P.A. Kemme, c.,.,Geerse, and Y. van der. Honing. 1993. The effect of dietary calcium levels on microbial phytase efficacy in growing pigs. J. Anim. Sci. 71 (Suppl. 1):166 (Abstr.).
Kemme, P.A., A. W. Jongbloed, Z. Mroz, and A. C. Beynen. 1997a. The efficacy of Aspergil/us niger phytase in rendering phytate phosphorus available for absorption in pigs is influenced by pig physiological status. J. Anim. Sci. (in press).
Kemme, P.A., J. S. Radcliffe, A. W. Jongbloed, and Z. Mroz. 1997b. Various factors affect phosphorus and calcium digestibility in diets for growing-finishing pigs. J. Anim. Sci. (in press).
Ketaren, P. P., E. S. Batterham, E. 8. Dettmann, and D. J. Farrell. 1993. Phosph_prus studies in pigs. 3. Effect of phytase supplementation on the digestibility and availability of phosphorus in soy-bean meal for grower pigs. Br. J. Nutr. 70:289.
Lei, X. G., P. K. Ku, E. R. Miller, M. T. Yokoyama, and D. E. Ullrey. 1994. Calcium level affects the efficacy of supplemental-microbial phytase in corn-soybean meal diets of weanling pigs. J. Anim. Sci. 72:139-143.
Liu, J., D. W. Bollinger, D. R. Ledoux, and T. L Veum. 1997a. Lowering the dietary calcium to total phosphorus (P) ratio increases the efficacy of supplemental microbial phytase in low-P corn-soybean meal diets fed to growing-finishing pigs. J. Anim. Sci.. (in press).
Liu, J., D. W. Bollinger, D.R. Ledoux, M. R. Ellersieck, and T. L. Veum. 1997b. Soaking increases the efficacy of supplemental microbial phytase in a lowphosphorus corn-soybean meal diet for growing pigs. J. Anim. Sci 75: 1292-1298.
Mroz, Z., A. W. Jongbloed, P. A. Kemme. 1994. Apparent digestibility and retention of dietary nutrients bound to phytate complexes is influenced by microbial phytase and feeding regimen in pigs. J. Anim. Sci. 72:126-132.
Mueller, J.P., J.P. Zublena, M. H. Poore, J.C. Barker, and J. T. Green. 1994. Managing pasture and hay fields receiving nutrients from anaerobic swine waste lagoons. NC Cooperative Ext. Service AG-506, Raleigh.
Nasi, M. 1990. Microbial phytase supplementation for improving availability of plant phosphorus in the diets of the growing pigs. J. Agric. Sci. in Finland. 61 :435-443.
49
-- --
""' I\ . 1lt
:'
~ . - --- - -------- --- --!
! I
NRG. 1988_ Nutrient Requirements of Swine (9th Ed-). National Academy Press, Washington, D. C.
O'Quinn, P.R., D. A. Knabe, and E. J. Gregg. 1997. Efficacy of Natuphos ®in
sorghum-based diets of finishing swine. J. Anim. Sci. 75:1299-1307. Pallauf, J. and G. Rimbach. 1996. Effect of supplemental phytase on mineral and
trace element bioavailability and heavy metal accumulation in pigs with different" type of diets. In: M. B. Coelho and E. T. Kornegay (Ed.) Phytase in Animal Nutrition and Waste Management, p. 451-465. BASF Corp., Mt. Olive, NJ.
Pointillart; A. 1988. Phytate phosphorus utilization in growing pigs. Proc. 4th Int. Seminar on Digestive Physiology in the Pig. p. 319. Polish Academy of Science. Jablonna, Poland.
Simons, P. C. M., H. A. J. Versteegh, A. W. Jongbloed, P.A. Kemme, P. Slump, K. 0. ,, Bos, M. G. E. Wolters, R. F. Beudeker, and G. J. Verschoor. 1990. Improvement of phosphorus availability by microbial phytase in broilers and pigs. Br. J. Nutr., 64:525-540.
Veum, T. L. 1996. Use of microbial phytase in corn-soybean meal and grain sorghum-canola meal diets for growing-finishing swine. In: M. B. Coelho and E.T. Kornegay (Ed.) Phytase in Animal Nutrition and Waste Management, p. 365-380. BASF Corp., Mt. Olive, NJ.
Veum, T. L., J. Liu, 0. W. Bollinger, and D. R. Ledoux. 1996a. Effect of replacement of .1 % inorganic phosphorus with microbial phytase in a corn-soybean meal diet on performance of growing-finishing pigs. J. Anim. Sci. 74 (Suppl. 1 ):52 (Abstr.). .,.
Veum, T. L., J. Liu, D. W. Bollinger, and 0. R. Ledoux. 1996b. Replacing .1 % of the inorganic phosphorus (iP) with microbial phytase in corn-soybean diets and'the effect on P digestibility by growing-finishing pigs. J. Anim. Sci. 74 (Suppl. 1):185 (Abstr.).
Veum, T. L., J. Liu, D. W. Bollinger, K. Zyla and 0. R. Ledoux. 1995. Microbiai phytase replaces· inorganic phosphorus in canola-grain sorghum diets for growingfinishing pigs. J. Anim. Sci. 73 (Suppl. 1 ):76.
Veum, T. L., J. Liu, 0. W. Bollinger, K. Zyla, and 0. R. Ledoux. 1994. Use of a microbial phytase in a canola-grain sorghum diet to increase phosphorus utilization by. growing pigs. J. Anim. Sci., 72 (Suppl. 1 ):218.
50
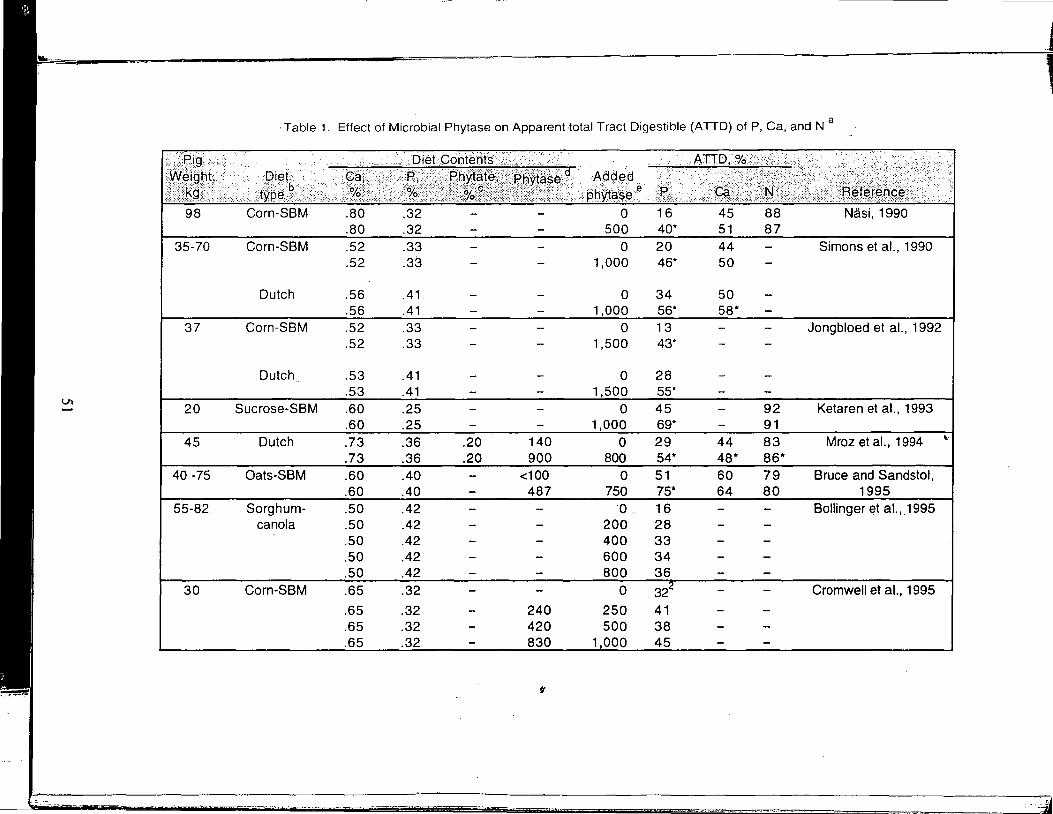
..._c.-
I Vo -
.·.·. <~ig,,, ~~IQ.ht;
. } oi~Q/(>''. 98
35-70
37
20
45
40 -75
55-82
30
·Table 1. Effect of Microbial Phytase on Apparenttotal Tract Digestible (ATTD) of P, Ca, and Na
Corn-SBM .80 .80
Corn-SBM .52 .52
Dutch .56 .56
Corn-SBM .52 .52
Dutch .53 ..
.53 Sucrose-SBM .60
.60 Dutch .73
.73 Oats-SBM .60
.60 --Sorghum- . 50
ca no la .50 .50 .50 .50
Corn-SBM .65
.65
.65
.65
,Diet.Conterifa
.32
.32
.,33
.33
.41
.41
.33
.33
.41
.41
.25
.25
.36
.36
.40
.40
.42
.42
.42
.42
.42
.32
.32
.32
.32
.20 140
.20 900 <100
487
240 420 830
t
A(jdgd
Ph~~~~·~ 0
500 0
1,000
0 1,000
0 1,500
0 1,500
0 1,000
0 800
0 750
0 . 200 400 600 800
0
250 500
1,000
16 40* 20 46*
34 56* 13 43*
28 55* 45 69* 29 54* 51 75* 16 28 33 34 36
32 41 38 45
45 51 44 50
50 58*
44 48* 60 64
88 87
92 91 83 86* 79 80
Nasi, 1990
Simons et al., 1990
Jongbloed et al., 1992
Ketaren et al., 1993
Mroz et al., 1994
Bruce and Sandstot, 1995
Bollinger et at., .1995
Cromwell et at., 1995
j
~
,.
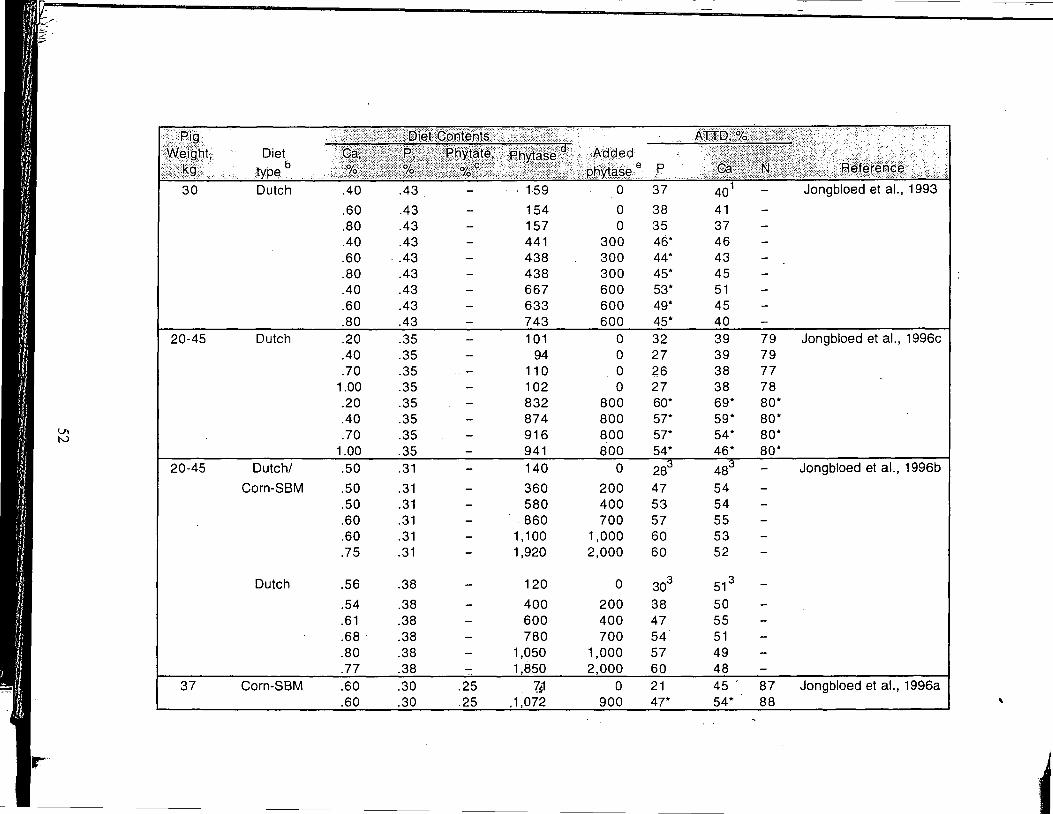
I
1
ix/Rig·•·. N¥ef96t; Diet
.· <: .. ~t;,it1:J,1:t,~;ii·!~i1l:i:i1t.~\(;~)1Ji~;f ~f~-!~;i,/.:~~~~,~;~~:; · ... L~h~t.::. e. ;_:'.-;g~::·.····· . b p .typg 30 Dutch .40 .43 - . 159 0 37 40
1 - Jongbloed et al., 1993
.60 .43 - 154 0 38 41
.80 .43 - 157 0 35 37
.40 .43 - 441 300 46* 46
.60 .. 43 - 438 300 44* 43
.80 .43 - 438 300 45* 45
.40 .43 - 667 600 53* 51
.60 .43 - 633 600 49* 45
.80 .43 - 743 600 45* 40 20-45 Dutch .20 .35 - 101 0 32 39 79 Jongbloed et al., 1996c
.40 .35 - 94 0 27 39 79
.70 .35 - 110 .0 26 38 77 1.00 .35 - 102 0 27 38 78 .20 .35 - 832 800 60* 69* 80* .40 .35 - 874 800 57* 59* 80*
Vl I .70 .35 - 916 800 57* 54* 80* N 1.00 .35 - 941 800 54* 46* 80*
20-45 Dutch/ .50 .31 - 140 0 283
483 - Jongbloed et al., 1996b
Corn-SBM .50 .31 - 360 200 47 54 .50 .31 - 580 400 53 54 .60 .31 - 860 700 57 55 .60 .31 - 1, 100 1,000 60 53 .75 .31 - 1,920 2,000 60 52
Dutch .56 .38 - 120 0 303
513
.54 .38 - 400 200 38 50
.61 .38 - 600 400 47 55
.68 .38 - 780 700 54 51
.80 .38 - 1,050 1,000 57 49
.77 .38 - 1,850 2,000 60 48 37 Corn-SBM .60 .30 .25 7s1 0 21 45 ' 87 Jongbloed et al., 1996a
.60 .30 .25 ,1,072 900 47* 54* 88 I '
,.. ~
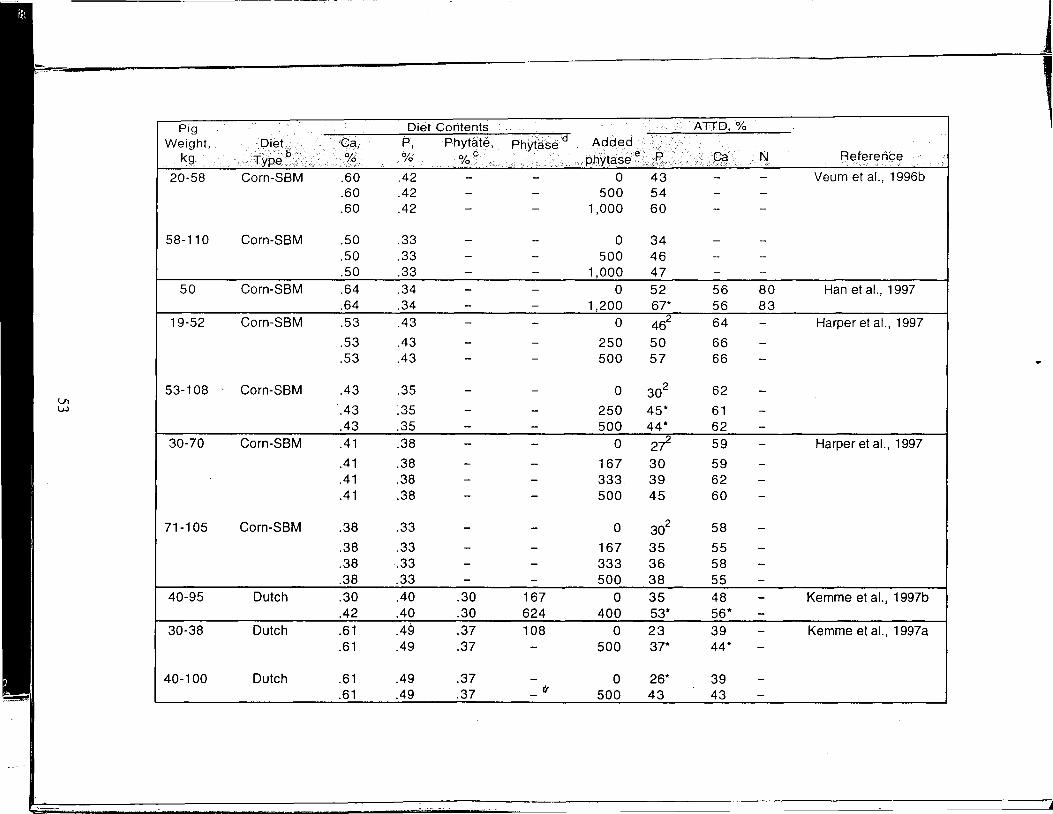
.......
Vl w
Pig Weight, Diet .... ·Ca,
kg . T b . % ... · .. .. .ype.,,, .. > ..
20-58 Corn-SBM .60 .60 .60
58-110 Corn-SBM .50 .50 .50
50 Corn-SBM .64 .64
19-52 Corn-SBM .53
.53
.53
53-108 Corn-SBM .43
.43 .43
30-70 Corn-SBM .41
.41
.41
.41
71-105 Corn-SBM .38
.38
.38
.38 40-95 Dutch .30
.42 30-38 Dutch .61
.61
40-100 Dutch .61 .61
]
Diet Contents "' ADD;%
, P, Phytate, PhYfase a Added . . O/o %c ....... ·· .... ·. •. ; .· .· ... phytase ~.. P< . .ca •... N Reference
.42 - - 0 43 - - Veum et al., 1996b
.42 - - 500 54 - -
.42 - - 1,000 60 - -
.33 - - 0 34 - --
.33 - - 500 46 - -
.33 - - 1,000 47 - -
.34 - - 0 52 56 80 Han et al., 1997
.34 - - 1,200 67* 56 83
.43 - - 0 462 64 - Harper et al., 1997
.43 - - 250 50 66 -
.43 - - 500 57 66 -
.35 - - 0 302 62 -
.35 - - 250 45* 61 -
.35 - - 500 44* 62 -
.38 - - 0 2i 59 - Harper et al., 1997
.38 - - 167 30 59 -
.38 - - 333 39 62 -
.38 - - 500 45 60 -
.33 - - 0 302 58 -
.33 - - 167 35 55 -
.33 - - 333 36 58 -
.33 - - 500 38 55 -
.40 .30 167 0 35 48 - Kemme et al., 1997b
.40 .30 624 400 53* 56* -
.49 .37 108 0 23 39 - Kemme et al., 1997a
.49 .37 - 500 37* 44* -
.49 .37 - 0 26* 39 -
.49 .37 (T
500 43 43 - -
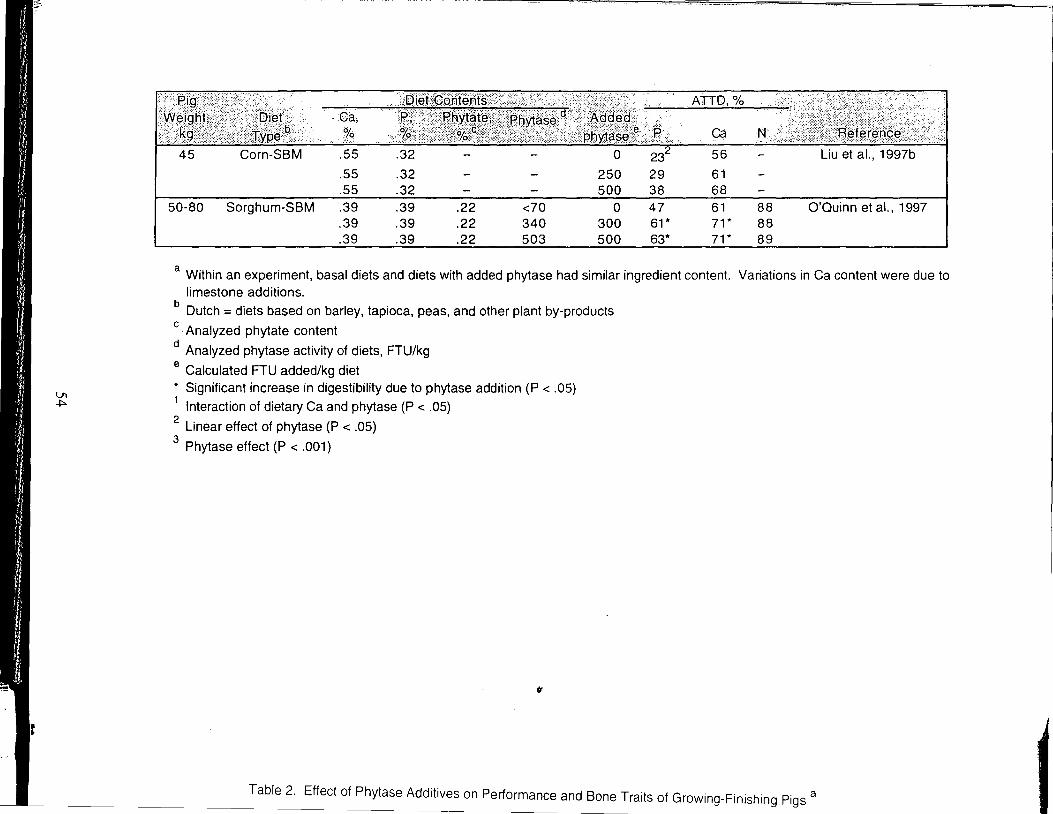
r
VI +:-
I·• '.c • <•• "rn' • . ~·- .:liii~iitii ~f !~,·~~gf~til~i ft ; . ATT: % N• ,'.,.'~''. •'"'''. - ,, .. , ,, 'I o 232 56 - Liu et al., 1997b 45 Corn-SBM
50-80 Sorghum-SBM
.55
.55
.55
.39
.39
.39
.32
.32
.32
.39 .22
.39 .22
.39 .22
<70 340 503
250 500
0 300 500
29 61 38 68 47 61* 63*
61 71 * 71*
88 88 89
O'Quinn et al., 1997
a Within an experiment, basal diets and diets with added phytase had similar ingredient content. Variations in Ca content were due to limestone additions.
b Dutch = diets based on barley, tapioca, peas, and other plant by-products c
·Analyzed phytate content
d Analyzed phytase activity of diets, FTU/kg
e Calculated FTU added/kg diet * Significant increase in digestibility due to phytase addition (P < .05) 1
Interaction of dietary Ca and phytase (P < .05) 2
Linear effect of phytase (P < .05) 3
Phytase effect (P < .001)
v
Table 2. Effect of Phytase Additives on Performance and Bone Traits of Growing-Finishing Pigs a
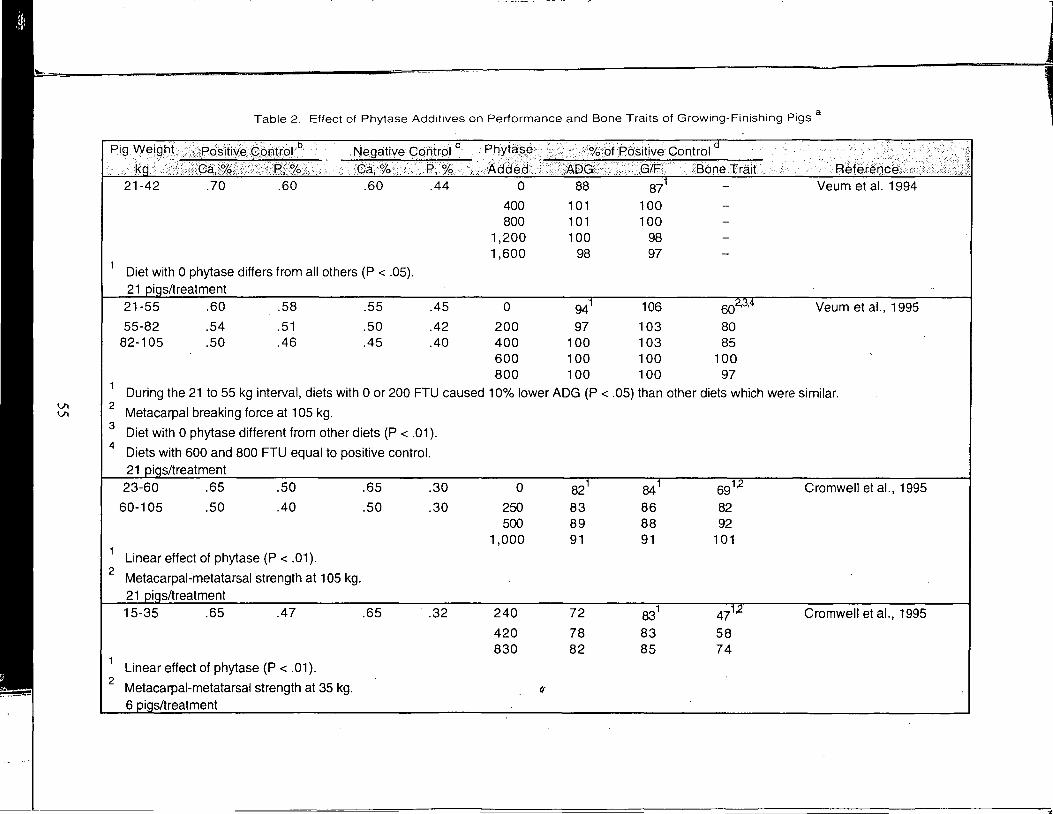
1 ... ___ _
Table 2. Effect of Phytase Additives on Performance and Bone Traits of Growing-Finishing Pigs a , Pig Weight . \positive. Control. . Negative Cqlltrol c Phyta~e ··· .· <%·oi:Positive Control
··-·. ka .•.. L·- ;'.;C:a;\%;:. >· R; ~/ci ; .. :ca.,O/o•··. )?,% 1 ..• -.•Adc:fed.····· :AoG> .GIF BoneTrait 21-42 .70 .60 .60 .44 0 88 871
400 101 100 800 101 100
1,200 100 98 1,600 98 97
Diet with 0 phytase differs from all others (P < .05). 21 ~igs/treatment 21-55 .60 .58 .55 .45 0 941 106 602;3,4 Veum et al., 1995
55-82 .54 .51 .50 .42 200 97 103 80 82-105 .50 .46 .45 .40 400 100 103 85
600 100 100 100 800 100 100 97
During the 21 to 55 kg interval, diets with 0 or 200 FTU caused 10% lower ADG (P < .05) than other diets which were similar.
~ I 2 Metacarpal breaking force at 105 kg.
3 Diet with O phytase different from other diets (P < .01 ).
4 Diets with 600 and 800 FTU equal to positive control. 21 ~igs/treatment
23-60 .65 .50 .65 .30 0 821 841
----- 691,2 Cromwell et al., 1995
60-105 .50 .40 .50 .30 250 83 86 82 500 89 88 92
1,000 91 91 101 Linear effect of phytase (P < .01 ).
2 Metacarpal-metatarsal strength at 105 kg. 21 ~igs/treatment 15-35 .65 .47 .65 .32 240 72 831 --471,2 Cromwell et al., 1995
420 78 83 58 830 82 85 74
Linear effect of phytase (P < .01 ). 2
Metacarpal-metatarsal strength at 35 kg. fl
6 oias/treatment
"
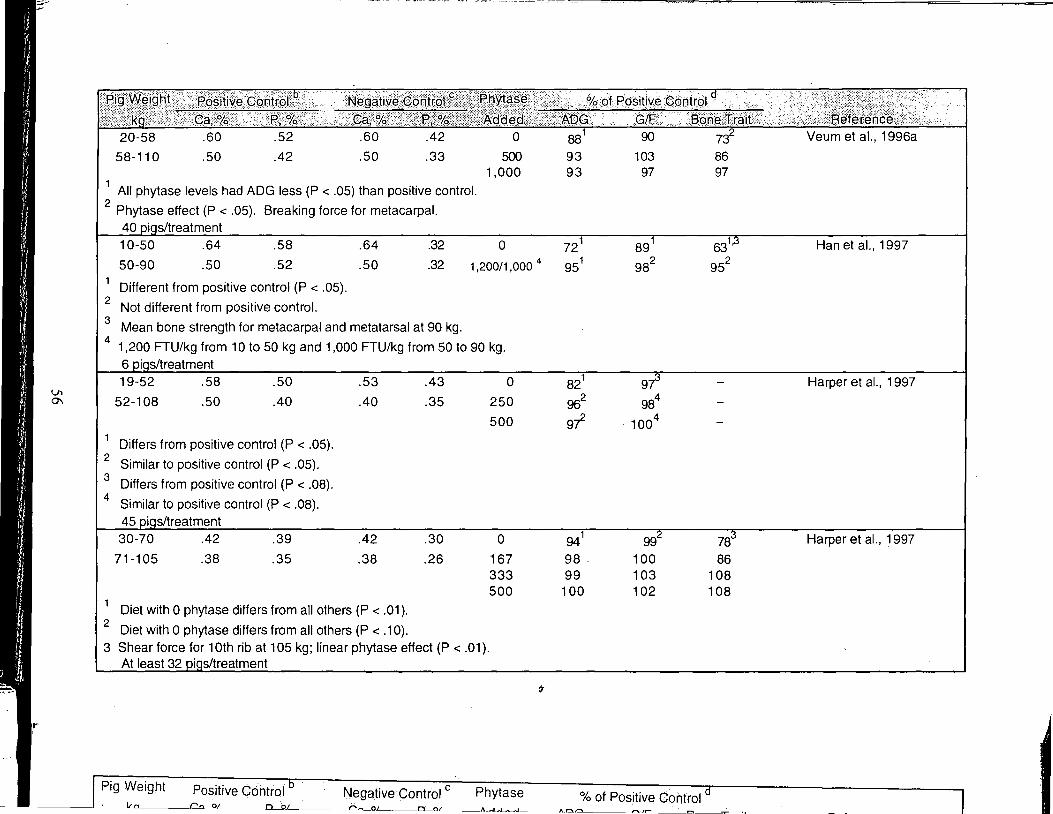
Vl I 0\
,.
·<·· ...•. /.~t~1J1?~·???~~~;.'..:~ . •.':h;;'dL? \t:TO:Pii>i1>
20-58 .60 .52
58-110 .50 .42
.60
.50
.42
.33
1 All phytase levels had ADG less (P < .05) than positive control.
2 Phytase effect (P < .05). Breaking force for metacarpal. 40 oias/treatment
0
500 1,000
10-50 .64 .58 .64 .32 0 72
50-90 .50 .52 .50 .32 1,200/1,000 4 951
Different from positive control (P < .05). 2
Not different from positive control. 3
Mean bone strength for metacarpal and metatarsal at 90 kg. 4
1,200 FTU/kg from 10 to 50 kg and 1,000 FTU/kg from 50 to 90 kg. 6 f2igs/treatment 19-52 .58 .50 .53
52-108 .50 .40 .40
Differs from positive control (P < .05). 2
Similar to positive control (P < .05). 3
Differs from positive control (P < .08). 4
Similar to positive control (P < .08). 45 f2igs/treatment 30-70 .42 .39 .42
71-105 .38 .35 .38
1 Diet with O phytase differs from all others (P < .01 ).
2 Diet with O phytase differs from all others (P < .10).
.43
.35
.30
.26
3 Shear force for 10th rib at 105 kg; linear phytase effect (P < .01 ). At least 32 oias/treatment
0
250
500
0
167 333 500
821
962
9f
941
98. 99
100
t
90
103 97
89
982
9y3
984
1004
97
63
952
-
--992-- --783
100 86 103 108 102 108
Pig Weight Positive Control NegativeControl c Phytase % of Positive Control
'~. -::, .
Veum et al., 1996a
Han et al., 1997
Harper et al., 1997
Harper et al., 1997
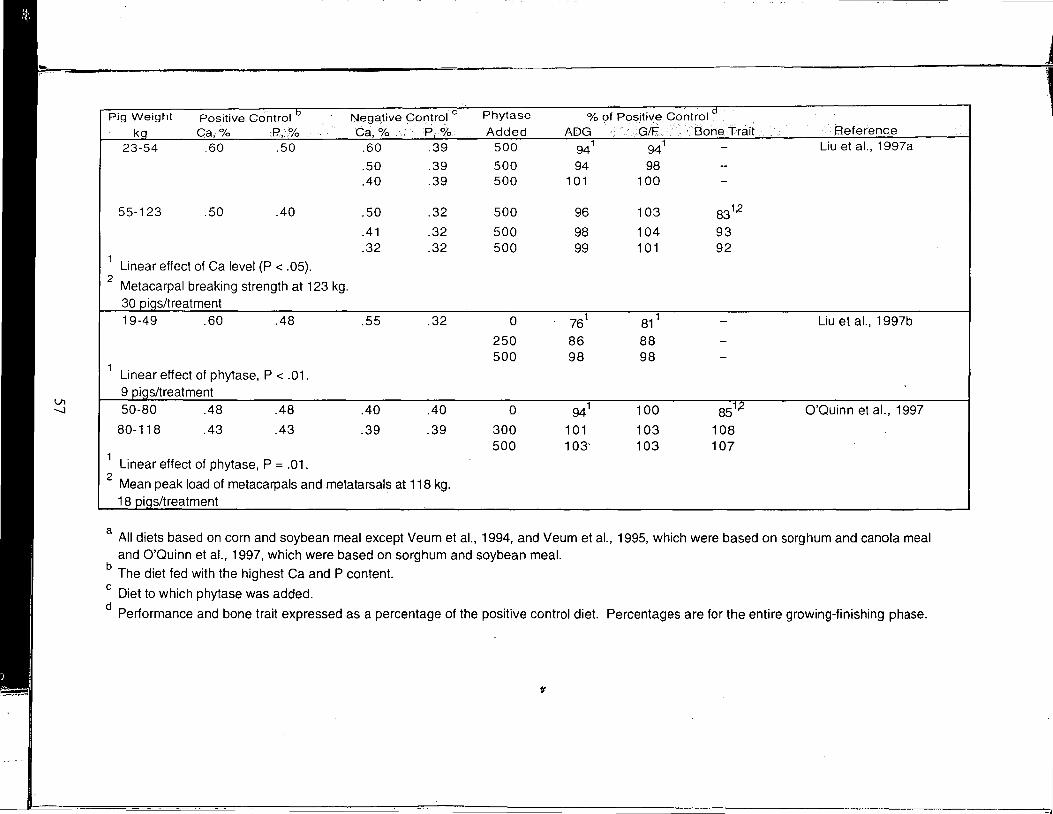
--
VI -.J
Pig Weight Positive Control 0 Nega.tive Control c Phytase % of Pos,itive Control d
ka Ca, 0/o P, 0/o Ca,% P, % Added ADG . · G/F ,. Bone Trait Reference 23-54 .60 .50 .60 .39 500 941 941 - Liu et al., 1997a
.50 .39 500 94 98 -
.40 .39 500 101 100 -
55-123 .50 .40 .50 .32 500 96 103 831,2
.41 .32 500 98 104 93
.32 .32 500 99 1 01 92 1
Linear effect of Ca level (P < .05). 2
Metacarpal breaking strength at 123 kg. 30 pigs/treatment 19-49 .60 .48 .55 .32 0 76
1 81
1 - Liu et al., 1997b
250 86 88 -500 98 98 -
1 Linear effect of phytase, P < .01. 9 piqs/treatment 50-80 .48 .48 .40 .40 0 94
1 100 851~ O'Quinn et al., 1997
80-118 .43 .43 .39 .39 300 101 103 108 500 103· 103 107
1 Linear effect of phytase, P = .01.
2 Mean peak load of metacarpals and metatarsals at 118 kg. 18 pigs/treatment
a All diets based on corn and soybean meal except Veum et al., 1994, and Veum et al., 1995, which were based on sorghum and canola meal and O'Quinn et al., 1997, which were based on sorghum and soybean meal.
b The diet fed with the highest Ca and P content.
c Diet to which phytase was added.
d Performance and bone trait expressed as a percentage of the positive control diet. Percentages are for the entire growing-finishing phase.
v
j ~
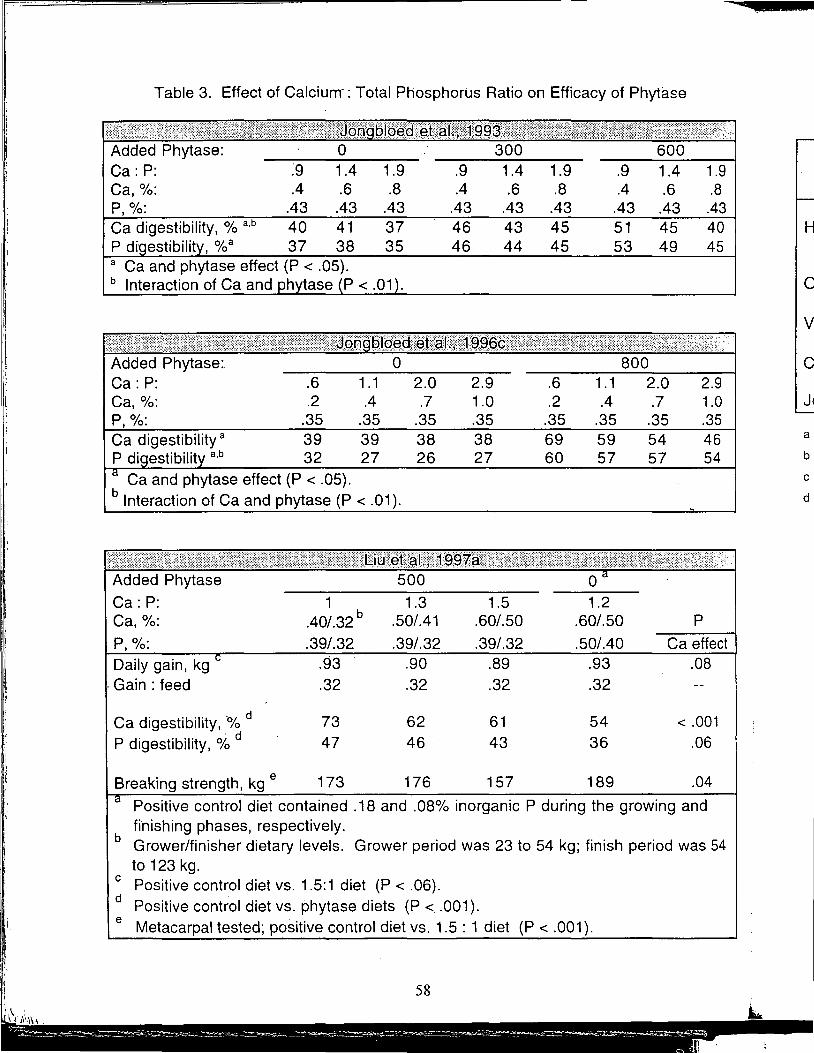
I 't
,\ ;l
I
I
Table 3. Effect of Calcium: Total Phosphorus Ratio on Efficacy of Phyta£e
Added Phytase: 0 Ca: P: :9 1.4 1.9 .9 Ca,%: .4 .6 .8 .4 P,%: .43 .43 .43 .43 Ca digestibility, % a.b 40 41 37 46 P di· estibilit , %a 37 38 35 46 a Ca and phytase effect (P < .05). b Interaction of Ca and h ase P < .01 .
Added Phytase: 0 Ca: P: .6 1 .1 2.0 Ca,%: .2 .4 .7 P,%: .35 .35 .35 Ca digestibility a 39 39 38 P di estibilit a,b 32 27 26
Ca and phytase effect (P < .05). b Interaction of Ca and phytase (P < .01 ).
Added Phytase
Ca: P: 1 1.3 Ca,%: .40/.32
b .50/.41
P,%: .39/.32 .39/.32 Daily gain, kg .93 .90
. Gain: feed .32 .32
Ca digestibility,% d 73 62 P digestibility, % d 47 46
Breaking strength, kg e 173 176
300 1.4 1.9 .6 .8
.43 .43 43 45 44 45
2.9 .6 1.0 .2 .35 .35 38 69 27 60
1.5 .60/.50
.39/.32 .89 .32
61 43
157
600 .9 1.4 1.9 .4 .6 .8 .43 .43 .43 51 45 40 53 49 45
800 1.1 .4
.35 59 57
1.2 .60/.50
.50/.40 .93 .32
54 36
189
2.0 2.9 .7 1.0 .35 .35 54 46 57 54
p
Ca effect .08
< .001 .06
.04
b
Positive control diet contained .18 and .08% inorganic P during the growing and ffnishing phases, respectively. Grower/finisher dietary levels. Grower period was 23 to 54 kg; finish period was 54 to 123 kg.
c Positive control diet vs. 1.5: 1 diet (P < .06). d
Positive control diet vs. phytase diets (P < .001 ). e Metacarpal tested; positive control diet vs. 1.5 : 1 diet (P < .001 ).
58
H
0
v
c
J~ I
a
b
c
d
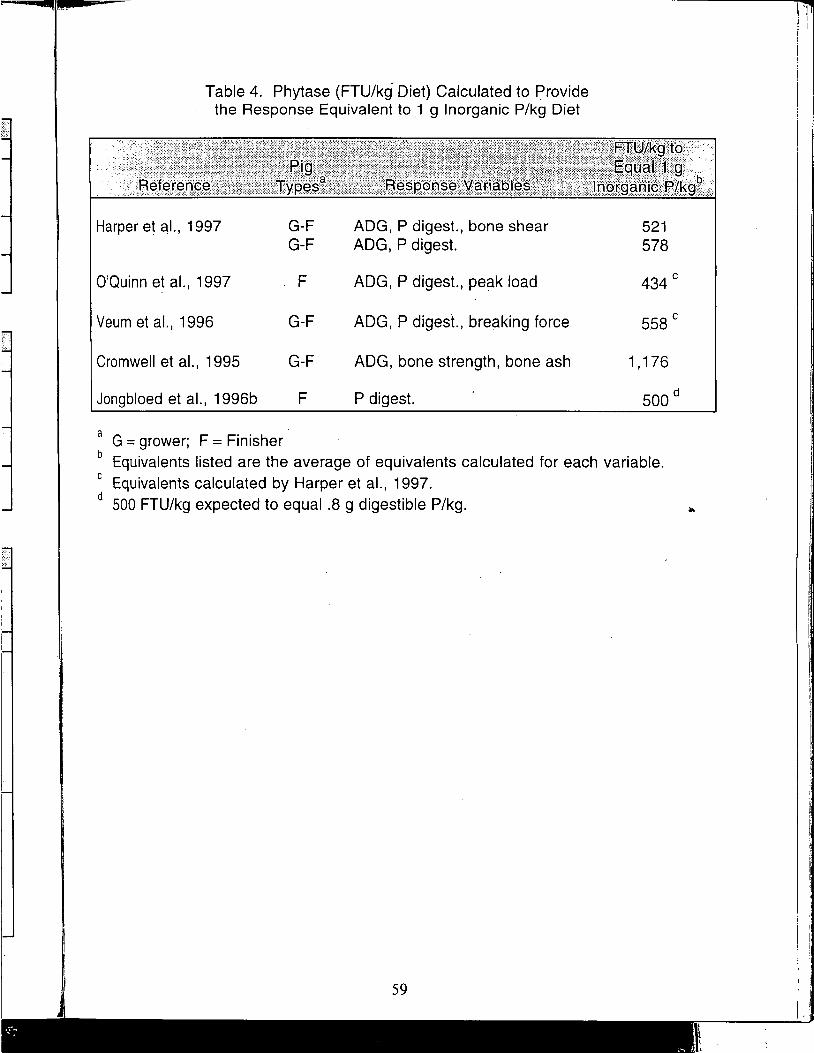
Table 4. Phytase (FTU/kg Diet) Calculated to Provide the Response Equivalent to .1 g Inorganic P/kg Diet
Harper et al., 1997 G-F ADG, P digest., bone shear G-F ADG, P digest.
O'Quinn et al., 1997 F ADG, P digest., peak load
Veum et al., 1996 G-F ADG, P digest., breaking force
Cromwell et al., 1995 G-F ADG, bone strength, bone ash
Jongbloed et al., 1996b F P digest.
a
521 578
434 c
558 c
1, 176
500 d
G = grower; F = Finisher b
Equivalents listed are the average of equivalents calculated for each variable. c
Equivalents calculated by Harper et al., 1997. ct 500 FTU/kg expected to equal .8 g digestible P/kg.
59
':! I
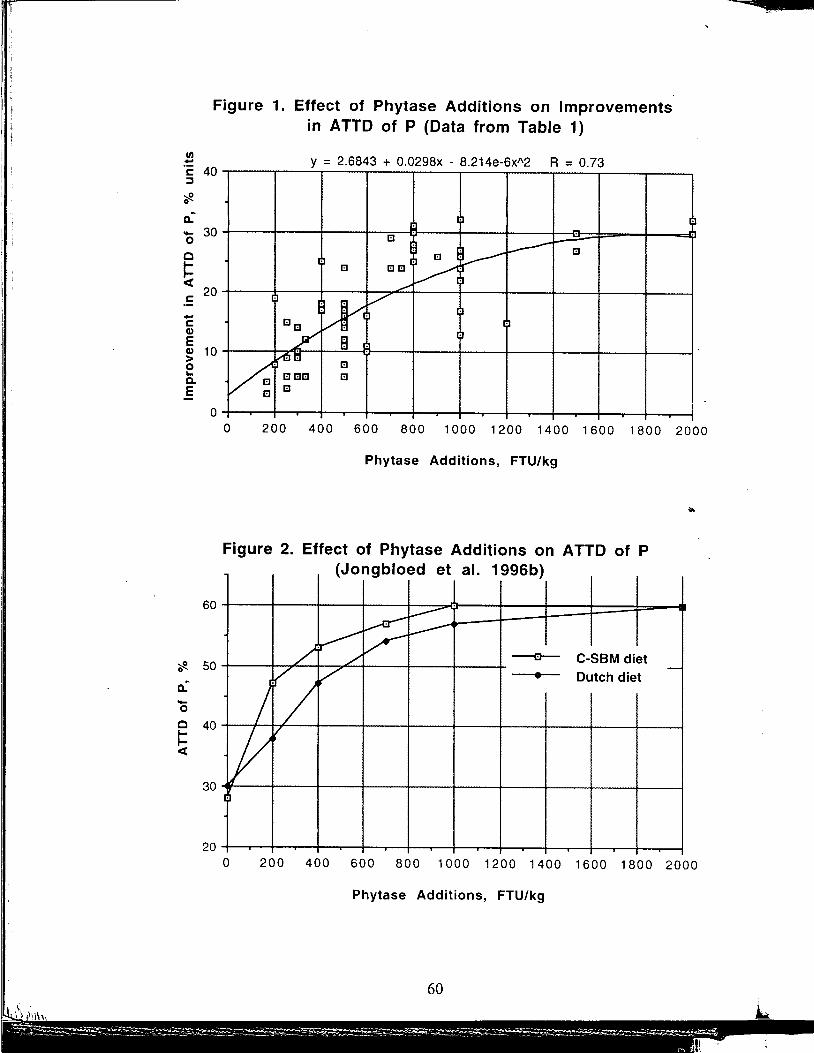
Figure 1. Effect of Phytase Additions on Improvements in ATTD of P (Data from Table 1)
111 .'!:::::
40 c: y = 2.6843 + 0.0298x - 8.214e-6x"2 R = 0.73
:::::s
::!! 0
0. -0 30
0
l:: < c: 20
-c: Q)
E Q) 10 > 0 .. c. E
04--.---+~..---+---.---+~~-+---.---+~..---+---.---+~~-+---...--+~~
0 200 400 600 800 1000 1200 1400 1600 1800 2000
Phytase Additions, FTU/kg
Figure 2. Effect of Phytase Additions on A TTD of P (Jongbloed et al 1996b) .
'# 50
0. -0
0 40 l:: <
60 L---
~ v L---
/ v / ----a- C-SBM diet
// v -• Dutch diet
I y 7
30 I·
20 0 200 400 600 800 1000 1200 1400 1600 1800 2000
Phytase Additions, FTU/kg
60
au;_.
A REVIEW OF THE USE OF NATUPHOS IN BROILER, LAYER AND TURKEY DIETS
W. Fraulene McKnight Senior Technical Services Specialist
BASF Corporation Farmerville LA
Most of the phosphorus in feed ingredients of plant origin occurs as phytic acid. The salts of phytic acid are described as phytates. In general, phytate accounts for about two thirds of the total phosphorus present in plants. Nori-ruminants~ such as poultry and pigs, have virtually no phytase activity of their own .. Thus, the availabi.lity of phosphorus in foodstuffs of plant origin is generally very low (Table 1 ). This low ,availability of phytate phosphorus poses two problems for producers: 1) the rieed to add inorganic phosphorus supplements to diets, and 2) the excretion of large amounts· bf phosphorus in manure.
In addition to low phosphor.us availability, phytate limits availability .of several other essential nutrients. The phytic acid molecule has a high phosphorus content (28.2%) and itS six phosphoric acid residues have various affinities for cations. One mole of phytic acid can bind an average of 3 to 6 moles of calcium to form insoluble phytates at the pH of the intestine. Formation of insoluble phytate makes both calcium and phosphorus unavailable. Phytic acid has chelating potential forming a wide variety of insoluble salts with di- and trivalent cations at neutral pH (Vohra et al., 1965; Oberleas, 1973). Zinc, Cu, Co, Mn, Fe and Mg can also complex, but Zn and Cu have the strongest binding affinity (Madda.iah~et al., 1964; Vohra et al., 1965). This binding potentially renders these minerals unavailable for intestinal absorption. Zinc is well known to complex with phytic acid and may be the trace element whose bioavailability is most influenced by phytate (Pallauf and Rimbach, 1995).
Phytic acid may also have a negative influence on the solubility of proteins and the function of pepsins because of the ionic binding between the phosphate groups of phytic acid and amino groups such as lysyl, histidyl and arginine (DeRham and Jost; 1979 and Fretzdorff et al., 1995) under acid condition. Under neutral conditions, the carboxyl groups of some amino acids may bind to phytate through a divalent or trivalent mineral (Anderson, 1995). Phytate-protein or phytate-mineral-protein complexes may reduce the utilization of. protein.
Phytase is an acid phosphatase enzyme which degrades phytate. It catalyzes the hydrolytic cleavage of the phosphoric add esters of inositol to liberate ortho-phosphates which can be absorbed. At the same time, minerals like Ca and Mg or trace elements may be liberated and converted into an absorbable form. Phytase activity is expressed as "phytase units" or FTU (FTU = fY!ase ynit) per unit of feed. This unit of measurement was developed in Europe and has .been adopted worldwide. One phytase unit (FTU} is the activity of phytase that generates 1 micromole of inorganic phosphorus per minute from an excess of sodium phytate at pH 5.5 and 37 degrees C. Measurement of released phosphorus is done photometrically. Having a standardized method to measure phytase activity is important because minor adjustments in temperature or pH result in large differences in phytase activity. ·
Natuphos™ is the registered trade mark of a phytase obtained by fermentation using genetically modified Aspergil/us niger. The genetic information originated from
61
~· . :I\
I
I I
I' I I 11
[i 1f 'I [,, I: 1: 1'
1: II I 1·
Aspergillus ficuum and was transferred to Aspergil/us niger which is commonly used as a highly efficient producer in fermentation processes. After fermentation the production strain organism is destroyed by increasing the temperature and lowering the pH and the enzyme is then removed in several filtration steps. The resulting enzyme solution, called ultra-filtrate, is free of any production organisms.
The efficacy of microbial phytase from Natuphos™ in broiler diets has been clearly demonstrated by several researchers. Schaner and Hoppe (1992), investigated the efficacy of microbial phytase for broilers in a series of trials (Tables 2 and 3). The control diets contained 0.65% tPhosphorus and 0.25% phytate phosphorus and 0.9% calcium. Phosphorus was decreased by 0.1 % and diets formulated with and without added microbial phytase. In torn/soybean meal diets, reducing dietary phosphorus by 0.1 % without inclusion of phytase resulted in decreased weight gains, increased feed conversion and reduced phosphorus retention. The addition of 1000 FTU/kg feed in the first trial and 500 FTU/kg in the second trial completely corrected the adverse effects caused by feeding reduced phosphorus levels. In a third trial using diets composed primarily of wheat (to increase native phytase) and soybean meal, live performance and toe ash measurements were used to determine response. Reducing phosphorus resulted a numerical(but non significant) decrease in weight gain and increase in feed conversion. Toe ash was significantly reduced when dietary phosphorus was reduced without the addition of phytase. Phytase inclusion reversed this effect. In a similar experiment, when soybean meal was replaced with peas and beans, the birds reacted to the decreased phosphorus with decreased weight gain and reduced toe ash. This adverse effect was completely compensated by inclusion of phytase at 500 FTU/kg.
Table 4 summarizes the results of several trials and shows the effect of phytase additi~n on phosphorus utilization by broilers. Phytase addition improved phosphorus utilization from an average of 47% to an average of 64%. In these trials, when more than one level of phytase was used, the level showing the highest phosphorus utilization was selected.
The effect of microbial phytase on utilization of trace elements has also been investigated in a number of studies. Thiel and Weifand (1992) found that adding phytase to diets containing 27 ppm zinc significantly improved zinc utilization. No effect was observed in diets containing 45 ppm zinc. Yi et al. (1996) using corn soy isolate type diets containing 20 ppm zinc supplemented with ZnS047H20 or with phytase found that approximately 0.9 mg zinc was released per 100 FTU phytase over the range of 150 to 600 units phytase.
Improved utilization of amino acids in Natuphos supplemented diets has also been reported. Baker and Beihl (1996), using in soy based diets found that the addition of 1200 FTU/kg of phytase elicited a feed efficiency but not a gain response in chicks fed amino acid deficient diets. They concluded that phytase may have a small but significant positive effect in improving the utilization of methionine, threonine, lysine and/or valine in the protein of soybean meal. Using turkeys, Yi et al. (1995) found that the apparent and true ileal digestibility's of nitrogen and amino acids were generally improved by phytase addition to diets containing 22.5 and 28.0% protein and 0.45% nPhosphorus. At 0.6% nPhosphorus, improvement was observed at 22.5% but not at 28.0% protein.
A trial was recently completed at Auburn University (McKnight, 1996) that investigated the efficacy of phytase in broiler grower/finisher diets. In this trial, the influence of phytase on phytate phosphorus availability was investigated using broilers 3 to 6 weeks of age. Day old chicks were maintained on a control diet adequate in all nutrients until 3 weeks of age at which time they were assigned to one of seven dietary treatments for 3 weeks. Experimental diets were formulated to contain: 1) 0.425% aP and 0.85% Ca; 2) 0.325% aP
I 62
!~'''" 11
acq
and 0.75% Ca; 3) as 2 plus 300 FTU/kg; 4) as 2 plus 600 FTU/kg; 5) 0.225% aP and 0.75% Ca; 6) as 3 plus 300 FTU/kg and ; 7) as 3 with 600 FTU/kg diet. Neither performance nor bone strength was significantly impacted by a reduction of aP to 0.325% and Ca to 0.7.5% as compared to diets containing 0.425% aP and 0.85% Ca. However, when aP was reduced to 0.225% and Ca to0.75%, a highly significant negative impact on bone strength was obser.ied (Table 5). The negative impact on bone strength associated with a dietary level of 0.225% aP and 0.75% Ca was completely reversed by the inclusion of 300 FTU/kg diet. Addition of phytase resulted in improved bone mineral content, increased bone density and increased bone strength. The addition of 300 FTU/kg diet completely reversed the negative effects associated with aP and Ca reduction and resulted in live performance and bone strength equal to the positive control diet (Table 6). Increasing phytase levels from 300 to 600 FTU provided no additional benefit over 300 FTU/kg.
Another study has recently been completed at VPI, (Kornegay, 1996) which investigated the efficacy of Natuphos in broiler grower/finisher diets. Commercial unsexed broilers (n=2988) were started on the day of hatch (housed on litter) and fed a common starter (1430 kcal ME/lb, 24% CP, 0.45% available phosphorus and 1.0% Calcium) diet for 3 weeks. At the end of 3 weeks (birds averaged 753 g weight), nine dietary treatments were stared and continued until the birds were seven we-eks of age. Three phosphorus levels (no added inorganic P, 0.1 % and 0.2% added as defluorinated phosphate) and three levels of Natuphos phytase (0, 200 and 400 FTU/kg) were used in a 3 X 3 factorial arrangement of treatments. The analyzed total phosphorus levels were 0.34, 0.42 and 0.48% for calculated levels of 0.36, 0.46, and 0.56%, respectively. Analyzed calcium levels were 0.54,' 0.64, and 0.71 %. Toe, tibia and performance measurements (Table 7) were increased when phosphorus and phytase were added to low phosphorus diets with the highest response to added phosphorus at the highest level when no phytase was added to the diet. The largest response to phytase, however, was usually at the two lower levels of phosphorus. Carcass measurements including breast yield were not effected, and mortality from 3 through 6 weeks was similar among treatments (3%). Equivalency values were estimated to average 290 FTU/kg for 1 gram P (or 0.1 %) for toe and tibia measurements and 231 FTU/kg per 1 gram P (or 0.1%) when body weight and body weight gain were averaged. Therefore, microbial phytase is very effective in broiler finisher diets for replacing supplemental inorganic phosphorus and reducing phosphorus excretion.
"'
The use of Natuphos in layer diets has been widely investigated. In a series of trials, Simons and Versteegh (1992, 1993) fed aP deficient diets supplemented with either MCP or phytase. Results of both trials indicated that the poor performance found with layers on deficient diets could be completely compensated by inclusion of either phytase or inorganic phosphorus from MCP. Trial 1 was conducted for 28 weeks and Trial 2 for 50 weeks. On the basis of regression analysis, it was concluded that the addition 300 FTU/kg diet was equivalent to 0.1 % aPhosphorus.
In another long term trial, Vahl et al. fed diets with a control diet containing 0.18% aP and supplemented this diet with either MCP to supply an additional 0.04, 0.08 or 0.18% aPhosphorus or microbial phytase at 300 FTU/kg. Phase feeding was used with phosphorus being reduced by 0.04% and calcium being increased from 3.5 to 4.0% of the diet from age 40 weeks forward. Table 8 summarizes this data. As the trial progressed, birds receiving the deficient diets had reduced egg production and increased mortality. Consequently, at 46 and 61 weeks of age, hens from deficient treatments (0.18 and 0.22% aP without phytase) were removed from the study_ and SVi{itched to adequate diets. Layers
63
\\ .
i'I
receiving 0.18% aPhosphorus with the addition of 300 FTU/Kg of phytase performed equally as well as hens receiving inorganic phosphorus from MCP.
At Auburn University, a 17 week experiment by Roland and Gordon (1996) was conducted to evaluate the effects of supplementing laying hen diets with a commercially produced microbial phytase (Natuphos ). Hy-Line W36 pullets (21 weeks of age, 1600) were randomly allocated to 1 of 1 O diets in a factorial arrangement with 5 levels of available phosphorus (.1, .2, .3, .4 and .5%) and 2 levels of phytase (0 and 300 FTU). Dietary energy, protein and calcium were maintained at 1280 kcal/lb, 16.6% and 4%, respectively. Criteria evaluated included egg production, feed consumption, egg weight, egg specific gravity and mortality. Feeding the .1 % available phosphorus diet without supplemental phytase decreased egg production 8.1 % over the entire study and 29.6% over the last 4 weeks, relative to other non-phytase supplemented diets. Similarly,· feed consumption of hens fed the .1 % available phosphorus diet without phytase decreased 5.8% over 17 weeks and 13.0% over the last 4 weeks. No decreases in egg production or feed consumption were observed when .1 available phosphorus diets were supplemented with phytase (82.1 % and 82.4 g, respectively). Egg specific gravity ' decreased and mortality increased when hens consumed the 0.1 available phosphorus diet without phytase. Supplementing the 0.1 % available phosphorus diet with phytase completely corrected all adverse effects. No deficiency symptoms were observed when feeding diets containing 0.2 to 0.5% available phosphorus. Phytase supplementation of these diets gave no further improvements in performance.
A separate study was concluded at Auburn University (Gordon and Roland, 1996) to investigate the impact of Natuphos on calcium availability. Fifteen hundred and thirty six Hyline W-36 hens 58 weeks of age were randomly allocated to one of 12 dietary treatments. Diets were fed in a factorial arrangement of treatments with three calcium ~ levels (2.5, 2.8, and 3.1 %), two levels of non-phytate phosphorus (0.1 and 0.3%) and two phytase levels (0 and 300 FTU/kg diet). All diets were considered calcium deficient and the lower level of phosphorus was considered deficient. Treatments were replicated eight times with 16 birds per replicate. Feed consumption, egg production, egg specific gravity and egg weights were determined weekly for 6 weeks. At the end of 6 weeks, the birds were sacrificed and tibias removed for bone density and mineral content measurements. Supplementing diets with phytase significantly increased egg production relative to the unsupplemented diets (Table 9). By week 6, production on non phytase O: 1 % phosphorus supplemented diets had fallen to 49% while phytase supplemented diets maintained production at 77%. A significant phosphorus X Phytase interaction indicated that phytase supplementation improved production on the 0.1 phosphorus supplemented diet but had little effect on the 0.3% supplemented phosphorus diet. A linear increase in egg production (from 76 to 77 to 79%) was observed as dietary calcium increased in the presenc~ of phytase. No evidence of a calcium effect was seen when phytase was not included in the diet. Typically the most sensitive used indicator of calcium metabolism in laying hens are measures of egg shell quality. In this study, increasing dietary calcium resulted in a linear increase in egg specific gravity (Table 10). Supplementing with phytase also improved egg specific gravity with the greatest increase occurring in the 0.1 % phosphorus supplemented diet. In the presence of phytase, adding additional phosphorus failed to impact egg specific gravity. Based on the data obtained from this study, the authors concluded that from 32 to 54% of the improvement in calcium utilization observed was associated with factors other than liberation of phytate phosphorus. The authors also concluded that phytase supplementation of diets containing 3.1 % calcium or less (calcium deficient diets) significantly increased caldum utilization.
64
A
In a study at the University of Minnesota (Waible P. E., et al, 1996), large strain Nicholas male and female turkeys were fed corn soy-bean meal type diets containing varying levels of calcium, phosphorus and phytase (Natuphos). The experiment began at 4 weeks of age and dietary adjustments were made at intervals as in the NRG (1994). The experimental design for this trial is given .in Table 11. Treatments three through eight contained no supplemental phosphorus and 30% of the NRG (1994) requirement for phosphorus. Phytase levels were either 500 FTU/kg diet or 400, 300, and 300 FTU/kg in successive dietary periods. Body weight data is summarized in Table 12 and bone density data in Table 13. Turkeys fed the control diets with both calcium and available phosphorus at 110% of the NRG (1994) requirement exhibited normal growth and bone development. Phytase supplementation of these diets did not influence growth or bone development. When phosphorus was reduced to 73% NRG and calcium to 100% NRG, growth and bone development were nearly as good as the control. In these diets, there were indications that phytase improved gain and bone development in both sexes. A further reduction in phosphorus to 52% NRG and calcium to 90% NRC resulted in a depressed growth rate and reduced bone density. Supplementation with phytase returned both growth and bone development to nearly that of the control diet. Feeding a corn/soy diet without the addition of supplemental inorganic phosphorus led to severely reduced weight gain and reduced bone density. Due to the poor performance and development of phosphorus deficiency rickets, these treatments were removed from the experiment. Similar diets supplemented with Natuphos had somewhat reduced weight gain and reduced bone density with performance better with calcium at 80% NRG as compared to 110% NRG. In diets that contain marginal levels of phosphorus (52% and 73% NRG), supplementation of phytase in decreasing amounts as the bird developed resulted in performance equal to a constant level of 500 FTU/kg. -o
Although earlier studies (Qian et al, 1994) with younger poults had suggested that 600 to 900 FTU/kg was necessary for turkeys, this study suggested that lower levels may be satisfactory with older poults and less sever phosphorus deficient diets.
Research trials, field trials under commercial production conditions and use by the commercial poultry industr'}I provide clear evidence that phytase from Natuphos improves phosphorus availability. This allows formulation of diets with reduced· phosphorus levels and results in reduced phosphorus excretion. Current BASF recommendations for use of Natuphos 5000 and Natuphos 600 in broiler, layer and turkey diets is given in Tables 14 and 15, respectively. Formulation can be accomplished by including Natuphos as an ingredient with specific nutrient values and making no changes in nutrient specifications. The economic impact of Natuphos is a function of several factors such as cost of Natuphos, inclusion level, cost of inorganic phosphorus, degree of replacement of inorganic phosphorus; and the use of animal by products. In many cases; the use of Natuphos reduces ration cost. Formulating with Natuphos provides producers a means of addressing phosphorus environmental challenges without impa~ting animal performance.
References Anderson, P. A. 1995. Interactions between proteins and constituents that affect
protein quality. In; (Ed.) G. W. Finley and D. T. Hopkins, Digestibility and Amino Acid Availability in Cereals and Oilseeds, Am. Assoc. of Cereal Chem., St. Paul, Minnesota, p *1.
\I. l . \ '
).
I
Baker, D. H., R. R. Beihl, 1996. Phosphorus, trace mineral and amino acid utilization in chickens and pigs fed microbial phytase and 1 alpha hydroxycholecalciferol. Proc. MD Nutrition Conf. 21-26.
De Rham, 0., and T. Jost. 1979. Phytate protein interactions in soybean extracts and low-phytate soy protein products. J. Food Sci. 44:596.
Fretzdorff, B., J. M. Brummer, W. Rocken, R. Greiner, U. Konietzny, K.-0. Jany. 1995. Reduktion des Phytinsaure-Gehaltes bei der Herstellung von Backwaren und Getreidenahrmittein. AID-Verbraucherdienst 40: 12
Gordon R, and D. A. Roland, 1996. Influence of supplemental phytase on calcium utilization of laying hens. BASF Technical Symposium Dec. 1996, page 32.
Kornegay, E.T., 1996. Phytase supplementation of corn-soybean meal broiler diets. BASF Technical Symposium Dec. 1996, page 63.
Maddaiah, V. T., A. A. Kurnick, and B. L. Reid. 1964. Phytic acid studies, Proc. Soc." Exp. Biol. Med. 115:391.
Oberleas, D. 1973. Phytates, in, Toxicants Occurring Naturally in Foods, National Academy of Sciences, Washington, DC, p 363.
Pallauf, J. and G. Rimbach. 1995. Recent results on phytic acid and phytase. Proc. 5th Forum Animal Nutrition, May 4-5, BASF, p 43.
Roland, D. A. and R. Gordon, 1996. Phosphorus and Calcium optimization in layer diets with phytase. BASF Technical Symposium Dec. 1996 page 17.
McKnight, W. F. 1996. Efficacy of microbial phytase in broiler grower diets. BASF Technical Symposium Dec. 1996, page 46.
Schaner, F. J. and P.P. Hoppe, 1992. Microbial phytase, a tool to alleviate environmental phosphorus pollution from broiler production. Proc. of the XIX Worlds Poultry Conference, Amsterdam,Vol.3,429.
Simons, P. C. M. and H. A. J. Versteegh. 1992. Role of phytase in poultry nutrition, in ,c.
Enzymes in Animal Nutrition, Wenk, C. and Boessinger, M., Eds., Proc. 1st Symp. Kartause lttingen, Switzerland, Oct. 13-16, · p 192.
Simons, P. C. M. and H. A. J. Versteegh, A. van Voorst, 1992. Informative study concerning the effect of the addition of microbial phytase to layer feed. Spelderholt, publication No. 573 (NL).
Simons, P.C.M., H.A.J. Versteegh, A. W. Jongbloed, P.A. Kemme, P. Slump, K.D. Bos, M.G.E. Wolters, R. F. Beudeker and V. Verchoor, 1990. Improvement of phosphorus availability by microbial phytase in broilers and pigs. Br. J. Nutr. 64:525-540.
Thiel, U. and E. Weigand. 1992. Influence of dietary zinc and microbial phytase supplementation on Zn retention and Zn excretion in broiler chicks, XIX World's Poultry Congress, Amsterdam, Netherlands, Sept. 20-24.
Vahl, H. A., G. J. Borggreve and H. P. Stappers, 1993. The effect of microbial phytase in layer feed. CLO-Schothorst experimental report No. 374 (NL).
Vohra, P., G. A. Gray, and F. H. Kratzer. 1965. Phytic acid-metal complexes. Proc. Soc. Exp. Biol. Med. 120:447.
Waibel, P. E., F. A. Atia and I. Hems, 1996. Effectiveness on Natuphos™ Phytase in improving the bioavailabilities of phosphorus in turkeys. BASF Technical Symposium, December 1996:75.
Yi, Z., E.T. Kornegay, and D. M. Denbow. 1996a. Supplemental microbial phytase improves zinc utilization in broilers. Poultry Sci. 75:(in press).
Yi, Z., E. T. Kornegay, E. T. and D. M. Denbow. 1995. Effect of microbial phytase on nitrogen and phosphorus retention and performance of turkey poults fed cornsoybean meal diets. Poultry Sci. 7 4(Suppl. 1):108.
" ,;
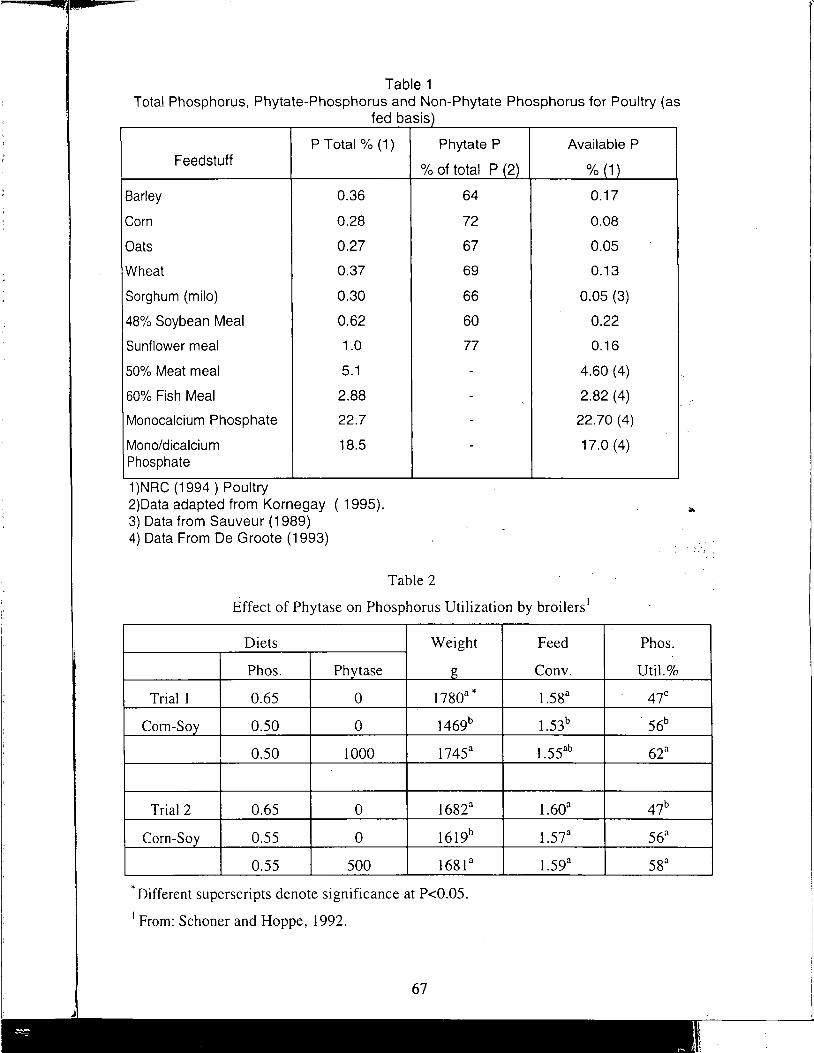
Table 1 Total Phosphorus, Phytate-Phosphorus and Non-Phytate Phosphorus for Poultry (as
fed basis)
P Total% (1) Phytate P Available P Feedstuff
% of total p (2) % (1)
Barley 0.36 64 0.17
Corn 0.28 72 0.08
Oats 0.27 67 0.05
Wheat 0.37 69 0.13
Sorghum (milo) 0.30 66 0.05 (3)
48% Soybean Meal 0.62 60 0.22
Sunflower meal 1.0 77 0.16
50% Meat meal 5.1 - 4.60 (4)
60% Fish Meal 2.88 - 2.82 (4)
Monocalcium Phosphate 22.7 - 22.70 (4)
Mono/dicalcium 18.5 - 17.0 (4) Phosphate
1 )NRC (1994 ) Poultry 2)Data adapted from Kornegay ( 1995). 3) Data from Sauveur (1989) 4) Data From De Groote (1993)
Table 2
Effect of Phytase on Phosphorus Utilization by broilers 1
Diets Weight
Phos. Phytase g
Trial 1 0.65 0 1780a*
Corn-Soy 0.50 0 1469b
0.50 1000 1745a
Trial 2 0.65 0 1682a
Corn-Soy 0.55 0 1619b
0.55 500 1681 a
*Different superscripts denote significance at P<0.05.
1 From: Schaner and Hoppe, 1992.
67
Feed Phos.
Conv. Util.%
l .58a 47c
1.53b . 56b
l .55ab 62a
l.60a 47b
l .57a 56a
l .59a 58a
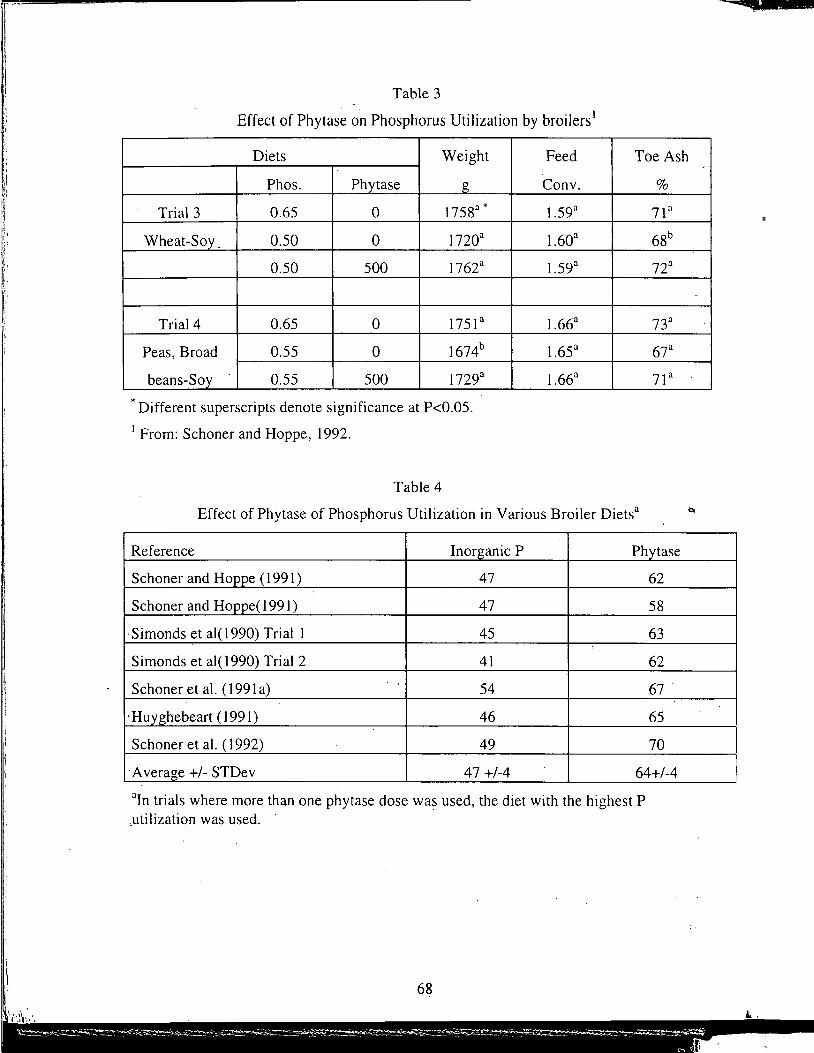
Table 3
Effect of Phytase on Phosphorus Utilization by broilers 1
Diets Weight
Phos. Phytase g
Trial 3 0.65 0 1758a *
Wheat-Soy_ 0.50 0 1720a
0.50 500 1762a
Trial 4 0.65 0 175la
Peas, Broad 0.55 0 1674b
beans-Soy 0.55 500 1729a
*Different superscripts denote significance at P<0.05. 1 From: Schoner and Hoppe, 1992.
Table 4
Feed
Conv.
l .59a
l .60a
l .59a
l.66a
l .65a
l .66a
Toe Ash
%
71 a
68b
72a
73a
67a
71 a
Effect of Phytase of Phosphorus Utilization in Various Broiler Dietsa
Reference Inorganic P Phytase
Schon er and Hoppe ( 1991) 47 62
Schoner and Hoppe( 1991) 47 58
·Simonds et al(l 990) Trial 1 45 63
Simonds et al(l 990) Trial 2 41 62
Schoner et al. (1991 a) 54 67
'Huyghebeart ( 1991) 46 65
Schoner et al. (1992) 49 70
·Average +/- STDev 47 +/-4 64+/-4
aln trials where more than one phytase dose was used, the diet with the highest P ,utilization was used.
68
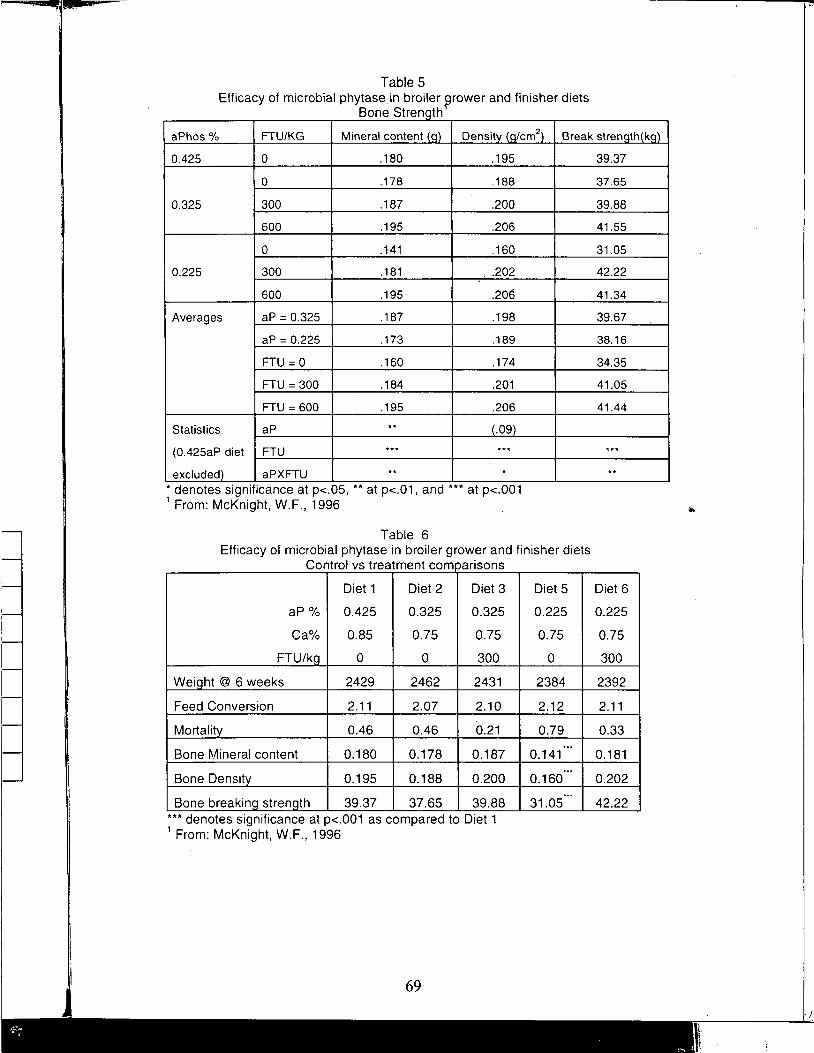
'" G
Table 5 Efficacy of microbial phytase in broiler ~rower and finisher
Bone Stren th diets
aPhos % FTU/KG Mineral content cm2 Break strength(kg)
0.425 0 .180 .195
0 .178 .188
0.325 300 .187 .200
600 .195 .206
0 .141 .160
0.225 300 .181 .202
600 .195 .206
Averages aP = 0.325 .187 .198
aP = 0.225 .173 .189
FTU = 0 .160 .174
FTU = 300 .184 .201
FTU = 600 .195 .206
Statistics aP .09
(0.425aP diet FTU
excluded aPXFTU • denotes significance at p<.05, •• at p<.01, and ••• at p<.001 1 From: McKnight, W.F., 1996 ,
Table 6 . Efficacy of microbial phytase in broiler grower and finisher diets
Control vs treatment com arisons
Diet 1 Diet 2 Diet 3
aP% 0.425 0.325 0.325
Ca% 0.85 0.75 0.75
FTU/k 0 0 300
Wei ht@ 6 weeks 2429 2462 2431
Feed Conversion 2.11 2.07 2.10
Mortali 0.46 0.46 0.21
Bone Mineral content 0.180 0.178 0.187
Bone Densit 0.195 0.188 0.200
Bone breakin 39.37 37.65 39.88 ••• denotes significance at p<.001 as compared to Diet 1 1 From: McKnight, W.F., 1996
69
5
5
Diet
0.22
0.7 5
0
238 4
2.1 2
0.7 9 ...
0.14 1 ...
0.160 ...
31.05
39.37
37.65
39.88
41.55
31.05
42.22
41.34
39.67
38.16
34.35
41.05
41.44
... ..
Diet 6
0.225
0.75
300
2392
2.11
0.33
0.181
0.202
42.22
, ..
.a.,
).
,..... l\' ;
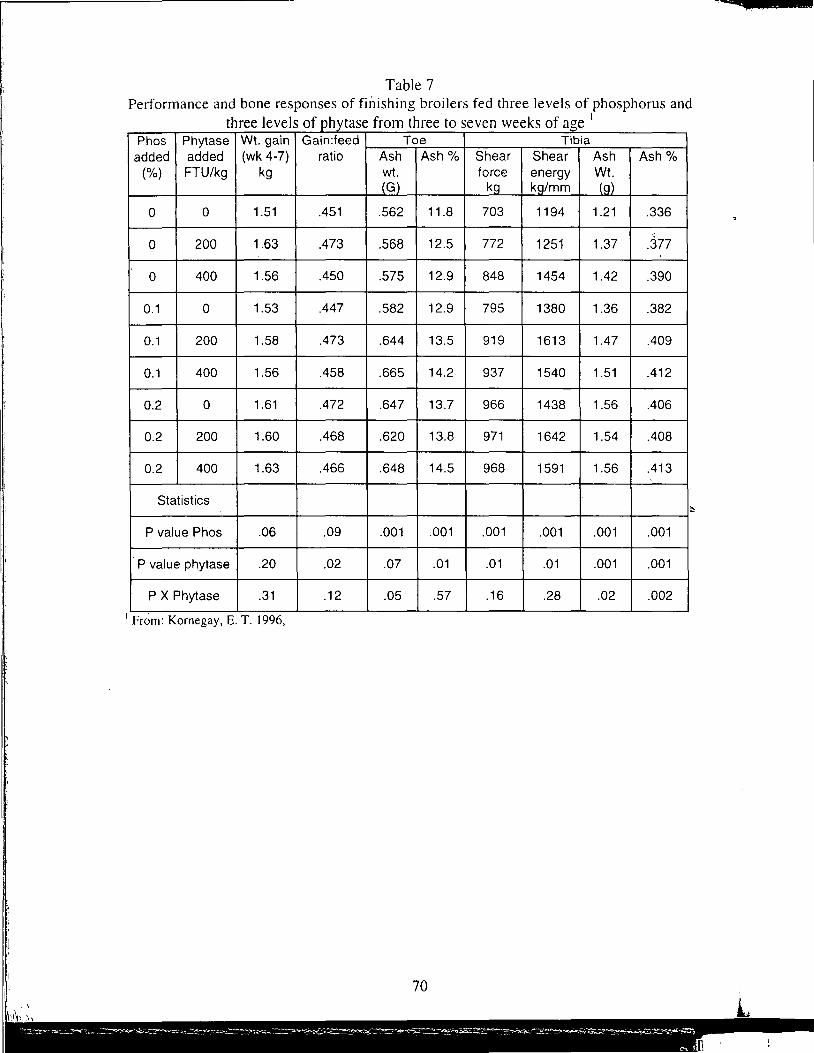
- ........ __ _ Table 7
Performance and bone responses of finishing broilers fed three levels of phosphorus and t h I I fh f h. k f I ree eve s o p 1ytase rom t ree to seven wee s o age
Phos Phytase Wt. gain Gain:feed Toe Tibia added added (wk 4-7) ratio Ash Ash% Shear Shear Ash Ash%
(%) FTU/kg kg wt. force energy Wt. (G) kg kg/mm (g)
0 0 1.51 .451 .562 11.8 703 1194 1.21 .336
0 200. 1.63 .473 .568 12.5 772 1251 1.37 .377
0 400 1.56 .450 .575 12.9 848 1454 1.42 .390
0.1 0 1.53 .447 .582 12.9 795 1380 1.36 .382
0.1 200 1.58 .473 .644 13.5 919 1613 1.47 .409
0.1. 400 1.56 .458 .665 14.2 937 1540 1.51 .412
0.2 0 1.61 .472 .647 13.7 966 1438 1.56 .406
0.2 200 1.60 .468 .620 13.8 971 1642 1.54 .408
0.2 400 1.63 .466 .648 14.5 968 1591 1.56 .413
Statistics
P value Phos .06 .09 .001 .001 .001 .001 .001 .001
P value phytase .20 .02 .07 .01 .01 .01 .001 .001
PX Phytase .31 .12 .05 .57 .16 .28 .02 .002
1 From: Kornegay, E.T. 1996,
70 '
l
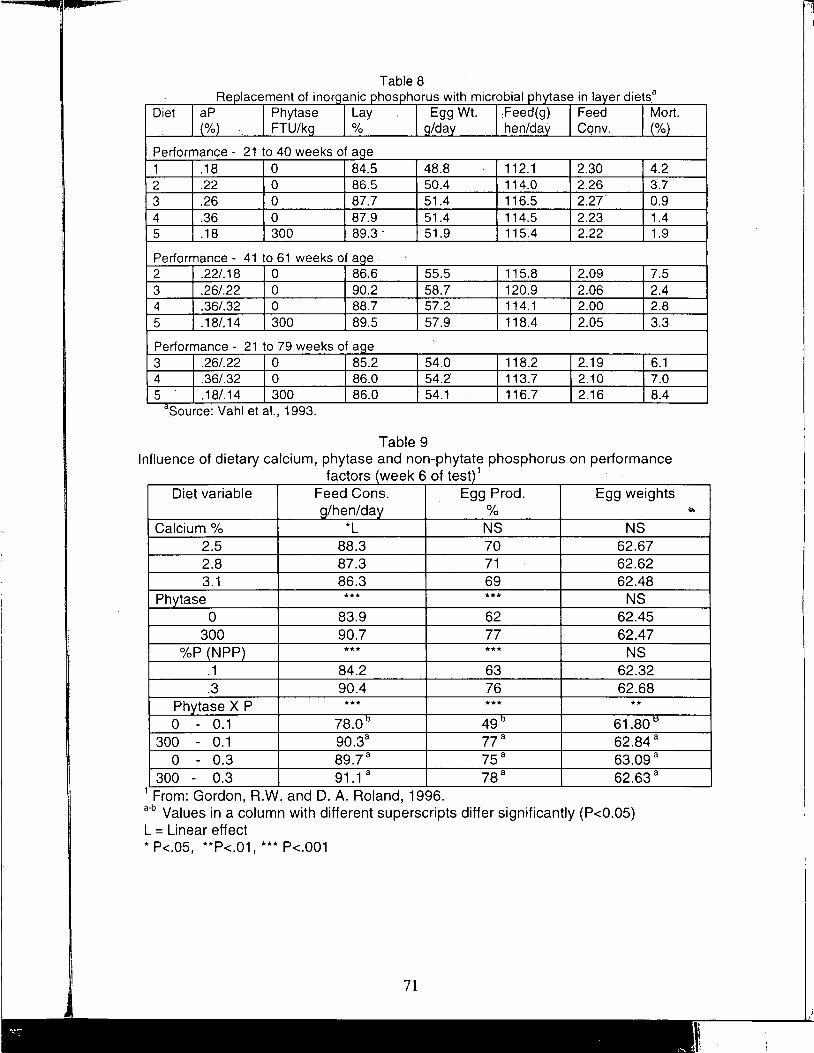
Table 8 Replacement of inorqanic phosphorus with microbial phytase in layer diets a
Diet aP Phytase I Lay Egg Wt. :Feed(g) Feed Mort. (%) FTU/kq % q/day hen/day Conv. (%)
Performance - 21 to 40 weeks of age 1 .18 0 84.5 48.8 112.1 2.30 4.2 2 .22 0 86.5 50.4 114.0 2.26 3.7 3 .26 0 87.7 51.4 116.5 2.27' 0.9 4 .36 0 87.9 51.4 114.5 2.23 1.4 5 .18 300 89.3, 51.9 115.4 2.22 1.9
Performance - 41 to 61 weeks of aqe 2 .22/.18 0 86.6 55.5 115.8 2.09 7.5 3 .26/.22 0 90.2 58.7 120.9 2.06 2.4 4 .36/.32 0 88.7 57.2 114.1 2.00 2.8 5 .18/.14 300 89.5 57.9 118.4 2.05 3.3
Performance - 21 to 79 weeks of age 3 .26/.22 0 85.2 54.0 118.2 2.19 6.1 4 .36/.32 0 86.0 54.2' 113.7 2.10 7.0 5 .18/.14 300 86.0 54.1 116.7 2.16 8.4
aSource: Vahl et al., 1993.
Table 9 Influence of dietary calcium, phytase and non-phytate phosphorus on performance
1 factors (week 6 of test) Diet variable Feed Cons. Egg Prod. Egg weights
g/hen/day % Calcium% *L NS NS
2.5 88.3 70 62.67 2.8 87.3 71 62.62 3.1 86.3 69 62.48
Phytase *** *** NS 0 83.9 62 62.45
300 90.7 77 62.47 %P (NPP) *** *** NS
.1 84.2 63 62.32
.3 90.4 76 62.68 Phytase X P *** *** ** 0 - 0.1 78.0° 49° 61.80t;j
300 - 0.1 90.3a 77a 62.84 a 0 - 0.3 89.7a 75a 63.09a
300 - 0.3 91.1 a 78a 62.63 a 1 From: Gordon, R.W. and D. A. Roland, 1996. a-b Values in a column with different superscripts differ significantly (P<0.05) L = Linear effect * P<.05, **P<.01, *** P<.001
71
.i.,
' "
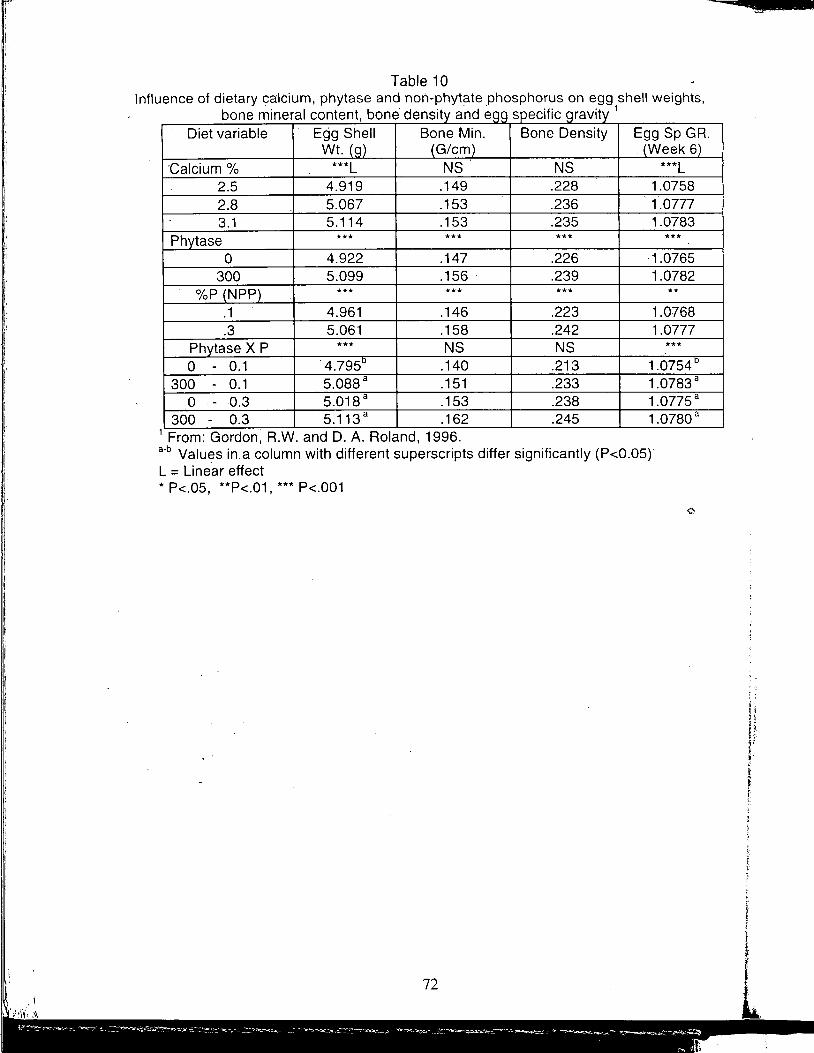
I
I I
.1 Iii i: I
I 11
'! I I
I t t
i,
Table 10 lnfluenGe of dietary calcium, phytase and non-phytate phosphorus on egg
1shell weights,
. d bone mineral content, bone density an eqq specific qravitv Diet variable Egg Shell Bone Min. Bone Density Egg Sp GR.
Wt. (q) (G/cm) (Week 6) ·calcium% ***L NS NS ***L
2.5 4.919 .149 .228 1.0758 2.8 5.067 .153 .236 1.0777 3.1 5.114 .153 .235 1.0783
Phvtase *** *** *** *** 0 4.922 .147 .226 1.0765
300 5.099 .156 . .239 1.0782 %P (NPP) *** *** *** **
.1 4.961 .146 .223 1.0768
.3 5.061 .158 .242 1.0777 Phvtase X P *** NS NS *** 0 - 0.1 . 4.795b .140 .213 1.0754 °
300 - 0.1 5.088 a .151 .233 1.0783 a
0 - 0.3 5.018 a .153 .238 1.0775 8
300 - 0.3 5.113 a .162 .245 1.0780 8
1 From: Gordon, R.W. and D. A. Roland, 1996. a-b Values in a column with different superscripts differ significantly (P<0.05)' L = Linear effect * P<.05, **P<.01, *** P<.001
I i
t i
! I
i L
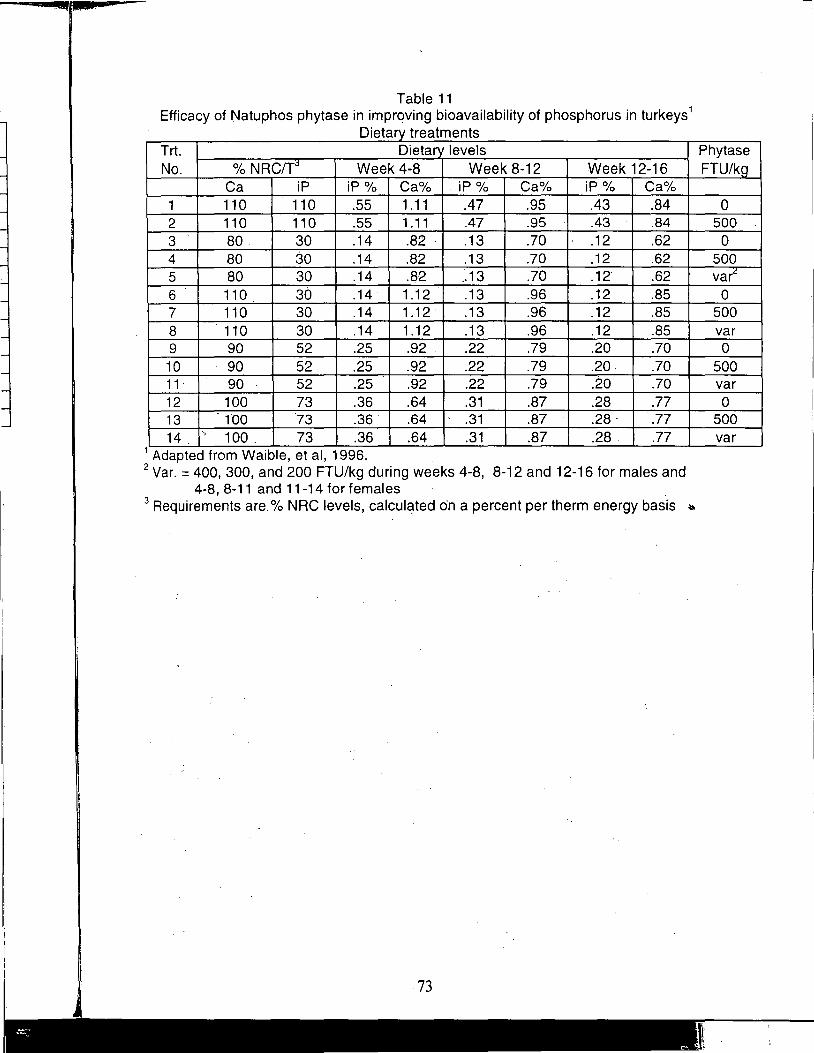
Table 11 Efficacy of Natuphos phytase in improving bioavailability of phosphorus in turkeys 1
o· t t 1e ary trea ments Trt. Dietari 1 levels Phytase No. % NRC/T::i Week 4-8 Week8-12 Week 12-16 FTU/kg
Ca iP iP% Ca% . iP% Ca% iP% Ca% 1 110 110 .55 1.11 .47 .95 .43 .84 0 2 110 110 .55 1.11 .47 .95 .43 .84 500 3 80 30 .14 .82 .13 .70 .12 .62 0 4 80 30 .14 .82 .13 .70 .12 .62 500 5 80 30 .14 .82 .. 13 .70 .12 .62 var~
6 110 30 .14 1.12 .13 .96 .12 .85 0 7 110 30 .14 1.12 .13 .96 .12 .85 500 8 110 30 .14 1.12 .13 .96 .12 .85 var 9 90 52 .25 .92 . .22 .79 .20 .70 0 10 90 52 .25 .92 .22 .79 .20 .70 500 11 90 52 .25 .92 .22 .79 .20 .70 var 12 100 73 .36 .64 .31 .87 .28 .77 0 13 mo 73 .36 .64 .31 .87 .28. .77 500 14 '> 100. 73 .36 .64 .31 .87 .28 .77 var
1 Adapted from Waible, et al, 1996. 2 Var. = 400, 300, and 200 FTU/kg during weeks 4-8, 8-12 and 12-16 for males and
4-8, 8-11 and 11-14 for females . 3 Requirements are.% NRC levels, calcul~ted o·n a percent per therm energy basis <i>
73
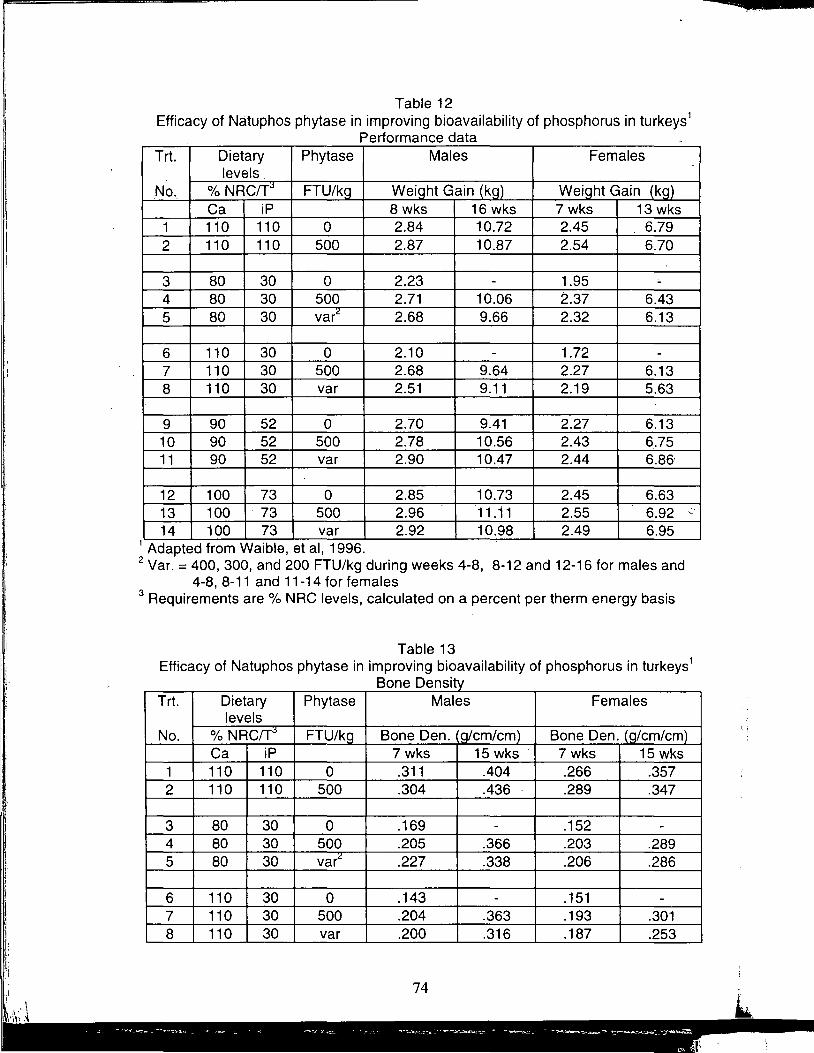
i. I
I
I I ~ 1
1
I Ii I
!:. ,~· ' 11 !I
Table 12 Efficacy of Natuphos phytase in improving bioavailability of phosphorus in turkeys 1
Performance data Trt. Dietary Phytase Males Females
levels No. % NRC/TJ FTU/kQ WeiQht Gain (kQ) WeiQht Gain (kQ)
Ca iP 8wks 16 wks 7wks 13 wks 1 110 110 0 2.84 10.72 2.45 6.79 2 110 110 500 2.87 10.87 2.54 6.70
3 80 30 0 2.23 - 1.95 " 4 80 30 500 2.71 10.06 2.37 6.43 5 80 30 var£ 2.68 9.66 2.32 6.13
6 110 30 0 2.10 - 1.72 -7 110 30 500 2.68 9.64 2.27 6.13 8 110 30 var 2.51 9.11 2.19 5.63
9 90 52 0 2.70 9.41 2.27 6.13 10 90 52 500 2.78 10.56 2.43 6.75 11 90 52 var 2.90 10.47 2.44 6.86
12 100 73 0 2.85 10.73 2.45 6.63 13 100 . 73 500 2.96 11.11 2.55 6.92 14 100 73 var 2.92 10.98 2.49 6.95
1 Adapted from Waible, et al, 1996. 2 Var.= 400, 300, and 200 FTU/kg during weeks 4-8, 8-12 and 12-16 for males and
4-8, 8-11 and 11-14 for females 3 Requirements are % NRC levels, calculated on a percent per therm energy basis
Table 13
'-
Efficacy of Natuphos phytase in improving bioavailability of phosphorus in turkeys 1
Bone Density Trt. Dietary Phytase Males Females
levels No. % NRC/TJ FTU/kg Bone Den. Ji/cm/cm) Bone Den. (Q/cm/cm)
Ca iP 7wks 15 wks 7wks 15 wks 1 110 110 0 .311 .404 .266 .357 2 110 110 500 .304 .436 .289 .347
3 80 30 0 .169 - .152 -4 80 30 500 .205 .366 .203 .289 5 80 30 var .227 .338 .206 .286
6 110 30 0 .143 - .151 -7 110 30 500 .204 .363 .193 .301 8 110 30 var .200 .316 .187 .253
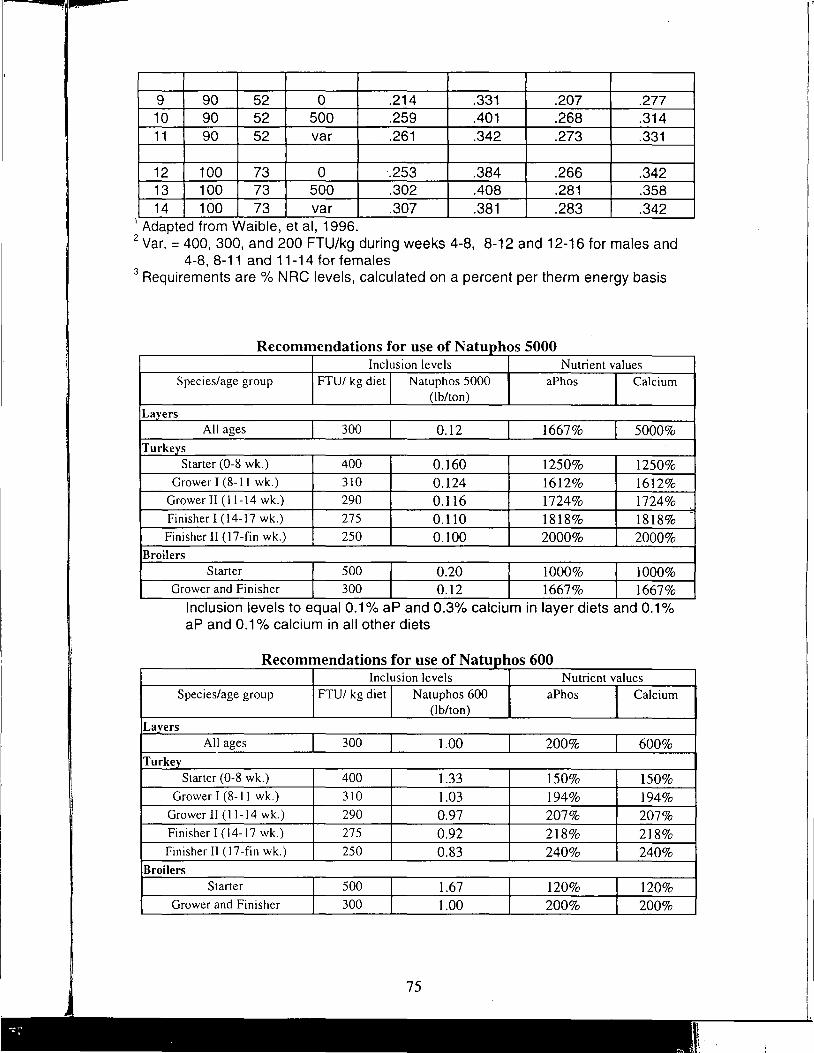
'
1
2
3
i
' ' i
I
9 90 52 0 .214 .331 .207 .277 10 90 52 500 .259 .401 .268 .314 11 90 52 var .261 .342 .273 .331
12 100 73 0 .253 .384 .266 .342 13 100 73 500 .302 .408 .281 .358 14 100 73 var .307 .381 .283 .342
Adapted from Waible, et al, 1996. Var. = 400, 300, and 200 FTU/kg during weeks 4-8, 8-12 and 12-16 for males and
4-8, 8-11 and 11-14 for females Requirements are % NRG levels, calculated on a percent per therm energy basis
Recommendations for use of Natu hos 5000 Inclusion levels Nutrient values
Species/age group FTU/ kg diet Natuphos 5000 aPhos Calcium (lb/ton)
La ers All ages 300 0.12 1667% 5000%
Turke s Starter (0-8 wk.) 400 0.160 1250% 1250%
Grower I (8-11 wk.) 310 0.124 1612% 1612% Grower II (11-14 wk.) 290 0.116 1724% 1724% Finisher I (14-17 wk.) 275 0.110 1818% 1818% Finisher II (17-fin wk.) 250 0.100 2000% 2000%
Broilers Starter 500 0.20 1000% 1000%
Grower and Finisher 300 0.12 1667% 1667% Inclusion levels to equal 0.1 % aP and 0.3% calcium in layer diets and 0.1 % aP and 0.1 % calcium in all other diets
Recommendations for use of Natu hos 600 Inclusion levels Nutrient values
Species/age group FTU/ kg diet Natuphos 600 aPhos Calcium (lb/ton)
La ers All ages 300 1.00 200% 600%
Turke Starter (0-8 wk.) 400 1.33 150% 150%
Grower I (8-11 wk.) 310 1.03 194% 194% Grower II (11-14 wk.) 290 0.97 207% 207% Finisher I ( 14-17 wk.) 275 0.92 218% 218% Finisher II (17-fin wk.) 250 0.83 240% 240%
Broilers Starter 500 1.67 120% 120%
Grower and Finisher 300 1.00 200% 200%
75
Inclusion levels to equal 0.1 % aP and 0.3% calcium in layer diets and 0.1 % aP and 0.1 % calcium iri all other diets
76
~
! I
i t I f ~ ~ i ~·
I l
s Sl
fil c~
J sJ
~ ~
pJ dJ
I
f~ (1
ril Sl
I OJ , pl
I
f~ tll
I le , a~
J I
cl
pl Sl
~ I
~ ~ ; a
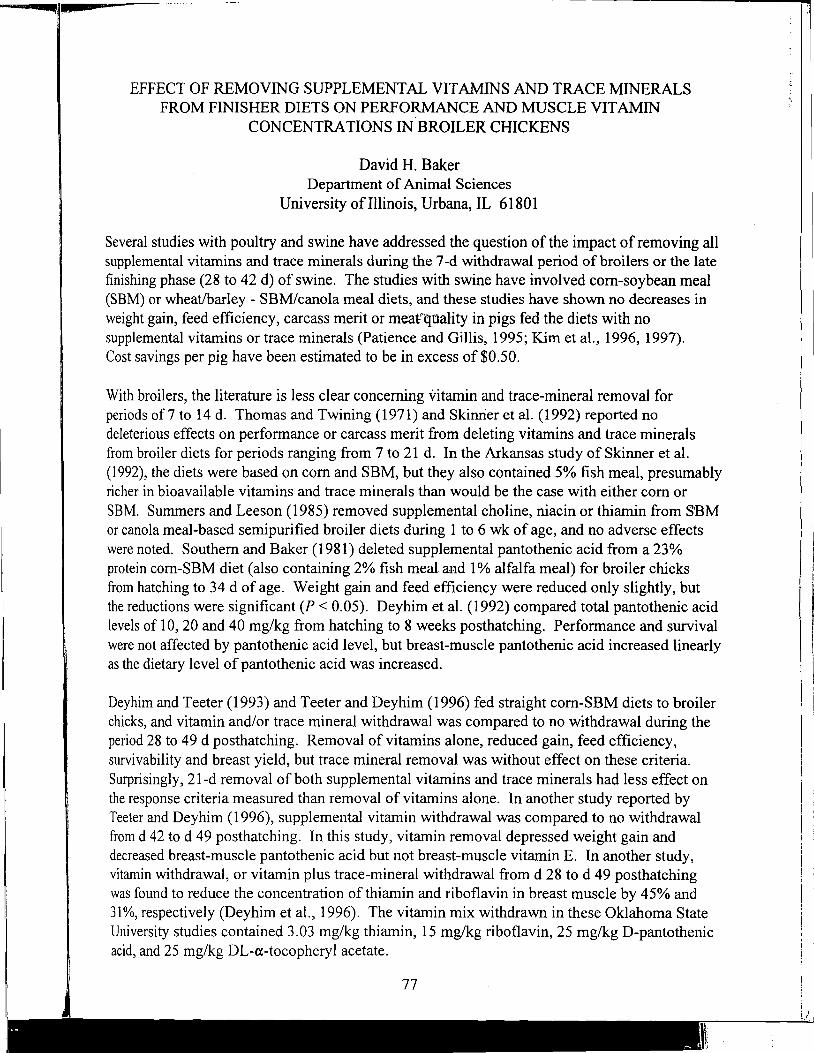
aq.
EFFECT OF REMOVING SUPPLEMENTAL VITAMINS AND TRACE MINERALS FROM FINISHER DIETS ON PERFORMANCE AND MUSCLE VITAMIN
CONCENTRATIONS IN BROILER CHICKENS
David H. Baker Department of Animal Sciences
University of Illinois, Urbana, IL 61801
Several studies with poultry and swine have addressed the question of the impact of removing all supplemental vitamins and trace minerals during the 7-d withdrawal period of broilers or the late finishing phase (28 to 42 d) of swine. The studies with swine have involved com-soybean meal (SBM) or wheat/barley - SBM/canola meal diets, and these studies have shown no decreases in weight gain, feed efficiency, carcass merit or meat'lJtiality in pigs fed the diets with no supplemental vitamins or trace minerals (Patience and Gillis, 1995; Kim et al., 1996, 1997). Cost savings per pig have been estimated to be in excess of $0.50.
With broilers, the literature is less clear concerning vitamin and trace-mineral removal for periods of 7 to 14 d. Thomas and Twining (1971) and Skinner et al. (1992) reported no deleterious effects on performance or carcass merit from deleting vitamins and trace minerals from broiler diets for periods ranging from 7 to 21 d. In the Arkansas study of Skinner et al. (1992), the diets were based on com and SBM, but they also contained 5% fish meal, presumably richer in bioavailable vitamins and trace minerals than would be the case with either com or SBM. Summers and Leeson ( 1985) removed supplemental choline, niacin or thiamin from SBM or canola meal-based semi purified broiler diets during 1 to 6 wk of age, and no adverse effects were noted. Southern and Baker (1981) deleted supplemental pantothenic acid from a 23% protein com-SBM diet (also containing 2% fish meal and 1 % alfalfa meal) for broiler chicks from hatching to 34 d of age. Weight gain and feed efficiency were reduced only slightly, but the reductions were significant (P < 0.05). Deyhim et al. (1992) compared total pantothenic acid levels of 10, 20 and 40 mg/kg from hatching to 8 weeks posthatching. Performance and survival were not affected by pantothenic acid level, but breast-muscle pantothenic acid increased linearly as the dietary level of pantothenic acid was increased.
Deyhim and Teeter (1993) and Teeter and Deyhim (1996) fed straight com-SBM diets to broiler chicks, and vitamin and/or trace mineral withdrawal was compared to no withdrawal during the period 28 to 49 d posthatching. Removal of vitamins alone, reduced gain, feed efficiency, survivability and breast yield, but trace mineral removal was without effect on these criteria. Surprisingly, 21-d removal of both supplemental vitamins and trace minerals had less effect on the response criteria measured than removal of vitamins alone. In another study reported by Teeter and Deyhim (1996), supplemental vitamin withdrawal was compared to no withdrawal from d 42 to d 49 posthatching. In this study, vitamin removal depressed weight gain and decreased breast-muscle pantothenic acid but not breast-muscle vitamin E. In another study, vitamin withdrawal, or vitamin plus trace-mineral withdrawal from d 28 to d 49 posthatching was found to reduce the concentration of thiamin and riboflavin in breast muscle by 45% and 31 %, respectively (Dey him et al., 1996). The vitamin mix withdrawn in these Oklahoma State University studies contained 3.03 mg/kg thiamin, 15 mg/kg riboflavin, 25 mg/kg D-pantothenic acid, and 25 mg/kg DL-a-tocopheryl acetate.
77
/.
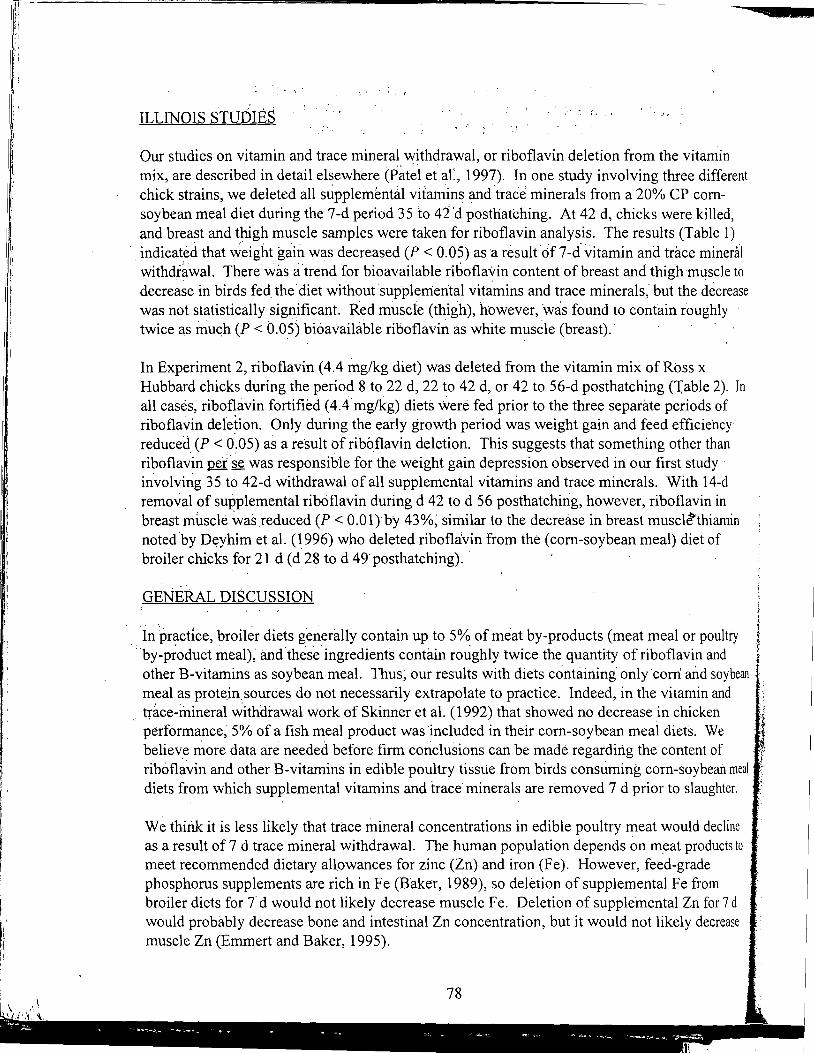
l f I
I! -,, J1 : ~
i' .. '
ILLINOIS STUDIES
Our studies on vitamin and trace mineral withdrawal, or riboflavin deletion from the vitamin mix, are described in detail elsewhere (P~t~l et al'., 1997). In one study involving three different chick strains, we deleted all supplemental vitamins '!llld trace minerals from a 20% CP comsoybean meal diet during the 7-d period 35 to 42'.'d postnatching. At 42 d, chicks were killed, and breast and thigh muscle samples were taken for riboflavin analysis. The results (Table 1)
. indicated that ~eight gain was decreased (P < 0.05) as a result cif 7-d-vitamin and trace mineral withdrawal. There was a ·trend for bioavailable riboflavin content of breast and thigh muscle to decrease in birds fed the diet withoutsupplerriental vitamins and trace minerals, but the decrease was not statistically sign.ificant. Red muscie (thigh), however, was found to contain roughly twice as much (P < 0.05) bioavailable riboflavi~ as white muscle (breast) ..
In Experiment 2, riboflavin (4.4 mg/kg diet) was deleted from the vitamin mix of Ross x Hubbard chicks during the period 8 to 22 d, 22 to 42 d, or 42 to 56-d posthatching ('(able 2). In all cases, riboflavin fortified ( 4.4· mg/kg) diets Were fed prior to the three separate periods of riboflavin deletion. Only during the early growth period was weight gain and feed efficiency reduced (P < 0:05) as a re·sult of riboflavin deletion. This suggests that something other than riboflavin~ se was responsible for the weight gain depression observed in: our first study · involving 35 to 42-d withdrawal of all supplemental vitamins and trace minerals. With 14-d removal of supplemental riboflavin during d 42 to d 56 posthatchirig, however, riboflavin in breast muscle was reduced (P < O.Ol)by 43%; similar to the decrease in breast muscltthiamin noted ·by Deyhim et al. (1996) who deleted riboflavin from the (com-soybean meal) diet of broiler chicks for 21 d (d 28 to d 49.posthatching). ·
GENERAL DISCUSSION
In practice, broiler diets g'enerally contain up to 5% of meat by-products (meat meal or poultry . by-p~oduct meal); and these ingredients contain roughly twice the quantity of riboflavin and other B-vitamins as soybean meal. Thus; our results with diets containing only corn' and soybean meal as protein.sources do not necessarily extrapolate to practice. Indeed, in the vitamin and
_ trace-mineral withdrawal work of Skinner et al. ( 1992) that showed no decrease in chicken ·: performance, 5% of a fish meal product was included in their com-soybean meal diets. We t believ_e more data are needed before firm conclusions can be made regarding the content of ~ riboflavin and other B-vitamins in edible poultry tissue from birds consuming com-soybean meal -~ diets from which supplemental vitamins and trace minerals are removed 7 d prior to slaughter.
We think it is less likely that trace mineral concentrations in edible poultry meat would decline as a result of 7 d trace mineral withdrawal. The human population depends on m_eat products to meet recommended dietary allowances for zinc (Zn) and iron (Fe). However, feed-grade phosphorus supplements are rich in Fe (Baker, 1989), so deletion of supplemental Fe from broiler diets for 7 d would not likely decrease muscle Fe. Deletion of supplemental Zn for 7 d would probably decrease bone and intestinal Zn concentration, but it would not likely decrease muscle Zn (Emmert and Baker, 1995).

!nt
~l to ase
In
1n
'y
bean
meal :r.
ne 5 to
d tse
SUMMARY
1.
2.
3.
4.
Poultry meat is considered a rich source of high quality protein, vitamins and trace minerals, and any management practice that might reduce the nutritional value of the product deserves attention.
With simple com-soybean meal diets, 7-d removal of supplemental vitamins and trace minerals from broiler diets during the period 35 to 42-d posthatching decreased daily weight gain in three different broiler strains.
The bioavailable riboflavin content of thigh muscle was almost twice as high as that of breast muscle.
Removal of supplemental riboflavin from the finisher diet for 7 d caused only a slight decrease in the riboflavin content of breast muscle, but 14-d removal resulted in a 43% decrease in breast-muscle riboflavin.
79
l! ' . ,
/,
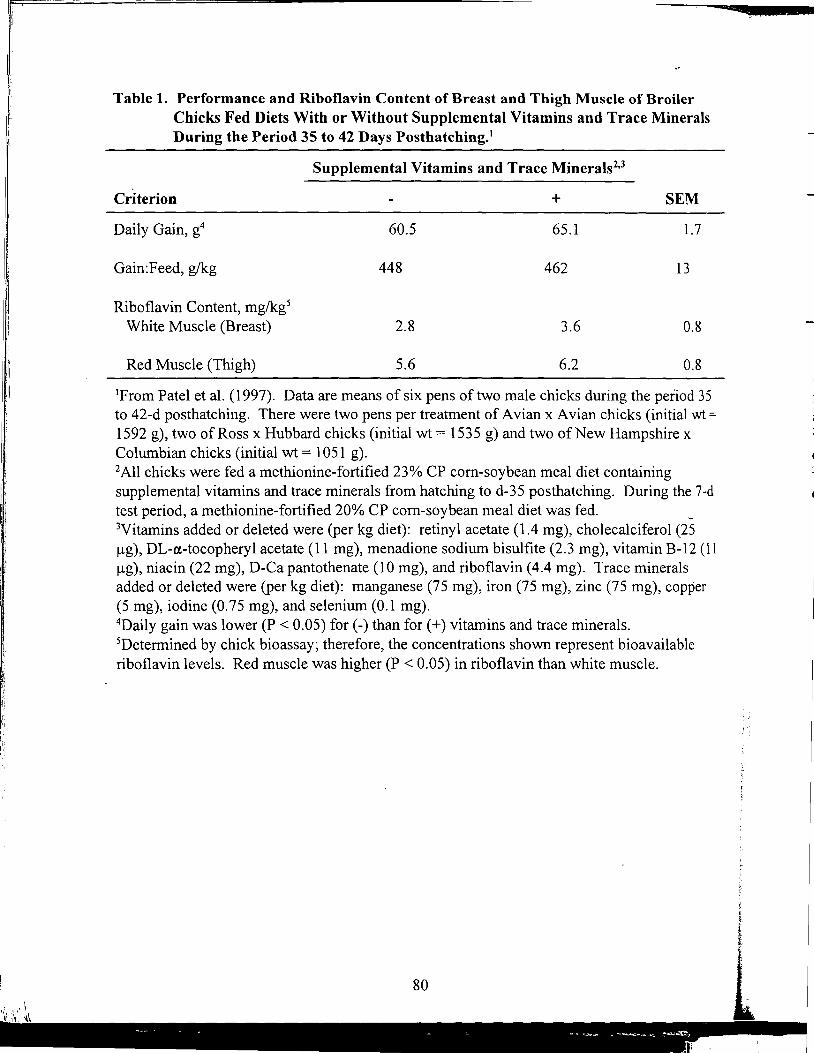
i 'I
'1
I
t
I
Table 1. Performance and Riboflavin Content of Breast and Thigh Muscle of Broiler Chicks Fed Diets With or Without Supplemental Vitamins and Trace Minerals During the Period 35 to 42 Days Posthatching.1
Criterion
Daily Gain, g4
Gain:Feed, g/kg
Riboflavin Content, mg/kg5
White Muscle (Breast)
Red Muscle (Thigh)
Supplemental Vitamins and Trace Minerals2•3
+
60.5 65.l
448 462
2.8 3.6
5.6 6.2
SEM
1.7
13
0.8
0.8
1From Patel et al. (1997). Data are means of six pens of two male chicks during the period 35 to 42-d posthatching. There were two pens per treatment of Avian x Avian chicks (initial wt=
1592 g), two of Ross x Hubbard chicks (initial wt= 1535 g) and two of New Hampshire x Columbian chicks (initial wt= 1051 g). 2All chicks were fed a methionine-fortified 23% CP com-soybean meal diet containing supplemental vitamins and trace minerals from hatching to d-35 posthatching. During the 7-d test period, a methionine-fortified 20% CP com-soybean meal diet was fed. _ 3Vitamins added or deleted were (per kg diet): retinyl acetate (1.4 mg), cholecalciferol (25 µg), DL-a-tocophery 1 acetate ( 11 mg), menadione sodium bisulfite (2.3 mg), vitamin B-12 (11 µg), niacin (22 mg), D-Ca pantothenate (10 mg), and riboflavin (4.4 mg). Trace minerals added or deleted were (per kg diet): manganese (75 mg), iron (75 mg), zinc (75 mg), copper (5 mg), iodine (0. 75 mg), and selenium (0.1 mg). 4Daily gain was lower (P < 0.05) for(-) than for(+) vitamins and trace minerals. 5Determined by chick bioassay; therefore, the concentrations shown represent bioavailable riboflavin levels. Red muscle was higher (P < 0.05) in riboflavin than white muscle.
80
(
! }
! '
l
' i
\1
Table 2. Performance and Breast Muscle Riboflavin Concentration of Broiler Chicks Fed Corn-Soybean Meal Diets With(+) or Without(-) Riboflavin Fortification1
d 8 to d 222 d 22 to d 42 d 42 to d 563
Criterion + + +
Daily gain, g 36.8 41.2 69.7 69.3 76.0 69.1
Gain:Feed, g/kg 669 724 529 ·525 424 402
Breast Muscle Riboflavin, mg/kg NA NA NA NA 2.1 3.7
1From Patel et al. (1997). Data are means of four pens of four male Ross x Hubbard chicks fed 23% CP, 20% CP or 18% CP methionine fortified com-soybean meal diets, respectively, during the period 8 to 22 d, 22 to 42 d, and 42 to 56-d posthatching. The supplemental riboflavin added or deleted from diets was provided at 4.4 mg/kg. Prior to each growth period assessed, all chicks had received riboflavin-supplemented ( 4.4 mg/kg) diets. 2Significant (P < 0.05) decrease in both daily gain and gain:feed for(-) riboflavin during d 8 to d 22 posthatching. 3Significant (P < 0.01) decrease in bioavailable riboflavin concentration in breast muscle of chicks fed (-) riboflavin diets from d 42 to d 56 posthatching.
81
LITERATURE CITED
Baker, D. H., 1989. Phosphorus supplements for poultry. Multistate Newsletter (Oct. 1989) l(No. 5):5-6.
Deyhim, F., T. Belay and R. G. Teeter. 1992. An evaluation of dietary pantothenic acid needs of broilers through eight weeks posthatching. Nutr. Res. 12:1549-1554.
Deyhim, F., B. J. Stoecker and R. G. Teeter, 1996. Vitamin and trace-mineral withdrawal effects on broiler breast tissue riboflavin and thiamin content. Poultry Sci. 75:201-202 ..
Deyhim, F. and R. G. Teeter. 1993. Dietary vitamin and/or trace mineral effects on performance, humeral-mediated immunity, and carcass composition of broilers during thermoneutral and high ambient temperature distress. J. Appl. Poultry Res. 2:347-355.
Emmert, J. L. and D. H. Baker, 1995. Zinc stores in chickens delay the onset of zinc deficiency symptoms. Poultry Sci. 74:1011-1021.
Kim, I. H., J. D. Hancock, L. L .Burnham, D. H. Kropf, R. H. Hines, K. C. Behnke, M. M. Rantanen and I. Mavromichalis, 1996. Omitting vitamin and trace mineral premixes from diets during late finishing (86 to 110 kg) did not reduce growth performance, carcass leanness, or meat quality. J. Anim. Sci. 74(Suppl. 1):60. (Abstr.)
Kim, I. H., J. D. Hancock, D. H. Kropf, R.H. Hines, J. H. Lee, J. S. Park, S. L. Johnston and P. Sorrell, 1997. Removing vitamin and trace mineral premixes from diets for finishing pigs (70 to 112 kg) did not affect growth performance, carcass characteristics, or meat quality. J. Anim. Sci. 75(Suppl. 1):135. (Abstr.)
Patel, K. P., H. M. Edwards III and D. H. Baker, 1997. Removal of vitamin and trace-mineral supplements from broiler finisher diets. J. Appl. Poultry Res. (in press).
Patience, J. F. and D. Gillis, 1995. Removal of vitamins and trace minerals from finishing diets: impact on animal performance. Prairie Swine Centre Annual Research Report, pp. 29-31.
Skinner, J. T., A. L. Waldroup and P. W. Waldroup, 1992. Effects ofremoval of vitamin and trace mineral supplements from grower and finisher diets on live performance and carcass composition of broilers. J. Appl. Poultry Res. 1:280-286.
Southern, L. Land D. H. Baker, 1981. Bioavailable pantothenic acid in cereal grains and soybean meal. J. Anim. Sci. 53 :403-408.
Summers, J. D. and S. Leeson, 1985. Choline, niacin and thiamine supplementation of canola . and soybean protein diets fed to broilers to 6 wk of age. Can. J. Anim. Sci. 65:217-220.
Teeter, R. G. and F. Deyhim, 1996. Vitamin withdrawal effects on performance, carcass composition, and tissue vitamin concentration of broilers exposed to various stress types. BASF Technical Report KC 9603, pp. 1-11.
Thomas, 0. P. and P. V. Twining, 1971. Broiler nutrition during the withdrawal period (7 to 8 112 weeks). Proc. Md Nutr. Conf., pp. 87-90.
82
.L
Farmer! UnfortJ availabl
I feeds, \1
1
tables. values~
METHJ FeedJ
I (DE) c~ energy.I gaseow
I
produc1 produd uses thJ
I Ash ha5 I
Digestil I
most oi Digestii
~xcretei mto pra were diJ fiber di~ fe~en~ nutnent
I low fib~ same a~ the con
Variabil
Formal energy i ffi . I
e 1c1ern convert! 0.82. I-l
s of
:cts
~y
P. 01gs ity.
:ts:
;"31.
bass I
0.
1es.
8
ENERGY VALUES OF FEEDS BASED ON NUTRIENT ANALYSIS
William P. Weiss Department of Animal Sciences
Ohio Agricultural Research and Development Center The Ohio State University, Wooster 44691
Farmers and nutritionists know the importance of providing adequate energy to cows. Unfortunately, we do not have commercial~scale methods for the direct measurement of the available energy content of feeds. For ration formulation and for placing an economic value on feeds, we must use energy values estimated from analytical data or from nutrient composition tables. Because of the importance of energy to milk production and feed costs, accurate energy values are important.
METHODS OF EXPRESSING FEED ENERGY
Feed energy is expressed based on which energetic losses are considered. The digestible energy (DE) content of a feed is determined by measuring the total energy of a feed and subtracting fecal energy. The metabolizable energy (ME) content is. determined by measuring DE, and urinary and gaseous energy. The net energy for lactation (NEL) is determined by measuring ME and heat production. The energy in a feed that is available to the animal to support milk, growth and milk production depends on the total energy in the feed, its digestibility, and how efficiently the animal uses the digestible nutrients. The ash and fat contents largely determine the total energy in it feed. Ash has no energy and fat has about 2.25 times more energy than carbohydrate or protein. Digestibility is much more difficult to measure and because variability in digestibility accounts for most of the variability in the energy content of feeds, accurate digestibility data are essential. Digestibility is measured by feeding cows the test feed and measuring the energy (or nutrient) excreted in the feces. The TDN system is based on digestibility. The efficiency of converting DE into productive energy depends on which nutrients are providing the DE and where the nutrients were digested. Digestible fiber provides less NEL per unit than does digestible starch because fiber digestion includes fermentation losses, but starch can be digested in the intestine without fermentation. The digestion of fiber also p~oduces more heat (heat increment) than other nutrients; therefore, the efficiency of converting DE to NEL is less for high fiber feeds than for low fiber feeds. Fat is not fermented and produces no urinary energy, so the ME of fat is the same as its DE. Fat also is converted into products more efficiently than other nutrients so that the conversion of fat ME to NEL is more efficient than that for other nutrients.
Variability in converting feed to useable energy
For most feeds the efficiency of converting total energy to DE ranges from 0.2 to 0.98 (i.e., energy digestibility ranges from 20 to 98%). High starch concentrates such as com have a high efficiency and low quality roughages such as straw have a low efficiency. The efficiency of converting DE to ME ranges from 0.75 to 1.0. For commonly fed feeds, the average is about 0.82. High fiber feeds have a lower efficiency and high fat feeds have a higher efficiency. Fat has
83
an efficiency of 1.0. The efficiency of converting~ to NEL ranges from about 0.58 to 0.63. High fat increases the efficiency and high fiber decreases the efficiency. Although variations in efficiency occur at all stages of energy utilization, the current NEL system mainly adjusts for differences in digestibility. Essentially all NEL values found in feed tables were derived from TDN using the standard NRC equation:
[l] . NEL (Meal/lb.)= 0.0111 X TDN (%) - 0.055
Because equation [l] has an intercept (-0.055), low TDN feeds are discounted more (less efficient conversion of DE to NEL) than high TDN feeds. Theoretically, the NEL system is superior to the TDN system, but because we estimate NEL values from TDN the theoretical advantages may be masked by inaccurate estimates. In practice, NEL and TDN have similar accuracy in · predicting animal performance.
ESTIMATING FEED ENERGY
Several nutrients are related to the energy value of feeds. Some relationships make biological sense; other relationships are purely a statistical phenomenon. The concentrations of ash, fat, and lignin are biologically related to energy. Ash has no energy (dilutes out energy) and fat contains a large amount of energy. In practice, however, ash and fat are not accurate as sole estimators of feed energy because their concentrations are typically low and they do not vary enough within feeds. Lignin is negatively correlated with fiber and dry matter digestibility, but lignin is an inaccurate estimator of feed energy because the assay is inaccurate and feeds contain small amounts oflignin. Fiber concentrations (NDF or ADF) are negatively r~lated to digestibility,'· because, on average, fiber is less digestible than nonfiber. The concentrations of ADF are more strongly correlated with digestibility than NDF concentrations. The higher analytical precision of measuring ADF may be the reason for that difference. Protein concentration is positively correlated with digestibility. Few equations use protein to estimate energy because of the indirect nature of the relationship (high protein= low fiber= high digestibility) and because the protein content can be influenced greatly by factors such as fertilization.
Methods based on ADF
The most common method to obtain estimated feed energy is the use of ADF-based equations. Feeds are analyzed for ADF, that value is entered into a linear regression equation, and a TDN or NEL value is calculated. Equations are usually developed by conducting digestibility trials with cattle or sheep fed feeds (usually a type of forage) with different concentrations of ADF. Total tract dry matter digestibility, TDN or DE is measured. The energy value (TDN or NEL calculated from TDN) is then regressed on the ADF content of the feed. Many of these equations have been compiled by Undersander et al. (1993); some of which are in Table 1. Many ADF equations have been developed for forages, few equations are available for concentrate and byproduct feeds.
For the same feed, the equations can be quite different depending on the data used to generate the equation. For example, the corn silage equation from New York has a slope that is more than
84
.L
t dil Pd
~~1
~ _1
A d d J J
I
(]
s s
~~ I
wil I
da1 I the
re~ eqJ ofl M-mJ us coJ rel! nuJ
I san cd thd gd thd
I
red
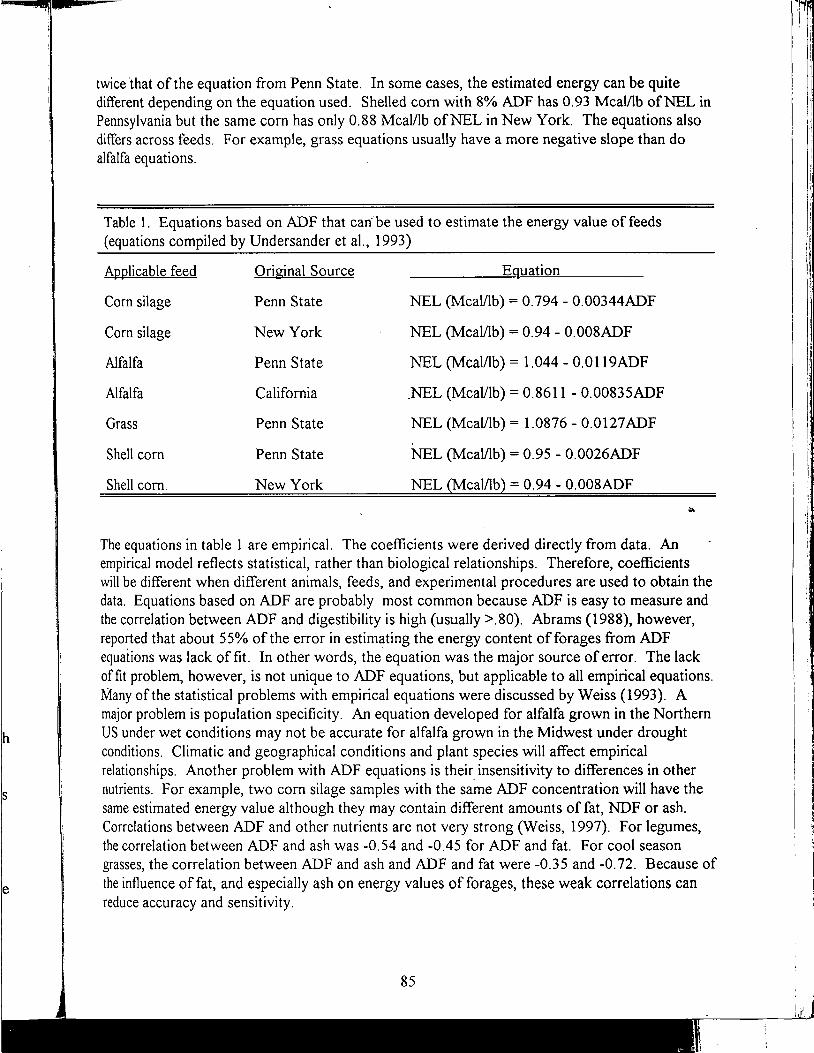
-
h
s
e
twice that of the equation from Penn State. In some cases, the estimated energy can be quite different depending on the equation used. Shelled corn with 8% ADF has 0.93 Meal/lb ofNEL in Pennsylvania but the same corn has only 0.88 Meal/lb ofNEL in New York. The equations also differs across feeds. For example, grass equations usually have a more negative slope than do alfalfa equations.
Table 1. Equations based on ADF that can'be used to estimate the energy value of feeds (equations compiled by Undersander et al., 1993)
Applicable feed Original Source Equation
Com silage Penn State NEL (Meal/lb)= 0.794 - 0.00344ADF
Com silage New York NEL (Meal/lb)= 0.94 - 0.008ADF
Alfalfa Penn State NEL (Meal/lb)= 1.044 - O.Ol 19ADF
Alfalfa California _NEL (Meal/lb)= 0.8611 - 0.00835ADF
Grass Penn State NEL (Meal/lb)= 1.0876 - 0.0127ADF
Shell corn Penn State NEL (Meal/lb)= 0.95 - 0.0026ADF
Shell corn. New York NEL {Meal/lb}= 0.94 - 0.008ADF
.i..
The equations in table 1 are empirical. The coefficients were derived directly from data. An empirical model reflects statistical, rather than biological relationships. Therefore, coefficients will be different when different animals, feeds, and experimental procedures are used to obtain the data. Equations based on ADF are probably most common because ADF is easy to measure and the correlation between ADF and digestibility is high (usually >.80). Abrams (1988), however, reported that about 55% of the error in estimating the energy content of forages from ADF equations was lack of fit. In other words, the equation was the major source of error. The lack offit problem, however, is not unique to ADF equations, but applicable to all empirical equations. Many of the statistical problems with empirical equations were discussed by Weiss (1993). A major problem is population specificity. An equation developed for alfalfa grown in the Northern US under wet conditions may not be accurate for alfalfa grown in the Midwest under drought conditions. Climatic and geographical conditions and plant species will affect empirical relationships. Another problem with ADF equations is their insensitivity to differences in other nutrients. For example, two corn silage samples with the same ADF concentration will have the same estimated energy value although they may contain different amounts of fat, NDF or ash. Correlations between ADF and other nutrients are not very strong (Weiss, 1997). For legumes, the correlation between ADF and ash was -0.54 and -0.45 for ADF and fat. For cool season grasses, the correlation between ADF and ash and ADF and fat were -0.35 and -0.72. Because of the influence of fat, and especially ash on energy values of forages, these weak correlations can reduce accuracy and sensitivity.
85
i
:i :1 I
I
!'
! I
11
Another limitation to these equations are that they are based entirely on digestibility. Harlan et al. (1991) actually measured NEL and used ADF to estimate those values. They obtained the following equations:
Alfalfa: NEL (Meal/lb)= 1.056 - 0.0143ADF Com silage: NEL (Meal/lb)= 1.00 - 0.0126ADF
That slopes of those equations are markedly higher (more negative) than slopes from ADF equations used to estimate calculated NEL (Table 1 ). This difference could simply reflect differences between empirical equations or it could reflect problems with the method used to estimate NEL. Based on other data in Harlan et al. (1992) at least some of the difference is caused by the method we use to estimate NEL. In other words, the equation based on TDN used to calculate NEL overestimates the energy value of forages. The ADF equations of Harlan et al. (1992) need to be validated on other data sets but theoretically the approach followed ,by Harlan et al. is an improvement over other ADF equations.
MECHANISTIC MODELS
The development and use of mechanistic models has increased. These models attempt to describe digestion and metabolism in biological terms rather than purely statistical terms. Most of the nutrients or chemical fractions in feeds that are known to contribute to available energy are included in the models. These models also may include rates of digestion and passage so that the effect of feed intake on digestibility can be included.
The Ohio State Model
In 1984, scientists at Ohio State University (Conrad et al., 1984) developed a mechanistic model that could be used to estimate TDN or NEL of most feeds. The model included energy from protein, nonfiber carbohydrate, fat, and NDF. The digestibility ofNDF was estimated based on lignin and NDF concentrations. The OSU model is based on true digestibility, hence a single equation is applicable to all feeds. The OSU model was revised in 1992 (Weiss et al., 1992) to correct a theoretical flaw and to provide more accurate values for byproduct feeds and heatdamaged forages. The basic components of the 1992 model are in Table 2.
Energy from protein. Except for heat-treated or heat-damaged feeds, CP is a uniform fraction (digestibility is constant among feeds) and has a true digestibility of about 92%. Acid detergent insoluble nitrogen can be used to adjust for heat-damage; however, the relationship between ADIN and protein digestibility is different for forages and concentrates (Equations [2] and [3] in Table 2). When heat-damage is not suspected, ADIN should be set at 7% for forages and 0% for concentrates.
Energy from nonfiber carbohydrate. Nonfiber carbohydrate (NFC) usually acts as a uniform fraction with a true digestibility of about 98%. The concentration of NFC in a feed can be calculated by subtracting ash, ether extract, CP, and CP-free NDF from 100 (equation [4]). For most normal forages, NDF can replace CP-free NDF, but for heat damaged forages and
°V' •.
he; I
NU I
pr~
Re
lo~ dig
I em Ad thJ
_I l
dl _1
[2
~j I
[5 I
[6 I
[1
~ c~ e~ ___;
am oils
.1 acu 94~ thaj
est1· mo
(eq] con
I
as Iii ace mn
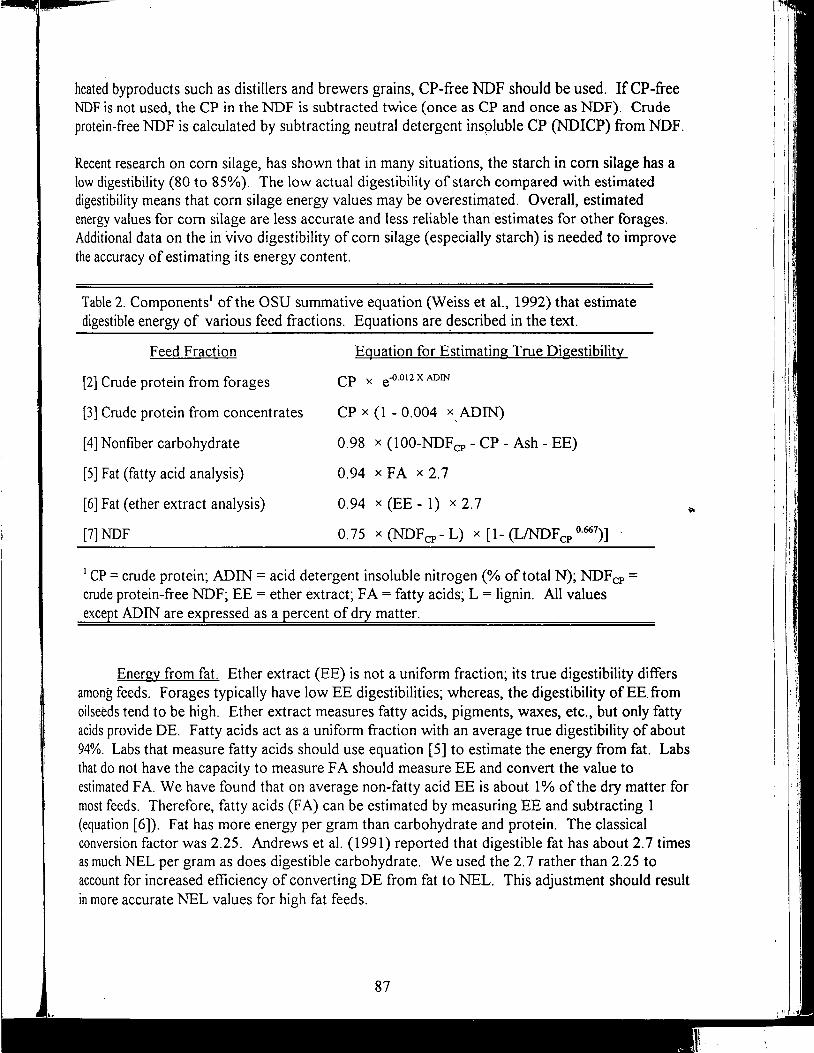
#SL
heated byproducts such as distillers and brewers grains, CP-free NDF should be used. If CP-free NDF is not used, the CP in the NDF is subtracted twice (once as CP and once as NDF). Crude protein-free NDF is calculated by subtracting neutral detergent inspluble CP (NDICP) from NDF.
Recent research on corn silage, has shown that in many situations, the starch in corn silage has a low digestibility (80 to 85%). The low actual digestibility of starch compared with estimated digestibility means that corn silage energy values may be overestimated. Overall, estimated energy values for corn silage are less accurate and less reliable than estimates for other forages. Additional data on the in vivo digestibility of corn silage (especially starch) is needed to improve the accuracy of estimating its energy content.
Table 2. Components' of the OSU summative equation (Weiss et al., 1992) that estimate digestible energy of various feed fractions. Equations are ~escribed in the text.
Feed Fraction
[2] Crude protein from forages
[3] Crude protein from concentrates
[4] Nonfiber carbohydrate
(5] Fat (fatty acid analysis)
(6] Fat (ether extract analysis)
(7] NDF
Equation for Estimating True Digestibility
CP x e-0.012 x ADIN
CP x (1 - 0.004 x. ADIN)
0.98 x (100-NDFcP - CP - Ash - EE)
0.94 x FA x 2.7
0.94 x (EE - 1) x 2.7
0.75 x (NDFcp- L) x [1- (LINDFcP 0·667
)]
1 CP =crude protein; ADIN =acid detergent insoluble nitrogen(% of total N); NDFcP = crude protein-free NDF; EE = ether extract; FA = fatty acids; L = lignin. All values except ADIN are expressed as a percent of dry matter.
Energy from fat. Ether extract (EE) is not a uniform fraction; its true digestibility differs among feeds. Forages typically have low EE digestibilities; whereas, the digestibility of EE from oilseeds tend to be high. Ether extract measures fatty acids, pigments, waxes, etc., but only fatty acids provide DE. Fatty acids act as a uniform fraction with an average true digestibility of about 94%. Labs that measure fatty acids should use equation [5] to estimate the energy from fat. Labs that do not have the capacity to measure FA should measure EE and convert the value to estimated FA. We have found that on average non-fatty acid EE is about 1% of the dry matter for most feeds. Therefore, fatty acids (FA) can be estimated by measuring EE and subtracting 1 (equation [6]). Fat has more energy per gram than carbohydrate and protein. The classical conversion factor was 2.25. Andrews et al. (1991) reported that digestible fat has about 2.7 times as much NEL per gram as does digestible carbohydrate. We used the 2. 7 rather than 2.25 to account for increased efficiency of converting DE from fat to NEL. This adjustment should result in more accurate NEL values for high fat feeds.
87
' Ji ,, ..
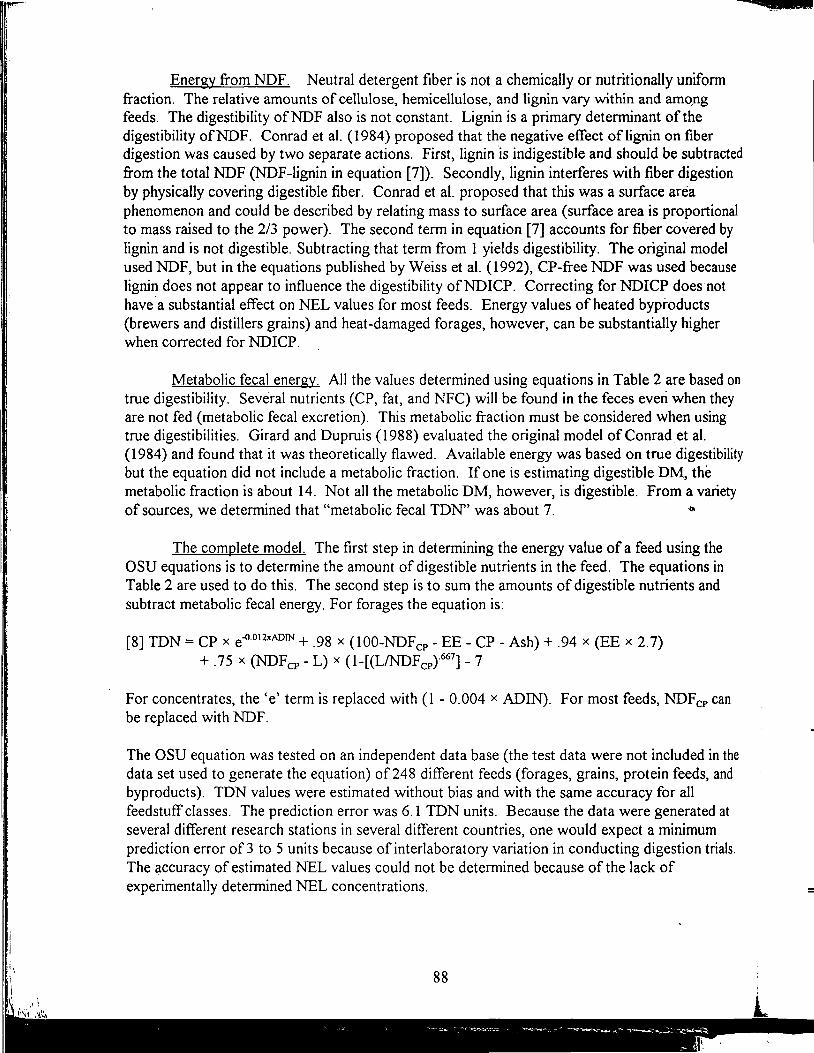
Energy from NDF. Neutral detergent fiber is not a chemically or nutritionally uniform fraction. The relative amounts of cellulose, hemicellulose, and lignin vary within and amqng feeds. The digestibility ofNDF also is not constant. Lignin is a primary determinant of the digestibility ofNDF. Conrad et al. (1984) proposed that the negative effect oflignin on fiber digestion was caused by two separate actions. First, lignin is indigestible and should be subtracted from the total NDF (NDF-lignin in equation [7]). Secondly, lignin interferes with fiber digestion by physically covering digestible fiber. Conrad et al. proposed that this was a surface area phenomenon and could be described by relating mass to surface area (surface area is proportional to mass raised to the 2/3 power). The second term in equation [7] accounts for fiber covered by lignin and is not digestible. Subtracting that term from 1 yields digestibility. The original model used NDF, but in the equations published by Weiss et al. (1992), CP-free NDF was used because lignin does not appear to influence the digestibility ofNDICP. Correcting for NDICP does not have.a substantial effect on NEL values for most feeds. Energy values of heated byproducts (brewers and distillers grains) and heat-damaged forages, however, can be substantially higher when corrected for NDICP.
Metabolic fecal energy. All the values determined using equations in Table 2 are based on true digestibility. Several nutrients (CP, fat, and NFC) will be found in the feces everi when they are not fed (metabolic fecal excretion). This metabolic fraction must be considered when using true digestibilities. Girard and Dupruis ( 1988) evaluated the original model of Conrad et al. (1984) and found that it was theoretically flawed. Available energy was based on true digestibility but the equation did not include a metabolic fraction. If one is estimating digestible DM, the metabolic fraction is about 14. Not all the metabolic DM, however, is digestible. From a variety of sources, we determined that "metabolic fecal TDN' was about 7. ~
The complete model. The first step in determining the energy value of a feed using the OSU equations is to determine the amount of digestible nutrients in the feed. The equations in Table 2 are used to do this. The second step is to sum the amounts of digestible nutrients and subtract metabolic fecal energy. For forages the equation is:
[8] TDN = CP x e-0.oiixADIN + .98 x (100-NDFcp - EE - CP - Ash)+ .94 x (EE x 2.7) + .75 x (NDFcp - L) x (1-[(LINDFcp}667
] - 7
For concentrates, the 'e' term is replaced with (1 - 0.004 x ADIN). For most feeds, NDFcP can be replaced with NDF.
The OSU equation was tested on an independent data base (the test data were not included in the data set used to generate the equation) of 248 different feeds (forages, grains, protein feeds, and byproducts). TDN values were estimated without bias and with the same accuracy for all feedstuff classes. The prediction error was 6.1 TDN units. Because the data were generated at several different research stations in several different countries, one would expect a minimum prediction error of 3 to 5 units because of interlaboratory variation in conducting digestion trials. The ~ccuracy of estimated NEL values could not be determined because of the lack of experimentally determined NEL concentrations.
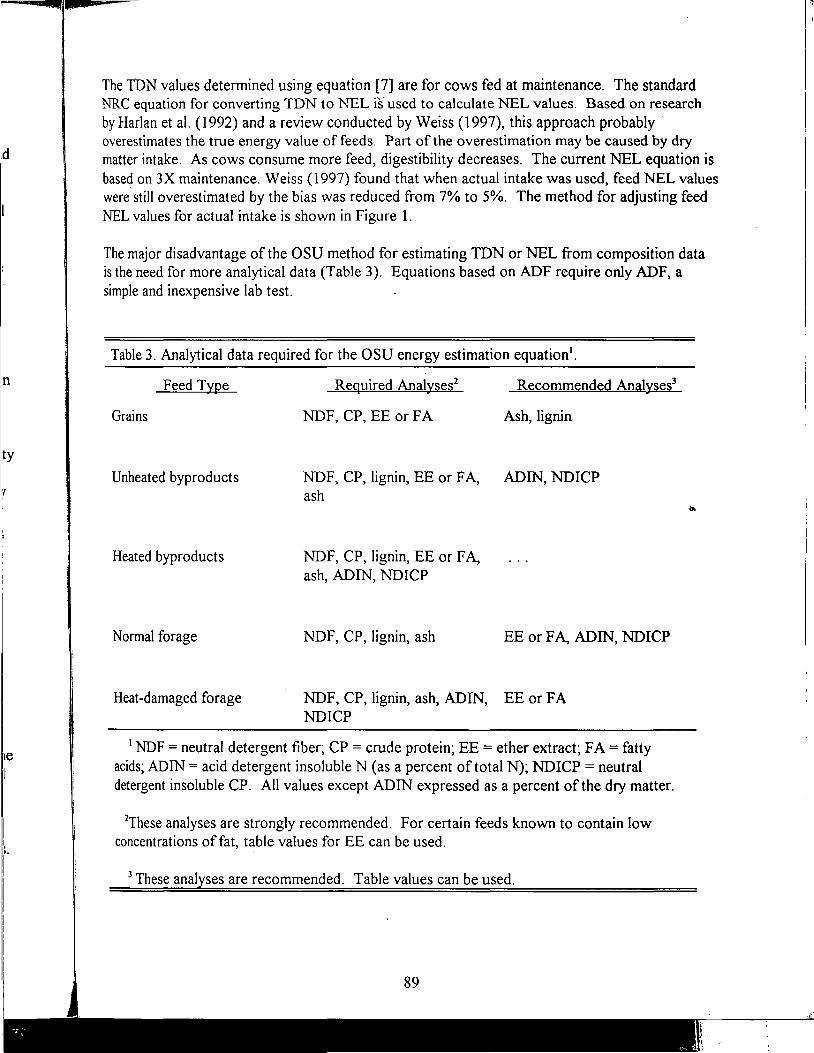
d
n
ty
'
1e l
..
za;
The TDN values determined using equation [7] are for cows fed at maintenance. The standard NRC equation for converting TDN to NEL is" used to calculate NEL values. Based on research by Harlan et al. (1992) and a review conducted by Weiss (1997), this approach probably · overestimates the true energy value of feeds. Part of the overestimation may be caused by dry matter intake. As cows consume more feed, digestibility decreases. The current NEL equation is based on 3X maintenance. Weiss (1997) found that when actual intake was used, feed NEL values were still overestimated by the bias was reduced from 7% to 5%. The method for adjusting feed NEL values for actual intake is shown in Figure 1.
The major disadvantage of the OSU method for estimating TDN or NEL from composition data is the need for more analytical data (Table 3). Equations based on ADF require only ADF, a simple and inexpensive lab test.
Table 3. Analytical data required for the OSU energy estimation equation'.
Feed Type
Grains
Unheated byproducts
Heated byproducts
Normal forage
Heat-damaged forage
Required Analyses2
NDF, CP, EE or FA
NDF, CP, lignin, EE or FA, ash
NDF, CP, lignin, EE or FA, ash, ADIN, NDICP
NDF, CP, lignin, ash
Recommended Analyses3
Ash, lignin
ADIN, NDICP
EE or FA, ADIN, NDICP
NDF, CP, lignin, ash, ADIN, EE or FA NDICP
1 NDF = neutral detergent fiber; CP = crude protein; EE = ether extract; FA= fatty acids; ADIN =acid detergent insoluble N (as a percent of total N); NDICP =neutral detergent insoluble CP. All values except ADIN expressed as a percent of the dry matter.
2These analyses are strongly recommended. For certain feeds known to contain low concentrations of fat, table values for EE can be used .
3 These analyses are recommended. Table values can be used.
89
l:
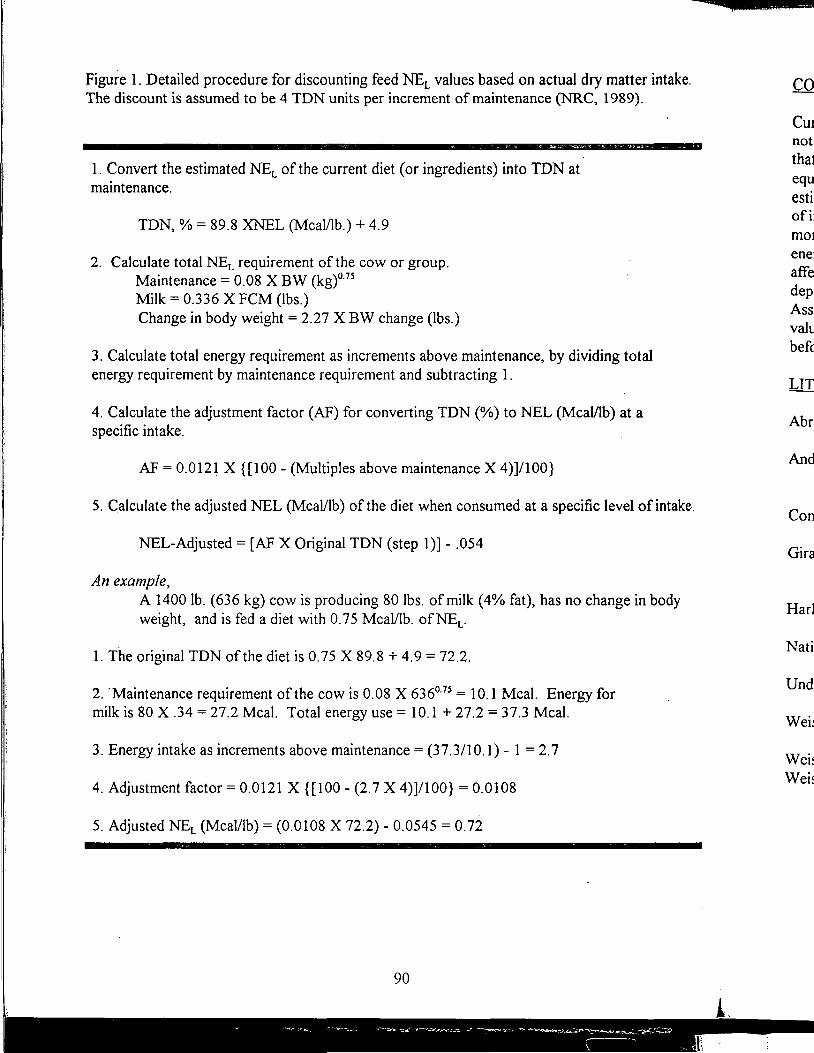
Figure 1. Detailed procedure for discounting feed NEL values based on actual dry matter intake. The discount is assumed to be 4 TDN units per increment of maintenance (NRC, 1989).
1. Convert the estimated NEL of the current diet (or ingredients) into TDN at maintenance.
TDN, % = 89.8 XNEL (Meal/lb.)+ 4.9
2. Calculate total NEL requirement of the cow or group. Maintenance= 0.08 X BW (kg)0
·75
Milk= 0.336 X FCM (lbs.) Change in body weight= 2.27 X BW change (lbs.)
3. Calculate total energy requirement as increments above maintenance, by dividing total energy requirement by maintenance requirement and subtracting 1.
4. Calculate the adjustment factor (AF) for converting TDN (%)to NEL (Meal/lb) at a specific intake.
AF= 0.0121 X {[100 - (Multiples above maintenance X 4)]/100}
5. Calculate the adjusted NEL (Meal/lb) of the diet when consumed at a specific level of intake.
NEL-Adjusted =[AF X Original TDN (step l)] - .054
An example, A 1400 lb. (636 kg) cow is producing 80 lbs. of milk (4% fat), has no change in body weight, and is fed a diet with 0.75 Meal/lb. ofNEL.
1. The original TDN of the diet is 0.75 X 89.8 + 4.9 = 72.2.
2. ·Maintenance requirement of the cow is 0.08 X 636°·75 = 10. l Meal. Energy for milk is 80 X .34 = 27.2 Meal. Total energy use= 10.1 + 27.2 = 37.3 Meal.
3. Energy intake as increments above maintenance= (37.3/10.1) - 1 = 2.7
4. Adjustment factor= 0.0121 X {[100 - (2.7 X 4)]/100} = 0.0108
5. Adjusted NEL (Meal/lb)= (0.0108 X 72.2) - 0.0545 = 0.72
90
ca -I Cm no;I that equl
.1 est11
f .1 0 ll
I mm I ene1
affej dep
Ass! valu befd
LITI
Abrl
And!
Con
Girn
Harl
Nati
Und
Weij WeJ W
.1 e1s
ca;µ
I
CONCLUSIONS
Currently most energy values for feeds are estimated from ADF equations. These equations are not sensitive to differences in other nutrients that affect energy content. A more robust equation that includes fiber, protein, fat, and ash is sensitive to these changes. Another problem with ADF equations is that they are unique to a specific set of samples. Equations based on ADF to estimate available energy of feeds should be evaluated carefully before they are used. The sample of interest should be very similar to those used to generate the equation. Equations must become more sophisticated to account for all the feed and animal factors that influence digestibility and energy metabolism. The equation described in this paper accounts for many of the plant factors affecting digestion but does not consider variation caused by the animal. Variable adjustments for depression in digestibility based on rates of digestion and passage should be incorporated. Associative effects may be important for some diets and need to be modeled. Estimated energy values obtained by any method are still estimates. Users must evaluate energy data carefully before ration formulation.
LITERATURE CITED
Abrams, S.M. 1988. Source of error in predicting digestible dry matter from the acid detergent fiber content of forages. Anim. Feed Sci. Technol. 21:205.
Andrews, S.M., H.F. Tyrrell, C.K. Reynolds, and R.A. Erdman. 1991. Net energy for lactation of calcium soaps oflong chain fatty acids for cows fed silage-based diets. J. Dairy Sci. 74:2588.
Conrad, H.R., W.P. Weiss, W.O. Odwongo, and W.L. Shockey. 1984. Estimating net energy~ lactation from components of cell solubles and cell walls. J. Dairy Sci. 67:427.
Girard, V., and G. Dupuis. 1988. Effect of structural and chemical factors of forages on potentially digestible fiber, intake and true digestibility by ruminants. 1Can. J. Anim. Sci. 68:787.
Harlan, D.W., J.B. Holter, and H.H. Hayes. 1991. Detergent fiber traits to predict productive energy of forages fed free choice to nonlactating dairy cattle. J. Dairy Sci. 74: 1337.
National Research Council. 1989. Nutrient requirements of dairy cattle. 6th rev. ed. Natl. Acad. Sci., Washington DC.
Undersander, D., D.R. Mertens, and N. Thi ex. 1993. Forage analysis procedures. National Forage Testing Assoc. Omaha, NE.
Weiss, W.P. 1997. Estimating available energy content of feeds for dairy cattle. J. Dairy Sci. (In press).
Weiss, W.P. 1993. Predicting energy values of feeds. J. Dairy Sci. 76:1802. Weiss, W.P., H.R. Conrad, and N.R. St. Pierre. 1992. A theoretically-based model for predicting
total digestible nutrient values for forages and concentrates. Anim. Feed Sci. Technol. 39:95.
91
. I
f
I ',

\ I' '' '.'
1'
' ~ :
Notes
( This page intentionally blank. )
92 1
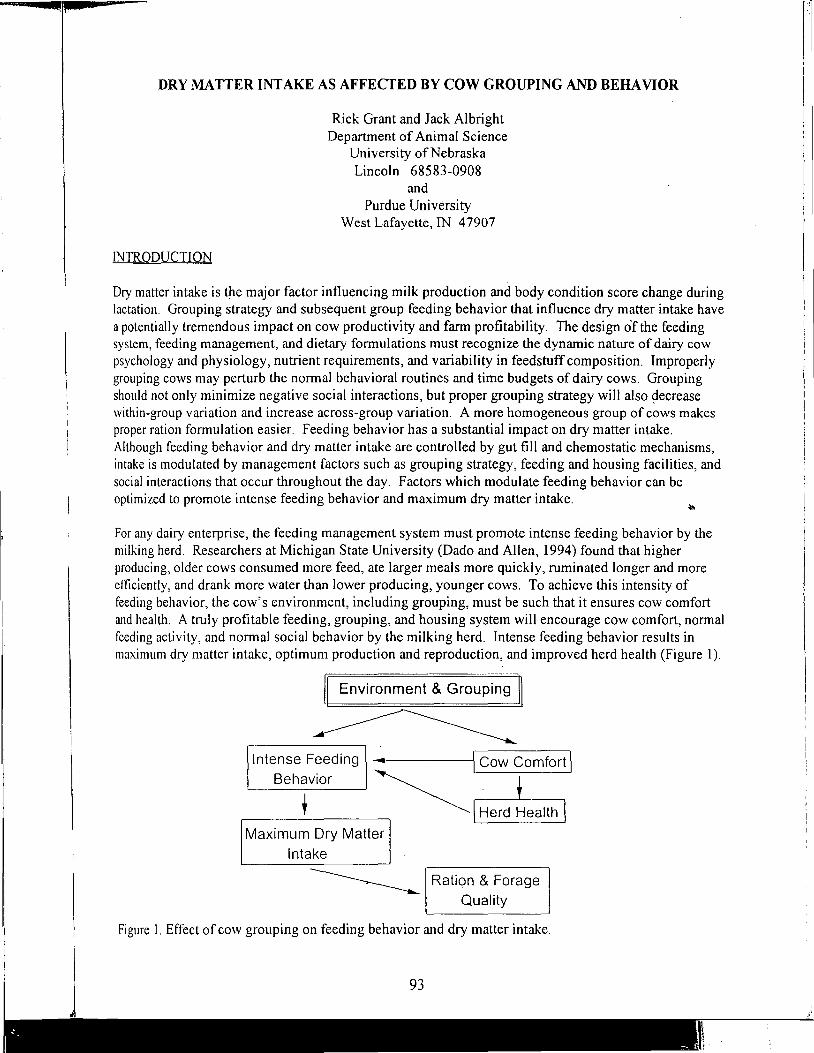
DRY MATTER INT AKE AS AFFECTED BY COW GROUPING AND BERA VIOR
INTRODUCTION
Rick Grant and Jack Albright Department of Animal Science
University of Nebraska Lincoln 68583-0908
and Purdue University
West Lafayette, IN 47907
Dry matter intake is the major factor influencing milk production and body condition score change during lactation. Grouping strategy and subsequent group feeding behavior that influence dry matter intake have a potentially tremendous impact on cow productivity and farm profitability. The design of the feeding system, feeding management, and dietary formulations must recognize the dynamic nature of dairy cow psychology and physiology, nutrient requirements, and variability in feedstuff composition. Improperly grouping cows may perturb the normal behavioral routines and time budgets of dairy cows. Grouping should not only minimize negative social interactions, but proper grouping strategy will also decrease within-group variation and increase across-group variation. A more homogeneous group of cows makes proper ration formulation easier. Feeding behavior has a substantial impact on dry matter intake. Although feeding behavior and dry matter intake are controlled by gut fill and chemostatic mechanisms, intake is modulated by management factors such as grouping strategy, feeding and housing facilities, and social interactions that occur throughout the day. Factors which modulate feeding behavior can be optimized to promote intense feeding behavior and maximum dry matter intake.
For any dairy enterprise, the feeding management system must promote intense feeding behavior by the milking herd. Researchers at Michigan State University (Dado and Allen, 1994) found that higher producing, older cows consumed more feed, ate larger meals more quickly, ruminated longer and more efficiently, and drank more water than lower producing, younger cows. To achieve this intensity of feeding behavior, the cow's environment, including grouping, must be such that it ensures cow comfort and health. A truly profitable feeding, grouping, and housing system will encourage cow comfort, normal feeding activity, and normal social behavior by the milking herd. Intense feeding behavior results in maximum dry matter intake, optimum production and reproduction, and improved herd health (Figure 1).
II Environment & Gro~~l~~---ij
Intense Feeding - 11 Cow Comfort\
Behavior ~ t f I Herd He}iillll
Maximum Dry Matter
Intake
---------..._ Ration & Forage Quality
Figure l. Effect of cow grouping on feeding behavior and dry matter intake.
93
,,1,
This paper will focus on the relationships among cow grouping, bunk space and competition for feed, facility design, cow behavior, age of cow, and stage of lactation. Although there are many effects of grouping strategy on herd performance, this paper will emphasize the impact on dry matter intake and feeding behavior.
FACtORS INFLUENCING GROUP SIZE AND NUMBER
Dividing the milking herd into groups allows for better herd management. Dairy cows have traditionally been managed in groups of 40 to 100 cows (Albright, 1978). Proper grouping can simplify cow movement, make observing cows easier, and allow rations to more closely match the requirements of each individual cow within the group. Several factors interact to determine the optimal group size of cows on any dairy herd. These factors include: 1) bunk space and competition for feed and water, 2) social interactions among cows and how they are affected by group size, 3) space available to the cow, 4) size of holding area and capacity of milking parlor, 5) animal size and age, 6) body condition, 7) days in milk, 8) stall size and quality, and 9) adequacy of ventilation. Rapid movement to and from the milking parlor, continuous availability of palatable feed, and relatively homogeneous cow characteristics can allow minor overcrowding without apparent stress problems (Shultz, 1992). Although we won't focus on the parlor capacity, the amount of time that cows spend in the holding area can help to determine the proper group size. Cows should spend no longer than 45 minutes to one hour waiting to be milked. Plan group sizes according to the number of cows that can be milked in that 45-minute period. A good thumb rule for group size in herds with herringbone and parallel parlors is four times the parlor size. For example, groups for a.double- I 0 parlor should be 80 cows or less. Actually, a realistic group size on any given farm will likely be a balance between maximizing use of parlor and limiting time in the holding area. Limited time in the holding area enhances cow comfort and well-being because it minimizes time away from feed, water, and resting areas.
A recent survey of the top producing herds in the US revealed that over 67% of producers used a total mixed ration feeding system, and that these producers averaged 2.9 groups of cows that were fed 2.7 times daily (Jordan and Fourdraine, 1993). Several researchers have examined various grouping strategies and suggested that cows might best be grouped by nutrient requirements {Sniffen et al., 1993). Williams and Oltenacu (1992) compared seven grouping strategies using a simulation model that included required nutrients per kilogram of dry matter intake, days in milk, test day milk, dairy merit, and merit weighted by days in milk. Grouping systems based on nutrient concentrations were most effective in return over feed costs, whereas the method based only on test day milk was least effective.
Sniffen et al. (1993) reviewed research that evaluated optimal group numbers on a dairy farm. Shifting a herd from one group to two groups increased fat-corrected milk production by 1 to 3%. Moving to three groups improved milk production by up to 2% versus two groups, but shifting to four groups from three only-resulted in a 0 to 1 % increase in milk. Overall, marginal return to additional groups declined beyond three. Most researchers have concluded that the milking herd should be divided into three groups for optimal efficiency. The actual grouping system selected will depend on herd size, facilities available, and other specifics of the farm situation. Of course, the minimum number of groups would be two: a milking plus a dry cow group. Nutritionally, three feeding or production groups plus two dry cow groups are often preferable. A fresh cow group for the first three weeks of lactation can serve as a transition from the dry to high-milk production groups.
GROUPING STRATEGIES AND DRY MATTER INTAKE
Rate of increase in dry matter intake during early lactation may be the primary determinant of energy intake and balance. Dry matter intake increases by approximately 3.3 to 5.5 pounds per week during the
94
first 3
:;~:: Drym/
~~::1· the di comp enviro1 compe
When1 their d and soi
suscep: foci Ii ti to 4 w
bef~rej env1ro
DryJ a close (1991) less on being
To redt to 3 wd concen
Due to the inte
that as I
linear11 Onep9 point,~ Despite cattle,~ from ill
. I
Separal
First-la smalle~ domina larger, J
with.oli fed sep
ly
:ach )n
~of
'8)
in or T
Ip :s
·oups ill ime
rimes and I md
l ::d by
[eed
ig a tree ree yond
:, and :mg ·often dry to
: the
µ
first 3 weeks of lactation (Grant and Albright, 1995). Generally, older cows have a more rapid rate of increase in dry matter intake during the first 5'weeks postpartum than first-lactation cows. This difference argues for separate grouping and management of heifers versus older cows, at least during the early part of the lactation.
Dry matter intake is controlled by gut fill and physiological mechanisms. However, psychogenic factors can substantially modulate dry matter intake. Psychogenic regulation of intake involves the cow's behavioral responses to inhibitory or stimulatory factors in the feed or feeding environment separate from the diet's energy or fill value. Palatability, social i'nteractions, and learning behavior are integral components of psychogenic modulation of intake. Grouping strategy is a primary component of the cow's environment that can influence dry matter intake as a result of its potential impact on cow comfort, competition for feed and water, and herd health.
When practical, heifers within several weeks of parturition should be grouped separately and adapted to their early postpartum environment (Grant and Albright, 1995). Cows that undergo abrupt environmental and social changes during the periparturient period often exhibit aberrant feeding behavior and are more susceptible to metabolic disorders. First-lactation heifers being introduced to new herdmates and milking facilities require careful management. A successful transition program, from 2 to 3 weeks prepartum to 3 to 4 weeks postpartum, may involve bringing heifers into the low-milk group approximately 3 weeks before parturition. For 1 week heifers pass through the milking parlor to become accustomed to the parlor environment, free stalls, and concrete lots (Grant and Albright, 1995).
Dry matter intake declines by approximately 30% during the last 7 to 10 days of pregnancy. Accordingly, a close-up diet should be formulated for this group of cows that contains higher nutrient density. Sniffen ( 1991) pointed out that dry matter intake capacity of a primiparous heifer within 2 weeks of parturition is less on a body weight basis than that for an older cow. Consequently, first-calf heifers may benefit from being fed separately before parturition.
To reduce competition from stronger cows, some researchers have recommended a fresh cow group from 1 to 3 weeks postpartum that would receive essentially the high-cow diet, but with higher dietary fiber concentrations to avoid ruminal acidosis and associated reductions in dry matter intake.
Due to constraints of limited cattle numbers and facilities at most research farms, few data exist regarding the interaction between group size and individual dry matter intake. Data from lambs, however, indicate that as number of lambs per pen increased, feed consumption per visit to a feeding station increased linearly. However, total feed consumption was greatest for an intermediate number of lambs per group. One possible explanation for these results could be that social facilitation increased feeding activity to a point, and then excessive competition caused a subsequent decline in intake (Grant and Albright, 1995). Despite the substantial time, herd, and facility commitments necessary for this type of research using dairy cattle, only data of this sort will allow development of grouping strategies that optimize dry matter intake from the transition period to later stages of lactation and the dry period.
Separate Grouping of Primiparous Cows
First-lactation cows can benefit from separate grouping. Heifers have greater growth requirements, smaller body size, greater persistency of laetation, and frequently a lower position in the group's dominance hierarchy. Phelps (l 992) reported the effect of separating smaller, primiparous heifers from larger, mature cows. When separated, primiparous cows produced significantly more milk. Competition with older cows resulted in less dry matter intake and milk production compared with primiparous cows fed separately. The difference in performance was proportional to the difference in body size between
95
. .
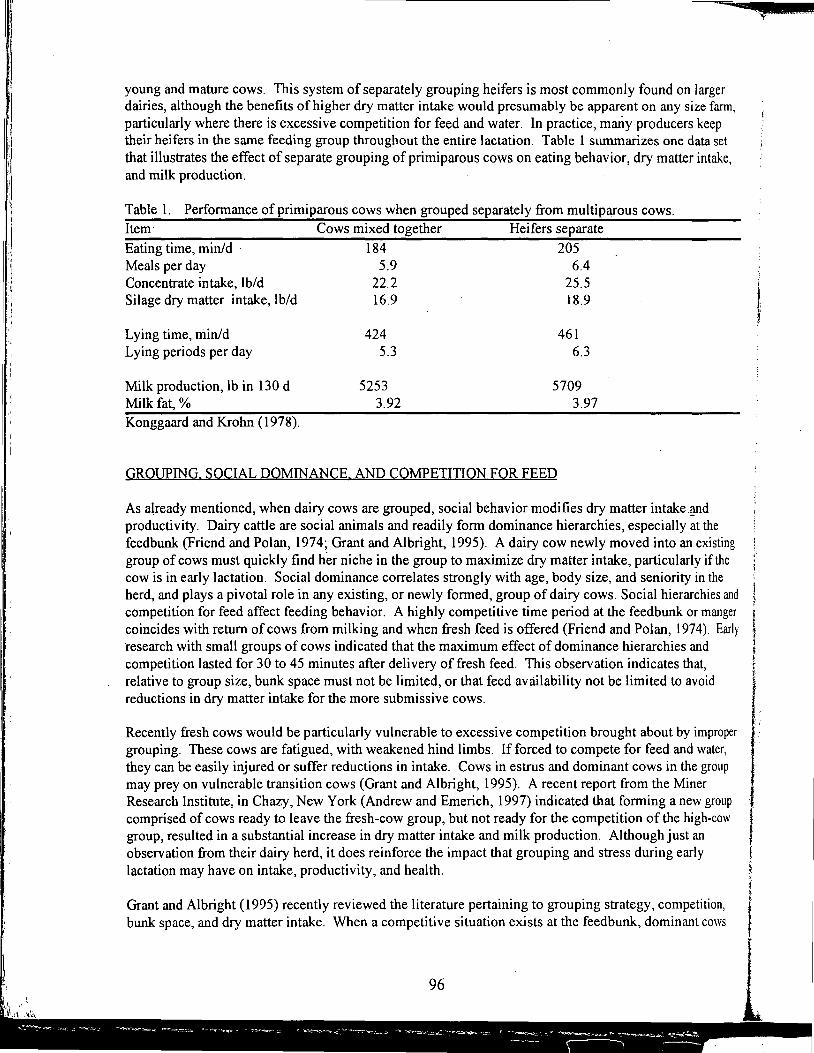
young and mature cows. This system of separately grouping heifers is most commonly found on larger dairies, although the benefits of higher dry matter intake would presumably be apparent on any size farm, particularly where there is excessive competition for feed and water. In practice, mariy producers keep their heifers in the same feeding group throughout the entire lactation. Table 1 summarizes one data set that illustrates the effect of separate grouping of primiparous cows on eating behavior, dry matter intake, and milk production.
Table 1. Performance of primiparous cows when grouped separately from multiparous cows. Item· Cows mixed together Heifers separate
Eating time, min/d · 184 205 Meals per day 5.9 6.4 Concentrate intake, Ibid 22.2 25.5 Silage dry matter intake, Ibid 16.9 18.9
Lying time, niin/d Lying periods per day
Milk production, lb in 130 d Milk fat,% Konggaard and Krohn ( 1978).
424 5.3
5253 3.92
461 6.3
5709 3.97
GROUPING. SOCIAL DOMINANCE. AND COMPETITION FOR FEED
As a~ready mentioned, when dairy cows are grouped, social behavior modifies dry matter intake 1!J1d productivity. Dairy cattle are social animals and readily form dominance hierarchies, especially at the feedbunk (Friend and Polan, 1974; Grant and Albright, 1995). A dairy cow newly moved into an existing group of cows must quickly find her niche in the group to maximize dry matter intake, particularly if the cow is in early lactation. Social dominance correlates strongly with age, body size, and seniority in the herd, and plays a pivotal role in any existing, or newly formed, group of dairy cows. Social hierarchies and competition for feed affect feeding behavior. A highly competitive time period at the feedbunk or manger i coincides with return of cows from milking and when fresh feed is offered (Friend and Polan, 1974). Early t research with small groups of cows indicated that the maximum effect of dominance hierarchies and t competition lasted for 30 to 45 minutes after delivery of fresh feed. This observation indicates that, i relative to group size, bunk space must not be limited, or that feed availability not be limited to avoid l reductions in dry matter intake for the more submissive cows. {
Recently fresh cows would be particularly vulnerable to excessive competition brought about by improper grouping. These cows are fatigued, with weakened hind limbs. If forced to compete for feed and water, they can be easily injured or suffer reductions in intake. Cows in estrus and dominant cows in the group may prey on vulnerable transition cows (Grant and Albright, 1995). A recent report from the Miner Research Institute, in Chazy, New York (Andrew and Emerich, 1997) indicated that forming a new group comprised of cows ready to leave the fresh-cow group, but not ready for the competition of the high-cow group, resulted in a substantial increase in dry matter intake and milk production. Although just an observation from their dairy herd, it does reinforce the impact that grouping and stress during early lactation may have on intake, productivity, and health.
Grant and Albright (1995) recently reviewed the literature pertaining to grouping strategy, competition, bunk space, and dry matter intake. When a competitive situation exists at the feedbunk, dominant cows
I f J I l f ! t
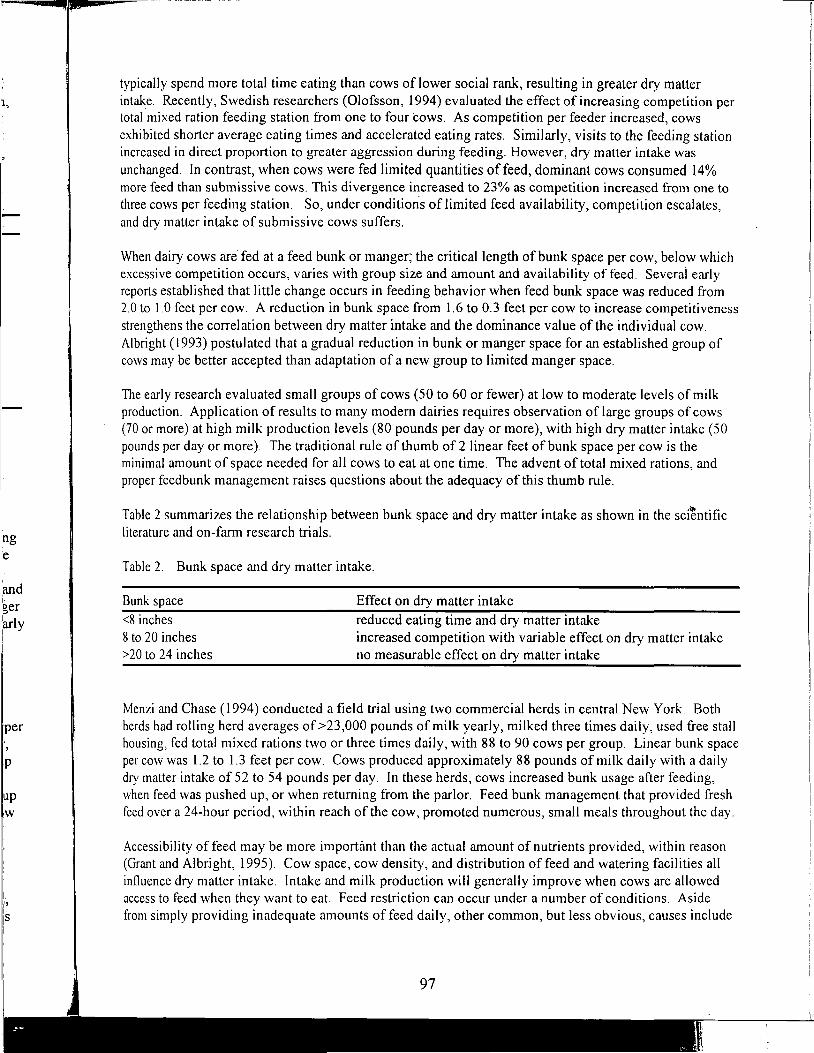
1,
ng e
'and ,. ger larly I ! I
I
per
p
up w
s
typically spend more total time eating than cows of lower social rank, resulting in greater dry matter intake. Recently, Swedish researchers (Olofsson, 1994) evaluated the effect of increasing competition per total mixed ration feeding station from one to four cows. As competition per feeder increased, cows exhibited shorter average eating times and accelerated eating rates. Similarly, visits to the feeding station increased in direct proportion to greater aggression during feeding. However, dry matter intake was unchanged. In contrast, when cows were fed limited quantities offeed, dominant cows consumed 14% more feed than submissive cows. This divergence increased to 23% as competition increased from one to three cows per feeding station. So, under conditions of limited feed availability, competition escalates, and dry matter intake of submissive cows suffers.
When dairy cows are' fed at a feed bunk or manger; the critical length of bunk space per cow, below which excessive competition occurs, varies with group size and amount and availability of feed. Several early reports established that little change occurs in feeding behavior when feed bunk space was reduced from 2.0 to 1.0 feet per cow. A reduction in bunk space from 1.6 to 0.3 feet per cow to increase competitiveness strengthens the correlation between dry matter intake and the dominance value of the individual cow. Albright (1993) postulated that a gradual reduction in bunk or manger space for an established group of cows may be better accepted than adaptation of a new group to limited manger space.
The early research evaluated small groups of cows (50 to 60 or fewer) at low to moderate levels of milk production. Application of results to many modem dairies requires observation of large groups of cows (70 or more) at high milk production levels (80 pounds per day or more), with high dry matter intake (50 pounds per day or more). The traditional rule of thumb of 2 linear feet of bunk space per cow is the minimal amount of space needed for all cows to eat at one time. The advent of total mixed rations, and proper feedbunk management raises questions about the adequacy of this thumb rule.
Table 2 summarizes the relationship between bunk space and dry matter intake as shown in the sci~ntific literature and on-farm research trials.
Table 2. Bunk space and dry matter intake.
Bunk space
<8 inches 8 to 20 inches >20 to 24 inches
Effect on dry matter intake
reduced eating time and dry matter intake increased competition with variable effect on dry matter intake no measurable effect on dry matter intake
Menzi and Chase (1994) conducted a field trial using two commercial herds in central New York. Both herds had rolling herd averages of>23,000 pounds of milk yearly, milked three times daily, used free stall housing, fed total mixed rations two or three times daily, with 88 to 90 cows per group. Linear bunk space per cow was 1.2 to 1.3 feet per cow. Cows produced approximately 88 pounds of milk daily with a daily dry matter intake of 52 to 54 pounds per day. In these herds, cows increased bunk usage after feeding, when feed was pushed up, or when returning from the parlor. Feed bunk management that provided fresh feed over a 24-hour period, within reach of the cow, promoted numerous, small meals throughout the day.
Accessibility offeed may be more important than the actual amount of nutrients provided, within reason (Grant and Albright, 1995). Cow space, cow density, and distribution offeed and watering facilities all influence dry matter intake. Intake and milk production will generally improve when cows are allowed access to feed when they want to eat Feed restriction can occur under a number of conditions. Aside from simply providing inadequate amounts of feed daily, other common, but less obvious, causes include
97
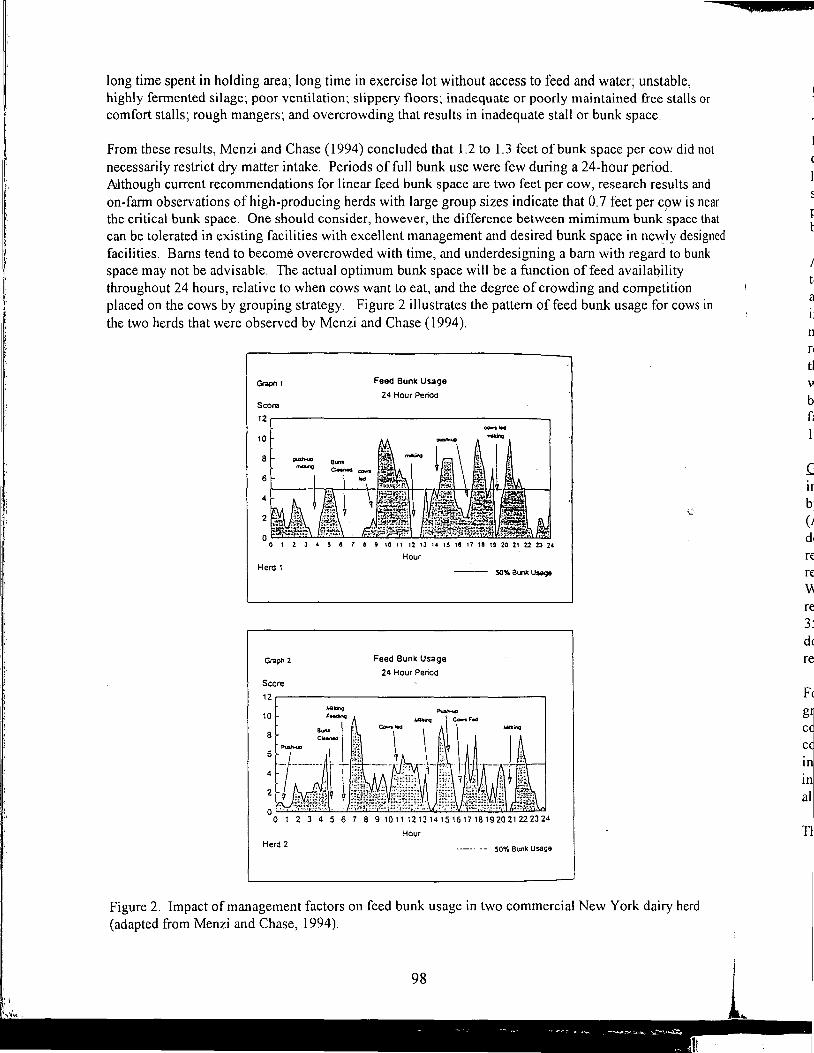
long time spent in holding area; long time in exercise lot without access to feed and water; unstable, highly fermented silage; poor ventilation; slippery floors; inadequate or poorly maintained free stalls or comfort stalls; rough mangers; and overcrowding that results in inadequate stall or bunk space.
From these results, Menzi and Chase (1994) concluded that 1.2 to 1.3 feet of bunk space per cow did not necessarily restrict dry matter intake. Periods of full bunk use were few during a 24-hour period. A>lthough current recommendations for linear feed bunk space are two feet per cow, research results and on-farm observations of high-producing herds with large group sizes indicate that 0.7 feet per cow is near the critical bunk space. One should consider, however, the difference between mimimum bunk space that can be tolerated in existing facilities with excellent management and desired bunk space in new.ly designed facilities. Barns tend to become overcrowded with time, and underdesigning a barn with regard to bunk space may not be advisable. The actual optimum bunk space will be a function of feed availability throughout 24 hours, relative to when cows want to eat, and the degree of crowding and competition placed on the cows by grouping strategy. Figure 2 illustrates the pattern of feed bunk usage for cows in the two herds that were observed by Menzi and Chase ( 1994 ).
Graph t
Scorn
Feed Bunk Usage
24 Hour Period
12~~~~~~~~~~~~~~~~~--.
10
8
6
4
2
Herd 1
Grapn 2
Score
2 3 ' 5 5
_. ... -
7 5 9 10 11 12 13 14 15 115 17 18 19 20 21 22 23 2•
Hour
Feed Bunk Usage
24 Hour Period
-- 50% a..,ic Usage
12~~~~~~~~~~~~~~~~~-,
10
Herd 2
2 3 4 5 6 7 8 9 101112131415161718192021222324
Hour
--··· ·-·- 50'!1 Bunk Usage
Figure 2. Impact of management factors on feed bunk usage in two commercial New York dairy herd (adapted from Menzi and Chase, 1994).
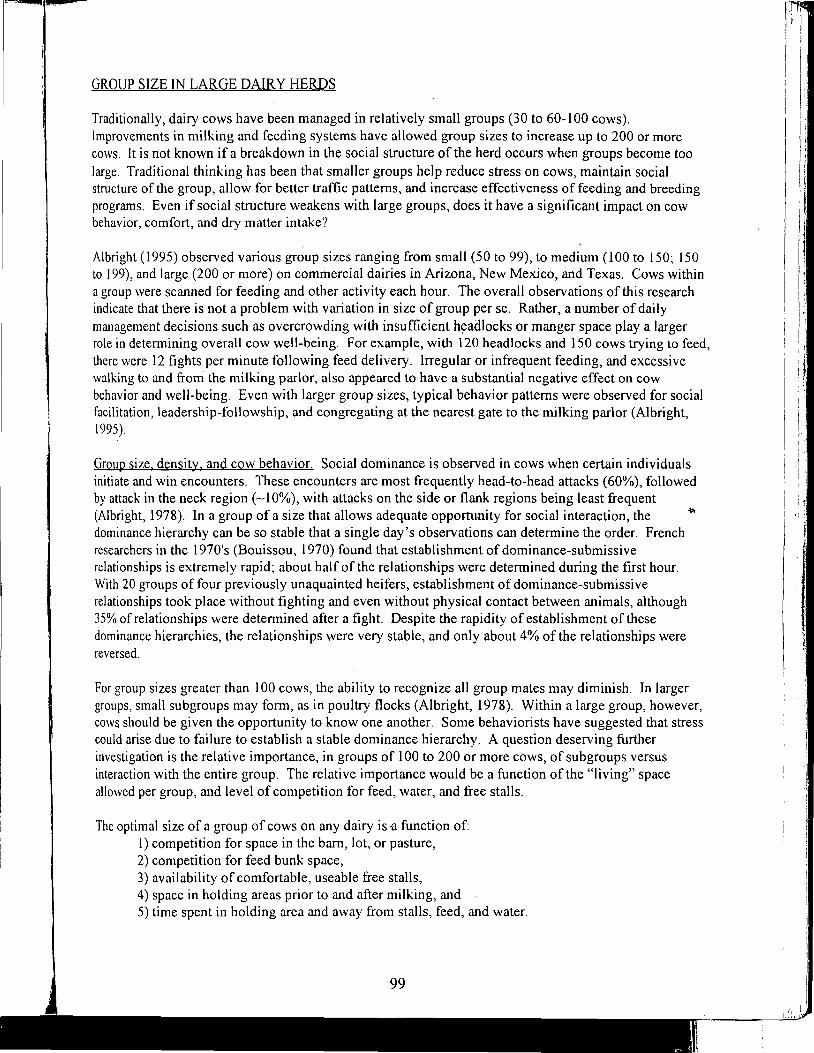
GROUP SIZE IN LARGE DAIRY HERDS
Traditionally, dairy cows have been managed in relatively small groups (30 to 60-100 cows). Improvements in milking and feeding systems have allowed group sizes to increase up to 200 or more cows. It is not known if a breakdown in the social structure of the herd occurs when groups become too large. Traditional thinking has been that smaller groups help reduce stress on cows, maintain social structure of the group, allow for better traffic patterns, and increase effectiveness of feeding and breeding programs. Even if social structure weakens with large groups, does it have a significant impact on cow behavior, comfort, and dry matter intake?
Albright (1995) observed various group sizes ranging from small (50 to 99), to medium (100 to 150; 150 to 199), and large (200 or more) on commercial dairies in Arizona, New Mexico, and Texas. Cows within a group were scanned for feeding and other activity each hour. The overall observations of this research indicate that there is not a problem with variation in size of group per se. Rather, a number of daily management decisions such as overcrowding with insufficient ht;adlocks or manger space play a larger role in determining overall cow well-being. For example, with 120 headlocks and 150 cows trying to feed, there were 12 fights per minute following feed delivery. Irregular or infrequent feeding, and excessive walking to and from the milking parlor, also appeared to have a substantial negative effect on cow behavior and well-being. Even with larger group sizes, typical behavior patterns were observed for social facilitation, leadership-followship, and congregating at the nearest gate to the milking parlor (Albright, 1995).
Group size. density. and cow behavior. Social dominance is observed in cows when certain individuals initiate and win encounters. These encounters are most frequently head-to-head attacks (60%), followed by attack in the neck region (~10%), with attacks on the side or flank regions being least frequent (Albright, 1978). In a group of a size that allows adequate opportunity for social interaction, the dominance hierarchy can be so stable that a single day's observations can determine the order. French researchers in the l 970's (Bouissou, 1970) found that establishment of dominance-submissive relationships is extremely rapid; about half of the relationships were determined during the first hour. With 20 groups of four previously unaquainted heifers, establishment of dominance-submissive relationships took place without fighting and even without physical contact between animals, although 35% of relationships were determined after a fight. Despite the rapidity of establishment of these dominance hierarchies, the relationships were very stable, and only about 4% of the relationships were reversed.
For group sizes greater than 100 cows, the ability to recognize all group mates may diminish. In larger groups, small subgroups may form, as in poultry flocks (Albright, 1978). Within a large group, however, cows should be given the opportunity to know one another. Some behaviorists have suggested that stress could arise due to failure to establish a stable dominance hierarchy. A question deserving further investigation is the relative importance, in groups of 100 to 200 or more cows, of subgroups versus interaction with the entire group. The relative importance would be a function of the "living" space allowed per group, and level of competition for feed, water, and free stalls.
The optimal size of a group of cows on any dairy is il function of: 1) competition for space in the barn, lot, or pasture, 2) competition for feed bunk space, 3) availability of comfortable, useable free stalls, 4) space in holding areas prior to and after milking, and 5) time spent in holding area and away from stalls, feed, and water.
:TT'l
i~
.I i ., I I
For instance, in field observations of l 0 dairy herds in Nebraska during the summer of 1997, in most cases farms with the highest dry matter intake and productivity had alleys of sufficient width so that two cows could comfortably walk in opposite directions behind the row of cows standing and eating at the-feed line. With insufficient space, either from design or overcrowding a group, normal movement of cows in the alley behind the feed manger disrupts eating activity, precipitates fights, and interferes with intense, focused feeding activity. Many free stall barns designed today provide for approximately 40 to.55 square feet of floor space per cow, exclusive of free stall and drinking areas. The alley between the feeding line and the first row of free stalls should be 14 feet wide to allow comfortable cow movement and avoid interference with aggressive eating activity.
What effect does "living space" have on a cow's well-being as measured by dry matter intake, milk production, and health? A Purdue University study (Albright, 1978) crowded small groups of cows (l 7 per group )from 100 square feet of lot space down to 25 square feet per cow. There were no differences in intake, milk production, milk leucocytes, or plasma cortisol. There were statistically fewer encounters, and fess total activity, among the crowded cows. When encounters did occur, they were most often between the most dominant and most submissive cows. Often, an encounter begins a chain reaction of encounters, in which a dominant cow butts another out of her way at the feed bunk, and this cow quickly finds a group mate that she can dominate, and so on. The relevance of these data to high producing cows in larger groups is open to debate. Some researchers have suggested that crowding may be less harmful in small groups where no strangers are encountered. As groups become larger, it is more difficult for cows to recognize group mates and their status in the social order of that group. Researchers in New Zealand (cited in Albright, 1978) have found that leucocytes increased significantly when cows with previous udder infections were under stress from overcrowding. Another practical consideration, aside from behavior and any potential impact on feeding activity, is the problem of keeping cows clean with reduced space per group. Apparently, cows with a previous history of mastitis are particularly susceptible to_ overcrowding stress. Adequate space near the feed bunk and water is critical. ·
Self-Locking Stanchions and Restraint in Feeding Area
As part of a regional dairy management research project, scientists at Purdue University and Utah State Univ.ersity evaluated the effect of extended lock-up times on cow behavior, well-being, and productivity. Self-locking stanchions are used commonly in commercial dairies to restrain cattle for various management tasks such as: 1) artificial insemination, 2) pregnancy checking, 3) monitoring herd health, and 4) top dressing a supplement. The system can be abused, and thus compromise cow comfort and health, if cows are allowed to remain in the headlocks beyond the period of time actually necessary for the management routine.
In the Utah studies (Arave et al., 1996), cows were housed in an open free stall barn with self-locking stanchions at the feed manger. The effect of an extended lock-up period of 4 hours (7 to 11 am or 9 to I pm) on stress response was measured during the spring (April-May, 53.6°F) or summer (July-August, 70.5°F). During periods when the cows were not locked up, serum cortisol concentrations averaged 9.4 ng/ml during the spring and 13.8 ng/ml during the summer. When cows were locked up for 4 hours, the corresponding cortisol values were: 14. 7 (spring) and 22. 9 (summer). Using cortisol as an index of stress, these researchers concluded that extended lock up was more stressful during warm summer versus cooler spring days. These changes in serum cortisol were associated with an 8.5% reduction in milk production for cows that were locked up for 4 hours daily during hot weather. Individual feed intake of the cows was estimated and did not differ between cows that were locked up or not. Although feed was available ad libitum during the extended lock-up times, as at all other times as well, this management procedure did not influence cows to eat more. Following extended lock up, cows were observed with their head in the manger approximately 0.7 h longer than following a non-lock up period. However, eating time was equal
100
A fa an
I
g~
nl SG a J fol v~
~1 K~ rat
in!
)
I
I~
;,
s
ot
for both treatments. Cows ruminated 0.5 h longer daily during the control period than when locked up for 4 h. Extended lock up did not influence cow time in free stalls or time spent near the feed manger. Following lock-up release, cows went immediately to waterers and then to free stalls.
In the Indiana studies (Arave et al., 1996; Bolinger, 1996), dry matter intake, milk yield, milk fat percentage, and somatic cell count were unaffected by 4-h extended lock up. Unlike the Utah data, plasma cortisol, as well as neutrophil:lymphocyte ratio, mastitis, and other health concerns were not affected by extended lock up times. Behaviorally, locked cows had elevated lying frequency during the remainder of the day, and grooming activity was greater throughout the rest of the day. Acts of aggression were greater during the period immediately followipg lock up, which could negatively impact the critically important intense feeding behavior. Locked cows ruminated less throughout the remainder of the day following lock up, although total daily rumination activity was unaffected. Although the proper use of self-locking stanchions for restraint of cows does not appear to substantially affect the overall well-being of the cow, there appears to be potential to adversely impact feeding and ruminating behavior.
MOVING COWS BETWEEN GROUPS
When making the decision to move cows from one group to another, we need to consider the labor, nutritional, and social impact of moving cows versus the increased feed efficiency resulting from grouping cows with similar nutritional and management requirements. Confirmed pregnancy, level of milk production, and body condition score should be major criteria for the decision to move cows from one group to another. The number of aggressive encounters following movement from one group to another can be reduced by housing cows in adjacent lots or groups, permitting some limited close proximity and physical contact. In some free stall barn designs, this would be possible, for instance if the fresh cow group were adjacent to the high cow group, or if the close-up group were adjacent to the fresh cow group.
0
Moving larger numbers of cows at one time versus moving only a few results in less fighting and social . disruption of the group. Handling procedures are more stressful for an isolated cow, so several cows should be handled or moved at one time. When cows are added to a socially stable group, the entire group may be disrupted through threat, butting, and physical aggression until the added cows have found their place in the social structure of that group. Early research (Schein and Fohrman, 1955) found that about one week was required for the dominance hierarchy to become re-established and stabilized after new cows were introduced into the group.
A regular routine for moving cows and adequate feeding space for the size of the group are important factors in the success of any grouping and cow movement system. One of the most common concerns among dairy producers is how to avoid reductions in dry matter intake when cows are shifted from one group to another. When a cow moves from one group to another, she is subjected to both social and nutritional stress.
Social effects associated with shifting cows between groups Cows are social animals and ranking within a group occurs based on dominance. When cows are moved from one group to another, a new social order for that group must be established. Several studies have been designed to partition the effects of social versus nutritional factors on dry matter intake and milk production associated with regrouping, in which cows but not rations are changed. Generally, studies indicated a 2.5 to 5.0% greater decrease in milk production due to social disturbances compared with control animals that were not regrouped.
Krohn and Konggaard ( 1980) conducted a series of trials to evaluate the effect of social changes with no ration changes. After transfer to a new group, the eating time decreased and number of confrontations increased substantially during the first day. Early lactation cows exhibited the greatest reduction in dry
101
I i i
1.
matter intake and milk production. Overall, these research results indicate that the influence of a social change is transitory, which agrees with observations that dominance hierarchy within a group is stable and quickly established (Bouissou, 1970; Albright, 1978). Most observations indicate that the social impacts of regrouping dairy cows last less than 7 days.
Nutritional effects associated with shifting cows between groups Ration characteristics are often the primary factors involved in al,tering milk production when cows are shifted from·one group to another. When grouping dairy cows, try to limit the change in nutrient density of total mixed rations among groups to <15%. The range in milk production among cows within a group should be 20 to 25 pounds of milk. If a one-group total mixed ration is fed, the ration should be balanced for approximately 30% above the group average milk production; for a two- and three-group total mixed ration system, the ration should be formulated for 20 and 10% over, respectively. Researchers at Virginia Polytechnic Institute reported the results of a large field trial which evaluated the effects of regrouping cows on milk production. The average decrease in milk was approximately 2.2 pounds per cow daily during the first 4 days after the group change. Cows that were not transferred to a new group showed a decrease in milk of 0.7 pounds during the same time period. However, as time passed, the cows appeared to adapt to the regrouping and the impact of the shift from group to group lessened.
In summary, the effect ofregrouping appears to be variable, but potentially significant at reducing dry matter intake and milk production. Cows should be moved from one group to another based on milk production level, body condition score, age, and generally, the cows should be moved at night and in groups to minimize social disruption. Remember that not only is there social pressure on the cow in her new group, but she may well have different feed, a new milker, and a different milking time.
CONCLUSIONS
Grouping strategy and cow behavior have a substantial impact on dry matter intake in dairy herds. Grouping is one of several important management factors that can influence the cow's ability to practice intense feeding behavior. Other important feeding management factors not discussed in this paper include feeding frequency as it affects feed availability, and feeding system such as use of a computer feeder. The impact of grouping strategy on cow comfort and herd health directly and indirectly influences dry matter intake and productivity of a dairy herd.
LITERATURE CITED
·Albright, J. L. 1978. Social considerations in grouping cows. Page 757 in Large Dairy Herd Management. C. J. Wilcox et al., eds. University Presses of Florida, Gainesville.
Albright, J. L. 1993. Feeding behavior of dairy cattle. J. Dairy Sci. 76:485. Albright, J. L. 1995. Progress report to regional research project NC-119 and Sabbatical leave of absence
report. Purdue University, W. Lafayette, IN. Andrew, N., and W. Emmerich. 1997. Grouping strategy for not-quite-perfect cows. Miner Institute Farm
Report. July. Arave, C. W., D. Bolinger, M. L. Shipka, and J. L. Albright. 1996. Effect of extended lock-up of lactating
cows on milk production. J. Anim. Sci. 74(Suppl. 1):43 (Abstr.) Arave, C. W., M. L. Shipka, J. Morrow-Tesch, and J. L. Albright. 1996. Changes in serum cortisol
following extended lock-up time of lactating cows. J. Dairy Sci. 79(Suppl. l ): 191 (Abstr.) Bolinger, D. J. 1996. The effects of restraint using self-locking stanchions on dairy cows in relation to
behavior, feed intake, milk production, physiological indicators, health, and well-being. M.S. Thesis, Purdue Univ., W. Lafayette, IN.
Bouissou, M. F. 1970. Role du contact physique dans la manifestation des relations hierarchiques chez les
102
1 c I
~ : s
s I
nd s
ps If
1e
:l
Jt.
:e
m
" Jes
bovins. Consequences pratiques. Ann. Zootech. (Paris). 19:279. Dado, R. G., and M. S. Allen. 1994. Variation in and relationships among feeding, chewing, and drinking
variables for lactating dairy cows. J. Dairy Sci. 77: 132. Friend, T. H., and C. E. Polan. 1974. Social rank, feeding behavior, and free stall utilization by dairy cattle.
J. Dairy Sci. 57: 1214. Grant, R. J., and J. L. Albright. 1995. Feeding behavior and management factors during the transition
period in dairy cattle. J. Anim. Sci. 73:2791. Jordan, E. R., and R.H. Fourdraine. 1993. Characterization of the management practices of the top milk
producing herds in the country. J. daii-y Sci. 76:3247. Konggaard, S. P., and C. C. Krohn. 1978. Performance of first-calf heifers in two different grouping
systems. Rep. Nat. Inst. Anim. Sci. Copenhagen, Denmark. Menzi, W., Jr., and L. E. Chase. 1994. Feeding behavior of cows housed in free stall barns. Page 829 in
Dairy Systems for the 2 lst Century. ASAE, St. Joseph, MI. Olofsson, J. 1994. Competition for feed in loose housing systems. Page 825 in Dairy Systems for the 21st
Century. ASAE, St. Joseph, MI. Phelps, A. 1992. Vastly superior first lactations when heifers fed separately. Feedstuffs. May. 11: 11. Schein, M. W., and M. H. Fohrman. 1955. Social dominance relationships in a herd of dairy cattle. Br. J.
Anim. Behav. 3:45. Schultz, T. A. 1992. Animal behavior related to physical facilities. Page 664 in Large Dairy Herd
Management. ADSA. Urbana, IL. Sniffen, C. J. 1991. Grouping management and physical facilities. Vet. Clin. North Am. Small Anim.
Pract. 7:465. Sniffen, C. J., R. W. Beverly, C. S. Mooney, M. B. Roe, and A. L. Skidmore. 1993. Nutrient requirements
versus supply in the dairy cow: strategies to account for variability. J. Dairy Sci. 76:3160. Williams, C. B., and R. A. Oltenacu. 1992. Evaluation of criteria used to group lactating cows using a
dairy production model. J. Dairy sci. 75: 155. -i..
103
)". I
--- __ft
" I•
" 'I
I•. ~
•i
I \
Notes
( This page intentionally blank. )
l
I
i
104 l.
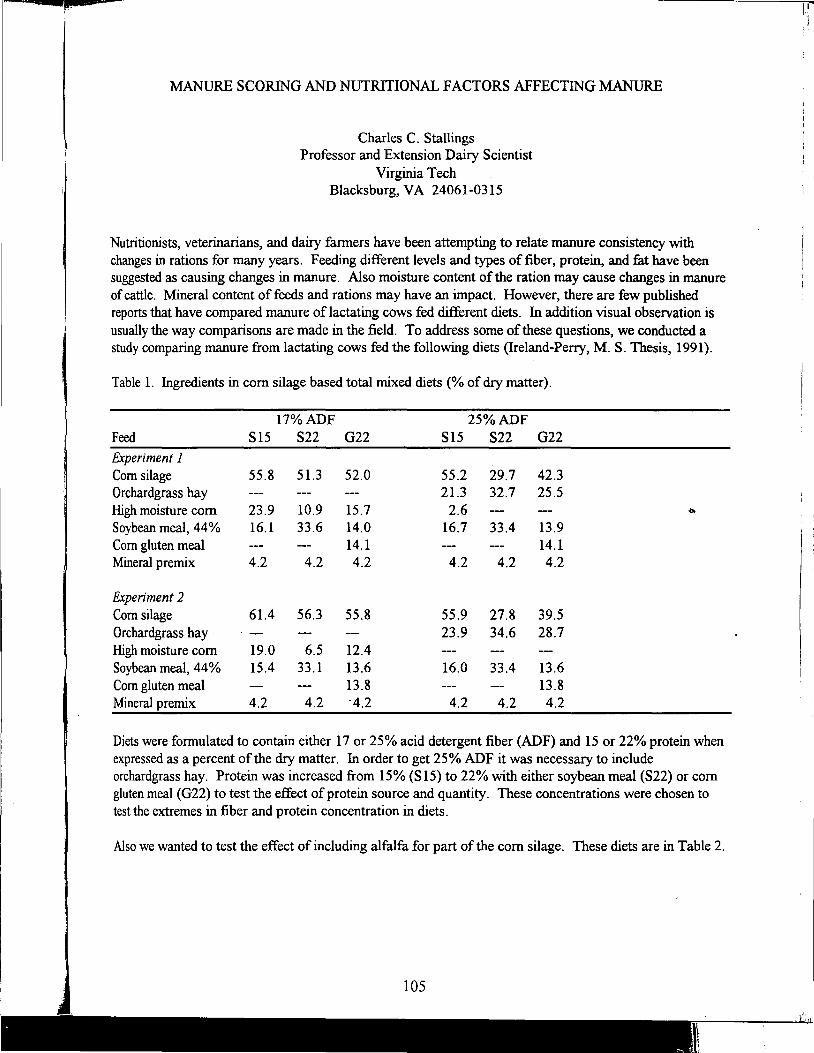
MANURE SCORING AND NUTRITIONAL FACTORS AFFECTING MANURE
Charles C. Stallings Professor and Extension Dairy Scientist
Virginia Tech Blacksburg, VA 24061-0315
Nutritionists, veterinarians, and dairy farmers have been attempting to relate manure consistency with changes in rations for many years. Feeding different levels and types of fiber, protein, and fat have been suggested as causing changes in manure. Also moisture content of the ration may cause changes in manure of cattle. Mineral content of feeds and rations may have an impact. However, there are few published reports that have compared manure of lactating cows fed different diets. In addition visual observation is usually the way comparisons are made in the field. To address some of these questions, we conducted a study comparing manure from lactating cows fed the following diets (Ireland-Perry, M. S. Thesis, 1991).
Table 1. Ingredients in com silage based total mixed diets(% of dry matter).
Feed Experiment 1 Corn silage Orchardgrass hay High moisture com Soybean meal, 44 % Corn gluten meal Mineral premix
Experiment 2 Corn silage Orchardgrass hay , High moisture com Soybean meal, 44 % Corn gluten meal Mineral premix
Sl5
55.8
23.9 16.1
4.2
61.4
19.0 15.4
4.2
17%ADF S22 G22
51.3 52.0
10.9 15.7 33.6 14.0
14.1 4.2 4.2
56.3 55.8
6.5 12.4 33.l 13.6
13.8 4.2 ·4.2
25%ADF Sl5 S22 G22
55.2 29.7 42.3 21.3 32.7 25.5
2.6 16.7 33.4 13.9
14.1 4.2 4.2 4.2
55.9 27.8 39.5 23.9 34.6 28.7
16.0 33.4 13.6 13.8
4.2 4.2 4.2
Diets were formulated to contain either 17 or 25% acid detergent fiber (ADF) and 15 or 22% protein when expressed as a percent of the dry matter. In order to get 25% ADF it was necessary to include orchardgrass hay. Protein was increased from 15% (S 15) to 22% with either soybean meal (S22) or com gluten meal (G22) to test the effect of protein source and quantity. These concentrations were chosen to test the extremes in fiber and protein concentration in diets.
Also we wanted to test the effect of including alfalfa for part of the com silage. These diets are in Table 2.
105
I I I
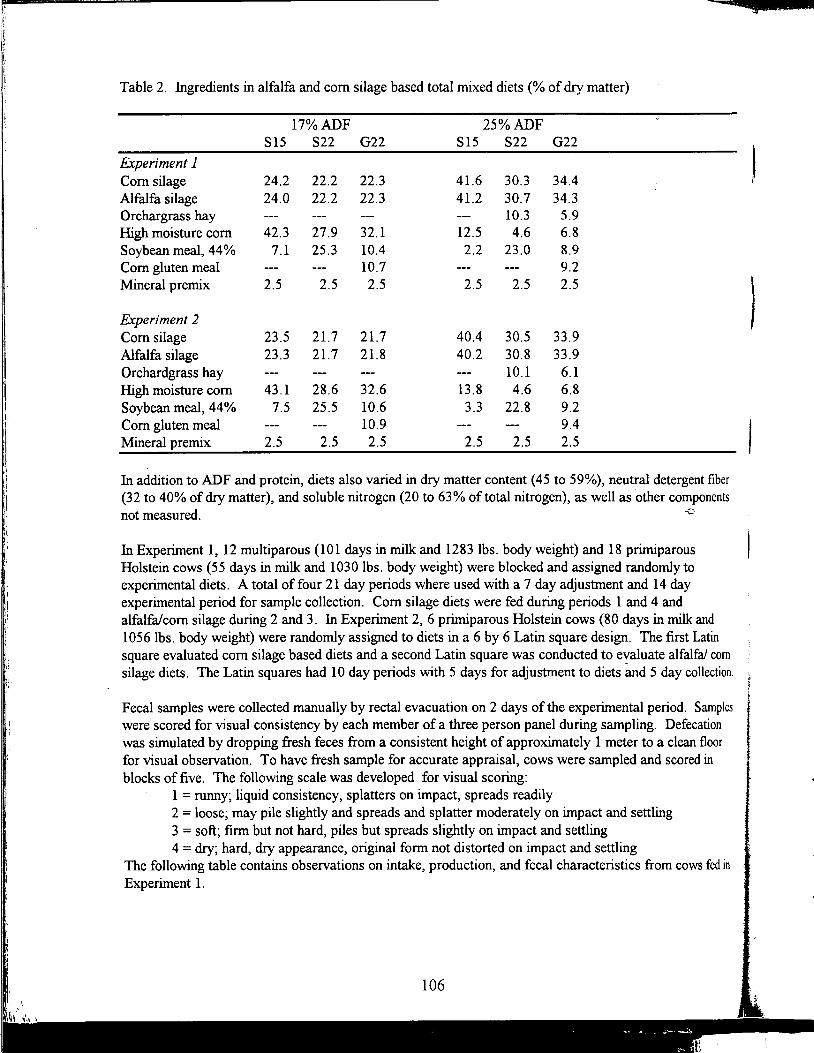
I I
I '' ;
Table 2. Ingredients in alfalfa and corn silage based total mixed diets(% of dry matter)
Experiment 1 Corn silage Alfalfa silage Orchargrass hay High moisture corn Soybean meal, 44 % Corn gluten meal Mineral premix
Experiment 2 Corn silage Alfalfa silage Orchardgrass hay High moisture corn Soybean meal, 44 % Corn gluten meal Mineral premix
Sl5
24.2 24.0
42.3 7.1
2.5
23.5 23.3
43.1 7.5
2.5
17%ADF S22 G22
22.2 22.3 22.2 22.3
27.9 32.1 25.3 10.4
10.7 2.5 2.5
21.7 21.7 21.7 21.8
28.6 32.6 25.5 10.6
10.9 2.5 2.5
25%ADF Sl5 S22 G22
41.6 30.3 34.4 41.2 30.7 34.3
10.3 5.9 12.5 4.6 6.8 2.2 23.0 8.9
9.2 2.5 2.5 2.5
40.4 30.5 33.9 40.2 30.8 33.9
10.1 6.1 13.8 4.6 6.8 3.3 22.8 9.2
9.4 2.5 2.5 2.5
In addition to ADF and protein, diets also varied in dry matter content (45 to 59%), neutral detergent fiber (32 to 40% of dry matter), and soluble nitrogen (20 to 63% of total nitrogen), as well as other components not measured. -<.:
In Experiment 1, 12 multiparous (101 days in milk and 1283 lbs. body weight) and 18 primiparous Holstein cows (55 days in milk and 1030 lbs. body weight) were blocked and assigned randomly to experimental diets. A total of four 21 day periods where used with a 7 day adjustment and 14 day experimental period for sample collection. Corn silage diets were fed during periods 1 and 4 and alfalfa/corn silage during 2 and 3. In Experiment 2, 6 primiparous Holstein cows (80 days in milk and 1056 lbs. body weight) were randomly assigned to diets in a 6 by 6 Latin square design. The first Latin square evaluated corn silage based diets and a second Latin square was conducted to evaluate alfalfa/ com silage diets. The Latin squares had 10 day periods with 5 days for adjustment to diets and 5 day collection.
Fecal samples were collected manually by rectal evacuation on 2 days of the experimental period. Samples were scored for visual consistency by each member of a three person panel during sampling. Defecation was simulated by dropping fresh feces from a consistent height of approximately 1 meter to a clean floor for visual observation. To have fresh sample for accurate appraisal, cows were sampled and scored in blocks of five. The following scale was developed for visual scoring:
1 =runny; liquid consistency, splatters on impact, spreads readily 2 = loose; may pile slightly and spreads and splatter moderately on impact and settling 3 = soft; firm but not hard, piles but spreads slightly on impact and settling 4 = dry; hard, dry appearance, original form not distorted on impact and settling
The following table contains observations on intake, production, and fecal characteristics from cows fed in Experiment 1.
106
)
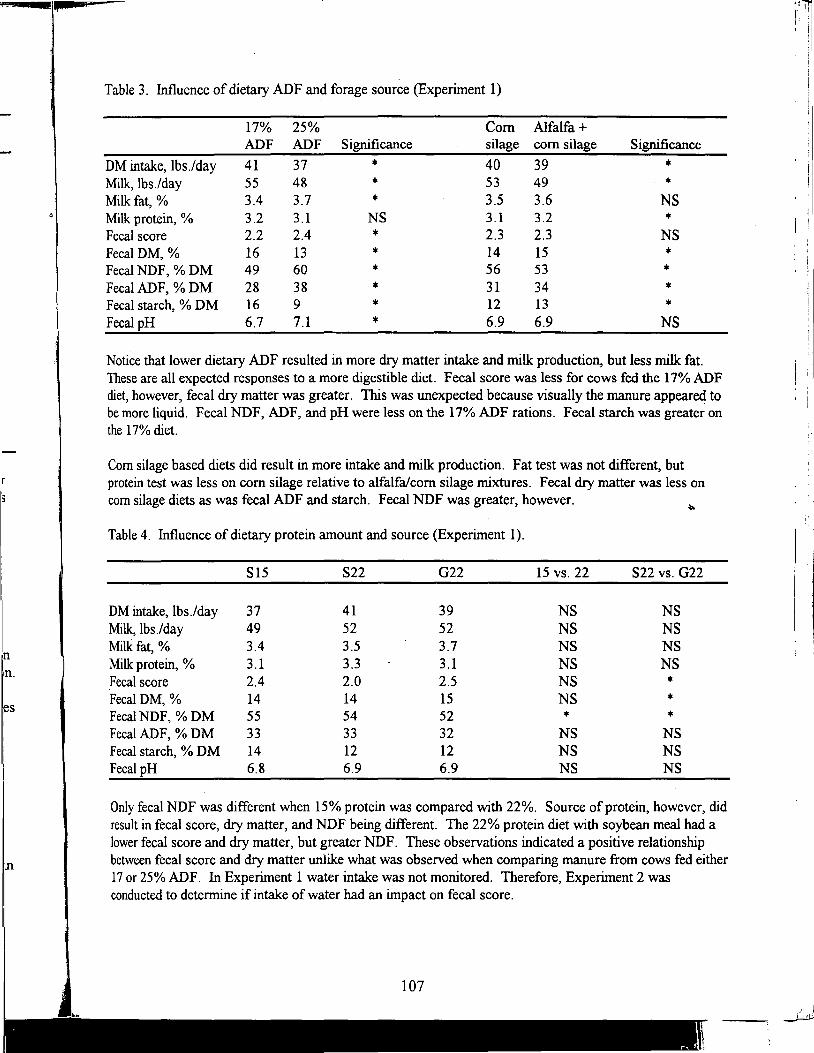
)
n in.
es
lil
Table 3. Influence of dietary ADF and forage source (Experiment 1)
17% 25% Corn Alfalfa+ ADF ADF Significance silage corn silage Significance
DM intake, lbs./day 41 37 • 40 39 • Milk, lbs./day 55 48 • 53 49 * Milk fat,% 3.4 3.7 • 3.5 3.6 NS Milk protein, % 3.2 3.1 NS 3.1 3.2 * Fecal score 2.2 2.4 • 2.3 2.3 NS FecalDM, % 16 13 • 14 15 • Fecal NDF, % DM 49 60 • 56 53 * Fecal ADF, % DM 28 38 • 31 34 • Fecal starch, % DM 16 9 • 12 13 • Fecal pH 6.7 7.1 • 6.9 6.9 NS
Notice that lower dietary ADF resulted in more dry matter intake and milk production, but less milk fat. These are all expected responses to a more digestible diet. Fecal score was less for cows fed the 17% ADF diet, however, fecal dry matter was greater. lbis was unexpected because visually the manure appeared to be more liquid. Fecal NDF, ADF, and pH were less on the 17% ADF rations. Fecal starch was greater on the 17% diet.
Corn silage based diets did result in more intake and milk production. Fat test was not different, but protein test was less on corn silage relative to alfalfa/com silage mixtures. Fecal dry matter was less on corn silage diets as was fecal ADF and starch. Fecal NDF was greater, however.
~
Table 4. Influence of dietary protein amount and source (Experiment 1).
Sl5 S22 G22 15 vs. 22 S22 vs. G22
DM intake, lbs./day 37 41 39 NS NS Milk, lbs./day 49 52 52 NS NS Mill( fat,% 3.4 3.5 3.7 NS NS Milk protein, % 3.1 3.3 3.1 NS NS Fecal score 2.4 2.0 2.5 NS • FecalDM, % 14 14 15 NS • Fecal NDF, % DM 55 54 52 • • Fecal ADF, % DM 33 33 32 NS NS Fecal starch, % DM 14 12 12 NS NS Fecal pH 6.8 6.9 6.9 NS NS
Only fecal NDF was different when 15% protein was compared with 22%. Source of protein, however, did result in fecal score, dry matter, and NDF being different. The 22% protein diet with soybean meal had a lower fecal score and dry matter, but greater NDF. These observations indicated a positive relationship between fecal score and dry matter unlike what was observed when comparing manure from cows fed either 17 or 25% ADF. In Experiment 1 water intake was not monitored. Therefore, Experiment 2 was conducted to determine if intake of water had an impact on fecal score.
' ' !
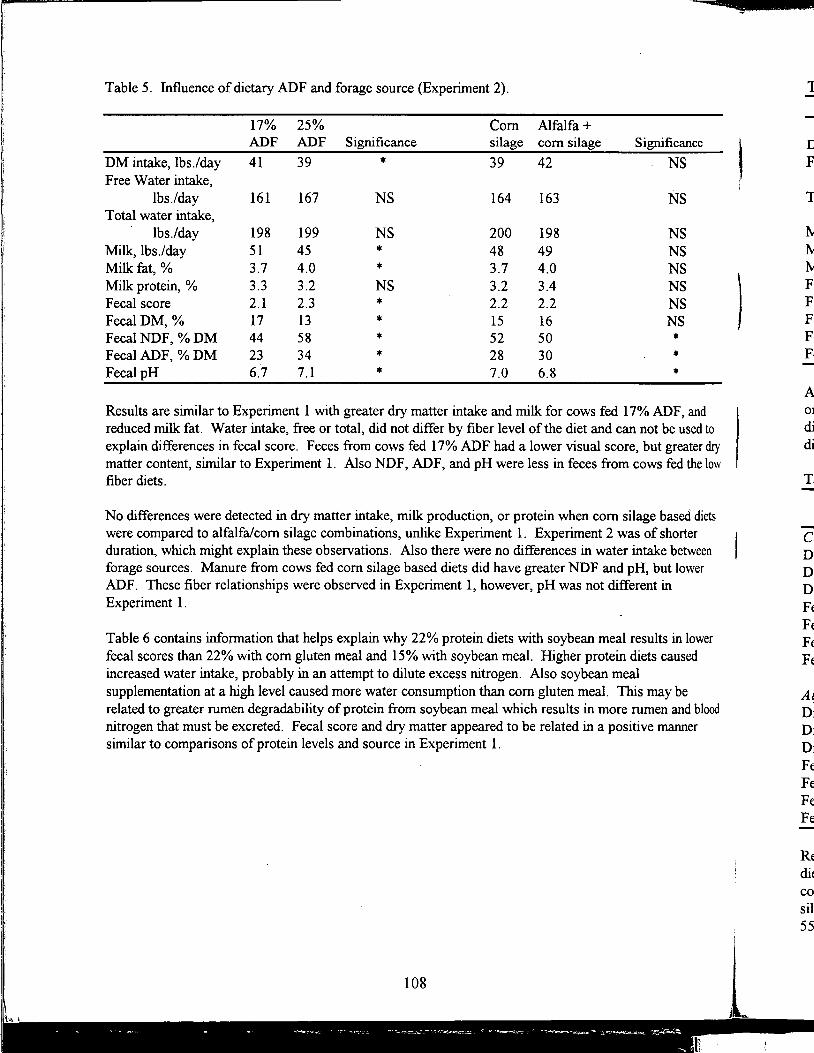
Table 5. Influence of dietary ADF and forage source {Experiment 2).
17% 25% Corn Alfalfa+ ADF ADF Significance silage com silage Significance
DM intake, lbs./day 41 39 * 39 42 NS Free Water intake,
lbs./day 161 167 NS 164 163 NS Total water intake,
lbs./day 198 199 NS 200 198 NS Milk, lbs./day 51 45 * 48 49 NS Milk fat,% 3.7 4.0 * 3.7 4.0 NS Milk protein, % 3.3 3.2 NS 3.2 3.4 NS Fecal score 2.1 2.3 * 2.2 2.2 NS FecalDM, % 17 13 * 15 16 NS Fecal NDF, % DM 44 58 * 52 50 * Fecal ADF, % DM 23 34 * 28 30 * Fecal pH 6.7 7.1 * 7.0 6.8 *
Results are similar to Experiment 1 with greater dry matter intake and milk for cows fed 17% ADF, and reduced milk fat. Water intake, free or total, did not differ by fiber level of the diet and can not be used to explain differences in fecal score. Feces from cows fed 17% ADF had a lower visual score, but greater dry matter content, similar to Experiment 1. Also NDF, ADF, and pH were less in feces from cows fed the low fiber diets.
No differences were detected in dry matter intake, milk production, or protein when corn silage based diets were compared to alfalfa/com silage combinations, unlike Experiment 1. Experiment 2 was of shorter duration, which might explain these observations. Also there were no differences in water intake between forage sources. Manure from cows fed com silage based diets did have greater NDF and pH, but lower ADF. These fiber relationships were observed in Experiment 1, however, pH was not different in Experiment 1.
Table 6 contains information that helps explain why 22% protein diets with soybean meal results in lower fecal scores than 22% with com gluten meal and 15% with soybean meal. Higher protein diets caused increased water intake, probably in an attempt to dilute excess nitrogen. Also soybean meal supplementation at a high level caused more water consumption than corn gluten meal. This may be related to greater rumen degradability of protein from soybean meal which results in more rumen and blood nitrogen that must be excreted. Fecal score and dry matter appeared to be related in a positive manner similar to comparisons of protein levels and source in Experiment 1.
108
)
L
l J
~ J N F F F F F
~ oJ cli cli
Tl
I
c D Di nl
I F~
I F~
I F~
I F~
I
A~ ;
Di nJ ni
I Fe Fd Fd Fd l R~
dil ~
co sil 55
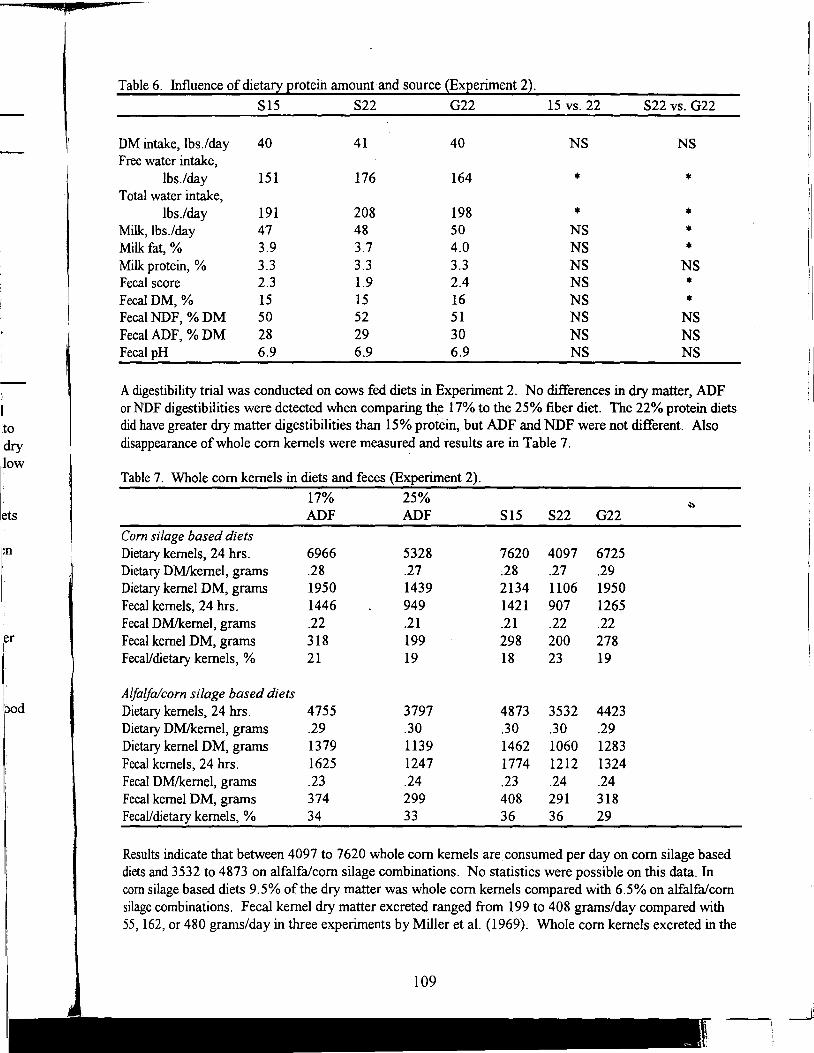
to dry low
ets
:n
I
!er I
ood
Table 6. Influence of dieta!)'. Erotein amount and source (ExEeriment 2).
Sl5 S22 G22 15 vs. 22 S22 vs. G22
DM intake, lbs./day 40 41 40 NS NS Free water intake,
lbs./day 151 176 164 • • Total water intake,
lbs./day 191 208 198 • • Mille, lbs./day 47 48 50 NS • Mille fat,% 3.9 3.7 4.0 NS • Mille protein, % 3.3 3.3 3.3 NS NS Fecal score 2.3 1.9 2.4 NS • FecalDM, % 15 15 16 NS • Fecal NDF, % DM 50 52 51 NS NS Fecal ADF, % DM 28 29 30 NS NS Fecal pH 6.9 6.9 6.9 NS NS
A digestibility trial was conducted on cows fed diets in Experiment 2. No differences in dry matter, ADF or NDF digestibilities were detected when comparing the 17% to the 25% fiber diet. The 22% protein diets did have greater dry matter digestibilities than 15% protein, but ADF and NDF were not different. Also disappearance of whole com kernels were measured and results are in Table 7.
Table 7. Whole com kernels in diets and feces (Experiment 2).
17% 25% ADF ADF Sl5 S22 G22
Com silage based diets Dietary kernels, 24 hrs. 6966 5328 7620 4097 6725 Dietary DM/kemel, grams .28 .27 28 .27 .29 Dietary kernel DM, grams 1950 1439 2134 1106 1950 Fecal kernels, 24 hrs. 1446 949 1421 907 1265 FecalDM/kemel,grams .22 .21 .21 .22 .22 Fecal kernel DM, grams 318 199 298 200 278 Fecal/dietary kernels, % 21 19 18 23 19
Alfalfa/corn silage based diets Dietary kernels, 24 hrs. 4755 3797 4873 3532 4423 Dietary DM/kemel, grams .29 .30 .30 .30 .29 Dietary kernel DM, grams 1379 1139 1462 1060 1283 Fecal kernels, 24 hrs. 1625 1247 1774 1212 1324 Fecal DM/kemel, grams .23 .24 .23 .24 .24 Fecal kernel DM, grams 374 299 408 291 318 Fecal/dietary kernels, % 34 33 36 36 29
Results indicate that between 4097 to 7620 whole com kernels are consumed per day on com silage based diets and 3532 to 4873 on alfalfa/com silage combinations. No statistics were possible on this data. In corn silage based diets 9.5% of the dry matter was whole com kernels compared with 6.5% on alfalfa/com silage combinations. Fecal kernel dry matter excreted ranged from 199 to 408 grams/day compared with 55, 162, or 480 gran1s/day in three experiments by Miller et al. (1969). Whole com kernels excreted in the
109
I'
feces with corn silage based diets were 18 to 23 % of that which was ingested and there did not appear to be an effect of fiber or protein amount or source. Alfalfa/com silage combinations resulted in 29 to 36% of the diet whole kernels being in the feces .. Therefore, there did appear to be greater whole kernel passage on alfalfa/com silage combinations when expressed as a% of whole kernels ingested. Miller et al. (1969) I found only 10% of whole diet kernels in the manure. The size of kernels ingested were .27 to .30 grams of dry matter per kernel compared to .21 to .24 for kernels in the feces. This indicates that small~r kernels 'r were more likely to pass out of the rumen and not be chewed and/or some digestion occurred to.the whole / kernel during movement through the gastrointestinal tract. Miller et al. (1969) analyzed fecal kernels and found loss of ash and protein.
RELA TIONSIDP OF MANURE SCORE TO DIET AND FECAL MEASUREMENTS
Correlation coefficients from Experiment 1 indicated visual fecal score was negatively associated with fat t corrected milk (-.18), dry matter intake (-.24), and diet dry matter (-.22). Positive correlation's between fecal score and fecal dry matter (.28), pH (.17), ADF (.34), NDF (.35) and diet soluble nitrogen (.14) were . detected. In Experiment 2 negative relationships existed between fecal score and free water intake (-.29), total water intake (-.42), and dry matter intake (- .34) indicating that lower fecal score (visually more liquid in appearance) was associated with greater water (free and total) and dry matter intake. Positive relationships existed with fecal pH (.36), ADF (.32), and NDF (.35) similar to Experiment 1. Diet and fecal dry matter were not related to score in Experiment 2, unlike Experiment 1.
Results indicate that cows producing more milk and consuming more feed will tend to have a feces with lower score. This observation is supported by work of Shellenberger and Kesler ( 1961). This would be likely because they would be expected to consume a more digestible diet (lower in fiber). More dry matter intake results in greater water intake according to various reports (Holter and Urban, 1992; MugJhy et al., 1983) and similar to our observations of greater free and total water intake. Also we observed that cows with lower fecal score to have feces with lower pH and fiber. Allen and Beede ( 1996) speculate that ruminal acidosis can cause increased fluidity of feces because lactic acid in the lumen of the intestine causes an influx of water from the blood. There was no indication that our 17% ADF diet caused acidosis, however. Dry matter intake was not reduced and milk fat was not depressed.
Cows consuming 17% ADF diets had feces that visually appeared to be of more liquid consistency but actually had greater dry matter content. These feces were composed of more nonfibrous components, such as starch, and perhaps greater microbial matter because of lower GI tract fermentation. Cows fed the 25% ADF diet had feces with greater visual score, lower dry matter content, and greater fiber. It may be fibrous material in the feces absorb large quantities of water, but contribute bulkiness and structural appearance of feces. Visual appearance indicates a dryer feces even though dry matter is less because the water is associated with fiber. Feces from cows fed low fiber diets have less fiber. Water intake was siffiilar for cows fed 17 and 25% ADF diets and would not explain differences.
Increasing protein in the diet with soybean meal resulted in feces with a lower score and dry matter than using corn gluten meal. Soybean meal is more degradable and would result in more rumen ammonia than com gluten meal. As a result water might be needed to excrete excess nitrogen via the urine. In Experiment 1, cows consuming the 22% protein diet with soybean meal had 29% of cows with a fecal score of 1, 52% with a score of2, and 19% with a score of 3 indicating cow variation in fecal score. No fecal score of 4 were recorded for any cow on any diet. Dry cows fed no grain and receiving mostly hay might be expected to have a fecal score of 4.
110
Qi
m
f
id
r
;S,
lh
l~s of
PRACTICAL CONSIDERATIONS RELATED TO MANURE SCORING
Manure scoring is not likely to become as popular as body condition scoring as a management tool. There are many factors that can impact on manure visual appearance, not all of which are nutritional. However, there are some things that can be said about obs~rving changes in manure.
1. Cows fed for production are likely to have feces that are more fluid in appearance than feces from cows fed higher fiber rations, although, dry matter may be greater.
2. High levels of ruminally degradable protein supplements can result in feces appearing more fluid, probably a result of increased water consumption in an effort to excrete excess nitrogen via the urine.
3. Adding alfalfa silage to com silage based diets does not appear to change the appearance, other than color, of the feces. Manure from cows fed com silage based diets was lighter in color than manure from cows fed alfalfa/com silage mixtures.
4. Cows fed com silage will excrete a certain amount of ingested whole kernels in their manure and this is expected. Processing of com plant during harvest or at ensiling can result in a more digestible kernel, especially if the kernel is hard.
5. There is cow to cow variation in visual appearance of feces from cows fed similar diets
6. Abrupt changes in appearance of feces can be an indicator of changes in composition of the ration, however, it will not always be clear how to correct problems because multiple factors can be the cause.
LITERATURE CITED
Allen, Mike and Dave Beede, 1996. Causes, detection, and prevention of ruminal acidosis in dairy cattle. Proc. Tri-State Dairy Nutrition Conference, p. 55.
Holter, J.B. and W. E. Urban, Jr., 1992 .. Water partitioning and intake prediction in dry and lactating cows. J. Dairy Sci. 75:1472.
Ireland-Perry, Rebecca L., 1991. Fecal consistency as related to dietary composition in lactating dairy cows. M. S. Thesis. Virginia Polytechnic Institute and State University, Blacksburg.
Ireland-Perry, R. L. and C. C. Stallings, 1993. Fecal consistency as related to dietary composition in lactating Holstein cows. J. Dairy Sci. 76:1074.
Miller, C. N., C. E. Polan, R. A. Sandy, and J. T. Huber, 1969. Effect of altering the physical form of com silage on utilization by dairy cattle. J. Dairy Sci. 5 2: 19 5 5.
Murphy, M. R., C. L. Davis, and G. C. McCoy. 1983. Factors affecting water consumption by Holstein cows in early lactation. J. Dairy Sci. 66:35.
Shellenberger, P.R. and E. M. Kesler, 1961. Rate of passage of feeds through the digestive tract of Holstein cows. J. Anim. Sci. 20:416.
111
I'. ~ . . i
Notes
(This page intentionally blank. )
Il
l : ~ 1 : aj fi
cj n d d
]
~ l ~ a1 .1
~ I~ f(
~1 ~ a c ~
I
B
al
~1 di ' .J
d
112
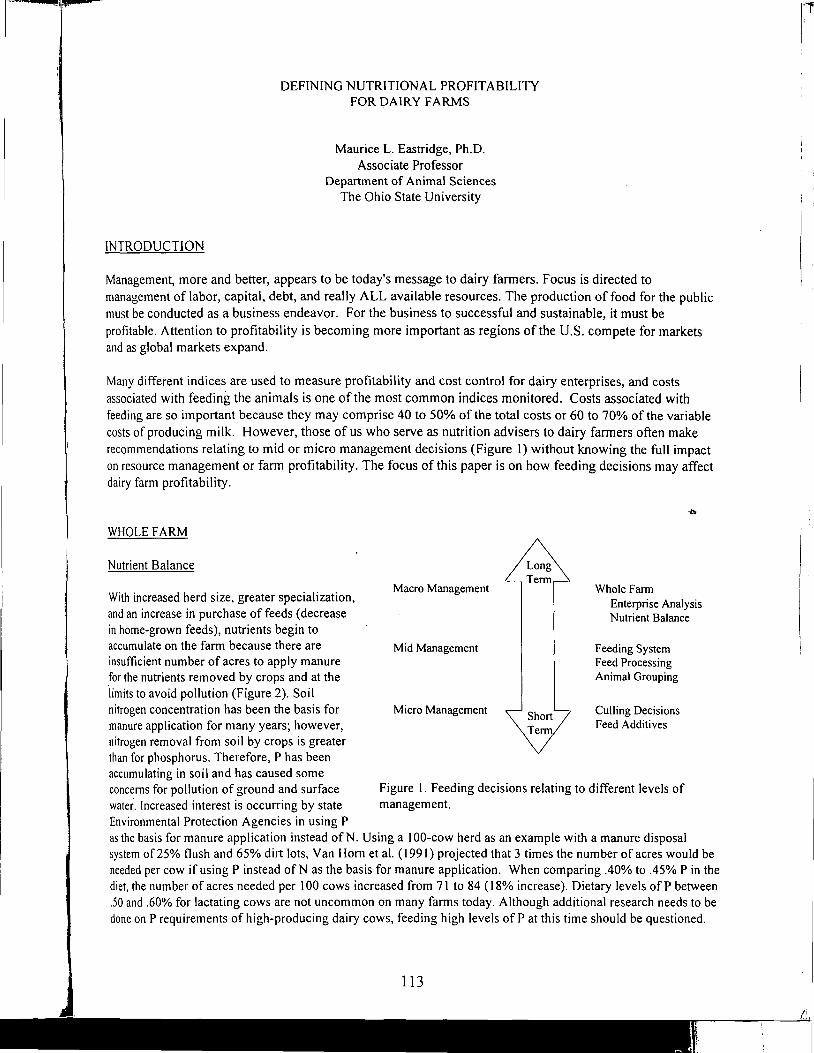
INTRODUCTION
DEFINING NUTRITIONAL PROFIT ABILITY FOR DAIRY FARMS
Maurice L. Eastridge, Ph.D. Associate Professor
Department of Animal Sciences The Ohio State University
Management, more and better, appears to be today's message to dairy farmers. Focus is directed to management of labor, capital, debt, and really ALL available resources. The production of food for the public must be conducted as a business endeavor. For the business to successful and sustainable, it must be
profitable. Attention to profitability is becoming more important as regions of the U.S. compete for markets and as global markets expand.
Many different indices are used to measure profitability and cost control for dairy enterprises, and costs associated with feeding the animals is one of the most common indices monitored. Costs associated with feeding are so important because they may comprise 40 to 50% of the total costs or 60 to 70% of the variable costs of producing milk. However, those of us who serve as nutrition advisers to dairy farmers often make recommendations relating to mid or micro management decisions (Figure 1) without knowing the full impact on resource management or farm profitability. The focus of this paper is on how feeding decisions may affect dairy farm profitability.
WHOLE FARM
Nutrient Balance
With increased herd size, greater specialization, and an increase in purchase of feeds (decrease in home-grown feeds), nutrients begin to accumulate on the farm because there are insufficient number of acres to apply manure for the nutrients removed by crops and at the limits to avoid pollution (Figure 2). Soil nitrogen concentration has been the basis for manure application for many years; however, nitrogen removal from soil by crops is greater than for phosphorus. Therefore, P has been accumulating in soil and has caused some concerns for pollution of ground and surface water. Increased interest is occurring by state Environmental Protection Agencies in using P
Macro Management
Mid Management
Micro Management
Long Term
Short Term
Whole Farm Enterprise Analysis Nutrient Balance
Feeding System Feed Processing Animal Grouping
Culling Decisions Feed Additives
Figure I. Feeding decisions relating to different levels of management.
as the basis for manure application instead ofN. Using a 100-cow herd as an example with a manure disposal system of25% flush and 65% dirt lots, Van Hom et al. (1991) projected that 3 times the number of acres would be needed per cow ifusing P instead ofN as the basis for manure application. When comparing .40% to .45% Pin the diet, the number of acres needed per I 00 cows increased from 7 I to 84 ( 18% increase). Dietary levels of P between .50 and .60% for lactating cows are not uncommon on many farms today. Although additional research needs to be done on P requirements of high-producing dairy cows, feeding high levels of Pat this time should be questioned.
113
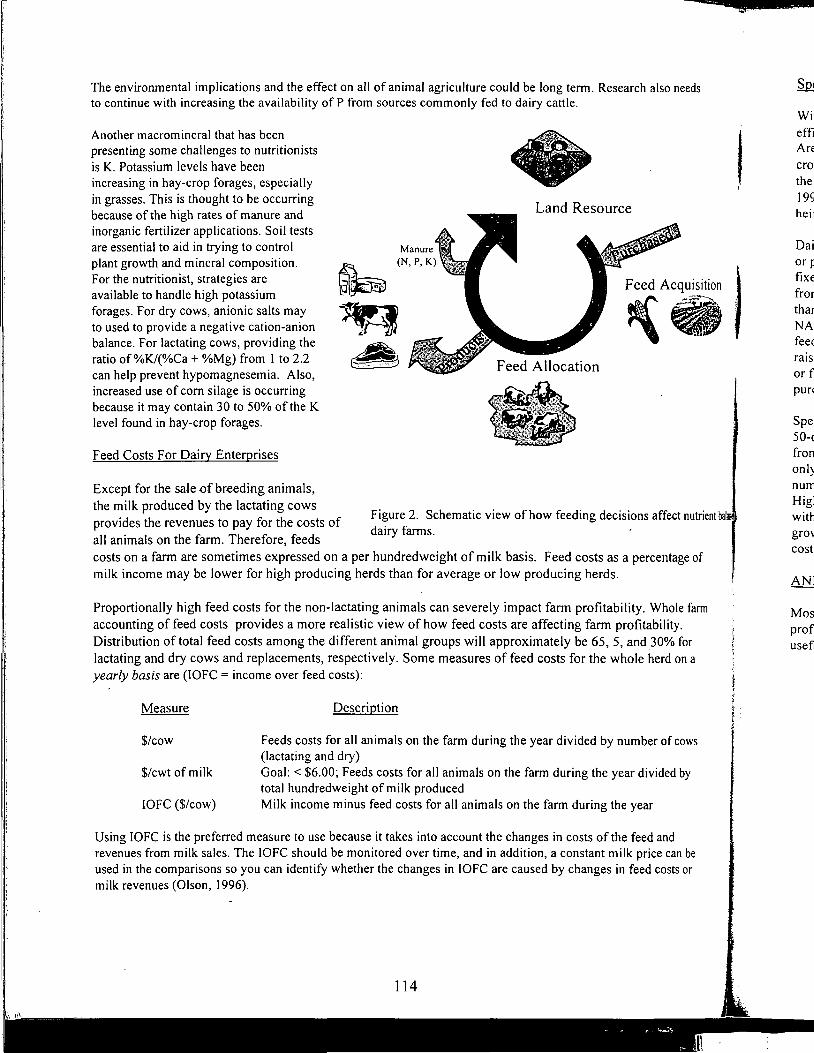
The environmental implications and the effect on all of animal agriculture could be long term. Research also needs to continue with increasing the availability of P from sources commonly fed to dairy cattle.
Another macrom ineral that has been presenting some challenges to nutritionists is K. Potassium levels have been increasing in hay-crop forages, especially in grasses. This is thought to be occurring because of the high rates of manure and inorganic fertilizer applications. Soil tests are essential to aid in trying to control plant growth and mineral composition. For the nutritionist, strategies are available to handle high potassium forages. For dry cows, anionic salts may to used to provide a negative cation-anion balance. For lactating cows, providing the ratio of%K/(%Ca +%Mg) from I to 2.2 can help prevent hypomagnesemia. Also, increased use of com silage is occurring because it may contain 30 to 50% of the K level found in hay-crop forages.
Feed Costs For Dairy Enterprises
Except for the sale of breeding animals, the milk produced by the lactating cows provides the revenues to pay for the costs of all animals on the farm. Therefore, feeds
Land Resource
Figure 2. Schematic view of how feeding decisions affect nutrient bal · dairy farms.
costs on a farm are sometimes expressed on a per hundredweight of milk basis. Feed costs as a percentage of milk income may be lower for high producing herds than for average or low producing herds.
Proportionally high feed costs for the non-lactating animals can severely impact farm profitability. Whole farm accounting of feed costs provides a more realistic view of how feed costs are affecting farm profitability. Distribution of total feed costs among the different animal groups will approximately be 65, 5, and 30% for lactating and dry cows and replacements, respectively. Some measures of feed costs for the whole herd on a yearly basis are (IOFC = income over feed costs):
Measure
$/cow
$/cwt of milk
IOFC ($/cow)
Description
Feeds costs for all animals on the farm during the year divided by number of cows (lactating and dry) Goal: < $6.00; Feeds costs for all animals on the farm during the year divided by total hundredweight of milk produced Milk income minus feed costs for all animals on the farm during the year
Using IOFC is the preferred measure to use because it takes into account the changes in costs of the feed and revenues from milk sales. The IOFC should be monitored over time, and in addition, a constant milk price can be used in the comparisons so you can identify whether the changes in IOFC are caused by changes in feed costs or milk revenues (Olson, I 996).
114
l I
fu2!
Wil effi ArJ
cro\ the I
19~
::: or 11
fix9 fron
I tha~ NAI feed
raisl or ft
I pur~
Spel 50-c
fro1 onl~ num
Higj wit~ gro~
cost~
ANJ
Mosl profi use fl
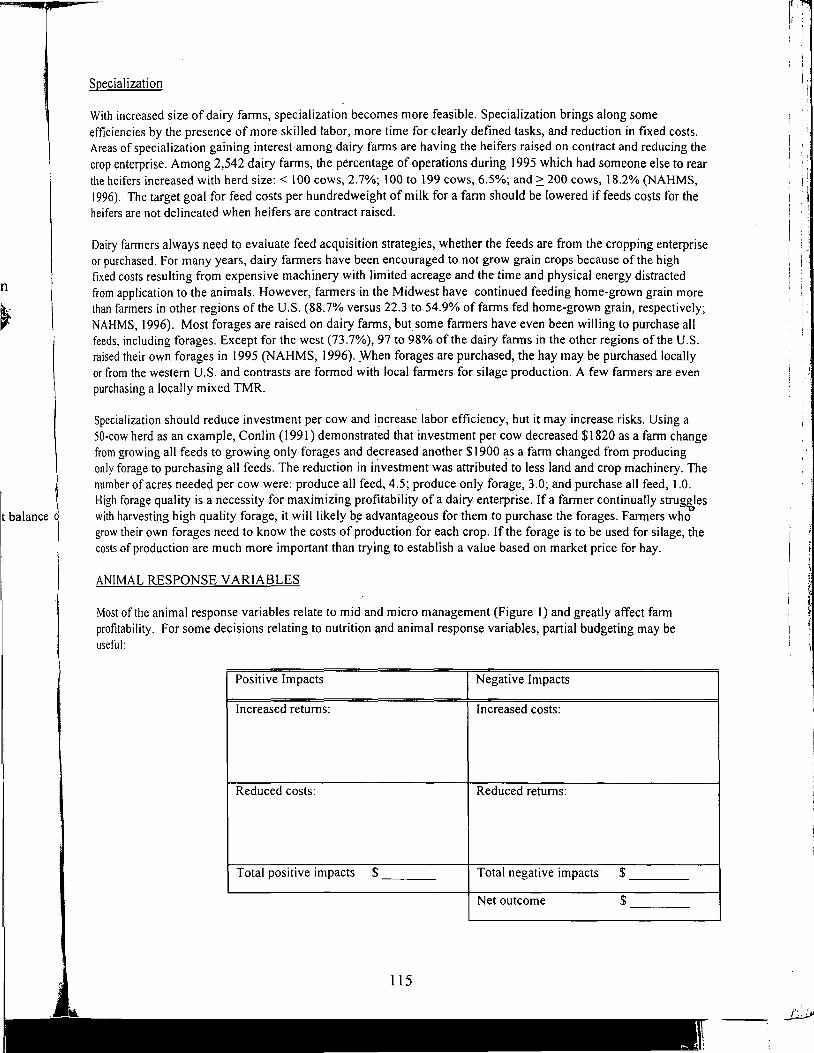
n
t balance I I
.fu1ecialization
With increased size of dairy farms, specialization becomes more feasible. Specialization brings along some efficiencies by the presence of more skilled labor, more time for clearly defined tasks, and reduction in fixed costs. Areas of specialization gaining interest among dairy farms are having the heifers raised on contract and reducing the crop enterprise. Among 2,542 dairy farms, the percentage of operations during 1995 which had someone else to rear the heifers increased with herd size: < I 00 cows, 2.7%; l 00 to 199 cows, 6.5%; and;:: 200 cows, 18.2% (NAHMS, 1996). The target goal for feed costs per hundredweight of milk for a farm should be lowered if feeds costs for the heifers are not delineated when heifers are contract raised.
Dairy farmers always need to evaluate feed acquisition strategies, whether the feeds are from the cropping enterprise or purchased. For many years, dairy farmers have been encouraged to not grow grain crops because of the high fixed costs resulting from expensive machinery with limited acreage and the time and physical energy distracted from application to the animals. However, farmers in the Midwest have continued feeding home-grown grain more than farmers in other regions of the U.S. (88.7% versus 22.3 to 54.9% of farms fed home-grown grain, respectively; NAHMS, 1996). Most forages are raised on dairy farms, but some farmers have even been willing to purchase all feeds, including forages. Except for the west (73.7%), 97 to 98% of the dairy farms in the other regions of the U.S. raised their own forages in 1995 (NAHMS, 1996). When forages are purchased, the hay may be purchased locally or from the western U.S. and contrasts are formed with local farmers for silage production. A few farmers are even purchasing a locally mixed TMR.
Specialization should reduce investment per cow and increase labor efficiency, but it may increase risks. Using a 50-cow herd as an example, Conlin (1991) demonstrated that investment per cow decreased $1820 as a farm change from growing all feeds to growing only forages and decreased another $1900 as a farm changed from producing only forage to purchasing all feeds. The reduction in investment was attributed to less land and crop machinery. The number of acres needed per cow were: produce all feed, 4.5; produce only forage, 3.0; and purchase all feed, 1.0. High forage quality is a necessity for maximizing profitability of a dairy enterprise. If a farmer continually strug~es with harvesting high quality forage, it will likely b~ advantageous for them to purchase the forages. Farmers who grow their own forages need to know the costs of production for each crop. Ifthe forage is to be used for silage, the costs of production are much more important than trying to establish a value based on market price for hay.
ANIMAL RESPONSE VARIABLES
Most of the animal response variables relate to mid and micro management (Figure I) and greatly affect farm profitability. For some decisions relating to nutrition and animal response variables, partial budgeting may be useful:
Positive Impacts Negative Impacts
Increased returns: Increased costs:
Reduced costs: Reduced returns:
Total positive impacts $ ___ _ Total negative impacts $ ___ _
Net outcome $ ___ _
I'
. I
.,'I . "
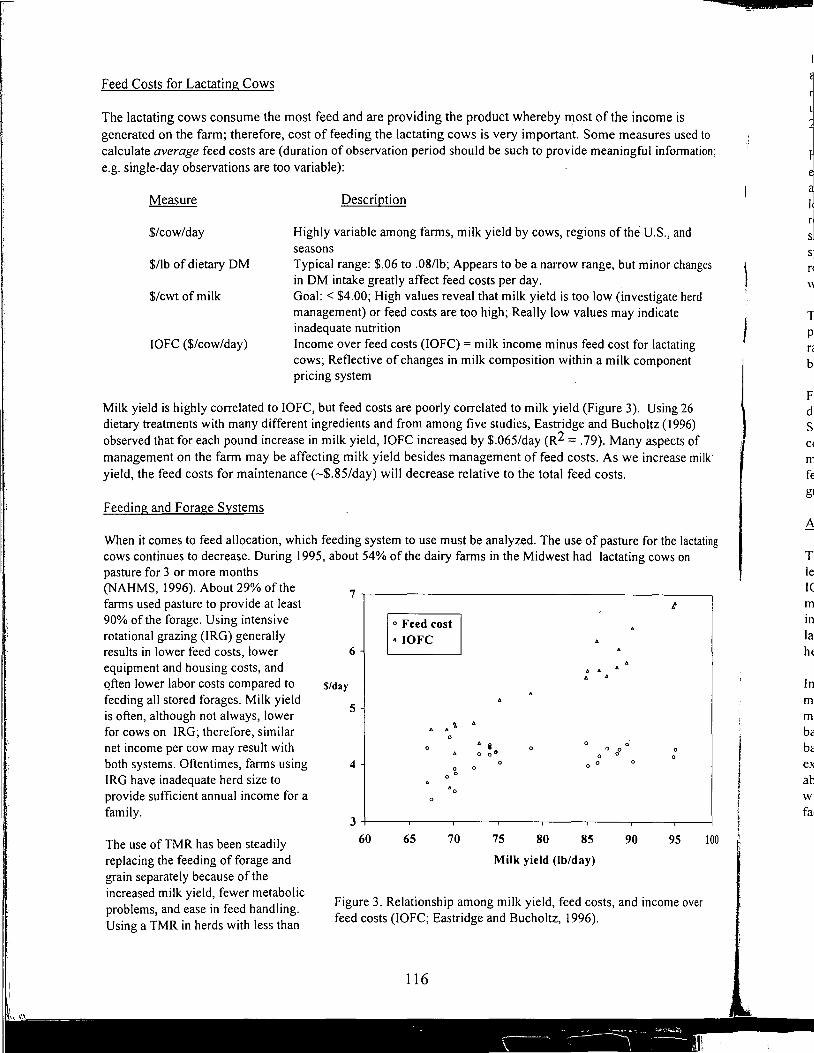
I 1
11 'I
Feed Costs for Lactating Cows
The lactating cows consume the most feed and are providing the product whereby most of the income is generated on the farm; therefore, cost of feeding the lactating cows is very important. Some measures used to calculate average feed costs are (duration of observation period should be such to provide meaningful information; e.g. single-day observations are too variable):
Measure
$/cow/day
Description
Highly variable among fanns, milk yield by cows, regions of the U.S., and seasons
$/lb of dietary OM Typical range: $.06 to .08/lb; Appears to be a narrow range, but minor changes in OM intake greatly affect feed costs per day.
$/cwt of milk
IOFC ($/cow/day)
Goal: < $4.00; High values reveal that milk yield is too low (investigate herd management) or feed costs are too high; Really low values may indicate inadequate nutrition Income over feed costs (IOFC) =milk income minus feed cost for lactating cows; Reflective of changes in milk composition within a milk component pricing system
Milk yield is highly correlated to IOFC, but feed costs are poorly correlated to milk yield (Figure 3). Using 26 dietary treatments with many different ingredients and from among five studies, Eastridge and Bucholtz (1996) observed that for each pound increase in milk yield, IOFC increased by $.065/day (R2 = .79). Many aspects of management on the farm may be affecting milk yield besides management of feed costs. As we increase milk yield, the feed costs for maintenance (-$.85/day) will decrease relative to the total feed costs.
Feeding and Forage Systems
When it comes to feed allocation, which feeding system to use must be analyzed. The use of pasture for the lactating cows continues to decrease. During 1995, about 54% of the dairy fanns in the Midwest had lactating cows on pasture for 3 or more months (NAHMS, 1996). About 29% of the fanns used pasture to provide at least 90% of the forage. Using intensive rotational grazing (IRG) generally results in lower feed costs, lower equipment and housing costs, and qften lower labor costs compared to feeding all stored forages. Milk yield is often, although not always, lower for cows on IRG; therefore, similar net income per cow may result with both systems. Oftentimes, fanns using IRG have inadequate herd size to provide sufficient annual income for a family.
The use ofTMR has been steadily replacing the feeding of forage and grain separately because of the increased milk yield, fewer metabolic problems, and ease in feed handling. Using a TMR in herds with less than
6
$/day
5
4
60
° Feed cost • IOFC
. . " 0
65
0
0 0 0
70
• I o o•
0
75
0
80
. . .
0 0 0
0 0
0 0
85
Milk yield (lb/day)
90 95
Figure 3. Relationship among milk yield, feed costs, and income over feed costs (IOFC; Eastridge and Bucholtz, 1996).
116
100
I I
1
~ j ~ ~ rl SI
I SI i n J
I
I ;1 r< bl
F
~I c~
ni fJ gJ
Al l Tl
lei ((j
~1 la1 hJ
In m1 mJ bJ
I b~ t ex
I ab I wi ! J
fa~ !
' ! "
:s
k
ing
100
f' I
J
100 cows and cows housed in tie-stall barns has been difficult because of inadequate number of animals in groups and equipment movement within the facility, respectively. In the latter case, new equipment has made the TMR
much more feasible for such housing systems. In the NAHMS (1996) study, 83.5% of the herds with~ 200 cows used a TMR, but only 35 .6% of all dairy operations uS'ed a TMR. There are still a lot of herds with < 100 cows; 28.2% of these operations used a TMR.
Hay is regarded by some as essential in diets for lactating dairy cows. Although hay does provide a safety level for effective fiber, it is not necessary to include in diets if we balance for adequate total NDF and forage NDF, provide adequate particle size of forages, and limit nonfiber carbohydrates. Silage usage continues to increase because of lower harvesting losses, lower labor costs, and its ease of handling. A hay production system may result in less net return to management than a silage based system, but dry hay can be an economical forage system, particularly for small farms (Rotz, 1996a). Large economic differences do not exist when comparing an alfalfa versus corn forage system, but having one-third to one-half of the forage system as corn silage can reduce economic risk, spread labor requirements throughout the forage production season, and provides the best long term nutrient balance for the whole farm (Rotz, l 996a).
The storage system for high quality forage needs to minimize nutrient losses and costs associated with milk production. Using a 100-cow dairy farm producing corn and alfalfa silages, Rotz (1996b) observed the following ranking of storage structures based on net return to management: silage bags> stave silos= silage bags> uncovered bunks.
Feed losses increase feed costs and reduce profitability, regardless of where the losses occur. The losses may occur during harvest, storage, and feeding. Losses during harvest may occur in the field or during transport to storage. Storage losses can be minimized by proper protection from environmental forces. Using silage as a example, proper coverage of bunker silos, removal of sufficient silage from the surface of the silo, patching holes in silage bags, minimizing length of time silage is mixed in the TMR during summer, etc. will reduce feed losses. Losses during feeding may be caused by worn mixing equipment, disposal of feed refusals instead of feeding to other animal groups, poor feed bunk design to minimize wastage of feed by cows, and rodents and birds.
Animal Grouping Strategies
The grouping strategies for a dairy farm will be affected by the feeding system, herd size, facilities, and production level for the herd, and these factors are not mutually exclusive. Grouping strategies should be designed to increase IOFC and minimize animal health problems. Less than a 5% incidence rate would be desirable, individually, for milk fever, ketosis, and displaced abomasum. Subclinical laminitis may exist as a herd problem if: > 5% of all cows in a herd exhibit lameness apart from that associated with infectious foot rot within a 12-month period,> 50% of all lameness in a herd occurs within 50 DIM, or> 25% of the cows within a lactation group show evidence of hemorrhage of the sole (Hoblet, 1993).
In general, two groups of dry cows are desired - far off and close up (-21 to -14 days to parturition). If herd size merits, considerable economic benefits have been observed in having a group for the first lactation cows. Two or more groups are usually established for the lactating cows, and the criteria for the groups often differ among farms based on herd size, milk production for the herd, and personal preferences. Rations for each group should be balanced for higher than the average yield for the group because it will be more economical to feed slightly in excess of nutrient requirements for the lower producing cows than to provide inadequate nutrients for all cows above the average. The distribution of cows around the average milk yield for the group is important for deciding with which milk yield to balance the diet. One approach is to balance the diet for the average yield times a lead factor, and the lead factor can be calculated as follows:
I) Determine the average and standard deviation for milk yield ofa group 2) Lead factor= average milk yield+ one standard deviation
average milk yield
117
Using general guidelines of I 0 to 30% above the average milk yield for which to balance the diet instead of knowing the distribution of milk yield for a group may result in limited milk yield because of inadequate nutrients or excess feed costs. ·
Several dairy farmers have implemented the feeding of a single TMR for all lactating cows, with the ration being balanced based on the high-producing cows in early lactation. This approach has been taken to reduce labor costs, simplify the feeding program, avoid milk production drops when animals are moved among groups, and to provide additional energy for body weight gain by thin cows during late lactation. Using a I 00-cow herd producing 23,022 lbs of RHA milk as an example, Eastridge and Bucholtz ( 1996) observed a $8,355 to $11,629 increase in IOFC using 5 ration scenarios for a two-group compared to a one-group system. The increased income came from reduced feed costs. Costly feed ingredients have to be fed to all cows in a one-group scenario when the primary need for the thin, late lactation cow is energy, and energy is less expensive than protein and feed additives. Over-conditioning of cows during late lactation should also be a concern for lower-producing herds. Adequate body condition of high producing cows continues to be a challenge, and sufficient dietary energy for replenishing body condition during late lactation must be provided. The inefficiency oflosing and gaining one body condition score is about 80 to 120 Meal ofNEL, and this may cost about $10 /cow/year in feed costs, which is low relative to total feed costs per cow (VandeHaar, 1995).
Feed Processing
Grain has a value based on market value or costs of production. Processing the cereal grain to increase digestibility will increase its value, but the costs of the grain will also increase, with the amount of increase dependent on the process used. If processing com to increase digestibility costs $20/ton ($.0 I/lb), a one pound increase in milk yield (milk price= $12.50/cwt) would be needed just to pay for the extra processing costs assuming that the cow is consuming 50 lbs OM intake and com consists of 25% of the diet. But if a 2: I or 3: 1 return to investment is expected, additional milk response is needed. Processing of oilseeds, oilseed meals, or other commodities may affect digestibility, alter degradability of protein, remove anti-quality factors, and improve handling, all ofwJ:ich need to be considered when evaluating returns. Change in milk composition by feeding processed grains must also be considered when evaluating returns because the composition of the milk affects milk price.
One of the most current topics relative to processing of forages is mechanical processing of com silage to decrease particle size of the kernels and thereby increase digestibility of the starch. The equipment and fuel costs associated with the processing are relatively high, and therefore, whether it is economical will vary from farm to farm and will depend on herd size, percentage of com silage in diets, percentage of the year that com silage is fed, and the maturity at which the silage was or will be harvested (Harrison et al., 1997). The more mature the com silage, the greater the need for the processing. Stover digestibility differs among hybrids and needs to be maintained at advanced stages of maturity.
Feed Additives
Contemplation ofusing a feed additive automatically gives rise to the question, "Will it be economical?". The first thing that must be explored is the evidence for its use:
Has there been sufficient research done with he product? Were the research studies conducted within the company, by universities, or both? Were the results of the studies complementary or conflicting? Is there evidence for the product's mode of action? What responses are expected by animals?
Then based on the expected responses by animals, cost of the product, and additional costs associated with use of the product, "Will be product result in $2 or more for each $1 invested?" If the product appears to hold promise, then before feeding it address the following questions:
118
j
I !
I
I
I
cl s9 ba la m et ba
I
s
s, de ~2
.ced the ; of
20 )W
ity
:Id
iSO
,1se I 1ed
iwm :1e
irst
of :,
How will the response be measured? How long will be product need to be fed to identify the responses? Is it feasible to feed it to only the most probable responsive animals?
After the product is fed, the following must be answered:
Did the animals respond favorably? Was the response sufficient to make the product an economical use? If the response was inadequate, are there some identifiable factors that prohibited response, and if so, could these factors be corrected? ·
The mode of action of the product should be specific, i.e., stabilize ruminal pH, increase milk protein percentage, increase OM intake, etc., but basically the product needs to increase milk revenue by increasing yield or changing milk composition, reduce metabolic disorders, improve reproductive performance, or increase body condition.
Feeding Frequency
Increasing the feeding frequency of a TMR beyond once per day may cause variable results. Feeding two or more times per day are likely to cause increases in OM intake ·if bunk space in limited, cows are not fed ad libitum, fermented or high-moisture feeds are fed, and feeding management is lacking (Grant and Albright, 1995). Cows in early lactation (0 to 12 weeks) fed diets with high fermentability and exposed to poor feeding management are most likely to respond with increased DM intake and milk yield (Robinson, 1989):
Feeding management Diet fermentability quality Relative response
High Good +++
High Poor +++++
Medium Good ++
Medium Poor ++++
Low Good +
Low Poor ++
Cows in mid lactation may also respond to increased feeding frequency, depending on milk yield potential and severity of conditions described above. If diets are fed ad libitum and diet fermentability is low, pushing the TMR back up along a fence-line may stimulate increased DM intake as much as another feeding and this requires less labor and fuel costs. When implementing an additional feeding, OM intake should increase, followed by an increase in milk yield (or improvement in some other response variable, e.g. body condition, decreased metabolic problems, etc.). The additional costs (feed, labor, and fuel) associated with increasing feeding frequency must be worthwhile based on animal response.
119
Culling Decisions
When cows are culled for voluntary reasons, feed costs become important in making the culling decision. The following strategy was adapted from Faust ( 1996) for deciding whether to cull an individual cowy:
Item Expenses Income
Milk value xx xx $/cowylday
Non~feed costs (herd basis) $/cow/day xx xx
Feed costs $/cowylday xx xx
IOFC xx xx $/cowylday
Decision: Cull cowy if IOFC _:::: non-feed costs
In the NAHMS (1996) study, 28.4% of the dairy farmers used a break-even milk yield in culling decisions, and the break even level (33.4 lbs/cow/day) was rather consistent among herd sizes. However, the actual break-even level that should be used will vary among herds and within herds; therefore, the IOFC guidelines discussed above should be used.
SUMMARY
Nutritional profitability for a dairy farm must be determined based on farm enterprise analysis, and nutrient balance on the farm must be monitored for sustainability of the enterprise. Recommendations at mid and micro management leve'ls· need to be made in context to their effects on the profitability of the whole enterprise. Dairy farms need to increase in specialization so they can become more competitive by being more economically efficient, but risks associated with specialization must be identified and managed. Animal responses to changes in feeding must be monitored and costs and revenues associated with the changes be determined. Dairy farmers need to know the costs of producing home-grown feeds and feed costs per hundredweight of milk and IOFC for the whole herd and for the lactating cows.
120
LITE -I Con Ii
I Eastri
Faust
Gran,
Harri~
Hobie
N . I
o] Robin Rotz,
Rotz,
Van H
Vande

LITERATURE CITED
Conlin, B.J. 1991. Managing $10 milk prospectives on dairy inputs and outputs. Dairy Update, Issue 106, University of Minnesota, St. Paul.
Eastridge, M.L., and H.F. Bucholtz. 1996. Effects of changes in feeding on income over feed costs. Page 175 in Proceedings Tri-State Dairy Nutrition Conference, The Ohio State University, Columbus.
Faust, M. 1996. Don't wait: Proper culling can mean $15,000 more income in a 100-cow herd. Spring Issue, Growth Lines, Roche Animal Nutrition and Health, Paramus, NJ.
Grant, R.J., and J.L. Albright. 1995. Feeding behavior and management factors during the transition period in dairy cattle. J. Anim. Sci. 73:2791.
Harrison, J.H., L. Johnson, C. Hunt, and J. Siciliano-Jones. 1997. Use of kernel-processed silage in dairy rations. Page 95 in Proceedings Silage: Field to Feedbunk. NRAES-99, NE Regional Agri. Eng. Ser., Ithaca, NY.
Hoblet, K.L. 1993. Subclinical laminitis. Page 3 in Proceedings Tri-State Dairy Nutrition Conference, The Ohio State University, Columbus.
National Animal Health Monitoring System. 1996. Part I: Reference of 1996 Dairy Management Practices. Centers for Epidemiology and Animal Health, USDA:APHIS:VS, Fort Collins, CO.
Olson, J.D. 1996. Monitoring feed costs. Page 161 in Proceedings Midwest Dairy Management Conference, University of Minnesota, St. Paul.
Robinson, P.H. 1989. Dynamic aspects of feeding management for dairy cows. J. Dairy Sci. 72: 1I97. Rotz, C.A. 1996a. A comparison of forages, harvesting, and storage systems. Page 32 in Proceedings
Midwest Dairy Management Conference, University of Minnesota, St. Paul. Rotz, C.A. l 996b. Economics of alternative silage systems. Page 50 in U.S. Dairy Forage Research
Center 1996 Research Summaries, USDA, ARS, Madison, WI. Van Hom, H.H., R. A. Nordstedt, A.V. Bottcher, E.A. Hanlon, D.A. Graetz, and C.F. Chambliss. 1991. Drury
Manure Management: Strategies for recycling nutrients to recover fertilizer value and avoid environmental pollution. Circular 10 I 6. University of Florida, Gainesville.
YandeHaar, M. 1995. Optimum level of milk. production: Nutritional considerations. Page I 35 in Proceedings Tri-State Dairy Nutrition Conference, The Ohio State University, Columbus.
121
t ', ' I I
/· .. i I•
Notes
( This page intentionally blank. )
In re< I Redu
l have I prodl b . I usrn centr! Our~
I herds
dise~
Muc~ som9 levels wouli and c mas ti milk
remo1 an as~ di seal exam! could
So, al
atteml comp] to hig have I therei
I
associ
In thJ d" I 1seas
122
FURTHER STUDIES ON MILK YIELD AND DISEASE IN DAIRY COWS
I. INTRODUCTION
Y.T. Grohn Section of Epidemiology
Department of Clinical Sciences College of Veterinary Medicine
Cornell University
In recent years, milk yield has become much more dependent upon intensive methods of husbandry. Reduced profit margins and an increasingly competitive business environment for the dairy farmer have made the practice of veterinary medicine necessarily focus upon whole-herd health and productivity. Incremental changes in milk yield can have major effects on profitability in this new business environment. Understanding the relationship between disease and milk yield is therefore central to the dairy industry, and is of paramount importance for sustainability of the dairy industry. Our ultimate goal is to help farmers make the best decisions regarding management of their dairy herds. To do this we need first to study the biological parameters involved, namely milk yield, disease, and reproductive performance.
Much debate has focused on whether or not-the higher milk yield attained in recent decades has in some way caused a concomitant increase in diseases of dairy cows. The effect of high mi!k yield levels on a cow's reproductive performance is also in question. On the other hand, certain dise.ases would themselves decrease yield. However, these relationships have been difficult to demonstrate, and controversy exists in the literature. For instance, there is a relationship between high yield and mastitis. Fortunately, few people would conclude that the purchase of mastitic cows will increase milk yield! The most plausible explanation is that cows with mastitis that have low yield are removed from the dairy herd, whereas high yielders are kept even if they have some mastitis. Thus an association exists, but the cause and effect are not clear. Does high yield cause disease? Does disease decrease yield? These questions are clearly interrelated, and difficult to study merely by examining associations. An association could occur because some external factor (i.e., management) could affect both yield and disease.
So, although some studies regarding the relationship between disease and milk yield have been attempted, they have been constrained by three factors: lack of a large health data base; lack of computing power; and lack of sophisticated statistical tools. We have been fortunate to have access to high quality data on Finnish Ayrshires (Grohn et al., 1994; Harman et al., 1996a, b); such data have not been previously available in the United States, where Holstein predominate. We have therefore established a new health and production data base in the Northeast US to study the association between milk yield and disease under Northeast management.
In this presentation, I will concentrate on the first question of the relationship between milk yield and disease: Does high milk yield predispose a cow to: 1) certain diseases, 2) delayed conception, and
123
' ' ,. F
3) increased culling? To properly address these 3 subquestions requires the inclusion of potential confounders, such as parity, season, herd, and other disorders in these models. By including these confounders, we can also determine the effect of disease on other diseases, delayed conception, and culling. The effect of disease on milk yield will be discussed separately, using left displaced abomasum as an example. Finally, I will discuss how the information can be combined so that the economic gains from increased yield can be compared to any economic losses from increased diseases. The material for this review was primarily taken from our own on-going epidemiologic (observational) research carried out with Holsteins in the Northeast US.
II. DOES HIGH MILK YIELD PREDISPOSE COWS TO CERTAIN DISEASES?
There has been much debate on whether the high milk yield attained recently has caused more diseases among dairy cows. These relationships have been difficult to demonstrate; both biology and management are possible explanations. High milk yield may cause negative energy balance in some cows, especially those still growing, and a disease state may be created. Selective culling muddies the issue further. High yielders are more likely to remain in the herd, and receive more veterinary treatement, even when they become ill, than low yielders.
The objective of this study was to examine whether previous 305-d milk yield had any effect on 7 different disorders (Grahn et al., 1995). We used logistic regression to study these associations in 8070 multiparous cows from 25 herds, calving between June 1990 and November 1993, in New York State. The 7 disorders (lactational incidence risk in parentheses) under study were retained placenta (7.4%), metritis (7.6%), ovarian cysts (9.1 %), milk fever (1.6%), ketosis (4.6%), abomasal displacement (6.3%), and mastitis (9.7%). The presence or absence of each of these disorders was the outcome, in 7 different models. Parity, calving season, and herd were included in each model as potential confounders (Table 1 ).
It was not necessary to include other disorders as confounders in the models, because their inclusion did not change the estimates of the other covariates meaningfully. However, disorders that did have a significant effect on other disorders are shown in Table 1 for demonstration purposes. Ketosis and
- retained placenta were risk factors for metritis. Mastitis and ketosis raised the risk of ovarian cysts. Milk fever, metritis, and abomasal displacement raised the risk of ketosis. Retained placenta and ketosis were significant predictors of displaced abomasum. Ovarian cysts were a risk factor for mastitis.
Higher milk yield was not a risk factor for any disorder, with the exception of ovarian cyst and mastitis (Table 1 ). The highest yielders were most likely to have ovarian cysts, compared to the lowest yielders. The effect was more marked in mastitic cows. Cows with higher milk yield were more likely to develop mastitis; there was a linear relationship between milk yield and odds of developing mastitis.
We found, in earlier studies on Finnish Ayrshires (Grahn et al., 1989; Grahn et al., 1990a, b; Grohn and Bruss, 1990; Grahn et al., 1994), that high milk yield is associated with a number of disorders
124
ial :se nd ed he ed pc
)re lgy :m ing ore
n7 ; in :ew 11ed .Ls al ;vas l·del !
ll:ion ave and BtS.
and for
and 1the vere .s of
:ohn ders
*44M
including, among others, metritis, ovarian cysts, and mastitis. The differences between Ayrshires and Holsteins may arise for several reasons. Finnish farms are much smaller than New York farms; management may differ. The Finnish studies contained over 5 times as many cows as our New York study. Also, in New York, a farmer may treat a disease, but in Finland only veterinarians treat disease.
The lack of association between milk yield and disease in this study, except for ovarian cysts and mastitis, may indicate that even the highest yielding cows can be managed according to their biological needs. Our finding, in Holsteins, that cows with higher milk yield were more likely to have ovarian cysts and mastitis does not necessarily imply that higher milk yield causes ovarian cysts and mastitis. At least 2 biological explanations for the association between high milk yield and mastitis are plausible: increased risk of injury and leaking of milk between milkings. Management, a difficult factor to account for under the best of circumstances, almost certainly plays a role. Selective culling and selective treatment of cows may explain, in particular, the association between high milk yield and occurrence of mastitis. Very high yielding cows, even when they become ill, are more likely to be kept in the milking herd for as long as possible; they are also more likely to receive treatment for their ailments. Lower yietders will be culled sooner. The magnitude of the effect of selective culling needs to be addressed in future studies.
125
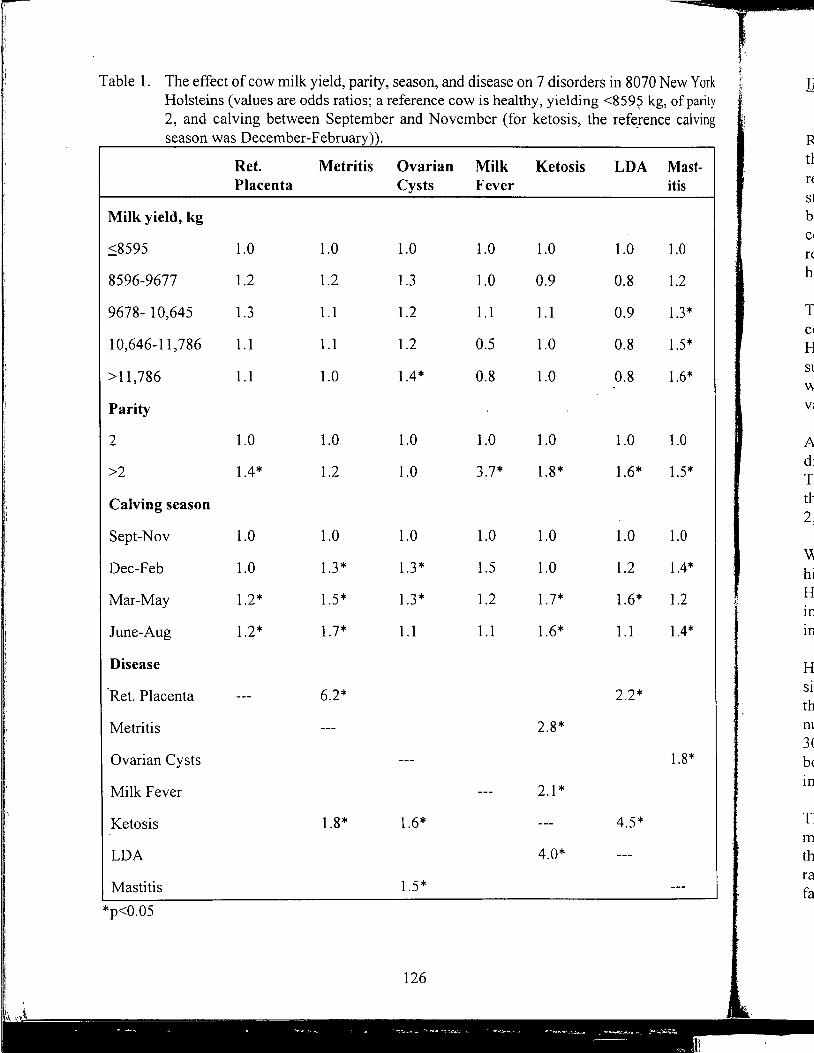
l Table 1. The effect of cow milk yield, parity, season, and disease on 7 disorders in 8070 New York ~ ,, IJ
Holsteins (values are odds ratios; a reference cow is healthy, yielding <859? kg, of parity 2, and calving between September and November (for ketosis, the refe_rence calving " ' season was December-February)). R
Ret. Metritis Ovarian Milk Ketosis LDA Mast- ~~ Placenta Cysts Fever itis sJ
Milk yield, kg bl
c1 .:::;8595 1.0 1.0 1.0 1.0 1.0 1.0 1.0 n
8596-9677 1.2 1.2 1.3 1.0 0.9 0.8 1.2 h
9678- 10,645 1.3 1.1 1.2 1.1 1.1 0.9 1.3* ~ 10,646-11,786 1.1 1.1 1.2 0.5 1.0 0.8 1.5* I
H
>11,786 1.1 1.0 1.4* 0.8 1.0 0.8 1.6* sJ ,
Parity v:
j 2 1.0 1.0 1.0 1.0 1.0 LO 1.0 I
1.5* di
>2 1.4* 1.2 1.0 3.7* 1.8* 1.6*
~ Calving season : Sept-Nov 1.0 1.0 1.0 1.0 1.0 1.0 1.0
Dec-Feb 1.0 1.3* 1.3* 1.5 1.0 1.2 1.4* hl I
Mar-May 1.2* 1.5* 1.3* 1.2 1.7* 1.6* 1.2 ·f' ~ m June-Aug 1.2* 1.7* 1.1 1.1 1.6* 1.1 1.4*
• I m
; Disease
Ret. Placenta 6.2* 2.2* I' tH I
nJ Metritis 2.8* I
3~ Ovarian Cysts 1.8* I
?~ I·'
2.1* m
Milk Fever I
Ketosis 1.8* 1.6* 4.5* Tl rn
LOA 4.0* tti d
Mastitis 1.5* d *p<0.05
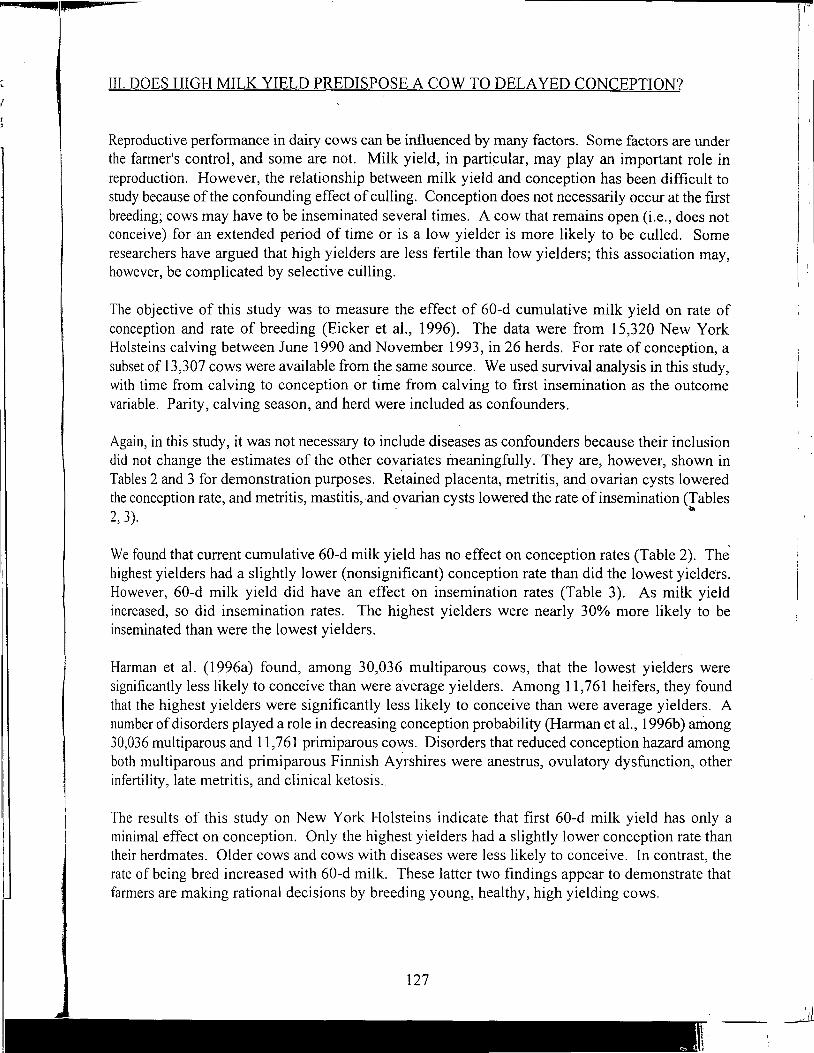
III. DOES HIGH MILK YIELD PREDISPOSE A COW TO DELAYED CONCEPTION?
Reproductive performance in dairy cows can be influenced by many factors. Some factors are under the farmer's control, and some are not. Milk yield, in particular, may play an important role in reproduction. However, the relationship between milk yield and conception has been difficult to study because of the confounding effect of culling. Conception does not necessarily occur at the first breeding; cows may have to be inseminated several times. A cow that remains open (i.e., does not conceive) for an extended period of time or is a low yielder is more likely to be culled. Some researchers have argued that high yielders are less fertile than low yielders; this association may, however, be complicated by selective culling.
The objective of this study was to measure the effect of 60-d cumulative milk yield on rate of conception and rate of breeding (Eicker et al., 1996). The data were from 15,320 New York Holsteins calving between June 1990 and November 1993, in 26 herds. For rate of conception, a subset of 13,307 cows were available from the same source. We used survival analysis in this study, with time from calving to conception or time from calving to first insemination as the outcome variable. Parity, calving season, and herd were included as confounders.
Again, in this study, it was not necessary to include diseases as confounders because their inclusion did not change the estimates of the other covariates meaningfully. They are, however, shown in Tables 2 and 3 for demonstration purposes. Retained placenta, metritis, and ovarian cysts lowered the conception rate, and metritis, mastitis, and ovarian cysts lowered the rate of insemination (Tables
. ~
2, 3).
We found that current cumulative 60-d milk yield has no effect on conception rates (Table 2). The. highest yielders had a slightly lower (nonsignificant) conception rate than did the lowest yielders. However, 60-d milk yield did have an effect on insemination rates (Table 3). As milk yield increased, so did insemination rates. The highest yielders were nearly 30% more likely to be inseminated than were the lowest yielders.
Harman et al. (l 996a) found, among 30,036 multiparous cows, that the lowest yielders were significantly less likely to conceive than were average yielders. Among 11,761 heifers, they found that the highest yielders were significantly less likely to conceive than were average yielders. A number of disorders played a role in decreasing conception probability (Harman et al., 1996b) among 30,036 multiparous and 11, 761 primiparous cows. Disorders that reduced conception hazard among both multiparous and primiparous Finnish Ayrshires were anestrus, ovulatory dysfunction, other infertility, late metritis, and clinical ketosis ..
The results of this study on New York Holsteins indicate that first 60-d milk yield has only a minimal effect on conception. Only the highest yielders had a slightly lower conception rate than their herdmates. Older cows and cows with diseases were less likely to conceive. In contrast, the rate of being bred increased with 60-d milk. These latter two findings appear to demonstrate that farmers are making rational decisions by breeding young, healthy, high yielding cows.
127
I I ,,.
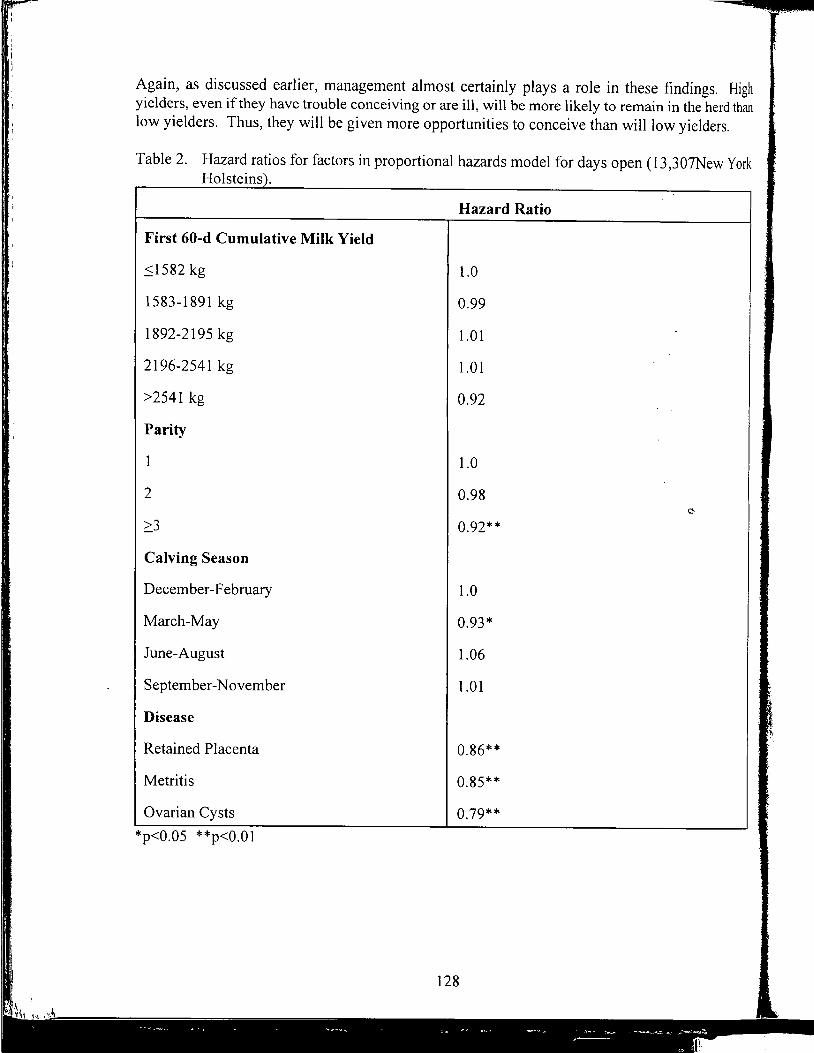
. '
Again, as discussed earlier, management almost certainly plays a role in these findings. High yielders, even if they have trouble conceiving or are ill, will be more likely to remain in the herd than low yielders. Thus, they will be given more opportunities to conceive than will low yielders.
Table 2. Hazard ratios for factors in proportional hazards model for days open (13,307New York Holsteins) .
Hazard Ratio
First 60-d Cumulative Milk Yield
::;1582 kg 1.0
1583-1891 kg 0.99
1892-2195 kg 1.01
2196-2541 kg 1.01
>2541 kg 0.92
Parity
1 1.0
2 0.98 .;:.
2:3 0.92**
Calving Season
December-February 1.0
March-May 0.93*
June-August 1.06
September-November 1.01
Disease
Retained Placenta 0.86**
Metritis 0.85**
Ovarian Cysts 0.79**
*p<0.05 **p<0.01
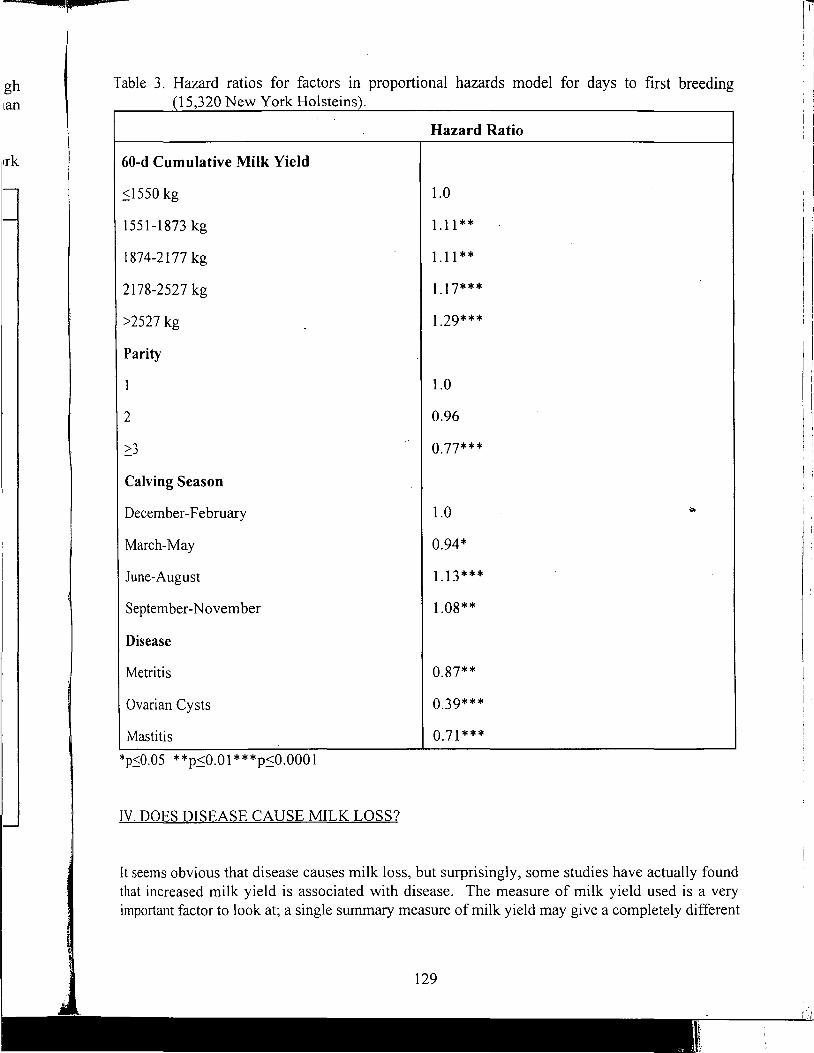
gh lan
Table 3. Hazard ratios for factors in proportional hazards model for days to first breeding (15,320 New York Holsteins).
Hazard Ratio
60-d Cumulative Milk Yield
Sl550 kg 1.0
1551-1873 kg 1.11**
1874-2177 kg 1.11**
2178-2527 kg 1.17***
>2527 kg 1.29***
Parity
1 1.0
2 0.96
~3 0.77***
Calving Season
December-February 1.0 .. March-May 0.94*
June-August 1.13***
September-November 1.08**
Disease
Metritis 0.87**
Ovarian Cysts 0.39***
Mas ti tis 0.71 ***
*pS0.05 **p~0.01 ***p~0.0001
IV. DOES DISEASE CAUSE MILK LOSS?
It seems obvious that disease causes milk loss, but surprisingly, some studies have actually found that increased milk yield is associated with disease. The measure of milk yield used is a very important factor to look at; a single summary measure of milk yield may give a completely different
129
\I
i
' I I Ir ' I '
1;
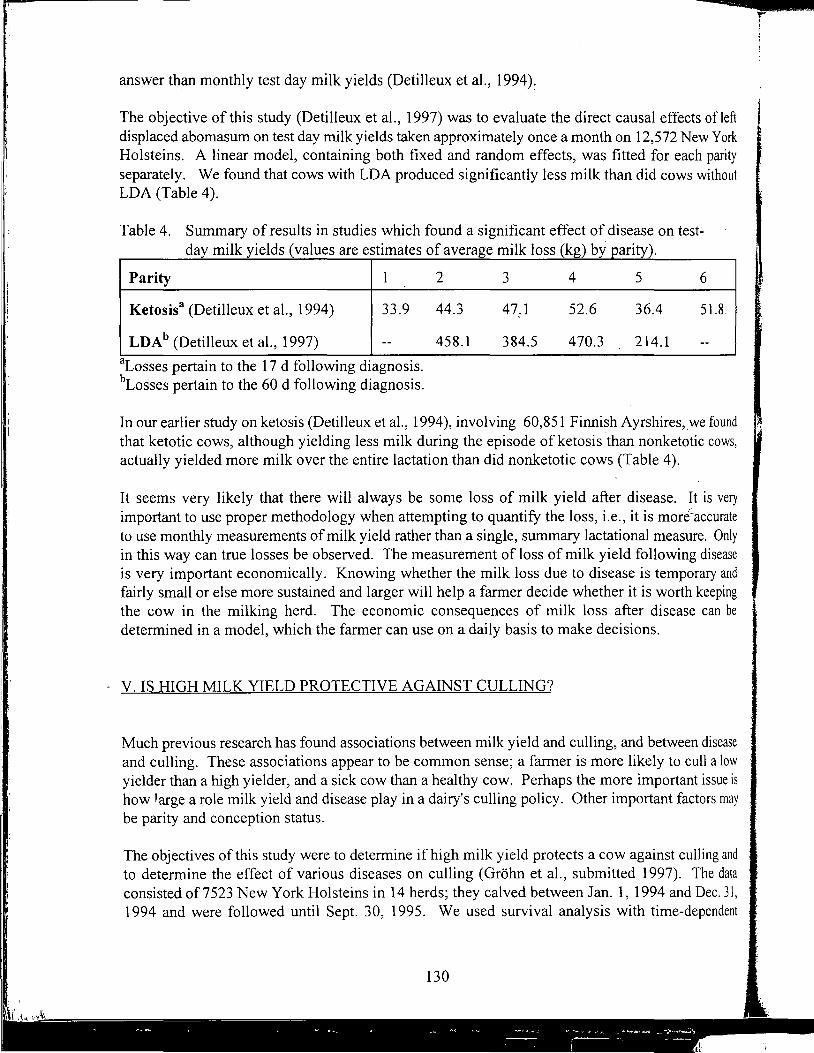
answer than monthly test day milk yields (Detilleux et al., 1994)'.
The objective of this study (Detilleux et al., 1997) was to evaluate the direct causal effects ofleft displaced abomasum on test day milk yields taken approximately once a month on 12,572 New York Holsteins. A linear model, containing both fixed and random effects, was fitted for each parity separately. We found that cows with LOA produced significantly less milk than did cows without LDA (Table 4).
Table 4. Summary of results in studies which found a significant effect of disease on test-d 'lk . ld ( 1 f t f 'lk 1 (k ) b . 'ty) ay m1 y1e s va ues are es 1ma es o average m1 oss g y par1
Parity 1
Ketosis3 (Detilleux et al., 1994) 33.9
LDA b (Detilleux et al., 1997) --
aLosses pertain to the 17 d following diagnosis. bLosses pertain to the 60 d following diagnosis.
2
44.3
458.1
3 4 5
47.1 52.6 36.4
384.5 470.3 214.1
6
51.8
--
In our earlier study on ketosis (Detilleux et al., 1994 ), involving 60,851 Finnish Ayrshires, we found that ketotic cows, although yielding less milk during the episode of ketosis than nonketotic cows, actually yielded more milk over the entire lactation than did nonketotic cows (Table 4).
It seems very likely that there will always be some loss of milk yield after disease. It is very important to use proper methodology when attempting to quantify the loss, i.e., it is more~accurate to use monthly measurements of milk yield rather than a single, summary lactational measure. Only in this way can true losses be observed. The measurement of loss of milk yield following disease is very important economically. Knowing whether the milk loss due to disease is temporary and fairly small or else more sustained and larger will help a farmer decide whether it is worth keeping the cow in the milking herd. The economic consequences of milk loss after disease can be determined in a model, which the farmer can use on a daily basis to make decisions.
- V. IS HIGH MILK YIELD PROTECTIVE AGAINST CULLING?
Much previous research has found associations between milk yield and culling, and between disease and culling. These associations appear to be common sense; a farmer is more likely to cull a low yielder than a high yielder, and a sick cow than a healthy cow. Perhaps the more important issue is how 1.arge a role milk yield and disease play in a dairy's culling policy. Other important factors may be parity and conception status.
The objectives of this study were to determine if high milk yield protects a cow against culling and to determine the effect of various diseases on culling (Grohn et al., submitted 1997). The data consisted of7523 New York Holsteins in 14 herds; they calved between Jan. 1, 1994 and Dec. 31, 1994 and were followed until Sept. 30, 1995. We used survival analysis with time-dependent
130
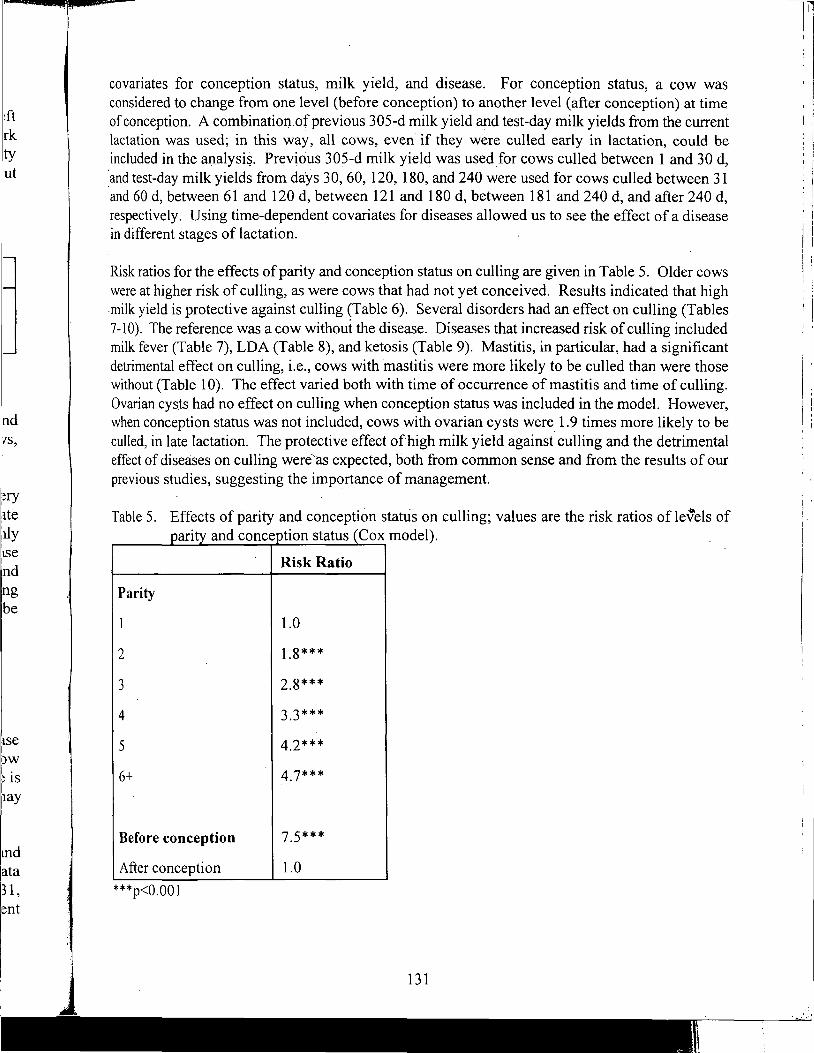
:ft rk ty ut
nd 'IS,
:ite itly tse 1nd ng be
ise
)W
! IS
my
md ata 31, ent
j
covariates for conception status, milk yield, and disease. For conception status, a cow was considered to change from one level (before conception) to another level (after conception) at time of conception. A combination.of previous 305-d milk yield and test-day milk yields from the current lactation was used; in this way, all cows, even if they were culled early in lactation, could be included in the analysis. Previous 305-d milk yield was used for cows culled between 1 and 30 d, :and test-day milk yields from days 30, 60, 120, 180, and 240 were used for cows culled between 31 and 60 d, between 61and120 d, between 121and180 d, between 181and240 d, and after 240 d, respectively. Using time-dependent covariates for diseases allowed us to see the effect of a disease in different stages of lactation.
Risk ratios for the effects of parity and conception status on culling are given in Table 5. Older cows were at higher risk of culling, as were cows that had not yet conceived. Results indicated that high milk yield is protective against culling (Table 6). Several disorders had an effect on culling (Tables 7-10). The reference was a cow without the disease. Diseases that increased risk of culling included milk fever (Table 7), LDA (Table 8), and ketosis (Table 9). Mastitis, in particular, had a significant detrimental effect on culling, i.e., cows with mastitis were more likely to be culled than were those without (Table 10). The effect varied both with time of occurrence of mastitis and time of culling. Ovarian cysts had no effect on culling when conception status was included in the model. However, when conception status was not included, cows with ovarian cysts were 1.9 times more likely to be culled, in late lactation. The protective effect of high milk yield against culling and the detrimental effect of diseases on culling were··as expected, both from common sense and from the results of our previous studies, suggesting the importance of management.
Table 5. Effects of parity and conception status on culling; values are the risk ratios of le~els of par1 ty d f t t (C model). an concep 10n s a us ox
Risk Ratio
Parity
1 1.0
2 1.8***
3 2.8***
4 3.3***
5 4.2***
6+ 4.7***
Before conception 7.5***
After conception 1.0
***p<0.001
131
i ' '
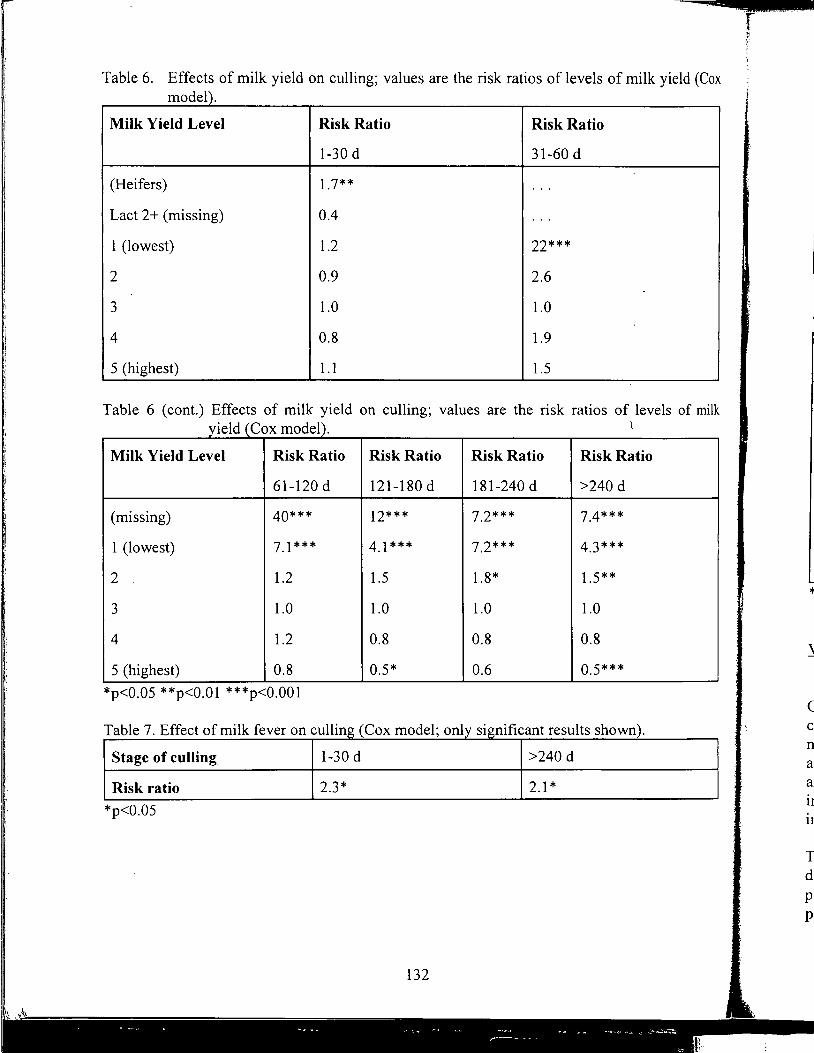
Table 6. Effects of milk yield on culling; values are the risk ratios of levels of milk yield (Cox model).
Milk Yield Level Risk Ratio Risk Ratio
1-30 d 31-60 d
(Heifers) 1.7** ...
Lact 2+ (missing) 0.4 ...
1 (lowest) 1.2 22***
2 0.9 2.6
3 1.0 1.0
4 0.8 1.9
5 (highest) 1.1 1.5
Table 6 (cont.) Effects of milk yield on culling; values are the risk ratios of levels of milk yield (Cox model). 1
Milk Yield Level Risk Ratio Risk Ratio Risk Ratio Risk Ratio
61-120 d 121-180 d 181-240d >240 d
(missing) 40*** 12*** 7.2*** 7.4***
1 (lowest) 7.1 *** 4.1*** 7.2*** 4.3***
2 1.2 1.5 1.8* 1.5**
3 1.0 1.0 1.0 1.0
4 1.2 0.8 0.8 0.8 J 5 (highest) 0.8 0.5* 0.6 0.5***
*p<0.05 **p<0.01 ***p<0.001
T bl 7 Effi t f "lk fi 11" (C a e ec o m1 ever on cu mg "fi t d l ox mo e ; orny s1gm ican resu lt h ) s s own.
Stage of culling 1-30 d >240 d
Risk ratio 2.3* 2.1 *
*p<0.05
132
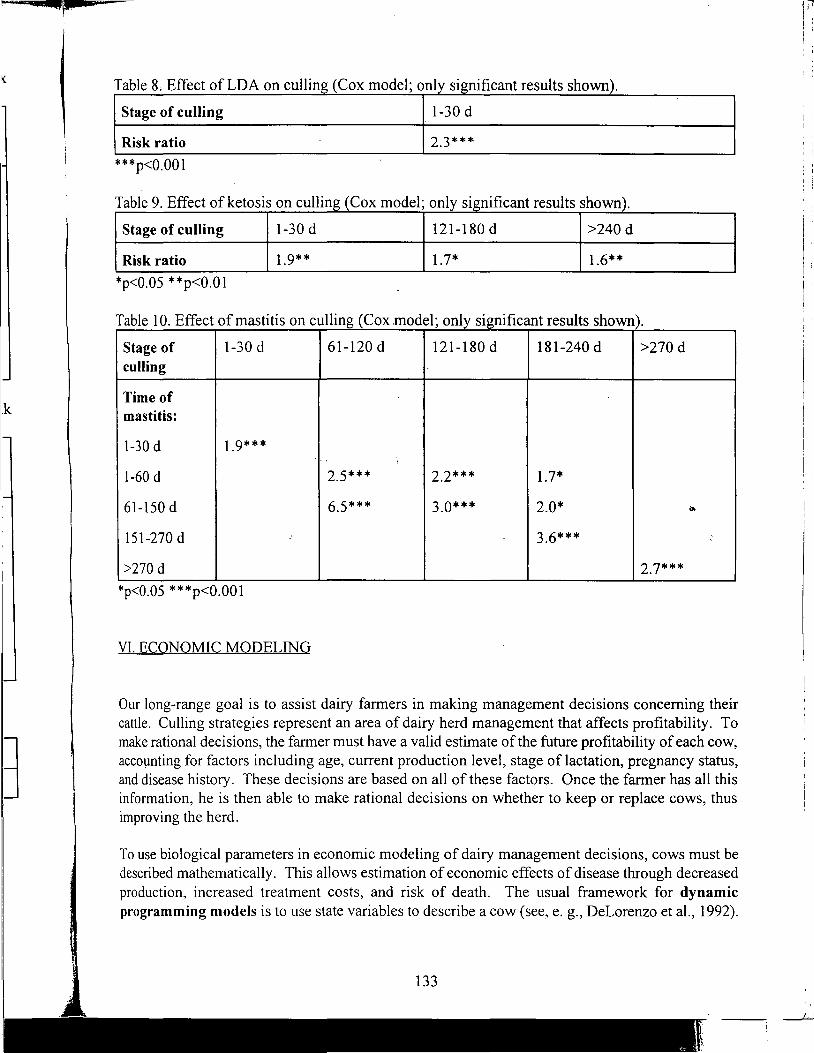
«p
.k
Table 8. Effect of LDA on cullin (Cox model; only si nificant results shown .
Stage of culling 1-30 d
Risk ratio 2.3***
***p<0.001
Table 9. Effect of ketosis on cullin (Cox model; only si nificant results shown .
Stage of culling 1-30 d 121-180 d >240d
Risk ratio 1.9** 1.7* 1.6**
*p<0.05 **p<0.01
11' (C f ff T bl 10 Effi a e ect o mas i is on cu mg ox mo d 1 'fi t It h ) e ; on y s1gm ican resu s s own .
Stage of 1-30 d 61-120 d 121-180 d 181-240 d >270 d culling
Time of mastitis:
1-30 d 1.9*** '
1-60 d 2.5*** 2.2*** 1.7*
61-150 d 6.5*** 3.0*** 2.0* 0
151-270 d -' 3.6***
>270 d 2.7***
*p<0.05 ***p<0.001
VI. ECONOMIC MODELING
Our long-range goal is to assist dairy farmers in making management decisions concerning their cattle. Culling strategies represent an area of dairy herd management that affects profitability. To make rational decisions, the farmer must have a valid estimate of the future profitability of each cow, accoµnting for factors including age, current production level, stage of lactation, pregnancy status, and disease history. These decisions are based on all of these factors. Once the farmer has all this information, he is then able to make rational decisions on whether to keep or replace cows, thus improving the herd.
To use biological parameters in economic modeling of dairy management decisions, cows must be described mathematically. This allows estimation of economic effects of disease through decreased production, increased treatment costs, and risk of death. The usual framework for dynamic programming models is to use state variables to describe a cow (see, e.g., DeLorenzo et al., 1992).
133
I'' I
: :
I I
At any stage of the cow's life, she is considered to be in a unique state which is described by values of the state variables. Transition probabilities describe the likelihood of changi'ii.g from one state to another. These are obtained through work such as that described above (measuring biological parameters such as milk yield, disease, and reproductive performance). The probabilities are then entered into the dynamic programming model, and the net present value of the cow is obtained. This is our long-range goal: to help the farmer determine whether a cow should be kept or replaced by a more profitable one.
VII. DISCUSSION
To appreciate the complexity involved in measuring the associations discussed in this presentation, one must realize the limits of epidemiological research. The major difficulty is that what is observed is the product of both biology (within cow factors, such as genetics, milk yield potential, and disease history) and environment (herd factors, such as housing, feeding, and other management decisions). The main biological issue is whether milk yield is so important that it proceeds even to the point that disease occurs, or whether the cow is able to restrict her yield before disease occurs. It seems reasonable to assume that most cows adjust their performance according to the nutrients available. Selection bias also plays a role in the findings; cows are managed and culled selectively. Nevertheless, with the proper study design and the control of confounding factors such as parity, calving season, and herd, valid estimates can be obtained.
We found, in New York Holsteins, high milk yield to be a risk factor for ovarian cysts an°cl mastitis, but not for any other disorders. High milk yield had no effect on conception rate, but it did increase a cow's chance of being inseminated. We also found that diseases, such as LDA, can cause shorttenn milk losses. High milk yield is protectiv~ against culling, and a number of disorders, including milk fever, LDA, ketosis, and mastitis, increase the risk of culling.
Our findings agree, in general, with our previous work carried out on Finnish Ayrshires. The diffr.rences may be due to several reasons, including larger sample size and more accurate disease recording in Finland. In New York, disease recording is still quite poor in some areas, although it is constantly improving. Consequently, many diseases may be underreported in New York. It seems likely that most disorders would occur at roughly the same frequency in both populations. Management almost certainly also plays a role; Finnish farms are much smaller than New York farms. Differing feeding (i.e., management) strategies may be in place. In addition, reproductive and culling policies may differ between the 2 populations.
Thus, we have seen that milk yield and various disorders are closely interrelated; Milk yield appears to play only a minor role, however. High milk yield may predispose a cow to a particular disorder(s), and many disorders may be responsible for a (sometimes temporary) drop in production. Both milk yield and disease may also play a role in reproductive performance. In addition, all of these factors are associated with culling. High milk yield is protective against culling, even in the presence of disease. Poor reproductive performance and/or slow recovery from disease may increase the risk of culling.
134
ues ~to
!cal lien ted. ced
lOn,
ved !ase ns). that ~ms
ble. ely. rity,
ii tis, :~ase ' 1ort-1·
!ling I
The ~ase
~hit :ems ons. '.ork :tive
1ears :r(s), milk ;tors ~e of ;k of
Having quantified all of these biological parameters, they may then be used in an economical model, to help farmers make decisions to maximize their profitability. The end result of the dynamic programming is the net present val.ue of a cow; this can be compared to that of another, potential replacement. Thus, the farmer will have all the information he needs to make rational decisions concerning his dairy herd.
REFERENCES DeLorenzo, M. A., T. H. Spreen, G. It Bryan, D. K. Beede, and J. A. M. van Arendonk, 1992.
Optimizing model: insemination, replacement, seasonal production, and cash flow. J. Dairy Sci. 75:885-896.
Detilleux, J. C., Y. T. Grohn, S. W. Eicker, and R. L. Quaas, 1997. Effects of left displaced abomasum on test day milk yields of Holstein cows. J. Dairy Sci. 80:121-126.
Detilleux, J. C., Y. T. Grohn, and R. L. Quaas, 1994. Effects of clinical ketosis on test day milk yields in Finnish Ayrshire cattle. J. Dairy Sci. 77:3316-3323.
Eicker, S. W., Grohn, Y. T., and J. A. Hertl, 1996. The association between cumulative milk yield, days open, and days to first breeding in New York Holstein cows. J. Dairy Sci. 79: 235-241.
Grohn, Y. T. and M. L. Bruss, 1990. Effect of diseases, production, and season on traumatic reticuloperitonitis and ruminal acidosis-in dairy cattle. J. Dairy Sci. 73:2355-2363.
Grohn, Y. T., S. W. Eicker, V .. Ducrocq, and J. A. Hertl. The effect of diseases on culling in New York State Holstein dairy cows. Submitted to J. Dairy Sci., 1997.
Grohn, Y. T., S. W. Eicker, and J. A. Hert!, 1995. The association between previous 305-day milk yield and disease in New York State dairy cows. J. Dairy Sci. 78:1693-1702.
. ~
Grohn, Y. T., H. N. Erb, C. E. McCulloch, and H. S. Saloniemi, 1989. Epidemiology of metabolic disorders in dairy cattle: association among host characteristics, disease, and production. J. Dairy Sci. 72:1876-1885.
Gri:ihn, Y. T., H. N. Erb, C. E. McCulloch, and H. S. Saloniemi, 1990a. Epidemiology of reproductive disorders in dairy cattle: associations among host characteristics, disease and production. Prev. Vet. Med. 8:25-39.
Grahn, Y. T., H. N. Erb, C. E. McCulloch, and H. S. Saloniemi, 1990b. Epidemiology of mammary gland disorders in multiparous Finnish Ayrshire cows. Prev. Vet. Med. 8:241-252.
Grahn, Y. T., J. A. Hert!, and J. L. Harman, 1994. Effect of early lactation milk yield on reproductive disorders in dairy cows. Am. J. Vet. Res. 55:1521-1528.
Harman, J. L., Y. T. Grohn, H. N. Erb, and G. Casella, 1996a. Event-time analysis of the effect of 60-day milk production on the parturition-to-conception interval in dairy cows. Am. J. Vet. Res. 57:634-639.
Harman, J. L., Y. T. Grohn, H. N. Erb, and G. Casella, 1996b. Event-time analysis of the effect of season of parturition, parity, and concurrent disease on parturition-to-conception interval in dairy cows. Am. J. Vet. Res. 57:640-645.
I
__;

Notes
( This page intentionally blank. )
136
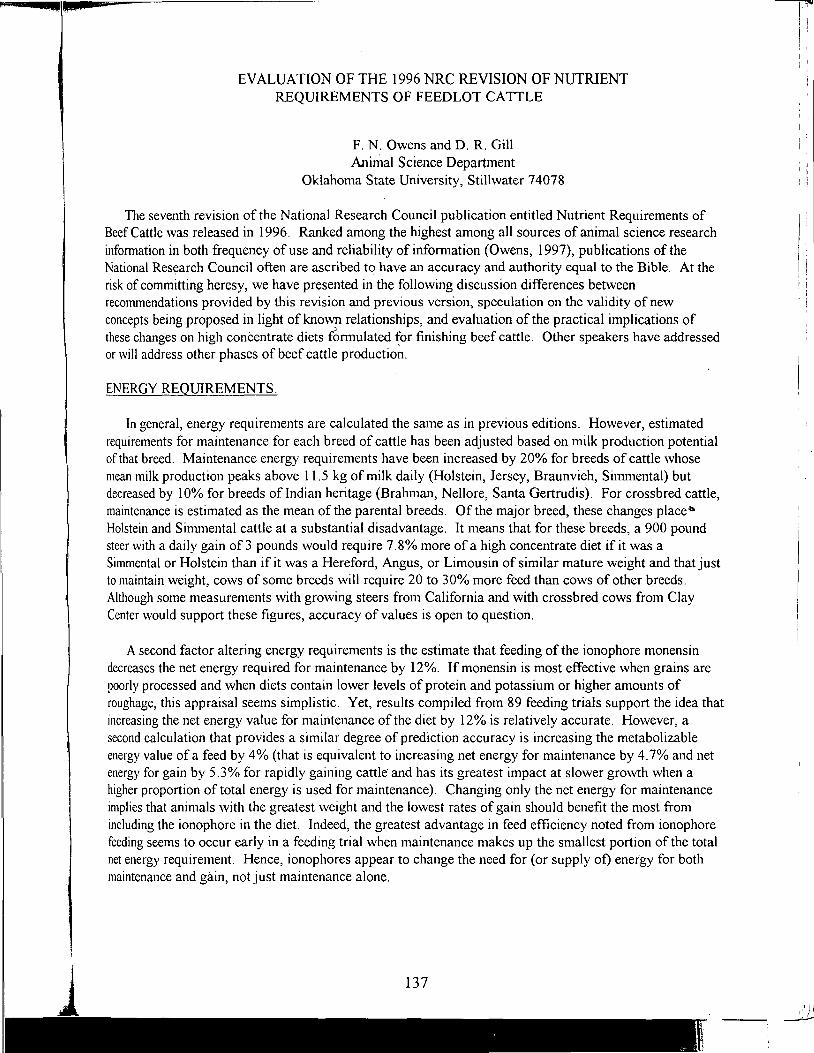
1
EVALUATION OF THE 1996 NRC REVISION OF NUTRIENT REQUIREMENTS OF FEEDLOT CA TILE
F. N. Owens and D.R. Gill Animal Science Department
Oklahoma State University, Stillwater 74078
The seventh revision of the National Research Council publication entitled Nutrient Requirements of Beef Cattle was released in 1996. Ranked among the highest among all sources of animal science research infonnation in both frequency of use and reliability of information (Owens, 1997), publications of the National Research Council often are ascribed to have an accuracy and authority equal to the Bible. At the risk of committing heresy, we have presented in the following discussion differences between recommendations provided by this revision and previous version, speculation on the validity of new concepts being proposed in light of known relationships, and evaluation of the practical implications of these changes on high concentrate diets f~rmulated for finishing beef cattle. Other speakers have addressed or will address other phases of beef cattle production.
ENERGY REQUIREMENTS.
In general, energy requirements are calculated the same as in previous editions. However, estimated requirements for maintenance for each breed of cattle has been adjusted based on milk production potential of that breed. Maintenance energy requirements have been increased by 20% for breeds of cattle whose mean milk production peaks above 11.5 kg of milk daily (Holstein, Jersey, Braunvieh, Simmental) but decreased by 10% for breeds oflndian heritage (Brahman, Nellore, Santa Gertrudis). For crossbred cattle, maintenance is estimated as the mean of the parental breeds. Of the major breed, these changes place~ Holstein and Simmental cattle at a substantial disadvantage. It means that for these breeds, a 900 pound steer with a daily gain of 3 pounds would require 7. 8% more of a high concentrate diet if it was a Simmental or Holstein than if it was a Hereford, Angus, or Limousin of similar mature weight and that just to maintain weight, cows of some breeds will require 20 to 30% more feed than cows of other breeds. Although some measurements with growing steers from California and with crossbred cows from Clay Center would support these figures, accuracy of values is open to question.
A second factor altering energy requirements is the estimate that feeding of the ionophore monensin decreases the net energy required for maintenance by 12%. If monensin is most effective when grains are poorly processed and when diets contain lower levels of protein and potassium or higher amounts of roughage, this appraisal seems simplistic. Yet, results compiled from 89 feeding trials support the idea that increasing the net energy value for maintenance of the diet by 12% is relatively accurate. However, a second calculation that provides a similar degree of prediction accuracy is increasing the metabolizable energy value of a feed by 4% (that is equivalent to increasing net energy for maintenance by 4.7% and net energy for gain by 5.3% for rapidly gaining cattle and has its greatest impact at slower growth when a higher proportion of total energy is used for maintenance). Changing only the net energy for maintenance implies that animals with the greatest weight and the lowest rates of gain should benefit the most from including the ionophore in the diet. Indeed, the greatest advantage in feed efficiency noted from ionophore feeding seems to occur early in a feeding trial when maintenance makes up the smallest portion of the total net energy requirement. Hence, ionophores appear to change the need for (or supply of) energy for both maintenance and gain, not just maintenance alone.
137
I' 'I I I 'I
I I: i I
I
: I I
I I
I I
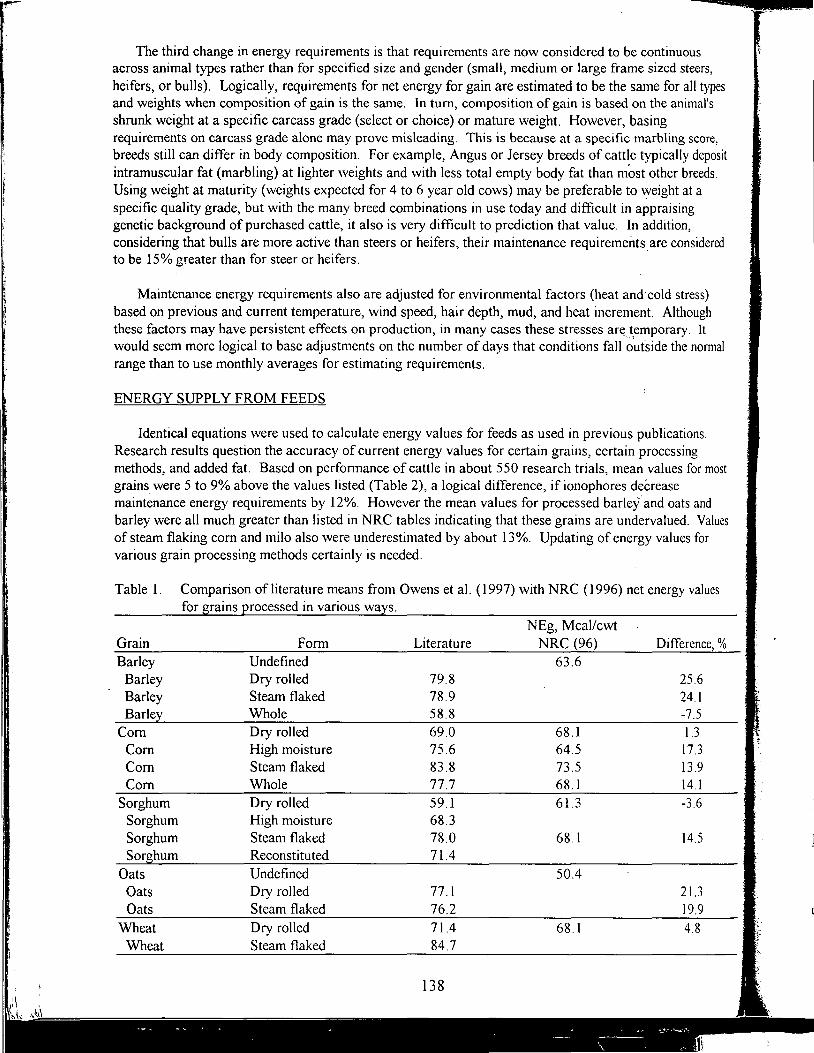
i I I
The third change in energy requirements is that requirements are now considered to be continuous across animal types rather than for specified size and gender (small, medium or large frame sized steers, heifers, or bulls). Logically, requirements for net energy for gain are estimated to be the same for all types and weights when composition of gain is the same. In turn, composition of gain is based on the animal's shrunk weight at a specific carcass grade (select or choice) or mature weight. However, basing requirements on carcass grade alone may prove misleading. This is because at a specific marbling score, breeds still can differ in body composition. For example, Angus or Jersey breeds of cattle typically deposit intramuscular fat (marbling) at lighter weights and with less total empty body fat than most other breeds. Using weight at maturity (weights expected for 4 to 6 year old cows) may be preferable to weight at a specific quality grade, but with the many breed combinations in use today and difficult in appraising genetic background of purchased cattle, it also is very difficult to prediction that value. In addition, considering that bulls are more active than steers or heifers, their maintenance requirements.are considered to be 15% greater than for steer or heifers.
Maintenance energy requirements also are adjusted for environmental factors (heat and·cold stress) based on previous and current temperature, wind speed, hair depth, mud, and heat increment. Although these factors may have persistent effects on production, in many cases these stresses an~ temporary. It would seem more logical to base adjustments on the number of days that conditions fall ~ufside the normal range than to use monthly averages for estimating requirements.
ENERGY SUPPLY FROM FEEDS
Identical equations were used to calculate energy values for feeds as used in previous publications. Research results question the accuracy of current energy values for certain grains, certain processing methods, and added fat. Based on performance of cattle in about 550 research trials, mean values for most grains were 5 to 9% above the values listed (Table 2), a logical difference, if ionophores decrease maintenance energy requirements by 12%. However the mean values for processed barley and oats and barley were all much greater than listed in NRC tables indicating that these grains are undervalued. Values of steam flaking corn and milo also were underestimated by about 13%. Updating of energy values for various grain processing methods certainly is needed.
Table 1. Comparison of literature means from Owens et al. ( 1997) with NRC ( 1996) net energy values for grains Erocessed in various wa~s.
NEg, Meal/cwt Grain Form Literature NRC (96) Difference, % Barley Undefined 63.6
Barley Dry rolled 79.8 25.6 Barley Steam flaked 78.9 24.1 Barie~ Whole 58.8 -7.5
Corn Dry rolled 69.0 68.1 1.3 Corn High moisture 75.6 64.5 17.3 Corn Steam flaked 83.8 73.5 13.9 Corn Whole 77.7 68.1 14.1
Sorghum Dry rolled 59.1 61.3 -3.6 Sorghum High moisture 68.3 Sorghum Steam flaked 78.0 68.1 14.5 Sorghum Reconstituted 71.4
Oats Undefined 50.4 Oats Dry rolled 77.1 21.3 Oats Steam flaked 76.2 19.9
Wheat Dry rolled 71.4 68.1 4.8 Wheat Steam flaked 84.7
;
::-
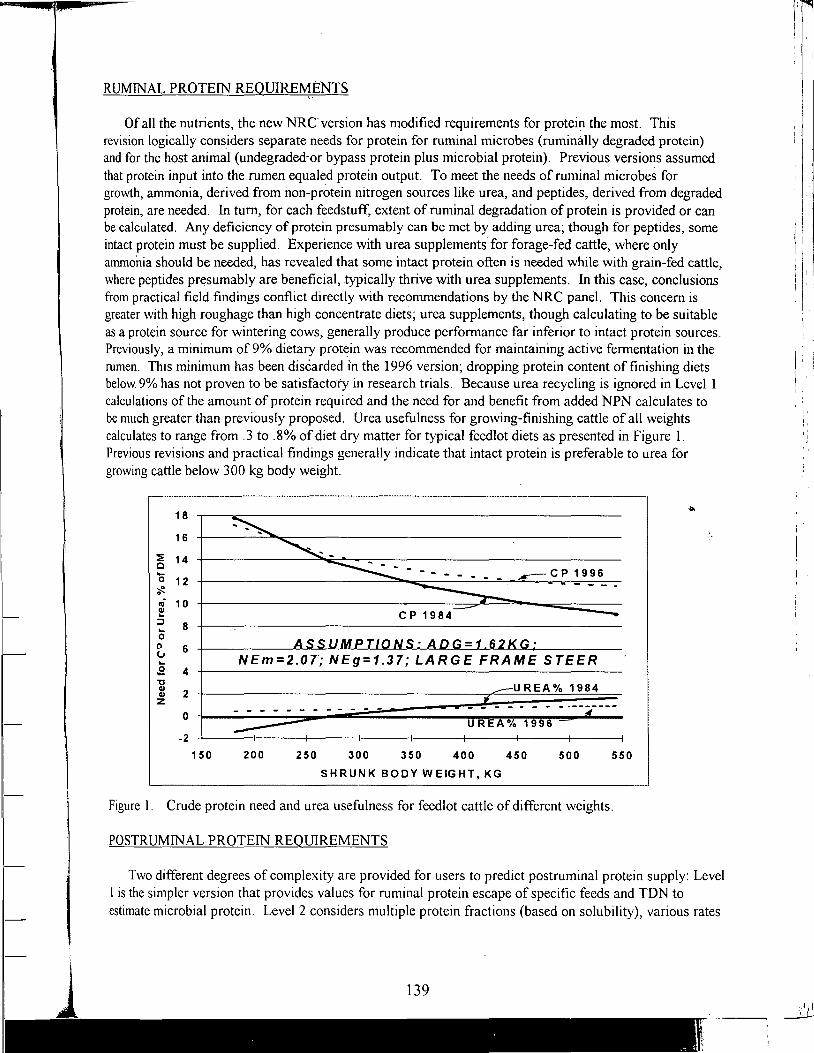
RUMINAL PROTEIN REQUJREMJ:NTS
Of all the nutrients, the new NRCversion has modified requirements for protein the most. This revision logically cons_iders separate needs for protein for ruminal microbes (ruminally degraded protein) and for the host animal (undegraded·or bypass protein plus microbial protein). Previous versions assumed that protein input into the rumen equaled protein output. To meet the needs of ruminal microbes for growth, ammonia, derived from non-protein nitrogen sources like urea, and peptides, derived from degraded protein, are needed. In tum, for each feedstuff, extent of ruminal degradation of protein is provided or can be calculated. Any deficiency of protein presumably can be met by adding urea; though for peptides, some intact protein must be supplied. Experience with urea supplements for forage-fed cattle, where only ammonia should be needed, has revealed that some intact protein often is needed while with grain-fed cattle, where peptides presumably are beneficial, typically thrive with urea supplements. In this case, conclusions from practical field findings conflict directly with recommendations by the NRC panel. This concern is greater with high roughage than high concentrate diets; urea supplements, though calculating to be suitable as a protein source for wintering cows, generally produce performance far inferior to intact protein sources. Previously, a minimum of 9% dietary prot~in was recommended for maintaining active fermentation in the rumen. This minimum has been discarded in the 1996 version; dropping protein content of finishing diets below 9% has not proven to be satisfactory in research trials. Because urea recycling is ignored in Level 1 calculations of the amount of protein required and the need for and benefit from added NPN cakulates to be much greater than previously proposed. Urea usefulness for growing-finishing cattle of all weights calculates to range from .3 to .8% of diet dry matter for typical feedlot diets as presented in Figure 1. Previous revisions and practical findings generally indicate that intact protein is preferable to urea for growing cattle below 300 kg body weight.
~-----------------· ---------·-------·----
18
16
::!:: 14 c -0 12 :,!! 0
,.c-CP1996 - - - ..
,,; 10 ~ ::::i 8 ...
c p 1984
0 D. 6 ll ... .E 4
NEm=2.0T; NEg=1.37; LARGE FRAME STEER
'ti QI
2 QI UREA% 1984
z 0 ------------
UREA% 1996 -2
150 200 250 300 350 400 450 500 550
S H RU N K B 0 DY W E IG HT, KG
Figure 1. Crude protein need and urea usefulness for feedlot cattle of different weights.
POSTRUMINAL PROTEIN REQUIREMENTS
Two different degrees of complexity are provided for users to predict postruminal protein supply: Level I is the simpler version that provides values for ruminal protein escape of specific feeds and TDN to estimate microbial protein. Level 2 considers multiple protein fractions (based on solubility), various rates
(i
I
1, ,,
I
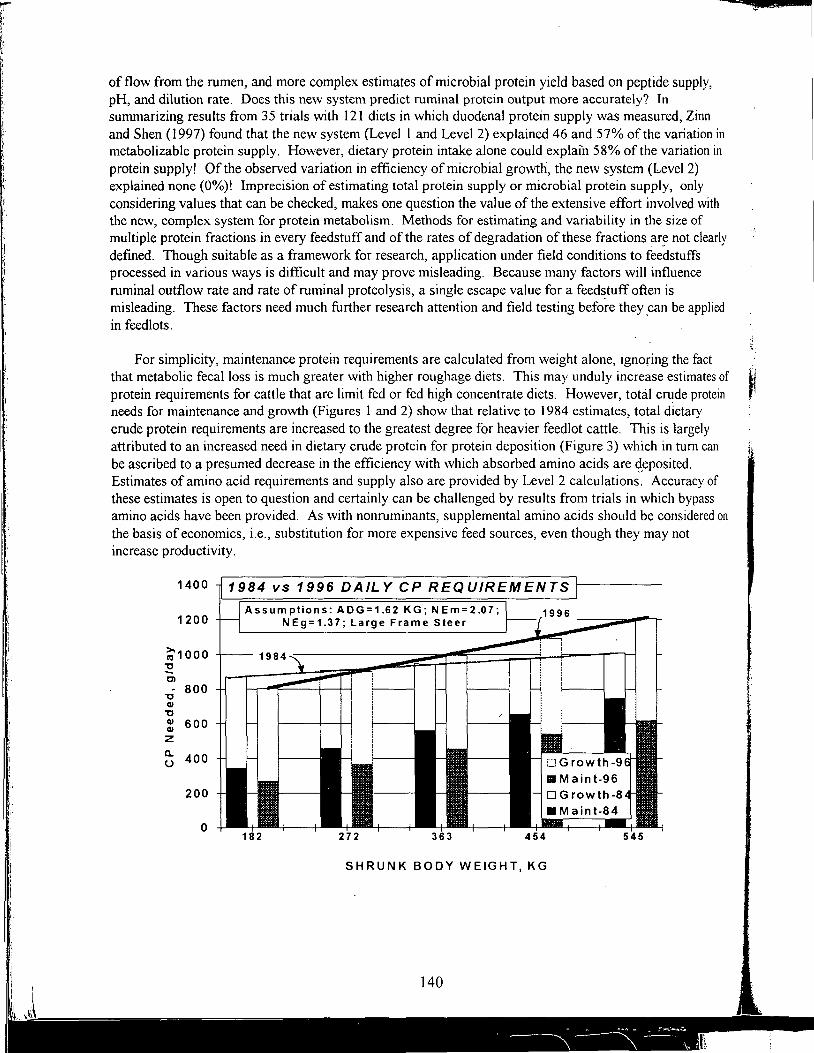
i I !'
I
Ii I' \
of flow from the rumen, and more complex estimates of microbial protein yield based on peptide supply, pH, and dilution rate. Does this new system predict ruminal protein output more accurately? In summarizing results from 35 trials with 121 diets in which duodenal protein supply was measured, Zinn and Shen (1997) found that the new system (Level I and Level 2) explained 46 and 57% of the variation in metabolizable protein supply. However, dietary protein intake alone could explain 58% of the variation in protein supply! Of the observed variation in efficiency of microbial growth, the new system (Level 2) explained none (0%)! Imprecision of estimating total protein supply or microbial protein supply, only considering values that can be checked, makes one question the value of the extensive effort involved with the new, complex system for protein metabolism. Methods for estimating and variability in the size of multiple protein fractions in every feedstuff and of the rates of degradation of these fractions ar~ not clearly defined. Though suitable as a framework for research, application under field conditions to feedstuffs processed in various ways is difficult and may prove misleading. Because many factors will influence ruminal outflow rate and rate of ruminal proteolysis, a single escape value for a feedstuff often is misleading. These factors need much further research attention and field testing before they ,can be applied in feedlots.
For simplicity, maintenance protein requirements are calculated from weight alone, ignoring the fact that metabolic fecal loss is much greater with higher roughage diets. This may unduly increase estimates of protein requirements for cattle that are limit fed or fed high concentrate diets. However, total crude protein needs for maintenance and growth (Figures 1 and 2) show that relative to 1984 estimates, total dietary crude protein requirements are increased to the greatest degree for heavier feedlot cattle. This is largely attributed to an increased need in dietary crude protein for protein deposition (Figure 3) which in tum can be ascribed to a presumed decrease in the efficiency with which absorbed amino acids are ~eposited. Estimates of amino acid requirements and supply also are provided by Level 2 calculations. Accuracy of these estimates is open to question and certainly can be challenged by results from trials in which bypass amino acids have been provided. As with nonruminants, supplemental amino acids should be considered on the basis of economics, i.e., substitution for more expensive feed sources, even though they may not increase productivity.
1400
1200
~1000 ~ Cl
- 800 "C QI
"C QI 600 QI
z Cl. 400 u
200
0
1984 vs 1996 DAILY CP REQUIREMENTS
Assumptions: ADG=1.62 KG; NEm=2.07; NEg=1.37; Large Frame Steer
182 272 363 454
SHRUNK BODY WEIGHT, KG
545
I
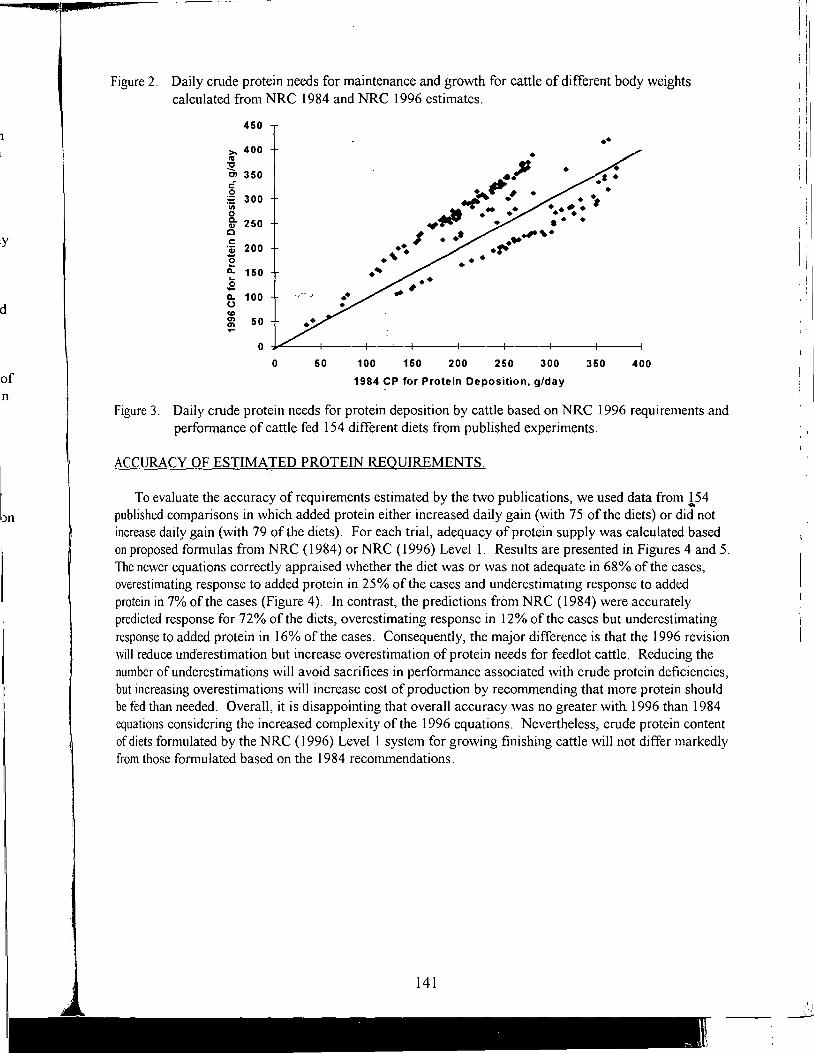
n
ly
d
of n
Figure 2. Daily crude protein needs for maintenance and growth for cattle of different body weights calculated from NRC 1984 and NRC 1996 estimates.
450
•• >. 400 ra 32 Cl 350 c: 0
:;:::; 300 'iii 0 ~ 250 c c: ·~ 200 0
• .JJ •
~,.. # •
fl'_,. ....
• • .,, . . . I • .• ... .,.~·
. .. ·~ .~.
•
... 0.. ... 150 . .. ,£ 0.. 100 /--.)
(.)
co en 50 en ....
0
0 50 100 150 200 250 300 350 400
1984 CP for Protein Deposition, g/day
Figure 3. Daily crude protein needs for protein deposition by cattle based on NRC 1996 requirements and perfonnance of cattle fed 154 different diets from published experiments.
ACCURACY OF ESTIMATED PROTEIN REQUIREMENTS.
To evaluate the accuracy of requirements estimated by the two publications, we used data from 154 .... published comparisons in which added protein either increased daily gain (with 75 of the diets) or did not increase daily gain (with 79 of the diets). For each trial, adequacy of protein supply was calculated based on proposed fonnulas from NRC ( 1984) or NRC ( 1996) Level 1. Results are presented in Figures 4 and 5. The newer equations correctly appraised whether the diet was or was not adequate in 68% of the cases, overestimating response to added protein in 25% of the cases and underestimating response to added protein in 7% of the cases (Figure 4). In contrast, the predictions from NRC (1984) were accurately predicted response for 72% of the diets, overestimating response in 12% of the cases but underestimating response to added protein in 16% of the cases. Consequently, the major difference is that the 1996 revision will reduce underestimation but in~rease overestimation of protein needs for feedlot cattle. Reducing the number of underestimations will avoid sacrifices in perfonnance associated with crude protein deficiencies, but increasing overestimations will increase cost of production by recommending that more protein should be fed than needed. Overall, it is disappointing that overall accuracy was no greater with 1996 than 1984 equations considering the increased complexity of the 1996 equations. Nevertheless, crude protein content of diets formulated by the NRC ( 1996) Level 1 system for growing finishing cattle will not differ markedly from those fonnulated based on the 1984 recommendations.
141
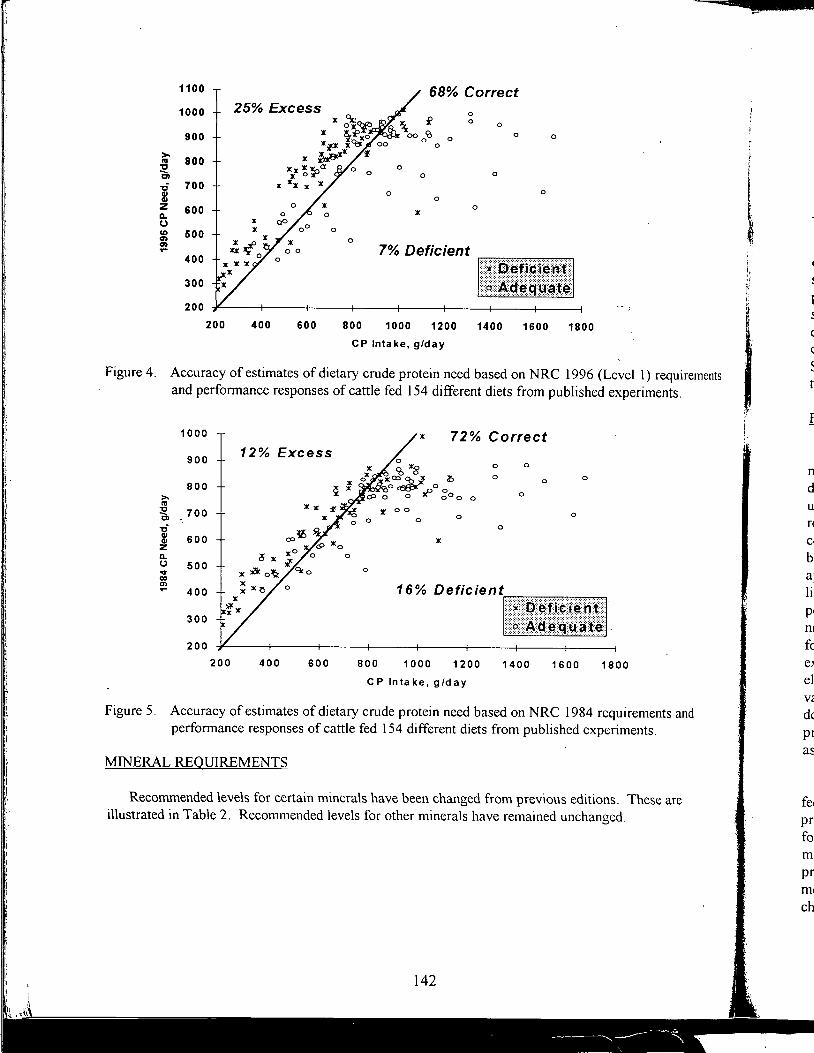
Figure 4.
Figure 5.
1100 68% Correct 1000
900
25% Excess 0 x ex: ~ 0
0 ox~ x ~»?xo 0
0 0 '11.f:X x'bi 0
>- 800 '11. ~'11..
"' ~ -c $ z II.. (.) co en en ...
,., "' ~ en -c Cl) Cl) z II.. () ..,. co en
xxx ~~a 0 0 0
700 X J:.X X '11.
0 0 0
600 0 x
500 0
0
400 7% Deficient
300
200
200 400 600 800 1000 1200 1400 1600 1800
CP Intake, g/day
Accuracy of estimates of dietary crude protein need based on NRC 1996 (Level 1) requirements and performance responses of cattle fed 154 different diets from published experiments.
1000
900 12% Excess
800
700
600 a
500
400
300
200
200 400 600
x 72% Correct
r. 0 0
a a
0
800 1000 1200
C P lnta ke, g/day
0
0
0
a
0
1400
0 a
0
1600 1800
Accuracy of estimates of dietary crude protein need based on NRC 1984 requirements and performance responses of cattle fed 154 different diets from published experiments.
MINERAL REQUIREMENTS
Recommended levels for certain minerals have been changed from previous editions. These are illustrated in Table 2. Recommended levels for other minerals have remained unchanged.
'
I
'
l
.
( I
~ ~ I ~
d I ; ~
fe pr fo
ml ~1 cl
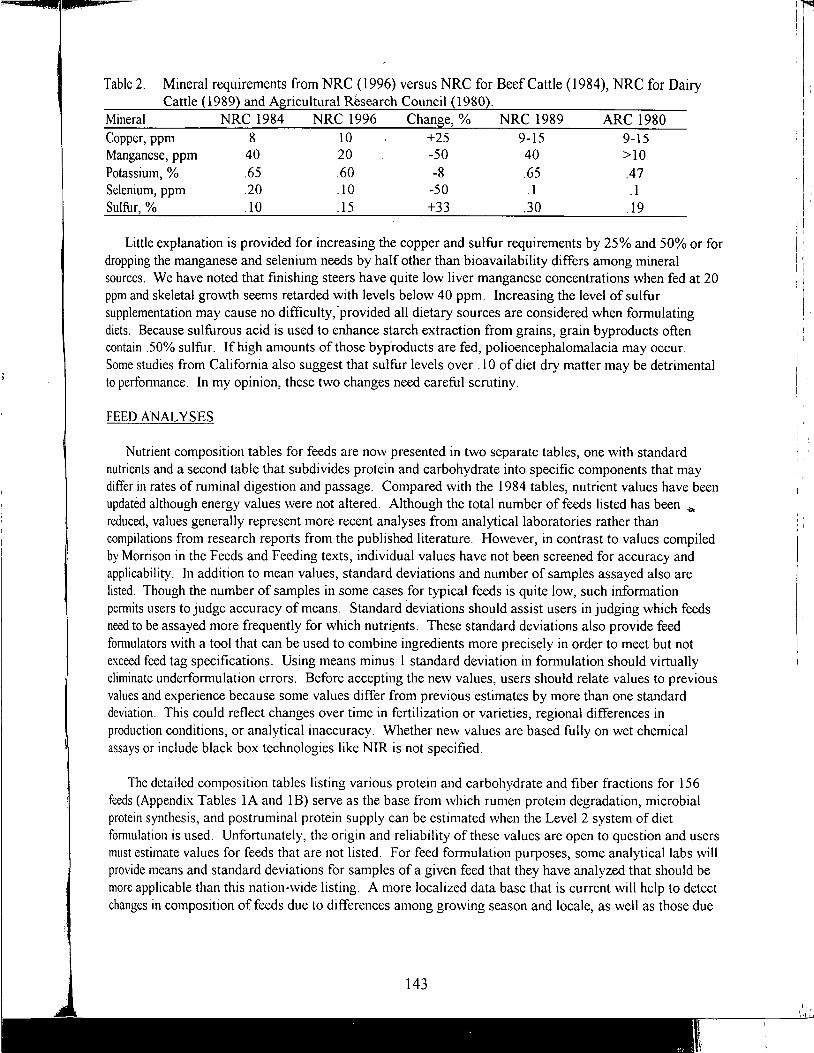
-- .,,
Table 2. Mineral requirements from NRC ( 1996) versus NRC for Beef Cattle ( 1984 ), NRC for Dairy Cattle (1989) and Agricultural Rbearch Council (1980).
Mineral Copper, ppm Manganese, ppm Potassium, % Selenium, ppm Sulfur,%
NRC 1984 NRC 1996 Change, % NRC 1989 8 10 +25 9-15
40 20 -50 40 .65 .60 -8 .65 .20 .10
.10
.15 -50 +33
. 1 .30
ARC 1980 9-15 >10 .47 .1 .19
Little explanation is provided for increasing the copper and sulfur requirements by 25% and 50% or for dropping the manganese and selenium needs by half other than bioavailability differs among mineral sources. We have noted that finishing steers have quite low liver manganese concentrations when fed at 20 ppm and skeletal growth seems retarded with levels below 40 ppm. Increasing the level of sulfur supplementation may cause no difficulty,-provided all dietary sources are considered when formulating diets. Because sulfurous acid is used to enhance starch extraction from grains, grain byproducts often contain .50% sulfur. If high amounts of those byp'roducts are fed, polioencephalomalacia may occur. Some studies from California also suggest that sulfur levels over .10 of diet dry matter may be detrimental to performance. In my opinion, these two changes need careful scrutiny.
FEED ANALYSES
Nutrient composition tables for feeds are now presented in two separate tables, one with standard nutrients and a second table that subdivides protein and carbohydrate into specific components that may differ in rates of ruminal digestion and passage. Compared with the 1984 tables, nutrient values have been updated although energy values were not altered. Although the total number of feeds listed has been .ii.
reduced, values generally represent more recent analyses from analytical laboratories rather than compilations from research reports from the published literature. However, in contrast to values compiled by Morrison in the Feeds and Feeding texts, individual values have not been screened for accuracy and applicability. In addition to mean values, standard deviations and number of samples assayed also are listed. Though the number of samples in some cases for typical feeds is quite low, such information permits users to judge accuracy of means. Standard deviations should assist users in judging ·which feeds need to be assayed more frequently for which nutri~nts. These standard deviations also provide feed formulators with a tool that can be used to combine ingredients more precisely in order to meet but not exceed feed tag specifications. Using means minus 1 standard deviation in formulation should virtually eliminate underformulation errors. Before accepting the new values, users should relate values to previous values and experience because some values differ from previous estimates by more than one standard deviation. This could reflect changes over time in fertilization or varieties, regional differences in production conditions, or analytical inaccuracy. Whether new values are based fully on wet chemical assays or include black box technologies like NIR is not specified.
The detailed composition tables listing various protein and carbohydrate and fiber fractions for 156 feeds (Appendix Tables lA and lB) serve as the base from which rumen protein degradation, microbial protein synthesis, and postruminal protein supply can be estimated when the Level 2 system of diet fomrnlation is used. Unfortunately, the origin and reliability of these values are open to question and users must estimate values for feeds that are not listed. For feed fommlation purposes, some analytical labs will provide means and standard deviations for samples of a given feed that they have analyzed that should be more applicable than this nation-wide listing. A more localized data base that is current will help to detect changes in composition of feeds due to differences among growing season and locale, as well as those due
143
'I 'I

) ~ . l
!
to differences in soil type, fertilization practices, and varieties. Compiled lists for localized feeds and byproducts being developed by extension personnel should prove useful for fqnnulators to sense composition changes and alert users to potential problems. To increase use of byproducts or co-products, producers should be encouraging and supporting efforts to compile such data.
FEED INT AKE ESTIMATES
Accurate estimates of feed intake are needed in order to convert requirements on a gram per day to a percentage basis. One of the major advancements in the 1996 revision is much greater accuracy in equations to estimate mean feed intake by feedlot cattle (Figures 6 and 7). Both precision and accuracy have been greatly improved and some very low intakes predicted from the 1984 equations are corrected. Intakes of roughage diets are not predicted as accurately as for higher concentrate diets, probably because of differences in nutritional history of the cattle and the low protein:energy ratio of many low quality forages. >-
ca ~ .c 28 -QI
.lll: 26 ca
.: 24 ... QI - 22 ca
:E: 20 >. ... 0 1 8 "C QI 1 6 > ... QI
14 "' .c 0 1 2
0
O b served and Predicted Dry Matter Intakes
4 8 12 16
Predicted DMI, lb./day
•
••
20 24
Figure 6. Observed dry matter intakes of cattle fed various cereal grains processed in different ways (Owens et al., 1997) as compared to estimated intakes based on NRC ( 1996) equations.
28 • Observed and •
>. 26 • "' ~ Predicted Dry ·:· :fi 24 Matter Intakes Gi" .x
"' 22 :f .. .. 20 = • "' :!: >. 18 .. • 0
"'C 1 6 .. c: .. ., 14 .0 0
1 2
0 4 8 1 2 1 6 20 24
Predicted DMI, lb./day
Figure 7. Observed dry matter intakes of cattle fed various cereal grains processed in different ways (Owens et al., 1997) as compared to estimated intakes based on NRC (1984) equations.
I:
:,
:e
Unfortunately, intake estimates are based on MEANS for a total feeding period, not sequential. Because feed intake by feedlot cattle typically increased to a plateau after 35 to 70 days on feed at the same time that nutrient requirements are changing, percentage requirements change with time on feed much more drastically than when calculated from mean intakes and mean requirements. Although such changes are difficult to match when the number of diets is limited and diverse cattle occupy a large pen in commercial feedyards, smaller producers with more uniform cattle might match requirements more precisely through providing a constant amount of supplement and letting grain intake vary over time. Nevertheless, whether it is economically advantageous to continuously meet nutrient requirements is not yet clear. If cattle have sufficient time to compensate for nutrient deficiencies early in the feedlot period, temporal nutrient deficiencies become less important. Nevertheless, over formulation with certain nutrients, especially protein and phosphorus, is raising environmental as well as economic concern today.
COMPUTERIZATION
Considering the multiple factors that influence requirements and interactions in the rumen that alter microbial protein synthesis and ruminal escape of dietai-y protein, a computer is needed to piece the various items together. Computer programming has two major adv,antages and several disadvantages. First, developing the computer program forces the programmer to consider relationships among factors on a broader scale, not simply a single set of tabular values. Secondly, the program forces the user to consider and input an array of factors like cattle type, dry matter intake and environmental measurements that can influence requirements and performance. This should help producers pinpoint problems. Secondly, it permits users to consider a wide variety of inputs. One disadvantage is that users cannot easily examine, alter or update the fundamental relationships buried in the program that may be inaccurate and require updating or modification. Such glitches only become evident with extended use, often with inputs markedly different from those used for program development. For example, based on the current program, increasing wind speed from 14 to 15 miles per hour can drop daily gain from 3 to 2 pounds per day. Users cannot easily detect which equations or relationships have questionable accuracy. A second disadvantage is- that users place an undue amount of faith in output from a "black box." This opens an opportunity for misuse or abuse that can be merely innocent or intentional. The program included with the new edition is not designed to provide least cost diets or least cost performance although users can use play with the values in an attempt to fit nutrient supply with nutrient requirements. Although it can be used to evaluate diet adequacy, it is not as "user friendly" as other programs. Including flags that indicate extrapolation beyond a feasible range or detect excessive levels of ce_rtain feeds or nutrients would be helpful. Finally, and of greatest research importance, outputs point out some of the topics and relationships that require greater attention. For example, must a diet always meet nutrient requirements for maximum performance or on a cost:benefit ratio might a slight deficiency reduce production cost? With seasonal fluctuations in availability of feeds, pasture and in cost of feeds, cattle have great potential for compensatory performance to correct for deficiencies in certain nutrients but not others. Input-output relationships generally are considered linear; however, slight limitations, as with limit feeding, may improve economic return with only a minor sacrifice in productivity. These topics point out gaps in knowledge that need further research attention and a major limitation that optimal diets must consider economics as well as rate of production.
NOVEL COMPONENTS
Certain ideas are proposed that need further attention and assessment. First, peptides are considered important for efficient microbial gro\\1h of starch-digesting ruminal microbes but not to maximize fiber digestion. These suggestions directly oppose field studies on degree to which urea can replace intact protein in diets. Secondly, the concept of "effective NDF" or a minimum fiber requirement is extrapolated largely from the dairy literature. Certainly, an increased supply of fiber is beneficial for prevention of acidosis, but effects on microbial protein synthesis and on dry matter intake, as proposed, cannot be substantiated from field studies. Giving each roughage some type of relative value for stimulating
145
rumination and saliva flow seems desirable, but the tabular values provided for various feeds and roughage processing methods need adjustment.
Amino acid supplies and requirements now can be estimated. Again, accuracy is open to question and results may unduly encourage development and use of specific ruminal escape amino acids.· Although supplies of amino acids can be estimated with some degree of accuracy, requirements are not well pinpointed.
APPLICATION
Considering the multiple inputs, the revision reinforces the need to customize crude protein and urea levels for specific diet types, cattle ages, types, and market weights. Although large feedlots typically use a maximum of 5 different diets, ideally different diets should be provided for cattle earlier versus later in the finishing period. Perhaps urea should be added to each truck load in larger feedlots to provide more customized diets. Because their feed intake is low, diets for starting cattle must be well fortified. The computer system simplifies checking of adequacy of a given fommla.. Tabular values of the variation on nutrient content of various feedstuffs should help users pinpoint the specific ingredients that need more frequent chemical analysis and allow one to fommlate with a safety margin. Emphasis on the environment alerts users to the large impact of heat or cold stress on feed intake and perfom1ance and alerts them to the need for or uselessness of escape protein and amino acid supplements. Overall, forcing users to provide multiple inputs calls their attention to differences in cattle type and size and to feed intake. Closer attention to environmental, animal, and ingredient details should improve productivity and efficiency.
From a research standpoint, the revision clearly illustrates numerous research gaps, about ruminal nitrogen requirements and postruminal amino acid needs, about how feed intake changes during the finishing period, about associative effects on feed intake and energy values of feeds, about fiber sources and levels to avoid acidosis, and about the potential for compensatory performance to correct for marginal nutrient deficiencies. Finally, the revision provides new targets for researchers to consider, discuss, criticize and debunk with renewed spirit assuring job security for future researchers! The committee should be soundly applauded for their attempts to provide new ideas, to coordinate diverse information, their attention to detail, and the immense amount of time and effort that they spent voluntarily in preparing this document
LITERATURE CITED
Agricultural Research Council. 1980. The Nutrient Requirements of Ruminant Livestock. Commonwealth Agricultural Bureaux, Slough, England.
NRC. 1984. Nutrient Requirements of Beef Cattle (6th Rev. Ed.) National Academy Press, Washington, DC.
NRC .. 1989. Nutrient Requirements of Dairy Cattle (6th Rev. Ed.) National Academy Press, Washington, DC.
NRC. 1996. Nutrient Requirements of Beef Cattle (7th Rev. Ed.) National Academy Press, Washington, DC.
Owens, F. N. 1997. D. S. Secrist, W. J. Hill, and D. R. Gill. 1997. The effects of grain source and grain processing on performance of feedlot cattle: A review. J. Anim. Sci. 75:868-879.
Owens, F. N. 1997. Sources of animal science research infom1ation: Usefulness and reliability. J. Anim. Sci. 75:331-338.
Zinn, R. A. and Y. Shen. 1997. Factorializing postruminal protein supplies for feedlot cattle: Assessment of 1996 NRC Beef Metabolizable Protein Concepts. Southwest Nutrition and Management Conference, Phoenix, AZ. University of Arizona.
146
I
I
t ! l
l I -1-
l ~ I s I
1 I
~ ~ a
I
E
~ ~
~ 11
I
d I
~ ~ n
I , ~
~ gil
~ 0
~ I
di I c1
pt
D CG
~ Tl . I 11 Bi l~
~I
I
I
T AILORfNG FEEDLOT NUlRITION AND MANAGEMENT PROGRAMS TO CATTLE TYPE, ORIGIN AND MARKET SYSTEM
Don Boggs and Robbi Pritchard Department of Animal and Range Science
South Dakota State University
Value-based, or true value, marketing systems are becoming increasingly popular among buyers and sellers of fed cattle. Value-based systems are designed to move the beef industry away from average pricing systems by rewarding the production of superior carcasses and discounting those that are less desirable. These systems represent, for beef producers who raise, and cattle feeders who feed cattle that consistently produce superior carcasses, an opportunity to capture as profit some of the additional value of the beef they produce. They also represent a significant increase in risk, especially for producers and feeders that do not accurately know the genetic potential for carcass merit of the cattle they grow and feed.
FACTORS AFFECTING BEEF CARCASS VALUE Numerous factors affect the value differences among beef carcasses. Foremost among these are USDA Quality and Yield Grades. Quality grade is an estimate of the palatability or eating characteristics of the beef. Quality grades are determined by the carcass maturity and the amount and distribution of the intramuscular fat or marbling. In young cattle less than 42 months of age marbling is the primary determinant. Cattle with 'A' (less than 30 months) and 'B' (30 to 42 months) maturity scores are considered young cattle and qualify for the USDA Quality Grades of Prime, Choice, Select and Standard .. Carcasses with the most marbling grade Prime and carcasses with very little marbling grade Standard. Carcasses with more marbling tend to have more flavor and are less susceptible to becoming too dry if they are overcooked. Beef with very little marbling tends to be less juicy and flavorful. .._
Yield grades are an estimate of the percentage of the trimmed, boneless retail cuts that a carcass would yield. The USDA Yield Grades (YG) are l, 2, 3, 4 and 5. A very lean, heavy muscled calf would have a YG of l while a very fat, light muscled calf would have a YG of 5. The percentage trimmed retail cuts for the yield grades are: YG 1 =82.0%, YG2=77 .4%, YG3=72.8%, YG4=68.2%, YG5=63.6%. The amount of fat thickness, the ribeye area, the carcass weight and the percent kidney, pelvic and heart fat (KPH) are the factors involved in yield grading.
Other factors, such as carcass weight, color of the lean (i.e. dark cutters), carcass maturity (i.e. hard bone), and bullock or stag appearance, also impar-t the value of carcass beef. Ideally, carcasses should weigh between 650 and 850 lb. However, most packers currently accept carcasses from 550 to 950 lb. without discounts. Lighter weight carcasses are discounted because they are inefficient to process and heavier weight carcasses are discounted because they create potion size concerns as well as fabrication problems when producing boxed beef.
Dark cutters, bullocks and hardbone carcasses are also severely discounted. Dark cutters have very dark colored muscle and are very difficult to merchandise. Dark cutting occurs when the animal uses up it's muscle glycogen (energy stores) prior to slaughter and is then not able to go through a normal rigor mortis. The result is dark, dry meat. Wild, excitable cattle are most susceptible to being dark cutters. However, improper handling techniques and management practices can result in dark cutting cattle of any type. Bullocks result from cryptorchids, late castrations or incomplete castration. Unfortunately, some extremely lean, expressively muscled steers are sometimes mis-graded as bullocks due to the masculine appearance of their carcasses. Hardbone occurs when cattle purchased as young cattle have bone maturities of 'C' or higher and thus cannot qualify for the Prime, Choice, Select or Standard quality grades.
'I
I I
I !
~ \
' )
I'
The USDA Ag Market Service has recently begun publishing the carcass premiums and discounts used by six of the major packers. Table 1 shows the premiums and discounts for the weeks of June 2, 1997 and November 25, 1996. As you can see these premiums and discounts vary considerably among packers as well as across time. In November 1996, the Choice/Select discount was at or near record levels as a high proportion of Select grade cattle came to market because of the high grain prices during the year. Since then the Choice/Select spread has normalized, dropping to $3.00 to $5.00 in the spring and increasing to the $7.00 to $8.00 range as summer begins. In contrast, the YG 4 and 5 discounts have remained relatively constant reflecting that most feedlots have stayed current in their marketings and have not sent inordinately high numbers of over finished cattle to market. The severe discounts for light and heavy weight carcasses, dark cutters, hardbone and bullock carcasses should emphasize the importance of avoiding these 'outlier' cattle if marketing on a grid or value-based pricing system.
BEEF PRICfNG SYSTEMS Live price bids are the most traditional and are still the most common in southern states. Live bids require the buyer to estimate both quality and yield grades of the group of cattle as well as any "outlier" cattle and then multiply this price estimate times the estimated dressing percentage to arrive at a live price bid. Live bids place the risk of low quality cattle entirely upon the buyer. The seller knows the value as soon as the cattle are weighed.
Carcass price bids are similar to live bids without the dressing percentage calculation. This system eliminates one estimate from the pricing equation. The seller is paid for the hanging carcass weight times the carcass price bid. Any carcass trimming results in less hanging weight, thus more risk is shifted to the seller. Carcass price bids are quite common for feeders in the Northern Great Plains due to perceived dressing percentage problems due to mud.
In both of these systems the buyer bases the bid on the expected deviation of a group of cattle from the average value of all cattle marketed during that time period. This average price is based on the supply and demand for beef of a given quality and yield grade in the marketplace. The individual bids for groups of cattle reflect how well the buyer feels the group meets the needs of the marketplace.
Grid pricing or "grade and yield" is becoming more and more common place. This is the system used in value based marketing programs because the seller is paid based on the actual quality and yield grades of the cattle, not the buyers estimates. In the grid pricing system the risk for "outlier" cattle is shifted to the seller. "Outlier cattle are those that are too light, too heavy, too fat or have too little marbling for the normal marketing channels. These cattle are discounted quite heavily in the market place. If a seller is using a grid
·system for marketing a group of cattle, it is very important to manage the group to avoid any "outliers".
As shown in Table 1, different markets demand different types of cattle and place premiums and discounts on different grades within the grid. The numerous alliances and branded beef programs also reward cattle of varying types. In a recent pricing demonstration at SDSU, five long-yearling Angus steers, five calf-fed Limou~in cross steers, and five steers representing various types of outliers were marketed on either a flat, carcass price bid , a high quality grid that rewarded hig..lier degrees of marbling or a high cutability grid that rewarded cattle with more desirable yield grades. When the fifteen steers were marketed as a group, the flat bid returned $10 and $50 more per head than the high quality and high cutability grids respectively. However when the cattle were sorted and marketed on the most appropriate grid, the value-based grids returned $27 more per head than the flat bid. This demonstration emphasizes the need to sort cattle into uniform groups of like kind and weight and also to search out the markets that best reward the type of cattle you are feeding. It also demonstrates the risk associated with grid or value-based marketing if the cattle don't perform on the rail as expected. Having a good estimate of the potential carcass merit of a set of cattle is of paramount importance when considering value-based marketing strategies.
~ I. r H
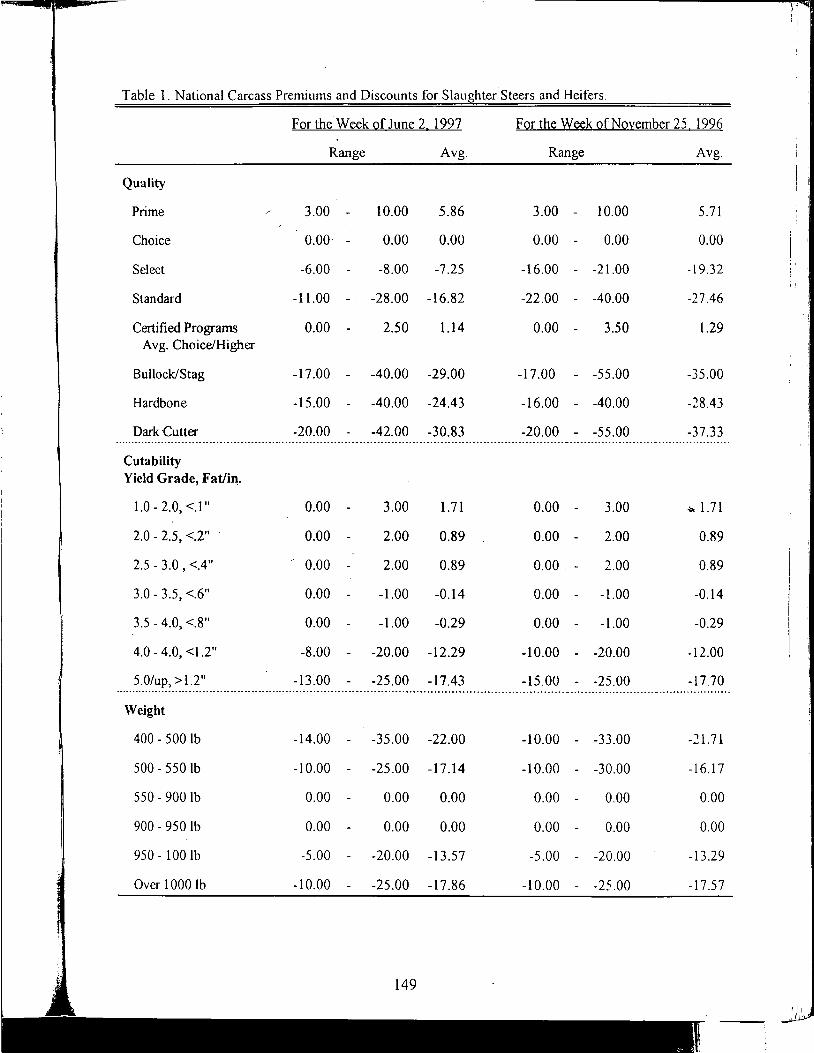
Table 1. National Carcass Premiums and Discounts for Slaughter.Steers and Heifers.
For the Week Qf June 2, 1997 For the Week of November 25, 1996
Range Avg. Range Avg.
Quality
Prime 3.00 10.00 5.86 3.00 10.00 5.71
Choice 0.00· - 0.00 0.00 0.00 - 0.00 0.00
Select -6.00 - -8.00 -7.25 -16.00 - -21.00 -19.32
Standard -11.00 - . -28.00 -16.82 -22.00 - -40.00 -27.46
Certified Programs 0.00 - 2.50 1.14 0.00 - 3.50 1.29 Avg. Choice/Higher
Bullock/Stag -17.00 - -40.00 -29.00 -17.00 - -55.00 -35.00
Hardbone -15.00 - -40.00 -24.43 -16.00 - -40.00 -28.43
Dark Cutter -20.00 -42.00 -30.83 -20.00 -55.00 -37.33
Cutability Yield Grade, Fat/in.
1.0 - 2.0, <.I" 0.00 - 3.00 1.71 0.00 3.00 ... 1.71
2.0 - 2.5, <.2" 0.00 - 2.00 0.89 0.00 - 2.00 0.89
2.5 - 3.0 '<.4" 0.00 - 2.00 0.89 0.00 - 2.00 0.89
3.0 - 3.5, <.6" 0.00 - -1.00 -0.14 0.00 - -1.00 -0.14
3.5 - 4.0, <.8" 0.00 - -1.00 -0.29 0.00 - -1.00 -0.29
4.0 - 4.0, <l .2" -8.00 - -20.00 -12.29 -10.00 - -20.00 -12.00
5.0/up, > 1.2" -13.00 - -25.00 -17.43 -15.00 - -25.00 -17.70
Weight
400 - 500 lb -14.00 - -35.00 -22.00 -10.00 - -33.00 -21. 71
500 - 550 lb -10.00 - -25.00 -17.14 -10.00 - -30.00 -16. l 7
550 - 900 lb 0.00 - 0.00 0.00 0.00 - 0.00 0.00
900 - 950 lb 0.00 - 0.00 0.00 0.00 - 0.00 0.00
950 - 100 lb -5.00 - -20.00 -13.57 -5.00 - -20.00 -13.29
Over 1000 lb -10.00 -25.00 -17.86 -10.00 -25.00 -1 7 .57
J.·
I ~ J I ! i.[1·
;\
L I
NUTRITION AND MANAGEMENT FOR IMPROVED CARCASS MERIT Feedlots have traditionally been used as a tool for improving the quality and value of feeder cattle; however, there is room to damage to the value of cattle as well. A feeder steer or heifer comes to the feedlot with an inherent genetic value. We know that frame size, muscling, fatness, and marbling are highly heritable traits.
Even tenderness is in large part predetermined by genetics. Technologies that can enhance genetic potentials are ver:,1 limited. Implants may be the only tool we can use in that manner today. In contrast it is relatively easy to prevent an animal from demonstrating its true genetic.potential. We can make them too big or too fat, under feed them causing low marbling scores, stress them so as to affect carcass quality and cause carcass blemishes by the contamination of tissues with exogenous compounds. The_ management necessary to prevent these problems is generally not expensive but does require attention to detail to consistently produce a desirable final product.
Carcass size and consequently the size of retail cuts is an important attribute that can be affected by post weaning management of cattle. Frame size is a measure of the size of an animal when it is expected to achieve a desirable degree of finish. This size can be manipulated by nutrition and implant strategies. If cattle are fed low energy diets (<l.75 lb/d ADG) for extended periods of time the mature size is increased. The degree that mature size increases is dependent upon the duration and degree of energy restriction. In the situation of small framed cattle and especially smaller heifers, an extended growing period becomes advantageous for increasing slaughter weight to a more desired level. These are the cattle that benefit from extensive beef production based upon forages. Large framed cattle exhibit the same biological response of increased mature size if grown slowly. Unfortunately there is not the same value at slaughter, since this can result in excessive carcass weight and discounts.
The reverse situation applies when cattle are managed in an intensive system where growth rate is maximized during each stage of production. In this situation carcass weight at an acceptable fat endpoint is reduced. This is an advantage for managing the very large framed cattle. They are the individuals best suited to feeding systems that have cattle ready for slaughter by 12 to 13 months of age. Smaller framed cattle becomt: subject to light weight carcass discounts in this system.
It is important when using an intensive or accelerated system to recognize some of the other concerns of managing for best outcome carcasses. These young cattle are often criticized for not grading very well. Two factors contribute to this observation. First is that the large framed cattle capable of producing adequately sized carcasses often come from bloodlines that are not noted for their ability to marble. Feedlots cannot do anything about that problem Second is that these intensively managed cattle are often marketed prematurely. The early marketing is the result of the difference in patterns of fat deposition for calf fed and yearling cattle. These differences are depicted in Figure 1. The development of visible fat deposits begins at lighter weights in the calf fed animals but is increasing at a slower rate than in the yearlings. As a result the calf fed begins to look ready before it truly reaches the desired slaughter endpoint. If marketed too soon they would not have the opportunity to express the desired degree of marbling.
Some of the high quality oriented beef alliances are recommending ~tensive or accelerated feeding systems for their participants. This recommendation is based primarily on a recent University of Illinois report that indicated a higher percentage Choice when calves were early weaned at 150 days of age and placed on a high energy ration. Work at SDSU (1988) showed a similar result when Charolais sired calves were weaned at 165 days of age and quickly worked on to finishing diets. While this strategy may improve marbling, care must be taken, especially with smaller framed calves, to avoid the previously discussed pitfalls. Marketing too early can result in lightweight carcasses and lower grades, while feeding too long could produce overly fat, Yield Grade 4 carcasses. Either situation could result in discounts that would quickly offset the premiums from a higher percentage Choice.
T~ 1m
.1 YH IS
us Im
cal cl2 onl
Tj ~j
I mfj
anj th~
.1 pn
I
SC~ ter ca~
: ng . I IS ~
apj cat thJ
NJ of cat ani h
. I 1g
real fetj to i
I
fini
res I >1(
cat
Ch
ch~ to ~ catl bal
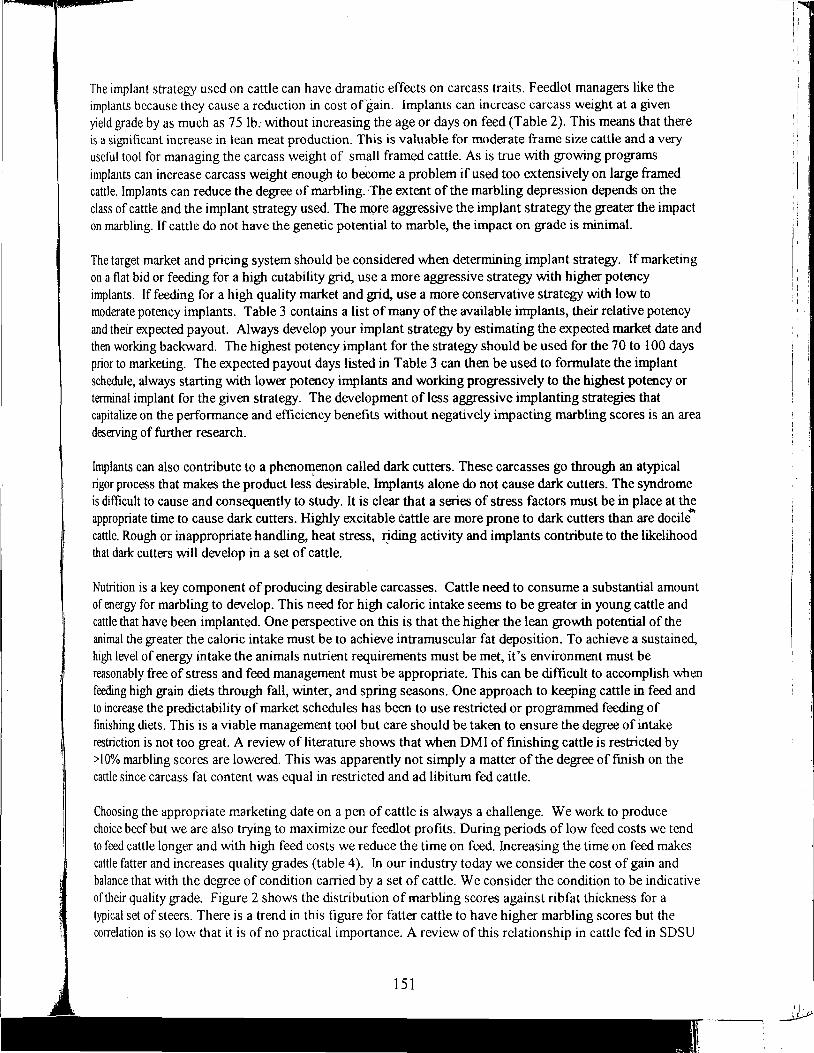
The implant strategy used on cattle can have dramatic effects on carcass traits. Feedlot managers like the implants because they cause a reduction in cost ofgain. implants can increase carcass weight at a given yield grade by as much as 75 lb. without increasing the age or days on feed (Table 2). This means that there is a significant increase in lean meat production. This is valuable for moderate frame size cattle and a very useful tool for managing the carcass weight of small framed cattle. As is true with growing programs implants can increase carcass weight enough to beeome a problem if used too extensively on large framed cattle. Implants can reduce the degree of marbling. ,The extent of the marbling depression depends on the class of cattle and the implant strategy used. The more aggressive the implant strategy the greater the impact on marbling. If cattle do not have the genetic potential to marble, the impact on grade is minimal.
The target market and pricing system should be considered when determining implant strategy. If marketing on a flat bid or feeding for a high cutability grid, use a more aggressive strategy with higher potency implants. If feeding for a high quality market and grid, use a more conservative strategy with low to moderate potency implants. Table 3 contains a list of many of the available implants, their relative potency and their expected payout. Always develop your implant strategy by estimating the expected market date and then working backward. The highest potency implant for the strategy should be used for the 70 to l 00 days prior to marketing. The expected payout days listed in Table 3 can then be used to formulate the implant schedule, always starting with lower potency implants and working progressively to the highest potency or terminal implant for the given strategy. The development of less aggressive implanting strategies that capitalize on the performance and efficiency benefits without negatively impacting marbling scores is an area deserving of further research.
Implants can also contribute to a pheno~enon called dark cutters. These carcasses go through an atypical rigor process that makes the product less desirable. Implants alone do not cause dark cutters. The syndrome is difficult to cause and consequently to study. It is clear that a series of stress factors must be in place at the appropriate time to cause dark cutters. Highly excitable cattle are more prone to dark cutters than are docilt cattle. Rough or inappropriate handling, heat stress, Ijding activity and implants contribute to the likelihood that dark cutters will develop in a set of cattle.
Nutrition is a key component of producing desirable carcasses. Cattle need to consume a substantial amount of energy for marbling to develop. This need for high caloric intake seems to be greater in young cattle and cattle that have been implanted. One perspective on this is that the higher the lean growth potential of the animal the greater the caloric intake must be to achieve intramuscular fat deposition. To achieve a sustained, high level of energy intake the animals nutrient requirements must be met, it's environment must be reasonably free of stress and feed management must be appropriate. This can be difficult to accomplish when feeding high grain diets through fall, winter, and spring seasons. One approach to keeping cattle in feed and to increase the predictability of market schedules has been to use restricted or programmed feeding of finishing diets. This is a viable management tool but care should be taken to ensure the degree of intake restriction is not too great. A review of literature shows that when DMI of finishing cattle is restricted by >I 0% marbling scores are lowered. This was apparently not simply a matter of the degree of finish on the cattle since carcass fat content was equal in restricted and ad libitum fed cattle.
Choosing the appropriate marketing date on a pen of cattle is always a challenge. We work to produce choice beef but we are also trying to maximize our feedlot profits. During periods of low feed costs we tend to feed cattle longer and with high feed costs we reduce the time on feed. Increasing the time on feed makes cattle fatter and increases quality grades (table 4 ). ln our industry today we consider the cost of gain and balance that with the degree of condition carried by a set of cattle. We consider the condition to be indicative of their quality grade. Figure 2 shows the distribution of marbling scores against ribfat thickness for a typical set of steers. There is a trend in this figure for fatter cattle to have higher marbling scores but the correlation is so low that it is of no practical importance. A review of this relationship in cattle fed in SDS U
151
II
;i
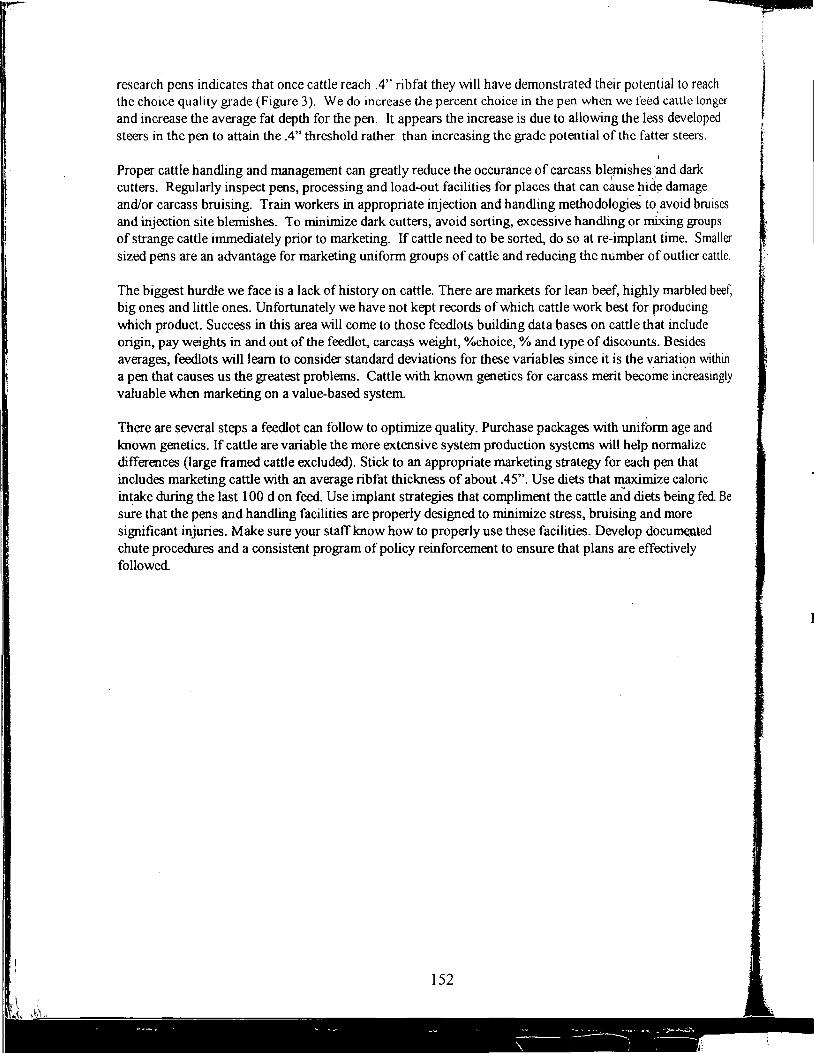
research pens indicates that once cattle reach .4" ribfat they will have demonstrated their potential to reach the choice quality grade (Figure 3). We do increase the percent choice in the pen when we feed cattle longer and increase the average fat depth for the pen. It appears the increase is due to allowing the less developed steers in the pen to attain the .4" threshold rather than increasing the grade potential of the fatter steers.
Proper cattle handling and management can greatly reduce the occurance of carcass bl~mishes_and dark cutters. Regularly inspect pens, processing and load-out facilities for places that can cause hide damage and/or carcass bruising. Train workers in appropriate injection and handling methodologieS to. avoid bruises and injection site blemishes. To minimize dark cutters, avoid sorting, excessive handling or mixing groups of strange cattle immediately prior to marketing. If cattle need to be sorted, do so at re-implant time. Smaller sized pens are an advantage for marketing uniform groups of cattle and reducing the number of outlier cattle.
The biggest hurdle we face is a lack of history on cattle. There are markets for lean beef, highly marbled beef, big ones and little ones. Unfortunately we have not kept records of which cattle work best for producing which product. Success in this area will come to those feedlots building data bases on cattle that include origin, pay weights in and out of the feedlot, carcass weight, %choice,% and type of discounts. Besides averages, feedlots will learn to consider standard deviations for these variables since it is the v_ariati?n within a pen that causes us the greatest problems. Cattle with known genetics for carcass merit become increasingly valuable when marketing on a value-based system.
There are several steps a feedlot can follow to optimize quality. Purchase packages with uniform age and known genetics. If cattle are variable the more extensive system production systems will help normalize differences (large framed cattle excluded). Stick to an appropriate marketing strategy for each pen that includes marketing cattle with an average ribfat thickness of about .45". Use diets that JI¥00mize caloric intake during the last 100 don feed. Use implant strategies that compliment the cattle and diets being fed. Be sure that the pens and handling facilities are properly designed to minimize stress, bruising and more significant injuries. Make sure your staff know how to properly use these facilities. Develop docu~ted chute procedures and a consistent program of policy reinforcement to ensure that plans are effectively followed ·
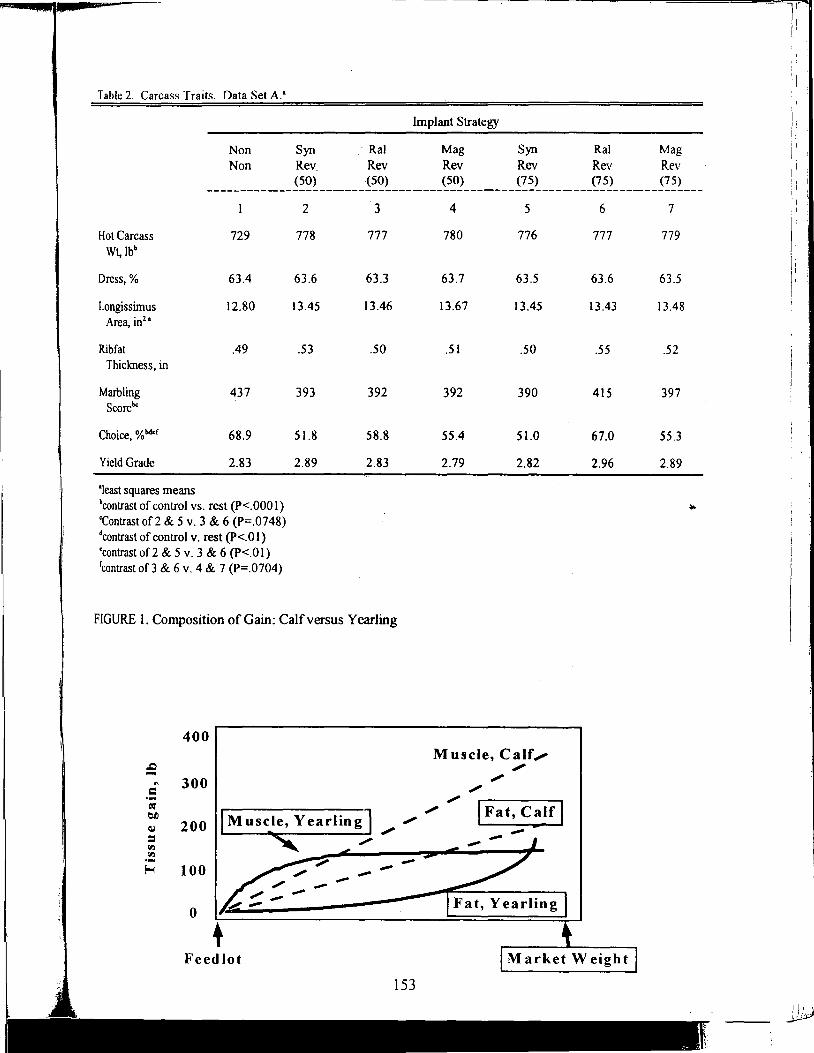
Table 2. Carcass Traits. Data Set A.•
Hot Carcass Wt,Jbb
Dress,%
Longissimus Area, in2
•
Rib fat Thickness, in
Marbling Score be
Choice, % bdef
Yield Grade
'least squares means
Non Non
729
63.4
12.80
.49
437
68.9
2.83
bcontrast of control vs. rest (P<.000 I) 'Contrast of 2 & 5 v. 3 & 6 (P=.0748) dcontrast of control v. rest (P<.O I) 'contrastof2 & 5 v. 3 & 6 (P<.01) rcontrastof3 & 6 v. 4 & 7 (P=.0704)
Syn Rev_ (50)
2
778
63.6
13.45
.53
393
51.8
2.89
. Ra!
Rev (50)
3
777
63.3
13.46
.50
392
58.8
2.83
FIGURE 1. Composition of Gain: Calf versus Yearling
400
.J:J
" 300 c ~ tl.O Muscle, Year ling ~ 200 ,. = ,, "' "' ~ ~ 100 ----
0
Feed lot
Implant Strategy
,.
-
Mag Rev (50)
4
780
63.7
13.67
.51
392
55.4
2.79
Syn Rev (75)
5
776
63.5
13.45
.50
390
51.0
2.82
Muscle, Calf,-,. ,. ,. ,. I Fat, Calf j ,. --
Ra! Rev (75)
6
777
63.6
13.43
.55
415
67.0
2.96
Market Weight
Mag Rev (75)
7
779
63.5
13.48
.52
397
55.3
2.89
,,
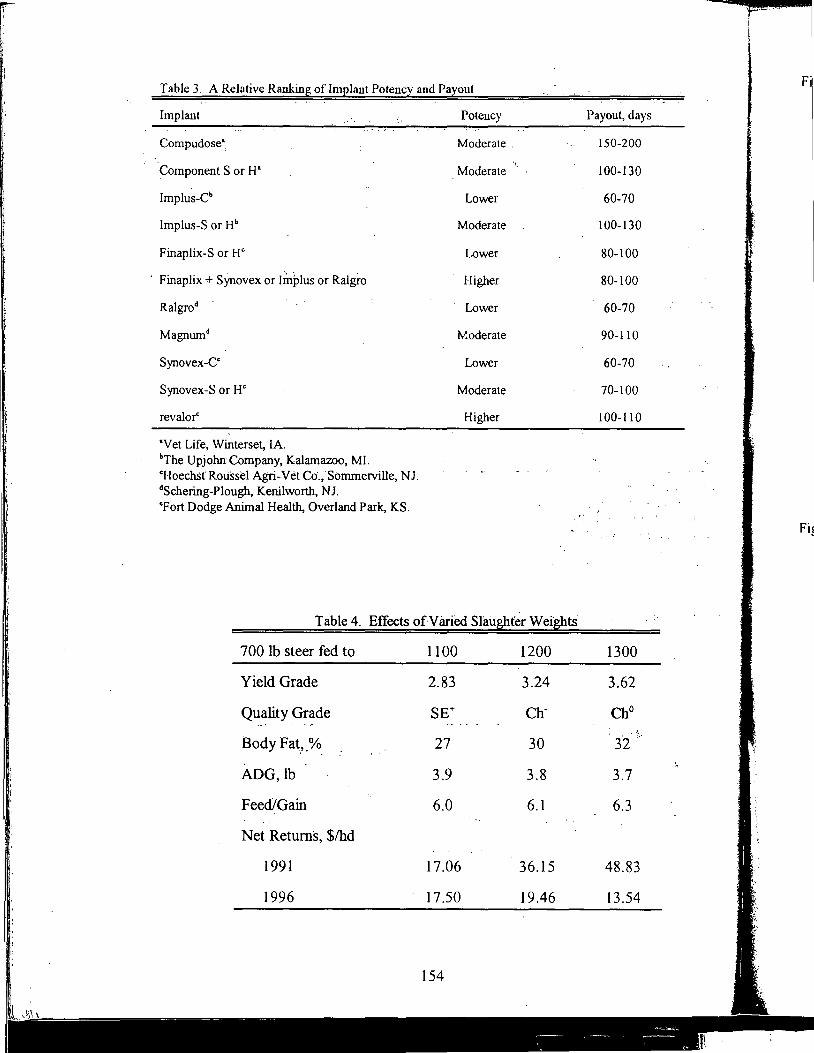
'
Ii .,
Table 3. A Relative Ranking ofimplant Potency and Payout
Implant
Compudose•.
Component S or H•
lmplus-Cb
lmplus-S or Hb
Finaplix-S or W
· Finaplix + Synovex or Implus or Ralgro
Ralgrod
Synovex-CC
Synovex-S or W
revalor"
·vet Life, Winterset, IA. bThe Upjohn Company, Kalamazoo, Ml. CH oechSt" Roussel Agri-vet co·.' Sommerville, NJ. dSchering-Plough, Kenilworth, NJ. <Fort Dodge Animal Health, Overland Park, KS.
Potency
Moderate ..
'(
Moderate ·
Lower
Moderate
Lower
Higher
Lower
W.oderate
Lower
Moderate
Higher
Table 4. Effects of.Varied Slaughter Weights
700 lb steer fed to 1100 1200
Yield Grade 2.83 3.24
Quality Grade SE+ ch-
Body Fat,,_% 27 30
ADG, lb 3.9 3.8
Feed/Gain 6.0 6.1
Net Returns, $/hd
1991 17.06 36.15
1996 17.50 19.46
Payout, days
150-200
100-130
60-70
100-130
80-100
80-100
60-70
90-110
60-70
70-100
100-110
1300
3.62
Ch0
3"2'
3.7
6.3
48.83
13.54
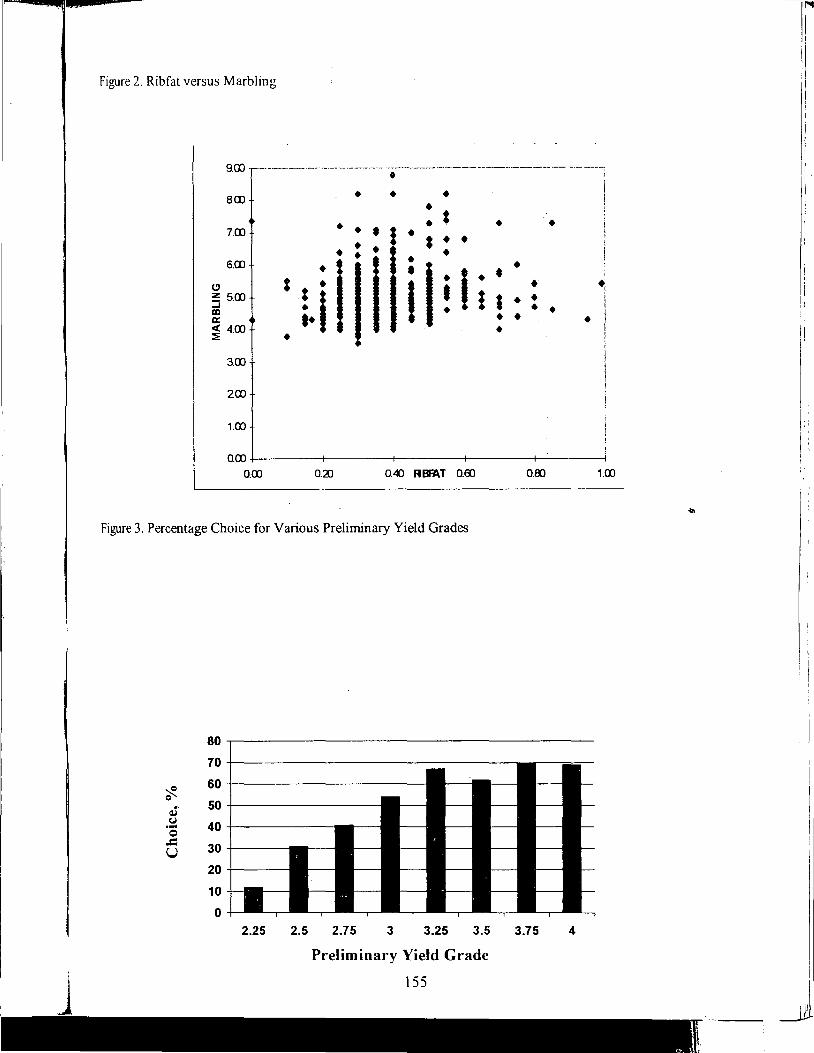
J
Figure 2. Rib fat versus Marbling
9.CD ··-------··----·-·--· --·-- ... ·-·-·-·--··· ··---·--·----·-- -···-·---·---------------·---·-· • 8.CD • • • • t • • 7.CD • • l • • i • • • • • • 6.CD
I I •
I • • I s • I • • C>
LI • i :!!::: 5.CD ....I • IXl a: ~ 4.CD •
3.CD
200
1.CD
O.CD
O.CD O.a:J 0.40 RIBFAT 0.00
Figure 3. Percentage Choice for Various Preliminary Yield Grades
80
70
~ 60
0
~ 50
CJ 40 .... 0
,.Q 30 u 20
10
0 2.25 2.5 2.75 3 3.25 3.5
Preliminary Yield Grade
155
• •
• • : • • l
I • • ' • • I I • • • I
• i I l
0.8'.l 1.CD
3.75 4
!I
I .

Notes
( This page intentionally blank. )
~ ~ ~ sl ~ ti
I
ti I g
~ c
fr N
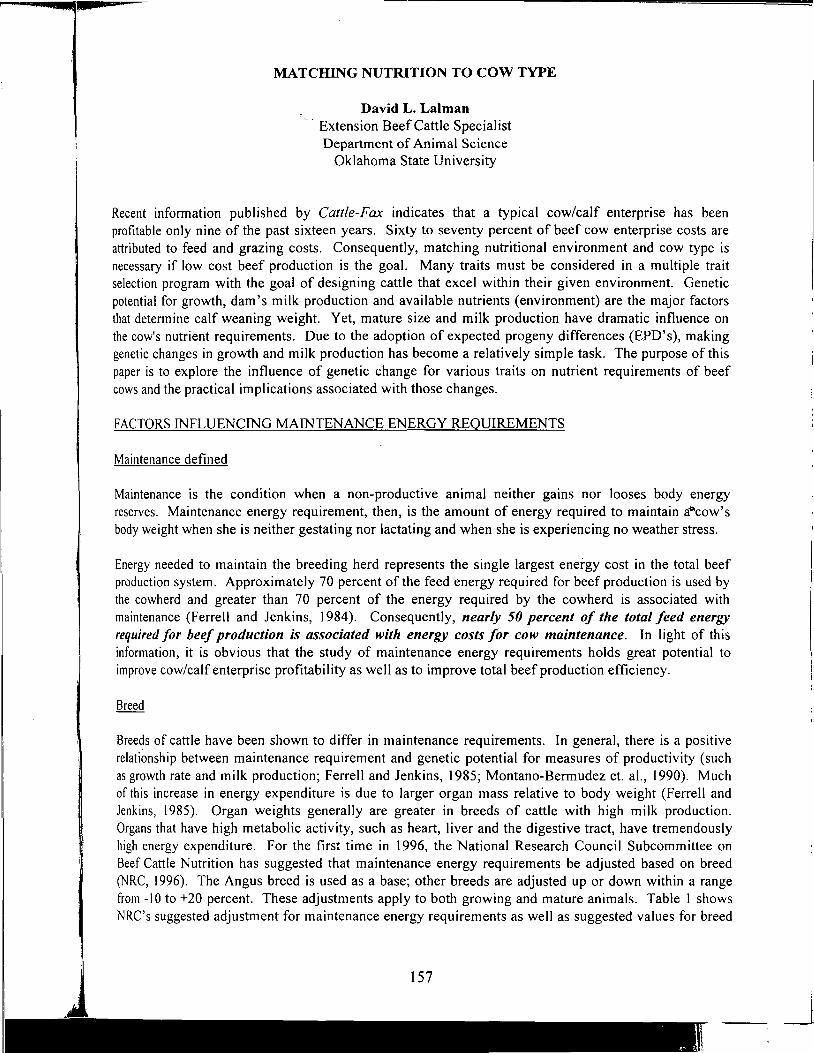
MATCHING NUTRITION TO COW TYPE
David L. Lalman Extension Beef Cattle Specialist Department of Animal Science
Oklahoma State University
Recent information published by Cattle-Fax indicates that a typical cow/calf enterprise has been profitable only nine of the past sixteen years. Sixty to seventy percent of beef cow enterprise costs are attributed to feed and grazing costs. Consequently, matching nutritional environment and cow type is necessary if low cost beef production is the goal. Many traits must be considered in a multiple trait selection program with the goal of designing cattle that excel within their given environment. Genetic potential for growth, dam's milk production and available nutrients (environment) are the major factors that determine calf weaning weight. Yet, mature size and milk production have dramatic influence on the cow's nutrient requirements. Due to the adoption of expected progeny differences (EPD's), making genetic changes in growth and milk production has become a relatively simple task. The purpose of this paper is to explore the influence of genetic change for various traits on nutrient requirements of beef cows and the practical implications associated with those changes.
FACTORS INFLUENCING MAINTENANCE ENERGY REQUIREMENTS
Maintenance defined
Maintenance is the condition when a non-productive animal neither gains nor looses body energy reserves. Maintenance energy requirement, then, is the amount of energy required to maintain a~cow's body weight when she is neither gestating nor lactating and when she is experiencing no weather stress.
Energy needed to maintain the breeding herd represents the single largest energy cost in the total beef production system. Approximately 70 percent of the feed energy required for beef production is used by the cowherd and greater than 70 percent of the energy required by the cowherd is associated with maintenance (Ferrell and Jenkins, 1984). Consequently, nearly 50 percent of the total feed energy required for beef production is associated with energy costs for cow maintenance. In light of this information, it is obvious that the study of maintenance energy requirements holds great potential to improve cow/calf enterprise profitability as well as to improve total beef production efficiency.
Breeds of cattle have been shown to differ in maintenance requirements. In general, there is a positive relationship between maintenance requirement and genetic potential for measures of productivity (such as growth rate and milk production; Ferrell and Jenkins, 1985; Montano-Bermudez et. al., 1990). Much of this increase in energy expenditure is due to larger organ mass relative to body weight (Ferrell and Jenkins, 1985). Organ weights generally are greater in breeds of cattle with high milk production. Organs that have high metabolic activity, such as heart, liver and the digestive tract, have tremendously high energy expenditure. For the first time in 1996, the National Research Council Subcommittee on Beef Cattle Nutrition has suggested that maintenance energy requirements be adjusted based on breed (NRC, 1996). The Angus breed is used as a base; other breeds are adjusted up or down within a range from -I 0 to +20 percent. These adjustments apply to both growing and mature animals. Table 1 shows NRC's suggested adjustment for maintenance energy requirements as well as suggested values for breed
157

average birth weight and peak milk production. Because little is known about the influence of crossbreeding on maintenance energy requirements, no heterosis is assumed. Energy requirement adjustments for crossbred animals are assumed to be a simple weighted average based on breed composition.
Table 1. Maintenance requirement adjustment, calf birth weight and peak milk production for selected beef breeds•
Maintenance requirement Peak milk yield, Breed Adjustment Birth weight, lb. lb./day Angus 1.00 68 18 Braford .95 79 15 Brahman .90 68 18 Brang us .95 73 18
Braunvieh 1.20 86 27 Charolais 1.00 86 20 Gelbvieh I. I 0 86 25 Hereford 1.00 79 15
Limousin 1.00 82 20 Santa Gertrudis .90 73 18 Shorthorn 1.00 82 19 Simmental 1.20 86 27 From NRC, 1996
Within breed differences
Di Costanzo et al. (1990) reported that the average maintenance requirements of Angus cows was 156.7 kcal metabolizable energy (ME) per kilogram of body weight-75 with standard deviation of 18.4. In other words, 95% of the data would have fallen within the range of 119.9 to 193.5 kcal ME I kg wr.75 (the mean plus or minus two standard deviations). If this variability represents genetic and not experimental variation, this wide range in maintenance energy requirements actually is good news because considerable variation is needed to make significant genetic progress through selection for any given trait. The bad news is that no simple method is available to determine maintenance requirements of individual cattle in order to enhance selection for this trait. Producers who select for females with moderate to high milk, yet maintain fleshing ability, relative to other animals in their herd, may be
.selecting cattle with lower maintenance requirements. However, the "easier fleshing" cows might simply be consuming more digestible energy than "harder keeping" cows.
Milking ability
As· mentioned above, maintenance energy requirements tend to increase as level of milk production increases. In a Nebraska study (Montano-Bermudez et al., 1990), cows of similar mature size but differing in milk production were used to compare maintenance energy requirements. Hereford X Angus cows represented the lower milk production group while Milking Shorthorn X Angus cows represented the higher milk production group (Table 2). Even though differences in milk production were moderate (18.7 versus 23.2 lb. per day), maintenance requirements for "high" milk cows were 9% higher during late gestation and I 0% higher during early lactation compared to "low" milk cows. However, no direct relationship between milk production and maintenance requirements has been established within a breed.
c a1 .1
trl ...:!]
Itl 1 ~
J ~ c~ c9
~ SU b I
p'I br
n~ mi ( I
f t j
f
s y :s h e It
n Jt IS
d :e g ;t
I.
Table 2. Maintenance energy requirements of crossbred beef cows differing in genetic potential for milk"
Item Low Milk High Milk Milk Production, lbs. per day Adjusted body weight, lbs. Late gestation maint. Req.,
18.7° l l40c
Kcal ME I kg WT75 Id I 08.5° Early lactation maint. Req., Kcal ME I kg WT75 I d I 30.5c
'Adapted from Montano-Bermudez et al., I 990. J. Anim. Sci. 68:2279. bAverage of measurements taken 46, 67 and 95 d post-calving. c,dMeans in the same row with different superscripts differ (P < .05).
Body composition
23.2 l 102d
Body composition varies tremendously both among and within breeds of cattle (Coleman et al., 1993; Marshall, 1994). Furthennore, the average composition of fed cattle has changed significantly over the past twenty years according to National Beef Quality Audit data (Table 3). The industry has selected for larger, leaner animals· and implemented more aggressive management systems in an effort to increase beef production efficiency and improve carcass cutability. Changes in composition of our nation's beef cowherd likely is less dramatic than those for fed cattle, due to the use of terininal sire mating systems and changes in finishing phase management that do not affect the cowherd. Nevertheless, these changes in fed cattle carcass composition probably reflect an evolution to leaner type beef cows.
Table 3. Carcass specifications for fed cattle, 1974-1995"
Item USDA, 1974 NBQA, 1991 Carcass weight, lbs. 678.7 ., 759.9 Fat thickness, inches .62 .59 Ribeye area, square inches I I .8 I 2.9 Ribeye area per I 00 lb. carcass wt., square inches USDA yield grade U.S. Prime and Choice Yield grades I & 2 'National Beef Quality Audit, I 995.
1.74 3.40
75% 30%
1.70 3. 16
55% 44%
NBQA, 1995
747.9 .47
12.8
1.71 2.82
48% 58%
Unfortunately, lean tissue mass has a staggering impact on maintenance energy requirements. Di Costanzo et al. ( 1990) estimated energy required for protein tissue maintenance to be 192.9 kcal ME/kg compared to 20.7 kcal ME/kg for fat tissue. Based on these estimates, a 10 percent increase in protein content of an 1100 lb beef cow results in a 7 percent increase in total energy required for maintenance (Table 4). Another concern associated with selecting leaner females in the Northern United States is that more energy is required to maintain thermo neutral conditions during winter. Leaner animals have less subcutaneous fat; fat serves as insulation against the cold. Together, these factors raise red flags as the beef industry focuses on halting its loss in market share. Certainly, waste fat must be minimized in beef production systems to improve product quality and reduce post-weaning inefficiencies. However, cattle breeders must keep in mind that selection for heavier muscled, leaner type beef cows will increase nutrient requirements. Tenninal sire mating systems that maximize progeny carcass merit while maintaining moderate cows with low feed requirements is a logical method to overcome this antagonism (Bennett and Williams, 1994).
159
f
'!
'' ' ~.
Table. 4. Maintenance energy requirements for 1100 lb. beef cows with moderate or high protein composition
Average protein composition8 High protein composition Empty body protein Percent Lbs.
Empty body fat Percent Lbs.
Energy required for maintenance, Meal ME I de Protein tissue Fat tissue Total
16.74 157.5
18.84 177.26
13.74 1.66
15.4
18.43 173.4
14.59 137.28
15.19 1.29
16.48 8Composition calculated for 1100 lb. live weight cow with body condition score 5 (NRC, 1996). bTen percent greater protein composition compared to cow with average protein composition. cCalculated using data of Di Costanzo et al., 1990. J. Anim. Sci. 68:2156.
MATCHING MATURE SIZE AND MILK PRODUCTION TO FEED RESOURCES
Mature size
Optimum cow size has been one of the most hotly debated topics in the beef industry for many years. Mature size is an important trait because of its influence on nutritional requirements, calf weaning weight and ultimately, carcass size. Early growth traits are correlated positively with mature size. In other words, when selection is based on growth rate alone, mature size will increase. Lar.ger cows have greater nutrient requirements simply because they have more biologically active tissue to maintain. However, greater nutrient requirements do not always mean lower cow efficiency. For example, a large factory may have greater fixed and variable costs compared to a small factory but cost per unit of product often favors the larger factory, because fixed costs are spread over more units of production. In areas of abundant, high quality forage, low cost feed grains and protein sources, the increased value of production per cow may offset the increased feed inputs. Table 5 shows the energy needed for maintenance, gestation (fetal development) and lactation of two cows differing in mature size with the same genetic potential for milk production.
Table 5. Comparison of energy required for 1100 and 1400 lb. beef cows".
Item Moderate Large Mature weight, lb. 1100 1400 Energy required for one year, expressed as megacalories of net energy Maintenanceb 3317 3976 Gestation 356 450 Lactation 899 899 Total 4572 5325
Difference, %
27
20 26
0 16
8 Assumes calf birth weight is 6.8% of cow weight and peak milk production is 18 lb. per day. bMaintenance energy requirements= .077 Meal NEm I kg empty shrunk weight.
Even though the 1400 lb. cow is 27% heavier than the 1100 lb. cow, she requires 20% greater energy for maintenance and 16% greater total energy. However, one key implication is that fewer 1400 lb. cows can be stocked on a given unit of land due to the greater total energy requirement. If stocking density is
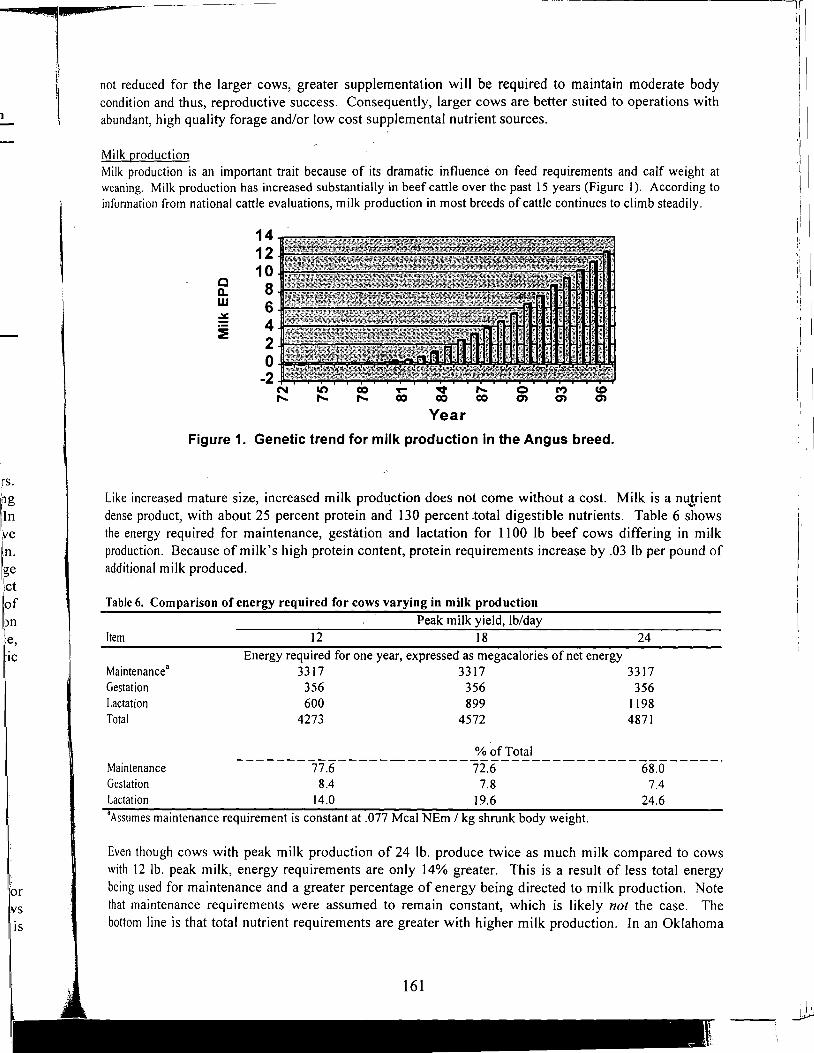
rs. 'ng I
11n ;ve I '.n. lge l1ct
of )n
:e, :IC
or IVS
IS
not reduced for the larger cows, greater supplementation will be required to maintain moderate body condition and thus, reproductive success. Consequently, larger cows are better suited to operations with abundant, high quality forage and/or low cost supplemental nutrient sources.
Milk production Milk production is an important trait because of its dramatic influence on feed requirements and calf weight at weaning. Milk production has increased substantially in beef cattle over the past 15 years (Figure 1 ). According to information from national cattle evaluations, milk production in most breeds of cattle continues to climb steadily.
14 12 10
c 8 a.. w 6 ~
::!: 4 2 0
-2 N It) co .... ""l:t' ,.... 0 C") CD ,.... ,.... ,.... co co co en en en
Year
Figure 1. Genetic trend for milk production in the Angus breed.
Like increased mature size, increased milk prodl!ction does not come without a cost. Milk is a nu..trient dense product, with about 25 percent protein and 130 percent .total digestible nutrients. Table 6 shows the energy required for maintenance, gestation and lactation for 1100 lb beef cows differing in milk production. Because of milk's high protein content, protein requirements increase by .03 lb per pound of additional milk produced.
Table 6. Comparison of energy required for cows varying in milk production
Peak milk yield, lb/day Item 12 18 24
Maintenance• Gestation Lactation Total
Maintenance Gestation Lactation
Energy required for one year, expressed as megacalories of net energy 3317 3317 3317 356 356 356 600 899 1198
4273 4572 4871
% of Total ----------------------------------------------· 77.6 72.6 68.0 8.4 7.8 7.4
14.0 19.6 24.6 'Assumes maintenance requirement is constant at .077 Meal NEm I kg shrunk body weight.
Even though cows with peak milk production of 24 lb. produce twice as much milk compared to cows with 12 lb. peak milk, energy requirements are only 14% greater. This is a result of less total energy being used for maintenance and a greater percentage of energy being directed to milk production. Note that maintenance requirements were assumed to remain constant, which is likely not the case. The bottom line is that total nutrient requirements are greater with higher milk production. In an Oklahoma
161
r
I I Ii :I ·1
'l I I
. J1· I 1., .··•
study (Buchanan et al., 1996), crossbred cows were mated to Hereford and Angus bulls that differed widely in milk expected progeny difference (EPD). Cows from both high and low milk EPD sires were managed together, so that both groups receive similar supplementation. During the first two years of this trial, Angus sired cows from bulls with high milk EPD's have had lower body ·condition scores at weaning compared to Angus sired cows from bulls with low milk EPD's (Table 7). Cows from Hereford sires ·did not differ significantly. Increasing milk production beyond moderate levels may add to enterprise risk due to year to year variation in forage availability, quality and supplement costs.
Table 7. Calf weaning weight and cow body condition score from cows sired by high and low milk EPD
bulls•.
Breed Milk EPD group MilkEPD 205 d weaning
weight, Lbs.b Cow body condition
Low -10.5
422
Hereford High 16.8
450
score 5.10 4.98 "From Buchanan et al., 1996. Okla. Agr. Exp. Sta. Res. Rep. P-951: I. b Average of steers and heifers. c.dMeans with different superscripts differ (P < .01 ).
Putting it all together
Angus Low High -13.7 19.2
430 470
5.26c 4.88d
In order to evaluate the economics of changing various traits, producers must have some guideline to estimate associated changes in production. Table .7 was developed to estimate milk production in beef cows. However, it can also be used to estimate. calf weaning weight and as such, is ~ usefal tool to evaluate cow size and milk production for a given operation.
Table 8. Relationship of mature cow weight, peak milk production and calf weaning weight• Peak Milk lb/day
Mature weight, lb. 6 12 18 24 30 Average expected 7 month steer calf weight, lb.
1030 431 475 510 1100 449 491 526 1170 464 506 541 1250 477 521 557 1320 491 537 572. 1400 504 550 587 1470 517 565 601 "Adapted from Fox et al., 1988. J. Anim. Sci. 66:1475.
546 561 576 590 605 620 634
574 590 607 623 638 656 671
Whether added weaning weight comes from milk production or increased mature size, the relationship between calf weight and sale price is usually negative. This negative relationship is magnified if milk production is sufficient to allow calves to become over-conditioned at weaning. Historical market prices for fleshy claves, as compared to moderate and thin calves sends a strong signal that over-conditioned calves do not perform as well during the growing phase. Usually, when grain prices are high, value of additional weaning weight is high. Conversely, when grain prices are low, value of additional weaning weight gain is low. Typically, this value ranges from $.45 to $.65 per pound of additional weight, but occasionally varies beyond this range. Another important factor influencing value of gain is seasonal price patterns. Typically, calf prices are higher in spring and lower in the fall. Consequently, value of
1
l ~ ~
1 1,
1J
l ~ Li ~ j pj cl ~ q
1 bF c I
'.~ r~I sq 21 Tl
t~
;~ '~, ~~ h, ha re m
Wi an
red ere :his : at ord
to
'.PD
e to ,Jeef I ',l to i
I
I 1= I_
ship milk ~ices
med 1e of nmg , but on al 1e of
SUQ.
added gain generally is higher for fall born calves. Of course, the higher cost of maintaining lactating cows through the winter months may offset this advantage.
Larger, heavier milking cows require more forage and so do their calves (Table 9). Calves from cows with greater milk production consume less forage compared to calves from cows with lower milk production. These factors have impljcations on herd size, stocking rate and profitability, and should be considered when designing the "optimum cow" for a given operation.
Table 9. Influence of cow size and milk production on calf value, herd size and calf income.
Item Calf Weightc Price I CW't $I Calf $ I Cow Exposede
Lb. Forage OM Required I Cowr Lb. Forage OM Required I Calf Total Forage OM Herd Size per 374 Acres8
Calf Income per 374 Acres Acres Required per 100 Cows8
I · 11 oo• I l 4oo· 126 186 246 186
491 526 561 587 $92.00 $89.54 $87.38 $85.95
$451.72 $470.97 $490.22 $504.52 $379.44 $395.61 $411.78 $423.80
7,533 8,061 8,587 9,387
1,288 1,137 1,011 1,348 8,821 9,198 9,598 10,735
104 100 96 86
$39,462 $39,561 $39,531 $36,447
359 374 390 436 'Mature cow weight, lb bPeak milk production, lb/d 'From Table 7. dValue of added gain is $.55 I Lb. 'Pregnancy rate is 89% and weaning rate is 84% (Northcutt, 1995). rFrom Fox, 1988.
246
620 $84.30
$522.67 $439.04
9,915
1,236 11,151
82
$36,001
453,.
8Dry matter production per acre is 3500 lb. Grazed forage utilization rate is 65% and hay storage/feeding loss is 20o/o. .
This example may partially explain why cow size and milk production has increased significantly over the past 20 years. Increased weaning weight and the subsequent increased return per cow is relatively easy to document. However, gradual changes in supplement amount, hay purchased, herd size, stocking rate or fertilizer inputs are much more difficult to document without detailed production and financial records.
Because of the increased forage intake by the cow and the calf (lower stocking rate), and the decreased value per pound of calf weaned, large cows in this example produce less total income when land area is held constant. As mentioned above, if stocking rate is not reduced, either more expensive purchased or harvested feeds must be provided, or !"eproduction will suffer dramatically. The end result is even lower returns than projected. As in the previous examples, these calculations do not consider the possible increase in maintenance requirements associated with increased milk production.
What about the incentive for purebred producers to select for added weight gain through increased milk and/or increased mature size? If commercial cattlemen do not understand the potential economic
163
I /! I I
l
1.;
I\
consequences of increasing either trait beyond moderate levels, they can provide a strong incentive for purebred breeders to select for extreme cattle. The incentive is in the form of sales and sale prices, favoring bulls with heavier weaning weights, frame size and/of yearling weights. With today's large breed association data bases, producers now can select for cattle with rapid growth within mature size llmitations. This often has been referred to as "bending the growth curve". This selection technique continues to have tremendous potential in improving beef production efficiency.
Finally, commercial cattlemen should strive to buy cattle from breeders with a similar environment and similar management to their own. Cattle that are raised in an "artificial" environment, with exceptionally high feed inputs, may not function well in a commercial setting where low cost production is the goal.
Considerations for retained ownership and beef alliances
If calves are to be retained through a grazing and/or feeding period, post-weaning growth potential and carcass merit become important factors. Little is known regarding the influence of added weight due to increased dam milk production. Some information from Australia indicates there is a negative relationship between dam's milk production and calf post-weaning gain. This would be expected if calves were fleshy at weaning due to high milk production in the dams. A study at OSU currently is evaluating this relationship. Logically, changes in genetic potential for milk production will need to be matched with genetic potential for growth to avoid inefficiencies.
More cow/calf producers are becoming concerned with end product characteristics because of increased involvement in alliances and retained ownership. Carcass weight specifications for value based marketing systems will have a greater influence on cow size in the future. Dr: Ron Bolze (1994) makes an excellent observation regarding mature cow size:
"As the industry continually responds to emerging concepts of Value Based Marketing in an attempt to produce more uniformity, consistency and consumer acceptability in endproduct specifications, another thought process may have merit. With the exception of the Southern climates requiring at least some Brahman derivative influence and the desert regions demanding extremely low maintenance cattle, the majority of the remaining continental United States could justify essentially the same type of genotype with merely adjustments in stocking rate to account for differences in feedstuff availability. Reducing genetic variation in this manner would have immeasurable positive impact on industry wide attempts to produce greater uniformity, consistency and consumer acceptability of beef."
Mature cow weight at body condition score 5 is a good indication of the feedlot finish weight (at low choice quality grade) of her male progeny. Assuming a carcass weight target window between 650 and 800 lb., mature cow weight would need to be limited to roughly 1100 to 1300 lb (Fox et al., 1988). In terminal sire mating systems, smaller cows can be mated with larger bulls to produce desired carcass weight and minimize cow maintenance requirements.
Summary
Maintenance energy requirements make up over 50% of feed energy needed to produce beef. Practical measurements to identify cattle with low maintenance requirements need to be developed in order to
d I
~;I
~ WI
I la1
thl be
j BJ
B~
B
Ca
Di
Fe
Fe1
Fo
1--q-.... --
:l )
e f s e
d d ':s
I
f ' r rd 1,n SS
1al to
i ~
·~
enhance selection for this trait. As the beef industry has implemented genetic and management changes to improve production efficiency and product quality, overhead costs associated with cow maintenance likely have increased as well. The optimum cow, j,n ,terms of size and milk production, depends on many factors; forage production and supplement costs are major considerations. Increased calf weaning weight provides ·a clear view of genetic and management change. The increased cost associated with larger, leaner type beef cows and/or excessive milk production is real, although difficult to measure. As the industry evolves into more shared risk/reward relationships across segments, the incentive to increase beef cow mature size, muscling and milk production beyond moderate levels will be dramatically reduced.
REFERENCES
Bennett, G.L., and C. B. Williams. 1994. Implications of genetic changes in body composition on beef production systems. J. Anim. Sci. 72:2756.
Bolze, Ron. 1994. Questions and answers about the antagonisms of milk production versus reproduction and maintenance requirements in beef cattle selection programs. Northwest Kansas Cow/Calf Seminars. p.9-18.
Buchanan, D.S., R. Gosz, E. Nesamvuni, and L. Knori. 1996. Calf performance and cow weight and condition for cows sired by high and low milk EPD Angus and Polled Hereford bulls. Okla. Agr. Exp. Sta. Res. Rep. P-951: I.
Coleman, S.W., B.C. Evans, and J.J. Guenther. 1993. Body and carcass composition of Angus and Charolais steers as affected by age and nutrition. J. Anim. Sci. 71 :86.
DiCostanzo, A., J.C. Meiske, S.D. Plegge, T.M. Peters, and R.D.Goodrich. 1990. Within-herd variation in energy utilization for maintenance and gain in beef cows. J. Anim. Sci. 68:2156.
Ferrell, C.L., and T.G. Jenkins. 1984. Energy utilization by mature, nonpregnant, cows of different types. J. Anim. Sci. 58:234.
non lactating
Ferrell, C.L., and T. G. Jenkins, 1985. Cow type and the nutritional environment: nutritional aspects. J. Anim. Sci. 61 :725.
Fox, D.G., C.J. Sniffen and J.D. O'Connor. 1988. Adjusting nutrient requirements of beef cattle for animal and environmental variations. J. Anim. Sci. 66: 1475.
Marshall, D.M., 1994. Breed differences and genetic parameters for body composition traits in beef cattle. J. Anim. Sci. 72:2745.
Montano-Bermudez, M., M.K. Nielsen, and G.H. Deutscher. 1990 Energy requirements for maintenance of cross bred beef cattle with different genetic potential for milk. J. Anim. Sci. 68:2279.
Northcutt, S.L., 1996. Oklahoma Standardized Performance Analyses (SPA), Oklahoma State University.
NRC. 1996. Nutrient Requirements of Beef Cattle (7th Ed.). National Academy Press, Washington, DC.
165
f "
I I
r I
Smith, G.C., J.W. Savell, H.G. Dolezal, T.G. Field, D.G. Gill, D.B. Griffin, D.S._:Hale, J.B. Morgan, S.L. Northcutt, J.D Tatum. 1995. Improving the Quality Consistency, Competitiveness and MarketShare of Beef. National Beef Quality Audit.
Rae, D.O., W.E. Kunkle, P.J. Chenoweth, R.S. Sand, and T. Tran. 1993. Relationship of parity and body condition score to pregnancy rates in Florida beefcattle. Theriogenolgy 39: 1143.
Ritchie, H.D. 1995. The optimum cow -- What criteria must she meet? In Proceedings of Beef Improvement Federation, Sheridan, WY.
I
I I
:.L. t -
LMj.
SUPPLEMENT AL NUTRITION OF BEEF COWS ON PASTURE
INTRODUCTION
JohnB. Hall Beef Cattle Extension Specialist
Animal and Poultry Science Department Virginia Tech University
Pastures provide the nutritional base for the beef cow herd. Depending on the location in the country and use of feeding strategies such as grazing stockpiled forage or crop residues, grazable forage may supply basal nutrition for 9 to 12 months of the year. Feed costs represent 60-70% of the total costs of cow/calf production. Therefore; reducing feed costs without impairing cow productivity should be a prominent goal for producer and nutritionist. Efficient use of pastures is essential to the profitability of the cow/calf operation.
Lately, both research and popular press articles have emphasized pasture management and managed intensive grazing. Although these techniques are important to reducing feed costs and improving animal performance, strategic nutrient supplementation of grazing brood cows offers a great opportunity to complement and enhance other grazing technologies. Often pasture supplements are designed to insure an excess of certain nutrients, but these may be at least costly if not unnecessary. Pasture supplements need further refinement to reduce feed costs in the beef cow/calf sector. "'
Arguably, development and management of a beef pasture supplementation program can be one of the most difficult and complex problems for nutrition professionals. The challenge is a direct result of the simultaneous changes in feed quality, feed av_c:i.ilability, and nutritional requirements of animals. In· addition, feedback on the successfulness of a supplementation system is slow .in beef cow/calf operations. Effects of supplementation.on calf weaning weights or pregnancy rates of cows are often not determine for several months after a change in supplement. Because of this time delay, it is often difficult to trouble shoot or refine a supplementation system. In contrast, effects ofa supplement program on milk production in dairy cattle can often be assessed in a mater ofweeb and refinements or corrections to the system can be made. Finally, beef cows are managed as a herd rather than individuals or small groups (i.e. pens); therefore, it is often difficult for producers to investigate supplementation .pr9grams without placing the entire herd on the system.· · ·
This paper will focus on the dynamic nature of pastures as a feedstuff and the temporal (seasonal) and species differences in nutrient content. In addition, the major nutrients lacking in grazable forage/pastures and their relationship to animal requirement will be covered. Finally, some general recommendations on"supplementation will be proposed. Pastures and grazable forages (i.e. stockpiled f()rage and dormant range) will be referred to in the remainder of this paper as pasture·. ·This ·paper will not specifically cover the grazing of crop residues, but many of the general principals will apply.
.).1 . . :
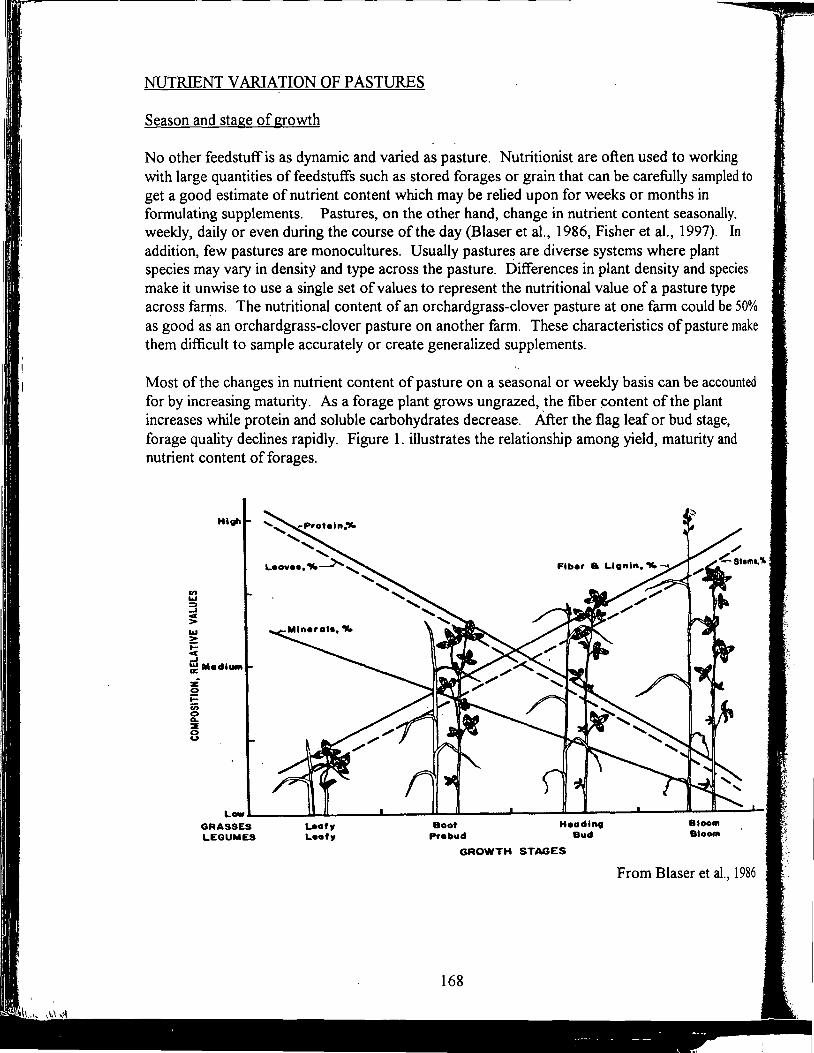
NUTRIENT VARIATION OF PASTURES
Season and stage of growth
No other feedstuff is as dynamic and varied as pasture. Nutritionist are often used to working with large quantities of feedstuffs such as stored forages or grain that can be carefully sampled to get a good estimate of nutrient content which may be relied upon for weeks or months in formulating supplements. Pastures, on the other hand, change in nutrient content seasonally. weekly, daily or even during the course of the day (Blaser et al., 1986, Fisher et al., 1997). In addition, few pastures are monocultures. Usually pastures are diverse systems where plant species may vary in density and type across the pasture. Differences in plant density and species make it unwise to use a single set of values to represent the nutritional value of a pasture type across farms. The nutritional content of an orchardgrass-clover pasture at one farm could be 50% as good as an orchard grass-clover pasture on another farm. These characteristics of pasture make them difficult to sample accurately or create generalized supplements.
Most of the changes in nutrient content of pasture on a seasonal or weekly basis can be accounted for by increasing maturity. As a forage plant grows ungrazed, the fiber content of the plant increases while protein and soluble carbohydrates decrease. , After the flag leaf or bud stage, forage quality declines rapidly. Figure 1. illustrates the relationship among yield, maturity and nutrient content of forages.
High
L-L.~~_J;LJl~~~L-~__;,.JJ....-'L~~-JL.-~~11.-...11.-~~....a..~~---~"--~-
GRASSES LEGUMES
Boot Pr•bwd
Headl"iii Bwd
GROWTH STAGES
168
From Blaser et al., 1986
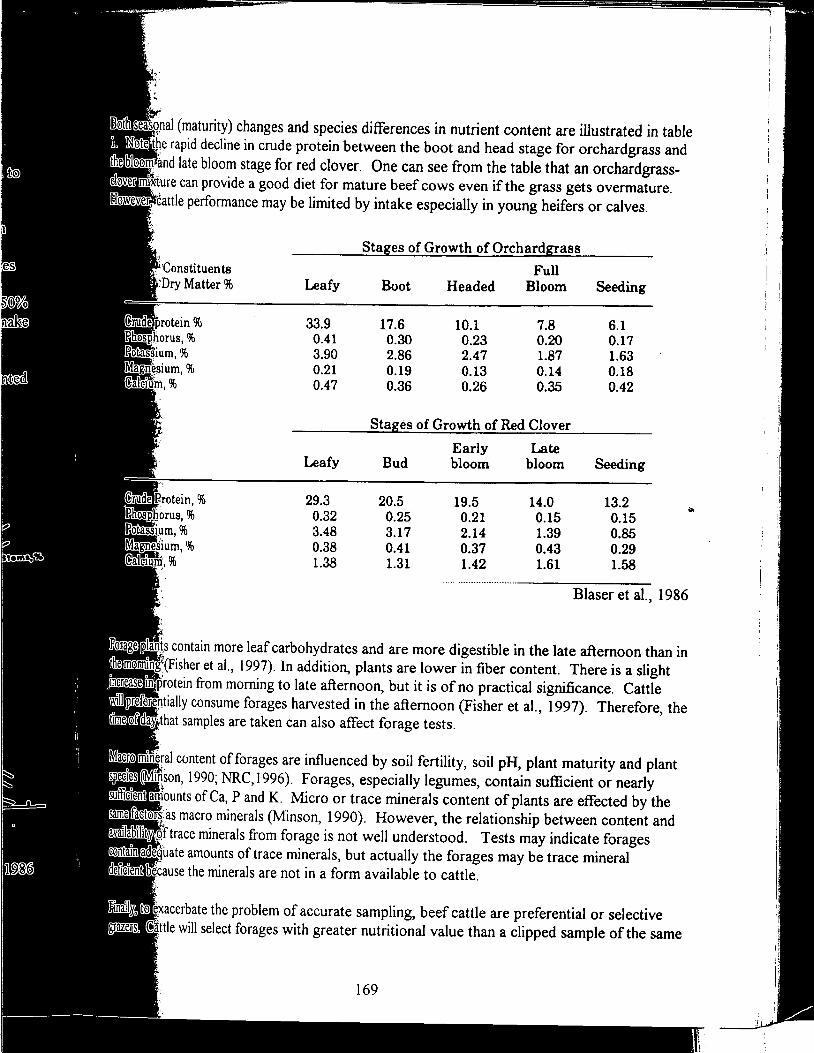
mis1ea91sq.nal (maturity) changes and species differences in nutrient content are illustrated in table 0te the rapid decline in crude protein between the boot and head stage for orchardgrass and
Iii · 100Ql· and late bloom stage for red clover. One can see from the table that an orchardgrassel(!i:v.eri mi~ure can provide a good diet for mature beef cows even if the grass gets overmature. : 0 e~. fl, cattle performance may be limited by intake especially in young heifers or calves.
Stag:es of Growth of Orchardgrass
Full Leafy Boot Headed Bloom Seeding
33.9 17.6 10.1 7.8 6.1 0.41 0.30 0.23 0.20 0.17 3.90 2.86 2.47 1.87 1.63 0.21 0.19 0.13 0.14 0.18 0.47 0.36 0.26 0.35 0.42
Stages of Growth of Red Clover
Early Late Leafy Bud bloom bloom Seeding
29.3 20.5 19.5 14.0 13.2 "' 0.32 0.25 0.21 0.15 0.15
3.48 3.17 2.14 1.39 0.85 0.38 0.41 0.37 0.43 0.29 1.38 1.31 1.42 1.61 1.58
.. ·······················
Blaser et al., 1986
P. nls contain more leaf carbohydrates and are more digestible in the late afternoon than in •
10111
·nltg"(Fisher et al., 1997). In addition, plants are lower in fiber content. There is a slight &•in111p'rotein from morning to late afternoon, but it is of no practical significance. Cattle
·n ·fl· eri.ntially consume forages harvested in the afternoon (Fisher et al., 1997). Therefore, the lime · fiMa· that samples are taken can also affect forage tests.
N aGrn · 'neral content of forages are influenced by soil fertility, soil pH, plant maturity and plant SP,eeies ·rjson, 1990; NRC,1996). Forages, especially legumes, contain sufficient or nearly Stl!Ileient a ~ounts of Ca, P and K. Micro or trace minerals content of plants are effected by the sam · faet0f~:as macro minerals (Minson, 1990). However, the relationship between content and a ail ll' · · f trace minerals from forage is not well understood. Tests may indicate forages
· · '.uate amounts of trace minerals, but actually the forages may be trace mineral · e'cause the minerals are not in a form available to cattle.
inallM, te exacerbate the problem of accurate sampling, beef cattle are preferential or selective attle will select forages with greater nutritional value than a clipped sample of the same
169
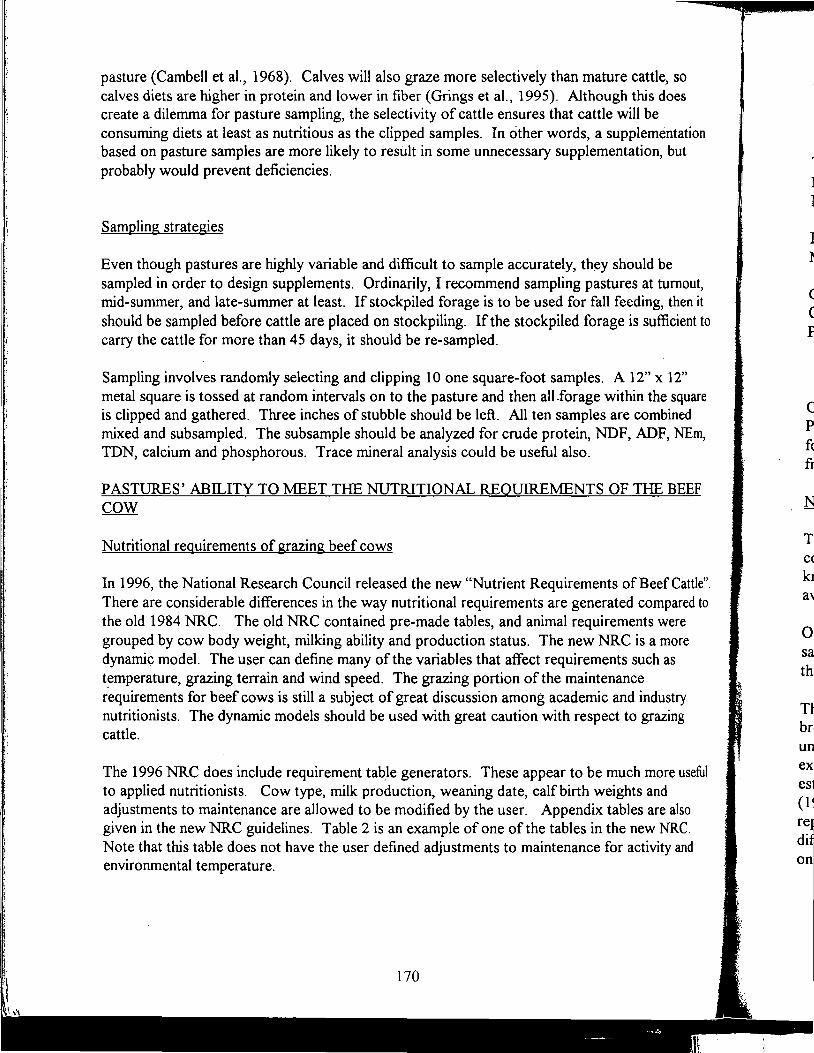
pasture (Cambell et al., 1968). Calves will also graze more selectively than mature cattle, so calves diets are higher in protein and lower in fiber (Grings et al., 1995). Although this does create a dilemma for pasture sampling, the selectivity of cattle ensures that cattle will be consuming diets at least as nutritious as the clipped samples. In other words, a supplementation based on pasture samples are more likely to result in some unnecessary supplementation, but probably would prevent deficiencies.
Sampling strategies
Even though pastures are highly variable and difficult to sample accurately, they should be sampled in order to design supplements. Ordinarily, I recommend sampling pastures at turnout, mid-summer, and late-summer at least. If stockpiled forage is to be used for fall feeding, then it should be sampled before cattle are placed on stockpiling. If the stockpiled forage is sufficient to carry the cattle for more than 45 days, it should be re-sampled.
Sampling involves randomly selecting and clipping 10 one square-foot samples. A 12" x 12" metal square is tossed at random intervals on to the pasture and then all-forage within the square is clipped and gathered. Three inches of stubble should be left. All ten samples are combined mixed and subsampled. The subsample should be analyzed for crude protein, NDF, ADF, NEm, TDN, calcium and phosphorous. Trace mineral analysis could be useful also.
PASTURES' ABILITY TO MEET THE NUTRITIONAL REQUIREMENTS OF THE BEEF cow
Nutritional requirements of grazing beef cows
In 1996, the National Research Council released the new "Nutrient Requirements of Beef Cattle". There are considerable differences in the way nutritional requirements are generated compared to the old 1984 NRC. The old NRC contained pre-made tables, and animal requirements were grouped by cow body weight, milking ability and production status. The new NRC is a more dynamic model. The user can define many of the variables that affect requirements such as t~mperature, grazing terrain and wind speed. The grazing portion of the maintenance requirements for beef cows is still a subject of great discussion among academic and industry nutritionists. The dynamic models should be used with great caution with respect to grazing cattle.
The 1996 NRC does include requirement tab.le generators. These appear to be much more useful to applied nutritionists. Cow type, milk production, weaning date, calf birth weights and adjustments to maintenance are allowed to be modified by the user. Appendix tables are also given in the new NRC guidelines. Table 2 is an example of one of the tables in the new NRC. Note that this table does not have the user defined adjustments to maintenance for activity and environmental temperature.
:1 I
~ I fo
iii I
N
l Tl
I CC!
id a~
0 s th
HI br un exl
I
es1 (1 ~
I
re~
di£ on
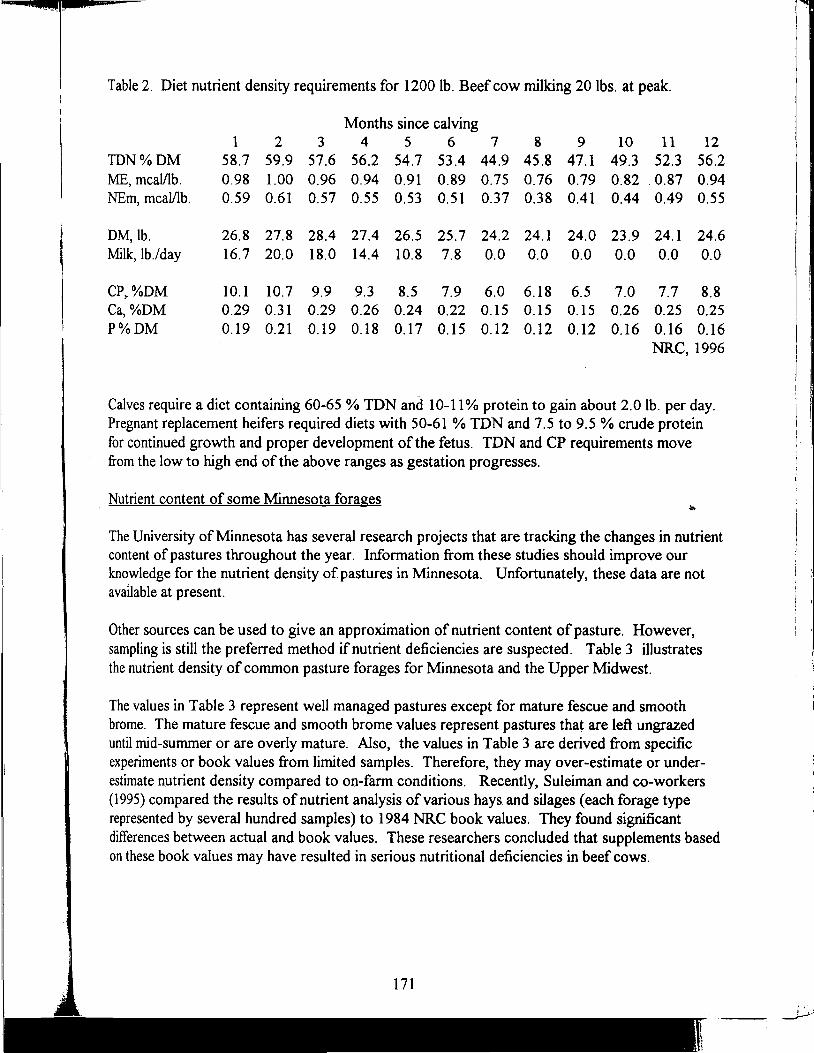
Table 2. Diet nutrient density requirements for 1200 lb. Beef cow milking 20 lbs. at peak.
Months since calving 1 2 3 4 s 6 7 8 9 10 11 12
TDN%DM 58.7 59.9 57.6 56.2 54.7 53.4 44.9 45.8 47.1 49.3 52.3 56.2 ME, meal/lb. 0.98 1.00 0.96 0.94 0.91 0.89 0.75 0.76 0.79 0.82 '0.87 0.94 NEm, meal/lb. 0.59 0.61 0.57 0.55 0.53 0.51 0.37 0.38 0.41 0.44 0.49 0.55
DM,lb. 26.8 27.8 28.4 27.4 26.S 25.7 24.2 24.1 24.0 23.9 24.1 24.6 Milk, lb./day 16.7 20.0 18.0 14.4 10.8 7.8 0.0 0.0 0.0 0.0 0.0 0.0
CP,.%DM 10.1 10.7 9.9 9.3 8.5 7.9 6.0 6.18 6.5 7.0 7.7 8.8 Ca, %DM 0.29 0.31 0.29 0.26 0.24 0.22 0.15 0.15 0.15 0.26 0.25 0.25 P%DM 0.19 0.21 0.19 0.18 0.17 0.15 0.12 0.12 0.12 0.16 0.16 0.16
NRC, 1996
Calves require a diet containing 60-65 % TDN and 10-11 % protein to gain about 2.0 lb. per day. Pregnant replacement heifers required diets with 50-61 % TDN and 7.5 to 9.5 % crude protein for continued growth and proper development of the fetus. TDN and CP requirements move from the low to high end of the above ranges as gestation progresses.
Nutrient content of some Minnesota forages
The University of Minnesota has several research projects that are tracking the changes in nutrient content of pastures throughout the year. Information from these studies should improve our knowledge for the nutrient density of pastures in Minnesota. Unfortunately, these data are not available at present.
Other sources can be used to give an approximation of nutrient content of pasture. However, sampling is still the preferred method if nutrient deficiencies are suspected. Table 3 illustrates the nutrient density of common pasture forages for Minnesota and the Upper Midwest.
The values in Table 3 represent well managed pastures except for mature fescue and smooth brome. The mature fescue and smooth brome values represent pastures that are left ungrazed until mid-summer or are overly mature. Also, the values in Table 3 are derived from specific experiments or book values from limited samples. Therefore, they may over-estimate or underestimate nutrient density compared to on-farm conditions. Recently, Suleiman and co-workers (1995) compared the results of nutrient analysis of various hays and silages (each forage type represented by several hundred samples) to 1984 NRC book values. They found significant differences between actual and book values. These researchers concluded that supplements based on these book values may have resulted in serious nutritional deficiencies in beef cows.
171
i. I
! l
' ' ' 'I t .' o!
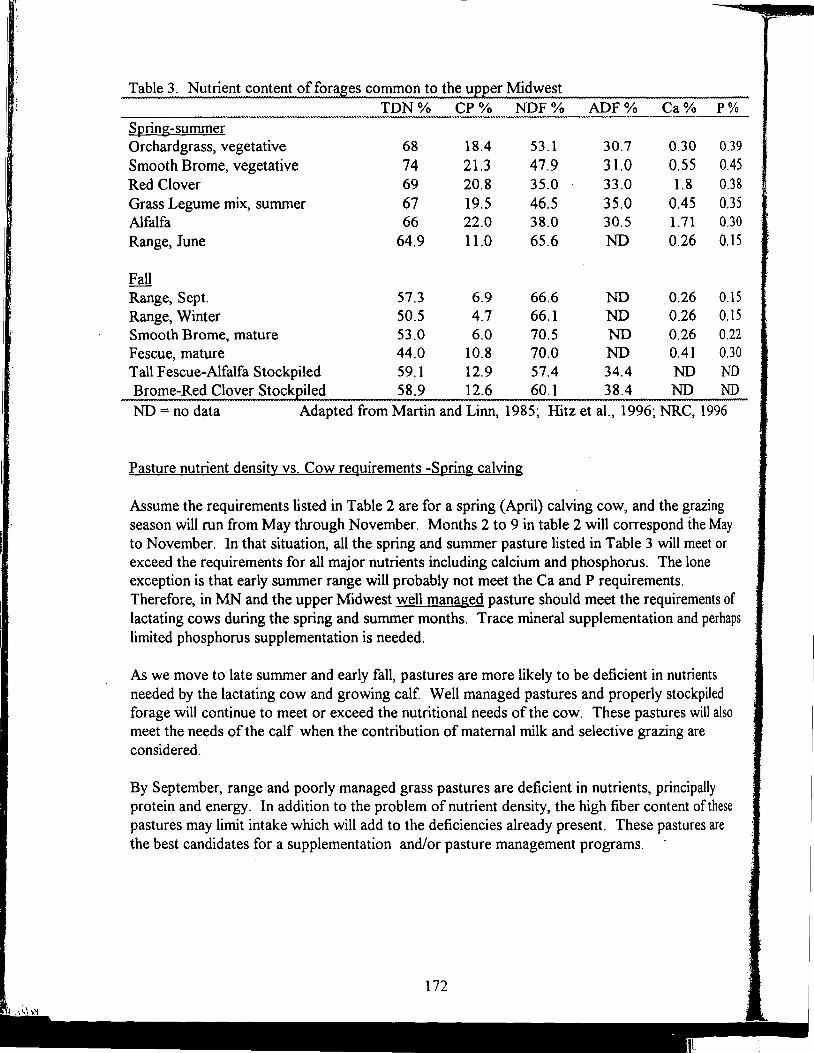
Table 3. Nutrient content offora8es common to the UEEer Midwest TDN% CP% NDF% ADF% Ca% P%
Spring-summer Orchardgrass, vegetative 68 18.4 53.1 30.7 0.30 0.39 Smooth Brome, vegetative 74 21.3 47.9 31.0 0.55 0.45 Red Clover 69 20.8 35.0 33.0 1.8 0.38 Grass Legume mix, summer 67 19.5 46.5 35.0 0.45 0.35 Alfalfa 66 22.0 38.0 30.5 1.71 0.30 Range, June 64.9 11.0 65.6 ND 0.26 0.15
Fall Range, Sept. 57.3 6.9 66.6 ND 0.26 0.15 Range, Winter 50.5 4.7 66.1 ND 0.26 0.15 Smooth Brome, mature 53.0 6.0 70.5 ND 0.26 0.22 F escue, mature 44.0 10.8 70.0 ND 0.41 0.30 Tall Fescue-Alfalfa Stockpiled 59.1 12.9 57.4 34.4 ND ND Brome-Red Clover StockEiled 58.9 12.6 60.1 38.4 ND ND ND= no data Adapted from Martin and Linn, 1985; Hitz et al., 1996; NRC, 1996
Pasture nutrient density vs. Cow requirements -Spring calving
Assume the requirements listed in Table 2 are for a spring (April) calving cow, and the grazing season will run from May through November. Months 2 to 9 in table 2 will correspond the May to November. In that situation, all the spring and summer pasture listed in Table 3 will meet or exceed the requirements for all major nutrients including calcium and phosphorus. The lone exception is that early summer range will probably not meet the Ca and P requirements. Therefore, in MN and the upper Midwest well managed pasture should meet the requirements of lactating cows during the spring and summer months. Trace mineral supplementation and perhaps limited phosphorus supplementation is needed.
As we move to late summer and early fall, pastures are more likely to be deficient in nutrients needed by the lactating cow and growing calf. Well managed pastures and properly stockpiled forage will continue to meet or exceed the nutritional needs of the cow. These pastures will also meet the needs of the calf when the contribution of maternal milk and selective grazing are considered.
By September, range and poorly managed grass pastures are deficient in nutrients, principally protein and energy. In addition to the problem of nutrient density, the high fiber content of these pastures may limit intake which will add to the deficiencies already present. These pastures are the best candidates for a supplementation and/or pasture management programs.
172
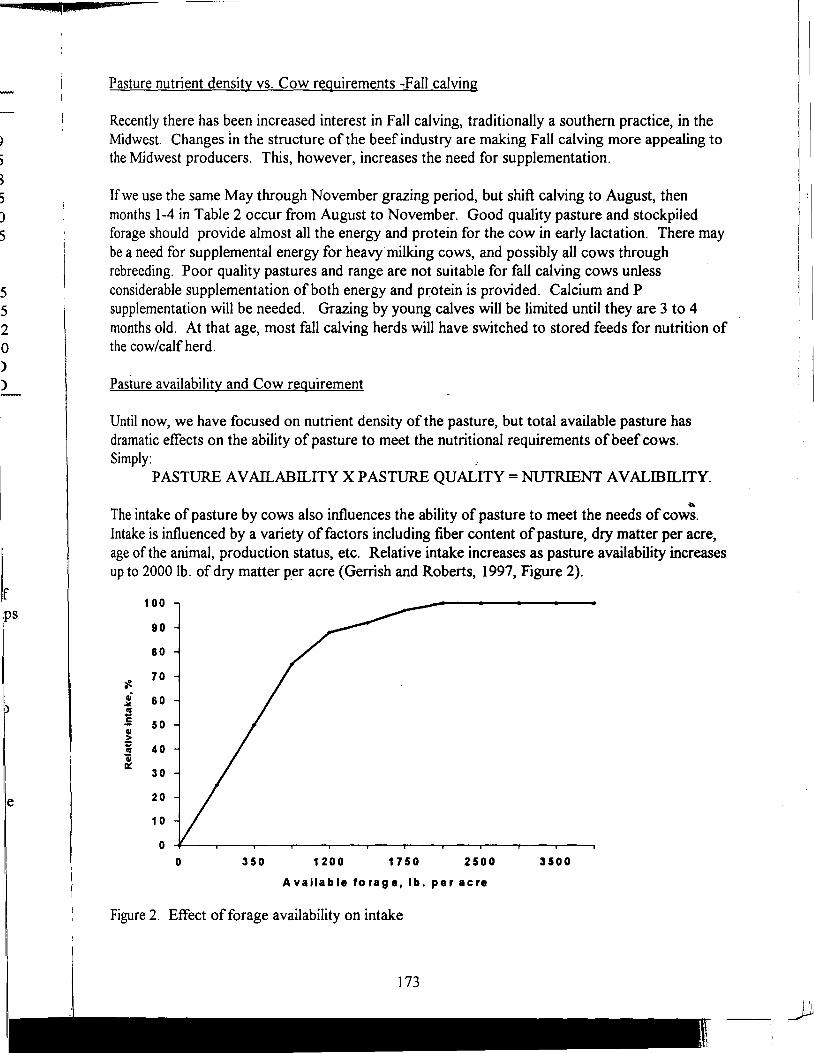
9 5 8 5 0 5
5 5 2 0 )
)
)
e
Pasture nutrient density vs. Cow requirements -Fall calving
Recently there has been increased interest in Fall calving, traditionally a southern practice, in the Midwest. Changes In the structure of the beef industry are making Fall calving more appealing to the Midwest producers. This, however, increases the need for supplementation.
Ifwe use the same May through November grazing period, but shift calving to August, then months 1-4 in Table 2 occur from August to November. Good quality pasture and stockpiled forage should provide almost all the energy and protein for the cow in early lactation. There may be a need for supplemental energy for heavy milking cows, and possibly all cows through rebreeding. Poor quality pastures and range are not suitable for fall calving cows unless considerable supplementation of both energy and protein is provided. Calcium and P supplementation will be needed. Grazing by young calves will be limited until they are 3 to 4 months old. At that age, most fall calving herds will have switched to stored feeds for nutrition of the cow/calf herd.
Pasture availability and Cow requirement
Until now, we have focused on nutrient density of the pasture, but total available pasture has dramatic effects on the ability of pasture to meet the nutritional requirements of beef cows. Simply:
PASTURE AVAILABILITY X PASTURE QUALITY =NUTRIENT AV ALIBILITY.
~
The intake of pasture by cows also influences the ability of pasture to meet the needs of cows. Intake is influenced by a variety of factors including fiber content of pasture, dry matter per acre, age of the animal, production status, etc. Relative intake increases as pasture availability increases up to 2000 lb. of dry matter per acre (Gerrish and Roberts, 1997, Figure 2).
100
90
80
~ 70
• oi 60 .¥ I'll s 50 GI > ;
40 I'll '; a:
30
20
10
0 0 350 1200 1750 2500 3500
Available forage, lb. per acre
Figure 2. Effect of forage availability on intake
173
The 2000 lb. per acre minimum is critical because cows graze selectively and only take a finite number of bites per day. Therefore, estimating pounds of dry matter per acre should be part of the sampling process.
SUPPLEMENTATION STRATEGIES
All supplementation programs should be based on providing the most limiting nutrient or nutrients. Remember the most limiting nutrient! This means sampling pastures as previously discussed. In addition, the production and economic benefits must be weighed against the cost of the supplementation program. If pasture availability is limited, then all nutrients may need to be supplemented .
Protein
Protein is often considered the most limiting nutrient in beef cattle rations. T~s belief has been ingrained in our minds based on excellent research which demonstrated positive responses to protein supplementation in gestating beef cows grazing dormant winter range (Clanton, 1982; McCollum and Horn, 1990; DelCurto et al., 1990). In general, cows in these studies that received the protein supplement had greater weight gains, increased forage intake, increased digestibility and improved conception rates.
As evidence to our understanding of the concept of protein supplementation, lick tanks, lick tubs and protein blocks stand as monuments in almost every pasture in the late summer, early fall and winter. However, analysis of pastures (and even most of our hay) indicates that protein supplementation is unriecessary for gestating cows consuming the forages most commonly grown in the Midwest. The excep!ion.s to this would be 1) dormant range in western MN and the Dakotas, 2) mature warm season grasses, 3) extremely poor quality pastures or hays, 4) limited forage availability. We should be concerned that the "monuments" are not instead tombstones.
Certainly, there are other situations were protein supplementation is probably needed. Fall calving cows and replacement heifers may need addition protein. Supplementation of fall calving cows grazing dormant range with 6 lb. of a 40 % crude protein supplement decreased weight loss during lactation, but the supplement did not alter calf weights, milk production or conception rates of cows. There may also be a benefit to protein supplementation of spring-calving cows that nurse calves through the late fall. Short and co-workers ( 1996) reported that feeding cows a 34 % crude protein supplement increased calf gains and persistency of lactation. It is important to note that effects of supplementation on cow weight and body condition varied with year. In fact, supplementation had negative effects on cow weight and body condition when forage quality was adequate to good.
Recently, research on protein supplementation of grazing cattle has concentrated on understanding the relationship among rumen degradable protein (RDP), undegradable protein (UDP; by-pass protein) and cow/calf performance. Pastures usually contain high levels of RDP
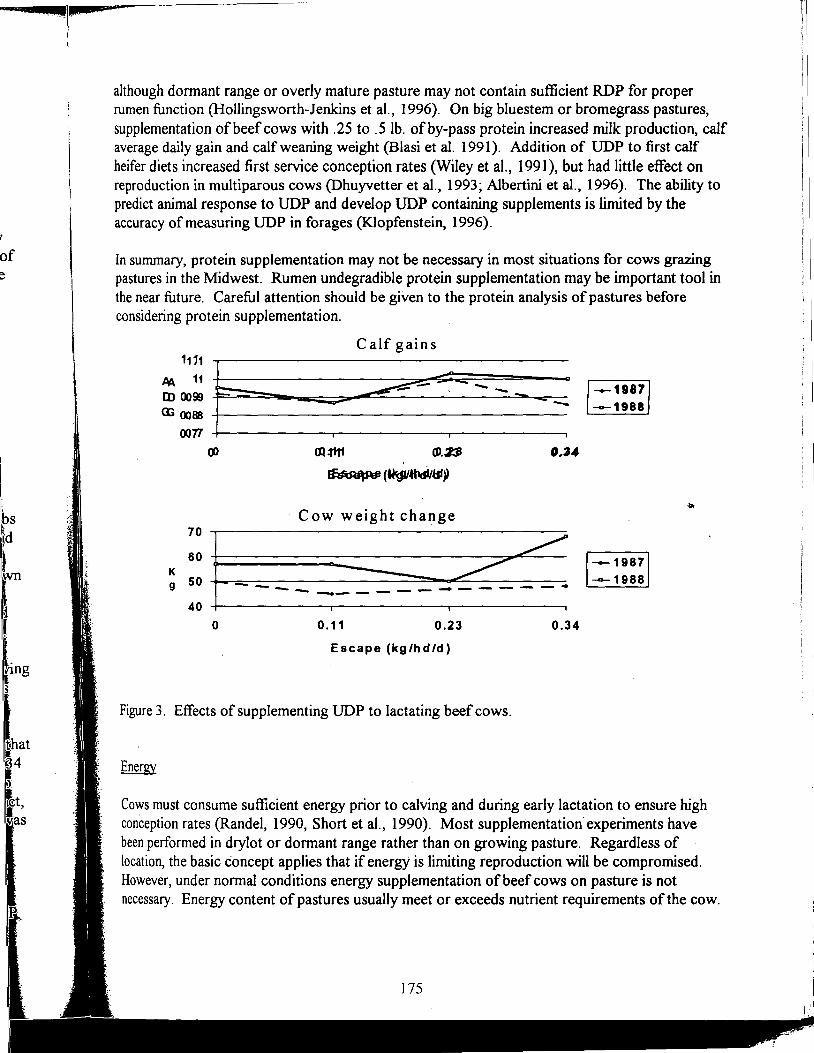
y of e
~
' J
although dormant range or overly mature pasture may not contain sufficient RDP for proper rumen function (Hollingsworth-Jenkins et al., 1996). On big bluestem or bromegrass pastures, supplementation of beef cows with .25 to .5 lb. of by-pass protein increased milk production, calf average daily gain and calf weaning weight (Blasi et al. 1991). Addition of UDP to first calf heifer diets increased first service conception rates (Wiley et al., 1991 ), but had little effect on reproduction in multiparous cows (Dhuyvetter et al., 1993; Albertini et al., 1996). The ability to predict animal response to UDP and develop UDP containing supplements is limited by the accuracy of measuring UDP in forages (Klopfenstein, 1996).
In summary, protein supplementation may not be necessary in most situations for cows grazing pastures in the Midwest. Rumen undegradible protein supplementation may be important tool in the near future. Careful attention should be given to the protein analysis of pastures before considering protein supplementation.
Calf gains
--1987 -1988
· Cow weight change 70
60 K g 50
40 E----~-----~4 --1987 --1988
0 0.11 0.23 0.34
Escape (kg/hd/d)
Figure 3. Effects of supplementing UDP to lactating beef cows.
Cows must consume sufficient energy prior to calving and during early lactation to ensure high conception rates (Randel, 1990, Short et al., 1990). Most supplementation experiments have been performed in drylot or dormant range rather than on growing pasture. Regardless of location, the basic concept applies that if energy is limiting reproduction will be compromised. However, under normal conditions energy supplementation of beef cows on pasture is not necessary. Energy content of pastures usually meet or exceeds nutrient requirements of the cow.
175 /,
However, when lactating cows are grazing poor quality forage or forage availability is limited energy supplementation may be beneficial.
When cattle are grazing abundant low-quality pastures energy supplementation often reduces forage intake and simply substitutes for the energy from pasture (Krysl & Hess, 1993). The timing of energy supplementation can affect grazing behavior with animals supplemented at noon (normally a rest period for cattle) consuming greater amount of forage and overall energy (Adams 1985). Most studies with energy supplementation of cows nursing calves have investigated combinations of energy and protein (Marston and Lusby, 1993; Marston et al., 199 5, F orcherio et al., 1?95). These studies often demonstrated complex interactions among type of energy supplement and protein source. Usually supplementing energy was oflimited value when protein requirements are met.
When forage availability is limited, energy supplementation becomes more important. In most cases, energy supplementation should be in the form of supplemental forage either hay or annual forage. In drought conditions, energy supplementation with com or wheat mids could be beneficial. One pound of com could substitute for approximately 5-8 lb. 9flow quality pasture (50 % TDN) as fed.
Other strategies for supplementing young calves should be applied when pasture is limited or quality may be below calf requirements. Creep grazing increased calf weights in a number of studies where forage availability was high, but quality was below calf needs (Blaser et al., 1986). Creep feeding of a high energy diet may also be beneficial when creep grazing is not feasible or forage availability is low. Calf creep supplements normally should contain an fiber based supplement or be limit fed if concentrates. Limit feeding concentrates tO creep fed calves increases weaning weights while preventing excess substitution of creep feed for forage (Faulkner et al., 1994 ). In most situations with cool seasons grasses, a protein supplement in the creep feed is not beneficial (Cremin et al., 1991) . However, calves grazing warm season grasses may benefit from protein as well as energy supplementation.
In summary, energy is usually the most limiting nutrient in late summer or early fall grazing. Beef cows nursing calves may need to be supplemented either with forage or an energy supplement. Calves will benefit from creep feeding when forage quantity and quality are limited. Creep feeding appears to be the most beneficial during the 60 to 80 days before weaning.
Calcium and Phosphorus
Most pastures in the Upper Midwest that contain legumes will easily meet the calcium requirements of beef cows. Cows, particularly first calf heifers, may benefit from limited calcium supplementation. Most of the soils in the Midwest are adequate to high in phosphorus as a result forages contain adequate or near adequate levels of phosphorus. The major concern with these two minerals is bioavailability, are the minerals in the plants available to the animal. The NRC requirements for beef cattle account for bioavailability by assuming a 50 % and 68 % absorption rate from the diet for Ca and P, respectively (NRC, 1996).
~
l I
]
l ]
~ I
~ ~
I
[\
ns
et
n
1
). I
11.
I' 11
\; ner 'bed 1efit
~eef
I
I''.
:~f l .. I. f
1
,··.
Phosphorus supplementation has been deemed critically important for grazing cattle for years. These recommendations are based on studies in extremely phosphorus deficient areas of the US and world (Kam, 1997; Fishwick et. al., 1977). Phosphorus supplementation enhanced reproduction and growth rate of beef cattle in areas where forages were P deficient. In Minnesota, pollution of surface water by P is of great concern. Grazing as well as feedlot cattle are often implicated as sources of Pin lakes and streams. We cannot totally discount the contribution of cattle to this problem. Owing to the nature of our soils in the area perhaps we have been over-supplementing Ca and P. We should consider reduction, but not elimination, of the amount of Ca and P in our pasture supplements.
Magnesium
Prevention of grass tetany by supplementation of young cattle and lactating beef cows during the spring has become common place. Levels of magnesium in forage are variable due to species, growing conditions and soil magnesium (Fontenot, 1979). Legumes have higher levels of magnesium than grasses, but supplementation may still be necessary. Because of the high risk involved with the loss of animals to grass tetany supplementation is recommended. Magnesium requirement for lactating cattle is 0. 20 % of dry matter (NRC, 1996). Magnesium oxide and magnesium sulfate are the preferred sources of Mg.
Trace minerals
Trace mineral supplementation is becoming increasingly complex. Interactions among trace, minerals and the extreme variability in- soil content and plant uptake create difficulties in understanding the contribution of pastures to trace mineral nutrition of beef cattle.
A recent survey of forage samples across the US indicated that forages/pastures in the Midwest were most likely to be deficient in copper. zinc and selenium (Corah & Dargatz, 1996). Supplementation of these minerals should be routine. In addition, iron concentrations in many Midwest samples exceeded 250 ppm. If forage samples exceed 250-500 ppm of Fe, the iron content can interfere with copper uptake resulting in a copper deficiency (Bremner et al., 1987). In addition, high sulfur concentrations can also interfere with uptake and use of other trace minerals.
Considering the high concentration of iron and sulfur in many Midwestern soils, additional supplementation of copper and other trace elements maybe warranted. Water should also be considered a significant source of Fe and Sin some areas. Water tests as well as forage tests may need to be taken if deficiencies in copper are suspected.
PRACTICAL SUPPLEMENTATION OF GRAZING BEEF COWS
Designing a supplementation program for grazing beef cows can be difficult, and because of variations in types of pasture and pasture management a generalized supplementation program is not feasible or prudent. The following suggestions may help in designing a supplementation program and reducing over-supplementation.
177
• Sample pastures for nutrient content • _Understand soil types and grazing/pasture management on a farm-by-farm basis • Energy is most likely to be the first limiting major nutrient • Protein supplementation may only be needed in a few incidences • Pasture availability is a greater problem in most grazing situations than nutrient density. • Proper pasture management will reduce the need for supplements. • Calcium, phosphorous and iron supplementation may need to be reduced compared to
standard practices. • Midwest forages are deficient in copper, zinc and selenium. • Be aware of interactions of minerals in pasture and water.
LITERATURE CITED
Adams, D. C., 1985. Effect of time of supplementation on performance, forage intake and grazing behavior of yearling beef steers grazing Russian wild ryegrass in the fall. J. Anim. Sci. Vol. 6l{No. 9) pp 1037-1042. ,
Albertini, H. L., D. E. Hawkins, M. K. Petersen, D. M. Hallford, T. T. Ross, R. A. Renner, K. K. Kane, and L.A. Appeddu, 1996. Undegradable intake protein (uip) and fat on reproductive and endocrine function of young beef cows. carbohydrate supplementation of wintering beef cattle. Proceedings, Western Section, American Society of Animal Science. Vol. 47, pp 197-200.
Blaser, Roy E. and Colleagues, 1986. Forage-Animal Management Systems. Bulletin 86.,7. Blasi, D. A., J. K. Ward, T. J. Klopfenstein, and R. A. Britton, 1991. Escape protein for beef
cows: III. Performance of lactating beef cows grazing smooth brome or big bluestem. J. Anim. Sci. Vol. 69(No. 6), pp 2294-2302.
Bremen, I., W.R. Humphries, M. Phillippo, M. J. Walker, and P. C. Morrice, 1987. Iron-induced copper deficiency in calves: dose-response relationships and interactions with molybdenum and sulfur. Anim. Prod. 45:403-414.
Campbell, C. M., K. S. Eng, Jr., A. B. Nelson and L. S. Pope, 1968. Use of the esophageal fistula in diet sampling with beef cattle. J. Anim. Sci. pp 231-23 3.
Clanton, D. C., 1982. Crude protein in range supplements. In: F. N. Owens (Ed.) protein requirements for cattle: Symposium. Oklahoma State Univ. MP 109:228.
Corah, Larry R., and David Dargatz, 1996. Forage analyses from cow/calf herds in 18 states. Beef CHAPA.
Cremin, J. D., Jr., D. B. Faulkner, N. R. Merchen, G. C. Fahey, Jr., R. L. Femanco, and C. L. Willms, 1991. Digestion criteria in nursing beef calves supplemented with limited levels of protein and energy. J. Anim. Sci. Vol. 69(No. 3) pp 1322-1331.
DelCurto, T., R. C. Cochran, T. G. Nagaraja, L. R. Corah, A. A. Beharka, and E. S. Vanzant, 1990. Comparison of soybean meal/sorghum grain, alfalfa hay and dehydrated alfalfa pellets as supplemental protein sources for beef cattle consuming dormant tallgrass-prairie forage. J. Anim. Sci. Vol. 68(No. 9), pp 2901-2915.
Dhuyvetter, D. V., M. K. Petersen, R. P. Ansotegui, R. A. Bellows, B. Nisley, R. Brownson, and M. W. Tess, 1993. Reproductive efficiency of range beef cows fed different quantities of
178
I.
of
of
e
i f
ruminally undegradable protein before breeding. J. Anim. Sci. Vol. 7l(No. 10), pp 2586-2593.
Faulkner, D. B., D. F. Hummel, D. D. Buskirk, L. L. Berger, D. F. Parrett, and G. f Cmarik, 1994. Performance and nutrient metabolism by nursing calves supplemented with limited or unlimited corn of soyhulls. J. Anim. Sci. Vol. 72(No. 2) pp 470-477.
Fisher, D. S., J.C. Burns, and H.F. Mayland, 1997. Variation in preference for morning or afternoon harvested hay in sheep, goats, and cattle. J. Anim. Sci. Vol. 75(Suppl. 1), p 201.
Fishwick, G., J. Fraser, R. G. Hemingway, J. J. Parkins, and N. S. Ritchie, 1977. The effects of dietary phosphorus inadequacy during pregnancy and lactation on the voluntary intake and digestibility of oat straw by beef cows and the performance of their calves. J. Agr. Sci. (Camb.) 88: 143-150.
Fontenot, J.P., 1979. Animal nutrition aspects of grass tetany. ASA Special Publication No. 35 pp 51-62.
Forcherio, J.C., G. E. Catlett, J. A. Paterson, M. S. Kerley, and M. R. Ellersieck, 1995. Supplemental protein and energy for beef cows consuming endophyte-infected tall fescue. J. Anim. Sci. Vol 73(No. 11) pp 3427-3436.
Gerrish, Jim and Craig Roberts, 1997. Missouri Grazing Manual. Forage Systems Research Center, University of Missouri.
Grings, E. E., D. C. Adams, and R. E. Short, 1995. Diet quality of suckling calves and mature steers on Northern Great Plains rangelands. J. Range Manage., 48:438-411.
Hess, B. W., K. K. Park, L. J. Krysl, M. B. Judkins, B. A. McCracken, and D.R. Hanks, 1994. Supplemental protein for beef cattle grazing dormant intermediate wheatgrass pastu4e: Effects on nutrient quality, forage intake, digesta kinetics, grazing behavior, rumi.nal fermentation, and digestion. J. Anim. Sci. Vol. 72(No. 8) pp 2113-2123.
Hitz, Andrew C., James R. Russell, Dennis R. Maxwell, and L. J. Secor, 1996. Efficacy of grazing stockpiled perennial forages for winter maintenance of beef cows. 1996 Beef Research Report, Iowa State University of Science and Technology. AS-632, pp 116-125
Hollingsworth-Jenkins, K. J., T. J. Klopfenstein, D. C. Adams, and J.B. Lamb, 1996. Ruminally degradable protein requirement of gestating beef cows grazing native winter sandhills range. J. Anim. Sci. Vol. 74(No. 6), pp 1343-1348.
Huber, S. A., M. B. Judkins, L. J. Krysl, T. J. Svejcar, B. W. Hess, and D. W. Holcombe, 1995. Cattle grazing a riparian mountain meadow: Effects of low and moderate stocking density on nutrition, behavior, diet selection,,and plant growth response. J. Anim. Sci. Vol. 73(No. 12), pp 3752-3765.
Kam, James F., 1997. Phosphorus supplementation of range cows in the Northern Great Plains. J. Range Manage. 50(1) pp 2-9.
Klopfenstein, Terry, 1996. Need for escape protein by grazing cattle. Animal Feed Science Technology 60, pp 191-199.
Krysl, L. J. and B. W. Hess, 1993. Influence of supplementation on behavior of grazing cattle. J. Anim. Sci. Vol. 71(No. 9) pp 2546-2555.
Marston, T. T., K. S. Lusby, and R. P. Wettemann, 1993. Effects of feeding different amounts of energy and protein supplements to fall-calving beef cows. Anim. Sci. Research Report 107.
179
-•;
i i
Marston, T. T., and K. S. Lusby, 1995. Effects of energy or protein supplements and stage production on intake and digestibility of hay by beef cows. J. Anim. Sci. Vol. 73(No. 3) pp 651-656.
Marston, T. T., K. S. Lusby, R. P. Wettemann, and H. T. Purvis, 1995. Effects of feeding energy or protein supplements before or after calving on perfonnance of spring-calving cows grazing native range. J. Anim. Sci. Vol. 73(No. 3) pp 657-664.
Martin, Neal P. and James G. Linn, 1985. Interpreting forage test results. Proceedings of the 10th Annual Minnesota Forage Day. pp 60-69.
McCollurn, F. T., and G. W. Horn, 1990. Protein supplementation of grazing livestock: A review. Prof Anim. Sci. 6: 1.
Minson, D. J., 1990. Forages in ruminant nutrition. New York: Academic Press. Nutrient Requirements of Beef Cattle, 1996. National Research Council. Poppi, Dennis P. and Stuart R. McLennan, 1995. Protein and energy utilization by ruminants at
pasture. J. Anim. Sci. 1995. Vol. 73(No. 1), pp 278-290. Randel, R. D., 1990. Nutrition and postpartum rebreeding in cattle. J. Anim. Sci. Vol. 68(No.
3) pp 853-862. Short, R. E., R. A Bellows, R. B. Staigmiller, J. G. Berardinelli, and E. E. Custer, 1990.
Physiological mechanisms controlling anestrus and infertility in postpartum beef cattle. J. Anim. Sci. Vol. 68(No. 3) pp 799-816.
Short, R. E., E. E. Grings, M. D. MacNeil, R. K. Heitschmidt, M. R. Haferkamp, and D. C. Adams, 1996. Effects of time of weaning, supplement, and sire breed of calf during the fall grazing period on cow and calfperfonnance. J. Anim. Sci. Vol. 74(No. 7) pp 1701-1710.
Suleiman, A, R. Corbett, E. Okine, and L. A Goonewardene, 1995. Composition of Aiberta forages compared to NRC values and the implications for feeding cattle. Proceedings, Western Section, American Society of Animal Science. Vol. 46, pp 372-375.
Surber, L. M. M., J. G. P. Bowman, B. F. Sowell, and T. K. Daniels, 1996. Non-structural carbohydrate supplementation of wintering beef cattle. Proceedings, Western Section, American Society of Animal Science. Vol. 47, pp 182-185.
Wiley, J. S., M. K. Petersen, R. P. Ansotegui, and R. A Bellows, 1991: Production from firstcalf beef heifers fed a maintenance or low level of prepartum nutrition and ruminally undegradable or degradable protein pospartum. J. Anim. Sci. Vol. 69(No. 11), pp 4279-4293.
Wiley, J. S., M. K. Petersen, C. K. Clark, R. P. Ansotegui, and D. W. Lodman, 1991. The influence oftiming and the addition of urea to supplements containing DL-Methionine on ruminal fennentation and cow weight change in beef cows. J. Anim. Sci. Vol. 69(No. 11), pp 4617-4627.
180
y
),
L\JCREASING THE ACCURACY OF FEEDING PROGRAMS FOR GROWING-FINISHING PIGS
J. E. Pettigrew Department of Animal Science
University of Minnesota
The world-wide pork production industry has responded impressively to the crucial demands offeeding an increasing world population with little or no increase in the amount of arable land available for producing feedstuffs. People in many developing countries have rising income, which allows them to purchase higherquality diets containing more pork and other meats, and that exacerbates the limitation of arable land. The pork industry has responded to this situation with a marked improvement in feed efficiency, but further improvements are needed. Some of the future improvefuents will derive from more accurately meeting the quantitative nutrient requirements of the pigs, and that is the subject of this paper.
ENERGY
Energy Density Targets
When several feed ingredients with differing energy densities are available for use in producing a diet for pigs, it is important to combine them in proportions that prpduce the appropriate energy density in the complete diet. lfthe energy density is too low, the growth rate of the pigs may be slowed. If it is too high, the pigs may become excessively fat.
In the Midwest, we have the luxury of building swine diets from com and soybean meal as the primary (often only) sources of energy and amino acids. The energy density of com-soy diets is not grossly inapprop'tiate for any class of pigs, and the economic advantage of using these feedstuffs has been so strong that sometimes other ingredients are not considered. In some cases the energy density is altered by inclusion of ingredients such as animal fat or wheat midds. In most cases changes in energy density are confounded with changes in energy sources (fat vs. fiber vs. starch).
It appears that the dietary energy density should be rather high for pigs up to about 100-150 lb. body weight in order to maximize lean accretion rate, then lower for heavier pigs in order to avoid excessive fatness (Johnston et al., 1996). Solid experimental documentation of the appropriate energy densities is lacking at present. However, formulating diets to meet predetermined energy density specifications will help us increase the accuracy offeeding programs for growing-finishing pigs, to maintain rapid growth without excessive fatness. I believe this is important even in the Midwest where diets are based largely on com and soybean meal.
NE VS. ME
The metabolizable energy (ME) system has served us well for many years, but it is imperfect. It undervalues fat relative to com and other grains, and it seriously overvalues fibrous ingredients (Johnston et al., 1996). There are clear advantages to the use of the net energy (NE) system. The principal drawback to the NE system is that the database of NE values offeedstuffs is limited. There are inconsistencies from laboratory to laboratory in NE values, as reviewed at this meeting last year (Johnston et al., 1996). However it is my judgement that the NE database now available is large enough and good enough that moving from ME to NE will produce a significant improvement in our ability to quantify the energy value of diets. I believe that we should shift from ME to NE, as we shifted from TDN to ME several decades ago. It is especially important when several alternative ingredients are considered for use in swine diets.
181
'i'.
AMINO ACIDS
Expression of Dietruy Levels and Requirements
Total vs. digestible amino acids. There is variation among ingredients in protein digestibility. We now have a large database of information on digestibility of individual amino acids in many feedstuffs. Formulation to target levels of digestible amino acids is clearly superior to use of target levels of total amino acids. We now should have completed the shift to digestible amino acids, in the same way we shifted from crude protein to total amino acids years ago.
Which measure of digestibility? First, it is clear that digestibility should be measured to the tenninal ileum rather than over the total digestive tract.
Most estimates of amino acid digestibility now available are of apparent digestibility. In other words, they reflect the net difference between the amounts of amino acids consumed and the amounts reaching the end of the ileum. This is not a measure of true digestibility because it counts as "undigested" the amino acids contained in materials secreted from the body into the gut and not reabsorbed from the small intestine (endogenous losses). However, it is theoretically an appropriate measure because it reflects the net amounts of amino acids actually available to the animal. If a feedstuff causes the body to secrete increased amounts of mucus or other proteins, and thus increases endogenous losses, the estimate of "digestibility" would be reduced appropriately.
Unfortunately, the experimental approach required for these measurements causes an in:iportant underestimation of the amino acid contribution of low-protein ingredients, including com and other grains, because with low-protein diets endogenous losses are larger relative to intake. In my opinion, this underestimation of the value oflow-protein ingredients forces us to look for other measures.
There is now a reasonable database of true digestibility of amino acids of a number offeedstuffs (Southern, 1991; Jondreville et al., 1995). There are both theoretical and practical concerns about the methods available for estimating true digestibility, but the values do not appear to contain systematic biases as serious as the problem with apparent digestibility values. Most estimates of "true" digestibility are .not unbiased estimates of the proportion of dietary amino acids the pig actually retrieves from the gut, so the· term "standardized digestibility" is sometimes used (Jondreville et al., 1995).
Lean Accretion Curves
All of the discussion above relates to methods for formulating diets to meet predetermined nutrient level requirements. There is also room for marked improvement in methods for estimating amino acid requirements. In fact, the greatest opportunity for increasing the accuracy offeeding programs lies in improved estimates of amino acid needs.
The fundamental difficulty is that amino acid requirements are not the same for all pigs. The U.S. pork industry has accepted and implemented the notion that leaner genetic strains of pigs require higher dietary con~1trations of amino acids. We have also adopted separate-sex feeding programs, in which dietary amino acid concentrations are higher for gilts than for barrows. We have adopted phase-feeding programs in an attempt to match the dietary amino acid concentrations to the stage of growth of pigs.
We have incorporated all of these sophisticated concepts and practices into pork production, at least qualitatively. However, there remains the daunting but important challenge of ensuring that these adjustments are quantitatively appropriate for the situation at hand.
J
f
f
0
Daily amino acid requirements can be calculated by a factorial method, simply adding the requirements for maintenance and for protein accretion. There are useful estimates of the maintenance requirements for amino acids (Fuller et al., 1989), so determining that component of the requirement is straightforward. However the amount of protein accreted each day varies dramatically with variation in body weight, genetic strain, gender, health status, ambient temperature, and stocking density. It is theoretically appealing to simply estimate potential protein accretion rates for specific genetic strains, for each gender and body weight, in "standard" conditions, then to adjust those rates for deviations from the "standard" conditions in health, temperature, and stocking density. However, at present we lack the quantitative information required to make the adjustments with confidence. We are left, then,' with a need for a more empirical approach for estimation of protein accretion rate, and then amino acid"'requirements, for individual situations.
One approach is to estimate the overall mean rate oflean accretion for a group of growing-finishing pigs, using data from kill sheets. Then we can estimate the lean accretion rate for each stage of growth, using an assumption about the shape of the lean accretion_ curve (lean accretion rate plotted against days on feed or against body weight). Once we have an estimate of the lean accretion rate for a given stage of growth, we can calculate the protein accretion rate and then the amino acid requirements. I believe that adopting this relatively simple approach will help us dramatically in our efforts to increase the accuracy of feeding programs for growing-finishing pigs.
Note that this approach estimates the requirements of the pigs as they perform in that production unit. It reflects not only the genetic strain and gender, but also health, ambient temperature, stocking density, and all other factors that impact lean accretion rates. One factor that influences lean accretion rate is nutrition. If the dietary amino acid level of the pigs tested is too low, that will limit lean accretion rate and cause underestimation of the requirements. It is critical that the tested pigs consume adequate diets. Note also that
.i..
lean accretion rates may change with season.
The "kill sheet" approach can be very valuable, but it has an important flaw. It assumes that the shape of the lean accretion curve is the same for all pigs, and that is not the case (Smith et al., 1996). That flaw pushes us to adopt an even more sophisticated approach, measurement of lean accretion curves for individual situations. A method for such measurements ,have been proposed (Schinckel et al., 1996), and a few measurements have been made (Smith et al., 1996). The method requires measurements of body composition of test pigs by real-time ultrasound on several occasions during the growing-finishing period. Detailed procedures have been presented (Dritz et al., 1997). Results to date have confirmed that the shape of the lean accretion curve is not constant, but varies widely from farm to farm. The results of these measurements have prompted changes in feeding programs, which have resulted in improved profits.
In my view, measurement oflean accretion curves for specific situations is the most powerful method available for increasing the accuracy offeeding programs for growing-finishing pigs.
PHOSPHORUS
The industry is now acutely aware that in many cases we must eliminate our traditional excessive supplementation of pig diets with phosphorus, in order to avoid unacceptable phosphorus buildup in soils. The availability of a commercial phytase product to improve utilization of the phosphorus in plant materials is important. Formulation of diets on the basis of available phosphorus is now routine. However, there remains a need to more accurately and precisely estimate phosphorus requirements of pigs so adequate supplies can be provided in the diet without large excesses. Phosphorus requirements undoubtedly vary among pigs and situations, in the same way and for the same reasons that amino acid requirements vary. There is a pressing need for methods that allow estimating these requirements for specific situations.
I i
SUMMARY
New methods that will support increasing the accuracy of feeding programs for growing-finishing pigs are now available. The most important is measurement oflean accretion curves as a basis for estimating amino acid requirements at each stage of growth. A less powerful but cheaper alternative is use of kill sheet information to estimate mean lean accretion, which requires assumption of a standard shape of the lean accretion curve. The time is right for implementing true (or standardized) ileal digestible amino acid and net energy systems, to improve accuracy in use of alternative feed ingredients. Available phosphorus values should be used, but a system for estimating phosphorus requirements under varying conditions is needed.
LITERATURE CITED
Dritz, S.S. M.D. Tokach, R.D. Goodband, and J.L. Nelssen. 1997. Growth curve analysis: Practical tools for making farm-specific decisions. Proc. Allen D. Leman Swine Conference Vol. 24.
Fuller, M.F., R. Mc William, T.C. Wang, and L.R. Giles. 1989. The optimum dietary amino acid pattern for growing pigs. 2. Requirements for maintenance and for tissue protein accretion. Br. J. Nutr. 62:255-267.
Johnston, L.J., J.E. Pettigrew and G.C. Shurson. 1996. Energy systems and their value for use in swine diet formulation. Proc. 57th Minnesota Nutrition Conference and Protiva Technical Symposium, pp 199-221.
Jondreville, C., J. Van den Broecke, F. Gatel, and S. Van Cauwenberghe. 1995. Ileal Digestibility of Amino Acids in Feedstuffs for Pigs. Institut Technique des Cereales et des Fourrages, Paris.
' Schinckel AP., P.V. Preckel,, and M.E. Einstein. 1996. Prediction of daily protein accretion rates of pigs
from estimates of fat-free lean gain between 20 and 120 kilograms live weight. J. Anim. Sci. 74:498-503.
Smith, J.W., M.D. Tokach, AP. Schinckel, S.S. Dritz, J.L. Nelssen, and R.D. Goodband. 1996. The use of real-time ultrasound to model the growth performance and lysine requirements of growing-finishing pigs on commercial farms. Kansas State University 1996 Swine Day Report, pp 117-121.
Southern, L.L. 1991. Digestible Amino Acids and Digestible Amino Acid Requirements for Swine. Biokyowa Technical Review-2. Nutri-Quest, Inc., St. Louis.
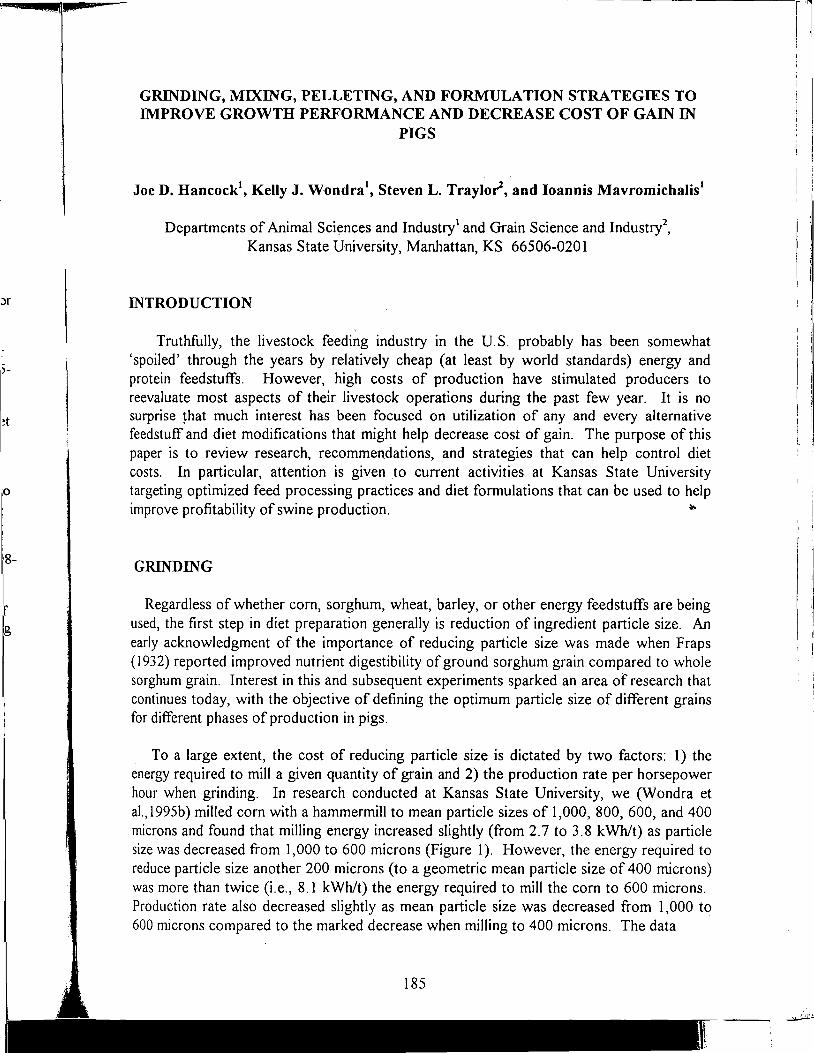
:>r
)-
,o
f g
GRINDING, MIXING, PELLETING, AND FORMULATION STRATEGIES TO IMPROVE GROWTH PERFORMANCE AND DECREASE COST OF GAIN IN
PIGS
Joe D. Hancock', Kelly J. Wondra', Steven L. Traylor2, and Ioannis Mavromichalis'
Departments of Animal Sciences and Industry' and Grain Science and Industry2,
Kansas State University, Manhattan, KS 66506-0201
INTRODUCTION
Truthfully, the livestock feeding industry in the U.S. probably has been somewhat 'spoiled' through the years by relatively cheap (at least by world standards) energy and protein feedstuffs. However, high costs of production have stimulated producers to reevaluate most aspects of their livestock operations during the past few year. It is no surprise !hat much interest has been focused on utilization of any and every alternative feedstuff and diet modifications that might help decrease cost of gain. The purpose of this paper is to review research, recommendations, and strategies that can help control diet costs. In particular, attention is given to current activities at Kansas State University targeting optimized feed processing practices and diet formulations that can be used to help improve profitability of swine production. -11>
GRINDING
Regardless of whether corn, sorghum, wheat, barley, or other energy feedstuffs are being used, the first step in diet preparation generally is reduction of ingredient particle size. An early acknowledgment of the importance of reducing particle size was made when Fraps (1932) reported improved nutrient digestibility of ground sorghum grain compared to whole sorghum grain. Interest in this and subsequent experiments sparked an area of research that continues today, with the objective of defining the optimum particle size of different grains for different phases of production in pigs.
To a large extent, the cost of reducing particle size is dictated by two factors: 1) the energy required to mill a given quantity of grain and 2) the production rate per horsepower hour when grinding. In research conducted at Kansas State University, we (Wondra et al., 1995b) milled corn with a hammermill to mean particle sizes of 1,000, 800, 600, and 400 microns and found that milling energy increased slightly (from 2.7 to 3.8 kWh/t) as particle size was decreased from 1,000 to 600 microns (Figure 1). However, the energy required to reduce particle size another 200 microns (to a geometric mean particle size of 400 microns) was more than twice (i.e., 8.1 kWh/t) the energy required t6 mill the com to 600 microns. Production rate also decreased slightly as mean particle size was decreased from 1, 000 to 600 microns compared to the marked decrease when milling to 400 microns. The data
r
i i i
I ',•,··
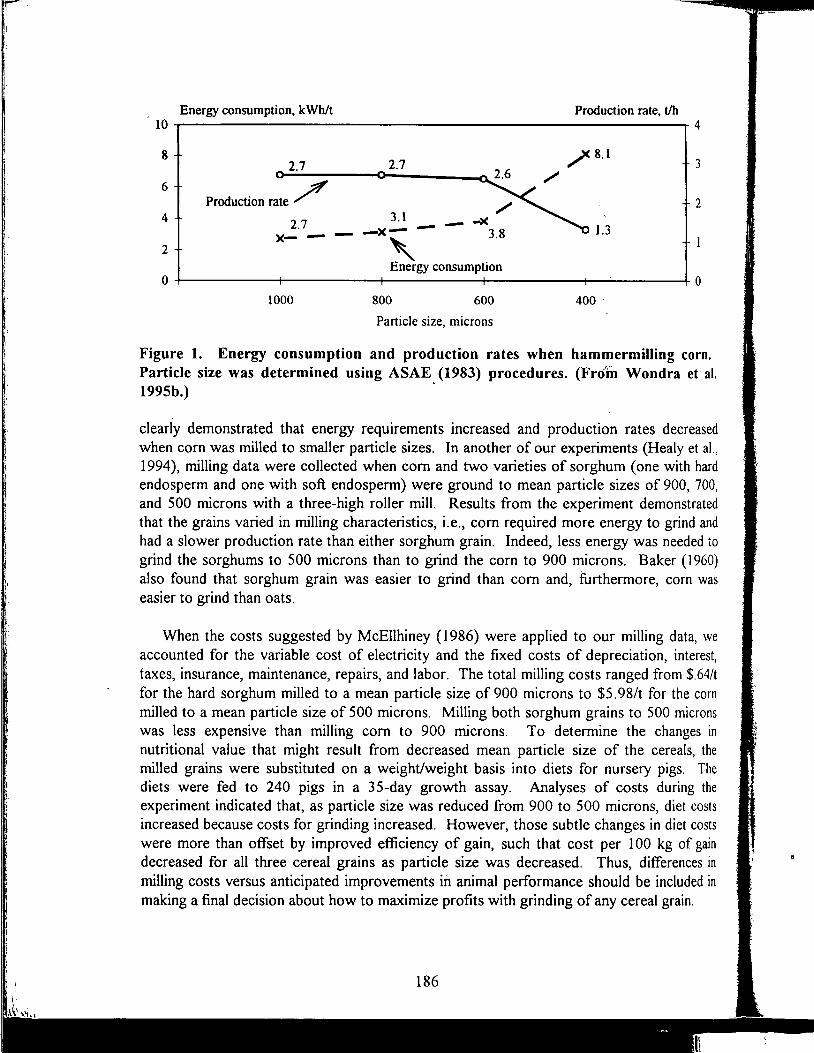
j1
I
il
!'
!'
!I )
Energy consumption, kWh/t Production rate, t/h 10 4
8 2.7 2.7 3
6 Production rate / 2
4 3.1 ..x 2.7 -x- -- 3.8 1.3 x- -
' 2 Energy consumption
0 0 1000 800 600 400 -
Particle size, microns
Figure 1. Energy consumption and production rates when hammermilling corn. Particle size was determined using ASAE (1983) procedures. (Fro'fu Wondra et al. 1995bJ .
clearly demonstrated that energy requirements increased and production rates decreased when com was milled to smaller particle sizes. In another of our experiments (Healy et al., 1994), milling data were collected when com and two varieties of sorghum (one with hard endosperm and one with soft endosperm) were ground to mean particle sizes of 900, 700, and 500 microns with a three-high roller mill. Results from the experiment demonstrated that the grains varied in milling characteristics, i.e., com required more energy to grind and had a slower production rate than either sorghum grain. Indeed, less energy was needed to grind the sorghums to 500 microns than to grind the com to 900 microns. Baker ( 1960) also found that sorghum grain was easier to grind than com and, furthermore, corn was easier to grind than oats.
When the costs suggested by McEllhiney ( 1986) were applied to our milling data, we accounted for the variable cost of electricity and the fixed costs of depreciation, interest, taxes, insurance, maintenance, repairs, and labor. The total milling costs ranged from $.64/t for the hard sorghum milled to a mean particle size of 900 microns to $5. 98/t for the com milled to a mean particle size of 500 microns. Milling both sorghum grains to 500 microns was less expensive than milling com to 900 microns. To determine the changes in nutritional value that might result from decreased mean particle size of the cereals, the milled grains were substituted on a weight/weight basis into diets for nursery pigs. The diets were fed to 240 pigs in a 35-day growth assay. Analyses of costs during the experiment indicated that, as particle size was reduced from 900 to 500 microns, diet costs increased because costs for grinding increased. However, those subtle changes in diet costs were more than offset by improved efficiency of gain, such that cost per 100 kg of gain decreased for all three cereal grains as particle size was decreased. Thus, differences in milling costs versus anticipated improvements in animal performance should be included in making a final decision about how to maximize profits with grinding of any cereal grain.
)
'
I~ t 'I
s n e e e :s :s n n .n
Although not the only potential benefit to animals of advanced processing techniques, improved performance is the most visible, easiest to measure, and of intense interest to the end users of the finished diets_, (i.e., livestock feeders). A few experiments indicate improved rate of gain with reduction of particle size, but improvements in efficiency of gain are more typical. The results of experiments by Mahan et al. (1966) and Lawrence (1983) showed greater gain/feed when the particle size of grain was reduced from coarse to fine. Also, Giesemann et al. (1990) reported improved efficiency of gain for finishing pigs fed corn and a bronze sorghum variety-as particle size was reduced. In our work (Wondra et al., 1995b) with corn ground to particle sizes ranging from 1,000 to 400 microns, we observed an 8% improvement in gain/feed for finishing pigs. Indeed, when we reviewed our data from several experiments, a 1.3% improvement in gain/feed for each 100-micron reduction in mean particle size seemed an appropriate "rule of thumb" for growing pigs fed diets with corn ranging from 1,200 to 400 microns. Thus, attention to proper milling is an effective way to ensure maximum performance of growing pigs.
Of notable importance is the fact that the benefits of proper milling also apply to sows. It is generally recognized that high-producing sows have nutrient requirements that may not be met by traditional dietary regimens. Increased nutrient intake of sows has been shown to improve performance (Brooks and Cole, 1972; Reese et al., 1982; King and Williams 1984; Brendemuhl et al., 1987). The method most often used to increase nutrient intake of sows is to increase nutrient density of the diet by adding more protein and(or) fat (which increases diet costs). Another approach is to increase feed intake by keeping the sows comfortable, e.g., use of drip cooling or fogging in hot summer months. This app?oach increase feed intake, but unfortunately, also increases the amount of nutrients excreted as feces. Surprisingly, little thought has been given to a third possibility, that is, to increase digestibility of the nutrients already in the diet.
We conducted a lactation experiment (Wondra et al., 1995e) using 100 prmuparous sows fed diets with corn milled to four particle sizes (1,200, 900, 600, and 400 microns). We were concerned that the diets with finely ground corn would not be palatable; however, this was not the case, and feed intake actually increased as particle size of corn was reduced (Figure 2). This· increased feed intake and marked increases in nutrient digestibility resulted in 14% greater intake of DE and an 11 % increase in litter weight gain. Finally, because of the improved digestibility of nutrients with reduction of particle size, a 21 % decrease in fecal excretion of DM and a 31 % decrease in fecal excretion of N occurred. These reductions in fecal excretion of nutrients have obvious and immediate implications in reducing the burden of waste management for swine producers.
To determine the effects of reducing particle size of cereal grains on nutrient metabolism during lactation, we used 38 second-parity sows in a metabolism experiment (Wondra et al., 1995d). The sows were fed corn-soybean meal-based diets, with the corn ground to 1,200, 900, 600, and 400 microns. The results indicated greater digestibilities of DM, N, and GE as corn particle size was reduced from 1,200 to 400 microns (Table l ). Digestible energy and ME values were maximized with the diet having 400 micron corn. Indeed, the ME concentration of the diet was increased from 3,399 to 3, 745 kcal/kg as particle size of com
4.6 Average daily feed intake, kg/d Energy digestibility,%
4.43 92 90.0 4.40 4.4
88
4.2 84
4.0 80
1200 900 600 400 1200 900 600 400 Particle size, microns Particle size, microns
17 Digestible energy intake, Mcal/d
41 Litter weight gain, kg
16 15.6 38.2 38.6
38 15
14 35
13
12 32
1200 900 600 400 1200 900 600 400 Particle size, microns Particle size, microns
Figure 2. Effects of corn particle size on lactation performance of primiparous sows and apparent digestibility and intake of energy. (From Wondra et al., 1995e.)
was reduced from 1,200 to 400 microns. To achieve the same increase in energy density with diet formulation methods, a 9% addition of soybean oil would be needed. Biological value and N retention increased as particle size was reduced from 1,200 to 600 microns but decreased as the particle size was reduced further to 400 microns. These decreases may have resulted from the amino acid profile of com. As a protein source, com is deficient in lysine, threonine, tryptophan, and valine, yet exceeds the requirements for other amino acids such as leucine (NRC, 1988). The amino acid composition of soybean meal complements that of com very well; however, with increased digestibility of only the com, diets would be high in digestible nonlimiting amino acids. The N from those excess amino acids would be excreted in the urine, thereby decreasing BV and percentage N retention.
Thus, in experiments with nursery pigs, finishing pigs, and lactating sows, our data indicated an optimum particle size of 600 microns or less for cereal grains. Though we feel confident about this recommendation, the question of an ideal amount of uniformity within that mean is still asked on a regular basis.
188
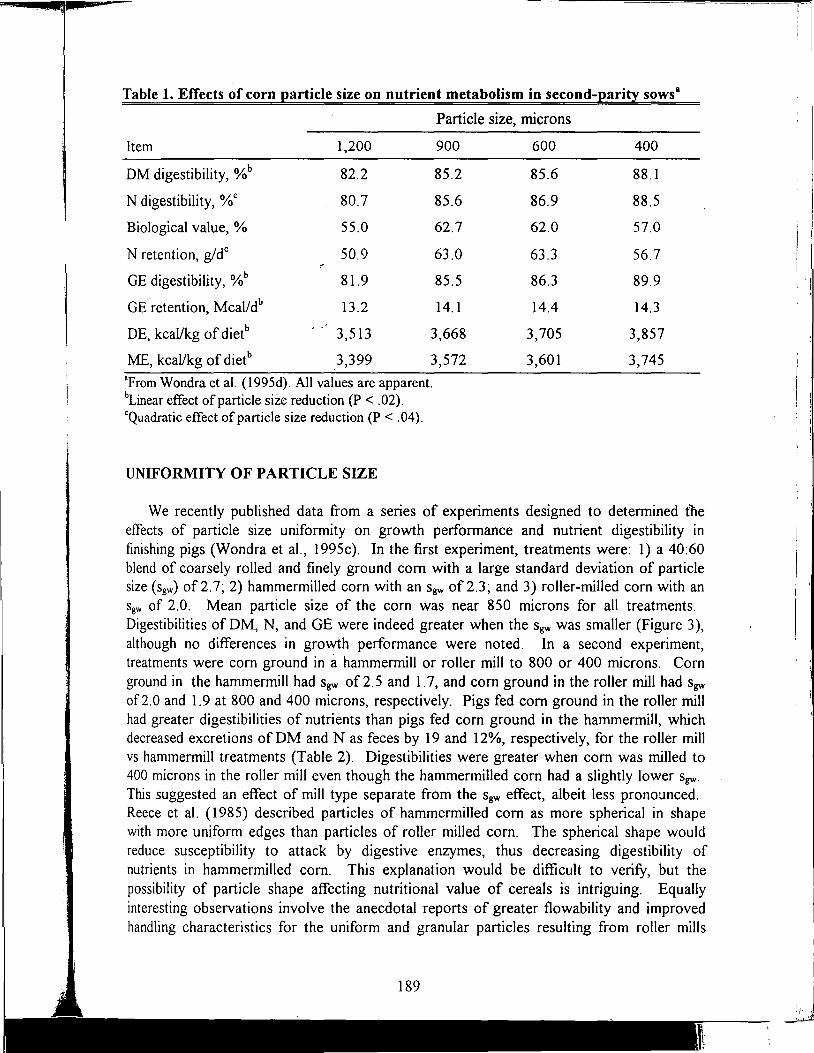
I ..
Table 1. Effects of corn particle size on nutrient metabolism in second-parity sowsa
Particle size, microns
Item 1,200 900 600 400
DM digestibility, %b 82.2 85.2 85.6 88.1
N digestibility, % c 80.7 85.6 86.9 88.5
Biological value, % 55.0 62.7 62.0 57.0
N retention, g/dc 50.9 63.0 63.3 56.7 <'
GE digestibility, % b 81.9 85.5 86.3 89.9
GE retention, Meal/db 13.2 14.1 14.4 14.3
DE, kcal/kg of dietb 3,513 3,668 3,705 3,857
ME, kcal/kg of dietb 3,399 3,572 3,601 3,745
"From Wondra et al. (1995d). All values are apparent. hLinear effect of particle size reduction (P < .02). cQuadratic effect of particle size reduction (P < .04).
UNIFORMITY OF PARTICLE SIZE
We recently published data from a series of experiments designed to determined fne effects of particle size uniformity on growth performance and nutrient digestibility in finishing pigs (Wondra et al., 1995c). In the first experiment, treatments were: 1) a 40:60 blend of coarsely rolled and finely ground com with a large standard deviation of particle size (sgw) of 2.7; 2) hammermilled com with an Sgw of 2.3; and 3) roller-milled com with an s8w of 2.0. Mean particle size of the com was near 850 microns for all treatments. Digestibilities of DM, N, and GE were indeed greater when the Sgw was smaller (Figure 3), although no differences in growth performance were noted. In a second experiment, treatments were com ground in a hammermill or roller mill to 800 or 400 microns. Com ground in the hammermill had Sgw of 2.5 and 1.7, and com ground in the roller mill had Sgw of 2.0 and 1.9 at 800 and 400 microns, respectively. Pigs fed com ground in the roller mill had greater digestibilities of nutrients than pigs fed com ground in the hamrnermill, which decreased excretions of DM and N as feces by 19 and 12%, respectively, for the roller mill vs hammermill treatments (Table 2). Digestibilities were greater when com was milled to 400 microns in the roller mill even though the hammermilled com had a slightly lower Sgw. This suggested an effect of mill type separate from the Sgw effect, albeit less prono:.mced. Reece et al. (1985) described particles of hammermilled com as more spherical in shape with more uniform edges than particles of roller milled com. The spherical shape would reduce susceptibility to attack by digestive enzymes, thus decreasing digestibility of nutrients in hammermilled com. This explanation would be difficult to verify, but the possibility of particle shape affecting nutritional value of cereals is intriguing. Equally interesting observations involve the anecdotal reports of greater flowability and improved handling characteristics for the uniform and granular particles resulting from roller mills
------- 1··
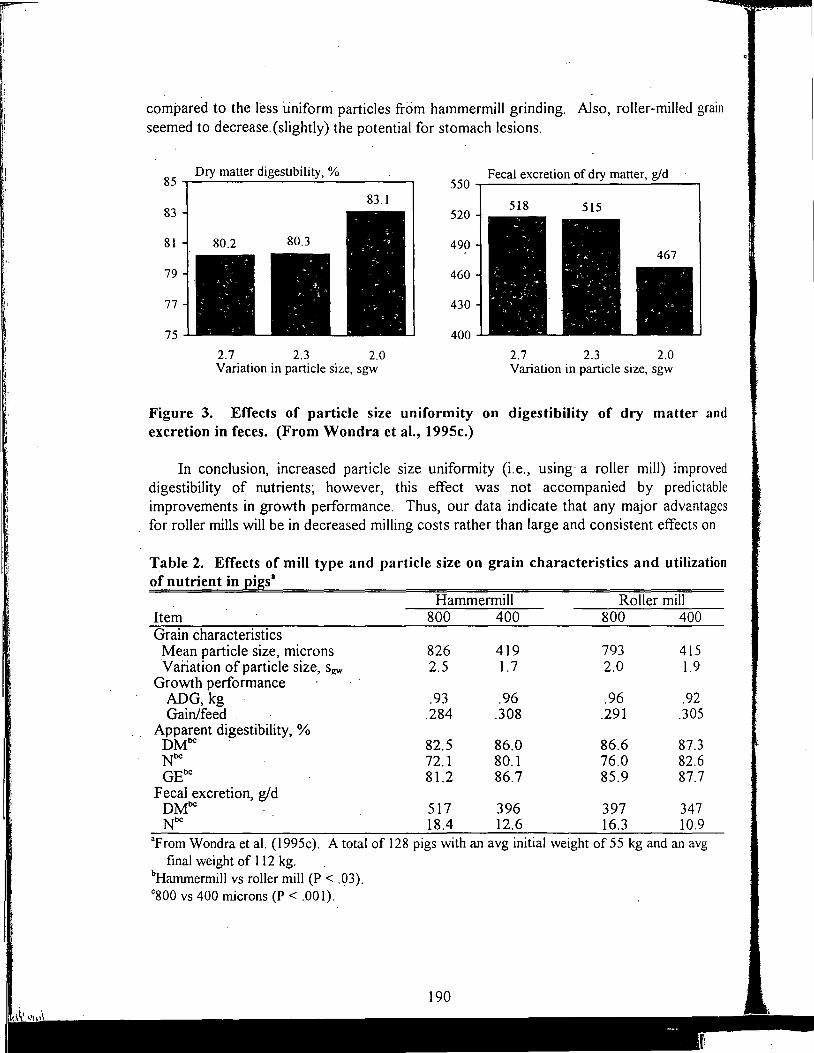
\ 't
''· J
compared to the less uniform particles from hammermill grinding. Also, roller-milled grain seemed to decrease.(slightly) the potential for stomach lesions.
85 Dry matter digestibility,% Fecal excretion of dry matter, g/d
550 83.l 518 515 83 520
81 490
79 460
77 430
75 400
2.7 2.3 2.0 2.7 2.3 2.0 Variation in particle size, sgw Variation in particle size, sgw
Figure 3. Effects of particle size uniformity on digestibility of dry matter and excretion in feces. (From Wondra et al., 1995c.)
In conclusion, increased particle size uniformity (i.e., using· a roller mill) improved digestibility of nutrients; however, this effect was not accompanied by predictable improvements in growth performance. Thus, our data indicate that any major advantages for roller mills will be in decreased milling costs rather than large and consistent effects on
Table 2. Effects of mill type and particle size on grain characteristics and utilization of nutrient in pigs•
Item Grain characteristics
Mean particle size, microns Variation of particle size, sj(W
Growth performance ADG, kg Gain/feed
Apparent digestibility, % DMbc . Nbc GE be
Fecal excretion, g/d DMbc . Nbc .
Hammermill 800 400
826 419 2.5 1.7
.93 .96 .284 .308
82.5 86.0 72.1 80.1 81.2 86.7
517 396 18.4 12.6
Roller mill 800 400
793 415 2.0 1.9
.96 .92 .291 .305
86.6 87.3 76.0 82.6 85.9 87.7
397 347 16.3 10.9
"From Wondra et al. (1995c). A total of 128 pigs with an avg initial weight of 55 kg and an avg final weight of 112 kg.
"Hanunermill v~ roller mill (P < .03). c800 vs 400 microns (P < .001).
growth performance of pigs. Therefore, it seems prudent to focus attention on the consistent improvements in performance that accompany decreased mean particle size rather than the subtle changes associated with greater uniformity of particle size.
MIX UNIFORMITY
Although numerous factors (e.g., overfilling the mixer, worn e_guipment, build up of ingredient residues, weighing errors, and postmixing segregation) are associated with variation in complete feeds, inadequate mixing is most typically implicated as the primary cause of lack in diet uniformity. From a feed manufacturing viewpoint, the optimum mixing procedure would require minimal inputs of time, electricity, and tabor. Thus, a standard is needed to indicate adequate (blif«:minimal)· mix--uniformity. That standard typically is a coefficient of variation (CV) for the distribution of some nutrient or marker within the feed, and a CV of 10% or less has been suggested by Beumer (1991), Lindley (1991), and Wicker and Poole ( 1991) as the "magic number" that represents an adequately mixed batch uf feed.
At present, there is no "standard" testing procedure that gives .accurate results in combination with low cost, speed, and utility. Chemical assays for drugs, vitamins, and crystalline amino acids have been used but are time-consuming, e_xpensive, and( or) noted for variability. Mineral element analyses are accurate and the distribution of chromium after adding a bolus of chromic oxide to a batch of feed has been used for many years by researchers as a measurement of mix uniformity. However, chromium determination (like that of most other minerals) is complicated and time-consuming and tends to require expensive equipment. Two notable exceptions include assays for the Na ions (the Omnion® assay) and Cl ions (th~ Quantab® assay) from salt. These two procedures often are used to indicate mix uniformity with generally good success. However, they are not satisfactory for diets with salt from several sources (e.g., whey, fish meal, blood products, and salt) because the many sources of Na and Cl confound interpretation of the results. For such problem applications, colored iron filings (the Microtracer™ procedure) often are used. The iron filings (colored with a water-soluble dye) are added to the mixer and then separated from the finished feed with a magnet. The filings are collected on filter paper and sprayed with water and the resulting colored spots are counted. Counting the colored spots is subjective and differentiating the spots resulting from different filings can be difficult. Yet, this procedure is popular, especially in diets for baby pigs where several ingredients supply salt. The question still remains, however, of just how well any of these assays predict differences in nutritional value of a finished feed.
Wicker and Poole (1991) reported data from a survey of commercial mixers and stated that more than 50% did not yield CVs of less that 10%. Similar results were reported by Stark et al. ( 1991) when evaluating on-farm feed mixers. However, little research actually relates diet uniformity to animal performance. Duncan ( 1973) reported that chick performance was affected by nonuniformity of dietary crude protein. However, Holden
I'! I,
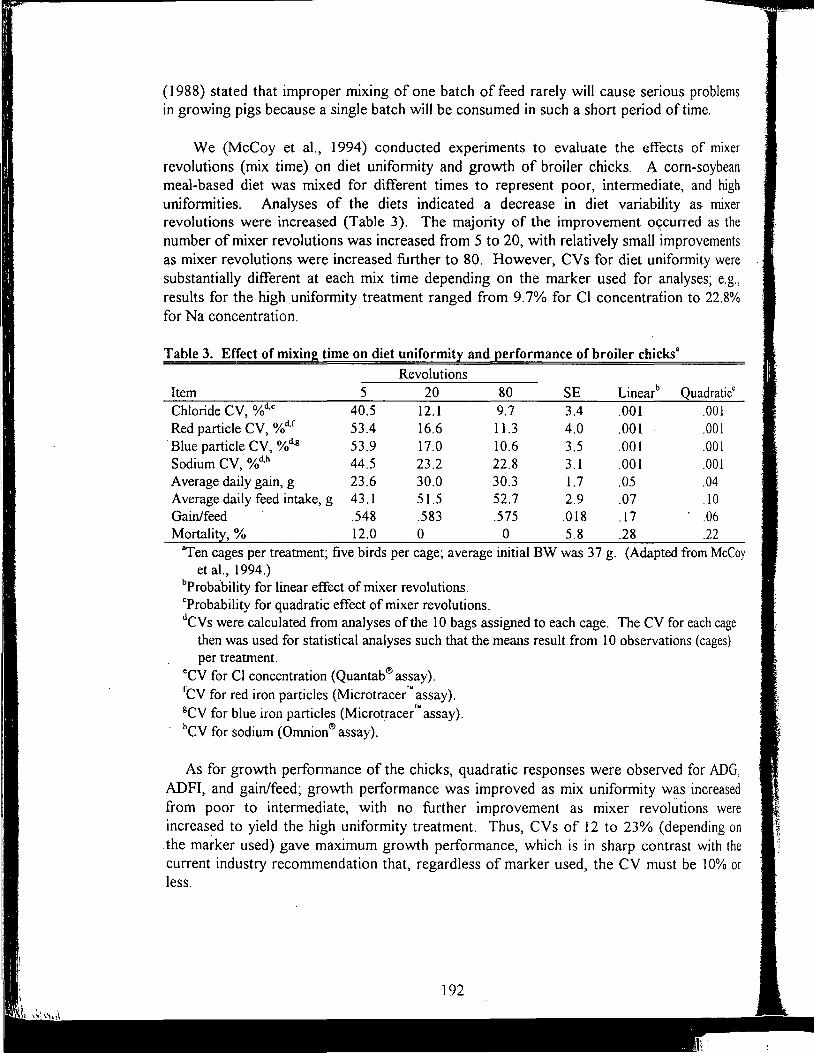
(1988) stated that improper mixing of one batch of feed rarely will cause serious problems in growing pigs because a single .batch will be consumed in such a short period of time.
We (McCoy et al., 1994) conducted experiments to evaluate the effects of mixer revolutions (mix time) on diet uniformity and growth of broiler chicks. A corn-soybean meal-based diet was mixed for different times to represent poor, intermediate, and high uniformities. Analyses of the diets indicated a decrease in diet variability as mixer revolutions were increased (Table 3). The majority of the improvement OC(Curred as the number of mixer revolutions was increased from 5 to 20, with relatively small improvements as mixer revolutions were increased further to 80. However, CVs for diet uniformity were substantially different at each mix time depending on the marker used for analyses; e.g., results for the high uniformity treatment ranged from 9.7% for Cl concentration to 22.8% for Na concentration. ·
Table 3. Effect of mixing time on diet uniformity and performance of broiler chicks"
Revolutions 20 80 Item 5 SE Linearb Quadratic'
12.1 9.7 Chloride CV, %d.c 40.5 3.4 .001 .001 16.6 11.3 Red particle CV, %d.f 53.4 4.0 .001 .001 17.0 10.6 Blue particle CV, %c1.8 53.9 3.5 .001 .001 23.2 22.8 Sodium CV, %d.h 44.5 3.1 .001 .001 30.0 30.3 Average daily gain, g 23.6 1.7 .05 .04 51.5 52.7 Average daily feed intake, g 43. l 2.9 .07 .10 .583 .575 Gain/feed .548 .018 .17 .06
Mortality,% 12.0 O O 5.8 .28 .22 "Ten cages per treatment; five birds per cage; average initial BW was 37 g. (Adapted from McCoy
et al., 1994.) bProbability for linear effect of mixer revolutions. cProbability for quadratic effect of mixer revolutions. dCVs were calculated from analyses of the 10 bags assigned to each cage. The CV for each cage
then was used for statistical analyses such that the means result from l 0 observations (cages) per treatment.
ccy for Cl concentration (Quantab® assay). rev for red iron particles (Microtracer'" assay). 8CV for blue iron particles (Microtracer'" assay). hey for sodium (Omnion® assay).
As for growth performance of the chicks, quadratic responses were observed for ADG, ADFI, and gain/feed; growth performance was improved as mix uniformity was increased from poor to intermediate, with no further improvement as mixer revolutions were increased to yield the high uniformity treatment. Thus, CVs of 12 to 23% (depending on .the marker used) gave maximum growth performance, which is in sharp contrast with the current industry recommendation that, regardless of marker used, the CV must be 10% or less.
192
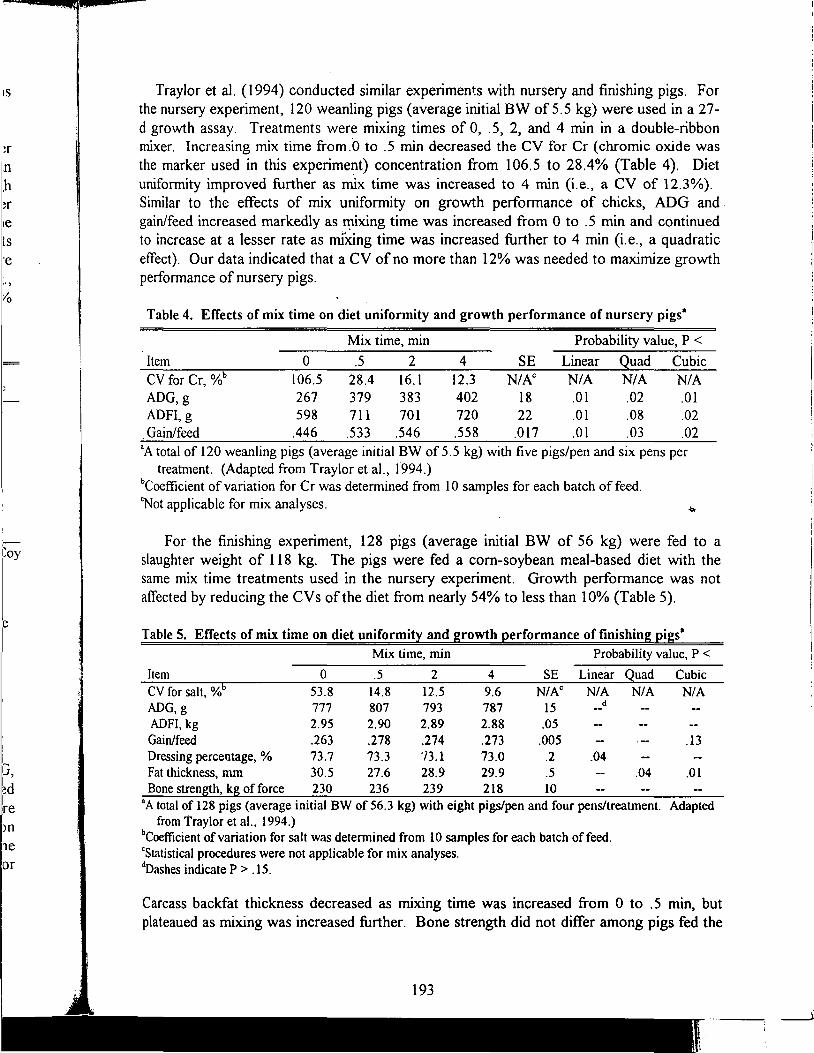
IS
:r
n . h :r 1e ts ·e .. ,
e
..... J,
~d
re )0
1e or
Traylor et al. (1994) conducted similar experiments with nursery and finishing pigs. For the nursery experiment, 120 weanling pigs (average initial BW of 5.5 kg) were used in a 27-d growth assay. Treatments were mixing times of 0, .5, 2, and 4 min in a double-ribbon mixer. Increasing mix time from.0 to .5 min decreased the CV for Cr (chromic oxide was the marker used in this experiment) concentration from 106.5 to 28.4% (Table 4). Diet uniformity improved further as mix time was increased to 4 min (i.e., a CV of 12.3%) . Similar to the effects of mix uniformity on growth performance of chicks, ADG and gain/feed increased markedly as ~x.ing time was increased from 0 to . 5 min and continued to increase at a lesser rate as miXing time was increased further to 4 min (i.e., a quadratic effect). Our data indicated that a CV of no more than 12% was needed to maximize growth performance of nursery pigs .
Table 4. Effects of mix time on diet uniformity and growth performance of nursery pigs•
Mix time, min Probability value, P <
Item 0 .5 2 4 SE Linear Quad Cubic CV for Cr, %b 106.5 28.4 16. l 12.3 N/A0 NIA NIA NIA ADG,g 267 379 383 402 18 .01 .02 .01 ADFI, g 598 711 701 720 22 .01 .08 .02 Gain/feed .446 .533 .546 .558 .017 .01 .03 .02
"A total of 120 weanling pigs (average initial BW of 5.5 kg) with five pigs/pen and six pens per treatment. (Adapted from Traylor et al., f994.)
bCoefficient of variation for Cr was determined from l 0 samples for each batch of feed. "Not applicable for mix analyses.
For the finishing experiment, 128 pigs (average initial BW of 56 kg) were fed to a slaughter weight of 118 kg. The pigs were fed a com-soybean meal-based diet with the same mix time treatments used in the nursery experiment. Growth performance was not affected by reducing the CVs of the diet from nearly 54% to less than 10% (Table 5).
Table 5. Effects of mix time on diet uniformity and growth performance of finishing pigs" Mix time, min Probability value, P <
Item 0 .5 2 4 SE Linear Quad Cubic CV for salt, %6 53.8 14.8 12.5 9.6 NIA0 NIA NIA NIA ADG, g 777 807 793 787 15 d
ADFI, kg 2.95 2.90 2.89 2.88 .05 Gain/feed .263 .278 .274 .273 .005 .13 Dressing percentage,% 73.7 73.3 "/3.1 73.0 .2 .04 Fat thickness, mm 30.5 27.6 28.9 29.9 .5 .04 .01 Bone strength, kg of force 230 236 239 218 10
"A total of 128 pigs (average initial BW of 56.3 kg) with eight pigs/pen and four pens/treatment. Adapted from Traylor et al., 1994.)
bCoefficient of variation for salt was determined from 10 samples for each batch of feed. <Statistical procedures were not applicable for mix analyses. dDashes indicate P > .15.
Carcass backfat thickness decreased as mixing time was increased from 0 to . 5 min, but plateaued as mixing was increased further. Bone strength did not differ among pigs fed the
193
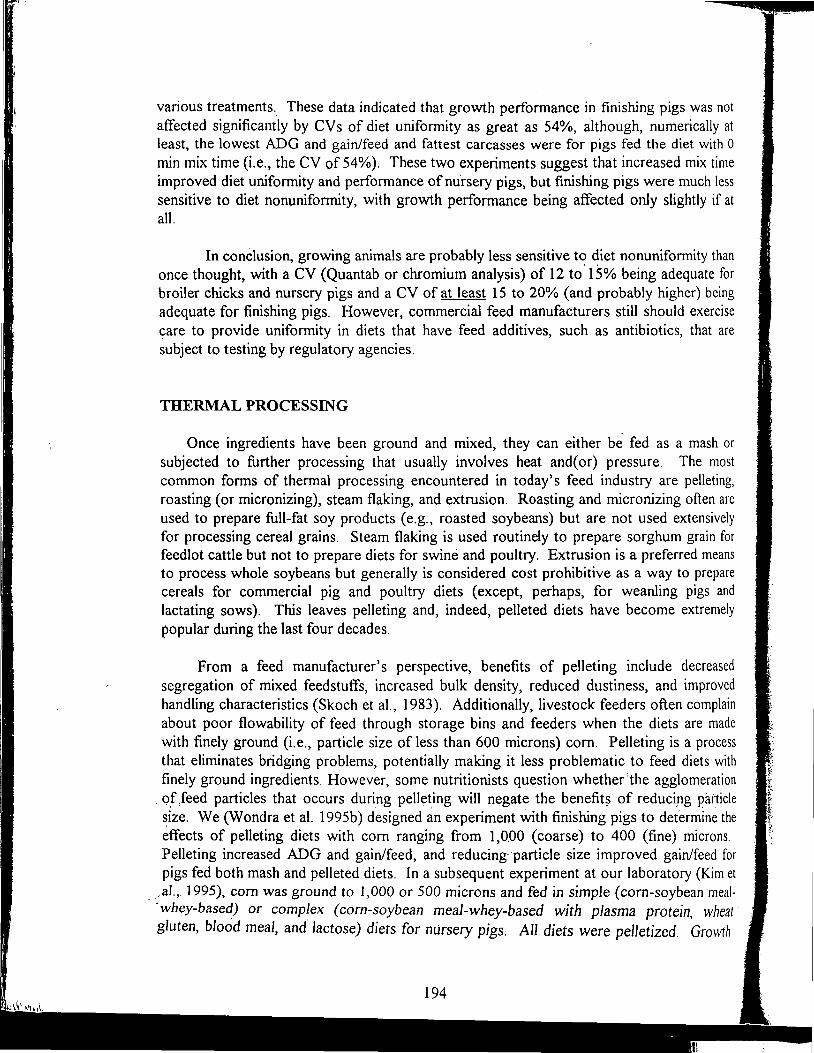
various treatments. These data indicated that growth performance in· finishing pigs was not affected significantly by CVs of diet uniformity as great as 54%, although, numerically at least, the lowest ADG and gain/feed and fattest carcasses were for pigs fed the diet with 0 min mix time (i.e., the CV of 54%). These two experiments suggest that increased mix time improved diet uniformity and performance of nursery pigs, but finishing pigs were much less sensitive to diet nonuniformity, with growth performance being affected only slightly if at all.
In conclusion, growing animals are probably less sensitive to diet nonuniformity than once thought, with a CV (Quantab or chromium analysis) of 12 to l S% being adequate for broiler chicks and nursery pigs and a CV of at least 15 to 20% (and probably higher) being adequate for finishing pigs. However, commercial feed manufacturers still should exercise care to provide uniformity in diets that have feed additives, such as antibiotics, that are subject to testing by regulatory agencies.
THERMAL PROCESSING
Once ingredients have been ground and mixed, they can either be fed as a mash or subjected to further processing that usually involves heat and( or) pressure. The most common forms of thermal processing encountered in today's feed industry are pelleting, roasting (or micronizing), steam flaking, and extrusion. Roasting and rnicronizing often are used to prepare full-fat soy products (e.g., roasted soybeans) but are not used extensively for processing cereal grains. Steam flaking is used routinely to prepare sorghum grain for feedlot cattle but not to prepare diets for swine and poultry. Extrusion is a preferred means to process whole soybeans but generally is considered cost prohibitive as a way to prepare cereals for commercial pig and poultry diets (except, perhaps, for weanling pigs and lactating sows). This leaves pelleting and, indeed, pelleted diets have become extremely popular during the last four decades.
From a feed manufacturer's perspective, benefits of pelleting include decreased segregation of mixed feedstuffs, increased bulk density, reduced dustiness, and improved handling characteristics (Skoch et al., 1983). Additionally, livestock feeders often complain about poor flowability of feed through storage bins and feeders when the diets are made with finely ground (i.e., particle size of less than 600 microns) com. Pelleting is a process that eliminates bridging problems, potentially making it less problematic to feed diets with finely ground ingredients. However, some nutritionists question whether the agglomeration
. o.f feed particles that occurs during pell~ting will negate the benefits of reduci,ng particle size. We (Wondra et al. 1995b) designed an experiment with finishing pigs to determine the effects of pelleting diets with com ranging from 1,0.00 (coarse) to 400 (fine) microns. Pelleting increased ADG and gain/feed, and reducing- particle size improved gain/feed for pigs fed both mash and pelleted diets. In a subsequent experiment at our laboratory (Kim et
.. al.,. 1995), com was ground to 1,000 or 500 microns and fed in simple (com-soybean meal·whey-based) or complex (com-soybean meal-whey-based with plasma protein, wheat gluten, blood meal, and. lactose) diets for nursery pigs. All diets were pelletized. Growth
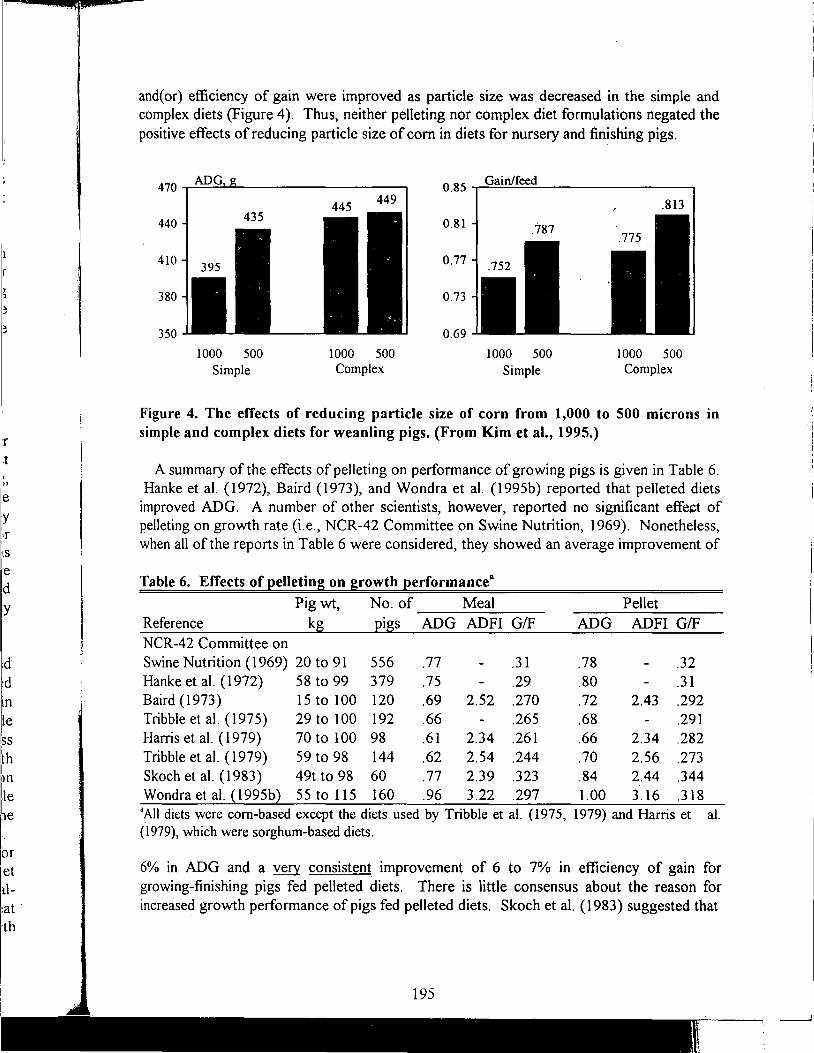
~ J
r .t
I ' ,, :e 1Y I If ! tS le
d y
:d :d m le SS
th JO
le 1e
or et il:at th
and(or) efficiency of gain were improved as particle size was decreased in the simple and complex diets (Figure 4). Thus, neither pelleting nor complex diet formulations negated the positive effects of reducing particle size of com in diets for nursery and finishing pigs.
470 ADG Gain/feed 0.85 ....--'="-='-;;...;;;__---------. .813
440 0.81
410 0.77
380 0.73
350 0.69
1000 500 1000 500 1000 500 1000 500 Simple Complex Simple Complex
Figure 4. The effects of reducing particle size of corn from 1,000 to 500 microns in simple and complex diets for weanling pigs. (From Kim et al., 1995.)
A summary of the effects of pelleting on performance of growing pigs is given in Table 6. Hanke et al. (1972), Baird (1973), and Wondra et al. (1995b) reported that pelleted diets
improved ADG. A number of other scientists, however, reported no significant effect of pelleting on growth rate (i.e., NCR-42 Committee on Swine Nutrition, 1969). Nonetheless, when all of the reports in Table 6 were considered, they showed an average improvement of
Table 6. Effects of ~elleting on growth ~erf ormance•
Pig wt, No. of Meal Pellet Reference kg E1gs ADG ADFI G/F ADG ADFI G/F NCR-42 Committee on Swine Nutrition ( 1969) 20 to 91 556 .77 .31 .78 .32 Hanke et al. (1972) 58 to 99 379 .75 .29 .80 .31 Baird ( 1973) 15 to 100 120 .69 2.52 .270 .72 2.43 .292 Tribble et al. (1975) 29 to 100 192 .66 .265 .68 .291 Harris et al. ( 1979) 70 to 100 98 .61 2.34 .261 .66 2.34 .282 Tribble et al. ( 1979) 59 to 98 144 .62 2.54 .244 .70 2.56 .273 Skoch et al. (1983) 49t to 98 60 .77 2.39 .323 .84 2.44 .344 Wondra et al. {1995b} 55 to 115 160 .96 3.22 .297 1.00 3.16 .318
"All diets were com-based except the diets used by Tribble et al. (1975, 1979) and Harris et al. (1979), which were sorghum-based diets.
6% in ADG and a ~ consistent. improvement of 6 to 7% in efficiency of gain for growing-finishing pigs fed pelleted diets. There is little consensus about the reason for increased growth performance of pigs fed pelleted diets. Skoch et al. ( 1983) suggested that
195
I
! l
pelleting increased the bulk density of diets and reduced. dustiness, making the diets more palatable. However, improved palatability is inconsistent. :with the decreased feed intake generally observed for pigs fed pelleted diets. In experiments from.our laboratory (Wondra et al., 1995b,c), DM, N, and GE digestibilities were increased by pelleting. Jensen and Becker (1965) suggested that pelleting gelatinized starch, thus making it more susceptible to enzymatic digestion. Although some argue that conditions during the pelleting process are not sufficient to gelatinize starch, others contend that the heat, hydration, and shear
1.
when pelleting do indeed disrupt the structure of starch and protein molecules,' making them more accessible for digestive enzymes. AJtematively, many researchers tend to attribute the improved performance of pigs fed pelleted diets to decreased feed wastage. This hypothesis would be valid if only efficiency of gain was improved but is inconsistent with improvements in nutrient digestibility and rate of gain.
Thus, decreased feed wastage probably does help improve efficiency of gain in pigs fed pelleted diets, but some factor(s) enhances digestibility of nutrients. Whether that factor(s) is a change in feeding behavior; a change in the way digestive tracts react to pelleted versus meal diet form (e.g., altered flow of digesta); or a direct effect of thermal processing (e.g., gelatinization of starch and denaturation of proteins) is yet to be determined. Nonetheless, nutrient excretion from pigs in regions of intensive livestock production is causing environmental concerns, and Wondra et al. ( l 995b) reported 23 and 22% reductions in excretion of DM and N in feces, respectively, as a result of pelleting. Therefore, grain processing techniques that increase nutrient digestibility and reduce nutrient excretion have special value to the swine industry. The only real question is how soon government regulations will force careful evaluation of every aspect of livestock production in an attempt to minimize waste production. When this finally does occur, processing methods that maximize nutrient digestibility will have added significance.
PELLET SIZE AND QUALITY
Once the decision has been made to pelletize, the question of what size pellet to manufacture often is asked. From an efficiency of milling standpoint, a large diameter pellet produced with a very thin die would maximize pellet mill output with minimum inputs of time and electricity. However, conventional wisdom dictates that small pigs prefer small pellets and large pigs prefer large pellets; therefore, many die sizes are needed to properly process feed.
To address the issue of optimum pellet size for pigs, we (Traylor et al., 1994) conducted a series of experiments to determine the effects of pellet size on growth performance in nursery and finishing pigs. For the nursery experiment, 210 weanling pigs (average initial BW of 5.4 kg) were used in a 29-d growth assay. The dietary treatments were a cornbased, meal control and 2-, 4-, 8-, and 12-mm pellets. For d 0 to 5~ pelleting improved ADG by 25% and gain/feed by 36% (Table 7). However, pellet size did not affect growth performance. For d 0 to 29, pelleting improved gain/feed by 4% compared to the meal diets, with maximum gain/feed with a pellet size of 4 mm.
196

Ii
Table 7. Effects of pellet size on growth performance of nursery pigsa
Pellet diameter, mm Item Meal 2 4 8 12 SE d 0 to 5
ADG, gb 124 151 148 165 158 12 ADFI, g 153 134- 132 162 142 l l Gain/feedb .810 l.127 l.121 1.019 1.113 .061
d 0 to 29 ADG,g 358 362 371 362 364 7 ADFI, g 537 . 510 516 541 532 11 Gain/feedb,c,d .667 .710 .719 .669 .684 .012
"A total of 210 pigs with six pens per treatment. (From Traylor et al., 1996.) bMeal vs pellets (P < .04). , 0Linear effect of pellet size (P < .05). dCubic effect of pellet size (P < .04).
In the finishing experiment, 80 ban:-ows (average initial BW of 58 kg) were fed a comsoybean meal-based diet with the same pellet size treatments used in the nursery experiment. Rate of gain was not affected by pelleting, but pigs fed pelleted diets tended to have improved gain/feed (Table 8). As pellet size was increased, ADG was improved, with the 4-mm pellets supporting the greatest gain/feed. Thus, it appears that producing several
Table 8. Effects of pellet size on growth performance and stomach morphology of finishing pigsa .... Pellet diameter, mm
Item Meal 2 4 8 12 SE ADG, kgb l.03 .94 l.01 l.02 l.05 .22 ADFI, kgb.c 3.01 2.62 2.76 2.85 3.05 .69 Gain/feedb,c .342 .361 .365 .357 .343 .007 Last rib fat depth, mm 24.6 23.2 23. l 23.6 23.4 1.0 Dressing percentage, % 72.4 72.4 72.5 72.5 72.1 .3
"A total of 80 pigs with eight pens per treatment. (From Traylor et al., 1996.) bLinear effect of pellet size (P < . 07). 'Meal vs pellets (P < .08).
different pellet sizes for pigs of various sizes is not necessary: Furthermore, a single die size of 4 to 5 mm seems adequate. These findings suggest that significant savings of time and money are possible with use of a single die to prepare diets for pigs from weaning to market. However, regardless of pellet size, there is still the issue of pellet quality.
For this paper, 'quality' will be defined as the ability of a pellet to withstand repeated handling without excessive breakage. Reimer (1992) suggested that many factors affect pellet quality, with the largest contributors being diet formulation, particle size, and conditioning (Figure 5). Indeed, our experiences here at Kansas State University confirm that diet formulation can have marked beneficial effects (e.g., when wheat enters into a formulation) or detrimental effects (e.g., when more than 1 or 2% fat is added before pellet-
197
-- -------1 ·
I , 1 I I I
,,
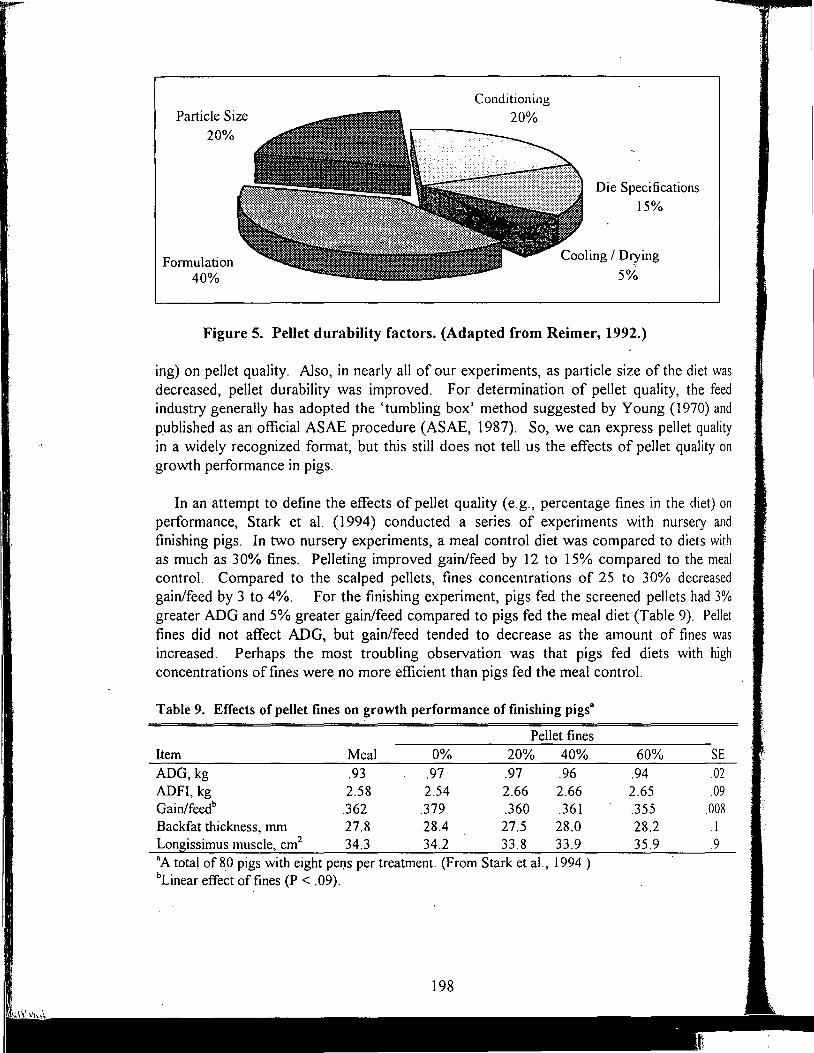
Particle Size
20%
Formulation 40%
Conditioning
20%
Die Specifications
15%
Cooling I Prying
5%
Figure 5. Pellet durability factors. (Adapted from Reimer, 1992.)
ing) on pellet quality. Also, in nearly all of our experiments, as particle size of the diet was decreased, pellet durability was improved. For determination of pellet quality, the feed industry generally has adopted the 'tumbling box' method suggested by Young (1970) and published as an official ASAE procedure (ASAE, 1987). So, we can express pellet quality in a widely recognized format, but this still does not tell us the effects of pellet quality on growth performance in pigs.
In an attempt to define the effects of pellet quality (e.g., percentage fines in the cliet) on performance, Stark et al. (1994) conducted a series of experiments with nursery and finishing pigs. In two nursery experiments, a meal control diet was compared to diets with as much as 30% fines. Pelleting improved gain/feed by 12 to 15% compared to the meal control. Compared to the scalped pellets, fines concentrations of 25 to 30% decreased gain/feed by 3 to 4%. For the finishing experiment, pigs fed the screened pellets had 3% greater ADG and 5% greater gain/feed compared to pigs fed the meal diet (Table 9). Pellet fines did not affect ADG, but gain/feed tended to decrease as the amount of fines was increased. Perhaps the most troubling observation was that pigs fed diets with high concentrations of fines were no more efficient than pigs fed the meal control.
Table 9. Effects of pellet fines on growth performance of finishing pigs"
Pellet fines Item Meal 0% 20% 40% 60% SE ADG, kg .93 .97 .97 .96 .94 .02 ADFI, kg 2.58 2.54 2.66 2.66 2.65 .09 Gain/feedb .362 .379 .360 .361 .355 .008 Backfat thickness, mm 27.8 28.4 27.5 28.0 28.2 .I Longissimus muscle, cm2 34.3 34.2 33.8 33.9 35.9 .9 "A total of 80 pigs with eight peQs per treatment. (From Stark et al., 1994.) bLinear effect of fines (P < .09).
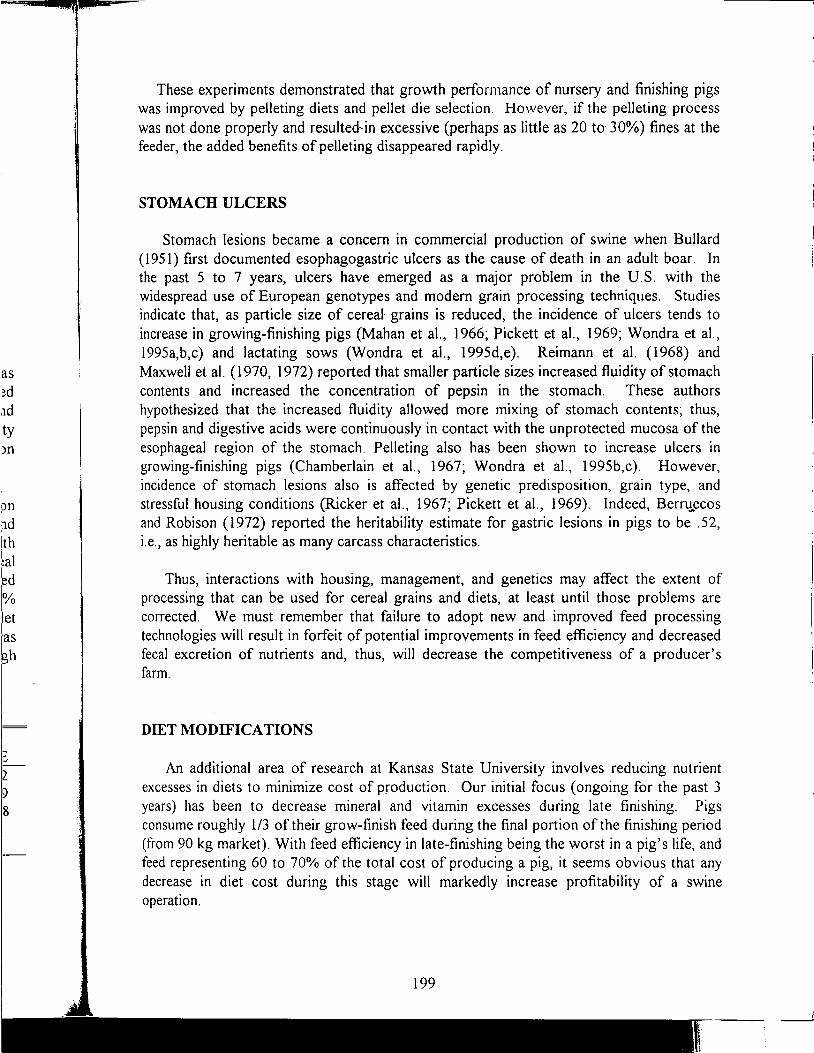
as ~d
.ld ty )n
pn ;Jd
Ith I ;~al 1ed 10;0 1 et as h
8
These experiments demonstrated that growth performance of nursery and finishing pigs was improved by pelleting diets and pellet die selection. However, if the pelleting process was not done properly and resulted-in excessive (perhaps as little as 20 to 30%) fines at the feeder, the added benefits of pelleting disappeared rapidly.
STOMACH ULCERS
Stomach lesions became a concern in commercial production of swine when Bullard (1951) first documented esophagogastric ulcers as the cause of death in an adult boar. In the past 5 to 7 years, ulcers have emerged as a major problem in the U.S. with the widespread use of European genotypes and modem grain processing techniques. Studies indicate that, as particle size of cereal grains is reduced, the incidence of ulcers tends to increase in growing-finishing pigs (Mahan et al., 1966; Pickett et al., 1969; Wondra et al., 1995a,b,c) and lactating sows (W0ndra et al., 1995d,e). Reimann et al. (1968) and Maxwell et al. (1970, 1972) reported that smaller particle sizes increased fluidity of stomach contents and increased the concentration of pepsin in the stomach. These authors hypothesized that the increased fluidity allowed more mixing of stomach contents; thus, pepsin and digestive acids were continuously in contact with the unprotected mucosa of the esophageal region of the stomach. Pelleting also has been shown to increase ulcers in growing-finishing pigs (Chamberlain et al., 1967; Wondra et al., l 995b,c). However, incidence of stomach lesions also is affected by genetic predisposition, grain type, and stressful housing conditions (Ricker et al., 1967; Pickett et al., 1969). Indeed, BernJ._ecos and Robison ( 1972) reported the heritability estimate for gastric lesions in pigs to be . 52, i.e., as highly heritable as many carcass characteristics.
Thus, interactions with housing, management, and genetics may affect the extent of processing that can be used for cereal grains and diets, at least until those problems are corrected. We must remember that failure to adopt new and improved feed processing technologies will result in forfeit of potential improvements in feed efficiency and decreased fecal excretion of nutrients and, thus, will decrease the competitiveness of a producer's farm.
DIET MODIFICATIONS
An additional area of research at Kansas State University involves reducing nutrient excesses in diets to minimize cost of production. Our initial focus (ongoing for the past 3 years) has been to decrease mineral and vitamin excesses during late finishing. Pigs consume roughly 1/3 of their grow-finish feed during the final portion of the finishing period (from 90 kg market). With feed efficiency in late-finishing being the worst in a pig's life, and feed representing 60 to 70% of the total cost of producing a pig, it seems obvious that any decrease in diet cost during this stage will markedly increase profitability of a swine operation.
199
Diets for late-finishing are far too often overfortified with nutrients such as protein, vitamins, and minerals, because nutrient allowances for ~nishing pigs have been derived from experiments where pigs were slaughtered at lighter market weights than common in the U.S. today. Lighter pigs tend to consume less feed; have greater lean growth potential and, thus, need greater concentrations of nutrients in their diets. Additional justification for this line of reasoning is found in the recognitio1,1 that specifications for nutrients such as Ca and P have been set with the idea that maximum bone strength would· be needed for replacement gilts selected from the finishing floor. With the terminal crossbreeding systems ~e so often see today, maximum bone strength is not an issu.e.
In our experiments, high-lean (PIC 326 boars x C-15 sows) pigs with good health status were used. Response criteria included growth performance, carcass measurements (dressing percentage, longissimus muscle depth, backfat thickness, and fat-free lean index), and muscle quality (subjective scores for marbling, color, and firmness, Hunter L measurements for color stability over time, shear force, and water loss when thawing and cooking). In the first experiment, 128 finishing pigs were fed a control diet (com-soybean meal-based with . 70% lysine, .65% Ca, and .55% P) with and without vitamin premix, trace mineral premix, and vitamin/trace mineral premixes. Feed and water were consumed ad libitum throughout the 30-day experiment (from 86 to 113 kg body weight). Rate and efficiency of gain, carcass measurements, and muscle quality were not affected by deleting the vitamin and( or) trace mineral premixes.
A second experiment was designed to determine the effects of reducing the inorganic P (monocalcium phosphate) additions during late-finishing. In this experiment, 128 pigs were used to test the same control diet against omitting 1/3, 2/3, or all of the monocalcium phosphate. Limestone concentration was adjusted to keep the Ca:P ratio constant at 1.2: I. Results suggested that omitting up to 2/3 of the monocalcium phosphate (to a total dietary
P concentration of .4% and daily P intake of 12 to 13 g) had no detrimental effect on growth performance or meat quality/color.
To verify the favorable results of the first two experiments, 160 pigs were fed from 90 to 118 kg body weight. Treatments were the same control diet, the control without the vitamin/trace mineral premixes, the control diet without 2/3 of the monocalcium phosphate, and the control diet without the vitamin/trace mineral premixes and 2/3 of the monocalcium phosphate. None of the dietary treatments had negative effects on growth performance or carcass measurements (Table 10). Also, all of the muscle quality and color determinations were within normal ranges. Thus, the practice of simply adding existing vitamin and mineral premixes to finishing diets, without giving thought to whether or riot they are particularly useful to the pig, needs reassessment. Not only does this practice increase cost of production, but it also increases the amount of nutrients that are excreted into the environment as potential pollutants. Further research is needed to: I) determine the consequences of omitting vitamins and minerals in late finishing when 'minimum excess' diets are fed to that point (i.e., our diets were well fortified up to late finishing); and 2) define a vitamin/trace mineral combination that actually affects some economically important trait in finishing pigs.
200
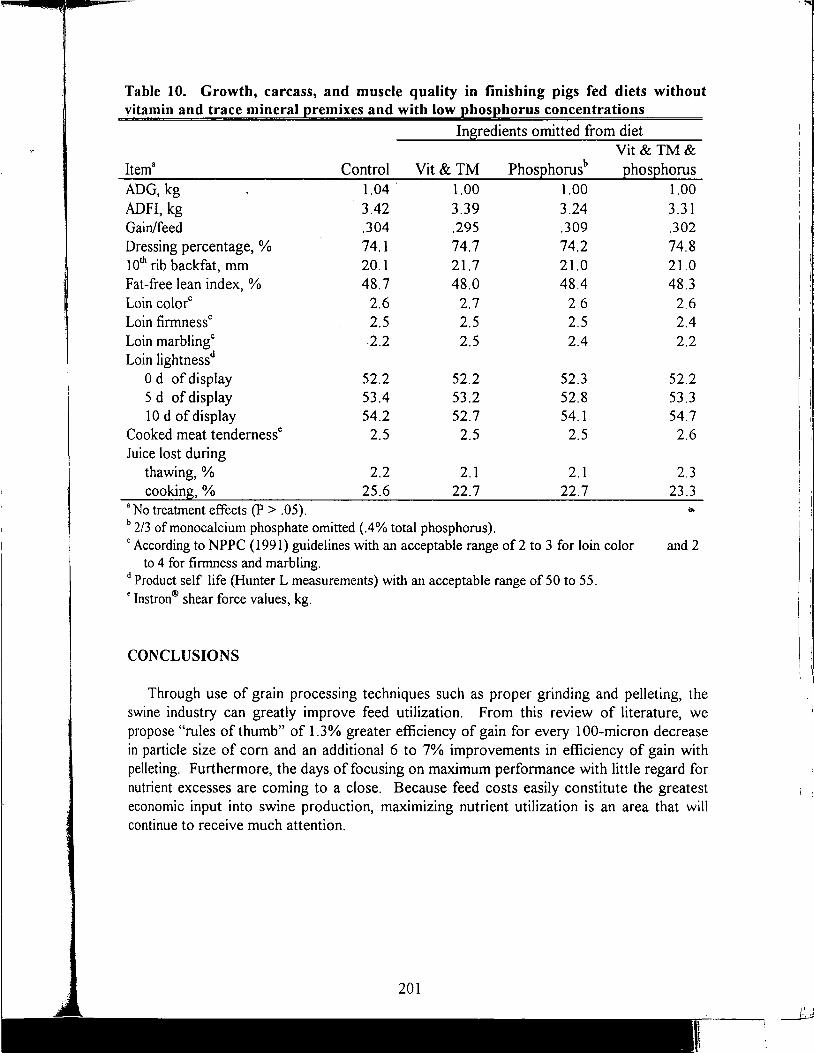
Table 10. Growth, carcass, and muscle quality in finishing pigs fed diets without vitamin and trace mineral premixes and with low phosphorus concentrations
Ingredients omitted from diet Vit& TM&
Item a Control Vit& TM PhosQhorusb QhOSQhorus ADG, kg ADFI, kg Gain/feed Dressing percentage, % l 0th rib backfat, mm Fat-free lean index, % Loin colo{ Loin firmnessc Loin marblingc Loin lightnessd
0 d of display 5 d of display 1 O d of display
Cooked meat tendemessc Juice lost during
thawing,% cooking,%
"No treatment effects (P > .05).
1.04.
3.42 .304 74.1 20. l 48.7
2.6 2.5 .2.2
52.2 53.4 54.2
2.5
2.2 25.6
1.00 3.39 .295 74.7 21.7 48.0
2.7 2.5 2.5
52.2 53.2 52.7
2.5
2.1 22.7
b 2/3 of monocalcium phosphate omitted (.4% total phosphorus).
1.00 3.24 .309 74.2 21.0 48.4
2.6 2.5 2.4
52.3 52.8 54.1
2.5
2.1 22.7
c According to NPPC ( 1991) guidelines with an acceptable range of 2 to 3 for loin color to 4 for firmness and marbling.
d Product self life (Hunter L measurements) with an acceptable range of 50 to 55. e Instron® shear force values, kg.
CONCLUSIONS
1.00 3.31 .302 74.8 21.0 48.3
2.6 2.4 2.2
52.2 53.3 54.7
2.6
2.3 23.3
and 2
Through use of grain processing techniques such as proper grinding and pelleting, the swine industry can greatly improve feed utilization. From this review of literature, we propose "rules of thumb" of 1.3% greater efficiency of gain for every 100-micron decrease in particle size of com and an additional 6 to 7% improvements in efficiency of gain with pelleting. Furthermore, the days of focusing on maximum performance with little regard for nutrient excesses are coming to a close. Because feed costs easily constitute the greatest economic input into swine production, maximizing nutrient utilization is an area that will continue to receive much attention.
201
I I

ABOUT THE AUTHORS
Joe D. Hancock is Associate Professor and Kelly r Wondra, Steven L. Traylor, and Ioannis Mavromichalis are Graduate Research Assistants. Send inquiries to Dr. Joe D.
Hancock, Room 246 Weber Hall (phone. 913-532-1230, fax 913-532-7059, and e-mail [email protected]). ·This paper is published in the Proceedings of the Minnesota
Nutrition Conference, Bloomington, MN, September 22-24, 1997.
LITERATURE CITED
ASAE. 1983. Method of determining and expressing fineness of feed materials by sieving. ln: Am. Soc. Agric. Eng. Standard S319. p 325. Yearbook of Standards, ASAE.
ASAE. 1987. Wafers, pellets, crumbles - definitions and methods for determining density, durability, and moisture content. In: Am. Soc. Agric. Eng. Standard S269.3. p318. Yearbook of Standards, ASAE.
Baird, D. M. 1973. Influence of pelleting swine diets on metabolizable energy, growth, and carcass characteristics. J. Anim. Sci. 36:516.
Baker, R J. 1960. Factors that affect the granulation and capacity in grinding of com, oats, and sorghum grain with a hammermill. M .S. Thesis. Kansas State Univ., Manhattan.
Berruecos, J.M., and 0. W. Robison. 1972. Inheritance of gastric ulcers in swine. J. Anim. Sci. 35:20. Beumer, I. H. 1991. Quality assurance as a tool to reduce losses in animal feed production. Adv. Feed
Technol. 6:6. Brendemuhl, J. H., A. J. Lewis, and E. R. Peo, Jr. 1987. Effect of protein and energy intake by primiparous
sows during lactation on sow and litter performance and sow serum thyroxin and urea concentrations. J. Anim. Sci. 64: 1060.
Brooks, P. H., and DJ.A. Cole. 1972. Studies in sow reproduction. 1. The effect of nutrition between weaning and remating on the reproductive performance ofprirniparous sows. Anim. Prod. 15:259.
Bullard, J. J. 1951. Gastric ulcers in a large boar. J. Am. Vet. Med. Assn. 119:129. Chamberlain, C. C., G. M. Merriman, E. R. Lidvall, and C. T. Gamble. 1967. Effects of feed processing
method and diet form on the incidence of esophagogastric ulcers in swine. J. Anim. Sci. 26:72. Duncan, M. S. 1973. Nutrient variation: Effect on quality control and animal performance. Ph.D.
Dissertation. Kansas State Univ., Manhattan. Fraps, G. S. 1932. Digestibility and production coefficients of pig feeds. Texas Agr. Exp. Sta. Bull. 454. Giesemann, M. A., A. J. Lewis, J. D. Hancock, and E. R. Peo, Jr. 1990. Effect of particle size of com and
grain sorghum on growth and digestibility of growing pigs. J. Anim. Sci. 68(Suppl. 1):104 (Abstr.).
Hanke, H. E., J. W. Rust, R. J. Meade, and L. E. Hanson. 1972. Influence of source of soybean protein and of pelleting on rate of gain and gain/feed of growing swine. J. Anim. Sci. 35:958.
Harris, D. D., L. F. Tribble, and D. E. Orr, Jr. 1979. The effects of meal versus different size pelleted forms ·of sorghum-soybean meal diets for finishing swine. p 57. Proc. 27th Annual Swine Short Course, Texas Tech University, Agric. SCi. Tech. Rep. No. T-5-144.
Healy, B. J., J. D. Hancock, G. A. Kennedy, P. J. Bramel-Cox, K. C. Behnke, and R. H. Hines. 1994. Optimum particle size of com and hard and soft sorghum for nursery pigs. J. Anim. Sci. 72:2227.
Holden, P. J. 1988. Diagnosing feed mixing problems is swine herds. Agri-Practice 9(4):3. Jensen, A.H., and D. E. Becker. 1965. Effect of pelleting diets and dietary components on the performance
of young pigs. J. Anim. Sci. 24:392. Kim, I. H., J. D. Hancock, M. R. Cabrera, R. H. Hines, M. M. Rantanen, and K. C. Behnke. 1995. Particle
size ( 1,000 vs 500 µm) affects nutritional value of simple and complex diets for weanling pigs and broiler chicks. p 84. Kansas Agric. Exp. Sta. Rep. of Prog. 746.
202
King, R. H., and I. H. Williams. 1984._ The effect of nutrition on the reproductive performance of first-litter sows. 2. Protein and energy intakes during lactation. Anim. Prod. 38:249.
Lawrence, T.L.J. 1983. The effects of cereal particle size and pelleting on the nutritive value of oat-based diets for the growing pig. Anim. Feed Sci. Tech. 8:91.
Lindley, J. A 199 l. Mixing processes for agricultural and food materials: I. Fundamentals of mixing. Agric. Eng. Res. 48:153. ·
Mahan, D. C., R. A Pickett, T. W. Perry, T. M. Curtin, W. R. Featherson, and W. M. Beeson. 1966. Influence of various nutritional factors and physical fonn of feed on esophagogastric ulcers in swine. J. Anim. Sci. 25:1019.
Maxwell, C. V., E. M. Reimann, W. G. Hoekstra, T. Kowalczyk, N. J. Benevenga, and R. H. Grummer. 1970. Effect of dietary particle size on lesion development and on the contents of various regions of the swine stomach. J. Anim. Sci. 30:911.
Maxwell, C. V., E. M. Reimann, W. G. Hoekstra, T. Kowalczyk, N. 1. Benevenga, and R. H. Grummer. 1972. Use of tritiated water to assess, in vivo, the effect of dietary particle size on the mixing of stomach contents of swine. J. Anim. Sci. 34:212.
McEllhiney, R.R. 1986. The cost of grain processing. Feed Manag. 37:30. McCoy, R. A., K. C. Behnke, J. D. Hancock, and R.R. McEllhiney. 1994. Effect of mixing uniformity on
broiler chick perfonnance. Poult Sci. 73:443. NCR-42 Committee on Swine Nutrition. 1969. Cooperative regional studies with growing swine: Effects of
source of ingredient, fonn of diet, and location on rate and efficiency of gain of growing swine. 1. Anim. Sci. 29:927.
NRC. 1988. Nutrient Requirements of Swine (9th Ed.). National Academy Press, Washington, DC. Pickett, R. A., W. H. Fugate, R. B. Harrington, T. W. Perry, and T. M. Curtin. 1969. Influence of feed
preparation and number of pigs per pen on performance and occurrence of esophagogastric ulcers in swine. J. Anim. Sci. 28:837.
Reece, F. N., B. D. Lott, and J. W. Deaton. 1985. The effects of feed fonn, grinding method, energy level, and gender on broiler performance in a moderate (21°C) environment. Poult. Sci. 64:1834. ~
Reese, D. E., B. D. Moser, E. R. Peo, Jr., A. J. Lewis, D. R. Zimmennan, J. E. Kinder, and W. W. Stroup. 1982. Influence of energy intake during lactation on the interval from weaning to first estrus in sows. J. Anim. Sci. 55:590.
Reimann, E. M., C. V. Maxwell, T. Kowalczyk, N. 1. Benevenga, R. H. Grummer, and W. G. Hoekstra. 1968. Effect of fineness of grind of corn on gastric lesions and contents of swine. J. Anim. Sci. 27:992.
Reimer, L. 1992. Conditioning. Proc. Northern Crops Institute Feed Mill Management and Feed Manufacturing Technol. Short Course. p 7. California Pellet Mill Co. Crawfordsville, IN.
Ricker, J. T., III, T. W. Perry, R. A. Pickett, and T. M. Curtin. 1967. Influence of various grains on the incidence of esophagogastric ulcers in swine. J. Anim. Sci. 26:736.
Skoch, E. R., S. F. Binder, C. W. Deyoe, G. L. Allee, and K. C. Behnke. 1983. Effects of pelleting conditions on perfonnance of pigs fed a com-soybean meal diet. 1. Anim. Sci. 57:922.
Stark, C. R., K. C. Behnke, R. D. Goodband, and J. A. Hansen. 1991. On-farm feed uniformity survey. p 144. Kansas Agric. Exp. Sta. Rep. Prog. 641.
Stark, C. R., K. C. Behnke, 1. D. Hancock, S. L. Traylor, and R. H. Hines. 1994. Effect of diet form and fines in pelleted diets on growth performance of nursery pigs. J. Anim. Sci. 72 (Suppl. 1): 214 (Abstr.).
Traylor, S. L., K. C. Behnke, J. D. Hancock, P. Sorrell, and R. H. Hines. 1996. Effects of pellet size on growth performance and nursery pigs. J. Anim. Sci. 74 (Suppl. 1):67 (Abstr.).
Traylor, S. L., 1. D. Hancock, K. C. Behnke, C. R. Stark, and R. H. Hines. 1994. Mix time affects diet unifonnity and growth perfonnance of nursery and finishing pigs. p 17 l. Kansas Agric. Exp. Sta. Rep. Prog. 717.
Tribble, L. F., D. D. Harris, and D. E. Orr, Jr. 1979. Effect of pellet size (diameter) on perfonnance of finishing swine. p 59. Proc. 27th Swine Short Course, Texas Tech Univ., Agric. Sci. Tech. Rep. No. T-5-144.
203 I' " '
Tribble, L. F., and A. M. Lennon. 1975. Meal versus pelleted sorghum-soybean>meal rations for growingfinishing swine. p 31. Proc. 23rd Annual Swine Short Course, Texas Tech Univ. Agric. Sci. Tech. Rep. No. T-5-111.
Wicker, D. L., and D.R. Poole. 1991. How is your mixer performing? Feed Manag. 42(9):40. Wondra, K. J., J. D. Hancock, K. C. Behnke, and R.H. Hines. 1995a. Effects of dietary buffers on growth
performance, nutrient digestibility, and stomach morphology in finishing pigs. J. Anim. Sci. 73:414.
Wondra, K. J., J. D. Hancock, K. C. Behnke, R.H. Hines, and C.R. Stark. 1995b. Effects of particle size and pelleting on growth performance, nutrient digestibility, and stomach morphology in finishing pigs. J. Anim. Sci. 73:757.
Wondra, K. J., J. D. Hancock, K. C. Behnke, and C.R. Stark. 1995c. Effects of mill type and particle size uniformity on growth performance, nutrient digestibility, and stomach morphology in finishing pigs. J. Anim. Sci. 73:2564.
Wondra, K. J., J. D. Hancock, G. A. Kennedy, K. C. Behnke, and K. R. Wondra. l 995d. Effects of reducing particle size of com in lactation diets on energy and nitrogen metabolism in second-parity sows. J. Anim. Sci. 73:427.
Wondra, K. J., J. D. Hancock, G. A. Kennedy, R. H. Hines, and K. C. Behnke. 1995e. Reducing particle size of com in lactation diets from 1,200 to 400 micrometers improves sow and litter performance. J. Anim. Sci. 73:421.
Young, L. R. 1970. Mechanical durability of feed pellets. M.S. Thesis. Kansas State Univ., Manhattan.
204
[]
~ I
b~
b~ thl h2
In pe
th~
In ev
I gr~
AN -I Ori ;;i corj bea
k.I
S II I ::
7 ~et, per I . I rm~
Thj I
Mal
•
NEW ANIMAL PROTEIN PRODUCTS FOR USE IN STARTER DIETS
INTRODUCTION
Dean R. Zimmerman Professor
Department of Animal Science Iowa State University
The inclusion of animal protein sources in diets specifically designed for pigs weaned at young ages goes back to the early 1950s when researchers developed dry diets that included high concentrations of milk byproducts (dried skim milk and dried whey). The benefits of these ingredients were attributable to both their protein and carbohydrate components. In the intervening years, many other animal protein sources have been used in pig starter diets.
The primary function of animal proteins in pig starters is as sources of amino acids. In general, when compared to vegetable protein sources, the amino acids of animal protein sources are more digestible for young pigs. However, most animal protein sources undergo some heat treatment and, in some cases, putrefaction before feeding. These conditions may lead to destruction or complexing of nutritionally critical amino acids. In general, animal proteins are high-quality proteins. That is, they have a good balance (ratio) of digestible amino acids that are close to the relative needs of the pig.
In addition to supplying amino acids to the young pig, animal protein sources may influence pig performance in other ways. In fact, the primary benefit of some animal protein feedstuffs may be from • these secondary affecters.
In general, animal protein feedstuffs are expensive relative to vegetable protein feedstuffs. Therefore, even though diets formulated with animal protein feedstuffs allow maximum rate and efficiency of growth, these diets may not produce the most profitable pig production.
ANIMAL PROTEIN FEEDSTUFFS
Dried skim milk. Early reports by Speer et al. (1954) and Diaz et al. (1959) demonstrated that pigs weaned at 1 to 2 weeks of age and about 2.6 kg body weight could be successfully reared on dry diets containing 40% dried skim milk plus other highly digestible ingredients. Subsequently, dried skim milk became the preferred source of protein and lactose in phase 1 diets. However, because of cost, dried skim milk is presently either not used or is used at only low concentrations in pig starters. Its contribution of milk sugar has been replaced by dried whey and feed grade lactose.
Dried whey. Although dried whey is used primarily as a source of lactose, when it is used at 20 to 25% of starter diets, it contributes significant high-quality protein. Mahan (1992) conducted research to determine the effects of the lactose and lactalbumin components of high-quality dried whey on performance of weanling pigs. His results indicate that the lactose in dried whey is the primary cause of improved weight gain and feed intake responses.
·The feeding value of dried whey, however, is dependent on proper processing, as was demonstrated by ,Mahan (1984). He found that a "food-grade" dried whey, but not a "feed-grade" dried whey, included at
205 , .
=------- ~;i. ,,J
i i
25% of pig starters improved rate of gain by 15%. The only obvious difference between sources of dried whey was a 3% greater concentration of ash in the "food-grade" product.
Whey is subject to the "browning reaction" that results in a complex forming between lactose and proteins with a decrease in the biological availability of lysine. This reaction is caused by high and extended drying temperatures and long periods of storage.
Fish meal. Fish meal that has been properly processed and preserved is a high-quality protein that has been widely and successfully used in diets for pigs of all ages. The research by Stoner et al. ( 1990) demonstrated that select menhaden fish meal could be successfully used at concentrations from Oto 20% in pig starter diets. In these diets, it replaced soybean meal protein and was equal in feeding value. Its use, therefore, should be based on economics. In the Midwestern states, the cost per unit of protein from fish meal is always greater than from soybean meal. Not all fish meal is of high quality. Without addition of an effective antioxidant, its lipid component will oxidize. Also, if allowed to putrefy before drying, proteins will be broken down, as indicated by high concentrations of volatile nitrogen.
Blood meal. Up to 20 years ago, blood meal was looked at as a very low-quality protein feedstuff for pigs. At that time, most blood meal was being "vat dried". This process produced a products with very low lysine availability as compared to flash, ring-dried blood meal (Waibel et al., 1977). With proper processing, blood meal is an excellent source of available lysine for pigs (Parsons et al., 1975). Its protein is, however, very low in isoleucine, and this limits the amount of blood meal that can be effectively used in pigs starter diets. Research by Kats et al. (1994b) indicated that the optimum concentration of spray-dried blood meal was about 2% in a diet fed from 7 to 28 days postweaning. In their paper, they re_ported that spray-dried bovine and porcine sources proved more effective than a flash, ring-dried source of blood meal fed at 2.5% of the diets to pigs weaned at 3 weeks of age.
Spray-dried plasma. Our first experiment evaluating spray-dried plasma in diets of weanling pigs was reported in 1987 (Zimmerman, 1987). We compared a spray-dried plasma and spray-dried blood meal to a flash, ring-dried blood meal. All blood products were fed at I 0% of the diet to pigs weaned between 3 and 4 weeks of age. The pigs fed plasma consumed more feed and grew more rapidly in the 4-week period. Since this initial report, we and many other researchers have reported results substantiating the positive feed intake and rate of gain responses to plasma. Reports by Gatnau et al. ( 1991 ), Gatnau and Zimmerman ( 1992), Kats et al. ( l 994a), and Coffey and Cromwell ( 1995) have investigated levels of plasma in starter diets. In general, these studies agree that maximum feed intake and growth responses are obtained with 6 to 8% plasma.
Mode of Action. After initial studies demonstrated positive feed intake and weight gain responses to plasma, our interest turned to understanding the mode of action. Our first goal was to establish the presence of immunoglobulins and antibodies in spray-dried plasma (Gatnau et al., 1989). Colostrumdeprived neonatal pigs were dosed by stomach tube with a suspension of reconstituted spray-dried plasma or saline. After one day, blood samples were taken. Blood from pigs dosed with plasma, but not those dosed with saline, were positive for immunoglobulins and antibodies for parvovirus and rotavirus. These results indicate that functional antibodies were present after spray drying, and they were absorbed by the neonatal pigs.
Next, we had observed, after running a number of experiments with plasma, that the magnitude of positive responses was related to how well the control pig~ grew. If control pigs grew slowly, the growth response to plasma was greater than ifthe control pigs grew rapidly. The slow growth of control animals was likely associated with a high challenge to antigens.
206
~no~ en~ ex8 faci ned col pla,
betj
dial
Ou~
~:]~ WO
fed 1111 '
mu~
and I
(unl to p pla fed
Roj<
res~ groJ com antil not l nu~ add ii to re
Othj I
~v:ta:1 hon grea
soy:
Evi
immj this thesJ
I
feedi I perffj
to pl]
~d
%
m
to 3
ot ;,
:d
rth als
Coffey and Cromwell ( 1995) and Stahly et al. ( 1995) demonstrated that pigs reared in "clean" environments responded less to plasma additions than pigs raised in "dirty" or "conventional" environments. We (Zimmerman, unpublished) also noticed this type of a response in an unpublished experiment in which two identical trials were repeated over time. The first trial was conducted in a new facility, and the second trial was conducted in the same facility 6 weeks later. Responses to plasma were negligible in the first trial in which all treatment groups grew rapidly. In the second trial, however, control pigs gained only 41 % as rapidly' for the first 2 weeks as in the first trial, and pigs fed 7.5% plasma grew 99% faster than control pigs. We also noted a large difference in diarrhea incidence between trials, with a much higher incidence in the second trial. In this second trial, incidence of diarrhea was decreased by feeding plasma.
Our next approach to determine the mode of action of plasma was to feed fractions of plasma protein that were supplied by American Protein Corporation (Gatnau et al., 1995). The fractions were albumin, immunoglobulins, and the low molecular weight components. These were fed in concentrations that would have been present in an 8% plasma diet and were compared to an 8% plasma diet. All diets were fed for 15 days to weanling pigs reared in a "dirty" environment. Grov.rth performance indicated that the immtinoglobulin fraction was responsible for the feed intake and rate of gain responses. Jejunum mucosa samples harvested from pigs both at 6 a.nd 15 days after initiation of the trial had higher lactase and maltase activity if pigs had been fed plasma or the immunoglobulin fraction. Recently Cain (unpublished) has again demonstrated that the active components that cause the performance responses to plasma are present in the immunoglobulin fraction. Weanling pigs fed the immunoglobulin fraction, plasma, and serum with immunoglobulins removed grew 55, 31, and 3% faster, respectively, than those fed a casein-based diet for 2 weeks.
Rojas et al. ( 1994) and Coffey and Cromwel I ( 1995) have investigated the relationship between responses to antimicrobials and plasma in weanling pigs. Both groups noted positive feed intake and growth rate responses to antibiotics and plasma, and these responses were additive in pigs fed a combination of antimicrobials and plasma. The additive responses are difficult to explain. If both antimicrobials and plasma prevent infections caused by enteric pathogens, the additive responses would not be expected. Recently, Cain and Zimmerman ( 1997) reported that feeding plasma reduced the number of days that weanling pigs shed rotavirus particles in their feces. Together, these results and the additive response of plasma and antimicrobials may indicate that the primary action of dietary plasma is to reduce rotavirus and, possibly, other enteric viral infections.
Others have attempted to explain the mode of action of plasma. Ermer et al. (1994) demonstrated that weanling pigs show a preference for a diet containing spray-dried plasma versus dried skim milk when both diets are offered simultaneously. de Rodas et al. ( 1995) investigated blood levels of IGF-1, growth hormone, and insulin in an attempt to explain the growth effect of plasma. Pigs fed plasma had slightly greater plasma growth hormone, lower insulin, and equal IGF-1 levels when compared with pigs fed soybean meal.
Evidence from the research with plasma conducted over the last 10 years strongly suggests that immunoglobulins in plasma are responsible for its positive effects. In summary, the factors supporting this conclusion are: 1) immunoglobulins and specific antibodies are present in spray-dried plasma; 2) these antibodies are absorbed across the intestine in neonatal pigs; 3) diarrhea incidence is decreased by feeding plasma; 4) activity of brush border enzymes is greater in pigs fed plasma; 5) the magnitude of performance responses to plasma decrease with age and body weight; and 6) the magnitude of responses to plasma are related to the health of the pigs.
207
I I

i
Egg yolk antibodies. Recently the Wisconsin Alumni Research Foundation has patented and licensed the production of egg yolk antibodies to Dupont and Con Agra (Anonymous, 1997). Potentially, antibodies to specific antigens will be produced by exposing laying hens to these antigens. Egg yolks produced by the hens will then be harvested and incorporated into the pig's diet. Antibodies present in the egg yolk material will inactivate specific antigens that cause reduction in feed intake and growth rate.
Hydrolyzed Porcine Small Intestine (HPSI). This material is a byproduct of the extraction of heparin from porcine smal I intestines. Intestines are ground, mixed with a buffered bacterial proteolytic enzyme solution, heated, and incubated. Heparin is then separated with the aid of ion exchange resins. The residual hydrolyzed suspension is then concentrated under vacuum and finally dried on soybean hulls producing a free-flowing dry product that is approximately 50% hydrolyze·d intestine and 50% soybean hulls. The amino acid composition indicates that it is of high quality, and most of the amino acids are in the free form. We (Zimmerman et al., 1997) have conducted a series of trials to evaluate the product as a replacement for protein (lysine) from dried whey in weanling pig diets. In pigs fed diets that included 5 to 6% product for the first 2 weeks postweaning, feed intake and weight gain were improved in a 2- or 4-week period after the product was no longer fed. This response pattern suggests that the active component(s) causing the positive responses may be speeding the maturation of the pig's digestive system. At this time, we do not understand the mode of action.
LITERATURE CITED
Anonymous. 1997. Modified egg yolks may provide antibodies to livestock. Feedstuffs 69(No. 23): 11. Cain, C. M ., and D. R. Zimmerman. 1997. Effect of spray-dried plasma (SOP) on fecal shedding of
hemolytic Escheriscia coli. (HEC) and rotavirus by pigs in a segregated early weaned (SEW) environment. J. Anim. Sci. 75(Suppl. 1 ):61.
Coffey, R. D., and G. L. Cromwell. 1995. The impact of environment and antimicrobial agents on the growth response of early weaned pigs to spray-dried porcine plasma. J. Anim. Sci. 73 :2532-2539.
de Rodas, B. Z., K. S. Sohn, C. V. Maxwell, and L. J. Spicer. 1995. Plasma protein for pigs weaned at 19 to 24 days of age: effect on performance and plasma insulin-like growth factor I, growth hormone, insulin and glucose concentrations. J. Anim. Sci. 73:3657-3665.
Diaz, F., V. C. Speer, P. G. Homeyer, V. W. Hays, and D. V. Catron. 1959. Comparative performances of baby pigs fed infant and baby pig diets. J. N utr. 68: 13 1-140.
Ermer, P. M., P. S. Miller, and A. J. Lewis. 1994. Diet preference and meal patterns of weanling pigs offered diets containing either spray-dried plasma or dried skim milk. J. Anim. Sci. 72: 1548-1554.
Gatnau, R., C. Cain, M. Drew, and D. R. Zimmerman. 1995. Mode of action of spray-dried porcine plasma in weanling pigs. J. Anim. Sci. 73(Suppl. !):82.
Gatnau, R., P. S. Paul, and D.R. Zimmerman. 1989. Spray dried porcine plasma as a source of immunoglobulins for newborn piglets. J. Anim. Sci. 67(Suppl. I ):244.
Gatnau, R., and D. R. Zimmerman. 1992. Determination of optimum levels of inclusion of spray-dried porcine plasma (SOPP) in diets of weanling pigs fed in practical conditions. J. Anim. Sci. 70(Suppl. 1):236.
Gatnau, R., D.R. Zimmerman, T. Diaz, and J. Johns. 1991. Determination of optimum levels ofspraydried porcine plasma (SOPP) in diets for weanling pigs. J. Anim. Sci. 69(Suppl. 1 ):369.
Kats, L. J., J. L. Nelssen, M. D. Tokach, R. D. Goodband, J. A. Hansen, and J. L. Laurin. 1994a. The effect of spray-dried porcine plasma on growth performance in the early weaned pig. J. Anim. Sci. 72:2075-2081.
Kats, L. J., J. L. Nelssen, M. D. Tokach, R. D. Goodband, T. L. Weeden, S. S. Oritz, J. A. Hansen, and K. G. Friesen. I 994b. The effect of spray-dried blood meal on growth performance of the earlyweaned pig. J. Anim. Sci. 72:2860-2869.
208
Mahan, D. C. 1984. Dried whey is not always dried whey. p. 1. Ohio Swine Res. & Industry Rep. 84(1):30~33.
Mahan, D. C. 1992. Efficacy of dried whey and its lactalbumin and lactose components at two dietary lysine levels on postweani11g pig performance and nitrogen balance. J. Anim. Sci. 70:2182-2187.
Parsons, M. J., E. R. Miller, W. G. Bergen, P. K. Ku, F. F. Green, and D. E. Ullrey. 1975. bioavailability of lysine in blood meal for swine. J. Anim. Sci. 41 :325.
Rojas, J. L., M. H. Jurgens, and D. R. Zimmerman. 1994. Effect of spray-dried porcine plasma, antimicrobial agents of their combination on performance of weanling pigs. !SU Swine Res. Rpt. ASL-Rl 156.
Speer, V., G. Ashton, F. Diaz, and D. Catron. 1954. New l.S.C. Pre-starter "75". la. Farm Sci. 8(10):3-6.
Stahly, T. S., D.R. Cook, S. G. Swenson, 1;-J. H. Williams, and D.R. Zimmerman. 1995. Growth responses of pigs to dietary plasma protein (PP) additions as influenced by pig antigen exposure and PP source. J. Anim. Sci. 73(Suppl. 1 ):81.
Stoner, G. R., G. L. Allee, J. L. Nelssen, M. E. Johnston, and R. B. Goodband. 1990. Effect of select menhaden fish meal in starter diets for pigs. J. Anim. Sci. 68:2729-2735.
Waibel, P. E., M. Cuperlovic, R. F. Hurrell, and K. J. Carpenter. 1977. Processing damage to lysine and other amino acids in the manufacture of blood meal. J. Agric. Food Chem. 25: 171-175.
Zimmerman, D.R. 1987. Porcine plasma proteins in diets of weanling pigs. !SU Swine Res. Rpt. ASLR482.
Zimmerman, D. R., J.C. Sparks, and C. M. Cain. 1997. Carry-over responses to an intestinal hydrolysate in weanling pig diets. J. Anim Sci. 75(Suppl. 1 ):71.

Notes
( This page intentionally blank. )
210
IMPACT OF ENVIRONMENTAL FACTORS AND DISEASE ON ANIMAL PERFORMANCE
INTRODUCTION
Michael E. Spurlock, G. Robert Frank, Steven G. Cornelius, R. P. Chapple, and Gawain M. Willis
Purina Mills, Inc., St. Louis, MO
The detrimental effect of disease and environmental stress on growth rate and efficiency of gain in food animals is of considerable economic importance. !he potential for improved profitability and animal well being has led scientists in industry and academia to investigate the mechanisms by which environmental stressors and clinical and subclinical disease challenges influence growth and efficiency of gain. The following discussion is an overview of how environmental and immunological stressors may suppress growth in food animals. Regulation of metabolic systems directly or indirectly by proinflammatory cytokines will be summarized and attention given to the potential for modulation of the inflammatory response by dietary fatty acids.
ENVIRONMENTAL STRESSORS
Studies conducted by Mcfarlane et al. (1989a,b) provide exemplary data that illustrate the impact of environmental stressors on growth performance. Multiple stressors (ammonia, beak trimming, coccidial challenge, electric shock, heat and noise) were evaluated in growing chicks in a complete factorial ~ arrangement. Protein and fat deposition (calculated by Chapple, 1994) are plotted against stressor order in Figure 1. The profound result of these studies was the near perfect linear reduction in protein and fat deposition as stressor number increased. Thus, it is clear that the effects of these stressors were additive and dose dependent in nature. Similar results have been reported for pigs (Hyun et al., 1997). This relationship has led to the hypothesis that stressors invoke an array of mediators that ultimately converge to a common mechanism by which growth rate and( or) efficiency of gain are depressed. It is certainly conceivable that stressors invoke biochemical changes at the cellular level which culminate in a depression of growth potential and thus a reduction in nutrient needs. As discussed below, cytokines are perhaps the fundamental link to this common mechanism. Neural connections between peripheral tissues and locations within the central nervous system that regulate food intake (described by Johnson, 1997) render it is quite possible that the reduction in growth potential causes simultaneously a reduction in food intake. Accordingly, devising strategies to augment nutrient intake in such cases may be a difficult endeavor.
Group size serves as a prototypic example of an environmental stressor that compromises growth (see Chapple, 1994 for a detailed review). Increasing the'number of pigs per pen, with feeder and water access and floor space per pig held constant, reduces weight gain and, in some instances, feed efficiency. As summarized in Table l, from average initial and final pig weights of 25.7 and 108.5 kg, respectively, we have shown recently (Frank et al., 1997) that daily gain and gain:feed decreased quadratically (P < .02) with increasing group size whereas fat depth increased quadratically (P < .01). It was determined in a subsequent study that the reduction in growth performance parallels a reduction in serum IGF-1 (Figure 2; increasing group size reduced daily gain (909 vs 836 g, respectively, for 1 vs 5 pigs/pen; P < .01 ), but had no effect on gain: feed. These data indicate the possibility that social factors may invoke metabolic changes of sufficient magnitude to cause alterations in both the rate and composition of gain. It may be interesting indeed to evaluate the efficacy of metabolic modifiers such as growth hormone and ractopamine (a 13-
211
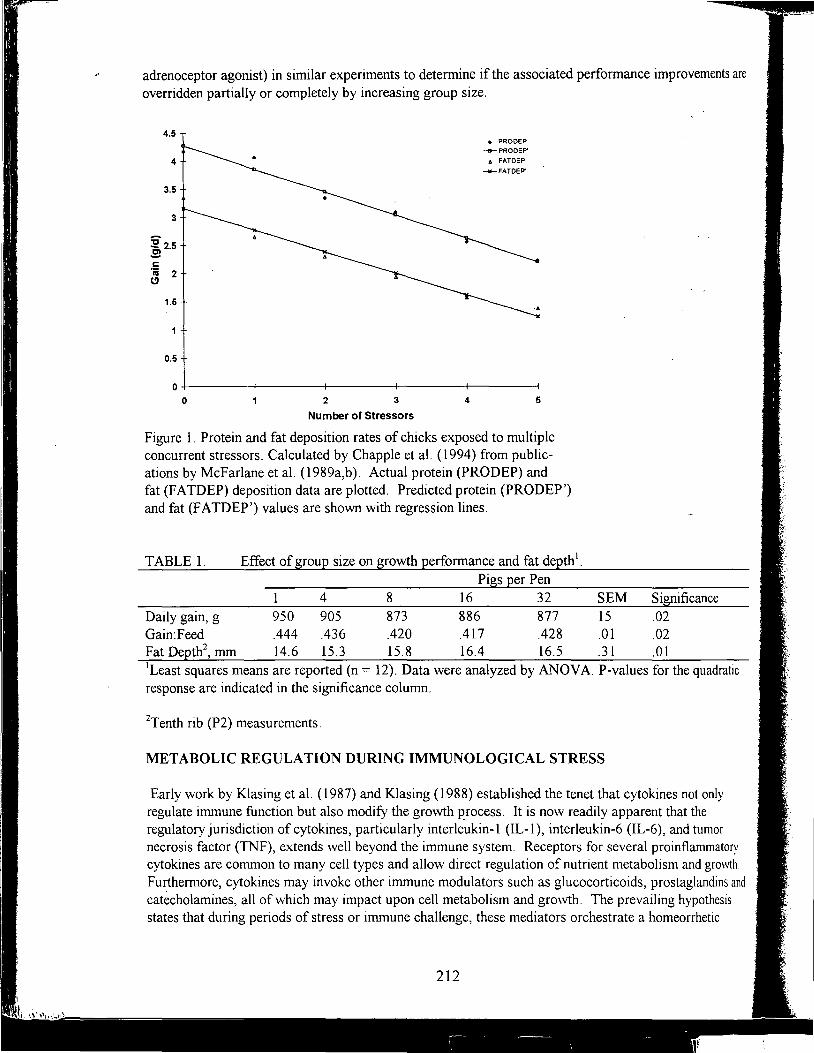
adrenoceptor agonist) in similar experiments to determine if the associated performance improvements are overridden partially or completely by increasing group size.
4.5
4
3.5
3
~2.5 c ii 2 (!)
1.5
0.5
0 2 3
Number of Stressors
4
• PROOEP -a-PRODEP'
6 FATDEP
--w--FATDEP'
5
Figure 1. Protein and fat deposition rates of chicks exposed to multiple concurrent stressors. Calculated by Chapple et al. (1994) from publications by Mcfarlane et al. (l 989a,b). Actual protein (PRODEP) and fat (F ATDEP) deposition data are plotted. Predicted protein (PRODEP') and fat (FA TD EP') values are shown with regression lines.
TABLE 1. Effect of group size on growth performance and fat depth 1.
Pigs per Pen 4 8 16 32 SEM Significance
Daily gain, g 950 905 873 886 877 15 .02 Gain:Feed .444 .436 .420 .417 .428 .01 .02 Fat Depth2
, mm 14.6 15.3 15.8 16.4 16.5 .31 .01 1Least squares means are reported (n = 12). Data were analyzed by ANOVA. P-values for the quadratic response are indicated in the significance column.
2Tenth rib (P2) measurements.
METABOLIC REGULATION DURING IMMUNOLOGICAL STRESS
Early work by Klasing et al. (1987) and Klasing (1988) established the tenet that cytokines not only regulate immune function but also modify the growth process. It is now readily apparent that the regulatory jurisdiction of cytokines, particularly interleukin- I (IL-1 ), interleukin-6 (IL-6), and tumor necrosis factor (TNF), extends well beyond the immune system. Receptors for several proinflammatory cytokines are common to many cell types and allow direct regulation of nutrient metabolism and growth. Furthermore, cytokines may invoke other immune modulators such as glucocorticoids, prostaglandins and catecholamines, all of which may impact upon cell metabolism and growth. The prevailing hypothesis states that during periods of stress or imnmne challenge, these mediators orchestrate a homeorrhetic
212
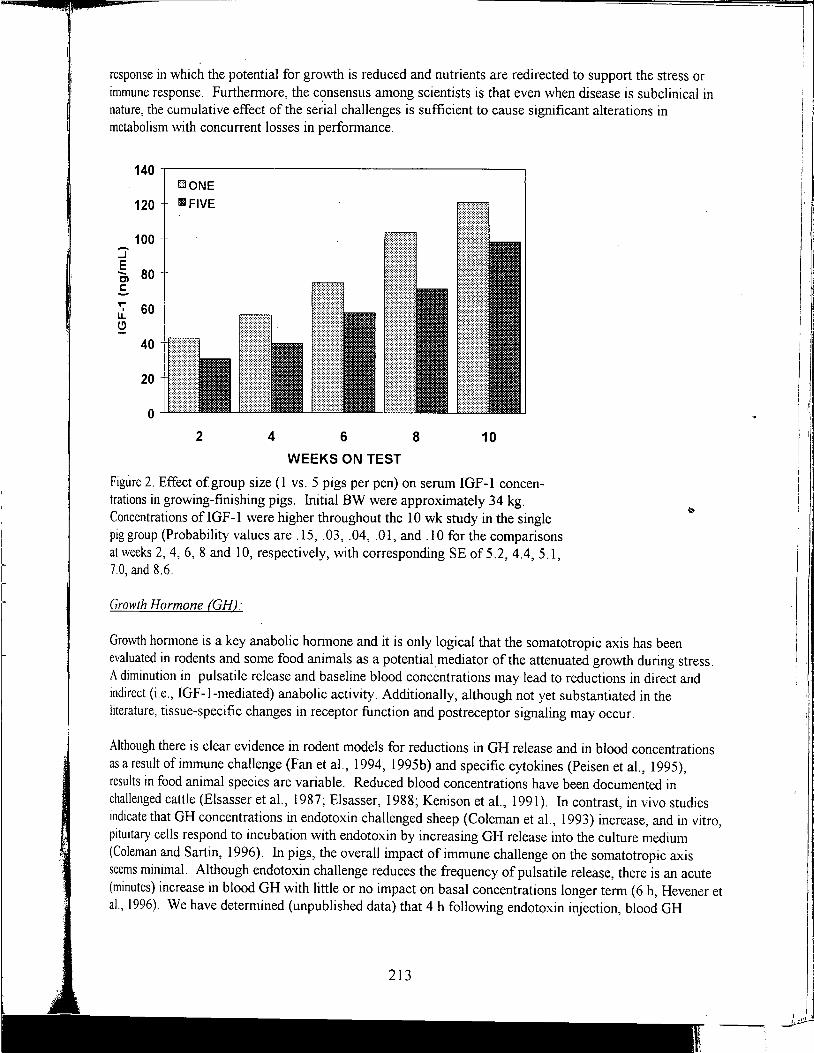
response in which the potential for growth is reduced and nutrients are redirected to support the stress or immune response. Furthermore, the consensus among scientists is that even when disease is subclinical in nature, the cumulative effect of the se~ial challenges is sufficient to cause significant alterations in metabolism with concurrent losses in performance.
140 BONE
120 lillFIVE
100 :i E
80 -Cl c ,.. 60 -I
u. C)
40
20
0
2 4 6 8 10 WEEKS ON TEST
Figure 2. Effect of group size (1 vs. 5 pigs per pen) on serum IGF-1 concentrations in growing-finishing pigs. Initial BW were approximately 34 kg. Concentrations of IGF-1 were higher throughout the 10 wk study in the single pig group (Probability values are .15, .03, .04, .01, and .10 for the comparisons at weeks 2, 4, 6, 8 and 10, respectively, with corresponding SE of 5.2, 4.4, 5.1, 7.0, and 8.6.
Growth Hormone (GHJ:
Growth hormone is a key anabolic hormone and it is only logical that the somatotropic axis has been evaluated in rodents and some food animals as a potential mediator of the attenuated growth during stress. A diminution in pulsatile release and baseline blood concentrations may lead to reductions in direct and indirect (i.e., IGF-1-mediated) anabolic activity. Additionally, although not yet substantiated in the literature, tissue-specific changes in receptor function and postreceptor signaling may occur.
Although there is clear evidence in rodent models for reductions in GH release and in blood concentrations as a result of immune challenge (Fan et al., 1994, 1995b) and specific cytokines (Peisen et al., 1995), results in food animal species are variable. Reduced blood concentrations have been documented in challenged cattle (Elsasser et al., 1987; Elsasser, 1988; Kenison et al., 1991). In contrast, in vivo studies indicate that GH concentrations in endotoxin challenged sheep (Coleman et al., 1993) increase, and in vitro, pituitary cells respond to incubation with endotoxin by increasing GH release into the culture medium (Coleman and Sartin, 1996). In pigs, the overall impact of immune challenge on the somatotropic axis seems minimal. Although endotoxin challenge reduces the frequency of pulsatile release, there is an acute (minutes) increase in blood GH with little or no impact on basal concentrations longer term (6 h, Hevener et al., 1996). We have determined (unpublished data) that 4 h following endotoxin injection, blood GH
213
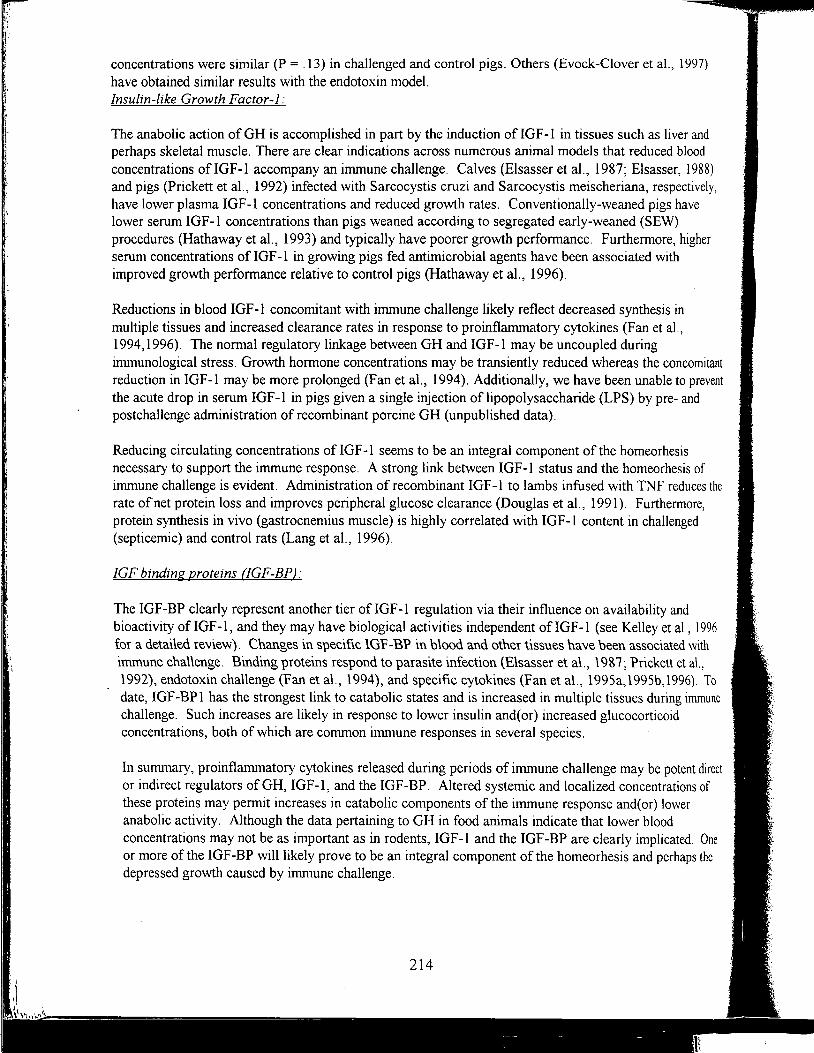
concentrations were similar (P = .13) in challenged and control pigs. Others (Evock-Clover et al., 1997) have obtained similar results with the endotoxin model. Insulin-like Growth Factor-]:
The anabolic action of GH is accomplished in part by the induction of IGF-1 in tissues such as liver and perhaps skeletal muscle. There are clear indications across numerous animal models that reduced blood concentrations ofIGF-1 accompany an immune challenge. Calves (Elsasser et al., 1987; Elsasser, 1988) and pigs (Prickett et al., 1992) infected with Sarcocystis cruzi and Sarcocystis meischeriana, respectively, have lower plasma IGF-1 concentrations and reduced growth rates. Conventionally-weaned pigs have lower serum IGF-1 concentrations than pigs weaned according to segregated early-weaned (SEW) procedures (Hathaway et al., 1993) and typically have poorer growth performance. Furthermore, higher serum concentrations of IGF-1 in growing pigs fed antimicrobial agents have been associated with improved growth performance relative to control pigs (Hathaway et al., 1996).
Reductions in blood IGF-1 concomitant with immune challenge likely reflect decreased synthesis in multiple tissues and increased clearance rates in response to proinflammatory cytokines (Fan et al., 1994, 1996). The normal regulatory linkage between GH and IGF-1 may be uncoupled during immunological stress. Growth hormone concentrations may be transiently reduced whereas the concomitant reduction in IGF-1 may be more prolonged (Fan et al., 1994). Additionally, we have been unable to prevent the acute drop in serum IGF-1 in pigs given a single injection of lipopolysaccharide (LPS) by pre- and postchallenge administration ofrecombinant porcine GH (unpublished data).
Reducing circulating concentrations ofIGF-1 seems to be an integral component of the homeorhesis necessary to support the immune response. A strong link between IGF-1 status and the homeorhesis of immune challenge is evident. Administration of recombinant IGF-1 to lambs infused with TNF reduces the rate ofnet protein loss and improves peripheral glucose clearance (Douglas et al., 1991). Furthermore, protein synthesis in vivo (gastrocnemius muscle) is highly correlated with IGF-1 content in challenged (septicemic) and control rats (Lang et al., 1996).
IGF binding proteins OGF-BPJ:
The IGF-BP clearly represent another tier ofIGF-1 regulation via their influence on availability and bioactivity ofIGF-1, and they may have biological activities independent ofIGF-1 (see Kelley et al., 1996 for a detailed review). Changes in specific lGF-BP in blood and other tissues have been associated with immune cha\\enge. Binding proteins respond to parasite infection (Elsasser et a\., l 987; Prickett et al., 1992), endotoxin challenge (Fan et al., 1994), and specific cytokines (Fan et al., 1995a,l995b,1996). To date, IGF-BPl has the strongest link to catabolic states and is increased in multiple tissues during immune challenge. Such increases are likely in response to lower insulin and( or) increased glucocorticoid concentrations, both of which are common immune responses in several species.
In summary, pro inflammatory cytokines released during periods of immune challenge may be potent direct or indirect regulators of GH, IGF-1, and the IGF-BP. Altered systemic and localized concentrations of these proteins may permit increases in catabolic components of the immune response and( or) lower anabolic activity. Although the data pertaining to GH in food animals indicate that lower blood concentrations may not be as important as in rodents, IGF-1 and the IGF-BP are clearly implicated. One or more of the IGF-BP will likely prove to be an integral component of the homeorhesis and perhaps the depressed growth caused by immune challenge.
214
lt lt
e
j
NUTRIENT TRANSPORT AND UTILIZATION
Glucose:
In immune-challenged animals, glucose uptake by peripheral tissues is dampened as a means of repartitioning energy to meet the needs of specific cell populations and tissues responsible for mounting the immune response. Thus, cytokine-induced alterations in insulin function are not surprising. Sophisticated whole animal studies involving euglycemic hyperinsulinemic clamps in combination with primed constant tracer infusion established quite clearly that LPS or IL-1 (Ling et al., 1994), and TNF (Lang et al., 1992; Ling et al., 1994) reduced the apparent rate of glucose uptake by skeletal muscle, heart and liver. The mechanisms by which cytokines influence insulin receptor signaling and glucose uptake are not known. Albeit, it is evident that the insulin resistance in skeletal muscle and adipose tissue is multifaceted, encompassing the availability of insulin receptors and glucose transporters and abnormalities in the . downstream signal transduction cascade (Moller and Flier, 1992).
Amino Acids:
A principal objective of the homeorhetic and catabolic activities that accompany immune challenge is ensuring that liver supplies of amino acids are sufficient to meet the increased requirements for glucogenic amino acids and synthesis of acute phase proteins. Indeed, the liver becomes the principle organ for amino acid uptake during infection (Austgen et al., 1991) as the capacities of hepatic amino acid transport systems are increased. Invading bacteria and their toxins stimulate the secretion of cytokines and stress hormones that augment hepatic blood flow, amino acid transporter numbers, and transport kinetics (Fischer et al., 1995). Endotoxemia (Inoue et al., 1994) and TNF treatment (Pacitti et al., 1993) have been associated with increased amino acid transport (increased V ma.x, systems A, N and ASC) by hepatocyte pla~ma membrane vesicles, an effect clearly abrogated by pretreatment with anti-TNF antibody (Inoue et al., 1994).
In contrast to liver, some skeletal muscle amino acid uptake mechanisms may be suppressed during periods of immunological stress by the same hormonal milieu that enhances uptake in the liver. a-Aminoisobutyric acid (AIB) uptake by soleus muscle of rats injected with either TNF or II-I is decreased (Zamir et al., 1993a). Although TNF has also been implicated in the decreased basal amino acid uptake by system A (reduced V ma.x and Km) in a rat model of cachexia (Garcia-Martinez et al., l 995a), it is not yet clear whether these effects are direct or mediated by IL-1 which is induced by TNF. Glucocorticoid antagonist may simply suppress the induction of IL-1 release by TNF.
Amino Acid Flux and Oxidation:
In keeping with newly established metabolic priorities, infection and inflammatory processes are generally accompanied by an increase in the flux of some amino acids from skeletal muscle pools to the liver. Furthermore, oxidation of branched-chain amino acids (BCAA) by skeletal muscle may increase as glucose is reserved for other metabolic needs. Cytokine-induced changes in both tissue and plasma amino acid concentrations reflect this altered metabolic state. Skeletal muscle is depleted of several essential and nonessential amino acids after a single injection ofTNF (Tayek, 1996). In the pig, within four h of a single injection of endotoxin there is a substantial increase (>55%) in plasma alanine relative to initial baseline concentrations and almost three-fold higher concentrations relative to pair-fed controls (Figure 3).
215
I,
/. ~·
200 mSAL lllllLPS
150
~ 100 ...J E -0 50 E c -Cll 0 Cl c I'll .c u -50
-100
-150 ALA GLY LYS
Figure 3. Changes in alanine (ALA), glycine (GLY) and lysine (L YS) concentrations in the plasma of growing pigs 4 h following a single i.m. injection of lipopolysaccharide (E.coli, 50 µg per kg BW). Feed intake in the saline (SAL) control group was restricted to that of the challenged (LPS) pigs. Differences are significant (P < .05) according to the t-test procedure.
Also, the dramatically different response to simple intake restriction (pair-fed control) vs immune challenge is evident in that the changes in plasma amino acids such as alanine and glycine in these two groups were markedly different.
The scenario that has evolved is one in which peripheral tissues such as skeletal muscle and adipose tissue are deprived of nutrients by modifications in insulin responsiveness and nutrient transport mechanisms orchestrated by TNF and other proinflammatory cytokines. It will indeed be interesting to determine in food animals if management strategies designed to limit disease transmission influence markers of insulin action or nutrient transport systems.
PROTEIN METABOLISM:
Protein Degradation and Svnthesis:
As skeletal muscle protein accretion in the growing animal is a reflection of the balance between protein synthesis and degradation rates, disease and stress-related perturbations of both processes are of much interest to food animal scientists. In challenged animals, three factors likely contribute to lower protein synthesis and accelerated protein degradation rates. First, challenge is generally associated with lower feed intake (Reviewed by Johnson, 1997). Thus, the supply of amino acids for protein synthesis is limited. Secondly, the nitrogen needs of the challenged animal for synthesis of acute phase proteins and other immune-related processes may impose a surprising burden on the animal. It has been calculated for humans that nitrogen needs for synthesis of ACP alone may peak at 1.2 g per kg of BW per day (Waterlow, 1991). Finally, the amino acid composition of skeletal muscle may be different than that of acute phase proteins, thus necessitating that total amino acid release from skeletal muscle exceed that
216
required for ACP synthesis .(Reeds et a.1., 1994 ). It is not surprising that protein losses during an immunological challenge are greater than that caused by reduced food intake (Tracey et al., 1988).
Both TNF and IL-I have been linked to depressed protein synthesis and(or) increased degradation rates in rodent models of immune challenge. Administration of these cytokines typically leads to an increase in skeletal muscle protein degradation rates (Zamir et al., 1992; Llovera et al., 1993a,b) with no change (Zamir et al., 1992) or an increase (Llovera et al., l 993a,b) in synthesis' rates. Even when synthesis rates have been increased by these cytokines, the magnitude of the change in degradation exceeds that of synthesis such that a net loss in protein results. Furthermore, although Ii-6 has not been routinely considered an initiator of protein degradation, Ebisui et al. ( 199 5) determined that this cytokine accelerates the degradation rates of some proteins in C2Cl2 myotube cultures. Others (Tsujinaka et al., 1996) have shown that an anti-IL-6 receptor antibody blocks increased expression of protease genes and muscle atrophy in IL-6 transgenic mice.
Finally, it should also be noted that cytokine-mediated release of nutrients from tissue stores may include tissues other than skeletal muscle. Evans et al. (1993) identified the intestinal tract as a possible donor of amino acids for synthetic processes and carbon for glucogenesis. These authors found that infusing dogs with TNF increased urinary nitrogen excretion without a corresponding increase in the flux of amino acids from hind limb muscle. Enterectomy blocked the increased urinary nitrogen disposal.
Activation of multiple proteolytic systems likely ensures adequate amino acid supplies for priority metabolic processes. Identification and characterization of the proteolytic systems that respond directly or indirectly to cytokines will undoubtedly facilitate our understanding of the changes in protein accretion associated with immune challenge and environmental stress.
LIPID METABOLISM:
Lipolvsis and Lipogenesis:
The catabolic response mediated by cytokines in challenged humans and animals encompasses major shifts in lipid metabolism. Energy intake is typically reduced during periods of immune challenge and fatty acid oxidation is increased to provide energy. Tumor necrosis factor seems to be a significant mediator of the lipolytic response (Green et al., 1994). Lipolytic responses have also been achieved, at least in the 3T3-F442A adipogenic cell line, with IL-1, interferon-a and interferon-y (Feingold et al., 1992; Doerrler et al., 19~4) and interferon-13 (Feingold et al., 1992). As regards lipogenesis in adipocytes, regulation by cytokines presents a rather complex mechanistic picture in that coordinate regulation of the expression of key lipogenic genes and their enzymatic activity is not always apparent (see Doe·rrler et al., 1994). Fatty acid synthesis is stimulated by IL-1 but reduced by TNF, IFN-a, and IFN-t. Moreover, it is clear from these data that proinflammatory cytokines target different steps in the lipogenic pathway and that changes in mRNA abundance do not necessarily parallel observed metabolic changes.
Lipoprotein lipase (LPL) also appears to be a target of cytokines and may play an active part in the homeorhetic response in diseased animals. This enzyme hydrolyzes circulating Iipoprotein triglycerides to - .
free fatty acids and monoacylglycerol for cellular uptake. Depressed LPL activity and expression may thus contribute to the hypertriglyceridemia common to infection in humans and rodent species. It has been suggested that the hypertriglyceridemic r~sponse is a specific response in which the Iipoproteins bind circulating antigens rendering them less immunogenic (Grunfeld and Feingold, 1992; Feingold and Grunfeld, 1992). Thus, it is not surprising that the inflammatory response would include suppressed LPL
217
i 'I 11
activity as one means of accumulating lipid in the blood. Multiple cytokines have been shown to regulate LPL activity and expression (Doerrler et al., 1994 ), and Ogawa et al. (1989) have sho'Arn that TNF and IL-1 act synergistically to suppress LPL activity in 3T3-Ll adipocytes. Although the effects of cytokines on LPL expression and activity are ,:veil established, it is interesting that our laboratory (unpublished data) and others (Webel et al., 1996) have been unable to document hypertriglyceridemia as a response to LPS in pigs despite marked increases in circulating cytokines.
ALTERATIONS OF FETAL GROWTH AND DEVELOPMENT BY IMMUNE CHALLENGE
The possible avenues by which immune challenge may influence gro'Ath and development may include the potential for challenge of the gestating dam to influence fetal growth and development. The localization of some cytokines to specific cell types in the developing fetus (Chen et al., 1991) and the discovery that fetal mononuclear cells are as capable as maternal cells of expressing IL-8 in response to a disease challenge (Taniguchi et al., 1993) have posed the interesting possibility that fetal growth and development may be altered if challenges are incurred during gestation. Stallmach et al. ( 199 5) documented the presence of numerous cytokines, including IL-1, TNF, IL-6, and IL-8, in human amniotic fluid and the latter three also in fetal blood. In particular, increased concentrations of IL-6 and IL-8 in fetal blood were associated with intrauterine growth retardation and( or) chorioamnionitis. Thus, it is conceivable that in utero exposure of the developing fetus to some proinflammatory cytokines compromises development in food animal species.
Placental Nutrient Deliverv:
The developing fetus is dependent upon the placenta for the nutrients required to support growth. Although we have traditionally considered the fetus as a somewhat of a parasite which extracts nutrients irrespective of m~temal status, stress and immunobiology may alter this relationship. Immune challenge may limit nutrient delivery to the fetus. Mechanisms may include reductions in placental amino acid transport orchestrated by cytokines or other immune modulators (Carbo et al., 1995). Thus, during the acute phase of an immune challenge, reduced nutrient availability may lead to impaired growth and development of the fetus, particularly if the challenge occurs during a critical stage of development such as during the formation of primary and secondary myofibers. Whether such alterations lead to permanent phenotypic changes has not been investigated. However, as discussed below, preliminary data indicate this to be a possibility.
Fetal Tissue Development:
Proliferation and differentiation of myogenic and adipogenic cells is a crucial aspect of development. Both of these cell populations may be impacted by proinflammatory cytokines. Differentiation of porcine preadipocytes is suppressed in vitro by adding either TNF or serum collected from infected pigs to the culture medium (Jewell et al., 1988), and McNamara et al. (unpublished data) determined that proliferation is reduced by TNF. Others (Torti et al., 1985) found a "de-differentiation" phenomenon in mature adipocytes exposed to TNF. These de-differentiated cells required stimulation with the appropriate hormonal milieu for re-differentiation.
Similar proliferation and differentiation responses have been documented in myoblasts. Using L8 myogenic cells, we have determined that proliferation and differentiation (i.e., formation of multinucleated myotubes) are markedly reduced by IL-1 and TNF (unpublished data). Furthermore, TNF and IFN-y (Bartoccioni et al., 1994) and TNF and IL-1 (unpublished data) act synergistically at low physiological concentrations to suppress myoblast proliferation. Such synergisms among cytokines are not surprising considering the overlap in cytokine signal transduction pathways.
218
1
1
l ~ c ~ I
1 1
J J
_I ~ of
~ th! h
.I I!
e;j ne
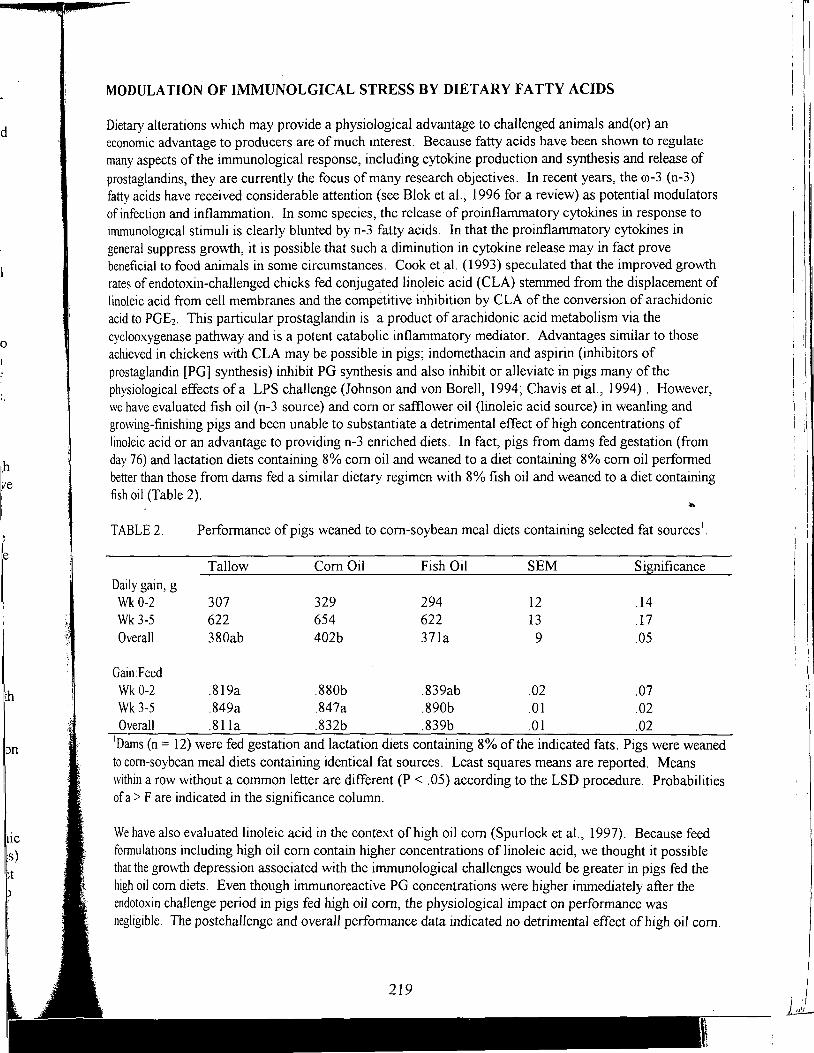
id
0
:h ve ! i I I.
I~
th
:m
UC
:s)
:t )
MODULATION OF IMMUNOLGICAL STRESS BY DIETARY FATTY ACIDS
Dietary alterations which may provide a physiological advantage to challenged animals and( or) an economic advantage to producers are of much interest. Because fatty acids have been shown to regulate many aspects of the immunological response, including cytokine production and synthesis and release of prostaglandins, they are currently the focus of many research objectives. In recent years, the co-3 (n-3) fatty acids have received considerable attention (see Blok et al., 1996 for a review) as potential modulators of infection and inflammation. In some species, the release of proinflammatory cytokines in response to immunological stimuli is clearly blunted by n-3 fatty acids. In that the proinflammatory cytokines in general suppress growth, it is possible that such a diminution in cytokine release may in fact prove beneficial to food animals in some circumstances. Cook et al. (1993) speculated that the improved growth rates of endotoxin-challenged chicks fed conjugated linoleic acid (CLA) stemmed from the displacement of linoleic acid from cell membranes and the competitive irlhibition by CLA of the conversion of arachidonic acid to PGE2. This particular prostaglandin is a product of arachidonic acid metabolism via the cyclooxygenase pathway and is a potent catabolic inflammatory mediator. Advantages similar to those achieved in chickens with CLA may be possible in pigs; indomethacin and aspirin (inhibitors of prostaglandin [PG] synthesis) inhibit PG synthesis and also inhibit or alleviate in pigs many of the physiological effects of a LPS challenge (Johnson and von Borell, 1994; Chavis et al., 1994). However, we have evaluated fish oil (n-3 source) and corn or safflower oil (linoleic acid source) in weanling and growing-finishing pigs and been unable to substantiate a detrimental effect of high concentrations of linoleic acid or an advantage to providing n-3 enriched diets. In fact, pigs from dams fed gestation (from day 76) and lactation diets containing 8% corn oil and weaned to a diet containing 8% corn oil performed better than those from dams fed a similar dietary regimen with 8% fish oil and weaned to a diet containing fish oil (Table 2).
TABLE 2.
Daily gain, g Wk 0-2 Wk 3-5 Overall
Gain:Feed
Performance of pigs weaned to com-soybean meal diets containing selected fat sources 1.
Tallow
307 622 380ab
Com Oil
329 654 402b
Fish Oil
294 622 37la
SEM
12 13 9
Significance
.14
.17
.05
Wk0-2 .819a .880b .839ab .02 .07 Wk 3-5 .849a .847a .890b .01 .02 Overall .81 la .832b .839b .01 .02
1Dams (n = 12) were fed gestation and lactation diets containing 8% of the indicated fats. Pigs were weaned to com-soybean meal diets containing identical fat sources. Least squares means are reported. Means within a row without a common letter are different (P < .05) according to the LSD procedure. Probabilities of a> F are indicated in the significance column.
We have also evaluated linoleic acid in the context of high oil com (Spurlock et al., 1997). Because feed formulations including high oil com contain higher concentrations of linoleic acid, we thought it possible that the grov.1h depression associated with the immunological challenges would be greater in pigs fed the high oil com diets. Even though immunoreactive PG concentrations were higher immediately after the endotoxin challenge period in pigs fed high oil com, the physiological impact on performance was negligible. The postchallenge and overall performance data indicated no detrimental effect of high oil corn.
219
I
I I
Furthermore, additional work with dietary fat sources indicates that over the course of a 12 wk growingfinishing study, feeding diets containing I 0% safflower is not detrimental, nor is fish oil beneficial (Table 3).
SUMMARY
The failure of commercially-reared food animals to achieve their genetic potential for growth rate and efficiency of gain is undoubtedly related to environmental and immunological stressors. Metabolically, the integrated response is one in which nutrients are repartitioned to immune-related processes which take precedence over growth. The scientific challenge is to develop technologies that encompass all aspects of the challenge from management strategies to nutritional and therapeutic intervention. A thorough understanding of how and why cytokines and other immune and stress modulators function in vivo will be the foundation for improving animal well being and producer profitability.
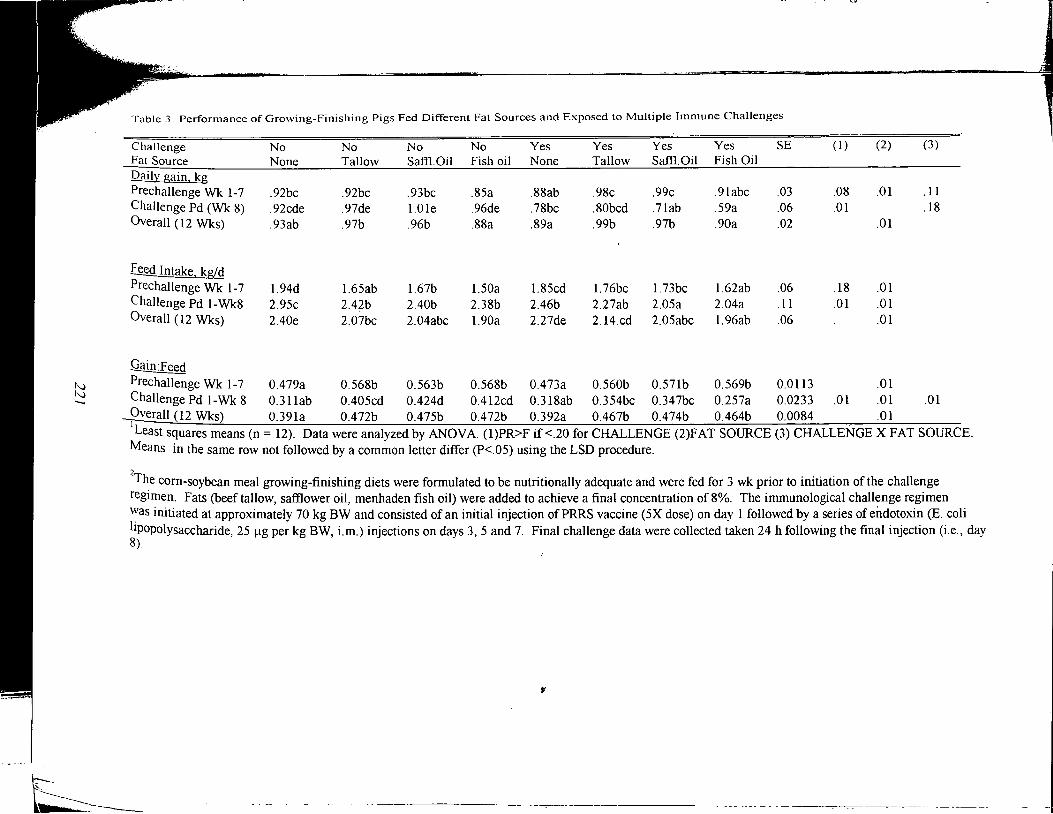
~ ._
Table 3. Performance of Growing-Finishing Pigs Fed Different Fat Sources and Exposed to Multiple Immune Challenges
Challenge No Fat Source None Daily gain, kg Prechallenge Wk 1-7 .92bc Challenge Pd (Wk 8) .92cde Overall (12 Wks) .93ab
F~ed Intake, kgLd Prechallenge Wk 1-7 l.94d Challenge Pd l-Wk8 2.95c Overall (12 Wks) 2.40e
Q.ain:Feed Prechallenge Wk 1-7 0.479a Challenge Pd 1-Wk 8 0.31lab
_Overall (12 Wks) 0.39la
No Tallow
.92bc
.97de
.97b
l.65ab 2.4fb 2.07bc
0.568b 0.405cd 0.472b
No Saffl.Oil
.93bc I.Ole .96b
l.67b 2.40b 2.04abc
0.563b 0.424d 0.475b
No Fish oil
.85a
.96de
.88a
l.50a 2.38b l.90a
0.568b 0.412cd 0.472b
Yes None
.88ab
.78bc
.89a
l.85cd 2.46b 2.27de
0.473a 0.318ab 0.392a
Yes Tallow
.98c
.80bcd
.99b
l.76bc 2.27ab 2.14.cd
0.560b 0.354bc 0.467b
Yes Saffl.Oil
.99c
.?lab
.97b
l.73bc 2.05a 2.05abc
0.57lb 0.347bc 0.474b
Yes Fish Oil
.9labc
.59a
.90a
l.62ab 2.04a l.96ab
0.569b 0.257a 0.464b
SE
.03
.06
.02
.06
.11
.06
0.0113 0.0233 0.0084
(I) (2) (3)
.08 .01 .11
.01 .18 .01
.18 .01
.01 .01 .01
.01 .01 .01 .01
.01 I Least squares means (n = 12). Data were analyzed by ANOV A. ( l)PR>F if <.20 for CHALLENGE (2)F AT SOURCE (3) CHALLENGE X FAT SOURCE.
Means in the same row not followed by a common letter differ (P<.05) using the LSD procedure.
2The com-soybean meal growing-finishing diets were formulated to be nutritionally adequate and were fed for 3 wk prior to initiation of the challenge
regimen. Fats (beef tallow, safflower oil, menhaden fish oil) were added to achieve a final concentration of 8%. The immunological challenge regimen was initiated at approximately 70 kg BW and consisted of an initial injection of PRRS vaccine (5X dose) on day 1 followed by a series of endotoxin (E. coli lipopolysaccharide, 25 µg per kg BW, i.m.) injections on days 3, 5 and 7. Final challenge data were collected taken 24 h following the final injection (i.e., day 8).
t
,.
.. :!
I· I
•L'
'
·" , I
i
I
l I
LITERATURE CITED
Austgen, T. R., M. K. Chen, T. C. Flynn and W. W. Souba. 199 l. The effects of endotoxin on splanchnic metabolism. J. Trauma 31:742-751.
Bartoccioni, E., D. Michaelis, and R. Hohlfeld. 1994. Constitutive and cytokine-induced production of interleukin-6 by human myoblasts. Immunol. Lett. 42: 135-138.
Blok, W. L., M. B. Katan, and J. W. M. van der Meer. 1996. Modulation of inflammation and cytokine production by dietary (n-3) fatty acids. J. Nutr. 126:1515-1533.
Carbo, N., F. J. Lopez-Soriano, and J.M. Argiles. 1995. Administration of tumor necrosis factor-alpha results in a decreased placental transfer of amino acids in the rat. Endocrinol. 136:3579-3584.
Chapple, R. P. 1994. Effect of stocking arrangement on pig performance. In: E. S. Batterham (Ed.) Manipulating Pig Production IV. p 87. Australasian Pig Science Association, Attwood, Victoria, Australia.
Chavis, C. S., D. L. Hancock, P. J. Ruwe-Kaiser, and M. E. Spurlock. 1994. The effects of aspirin and E. coli lipopolysaccharide on performance, calpain, and calpastatin activities in growing pigs. J. Anim. Sci. 72 (Suppl. 2):50 (Abstr.)
Chen, H. L., Y. Yang, X. L. Hu, K. K. Yelavarthi, J. L. Fishback, and J. S. Hunt. 1991. Tumor necrosis factor alpha mRNA and protein are present in human placental and uterine cells at early and late stages of gestation. Am. J. Pathol. 139:327-335.
Coleman, E. S., T. H. Elsasser, R. J. Kemppainen, D. A Coleman, and J. L. Sartin. 1993. Effect of endotoxin on pituitary hormone secretion in sheep. Neuroendocrinology 58: 111-122.
Coleman, E. S., and J. L. Sartin. 1996. Endotoxin stimulates in vitrc pituitary growth hormone release in eicosanoid-dependent manner. Am. J. Vet. Res. 57:1662-1667.
Cook, M. E., C. C. Miller, Y. Park, and M. Pariza. 1993. Immune modulation by altered nutrient metabolism: Nutritional control of immune-induced growth depression. Poult. Sci. 72: 1301-1306.
Doerrler, W., K. R. Feingold, and C. Grunfeld. 1994. Cytokines induce catabolic effects in cultured adipocytes by multiple mechanisms. Cytokine 6:478-484.
Douglas, R. G., P. D. Gluckman, B. H. Breier, J. L. McCall, B. Parry, and J. H.F. Shaw. 1991. Effects of recombinant IGF-I on protein and glucose metabolism in rTNF-infused lambs. Am. J. PhysioL 261 (Endocrinol. Metab. 24):E060-E612.
Ebisui, C., T. Tsujinaka, T. Morimoto, K. Kan, S. Iijima, M. Yano, E.Kominami, K. Tanaka, and M. Monden. 1995. Interleukin-6 induces proteolysis by activating intracellular proteases (cathepsins B and L, proteasome) in C2Cl2 myotubes. Clinical Science 89:431-439.
Elsasser, T. H., T. S. Rumsey, A. C. Hammond, and R. Fayer. 1987. Influence of parasitism on plasma concentrations of growth hormone, somatomedin-C, and somatomedin binding proteins in calves. J. Endocrinol. 116: 191-200.
Elsasser, T. H. 1988. Influence of parasitic infections on growth related hormones and nutrient utilizations in cattle. In: Steffens, G. L., and T. S. Rumsey (eds). Beltsville Symposium in Agriculture Research, Biomechanisms Regulating Growth and Development. Kluwer Academic, Boston p. 421-435.
Evans, D. A., D. 0. Jacobs, and D. W. Wilmore. 1993. Effects of tumour necrosis factor on protein metabolism. Br. J. Surg. 80: 1019-1023.
Evock-Clover, C. M., M. J. Myers, and N. C. Steele. 1997. Effects of an endotoxin challenge on growth performance, carcass accretion rates, and serum hormone and metabolite concentrations in control pigs and those treated with recombinant porcine somatotropin. J. Anim. Sci. 75: 1784-1790.
Fan, J., P. E. Molina, M. C. Gelato, and C.H. Lang. 1994. Differential tissue regulation of insulin-like growth factor-I content and binding proteins after endotoxin. Endocrinology 134:1685-1692.
Fan, J. Y., H. Li, G. J. Bagby, and C. H. Lang. l 995a. Modulation of inflammation-induced changes in insulin-like growth factor (IGF)-1 and IGF binding protein-I by anti-TNF antibody. Shock 4:21-26.
Fan, J., D. Char, G. J. Bagby, M. C. Gelato, and C.H. Lang. 1995b. Regulation of insulin-like growth factor (IGF)-1 and IGF~binding proteins by tumor necrosis factor. Am. J. Physiol. 266 (Regulatory Integrative Comp. Physiol):Rl204-Rl212.
Fan, J., M .. M. Wojnar, M. Theodorakis, and C.H. Lang. 1996. Regulation of insulin-like growth factor (IGF)-1 mRNA and peptide and IGF-binding proteins by interleukin-1. Am. J. Physiol. 270 (Regulatory Integrative Comp. Physiol):R621-R629.
Feingold, K. R., W. Doerrler, C. A. Dinarello, W. Fiers, and C. Grunfeld. 1992. Stimulation of lipolysis in cultured fat cells by tumor necrosis factor, interleukin-I, and the interferons is blocked by inhibition of prostaglandin synthesis. Endocrinology 13 0: 10-16.
Feingold, K. R., and C. Grunfeld. 1992. Role of cytokines in inducing hyperlipidemia. Diabetes 41: 97-101.
Fischer, C. P., B. P. Bode, S. F. Abcouwer, G. C. Lukaszewicz, and W.W. Souba. 1995. Hepatic uptake of glutarnine and other amino acids during infection and inflammation. Shock 3:315-322.
Frank, G. R., M. E. Spurlock, S. G. Cornelius, G. M. Willis, and M. McComb. 1997. Effects of group size on performance, fat depth and serum concentrations of insulin-like growth factor- I in growingfinishing pigs. J. Anim. Sci. 75 (Suppl. 1):37 (abstr. # 32).
Garcia-Martinez, C., F. J. Lopez-Soriano, and J.M. Argiles. 1995a. Amino acid uptake in skeletal muscle of rats bearing the Yos~ida AH-130 ascites hepatoma. Molecular and Cellular Biochem. 148: 17-23.
Green, A., S. B. Dobias, D. J. A. Walters, and A. R. Brasier. 1994. Tumor necrosis factor increases the rate of lipolysis in primary cultures of adipocytes without altering levels of hormone-sensitive lipase. Endocrinology 134:2581-2588.
Grunfeld, C., and K. R. Feingold. 1992. Tumor necrosis factor, interleukin, and interferon induced changes .. in lipid metabolism as part of host defense. P.S.E.B.M. 200:224-227.
Hathaway, M. R., W.R. Dayton, M. E. White, T. L. Henderson, and T. B. Hennington. 1996. Serum insulin-like growth factor I (IGF-1) concentrations are increased in pigs fed antimicrobials. J. Anim. Sci. 74: 1541-1547.
Hathaway, M. R., W.R. Dayton, B. Wiseman, T. Molitor, and M. E. White. 1993. Effect of weaning pigs at 10 days to off-site nurseries on growth rate, IGF-1 levels, and serum mitogenic activity. J. Anim. Sci. 7l(Suppl. 1):43 (Abstr.)
Hevener, W., G. W. Almond, J. D. Armstrong, R. G. Richards, P.R. Davies, and J.Deen. 1996. Acute endotoxemia in finishing pigs: effects on serum somatotropin and insulin-like growth factor-I. In:
. Pier Giorgio Monetti and Giorgio Vignola (Ed.) Proc. 14th Congress, Int. Pig Vet. Soc. p 733. Press Point, Abbiategrasso, Italy.
Hyun, Y., M. Ellis, and R. W. Johnson. 1997. Multiple concurrent stressors depress performance in grower pigs in an additive fashion. J. Anim. Sci. 75(Suppl. 1):37 (abstr. # 33).
Inoue, Y., B. P. Bode, and W.W. Souba. 1994. Antibody to tumor necrosis factor attenuates endotoxinstimulated amino acid transport in rat liver. Surg. 116:356-365.
Jewell, D. E., D. D. Jones, R. J. Martin, A. Prestwood, and G. J. Hausman. 1988. Sera from pigs infected with Sarcocystis suicanis and cachectin decrease preadipocyte differentiation in primary culture. J. Anim. Sci. 66:2992-2999.
Johnson, R. W. 1997. Inhibition of growth by pro-inflammatory cytokines: An integrated view. J. Anim. Sci. 75: 1244-1255.
Johnson, R. W., and E. von Borell. 1994. Lipopolysaccharide-induced sickness behavior in pigs is inhibited by pretreatment with indomethacin. J. Anim. Sci. 72:309-313.
223
Kelley, K. M., Y. Oh, S. E. Gargosky, Z. Gucev, T. Matsumoto, V. Hwa, L. Ng, D. M. Simpson, and R. G. Rosenfeld. 1996. Insulin-like growth factor-binding proteins (IGFBPs) and their regulatory dynamics. Int. J. Biochem. Cell. Biol. 28:619-637.
Kenison, D. C., T. H. Elsasser, and RF ayer. 1991. Tumor necrosis factor as a potential mediator of acute metabolic and hormonal responses to endotoxemia in calves. Am. J. Vet. Res. 52:1320-1326.
Klasing, K. C., D. E. Laurin, R. K. Peng, and D. M. Fry. 1987. Immunologically mediated growth depression in chicks: Influence of feed intake, corticosterone and interleukin-1. J. Nutr. 117: 1629-1637.
Klasing, K. C. 1988. Nutritional aspects of leukocytic cytokines. J. Nutr. 118: 1436-1446. Lang, Charles, H., C. Dobrescu, and G. J. Bagby. 1992. Tum or necrosis factor impairs insulin action on
peripheral glucose disposal and hepatic glucose output. Endocrinology 130:43-52. Lang, C.H., J. Fan, R. Cooney, and T. C. Vary. 1996. IL-1 receptor antagonist attenuates sepsis-induced
alterations in the IGF system and protein synthesis. Arn. J. Physiol. 270 (Endocrinol. Metab. 33):E430-E437.
Llovera, M., F. J. Lopez-Soriano, and J. Argiles. l 993a. Effects of tumor necrosis factor-a on muscleprotein turnover in female wistar rats. J. of Natl. Cancer Inst. 85: 1334-1339.
Llovera, M., F. J. Lopez-Soriano, and J.M. Argiles. 1993b. Chronic tumour necrosis factor-a treatment modifies protein turnover in rat tissues. Biochemistry and Molecular Biology International. 30:29-36.
Mcfarlane, J.M., S. E. Curtis, R. Shanks, S. G. Carmer. 1989a. Multiple Concurrent Stressors in Chicks. 1. Effect on Weight Gain, Feed Intake and Behavior. Poultry Sci. 68:501-509.
Mcfarlane, J.M., S. E. Curtis, J. Simon, 0. Izquierdo ....... 1989b. Multiple Concurrent Stressors in Chicks. 2. Effects on Hematologic, Body Composition, and Pathologic Traits. Poultry Sci. 68:510-521.
Moll'er, D. E., and J. S. Flier. 1992. Insulin resistance: mechanisms, syndromes, and implicat~ons. N. Sngl. J. Med. 325:938-948. -
Ogawa, Hiraki, S. Nielsen, and M. Kawakami. 1989. Cachectin/tumor necrosis factor and interleukin-I show different modes of combined effect on lipoprotein lipase activity and intracellular lipolysis in 3T3-L 1 cells. Biochimica et Biophysica Acta. 1003: 131-135.
Pacitti, A. J., Y. Inoue, and W. W. Souba. 1993. Tumor necrosis factor stimulates amino acid transport in plasma membrane vesicles from rat liver. J. Clin. Invest. 91:474-483.
Peisen, J. N., K. J. McDonnell, S. E. Mulroney, and M. D. Lumpkin. 1995. Endotoxin-induced suppression of the somatotropic axis is mediated by interleukin- p3 and corticotropin-releasing factor in the juvenile rat. Endocrinology 136:3378-3390.
Prickett, M. D., A. M. Latimer, R.H. McCusker, G. J. Hausman, and A. K. Prestwood. 1992. Alterations of serum insulin-like growth factor-I (IGF-1) and IGF-binding proteins (IGFBPS) in swine infected with the protozoan parasite sarcocystis miescheriana. Domestic Animal Endocrinology 9:285-296.
Reeds, P. J., C.R. Fjeld, and J. Jahoor. 1994. Do the differences between the amino acid compositions of acute-phase and muscle proteins have a bearing on nitrogen loss in traumatic states? J. Nutr. 124:906-910.
Spurlock, M. E., G. R. Frank, G. M. Willis, J. L. Kuske, and S. G. Cornelius. 1997. Effect of dietary energy source and immunological challenge on growth perforn1ance and immunological variables in growing pigs. J. Anim. Sci. 75:720-726.
Stallmach, Thomas, G. Hebisch, H. I. Joller-Jemelka, P. Organ, J. Schwaller, and M. Engelmann. 1995. Cytokine production and visualized effects in the feto-maternal unit. Quantitative and topographic data on cytokines during intrauterine disease. Laboratory Investigation 73:384.
224
' R.
;ute
~9-
1n
ced
1.t
cks.
:ngl.
,l
i' m
rm ;s1on
ions
y
of
.es
).
Jhic
Taniguchi, T., N. Matsuzaki, K. Shimoya, R. Neki, T. Okada, H. Kitajima, F. Saji, and 0. Tanizawa. 1993. Fetal mononuclear cells show a comparable capacity with maternal mononuclear cells to produce IL-8 in response to lipopolysaccharide in chorioamnionitis. J. Reprod. Immunol. 23:1-12.
Tayek, John A. 1996. Effects of tumor necrosis factor alpha on skeletal muscle amino acid metabolism studied in-vivo. J. of Amer. College of Nutrition. 15 (2):164-168.
Torti, F. M., B. Dieckmann, B. Beutler, A. Cerami, and G. M. Ringold. 1985. A macrophage factor inhibits adipocyte gene expression: an in vitro model of cachexia. Science 229:867-869.
Tracey, K. L., H. Wei, K. Manogue, Y. Fong, D. G. Hesse, H. T. Nguyen, G. C .Kuo, B. Beutler, R. S. · Cotran, A. Cerami, and S. F. Lowry. 1988. Cachectin/tumor necrosis factor induces cachexia,
anemia, and inflammation. J. Exp. Med. 167:1211-1227. Tsujinaka, T., J. Fujita, C. Ebisui, M. Yano, E. Kominami, K. Suzuki, K. Tanaka, A. Katsume, Y.
Ohsugi, H. Shiozaki, and M. Monden. 1996. Interleukin 6 receptor antibody inhibits muscle atrophy and modulates proteolytic systems in interleukin 6 transgenic mice. J. Clin. Invest. 97:244-249.
Webel, D., B. N. Finck, D. Baker, and R. W. Johnson. [submitted]. Tumor necrosis factor-a, interleukin-6 and several blood metabolites in swine following intraperitoneal injections of Iipopolysaccharide. J. Anim. Sci.
Webel, D. M., B. N. Finck, D. H. Baker, and R. W. Johnson. 1997. Time course of increased plasma cytokines, cortisol, and urea nitrogen in pigs following intraperitoneal injection of lipopolysaccharide. J. Anim. Sci. 1997. 75:1514-1520
Waterlow, J. C. 1991. Protein-energy m·alnutrition: challenges and controversies. Proc. Nutr. Soc. India 37:59-86.
Zamir, Oded, P-0. Hasselgren, S. L. Kunkel, J. Frederick, T. Higashiguchi, and J.E. Fischer. 1992. Evidence that tumor necrosis factor participates in the regulation of muscle proteolysis during sepsis. Arch. Surg. 127:170-174.
Zamir, Oded, P-0. Hasselgren, D. von Allmen, and J.E. Fischer. 1993b. In vivo administration of• interleukin-la induces muscle proteolysis in normal and adrenalectomized rats. Metabolism 41:204-208.
Zamir, Oded, P-0. Hasselgren, and H. James. 1993a. Effect of tumor necrosis factor or interleukin-I on muscle amino acid uptake and the role of glucocorticoids. Surg. Gynecol. Obstet. 177:27-32.
: ~ : ; I i I I'
. i
I I : I : !
l I
' i
j
L

Notes
(This page intentionally blank. )
STRESS AND NUTRITION INTERACTIONS: EMPHASIS ON VITAMIN C
J. S. McKee Animal Physiologist
Department of Animal Sciences University of Illinois at Urbana-Champaign
"An organism constantly interacts with its microenvironment, physiological and biological; hence the physiology of an organism cannot be described without considering its environmental interactions. A whole organism is not equal to the sum of its parts. Out of the whole organism there emerge unique characteristics not present in any of the isolated parts. It is important, therefore, to analyze the relation between components of the environment and the whole organism".
C. Ladd Prosser ( I 99 I )
INTRODUCTION
Technological developments by animal scientists and agricultural engineers over the past 40 years have enabled poultry producers to market a two Kg broiler chicken in half the time, a reduction of one day per year (Portsmouth and Hand, 1987). These technological innovations were necessary to support the rapidly growing world population which is expected to double in the next 40 years. The economic demands that we have placed upon poultry however, have manifested in numerous physiological pathologies including 'green muscle', a condition in which the breast muscle grows so quickly that regional blood flow is mechanically occluded causing the breast muscle to become necrotic (personal communication); ascites or right congestive heart failure, and tibial dyschondroplasia. The need to improve upon existing technologies and the need to develop new technologies is obvious if the animal production industry is to be successful at addressing these issues. To meet the challenge of feeding the growing world population, technologies which increase the efficiency at which animals convert feed into salable product need to be emphasized. Reducing the amount of feed required to produce a unit of meat or eggs would permeate all aspects of agriculture. One would expect lower input costs associated with growing, harvesting, processing, and storing feed (NRC, 1994). In addition, technologies that increase feed efficiency would be expecJed to reduce animal waste attenuating the problems of drinking water contamination and eutrophication of bodies of water. A major factor limiting the efficiency of performance in the animal production industry is stress. Specifically 'distress' (from the Latin dis=bad) or stress that has negative qualities including the diversion of nutrients away from production processes, impaired disease resistance, and reduced animal well-being. Despite vast improvements in genetics and nutrition, poultry do not perform optimally in a sub-optimal or stressful environment. The present paper addresses three major themes: (I) the environment and its effects on performance, (2) how does stress influence performance, and (3) nutritional alternatives that have been shown to alleviate stress and enhance efficiency of performance.
ENVIRONMENT AND PERFORMANCE
The environment is the sum of the impact of all of the physical and psychological variables which impinge upon an animal (Table I). Animal management systems serve to modify the macroenvironment (i.e. weather and climate) which allows the producer to provide a manageable microenvironment that is conducive to animal production and welfare; however, weather and climate greatly influence the economics of the modification. The environmental variables of the animals microenvironment can have both positive and negative effects on animal production. For example, photoperiod if managed properly can increase egg production and lean tissue growth (Buyse et al., 1996) whereas ventilation must be managed properly to prevent heat prostration during hot weather or the accumulation of moisture and air pollutants, such as dust, ammonia, and bacteria during cold weather. Microenvironmental variables vary in intensity, duration, time, and space and affect the various stages of energy conversion or metabolism from feed consumption to substrate utilization. Metabolic responses can range from appetite suppression and proteolysis by pro-inflammatory cytokines to appetite stimulation in cool environments or from the partitioning of substrates into eggs through photoperiod to the partitioning of energy to sustain contraction of the intercostal muscles during panting in hot environments. Proper management of the microenvironment will maximize the
227
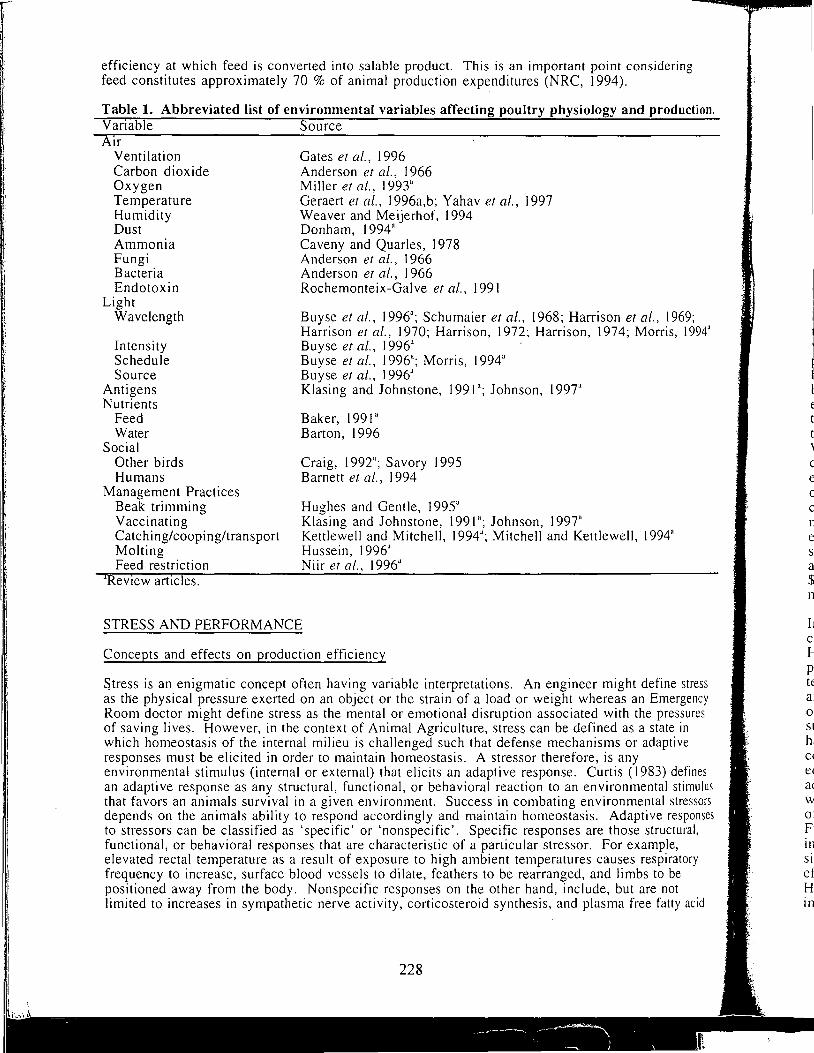
efficiency at which feed is converted into salable product. This is an important point considering feed constitutes approximately 70 % of animal production expenditures (NRC, 1994).
Table 1. Abbreviated list of environmental variables affecting poultry physiology and production. Variable Source Air
Ventilation Carbon dioxide Oxygen Temperature Humidity Dust Ammonia Fungi Bacteria Endotoxin
Light Wavelength
Intensity Schedule Source
Antigens Nutrients
Feed Water
Social Other birds Humans
Management Practices Beak trimming Vaccinating Catching/cooping/transport Molting Feed restriction
Review articles.
Gates et al., 1996 Anderson et al., 1966 Miller et al., 1993" Geraert et al., 1996a,b; Yahav et al., 1997 Weaver and Meijerhof, 1994 Donham, 1994" Caveny and Quarles, 1978 Anderson et al., 1966 Anderson et al., 1966 Rochemonteix-Galve et al., 1991
Buyse et al., 1996"; Schumaier et al., 1968; Harrison et al., 1969; Harrison et al., 1970; Harrison, 1972; Harrison, 1974; Morris, 1994" Buyse et al., 1996" Buyse et al., 1996"; Morris, 1994" Buyse et al., 1996" Klasing and Johnstone, 1991 "; Johnson, 1997"
Baker, 1991" Barton, 1996
Craig, 1992"; Savory 1995 Barnett et al., 1994
Hughes and Gentle, 1995" Klasing and Johnstone, 1991 "; Johnson, 1997" Kettlewell and Mitchell, 1994"; Mitchell and Kettlewell, 1994" Hussein, 1996" Ni ir et al., 1996"
STRESS AND PERFORMANCE
Concepts and effects on production efficiency
Stress is an enigmatic concept often having variable interpretations. An engineer might define stress as the physical pressure exerted on an object or the strain of a load or weight whereas an Emergency Room doctor might define stress as the mental or emotional disruption associated with the pressures of saving lives. However, in the context of Animal Agriculture, stress can be defined as a state in which homeostasis of the internal milieu is challenged such that defense mechanisms or adaptive responses must be elicited in order to maintain homeostasis. A stressor therefore, is any environmental stimulus (internal or external) that elicits an adaptive response. Curtis ( 1983) defines an adaptive response as any structural, functional, or behavioral reaction to an environmental stimulus that favors an animals survival in a given environment. Success in combating environmental stressors depends on the animals ability to respond accordingly and maintain homeostasis. Adaptive responses to stressors can be classified as 'specific' or 'nonspeci fie'. Specific responses are those structural, functional, or behavioral responses that are characteristic of a particular stressor. For example, elevated rectal temperature as a result of exposure to high ambient temperatures causes respiratory frequency to increase, surface blood vessels to dilate, feathers to be rearranged, and limbs to be positioned away from the body. Nonspecific responses on the other hand, include, but are not limited to increases in sympathetic nerve activity, corticosteroid synthesis, and plasma free fatty acid
228
I
I
: I ~ I
: ~ G
~
~ e s a $ n
I.
I_
IS
s ~s
and glucose concentrations. Nonspecific responses are characteristic of a generalized stress response invoked by all stressors including high ambient temperature, antigenic stimulation, and fear. Specific and nonspecific responses therefore, are not mutually exclusive. In fact they can occur simultaneously as in the example of high ambient temperature. Furthermore, specific and nonspecific responses compliment one another. For example, the nonspecific elevation in blood free fatty acids in response to heat stress serve as the primary energy source for respiratory muscles during panting, a specific response to heat stress. Likewise, the specific effect of shunting blood away from the gastrointestinal tract in response to heat stress facilitates the delivery of substrates to tissues (i.e. the respiratory muscles) involved in combating the stressor. Adaptive responses to stressors can have catastrophic economic consequences even when there is no mortality emphasizing the importance of understanding animal-environmental relations. Only until we understand these relations better can we begin to prescribe an environment that is conducive to optimal performance.
When does an environmental variable become a stressor? There are limits in which a particular variable may fluctuate without challenging homeostasis and invoking an adaptive response. For example, the thermoneutral zone represents the range of environmental temperatures where metabolic rate is the lowest. Exceeding the limits of the thermoneutral zone will induce physiological and behavioral defense mechanisms necessary to maintain homeostasis. Temperatures below the thermoneutral zone are collectively referred to as cold stress and it is within this temperature range when the bird must increase heat production to match the added environmental heat loss. In general, poultry meet this demand by increasing feed consumption and heat production. Although this is biologically sound favoring survival, the cost associated with an increase in feed consumption cannot be recouped since the feed energy will ultimately be dissipated to the environment as heat. The one exception might be lower supplemental heating costs during cold weather. Environmental temperatures above the thermoneutral zone are collectively referred to as heat stress and it is within this temperature range when the bird must increase heat loss to match the environmental heat load. Wild birds exposed to temperature extremes can change their environment behaviorally by seeking a cooler environment. From a metabolic energy standpoint, behavioral responses are more cost effective to the animal. However, the confines of poultry production systems limit the extent to which domesticated birds can alter their environment behaviorally. As a result, birds will lower their feed consumption to reduce body heat production. Although this response favors survival, the decre~se in nutrient intake attenuates production. In addition, these animals may need to employ more energetically expensive defense mechanisms such as panting to dissipate heat. Panting has been shown to account for 15, 16, and 19 % of the total energy expenditure in heat-stressed hens, broilers, and sows, respectively. Economically this translates to mean that a producer will pay approximately $1.15 per unit of feed to maintain a bird in hot weather compared to $1.00 per unit of feed to maintain the same bird under thermoneutral conditions.
Investigations of the impact that environmental stress has on poultry performance has usually consisted of oversimplifying the problem by investigating the effects of one or two stressors. However, in most situations, this is not representative of environments in commercial poultry production. Stressors common to poultry production may include extreme environmental temperatures, inadequate ventilation, air pollutants, disease, handling, beak trimming, vaccinations, and crowding. These stressors vary in intensity, duration, and time and often occur concurrently with other stressors (Curtis, 1983). Efforts to elucidate biological interactions among multiple concurrent stressors and to assess the cumulative stress they impose and their effects on poultry performance have been less than consistent. Curtis et al. ( 1975) demonstrated that aerial dust and ammonia concentrations had an additive effect on daily weight gain in pigs, in which their combined effect was equal to the sum of their individual effects. Mcfarlane et al. (I 989a,b) extended the concept of additivity when it was reported that body weight gain, feed intake, and feed efficiency decreased, whereas heterophil/lymphocyte ratios increased linearly as a function of stressor 'order' (the number of stressors imposed simultaneously) indicating an additive effect of increasing stressor order. Furthermore, chicks responded to each stressor in the same fashion whether that stressor was imposed individually or concurrently with up to five other stressors. This suggests that in practical production situations, effects of multiple concurrent stressors on performance may be estimated by adding the effects of the respective stressors when acting individually. Using similar methodology, McKee and Harrison ( 1995) reported an additive effect of systematically increasing the number of stressors imposed simultaneously using beak-trimming, coccidiosis, and high ambient temperature. However,
____lJi.j -1
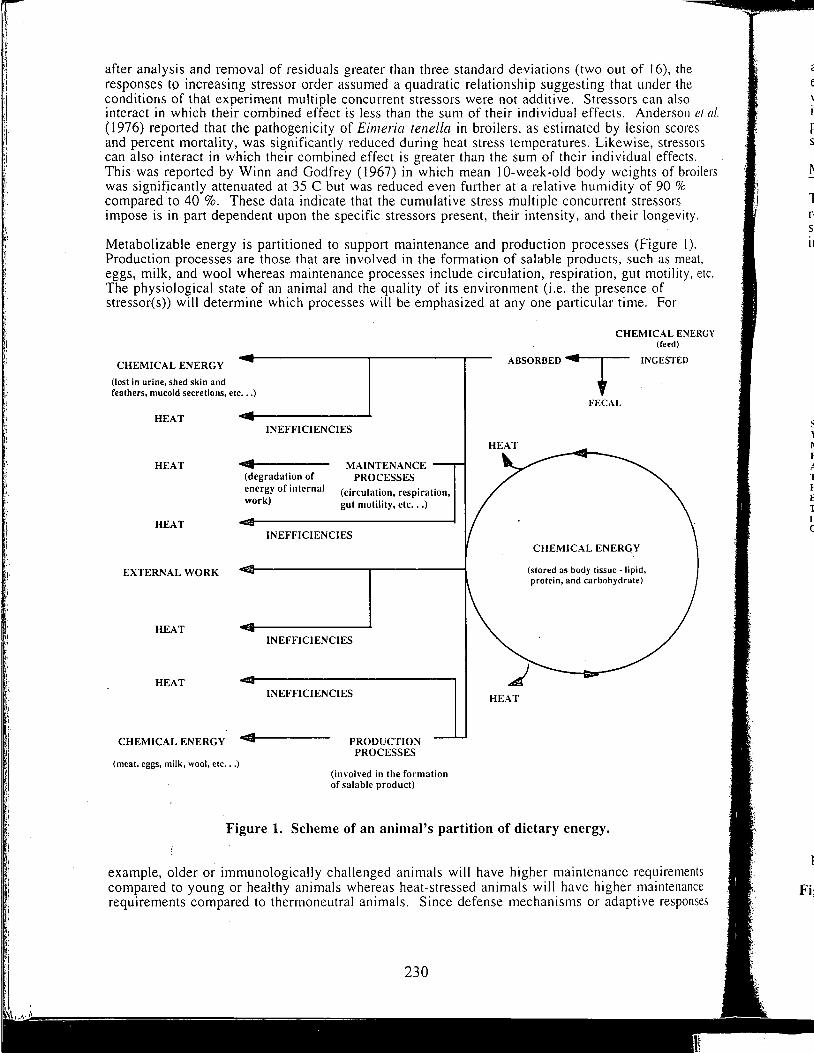
;.i
after analysis and removal of residuals greater than three standard deviations (two out of 16), the responses to increasing stressor order assumed a quadratic relationship suggesting that under the conditions of that experiment multiple concurrent stressors were not additive. Stressors can also interact in which their combined effect is less than the sum of their individual effects. Anderson et al. ( 1976) reported that the pathogenicity of Eimeria tenella in broilers, as estimated by lesion scores and percent mortality, was significantly reduced during heat stress temperatures. Likewise, stressors can also interact in which their combined effect is greater than the sum of their individual effects. This was reported by Winn and Godfrey ( 1967) in which mean 10-week-old body weights of broilers was significantly attenuated at 35 C but was reduced even further at a relative humidity of 90 % compared to 40 %. These data indicate that the cumulative stress multiple concurrent stressors impose is in part dependent upon the specific stressors present, their intensity, and their longevity.
Metabolizable energy is partitioned to support maintenance and production processes (Figure I). Production processes are those that are involved in the formation of salable products, such as meat, eggs, milk, and wool whereas maintenance processes include circulation, respiration, gut motility, etc. The physiological state of an animal and the quality of its environment (i.e. the presence of stressor(s)) will determine which processes will be emphasized at any one particular time. For
CHEMICAL ENERGY
(lost in urine, shed skin and feathers, mucoid secretions, etc ... )
HEAT
HEAT
HEAT
EXTERNAL WORK
HEAT
HEAT
INEFFICIENCIES
(degradation of energy of internal work)
MAINTENANCE PROCESSES
(circulation, respiration, gut motility, etc ... )
INEFFICIENCIES
INEFFICIENCIES
INEFFICIENCIES
CHEMICAL ENERGY ""<la------ PRODUCTION PROCESSES
(meat, eggs, milk, wool, etc ... ) (involved in the formation of salable product)
CHEMICAL ENERGY
AOSORBEDT
FECAL
(feed)
INGESTED
HEAT
HEAT
CHEMICAL ENERGY
(stored as body tissue - lipid, protein, and carbohydrate)
Figure 1. Scheme of an animal's partition of dietary energy.
example, older or immunologically challenged animals will have higher maintenance requirements compared to young or healthy animals whereas heat-stressed animals will have higher maintenance requirements compared to thermoneutral animals. Since defense mechanisms or adaptive responses
230
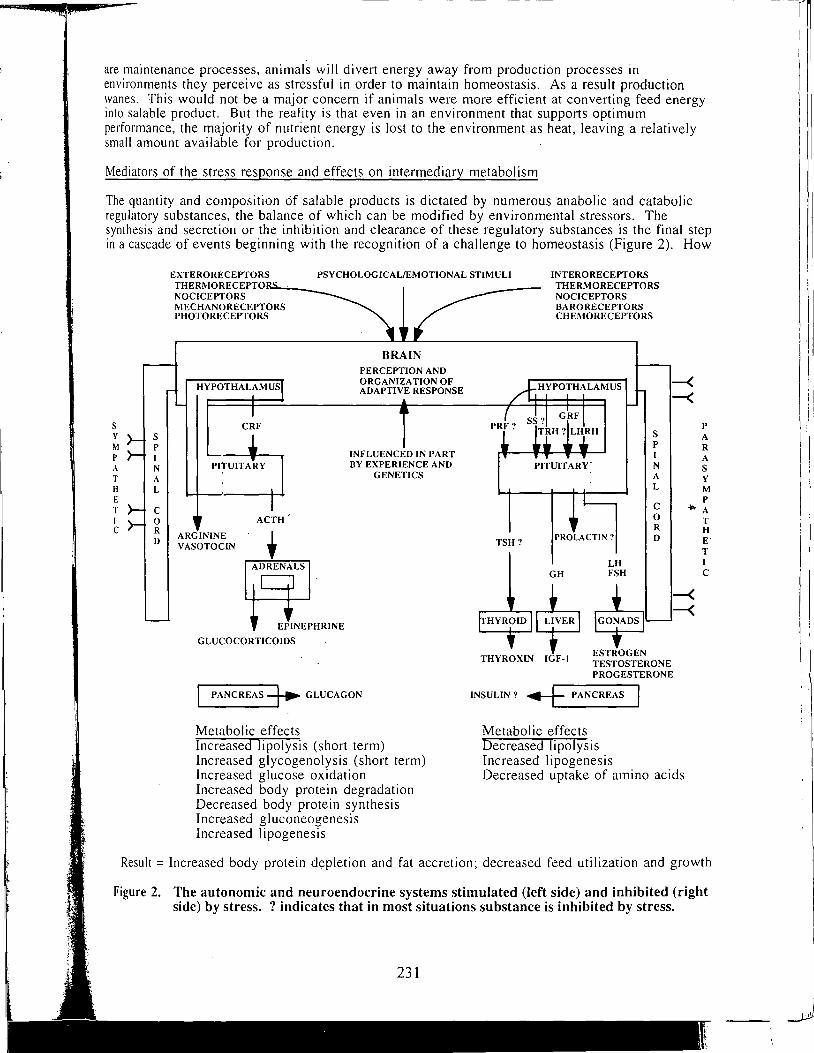
are maintenance processes, animals will divert energy away from production processes in environments they perceive as stressful in order to maintain homeostasis. As a result production wanes. This would not be a major concern if animals were more efficient at converting feed energy into salable product. But the reality is that even in an environment that supports optimum performance, the majority of nutrient energy is lost to the environment as heat, leaving a relatively small amount available for production.
Mediators of the stress response and effects on intermediary metabolism
The quantity and composition cif salable products is dictated by numerous anabolic and catabolic regulatory substances, the balance of which can be modified by environmental stressors. The synthesis and secretion or the inhibition and clearance of these regulatory substances is the final step in a cascade of events beginning with the recognition of a challenge to homeostasis (Figure 2). How
s y M p A T H E T I c
s p I N A L
c 0 R D
EXTERORECEPTORS PSYCHOLOGICAL/EMOTIONAL STIMULI INTERORECEPTORS THERMORECEPTORS NOCICEPTORS
THERMORECEPTO. ___ _
NOCICEPTORS MECHANORECEPTORS PHOTO RECEPTORS
HYPOTHALAMUS
CRF
ACTH
ARGININE 1 VASOTOCIN '
r-A-:D,...,R""E"'"N,.....A~LS,,...,
EPINEPHRINE
GLUCOCORTICOIDS
BRAIN PERCEPTION AND ORGANIZATION OF ADAPTIVE RESPONSE
INFLUENCED IN PART BY EXPERIENCE AND
GENETICS
PANCREAS --i-. GLUCAGON
Metabolic effects Increased lipolysis (short term) Increased glycogenolysis (short term) Increased glucose oxidation Increased body protein degradation Decreased body protein synthesis Increased gluconeogenesis Increased lipogenesis
BARO RECEPTORS CHEMORECEPTORS
PITUITARY.
s p I N A L
--< ~
p
A R A s y M p
c .ii. A
TSH? PROLACTIN?
GH LH FSH
0 R D
'---+----' $ !::;:::~ THYROXIN IGF-1 TESTOSTERONE
--< ~
PROGESTERONE
INSULIN? ..+ PANCREAS
Metabolic effects Decreased hpolysis Increased 1 ipogenesis Decreased uptake of amino acids
T H E" T I c
Result = Increased body protein depletion and fat accretion; decreased feed utilization and growth
Figure 2. The autonomic and neuroendocrine systems stimulated (left side) and inhibited (right side) by stress. ? indicates that in most situations substance is inhibited by stress.
231
T
I'
" i, i .\
'::i,'
a bird perceives a particular stressor will determine the quality and magnitude of the adaptive response and has been shown to be modified in part by experience, genetics, sex, age, and physiological state (Moberg, 1985). Once perceived, the bird will organize a stress response typically consisting of specific and nonspecific behavioral, autonomic, and neuroendocrine responses. However, because the confines of poultry production systems limit the extent to which birds can alter their environment behaviorally, birds have to rely primarily on autonomic and neuroendocrine responses. A review of these systems has been provided by Siegel ( 1995). In brief, increased sympathetic nerve activity and elevations in plasma epinephrine constitute the 'fight or flight' response (Cannon, 1929), characterized in part by increases in respiration, bronchodilation, pupillary dilation, heart rate, blood pressure, and blood free fatty acids and glucose concentrations. These responses increase the availability and delivery of nutrients to tissues involved in combating or averting the offensive stimulus. The 'fight .or flight' response is initiated within seconds of perception of a threat to homeostasis and is generally transient. Activation of the hypothalamicpituitary-adrenal axis on the other hand, is slower and its effects are more enduring. Hypothalamic stimulation and release of corticotropin-releasing factor (CRF) stimulates the anterior pituitary to release adrenocorticotropin hormone (ACTH) which acts on several cell types including the adrenal cortex where it stimulates the synthesis of corticosteroids, primarily corticosterone in birds. The fraction of corticosterone not bound to albumin and corticosteroid binding globulin represents the biologically active fraction and has profound effects on intermediary metabolism. Corticosterone increases plasma non-protein nitrogen (Siegel, 1962) and glucose (Snedecor et al., 1963) in birds indicating increased skeletal muscle degradation and gluconeogenesis. In addition, corticosterone increases hepatic synthesis of triglycerides (Nagra and Meyer, 1963). Other regulatory substances generally stimulated by stress include glucagon and vasotocin and contribute to the elevations in plasma glucose concentrations and blood pressure, respectively. The parasympathetic nervous system mediates vegetative biological functions including gastrointestinal tract motility and secretion and its tone is attenuated during stress. Other regulatory substances attenuated during stress include leutenizing-hormone-releasing hormone (LHRH) and growth-hormone-releasing factor (GRF) which in tum stimulate the pituitary to release leutenizing and follicle -stimulating hormone (LH and FSH) and growth hormone (GH), respectively. As a result, liver and gonadal secretion of insulin-likegrowth factor- I (IGF-1) and steroid hormones is inhibited. The effects of stress on prolactin, thyroxine, and insulin secretion is generally inhibitory. The cumulative effect of these autonomic and neuroendocrine changes favors a shift toward protein catabolism and fat accretion, and forms the basis for impaired growth and feed utilization in birds exposed to stress.
Until recently, the autonomic and neuroendocrine systems have been considered the primary integrators of stress responses; however, it is becoming increasingly evident that pro-inflammatory cytokines alter behavioral, metabolic, and neuroendocrine responses (Table 2; Klasing, 1988; Klasing and Johnstone, 1991; Johnson, 1997). These responses can even occur when a bird exhibits no clinical manifestations of a disease as occurs in subclinical infections or following routine vaccinations (Chamblee et al., 1992). Following antigenic stimulation, lowered feed intake (Klasing et al., 1987) and the requirement for the synthesis of acute phase proteins (Richards et al., 1991) results in increased muscle proteolysis. This response is mediated in part by IL- I and corticosterone where IL-1 acts directly on muscle to increase protein degradation whereas corticosterone primarily ·attenuates protein synthesis. It has been reported that approximately 60 % of the amino acids incorporated into acute phase proteins are derived from body protein degradation, primarily skeletal muscle (Johnson, 1997). Furthermore, IL- I has been shown to inhibit the anabolic effects of insulin on skeletal muscle (Klasing and Johnstone, 1991 ). Although there is little known about the direct effects of pro-inflammatory cytokines on lipogenesis in vivo, incubation of chicken apidocytes with supernatant obtained from stimulated macrophages increased lipogenesis by 200% (Butterwith and Griffin, 1989). However, it is known that in vivo, cytokines do stimulate lipogenesis indirectly by stimulating corticosterone synthesis by the adrenals via cytokine-derived ACTH (Mashaly et al., 1993). Although adipose tissue is not considered to be a primary site of lipogenesis in poultry, alterations in lipogenic activity of adipose tissue in response to cytokines may contribute to the general increase in lipogenesis in immunologically challenged birds. The cumulative effect of these responses favors body protein catabolism and fat accretion, forms the basis for impaired growth and feed utilization in chickens subjected to antigenic stimulation, and is commonly referred to as immunological stress.
232
l !
G
i Prl
l j j
Mi ~ ]
Hd
~ ~I ~
' ·+ res .iM
;~~ tnfl mel
adrl
ST]
Re~I nee Th
~eustd is r~ tnC Kg op ti
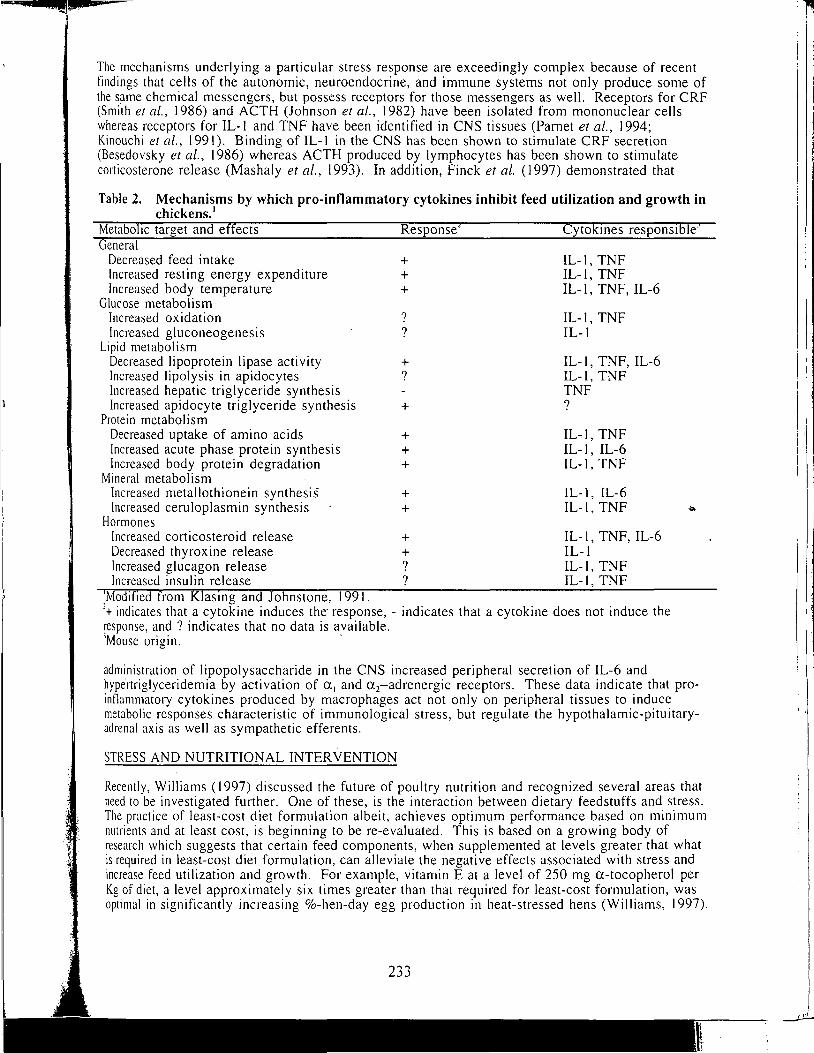
...._,.
The mechanisms underlying a particular stress response are exceedingly complex because of recent findings that cells of the autonomic, neuroendocrine, and immune systems not only produce some of the same chemical messengers, but possess receptors for those messengers as well. Receptors for CRF (Smith et al., 1986) and ACTH (Johnson et al., 1982) have been isolated from mononuclear cells whereas receptors for IL- I and TNF have been identified in CNS tissues (Pamet et al., 1994; Kinouchi et al., 1991 ). Binding of IL- I in the CNS has been shown to stimulate CRF secretion (Besedovsky et al., 1986) whereas ACTH produced by lymphocytes has been shown to stimulate corticosterone release (Mashaly et al., 1993). In addition, Finck et al. (1997) demonstrated that
Table 2. Mechanisms by which pro-inflammatory cytokines inhibit feed utilization and growth in chickens. 1
Metabolic target and effects Response2 Cytokmes respons1ble3
General Decreased feed intake Increased resting energy expenditure Increased body temperature
Glucose metabolism Increased oxidation Increased gluconeogenesis
Lipid metabolism Decreased lipoprotein lipase activity Increased lipolysis in apidocytes Increased hepatic triglyceride synthesis Increased apidocyte triglyceride synthesis
Protein metabolism Decreased uptake of amino acids Increased acute phase protein synthesis Increased body protein degradation
Mineral metabolism Increased metallothionein synthesis Increased ceruloplasmin synthesis
Hormones
+ + +
? ?
+ ?
+
+ + +
+ +
IL-I, TNF IL-I, TNF IL- I, TNF, IL-6
IL-I, TNF IL- I
IL- I , TNF, IL-6 IL-1, TNF TNF ?
IL-I, TNF IL-I, IL-6 IL-I, TNF
IL-I, IL-6 IL-I, TNF
Increased corticosteroid release + IL- I, TNF, IL-6 Decreased thyroxine release + IL- I Increased glucagon release ? IL- I, TNF Increased insulin release ? IL- I, TNF
'Modified from Klasing and Johnstone, 1991. 2+ indicates that a cytokine induces the· response, - indicates that a cytokine does not induce the response, and ? indicates that no data is available. )Mouse origin. ·
administration of lipopolysaccharide in the CNS increased peripheral secretion of IL-6 and hypertriglyceridemia by activation of a, and az-adrenergic receptors. These data indicate that proinflammatory cytokines produced by macrophages act not only on peripheral tissues to induce metabolic responses characteristic of immunological stress, but regulate the hypothalamic-pituitaryadrenal axis as well as sympathetic efferents.
STRESS AND NUTRITIONAL INTERVENTION
Recently, Williams ( 1997) discussed the future of poultry nutrition and recognized several areas that need to be investigated further. One of these, is the interaction between dietary feedstuffs and stress. The practice of least-cost diet formulation albeit, achieves optimum performance based on minimum nutrients and at least cost, is beginning to be re-evaluated. This is based on a growing body of research which suggests that certain feed components, when supplemented at levels greater that what is required in least-cost diet formulation, can alleviate the negative effects associated with stress and increase feed utilization and growth. For example, vitamin E at a level of 250 mg a-tocopherol per Kg of diet, a level approximately six times greater than that required for least-cost formulation, was optimal in significantly increasing %-hen-day egg production in heat-stressed hens (Williams, 1997).
! •
~· ii
This response may be attributed to reductions in lipid peroxidation of very low density lipoproteins (VLDL), the main lipid precursors for yolk development, or an increased accessibility of VLDL receptors on the oocyte membrane due to increased membrane integrity. Dietary inclusion of feedstuffs not normally found in poultry rations have also been shown to enhance performance. Conjugated linoleic acid (CLA), an isomer of linoleic acid, represents one such compound. Conjugated linoleic acid occurs naturally in animal products, especially those that are derived form ruminants. Recently, CLA was reported to be extremely effective in preventing the catabolic effects associated with antigenic stimulation in chickens without adversely affecting immune function (Cook et al., 1993). Because CLA also decreased skeletal muscle arachidonic acid (AA), and that cyclooxygenase products (PGE2) increase proteolysis of skeletal muscle in response to IL- I (Dinarello, 1984 ), it was concluded that CLA may prevent immune-induced catabolism by decreasing the synthesis of AA. Additionally, dietary inclusion of feedstuffs considered unnecessary for poultry have also been shown to enhance performance. Vitamin C (VC) falls into this category.
Because chickens can synthesize VC in the kidney (Chaudhuri and Chatterjee, 1969), it is generally not added to poultry diets. However, in a review by Pardue and Thaxton (I 986), numerous reports suggest that VC utilization during certain nutritional, pathological, and environmental stressors can exceed it's rate of synthesis, and that the provision of supplemental VC under these conditions benefits poultry. Responses to VC supplementation in poultry however, have been quite variable. This variability may be due in large to the vitamin's inherent instability. Under aerobic conditions VC is oxidized to L-dehydroascorbic acid by the loss of an electron and a proton at each of the number 2 and 3 carbon atoms of the Jactone ring. At physiological pH, the lactone ring of Ldehydroascorbic acid is very unstable and is readily hydrolyzed to diketo-L-gulonic acid, a compound with no antiscorbutic properties. The oxidation of VC is expedited by the presence of trace minerals, oxygen, moisture, light, heat, and neutral or alkaline pH. The mode of administration of dietary VC must also be considered or the biological activity of VC prior to experimentation may be grossly overestimated. Other sources of variation in responses to VC supplementation may be due to experimental methodology and the paradoxical biphasic effect VC has on enzymes of the Mixed Function Oxidase system (Shimizu, 1970; Ginter et al., 1984). Although, a review of the literature indicates that the variability in response to VC supplementation has been considerably less in recent years than in past years. This can probably be attributed to the development and implementation of more stable VC derivatives. Nevertheless, the incorporation of supplemental VC as a management alternative continues to increase as nutritionists and producers measure the benefits.
Recent studies have shown that supplemental VC has improved performance in poultry subjected to heat stress (Kutlu and Forbes, 1993; Jaffar and Blaha, 1996) and antigenic stimulation (Gross, 1992), while alleviating stress-induced increases in heterophil/lymphocyte ratios (Pardue and Williams, 1990; Gross, 1992), plasma corticosterone (Pardue et al., 1985; Satterlee et al., I 989), and serum uric acid concentrations (Pardue et al., 1985). Improved performance of VC-suppl"emented, heat-stressed broiler chickens has been shown to correspond with lower plasma corticosterone concentrations (Pardue et al., 1985; Kutlu and Forbes, 1993; McKee and Harrison, 1995), and it has been postulated that the improved performance results from a decrease in protein-9erived gluconeogenesis (Pardue et al., 1985). In fact, fifteen years prior, Shimizu (1970) reported that VC inhibited in vitro, bovine
· adrenal NADPH-cytochrome P-450 reductase (P-450m), the enzyme responsible for converting cholesterol into pregnenolone. He reported that low concentrations of VC stimulated P-450'", while higher concentrations inhibited enzyme activity. Several years later, Kitabchi and West (1975) reported a negative correlation between rat adrenal VC concentrations and the rate of steroid synthesis. Furthermore, Hayano et al. ( 1956) and Kitabchi ( 1967) demonstrated that VC inhibits the 11-hydroxylation and 21-hydroxylation steps in beef adrenal steroid synthesis. The fact that VC inhibited the heterophil/lymphocyte ratio in response to ACTH but not to corticosterone provided further evidence that the anti-stress effects of VC occur in the adrenals.
Because it was reported that multiple concurrent stressors have an additive detrimental effect on performance (Mcfarlane et al., 1989), we hypothesized that one could subtract out the detrimental effect of a particular stressor in a complex of stressors by incorporating a specific alleviator for that stressor. To test this hypothesis, 2 X 2 X 2 X 3 factorial combinations of beak trimming (sham operated or beak trimmed cauterized), coccidiosis (gavaged with 0 or 3 X 10° sporulated £. tenet/a
234
\/
m m !ff)
2>J
2.fJ
2Yl
21)
210
IO
19.l
18) • 1;u t:.
lffl II
lo)
C) 0.9
0.8.
0.8
0.7.
0.7
0.6.
• 0
I
0.6 : ~I 0.5.
· igure 2.
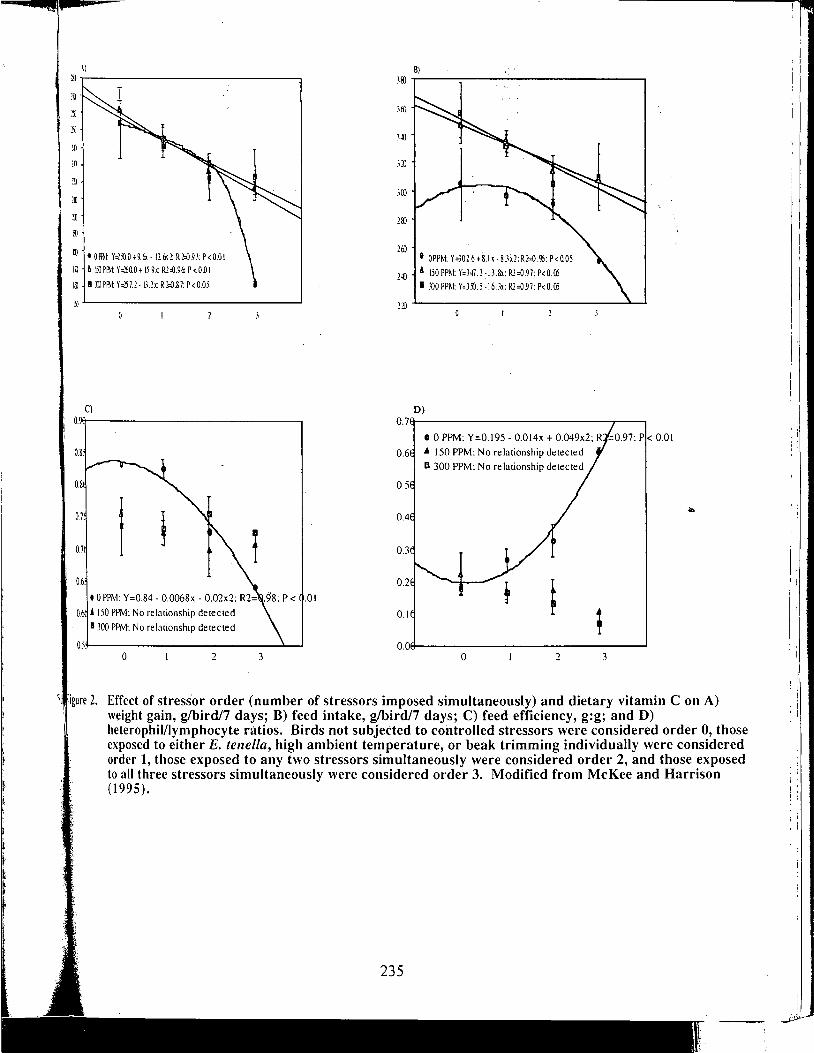
\)
Wr-----------------. !lJ
:ro
~]
lll
m
ID • 0111'1: Y'2'il.0+9.m · 126.12: R2'0.9J: P<0.01 m b l'JP!lll: Y"6QO+ 15.9c R1,\l.% P<0.01
lfil 1.lllPllll:Y=l.17.2·1.l.1.cRM.Sl:P<0.05
w'-----------------'
C) 0.9·tt---------------~
0.8.
0.8
l 0.7.
07
0.6.
0. ! 150 PPM: No relationship detected
1300 PPM: No relationship detected O.i_,__ ____________ ......__.
0 2 3
.01
BJ 38) .....---------------~
)({)
.l]
.lCO
28l
200 • OPPH Y=J01.6+S.lx ·8Jx1:R~O.'ll: P<U05
HJ 6 150PPM:Y=l47.l·ll.&l:R2=0.97:P<0.0i I :i:io PPM: Y=Hl.5 -16.Jx: Rl=0.97: P< O.Oi
]]~---------------"---"
D) 0.7H-------------~-~
I 0 PPM: Y=0.195 · 0.014x + 0.049x2: R -0.97: P < 0.01 0.6 A 150 PPM: No relationship detected
a 300 PPM; No relationship detected
0.5
0.4
0.3
0.2
0.1
0.0 0 2
; 3
>:, !igure 2. Effect of stressor order (number of stressors imposed simultaneously) and dietary vitamin C on A) w~ight gain, g/bird/7 days; B) feed intake, g/bird/7 days; C) feed efficiency, g:g; and D) heterophil/lymphocyte ratios. Birds not subjected to controlled stressors were considered order 0, those exposed to either E. tenella, high ambient temperature, or beak trimming individually were considered order 1, those exposed to any two stressors simultaneously were considered order 2, and those exposed to all three stressors simultaneously were considered order 3. Modified from McKee and Harrison (1995).
i ! :
'i
I
' I I
,f
oocysts), temperature (28 or 33 C), and VC (0, I 50, or 300 mg ST A Y-C® per Kg feed) were started in IO-day-old broiler chicks and lasted for one week. Birds not subjected to controlled stressors were considered order 0, those exposed to either E. tenella, high ambient temperature. or beak trimming individually were considered order l, those exposed to any two stressors simultaneously were considered order 2, and those exposed to all three stressors simultaneously were considered order 3. Weight gain, feed intake, and feed efficiency were evaluated for the seven day experimental period, whereas plasma corticosterone and heterophil/lymphocyte ratios (H/L) were measured once at the end of the seven day experimental period. Weight gain, feed intake, feed efficiency, and H/L are depicted in Panels A, B, C, and D of Figure 2, respectively. Although not indicated, VC at both I 50 and 300 ppm significantly alleviated the depression in weight gain in birds exposed to stressor order 3. This effect was responsible for the reduction in the slope of the regression line, shifting it from a quadratic response to a linear response. Supplemental VC also significantly improved feed intake in birds classified as stressor orders 0, 1, and 3 with numerical differences favoring VC supplementation at stressor order 2. Although no statistical differences were detected between dietary treatments within a given stressor order for feed efficiency, increasing stressor order significantly reduced feed efficiency in a quadratic fashion. However, no relationship was detected between feed efficiency and stressor order for the YC-supplemented birds. This indicates that feed efficiency of YC-supplemented birds was hot influenced by increasing stressor order. A similar situation can be seen with respect to H/L. Increasing stressor order significantly elevated H/L in a quadratic fashion in the unsupplemented birds. However, no relationship was detected between H/L and stressor order for the YCsupplemented birds. This indicates that H/L in VC-supplemented birds were not influenced by increasing stressor order. Unsupplemented birds had significantly higher H/L compared to YCsupplemented birds at stressor orders 1, 2, and 3. Despite these results, no differences were detected in plasma corticosterone concentrations with respect to stressor order or VC. A couple of factors may explain this observation, interestingly the same observation was made by McFarlane et al. ( 1989) with respect to stressor order. First, the timecourse in which corticosterone remains elevated following exposure to stress is considerably shorter than seven days (Edens and Siegel, 1975). This suggests that plasma corticosterone levels were probably elevated earlier in the seven day period, probably within the first 12 hours following the onset of stress, but returned close enough to levels expressed by non-stressed birds by the end of the period that no statistical differences could be detected. The fact that H/L increased and weight gain decreased as a function of stressor order suggests that ;lasrna corticosterone concentrations were indeed elevated. In addition, Gross and Siegel ( 1983) reported that H/L and concentrations of plasma corticoids do not correlate well. The H/L measures a physiological change, whereas the concentration of corticoids in the blood is affected before physiological change can occur. They concluded that the H/L ratio is a better measure of long-term changes in the environment, and the concentration of corticoids is a better measure of short-term changes. Second, we reported total (bound and unbound) corticosterone which is not biologically meaningful considering only the unbound form, which represents a minor percentage of the total, is biologically active. In fact it has been reported that total corticosterone concentrations do not change . dramatically following exposure to stress, but the synthesis and binding affinity of corticosteroid binding globulin for corticosterone significantly decreases elevating the unbound or biologically active fraction (Fleshner et al., 1995).
In addition to the observed benefits on weight gain, VC has also been shown to improve the composition of growth. In a recent study evaluating the relative bioavailability of Stabilized Vitamin C® (SVC) in the drinking water of broilers from hatch to market weight, we observed that 35-day-old body weights were not statistically different between unsupplemented birds and birds receiving 1000 ppm SVC; however, birds receiving 1000 ppm SVC expressed a significant 7 .84 % increase in carcass protein and a 4.27 % decrease in carcass lipid which approached significance (McKee and Harrison, accepted). These birds also expressed a substantial, concomitant reduction in feed conversion during week five and expressed the highest levels of plasma VC. These results suggest that supplemental VC may influence nutrient utilization or partitioning by increasing and decreasing protein and lipid accretion, respectively. Similar findings have been reported in male pigs supplemented with 0 to 500 mg VC/Kg feed from 35 to I 00 Kg of body weight (Mou rot et al., 1990). During the finishing period food conversion and average daily gain were lower and higher, respectively. Ascorbic acid markedly increased and decreased the percentage of muscle and fat, respectively, in the half carcasses of these pigs slaughtered at I 00 Kg. When analyzed by major cuts, loin weight was significantly greater and back fat weight was substantially lowered. Similar results have been obtained in broiler
236
cl I re
sil ~
1 Tl
a~I e1 Si
1
wl rej
~~I SU
ex
lol co bn grl
I se1 red
I SUJ
an1 ad1 :wil 1119 mu
I
pr9 reo S -'I e~1 t~~ t1s1 syri pou
I
Fu~ live al. ,I SU~
qul lipi VC broi anil
Ill
IC
a :y
ty :h
e
s
chickens supplemented over a considerably shorter time period (Krautmann et al., 1990). They reported the pooled analysis of six trials resulted in a I. I 0 % increase in chilled carcass yields and a significantly higher percentage of boneless, skinless breast meat when supplemented with I 200 ppm VC for 24 hours prior to catching and cooping. Fletcher and Cason ( 1990) however, did not observe any significant effects of VC-supplementation on processing yield, but numerical responses favored VC supplementation.
The mechanism(s) by which supplemental VC modifies metabolism to decrease body fat deposition and increase protein accretion remain unclear. Increases in muscle protein deposition (growth) can either be a result of changes in the rate of protein synthesis or in the rate of degradation or both. Since VC is a required cofactor for the synthesis of catecholamines, one could hypothesize a situation where pharmacological doses of VC may elevate levels of catecholamines acting on ~-adrenergic receptors to increase protein anabolism and lipid catabolism. In addition, VC has recently been shown to be a potent inhibitor of catechol-o-methyl transferase, the enzyme that metabolizes epinephrine to the inactive metabolite metanephrine (Kern and Bernards, 1997). The evidence to support a role for VC in attenuating protein degradation is more convincing. Four-week-old broilers exposed to acute heat stress and supplemented with I 000 ppm VC since hatch, expressed significantly lower plasma corticosterone and plasma protein concentrations and higher serum uric acid concentrations compared to unsupplemented, heat-stressed birds (Pardue et al., 1985). Similarly, broiler chickens reared under a high temperature regimen with 300 ppm VC expressed significantly greater body weights from week four through eight which corresponded to significant reductions in serum uric acid concentrations (Kassab et al., 1990). The authors attributed this to VC-induced reductions in circulating corticosteroids. Similar reductions in plasma corticosterone by supplemental VC have also been documented (Satterlee et al., 1989; Kutlu and Forbes, 1993; McKee and Harrison, 1995). It has been reported that high levels of VC inhibit key enzymes involved in adrenal steroidogenesis (Hayano et al., 1956; Kitabchi, 1967). However, these reports do not agree with work done by Freeman ( 1980) who demonstrated that injections of 200 mg VC/Kg body weight increased plasma corticosterone. It has also been demonstrated that VC prevents chicken skeletal muscle protein degradation by r~acting with free radicals and preventing oxidative stress-induced proteolysis (Gecha and Fagan, 1992). In addition to lower blood levels of cortisol, Degwitz ( 1987) reported a concomitant increase in circulating thyroid hormones in VC-supplemented guinea pigs.• Similar VC-induced elevations of thyroid hormones have been reported in poultry maintained at high environmental temperatures (Abdel-Wahab et al., 197 5). Among the many systemic effects of thyroid hormones, they increase the number and affinity of ~-adrenergic receptors in a variety of tissues (Ganong, 1993) which may facilitate protein accretion. These data also suggest a possible synergism between epinephrine and thyroxine. Reductions in lipid content of VC-supplemented poultry may also be explained in part by an increase in thyroid activity in promoting lipolysis. Furthermore, supplemental VC has been reported to facilitate lipid utilization indirectly by increasing liver and skeletal muscle carnitine concentrations (Hughes et al., 1980; Ha et al., 1994; Miyasaki et al., 1995). These cellular events have been confirmed at the level of the whole animal in which VCsupplemented heat-stressed broiler chickens exhibited a significant reduction in the respiratory quotient compared to their unsupplemented counterparts (McKee et al., in press). An increase in lipi9 utilization may explain why poultry perform better in hot weather when provided supplemental YC (Pardue et al., 1985; Kutlu and Forbes, 1993). High fat diets have been known to stimulate broiler growth in hot environments (Curtis, 1983). Fat or VC supplemented diets would improve an animal's heat tolerance because fat metabolism produces a lower heat increment.
237
;,,;
l I,
I .l \l 1
.. :\.'
,i
(,1
LITERATURE CITED
Abdel-Wahab, M. F., M. S. Abdo, Y. M. Megahad, M. EI-S. Attia, and A. A. Farahat, 1975. The effect of vitamin C supplement on thyroid activity of chickens using 1251. Zbl. Yet. Med. A. 22:769-775.
Anderson, D. P., C. W. Beard, and R. P. Hanson, 1966. Influence of poultry house dust, ammonia, and carbon dioxide on the resistance of chickens to newcastle disease virus. Avian Dis. 10:177-188.
Anderson, W. I., M. W. Reid, and J. K. Johnson, 1976. Effects of high environmental temperatures on cecal coccidiosis. Poultry Sci. 55: 1429-1435.
Baker, D. H., 1991. Partitioning of nutrients for growth and other metabolic functions: efficiency and priority considerations. Poultry Sci. 70: 1797-1805.
Barnett, J. L., P.H. Hemsworth, D. P. Hennessy, T. H. McCallum, and E. A. Newman, 1994. The effects of modifying the amount of human contact on behavioral, physiological, and production responses of laying hens. Appl. Anim. Behav. Sci. 41:87-100.
Barton, T. L., 1996. Relevance of water quality to broiler and turkey performance. Poultry Sci. 75:854-856.
Besedovsky, H. E., A. E. de! Rey, E. Sorkin, and C. A. Dinarello, 1986. Immunoregulatory feedback between interleukin- I and glucocorticoid hormones. Science 233 :652-655.
Butterwith, S. C. and H. D. Griffin, 1989. The effects of macrophage-derived cytokines on lipid metabolism in chicken (Gallus domesticus) hepatocytes and apidocytes. Comp. Biochem. Physiol. 94A:72 l -724.
Buyse, J., E. R. Kuhn, and E. Decuypere, 1996. The use of intermittent lighting in broiler raising. I. Effect on broiler performance and efficiency of nitrogen retention. Poultry Sci. 75:589-594.
Buyse, J., P. C. M. Simmons, F. M. G. Boshouwers, and E. Decuypere, 1996. Effect of intermittent lighting, light intensity and source on the performance and welfare of broilers. World's Poultry Sci. J. 52:121-130.
Cannon, W. B., 1929. Bodily changes in pain, fear, and rape: An account of recent researches into the function of emotional excitement, 2nd ed. Appel ton, New York, NY.
Caveny, D. D. and C. L. Quarles, 1978. The effects of atmospheric ammonia stress on broiler performance and carcass quality. Poultry Sci. 57: 1124-1125.
Chamblee, T. N., J. R. Thompson, and J.P. Thaxton, 1992. Effect of day old vaccination on oroiler performance. Poultry Sci. 71 (Suppl. I): 144.(Abstr.)
Chaudhuri, C. R. and I. B. Chatterjee, 1969. L-ascorbic acid synthesis in birds: Phylogenetic trend. Science 164:435-436.
Cook, M. E., C. C. Miller, Y. Park, and M. Pariza, 1993. Immune modulation by altered nutrient metabolism: nutritional control of immune-induced growth depression. Poultry Sci. 72:1301-1305.
Craig, J. V., 1992. Measuring social behavior in poultry. Poultry Sci. 71 :650-657 . Curtis, S. E., 1983. Environment and animal function and performance. In: Environmental
management in animal agriculture. pp.7-24. Curtis, S. E., C. R. Anderson, and J. Simon, 1975. Effects of aerial ammonia, hydrogen sulfide, and
swine-house dust on the rate of gain and respiratory-tract structure in swine. J. Anim. Sci. 41 :735-739.
Degwitz, E., 1987. Some effects of vitamin C may be indirect, since it affects the blood levels of cortisol and thyroid hormones. Ann. N.Y. Acad. Sci. 498:470-475.
Dinarello, C. A., 1984. Interleukin- I. Rev. Infect. Dis. 6:51-95. Donham, K. H., 1994. Swine confinement buildings. In: Organic dust: Exposure, effects, and
prevention. Ed. Rylander R. and Jacobs, R. R. pp2 I 9-232. Edens, F. W. and H. S. Siegel, 1975. Adrenal responses in high and low ACTH response lines of
chickens during acute heat stress. Gen. Comp. Endocrinol. 25:64-73. Finck, B. N., R. Dantzer, K. W. Kelly, J. Woods, and R. W. Johnson, 1997. Central lipopolysaccharide
elevates plasma interleukin-6 concentration by an a-adrenoreceptor-mediated mechanism. Am. J. Physiol. (In press).
Fleshner, M., T. Deak, R. L. Spencer, M. L. Laudenslager, L. R. Watkins, and S F. Maier, 1995. A long term increase in basal levels of corticosterone and a decrease in corticosteroid-binding globulin after acute stressor exposure. Endocrinol. 136:5336-5342.
238
H
H
H
H
H
H
H
K
K
~.
1ck
I. i94.
I 1er I 'I
d
·ide
[)' ::>
Fletcher, D. L. and J. A. Cason, 1990. The effect of vitamin Con live shrink processing yield and meat quality of broilers. Poultry Sci. 69(Suppl. 1 ): 52 (Abstr.)
Freeman, B. M., 1980. Ascorbic acid and adrenal cortical activity in the immature domestic fowl. Comp. B iochem. Physiol. 67A:183-186.
Ganong, W. F., 1993. Review of medical physiology. 16th ed. Appleton and Lange, Norwalk, CT. Gates, R. S., D. G. Overhults, and S. H. Zhang, 1996. Minimum ventilation for modem broiler
facilities (with appendix). Trans. ASAE 39: 1135-44. Gecha, 0. M. and J. M. Fagan, 1992. Protective effect of ascorbic acid on the breakdown of proteins
exposed to hydrogen peroxide in chicken skeletal muscle. J. Nutr. 122:2087-2093. Gernert, P. A., J. C. F. Padilha, and S. Guillaumin, I 996a. Metabolic and endocrine changes induced
by chronic heat exposure in broiler chickens: growth performance, body composition and energy retention. British J. Nutr. 75: 195-204.
Gernert, P. A., J. C. F. Padilha, and S. Guillaumin, l 996b. Metabolic and endocrine changes induced by chronic heat exposure in broiler chickens: biological and endocrinological variables. British J. Nutr. 75:205-216.
Ginter, E., A. Kosinova, A. Hudecova, and U. Mlynarcikova, 1984. Parabolic response of hepatic microsomal hydroxylating system and lipids to graded doses of ascorbic acid in guinea pigs on low and high a-tocopherol intake. J. Nutr. 114:485-492.
Gross, W. B., 1992. Effects of ascorbic acid on stress and disease in chickens. Avian Dis. 36:688-692.
Gross, W. B. and H. S. Siegel, 1983. Evaluation of the heterophil/lymphocyte ratio as a measure of stress in chickens. Avian Dis. 27:972-979.
Ha, T. Y., M. Otsuka, and N. Arakawa, 1994. Ascorbate indirectly stimulates fatty acid utilization in primary culture guinea pig hepatocytes by enhancing carnitine synthesis, J. Nutr. 124:732-737.
Harrison, P. C., J. McGinnis, G. Schumaier, and J. Lauber, 1969. Sexual maturity and subsequent reproductive performance of white leghorn chickens subjected to different parts of the light spectrum. Poultry Sci. 47:878-883.
Harrison, P. C., J. D. Latshaw, J.M. Casey, and J. McGinnis, 1970. Influence of decreased length of different spectral photoperiods on testis development of domestic fowl. J. Reprod. Fert. ~ 22:269-275.
Harrison, P. C., 1972. Extraretinal photocontrol of reproductive responses of leghorn hens to photoperiods of different length and spectrum. Poultry Sci. 51 :2060-2064.
Harrison, P. C., 1974. Spectrum influence on extraretinal control of daily oviposition cycles. Poultry Sci. 53:560-564.
Hayano, M., N. Saba, R. I. Dorfman, and 0. Hechter, 1956. Some aspects of the biogenesis of adrenal steroid hormones. Rec. Progr. Horm. Res. 12:79-86.
Hughes, B. and M. Gentle, 1995. Beak trimming of poultry: its implications for welfare. World's Poultry .Sci. 51:51-61. ,
Hughes, R. E., R. J. Hurley, and E. Jones, 1980. Dietary ascorbic acid and muscle camitine (~-OH-g(trimethylamino) butyric acid) in guinea-pigs. British. J. Nutr. 43:385-387.
Hussein, A. S., 1996. Induced moulting procedures in laying fowl. World's Poultry Sci. J. 52:175-188.
Jaffar, G. H. and J. Blaha, 1996. Effect of ascorbic acid supplementation in drinking water on growth rate, feed consumption and feed efficiency of broiler chickens maintained under acute heat stress conditions. Zivocisna Vyroba 41 :485-490.
Johnson, R. W., 1997. Inhibition of growth by pro-inflammatory cytokines: An integrated view. J. Anim. Sci. 75: 1244-1255.
Johnson, E.W., E. M. Smith, B. A. Torres, and J.E. Blalock, 1982. Neuroendocrine hormone regulation of in vitro antibody production. Proc. Natl. Acad. Sci. 79:4171-4174.
Kassab, A., A. A. Al-Senied, and M. H. Injidi, 1990. Effect of dietary ascorbic acid on the physiology and performance of heat-stressed broiler chickens. In: Ascorbic acid in domestic animals. Wenk, C., R. Fenster, and L. Volker Ed. pp270-285.
Kern, C. and C. M. Bernards, 1997. Ascorbic acid inhibits spinal meningeal catechol-o-methyl transferase in vitro, markedly increasing epinephrine bioavailability. Anesthesiol. 86:405-409.
Kettlewell, P. J. and M. A. Mitchell, 1994. Catching, handling, and loading of poultry for road transportation. World's Poultry Sci. J. 50:54-56.
Kinouchi, K., G. Brown, G. Pasternak, and D. B. Donner, 1991. Identification and characterization of receptors for tumor necrosis factor-ex in the brain. Biochem. Biophys. Res. Commun. 181:1532-1538.
Kitabchi, A. E., 1967. Ascorbic acid in steroidogenesis. Nature 215: 1385-1386. Kitabchi, A. E. and W. H. West, 1975. Effects of steroidogenesis on ascorbic acid content and uptake
in isolated adrenal cells. Ann. N.Y. Acad. Sci. 258:422-431. Klasing, K. C., D. E. Laurin, R. K. Peng, and D. M. Fry, 1987. Immunologically mediated growth
depression in chicks: Influence of feed intake, corticosterone and interleukin-I. J. Nutr. 117:1629-1637.
Klasing, K. C., 1988. Nutritional aspects of leukocytic cytokines. J. Nutr. 118:1436-1446. Klasing, K. C. and B. J. Johnstone, 1991. Monokines in growth and development. Poultry Sci.
70:1781-1789. Krautmann, B. A., M. J. Gwyther, and L. A. Peterson, 1990. Practical applications of ascorbic acid in
domestic animals. In: Ascorbic acid in domestic animals. Wenk, C., R. Fenster, and L. Volker Ed. pp292-313.
Kutlu, H. R. and J. M. Forbes, 1993. Self-selection of ascorbic acid in coloured foods by heatstressed broiler chicks. Physiol. Behav. 53:103-110.
Mashaly, M. M., J. M. Trout, and G. L. Hendricks, III, 1993. The endocrine function of the immune cells in the initiation of humoral immunity. Poultry Sci. 72: 1289-1293.
Mcfarlane, J.M., S. E. Curtis, R. D. Shanks, and S. G. Carmer, 1989a. Multiple concurrent stressors in chicks. I. Effect on weight gain, feed intake, and behavior. Poultry Sci. 68:501-509.
Mcfarlane, J. M. and S. E. Curtis, 1989b. Multiple concurrent stressors in chicks. 3. Effects on plasma corticosterone and the heterophil:Iymphocyte ration. Poultry Sci. 68:522-527.
McKee, J. S. and P. C. Harrison, 1995. Effects of supplemental ascorbic acid on the performance of broiler chickens exposed to multiple concurrent stressors. Poultry Sci. 74: 1772-1785.
McKee, J. S. and P. C. Harrison, 1997. Effects of supplemental ascorbic acid on the energy conversion of the domestic fowl during heat stress and feed withdrawal. Poultry Sci. (In press). ·
McKee, J. S. and P. C. Harrison, 1998. Relative bioavailability-0f Stabilized Vitamin C® in the drinking water of broilers from hatch to market weight: effects on plasma ascorbic acid, growth, and body composition. Poultry Sci. (Accepted).
Miller, J. K., E. Brzezinska-Slebodzinska, and F. C. Madsen, 1993. Oxidative stress, antioxidants, and animal function. J. Dairy Sci. 76:2812-2823.
Mithcell, M. A. and P. J. Kettlewell, 1994. Road transportation of broiler chickens: induction of physiological stress. World's Poultry Sci. J. 50:57-59.
Miyasaki, T., M. Sato, R. Yoshinaka, and M. Sakaguchi, 1995. Effect of vitamin Con lipid and carnitine metabolism in rainbow trout. Fisheries Sci. 61:501-506.
Moberg, G. P., 1985. Biological response to stress: Key to assessment of animal well-being? In: Animal stress. Ed. Moberg, G. P. pp.27-50.
Morris, T. R., 1994. Lighting for layers: what we know and what we'need to know. World's Poultry Sci. J. 50:283-287.
Mourot, J., A. Aumaitre, and P. Wallet, 1990. Effect of dietary supplement of vitamin C on growth and pig meat quality. In: Ascorbic acid in domestic animals. Wenk, C., R. Fenster, and L. Volker Ed. ppl76-185.
Nagra, C. L. and R. K. Meyer, 1963. Influence of corticosterone on the metabolism of palmitate and glucose in cockerels. Gen. Comp. Endocrinol. 3: 131-138.
National Research Council, 1994. Metabolic modifiers: Effects on the nutrient requirements of foodproducing animals. National Academy Press, Washington, D.C.
Nir, I., Z. Nitsan, E. A. Dunnington, and P. B. Siegel, 1996. Aspects'of food intake restriction in young domestic fowl: metabolic and genetic considerations. World's Poultry Sci. J. 52:251-266.
Pardue, S. L., J. P. Thaxton, and J. Brake, 1985. Role of ascorbic acid in chicks exposed to high environmental temperature. J. Appl. Physiol. 58:151 l-1516.
Pardue, S. L. and J. P. Thaxton, 1986. Ascorbic acid in poultry: A review. World's Poultry Science J. 42:107-123.
Pardue, S. L. and S. H. Williams, 1990. Ascorbic acid dynamics in avian neonates during stress. In: Ascorbic acid in domestic animals. Wenk, C., R. Fenster, and L. Volker Ed. pp28-42.
240
p,
p
R
R
Si
y
.e
1
. i
Parnett, P., S. Amindari, W. Wu, D. L. Brunke-Reese, E. Goujon, J. A. Weyhenmeyer, R. Dantzer, and K. W. Kelly, 1994. Expression of type I and type II interleukin- I receptors in mouse brain. Mol. Brain Res. 27:63-70.
Portsmouth, J. I. and P. Hand, 1987. Trends and developments in breeding hens I. Energy and protein utilization. Int. Hatchery Practices 2:1-10.
Richards, C., J. Gauldie, and H. Baumann, 1991. Cytokine control of acute phase protein expression. Eur. Cytokine Netw. 2:89-98.
Rochemonteix-Galve, B., B. Marchat-Amoruso, J.M. Dayer, and R. Rylander, 1991. Tumor necrosis factor and interleukin- I activities in free lung cells after single and repeated inhalation of bacterial endotoxin. Inf. Immunol. 59:3646-3650.
Satterlee, D. G., I. Aguilera-Quintana, B. J. Munn, and B. A. Krautmann, 1989. Vitamin C amelioration of the adrenal stress response in broiler chickens being prepared for slaughter. Comp. Biochem. Physiol. 94:569-574.
Savory, C. J., 1995. Feather pecking and cannibalism. World's Poultry Sci. J. 51:215-219. Schumaiier, G., P. C. Harrison, and J. McGinnis, 1968. Effect of colored fluorescent light on growth,
cannibalism, and subsequent egg production of single comb white leghorn pullets. Poultry Sci. 47:1599-1602.
Shimizu, K., 1970. Effects of ascorbic acid on the side chain cleavage of cholesterol. Biochim. Biophys. Acta. 2 I 0:333-340.
Siegel, H. S., 1962. Age and sex modification of responses to adrenocorticotropin in young chickens. II. Changes in adrenal cholesterol and blood constituent levels. Poultry Sci. 41:321-331.
Siegel, H. S., 1995. Stress, strains, and resistance. British Poultry Sci. 36:3-22. Smith, E. M., A. C. Mori!!, W. J. Meyer, and J. E. Blalock, I 986. Corticotropin releasing factor
induction of leukocyte derived immunoreactive ACTH and endorphins. Nature 321 :881-882.
Snedecor, J. G., D. B. King, and R. C. Hendrikson, 1963. Studies on the chick glycogen body: Effects of hormones and normal glycogen turnover. Gen. Comp. Endorinol. 3: 176-183.
Weaver, W. D., Jr., and R. Meijerhof, 1991. The effect of different levels of humidity and air movement on litter conditions, ammonia levels, growth, and carcass quality for broiler .,. chickens. Poultry Sci. 70:746-755.
Williams, P. E. V., 1997. Poultry production and science: future directions in nutrition. World's Poultry Sci. J. 53:33-48.
Winn, P. N. and E. F. Godfrey, 1967. The effect of humidity on growth and feed conversion of broiler chickens. Int. J. Biometeor. 11 :39-50.
Yahav, S., A. Straschnow, and I. Plavnik, 1997. Blood system response of chickens to changes in environmental temperature. Poultry Sci. 76:627-633 .

Notes
(This page intentionally blank. )
I
RECENT RESEARCH ON THREONINE NEEDS FOR POULTRY - TURKEY AND BROILER STUDIES
M. T. Kidd Nutri-Quest, Inc.
1400 Elbridge Payne Road, Suite 110 Chesterfield, Missouri 63017
Commercial broiler and turkey diets composed primarily of corn and soybean meal are usually supplemented with a commercially available methionine source and crystalline L-lysine·HCI. The dietary inclusion of these amino acids generally reduces the dietary crude protein level. It is important to respect other essential amino acid requirements by establishing nutrient minimums in linear programming as dietary crude protein is decreased so that marginal amino acid deficiencies do not occur. Indeed, dietary threonine's degree of limitation may result in marginal feed conversion and breast meat responses in broilers (Kidd et al., 1997; Kidd and Kerr, 1997) and turkeys (Lilburn and Barbour, 1996; Lehmann et al., 1997). This paper presents one experiment involving dietary crude protein titration and amino acid supplementation in Large White toms. In addition, threonine requirement experiments in growing broilers and turkeys are presented.
TURKEY STUDIES
l) Kidd, M. T., B. J. Kerr, I. A. England, and P. W. Waldroup, 1997. Performance and Carcass Composition of Large White Toms as Affected by Dietary Crude Protein and Threonine Supplements. Poultry Sci. 76. (In press)
Methods Large White Nicholas toms received eight dietary treatments (six replications per treatment) from 0 to 18 weeks of age. All dietary treatments had methionine, total sulfur amino acids, lysine, threonine, and tryptophan levels formulated to meet a minimum of 105% of NRC (1994) recommendations. The experimental diets were formulated to meet four crude protein (CP) levels of 100, 92, 84, and 76% of NRC (1994) recommendations (Table 1). Diets were fed from 0 to 3, 3 to 6, 6 to 9, 9 to 12, 12 to 15, and 15 to 18 weeks of age. Supplements of L-threonine (0.1 and 0.2% of diet) were added to the experimental diets containing 92 and 84% of NRC CP levels at the expense of a nonnutritive filler (sulka flock). The dietary treatments consisted of: 1) 100% NRC CP; 2) 92% NRC CP; 3) 92% NRC CP plus 0.1 % L-threonine; 4) 92% NRC CP plus 0.2% L-threonine; 5) 84% NRC CP; 6) 84% NRC CP plus 0.1 % L-threonine; 7) 84% NRC CP plus 0.2% L-
Proc. Minnesota Nutr. Conf. (1997)
243
threonine; and 8) 76% NRC CP.
Pen weights were obtained at 0, 3, 6, 12, and 18 weeks of age. Feed consumption was determined at 3, 6, 12, and 18 weeks of age. Mortality was recorded throughout the experiment. Processing was conducted at 18 weeks of age.
Results The body weight (BW) of toms was affected by dietary treatments at 3, 6, 12, and 18 weeks of age (Table 2). At 3 weeks of age, toms fed the diet containing 84% of NRC CP had equal BW compared to the toms fed the diet containing 100% of NRC CP. However, 3 week BW of toms receiving 92% of NRC CP was depressed (P < 0.037) when 0.2% L-threonine was added to the diet. At 6 weeks of age, BW of toms was decreased (P s 0.001) in all low CP treatments regardless of L-threonine supplements. Toms receiving the 76% NRC CP treatment had depressed (P < 0.001) BW at 12 weeks of age in comparison to all other dietary treatments. Also, BW of toms receiving the 92% NRC CP treatment was equal to (P s 0.001) the 100% NRC CP treatment and additions of L-threonine showed no beneficial effects. Body weights of 18 weeks old toms receiving the 84 and 76% NRC CP treatments were depressed (P s 0.001). However, adding 0.1 % L-threonine, but not 0.2% L-threonine, to the 84% NRC CP treatment restored BW equal to (P < 0.001) the 100 and 92% NRC CP treatments.
Dietary treatments did not alter 0-3- or 3-6-week period feed:gain (Table 2). Statistically equivalent feed:gain responses in the 6-12-week period were observed in the 100, 92, and 84% NRC CP treatments and supplements of Lthreonine showed no beneficial effects. Decreasing CP from 92% of NRC to 84 and 76% of NRC CP increased (P s O.OQl) 12-18 week feed:gain. However, supplementing the 84% NRC CP diet with 0.1 % L-threonine restored the feed:gain response equal to (P s 0.001) the toms receiving diets containing 92% of NRC CP. Cumulative feed:gain (0 to 12 and 0 to 18 weeks of age) was statistically equivalent in the 100, 92, and 84% NRC CP treatments. However, cumulative feed:gain was increased (P < 0.001) in the 0-12- and 0-18-week periods when dietary CP was decreased to 76% of NRC. Differences among treatments for mortality did not occur.
Carcass composition results are presented in Table 3. Hot and cold carcass as a percentage of live BW or actual weight were decreased (P < 0.010 and P s 0.013, respectively) when dietary CP was decreased to 76% of NRC. Also, decreasing CP to 84% of NRC without additional L-threonine decreased hot and cold carcass weights below that of toms receiving diets containing 100% NRC CP (P < 0.001). Differences in dietary treatments for fat, in grams or as a percentage of hot carcass, were not observed. Toms receiving the diet containing 92% of NRC CP had absolute and relative breast meat responses that were higher (P s 0.001) than toms receiving diets containing 84 and 76% NRC CP. Thigh yield did not differ among treatments. Thigh weight was
244
decreased when CP was reduced to 84 and 76% NRC (P < 0.001). However, supplements of L-threonine to the diets containing 84% NRC CP restored thigh weights equal to the 100% NRC CP diet (P < 0.001). Drumstick and wing yield were highest (P s 0.001) in the 76% NRC CP treatment. Drumstick and wing weights were decreased in toms receiving diets containing 84 and 76% NRC CP (P s 0.001). Supplements of L-threonine (0.1 or 0.2%) restored drumstick weight, but not wing weight, equal to the diet containing 100% of NRC CP (P < 0.001). Shank length was not affected by dietary treatments, but keel length was increased (P s 0.003) in the 100% NRC CP treatment. Decreasing CP to 92 or 84% of NRC required supplements of 0.1 % dietary Lthreonine to restore keel length statistically equivalent to the 100% NRC CP treatment.
Conclusions The 84% NRCCEdiet resulted in toms having good growth and feed conversion, but marginal breast meat yield. It may be that supplements of L-threonine and L-tryptophan, in addition to DL-methionine and L-lysine, allowed good performance (growth and feed conversion) to be attained at a CP level of 84% of NRC. Decreasing CP below 92% of NRC recommendations limited breast meat weight and yield. Marginal deficiencies in valine, isoleucine, and arginine may have resulted in suboptimal breast meat responses when CP was decreased below 92% NRC CP.
2) Threonine Responses in Growing Toms
Methods Threonine requirements were estimated in male BUT A toms from 0 to 3, 3 to 6, and 6 to 9 weeks of age. The experimental design consisted of seven graded levels of threonine and· a·-positive control diet (8 treatments and six replications). Toms in the 3 to 6 and 6 to 9 week time periods received common basal diets for three weeks prior to receiving the experimental diets. Threonine deficient diets were formulated using the ingredients corn, peanut meal, soybean meal, and poultry meal. The diets were supplemented with crystalline amino acids so that nutrient minimums for all essential amino acids were at a minimum of 110% of NRC (1994) suggested recommendations. The positive control diet consisted of corn, soybean meal, and poultry meal.
Results and Conclusions Gain and feed:gain were measured for the 0 to 3, 3 to 6, and 6 to 9 week periods and are presented in Figures 1 through 3, respectively. In all time periods the experimental diet with the lowest level of threonine was clearly deficient in threonine. Threonine response curves for gain and feed:gain were quadratic for all time periods which allowed requirement estimates to be predicted.
Total dietary threonine requirements (% of diet) estimated from 95% of the l!.symptote are as follows:
245
fl'/
Parameter
Gain (O to 3 wk) Feed:gain (0 to 3 wk) Gain (3 to 6 wk) Feed:gain (3 to 6 wk) Gain (6 to 9 wk) Feed:gain (6 to 9 wk)
BROILER STUDY
BUTA Toms
Threonine requirement % of diet
0.93 0.97 0.88 0.89 0.77 0.78
3) Kidd, M. T. and B. J. Kerr, 1997. Threonine Responses in 30 to 42 Day Old Commercial Broilers. J. Applied Poultry Res. 6'. (In press)
Methods A threonine deficient basal diet composed of corn, peanut meal, grain sorghum, and soybean meal and a corn and soybean meal positive control diet were formulated using linear programming (Table 4). One-hundred twenty Ross x Ross male broilers were allocated to each of 56 floor pens containing two bell waterers,· three tube feeders, and new (built up) pine shavings. Each pen measured 3.66 x 3.05 m. Broilers were reared in a dosed-sided house with thermostatically controlled heating and ventilation fans. House temperature for the 30 to 42 day period was 21 C. Broilers consumed fee.d and water on an ad libitum b_asis and were provided continuous.incandescent lighting. All broilers received a common ba,sal diet from 18 to 30 days of age meeting or exceeding all nutrient requirements established by the NRC (1994) and treatment diets were given from 30 to 42 days of age. Treatments consisted of seven graded levels of threonine (0.55 to 0.85% of diet) and a corn and soybean meal positive control. Aliquots of threonine in 0.05% increments were added using crystalline L-threonine at the expense of washed builders sand. The coccidiostat salinomycin was used in all diets. During linear programming crystalline 'amino acids were included as ingredients so that the threonine deficient diets met a minimum of 110% of all amino acid suggested recommendations (NRC, 1994). Sodium bi.carbonate was also used as a buffer so that the Jhreonine deficient diets had dietary electrolyte balances that would not result in acidosi~.
Broile~s-were w~ighed on a pen basis at 30 .and 42 days of age. Weight gain and feed consumpt~on were measured for .the 30 to 42 day period. Feed conversion (adjusted for mortality) was measured for the 30 to 42 ~ay period. Mortality was recorded throughout the experiment. Broilers were processed at 42 days of ag~.
246

Results The experimental basal diet containing 0.55% total dietary threonine was clearly deficient in threonine as shown by body weight gain and feed:gain responses (Table 5). Performance of broilers fed the threonine supplemented sorght:m, peanut meal, corn, and poultry meal basal diets was equal to or better than the corn and soybean meal positive control containing 0.76% dietary threonine. Increasing dietary threonine (0.60% versus 0.65% dietary threonine) resulted in a 7% increase in body weight gain (P'.5:0.001). Similarly, the feed:gain response was improved by 10 points as threonine was increased from 0.60% to 0.65% of diet (P'.5:0.001). No statistical beneficial affects of dietary threonine were observed beyond 0.65% of diet for the variables weight gain and feed:gain. These results suggest that the NRC (1994) 21 to 42 day threonine requirement of 0.74% of diet may be too high. However, we anticipated that gain and feed:gain would be optimized with a lower level of threonine as compared to the NRC (1994) requirement because we evaluated our responses in a 30 to 42 day old bird. Indeed, a 21 to 30 day requirement E;?xperiment would result in a much higher value than our experiment.
Carcass traits as affected by graded levels of threonine are presented in Table 6. Carcass responses of broilers fed the threonine supplemented sorghum, peanut meal, corn, and poultry meal basal diets was equal to or better than the corn and soybean meal positive control diet containing 0.76% dietary threonine. Results of 42 day live weight from broilers selected for processing (56 broilers/treatment group) are in similar agreement with results from 30 to 42 day weight gain. In general, results obtained from carcass traits are variable. For example, statistically optimal responses from threonine on carcass yield, percentage abdominal fat, and percentage total breast meat yield occurred at dietary threonine levels of 0.65%, 0.60%, and 0.75% respectively. Total deboned breast meat and deboned thigh meat were optimized when dietary threonine was added up to 0.70% of diet (P'.5:0.001). The amount of threonine required to optimize breast meat yield (0.75% of diet) was higher than that required to optimize other carcass traits, gain, or feed:gain.
Conclusions Total dietary threonine requirements (% of diet) estimated from 95% of the asymptote are as follows:
Ross x Ross male Broiler, 30 to 42 Day of Age
Parameter
Gain Feed:gain Breast meat Breast yield
Threonine requirement % of diet
0.70 0.70 0.78 0.76
I '!
''.! I" \
I
I I i ,JI I
I I,
LITERATURE CITED
Kidd~ M. T. and B. J. Kerr, 1997. Threonine responses in 30 to 42 day old C()mmercial broilers. J. Applied Poultry Res. 6. (In press)
Kidd, M. T., B. J. Kerr, J. A. England, and P. W. Waldroup, 1997. Performance and carcass composition of large white toms as affected by dietary crude protein and threonine supplements. Poultry Sci. 76. (In press)
Lehmann, D., M. Pack, and H. Jeroch, 1997. Effects of dietary threonine in starting, growing, and finishing turkey toms. Poultry Sci. 76:696-702.
Lilburn, M. S., and G. A. Barbour, 1996. Threonine requirements of turkeys. Pages 229-233 in: Proc. Arkansas Nutrition Conference, Fayetteville, AR.
National Research Council, 1994. Nutrient Requirements of Poultry, 9th rev. ed. National Academy Press, Washington, DC.
248
Cf)
Q) > <l.J -A.. u
~ z
c--i' 0\
0 0 ....... ....... 0 Cf)
<l.J ·-i... <l.J Cf)
...... <l.J a
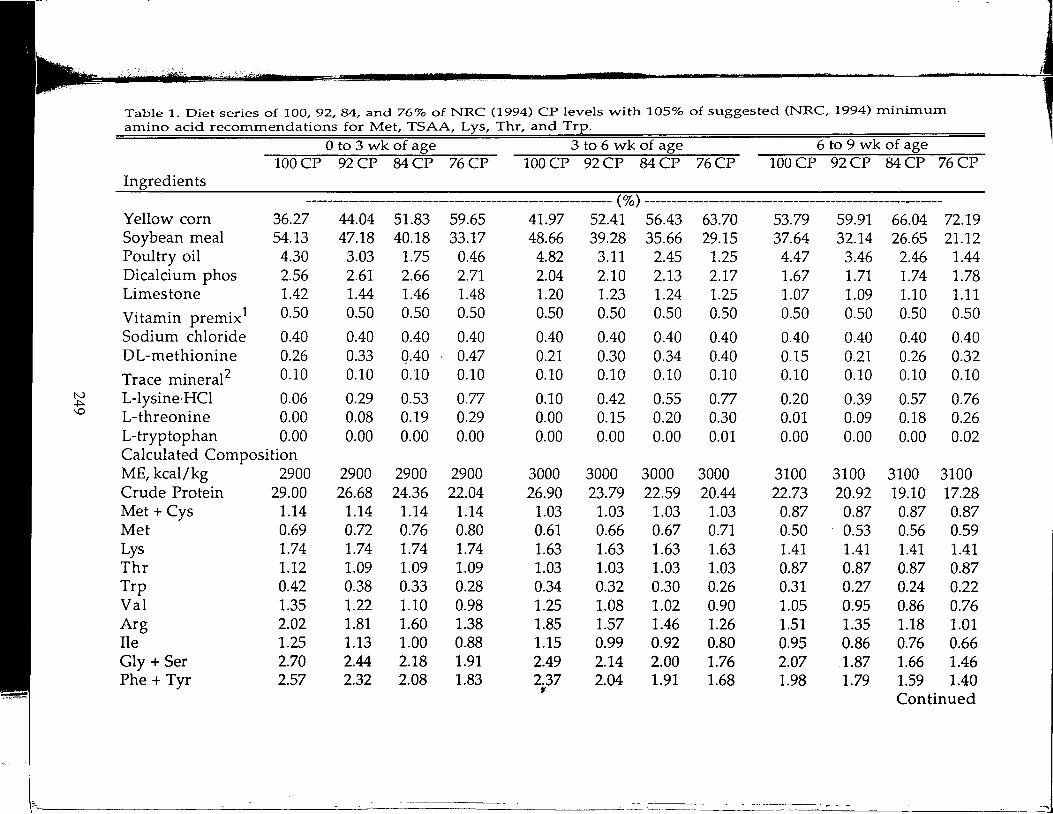
-
···"-~r...-<~- .... :.;_._.· .';::, ....... ,:.:~ A
~ Table I. Diet series of 100, 92, 84, and 76% of NRC (1994) CP levels with 105% of suggested (NRC, 1994) minimum amino acid recommendations for Met, TSAA, Lys, Thr, and Trp.
0 to 3 wk of age 3 to 6 wk of age 6 to 9 wk of age lOOCP 92CP 84CP 76CP lOOCP 92CP 84CP 76CP 100 CP 92 CP 84 CP 76 CP
Ingredients -------------------------------------------- ( o/o) --------------------------------------------
Yellow corn 36.27 44.04 Sl.83 S9.6S 41.97 S2.41 S6.43 63.70 S3.79 S9.91 66.04 72.19 Soybean meal S4.13 47.18 40.18 33.17 48.66 39.28 3S.66 29.lS 37.64 32.14 26.6S 21.12 Poultry oil 4.30 3.03 l.7S 0.46 4.82 3.11 2.4S l.2S 4.47 3.46 2.46 1.44 Dicalcium phos 2.S6 2.61 2.66 2.71 2.04 2.10 2.13 2.17 1.67 1.71 1.74 1.78 Limestone 1.42 1.44 1.46 1.48 1.20 1.23 1.24 l.2S 1.07 1.09 1.10 1.11
Vitamin premix1 a.so a.so a.so a.so a.so a.so a.so 0.50 a.so a.so a.so a.so Sodium chloride 0.40 0.40 0.40 0.40 0.40 0.40 0.40 0.40 0.40 0.40 0.40 0.40 DL-methionine 0.26 0.33 Q.40 0.47 0.21 0.30 0.34 0.40 0.15 0.21 0.26 0.32
Trace mineral2 0.10 0.10 0.10 0.10 0.10 0.10 0.10 0.10 0.10 0.10 0.10 0.10
L-1 ysine· HCl 0.06 0.29 0.53 0.77 0.10 0.42 o.ss 0.77 0.20 0.39 O.S7 0.76 L-threonine 0.00 0.08 0.19 0.29 0.00 0.15 0.20 0.30 0.01 0.09 0.18 0.26 L-tryptophan 0.00 0.00 0.00 0.00 0.00 0.00 0.00 0.01 0.00 0.00 0.00 0.02 Calculated Composition ME, kcal/kg 2900 2900 2900 2900 3000 3000 3000 3000 3100 3100 3100 3100 Crude Protein 29.00 26.68 24.36 22.04 26.90 23.79 22.59 20.44 22.73 20.92 19.10 17.28 Met+ Cys 1.14 1.14 1.14 1.14 1.03 1.03 1.03 1.03 0.87 0.87 0.87 0.87 Met 0.69 0.72 0.76 0.80 0.61 0.66 0.67 0.71 a.so O.S3 O.S6 0.59 Lys 1.74 1.74 1.74 1.74 1.63 1.63 1.63 1.63 1.41 1.41 1.41 1.41 Thr 1.12 1.09 1.09 1.09 1.03 1.03 1.03 1.03 0.87 0.87 0.87 0.87 Trp 0.42 0.38 0.33 0.28 0.34 0.32 0.30 0.26 0.31 0.27 0.24 0.22 Val 1.35 1.22 1.10 0.98 1.25 1.08 1.02 0.90 1.05 0.9S 0.86 0.76 Arg 2.02 1.81 1.60 1.38 l.8S 1.57 1.46 1.26 l.Sl l.3S 1.18 1.01 Ile 1.25 1.13 1.00 0.88 1.15 0.99 0.92 0.80 0.95 0.86 0.76 0.66 Gly +Ser 2.70 2.44 2.18 1.91 2.49 2.14 2.00 1.76 2.07 .1.87 1.66 1.46 Phe + Tyr 2.57 2.32 2.08 1.83 2.37 2.04 1.91 1.68 1.98 1.79 l.S9 1.40 v
Continued
:;;. .,
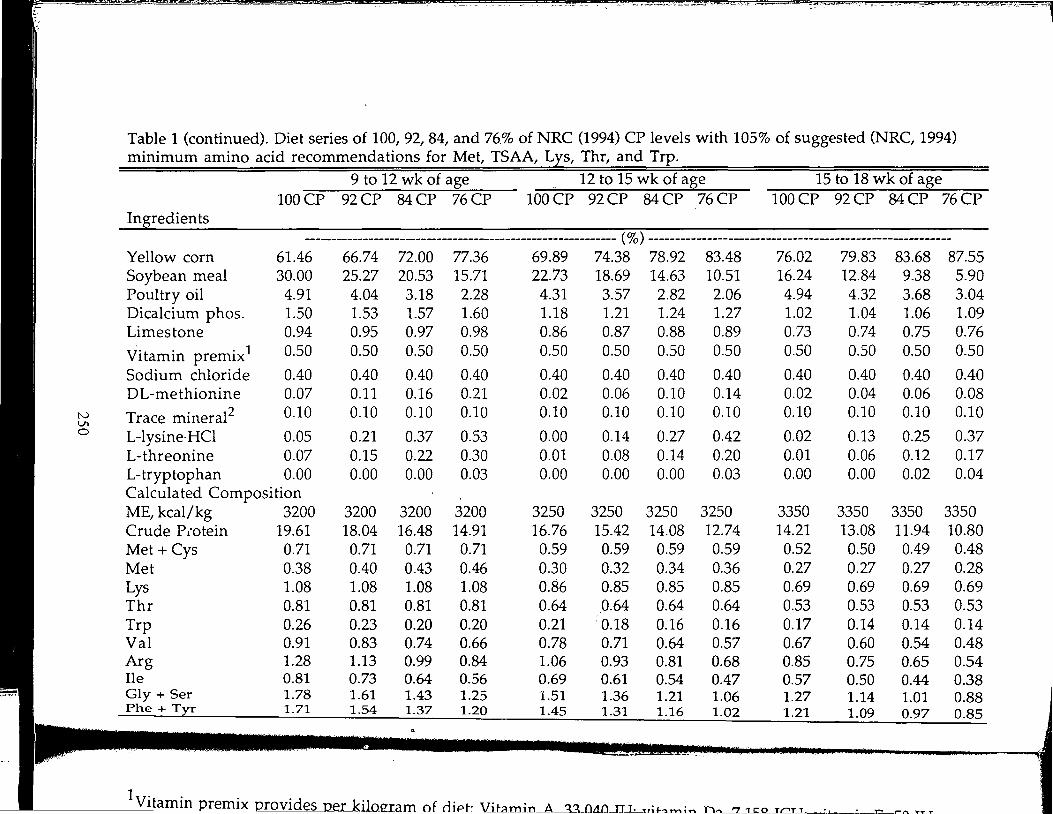
~- -~~_....-_ -~-~~~·---.~.-,,.._~___:~---. --~---=--.r-~:-~ .. -~...;:__.-:...~~~~~-;;-:-~---
Table 1 (continued). Diet series of 100, 92, 84, and 76.% of NRC (1994) CP levels with 105% of suggested (NRC, 1994) minimum amino acid recommendations for Met, TSAA, Lys, Thr, and Trp.
9 to 12 wk of age -
12 to 15 wk of age 15 to 18 wk of age lOOCP 92CP 84CP 76CP lOOCP 92CP 84CP 76CP lOOCP 92CP 84CP 76CP
Ingredients ------------------------------------------------ ( % ) ------------------------------------------------
Yellow corn 61.46 66.74 72.00 77.36 69.89 74.38 78.92 83.48 76.02 79.83 83.68 87.SS Soybean meal 30.00 2S.27 20.53 lS.71 22.73 18.69 14.63 10.51 16.24 12.84 9.38 S.90 Poultry oil 4.91 4.04 3.18 2.28 4.31 3.57 2.82 2.06 4.94 4.32 3.68 3.04 Dicalcium phos. l.SO l.S3 1.57 1.60 1.18 1.21 1.24 1.27 1.02 1.04 1.06 1.09 Limestone 0.94 0.95 0.97 0.98 0.86 0.87 0.88 0.89 0.73 0.74 0.7S 0.76
Vitamin premix1 0.50 0.50 0.50 a.so a.so a.so 0.50 0.50 a.so a.so 0.50 0.50
Sodium chloride 0.40 0.40 0.40 0.40 0.40 0.40 0.40 0.40 0.40 0.40 0.40 0.40 DL-methionine 0.07 0.11 0.16 0.21 0.02 0.06 0.10 0.14 0.02 0.04 0.06 0.08
N Trace mineral2 0.10 0.10 0.10 0.10 0.10 0.10 0.10 0.10 0.10 0.10 0.10 0.10 VI 0 L-lysine·HCl o.os 0.21 0.37 0.53 0.00 0.14 0.27 0.42 0.02 0.13 0.2S 0.37
L-threonine 0.07 0.lS 0.22 0.30 0.01 0.08 0.14 0.20 0.01 0.06 0.12 0.17 L-tryptophan 0.00 0.00 0.00 0.03 0.00 0.00 0.00 0.03 0.00 0.00 0.02 0.04 Calculated Composition ME, kcal/kg 3200 3200 3200 3200 32SO 32SO 32SO 32SO 33SO 3350 3350 33SO Crude P iOtein 19.61 18.04 16.48 14.91 16.76 lS.42 14.08 12.74 14.21 13.08 11.94 10.80 Met+ Cys 0.71 0.71 0.71 0.71 0.59 0.59 0.59 0.59 0.52 0.50 0.49 0.48 Met 0.38 0.40 0.43 0.46 0.30 0.32 0.34 0.36 0.27 0.27 0.27 0.28 Lys 1.08 1.08 1.08 1.08 0.86 0.8S 0.85 0.8S 0.69 0.69 0.69 0.69 Thr 0.81 0.81 0.81 0.81 0.64 0.64 0.64 0.64 O.S3 0.53 O.S3 0.53 Trp 0.26 0.23 0.20 0.20 0.21 '0.18 0.16 0.16 0.17 0.14 0.14 0.14 Val 0.91 0.83 0.74 0.66 0.78 0.71 0.64 0.57 0.67 0.60 0.54 0.48 Arg 1.28 1.13 0.99 0.84 1.06 0.93 0.81 0.68 0.8S 0.75 0.6S 0.54 Ile 0.81 0.73 0.64 0.56 0.69 0.61 0.54 0.47 0.57 0.50 0.44 0.38 Gly +Ser 1.78 1.61 1.43 1.25 1.51 1.36 1.21 1.06 1.27 1.14 1.01 0.88 Phe + Tyr 1.71 1.54 1.37 1.20 1.45 1.31 1.16 1.02 1.21 1.09 0.97 0.85
1v·t · · ·d k'1 · 1 am1n 2rem1x 12rov1 es n_e_r_ l oe:rani_0Ld1e.t:_\Titamin_~---3.3_0L1.1Lrr_r_._.,_;i-_,,.,.....;.,.._n,.._7_u::0_yc.Lr. __ :L...._:_=-,...,.. ..... T ------------
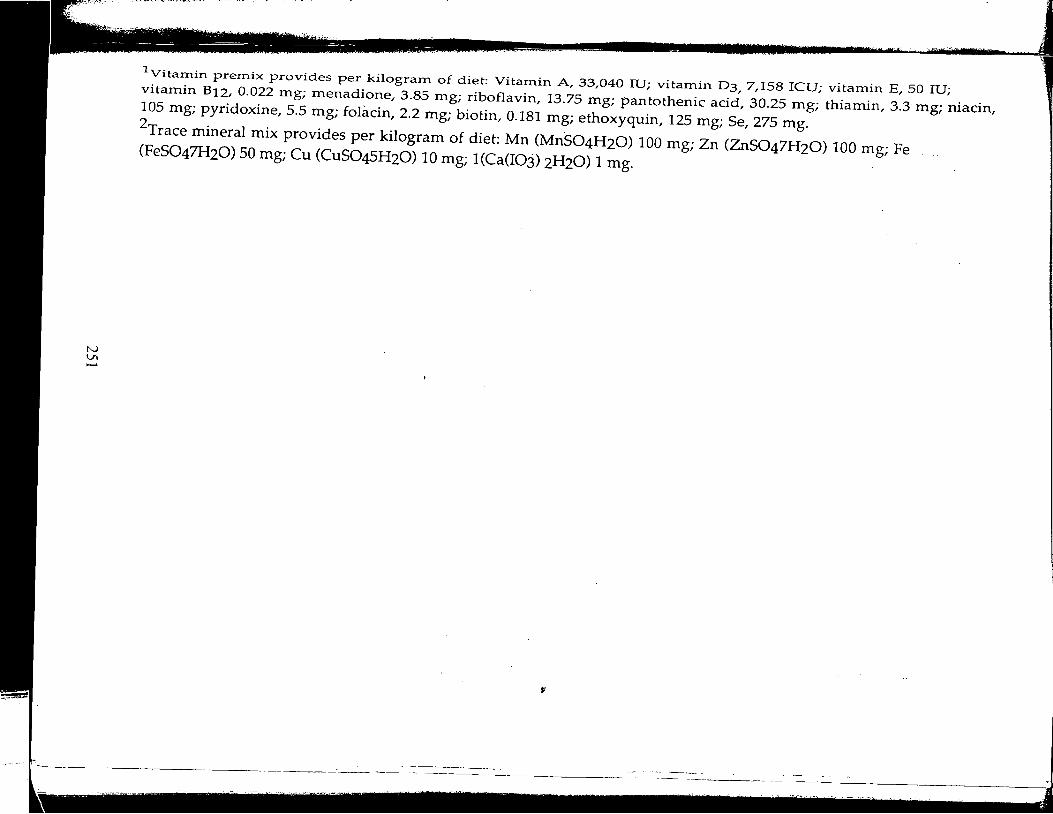
N Vl
1
Vitamin premix provides per kilogram of diet: Vitamin A, 33,040 IU; vitamin D3, 7,158 ICU; vitamin E, 50 IU; vitamin B12, 0.022 mg; menadione, 3.85 mg; riboflavin, 13.75 mg; pantothenic acid, 30.25 mg; thiamin, 3.3 mg; niacin, 105 mg; pyridoxine, 5.5 mg; fofacin, 2.2 mg; biotin, 0.181 mg; ethoxyquin, 125 mg; Se, 275 mg. 2Trace mineral mix provides per kilogram of diet: Mn (MnS04H20) 100 mg; Zn (ZnS047H20) 100 mg; Fe
(FeS047H20) 50 mg; Cu (CuS04SH20) 10 mg; l(Ca(IOj) 2H20) 1 mg.
v
-- J
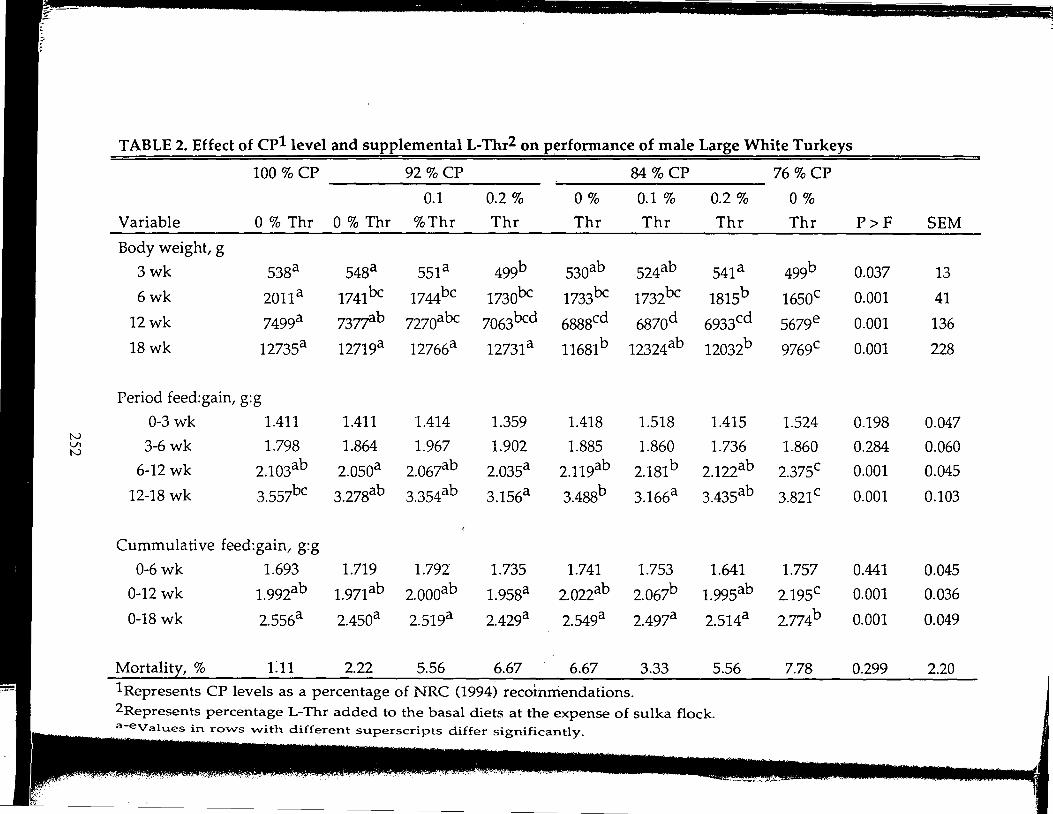
TABLE 2. Effect of cpl level and supplemental L-Thr2 on performance of male Large White Turkeys
100 % CP 92%CP 84%CP 76%CP
0.1 0.2 % 0% 0.1 % 0.2 % 0%
Variable 0 % Thr 0 % Thr %Thr Thr Thr Thr Thr Thr P>F SEM
Body weight, g
3wk 538a 548a 551a 499b 53oab 524ab 541a 499b 0.037 13
6wk 2011a 1741bc 1744bc 1730bc 1733bc 1732bc 1815b 1650c 0.001 41
12wk 7499a 73~b 7270abc 7063bcd 6888cd 6870d 6933cd 5679e 0.001 136
18wk 12735a 12719a 12766a 12731a 11681b 12324ab 12032b 9769c 0.001 228
Period feed:gain, g:g
0-3 wk 1.411 1.411 1.414 1.359 1.418 1.518 1.415 1.524 0.198 0.047 N
3-6wk 1.798 1.864 1.967 1.902 1.885 1.860 1.736 1.860 0.284 0.060 V1 N
6-12 wk 2.103ab 2.05oa 2.067ab 2.035a 2.119ab 2.181 b 2.122ab 2.375c 0.001 0.045
12-18 wk 3557bc 3.278ab 3.354ab 3.156a 3.488b 3.166a 3.435ab 3.821 c 0.001 0.103
(
Cummulative feed:gain, g:g
0-6wk 1.693 1.719 1.792 1.735 1.741 1.753 1.641 1.757 0.441 0.045
0-12 wk l.992ab l.971ab 2.oooab l.958a 2.022ab 2.067b l.995ab 2.195C 0.001 0.036
0-18 wk 2.556a 2.450a 2.519a 2.429a 2.549a 2.497a 2.514a 2.774b 0.001 0.049
Mor tali tl, % 1.11 2.22 5.56 6.67 6.67 3.33 5.56 7.78 0.299 2.20
1 Represents CP levels as a percentage of NRC (1994) recoinrriendations. 2Represents percentage L-Thr added to the basal diets at the expense of sulka flock. a~evalues in rows with different superscripts differ significantly.
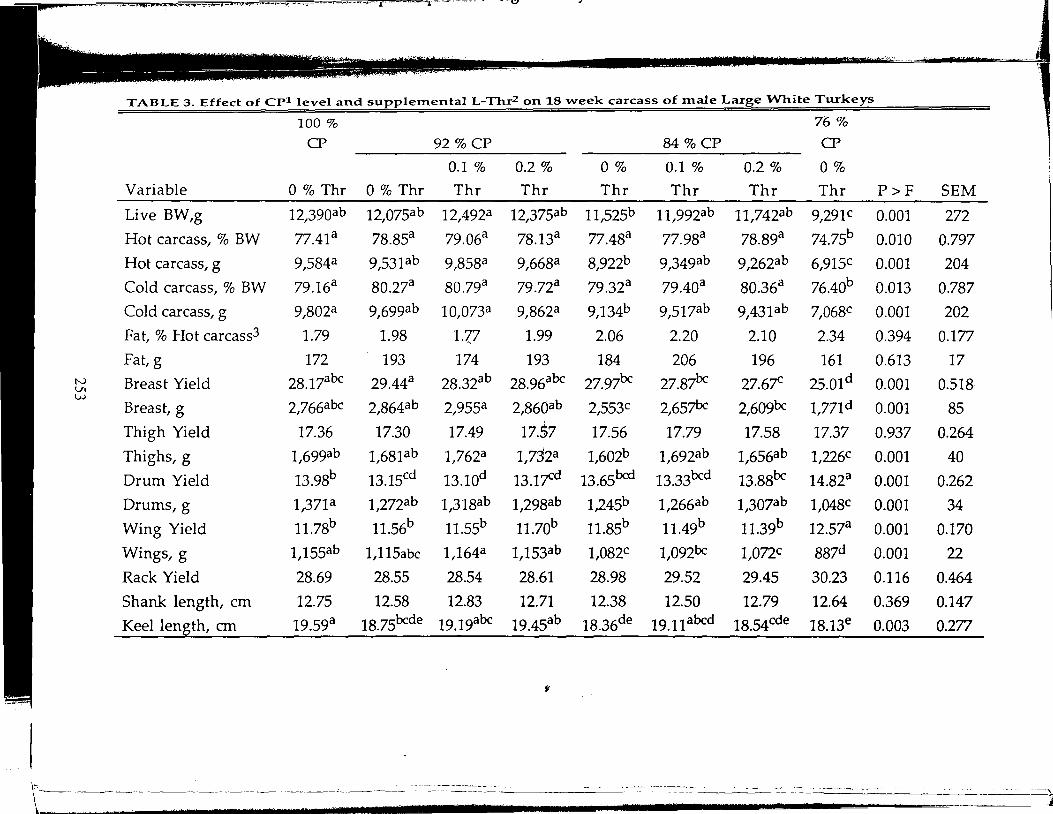
.. --.;:;;:;=;-.,.. :"!.l -·~·•--,~ii-it-'*·"··;:-;c1 .... -,--,;:""' - -·-·-.-- .... -r-·-c·· - .. -=>J_-···-- .. ,. -- - --·o ./
,·;'."'.''"•<'·-
TABLE 3. Effect of CP1 level and supplemental L-Thr2 on 18 -week carcass of male Large White Turkeys
100 % 76 %
CP 92%CP 84%CP CP
0.1 % 0.2 % 0% 0.1 % 0.2 % 0%
Variable 0 % Thr 0 % Thr Thr Thr Thr Thr Thr Thr P>F SEM
Live BW,g 12,390ab 12,075ab 12,492a 12 375ab I 11,525b 11,992ab 11 742ab
I 9,291C 0.001 272
Hot carcass, % BW 77.41a 78.85a 79.06a 78.13a 77.48a 77.98a 78.89a 74_75b 0.010 0.797
Hot carcass, g 9,584a 9,53Jab 9,858a 9,668a 8,922b 9,349ab 9 262ab I 6,915C 0.001 204
Cold carcass, % BW 79.16a 80.27a 80.79a 79.72a 79.32a 79.40a 80.36a 76.40b 0.013 0.787
Cold carcass, g 9,802a 9,699ab 10,073a 9,862a 9,134b 9,517ab 943pb I 7,068C 0.001 202
Fat, % Hot carcass3 1.79 1.98 1.{7 1.99 2.06 2.20 2.10 2.34 0.394 0.177
Fat, g 172 193 174 193 184 206 196 161 0.613 17 N Breast Yield 28.17abc 29.44a 28.32ab 28.96abc 27.97bc 27.87bc 27.6~ 25.0ld 0.001 0.518 Vt w
2,766abc 2,864ab 2,860ab Breast, g 2,955a 2,553C 2,657bc 2,609bc 1,771d 0.001 85
Thigh Yield 17.36 17.30 17.49 17.57 17.56 17.79 17.58 17.37 0.937 0.264
Thighs, g 1,699ab 1,681ab 1,762a 1 7.32a I 1,602b 1 692ab I 1 656ab
I 1,226C 0.001 40
Drum Yield 13.98b 13.15cd 13.lOd 13.l~d 13.65bcd 1333bcd 13.88bc 14.82a 0.001 0.262
Drums, g 1,371a 1,272ab 1 318ab I 1,298ab 1,245b 1 266ab
I 1 307ab I
1,Q48C 0.001 34
Wing Yield 11.78b 11.56b 11.55b 11.70b 11.85b 11.49b 11.39b 12.57a 0.001 0.170
Wings, g 1,155ab 1,115abc 1,164a 1,153ab 1,082C 1,092bc 1,072C 887d 0.001 22
Rack Yield 28.69 28.55 28.54 28.61 28.98 29.52 29.45 30.23 0.116 0.464
Shank length, cm 12.75 12.58 12.83 12.71 12.38 12.50 12.79 12.64 0.369 0.147
Keel length, cm 19.59a 18.75bcde 19.19abc 19.45ab 18.36de 19.11abcd 18.54cde 18.13e 0.003 0.277
t
\~ ----- _____ -_--_-- -·--:_:_--:_=--.::.___ =~- ---·------ -·-·-- ---~- -""\' \
N Vi -+::>.
~-==----:;:'="? -~ .... ~-~·~·-c-· ~~.;;.. -:-.-~- ...... ·-·-·---~- ~-. -···:.-'- ., .. _-"', .. _,....,.:-~~-...-""'"''.;...'!J"_,_•:;:;:?OV•-~;.Lff~ ... -: .... _~,:;:::a:, <>&.Cf!'~ ~--,
lRepresents CP levels as a percentage of NRC (1994) recommendations.
2Represents percentage L-Thr added to the basal diets at the expense of sulka flock.
3Represents abdominal and outer gizzard fat.
a-evalues in rows with different superscripts differ significantly.
O" l't> > I t'Tj > () ....... ..., < > CJ ..., l' ';;;>' ';;;>' () ';;;>' () l' ';;;>' < Cf) Cf) l' l' t:l < l' Cf) t:l l' '"O '"O (/) ""d (/) () I ,_,,....., i-i c X _.,... ......,. -' SlJ Q '"1 SlJ '"1 ........ ::T'°< ~ ~ '"1 ~ SlJ I ~ ....... Q SlJ I I r--t SlJ I Q .............. Q Q Q ltl (") ,.._ 7 ~ .._ -:::::::; >-g ~ ~ ~ .,..._ ..__ '<! .....-~ '<! ~ en ro ro ,.... tT1 .__ ~ ~· "" - ,.._ ....... ~· ........ - .........
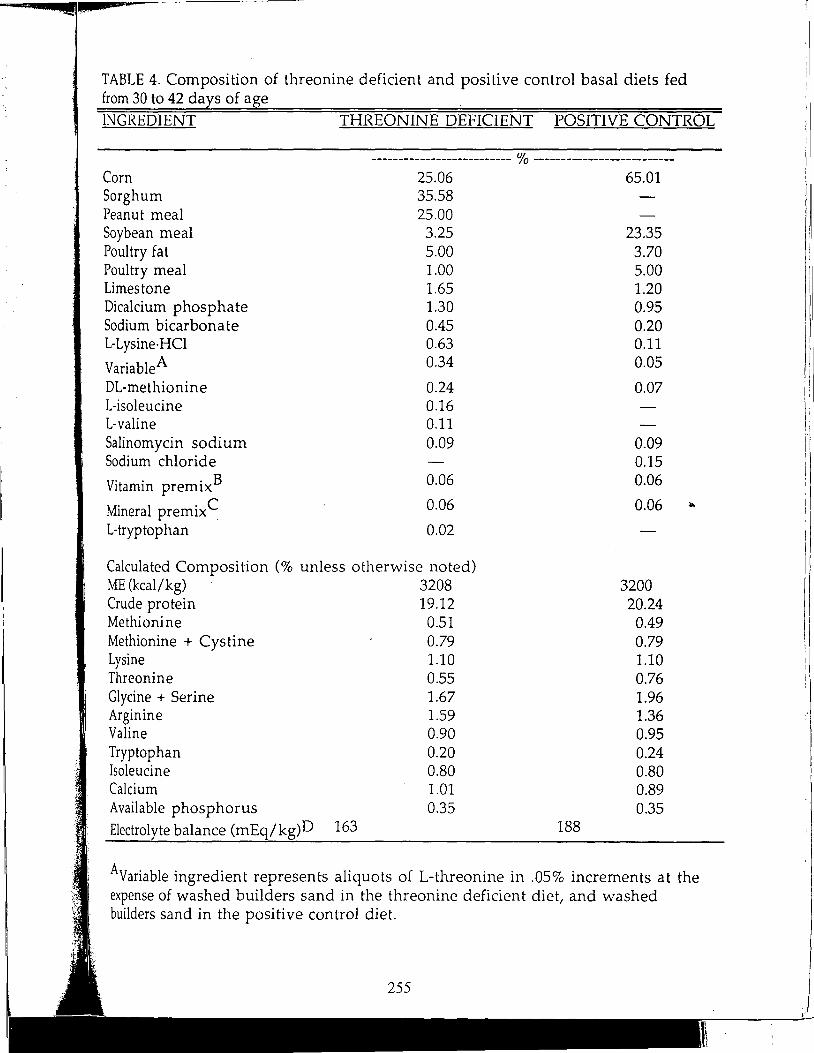
' ' I
' l ~
: ~
TABLE 4. Composition of threonine deficient and positive control basal diets fed from 30 to 42 days of age
INGREDIENT THREONINE DEFICIENT POSITIVE CONTROL
-------------------------- o/'o --------------------------Corn 25.06 65.01 Sorghum 35.58 Peanut meal 25.00 Soybean meal 3.25 23.35 Poultry fat 5.00 3.70 Poultry meal 1.00 5.00 Limestone 1.65 1.20 Dicalcium phosphate 1.30 0.95 Sodium bicarbonate 0.45 0.20 L-Lysine·HCl 0.63 0.11
VariableA 0.34 0.05
DL-methionine 0.24 0.07 L-isoleucine 0.16 L-valine 0.11 Salinomycin sodium 0.09 0.09 Sodium chloride 0.15
Vitamin premixB 0.06 0.06
Mineral premixC 0.06 0.06 ... L-tryptophan 0.02
Calculated Composition (% unless otherwise noted) ME (kcal/kg) 3208 3200 Crude protein 19.12 20.24 Methionine 0.51 0.49 Methionine + Cys tine 0.79 0.79 Lysine 1.10 1.10 Threonine 0.55 0.76 Glycine + Serine 1.67 1.96 Arginine 1.59 1.36 Valine 0.90 0.95 Tryptophan 0.20 0.24 Isoleucine 0.80 0.80 Calcium 1.01 0.89 Available phosphorus 0.35 0.35
Electrolyte balance (mEq/kg)D 163 188
Avariable ingredient represents aliquots of L-threonine in .05% increments at the expense of washed builders sand in the threonine deficient diet, and washed builders sand in the positive control diet.
255
l I I I
Bvitamin premix provided per kilogram of diet: vitamin A (source unspecified), 11,894 IU; cholecalciferol (D-activated animal sterol), 2,379 IU; vitamin E (source unspecified), 7.9 IU; niacin, 27.8 mg; pantothenic acid, 17.2 mg; riboflavin, 6.6 mg; thiamine, 1.32 mg; pyridoxine, 1.32 mg; menadione, 0.72 mg; folic acid, 0.70 mg; biotin, 0.12 mg; cyanocobalamin, 0.01 mg; selenium, 0.12 mg.
CMineral premix provided per kilogram of diet: manganese, 146 mg; zinc, 120 mg; iron, 48 mg; copper, 4.8 mg, iodine, 2.9 mg; calcium, 278 mg.
D Electrolyte balance= dietary sodium + potassium - chloride in mEq/kg of diet.
' l
'
0.
0.
0.
0.1 0.1
0.1 O.l
I PC!
I
SE I
p~
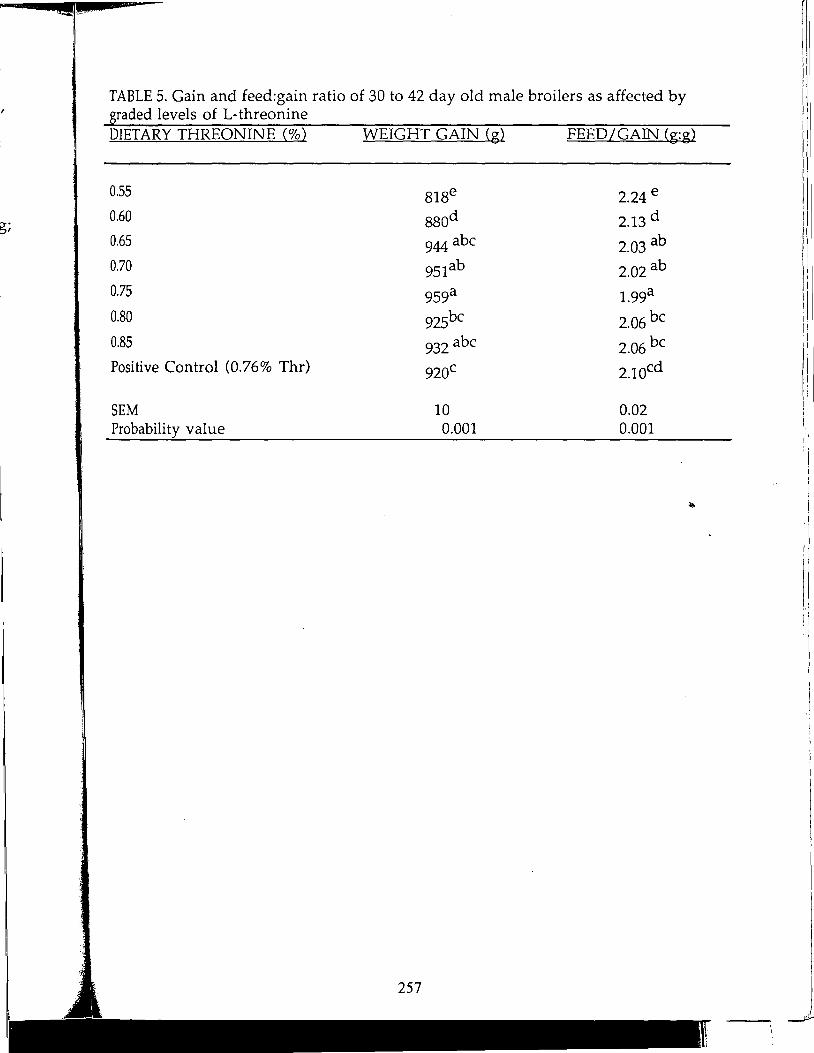
) I
g;
TABLE 5. Gain and feed:gain ratio of 30 to 42 day old male broilers as affected by graded levels of L-threonine DIETARY THREONINE (%) WEIGHT GAIN (g) FEED/GAIN (g:g)
0.55 818e 2.24 e 0.60 880d 2.13 d 0.65 944 abc 2.03 ab 0.70 951ab 2.02 ab 0.75 959a l.99a 0.80 925bc 2.06 be 0.85 932 abc 2.06 be Positive Control (0.76% Thr) 920c 2.1ocd
SEM 10 0.02 Probability value 0.001 0.001
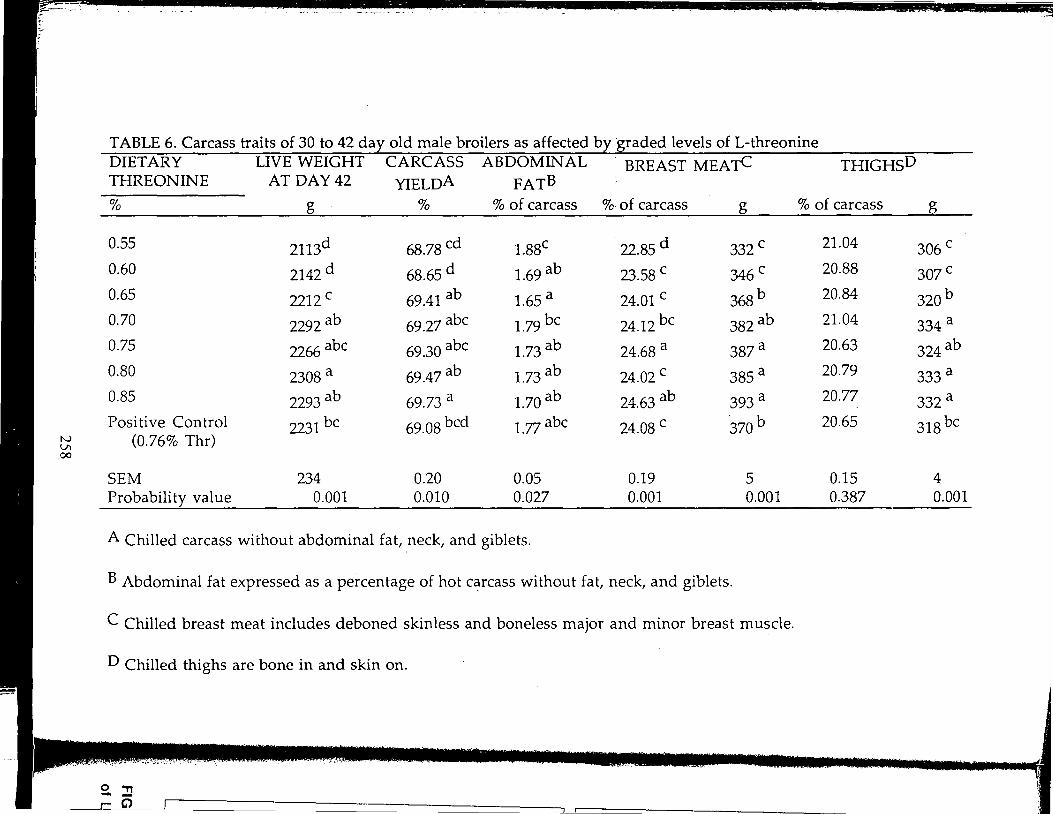
N Vl 00
TABLE 6. Carcass traits of 30 to 42 day old male broilers as affected by graded levels of L-threonine DIETARY LIVE WEIGHT CARCASS ABDOMINAL . BREAST MEATC THREONINE AT DAY 42 YIELDA FATB % g % % of carcass %of carcass g
0.55 2113d 68.78 cd l.88c 22.85 d 332 c 0.60 2142 d 68.65 d 1.69 ab 23.58 c 346 c 0.65 2212 c 69.41 ab 1.65 a 24.01 c 368 b 0.70 2292 ab 69.27 abc 1.79 be 24.12 be 382 ab 0.75 2266 abc 69.30 abc 1.73 ab 24.68 a 387a 0.80 2308 a 69.47 ab 1.73 ab 24.02 c 385 a 0.85 2293 ab 69.73 a 1.70 ab 24.63 ab 393 a Positive Control 2231 be 69.08 bed 1.7? abc 24.08 c ,370 b
(0.76% Thr)
SEM 234 0.20 0.05 0.19 5 Probability value 0.001 0.010 0.027 0.001 0.001
A Chilled carcass without abdominal fat, .neck, and giblets.
B Abdominal fat expressed as a percentage of hot carcass without fat, neck, and giblets.
C Chilled breast meat includes deboned skinless and boneless major and minor breast muscle.
D Chilled thighs are bone in and skin on.
2. "T1 r= G)
,,,-~:-.·~-:-.. ~·· ,.
THIGHSD
% of carcass
21.04
20.88
20.84
21.04
20.63
20.79
20.77
20.65
0.15 0.387
g
306 c
307c
320 b
334 a
324ab
333 a
332 a
318 be
4 0.001
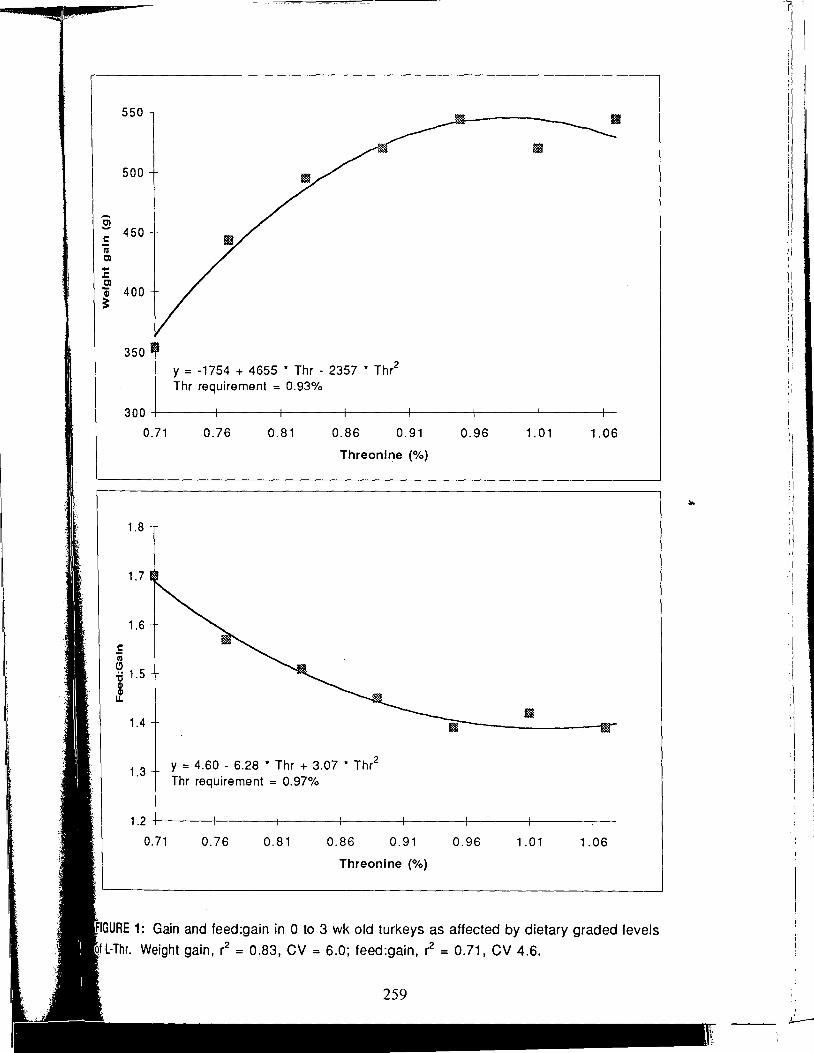
...... ~ c: IV Cl .. J: Cl i ;:
550
500
450
400
350
y = -1754 + 4655 * Thr - 2357 * Thr2
Thr requirement = 0.93%
300-+-~~-+-~~~-+-~~---t~~~-t-~~~-t--~~---r~~~-t-
O. 71
1.8
1.7
1.6
1.4
1.3
0.76 0.81 0.86 0. 91
Threonine (%)
y = 4.60 - 6.28 * Thr + 3.07 * Thr2
Thr requirement = 0.97%
0.96 1. 01 1.06
1.2-1-~~--+-~~~-+-~~----j~~~-1--~~~-+-~~----j~~~-1--~
0. 71 0.76 0.81 0.86 0. 91 0.96 1. 01 1.06
Threonine (%)
Gain and feed:gain in O to 3 wk old turkeys as affected by dietary graded levels
Weight gain, r2 = 0.83, CV = 6.0; feed:gain, r2 = 0.71, CV 4.6.
259
!/
I
J )
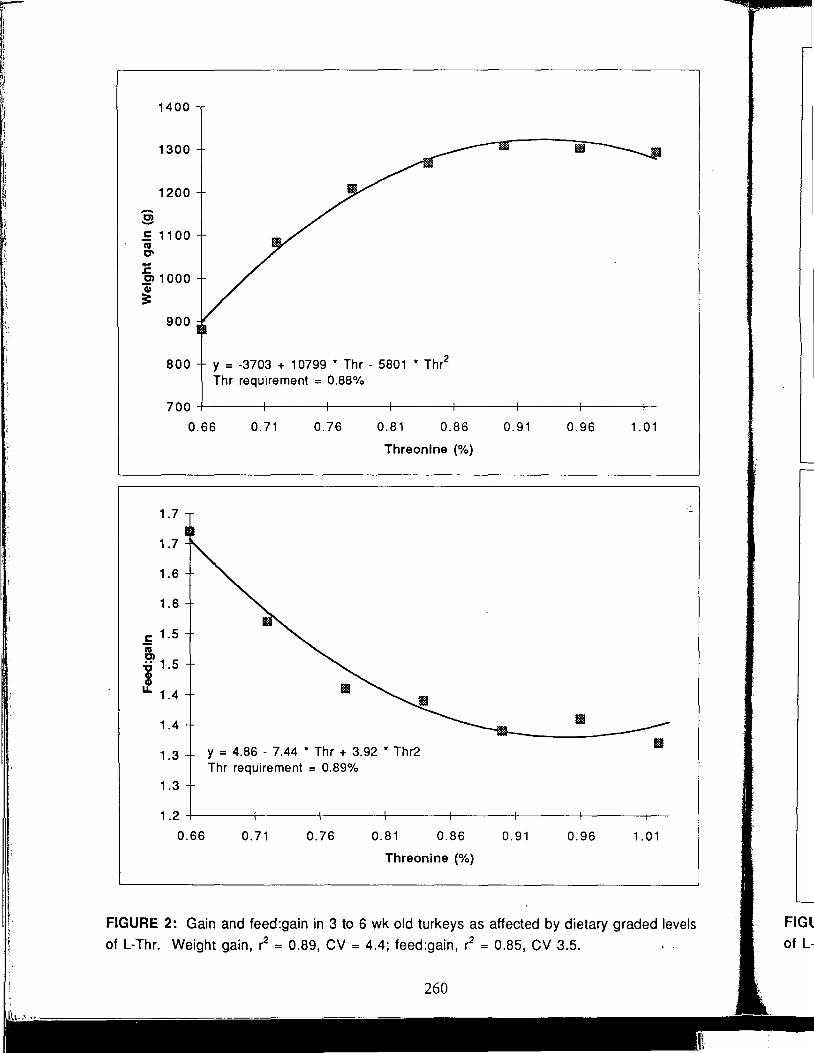
··~
t
' ,,
1400
1300
1200
c; -.E 1100 as C' -]> 1000
~ 900
800 y = -3703 + 10799 * Thr - 5801 * Thr2
Thr requirement = 0.88%
700 -f-~~-+~~~--r-~~--r~~~-t-~~--1~~~---+-~~~1---
1.7
1.7
1.6
1.6
c 1.5 iV C> 11.5 u. 1.4
1.4
1.3
1.3
0.66 0. 71 0.76 0.81 0.86
Threonine (%)
y = 4.86 - 7.44 * Thr + 3.92 * Thr2 Thr requirement = 0.89%
0. 91 0.96 1. 01
11111
1.2-t---~~--t~~~-t-~~~+-~~-+~~~-1---~~~+-~~-+~
0.66 0. 71 0.76 0.81 0.86 0. 91 0.96 1. 01
Threonine (%)
FIGURE 2: Gain and feed:gain in 3 to 6 wk old turkeys as affected by dietary graded levels
of L-Thr. Weight gain, r2 = 0.89, CV = 4.4; feed:gain, r2 = 0.85, CV 3.5.
I
FIGU I
of L-·
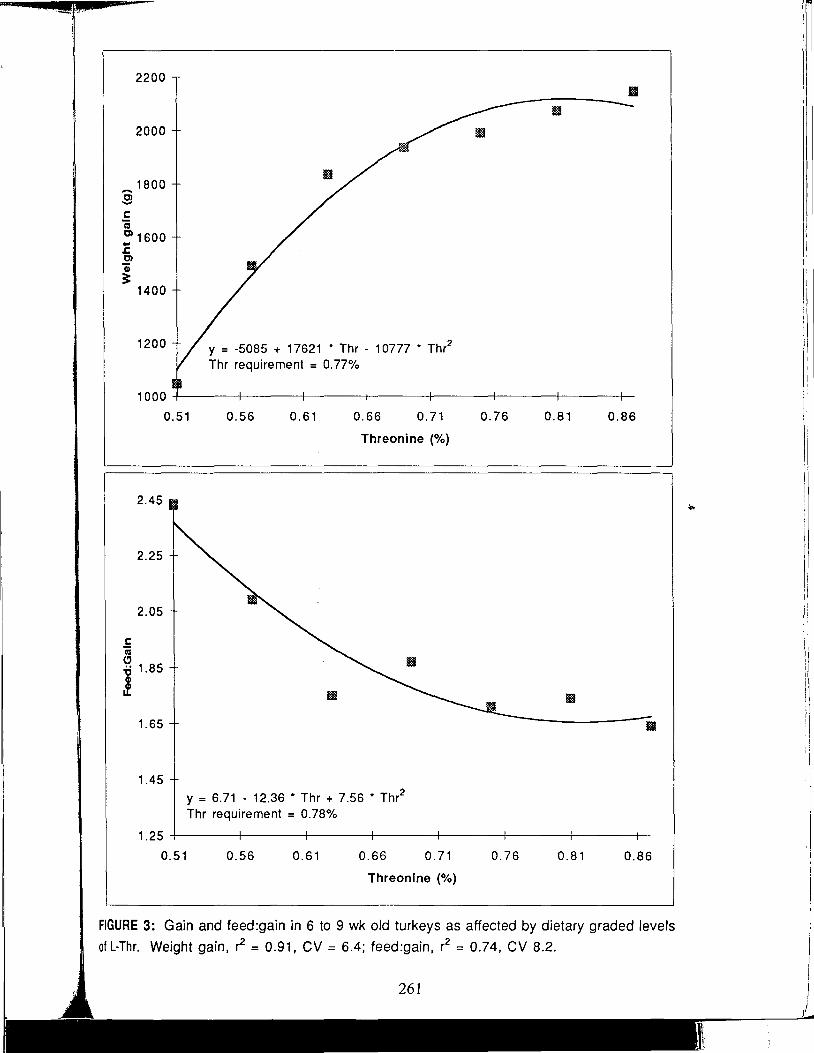
2200
2000
...... 1800
..9 c iii Cl 1600 .. .c C)
'i 3':
1400
1200 y = -5085 + 17621 * Thr - 10777 * Thr2
Thr requirement = 0.77%
~-----11111
1000-1-~~--+~~~-+-~~--+~~~-1--~~___,1--~~-1-~~~-1-
2.45
2.25
2.05
c (ij CJ 'ii 1.85
~
1.65
1.45
0.51 0.56 0.61 0.66 0. 71
Threonine (%)
y = 6.71 - 12.36 * Thr + 7.56 * Thr2
Thr requirement = 0.78%
0.76 0.81 0.86
1.25-1-~~---1~~~--1-~~~-+-~~~1--~~-1-~~~-+-~~~-1-
0.51 0.56 0.61 0.66 0. 71 0.76 0.81 0.86
Threonine (%)
FIGURE 3: Gain and feed:gain in 6 to 9 wk old turkeys as affected by dietary graded levels
of L-Thr. Weight gain, r2 = 0.91, CV = 6.4; feed:gain, r2 = 0.74, CV 8.2.
[;
I
I
1i !I ·i •'
;1 " 11
11
i\ ,, I

Notes
( This page intentionally blank. )
INTRODUCTION
NIR ~'UTILITY AND APPLICATIONS
Daniel J. Dyer and Ping Feng E.I. duPont and Company
Quality Grains division 10700 Justin Drive
Des Moines, IA 50322
NIR, or Near-Infrared Reflectance spectroscopy, and its younger sibling NIT, or Near-Infrared Transmittance spectroscopy, have enjoyed dramatic growth in acceptance as analytical techniques for feedstuffs. It was,only twenty-five years ago when the first commercial instruments and commercial applications were attempted, with a flurry of important publications on the subject in the mid-1970's, such as determination of protein and oil in com, soybean and oat by Hymowitz, et al (1974); analysis of soybean protein and oil content by Rinne, et al (1975); analysis of protein and moisture in cereal grains by Williams (1975); and analysis of forage composition by Norris, et al (1976). By the mid-1980's, NIR became an accepted standard for the analysis of pr9tein content in wheat at grain elevators, including the publication of AACC Approved standard method 39-10. ~
Following the initial focus of commercial application to the analysis of protein and moisture in cereals, the technique expanded to the analysis of most all feedstuffs, from cereals, grains, and oilseed products, to forage and silage, to animal by-product meals and fats. In addition to being applied to diverse materials, the analytical method itself has evolved into numerous techniques, which use different spectral regions, different methods of producing and collecting spectra, different statistical processes for instrument calibration, and different techniques of sampling. Also during the last two decades the technique has gained wide popularity in other analytical applications, including the petroleum, chemical, tobacco, pharmaceutical and food industries for process and quality control. The popularity ofNIR has been fueled by its inherent advantages of minimal sample preparation and extremely high reproducibility.
So widespread is the use of NIR spectroscopy that an international society (the International Committee for Near Infrared Spectroscopy) was formed in 1986. This society holds international conferences where the latest techniques of NIR spectroscopy across industries are introduced and discussed. Proceedings of these international conferences are published, with the most recent being Near Infrared Spectroscopy: The Future Waves, [Davies and Williams ed. (1996)]. It is little wonder that a technique so young, yet one which has diversified so rapidly, has create9 a wide range of opinion regarding practical utility.
263
BASICS OF NIR SPECTROSCOPY
Certainly, while NIR spectroscopy has been used in hundreds of analytical applications, in practical use the performance of the technique varies widely. Before reviewing the performance of various NIR analytical methods, it is useful to review the fundamentals on which the technique is based.
Because of the way in which NIR instruments are typically used in commercial applications; where the operator places a sample in the instrument, presses some buttons, and shortly thereafte~ analytical results appear, the method tends to be a 'black box' to many users. In fact, the technique is really relatively simple and easy to understand. Begin with a simple analogy. Thin!: of the grass in your yard. Let's assume that it is green. Why does it look green? Because, when light strikes the grass, it absorbs the red wavelengths, and reflects the yellow and blue, which combined make green, back to your eyes. If the grass is sparse, you will see a little green; if it is a dense, healthy lawn you see a deep, intense green. More grass - more green. Not only can you get a sense of how much grass is present by how much green you _see, you can also distinguish the grass from other objects based on the color of light reflected. Imagine the asphalt in the street. Your eyes can distinguish the grass from the asphalt on the basis of color, because the grass and the asphalt reflect different portions of the light spectrum.
This same principle is the basis ofNIR spectroscopy. Near-Infrared is a narrow portion of the spectrum of electromagnetic radiation, just as visible light is. In fact, Near-Infrared is that portion of the spectrum that is the next longer wavelengths just outside the region which is visible to the human eye. And, just like different items have different colors in the range of the spectrum that we can see, so grass is green and asphalt black; so different substances have different Near-Infrared spectra, so water 'looks' different to a NIR spectrometer than protein or oil or fiber. And just like a thick lawn looks more green than a sparse lawn; more water absorbs more of the characteristic NIR spectrum than less water. So, tl)e instrument can not only differentiate between water and other components; it can also tell how much water is present based on how strong the absorbance is.
If these characteristic absorbances were unique to each substance, NIR might just be a perfect analytical method. Unfortunately, it is not quite that simple. Each type of substance has many NIR absorbance bands, and the absorbances for one type of substance overlap those of many others. So, when you try to measure the protein absorbance in a complex substance like soymeal, at any point in the NIR spectrum that you choose, you will also be measuring some absorbance due to water, fiber, oil, etc. To make matters worse, the absorbance you measure is affected by sample temperature. How can anything so convoluted be at all useful as an analytiiral method? The answer lies in the process of calibration. Hundreds of samples are generally useo to develop a robust calibration that has practical utility. The samples must represent all of the: range in variation that will be encountered in the substance to be analyzed. Once these calibration samples are assembled, numerous statistical processes are applied to create correlations between the spectral absorbances and the components to be measured.
264
nance
1s; ere after
Think , when ich if it is
:an you uish 1e
the
::the
I '•
rf ilie
:mor >sorbs
:nt
feet flany ny
ne ffe lS
~lytical ·used fthe
;;o
To list the applications and evaluate the utility ofNIR in the analysis of feedstuffs, we need to understand one other important distinction in the methods of Near-Infrared spectroscopy. The original method was based on reflecting the Near-Infrared radiation off of the surface of the sample to the detector. This method is referred to as Near-Infrared Reflectance, or NIR. While the sample preparation required for NIR analysis is much simpler and more rapid than more traditional methods of analysis, it is generally still necessary to grind the sample to a uniform fine particle size to facilitate presenting a smooth, uniform surface to the spectrometer for reflectance. More recently, many applications have been developed in which the Near-Infrared radiation passes through the sample, and is measured on the side opposite to the incident radiation. This method is termed Near-Infrared Transmittance, or NIT. NIT has the advantage of very minimal or no sample preparation, as no sample grinding is required, resulting in greater reproducibility. However, this ease of use comes at the cost of lower sensitivity, so that many specific analyses are only practical using the more sensitive method of NIR.
PRACTICAL APPLICATIONS
NIR calibrations have been published, and in many cases are commercially available, for nearly all common feedstuffs. All of these have some value in practical use; but clearly, some perform better than others. While all organic substances absorb Near-Infrared radiation to some extent, water and protein have stronger and more characteristic absorbance than do oil or carbohydrate. Further complicating the analysis of carbohydrates, like sucrose, starch, or fiber fractions; is that the different classes of carbohydrates have similar spectra and are generally all present • simultaneously in a sample. Even more problematic are analytes which have no characteristic absorbance, such as ash. The measurement of ash by NIR appears to be more a function of measuring what isn't ash in the sample than what is.
When evaluating the performance of an analytical method, two factors are considered: the accuracy and the precision. The accuracy, usually measured by the standard error of prediction, or SEP, for NIR calibrations, is how close the determined values are to the 'true' value. The precision is how well the method can reproduce the value when the analysis is repeated. As a rule, the precision ofNIR analyses is superior to other traditional methods of analysis for virtually any analyte. This is a matter of the minimal sample preparation required, and the fact that absorbance spectra can be measured with excellent reproducibility. When both methods are applicable, NIT generally has even greater precision than NIR.
NEAR INFRARED TRANSMITTANCE (NIT)
NIT is most commonly used for the analysis of major components in whole cereals, grains, or oilseeds. In widespread use for only the last decade, NIT has rapidly replaced NIR for the analysis of protein and moisture in wheat- a common use of practical Near-Infrared spectroscopy. At this time there are centrally organized networks of NIT instruments for wheat protein analysis in grain elevators in the U.S., Canada, Australia, and several European nations. As a rule of thumb, NIT is only useful for analytes which comprise one percent and greater of the
265 i)
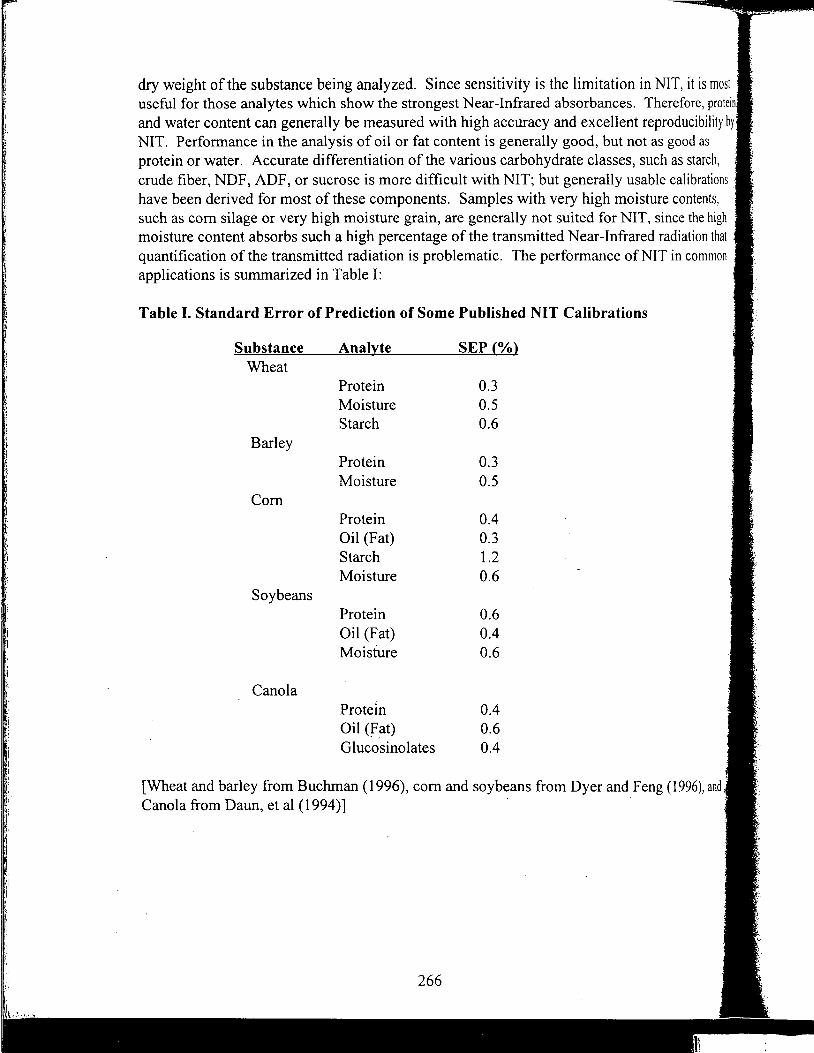
i: ,,
dry weight of the substance being analyzed. Since sensitivity is the limitation in NIT, it is most useful for those analytes which show the strongest Near-Infrared absorbances. Therefore, protein and water content can generally be measured with high accuracy and excellent reproducibility by NIT. Performance in the analysis of oil or fat content is generally good, but not as good as protein or water. Accurate differentiation of the various carbohydrate classes, such as starch, crude fiber, NDF, ADF, or sucrose is more difficult with NIT; but generally usable calibrations have been derived for most of these components. Samples with very high moisture contents, such as com silage or very high moisture grain, are generally not suited for NIT, since the high moisture content absorbs such a high percentage of the transmitted Near-Infrared radiation that quantification of the transmitted radiation is problematic. The performance of NIT in common applications is summarized in Table I:
Table I. Standard Error of Prediction of Some Published NIT Calibrations
Substance Analyte SEP(%) Wheat
Protein 0.3 Moisture 0.5 Starch 0.6
Barley Protein 0.3 Moisture 0.5
Com Protein 0.4 Oil (Fat) 0.3 Starch 1.2 Moisture 0.6
Soybeans Protein 0.6 Oil (Fat) 0.4 Moisture 0.6
Cano la Protein 0.4 Oil (Fat) 0.6 Glucosinolates 0.4
[Wheat and barley from Buchman (1996), corn and soybeans from Dyer and Feng (1996),and Canola from Daun, et al (1994)]
266
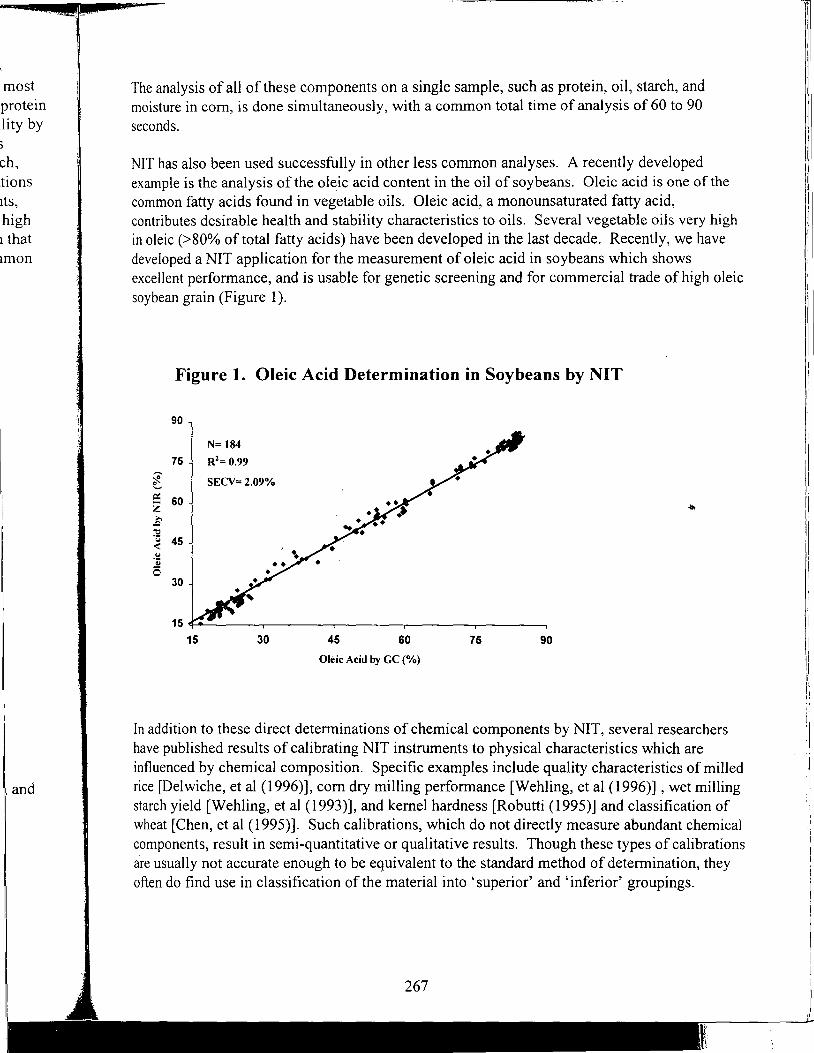
most protein ility by s ch, ttions its, high 1 that imon
, and
The analysis of all of these components on a single sample, such as protein, oil, starch, and moisture in com, is done simultaneously, with a common total time of analysis of 60 to 90 seconds.
NIT has also been used successfully in other less common analyses. A recently developed example is the analysis of the oleic acid content in the oil of soybeans. Oleic acid is one of the common fatty acids found in vegetable oils. Oleic acid, a monounsaturated fatty acid, contributes desirable health and stability characteristics to oils. Several vegetable oils very high in oleic (>80% of total fatty acids) have been developed in the last decade. Recently, we have developed a NIT application for the measurement of oleic acid in soybeans which shows excellent performance, and is usable for genetic screening and for commercial trade of high oleic soybean grain (Figure 1 ).
Figure 1. Oleic Acid Determination in Soybeans by NIT
90
N= 184
75 R2= 0.99
~ ~ SEC\1=2.09%
::: z 60
£ :2 .... 45 < .!:! .. 0
30
15 15 30 45 60 75 90
Oleic Acid by GC (%)
In addition to these direct determinations of chemical components by NIT, several researchers have published results of calibrating NIT instruments to physical characteristics which are influenced by chemical composition. Specific examples include quality characteristics of milled rice [Delwiche, et al ( 1996)], com dry milling performance [Wehling, et al ( 1996)] , wet milling starch yield [Wehling, et al (1993)], and kernel hardness [Robutti (1995)] and classification of wheat [Chen, et al (1995)]. Such calibrations, which do not directly measure abundant chemical components, result in semi-quantitative or qualitative results. Though these types of calibrations are usually not accurate enough to be equivalent to the standard method of determination, they often do find use in classification of the material into 'superior' and 'inferior' groupings.
I
I ·1
I 'I
II
I
I I
I
I )
NEAR-INFRARED REFLECTANCE
Near-Infrared Reflectance, for which the acronym NIR was coined, was developed prior to NIT. Because NIR measures the Near-Infrared radiation which is reflected off of the surface of a sample, rather than NIT which measures the Near-Infrared radiation penetrating the sample, more Near-Infrared radiation reaches the NIR detector than the NIT detector. Also, NIR can be practically used over a wider range of the Near-Infrared radiation spectrum than NIT. The result is that NIR has greater sensitivity than NIT, making it possible to use NIR to measure components which are less abundant than those which can be measured by NIT. While the general rule of thumb for NIT is that the analyte should comprise one percent or greater of the dry weight of the sample; for NIR it is reasonable to develop calibrations for analytes which are one-tenth of one percent or greater of the sample dry weight.
The disadvantage ofNIR versus NIT is that, to obtain accurate and reproducible analysis by measuring reflectance, the reflecting surface should be as smooth and uniform as possible. For this purpose, substances are usually dried and ground to a fine powder (generally to pass a one mm screen). This sample preparation introduces additional variability to the analysis, and slows analytical throughput as compared to NIT. However, for samples which are inherently inhomogeneous, such as com silage, grinding is generally necessary simply to prepare a consistent sample for analysis.
Applications on NIR analysis of feedstuffs abound in the literature throughout the last twenty years. Many such calibrations can be purchased commercially, or are supplied with th'.?. instrumentation from the manufacturer. In general, methods for the proximate analysis (protein, oil, crude fiber and moisture) of cereals, coarse grains, oilseeds, oilseed meals, forage and silage are well established and in common commercial use.
Recently, we conducted a comparison of the analysis of com silage samples by commercial laboratories using traditional analytical procedures, and others using NIR analysis. Eight samples were prepared and distributed in triplicate to seven laboratories which perform traditional methods of analysis (referred to as 'wet chemistry') and four laboratories which perform silage analysis by NIR. The samples were not identified as part of a testing set. and the replicates of the samples were treated and identified as independent samples. From this test. it was possible to calculate the standard deviation between replicates as a measure of precision for each lab, to measure the standard deviation between labs as a measure of.agreement between lab1 using the same technique, and to calculate the average determined value by each technique for each sample:
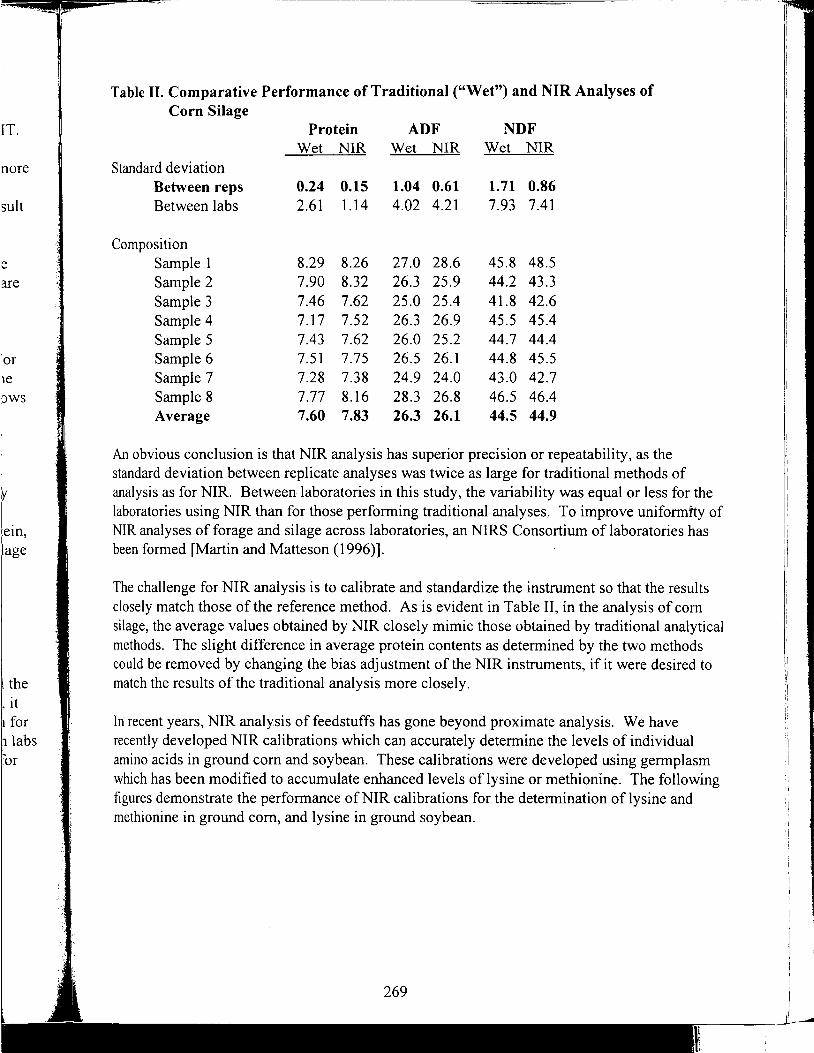
[T.
no re
sult
e :rre
·or ie DWS
:y
lein, i[age
l the , it 1 for 1 labs :Or
.. ' :. i
Table II. Comparative Performance of Traditional ("Wet") and NIR Analyses of Corn Silage
Protein ADF NDF Wet NIR Wet NIR Wet NIR
Standard deviation Between reps 0.24 0.15 1.04 0.61 1.71 0.86 Between labs 2.61 1.14 4.02 4.21 7.93 7.41
Composition Sample 1 8.29 8.26 27.0 28.6 45.8 48.5 Sample 2 7.90 8.32 26.3 25.9 44.2 43.3 Sample 3 7.46 7.62 25.0 25.4 41.8 42.6 Sample 4 7.17 7.52 26.3 26.9 45.5 45.4 Sample 5 7.43 7.62 26.0 25.2 44.7 44.4 Sample 6 7.51 7.75 26.5 26.1 44.8 45.5 Sample 7 7.28 7.38 24.9 24.0 43.0 42.7 Sample 8 7.77 8.16 28.3 26.8 46.5 46.4 Average 7.60 7.83 26.3 26.1 44.5 44.9
An obvious conclusion is that NIR analysis has superior precision or repeatability, as the standard deviation between replicate analyses was twice as large for traditional methods of analysis as for NIR. Between laboratories in this study, the variability was equal or less for the laboratories using NIR than for those performing traditional analyses. To improve uniformhy of NIR analyses of forage and silage across laboratories, an NIRS Consortium of laboratories has been formed [Martin and Matteson (1996)].
The challenge for NIR analysis is to calibrate and standardize the instrument so that the results closely match those of the reference method. As is evident in Table II, in the analysis of com silage, the average values obtained by NIR closely mimic those obtained by traditional analytical methods. The slight difference in average protein contents as determined by the two methods could be removed by changing the bias adjustment of the NIR instruments, if it were desired to match the results of the traditional analysis more Closely.
In recent years, NIR analysis of feedstuffs has gone beyond proximate analysis. We have recently developed NIR calibrations which can accurately determine the levels of individual amino acids in ground com and soybean. These calibrations were developed using germplasm which has been modified to accumulate enhanced levels of lysine or methionine. The following figures demonstrate the performance of NIR calibrations for the determination of lysine and methionine in ground com, and lysine in ground soybean .
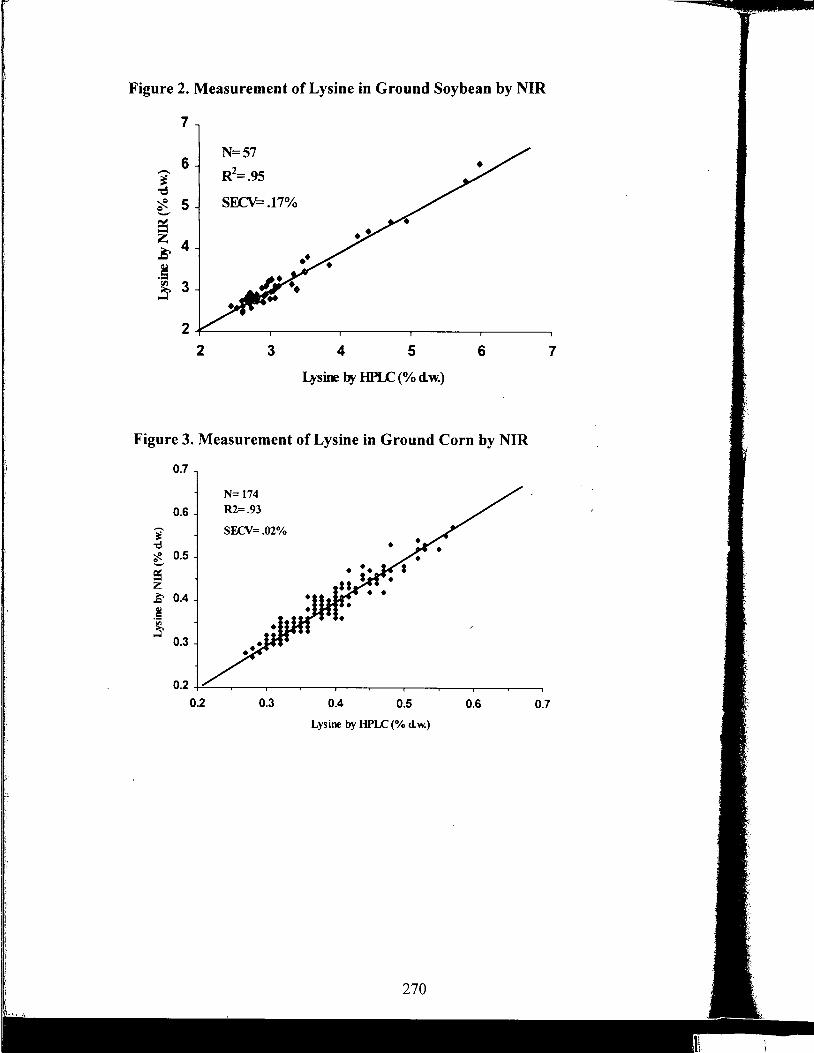
Figure 2. Measurement of Lysine in Ground Soybean by NIR
7
6 N=57
- R2=.95 it -d ~ 0 5 SF.CV=.17% -~ 4 e -~ 3' 3
2
2 3 4 5 6
4'sine byHPLC(%dw.)
Figure 3. Measurement of Lysine in Ground Corn by NIR
0.7
0.6
1 -d ~ ~
0.5
$ z £ 0.4 ~ ·;;; s
0.3
0.2
0.2
N= 174
R2=.93
SECV=.02%
0.3
•
0.4 0.5 0.6
Lysine by HPLC (% dw.)
270
7
0.7
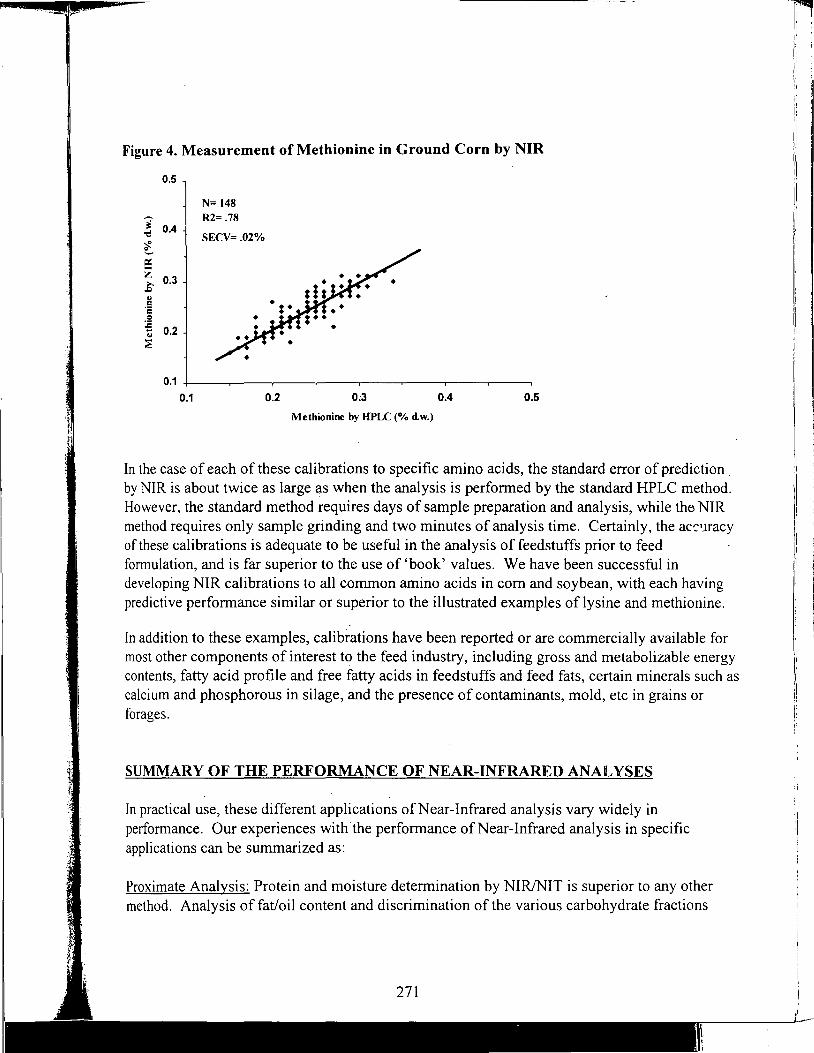
' l f I
~ ; I
Figure 4. Measurement of Methionine in Ground Corn by NIR
0.5
N= 148
1 R2= .78 0.4 -d SECV=.02%
~ ~
e: z 0.3 E !! ·;: .5! .s 0.2 .. :.;
0.1 +----.-----.---.---,----,.------,-----,------,
0.1 0.2 O;J 0.4 0.5
Methionine by HPLC (% dw.)
In the case of each of these calibrations to specific amino acids, the standard error of prediction . by NIR is about twice as large £!.S when the analysis is performed by the standard HPLC method. However, the standard method requires days of sample preparation and analysis, while the NIR method requires only sample grinding and two minutes of analysis time. Certainly, the acc"1racy of these calibrations is adequate to be useful in the analysis of feedstuffs prior to feed fonnulation, and is far superior to the use of 'book' values. We have been successful in developing NIR calibrations to all common amino acids in com and soybean, with each having predictive performance similar or superior to the illustrated examples of lysine and methionine.
In addition to these examples, calibrations have been reported or are commercially available for most other components of interest to the feed industry, including gross and metabolizable energy contents, fatty acid profile and free fatty acids in feedstuffs and feed fats, certain minerals such as calcium and phosphorous in silage, and the presence of contaminants, mold, etc in grains or forages.
'I 1 SUMMARY OF THE PERFORMANCE OF NEAR-INFRARED ANALYSES ' I , I
f :
In practical use, these different applications of Near-Infrared analysis vary widely in performance. Our experiences with the performance of Near-Infrared analysis in specific applications can be summarized as:
Proximate Analysis: Protein and moisture determination by NIRJNIT is superior to any other method. Analysis of fat/oil content and discrimination of the various carbohydrate fractions
1
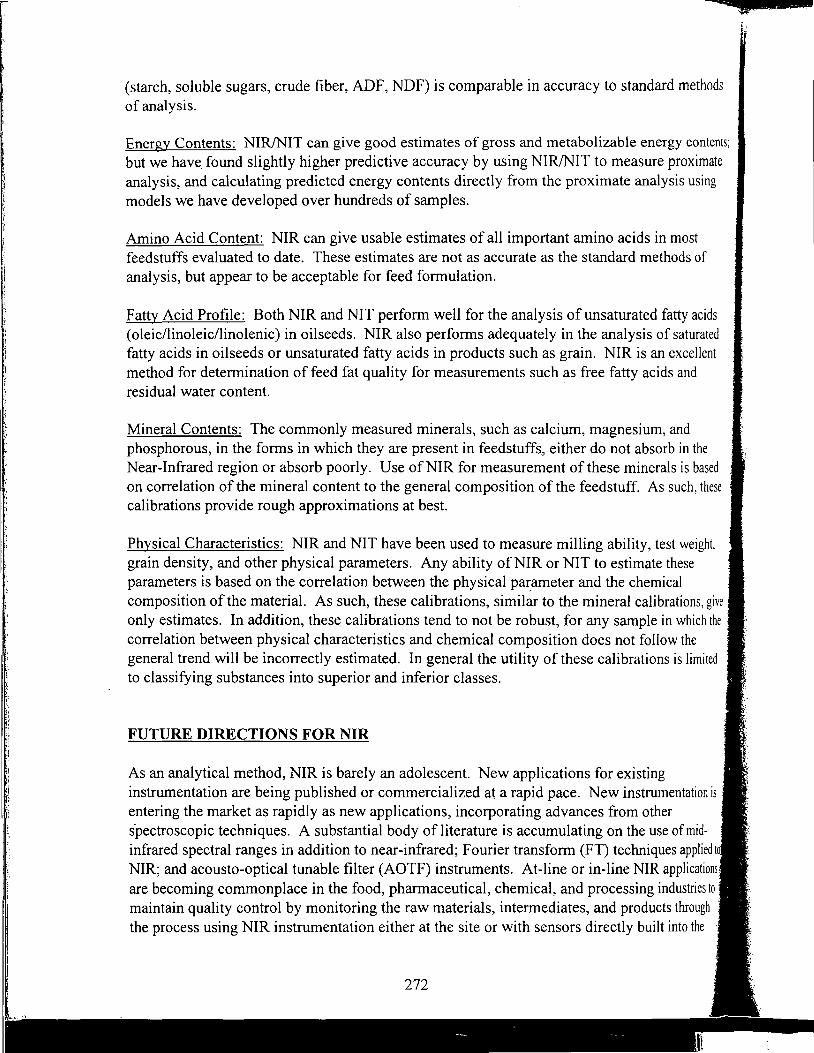
11.
11 I I
(starch, soluble sugars, crude fiber, ADF, NDF) is comparable in accuracy to standard methods of analysis.
Energy Contents: NIR!NIT can give good estimates of gross and metabolizable energy contents; but we have. found slightly higher predictive accuracy by using NIR/NIT to measure proximate analysis, and calculating predicted energy contents directly from the proximate analysis using models we have developed over hundreds of samples.
Amino Acid Content: NIR can give usable estimates of all important amino acids in most feedstuffs evaluated to date. These estimates are not as accurate as the standard methods of analysis, but appear to be acceptable for feed formulation.
Fatty Acid Profile: Both NIR and NIT perform well for the analysis of unsaturated fatty acids ( oleic/linoleic/linolenic) in oilseeds. NIR also performs adequately in the analysis of saturated fatty acids in oilseeds or unsaturated fatty acids in products such as grain. NIR is an excellent method for determination of feed fat quality for measurements such as free fatty acids and residual water content.
Mineral Contents: The commonly measured minerals, such as calcium, magnesium, and phosphorous, in the forms in which they are present in feedstuffs., either do not absorb in the Near-Infrared region or absorb poorly. Use ofNIR for measurement of these minerals is based on correlation of the mineral content to the general composition of the feedstuff. As such, these calibrations provide rough approximations at best.
Physical Characteristics: NIR and NIT have been used to measure milling ability, test weight. grain density, and other physical parameters. Any ability ofNIR or NIT to estimate these parameters is based on the correlation between the physical parameter and the chemical composition of the material. As such, these calibrations, similar to the mineral calibrations, give only estimates. In addition, these calibrations tend to not be robust, for any sample in which the correlation between physical characteristics and chemical composition does not follow the general trend will be incorrectly estimated. In general the utility of these calibrations is limited to classifying substances into superior and inferior classes.
FUTURE DIRECTIONS FOR NIR
As an analytical method, NIR is barely an adolescent. New applications for existing instrumentation are being published or commercialized at a rapid pace. New instrumentation is entering the market as rapidly as new applications, incorporating advances from other s"pectroscopic techniques. A substantial body of literature is accumulating on the use of midinfrared spectral ranges in addition to near-infrared; Fourier transform (FT) techniques applied to NIR; and acousto-optical tunable filter (AOTF) instruments. At-line or in-line NIR applications are becoming commonplace in the food, pharmaceutical, chemical, and processing industries to maintain quality control by monitoring the raw materials, intermediates, and products through the process using NIR instrumentation either at the site or with sensors directly built into the
272
ods
tents; tate ig
ds :ed nt
;ed 1ese
give the
ted
i is '
~d to ons . to h
process streams. Speed ofNIR analysis is continually increasing. NIT instruments are now being used to perform quality control analyses on individual pharmaceutical tablets, and a recently released instrument can sort individual seeds based on their composition as determined by NIR at the speed of fifty seed per minute.
Other dramatic improvements are being made in the methods for the development ofNIR calibrations, instrument standardization, and data processing. Recently, artificial intelligence methods referred to as neural networks have been applied to the derivation of calibrations. Neural networks are meant to simulate the learning process of the human brain, in which the process of 'training' involves repetitive learning from a very large set of information. To date, neural network derived calibrations have proven to be more robust and linear over a wider range of component concentration than calibrations derived by the more common methods of multiplelinear regression or partial least squares
In addition to the analysis of feedstuffs, other uses of NIR of interest to the feed and livestock industries are in nutrition management and product quality control. Numerous NIR or NIT applications have been published in the last ten years, including the measurement of glucose and lipoprotein in blood, and body fat content, all measured directly through the skin. NIR or NIT are also used commercially to measure composition of milk and milk products, and to measure moisture, fat, and protein in processed meat products.
CONCLUSION
With the broad utility of NIR and NIT in feedstuffs analysis, nutrition management, and quality control already demonstrated in the feed and livestock industries; and the rate at which new technology is evolving in the ~ea of Near-Infrared spectroscopy; NIRis destined to become the major analytical influence for these industries. With the current technology, it is both practical and cost-efficient for any company formulating feed to analyze the quality and composition of all incoming feed ingredients and to control feed formulation accordingly. In-line control of feed formulation and animal feeding through the use of Near-Infrared analysis is already beginning to be implemented; as it has been in other process industries. Even veterinary medicine will begin to benefit from NIR technology, as portable analyzers, calibrated to measure blood and tissue analyses directly through the skin, are developed and commercialized.
REFERENCES
Buchman, N. B. 1996. Near infrared networking - the ultimate control, in Near Infrared Spectroscopy: The Future Waves, Davies and Williams, ed., NIR Publications, West Sussex, U.K.
Chen, Y. R., Delwiche, S. R., and Hruschka, W.R. 1995. Classification of hard red wheat by feedforward backpropagation neural networks. Cereal Chem. 72(3):317-319.
273
Daun, J. K., Clear, K. M., Williams, P. 1994. Comparison of three whole seed nearinfrared analyzers for measuring quality components of canola seed. JAOCS, 71(10): 1063-1068.
Davies, A. M. C., and Williams, P., ed., 1996. Near Infrared Spectroscopy: The Future Waves. NIR Publications, West Sussex, U.K.
Delwiche, S. R., McKenzie, K. S>, and Webb, B. D. 1996. Quality characteristics in rice by near-infrared reflectance analysis of whole-grain milled samples, Cereal Chem., 73(2):257-263.
Dyer, D. J., and Feng, P. 1996. Near infrared applications in the development of genetically altered grains, in Near Infrared Spectroscopy: The Future Waves, Davies and Williams, ed., NIR Publications, West Sussex, U.K.
Hymowitz, T., Dudley, J. W., Collins, F. I., and Brown, C.M. 1974. Estimations of protein and oil concentration in com, soybean, and oat seed by near-infrared light reflectance. Crop Sci. 14:713-715.
Martin, N. P. and Matteson, M. 1996. Near infrared spectroscopy forage and feed testing network: a model of cooperation, in Near Infrared Spectroscopy: The Future Waves, Davies and Williams, ed., NIR Publications, West Sussex, U.K.
Norris, K. H., Barnes, R. F., Moore, J.E., and Shenck, J. S. 1976. Predicting forage quality by infrared reflectance spectroscopy. J. Anim. Sci. 43:889-897.
Rinne, R. W., Gibbons, S., Bradley, J., Sief, R., and Brim, C. A. 1975. Soybean protein and oil percentages determined by infrared analysis. U. $. Dep. Agric. Agric. Res. Publ. ARC-NC-26.
Robutti, J. L. 1995. Maize kernel hardness estimation in breeding by near-infrared transmission analysis. Cereal Chem. 72(6):632-636.
Wehling, R. L., Jackson, D. S., and Hamaker, B. R. 1996. Prediction of com dry-milling quality by near-infrared spectroscopy. Cereal Chem. 73(5):543-546.
Wehling, R. L., Jackson, D.S., Hooper, D. G., and Ghaedian, A. R. 1993. Prediction of wet-milling starch yield from com by near-infrared spectroscopy. Cereal Chem. 70(6):720-723.
Williams, P.C. 1975. Application of near infrared reflectance spectroscopy to analysis of cereal grains and oilseeds. Cereal Chem. 52:561-576.
274
9 r
s a p c
1 J cJ al oJ a~ ru
Tl
Rj I
N~
M M
;, Ta
_I _I B~ Da s Po1
I Pet Otl1
ToJ __ ,
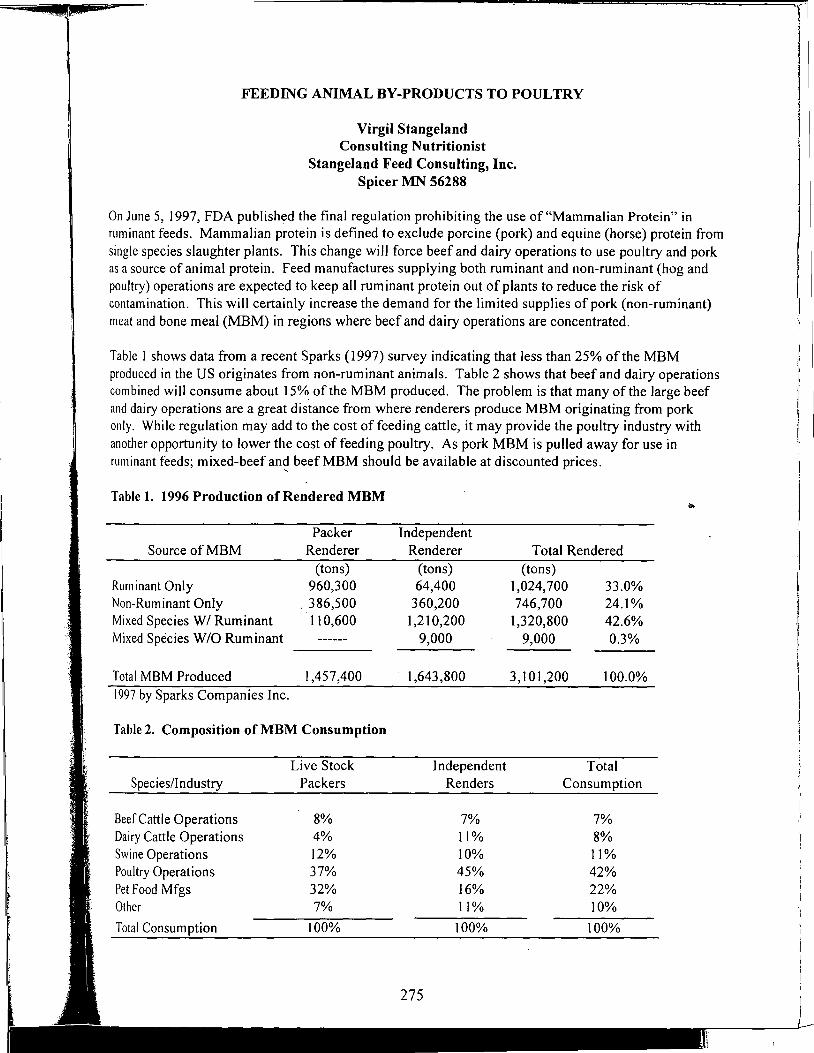
FEEDING ANIMAL BY-PRODUCTS TO POULTRY
Virgil Stangeland Consulting Nutritionist
Stangeland Feed Consulting, Inc. Spicer MN 56288
On June 5, 1997, FDA published the final regulation prohibiting the use of "Mammalian Protein" in ruminant feeds. Mammalian protein is defined to exclude porcine (pork) and equine (horse) protein from single species slaughter plants. This change will force beef and dairy operations to use poultry and pork as a source of animal protein. Feed manufactures supplying both ruminant and non-ruminant (hog and poultry) operations are expected to keep all ruminant protein out of plants to reduce the risk of contamination. This will certainly increase the demand for the limited supplies of pork (non-ruminant) meat and bone meal (MBM) in regions where beef and dairy operations are concentrated.
Table 1 shows data from a recent Sparks (1997) survey indicating that less than 25% of the MBM produced in the US originates from non-ruminant animals. Table 2 shows that beef and dairy operations combined will consume about 15% of the MBM produced. The problem is that many of the large beef and dairy operations are a great distance from where renderers produce MBM originating from pork only. While regulation may add to the cost of feeding cattle, it may provide the poultry industry with another opportunity to lower the cost of feeding poultry. As pork MBM is pulled away for use in ruminant feeds; mixed-beef an~ beef MBM should be available at discounted prices.
Table 1. 1996 Production of Rendered MBM .. Packer Independent
Source of MBM Renderer Renderer Total Rendered (tons) (tons) (tons)
Ruminant Only 960,300 64,400 1,024,700 33.0% Non-Ruminant Only . 386,500 360,200 746,700 24.1% Mixed Species WI Ruminant 110,600 1,210,200 1,320,800 42.6% Mixed Species W/O Ruminant 9,000 9,000 0.3%
Total MBM Produced 1,457,400 1,643,800 3,101,200 100.0% 1997 by Sparks Companies Inc.
Table 2. Composition of MBM Consumption
Live Stock Independent Total Species/Industry Packers Renders Consumption
Beef Cattle Operations 8% 7% 7% Dairy Cattle Operations 4% 11% 8% Swine Operations 12% 10% 11% Poultry Operations 37% 45% 42% Pet Food Mfgs 32% 16% 22% Other 7% 11% 10%
Total Consumption 100% 100% 100%
This is an opportune time to reevaluate MBM sources considering the differences between beef and pork protein products. In the discussion that follows: 1. Current research on the nutritional value of MBM will be examined, 2. Nutritional data of upper midwest products will be presented and discussed, and 3. Factors affecting MBM quality and value will be considered. Meat and bone meal has long been valued for energy, protein, phosphorus, and calcium content. Animal proteins are valued alternatives to vegetable proteins because of the anti-nutritional factors they don't contain (such as gossypol, glucosinolates, tannins, lectins, phytates, oxalates, alkaloids, cyanogens, or antitrypsin factors). In addition, animal proteins do not contain oligosaccharides and other non-starch polysaccharides (NSP) that have been shown to alter gut viscosity and reduce the digestibility of fats and proteins. There is also · evidence to show that oligosaccharides and NSP alter gut fermentation, producing wet-sticky droppings which could lead to foot pad lesions, hock disorders and eventually to breast blisters in broiler chickens and turkeys (Boling and Firman 1997).
Meat and bone meal often loses much of its value because of nutrient variability as shown in Table 3. Although protein, fat and fiber variation can affect the performance of poultry, the variability of calcium, phosphorus, salt, and sodium usually limit its use in poultry feeds. Table 4 shows how this variability might carry over into the finished feed. When used at 4% of the diet, the most variable source of MBM can cause the non-phytate phosphorus level to vary from 34% to 60% of the NRC requirement for broiler chickens. Whereas, 12% inclusion of the least variable MBM caused the nonphytate phosphorus to vary from 102-114% of the tom turkey, ( 4-8 weeks ofage) requirement.
The biological availability of phosphorus of MBM has been investigated in broiler chickens and turkeys. Waldroup and Adams (1994) concluded that there was no significant difference in the relative biological availability of phosphorus in animal proteins vs. dicalcium phosphate for broiler chickens; having evaluated six sources of poultry by-product meal and eleven sources of MBM originating frum beef, pork, and blends. Sell and Jeffrey (1996) conducted two experiments to compare the dietary availability of phosphorus from MBM with that of phosphorus from dicalcium phosphate for turkey poults and concluded that the relative availability of phosphorus in MBM was equal to the phosphorus from dicalcium phosphate.
In 1996, ten samples were taken from each of six sources of MBM and sent to Degussa Corporation for AA analysis. The summary of these results (Table 5) shows that the AA variation, in most cases, is greater than the protein variation, with cystine and tryptophan being the most variable.
276
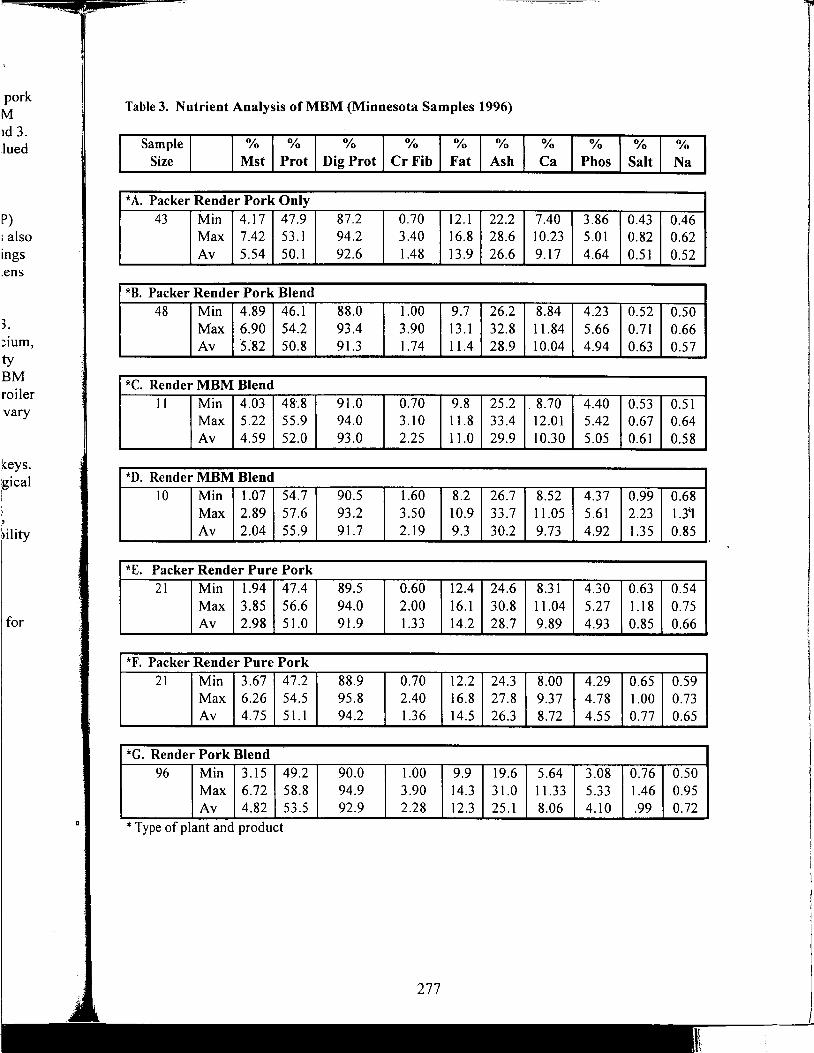
pork M id 3. Jued
P) •also in gs :ens
3. ::mm, ty BM railer vary
keys. 1gical 1
for
Table 3. Nutrient Analysis ofMBM (Minnesota Samples 1996)
Sample O/o O/o O/o O/o O/o O/o
Size Mst Prot Dig Prot Cr Fib Fat Ash
*A. Packer Render Pork Only 43 Min 4.17 47.9 87.2 0.70 12.1 22.2
Max 7.42 53.1 94.2 3.40 16.8 28.6 Av 5.54 50. l 92.6 1.48 13.9 26.6
*B. Packer Render Pork Blend 48 Min 4.89 46.l 88.0 1.00 9.7 26.2
Max 6.90 54.2 93.4 3.90 13. l 32.8 Av 5.82 50.8 91.3 1.74 11.4 28.9
*C. Render MBM Blend 11 Min 4.03 48.8 91.0 0.70 9.8 25.2
Max 5.22 55.9 94.0 3.10 11.8 33.4 Av 4.59 52.0 93.0 2.25 11.0 29.9
*D. Render MBM Blend 10 Min 1.07 54.7 90.5 1.60 8.2 26.7
Max 2.89 57.6 93.2 3.50 10.9 33.7 Av 2.04 55.9 91.7 2.19 9.3 30.2
*E. Packer Render Pure Pork 21 Min 1.94 47.4 89.5 0.60 12.4 24.6
Max 3.85 56.6 94.0 2.00 16.1 30.8 Av 2.98 51.0 91.9 1.33 14.2 28.7
*F. Packer Render Pure Pork 21 Min 3.67 47.2 88.9 0.70 12.2 24.3
Max 6.26 54.5 95.8 2.40 16.8 27.8 Av 4.75 51.1 94.2 1.36 14.5 26.3
*G. Render Pork Blend 96 Min 3.15 49.2 90.0 1.00 9.9 19.6
Max 6.72 58.8 94.9 3.90 14.3 31.0 Av 4.82 53.5 92.9 2.28 12.3 25.1
* Type of plant and product
277
O/o O/o O/o O/o
Ca Phos Salt Na
7.40 3.86 0.43 0.46 10.23 5.01 0.82 0.62 9.17 4.64 0.51 0.52
8.84 4.23 0.52 0.50 11.84 5.66 0.71 0.66 10.04 4.94 0.63 0.57
. 8.70 4.40 0.53 0.51 12.01 5.42 0.67 0.64 10.30 5.05 0.61 0.58
8.52 4.37 0.99 0.68 11.05 5.61 2.23 1.3'1 9.73 4.92 1.35 0.85
8.31 4.30 0.63 0.54 11.04 5.27 1.18 0.75 9.89 4.93 0.85 0.66
8.00 4.29 0.65 0.59 9.37 4.78 1.00 0.73 8.72 4.55 0.77 0.65
5.64 3.08 0.76 0.50 11.33 5.33 1.46 0.95 8.06 4.10 .99 0.72
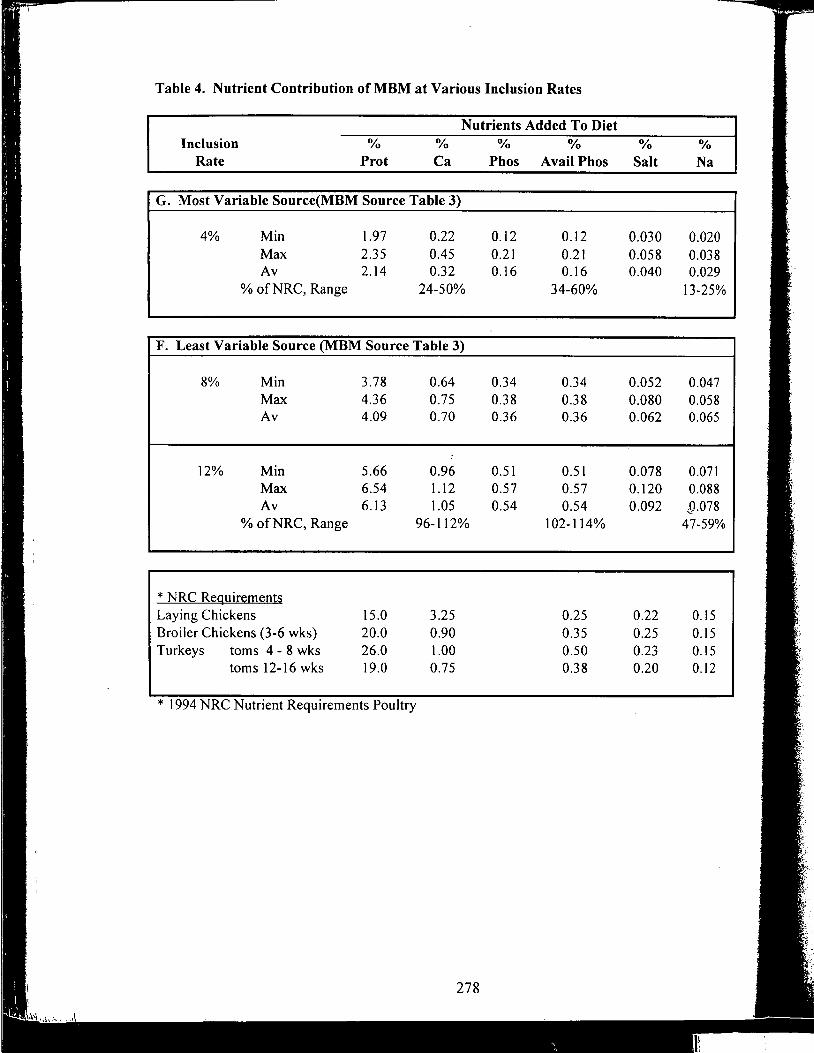
Table 4. Nutrient Contribution of MBM at Various Inclusion Rates
Nutrients Added To Diet Inclusion O/o O/o
Rate Prot Ca
G. Most Variable Source(MBM Source Table 3)
4% Min 1.97 0.22 Max 2.35 0.45 Av 2.14 0.32
% ofNRC, Range 24-50%
F. Least Variable Source (MBM Source Table 3)
8% Min Max Av
12% Min Max Av
% of NRC, Range
* NRC Requirements Laying Chickens Broiler Chickens (3-6 wks) Turkeys toms 4 - 8 wks
toms 12-16 wks
3.78 4.36 4.09
5.66 6.54 6.13
15.0 20.0 26.0 19.0
0.64 0.75 0.70
0.96 1.12 1.05
96-112%
3.25 0.90 1.00 0.75
* 1994 NRC Nutrient Requirements Poultry
278
O/o
Phos
0.12 0.21 0.16
0.34 0.38 0.36
0.51 0.57 0.54
O/o
Avail Phos
0.12 0.21 0.16
34-60%
0.34 0.38 0.36
0.51 0.57 0.54
102-114%
0.25 0.35 0.50 0.38
O/o
Salt
0.030 0.058 0.040
0.052 0.080 0.062
0.078 0.120 0.092
0.22 0.25 0.23 0.20
O/o
Na
0.020 0.038 0.029
13-25%
0.047 0.058 0.065
0.071 0.088 ;_0.078
47-59%
0.15 0.15 0.15 0.12
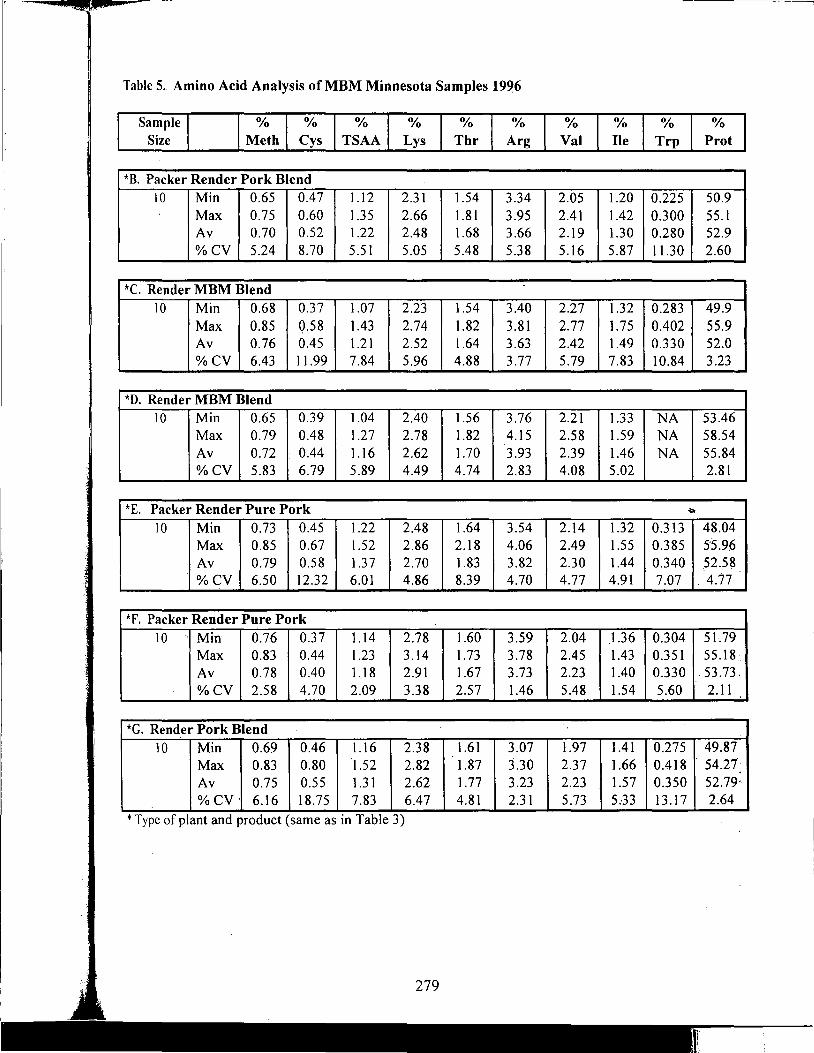
Table 5. Amino Acid Analysis of MBM Minnesota Samples 1996
Sample Size
0/o 0/o 0/o o/o Meth Cys TSAA Lys
*B. Packer Render Pork Blend 10 Min 0.65 0.47 1.12 2.31
Max 0.75 0.60 1.35 2.66 Av 0.70 0.52 1.22 2.48 %CV 5.24 8.70 5.51 5.05
*C. Render MBM Blend 10 Min 0.68 0.37 1.07 2.23
Max 0.85 Q.58 1.43 2.74 Av 0.76 0.45 1.21 2.52 %CV 6.43 11.99 7.84 5.96
*D. Render MBM Blend IO Min 0.65 0.39 1.04 2.40
Max 0.79 0.48 1.27 2.78 Av 0.72 0.44 1.16 2.62 %CV 5.83 6.79 5.89 4.49
*E. Packer Render Pure Pork 10 Min 0.73 0.45 1.22 2.48
Max 0.85 0.67 1.52 2.86 Av 0.79 0.58 1.37 2.70 %CV 6.50 12.32 6.01 4.86
*F. Packer Render Pure Pork 10 ·.Min 0.76 0.37 1.14 2.78
Max 0.83 0.44 1.23 3.14 Av 0.78 0.40 1.18 2.91 %CV 2.58 4.70 2.09 3.38
*G. Render Pork Blend 10 Min 0.69 0.46 1.16 2.38
Max 0.83 0.80 1.52 2.82 Av 0.75 0.55 1.31 2.62 %CV· 6.16 18.75 7.83 6.47
*Type of plant and product (same as in Table 3)
O/o O/o
Thr Arg
1.54 3.34 1.81 3.95 1.68 3.66 5.48 5.38
-1.54 3.40 1.82 3.81 1.64 3.63 4.88 3.77
1.56 3.76 1.82 4.15 1.70 3.93 4.74 2.83
1.64 3.54 2.18 4.06 1.83 3.82 8.39 4.70
1.60 3.59 1.73 3.78 1.67 3.73 2.57 1.46
1.61 3.07 1.87 3.30 1.77 3.23 4.81 2.31
O/o
Val
2.05 2.41 2.19 5.16
2.27 2.77 2.42 5.79
2.21 2.58 2.39 4.08
2.14 2.49 2.30 4.77
2.04 2.45 2.23 5.48
1.97 2.37 2.23 5.73
O/o O/o O/o
Ile Trp Prot
1.20 0.225 50.9 1.42 0.300 55.l 1.30 0.280 52.9 5.87 11.30 2.60
1.32 0.283 49.9 1.75 0.402 55.9 1.49 0.330 52.0 7.83 10.84 3.23
1.33 NA 53.46 1.59 NA 58.54 1.46 NA 55.84 5.02 2.81
"' 1.32 0.313 48.04 1.55 0.385 s-'5.96 1.44 0.340 52.58 4.91 7.07 ' 4.77
1.36 0.304 51.79 1.43 0.351 55.18 1.40 0.330 . 53.73. 1.54 5.60 2.11
1.41 0.275 49.87 1.66 0.418 54.27 1.57 0.350 52.79·· 5:33 13.17 2.64
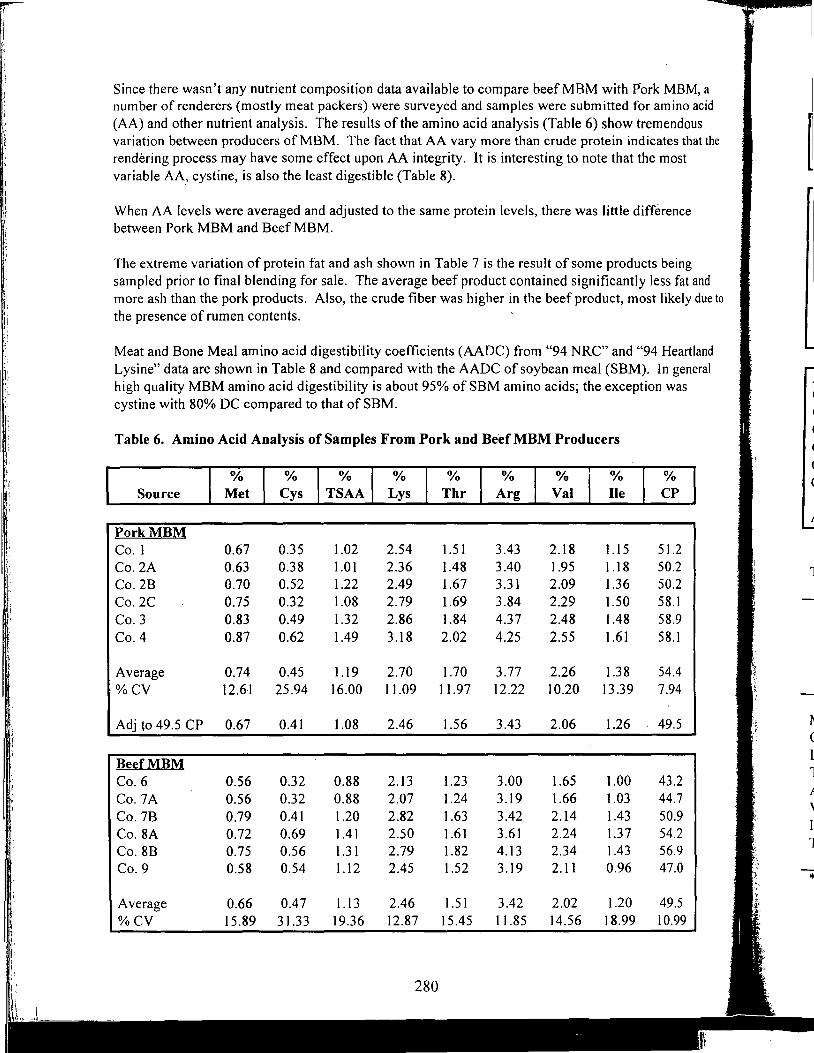
: !
'
' l ',
11'
I', I\ , k ... I ___ _
Since there wasn't any nutrient composition data available to compare beef MBM with Fork MBM, a number of renderers (mostly meat packers) were surveyed and samples were submitted for amino acid (AA) and other nutrient analysis. The results of the amino acid analysis (Table 6) show tremendous variation between producers of MBM. The fact that AA vary more than crude protein indicates that the rendering process may have some effect upon AA integrity. It is interesting to note that the most variable AA? cystine, is also the least digestible (Table 8).
When AA levels were averaged and adjusted to the same protein levels, there was little difference between Pork MBM and Beef MBM.
The extreme variation of protein fat and ash shown in Table 7 is the result of some products being sampled prior to final blending for sale. The average beef product contained significantly less fat and more ash than the pork products. Also, the crude fiber was higher in the beef product, most likely due to
the presence of rumen contents.
Meat and Bone Meal amino acid digestibility coefficients (AADC) from "94 NRC" and "94 Heartland Lysine" data are shown in Table 8 and compared with the AADC of soybean meal (SBM). In general high quality MBM amino acid digestibility is about 95% of SBM amino acids; the exception was cystine with 80% DC compared to that of SBM.
Table 6. Amino Acid Analysis of Samples From Pork and Bed MBM Producers
Source
PorkMBM Co. 1 Co. 2A Co. 2B Co. 2C Co. 3 Co. 4
Average -%CV
Adj to 49.5 CP
BeefMBM Co. 6 Co. 7A Co. 78 Co. 8A Co. 8B Co. 9
Average %CV
% Met
0.67 0.63 0.70 0.75 0.83 0.87
0.74 12.61
0.67
0.56 0.56 0.79 0.72 0.75 0.58
% Cys
0.35 0.38 0.52 0.32 0.49 0.62
0.45 25.94
0.41
0.32 0.32 0.41 0.69 0.56 0.54
0.66 0.47 15.89 31.33
% TSAA
1.02 1.01 1.22 1.08 1.32 1.49
1.19 16.00
1.08
0.88 0.88 1.20 1.41 1.31 1.12
1.13 19.36
% Lys
2.54 2.36 2.49 2.79 2.86 3.18
2.70 11.09
2.46
2.13 2.07 2.82 2.50 2.79 2.45
2.46 12.87
280
O/o
Thr
1.51 1.48 1.67 1.69 1.84 2.02
1.70 11.97
1.56
1.23 1.24 1.63 1.61 1.82 1.52
1.51 15.45
O/o
Arg
3.43 3.40 3.31 3.84 4.37 4.25
3.77 12.22
3.43
3.00 3.19 3.42 3.61 4.13 3.19
3.42 11.85
% Val
2.18 1.95 2.09 2.29 2.48 2.55
2.26 10.20
2.06
1.65 1.66 2.14 2.24 2.34 2.11
2.02 14.56
O/o
lie
1.15 1.18 1.36 1.50 1.48 1.61
1.38 13.39
1.26
1.00 1.03 1.43 1.37 1.43 0.96
1.20 18.99
% CP
51.2 50.2 50.2 58.1 58.9 58.1
54.4 7.94
49.5
43.2 44.7 50.9 54.2 56.9 47.0
49.5 10.99
! I
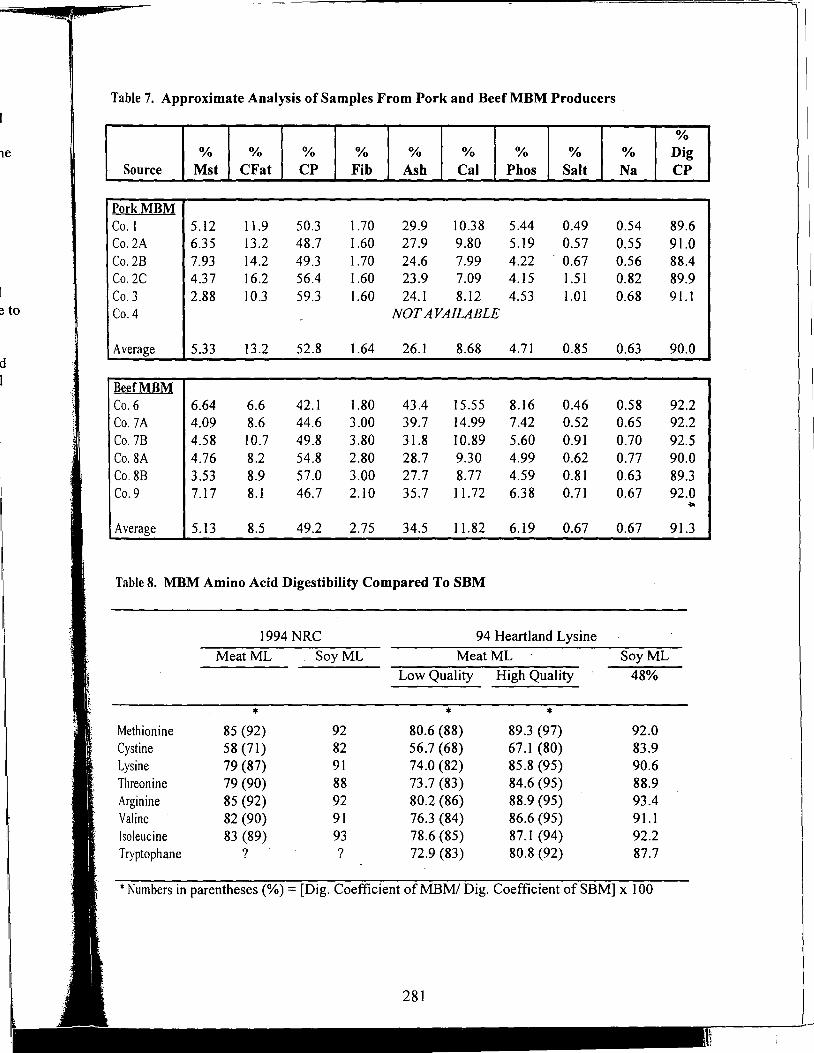
l
.d
the
e to
d I
Table 7. Approximate Analysis of Samples From Pork and Beef MBM Producers
O/o % O/o % % % % % % Source Mst CF at CP Fib Ash Cal Phos Salt Na
PorkMBM Co. I 5.12 11.9 50.3 1.70 29.9 I 0.38 5.44 0.49 0.54 Co. 2A 6.35 13.2 48.7 1.60 27.9 9.80 5.19 0.57 0.55 Co. 2B 7.93 14.2 49.3 1.70 24.6 7.99 4.22 ' 0.67 0.56 Co. 2C 4.37 16.2 56.4 1.60 23.9 7.09 4.15 1.51 0.82 Co. 3 2.88 10.3 59.3 1.60 24.1 8.12 4.53 1.01 0.68 Co.4 NOT AVAILABLE -
Average 5.33 13.2 52.8 1.64 26.1 8.68 4.71 0.85 0.63
B~efMBM
Co.6 6.64 6.6 42.1 1.80 43.4 15.55 8.16 0.46 0.58 Co. 7A 4.09 8.6 44.6 3.00 39.7 14.99 7.42 0.52 0.65 Co. 7B 4.58 10.7 49.8 3.80 31.8 10.89 5.60 0.91 0.70 Co. SA 4.76 8.2 54.8 2.80 28.7 9.30 4.99 0.62 0.77 Co. SB 3.53 8.9 57.0 3.00 27.7 8.77 4.59 0.81 0.63 Co.9 7.17 8.1 46.7 2.10 35.7 11.72 6.38 0.71 0.67
Average 5.13 8.5 49.2 2.75 34.5 11.82 6.19 0.67 0.67
Table 8. MBM Amino Acid Digestibility Compared To SBM
1994 NRC 94 Heartland Lysine
MeatML Soy ML MeatML Soy ML
Low Quality High Quality 48%
* * * Methionine 85 (92) 92 80.6 (88) 89.3 (97) 92.0 Cystine 58 (71) 82 56.7 (68) 67.l (80) 83.9 Lysine 79 (87) 91 74.0 (82) 85.8 (95) 90.6 Threonine 79 (90) 88 73.7 (83) 84.6 (95) 88.9 Arginine 85 (92) 92 80.2 (86) 88.9 (95) 93.4 Valine 82 (90) 91 76.3 (84) 86.6 (95) 91.1 lsoleucine 83 (89) 93 78.6 (85) 87.1 (94) 92.2 Tryptophane ? ? 72.9 (83) 80.8 (92) 87.7
*Numbers in parentheses(%)= [Dig. Coefficient of MBM/ Dig. Coefficient of SBM] x 100
% Dig CP
89.6 91.0 88.4 89.9 91.1
90.0
92.2 92.2 92.5 90.0 89.3 92.0
"' 91.3
·I
! .;
:i i
:;
Carlson, et al. ( 1992) reported that the true lysine digestibility of SBM and MBM was 91 % and 92%, respectively; whereas cystine digestibility was 83% and 81 %, respectively, for young turkeys.
Parsons, et al. (1996) evaluated the protein quality of 14 MBM suppliers in the US and Canada. True digestible AA and TME values determined in cecectomized roosters were generally lower than those determined in conventional roosters. True digestibility of AA also varied among MBM, with the mean (and range) for lysine, methionine, and cystine in cecectomized birds being 81 % (73 to 88), 85% (77 to 91) and 58% (37 to 72%), respectively. Ash content (bone, calcium, and phosphorus, etc.) was negatively correlated with protein efficiency ratio. Pepsin N digestibility values determined using 0.002% or 0.0002% pepsin were positively correlated with lysine digestibility. However, the standard pepsin N digestibility test using 0.2% pepsin was not correlated with in vivo protein-quality.
Wang (1997) measured the true AA digestibility of 32 MBM samples originating from beef, pork, and mixed sources. The methionine and lysine digestibility of mixed meat and bone was significantly lower than those for pork or beefMBM. Whereas, there was little difference of pork and beef AA digestibility. Higher processing temperatures and in some cases longer retention time had an adverse effect on AA digestibility. The processing temperature effect was the greatest for cystine. As in the Parsons study a significant negative correlation was found between ash (bone and collagen) and cystine and lysine digestibility.
Firman (1992) evaluated the amino acid digestibility of MBM using cecectomized roosters and cecectomized male and female turkeys of various ages, and concluded that little difference exists between digestibilities of different groups of turkeys or when compared to cockerels. In a later study, Firman and Remus (1994) found that adding corn oil to the test MBM significantly improved the digestibility of limiting AA for roosters and turkeys.
Much evidence shows that NRC ( 1994) has underestimated the energy content of MBM (Table 9). Carlson, et al. (1992) formulated diets containing 10% MBM with a 1175 kcal/lb metabolizable energy value and obtain better than expected energy conversion.
Dale (1997) evaluated MBM from beef and pork, separating bone from "meat and fat" and determined the TME of the fractions and concluded that the combined fractions contained 8.5 to 12.5% more TME than the complete meal, suggesting practical formulation energy values of 1115 kcal/lb for beef MBM and 1275 kcal/lb for pork MBM.
Table 10 compares the nutrient composition of MBM with SBM. The energy levels are comparable except higher fat and protein MBM would contain more energy than SBM. Meat and bone meal being relatively low in swine ME compared to SBM, is the primary reason that MBM is valued much higher for poultry than pigs.
Critical AA levels of MBM are lower than SBM AA; therefore MBM diets would need to be supplemented with synthetic amino acids (lysine, methionine, threonine, tryptophan) or complemented with protein sources rich in isoleucine and other limiting AA. Meat and bone meal has lower potassium and is higher in salt and sodium content than SBM, necessitating adjustments in electrolyte ratios, and
r may require supplementation with potassium chloride and/or sodium carbonate.
282
l ]
:1 al
* ' t l
T ;::
m in
0 I co
Fi pr th M
H~ pr<
I pr~
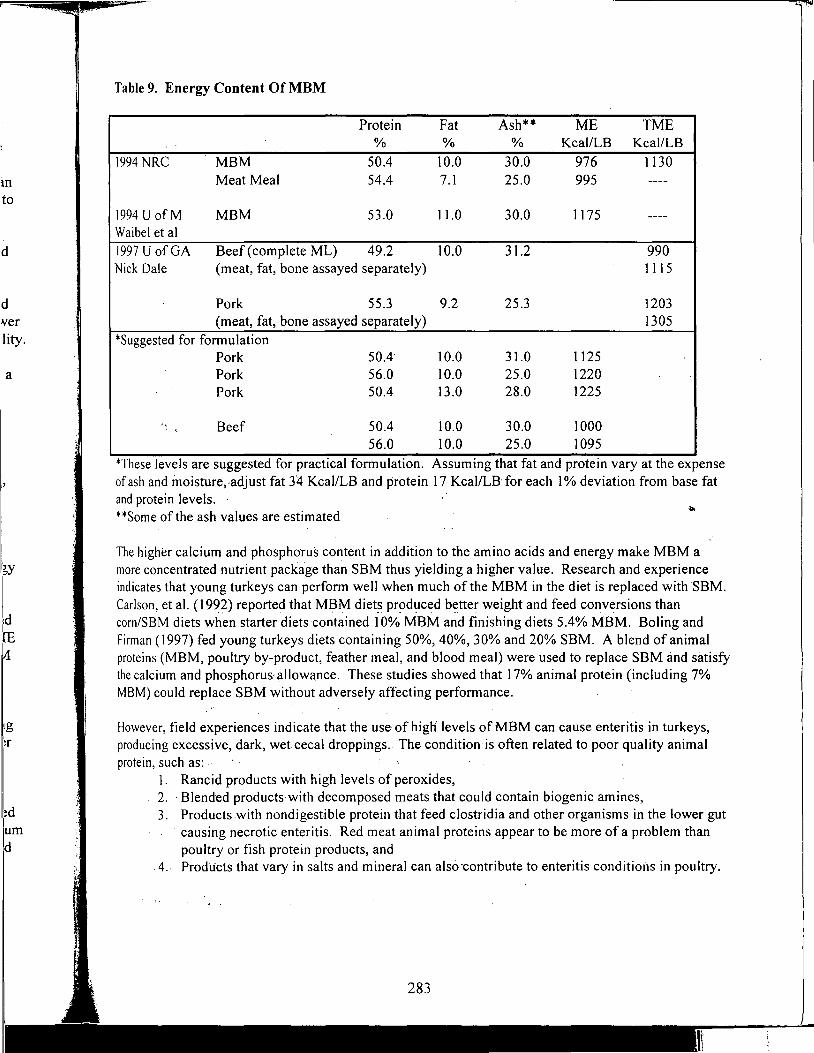
m to
d
d ver
I I I
lity.
a
'~Y
:d CE t1
tg ~r
~d
um d
Table 9. Energy Content Of MBM
Protein Fat Ash** ME TME % % % Kcal/LB Kcal/LB
1994 NRC MBM 50.4 10.0 30.0 976 1130 Meat Meal 54.4 7.1 25.0 995 ----
1994 U of M MBM 53.0 11.0 30.0 1175 ----Waibel et al 1997 U of GA Beef (complete ML) 49.2 10.0 31.2 990 Nick Dale (meat, fat, bone assayed separately) 1115
Pork 55.3 9.2 25.3 1203 (meat, fat, bone assayed separately) 1305
*Suggested for formulation Pork 50.4 10.0 31.0 1125 Pork 56.0 10.0 25.0 1220 Pork 50.4 13.0 28.0 1225
': Beef 50.4 10.0 30.0 1000 56.0 10.0 25.0 1095
*These levels are suggested for practical formulation. Assuming that fat and protein vary at the expense of ash and moisture, ·adjust fat 34 Kcal/LB and protein 17 Kcal/LB for each 1 % deviation from base fat and protein levels. **Some of the ash values are estimated
The higher calcium and phosphorus content in addition to the amino acids and energy make MBM a more concentrated nutrient package than SBM thus yielding a higher value. Research and experience indicates that young turkeys can perform well when much of the MBM in the diet is replaced with SBM. Carlson, et al. (1992) reported that MBM diet~ pr9duced b~tter weight and feed conversions than corn/SBM diets when starter diets contained 10% MBM and finishing diets 5.4% MBM. Boling and Firman ( 1997) fed young turkeys diets containing 50%, 40%, 30% and 20% SBM. A blend of animal proteins (MBM, poultry by-product, feather meal, and blood meal) were used to replace SBM and satisfy the calcium and phosphorus· allowance. ·These studies showed that 17% animal protein (including 7% MBM) could replace SBM without adversely affecting performance.
However, field experiences indicate that the use of high levels of MBM can cause enteritis in turkeys, producing excessive, dark, wet cecal droppings. The condition is often related to poor quality animal protein, such .as: ..
I. Rancid products with high levels of peroxides, 2. ·Blended products with decomposed meats that could contain biogenic amines, 3. Products with nondigestible protein that feed clostridia and other organisms in the lower gut
· causing necrotic enteritis. Red meat animal proteins appear to be more of a problem than poultry or fish protein products, and
4.- Products that vary in salts and mineral can als6·contribute to enteritis conditions in poultry.
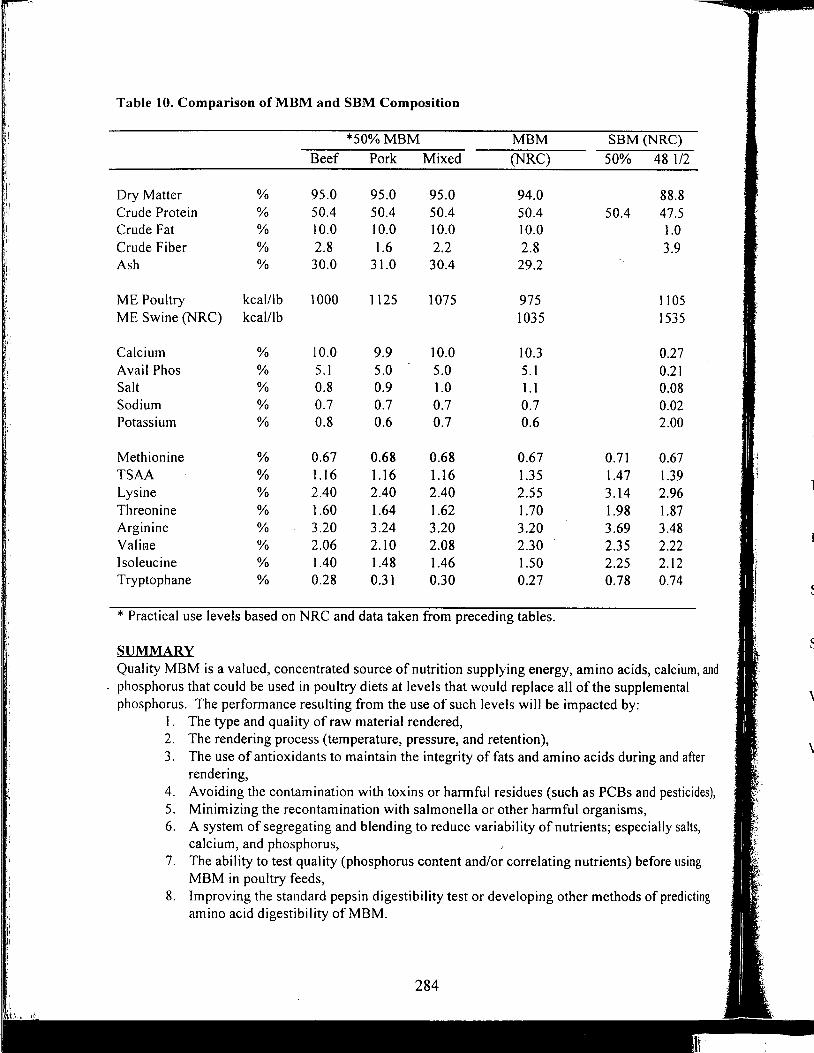
,,
Table 10. Comparison of MBM and SBM Composition
H *50%MBM MBM SBM {NRC)
Beef Pork Mixed (NRC) 50% 48 1/2 ! :I'
Dry Matter % 95.0 95.0 95.0 94.0 88.8 II :1 Crude Protein % 50.4 50.4 50.4 50.4 50.4 47.5 J'·,
:1. Crude Fat % 10.0 10.0 10.0 10.0 1.0 Crude Fiber % 2.8 1.6 2.2 2.8 3.9 Ash % 30.0 31.0 30.4 29.2
ME Poultry kcal/lb 1000 1125 1075 975 1105 ME Swine (NRC) kcal/lb 1035 1535
Calcium % 10.0 9.9 10.0 10.3 0.27 Avail Phos % 5.1 5.0 5.0 5.1 0.21 Salt % 0.8 0.9 1.0 1.1 0.08 Sodium % 0.7 0.7 0.7 0.7 0.02 Potassium % 0.8 0.6 0.7 0.6 2.00
Methionine % 0.67 0.68 0.68 0.67 0.71 0.67 TSAA % 1.16 1.16 1.16 1.35 1.47 1.39 Lysine % 2.40 2.40 2.40 2.55 3.14 2.96 Threonine % 1.60 1.64 1.62 1.70 1.98 1.87
.Jl Arginine % 3.20 3.24 3.20 3.20 3.69 3.48 'i I ValiHe % 2.06 2.10 2.08 2.30 2.35 2.22 I'
" Isoleucine % 1.40 1.48 1.46 1.50 2.25 2.12 Tryptophane % 0.28 0.31 0.30 0.27 0.78 0.74
* Practical use levels based on NRC and data taken from preceding tables.
I• SUMMARY Quality MBM is a valued, concentrated source of nutrition supplying energy, amino acids, calcium, and phosphorus that could be used in poultry diets at levels that would replace all of the supplemental phosphorus. The performance resulting from the use of such levels will be impacted by:
I. The type and quality of raw material rendered, 2. The rendering process (temperature, pressure, and retention), 3. The use of antioxidants to maintain the integrity of fats and amino acids during and after
rendering, 4. Avoiding the contamination with toxins or harmful residues (such as PCBs and pesticides), 5. Minimizing the recontamination with salmonella or other harmful organisms, 6. A system of segregating and blending to reduce variability of nutrients; especially salts,
calcium, and phosphorus, ~I 7. The ability to test quality (phosphorus content and/or correlating nutrients) before using i Ii MBM in poultry feeds, I 8. Improving the standard pepsin digestibility test or developing other methods of predicting
amino acid digestibility of MBM.
n,and
~er
:ides),
its, ;.
ing
ACKNOWLEDGMENTS The amino acid assays and other nutrient analysis were provided by Degussa Corporation, Allendale, NJ 07401 and Willmar Poultry Company, Willmar MN 56201.
LITERATURE CITED Boling, S. D. and J. D. Firman., 1997. Rendered by-products as soybean meal replacement in turkey
rations. J. Appl. Poultry Res. In Press
Carlson, C. W., P. E. Waibel, J. K. Liu, J. A. Brannon, S. L. Noll, 1992. Performance of male turkeys fed canola, meat, poultry bi-product, and feather meals replacing a live quantity of bioavailable protein from soybean meal. Pr9c. 53rd MN Nutrition Conf. 293-302
Dale, Nick, I 997. Metabolizable energy of meat and bone meal. J. Appl. Poultry Res. 6: 169-173.
Firman, J. D., 1992. Amino acid digestibilities of soybean meal and meat meal in male and female turkeys of different ages. J. Appl. Poultry Res. I :350-354.
Firman, J. D. and J. C. Remus, 1994. Fat additions increase digestibility of meat and bone meal. J. Appl. Poultry Res. 3:80-82.
Heartland Lysine, Inc., 1995. Digestibility of essential amino acids for poultry and swine. Heartland Lysine, Inc., Chicago, IL 6063 I
National Research Council, 1994. Nutrient requirements of poultry, 9th rev. ed. National Academy Press, Washington, DC. •
Parsons, C. M., F. Castanon, and Y. Han, 1996. Protein and amino acid quality of meat and bone meal. Poultry Science. 76:361-368.
Sell, J. L. and M. J. Jeffrey, 1996. Availability for poults of phosphorus from meat and bone meals of different particle sizes. Poultry Science. 75:232-239.
Spark Companies, Inc., 1997. The economic impact of proposed regulations concerning ruminant-based protein products. Prepared for: National Renders Association.
Waldroup, P. W. and M. H. Adams, 1994. Evaluation of the phosphorus provided by animal proteins in the diet of broiler chickens. J. Appl. Poultry Res. 3:209-218.
Wang, Xincheng, 1997. Effect of processing methods and raw material sources on protein quality of animal protein meals. Ph.D. Thesis University of Illinois, Urbana.

Notes
( This page intentionally blank. )
286