23combinepdf.pdf - itam society
TRANSCRIPT
23th International Conference on IT Applications and ManagementTheme: Future of Work in a Hyper-Connected World
February 5 ~ 7, 2020
Host and venue: Rajagiri Business School, Kerala, India
Supported by Korea Data Strategy Society
Editorial BoardJeong Hoon Lee (Hansung U., Korea)
Sateesh Kumar Ojha (Tribhuvan U., Nepal)
Rofin T.M.(National Institute of Technology, Karnataka, Surathkal, India)
Published byKorea Database Strategy Society (KDSS)
Printed atNepal Printing Support, Anamnagar, Kathmandu-29, T: +977 1 5706821

Preface
The theme of the 23rd ITAM International Conference is “Future of Work in a Hyper-Connected World”. We believe that there are ample reasons for massive changes in the nature of work, the working environment, the medium of work, the management and coordination of work, and the space and place of working. Technological changes are the major drivers of these changes. However, the changes in digital technology will juxtapose with the changes in generation, social roles and aging of society, global influence of employment, cultural changes, and changes in the view of the world and global environment. Researchers and students will need to develop sufficient diversity in knowledge and perspective to make an advancement on such complex and critical phenomena. We hope ITAM 23 be an open field of discourse on this issue. Researchers from different fields and different countres will be able to enjoy the discussion and develop useful perspectives and insights on this critical issue.
The 23rd ITAM International Conference is hosted by Rajagiri Business School located in Cochin, the beautiful city of Kerala, India. I appreciate hosting members of RBS, most of all the organizing chairs Prof. Mani Sam and Prof. Santosh Rangnekar. I also express my thanks to the people who prepared all the details of the event. To name a few, Prof. Jaedong Kang who is in charge of local arrangements, Professor Sateesh Kumar Ojha who prepared proceeding books as he always did. My appreciation also extends to organizations including Korea Data Strategy Society and ISTD India for their generous supports. The success of the series of congress relies on the active participants of all the members of ITAM international committee and delegates who contributed their research. I appreciate all the delegates and researchers participating in ITAM-23.
I wish all the delegates enjoy this wonderful academic gathering. We will all cherish this wonderful memory of meaningful interaction among professors, researchers and emerging generation of scholars and managers.
Namjae ChoChairman, International ITAM Society
Professor, School of Business, Hanyang University, Korea

Conference Management TeamChairman of International ITAM SocietyNamjae Cho (Hanyang U., Korea)
Advisory BoardSung Kun Kim (Chung Ang U., Korea)
Saji Mathew (IIT Madras, India)
Kanes Rajah (CEPD London, UK)
Uthai Tanlamai (Chulalongkorn. U., Thailand)
Oliver H. M. Yau (Open U. of Hong Kong)
Conference General ChairMyeong Gil Choi (Chung Ang U., Korea)
Joseph Injodey (Rajagiri Business School, India)
Co-chairs of Organizing CommitteeSantosh Rangnekar (IIT Roorkee, India)
Mani P. Sam (Rajagiri Business School, India)
Program ChairsJung Seung Lee (Hoseo U., Korea)
Jaedong Kang (Rajagiri Business School, India)
Publication ChairsJeong Hoon Lee (Hansung U., Korea)
Sateesh Kumar Ojha (Tribhuvan U., Nepal)
Rofin T.M.(National Institute of Technology, Karnataka)
Registration ChairsChien-Chang Chen (Tamkang U., Taiwan)
Sreejith R. (Rajagiri Business School, India)
Hue Mi Um (Bucheon U., Korea)
Local Arrangement ChairsDeepak Babu (Rajagiri Business School, India)
Minsun Kim (Hyupsung U., Korea)
Pooja Garg (IIT Roorkee, India)
International Organizing CommitteeAli Abdulbaqi Ameen (Lincoln U. College, Malaysia)Anirut Asawasakulsorn (Naresuan U., Thailand)Patrick Bouchet (Bourgogne U., France)Ahmed Bounfour (U. De Paris Sud, France)Wei Hui Dai (Fudan U., China)Elena García de Soto (Huelva U., Spain)Neetha Eappen(Rajagiri Business School, India)Andre M. Everett (Ottago U., New Zealand)Haluk Gorgun (YTU, Turkey)Tej Bahadur Gurung (Tribhuvan U., Nepal)Yanki Hartijasti (U. of Indonesia, Indonesia)Kyeong Kang (U. Of Technology, Sydney, Australia)Ajay Khadka (Tribhuvan U., Nepal)Gyeung Min Kim (Ewha W. U., Korea)Ji-Hee Kim (Canisius College, U.S.A.)Jinsoo Kim (Chung-Ang U., Korea)Kijoo Kim (Konyang U., Korea)Sang-Jun Kim (Kindai U., Japan)Soo Kyung Kim (Dankuk U., Korea)Seokha Koh (Chungbuk Nat’l U., Korea)Jitsama Kurusakdapong, (Chulalongkorn U., Thailand)Anne-Marie Lebrun (Bourgogne U., France)Bernard Lee (Hong Kong Shue Yan U., Hong Kong)Jeong Hyun Lee (Korea Data Agency, Korea)Gyoo Gun Lim (Hanyang U., Korea)Iraj Mahdavi (President, Mazandaran U. of S&T, Iran)Masayuki Maruyama (Kansai Int’l U., Japan)Kakutani Naohisa (Meio U., Japan)Pratima Pradhan (Singhania U., India)Stella So, Lai Man (The Chinese U. of Hong Kong)Do Van Tuan (Dong-A U., Vietnam)Alfonso Vargas-Sánchez (Huelva U., Spain)Chi-Chien Wang (NTPU, Taiwan)Sean Watts (American U. of Vietnam)Jaehoon Whang (Yonsei U., Korea)
Table of Contents1. Qualitative and Quantitative Data Analysis Approaches in Management Research: How and What to Choose? 1 Sateesh Kumar Ojha and Jagadish Chandra Wagle2. IdentificationofFactorsofHardandSoftHumanResourceManagementPractices 7 Charu Goyal3. LinkingGreenHumanResourceManagementandJobPursuitIntentions: ModelingOrganizationalPrestigeasMediator 15 Richa Chaudhary4. EmployeesEngagementinNepaleseBankingSector 20 Ram Hari Silwal5. FactorsAffectingEmployeeMotivationofBankingSectorsinNepal 27 Narayan Prasad Aryal, Aaditya Acharya & Ashim Hang Limbu6. ComparionofEmployeeMotivationofPrivateandGovernmentOwnedBanksofNepal 35 Narayan Prasad Aryal, Aaditya Acharya & Ashim Hang Limbu7. AcceptanceofHealthMonitoringTechnologybyIndependentlyLivingElderly 40 Uthai Tanlamai, Aim-Orn Jaikengkit and Trirat Jarutach8. PatentTrendAnalysisofEasternAsianCountriesbetween2000and2019: Taiwan,China,Japan,SouthKorea,andSingapore 46 Yann-Jy Yang and Chih-Chien Wang9. RoleofICTintheDevelopmentandManagementofSmartCities 53 Milan Patna and Sateesh Kumar Ojha10. ImperiousStaple:IndividualValues&KnowledgeWorkerProductivity59 Abhay D Joshi and Rajesh Jain 11. TheRisksofHumanFactorsinCloudComputing 61 Myeonggil Choi and Hyemi Um12. ATheoreticalModelforPsychologicalEmpowermentofTelecentreUsersUsingICT 64 Jyoti Arya and Santosh Rangnekar13. ImpactofAdvanceDigital&MobileTechnologyonWorkCulture 65 Amit Singh Rathore, Chetan Sharma and Anita Chauhan14. AStudyofVlogthatAnalyzeVariablesAffectinganEntertainmentEffect: UsingSocialCommunicationasaControlVariable 73 Yu Gisoeb, Lim Jeong Hun and Cho Namjae 15. RoleofSocialMediaMarketingonConsumerBuyingBehavioron AlcoholicProductInsideKathmanduValley 81 Yeak Narayan Sharma16. BuildingGreenEntrepreneurship:AJourneyofEnvironmentalAwarenessto GreenEntrepreneursinThailand 91 Kornthong Tesprasit, Pakatip Aksharanandana and Athikom Kanchanavibhu17. AStudyofthePrioritythatAffectSuccessioninFamilyBusiness: ComparinganIncumbent’sViewandaSuccessor’sView 99 Yunseok Lee, Gisoeb Yu, Ji-Hee Kim and Namjae Cho18. StudyontheFactorsInfluencingEntrepreneurialIntentionsamongUniversityStudents 108 Gopal Bahadur Bhandari19. ManagerialEffectiveness:AnIndianManufacturingSectorExperience 120 Shruti Sarkar and S. Rangnekar 20. RoleofSocio-DemographicVariablesonAdaptivePerformance 122 Aditi Bisht and S. Rangnekar
21. TheUseofSocialMediaamongMulti-GenerationalTourists 124 Yanki Hartijasti and Namjae Cho22. AStudyofDestinationBrandPersonalityoftheWorldHeritageSiteofElloraCaves 130 Nagarjun Ragde23. HomestayTourisminBarpak:anExperienceonitsChallengesafterGorakhaEarthquake 138 Sujan Lamichhane and Sateesh Kumar Ojha24. AnalyzingthePotentiality&NecessityofDevelopingtheEasternPartofNepal asoneoftheUniqueNaturalTouristicDestination 142 Surya Bahadur Ghimire25. GovernanceImplicationsofUsingSoftwarePlatform 150 Gyeung-min Kim26. AScientometricAnalysis:BlockChainApplicationsInVehicularAdhocNetwork 152 Shivangi Chaudhary and Santosh Rangnekar27. IsaGeneralQualityModelofSoftwarePossible:PlayabilityversusUsability? 158 Seokha Koh and Jialei Jiang28. DecisionSupportSystemforPrognosisandTreatmentofLungCancerBasedonBigData 167 Jiaying Cheng, Wenbo Xu, Fang Xie, Shuangshuang Dai and Weihui Dai29. E-serviceQualityforSustainableCompetitiveAdvantage 175 Dwarika Upreti30. AssessingMunicipalWardServiceQualityandCitizenSatisfaction:theCaseofParbatDistrict,Nepal 183 Dinesh Sharma, Heesun Kim and Jaehoon Whang31. ConsumerPerceptionsandImportanceofServiceQualityinCustomerSatisfactionon FastFoodRestaurants:AStudyofKathmanduValley 187 Sateesh Kumar Ojha, Roopesh Shrestha and Yeak Narayan Sharma32. EffectsofJobElementsonTurnoverandRetentionofEmployees- ACasefromMicroFinanceInstitutionsinNepal 192 Rabin Subedi, Surendra Neupane and Raju Ram Adhikari 33. UrbanWasteWaterManagementInfrastructureAnalysis-CaseStudyofGuheshwori(Wwtp) 199 Ashish Ghimire, Sateesh Kumar Ojha and Raman Badaila34. ApplicationofWasteWaterintheDesertforitsTreatmentandReclamationofDesert 204 Rajan Raj Pandey35. CausesofDelayofConstructionofDesignandBuildofVariousMotorableBridgesunder BridgeProject,DepartmentofRoadinNepal 208 Surya Prasad Timilsina and Sateesh Kumar Ojha36. TrendofOccurrenceofNaturalDisastersandMitigatingEffortsinNepal 217 Bishnu Gotame and Sateesh Kumar Ojha 37. FactorsInfluencingAdmissioninHigherEducationInNepal 227 Jagadish Chandra Wagle and Sateesh Kumar Ojha38. Poverty–AnAlarmingIssueforStudentsDropoutinSchoolsinNepal 232 Jayaram Wagley39. FactorsAffectingtheQualityofEngineeringEducationinNepal 238 Basanta Chandra Marahatta 40. TheoreticalPerspectiveofSocialInclusion:IntegratingSocietyin ClassroomManagementandSocialJustice 244 Sateesh Kumar Ojha and Yashodham Tripathi
23rd International Conference on IT Applications and ManagementTheme: Future of Work in a hyper-connected world
February 5 ~ 7, 2020Host and venue: Rajagiri Business School, Kerala, India
Supported by Korea Data Strategy Society
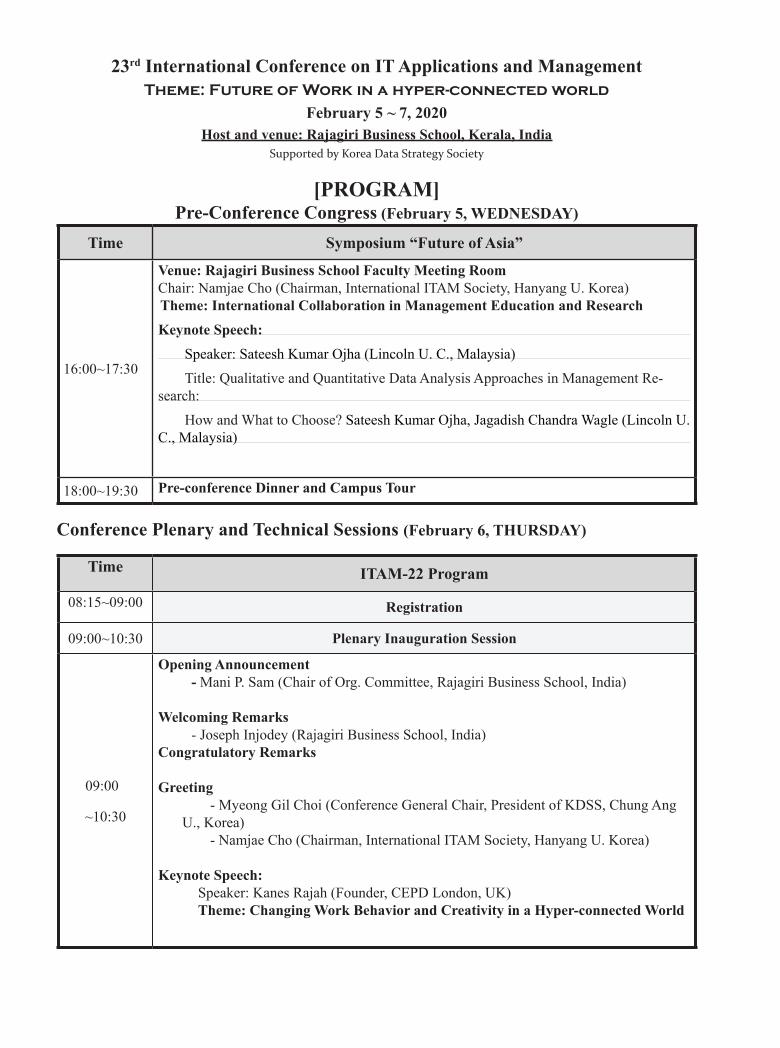
[PROGRAM]Pre-Conference Congress (February 5, WEDNESDAY)
Time Symposium “Future of Asia”
16:00~17:30
Venue: Rajagiri Business School Faculty Meeting RoomChair: Namjae Cho (Chairman, International ITAM Society, Hanyang U. Korea)Theme: International Collaboration in Management Education and Research
Keynote Speech:
Speaker: Sateesh Kumar Ojha (Lincoln U. C., Malaysia)
Title: Qualitative and Quantitative Data Analysis Approaches in Management Re-search:
How and What to Choose? Sateesh Kumar Ojha, Jagadish Chandra Wagle (Lincoln U. C., Malaysia)
18:00~19:30 Pre-conference Dinner and Campus Tour
Conference Plenary and Technical Sessions (February 6, THURSDAY)
Time ITAM-22 Program
08:15~09:00 Registration
09:00~10:30 Plenary Inauguration Session
09:00
~10:30
Opening Announcement - Mani P. Sam (Chair of Org. Committee, Rajagiri Business School, India)
Welcoming Remarks- Joseph Injodey (Rajagiri Business School, India)
Congratulatory Remarks
Greeting Speech - Myeong Gil Choi (Conference General Chair, President of KDSS, Chung Ang
U., Korea)- Namjae Cho (Chairman, International ITAM Society, Hanyang U. Korea)
Keynote Speech: Speaker: Kanes Rajah (Founder, CEPD London, UK)Theme: Changing Work Behavior and Creativity in a Hyper-connected World
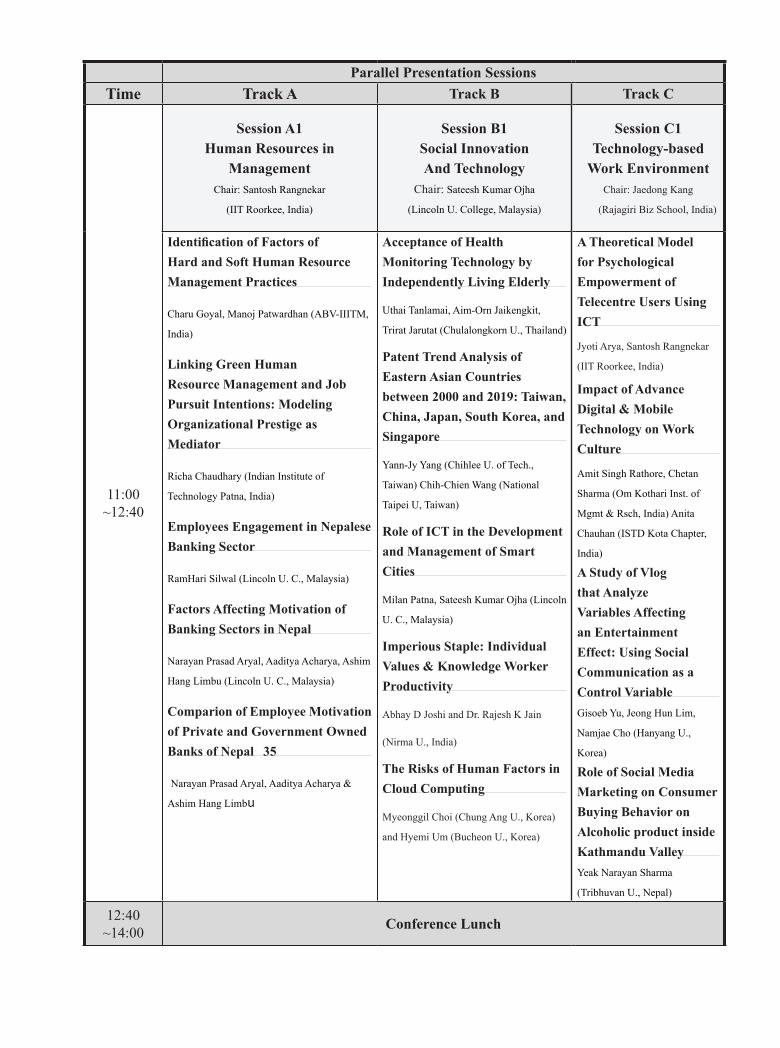
Parallel Presentation SessionsTime Track A Track B Track C
11:00~12:40
Session A1Human Resources in
ManagementChair: Santosh Rangnekar
(IIT Roorkee, India)
Session B1Social InnovationAnd Technology
Chair: Sateesh Kumar Ojha
(Lincoln U. College, Malaysia)
Session C1 Technology-based
Work EnvironmentChair: Jaedong Kang
(Rajagiri Biz School, India)
Identification of Factors of Hard and Soft Human Resource Management Practices
Charu Goyal, Manoj Patwardhan (ABV-IIITM,
India)
Linking Green Human Resource Management and Job Pursuit Intentions: Modeling Organizational Prestige as Mediator
Richa Chaudhary (Indian Institute of
Technology Patna, India)
Employees Engagement in Nepalese Banking Sector
RamHari Silwal (Lincoln U. C., Malaysia)
Factors Affecting Motivation of Banking Sectors in Nepal
Narayan Prasad Aryal, Aaditya Acharya, Ashim
Hang Limbu (Lincoln U. C., Malaysia)
Comparion of Employee Motivation of Private and Government Owned Banks of Nepal 35
Narayan Prasad Aryal, Aaditya Acharya &
Ashim Hang Limbu
Acceptance of Health Monitoring Technology by Independently Living Elderly
Uthai Tanlamai, Aim-Orn Jaikengkit,
Trirat Jarutat (Chulalongkorn U., Thailand)
Patent Trend Analysis of Eastern Asian Countries between 2000 and 2019: Taiwan, China, Japan, South Korea, and Singapore
Yann-Jy Yang (Chihlee U. of Tech.,
Taiwan) Chih-Chien Wang (National
Taipei U, Taiwan)
Role of ICT in the Development and Management of Smart Cities
Milan Patna, Sateesh Kumar Ojha (Lincoln
U. C., Malaysia)
Imperious Staple: Individual Values & Knowledge Worker Productivity
Abhay D Joshi and Dr. Rajesh K Jain
(Nirma U., India)
The Risks of Human Factors in Cloud Computing
Myeonggil Choi (Chung Ang U., Korea)
and Hyemi Um (Bucheon U., Korea)
A Theoretical Model for Psychological Empowerment of Telecentre Users Using ICT
Jyoti Arya, Santosh Rangnekar
(IIT Roorkee, India)
Impact of Advance Digital & Mobile Technology on Work Culture
Amit Singh Rathore, Chetan
Sharma (Om Kothari Inst. of
Mgmt & Rsch, India) Anita
Chauhan (ISTD Kota Chapter,
India)
A Study of Vlog that Analyze Variables Affecting an Entertainment Effect: Using Social Communication as a Control VariableGisoeb Yu, Jeong Hun Lim,
Namjae Cho (Hanyang U.,
Korea)
Role of Social Media Marketing on Consumer Buying Behavior on Alcoholic product inside Kathmandu Valley Yeak Narayan Sharma
(Tribhuvan U., Nepal)
12:40~14:00 Conference Lunch
14:00
~15:40
Session A2: Entrepreneurship and Family
Business Chair: Pratima Pradhan
(Singhania U. Nepal)
Session B2New Developments
In TourismChair: Yanki Hartijasti
(U. of Indonesia, Indonesia)
Session C2: ICT and Digital Media
In PracticeChair: Uthai Tanlamai
(Chulalongkorn. U., Thailand)
Building Green Entrepreneur-
ship: A Journey of Environmental
Awareness to Green Entrepreneurs
in Thailand
Kornthong Tesprasit, Pakatip Aksharanandana,
Athikom Kanchanavibhu (Chulalongkorn U.,
Thailand)
A Study of the priority that affect
Succession in Family Business:
Comparing an incumbent’s view
and a successor’s view
Yunseok Lee, Gisoeb Yu (Hanyang U., Korea),
Ji-Hee Kim (Canisius College, U.S.A.), and
Namjae Cho (Hanyang U., Korea)
Study on the Factors Influencing
Entrepreneurial Intentions among
University Students
Gopal Bahadur Bhandari (Lincoln U. C.,
Malaysia)
Managerial Effectiveness: An
Indian Manufacturing Sector
Experience
Shruti Sarkar, Santosh Rangnekar (IIT
Roorkee, India)
Role of Socio-Demographic
Variables on Adaptive Performance
Aditi Bisht, Santosh Rangnekar
(IIT Roorkee, India)
The Use of Social Media among
Multi-Generational Tourists
Yanki Hartijasti (U. of Indonesia, Indone-
sia) Namjae Cho (Hanyang U., Korea)
A Study of Destination Brand
Personality of the World Heri-
tage site of Ellora Caves
Nagarjun Ragde (Symbiosis International
U., India)
The Adoption of Artificial In-
telligence-based Services in the
Hotel Industry: Prospects and
Challenges
Kichan Nam, Prakash Chathoth, Sajid
Khan, Abdelkader Daghfous (American U.
of Sharjah, UAE) Christopher Dutt (Emir-
ates Academy of Hospitality Management)
Homestay Tourism in Barpak:
An Experience on its Challenges
After Gorakha Earthquake
Sujan lamichane, Sateesh kumar Ojha
(Lincoln U. C., Malaysia)
Analyzing the Potentiality &
Necessity of Developing the
Eastern Part of Nepal as one of
the Unique Natural Touristic
Destination
Surya Bahadur Ghimire
(Lincoln U. C., Malaysia)
Governance Implica-
tions of Using Software
Platform
Gyeung-min Kima (Ewha Wom-
ans U., Korea)
A Scientometric Analysis
Block Chain Applica-
tions in Vehicular Adhoc
Network
Shivangi Chaudhary, Santosh
Rangnekar (IIT Roorkee, India)
Is a General Quality
Model of Software Pos-
sible: Playability versus
Usability?
Seokha Koh, Jialei Jiang
(Chungbuk National U., Korea)
Decision Support System
for Prognosis and Treat-
ment of Lung Cancer
Based on Big Data
Jiaying Cheng (Dazhong
Transport., China), Wenbo Xub
(Fudan U., China), Fang Xie
(Shanghai Billow Info Sci and
Tech, China), Shuangshuang Dai
(Shanghai U. of Med. & Health
Sci., China) and Weihui Dai
(Fudan U., China)
15:40~16:00 Coffee Break
16:00
~17:40
Session A3Managing Service Business and
QualityChair: Gyeung-min Kima
(Ewha Womans U., Korea)
Session B3 Public Service and Social
Transformation Chair: Chih-Chien Wang
(National Taipei U, Taiwan)
Session C3 Education and Social
ContextsChair: Rajesh K Jain
(Nirma U., India)
Assessing Municipal Ward Service Quality and Citizen Satisfaction: The Case of Parbat District, NepalDinesh Sharma, Heesun Kim, Jaehoon Whang (Yonsei U., Korea)
Consumer Perceptions and Impor-tance of Service Quality in Cus-tomer Satisfaction on Fast Food Restaurants: A Study of Kathman-du Valley: A Study on Fast Food Restaurants of Kathmandu, NepalSateesh Kumar Ojha, Roopesh Shrestha (Lin-coln U. C., Malaysia)
E-service quality for sustainable competitive advantage Dwarika Upreti (Nepal Mega C., Nepal)
Effects of Job Elements on Turn-over and Retention of Employees- A Case from Micro Finance Institu-tions in NepalRabin Subedi (Lincoln U. C., Malaysia) Suren-dra Neupane, Raju Ram Adhikari (Tribhuvan U., Nepal)
Urban Waste Water Manage-ment Infrastructure Analy-sis- Case Study of Guheshwori WwtpAshish Ghimire, Sateesh Kumar Ojha (Lin-coln U. C., Malaysia) Raman Badaila (Soil Water and Air Testing Lab, Nepal)
Application of Waste Water in the Desert for its Treatment and Reclamation of DesertRajan Raj Pandey (Lincoln U. C., Malay-sia)
Causes of Delay of Construction of Design and Build of Various Motorable Bridges under Bridge Project, Department of Road in NepalSurya Prasad Timilsina, Sateesh Kumar Ojha (Lincoln U. C., Malaysia)
Trend of Occurrence of Natural Disasters and Mitigating Efforts in NepalBishnu Gotamea, Sateesh Ojhab (Lincoln U. C., Malaysia)
Factors Influencing Admission in Higher Education in NepalJagadish Chandra Wagle, Sa-teesh Kumar Ojha (Lincoln U. C., Malaysia)
Poverty – An Alarm-ing Issue for Students Dropout in Schools in NepalJayaram Wagley (Lincoln U. C., Malaysia)
Factors Affecting the Quality of Engineering Education in Nepal Basanta Chandra Marahatta (Lincoln U. C., Malaysia)
Theoretical Perspective of Social Inclusion: Integrating Society in Classroom Management and Social justiceSateesh Kumar Ojha, Yashodham Tripathi (Lincoln U. C., Malaysia)
17:40
~18:00
Plenary Valedictory Session1) Closing Address - Mani Sam (Rajagiri Business School)
- Namjae Cho (Chairman of International ITAM Society)2) Announcement of the Next Conference
18:30~21:00 Banquet
Conference Industry Visit (February 7, FRIDAY)
Time Industrial Visit
09:00~14:00 DentCare Dental Lab Pvt. Ltd. Muvattupuzha, Kerala
(IITAMS)
International ITAM Society Korea Data Strategy Society Rajagiri Business School
1
Qualitative and Quantitative Data Analysis Approaches in Management Research: How and What to Choose?
Sateesh Kumar [email protected]
Jagadish Chandra WagleLincoln University College, Malaysia
AbstractIt has been urgent to develop an idea to shed light on the problems of adopting methodology in management research. There are differing opinions between using qualitative approaches and quantitative approaches in management research. To the same problems, researchers give differing opinions. What is the underlying assumption between them to give conflicting opinions, and how these differing opinions are made complementary to each other are the major issues this research tries to resolve? The methodology adopted will be an extensive survey of the literature. More than 100 literature published in this connection will be reviewed.
KeywordsQualitative approaches, quantitative approaches.
BackgroundBusiness research is done to solve business problems. Research is a process of data collection, analysis of the collected data, and finding the truth about the solution of the problem so that the chance of business failure can be reduced. Business activities are carried out with the business organizations composed of the people of different tasks and duties, different departments and sub-departments equipped by people having common tasks. For addressing these tasks and bringing efficiencies, different studies are necessary from time to time and update the organization to make it capable to respond to the environment.
While doing research the academician is divided into different groups following different approaches are commonly known as qualitative and quantitative-one who boasts of doing depth understanding of the situation by values and subjective assessment and another boast of measuring the attributes in quantitative terms. Both the group argues their opinions strongly, but the problem is do the business gets the best solution from these equally?
Statement of the ProblemsThousands of researches in business are conducted each year in the world in the name of giving solutions to business problems and generating knowledge. If each research endeavors to solve the business problems then
by using different methods can there be found out one prescribed solution acceptable all? Is there only one solution for a problem in the business, or a solution can be an answer to many problems? A large number of such issues have emerged.
There seem many types of research conducted using different methods and if the findings are not similar which means solutions are not similar. It means some solutions are better than other solutions. In business, the solution is measured in the context of the time, cost and speed, and quality to finish the goods and services. If this is so the solution bearing high cost, more time and less speed and low-quality solution are not better and such tools, methods of study is not a better method. In this connection, there does not seem any article written so this article tries to fulfill these issues. Two opposite views can be observed one is ” if there exists something, it should have the capability to be measured”. Another view is that there exist so many things but we cannot measure but can be felt of their existence. Therefore this research is being done to answer the questions to these issues. Research ObjectivesThis research is carried by the researcher to know how different paradigm views the management research, do they contradict each other for the same thing or they give different results, how they can be used to solve business problems
2
Objective The objective of the research is to analyses how different paradigm of research philosophy is being used by academicians and practitioners while doing business research. Another objective is to search the points where these paradigms meet to find the solution of the business.
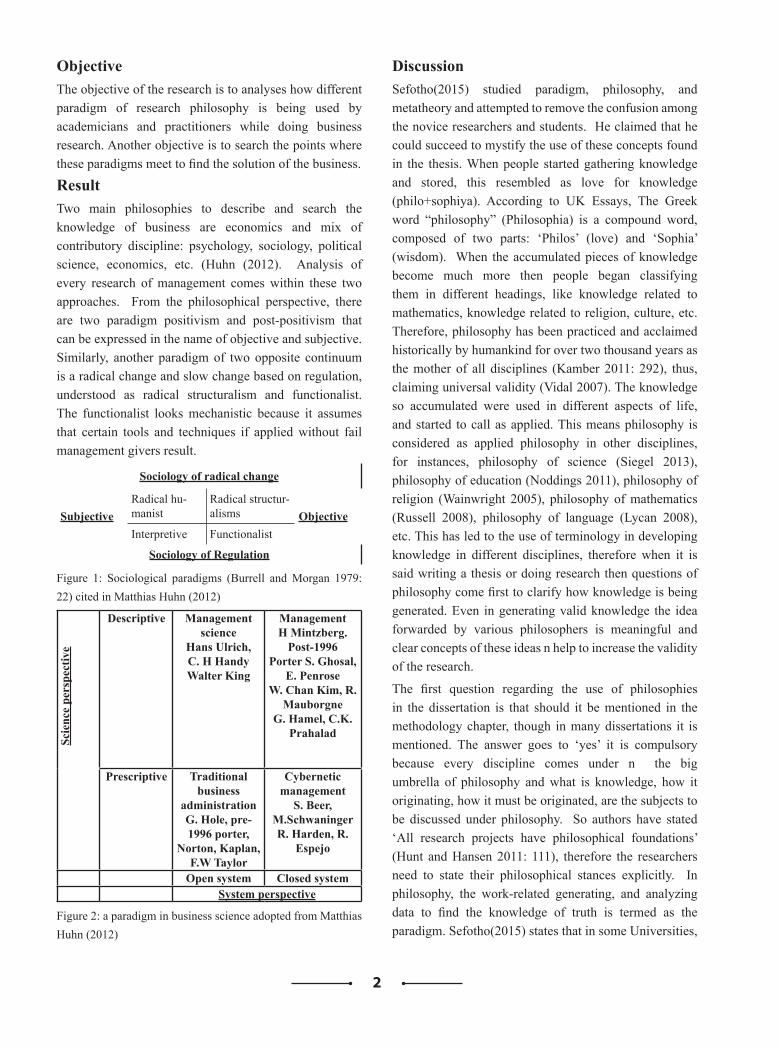
Result Two main philosophies to describe and search the knowledge of business are economics and mix of contributory discipline: psychology, sociology, political science, economics, etc. (Huhn (2012). Analysis of every research of management comes within these two approaches. From the philosophical perspective, there are two paradigm positivism and post-positivism that can be expressed in the name of objective and subjective. Similarly, another paradigm of two opposite continuum is a radical change and slow change based on regulation, understood as radical structuralism and functionalist. The functionalist looks mechanistic because it assumes that certain tools and techniques if applied without fail management givers result.
Sociology of radical change
SubjectiveRadical hu-manist
Radical structur-alisms Objective
Interpretive Functionalist
Sociology of Regulation
Figure 1: Sociological paradigms (Burrell and Morgan 1979: 22) cited in Matthias Huhn (2012)
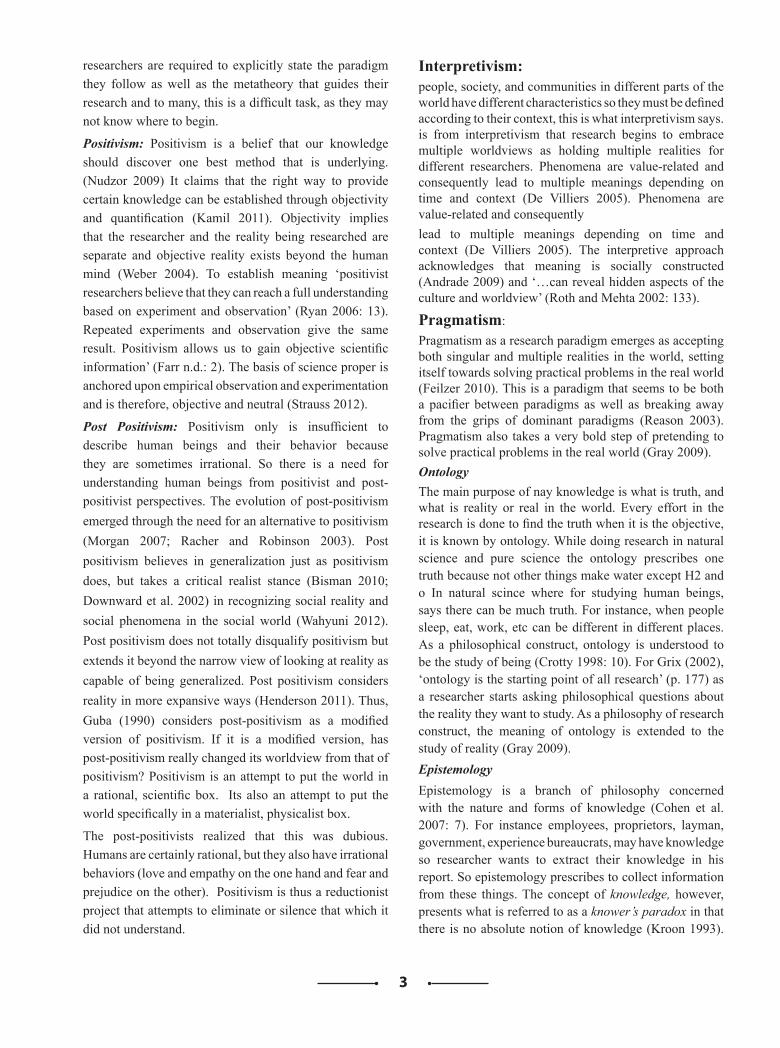
Scie
nce
pers
pect
ive
Descriptive Management science
Hans Ulrich, C. H Handy Walter King
ManagementH Mintzberg.
Post-1996Porter S. Ghosal,
E. PenroseW. Chan Kim, R.
MauborgneG. Hamel, C.K.
Prahalad
Prescriptive Traditional business
administrationG. Hole, pre-1996 porter,
Norton, Kaplan, F.W Taylor
Cybernetic management
S. Beer, M.SchwaningerR. Harden, R.
Espejo
Open system Closed systemSystem perspective
Figure 2: a paradigm in business science adopted from Matthias Huhn (2012)
DiscussionSefotho(2015) studied paradigm, philosophy, and metatheory and attempted to remove the confusion among the novice researchers and students. He claimed that he could succeed to mystify the use of these concepts found in the thesis. When people started gathering knowledge and stored, this resembled as love for knowledge (philo+sophiya). According to UK Essays, The Greek word “philosophy” (Philosophia) is a compound word, composed of two parts: ‘Philos’ (love) and ‘Sophia’ (wisdom). When the accumulated pieces of knowledge become much more then people began classifying them in different headings, like knowledge related to mathematics, knowledge related to religion, culture, etc. Therefore, philosophy has been practiced and acclaimed historically by humankind for over two thousand years as the mother of all disciplines (Kamber 2011: 292), thus, claiming universal validity (Vidal 2007). The knowledge so accumulated were used in different aspects of life, and started to call as applied. This means philosophy is considered as applied philosophy in other disciplines, for instances, philosophy of science (Siegel 2013), philosophy of education (Noddings 2011), philosophy of religion (Wainwright 2005), philosophy of mathematics (Russell 2008), philosophy of language (Lycan 2008), etc. This has led to the use of terminology in developing knowledge in different disciplines, therefore when it is said writing a thesis or doing research then questions of philosophy come first to clarify how knowledge is being generated. Even in generating valid knowledge the idea forwarded by various philosophers is meaningful and clear concepts of these ideas n help to increase the validity of the research.
The first question regarding the use of philosophies in the dissertation is that should it be mentioned in the methodology chapter, though in many dissertations it is mentioned. The answer goes to ‘yes’ it is compulsory because every discipline comes under n the big umbrella of philosophy and what is knowledge, how it originating, how it must be originated, are the subjects to be discussed under philosophy. So authors have stated ‘All research projects have philosophical foundations’ (Hunt and Hansen 2011: 111), therefore the researchers need to state their philosophical stances explicitly. In philosophy, the work-related generating, and analyzing data to find the knowledge of truth is termed as the paradigm. Sefotho(2015) states that in some Universities,
3
researchers are required to explicitly state the paradigm they follow as well as the metatheory that guides their research and to many, this is a difficult task, as they may not know where to begin.
Positivism: Positivism is a belief that our knowledge should discover one best method that is underlying. (Nudzor 2009) It claims that the right way to provide certain knowledge can be established through objectivity and quantification (Kamil 2011). Objectivity implies that the researcher and the reality being researched are separate and objective reality exists beyond the human mind (Weber 2004). To establish meaning ‘positivist researchers believe that they can reach a full understanding based on experiment and observation’ (Ryan 2006: 13). Repeated experiments and observation give the same result. Positivism allows us to gain objective scientific information’ (Farr n.d.: 2). The basis of science proper is anchored upon empirical observation and experimentation and is therefore, objective and neutral (Strauss 2012).
Post Positivism: Positivism only is insufficient to describe human beings and their behavior because they are sometimes irrational. So there is a need for understanding human beings from positivist and post-positivist perspectives. The evolution of post-positivism emerged through the need for an alternative to positivism (Morgan 2007; Racher and Robinson 2003). Post positivism believes in generalization just as positivism does, but takes a critical realist stance (Bisman 2010; Downward et al. 2002) in recognizing social reality and social phenomena in the social world (Wahyuni 2012). Post positivism does not totally disqualify positivism but extends it beyond the narrow view of looking at reality as capable of being generalized. Post positivism considers reality in more expansive ways (Henderson 2011). Thus, Guba (1990) considers post-positivism as a modified version of positivism. If it is a modified version, has post-positivism really changed its worldview from that of positivism? Positivism is an attempt to put the world in a rational, scientific box. Its also an attempt to put the world specifically in a materialist, physicalist box.
The post-positivists realized that this was dubious. Humans are certainly rational, but they also have irrational behaviors (love and empathy on the one hand and fear and prejudice on the other). Positivism is thus a reductionist project that attempts to eliminate or silence that which it did not understand.
Interpretivism: people, society, and communities in different parts of the world have different characteristics so they must be defined according to their context, this is what interpretivism says. is from interpretivism that research begins to embrace multiple worldviews as holding multiple realities for different researchers. Phenomena are value-related and consequently lead to multiple meanings depending on time and context (De Villiers 2005). Phenomena are value-related and consequentlylead to multiple meanings depending on time and context (De Villiers 2005). The interpretive approach acknowledges that meaning is socially constructed (Andrade 2009) and ‘…can reveal hidden aspects of the culture and worldview’ (Roth and Mehta 2002: 133).
Pragmatism: Pragmatism as a research paradigm emerges as accepting both singular and multiple realities in the world, setting itself towards solving practical problems in the real world (Feilzer 2010). This is a paradigm that seems to be both a pacifier between paradigms as well as breaking away from the grips of dominant paradigms (Reason 2003). Pragmatism also takes a very bold step of pretending to solve practical problems in the real world (Gray 2009).OntologyThe main purpose of nay knowledge is what is truth, and what is reality or real in the world. Every effort in the research is done to find the truth when it is the objective, it is known by ontology. While doing research in natural science and pure science the ontology prescribes one truth because not other things make water except H2 and o In natural scince where for studying human beings, says there can be much truth. For instance, when people sleep, eat, work, etc can be different in different places. As a philosophical construct, ontology is understood to be the study of being (Crotty 1998: 10). For Grix (2002), ‘ontology is the starting point of all research’ (p. 177) as a researcher starts asking philosophical questions about the reality they want to study. As a philosophy of research construct, the meaning of ontology is extended to the study of reality (Gray 2009).EpistemologyEpistemology is a branch of philosophy concerned with the nature and forms of knowledge (Cohen et al. 2007: 7). For instance employees, proprietors, layman, government, experience bureaucrats, may have knowledge so researcher wants to extract their knowledge in his report. So epistemology prescribes to collect information from these things. The concept of knowledge, however, presents what is referred to as a knower’s paradox in that there is no absolute notion of knowledge (Kroon 1993).
4
The paradox A RESEARCHER’S DILEMMA 31 of the knower begets the epistemic paradox (Burge 1984) in research in that the researcher is faced with the task to establish what can be known (Kroon 1993). This scenario is compounded by the proliferation of epistemologies in academia (Pallas 2001). It is, perhaps, this paradox that prompts human beings to want to know and researchers to feel obliged to provide answers. It is generally agreed that epistemology as a theory of knowledge answers the question: ‘How, and what, can we know?’ (Willig 2013: 6). The objective of epistemology is the production of knowledge and reflection (How, andwhat can we know) on different knowledge claim about phenomena (Soini et al. 2011). Researchers are expected to make explicit their epistemological positions, stances, claims, or assumptions (Kamil 2011). Epistemological assumptions are concerned with how knowledge can be created, acquired and communicated, in other words, what it means to know.
Methodology: Methodology is concerned with what tools and techniques to be used, generally, it is a questionnaire, interview schedule, observation, focus group discussion, and content analysis. Sand so introducing methodology, Sobh, and Perry (2006: 1195) note that: ‘Essentially, ontology is ‘reality’, epistemology is the relationship between
that reality and the researcher and methodology is the technique used by the researcher to discover that reality’. There are varieties of research methodologies designed to address a multiplicity of problems in research (Tuli 2010). The methodology must be informed by a paradigm, be it a positivist, post-positivist or interpretive paradigm. According to Hesse-Biber and Leavy (2011: 5), there are three major methodological approaches in qualitative research: (1) post-positivist, (2) interpretive, and (3) critical. Post-positivism posits that the social world is patterned and that causal relationship can be discovered and tested via reliable strategies.A metatheory is generally conflated with paradigm and this causes a metatheoretical impasse (Sklair 1988). It is imperative to clarify the relationship and solve the predicament this dilemma poses for many beginning researchers. While the theory is a set of propositions (Sklair 1988), metatheory is ‘… about the structure and implications of existent theories’ (Turner 1990: 38). Thus, the metatheory is indeed a theory about a particular theory in a certain field of study ‘… engaging in philosophical debate, and offering ideological critique and commentary’ (p. 39). Similarly, metatheory, therefore, relates to the part of the research that concerns itself with theory within a given paradigm (Brink et al. 2012). Metatheory can assist researchers to be theory-specific in the choice of theories they use to support their research.
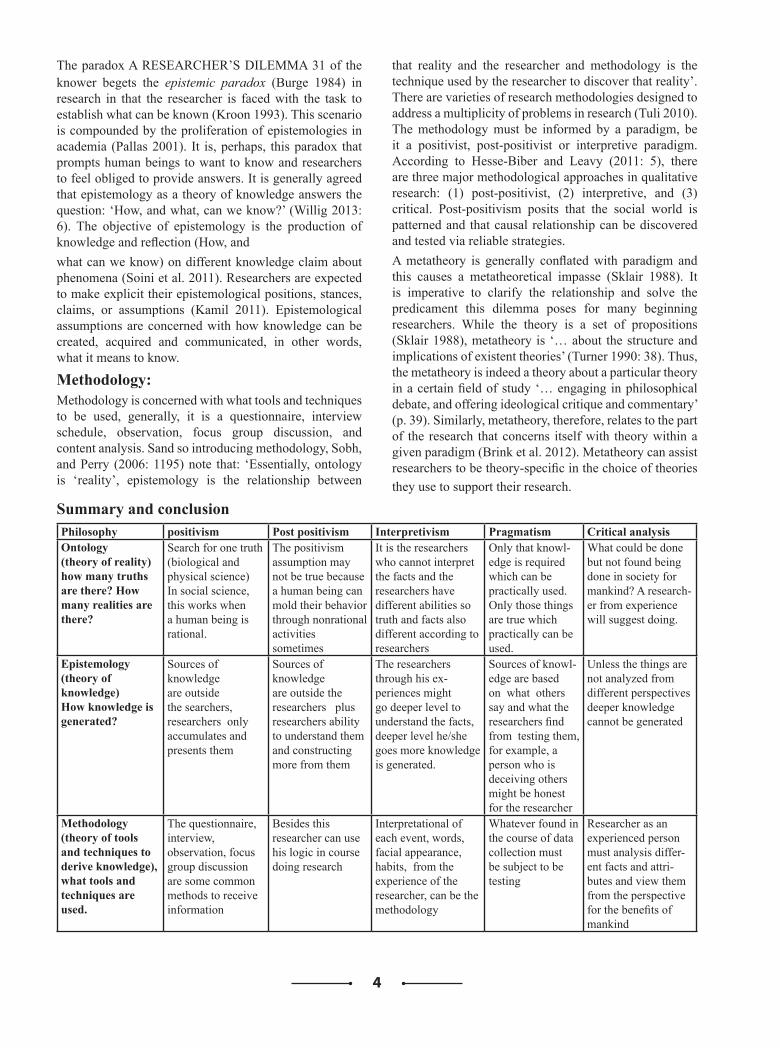
Summary and conclusion Philosophy positivism Post positivism Interpretivism Pragmatism Critical analysis Ontology (theory of reality) how many truths are there? How many realities are there?
Search for one truth (biological and physical science)In social science, this works when a human being is rational.
The positivism assumption may not be true because a human being can mold their behavior through nonrational activities sometimes
It is the researchers who cannot interpret the facts and the researchers have different abilities so truth and facts also different according to researchers
Only that knowl-edge is required which can be practically used. Only those things are true which practically can be used.
What could be done but not found being done in society for mankind? A research-er from experience will suggest doing.
Epistemology (theory of knowledge)How knowledge is generated?
Sources of knowledge are outside the searchers, researchers only accumulates and presents them
Sources of knowledge are outside the researchers plus researchers ability to understand them and constructing more from them
The researchers through his ex-periences might go deeper level to understand the facts, deeper level he/she goes more knowledge is generated.
Sources of knowl-edge are based on what others say and what the researchers find from testing them, for example, a person who is deceiving others might be honest for the researcher
Unless the things are not analyzed from different perspectives deeper knowledge cannot be generated
Methodology (theory of tools and techniques to derive knowledge), what tools and techniques are used.
The questionnaire, interview, observation, focus group discussion are some common methods to receive information
Besides this researcher can use his logic in course doing research
Interpretational of each event, words, facial appearance, habits, from the experience of the researcher, can be the methodology
Whatever found in the course of data collection must be subject to be testing
Researcher as an experienced person must analysis differ-ent facts and attri-butes and view them from the perspective for the benefits of mankind
5
Reference: Matthias Huhn (2012) Cybernetic Management
Paradigms. In Systemic Management for Intelligent Organizations Concepts, Models-Based Approaches and Applications, Springer Heidelberg New York Dordrecht London.
Maximus Monaheng Sefotho (2015). A Researcher’s Dilemma: Philosophy in Crafting Dissertations and Theses. J Soc Sci, 42(1,2): 23-36 (2015)
ht tps : / /www.ukessays .com/essays /phi losophy/philosophia.php
Kamber R (2011). Philosophy’s future as a problem-solving discipline: The promise of experimental philosophy. Essays in Philosophy, 12(2): 7.
Vidal C (2007). An Enduring Philosophical Agenda: Worldview Construction as a Philosophical Method. Submitted for publication http://cogprints.org/
Noddings N (2011). Philosophy of Education. 3rd Edition. Boulder, CO: Westview Press.
Siegel H (2013). Penelope Maddy Second philosophy: A naturalistic method. Brit J Phil Sci, 61 (2010): 897–903.
Wainwright WJ (Ed.) (2005). The Oxford Handbook of Philosophy of Religion. Oxford: Oxford University Press.
Lycan WG (2008). Philosophy of Language: A Contemporary Introduction. London: Routledge.
Hunt S, Hansen J (2011). The philosophical foundations of marketing research: For scientific realism and truth. In: P Maclaran, M Saren, B Stern, M Tadajewski (Eds.): The SAGE Handbook of Marketing Theory. London: SAGE Publications Ltd., pp. 111-127. From <doi: https: //dx.doi.org/10.4135/9781446 2224 54.n7).
Nude or HP (2009). A critical commentary on combined methods approaches to researching educational and
social issues. Issues in Educational Research, 19(2): 114.
Kamil NM (2011). The quagmire of philosophical standpoints (paradigms) in management research. Postmodern Openings, 2(5): 5.
Ryan AB 2006. Post-positivist approaches to research. In: M Antonesa, H Fallon, AB Ryan, A Ryan, T Walsh, with L Borys (Eds.): Researching and Writing
Strauss D 2012. Developing a scientific culture through supervision. Koers - Bulletin for Christian Scholarship, 77(2): 11.
Farr Z n.d. Critically assess the impact of positivist approaches to understanding crime.
Kroon F (1993.) Rationality and epistemic paradox. Synthese, 94(3): 377-408.
Morgan DL 2007. Paradigms lost and pragmatism regained: Methodological implications of combining qualitative and quantitative methods. Journal of Mixed Methods Research, 1(1): 48-76.
Bisman J (2010). Postpositivism and accounting research: A (personal) primer on critical realism. Australasian Accounting Business and Finance Journal, 4(4): 3-25.
Wahyuni D (2012). The research design maze: Understanding paradigms, cases, methods, and methodologies. Journal of Applied Management Accounting Research, 10(1): 69-80.
Guba EG, Lincoln YS (1994). Competing paradigms in qualitative research. In: NK Denzin, YS Lincoln (Eds.): Handbook of Qualitative Research. Thousand Oaks, CA: Sage, pp. 105-117.
Alise MA, Teddlie C (2010). A continuation of the paradigm wars? Prevalence rates of methodological approaches across the social/behavioral sciences. Journal of Mixed Methods Research, 4(2): 103-126.
De Villiers MR 2005. Interpretive research models for informatics: Action research, grounded theory, and the family of design-and development research. Alternation, 12(2): 10-52.
Racher FE, Robinson S (2003). Are phenomenology and postpositivism strange bedfellows? Western Journal of Nursing Research, 25(5): 464-481.
Roth WD, Mehta JD (2002). The Rashomon effect combining positivist and interpretive approaches in the analysis of contested events. Sociological Methods and Research, 31(2): 131-173.
Burke ME (2007). Making choices: Research paradigms and information management: Practical applications of philosophy in IM research. Library Review, 56(6): 476-484.
Gray DE (2009). Doing Research in the Real World. 2nd Edition. London: Saga Publications.
Grix J 2004. The Foundations of Research. Palgrave: Basingstoke
Gray DE (2009). Doing Research in the Real World. 2nd Edition. London: Saga Publications.
6
Willig C (2013). Introducing Qualitative Research in Psychology. Boston: Open University Press.
Sobh R, Perry C 2006. Research design and data analysis in realism research. European Journal of Marketing, 40(11/12): 1194-1209.
Soini H, Kronqvist EL, Huber GL, Maxwell J, Kiegelmann M, Gento S, Ricoy MC 2011. Qualitative
Psychology Nexus Vol. VIII: Epistemologies for Qualitative Research. Tubingen Germany: Die Deutsche Bibliothek.
Tuli F (2010). The basis of a distinction between qualitative and quantitative research in social science: Reflection on ontological, epistemological and methodological perspectives. Ethiopian Journal of Education and Science, 6(1): 97-108.
Sklair L (1988). Transcending the impasse: Metatheory, theory, and empirical research in the sociology of development and underdevelopment. World Development, 16(6): 697-709.
Turner BS (1990.) Outline of a theory of citizenship. Sociology, 24: 189 – 217.
Hesse-Biber SN, Leavy P 2011.The Practice of Qualitative Research. 2nd Edition. London: SAGE Publications, Inc.
Brink H, van der Walt Cvan, Rensburg G (2012.) Fundamentals of Research Methodology for Health Care Professionals. Cape Town: Juta.
7
Identification of Factors of Hard and Soft Human Resource Management Practices
Charu GoyalResearch Scholar at ABV-IIITM, Gwalior, reached by [email protected]
Manoj PatwardhanProfessor at ABV-IIITM, Gwalior, reached by [email protected]
AbstractThe Human Resource (HR) system comprises of various interrelated HR practices that forms the bundles. These bundles of Human Resource practices impact the organizational performance. The hard and soft HR bundles are the two sets of the same continuum that describes the strategic approach of the HR system. The purpose of this study is to identify the hard and soft HRM practices from the literature and then empirically test them with the help of factor analysis. The study is conducted on the service industry employees in India. The survey includes the employees from the middle and top-level executives of the service firms. The sample size for the study is 160. Principal component analysis with VARIMAX rotation and Confirmatory Factor Analysis was used to obtain the results. The data analysis was done on SPSS V.20 and AMOS V.22. The results provide knowledge of the HR practices under the hard and soft HRM bundles implemented in the service industry.
KeywordsFactor analysis, Hard HRM, Soft HRM, Service industry, Strategic HR practices.1. IntroductionHuman resource strategic orientation is a tactical approach for managing employment relations, adopted by the firms to manage the workforce to achieve best outcomes (Boxall & Purcell, 2000). The strategic orientation behind every HR practice can be understood through various Human Resource Management (HRM) models, out of which Soft and Hard model appears to be the two important models (Kidombo, 2007; Truss, 1999, 1997; Guest, 1987). The focus of many researchers is connected with the implementation of HR practices and policies. The approach of HRM has always been controversial. Some authors argue that HRM is focused mainly on task completion while others say its approach is always developmental. Based on these two different perceptions, HRM practices and policies have been categorised as Soft and Hard HRM. The Soft Human Resource Strategic Orientation suggests that all the essential HR activities like recruitment, training, appraisals, and rewards should be in a manner that nourishes the employee's efforts and behaviour. This will apparently help the employees to contribute more towards the organizational goals. The Hard Human Resource Strategic Orientation has projected HRM practices and policies to be highly integrated with
the business strategies that aim to maximize productivity and profitability. It considers employees to be just a factor of production (Rahman et al., 2017). Thus, the strategic orientation of HR can be categorised as the soft and hard strategic orientation based on the two approaches followed by the organizations. The Harvard model of human resource management works on the strategy of developing a good relationship between managers and employees. It focuses on soft HR practices. The model states the managers should strategize to on employee commitment, and not on controlling them. On the other hand, the Michigan model works as a framework for hard HRM, where employees are seen as any other resource to the organization which needs to be managed well to obtain maximum benefits. The ultimate goal of HRM practices is to get organizational performance (Vanajamma24, 2015).
Human Resource Management Practices leads to Organizational Performance. Every organization practice HRM in a different manner. The goal of the organizations is to draw more and more benefits from their employees that would ultimately fulfil its organizational goals. The difference lies in the approach that is followed to achieve those organizational goals. Nowadays, the HR strategy is aligned with the business strategy to gain more and
8
more benefits. This is one of the reasons why strategic HR has a different approach from traditional HRM. The literature suggests that there are certain approaches that an organization follows for managing its employees. Based on the models of HR approach, two major strategic orientations, soft and hard approach, has been found. Some organizations follow soft strategic orientation; some may follow the hard strategic orientation, while others may follow a combination of both the orientations. Therefore, it is assumed that some organizations will follow the soft approach, some will follow the hard method, and some will follow a combination of both of these approaches. Thus, this study is an attempt to identify those measures of soft and hard HRM practices which could lead to better organizational performance. The earlier research done related to this issue has been limited to other industries, and the variables for the study had been defined. Kidombo et al. (2012) studied the relationship of the soft and hard element of human resource management with the affective, continuance and normative components of organizational commitment. The study was conducted on private manufacturing companies in Kenya. The results of the study concluded that there is a positive relationship between both the strategic orientation of human resource and the two components of commitment that are affective and continuance. Further, the results found that a negative relationship exists between the hard strategic orientation of human resource and normative part of organizational commitment. One major research gap found in earlier researches is that the data was collected only from the HR managers and not the other level of employees. Edgar and Geare (2005) discussed in their study that it is clear from the previous studies that certain HRM practices are able to achieve firm performance, but it is still not clear that what human resource practices impact the variables of firm performance and to what extent. Soft HRM states that the benefits of human resource practices can be achieved through a neo-pluralistic mechanism while the Hard HRM states that the orientation of human resource management practices should be uniformly unrealistic and more focused on managerial values. The human resource practices studied earlier with respect to the soft and HRM approaches are training and development (Truss et al., 1997; K’ Obonyo and Dimba, 2009), compensation practices (K’ Obonyo and Dimba, 2009), employee engagement (Jenkins and Delbridge, 2013). The paper extends the current literature by identifying the measures of soft and hard HRM practices. The objective
of this study is to identify the measures of soft and hard HRM from the literature and provide empirical evidence for the same with the help of factor analysis.
This paper comprises of four sections. In Section 2, the authors reviewed the literature on soft and hard human resource management practices. Section 3 describes the research methodology. In Section 4, the empirical results and analysis are shown. Discussions are provided in Section 5. Finally, in Section 6, the conclusions are provided.
2. Literature ReviewThe two contrary concepts of hard and soft versions of human resource management are difficult to incorporate into a single model. The soft approach to HRM is derived from the human relations school of thought while the hard approach to HRM is derived from the strategic management and business policy line of thought (Beardwell and Holden, 1997; Storey, 1992). The former is oriented towards the development of employees as view them as assets and active partners to the firm, while the latter is focused on achieving the targets by considering employees as a means to an end (Kidombo et al., 2012). The key difference between the two orientation is only about the emphasis, i.e. should it be more on human or the resource. Soft HRM is associated with the human relations movement, goals of flexibility and adaptability. On the other hand, Hard HRM stresses the quantitative, calculative, and strategic aspect of the business (Truss et al. 1997).
Ihuah (2014) studied the literature on Hard and Soft HRM models to find the best practices that give better employee performance for any organization. The author argues that both hard and soft HR practices are practised together. The Harvard model of HRM is the framework for the soft HR practices by creating an environment of awareness and understanding between the employees and the organization. The Michigan model focuses on the strategic aspects of recruitment, appraisal, rewards, and development of employees for fulfilling the organizational strategies. The author concluded that soft HRM practices are better than hard HRM practices for employee development. Human resource practices like highly qualified personnel, skill-enhancing; motivation increasing and opportunity for growth and knowledge sharing are the bundles of HR practices that are positively linked with the innovation outcomes at workplaces (Chowhan et al., 2017).
9
The HRM architecture needs to focus on those HRM practices that emphasize the recruitment and selection, training and development, performance and workforce planning. Literature suggests that HRM practices have a positive relationship with organizational performance. The alignment of business strategy with the HR strategy moderates the relationship between HRM practices and talent management practices, and talent management practices and firm performance (Glaister et al., 2017). The study conducted in a private organization of Tanzania to investigate the compensation practice and its impact both in soft and hard approach. It was concluded that the soft compensation HRM practice gives a positive impact on the job satisfaction of employees while on the other hand, the hard compensation HRM practice gives a negative impact on the job satisfaction of employees (Michael, 2017). The soft HRM primarily aims to work on employee development; on the other hand; the hard HRM aims to increase more and more productivity and cost. The study could be considered to have a major research gap as no universal measurement scale could be found or developed so far that will altogether study the dimensions of soft and hard HRM. The results to have the limitation that they could not be generalized. The sample size was also found to be very small. However, the study concludes that all the HRM practices existing in an organization are a combination of soft and hard approach (Rahman et al., 2017).
Some of the identified soft HRM practices are higher recruitment at job entry levels, employee participation, job security, heavy training and development, extensive reward plans and appraisal programmes that enhance employee loyalty, participation, job performance and overall firm performance (Arthur, 1994; Kidombo, 2007; Rodriquez and Ventura, 2003). Some of the hard HRM practices are recruitment above job entry levels from the external market, limited job security, limited training and development, low participation in decision-making processes, and quantitative measures of performance, which reduce direct labour costs and enhance firm performance (Rodriquez & Ventura, 2003). Yang and Yang (2012) found that it is necessary to integrate the hard side of the system, i.e. the technical aspect with the soft side of the system, i.e. human factors. The people factors like empowerment, respect, job security, job satisfaction, direct authority, sharing of company success, and the pursuit of perfection are critical to the successful implementation of HRM system and TQM practices.
According to Truss (1999), the approach of HRM may be soft or hard, and the management thinks that they are following the soft approach, but in reality, the employees experience a hard approach that focused on performance. Therefore, this may happen that the organization signals one approach but the employee, as a receiver perceives the different approach. So, it is essential to study not only the implementation of HRM but also the perception of employees towards these HRM practices and methods.Terzioviski and Sohal (2000) suggested that the managers for future development initiatives are required to implement strategies for continuous improvement that should be based on soft management practices. Cunningham (2016) indicated that soft HRM policies help in upgrading the training of employees so they can possess the necessary practical skills and work orientation. Contrary to this, hard HRM policies focus on employment degradation and standardization by bringing work pressures. Ashton (2018) researched to find how soft human resource management practices lead to job satisfaction and job retention in the Thai hotel industry. A comprehensive model drawn from the theories of commitment and motivation was developed. The study concluded soft HRM practices helped to resolve the crisis of shortage of labour and skills, and thus improves job satisfaction and retention in the hotel industry. To improve performance and gain productivity, the organizations sometimes intensify the workload. In the process of obtaining short-term financial benefits, they get directed towards the hard HRM approach. This successfully yields the economic gains in the short run but is responsible for hindering the organizational commitment in a long period (Cook et al. 2016). The study about the ‘black-box’ of HRM identifies the factors that link the HRM practices with organizational performance (Harney and Jordan 2008). Gill and Meyer (2011) found that there is a massive gap between soft HRM rhetoric and soft HRM in reality. Resistance to change, decrease in job satisfaction, low productivity rate, and less organizational commitment are some of the negative outcomes experienced by the managers from their employees due to the gap in rhetoric and reality of HRM practices. The author further suggested that when the organizations would increase the use of soft HRM model and also decrease the difference between the HRM policy rhetoric and reality would not only lessen the adverse outcomes but would enhance the positive results too. Based on the literature review, a need to explore the measures of soft and hard human resource management practices was identified and also highlights the research gap that is in need to be fulfilled through future studies.
10
3. Research methodology 3.1 Sample and procedures
Data for this study were collected from India. The sample for this study comprised of the middle and high level employees from the service sector. The sample covers the IT and Banking industries. The data was collected with the help of a self-administered questionnaire. Respondents were informed that the purpose of the survey is research on soft and hard HRM practices existing in their organization and that their responses will be kept confidential. The participation was voluntary by the respondents.
The convenient sampling method was used for the collection of data. A total of 178 respondents were approached for this purpose, out of which 169 respondents took the survey. After deleting half-filled responses, a total of 160 responses were gained for analysing the results. Apart from the measures of soft and hard HRM, the survey instruments collect the basic information about the respondents like name, age, gender, company, and designation. This information was also optional to be completed by the respondent or not, keeping in mind that they may not find it suitable to share their details.
3.2 Measures
The study first collects the measures of soft and hard HR practices from the literature. From the literature, various existing scales were identified out of which the authors prefer to choose the scale Kidombo (2007) because the scale focuses on soft and hard approach towards HR practices and the questions of the measurement scale were easy to understand for the respondents. The scale consisted of 25 items. A 5-point Likert scale was used ranging from 1 (Strongly disagree) to 5 (Strongly agree).
3.3 Data Analysis Tools
The data collected was analysed with the help of SPSS V.20 and AMOS V.22. Principal component analysis with
VARIMAX rotation and Confirmatory Factor Analysis was performed to generate the output. The reliability of the questionnaire was explained with the help of Cronbach’s alpha.
4. Results and Analysis
4.1 Reliability
The reliability of the measuring instrument was calculated using Cronbach’s Alpha, as shown in Table 1. For 25 items and 160 respondents, the reliability score obtained was .839, which is acceptable. The acceptable value of Cronbach’s alpha should be above .70 (Nunnally, 1978).
Table 1: Reliability StatisticsCronbach's Alpha N of Items
.839 254.2 Exploratory Factor Analysis
The data reduction method used to find the factors of soft and hard HRM practices was Exploratory Factor Analysis based on the principal component method. The KMO criterion was used to find whether the correlation between the variables is acceptable or not to proceed further for exploratory factor analysis. The KMO and Bartlett's test value obtained was .840 with a significant value of .000, which was acceptable to proceed for factor analysis. Table 2 shows the values of KMO analysis.
Table 2: KMO and Bartlett's TestKaiser-Meyer-Olkin Measure of Sampling Adequacy.
.840
Bartlett's Test of Sphericity
Approx. Chi-Square 2386.963df 300Sig. .000
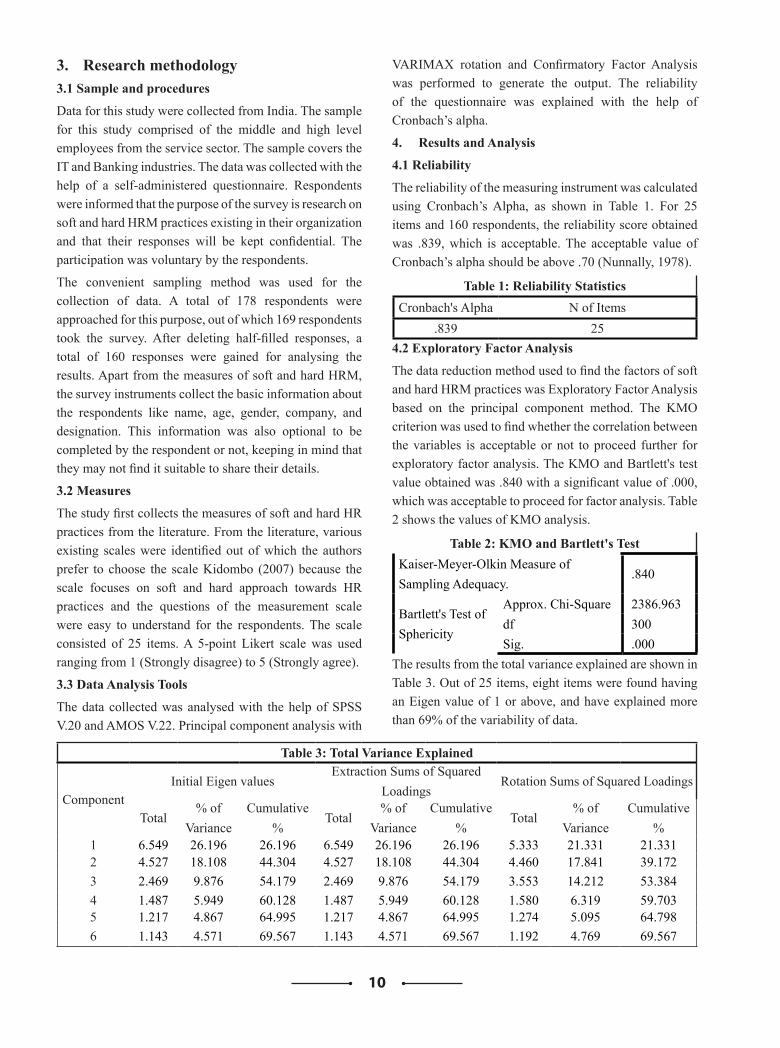
The results from the total variance explained are shown in Table 3. Out of 25 items, eight items were found having an Eigen value of 1 or above, and have explained more than 69% of the variability of data.
Table 3: Total Variance Explained
ComponentInitial Eigen values
Extraction Sums of Squared Loadings
Rotation Sums of Squared Loadings
Total% of
VarianceCumulative
%Total
% of Variance
Cumulative %
Total% of
VarianceCumulative
%1 6.549 26.196 26.196 6.549 26.196 26.196 5.333 21.331 21.3312 4.527 18.108 44.304 4.527 18.108 44.304 4.460 17.841 39.1723 2.469 9.876 54.179 2.469 9.876 54.179 3.553 14.212 53.3844 1.487 5.949 60.128 1.487 5.949 60.128 1.580 6.319 59.7035 1.217 4.867 64.995 1.217 4.867 64.995 1.274 5.095 64.7986 1.143 4.571 69.567 1.143 4.571 69.567 1.192 4.769 69.567
11
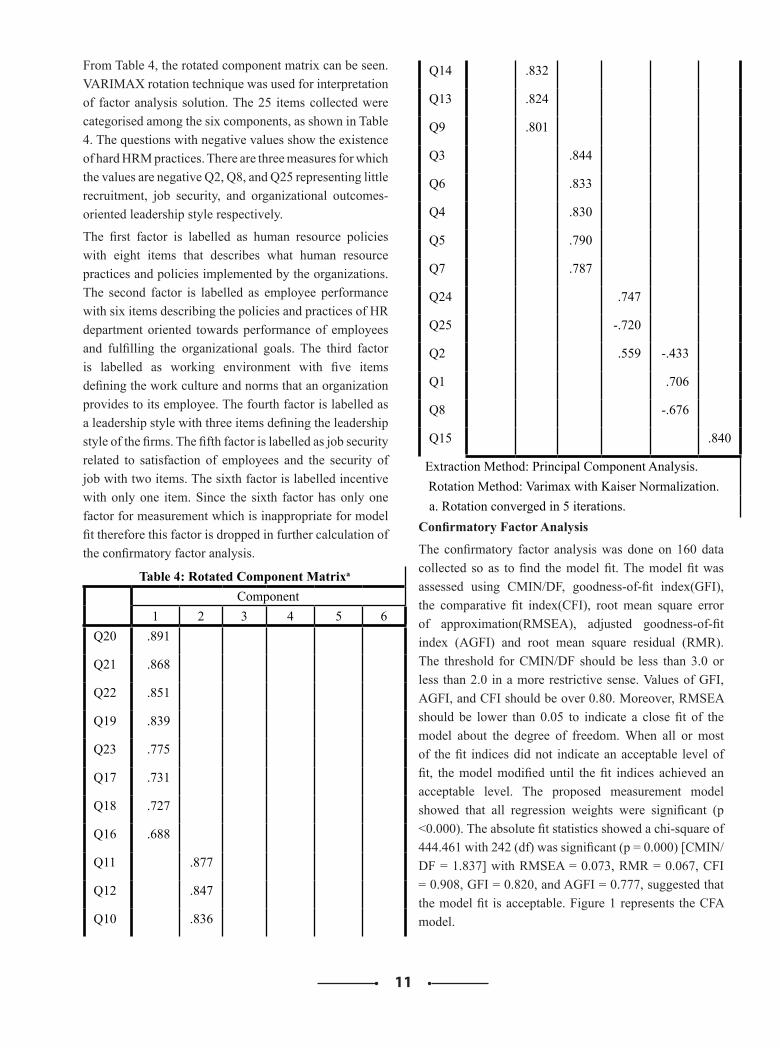
From Table 4, the rotated component matrix can be seen. VARIMAX rotation technique was used for interpretation of factor analysis solution. The 25 items collected were categorised among the six components, as shown in Table 4. The questions with negative values show the existence of hard HRM practices. There are three measures for which the values are negative Q2, Q8, and Q25 representing little recruitment, job security, and organizational outcomes-oriented leadership style respectively.
The first factor is labelled as human resource policies with eight items that describes what human resource practices and policies implemented by the organizations. The second factor is labelled as employee performance with six items describing the policies and practices of HR department oriented towards performance of employees and fulfilling the organizational goals. The third factor is labelled as working environment with five items defining the work culture and norms that an organization provides to its employee. The fourth factor is labelled as a leadership style with three items defining the leadership style of the firms. The fifth factor is labelled as job security related to satisfaction of employees and the security of job with two items. The sixth factor is labelled incentive with only one item. Since the sixth factor has only one factor for measurement which is inappropriate for model fit therefore this factor is dropped in further calculation of the confirmatory factor analysis.
Table 4: Rotated Component Matrixa
Component1 2 3 4 5 6
Q20 .891
Q21 .868
Q22 .851
Q19 .839
Q23 .775
Q17 .731
Q18 .727
Q16 .688
Q11 .877
Q12 .847
Q10 .836
Q14 .832
Q13 .824
Q9 .801
Q3 .844
Q6 .833
Q4 .830
Q5 .790
Q7 .787
Q24 .747
Q25 -.720
Q2 .559 -.433
Q1 .706
Q8 -.676
Q15 .840
Extraction Method: Principal Component Analysis. Rotation Method: Varimax with Kaiser Normalization.a. Rotation converged in 5 iterations.
Confirmatory Factor Analysis
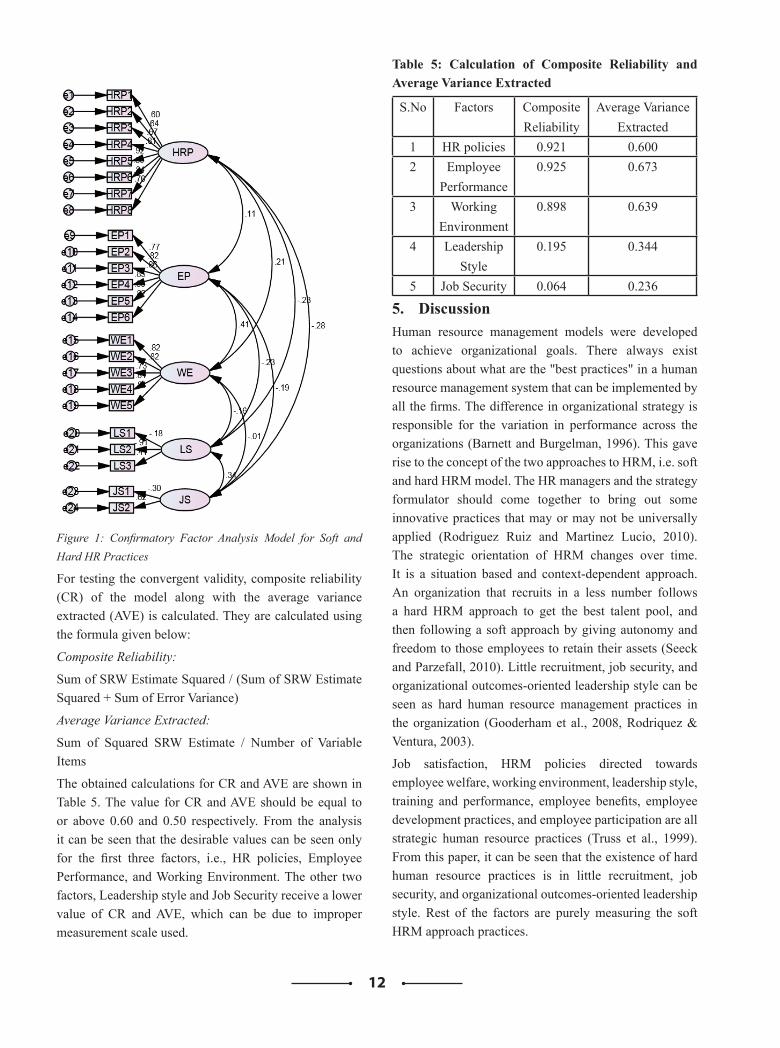
The confirmatory factor analysis was done on 160 data collected so as to find the model fit. The model fit was assessed using CMIN/DF, goodness-of-fit index(GFI), the comparative fit index(CFI), root mean square error of approximation(RMSEA), adjusted goodness-of-fit index (AGFI) and root mean square residual (RMR). The threshold for CMIN/DF should be less than 3.0 or less than 2.0 in a more restrictive sense. Values of GFI, AGFI, and CFI should be over 0.80. Moreover, RMSEA should be lower than 0.05 to indicate a close fit of the model about the degree of freedom. When all or most of the fit indices did not indicate an acceptable level of fit, the model modified until the fit indices achieved an acceptable level. The proposed measurement model showed that all regression weights were significant (p <0.000). The absolute fit statistics showed a chi-square of 444.461 with 242 (df) was significant (p = 0.000) [CMIN/DF = 1.837] with RMSEA = 0.073, RMR = 0.067, CFI = 0.908, GFI = 0.820, and AGFI = 0.777, suggested that the model fit is acceptable. Figure 1 represents the CFA model.
12
Figure 1: Confirmatory Factor Analysis Model for Soft and Hard HR Practices
For testing the convergent validity, composite reliability (CR) of the model along with the average variance extracted (AVE) is calculated. They are calculated using the formula given below:
Composite Reliability:
Sum of SRW Estimate Squared / (Sum of SRW Estimate Squared + Sum of Error Variance)
Average Variance Extracted:
Sum of Squared SRW Estimate / Number of Variable Items
The obtained calculations for CR and AVE are shown in Table 5. The value for CR and AVE should be equal to or above 0.60 and 0.50 respectively. From the analysis it can be seen that the desirable values can be seen only for the first three factors, i.e., HR policies, Employee Performance, and Working Environment. The other two factors, Leadership style and Job Security receive a lower value of CR and AVE, which can be due to improper measurement scale used.
Table 5: Calculation of Composite Reliability and Average Variance Extracted
S.No Factors Composite Reliability
Average Variance Extracted
1 HR policies 0.921 0.6002 Employee
Performance0.925 0.673
3 Working Environment
0.898 0.639
4 Leadership Style
0.195 0.344
5 Job Security 0.064 0.236
5. DiscussionHuman resource management models were developed to achieve organizational goals. There always exist questions about what are the "best practices" in a human resource management system that can be implemented by all the firms. The difference in organizational strategy is responsible for the variation in performance across the organizations (Barnett and Burgelman, 1996). This gave rise to the concept of the two approaches to HRM, i.e. soft and hard HRM model. The HR managers and the strategy formulator should come together to bring out some innovative practices that may or may not be universally applied (Rodriguez Ruiz and Martinez Lucio, 2010). The strategic orientation of HRM changes over time. It is a situation based and context-dependent approach. An organization that recruits in a less number follows a hard HRM approach to get the best talent pool, and then following a soft approach by giving autonomy and freedom to those employees to retain their assets (Seeck and Parzefall, 2010). Little recruitment, job security, and organizational outcomes-oriented leadership style can be seen as hard human resource management practices in the organization (Gooderham et al., 2008, Rodriquez & Ventura, 2003).
Job satisfaction, HRM policies directed towards employee welfare, working environment, leadership style, training and performance, employee benefits, employee development practices, and employee participation are all strategic human resource practices (Truss et al., 1999). From this paper, it can be seen that the existence of hard human resource practices is in little recruitment, job security, and organizational outcomes-oriented leadership style. Rest of the factors are purely measuring the soft HRM approach practices.
13
The results from the Confirmatory Factor Analysis provide an insight of the soft and hard HRM variables and their measuring factors. The model is fit to measure the HR policies implemented by the organizations, the performance of employees, and the perception of employees towards their working environment. However, the model does not fit for the measurement of job security and leadership style which is a matter of concern. This result is not as per the previous results obtained by Kidombo (2007). The reason behind this could be several like the less number of factors used for measurement, not suitable to the sample used for study, or less number of sample size. Based on the analysis of results, it was clear that the organizations are more oriented towards soft HRM approach as compared to hard HRM approach. The objective of the organization is to achieve performance, growth, and organizational development. These HR practices are the mediators to those organizational goals. The scale used for this study Kidombo (2007) includes 25 items out of which 22 were found to be soft HR practices, and 3 were hard HR practices. There is a slight difference in the items of hard HR practices of this study with respect to Mulabe (2013). This suggests that employees interpret the hard and soft HR practices similarly over and over again.
After the analysis of results, there were certain measures having a low score. This implies that more measures for the factors should be added to this measurement scale. It was also found that a few questions, in general, were ambiguous to be understood by the employees. There is a possibility of gaining new or different insight to the soft and hard human resource practices on analysing the other existing measurement scales like Gill and Meyer (2011), Truss et al. (1999), Farquharson and Baum (2002), and Jenkins and Delbridge (2013).
6. ConclusionThe results indicate that extensive training, employee participation, high job security, extensive recruitment and extensive reward plans are the measures of Soft HR practices. Tight management control, close direction, limited and informal training, selective recruitment, low job security are the measures of Hard HR practices. The objective of this research was to identify and explore the factors of soft and hard HR practices. The scale used for this purpose Kidombo (2007) highlights the fact that there are certain limitations on this scale. There were few factors having only two items suggesting that the
questions either were not clear to the employees or need more items to support them. Also, it was found that the scale has only three items for the measurement of hard HR approach, which is again a limitation. So there is a need for the modification of this scale. The results have concluded the orientation of the organizations these days towards the soft HR practices in the service industry. The results also indicates the requirement to use another scale for measurement of the soft and hard HRM practices because the scale by Kidombo (2007) cannot be fully considered a good measuring scale as implied from the analysis. Thus a need for future analysis in this area using other measurement scale is desirable.
ReferencesArthur, J.B., 1994. Effects of human resource systems on
manufacturing performance and turnover. Academy of Management journal, 37(3), pp.670-687.
Ashton, A.S., 2018. How human resources management best practice influence employee satisfaction and job retention in the Thai hotel industry. Journal of Human Resources in Hospitality & Tourism, 17(2), pp.175-199.
Barnett, W.P. and Burgelman, R.A., 1996. Evolutionary perspectives on strategy. Strategic Management Journal, 17(S1), pp.5-19.
Beardwell, I. and Holden, L., 1997. Human Resource Management–A Contemporary Perspective, London. Financial Times Management.
Boxall, P. and Purcell, J., 2000. Strategic human resource management: where have we come from and where should we be going?. International journal of management reviews, 2(2), pp.183-203.
Chowhan, J., Pries, F. and Mann, S., 2017. Persistent innovation and the role of human resource management practices, work organization, and strategy. Journal of Management & Organization, 23(3), pp.456-471.
Cook, H., MacKenzie, R. and Forde, C., 2016. HRM and performance: the vulnerability of soft HRM practices during recession and retrenchment. Human Resource Management Journal, 26(4), pp.557-571.
Cunningham, I., 2016. Non-profits and the ‘hollowed out’state: the transformation of working conditions through personalizing social care services during an era of austerity. Work, Employment and Society, 30(4), pp.649-668.
Edgar, F. and Geare, A., 2005. HRM practice and employee attitudes: different measures–different results. Personnel review, 34(5), pp.534-549.
Farquharson, L. and Baum, T., 2002. Enacting organisational change programmes: a centre
14
stage role for HRM?. International Journal of Contemporary Hospitality Management, 14(5), pp.243-250.
Gill, C. and Meyer, D., 2011. The role and impact of HRM policy. International Journal of Organizational Analysis, 19(1), pp.5-28.
Glaister, A.J., Karacay, G., Demirbag, M. and Tatoglu, E., 2018. HRM and performance—The role of talent management as a transmission mechanism in an emerging market context. Human Resource Management Journal, 28(1), pp.148-166.
Guest, D.E., 1987. Human resource management and industrial relations [1]. Journal of management Studies, 24(5), pp.503-521.
Harney, B. and Jordan, C., 2008. Unlocking the black box: line managers and HRM-performance in a call centre context. International Journal of productivity and performance management, 57(4), pp.275-296.
Ihuah, P.W., 2014. A review of soft and hard approaches of human resource management and the success of real estate development in Nigeria. Journal of Business Management and Economic Development (JBMED), 1(1), pp.16-23.
Jenkins, S. and Delbridge, R., 2013. Context matters: Examining ‘soft’and ‘hard’approaches to employee engagement in two workplaces. The International Journal of Human Resource Management, 24(14), pp.2670-2691.
Kidombo, H.J., 2007. Human Resource Strategic Orientation, Organizational Commitment and Firm Performance: The case of Large Private Manufacturing Firms in Kenya (Doctoral dissertation, PhD Thesis).
Kidombo, H.J., K’Obonyo, P. and Gakuu, C.M., 2012. Human resource strategic orientation And organizational commitment in Kenyan manufacturing firms. International Journal of Arts and Commerce, 1(7), pp.7-28.
K’Obonyo, P. and Dimba, B.A., 2009. The effect of strategic human resource management practices on performance of manufacturing multinational companies in Kenya: Moderating role of employee cultural orientations and mediating role of employee motivation.
Marescaux, E., De Winne, S. and Sels, L., 2012. HR practices and HRM outcomes: The role of basic need satisfaction. Personnel Review, 42(1), pp.4-27.
Michael, F., 2017. Hard and Soft Human Resource Management Compensation Practices on Employee Job Satisfaction. ORSEA JOURNAL, 5(1).Morris, J., Wilkinson, B. and Munday, M., 2000. Farewell to
HRM? Personnel practices in Japanese manufacturing plants in the UK. International Journal of Human Resource Management, 11(6), pp.1047-1060.
Mulabe, J.K., 2013. Human resource strategic orientation, employee outcomes, organizational factors and performance of state corporations in Kenya. School of Business, University of Nairobi.
Nunnally, J. C., 1978. Psychometric theory (2nd ed.). New York: McGraw-Hill.
Rahman, T., Tabassum, A. and Sultana, N., 2017. Identifying the Reliability and Validity of Hard and Soft HRM Measures: A Study on the Banking Sector of Bangladesh. ABAC Journal, 37(2), pp.104-117.
Rodriguez Ruiz, O. and Martinez Lucio, M., 2010. The study of HRM in Spain: the Americanization of Spanish research and the politics of denial?. The International Journal of Human Resource Management, 21(1), pp.125-143.
Rodríguez, J.M. and Ventura, J., 2003. Human resource management systems and organizational performance: An analysis of the Spanish manufacturing industry. The International Journal of Human Resource Management.
Seeck, H. and Parzefall, M.R., 2010. From HRM to psychological contracting-the case of Finnish mobile content producing companies. The International Journal of Human Resource Management, 21(15), pp.2677-2693.
Storey, J., 1992. Developments in the management of human resources: an analytical review. Blackwell.
Terziovski, M. and Sohal, A.S., 2000. The adoption of continuous improvement and innovation strategies in Australian manufacturing firms. Technovation, 20(10), pp.539-550.
Truss, C., Gratton, L., Hope‐Hailey, V., McGovern, P. and Stiles, P., 1997. Soft and hard models of human resource management: a reappraisal. Journal of Management Studies, 34(1), pp.53-73.
Truss, C., 1999. Human resource management: gendered terrain?. International Journal of Human Resource Management, 10(2), pp.180-200.
Vanajamma, K. H., 2015. Human Resource Management Model For New Global Economy: An Overview. International Journal of Organizational Behaviour & Management Perspectives, 4(1), pp.1444-1448.
Yang, C.C. and Yang, K.J., 2013. An integrated model of the Toyota production system with total quality management and people factors. Human Factors and Ergonomics in Manufacturing & Service Industries, 23(5), pp.450-461.
15
Linking Green Human Resource Management and Job Pursuit Intentions: Modeling Organizational Prestige as Mediator
Richa ChaudharyDepartment of Humanities & Social Sciences, Indian Institute of Technology Patna (IIT Patna), Bihta,Bihar-801106
Telephone No. 9661596799/0612-302-8398, Email: [email protected]
Abstract The purpose of the study was to examine the impact of green human resource management (GHRM) on prospective employees’ job pursuit intentions (JPI). In addition, attempt was made to unfold the underlying psychological processes by proposing and testing Organizational prestige (OP) as mediator of the relationship between GHRM and JPI. Data were collected from 172 undergraduate engineering students of a reputed engineering institute of India. Data were analyzed using hierarchical linear regression procedures with the help of SPSS process macro. The results provided support for the hypothesized research model where GHRM was found to relate positively and significantly with JPI and the relationship was partially mediated by OP. The study expands the nomological network of GHRM by providing empirical evidence of its effect on prospective employee outcomes from an emerging economy. The study also carries significant implications for corporate communication and recruitment process. Detailed implications for theory and practice are discussed.
KeywordsGreen human resource management, organizational prestige, job pursuit intentions, mediation, India
IntroductionHiring talent is not easy especially in the hard times. To further emphasize upon severity of the issue, recent research by Harvard business review reports that most global organizations will run into staffing problems in the emerging markets [1]. In this highly competitive business environment where war for talent is witnessed in almost every sector of the economy, attracting and retaining a quality workplace can provide a firm with significant competitive advantage. Although a developing country like India has an advantage of having largest set of youth population, most of them lack the employability skills and too few are fit for hiring [2]. Thus, with a large number of organizations competing for a limited talent pool, attracting right talent has become a big challenge for the organizations.
To attract quality applications, organizations need to understand that employees these days expect more than just financial rewards and benefits from their employer [3]. Besides salary, other factors such as organizational reputation and prestige have also been reported as antecedents to job pursuit intentions among applicants in the past studies [4]. Studies have reported socially responsible firms are preferred over others by the job
applicants [5,6]. In this direction, numbers of studies have established the benefits of corporate social performance for attracting quality workplace to apply for positions in the organization. However, environment as an important component of corporate social responsibility (CSR) has received less attention in the recruitment literature. Additionally, a great deal of inconsistency exists in the available literature on environmental CSR where some studies have reported positive outcomes of organizational environmental involvement for prospective employees [4,7] while others failed to find any significant association [8,9].
With this backdrop, the present study focuses on environmental aspect of corporate social performance by examining the impact of green human resource management (GHRM) practices on job pursuit intentions (JPI) of prospective employees. In addition, the study aims to understand the underlying processes through which GHRM influences JPI by proposing organizational prestige (OP) as mediator of the relationship.
Theoretical Framework and Research HypothesesGHRM reflects HRM facet of environmental management [10]. It refers to the use of HRM policies and practices to
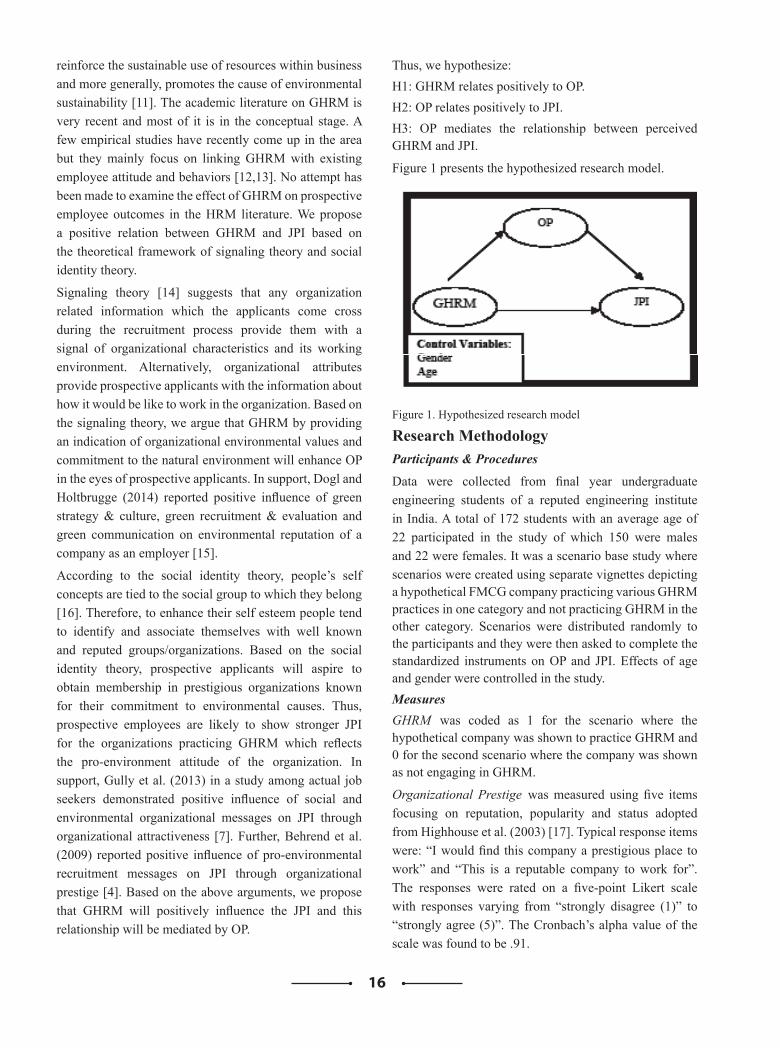
16
reinforce the sustainable use of resources within business and more generally, promotes the cause of environmental sustainability [11]. The academic literature on GHRM is very recent and most of it is in the conceptual stage. A few empirical studies have recently come up in the area but they mainly focus on linking GHRM with existing employee attitude and behaviors [12,13]. No attempt has been made to examine the effect of GHRM on prospective employee outcomes in the HRM literature. We propose a positive relation between GHRM and JPI based on the theoretical framework of signaling theory and social identity theory.
Signaling theory [14] suggests that any organization related information which the applicants come cross during the recruitment process provide them with a signal of organizational characteristics and its working environment. Alternatively, organizational attributes provide prospective applicants with the information about how it would be like to work in the organization. Based on the signaling theory, we argue that GHRM by providing an indication of organizational environmental values and commitment to the natural environment will enhance OP in the eyes of prospective applicants. In support, Dogl and Holtbrugge (2014) reported positive influence of green strategy & culture, green recruitment & evaluation and green communication on environmental reputation of a company as an employer [15].
According to the social identity theory, people’s self concepts are tied to the social group to which they belong [16]. Therefore, to enhance their self esteem people tend to identify and associate themselves with well known and reputed groups/organizations. Based on the social identity theory, prospective applicants will aspire to obtain membership in prestigious organizations known for their commitment to environmental causes. Thus, prospective employees are likely to show stronger JPI for the organizations practicing GHRM which reflects the pro-environment attitude of the organization. In support, Gully et al. (2013) in a study among actual job seekers demonstrated positive influence of social and environmental organizational messages on JPI through organizational attractiveness [7]. Further, Behrend et al. (2009) reported positive influence of pro-environmental recruitment messages on JPI through organizational prestige [4]. Based on the above arguments, we propose that GHRM will positively influence the JPI and this relationship will be mediated by OP.
Thus, we hypothesize:H1: GHRM relates positively to OP.H2: OP relates positively to JPI.H3: OP mediates the relationship between perceived GHRM and JPI.
Figure 1 presents the hypothesized research model.
Figure 1. Hypothesized research model
Research MethodologyParticipants & Procedures
Data were collected from final year undergraduate engineering students of a reputed engineering institute in India. A total of 172 students with an average age of 22 participated in the study of which 150 were males and 22 were females. It was a scenario base study where scenarios were created using separate vignettes depicting a hypothetical FMCG company practicing various GHRM practices in one category and not practicing GHRM in the other category. Scenarios were distributed randomly to the participants and they were then asked to complete the standardized instruments on OP and JPI. Effects of age and gender were controlled in the study. MeasuresGHRM was coded as 1 for the scenario where the hypothetical company was shown to practice GHRM and 0 for the second scenario where the company was shown as not engaging in GHRM.
Organizational Prestige was measured using five items focusing on reputation, popularity and status adopted from Highhouse et al. (2003) [17]. Typical response items were: “I would find this company a prestigious place to work” and “This is a reputable company to work for”. The responses were rated on a five-point Likert scale with responses varying from “strongly disagree (1)” to “strongly agree (5)”. The Cronbach’s alpha value of the scale was found to be .91.
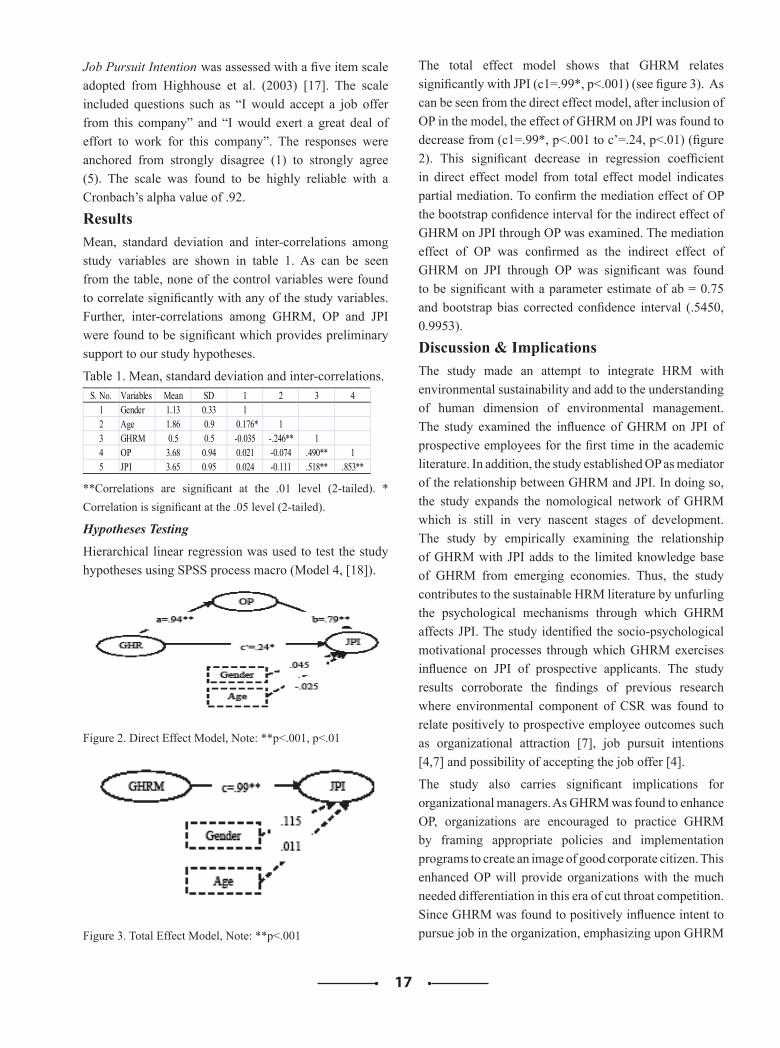
17
Job Pursuit Intention was assessed with a five item scale adopted from Highhouse et al. (2003) [17]. The scale included questions such as “I would accept a job offer from this company” and “I would exert a great deal of effort to work for this company”. The responses were anchored from strongly disagree (1) to strongly agree (5). The scale was found to be highly reliable with a Cronbach’s alpha value of .92.
ResultsMean, standard deviation and inter-correlations among study variables are shown in table 1. As can be seen from the table, none of the control variables were found to correlate significantly with any of the study variables. Further, inter-correlations among GHRM, OP and JPI were found to be significant which provides preliminary support to our study hypotheses.
Table 1. Mean, standard deviation and inter-correlations.S. No. Variables Mean SD 1 2 3 4
1 Gender 1.13 0.33 12 Age 1.86 0.9 0.176* 13 GHRM 0.5 0.5 -0.035 -.246** 14 OP 3.68 0.94 0.021 -0.074 .490** 15 JPI 3.65 0.95 0.024 -0.111 .518** .853**
**Correlations are significant at the .01 level (2-tailed). * Correlation is significant at the .05 level (2-tailed).
Hypotheses Testing
Hierarchical linear regression was used to test the study hypotheses using SPSS process macro (Model 4, [18]).
Figure 2. Direct Effect Model, Note: **p<.001, p<.01
Figure 3. Total Effect Model, Note: **p<.001
The total effect model shows that GHRM relates significantly with JPI (c1=.99*, p<.001) (see figure 3). As can be seen from the direct effect model, after inclusion of OP in the model, the effect of GHRM on JPI was found to decrease from (c1=.99*, p<.001 to c’=.24, p<.01) (figure 2). This significant decrease in regression coefficient in direct effect model from total effect model indicates partial mediation. To confirm the mediation effect of OP the bootstrap confidence interval for the indirect effect of GHRM on JPI through OP was examined. The mediation effect of OP was confirmed as the indirect effect of GHRM on JPI through OP was significant was found to be significant with a parameter estimate of ab = 0.75 and bootstrap bias corrected confidence interval (.5450, 0.9953).
Discussion & ImplicationsThe study made an attempt to integrate HRM with environmental sustainability and add to the understanding of human dimension of environmental management. The study examined the influence of GHRM on JPI of prospective employees for the first time in the academic literature. In addition, the study established OP as mediator of the relationship between GHRM and JPI. In doing so, the study expands the nomological network of GHRM which is still in very nascent stages of development. The study by empirically examining the relationship of GHRM with JPI adds to the limited knowledge base of GHRM from emerging economies. Thus, the study contributes to the sustainable HRM literature by unfurling the psychological mechanisms through which GHRM affects JPI. The study identified the socio-psychological motivational processes through which GHRM exercises influence on JPI of prospective applicants. The study results corroborate the findings of previous research where environmental component of CSR was found to relate positively to prospective employee outcomes such as organizational attraction [7], job pursuit intentions [4,7] and possibility of accepting the job offer [4].
The study also carries significant implications for organizational managers. As GHRM was found to enhance OP, organizations are encouraged to practice GHRM by framing appropriate policies and implementation programs to create an image of good corporate citizen. This enhanced OP will provide organizations with the much needed differentiation in this era of cut throat competition. Since GHRM was found to positively influence intent to pursue job in the organization, emphasizing upon GHRM
18
practices of the organization during recruitment process may help organizations to attract quality applicants. Since the sample for the present study consisted of final year engineer students, highlighting about green culture and values of the organization in the campus recruitment process may assist organizations in enticing applicants to apply for the job in their organization. Thus, the study carries significant implications for corporate communication and recruitment advertising.
Limitations and Scope for Future ResearchThe study has some limitations which provide directions for future research. First, the cross sectional research design doesn’t allow inferring causality. To establish causal relationship, future researchers should examine the relationships among study variables using experimental and longitudinal study designs. Second, the sample for the present study consisted of final year undergraduate engineering students who will soon be available in the labor market and constitute the pool of prospective employees. However, the study should be replicated with actual labor pool in the labor market to get better estimates. Third, although the study illuminates the underlying processes through which GHRM influences JPI, the strength of relationship may vary for different individuals. For example, the above relationship is likely to be stronger for individuals with strong environmental values than others. Therefore, future research may consider examining individual difference variables as moderator of the relationship between GHRM and JPI.
References[1] https://www.peoplematters.in/article/talent-
acquisition/hiring-talent-how-to-get-the-best-in-the-worst-of-times-16229.
[2] https://www.wsj.com/articles/SB10001424052748703515504576142092863219826.
[3] D. M. Rousseau, “Is there such a thing as “evidence-based management”?.”, Academy of management review, vol. 31 no. 2, pp. 256-269, 2006.
[4] T. S. Behrend, B. A. Baker, and L. F. Thompson, “Effects of pro-environmental recruiting messages: The role of organizational reputation”, Journal of Business and Psychology, vol. 24, no.3, pp. 341-350, 2009.
[5] D. W. Greening, and D. B. Turban, “Corporate social performance as a competitive advantage in attracting a quality workforce”, Business and Society, vol. 39, no. 3, pp. 254–80, 2000.
[6] H. S. Albinger, and S. J. Freeman, “Corporate social performance and attractiveness as an employer to different job seeking populations”, Journal of Business Ethics, vol. 28, no.3, pp. 243-253, 2000.
[7] S. M. Gully, J. M. Phillips, W. G. Castellano, K. Han, and A. Kim, “A mediated moderation model of recruiting socially and environmentally responsible job applicants”, Personnel Psychology, vol. 66, no.4,pp. 935-973, 2013.
[8] B. Lis, “The relevance of corporate social responsibility for a sustainable human resource management: an analysis of organizational attractiveness as a determinant in employees' selection of a (potential) employer”, Management Revue, vol. 23, no. 3, pp. 279-295, 2012.
[9] D. B. Turban, and D. W. Greening, “Corporate social performance and organizational attractiveness to prospective employees”, Academy of Management Journal, vol. 40, no.3, pp. 658-672, 1997.
[10] D. W. Renwick, T. Redman, and S. Maguire, “Green human resource management: A review and research agenda”, International Journal of Management Reviews, vol. 15, no. 1, pp. 1-14, 2013.
[11] S. Marhatta, and S. Adhikari, “Green HRM and sustainability”, International eJournal Of Ongoing Research in Management & IT, 2013. Retrieved from www.asmgroup.edu.in/incon/publication/incon13-hr-006pdf
[12] J. Dumont, J. Shen, and X. Deng, “Effects of Green HRM Practices on Employee Workplace Green Behavior: The Role of Psychological Green Climate and Employee Green Values”, Human Resource Management, vol. 56, no.4, pp. 613-627, 2016.
[13] J. Shen, J. Dumont, and X. Deng, “Employees’ perceptions of green HRM and non-green employee work outcomes: The social identity and stakeholder perspectives”, Group & Organization Management, 2016. doi: 10.1177/1059601116664610.
[14] S. L. Rynes, “Recruitment, job choice, and post-hire consequences: A call for new re-search directions”, in M. D. Dunnette, and L. M. Hough, (Eds), Handbook of industrial and organizational psychology (2nd ed.), Consulting Psychologists Press, Palo Alto, CA, pp. 399-444, 1991.

19
[15] C. Dögl, and D. Holtbrügge, “Corporate environmental responsibility, employer reputation and employee commitment: an empirical study in developed and emerging economies”, The International Journal of Human Resource Management, vol. 25, no.12, pp. 1739-1762, 2014.
[16] M. A. Hogg, and D. Abrams, Social identifications: A social psychology of intergroup relations and group processes, Routledge, London. 1988.
[17] S. Highhouse, F. Lievens, and E. F. Sinar, “Measuring attraction to organizations”. Educational and psychological Measurement, vol. 63, no.6, pp. 986-1001, 2003.
[18]A. F. Hayes, Introduction to mediation, moderation, and conditional process analysis: A regression-based approach, Guilford Press, New York, 2013.
20
Employees Engagement in Nepalese Banking Sector
Ram Hari SilwalResearch scholar
Lincoln University College, Malaysia
AbstractThe purpose of this study was to access factors affecting employee engagement in Nepalese commercial banks.Employee engagement is an issue of concern to all organizations and they adopt monetary as well as non monetary methods to maintain a pool of engaged talented work force. An organization having engaged employees leads to higher level of productivity, efficiency and overall organizational effectiveness. This paper investigates the effects of participation, compensation package, training and development and work environment on employee engagement. A purposive sampling technique has been used to identify respondents who were bankers in Nepal. Data was collected from 152 respondents. A well-structured questionnaire was designed to collect the data from respondents. Multiple regression and structural equation modeling have been used to test the hypotheses. Cronbach Alpha has been used to ensure the reliability of the collected data deployed in the research. The result reveals that there are significant relationship between participation, compensation package, training and development and work environment and employees engagement. Finally, it was found that there is significant influence of participation, compensation package, training and development and work environment on employees’ engagement working in Nepalese commercial Banks.
Keywords Employee Engagement, Compensation Package, Training Development, Work Environment, Nepal.
IntroductionA bank is a financial institution that has licensed to receive deposits and make loans. Banks may also provide financial services, such as wealth management, currency exchange and safe deposit boxes. There are two types of banks: commercial/retail banks and investment banks. In most countries, banks are regulated by the national government or central bank. All the banks are operated for a profit earning purpose which is gained through the gap between demand and supply interest rates. Human resource plays a very important role for the success of banks.
Employees are very important inputs in the production process for any given sector. Their skills, roles and satisfaction at the place of work influence the competitive edge of the firm within the sector. They should be satisfied, motivated and managed in a way that enhances their level of engagement with the organization. Employee engagement is rightly viewed as a key aspect of productivity. Its measurement of an employee’s emotional commitment to an organization; Employee engagement is
a workplace approach resulting in the right conditions for all members of an organization to give of their best each day, committed to their organization’s goals and values, motivated to contribute to organizational success, with an enhanced sense of their own well-being. Human resources strategies and policies that are concerned with the use of labor in firm (Boxall & Purcell, 2004) consequently need to be effective.
Employee engagement is the key focus of both business entrepreneurs and academic researchers and is a blistering issue of modern business environment. Baumruk (2004) contends that every organization wants to gain competitive advantage and employee engagement is the best tool for achieving it. In fact, employee engagement is considered to be the most powerful factor to measure a company’s vigor and orientation towards superior performance. Employee engagement involves creating prospect for human resources to attach with their managers, colleagues and organization. Engagement is a perception that places continuous improvement, change and flexibility at the empathy of what it means.
21
Managers want to improve employee engagement on grounds that it leads to superior performance, reduces staff turnover and improves the well-being of employees (Macey & Schneider, 2008; Hakanen et al., 2008). Engaged employee’s value, enjoy and have pride in their work and are more willing to help each other and the organization succeed. LePine, Erez, & Johnson (2002) argue that engaged employees take additional responsibility, invest more effort in their jobs, share information with other employees and remain with the organization than employees who are less engaged. Studies by Bloom and Michael (2002) indicate that although the primary focus of engagement efforts has mostly been on team-building programs and nonfinancial rewards, egalitarian pay structures have been found to be related to employee cooperation, involvement, satisfaction and commitment; all of which have been used as proxies for employee engagement. A study by Konard, (2006) established that high-involvement work practices; techniques used by the management to efficiently involve their employees in their works and receive high performance among employees can contribute in effective employee engagement.
A bank should take care of its employee’s satisfaction towards their work. It is very important factor which can affect the goal of the organization in a positive or a negative way. An organization can take care of its employees considering various factors like salary and wages, working environment, work load, motivational activities etc. If these can be managed and can be carried forward then the organization can achieve its goal in desired time period as per its plans. If employees are not satisfied they might not get engaged with the company which might create a negative impact upon its goal. Therefore, efforts have to be made by the organization to maintain its employee’s satisfaction and must be able to take its work in return to achieve its goal in desired time frame and also to be able to have its employee’s engagement in its organization.
It is common cause that everyone in business should understand the objectives and pull in the same direction to maximize profit and growth. There is a measure of success stories in this regard especially where people and productivity issues occupy the centre stage; morale, commitment and engagement are positively affected. Nevertheless, some organizations have year after year made a concerted effort to address employee commitment and engagement issues and as always, successes have
varied from organization to organization (Wellins, Bernthal & Phelps, 2005). It takes little persuasion on a theoretical level to convince a business leader, that employees who are more committed or engaged, work harder and smarter, and will be better for the company than those who turn up and do merely what they are obliged to do (Gallup Research Report,2003). The Gallup Research Report (2003) estimated that actively disengaged workers are 10 times more likely to say they will leave their organizations within a year than engaged staff. Their 2003 survey in the US and Canada of 1000 workers found that only a quarter were actively engaged in their work with a huge group of between 56% and 60% not engaged and 17% actively disengaged. The research estimates that actively disengaged (uncommitted) workers cost US businesses between $270 and $343 billion a year due to low productivity.Employees who are satisfied, motivated and managed in a proper way will give crucial competitive advantages including higher productivity and lower employee turnover. It is important for the managers to cultivate engagement given that disengagement or alienation is central to the problem of workers’ lack of commitment and motivation. Weatherly (2003) argues that human capital can be development and cultivated, but it can also decide to leave the organization, become sick, disheartened, and even influences others to behave in a way that may not be to the advantage of an employer, thus usurping or siphoning off resources intended for use elsewhere in the organization.
HypothesisA hypothesis is a specific statement of prediction. It describes in concrete (rather than theoretical) terms what you expect will happen in your study. The hypothesis formulated for this research is as follows.
H1: There is positive influence of participation and involvement on employee engagement.
H2: There is positive influence of compensation package on employee engagement.
H3: There is positive influence of training and development on employee engagement.
H4: There is positive influence of work environment on employee engagement.
Literature ReviewThe international survey research (2003) formally defines employees’ engagement as a process by which an organization increases commitment and contribution
22
of its employees to achieve superior business results. They conclude that employee engagement is a combination of n employee’s cognitive, affective and behavioral commitment to a company. Kokemuller (2010) defines Employee engagement as the level to which employees feel motivated and involved in their workplace. Job responsibilities, work relationships and growth opportunities are among primary internal factors affecting engagement. External factors include competing career opportunities, along with the family and social obligations.Employee engagement has its roots in classic work done in employee motivation, in the form of intrinsic motivation (Hertzberg, 1966). Bateman and grant (2003) state that intrinsic motivation is said to exist when behavior is performed for its own sake rather than to obtain material or social reinforces. AlthoughDeming (1993) placed great weight on the value system, he also acknowledged the vital role of intrinsic motivation and the need to engage workers in their work. It would appear that employee engagement is strongly linked to the work of classic motivation theorists and researchers. Engagement at work was conceptualized by Kahn (1990) as the ‘harnessing of organizational members’ selves to their work roles. In engagement, people employ and express themselves physically, cognitively and emotionally during role performances. Kahn (1990) goes on to suggest that employees experience dimensions of personal engagement (or disengagement) during daily task performances. Engagement occurs when one is cognitively vigilant and/or emotionally connected to others. In other words, employees who know what are expected of them, who form strong relationships with coworkers and managers, or how in other ways experience meaning in their work, are engaged. Disengages employees, on the other hand, disconnect themselves from work roles and withdraw cognitively and emotionally. Disengage employees display incomplete role performances and task behaviors become effortless, automatic or robotic (Hochschild, 1983).
Hochschild (1983) stated that unemployment of the self in one’s role is considered as robotic or work and work contexts shape the process of people presenting and absenting themselves during task performances. Kahn (1990) suggested that there are two major dimensions of engagement which include emotional and cognitive engagement. To be emotionally engaged is to form meaningful connections to others and to experience empathy and concern for other’s feelings. In contrast,
being cognitively engaged refers to those who are acutely aware of their mission and role in the work environment. According to Kahn (1990, 1992) employees can be engaged on one dimension and not the other. However, the more engaged an employee is on each dimension, the higher his or her overall personal engagement.The second related construct to engagement in organizational behavior is the notion of flow advanced by Crabtree (2003). Gratton (2000) defines flow as the ‘holistic sensation’ that people feel when they act with total involvement. Flow is the state in which there is little distinction between the self and environment. When individuals are in flow state little conscious control is necessary for their actions. Employee engagement is thus the level of commitment and involvement an employee has towards their organization and its values. An engaged employee is aware of business context, and works with colleagues to improve performance within the job for the benefit of the organization. The organization must work to develop and nurture engagement, which requires a two- way relationship between employer and employee. The employee engagement is a barometer that determines the association of a person with the organization.Engagement is most closely associated with the existing construction of job involvement (brown 1996) and flow. Job involvement is defined as ‘the degree to which the job situation is central to the person and his or her identity. Kee (2003) maintained that job involvement is a cognitive or belief state of psychological identification. Job involvement is thought to depend on both needs saliency and the potential of a job to satisfy these needs. Thus, job involvement results from a cognitive judgment about the needs satisfying abilities of the job. Finally, engagement may be thought of as an antecedent to job involvement in that individuals who experience deep engagement in their roles should come to identify with their jobs.Human Resources (HR) practitioners believe that the engagement challenge has a lot to do with how employee feels about the work experience and how he or she is treated in the organization. It has a lot to do with emotions which are fundamentally related to drive bottom line success in a company. There will always be people who never give their best efforts no matter how hard HR and line managers try to engage them. But for the most part employees want to commit to companies because doing to satisfy a powerful and a basic need in connect with and contributed to something significant.The view of Melcrum (2005) in their employee engagement survey which perceive employee engagement as about translating employee potential into employee
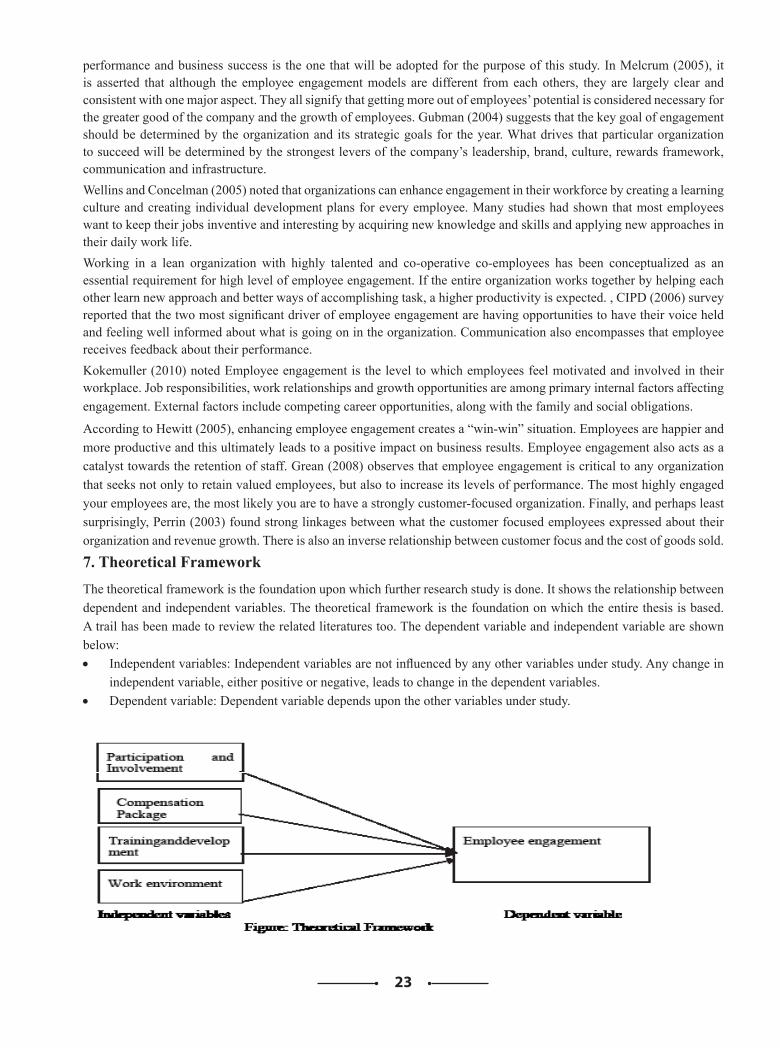
23
performance and business success is the one that will be adopted for the purpose of this study. In Melcrum (2005), it is asserted that although the employee engagement models are different from each others, they are largely clear and consistent with one major aspect. They all signify that getting more out of employees’ potential is considered necessary for the greater good of the company and the growth of employees. Gubman (2004) suggests that the key goal of engagement should be determined by the organization and its strategic goals for the year. What drives that particular organization to succeed will be determined by the strongest levers of the company’s leadership, brand, culture, rewards framework, communication and infrastructure.Wellins and Concelman (2005) noted that organizations can enhance engagement in their workforce by creating a learning culture and creating individual development plans for every employee. Many studies had shown that most employees want to keep their jobs inventive and interesting by acquiring new knowledge and skills and applying new approaches in their daily work life. Working in a lean organization with highly talented and co-operative co-employees has been conceptualized as an essential requirement for high level of employee engagement. If the entire organization works together by helping each other learn new approach and better ways of accomplishing task, a higher productivity is expected. , CIPD (2006) survey reported that the two most significant driver of employee engagement are having opportunities to have their voice held and feeling well informed about what is going on in the organization. Communication also encompasses that employee receives feedback about their performance.Kokemuller (2010) noted Employee engagement is the level to which employees feel motivated and involved in their workplace. Job responsibilities, work relationships and growth opportunities are among primary internal factors affecting engagement. External factors include competing career opportunities, along with the family and social obligations.
According to Hewitt (2005), enhancing employee engagement creates a “win-win” situation. Employees are happier and more productive and this ultimately leads to a positive impact on business results. Employee engagement also acts as a catalyst towards the retention of staff. Grean (2008) observes that employee engagement is critical to any organization that seeks not only to retain valued employees, but also to increase its levels of performance. The most highly engaged your employees are, the most likely you are to have a strongly customer-focused organization. Finally, and perhaps least surprisingly, Perrin (2003) found strong linkages between what the customer focused employees expressed about their organization and revenue growth. There is also an inverse relationship between customer focus and the cost of goods sold.
7. Theoretical FrameworkThe theoretical framework is the foundation upon which further research study is done. It shows the relationship between dependent and independent variables. The theoretical framework is the foundation on which the entire thesis is based. A trail has been made to review the related literatures too. The dependent variable and independent variable are shown below: • Independent variables: Independent variables are not influenced by any other variables under study. Any change in
independent variable, either positive or negative, leads to change in the dependent variables. • Dependent variable: Dependent variable depends upon the other variables under study.
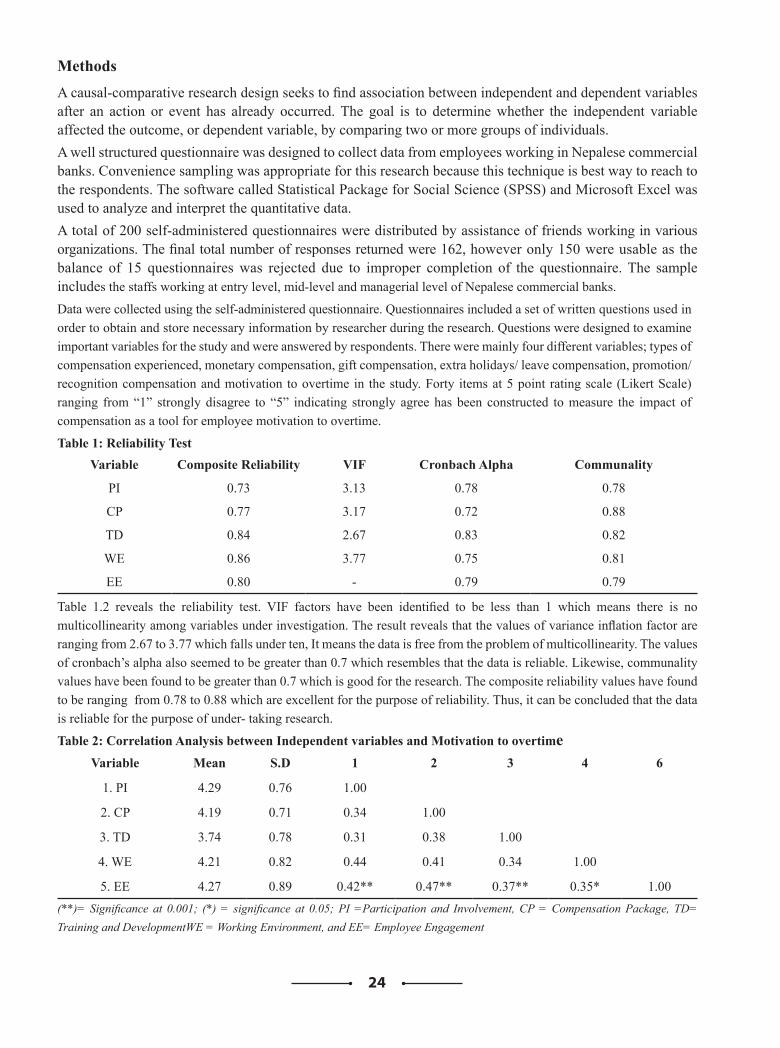
24
MethodsA causal-comparative research design seeks to find association between independent and dependent variables after an action or event has already occurred. The goal is to determine whether the independent variable affected the outcome, or dependent variable, by comparing two or more groups of individuals. A well structured questionnaire was designed to collect data from employees working in Nepalese commercial banks. Convenience sampling was appropriate for this research because this technique is best way to reach to the respondents. The software called Statistical Package for Social Science (SPSS) and Microsoft Excel was used to analyze and interpret the quantitative data. A total of 200 self-administered questionnaires were distributed by assistance of friends working in various organizations. The final total number of responses returned were 162, however only 150 were usable as the balance of 15 questionnaires was rejected due to improper completion of the questionnaire. The sample includes the staffs working at entry level, mid-level and managerial level of Nepalese commercial banks.
Data were collected using the self-administered questionnaire. Questionnaires included a set of written questions used in order to obtain and store necessary information by researcher during the research. Questions were designed to examine important variables for the study and were answered by respondents. There were mainly four different variables; types of compensation experienced, monetary compensation, gift compensation, extra holidays/ leave compensation, promotion/ recognition compensation and motivation to overtime in the study. Forty items at 5 point rating scale (Likert Scale) ranging from “1” strongly disagree to “5” indicating strongly agree has been constructed to measure the impact of compensation as a tool for employee motivation to overtime.
Table 1: Reliability TestVariable Composite Reliability VIF Cronbach Alpha Communality
PI 0.73 3.13 0.78 0.78
CP 0.77 3.17 0.72 0.88
TD 0.84 2.67 0.83 0.82
WE 0.86 3.77 0.75 0.81
EE 0.80 - 0.79 0.79
Table 1.2 reveals the reliability test. VIF factors have been identified to be less than 1 which means there is no multicollinearity among variables under investigation. The result reveals that the values of variance inflation factor are ranging from 2.67 to 3.77 which falls under ten, It means the data is free from the problem of multicollinearity. The values of cronbach’s alpha also seemed to be greater than 0.7 which resembles that the data is reliable. Likewise, communality values have been found to be greater than 0.7 which is good for the research. The composite reliability values have found to be ranging from 0.78 to 0.88 which are excellent for the purpose of reliability. Thus, it can be concluded that the data is reliable for the purpose of under- taking research.
Table 2: Correlation Analysis between Independent variables and Motivation to overtimeVariable Mean S.D 1 2 3 4 6
1. PI 4.29 0.76 1.00
2. CP 4.19 0.71 0.34 1.00
3. TD 3.74 0.78 0.31 0.38 1.00
4. WE 4.21 0.82 0.44 0.41 0.34 1.00
5. EE 4.27 0.89 0.42** 0.47** 0.37** 0.35* 1.00(**)= Significance at 0.001; (*) = significance at 0.05; PI =Participation and Involvement, CP = Compensation Package, TD= Training and DevelopmentWE = Working Environment, and EE= Employee Engagement
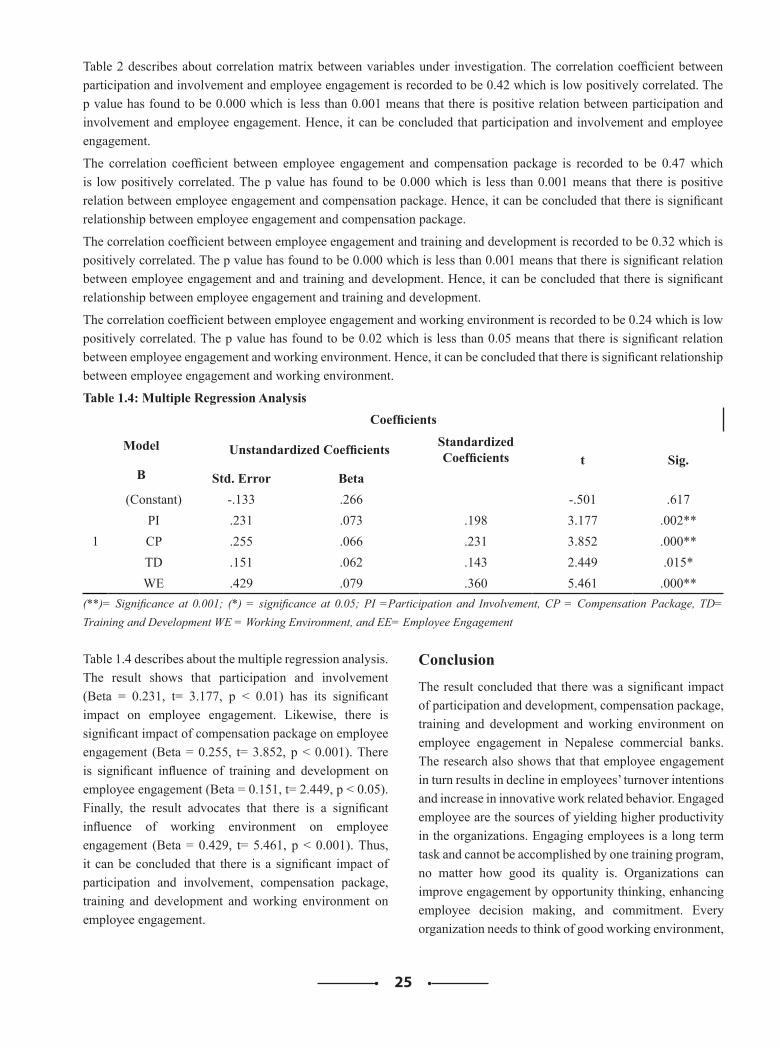
25
Table 2 describes about correlation matrix between variables under investigation. The correlation coefficient between participation and involvement and employee engagement is recorded to be 0.42 which is low positively correlated. The p value has found to be 0.000 which is less than 0.001 means that there is positive relation between participation and involvement and employee engagement. Hence, it can be concluded that participation and involvement and employee engagement.
The correlation coefficient between employee engagement and compensation package is recorded to be 0.47 which is low positively correlated. The p value has found to be 0.000 which is less than 0.001 means that there is positive relation between employee engagement and compensation package. Hence, it can be concluded that there is significant relationship between employee engagement and compensation package.
The correlation coefficient between employee engagement and training and development is recorded to be 0.32 which is positively correlated. The p value has found to be 0.000 which is less than 0.001 means that there is significant relation between employee engagement and and training and development. Hence, it can be concluded that there is significant relationship between employee engagement and training and development.
The correlation coefficient between employee engagement and working environment is recorded to be 0.24 which is low positively correlated. The p value has found to be 0.02 which is less than 0.05 means that there is significant relation between employee engagement and working environment. Hence, it can be concluded that there is significant relationship between employee engagement and working environment.
Table 1.4: Multiple Regression Analysis Coefficients
Model
B
Unstandardized Coefficients Standardized Coefficients t Sig.
Std. Error Beta
1
(Constant) -.133 .266 -.501 .617PI .231 .073 .198 3.177 .002**CP .255 .066 .231 3.852 .000**TD .151 .062 .143 2.449 .015*WE .429 .079 .360 5.461 .000**
(**)= Significance at 0.001; (*) = significance at 0.05; PI =Participation and Involvement, CP = Compensation Package, TD= Training and Development WE = Working Environment, and EE= Employee Engagement
Table 1.4 describes about the multiple regression analysis. The result shows that participation and involvement (Beta = 0.231, t= 3.177, p < 0.01) has its significant impact on employee engagement. Likewise, there is significant impact of compensation package on employee engagement (Beta = 0.255, t= 3.852, p < 0.001). There is significant influence of training and development on employee engagement (Beta = 0.151, t= 2.449, p < 0.05). Finally, the result advocates that there is a significant influence of working environment on employee engagement (Beta = 0.429, t= 5.461, p < 0.001). Thus, it can be concluded that there is a significant impact of participation and involvement, compensation package, training and development and working environment on employee engagement.
ConclusionThe result concluded that there was a significant impact of participation and development, compensation package, training and development and working environment on employee engagement in Nepalese commercial banks. The research also shows that that employee engagement in turn results in decline in employees’ turnover intentions and increase in innovative work related behavior. Engaged employee are the sources of yielding higher productivity in the organizations. Engaging employees is a long term task and cannot be accomplished by one training program, no matter how good its quality is. Organizations can improve engagement by opportunity thinking, enhancing employee decision making, and commitment. Every organization needs to think of good working environment,
26
training and development, lucrative compensation package and participation and involvement of employee to provide good output. Organizations need to instill a sense of involvement, positive emotions about their work and a sense of community in their employees. Emphasis should be given employee opinions and opportunities should be provided to them to be heard. Transparency from the senior leadership will also make the organization culture more open. The research revealed that it was suggested that organizations use appropriate training programmes to ensure supervisors build a supportive environment to empower their subordinates.
ReferencesBaumruk, R. (2004). The missing link: the role of employee
engagement in business success. Workspan, 47(11), 48-52.
Brown, M. C. (1998). The intellect industry: Profiting and learning from professional services firms. Chichester, England: John Wiley & Sons Ltd.
CIPD (2007), Employee Engagement, http://www.cipd.co.uk/subjects/empreltns/general/empengmt.htm?IsSrchRes=1
Crabtree, S. (2005). Engagement keeps the doctor away. Gallup Management
Journal, http://gmj.gallup.com (January 13).Gallup (2006). Gallup study: engaged employees
inspire company innovation: national survey finds that passionate workers are most likely to drive organizations forwardʹ, The Gallup Management Journal, http://gmj.gallup.com/content/24880/GallupStudyEngagedEmployees InspireCompany.aspx
Graen, G. B. (2008). Enriched engagement through assistance to systems’ change: a proposal, Industrial and Organisational Psychology, 1, 74–75
Hackman, J. R., & Oldham, G. (1980). Work redesign. Reading, MA: Addison-Wesley.
Herzberg, F., Mausner, B., & Snyderman, B. B. (1959). The motivation to work. New York, NY: John Wiley & Sons, Inc.
Hewitt Associates LLC. (2005). Employee engagement. RetrievedApril 29, 2005,from http://was4.hewitt.com/hewitt/services/talent/subtalent/ee_engagement.htm
Kahn, W. A. (1990). Psychological conditions of personal engagement and disengagement at work. Academy of Management Journal, 33(4), 692-724.
Kress, N. (2005). Engaging your employees through the power of communication.
Workspan, 48(5), 26-32.
Macey, W. H., & Schneider, B. (2008, March). The Meaning of Employee Engagement. Industrial and Organizational Psychology, 1(1), 3-30.
Melcrum (2007), The Practitioner’s Guide to: essential techniques for employee engagement, Melcrum Publishing Limited
Perrin, T. (2003). Working Today: Understanding What Drives Employee Engagement, Towers Perrin HR Services.
27
Statement of the ProblemThe recent mushroom growth of banks in Nepal has been continuous. As of December, 2019, there are 27 commercial banks in Nepal (Source: Nepal Rastra Bank). In context of Nepal, there is a high rate of Nepalese youth taking up management degrees aspiring to land themselves a job in bank, so much so that graduates with degrees that specialize on counterparts other than banking sector end up competing for the jobs as in their first career prospects. Hence, banking sectors are one of the most desired places to work in Nepal and the growth of financial institution has been undeniably noticeable over the past decade.
Despite such growth, Nepali Banking Sector has been going through inconsistent employee turnovers. having a reputation of one of the most desirable jobs in Nepal, banking sectors yet struggle in employee retention. Various factors such as prevalence of stiff competition, overall poor job satisfaction contribute in the threat of employee turnover. Job satisfaction, “Any combination of psychological and environmental circumstances that makes a person say, I am satisfied with my job.” (Neupane has cited Hoppok, 1953). It suggests that Job satisfaction is subjective and differs from each individual considering their best interest might be in external environment, career development or financial benefits. This is one of the reasons why the brain-drain (Foreign employment) is increasing in Nepal. In this scenario individuals who are skilled for the banking sector are also after foreign employment. So, this adds another big threat in banks to
retain this skilled manpower while competing with global employers.
Career satisfaction has been taken in as the main internal consideration in regards to retention problems. Adhikari has cited Arthur, et al, (2005), “an outcome of a person’s career experiences, which may be explained as the accomplishment of desirable work-related outcomes at any point in a person’s world experiences overtime.” Which suggests career satisfaction is equal to career success, success being subjective to each individual. However, Boaman Richard has cited Denhardt et al, satisfaction is based on past experiences whereas motivation is tilted towards the future actions. Thus, causes of dissatisfaction of banking professionals like such have been explored in the previous studies. Unlike those studies, this research rather focuses on the future actions i.e. motivation. This study, therefore, is an attempt to provide clearer picture on the employee turnover and presenting motivation as an influential factor in hopes that the banking industry will be able to mitigate the turnover issues and enhance satisfaction level.
According to society for Human Resource Management (2010), “Motivation is generally defined as the psychological forces that determine the direction of person’s persistence in the face of obstacles.” Which means an individual’s perception regarding their organizational duties and responsibility fulfillment which results to better performance and higher productivity. Hence, Motivation is a psychological concept involved in getting something done by somebody else. The organization has a set of
Factors Affecting Employee Motivation of Banking Sectors in Nepal
Narayan Prasad Aryal, Aaditya Acharya & Ashim Hang LimbuSaraswati Multiple Campus, Tribhuvan University
Abstract Researches in the motivational fields reveal that unless employees do not feel satisfied, the aims and objectives of the organization cannot be attained. There is mushroom growth of banking sectors in countries carrying huge amount of investments. Hence, the research tries to investigate the key factors influencing the employee motivational factors of banking sectors.The research is based on the employees’ perception of motivational factors from three sample banks, authorized as “A” class. Preliminary survey has thrown some clues that leadership style of managers, recording and rewarding the best performer as key factors.
Keywords Employee motivation, organizational vision, leadership styles, external and internal rewards.
28
goals and objectives which are meant to be achieved by using available resources like physical resources, financial resource, human resources and information. All these resources except for human resources fall under category of technical resource. Which can be understood and used by given instructions and fixed techniques. But the human resources in organization are hard to understand. Even though we have a lot of theories, researches and findings in the subject of human resource management, but none of these are totally applicable in any organization because human resources in each organization is different. Even more to that: thought, behavior, and cognition process of each employee is different in the same organization.The manager is at the topmost in the organizational hierarchies. So, the role of manager is to understand the overall working process of motivation and use this to make his/her employee to perform the given task in the best way they can. Whenever the term motivation is used, it should describe “why a person does something” (Kendra Cherry, 2010). So, manager trying to motivate his/her employee; for example, to work an extra hour, or meet some client on the off day, should have an answer to his/her employee’s question: “why should I work?”. Answer to this question can be simple; organization will fulfill their needs if they work. Needs of human being can be classified in different types such as: physiological (basic) needs, security (safety) needs, affiliation (social) needs, esteem needs, and self-actualization needs, (Maslow, 1943).Not only the verbal assurance of fulfilling these needs of employee will motivate them, but they have to trust in the capacity and reputation of the organization that it can someday fulfill all their needs. This is why company with strong corporate image has less employee turnover rate than compared to the company with weak corporate image despite of what salary they pay to their employees.Motivation however isn’t one dimensional as Nepali, T. N. (2018) suggests it consists of willingness, ability and the environment to do the work. Managers must be able to maintain these terms in the employees for the motivation to effective. The objective of this research is concerned with the understanding of such phenomenon:
1. Employee motivational status in commercial bank of Nepal to identify various factors affecting it.
2. Employee performance
3. Labor relation
4. Training and development status
The paper further proceeds with literature review, and its expansion with additional reasons. Then the methodology is described further with collecting and analyzing of the data, then the paper concludes with discussion of the result.
ObjectivesThe objectives of this research are as follows:• To investigate the employee motivational status
in commercial bank of Nepal and identify various factors affecting it.
Literature ReviewMany researchers and scholars have propounded various theories and literatures regarding employee motivation in past. Theories and literatures that are applicable to use in today’s business environment is considered for review. Motivation is derived from Latin word: movere which means “to move”. Motivation is an older concept and is said to be evolved with introduction of organization and management. Davis and Palladino (2004) define motivation as “physiological and psychological factors that account for the arousal (energizing), direction, and persistence of behavior”. There are two forms of motivation Intrinsic and Extrinsic. Intrinsic motivation is concerned with skill development, Intellectual achievement and self-improvement whereas extrinsic motivation is concerned with approval, proof of ability or avoidance. There is also the prevalence of monetary and non-monetary rewards while motivating all of these motivation techniques are used in following two types of theories:1) Need theories2) Process theories
1) Need theories:It explains “what drives behavior?” This theory asserts that “desires” is what motivates an individual to satisfy their needs. (Essays, Uk,2018)In 1943, a human psychologist, Abraham Maslow developed a theory stating that human needs are unlimited and to fulfill these needs human are motivated to do given task. He believed that human needs are arranged in a hierarchical pattern from the basic needs to the highest-level needs. Only when the basic needs are fulfilled other higher needs are developed.
Another important theory was developed by Frederick Herzberg (1968) who was among the first behavioral scientists to look at employee motivation from different perspectives. After he conducted a research among 200 engineers and accountants; found that there are two types of needs or factors: hygiene factors and motivating factors. Hygiene factors are basic needs like company policy and administration, supervision, working conditions, salary, personal life, job security, status etc. The presence of these factors doesn’t motivate employees in the organization but in the absence, employees are
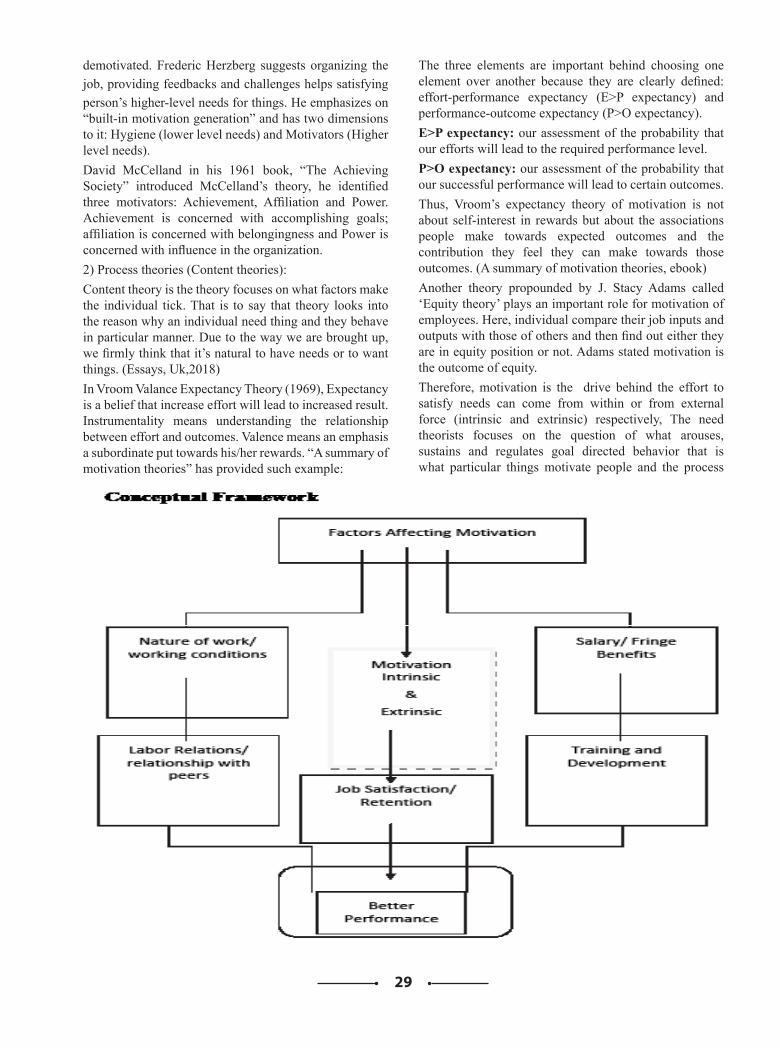
29
demotivated. Frederic Herzberg suggests organizing the job, providing feedbacks and challenges helps satisfying person’s higher-level needs for things. He emphasizes on “built-in motivation generation” and has two dimensions to it: Hygiene (lower level needs) and Motivators (Higher level needs). David McCelland in his 1961 book, “The Achieving Society” introduced McCelland’s theory, he identified three motivators: Achievement, Affiliation and Power. Achievement is concerned with accomplishing goals; affiliation is concerned with belongingness and Power is concerned with influence in the organization. 2) Process theories (Content theories):Content theory is the theory focuses on what factors make the individual tick. That is to say that theory looks into the reason why an individual need thing and they behave in particular manner. Due to the way we are brought up, we firmly think that it’s natural to have needs or to want things. (Essays, Uk,2018)In Vroom Valance Expectancy Theory (1969), Expectancy is a belief that increase effort will lead to increased result. Instrumentality means understanding the relationship between effort and outcomes. Valence means an emphasis a subordinate put towards his/her rewards. “A summary of motivation theories” has provided such example:
The three elements are important behind choosing one element over another because they are clearly defined: effort-performance expectancy (E>P expectancy) and performance-outcome expectancy (P>O expectancy).E>P expectancy: our assessment of the probability that our efforts will lead to the required performance level.P>O expectancy: our assessment of the probability that our successful performance will lead to certain outcomes.Thus, Vroom’s expectancy theory of motivation is not about self-interest in rewards but about the associations people make towards expected outcomes and the contribution they feel they can make towards those outcomes. (A summary of motivation theories, ebook)Another theory propounded by J. Stacy Adams called ‘Equity theory’ plays an important role for motivation of employees. Here, individual compare their job inputs and outputs with those of others and then find out either they are in equity position or not. Adams stated motivation is the outcome of equity.Therefore, motivation is the drive behind the effort to satisfy needs can come from within or from external force (intrinsic and extrinsic) respectively, The need theorists focuses on the question of what arouses, sustains and regulates goal directed behavior that is what particular things motivate people and the process
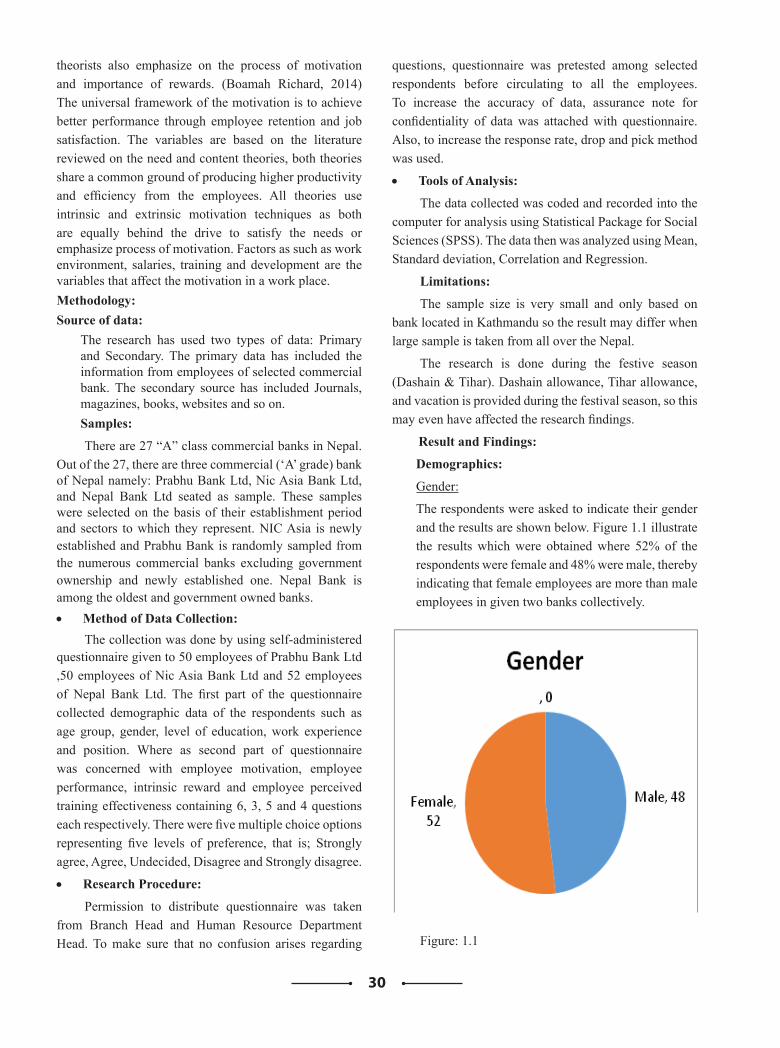
30
theorists also emphasize on the process of motivation and importance of rewards. (Boamah Richard, 2014) The universal framework of the motivation is to achieve better performance through employee retention and job satisfaction. The variables are based on the literature reviewed on the need and content theories, both theories share a common ground of producing higher productivity and efficiency from the employees. All theories use intrinsic and extrinsic motivation techniques as both are equally behind the drive to satisfy the needs or emphasize process of motivation. Factors as such as work environment, salaries, training and development are the variables that affect the motivation in a work place. Methodology:Source of data:
The research has used two types of data: Primary and Secondary. The primary data has included the information from employees of selected commercial bank. The secondary source has included Journals, magazines, books, websites and so on.Samples:
There are 27 “A” class commercial banks in Nepal. Out of the 27, there are three commercial (‘A’ grade) bank of Nepal namely: Prabhu Bank Ltd, Nic Asia Bank Ltd, and Nepal Bank Ltd seated as sample. These samples were selected on the basis of their establishment period and sectors to which they represent. NIC Asia is newly established and Prabhu Bank is randomly sampled from the numerous commercial banks excluding government ownership and newly established one. Nepal Bank is among the oldest and government owned banks.• Method of Data Collection:
The collection was done by using self-administered questionnaire given to 50 employees of Prabhu Bank Ltd ,50 employees of Nic Asia Bank Ltd and 52 employees of Nepal Bank Ltd. The first part of the questionnaire collected demographic data of the respondents such as age group, gender, level of education, work experience and position. Where as second part of questionnaire was concerned with employee motivation, employee performance, intrinsic reward and employee perceived training effectiveness containing 6, 3, 5 and 4 questions each respectively. There were five multiple choice options representing five levels of preference, that is; Strongly agree, Agree, Undecided, Disagree and Strongly disagree.
• Research Procedure:
Permission to distribute questionnaire was taken from Branch Head and Human Resource Department Head. To make sure that no confusion arises regarding
questions, questionnaire was pretested among selected respondents before circulating to all the employees. To increase the accuracy of data, assurance note for confidentiality of data was attached with questionnaire. Also, to increase the response rate, drop and pick method was used.
• Tools of Analysis:
The data collected was coded and recorded into the computer for analysis using Statistical Package for Social Sciences (SPSS). The data then was analyzed using Mean, Standard deviation, Correlation and Regression.
Limitations:
The sample size is very small and only based on bank located in Kathmandu so the result may differ when large sample is taken from all over the Nepal.
The research is done during the festive season (Dashain & Tihar). Dashain allowance, Tihar allowance, and vacation is provided during the festival season, so this may even have affected the research findings.
Result and Findings:
Demographics:
Gender:
The respondents were asked to indicate their gender and the results are shown below. Figure 1.1 illustrate the results which were obtained where 52% of the respondents were female and 48% were male, thereby indicating that female employees are more than male employees in given two banks collectively.
Figure: 1.1
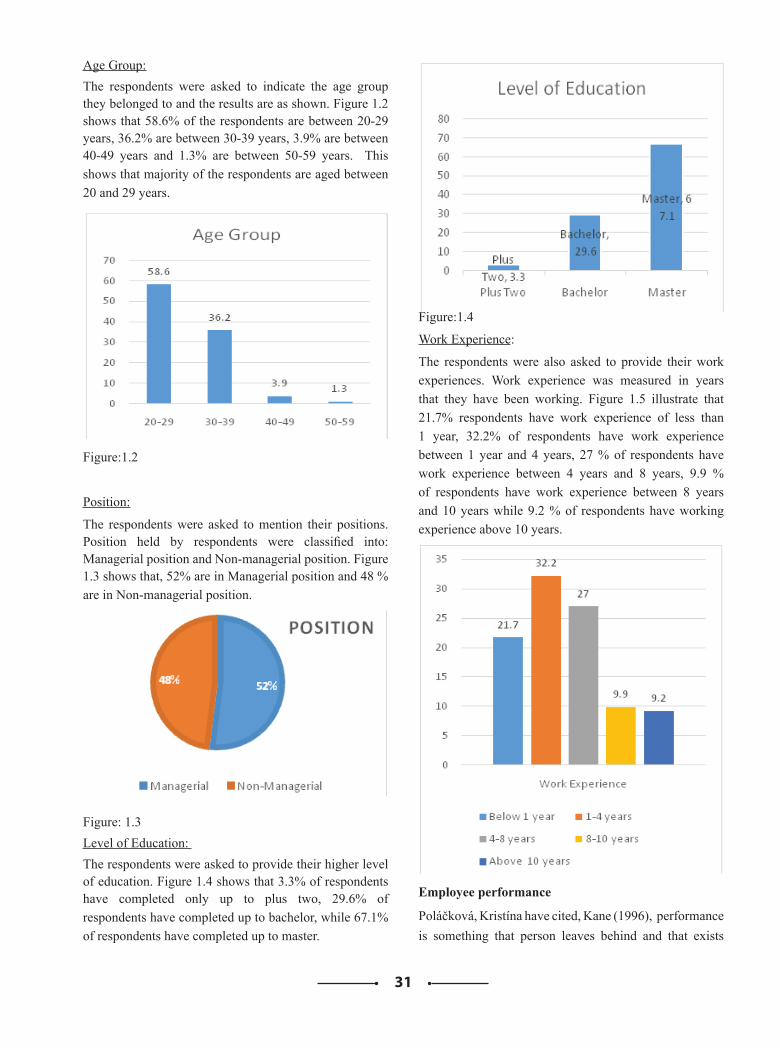
31
Age Group:The respondents were asked to indicate the age group they belonged to and the results are as shown. Figure 1.2 shows that 58.6% of the respondents are between 20-29 years, 36.2% are between 30-39 years, 3.9% are between 40-49 years and 1.3% are between 50-59 years. This shows that majority of the respondents are aged between 20 and 29 years.
Figure:1.2
Position:
The respondents were asked to mention their positions. Position held by respondents were classified into: Managerial position and Non-managerial position. Figure 1.3 shows that, 52% are in Managerial position and 48 % are in Non-managerial position.
Figure: 1.3Level of Education: The respondents were asked to provide their higher level of education. Figure 1.4 shows that 3.3% of respondents have completed only up to plus two, 29.6% of respondents have completed up to bachelor, while 67.1% of respondents have completed up to master.
Figure:1.4
Work Experience:
The respondents were also asked to provide their work experiences. Work experience was measured in years that they have been working. Figure 1.5 illustrate that 21.7% respondents have work experience of less than 1 year, 32.2% of respondents have work experience between 1 year and 4 years, 27 % of respondents have work experience between 4 years and 8 years, 9.9 % of respondents have work experience between 8 years and 10 years while 9.2 % of respondents have working experience above 10 years.
Employee performance
Poláčková, Kristína have cited, Kane (1996), performance is something that person leaves behind and that exists
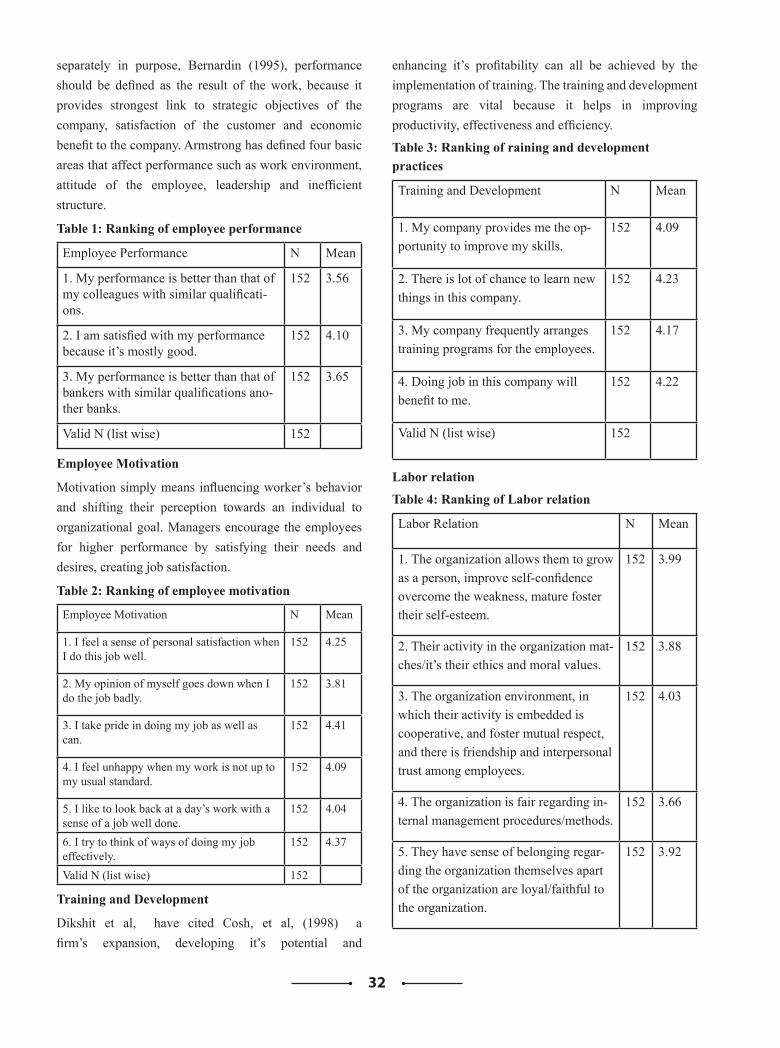
32
separately in purpose, Bernardin (1995), performance should be defined as the result of the work, because it provides strongest link to strategic objectives of the company, satisfaction of the customer and economic benefit to the company. Armstrong has defined four basic areas that affect performance such as work environment, attitude of the employee, leadership and inefficient structure.
Table 1: Ranking of employee performance
Employee Performance N Mean
1. My performance is better than that of my colleagues with similar qualificati-ons.
152 3.56
2. I am satisfied with my performance because it’s mostly good.
152 4.10
3. My performance is better than that of bankers with similar qualifications ano-ther banks.
152 3.65
Valid N (list wise) 152
Employee Motivation
Motivation simply means influencing worker’s behavior and shifting their perception towards an individual to organizational goal. Managers encourage the employees for higher performance by satisfying their needs and desires, creating job satisfaction.
Table 2: Ranking of employee motivation
Employee Motivation N Mean
1. I feel a sense of personal satisfaction when I do this job well.
152 4.25
2. My opinion of myself goes down when I do the job badly.
152 3.81
3. I take pride in doing my job as well as can.
152 4.41
4. I feel unhappy when my work is not up to my usual standard.
152 4.09
5. I like to look back at a day’s work with a sense of a job well done.
152 4.04
6. I try to think of ways of doing my job effectively.
152 4.37
Valid N (list wise) 152
Training and Development
Dikshit et al, have cited Cosh, et al, (1998) a firm’s expansion, developing it’s potential and
enhancing it’s profitability can all be achieved by the implementation of training. The training and development programs are vital because it helps in improving productivity, effectiveness and efficiency.
Table 3: Ranking of raining and development practices
Training and Development N Mean
1. My company provides me the op-portunity to improve my skills.
152 4.09
2. There is lot of chance to learn new things in this company.
152 4.23
3. My company frequently arranges training programs for the employees.
152 4.17
4. Doing job in this company will benefit to me.
152 4.22
Valid N (list wise) 152
Labor relation
Table 4: Ranking of Labor relation
Labor Relation N Mean
1. The organization allows them to grow as a person, improve self-confidence overcome the weakness, mature foster their self-esteem.
152 3.99
2. Their activity in the organization mat-ches/it’s their ethics and moral values.
152 3.88
3. The organization environment, in which their activity is embedded is cooperative, and foster mutual respect, and there is friendship and interpersonal trust among employees.
152 4.03
4. The organization is fair regarding in-ternal management procedures/methods.
152 3.66
5. They have sense of belonging regar-ding the organization themselves apart of the organization are loyal/faithful to the organization.
152 3.92
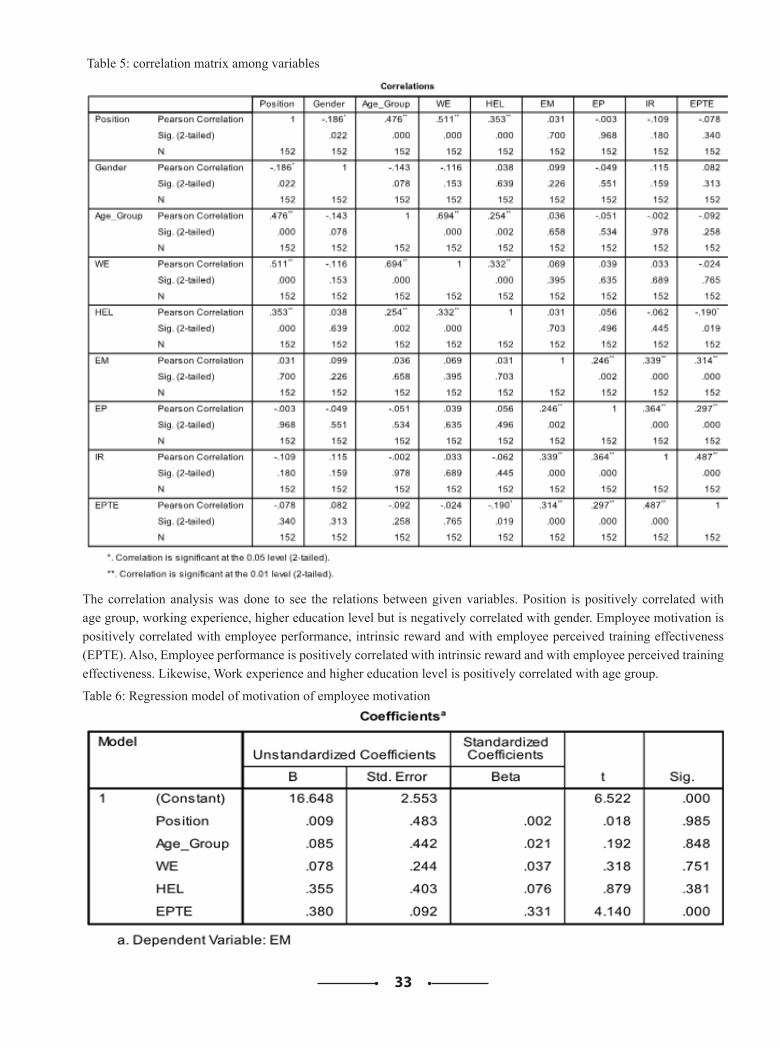
33
Table 5: correlation matrix among variables
The correlation analysis was done to see the relations between given variables. Position is positively correlated with age group, working experience, higher education level but is negatively correlated with gender. Employee motivation is positively correlated with employee performance, intrinsic reward and with employee perceived training effectiveness (EPTE). Also, Employee performance is positively correlated with intrinsic reward and with employee perceived training effectiveness. Likewise, Work experience and higher education level is positively correlated with age group.
Table 6: Regression model of motivation of employee motivation
34
References Adhikari, J. R. (2018) Work family conflict and career
satisfaction in banking sector of Nepal Essays, UK. (November 2018). Differences Between Need and Process Theories Of Motivation Philosophy Essay. Retrieved from https://www.ukessays.com/essays/philosophy/differences-between-need-and-process-theories-of-motivation-philosophy-essay.php?vref=1
Baron, B. & Byrne, B.(2010). Social Psychology. Pearson Education, Inc.
Boamah R.(2014) - The effect of motivation on employees performance, Boamah R.(2014) - The effect of motivation on employees performance thesis
Davis, P. (2004). Psychology
Dikshit, A. & Jain, T. (2017). Employee Retention, Training and Development in Banking Sector: A Review Paper. SSRN Electronic Journal. 10.2139/ssrn.2970490. https://doi.org/10.3126/nccj.v4i1.24728
https://www.verywellmind.com/kendra-cherry-2794702
Maslow, A.H.(1943). A Theory of Human Motivation.
Nepali, T. N. (2018). Motivation as Myth or Reality in Modern Corporate World in Nepal: A Survey. NCC Journal, 3(1), 185-199. https://doi.org/10.3126/nccj.v3i1.20262
Neupane, B. (2019). A Study on Factors Influencing the Job Satisfaction of Bank Employees in Nepal (With special reference to Kathmandu, Lalitpur, and Bhaktapur District). NCC Journal, 4(1), 9-15.
Poláčková, Kristína. (2016). MOTIVATION, PERFORMANCE AND EFFICIENCY. 2.. 17-19. 10.13140/RG.2.1.2353.5126.
Poudel, P.. (2014). Foundations of Human Resource Management.
The regression analysis was carried out to drive the equation between dependent variable with independent variables. For dependent variables, we have employee motivation where independent variables are position, age group, work experience, higher education level and employee perceived training effectiveness.
The given equation is drawn from the analysis:
Y= 16.648+0.009position+0.085Age_group+0.078WE + 0.355HEL + 0.380EPTE
Here ‘Y’ is employee motivation, it depends positively on all given indirect variables as such, 38% with Employee perceived training effectiveness, 35.5% with higher education level, 7.8% with work experience, 8.5% with age group and only 0.9% with position. The constant for the regression equation is 16.648.
ConclusionThe final result of this research is little interesting. Many researche paper have shown that giving recognition and increment in position will actually motivate employee in the organization. But this research shows position play very less role in motivating employees rather training plays crucial role in employee motivation. It may be because people want some value being added on their life by working in any organization.
However, the findings and conclusion drawn from this research should be verified once again by taking large sample size from all across the country. This research opens a wide scope for new researchers to examine the relation between promotion in position and employee motivation.
35
Comparion of Employee Motivation of Private and Government Owned Banks of Nepal
Narayan AryalResearch scholar, Lancoln University College, Malaysia
Saraswati Multiple CampusAaditya Acharya
Saraswati Multiple CampusSateesh Kumar Ojha
Lancoln University College, Malaysia
AbstractThe quality of service provided by the banking sectors has been polarizing between the private and government owned banks. The reason for such differences range from political to socio-economical factors. However, motivation of employees from the banking sector has been considered while in-specting the difference between private and government owned banks. Hence, an attempt has been made to compare employee motivation status.
Keywords Employee motivation, Employee performance, Bank employees.
Statement of The Problem Commercial banks in Nepal has been growing previously in a very rapid manner, the first privately owned commercial bank of Nepal, Nabil Bank limited, was established in the year 2041 BS. Due to the Maoist insurgency, the economic growth of Nepal remained stagnant and sluggish for a certain period of time, but since the end of insurgency the establishment of commercial banks has been established rapidly. However, the banking sector hasn’t been immune from economic instability, fragile and limited, stock and capital markets, and poor governance. Despite some of these limitations, banking systems in underdeveloped countries remain integral components of the general economic systems and they can be considered as key element in any development effort. (Jha and Hui has cited Zeinab, 2006) The commercial banks are divided into three separate groups based on ownership namely (i) public sector banks (ii) joint venture banks (iii) domestic private banks.
Financial units such as commercial banks are the back bone of the country. In order to flourish, it requires better execution in the banking services, which leads to the performance of the employees, we all know the performance of the employees are directly interlinked with the motivation of the workers. “Motivation is an individual’s degree of willingness to exert and maintain effort towards organizational goals” Dieleman, M, et
al, (2003) The motivation status amongst the private and government companies has been quite divided as traditionally, the government owned banks are more likely to be affected due to the direct political interference in the banking activities. Government sector employees are often stereotyped as underperformers, lazy and inadequate. Meanwhile the private sector employees are considered to be more aware and obedient in regards to work.
However, very less effort has been made to identify the given environmental situations and the causes behind the gap between the commercial banks with different ownerships. This paper analyzes the motivation status in private and government sector banks as the comparison between the sample banks, it is an attempt to bridge the gap between the private and government sector, and at the same time point out the differences and similarities in the motivating factor and causal reason behind them. The main objectives of this paper are:
• To examine the current level of employee motivation status in both government and private sector banks.
• To identify the motivational factors available in the employees.
• Compare and contrast between the employees of public and private sector.
36
Literature Review Alongside the expansion of banking sector it has been crucial to preserve the quality of service provided. As usually the perception regarding the private and government banks are based on the quality of services they provide, due to political instability and incapability of government, administration on government organization seems very weak which is why services they are providing to consumer is poor. Employee motivation plays a important role whilst determination of services the organization provides, the organizational behaviour towards their subordinates reflects on the serivces they provide.
According to MacMillian (2007) what motivates an individual is difficult to determine as the preferences may vary from one individual to another, thus one of the biggest blunders made by the managers is overestimating or underestimating the mind of their employees. But in order to get efficient and effective work from the employees it is necessary for the managers to determine what are the drivers or factors that motivate employees to give their full potential (Nawaz Ahmed, at, el cited Hahn and Kleiner 2002, Westover 2008).
(Sadia and Uzma Rahsid have cited Conway &Biner, 2002; Coyle- Shapiro, 2002) A review shows that five dimensions are prevalent in many operationalization of the job contents. First, financial rewards refer to the provision of just and appropriate rewards. Second, Job Content refers to the provision of right job i.e. job for which one has the best aptitude and attitude, challenging, varied and interesting work. Third, career development opportunities refer to opportunities for promotion and development within the organization or field of work. Fourth, supportive & social atmosphere refers to the congenial and cooperative working environment and, fifth, respect for private life refers to the employer‘s respect and understanding for the employee‘s personal situation.
Nepal’s scenario there are very few government sector companies that are able to keep their employees motivated as the motivational level of the employees in government sectors are usually low in the developing countries like Nepal. Since the government and private sectors have different organizational systems, working environment, and career development opportunities, it occurs that the motivational drive between the employees of these organizations with different traits also differs.
MethodologySample &Source of data:
Two commercial (‘A’ grade) bank of Nepal namely: NIC Asia Bank Ltd and Neal Bank Ltd. Primary source of data includes questionnaire filled from employees of both banks. Nic Asia is emerging private bank whereas Nepal Bank is well-established government bank. While secondary data are taken from different book, journal and websites.
Method of data collectionThe questionnaire was collected from 50 employees of Nic Asia Bank Ltd and 52 employees of Nepal Bank Ltd. The first part of the questionnaire collected demographic data of the respondents such as age group, gender, level of education, work experience and position. Whereas second part of questionnaire was concerned with employee motivation, employee performance, intrinsic reward and employee perceived training effectiveness containing 6, 3, 5 and 4 questions each respectively. There were five multiple-choice options representing five levels of preference, that is; strongly agree, Agree, Undecided, Disagree and strongly disagree.
Research ProcedureTo circulate the questionnaire, permission was obtained from Branch manager of each branch and human resource head. The questionnaire was explained to few respondents and drop and pick approach was used to increase the response rate.
Tools of AnalysisThe data collected was recorded and analyzed using Statistical Package for Social Sciences (SPSS). Frequencies and descriptive analysis were done along with T-test.
Result and FindingsDemographics:
Gender:
In Table 1 below the gender, comparison between two banks is presented. The percentage of male employees in Nic Asia is 52% while 51.9% in Nepal Bank. In addition, percentage of female employees is 48% in NIC Asia and 48.1% in Nepal Bank. We can conclude, there is no significant difference between private bank and government bank regarding gender.
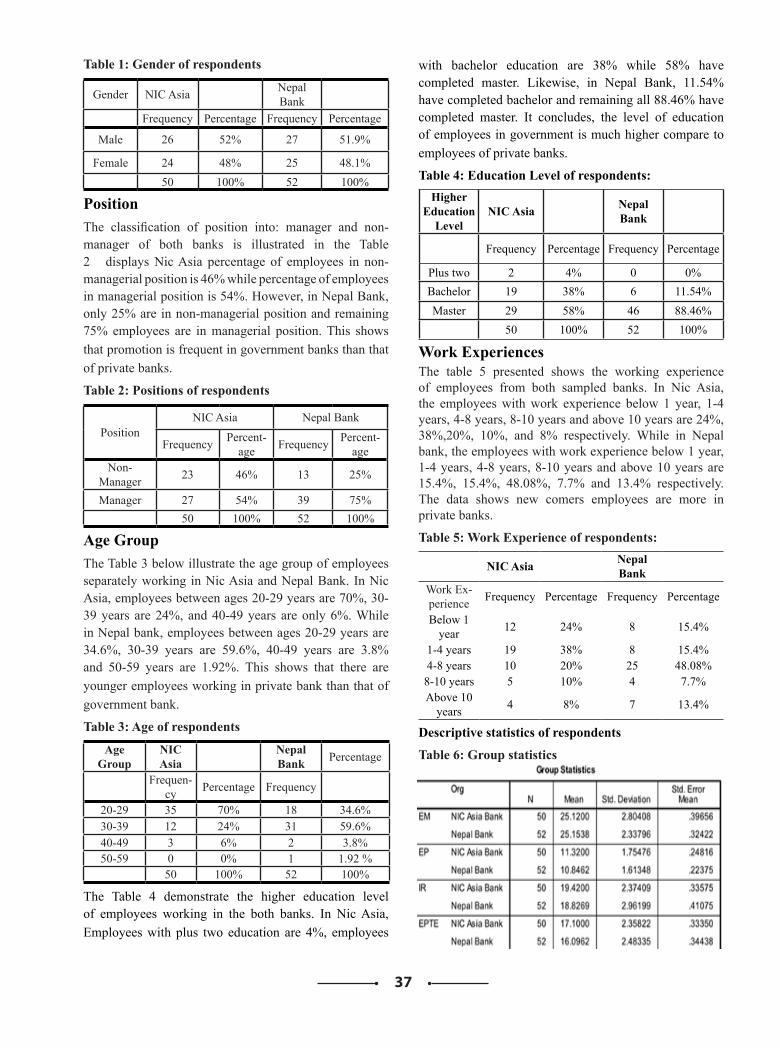
37
Table 1: Gender of respondents
Gender NIC Asia Nepal Bank
Frequency Percentage Frequency Percentage
Male 26 52% 27 51.9%
Female 24 48% 25 48.1%50 100% 52 100%
Position The classification of position into: manager and non-manager of both banks is illustrated in the Table 2 displays Nic Asia percentage of employees in non-managerial position is 46% while percentage of employees in managerial position is 54%. However, in Nepal Bank, only 25% are in non-managerial position and remaining 75% employees are in managerial position. This shows that promotion is frequent in government banks than that of private banks.
Table 2: Positions of respondents
PositionNIC Asia Nepal Bank
Frequency Percent-age Frequency Percent-
age Non-
Manager 23 46% 13 25%
Manager 27 54% 39 75%50 100% 52 100%
Age GroupThe Table 3 below illustrate the age group of employees separately working in Nic Asia and Nepal Bank. In Nic Asia, employees between ages 20-29 years are 70%, 30-39 years are 24%, and 40-49 years are only 6%. While in Nepal bank, employees between ages 20-29 years are 34.6%, 30-39 years are 59.6%, 40-49 years are 3.8% and 50-59 years are 1.92%. This shows that there are younger employees working in private bank than that of government bank.
Table 3: Age of respondents
Age Group
NIC Asia
Nepal Bank Percentage
Frequen-cy Percentage Frequency
20-29 35 70% 18 34.6%30-39 12 24% 31 59.6%40-49 3 6% 2 3.8%50-59 0 0% 1 1.92 %
50 100% 52 100%
The Table 4 demonstrate the higher education level of employees working in the both banks. In Nic Asia, Employees with plus two education are 4%, employees
with bachelor education are 38% while 58% have completed master. Likewise, in Nepal Bank, 11.54% have completed bachelor and remaining all 88.46% have completed master. It concludes, the level of education of employees in government is much higher compare to employees of private banks.
Table 4: Education Level of respondents:Higher
Education Level
NIC Asia Nepal Bank
Frequency Percentage Frequency Percentage
Plus two 2 4% 0 0%Bachelor 19 38% 6 11.54%Master 29 58% 46 88.46%
50 100% 52 100%
Work ExperiencesThe table 5 presented shows the working experience of employees from both sampled banks. In Nic Asia, the employees with work experience below 1 year, 1-4 years, 4-8 years, 8-10 years and above 10 years are 24%, 38%,20%, 10%, and 8% respectively. While in Nepal bank, the employees with work experience below 1 year, 1-4 years, 4-8 years, 8-10 years and above 10 years are 15.4%, 15.4%, 48.08%, 7.7% and 13.4% respectively. The data shows new comers employees are more in private banks.
Table 5: Work Experience of respondents:
NIC Asia Nepal Bank
Work Ex-perience Frequency Percentage Frequency Percentage
Below 1 year 12 24% 8 15.4%
1-4 years 19 38% 8 15.4%4-8 years 10 20% 25 48.08%8-10 years 5 10% 4 7.7%Above 10
years 4 8% 7 13.4%
Descriptive statistics of respondents
Table 6: Group statistics
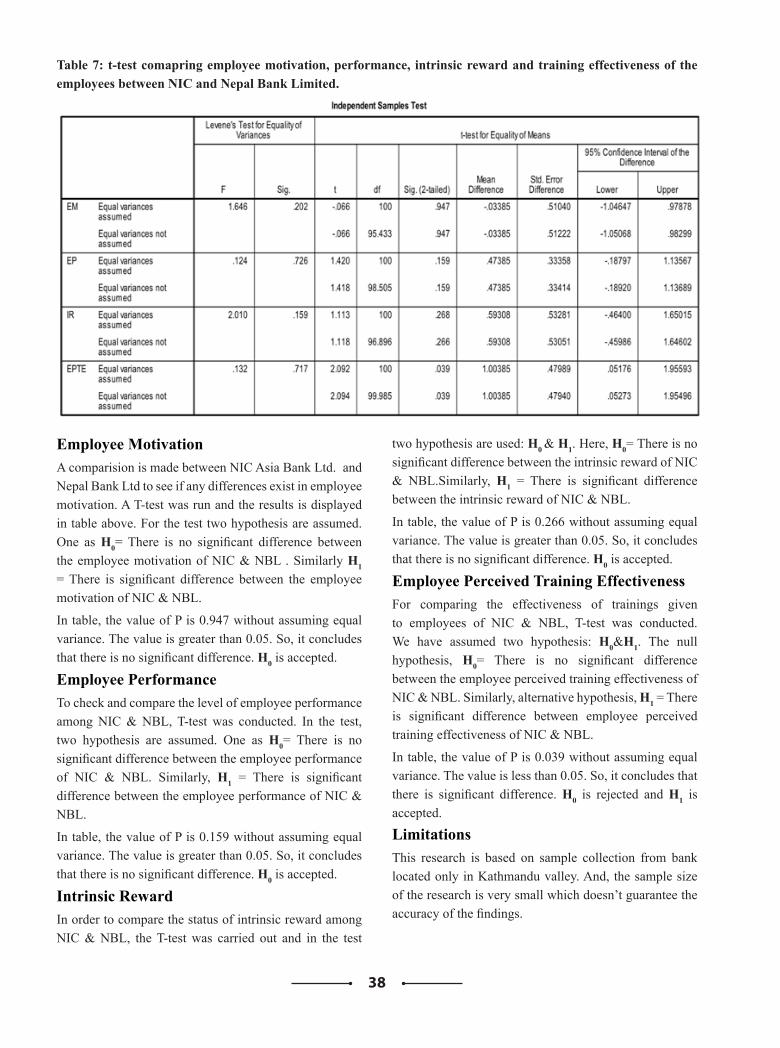
38
Table 7: t-test comapring employee motivation, performance, intrinsic reward and training effectiveness of the employees between NIC and Nepal Bank Limited.
Employee MotivationA comparision is made between NIC Asia Bank Ltd. and Nepal Bank Ltd to see if any differences exist in employee motivation. A T-test was run and the results is displayed in table above. For the test two hypothesis are assumed. One as H0= There is no significant difference between the employee motivation of NIC & NBL . Similarly H1 = There is significant difference between the employee motivation of NIC & NBL.
In table, the value of P is 0.947 without assuming equal variance. The value is greater than 0.05. So, it concludes that there is no significant difference. H0 is accepted.
Employee PerformanceTo check and compare the level of employee performance among NIC & NBL, T-test was conducted. In the test, two hypothesis are assumed. One as H0= There is no significant difference between the employee performance of NIC & NBL. Similarly, H1 = There is significant difference between the employee performance of NIC & NBL.
In table, the value of P is 0.159 without assuming equal variance. The value is greater than 0.05. So, it concludes that there is no significant difference. H0 is accepted.
Intrinsic RewardIn order to compare the status of intrinsic reward among NIC & NBL, the T-test was carried out and in the test
two hypothesis are used: H0 & H1. Here, H0= There is no significant difference between the intrinsic reward of NIC & NBL.Similarly, H1 = There is significant difference between the intrinsic reward of NIC & NBL.
In table, the value of P is 0.266 without assuming equal variance. The value is greater than 0.05. So, it concludes that there is no significant difference. H0 is accepted.
Employee Perceived Training EffectivenessFor comparing the effectiveness of trainings given to employees of NIC & NBL, T-test was conducted. We have assumed two hypothesis: H0&H1. The null hypothesis, H0= There is no significant difference between the employee perceived training effectiveness of NIC & NBL. Similarly, alternative hypothesis, H1 = There is significant difference between employee perceived training effectiveness of NIC & NBL.
In table, the value of P is 0.039 without assuming equal variance. The value is less than 0.05. So, it concludes that there is significant difference. H0 is rejected and H1 is accepted.
LimitationsThis research is based on sample collection from bank located only in Kathmandu valley. And, the sample size of the research is very small which doesn’t guarantee the accuracy of the findings.
39
ConclusionTo the contrary, of our predictions and general understanding, the status of employee motivation is not very different among private and government banks. Yet the trainings and development effectiveness in government bank was found comparatively low than that of a private bank. Therefore, this research suggests that government banks should emphasize more on employee trainings and development.
ReferencesJha, A. K. & Xiaofeng H. (2012). A comparison of
financial performance of commercial banks: A case study of Nepal. African Journal of Business Management. 10.5897/AJBM11.3073.
Ahmed, Rizwan & Mangi, Riaz & Ahmad, Nawaz & Karachi, Pakistan & Rizwan, Raheem & Ahmed, & Riaz, Ahmed & Palwishah, Rana & Pakistan, Karachi & Susan, Anmool & Ahmed, Raheem. (2018). Factors Motivating Employees in Public Sector Banks: An Empirical Investigation.
Sadia Rashid, Uzma Rashid , Work Motivation Differences between Public and Private Sector.
40
Acceptance of Health Monitoring Technology by Independently Living Elderly
Uthai Tanlamaia, Aim-Orn Jaikengkitb, Trirat Jarutachc
a Department of Accountancy, Chulalongkorn Business School,Chulalongkorn University, Bangkok 10330, ThailandTel: +668-1628-3863, Email: [email protected]
b Department of Accountancy, Chulalongkorn Business School,Chulalongkorn University, Bangkok 10330, Thailand
Tel: +668-7559-1155, Email: [email protected] c Center of Excellence in Universal Design, Chulalongkorn University,
Bangkok 10330, Thailand Tel: +668-9040-7351, Email: [email protected]
Abstract
The objective of this study is to explore the needs and the factors that motivate elders to use activity monitoring devices on a routine basis. These wearable devices would monitor the physical movements and analyze the activity patterns of individual elderly. The scope of the study is elderly live in a nursing home built by a renowned charity in Thailand. This facility is apartments for elders that have 24/7 medical personnel on-site. The apartment allows independent living retirees until they choose to leave or until death. Ninety-four elderly returned the survey examining the intention to use the activity monitoring wearables. Three factors influencing the intention to use health monitoring technology include acceptance of personal health data collection, acceptance of technology, and acceptance of a health monitoring device. The result shows positive relationships between these acceptance factors and the elderly intention to use the devices. There is no difference in the relationships found among the three different age-groups—young-old (60-69), older-old (70-79), and oldest-old (80 and above). Most elderly perceive the benefits of health monitoring technology at a moderate level. The young-old elderly are less cautious about the trade-off between privacy and benefits of health monitoring technology. The three most voted reasons for accepting these devices are improving healthcare standards, allow independent living, and improve quality of life. Device cost and difficult to use are the two most concerns of elder’s adoption.
Keywords
Internet of Things, the Technology Acceptance Model, Health monitoring technology, Activity monitoring devices
IntroductionTo cope with the aging society, the government from a developing country like Thailand has to increase the healthcare budget for the elderly. Although government subsidies for health-related expenses have increased in recent years, the rising cost of healthcare expenditures for elders living at home with their families still puts a great burden on them. Sasiwongsaroj & Burasit (2019) discuss the problem of the public healthcare management system in Thailand. They point out the report from the Ministry of Public Health that the Thai government increases the elder’s healthcare budget for medical technologies. However, the distributions of these medical instruments are not equally to all elderly – the majority of them are available in the metropolis, and not the provincial areas.
One of the greatest challenges for all parties involved is how to help the elderly to have good health, less illness, and maintain independent living as long as possible. A health monitoring device for activity tracking can be part of the solution for the health promotion and fall detection of the elderly. Nevertheless, the elderly may have a reservation about the use of these health tracking devices. To adopt health monitoring technology, one must realize that they may have to compromise the privacy of their health data with more convenient healthcare services. The elderly also need to learn and keep up with new technology to use it to promote their quality of life continuingly.
The objective of this study is to explore the factors that motivate elders to use activity monitoring devices on a routine basis. The survey research focuses on three factors
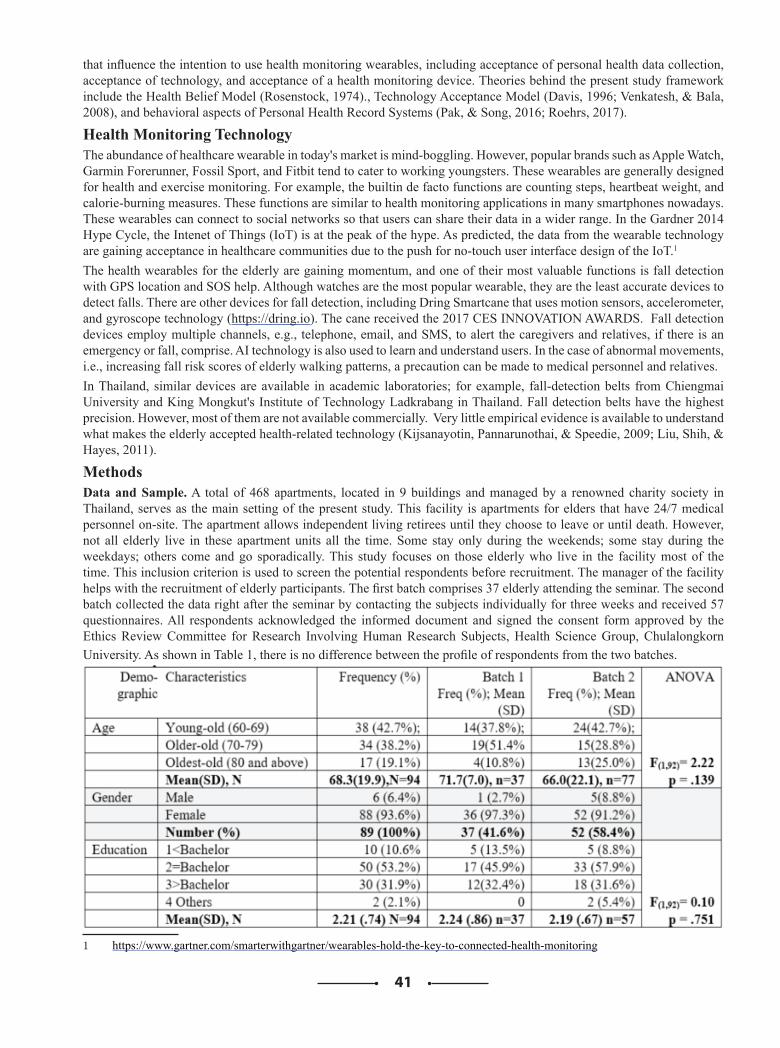
41
that influence the intention to use health monitoring wearables, including acceptance of personal health data collection, acceptance of technology, and acceptance of a health monitoring device. Theories behind the present study framework include the Health Belief Model (Rosenstock, 1974)., Technology Acceptance Model (Davis, 1996; Venkatesh, & Bala, 2008), and behavioral aspects of Personal Health Record Systems (Pak, & Song, 2016; Roehrs, 2017).
Health Monitoring TechnologyThe abundance of healthcare wearable in today's market is mind-boggling. However, popular brands such as Apple Watch, Garmin Forerunner, Fossil Sport, and Fitbit tend to cater to working youngsters. These wearables are generally designed for health and exercise monitoring. For example, the builtin de facto functions are counting steps, heartbeat weight, and calorie-burning measures. These functions are similar to health monitoring applications in many smartphones nowadays. These wearables can connect to social networks so that users can share their data in a wider range. In the Gardner 2014 Hype Cycle, the Intenet of Things (IoT) is at the peak of the hype. As predicted, the data from the wearable technology are gaining acceptance in healthcare communities due to the push for no-touch user interface design of the IoT.1 The health wearables for the elderly are gaining momentum, and one of their most valuable functions is fall detection with GPS location and SOS help. Although watches are the most popular wearable, they are the least accurate devices to detect falls. There are other devices for fall detection, including Dring Smartcane that uses motion sensors, accelerometer, and gyroscope technology (https://dring.io). The cane received the 2017 CES INNOVATION AWARDS. Fall detection devices employ multiple channels, e.g., telephone, email, and SMS, to alert the caregivers and relatives, if there is an emergency or fall, comprise. AI technology is also used to learn and understand users. In the case of abnormal movements, i.e., increasing fall risk scores of elderly walking patterns, a precaution can be made to medical personnel and relatives. In Thailand, similar devices are available in academic laboratories; for example, fall-detection belts from Chiengmai University and King Mongkut's Institute of Technology Ladkrabang in Thailand. Fall detection belts have the highest precision. However, most of them are not available commercially. Very little empirical evidence is available to understand what makes the elderly accepted health-related technology (Kijsanayotin, Pannarunothai, & Speedie, 2009; Liu, Shih, & Hayes, 2011).
MethodsData and Sample. A total of 468 apartments, located in 9 buildings and managed by a renowned charity society in Thailand, serves as the main setting of the present study. This facility is apartments for elders that have 24/7 medical personnel on-site. The apartment allows independent living retirees until they choose to leave or until death. However, not all elderly live in these apartment units all the time. Some stay only during the weekends; some stay during the weekdays; others come and go sporadically. This study focuses on those elderly who live in the facility most of the time. This inclusion criterion is used to screen the potential respondents before recruitment. The manager of the facility helps with the recruitment of elderly participants. The first batch comprises 37 elderly attending the seminar. The second batch collected the data right after the seminar by contacting the subjects individually for three weeks and received 57 questionnaires. All respondents acknowledged the informed document and signed the consent form approved by the Ethics Review Committee for Research Involving Human Research Subjects, Health Science Group, Chulalongkorn University. As shown in Table 1, there is no difference between the profile of respondents from the two batches.
Table 1. Respondent Profiles between Data Collection
1 https://www.gartner.com/smarterwithgartner/wearables-hold-the-key-to-connected-health-monitoring
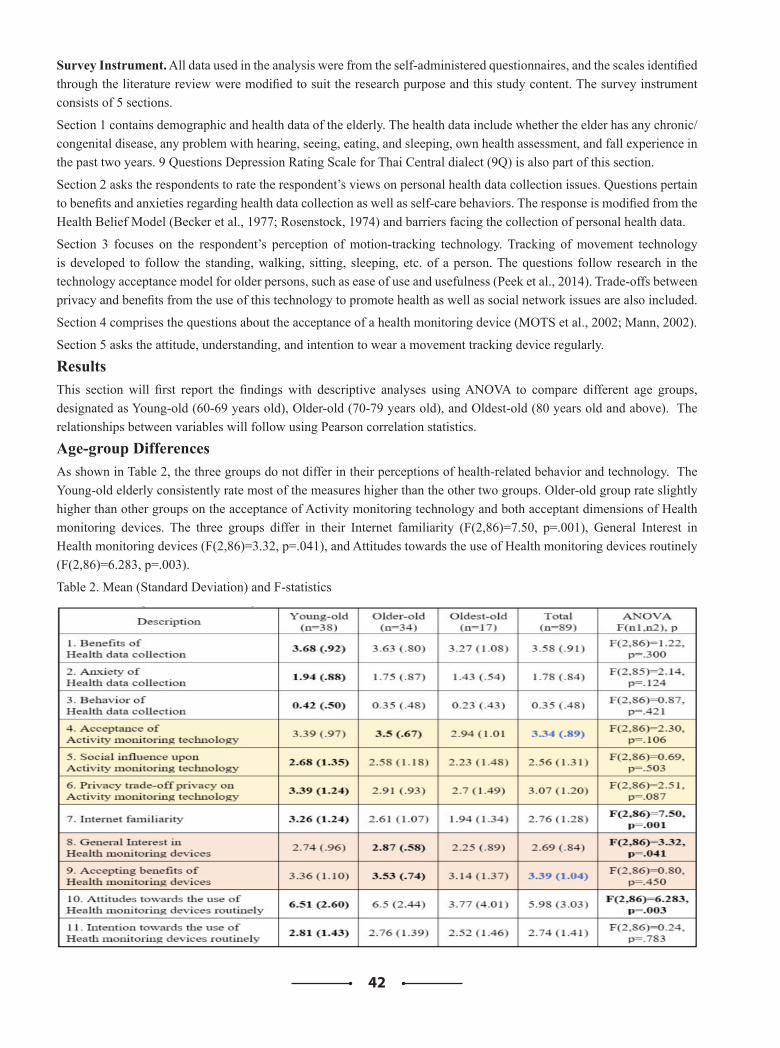
42
Survey Instrument. All data used in the analysis were from the self-administered questionnaires, and the scales identified through the literature review were modified to suit the research purpose and this study content. The survey instrument consists of 5 sections.
Section 1 contains demographic and health data of the elderly. The health data include whether the elder has any chronic/ congenital disease, any problem with hearing, seeing, eating, and sleeping, own health assessment, and fall experience in the past two years. 9 Questions Depression Rating Scale for Thai Central dialect (9Q) is also part of this section.
Section 2 asks the respondents to rate the respondent’s views on personal health data collection issues. Questions pertain to benefits and anxieties regarding health data collection as well as self-care behaviors. The response is modified from the Health Belief Model (Becker et al., 1977; Rosenstock, 1974) and barriers facing the collection of personal health data.
Section 3 focuses on the respondent’s perception of motion-tracking technology. Tracking of movement technology is developed to follow the standing, walking, sitting, sleeping, etc. of a person. The questions follow research in the technology acceptance model for older persons, such as ease of use and usefulness (Peek et al., 2014). Trade-offs between privacy and benefits from the use of this technology to promote health as well as social network issues are also included.
Section 4 comprises the questions about the acceptance of a health monitoring device (MOTS et al., 2002; Mann, 2002).
Section 5 asks the attitude, understanding, and intention to wear a movement tracking device regularly.
ResultsThis section will first report the findings with descriptive analyses using ANOVA to compare different age groups, designated as Young-old (60-69 years old), Older-old (70-79 years old), and Oldest-old (80 years old and above). The relationships between variables will follow using Pearson correlation statistics.
Age-group DifferencesAs shown in Table 2, the three groups do not differ in their perceptions of health-related behavior and technology. The Young-old elderly consistently rate most of the measures higher than the other two groups. Older-old group rate slightly higher than other groups on the acceptance of Activity monitoring technology and both acceptant dimensions of Health monitoring devices. The three groups differ in their Internet familiarity (F(2,86)=7.50, p=.001), General Interest in Health monitoring devices (F(2,86)=3.32, p=.041), and Attitudes towards the use of Health monitoring devices routinely (F(2,86)=6.283, p=.003).
Table 2. Mean (Standard Deviation) and F-statistics
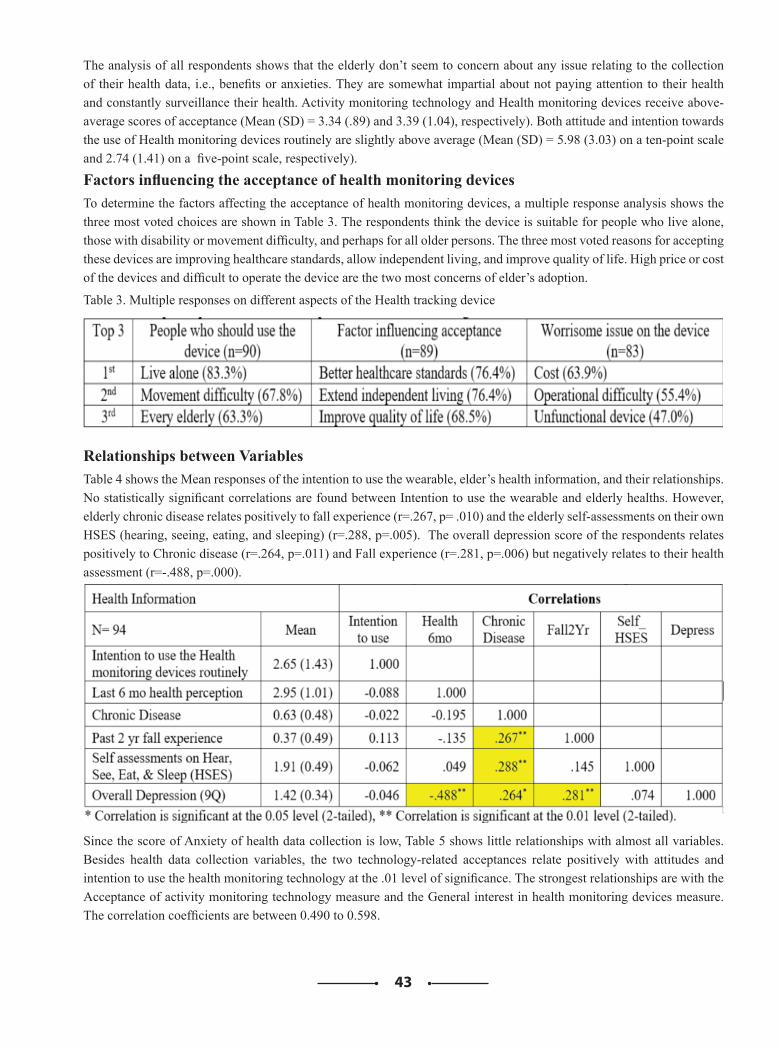
43
The analysis of all respondents shows that the elderly don’t seem to concern about any issue relating to the collection of their health data, i.e., benefits or anxieties. They are somewhat impartial about not paying attention to their health and constantly surveillance their health. Activity monitoring technology and Health monitoring devices receive above-average scores of acceptance (Mean (SD) = 3.34 (.89) and 3.39 (1.04), respectively). Both attitude and intention towards the use of Health monitoring devices routinely are slightly above average (Mean (SD) = 5.98 (3.03) on a ten-point scale and 2.74 (1.41) on a five-point scale, respectively).
Factors influencing the acceptance of health monitoring devicesTo determine the factors affecting the acceptance of health monitoring devices, a multiple response analysis shows the three most voted choices are shown in Table 3. The respondents think the device is suitable for people who live alone, those with disability or movement difficulty, and perhaps for all older persons. The three most voted reasons for accepting these devices are improving healthcare standards, allow independent living, and improve quality of life. High price or cost of the devices and difficult to operate the device are the two most concerns of elder’s adoption.
Table 3. Multiple responses on different aspects of the Health tracking device
Relationships between VariablesTable 4 shows the Mean responses of the intention to use the wearable, elder’s health information, and their relationships. No statistically significant correlations are found between Intention to use the wearable and elderly healths. However, elderly chronic disease relates positively to fall experience (r=.267, p= .010) and the elderly self-assessments on their own HSES (hearing, seeing, eating, and sleeping) (r=.288, p=.005). The overall depression score of the respondents relates positively to Chronic disease (r=.264, p=.011) and Fall experience (r=.281, p=.006) but negatively relates to their health assessment (r=-.488, p=.000).
Table 4. Correlations between Health information and Elderly Intention to use the Health monitoring devices routinely
Since the score of Anxiety of health data collection is low, Table 5 shows little relationships with almost all variables. Besides health data collection variables, the two technology-related acceptances relate positively with attitudes and intention to use the health monitoring technology at the .01 level of significance. The strongest relationships are with the Acceptance of activity monitoring technology measure and the General interest in health monitoring devices measure. The correlation coefficients are between 0.490 to 0.598.
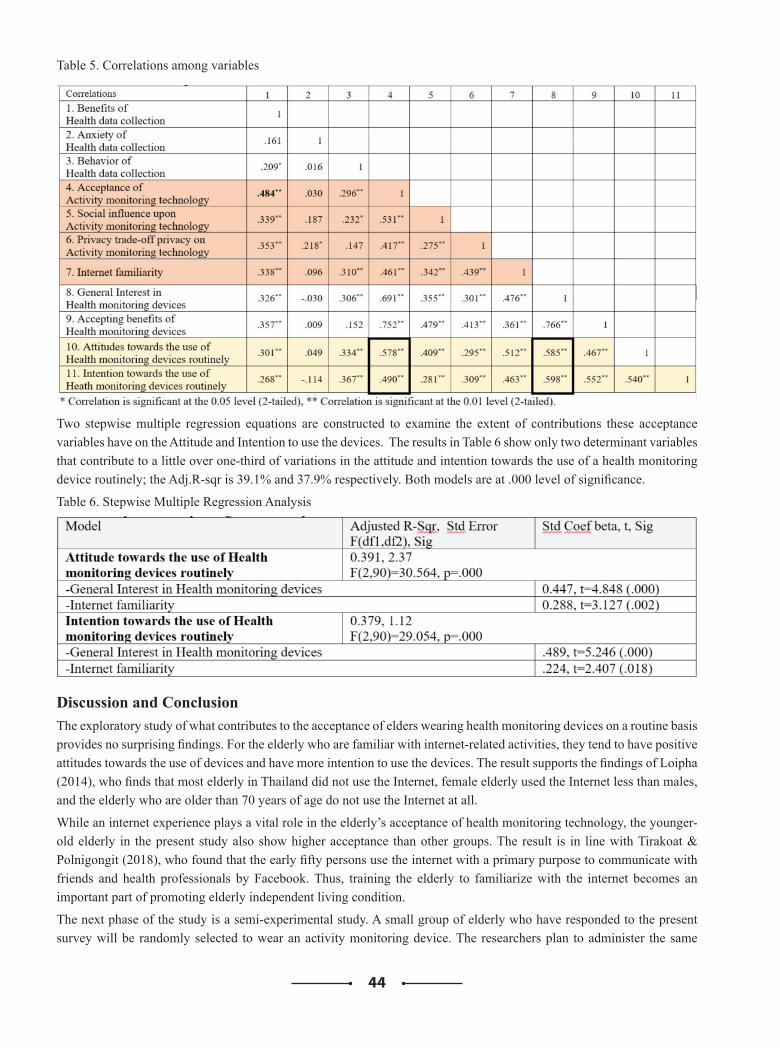
44
Table 5. Correlations among variables
Two stepwise multiple regression equations are constructed to examine the extent of contributions these acceptance variables have on the Attitude and Intention to use the devices. The results in Table 6 show only two determinant variables that contribute to a little over one-third of variations in the attitude and intention towards the use of a health monitoring device routinely; the Adj.R-sqr is 39.1% and 37.9% respectively. Both models are at .000 level of significance.
Table 6. Stepwise Multiple Regression Analysis
Discussion and ConclusionThe exploratory study of what contributes to the acceptance of elders wearing health monitoring devices on a routine basis provides no surprising findings. For the elderly who are familiar with internet-related activities, they tend to have positive attitudes towards the use of devices and have more intention to use the devices. The result supports the findings of Loipha (2014), who finds that most elderly in Thailand did not use the Internet, female elderly used the Internet less than males, and the elderly who are older than 70 years of age do not use the Internet at all.
While an internet experience plays a vital role in the elderly’s acceptance of health monitoring technology, the younger-old elderly in the present study also show higher acceptance than other groups. The result is in line with Tirakoat & Polnigongit (2018), who found that the early fifty persons use the internet with a primary purpose to communicate with friends and health professionals by Facebook. Thus, training the elderly to familiarize with the internet becomes an important part of promoting elderly independent living condition.
The next phase of the study is a semi-experimental study. A small group of elderly who have responded to the present survey will be randomly selected to wear an activity monitoring device. The researchers plan to administer the same
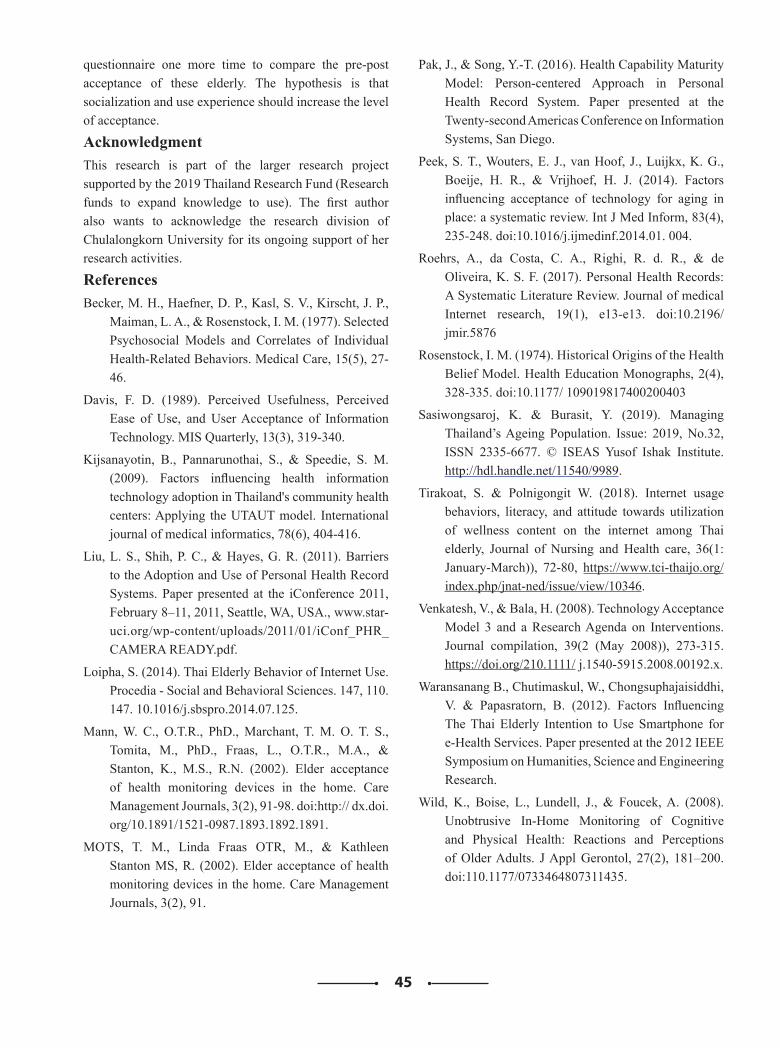
45
questionnaire one more time to compare the pre-post acceptance of these elderly. The hypothesis is that socialization and use experience should increase the level of acceptance.
AcknowledgmentThis research is part of the larger research project supported by the 2019 Thailand Research Fund (Research funds to expand knowledge to use). The first author also wants to acknowledge the research division of Chulalongkorn University for its ongoing support of her research activities.
ReferencesBecker, M. H., Haefner, D. P., Kasl, S. V., Kirscht, J. P.,
Maiman, L. A., & Rosenstock, I. M. (1977). Selected Psychosocial Models and Correlates of Individual Health-Related Behaviors. Medical Care, 15(5), 27-46.
Davis, F. D. (1989). Perceived Usefulness, Perceived Ease of Use, and User Acceptance of Information Technology. MIS Quarterly, 13(3), 319-340.
Kijsanayotin, B., Pannarunothai, S., & Speedie, S. M. (2009). Factors influencing health information technology adoption in Thailand's community health centers: Applying the UTAUT model. International journal of medical informatics, 78(6), 404-416.
Liu, L. S., Shih, P. C., & Hayes, G. R. (2011). Barriers to the Adoption and Use of Personal Health Record Systems. Paper presented at the iConference 2011, February 8–11, 2011, Seattle, WA, USA., www.star-uci.org/wp-content/uploads/2011/01/iConf_PHR_CAMERA READY.pdf.
Loipha, S. (2014). Thai Elderly Behavior of Internet Use. Procedia - Social and Behavioral Sciences. 147, 110. 147. 10.1016/j.sbspro.2014.07.125.
Mann, W. C., O.T.R., PhD., Marchant, T. M. O. T. S., Tomita, M., PhD., Fraas, L., O.T.R., M.A., & Stanton, K., M.S., R.N. (2002). Elder acceptance of health monitoring devices in the home. Care Management Journals, 3(2), 91-98. doi:http:// dx.doi.org/10.1891/1521-0987.1893.1892.1891.
MOTS, T. M., Linda Fraas OTR, M., & Kathleen Stanton MS, R. (2002). Elder acceptance of health monitoring devices in the home. Care Management Journals, 3(2), 91.
Pak, J., & Song, Y.-T. (2016). Health Capability Maturity Model: Person-centered Approach in Personal Health Record System. Paper presented at the Twenty-second Americas Conference on Information Systems, San Diego.
Peek, S. T., Wouters, E. J., van Hoof, J., Luijkx, K. G., Boeije, H. R., & Vrijhoef, H. J. (2014). Factors influencing acceptance of technology for aging in place: a systematic review. Int J Med Inform, 83(4), 235-248. doi:10.1016/j.ijmedinf.2014.01. 004.
Roehrs, A., da Costa, C. A., Righi, R. d. R., & de Oliveira, K. S. F. (2017). Personal Health Records: A Systematic Literature Review. Journal of medical Internet research, 19(1), e13-e13. doi:10.2196/jmir.5876
Rosenstock, I. M. (1974). Historical Origins of the Health Belief Model. Health Education Monographs, 2(4), 328-335. doi:10.1177/ 109019817400200403
Sasiwongsaroj, K. & Burasit, Y. (2019). Managing Thailand’s Ageing Population. Issue: 2019, No.32, ISSN 2335-6677. © ISEAS Yusof Ishak Institute. http://hdl.handle.net/11540/9989.
Tirakoat, S. & Polnigongit W. (2018). Internet usage behaviors, literacy, and attitude towards utilization of wellness content on the internet among Thai elderly, Journal of Nursing and Health care, 36(1: January-March)), 72-80, https://www.tci-thaijo.org/index.php/jnat-ned/issue/view/10346.
Venkatesh, V., & Bala, H. (2008). Technology Acceptance Model 3 and a Research Agenda on Interventions. Journal compilation, 39(2 (May 2008)), 273-315. https://doi.org/210.1111/ j.1540-5915.2008.00192.x.
Waransanang B., Chutimaskul, W., Chongsuphajaisiddhi, V. & Papasratorn, B. (2012). Factors Influencing The Thai Elderly Intention to Use Smartphone for e-Health Services. Paper presented at the 2012 IEEE Symposium on Humanities, Science and Engineering Research.
Wild, K., Boise, L., Lundell, J., & Foucek, A. (2008). Unobtrusive In-Home Monitoring of Cognitive and Physical Health: Reactions and Perceptions of Older Adults. J Appl Gerontol, 27(2), 181–200. doi:110.1177/0733464807311435.
46
Patent Trend Analysis of Eastern Asian Countries between 2000 and 2019: Taiwan, China, Japan, South Korea, and Singapore
Yann-Jy Yanga and Chih-Chien Wangb a Department of Commerce Technology and Management, Chihlee University of Technology
313, Sec. 1, Wenhua Rd., Banqiao Dist., New Taipei City 220, TaiwanE-mail: [email protected]
b Graduate Institute of Information Management, National Taipei University151, University Rd, Sansia District, New Taipei 237, Taiwan
E-mail: [email protected]
AbstractTechnology capacity is important basis for economic development for countries without abundant natural resources. For the past few decades, Eastern Asian is a booming area with fast technology development and intensive industry competition. In the current study, we review granted US patent trend of five Eastern Asian countries: Taiwan, China, Japan, South Korea, and Singapore for the period of 2000 to 2019. Based on the patent of the trend analysis, we found that Japan plays a dominant role in these five countries. Besides, we also found that China was a shiny star in the the period of 2000 to 2019. Taiwan was a second place in the 2000s in most fields. Nevertheless, the growth rate of the patent number of Taiwan was lower than in China and South Korea. In the late 2010s, Taiwan already falled behine China and South Korea.Keywords Patent Analysis, Asian, US Patent, Technology Development.
IntroductionR & D activities have an association with industry comparative advantage[1]. In the technology age, it is essential to building national competities by developing technology capacity, especially for countries without abundant natural resources. Several east Asian countries, such as Taiwan, China, Japan, South Korea, and Singapore, depend on the technical industry rather than natural resources to support their economic development. The economy of these countries is rising for the past few decades. However, the economy of China is not only rising but also booming. As the fastest-growing major economy, the average economic growth rates in China is as fast as 6% or more 1. China is ideed developing itself as a world factory. Furthermore, China already its sustainable position in many technology fields. Low technology is now just a stereotype rather than a real fact for some China industries. China’s technology development dramatically progresses in the past two decades. Reviewing past technology development can help us to make appropriate technology policy for the future. Analyze patent trend is useful for comparing the national competitiveness and for making technology management decision [3-6]. Previous studies also used patent analysis to discuss the industry competitiveness of the countries [7,8]
1 https://en.wikipedia.org/wiki/Economy_of_China
Patent Data AnalysisPatent data analysis is considered as an important approach to evaluate technological analysis [9] and national competitiveness in technology development [3-6]. There is plenty of research that used patent analysis for a variety of purposes. For example, the previous study discusses patterns of innovation to discuss the competition of countries [10]. The research used patent analysis to forecast emerging new technologies [11,12]. Patent analysis can also be used to discuss industry growth [13] and knowledge collaboration network of industry [14]. The previous study has also use patent data to compare the technology development of countries. In the past, Taiwan and South Korea were two countries that were frequently compared in past studies since these two countries frequently compete in world trade [15-19]. Recently, due to the rising of China economy development, there were more and more studies focused on the patent analysis of China [20-23], and compare the patent of China and other countries [24-26].
Data CollectionA granted patent only protects the invention in the country that patent is granted. The invention does not be protected in countries where the patent applicant does not seek protection. Thus, the patent applicant has to apply for the patent in the countries they hope to protect the invention. From the cost consideration, the patent applicant will not
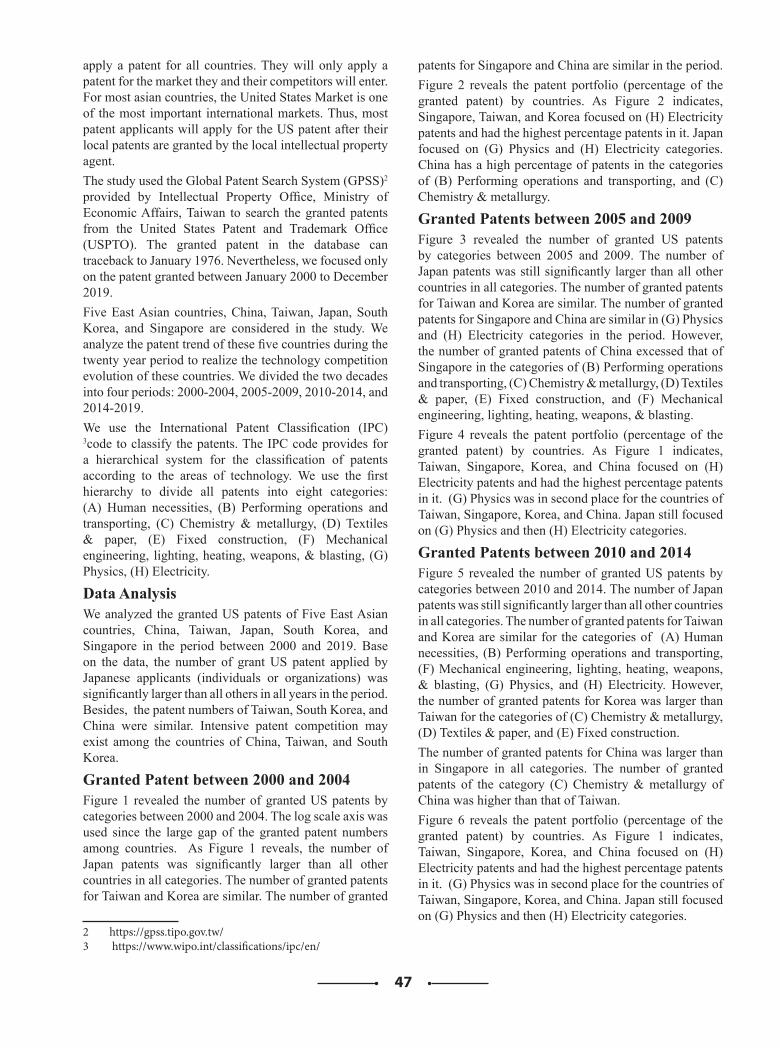
47
apply a patent for all countries. They will only apply a patent for the market they and their competitors will enter. For most asian countries, the United States Market is one of the most important international markets. Thus, most patent applicants will apply for the US patent after their local patents are granted by the local intellectual property agent.The study used the Global Patent Search System (GPSS)2 provided by Intellectual Property Office, Ministry of Economic Affairs, Taiwan to search the granted patents from the United States Patent and Trademark Office (USPTO). The granted patent in the database can traceback to January 1976. Nevertheless, we focused only on the patent granted between January 2000 to December 2019. Five East Asian countries, China, Taiwan, Japan, South Korea, and Singapore are considered in the study. We analyze the patent trend of these five countries during the twenty year period to realize the technology competition evolution of these countries. We divided the two decades into four periods: 2000-2004, 2005-2009, 2010-2014, and 2014-2019. We use the International Patent Classification (IPC) 3code to classify the patents. The IPC code provides for a hierarchical system for the classification of patents according to the areas of technology. We use the first hierarchy to divide all patents into eight categories: (A) Human necessities, (B) Performing operations and transporting, (C) Chemistry & metallurgy, (D) Textiles & paper, (E) Fixed construction, (F) Mechanical engineering, lighting, heating, weapons, & blasting, (G) Physics, (H) Electricity.
Data AnalysisWe analyzed the granted US patents of Five East Asian countries, China, Taiwan, Japan, South Korea, and Singapore in the period between 2000 and 2019. Base on the data, the number of grant US patent applied by Japanese applicants (individuals or organizations) was significantly larger than all others in all years in the period. Besides, the patent numbers of Taiwan, South Korea, and China were similar. Intensive patent competition may exist among the countries of China, Taiwan, and South Korea.
Granted Patent between 2000 and 2004Figure 1 revealed the number of granted US patents by categories between 2000 and 2004. The log scale axis was used since the large gap of the granted patent numbers among countries. As Figure 1 reveals, the number of Japan patents was significantly larger than all other countries in all categories. The number of granted patents for Taiwan and Korea are similar. The number of granted
2 https://gpss.tipo.gov.tw/3 https://www.wipo.int/classifications/ipc/en/
patents for Singapore and China are similar in the period. Figure 2 reveals the patent portfolio (percentage of the granted patent) by countries. As Figure 2 indicates, Singapore, Taiwan, and Korea focused on (H) Electricity patents and had the highest percentage patents in it. Japan focused on (G) Physics and (H) Electricity categories. China has a high percentage of patents in the categories of (B) Performing operations and transporting, and (C) Chemistry & metallurgy.
Granted Patents between 2005 and 2009Figure 3 revealed the number of granted US patents by categories between 2005 and 2009. The number of Japan patents was still significantly larger than all other countries in all categories. The number of granted patents for Taiwan and Korea are similar. The number of granted patents for Singapore and China are similar in (G) Physics and (H) Electricity categories in the period. However, the number of granted patents of China excessed that of Singapore in the categories of (B) Performing operations and transporting, (C) Chemistry & metallurgy, (D) Textiles & paper, (E) Fixed construction, and (F) Mechanical engineering, lighting, heating, weapons, & blasting. Figure 4 reveals the patent portfolio (percentage of the granted patent) by countries. As Figure 1 indicates, Taiwan, Singapore, Korea, and China focused on (H) Electricity patents and had the highest percentage patents in it. (G) Physics was in second place for the countries of Taiwan, Singapore, Korea, and China. Japan still focused on (G) Physics and then (H) Electricity categories.
Granted Patents between 2010 and 2014Figure 5 revealed the number of granted US patents by categories between 2010 and 2014. The number of Japan patents was still significantly larger than all other countries in all categories. The number of granted patents for Taiwan and Korea are similar for the categories of (A) Human necessities, (B) Performing operations and transporting, (F) Mechanical engineering, lighting, heating, weapons, & blasting, (G) Physics, and (H) Electricity. However, the number of granted patents for Korea was larger than Taiwan for the categories of (C) Chemistry & metallurgy, (D) Textiles & paper, and (E) Fixed construction. The number of granted patents for China was larger than in Singapore in all categories. The number of granted patents of the category (C) Chemistry & metallurgy of China was higher than that of Taiwan.Figure 6 reveals the patent portfolio (percentage of the granted patent) by countries. As Figure 1 indicates, Taiwan, Singapore, Korea, and China focused on (H) Electricity patents and had the highest percentage patents in it. (G) Physics was in second place for the countries of Taiwan, Singapore, Korea, and China. Japan still focused on (G) Physics and then (H) Electricity categories.
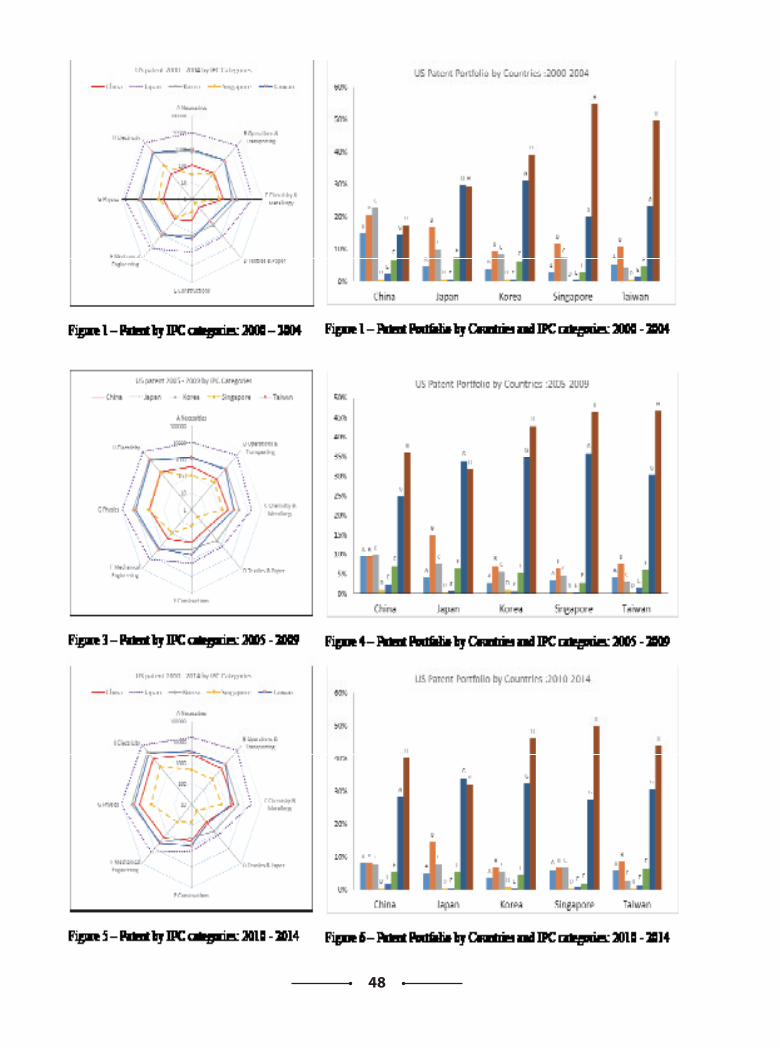
48
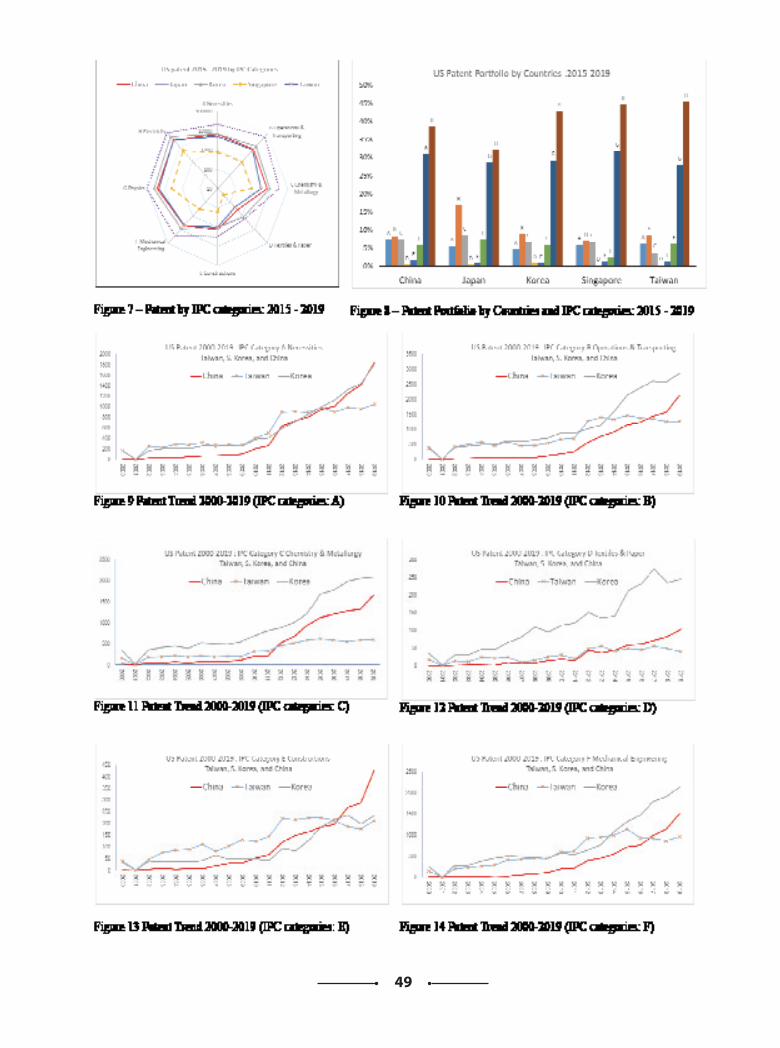
49
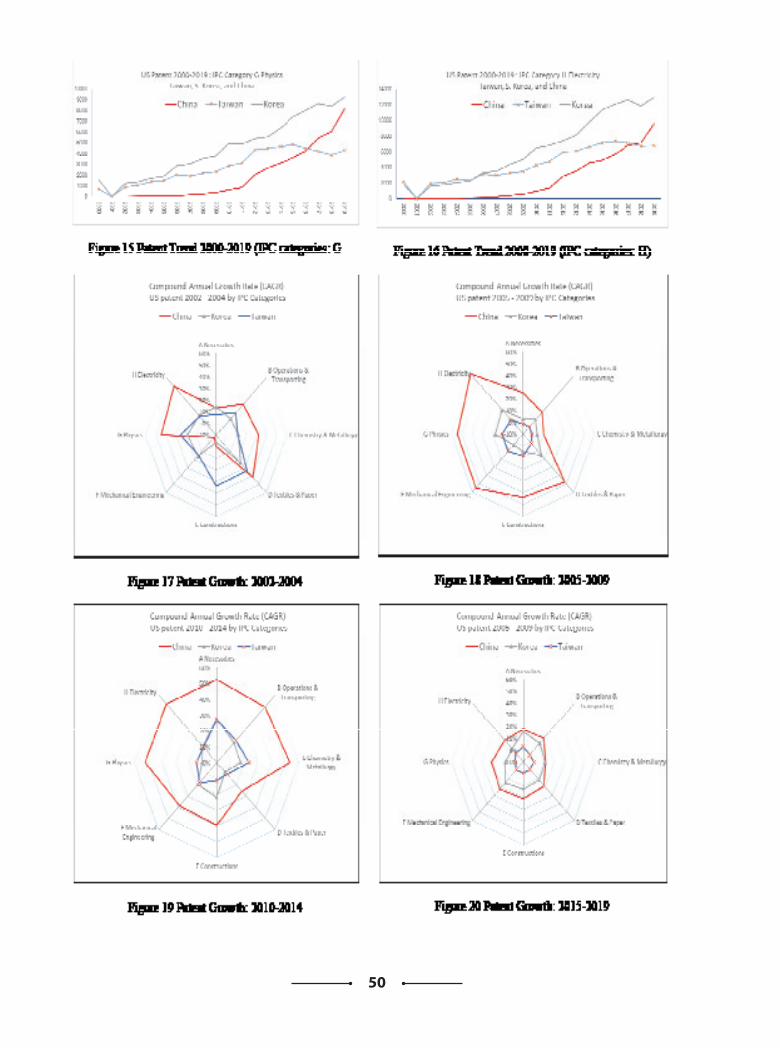
50
51
Granted Patents between 2015 and 2019
Figure 7 revealed the number of granted US patents by categories between 2015 and 2019. The number of Japan patents was still significantly larger than all other countries in all categories. The numbers of granted patents for Korea were higher than that for Taiwan in all categories. The numbers of granted patents for Korea were higher than that for Taiwan in all categories after the year 2017 for all categories. Taiwan lost its leading position to China in all categories. In some categories, the number of granted patents for China is closed to that for Korea.
Figure 8 reveals the patent portfolio (percentage of the granted patent) by countries. All counties, Taiwan, Singapore, Korea, China, and Japan focused on (H) Electricity patents and had the highest percentage patents in it. (G) Physics was in second place.
Competition Among Taiwan, South Korea, and ChinaBased on Figure 1 to Figure 8, we can realize the intensive patent competition existed among the countries of Taiwan, South Korea, and China. Figure 9 to 16 reveal the number of the granted patents of all IPC categories. The number of China’s granted US patents in all categories dramatically increase in the period between 2001 and 2019. To show the dramatical rise of the patent numbers, we used Figure 17 to report the compound annual growth rate of Taiwan, South Korea, and China. Since the 1997 Asian financial crisis, the grant patent number in 2001 is at the historic low point. We calculate the compound annual growth rate from 2002.
In the period of 2002 to 2004, China had the highest CAGR in categories (B) Operations & Transporting, (C) Chemistry & Metallurgy, (D) Textiles & Paper, (G) Physics 45% and (H) Electricity. Taiwan had the highest CAGR in (E) Fixed construction. South Korea had the highest CAGR in (A) Necessicity.
In the period of 2005 to 2009, China had the highest CAGR in all eight categories. The CAGR of Taiwan granted patents in categories (E) Fixed construction and (F) Mechanical engineering, lighting, heating, weapons, & blasting were higher than South Korea. The CAGR of South Korea granted patents in categories (B) Operations & Transporting, (C) Chemistry & Metallurgy, (D) Textiles & Paper, (G) Physics 45% and (H) Electricity were higher than Taiwan.
In the period of 2010 to 2014, China had the highest CAGR
in all eight categories. The CAGR of Taiwan granted patents in categories (B) Operations & Transporting, (C) Chemistry & Metallurgy were slightly higher than South Korea. The CAGR of South Korea granted patents in categories (E) Fixed construction and (F) Mechanical engineering, lighting, heating, weapons, & blasting were higher than were higher than Taiwan.
In the period of 2010 to 2014, the increase of the number of Taiwan’s patent slows down obviously. China still had the highest CAGR in all eight categories. However, the CAGRs of South Korea granted patents in all eight categories were significantly larger than that of Taiwan. It is obviously a warning signal in the technology competition between Taiwan and South Korea.
DiscussionTechnology is a way that countries without natural resouce to find competence for sustainable economy development. The current study summary the recent patent development trend of five Eastern Asian countries: Taiwan, South Korea, Japan, China, and Singapore. We find that the patent of these countries dramatically rised for the past few decades. Beside, we also find that China already gets some sustainable position in many technology fields. We can conclude that China’s technology development dramatically progresses in the past two decades.
Reviewing the past technology development can help us to make appropriate technology policy for the future. We think the research results are useful for making national technology policy.
References [1] Papadakis, M. (1995). The delicate task of linking
industrial R&D to national competitiveness. Technovation, 15(9), 569-583.
[2] Han, Q., Heimerl, F., Codina-Filba, J., Lohmann, S., Wanner, L., & Ertl, T. (2017). Visual patent trend analysis for informed decision making in technology management. World Patent Information, 49, 34-42.
[3] Papadakis, M. (1995). The delicate task of linking industrial R&D to national competitiveness. Technovation, 15(9), 569-583.
[4] Wang, T. Y., Chien, S. C., & Kao, C. (2007). The role of technology development in national competitiveness—Evidence from Southeast Asian countries. Technological Forecasting and Social Change, 74(8), 1357-1373.
[5] Chen, D. Z., Lin, W. Y., & Huang, M. H. (2007). Using
52
essential patent index and essential technological strength to evaluate industrial technological innovation competitiveness. Scientometrics, 71(1), 101-116.
[6] Afzal, M., Lawrey, R., & Gope, J. (2019). Understanding national innovation system (NIS) using porter’s diamond model (PDM) of competitiveness in ASEAN-05. Competitiveness Review: An International Business Journal.
[7] Kwak, H., & Lee, S. (2019). Competitiveness Analysis for Artificial Intelligence Technology through Patent Analysis. The Journal of Information Systems, 28(3), 141-158.
[8] Kim, C., Kwon, S., & Kim, J. (2016). The Evaluation of Korea's Competitiveness in Lubricants Industries Using Patent Index Analysis. Korean Chemical Engineering Research, 54(3), 332-339.
[9] Abraham, B. P., & Moitra, S. D. (2001). Innovation assessment through patent analysis. Technovation, 21(4), 245-252.
[10] Choung, J. Y. (1998). Patterns of innovation in Korea and Taiwan. IEEE Transactions on Engineering Management, 45(4), 357-365.
[11] Kyebambe, M. N., Cheng, G., Huang, Y., He, C., & Zhang, Z. (2017). Forecasting emerging technologies: A supervised learning approach through patent analysis. Technological Forecasting and Social Change, 125, 236-244.
[12] Daim, T. U., Rueda, G., Martin, H., & Gerdsri, P. (2006). Forecasting emerging technologies: Use of bibliometrics and patent analysis. Technological Forecasting and Social Change, 73(8), 981-1012.
[13] Pantano, E., Priporas, C. V., Sorace, S., & Iazzolino, G. (2017). Does innovation-orientation lead to retail industry growth? Empirical evidence from patent analysis. Journal of Retailing and Consumer Services, 34, 88-94.
[14] Guan, J., & Liu, N. (2016). Exploitative and exploratory innovations in knowledge network and collaboration network: A patent analysis in the technological field of nano-energy. Research policy, 45(1), 97-112.
[15] Wu, C. Y., & Mathews, J. A. (2012). Knowledge flows in the solar photovoltaic industry: Insights from patenting by Taiwan, Korea, and China. Research Policy, 41(3), 524-540.
[16] Park, K. H., & Lee, K. (2006). Linking the
technological regime to the technological catch-up: analyzing Korea and Taiwan using the US patent data. Industrial and corporate change, 15(4), 715-753.
[17] Jung, S., & Imm, K. Y. (2002). The patent activities of Korea and Taiwan: a comparative case study of patent statistics. World Patent Information, 24(4), 303-311.
[18] Choung, J. Y., & Hwang, H. R. (2000). National systems of innovation: Institutional linkages and performances in the case of Korea and Taiwan. Scientometrics, 48(3), 413-426.
[19] Hu, A. G., & Jaffe, A. B. (2003). Patent citations and international knowledge flow: the cases of Korea and Taiwan. International journal of industrial organization, 21(6), 849-880.
[20] Trappey, C. V., Wu, H. Y., Taghaboni-Dutta, F., & Trappey, A. J. (2011). Using patent data for technology forecasting: China RFID patent analysis. Advanced Engineering Informatics, 25(1), 53-64.
[21] Dang, J., & Motohashi, K. (2015). Patent statistics: A good indicator for innovation in China? Patent subsidy program impacts on patent quality. China Economic Review, 35, 137-155.
[22] Gao, X., Guan, J., & Rousseau, R. (2011). Mapping collaborative knowledge production in China using patent co-inventorships. Scientometrics, 88(2), 343-362.
[23] Motohashi, K. (2008). Assessment of technological capability in science industry linkage in China by patent database. World patent information, 30(3), 225-232.
[24] Wu, C. Y., & Mathews, J. A. (2012). Knowledge flows in the solar photovoltaic industry: Insights from patenting by Taiwan, Korea, and China. Research Policy, 41(3), 524-540.
[25] Wu, C. Y. (2014). Comparisons of technological innovation capabilities in the solar photovoltaic industries of Taiwan, China, and Korea. Scientometrics, 98(1), 429-446.
[26] Shie, V. H., & Meer, C. D. (2010). Is this the Asian century? China, India, South Korea and Taiwan in the age of intellectual capitalism. Journal of Contemporary Asia, 40(1), 1-21.
53
Role of ICT in the Development and Management of Smart Cities
Milan PatnaPh.D. Scholar
Lincoln university College [email protected]
Sateesh Kumar [email protected]
Abstract
The city is becoming famous one after another from the perspective how much it has facilitated to the citizens of the city. Most of the facilities are guided by ICT networks. The state of people’s comfort, security, living standard in a city life make a city character known as smart city. Living, transporting, shopping, recreation, banking, and payment of utilities are the examples. This study tries to explore how much cities of Nepal can develop ICT so that it can facilitate the people accordingly and go towards the direction of smart city. The analysis is based on the information provided by government departments, and government authorities working for the development of ICT in the country. Keywords
ICT, smart city
BackgroundThe term “smart city “was coined towards the end of the 20th century. It is rooted in the implementation of user-friendly information and communication technologies developed by major industries for urban spaces. Though The United Nations Economic and Social Council has stated that there is no standardized commonly accepted definition of a smart city (United Nations Economic and Social Council, 2016). It could mean different things to different cities in different countries regarding their level of development and cultural perspective. Its meaning has since been expanded to relate to the future of cities and their development. Smart cities are forward-looking, progressive and resource-efficient while providing at the same time a high quality of life. They promote social and tech-nological innovations and link existing infrastructures. They incorporate new energy, traffic and transport concepts that go easy on the environment. Their focus is on new forms of governance and public participation. Intelligent decisions need to be taken at the strategic level if cities want to become smart. It takes more than individual projects but careful decisions on long-term implementations. Considering cities as entire systems can help them achieve their ultimate goal of
becoming smart. Smart cities forcefully tackle the current global challenges, such as climate change and scarcity of resources. Their claim is also to secure their economic competitiveness and quality of life for urban populations continuously on the rise.
The government introduced the concept of ‘smart city’ for the first time in 2012.Several times, the government has declared to build smart cities. Not only the government, but also the political parties, especially during the time of local level election, had promised with the people to make each municipality as a smart city, if they won the local level election. Recently, the cabinet meeting decided to set up the smart cities in four different corners with proper urban planning in order to ease the population density in the Kathmandu downtown. Out of Kathmandu, the government is also on the process of making smart city developmental plans in Lumbini, Nijgadh and Palungtar area of Gorkha. Likewise, newly elected city leaders/Mayors are also planning to build smart cities.
In order to promote smart city initiatives in Nepal and provide ideas, knowledge, information, resources on smart city development, Green Institute has come up with “Nepal Smart City Summit”. The main objectives of the summit are to:
54
• Acquire idea, knowledge, and information on smart city development
• Explore all the smart city projects and technologies available at national and international level
• Build partnerships with valuable stakeholders
• Connect with potential investors for smart city projects/initiatives
Connect with over 50 speakers and thought leaders from Nepal and abroad
Government of Nepal introduced the concept of Smart City in Nepal through the Budget Speech in 2015 to develop 10 cities including Palungtaar, Waling, Nijgadh and Lumbini as Smart City.
The case studies of the Smart City Concept note – Shrawan 2015 by National planning commission and Final Report: Preparation of Concept and Indicators for Smart Cities in Nepal (2015) prepared by New Town Project Coordination Office, Department of Urban Development and Building Construction (DUDBC) DUDBC,
Statement of the ProblemsThe name of smart city is alarming and charming, but converting an old city into smart is difficult task especially challenging for developing countries. Basically developing countries lack infrastructure required for smart city. But the developing new cities would be relatively easy because everything can be planned beforehand. Rapid urbanization. By 2030, 60% of world’s population is expected to live in cities results in heavy strain on energy, transportation, water, building and public spaces(Smart cities, Gov of India, 2011). Increasing need is the being felt for smart city which are both efficient, sustainable and Can generate economic prosperity & social wellbeing. From many angles people are demanding comfortable cities in every countries and Nepal cannot escape form this. The demand and expectations of the citizen in the country is rising and if the ability of the government to full fill the expectations of fulfilling the demands of the people to offer and meet the demand then there would be problems even the people who are competent leave the city and country and the city will suffer. This article is directed to raise the issues relating to making cities of the countries smart so that people will not be deprived of using the facilities of smart cities just because they are born in the country.
Characteristics of Smart City as Defined by National Planning Commission;
There are four characteristics that identifies the Smart City.
Smart People: Smart People make smart city. The different indicators of this characteristics are: Inclusiveness, Education, Health, Creativity
Smart Governance: The public services are needed to be answerable, transparent and inclusive as well as it should be serviceable to people in efficient way. The indicators are: Information and technology infrastructure, Online services, Transparent and open government.
Smart Infrastructure: The indicators of Smart Infrastructure are: Physical Infrastructure, Transportation, Energy, Housing and Buildings, Urban Service infrastructures including water supply, sanitation etc. Social Infrastructure, Green Infrastructure
Smart Economy: The economic activities should be reliable and the micro as well as macroeconomics should lead to the smart behavior and practice. The indicators are: Innovation and Entrepreneurship, Productivity and Job creation
Green Business
Characteristics of Smart City as Defined by New Town Project Coordination Office, (Dudbc)
The ideas of Robinson are adopted by this report which are discussed as: (1) A Smarter City is in a position to make a success of the present (2) A Smarter City is on course for a successful future (3) A Smarter City creates sustainable, equitably distributed growth, (4)
A Smarter City operates as efficiently & intelligently as possible: (5) A Smarter City enables citizens, communities, entrepreneurs & businesses to do their best; (6).A Smarter City harnesses technology effectively and makes it accessible.The European Smart City Model 2016 indicators for smart economy are adopted by DUDBC. The Six Characteristics are identified for the Smart City as: Smart Economy, Smart Governance, Smart People, Smart Mobility, Smart Mobility and Smart LivingResearch QuestionsThrough this study the researcher wants to know is Nepalese government thinking to make the country smart? If is thinking how it will make the smart cities? What is its model, what is the actions plans of the government to make the cities smart?
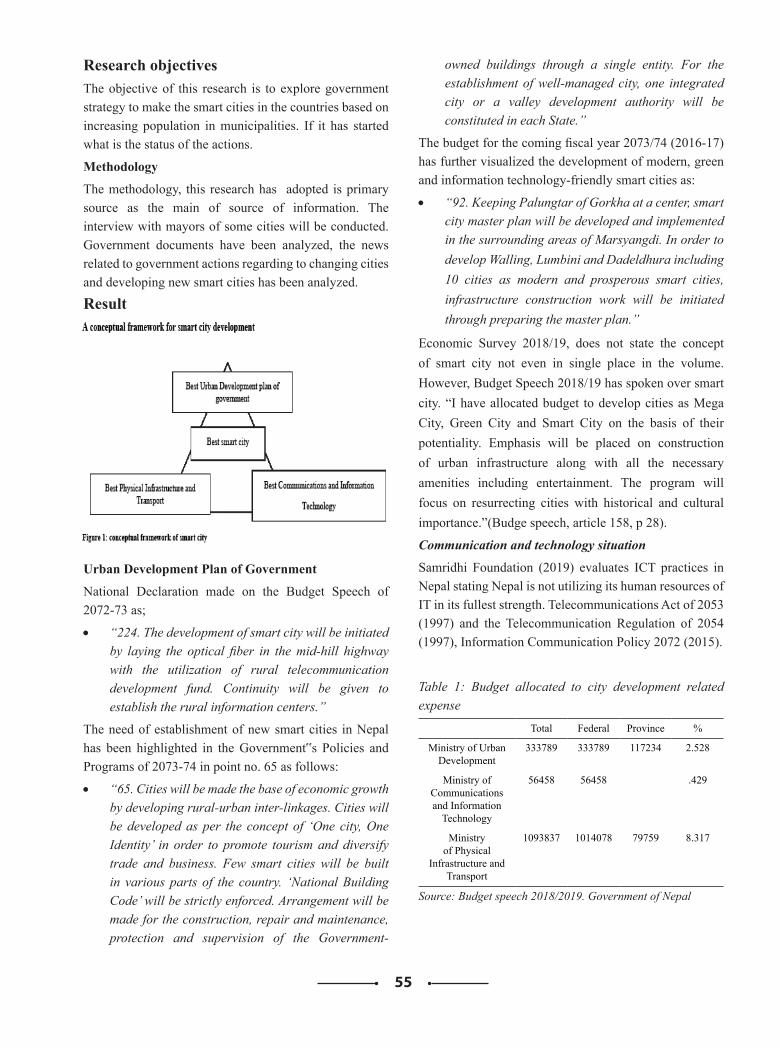
55
Research objectivesThe objective of this research is to explore government strategy to make the smart cities in the countries based on increasing population in municipalities. If it has started what is the status of the actions.
Methodology
The methodology, this research has adopted is primary source as the main of source of information. The interview with mayors of some cities will be conducted. Government documents have been analyzed, the news related to government actions regarding to changing cities and developing new smart cities has been analyzed.
Result
Urban Development Plan of Government
National Declaration made on the Budget Speech of 2072-73 as;
• “224. The development of smart city will be initiated by laying the optical fiber in the mid-hill highway with the utilization of rural telecommunication development fund. Continuity will be given to establish the rural information centers.”
The need of establishment of new smart cities in Nepal has been highlighted in the Government‟s Policies and Programs of 2073-74 in point no. 65 as follows:
• “65. Cities will be made the base of economic growth by developing rural-urban inter-linkages. Cities will be developed as per the concept of ‘One city, One Identity’ in order to promote tourism and diversify trade and business. Few smart cities will be built in various parts of the country. ‘National Building Code’ will be strictly enforced. Arrangement will be made for the construction, repair and maintenance, protection and supervision of the Government-
owned buildings through a single entity. For the establishment of well-managed city, one integrated city or a valley development authority will be constituted in each State.”
The budget for the coming fiscal year 2073/74 (2016-17) has further visualized the development of modern, green and information technology-friendly smart cities as:
• “92. Keeping Palungtar of Gorkha at a center, smart city master plan will be developed and implemented in the surrounding areas of Marsyangdi. In order to develop Walling, Lumbini and Dadeldhura including 10 cities as modern and prosperous smart cities, infrastructure construction work will be initiated through preparing the master plan.”
Economic Survey 2018/19, does not state the concept of smart city not even in single place in the volume. However, Budget Speech 2018/19 has spoken over smart city. “I have allocated budget to develop cities as Mega City, Green City and Smart City on the basis of their potentiality. Emphasis will be placed on construction of urban infrastructure along with all the necessary amenities including entertainment. The program will focus on resurrecting cities with historical and cultural importance.”(Budge speech, article 158, p 28).
Communication and technology situation
Samridhi Foundation (2019) evaluates ICT practices in Nepal stating Nepal is not utilizing its human resources of IT in its fullest strength. Telecommunications Act of 2053 (1997) and the Telecommunication Regulation of 2054 (1997), Information Communication Policy 2072 (2015).
Table 1: Budget allocated to city development related expense
Total Federal Province %
Ministry of Urban Development
333789 333789 117234 2.528
Ministry of Communications and Information
Technology
56458 56458 .429
Ministry of Physical
Infrastructure and Transport
1093837 1014078 79759 8.317
Source: Budget speech 2018/2019. Government of Nepal
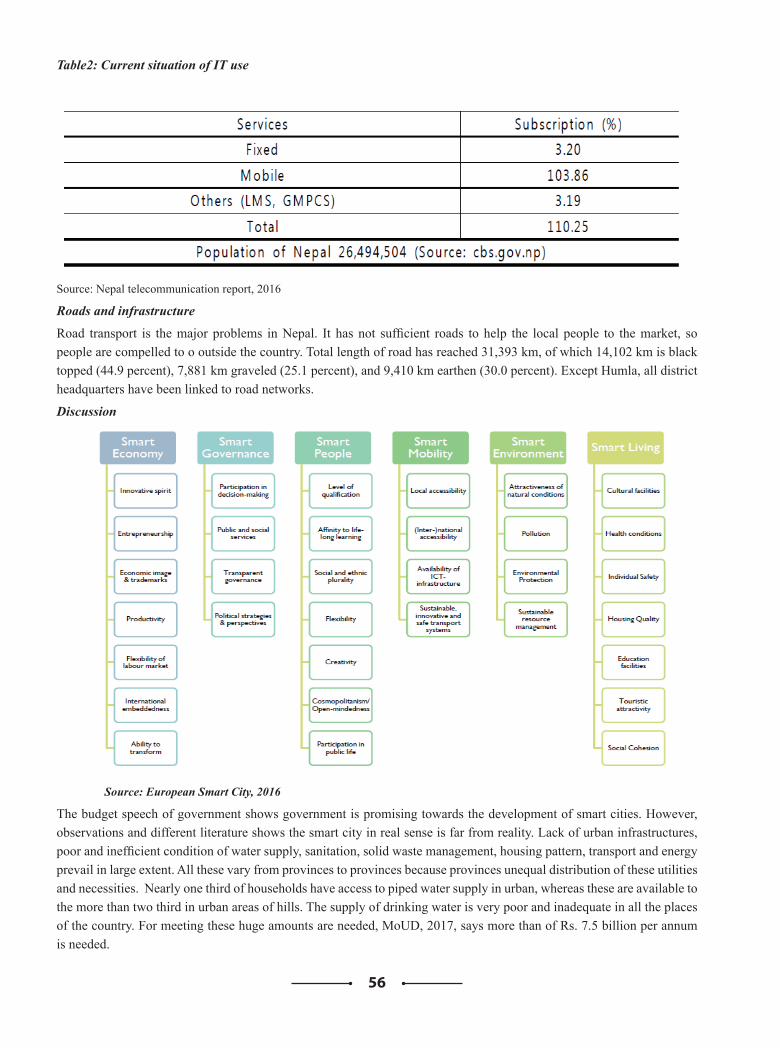
56
Table2: Current situation of IT use
Source: Nepal telecommunication report, 2016
Roads and infrastructure
Road transport is the major problems in Nepal. It has not sufficient roads to help the local people to the market, so people are compelled to o outside the country. Total length of road has reached 31,393 km, of which 14,102 km is black topped (44.9 percent), 7,881 km graveled (25.1 percent), and 9,410 km earthen (30.0 percent). Except Humla, all district headquarters have been linked to road networks.
Discussion
Source: European Smart City, 2016
The budget speech of government shows government is promising towards the development of smart cities. However, observations and different literature shows the smart city in real sense is far from reality. Lack of urban infrastructures, poor and inefficient condition of water supply, sanitation, solid waste management, housing pattern, transport and energy prevail in large extent. All these vary from provinces to provinces because provinces unequal distribution of these utilities and necessities. Nearly one third of households have access to piped water supply in urban, whereas these are available to the more than two third in urban areas of hills. The supply of drinking water is very poor and inadequate in all the places of the country. For meeting these huge amounts are needed, MoUD, 2017, says more than of Rs. 7.5 billion per annum is needed.
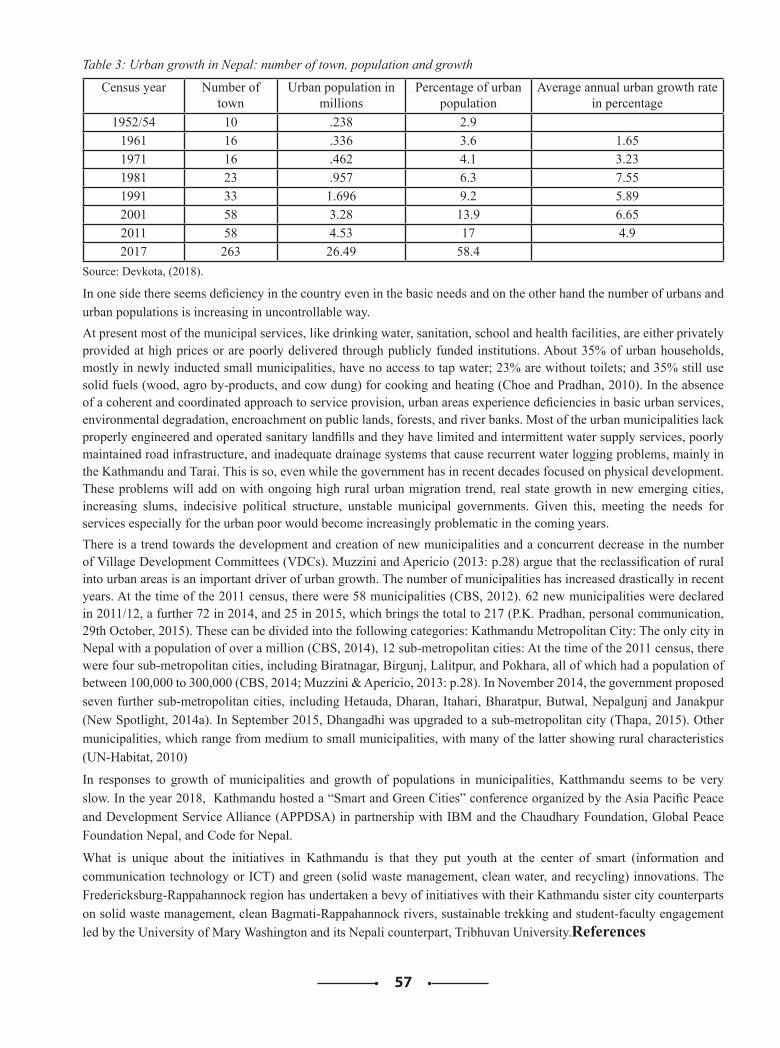
57
Table 3: Urban growth in Nepal: number of town, population and growth
Census year Number of town
Urban population in millions
Percentage of urban population
Average annual urban growth rate in percentage
1952/54 10 .238 2.91961 16 .336 3.6 1.651971 16 .462 4.1 3.231981 23 .957 6.3 7.551991 33 1.696 9.2 5.892001 58 3.28 13.9 6.652011 58 4.53 17 4.92017 263 26.49 58.4
Source: Devkota, (2018).
In one side there seems deficiency in the country even in the basic needs and on the other hand the number of urbans and urban populations is increasing in uncontrollable way. At present most of the municipal services, like drinking water, sanitation, school and health facilities, are either privately provided at high prices or are poorly delivered through publicly funded institutions. About 35% of urban households, mostly in newly inducted small municipalities, have no access to tap water; 23% are without toilets; and 35% still use solid fuels (wood, agro by-products, and cow dung) for cooking and heating (Choe and Pradhan, 2010). In the absence of a coherent and coordinated approach to service provision, urban areas experience deficiencies in basic urban services, environmental degradation, encroachment on public lands, forests, and river banks. Most of the urban municipalities lack properly engineered and operated sanitary landfills and they have limited and intermittent water supply services, poorly maintained road infrastructure, and inadequate drainage systems that cause recurrent water logging problems, mainly in the Kathmandu and Tarai. This is so, even while the government has in recent decades focused on physical development. These problems will add on with ongoing high rural urban migration trend, real state growth in new emerging cities, increasing slums, indecisive political structure, unstable municipal governments. Given this, meeting the needs for services especially for the urban poor would become increasingly problematic in the coming years. There is a trend towards the development and creation of new municipalities and a concurrent decrease in the number of Village Development Committees (VDCs). Muzzini and Apericio (2013: p.28) argue that the reclassification of rural into urban areas is an important driver of urban growth. The number of municipalities has increased drastically in recent years. At the time of the 2011 census, there were 58 municipalities (CBS, 2012). 62 new municipalities were declared in 2011/12, a further 72 in 2014, and 25 in 2015, which brings the total to 217 (P.K. Pradhan, personal communication, 29th October, 2015). These can be divided into the following categories: Kathmandu Metropolitan City: The only city in Nepal with a population of over a million (CBS, 2014), 12 sub-metropolitan cities: At the time of the 2011 census, there were four sub-metropolitan cities, including Biratnagar, Birgunj, Lalitpur, and Pokhara, all of which had a population of between 100,000 to 300,000 (CBS, 2014; Muzzini & Apericio, 2013: p.28). In November 2014, the government proposed seven further sub-metropolitan cities, including Hetauda, Dharan, Itahari, Bharatpur, Butwal, Nepalgunj and Janakpur (New Spotlight, 2014a). In September 2015, Dhangadhi was upgraded to a sub-metropolitan city (Thapa, 2015). Other municipalities, which range from medium to small municipalities, with many of the latter showing rural characteristics (UN-Habitat, 2010)
In responses to growth of municipalities and growth of populations in municipalities, Katthmandu seems to be very slow. In the year 2018, Kathmandu hosted a “Smart and Green Cities” conference organized by the Asia Pacific Peace and Development Service Alliance (APPDSA) in partnership with IBM and the Chaudhary Foundation, Global Peace Foundation Nepal, and Code for Nepal.
What is unique about the initiatives in Kathmandu is that they put youth at the center of smart (information and communication technology or ICT) and green (solid waste management, clean water, and recycling) innovations. The Fredericksburg-Rappahannock region has undertaken a bevy of initiatives with their Kathmandu sister city counterparts on solid waste management, clean Bagmati-Rappahannock rivers, sustainable trekking and student-faculty engagement led by the University of Mary Washington and its Nepali counterpart, Tribhuvan University.References
58
GoV, Nepal, Budger speech 2015
GoV, Nepal, Budger speech 2016
GoV, Nepal, Budger speech 2017
GoV, Nepal, Wconomic Survey 2017
https://ec.europa.eu/info/eu-regional-and-urban-development/topics/cities-and-urban-development/city-initiatives/smart-cities_en
Devkota, K(2018). Challenges of Inclusive Urbanization in the Face of Political Transition in Nepal. In Mugambwa, J. & Katusiimeh, M. W. Editors Handbook of research on urban governance and management in the developing world (159-171)
Muzzini, E. and Aparicio, G. (2013). Urban Growth and Spatial Transition in Nepal. Washington D.C.: World Bank. http://dx.doi.org/10.1596/978-0-8213-9659-9
CBS. (2012). National Population and Housing Census 2011: National Report. Kathmandu: Central Bureau of Statistics, Government of Nepal. http://countryoffice.unfpa.org/nepal/drive/Nepal-Census-2011- Vol1.pdf 22 GSDRC Helpdesk Research Report
CBS. (2014). National Population and Housing Census 2011: Urban Tables. Kathmandu: Central Bureau of Statistics, Government of Nepal. http://elibrary.xyz/cbs/image/data/Population/Urban%20Volume/UrbanVolume_Part01.pdf
Thapa, G. (2015, 19th September). Govt declares 26 new municipalities. The Kathmandu Post [online]. http://kathmandupost.ekantipur.com/news/2015-09-19/govt-declares-26-new-municipalities.html
UN-Habitat. (2010). Nepal Urban Housing Sector Profile. Nairobi: United Nations Human Settlements Programme. http://un.org.np/sites/default/files/NEPAL%20Housing%20Profile_2.pdf
Choe, K. and Pradhan, P. (2010). Unleashing Economic Growth: Region-based Urban Development Strategy for Nepal. Manila: Asian Development Bank. http://www.adb.org/sites/default/files/publication/27498/unleashing-economic-growth-nepal.pdf
Concept of Smart City, Shrawan 2073: National Planning Commission, Nepal
Entire Credit for collection and preparation of this report goes to: Ar. Damodar Acharya, Ar. Pusp Raj Bhatt and Ar, Abushan Panta
Final Report: Preparation of Concept and Indicators for Smart Cities in Nepal (CS-18-072/73): New Town Coordination Office, DUDBC, Nepal
59
Imperious Staple : Individual Values & Knowledge Worker Productivity
Abhay D Joshi Research Scholar with Nirma University
Rajesh Jain Professor Operations Management Nirma University; Chair ASQ LMC Ahmedabad, Chair Operations QT & GM Area
AbstractPurpose – The purpose of this paper is to propose useable framework for measurement of individual white collar productivity encompassing both the Qualitative & Quantitative measures. The paper also explores the relationship between individual values and organisation culture and its effect on productivity.The paper takes in to account the complexities and dilemma in measurement of knowledge worker productivity as been highlighted in the academic literature.KeywordsPerceived Productivity, Productivity, Knowledge Worker Productivity, Individual Values Literature Review : General, Attempts made, Difficulty , limitations & Gaps.
Individual ValuesThe globalisation of market and economy has meant obliteration of geographical boundaries and free flow of trade , information across countries. Further the progression of social, IT platforms have rapidly protracted the reach to customer and markets, and also real time availability of knowledge and information. This also has led to evolution of thinking pattern, values and perceptions and outlook towards outer world.
Grube et al (1994) quoted values are cognitive representation of individual needs and desire and as also of societal demand. The values especially become critical when there is conflict between individual, group and society.
Cennamo and garner 2008 studied the difference in expectations and priority of work values across generation. He quoted Generation ‘X’ was concerned with status and organisation values , while the Generation ‘Y’ with status and freedom. The current generation has high expectation from workplace, low tolerance for criticism, low organisational commitment.
Indian economy has had the impact of globalisation. At the same time no research is available to examine if any and what value transition have happened as an impact &backdrop of globalisation as mentioned above .
ProductivityThere is plethora of research , tools and techniques available to achieve productivity at shop floor predominantly seen
as repetitive , cyclic , process oriented output that is consistent with
less or variability with in permissible limits. Frederick Taylor (1911) pioneered the concept of scientific management which intended to standardize work , reduce variability , achieve close to 100 percent consistency in output in efficient manner to achieve higher productivity. Many tangible indices like Output per labour hour, were suggested that were useful to establish and further improve the productivity.
The invent and strong presence of service industry has changed the constituents of the workforce. At the beginning of 20th century the ratio of blue collar to white collar was 2:1 which gradually stands at 1:2 at the end of last century. Emergence of Knowledge worker is consequence of a broader shift from industrial to a post-industrial society ( Drucker, 1988).
The research so far indicates knowledge worker productivity is not easy to establish unlike in the case of manufacturing industry with the definitive output in a given period of time, is possible to be measured, improved and standardised. The challenge with knowledge worker is that the tasks being performed by them are not fixed or repetitive, have no standard times or procedure and the same tasks may be performed differently by different worker depending on numerous factors many of them invisible. Knowledge work in primarily invisible , it is hidden in the head of knowledge worker (Fisher,1998). In the same context Drucker (1999) states .. the challenge
60
today is not to increase manual workers productivity but to measure and increase knowledge worker productivity.
Leaman and bordass (2000) acknowledge it is difficult to establish meaningful productivity measure for office occupants and therefore proposed that perceived productivity rather than actual productivity to be used as surrogate measure of productivity.Oseland(1999) reiterates the complexity in establishing tangible measures of office productivity, especially in service sector, since the outputs tend to be ill defined and prone to wide range of variations.
This has resulted in no commonly established or agreed framework to define and measure white collar productivity even after multiple attempts made by researchers.
Design /Methodology/ Approach –
The research aims at establishing the value priorities across generation post the globalisation. The tools proposed to be used is Short Schwartz Value Survey (SSVS) to determine the present
value priorities among Indian employed population. As quoted by Kurt Lewin the behaviour is function of person in their environment. Extending this approach the study proposes to examine the correlation between the individual values as they mean today with the organisation cultural attributes. The organisation cultural attributes are proposed to be measure through Minnesota satisfaction framework.Next the author presents the dilemma faced in definition & measurement of white collar productivity based on the past research. The author hounds on how productivity is defined and how the measurements have been done considering not only the variability of output but as well the difficulty in establishing the input value. Accepting the limitations expressed in the research so far, the author proposes integrated frame work based on the synthesis of some of the approaches presented so far and assimilates KPI from diverse established metrics & scales with specific focus on productivity dimension that is plausible and practical to measure.
Findings – Self Perceived Productivity Frame work is proposed as a surrogate measure of productivity. The questionnaire to capture the impact of attributes inclusive of Qualitative , Quantitative & Organisational aspects based on lead , sub lead & Lag measures to assess productivity is formulated. It is proposed that even in absence of universally agreed and established measure , a baseline measure, shall be supportive towards forming
continuous improvement mindset, as an absolute one point productivity measure is impractical considering the fluid & complex nature intrinsic human values that is central to extrinsic human behaviour.
The study on individual values its relationship with organisational attributes is work in progress.
Limitations – The proposed framework is work in progress and needs to be validated through research tools to establish the causal relationship of proposed attributes to perceived productivity. There may be need to extensive future research including qualitative interviews of practicing managers to ascertain the elements and measurement methodology.Theoretical Implication - The research shall encompass both the qualitative and quantitative indices. The research will also articulate the measurement criteria for these indices, which can be denoted as existing base value, that can be put on improvement path, by taking year on year, delta improvement targets in knowledge worker productivity, to bring efficacy and efficiency in product manufacturing and service delivery.
Practical Implication - The practicing managers can transfer the findings & learning of the study to focus on enablers and inhibitors aspects with respect to the perceived productivity. This will help the mangers to focus intrinsically, deliver on one of their primary and elementary role of continual improvement and contribute to get the organisational objective be met in effectual and prolific manner to gain competitive edge.Originality & Value - With progression of service industry, the proportion of Knowledge worker is big constituent of total workforce. A study indicates that in beginning of 20th century, and the initiation of industrial revolution the ratio of blue collar worker to white collar worker was 2:1, and towards the end of century it has reversed to 1:2. Automation now drives the manufacturing activities while the white collar is credited with contribution towards the economic performance in this century. It is imperative hence to establish productivity norms for knowledge worker. The framework envisaged shall be realistically measurable to provide baseline data for self-assessed productivity scale and set tone for continuous improvement for enhanced productivity year on year. The establishment of present value priorities and its relationship and resultant effect on productivity shall be useful to drive improvement to achieve higher levels contribution from knowledge worker to achieve rocketing growth for the economic system at macro level and sustenance of better quality of life for the mankind.
61
The Risks of Human Factors in Cloud Computing
Myeonggil Choi, Dept.of Business Administration Chung-Ang University, Seoul,Korea, [email protected] Um, Dept.of Knowledge Management, Chung-Ang Univ. Seoul, Korea, [email protected]
AbstractAfter Amazon introducing cloud computing, the cloud is rapidly changing the ecosystem of the IT industry and users. The cloud is an on-demand service that provides a user with virtualized information resources using the Internet and charges a fee based on the usage amount of the user. Cloud services are expanding the cloud services market for private companies and individual users with the convenience and efficiency of low-cost performance management. South Korea is also trying to introduce the cloud, recognizing the benefits of the cloud, but the introduction of cloud services is not active as a technical and institutional barrier. The paper investigates the vulnerabilities from the perspectives of human factors.
KeywordsHuman factors, cloud systems, vulnerabilities of cloud systems.
IntroductionA systematic analysis of unknown technical and administrative security issues that exist in public clouds is required. Cloud security issues are known fragmentally from a technical point of view through the literature, but systematic issues derived from the integrated operation of management issues and technical issues. The fact is that analysis is lacking. The security issues posed by administrative characteristics of the cloud are based on the cloud service designers and service operators surrounding the cloud service, cloud security certification and security architects,
It is necessary to systematically analyze the unknown technical security problems and administrative security problems that exist in the public sectors. The problem of security of cloud is analyzed from the perspective of technology. However, there is a lack of systematic analysis of security risks derived from the operational and management problems in which administrative and technical problems are integrated.
Governments have limited human resources and budgets to voluntarily solve all computing services, and in particular, some of the services for citizens are cloud operators that provide services to the general user. There seems to be an advantage in terms of cost-effectiveness of this service. However, in order for public institutions to use the cloud efficiently, existing security certification schemes need to supplement the overlooked aspects. In this research, we would like to propose an administrative
security policy, and an institutional security policy for the cloud that can complement such points. In this study, the proposed integrated policy options are based on the trust of the private and public sectors to fine-tune information security policies and enforce good faith obligations between service providers and service users. It seems that the effectiveness when fulfilling it can be guaranteed.
The Cloud ComputingeA. The Features of Cloud Service
The cloud service provides a virtual machine, a network, and a storage resource provided by a cloud operator via a network with users. Users connect to cloud systems remotely over a network to use computing resources such as computer systems, software systems, storage systems, and the like. Cloud services allow users to use the system as much as they like and pay only for the capacity, so users can use the system at the minimum cost and minimize waste of computing resources .The advantages of cloud system are that even when it is difficult or unpredictable to predict the demand for the use of computing resources, the flexibility of using the computing resources to provide smooth services is flexible and depends on the usage. The advantage is that we can ensure service continuity from the user's point of view and make efforts to minimize the costs associated with using computing. Cloud service operates large-scale computer resources from the perspective of a cloud service provider, but has the advantage of realizing economies of scale that can manage resources efficiently.
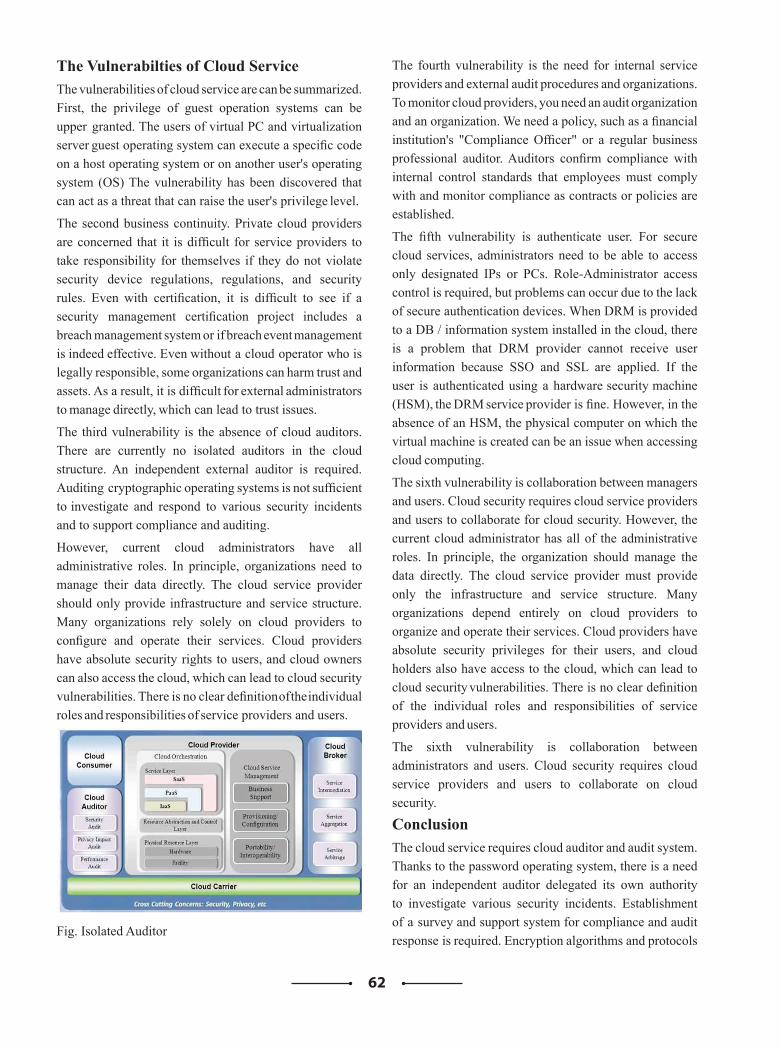
62
The Vulnerabilties of Cloud ServiceThe vulnerabilities of cloud service are can be summarized. First, the privilege of guest operation systems can be upper granted. The users of virtual PC and virtualization server guest operating system can execute a specific code on a host operating system or on another user's operating system (OS) The vulnerability has been discovered that can act as a threat that can raise the user's privilege level.
The second business continuity. Private cloud providers are concerned that it is difficult for service providers to take responsibility for themselves if they do not violate security device regulations, regulations, and security rules. Even with certification, it is difficult to see if a security management certification project includes a breach management system or if breach event management is indeed effective. Even without a cloud operator who is legally responsible, some organizations can harm trust and assets. As a result, it is difficult for external administrators to manage directly, which can lead to trust issues.
The third vulnerability is the absence of cloud auditors. There are currently no isolated auditors in the cloud structure. An independent external auditor is required. Auditing cryptographic operating systems is not sufficient to investigate and respond to various security incidents and to support compliance and auditing.
However, current cloud administrators have all administrative roles. In principle, organizations need to manage their data directly. The cloud service provider should only provide infrastructure and service structure. Many organizations rely solely on cloud providers to configure and operate their services. Cloud providers have absolute security rights to users, and cloud owners can also access the cloud, which can lead to cloud security vulnerabilities. There is no clear definition of the individual roles and responsibilities of service providers and users.
Fig. Isolated Auditor
The fourth vulnerability is the need for internal service providers and external audit procedures and organizations. To monitor cloud providers, you need an audit organization and an organization. We need a policy, such as a financial institution's "Compliance Officer" or a regular business professional auditor. Auditors confirm compliance with internal control standards that employees must comply with and monitor compliance as contracts or policies are established.
The fifth vulnerability is authenticate user. For secure cloud services, administrators need to be able to access only designated IPs or PCs. Role-Administrator access control is required, but problems can occur due to the lack of secure authentication devices. When DRM is provided to a DB / information system installed in the cloud, there is a problem that DRM provider cannot receive user information because SSO and SSL are applied. If the user is authenticated using a hardware security machine (HSM), the DRM service provider is fine. However, in the absence of an HSM, the physical computer on which the virtual machine is created can be an issue when accessing cloud computing.
The sixth vulnerability is collaboration between managers and users. Cloud security requires cloud service providers and users to collaborate for cloud security. However, the current cloud administrator has all of the administrative roles. In principle, the organization should manage the data directly. The cloud service provider must provide only the infrastructure and service structure. Many organizations depend entirely on cloud providers to organize and operate their services. Cloud providers have absolute security privileges for their users, and cloud holders also have access to the cloud, which can lead to cloud security vulnerabilities. There is no clear definition of the individual roles and responsibilities of service providers and users.
The sixth vulnerability is collaboration between administrators and users. Cloud security requires cloud service providers and users to collaborate on cloud security.
ConclusionThe cloud service requires cloud auditor and audit system. Thanks to the password operating system, there is a need for an independent auditor delegated its own authority to investigate various security incidents. Establishment of a survey and support system for compliance and audit response is required. Encryption algorithms and protocols
63
on the cloud require secure password policies and detailed procedures for management.
The cloud services enhance security awareness and capabilities of cloud operators Currently, there are cases where cloud administrators are not security officers but general information system officers have a low level of understanding of security. It is necessary to establish a job description system in order to improve the job skills of the cloud staff and minimize the gaps in the work due to the change of assistant positions.
The cloud services contract using cloud of public institution Piryogua SLA enhancement. Cloud service providers will need to provide a thorough explanation of key issues such as cloud infrastructure, algorithms used, key storage, and key management when contracting with public institutions. Standard contracts for responsibilities and obligations with public institutions and cloud service providers will likely be required.
References[1] Dekker, M.; Karsberg, C. Technical Guideline in
Security Measures Version 2.0, European Union Agency for Network and Information Security. 2014
[2] Federal Office for Information Security (BSI), BSI-Standard 100-3: Risk Analysis Based on IT-Grundschutz Version 2.5. online:https://www.bsi.bund.de/EN/Publications/BSIStandards/ BSIStandards_node.html (accessed on 25 February 2015).
[3] NIST SP 800-125a, Security Recommendations for Seerver-based Hyperviosr Platform, 2018.
[4] Spectre Attacks : Exploiting Speculative Execution (Google project zero)
64
A Theoretical Model for Psychological Empowerment of Telecentre Users Using ICT
Jyoti Arya1 and Santosh Rangnekar 21Research Scholar, Department of Management Studies,IIT Roorkee,
Haridwar Highway ,Roorkee , Uttarkhand 247667.Tel:-+91-8650252982,E-
mail:[email protected], Department of Management Studies,IIT Roorkee,
Haridwar Highway ,Roorkee , Uttarkhand 247667.Tel:-+91-9410543454,E-
mail:[email protected]
AbstractThe Information and Communication technology practice among rural communities can be promoted in the course of community telecentres. There is gap of enough knowledge and empowerment in terms of involvement and participation in ICT programs. The main aim of this paper proposes a theoretical model for analyzing psychological empowerment of telecentres users based on review of literature. The psychological empowerment theories that consist of intrapersonal, interactional and behavioral components form the foundation of the model. ICT has also been associated to the hope of community empowerment where dimensions include Meaning, Competence, Determination and impact for enhancing equality and increasing social capital. The concept of empowerment is seen important due to it being a prerequisite for competitiveness where IT facilitates business operations We can use this model to scrutinize the relationship among the apparatus of psychological empowerment for different populations and settings, and create an possibility for accepting individual users of telecentre.KeywordsRural ICT, Psychological empowerment, Telecentre
65
Impact of Advance Digital & Mobile Technology on Work Culture
Amit Singh RathoreProfessor & Director, Om Kothari Institute of Management & Research
Chetan Sharma Associate Professor, Om Kothari Institute of Management & Research
Anita ChauhanChairperson – ISTD Kota Chapter
Founder- Kota GyanDwar Education Society
Abstract
This article is focused on the use of the advance digital technology by the personals and its impact on the work culture of the organization. Digital technology has transformed nearly every aspect of modern life. Travel, work, shopping, entertainment, and communications are just some of the areas that have been revolutionized in recent decades. It's now rare to find an electronic device or piece of machinery that doesn't incorporate digital technology in some way. Digital technology means that devices can be more compact, faster, lighter, and more versatile. Huge amounts of information can be stored locally or remotely and moved around virtually instantaneously. Even the term "information" has expanded to include media such as photos, audio, and video, and no longer refers to just words and numbers. This article attempts to interpret the progress, direction, and purpose of current research on the effects of technology on work and organizations. After a review of key breakthroughs in the evolution of technology, we consider the disruptive effects of emerging information and communication technologies.
Keywords
Digital Technology, Internet, Email, Social Networking Website, Cloud Computing, Web & Mobile Application.
1. Introduction
Technological advancements have entirely reshaped the organizations by making their business processes highly integrated, and more streamlined. This is more so in case of small or medium enterprises. Run by a few people, small businesses need technology like nothing else. Technological advancements have facilitated these businesses in running their tasks smoothly and performing well than ever before. Technology in the workplace is like a facilitator that makes an action or process easier to keep the whole workflow smooth and on track. Facility management software such as not long ago, companies were in a mess as they had to deal with a lot of paperwork, meetings had to be held in rooms, travel expenses were incurred on client meetings and communication across the organization was not so easy. From the ways of
communication to the methods of solution, technology has helped businesses come a long way. All the operational and communication issues have now been simplified and streamlined with the help of new technology. Businesses no longer need to take a pause in any of their tasks.The smart mobile phone and various digital applications on it accelerated the overall communication process in the organizations. Cell phones have made communication easier both inside and outside the workplace by allowing employees to receive important calls without having to spend every moment behind a desk. They are also useful for getting in touch with sales staff and other professionals who spend most of their work hours outside the office. However, there are numerous disadvantages of cellular phones when they're used in the workplace, from disrupting work to just plain wasting time.
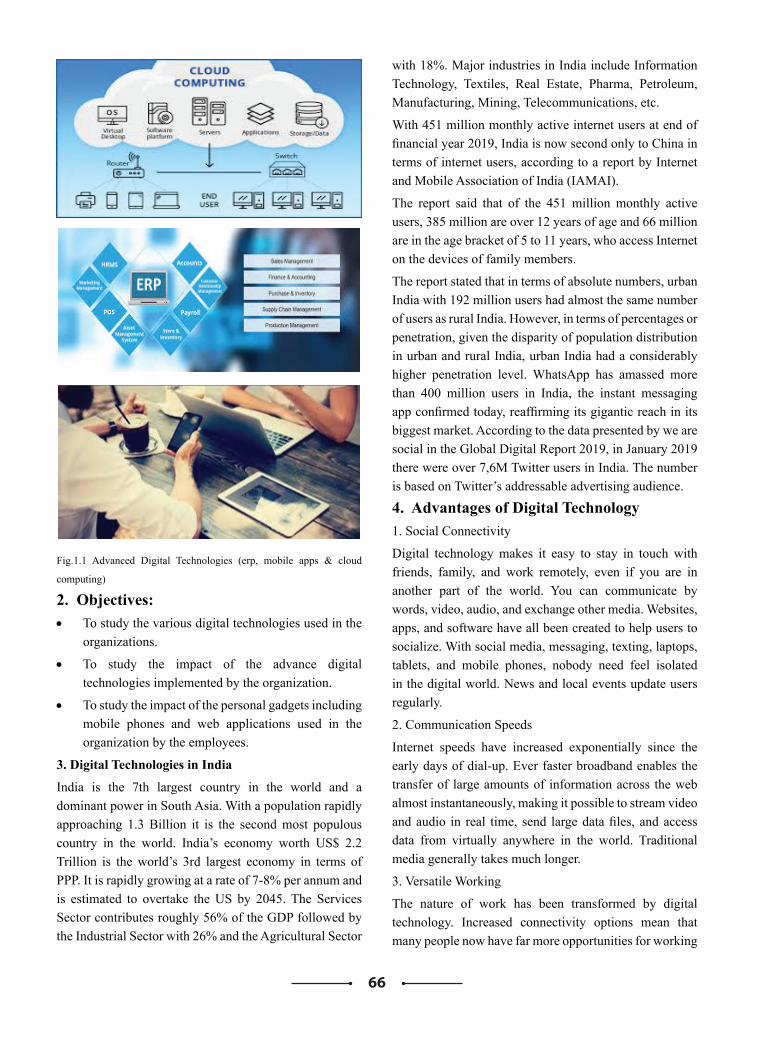
66
Fig.1.1 Advanced Digital Technologies (erp, mobile apps & cloud
computing)
2. Objectives: • To study the various digital technologies used in the
organizations.
• To study the impact of the advance digital technologies implemented by the organization.
• To study the impact of the personal gadgets including mobile phones and web applications used in the organization by the employees.
3. Digital Technologies in India
India is the 7th largest country in the world and a dominant power in South Asia. With a population rapidly approaching 1.3 Billion it is the second most populous country in the world. India’s economy worth US$ 2.2 Trillion is the world’s 3rd largest economy in terms of PPP. It is rapidly growing at a rate of 7-8% per annum and is estimated to overtake the US by 2045. The Services Sector contributes roughly 56% of the GDP followed by the Industrial Sector with 26% and the Agricultural Sector
with 18%. Major industries in India include Information Technology, Textiles, Real Estate, Pharma, Petroleum, Manufacturing, Mining, Telecommunications, etc.
With 451 million monthly active internet users at end of financial year 2019, India is now second only to China in terms of internet users, according to a report by Internet and Mobile Association of India (IAMAI).
The report said that of the 451 million monthly active users, 385 million are over 12 years of age and 66 million are in the age bracket of 5 to 11 years, who access Internet on the devices of family members.
The report stated that in terms of absolute numbers, urban India with 192 million users had almost the same number of users as rural India. However, in terms of percentages or penetration, given the disparity of population distribution in urban and rural India, urban India had a considerably higher penetration level. WhatsApp has amassed more than 400 million users in India, the instant messaging app confirmed today, reaffirming its gigantic reach in its biggest market. According to the data presented by we are social in the Global Digital Report 2019, in January 2019 there were over 7,6M Twitter users in India. The number is based on Twitter’s addressable advertising audience.
4. Advantages of Digital Technology 1. Social Connectivity
Digital technology makes it easy to stay in touch with friends, family, and work remotely, even if you are in another part of the world. You can communicate by words, video, audio, and exchange other media. Websites, apps, and software have all been created to help users to socialize. With social media, messaging, texting, laptops, tablets, and mobile phones, nobody need feel isolated in the digital world. News and local events update users regularly.
2. Communication Speeds
Internet speeds have increased exponentially since the early days of dial-up. Ever faster broadband enables the transfer of large amounts of information across the web almost instantaneously, making it possible to stream video and audio in real time, send large data files, and access data from virtually anywhere in the world. Traditional media generally takes much longer.
3. Versatile Working
The nature of work has been transformed by digital technology. Increased connectivity options mean that many people now have far more opportunities for working
67
from home, as remote working becomes increasingly common. Many jobs can now be done from hundreds, or even thousands of miles away without difficulty. Without the need for all workers to be present in the same building, many other flexible working practices are now possible.
4. Learning Opportunities
Anybody with access to the internet now has access to a huge proportion of the world's knowledge over the web. Lessons and courses can now be delivered virtually online. Communication advances mean that you can now easily communicate with most of the world's population and learn directly from sources, for example if you are trying to understand foreign events, or learning a new language. Digital technology can also be easier to use for people with disabilities and often give them equal access.
5. Automation
Digital technology is increasingly making machines smarter. In some cases, the machines no longer need humans to operate them, freeing up workers from often boring tasks for more interesting pursuits. In other cases, smarter machines mean better standards of safety, or a better experience for the user. Products and services drop in price as the technology develops and becomes more common. Many tasks can now be done directly by customers, rather than having to be done through another person acting as an intermediary, for instance, booking a holiday.
6. Information Storage
Digital technology enables the storage of massive amounts of information in relatively small spaces. Large amounts of media, such as photos, music, videos, contact information, and other documents can be carried around on small devices like mobile phones. As well as physical locations, data can also be stored online, enabling it to be accessed from any device which has internet access.
Creative options for editing videos and photos have increased exponentially with the advent of digital technology. The technology is more affordable and easier to use too, what used to require a studio with expensive equipment can now be done at home
7. Editing
One of the great advantages of digital technology over traditional media is that the information can be easier to edit or manipulate. Word processing has brought about a revolution in the editing of text. Video editing, which used to require expensive studios and equipment, can now be
done on a laptop in a bedroom. All sorts of photographic effects are now available, as well as the ability creatively alter images.
8. Accurate Duplication
One of the great things about digital technology is that it enables the exact duplication of media. For instance, you can write a work report and email it to multiple recipients, or you can distribute multiple copies of photos to family and friends. Breakthroughs in technology are now happening in the field of 3D printing, which looks set to radically transform our world.
9. GPS and Mapping
Finding your way around used to involve referring to a paper map, but digital combined with satellite technology has transformed travel. GPS services can now pinpoint your position accurately, update you on traffic jams and road closures in real time, and give you lots of up-to-date information such as time of arrival at your destination, as well as alternative routes. If you want to find a gas station or drugstore that's open, that's easy too.
10. Transportation
Many trains and airplanes already rely to an extent on digital technology. Road vehicles, such as cars and trucks, will become fully automated in the not too distant future. Accessing timetables, as well as booking planes and trains now often takes place online. Passports contain digital chips that hold information, enabling self service machines to speed up the process of checking in and passing through customs.
11. Low Cost
Aside from paying for an internet service and the basics like a modem, much of what the digital world offers can be accessed for free. Sending an email, communicating via a video link-up with family, and surfing the internet generally cost nothing. It can provide opportunities for low cost self-education, setting up a business, buying and selling items, or earning money online.
12. Entertainment
The entire entertainment industry and the way that people amuse themselves has been radically transformed. Many people get their fun from online social media, or playing computer games. Traditional media has evolved too, as televisions and broadcasting have become digitalized, along with radio.
Traditional sources of news such as newspapers have seen a dramatic decline in recent years, as digital media takes
68
over. Many people now get their news via social media, as well as directly from news websites.
13. News
Increasing numbers of people get their news online, either via a website or social media. Even traditional news media, such as TV and radio, have been digitalized. People have more options for news sources than ever, and most of it is available 24 hours per day. Independent and do-it-yourself journalism is now very common, as well as ordinary people taking photos and videos on their phones at locations where a news event is taking place.
14. Warfare
Advances in technology mean that wars can increasingly fought remotely, avoiding the risks associated with having soldiers physically present on or above the battlefield, where they are prone to injury or death. Drones and missile technology are particularly reliant on digital technology to work effectively, but most machinery is being gradually becoming increasingly automated.
15. Banking and Finance
There's no doubt that digitalization has led to a revolution in financial matters. Online banking done either through a laptop, tablet, or phone app is now the norm. Bank users can now check their incoming and outgoing payments remotely, as well as arrange money transfers and bill payments. Outside of banking, other financial matters, such as buying and selling currency and shares can be dealt with online. Transferring money between accounts both nationally and internationally has also seen a great deal of innovation in recent years.
16. Smaller Sized Devices
One general effect of digital technology that is almost taken for granted is that devices can be made much smaller. The phones that we carry around are mini-computers, for example, capable of surfing the net, working as calculators, planning journeys, capturing and playing photos, audio, and videos, providing games for our amusement, as well as operating as phones and having other functions. Smaller devices generally means more portability and less space used up in living spaces.
5. Disadvantages of Advanced Digital Technology
1. Data Security
Digital technology means that vast amounts of data can be collected and stored. This can be private information concerning individuals or organizations. It can be very difficult to keep this data safe. Just a single breach can
mean vast amounts of private information going into the hands of criminals, terrorists, foreign enemies, or other malign entities.
2. Crime and Terrorism
The internet is fertile territory for malevolent forces to operate, thanks to its international nature, large scale, and the relative anonymity that users can enjoy. Examples of this include: terrorists using social media to promote themselves and encourage others; drug dealers using the dark web to trade; pedophiles using chat rooms and other places to exchange photos, videos and other information; and authoritarian regimes attempting to sway or distort elections in democratic countries.
3. Complexity
We no longer understand the devices and machines that we interact with on a daily basis. Fixing a modern car now means interacting with a computer, it is no longer just mechanical. Using a phone can involve tackling all sorts of complicated settings. Minor glitches in a laptop can cost both time and expense.
4. Privacy Concerns
It's become much harder to have personal privacy in the digital world and that's on top of the dangers of your personal data being stolen or sold. For instance, everybody has the ability to take photos and video footage on their mobile phone, then post it online. Employers can search for people online and maybe find unflattering photographs, or see them expressing controversial opinions in social media or blogs. Digital cameras watch and record our movements in public places. Minor indiscretions can now haunt an individual for life when they're posted on the internet. Controlling your personal information is very difficult and sometimes impossible.
5. Social Disconnect
There is an increasing tendency for people to socialize and communicate via digital devices rather than through real life contact. This can easily lead to a sense of disconnect and isolation. Human beings have evolved over thousands of years to have real contact, taking that away is a bad idea. Studies have suggested that the lack of real life contact is causing depression and other forms of mental illness in many people.
There are a number of psychological studies suggesting that the digital world is causing an increased risk of mental illness. Examples include reliance on social media for contact, online bullying, and work stress through information overload.
69
6. Work Overload
Many modern workers spend their days trying to keep up with the hundreds of emails that they are sent each week, all of which require reading and some of which require replies or action. Texts from colleagues in the evenings or on the weekend can mean that people never fully escape work. Organizing the vast amount of digital data acquired in some jobs, such as minutes of meetings, training videos, photographs, reports can also be a huge headache.
7. Digital Media Manipulation
Digital media such as photographs, audio, and video are easy to edit, making the manipulation of media widespread. It's not always easy to tell what is real and what is fake anymore. Photographs can be altered using editing tools such as Photoshop. Digital audio and video can be doctored.
8. Job Insecurity
It used to be that you had to be physically present at a workplace to do a job, but now many work tasks are performed remotely via the internet. That means a Third World worker in a low wage economy can undercut you and take your job. Increasingly, humans aren't needed at all for many tasks, as computers gradually replace them. Driving jobs, for instance, will disappear soon as vehicles become self-driven.
9. Plagiarism and Copyright
Digital media is remarkably easy to copy and reproduce. Copyright laws are increasingly hard to enforce, as the music and movie industries have discovered to their cost. School kids can copy and paste their homework projects without really learning anything.
10. Anonymity and Fake Personas
Digital technology provides wide scope for users to hide their identities. Studies show that people are much more likely to behave anti-socially if they don't think that there will be any consequences. Bullying, trolling, stalking, threatening, and insulting behavior have all increased dramatically with the rise of the internet. People assume fake personas for the purposes of scamming and defrauding. Pedophiles use fake personas to gain access and befriend children.
11. Over-reliance on Gadgets
Reliance upon mobile phones, computers, and other digital gadgets has become common. Many people have all their contact information, photographs, texts, and other personal information on their phones. If they lose
them, or the gadget breaks or runs out of power, then they are in trouble. Basic living skills, like finding one's way around the streets of a town, have been replaced by taking directions from a GPS system.
Computer gaming addiction can cause multiple problems for users caught up in it. Consequences include negative effects on social life, finances, academic achievement, sleep patterns, as well as emotional and health problems.
12. Addiction
Social media, computer games, messaging, and dating websites can all be addictive. Games want you to play so that you will buy the next version. Websites want you to interact so that they can bring in advertising money. Users end up wasting vast amounts of time and hemorrhaging money for low return.
13. Second-hand Living
Many people no longer experience real life events directly. Music concerts or live shows are videoed on mobile phones, events are photographed, audio is recorded. Media is uploaded onto social sites. Life becomes something that is experienced through the prism of digital media rather than at first hand.
14. Organization and Storage
Digital media can be very difficult to organize. Photos and music, for instance, can be located on numerous devices, such as mobile phones, tablets, laptops, and portable hard drives. Individual items can be hard to find, easy to accidentally delete or lose, and the device they are stored on can be lost, stolen, or suffer catastrophic malfunction. Digital media can be difficult to store and maintain long term. File formats change over time. In some instances traditional media can last longer than their digital equivalent.
15. Depersonalized Warfare
Digital technology means that weapons can be deployed anywhere in the world without any human military presence. Drones turn war into a computer game. Intercontinental missiles follow streets and landmarks in foreign countries remotely. Satellites photograph and video from space.
16. Longevity
Digital gadgets typically have a short lifespan and become archaic quickly. As the technology advances at a pace, devices and machines quickly become unusable because they are too slow, incompatible, or are simply superseded.
70
Much of life's tasks can now take place without leaving the house. The downside to this is that society is becoming increasing depersonalized.
17. Social Depersonalization
Society continues to become more and more depersonalized as digitized machines replace humans. People shop online, do their banking online, pay bills online, and increasingly work online. Transport is also set to become automated, which will result in taxis and delivery vehicles being driver free.
18. Disadvantage of using Cell Phones at work place
- Disruption of Workflow
One of the disadvantages of smartphones in the workplace is that cell phone communication, both in the form of personal calls and work-related calls may disrupt an employee's work flow since it increases the perception that your employees are always available to accept calls.
As every worker knows, one of the disadvantages of telephone calls of any kind is that they disrupt whatever you're doing. Adding cell phones to the mix adds one more disruption. An employee who has to stop work tasks throughout the day to answer phones may suffer from decreased productivity, which can cause the employee to miss deadlines or put in extra hours to complete projects on time.
- Difficulty Monitoring Calls
Some small businesses have a vested interest in monitoring calls made during work hours. It can help reduce personal calls and provide information you can use to coach employees on communicating with clients and business contacts more effectively. Setting up a call-monitoring system on a traditional land-line network is relatively simple. However, it is not typically possible for small business owners to monitor communications via cell phone.
- Balance Between Work and Life
Employees who receive work-related calls outside of normal work hours, whether on a company-provided phone or a personal cell phone, may feel an imbalance between their work and personal lives. That's one of the disadvantages of mobile communication. It can be difficult for an employee to enjoy time away from work when her duties spill over into family, social and rest time. This can increase employee stress, reducing the ability of employees to manage work tasks effectively.
- Misuse of Cell Phones
Cellular phones allow employees to communicate through media other than voice. Enhanced technology allows the transmission and receipt of text messages, videos, pictures, emails and instant messages. Employees who have access to other employees' cell phone numbers may use cellular communication to send harassing or inappropriate texts, emails and instant messages.
They may also send communications, pictures and videos that the recipient finds offensive or unprofessional. This can create workplace discord and increase the need for employee discipline and company-wide discussions about harassment policies.
Concerns about privacy are also valid. The more people conduct personal business and socialize on their cell phones, the more likely that private issues will be overheard or seen. You know you have enough opportunity for employee gossip without adding cell phones to the mix.
- The Time Adds Up Quickly
Another of the disadvantages of cell phones being nearby is that it's so tempting to use them. People admit to using their cell phones during the workday to check their personal email and get on social media. Maybe a quick internet search on websites they can't use on work computers. Just a few minutes here, a few minutes there adds up to nearly an hour of personal cell phone use at work each day. From an employer's point of view, that's wasted company time.
6. ConclusionThe proper and wise use of technology is very good for the organization growth as it gives a competitive edge to the organization. The technology are flexible, easy to use, work with accuracy, provide automation to the system, this makes the technology more useful for the organizations. Work culture and organization sentiments get badly affected by the technology used with malafied intentions by any personal of the organization. It creates a bad example so the high morale of the employees is must before providing any access to them through technology to the crucial information and processes of the organization.
It has been observed that the personal gadgets used by the employees are also a part of the advance technology used nowadays in the organization which makes the overall communication more effective. Technology has two faces good as well bad. Proper and sensible use gives the good results of using technology on the other
71
hand using technology with some negative intentions or say overutilization of the technology just for fun and enjoying forgetting the sense of responsibility makes the technologies disadvantageous for the organization.
7. SuggestionsProvide proper training to the employees so that they will use the technology implemented by the organization efficiently.
Banning Personal Cell Phone Use and providing a common office phone for the emergency and official calls.
For all of these reasons, many companies are banning employee use of personal cell phones during the work day, except for during lunches and breaks. If you think you need to do this, it's important to state a clear policy and stick to it. Personal cell phones should be put away, out of sight and temptation. If someone needs to check on a sick child or is expecting an important call, exceptions can be made if they notify their supervisors first.
No more glancing at cell phones during meetings. No more sending "just a quick text." The best way to make everyone comply? Set the example and don't be seen on your personal cell phone during work hours, either.
Issuing guidelines on the use of the official phones and institute internet usage:
The disciplinary guidelines should be constituted to control the use of the personal digital system to the employees. Restrict the social chatting website and the personal group.
Develop a Reward System : This will encourage the employees to make the use of the time and technology for the constructing and development purpose.
Put a Firewall on the Server: This is to provide the access to the websites which are required for the employees for conducting and executing the official work.
Restructure the working system to develop the morale of the employees: The organization should make develop the morale of the employees so they have a sense of responsibility to make a good and proper use of the technology.
Conduct motivational and work culture mannerism programme: The seminar and EDP’s should be conducted to develop the morale of the employees so that they make use of the digital gadgets for some good purpose.
BibliographyBooks & References
• Ambrose ML, Alder GS. 2000. Designing, implementing, and utilizing computerized performance monitoring: enhancing organizational justice. Res. Personnel Human Resources Manag.18:187–219.
• Andreessen M. 2011. Why software is eating the world. The Wall Street Journal, Aug. 20. http://www.wsj.com/articles/SB10001424053111903480904576512250915629460
• Applegate LM, Austin RD, McFarlan FW. 2002. Creating Business Advantage in the Information Age. Boston: McGraw-Hill
• Aral S, Weill P. 2007. IT assets, organizational capabilities and firm performance. Organ. Sci. 18(5):763–80
• Autor DH, Dorn D. 2013. The growth of low-skill service jobs and the polarization of the U.S. labor market. Am. Econ. Rev. 103(5):1533–97
• Ball K. 2010. Workplace surveillance: an overview. Labor Hist. 51:87–106
• Bandura A. 1997. Self-Efficacy: The Exercise of Control. New York: Freeman
• Barley SR. 1986. Technology as an occasion for structuring: evidence from observation of CT scanners and the social order of radiology departments. Adm. Sci. Q. 31:78–108
• Barley SR. 1990. The alignment of technology and structure through roles and networks. Adm. Sci. Q. 35:61–103
• Ciborra C, Lanzara GF. 1994. Formative contexts and ICT: understanding the dynamics of innovation in organizations. Account. Manag. Inf. Technol. 4(2):61–86
• Coovert MD, Thompson LF, eds. 2014a. The Psychology of Workplace Technology. New York: Routledge
• Coovert MD, Thompson LF. 2014b. Toward a synergistic relationship between psychology and technology. See Coovert & Thompson 2014a, pp. 1–17
• Daft RL, Lengel RH. 1986. Organizational information requirements, media richness and structural design. Manag. Sci. 32(5):554–71
72
• Davenport TH, Kirby J. 2015. Beyond automation: strategies for remaining gainfully employed in an era of very smart machines. Harvard Bus. Rev. 93(6):58–65
• Davis FD. 1989. Perceived usefulness, perceived ease of use, and user acceptance of information technology. MIS Q. 13(3):319–40
• Deci EL, Ryan RM. 2012. Self-determination theory. In Handbook of Theories of Social Psychology, Vol. 1, ed.
• PAM Van Lange, AW Kruglanski, ET Higgins, pp. 416–37. Thousand Oaks, CA: Sage
• Demaerschalk BM, Vargas JE, Channer DD, Noble BN, Kiernan TJ, et al. 2012. Smartphone teleradiology.
• Brynjolfsson E, McAfee D. 2014. The Second Machine Age: Work, Progress, and Prosperity in a Time of Brilliant Technologies. New York: W.W. Norton
• Burkhardt ME, Brass DJ. 1990. Changing patterns or patterns of change: the effects of a change in technology on social network structure and power. Adm. Sci. Q. 35:104–27
• Carlile PR. 2002. A pragmatic view of knowledge and boundaries: boundary objects in new product development. Organ. Sci. 13(4):442–55
• Carter NM. 1984. Computerization as a predominate
technology: its influence on the structure of newspaper organizations. Acad. Manag. J. 27:247–70
• Cascio WF. 2011. The virtual global workforce: leveraging its impact. Presented at Annu. SIOP Leading-Edge Consort, 7th, Louisville, KY Websites
• https:/ /www.statista.com/statist ics/730306/whatsapp-status-dau/
• https://web.archive.org/web/20081007132355/http://history.sandiego.edu/gen/recording/digital.html
• https://turbofuture.com/computers/Advantages-of-Digital-Technology
• https://adt2b.com/eng/
• https://www.essindia.com/erp-in-india
• h t t p s : / / w w w. q u i c k f m s . c o m / b l o g / 6 - w a y s -technology-has-reshaped-the-workplace/
• https://smallbusiness.chron.com/disadvantages-cell-phone-communication-workplace-12818.html
• https://turbofuture.com/misc/Disadvantages-of-Digital-Technology
• https://www.dtcoa.com.au/dailynews/2019/3/22/what-is-a-smart-city
• https://www.marketexpert24.com/
• https://tech.economictimes.indiatimes.com/
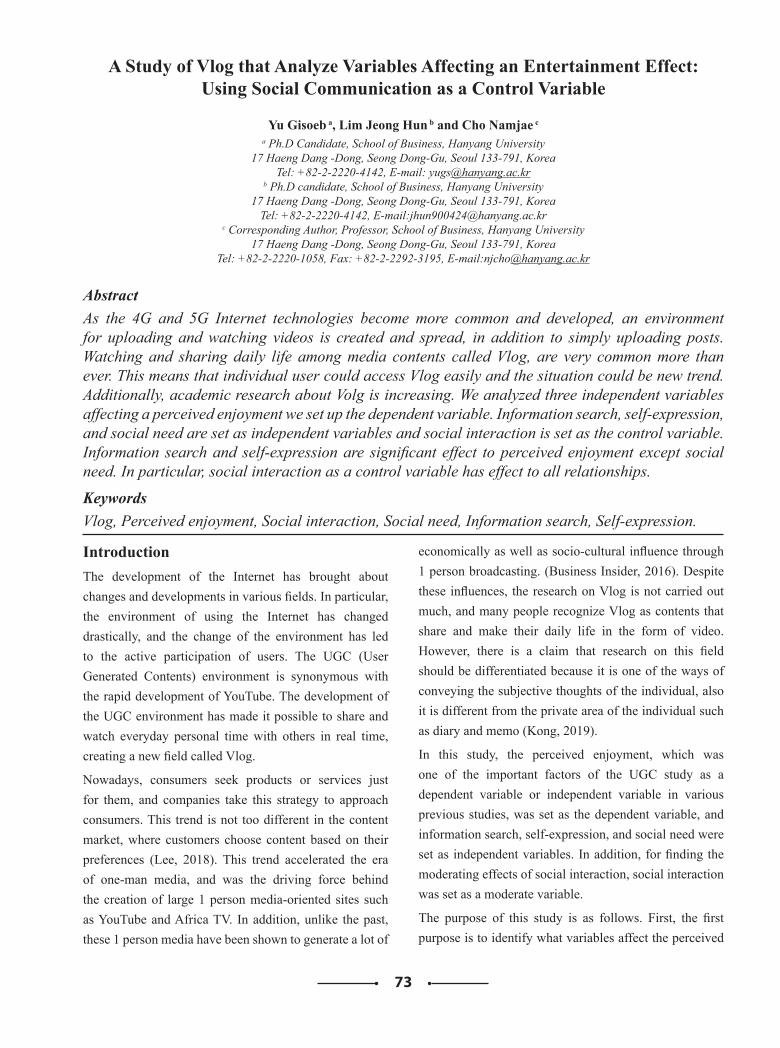
73
A Study of Vlog that Analyze Variables Affecting an Entertainment Effect: Using Social Communication as a Control Variable
Yu Gisoeb a, Lim Jeong Hun b and Cho Namjae c
a Ph.D Candidate, School of Business, Hanyang University17 Haeng Dang -Dong, Seong Dong-Gu, Seoul 133-791, Korea
Tel: +82-2-2220-4142, E-mail: [email protected] Ph.D candidate, School of Business, Hanyang University
17 Haeng Dang -Dong, Seong Dong-Gu, Seoul 133-791, KoreaTel: +82-2-2220-4142, E-mail:[email protected]
c Corresponding Author, Professor, School of Business, Hanyang University17 Haeng Dang -Dong, Seong Dong-Gu, Seoul 133-791, Korea
Tel: +82-2-2220-1058, Fax: +82-2-2292-3195, E-mail:[email protected]
Abstract As the 4G and 5G Internet technologies become more common and developed, an environment for uploading and watching videos is created and spread, in addition to simply uploading posts. Watching and sharing daily life among media contents called Vlog, are very common more than ever. This means that individual user could access Vlog easily and the situation could be new trend. Additionally, academic research about Volg is increasing. We analyzed three independent variables affecting a perceived enjoyment we set up the dependent variable. Information search, self-expression, and social need are set as independent variables and social interaction is set as the control variable. Information search and self-expression are significant effect to perceived enjoyment except social need. In particular, social interaction as a control variable has effect to all relationships.
Keywords Vlog, Perceived enjoyment, Social interaction, Social need, Information search, Self-expression.
Introduction The development of the Internet has brought about changes and developments in various fields. In particular, the environment of using the Internet has changed drastically, and the change of the environment has led to the active participation of users. The UGC (User Generated Contents) environment is synonymous with the rapid development of YouTube. The development of the UGC environment has made it possible to share and watch everyday personal time with others in real time, creating a new field called Vlog.
Nowadays, consumers seek products or services just for them, and companies take this strategy to approach consumers. This trend is not too different in the content market, where customers choose content based on their preferences (Lee, 2018). This trend accelerated the era of one-man media, and was the driving force behind the creation of large 1 person media-oriented sites such as YouTube and Africa TV. In addition, unlike the past, these 1 person media have been shown to generate a lot of
economically as well as socio-cultural influence through 1 person broadcasting. (Business Insider, 2016). Despite these influences, the research on Vlog is not carried out much, and many people recognize Vlog as contents that share and make their daily life in the form of video. However, there is a claim that research on this field should be differentiated because it is one of the ways of conveying the subjective thoughts of the individual, also it is different from the private area of the individual such as diary and memo (Kong, 2019).
In this study, the perceived enjoyment, which was one of the important factors of the UGC study as a dependent variable or independent variable in various previous studies, was set as the dependent variable, and information search, self-expression, and social need were set as independent variables. In addition, for finding the moderating effects of social interaction, social interaction was set as a moderate variable.
The purpose of this study is as follows. First, the first purpose is to identify what variables affect the perceived
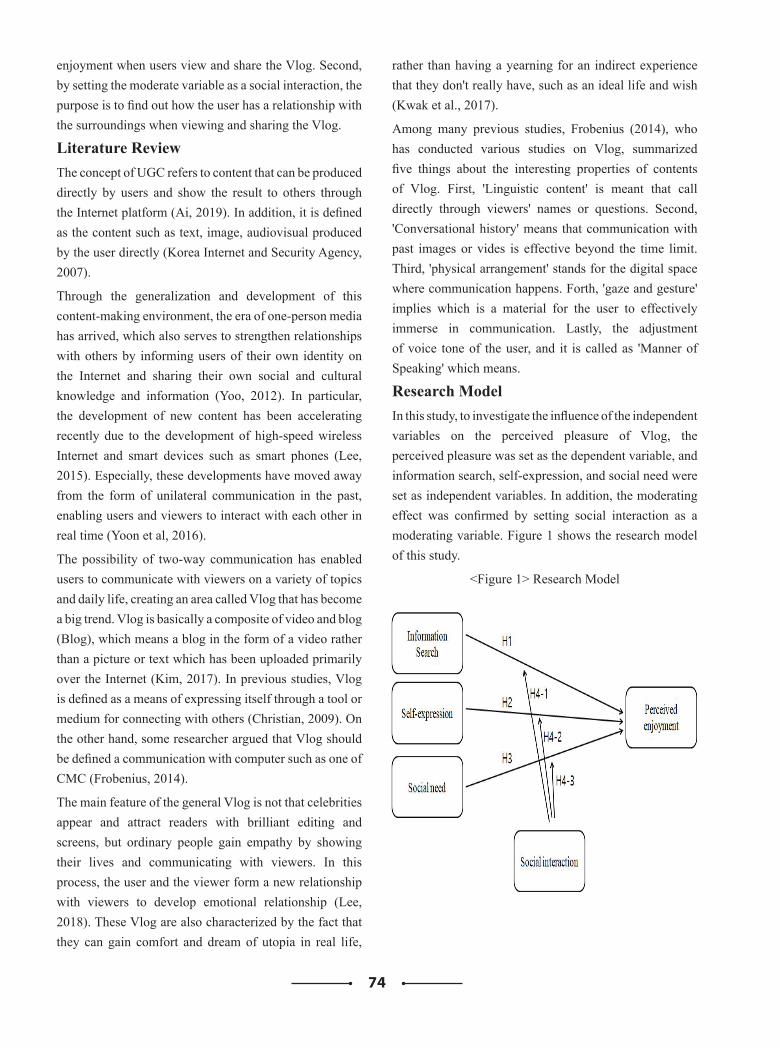
74
enjoyment when users view and share the Vlog. Second, by setting the moderate variable as a social interaction, the purpose is to find out how the user has a relationship with the surroundings when viewing and sharing the Vlog.
Literature ReviewThe concept of UGC refers to content that can be produced directly by users and show the result to others through the Internet platform (Ai, 2019). In addition, it is defined as the content such as text, image, audiovisual produced by the user directly (Korea Internet and Security Agency, 2007).
Through the generalization and development of this content-making environment, the era of one-person media has arrived, which also serves to strengthen relationships with others by informing users of their own identity on the Internet and sharing their own social and cultural knowledge and information (Yoo, 2012). In particular, the development of new content has been accelerating recently due to the development of high-speed wireless Internet and smart devices such as smart phones (Lee, 2015). Especially, these developments have moved away from the form of unilateral communication in the past, enabling users and viewers to interact with each other in real time (Yoon et al, 2016).
The possibility of two-way communication has enabled users to communicate with viewers on a variety of topics and daily life, creating an area called Vlog that has become a big trend. Vlog is basically a composite of video and blog (Blog), which means a blog in the form of a video rather than a picture or text which has been uploaded primarily over the Internet (Kim, 2017). In previous studies, Vlog is defined as a means of expressing itself through a tool or medium for connecting with others (Christian, 2009). On the other hand, some researcher argued that Vlog should be defined a communication with computer such as one of CMC (Frobenius, 2014).
The main feature of the general Vlog is not that celebrities appear and attract readers with brilliant editing and screens, but ordinary people gain empathy by showing their lives and communicating with viewers. In this process, the user and the viewer form a new relationship with viewers to develop emotional relationship (Lee, 2018). These Vlog are also characterized by the fact that they can gain comfort and dream of utopia in real life,
rather than having a yearning for an indirect experience that they don't really have, such as an ideal life and wish (Kwak et al., 2017).
Among many previous studies, Frobenius (2014), who has conducted various studies on Vlog, summarized five things about the interesting properties of contents of Vlog. First, 'Linguistic content' is meant that call directly through viewers' names or questions. Second, 'Conversational history' means that communication with past images or vides is effective beyond the time limit. Third, 'physical arrangement' stands for the digital space where communication happens. Forth, 'gaze and gesture' implies which is a material for the user to effectively immerse in communication. Lastly, the adjustment of voice tone of the user, and it is called as 'Manner of Speaking' which means.
Research ModelIn this study, to investigate the influence of the independent variables on the perceived pleasure of Vlog, the perceived pleasure was set as the dependent variable, and information search, self-expression, and social need were set as independent variables. In addition, the moderating effect was confirmed by setting social interaction as a moderating variable. Figure 1 shows the research model of this study.
<Figure 1> Research Model
75
Hypothesis of this study is as follow.
H1: Information search is associated to perceived enjoyment.
H2: Self-expression is associated to perceived enjoyment.
H3: Social need is associated to perceived enjoyment.
H4-1: Social interaction moderates between perceived enjoyment and information retrieval.
H4-2: Social interaction moderates between perceived enjoyment and self-expression.
H4-3: Social interaction moderates between perceived enjoyment and social need.
Perceived EnjoymentPerceived enjoyment is the fun of using the system by focusing on internal motivation and is often used as a perceptual element for users in the information system (Ha, 2008). The perceived enjoyment, which is often used with the meaning of enjoyment or fun, has been revealed through previous studies as an important factor for the use of the system (Ha, 2008). In particular, perceived enjoyment has been shown to affect user satisfaction, good mood, and immediate and subjective experience (Webster et al., 1993). Perceived enjoyment is an important determinant of the acceptance of new information technologies, and can also trigger the promotion of a product or service, which can be interpreted as an important variable for the success of users who use Vlog or the company that operates the site (Maignan et al., 1995; Al-gahtani et al., 1999).
Information SearchInformation retrieval is described as an important part of information seeking in consumer behavior, which is defined as information retrieval (Novak et al., 2000). Novak et al. (2000) categorized into objective-oriented search, which seeks information for a specific purpose, and experiential search, where consumers search for information by their own interests in everyday life. In the various previous studies, when searching for information, the user searched for more than one topic, which can be explained by the existence of various demands for information in the online environment (Janiszewski,
1998). In this study, Vlog users defined information search as an action to obtain the information using Vlog sites.
Self-expressionIn the case of YouTube, one of the most popular sites in Vlog, it was the space for free self-expression since its inception (Jung et al., 2013). As such, self-expression became a new trend called UGC, creating explosive demand and supply, and various aspects of self-expression were actively researched. In particular, people who have the stronger self-expression, they active the UGC participation more than others (Kim et al., 2007). In this study, self-expression, which is one of the important factors related to UGC, was set as an independent variable to find out how it affects perceived pleasure.
Social NeedSocial need can be said to be the basic desires of human beings to establish and maintain relationships with others (Baumeister et al., 1995). These social need have evolved to make people feel happier as they are satisfied. (Baumeister et al., 1995, ; Hill et al., 1989). These social need generally follow Maslow's theory of needs that human basic needs can be met after they are satisfied. In this study, social need was applied to share or watch Vlog.
Social InteractionMany previous studies have studied on-line interactions. Among them, users who use online more often have less social activities and conversations, and have more loneliness (Kraut et al., 1998). However, other studies have argued that online users are more social than those who are not (Hampton et al., 2003). Although there are many different views of social interaction online, a common concept is that social activity online plays a significant role (Haythornthwaite, 2002). Therefore, in this study, despite the conflicting studies, social interaction is an important factor for the user in using Vlog, and it is expected to bring about a moderating effect between independent and dependent variables.
The measurement tools for the variables used in this study are summarized in <Table 1>.
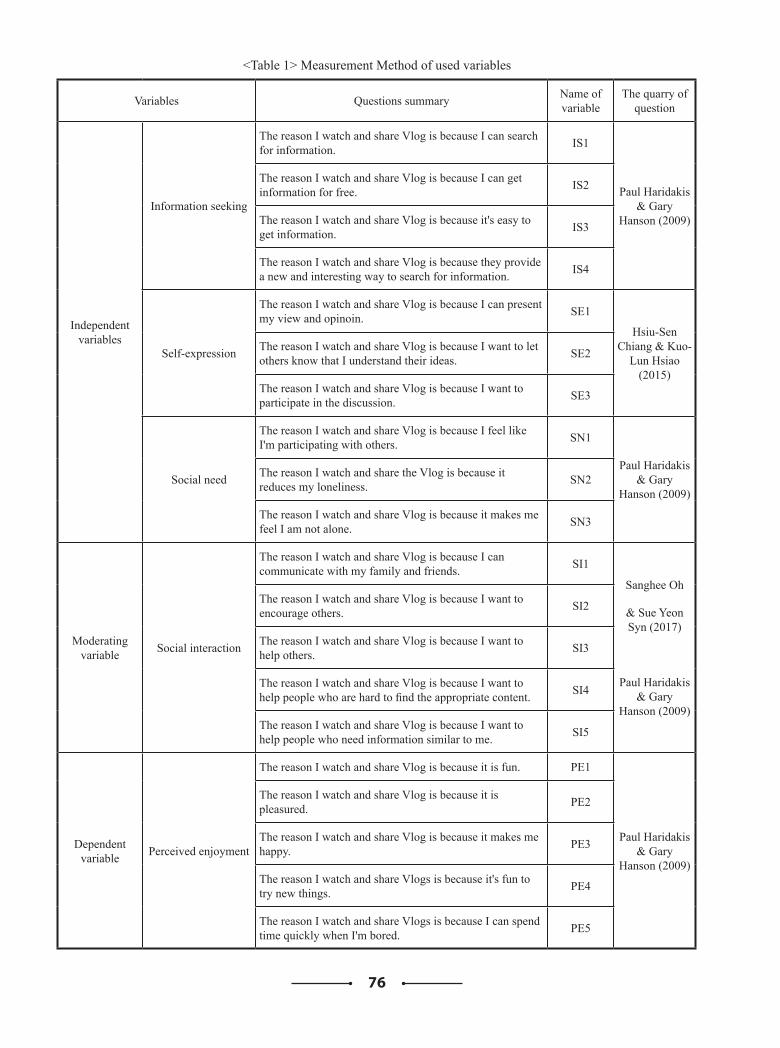
76
<Table 1> Measurement Method of used variables
Variables Questions summary Name of variable
The quarry of question
Independent variables
Information seeking
The reason I watch and share Vlog is because I can search for information. IS1
Paul Haridakis & Gary
Hanson (2009)
The reason I watch and share Vlog is because I can get information for free. IS2
The reason I watch and share Vlog is because it's easy to get information. IS3
The reason I watch and share Vlog is because they provide a new and interesting way to search for information. IS4
Self-expression
The reason I watch and share Vlog is because I can present my view and opinoin. SE1
Hsiu-Sen Chiang & Kuo-
Lun Hsiao (2015)
The reason I watch and share Vlog is because I want to let others know that I understand their ideas. SE2
The reason I watch and share Vlog is because I want to participate in the discussion. SE3
Social need
The reason I watch and share Vlog is because I feel like I'm participating with others. SN1
Paul Haridakis & Gary
Hanson (2009)
The reason I watch and share the Vlog is because it reduces my loneliness. SN2
The reason I watch and share Vlog is because it makes me feel I am not alone. SN3
Moderating variable Social interaction
The reason I watch and share Vlog is because I can communicate with my family and friends. SI1
Sanghee Oh
& Sue Yeon Syn (2017)
Paul Haridakis & Gary
Hanson (2009)
The reason I watch and share Vlog is because I want to encourage others. SI2
The reason I watch and share Vlog is because I want to help others. SI3
The reason I watch and share Vlog is because I want to help people who are hard to find the appropriate content. SI4
The reason I watch and share Vlog is because I want to help people who need information similar to me. SI5
Dependent variable Perceived enjoyment
The reason I watch and share Vlog is because it is fun. PE1
Paul Haridakis & Gary
Hanson (2009)
The reason I watch and share Vlog is because it is pleasured. PE2
The reason I watch and share Vlog is because it makes me happy. PE3
The reason I watch and share Vlogs is because it's fun to try new things. PE4
The reason I watch and share Vlogs is because I can spend time quickly when I'm bored. PE5
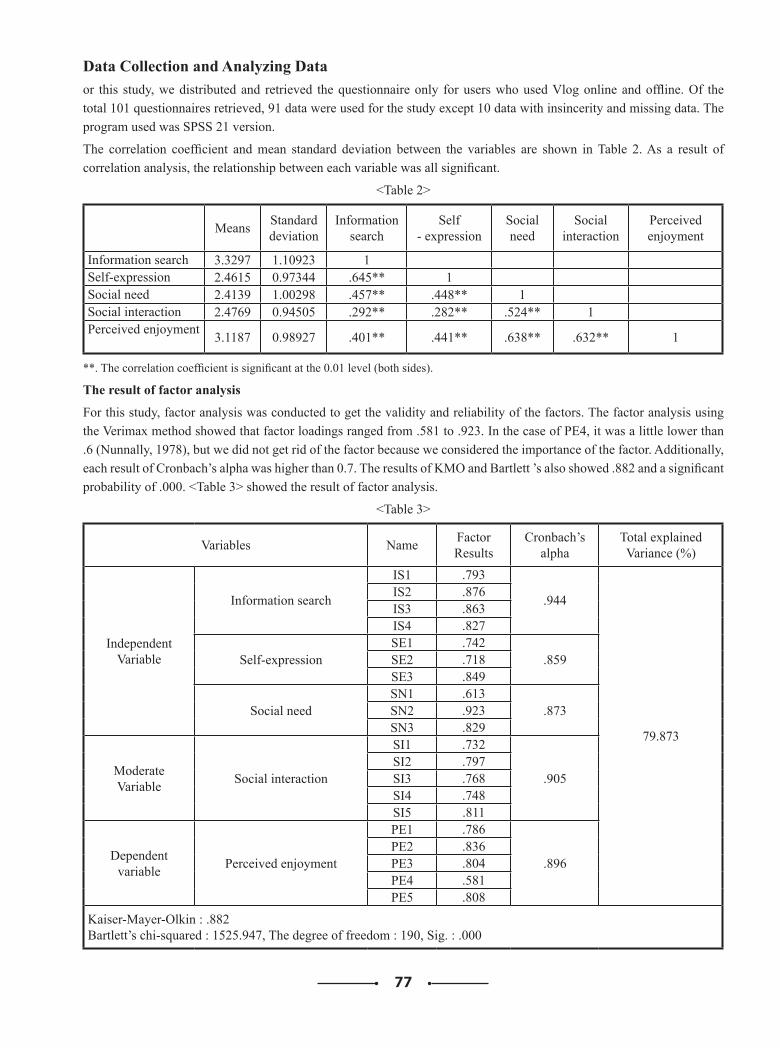
77
Data Collection and Analyzing Dataor this study, we distributed and retrieved the questionnaire only for users who used Vlog online and offline. Of the total 101 questionnaires retrieved, 91 data were used for the study except 10 data with insincerity and missing data. The program used was SPSS 21 version.
The correlation coefficient and mean standard deviation between the variables are shown in Table 2. As a result of correlation analysis, the relationship between each variable was all significant.
<Table 2>
Means Standard deviation
Information search
Self- expression
Social need
Social interaction
Perceived enjoyment
Information search 3.3297 1.10923 1Self-expression 2.4615 0.97344 .645** 1Social need 2.4139 1.00298 .457** .448** 1Social interaction 2.4769 0.94505 .292** .282** .524** 1Perceived enjoyment 3.1187 0.98927 .401** .441** .638** .632** 1
**. The correlation coefficient is significant at the 0.01 level (both sides).
The result of factor analysis
For this study, factor analysis was conducted to get the validity and reliability of the factors. The factor analysis using the Verimax method showed that factor loadings ranged from .581 to .923. In the case of PE4, it was a little lower than .6 (Nunnally, 1978), but we did not get rid of the factor because we considered the importance of the factor. Additionally, each result of Cronbach’s alpha was higher than 0.7. The results of KMO and Bartlett ’s also showed .882 and a significant probability of .000. <Table 3> showed the result of factor analysis.
<Table 3>
Variables Name FactorResults
Cronbach’s alpha
Total explained Variance (%)
IndependentVariable
Information search
IS1 .793
.944
79.873
IS2 .876IS3 .863IS4 .827
Self-expressionSE1 .742
.859SE2 .718SE3 .849
Social needSN1 .613
.873SN2 .923SN3 .829
ModerateVariable Social interaction
SI1 .732
.905SI2 .797SI3 .768SI4 .748SI5 .811
Dependentvariable Perceived enjoyment
PE1 .786
.896PE2 .836PE3 .804PE4 .581PE5 .808
Kaiser-Mayer-Olkin : .882Bartlett’s chi-squared : 1525.947, The degree of freedom : 190, Sig. : .000
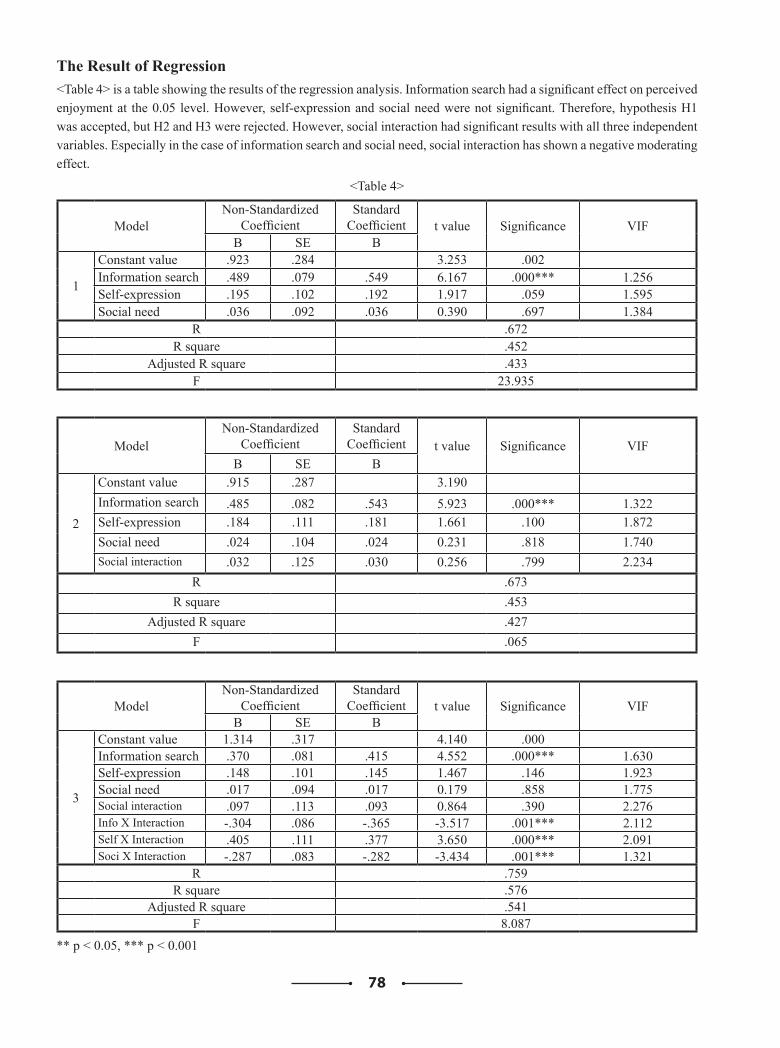
78
The Result of Regression<Table 4> is a table showing the results of the regression analysis. Information search had a significant effect on perceived enjoyment at the 0.05 level. However, self-expression and social need were not significant. Therefore, hypothesis H1 was accepted, but H2 and H3 were rejected. However, social interaction had significant results with all three independent variables. Especially in the case of information search and social need, social interaction has shown a negative moderating effect.
<Table 4>
ModelNon-Standardized
CoefficientStandard
Coefficient t value Significance VIFB SE B
1
Constant value .923 .284 3.253 .002Information search .489 .079 .549 6.167 .000*** 1.256Self-expression .195 .102 .192 1.917 .059 1.595Social need .036 .092 .036 0.390 .697 1.384
R .672R square .452
Adjusted R square .433F 23.935
ModelNon-Standardized
CoefficientStandard
Coefficient t value Significance VIFB SE B
2
Constant value .915 .287 3.190Information search .485 .082 .543 5.923 .000*** 1.322Self-expression .184 .111 .181 1.661 .100 1.872Social need .024 .104 .024 0.231 .818 1.740Social interaction .032 .125 .030 0.256 .799 2.234
R .673R square .453
Adjusted R square .427F .065
ModelNon-Standardized
CoefficientStandard
Coefficient t value Significance VIFB SE B
3
Constant value 1.314 .317 4.140 .000Information search .370 .081 .415 4.552 .000*** 1.630Self-expression .148 .101 .145 1.467 .146 1.923Social need .017 .094 .017 0.179 .858 1.775Social interaction .097 .113 .093 0.864 .390 2.276Info X Interaction -.304 .086 -.365 -3.517 .001*** 2.112Self X Interaction .405 .111 .377 3.650 .000*** 2.091Soci X Interaction -.287 .083 -.282 -3.434 .001*** 1.321
R .759R square .576
Adjusted R square .541F 8.087
** p < 0.05, *** p < 0.001
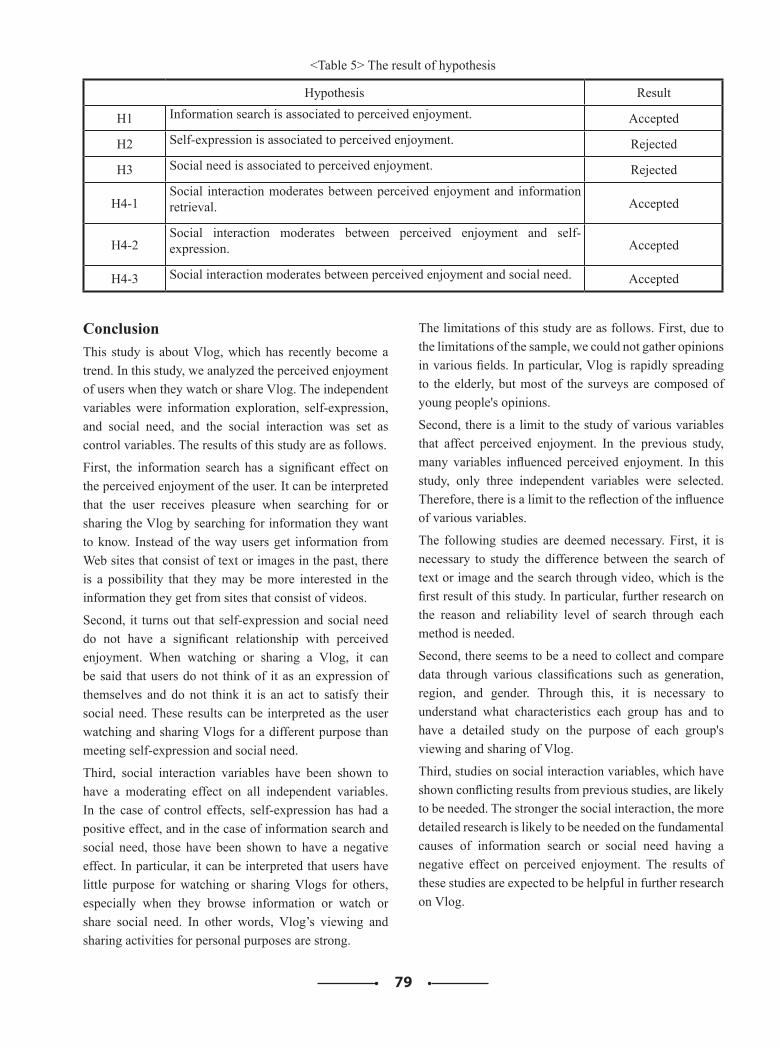
79
<Table 5> The result of hypothesis
Hypothesis Result
H1 Information search is associated to perceived enjoyment. Accepted
H2 Self-expression is associated to perceived enjoyment. Rejected
H3 Social need is associated to perceived enjoyment. Rejected
H4-1Social interaction moderates between perceived enjoyment and information retrieval. Accepted
H4-2Social interaction moderates between perceived enjoyment and self-expression. Accepted
H4-3 Social interaction moderates between perceived enjoyment and social need. Accepted
ConclusionThis study is about Vlog, which has recently become a trend. In this study, we analyzed the perceived enjoyment of users when they watch or share Vlog. The independent variables were information exploration, self-expression, and social need, and the social interaction was set as control variables. The results of this study are as follows.
First, the information search has a significant effect on the perceived enjoyment of the user. It can be interpreted that the user receives pleasure when searching for or sharing the Vlog by searching for information they want to know. Instead of the way users get information from Web sites that consist of text or images in the past, there is a possibility that they may be more interested in the information they get from sites that consist of videos.
Second, it turns out that self-expression and social need do not have a significant relationship with perceived enjoyment. When watching or sharing a Vlog, it can be said that users do not think of it as an expression of themselves and do not think it is an act to satisfy their social need. These results can be interpreted as the user watching and sharing Vlogs for a different purpose than meeting self-expression and social need.
Third, social interaction variables have been shown to have a moderating effect on all independent variables. In the case of control effects, self-expression has had a positive effect, and in the case of information search and social need, those have been shown to have a negative effect. In particular, it can be interpreted that users have little purpose for watching or sharing Vlogs for others, especially when they browse information or watch or share social need. In other words, Vlog’s viewing and sharing activities for personal purposes are strong.
The limitations of this study are as follows. First, due to the limitations of the sample, we could not gather opinions in various fields. In particular, Vlog is rapidly spreading to the elderly, but most of the surveys are composed of young people's opinions.
Second, there is a limit to the study of various variables that affect perceived enjoyment. In the previous study, many variables influenced perceived enjoyment. In this study, only three independent variables were selected. Therefore, there is a limit to the reflection of the influence of various variables.
The following studies are deemed necessary. First, it is necessary to study the difference between the search of text or image and the search through video, which is the first result of this study. In particular, further research on the reason and reliability level of search through each method is needed.
Second, there seems to be a need to collect and compare data through various classifications such as generation, region, and gender. Through this, it is necessary to understand what characteristics each group has and to have a detailed study on the purpose of each group's viewing and sharing of Vlog.
Third, studies on social interaction variables, which have shown conflicting results from previous studies, are likely to be needed. The stronger the social interaction, the more detailed research is likely to be needed on the fundamental causes of information search or social need having a negative effect on perceived enjoyment. The results of these studies are expected to be helpful in further research on Vlog.
80
References[1] Ai Danni, "An Analysis of UGC Video Contents
based on Uses and Gratification : Focused on the Development of Tik Tok App and China's Vlog", Deprtment of Media and Communication, Sungkyunkwan University, 2019
[2] Baumeister, Roy F , Leary, Mark R, "The need to belong: Desire for interpersonal attachments as a fundamental human motivation", Psychological bulletin, Vol.117 No.3, 1995
[3] Christian, A. J., “ Real vlogs: The rules and meanings of online personal videos, peer-reviewed journal on the internet, 2009
[4] Frobenius, M., “ Audience design in monologues: How vloggers involve their viewers”, Journal of Pragmatics , 72 , 59-72, 2014
[5] Gyeong-Tae Gwak, Eun-Kyung Kim, "Daily Life in Observation Entertainment Program, Form a Place for Collective Communication", Asia-pacific Journal of Multimedia Services Convergent with Art, Humanities, and Sociology, Vol.7, No.7, pp. 813-820, 2017
[6] Ha, Yeon-hwa, "The effects of Perceived-enjoyment on Brand Attitude by using experiences of Brand’s UCC", The Graduated School of Chung-Ang University, 2008
[7] Hampton, K., & Wellman, B., "Neighboring in netville: How the Internet supports community and social capital in a wired suburb", City & Community, Vol.2, No.4, pp.277-311, 2003
[8] Haythornthwaite, C., "Strong, weak, and latent ties and the impact of new media", Information Society, Vol.18, No.5, pp.385-401, 2002
[9] Hill K., Hurtado, M., "Hunter-gatherers of the new world", American Scientist, Vol.77, pp.437-43, 1989
[10] Hojin, Lee, "How does broadcasting evolve in the Internet age? in Korean", Broadcasting and Media Magazine, Vol.20 No.4, pp. 74-80, 2015
[11]Hsiu-Sen Chiang, Kuo-Lun Hsiao, “YouTube stickiness: the needs, personal, and environmental perspective”, Internet Research, Vol. 25 No.1, pp.85-106, 2015
[12]Jae Mee Yoo, "A Study on the Promotional Activities Employing SNS(Social Network Service", Research Institute of Business and Economics, Vol.35 No.2, pp.101-123, 2012
[13] Jane Webster, Linda Trevino and Lisa Ryan, “The dimensionality and correlates of flow in human-computer interactions,” Computer in Human Behavior, Vol.9, No.4, pp.412-413, 1993
[14] Janiszewski, C., "The influence of display characteristics on visual exploratory search behavior", Journal of Consumer Research, Vol.25, No.3, 290-301, 1998
[15] Jiyoung, Kim, "Show one's daily life by video, Vlog in Korean" Sisunnews, 2017, http://www.sisunnews.
co.kr/news/articleView.html?idxno=61776[16] Jung Bora, Kim Seongcheol, "Predicting and
Explaining YouTube Users Continuance Intention to Generate and Share a Parody", Journal of Cybercommunication Academic Society, Vol.30, No.4, pp.131-167, 2013
[17] Kayoung, Lee, "The Impact of YouTube Daily Vlogs’ Intimate Viewing on Viewing Satisfaction : Focusing on Parasocial Interaction and Social Presence", The Graduate School of Ewha Womans University, 2018
[18] Kong, Hanna, "A Study on The Discourse of the Other in Youtube Vlog", The Graduate School of Ewha Womans University, 2019
[19] Korea Internet & Security Agency, “Analysis of Blogger Internet usage”. Seoul : Korea Internet & Security Agency, 2007
[20] Kraut, R., Patterson, M., Lundmark, V., Kiesler, S., Mukopadhyay, T., & Scherlis, W. (1998). "Internet paradox: A social technology that reduces social involvement and psychological well-being", American Psychologist, Vol.53 No.9, pp.1017–1032, 1998
[21] Maignan, I., and B. A. Lukas., “The Nature and Social Users of the Internet: A Qualitative Investigation.”, The Journal of Consumer Affairs, Vol.31, No.2, pp.346-371, 1995
[22] Maslow, A., "A theory of human motivation", Psychological Review, Vol.50, pp.370-396, 1943
[23] Myung-Hoon Sung, In-Hee Lee, "Uses and Gratifications of User-Created Contents : Expressing Self with Self-Produced Video Clips", Korean Journal of Communication & Information, Vol.40, No.4, pp.45~79, 2007
[24] Novak, T. P., Hoffman, D. L. & Yung, Y. F., "Measuring the customer experience in online environments : A structural modeling approach", Marketing science, Vol.19 No.1, pp.22-42, 2000
[25] Nunnally, Psychometric Theory, Second Edition, New York, McGraw-Hill, 1978
[26]Said S. Al-Gahtani &Malcolm King, "Attitudes, satisfaction and usage: Factors contributing to each in the acceptance of information technology", Behaviour and information technology, Vol.18, No.4, 1999
[27] Yeon Jeong Kim, Bang Gi Jun, Yoo Jung Kim, So-Ra Kang, "Determinants of participation in UCC services", Journal of Korea technology innovation society, Vol.10, No.3, 2007
[28] Youngseok, Yoon, Hyunwoo, Lee, “Personal broadcast platform technology”, Journal of The Korean Institute of Communication Sciences, Vol.33, No.4, pp.56-63, 2016
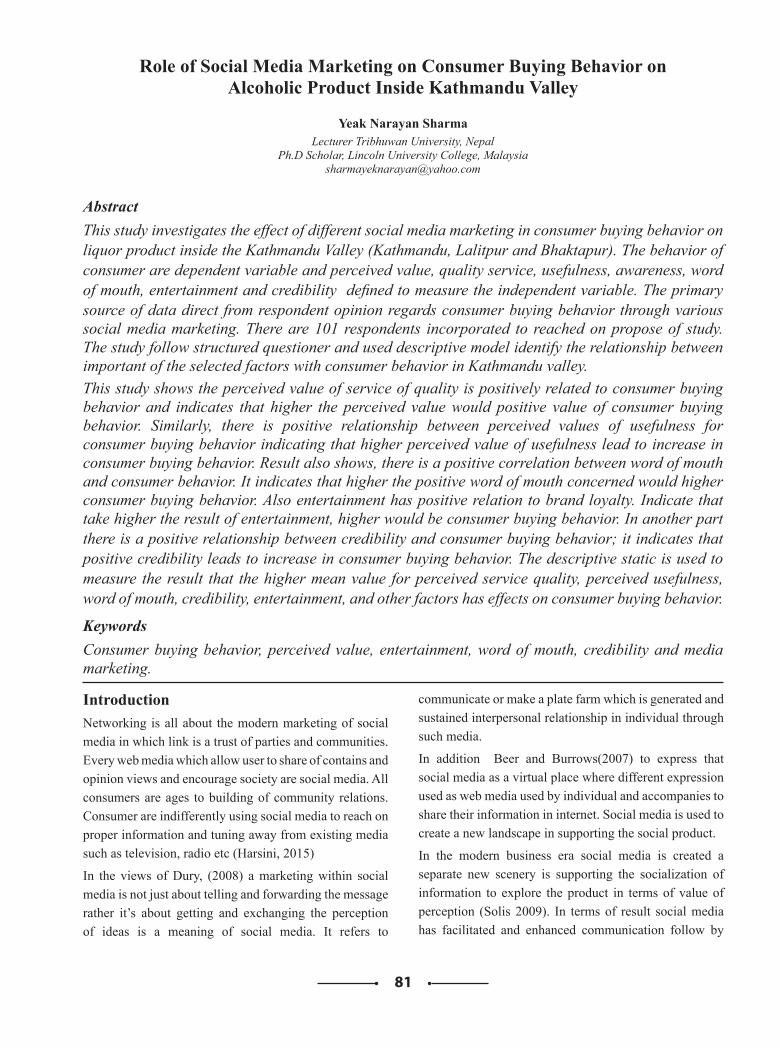
81
Role of Social Media Marketing on Consumer Buying Behavior on Alcoholic Product Inside Kathmandu Valley
Yeak Narayan SharmaLecturer Tribhuwan University, Nepal
Ph.D Scholar, Lincoln University College, [email protected]
AbstractThis study investigates the effect of different social media marketing in consumer buying behavior on liquor product inside the Kathmandu Valley (Kathmandu, Lalitpur and Bhaktapur). The behavior of consumer are dependent variable and perceived value, quality service, usefulness, awareness, word of mouth, entertainment and credibility defined to measure the independent variable. The primary source of data direct from respondent opinion regards consumer buying behavior through various social media marketing. There are 101 respondents incorporated to reached on propose of study. The study follow structured questioner and used descriptive model identify the relationship between important of the selected factors with consumer behavior in Kathmandu valley.This study shows the perceived value of service of quality is positively related to consumer buying behavior and indicates that higher the perceived value would positive value of consumer buying behavior. Similarly, there is positive relationship between perceived values of usefulness for consumer buying behavior indicating that higher perceived value of usefulness lead to increase in consumer buying behavior. Result also shows, there is a positive correlation between word of mouth and consumer behavior. It indicates that higher the positive word of mouth concerned would higher consumer buying behavior. Also entertainment has positive relation to brand loyalty. Indicate that take higher the result of entertainment, higher would be consumer buying behavior. In another part there is a positive relationship between credibility and consumer buying behavior; it indicates that positive credibility leads to increase in consumer buying behavior. The descriptive static is used to measure the result that the higher mean value for perceived service quality, perceived usefulness, word of mouth, credibility, entertainment, and other factors has effects on consumer buying behavior.
Keywords Consumer buying behavior, perceived value, entertainment, word of mouth, credibility and media marketing.
IntroductionNetworking is all about the modern marketing of social media in which link is a trust of parties and communities. Every web media which allow user to share of contains and opinion views and encourage society are social media. All consumers are ages to building of community relations. Consumer are indifferently using social media to reach on proper information and tuning away from existing media such as television, radio etc (Harsini, 2015)
In the views of Dury, (2008) a marketing within social media is not just about telling and forwarding the message rather it’s about getting and exchanging the perception of ideas is a meaning of social media. It refers to
communicate or make a plate farm which is generated and sustained interpersonal relationship in individual through such media.
In addition Beer and Burrows(2007) to express that social media as a virtual place where different expression used as web media used by individual and accompanies to share their information in internet. Social media is used to create a new landscape in supporting the social product.
In the modern business era social media is created a separate new scenery is supporting the socialization of information to explore the product in terms of value of perception (Solis 2009). In terms of result social media has facilitated and enhanced communication follow by
82
making it easier to spread useful information with vast online audiences creating a global impact (Smith and Zook 2011)
Recent social media site provide a virtual space for people to communicate information through the internet and web, which might be a transformer of socialization. Perceived usefulness, perceive behavior control and perceived peer influence impact attitude toward purchasing from a virtual store including social media. Consumer buying behavior attitude influence towards the purchasing through virtual store (Barkhiet al. 2008).
Similarly, the presence or absence of a product name affect online shopper’s perceived risk. In addition there is no risk to online shoppers brand familiarity and perceived risk. Further online shopper’s possess lower perceived risk than non-shoppers (Huang et al.2004).
Issues of trust and information security are the major barriers with all e-commerce(Aljiferiet al. 2003). Furthermore, uncertainty and perceived risk barriers to consumer buying through social media.(Littler and Melanthiou, 2006).
Means of social mediaAs define of social media it is a network-based technology that facilitates the sharing of ideas and information and the building of virtual networks with different society and people which interact with friends, family. The power of social media is an ability to connect and share information with in-network. It is an internet-based and offers users easy electronic communication of personal information and other content, such as videos and photos. Users engage with social media via computer, tablet or smartphone via web-based software or web application, often utilizing it for messaging.
Social media is a series of websites and applications designed to allow people to share content quickly, efficiently and in real-time. Most people today define social media as apps on their smartphone or tablet, but the truth is, this communication tool started with computers. This misconception stems from the fact that most social media users access their tools via apps. The ability to share photos, opinions, events, etc in real-time has transformed the way we do life and it is also transforming the way we do business. Retailers who engage social media as part of their marketing strategy have seen great results. Some social media sites have greater potential for content that is posted there to spread virally over social networks. The idea that social media are defined by their ability to bring
people together has been seen as too broad a definition, as this would suggest that the telegraph and telephone were also social media. Social media technologies take many different forms including blogs, business networks, enterprise social networks, forums, microblogs, photo sharing, products/services review, social bookmarking, social gaming, social networks, video sharing, and virtual worlds. There are various tools of social media sites used in media marketing, which can define as below :
Facebook is a popular free social networking website that allows registered users to create profiles, upload photos and video, send messages and keep in touch with friends, family and colleagues.
Twitter is a free micro blogging service that allows registered members to broadcast short posts called tweets. Twitter members can broadcast tweets and follow other users' tweets by using multiple platforms and devices.
Google+ (pronounced Google plus) is Google's social networking project, designed to replicate the way people interact offline more closely than is the case in other social networking services. The project’s slogan is “Real-life sharing rethought for the web.”
Wikipedia is a free, open content online encyclopedia created through the collaborative effort of a community of users known as Wikipedians. Anyone registered on the site can create an article for publication; registration is not required to edit articles. Wikipedia was founded in January of 2001.
LinkedIn is a social networking site designed specifically for the business community. The goal of the site is to allow registered members to establish and document networks of people they know and trust professionally.
Pinterest is a social curation website for sharing and categorizing images found online. Pinterest requires brief descriptions but the main focus of the site is visual. Clicking on an image will take you to the original source, so, for example, if you click on a picture of a pair of shoes, you might be taken to a site where you can purchase them. An image of blueberry pancakes might take you to the recipe; a picture of a whimsical birdhouse might take you to the instructions.
Social media is becoming an integral part of life online as social websites and applications proliferate. Most traditional online media include social components, such as comment fields for users. In business, social media is used to market products, promote brands, and connect to
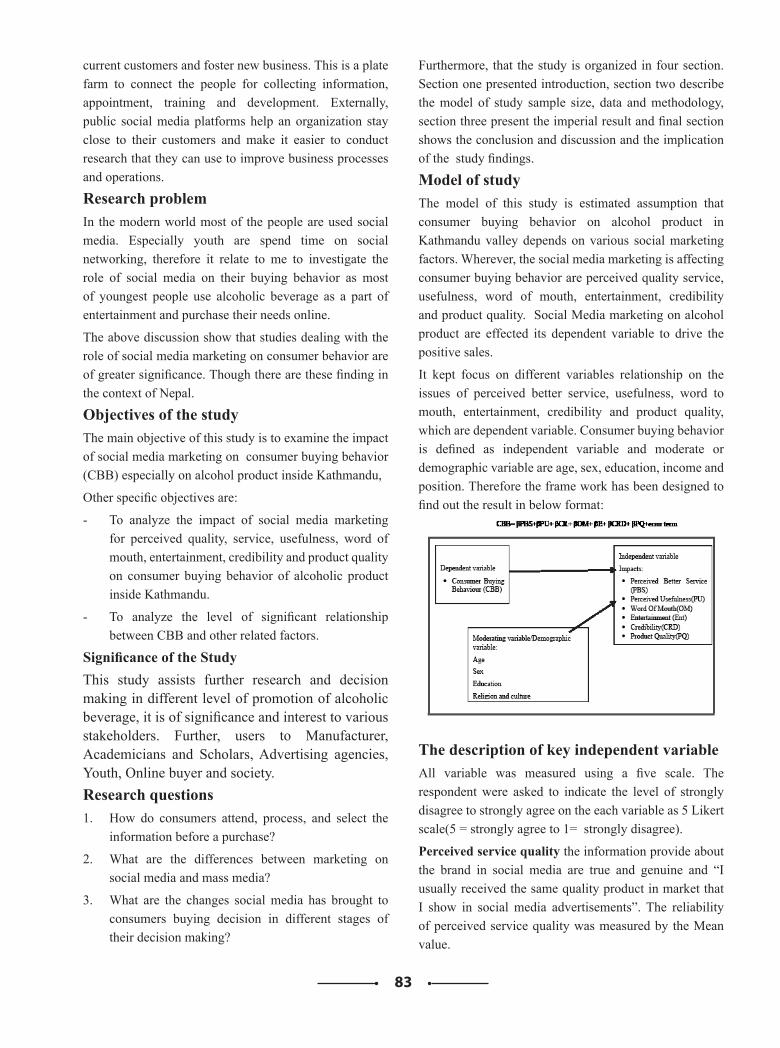
83
current customers and foster new business. This is a plate farm to connect the people for collecting information, appointment, training and development. Externally, public social media platforms help an organization stay close to their customers and make it easier to conduct research that they can use to improve business processes and operations.
Research problem In the modern world most of the people are used social media. Especially youth are spend time on social networking, therefore it relate to me to investigate the role of social media on their buying behavior as most of youngest people use alcoholic beverage as a part of entertainment and purchase their needs online.
The above discussion show that studies dealing with the role of social media marketing on consumer behavior are of greater significance. Though there are these finding in the context of Nepal.
Objectives of the studyThe main objective of this study is to examine the impact of social media marketing on consumer buying behavior (CBB) especially on alcohol product inside Kathmandu,
Other specific objectives are:
- To analyze the impact of social media marketing for perceived quality, service, usefulness, word of mouth, entertainment, credibility and product quality on consumer buying behavior of alcoholic product inside Kathmandu.
- To analyze the level of significant relationship between CBB and other related factors.
Significance of the StudyThis study assists further research and decision making in different level of promotion of alcoholic beverage, it is of significance and interest to various stakeholders. Further, users to Manufacturer, Academicians and Scholars, Advertising agencies, Youth, Online buyer and society. Research questions1. How do consumers attend, process, and select the
information before a purchase?
2. What are the differences between marketing on social media and mass media?
3. What are the changes social media has brought to consumers buying decision in different stages of their decision making?
Furthermore, that the study is organized in four section. Section one presented introduction, section two describe the model of study sample size, data and methodology, section three present the imperial result and final section shows the conclusion and discussion and the implication of the study findings.
Model of studyThe model of this study is estimated assumption that consumer buying behavior on alcohol product in Kathmandu valley depends on various social marketing factors. Wherever, the social media marketing is affecting consumer buying behavior are perceived quality service, usefulness, word of mouth, entertainment, credibility and product quality. Social Media marketing on alcohol product are effected its dependent variable to drive the positive sales.
It kept focus on different variables relationship on the issues of perceived better service, usefulness, word to mouth, entertainment, credibility and product quality, which are dependent variable. Consumer buying behavior is defined as independent variable and moderate or demographic variable are age, sex, education, income and position. Therefore the frame work has been designed to find out the result in below format:
The description of key independent variable All variable was measured using a five scale. The respondent were asked to indicate the level of strongly disagree to strongly agree on the each variable as 5 Likert scale(5 = strongly agree to 1= strongly disagree).
Perceived service quality the information provide about the brand in social media are true and genuine and “I usually received the same quality product in market that I show in social media advertisements”. The reliability of perceived service quality was measured by the Mean value.
84
According to the (Bloemer et al. 1999), Tsiotsou(2005) and Lee (19970), there is a positive relationship between perceived service quality and consumer buying behavior. It is defined as hypothesis one :(H1)
Perceived usefulness refers to the positive perception os consumers towards the product offer, According to the (Sambasivan et al. 2010) and Gamal(2010), there is a positive relationship between perceived usefulness and consumer buying behavior. It is defined as hypothesis two :(H2). The reliability of perceived usefulness was measured by the Mean value.
Word of Mouth refers online sites is the fastest and effective communication to flow the product information and received the positive or negative perception from consumers towards the product offer, According to the (Park and Kim 2008) and Ragowsky (2008) revealed that one line word of mouth effects online trust ship of gender towards the product. There is a positive relationship between perceived word of mouth and consumer buying behavior. It is defined as hypothesis three :(H3)
The reliability of perceived service quality was measured by the Mean value.
Entertainment refers there is direct effects of dimension of happiness, popularity and other event towards intend of buying behavior. It shows the buying behavior through online sites is the affects their buying intention of entertainment level like musical style, open house party, New Year, festivals. Based on the study developer (Broekemieret al 2008) purchases intent was higher when happy mode. There is positive relationship between Entertainment and consumer buying behavior. It is defined as hypothesis four: (H4)
The reliability of perceived service quality was measured by the Mean value.
Credibility refers originated or goodwill of source there is direct effects of goodwill, believability, trustworthiness, expertise, attractiveness and characteristics of product on buying behavior. Buying behavior through online sites is the effects their credibility. Based on the study developer (Ohanion 1990) there is a positive relationship between credibility and consumer buying behavior. It is defined as hypothesis five :(H5)
The reliability of perceived service quality was measured by the Mean value.
Product quality refers to the all attention of quality on strength of price, life, socialization, important and other
factors which are there direct effects on buying behavior. Based on the study developer (Broekemieret al 2008) there is a positive relationship between product quality and consumer buying behavior. It is defined as hypothesis six :(H6)
The reliability of perceived service quality was measured by the Mean value.
Others factors have used on decision-making process, which is impacted on social media marketing and buying decision.
Ethical considerationAll the information collected from different consumer and customer was only for the purpose of completion of my study. The participants will be completely voluntary and their right to refuse of participant will be respect and every participant will be informed about the purpose of the study and instructed how to fill the questionnaire.
Limitation Despite the fact that theories were approved by findings from survey and the research is able to provide a certain degree of new insights in relating to the current situation, limitations may still exist on following:a) Limited sample size
b) Limited respondent
c) Based on only Kathmandu
d) Limited time
e) Data are used for only study purpose
Methodology, result and discussionThis chapter justifies the study approaches and techniques chosen to answer the study questions. In the process of data analysis, descriptive static have been computed and the results are presented in table 1 to 6. Furthermore, it is addressed the study design, population and data collection, research procedures and data analysis methods and the limitation of the study.
Design of study The study selected the descriptive research design as the blueprint for the study. According to Robson (2002), a descriptive research is a study that seeks to “present an accurate profile of events, persons or situations” (p. 59). The descriptive model has design for this study as it sought to establish the impact of social media on consumer buying behavior.
Study designs were categorized into two approaches, the cross-sectional research and longitudinal research survey.
85
A cross-sectional study investigates a specific problem at a defined period of time (Saunders et al., 2007). A study can also be longitudinal where a specific phenomenon is investigated at different periods of time (Malhotra & Birks, 2007).
Procedures of study The study process began with collection of primary date from direct interview and secondary data from different website and other mass media. The sample size defines as given in Table 1.
Table 1: Sample size
Sources of data Method of analysisManufacturer opinion (5 ) open end questionnaire
Qualitative
Social organization(10) QualitativeAdvertising Agency (10) QualitativeManufacturing employee (10) QualitativeConsumer(50 ) QualitativeWhole/Rtl (10) QualitativeRestaurants and bar (6) Qualitative
Instruments
The instruments will be questionnaire schedule. The method of scaling is Likert scale, there was five standard of each respondent strongly agree to not agree. All the opinions received from them will be assigned 1 to 5 rage value (1= strongly disagree and 5= strongly agree). After receiving respondent information all data are entered in SPSS. Relevant statistical calculation had done. Some of the statistical measures used to measure reliability of the instrument descriptive statistic and measure opinion for objectives of the study.
Tools
1. Reliability and validity analysis2. Descriptive statistics (Mean, Standard deviation,
Correlation)
Data analysis Data analysis refers to the process of making sense from raw data collected during the course of the study. The data for the study was collected from primary and secondary sources and was entered into Version 20 of the Statistical Package for Social Sciences (SPSS) = to conduct analysis. In data analysis, the type of statistical analysis can either be descriptive or inferential and depends on the objectives of a study.
According to Creswell and Plano Clark (2007), this type
of analysis allows researchers to compare the effect of independent variables by analyzing changes in the dependent variable.
The study used regression and correlation analysis to measure the strength of relationship and direction of decision making with relationship between consumer buying behavior and social media marketing.
Result Analysis and interpretation:
Table 2 - Age profile of Respondent
Range Frequency Percent20-30 53 52.531-40 22 21.8
50 above 26 25.7Total 101 100.0
Source: Field study
The age of respondent profile presented in table 2, the majority of respondent dominated by 20-30 years of 52.5%. Which is a youngest crowed. They mostly used smartphone and other IT application.
Table 3 - Qualification profile of respondent
Education Frequency PercentSLC 25 24.8IA 19 18.8BA 31 30.7
Master 24 23.833 1 1.044 1 1.0
Source: Field study
The profile of qualification of respondent presented in table 3, the majority of respondent were bachelor degree holder 30.7% and lowest result was intermediate level of respondent 18.8%. Which shows the good result of respondent was involved in purchasing of alcohol in market.
Table 4 - Experience Profile of the respondent
Age level Frequency Percentbelow 5year 3 3.0
5-10 45 44.611-15 43 42.6
15 above 10 9.9Total 101 100.0
Source: Field study
The table 4 represents a profile of experience of respondent.
86
The experience level was divided in four categories. The result shows 5 to 10 years’ experience people have majority in study. The majority of experienced people were 44.6% and lowest ratio is 3% belong in below 5 years. The result seemed more middle level experience people are involved in purchasing the product.
Table 5 - Profession Profile of the respondent
Businessman 11 10.9Employee 35 34.7Consumer 24 23.8social worker 31 30.7
Total 101 100.0Source: Field study
The professional profile of consumer represented in table 5, which have a result more employee were participated in study at result of 34.7%. Lowest were businessman at 10.9%. This result seemed more professional people directly goes to own purchase than businessman, consumer, social worker. In the view of respondent most of them was private sector. They have a practice to use an app to identify the product.
Result Analysis
Level of statement: 1=Strongly disagree, 2=Disagree, 3=neither agree nor disagree, 4=Agree and 5=Strongly Agree
Table 6 - Opinion of respondent on social media effect
Statement/Scale 5 4 3 2 1 Avg.Social media advertisement is better than mass media 2.00 13.9 30.7 40.7 12.9 3.49Social Media marketing create perceived service quality 27.7 31.7 30.7 7.90 1.00 3.60Social media marketing positive perception on usefulness 9.90 16.8 25.7 31.7 15.8 3.27Social media marketing word of mouth to promote the product 7.90 11.9 22.8 28.7 28.7 3.58Social media marketing is a better way to buying decision 7.90 11.9 31.7 26.7 21.8 3.43Social media marketing show the credibility 17.8 12.9 43.6 18.8 6.9 2.84Social media shows entertainment is a tools of CBB 7.90 11.9 31.7 26.7 21.8 3.43Social media marketing replace the all mass media 1.00 15.8 31.7 14.9 36.6 3.70Consumer use social media for buying decision 2.00 14.9 32.7 19.8 30.7 3.47Social media marketing is better communication word of mouth 2.00 14.9 36.6 27.7 18.8 3.62Social media marketing product perceived in quality 3.00 13.9 41.6 28.7 12.9 3.35Social media marketing provide quality product information 19.8 18.8 32.7 12.9 15.8 2.86Social media marketing favor entertainment quality product 18.8 24.8 19.8 16.8 19.8 2.94Social media marketing show the perceived usefulness 20.8 28.7 21.8 10.9 17.8 2.76Social media marketing change CBB 6.90 17.8 28.7 19.8 26.7 3.42Consumer buying behavior depend on credibility of goods 13.9 21.8 26.7 19.8 17.8 3.06
Source: Field study
ExplanationThe respondents view on Social media advertisement is better than mass media:
According to the respondent, this statement mean score is 3.49, which is nearly agree, but not purely agreed. 40.7% of the respondent’s response seemed “neither agree nor disagree”, which is greater than other respondent “agree and strongly agreed”. There were a lowest result of 2% respondent are strongly disagree. This seemed average level of consumer to follow the social media marketing.
The respondent view on social Media marketing create perceived service quality:
Regarding this service quality matter the mean score is 3.36, it is nearly agree, but not purely agreed. 30.7% of the respondent’s response seemed “neither agree nor disagree”, which is greater than other respondent “agree and strongly agreed”. The lowest result on 7.9% respondent is disagree. This seemed the more consumers do not believe the service quality on social media marketing of product and its effects on buying behavior but little bit concept is coming in Nepal.
87
The respondents view on Social media marketing positive perception on usefulness:
In terms of usefulness of perception, the mean value is 3.27; it is nearly neither agrees, but not purely agreed. 31.7% of the respondent’s response seemed “agree”, which is greater than “strongly agree”. There were a lowest result of 9.9% respondent are strongly agree. This seemed least consumer believes the usefulness of social media marketing and has positive effects on buying decision. This practice might be increased.
The respondents view on Social media marketing is word of mouth to promote the product:
In terms of this matters word of mouth in promotion of product the mean value level on 3.58, it is nearly agreed, but not purely agreed. 28.7% of the respondent’s response seemed “agree and strongly agree”, which is greater than other respondent is. There were a lowest result of 7.9% respondent are strongly agree. This seemed more than 56% of consumer believing social media marketing in tools of prompt communication to follow the product information for promotion. This might a better away to promote the product to make for buying decisions.
The respondents view on Social media marketing is a better way to buying decision:
The way of buying decision with effects of social media, the mean value is 3.43; it is nearly agreed, but not purely agreed. 31.7% of the respondent’s response seemed “neither agree nor disagree”, which is greater than other respondent “agree and strongly agree”. There were a lowest result of 7.9% respondent are strongly agree. This seemed majority of consumer is not reaching social media marketing for buying decision but the level of user is increased.
The respondents view on Social media marketing show the credibility:
The social media marketing effects shown credibility on buying decision the mean value it’s 2.84, it is nearly neither agree nor disagree, but not purely disagreed. 43.6% of the respondent’s response seemed “neither agree nor disagree”, which is greater than other respondent “agree and strongly agree”. There were a lowest result of 6.9% respondent are strongly not agree. This seemed consumer believing social media marketing in tools of identify the credibility and buying decision.
1. The respondents view on Social media entertainment is a tools of Consumer buying behavior:
Regards on this matter entertainment is a factor on consumer buying behavior the mean value is 3.43, it is nearly agreed, but not purely agreed. 31.7% of the respondent’s response seemed “neither agree nor disagree”, which is greater than other respondent “agree and strongly agree”
The respondents view on Social media marketing replace the all mass media:
The factor social media marketing replace mass media the mean value is 3.70, it is nearly agreed, but not purely agreed. 36.6% of the respondent’s response seemed “strongly agree”, which is greater than other respondent is “agree”. There were a lowest result of 1.0% respondent are strongly agree. This seemed social media marketing is not a part of mass media but its effect will come in mass media, which will not be a part of advertising in future and expend on social media is not appropriate.
The respondents view on Consumer use social media for buying decision:
In fact on above matters consumer use social media for their buying mean value is 3.47, it is nearly agreed, but not purely agreed. 36.6% of the respondent’s response seemed “neither agree nor disagree”, which is greater than other respondent “agree and strongly agree”. There were a lowest result of 2.0% respondent are strongly agree. This is a very low result and seemed very less people following to social media for their buying decision. There is no role of social media for buying decisions.
The respondents view on Social media marketing is better communication word of mouth:
Regard on social media marketing is a better way for word of mouth the mean value is 3.62, which is nearly agreed, but not purely agreed. 32.7% of the respondent’s response seemed “neither agree nor disagree”, which is greater than other respondent “agree and strongly agree”. There were a lowest result of 2.0% respondent are strongly agree. This is a very low result and seemed very less people following to social media for their buying decision. There are fewer roles of social media for transferring information to consumer. Less people are using Social media to identify the product before buying decision.
The respondents view on Social media marketing product perceived in quality:
The use of social media marketing perceived product quality related to buying decision the mean value is 3.35; it is nearly agreed, but not purely agreed. 41.6%
88
of the respondent’s response seemed “neither agree nor disagree”, which is greater than other respondent “agree and strongly agree”. There were a lowest result of 3.0% respondent are strongly agree. This is a very low result and seemed very less people following to social media for their perceived quality on buying decision. There is no more roles of social media for buying decisions.
The respondents view on Social media marketing provide quality product information:
In the view of quality product information the mean value is 2.86; it is nearly agreed, but not purely agreed. 32.7% of the respondent’s response seemed “neither agree nor disagree”, which is greater than other respondent “agree and strongly agree”. There were a lowest result of 12.9% respondent are disagree and majority were on above line. This seemed social media marketing providing quality information of product which has a role on their buying decision.
The respondents view on Social media marketing favor entertainment quality product:
In the favor of entertainment have on buying decision the mean value is 2.94, which is nearly “neither agree nor disagree”, but not purely disagree. 24.8% of the respondent’s response seemed “agree”, which is greater than other respondent “strongly agree”. There were a lowest result of 16.8% respondent are disagree. This seemed majority are going to use social media for buying decision at the event of entertainment.
The respondents view on Social media marketing show the perceived usefulness:
Regards on the impactful on perceived usefulness mean value is 2.76, which is nearly agreed, but not purely agreed. 28.7% of the respondent’s response seemed “agree”, which is greater than other respondent “strongly agree”. There were a lowest result of 10.9% respondent are disagree. This seemed majority are going to use social media for buying decision with their usefulness. There is a role of social media for buying decisions.
The respondents view on Social media marketing change CBB:
In terms of buying decision’s related with social media the mean value is 3.42, it is nearly agreed, but not purely agreed. 28.7% of the respondent’s response seemed “neither agree nor disagree”, which is greater than other respondent “agree and strongly agree”. There was a lowest result of 6.9% respondent are “strongly agree”.
This seemed still the less people are use social media for buying decision. It is slowly changing the buying decisions not in full phase.
The respondents view on Consumer buying behavior depend on credibility of goods:
Once the buying decisions credibility of product has impact the mean value is 3.06, which is nearly disagreed, but not in the level of agreed. 26.7% of the respondent’s response seemed “neither agree nor disagree”, which is greater than other respondent “agree and strongly agree”. There was a lowest result of 13.9% respondent are “strongly agree”. This seemed credibility has impact on social media marketing. There is a role of social media for buying decisions.
Summary and conclusionThe motive of the study was stimulated by personal interest in how consumer behavior has changed in the Digital Age, in particular with social media. The collected information available to us increases in each and every day; as a result, we are tremendously exposed and attained to different aspects of information via the Social Media available to us in Internet. The accessibility and transparency that social media offers has led changes in how consumers position themselves in today’s market, in which it is inevitable and necessary for companies to equip with a new marketing mindset. The central gravity of the study was to explain why, when, and how social media has impacted on consumer buying decision both in theory and in practice. There is a generous amount of reports relating to social media marketing which are primarily aimed to help businesses benefit from this marketing trend. In the modern businesses assume that they are on the right track in the new marketing era, for instance engaging customers by creating a Facebook page; in fact, customers may not share the same picture to promote product in market. Therefore, the research was carried out in the perception of consumers in Kathmandu, which was aimed to explain the role of social media marketing on product sales. Additionally, the study to gain new insights to identify potential consequences and opportunities via social media, for instance to develop appropriate ways to tab into the decision making process at the right time, why the social media marketing campaigns may not be executing as they would have anticipated essentially, the theoretical framework of this research was built upon consumer buying behavior by using social media to make easy life.
89
The data analysis of the study have both proven that, no matter it is in association with social media or mass media, consumers are highly selective in attending, process, and selecting the information before a purchase takes place. Information exposure is highly selective in the initial stage of information, because consumers have the selections of information source, in which determinates the type of information that consumer will be exposed to.
Consequently, this principle feature of social media has created a new landscape in supporting the socialization of information, and has forced marketers to give up what they old mind-set in dealing with mass media marketing. As the collected feedback from the individuals, it has emphasized that, in particular with social media, consumers are able to access to for service quality, quality product, usefulness, credibility, difference between mass and social media, entertainment, buying decision process, transformation of information and word of mouth. In other words, marketing via social media is more about creating high-quality contents that are consumer relevant. Moreover, marketing through social media focuses on building relationships between consumers and product credibility. The study findings have shown that the level of social media reflected in the new marketing approach, because consumers are empowered. As many respondents have reflected that social media has provided a more effective platforms to communicate with one another and with the company. Finally the core objective of the study was to find out the changes that social media has brought to consumers in each stage of their decision-making process. According to the finding, social media still cannot be considered as a powerful tool to trigger a purchase in Kathmandu, whereas individuals have reflected that mass media still remains a certain influence in gaining awareness, for instance discounts available in stores, or a good deal. Social media has considered as a powerful tool in getting relevant information, while mass media creates awareness of certain discounts or promotions.
In theory, information exposure through mass media is considered as a passive process as individuals are exposed and receiving information unconsciously. However, when consumers seek out information initiatives, it is perceived as an active process. In the process of study consumers play an active role in the course of information acquisition because of the accessibility and availability of information on social media.
To conclude, from the findings of this research, can be observed that consumers in Kathmandu are actively utilizing social media as a tool in-validating of the purchase decisions; however, consumers are deemed to be inactive in sharing their word of mouth to others with the available social media. The consistency in the gathered data and time-honored theories relating to consumer behavior and contemporary frameworks regarding social media marketing, it has suggested that the essence of consumer behavior still remains the same even after the initiation of social media, in which individuals have to go through the all the stages before a purchase, instead of straight to the purchase decision once a thought of purchase being initiated.
Future considering the study’s limited time and scope of this study, many theories related to the subject were covered but in a rather general perspective so as to provide a big picture for the readers. Therefore, if further study could be conducted, then an in-depth survey should be carried out in undertaking the study.
It would be absolutely useful and interesting to have a case for company as a reference of the study. By studying the case company, it may offer a comparison between what company thinks it is working out, and what does their consumer actually perceive. Would the result reflect a diverse perception from two different parties in regards of social media and decision-making process? The results could help company to gain an evident insight and to identify actual tactics to tackle the situation as well as their advertising decision. Since study has revealed that consumers do not feel encouraged to generate the word of mouth through social media, and this indications may imply that marketers would have to carry out certain actions in order to provoke these conversations. Therefore, nowadays number of online shops are allowing to serve in association of social media and a future study can be conducted based on this perspective in investigating the reasons associating with this particular feeling and how it could be altered in order to utilize social media as an effective purchase validation tool. In further study could be conducted for companies, then theories could be implied more accurately, because some of the theories are proposed and developed in aiming to help companies to gain a better position in the transition from the traditional marketing approach to the new marketing mindset.
90
References1. Barkhi, R. F. Belanger & J. Hicks(2008), A model
of determinants of purchasing from virtual stores, Journal of Organizational Computing and Electronic Commerce, 18(3).
2. Beer, D. & R. Burrows (2007) Sociology and of and in web 2.0: Some initial considerations, sociological research online, 12(5), 17.
3. Davis, F. D. (1998). Perceived usefulness, perceived ease of use and user acceptance of information technology. MIS Quarterly, 13(2), 319-340.
4. Dury, G. (2008) Opinion piece: Social Media: Should Marketers engage and how can it be done effectively? Journal of direct, data and digital marketing practices 9(3), 274-277.
5. Elias, T R (2009). E-fluence at the point of contact: Impact of word of mouth and personal relevance of services on consumer buying behavior, attitude in online environments (Doctoral dissertation, The Ohio State University).
6. Harsahni, C. S. (2015). Influence of Social Media Adverts on consumer purchase initiation, International journal of current Engineering and scientific research, 2(10). 110-115.
7. Smith, P. R. & Z. Zook, (2011). Marketing Communications: Integrating Offline and online with social media.
8. Solis, B. and Breakenridge, D K (2009). Putting the public back in public relation: How social media is reinventing the aging business of PR.FT Press.
9. https://www.mbaknol.com/marketing-management/consumer-behaviour-and-factors-influencing-buyer-behavior/
10. https://www.ukessays.com/essays/marketing/si tuat ional- influences-affect ing-consumer-purchasing-decision-marketing-essay.
11. https://www.managementstudyguide.com/social-factors-affecting-consumer-behaviour.htm
12. http://marketmedialife.blogspot.com/2012/09/marketing-101-cultural-factors.html
91
Building Green Entrepreneurship: A Journey of Environmental Awareness to Green Entrepreneurs in Thailand
Kornthong Tesprasita, Pakatip Aksharanandanab and Athikom Kanchanavibhuc
a,b,c Technopreneurship and Innovation Management Program, Chulalongkorn University, Bangkok, Thailand
a,Tel: +666-3563-6444, Email: [email protected]
AbstractGlobal waste has become a global issue and we can see the new trend of discovery businesses established to focus on solving the waste problem using new renewable energy technology and the circular economy business model. This paper aims to study factors that impact green entrepreneurship in Thailand, such as environmental concern, organizational environment, founder demographics, education background, entrepreneurship awareness, as well as external factors of a business. The study analyzes the data from three qualitative in-depth interviews with green entrepreneur founders who started the businesses in polymer up-cycling, waste management, and renewable energy. The study finds overseas educational background to be one of the key main drivers for the entrepreneurial courage to decide to pursue a new business venture. By having the exposure toward the different culture, three entrepreneurs hands-on experiential learning through three key drivers who are composed of the can-do attitude, the willingness to be self-employed, and the way of seeking for the freedom to express their passions.
Keywords Green Entrepreneur, Environmental Awareness, Innovation, Technology.
IntroductionGlobal waste problems could grow by 70 percent by 2050 as urbanization and populations rise (Kristyn Schrader-King and Andy Liu, 2018). A booming waste burden could contribute to climate change impact; consequently, waste becomes a big problem worldwide including Thailand (Visvanathan, 2011). These crucial waste problems have not only led to climate change but generated extreme weather events, air pollution, and bad respiratory health. The Thai study found population has produced waste of about 1.14 kilograms per person per day or more than 2 million tons in total (Pollution Control Department, Ministry of Natural Resources and Environment Thailand, 2016, 2017). Thailand is ranked 6th of the country that dumped plastic waste into the sea. The overuse of plastic grocery bags is a shred of evidence that Bangkok has a huge waste and crisis of waste management problems these years. Thai Government announced the national waste policy roadmap during the year 2018 to 2030 to reduce the amount of plastic waste 0.78 million tons per year (Environmental Quality Promotion Department, Ministry of Natural Resources and Environment Thailand, 2019).
This research aims to understand what reasons, triggers, and success factors of green entrepreneurship and to identify the relationship between environmental awareness to green entrepreneurship. The analysis data relies on the perceptions and attitudes towards the environmental awareness of three entrepreneurs. A notable research challenge in this study is to find the key trigger that would convert environmental awareness entrepreneurs to green entrepreneurs.Literature ReviewIn the private sector, Corporate Social Responsibility (CSR) is a concept whereby companies integrate social and environmental concerns in business operations and interaction with their stakeholders voluntarily (Commission of the European Communities, 2002). Ethical behavior, a concern for people, and the environment have been shown to have a positive correlation with corporate performance (David Crowther and Guler Aras, 2008). According to the research, there was a relationship between the environmental entrepreneurs who systematically run waste management business and the creation of an economic circulate community to the ecosystem (W. Singirunnusorn, K. Donlakorn & W. Kaewhanin, 2012).
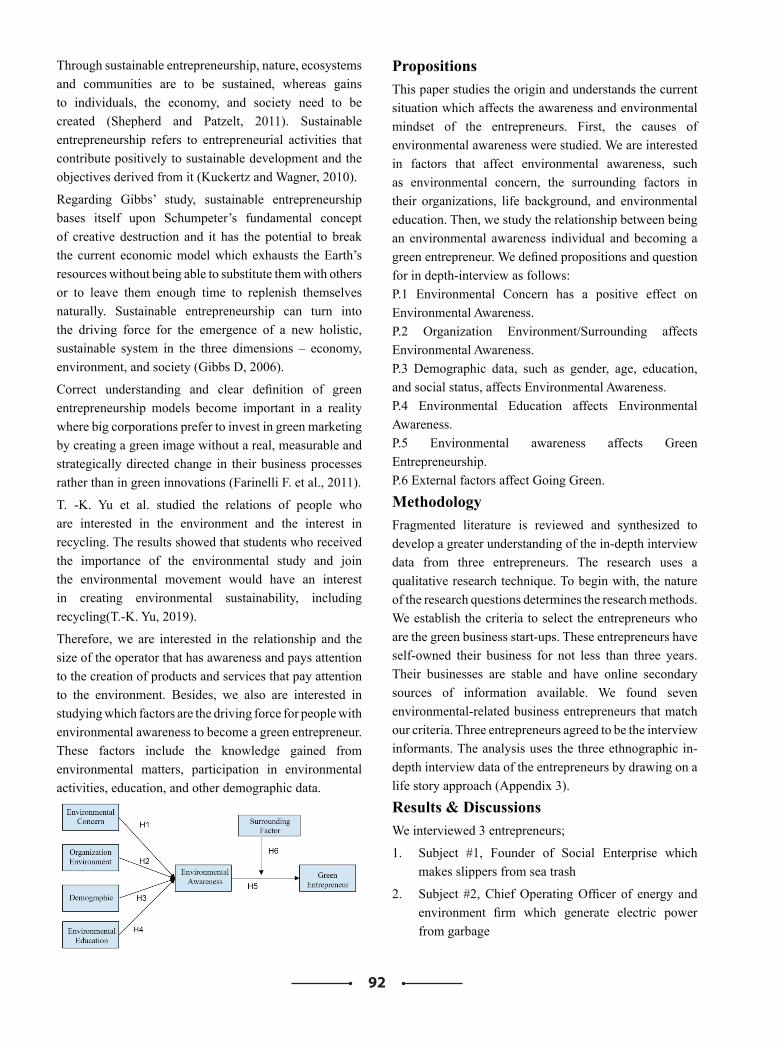
92
Through sustainable entrepreneurship, nature, ecosystems and communities are to be sustained, whereas gains to individuals, the economy, and society need to be created (Shepherd and Patzelt, 2011). Sustainable entrepreneurship refers to entrepreneurial activities that contribute positively to sustainable development and the objectives derived from it (Kuckertz and Wagner, 2010).
Regarding Gibbs’ study, sustainable entrepreneurship bases itself upon Schumpeter’s fundamental concept of creative destruction and it has the potential to break the current economic model which exhausts the Earth’s resources without being able to substitute them with others or to leave them enough time to replenish themselves naturally. Sustainable entrepreneurship can turn into the driving force for the emergence of a new holistic, sustainable system in the three dimensions – economy, environment, and society (Gibbs D, 2006).
Correct understanding and clear definition of green entrepreneurship models become important in a reality where big corporations prefer to invest in green marketing by creating a green image without a real, measurable and strategically directed change in their business processes rather than in green innovations (Farinelli F. et al., 2011).
T. -K. Yu et al. studied the relations of people who are interested in the environment and the interest in recycling. The results showed that students who received the importance of the environmental study and join the environmental movement would have an interest in creating environmental sustainability, including recycling(T.-K. Yu, 2019).
Therefore, we are interested in the relationship and the size of the operator that has awareness and pays attention to the creation of products and services that pay attention to the environment. Besides, we also are interested in studying which factors are the driving force for people with environmental awareness to become a green entrepreneur. These factors include the knowledge gained from environmental matters, participation in environmental activities, education, and other demographic data.
Conceptual Framework
PropositionsThis paper studies the origin and understands the current situation which affects the awareness and environmental mindset of the entrepreneurs. First, the causes of environmental awareness were studied. We are interested in factors that affect environmental awareness, such as environmental concern, the surrounding factors in their organizations, life background, and environmental education. Then, we study the relationship between being an environmental awareness individual and becoming a green entrepreneur. We defined propositions and question for in depth-interview as follows:P.1 Environmental Concern has a positive effect on Environmental Awareness.P.2 Organization Environment/Surrounding affects Environmental Awareness.P.3 Demographic data, such as gender, age, education, and social status, affects Environmental Awareness.P.4 Environmental Education affects Environmental Awareness.P.5 Environmental awareness affects Green Entrepreneurship.P.6 External factors affect Going Green.
MethodologyFragmented literature is reviewed and synthesized to develop a greater understanding of the in-depth interview data from three entrepreneurs. The research uses a qualitative research technique. To begin with, the nature of the research questions determines the research methods. We establish the criteria to select the entrepreneurs who are the green business start-ups. These entrepreneurs have self-owned their business for not less than three years. Their businesses are stable and have online secondary sources of information available. We found seven environmental-related business entrepreneurs that match our criteria. Three entrepreneurs agreed to be the interview informants. The analysis uses the three ethnographic in-depth interview data of the entrepreneurs by drawing on a life story approach (Appendix 3).
Results & DiscussionsWe interviewed 3 entrepreneurs;
1. Subject #1, Founder of Social Enterprise which makes slippers from sea trash
2. Subject #2, Chief Operating Officer of energy and environment firm which generate electric power from garbage
93
3. Subject #3, Chief Executive Officer of a solar firm which provides solar rooftop for factory roof to produce electricity
For (P1) and (P2), we found that 2 out of 3 entrepreneurs have environmental concerns in the workplace and all have concerns in daily life. Subject 1 works at the polymer laboratory at University; he realizes the bad perspective toward plastic-based products. Since he lives close to the sea and has found waste increasing in the sea, he decides to manage a recycling plant to separate the recyclable plastics and generates electric power from these combustible wastes. He has to deal with the environment with high odor. To turn garbage into electricity by burning all combustible wastes, including day-by-day spoilage, Subject 2 has to deal with bad smell emitted to community and wastewater management. In daily life, Subject 2 also has to separate the recyclable wastes and reduce plastic bag usage. Subject 3 founded a solar rooftop company to turn sunlight into electricity and sell that back to the factory at a low price. His warehouse has followed safety regulations, but there was no environmental concern engagement. However, because of living in Bangkok, a crowded city, he also concerns about the environment and pollution awareness.
Demographic (P3) shows positive effects on environmental awareness, especially at the education level.
Our study evaluates the impact of entrepreneur education on green entrepreneurship. There was an effect of overseas education on social and environmental responsibility in a long time after graduating. As mediated by male gender and strong family business background, all correspondents finished engineering at the undergraduate level, and all pursued their studies in business and related sciences at graduate levels. 2 out of 3 studied abroad since they were in high school. There was only one who studied entrepreneurship class, while others did not have it. Educational background in Science and Engineering has further developed the idea of entrepreneurship in terms of generating basic science techniques and foresting logical thinking processes. Since all used to study overseas for five years or more, this broaden-culture education has nourished them over the years. These benefits them to become more creative, opportunity oriented, proactive, and full of self-reliance. When we discuss entrepreneurship in education differs significantly, these overseas educational backgrounds have affected a growth into entrepreneurial career paths from scratch, seeking
new businesses, opening the new start-up company, and being own boss.
Former occupation and economic status also have positive effects on entrepreneurship succession. Entrepreneurs who have stable economic status have no barrier to creating a new green business. Former occupations grow business mindset, 2 out of 3 interviewees said that business trigger is revenue. They thought green businesses with a business-driven mindset could have great success. Education background in an overseas country, especially in entrepreneurial countries such as the United States, plays a vital role in entrepreneurial spirits within our respondents.
● First, they have a broader point of view on diversity among different cultures and environments, which can be used to start a new business in Thailand.
● Second, they have positive spirits that it is possible to start a new business and create a viable business by themselves.
● Third, by having a strong connection from both the education network and their family business network, it compliments each other to have a complete team covering from finance, engineer, marketing, and any unique area such as political power, which is required to run a new business.
Based on the interview with our correspondents, connection and business network play a vital role in enabling successful entrepreneurship, especially for the Effectual Entrepreneurs style, where the founders keep adapting their business based on available resources and business opportunities. We find that connection is acting as enabling factors in the following situations:
● Starting a business; we find that the founder teams usually are friends and connecting developed during academia time or business network
● Expanding a business; we find that by having a large business network, the business can identify new business opportunities and further develop their business
Surprisingly, we found that three informants have full environmental awareness; however, they’ve never joined any environmental activity (P4). Basic education backgrounds and their ecosystem formed environmental awareness. From criteria as sustainable operations, efficient energy usage, low operation cost, eco-friendly, least pollution and stable both politics and environmental
94
activities, all three correspondents was defined as green entrepreneurs (P5). Greenery and Sustainable Development Enterprise (SDE) trend are creating a new business opportunity for new entrepreneurs due to traditional players are mostly small and unable to use technology and develop a scalable and sophisticated business model.
The interviews review an incompatibility of environmental awareness to entrepreneurial intention and business opportunity, but awareness affects the living attitude. In these three green businesses, innovation usage is applied to any process and operation to produce the appropriate products and optimize the best eco-friendly process. In some perspectives, all three green entrepreneurs have a successful business. Although all three businesses have obstacles (P6), with the characteristics of these entrepreneurs, they can find their solutions with close teamwork and professional in the organization. From the in-depth interview, we found that three entrepreneurs can estimate their abilities, strengths, and weaknesses and evaluate their products. The common approaches of these three informants are finding business supporters such as collaboration with partners, long-term concessions with government, and a good business model.
Concluding Thoughts and ImplicationsFor this phase of the study, the main themes were collated from three in-depth interviews by identifying the common patterns across the transcribed interviews. Overseas educational background is one of the key main drivers for the entrepreneurial courage to decide to pursue a new business venture. By having the exposure toward the different culture, three entrepreneurs hands-on experiential learning through three key drivers who are composed of the can-do attitude, the willingness to be self-employed, and the way of seeking for the freedom to express their passions. These drivers motivate all three informants to go extreme in their way. The connection is also the enabling factor that plays a critical role in securing sustainable business as well as to drive growth via the network of business partners.
Next, entrepreneurial opportunity in the current business landscape creates ample room for a green entrepreneur because they are aware of the global waste concerns. Greenery and Sustainable Development Enterprise (SDE) trends are creating business opportunities for new players. Being an effectual entrepreneur’s style helps them to quickly seize business opportunities and grow the
business with calculated and manageable risks. Lastly, our correspondents possess a competitive advantage by having financial resources to sufficiently focus on business development without having to worry about financing and loan management that will generally force founders to choose the risk-averse approach or unable to capture the business opportunities that need sharp decision and investment.
RecommendationBased on our study, we found three key success factors that contribute to becoming a successful green entrepreneur: funds and resources, network and connection, new opportunity identification and process capture. Even without these factors from the beginning, it is possible to become successful with below recommendation:
1. Securing enough funds and resources to start a business: A hand on learning from our study identifies funding and investment followed by resource impacts the green business. The difference distinguishes green entrepreneurs from others easily attract funding from the right investors and compete with traditional growth. Since green businesses seek to leverage technology to create environmentally-friendly products and to encourage social good, it helps to solve problems through the development of an innovative solution. The entrepreneur could use the benefit of green business to gain financial support from green investors, green venture capitalists, leading financial institutions, or crowdfunding platforms.
2. Expanding the professional network and connection: The entrepreneur needs to keep the network to create an opportunity of being a successful green entrepreneur. Bringing a good network and integrating team from different parts of various experiences become a challenge to be accomplished. Although it is very difficult to do, discovering green business opportunities is likely to come across from friends and partners. Entrepreneurs could engage with their various professional friends, network and connection to accelerate the arrival of new opportunities.
3. Scouting for new opportunities and become swift when an opportunity arises: It is a great performance for entrepreneurs if they could identify a potential environmental-related green business opportunity and grasp its hotbed trend at the right time. Defining new customer propositions and leveraging from idea to implementation will help green entrepreneurs create the development of better products, standard services,
95
and experiences throughout the flows. Generating environmental awareness can drive the increase in customer engagement and sustainable sales growth, which supports green entrepreneurs to move forward and become more competitive in this green environmental activity business journey.
ReferencesA. Kuckertz and B. Wagner, J. Bus. Ventur. (2010),
The influence of sustainability orientation on entrepreneurial intentions investigating the role of business experience, sustainable development, and entrepreneurship, 524-539.
Chettiyapan Visvanathan (2011), Waste Management, Volume 31, Issue 6, 1083-1084.
Commission of the European Communities (2002), A European action framework for CSR Defining, communication from commission concerning Corporate Social Responsibility: A business contribution to Sustainable Development, 5.
D.A. Shepherd and H. Patzelt (2011), The new field of sustainable entrepreneurship studying entrepreneurial action linking “What is to be sustained” with “What is to be developed” Entrep. Theory Pract., 137-163.
David Crowther and Guler Aras (2008), Corporate Social Responsibility, Ventus Publishing ApS.
Environmental Quality Promotion Department (EQP) Report Statement (2019) The answer to the question of waste in Thailand. Ministry of Natural Resources and Environment Thailand.
Farinelli F. et al (2011), Green entrepreneurship: the missing link towards a greener economy, ATDF Journal 8.
Gibbs D. (2006), Sustainability entrepreneurs, ecopreneurs and the development of a sustainable economy, Greener Management International Issue 55, 63-78.
Kristyn Schrader-King and Andy Liu (2018), Global Waste Problem, Global Waste to Grow by 70 Percent by 2050 Unless Urgent Action is Taken: World Bank Report, The World Bank.
Pollution Control Department (PCD) Report Statement (2016, 2017). Ministry of Natural Resources and Environment Thailand.
T.-K. Yu, Feng-Yi Lin, Kai-Yun Kao, Cheng-Min Chao, Tai-Yi Yu (2019), An innovative environmental citizen behavior model: Recycling intention as climate change mitigation strategies, Journal of Environmental Management 247, 499–508.
W. Singhirunnusorn, K. Donlakorn & W. Kaewhanin, Procedia (2012) - Social and Behavioral Sciences 36, 688 – 697.
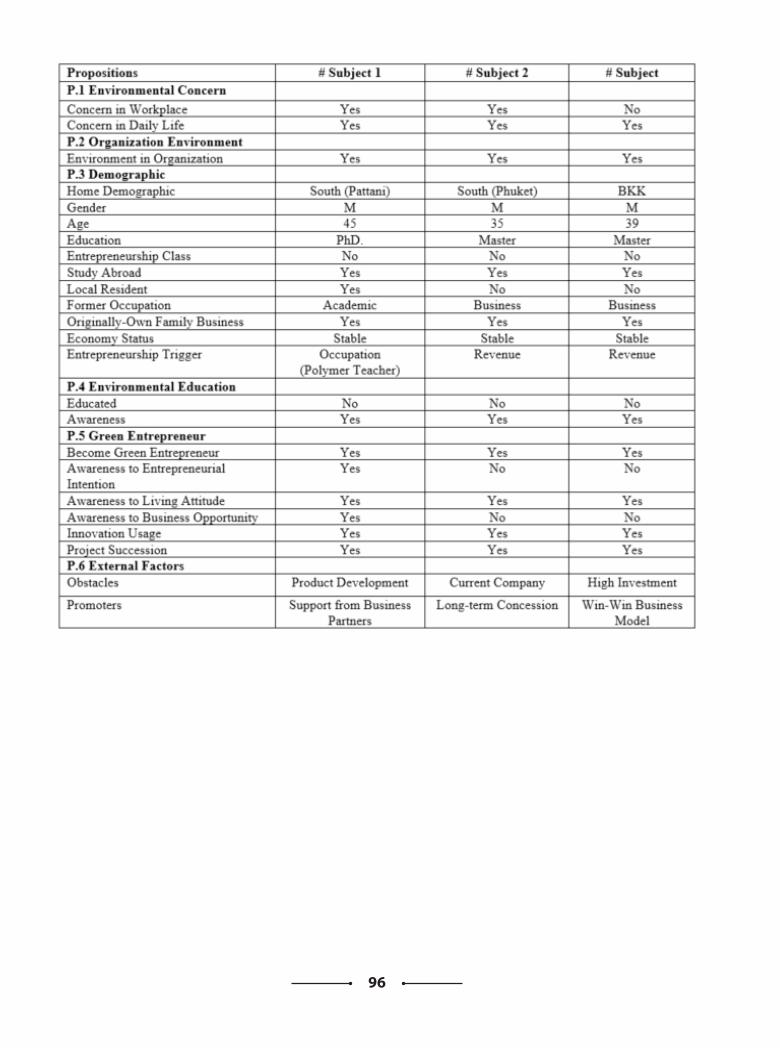
96
97
Appendix 1In-depth interview results of 3 entrepreneurs
shown in any componentsAppendix 2
Cases and Insights with a Life-Story Approach
Entrepreneurs Life Theme:
Subject #1 The Polymer Upcycling Entrepreneur
Subject 1 was born and grew up in Songkla province, one of the prominent provinces in the southern part of Thailand. He loved nature since he lived very close to the beach. In terms of educational background, he graduated with a bachelor's degree from Mechanical Engineering, Chulalongkorn University, Bangkok, Thailand, and got a scholarship from the same University to further his study about Polymer Science and PhD. in Macromolecular Science from Case Western Reserve University in the USA as follows. He is now the lecturer in the Faculty of Sciences and Technologies in the Department of Rubber and Polymer Technology at Prince of Songkla University (PSU), Pattani campus. At the same time, he also runs an environmentally friendly business named “Trash Hero” in Pattani, starting from the small acts as a social enterprise to change Thai society.
Trash Hero is the group of volunteers who collect trash on the beach every week. The Trash Hero group can be found in Thailand and another country. Trash Hero was launched firstly at Koh Lipe, by Roman Peter, from Switzerland. The inspiration to do Trash Hero was initiated from the “Tlejourn” project, the waste recycling project of the southern beach to be the source of the shoes and sell to the customers. The problem occurred when there were not enough of raw waste materials. He decided to get into Trash Hero and run it well in Pattani. There is a group of people who are interested in this project and jointly collect trash at the beach, cleanse, developed by locals, and transfer the trash to be the shoes. Trash Hero activities become his day-to-day daily life, responsibility, and lifestyle. He was very enjoyable and felt that he could do better for society. Local people together help and get revenue sharing, while Thai Society will see the message to do this social and environmental awareness of work, and they will realize that they can reduce the impact from the trash as well.
Entrepreneurs Life Theme:
Subject #2 The Waste Management Entrepreneur
Subject 2 has grown into a construction-based business family. He studied abroad since high school and he graduated Engineering program in a Master's Degree. After graduation and being a student who lives overseas for almost ten years, he went back to Bangkok to help the family business. He also has a closed connection with the other three friends who studied abroad and see opportunities in energy and environment business. He and his friends set up the energy and environment firm in 2014. The company has become Thailand’s leading company in implementing a “Zero Waste, Zero Landfill" model designed specifically for the country. After starting the firm in 2014, he fully contributes his time to his environmentally friendly waste management company. He hired the professional to run the family business in Property & Land. As stated above, the energy and environment firm started in 2014 aiming to be the leading company in creating the best energy and environmental sustainability solution that would sustain both environmentally and financially.
In the following year, he created the waste management solution, the first investment in Samut Sakhon Province in Thailand, taking over land to start the first full-scale zero-waste piloting plant. These impacts reduce the waste and it consequently affected the conflict on financial benefit among traditional local waste companies in a particular area. He has tackled the problems specifically in the rural area and gained the lesson learn from preventing “Mafia” of tradition local trash influential companies by cooperating with the private leading local firms and the government sector. While he was challenged on the firm, he tried to learn and adopt best practices from Canada and Europe for waste management combined with advanced technologies from other countries and localized it in Thai Style. Not only seeing the business opportunity and grasping it on time with his professional teamwork, But he also inspires to increase Thai people’s understanding of the important role they play in effective waste management. This includes what the company he would like to move towards a waste-free for generating a better environment.
Entrepreneurs Life Theme:
Subject #3 The Renewable Energy Entrepreneur
From the education background, Subject 3 had studied the primary education level at Saint Gabriel, Bangkok Thailand until ninth grade before leaving to study in the United States for the high school and continue his
98
bachelor's and master’s degrees in the Engineering field from Duke University. He started his career at Unilever Thai Trading, Bangkok, Thailand as a marketing & sales trainee where he learned skills around the trading business. As he has strong entrepreneurship spirits and encountered with air-compressor manufacturing company looking for a distributor, he left from Unilever and started his own trading company Nova Trade International Co., Ltd. focusing on industrial air-compressor, wastewater treatment equipment, and biogas for ten years before he start new business with his partner that worked together for 4 years to implement a complete wastewater treatment solution.
After 3 years in this business, he started to have the opportunity to implement a solar system with funds from different sources such as PEA’s ENCON fund, BANPU Power. The business model offers to invest in the long term 25 years for an industrial customer that has a factory that has high electricity consumption demand. After this business model become stable and continue to expand, he set up a new solar company in March 2019 to focus on fund management and aiming to push this company into Thailand’s stock exchange (SET) within five years. In the same year, he was invited to work with Scan Inter Public Company Limited (“SCN"), where his brother works, to start the new joint venture Scan Advance Power Co., Ltd. ("SAP") in October 2019 with the business focus on rooftop solar cell for environmentally conscious businesses and to provide complete solar solution from lead management, feasibility assessment, budgetary proposal, MOU, details assessment using drone, until final proposal stage. One first target group is a small group of customers; for example, Yashiyado Alloy Wheels.
Appendix 3Questionnaire Guideline
I. Study the origin and understand the current situation which affects awareness and environmental mindset.
P.1 Environmental Concern has a positive effect on Environmental Awareness.
• QP1A Do you realize any environmental problems around your workplace and in everyday life? What is your opinion?
Do you think we can get involved in the solution?
P.2 Organization Environment affects Environmental Awareness.
• QP2A Does your organization have an awareness of environmental problems? Whether it is the light, sound or smell?
P.3 Demographic data including gender, age, education, and social status, etc., affect Environmental Awareness.
• QP3A As operators, do you think the level of education, age, gender, and social status affect awareness and establish an Environmental mindset (Environmental Awareness)?
• QP3B Which factors are the motivation for you to be interested in the environment? Does your current occupation relate to environmental interest?
P.4 Environmental Education affects Environmental Awareness.
• QP4A Have you ever received knowledge about the environment or joined environmental events whether personally or organized by the organization?
• QP4B After receiving the knowledge how do you aware of the environment?
II. Study the relationship of Environmental Awareness and being the Green Entrepreneurship
P.5 Environmental awareness affects green entrepreneurship.
• QP5A Do you think you are a Green entrepreneur? (Based on sustainable operations, efficient energy usage, low operation cost, eco-friendly, least pollution and stable both politics and environmental activities.)
• QP5B Do you think environmental awareness affects you to start your business?
• QP5C Do you think environmental awareness affects your attitude towards work and personal life?
• QP5D Do you think environmental awareness affects your business opportunity?
• QP5E How are innovations used in entrepreneurship and your business operations?
• QP5F What is the succession of your project?
As covariant, external factors such as obstacles and promoters were concerned.
P.6 External factors that affect Going green.
• QP6A What factors are obstacles to becoming a green entrepreneur?
• QP6B What factors do you think support or encourage you to become a green entrepreneur?
99
A Study of the Priority that Affect Succession in Family Business: Comparing an Incumbent’s View and a Successor’s View
Yunseok Leea, Gisoeb Yub, Ji-Hee Kimc and Namjae Chod
a Ph.D Candidate, School of Business, Hanyang University17 Haeng Dang -Dong, Seong Dong-Gu, Seoul 133-791, Korea
Tel: +82-2-2220-4142, E-mail:[email protected] Ph.D Candidate, School of Business, Hanyang University
17 Haeng Dang -Dong, Seong Dong-Gu, Seoul 133-791, KoreaTel: +82-2-2220-4142, E-mail [email protected]
c Associate Professor, Richard J. Wehle School of Business, Canisius College2001 Main Street, Buffalo NY 14208-1517
Tel: +1-716-888-2606, E-mail: [email protected] Corresponding Author, Professor, School of Business, Hanyang University
17 Haeng Dang -Dong, Seong Dong-Gu, Seoul 133-791, KoreaTel: +82-2-2220-1058, Fax: +82-2-2292-3195, E-mail:[email protected]
Abstract The share of family business in various parts of each country is quite large. However, there is a lack of interest in and research on family business, and in particular, succession studies are lacking in so many parts even that there is no general theory. In this study, priority analysis of various factors affecting succession in succession process was conducted. The analysis was conducted with four factors as the first tier and each one has three subcategories as the second tier. As a result of this study, the priority of factors affecting succession that incumbents and successors thought was significantly different. This means that for successful succession, family members must have appropriate preparation and consultation.
Keywords Family business, Incumbent, Successor, Succession, AHP method
Introduction Family Business is the most common form of business in the world and this plays an important role for the growth and productive society of each country (Kim, 1998). Family business has a direct impact on the GDP, employment, etc. of each country (Sharma et al., 2001). In the United States, 80% to 90% of the 18 million businesses are operated by families (Duman 1992), and the other research showed that more than 50% of the US employment rate and GNP are found (Dyer, 1986). Family business account for one-third of Fortune 500 companies (Morris et al., 1997).
But even with these influences, there is a lack of research on family businesses, and even a unified word for family business does not exist. This situation implies that a unified expression or word is needed for the amicable study of family business. In particular, in Korea, not only the research of family business, but also the data of Family Business is insufficient (Hong, 2001). It is also clear that most studies focus on case studies rather than
empirical studies due to the lack of data (Kim et al., 2011). Moreover, few of these studies have examined the factors that affect family relationships (Kim et al., 2013).
Although many previous studies exist in this study, we analyzed the factors that influence succession, which are increasing the necessity of research. Factors used in each tier were selected as factors that had a significant effect on succession in previous studies. The 1 tier was set up with four factors; the relationship between incumbent and successor, management ability of successor, self-efficacy of successor, succession planning. Tier 2 is a subcategory of each Tier 1, and each of three factors is set.
The purpose of this study is as follows. First, in order to prepare for succession, the priority of factors affecting succession are identified from the viewpoint of incumbent and successor, who are the core players of succession. Second, by comparing and analyzing the views of incumbent and successor, the study provides useful information and guidelines for successful succession.
100
Literature ReviewThe research on family business is divided into four areas: financial research, business strategic research, company governance research, and succession research (Nam, 2013). Of these, succession studies accounted for one third of all studies, but there is no general theory describing succession or succession planning (Chua et al., 1998). Dyer argued that the most important problem in family businesses is succession (Dyer, 1986). However research on succession is difficult because it is very complex and difficult to manage highly emotional processes (Matthews et al., 1999).
The importance of succession in family business is also shown in rate. About 30% of family business successfully succeeds from the first generation to the second generation, and only 13% succeeds successfully from the second generation to the third generation. Only 4% of family business succeeds from the 3rd generation to the 4th generation successfully (Ward, 1987). The ratio means that if the family business does not value succession or does not prepare for succession, the chances of survival for the next generation will drop dramatically. One of research has shown that the average life span of a family business and the management period of a founder coincide with 25 years (Nam, 2013), which indicates that the majority of family business have failed to succeed.
In addition to the survival of family business, succession studies can identify its importance from a variety of perspectives. Representatively, the importance can be explained from a management, family, and social perspective. In perspective of management, succession can be defined as the most important event in the development of a company and its life cycle. Successful succession can be seen in many areas of improvement in management performance such as operating profit ratio, return on asset and return of equity (IBK Economic Research Institute, 2007). Succession also plays an important role in family perspective. Succession can be a rewarding opportunity for family members (Kim, 2015) and means that they can continue to pursue the values family pursue. Succession also provides an opportunity for family members to learn about what family does business during the succession process. From social perspective, successful succession means maintaining social and economic stability. It is possible to avoid the disappearance of tangible and intangible assets of companies due to the succession failure, and to keep stable employment of members (Kim, 2015).
Through a variety of previous studies, it is concluded that the most important purpose of family business is survival (Kim et al., 2016), and that survival of family business means successful succession. But the problem is that succession is not a simple or temporary business event, and additionally there are no guidelines (Danco, 1980). Although many previous studies have studied the factors that influence succession in order to find successfully guide succession (Nam, 2013), priorities or new factors are identified in terms of incumbents or successors who are key-player in succession. There is a lack of research on this.
Definition of VariablesDefinition of Family BusinessThere is no clear definition about family business, even term for family business. Usually, family business is called by each scholar. In general, however, family business is defined by family members' participation in family business, ownership, and the right of management. Examing at the definition of a family business in the previous studies, Park (2007) and others argued that the family members were the largest shareholders of the company and that they should participate in the board or management team, while Faccio et al argued that the final owner should be a family member or an unlisted company of family members. In the case of Maury, the largest shareholder with 10% of the voting rights is family members or an unlisted company. Astranchan and Shanker (1996) proposed the concept of family business in three categories. First, family members do not participate directly in family business, but they suggest the strategic direction of family business and it is called a broad concept. Second, only founder participates in family business, and the concept name is a middle concept. Lastly, the most detailed concept is a narrow concept. A narrow concept means that more than two generations should be participated in family business. In this study, we defined the family business using middle concept of Astanchan and Shanker's family firms.
The Relationship between Incumbent and SuccessorIncumbent and successor are the most important key-players in the succession process. Many previous studies of succession have shown that good relationships between incumbent and successor have a significant effect on succession. The positive relationship between the two key players is essential, not optional. The relationship between
101
incumbent and successor can be defined as level of mutual trust (Kim et al., 2013, Back et al., 2017), sharing vision of the business (Hwang et al., 2013, Kim et al., 2013), and communication (Song et al., 2017, Morris et al, 1997, Shin, 2013).
Managerial Ability of SuccessorThe successor's managerial ability is one of the factors influencing the overall succession process. The successor may be selected depending on the managerial ability, and it could make the succession smoothly. Additionally, the successor, who has high managerial ability, may be a driving force to develop the company after the succession. Managerial ability of successor is composed of business competence (Morris et al., 1997, Kang et al., 2009), education and training (Kim et al., 2016, Hwang, 2008), and interpersonal management ability (Nam, 2005, Kim, 2016).
Self-efficacy of SuccessorThe self-efficacy was proposed by Bandura(1982). The self-efficacy expresses a positive psychological state, which means the individual could finish personal
tasks successfully and influence the performance of the organization positively. In family business study, various scholars have found that these successors' self-efficacy increases successor’s willingness to take over the business and affects succession favorably. The successor’s self-efficacy could be defined as willingness of succession (Venter et al., 2005, Chung et al., 2016), confidence of overcoming crisis (Hwang, 2012), and confidence of achieving objective (Suh 2015, Lim et al., 2016, Hwang 2012).
Succession PlanSuccession is not a fragmentary family business event, but a long-term business plan that requires thorough preparation. Such succession is a problem that must be solved in order to have family business permanence, and succession planning is essential in various business fields. Succession plan in family business, which is crucial important for survival, has many sub-plan, such as finance plan (Morris et al., 1997, Song 2014, Hwang 2008), leadership transformation plan (Cho 2012, Nam 2013, Hwang 2012), and human-organization management plan (Kim et al., 2018).
Table 1 is shown factors which is used in this study.
<Table 1> Factors used in this study
TierFactor 1 Factor 2 Factor 3 Factor 4
Tier
1
Relationship between incumbent and
successor
Successor's managerial ability
Successor's self-efficacy Succession Plan
Tier
2
Level of mutual trust Business competence Willingness of succession Finance plan
Sharing vision of the company Education and training Confidence of
overcoming crisisLeadership
transformation plan
Communication Interpersonal management ability
Confidence of achieving objectives
Human-organization management plan
MethodsAnalytic Hierarchy Process (AHP)
Analytic Hierarchy Process (AHP) analysis is one of the decision making methods developed by Thomas Saaty in the 1970s. AHP methodology is a method of making a decision by comparing and analyzing the importance through a pairwise comparison between the factors constituting each hierarchical structure. AHP methodology also is a method of identifying the importance between each tier and calculating the weight among tiers to indicate the relative priority among each factor. The AHP
methodology has various advantages, such as being able to measure intangible, provide comprehensive and final figures for each factor, or verify logical consistency for the judgments to be used in determining priorities in the decision-making process (Park Sung-no, 2015). The AHP methodology is generally implemented in five steps. The first step is decision stratification, dividing the elements into each tier, and the second step is to perform a pairwise comparison between factors. The scale is usually 9 points. Third, the process of eliciting relative weights through the results of a two-way comparison between factors. Fourth is the process of measuring consistency ratios, which means
102
that consistency index is divided by random index. At this point, Saaty argued that if the consistency ratio is less than 0.1, there is no problem to continue study, and if it is less than 0.2, the ratio is reasonable. It was recommended to conduct the study again if the consistency ratio was above 0.2. The final step is to derive the final weight by adding the weights between the derived factors, select meaning, and select the best decision.
MethodsResult of Sample Analysis (Incumbent)For this study, we conducted the survey to incumbent and successor. We collected total 164 data, 76 incumbent data and 88 successor data.
According to incumbent respondents, men were 62 (84.2), and women were 12 (15.8). The incumbent considered 68 (89.5) men as successors and 8 (10.5) as women. Incumbent ruminated successor as children 60 (78.9), relatives 2 (2.6), professional managers 10 (13.2), employees in the company 2 (2.6), and the others 2 (2.6). The age of incumbent was that under 45 was 7 (9.2), 46~50 was 18 (23.7), 51~55 was 20 (26.3), 56~60 was 12 (15.8), and over 60 was 19 (25). The rate of succession circumstances was that the percentage of the preparing succession was 53 (69.7), during succession was 16 (21.1), and the other was 7 (9.2).
By industry, the manufacturing field was 25 (32.9), the construction field was 11 (14.5), the distribution field was 13 (17.1), the service field was 18 (23.7), the financial field was 5 (6.6), the agriculture field was 2 (2.6), and the other was 2 (2.6). Working period of incumbent accounted for less than 10 years for 8 (10.5), 10~15 years for 9 (11.8), 15~20 years for 22 (28.9), 20~25 years for 14 (18.4), and over 25 years for 23 (30.3). Table 2 was shown the result of incumbent data analysis.
<Table 2> The result of incumbent data
Division Category Frequency Ratio (%) Total
GenderMale 64 84.2
76Female 12 15.8
Successor's gender
Male 68 89.576
Female 8 10.5
Succession object
Children 60 78.9
76
Relative 2 2.6Professional
manager10 13.2
In-company staff 2 2.6
Other 2 2.6
Age
Under 45 7 9.2
7646 ~ 50 age 18 23.751 ~ 55 age 20 26.356 ~ 60 age 12 15.8
over 60 19 25.0
Successioncircumstances
Preparing succession 53 69.7
76In succession 16 21.1None 7 9.2
Industry
Manufacturing 25 32.9
76
Construction 11 14.5Distribution 13 17.1
Service 18 23.7Financial 5 6.6
Agriculture 2 2.6Other 2 2.6
Working period
Less than 10 8 10.5
7610 ~ 15 years 9 11.816 ~ 20 years 22 28.921 ~ 25 years 14 18.4over 25 years 23 30.3
Result of Sample Analysis (Successor)According to successor respondents, men were 81 (92.0), and women were 7 (8.0). The age of successor was 26~30 years for 13 (14.8), 31~35 years for 53 (60.2), 36~40 years for 18 (20.5), and over 40 years for 4 (4.5). Succession circumstance was that the rate of the preparing succession was 26 (29.5), during succession was 28 (31.8), completed succession was 5(5.7), and none was 29 (33.0). For industry, the manufacturing field was 42 (47.7), the construction field was 6 (6.8), the distribution field was 8 (9.1), the service field was 13 (14.8), the financial field was 1 (1.1), the agriculture field was 6 (6.8), and the other was 12 (13.6). The position in the company was that C.E.O. was 16 (18.2), director was 13 (14.8), department head was 10 (11.4), senior manager was 10 (11.4), junior manager was 18 (20.5), and the other was 21 (23.9). Working period of successor accounted for less than 1 years for 22 (17.0), 1~3 years for 17 (19.3), 3~5 years for 15 (17.0), 5~10 years for 26 (29.5), and over 10 years for 8 (9.1). Table 3 was shown the result of successor data analysis.
<Table 3> The result of successor data
Division Category Frequency Ratio (%) Total
GenderMale 81 92.0
88Female 7 8.0
Age
26 ~ 30 age 13 14.8
8831 ~ 35 age 53 60.236 ~ 40 age 18 20.5Over 40 age 4 4.5
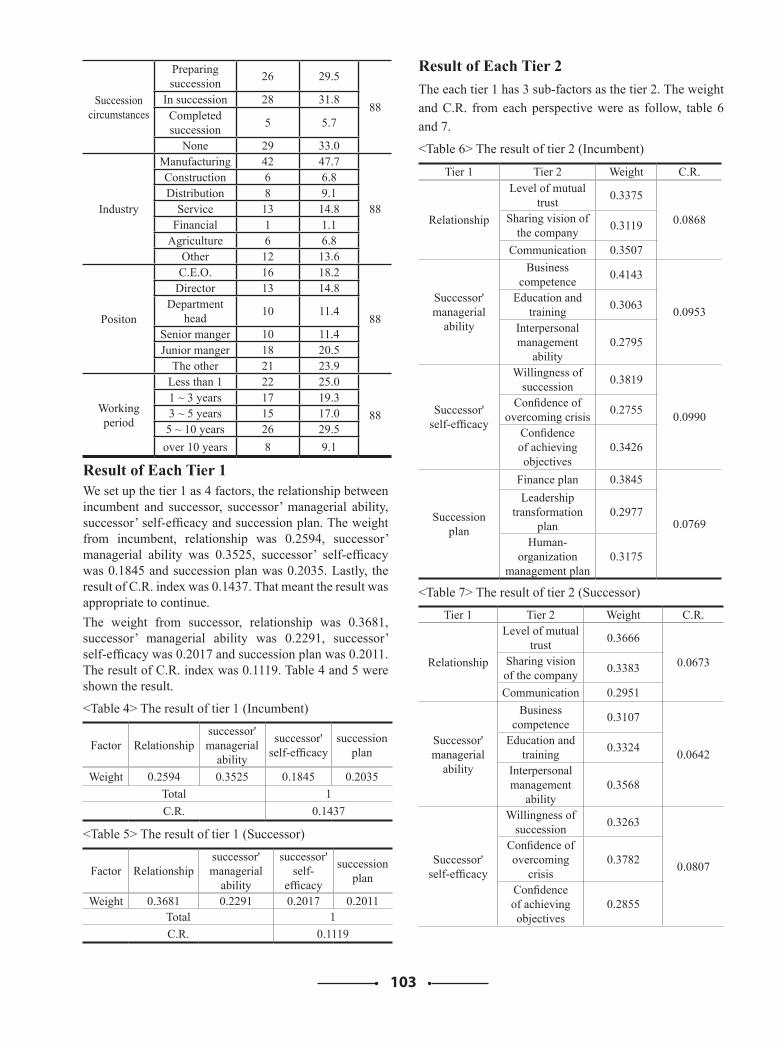
103
Successioncircumstances
Preparing succession 26 29.5
88In succession 28 31.8Completed succession 5 5.7
None 29 33.0
Industry
Manufacturing 42 47.7
88
Construction 6 6.8Distribution 8 9.1
Service 13 14.8Financial 1 1.1
Agriculture 6 6.8Other 12 13.6
Positon
C.E.O. 16 18.2
88
Director 13 14.8Department
head 10 11.4
Senior manger 10 11.4Junior manger 18 20.5
The other 21 23.9
Working period
Less than 1 22 25.0
881 ~ 3 years 17 19.33 ~ 5 years 15 17.05 ~ 10 years 26 29.5over 10 years 8 9.1
Result of Each Tier 1We set up the tier 1 as 4 factors, the relationship between incumbent and successor, successor’ managerial ability, successor’ self-efficacy and succession plan. The weight from incumbent, relationship was 0.2594, successor’ managerial ability was 0.3525, successor’ self-efficacy was 0.1845 and succession plan was 0.2035. Lastly, the result of C.R. index was 0.1437. That meant the result was appropriate to continue. The weight from successor, relationship was 0.3681, successor’ managerial ability was 0.2291, successor’ self-efficacy was 0.2017 and succession plan was 0.2011. The result of C.R. index was 0.1119. Table 4 and 5 were shown the result.
<Table 4> The result of tier 1 (Incumbent)
Factor Relationship successor' managerial
ability
successor' self-efficacy
succession plan
Weight 0.2594 0.3525 0.1845 0.2035Total 1C.R. 0.1437
<Table 5> The result of tier 1 (Successor)
Factor Relationship successor' managerial
ability
successor' self-
efficacy
succession plan
Weight 0.3681 0.2291 0.2017 0.2011Total 1C.R. 0.1119
Result of Each Tier 2The each tier 1 has 3 sub-factors as the tier 2. The weight and C.R. from each perspective were as follow, table 6 and 7.
<Table 6> The result of tier 2 (Incumbent)
Tier 1 Tier 2 Weight C.R.
Relationship
Level of mutual trust 0.3375
0.0868Sharing vision of the company 0.3119
Communication 0.3507
Successor' managerial
ability
Business competence 0.4143
0.0953Education and
training 0.3063
Interpersonal management
ability0.2795
Successor' self-efficacy
Willingness of succession 0.3819
0.0990Confidence of
overcoming crisis 0.2755
Confidence of achieving objectives
0.3426
Succession plan
Finance plan 0.3845
0.0769
Leadership transformation
plan0.2977
Human-organization
management plan0.3175
<Table 7> The result of tier 2 (Successor)
Tier 1 Tier 2 Weight C.R.
Relationship
Level of mutual trust 0.3666
0.0673Sharing vision of the company 0.3383
Communication 0.2951
Successor' managerial
ability
Business competence 0.3107
0.0642Education and
training 0.3324
Interpersonal management
ability0.3568
Successor' self-efficacy
Willingness of succession 0.3263
0.0807
Confidence of overcoming
crisis0.3782
Confidence of achieving objectives
0.2855
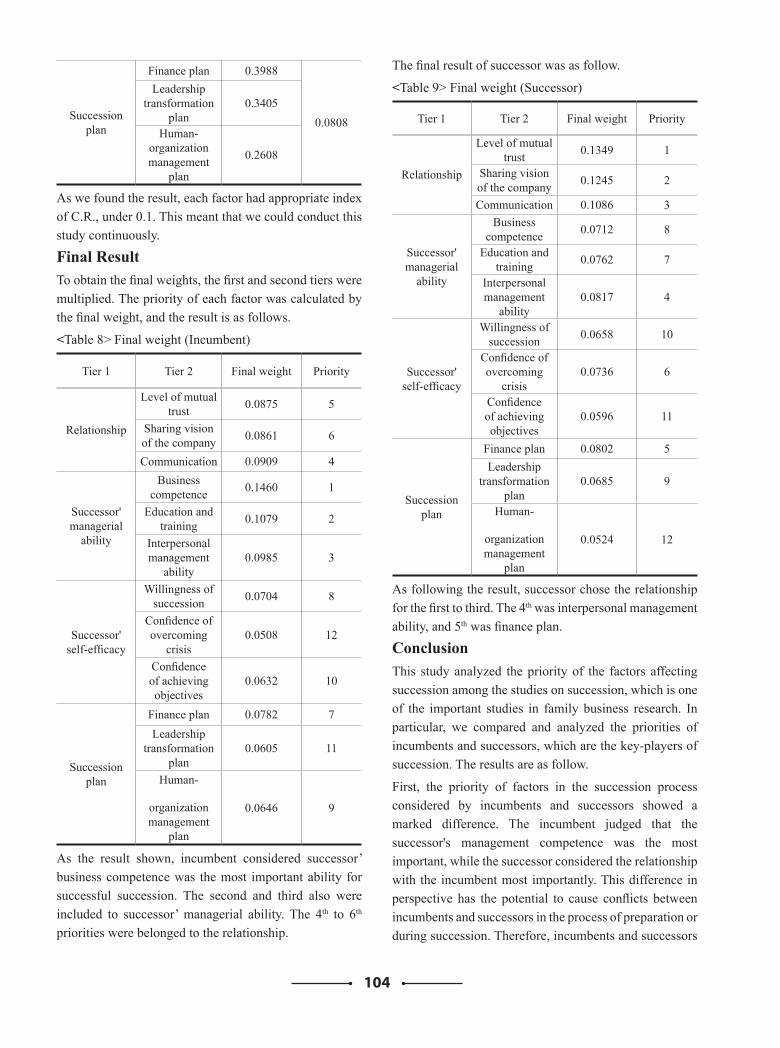
104
Succession plan
Finance plan 0.3988
0.0808
Leadership transformation
plan0.3405
Human-organization management
plan
0.2608
As we found the result, each factor had appropriate index of C.R., under 0.1. This meant that we could conduct this study continuously.
Final ResultTo obtain the final weights, the first and second tiers were multiplied. The priority of each factor was calculated by the final weight, and the result is as follows.
<Table 8> Final weight (Incumbent)
Tier 1 Tier 2 Final weight Priority
Relationship
Level of mutual trust 0.0875 5
Sharing vision of the company 0.0861 6
Communication 0.0909 4
Successor' managerial
ability
Business competence 0.1460 1
Education and training 0.1079 2
Interpersonal management
ability0.0985 3
Successor' self-efficacy
Willingness of succession 0.0704 8
Confidence of overcoming
crisis0.0508 12
Confidence of achieving objectives
0.0632 10
Succession plan
Finance plan 0.0782 7Leadership
transformation plan
0.0605 11
Human-
organization management
plan
0.0646 9
As the result shown, incumbent considered successor’ business competence was the most important ability for successful succession. The second and third also were included to successor’ managerial ability. The 4th to 6th priorities were belonged to the relationship.
The final result of successor was as follow.
<Table 9> Final weight (Successor)
Tier 1 Tier 2 Final weight Priority
Relationship
Level of mutual trust 0.1349 1
Sharing vision of the company 0.1245 2
Communication 0.1086 3
Successor' managerial
ability
Business competence 0.0712 8
Education and training 0.0762 7
Interpersonal management
ability0.0817 4
Successor' self-efficacy
Willingness of succession 0.0658 10
Confidence of overcoming
crisis0.0736 6
Confidence of achieving objectives
0.0596 11
Succession plan
Finance plan 0.0802 5Leadership
transformation plan
0.0685 9
Human-
organization management
plan
0.0524 12
As following the result, successor chose the relationship for the first to third. The 4th was interpersonal management ability, and 5th was finance plan.
ConclusionThis study analyzed the priority of the factors affecting succession among the studies on succession, which is one of the important studies in family business research. In particular, we compared and analyzed the priorities of incumbents and successors, which are the key-players of succession. The results are as follow.
First, the priority of factors in the succession process considered by incumbents and successors showed a marked difference. The incumbent judged that the successor's management competence was the most important, while the successor considered the relationship with the incumbent most importantly. This difference in perspective has the potential to cause conflicts between incumbents and successors in the process of preparation or during succession. Therefore, incumbents and successors
105
will need to share the factors to prepare and develop for successful succession. They should reduce the elements of conflict that come from differences in perspective.
Second, the incumbent selected that the successor's management capability was the most important factor for succession. In particular, it was confirmed that the three sub-factors that constitute the successor's self-efficacy were pushed down. These results indicated that when a incumbent selects a successor, the successor’s thoughts and intentions are less important, which means that the incumbent is more likely to select the successor regardless of the successor's willingness to take over the company. However, the rate of success for succession in situations will inevitably decrease. It is also possible that the incumbent determined by looking at the future of the family business after the succession rather than the current succession situation. In other words, when the successor inherited the family business, he or she would be judged whether the family business can be led well.
Third, the successor selected overwhelmingly the relationship with the incumbent as the most important factor. These results could be interpreted the successor in the succession process, usually they have little authority to make choices, and most of the choices are made by successors. In addition, since the process of succession is largely dependent on the will or choice of the incumbent without general guidelines or samples, it can be seen that the choice of the successor is not widespread except in the path of trusting the incumbent. And this result also showed that if the preceding result is a future-oriented incumbent view, the successor had a current-oriented view. It may be said that acquiring the current family business is more important to the successor than to the future development of the family business.
Lastly, both incumbent and successor judged that the importance of succession planning was relatively insignificant. Although it is a succession process that requires a lot of time and effort, this result could be seen that related to the current culture, which is not familiar with succession. It is necessary to raise many cautions for successful succession of family companies in various fields.
The limitations of this study are as follows. First, according to the purpose of this study, we compared and analyzed the perspectives of incumbents and successors, who are the key-players in succession, but there are various stakeholders. In particular, various stakeholders,
including family members, relatives and non-family members, are expected to influence the succession process in a variety of ways, but there are limits to the interpretation and analysis of these effects.
Second, this study identified the priorities of factors that have a significant effect on succession in the previous studies. However, succession is a complex emotional process, and many factors besides the 16 factors selected in this study will be affected. Therefore, there are limitations to fully explain the succession process with the factors used in this study.
In the future, the following studies are needed. First, it is necessary to study the cause of the difference in viewpoints between incumbent and successor. A detailed study of the reasons behind these choices and the background may be needed to analyze how each perspective differs. Second, research on various stakeholders, excluding the incumbent and successor, is likely to be needed. By conducting research on those who directly and indirectly influence, there would be a need to study the consequences of factors that the successor must prepare first for succession. In addition, it is necessary to study how each stakeholder affects succession. Through this, the success rate of succession could be increased by identifying the degree of involvement of each stakeholder in succession and making guidelines for managing them. Finally, future research would need to study the succession plans that the incumbent and the successor chose to be of less importance. In particular, by analyzing the circumstances in which incumbent and successor had to make such choices, it would be necessary to study whether the situation did not require succession planning or whether it was an important situation but they did not recognize. Through this, there seemed to be a need to convey the importance and difficulty of succession to both family companies and the environment surrounding them such as governments.
References [1]Bandura, A., "Self-efficacy Mechanism in Human
Agency", American Psychologist, Vol.37, 1982, pp.122-147
[2]Byung Nam Cho, "Eine Studie über die Strategie für Unternehmensnachfolge von Deutschen Unternehmen", Koreanische Zeitschrift fuer Wirtschaftswissenschaften, Vol.30, No.3, 2012pp.23-47
[3]Chung, Dae-Yong, Im, Jin-Hyuk,“The Moderating
106
Effect of SocialSupport and Mediation Effect of Social Capital between Self‐Leadership and Self‐Efficacy of Successor and Succession Intention in Family Business”, Korea Association of Business Education, Vol.31, No.1, 2016, pp.191-211.
[4]Chrisman, J.J, Chua, JH., and Sharma, P., “Important Attributes of Successors in Family Business: An Exploratory Study", Family Business Review, 11(1), 1998, pp.19-34.
[5]Danco, L. "Inside the Family Business", Cleveland, Ohio University Press, 1980
[6]Duman, R. "Family firms are different", Entrepreneurship Theory and Practice, 1992, 17:13-21
[7]Dyer, W.G. "Cultural Change in Family Firms", San Francisco: Jossey-Bass, 1986
[8]E. Venter, C. Boshoff, G. Mass, "The influence of successor-related factors on the succession process in small and medium-sized family businesses", Family Business Review, Vol. 18, No.1, 2005
[9]Hong, Kyung-A, "The study of the factors for the successful family business", The graduate school of Ewha Womans University, 2001
[10]Hwang Jo-Ik, Nam Young-Ho, "A Study on the Competence Development of Successor through the Education and Training in Small and Medium-Sized Family Business", Korean Journal of Business Administration, Vol.26, No.5, 2013, pp.1079~1101
[11]Hwang,Jo ik,"A Study on the Competence Development of Successor through the Education and Training to Improve the Efficiency of Succession in Small and Medium-Sized Family Business", Department of Venture Technology & Management Graduate School of Konkuk University, 2012.
[12]IBK Economic Research Institute, “Current Status and Challenges of Management Succession in SMEs”, 2007
[13]Jin-Hyuk Im, Jang-Hee Lee, "The Moderating Effect of Self-Efficacy of Successor between Social and Human Capital in Family Business and Succession Attitude of Successor", Korean Industrial Economic Association, Vol.29, No.6, 2016, pp.2581-2606.
[14]Kang Jung-Moon, Lee Dong-myung, Moon Jong-beom, "Study on Elements Influencing on Effective Management Succession of Small Family Business", Journal of the Korean Entrepreneurship Socieity,
Vol.4-1, 2009, pp.1-28.
[15]Kim, Bong Soon, Han Moon-Sung, Jang Yong-Un, "A Study on the Impacts of Successor’s Self-efficiency on Business Performance and Sustainability -Focused on Family Owned Business”, The Academic Society of Global Business Administration, Vol. 2016, No.1, 2016, pp.179~232.
[16]Kim, Ki Hyung, "The effects of the distinction in family business on CEO succession types – the behavioral agency theory, Department of Business Administration, Sungkyunkwan University, 2015
[17]Kim, Ji Hee "Family Business in Korea, U.S.A., and Germany - Theory and Practice", Consumer Studies and Family Resource Management The Graduate School of Ewha Womans University, 1998.
[18]Kim Jung-Won, Kim Dong-chul, "An Exploratory Research on HRM Scale Development: Focused on Potential Applications of Malcolm Boldridge Model and preceding research of HRM Scale", Korean Academy of Organization and Management, Vol.42, No.3, 2018, pp.31-66
[19]Matthews, C. H., T. W.Moore & A. S. Fialko, "Succession in the family firms: A cognitive categorization perspective," Family Business Review, 12(2), 1999, pp.159-170.
[20]Morris, M. H., Williams, R. W., Allen, J. A., and Avila, R. A., "Correlates of success in family business transitions", Journal of Business Venturing, Vol.12, 1997, pp. 385-401.
[21]Nam, Young-Ho, "A Study on the Succession Planning in Korean family Businesses", Korea Journal of Business Administration, Vol.23, No.2, 2005, pp.1461-1480
[22]Park, Sae Yeul, "the Effects of Governance Characteristics of Family Firms on Firm Value and Performance: Evidence from Korea", The graduate school of Yonsei University, 2008
[23]Park, Sung No "A study on selection factors for raw material supplier of cosmetics company by using AHP method", Graduate school, Chungbuk National University, 2015
[24]Thomas Saaty, "The analytic hierarchy process", New York : McGrae-Hill, 1980
[25]Thomas Saaty, "How to make a decision : The Analytic Hierarchy Process", European Journal of Operational Research, Vol.48, 1990.
107
[26]Shanker, M. C. and Astrachan, J. H., "Myths and Realities: Family Businesses’ Contribution to the US Economy-A Framework for Assessing Family Business Statistics", Family Business Review, Vol. 9, No. 2, 1996, pp. 107-123.
[27]Sharma, P., Chrisman, J.J., Pablo, A.L., and Chua, J.H., “Determinants of Initial Satisfaction with the Succession Process in Family Firms: A Conceptual Model”, Entrereneurship Theory and Practice, 25(3), 2001, pp.17-35
[28]Song Duk Geun, Nam, Young-Ho, "Management Performances of Family Business : An Open Dialogue, Ethical Norm, and Family Capital", The Academic Society of Global Business Administration, Vol.12, No.2, 2017, pp.283-309
[29]Song Kyung-Ae, "A Study on Effects of Variables to influence Family Business Succession", Graduate School of Policy, Korea University, 2014
[30]Suh jung-Hyun, "The Impact of Self-Efficacy on Organizational Performance : Focusing on Moderation Effect of Organizational Communication:, Graduate School Of Education, Hanyang University, 2015
[31]Sun-Hwa Kim, Young-Ho Nam, "A Literature Review on Stakeholder’s Factors Affecting the Succession Process ", Asia Pacific Journal of Small Business, Vol.33, No.3, 2011, pp.23-48.
[32]Sun-Hwa Kim, Young-Ho Nam, "Incumbent and Successor-related Factors that Influence the Effective Succession Process in Family Business ", Journal of Industrial Economics and Business, Vol.26 No.3, 2013, pp.1337-1359.
[33]Unjung Shin, "A study of a Perceived Successful Succession in Family Businesses : The moderating effects of Intellectual Capital", Department of Management Graduate School Yeungnam University, 2013.
[34]Ward, J. L., Keeping The Family Business Healthy : How to Plan for Continuing Growth, Profitability , and Family Leadership, S an Francisco: Jossey-Brass, 1987
[35]Woo-youn Hwang "An Empirical Study of Family Business Succession Factors and Their Effects on Corporate Performance", Department of Venture Technology & Management The Graduate School of Konkuk University, 2008.
[36]Yujin Back, Jinhwan Hong, "The Study onthe Effects of Predecessor-Successor Relationship on Effective Succession: Focusing on Mediating Effect of Succession Preparedness", Asia Pacific Journal of Small Business, Vol.39, No.3, 2017, pp. 31-56.
108
Study on the Factors Influencing Entrepreneurial Intentions among University Students
Gopal Bahadur BhandariPhD Scholar, Faculty of Business and Accountancy
Lincoln University College, [email protected]
Principal, Xavier International School & College, Kathmandu, Nepal
Abstract University students are the most capable segment of the potential entrepreneurial supply, and their reactions may stimulate policy inferences. This paper focuses on reviewing the findings of previous studies conducted by various researchers with the aim to identify the determinants or the factors that are influencing the entrepreneurial intentions (decisions) among university students. The study draws a conclusion about further investigations needed to be conducted regarding the entrepreneurial intentions among university students to better comprehend this complex field of innovation and entrepreneurship.Research has shown that entrepreneurship will help these university graduates to develop their own careers and also ease unemployment by expanding the job market. Entrepreneurship is the key source of economic growth and innovation in both developed and emerging and developing economies. This paper will provide a comprehensive analysis on the impact of individual/psychological factors, family background factors and social environment factors on individual’s entrepreneurial intentions.
Keywords Entrepreneurship, Entrepreneurial Intention, Business, University Students.
Introduction Relevance of the topic:
Unemployment has been rising all over the world, and the employment problem of university graduates is becoming more and more serious. Entrepreneurship is the solution to unemployment problems (Egunsola, et al., 2012).
In modern societies, entrepreneurship is one of the most potent economic forces. Our future wellbeing therefore depends critically on current and future entrepreneurial activities. Young people, and especially the students, represent tomorrow's entrepreneurs. It is therefore imperative to know how many students intend to pursue an entrepreneurial career, why, why not, and how many are or have already created a business in the founding process (International GUESSS Report 2016). Venture creation is therefore a major source of employment in many countries. According to Reilly and Carsrud (2000), the entrepreneurial intention is the best predictor of entrepreneurial behavior or the creation of a new business. The reasons of why students do or do not intent to run their own business have been interested by many researchers
in entrepreneurship literature (Iakowleva et al., 2014; Moriano et al., 2012; Krueguer et al., 2000; Kolvereid, 1996). Entrepreneurs play a crucial role in developing the national economy, well-being of a society (Iakowleva et al., 2014), innovation and employment (Kelley et al., 2011). Policymakers, companies, government and other agencies are becoming increasingly interested in entrepreneurial growth (Owoseni, 2014).
This paper also examines the influence of other factors such as individual/psychological factors, family background factors and social environment factors. The purpose of this study was to explore the factors that influence entrepreneurial intentions among students in Nepal. To promote graduate entrepreneurship and drive employment through entrepreneurship, students ' entrepreneurial intentions and their influencing factors need to be explored. The objective of this literature review study is to analyze researches previous carried out in the field of entrepreneurship to identify the determinants or the factors that are influencing the entrepreneurial intentions (decisions) among university students.
109
According to report published by the Global Entrepreneurship Monitor (GEM), the most common age group for new start-ups in most economies was the age range of 25−34 or 35−44. People of this age may be more courageous about their future and more excited about opportunities (GEM, 2018−2019 Global Report, p. 22). This study examines the entrepreneurial intentions of educated young people of Nepal and provides suggestions to policymakers for potential policies that could strengthen the economy. Without understanding the factors related to EI among university students, countries may neglect the entrepreneurial pool that is likely to develop after graduation. Countries with a high unemployment rate should use their entrepreneurial potential for good economic conditions and well-being. Particularly in low-and middle-income countries (such as Nepal), the role of an entrepreneur in the economy is very important.
Motivation of the StudyThere is a lack of entrepreneurial activity for economic development in Nepal. University students constitutes the most capable segment of potential entrepreneurial supply, and their reaction may have stimulating policy inferences.
Some of today's most famous companies were founded on the university campus. Facebook was founded in 2004 by Mark Zuckerberg, Dustin Mosckovitz, Eduardo Saverin, Andrew Mccolum and Chris Hughes, who created one of the most successful social networks. Google was founded in 1998 by Larry Page and Sergey Brin, who met for the first time on their Stanford University campus tour .The pair became friends and developed the most powerful and effective search engine in the world while they were PhD students working together on the Stanford Digital Library Project. Jerry Yang and David Filo, a pair of Stanford University PhD candidates in 1994, founded Yahoo. Dropbox was founded by MIT students Arash Ferdowski and Drew Houston in 2007, who were tired of email’s inability to send and receive large files. Reddit, founded in 2005, is an information sharing website on which users have the ability to vote on content, and was created by Steve Huffman and Alexis Ohanian, both students at University of Virginia. And Snapchat, a hugely popular app that enables user editing of picture and video content along with duration of availability, was created by two frat brothers Evan Spiegel and Robert Murphy at Stanford (2011), when Murphy entered Spiegel’s room to chat about a photo he regretted sending and how it would be easier if the photo magically disappeared once the
recipient viewed it. Startups are increasingly coming from universities and student founders. An in-depth analytical investigation of them and their communities is therefore crucial.
Methods This is the review study which examined the determinants or factors that influence the entrepreneurial intentions (decisions) of university students in the course of this descriptive research; a secondary source has been used. The types of secondary data used are journals of research and books. There are several factors that affect entrepreneurial intentions, such as: personality traits (self-confidence, risk-taking skills, control locus, need for achievement, etc.), cultural factors (religion), social factors (role models), economic factors (monetary aspects), political factors, demographic factors, technological factors, etc. in order to analyze more accurately the impact of those factors on university student’s entrepreneurial intentions, we utilize structural equation modeling (SEM) to verify the conceptual model we constructed.
Literature Review and Conceptual Model Entrepreneurship is about establishing a new business where no one existed before. The first type of entrepreneurship is small and medium enterprise entrepreneurship (SME). Innovation-driven enterprise (IDE) Entrepreneurship is the second type. SME vs. IDE Entrepreneurship: Focus on addressing local and regional markets only. Focus on global/regional markets. Innovation is not necessary to SME establishment and growth, nor is competitive advantage. The company is based on some sort of innovation (tech, business process, and model) and potential competitive advantage. “Non-tradable jobs”—jobs generally performed locally (e.g., restaurants, dry cleaners, and service industry). “Tradable jobs”- Jobs that do not have to be performed locally. Most often family businesses or businesses with very little external capital, more diverse ownership base including a wide array of external capital providers. The company typically grows at a linear rate. When you put money into the company, the system (revenue, cash flow, jobs, etc.) will respond quickly in a positive manner. The company starts by losing money, but if successful will have exponential growth which requires investment. When you put money into the company, the revenue/cash flow/jobs numbers do not respond quickly. Innovation is all about entrepreneurship. Innovation is the result of pain and problem. Professor Ed Roberts from MIT: Innovation=
110
Invention X Commercialization. Innovation is a product rather than a sum of invention and commercialization. If there is commercialization but no invention or invention but no commercialization then no innovation is present.
The invention (an idea, a technology, or some sort of intellectual property) is important, but the entrepreneur does not need to create the invention. In fact, the inventions that lead to innovation driven companies often come from elsewhere. Such was the case with Steve Jobs, who identified others’ and commercialized them effectively through Apple.
Studies have shown that a potential growth in entrepreneurship activities has a positive impact on social development as well as on the contribution of the national economy (Gürol & Atsan, 2006, p. 52; Yaman, 2018; Zarefard & Cho, 2017). All in all, we know that “Entrepreneurs contribute to employment and prosperity in their communities” (GEM, 2018−2019 Global Report,
p. 25). In the literature, the contribution of entrepreneurship to the economy has been highly processed and the positive impact of entrepreneurship on the economy has been empirically proven many times (Audretsch et al., 2001; Carree & Thurik, 2003; Quadrini, 2009; Reynolds et al., 2005; Schmitz, 1989; Wong et al., 2005). However, for more than a decade, policymakers and researchers have done a lot of work on discovering the factors that influence EI and trying to understand the literature on entrepreneurship (Kautonen, Van Gelderen, & Fink, 2015). The main objective of the researchers and policymakers in this area is to positively influence the entrepreneurial intentions of individuals and to transform these intentions into new business set-ups in the real world. The first step for this is to understand the ‘entrepreneurial intention (EI)’. According to Cognitive Theory, intention can be defined as a specific tendency that leads an individual to perform an action or a series of actions, as it is the product of conscious thinking that directs behavior (Ajzen, 1991). In this context, EI can refer to the intention of an individual to create a new firm and/or a new job. Researchers have developed many models to explain intention (e.g. the Entrepreneurial Event Model (EEM), Theory of Planned Behavior (TPB)). The most comprehensive and widely accepted theory that describes EI is TPB. TPB basically assumes that there are three antecedents that affect EI. These are perceived behavioral control (PBC), attitude towards behavior (ATB) and subjective norms (SNs). Although these antecedents are discussed in detail later in
the study, following the study of Liñán and Chen (2009), it [i.e. the study] has also tried to once again reveal the strength of this model in predicting EI. Therefore, the EI in this study has been discussed within the scope of TPB. In this study, the EI was measured among university students. This is because, in line with the literature (Liñán & Chen, 2009; Nabi, Liñán, Fayolle, Krueger, & Walmsley, 2017) ‘university students’ are marked as the most important potential entrepreneur candidates. Many studies (Nabi et al., 2017, p. 278; Nabi & Liñán, 2011) have emphasized that university students are the most important tool in combating unemployment as well as increasing competitiveness (Türker & Selçuk, 2009, p. 143). Thus, the way to transform potential entrepreneur candidates (here, university students) into real entrepreneurs would seem to be to have the ability to identify factors affecting EI with deeper knowledge. There are many definitions for entrepreneurship developed over the few recent decades. Schumpeter (1960) considered that entrepreneurs are people who create new products or services in new or existing market and entrepreneurship becomes one of the most important factors in countries’ economic growth (Schumpeter, 1960, p.12; De Bruin et al., 2006, p. 686). “The environment itself creates entrepreneurship” (Bernat et al., 2016, p. 271), the reason is that operating organizations have a must for reacting quickly to unanticipated changes, they also need “to adapt to unpredicted outcomes of the predicted changes” (Timmons, 1990). Kirzner (1985) defined that entrepreneur as a person who might optimize information in such a way in order to discover the new and improved business opportunities (Korpysa, 2012). Talpas (2014, p.198) considered entrepreneurship as a process that can be recognized throughout business activities by showing effective leadership within uncertain market, risks and competitive conditions, while Zimmer and Scarborough (1996, p.19) claimed that entrepreneurs can also be known as the owners who, with skillful manner, who are able to associate various factors of production, transform to a smaller economic resources into a bigger platform effectively and rising profits. Also, entrepreneurship is the process of creating and building new venture and new business organization (Shane & Venkataraman, 2000), that not only provides goods and services, creates job opportunities but also contributes to the development of economy and the national income. Lin et al. (2017) argued that “it is the process of designing, launching and running a new business”, and it also tends to some topics such
111
as policy, government programs, entrepreneurial training, funds, etc. that not only promotes the development of starting a new business but it also supports entrepreneurs in their business activities. In addition, OECD (2006) stresses that entrepreneurship is defined as a process, where entrepreneurs establish and develop enterprises to supply new products and services, or create additional value to products and services. Entrepreneurial intention
Krueger and Brazeal (1994) defined entrepreneurial intention as the intent to set up a new business, or the intent to be self-employed (Douglas & Shepherd, 2002) or the intent to own a business (Crant, 1996). There are many reasons such as personal circumstances, social and politic issues and business environment, which might become either big obstacles or motivated factors to transform this intent becoming a reality. Thus, entrepreneurial intention is perceived as an essential and fundamental condition to be a nascent entrepreneur. Whereas entrepreneurship is determined as the emergent process of an organization (Gartner et al., 1992), an individual’s intention to pursue an entrepreneurial career is crucial to this process (Lee et al., 2011, p.126). Moreover, entrepreneurial intention is considered the first step in a series of action to found an organization (Bird, 1988), yet Fishbein and Ajzen (1975) argued that intentions toward a behavior can be seen as important indicators of that behavior. In other words, intentions are still seen as the best predictor of individual behavior (Krueger, 2008). According to Ajzen (1991), who introduced Theory of Planned Behavior, intentions are determined by social/subjective norms and perceived behavioral control. Social norms are considered individual’s perception of his or her behavior that is consistent with significant thoughts of others, while perceived behavior control is the range of the target behavior within the ability of a decision maker (Esfandiar et al., 2017; Bygrave & Hofer, 1991). Do and Dadvari (2016) also defined entrepreneurial intention as an attentive state of mind that reflects personal experience, awareness and interest toward planned entrepreneurial activity
Entrepreneurial Intention (EI)In general, intention can be defined as an individual's motivation to carry out a conscious plan or movement (Conner & Armitage, 1998). According to cognitive theory, intention can be defined as a specific tendency which leads a person to perform an action or a series of actions as it is the product of conscious thinking that
directs behavior (Ajzen, 1991; Parker, 2004). In this context, EI may be referred to as the intention of an individual to establish a new firm and/or a new job or new value driver in existing organizations (Wu & Wu, 2008). Zhao, Hills and Siebert (2005) define EI as an intention to start a new business, while Thompson's (2009) definition focuses on an individual's belief that aims to start a new business in the future. Krueger, Reilly and Carsrud (2000) have shown that the EI is the primary predictor of future entrepreneurial behavior. The EI predicts that people will choose to set up their own firms (Davidsson, 1995, p. 6). Thus, in order to understand the processes leading to the establishment and growth of new companies, it is necessary to understand and explain the EI of individuals and the entrepreneurial attitudes behind it in detail (Krueger, 2007, p. 124). Entrepreneurship intentions shall determine the form and direction of the organizations at their inception. As a result, future activities such as survival, growth and development of these organizations will be the result of these intentions (Bird, 1988) In other words, understanding individual entrepreneurial intentions (EIs) means understanding the actual behavior of entrepreneurs at the end of decision-making processes (Bird, 1988; Lee, Lim, & Pathak, 2011, p. 6; Shook, Priem, & Mcgee, 2003, p. 380). Entrepreneur's intention among students can be defined as factors that directly or indirectly affect the decision of the students to be an entrepreneur or say to set up a business. The intention is very important before the establishment of any business enterprise. Intention is the starting point for self-employment and the start-up of a business. There is a very limited understanding of the factors affecting the EI of young people (such as students) who have not yet started their own business ventures (Veciana, Aponte, & Urbano, 2005). So, basically, entrepreneurship intention can be defined as the idea of pursuing entrepreneurship and the brainstorming with regard to the entrepreneurship. Intentions are regarded as the best indicators of planned behavior (Krueger et al., 2000, p. 411), especially when that behavior is rare and entrepreneurial behavior is largely planned. In this study, university students were identified as the target group to predict EI. According to Mueller and Thomas (2000, pp. 62−63), there are many important reasons for selecting university students as target samples in EI studies.Today's university students are believed to be a significant part of the pool of potential entrepreneurs in both developed and developing countries.
112
Leading EI ModelsIn the 1980s, EI studies mostly focused on personality variables, demographic features, background and social environment, which have an impact on EI (Gartner 1988; Kolvereid, 1996; Shapero & Sokol, 1982). Neverthless, the modelling of entrepreneurship mostly based on personality traits (e.g. need for achievement, locus of control) and demographic factors (e.g. age, gender, origin) does not demonstrate much understanding about how the entrepreneurial process takes place (Liñán et al., 2011, p. 197). According to Gartner (1988, p. 48), focusing on the personality characteristics of the entrepreneur or trying to define the entrepreneur is not useful in understanding entrepreneurship because an average personality profile of entrepreneurs cannot be determined. In the 1990s, academicians and practitioners in the entrepreneurial field began to adopt the integration of theories from the area of social psychology (Liñán & Fayolle, 2015, p. 908). Later, the studies mostly focused on the prediction of EI rather than its realization (Van Gelderen et al., 2008). This period, which started with the social cognitive theory proposed by Bandura (1986), proposed a framework model for understanding or predicting human behavior. After that, studies focused mostly on understanding the entrepreneurship process and a number of models have been developed to explain EI (Davidsson, 1995, p, 4; Segal et al., 2005, pp. 44−47). The best known of these are: (1) Bird’s conceptual model of intentionality; (2) the Entrepreneurial Event Model (EEM); and (3) the Theory of Planned Behavior (TPB) (Shook et al., 2003, p. 383).
Theories of Entrepreneurial Intention The model of Entrepreneurial Event (EE) developed by [18] suggests that human behaviour is guided by ―inertia‖ and so an individual will not stop doing a particular thing unless he or she is interrupted by a force outside itself. [18] and [19] stated that, the interruptions may be negative or positive, this force the decision makers to choose the best available opportunity out of other options. According to EE theory, factors that determine intentions, are perceived desirability which refers to the attractiveness related to the task of starting up a business and becoming an entrepreneur, (perceived feasibility which refers to the degree to which an individual feels that he/she is capable of starting a new venture, and the propensity to act upon opportunities which refers to the individual’s willingness to act on decisions. For the model outside factors do not directly influence individual’s intentions. Start-up
intentions come from two main dimensions, perceived desirability and perceived feasibility.
Another model on intentions is the Theory of Planned Behaviour (TPB). The theory provides a framework for understanding and predicting the entrepreneurial intention through personal and social factors. Ajzen’s theory of planned behaviour (TPB) assumes that human behaviours are planned and are therefore preceded by intention toward that behaviour. Behavioral intentions are determined by three main attitudinal antecedents which are 1) Attitude toward Performing the Behaviour; 2) Subjective Norm and 3) Perceived Behavioural Control. All other factors are theorised to influence intentions through these three components. Attitude toward performing the behaviours is defined by Ajzen as the perception of an individual or their judgment of performing a particular behaviour, the expected results and the impact of the outcomes. Outcomes may be personal quality of life, personal wealth, independent, stress, and community benefits. People will choose to be entrepreneurs if the total utility they expect to obtain from an entrepreneurial venture, are more than the expected utility from the best employment they can get in the job market. The entrepreneurial utility is defined as benefits derived from income, independence, risk bearing, work effort, and the special rewards linked with self-employment. The second antecedent, subjective norm, is defined as the individual’s viewpoints of the values, thinking, beliefs, and norms held by significant others who have a huge influence on them or whom they really respect. Normative beliefs concern the perceived probability that important referent individuals or groups will approve or reject a given behaviour. These individuals or groups set the norm that specifies how the subject should behave. An example of social norms could be that family members expect you to become a doctor or an engineer in the future just because it is considered as an honour and a famous career under the view of majority Ghanaian people. In Ghana for example people from Kwawu origin are expected by their families to own businesses, a family tradition. The impact and predictive power of social norm is weak in individuals who have strong desire to achieve and a high orientation to implement the behaviour or who has high level of internal locus of control. The subjective norm construct is generally found to be a weak predictor of intention. There are a lot of conflicting opinions and assertions. A direct relation between subjective norms and entrepreneurial intentions others do not. The Perceived Behavioural Control or Perceived Self Efficacy
113
is the personal belief about the possibility to conduct the planned behaviour, the faculty of thoughts, physical mental, passion, finance and resources to personally control and execute the action. the traditionally weak role of the subjective norm in the TPB is an important concern within the area of entrepreneurship. Researchers assert that the perceived behavioural control is positively, associated with entrepreneurial intentions.
Factors influencing Entrepreneurial IntentionSome researchers have proposed new models about entrepreneurial intentions (Davidsson, 1995; Elfving, Brannback, & Carsrud, 2009; Kruger & Brazeal, 1994). These models analyze many different factors affecting individual’s entrepreneurial intentions. Those may be divided into three categories: individual or psychological factors, family background factors and social and environmental factors.
Personality Entrepreneurial Traits:1) Self-efficacy. According to Shook, Bratianu, 2010; Guerrero, et. al., 2008; Liñán, et. al., 2011, self-efficacy is a power or capacity to produce a desired effect, and is one of the key factors of the entrepreneurial intention. Sánchez (2011) states that self-efficacy is an important determinant of successful entrepreneurial behaviours. De Noble, et. al. (1999) measures entrepreneurial self-efficacy by the six factors: 1) risk and uncertainty management skills; 2) innovation and product development skills; 3) interpersonal and networking management skills; 4) opportunity recognition; 5) procurement and allocation of critical resources and 6) development and maintenance of an innovative environment. Other scientists (McGee, et. al., 2009) define self-efficacy through the five dimensions (searching, planning, marshalling, implementing people, and implementing finance).
2) Risk taking is the tendency of an individual to take risks (Pillis, Reardon, 2007). The individuals who tolerate higher risk are more inclined to entrepreneurship while the ones who tolerate lower risk are less inclined to entrepreneurship.
3) Proactiveness or the propensity to act is associated with entrepreneurial behavioural intentions. Segal, et. al. (2005) identifies this personality trait with tolerance for risk.
4) Behavioural control – it measures the individuals’ perception of how easily and successfully they could
establish and run a business, if they chose to start one (Kautonen, et. al., 2011).
5) Need for achievement is one of the widely-spread indicators showing whether a person is inclined to entrepreneurship or not.
6) Internal locus of control is associated with entrepreneurial success. The people who show strong self-control usually believe that the quality of life depends on their own actions, for example, education, hard work and so forth.
7) Attitude towards business. The attitude of young people from developed and developing countries towards business was researched in more detail by Iakovleva, et. al. (2011). It was evaluated by the following factors: business advantages and disadvantages, the feeling of happiness from the performed activity, business as an interesting and attractive occupation. Liñán, et. al. (2011) describes the attitude towards business as individual associations (positive or negative) about an entrepreneur
Individual/Psychological Factors Many researchers have explored the impact of gender on their entrepreneurial intentions..Some researchers have found that males have stronger intentions than females (Matthews & Moser, 1995).Some argue that women's low entrepreneurial intentions are due to their low self-efficacy. They may avoid starting their own business because of a lack of capacity (Fielden, et al, 2003).Some stereotypical images, caused by their responsibility to support the family, and may have a negative impact on the entrepreneurial intentions of women.
Researchers also focus on the impact of personality traits on the individual's entrepreneurial intentions.. Some researchers considered personality traits to be an important factor. Compared to other people, entrepreneurs show certain personality traits, such as strong achievement orientation, strong individual control, risk-taking willingness, endurance, and intelligence (Shaver, 1995), but other researchers argue that these personality traits cannot be taken as an effective explanation of their choice of start-up (Gartner, 1985).
Some research shows that individual attitudes towards entrepreneurship are apparently related to their entrepreneurial behavior, which is mediated by intentions (Ajzen & Fishbein, 1977). Ajzen (1991) points out those individual attitudes are important factors that influence their entrepreneurial intentions.
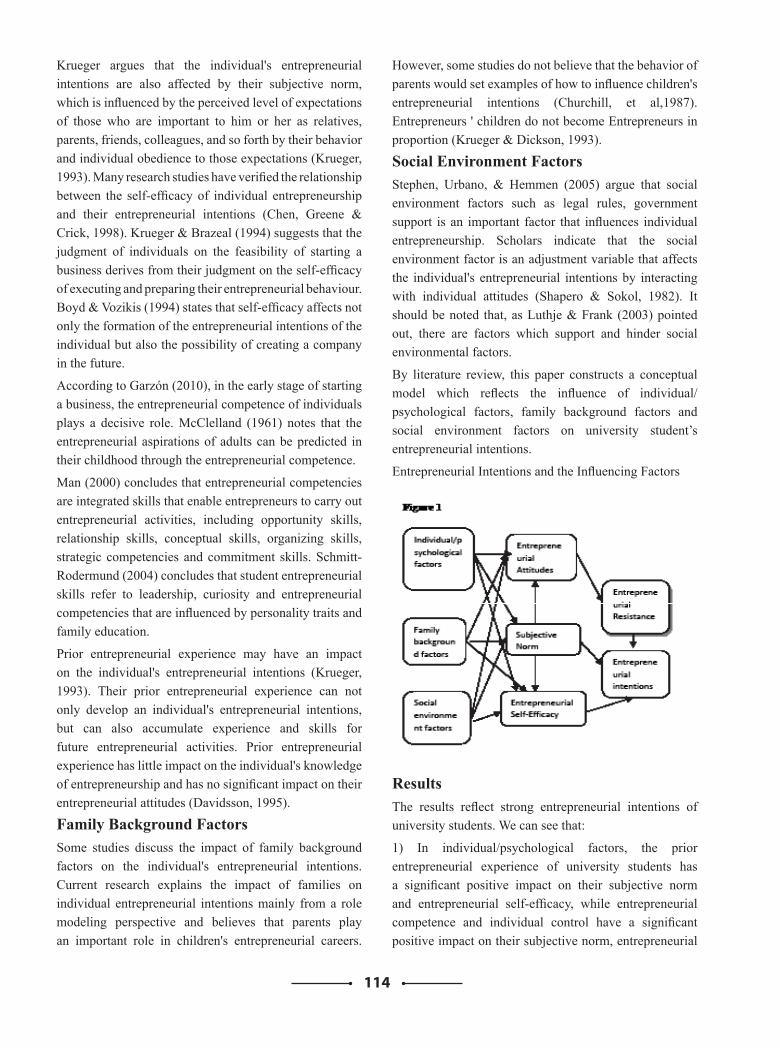
114
Krueger argues that the individual's entrepreneurial intentions are also affected by their subjective norm, which is influenced by the perceived level of expectations of those who are important to him or her as relatives, parents, friends, colleagues, and so forth by their behavior and individual obedience to those expectations (Krueger, 1993). Many research studies have verified the relationship between the self-efficacy of individual entrepreneurship and their entrepreneurial intentions (Chen, Greene & Crick, 1998). Krueger & Brazeal (1994) suggests that the judgment of individuals on the feasibility of starting a business derives from their judgment on the self-efficacy of executing and preparing their entrepreneurial behaviour. Boyd & Vozikis (1994) states that self-efficacy affects not only the formation of the entrepreneurial intentions of the individual but also the possibility of creating a company in the future.
According to Garzón (2010), in the early stage of starting a business, the entrepreneurial competence of individuals plays a decisive role. McClelland (1961) notes that the entrepreneurial aspirations of adults can be predicted in their childhood through the entrepreneurial competence.
Man (2000) concludes that entrepreneurial competencies are integrated skills that enable entrepreneurs to carry out entrepreneurial activities, including opportunity skills, relationship skills, conceptual skills, organizing skills, strategic competencies and commitment skills. Schmitt-Rodermund (2004) concludes that student entrepreneurial skills refer to leadership, curiosity and entrepreneurial competencies that are influenced by personality traits and family education.
Prior entrepreneurial experience may have an impact on the individual's entrepreneurial intentions (Krueger, 1993). Their prior entrepreneurial experience can not only develop an individual's entrepreneurial intentions, but can also accumulate experience and skills for future entrepreneurial activities. Prior entrepreneurial experience has little impact on the individual's knowledge of entrepreneurship and has no significant impact on their entrepreneurial attitudes (Davidsson, 1995).
Family Background FactorsSome studies discuss the impact of family background factors on the individual's entrepreneurial intentions. Current research explains the impact of families on individual entrepreneurial intentions mainly from a role modeling perspective and believes that parents play an important role in children's entrepreneurial careers.
However, some studies do not believe that the behavior of parents would set examples of how to influence children's entrepreneurial intentions (Churchill, et al,1987). Entrepreneurs ' children do not become Entrepreneurs in proportion (Krueger & Dickson, 1993).
Social Environment FactorsStephen, Urbano, & Hemmen (2005) argue that social environment factors such as legal rules, government support is an important factor that influences individual entrepreneurship. Scholars indicate that the social environment factor is an adjustment variable that affects the individual's entrepreneurial intentions by interacting with individual attitudes (Shapero & Sokol, 1982). It should be noted that, as Luthje & Frank (2003) pointed out, there are factors which support and hinder social environmental factors.
By literature review, this paper constructs a conceptual model which reflects the influence of individual/psychological factors, family background factors and social environment factors on university student’s entrepreneurial intentions.
Entrepreneurial Intentions and the Influencing Factors
Results The results reflect strong entrepreneurial intentions of university students. We can see that:
1) In individual/psychological factors, the prior entrepreneurial experience of university students has a significant positive impact on their subjective norm and entrepreneurial self-efficacy, while entrepreneurial competence and individual control have a significant positive impact on their subjective norm, entrepreneurial
115
self-efficacy and entrepreneurial attitude. Risk propensity has a significant positive impact on the student's subjective norm. Factors such as gender, innovation orientation and achievement orientation have no significant impact on the student's entrepreneurial attitude, subjective norm and entrepreneurial self-efficacy.
2) Family background factors such as the entrepreneurship of grandparents, parents, relatives and friends have no significant impact on the student's entrepreneurial attitude, subjective norm and entrepreneurial self-efficacy. They only have an indirect connection with the student's previous entrepreneurial experience.
3) In the social environment, policy support, the entrepreneurial environment has a significant positive impact on the entrepreneurial attitude, the subjective norm and the entrepreneurial self-efficacy of university students.
4) The subjective norm of university students also has a significant positive influence on their entrepreneurial attitude and entrepreneurial self-efficacy.
5) The entrepreneurial attitude, the subjective norm and the entrepreneurial self-efficacy of university students have a significant positive impact on their entrepreneurial intentions, while the entrepreneurial resistance has a significant negative impact on their entrepreneurial intentions. Entrepreneurial Resistance (ER) ‐It is measured from the aspects of self-confidence, fund, time, family support, commercial skills and entrepreneurial education.
Conclusions and DiscussionsThe results indicate that:
The subjective norm of university students has a significant positive impact on their entrepreneurial attitude and entrepreneurial self-efficacy, and all of these factors have a significant positive impact on their entrepreneurial intentions.In individual / psychological factors, the entrepreneurial experience of university students has a significant positive impact on their subjective norm and entrepreneurial self-efficacy. Entrepreneurial competence and the influence of individual university students have a significantly positive impact on some of the intervening variables, such as the entrepreneurial mentality of the student, subjective standard and entrepreneurial self-efficacy, which have a significant positive impact on the entrepreneurial intentions of the student.
Student’s risk propensity also exerts significant positive impact on their subjective norm. By this intervening variable, their entrepreneurial intentions are affected.
Family background factors have no significant impact on student’s entrepreneurial attitude, subjective norm, entrepreneurial self-efficacy and entrepreneurial intention.
In social environment factors, both supporting policies and entrepreneurial environment of society have significant positive impact on student’s entrepreneurial attitude, subjective norm, and entrepreneurial self-efficacy, which have significant positive impact on student’s entrepreneurial intentions as intervening variables. Some entrepreneurial resistances caused by lack of self-confidence, funds, time, family support, business skills and entrepreneurial education have significantly negative impact on student’s entrepreneurial intentions.
The results mentioned above are of significance to policy making. In three types of factors including individual/psychological factors, family background factors and social environment factors, except family background factors, individual/psychological factors and social environment factors have significant influence on university student’s entrepreneurial intentions. Family background factors of university students can’t be controlled by policy, but individual/psychological factors and social environment factors can be regulated by education and relevant policy instruments. For instance, we can support university students for creating their own business and promote their entrepreneurial competence, self controllability and entrepreneurial self-efficacy to make them acquire more successful entrepreneurial experiences by taking a series of measures such as entrepreneurial education and entrepreneurial skill training, developing appropriate risk propensity, making a encouraging and supporting atmosphere, setting up entrepreneurial funds and incubating entrepreneurship of university students. By these education and supporting policies, individual/psycho- logical status of university students and social environment are expected to be changed to promote university student’s entrepreneurial intentions, reaching the goal of promoting employment by entrepreneurship.
Recommendations We derive a few key recommendations for the various stakeholders based on the above findings.
Public and private institutions should further enhance and improve the educational offerings for entrepreneurship.
116
The overall goal should be to make as many students as possible aware of the entrepreneurship. Those students should make a conscious decision about whether or not to become entrepreneurs.
Entrepreneurship education must provide them with the tools, skills and abilities not only to become entrepreneurs but also to become successful entrepreneurs.
Before creating a business many students want to gain professional experience. This can be just as challenging as getting "locked in" in the corporate world. Policymakers and regulatory authorities should therefore make it as easy as possible to become an entrepreneur, such as reducing administrative and legal barriers, facilitating access to financial resources and supporting networking opportunities in general. Otherwise the cost of leaving organizational job will become too high.
Gender is a major issue here. Policymakers should focus even more on enabling women to start entrepreneurial careers, whether through tailor-made offers such as networking events, specific mentoring and counseling, or facilitating family and entrepreneurship combinations.Parents, and especially entrepreneurial parents, need to know they are important role models. They are not supposed to paint a too rosy or too bad picture of being an entrepreneur (especially when the business is not doing well). A realistic picture is most useful so offspring can decide for themselves whether or not they want to become entrepreneurs.Most of the students intend to start a business with partners or have already created it. A key to success is finding the right co-founders. Therefore, it is imperative to help with this endeavour, for example by providing universities or other institutions with co-founder matching platforms.
Universities play a crucial and extremely important role in general. Their tasks are varied, such as providing high-quality entrepreneurship courses, events such as start-up evenings or contests on business plans, and creating an entrepreneurial environment. This is to sensitize students for entrepreneurship, to provide them with the necessary tools and skills and also to support them in the longer term in their business activities.
Universities should be aware of this role and should endeavor to meet all the high expectations in this respect.
A truly important question is why a business is actually created, or for what purpose. Students should be aware of their underlying motivational drivers (e.g., social identity of their founder) and think and act accordingly.
As an educator, the university could foster students’ interests towards entrepreneurship by:i) Providing students with ideas to start new businesses ii) Offering bachelors or masters studies on entrepreneurship iii) Arranging workshops and conferences on entrepreneurship iv) Offering project work focused on entrepreneurship v) Creating awareness of entrepreneurship as a possible career choice
As a promoter of entrepreneurship, the university could play its role by: i) Allowing business ventures run by students to use university services ii) Bringing students in contact with the network needed to start new business ventures iii) Bringing entrepreneurial students in contact with each other iv) Providing students with the financial means to start new business ventures
Finally, students should be aware that it is not a "must" to become an entrepreneur; but it is a very attractive and viable option worth considering. Additionally, there are many ways to be an entrepreneur; examples are creating a business, taking over one (e.g., one of the parents), or being a corporate entrepreneur within an existing business.
In conclusion, student entrepreneurship is an important and fascinating field that deserves further attention from scholars, practitioners and policy makers to enhance and foster the creation of successful new ventures.
References[1] Aulet, B. (2013), Disciplined entrepreneurship, 24
steps to a successful startup, John Wiley & Sons.
[2] Sensor, D & Singers,S. (2009), Start-Up Nation. (1st ed.). New Work: Hachette Book Group.
[3] Holt, D.H. (2018), Entrepreneurship -New Venture Creation. (4th ed.). India: Pearson.
[4] Khanka, S.S. (2018), Entrepreneurship Development. (4th ed.), India: S Chand
[5] Ali, A., Topping, K. J., & Tariq, R. H. (2010), Entrepreneurial Attributes among Postgraduate Students of a Pakistani University. Online Submission, 7(5), 66-77.
[6] Ajzen, I. (1991), The theory of planned behavior. Organizational behavior and human decision processes, 50(2), 179-211.
[7] Ajzen, I., & Fishbein, M. (2000), Attitudes and the attitude-behavior relation: Reasoned and automatic processes, European review of social psychology, 11 (1), 1-33.
117
[8] Aslam, T. M., Awan, A. S., & Khan, T. M. (2012), An Empirical study of Family back ground and Entrepreneurship as Career selection among University Students of Turkey and Pakistan. International Journal of Business and Social Science, 3(15), 118-123.
[9] Alam, S. (2018), Factors affecting entrepreneurial intention in Bangladesh.
[10] Ajzen, I. & Fishbein, M.(1977), Attitude-behavior Relations, A Theoretical Analysis and Review of Empirical Research. Psychological Bulletin, 84(5), 888-918.
[11] Ajzen, I. (1987). Attitudes, Traits and Actions:, Dispositional Prediction of Behavior in Personality and Social Psychology, Advances in Experimental Social Psychology, 20, 1-63.
[12] Ajzen, I. (1991), The Theory of Planned Behavior. Organizational Behavior and Human Decision Processes, 50(2), 179 – 211.
[13] Athayde, R. (2009), Measuring Enterprise Potential in Young People. Entrepreneurship Theory and Practice, 33(2), 481-500.
[14] Bird, B. (1995), Toward a Theory of Entrepreneurial Competency, .In J.A.Katz & R.H.Brockhaus, Sr.(Eds), Advances in Entrepreneurship, Firm Emergence, and Growth. 2,51-72. Greenwich, CN: JAI Press
[15] Bird, B. (1988), Implementing entrepreneurial ideas: The case for intention. Academy of management Review, 13(3), 442-453.
[16] Boyd, N.G. & Vozikis, G.S. (1994), The Influence of Self-efficacy on the Development of Entrepreneurial Intentions and Actions, Entrepreneurship Theory and Practice, 18(4), 63-77.
[17] Churchill,N.C. Carsrud, A.L., Gaglio, C.M., & Olm, K.W. (1987), Entrepreneurs-mentors, Networks and Successful New Venture De-velopment: An Exploratory Study. American Journal of Small Business, 12(2), 13-18.
[18] Chandler, G.N. & Jansen, E. (1992), The Founder’s Self-assessed Competence and Venture Performance. Journal of business venturing, 7(3), 223-236
[19] Chen, C. C., Greene, P.G., & Crick, A. (1998), Does Entrepreneurial Self-efficacy Distinguish Entrepreneurs from Managers? Journal of Business Venturing, 13(4), 295–316.
[20] Davidson, P. (1995), Determinants of Entrepreneurial Intentions. Paper prepared for the RENT IX Workshop, Piacenza, Italy, 11. 23-24.
[21] Durst, S., & Sedenka, J. (2016), Entrepreneurial intentions and behaviour of students attending Swedish Universities, Global University Entrepreneurial Spirit Students’ Survey 2016. National Report, Sweden, Skövde, University of Skovde.
[22] Drost, E. A. (2010), Entrepreneurial intentions of business students in Finland: implications for education. Advances in Management, 3(7), 28-35
[23] Elfving, J., Brännback, M., & Carsrud, A. (2009), Toward a Contextual Model of Entrepreneurial Intentions. In A.L.Carsrud, & M.Brännback (Eds).Understanding the Entrepreneurial Mind, Opening the Black Box, New York: Springer, 23-33.
[24] Fielden, S.L., Davidson, M.J., Dawe, A.J., & Makin, P.J. (2003), Factors Inhibiting the Economic Growth of Female Owned Small Businesses in North West England, Journal of Small Business and Enterprise Development, 10( 2), 152-166.
[25] Francis, D.H. & Banning, K. (2001). Who Wants to be an Entrepreneur? Journal of Academy of Business Education, 1(2), 5–11.
[26] Gartner, W. B. (1985), A Conceptual Framework for Describing the Phenomenon of New Venture Creation, The Academy of Manage-ment Review, 10(4), 696-706.
[27] Garzon, M.D. (2010), A Comparison of Personal Entrepreneurial Competences between Entrepreneurs and CEOs in Service Sector, Service Business, 4,289-303.
[28] Hau, J., Wen, Z., & Cheng, Z.(2004), Structural Equation Model and Its Applications, Beijing: Educational Science Publishing House.
[29] Israr, M., & Saleem, M. (2018), Entrepreneurial intentions among university students in Italy, Journal of Global Entrepreneurship Research, 8(1), 20.
[30] Indarti, N., Rostiani, R., & Nastiti, T. (2016), Underlying factors of entrepreneurial intentions among Asian students, The South East Asian Journal of Management, 143-160.
[31] Indarti, N. (2004), Factors affecting entrepreneurial intentions among Indonesian students, Journal of Indonesian Economy and Business, 19(1).
118
[32] Khuong, M. N., & An, N. H. (2016), The factors affecting entrepreneurial intention of the students of Vietnam national university, a mediation analysis of perception toward entrepreneurship. Journal of Economics, Business and Management, 4(2), 104-111.
[33] Kautonen, T.‐Tornikoski, E.T., & Kibler, E. (2009), Entrepreneurial Intentions in the Third Age, the Impact of Perceived Age Norms, Small Business Economics, 37(2), 219-234.
[34] Korunka, C., Frank, H., Lueger, M., & Mugler, J. (2003), The Entrepreneurial Personality in the Context of Resources, Environment, and the Startup Process—A Configurational Approach, Entrepreneurship Theory and Practice, 28(1), 23–42.
[35] Krueger, N. (1993), The Impact of Prior Entrepreneurial Exposure on Perceptions of New Venture Feasibility and Desirability, Entrepreneurship Theory and Practice, 18(1), 5-21.
[36] Krueger, N. F,Jr & Brazeal, D. V. (1994), Entrepreneurship Potential and Potential Entrepreneurs, Entrepreneurship Theory and Practice‐18(3),91-104.
[37] Krueger, N. F,Jr & Carsrud, A. L. (1993). Entrepreneurial Intentions: Applying the Theory of Planned Behavior, Entrepreneurship and Regional Development, 5(4), 315–330.
[38] Krueger Jr, N. F., Reilly, M. D., & Carsrud, A. L, (2000), Competing models of entrepreneurial intentions, Journal of business venturing, 15(5-6), 411-432.
[39] Krueger, N. (1993), The impact of prior entrepreneurial exposure on perceptions of new venture feasibility and desirability, Entrepreneurship theory and practice, 18(1), 5-21.
[40] Krueger, N.F,Jr & Dickson, P. (1993), Perceived Self-efficacy and Perceptions of Opportunity and Threat, Psychological Reports, 72(3), 1235-1240.
[41] Krueger, N.F,Jr& Dickson, P. (1994), How Believing in Ourselves Increases Risk Taking: Self-efficacy and Perceptions of Opportunity and Threat, Decision Sciences, 25,385-400.
[42] Lee, L., Wong, P. K., Foo, M.D., & Leung, A. (2011), Entrepreneurial Intentions: the Influence of Organizational and Individual Factors, Journal of Business Venturing, 26(1), 124-136.
[43] Linan, F. & Chen, Y.W. (2009), Development and Cross-Cultural Application of a Specific Instrument to Measure Entrepreneurial Intentions, Entrepreneurship Theory and Practice, 33(3), 593-617.
[44] Luthje C. & Frank, N. (2003), The Making of an Entrepreneur, Testing a Model of Entrepreneurial Intent Among Engineering Students at MIT, R&D Management,33 (2),135-147.
[45] Man, T. W. Y. (2000), Entrepreneurial Competencies of SME Own-er/Managers in the Hong Kong Services Sector, a Qualitative Analysis, Journal of Enterprising Culture,8(3),235-254.
[46] Matthews, C. & Moser, S. (1995), Family Background and Gender: Implications for Interest in Small Firm Ownership, Entrepreneurship and Regional Development, 7, 365–377.
[47] McClelland, D.C (1961), The achieving society, New York: Van No Strand.
[48] Morris, M. H. & Jones, F. F. (1999), Entrepreneurship in Established Organizations, The Case of the Public Sector, Entrepreneurship Theory and Practice, 24(1), 71–91.
[49] Niroula, K., & Bajracharya, S. (2019), Entrepreneurial Intention Among Students in Nepal (Master's thesis, Universitetet i Agder; University of Agder).
[50] Oh, Y. (2017), Student Entrepreneurship at Cornell University: A Case Study.
[51] Owoseni, O. O. (2014), The influence of some personality factors on entrepreneurial intentions, International Journal of Business and Social Science, 5(1).
[52] Owoseni, O. O., & Akambi, P. A. (2010), Entrepreneurial intentions, A theoretical framework, Journal of management and corporate governance, 2(4), 132-148.
[53] Pauceanu, A., Alpenidze, O., Edu, T., & Zaharia, R. (2019), What Determinants Influence Students to Start Their Own Business? Empirical Evidence from United Arab Emirates Universities. Sustainability, 11(1), 92.
[54] Remeikiene, R., Startiene, G., & Dumciuviene, D. (2013, June), Explaining entrepreneurial intention of university students: The role of entrepreneurial education, In International Conference (pp. 299-307).
119
[55] Raza, S. A., Qazi, W., & Shah, N. (2018), Factors affecting the motivation and intention to become an entrepreneur among business university students. International Journal of Knowledge and Learning, 12(3), 221-241.
[56] Schmitt-Rodermund, E. (2004), Pathways to Successful Entrepreneur-ship: Parenting, Personality, Early Entrepreneurial Competence, and Interests. Journal of Vocational Behavior, 65(3), 498–518.
[57] Shapero, A. & Sokol, L. (1982), The Social Dimensions of Entrepreneurship. In C.A. Kent, D.L. Sexton, & K.H. Vesper (Eds.), Encyclopedia of Entrepreneurship. Englewood Cliffs, NJ: Prentice-Hall, 72-90.
[58] Shaver, K.G. (1995), The Entrepreneurial Personality Myth. Business and Economic Review, 41(3), 20-23.
[59] Shaver, K. G. & Scott, L. R. (1991), Person, Process, Choice: the Psychology of New Venture Creation, Entrepreneurship Theory and Practice, 16(2), 23–45.
[60] Sitoula, T. (2015), Challenges and prospects of youth entrepreneurship in Kathmandu (Master's thesis, Universitetet i Nordland).
[61] Stephen, F., Urbano, D., & Hemmen, S. (2005), The Impact of Institutions on Entrepreneurial Activity, Managerial and Decision Economics, 26, 413–419.
[62] Solesvik, M. Z., Westhead, P., Kolvereid, L., & Matlay, H. (2012), Student intentions to become self-employed: the Ukrainian context. Journal of Small Business and Enterprise Development, 19(3), 441-460.
[63] Sieger, P., Fueglistaller, U., & Zellweger, T. (2014), Student entrepreneurship across the Globe: a look at intentions and activities, International Report of the GUESSS Project 2013/2014.
[64] Samo, A.H, and Inayat, S, (2019), Global University
Entrepreneurial Student Spirit Survey(GUESS), Country Report Pakistan .
[65] Shapero, A., & Sokol, L. (1982), The social dimensions of entrepreneurship, Encyclopedia of entrepreneurship, 72-90.
[66] Tabachnick, B. G. & Fidell, L. S. (2001), Using Multivariate Statistics, Boston: Allyn and Bacon.
[67] Taha, K. A. S., Ramlan, S. N., & Noor, I. M. (2017), The Factors Affecting Entrepreneurial Intentions of University Students in Malaysia. International Journal of Business and Technopreneurship, 7(2), 189-202.
[68] Van Gelderen, M., Brand, M., Van Praag, M., Bodewes, W., Poutsma, E., & Van Gils, A.(2008), Explaining Entrepreneurial Intentions by Means of the Theory of Planned Behavior. Career Development In-ternational, 13(6), 538-559.
[69] Turker, D., & Sonmez Selçuk, S. (2009), Which factors affect entrepreneurial intention of university students?, Journal of European industrial training, 33(2), 142-159.
[70] Tanveer, M. A., Zfar, S., Shafique, S., Jhangir, M., & Rizvi, S. (2013), Motivational Factors and Students Entrepreneurial Intention in Pakistan. Journal of Basic and Applied Scientific Research, 3(4), 263-269.
[71] Tkachev, A., & Kolvereid, L. (1999), Self-employment intentions among Russian students. Entrepreneurship & Regional Development, 11(3), 269-280.
[72] Xiong, X., & Xie, M. Problems and Solutions of Chinese University Students’ Entrepreneurship.
120
Managerial Effectiveness: An Indian Manufacturing Sector Experience
Shruti Sarkar1 and S. Rangnekar2
1 Research Scholar, 2 ProfessorDepartment of Management Studies, IIT Roorkee, India
Keyword
Managerial effectiveness, demographics, indian manufacturing, adaptability, flexibility, productivity.
Introduction and research gapA positive approach to organizations is of utmost importance in order to sustain in the present business environment which is highly diverse, complex, dynamic, competitive business environment, with high economic and socio-political volatility. Doing the right things, in the right manner leads to effectiveness and it shapes manager’s intelligence, and competency into outputs. Effectiveness makes a manager successful in achieving both individual as well as organisational goals. Hence. In order to facilitate growth of an organisation, it is important to develope managerial effectiveness. (Samson and Daft, 2009).
Managerial effectiveness is an extremely broad topic, and hence it’s literature is full of ample misunderstanding and vagueness: “What is Effectiveness?”, “Who is an effective manager?”, and “How to gauge and quantify effectiveness?” (Analoui, 1999; Bamel et al., 2011; Hamlin et al.2011). Margerison (1981) defined effective manager effectiveness as one who acts with accordance to the situation. Hersey and Blanchard (1995) proposed that effectiveness is an amalgation of personal attributes and dimensions of the manager’s job in satisfying requirements of organization. According to O’Driscol (1995), managerial effectiveness is meant by fulfilment of objectives with optimum utilisation of resources. A number of scholars have studied ME in terms of job roles and job behaviour (Rastogi, 2009; Hamlin & Patel, 2012) whereas, others correlate it with the skills and required competencies (Allen et al., 2006; Narayan & Rangnekar, 2011; Bamel & Rangnelar, 2015).
Effectiveness of employees predicts constructive Organizational results like low turnover intention, Organizational citizenship behaviour, Organizational commitment, job satisfaction (Analoui et al., 2009). According to Walton & Dawson, 2001, ME lies at the heart of majority of management and organizational
theories. Effectiveness of an individual is the product of many factors, i.e. personal attributes (Shao et al., 2006), competencies (Raelin and Cooledge,
1995), work set up and work culture (Miron et al., 2004), forces within and outside the organization (Page et al., 2003), structural and contextual variables of work (Reigle, 2001) and organizational psychological climate (Willcocks, 1998). In sum, organizational climate has been underlined as a major determinant of employee performance, job behaviours and firm effectiveness (Abdel-Razek, 2011) and is therefore worthy of deeper consideration in relation to specific national contexts. Hence Managerial effectiveness can be viewed as an essential research topic for many reasons.
Objective
The objective of this paper is to conduct an investigation into the interaction of three factors: gender (male and female), and level of manager (senior, middle, junior) and education level (graduate, post-graduate and PhD) in relation to the concept of managerial effectiveness in the Indian context.
Methodology
Method used to collect data was cross sectional research design. The data were collected by adopting the convenience sampling method through the training programs conducted for the engineering and management executives in the manufacturing public sector undertaking in India. Scale for measuring adaptive performance is adapted from Mott et al. (1972) using Likert scale ranging from 1 (strongly disagree) to 7 (strongly agree). This section of the study deals with the analysis of data using IBM SPSS (version 24.00). Linear regression and also Spearman’s correlation was used to test the data. Sample size is 134.
Findings
This study found out that only level of manager (senior, middle, junior) impacted managerial effectiveness.
121
The result also indicated partial positive relationship between the demographic characteristics and managerial effectiveness. It accounted for about 7% of factors that explained the managerial effectiveness of the employees. No relation with respect to gender and education level do not affect managerial effectiveness. This study attempts to understand the impact of socio demographic characteristics like age, gender etc of manufacturing sector employees.
Discussion
Respondents in our study have high managerial effectiveness as evident by their self- determined profile. By referring to responses in ME subscales, we believe it is potentially due to superior performance in dimension of productivity and adaptability. The results of the present study are consistent with the outcomes of many previous studies in that, to have high ME, an executive must have high adaptability (Bamel et al., 2015). In our study, age of the executives does not play an important role in individual difference. This is a new finding since previous studies showed positive correlation between age and adaptive performance.
Managerial implications.
Findings of the current study provides insights on interaction pattern of predictor variables in relation to psychological ownership in organizational context. The study attempted to gather the views of executives regarding adaptability, productivity and flexibility as constructs of managerial effectiveness. Comparative analysis of different categories of managers (based on gender, organizational position, and education level) provide an understanding of these issues in the Indian manufacturing
sector context. Through its empirical evidence the study offers suggestions for managerial action.
Scope for future work/ limitation
There are some limitations with the current study that future research might be able to overcome. First, all measures are self-report. Some judgments can be biased. Second, due to time and resource constraint, the sample size is 134, which might not offer an appropriate foundation for generalizing the result of this research.
References
• Allen, J.L., Rybczyk, E.J. & Judd, B. (2006). Communication style and the managerial effectiveness of male and female supervisors. Journal of Business and Economic Research, 4(8), 7-20.
• Analoui, F. (1999). Eight parameters of managerial effectiveness: a study of senior managers in Ghana, Journal of Management Development, 18(4), 362-389.
• Hamlin, R.G., Sawyer, J. & Sage, L. (2011). Perceived managerial and leadership effectiveness in a non-profit organization: an exploratory and cross-sector comparative study. Human Resource Development International, 14(2), 217-234.
• Margerison, C. (1981). Where’d you learn to be a manager? Supervisory Management, 26(2), 40-53.
• Raelin, J.A. & Cooledge, A.S. (1995). From generic to organic competencies. Human Resource Planning, 18(3), 24-33.
122
Role of Socio-Demographic Variables on Adaptive Performance
Aditi Bisht1 and S. Rangnekar2 1 Research Scholar, 2 Professor,
Department of Management Studies, IIT Roorkee, India
Keyword Adaptive performance, demographic characteristics, manufacturing sector.
Introduction and research gapWorking environment is changing due to the advancement of technology. Adaptive performance is an important construct measuring the dimensions of this variable. Technology has forced employees to enhance their skills and also adjust accordingly (Ilgen and Pulakos, 1999, (Pulakos, Dorsey, & White, 2006). Hesketh and Neal (1999) were the first to coin this term. They also widened the concept of performance, including adaptive performance as the third one after task performance and contextual performance. Various authors studying this concept have enhanced the study on adaptive behavior, but Pulakos et al. (2000, 2002) were the first to develop a full model of adaptive performance. It consists of eight dimensions. Pulakos et al. (2000) who tested critical incidents from various jobs which identifies with adaptive performance. Eight dimensions which we have used are: (1) Handling Emergencies or Crises; (2) Handling Work Stress; (3) Solving Problems Creatively; (4) Dealing with Uncertain and Unpredictable Work Situations; (5) Learning Work Tasks, Technologies and Procedures; (6) Demonstrating Interpersonal Adaptability; (7) Demonstrating Cultural Adaptability; and (8) Demonstrating Physical Adaptability (Pulakos et al., 2000). We used this as it provides fundamental knowledge to discuss various aspects of a job. Prior experience has been shown to be a significant factor of adaptive performance (e.g., Griffin & Hesketh, 2003; Pulakos et al., 2002; Şahin & Gürbüz, 2014). Age is another variable studied as a factor affecting adaptive performance. Goštautaitė and Bučiūnienė (2015) demonstrated that there is a linear negative relationship between age and adaptive performance. Other authors have shown insignificant results. This research gap indicates that more research needs to be done on the relationship between adaptive performance and age.
ObjectiveOur research is important to understand the nature and requirements of employees in workplace environment. We propose to empirically examine the role of
demographic variables on adaptive performance. Our demographic variables include age, gender, marital status and educational qualifications.
MethodologyMethod used to collect data was cross sectional research design. Convenience sampling was used in manufacturing companies of North India. It was collected during training programmes. Scale for measuring managerial were adapted from Ployhart & Bliese, 2006; Pulakos et al. 2000 using Likert scale ranging from 1 (strongly disagree) to 7 (strongly agree). This section of the study deals with the analysis of data using IBM SPSS (version 24.00). Linear regression and also Spearman’s correlation was used to test the data.
FindingsThis study found out that only age and years of service predicted adaptive performance of employees. The result also indicated partial positive relationship between the demographic characteristics and adaptive performance. It accounted for about 15% of factors that explained the adaptive performance of the participants. This study attempts to understand the impact of socio demographic characteristics like age, gender etc of manufacturing sector employees.
DiscussionAge of employee plays an important role in individual difference. This is a new finding since previous studies showed negative correlation between age and adaptive performance. But it does not show high correlation. More studies are required to examine it empirically. Respondents in our study have high adaptive performance as evident by their self-determined profile. By referring to responses in adaptive performances subscales, we believe it is potentially due to superior performance in dimension of interpersonal adaptability and cultural adaptability.
ImplicationsThis is an important study covering the manufacturing sector employees of North India studying the adaptability
123
of employees. It adds to the literature of adaptive performance about which dimension should be given more importance.It can also help employers in selection of employees who are more adaptable in changing environment.
Scope for future work/ limitationThere are some limitations with the current study that future research might be able to overcome. First, all measures are self-report. Some judgments can be biased. Second, due to time and resource constraint, the sample size is 165, which might not offer an appropriate foundation for generalizing the result of this research.
References1. Goštautaitė, B., & Bučiūnienė, I. (2015). The role of
work characteristics in enhancing older employees’ performance: Evidence from a post-Soviet country. The International Journal of Human Resource Management, 26 , 757-782
2. Griffin, Barbara & Hesketh, Beryl. (2003). Adaptable Behaviours for Successful Work and Career Adjustment. Australian Journal of Psychology, 55, 65-73.
3. Han, T. Y., & Williams, K. J. (2008). Multilevel investigation of adaptive performance: Individual- and team-level relationships. Group & Organization Management, 33 , 657- 684
4. Jundt, D. & Shoss, Mindy & Huang, Jason. (2014). Individual adaptive performance in organizations: A review. Journal of Organizational Behavior. 36.
5. Park, S., & Park, S. (2019). Employee Adaptive Performance and Its Antecedents: Review and Synthesis. Human Resource Development Review, 18(3), 294–324.
6. Pulakos, E. D., Arad, S., Donovan, M. A., &Plamondon, K. E. (2000). Adaptability in the work place: Development of a taxonomy of adaptive performance. Journal of Applied Psychology, 85, 612–624.
7. Ployhart, R. E., &Bliese, P. D. (2005). Individual adaptability (I-ADAPT) theory: Conceptualizing the antecedents, consequences, and measurement of individual differences in adaptability. Advances in Human Performance and Cognitive Engineering Research. Emerald, 6, 3 – 39
124
The Use of Social Media among Multi-Generational Tourists
Yanki Hartijasti1 and Namjae Cho2
1Faculty of Economics and Business Universitas Indonesia, Jakarta 10430, IndonesiaE-mail: [email protected]; [email protected]
2School of Business Hanyang University, Seoul, South KoreaE-mail: [email protected]
AbstractLiving in the digital world, social media has become a part of traveler’s life because it is a powerful means of searching and sharing information. Prior studies have limited studies on age characteristics as an influential element in using social media in a trip. The objective of this study is to examine traveler’s use of social media for travel purposes and specifically identify if there is a difference in searching and sharing travel information from social media among multigenerational travelers. Data analysis from 386 respondents revealed that all generations have a different way in searching and sharing travel information from social media.
KeywordsUse of Social Media, Searching and Sharing Travel Information, Multi-Generational Travelers.
IntroductionLiving in the digital world, social media has become a part of traveler’s life because it is a powerful means of searching and sharing travel information. Accordingly, tourists have shifted holiday search from traditional areas of travel agents to social media [38]. Facebook, Instagram, travel review websites (i.e., TripAdvisor, Lonely Planet), and YouTube are several examples of social media where people can use as reference for travel planning.
Considering that the Internet provides “nearly limitless amounts of information with relatively minimal cost” [23], prior studies reveal that “social media sites influence the decision-making process to buy goods or service through electronic word of mouth, especially on the opportunity to offer customized information” [41]. That is why social media sites have become “more credible, reliable, and timely sources of information than the advertising messages delivered by travel agent companies, as well as value advice on certain goods or services” [11; 13; 15].
Consequently, social media has become an influential tool for planning travel experience [13; 15]. Because of social media, “travelers have access to almost unlimited travel information created by other travelers, as well as sharing travel experiences with friends.”
Nevertheless, travelers have different behaviors regarding the use of social media for travel planning / purposes [10; 19; 25; 41]. Background of travelers, such as the level of technology savvy among different age group, is presumed
to be one of the many other factors. Younger generations (Gen Y and Z) have blended their daily lives and much more “connected" on social media compare to the older generations (Gen X and Baby Boomers) [14; 26].There is a limited study on the differences among travelers regarding their use of social media for travel purposes especially in relation to age group [21; 40]. Therefore, the objective of this paper is to examines traveler’s use of social media for travel purposes and specifically identify if there is a difference in searching and sharing travel information from social media among multigenerational travelers. Findings of this study will be useful to travel social media marketers in designing strategies based on the needs of each generation.
Literature ReviewThis section will talk about travelers’ use of social media and several empirical studies related to sharing travel experience on social media. Definition of social media is presented before understanding travelers’ use of social media.
Social Media
Social media is defined as “a broad term that describes software tools which help create user generated content that can be shared” [31]. Social media offers the “tools or means of communication that allows users both to create their own profiles and content, as well as invite other online contacts to get in touch” [27; 41), “post comments and other media files and join virtual groups that share common interest” [27].
125
Accordingly, social media is “the environment where social networking takes place and altered the way users can gather information and make a buying plan [41]. Social media comprises sites that are related to social networking, consumer reviews, content communities, forums, and wikis.
Nowadays, social media sites have become more reliable and relevant sources of information than the advertising messages delivered by companies [11]. This means that online consumers will look for products and services through social networking. Most users value interacting and communicating with others, which means they will also value advice (negative or positive) on certain goods and services [11].
Travelers’ Use of Social Media
Typically, travelers’ use of social media is divided in three phases: before, during and after the trip. Social media are largely used before traveling to search for ideas on where to go, accommodation options, excursions and other leisure activities [9; 13]. Before the trip, travelers want to reduce risk and hope to enjoy travel experience by reading and viewing user generated content (UGC) [15] but are not actively participating by creating content.
During the trip, social media is used in a much lower level than before the trip to search holiday related information [9; 13]. Travelers also start to share their travel experiences by producing comments and reviews, in addition to sharing videos and photos [33]. However, producing social media content is much lower than consuming [13].
After the trip, social media is a means to post information regarding their trip through comments, reviews, photos or pictures, as well as sharing holiday photos or videos [13; 28]. But during this phase, activities of sharing travel information is the lowest among the previous phases.
Research MethodsIn this section, questionnaire and measurement, data collection, and data analysis are presented.
Questionnaire and Measurement
Questionnaire regarding “Travelers’ Use of Social Media” was slightly modified from Amaro et al. [1]. An opening paragraph was included in the questionnaire to provide participants with an overview of the study’s purpose and to ensure the confidentiality of the answers. Respondents were given an e-mail contact in case they had any questions.
The questionnaire was divided into two main sections. The first section was questionnaires on “Travelers’ Use of Social Media.” Each item was measured using a 5-point Likert scale, where 1 is strongly disagree and 5 is strongly agree. Respondents were asked to recall their trips domestically or globally taken within the last few years to answer these questions. For the purpose of this study, the use of social media was defined as online platforms and tools that travelers use before, during, and after the trip.The second section consisted of demographic data, such as gender, age, citizenship, and questions about travel-related behaviors, namely favourite social media apps, trip purposes, trip companion, and country of destination.Data collection Using a quantitative methodology, the questionnaire was distributed online, using Google Forms, from January 2018 to June 2019. Online survey was used because it is easily disseminated and less costs [4]. Email invitations with a link to the questionnaire were sent to colleagues, students and other contacts.A total of 426 surveys were obtained. From 426, there were several nationalities, namely Indonesia: 177, Philippines: 60, Other ASEAN countries: 7, India: 55, Pakistan: 50, Sri Lanka: 22, Nepal: 15, and other nationalities outside Asia: 40. Considering the majority of respondents were Asian, 40 respondents from outside Asia were excluded.
Furthermore, generation was classified into four groups, namely Gen Z (born in 1995 to 2015): 4-25 years, Gen Y (born in 1980 to 1994): 26-40 years, Gen X (born in 1965 to 1979): 41-55 years, and Gen Baby Boomers (BB) (born in 1944 to 1964): 56-75 years.
Data analysis
Descriptive analysis was used to present each generation’s traveling profile of using social media. To answer the research objective, one-way analysis of variance (ANOVA) was utilized to determine whether there are any significant differences between multigenerational travellers in using social media, especially searching and sharing travel information.
Results Results section contains respondent profile and travelers’ use of social media.
Respondent profile
The 386 respondents were from countries in Asia. Therefore, it was grouped into country of origin from South East Asia (63%) and South Asia (37%). Table 1 shows country of origin by generations.
126
Table 1: Country of Origin by Generations
GEN South East Asia
%/ total
South Asia
%/ total n
Z 31 13% 42 30% 73Y 130 53% 75 53% 205X 68 28% 23 16% 91
BB 15 6% 2 1% 17Total 244 63% 142 37% 386
Gender splits are relatively even for male (53%) and female (47%). Respondents had the trips between the year of 2014 to 2019. Destination countries are ASEAN countries (37%) specifically Indonesia and Singapore, South Asia (18%) specifically India, East Asia (17%) specifically Japan, and Europe (9%).
Favorite social media apps used by all generations are Facebook and Instagram. Facebook is preferred more by Gen X and Baby Boomers, while Instagram by Gen Y and Z. Other social media used were WhatsApp and Twitter.
Trip purposes of all generations are for pleasure (54%), family trip (17%), work / conference (14%), and tour (6%). Gen Y and Z prefer traveling with friends or colleagues, while Gen X and BB with family.
Travelers’ use of social media
While traveling, respondents used social media before, during, and after the trip. Table 2 shows that all respondents have high level of using social media for arranging the trip before traveling; just like the previous studies [3], except Gen Baby Boomers (BB) who only have moderate level.
Table 2: Travelers’ Use of Social MediaGeneration (n) Total
(386)Gen Z
(73)Gen Y (205)
Gen X (91)
BB (17)
Before traveling 4.04 3.95 4.06 4.16 3.51While traveling
search info4.15 3.99 4.23 4.18 3.63
While traveling share experience
3.68 4.01 3.74 3.43 2.91
After traveling 3.11 3.42 3.18 2.86 2.28
Before traveling, Gen X, Y, and BB searched information to plan the trip differently. They would obtain travel information to make the right decision by looking for the destinations’ pictures or searching on social media websites. They would also like to read travel and hotel reviews to benefit from other travelers’ experiences, aside from revealing unusual personal experiences as well. However, Gen BB is different because they were not as tech-savvy as the younger generations, that is why they only search travel information in a moderate level. Gen BB prefer to travel with family and usually Gen BB has
Gen Y children. So, they might want to discuss with their family before deciding the best travel plan for the whole family.
During traveling, Gen X, Y and BB still searched for tour or food information but in a different way. For example, although Asian like to eat, however, they had different preferences especially if going with family. In sharing travel experiences and uploading photos in their social media, Gen X and BB would post photos in Facebook in a moderate level, while Gen Y and Z in Instagram in a high level. Several reasons why they like sharing travel experiences and uploading photos are to let their friends know good destinations, enjoy the trip, gain social status, indirectly telling their contact their whereabout.
After traveling, all generations have medium level of using social media in sharing travel experiences, except Gen BB who only has low level. All generations had different way of posting the remaining photos in their social media. For example, Gen X and BB would post photos in their social media (Facebook) for personal documents and let their friends know their travel experiences that may be useful in the future. Many times, Gen X and BB only wrote “Late Post” or the locations in the caption, while Gen Y and Z would write in more details about their travel activities or places they have visited. Gen Z might also show their experiences not only by pictures but also videos.
After traveling, sharing information that may be useful to friends by providing quality travel information and suggestions based upon their experience. They also like to post likes and dislikes about tourist destinations to prevent people going to bad places by writing review on travel websites. Furthermore, they post pictures or videos on social media websites for personal documents.
Table 3: Travelers’ Use of Social Media by Generations
Total mean
(I) Gen(mean)
(J) Gen(mean) (I-J) Sig.
Before Travelingsearch info
3.95 BB (3.51)Y (4.06)
X (4.16)
-0.55
-0.65
.044
.017While
Travelinga. Search
information 3.99Y (4.23)
BB (3.63) 0.60 .023
b. Share experience 4.01
Z (4.01) X (3.43)
BB (2.91)
0.58
1.10
.001
.000After
Traveling share info
3.14Z (3.42) X (2.86)
BB (2.28)
0.56
1.13
.004
.000
127
Using one-way analysis of variance, Table 3 showed there is a significant difference between travelers’ use of social media before, during, and after traveling among the four generations. Gen BB had moderate level of using social media before and during traveling and low level after traveling.
It means that in searching information for travel plan before and during the trip, Baby Boomers have different way with the other generations. In sharing information and experiences, Gen Baby Boomers is similar to Gen X but different with Gen Y and Z.
DiscussionResults show that all generations are using social media more for searching travel information than sharing it. However, only Gen X, Y, and Z are fully engaged in using social media to search travel information. Gen BB has moderate engagement.
In this study, three-fourths of Baby Boomers respondents have an annual income more than USD10,000 which means most of them are in the management level position. Being the least tech-savvy of all generations and have younger generation subordinates in the workplace or Gen Y children, hence, they are more likely to their staff or children to search travel information for them. They might also prefer to get information from face-to-face discussion.
Based on “Online Travel Review Study,” around three-quarter of travelers search others’ online reviews in TripAdvisor, Lonely Planet, Google, local destination websites, etc. [34]. To feel confident, they would accurately “read multiple recent travel reviews across several pages to get an overall sense of people’s opinions” especially before booking a hotel or a restaurant [34].
The reason for searching information is because people trust peer travelers rather than travel service providers. Traveler reviews can “keep up to date with the tourist sites” [28] and “give the possibility to exchange information about tourist sites with travel communities” [7; 28]. Younger travelers are even willing to use live chat while planning their trip [34].
From TripAdvisor Study, it was found that there is a significant difference with respect to Internet use skills of the frequent travel review readers. The frequent travel review readers tend to be younger, have somewhat higher incomes, and have high Internet use and online search skills [34]. This report can be used to explain why this
study found Gen Baby Boomers has significant difference with all the generations in searching and sharing travel information. Gen BB usually has the least tech-savvy among the other generations.
Furthermore, in the last few years many travel review websites have made information search more personalized, active and interactive, which contributes to its hedonic value [18]. That is why a significant number of studies have shown that individuals use travel related social media not only for searching information purposes but also because they consider its use enjoyable [3; 8; 22; 36; 39].
Those studies revealed that reading travel reviews “added fun to the trip planning process, made travel planning more enjoyable, and made travelers feel more excited about traveling” [15; 16; 28] because of its reliability and relevant information. Moreover, other study found that “tourists may be more confident in selecting a destination or tourism experience when positive and negative online consumer reviews (OCRs) are available” [29].Furthermore, it is commonly found that sharing travel information or experience is less than searching. Only “a quarter of travelers actively posted travel review online” [34; 39] “to share good experiences with fellow travelers as a true guide during the planning process" aside from sharing their grievances [34].TripAdvisor Report found that “travel review writers are very skilled at using Internet and searching online.” Additionally, they travel for pleasure, that is why they are willing to write travel reviews to help other peer travelers to have unforgettable trip [34].Results of this study show that all generations are using social media in a high level before the trip, a bit lower during the trip, and moderate level after the trip. Earlier studies have shown an interesting debate regarding the use of social media before, during, and after traveling. For example, with respondents from Australia social media is predominantly used before the trip [9], whereas others claim it is higher after the trip with travelers residing in Former Soviet Union Republics [13].This difference may be due to cultural differences, because collectivist societies are more likely to post reviews “to help other travelers” [5], which is reflected in tourists’ social support by sharing their travel experiences online [30]. Moreover, group values and the opinions of others are considered to be more important in collectivist countries, in addition to fostering interpersonal exchanges [17].
128
All of the respondents in this study are from Asia which have collectivist culture. The detailed result of this study shows that all generations are searching travel information before and during the trip. Although they were traveling with friends or family, they didn’t want to take risk having bad travel experiences; hence, they searched tips from other travelers or read from travel review websites thoroughly. They might ask the itinerary of their friends who have visited the places. If their friends were satisfied with the trip, they would like to follow the same routes. Traveling is a bit costly so they need to plan ahead to minimize disappointment.
They are more enthusiastic sharing travel experiences during the trip rather than after the trip. They want to share their joy in their social media (Facebook and Instagram) and are willing to share their experiences if anybody asks for it. However, they are using social media more for searching travel information rather than sharing travel reviews and experiences to reduce the risk.
Conclusion
This research demonstrates all generations preferred to search travel information before and during the trip to reduce risk of having bad travel experiences. However, after the trip they are not as enthusiastic as before and during the trip to share information for others to learn from their experiences. Additionally, multigenerational travelers have different ways of using social media depending on their level of tech savvy. Consequently, Gen BB travelers have a significant difference with all the younger generations in each phase of using social media.
With all Asian respondents, this study demonstrates a similar finding that searching travel information is the highest before the trip, lower a bit during the trip, and the lowest after the trip [e.g. 6; 12]. It seems difficult to motivate travelers to write travel reviews especially Gen Baby Boomers. These results provide useful insights to travel online marketers and social media websites providers. Accordingly, they need to make it easy for travelers, especially for Gen Baby Boomers, to write reviews because all generations read other travelers’ reviews frequently.
Limitations and future research
Using a convenience sample is common in the tourism literature [e.g. 20; 32; 35; 37]. However, the respondents in this study do not represent each country’s population as they were collected from online survey. Therefore, the results of this study cannot be generalized.
Future studies should be carried out with larger number of samples from other Asian countries to see if the results hold across Asia. To get balance number of respondents from all generations, future research should also send email or distribute hardcopy questionnaire directly to Gen Baby Boomers.
References[1] Amaro, S., Duarte, P., & Henriques, C. (2016).
Travelers’ use of social media: A clustering approach. Annals of Tourism Research, 59, 1-15.
[2] Amaro, S. & Duarte, P. (2017). Social media use for travel purposes: A cross cultural comparison between Portugal and the UK. Information Technology and Tourism, 17(2), 161-181.
[3] Ayeh, J. K., Au, N., & Law, R. (2013). Predicting the intention to use consumer-generated media for travel planning. Tourism Management, 35(April), 132–143.
[4] Baltar, F., & Brunet, I. (2012). Social research 2.0: Virtual snowball sampling method using Facebook. Internet Research, 22(1), 57-74.
[5] Cassidy, L., & Pabel, A. (2019). Travel review website usage: a cultural perspective. Journal of Hospitality and Tourism Technology, 10(3), 311-322.
[6] Chiu, C., Lin, D., & Silverman, A. (2012). China’s social-media boom. McKinsey and Company.
[7] Chung, J. Y., & Buhalis, D. (2008a). Information needs in online social networks. Information Technology & Tourism, 10, 267–281.
[8] Chung, J. Y., & Buhalis, D. (2008b). Web 2.0: A study of online travel community. In P. O’Connor, W. Hopken, & U. Gretzel (Eds.), Information and communication technologies in tourism 2008 (pp. 70–81). Vienna, Austria: Springer.
[9] Cox, C., Burgess, S., Sellitto, C., & Buultjens, J. (2009). The role of user-generated content in tourists’ travel planning behavior. Journal of Hospitality Marketing & Management, 18(8), 743–764.
[10] DiMaggio, P., Hargittai, E., Celeste, C., & Shafer, S. (2004). Digital inequality: From unequal access to differentiated use. In K. Neckerman (Ed.), Social inequality (pp. 355–400). New York, NY: Russell Sage Foundation.
[11] Evans, J., & Foxall, G. (2009). Consumer behavior (2nd edition). Chichester, England: John Wiley Press.

129
[12] Foster, M., West, B., & Francescucci, A. (2011). Exploring social media user segmentation and online brand profiles. Journal of Brand Management, 19(1), 4–17.
[13] Fotis, J., Buhalis, D., & Rossides, N. (2012). Social media use and impact during the holiday travel planning process. In M. Fuchs, F. Ricci, & L. Cantoni (Eds.), Information and communication technologies in tourism (pp. 13–24). Vienna, Austria: Springer Verlag.
[14] Fox, S. (2004). Older Americans and the Internet. Pew Internet and American Life Project. Retrieved from http://www.pewinternet.org/PPF/r/117/report_display.asp
[15] Gretzel, U., & Yoo, K. H. (2008). Use and impact of online travel reviews. In P. O’Connor, W. Hopken, & U. Gretzel (Eds.), Information and communication technologies in tourism (pp. 35–46). Vienna, Austria: Springer.
[16] Gretzel, U., Yoo, K. H., & Purifoy, M. (2007). Online travel review study: Role & impact of online travel reviews. Laboratory for Intelligent Systems in Tourism.
[17] Gretzel, U., Kang, M., & Lee, W. (2008). Differences in consumer-generated media adoption and use: A cross-national perspective. Journal of Hospitality Marketing & Management, 17(1), 99–120.
[18] Gretzel, U. (2012). Introduction to the section on web 2.0 and travellers’ behaviour. In M. Sigala, E. Christou, & U. Gretzel (Eds.), Social media in travel, tourism and hospitality: Theory, practice and cases (pp. 167–169). Surrey: Ashgate.
[19] Hargittai, E. (2007). A framework for studying differences in people’s digital media uses. In N. Kutschner & H.U. Otto (Eds.), Cyberworld unlimited? (pp. 121–137). Wiesbaden, Germany: VS Verlag für Sozialwissenschaften/GWVFachverlage GmbH
[20] Hong, J.-C., Hwang, M.-Y., Szeto, E., Tsai, C.-R., Kuo, Y.-C., & Hsu, W.-Y. (2016). Internet cognitive failure relevant to self-efficacy, learning interest, and satisfaction with social media learning. Computers in Human Behavior, 55, 214–222. http://dx.doi.org/10.1016/j.chb.2015.09.010.
[21] Ip, C., Lee, H. A., & Law, R. (2012). Profiling the users of travel websites for planning and online
experience sharing. Journal of Hospitality & Tourism Research, 36(3), 418–426.
[22] Kang, M., & Schuett, M.A. (2013). Determinants of sharing travel experiences in social media. Journal of Travel & Tourism Marketing, 30(1-2), 93-107.
[23] Kim, D.-Y., Lehto, X. Y., & Morrison, A. M. (2007). Gender differences in online travel information search: Implications for marketing communications on the internet. Tourism Management, 28(2), 423–433.
[24] Kim, L. H., Qu, H., & Kim, D. J. (2009). A study of perceived risk and risk reduction of purchasing air-tickets online. Journal of Travel & Tourism Marketing, 26(3), 203–224.
[25] Livingstone, S., & Helsper, E. (2007). Gradations in digital inclusion: Children, young people, and the digital divide. New Media and Society, 9, 671–696.
[26] Madden, M. (2006). Internet penetration and impact. Pew Internet and American Life Project. Retrieved from http://www.pewinternet.org/PPF/r/182/report_display.asp
[27] Paquette, H. (2013). Social media as a marketing tool: A literature review. University of Rhode Island, p. 1-27.
[28] Parra-López, E., Gutiérrez-Taño, D., Díaz-Armas, R. J., & Bulchand-Gidumal, J. (2012). Travellers 2.0: Motivation, opportunity and ability to use social media. In M. Sigala, E. Christou, & U. Gretzel (Eds.), Social media in travel, tourism and hospitality: Theory, practice and cases (pp. 171–187). Surrey, UK: Ashgate.
[29] Sahin, I., Gulmez, M., & Kitapci, O. (2017). E-complaint tracking and online problem-solving strategies in hospitality management: plumbing the depths of reviews and responses on TripAdvisor. Journal of Hospitality and Tourism Technology, 8(3), 372-394.
[30] Sarkar, S. K., Au, N., & Law, R. (2013). Analysing ecotourists’ satisfaction in socialisation and knowledge sharing intentions via social media. In Xiang Z. and Tussyadiah I. (Eds), Information and Communication Technologies in Tourism 2014, Springer, Cham, Germany, pp. 313-326.
[31] Sinclaire, J., K., Vogus, C., E. (2011). Adoption of social networking sites: an exploratory adaptive structuration perspective for global organizations.
130
Information Technology Management, 293-314.
[32] Sung, Y., Su, C., & Chang, W. (2016). The quality and value of Hualien’s Amis Harvest Festival. Annals of Tourism Research, 56, 128–131.
[33] Text100 (2013). Digital index: Travel & tourism. Retrieved November 21st, 2014, from http://info.text100.com/travel-tourismdigital-index-2012/info.text100.com/travel-tourism-digital-index-2012.html
[34] Tripadvisor (2019, July 16). Online reviews remain a trusted source of information when booking trips: Reveals new research. Retrieved January 2, 2020, from https://tripadvisor.mediaroom.com/2019-07-16-Online-Reviews-Remain-a-Trusted-Source-of-Information-When-Booking-Trips-Reveals-New-Research
[35] Tsiotsou, R. H. (2015). The role of social and parasocial relationships on social networking sites loyalty. Computers in Human Behavior, 48, 401–414.
[36] Wang, Y., & Fesenmaier, D. R. (2004). Modeling participation in an online travel community. Journal of Travel Research, 42(3), 261–270.
[37] Wolff, K., & Larsen, S. (2014). Can terrorism make us feel safer? Risk perceptions and worries before and after the July 22nd attacks. Annals of Tourism Research, 44, 200–209.
[38] Yasin, B., Baghirov, F., & Zhang, Y. (2017). The role of travel experience and gender on travel information source selection. Journal of Hospitality and Tourism Technology,8(2), 296-310.
[39] Yoo, K.-H., & Gretzel, U. (2011). Influence of personality on travel-related consumer-generated media creation. Computers in Human Behavior, 27(2), 609–621.
[40] Yoo, K.-H., & Gretzel, U. (2012). Use and creation of social media by travellers. In M. Sigala, E. Christou, & U. Gretzel (Eds.), Social media in travel, tourism and hospitality: Theory, practice and cases (pp. 189–205). Surrey, UK: Ashgate.
[41] Zeng, B., & Gerritsen, R. (2014). What do we know about social media in tourism? A review. Tourism Management Perspectives, 10, 27–36.
131
A Study of Destination Brand Personality of the World Heritage Site of Ellora Caves
Nagarjun RagdeSymbiosis School of Economics
Symbiosis International University, Pune 1033, IndiaTel: +91-9657931095, E-mail: [email protected]
AbstractGlobally Tourism is the fastest growing industry for which competitive destinations are trying their best to promote their tourism products by developing appropriate brand strategies for marketing their products. Identification of Brand Personality is one of the strategies where Destination Marketing Organizations (DMOs) are focusing upon. This study aims to explore the brand personality traits of the first world heritage site of India i.e. Ellora caves situated in Aurangabad District of Maharashtra State. Primary data was collected using interview schedule and questionnaires from 23 tourism stakeholders of Aurangabad region and 90 domestic tourists at Ellora respectively. For this research Exploratory Factor Analysis (EFA) is done and Cronbach’s Alpha was used for testing the reliability. The implications of this paper are dual which are related to academic contribution and policy making for the stakeholders relating to branding of Ellora.KeywordsBrand Personality, Ellora, Exploratory Factor Analysis (EFA), Destination marketing organizations.
IntroductionIn the past few decades, tourism has experienced continued growth and has become one of the fastest growing economic sectors in the world. Economic analysis report of World Travel and Tourism Council (2018) identified tourism as one of the world‟s largest economic sector supporting 01 in 10 jobs (319 million) worldwide and generating 10.4% (US $8.8 trillion) of world GDP. Travel Industry has lead to a range of Niche goods and services having larger demand who are gaining importance not only socially but also economically (Sofronov, 2018).
For this, marketing has become an integral part of any competitive country or destination to increase the number of tourist flow. Hence, all the competitors are adopting new marketing strategies.
The DMO‟s do an intensive research and come up with the programs which could satisfying the tourists needs and wants as well as their marketing visions, goals and objectives to position the destination in the market with a unique brand. For this the study of brand personality is gaining due importance which elaborates the tourism attributes of the destinations through the consumers perceptions.
Tourism in India and Maharashtra-
India, being the largest country in the south Asian sub-region is well-known cultural tourism destination in the world and attracts major tourist traffic of the region (UNWTO, 2016). India received 10.04 million international tourists (Growth Rate of 14%) in the year 2017 and earned foreign exchange of USD 27.31 billion (Ministry of Tourism [MOT], 2018.Similarly Maharashtra which is a leading tourism state in India also receives more tourists in comparison to other states. According to (MOT, 2018) It welcomes nearly 120000000 domestic tourists and 5100000 with an share of 7% and 18% respectively in 2017. The reason for it is the unlimited tourism products such as world heritage sites like Ajanta and Ellora caves, CST (Chattrapati Shivaji Terminus), Western Ghats and Mumbai‟s Victorian Gothic and art deco ensembles. It has huge coastline to cater beach tourists, Wildlife Sanctuaries, Bird Sanctuaries, Hill Stations ,Lakes, forts and many religious sites,
The sample chosen by the researcher is Ellora which is an important tourism destination having world heritage status near Aurangabad. Considering miniscule literature on branding and specifically brand personality of Maharashtra and Ellora this research aims to study
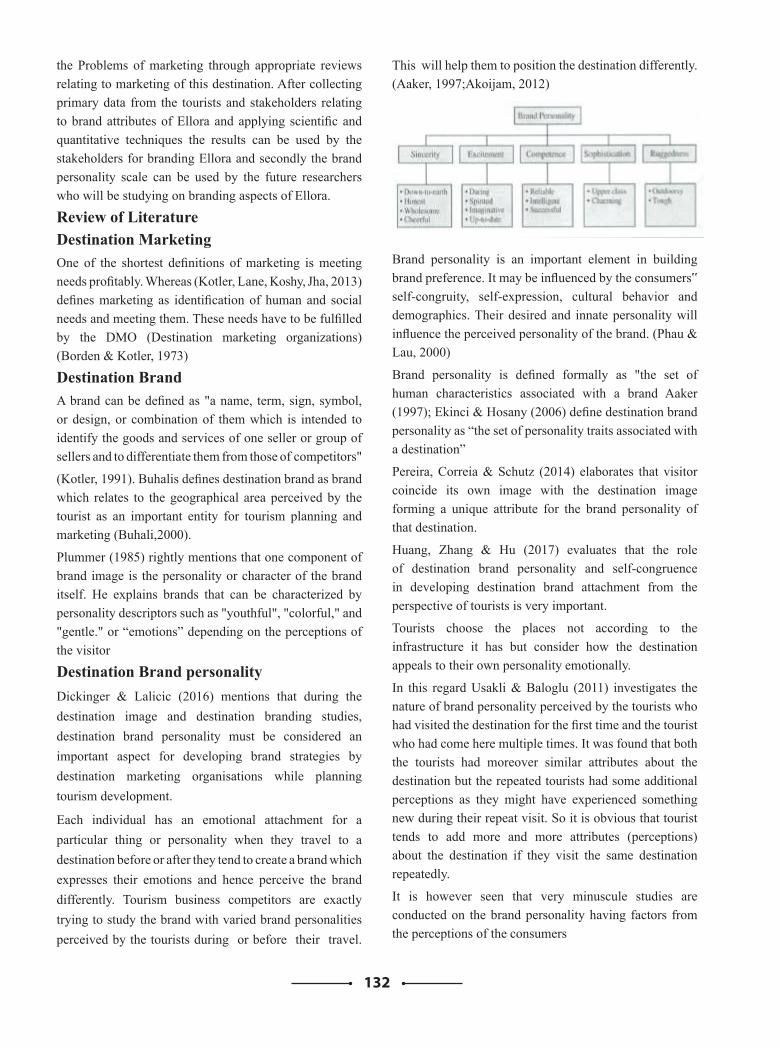
132
the Problems of marketing through appropriate reviews relating to marketing of this destination. After collecting primary data from the tourists and stakeholders relating to brand attributes of Ellora and applying scientific and quantitative techniques the results can be used by the stakeholders for branding Ellora and secondly the brand personality scale can be used by the future researchers who will be studying on branding aspects of Ellora.
Review of LiteratureDestination MarketingOne of the shortest definitions of marketing is meeting needs profitably. Whereas (Kotler, Lane, Koshy, Jha, 2013) defines marketing as identification of human and social needs and meeting them. These needs have to be fulfilled by the DMO (Destination marketing organizations) (Borden & Kotler, 1973)
Destination BrandA brand can be defined as "a name, term, sign, symbol, or design, or combination of them which is intended to identify the goods and services of one seller or group of sellers and to differentiate them from those of competitors"
(Kotler, 1991). Buhalis defines destination brand as brand which relates to the geographical area perceived by the tourist as an important entity for tourism planning and marketing (Buhali,2000).
Plummer (1985) rightly mentions that one component of brand image is the personality or character of the brand itself. He explains brands that can be characterized by personality descriptors such as "youthful", "colorful," and "gentle." or “emotions” depending on the perceptions of the visitor
Destination Brand personalityDickinger & Lalicic (2016) mentions that during the destination image and destination branding studies, destination brand personality must be considered an important aspect for developing brand strategies by destination marketing organisations while planning tourism development.
Each individual has an emotional attachment for a particular thing or personality when they travel to a destination before or after they tend to create a brand which expresses their emotions and hence perceive the brand differently. Tourism business competitors are exactly trying to study the brand with varied brand personalities perceived by the tourists during or before their travel.
This will help them to position the destination differently. (Aaker, 1997;Akoijam, 2012)
Table: 1 The Dimensions of Brand Personality by Jennifer Aaker (Aaker, 1997)
Brand personality is an important element in building brand preference. It may be influenced by the consumers‟ self-congruity, self-expression, cultural behavior and demographics. Their desired and innate personality will influence the perceived personality of the brand. (Phau & Lau, 2000)
Brand personality is defined formally as "the set of human characteristics associated with a brand Aaker (1997); Ekinci & Hosany (2006) define destination brand personality as “the set of personality traits associated with a destination”
Pereira, Correia & Schutz (2014) elaborates that visitor coincide its own image with the destination image forming a unique attribute for the brand personality of that destination.
Huang, Zhang & Hu (2017) evaluates that the role of destination brand personality and self-congruence in developing destination brand attachment from the perspective of tourists is very important.
Tourists choose the places not according to the infrastructure it has but consider how the destination appeals to their own personality emotionally.
In this regard Usakli & Baloglu (2011) investigates the nature of brand personality perceived by the tourists who had visited the destination for the first time and the tourist who had come here multiple times. It was found that both the tourists had moreover similar attributes about the destination but the repeated tourists had some additional perceptions as they might have experienced something new during their repeat visit. So it is obvious that tourist tends to add more and more attributes (perceptions) about the destination if they visit the same destination repeatedly.
It is however seen that very minuscule studies are conducted on the brand personality having factors from the perceptions of the consumers
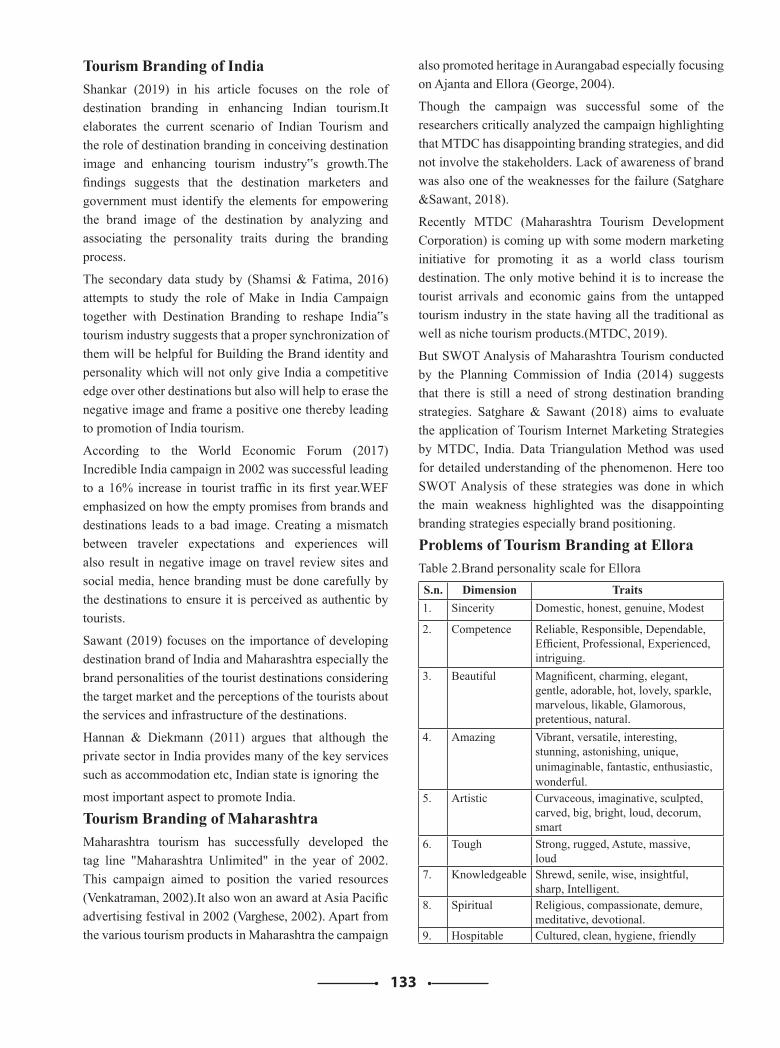
133
Tourism Branding of IndiaShankar (2019) in his article focuses on the role of destination branding in enhancing Indian tourism.It elaborates the current scenario of Indian Tourism and the role of destination branding in conceiving destination image and enhancing tourism industry‟s growth.The findings suggests that the destination marketers and government must identify the elements for empowering the brand image of the destination by analyzing and associating the personality traits during the branding process.
The secondary data study by (Shamsi & Fatima, 2016) attempts to study the role of Make in India Campaign together with Destination Branding to reshape India‟s tourism industry suggests that a proper synchronization of them will be helpful for Building the Brand identity and personality which will not only give India a competitive edge over other destinations but also will help to erase the negative image and frame a positive one thereby leading to promotion of India tourism.
According to the World Economic Forum (2017) Incredible India campaign in 2002 was successful leading to a 16% increase in tourist traffic in its first year.WEF emphasized on how the empty promises from brands and destinations leads to a bad image. Creating a mismatch between traveler expectations and experiences will also result in negative image on travel review sites and social media, hence branding must be done carefully by the destinations to ensure it is perceived as authentic by tourists.
Sawant (2019) focuses on the importance of developing destination brand of India and Maharashtra especially the brand personalities of the tourist destinations considering the target market and the perceptions of the tourists about the services and infrastructure of the destinations.
Hannan & Diekmann (2011) argues that although the private sector in India provides many of the key services such as accommodation etc, Indian state is ignoring the
most important aspect to promote India.
Tourism Branding of MaharashtraMaharashtra tourism has successfully developed the tag line "Maharashtra Unlimited" in the year of 2002. This campaign aimed to position the varied resources (Venkatraman, 2002).It also won an award at Asia Pacific advertising festival in 2002 (Varghese, 2002). Apart from the various tourism products in Maharashtra the campaign
also promoted heritage in Aurangabad especially focusing on Ajanta and Ellora (George, 2004).
Though the campaign was successful some of the researchers critically analyzed the campaign highlighting that MTDC has disappointing branding strategies, and did not involve the stakeholders. Lack of awareness of brand was also one of the weaknesses for the failure (Satghare &Sawant, 2018).
Recently MTDC (Maharashtra Tourism Development Corporation) is coming up with some modern marketing initiative for promoting it as a world class tourism destination. The only motive behind it is to increase the tourist arrivals and economic gains from the untapped tourism industry in the state having all the traditional as well as niche tourism products.(MTDC, 2019).
But SWOT Analysis of Maharashtra Tourism conducted by the Planning Commission of India (2014) suggests that there is still a need of strong destination branding strategies. Satghare & Sawant (2018) aims to evaluate the application of Tourism Internet Marketing Strategies by MTDC, India. Data Triangulation Method was used for detailed understanding of the phenomenon. Here too SWOT Analysis of these strategies was done in which the main weakness highlighted was the disappointing branding strategies especially brand positioning.
Problems of Tourism Branding at ElloraTable 2.Brand personality scale for ElloraS.n. Dimension Traits1. Sincerity Domestic, honest, genuine, Modest
2. Competence Reliable, Responsible, Dependable, Efficient, Professional, Experienced,intriguing.
3. Beautiful Magnificent, charming, elegant, gentle, adorable, hot, lovely, sparkle, marvelous, likable, Glamorous, pretentious, natural.
4. Amazing Vibrant, versatile, interesting, stunning, astonishing, unique,unimaginable, fantastic, enthusiastic, wonderful.
5. Artistic Curvaceous, imaginative, sculpted, carved, big, bright, loud, decorum, smart
6. Tough Strong, rugged, Astute, massive,loud
7. Knowledgeable Shrewd, senile, wise, insightful, sharp, Intelligent.
8. Spiritual Religious, compassionate, demure, meditative, devotional.
9. Hospitable Cultured, clean, hygiene, friendly
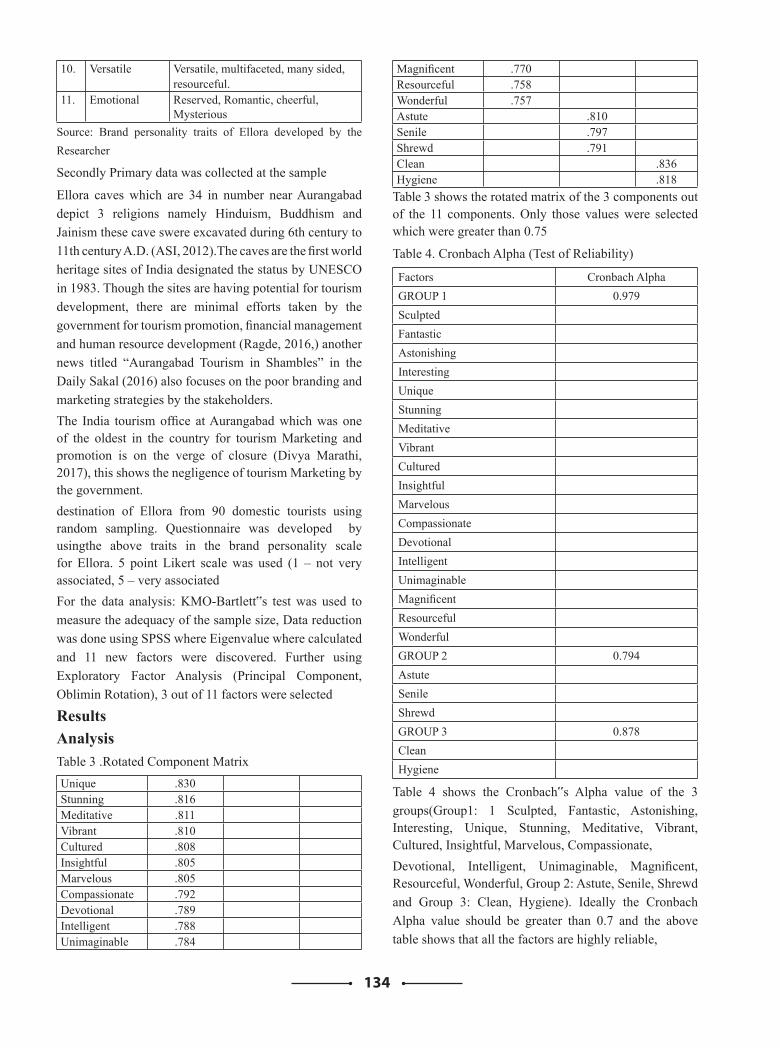
134
10. Versatile Versatile, multifaceted, many sided, resourceful.
11. Emotional Reserved, Romantic, cheerful, Mysterious
Source: Brand personality traits of Ellora developed by the Researcher
Secondly Primary data was collected at the sample
Ellora caves which are 34 in number near Aurangabad depict 3 religions namely Hinduism, Buddhism and Jainism these cave swere excavated during 6th century to 11th century A.D. (ASI, 2012).The caves are the first world heritage sites of India designated the status by UNESCO in 1983. Though the sites are having potential for tourism development, there are minimal efforts taken by the government for tourism promotion, financial management and human resource development (Ragde, 2016,) another news titled “Aurangabad Tourism in Shambles” in the Daily Sakal (2016) also focuses on the poor branding and marketing strategies by the stakeholders.The India tourism office at Aurangabad which was one of the oldest in the country for tourism Marketing and promotion is on the verge of closure (Divya Marathi, 2017), this shows the negligence of tourism Marketing by the government.destination of Ellora from 90 domestic tourists using random sampling. Questionnaire was developed by usingthe above traits in the brand personality scale for Ellora. 5 point Likert scale was used (1 – not very associated, 5 – very associatedFor the data analysis: KMO-Bartlett‟s test was used to measure the adequacy of the sample size, Data reduction was done using SPSS where Eigenvalue where calculated and 11 new factors were discovered. Further using Exploratory Factor Analysis (Principal Component, Oblimin Rotation), 3 out of 11 factors were selected
ResultsAnalysisTable 3 .Rotated Component MatrixUnique .830Stunning .816Meditative .811Vibrant .810Cultured .808Insightful .805Marvelous .805Compassionate .792Devotional .789Intelligent .788Unimaginable .784
Magnificent .770Resourceful .758Wonderful .757Astute .810Senile .797Shrewd .791Clean .836Hygiene .818
Table 3 shows the rotated matrix of the 3 components out of the 11 components. Only those values were selected which were greater than 0.75
Table 4. Cronbach Alpha (Test of Reliability)
Factors Cronbach AlphaGROUP 1 0.979SculptedFantasticAstonishingInterestingUniqueStunningMeditativeVibrantCulturedInsightfulMarvelousCompassionateDevotionalIntelligentUnimaginableMagnificentResourcefulWonderfulGROUP 2 0.794AstuteSenileShrewdGROUP 3 0.878CleanHygiene
Table 4 shows the Cronbach‟s Alpha value of the 3 groups(Group1: 1 Sculpted, Fantastic, Astonishing, Interesting, Unique, Stunning, Meditative, Vibrant, Cultured, Insightful, Marvelous, Compassionate,Devotional, Intelligent, Unimaginable, Magnificent, Resourceful, Wonderful, Group 2: Astute, Senile, Shrewd and Group 3: Clean, Hygiene). Ideally the Cronbach Alpha value should be greater than 0.7 and the above table shows that all the factors are highly reliable,
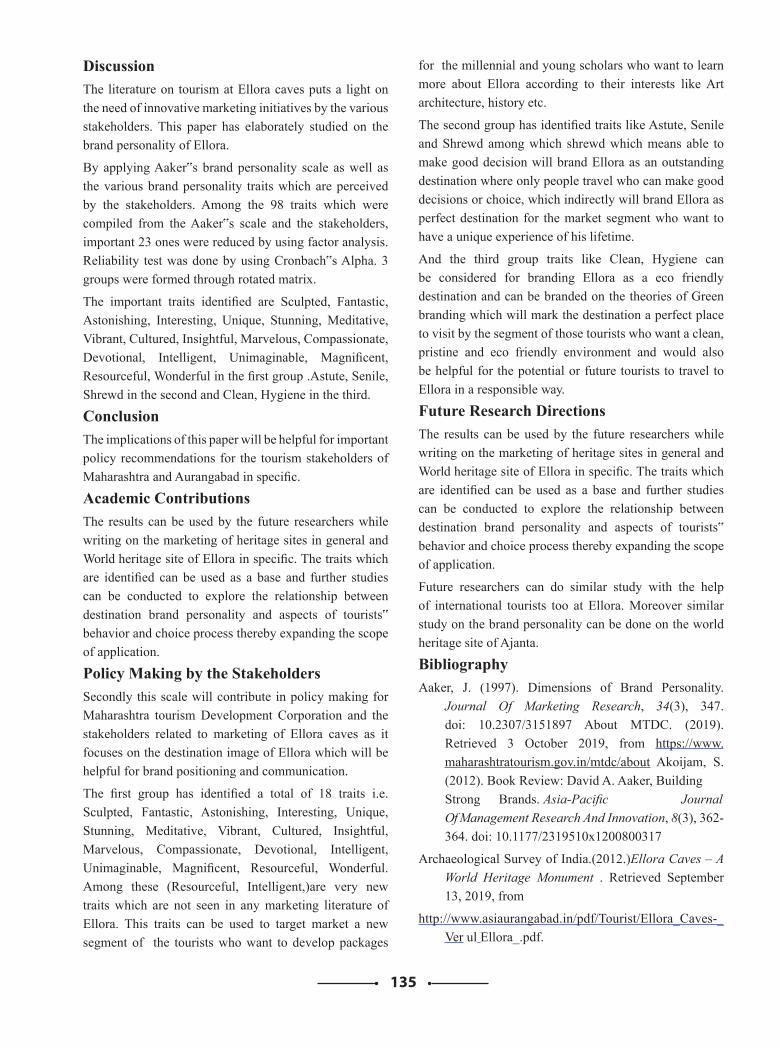
135
DiscussionThe literature on tourism at Ellora caves puts a light on the need of innovative marketing initiatives by the various stakeholders. This paper has elaborately studied on the brand personality of Ellora.
By applying Aaker‟s brand personality scale as well as the various brand personality traits which are perceived by the stakeholders. Among the 98 traits which were compiled from the Aaker‟s scale and the stakeholders, important 23 ones were reduced by using factor analysis. Reliability test was done by using Cronbach‟s Alpha. 3 groups were formed through rotated matrix.
The important traits identified are Sculpted, Fantastic, Astonishing, Interesting, Unique, Stunning, Meditative, Vibrant, Cultured, Insightful, Marvelous, Compassionate, Devotional, Intelligent, Unimaginable, Magnificent, Resourceful, Wonderful in the first group .Astute, Senile, Shrewd in the second and Clean, Hygiene in the third.
ConclusionThe implications of this paper will be helpful for important policy recommendations for the tourism stakeholders of Maharashtra and Aurangabad in specific.
Academic ContributionsThe results can be used by the future researchers while writing on the marketing of heritage sites in general and World heritage site of Ellora in specific. The traits which are identified can be used as a base and further studies can be conducted to explore the relationship between destination brand personality and aspects of tourists‟ behavior and choice process thereby expanding the scope of application.
Policy Making by the StakeholdersSecondly this scale will contribute in policy making for Maharashtra tourism Development Corporation and the stakeholders related to marketing of Ellora caves as it focuses on the destination image of Ellora which will be helpful for brand positioning and communication.
The first group has identified a total of 18 traits i.e. Sculpted, Fantastic, Astonishing, Interesting, Unique, Stunning, Meditative, Vibrant, Cultured, Insightful, Marvelous, Compassionate, Devotional, Intelligent, Unimaginable, Magnificent, Resourceful, Wonderful. Among these (Resourceful, Intelligent,)are very new traits which are not seen in any marketing literature of Ellora. This traits can be used to target market a new segment of the tourists who want to develop packages
for the millennial and young scholars who want to learn more about Ellora according to their interests like Art architecture, history etc.
The second group has identified traits like Astute, Senile and Shrewd among which shrewd which means able to make good decision will brand Ellora as an outstanding destination where only people travel who can make good decisions or choice, which indirectly will brand Ellora as perfect destination for the market segment who want to have a unique experience of his lifetime.
And the third group traits like Clean, Hygiene can be considered for branding Ellora as a eco friendly destination and can be branded on the theories of Green branding which will mark the destination a perfect place to visit by the segment of those tourists who want a clean, pristine and eco friendly environment and would also be helpful for the potential or future tourists to travel to Ellora in a responsible way.
Future Research DirectionsThe results can be used by the future researchers while writing on the marketing of heritage sites in general and World heritage site of Ellora in specific. The traits which are identified can be used as a base and further studies can be conducted to explore the relationship between destination brand personality and aspects of tourists‟ behavior and choice process thereby expanding the scope of application.
Future researchers can do similar study with the help of international tourists too at Ellora. Moreover similar study on the brand personality can be done on the world heritage site of Ajanta.
BibliographyAaker, J. (1997). Dimensions of Brand Personality.
Journal Of Marketing Research, 34(3), 347. doi: 10.2307/3151897 About MTDC. (2019). Retrieved 3 October 2019, from https://www.maharashtratourism.gov.in/mtdc/about Akoijam, S. (2012). Book Review: David A. Aaker, Building Strong Brands. Asia-Pacific Journal Of Management Research And Innovation, 8(3), 362-364. doi: 10.1177/2319510x1200800317
Archaeological Survey of India.(2012.)Ellora Caves – A World Heritage Monument . Retrieved September 13, 2019, from
http://www.asiaurangabad.in/pdf/Tourist/Ellora_Caves-_Ver ul Ellora_.pdf.
136
Aurangabad Tourism in Shambles. (2016), Daily Sakal Aurangabad's 'Ajanta and Ellora' can become a hotspot for Buddhist Tourism.(2018, September 13). Economic Times. Borden, N. H., &Kotler, P. (1973). Marketing Management: Analysis, Planning and Control. Journal of Marketing, 37(1), 110. doi: 10.2307/1250783
Buhalis, D. (2000). Marketing the competitive destination of the future. Tourism Management, 21(1), 97–116. doi: 10.1016/s0261-5177(99)00095-3
Dickinger, A., &Lalicic, L. (2015). An analysis of destination brand personality and emotions: a comparison study. Information Technology & Tourism, 15(4), 317–340. doi: 10.1007/s40558-015-0044-x
Ekinci, Y., &Hosany, S. (2006). Destination Personality: An Application of Brand Personality to Tourism Destinations.
Journal of Travel Research, 45(2), 127–139. doi: 10.1177/0047287506291603
George, T. C. (2004, April). 'Maharashtra Unlimited' on tourism front. The Hindu Business Line.
Hannam, K., &Diekmann, A. (2011). Tourism and India: a critical introduction. London: Routledge.
Huang, Z. J., Zhang, C., & Hu, J. (2017). Destination brand personality and destination brand attachment – the involvement of self-congruence. Journal of Travel & Tourism Marketing, 34(9), 1198–1210. doi: 10.1080/10548408.2017.1330171
Joshi, M. (2017). ‐‐‐‐‐‐‐‐ ‐‐ 1956 ‐‐‐ ‐‐‐‐‐‐‐ ‐‐‐ ‐‐‐‐‐‐ ‐‐‐‐‐‐ ‐‐‐ ‐‐‐‐‐. Divya Marathi .
Kotler, P., Keller, K. L., Koshy, A., &Jha, M. (2013).
Marketing management (14th ed.). Upper Saddle River, NJ: Pearson/Prentice Hall.
Kotler, Philip H. (1991), Marketing Management: Analysis, Planning, and Control (8th ed.) Englewood Cliffs, NJ: Prentice-Hall, Inc.
Ministry of Tourism Government of India. (2018). Statement Containing Brief Activities of The Ministry of Tourism 2018. Delhi.
Pereira, R., Correia, A., & Schutz, R. (2012). Destination Branding: A Critical Overview. Journal Of Quality Assurance In Hospitality & Tourism, 13(2), 81-102. doi: 10.1080/1528008x.2012.645198
Phau, I., & Lau, K. C. (2000).Conceptualizing brand personality: A review and research propositions. Journal of Targeting, Measurement and Analysis for Marketing, 9(1), 52–69.doi: 10.1057/palgrave.jt.5740005
Planning Commission of India.(2014).Tourism. Delhi Plummer, J. T. (2000). How Personality Makes a Difference. Journal of Advertising Research, 40(6), 79–83.doi: 10.2501/jar-40-6-79-83
Ragde, R. (2016).Management of world heritage sites of Aurangabad. Panel discussion, Lokmat Bhavan, Aurangabad.
Ragde, R. (2018). Marketing of Tourism of Aurangabad for Thailand. Keynote, International colloquium on Indo- Thai Buddhist Tourism, International Center for Buddhist Tourism, Department of Tourism, Dr Babasaheb Ambedkar Marathwada University, Aurangabad
Ragde, R. (2018). Planning of Aurangabad tourism. Keynote, Aurangabad travel and tourism association 7thfoundation day, Aurangabad.
Satghare, H., &Sawant, M. (2018). SWOT Analysis of Marketing Strategies Applied by MTDC for Promotion of Maharashtra Tourism. Atna - Journal of Tourism Studies, 13(2), 79–95. doi: 10.12727/ajts.20.6
Sawant, M (2018).Marketing of Buddhist Sites in India. Convener‟s speech. Center for Buddhist Tourism, Department of Tourism, Dr Babasaheb Ambedkar Marathwada University, Aurangabad
Sawant, M. (2019). India –Business opportunities in International Tourism. Lecture, International Business School, Hanyang University Seoul, South Korea
Shamsi, M. S., &Fatima , U. S. (2015). MAKING INDIA THROUGH „MAKE IN INDIA‟ AND DESTINATION
BRANDING. JOURNAL OF INTELLECTUAL STUDIES &
THEORIES 4. Retrieved from https://www.researchgate.net/publication/307210666_MAK ING_INDIA_THROUGH_'MAKE_IN_INDIA'_AND_DE STINATION_BRANDING
Shankar, S. (2019) Role of Destination Branding in Enhancing Indian Tourism. International Journal
137
of Research and Innovation in Social Science ,3(1). Retrieved from https://www.rsisinternational.org/journals/ijriss/Digital-Libr ary/volume-3-issue-1/05-10.pdf
Sofronov, B. (2018). THE DEVELOPMENT OF THE TRAVEL AND TOURISM INDUSTRY IN THE WORLD.
Annals Of Spiru Haret University. Economic Series, 18(4), 123-137. doi: 10.26458/1847
UNWTO.(2016).Tourism Highlights,.Retrieved September 13, 2019, from https://www.e-unwto.org/doi/book/10.18111/978928441814 5.
Usakli, A., & Baloglu, S. (2011). Destination brand personality and behavioral intentions: A comparison of first-time and repeat visitors. In M. D. Alvarez, C. A. Genc,
B. Hatipoglu, D. Salman, & D. Unalan (Eds.), Advances in hospitality and tourism marketing and management (pp. 269–274). Istanbul, Turkey: Bogazici University
Varghese, N. (2002). Maharashtra shows its wares. The Hindu Business Line.
Venkatraman, L. (2002, January). Unlimited campaign by Maharashtra. The Hindu Business Line.
World Economic Forum .(2017). Incredible India 2.0 India’s $20 Billion Tourism Opportunity.
World Travel and Tourism Council.(2018).Economic Impact. Retrieved from https: //www.wttc.org/economic-impact/.
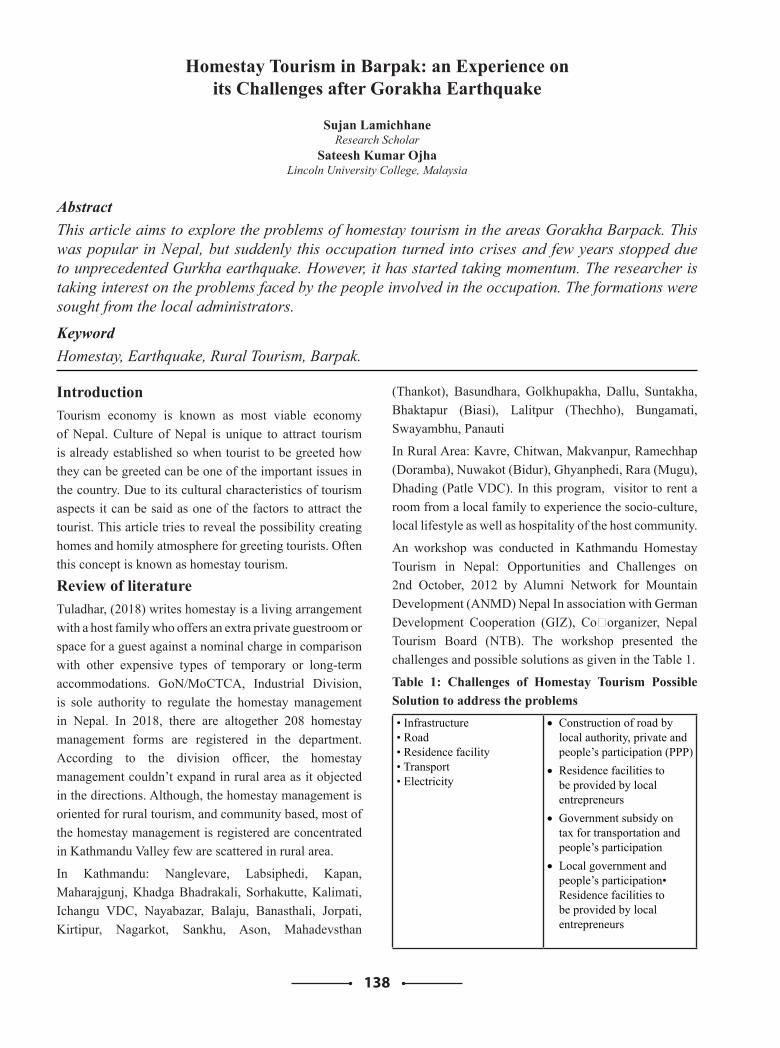
138
Homestay Tourism in Barpak: an Experience on its Challenges after Gorakha Earthquake
Sujan LamichhaneResearch Scholar
Sateesh Kumar Ojha Lincoln University College, Malaysia
AbstractThis article aims to explore the problems of homestay tourism in the areas Gorakha Barpack. This was popular in Nepal, but suddenly this occupation turned into crises and few years stopped due to unprecedented Gurkha earthquake. However, it has started taking momentum. The researcher is taking interest on the problems faced by the people involved in the occupation. The formations were sought from the local administrators.
KeywordHomestay, Earthquake, Rural Tourism, Barpak.
Introduction Tourism economy is known as most viable economy of Nepal. Culture of Nepal is unique to attract tourism is already established so when tourist to be greeted how they can be greeted can be one of the important issues in the country. Due to its cultural characteristics of tourism aspects it can be said as one of the factors to attract the tourist. This article tries to reveal the possibility creating homes and homily atmosphere for greeting tourists. Often this concept is known as homestay tourism.
Review of literatureTuladhar, (2018) writes homestay is a living arrangement with a host family who offers an extra private guestroom or space for a guest against a nominal charge in comparison with other expensive types of temporary or long-term accommodations. GoN/MoCTCA, Industrial Division, is sole authority to regulate the homestay management in Nepal. In 2018, there are altogether 208 homestay management forms are registered in the department. According to the division officer, the homestay management couldn’t expand in rural area as it objected in the directions. Although, the homestay management is oriented for rural tourism, and community based, most of the homestay management is registered are concentrated in Kathmandu Valley few are scattered in rural area.
In Kathmandu: Nanglevare, Labsiphedi, Kapan, Maharajgunj, Khadga Bhadrakali, Sorhakutte, Kalimati, Ichangu VDC, Nayabazar, Balaju, Banasthali, Jorpati, Kirtipur, Nagarkot, Sankhu, Ason, Mahadevsthan
(Thankot), Basundhara, Golkhupakha, Dallu, Suntakha, Bhaktapur (Biasi), Lalitpur (Thechho), Bungamati, Swayambhu, Panauti
In Rural Area: Kavre, Chitwan, Makvanpur, Ramechhap (Doramba), Nuwakot (Bidur), Ghyanphedi, Rara (Mugu), Dhading (Patle VDC). In this program, visitor to rent a room from a local family to experience the socio-culture, local lifestyle as well as hospitality of the host community.
An workshop was conducted in Kathmandu Homestay Tourism in Nepal: Opportunities and Challenges on 2nd October, 2012 by Alumni Network for Mountain Development (ANMD) Nepal In association with German Development Cooperation (GIZ), Co‐organizer, Nepal Tourism Board (NTB). The workshop presented the challenges and possible solutions as given in the Table 1.
Table 1: Challenges of Homestay Tourism Possible Solution to address the problems• Infrastructure• Road• Residence facility• Transport• Electricity
• Construction of road by local authority, private and people’s participation (PPP)
• Residence facilities to be provided by local entrepreneurs
• Government subsidy on tax for transportation and people’s participation
• Local government and people’s participation• Residence facilities to be provided by local entrepreneurs
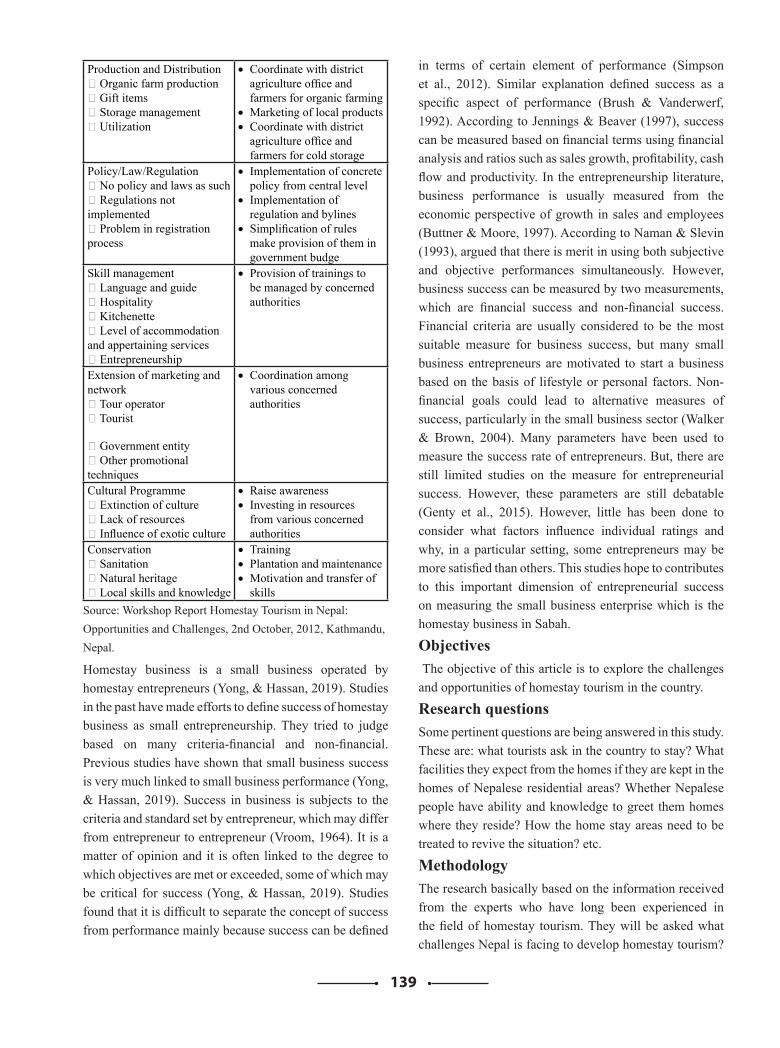
139
Production and Distribution‐ Organic farm production‐ Gift items‐ Storage management‐ Utilization
• Coordinate with district agriculture office and farmers for organic farming
• Marketing of local products• Coordinate with district
agriculture office and farmers for cold storage
Policy/Law/Regulation‐ No policy and laws as such‐ Regulations not implemented‐ Problem in registration process
• Implementation of concrete policy from central level
• Implementation of regulation and bylines
• Simplification of rules make provision of them in government budge
Skill management‐ Language and guide‐ Hospitality‐ Kitchenette‐ Level of accommodation and appertaining services‐ Entrepreneurship
• Provision of trainings to be managed by concerned authorities
Extension of marketing and network‐ Tour operator‐ Tourist
‐ Government entity‐ Other promotionaltechniques
• Coordination among various concerned authorities
Cultural Programme‐ Extinction of culture‐ Lack of resources‐ Influence of exotic culture
• Raise awareness• Investing in resources
from various concerned authorities
Conservation‐ Sanitation‐ Natural heritage‐ Local skills and knowledge
• Training• Plantation and maintenance• Motivation and transfer of
skillsSource: Workshop Report Homestay Tourism in Nepal: Opportunities and Challenges, 2nd October, 2012, Kathmandu, Nepal.
Homestay business is a small business operated by homestay entrepreneurs (Yong, & Hassan, 2019). Studies in the past have made efforts to define success of homestay business as small entrepreneurship. They tried to judge based on many criteria-financial and non-financial. Previous studies have shown that small business success is very much linked to small business performance (Yong, & Hassan, 2019). Success in business is subjects to the criteria and standard set by entrepreneur, which may differ from entrepreneur to entrepreneur (Vroom, 1964). It is a matter of opinion and it is often linked to the degree to which objectives are met or exceeded, some of which may be critical for success (Yong, & Hassan, 2019). Studies found that it is difficult to separate the concept of success from performance mainly because success can be defined
in terms of certain element of performance (Simpson et al., 2012). Similar explanation defined success as a specific aspect of performance (Brush & Vanderwerf, 1992). According to Jennings & Beaver (1997), success can be measured based on financial terms using financial analysis and ratios such as sales growth, profitability, cash flow and productivity. In the entrepreneurship literature, business performance is usually measured from the economic perspective of growth in sales and employees (Buttner & Moore, 1997). According to Naman & Slevin (1993), argued that there is merit in using both subjective and objective performances simultaneously. However, business success can be measured by two measurements, which are financial success and non-financial success. Financial criteria are usually considered to be the most suitable measure for business success, but many small business entrepreneurs are motivated to start a business based on the basis of lifestyle or personal factors. Non-financial goals could lead to alternative measures of success, particularly in the small business sector (Walker & Brown, 2004). Many parameters have been used to measure the success rate of entrepreneurs. But, there are still limited studies on the measure for entrepreneurial success. However, these parameters are still debatable (Genty et al., 2015). However, little has been done to consider what factors influence individual ratings and why, in a particular setting, some entrepreneurs may be more satisfied than others. This studies hope to contributes to this important dimension of entrepreneurial success on measuring the small business enterprise which is the homestay business in Sabah.
Objectives The objective of this article is to explore the challenges and opportunities of homestay tourism in the country.
Research questionsSome pertinent questions are being answered in this study. These are: what tourists ask in the country to stay? What facilities they expect from the homes if they are kept in the homes of Nepalese residential areas? Whether Nepalese people have ability and knowledge to greet them homes where they reside? How the home stay areas need to be treated to revive the situation? etc.
MethodologyThe research basically based on the information received from the experts who have long been experienced in the field of homestay tourism. They will be asked what challenges Nepal is facing to develop homestay tourism?
140
What residential people should do to attract them to their homes? What could be done if the areas where homestay tourism is in practice fall suddenly crises into the natural calamity? What further activities are required? How the situations need to be recovered? To reach to the validity a number of such experienced and experts will be enquired. Their responses will be analyses. To remove the biases and effects of one respondents to other they will be asked separately. Their responses will be separately analyzed to reveal the findings.
Results and discussionInterview with respondent 1Question from researcher: You have spent many decades in tourism and did lots of experience in home stay tourism, what you felt as challenges of homestay tourism? Please share your Idea. I need some information about Warback regarding challenges of transportation, accommodation, resources, communication, hospitality, etc.Answer from respondent 1: “My name is Sane Gurung, working as Ward Chairman of this areas. I have to look after the development of this area. It was established homestay in the year 2066(2009), All the constrains it had but also running with the hard work and sprit of the villagers, but seem very much disturbed when great earthquake, Gorakha Earthquake, of 15 April 2015 damages the place very badly, no house and shelters remained stand. This has added further challenges in the areas by crating the need much more funds for constructing road link, and homes. The occupations of the villagers which were running and 33% of the income being generated became stopped, this has led to further deterioration of employment and economic status of villagers”.
Interpretation from researcher: Warpak is a village development committee in Gorkha District in the Gandaki Zone of northern-central Nepal. It is centered on the village of Barpak. At the time of the 1991 Nepal census it had a population of 4,5156 and had 888 houses(census 2002) . Being close to the epicenter and lodged on a steep hillside, Barpak was extremely hard hit by the April 2015 Nepal earthquake. The opinion Mr. Sane Gurung was very serious about the devastate of the Warpak and and the consequences appeared thereafter due to the earthquake of 7.8 rector scale. Warpack damage was rated one of the most damaging place at that time after Sindhupalchowk. It brought many households of those areas into road.
Interview with respondent 2Question from researcher: You have spent many decades in tourism and did lots of experience in home stay tourism, what you felt as challenges of homestay tourism? Please share your Idea. I need some information about Warback regarding challenges of transportation, accommodation, resources, communication, hospitality, etc.
Answer from respondent 2: “My name is Khem Ghale, working as Chairman of home stay Warpack. areas. I have to look after the development of this area. It was established homestay in the year 2066(2009), All the constrains it had but also running with the hard work and sprit of the villagers, but seem very much disturbed when great earthquake, Gorakha Earthquake, of 15 April 2015 damages the place very badly, no house and shelters remained stand. Though the situation was very devastating due to the Gorkha Earthquake, all the 22 houses were damaged heavily which were totally vanished. But now sprit and hard work villagers with the help of support from government have been able to construct 20 houses and started to run. Two houses still not has been completed and have not started the business.
Interpretation from researcher: Though the massive damage of the homes could not detach the villagers from their side occupation, homestay tourism, they tried hard to be recovered so after 4 years they are being recovered to their occupation again, this shows their zeal and passion towards their occupation. For the success of any occupation they require passion and hard work. As many practitioners and authors have stressed passion and hard work for the successful operation of any entrepreneurial venture (Alaska Small Business Development Center,2016).
Interview with respondent 3You have spent many decades in tourism and did lots of experience in home stay tourism, what you felt as challenges of homestay tourism? Please share your Idea. I need some information about Warback regarding challenges of transportation, accommodation, resources, communication, hospitality, etc.
Answer from respondent 3: “My name is Manoj Ghale, working in this line for many years, I am Ex-Chairman of home stay Warpack. Now current chairman is looking after this area. My opinion is every new generation must be prepared for this. New members are to be added in this areas, and new thinking needs to be
141
brought in this areas for the development of homestay for its growth and sustainability. If this way we go we can be successful because of the participation in this areas and opportunities to everyone.
Interpretation from researcher: For the successful operation of any area and venture there requires succession planning and provisions of opportunities to all. Ex-chairman displays this trait in his interview. If all members are given this opportunity then there seem and develop social harmony, cooperation, and trust among members which is key to any organizations for the success and being effective and efficient (Yong, & Hassan, 2019).
ReferencesBrush, C.G., & Vanderwerf, P.A. (1992). A comparison
of methods and sources for obtaining estimates of new venture performance. Journal of Business Venturing, 7, 157–170.
Buttner, H.E., & Moore, D.P. (1997). Women’s organizational exodus to entrepreneurship: Self-reported motivations and correlates with success. Journal of Small Business Management, 35, 34–46.
Genty, K., Idris, K., Wahizat, N., Wahat, A., & Kadir, S.A. (2015). Demographic factors and entrepreneurial success: A conceptual review. International Journal of Management Sciences, 6(8), 366–374.
Homestay Management In Nepal Perspective And Challenges, By Dr. Gyanendra Ratna Tuladhar 2018/08/28, https://gantabyanepalnews.com/opinion/7262
Jennings, P., & Beaver, G. (1997). The performance and competitive advantage of small firms: A management perspective. International Small Business Journal, 15(2), 63–75
Naman, J.L., & Slevin, D.P. (1993). Entrepreneurship and the concept of fit: A model and empirical tests, 14, 137-153.
Nepal Census 2001". Nepal's Village Development Committees. Digital Himalaya. Retrieved 2008-08-31.
Simpson, M., Padmore, J., & Newman, N. (2012). Towards a new model of success and performance in SMEs. International Journal of Entrepreneurial Behavior & Research, 18(3), 264–285.
The 2nd annual Alaska SBDC Small Business Survey Report (2016). Passion: The Key to Successful Entrepreneurship.
Vroom, V. H. (1964). Work and motivation. Oxford, England: Wiley.
Walker, E., & Brown, A. (2004). What success factors are important to small business owners? International Small Business Journal, 22(6), 577–594.
Yong, K. and Hassan, A.R. (2019). A Conceptual Framework of Community Participation and Entrepreneurial Success towards the Homestay Business in Sabah, Malaysia. Academy of Entrepreneurship Journal (Print ISSN: 1087-9595; Online ISSN: 1528-2686), 2019 Vol: 25 Issue: 1
142
Analyzing the Potentiality & Necessity of Developing the Eastern Part of Nepal as one of the Unique Natural Touristic Destination.
Surya Bahadur GhimirePhD Scholar
Lincoln University College, [email protected]
+9779851136111
AbstractThe area of Nepal is 147181 square km. with the length of 885 km. from east to west and mean width of 193 km. which may vary from 145-243 km. North to South with irregular rectangular shape. High mountains cover 83% of the total land area of the country and undulating ecotourism has been a global phenomenon and have not been restricted to any particular region of the world. Lusher and more tropical than the Western part of Nepal, the Eastern part is much more natural and fertile. The Terai portions are highly populous. Since the eastern part of Nepal is considered as the gateway for the Indian tourist, it ever carries the high potentiality of developing into prosperous destination in terms of natural tourism promotion. There are several unexplored destinations around the eastern part of Nepal. The settlement of several ethnic groups produces the high probability of promoting natural and cultural tourism by promoting the concept of homestay and filming the real culture of eastern part of Nepal.The Eastern Region of Nepal was opened for trekkers in 1988 however; it is still on the course of development. Trekking in eastern region of Nepal occupies around 15% of the total land area of Nepal. Eastern region of Nepal consists of the one of the best geographical structures in the world drawing the interest of thousands of travelers every year. The region consists of 3 zones: Mechi, Koshi and Sagarmatha with 16 districts. The altitude of this region ranges between 8,848 m. to 60 m as it includes both Terai and Himalayan region. The unique combination of nature and culture and the amazing dense forests of rhododendron in the tropical lowlands and yak grazing pastures at high altitudes surrounded by peaks of Kanchenjunga are other probable tourist destination that are yet to be explored for the nature lovers. The theme of ecotourism can be easily explored to the eastern part of Nepal since the major part of this region is still untouched.
Keywords Tourism in Nepal, Ecotourism, alternative tourism, marketing promotion and strategies of tourism, climate changes, information technologies, trekking & Culture tour.
IntroductionThough the tourism in the small Himalayan Kingdom of Nepal is a relatively new phenomenon, there is no doubt, the geographical feature of Nepal proves that it is purely gifted for exploring tourism. The country was opened to the Western world in the early 1960’s. Since more than 83% of the total land is covered with high and snowcapped mountains, it is one of the best touristic destinations for the adventure and nature lovers. The country is nestled
among the world’s highest mountains, the Himalayas and the world’s highest summit, Mt Everest. There are several reasons why Nepal is for them who love nature, culture and mountains. The rectangle shape and the slopping geographical situation of Nepal is discovered to explore Mountain tourism and natural tourism rather than constructing huge man-made attractions and luxury touristic destinations. We have 8 highest mountains out of 14 in the world with the altitude of 8000mts. There are more than 1610 snow-capped mountains with the altitude
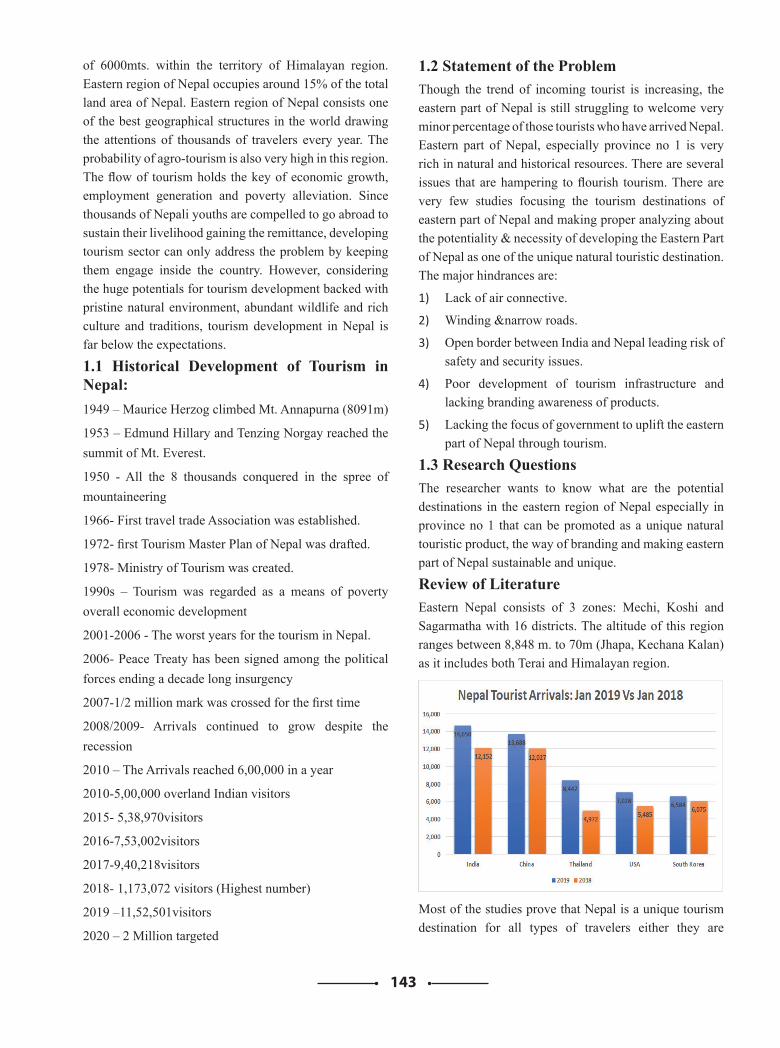
143
of 6000mts. within the territory of Himalayan region. Eastern region of Nepal occupies around 15% of the total land area of Nepal. Eastern region of Nepal consists one of the best geographical structures in the world drawing the attentions of thousands of travelers every year. The probability of agro-tourism is also very high in this region. The flow of tourism holds the key of economic growth, employment generation and poverty alleviation. Since thousands of Nepali youths are compelled to go abroad to sustain their livelihood gaining the remittance, developing tourism sector can only address the problem by keeping them engage inside the country. However, considering the huge potentials for tourism development backed with pristine natural environment, abundant wildlife and rich culture and traditions, tourism development in Nepal is far below the expectations.
1.1 Historical Development of Tourism in Nepal: 1949 – Maurice Herzog climbed Mt. Annapurna (8091m)
1953 – Edmund Hillary and Tenzing Norgay reached the summit of Mt. Everest.
1950 - All the 8 thousands conquered in the spree of mountaineering
1966- First travel trade Association was established.
1972- first Tourism Master Plan of Nepal was drafted.
1978- Ministry of Tourism was created.
1990s – Tourism was regarded as a means of poverty overall economic development
2001-2006 - The worst years for the tourism in Nepal.
2006- Peace Treaty has been signed among the political forces ending a decade long insurgency
2007-1/2 million mark was crossed for the first time
2008/2009- Arrivals continued to grow despite the recession
2010 – The Arrivals reached 6,00,000 in a year
2010-5,00,000 overland Indian visitors
2015- 5,38,970visitors
2016-7,53,002visitors
2017-9,40,218visitors
2018- 1,173,072 visitors (Highest number)
2019 –11,52,501visitors
2020 – 2 Million targeted
1.2 Statement of the ProblemThough the trend of incoming tourist is increasing, the eastern part of Nepal is still struggling to welcome very minor percentage of those tourists who have arrived Nepal. Eastern part of Nepal, especially province no 1 is very rich in natural and historical resources. There are several issues that are hampering to flourish tourism. There are very few studies focusing the tourism destinations of eastern part of Nepal and making proper analyzing about the potentiality & necessity of developing the Eastern Part of Nepal as one of the unique natural touristic destination. The major hindrances are:
1) Lack of air connective.
2) Winding &narrow roads.
3) Open border between India and Nepal leading risk of safety and security issues.
4) Poor development of tourism infrastructure and lacking branding awareness of products.
5) Lacking the focus of government to uplift the eastern part of Nepal through tourism.
1.3 Research QuestionsThe researcher wants to know what are the potential destinations in the eastern region of Nepal especially in province no 1 that can be promoted as a unique natural touristic product, the way of branding and making eastern part of Nepal sustainable and unique.
Review of Literature Eastern Nepal consists of 3 zones: Mechi, Koshi and Sagarmatha with 16 districts. The altitude of this region ranges between 8,848 m. to 70m (Jhapa, Kechana Kalan) as it includes both Terai and Himalayan region.
Most of the studies prove that Nepal is a unique tourism destination for all types of travelers either they are
144
adventurous lovers, pleasure lovers or researchers. Since the major portion of the area of Nepal is covered with snowcapped mountains, obviously it possesses huge potentialities for promoting mountain tourism connecting the nature too and branding in the international sector. There are several activities related to mountain tourism. Among them trekking and expedition are more popular. The dreamers having the confidant of power explore the Himalayas by trekking till their base camps. Most of the bold hearted climbers conquer them by climbing till the summit.
2.1 Trends of Tourist Increment in Nepal (Country-wise)
According to the Department of Immigration, a total of 975,557 visitors arrived Nepal in the first 10 months of 2019. Among them 123,267 arrived via air and 155,058 via land. Chinese tourists had the biggest share in the tourist arrival with 10.45 percent share among the total tourists entering the country in a month. Some 15,037 Chinese tourists arrived to Nepal in October in comparison to 13,489 in 2018. The arrival rate of Chinese tourists for October increased by 11.5 percent. A total of 134,281 Chinese tourists had visited Nepal in the first 10 months whereas the number was 122,986 last year. During the review month tourist arrival from countries like India, Bangladesh and Israel increased significantly. Indian tourist arrival rate increased by 9.1% and the number reached 12,707 this year. It was 1,757 last year. The number of visitors from Bangladesh and Israel stood at 2,786 and 1,616, respectively. The numbers are 58.6% and 57.8% more than the arrivals last year. Altogether 21,720 visitors from SAARC countries, 28,789 from Asia and 42,297 from Europe visited Nepal in October. The Himalayan country saw 12,109 arrivals from the United States and 2,624 from Canada.
2.2 Potentiality of Tourism Promotion in the Eastern Part of NepalTrekking in Eastern Nepal includes an approach to great Himalayan range including world’s highest mountain, Mt. Everest, Makalu Barun National Park, Kanchenjunga Trekking and KoshiTappu Wild Life Reserve are the major attractions of Eastern Nepal. The base camp of either Makalu (8463m) the world's fifth-highest peak or of Kanchenjunga (8586m), the world's third tallest peak are the glory of the eastern region.
The major cities of the Eastern region are Biratnagar, Itahari, Birtamod, Rajbiraj, Dharan and Dhankuta.
Famous places of this region include Namche Bazaar, a town nearby the base camp of Mt. Everest, Gaighat, located in a valley made by rivers Baruwa and Triyuga, and also destinations such as Dhankutta, Khandbari and Bhojpur are large, prosperous and clean. There are several Himalaya Range, hills, Snow Fed Rivers, National Parks and Wildlife Reserves etc.
Adventure: Mountaineering, Trekking, Rafting and Kayaking, jungle safari, paragliding, Bungy Jumping, Canyoning, Mountain Biking, fishing, Volunteer tourism, Eco-tourism, Green tourism etc.
Eastern region of Nepal is very fertile. This region cultivates the world’s best Orthodox Tea, large cardamom (Amomum subulatumRoxb), “Rudruksha”Elaeocarpus ganitrus, one of the holy seed used as a prayer bead in Hinduism are highly grown in this region. Agro-tourism, Bird watching, Sports tourism, Religious Tourism, Yoga and Meditation, Rural Tourism, Community-based tourism, Home-stay with ethnic traditional and cultural exposure tourism etc are some probable tourism products that should be branded and promoted globally to attract the attention of visitors.
2.3 Tourism in Eastern Nepal:If we turn few historical pages of tourism movement in the eastern part of Nepal, we can easily find that it was opened for trekkers in 1988. Though the historical dates seem bit far yet this region is still on the course of development. The unique and fragile geographical feature, winding and narrow roads, weak focus of government, improper tourism development plans and policies, open border system are some major hindrances to brand this region as unique touristic destinations.
There are thick forests of rhododendron in the tropical lowlands and yak grazing pastures at high altitudes surrounded by peaks of Kanchenjunga, Kambachen, Yalung Kang &Jannu (Mystery Peak) Himalayas. The major part of this region is covered by “Charkoshijhadi” recognized as the dense forests with several flora and fauna.
What might be the possible ways to promote the eastern region of Nepal if the roadways are not safe? There is very simple answer that there are already several domestic airports which are in good condition and are able to hold continuous flights in most of the seasons. There are altogether 14 airports as listed below which are always waiting the arrivals of visitors:
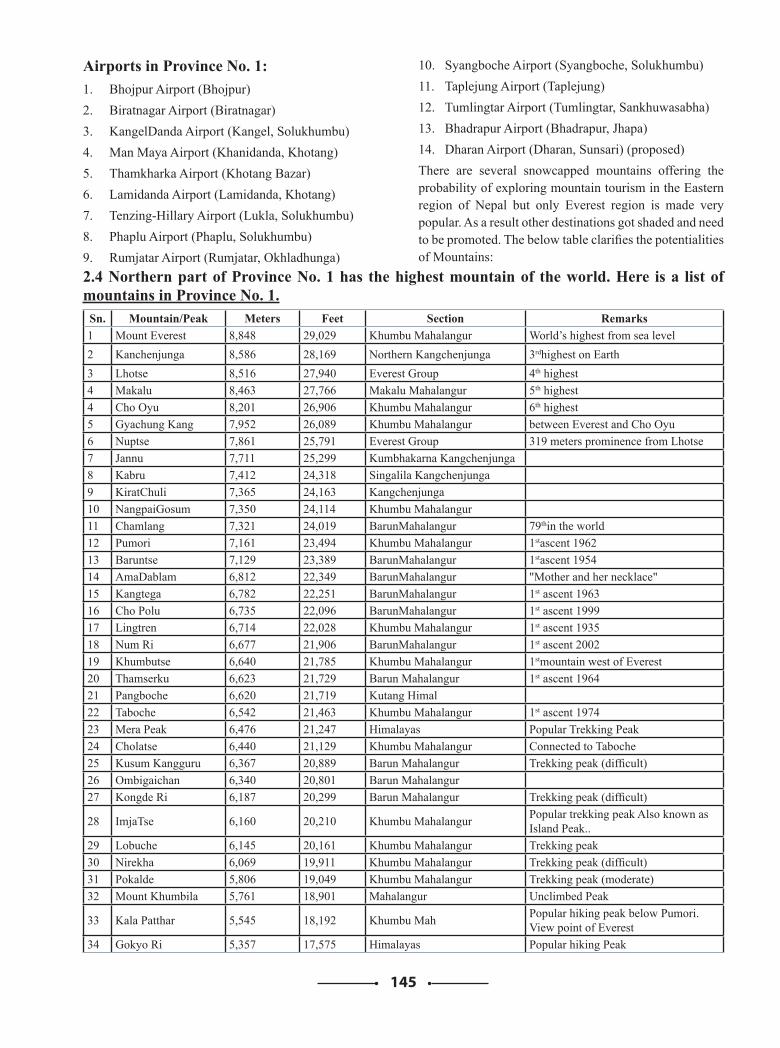
145
Airports in Province No. 1:1. Bhojpur Airport (Bhojpur)2. Biratnagar Airport (Biratnagar)3. KangelDanda Airport (Kangel, Solukhumbu)4. Man Maya Airport (Khanidanda, Khotang)5. Thamkharka Airport (Khotang Bazar)6. Lamidanda Airport (Lamidanda, Khotang)7. Tenzing-Hillary Airport (Lukla, Solukhumbu)8. Phaplu Airport (Phaplu, Solukhumbu)9. Rumjatar Airport (Rumjatar, Okhladhunga)
10. Syangboche Airport (Syangboche, Solukhumbu)11. Taplejung Airport (Taplejung)12. Tumlingtar Airport (Tumlingtar, Sankhuwasabha)13. Bhadrapur Airport (Bhadrapur, Jhapa)14. Dharan Airport (Dharan, Sunsari) (proposed) There are several snowcapped mountains offering the probability of exploring mountain tourism in the Eastern region of Nepal but only Everest region is made very popular. As a result other destinations got shaded and need to be promoted. The below table clarifies the potentialities of Mountains:
2.4 Northern part of Province No. 1 has the highest mountain of the world. Here is a list of mountains in Province No. 1.
Sn. Mountain/Peak Meters Feet Section Remarks1 Mount Everest 8,848 29,029 Khumbu Mahalangur World’s highest from sea level2 Kanchenjunga 8,586 28,169 Northern Kangchenjunga 3rdhighest on Earth3 Lhotse 8,516 27,940 Everest Group 4th highest4 Makalu 8,463 27,766 Makalu Mahalangur 5th highest4 Cho Oyu 8,201 26,906 Khumbu Mahalangur 6th highest5 Gyachung Kang 7,952 26,089 Khumbu Mahalangur between Everest and Cho Oyu6 Nuptse 7,861 25,791 Everest Group 319 meters prominence from Lhotse7 Jannu 7,711 25,299 Kumbhakarna Kangchenjunga 8 Kabru 7,412 24,318 Singalila Kangchenjunga 9 KiratChuli 7,365 24,163 Kangchenjunga 10 NangpaiGosum 7,350 24,114 Khumbu Mahalangur 11 Chamlang 7,321 24,019 BarunMahalangur 79thin the world12 Pumori 7,161 23,494 Khumbu Mahalangur 1stascent 196213 Baruntse 7,129 23,389 BarunMahalangur 1stascent 195414 AmaDablam 6,812 22,349 BarunMahalangur "Mother and her necklace"15 Kangtega 6,782 22,251 BarunMahalangur 1st ascent 196316 Cho Polu 6,735 22,096 BarunMahalangur 1st ascent 199917 Lingtren 6,714 22,028 Khumbu Mahalangur 1st ascent 193518 Num Ri 6,677 21,906 BarunMahalangur 1st ascent 200219 Khumbutse 6,640 21,785 Khumbu Mahalangur 1stmountain west of Everest20 Thamserku 6,623 21,729 Barun Mahalangur 1st ascent 196421 Pangboche 6,620 21,719 Kutang Himal 22 Taboche 6,542 21,463 Khumbu Mahalangur 1st ascent 197423 Mera Peak 6,476 21,247 Himalayas Popular Trekking Peak24 Cholatse 6,440 21,129 Khumbu Mahalangur Connected to Taboche25 Kusum Kangguru 6,367 20,889 Barun Mahalangur Trekking peak (difficult)26 Ombigaichan 6,340 20,801 Barun Mahalangur 27 Kongde Ri 6,187 20,299 Barun Mahalangur Trekking peak (difficult)
28 ImjaTse 6,160 20,210 Khumbu Mahalangur Popular trekking peak Also known as Island Peak..
29 Lobuche 6,145 20,161 Khumbu Mahalangur Trekking peak30 Nirekha 6,069 19,911 Khumbu Mahalangur Trekking peak (difficult)31 Pokalde 5,806 19,049 Khumbu Mahalangur Trekking peak (moderate)32 Mount Khumbila 5,761 18,901 Mahalangur Unclimbed Peak
33 Kala Patthar 5,545 18,192 Khumbu Mah Popular hiking peak below Pumori. View point of Everest
34 Gokyo Ri 5,357 17,575 Himalayas Popular hiking Peak
146
2.5 Major Attractions and the Potential Tourism Products of Eastern Nepal:Eastern region of Nepal, generally the Terai region is known as the “granary of Nepal” because of high cultivation land and fertile soil. This region is not only fertile for agriculture but also carry high potential of promoting as one of the unique natural touristic destinations in the world. Lying on the lap of “Sagarmatha” this region boosts with the following potentials that are heartbeat of any tourism products:
A) Protected areas1. Sagarmatha National Park, (Solukhumbu)
2. Makalu Barun National Park, (Solukhumbu and Sankhuwasabha)
3. KoshiTappu Wildlife Reserve, (Sunsari, Saptari and Udayapur)
4. Kanchenjunga Conservation Area, (Sankhuwasabha)
B) Religious destinations: Hindu Shrines1. Satasi Dham, Arjundhara, (Jhapa)
2. Buddha Dham, Maisthan or Mai Pokhari, Larumba, (Ilam)
3. Singh Devi, Gupteshwar Mahadev, (Panchthar)
4. Pathibhara Devi Temple, (Taplejung)
5. Viratkali, (Morang)
6. BudhaSubba Temple, Barahachhetra, (Sunsari)
7. Chhintang Devi, Margsthan, (Dhankuta)
8. Singhvahini, (Tehrathum)
9. Siddhkali, Manakamna, (Sankhuwasabha)
10.Singhkali, Chandisthan, (Bhojpur)
11. Chaudandi Devi, (Udayapur)
12. Halesi Mahadev Temple, (Khotang)
13. Champadevi, (Okhaldhunga)
14. SyanbocheGumba, (Solukhumbu)
15. Gokyo Lake Complex, (Solukhumbu)
16. Mai Pokhari, (Ilam)
C) Mountains for Expedition1. Mt. Everest (Highest mountain of the world)
2. Kanchenjunga (3rdhighest mountain of the world)
3. Lhotse (4thhighest mountain of the world)
4. Makalu (5thhighest mountain of the world)
5. Cho Oyu (6thhighest mountain of the world)
D) Hiking Peaks Gokyo Ri, Kala Patthar, Chola pass
E) Trekking PeaksMera Peak, Lobuche, Kusum Kanguru, Kongde Ri, Nirekha, Pokalde, Mount Khumbila
F) White Water River RaftingTamor river rafting, Dhudkoshi river rafting,Arun river rafting
G) Paragliding destinationsBhedetar paragliding, Temkedanda paragliding, DhankutaChuliban hill and Yakchanaghat, Udaypur
Belaka Municipality from Bopatang hill and Champakot at Mainamaini.
H) Major Trekking trails (Most of them are untouched) 1. Limbu cultural trail trek Taplejung
2. Ilam tea garden trek Ilam
3. Arun valley trek Solukhumbu
4. Kanchenjunga base camp trek Taplejung
5. Everest base camp trek Solukhumbu
6. Everest view trek Solukhumbu
7. Sherpa village trail trek Solukhumbu
8. Makalu base camp trek Sangkhuwasabha
9. Gokyo ganjala pass trek Solukhumbu
10. Chola pass trek Solukhumbu
11. Namje village tour Dhankuta
12. Jiri Everest trek Solukhumbu
13. Rai cultural trail trek Dhankuta/Bhojpur/Solukhumbu
14. Agricultural trek Dhankuta
15. Mundum Trekking Trail Bhojpur/Khotang
I) Orthodox Tea State, Typical Nepal Herbal Spices & Other Several Tourism Products:Nepali tea is a beverage made from the leaves of tea plants. The major part of Eastern Nepal like Jhapa, Ilam, Panchtar, Dhankuta, Terhathum, Bhojpur, Solukhumbu etc are tested for the best cultivation of tea all over the world. There are several valuable spices found and grown in any part of eastern region. Among the big cardamom is very valuable. Taplejung collects huge amount of Indian currencies during the season of big cardamom harvestmen. Rudraksha a seed that is used as a prayer bead in Hinduism is very popular. Rudraksha with a single face
147
is very precious. Chinese tourist visits the eastern part of Nepal for collecting these beads since they also regard those beads as a holy seed according to Buddhism. This will also increase the flow of local and Chinese tourists all over the eastern part of Nepal.
Most of the local and international tourist put interest to visit Eastern part of Nepal to explore nature with several flora-fauna. They also desire to enjoy the greenery of tea state, several seasonal fruits, natural spices, Yak cheese and several other products made from Yak milk.
2.6 Source marketing Primary Markets: – India – China –Srilanka–Bhutan– Srilanka–Japan–Korea
Secondary Markets: – Germany – France – Spain – Italy – UK
Emerging Markets: – Malaysia –Thailand –Singapore – East Europe – Middle East
1. Objectives: The major objective of this research is to investigate why eastern part of Nepal should be promoted as one of the unique natural touristic destinations and what are its potentiality. The following points carry the real essence of objectives:
a) To focus in improving the air connectivity in the eastern part of Nepal.
b) Branding tourism products, promoting them and creating awareness among the host committees in province no 1.
2. Methodology:The researcher has followed qualitative techniques. Assumption that has to be tested through quantitative techniques are not formulated for the research purpose. This research is based on logical conclusion that due to the availability of tourism resources, attractions, some facilities and easy access from Kathmandu; This study is fully supported by the previous studies, researches, regular observations and interactions with local people and tourism entrepreneurs and visitors before the actual research have been done by the researcher.
3. Findings/Results:There are several issues found that are to be seriously considered into action by both government and nongovernment authorities to make Nepal sustainable through ecotourism. The following recommendations are the major findings of this thesis.
• Since the eastern region of Nepal especially province no 1 is very poor in educating the people in the topic of tourism promotion, it has to be started very seriously as the main organ of development.
• Initial preliminary studies are not conducted seriously with tourism and its development components and aspects of the study area.
• The local or the hosting communities are not so conscious about the formulation of local tourism development plan, policies and implementation procedures too.
• There are no proper distributions of clean drinking water, electricity, telephone and Internet access all over the major touristic destinations.
• There are very few establishments of tourism information centers to educate and facilitate the tourists as well as to educate and aware the host committees.
• The concern authorities are not so aware about the meaning & impact of carrying capacity concept.
• The open border system between Nepal and India is providing easy access for the Indian tourist to explore the region but that is creating huge issues of safety and security.
• There are no well-trained trekking guides, tour guides, porters and other supporting staffs in need.
• Since there are narrow and winding roads, there are 14 domestic airports in province no1 which carry huge probability of connecting various touristic destinations all over the region which are to be upgraded and operated very seriously.
• Effective marketing and promotional strategies are not adopted for branding and advertising the tourism products. This is resulting the lacking of branding any tourism product and difficult to promote in needy communities globally.
4. DiscussionsAfter the depth analyses of the potentiality and necessity of natural tourism in the eastern region of Nepal, the following issues and challengesare rectified which should be taken consideration to transform asone of the unique natural touristic destination. Most of the research found the lacking of branding the tourism products of eastern part of Nepal. The issue of promoting the tourism after branding is another huge issue. Some of my opinions are listed below:
148
• Developing the basic components in all touristic destinations are highly recommended. For example, connections of electricity, means of communication, safe roads, bridges and proper transportations etc.
• The number of outbound tourists has been increasing continuously in China and India that are sustaining economic growth even at the time of global financial crisis. Therefore, the eastern part of Nepal should focus on these two markets with the innovative and attractive neighborhood tourism measures because the eastern part of Nepal is the gateway to India. Since Chinese tourists are very fond of drinking organic orthodox green tea, they can be attracted in the eastern part of Nepal which is considered as the heaven to cultivate the best quality of tea in the world. There are even several historical, cultural and religious destinations scattered everywhere that will drag the attention of Indian tourists too.
• Given the low level of travel and tourism competitiveness, province one should focus on developing new tourism infrastructures in the country. Development of infrastructures and superstructures should precede to the dissemination of information while formulating tourism development strategies through promotional component is also equally important.
• Since the existing tourism policy has still some inbuilt structural weaknesses, the new tourism policy should be structured so as to back up goal by objectives, equip objectives with clearly spelt policies and strategies supporting policies and strategies by programs and plan of actions.
• Tourism administration should facilitate effective coordination among all the policy actors and stakeholders, who often have conflicting interest and values, in order to achieve the set objectives of tourism plans and policies.
• The province government is burning huge budget in the name of tourism promotions every year. This is going in vain because they never sit and plan the strategies before implementations. This is resulting the bad impact in developing the tourism products. It has to be planned with the experts who are really aware about planning and developing the best tourism model according to necessity and probability of proper region.
• Tourism is only one way to eliminate the poverty
and stop youth power drain out from the country by creating huge employment. Province one has the potentiality of creating such opportunities if the government and concern authorities could aware them about the importance and necessity of developing tourism destinations and creating good momentum in tourism.
• Since there are several casts and sub casts scattered everywhere in every state, they have their own diverse traditions and cultures. Their culture and traditions are the best tourism products to the visitors. They can maintain their livelihood easily crafting various traditional cultures as tourism products. As a result, the endangered traditions and cultures will be preserved for the coming generations too.
5. Conclusion:This research completed focus in identifying the potentialities of tourism products in the eastern region of Nepal especially province no 1 and analysis the reason why it is not popularly promoted being one of the unique touristic destination. Several methodologies were used with questioners and direct interviewing the locals and concern experts who are in touch with the concern topics. Very few researchers have conducted surficial studies about the topics previously and suggested few guidelines for promoting this eastern region. Province no1 can be branded as one of the unique natural and adventure touristic destinations if the findings of this research are analyzed and implemented properly into actions.
ReferencesAcharya, P (2001), " Socio-economic impacts
of tourism in Lumbini, Nepal A Case Study”, available at http://www.lumbinitrust.org/buletins/ec4f6233d1b87506.96216119.pdf, accessed on: 2nd July 2013.
Adhikai, S.K (2003), Tourism in Nepal, unpublished M.A. Thesis Submitted to central Dept. of Economics,
Tribhuvan University.Page34
Aryal, D (2005). Economic Impact of Tourism in Nepal. An Article (Eco) T.U. Kirtipur, pp 56
Arrivals and Associated Expenditures of Non-Residents (http://www.unwto.org/statistics/border.pdf)
Ghimire,B.(2013),“Nepal’s Tourism Statistics 2012,” available at
http://www.tourism.gov.np/uploaded/TourrismStat2012.pdf, accessed on: 10th July, 2013
149
Kunwar, R.R.,(1997) Tourism and Development (Science and Industry Interface), Kathmandu, pp 56
MOTCA (2013). Accessed from worldwide web site. http://www.motca.gov.np.
Nepal in Figures (2013) Government of Nepal National Planning Commission Secretariat Central Bureau of
Statistics Ram ShahpathThapathali Kathmandu, Nepal.
Nepal Tourism Board., (2013), NTB News Letter, 5(35), Kathmandu, Nepal
Paudyal, S.B, (1997), " Tourism development Nepal in the context of regional perspective ", The Economic Journal of Nepal, 20(7), pp 45-49
UNWTO (2013). World Tourism Highlights. World Tourism
Organization.Source:https:\\www.unwto.org\index.php accessed on November 2, 2013
Sharma, O. P (2001), Tourism Development and Planning in Nepal. A Ph. D. Thesis presented to Faculty of Social Sciences, Banaras Hindu University, India,pp 28-34
Sherestha, H.P (1998) Tourism Marking in Nepal: An Unpublished PhD Thesis Submitted to Tribhuvan University, Kathmandu, pp 72
Upadhaya, R.P. (2008), Reading in Rural Tourism, Sunlight Publication (Students books) Kirtipur, Kathmandu, pp 431-45
World Tourism Organization. (2005). Tourism as an International Traded Service - A Guide for Measuring
KC. A. (2016), Ecotourism and Its Role in Sustainable Development of Nepal.
Lindberg, K. (1997), Economic aspects of ecotourism in Ecotourism: A guide for planners and managers, 2 (1), pp 87-117. http://tourism.gov.np/files/statistics/2.pdf
http: / /www.tourismdepartment.gov.np/tourism-statisticshttp://www.xinhuanet.com/english/2019-11/11/c_138546609.htm
https://www.nepalisansar.com/tourism/nepal-tourist-arrivals-2019-jan-reports-25-y-o-y-rise
https://www.ceicdata.com/en/indicator/nepal/visitor-arrivals
http: / /www.agiletrek.com/travel-news/tourism-potentiality-in-province-no--of-nepal.htm
150
Governance Implications of Using Software Platform
Gyeung-min Kima
aCollege of BusinessEwha Womans University
AbstractThe platform is considered to be important strategy for the firm to enhance its value proposition. Although the platform strategy could bring the opportunities, it also could bring risks, limitations, and responsibilities for the organization. This research explores the opportunities, risks, limitations, and responsibilities that such software platform brings to the organization. This research intends to provide guidance for the governing body of organization that is accountable for the organization’s use of ‘software platform’. Thus, this research focus on governance and not on the technologies themselves.
KeywordsSoftware Platform, Strategy, Governance
1. IntroductionToday, business models of many successful companies such as Uber, Apple and Netflix are based on platforms [5]. A source of value for these platforms is software. Software platforms allow firms to deliver enhanced or new value propositions that are unprecedent before. By emphasizing the importance of software, Jeff Immelt, a former CEO of GE says, “every industrial company must become a software company.” By running a series of industrial applications on the software platform called Predix, GE provides many predictive services to the client companies across industries [3]. Based on Predix, GE transformed itself from a manufacturing company into both a platform company and an application-based company [4].
To emphasize the importance of software platform for the firm’s strategy, Gurbaxani [4] asserts, “executives must view their business as software companies” and “reimagine with software to create real opportunities and inevitably threats (p.6).” Since such digital transformation as platform-based transformation requires dramatic changes in operation, structure and culture, 63% of executives reply the importance of the board partnership [12].
Although ISO 38500 specifies what the governance body of organization (owners, directors, partners, executive managers) should do in terms of the use of IT in organization [6], in reality, IT governance has been ignored by the board and has been the job of CIO.
According to Nolan and McFarlan [7], the board members lack knowledge about IT to ask fundamental questions about IT governance. “The lack of board oversight for IT activities is dangerous [p. 98, 7].”
As IT becomes increasingly important for the firm, IT governance cannot be ignored. The company faces the competitive risk if not using IT strategically. Firm’s future strategy is dependent on strategic use of these digital technologies. Firm needs to reshape their strategy using the digital technologies [12]. In addition, Rickards and Grossman [12] assert that “board directors must able to communicate how advance in technology will ultimately affect the entire enterprise [p. 4].” Ransbotham et al. [10] report that “to develop their understanding of digital, many executives have taken trips to Silicon Valley to experience digital natives [p.11].”The research questions put forth are: what are the opportunities, risks, limitations, and
responsibilities that such software platform brings to the organization?
what are the governance implications of using the software platform?
This research intends to provide guidance for the governing body of organization that is accountable for the organization’s use of ‘software platform’. This document only covers ‘software platform’ to the extent necessary to understand the governance implications of their use. This research emphasizes on governance and not on the technologies themselves.
In the next section, we will review the literature about IT Governance. Then we derive the guidelines for the governing body to develop software platforms.
151
2. IT GovernanceGovernance means setting rules and policies, directing, monitoring and controlling [13]. Governance is a duty of governing bodies of organization. The governing bodies have accountability to explain firms’ activity to the stakeholders based on the purpose of the organizations, laws and policies. IT Governance is a part of corporate governance [11,14]. For the use of IT, the governing body needs to not only set rules and policies for the use of IT but also direct, monitor and control the use of IT. For proper governance, the governing body needs to set up IT management system and delegates management responsibilities to senior and operational management. Although the details of IT management are delegated to the management team, the ultimate accountability of IT governance resides in the governing body.ISO 38500 describes “to meet their accountability, members of the governing body should ensure that there is effective governance of IT within the organization, involving both their own activities in setting direction for organizational use of IT as well as their oversight of management of IT within the organization [6].”
3. Software Platform as Strategy: What the governance needs to knowISO/IEC 38500, which is international standard for Governance of IT specifies the role of the governance body as Evaluate, Direct and Monitor (EDM) IT management; and specifies five principles that the governing body should follow including Strategy, Conformance, Performance, Human behavior and Acquisition [6]. For the use of IT, the governing body is accountable that proper IT is acquired (invested) to create value for the company, the IT investment is aligned with firm’s purpose and strategy of their business (Strategy); comply to the laws and policies (Conformance); is acquired with valid reasons and transparent process (Acquisition); produce desired performance (Performance); and consider human behavior (Human Behavior). By the time the presentation on the current research is made in ITAM, we will have done on investigating what the governance needs to know or focus on to develop software platform in terms of Strategy, Conformance, Performance, Human behavior and Acquisition aspects.
4. ConclusionInadequate governance of software platform can expose an organization to risks including low quality service, negative customer experience, loss of confidence in platform reputation, loss of trust from stakeholders, decreased economic sustainability [2,15]. This research intends to provide guidance for the governing body of organization to meet their accountability. This research
also intends to assure stakeholders that they could have confidence in the organization’s use of software platform if the guidance suggested by this research is followed.
References [1] Alstyne, M., Parker, G., and Choudary, S., Pipelines,
Platforms, and the New Rules of Strategy, April 2016, p. 54-62.
[2] Boudreau, K., Open Platform Strategies and Innovation: Granting Access vs. Devolving Control, Management Science. Oct 2010, Vol. 56 Issue 10, p. 1849-1872.
[3] Davenport, T., Analytics 3.0, Harvard Business Review, December 2013.
[4] Gurbaxani, V., You don’t Have to Be a Software Company to Think Like One, Harvard Business Review, April 20, 2016.
[5] Hagiu, A. and Altman, A., Finding the Platform in Your Product, Harvard Business Review, July–August 2017.
[6] ISO, ISO/IEC JTC 1 38500 Governance of IT, 2015.[7] Nolan and McFarlan, Information Technology and
the Board of Directors, Harvard Business Review, October 2005, p. 96-106.
[8] Osterwalder, A. C-Suite Needs a Chief Entrepreneur. Harvard Business Review, June 25, 2015
[9] Osterwalder, A., Pigneur, Y. and Guppata, K., Don’t Let Your Company Culture Just Happen, C-Suite Needs a Chief Entrepreneur, Harvard Business Review, July 07, 2016
[10] Ransbotham, S, Kiron, D. and Gerbert, P., Reshaping Business With Artificial Intelligence, MIT Sloan Management Review, 2017, p. 1-17.
[11] Read, T.., Discussion of director responsibility for IT governance, International Journal of Accounting Information Systems, 5(2), 2004, p. 105-107.
[12] Rickards, T and Grossman, R., The Board Directors You Need for a Digital Transformation, Harvard Business Review, July 13, 2017.
[13] SáCouto, E., Lopes, F. and Sousa, R., Can IS/IT Governance Contribute for Business Agility?, Procedia Computer Science, Volume 64, 2015, p. 1099-1106.
[14] Trites, G., Discussion of director responsibility for IT governance, International Journal of Accounting Information Systems, 5(2), 2004, p. 89-99.
[15] Wareham, J., Fox, P.; Giner, J., Technology Ecosystem Governance, Organization Science. Jul/Aug2014, Vol. 25 Issue 4, p. 1195-1215.
[16] Zeng, M., Alibaba and the Future of Business, Harvard Business Review. Sep/Oct2018, Vol. 96 Issue 5, p. 88-96.
152
A Scientometric Analysis: Block Chain Applications In Vehicular Adhoc Network
Shivangi Chaudhary1 and Santosh Rangnekar21Research Scholar, Center for Transportation, IIT Roorkee, Uttarakhand, 247667
Tel:-+9519044109,Email id: - [email protected]
2Professor, Department of Management Studies, Associated Faculty in Center for Transportation, IIT Roorkee, Uttarakhand, 247667Tel: - +9410543454
Email id:[email protected]
AbstractResearch Problem: -The research problem focuses on how block chain technology is helpful for thesecurity issuesfacedbytheVehicularnetworksduringsafeand secure exchange of the enormous amount of information between vehicles & roadside units in order to improve the driving experiences and the avoiding trafficaccidents.Research objective: -The main objective of conducting scientometric analysis is to combine the overall past studies results and latest trends about the application of block chain technology in vehicular Adhoc Networks through the papers published in the time span of 2000-2020 in the Web of science (WoS) and Scopus database.Research Methodology - The research methodology here is a time bound (2000-2020) search of Web of science (WoS), Scopus databases, according to the keywords related to the block chain technology application in Vehicular network and then exporting the results in the CiteSpace software to get visualization of analytical mapping. In total 86 documents were found out after removing duplicity. The keywords used in the search in were “Vehicular Adhoc Networks”, “Block chain”, “Network security,“Internet of things”, “Vehicles”, “Cryptography”, “security” and “data privacy”. The document type were article, conference papers, reviews and conference reviews.Research Findings: - The research findings shows that the Application of the Block chain technology in the field of “Vehicular Adhoc Network” for security issueshasstartedfrom2017andgainedmomentuminthe year 2019.Where many researchers has proposed various Block chain frame works for improving the performance of the Vehicular Adhoc networks. Asthe data dissemination of the information between the vehicles & infrastructure could be safe and securedue to the blockage of the intrudersattack.This paper outlines the general summary of the key literatures related to the application of block chain in the Vehicular Network as well as the approach for conducting the scientometric analysis.
KeywordsBlock Chain, Vehicular Adhoc Network, Security Issues, Scientometric Analysis.
IntroductionRise in science and technology, &interoperable wireless technologies has made the necessity of the use of Vehicular adhoc networks (VANET) in the transportation for many countries. According to the literature there has been significant research in this particular field from last many years. The main application of vehicular networks is for Safety, Commercial and Environmental Purposes. But due to the dynamic characteristics of the vehicular Network
such as its Topology, Scalability, Routing protocols and its architecture makes its more vulnerable for the Intruders attacks. The Vehicular adhoc networks architecture are Inter-vehicular Communication and Intra-vehicular Communication. The inter Vehicular Communication includes the communication established between the vehicles and the Intra Vehicular Communication means the communication established between the Roadside Units(RSU) andthe vehicles.
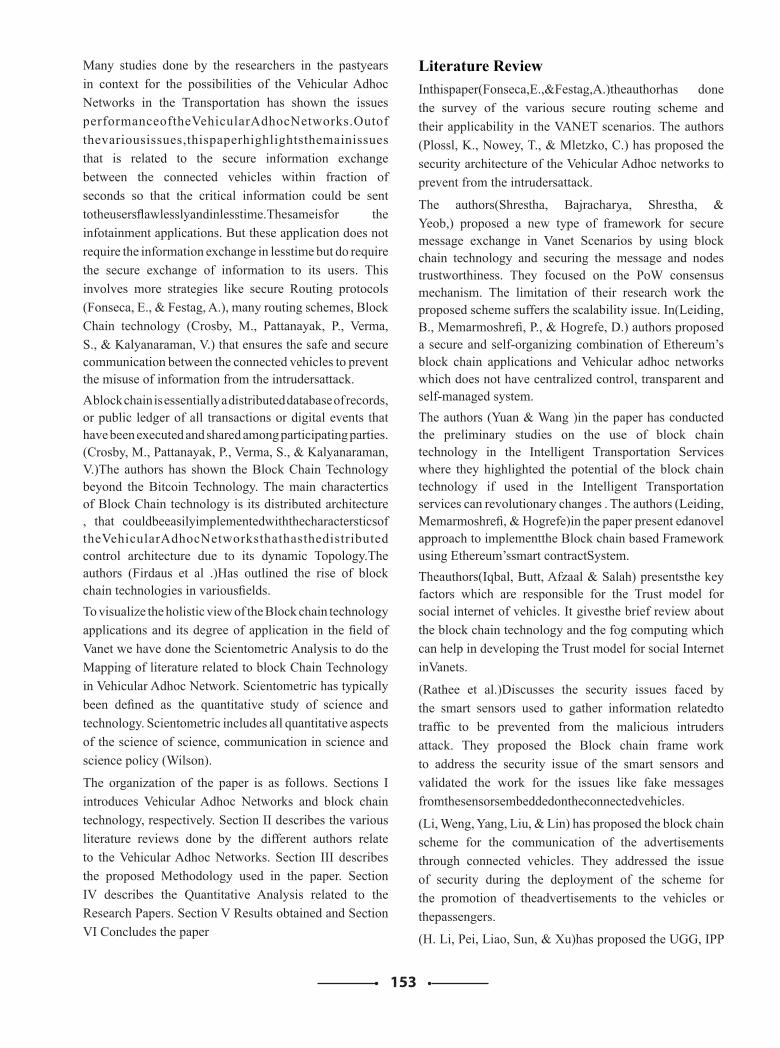
153
Many studies done by the researchers in the pastyears in context for the possibilities of the Vehicular Adhoc Networks in the Transportation has shown the issues performanceoftheVehicularAdhocNetworks.Outof thevariousissues,thispaperhighlightsthemainissues that is related to the secure information exchange between the connected vehicles within fraction of seconds so that the critical information could be sent totheusersflawlesslyandinlesstime.Thesameisfor the infotainment applications. But these application does not require the information exchange in lesstime but do require the secure exchange of information to its users. This involves more strategies like secure Routing protocols (Fonseca, E., & Festag, A.), many routing schemes, Block Chain technology (Crosby, M., Pattanayak, P., Verma, S., & Kalyanaraman, V.) that ensures the safe and secure communication between the connected vehicles to prevent the misuse of information from the intrudersattack.A block chain is essentially a distributed database of records, or public ledger of all transactions or digital events that have been executed and shared among participating parties. (Crosby, M., Pattanayak, P., Verma, S., & Kalyanaraman, V.)The authors has shown the Block Chain Technology beyond the Bitcoin Technology. The main charactertics of Block Chain technology is its distributed architecture , that couldbeeasilyimplementedwiththecharactersticsof theVehicularAdhocNetworksthathasthedistributed control architecture due to its dynamic Topology.The authors (Firdaus et al .)Has outlined the rise of block chain technologies in variousfields.To visualize the holistic view of the Block chain technology applications and its degree of application in the field of Vanet we have done the Scientometric Analysis to do the Mapping of literature related to block Chain Technology in Vehicular Adhoc Network. Scientometric has typically been defined as the quantitative study of science and technology. Scientometric includes all quantitative aspects of the science of science, communication in science and science policy (Wilson).
The organization of the paper is as follows. Sections I introduces Vehicular Adhoc Networks and block chain technology, respectively. Section II describes the various literature reviews done by the different authors relate to the Vehicular Adhoc Networks. Section III describes the proposed Methodology used in the paper. Section IV describes the Quantitative Analysis related to the Research Papers. Section V Results obtained and Section VI Concludes the paper
Literature ReviewInthispaper(Fonseca,E.,&Festag,A.)theauthorhas done the survey of the various secure routing scheme and their applicability in the VANET scenarios. The authors (Plossl, K., Nowey, T., & Mletzko, C.) has proposed the security architecture of the Vehicular Adhoc networks to prevent from the intrudersattack.
The authors(Shrestha, Bajracharya, Shrestha, & Yeob,) proposed a new type of framework for secure message exchange in Vanet Scenarios by using block chain technology and securing the message and nodes trustworthiness. They focused on the PoW consensus mechanism. The limitation of their research work the proposed scheme suffers the scalability issue. In(Leiding, B., Memarmoshrefi, P., & Hogrefe, D.) authors proposed a secure and self-organizing combination of Ethereum’s block chain applications and Vehicular adhoc networks which does not have centralized control, transparent and self-managed system.The authors (Yuan & Wang )in the paper has conducted the preliminary studies on the use of block chain technology in the Intelligent Transportation Services where they highlighted the potential of the block chain technology if used in the Intelligent Transportation services can revolutionary changes . The authors (Leiding, Memarmoshrefi, & Hogrefe)in the paper present edanovel approach to implementthe Block chain based Framework using Ethereum’ssmart contractSystem.Theauthors(Iqbal, Butt, Afzaal & Salah) presentsthe key factors which are responsible for the Trust model for social internet of vehicles. It givesthe brief review about the block chain technology and the fog computing which can help in developing the Trust model for social Internet inVanets.
(Rathee et al.)Discusses the security issues faced by the smart sensors used to gather information relatedto traffic to be prevented from the malicious intruders attack. They proposed the Block chain frame work to address the security issue of the smart sensors and validated the work for the issues like fake messages fromthesensorsembeddedontheconnectedvehicles.
(Li, Weng, Yang, Liu, & Lin) has proposed the block chain scheme for the communication of the advertisements through connected vehicles. They addressed the issue of security during the deployment of the scheme for the promotion of theadvertisements to the vehicles or thepassengers.
(H. Li, Pei, Liao, Sun, & Xu)has proposed the UGG, IPP
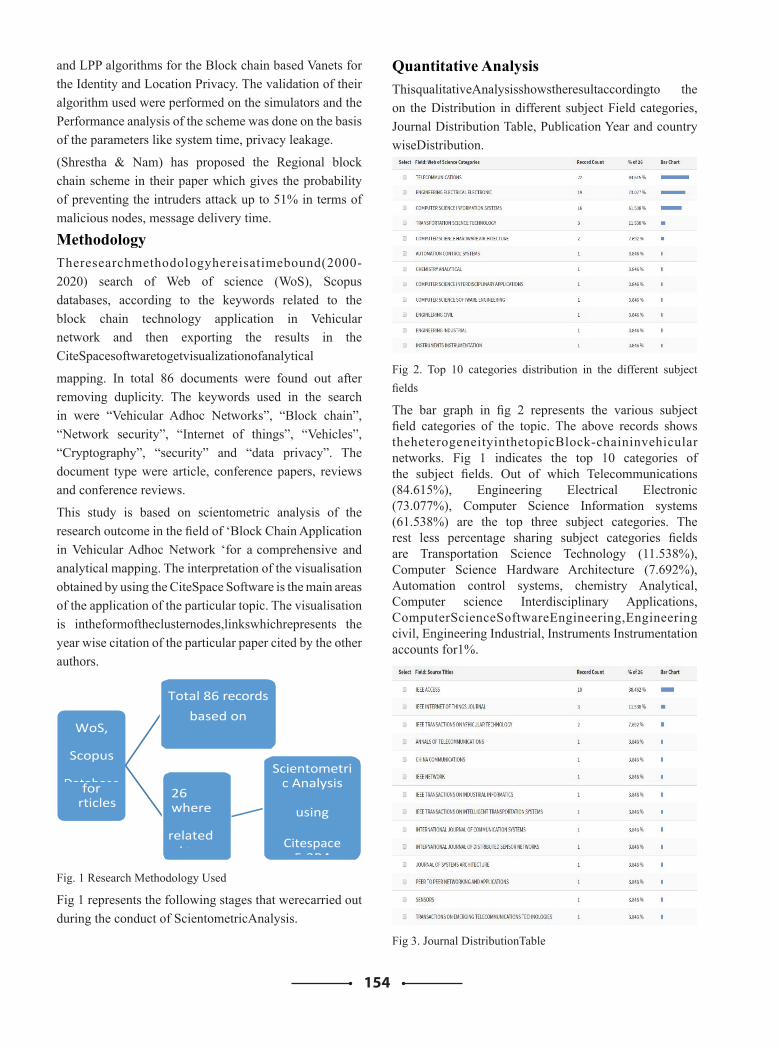
154
and LPP algorithms for the Block chain based Vanets for the Identity and Location Privacy. The validation of their algorithm used were performed on the simulators and the Performance analysis of the scheme was done on the basis of the parameters like system time, privacy leakage.
(Shrestha & Nam) has proposed the Regional block chain scheme in their paper which gives the probability of preventing the intruders attack up to 51% in terms of malicious nodes, message delivery time.
MethodologyTheresearchmethodologyhereisatimebound(2000- 2020) search of Web of science (WoS), Scopus databases, according to the keywords related to the block chain technology application in Vehicular network and then exporting the results in the CiteSpacesoftwaretogetvisualizationofanalytical
mapping. In total 86 documents were found out after removing duplicity. The keywords used in the search in were “Vehicular Adhoc Networks”, “Block chain”, “Network security”, “Internet of things”, “Vehicles”, “Cryptography”, “security” and “data privacy”. The document type were article, conference papers, reviews and conference reviews.
This study is based on scientometric analysis of the research outcome in the field of ‘Block Chain Application in Vehicular Adhoc Network ‘for a comprehensive and analytical mapping. The interpretation of the visualisation obtained by using the CiteSpace Software is the main areas of the application of the particular topic. The visualisation is intheformoftheclusternodes,linkswhichrepresents the year wise citation of the particular paper cited by the other authors.
Fig. 1 Research Methodology Used
Fig 1 represents the following stages that werecarried out during the conduct of ScientometricAnalysis.
WoS,
Scopus
Database Search
Total 86 records based on
Keywords
for
A rticles
26 where
related to block
Scientometric Analysis
using
Citespace 5.3R4
Quantitative AnalysisThisqualitativeAnalysisshowstheresultaccordingto the on the Distribution in different subject Field categories, Journal Distribution Table, Publication Year and country wiseDistribution.
Fig 2. Top 10 categories distribution in the different subject fields
The bar graph in fig 2 represents the various subject field categories of the topic. The above records shows theheterogeneityinthetopicBlock-chaininvehicular networks. Fig 1 indicates the top 10 categories of the subject fields. Out of which Telecommunications (84.615%), Engineering Electrical Electronic (73.077%), Computer Science Information systems (61.538%) are the top three subject categories. The rest less percentage sharing subject categories fields are Transportation Science Technology (11.538%), Computer Science Hardware Architecture (7.692%), Automation control systems, chemistry Analytical, Computer science Interdisciplinary Applications, ComputerScienceSoftwareEngineering,Engineering civil, Engineering Industrial, Instruments Instrumentation accounts for1%.
Fig 3. Journal DistributionTable
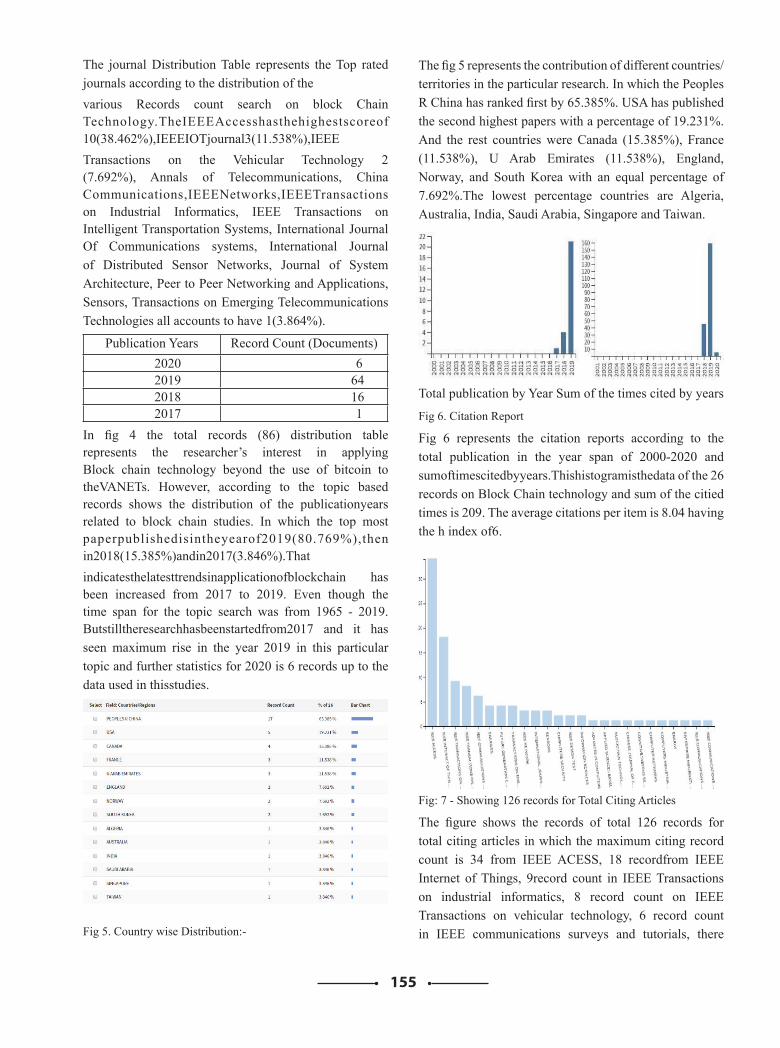
155
The journal Distribution Table represents the Top rated journals according to the distribution of thevarious Records count search on block Chain Technology.TheIEEEAccesshasthehighestscoreof 10(38.462%),IEEEIOTjournal3(11.538%),IEEETransactions on the Vehicular Technology 2 (7.692%), Annals of Telecommunications, China Communications,IEEENetworks,IEEETransactions on Industrial Informatics, IEEE Transactions on Intelligent Transportation Systems, International Journal Of Communications systems, International Journal of Distributed Sensor Networks, Journal of System Architecture, Peer to Peer Networking and Applications, Sensors, Transactions on Emerging Telecommunications Technologies all accounts to have 1(3.864%).
Publication Years Record Count (Documents)2020 62019 642018 162017 1
In fig 4 the total records (86) distribution table represents the researcher’s interest in applying Block chain technology beyond the use of bitcoin to theVANETs. However, according to the topic based records shows the distribution of the publicationyears related to block chain studies. In which the top most paperpublishedisintheyearof2019(80.769%),then in2018(15.385%)andin2017(3.846%).Thatindicatesthelatesttrendsinapplicationofblockchain has been increased from 2017 to 2019. Even though the time span for the topic search was from 1965 - 2019.Butstilltheresearchhasbeenstartedfrom2017 and it has seen maximum rise in the year 2019 in this particular topic and further statistics for 2020 is 6 records up to the data used in thisstudies.
Fig 5. Country wise Distribution:-
The fig 5 represents the contribution of different countries/ territories in the particular research. In which the Peoples R China has ranked first by 65.385%. USA has published the second highest papers with a percentage of 19.231%. And the rest countries were Canada (15.385%), France (11.538%), U Arab Emirates (11.538%), England, Norway, and South Korea with an equal percentage of 7.692%.The lowest percentage countries are Algeria, Australia, India, Saudi Arabia, Singapore and Taiwan.
Total publication by Year Sum of the times cited by years
Fig 6. Citation Report
Fig 6 represents the citation reports according to the total publication in the year span of 2000-2020 and sumoftimescitedbyyears.Thishistogramisthedata of the 26 records on Block Chain technology and sum of the citied times is 209. The average citations per item is 8.04 having the h index of6.
Fig: 7 - Showing 126 records for Total Citing Articles
The figure shows the records of total 126 records for total citing articles in which the maximum citing record count is 34 from IEEE ACESS, 18 recordfrom IEEE Internet of Things, 9record count in IEEE Transactions on industrial informatics, 8 record count on IEEE Transactions on vehicular technology, 6 record count in IEEE communications surveys and tutorials, there
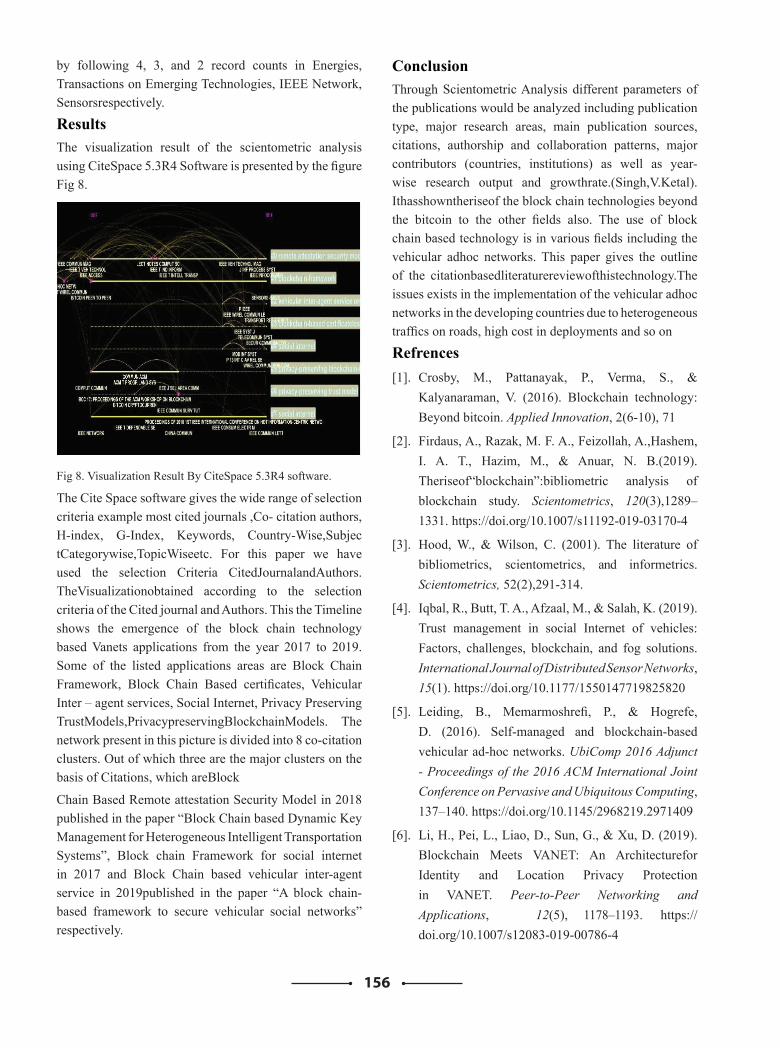
156
by following 4, 3, and 2 record counts in Energies, Transactions on Emerging Technologies, IEEE Network, Sensorsrespectively.
ResultsThe visualization result of the scientometric analysis using CiteSpace 5.3R4 Software is presented by the figure Fig 8.
Fig 8. Visualization Result By CiteSpace 5.3R4 software.
The Cite Space software gives the wide range of selection criteria example most cited journals ,Co- citation authors, H-index, G-Index, Keywords, Country-Wise,SubjectCategorywise,TopicWiseetc. For this paper we have used the selection Criteria CitedJournalandAuthors.TheVisualizationobtained according to the selection criteria of the Cited journal and Authors. This the Timeline shows the emergence of the block chain technology based Vanets applications from the year 2017 to 2019. Some of the listed applications areas are Block Chain Framework, Block Chain Based certificates, Vehicular Inter – agent services, Social Internet, Privacy Preserving TrustModels,PrivacypreservingBlockchainModels. The network present in this picture is divided into 8 co-citation clusters. Out of which three are the major clusters on the basis of Citations, which areBlock
Chain Based Remote attestation Security Model in 2018 published in the paper “Block Chain based Dynamic Key Management for Heterogeneous Intelligent Transportation Systems”, Block chain Framework for social internet in 2017 and Block Chain based vehicular inter-agent service in 2019published in the paper “A block chain-based framework to secure vehicular social networks” respectively.
ConclusionThrough Scientometric Analysis different parameters of the publications would be analyzed including publication type, major research areas, main publication sources, citations, authorship and collaboration patterns, major contributors (countries, institutions) as well as year-wise research output and growthrate.(Singh,V.Ketal).Ithasshowntheriseof the block chain technologies beyond the bitcoin to the other fields also. The use of block chain based technology is in various fields including the vehicular adhoc networks. This paper gives the outline of the citationbasedliteraturereviewofthistechnology.The issues exists in the implementation of the vehicular adhoc networks in the developing countries due to heterogeneous traffics on roads, high cost in deployments and so on
Refrences[1]. Crosby, M., Pattanayak, P., Verma, S., &
Kalyanaraman, V. (2016). Blockchain technology: Beyond bitcoin. Applied Innovation, 2(6-10), 71
[2]. Firdaus, A., Razak, M. F. A., Feizollah, A.,Hashem, I. A. T., Hazim, M., & Anuar, N. B.(2019).Theriseof“blockchain”:bibliometric analysis of blockchain study. Scientometrics, 120(3),1289–1331. https://doi.org/10.1007/s11192-019-03170-4
[3]. Hood, W., & Wilson, C. (2001). The literature of bibliometrics, scientometrics, and informetrics. Scientometrics, 52(2),291-314.
[4]. Iqbal, R., Butt, T. A., Afzaal, M., & Salah, K. (2019). Trust management in social Internet of vehicles: Factors, challenges, blockchain, and fog solutions. International Journal of Distributed Sensor Networks, 15(1). https://doi.org/10.1177/1550147719825820
[5]. Leiding, B., Memarmoshrefi, P., & Hogrefe, D. (2016). Self-managed and blockchain-based vehicular ad-hoc networks. UbiComp 2016 Adjunct - Proceedings of the 2016 ACM International Joint Conference on Pervasive and Ubiquitous Computing, 137–140. https://doi.org/10.1145/2968219.2971409
[6]. Li, H., Pei, L., Liao, D., Sun, G., & Xu, D. (2019).Blockchain Meets VANET: An Architecturefor Identity and Location Privacy Protection in VANET. Peer-to-Peer Networking and Applications, 12(5), 1178–1193. https://doi.org/10.1007/s12083-019-00786-4
157
[7]. Li,M.,Weng,J.,Yang,A.,Liu,J.-N.,&Lin,X. (2019). Towards Blockchain-based Fair and Anonymous Ad Dissemination in Vehicular Networks. IEEE Transactions on Vehicular Technology, 1–1. https://doi.org/10.1109/tvt.2019.2940148
[8].Plossl,K.,Nowey,T.,&Mletzko,C.(2006,April). Towards a security architecture for vehicular ad hoc networks. In First InternationalConference on Availability, Reliability and Security (ARES'06) (pp. 8-pp). IEEE
[9]. Rathee, G., Sharma, A., Iqbal, R., Aloqaily, M., Jaglan, N., & Kumar, R. (2019). A blockchain framework for securing connected and autonomous vehicles. Sensors (Switzerland), 19(14).https://doi.org/10.3390/s19143165
[10]. Shrestha, R., Bajracharya, R., Shrestha, A. P., & Nam,S.Y.(2019).Anewtypeofblockchainfor secure message exchange in VANET. Digital Communications and Networks, (April). https://doi.org/10.1016/j.dcan.2019.04.003
[11]. Shrestha, R., & Nam, S. Y. (2019). Regional Blockchain for Vehicular Networks to Prevent 51% Attacks. IEEE Access, 7, 95033–95045. https://doi.org/10.1109/ACCESS.2019.292875 3
[12].Singh, V. K., Banshal, S. K., Singhal, K., & Uddin, A. (2015). Scientometric mapping of research on ‘Big Data’. Scientometrics, 105(2), 727-741
[13]. Yuan, Y., & Wang, F. Y. (2016). Towards blockchain-based intelligent transportation systems. IEEE Conference on Intelligent Transportation Systems, Proceedings, ITSC, 2663–2668. https://doi.org/10.1109/ITSC.2016.7795984
158
Is a General Quality Model of Software Possible: Playability versus Usability?
Seokha Koha and Jialei Jiangb
Professora and Doctoral Studentb Department of Management Information Systems, Chungbuk National University
1 Chungdae-ro Seowon-gu Cheongju, Chungbuk 362-763, KoreaTel: +82-43-261-7062, Mobile: +82-10-4417-7062, Fax: +82-43-273-2355, E-mail: [email protected]
AbstractThis paper addresses the issue ‘Is a general quality model of software possible? If possible, how specific can/should it be?’ ISO 25000 Series SQuaRE is generally regarded as a general quality model which can be applied to most kinds of software. Usability is one of the 8 characteristics of SQuaRE’s Product Quality Model. It is the main issue associated with SQuaRE’s Quality in Use Model too. it is the most important concept associated software quality since using is the only ultimate goal of software products. Playability, however, is generally regarded as a special type of usability, which can be applied to game software. This common idea contradicts with the idea that SQuaRE is valid for most kinds, at least many kinds, of software. The empirical evidences of this paper show that SQuaRE is too specific to be a general quality model of software.
KeywordsSoftware Quality, Usability, Playability, ISO/IEC (The International Standard Organization) 25000 Series SQuaRE (Systems and software Quality Requirement and Evaluation).
IntroductionThis paper addresses the issue ‘Is a general quality model of software possible? If possible, how specific can/should it be?’ Koh and Koh [2018] define the quality and usability of a software product as ‘how good or bad is a product? 1’ and ‘how good is a product for being used,’ respectively.
On the other hand, ISO/IEC’s SQuaRE defines the quality and usability of a software-intensive computer system as ‘the degree to which the system satisfies the stated and implied needs of its various stakeholders, and thus provides value’ and ‘the degree to which a product or system can be used by specified users to achieve specified goals with effectiveness, efficiency and satisfaction in a specified context of use,’ respectively [ISO/IEC 25010:2011, pp.8, 12, 18; ISO/IEC 25022:2016]. SQuaRE defines quality in use as ‘the degree to which a product can be used by specific users to meet their needs to achieve specific goals with effectiveness, efficiency, freedom from risk and satisfaction in specific contexts of use.’ [ISO/IEC 25010:2011, pp.8, 12, 18; ISO/IEC 25022:2016]. The definition is almost the same as that of
1 In this paper, italic font emphasizes that corresponding part is quoted with no or only slight changes from the cited literature.
usability except that it includes “freedom from risk and context coverage”.
SQuaRE defines usability as one of 8 characteristics of software product quality. It is noticeable, however, that SQuaRE provide no explicit and specific definition of the software quality and the software product quality. It is also noticeable that Koh and Koh’s [2018] definitions are very simple and precise in sharp contrast with those of SQuaRE.
Software quality is a very confusing concept. Koh and his colleagues [Koh 2016, 2017a, 2017b; Koh and Jiang 2017; Koh and Koh 2018, Koh 2019] try to resolve the confusion associated with software quality by elaborating the views regarding software quality into a generic model of software quality view. According to the software quality view model, the playability of a game software product can be defined as ‘how good is a product for being used’ or, in short, ‘goodness for playing’ [Koh and Koh 2018, Koh 2019]. Since playing can be classified as a special sub-type of using, according to the software quality view model, playability can be classified as a special sub-type of usability [Koh and Koh 2018, Koh 2019].
Gonzalez Sanchez et al. [2009a, 2009b] define playability as “a set of properties that describe the player experience
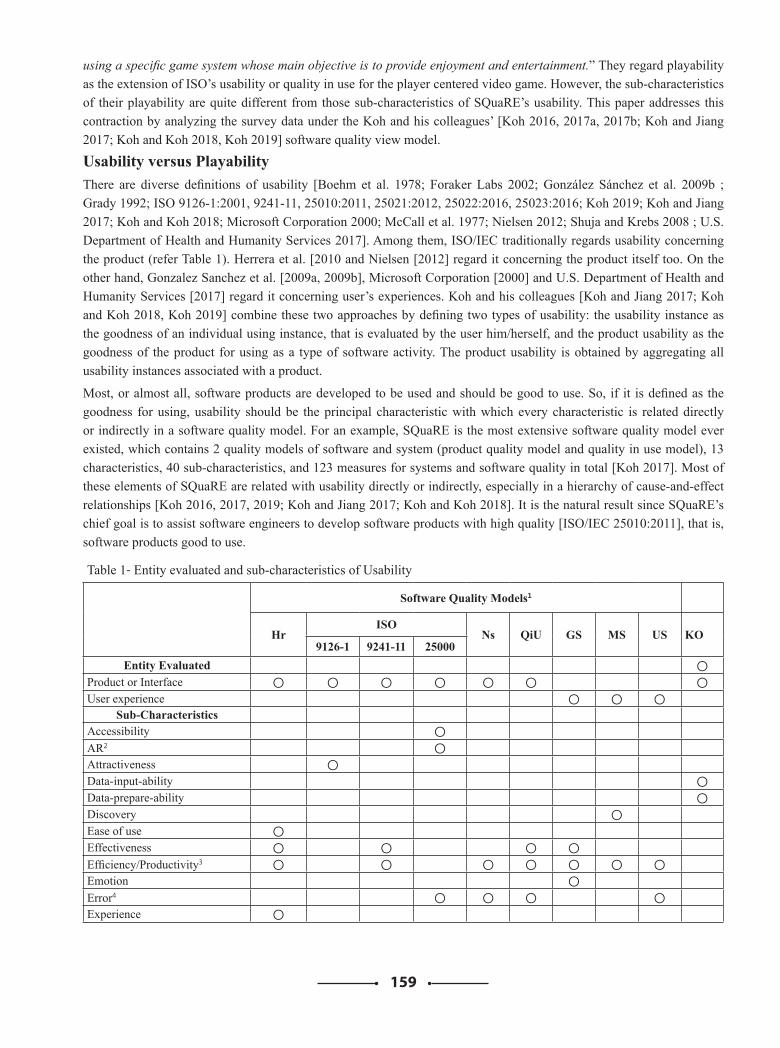
159
using a specific game system whose main objective is to provide enjoyment and entertainment.” They regard playability as the extension of ISO’s usability or quality in use for the player centered video game. However, the sub-characteristics of their playability are quite different from those sub-characteristics of SQuaRE’s usability. This paper addresses this contraction by analyzing the survey data under the Koh and his colleagues’ [Koh 2016, 2017a, 2017b; Koh and Jiang 2017; Koh and Koh 2018, Koh 2019] software quality view model.
Usability versus PlayabilityThere are diverse definitions of usability [Boehm et al. 1978; Foraker Labs 2002; González Sánchez et al. 2009b ; Grady 1992; ISO 9126-1:2001, 9241-11, 25010:2011, 25021:2012, 25022:2016, 25023:2016; Koh 2019; Koh and Jiang 2017; Koh and Koh 2018; Microsoft Corporation 2000; McCall et al. 1977; Nielsen 2012; Shuja and Krebs 2008 ; U.S. Department of Health and Humanity Services 2017]. Among them, ISO/IEC traditionally regards usability concerning the product (refer Table 1). Herrera et al. [2010 and Nielsen [2012] regard it concerning the product itself too. On the other hand, Gonzalez Sanchez et al. [2009a, 2009b], Microsoft Corporation [2000] and U.S. Department of Health and Humanity Services [2017] regard it concerning user’s experiences. Koh and his colleagues [Koh and Jiang 2017; Koh and Koh 2018, Koh 2019] combine these two approaches by defining two types of usability: the usability instance as the goodness of an individual using instance, that is evaluated by the user him/herself, and the product usability as the goodness of the product for using as a type of software activity. The product usability is obtained by aggregating all usability instances associated with a product.
Most, or almost all, software products are developed to be used and should be good to use. So, if it is defined as the goodness for using, usability should be the principal characteristic with which every characteristic is related directly or indirectly in a software quality model. For an example, SQuaRE is the most extensive software quality model ever existed, which contains 2 quality models of software and system (product quality model and quality in use model), 13 characteristics, 40 sub-characteristics, and 123 measures for systems and software quality in total [Koh 2017]. Most of these elements of SQuaRE are related with usability directly or indirectly, especially in a hierarchy of cause-and-effect relationships [Koh 2016, 2017, 2019; Koh and Jiang 2017; Koh and Koh 2018]. It is the natural result since SQuaRE’s chief goal is to assist software engineers to develop software products with high quality [ISO/IEC 25010:2011], that is, software products good to use.
Table 1- Entity evaluated and sub-characteristics of Usability
Software Quality Models1
HrISO
Ns QiU GS MS US KO9126-1 9241-11 25000
Entity Evaluated ○Product or Interface ○ ○ ○ ○ ○ ○ ○User experience ○ ○ ○
Sub-CharacteristicsAccessibility ○AR2 ○Attractiveness ○Data-input-ability ○Data-prepare-ability ○Discovery ○Ease of use ○Effectiveness ○ ○ ○ ○Efficiency/Productivity3 ○ ○ ○ ○ ○ ○ ○Emotion ○Error4 ○ ○ ○ ○Experience ○
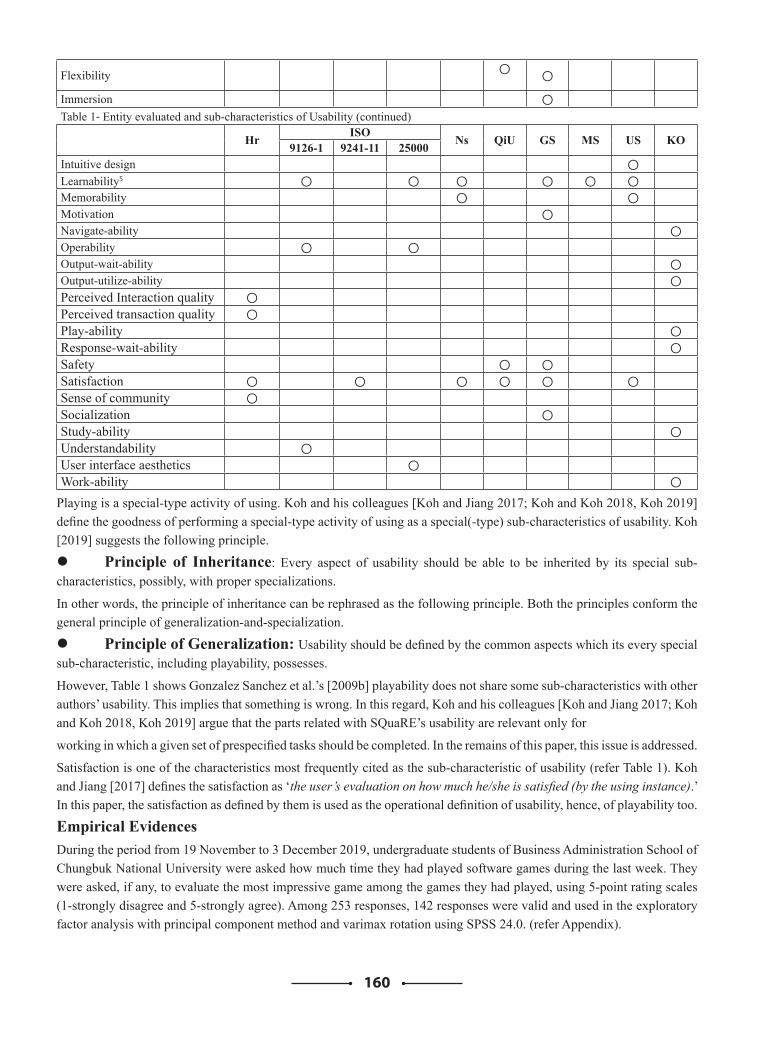
160
Flexibility ○ ○
Immersion ○Table 1- Entity evaluated and sub-characteristics of Usability (continued)
Hr ISO Ns QiU GS MS US KO9126-1 9241-11 25000Intuitive design ○Learnability5 ○ ○ ○ ○ ○ ○Memorability ○ ○Motivation ○Navigate-ability ○Operability ○ ○Output-wait-ability ○Output-utilize-ability ○Perceived Interaction quality ○Perceived transaction quality ○Play-ability ○Response-wait-ability ○Safety ○ ○Satisfaction ○ ○ ○ ○ ○ ○Sense of community ○Socialization ○Study-ability ○Understandability ○User interface aesthetics ○Work-ability ○
Playing is a special-type activity of using. Koh and his colleagues [Koh and Jiang 2017; Koh and Koh 2018, Koh 2019] define the goodness of performing a special-type activity of using as a special(-type) sub-characteristics of usability. Koh [2019] suggests the following principle.
Principle of Inheritance: Every aspect of usability should be able to be inherited by its special sub-characteristics, possibly, with proper specializations.
In other words, the principle of inheritance can be rephrased as the following principle. Both the principles conform the general principle of generalization-and-specialization.
Principle of Generalization: Usability should be defined by the common aspects which its every special sub-characteristic, including playability, possesses.
However, Table 1 shows Gonzalez Sanchez et al.’s [2009b] playability does not share some sub-characteristics with other authors’ usability. This implies that something is wrong. In this regard, Koh and his colleagues [Koh and Jiang 2017; Koh and Koh 2018, Koh 2019] argue that the parts related with SQuaRE’s usability are relevant only for
working in which a given set of prespecified tasks should be completed. In the remains of this paper, this issue is addressed.
Satisfaction is one of the characteristics most frequently cited as the sub-characteristic of usability (refer Table 1). Koh and Jiang [2017] defines the satisfaction as ‘the user’s evaluation on how much he/she is satisfied (by the using instance).’ In this paper, the satisfaction as defined by them is used as the operational definition of usability, hence, of playability too.
Empirical EvidencesDuring the period from 19 November to 3 December 2019, undergraduate students of Business Administration School of Chungbuk National University were asked how much time they had played software games during the last week. They were asked, if any, to evaluate the most impressive game among the games they had played, using 5-point rating scales (1-strongly disagree and 5-strongly agree). Among 253 responses, 142 responses were valid and used in the exploratory factor analysis with principal component method and varimax rotation using SPSS 24.0. (refer Appendix).
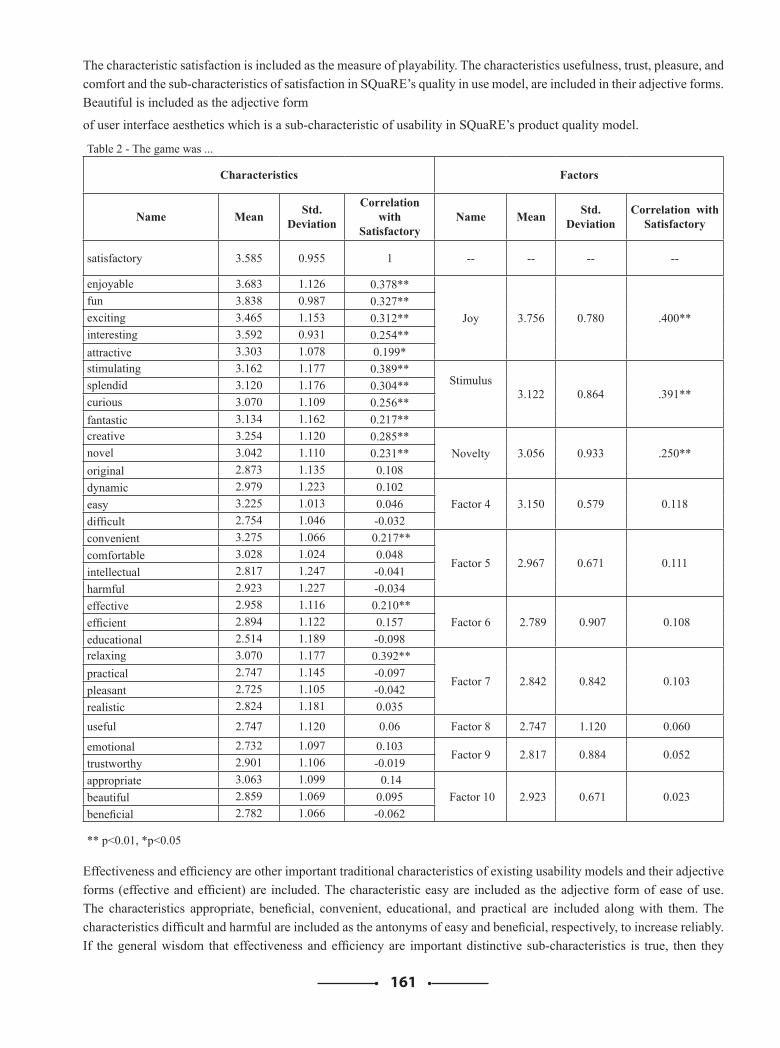
161
The characteristic satisfaction is included as the measure of playability. The characteristics usefulness, trust, pleasure, and comfort and the sub-characteristics of satisfaction in SQuaRE’s quality in use model, are included in their adjective forms. Beautiful is included as the adjective form
of user interface aesthetics which is a sub-characteristic of usability in SQuaRE’s product quality model.
Table 2 - The game was …
Characteristics Factors
Name Mean Std. Deviation
Correlation with
SatisfactoryName Mean Std.
DeviationCorrelation with
Satisfactory
satisfactory 3.585 0.955 1 -- -- -- --
enjoyable 3.683 1.126 0.378**
Joy 3.756 0.780 .400**fun 3.838 0.987 0.327**exciting 3.465 1.153 0.312**interesting 3.592 0.931 0.254**attractive 3.303 1.078 0.199*stimulating 3.162 1.177 0.389**
Stimulus3.122 0.864 .391**
splendid 3.120 1.176 0.304**curious 3.070 1.109 0.256**fantastic 3.134 1.162 0.217**creative 3.254 1.120 0.285**
Novelty 3.056 0.933 .250**novel 3.042 1.110 0.231**original 2.873 1.135 0.108dynamic 2.979 1.223 0.102
Factor 4 3.150 0.579 0.118easy 3.225 1.013 0.046difficult 2.754 1.046 -0.032convenient 3.275 1.066 0.217**
Factor 5 2.967 0.671 0.111comfortable 3.028 1.024 0.048intellectual 2.817 1.247 -0.041harmful 2.923 1.227 -0.034effective 2.958 1.116 0.210**
Factor 6 2.789 0.907 0.108efficient 2.894 1.122 0.157educational 2.514 1.189 -0.098relaxing 3.070 1.177 0.392**
Factor 7 2.842 0.842 0.103practical 2.747 1.145 -0.097pleasant 2.725 1.105 -0.042realistic 2.824 1.181 0.035
useful 2.747 1.120 0.06 Factor 8 2.747 1.120 0.060
emotional 2.732 1.097 0.103Factor 9 2.817 0.884 0.052
trustworthy 2.901 1.106 -0.019appropriate 3.063 1.099 0.14
Factor 10 2.923 0.671 0.023beautiful 2.859 1.069 0.095beneficial 2.782 1.066 -0.062
** p<0.01, *p<0.05
Effectiveness and efficiency are other important traditional characteristics of existing usability models and their adjective forms (effective and efficient) are included. The characteristic easy are included as the adjective form of ease of use. The characteristics appropriate, beneficial, convenient, educational, and practical are included along with them. The characteristics difficult and harmful are included as the antonyms of easy and beneficial, respectively, to increase reliably. If the general wisdom that effectiveness and efficiency are important distinctive sub-characteristics is true, then they
162
will be very closely correlated with the characteristics efficient, effective, or useful. At least, we had thought so.
Other characteristics are included on our individual judgement. Some of them are identified during the preliminary interviews of the survey.
All the characteristics except satisfactory are used in the factor analysis. Table 2 shows the results. The factor analysis identified 10 factors. We named 3 factors as Joy, Stimulus, and Novelty, respectively. However, we failed to name the rest 7 factors. The characteristic satisfaction is excluded from the factor analysis. If it is included an exploratory factor analysis, it belongs to the factor Joy, leaving the results almost the same as those presented in this paper. Table 2 shows that the 3 factors and the characteristics that belong to them, except original, are highly correlated with satisfaction. Beside them, only the characteristics convenient, effective, and relaxing are statistically significantly correlated with the characteristic satisfaction at the 1% significance level.
On the other hand, the characteristics appropriate, beautiful, beneficial, comfortable, difficult, dynamic, easy, educational, efficient, emotional, harmful, intellectual, pleasant, practical, realistic, trustworthy, and useful, are proven to be lowly correlated with the characteristic satisfaction. Especially, it is noticeable that the characteristics beautiful, comfortable, efficient, pleasant, trustworthy, and useful are lowly correlated with the characteristic satisfaction.
The mean values of the characteristic satisfactory and the characteristics that belong to the factor Joy are especially large: those of the characteristics satisfactory, enjoyable, fun, exciting, interesting, and attractive are 3.585, 3.683, 3.838, 3.465, 3.592, and 3.303, respectively. The mean values of the characteristics that belong to the factors Stimulus and Novelty are larger than 3.0 with the only exception of 2.873 of the characteristic original.
On the other hand, the mean values of most characteristics that belong to the other factors are smaller than 3.0. The exceptions are the characteristics easy, convenient, comfortable, relaxing, and appropriate: their mean values are 3.225, 3.275, 3.028, 3.070, and 3.063, respectively. It is especially noticeable that those of the characteristics effective, efficient, useful, beautiful are smaller than 3.0.
DiscussionsThe empirical evidences clearly show that Joy is the utmost important driving factor of software game while
the characteristics effectiveness, efficiency, and usefulness are not important to software games. It conforms to the common sense that people play software games to get joy, but not to accomplish some practical tasks, for example, that are assigned to the workers of corporations as their jobs in their work places.
The empirical evidences also show that the factors Stimulus and Novelty are important too. People may play a software game to get stimulated when they feel dull. A cause-and-effect relationship may exist among the factors Joy, Stimulus, and Novelty. Especially, the factor Novelty may influence both the factors Joy and Stimulus as a cause. This issue should be investigated further.
Mean values of the characteristics convenient and relaxing are larger than 3.0 and they are statistically significantly correlated with the characteristic satisfaction. The characteristic relaxing may represent a factor that contrasts with the factor Stimulus. Some people may play a software game to get stimulated while others may play a (another kind of) game to feel relaxed. It shares the same factor, however, with the characteristics practical and pleasant. We had expected the character practical to constitute the same factor with the characteristics effective, efficient, and useful. This seemingly incongruity should be resolved by further researches.
The characteristic convenient seems to be more related with the environment in which a software game is played rather than the game itself, for example, with the process through which the user gets to be able to play the game. The mean value of the characteristic comfortable is larger than 3.0 too, although it is only very slightly correlated with the characteristic satisfaction. It seems to be more related with the environment in which a software game is played rather than the game itself too. It is very odd that these two characteristics form a factor together with the characteristic intelligent. It is one of the deficiencies of this research not to distinguish the characteristics associated with the software game itself and those chiefly associated with the system or environment in which the game is played. This shortcoming should be resolved by further researches too.
The characteristics with mean value under 3.0 and statistically insignificant correlation with the characteristic satisfactory (the characteristics appropriate, beautiful, beneficial, comfortable, dynamic, difficult, easy, educational, efficient, emotional, harmful, intelligent, original, pleasant, practical, realistic, trustworthy, useful)
163
can be interpreted that they are not important or relevant to the game software. Such characteristics encompass most traditional characteristics of existing usability models including SQuaRE. For an example, the empirical evidences show that the characteristic appropriate is not important. The characteristic appropriate recognizability of SQuaRE cannot be important or relevant for the game software.
The only exceptions are the characteristics satisfaction and effectiveness. This fact supports Koh and his colleagues’ colleagues’ [Koh and Jiang 2017; Koh and Koh 2018, Koh 2019] argument that the characteristic satisfactory can be used as an operational definition of usability, at least, for the game software. It is especially noticeable that the characteristic satisfaction reflects the user’s overall evaluation of the instance of his/her playing a software game while the other characteristics reflect the user’s evaluation of specific aspects of his/her playing instance or the software game that he/she played itself.
It is noticeable that the characteristic effective turned out to be statically correlated with the characteristic satisfaction even though its mean value is under 3.0. ‘Effective’ can have various meanings according to the goals of the users of software. For example, ‘effective’ may mean ‘being joyful’ for a game player, ‘completing some tasks’ for a worker, or ‘getting knowledge’ for a student. It is especially noticeable that the characteristics appropriate, educational, easy, or trustworthy may turn out to be important for educational software games.
In summary, the empirical evidences clearly show that the factors Joy, Stimulus, and Novelty are important for the game software and that most traditional characteristics of existing usability models including SQuaRE are neither important nor relevant for the game software. This conclusion also supports Koh and his colleagues’ [Koh and Jiang 2017; Koh and Koh 2018, Koh 2019] argument that usability should be variously and specifically defined for each type of software. Most existing usability models are too specific to be a generic model that can be applied to the general software.
ConclusionsIn this paper, 142 responses collected from undergraduate students of Business Administration School of Chungbuk National University during the period from 19 November to 3 December 2019 were used in an exploratory factor analysis with principal component method and varimax rotation using SPSS 24.0. The students were asked to
evaluate the most impressive game among the games they had played, if any, using 5-point rating scales (1-strongly disagree and 5-strongly agree). The satisfaction which the player evaluated on her/his experience of playing a game is used as the operational definition of playability. It is noticeable that characteristic satisfaction reflects the user’s overall evaluation of the instance of his/her playing a software game. The other characteristics included reflect the user’s evaluation of specific aspects of his/her playing experience instance or the software game that he/she played. The characteristics usefulness, trust, pleasure, and comfort and the sub-characteristics of satisfaction in the quality in use model of SQuaRE, are included in their adjective forms. The characteristic beautiful is included as the adjective form of user interface aesthetics which is a sub-characteristic of usability in the product quality model of SQuaRE. The characteristics effectiveness and efficiency are other important traditional characteristics of usability and their adjective forms (effective and efficient) are included. The characteristic easy are included as the adjective form of ease of use. The characteristics appropriate, beneficial, convenient, educational, and practical are included along with them. The characteristics difficult and harmful are included as the antonyms of the characteristics easy and beneficial, respectively, to increase reliably. Other characteristics are included on the authors’ individual judgement. Some of them are identified during the preliminary interviews of the survey.
The empirical evidences show that the factors Stimulus, Novelty, and, especially, Joy are the utmost important driving factors for the game software while most traditional characteristics of existing usability models including SQuaRE (for example, the characteristics appropriate recognizability, ease of use, comfort, effectiveness, efficiency, pleasure, trust, usefulness) are neither important nor relevant for the game software. the empirical evidences also support Koh and his colleagues’ [Koh and Jiang 2017; Koh and Koh 2018, Koh 2019] argument that usability should be variously and specifically defined for each specific type of software. Most existing usability models are too specific to be a generic model that can be applied to the general software. The empirical evidences also implies that ‘effective’ can have various meaning depending on the goals of using a software product and, hence, lacks validity and reliability. The empirical evidences also show that it is necessary for the characteristics included in this paper to be defined more rigorously.
164
The analysis in this research is never meant to be confirmatory nor conclusive. It is very exploratory. Although data, analysis, and interpretation of the research are reasonably valid, reliable, and meaningful, the conclusions should be confirmed and elaborated by further researches. Especially, the characteristics associated with the software game itself and those chiefly associated with the system or environment in which the game is played are not rigorously distinguished. This shortcoming should be resolved by further researches. A cause-and-effect relationship among the factors of usability may exist. This issue should be investigated by the further researches too.
References[1] Alnanih, R., O. Ormandjieva, T. Radhakrishnan,
“A New Quality-in-Use Model for Mobile User Interfaces,” Proceedings of Joint Conference of the 23nd International Workshop on Software Measurement (IWSM) and the Eighth International Conference on Software Process and Product Measurement (Mensura), 2013, pp.165-170.
[2] Boehm, B.W., Software Engineering Economics, Prentice Hall PTR: Upper Saddle River, NJ, USA, 1981.
[3] Foraker Labs, “Introduction to User-Centered Design,” http://www.usabilityfirst.com/about-usability/introduction-to-user-centered-design/, 2002 (reference date: 17/04/2017).
[4] Grady, R.B. Practical Software Metrics for Project Management and Process Improvement, Prentice-Hall, 1992
[5] González Sánchez, J.L., F. Montero Simarro, N. Padilla Zea, F.L. Guitierrez Vela, “Playability as Extension of Quality in Use in Video Games,” Proceedings of the Second International Workshop on the Interplay between Usability Evaluation and Software Development (I-USED'09), Uppsala, Sweden, August 24, 2009a.
[6] Gonzalez Sanchez, J.L., N.P. Zea, F.L. Gutierrez Vela, “Playability: How to Identify the Player Experience in a Vedio Game,” Proceedings of IFIP Conference on Human-Computer Interaction: Human-Computer Interaction – INTERACT 2009, 2009b, pp.356-359.
[7] Herrera, M., M.A. Moraga, I. Caballero, and C. Calero, “Quality in Use Model for Web Portals (QiUWeP),” In: Daniel F., Facca F.M. (eds) Current
Trends in Web Engineering. ICWE 2010, Lecture Notes in Computer Science, vol 6385, Springer: Berlin, Heidelberg, 2010, pp.91-101.
[8] ISO/IEC 9126-1:2001, Software Engineering – Product Quality – Part I: Quality Model, ISO, 2001.
[9] ISO/IEC 9241-11:1998, Ergonomic Requirements for Office Work with Visual Display Terminals (VDTs) – Part 11: Guidance on Usability, ISO, 1998.
[10] ISO/ IEC 25010:2011, Systems and Software Engineering – Systems and Software Quality Requirements and Evaluation (SQuaRE) – System and Software Quality Models, ISO, 2011.
[11] ISO/IEC 25021:2012, Systems and Software Engineering – Systems and Software Quality Requirements and Evaluation (SQuaRE) – Quality Measure Elements, ISO, 2012.
[12] ISO/IEC 25022:2016, Systems and Software Engineering – Systems and Software Quality Requirements and Evaluation (SQuaRE) – Measurement of Quality in Use, ISO, 2016.
[13] ISO/IEC 25023:2016, Systems and Software Engineering – Systems and Software Quality Requirements and Evaluation (SQuaRE) – Measurement of system and Software Product Quality, ISO, 2016.
[14] Koh, S., “Cause-and-Effect Perspective on Software Quality: Application to ISO/IEC 25000 Series SQuaRE’s Product Quality Model,” Journal of Information Technology Applications & Management, Vol.23, No.3, Sept. 2016, pp.71-86.
[15] Koh, S., “The Checklist for System and Software Product Quality Implied in the Product Quality Model of ISO/IEC 25000 Series SQuaRE,” Proceedings of 17th International Conference on IT Applications and Management: Babolsar, Iran, 22-23 February 2017a, pp.126-136.
[16] Koh. S., “The Principle of One Quality View and Division of Product Quality Model of ISO/IEC 25000 Series SQuaRE,” Asian Journal of Information and Communications, Vol.9, No.1, 2017b, pp.87-101.
[17] Koh, S., “An Activity-Centric Quality Model of Software,” Journal of Information Technology Applications & Management, Vol.26, No.2, April 2019, pp.111-123.
[18] Koh, S., J. Jiang, “What should Using a Software Product and Usability of the Software product be?”
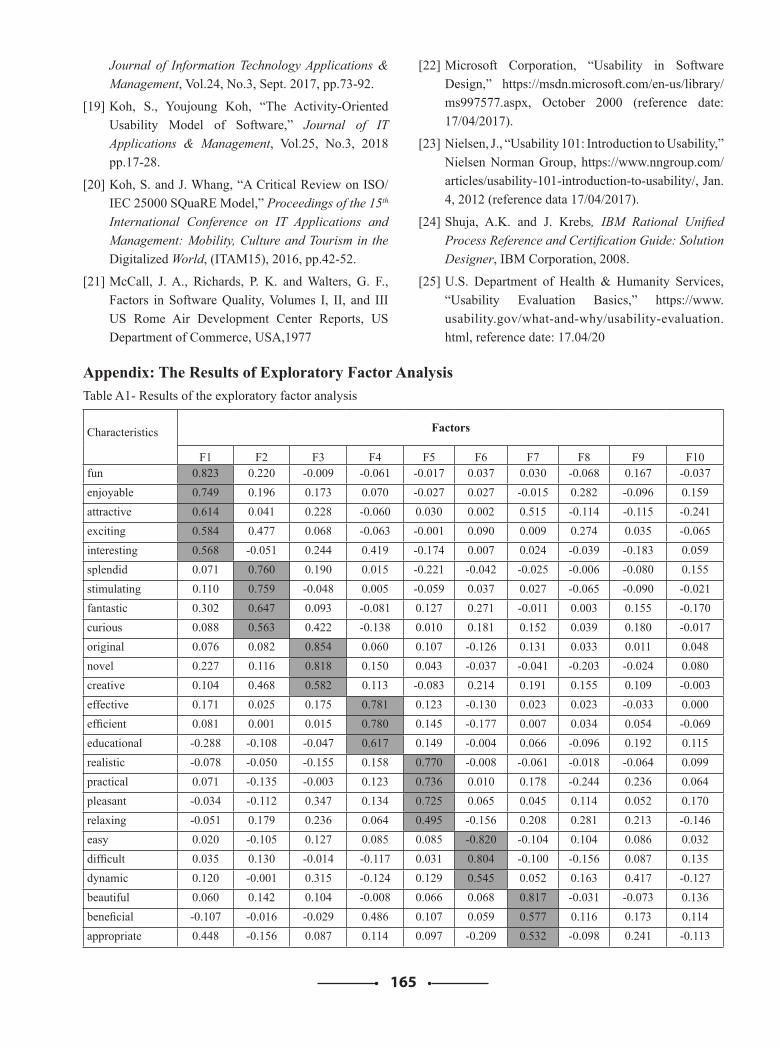
165
Journal of Information Technology Applications & Management, Vol.24, No.3, Sept. 2017, pp.73-92.
[19] Koh, S., Youjoung Koh, “The Activity-Oriented Usability Model of Software,” Journal of IT Applications & Management, Vol.25, No.3, 2018 pp.17-28.
[20] Koh, S. and J. Whang, “A Critical Review on ISO/IEC 25000 SQuaRE Model,” Proceedings of the 15th International Conference on IT Applications and Management: Mobility, Culture and Tourism in the Digitalized World, (ITAM15), 2016, pp.42-52.
[21] McCall, J. A., Richards, P. K. and Walters, G. F., Factors in Software Quality, Volumes I, II, and III US Rome Air Development Center Reports, US Department of Commerce, USA,1977
[22] Microsoft Corporation, “Usability in Software Design,” https://msdn.microsoft.com/en-us/library/ms997577.aspx, October 2000 (reference date: 17/04/2017).
[23] Nielsen, J., “Usability 101: Introduction to Usability,” Nielsen Norman Group, https://www.nngroup.com/articles/usability-101-introduction-to-usability/, Jan. 4, 2012 (reference data 17/04/2017).
[24] Shuja, A.K. and J. Krebs, IBM Rational Unified Process Reference and Certification Guide: Solution Designer, IBM Corporation, 2008.
[25] U.S. Department of Health & Humanity Services, “Usability Evaluation Basics,” https://www.usability.gov/what-and-why/usability-evaluation.html, reference date: 17.04/20
Appendix: The Results of Exploratory Factor AnalysisTable A1- Results of the exploratory factor analysis
Characteristics Factors
F1 F2 F3 F4 F5 F6 F7 F8 F9 F10fun 0.823 0.220 -0.009 -0.061 -0.017 0.037 0.030 -0.068 0.167 -0.037enjoyable 0.749 0.196 0.173 0.070 -0.027 0.027 -0.015 0.282 -0.096 0.159attractive 0.614 0.041 0.228 -0.060 0.030 0.002 0.515 -0.114 -0.115 -0.241exciting 0.584 0.477 0.068 -0.063 -0.001 0.090 0.009 0.274 0.035 -0.065interesting 0.568 -0.051 0.244 0.419 -0.174 0.007 0.024 -0.039 -0.183 0.059splendid 0.071 0.760 0.190 0.015 -0.221 -0.042 -0.025 -0.006 -0.080 0.155stimulating 0.110 0.759 -0.048 0.005 -0.059 0.037 0.027 -0.065 -0.090 -0.021fantastic 0.302 0.647 0.093 -0.081 0.127 0.271 -0.011 0.003 0.155 -0.170curious 0.088 0.563 0.422 -0.138 0.010 0.181 0.152 0.039 0.180 -0.017original 0.076 0.082 0.854 0.060 0.107 -0.126 0.131 0.033 0.011 0.048novel 0.227 0.116 0.818 0.150 0.043 -0.037 -0.041 -0.203 -0.024 0.080creative 0.104 0.468 0.582 0.113 -0.083 0.214 0.191 0.155 0.109 -0.003effective 0.171 0.025 0.175 0.781 0.123 -0.130 0.023 0.023 -0.033 0.000efficient 0.081 0.001 0.015 0.780 0.145 -0.177 0.007 0.034 0.054 -0.069educational -0.288 -0.108 -0.047 0.617 0.149 -0.004 0.066 -0.096 0.192 0.115realistic -0.078 -0.050 -0.155 0.158 0.770 -0.008 -0.061 -0.018 -0.064 0.099practical 0.071 -0.135 -0.003 0.123 0.736 0.010 0.178 -0.244 0.236 0.064pleasant -0.034 -0.112 0.347 0.134 0.725 0.065 0.045 0.114 0.052 0.170relaxing -0.051 0.179 0.236 0.064 0.495 -0.156 0.208 0.281 0.213 -0.146easy 0.020 -0.105 0.127 0.085 0.085 -0.820 -0.104 0.104 0.086 0.032difficult 0.035 0.130 -0.014 -0.117 0.031 0.804 -0.100 -0.156 0.087 0.135dynamic 0.120 -0.001 0.315 -0.124 0.129 0.545 0.052 0.163 0.417 -0.127beautiful 0.060 0.142 0.104 -0.008 0.066 0.068 0.817 -0.031 -0.073 0.136beneficial -0.107 -0.016 -0.029 0.486 0.107 0.059 0.577 0.116 0.173 0.114appropriate 0.448 -0.156 0.087 0.114 0.097 -0.209 0.532 -0.098 0.241 -0.113
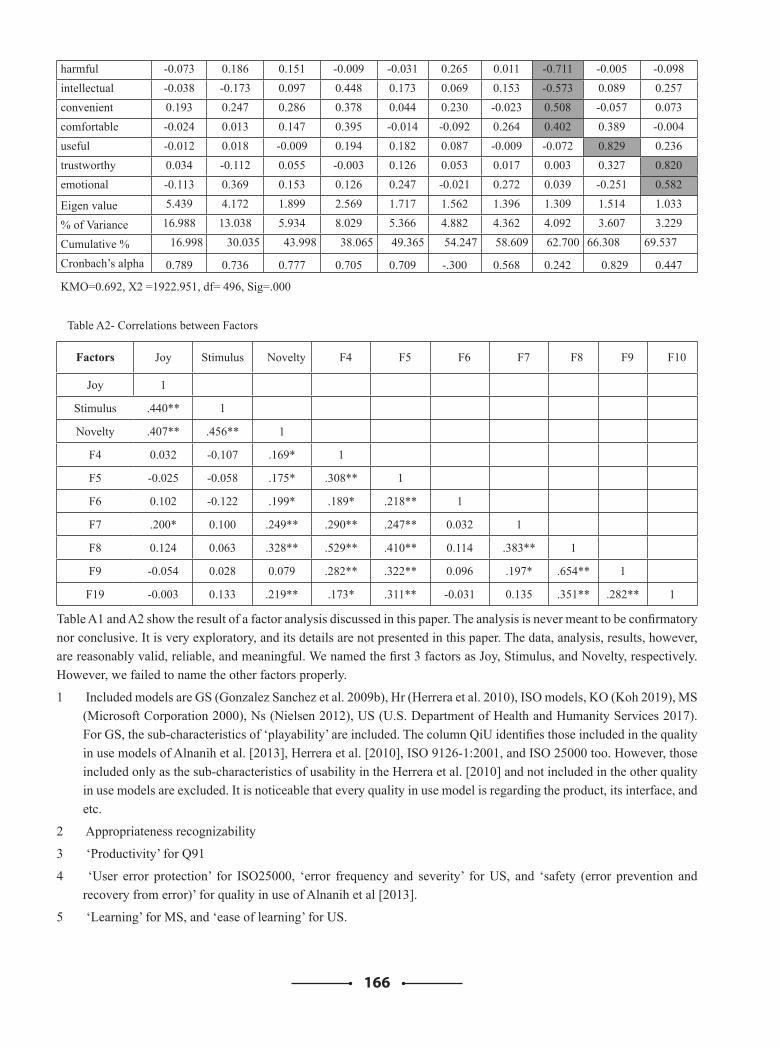
166
harmful -0.073 0.186 0.151 -0.009 -0.031 0.265 0.011 -0.711 -0.005 -0.098intellectual -0.038 -0.173 0.097 0.448 0.173 0.069 0.153 -0.573 0.089 0.257convenient 0.193 0.247 0.286 0.378 0.044 0.230 -0.023 0.508 -0.057 0.073comfortable -0.024 0.013 0.147 0.395 -0.014 -0.092 0.264 0.402 0.389 -0.004useful -0.012 0.018 -0.009 0.194 0.182 0.087 -0.009 -0.072 0.829 0.236trustworthy 0.034 -0.112 0.055 -0.003 0.126 0.053 0.017 0.003 0.327 0.820emotional -0.113 0.369 0.153 0.126 0.247 -0.021 0.272 0.039 -0.251 0.582
Eigen value 5.439 4.172 1.899 2.569 1.717 1.562 1.396 1.309 1.514 1.033
% of Variance 16.988 13.038 5.934 8.029 5.366 4.882 4.362 4.092 3.607 3.229
Cumulative % 16.998 30.035 43.998 38.065 49.365 54.247 58.609 62.700 66.308 69.537
Cronbach’s alpha 0.789 0.736 0.777 0.705 0.709 -.300 0.568 0.242 0.829 0.447
KMO=0.692, X2 =1922.951, df= 496, Sig=.000
Table A2- Correlations between Factors
Factors Joy Stimulus Novelty F4 F5 F6 F7 F8 F9 F10
Joy 1
Stimulus .440** 1
Novelty .407** .456** 1
F4 0.032 -0.107 .169* 1
F5 -0.025 -0.058 .175* .308** 1
F6 0.102 -0.122 .199* .189* .218** 1
F7 .200* 0.100 .249** .290** .247** 0.032 1
F8 0.124 0.063 .328** .529** .410** 0.114 .383** 1
F9 -0.054 0.028 0.079 .282** .322** 0.096 .197* .654** 1
F19 -0.003 0.133 .219** .173* .311** -0.031 0.135 .351** .282** 1
Table A1 and A2 show the result of a factor analysis discussed in this paper. The analysis is never meant to be confirmatory nor conclusive. It is very exploratory, and its details are not presented in this paper. The data, analysis, results, however, are reasonably valid, reliable, and meaningful. We named the first 3 factors as Joy, Stimulus, and Novelty, respectively. However, we failed to name the other factors properly.
1 Included models are GS (Gonzalez Sanchez et al. 2009b), Hr (Herrera et al. 2010), ISO models, KO (Koh 2019), MS (Microsoft Corporation 2000), Ns (Nielsen 2012), US (U.S. Department of Health and Humanity Services 2017). For GS, the sub-characteristics of ‘playability’ are included. The column QiU identifies those included in the quality in use models of Alnanih et al. [2013], Herrera et al. [2010], ISO 9126-1:2001, and ISO 25000 too. However, those included only as the sub-characteristics of usability in the Herrera et al. [2010] and not included in the other quality in use models are excluded. It is noticeable that every quality in use model is regarding the product, its interface, and etc.
2 Appropriateness recognizability
3 ‘Productivity’ for Q91
4 ‘User error protection’ for ISO25000, ‘error frequency and severity’ for US, and ‘safety (error prevention and recovery from error)’ for quality in use of Alnanih et al [2013].
5 ‘Learning’ for MS, and ‘ease of learning’ for US.
167
Decision Support System for Prognosis and Treatment of Lung Cancer Based on Big Data
Jiaying Chenga, Wenbo Xub, Fang Xiec, Shuangshuang Daid and Weihui Daie
a Dazhong Transportation (Group) Co. Ltd., Shanghai 200030, ChinaTel: +86-15502138848, E-mail: [email protected]
b Software School, Fudan University, Shanghai 200433, ChinaTel: +86-21-25011241, E-mail: [email protected]
c Shanghai Billow Information Science and Technology, Co. Ltd, Shanghai, ChinaTel: +86-13647397816, E-mail: [email protected]
d College of medical devices, Shanghai University of Medicine & Health Sciences, Shanghai, ChinaTel: +86- 18816519252, E-mail: [email protected]
e School of Management, Fudan University, Shanghai 200433, ChinaTel: +86-21-25011241, E-mail: [email protected]
AbstractLung cancer has become one of the common and serious diseases threatening human health. Its prognosis and treatment involve a series of factors which have complex influences and should be considered comprehensively in order to conduct a personalized optimal treatment plan. Based on the big data collected by Hadoop platform, this paper studied the above factors and proposed an effective prognosis method, which took Cox-model to evaluate the overall survival probability and employed BP-GA neural network to find the best treatment regimen with the longest prediction of survival time. For clinical application, a decision-making tree was presented for improving the current clinical pathway. The decision support system with cloud platform and micro service architecture were designed for prognosis and treatment accessed by doctor’s workbench system and mobile terminals.
KeywordsLung Cancer, Prognosis and Treatment, Decision Support System, Clinical Pathway.IntroductionWith the changes of people’s living environment and lifestyle in modern society, the incidences of diseases such as high blood pressure, diabetes, coronary heart disease and cancer, have soared during the past decade. As the major disease threatening human health, cancer increased with the new cases by more than 70% in the ten years from 1999 to 2008 according to the estimation by World Health Organization (WHO)[1][2]. In the meantime, the cancer spectrum has changed dramatically, from being dominated by gastrointestinal malignancies to lung and breast cancers. At present, lung cancer, stomach cancer, colorectal cancer, liver cancer and esophageal cancer are the most common cancers in China. Among which, lung cancer is acknowledged as the widely concerned health threats, leading to 1.6 million deaths yearly[3]. Researchers point out that lung cancer rank top among different countries[4][5], whose mortality remaines 25% in the United States and 30% in China[4].
In order to make a correct treatment plan for different patients of lung cancers, the prognosis of disease’s development and its influence factors should be evaluated and analyzed accurately. Existing studies have shown that the above influence factors involve many aspects such as pathological classification, tumor’s diameter and differentiation’s degree, invasive degree of visceral pleura, and patient’s age, sex, physical conditions, etc., which are all important to affect the prognosis and treatment[6]-[8]. In the traditional clinical pathway, we can only consider the linear classification of those factors or divide them into different stages. This easily leads to the imprecise decision making on conducting an optimal treatment plan for different patients, because the above factors usually have complex nonlinear correlations, and on the other hand, the implied information contained in various physiological and imageological examinations can’t be utilized sufficiently.
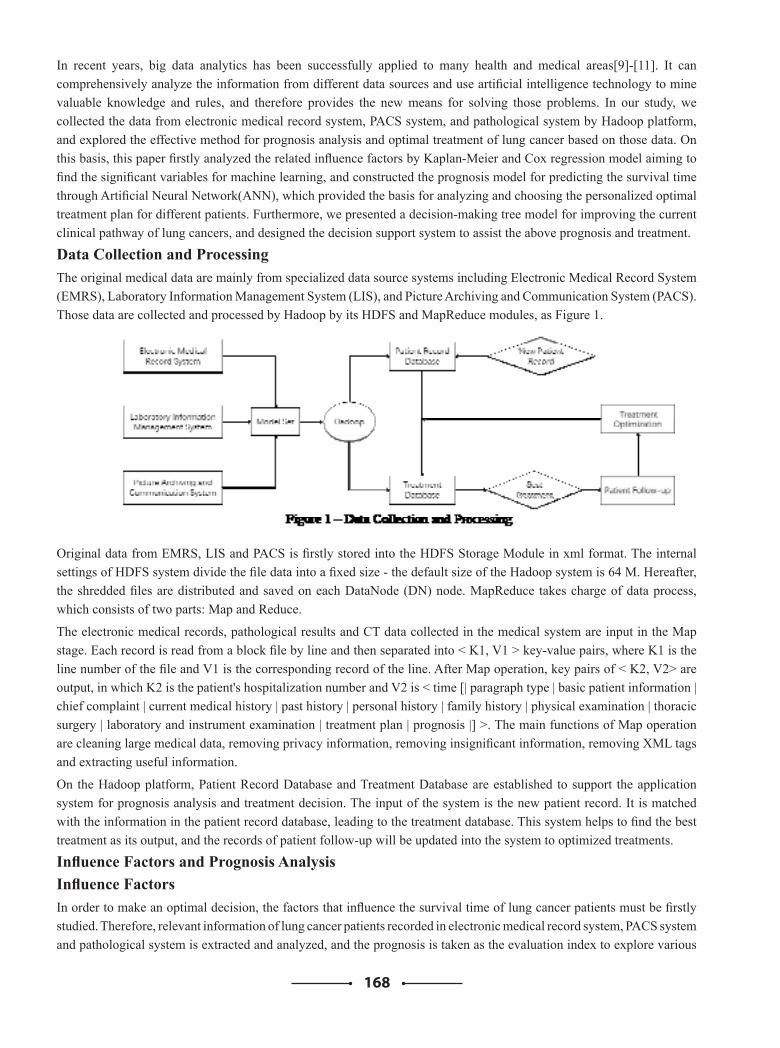
168
In recent years, big data analytics has been successfully applied to many health and medical areas[9]-[11]. It can comprehensively analyze the information from different data sources and use artificial intelligence technology to mine valuable knowledge and rules, and therefore provides the new means for solving those problems. In our study, we collected the data from electronic medical record system, PACS system, and pathological system by Hadoop platform, and explored the effective method for prognosis analysis and optimal treatment of lung cancer based on those data. On this basis, this paper firstly analyzed the related influence factors by Kaplan-Meier and Cox regression model aiming to find the significant variables for machine learning, and constructed the prognosis model for predicting the survival time through Artificial Neural Network(ANN), which provided the basis for analyzing and choosing the personalized optimal treatment plan for different patients. Furthermore, we presented a decision-making tree model for improving the current clinical pathway of lung cancers, and designed the decision support system to assist the above prognosis and treatment.
Data Collection and ProcessingThe original medical data are mainly from specialized data source systems including Electronic Medical Record System (EMRS), Laboratory Information Management System (LIS), and Picture Archiving and Communication System (PACS). Those data are collected and processed by Hadoop by its HDFS and MapReduce modules, as Figure 1.
Original data from EMRS, LIS and PACS is firstly stored into the HDFS Storage Module in xml format. The internal settings of HDFS system divide the file data into a fixed size - the default size of the Hadoop system is 64 M. Hereafter, the shredded files are distributed and saved on each DataNode (DN) node. MapReduce takes charge of data process, which consists of two parts: Map and Reduce.
The electronic medical records, pathological results and CT data collected in the medical system are input in the Map stage. Each record is read from a block file by line and then separated into < K1, V1 > key-value pairs, where K1 is the line number of the file and V1 is the corresponding record of the line. After Map operation, key pairs of < K2, V2> are output, in which K2 is the patient's hospitalization number and V2 is < time [| paragraph type | basic patient information | chief complaint | current medical history | past history | personal history | family history | physical examination | thoracic surgery | laboratory and instrument examination | treatment plan | prognosis |] >. The main functions of Map operation are cleaning large medical data, removing privacy information, removing insignificant information, removing XML tags and extracting useful information.
On the Hadoop platform, Patient Record Database and Treatment Database are established to support the application system for prognosis analysis and treatment decision. The input of the system is the new patient record. It is matched with the information in the patient record database, leading to the treatment database. This system helps to find the best treatment as its output, and the records of patient follow-up will be updated into the system to optimized treatments.
Influence Factors and Prognosis Analysis Influence FactorsIn order to make an optimal decision, the factors that influence the survival time of lung cancer patients must be firstly studied. Therefore, relevant information of lung cancer patients recorded in electronic medical record system, PACS system and pathological system is extracted and analyzed, and the prognosis is taken as the evaluation index to explore various
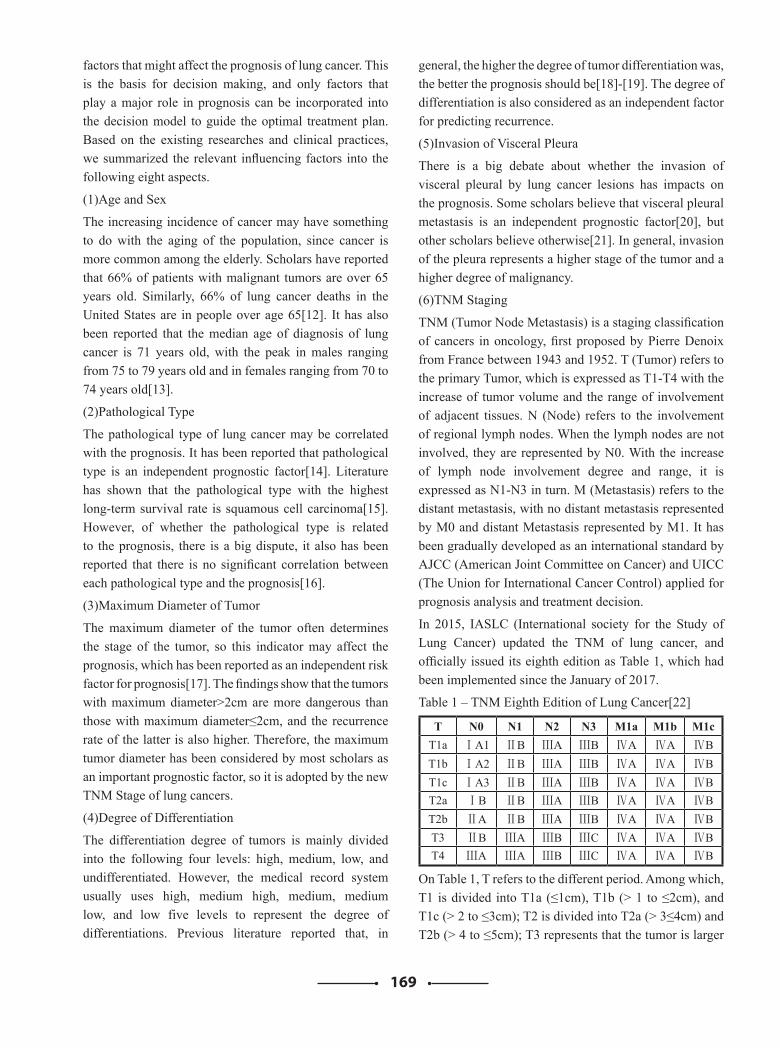
169
factors that might affect the prognosis of lung cancer. This is the basis for decision making, and only factors that play a major role in prognosis can be incorporated into the decision model to guide the optimal treatment plan. Based on the existing researches and clinical practices, we summarized the relevant influencing factors into the following eight aspects.
(1)Age and Sex
The increasing incidence of cancer may have something to do with the aging of the population, since cancer is more common among the elderly. Scholars have reported that 66% of patients with malignant tumors are over 65 years old. Similarly, 66% of lung cancer deaths in the United States are in people over age 65[12]. It has also been reported that the median age of diagnosis of lung cancer is 71 years old, with the peak in males ranging from 75 to 79 years old and in females ranging from 70 to 74 years old[13].
(2)Pathological Type
The pathological type of lung cancer may be correlated with the prognosis. It has been reported that pathological type is an independent prognostic factor[14]. Literature has shown that the pathological type with the highest long-term survival rate is squamous cell carcinoma[15]. However, of whether the pathological type is related to the prognosis, there is a big dispute, it also has been reported that there is no significant correlation between each pathological type and the prognosis[16].
(3)Maximum Diameter of Tumor
The maximum diameter of the tumor often determines the stage of the tumor, so this indicator may affect the prognosis, which has been reported as an independent risk factor for prognosis[17]. The findings show that the tumors with maximum diameter>2cm are more dangerous than those with maximum diameter≤2cm, and the recurrence rate of the latter is also higher. Therefore, the maximum tumor diameter has been considered by most scholars as an important prognostic factor, so it is adopted by the new TNM Stage of lung cancers.
(4)Degree of Differentiation
The differentiation degree of tumors is mainly divided into the following four levels: high, medium, low, and undifferentiated. However, the medical record system usually uses high, medium high, medium, medium low, and low five levels to represent the degree of differentiations. Previous literature reported that, in
general, the higher the degree of tumor differentiation was, the better the prognosis should be[18]-[19]. The degree of differentiation is also considered as an independent factor for predicting recurrence.
(5)Invasion of Visceral Pleura
There is a big debate about whether the invasion of visceral pleural by lung cancer lesions has impacts on the prognosis. Some scholars believe that visceral pleural metastasis is an independent prognostic factor[20], but other scholars believe otherwise[21]. In general, invasion of the pleura represents a higher stage of the tumor and a higher degree of malignancy.
(6)TNM Staging
TNM (Tumor Node Metastasis) is a staging classification of cancers in oncology, first proposed by Pierre Denoix from France between 1943 and 1952. T (Tumor) refers to the primary Tumor, which is expressed as T1-T4 with the increase of tumor volume and the range of involvement of adjacent tissues. N (Node) refers to the involvement of regional lymph nodes. When the lymph nodes are not involved, they are represented by N0. With the increase of lymph node involvement degree and range, it is expressed as N1-N3 in turn. M (Metastasis) refers to the distant metastasis, with no distant metastasis represented by M0 and distant Metastasis represented by M1. It has been gradually developed as an international standard by AJCC (American Joint Committee on Cancer) and UICC (The Union for International Cancer Control) applied for prognosis analysis and treatment decision.
In 2015, IASLC (International society for the Study of Lung Cancer) updated the TNM of lung cancer, and officially issued its eighth edition as Table 1, which had been implemented since the January of 2017.
Table 1 – TNM Eighth Edition of Lung Cancer[22]
T N0 N1 N2 N3 M1a M1b M1cT1a ⅠA1 ⅡB ⅢA ⅢB ⅣA ⅣA ⅣBT1b ⅠA2 ⅡB ⅢA ⅢB ⅣA ⅣA ⅣBT1c ⅠA3 ⅡB ⅢA ⅢB ⅣA ⅣA ⅣBT2a ⅠB ⅡB ⅢA ⅢB ⅣA ⅣA ⅣBT2b ⅡA ⅡB ⅢA ⅢB ⅣA ⅣA ⅣBT3 ⅡB ⅢA ⅢB ⅢC ⅣA ⅣA ⅣBT4 ⅢA ⅢA ⅢB ⅢC ⅣA ⅣA ⅣB
On Table 1, T refers to the different period. Among which, T1 is divided into T1a (≤1cm), T1b (> 1 to ≤2cm), and T1c (> 2 to ≤3cm); T2 is divided into T2a (> 3≤4cm) and T2b (> 4 to ≤5cm); T3 represents that the tumor is larger
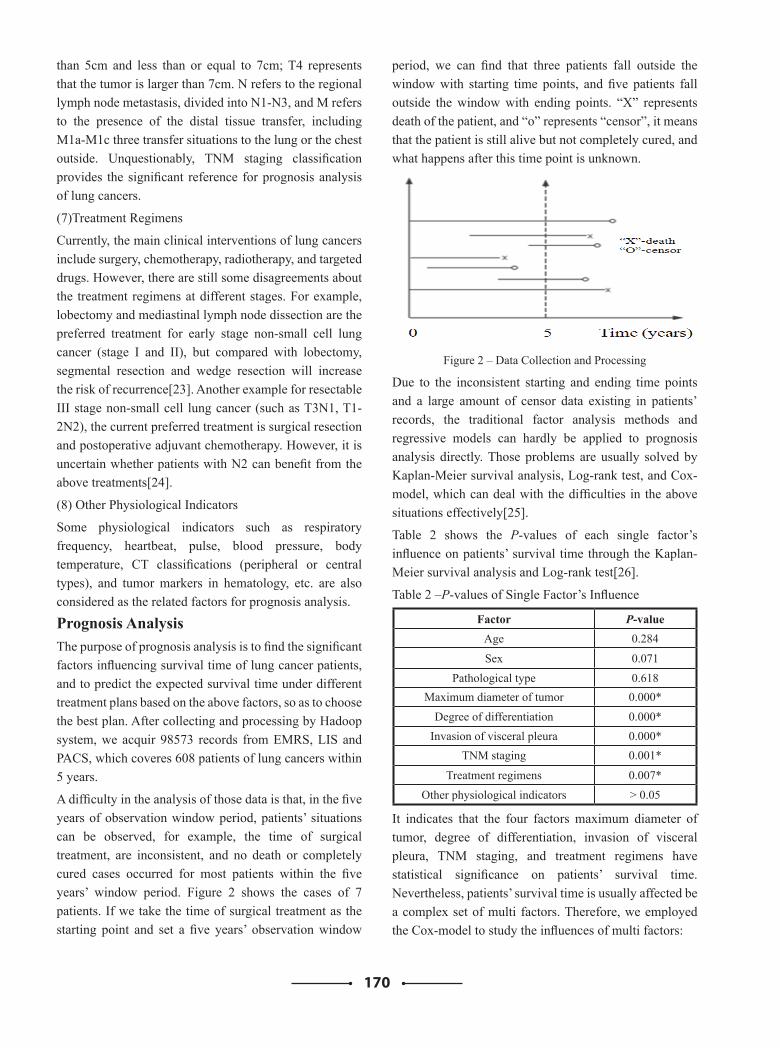
170
than 5cm and less than or equal to 7cm; T4 represents that the tumor is larger than 7cm. N refers to the regional lymph node metastasis, divided into N1-N3, and M refers to the presence of the distal tissue transfer, including M1a-M1c three transfer situations to the lung or the chest outside. Unquestionably, TNM staging classification provides the significant reference for prognosis analysis of lung cancers.
(7)Treatment Regimens
Currently, the main clinical interventions of lung cancers include surgery, chemotherapy, radiotherapy, and targeted drugs. However, there are still some disagreements about the treatment regimens at different stages. For example, lobectomy and mediastinal lymph node dissection are the preferred treatment for early stage non-small cell lung cancer (stage I and II), but compared with lobectomy, segmental resection and wedge resection will increase the risk of recurrence[23]. Another example for resectable III stage non-small cell lung cancer (such as T3N1, T1-2N2), the current preferred treatment is surgical resection and postoperative adjuvant chemotherapy. However, it is uncertain whether patients with N2 can benefit from the above treatments[24].
(8) Other Physiological Indicators
Some physiological indicators such as respiratory frequency, heartbeat, pulse, blood pressure, body temperature, CT classifications (peripheral or central types), and tumor markers in hematology, etc. are also considered as the related factors for prognosis analysis.
Prognosis AnalysisThe purpose of prognosis analysis is to find the significant factors influencing survival time of lung cancer patients, and to predict the expected survival time under different treatment plans based on the above factors, so as to choose the best plan. After collecting and processing by Hadoop system, we acquir 98573 records from EMRS, LIS and PACS, which coveres 608 patients of lung cancers within 5 years.
A difficulty in the analysis of those data is that, in the five years of observation window period, patients’ situations can be observed, for example, the time of surgical treatment, are inconsistent, and no death or completely cured cases occurred for most patients within the five years’ window period. Figure 2 shows the cases of 7 patients. If we take the time of surgical treatment as the starting point and set a five years’ observation window
period, we can find that three patients fall outside the window with starting time points, and five patients fall outside the window with ending points. “X” represents death of the patient, and “o” represents “censor”, it means that the patient is still alive but not completely cured, and what happens after this time point is unknown.
Figure 2 – Data Collection and Processing
Due to the inconsistent starting and ending time points and a large amount of censor data existing in patients’ records, the traditional factor analysis methods and regressive models can hardly be applied to prognosis analysis directly. Those problems are usually solved by Kaplan-Meier survival analysis, Log-rank test, and Cox-model, which can deal with the difficulties in the above situations effectively[25].
Table 2 shows the P-values of each single factor’s influence on patients’ survival time through the Kaplan-Meier survival analysis and Log-rank test[26].
Table 2 –P-values of Single Factor’s Influence
Factor P-valueAge 0.284
Sex 0.071Pathological type 0.618
Maximum diameter of tumor 0.000*
Degree of differentiation 0.000*Invasion of visceral pleura 0.000*
TNM staging 0.001*
Treatment regimens 0.007*Other physiological indicators > 0.05
It indicates that the four factors maximum diameter of tumor, degree of differentiation, invasion of visceral pleura, TNM staging, and treatment regimens have statistical significance on patients’ survival time. Nevertheless, patients’ survival time is usually affected be a complex set of multi factors. Therefore, we employed the Cox-model to study the influences of multi factors:
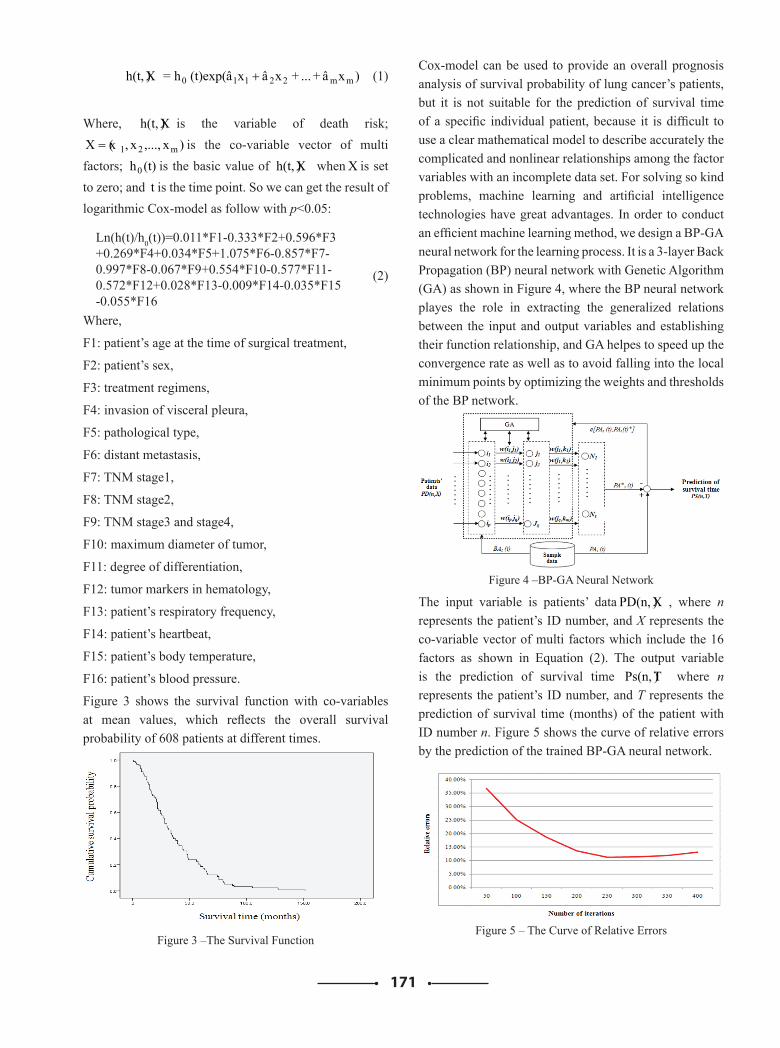
171
)xâ+...+xâx(t)exp(â h=X)h(t, mm22110 + (1)
Where, X)h(t, is the variable of death risk; )x,...,x,(xX m21= is the co-variable vector of multi
factors; (t)h0 is the basic value of X)h(t, when X is set to zero; and t is the time point. So we can get the result of logarithmic Cox-model as follow with p<0.05:
(2)
Where,
F1: patient’s age at the time of surgical treatment,
F2: patient’s sex,
F3: treatment regimens,
F4: invasion of visceral pleura,
F5: pathological type,
F6: distant metastasis,
F7: TNM stage1,
F8: TNM stage2,
F9: TNM stage3 and stage4,
F10: maximum diameter of tumor,
F11: degree of differentiation,
F12: tumor markers in hematology,
F13: patient’s respiratory frequency,
F14: patient’s heartbeat,
F15: patient’s body temperature,
F16: patient’s blood pressure.
Figure 3 shows the survival function with co-variables at mean values, which reflects the overall survival probability of 608 patients at different times.
Figure 3 –The Survival Function
Ln(h(t)/h0(t))=0.011*F1-0.333*F2+0.596*F3+0.269*F4+0.034*F5+1.075*F6-0.857*F7-0.997*F8-0.067*F9+0.554*F10-0.577*F11-0.572*F12+0.028*F13-0.009*F14-0.035*F15 -0.055*F16
Cox-model can be used to provide an overall prognosis analysis of survival probability of lung cancer’s patients, but it is not suitable for the prediction of survival time of a specific individual patient, because it is difficult to use a clear mathematical model to describe accurately the complicated and nonlinear relationships among the factor variables with an incomplete data set. For solving so kind problems, machine learning and artificial intelligence technologies have great advantages. In order to conduct an efficient machine learning method, we design a BP-GA neural network for the learning process. It is a 3-layer Back Propagation (BP) neural network with Genetic Algorithm (GA) as shown in Figure 4, where the BP neural network playes the role in extracting the generalized relations between the input and output variables and establishing their function relationship, and GA helpes to speed up the convergence rate as well as to avoid falling into the local minimum points by optimizing the weights and thresholds of the BP network.
Figure 4 –BP-GA Neural Network
The input variable is patients’ data X)PD(n, , where n represents the patient’s ID number, and X represents the co-variable vector of multi factors which include the 16 factors as shown in Equation (2). The output variable is the prediction of survival time T)Ps(n, where n represents the patient’s ID number, and T represents the prediction of survival time (months) of the patient with ID number n. Figure 5 shows the curve of relative errors by the prediction of the trained BP-GA neural network.
Figure 5 – The Curve of Relative Errors
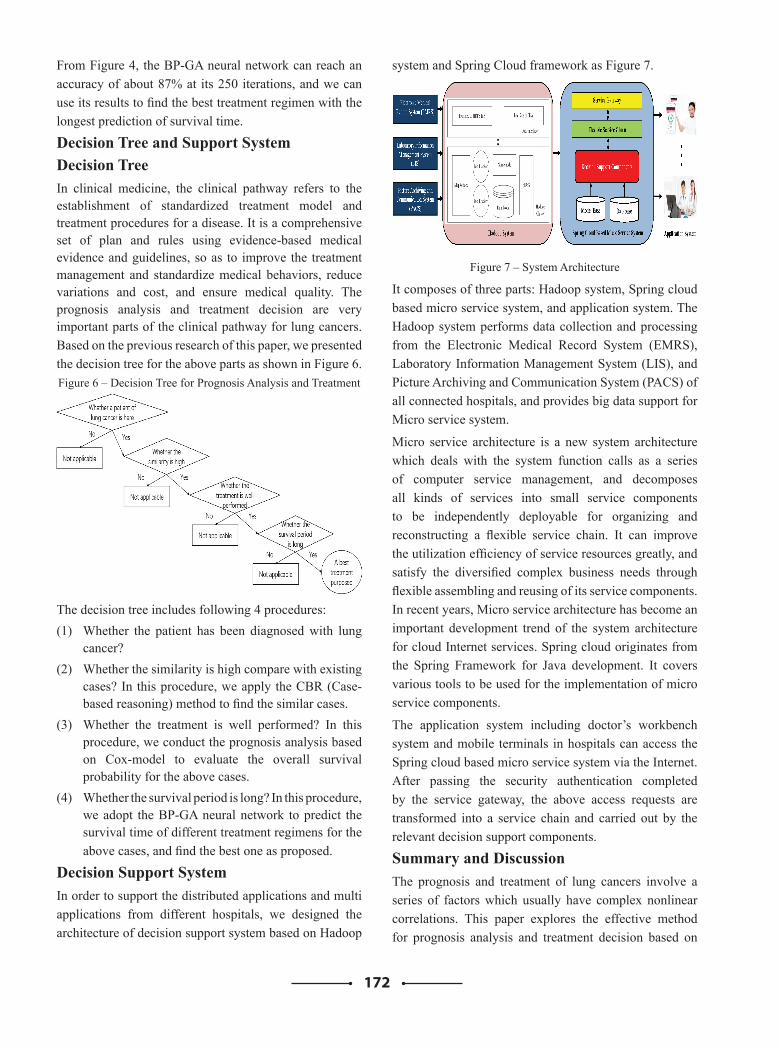
172
From Figure 4, the BP-GA neural network can reach an accuracy of about 87% at its 250 iterations, and we can use its results to find the best treatment regimen with the longest prediction of survival time.
Decision Tree and Support SystemDecision TreeIn clinical medicine, the clinical pathway refers to the establishment of standardized treatment model and treatment procedures for a disease. It is a comprehensive set of plan and rules using evidence-based medical evidence and guidelines, so as to improve the treatment management and standardize medical behaviors, reduce variations and cost, and ensure medical quality. The prognosis analysis and treatment decision are very important parts of the clinical pathway for lung cancers. Based on the previous research of this paper, we presented the decision tree for the above parts as shown in Figure 6.Figure 6 – Decision Tree for Prognosis Analysis and Treatment
The decision tree includes following 4 procedures:(1) Whether the patient has been diagnosed with lung
cancer?(2) Whether the similarity is high compare with existing
cases? In this procedure, we apply the CBR (Case-based reasoning) method to find the similar cases.
(3) Whether the treatment is well performed? In this procedure, we conduct the prognosis analysis based on Cox-model to evaluate the overall survival probability for the above cases.
(4) Whether the survival period is long? In this procedure, we adopt the BP-GA neural network to predict the survival time of different treatment regimens for the above cases, and find the best one as proposed.
Decision Support SystemIn order to support the distributed applications and multi applications from different hospitals, we designed the architecture of decision support system based on Hadoop
system and Spring Cloud framework as Figure 7.
Figure 7 – System Architecture
It composes of three parts: Hadoop system, Spring cloud based micro service system, and application system. The Hadoop system performs data collection and processing from the Electronic Medical Record System (EMRS), Laboratory Information Management System (LIS), and Picture Archiving and Communication System (PACS) of all connected hospitals, and provides big data support for Micro service system.
Micro service architecture is a new system architecture which deals with the system function calls as a series of computer service management, and decomposes all kinds of services into small service components to be independently deployable for organizing and reconstructing a flexible service chain. It can improve the utilization efficiency of service resources greatly, and satisfy the diversified complex business needs through flexible assembling and reusing of its service components. In recent years, Micro service architecture has become an important development trend of the system architecture for cloud Internet services. Spring cloud originates from the Spring Framework for Java development. It covers various tools to be used for the implementation of micro service components.
The application system including doctor’s workbench system and mobile terminals in hospitals can access the Spring cloud based micro service system via the Internet. After passing the security authentication completed by the service gateway, the above access requests are transformed into a service chain and carried out by the relevant decision support components.
Summary and DiscussionThe prognosis and treatment of lung cancers involve a series of factors which usually have complex nonlinear correlations. This paper explores the effective method for prognosis analysis and treatment decision based on
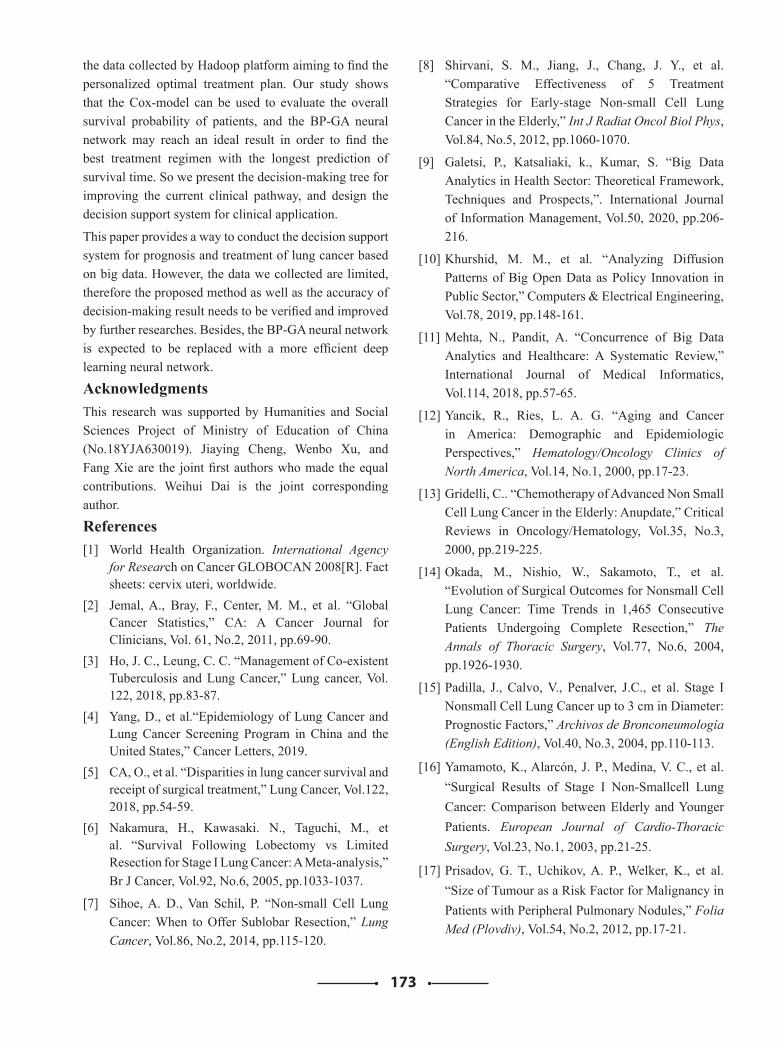
173
the data collected by Hadoop platform aiming to find the personalized optimal treatment plan. Our study shows that the Cox-model can be used to evaluate the overall survival probability of patients, and the BP-GA neural network may reach an ideal result in order to find the best treatment regimen with the longest prediction of survival time. So we present the decision-making tree for improving the current clinical pathway, and design the decision support system for clinical application.
This paper provides a way to conduct the decision support system for prognosis and treatment of lung cancer based on big data. However, the data we collected are limited, therefore the proposed method as well as the accuracy of decision-making result needs to be verified and improved by further researches. Besides, the BP-GA neural network is expected to be replaced with a more efficient deep learning neural network.
AcknowledgmentsThis research was supported by Humanities and Social Sciences Project of Ministry of Education of China (No.18YJA630019). Jiaying Cheng, Wenbo Xu, and Fang Xie are the joint first authors who made the equal contributions. Weihui Dai is the joint corresponding author.
References[1] World Health Organization. International Agency
for Research on Cancer GLOBOCAN 2008[R]. Fact sheets: cervix uteri, worldwide.
[2] Jemal, A., Bray, F., Center, M. M., et al. “Global Cancer Statistics,” CA: A Cancer Journal for Clinicians, Vol. 61, No.2, 2011, pp.69-90.
[3] Ho, J. C., Leung, C. C. “Management of Co-existent Tuberculosis and Lung Cancer,” Lung cancer, Vol. 122, 2018, pp.83-87.
[4] Yang, D., et al.“Epidemiology of Lung Cancer and Lung Cancer Screening Program in China and the United States,” Cancer Letters, 2019.
[5] CA, O., et al. “Disparities in lung cancer survival and receipt of surgical treatment,” Lung Cancer, Vol.122, 2018, pp.54-59.
[6] Nakamura, H., Kawasaki. N., Taguchi, M., et al. “Survival Following Lobectomy vs Limited Resection for Stage I Lung Cancer: A Meta-analysis,” Br J Cancer, Vol.92, No.6, 2005, pp.1033-1037.
[7] Sihoe, A. D., Van Schil, P. “Non-small Cell Lung Cancer: When to Offer Sublobar Resection,” Lung Cancer, Vol.86, No.2, 2014, pp.115-120.
[8] Shirvani, S. M., Jiang, J., Chang, J. Y., et al. “Comparative Effectiveness of 5 Treatment Strategies for Early-stage Non-small Cell Lung Cancer in the Elderly,” Int J Radiat Oncol Biol Phys, Vol.84, No.5, 2012, pp.1060-1070.
[9] Galetsi, P., Katsaliaki, k., Kumar, S. “Big Data Analytics in Health Sector: Theoretical Framework, Techniques and Prospects,”. International Journal of Information Management, Vol.50, 2020, pp.206-216.
[10] Khurshid, M. M., et al. “Analyzing Diffusion Patterns of Big Open Data as Policy Innovation in Public Sector,” Computers & Electrical Engineering, Vol.78, 2019, pp.148-161.
[11] Mehta, N., Pandit, A. “Concurrence of Big Data Analytics and Healthcare: A Systematic Review,” International Journal of Medical Informatics, Vol.114, 2018, pp.57-65.
[12] Yancik, R., Ries, L. A. G. “Aging and Cancer in America: Demographic and Epidemiologic Perspectives,” Hematology/Oncology Clinics of North America, Vol.14, No.1, 2000, pp.17-23.
[13] Gridelli, C.. “Chemotherapy of Advanced Non Small Cell Lung Cancer in the Elderly: Anupdate,” Critical Reviews in Oncology/Hematology, Vol.35, No.3, 2000, pp.219-225.
[14] Okada, M., Nishio, W., Sakamoto, T., et al. “Evolution of Surgical Outcomes for Nonsmall Cell Lung Cancer: Time Trends in 1,465 Consecutive Patients Undergoing Complete Resection,” The Annals of Thoracic Surgery, Vol.77, No.6, 2004, pp.1926-1930.
[15] Padilla, J., Calvo, V., Penalver, J.C., et al. Stage I Nonsmall Cell Lung Cancer up to 3 cm in Diameter: Prognostic Factors,” Archivos de Bronconeumología (English Edition), Vol.40, No.3, 2004, pp.110-113.
[16] Yamamoto, K., Alarcón, J. P., Medina, V. C., et al. “Surgical Results of Stage I Non-Smallcell Lung Cancer: Comparison between Elderly and Younger Patients. European Journal of Cardio-Thoracic Surgery, Vol.23, No.1, 2003, pp.21-25.
[17] Prisadov, G. T., Uchikov, A. P., Welker, K., et al. “Size of Tumour as a Risk Factor for Malignancy in Patients with Peripheral Pulmonary Nodules,” Folia Med (Plovdiv), Vol.54, No.2, 2012, pp.17-21.
174
[18] Shimada, Y., Saji, H., Yoshida, K. et al. “Pathological Vascular Invasion and Tumor Differentiation Predict Cancer Recurrence in Stage ia Non–Small-Cell Lung Cancer After Complete Surgical Resection,” Journal of Thoracic Oncology, Vol.7, No.8, 2012, pp.1263-1270.
[19] Ou, S. H. I., Zell, J. A., Ziogas, A., et al. “Prognostic Factors for Survival of Stage I Non-small Cell Lung Cancer Patients,” Cancer, Vol.110, No.7, 2007, pp. 1532-1541.
[20] Onn, A., Herbst, R. S., Correa, A. M., et al. “Tumor Cavitation in Stage I Non–Small Cell Lung Cancer: Epidermal Growth Factor Receptor Expression and Prediction of Poor Outcome1,” Radiology, Vol.237, No.1, 2005, pp.342-347.
[21] Chang, Y. L., Lin, M. W., Wu, C. T., et al. “The significance of visceral pleural surface invasion in 321 cases of non-small cell lung cancers with pleural retraction,” Annals of surgical oncology, Vol. 19, No. 9, 2012, pp.3057-3064.
[22] Frank, C. D., Daniel, J. B., Anthony, W. K., et al. “The Eighth Edition Lung Cancer Stage Classification,” CHEST, Vol. 151, No.1, 2017, pp.193-203.
[23] Ginsberg, R. J., Rubinstein, L.V. Lawrence, V. R. “Randomized trial of lobectomy versus limited resection for T1 No non-small cell lung cancer,” The Annuals of Thoracic Surgery, Vol. 60, No. 3, 1995, pp. 615-623.
[24] PORT Meta-analysis Trialists Group. “Postoperative radiotherapy in non-small-cell lung cancer: Systematic review and meta-analysis of individual patient data from nine randomised controlled trials,” Lancet, Vol. 352, No. 9124, 1998, pp. 257-263.
[25] Ying, L., Jing, Z., et al. “Multi-factor retrospective study in 91 small cell lung cancer patients,” Chinese Journal of Lung Cancer, Vol. 17, No. 8, 2014, pp. 588-595.
[26] Xu, W. B, Research and Implementation of Clinical DSS for Lung Cancer based on Medical Big Data, Fudan University, Shanghai, China, 2016.

175
E-service Quality for Sustainable Competitive Advantage
Dwarika UpretiLecturer- Nepal Mega College,
Babarmahal, [email protected]; +9779851022426
AbstractThe study examines the e-service quality for sustainable competitive advantage in Nepalese banking industry. The study determines e-service quality ensure sustainable competitive advantages in banking sector of Nepal. The study focuses on finding out the influence of Efficiency, Security, Availability and Customer Support on competitive advantage. The Primary data was collected via a well-structured questionnaire using simple random sampling technique from 152 employees working in different commercial banks. Descriptive statistics, t-test, f-test, correlation and multiple regression analysis were used to diagnose data collected to meet the objectives of the study. Efficiency, security, availability and customer support were used as independent variables and competitive advantage as dependent variable. Correlation shows that all independent variables have significant relationship with competitive advantage.
Keywords Efficiency, security, availability and customer support and competitive advantage.
Background InformationToday’s business environment is very competitive. It is now a lot easier and cheaper to start a business, particularly with technology enabling business to be conducted online and internationally to win customers in foreign markets. Sustainable competitive advantage is the key to business success. It is the force that enables a business to have greater focus, more sales, better profit margins, and higher customer and staff retention than competitors do. Sustaining competitive advantage is one of the most concerns of companies in order to compete with rivals to attract new customers and keep the existence. Companies are trying to work on strategies with proper drivers and resources to sustain advantages. One of these drivers is service quality, which was a determinant factor for customers and their perception about different companies. With increased portion of Internet in business, all these discussions shift in to the cyber space. In other words, companies are trying to sustain competitive advantage on the Internet through different ways.
Delivering E-service to the customers, E-service quality and its dimensions is important to customers and decision makers. With the rapid development of information and communication technology, Internet and World Wide Web (WWW) have become important tools in business, which has a major impact on business world. Internet
has significantly revolutionized service industry in the last decade. In the early stage of Internet market, online service companies had competed with traditional service companies by providing service at lower prices. With an increasing number of service companies participating in the Internet market, the initial price advantages in online service has nullified, and low price has become a minimum qualification to compete in the Internet market. Therefore, service companies operating in the Internet market need to find something else to attract customers to their online service. As a result, e-service quality is becoming even more critical for companies to retain and attract customers in the digital age.
E-service (Electronic service, online service or Web-based service) might be the key to long term advantages in the digital times, and e-service quality is becoming even more critical for companies to retain and attract customers in the digital age. Though e-service is very important in the Internet market, most online service companies in Nepal seem not to focus on their online service for their customers. They do not recognize that the competition among online service companies relies mainly on their online service, and they do not have the motivation to adopt some strategies to develop or improve their online service for customers. Even though some companies have realized the importance of online service
176
to customers, they seem not to understand customer’s perception of online service and how customers assess their online service quality. Currently, despite many studies concerning traditional service quality, relatively few studies have been conducted in the Internet market, and even less on E- service quality. The application of eservices is discussed in relation to its implementation technology such as web based services along with other concepts such as service oriented computing, and by integrating it with different disciplines to form new areas such as e-Government, e-Business, e-Health, e-Banking and eLearning.
Since there is not any previous study done, on the impact of “E-service quality for sustainable competitive advantages for the Nepalese Business firm”, this research is little effort as master’s level thesis fulfillment on the same topic. In this study, we will discuss about service and e-service quality aspects and dimensions and then discuss about terms of strategies which companies can sustain competitive advantage especially through the Internet to answer our research question such as the significant relationship between e-service quality and sustainable competitive advantage, influence of e-service quality on sustainable competitive advantage.
In the bigger definition, e-service can be defined as the provision of service over electronic networks such as Internet (Rust and Lemon, 2001). This notion of e-service includes not only the services provided by a typical service organization, but also those provided by goods manufacturers whose success vitally depends on the quality of the service. Since its conceptual inception in the late 1780s in Europe and formal introduction in 1993 by the US Government, the term ‘E-Government’ has now become one of the recognized research domains especially in the context of public policy and now has been rapidly gaining strategic importance in public sector modernization. E-service is one of the branches of this domain and its attention has been creeping up among the practitioners and researchers.
E-Service is a highly generic term, usually referring to ‘the provision of services via the Internet (the prefix 'e' standing for ‘electronic’, as it does in many other usages), thus e-Service may also include e-Commerce, although it may also include non-commercial services (online), which is usually provided by the government.’ 'E-Service constitutes the online services available on the Internet, whereby a valid transaction of buying and selling
(procurement) is possible, as opposed to the traditional websites, whereby only descriptive information are available, and no online transaction is made possible.
Today, technology-based interfaces have developed many changes in ways of providing services and different ways of interacting customers through these interfaces. Electronic service is becoming more important in company strategies for their e-commerce activities. Online services are very different from traditional services through other channels interface. E-service could be supposed as a sort of interactive information service. This information can be used for service providers to analyze consumers' behavior to customize the e-service. Rowley (2006) mentioned two basic elements of e-service characteristics in types of delivery are e-service as information service and e-service as self-service.
The concept of e-service (short for electronic service), represents one prominent application of utilizing the use of Information and communication technologies (ICTs) in different areas. However, providing an exact definition of e-service is hard to come by as researchers have been using different definitions to describe e-service. Despite these different definitions, it can be argued that they all agree about the role of technology in facilitating the delivery of services, which make them more of electronic services.
E-Service is defined as “deeds, efforts or performances whose delivery is mediated by information technology (including the web, information kiosks and mobile devices). Such E-service includes the service element of e-tailing, customer support, and service delivery”. This definition reflects three main components- service provider, service receiver and the channels of service delivery (i.e., technology). For example, as concerned to public e-service, public agencies are the service provider and citizens as well as businesses are the service receiver. The channel of service delivery is the third requirement of e-service. Internet and websites is the main channel of e-service delivery while other classic channels (e.g. telephone, call center, mobile phone, and television) are also considered.
E-service is not only ordering, communicating with emails and fulfilling requests, it can cover all business commerce aspects and features. Theories and experiences about e-service are still new and in their infancy. Hence, there are many definitions from different people, which differ. Some define e- service as the web-based services; some
177
suggest it as an interactive service which is delivered via the Internet, whereas some define e-service as self-service or information service. Services can be divided into three categories especially for banking industry: Core Services, Additional Services, and Problem Solving Services (Rowley 2006). Chen and Chang (2003) define three steps in e-service experience: Interaction, Transaction and Fulfillment.
Service in Nepalese Banking IndustryEvolution of banking started in Nepal in 1973 by Nepal Bank Limited (government sector). With time, the joint venture banks were started to establish. The first joint venture bank is Nepal Arab Bank Limited established in 1984, which is now known as NABIL Bank. In early 1990, the NABIL bank introduced credit card in Nepal. Another joint venture bank, The Himalayan Bank limited had introduced Automated teller Machine (ATM) in 1995. Himalayan Bank limited was also the first bank to introduce Tele Banking (Telephone Banking) in Nepal.
The evolution of private sector banks and e-Banking was started in the year of 2001 by the Kumari Bank Limited. Kumari Bank Limited was the first bank, which introduced Internet Banking in Nepal in 2002. Similarly, another bank Laxmi Bank Limited was the first bank to introduce the SMS- Banking or Mobile Banking in Nepal in the Year of 2004.
The status of e-Banking is in massive development. Almost all of the commercial banks have implemented a part of e-Banking. Under the Nepal ACT 2061, Electronic Transaction Act was established in Nepal. It defines the transition or data transferring using electronic media safely and adequately through this system. In Nepal, consumers are facilitated with e-commerce via certain Commercial Banks. Today, the availability of Channels in e-Banking in Nepal is Automated Teller (ATM), Point of Sales (POS), Telephone Banking (Tele Banking), Internet Banking, Mobile Banking (SMS Banking). Consumer’s e-banking is a comprehensive retail-banking platform available with wide range of functionality. In Nepal, the numbers of internet added every year are more than 2.25 million last year and growing rapidly. The reference is from the regulator NTA’s MIS which says 16.67 million Nepalese currently connect to the internet. This figure is actually 63 percent of the total population as per MIS of OCT 2017. This internet penetration index indicates the accessibility of internet to the people of Nepal. Last year Mangsir,
the internet penetration was 54 percent. TKP mentions in other way as 250 users were added in an hour last year. The competition between major telecom operators encouraged them to provide cellular coverage to different parts of the country. The cellular/ mobile coverage is one of the main driver of this internet connectivity and usage. As per the TKP data, around 95.62 percent of people live within the coverage area of mobile tower. Other drivers for increment in internet users include the inexpensive cellular phone and availability of different browsers, applications. Over 40% are using ADSL access as well as fiber internet and remaining uses Data Internet in their mobile provided by the mobile operators such as Ncell and NTC. Talking about the ISP service provider, at least 23 ISPs provide internet in Nepal. In the city areas, there are many options from telecom operators, ISP in both wireless and fixed technology. However, in remote areas, the slow 2G in either GSM or and CDMA technology is available. The most of the rural areas still awaits high speed 3G, 4G and other broadband services. The internet reach can increase significantly and of good use, if such high speed internet services reach all of the places in Nepal.
The amount and scale of products and services offered online has grown continuously, basically providing something to everyone. Nowadays, the incredible development of the Internet has changed the way that bank conduct business with their customers. As a result, many banks have used Internet as a new channel to provide their customers 24 hours services a day. With the advent of the Internet, customers can access more financial information and wider range of e-services. Now the customers can check their account details, transfer money and pay their bills through internet within the small span of time.
Even if the branch is closed, account information is available all the time. Besides internet banking due to the advent of electronic transaction it has been possible for customers to buy and pay for the products online anytime they want. All of these facilities are only because of the prominent use of internet. Internet has also changed the nature of competition among companies providing banking and investment services. Those having more traditional look on the business are forced to change their view towards the markets. This means taking more proactive approach to provide Internet and mobile services.
178
Objectives of the StudyThe major objective of the study is to identify the need of competitive advantage sustainability on eservice quality used by different commercial banks. Other specific objectives of the study are listed below:
i. To analyze the influence of E-Service Quality on sustainable competitive advantage.
ii. To analyze the impact of E-service quality on sustainable competitive advantage for Nepalese commercial banks.
iii. To determine the level of knowledge and the general opinion of customers and bankers regarding e-service.
Research HypothesisThis research illustrates five dimensions which are gathered from a variety of researchers in terms of e-service quality dimensions and they are the most significant ones. Although some terms have been repeated in most studies’ others have different definitions in different studies. Now we put Competitive advantage as the constant variable for our hypotheses and suppose five e-service quality dimensions as independent variables.
The hypothesis to be tested in this research study would be:
H1: Efficiency of e-service has an impact on sustainable competitive advantage.
H2: Security of e-service has an impact on sustainable competitive advantage.
H3: Availability of e-service system has an impact on sustainable competitive advantage.
H4: Fulfillment of e-service has an impact on sustainable competitive advantage.
H5: Customer Support for e-service has an impact on sustainable competitive advantage.
Literature ReviewGronroos (2000) advocated that service quality could differentiate what companies offer for their customers. It can be a source of achieving competitive advantage when Internet facilitates comparing different services (Baeney, 1997). The low cost of getting information about different services before purchasing is another key determinant of sustaining advantages on the Internet (Santos, 2003).
Oliviera (2002) state that e-service quality can lead to competitive advantage, this is through the business performance and could be happened by using different
kind of resources. The business models which prefer to take their customers to e-services rather than traditional ones are more cost-effective and scalable (Schultze, 2003). Zeithaml (2002) discusses e-service quality as a factor in differentiating strategy for company’s e-business. The factors of e-service quality can also increase the trust (Lee and Lin, 2005) and establish a brand positioning for customers (Rowley, 2004).
Yang (2006) noted that in 70s decade companies changed their way to sustain competitive advantage by emphasizing more on product quality because cost advantage did no longer worked against rivals. After that in 80s, sustaining advantage with cost and quality became more, difficult therefore focus of companies was on some internal activities and improving operational effectiveness, further it was witnessed that in 90s, other activities apart from core processes such as after sale service and premium service has begun to play the more important role in sustaining competitive advantages. With developing internet business activities, the trend was continued with offering additional services for core product and some information services with focusing on improving the quality of services through the cyber space.Zeithaml (2002) mentioned that company's find, improving service quality as a way of gaining and sustaining competitive advantage for businesses while information and communication technologies are growing. Yang (2001) noted that e-service quality demonstrates whether or not the e-commerce strategy was successful. It can increase customer retention, attractiveness and hit rate against other rivals (Santos, 2003). In addition, all these could build the competitive advantage for online commerce (Santos, 2003 and Gronroos, 2000). Santos (2003) stated that e-service quality could build uniqueness that is truer for small firms and businesses. The role of advantages, which are not price-based, are more important on the Internet because checking specifications and prices are almost free on the Internet. She concluded from her research “High e-service quality provides long-term benefits to a company.” E-service quality build a Competitive Advantage for online businesses and can give customers feedbacks and make more close relations so they feels more involved in the process and all these create competitive advantage for the firm. Nearly two decades of offering service quality was a key for differentiation against rivals and creating competitive advantage (Santos, 2003). Griff and Palmer (1999) mentioned that if use of the Internet is well utilized, it can increase the overall service expectation and create Competitive Advantage in different businesses.
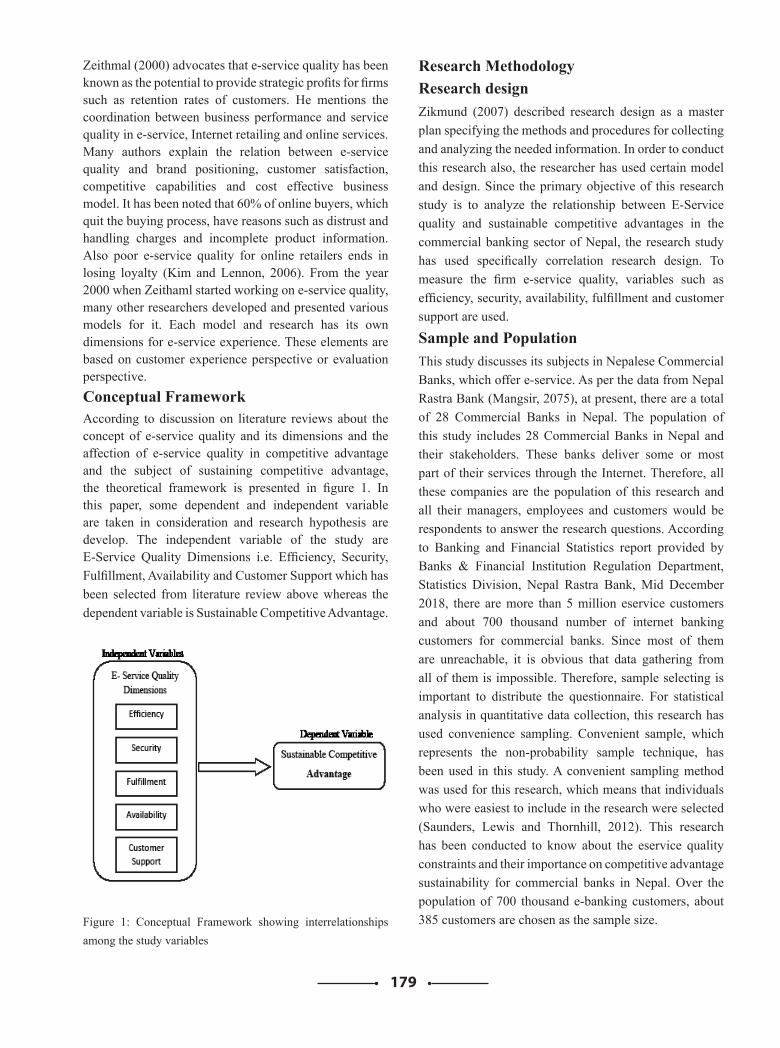
179
Zeithmal (2000) advocates that e-service quality has been known as the potential to provide strategic profits for firms such as retention rates of customers. He mentions the coordination between business performance and service quality in e-service, Internet retailing and online services. Many authors explain the relation between e-service quality and brand positioning, customer satisfaction, competitive capabilities and cost effective business model. It has been noted that 60% of online buyers, which quit the buying process, have reasons such as distrust and handling charges and incomplete product information. Also poor e-service quality for online retailers ends in losing loyalty (Kim and Lennon, 2006). From the year 2000 when Zeithaml started working on e-service quality, many other researchers developed and presented various models for it. Each model and research has its own dimensions for e-service experience. These elements are based on customer experience perspective or evaluation perspective.Conceptual FrameworkAccording to discussion on literature reviews about the concept of e-service quality and its dimensions and the affection of e-service quality in competitive advantage and the subject of sustaining competitive advantage, the theoretical framework is presented in figure 1. In this paper, some dependent and independent variable are taken in consideration and research hypothesis are develop. The independent variable of the study are E-Service Quality Dimensions i.e. Efficiency, Security, Fulfillment, Availability and Customer Support which has been selected from literature review above whereas the dependent variable is Sustainable Competitive Advantage.
Figure 1: Conceptual Framework showing interrelationships among the study variables
Research MethodologyResearch designZikmund (2007) described research design as a master plan specifying the methods and procedures for collecting and analyzing the needed information. In order to conduct this research also, the researcher has used certain model and design. Since the primary objective of this research study is to analyze the relationship between E-Service quality and sustainable competitive advantages in the commercial banking sector of Nepal, the research study has used specifically correlation research design. To measure the firm e-service quality, variables such as efficiency, security, availability, fulfillment and customer support are used.
Sample and PopulationThis study discusses its subjects in Nepalese Commercial Banks, which offer e-service. As per the data from Nepal Rastra Bank (Mangsir, 2075), at present, there are a total of 28 Commercial Banks in Nepal. The population of this study includes 28 Commercial Banks in Nepal and their stakeholders. These banks deliver some or most part of their services through the Internet. Therefore, all these companies are the population of this research and all their managers, employees and customers would be respondents to answer the research questions. According to Banking and Financial Statistics report provided by Banks & Financial Institution Regulation Department, Statistics Division, Nepal Rastra Bank, Mid December 2018, there are more than 5 million eservice customers and about 700 thousand number of internet banking customers for commercial banks. Since most of them are unreachable, it is obvious that data gathering from all of them is impossible. Therefore, sample selecting is important to distribute the questionnaire. For statistical analysis in quantitative data collection, this research has used convenience sampling. Convenient sample, which represents the non-probability sample technique, has been used in this study. A convenient sampling method was used for this research, which means that individuals who were easiest to include in the research were selected (Saunders, Lewis and Thornhill, 2012). This research has been conducted to know about the eservice quality constraints and their importance on competitive advantage sustainability for commercial banks in Nepal. Over the population of 700 thousand e-banking customers, about 385 customers are chosen as the sample size.
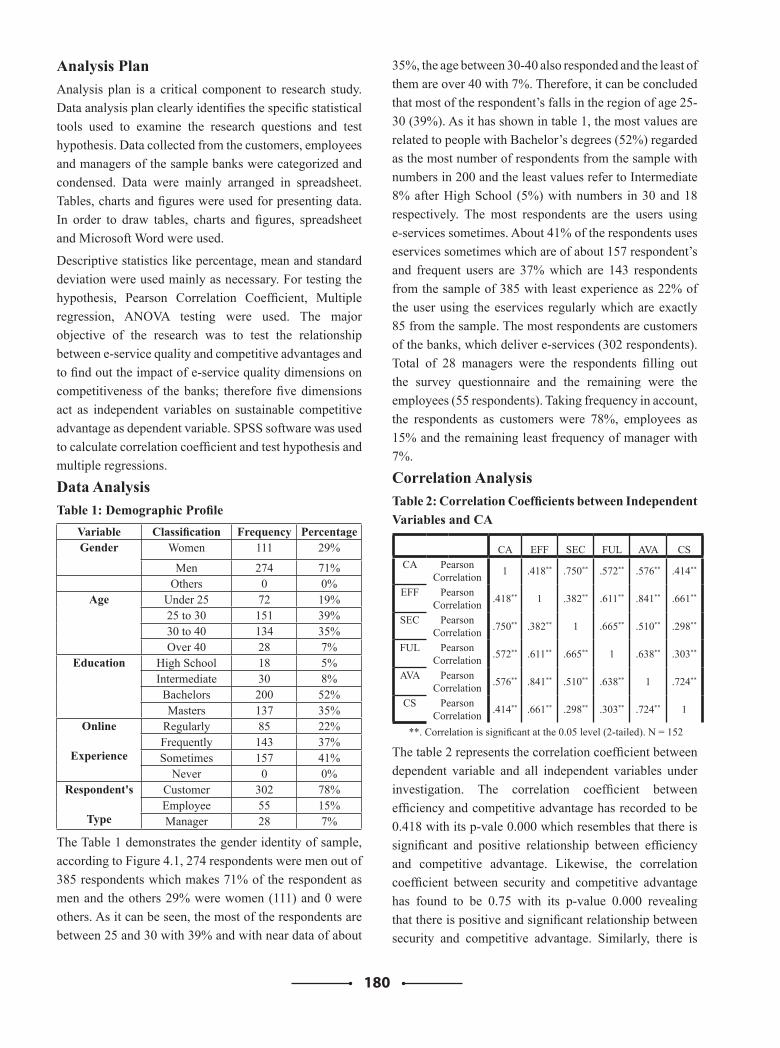
180
Analysis Plan Analysis plan is a critical component to research study. Data analysis plan clearly identifies the specific statistical tools used to examine the research questions and test hypothesis. Data collected from the customers, employees and managers of the sample banks were categorized and condensed. Data were mainly arranged in spreadsheet. Tables, charts and figures were used for presenting data. In order to draw tables, charts and figures, spreadsheet and Microsoft Word were used.
Descriptive statistics like percentage, mean and standard deviation were used mainly as necessary. For testing the hypothesis, Pearson Correlation Coefficient, Multiple regression, ANOVA testing were used. The major objective of the research was to test the relationship between e-service quality and competitive advantages and to find out the impact of e-service quality dimensions on competitiveness of the banks; therefore five dimensions act as independent variables on sustainable competitive advantage as dependent variable. SPSS software was used to calculate correlation coefficient and test hypothesis and multiple regressions.
Data Analysis Table 1: Demographic Profile
Variable Classification Frequency PercentageGender Women 111 29%
Men 274 71%Others 0 0%
Age Under 25 72 19%25 to 30 151 39%30 to 40 134 35%Over 40 28 7%
Education High School 18 5%Intermediate 30 8%
Bachelors 200 52%Masters 137 35%
Online
Experience
Regularly 85 22%Frequently 143 37%Sometimes 157 41%
Never 0 0%Respondent's
Type
Customer 302 78%Employee 55 15%Manager 28 7%
The Table 1 demonstrates the gender identity of sample, according to Figure 4.1, 274 respondents were men out of 385 respondents which makes 71% of the respondent as men and the others 29% were women (111) and 0 were others. As it can be seen, the most of the respondents are between 25 and 30 with 39% and with near data of about
35%, the age between 30-40 also responded and the least of them are over 40 with 7%. Therefore, it can be concluded that most of the respondent’s falls in the region of age 25-30 (39%). As it has shown in table 1, the most values are related to people with Bachelor’s degrees (52%) regarded as the most number of respondents from the sample with numbers in 200 and the least values refer to Intermediate 8% after High School (5%) with numbers in 30 and 18 respectively. The most respondents are the users using e-services sometimes. About 41% of the respondents uses eservices sometimes which are of about 157 respondent’s and frequent users are 37% which are 143 respondents from the sample of 385 with least experience as 22% of the user using the eservices regularly which are exactly 85 from the sample. The most respondents are customers of the banks, which deliver e-services (302 respondents). Total of 28 managers were the respondents filling out the survey questionnaire and the remaining were the employees (55 respondents). Taking frequency in account, the respondents as customers were 78%, employees as 15% and the remaining least frequency of manager with 7%.
Correlation AnalysisTable 2: Correlation Coefficients between Independent Variables and CA
CA EFF SEC FUL AVA CSCA Pearson
Correlation 1 .418** .750** .572** .576** .414**
EFF Pearson Correlation .418** 1 .382** .611** .841** .661**
SEC Pearson Correlation .750** .382** 1 .665** .510** .298**
FUL Pearson Correlation .572** .611** .665** 1 .638** .303**
AVA Pearson Correlation .576** .841** .510** .638** 1 .724**
CS Pearson Correlation .414** .661** .298** .303** .724** 1
**. Correlation is significant at the 0.05 level (2-tailed). N = 152
The table 2 represents the correlation coefficient between dependent variable and all independent variables under investigation. The correlation coefficient between efficiency and competitive advantage has recorded to be 0.418 with its p-vale 0.000 which resembles that there is significant and positive relationship between efficiency and competitive advantage. Likewise, the correlation coefficient between security and competitive advantage has found to be 0.75 with its p-value 0.000 revealing that there is positive and significant relationship between security and competitive advantage. Similarly, there is
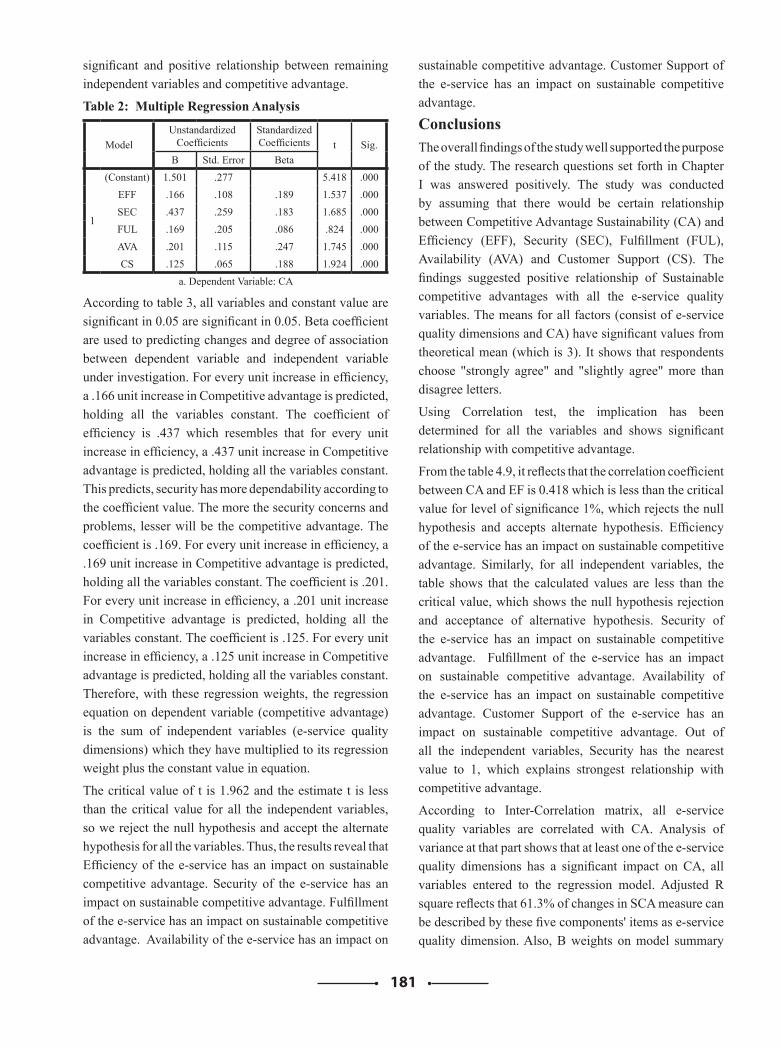
181
significant and positive relationship between remaining independent variables and competitive advantage.
Table 2: Multiple Regression Analysis
ModelUnstandardized
CoefficientsStandardized Coefficients t Sig.
B Std. Error Beta
1
(Constant) 1.501 .277 5.418 .000EFF .166 .108 .189 1.537 .000SEC .437 .259 .183 1.685 .000FUL .169 .205 .086 .824 .000AVA .201 .115 .247 1.745 .000CS .125 .065 .188 1.924 .000
a. Dependent Variable: CA
According to table 3, all variables and constant value are significant in 0.05 are significant in 0.05. Beta coefficient are used to predicting changes and degree of association between dependent variable and independent variable under investigation. For every unit increase in efficiency, a .166 unit increase in Competitive advantage is predicted, holding all the variables constant. The coefficient of efficiency is .437 which resembles that for every unit increase in efficiency, a .437 unit increase in Competitive advantage is predicted, holding all the variables constant. This predicts, security has more dependability according to the coefficient value. The more the security concerns and problems, lesser will be the competitive advantage. The coefficient is .169. For every unit increase in efficiency, a .169 unit increase in Competitive advantage is predicted, holding all the variables constant. The coefficient is .201. For every unit increase in efficiency, a .201 unit increase in Competitive advantage is predicted, holding all the variables constant. The coefficient is .125. For every unit increase in efficiency, a .125 unit increase in Competitive advantage is predicted, holding all the variables constant. Therefore, with these regression weights, the regression equation on dependent variable (competitive advantage) is the sum of independent variables (e-service quality dimensions) which they have multiplied to its regression weight plus the constant value in equation.
The critical value of t is 1.962 and the estimate t is less than the critical value for all the independent variables, so we reject the null hypothesis and accept the alternate hypothesis for all the variables. Thus, the results reveal that Efficiency of the e-service has an impact on sustainable competitive advantage. Security of the e-service has an impact on sustainable competitive advantage. Fulfillment of the e-service has an impact on sustainable competitive advantage. Availability of the e-service has an impact on
sustainable competitive advantage. Customer Support of the e-service has an impact on sustainable competitive advantage.
ConclusionsThe overall findings of the study well supported the purpose of the study. The research questions set forth in Chapter I was answered positively. The study was conducted by assuming that there would be certain relationship between Competitive Advantage Sustainability (CA) and Efficiency (EFF), Security (SEC), Fulfillment (FUL), Availability (AVA) and Customer Support (CS). The findings suggested positive relationship of Sustainable competitive advantages with all the e-service quality variables. The means for all factors (consist of e-service quality dimensions and CA) have significant values from theoretical mean (which is 3). It shows that respondents choose "strongly agree" and "slightly agree" more than disagree letters.
Using Correlation test, the implication has been determined for all the variables and shows significant relationship with competitive advantage.
From the table 4.9, it reflects that the correlation coefficient between CA and EF is 0.418 which is less than the critical value for level of significance 1%, which rejects the null hypothesis and accepts alternate hypothesis. Efficiency of the e-service has an impact on sustainable competitive advantage. Similarly, for all independent variables, the table shows that the calculated values are less than the critical value, which shows the null hypothesis rejection and acceptance of alternative hypothesis. Security of the e-service has an impact on sustainable competitive advantage. Fulfillment of the e-service has an impact on sustainable competitive advantage. Availability of the e-service has an impact on sustainable competitive advantage. Customer Support of the e-service has an impact on sustainable competitive advantage. Out of all the independent variables, Security has the nearest value to 1, which explains strongest relationship with competitive advantage.
According to Inter-Correlation matrix, all e-service quality variables are correlated with CA. Analysis of variance at that part shows that at least one of the e-service quality dimensions has a significant impact on CA, all variables entered to the regression model. Adjusted R square reflects that 61.3% of changes in SCA measure can be described by these five components' items as e-service quality dimension. Also, B weights on model summary
182
for regression shows the linear positive impact for each e-service quality dimensions on sustainable competitive advantage. The beta value of each independent values were positive with the dependent variables and were impactful on change on any variables. The more impactful variable among other e-service variables was security with 0.437. This implies that, for every change in security issues or perspective of Nepalese Banking sector per year, the bank will acquire competitive advantage by 0.437 times for the time period. The main point is that among other e-service variables, Security had the strongest relationship with Sustainable competitive advantage as indicated by r=0.950. SCA and Fulfillment had second closest relationship as indicated by r=0.930. Using ANOVA table, the F-value as 32 indicates that all the outputs are well significant with the hypothesis that the study assumed and is strong in the relationship between the dependent and independent variables.
To sum up the results, it can be concluded that e-service quality can have significant effects on sustainable competitive advantage of the banks along with its dimensions. Customers are evaluating the quality of offered e-service with their criteria, consciously or unconsciously and the result of these evaluations will lead them to choose, stay with or change a specific firm among many.
References Barney, J. B. (1997). Gaining and sustaining competitive
advantage: Theory and practice. Boston: Addison-Wesley Pub. Company
Chen, S. J. & Chang, T. Z. (2003). A descriptive model of online shopping process: Some empirical results. International Journal of Service Industries Management, 556-69.
Gronroos, C. (1982). Strategic management and marketing in service sector. Cambridge, MA. Marketing Science Institute.
Gronroos, C. (1984). A service quality model and its market implications. European Journal of Marketing, 36-44.
Gronroos, C., Heinonen, F., Isoniemi, K., & Lindholm, M. (2000). The net offer model: A case example from the virtual marketplace. Management Decision, 243-52.
Porter, M. E. (1998). Competitive advantage, creating and sustaining superior performance. New York: Free Press.
Saunders, M. N., Lewis, P., & Thronhill, A. (2009). Research methods for business students (6th edition), Delhi: Pearson.
Santos, J. (2003). E-service quality – A model of virtual service dimensions. Managing Service Quality, 233-47.
Zeithaml, V. A. (2002). Service quality, profitability and the economic worth of customers: What we know and what we need to learn. Journal of the Academy of Marketing Science, 67-85.
Yang, C. (2006). Establishment of a quality-management system for service industries, Total Quality Management, 1129–1154, November 2006.
Yin, R. K. (2003). Case study research: Design and method (3rd edition). London: Sage.
Oliver, R. L. (1980). A cognitive model of antecedents and consequences of satisfaction decisions. Journal of Marketing Research, 460-469.
Lee, G., & Lin, H. (2005). Customer perceptions of e-service quality in online shopping. International Journal of Retail and Distribution Management, 161-176.
183
Assessing Municipal Ward Service Quality and Citizen Satisfaction: the Case of Parbat District, Nepal
Dinesh SharmaThe Graduate School of Government, Business, and Entrepreneurship, Yonsei University, [email protected]
Heesun KimCollege of Government and Business, Yonsei University, [email protected]
Jaehoon WhangCollege of Government and Business, Yonsei University, [email protected]
AbstractThis study attempts to investigate different dimensions in assessing municipal ward service quality and citizen satisfaction. Based on SERVPERF model, this research found that municipal ward service quality at Bihadi Rural Municipality(BRM) and Phalewash Urban Municipality(PUM) could be measured by six service quality dimensions instead of original five dimensions. Cost dimension was added in original five service quality dimensions; tangibility, reliability, responsiveness, assurance and empathy to measure the satisfaction of municipal ward service. Data were collected from 136 respondents of BRM and PUM, and analyzed using SPSS. This study found that tangibility, assurance and cost were significant with municipal ward service satisfaction at BRM and PUM. However, only profession was found to be significant at a socio-demographics level. Farming profession respondents perceived significant lower level of municipal ward service satisfaction than respondents of other professions. Thus, this study suggests that plan and policy related tangibility, assurance and cost, have significant impact on municipal ward service satisfaction.
KeywordsMunicipal ward service quality, Municipal ward service satisfaction; SERVPEFR.
I. IntroductionNepal had experienced 15 years of political vacuum, where a significant lack of local bodies resulted in various discomfort for the population. In 2015 federal constitution was implemented in Nepal with three-tier governing structures; federal, provincial, and local level. However, the governing members at local level were only satisfied through election in 2017, fulfilling the political absence with new representatives. Now Nepal is divided into 7 provinces, 77 district and 753 LGs (6 metropolises, 11 sub-metropolises, 293 Urban Municipalities (UM) and 460 Rural Municipalities (RM)).
UM and RM compose of wards to deliver effective services and monitor developmental works. Local Government Operation Act, 2017 (LGOA, 2017) defines ward means the ward of the RM and UM. RM includes a wide range of wards incorporated, from five to twenty-one wards. UM ranges from nine to thirty-five wards. Wards are represented by a ward chairperson and four ward members. Under this governing structure, wards are
the closet government unit to its population.
The Constitution of Nepal (2015) gives abundant function to Local Government (LG) such as managing local affairs, health, education, development, service delivery etc. In terms of service delivery, LGOA (2017) defines the function, duty and responsibility of making policy and standard of managing local service as well as promote, regulate of the use of information and communication technology in managing local services, plan human resource management for local services.
Different caste and ethnic groups in Nepal experienced discrimination and inequality from a cultural, economic, social, and political perspective (Tiwari, 2010). In particular, civil war resulted in unequal access to public services (S. M. Murshed, 2005). More than 13,000 people lost their lives in a in a decade-long (1996–2006) civil war in Nepal. Among many reasons of civil war, hurdles for getting public services and lack of trust on public institution have also play a role in cultivating conflict. In order to resolve these issues, peace accord between
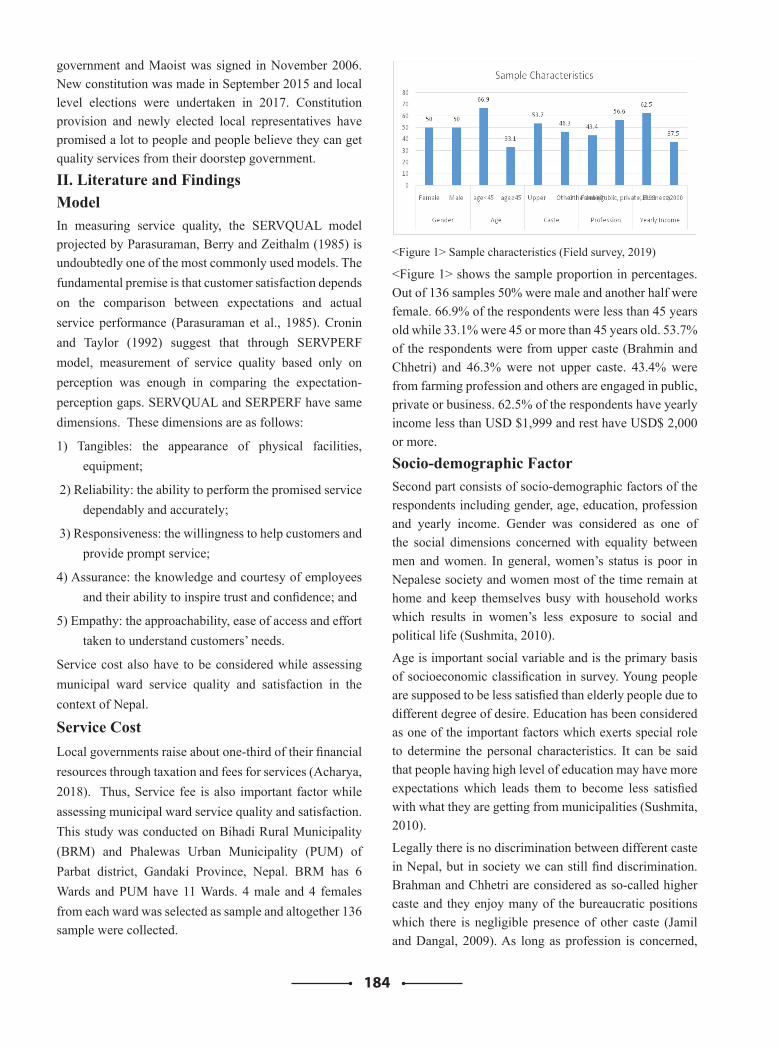
184
government and Maoist was signed in November 2006. New constitution was made in September 2015 and local level elections were undertaken in 2017. Constitution provision and newly elected local representatives have promised a lot to people and people believe they can get quality services from their doorstep government.
II. Literature and FindingsModelIn measuring service quality, the SERVQUAL model projected by Parasuraman, Berry and Zeithalm (1985) is undoubtedly one of the most commonly used models. The fundamental premise is that customer satisfaction depends on the comparison between expectations and actual service performance (Parasuraman et al., 1985). Cronin and Taylor (1992) suggest that through SERVPERF model, measurement of service quality based only on perception was enough in comparing the expectation-perception gaps. SERVQUAL and SERPERF have same dimensions. These dimensions are as follows:
1) Tangibles: the appearance of physical facilities, equipment;
2) Reliability: the ability to perform the promised service dependably and accurately;
3) Responsiveness: the willingness to help customers and provide prompt service;
4) Assurance: the knowledge and courtesy of employees and their ability to inspire trust and confidence; and
5) Empathy: the approachability, ease of access and effort taken to understand customers’ needs.
Service cost also have to be considered while assessing municipal ward service quality and satisfaction in the context of Nepal.
Service CostLocal governments raise about one-third of their financial resources through taxation and fees for services (Acharya, 2018). Thus, Service fee is also important factor while assessing municipal ward service quality and satisfaction. This study was conducted on Bihadi Rural Municipality (BRM) and Phalewas Urban Municipality (PUM) of Parbat district, Gandaki Province, Nepal. BRM has 6 Wards and PUM have 11 Wards. 4 male and 4 females from each ward was selected as sample and altogether 136 sample were collected.
<Figure 1> Sample characteristics (Field survey, 2019)
<Figure 1> shows the sample proportion in percentages. Out of 136 samples 50% were male and another half were female. 66.9% of the respondents were less than 45 years old while 33.1% were 45 or more than 45 years old. 53.7% of the respondents were from upper caste (Brahmin and Chhetri) and 46.3% were not upper caste. 43.4% were from farming profession and others are engaged in public, private or business. 62.5% of the respondents have yearly income less than USD $1,999 and rest have USD$ 2,000 or more.
Socio-demographic FactorSecond part consists of socio-demographic factors of the respondents including gender, age, education, profession and yearly income. Gender was considered as one of the social dimensions concerned with equality between men and women. In general, women’s status is poor in Nepalese society and women most of the time remain at home and keep themselves busy with household works which results in women’s less exposure to social and political life (Sushmita, 2010).
Age is important social variable and is the primary basis of socioeconomic classification in survey. Young people are supposed to be less satisfied than elderly people due to different degree of desire. Education has been considered as one of the important factors which exerts special role to determine the personal characteristics. It can be said that people having high level of education may have more expectations which leads them to become less satisfied with what they are getting from municipalities (Sushmita, 2010).
Legally there is no discrimination between different caste in Nepal, but in society we can still find discrimination. Brahman and Chhetri are considered as so-called higher caste and they enjoy many of the bureaucratic positions which there is negligible presence of other caste (Jamil and Dangal, 2009). As long as profession is concerned,
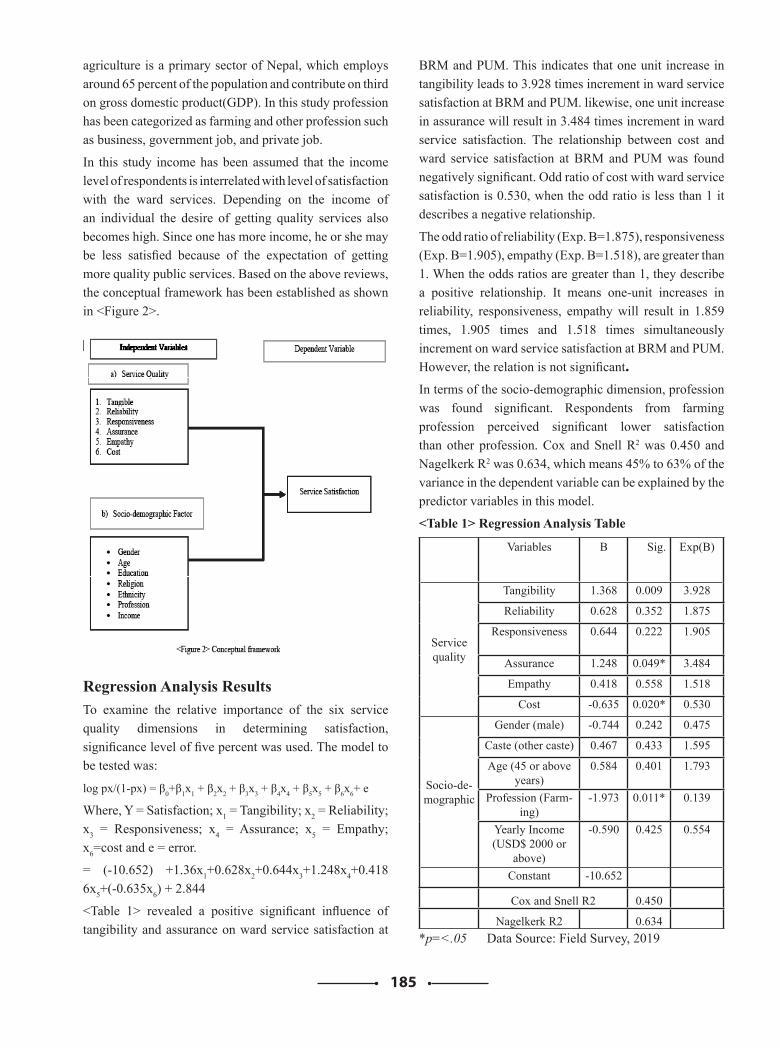
185
agriculture is a primary sector of Nepal, which employs around 65 percent of the population and contribute on third on gross domestic product(GDP). In this study profession has been categorized as farming and other profession such as business, government job, and private job.
In this study income has been assumed that the income level of respondents is interrelated with level of satisfaction with the ward services. Depending on the income of an individual the desire of getting quality services also becomes high. Since one has more income, he or she may be less satisfied because of the expectation of getting more quality public services. Based on the above reviews, the conceptual framework has been established as shown in <Figure 2>.
Regression Analysis ResultsTo examine the relative importance of the six service quality dimensions in determining satisfaction, significance level of five percent was used. The model to be tested was:
log px/(1-px) = β0+β1x1 + β2x2 + β3x3 + β4x4 + β5x5 + β6x6+ e
Where, Y = Satisfaction; x1 = Tangibility; x2 = Reliability; x3 = Responsiveness; x4 = Assurance; x5 = Empathy; x6=cost and e = error.
= (-10.652) +1.36x1+0.628x2+0.644x3+1.248x4+0.4186x5+(-0.635x6) + 2.844
<Table 1> revealed a positive significant influence of tangibility and assurance on ward service satisfaction at
BRM and PUM. This indicates that one unit increase in tangibility leads to 3.928 times increment in ward service satisfaction at BRM and PUM. likewise, one unit increase in assurance will result in 3.484 times increment in ward service satisfaction. The relationship between cost and ward service satisfaction at BRM and PUM was found negatively significant. Odd ratio of cost with ward service satisfaction is 0.530, when the odd ratio is less than 1 it describes a negative relationship.
The odd ratio of reliability (Exp. B=1.875), responsiveness (Exp. B=1.905), empathy (Exp. B=1.518), are greater than 1. When the odds ratios are greater than 1, they describe a positive relationship. It means one-unit increases in reliability, responsiveness, empathy will result in 1.859 times, 1.905 times and 1.518 times simultaneously increment on ward service satisfaction at BRM and PUM. However, the relation is not significant.In terms of the socio-demographic dimension, profession was found significant. Respondents from farming profession perceived significant lower satisfaction than other profession. Cox and Snell R2 was 0.450 and Nagelkerk R2 was 0.634, which means 45% to 63% of the variance in the dependent variable can be explained by the predictor variables in this model.
<Table 1> Regression Analysis Table
Variables B Sig. Exp(B)
Service quality
Tangibility 1.368 0.009 3.928
Reliability 0.628 0.352 1.875
Responsiveness 0.644 0.222 1.905
Assurance 1.248 0.049* 3.484
Empathy 0.418 0.558 1.518
Cost -0.635 0.020* 0.530
Socio-de-mographic
Gender (male) -0.744 0.242 0.475
Caste (other caste) 0.467 0.433 1.595
Age (45 or above years)
0.584 0.401 1.793
Profession (Farm-ing)
-1.973 0.011* 0.139
Yearly Income (USD$ 2000 or
above)
-0.590 0.425 0.554
Constant -10.652
Cox and Snell R2 0.450
Nagelkerk R2 0.634*p=<.05 Data Source: Field Survey, 2019
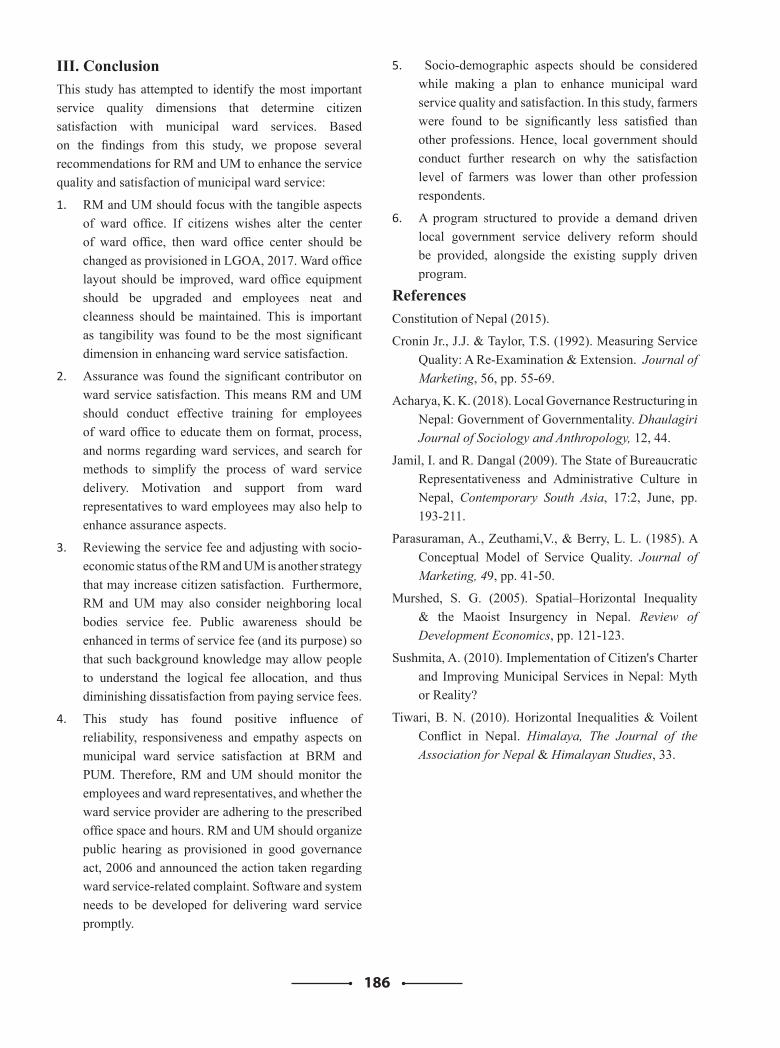
186
III. ConclusionThis study has attempted to identify the most important service quality dimensions that determine citizen satisfaction with municipal ward services. Based on the findings from this study, we propose several recommendations for RM and UM to enhance the service quality and satisfaction of municipal ward service:
1. RM and UM should focus with the tangible aspects of ward office. If citizens wishes alter the center of ward office, then ward office center should be changed as provisioned in LGOA, 2017. Ward office layout should be improved, ward office equipment should be upgraded and employees neat and cleanness should be maintained. This is important as tangibility was found to be the most significant dimension in enhancing ward service satisfaction.
2. Assurance was found the significant contributor on ward service satisfaction. This means RM and UM should conduct effective training for employees of ward office to educate them on format, process, and norms regarding ward services, and search for methods to simplify the process of ward service delivery. Motivation and support from ward representatives to ward employees may also help to enhance assurance aspects.
3. Reviewing the service fee and adjusting with socio-economic status of the RM and UM is another strategy that may increase citizen satisfaction. Furthermore, RM and UM may also consider neighboring local bodies service fee. Public awareness should be enhanced in terms of service fee (and its purpose) so that such background knowledge may allow people to understand the logical fee allocation, and thus diminishing dissatisfaction from paying service fees.
4. This study has found positive influence of reliability, responsiveness and empathy aspects on municipal ward service satisfaction at BRM and PUM. Therefore, RM and UM should monitor the employees and ward representatives, and whether the ward service provider are adhering to the prescribed office space and hours. RM and UM should organize public hearing as provisioned in good governance act, 2006 and announced the action taken regarding ward service-related complaint. Software and system needs to be developed for delivering ward service promptly.
5. Socio-demographic aspects should be considered while making a plan to enhance municipal ward service quality and satisfaction. In this study, farmers were found to be significantly less satisfied than other professions. Hence, local government should conduct further research on why the satisfaction level of farmers was lower than other profession respondents.
6. A program structured to provide a demand driven local government service delivery reform should be provided, alongside the existing supply driven program.
ReferencesConstitution of Nepal (2015).
Cronin Jr., J.J. & Taylor, T.S. (1992). Measuring Service Quality: A Re-Examination & Extension. Journal of Marketing, 56, pp. 55-69.
Acharya, K. K. (2018). Local Governance Restructuring in Nepal: Government of Governmentality. Dhaulagiri Journal of Sociology and Anthropology, 12, 44.
Jamil, I. and R. Dangal (2009). The State of Bureaucratic Representativeness and Administrative Culture in Nepal, Contemporary South Asia, 17:2, June, pp. 193-211.
Parasuraman, A., Zeuthami,V., & Berry, L. L. (1985). A Conceptual Model of Service Quality. Journal of Marketing, 49, pp. 41-50.
Murshed, S. G. (2005). Spatial–Horizontal Inequality & the Maoist Insurgency in Nepal. Review of Development Economics, pp. 121-123.
Sushmita, A. (2010). Implementation of Citizen's Charter and Improving Municipal Services in Nepal: Myth or Reality?
Tiwari, B. N. (2010). Horizontal Inequalities & Voilent Conflict in Nepal. Himalaya, The Journal of the Association for Nepal & Himalayan Studies, 33.
187
Consumer Perceptions and Importance of Service Quality in Customer Satisfaction on Fast Food Restaurants: A Study of Kathmandu Valley
(A Study on Fast Food Restaurants of Kathmandu, Nepal)
Sateesh Kumar Ojha [email protected]
Roopesh Shrestha Ph.D Student Research scholar
Lincoln University College, [email protected]
Yeak Narayan SharmaLecturer Tribhuwan University, Nepal
Ph.D Scholar, Lincoln University College, [email protected]
AbstractThe fast food culture in Kathmandu is expanding rapidly increasing due to the change to affluence society from ordinary society, rapid urbanization process, and changing life styles. This paper sought to assess the perceptions of customers about service quality in selected fast food restaurants in Kathmandu based on the criteria of Tangibility, reliability, empathy, assurance and responsiveness. One hundred and eighty customers were randomly selected for seeking information.
Keywords Service quality, Customer perception, Customer satisfaction, Fast food restaurants.
Introduction Especially fast food business have become a major revenue generated field in all over Nepal and in the world. Service quality plays a vital role to make the customers delighted, satisfied and insists them to revisit the restaurant. With the exception of McDonalds’ and KFC none of the other fast food chains are known to operate under franchise agreements. The capital city remains the center of fast foods in Nepal, although with the rapid urbanization and expansion of the other cities like Pokhara, Chitwan is also growing.
Since the 1990s Nepal has had one of the fastest economic growth rate due to liberalization. The consumer’s tastes and needs are dynamic, implying that every brand should constantly seek ways to offer freshness in order to remain relevant in the market place. The restaurant industry is no longer divided into clear-cut segments since the services offered do sometimes overlap. Many of the fast food restaurants offer similar products or services. Therefore, the way and manner their services are provided are critical to gaining competitive edge.
The restaurant diner seem to have added some scrutiny to his/her menu perusal and upped what he/she perceives as
value. In other words, they have brought more emotion into the cherished but less frequent outside dining experience. In addition to the “feel good” experiences they are also critical of food taste. The question then is – what is the potential fast food restaurant guest looking for? What must fast food restaurant owner do to be able to project the right image as well as
meet the needs of the customers? Because many of the fast food restaurants provide undifferentiated products, service quality becomes a discriminator between superior/inferior product and service. Any service provider that seeks to enjoy competitive edge must respond to customer needs so as to promote satisfaction and gain customer loyalty. In other words, you must either adapt or die. Consequently, this paper sought to assess the perceptions of customers about service quality in selected fast food restaurants in Kathmandu. There are several studies that address behavioral service quality, customer satisfaction, and behavioral intentions in fast food restaurant (FFRs) (Brady et al. 2001, Gilbert. et al. 20004; Kara et al. (1995). However, to the best of our knowledge none has focused on the capital city Kathmandu.
188
Objectives of the Study The objective of this study is to assess the customer perceptions about the quality of service in selected fast food restaurants in Kathmandu. The specific objectives included:
• Determine how often customers purchase fast foods.
• Determine the dimensions/attributes of service quality.
Literature ReviewIn the philosophical words of Peppers and Rogers “The only value your company will ever create is the value that comes from customers – the ones you have now and the ones you will have in future”. This is absolutely true. Customer value is an asset to the organization. Munusamy, Chelliah and Mun (2010) argued that in order to maintain the customer, the organization needs to ensure that the right products and services, supported by the right promotion and making it available at the right time for the customers. They argue that customer satisfaction measurement is a postconsumption assessment by the user, about the products or services gained. Consumers tend to organize information at various levels of abstraction which range from simple product attributes to complex personal values. Micuda and Dinculescu (2010) noted that attributes that signal quality have been dichotomized into “intrinsic” and “extrinsic” cues. Intrinsic cues are attributes that are part of the physical composition of the product such as flavor, color, size, fitness for use, styles and so on. They cannot be changed without changing the nature of the product and are consumed along with the product. On the other hand, extrinsic cues are attributes that relate to the product, but are not product-specific and can serve as general indicators of quality across all types of products.
Quality in service has been defined as a construct composed of a technical dimension and a functional or rational dimension: the former centers. Upon what is delivered by the company to the customer – result, whereas the latter refers to the way the service is performed (Gronroos, 1984). A fast food restaurant (FFR) also known as a Quick Service Restaurant (QSR) within the industry itself, is a specific type of restaurant characterized both by the fast cuisine and by minimal table service. Food served in fast food restaurants are cooked in bulk in advance and kept hot, is finished and packaged to order and is usually available ready to take away, even though seating may
be provided. The term “fast food” was recognized in a dictionary by Merriam-Webster in 1952.
Some trace the modern history of fast foods in America to July 7, 1912 with the opening of a fast food restaurant called the Automat in New York. The Automat was a cafeteria with its prepared foods behind small glass windows and coin-operated slots. The company also popularized the notion of “take-out” food, with their slogan “less work for mother”. Most historians and secondary school textbooks state that A & W was the first fast food restaurant which opened in 1919 (Grass, 1977). By 1961 Ray Krock bought out the McDonald brothers and created what is now the modern McDonald’s corporation. One of his major business strategy was to promote cleanliness of his restaurants to the growing groups of Americans that had become aware of food safety issues. Fast food has generally been designed to be eaten “on –the –go” and often does not require traditional cutlery and is eaten as a finger food. In his best-selling 2001 book Fast Food Nation, Schlossberg (2001) leveled a broad, socio-economic critic against the fast food industry, documenting how fast food rose from small, family-run businesses (like McDonald brothers’ hamburger joint) into large, multinational corporate juggernauts whose economies of scale radically transformed agriculture, meat processing, and labour markets in the late 20th century. He argues further that while the innovations of fast food industry gave Americans more and cheaper dining options, it has come at the price of destroying the environment, economy, and small-town communities of rural America while shielding consumers from the real costs of their convenient meals, both in terms of health and the broader impact of large-scale food production and processing on workers, animals and land. Little room for cooking at home. Service quality is reflected in a consumer’s evaluative perception of an encountered service (Cronin & Taylor 1994). Zeithaml and Bitner (2000) suggested that consumers judge the quality of a service based on their perceptions of the technical outcome provided, the process by which the outcome is delivered, and the quality of the physical surroundings where the service is delivered. Today, almost all the FFRS focus on several ways to increase their service quality in order to increase the level of satisfaction among their customers and thus increase their purchase intentions as well as loyalty (Qin & Prybutok, 2008; Gilbert, Veloutson, Goode, &
Moutnho, 2004; Kara, Kaynak, & Kucukemiroglu, 1995). When FFRS are able to achieve or exceed the expectations
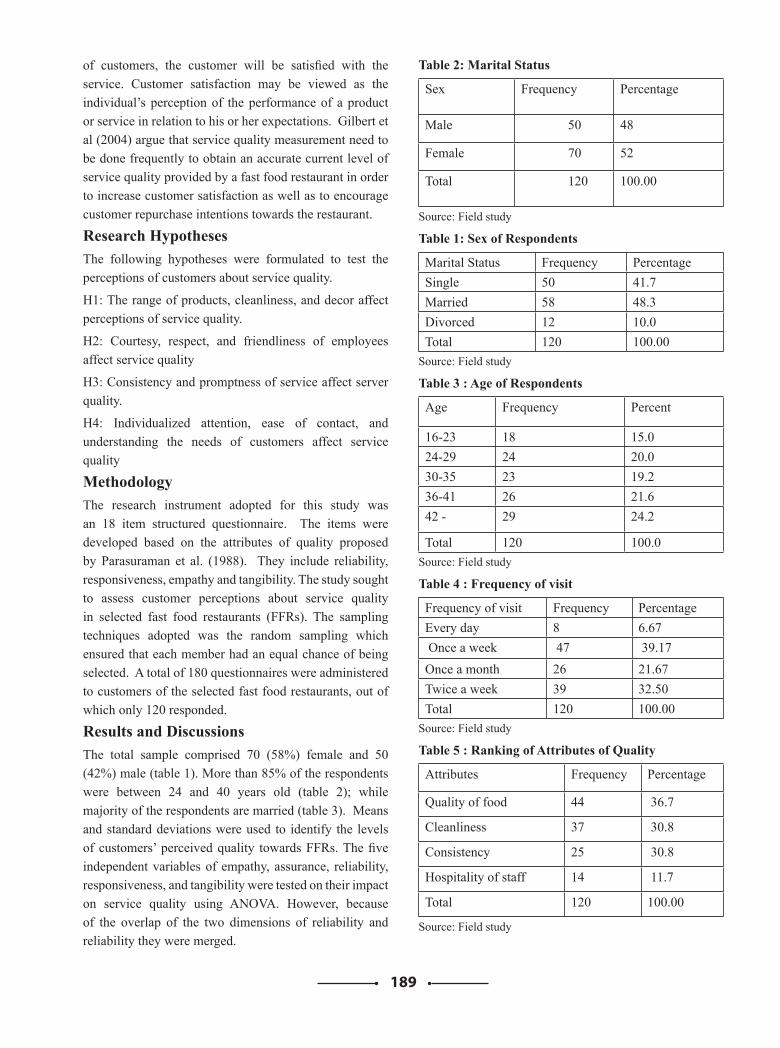
189
of customers, the customer will be satisfied with the service. Customer satisfaction may be viewed as the individual’s perception of the performance of a product or service in relation to his or her expectations. Gilbert et al (2004) argue that service quality measurement need to be done frequently to obtain an accurate current level of service quality provided by a fast food restaurant in order to increase customer satisfaction as well as to encourage customer repurchase intentions towards the restaurant.
Research Hypotheses The following hypotheses were formulated to test the perceptions of customers about service quality.
H1: The range of products, cleanliness, and decor affect perceptions of service quality.
H2: Courtesy, respect, and friendliness of employees affect service quality
H3: Consistency and promptness of service affect server quality.
H4: Individualized attention, ease of contact, and understanding the needs of customers affect service quality
Methodology The research instrument adopted for this study was an 18 item structured questionnaire. The items were developed based on the attributes of quality proposed by Parasuraman et al. (1988). They include reliability, responsiveness, empathy and tangibility. The study sought to assess customer perceptions about service quality in selected fast food restaurants (FFRs). The sampling techniques adopted was the random sampling which ensured that each member had an equal chance of being selected. A total of 180 questionnaires were administered to customers of the selected fast food restaurants, out of which only 120 responded.
Results and DiscussionsThe total sample comprised 70 (58%) female and 50 (42%) male (table 1). More than 85% of the respondents were between 24 and 40 years old (table 2); while majority of the respondents are married (table 3). Means and standard deviations were used to identify the levels of customers’ perceived quality towards FFRs. The five independent variables of empathy, assurance, reliability, responsiveness, and tangibility were tested on their impact on service quality using ANOVA. However, because of the overlap of the two dimensions of reliability and reliability they were merged.
Table 2: Marital Status Sex Frequency Percentage
Male 50 48
Female 70 52
Total 120 100.00
Source: Field study
Table 1: Sex of Respondents
Marital Status Frequency PercentageSingle 50 41.7 Married 58 48.3 Divorced 12 10.0 Total 120 100.00
Source: Field study
Table 3 : Age of Respondents
Age Frequency Percent
16-23 18 15.0 24-29 24 20.0 30-35 23 19.2 36-41 26 21.6 42 - 29 24.2
Total 120 100.0Source: Field study
Table 4 : Frequency of visit
Frequency of visit Frequency PercentageEvery day 8 6.67 Once a week 47 39.17 Once a month 26 21.67 Twice a week 39 32.50 Total 120 100.00
Source: Field study
Table 5 : Ranking of Attributes of Quality
Attributes Frequency Percentage
Quality of food 44 36.7
Cleanliness 37 30.8
Consistency 25 30.8
Hospitality of staff 14 11.7
Total 120 100.00
Source: Field study
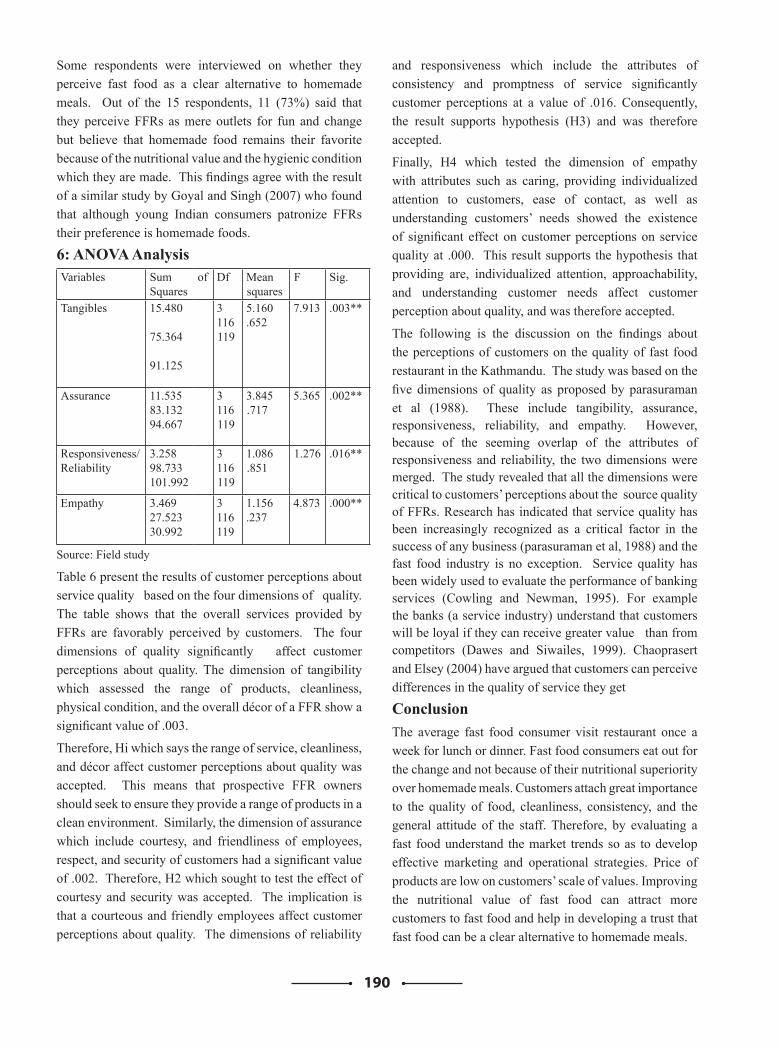
190
Some respondents were interviewed on whether they perceive fast food as a clear alternative to homemade meals. Out of the 15 respondents, 11 (73%) said that they perceive FFRs as mere outlets for fun and change but believe that homemade food remains their favorite because of the nutritional value and the hygienic condition which they are made. This findings agree with the result of a similar study by Goyal and Singh (2007) who found that although young Indian consumers patronize FFRs their preference is homemade foods.
6: ANOVA AnalysisVariables Sum
Squares of Df Mean
squaresF Sig.
Tangibles
15.480 75.364 91.125
3 116 119
5.160 .652
7.913
.003**
Assurance
11.53583.132 94.667
3 116 119
3.845 .717
5.365 .002**
Responsiveness/Reliability
3.258 98.733 101.992
3 116 119
1.086 .851
1.276 .016**
Empathy 3.469 27.523 30.992
3 116 119
1.156 .237
4.873 .000**
Source: Field study
Table 6 present the results of customer perceptions about service quality based on the four dimensions of quality. The table shows that the overall services provided by FFRs are favorably perceived by customers. The four dimensions of quality significantly affect customer perceptions about quality. The dimension of tangibility which assessed the range of products, cleanliness, physical condition, and the overall décor of a FFR show a significant value of .003.
Therefore, Hi which says the range of service, cleanliness, and décor affect customer perceptions about quality was accepted. This means that prospective FFR owners should seek to ensure they provide a range of products in a clean environment. Similarly, the dimension of assurance which include courtesy, and friendliness of employees, respect, and security of customers had a significant value of .002. Therefore, H2 which sought to test the effect of courtesy and security was accepted. The implication is that a courteous and friendly employees affect customer perceptions about quality. The dimensions of reliability
and responsiveness which include the attributes of consistency and promptness of service significantly customer perceptions at a value of .016. Consequently, the result supports hypothesis (H3) and was therefore accepted.
Finally, H4 which tested the dimension of empathy with attributes such as caring, providing individualized attention to customers, ease of contact, as well as understanding customers’ needs showed the existence of significant effect on customer perceptions on service quality at .000. This result supports the hypothesis that providing are, individualized attention, approachability, and understanding customer needs affect customer perception about quality, and was therefore accepted.
The following is the discussion on the findings about the perceptions of customers on the quality of fast food restaurant in the Kathmandu. The study was based on the five dimensions of quality as proposed by parasuraman et al (1988). These include tangibility, assurance, responsiveness, reliability, and empathy. However, because of the seeming overlap of the attributes of responsiveness and reliability, the two dimensions were merged. The study revealed that all the dimensions were critical to customers’ perceptions about the source quality of FFRs. Research has indicated that service quality has been increasingly recognized as a critical factor in the success of any business (parasuraman et al, 1988) and the fast food industry is no exception. Service quality has been widely used to evaluate the performance of banking services (Cowling and Newman, 1995). For example the banks (a service industry) understand that customers will be loyal if they can receive greater value than from competitors (Dawes and Siwailes, 1999). Chaoprasert and Elsey (2004) have argued that customers can perceive differences in the quality of service they get
ConclusionThe average fast food consumer visit restaurant once a week for lunch or dinner. Fast food consumers eat out for the change and not because of their nutritional superiority over homemade meals. Customers attach great importance to the quality of food, cleanliness, consistency, and the general attitude of the staff. Therefore, by evaluating a fast food understand the market trends so as to develop effective marketing and operational strategies. Price of products are low on customers’ scale of values. Improving the nutritional value of fast food can attract more customers to fast food and help in developing a trust that fast food can be a clear alternative to homemade meals.
191
ReferencesBloemer, J., Ruyter, K. and Wetzels, M. (1999) “Linking
Perceived Service quality and Service Loyalty: a Multidimensional Perspective”, European Journal of Marketing Science, Vol. 33, No. 11/12, pp. 1082-1106.
Business Wire (2011) Research and Markets: Fast Food in Nigeria, Research Markets
Chee, L.K. (2010) “The Fast Food Market: A Study of Buying Behaviour and Restaurant Image”, University of Malaya, Faculty of Economics and Administration.
Cronin, J. and `Taylor, S. (1992) Measuring Service Quality: a Re-examination and Extension”, Journal of Marketing, Vol. 56, pp. 56-68.
Gremler, D. and Brown, S. (1999) The Loyalty Ripple Effect: Appreciating the Full Value of Customers”, International Journal of Service Industry Management, Vol. 10, No. 3, pp. 271-291.
Goyal, A. and Singh, N.P. (2007) “Consumer Perception about Fast Food in India: an Exploratory Study”, British Food Journal, Vol. 109, ISS 2, pp. 137-51.
Gronroos, C. (1984) A Service Quality Model and Its Marketing Implications”, European Journal of Marketring, Vol. 18, No. 4, pp. 37-44.
McClearly, K.W. and Weaver, P.A. (1982) Improving Employee Service Levels through Identifying Sources of Customer Satisfaction”, International Journal of Hospitality Management, Vol. 1, No. 2, pp. 85-9
Micuda, D.I. and Dinculescu, E.S. (2010) “Service Quality Attributes in Retail Banking”, Faculty of Management Marketing.
Munusamy, J. Chelliah, S., and Mun, H. W. (2010) “Service Quality Delivery and Its Impact on Customer Satisfaction in Malaysia”, International Journal of Innovation Management and Technology, Vol. 1, No. 4, October, pp. 398-404.
Parasuraman, A., Zeithaml, V.A. and Berry, L.L. (1988) “SERVQUAL – a Multiple – item Scale for Measuring Consumer Perceptions of Service Quality”, Journal of Retailing, Vol. 64, No. 1, pp. 1240.
Tontini, G. and Silveira, A. (2007) “Identification of Satisfaction Attributes using Competitive Analysis of the Improvement Gap”, Management, Vol. 27, No. 5, pp. 482-500.
Zeithaml, V., Benry, L. and Parasuraman, A. (1996) “The Behavioral Consequences of Service Quality”, Journal of Marketing, Vol. 60, pp. 31-46.
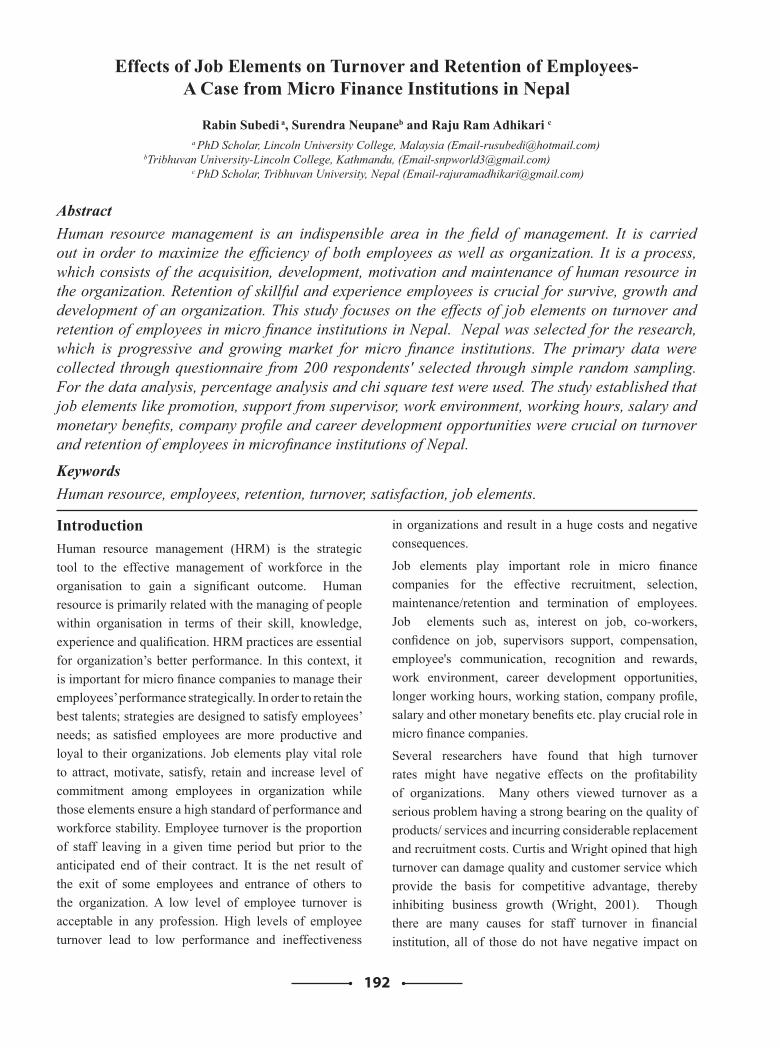
192
Effects of Job Elements on Turnover and Retention of Employees- A Case from Micro Finance Institutions in Nepal
Rabin Subedi a, Surendra Neupaneb and Raju Ram Adhikari c a PhD Scholar, Lincoln University College, Malaysia ([email protected])
bTribhuvan University-Lincoln College, Kathmandu, ([email protected]) c PhD Scholar, Tribhuvan University, Nepal ([email protected])
AbstractHuman resource management is an indispensible area in the field of management. It is carried out in order to maximize the efficiency of both employees as well as organization. It is a process, which consists of the acquisition, development, motivation and maintenance of human resource in the organization. Retention of skillful and experience employees is crucial for survive, growth and development of an organization. This study focuses on the effects of job elements on turnover and retention of employees in micro finance institutions in Nepal. Nepal was selected for the research, which is progressive and growing market for micro finance institutions. The primary data were collected through questionnaire from 200 respondents' selected through simple random sampling. For the data analysis, percentage analysis and chi square test were used. The study established that job elements like promotion, support from supervisor, work environment, working hours, salary and monetary benefits, company profile and career development opportunities were crucial on turnover and retention of employees in microfinance institutions of Nepal.
Keywords Human resource, employees, retention, turnover, satisfaction, job elements.
IntroductionHuman resource management (HRM) is the strategic tool to the effective management of workforce in the organisation to gain a significant outcome. Human resource is primarily related with the managing of people within organisation in terms of their skill, knowledge, experience and qualification. HRM practices are essential for organization’s better performance. In this context, it is important for micro finance companies to manage their employees’ performance strategically. In order to retain the best talents; strategies are designed to satisfy employees’ needs; as satisfied employees are more productive and loyal to their organizations. Job elements play vital role to attract, motivate, satisfy, retain and increase level of commitment among employees in organization while those elements ensure a high standard of performance and workforce stability. Employee turnover is the proportion of staff leaving in a given time period but prior to the anticipated end of their contract. It is the net result of the exit of some employees and entrance of others to the organization. A low level of employee turnover is acceptable in any profession. High levels of employee turnover lead to low performance and ineffectiveness
in organizations and result in a huge costs and negative consequences.
Job elements play important role in micro finance companies for the effective recruitment, selection, maintenance/retention and termination of employees. Job elements such as, interest on job, co-workers, confidence on job, supervisors support, compensation, employee's communication, recognition and rewards, work environment, career development opportunities, longer working hours, working station, company profile, salary and other monetary benefits etc. play crucial role in micro finance companies.
Several researchers have found that high turnover rates might have negative effects on the profitability of organizations. Many others viewed turnover as a serious problem having a strong bearing on the quality of products/ services and incurring considerable replacement and recruitment costs. Curtis and Wright opined that high turnover can damage quality and customer service which provide the basis for competitive advantage, thereby inhibiting business growth (Wright, 2001). Though there are many causes for staff turnover in financial institution, all of those do not have negative impact on
193
well being of an organization. Financial institution should differentiate between voluntary and involuntary turnover and take actions on the one under their control. Retention activities may be defined as a sum of all those activities aimed at increasing organizational commitment of employees, giving them an overall ambitious and myriad of opportunities where they can grow by outperforming others (Bogdanowicz, 2002). Maertz & Griffeth have explained the factors such as competitive salary, friendly working environment, healthy interpersonal relationships and job security were frequently cited by employees as key motivational variables that influenced their retention in the organizations (Carl p. Meartz, 2004). Turnover intention refers to leave the job on a voluntary basis. Various studies have investigated on actual turnover and the concept of turnover intention, which relates to behavioural attitudes. Moreover, turnover intention can be understood as voluntarily change employers or to depart the entire labour market. Turnover intentions are the best predictors of actual turnover. Griffeth R. W., Hom P. W. & Gaertner S. conducted a research on ‘A Meta-analysis of antecedents and correlates of employee turnover: Update, moderator tests, and research implications for the next millennium’, they argued in their study that intention to quit and actual turnover had a significant positive relationship (Griffeth R. W., 2000). According to Michael, B., & Prince, A., & Chacko, A., behavioural intention to quit is theoretically seen as an important antecedent to actual turnover. (B. Michael, 2016). Pathak G. P. concluded that there was a significant relationship between the retention factors and employees’ commitment in Nepalese commercial banks (Pathak, 2018). Rasha M. ,Thomas K. N. and Benjamin M. studied to evaluate the factors affecting employee retention in the banking sector of Sudan with a specific focus on Agricultural Bank of Sudan revealed that training plays a significant role in retaining employees and working environment influences employee retention. (Mohamed & Mulili, 2017). Rose and others had recognized that high turnover at any organizational levels constitutes a waste of human resources. They agreed with this view and said that turnover is not a good phenomenon for organization because valuable human resources are lost. In today’s changing world of work, reasonable levels of employee-initiated turnover facilitated organizational flexibility and employee independence, and they can lessen the need for management layoff (R, 2016).
Job satisfaction has been a widely studied variable in determining turnover intention. It is certainly a highly important variable in organizational studies. Job
satisfaction is a factor that encourages employees to stay longer in current organisation. Ratna and Chawla also agreed on the notion that job satisfaction can be used to understand turnover process. According to them job satisfaction is the main predictor of turnover intention (Ratna R & Chawla, 2012). Slavianska initiated that the organization must go straight to the employees when they think about job satisfaction. This is because they are involved in every single task in the organization and therefore, they could give the necessary feedback to the employers regarding their satisfaction to the job they have been performed (Slavianska, 2012).Employee's issues are the most sensitive one and need to well handle properly by micro finance institutions. Employees satisfaction and productivity of organization may be increased by maintaining job element such as; supervisor support, compensation, employees communication, recognition and rewards, work environment, career development, longer working hours, working station, company profile and salary and other monetary benefits. The growth of microfinance institution seems complex to handle the human resource for proper handling of job. The present study will contribute a deeper understanding of job elements in microfinance institution in Nepal. This research focused to fill the gap in the study of human resources in general, as well as microfinance institutions in particular on retention and turnover.MethodsThis study was conducted among 200 respondents selected through simple random sampling technique. Questionnaire was used to collect primary data. For the data analysis descriptive and chi square test were used. Frequencies analysis was employed for demographic characters, time spent in current job, feeling of employees regarding freedom while working, frequency of getting promotion and scale of job elements. The chi square test was applied to know the significant association between job elements and satisfaction from job and job elements and time spent in the job.
Results and DiscussionIn this section the results of the study are presented and discussed with reference to the purpose of the study. The detailed analysis of demographic characteristics of employees, time spent in current job, feeling of employees regarding freedom while working, frequency of getting promotion and scale of job elements, the association between job elements and level of satisfaction as well as association between job elements and time spent in the job are presented and discussed.
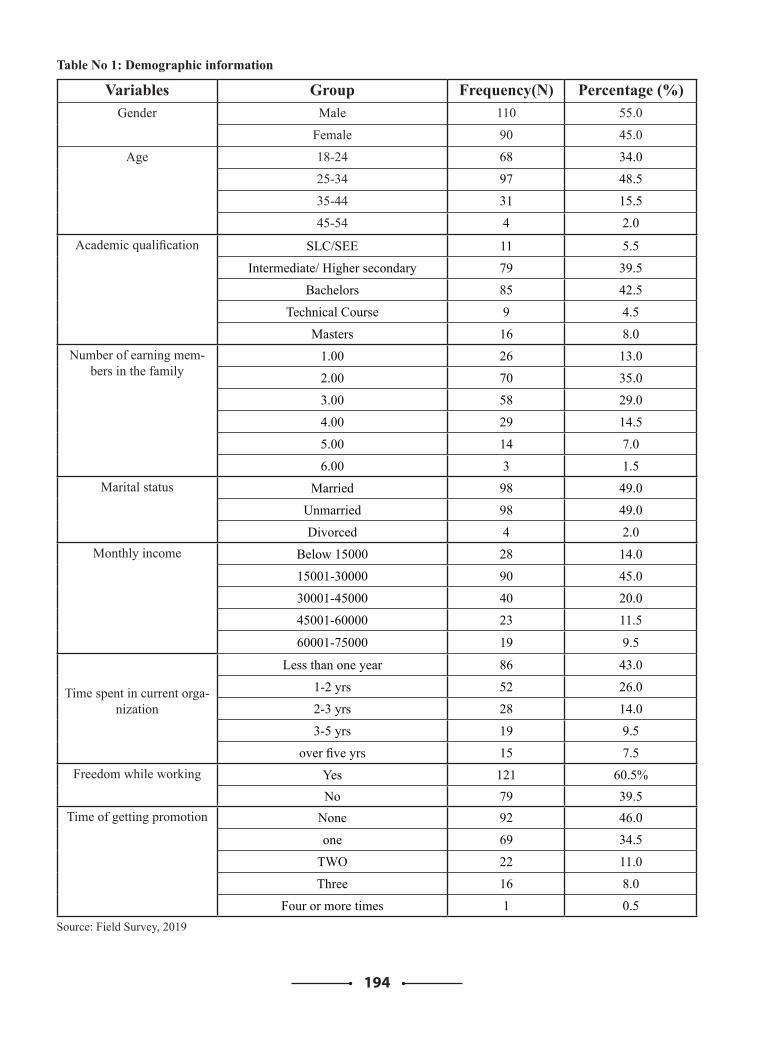
194
Table No 1: Demographic information
Variables Group Frequency(N) Percentage (%)Gender Male 110 55.0
Female 90 45.0
Age 18-24 68 34.0
25-34 97 48.5
35-44 31 15.5
45-54 4 2.0
Academic qualification SLC/SEE 11 5.5
Intermediate/ Higher secondary 79 39.5
Bachelors 85 42.5
Technical Course 9 4.5
Masters 16 8.0Number of earning mem-
bers in the family1.00 26 13.0
2.00 70 35.0
3.00 58 29.0
4.00 29 14.5
5.00 14 7.0
6.00 3 1.5Marital status Married 98 49.0
Unmarried 98 49.0
Divorced 4 2.0Monthly income Below 15000 28 14.0
15001-30000 90 45.0
30001-45000 40 20.0
45001-60000 23 11.5
60001-75000 19 9.5
Time spent in current orga-nization
Less than one year 86 43.0
1-2 yrs 52 26.0
2-3 yrs 28 14.0
3-5 yrs 19 9.5
over five yrs 15 7.5Freedom while working Yes 121 60.5%
No 79 39.5Time of getting promotion None 92 46.0
one 69 34.5
TWO 22 11.0
Three 16 8.0
Four or more times 1 0.5Source: Field Survey, 2019
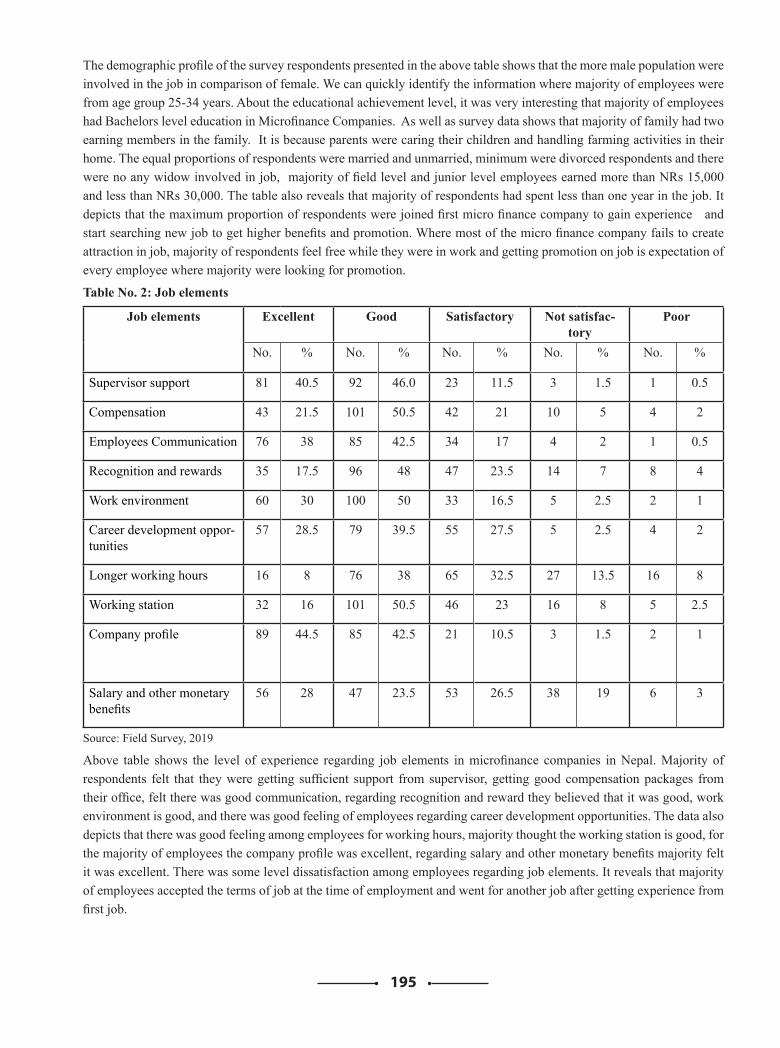
195
The demographic profile of the survey respondents presented in the above table shows that the more male population were involved in the job in comparison of female. We can quickly identify the information where majority of employees were from age group 25-34 years. About the educational achievement level, it was very interesting that majority of employees had Bachelors level education in Microfinance Companies. As well as survey data shows that majority of family had two earning members in the family. It is because parents were caring their children and handling farming activities in their home. The equal proportions of respondents were married and unmarried, minimum were divorced respondents and there were no any widow involved in job, majority of field level and junior level employees earned more than NRs 15,000 and less than NRs 30,000. The table also reveals that majority of respondents had spent less than one year in the job. It depicts that the maximum proportion of respondents were joined first micro finance company to gain experience and start searching new job to get higher benefits and promotion. Where most of the micro finance company fails to create attraction in job, majority of respondents feel free while they were in work and getting promotion on job is expectation of every employee where majority were looking for promotion.
Table No. 2: Job elements
Job elements Excellent Good Satisfactory Not satisfac-tory
Poor
No. % No. % No. % No. % No. %
Supervisor support 81 40.5 92 46.0 23 11.5 3 1.5 1 0.5
Compensation 43 21.5 101 50.5 42 21 10 5 4 2
Employees Communication 76 38 85 42.5 34 17 4 2 1 0.5
Recognition and rewards 35 17.5 96 48 47 23.5 14 7 8 4
Work environment 60 30 100 50 33 16.5 5 2.5 2 1
Career development oppor-tunities
57 28.5 79 39.5 55 27.5 5 2.5 4 2
Longer working hours 16 8 76 38 65 32.5 27 13.5 16 8
Working station 32 16 101 50.5 46 23 16 8 5 2.5
Company profile 89 44.5 85 42.5 21 10.5 3 1.5 2 1
Salary and other monetary benefits
56 28 47 23.5 53 26.5 38 19 6 3
Source: Field Survey, 2019
Above table shows the level of experience regarding job elements in microfinance companies in Nepal. Majority of respondents felt that they were getting sufficient support from supervisor, getting good compensation packages from their office, felt there was good communication, regarding recognition and reward they believed that it was good, work environment is good, and there was good feeling of employees regarding career development opportunities. The data also depicts that there was good feeling among employees for working hours, majority thought the working station is good, for the majority of employees the company profile was excellent, regarding salary and other monetary benefits majority felt it was excellent. There was some level dissatisfaction among employees regarding job elements. It reveals that majority of employees accepted the terms of job at the time of employment and went for another job after getting experience from first job.
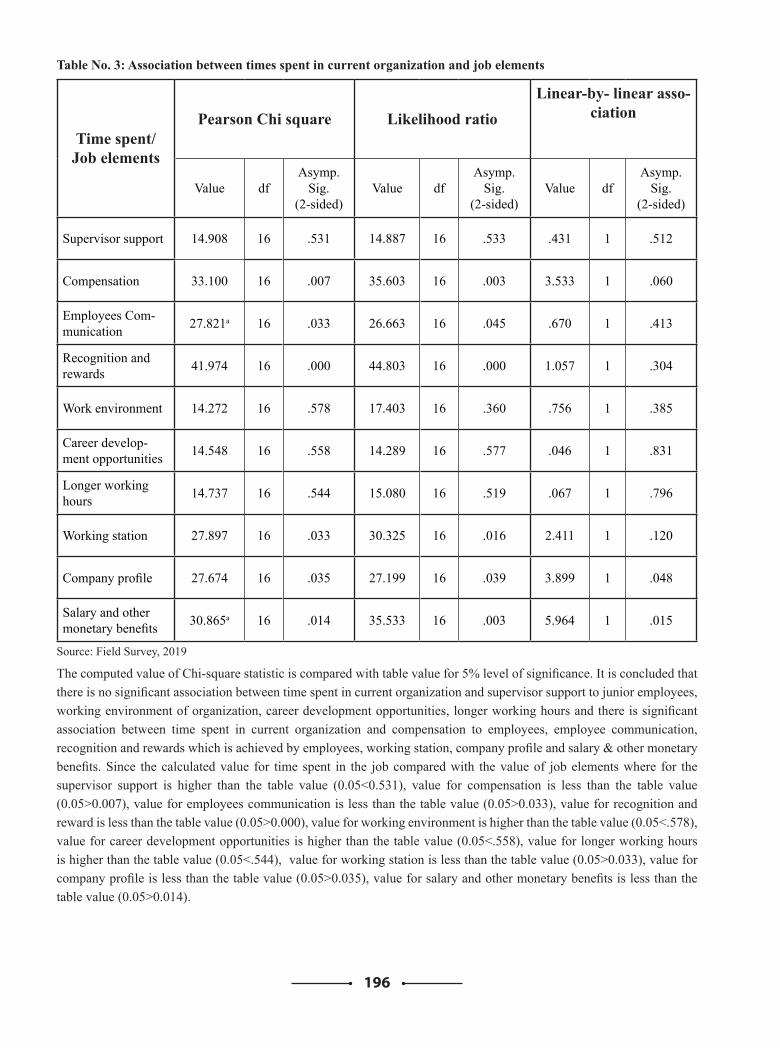
196
Table No. 3: Association between times spent in current organization and job elements
Time spent/ Job elements
Pearson Chi square Likelihood ratioLinear-by- linear asso-
ciation
Value dfAsymp.
Sig. (2-sided)
Value dfAsymp.
Sig. (2-sided)
Value dfAsymp.
Sig. (2-sided)
Supervisor support 14.908 16 .531 14.887 16 .533 .431 1 .512
Compensation 33.100 16 .007 35.603 16 .003 3.533 1 .060
Employees Com-munication 27.821a 16 .033 26.663 16 .045 .670 1 .413
Recognition and rewards 41.974 16 .000 44.803 16 .000 1.057 1 .304
Work environment 14.272 16 .578 17.403 16 .360 .756 1 .385
Career develop-ment opportunities 14.548 16 .558 14.289 16 .577 .046 1 .831
Longer working hours 14.737 16 .544 15.080 16 .519 .067 1 .796
Working station 27.897 16 .033 30.325 16 .016 2.411 1 .120
Company profile 27.674 16 .035 27.199 16 .039 3.899 1 .048
Salary and other monetary benefits 30.865a 16 .014 35.533 16 .003 5.964 1 .015
Source: Field Survey, 2019
The computed value of Chi-square statistic is compared with table value for 5% level of significance. It is concluded that there is no significant association between time spent in current organization and supervisor support to junior employees, working environment of organization, career development opportunities, longer working hours and there is significant association between time spent in current organization and compensation to employees, employee communication, recognition and rewards which is achieved by employees, working station, company profile and salary & other monetary benefits. Since the calculated value for time spent in the job compared with the value of job elements where for the supervisor support is higher than the table value (0.05<0.531), value for compensation is less than the table value (0.05>0.007), value for employees communication is less than the table value (0.05>0.033), value for recognition and reward is less than the table value (0.05>0.000), value for working environment is higher than the table value (0.05<.578), value for career development opportunities is higher than the table value (0.05<.558), value for longer working hours is higher than the table value (0.05<.544), value for working station is less than the table value (0.05>0.033), value for company profile is less than the table value (0.05>0.035), value for salary and other monetary benefits is less than the table value (0.05>0.014).
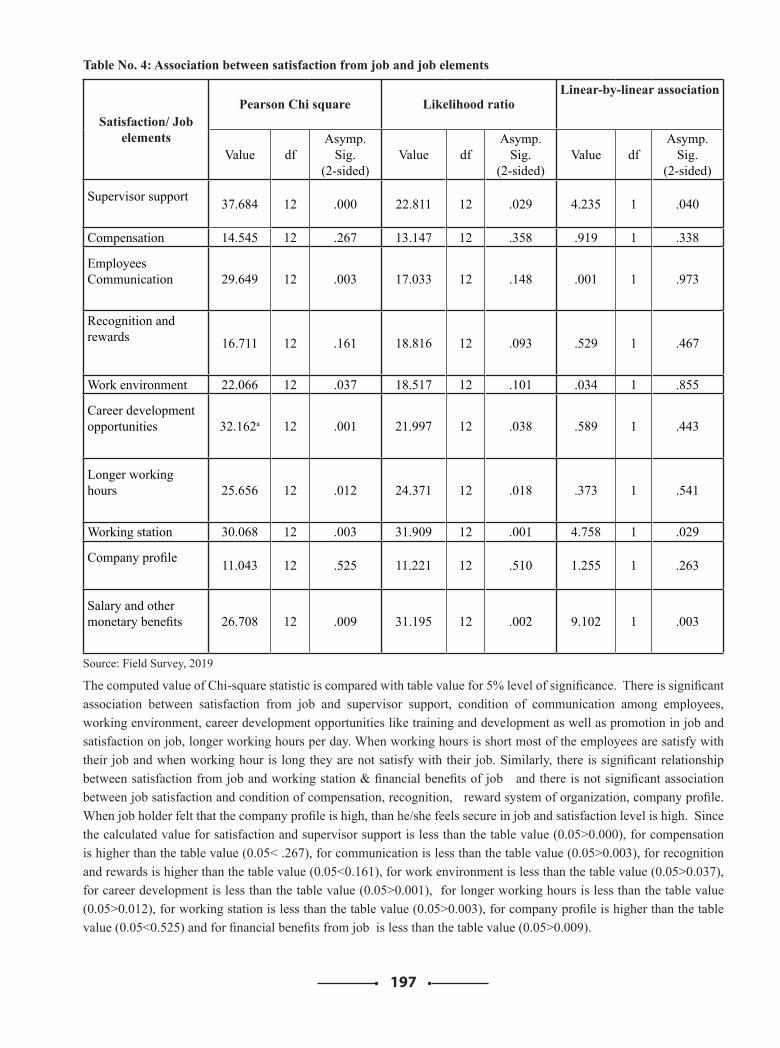
197
Table No. 4: Association between satisfaction from job and job elements
Satisfaction/ Job elements
Pearson Chi square Likelihood ratioLinear-by-linear association
Value dfAsymp.
Sig. (2-sided)
Value dfAsymp.
Sig. (2-sided)
Value dfAsymp.
Sig. (2-sided)
Supervisor support 37.684 12 .000 22.811 12 .029 4.235 1 .040
Compensation 14.545 12 .267 13.147 12 .358 .919 1 .338
Employees Communication 29.649 12 .003 17.033 12 .148 .001 1 .973
Recognition and rewards 16.711 12 .161 18.816 12 .093 .529 1 .467
Work environment 22.066 12 .037 18.517 12 .101 .034 1 .855
Career development opportunities 32.162a 12 .001 21.997 12 .038 .589 1 .443
Longer working hours 25.656 12 .012 24.371 12 .018 .373 1 .541
Working station 30.068 12 .003 31.909 12 .001 4.758 1 .029
Company profile 11.043 12 .525 11.221 12 .510 1.255 1 .263
Salary and other monetary benefits 26.708 12 .009 31.195 12 .002 9.102 1 .003
Source: Field Survey, 2019
The computed value of Chi-square statistic is compared with table value for 5% level of significance. There is significant association between satisfaction from job and supervisor support, condition of communication among employees, working environment, career development opportunities like training and development as well as promotion in job and satisfaction on job, longer working hours per day. When working hours is short most of the employees are satisfy with their job and when working hour is long they are not satisfy with their job. Similarly, there is significant relationship between satisfaction from job and working station & financial benefits of job and there is not significant association between job satisfaction and condition of compensation, recognition, reward system of organization, company profile. When job holder felt that the company profile is high, than he/she feels secure in job and satisfaction level is high. Since the calculated value for satisfaction and supervisor support is less than the table value (0.05>0.000), for compensation is higher than the table value (0.05< .267), for communication is less than the table value (0.05>0.003), for recognition and rewards is higher than the table value (0.05<0.161), for work environment is less than the table value (0.05>0.037), for career development is less than the table value (0.05>0.001), for longer working hours is less than the table value (0.05>0.012), for working station is less than the table value (0.05>0.003), for company profile is higher than the table value (0.05<0.525) and for financial benefits from job is less than the table value (0.05>0.009).
198
ConclusionEmployee retention issue is emerging as one of the most crucial workforce management challenge in Nepal. Successful organizations will be those which adapt their organizational behavior to the realities of the current work environment. In fact, the dynamics of the work environment will have to reflect a diverse population comprised of individuals whose motivations, beliefs and value structures differ vastly from the past and one another. The most of the micro finance companies in Nepal fail to create attraction in job. There were not proper strategies to retain lower employees. Freedom on working condition is important aspect of job. Majority feel free while they are in work even though they were not getting any promotion. Regarding the job elements in microfinance companies in Nepal majority of respondents felt good temporarily. Time spent in current organization is largely determined by compensation, employee communication, recognition and rewards, working station, company profile and salary & other monetary benefits. The value of satisfaction from job relate to the supervisor support, condition of communication among employees, working environment, career development opportunities like training and development as well as promotion . In terms of working hours, when working hours is less, most of the employees are satisfy with their job. When job holder felt that the company profile is high, then he/she feels secure in job and satisfaction level is observed high.
BibliographyB. Michael, A. p. (2016). Impact of compensation package
on employee retention. International journal of research in commerce and management 7 (10) , 36-40.
Bogdanowicz, M. A. (2002). The value of Knowledge and the value of new knowledge worker. Generation in the new economy. Journal of Europian Industrial training, 26 (2/3/4) , 125-129.
Carl p. Meartz, J. r. (2004). Eight Motivational forces and Voiuntary Turnover: A theoyetical Synthesis with implication for research. Journal of management, volum 30 , issue 5 , 667-683.
Griffeth R. W., H. P. (2000). A Meta Analysis of antecedents and correlates of employee turnover: Updates, moderator tests, and research implications for the next millennium. Journal of management .
Mohamed, R., & Mulili, T. K. (2017). Factors Determining Employee Retention in the Banking Sector:A case study of Agriculture Bank of Sudan. Journal of Education and Entrepreneurship , 4 (10), 1-23.
Pathak, G. P. (2018). Influence of Retention Factors on Employees Commitment: Evidence from Nepalese Commercial Banks. International Journal of Innovative research in Science,Engineering and Technology , 7 (6), 7031-7039.
R, R. S. (2016). Role of HR practices, job satisfaction, and organization commitment in employee retention. Role of HR practices, job satisfaction, and organizatio International journal of research in commerce & management, 7(10), 1-3. , 1-3.
Ratna R & Chawla, S. (2012). Key factors in retention and retention strategies. Global management review, 6(3), 35-46. , 35-46.
Slavianska. (2012). Measuring the impact of human resource management practices on employee turnover. Measuring the impact of human resource mana Problems of management in the 21st century, 4, 63-73. , 63-73.
Wright, s. c. (2001). Retaining employee- The fast track to commitment. Management Research News, Vol 24, Issue 8/9 , 59-64.
199
Urban Waste Water Management Infrastructure Analysis- Case Study of Guheshwori (Wwtp)
Ashish Ghimire Ph.D Scholar, Lincoln University College, Malaysia
Sateesh Kumar Ojha [email protected]
Raman Badaila Soil Water and Air Testing Laboratories, Kathmandu Nepal
AbstractAs Nepal moves towards Urbanization, the need for wastewater management in urban areas is imminent. Waste Water management aims to provide clean water for a variety of purposes, without harming the environment. The major objectives of this study are to analyze the wastewater treatment efficiency of Guheshwori WWTP and to identify the gap in design and implementation. The laboratory analysis was done at Soil Water and Air Testing Laboratories, Kathamndu, Nepal.
KeywordsWastewater treatment, Activated Sludge Process, Performance.
IntroductionAs of 2017, rural population that comprises over 41.6 percent of the total population dominates Nepal. The remaining 58.4 percent of the population live in so called urban areas, most of which are practically rural—meaning the absence of basic services, amenities and opportunities that are commonly anticipated in urban areas. Nepal’s urban population has increased to 17% in 2011 from 13.9% of 2001, urban population growth rate was at 3.38%. Urban population became 38.2 in 2016 and 58.4% in 2017. But these are urban by law, which is rendered so through the declaration of a certain territory as a “municipality”. Among these urban areas, Kathmandu valley that comprises two metropolitan cities and part of surrounding municipalities presently has more than 2.5 million people and is growing at 4 percent per year (World Bank, 2013). The valley comprises one of the fastest growing metropolitan area in South Asia, but it faces unprecedented challenges of rapid urbanization as it faces severe problems of drinking water, sanitation, air pollution, squatter settlements and so forth. However, unlike in other South Asian countries, rapid urbanization in Nepal that has been quite prominent over the past two decades has unfortunately not been accompanied by comparable economic growth.
Civilization in Kathmandu is related to rivers. Still many people are dependent on these water bodies. With increasing population, the wastewater generation has also increased in Kathmandu Valley (Sukla et al, 2012). Like in most of the urban cities (Mishra et al. 2017 & Purandara et al. 2012), most of the wastewater generated is directly discharged to Bagmati River and it’s tributaries without proper treatment. Bagmati River, being the largest in the capital city of Kathmandu Valley receives the wastewater from Gokarna, Bouddha, Jorpati, Chabahail, Tushal, Mitraprak, Gaurighat and Pashupati areas. Guheshwori wastewater Treatment plant was established to improve the quality of water that is being directly discharged into the Bagmati River. The Guheswori wastewater treatment plant is a biological wastewater treatment plant. It is based on technology of extended aeration consisting of deep oxidation ditch of Carrousel type. Untreated wastewater contains organic matter, pathogenic microorganism, nutrients like nitrate and phosphate, toxic compound and solid particles (Abdel-Raouf, Al-Homaidan, & Ibraheem, 2012).
With the aim of improving the water quality of Bagmati, five treatment plants are under construction in Kathmandu Valley (Thapa et al., 2019). These are oxidation ditch at Guheshwori, aerated lagoons at Sallaghari and Hanumanghat and non-aerated lagoons at Kodku and Dhobighat (Asian Development Bank 2013 & GoN/NTNC
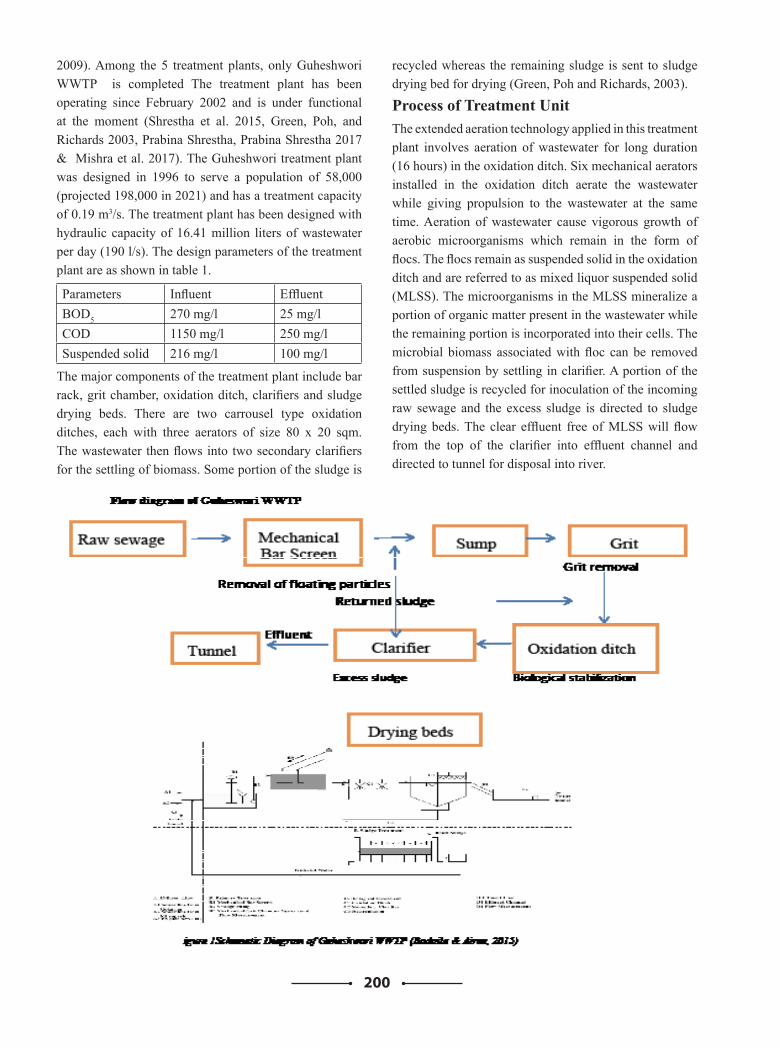
200
2009). Among the 5 treatment plants, only Guheshwori WWTP is completed The treatment plant has been operating since February 2002 and is under functional at the moment (Shrestha et al. 2015, Green, Poh, and Richards 2003, Prabina Shrestha, Prabina Shrestha 2017 & Mishra et al. 2017). The Guheshwori treatment plant was designed in 1996 to serve a population of 58,000 (projected 198,000 in 2021) and has a treatment capacity of 0.19 m3/s. The treatment plant has been designed with hydraulic capacity of 16.41 million liters of wastewater per day (190 l/s). The design parameters of the treatment plant are as shown in table 1.
Parameters Influent EffluentBOD5 270 mg/l 25 mg/lCOD 1150 mg/l 250 mg/lSuspended solid 216 mg/l 100 mg/l
The major components of the treatment plant include bar rack, grit chamber, oxidation ditch, clarifiers and sludge drying beds. There are two carrousel type oxidation ditches, each with three aerators of size 80 x 20 sqm. The wastewater then flows into two secondary clarifiers for the settling of biomass. Some portion of the sludge is
recycled whereas the remaining sludge is sent to sludge drying bed for drying (Green, Poh and Richards, 2003).
Process of Treatment UnitThe extended aeration technology applied in this treatment plant involves aeration of wastewater for long duration (16 hours) in the oxidation ditch. Six mechanical aerators installed in the oxidation ditch aerate the wastewater while giving propulsion to the wastewater at the same time. Aeration of wastewater cause vigorous growth of aerobic microorganisms which remain in the form of flocs. The flocs remain as suspended solid in the oxidation ditch and are referred to as mixed liquor suspended solid (MLSS). The microorganisms in the MLSS mineralize a portion of organic matter present in the wastewater while the remaining portion is incorporated into their cells. The microbial biomass associated with floc can be removed from suspension by settling in clarifier. A portion of the settled sludge is recycled for inoculation of the incoming raw sewage and the excess sludge is directed to sludge drying beds. The clear effluent free of MLSS will flow from the top of the clarifier into effluent channel and directed to tunnel for disposal into river.
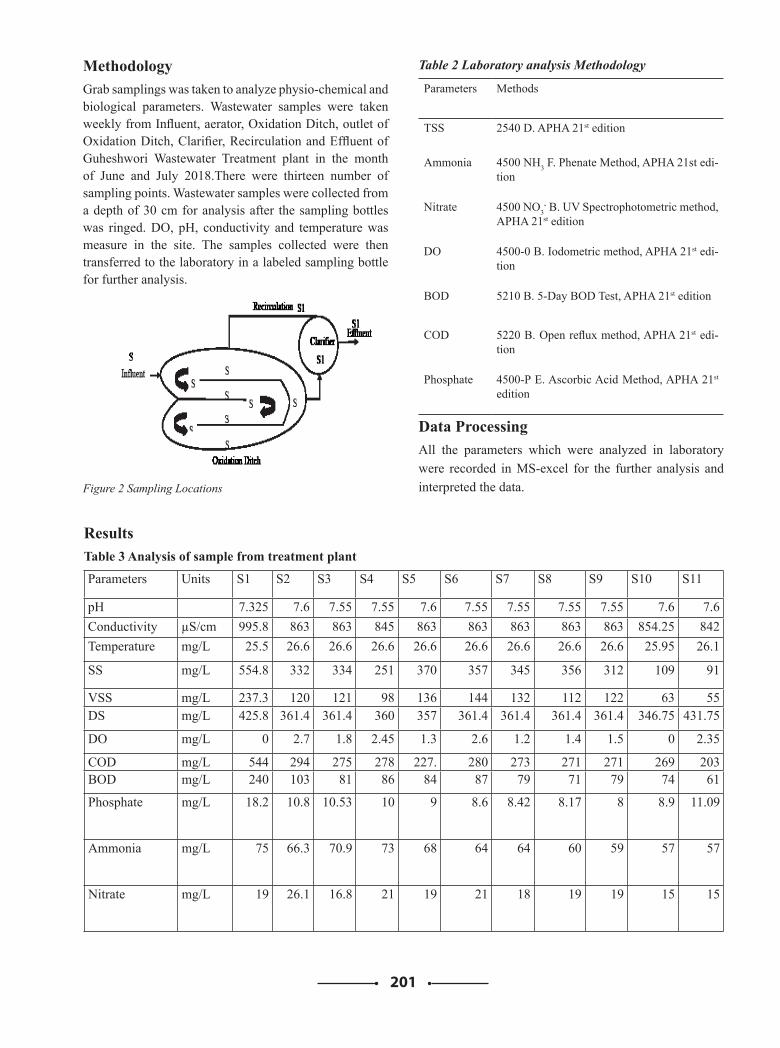
201
MethodologyGrab samplings was taken to analyze physio-chemical and biological parameters. Wastewater samples were taken weekly from Influent, aerator, Oxidation Ditch, outlet of Oxidation Ditch, Clarifier, Recirculation and Effluent of Guheshwori Wastewater Treatment plant in the month of June and July 2018.There were thirteen number of sampling points. Wastewater samples were collected from a depth of 30 cm for analysis after the sampling bottles was ringed. DO, pH, conductivity and temperature was measure in the site. The samples collected were then transferred to the laboratory in a labeled sampling bottle for further analysis.
Figure 2 Sampling Locations
Results Table 3 Analysis of sample from treatment plant
Parameters Units S1 S2 S3 S4 S5 S6 S7 S8 S9 S10 S11
pH 7.325 7.6 7.55 7.55 7.6 7.55 7.55 7.55 7.55 7.6 7.6 Conductivity µS/cm 995.8 863 863 845 863 863 863 863 863 854.25 842 Temperature mg/L 25.5 26.6 26.6 26.6 26.6 26.6 26.6 26.6 26.6 25.95 26.1
SS mg/L 554.8 332 334 251 370 357 345 356 312 109 91
VSS mg/L 237.3 120 121 98 136 144 132 112 122 63 55DS mg/L 425.8 361.4 361.4 360 357 361.4 361.4 361.4 361.4 346.75 431.75
DO mg/L 0 2.7 1.8 2.45 1.3 2.6 1.2 1.4 1.5 0 2.35
COD mg/L 544 294 275 278 227. 280 273 271 271 269 203BOD mg/L 240 103 81 86 84 87 79 71 79 74 61
Phosphate mg/L 18.2 10.8 10.53 10 9 8.6 8.42 8.17 8 8.9 11.09
Ammonia mg/L 75 66.3 70.9 73 68 64 64 60 59 57 57
Nitrate mg/L 19 26.1 16.8 21 19 21 18 19 19 15 15
Table 2 Laboratory analysis Methodology
Parameters Methods
TSS 2540 D. APHA 21st edition
Ammonia 4500 NH3 F. Phenate Method, APHA 21st edi-tion
Nitrate 4500 NO3- B. UV Spectrophotometric method,
APHA 21st edition
DO 4500-0 B. Iodometric method, APHA 21st edi-tion
BOD 5210 B. 5-Day BOD Test, APHA 21st edition
COD 5220 B. Open reflux method, APHA 21st edi-tion
Phosphate 4500-P E. Ascorbic Acid Method, APHA 21st edition
Data Processing All the parameters which were analyzed in laboratory were recorded in MS-excel for the further analysis and interpreted the data.
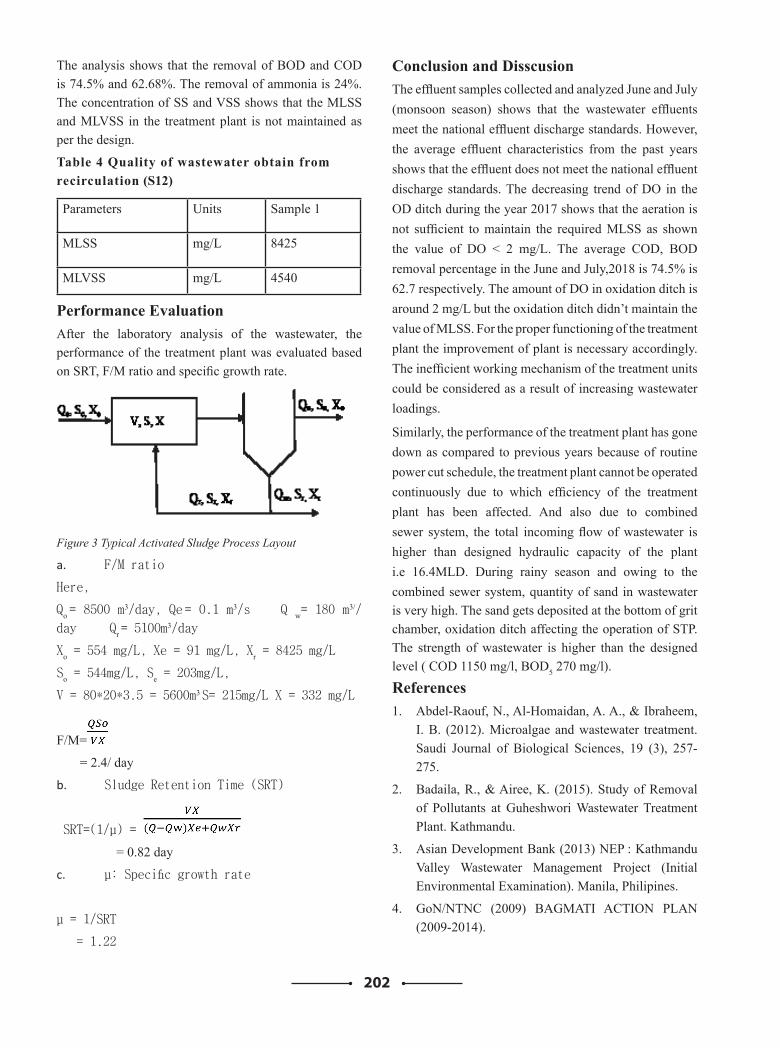
202
The analysis shows that the removal of BOD and COD is 74.5% and 62.68%. The removal of ammonia is 24%. The concentration of SS and VSS shows that the MLSS and MLVSS in the treatment plant is not maintained as per the design.
Table 4 Quality of wastewater obtain from recirculation (S12)
Parameters Units Sample 1
MLSS mg/L 8425
MLVSS mg/L 4540
Performance Evaluation After the laboratory analysis of the wastewater, the performance of the treatment plant was evaluated based on SRT, F/M ratio and specific growth rate.
Figure 3 Typical Activated Sludge Process Layout
a. F/M ratio
Here,
Qo = 8500 m3/day, Qe = 0.1 m
3/s Q w= 180 m3//
day Qr = 5100m3/day
Xo = 554 mg/L, Xe = 91 mg/L, Xr = 8425 mg/L
So = 544mg/L, Se = 203mg/L,
V = 80*20*3.5 = 5600m3 S= 215mg/L X = 332 mg/L
F/M=
= 2.4/ day
b. Sludge Retention Time (SRT)
SRT=(1/µ) =
= 0.82 day
c. µ: Specific growth rate
µ = 1/SRT
= 1.22
Conclusion and DisscusionThe effluent samples collected and analyzed June and July (monsoon season) shows that the wastewater effluents meet the national effluent discharge standards. However, the average effluent characteristics from the past years shows that the effluent does not meet the national effluent discharge standards. The decreasing trend of DO in the OD ditch during the year 2017 shows that the aeration is not sufficient to maintain the required MLSS as shown the value of DO < 2 mg/L. The average COD, BOD removal percentage in the June and July,2018 is 74.5% is 62.7 respectively. The amount of DO in oxidation ditch is around 2 mg/L but the oxidation ditch didn’t maintain the value of MLSS. For the proper functioning of the treatment plant the improvement of plant is necessary accordingly. The inefficient working mechanism of the treatment units could be considered as a result of increasing wastewater loadings.
Similarly, the performance of the treatment plant has gone down as compared to previous years because of routine power cut schedule, the treatment plant cannot be operated continuously due to which efficiency of the treatment plant has been affected. And also due to combined sewer system, the total incoming flow of wastewater is higher than designed hydraulic capacity of the plant i.e 16.4MLD. During rainy season and owing to the combined sewer system, quantity of sand in wastewater is very high. The sand gets deposited at the bottom of grit chamber, oxidation ditch affecting the operation of STP. The strength of wastewater is higher than the designed level ( COD 1150 mg/l, BOD5 270 mg/l).
References1. Abdel-Raouf, N., Al-Homaidan, A. A., & Ibraheem,
I. B. (2012). Microalgae and wastewater treatment. Saudi Journal of Biological Sciences, 19 (3), 257-275.
2. Badaila, R., & Airee, K. (2015). Study of Removal of Pollutants at Guheshwori Wastewater Treatment Plant. Kathmandu.
3. Asian Development Bank (2013) NEP : Kathmandu Valley Wastewater Management Project (Initial Environmental Examination). Manila, Philipines.
4. GoN/NTNC (2009) BAGMATI ACTION PLAN (2009-2014).
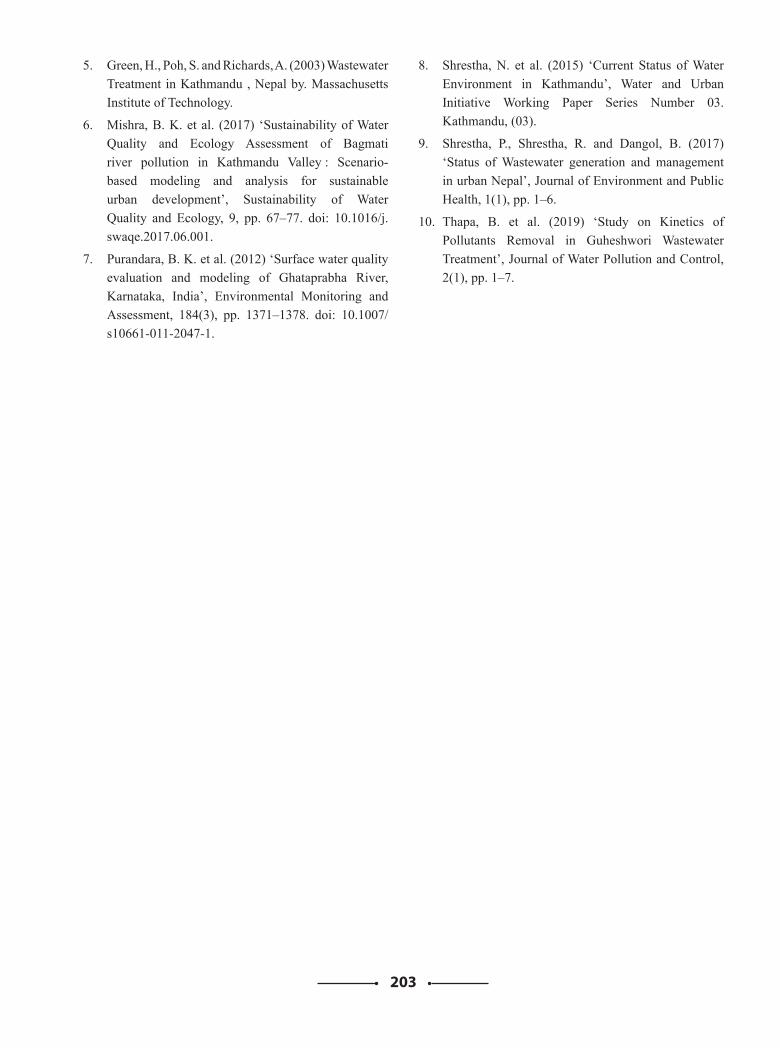
203
5. Green, H., Poh, S. and Richards, A. (2003) Wastewater Treatment in Kathmandu , Nepal by. Massachusetts Institute of Technology.
6. Mishra, B. K. et al. (2017) ‘Sustainability of Water Quality and Ecology Assessment of Bagmati river pollution in Kathmandu Valley : Scenario-based modeling and analysis for sustainable urban development’, Sustainability of Water Quality and Ecology, 9, pp. 67–77. doi: 10.1016/j.swaqe.2017.06.001.
7. Purandara, B. K. et al. (2012) ‘Surface water quality evaluation and modeling of Ghataprabha River, Karnataka, India’, Environmental Monitoring and Assessment, 184(3), pp. 1371–1378. doi: 10.1007/s10661-011-2047-1.
8. Shrestha, N. et al. (2015) ‘Current Status of Water Environment in Kathmandu’, Water and Urban Initiative Working Paper Series Number 03. Kathmandu, (03).
9. Shrestha, P., Shrestha, R. and Dangol, B. (2017) ‘Status of Wastewater generation and management in urban Nepal’, Journal of Environment and Public Health, 1(1), pp. 1–6.
10. Thapa, B. et al. (2019) ‘Study on Kinetics of Pollutants Removal in Guheshwori Wastewater Treatment’, Journal of Water Pollution and Control, 2(1), pp. 1–7.
204
Application of Waste Water in the Desert for its Treatment and Reclamation of Desert
Rajan Raj PandeyPhd Student, Lincoln University College, KL, Malaysia
December, 2019
AbstractWastewater treatment is costly and complex particularly to the third world. It is creating land and water pollution. One- third of terrestrial land in the world is barren and t hunger is prevalent. The waste water if applied, for treatment, to desert can reclaim it to land for growing more food to feed the hungry world. A bench- scale model filled with sand is required to apply waste water regularly. The growth of plants, if any, needs to be observed periodically and the sand needs to be tested regularly for its content to see whether it turned in to soil.
Keywords Waste water, desert, treatment, reclamation, soil, hunger, plant growth, bench- scale model, test and observation.
IntroductionThis chapter includes background, statement of the problem, research question, research objectives, limitation and chapter schemes.
BackgroundThere are several methods of treating waste water around the world. Waste water treatment has recently become very complex and costly operation around the world especially in the poor countries and the ones adjoining the deserts. The pollution of water bodies, land and ground water has led to grave environmental consequences in different parts of the world- especially in the poor countries with deserts. The environmental pollution has resulted in various types of diseases and deformities in the people residing in those areas. Such ill health conditions among those people have impacted on the increased morbidity and mortality and further pushing them into the vicious cycle of poverty and hunger. It is the need of the hour to find out different affordable options for treatment of waste water for such countries to address the above problem.
The world has one third of its terrestrial land covered by deserts from Sahara in Africa to Gobi in Mongolia. It has led to underutilization of available land mass in earth for agriculture resulting into world hunger. The current (2019/11/10) world population is 7.74 B. [Source: https://www.worldometers.info/world-population/].
The population carrying capacity of earth as per many scientists stands at 9 to 10 billion. One prominent scientist
and Socio- biologist Edward O. Wilson of Harvard University has based his estimate on calculations of the Earth's available resources. He emphasized in his book "The Future of Life" (Knopf, 2002), - The limits of the biosphere are fixed. He concludes that 10 billion people are the uppermost population limit based on food availability in earth. Because it's extremely unlikely that everyone will agree to stop eating meat, Wilson opines that the maximum carrying capacity of the Earth based on food resources will almost be below 10 billion. [Source: When Will Earth Run Out of Food? https://www.livescience.com/ 16493-people-planet-earth-support.html]
Statement of the ProblemAs already mentioned in the Background section the treatment and final disposal of waste water is very complex and costly causing untreated disposal of the same resulting into environmental pollution in different parts of the third world impacting human morbidity and mortality adversely and pushing them into a vicious cycle of hunger and poverty.
Let us explore the problems in deserts now and find out why there are no (or less) plants and animals in the deserts. The following are the conditions that have to be met for plant growth anywhere in the earth:
1. Absence of medium to support the plant, like; soil, rock, sand, timber or any other non- conventional one is hindrance to plant growth.
2. Absence of moisture at the supporting media for
205
the roots to absorb it for photosynthesis limits plant growth.
3. Absence of seeds or saplings does not allow growth of plant.
4. Absence of light, not necessarily heat, to support photosynthesis is another limiting factor for plant growth.
5. Availability of Carbon dioxide in the atmosphere for making food by plant is necessary for plant growth.
6. Oxygen in the atmosphere is necessary for respiration by the plants.
7. Primary nutrients like; N, P, K are a must and other around 16 different secondary nutrients like; Calcium (Ca), Zinc (Zn), Iron (Fe), Sodium (Na), Molybdenum (Mo) etc. are needed in the root zone for better growth of plants.
Now, let us see what the desert is devoid of the aforementioned conditions? The desert lacks only; moisture and nutrients and all other conditions are met. Carbon dioxide and oxygen are available from atmosphere, support for root can be provided by the sand mass, light is abundant and seeds are often scattered through bird droppings or are wind- blown as well.
The waste water has become a major problem for any growing or bigger cities as well. It contains both the nutrient and moisture that the plants are deprived of in the deserts.
So, a research can be done in a bench scale pilot model (replicating conditions at desert) to see if waste water could be applied for saving the cost of treatment and reclaim the desert sand to turn it into arable land for growing plants. Later, if successful, it can be replicated in real desert condition to grow some food and feed the hungry world.
The following are the examples of application of waste water in the deserts around the world:
Application of treated waste water has begun in Dubai, U. A. E. since 2014. The following treatments are provided before application into the desert:
- Mechanical Treatment: Done for removing physical wastes from waste water,
- Biological Treatment: Done for removing biological matters from waste water;
- Tertiary Treatment: Further treating (or also called as polishing) chemically with filtration
and disinfection, carried out for a better quality of treated waste water effluent. [Source:https://www.researchgate.net/publication/324574420_The_Use_of_Treated_Wastewater_in_Converting_Desert_Regions_A_Case-Study_of_Dubai_UAE]
Another example of application of waste water is from Egypt. Treated waste water is applied to the Serapium Forest that provides the plants with a natural source of primary nutrients (N, P, K) and others. Hammad describes that the wastewater is rich in phosphorus and nitrogen— a naturally occurring MiracleGro after separating from human feces.
The waste water originates from a population of 400,000 of the nearby Ismalia city. The coarse solids are removed from the waste water and pumped to the desert dozen miles away using pipeline. Settling basins separate even more solids here at the irrigated forest site. Microorganisms in huge vats carry out final treatment by diffusing oxygen to expedite bacterial treatment process.
The nutrients present in the treated waste water effectively supercharge the forest. It was a portion of Egypt’s National Program for the Safe Use of Treated Sewage Water for Afforestation, launched in 1994. Plantations with trees are to be raised in a land area of 2,500 square miles at different locations of desert, irrigated with the wastewater from nearby urban centers under this initiative. [Source:https://reasonstobecheerful.world/greening-the-desert-with-wastewater/]
An example from Israel is as following: About 90% of the total volume of waste water produced in Israel is collected through central sewerage systems, 80% of which is treated and about 70% is treated for reuse. One third of the total waste water volume is treated to a high degree in the Dan Region Wastewater Treatment Plant (WWT), another one- third is treated to lower degree and the rest one- third is left almost untreated.
This WWT Project is a sophisticated system catering 220 Square Kilometers (km2) of area with a population of 1.3 million includes the large metropolis of Tel Aviv- Jaffa and seven other municipalities. 87 Million Cubic Meters (MCM) of wastewater were treated at the plant in 1993, of which 75 MCM accounted for recharge and the rest about 100 MCM (including groundwater) were pumped for agricultural irrigation in the Negev desert. The effluent quality of waste water of Dan WWT Plant were observed to a level of 20-25 mgs/ liter of BOD and 30-40 mgs/ liter of suspended solids after biological treatment of
206
wastewater including nutrient removal. [Source: https://mfa.gov.il/mfa/pressroom/ 1994/pages/wastewater%20treatment.aspx ]
All of the above three examples include waste water treatment before application in the desert and the purpose is to raise vegetation only and not reclamation of desert itself.
The researcher, in this case, aims at using raw waste water containing organic matters that would change in to humus with time and combine with sand grains and turn the sand mass in to soil.
Research QuestionsThe following are the research questions the researcher wants to know:
a. Will the waste water be treated by applying it over the sand mass?
b. Will there be plant growth because of application of waste water in the sand mass?
c. Will the ground water be contaminated by various types of chemicals and heavy metals that might be present in the waste water? A probable answer for this question could be: To propose for raising a forest for over a decade so that almost all of the chemicals in the surface and subsurface have been uptaken by the plant roots via osmotic pressure. The ground water table in desert areas is normally far deep and it is not possible to be contaminated either chemically or microbiologically.
d. Will the micro- climate of desert change over time with such continuous application of waste water?
e. Finally, will the desert be reclaimed over time and serve the humankind?
ObjectiveThe objective of this research is;
- to investigate whether waste water can be applied in effective way in desert
- to explore the possible ways to apply raw waste water to turn the sand into soil for reducing desert area
to create a desert like condition over a bench- scale pilot model of a box filled with sand and see, over the period of time, whether it can be reclaimed to soil and find out the possibility of applying the same in the existing deserts.
-
Literature ReviewThe literatures reviewed are displayed in References.
All relevant books, research works done in past, websites, documentaries, TV programs, You tube videos, Mobile Applications, as available, Newspapers etc. have been reviewed during the course of literature review for this PhD dissertation.
MethodologyThe following is the proposed methodology for the research:
a. A rectangular parallelepiped bench scale model of fiber glass is required to be filled with 2 cubic meters of desert sand or synthetically prepared desert- like sand.
b. Few high powered, probably 5 numbers of 500 watts each, incandescent lamps will be hung over the fiber- glass trough to simulate the heat of desert. These lights will be turned on in the morning and turned off in the evening.
c. 200 liters of waste water shall be collected and sprinkled over the trough every day and 200 liters of already applied wastewater shall be wasted every day, after seven days of application, safely to nearby city sewer.
d. Any vegetation growth in the duration of research is required to be observed, photographed, measured and documented weekly. The average growth of vegetation needs to be recorded in MS Excel Tables and plotted in MS Excel graphs. A trend line of the resulting bars also needs to be depicted in the graph over the period of time of research.
e. The change of sand in to soil, if any, needs to be observed and tested in the lab- if visually observed. The content of the sand/ soil is required to be tested chemically in soil testing laboratories of Kathmandu after every quarter of a year until the end of research.
f. The results of the soil tests need to be recorded in MS Excel tables and graphs need to be plotted for various relevant constituents of sand/ soil.
g. Reliability and validity of this research is required to be done by sending recorded and analyzed data frequently and sending the draft report to the Supervisor and Subject Matter Guide and feedback needs to be obtained for incorporating in the report. The tools for research require continuous improvement if and when needed.
207
h. A draft report needs to be prepared and presented in international conferences as per the requirement of the course.
i. Final report needs to be prepared and presented at Lincoln University College, KL, Malaysia at the end of the research.
1. EthicsI solemnly declare that I have abided by the following codes of ethics:
a. Due process of research, report preparation and presentation has been followed.
b. Have not indulged in to coercion with relevant people and institution.
c. Have not indulged in to plagiarism of any form- whatsoever.
d. Have not used the information received during this research for any other purposes.
e. Have used all appropriate tools and techniques only.
f. Due regards and credits have been given to other authors that are connected to this research.
Finding and Discussion So far, I have reviewed five different online literatures as mentioned in the References section and have learned that such application can reclaim the desert theoretically. Only field application of this experiment can conclude on whether this hypothesis is a feasible one.
References1. https://www.worldometers.info/world-population/
2. When Will Earth Run Out of Food?- https://www.livescience.com/16493-people-planet-earth-support.html
3. https://www.researchgate.net/publication/324574420_The_Use_of_Treated_Wastewater_in_Converting_Desert_Regions_A_Case-Study_of_Dubai_UAE
4. https://reasonstobecheerful.world/greening-the-desert-with-wastewater/
5. https://mfa.gov.il/mfa/pressroom/1994/pages/wastewater%20treatment.aspx
208
Causes of Delay of Construction of Design and Build of Various Motorable Bridges under Bridge Project, Department of Road in Nepal
Surya Prasad TimilsinaPh.D Scholar,
Lincoln University CollegeSateesh Kumar Ojha
Tribhuvan University, Nepal
AbstractThis paper aims to detect the causes of delays in the design and build of the motorable bridge under the bridge project, department of roads in Nepal. The research is based on intensive literature review, primary data, secondary data and interviews. The survey which was carried out through the questionnaires was used to assess the perceptions of the respondents involved in the construction of the design and build of the bridge project. The questionnaire was divided into three parts. The main part focused on the causes of delays in design and build during construction projects. In total 56 causes of bridge construction delay were identified through the literature review and a pilot survey of three groups of respondents who are involved in the construction of the design and build of bridge construction projects. The ten most important causes identified by the study are: (1) Lack of stakeholder analysis (2) Poor portfolio management (3) lack of inadequate pre execution planning and improper time management (4) Lack of site management (5) inadequate budget allocation and delay in payment (6) lack of provision of reward and penalty, (7) Lack of detail survey, improper soil exploration and preparing report without depth study and (8) contractor’s excessive workload. Furthermore, the test indicates that there is no significant variation that exists among the three groups of respondents, i.e. owners, consultants and contractors. Once the problem of unnecessary delay is solved, the cost, quality, and schedule of the bridge construction projects can be maintained and the competency of the construction industry in Nepal will be improved.
KeywordsConstruction Industry, Design and Build, Motorable Bridge, Delay.
IntroductionConstruction delay is considered to be one of the recurring problems in the developing counry and it has an adverse effect on project success in terms of time, cost and quality. Delays in bridge construction are the most serious problems which can even slow down the national development. It is widely accepted that a project is successful when it is finished on time. Unfortunately, due to many reasons, large number of bridge construction projects fail to follow the planned schedule and are hence delayed. In Nepal, implementation delays in public sector investments seem to be common feature. There are two government agencies formed for road and bridge construction of Nepal. The Local Road Network (LRN) and Strategic Road Network have been undertaken by the Department of Road (DOR). Mainly the DOR Bridge Project started the design and build of construction of
moterable bridge for FY 2012/2013.There are about 180 design and build motorable bridges under SRN and LRN till FY 2018/19. Out of 30 Design and build bridges under the bridge project sector no-3, 10 are completed and others are under construction. Almost all the bridge projects are facing schedule overrun and have become great challenges to implementing agencies like the Department of Road (DOR).
Literature RevewA number of studies have been carried out to determine the causes of delay inconstruction industry.HardikLakhandw [1] (2019),Results of the study identifiedunder 9 major groups are Project related, Ownerrelated, Contractor related, Consultant related, Design-related, Material related, Equipmentrelated, Labour related and External factors depending on their nature and mode ofoccurrence.SaravanaKarunakarana[2]
209
(2018), result of this study reviews the significant delay factor causes are identified to begin with poor project planning and scheduling, followed by frequent design changes, existence of many underground utilities, unforeseen additional work, shortage of materials, failure of material and equipment, poor communication and interaction, labour issues, weather, improper construction method, inexperienced contractors and poor site investigation. Sigha Bahadur Bista, Khet Raj Dahal[3] (2018) In the context of Nepal, result of this,Low biddind islarge number of existing variables like unrealistic norms, unrealistic district rates, ambiguities in contract document and social acceptance should be minimized. Such variables and performance acts as inversely proportional to each other in this case.Islam Muhammad Saiful,TrigunarsyahBarobang, [6](2017)The result of this study the financial issues like contractor’s cash flow problem, and delay in progress payment by owner, managerial issue such as poor site management, contractor related factor, i.e., improper planning and scheduling, and owner related factor like change order during construction are the most important and frequent factors that directly force to schedule delay all over the developing world. Arjun Suwal, Santos Kumar Shrestha[7] (2016), According to this study the main causes of delay are unusual low bid by contractors, lack of planned pre-execution of the project, delay in receiving clearances from various government authorities, poor site management and supervision by contractors due to large number of work in hand. M. AtibuSeboru, [11] (2015 The study was based in Kenya. There were top five causes of delay identified by both consultants and contractors were: Payment by client; Slow decision-making and bureaucracy in client organization; Claims; Inadequate planning / scheduling; and Rain.KevalJ.Shah Prof. M. R. Apte, [15](2015)This study find the Most of reasons for delays are related with contractor performance such as site management, labour productivity, and lack of expert proficiency in supervision etc. Same as delay in drawing and delay in design come under client responsibility.N. Hytiris, R. Stott, and K. McInnes, [26](2014), Stated site investigation is one of earliest process and very essential in any types of construction in order to execute a project successfully within the cost and timeline. R. Hasan, S. Suliman, and Y. Al Malki, [25](2014) in case of Bahrain,The researcher concluded that there are many causes of delay related to contractors such as the improper planning and scheduling. One of the major causes related to the owner, i.e. MOW is delay in decision making. The main problems related to
consultants are due to lack of experience. Moreover, cost and time overruns were two of the most frequent effects of delay.K. Gidado and G. Niazai, [30](2012), in case of Afghanistan Security,corruption,poor qualification of the contractor’s technical staff, payment delays are the causes of delay in construction contruction projects.Kazaz, A., Ulubeyli, S. and Tuncbilekli, N.A. [31], 2011 in the case of Turkey,According to the results, “design and material changes” was found to be the most predominant factor, followed by “delay of payments” and “cash flow problems and managerial causes of time extensions are encountered in developed and developing countries, whereas financial causes are experienced in developing countries onlyPourrostam, T. and Ismail, A. [33](2011),This study identified predominant causes of delay are poor site management and supervision, delay in progress payment by clients, change orders by client during construction, ineffective planning and scheduling of project by contractor, financial difficulties by contractor, slowness in decision making process by client, delays in producing design documents, late in reviewing and approving design documents by client, poor contract management by consultant and problems with subcontractors. M. Haseeb, A. Bibi, and W. Rabbani, [34](2011)This study conducted a research on problems of projects and effects of delays inthe construction industry of Pakistan. They the most common factor of delay are natural disaster inPakistan like flood and earthquake and some others like financial and payment problems,improper planning, poor site management, insufficient experience, shortage of materials andequipment etc.M. R. Abdullah, I. A. Rahman, and A. A. A. Azis, 2010,Experience is vital in the construction industry as it comes with valuable knowledge that could not be obtained from other sources. Inexperienced contractors are one of the factors that will create havoc in overrun time of a construction project. G. Sweis, [36] (2008), study state that inexperienced contractors is a critical factor that contributes to time overrun in construction project in jordan. For instance, lack of suitable technique in the construction might slow the work progress and directly affects the project schedule.
Objective of the Study The objectives of this study are:• To expolor the status to bridge completion rate.• To determine the major bridge construction delays of
the project in Nepal.• To recommend an amicable solution for minimizing
delays in bridge construction projects.
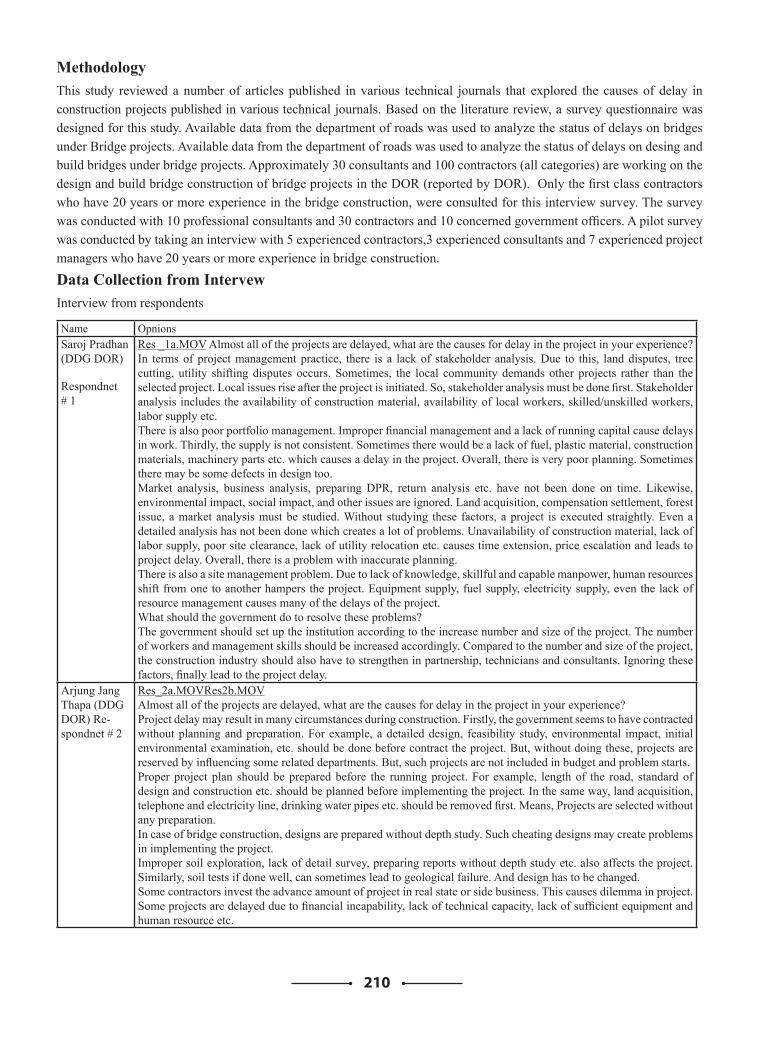
210
MethodologyThis study reviewed a number of articles published in various technical journals that explored the causes of delay in construction projects published in various technical journals. Based on the literature review, a survey questionnaire was designed for this study. Available data from the department of roads was used to analyze the status of delays on bridges under Bridge projects. Available data from the department of roads was used to analyze the status of delays on desing and build bridges under bridge projects. Approximately 30 consultants and 100 contractors (all categories) are working on the design and build bridge construction of bridge projects in the DOR (reported by DOR). Only the first class contractors who have 20 years or more experience in the bridge construction, were consulted for this interview survey. The survey was conducted with 10 professional consultants and 30 contractors and 10 concerned government officers. A pilot survey was conducted by taking an interview with 5 experienced contractors,3 experienced consultants and 7 experienced project managers who have 20 years or more experience in bridge construction.
Data Collection from IntervewInterview from respondents
Name OpnionsSaroj Pradhan (DDG DOR)
Respondnet # 1
Res _1a.MOV Almost all of the projects are delayed, what are the causes for delay in the project in your experience?In terms of project management practice, there is a lack of stakeholder analysis. Due to this, land disputes, tree cutting, utility shifting disputes occurs. Sometimes, the local community demands other projects rather than the selected project. Local issues rise after the project is initiated. So, stakeholder analysis must be done first. Stakeholder analysis includes the availability of construction material, availability of local workers, skilled/unskilled workers, labor supply etc.There is also poor portfolio management. Improper financial management and a lack of running capital cause delays in work. Thirdly, the supply is not consistent. Sometimes there would be a lack of fuel, plastic material, construction materials, machinery parts etc. which causes a delay in the project. Overall, there is very poor planning. Sometimes there may be some defects in design too.Market analysis, business analysis, preparing DPR, return analysis etc. have not been done on time. Likewise, environmental impact, social impact, and other issues are ignored. Land acquisition, compensation settlement, forest issue, a market analysis must be studied. Without studying these factors, a project is executed straightly. Even a detailed analysis has not been done which creates a lot of problems. Unavailability of construction material, lack of labor supply, poor site clearance, lack of utility relocation etc. causes time extension, price escalation and leads to project delay. Overall, there is a problem with inaccurate planning.There is also a site management problem. Due to lack of knowledge, skillful and capable manpower, human resources shift from one to another hampers the project. Equipment supply, fuel supply, electricity supply, even the lack of resource management causes many of the delays of the project.What should the government do to resolve these problems?The government should set up the institution according to the increase number and size of the project. The number of workers and management skills should be increased accordingly. Compared to the number and size of the project, the construction industry should also have to strengthen in partnership, technicians and consultants. Ignoring these factors, finally lead to the project delay.
Arjung Jang Thapa (DDG DOR) Re-spondnet # 2
Res_2a.MOVRes2b.MOVAlmost all of the projects are delayed, what are the causes for delay in the project in your experience?Project delay may result in many circumstances during construction. Firstly, the government seems to have contracted without planning and preparation. For example, a detailed design, feasibility study, environmental impact, initial environmental examination, etc. should be done before contract the project. But, without doing these, projects are reserved by influencing some related departments. But, such projects are not included in budget and problem starts.Proper project plan should be prepared before the running project. For example, length of the road, standard of design and construction etc. should be planned before implementing the project. In the same way, land acquisition, telephone and electricity line, drinking water pipes etc. should be removed first. Means, Projects are selected without any preparation.In case of bridge construction, designs are prepared without depth study. Such cheating designs may create problems in implementing the project. Improper soil exploration, lack of detail survey, preparing reports without depth study etc. also affects the project. Similarly, soil tests if done well, can sometimes lead to geological failure. And design has to be changed. Some contractors invest the advance amount of project in real state or side business. This causes dilemma in project. Some projects are delayed due to financial incapability, lack of technical capacity, lack of sufficient equipment and human resource etc.
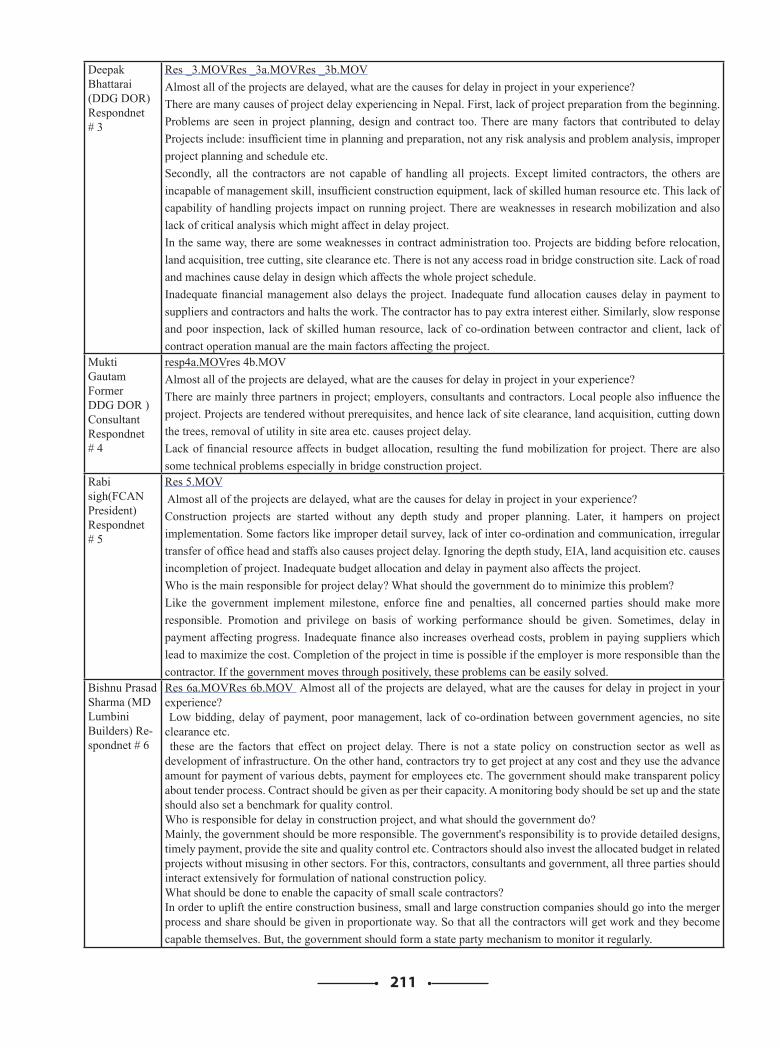
211
Deepak Bhattarai (DDG DOR)Respondnet # 3
Res _3.MOVRes _3a.MOVRes _3b.MOVAlmost all of the projects are delayed, what are the causes for delay in project in your experience?There are many causes of project delay experiencing in Nepal. First, lack of project preparation from the beginning. Problems are seen in project planning, design and contract too. There are many factors that contributed to delay Projects include: insufficient time in planning and preparation, not any risk analysis and problem analysis, improper project planning and schedule etc.Secondly, all the contractors are not capable of handling all projects. Except limited contractors, the others are incapable of management skill, insufficient construction equipment, lack of skilled human resource etc. This lack of capability of handling projects impact on running project. There are weaknesses in research mobilization and also lack of critical analysis which might affect in delay project. In the same way, there are some weaknesses in contract administration too. Projects are bidding before relocation, land acquisition, tree cutting, site clearance etc. There is not any access road in bridge construction site. Lack of road and machines cause delay in design which affects the whole project schedule.Inadequate financial management also delays the project. Inadequate fund allocation causes delay in payment to suppliers and contractors and halts the work. The contractor has to pay extra interest either. Similarly, slow response and poor inspection, lack of skilled human resource, lack of co-ordination between contractor and client, lack of contract operation manual are the main factors affecting the project.
Mukti Gautam Former DDG DOR ) ConsultantRespondnet # 4
resp4a.MOVres 4b.MOVAlmost all of the projects are delayed, what are the causes for delay in project in your experience?There are mainly three partners in project; employers, consultants and contractors. Local people also influence the project. Projects are tendered without prerequisites, and hence lack of site clearance, land acquisition, cutting down the trees, removal of utility in site area etc. causes project delay. Lack of financial resource affects in budget allocation, resulting the fund mobilization for project. There are also some technical problems especially in bridge construction project.
Rabi sigh(FCAN President) Respondnet # 5
Res 5.MOV Almost all of the projects are delayed, what are the causes for delay in project in your experience?Construction projects are started without any depth study and proper planning. Later, it hampers on project implementation. Some factors like improper detail survey, lack of inter co-ordination and communication, irregular transfer of office head and staffs also causes project delay. Ignoring the depth study, EIA, land acquisition etc. causes incompletion of project. Inadequate budget allocation and delay in payment also affects the project.Who is the main responsible for project delay? What should the government do to minimize this problem?Like the government implement milestone, enforce fine and penalties, all concerned parties should make more responsible. Promotion and privilege on basis of working performance should be given. Sometimes, delay in payment affecting progress. Inadequate finance also increases overhead costs, problem in paying suppliers which lead to maximize the cost. Completion of the project in time is possible if the employer is more responsible than the contractor. If the government moves through positively, these problems can be easily solved.
Bishnu Prasad Sharma (MD Lumbini Builders) Re-spondnet # 6
Res 6a.MOVRes 6b.MOV Almost all of the projects are delayed, what are the causes for delay in project in your experience? Low bidding, delay of payment, poor management, lack of co-ordination between government agencies, no site clearance etc. these are the factors that effect on project delay. There is not a state policy on construction sector as well as development of infrastructure. On the other hand, contractors try to get project at any cost and they use the advance amount for payment of various debts, payment for employees etc. The government should make transparent policy about tender process. Contract should be given as per their capacity. A monitoring body should be set up and the state should also set a benchmark for quality control. Who is responsible for delay in construction project, and what should the government do?Mainly, the government should be more responsible. The government's responsibility is to provide detailed designs, timely payment, provide the site and quality control etc. Contractors should also invest the allocated budget in related projects without misusing in other sectors. For this, contractors, consultants and government, all three parties should interact extensively for formulation of national construction policy.What should be done to enable the capacity of small scale contractors?In order to uplift the entire construction business, small and large construction companies should go into the merger process and share should be given in proportionate way. So that all the contractors will get work and they become capable themselves. But, the government should form a state party mechanism to monitor it regularly.
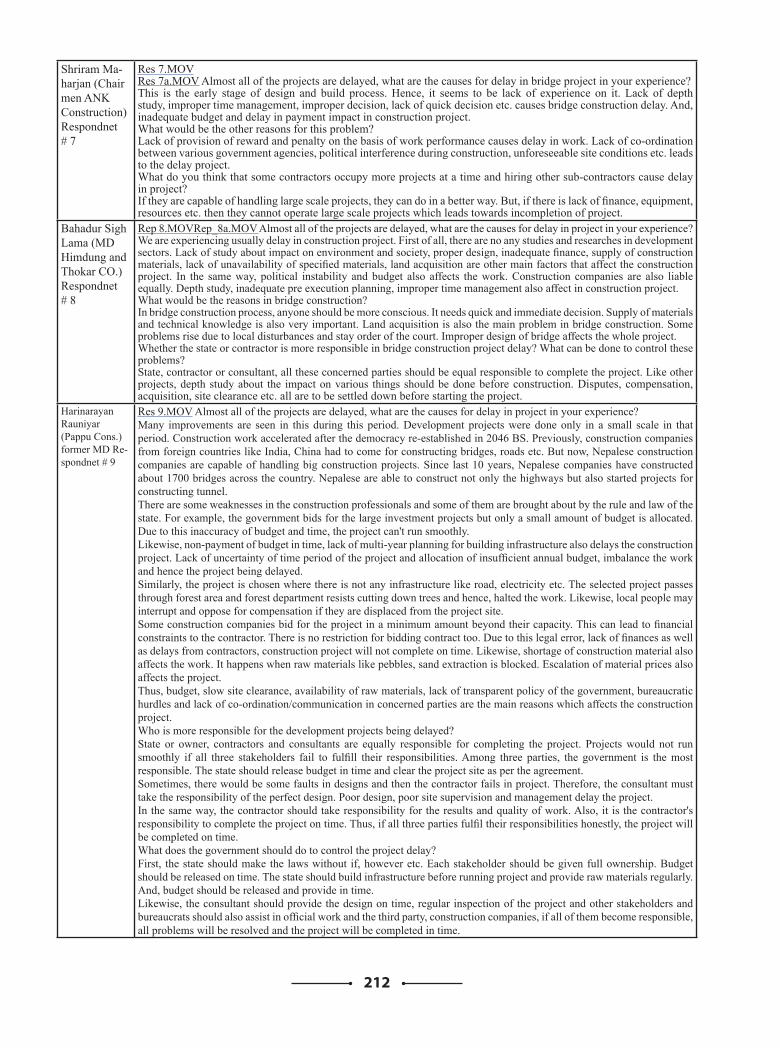
212
Shriram Ma-harjan (Chair men ANK Construction) Respondnet # 7
Res 7.MOVRes 7a.MOV Almost all of the projects are delayed, what are the causes for delay in bridge project in your experience?This is the early stage of design and build process. Hence, it seems to be lack of experience on it. Lack of depth study, improper time management, improper decision, lack of quick decision etc. causes bridge construction delay. And, inadequate budget and delay in payment impact in construction project.What would be the other reasons for this problem?Lack of provision of reward and penalty on the basis of work performance causes delay in work. Lack of co-ordination between various government agencies, political interference during construction, unforeseeable site conditions etc. leads to the delay project.What do you think that some contractors occupy more projects at a time and hiring other sub-contractors cause delay in project?If they are capable of handling large scale projects, they can do in a better way. But, if there is lack of finance, equipment, resources etc. then they cannot operate large scale projects which leads towards incompletion of project.
Bahadur Sigh Lama (MD Himdung and Thokar CO.) Respondnet # 8
Rep 8.MOVRep_8a.MOV Almost all of the projects are delayed, what are the causes for delay in project in your experience?We are experiencing usually delay in construction project. First of all, there are no any studies and researches in development sectors. Lack of study about impact on environment and society, proper design, inadequate finance, supply of construction materials, lack of unavailability of specified materials, land acquisition are other main factors that affect the construction project. In the same way, political instability and budget also affects the work. Construction companies are also liable equally. Depth study, inadequate pre execution planning, improper time management also affect in construction project. What would be the reasons in bridge construction?In bridge construction process, anyone should be more conscious. It needs quick and immediate decision. Supply of materials and technical knowledge is also very important. Land acquisition is also the main problem in bridge construction. Some problems rise due to local disturbances and stay order of the court. Improper design of bridge affects the whole project.Whether the state or contractor is more responsible in bridge construction project delay? What can be done to control these problems?State, contractor or consultant, all these concerned parties should be equal responsible to complete the project. Like other projects, depth study about the impact on various things should be done before construction. Disputes, compensation, acquisition, site clearance etc. all are to be settled down before starting the project.
Harinarayan Rauniyar (Pappu Cons.) former MD Re-spondnet # 9
Res 9.MOV Almost all of the projects are delayed, what are the causes for delay in project in your experience? Many improvements are seen in this during this period. Development projects were done only in a small scale in that period. Construction work accelerated after the democracy re-established in 2046 BS. Previously, construction companies from foreign countries like India, China had to come for constructing bridges, roads etc. But now, Nepalese construction companies are capable of handling big construction projects. Since last 10 years, Nepalese companies have constructed about 1700 bridges across the country. Nepalese are able to construct not only the highways but also started projects for constructing tunnel.There are some weaknesses in the construction professionals and some of them are brought about by the rule and law of the state. For example, the government bids for the large investment projects but only a small amount of budget is allocated. Due to this inaccuracy of budget and time, the project can't run smoothly.Likewise, non-payment of budget in time, lack of multi-year planning for building infrastructure also delays the construction project. Lack of uncertainty of time period of the project and allocation of insufficient annual budget, imbalance the work and hence the project being delayed.Similarly, the project is chosen where there is not any infrastructure like road, electricity etc. The selected project passes through forest area and forest department resists cutting down trees and hence, halted the work. Likewise, local people may interrupt and oppose for compensation if they are displaced from the project site.Some construction companies bid for the project in a minimum amount beyond their capacity. This can lead to financial constraints to the contractor. There is no restriction for bidding contract too. Due to this legal error, lack of finances as well as delays from contractors, construction project will not complete on time. Likewise, shortage of construction material also affects the work. It happens when raw materials like pebbles, sand extraction is blocked. Escalation of material prices also affects the project.Thus, budget, slow site clearance, availability of raw materials, lack of transparent policy of the government, bureaucratic hurdles and lack of co-ordination/communication in concerned parties are the main reasons which affects the construction project.Who is more responsible for the development projects being delayed?State or owner, contractors and consultants are equally responsible for completing the project. Projects would not run smoothly if all three stakeholders fail to fulfill their responsibilities. Among three parties, the government is the most responsible. The state should release budget in time and clear the project site as per the agreement.Sometimes, there would be some faults in designs and then the contractor fails in project. Therefore, the consultant must take the responsibility of the perfect design. Poor design, poor site supervision and management delay the project.In the same way, the contractor should take responsibility for the results and quality of work. Also, it is the contractor's responsibility to complete the project on time. Thus, if all three parties fulfil their responsibilities honestly, the project will be completed on time.What does the government should do to control the project delay?First, the state should make the laws without if, however etc. Each stakeholder should be given full ownership. Budget should be released on time. The state should build infrastructure before running project and provide raw materials regularly. And, budget should be released and provide in time.Likewise, the consultant should provide the design on time, regular inspection of the project and other stakeholders and bureaucrats should also assist in official work and the third party, construction companies, if all of them become responsible, all problems will be resolved and the project will be completed in time.
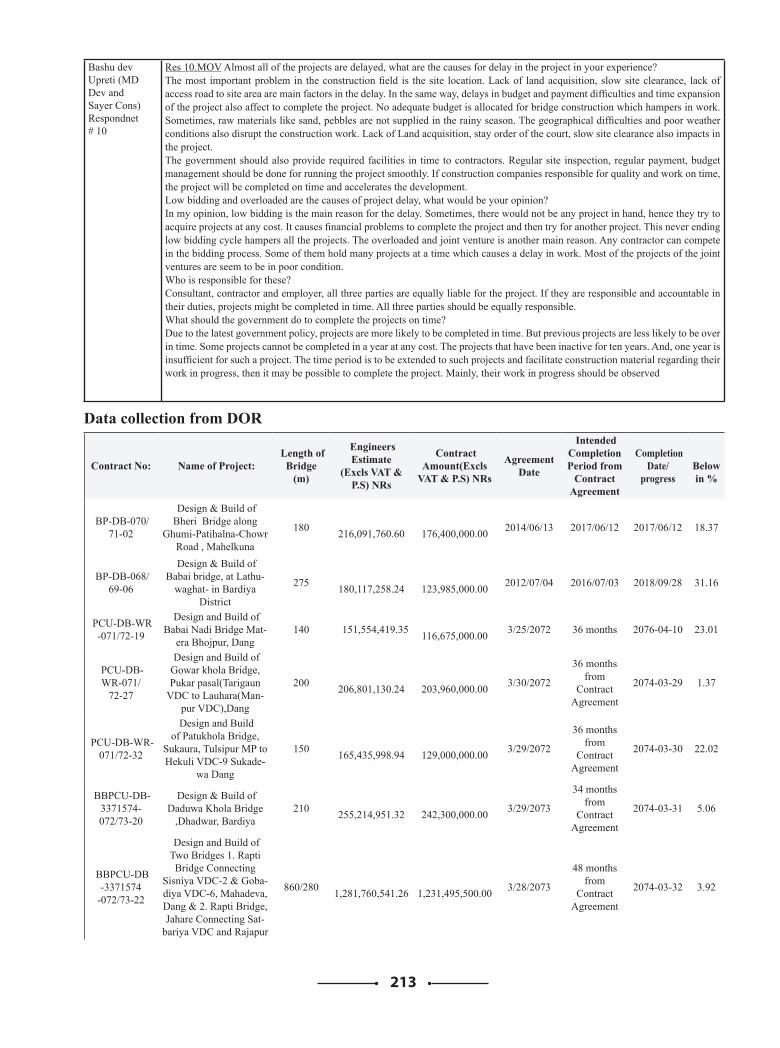
213
Bashu dev Upreti (MD Dev and Sayer Cons) Respondnet # 10
Res 10.MOV Almost all of the projects are delayed, what are the causes for delay in the project in your experience? The most important problem in the construction field is the site location. Lack of land acquisition, slow site clearance, lack of access road to site area are main factors in the delay. In the same way, delays in budget and payment difficulties and time expansion of the project also affect to complete the project. No adequate budget is allocated for bridge construction which hampers in work. Sometimes, raw materials like sand, pebbles are not supplied in the rainy season. The geographical difficulties and poor weather conditions also disrupt the construction work. Lack of Land acquisition, stay order of the court, slow site clearance also impacts in the project.The government should also provide required facilities in time to contractors. Regular site inspection, regular payment, budget management should be done for running the project smoothly. If construction companies responsible for quality and work on time, the project will be completed on time and accelerates the development. Low bidding and overloaded are the causes of project delay, what would be your opinion?In my opinion, low bidding is the main reason for the delay. Sometimes, there would not be any project in hand, hence they try to acquire projects at any cost. It causes financial problems to complete the project and then try for another project. This never ending low bidding cycle hampers all the projects. The overloaded and joint venture is another main reason. Any contractor can compete in the bidding process. Some of them hold many projects at a time which causes a delay in work. Most of the projects of the joint ventures are seem to be in poor condition.Who is responsible for these?Consultant, contractor and employer, all three parties are equally liable for the project. If they are responsible and accountable in their duties, projects might be completed in time. All three parties should be equally responsible.What should the government do to complete the projects on time?Due to the latest government policy, projects are more likely to be completed in time. But previous projects are less likely to be over in time. Some projects cannot be completed in a year at any cost. The projects that have been inactive for ten years. And, one year is insufficient for such a project. The time period is to be extended to such projects and facilitate construction material regarding their work in progress, then it may be possible to complete the project. Mainly, their work in progress should be observed
Data collection from DOR
Contract No: Name of Project: Length of
Bridge(m)
Engineers Estimate
(Excls VAT & P.S) NRs
Contract Amount(Excls
VAT & P.S) NRs
Agreement Date
Intended Completion Period from
Contract Agreement
Completion Date/
progress
Below in %
BP-DB-070/71-02
Design & Build of Bheri Bridge along
Ghumi-Patihalna-Chowr Road , Mahelkuna
180 216,091,760.60
176,400,000.00 2014/06/13 2017/06/12 2017/06/12 18.37
BP-DB-068/69-06
Design & Build of Babai bridge, at Lathu-
waghat- in Bardiya District
275 180,117,258.24
123,985,000.00 2012/07/04 2016/07/03 2018/09/28 31.16
PCU-DB-WR-071/72-19
Design and Build of Babai Nadi Bridge Mat-
era Bhojpur, Dang 140 151,554,419.35
116,675,000.00 3/25/2072 36 months 2076-04-10 23.01
PCU-DB-WR-071/
72-27
Design and Build of Gowar khola Bridge, Pukar pasal(Tarigaun
VDC to Lauhara(Man-pur VDC),Dang
200 206,801,130.24
203,960,000.00 3/30/2072
36 months from
Contract Agreement
2074-03-29 1.37
PCU-DB-WR-071/72-32
Design and Build of Patukhola Bridge,
Sukaura, Tulsipur MP to Hekuli VDC-9 Sukade-
wa Dang
150 165,435,998.94
129,000,000.00 3/29/2072
36 months from
Contract Agreement
2074-03-30 22.02
BBPCU-DB-3371574-072/73-20
Design & Build of Daduwa Khola Bridge
,Dhadwar, Bardiya 210
255,214,951.32
242,300,000.00 3/29/2073
34 months from
Contract Agreement
2074-03-31 5.06
BBPCU-DB-3371574
-072/73-22
Design and Build of Two Bridges 1. Rapti Bridge Connecting
Sisniya VDC-2 & Goba-diya VDC-6, Mahadeva, Dang & 2. Rapti Bridge, Jahare Connecting Sat-
bariya VDC and Rajapur
860/280 1,281,760,541.26
1,231,495,500.00 3/28/2073
48 months from
Contract Agreement
2074-03-32 3.92
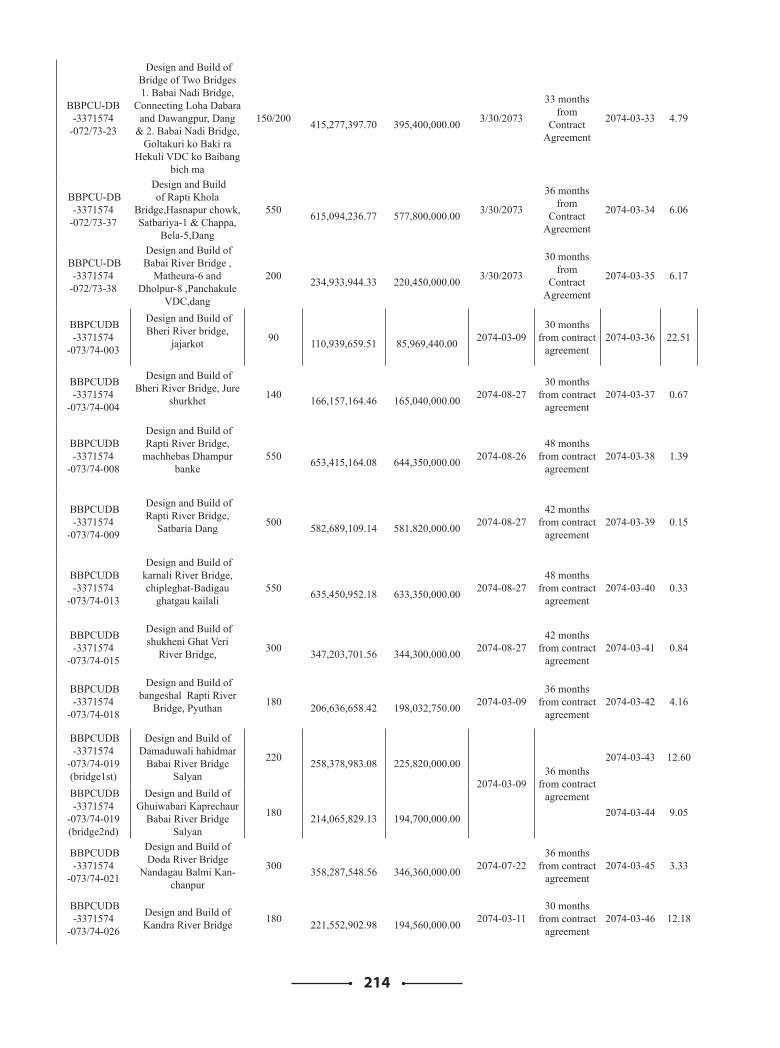
214
BBPCU-DB-3371574
-072/73-23
Design and Build of Bridge of Two Bridges 1. Babai Nadi Bridge,
Connecting Loha Dabara and Dawangpur, Dang
& 2. Babai Nadi Bridge, Goltakuri ko Baki ra
Hekuli VDC ko Baibang bich ma
150/200 415,277,397.70
395,400,000.00 3/30/2073
33 months from
Contract Agreement
2074-03-33 4.79
BBPCU-DB-3371574
-072/73-37
Design and Build of Rapti Khola
Bridge,Hasnapur chowk, Satbariya-1 & Chappa,
Bela-5,Dang
550 615,094,236.77
577,800,000.00 3/30/2073
36 months from
Contract Agreement
2074-03-34 6.06
BBPCU-DB-3371574
-072/73-38
Design and Build of Babai River Bridge ,
Matheura-6 and Dholpur-8 ,Panchakule
VDC,dang
200 234,933,944.33
220,450,000.00 3/30/2073
30 months from
Contract Agreement
2074-03-35 6.17
BBPCUDB-3371574
-073/74-003
Design and Build of Bheri River bridge,
jajarkot
90 110,939,659.51
85,969,440.00 2074-03-09
30 months from contract
agreement2074-03-36 22.51
BBPCUDB-3371574
-073/74-004
Design and Build of Bheri River Bridge, Jure
shurkhet
140 166,157,164.46
165,040,000.00 2074-08-27
30 months from contract
agreement2074-03-37 0.67
BBPCUDB-3371574
-073/74-008
Design and Build of Rapti River Bridge,
machhebas Dhampur banke
550 653,415,164.08
644,350,000.00 2074-08-26
48 months from contract
agreement2074-03-38 1.39
BBPCUDB-3371574
-073/74-009
Design and Build of Rapti River Bridge,
Satbaria Dang
500 582,689,109.14
581,820,000.00 2074-08-27
42 months from contract
agreement2074-03-39 0.15
BBPCUDB-3371574
-073/74-013
Design and Build of karnali River Bridge, chipleghat-Badigau
ghatgau kailali
550 635,450,952.18
633,350,000.00 2074-08-27
48 months from contract
agreement2074-03-40 0.33
BBPCUDB-3371574
-073/74-015
Design and Build of shukheni Ghat Veri
River Bridge,
300 347,203,701.56
344,300,000.00 2074-08-27
42 months from contract
agreement2074-03-41 0.84
BBPCUDB-3371574
-073/74-018
Design and Build of bangeshal Rapti River
Bridge, Pyuthan
180 206,636,658.42
198,032,750.00 2074-03-09
36 months from contract
agreement2074-03-42 4.16
BBPCUDB-3371574
-073/74-019 (bridge1st)
Design and Build of Damaduwali hahidmar
Babai River Bridge Salyan
220 258,378,983.08
225,820,000.00
2074-03-0936 months
from contract agreement
2074-03-43 12.60
BBPCUDB-3371574
-073/74-019 (bridge2nd)
Design and Build of Ghuiwabari Kaprechaur
Babai River Bridge Salyan
180 214,065,829.13
194,700,000.00 2074-03-44 9.05
BBPCUDB-3371574
-073/74-021
Design and Build of Doda River Bridge
Nandagau Balmi Kan-chanpur
300 358,287,548.56
346,360,000.00 2074-07-22
36 months from contract
agreement2074-03-45 3.33
BBPCUDB-3371574
-073/74-026
Design and Build of Kandra River Bridge 180
221,552,902.98
194,560,000.00 2074-03-1130 months
from contract agreement
2074-03-46 12.18
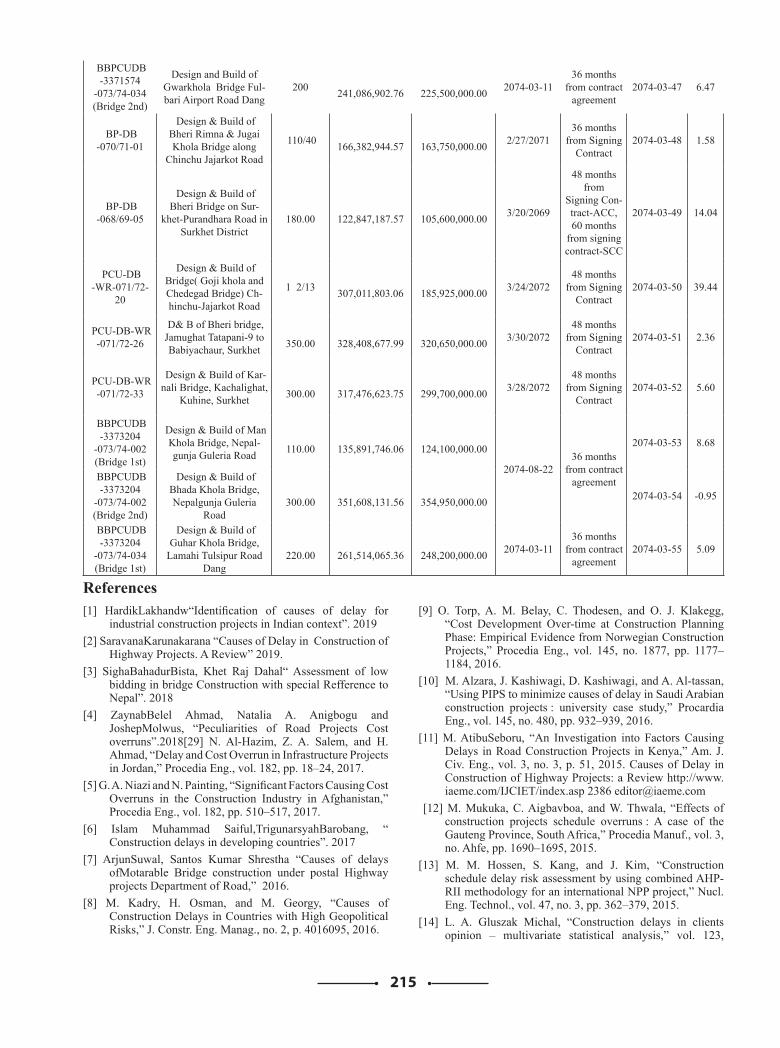
215
BBPCUDB-3371574
-073/74-034 (Bridge 2nd)
Design and Build of Gwarkhola Bridge Ful-bari Airport Road Dang
200 241,086,902.76
225,500,000.00 2074-03-11
36 months from contract
agreement2074-03-47 6.47
BP-DB-070/71-01
Design & Build of Bheri Rimna & Jugai Khola Bridge along
Chinchu Jajarkot Road
110/40 166,382,944.57
163,750,000.00 2/27/2071
36 months from Signing
Contract2074-03-48 1.58
BP-DB-068/69-05
Design & Build of Bheri Bridge on Sur-
khet-Purandhara Road in Surkhet District
180.00
122,847,187.57
105,600,000.00 3/20/2069
48 months from
Signing Con-tract-ACC, 60 months
from signing contract-SCC
2074-03-49 14.04
PCU-DB-WR-071/72-
20
Design & Build of Bridge( Goji khola and Chedegad Bridge) Ch-hinchu-Jajarkot Road
1 2/13 307,011,803.06
185,925,000.00 3/24/2072
48 months from Signing
Contract2074-03-50 39.44
PCU-DB-WR-071/72-26
D& B of Bheri bridge, Jamughat Tatapani-9 to Babiyachaur, Surkhet
350.00
328,408,677.99
320,650,000.00 3/30/2072
48 months from Signing
Contract2074-03-51 2.36
PCU-DB-WR-071/72-33
Design & Build of Kar-nali Bridge, Kachalighat,
Kuhine, Surkhet
300.00
317,476,623.75
299,700,000.00 3/28/2072
48 months from Signing
Contract2074-03-52 5.60
BBPCUDB-3373204
-073/74-002 (Bridge 1st)
Design & Build of Man Khola Bridge, Nepal-gunja Guleria Road
110.00
135,891,746.06
124,100,000.00
2074-08-2236 months
from contract agreement
2074-03-53 8.68
BBPCUDB-3373204
-073/74-002 (Bridge 2nd)
Design & Build of Bhada Khola Bridge, Nepalgunja Guleria
Road
300.00
351,608,131.56
354,950,000.00 2074-03-54 -0.95
BBPCUDB-3373204
-073/74-034 (Bridge 1st)
Design & Build of Guhar Khola Bridge,
Lamahi Tulsipur Road Dang
220.00
261,514,065.36
248,200,000.00 2074-03-11
36 months from contract
agreement2074-03-55 5.09
References[1] HardikLakhandw“Identification of causes of delay for
industrial construction projects in Indian context”. 2019[2] SaravanaKarunakarana “Causes of Delay in Construction of
Highway Projects. A Review” 2019.[3] SighaBahadurBista, Khet Raj Dahal“ Assessment of low
bidding in bridge Construction with special Refference to Nepal”. 2018
[4] ZaynabBelel Ahmad, Natalia A. Anigbogu and JoshepMolwus, “Peculiarities of Road Projects Cost overruns”.2018[29] N. Al-Hazim, Z. A. Salem, and H. Ahmad, “Delay and Cost Overrun in Infrastructure Projects in Jordan,” Procedia Eng., vol. 182, pp. 18–24, 2017.
[5] G. A. Niazi and N. Painting, “Significant Factors Causing Cost Overruns in the Construction Industry in Afghanistan,” Procedia Eng., vol. 182, pp. 510–517, 2017.
[6] Islam Muhammad Saiful,TrigunarsyahBarobang, “ Construction delays in developing countries”. 2017
[7] ArjunSuwal, Santos Kumar Shrestha “Causes of delays ofMotarable Bridge construction under postal Highway projects Department of Road,” 2016.
[8] M. Kadry, H. Osman, and M. Georgy, “Causes of Construction Delays in Countries with High Geopolitical Risks,” J. Constr. Eng. Manag., no. 2, p. 4016095, 2016.
[9] O. Torp, A. M. Belay, C. Thodesen, and O. J. Klakegg, “Cost Development Over-time at Construction Planning Phase: Empirical Evidence from Norwegian Construction Projects,” Procedia Eng., vol. 145, no. 1877, pp. 1177–1184, 2016.
[10] M. Alzara, J. Kashiwagi, D. Kashiwagi, and A. Al-tassan, “Using PIPS to minimize causes of delay in Saudi Arabian construction projects : university case study,” Procardia Eng., vol. 145, no. 480, pp. 932–939, 2016.
[11] M. AtibuSeboru, “An Investigation into Factors Causing Delays in Road Construction Projects in Kenya,” Am. J. Civ. Eng., vol. 3, no. 3, p. 51, 2015. Causes of Delay in Construction of Highway Projects: a Review http://www.iaeme.com/IJCIET/index.asp 2386 [email protected]
[12] M. Mukuka, C. Aigbavboa, and W. Thwala, “Effects of construction projects schedule overruns : A case of the Gauteng Province, South Africa,” Procedia Manuf., vol. 3, no. Ahfe, pp. 1690–1695, 2015.
[13] M. M. Hossen, S. Kang, and J. Kim, “Construction schedule delay risk assessment by using combined AHP-RII methodology for an international NPP project,” Nucl. Eng. Technol., vol. 47, no. 3, pp. 362–379, 2015.
[14] L. A. Gluszak Michal, “Construction delays in clients opinion – multivariate statistical analysis,” vol. 123,
216
Engineering and Management, 18(3), 426-435. [32] Haseeb, M., Bibi, A. and Rabbani, W. Problems of projects
and effects of delay in the construction industry of Pakistan. Australian Journal of Business and Management Research, 1(5), 41-50, 2011.
[33] Pourrostam, T. and Ismail, A. Significant factors causing and effects of delay in Iranian construction projects. Australian Journal of Bas. App. Sci., 5(7). 2011.
[34] M. Haseeb, A. Bibi, and W. Rabbani, “Causes and Effects of Delays in Large Construction Projects of Pakistan,” Kuwait Chapter Arab. J. Bus. Manag.Rev., vol. 1, no. 4, pp. 18–42, 2011.
[35] Ram Singh, “Delays and Cost Overruns In Infrastructure Projects: Extent, Causes And Remedies”, Economic And Political Weekly, Vol.21. May 22, 2010, Pp 43-54. 5. Creedy, G. D., Skitmore, M., Wong, J. K. W., “Evaluation of Risk Factors Leading to CostOverrun in Delivery of Highway Construction Projects”,. Journal of ConstructionEngineering and Management.ASCE, Vol. 136 (5) 528-537, (2010)
[36] G. Sweis, “Delays in construction projects : The case of Jordan,” vol. 26, pp. 665–674, 2008.
[37] K. C. Iyer, N. B. Chaphalkar, and G. A. Joshi, “Understanding time delay disputes in construction contracts,” Int. J. Proj. Manag., vol. 26, no. 2, pp. 174–184, 2008.
[38] M. Sebt, H. Rajaei, and M. Pakseresht, “A Fuzzy Modeling Approach to Weather Delays Analysis in Construction Projects,” … J. Civ. …, vol. 5, no. 3, pp. 169–181, 2007.
[39]OwolabiJames, “Causes and Effect of Delay on Project Construction Delivery Time”. Public
Procurement Act 2007 and Public Procurement Rules 2008, Kathmandu: Nepal Law
[40] M. Sambasivan and Y. W.Soon, “Causes and effects of delays in Malaysian construction industry,” Int. J. Proj.Manag., vol. 25, no. 5, pp. 517–526, 2007.
[41] S. A. Assaf and S. Al-Hejji, “Causes of delay in large construction projects,” Int. J. Proj. Manag., vol. 24, no. 4, pp. 349–357, 2006.
[42] C. Wu, T. Hsieh, and W. Cheng, “Statistical analysis of causes for design change in highway construction on Taiwan,” Int. J. Proj.Manag., vol. 23, no. 7, pp. 554–563, 2005.
[43] A. P. C. Chan, D. Scott, and A. P. L. Chan, “Factors Affecting the Success of a Construction Project,” J. Constr. Eng. Manag., vol. 130, no. 1, pp. 153–155, 2004.
[44] F. D. K. Fugar and A. B. Agyakwah-baah, “Delays in Building Construction Projects in,” 2003.
[45] N. S.M.Vidalis, “COST AND TIME OVERRUNS IN HIGHWAY CONSTRUCTION S. M. Vidalis,” 2002.
[46] M. R. Manavazhi and D. K. Adhikari, “Material and equipment procurement delays in highway projects in Nepal,” Int. J. Proj.Manag., vol. 20, no. 8, pp. 627–632, 2002. SaravananKarunakaran, M. A. Malek and M. Z. Ramli http://www.iaeme.com/IJCIET/index.asp 2385 [email protected]
[47] A. M. Odeh and H. T. Battaineh, “Causes of construction delay: Traditional contracts,” Int. J. Proj. Manag., vol. 20, no. 1, pp. 67–73, 2001.
[48] A. H. Al-Momani, “Construction delay: a quantitative analysis,” Int. J. Proj. Manag., vol. 18, pp. 51–59, 2000.
pp. 182–189, 2015. Causes of Delay in Construction of Highway Projects: a Review http://www.iaeme.com/IJCIET/index.asp 2384 [email protected]
[15] KevalJ.Shah Prof. M. R. Apte, “Causes of Delay in Construction of Bridge Girder.” 2015.
[16] Divya.R and S.Ramya, “Causes, Effects And Method Of Minimizing Delays In Construction Projects,” Natl. Conf. Res. Adv. Commun. Comput.Electr. Sci. Struct., pp. 47–53, 2015.
[17] M. Y. Honrao and P. D. B. Desai, “Study of Delay in Execution of Infrastructure Projects –,” vol. 5, no. 6, pp. 1–8, 2015.
[18] MonoharamKesovan, MavanesanGobindan,PujithaDissanayak, “Analysis of factors Contributing Civil Engineering Construction project delays in Sri Lankan Building Construction industries,”2015.
[19]Ashwiniarunsalunkhe, Rahul S. Patil“EffectOf Construction Delays On Project Time Overrun Indian Scenario (2014)
[20] Marzouk, M.M. and El-Rasas, T.I. “Analyzing delay causes in Egyptian construction projects. Journal of Advanced Research, 5(1), 49–55.”2014.
[21]Choudhry, R.M., Aslam, M.A., Hinze, J.W. and Arain, F.M. Cost and schedule risk analysis of bridge construction in Pakistan: Establishing risk guidelines. Journal of Construction Engineering Management, 10.1061/(ASCE)CO.1943-7862.0000857.2014.
[22] Marzouk, M.M. and El-Rasas, T.I. Analyzing delay causes in Egyptian construction projects. Journal of Advanced Research, 5(1), 49–55. 2014.
[23] Kuikel S., “Causes of Delay in local road bridge construction of Nepal”, Nepal Engineering
College, Pokhara University, (2014)[24] A. H. Memon, I. A. Rahman, M. Akram, and N. Ali,
“Significant Factors Causing Time Overrun in Construction Projects of Peninsular Malaysia,” vol. 8, no. 4, pp. 16–28, 2014.
[25] R. Hasan, S. Suliman, and Y. Al Malki, “An investigation into the delays in road projects in Bahrain,” Int. J. Res. Eng. Sci., vol. 2, no. 2, pp. 38–47, 2014.
[26] N. Hytiris, R. Stott, and K. McInnes, “The importance of site investigation in the construction industry: A lesson to be taught to every graduate civil and structural engineer,” World Trans. Eng. Technol. Educ., vol. 12, no. 3, pp. 414–419, 2014.
[27] M. M. Marzouk and T. I. El-rasas, “Analyzing delay causes in Egyptian construction projects,” J. Adv. Res., vol. 5, no. 1, pp. 49–55, 2014.
[28] Sri NuwanRandunupura and C. Hadiwattege, “Plant Equipment Management to Minimize Delays in Roads Construction Projects,” Second World Constr. Symp. 2013 SocioEconomic Sustain. Constr., vol. 30, pp. 333–342, 2013.
[29] I. Mahamid, “Common risks affecting time overrun in road construction projects in Palestine: Contractors’ perspective,” Australas. J. Constr. Econ. Build., vol. 13, no. 2, pp. 45–53, 2013.
[30] K. Gidado and G. Niazai, “Causes of project delay in the construction industry in Afghanistan,” EPPM 2012, Univ. Bright.UK, 10-11th Sept., pp. 63–74, 2012.
[31] Kazaz, A., Ulubeyli, S. and Tuncbilekli, N.A. (2012) Causes of delay in construction projects in Turkey. Journal of Civil
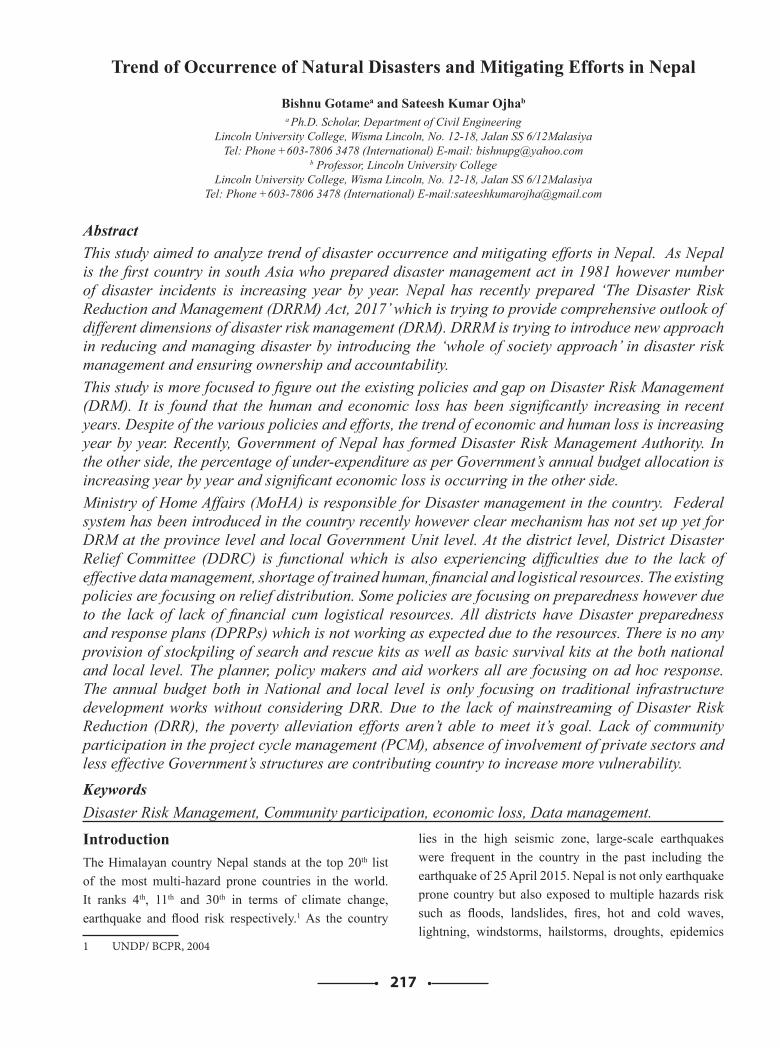
217
Trend of Occurrence of Natural Disasters and Mitigating Efforts in Nepal
Bishnu Gotamea and Sateesh Kumar Ojhab a Ph.D. Scholar, Department of Civil Engineering
Lincoln University College, Wisma Lincoln, No. 12-18, Jalan SS 6/12MalasiyaTel: Phone +603-7806 3478 (International) E-mail: [email protected]
b Professor, Lincoln University CollegeLincoln University College, Wisma Lincoln, No. 12-18, Jalan SS 6/12Malasiya
Tel: Phone +603-7806 3478 (International) E-mail:[email protected]
Abstract This study aimed to analyze trend of disaster occurrence and mitigating efforts in Nepal. As Nepal is the first country in south Asia who prepared disaster management act in 1981 however number of disaster incidents is increasing year by year. Nepal has recently prepared ‘The Disaster Risk Reduction and Management (DRRM) Act, 2017’ which is trying to provide comprehensive outlook of different dimensions of disaster risk management (DRM). DRRM is trying to introduce new approach in reducing and managing disaster by introducing the ‘whole of society approach’ in disaster risk management and ensuring ownership and accountability.This study is more focused to figure out the existing policies and gap on Disaster Risk Management (DRM). It is found that the human and economic loss has been significantly increasing in recent years. Despite of the various policies and efforts, the trend of economic and human loss is increasing year by year. Recently, Government of Nepal has formed Disaster Risk Management Authority. In the other side, the percentage of under-expenditure as per Government’s annual budget allocation is increasing year by year and significant economic loss is occurring in the other side.Ministry of Home Affairs (MoHA) is responsible for Disaster management in the country. Federal system has been introduced in the country recently however clear mechanism has not set up yet for DRM at the province level and local Government Unit level. At the district level, District Disaster Relief Committee (DDRC) is functional which is also experiencing difficulties due to the lack of effective data management, shortage of trained human, financial and logistical resources. The existing policies are focusing on relief distribution. Some policies are focusing on preparedness however due to the lack of lack of financial cum logistical resources. All districts have Disaster preparedness and response plans (DPRPs) which is not working as expected due to the resources. There is no any provision of stockpiling of search and rescue kits as well as basic survival kits at the both national and local level. The planner, policy makers and aid workers all are focusing on ad hoc response. The annual budget both in National and local level is only focusing on traditional infrastructure development works without considering DRR. Due to the lack of mainstreaming of Disaster Risk Reduction (DRR), the poverty alleviation efforts aren’t able to meet it’s goal. Lack of community participation in the project cycle management (PCM), absence of involvement of private sectors and less effective Government’s structures are contributing country to increase more vulnerability. Keywords Disaster Risk Management, Community participation, economic loss, Data management.
Introduction The Himalayan country Nepal stands at the top 20th list of the most multi-hazard prone countries in the world. It ranks 4th, 11th and 30th in terms of climate change, earthquake and flood risk respectively.1 As the country
1 UNDP/ BCPR, 2004
lies in the high seismic zone, large-scale earthquakes were frequent in the country in the past including the earthquake of 25 April 2015. Nepal is not only earthquake prone country but also exposed to multiple hazards risk such as floods, landslides, fires, hot and cold waves, lightning, windstorms, hailstorms, droughts, epidemics
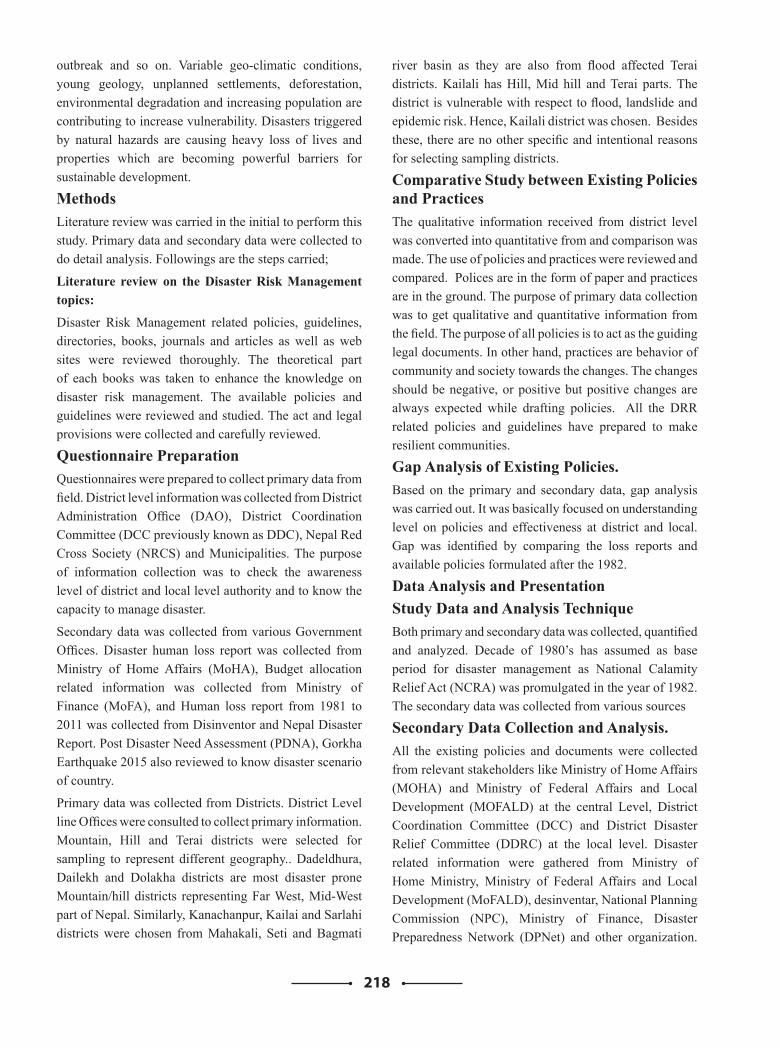
218
outbreak and so on. Variable geo-climatic conditions, young geology, unplanned settlements, deforestation, environmental degradation and increasing population are contributing to increase vulnerability. Disasters triggered by natural hazards are causing heavy loss of lives and properties which are becoming powerful barriers for sustainable development.
Methods Literature review was carried in the initial to perform this study. Primary data and secondary data were collected to do detail analysis. Followings are the steps carried;
Literature review on the Disaster Risk Management topics:
Disaster Risk Management related policies, guidelines, directories, books, journals and articles as well as web sites were reviewed thoroughly. The theoretical part of each books was taken to enhance the knowledge on disaster risk management. The available policies and guidelines were reviewed and studied. The act and legal provisions were collected and carefully reviewed.
Questionnaire PreparationQuestionnaires were prepared to collect primary data from field. District level information was collected from District Administration Office (DAO), District Coordination Committee (DCC previously known as DDC), Nepal Red Cross Society (NRCS) and Municipalities. The purpose of information collection was to check the awareness level of district and local level authority and to know the capacity to manage disaster.
Secondary data was collected from various Government Offices. Disaster human loss report was collected from Ministry of Home Affairs (MoHA), Budget allocation related information was collected from Ministry of Finance (MoFA), and Human loss report from 1981 to 2011 was collected from Disinventor and Nepal Disaster Report. Post Disaster Need Assessment (PDNA), Gorkha Earthquake 2015 also reviewed to know disaster scenario of country.
Primary data was collected from Districts. District Level line Offices were consulted to collect primary information. Mountain, Hill and Terai districts were selected for sampling to represent different geography.. Dadeldhura, Dailekh and Dolakha districts are most disaster prone Mountain/hill districts representing Far West, Mid-West part of Nepal. Similarly, Kanachanpur, Kailai and Sarlahi districts were chosen from Mahakali, Seti and Bagmati
river basin as they are also from flood affected Terai districts. Kailali has Hill, Mid hill and Terai parts. The district is vulnerable with respect to flood, landslide and epidemic risk. Hence, Kailali district was chosen. Besides these, there are no other specific and intentional reasons for selecting sampling districts.
Comparative Study between Existing Policies and PracticesThe qualitative information received from district level was converted into quantitative from and comparison was made. The use of policies and practices were reviewed and compared. Polices are in the form of paper and practices are in the ground. The purpose of primary data collection was to get qualitative and quantitative information from the field. The purpose of all policies is to act as the guiding legal documents. In other hand, practices are behavior of community and society towards the changes. The changes should be negative, or positive but positive changes are always expected while drafting policies. All the DRR related policies and guidelines have prepared to make resilient communities.
Gap Analysis of Existing Policies.Based on the primary and secondary data, gap analysis was carried out. It was basically focused on understanding level on policies and effectiveness at district and local. Gap was identified by comparing the loss reports and available policies formulated after the 1982.
Data Analysis and PresentationStudy Data and Analysis TechniqueBoth primary and secondary data was collected, quantified and analyzed. Decade of 1980’s has assumed as base period for disaster management as National Calamity Relief Act (NCRA) was promulgated in the year of 1982. The secondary data was collected from various sources
Secondary Data Collection and Analysis.All the existing policies and documents were collected from relevant stakeholders like Ministry of Home Affairs (MOHA) and Ministry of Federal Affairs and Local Development (MOFALD) at the central Level, District Coordination Committee (DCC) and District Disaster Relief Committee (DDRC) at the local level. Disaster related information were gathered from Ministry of Home Ministry, Ministry of Federal Affairs and Local Development (MoFALD), desinventar, National Planning Commission (NPC), Ministry of Finance, Disaster Preparedness Network (DPNet) and other organization.
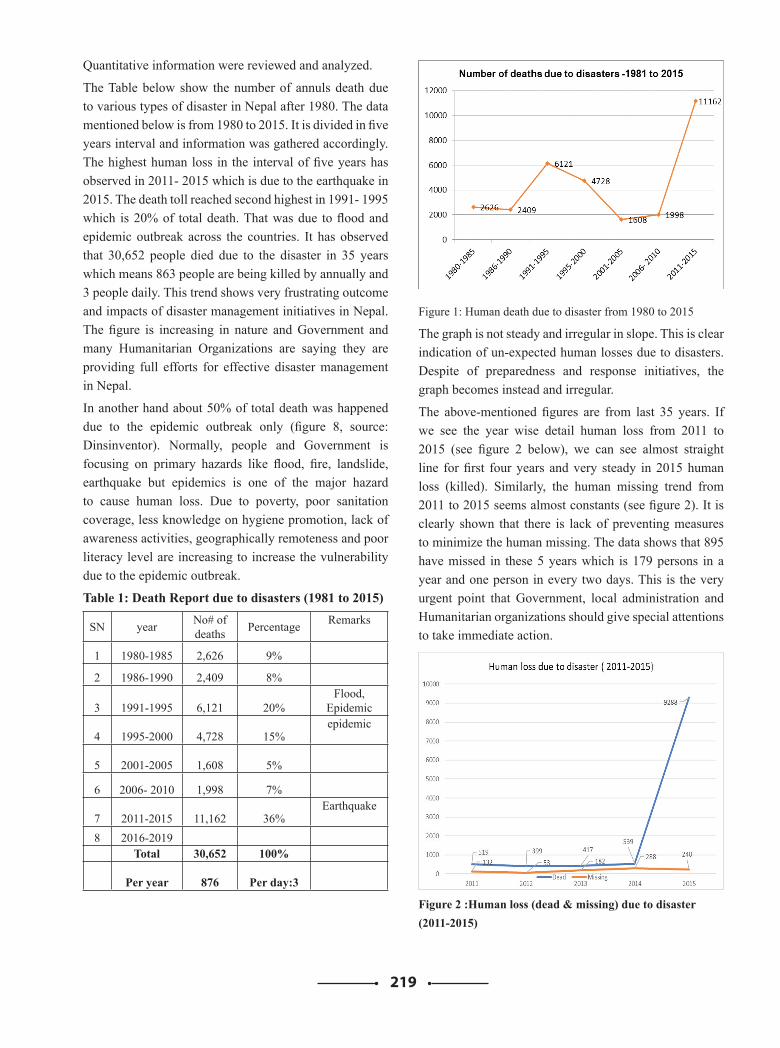
219
Quantitative information were reviewed and analyzed.
The Table below show the number of annuls death due to various types of disaster in Nepal after 1980. The data mentioned below is from 1980 to 2015. It is divided in five years interval and information was gathered accordingly. The highest human loss in the interval of five years has observed in 2011- 2015 which is due to the earthquake in 2015. The death toll reached second highest in 1991- 1995 which is 20% of total death. That was due to flood and epidemic outbreak across the countries. It has observed that 30,652 people died due to the disaster in 35 years which means 863 people are being killed by annually and 3 people daily. This trend shows very frustrating outcome and impacts of disaster management initiatives in Nepal. The figure is increasing in nature and Government and many Humanitarian Organizations are saying they are providing full efforts for effective disaster management in Nepal.
In another hand about 50% of total death was happened due to the epidemic outbreak only (figure 8, source: Dinsinventor). Normally, people and Government is focusing on primary hazards like flood, fire, landslide, earthquake but epidemics is one of the major hazard to cause human loss. Due to poverty, poor sanitation coverage, less knowledge on hygiene promotion, lack of awareness activities, geographically remoteness and poor literacy level are increasing to increase the vulnerability due to the epidemic outbreak.
Table 1: Death Report due to disasters (1981 to 2015)
SN year No# of deaths Percentage Remarks
1 1980-1985 2,626 9%
2 1986-1990 2,409 8%
3 1991-1995 6,121 20%Flood,
Epidemic
4 1995-2000 4,728 15%epidemic
5 2001-2005 1,608 5%
6 2006- 2010 1,998 7%
7 2011-2015 11,162 36%Earthquake
8 2016-2019Total 30,652 100%
Per year 876 Per day:3
Figure 1: Human death due to disaster from 1980 to 2015
The graph is not steady and irregular in slope. This is clear indication of un-expected human losses due to disasters. Despite of preparedness and response initiatives, the graph becomes instead and irregular.
The above-mentioned figures are from last 35 years. If we see the year wise detail human loss from 2011 to 2015 (see figure 2 below), we can see almost straight line for first four years and very steady in 2015 human loss (killed). Similarly, the human missing trend from 2011 to 2015 seems almost constants (see figure 2). It is clearly shown that there is lack of preventing measures to minimize the human missing. The data shows that 895 have missed in these 5 years which is 179 persons in a year and one person in every two days. This is the very urgent point that Government, local administration and Humanitarian organizations should give special attentions to take immediate action.
Figure 2 :Human loss (dead & missing) due to disaster (2011-2015)
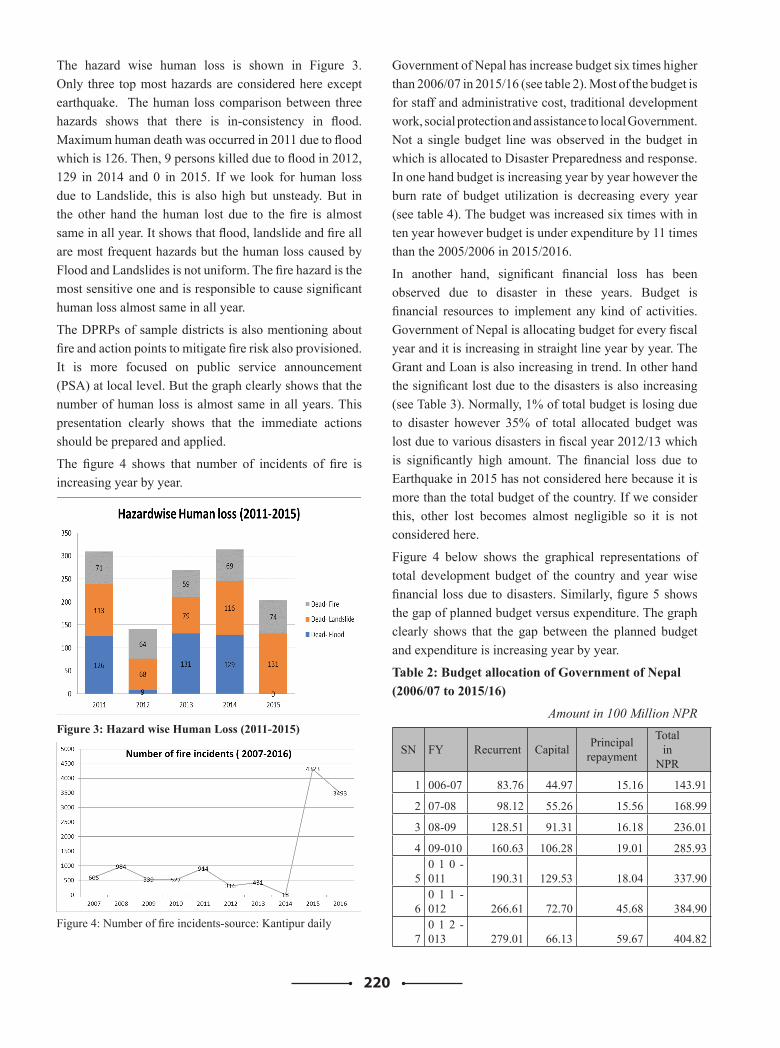
220
The hazard wise human loss is shown in Figure 3. Only three top most hazards are considered here except earthquake. The human loss comparison between three hazards shows that there is in-consistency in flood. Maximum human death was occurred in 2011 due to flood which is 126. Then, 9 persons killed due to flood in 2012, 129 in 2014 and 0 in 2015. If we look for human loss due to Landslide, this is also high but unsteady. But in the other hand the human lost due to the fire is almost same in all year. It shows that flood, landslide and fire all are most frequent hazards but the human loss caused by Flood and Landslides is not uniform. The fire hazard is the most sensitive one and is responsible to cause significant human loss almost same in all year.
The DPRPs of sample districts is also mentioning about fire and action points to mitigate fire risk also provisioned. It is more focused on public service announcement (PSA) at local level. But the graph clearly shows that the number of human loss is almost same in all years. This presentation clearly shows that the immediate actions should be prepared and applied.
The figure 4 shows that number of incidents of fire is increasing year by year.
Figure 3: Hazard wise Human Loss (2011-2015)
Figure 4: Number of fire incidents-source: Kantipur daily
Government of Nepal has increase budget six times higher than 2006/07 in 2015/16 (see table 2). Most of the budget is for staff and administrative cost, traditional development work, social protection and assistance to local Government. Not a single budget line was observed in the budget in which is allocated to Disaster Preparedness and response. In one hand budget is increasing year by year however the burn rate of budget utilization is decreasing every year (see table 4). The budget was increased six times with in ten year however budget is under expenditure by 11 times than the 2005/2006 in 2015/2016.
In another hand, significant financial loss has been observed due to disaster in these years. Budget is financial resources to implement any kind of activities. Government of Nepal is allocating budget for every fiscal year and it is increasing in straight line year by year. The Grant and Loan is also increasing in trend. In other hand the significant lost due to the disasters is also increasing (see Table 3). Normally, 1% of total budget is losing due to disaster however 35% of total allocated budget was lost due to various disasters in fiscal year 2012/13 which is significantly high amount. The financial loss due to Earthquake in 2015 has not considered here because it is more than the total budget of the country. If we consider this, other lost becomes almost negligible so it is not considered here.
Figure 4 below shows the graphical representations of total development budget of the country and year wise financial loss due to disasters. Similarly, figure 5 shows the gap of planned budget versus expenditure. The graph clearly shows that the gap between the planned budget and expenditure is increasing year by year.
Table 2: Budget allocation of Government of Nepal (2006/07 to 2015/16)
Amount in 100 Million NPR
SN FY Recurrent Capital Principal repayment
Total in
NPR
1 006-07 83.76 44.97 15.16 143.91
2 07-08 98.12 55.26 15.56 168.99
3 08-09 128.51 91.31 16.18 236.01
4 09-010 160.63 106.28 19.01 285.93
50 1 0 -011 190.31 129.53 18.04 337.90
60 1 1 -012 266.61 72.70 45.68 384.90
70 1 2 -013 279.01 66.13 59.67 404.82
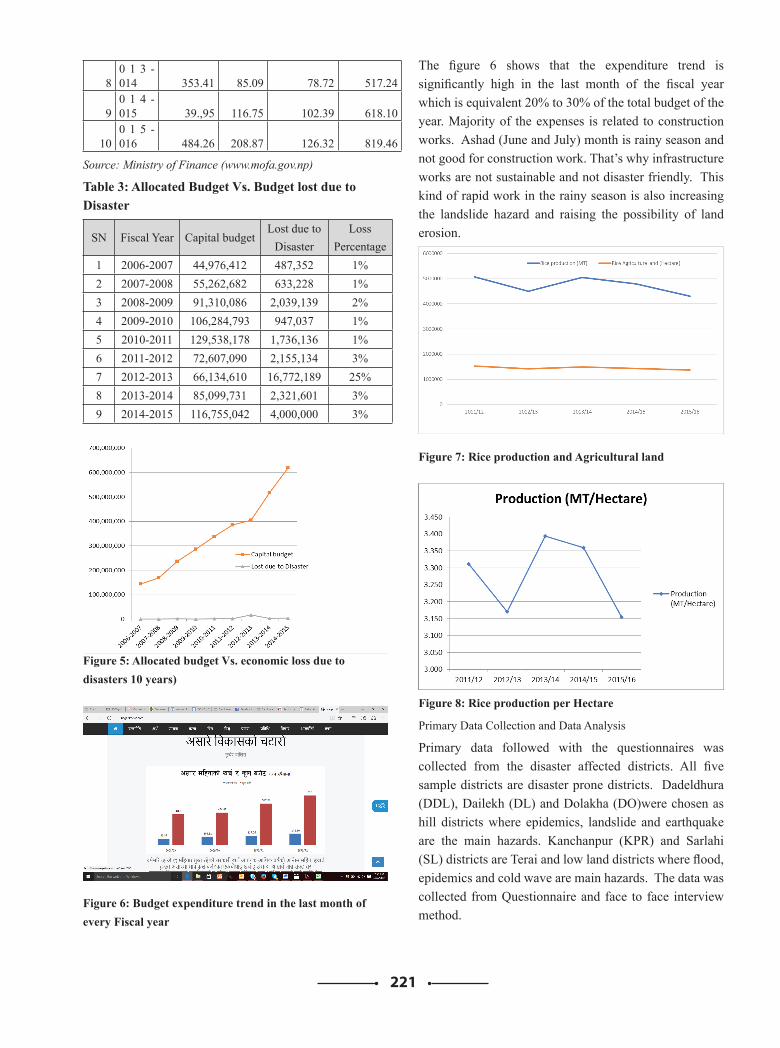
221
80 1 3 -014 353.41 85.09 78.72 517.24
90 1 4 -015 39.,95 116.75 102.39 618.10
100 1 5 -016 484.26 208.87 126.32 819.46
Source: Ministry of Finance (www.mofa.gov.np)
Table 3: Allocated Budget Vs. Budget lost due to Disaster
SN Fiscal Year Capital budgetLost due to
DisasterLoss
Percentage1 2006-2007 44,976,412 487,352 1%2 2007-2008 55,262,682 633,228 1%3 2008-2009 91,310,086 2,039,139 2%4 2009-2010 106,284,793 947,037 1%5 2010-2011 129,538,178 1,736,136 1%6 2011-2012 72,607,090 2,155,134 3%7 2012-2013 66,134,610 16,772,189 25%8 2013-2014 85,099,731 2,321,601 3%9 2014-2015 116,755,042 4,000,000 3%
Figure 5: Allocated budget Vs. economic loss due to disasters 10 years)
Figure 6: Budget expenditure trend in the last month of every Fiscal year
The figure 6 shows that the expenditure trend is significantly high in the last month of the fiscal year which is equivalent 20% to 30% of the total budget of the year. Majority of the expenses is related to construction works. Ashad (June and July) month is rainy season and not good for construction work. That’s why infrastructure works are not sustainable and not disaster friendly. This kind of rapid work in the rainy season is also increasing the landslide hazard and raising the possibility of land erosion.
In another hand, due to climate change effects and flooding, the production of main crop of rice is irregular year by year. Irregular rain fall, drought and excessive rainfall are also contributing to reduce rice production. In other hand rice production land is decreasing day by day. The serious agriculture land loss year by year may hit country in food security side at any time.
Figure 7: Rice production and Agricultural land
Figure 8: Rice production per Hectare
Primary Data Collection and Data Analysis Primary data followed with the questionnaires was collected from the disaster affected districts. All five sample districts are disaster prone districts. Dadeldhura (DDL), Dailekh (DL) and Dolakha (DO)were chosen as hill districts where epidemics, landslide and earthquake are the main hazards. Kanchanpur (KPR) and Sarlahi (SL) districts are Terai and low land districts where flood, epidemics and cold wave are main hazards. The data was collected from Questionnaire and face to face interview method.
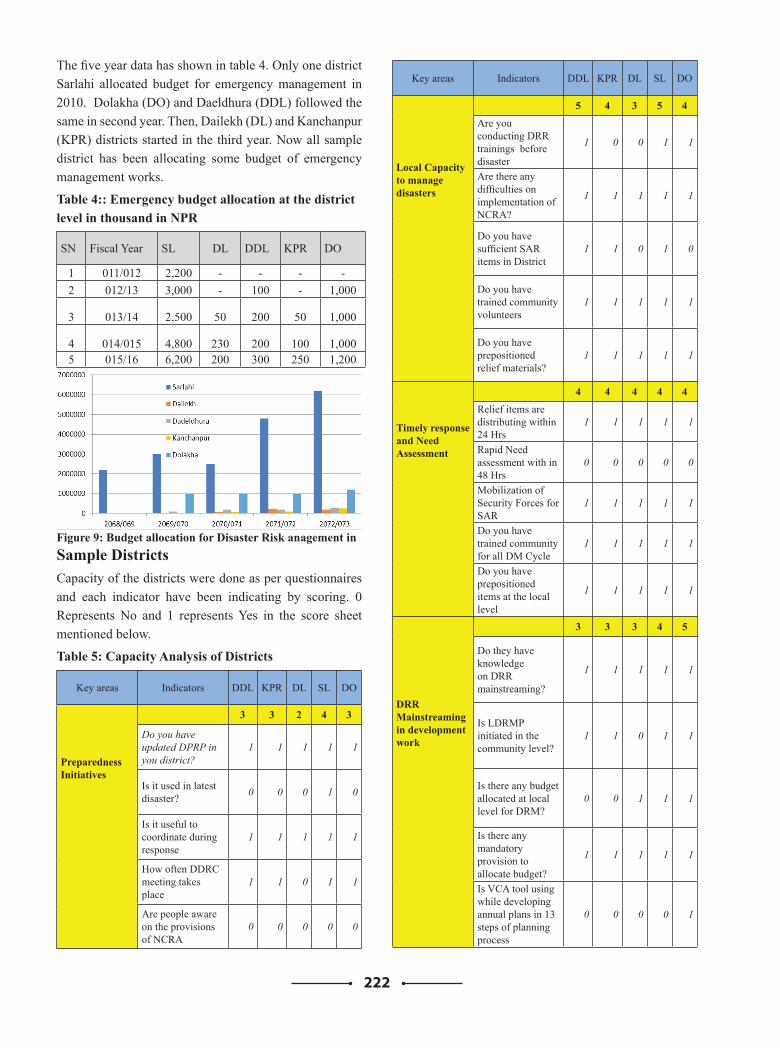
222
The five year data has shown in table 4. Only one district Sarlahi allocated budget for emergency management in 2010. Dolakha (DO) and Daeldhura (DDL) followed the same in second year. Then, Dailekh (DL) and Kanchanpur (KPR) districts started in the third year. Now all sample district has been allocating some budget of emergency management works.
Table 4:: Emergency budget allocation at the district level in thousand in NPR
SN Fiscal Year SL DL DDL KPR DO
1 011/012 2,200 - - - -2 012/13 3,000 - 100 - 1,000
3 013/14 2,500 50 200 50 1,000
4 014/015 4,800 230 200 100 1,0005 015/16 6,200 200 300 250 1,200
Figure 9: Budget allocation for Disaster Risk anagement in Sample DistrictsCapacity of the districts were done as per questionnaires and each indicator have been indicating by scoring. 0 Represents No and 1 represents Yes in the score sheet mentioned below.
Table 5: Capacity Analysis of Districts
Key areas Indicators DDL KPR DL SL DO
Preparedness Initiatives
3 3 2 4 3
Do you have updated DPRP in you district?
1 1 1 1 1
Is it used in latest disaster? 0 0 0 1 0
Is it useful to coordinate during response
1 1 1 1 1
How often DDRC meeting takes place
1 1 0 1 1
Are people aware on the provisions of NCRA
0 0 0 0 0
Key areas Indicators DDL KPR DL SL DO
Local Capacity to manage disasters
5 4 3 5 4Are you conducting DRR trainings before disaster
1 0 0 1 1
Are there any difficulties on implementation of NCRA?
1 1 1 1 1
Do you have sufficient SAR items in District
1 1 0 1 0
Do you have trained community volunteers
1 1 1 1 1
Do you have prepositioned relief materials?
1 1 1 1 1
Timely response and Need Assessment
4 4 4 4 4Relief items are distributing within 24 Hrs
1 1 1 1 1
Rapid Need assessment with in 48 Hrs
0 0 0 0 0
Mobilization of Security Forces for SAR
1 1 1 1 1
Do you have trained community for all DM Cycle
1 1 1 1 1
Do you have prepositioned items at the local level
1 1 1 1 1
DRR Mainstreaming in development work
3 3 3 4 5
Do they have knowledge on DRR mainstreaming?
1 1 1 1 1
Is LDRMP initiated in the community level?
1 1 0 1 1
Is there any budget allocated at local level for DRM?
0 0 1 1 1
Is there any mandatory provision to allocate budget?
1 1 1 1 1
Is VCA tool using while developing annual plans in 13 steps of planning process
0 0 0 0 1
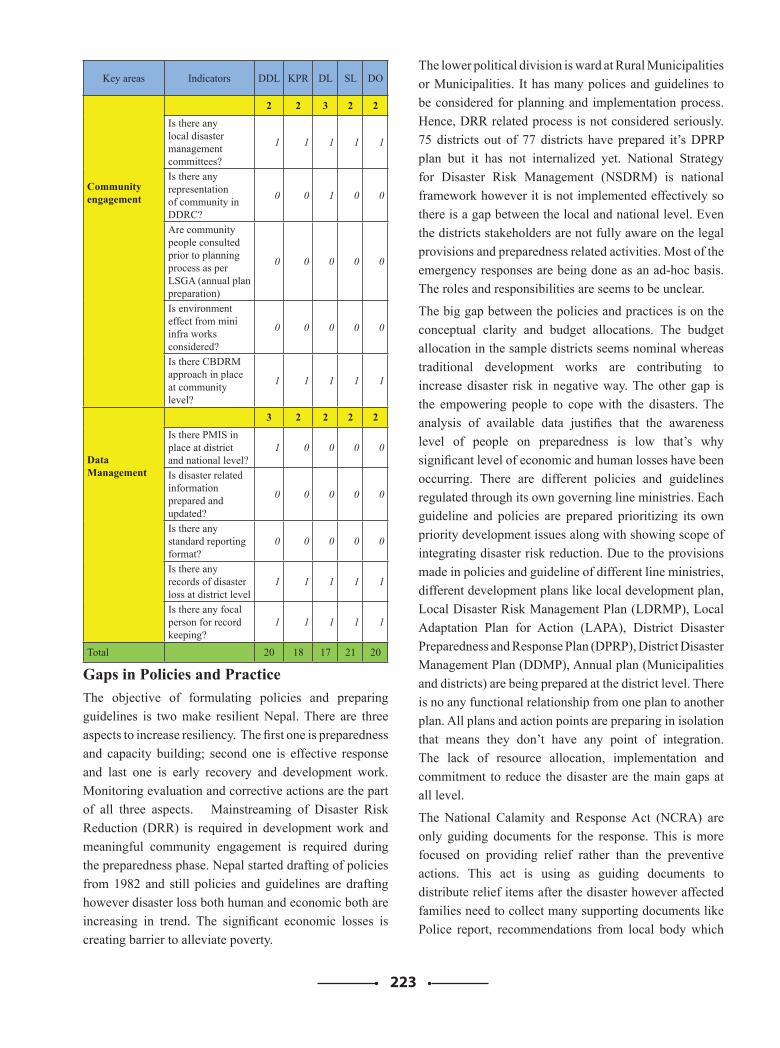
223
Key areas Indicators DDL KPR DL SL DO
Community engagement
2 2 3 2 2Is there any local disaster management committees?
1 1 1 1 1
Is there any representation of community in DDRC?
0 0 1 0 0
Are community people consulted prior to planning process as per LSGA (annual plan preparation)
0 0 0 0 0
Is environment effect from mini infra works considered?
0 0 0 0 0
Is there CBDRM approach in place at community level?
1 1 1 1 1
Data Management
3 2 2 2 2Is there PMIS in place at district and national level?
1 0 0 0 0
Is disaster related information prepared and updated?
0 0 0 0 0
Is there any standard reporting format?
0 0 0 0 0
Is there any records of disaster loss at district level
1 1 1 1 1
Is there any focal person for record keeping?
1 1 1 1 1
Total 20 18 17 21 20
Gaps in Policies and PracticeThe objective of formulating policies and preparing guidelines is two make resilient Nepal. There are three aspects to increase resiliency. The first one is preparedness and capacity building; second one is effective response and last one is early recovery and development work. Monitoring evaluation and corrective actions are the part of all three aspects. Mainstreaming of Disaster Risk Reduction (DRR) is required in development work and meaningful community engagement is required during the preparedness phase. Nepal started drafting of policies from 1982 and still policies and guidelines are drafting however disaster loss both human and economic both are increasing in trend. The significant economic losses is creating barrier to alleviate poverty.
The lower political division is ward at Rural Municipalities or Municipalities. It has many polices and guidelines to be considered for planning and implementation process. Hence, DRR related process is not considered seriously. 75 districts out of 77 districts have prepared it’s DPRP plan but it has not internalized yet. National Strategy for Disaster Risk Management (NSDRM) is national framework however it is not implemented effectively so there is a gap between the local and national level. Even the districts stakeholders are not fully aware on the legal provisions and preparedness related activities. Most of the emergency responses are being done as an ad-hoc basis. The roles and responsibilities are seems to be unclear.
The big gap between the policies and practices is on the conceptual clarity and budget allocations. The budget allocation in the sample districts seems nominal whereas traditional development works are contributing to increase disaster risk in negative way. The other gap is the empowering people to cope with the disasters. The analysis of available data justifies that the awareness level of people on preparedness is low that’s why significant level of economic and human losses have been occurring. There are different policies and guidelines regulated through its own governing line ministries. Each guideline and policies are prepared prioritizing its own priority development issues along with showing scope of integrating disaster risk reduction. Due to the provisions made in policies and guideline of different line ministries, different development plans like local development plan, Local Disaster Risk Management Plan (LDRMP), Local Adaptation Plan for Action (LAPA), District Disaster Preparedness and Response Plan (DPRP), District Disaster Management Plan (DDMP), Annual plan (Municipalities and districts) are being prepared at the district level. There is no any functional relationship from one plan to another plan. All plans and action points are preparing in isolation that means they don’t have any point of integration. The lack of resource allocation, implementation and commitment to reduce the disaster are the main gaps at all level.
The National Calamity and Response Act (NCRA) are only guiding documents for the response. This is more focused on providing relief rather than the preventive actions. This act is using as guiding documents to distribute relief items after the disaster however affected families need to collect many supporting documents like Police report, recommendations from local body which
224
is very tedious and complicated for extremely remote places. Only few people are receiving assistance from Government annually
National disaster response frame work (NDRF) is another policy to use as a guidance document during the emergency. Due to the lack of roles and responsibilities, emergency response and immediate support have not happened on time. The collected information of all sample districts clearly shows that adequate resources haven’t allocated at the district level. Adequate coordination among the various organizations has happened and there are no any responsible functional offices at the local level. NEOC and DEOC are assumed for effective data management however DEOC has not able to strengthen. Due to the less effectiveness of the DEOC at the district level, NEOC is not able to maintain functional relationship with DDRCs, Rural Municipalities (RMs), Municipalities and Humanitarian organizations.
Government of Nepal committed to form National Disaster Management Authority and to formulate new disaster management act about one decade ago but it has not formulate yet. There is not an adequate mechanism to implement the National Building Codes (NBC) to guard against the risks of earthquake. The simplified version of National Building Code, Mandatory Rule of Thumb (MRT) is also not able to implement. Only Lalitpur and Dhangadhi sub Metro City and Dharan Municipality have claimed that they are implementing NBC effectively. The Building Regulations under the Building Act do not yet establish a mechanism for approval of smaller buildings at local level, although these are covered in the Act itself.
Land use planning and high-risk settlements are another aspect of increasing vulnerability of communities. Due to the lack of proper policy and understanding on land management, ad-hoc urban trend is increasing and proper constructions have not made. There is no clear role between Department of Urban Development and Building Construction (DUDBC) and respective Municipalities. Government is increasing number of municipalities but capacity development of such municipalities has not given priority. There are many RMs which are susceptible to many kind of disasters. They can’t able to implement NBC in traditional ways. There is no consistent legal mechanism to relocate individuals or communities from high-risk land. Early warning and DRR communications has not considered. Some of the initiations have taken in Karnali and Narayani river however it is not sufficient.
Provision of community based disaster management is lack in all policies and practices.
Involvement and active participation of private sector in all phase of disaster cycle management is not provisioned in all documents. Public private partnership must be ensured in all cycle of disaster management.
Findings and RecommendationNepal has developed some policies and guidelines for effective disaster management. Government of Nepal, UN, Humanitarian Organizations, Red Cross societies and civil societies are providing special care and attention to minimize effect of disasters by increasing the resiliency of country and communities. After the three decades of starting formulation policies in Nepal, country is still experiencing big threats of disasters which are responsible for significant economic loss.
a. Inconstancy in Data management: There is no consistency on data management, dissemination and sharing at all level. There is no any specific data management format at all level. Due to the lack of adequate information management system (IMS), all sample districts are not able to maintain records effectively. The available information clearly shows that disaster is one of the hindering of all districts. It is resisting the development efforts and increasing vulnerability of the districts. Due to unavailability of data, proper planning hasn’t done. Due to the lack of proper planning, effective development hasn’t occurred.
b. Lack of proper guidelines and implementation: Despite of the dozens of guiding documents and policies, vulnerability of the country is increasing day by day. Most of the time has been spending on policy formulation but execution has not happened at all level. Ad-hoc basis implementation is not bringing significant changes. It is found that due to the lack of financial resources, plans of districts have not executed. There is no any contingency plan and proper monitoring plan. Milestones haven’t fixed. So, all districts are not able to meet its target.
c. Less community participation in planning and implementation: It is found that community participation is less in planning and implementation level. Only Government Officials are taking lead in all kind of decisions at the district level. District level authorities are focusing only relief and response.
225
d. Lack of capacity development and stockpiling: All of districts have not any capacity development plans like search and rescue trainings, first aid trainings, Hygiene promotion training and other emergency management trainings. Some of the events are carried by Nepal Red Cross Society and some I/NGOs however it is in very small scale. The prepositioning of life saving materials is not happening in all districts. Only Nepal Red Cross Society has nonfood items (NFI) for distribution which is negligible as compared with district populations.
e. Significant economic loss and threat to food security: The increasing trend of disaster events is responsible for big number of human loss and significant economic loss. Number of floods in Terai and land slide in hill area is responsible for significant loss in agriculture land which is supporting for decrease in food production. This loss in production and productivity may increase food insecurity at any time.
Conclusion:From the above analysis, it came to know that Nepal has many policies for Disaster Risk Management. The first Act was formulated in 1982 and within thirty two years of journey more than ten documents were formulated. About three persons have been killing in Nepal due to various forms of Disasters and every Nepalese is a risk from two hazards. The Government Officials are claiming that due to the unavailability of financial resources, they are not able to manage disaster risk effectively. The human and economic loss trend gives serious threats to policy makers, implementers and civil societies to take immediate actions. Disasters are causing effects in multiple sectors like livelihood, food security, tourism, development, education, health etc.
Recommendations:Policy level intervention:The existing policies are only focusing on relief distribution. The adequate policies focused on preparedness, capacity development of community and stakeholders, early recovery plan should be prepared and in place.
High level of Community engagement:
High level community engagement in planning, implementation and monitoring stages should be ensured. Community people are fully aware on the local context,
capacity and gap of their community. Hence, their engagement will support for drafting favorable policies and plan.
Proper definition of mainstreaming of DRR:There are many policies and guidelines available in Nepal. Due to the clarity on role and responsibilities, effective implementation has not occurred. Hence, proper definition of mainstreaming with key guidance note, indicators and monitoring tools should be prepared and applied. Any policies should align with 13 steps of planning process.
Capacity development on search and rescue (SAR) & emergency management:As the community people are the first responder, the capacity development efforts like training on search and rescues, first aid, relief distribution, Orientation on Sphere, training on Vulnerability Capacity Assessment (VCA) and comprehensive training on emergency management should be focused. Community volunteers, Female Community Health Volunteers (FCHVs), Teachers, Village Health Workers (FHW), representatives of ward citizen forum (WCF), youths, local stakeholders etc should be engaged in such type of capacity development efforts.
Further study is recommended to check the effectiveness of policies: The effectiveness of such policies should be studied by involving community people and stakeholders in the different level. The preparedness focused Disaster Management Act should be drafted as soon as possible by clarifying roles and responsibilities of all stakeholders at different level.
The study was carried in only five districts. Hence, similar type of study is recommended to conduct in other disaster affected districts and communities.
References:1. Little, P.D1., Smith, K. 2, Barbara A. Cellarius3, D.
Layne Coppock4 and Christopher Barrett5Avoiding Disaster: Diversification and Risk Management among East African Herders
2. Jigyasu, R.sustainable post disaster reconstruction through integrated risk management – the case of rural communities in south asia
3. Ramesh Guragain 1, Ganesh Jimee2 and Amod Mani Dixit3earthquake awareness and effective planning through participatory risk assessment: an experience from Nepal
226
4. NBC (1994), Nepal National Building Code (NBC), Ministry of Urban Development, Department of Urban Development and Building Construction (DUDBC)
5. ATC-13, (1995), Earthquake Damage Evaluation Data for Probable Maximum Loss Studies of California Buildings, Applied Technology Council, California
6. Jimee, G. (2006), GIS for Seismic Building Loss Estimation: A Case Study from Lalitpur Sub-Metropolitan City Area, Kathmandu, Nepal. M. Sc. Thesis, Enschede, 114 pp
7. http://www.adrc.asia/countryreport/NPL/NPLeng98/
8. Dr. Meen B. Poudyal Chhetri, disaster management in Nepal: a review
9. Poudyal Chhetri, M.B. (1998) “ Disaster Management in Nepal: Challenges and Opportunities” an unpublished research paper, 1998 Kathmandu, Nepal.
10. Nepal Disaster Report 2011, DP Net Nepal.
11. Nepal Disaster Report 2015 http://www.drrportal.gov.np/uploads/document/329.pdf
12. Pradip Kumar Koirala1 and Rita Dhakal Jayasawal2 Emerging Trends in Disaster Management Policy in Nepal
13. UNDP, the Bureau for Crisis Prevention and Recovery (BCPR) http://www.undp.org/content/undp/en/home/librarypage/crisis-prevention-and-recovery/preventing-crisis--enabling-recovery--bcpr-annual-report-2011.html
14. Local Disaster Risk Management planning guidelines (LDRMP), Ministry of Federal Affairs and Local development (MoFALD)
15. Disaster Preparedness and Response planning (DPRP) guidelines, Ministry of Home Affairs (MoHA)
16. Local Self Governance Act 1999 Local Self Governance Act 1999 (LSGA, 1999), Ministry of Federal Affairs and Local development (MoFALD)
17. National strategy for Disaster Risk Management, Ministry of Home Affairs (MoHA)
18. National Disaster Response Framework (NDRF), Ministry of Home Affairs (MoHA)
19. Annual budget, Ministry of Finance, Government of Nepal.
20. Nepal Disaster Report 2015, DP Net Nepal.
21. Nepal Disaster Report 2019, DP Net Nepal.
227
Factors Influencing Admission in Higher Education In Nepal
Jagadish Chandra WagleResearch scholar,
Lincoln University Collge, [email protected] Kumar Ojha
AbstractEducation sectors are becoming competitive day by day. Students see many tangible and intangible facets in the higher education while taking admission. Many western countries seem to attract the students from developing countries and institutions of these countries are becoming successful. This study is trying to analyze these facets so that some insight could be developed, how the higher education sector be developed so that this sector attracts the students and these sectors could show their reason of establishment.
KeywordsHigher education, facets of admission in higher education
BackgroundThe total students from both community and institutionalized schools studying at grades 1-12 has been 72,14525 in the academic year 2018(Economics survey, 2018/19). Out of these the enrolment in 9 to 12 is 1659146 students, and one-fourth of these, which is more than four hindered thousand come to the market for higher studies. They dispersed in different higher education institutions so how they dispersed what factors affect their disbursement and choices of higher education is interesting thing.
Statement of the ProblemsEvery year more and more students are going to abroad for the study, and their numbers are increasing. This is reflected in the enrolment pattern of the countries higher education and documents published in foreign universities. For instance, US documents published by Department of State Bureau of Educational and Cultural Affairs have stated that the number of Nepali students studying in the United States has increased by 14.3 percent over the prior year. The report also shows the number of Nepali students in the United States has once again posted the highest growth among the top 25 sending countries, and increased to a record level, totaling 13,270 – the third year in a row to see growth. Nepal now ranks 10th among the top 25 for undergraduate students in the U.S. The news published recently in Himalayan times states the report of recent research of a group of educationists has shown that 70 percent of students seek to study abroad to get
employment there. The education ministry said the no objection letter was issued to 32,743 students seeking to study in Australia, 11,181 students to study in Japan, 2,485 to study in USA, 1,997 to study in China and 1,978 to study in India. If studies are not done to study the factor associated to such situation and prevailed situation continue, the consequent can be still more deteriorating. So his study is forwarded.
ObjectiveMain objective of this study is to examine the pattern of student’s choice of different universities and institutions in higher education.
Research QuestionThrough this study the researcher wanted to know what factors students see in the universities before joining. What are the different situations of enrolment in different streams? Do all universities have same pattern of student’s enrolment, etc.
MethodThe method used in the article is both primary and secondary. Different enrolment situation in higher education are analyzed in terms of growth, streams and universities. Inquiries with some of the authorizes were made by meeting personally for getting their opinions about the choices of the universities.
Literature Review Survey of literature was done to develop insight the
228
reasons of students choice of university. According to Fernandez (2010), individuals act rationally in ways that maximize their utility, given their personal preferences. This model is commonly known as economic model (DesJardins and Toutkoushian, 2005). Some other researchers pointed sociological model, which includes-three variables: the identification and interrelationship of factors including parental encouragement influence of significant others and academic performance (Hossler, Braxton, and Coopersmith, 1989). The three-stage model Hossler and Gallagher’s (1987) emphasizes the stage of predisposition, search, and choice. The predisposition phase is the first step where students decide whether they will continue their education based on their socioeconomic status, parent encouragement and support, extracurricular activities, and pre-college curriculum aid in determining a student’s ability to attend college. Second phase is the search phase, when the student starts to gather information about higher education institutions. The final phase, choice, is when the student decides which institution to attempt to attend. Yamamoto (2006) says that brochures, posters, meetings, sponsorships, billboards, web pages, and TV and newspaper advertisements are mostly used as communication tools for university selection.
Factors Affecting University ChoiceTable 1: Summary of the literature reviewed for factors affecting university choice by students
Factors Authorsacademic reputations, accreditations, proximity, costs, and potential marketability
Webb (1993)
that quality of faculty and degrees, overall academic reputation
Chapman (1993)
quality of faculty, degree programs, costs, variety of offerings, and classroom instruction.
Kallio (1995)
influence of personalcontacts, parents, location, and social life
Donnellan(2002)
quality and flexibility degree/course combinations, availability of accommodation, costs and close proximity to home.
Holdsworth and Nind
(2006)job availability that determine student’s university choice
Kaynama and Smith (1996)
subject of interest is the most important determinant while choosing university,followed by tuition and other costs.
Connor, Burton, Pearson,
Pollard, and Regan, 1999;
Connor, Pearson,
Court, andJagger, 1996
interest of study, influence of others, and career prospects
Strasser, Ozgur, and Schroeder
(2002)institution characteristics, knowledge and awareness of the host country, recommendation from friends and relatives, environment, cost, social link and geographic proximity
Mazzarol and Soutar(2002)
campus staff, students, and other networking Wilson (2002)
academic reputation, quality of faculty and instruction, location, cost, scholarship offers, financial aid, and student employment opportunities. size of institution, surrounding community, friendly service, availability of graduate program, variety of course offered, extracurricular programs, admission requirements, admission to graduateschool, affiliation, attractiveness of campus facilities, class size, and quality of social life.
Hoyt and Brown (2003)
quality of education, academic prestige, availability of major, library, and information technology facilities
Price, Matzdorf, Smith, and
Agahi (2003)
personal, academic quality and facilities, campus, socialization, and financial aids
Sidin, Hussin, and Soon
(2003)the reputation, nature other courses, location and address, financial considerations, facilities, social climate of the department, program structure and accreditation factors
Donaldson and
McNicholas (2004),
job prospects Maringe (2006)
the programs, academic prestige of departments, academic prestige of the university, dormitory and campus facilities, and job placement of graduates
Lewis, and Paton (2004)
Academic reputation, distance from home location, own perception, graduate employment, social life nearby, entry requirements, teaching reputation, quality of the faculty, and information supplied by university and research reputation
Briggs (2006)
academic excellence, job market prospects and location matter
Alves and Raposo (2007)
academic, financial, and individual traits or experiences
Strayhorn,Blakewood, and DeVita (2008)
fee payment, availability offinancial aid, and reasonable accommodation costs
Foskett, Roberts, and
Maringe (2006)living conditions (location, convenience, and campus), learning environment (faculty, curriculum,and research), reputation (academic reputation and alumni reputation), economy (tuition fee, subsidies, and employability) and strategy (exam subjects, exam pass rate, and graduation requirements). Employability, curriculum, academic reputation, faculty, and research environment
Ho and Hung (2008
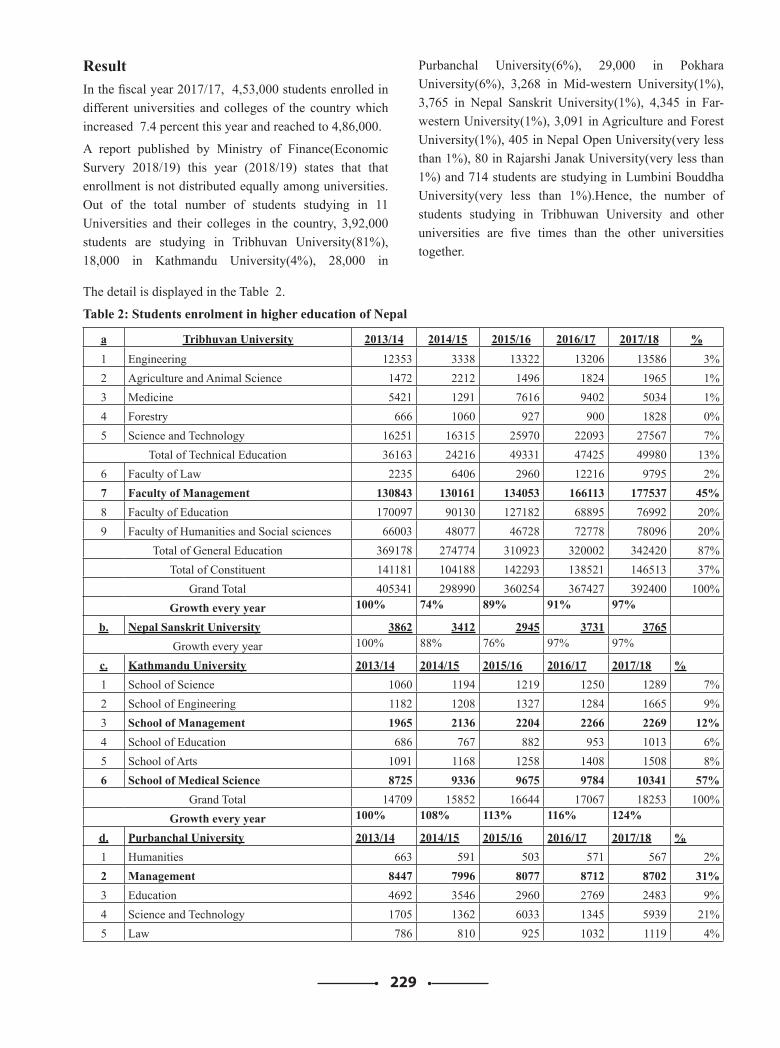
229
ResultIn the fiscal year 2017/17, 4,53,000 students enrolled in different universities and colleges of the country which increased 7.4 percent this year and reached to 4,86,000.
A report published by Ministry of Finance(Economic Survery 2018/19) this year (2018/19) states that that enrollment is not distributed equally among universities. Out of the total number of students studying in 11 Universities and their colleges in the country, 3,92,000 students are studying in Tribhuvan University(81%), 18,000 in Kathmandu University(4%), 28,000 in
Purbanchal University(6%), 29,000 in Pokhara University(6%), 3,268 in Mid-western University(1%), 3,765 in Nepal Sanskrit University(1%), 4,345 in Far-western University(1%), 3,091 in Agriculture and Forest University(1%), 405 in Nepal Open University(very less than 1%), 80 in Rajarshi Janak University(very less than 1%) and 714 students are studying in Lumbini Bouddha University(very less than 1%).Hence, the number of students studying in Tribhuwan University and other universities are five times than the other universities together.
The detail is displayed in the Table 2.
Table 2: Students enrolment in higher education of Nepal
a Tribhuvan University 2013/14 2014/15 2015/16 2016/17 2017/18 %
1 Engineering 12353 3338 13322 13206 13586 3%2 Agriculture and Animal Science 1472 2212 1496 1824 1965 1%3 Medicine 5421 1291 7616 9402 5034 1%4 Forestry 666 1060 927 900 1828 0%5 Science and Technology 16251 16315 25970 22093 27567 7%
Total of Technical Education 36163 24216 49331 47425 49980 13%6 Faculty of Law 2235 6406 2960 12216 9795 2%7 Faculty of Management 130843 130161 134053 166113 177537 45%8 Faculty of Education 170097 90130 127182 68895 76992 20%9 Faculty of Humanities and Social sciences 66003 48077 46728 72778 78096 20%
Total of General Education 369178 274774 310923 320002 342420 87%Total of Constituent 141181 104188 142293 138521 146513 37%
Grand Total 405341 298990 360254 367427 392400 100%Growth every year 100% 74% 89% 91% 97%
b. Nepal Sanskrit University 3862 3412 2945 3731 3765Growth every year 100% 88% 76% 97% 97%
c. Kathmandu University 2013/14 2014/15 2015/16 2016/17 2017/18 %1 School of Science 1060 1194 1219 1250 1289 7%2 School of Engineering 1182 1208 1327 1284 1665 9%3 School of Management 1965 2136 2204 2266 2269 12%4 School of Education 686 767 882 953 1013 6%5 School of Arts 1091 1168 1258 1408 1508 8%6 School of Medical Science 8725 9336 9675 9784 10341 57%
Grand Total 14709 15852 16644 17067 18253 100%Growth every year 100% 108% 113% 116% 124%
d. Purbanchal University 2013/14 2014/15 2015/16 2016/17 2017/18 %1 Humanities 663 591 503 571 567 2%2 Management 8447 7996 8077 8712 8702 31%3 Education 4692 3546 2960 2769 2483 9%4 Science and Technology 1705 1362 6033 1345 5939 21%5 Law 786 810 925 1032 1119 4%
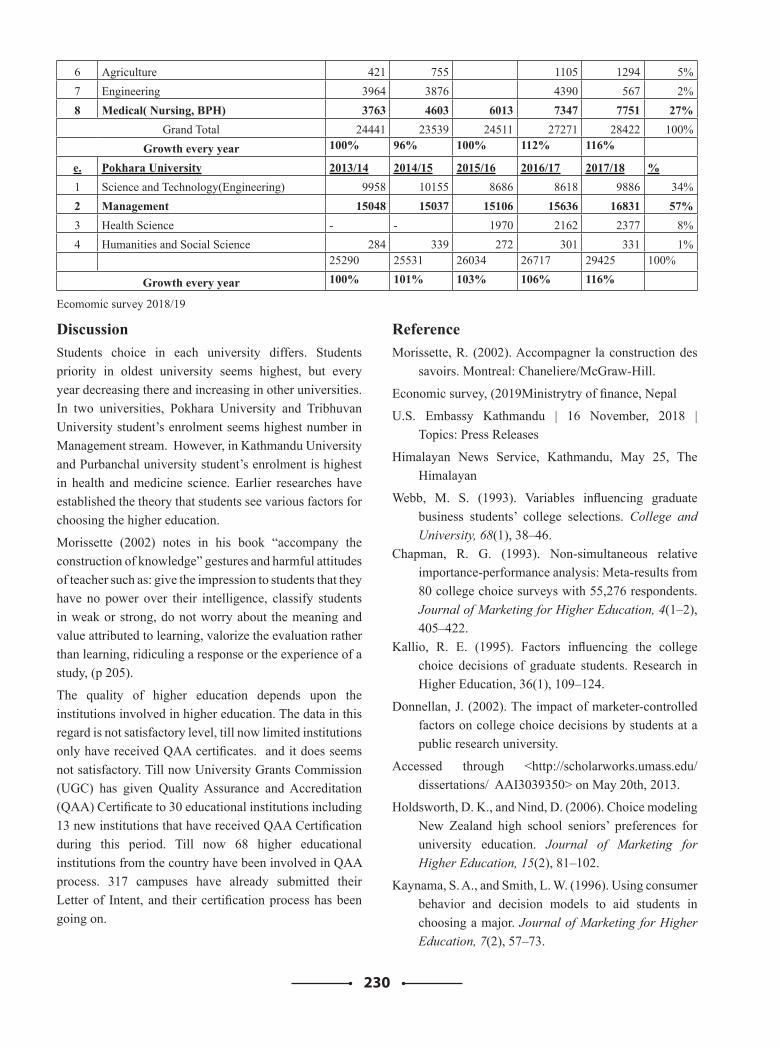
230
6 Agriculture 421 755 1105 1294 5%7 Engineering 3964 3876 4390 567 2%8 Medical( Nursing, BPH) 3763 4603 6013 7347 7751 27%
Grand Total 24441 23539 24511 27271 28422 100%Growth every year 100% 96% 100% 112% 116%
e. Pokhara University 2013/14 2014/15 2015/16 2016/17 2017/18 %1 Science and Technology(Engineering) 9958 10155 8686 8618 9886 34%2 Management 15048 15037 15106 15636 16831 57%3 Health Science - - 1970 2162 2377 8%4 Humanities and Social Science 284 339 272 301 331 1%
25290 25531 26034 26717 29425 100%
Growth every year 100% 101% 103% 106% 116%
Ecomomic survey 2018/19
DiscussionStudents choice in each university differs. Students priority in oldest university seems highest, but every year decreasing there and increasing in other universities. In two universities, Pokhara University and Tribhuvan University student’s enrolment seems highest number in Management stream. However, in Kathmandu University and Purbanchal university student’s enrolment is highest in health and medicine science. Earlier researches have established the theory that students see various factors for choosing the higher education.
Morissette (2002) notes in his book “accompany the construction of knowledge” gestures and harmful attitudes of teacher such as: give the impression to students that they have no power over their intelligence, classify students in weak or strong, do not worry about the meaning and value attributed to learning, valorize the evaluation rather than learning, ridiculing a response or the experience of a study, (p 205).
The quality of higher education depends upon the institutions involved in higher education. The data in this regard is not satisfactory level, till now limited institutions only have received QAA certificates. and it does seems not satisfactory. Till now University Grants Commission (UGC) has given Quality Assurance and Accreditation (QAA) Certificate to 30 educational institutions including 13 new institutions that have received QAA Certification during this period. Till now 68 higher educational institutions from the country have been involved in QAA process. 317 campuses have already submitted their Letter of Intent, and their certification process has been going on.
ReferenceMorissette, R. (2002). Accompagner la construction des
savoirs. Montreal: Chaneliere/McGraw-Hill.
Economic survey, (2019Ministrytry of finance, Nepal
U.S. Embassy Kathmandu | 16 November, 2018 | Topics: Press Releases
Himalayan News Service, Kathmandu, May 25, The Himalayan
Webb, M. S. (1993). Variables influencing graduate business students’ college selections. College and University, 68(1), 38–46.
Chapman, R. G. (1993). Non-simultaneous relative importance-performance analysis: Meta-results from 80 college choice surveys with 55,276 respondents. Journal of Marketing for Higher Education, 4(1–2), 405–422.
Kallio, R. E. (1995). Factors influencing the college choice decisions of graduate students. Research in Higher Education, 36(1), 109–124.
Donnellan, J. (2002). The impact of marketer-controlled factors on college choice decisions by students at a public research university.
Accessed through <http://scholarworks.umass.edu/dissertations/ AAI3039350> on May 20th, 2013.
Holdsworth, D. K., and Nind, D. (2006). Choice modeling New Zealand high school seniors’ preferences for university education. Journal of Marketing for Higher Education, 15(2), 81–102.
Kaynama, S. A., and Smith, L. W. (1996). Using consumer behavior and decision models to aid students in choosing a major. Journal of Marketing for Higher Education, 7(2), 57–73.
231
Connor, H., Pearson, R., Court, G., and Jagger, N. (1996). University challenge: Student choices in the 21st Century. Accessed through <http://files.eric.ed.gov/fulltext/ED399918.pdf> on November 22nd, 2013.
Connor, H., Burton, R., Pearson, R., Pollard, E., and Regan, J. (1999). Making the right choice: How students choose universities and colleges. Brighton, England: Institute for Employment Studies. Accessed through <http://intouniversity.org/sites/all/files/userfiles/files/IES%20-20Making%20the%20Right%20Choice%20(summary). pdf> on November 12th, 2013.
Strasser, S. E., Ozgur, C., and Schroeder, D. L. (2002). Selecting a business college major: An analysis of criteria and choice using the analytical hierarchy process. American Journal of Business, 17(2), 47–56.
Mazzarol, T., and Soutar, G. N. (2002). “Push-pull” factors influencing international student destination choice. International Journal of Educational Management, 16(2), 82–90.
Hoyt, J. E., and Brown, A. B. (2003). Identifying college choice factors to successfully market your institution. College and University, 78(4), 3–10.
Price, I. F., Matzdorf, F., Smith, L., and Agahi, H. (2003). The impact of facilities on student choice of university. Facilities, 21(10), 212–222.
Sidin, S. M., Hussin, S. R., and Soon, T. H. (2003). An exploratory study of factors influencing the college choice decision of undergraduate students in Malaysia. Asia Pacific Management Review, 8(3), 259–280.
Donaldson, B., and McNicholas, C. (2004). Understanding the postgraduate education market for UK?based students: a review and empirical study. International Journal of Nonprofit and Voluntary Sector Marketing, 9(4), 346–360.
Briggs S., and Wilson A. (2007). Which university? A study of the influence of cost and information factors on Scottish undergraduate choice. Journal of Higher Education Policy and Management, 29(1), 57–72
Alves, H., and Raposo, M. (2007). Conceptual model of student satisfaction in higher education. Total Quality Management, 18(5), 571–588
Strayhorn, T. L., Blakewood, A. M., and DeVita, J. M. (2008). Factors affecting the college choice of African American gay male undergraduates:
Implications for retention. National Association of Student Affairs Professionals Journal, 11(1), 88–108.
Foskett, N., Roberts, D., and Maringe, F. (2006). Changing fee regimes and their impact on student attitudes to higher education. Southampton, England: University of Southampton.
Maringe, F. (2006). University and course choice - Implications for positioning, recruitment and marketing. International Journal of Educational Management, 20(6), 466–479.
Ho, H. F., and Hung, C. C. (2008). Marketing mix formulation for higher education: An integrated analysis employing analytic hierarchy process, cluster analysis and correspondence analysis. International Journal of Educational Management, 22(4), 328–340.
232
Poverty – An Alarming Issue for Students Dropout in Schools in Nepal
Jayaram WagleyPhD Scholar, Faculty of Social ScienceLincoln University College, MalaysiaE-mail: [email protected]
AbstractEducation is an important component of human resource development and is the most important determinant of income poverty. This paper aims to deal with mainly secondary data to produce the linkage between poverty and school dropout children of Nepal. It will also study various reasons of dropout and discovers poverty as a primary factor. It can also produce a precise statement relevant to the policy makers for the formulation of policies. For this purpose, secondary data published by UNICEF, UNDP, census 2011 and Central Bureau of Statistics are used. The descriptive findings based on these data help to understand that the educational achievement is related to the level of income of a family. It will also suggest the concerned on how to decrease the dropout rates. Hence this paper calls for the proper policies and plans for lessening poverty of the country which will surely help in decreasing school dropout.
Keywords Poverty, school dropout, education, income, Nepal.
Introduction Education is believed to be the basic right of a citizen in any country (Global Action for Children, 2010) which is essential for the overall development of an individual as well as the nation. But it can be observed that a significant number of students are dropping out of the school before they complete their education. The school dropout simply refers to a child who leaves his/her education at primary, lower secondary or secondary level. The dropout rate is simply the proportion of total dropout student population against the total students enrolled at the beginning of the school session. Many children enter the school but are unable to complete their education due to some factors such as socio-cultural issues, low education level of parents, health issues, disability and chiefly poverty.
This paper focuses poverty as a major cause of school dropout. Poverty is a key issue which may give rise to malnutrition, illness, absenteeism, lack of study materials, etc. (Ballantine, 1993., Cara, 2005., Chivore, 1987., Koloi, 2007., Paula & Gruskin, 2003) It is really a hard situation for those destitute parents of Nepal to continue their kids with school education when they are unable to provide the basic daily needs. School dropout has been one of the serious problems in primary level. Primary education acts as a catalyst of social change. It can truly beat the traditional inequalities based on gender, caste and class which are prevalent in the developing nations like Nepal.
There are many factors behind these drop-out rates. The most significant factor is poverty – 25% of the poorest children do not step into the school. It is obvious that the parents of many families living in poverty want their children to work and earn rather than obtain an education. So the children aged between 5 to 14 years are forced to child labour. This figure is 37% while for children between the ages of 10 and 14 the rates are even higher – 61% (UNICEF 2016)According to World Bank (2010) data, 1 out of 4 of the whole population of Nepal earns less than the national poverty line of US$1.25 per day. Nepal’s position is in 145 out of 187 countries on the Human Development Index 2015 and it is one of the poorest countries in the world. During the past 15 years, Nepal has witnessed an unstable economic growth, with its Gross Domestic Product (GDP) growth rate ranging from very low value, i.e. 0.1 per cent in 2002 and became up to 6.1 percent in 2008. Due to economic slowdown, the GDP growth rate has gradually diminished since 2008 to as low as 3.4 percent in 2011. Literacy is universally linked with poverty reduction. The higher percentage of illiteracy means the higher percentage of poverty level. It means that there are many children in educational vulnerability due to deprived economic condition (UNICEF, 2016).
Ballantine (1993) referred to school dropout children as the “at risk” students. They are always at a sympathy level
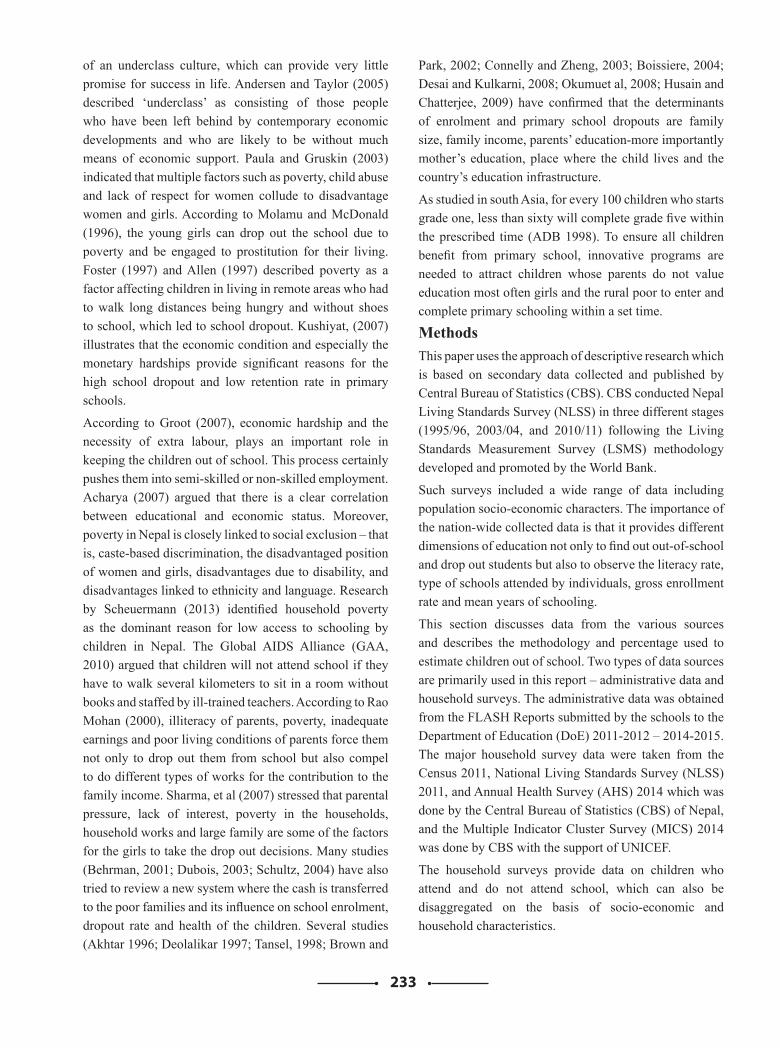
233
of an underclass culture, which can provide very little promise for success in life. Andersen and Taylor (2005) described ‘underclass’ as consisting of those people who have been left behind by contemporary economic developments and who are likely to be without much means of economic support. Paula and Gruskin (2003) indicated that multiple factors such as poverty, child abuse and lack of respect for women collude to disadvantage women and girls. According to Molamu and McDonald (1996), the young girls can drop out the school due to poverty and be engaged to prostitution for their living. Foster (1997) and Allen (1997) described poverty as a factor affecting children in living in remote areas who had to walk long distances being hungry and without shoes to school, which led to school dropout. Kushiyat, (2007) illustrates that the economic condition and especially the monetary hardships provide significant reasons for the high school dropout and low retention rate in primary schools.
According to Groot (2007), economic hardship and the necessity of extra labour, plays an important role in keeping the children out of school. This process certainly pushes them into semi-skilled or non-skilled employment. Acharya (2007) argued that there is a clear correlation between educational and economic status. Moreover, poverty in Nepal is closely linked to social exclusion – that is, caste-based discrimination, the disadvantaged position of women and girls, disadvantages due to disability, and disadvantages linked to ethnicity and language. Research by Scheuermann (2013) identified household poverty as the dominant reason for low access to schooling by children in Nepal. The Global AIDS Alliance (GAA, 2010) argued that children will not attend school if they have to walk several kilometers to sit in a room without books and staffed by ill-trained teachers. According to Rao Mohan (2000), illiteracy of parents, poverty, inadequate earnings and poor living conditions of parents force them not only to drop out them from school but also compel to do different types of works for the contribution to the family income. Sharma, et al (2007) stressed that parental pressure, lack of interest, poverty in the households, household works and large family are some of the factors for the girls to take the drop out decisions. Many studies (Behrman, 2001; Dubois, 2003; Schultz, 2004) have also tried to review a new system where the cash is transferred to the poor families and its influence on school enrolment, dropout rate and health of the children. Several studies (Akhtar 1996; Deolalikar 1997; Tansel, 1998; Brown and
Park, 2002; Connelly and Zheng, 2003; Boissiere, 2004; Desai and Kulkarni, 2008; Okumuet al, 2008; Husain and Chatterjee, 2009) have confirmed that the determinants of enrolment and primary school dropouts are family size, family income, parents’ education-more importantly mother’s education, place where the child lives and the country’s education infrastructure.
As studied in south Asia, for every 100 children who starts grade one, less than sixty will complete grade five within the prescribed time (ADB 1998). To ensure all children benefit from primary school, innovative programs are needed to attract children whose parents do not value education most often girls and the rural poor to enter and complete primary schooling within a set time.
MethodsThis paper uses the approach of descriptive research which is based on secondary data collected and published by Central Bureau of Statistics (CBS). CBS conducted Nepal Living Standards Survey (NLSS) in three different stages (1995/96, 2003/04, and 2010/11) following the Living Standards Measurement Survey (LSMS) methodology developed and promoted by the World Bank.
Such surveys included a wide range of data including population socio-economic characters. The importance of the nation-wide collected data is that it provides different dimensions of education not only to find out out-of-school and drop out students but also to observe the literacy rate, type of schools attended by individuals, gross enrollment rate and mean years of schooling.
This section discusses data from the various sources and describes the methodology and percentage used to estimate children out of school. Two types of data sources are primarily used in this report – administrative data and household surveys. The administrative data was obtained from the FLASH Reports submitted by the schools to the Department of Education (DoE) 2011-2012 – 2014-2015. The major household survey data were taken from the Census 2011, National Living Standards Survey (NLSS) 2011, and Annual Health Survey (AHS) 2014 which was done by the Central Bureau of Statistics (CBS) of Nepal, and the Multiple Indicator Cluster Survey (MICS) 2014 was done by CBS with the support of UNICEF.
The household surveys provide data on children who attend and do not attend school, which can also be disaggregated on the basis of socio-economic and household characteristics.
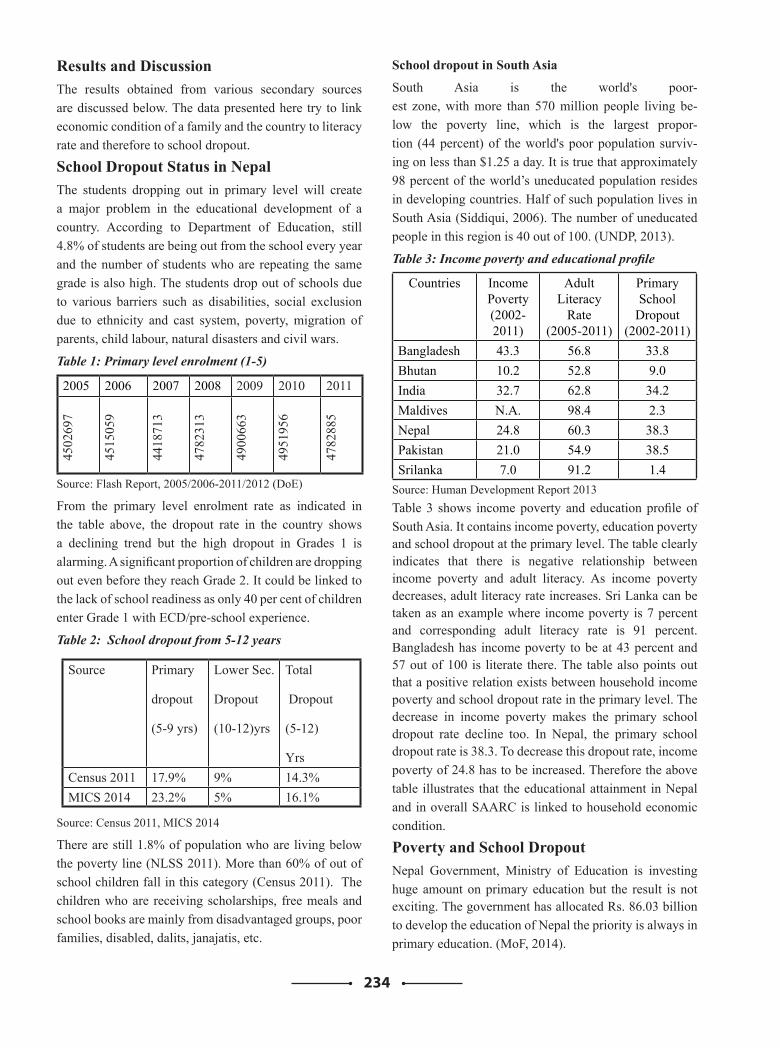
234
Results and DiscussionThe results obtained from various secondary sources are discussed below. The data presented here try to link economic condition of a family and the country to literacy rate and therefore to school dropout.
School Dropout Status in NepalThe students dropping out in primary level will create a major problem in the educational development of a country. According to Department of Education, still 4.8% of students are being out from the school every year and the number of students who are repeating the same grade is also high. The students drop out of schools due to various barriers such as disabilities, social exclusion due to ethnicity and cast system, poverty, migration of parents, child labour, natural disasters and civil wars.
Table 1: Primary level enrolment (1-5)
2005 2006 2007 2008 2009 2010 2011
4502
697
4515
059
4418
713
4782
313
4900
663
4951
956
4782
885
Source: Flash Report, 2005/2006-2011/2012 (DoE)
From the primary level enrolment rate as indicated in the table above, the dropout rate in the country shows a declining trend but the high dropout in Grades 1 is alarming. A significant proportion of children are dropping out even before they reach Grade 2. It could be linked to the lack of school readiness as only 40 per cent of children enter Grade 1 with ECD/pre-school experience.
Table 2: School dropout from 5-12 years
Source Primary
dropout
(5-9 yrs)
Lower Sec.
Dropout
(10-12)yrs
Total
Dropout
(5-12)
YrsCensus 2011 17.9% 9% 14.3%MICS 2014 23.2% 5% 16.1%
Source: Census 2011, MICS 2014
There are still 1.8% of population who are living below the poverty line (NLSS 2011). More than 60% of out of school children fall in this category (Census 2011). The children who are receiving scholarships, free meals and school books are mainly from disadvantaged groups, poor families, disabled, dalits, janajatis, etc.
School dropout in South Asia
South Asia is the world's poor-est zone, with more than 570 million people living be-low the poverty line, which is the largest propor-tion (44 percent) of the world's poor population surviv-ing on less than $1.25 a day. It is true that approximately 98 percent of the world’s uneducated population resides in developing countries. Half of such population lives in South Asia (Siddiqui, 2006). The number of uneducated people in this region is 40 out of 100. (UNDP, 2013).
Table 3: Income poverty and educational profile
Countries Income Poverty (2002-2011)
Adult Literacy
Rate(2005-2011)
Primary School
Dropout(2002-2011)
Bangladesh 43.3 56.8 33.8Bhutan 10.2 52.8 9.0India 32.7 62.8 34.2Maldives N.A. 98.4 2.3Nepal 24.8 60.3 38.3Pakistan 21.0 54.9 38.5Srilanka 7.0 91.2 1.4
Source: Human Development Report 2013Table 3 shows income poverty and education profile of South Asia. It contains income poverty, education poverty and school dropout at the primary level. The table clearly indicates that there is negative relationship between income poverty and adult literacy. As income poverty decreases, adult literacy rate increases. Sri Lanka can be taken as an example where income poverty is 7 percent and corresponding adult literacy rate is 91 percent. Bangladesh has income poverty to be at 43 percent and 57 out of 100 is literate there. The table also points out that a positive relation exists between household income poverty and school dropout rate in the primary level. The decrease in income poverty makes the primary school dropout rate decline too. In Nepal, the primary school dropout rate is 38.3. To decrease this dropout rate, income poverty of 24.8 has to be increased. Therefore the above table illustrates that the educational attainment in Nepal and in overall SAARC is linked to household economic condition.
Poverty and School DropoutNepal Government, Ministry of Education is investing huge amount on primary education but the result is not exciting. The government has allocated Rs. 86.03 billion to develop the education of Nepal the priority is always in primary education. (MoF, 2014).
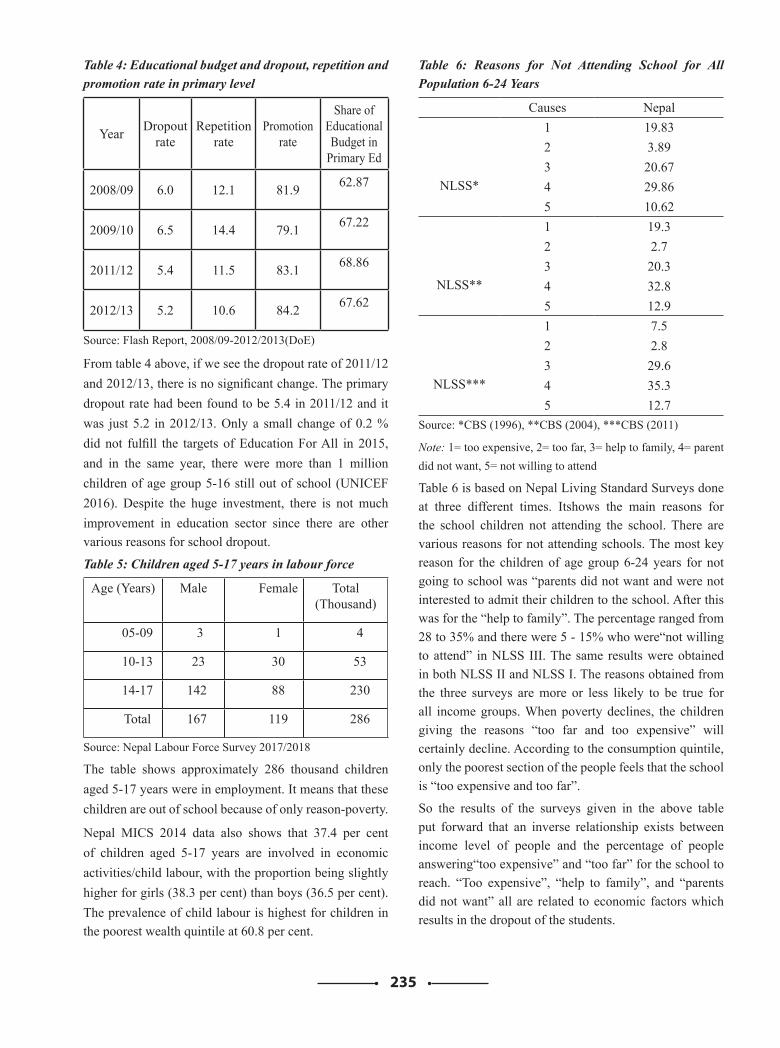
235
Table 4: Educational budget and dropout, repetition and promotion rate in primary level
Year Dropout rate
Repetition rate
Promotion rate
Share of Educational Budget in
Primary Ed
2008/09 6.0 12.1 81.9 62.87
2009/10 6.5 14.4 79.1 67.22
2011/12 5.4 11.5 83.1 68.86
2012/13 5.2 10.6 84.2 67.62
Source: Flash Report, 2008/09-2012/2013(DoE)
From table 4 above, if we see the dropout rate of 2011/12 and 2012/13, there is no significant change. The primary dropout rate had been found to be 5.4 in 2011/12 and it was just 5.2 in 2012/13. Only a small change of 0.2 % did not fulfill the targets of Education For All in 2015, and in the same year, there were more than 1 million children of age group 5-16 still out of school (UNICEF 2016). Despite the huge investment, there is not much improvement in education sector since there are other various reasons for school dropout.
Table 5: Children aged 5-17 years in labour force
Age (Years) Male Female Total(Thousand)
05-09 3 1 4
10-13 23 30 53
14-17 142 88 230
Total 167 119 286
Source: Nepal Labour Force Survey 2017/2018
The table shows approximately 286 thousand children aged 5-17 years were in employment. It means that these children are out of school because of only reason-poverty.
Nepal MICS 2014 data also shows that 37.4 per cent of children aged 5-17 years are involved in economic activities/child labour, with the proportion being slightly higher for girls (38.3 per cent) than boys (36.5 per cent). The prevalence of child labour is highest for children in the poorest wealth quintile at 60.8 per cent.
Table 6: Reasons for Not Attending School for All Population 6-24 Years
Causes Nepal
NLSS*
1 19.832 3.893 20.674 29.865 10.62
NLSS**
1 19.32 2.73 20.34 32.85 12.9
NLSS***
1 7.52 2.83 29.64 35.35 12.7
Source: *CBS (1996), **CBS (2004), ***CBS (2011)
Note: 1= too expensive, 2= too far, 3= help to family, 4= parent did not want, 5= not willing to attend
Table 6 is based on Nepal Living Standard Surveys done at three different times. Itshows the main reasons for the school children not attending the school. There are various reasons for not attending schools. The most key reason for the children of age group 6-24 years for not going to school was “parents did not want and were not interested to admit their children to the school. After this was for the “help to family”. The percentage ranged from 28 to 35% and there were 5 - 15% who were“not willing to attend” in NLSS III. The same results were obtained in both NLSS II and NLSS I. The reasons obtained from the three surveys are more or less likely to be true for all income groups. When poverty declines, the children giving the reasons “too far and too expensive” will certainly decline. According to the consumption quintile, only the poorest section of the people feels that the school is “too expensive and too far”.
So the results of the surveys given in the above table put forward that an inverse relationship exists between income level of people and the percentage of people answering“too expensive” and “too far” for the school to reach. “Too expensive”, “help to family”, and “parents did not want” all are related to economic factors which results in the dropout of the students.
236
ConclusionHence, it is essential to have sufficient physical and human resources to ‘improve abilities’ and ‘provide opportunities’ for better education. Lack of such resources is highly related with school dropouts. Particularly, social and economic deprivation due to family circumstances affects on the schooling experience of the lower social class. On one hand, there are no attractive factors to motivate children to remain longer in schools. On the other hand, such children’s socio economic background compels them to drop out the school and engage in non-educational activities to support their parents’ economic burden and monetary achievements.
This paper briefly presented the connection between income poverty and education in Nepal. The conclusions drawn from the various secondary data are as follows:
a) Literacy rate and household income poverty are inversely proportional to each other. When one increases, the other decreases and vice-versa.
b) Increase in the number of child work force means higher number of dropout from the school.
c) The government is investing huge sum of money in education sector but there are other reasons which are keeping students out of school and the result is not improving.
d) There are various reasons for the students not to attend the school but most of the reasons, directly or indirectly, are linked to economic condition of the family and the country.
It means when poverty increases, the school dropout and literacy rate decreases.
RecommendationPoverty is the most significant barrier to education in most countries (Epstein, 2010). Even if education is free, indirect costs of education (such as transport, uniforms and stationery) can make school unaffordable to poor families. Therefore it is recommended that the concerned authorities need to make education accessible to every child. Following are some of the recommendations provided by the author.
a) Education needs to be made compulsory by the government.
b) Many parents are not aware of the scholarships provided by the government to the deprived children. Hence such scholarships do not reach to the targeted group.
c) The scholarship provided by the government should be also enough to meet the indirect costs for education. The students sometimes have to pay for extra text-books and classes.
d) Parents, government and non-government organizations have to mainly focus on the financial needs and problems of the students.
e) Rules and regulations on child labour have to be strictly implemented.
AcknowledgmentTo prepare this report, the author needed various secondary data. The author is grateful to those who helped in gathering the data and is very thankful for any constructive commentsand suggestions to improve this script. Indications of any mistakes or defects are also very happily welcomed.
References[1] Acharya, S., Social inclusion: Gender and equity
in education swaps in South Asia, United Nations Children’s Fund, Kathmandu, Nepal, 2007.
[2] Akhtar, S. (1996). Do girls have a higher school drop-outrate than boys? A hazard rate analysis of evidence from aThird World city. Urban Studies, 33(1), 49-62.
[3] Ballantine, J. H. (1993). The sociology of education: A systematic analysis. Englewood Cliffs: Prentice Hall.
[4] Behrman, J.& James C. K.,(1999) “Household Income and Child Schooling in Vietnam”,The World Bank Economic Review, 13(2).
[5] Brown, P. H., & Park, A, 2002. “Education and Poverty in Rural China”. Economics ofEducation Review, 21(6), 523-41.
[6] Catterall, J. S. (1985). On the social costs of dropping out of schools. (Report No. 86-SEPT-3). Stanford, CA: Stanford University, Center for Educational Research.
[7] Central Bureau of Statistics National Living Standards Survey, National Living Standards Survey, CBS, Government of Nepal, Kathmandu, 2011.
[8] CBS. (2011b). Preliminary Results of National Population Census 2011. Kathmandu: CentralBureau of Statistics.
[9] Connelly, R., & Zheng, Z, 2003. “Determinants of School Enrolment and Completion of 10-18Year
237
Olds in China”. Economics of Education Review, 22(4), 379-88.
[10] Deolalikar, A, 1997. “The Determinants of Primary School Enrolment and Household School Expenditures in Kenya: Do They Vary by Income?” Mimeograph. Washington: Department of Economics, University of Washington.
[11] Desai, S., & Kulkarni, V, 2008. “Changing Educational Inequalities in India in the Context ofAffirmative Action”. Demography, 45(2), 245-270.
[12] Epstein, A. (2010). Making the Case for an Equity Focus in Education.United Nations Children’s Fund, New York, USA.
[13] MoE (2012). Flash Report. Retrieved from http://www.ncf.org.np/upload/files/1006_en_flash%20i%202068%20(2011/12)_1346396154.pdf
[14] MoE (2011). Flash Report. Retrieved from http://www.ncf.org.np/upload/files/1005_en_Final%20Flash%20II%202067%20(%202010- 11)_1346399110.pdf
[15] Global Action for Children, (2010). Child abuse.http://www.globalactionforchildren.org/index.php/advocacy/stand-campaign Accessed on 21 December, 2019.
[16] Groot, A. D. (2007). Deprived Children and Education in Nepal. Amsterdam: International Research on Working Children (IREWOC).
[17] Husain, Z., & Chatterjee, A., 2009. “Primary Completion Rates across Socio-religious Communities in India”. Economic and Political Weekly, XLIV (15), 59-67.
[18] ILO,and CBS Nepal (Central Bureau of Statistics). 2012. Nepal Child Labour Report: Based on Data Drawn from the Nepal Labour Force Survey 2008. Kathmandu: ILO and CBS.
[19] Ministry of Education (MoE) (2009), School Sector Reform Plan 2009-2015, MoE, Government of Nepal, Kathmandu, Nepal.
[20] MoE. (2011). Flash Report 1, 2011-2012. Kathmandu: Ministry of Education.
[21] MoES. (2003). Education for All; National Plan of Action. Kathmandu: Ministry of Educationand Sports, National Planning Commission for UNESCO.
[22] Thapa, S. B. (2010). The Educational Kuznets Curve: A case of Nepal. Tribhuvan University Journal, 27 (1-2).
[23] UNICEF. 2016. Global Initiative on Out-of-school Children: Nepal Country Study. Kathmandu, Nepal: Ministry of Education & UNICEF.
Number of lower secondary school age out-of-school children (millions)
Total percentage of out-of-school children years out of total population
Total number of primary and lower secondary school age out-of-school children
(millions)
238
Factors Affecting the Quality of Engineering Education in Nepal
Basanta Chandra Marahatta PhD Scholar, Department of Engineering,
Lincoln University College, MalaysiaE-mail: [email protected]
Abstract Higher Engineering Education in Nepal was started only in 1978. With the liberal policy of the Government of Nepal, many private engineering colleges were established after 1994 and recently there are altogether 43. In almost all college of Nepal, the result of the board semester examinations is deteriorating. This research paper aims to analyze different factors that are affecting the deterioration of the quality of engineering education which is being reflected through poor results in board examination and the insufficient performance of the engineering products in professional practices in different organizations. For this purpose, different literature in regards to the quality assurance of engineering education was collected as a secondary data and reviewed from one side, and from the other, as a primary data, different colleges were visited and conducted informal meeting with concerned persons and collected views about the quality deterioration. Based on the above mentioned activities result/discussion and recommendations is prepared in this research paper.
Keywords Universities, colleges, engineering, education, norms & standards, quality, assurance, deterioration, globalization.
Introduction Higher Engineering Education is new for Nepal. It was started only in 1978. Still in Nepal, substantial numbers of the engineers practicing in different sectors of the country are the product of different countries of the world. Institute of Engineering (IOE) under Tribhuvan University (TU), for the first time, has started BE in civil engineering courses with an intake capacity of 24 students only in 1978. But this program could not get continuity in next two years. Since 1981, IOE is running BE courses regularly in different branches.
Privatization and open market economy has been popular in the international arena since the last few decades and Nepal has not been exception to it. The government of Nepal, particularly, after the dawn of democracy in 1990, has given major priority to the privatization. Consequently many private institutions in educational sector have come into existence. But in higher engineering education, the first private engineering college, Nepal Engineering College (nec) in an affiliation with Tribhuvan University was started in 1994. In the same year, the Katmandu University (KU) also started Bachelor’s degree course in engineering. In 1998, two more private engineering colleges in an affiliation with TU namely Kantipur
Engineering College and Katmandu Engineering College had started their operation. In 1999, Pokhara Engineering College had started to run BE course in an affiliation with Pokhara University. Acme Engineering College affiliated to Purbanchal University was started in 2000.
No doubt, any education must be of good quality. The quality of engineering education must be even more due to many of the reasons. Engineering profession is very responsible one. They directly involved in infrastructure development. Minor mistake in designing and construction of infrastructure may cause great disaster in the society.
Globalization has changed the role; responsibility, scope and scale of today’s engineers. Today an engineer must have sufficient knowledge in scientific and mathematical fundamentals, engineering principles and design together with global outlook and the broader skills to work in society inside the country and abroad. And so, the quality of engineering education is challenged to prepare a technically competent graduate, as it has done traditionally, and to add several dimensions of broadening within a period of the study.
As the engineering has become a more global profession; issues of quality assurance of engineering education have been amplified. Employers inside the country or abroad
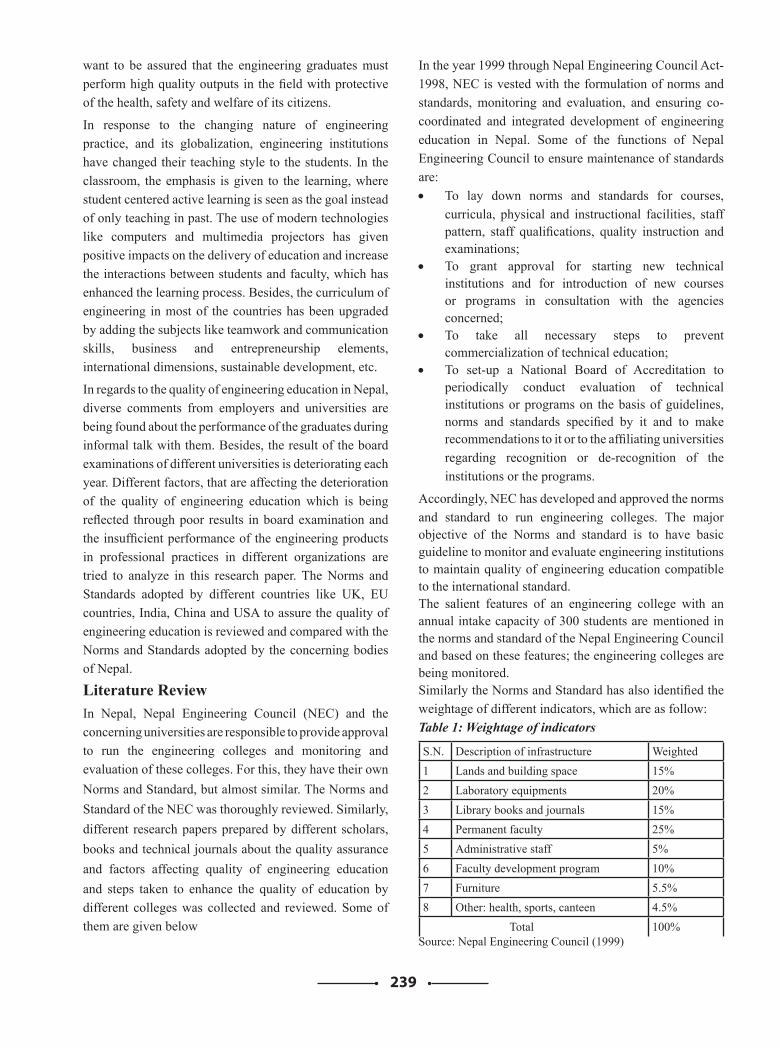
239
want to be assured that the engineering graduates must perform high quality outputs in the field with protective of the health, safety and welfare of its citizens.
In response to the changing nature of engineering practice, and its globalization, engineering institutions have changed their teaching style to the students. In the classroom, the emphasis is given to the learning, where student centered active learning is seen as the goal instead of only teaching in past. The use of modern technologies like computers and multimedia projectors has given positive impacts on the delivery of education and increase the interactions between students and faculty, which has enhanced the learning process. Besides, the curriculum of engineering in most of the countries has been upgraded by adding the subjects like teamwork and communication skills, business and entrepreneurship elements, international dimensions, sustainable development, etc.
In regards to the quality of engineering education in Nepal, diverse comments from employers and universities are being found about the performance of the graduates during informal talk with them. Besides, the result of the board examinations of different universities is deteriorating each year. Different factors, that are affecting the deterioration of the quality of engineering education which is being reflected through poor results in board examination and the insufficient performance of the engineering products in professional practices in different organizations are tried to analyze in this research paper. The Norms and Standards adopted by different countries like UK, EU countries, India, China and USA to assure the quality of engineering education is reviewed and compared with the Norms and Standards adopted by the concerning bodies of Nepal.
Literature ReviewIn Nepal, Nepal Engineering Council (NEC) and the concerning universities are responsible to provide approval to run the engineering colleges and monitoring and evaluation of these colleges. For this, they have their own Norms and Standard, but almost similar. The Norms and Standard of the NEC was thoroughly reviewed. Similarly, different research papers prepared by different scholars, books and technical journals about the quality assurance and factors affecting quality of engineering education and steps taken to enhance the quality of education by different colleges was collected and reviewed. Some of them are given below
In the year 1999 through Nepal Engineering Council Act-1998, NEC is vested with the formulation of norms and standards, monitoring and evaluation, and ensuring co-coordinated and integrated development of engineering education in Nepal. Some of the functions of Nepal Engineering Council to ensure maintenance of standards are: • To lay down norms and standards for courses,
curricula, physical and instructional facilities, staff pattern, staff qualifications, quality instruction and examinations;
• To grant approval for starting new technical institutions and for introduction of new courses or programs in consultation with the agencies concerned;
• To take all necessary steps to prevent commercialization of technical education;
• To set-up a National Board of Accreditation to periodically conduct evaluation of technical institutions or programs on the basis of guidelines, norms and standards specified by it and to make recommendations to it or to the affiliating universities regarding recognition or de-recognition of the institutions or the programs.
Accordingly, NEC has developed and approved the norms and standard to run engineering colleges. The major objective of the Norms and standard is to have basic guideline to monitor and evaluate engineering institutions to maintain quality of engineering education compatible to the international standard. The salient features of an engineering college with an annual intake capacity of 300 students are mentioned in the norms and standard of the Nepal Engineering Council and based on these features; the engineering colleges are being monitored. Similarly the Norms and Standard has also identified the weightage of different indicators, which are as follow:Table 1: Weightage of indicators
S.N. Description of infrastructure Weighted 1 Lands and building space 15%2 Laboratory equipments 20%3 Library books and journals 15%4 Permanent faculty 25%5 Administrative staff 5%6 Faculty development program 10%7 Furniture 5.5%8 Other: health, sports, canteen 4.5% Total 100%
Source: Nepal Engineering Council (1999)
240
In India, All India Council for Technical Education (AICTE) is responsible to provide approval to run engineering program in deferent discipline. The Norms and standard to provide approval to run the institutions and to regulate the approved institutions is developed by AICTE. Following given are the highlights of the Norms and Standard developed by AICTE (for an intake capacity of 60 students per discipline) to provide approval to the engineering institutions:
1. Land requirement: 2.5 Acre2. Built up Area of the institutions are based on the
carpet areas of following room:• Class room: 66 sqm• Tutorial Room: 33 sqm• Laboratory: 66 sqm• Workshop: 200sqm• Computer center: 150sqm• Drawing Hall: 132sqm• Library/Reading Room: 400sqm• Seminar Hall: 132sqm• Sufficient administrative Area • Sufficient areas for amenities
3. Books and Journals:4. Lab Equipments5. Faculty requirement 6. Faculty cadre and qualification
The Accreditation Board for Engineering and Technology (ABET) has been responsible for the assurance of quality in engineering education in the United States from 1932,. Over the past decade, ABET has been engaged in a major reform to encourage curricular innovation and to improve the accreditation process, while continuing to assure the quality of engineering education at some 300 institutions process has resulted in new criteria for the evaluation of engineering programs, Engineering Criteria 2000 (EC2000). This new approach replaces previous guidelines and criteria that had become increasingly lengthy and prescriptive over the years, and were often seen as a constraint on curricular innovation. As per ABET, to be a quality education, engineering programs must demonstrate that their graduates have:
• An ability to apply knowledge of mathematics, science, and engineering
• An ability to design and conduct experiments, as well as to analyze and interpret data
• An ability to design a system, component , or process to meet desired needs
• An ability to function on multi-disciplinary teams
• An ability to identify, formulate, and solve engineering problems
• An understanding of professional and ethical responsibility
• An ability to communicate effectively • The broad education necessary to understand the
impact of engineering solutions in a global and societal context
• A recognition of the need for, and an ability to engage in life-long learning
• A knowledge of contemporary issues • An ability to use the techniques, skills, and
modern engineering tools necessary for engineering practice.
Similarly, EC2000 also has briefly stated requirements for student quality, faculty qualifications, facilities, and institutional support.With support from the European Commission under the Socrates II Thematic Network program, the Enhancing Engineering Education in Europe (E4) project is pursuing following five areas:
1. Employability through innovative curricula2. Quality assessment and transparency for
enhanced mobility and trans-European recognition
3. Engineering professional development for Europe
4. Enhancing the European dimension5. Innovative learning and teaching methods
In the quality assessment activity, the following objectives are being pursued:
• Establish lists of ‘qualification attributes’ for engineering graduates, distinguished by branches (specialties) and types
• Identify methodologies of quality control for study courses
• Adopt methodologies of quality assessment of achieved competencies
• Promote pilot projects on ‘qualification attributes’ (competencies) lists and on quality assurance and assessment
• Collect and highlight examples of good practice• Comparison of loading of similar named courses
in leading universitiesIn the innovative learning and teaching methods activity, following given are the aims and objectives:
• Institutional support required for innovative teaching and learning methods
• Role of information and communications technology in the new learning environment
• Facilitation of open distance learning in higher engineering education
241
• Adopt teaching and learning attitudes to support modern networked university
• New learning technologies and methods in support of learning through design, projects and team work
• Multidisciplinary methods to encourage self-direction and an entrepreneurial spirit
Thematic Network E4 was initiated in 2001, and completed its work in 2004. Some 112 institutions from all 15 EU member states have been involved on the program, with central administration provided by the University of Florence.Professor Pahari, Bharat (2008) mentions that the quality of engineering education in Nepal is low. But the Professor Bhattarai, Deepak (2010) disagree the comment on quality of engineering education in Nepal mentioned in the thesis of Professor Pahari (2008). Professor Bhattarai further comments and says that this has not been substantiated by any research work in the thesis of Professor Pahari. The Professor Bhattarai in his paper gives three major evident, which proof the quality of engineering education is excellent in Nepal, but realizes that there are a lot of challenges, which if not managed, will deteriorate the quality of engineering education in future.
Journal IDEAS No. 17 was published with financial support of the Federation of Lebanese Engineers with partial subvention from the World Federation of Engineering Organizations in December 2011. In this issue, a paper written by Prof. Wlodzimierz Miszalski, from Polish Federation of Engineering Associations, Warsaw, Poland, in title “Improving Quality of Engineering Education, the Role of Future World University” was published and this paper describes different approaches to estimation quality of engineering education as outcomes, potential, process and hybrid approach of Technology. He in his paper describes the importance of quality of engineering education from the mobility point of view. There are different approaches to describe the quality. At least three basic approaches are
given by him to define the quality of education:
- Education program outcomes approach,
- Education potential approach,- Education process approachThe outcomes approach is the most popular one. In general, it consists in description of the required capabilities of graduates from engineering education programs. The potential approach emphasizes qualifications and prestige of faculty staff, modernity of laboratory equipment, standard of educational infrastructure - as the components of engineering education qualityThe process approach consists in evaluation: structure, organization and length of teaching and learning processes, curriculum, syllabus, sequence and length of particular courses and topics.
Methods The method adopted is based on primary and secondary data. As a primary data, different colleges were visited and conducted informal meeting with relevant and concerning persons of the colleges. As a secondary data relevant Source: Nepal Engineering Council (1999)
appropriate documents were collected from the colleges in Nepal and related documents, research papers and articles were downloaded from different website and analyzed thoroughly.
In Nepal, there are six universities, which are providing engineering education through eight constituents and 43 affiliated colleges. In almost all colleges, the result of the board semester examinations is deteriorating. All together five colleges (two constituent and three affiliated) of four universities given below was randomly selected:
1. Institute of Engineering, Pulchok Campus, constituents college of Tribubhan University (TU)
2. School of Engineering, Constituents College of Kathmandu University (KU).
3. Kantipur Engineering College, affiliated college of TU
4. Acme Engineering College, affiliated college of Purbanchal University (PU)
5. Nepal Engineering College, affiliated college of Pokhara University (PKU)
During the visit, an informal meeting was conducted with management persons, faculty members and the students of the above mentioned colleges to get their views about the factors affecting the quality of engineering education and is documented in separate heading (Result/Discussion) of this paper.
As a secondary data, relevant documents of the selected colleges were collected and thoroughly reviewed what measures have taken for the quality assurance of engineering educations. The Norms and standards to assure the quality of engineering education developed by Nepal Engineering Council and four universities (TU, KU, PU, PKU was reviewed and compared with the Norms and standards developed by other relevant bodies of USA, UK, European Union, India and China for the quality assurance of engineering education. The syllabus of engineering followed by different countries will also be downloaded and compared with the syllabus adopted in Nepal. Based on these activities, the results are derived and discussed in separate heading of this paper.
242
Result/DiscussionThe Engineering profession in Nepal is treated as one of the prestigious profession because of the potential effects of its work in the society. It covers everything from buildings, roads, dams, bridges, airports and railways to industries, computers, software, aircrafts and satellites. Its works cover the entire spectrum of the nation, from the most affluent and urban to the most backward. Engineers have been commanding high respect in the society. So the demand of engineering study is substantially increasing. Hence, to meet the increasing demand of the engineering education, private engineering colleges were established. With the establishment of these colleges, access in engineering education has been increased substantially, but at the same time the quality of education seems deteriorating. With the review of documents and discussion with relevant persons of different engineering colleges, the following factors that are deteriorating the quality of engineering education is found and is summarized below:1. Infrastructure of all colleges is not
sufficient:The colleges do not have sufficient carpet areas required for class room, Tutorial room, Laboratory, Workshop etc as per international standard. The number of books in Library, Lab equipments is also in minimum level. The insufficiency of the colleges’ infrastructure compatible with international standard is causing poor teaching and learning environment in the colleges resulting to the quality deterioration.2. Funding Problem: A big amount of the money for complex development, laboratories and library establishment, furnishing and others is required to establish, operate and sustain engineering college. The major source of the funding for constituents colleges is the donation from the government, which seems not sufficient. In case of affiliated (private) engineering colleges the major source of funding is either equity and students’ fee or debt. The management of this big amount only from equity i.e. share amount from the promoters is almost impossible. It is very necessary to manage debt amount from different financial institutions. There is no any system within the policy of the government to subsidize in interest rate prioritizing different sectors. From very ancient to modern, an education is taken as basic needs like food, shelter, and other economic needs. So the government should give major priority for the development of education sectors in the country. Accordingly, the government must provide different support to the private educational institutions including the system of provision of soft loan to these institutions.
But there is no any systems of providing loan in subsidize interest rate, rather, the educational institutions are enforced to pay high interest rate. 3. Faculty Problem:The teaching profession in our country is still not a mostly wanted profession of the engineers. Most of the engineers come to this profession as there is no any other job for them. After having one or two years of teaching experience either they go for further study or to other governmental organization. Therefore there is problem of the experienced, fully committed and consistent faculty in engineering colleges. There is great problem of retention of faculty and with the frequent turnover of the teaching faculties; the quality of engineering education is going down.
4. Syllabus are not timely updated: The syllabus should be updated as per the innovation of new technology. In the syllabus there are still few some subjects, which are already outdated. Some subjects, which are very useful during professional practice, are not being integrated in the syllabus, due to the time constraints. As engineering is an applied science, some duration in the syllabus has to be provided for internship, which is lagging. 5. Academic Calendar Management
Problem:With the increase of private engineering colleges, the access in engineering education has been increased, but in same time, the colleges are enforced to admit lower grade students. The teaching hours allocated in the curriculum is not sufficient for those kind of students and additional classes are required to manage for them. But the duration of the semester is only 15 weeks and within this time frame a lot of disturbance is being experienced. Similarly a lot of time goes in the management of the internal, final semester and back paper examinations. The total weeks available for two semesters are only 52 weeks. About eight weeks requires conducting two final semester examination and four weeks for the preparation to the examination. About four weeks require for back paper examination. Four weeks is necessary to conduct internal assessment (two assessments in each two semesters and one week require for one assessment). At least four weeks are necessary for the vacation in a year (Most of the colleges are providing four weeks’ vacation during Dasain to Tihar). Almost two weeks require conducting extracurricular activities. So practically the course designed for 15 weeks is required to accomplish within 12 weeks. So it is always necessary to add more classes to cover the course and in result students will be overloaded, which is expressed as poor result in final semester examination.
243
6. Students Problem:The discipline of the students almost in all colleges is declining. There is a problem of group class bunk. Students do not study regularly and labors during examination only. There is high absenteeism of the students in the class. Students give less attention in the class. The students are not eager for self study, deny to go to the library to read reference books/journals and depend only in the class note. The negligence of the students on their regular study is causing the bad result in board examinations.Conclusion/RecommendationsHigher Engineering Education in Nepal is still young. It has a history of about 30 years. Due to the lack of sufficient experiences, it is not progressing as per expectations. To develop engineering education at par of the international level and enhance the quality of education additional efforts from all sectors has to be done. The government of Nepal should take lead responsibility to enhance the quality of engineering education. For this adequate budget has to be allocated for the universities and constituents colleges. Similarly, loan to the affiliated colleges to be provided in with subsidize interest rate. Nepal engineering Council and concerning universities should update their Norms and Standard for the monitoring and evaluation of the colleges. Both the organizations should monitor the colleges, and based on the findings of the monitoring grading of the colleges has to be done and publish the grading of all colleges. Engineering colleges from another side should develop separate quality enhancement plan of engineering education and implement accordingly. The college management should upgrade the physical infrastructure, laboratories and library of the colleges. It seems the teaching faculties are under paid in the colleges. So the college management requires analyzing the causes behind the fast turnover of the teaching faculty and developing and implementing faculty retention plan.
AcknowledgementThe author of this paper is grateful to the management persons, teaching faculties and students for giving opportunity to visit their respective colleges and spare time for informal meeting with them. The author of this study, at the same time, would be more than happy to get further comments, insights, suggestions, recommendations and inputs in correcting mistakes or oversight if any.
ReferencesProfessor Pahari, Bharat (2008), “Education Reform
strategies for Quality of Engineering Higher
Education in Nepal”, Thesis submitted to KU in partial fulfillment of the requirement for the degree of Doctor of Philosophy
Professor Bhattarai, Deepak (2010) “Engineering Education in Nepal: Prospects and Challenges in the new Environment”, Paper presented at the International Seminar on Making Globalization Work: The Role of Consultants. Prospects and Challenges in the new Environment
Prof. Wlodzimierz Miszalski (2011) “Improving Quality of Engineering Education, the Role of Future World University” Paper published in Journal IDEAS No. 17, pp 7-12 with financial support of the Federation of Lebanese Engineers with partial subvention from the World Federation of Engineering Organizations in December 2011.
Aldert Kamp (2016).” Engineering Education in the Rapidly Changing World, Rethinking the Vision for Higher Engineering Education” Second edition.
Ernst & Young–FICCI (2011), report of Higher Education Summit 2011 with the theme “Private Sector Participation in Higher Education” organized by Federation of Indian Chamber of Commerce (FICCI)
Mishra, A. (2017). Challenges in Quality Improvement of Engineering Education in India. PEOPLE: International Journal of Social Sciences, 3(1), 254-260
Higher Education Reform Project. (2014). Environmental Management Framework for Higher Education Reform Project Nepal. Kathmandu: Higher Education Reform Project.
Nepal Engineering Council. https://nec.gov.np/ Institute of Engineering (IOE), Retrieved from www.
ioe.edu.np
Kathmandu University (KU) Retrieved from https://www.ku.edu.np/
Purbanchal University (PU) Retrieved from http://www.purbuniv.edu.np
Pokhara University (PKU) Retrieved from http://www.pokuniv.edu.np
Acme Engineering College Retrieved from https://acme.edu.np/
Kantipur Engineering College Retrieved from http://kec.edu.np/
Nepal Engineering College Retrieved from http://needu.np/
244
Theoretical Perspective of Social Inclusion: Integrating Society in Classroom Management and Social Justice
Sateesh Kumar OjhaYashodham Tripathi
AbstractThe key question addressed in this article is social inclusion, as an opposite concept of social exclusion. The author provides historical social inclusion/exclusion terminology. Further, some of the principles of social inclusion are presented. A brief review of the literature provides key views and theories of social inclusion.The concept of social inclusion, in spite of being a new concept, has become very popular all over the world. However, there is still a need for a good understanding of the concept and phenomenon. There are several kinds of literature nowadays on social inclusion, and these may of course provide an insight to understand this concept. This article will add an effort to the understanding of social inclusion from a theoretical perspective.The theories give rise to a good understanding of a phenomenon. Thus, this article aims to provide another brick on the wall of understanding the concept of social inclusion. In fact there are several theories in social science that can be related to the concept and the understanding of social inclusion. However, some of the theories like social integration or solidarity, social closure, social cohesion, social change, social capital, social justice etc. are widely found to be used in this connection. And, in this article, I have tried to relate, explain and see social inclusion from the lens of social integration, social justice in the classroom management.Among the theorists, for social integration, I have referred mainly to Emile Durkheim and Hilary Silver. Similarly, for the theory of social justice, I have referred John Rawls. I have referred to Pierre Bourdieu, James S. Coleman and Robert Putnam.Since my aim was to provide a better and in-depth insight into the understanding of the phenomenon of social inclusion for myself and with a connection in classroom management that it will be of good use for others as well, I have used the method of literature review. And, thus, this article has become an outcome of a theoretical review.Finally, I found that relating and connecting social inclusion with the theories of social integration, social justice in classroom, I concluded that all the individuals or groups must be integrated in the classroom and brought under the social networks of every opportunity for their holistic development in their social, cultural and academic achievement axes along with the equal access to education in classroom to acquire a quality of education with social justice. This explains what social inclusion really is in classroom management.
KeywordsSocial inclusion, social integration, solidarity, social justice. classroom management.
IntroductionSocial inclusion which has been careful to have entered the public dialogue only after the 80s has attained to occupy a good space in several sectors in the global as well as the Nepalese context. In almost all the sectors such as education, health, politics and civil service, their existence of social inclusion and policy for inclusion.
A socially inclusive society is defined as one where all
people feel valued, their differences are respected, and their basic needs are met so they can live in dignity. A socially inclusive society is a society where all people are recognized and accepted and have a sense of belonging. Social inclusion is seen to be defined in relation to social exclusion. Some analysts have argued that both inclusion and exclusion are the inseparable sides of the same coin. Social exclusion is the process of being shut out from
245
the social, economic, political and cultural systems which contribute to the integration of a person into the community (Cappo, 2002). Social inclusion, community inclusion, social connectedness, normalization, social integration, social citizenship - all these are terms that relate to the importance of the links between the individual members of our society and the role of each person as a member of this group.
There are some values that underpin social inclusion, such as everyone needs support (sometimes some of us need more support than others; everyone can learn (as human beings we all grow and change and make mistakes: and we are all capable of learning); everyone can contribute (we need to recognize, encourage and value each person’s contributions, including our own); everyone can communicate (not using words doesn’t mean we don’t have anything to say); everyone is ready, None of us has to pass a test or meet a set of criteria before we can be included, and together we are better (we are not dreaming of a world where everyone is like us, the difference is our most important renewable resource).
Social exclusion vs. social inclusion The social exclusion term was eventually imported from France by the New Labor government in the 1990s (Barry, 1998). However, for New Labor, the socially excluded were regarded as the poor but not only the poor. They stated that socially excluded often lack the necessary skills and capabilities to get and keep a job and are often cut off from the world of work and education. This definition, however narrow, resulted in the establishment of the Government’s Social Inclusion Unit in 1997 (Driver and Martell, 2006). Social exclusion can also manifest itself in numerous ways: failure at school, job insecurity, social isolation, poor housing and excessively frequent illnesses, to mention but a few examples. The concept was later adopted by the European Union in the late 1980s as a key concept in social policy and in many instances replaced the concept of poverty. This concept which had first appeared in Europe as a response to the crisis of the welfare. The authorship of the expression is given to René Lenoir, which constituted the “exclusion” category of population, which, according to him, was a tenth of the French population. Lenoir determined as excluded people who are mentally and physically handicapped, suicidal people, aged invalids, abused children, substance abusers, delinquents, single parents, multi-problem households, marginal, asocial persons,
and other social ‘misfits’. But, in fact, the concept of social exclusion, both France and in Europe, was due to the failure of the integrative institution in these countries. The concept has its roots in the functionalist social theory of Emile Durkheim (Room 1995, cited in O’Brien and Penna, 2007:3). In the early 20th century, society was undergoing a transition of moving from an agrarian society to an industrial society. This economic displacement will be accompanied by social dislocations. Durkheim was concerned with how social order and stability could be maintained in a society. The concept of social exclusion and the contemporary European research agenda on it has by the problems associated with maintaining social order and stability (O’Brien and Penna, 2007). This concept, which first emerged in the policy discourse in France and its adoption later by other European countries, have had an increasing impact on the analyses of social disadvantages in Europe over the last couple of decades (Aasland and Flotten, 2000:1026; Gore and Figueiredo, 1997, cited in Francis, 2002:74).
While some claim that social exclusion is more illuminating and holds the promise of understanding disadvantaged groups better, others argue that this concept is so evocative, ambiguous, multidimensional and elastic that it can be defined in many different ways and owing to its ambiguity in the definition it may mean all things to all people. Howsoever, the term has been used, defined, conceptualized, the article here makes an effort to review accessible literature on the topic. The concept of social inclusion gained prominence in the policy discourse in Europe since it replaced the concept of poverty, taking into its fold more dimensions of people’s lives than the poverty concept. According to Ashland and Flotten (Aasland and Flotten, 2000:1027), the concept is vague and is employed to describe a multitude of situations and processes, which is often loaded with economic, social, cultural and political connotations. They consider social exclusion as multidimensional phenomena and have considered several important living condition variables as proxies for social exclusion. They are excluded from formal citizenship rights, from the labor market, from participation in civil society and from social arenas. At Geddes and Belington (Geddes and Belington, 2001) we find a multidimensional concept of exclusion, as labeling of Francis`s multifaceted character of social deprivation concept (Francis 2000). Francis stressed that, in distinction to poverty, which has been primarily thought about in economic terms, the social exclusion also takes
246
into consideration deprivation in a number of spheres. In support of his theory, he states three questions that are of vital importance in order to assess the concept of social exclusion:
How does it differ from that of poverty?
What does it add to our understanding of deprivation?
Does it increase our capacity to address such social ills? (Francis, 2000:75).
The concept of social exclusion clearly indicates different conceptions of what constitutes social inclusion and exclusion.
The concepts and definitions vary both in academia and in development policies. Thus, some analysts see social exclusion as a cause of poverty, others suggest that it is both an expression and a determinant of poverty, and most would probably agree that poverty is a form of social exclusion (de Han, 1998, cited in Jackson, 1999:126). Although social exclusion has developed in a range of paradigmatic styles in different political and intellectual contexts (Silver, 1995, cited in Jackson, 1999:126), social exclusion is discussed predominantly in terms of its relationship to poverty. Is it a cause or consequence of poverty? How does it differ from other ways of conceptualizing poverty? (de Hann, 1998, Gore and Figueredo, 1997, cited in Jackson, 1999:126).
Given his variations on the conception of exclusion, Francis (2000) contends that the notion of social exclusion, while carrying a number of pointers for a broader and less income-focused conception of generation is not a very precise or a nuanced one (Francis, 2000:76). Indeed one may suspect with Atkinson (1998:13) that it has gained such wide currency partly because it means all things to all people.
Social inclusion is seen to be defined in relation to social exclusion. Some analysts have argued that both inclusion and exclusion are the inseparable sides of the same coin. However, some comment that academic debate on social exclusion has been relatively silent on its assumed conclusion. It, therefore, remains the case that in the majority of the exclusion literature the nature and meaning of social inclusion are merely implied or requested (Cameron, 2006:396). Despite the fact that social inclusion has been defined with regards to social exclusion in many of the literature, Jackson (1999) argues that there can be simultaneous exclusion and inclusion, that is individuals and groups can be excluded in one
domain and included in another. Thus, the included/excluded dualism apparent in the writings of social inclusion and exclusion cannot be taken at face value. The politics of dualistic inclusion/exclusion deserve questioning in other ways. One of these is to consider in what sense there is a single center of social integration, who is excluded from what, and whose representation of the center is privileged (Jackson, 1999:133). Social inclusion, the converse of social exclusion, is affirmative action to change the circumstances and habits that lead to (or have led to) social exclusion. The World Bank defines social inclusion as the process of improving the ability, opportunity, and dignity of people, disadvantaged on the basis of their identity, to take part in society. (World Bank 2013, Inclusion Matters: The Foundation for Shared Prosperity). Social Inclusion ministers have been appointed, and special units established, in a number of jurisdictions around the world. The first Minister for Social Inclusion was Premier of South Australia Mike Rann, who took the portfolio in 2004. Based on the UK’s Social Exclusion Unit, established by Prime Minister Tony Blair in 1997, Rann established the Social Inclusion Initiative in 2002. It was headed by Monsignor David Cappo and was serviced by a unit within the Department of Premier and Cabinet. Cappo sat on the Executive Committee of the South Australian Cabinet and was later appointed Social Inclusion Commissioner with wide powers to address social disadvantage. Cappo was allowed to roam across agencies given that most social disadvantage has multiple causes necessitating a “joined-up” rather than a single agency response (April 2006, Cappo appointed Social Inclusion Commissioner). The Initiative drove a big investment by the South Australian Government in strategies to combat homelessness, including establishing Common Ground, building high-quality inner-city apartments for “rough sleeping” homeless people, the Street to Home initiative 4 and the ICAN flexible learning program designed to improve school retention rates. It also included major funding to revamp mental health services following Cappo’s “Stepping Up” report, which focused on the need for community and intermediate levels of care and an overhaul of disability services. In 2007 Australian Prime Minister Kevin Rudd appointed Julia Gillard as the nation’s first Social Inclusion Minister. There are countries, Italy for example, that have a legal concept of social exclusion. In Italy, “esclusione sociale” is defined as poverty combined with social alienation, by the statute n. 328 (11-8-2000), that instituted a state investigation
247
commission named “Commissione di indagine sull’ Esclusione Sociale” (CIES) to make an annual report to the government on legally expected issues of social exclusion. The Vienna Declaration and Programme of Action, a document on international human rights instruments affirms that “extreme poverty and social exclusion constitute a violation of human dignity and that urgent steps are necessary to achieve better knowledge of extreme poverty and its causes, including those related to the program of development, in order to promote the human rights of the poorest and to put an end to extreme poverty and social exclusion and promote the enjoyment of the fruits of social progress. It is essential for States to foster participation by the poorest people in the decision making process by the community in which they live, the promotion of human rights and efforts to combat extreme poverty.
Inclusive Quality Education Leads to More Inclusive Societies Exclusion starts very early in life. A holistic vision of education is imperative. Comprehensive early childhood care and education programs improve children’s well being, prepare them for primary school and give them a better chance of succeeding once they are in school. All evidence shows that the most disadvantaged and vulnerable children benefit the most from such programs. Ensuring that adults, particularly mothers, are literate has an impact on whether their children and especially their daughters attend school. Linking inclusion to broader development goals will contribute to the reform of education systems, to poverty alleviation and to the achievement of all the Millennium Development Goals. An inclusive system benefits all learners without any discrimination towards any individual or group. It is founded on values of democracy, tolerance, and respect for differences. It is inefficient to have school systems where children are not learning because of poor quality. Schools with high repetition rates often fail to work in preventive ways. The expenditure incurred by schools when students repeat a grade would be better used to provide additional support to those who encounter difficulties. Several cost-effective measures to promote inclusive quality education have been developed in countries with scarce resources. These include training-of-trainer models for professional development, linking students in pre-service teacher training with schools and converting special needs schools into resource centers that provide expertise and support
to clusters of regular schools. Inclusion in education involves (Booth and Ainscow 2011, 3rd edition):
Why inclusion? Because the world is changing, because moral values are being re-examined as stereotypical thinking is increasingly exposed, because of national and international guidance advocates inclusion and, quite simply, because any alternative seems unacceptable, if not morally flawed. Education needs to change to accommodate everyone. The overall goal is to ensure that a school is a place where all children participate and are treated equally. This involves a change in how we think about education. Inclusive education is an approach that looks into how to transform education systems in order to respond to the diversity of learners. It means enhancing the quality of education by improving the effectiveness of teachers, promoting learning-centered methodologies, developing appropriate textbooks and learning materials and ensuring that schools are safe and healthy for all children. Strengthening links with the community is also vital: the relationship between teachers, students, parents and society at large is crucial for developing inclusive learning environments.
Inclusive education can promote successful learning. Efforts to expand enrolment must be accompanied by policies to enhance educational quality at all levels, informal and non-formal settings. We have to work on an ‘access to success’ continuum by promoting policies to ensure that excluded children get into school coupled with programs and practices that ensure they succeed there. It is a process that involves addressing and responding to the diverse needs of learners. This has implications for teaching, the curriculum, ways of interacting and relations between the schools and the community.
Profound economic and societal changes in the countries of Western Balkans, like Albania, have resulted in great inequities in access to and participation in education, training, and employment. Skill mismatches have emanated as a consequence of these structural changes, giving rise to the long term unemployment, poverty and social exclusion of young people and older workers alike. Although skill mismatches should ideally be addressed by vocational education and training (VET), national systems have failed to provide this vital function. In omitting to equip the most disadvantaged workers with appropriate skills they have also failed to fulfill their role of supporting social inclusion (at an individual level) and social cohesion (at a societal level). The Western
248
Balkans, on the other hand, share common present-day aspirations for EU membership and are involved in the process of accession to the European Union, although at various stages. Combating social exclusion and poverty is among the key priorities of the European Union. Building a more inclusive Europe is vital to achieving the European Union’s goals of sustained economic growth, more and better jobs and greater social cohesion, as re-iterated by the Europe 2020 strategy. Therefore, social inclusion is a policy area highly relevant to the candidate countries and the potential candidates. The main intention of this article is to describe the relationship of the phenomenon of social inclusion with the existing theories. In fact, there are several theories in the literature; however, I have purposively selected those theories which are closely related to the phenomenon of social inclusion and at the same time are more relevant. The theories are:1. Theory of Social Integration, 2. Theory of Social Justice and Social integration, here in this article has been explained from Durkheimian and Silver’s solidarity perspective. Also, the theory of social justice has been explained on the basis of John Rawls and for the theory of social capital, I have referred to Pierre Bourdieu, James S. Coleman and Robert Putnam.
Purpose of the StudyThe purpose of this study is to explore and explain the relationship and the relevance of the phenomenon of social inclusion with the existing theories and hence find a common intersection among the theories so that it helps to put forward the phenomenon of social inclusion itself as a social theory.
MethodologyI have followed the literature review method for preparing this article. The literature includes the books, journal articles and the documents related to social exclusion, social inclusion and the theories mentioned above.
Review of the LiteratureIn this part, I have given an account of social inclusion from a theoretical, thematic and empirical perspective. I have explained how this phenomenon relates to the existing relevant theories as those mentioned above.
Social InclusionThe understanding of this phenomenon may be different from people to people; it can simply be understood as an anti-exclusionary process and an outcome. Guildford
(2000) likes to relate inclusion as an everyday meaning which means to be accepted and to be able to participate fully within the families, communities, and society (Guildford, 2000). It sounds resonating with the fact that due to different reasons individuals or groups of people are found to be detached from different kinds of opportunity which are responsible for their backwardness. And, therefore, to bring them to the mainstream of development, they need to be included in the development program for their individual and group development, and ultimately for the development of the country.
In this line, Sen (2000) also puts forward his opinion such that inclusion is characterized by a society’s widely shared social experience and active participation thereby providing broad equality of opportunities and life chances for individuals to achieve the basic level of well-being for all citizens. According to Sen’s opinion, at least a basic level of well-being is needed for every human being. And, for this, equal opportunity must be provided to everyone through their active participation (Sen, 2000). Also, Bhalla and Lapeyre (1997) add that when people are excluded from the main sources of income, their first priority is survival and a basic livelihood (Bhalla & Lapeyre, 1997). But, in my opinion, only providing the necessary things for survival and a basic livelihood cannot be taken as the inclusion because inclusion should be accompanied by valuing of diversity through recognition and respect (Shookner, 2002) and in addition, in a socially inclusive society, all people feel valued, their differences are respected and their basic needs are met so they can live in dignity (Cappo, 2002).
It has also been understood that there prevail many institutional barriers that are responsible for the marginalization and deprivation of individuals not only from an economic perspective but also from a socio-cultural, religious and political point of view. This understanding of social inclusion resonates with the experience of Bennette (2003) who explains social inclusion as the removal of institutional barriers and the enhancement of incentives to increase the access of diverse individuals and groups to development opportunities, changes at the system level and in the external institution environment or opportunity structure. So, according to Bennette, social inclusion is responsible for bringing change from the system level to the structure of the opportunity so that it provides access to diverse people or groups for their development (Bennette, 2003).
249
Therefore, social inclusion can be defined as an anti-exclusionary phenomenon that brings the excluded or marginalized and deprived people to the mainstream of development through the removal of all kinds of social, cultural, political and economic barriers thereby providing equal opportunities to every individuals and group through social justice. Moreover, it is about valuing and respecting the need of including every individual and group for the holistic development of a society.
Below, an attempt has been made to look at the social inclusion from the lens of relevant theories.
Social Inclusion and Social IntegrationIn this section, I have intended to elaborate on the meaning of social integration from a theoretical perspective. At the same time, I have also tried to explain how the theory of social integration explains the concept and understanding of social inclusion.
“Social integration is the process of creating unity, inclusion, and participation at all levels of society within the diversity of personal attributes so that every person is free to be the person he/she wants to be. Personal attributes include socio-economic class, age, gender, sexual preference and expression, political ideas, ethnicity and cultural traits, religion, citizenship and geographical region of origin and so on. Social integration enables persons, regardless of their attributes, to enjoy equal opportunities, rights and services that are available to the so-called mainstream group. Social integration can be considered to be antonym to social inclusion, which is broader than poverty and deprivation, and which neglects people’s rights.” (Cruz-Saco, 2008, p. 2).
In this way, Cruz-Saco explains social integration which resembles social inclusion in a broader sense. Thus, it seems that social inclusion can be realized to be very close to social integration.
I prefer to explain social inclusion from a Durkheimian perspective of social integration too. In the theory of social integration, Durkheim puts two types of social solidarity: mechanical and organic. Mechanical solidarity stands for the solidarity that normally operates in traditional and small scale society usually based on kinship ties of familial networks. On the other hand, organic solidarity connects people through their mutual reliance on the division of labor. In this connection, Silver (1994) puts forward three paradigms of social exclusion they are: solidarity, specialization and monopoly. In this context as originally stated,
“… all three paradigms must be distinguished from organic approaches to social integration. The solidarity, specialization, and monopoly paradigms of social integration fall within the spectrum of mainstream sociological thought which attributes greater scope and autonomy to civil society….” (Silver, 1994, p. 546).
Thus, Silver (1994) argues that all three paradigms are put forward within the spectrum of social integration. Also, Beresnevièiûtë (2003), argues that social integration indicates principles by which individuals (actors, agents or subjects) are bound to each other in the social space and it refers to relations among the actors and integration of a social system means the reciprocal interaction of segments of a certain social structure (Beresnevièiûtë, 2003). In addition, social integration is described as a highly desirable outcome that reflects the existence of social cohesion, a strong institutional foundation and a culture of acceptance. And, promoting social integration through inclusive policies reduces economic inequality and poverty and also promotes sustainable and equitable development. This makes society better (Cruz-Saco, 2008).
Thus this clearly shows that social inclusion can be well understood from the perspective of social integration. However, in my opinion, social integration along with social justice supplements the meaning of social inclusion to a greater extent.
Social Inclusion and Social JusticeSocial inclusion can be better understood from the lens of the theory of social justice. Without linking the understanding of social justice, the contextualization of social inclusion remains incomplete. Moreover, I have found Rawls Social Justice Theory more appropriate for this purpose.
Well, Rawls theory of justice gives emphasis to the rules to form and maintain a society thereby offering a liberal account of justice and emphasizing the value of equality. He describes the role of justice in social cooperation; the basic structure of society and also presents justice as fairness. He writes,
“Justice is the first virtue of social institutions, as truth is of systems thought. A theory however elegant and economical must be rejected or revised if I’ is untrue; likewise, laws and institutions no matter how efficient and well-arranged must be reformed or abolished if they are unjust” (Rawls, 1971, p. 3)
250
Therefore, according to Rawls, the first priority goes to the basic structure of a just society. He, in this context, emphasizes how major institutions like the political constitution and the principal economic and social arrangements distribute fundamental rights and duties.
Next, Rawls puts justice forward as fairness. This can be better explained through the two principles of justice forwarded by him. “First: each person is to have an equal right to the most extensive scheme of equal basic liberties compatible with a similar scheme of liberties for others. Second: social inequalities are to be arranged so that they are both (a) reasonably expected to be everyone’s advantage, and (b) attached positions and offices open to all” (Rawls, 1971, p. 53).In fact, a more inclusive interpretation of social inclusion is identified through social justice ideology from the perspective of which increasing social inclusion is understood on the basis of human rights, the egalitarianism of opportunities, human dignity and fairness for all (Gidley, Hampson, Wheeler, & Breded-Samuel, 2010). Thus, looking at social inclusion from the lens of social justice stresses that every person in a society should entertain equal rights and opportunities. Everyone in the society is to be equally advantaged and all the doors of opportunities are to be made open for all. From a social justice perspective, it can also be understood that the laws and rules are for human beings and a prevailing rule which is unjust must be amended for the betterment of everyone.Thus, most of the theorists of social capital commonly like to mention about the social networks. And I prefer to use the social network from the lens of social inclusion saying that all the social networks shall be enriched by bringing the deprived, marginalized or excluded groups into the networks that would bond and bridge them in order to offer equal opportunities in social, cultural, economic and political sectors for their holistic development through social justice.
ConclusionIn writing this article, I came to understand that the concept of social inclusion has been taken as both process and outcome can be better explained and understood from the lens of social integration, social justice and social capital.
Now, in concluding this article I would like to propose the phenomenon of social inclusion as “the theory of social inclusion” in classroom management. Moreover, this will be useful in other subjects of social sciences as well. And I would like to define it as:
“Social inclusion is about integrating the individuals or groups in the classroom management with value and respect and bringing them under the social networks of every opportunity for their holistic development including their equal access in social, economic, cultural, education and classroom management along with the emphasized access of education to every individual to acquire a quality education with social justice”.
Finally, I must also mention that everybody in a society should be incorporated in the social inclusion and no group or individual, whether from the advantaged group or marginalized group, feel or realized to be excluded.
Education, training, and employment represent central dimensions of social exclusion. These are interlinked, as limited access to education and training services affects employability. Unemployment does not relate only to poor living conditions and inability to afford material goods, services and housing, but in itself, it inhibits people’s ability to fully participate in society, build social networks and realize their potential. Beyond individual benefits, vocational learning is commonly viewed as having two purposes: increasing economic competitiveness and increasing social inclusion and cohesion.
An inclusive education system benefits all learners without any discrimination towards any individual or group. Inclusive education can promote successful learning. Inclusive education is an approach that looks into how to transform education systems in order to respond to the diversity of learners. It means enhancing the quality of education by improving the effectiveness of teachers, promoting learning-centered methodologies, developing appropriate textbooks and learning materials and ensuring that schools are safe and healthy for all.
ReferencesBennette, L. (2003). Towards an inclusive society:
Agency, structure, and diversity in Nepal. Agenda of Transformation: Inclusion in Nepali Democracy. Lalitpur: Socio Science Baha.
Beresnevièiûtë, V. (2003). Dimensions of Social Integration: Appraisal of Theoretical Approaches. In Ethnicity Studies (pp. 96-108). Vilnius: Institute for Social Research.
Bhalla, A., & Lapeyre, F. (1997). Social Exclusion: Towards an Analytical and Operational Framework. In Development and Change (Vol. 28, pp. 413-433). UK: Blackwell Publishers Ltd.
251
Bourdieu, P. (1984). The Forms of Social Capital. Retrieved from http://www.marxists.org/reference/subject/philosophy/works/fr/bourdieu-forms-capital.htm
Bourdieu, P. (1986). The Forms of Capital. Newyork.
Bourdieu, P. (1986). The Forms of Social Capital. In Handbook of Theory and Research for the Sociology of Education (pp. 241-258). Newyork.
Cappo, D. (2002, November). Social inclusion initiative: Social Inclusion, participation and empowerment. Retrieved from: www.socialinclusion.sa.gov.au/files/speech_02nov_acoss.pdf.
Coleman, J. S. (1988). Social Capital in the Creation of Human Capital. American Journal of Sociology, 94, 95-120.
Cruz-Saco, M. A. (2008). Promoting Social Integration: Economic, Social and Political Dimensions with a focus on Latin America. United Nations, Department of Economics and Social Affairs. Helsinki, Finland.
Gauntlett, D. (2011). Making is Connecting: The social meaning of creativity. Retrieved from www.making is connecting.org.
Gidley, J. M., Hampson, G. P., Wheeler, L., & Breded-Samuel, E. (2010). Social Inclusion: Context, Theory, and Practice. The Australian Journal of University-Community Engagement, 5(1), 6-36.
Guildford, J. (2000). Making the Case for Social and Economic Inclusion. Halifax: Population and Public health Branch, Atlantic Regional Office, Canada.
Lin, N. (1999). Building a Network Theory of Social Capital. Retrieved from INSNA: www.insna.org/PDF/Keynote/1999.pdf
Ottebjer, L. (2005). Bourdieu, Coleman, and Putnam on Social Capital: Applications in literature and implications for public health policy and practice. Karolinska Institutet.
Rawls, J. (1971). A Theory of Justice. USA: The President and Fellows of Harvard University.
Sen, A. (2000). Social Exclusion: Concept, Application, and Scrutiny. Retrieved from Asian Development Bank:http://www.adb.org/documents/books/social_exclusion/social_exclusion.pdf
Shookner, M. (2002). An inclusion Lens: Workbook for looking at the social and economic exclusion and inclusion. Canada: Population Health Research Unit Dalhousie University and Social Inclusion Reference Group.
Silver, H. (1994). Social Exclusion and Social Solidarity: Three Paradigms. In International Labour Review (pp. 531-578).