canadian nuclear society
TRANSCRIPT

CANADIAN NUCLEAR SOCIETY
INIS-CA—0071
wmmmCA0000001
November 16 - 18, 1997Holiday Inn on KingToronto, Canada
ISBN 0-919784-54-2

FOREWORD
These proceedings record the information presented at the 4th InternationalConference on CANDUMaintenance held November 16-18, 1997 in Toronto,Canada.
The papers for these proceedings were prepared according to guidelines supplied by theCanadian Nuclear Society and are generally published as submitted by the authors.Responsibility for the content of each paper rests solely with the author.
The proceedings are copyrighted by the Canadian Nuclear Society. Requests for furtherinformation concerning these proceedings, permission to reprint any part of theseproceedings, or orders for copies of these proceedings should be addressed to:
Canadian Nuclear Society144 Front Street West, Suite 475Toronto, OntarioM5J2L7
Telephone: (416) 977-7620Fax: (416) 979-8356
(i)

CONFERENCE ORGANIZING COMMITTEEConference Chair
Committee Chair
Technical Program
Treasurer
Exhibit Co-ordinators
Conference Facilities
Registration
Publications
Secretary
Plenary Sessionand Guest Speakers
InternationalParticipation
Site Representatives
Associate Members
Rod WhiteGeneral Manager, GenerationNB Power
Dominic IafrateOntario Hydro
Martin ReidKarel MikaOntario Hydro
John MarczakOntario Hydro
Heather SmithRonnie FaulknerAECL
Isabel FranklinAECL
Sylvie CaronCNS/CNA
Tim McLaughlinGE Canada
Eva MarczakOntario Hydro
Don BurnettAECL
Jim GeorgasAECL
Marlene RamphalKimberly YimOntario Hydro
Greg ShikazeBabcock and Wilcox
Paul LafreniereHydro Quebec
David ReevesNB Power
Charles KittmerAECL

4th CNS INTERNATIONAL CONFERENCE ON CANDU MAINTENANCENOVEMBER 1997
TABLE OF CONTENTS
SESSION 1
SESSION 1A - SPECIALIZED COMPONENT MAINTENANCEPage
Computer-Based Protective Relaying Maintenance Program Paper not availableL. Siekierski, Ontario Hydro, Bruce B
CANDU Digital Control Computer Upgrade Options 1M. de Jong, J. de Grosbois, T. Qian, AECL
SESSION IB - IMPROVING HUMAN PERFORMANCE - 1
Human Performance Monitoring and Improvement at Pickering Paper not availableM. Reid, Ontario Hydro, Pickering
How and When Will Self-Evaluation Improve Maintenance of CANDU Plants? 12K. Mika, Ontario Hydro, Bruce B
SESSION ID - STEAM GENERATOR LEAK DETECTION
Steam Generator Leak Detection at Bruce A Unit 1 16K. Maynard, V. Singh, Ontario Hydro TechnologiesD. Mclnnes, Ontario Hydro, Bruce A
Acoustic Tool for Leak Inspections in Steam Generator Divider Plates 23J. Kowalewski, P. Maak, M. Colbert, R. Black, K. Yiu, Ontario Hydro Technologies
Validating Eddy Current Array Probes for Inspecting Steam Generator Tubes 29S. Sullivan, V. Cecco, L. Obrutsky, J. Lakhan, A. Park, AECL
SESSION IE - FUEL CHANNEL INSPECTIONS
Eddy Current and Ultrasonic Fuel Channel Inspection at Karachi NPP . . . 36W. Mayo, AECLM. Alam, Pakistan Atomic Energy Commission
Detailed Simulation of Ultrasonic Inspections 45K. Chaplin, S. Douglas, D. Dunford, L. Lo, C. Daza, AECL
(iii)
SESSION 2
SESSION 2A- ROTATING EQUIPMENT MAINTENANCE
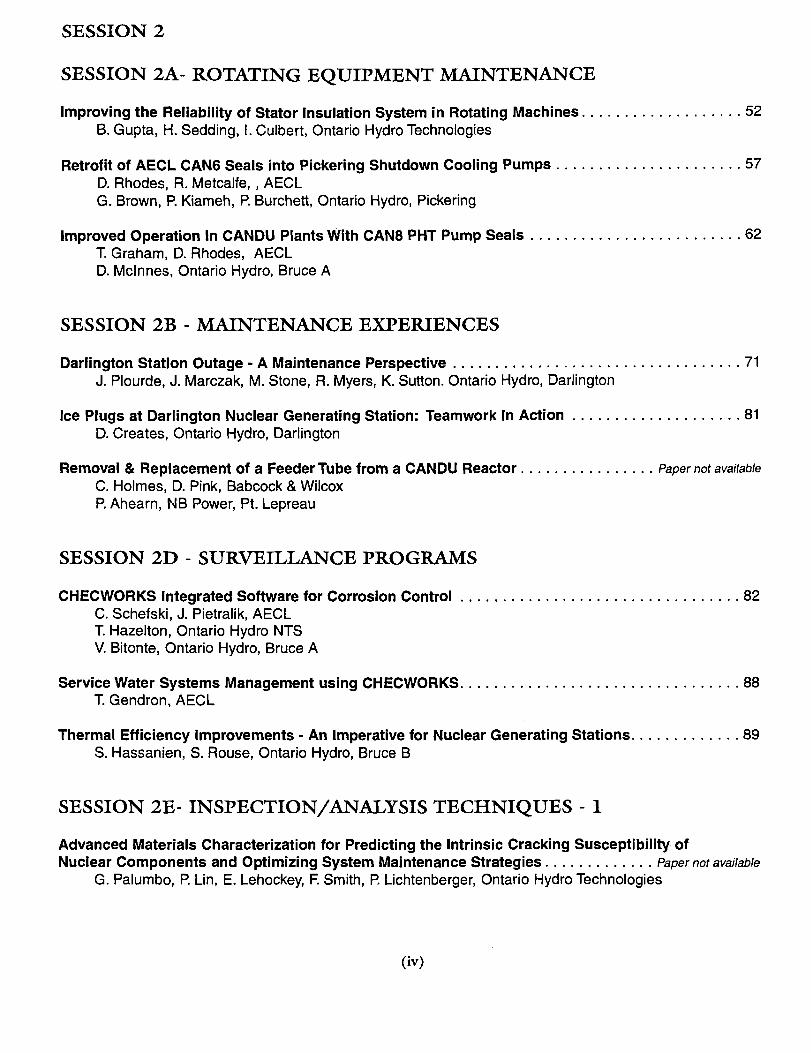
Improving the Reliability of Stator Insulation System in Rotating Machines 52B. Gupta, H. Sedding, I. Culbert, Ontario Hydro Technologies
Retrofit of AECL CAN6 Seals into Pickering Shutdown Cooling Pumps 57D. Rhodes, R. Metcalfe, , AECLG. Brown, P. Kiameh, P. Burchett, Ontario Hydro, Pickering
Improved Operation In CANDU Plants With CAN8 PHT Pump Seals 62T. Graham, D. Rhodes, AECLD. Mclnnes, Ontario Hydro, Bruce A
SESSION 2B - MAINTENANCE EXPERIENCES
Darlington Station Outage - A Maintenance Perspective 71J. Plourde, J. Marczak, M. Stone, R. Myers, K. Sutton. Ontario Hydro, Darlington
Ice Plugs at Darlington Nuclear Generating Station: Teamwork In Action 81D. Creates, Ontario Hydro, Darlington
Removal & Replacement of a Feeder Tube from a CANDU Reactor Paper not availableC. Holmes, D. Pink, Babcock & WilcoxP. Ahearn, NB Power, Pt. Lepreau
SESSION 2D - SURVEILLANCE PROGRAMS
CHECWORKS Integrated Software for Corrosion Control 82C. Schefski, J. Pietralik, AECLT. Hazelton, Ontario Hydro NTSV. Bitonte, Ontario Hydro, Bruce A
Service Water Systems Management using CHECWORKS 88T. Gendron, AECL
Thermal Efficiency Improvements - An Imperative for Nuclear Generating Stations 89S. Hassanien, S. Rouse, Ontario Hydro, Bruce B
SESSION 2E- INSPECTION/ANALYSIS TECHNIQUES - 1
Advanced Materials Characterization for Predicting the Intrinsic Cracking Susceptibility ofNuclear Components and Optimizing System Maintenance Strategies Paper not available
G. Palumbo, P. Lin, E. Lehockey, F. Smith, P. Lichtenberger, Ontario Hydro Technologies
(iv)

The Application of Operating Deflection Shape Analysis to Resolve Structural Vibration Problems . . 96E. Horton, B. Alavi, R. Zemdegs, Ontario Hydro, Pickering
SO8: Investigation and Repair of a Cracked Feeder at Point Lepreau 97A. Celovsky, T. Gendron, M.Wright, S. Usmani, AECLJ. Slade, NB Power, Pt. Lepreau
SESSION 3
SESSION 3A - INSPECTION TECHNIQUES - 2
Optical Technologies for Measurement and Inspection 110D. Mader, Ontario Hydro Technologies
Modeling the Vibration of Fuel Channels and Adjuster Units in CANDU Reactors to SupportIn-Core Flux Detector Noise Analysis 119
D. Derksen, D. Chidley, AECLB. Smith, O. Glockler, Ontario Hydro NTS
Darlington NGS A: SGECS Condensation Induced Waterhammer Analysis and SGECS HotCommissioning Test 120
C. So, AECLP. Chang, D. Meranda, Ontario Hydro, Darlington
SESSION 3B - MAINTENANCE MANAGEMENT STRATEGIES
Maintenance Recovery at Pickering Paper not availableJ. Coleby, R. Zemdegs, Ontario Hydro, Pickering
Implementation of, and Lessons Learned from Work Management Process and OrganizationalStructure Improvements at Pickering Paper not available
S. Seedhouse, D. Hunter, T. Chong, Ontario Hydro, Pickering
SESSION 3C - VALVE MAINTENANCE
Valve Packing Manual: A Maintenance Application Guide 130J. Aikin, AECLR. McCutcheon, Ontario Hydro NTSD. Cumming, Ontario Hydro, Bruce BC. Spence, Ontario Hydro, Darlington
Packing Configuration Performance for Small Stem Diameters 137J. Aikin, A. Eyvindson, AECLC. Spence, Ontario Hydro, DarlingtonD. Cumming, Ontario Hydro, Bruce B
(v)
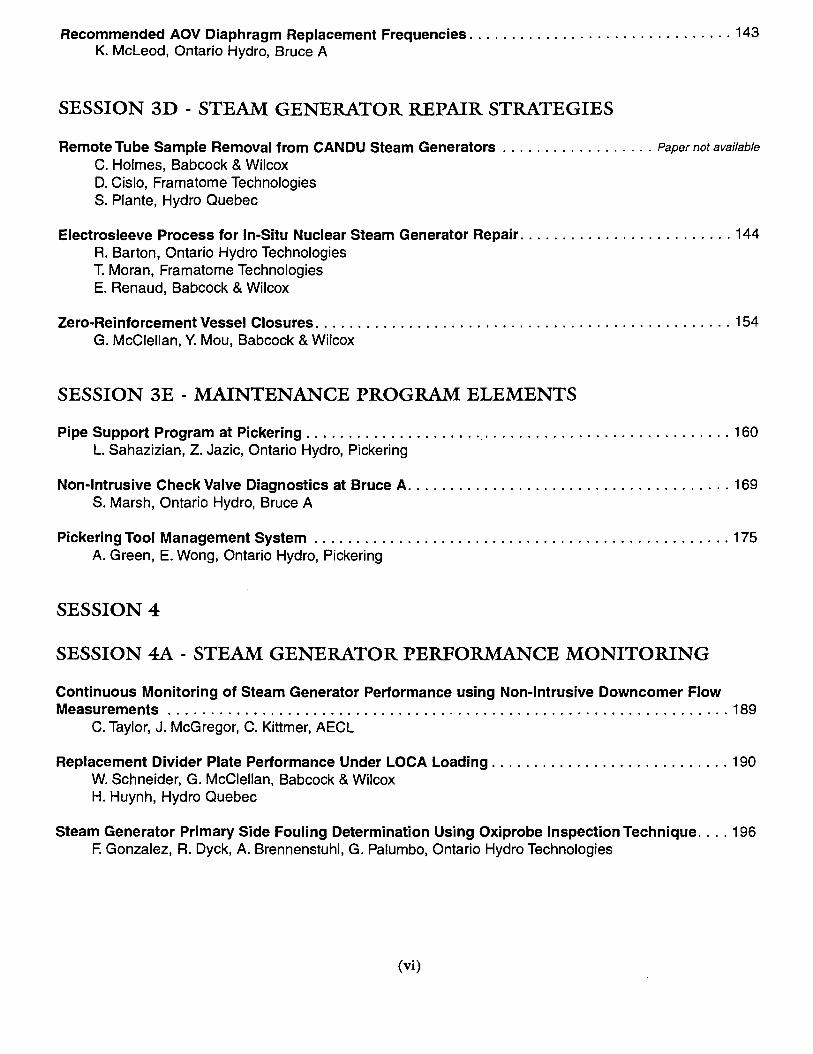
Recommended AOV Diaphragm Replacement Frequencies 143K. McLeod, Ontario Hydro, Bruce A
SESSION 3D - STEAM GENERATOR REPAIR STRATEGIES
Remote Tube Sample Removal from CANDU Steam Generators Paper not availableC. Holmes, Babcock & WilcoxD. Cislo, Framatome TechnologiesS. Plante, Hydro Quebec
Electrosleeve Process for In-Situ Nuclear Steam Generator Repair 144R. Barton, Ontario Hydro TechnologiesT. Moran, Framatome TechnologiesE. Renaud, Babcock & Wilcox
Zero-Reinforcement Vessel Closures 154G. McClellan, Y. Mou, Babcock & Wilcox
SESSION 3E - MAINTENANCE PROGRAM ELEMENTS
Pipe Support Program at Pickering 160L. Sahazizian, Z. Jazic, Ontario Hydro, Pickering
Non-Intrusive Check Valve Diagnostics at Bruce A 169S. Marsh, Ontario Hydro, Bruce A
Pickering Tool Management System 175A. Green, E. Wong, Ontario Hydro, Pickering
SESSION 4
SESSION 4A - STEAM GENERATOR PERFORMANCE MONITORING
Continuous Monitoring of Steam Generator Performance using Non-Intrusive Downcomer FlowMeasurements 189
C. Taylor, J. McGregor, C. Kittmer, AECL
Replacement Divider Plate Performance Under LOCA Loading 190W. Schneider, G. McClellan, Babcock & WilcoxH. Huynh, Hydro Quebec
Steam Generator Primary Side Fouling Determination Using Oxiprobe Inspection Technique. . . . 196F. Gonzalez, R. Dyck, A. Brennenstuhl, G. Palumbo, Ontario Hydro Technologies
(vi)

SESSION 4D - REACTOR INSTRUMENTATION
Laboratory Tests of a Modified He-3 Detector for Use with Startup Instrumentation 210T. Qian, P. Tonner, N. Keller, AECLW. Buyers, National Research Council of Canada
Self-Heating, Gamma Heating and Heat Loss Effects on Resistance Temperature Detector (RTD)Accuracy 221
T. Qian, W. Hinds, P. Tonner, AECL
SESSION 4E - SYSTEM SURVEILLANCE
Sending More Process Data Without Additional Cables Paper not availableH. Licht, R. Roicha, M. Rodych, AECL
Nondestructive Elemental Analysis of Corrosion and Wear Products from Primary and SecondaryCANDU Water Circuits 234
B. Sawicka, AECL
Primary Side Crud Sampling and Characterization: How It May Help to Better Maintain CANDUReactors 243
J. Sawicki, B. Sawicka, AECLM. Dymarski, Ontario Hydro, Darlington
SESSION 5
SESSION 5A - PREVENTIVE MAINTENANCE MANAGEMENT
Reliability Centred Maintenance (RCM) Living Program Paper not availableI. Khan, R. Aumell, Ontario Hydro, Bruce A
Infrared Thermography Program at Darlington 253B. Speer, Ontario Hydro, Darlington
SESSION 5D - MAINTENANCE EXPERIENCE
Upgrading Inflatable Door Seals Paper not availableT. Sykes, R. Metcalfe, L. Welch, AECL
RTD Problems at Darlington 259D. McAllindon, AECLD. Sloan, Ontario Hydro, DarlingtonP. Mayer, Ontario Hydro Technologies
(vii)

Shielding and Filtering Techniques to Protect Sensitive Instrumentation from ElectromagneticInterference Caused by Arc Welding 268
W. Kalechstein, AECL
SESSION 5E - RADIATION PROTECTION
Application of the ALARA Principle to the Bleed Condenser Relief Valve Replacement Project . . 276T. Wong, J. Kroft, Ontario Hydro, Darlington
Controlling Radiation Fields in CANDU Reactors using Chemical Decontamination Technologies.. 281D. Miller, D. Guzonas, R. Speranzini, AECLR. Laporte, Hydro QuebecT. Dereski, Ontario Hydro NTS
Dosimetry Results for AECL Personnel Involved in Maintenance Activities at Off-Shore CANDUStations 289
R. Khaloo, AECL
SESSION 6
SESSION 6A - IMPROVING HUMAN PERFORMANCE - 2
Development and Implementation of the Pre-Job Briefing Process for Maintenance Work atPickering Paper not available
A. Farrell, Ontario Hydro, Pickering
Control Maintenance Training Program for Special Safety Systems at Bruce B 299T. Zettel, G. Reinwald, Ontario Hydro, Bruce B
SESSION 6B - REACTOR FACE MAINTENANCE
Development of an Improved Low Profile Hub Seal Refurbishment Tool 306L. Wagg, AECL
Strategies for Accelerating the SLARette Process 309P. Grewal, AECL
SESSION 6C - AGING MANAGEMENT
The Structural Aging Assessment Program; Ranking Methodology forCANDU Nuclear Generating Station Concrete Components 320
K. Philipose, C. Seni, AECLP. Muknerjee, E. McColm, Ontario Hydro Technologies
(viii)
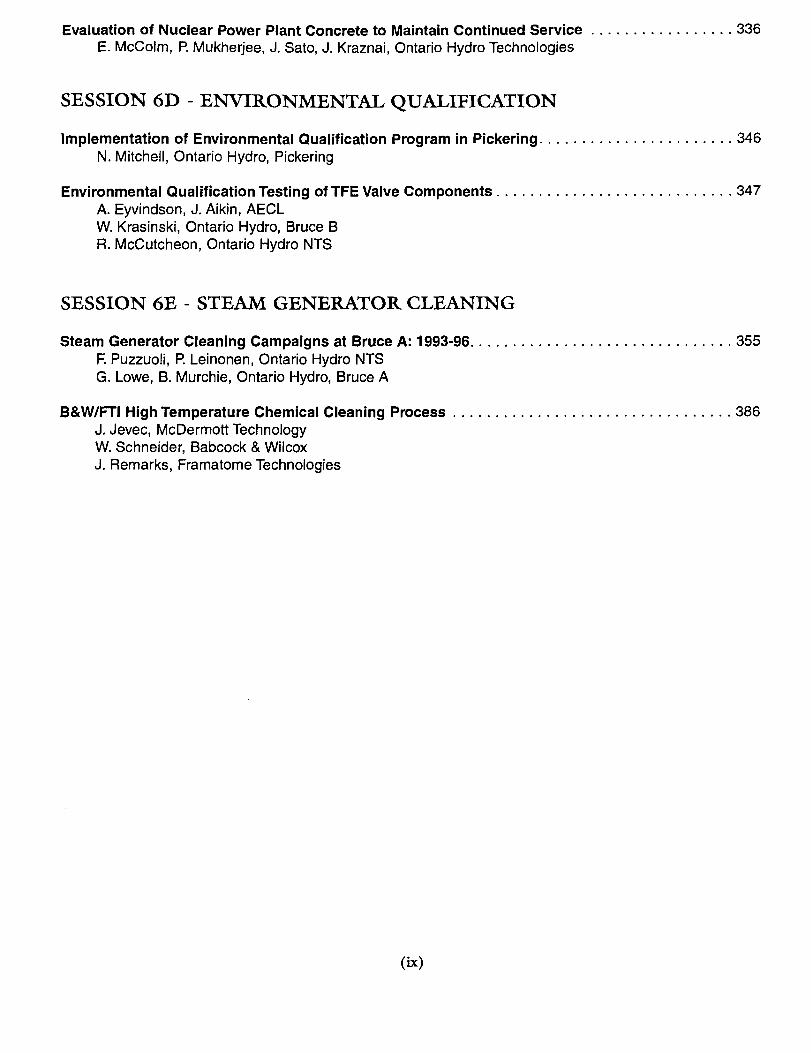
Evaluation of Nuclear Power Plant Concrete to Maintain Continued Service 336E. McColm, P. Mukherjee, J. Sato, J. Kraznai, Ontario Hydro Technologies
SESSION 6D - ENVIRONMENTAL QUALIFICATION
Implementation of Environmental Qualification Program in Pickering 346N. Mitchell, Ontario Hydro, Pickering
Environmental Qualification Testing of TFE Valve Components 347A. Eyvindson, J. Aikin, AECLW. Krasinski, Ontario Hydro, Bruce BR. McCutcheon, Ontario Hydro NTS
SESSION 6E - STEAM GENERATOR CLEANING
Steam Generator Cleaning Campaigns at Bruce A: 1993-96 355F. Puzzuoli, P. Leinonen, Ontario Hydro NTSG. Lowe, B. Murchie, Ontario Hydro, Bruce A
B&W/FTI High Temperature Chemical Cleaning Process 386J. Jevec, McDermott TechnologyW. Schneider, Babcock & WilcoxJ. Remarks, Framatome Technologies
(ix)

CA0000002
CANDU® Digital Control Computer Upgrade Options
M. S. de Jong, J. de Grosbois and T. QianAtomic Energy of Canada Limited
Instrumentation and Control BranchChalk River Laboratories
Chalk River, OntarioKOJ 1J0
Abstract
This paper reviews the evolution of DigitalControl Computers (DCC) in CANDU powerplants to the present day. Much of this evolutionhas been to meet changing control or displayrequirements as well as the replacement ofobsolete, or old and less reliable technology withbetter equipment that is now available. Thecurrent work at AECL and Canadian utilities toinvestigate DCC upgrade options, alternatives,and strategies are examined. The dependence ofa particular upgrade strategy on the overall plantrefurbishment plans are also discussed.Presently, the upgrade options range fromreplacement of individual obsolete systemcomponents, to replacement of the entire DCChardware without changing the software, tocomplete replacement of the DCCs with afunctionally equivalent system using new controlcomputer equipment and software. Key issues,constraints and objectives associated with theseDCC upgrade options are highlighted.
1. INTRODUCTION
CANDU plants have been pioneers in the use ofcomputer control systems for nuclear powerplants. Digital Control Computers (DCCs) havebeen used in all CANDU plants built since theconstruction of Pickering A in the early 1970s.Initially, IBM 1800 series computers were usedin Pickering A. Since then, computers based onthe VARIAN Vlx series architecture have beenused in all CANDU plants except Darlington,which uses DCCs based on DEC PDP-11minicomputers. Although some design andimplementation details differ between stations,all plant DCCs have a similar system hardwareand software architecture, and a basic commonsystem functionality and behaviour.
The original configuration of the VARIAN-basedDCCs is shown in Figure 1.
1 CANDU9 is a registered trademark of AECL.

DCCX
.'.'•: VARIAN
CPV Chassis : ;
fixed Head Oiik : :. . : • . . . • . ;
PaperTipe
RAMTEKDispiajtSyaem
DCCY
VARIAN '. • ^
iCPUdsssis
UmLui*
-
RAMTEK
fixed Had KA i : :
i MrwingAnjiEklt:
i , • • : • • • : 1
Analog JhpmrtXupui :• ; • . • • . : • • • • ' I
Dig^ullnpa/Ouqjta
Figure 1: Original DCC System Configuration
Each plant uses two computers (DCCX andDCCY) in a dual-redundant configuration. EachDCC has the same basic complement ofperipherals: a paper-tape reader/punch, a fixed-head disk for fast mass storage, a moving-armdisk for removable bulk storage, a range ofanalog and digital input-output modules and asophisticated RAMTEK display system withmultiple CRT displays. A single fast contactscanner is accessed by both DCCs. In addition,DCCX has additional inputs for flux mappingand channel temperature monitoring, and DCCYhas additional inputs and outputs for fuelhandling.
The software on these computers consists of aseries of separate control programs that run asseparate processor tasks, scheduled and co-ordinated to run on regular fixed periods by asystem executive. The system executiveperforms ongoing internal diagnostics thatprovide hardware and software self-checks and italso monitors and manages all interrupts andgeneral input/output driver routines to serviceperipheral devices. There are several differentcontrol programs that perform the fundamentalalgorithms for control of the main systems of the
nuclear plant, and also display-annunciationprograms that provide the operator interface.
The diagnostic programs run to ensure that theother control and display programs arefunctioning properly. If a malfunction isdetected, the diagnostic programs takeappropriate action. These actions include re-trying the program or operation that failed,transferring control to the other DCC, shuttingdown or restarting the DCC, and notifying theoperator of any actions taken. A specialcharacteristic of the DCC system configuration isthat most of the control and display programs runon both computers at the same time, but only oneversion of each program controls the outputsassociated with that program. If a programcontrolling the outputs fails, then control of theoutputs is transferred automatically to thecorresponding program on the other DCC. Thus,the "master-slave" relationship between the twoDCC computers can be effectively allocated on aprogram-by-program basis.
The main control programs that run on the DCCsare the following:
• Reactor Regulating System,

• Steam Generator Pressure Control,
• Unit Power Regulation,
• Steam Generator Level Control,
• Heat Transport Pressure and InventoryControl, and
• Moderator Temperature Control.
The display and annunciation programs providethe main operator interface to the computersystem for monitoring and supervision. Operatorscan request that different reactor status displaysbe presented on the CRTs by data entry at thededicated keypads for the CRTs.
The VARIAN computer architecture is a 16-bitminicomputer system that was developed in theearly 1970's. The computer performancerequirements are very demanding for this olderdesign: each DCC has several thousand analogand digital inputs; some of the control programsmust be run several times each second; and eachDCC drives several CRT monitors and receivesinputs from several keypads. To achieve thenecessary performance, some special hardwaresystems (e.g., the RAMTEK display system)were used to reduce the CPU load, and allsoftware was written in VARIAN assemblylanguage to maximise the execution speed, andminimise the memory requirements.
Over the past twenty years, these computers andtheir associated programs have demonstrated thehigh reliability required for CANDU NuclearPower Plant operation. DCC maintenance staffcan also be credited with improving systemperformance and maintaining acceptable overallhardware failure rates with both corrective andpreventative maintenance, despite ageing of DCCsystems and their components.
2. WHY UPGRADE?
Despite the success of the original DCC design, aneed has arisen to upgrade and refurbish thesesystems. This need arises from several sources:
• The reliability of some of the originalcomponents is not as good as what is nowavailable. Specific improvements can bemade that reduce maintenance and improveavailability.
• The technology used in these computers isold and in some cases obsolete. Obtaining
spares and/or replacement parts is becomingmore difficult as time goes on.
• There is evidence of component ageing that isshowing up as increased failure rates aftermany years of operation.
• There has been an evolution in the functionalrequirements and expectations of plantprocess control systems driven by acombination of operational experience,industry technology advances, changingregulatory requirements, and more stringentinternational standards.
Many of the original peripherals were based onelectro-mechanical components which tended tobreak down more frequently than was expected.The paper-tape reader/punch, fixed-head disk,moving-arm disk and the early impact lineprinters are typical components in this category.
Often compounding any problems with theoriginal equipment is that many of the originalcomponents are now obsolete and no longeravailable. The lifetime of the technology used inthe DCC system varies dramatically. Forexample, many of the TTL-level integratedcircuits (ICs) are still available but the diskhardware has been largely unavailable since theend of the 1970s. When equipment orcomponents are obsolete, significant problemscan occur in finding suitable qualifiedreplacements when needed. In some cases, thesystem containing the obsolete components mustbe completely replaced or re-designed. CAEnow offers board level replacements for theoriginal input/output cards, which are a "form,fit, and function" replacement based on aredesign. Obsolete equipment in the DCCs nowincludes not only most of the original electro-mechanical devices, but also the originalVARIAN computers, the core memory, and theRAMTEK display systems.
Ageing of electronic components is generally nota problem provided adequate maintenance isperformed and a suitable operating environmentis provided. Nevertheless, when the originalDCC computer systems where designed andmanufactured, appropriate hardware technologywas not available which could be demonstratedto last for the required 30 to 40 year lifetime of aplant. Long-term in-service usage with manycomponents and assemblies used in the DCC waslimited at the time. Today there is some concernabout the possible deterioration of cable

sheathing insulation materials (i.e., certainplastics) used in some plants. Mechanicalvibration can also be a possible source of failuresof ribbon cables or circuit boards. Leakagecurrents in some devices tend to increase withage, causing marginal performance or failuresafter some years. Components in this categoryinclude electrolytic capacitors and opto-isolators.Operating the DCCs at elevated temperatures hasalso been shown to result in more frequentcomponent failures. Thermal expansion andcontraction effects due to ambient temperatureswings are thought to have caused recurringproblems with integrated circuit seating inmounting sockets. Factors such as cooling fanfailures, dust accumulation in core memory, dirtyfan filters, and repeated power-up cycles havebeen cited to accelerate ageing and increasecomponent failure rates.
Finally, the expectations of computer-basedoperator interfaces have changed enormouslysince the CANDU DCC operator interface wasoriginally designed. This reflects both theincreasing use of computerised operatorinterfaces throughout the industry and the betterunderstanding of how to design these interfacesfor safer and more effective use by plantpersonnel. There now exist internationalstandards and guidelines for the design ofoperator interfaces, and both customers andregulators are requesting or requiring compliancewith these standards. For example, the ongoingdevelopment of the CAMLS (CANDU AdvancedMessage List System) system by COG, and theACCIS (Advanced Control Centre InformationSystem) plant display system for CANDU 9,indicate the direction in which present and futureoperator interfaces are evolving. Meeting thedemands for this increased functionality in theexisting DCCs will push the design limits of thehardware and software.
3. INFRASTRUCTURE FOR UPGRADESAccurate design basis documentation, goodconfiguration management tools and processes,suitable hardware and software developmenttools, and an effective maintenance program areessential before considering any major upgrade.Plant operators must have complete knowledgeof the present state of the equipment, its pastmaintenance history, and effective tools and testenvironments to verify and validate any system
changes. Only in these circumstances can aneffective upgrade strategy be planned.
At present, the hardware configuration is wellknown. However, it is important to have ascomplete a history of hardware failures andchanges as possible. Over the long term, thishistory permits identification of particular itemsthat may be failing more frequently, or requiremore maintenance than expected. Theeffectiveness of any changes to the design or tomaintenance procedures to address theseproblems can also be determined over a period oftime. A current COG work project is examiningthe maintenance, reliability and upgrade historyof all Canadian CANDU plants that use theVARIAN-based DCCs to identify any specificcost-effective incremental upgrades, designenhancements, or maintenance procedures.
The DCC software presents a general challengeto plants considering upgrades that requiresoftware changes. The original software hasdemonstrated its reliability for over severalhundred reactor-years of operation, with only afew deficiencies found and corrected in that time.However, most of the software was developedbefore the current software developmentstandards were available, resulting in potentiallyincomplete documentation and test cases forverification and validation of the functionality ofthe software. Ideally, the softwaredocumentation and development environmentshould be updated to meet current guidelines andstandards for reactor control software. This is amajor undertaking for any plant. The design ofthe original software, programmed in assemblerwith the required optimizations for speed andmemory, makes this task even more challenging.As a result, upgrade options that do not requireany, or at least minimize, software changes arefrequently preferred over alternatives that, whilemore attractive for other reasons, requiresignificant software revisions to the existingDCC software. Nevertheless, over the long term,updated DCC system documentation andcomplete software validation test suites that meetcurrent standards are essential to provide thebroadest range of upgrade options.
4. UPGRADE STRATEGIESThe potential upgrade options or strategies to beconsidered for DCCs in existing CANDUs canbe classified into four, somewhat overlapping,categories".

individualupgrades;
component replacements or
• subsystem upgrades with functionallyequivalent replacements;
• upgrading subsystems and moving displayfunctions to a Plant Display System; and
• complete DCC replacement with DCSequipment.
4.1. Individual Component Replacements
This level of upgrade can easily be regarded asjust good maintenance. Essentially, componentsthat are found to be failing at an unacceptablerate are replaced on a regular basis, or alternatecomponents that are functionally the same, butmore capable of withstanding the operatingstresses are substituted. For example, manyplants now replace all electrolytic capacitors inDC power supplies regularly every so manyyears, as these capacitors were observed todeteriorate with time and use. Similarly, resistorshave been substituted in some circuits withhigher power ratings where failures had beenobserved with lower power rated resistors.
Opto-isolators in digital input-output boards alsoappear to deteriorate after some years of use,with the leakage current increasing withincreasing age. Newer component designs maynot be as susceptible to these effects. Hardwaredesign modifications such as these are fairly easyto implement since there is no fundamentalchange in the circuit functionality, and thoroughtesting of the changes is usually straight-forward. After implementation, some re-calibration of the system may be necessary, butno software changes are required.
4.2. Subsystem Upgrades by EquivalentFunctional Replacements and Add-Ons
Most of the upgrades to the present DCCs are inthe category of DCC subsystem modificationsthat require little or no software changes. Inmost cases, these can be thought of as either"equivalent functional" replacements or "add-ons". Up to now, most of these types of changeshave involved the replacement of the originalelectro-mechanical peripheral devices with moremodern technology, having either equivalent orbetter functionality. There are several reasonsfor this:
• Many of the ^original electro-mechanicaldevices were amongst the least reliablecomponents of the original DCCs, i.e., thesedevices needed the most maintenance.
• The logical and electrical interface isrelatively simple, allowing the original systemto be replaced by a newer system with thesame interface.
• In some cases, the original equipment was inrelatively widespread use on various otherindustrial systems, resulting in a sufficientlylarge commercial market for upgradedreplacement systems.
It is also at this point that there exists somedivergence in upgrade strategies. Often thereplacement equipment has much betterperformance than the original equipment, e.g.,faster access or larger capacity. However, thesecapabilities can only be exploited by modestchanges in the DCC software, usually in theexecutive. Thus decisions must be made whetherto upgrade the software to take advantage of thepotential performance improvements, or to leavethe software alone with the assurance that thenew system will perform exactly the same as theoriginal system.
The choice between these options is nevercompletely clear, as it depends heavily on theconfidence with which changes to the softwarecan be made and tested, versus the benefits ofany performance improvements. Plants that havegood control of the software configuration, goodtest suites for software changes, and goodhardware and software diagnostic tools are wellpositioned to take advantage of any performanceimprovements available through hardwareupgrades with modest software changes.
For example, AECL has developed a paper-tapereader-punch replacement that uses a standardIBM-compatible personal computer, which hasbeen installed in some Canadian plants, and innewer CANDU 6 plants abroad. In this case theelectrical interface was simple to duplicate, andno DCC software changes were necessary.
A common upgrade in all older plants has beenthe replacement of the fixed-head disk with abattery-backed-up RAM disk unit from ImperialTechnology. Here an electro-mechanical systemis replaced by an all solid-state memory unit,providing greater reliability through theelimination of the moving parts. The

replacement system is also capable of higherthroughput to the CPU with a redesign of theoriginal fixed-head disk controller and somesoftware modifications.
Another valuable upgrade is the use of theAECL-developed Parallel Data Link Controllercards which serve as a general purpose interfacebetween a DCC and a standard IBM-compatiblepersonal computer. While this modificationrequires DCC software changes to be effective,the addition of this card permits most of thefeatures available on IBM PCs to be accessibleto the DCCs. Some of the ways this capabilityhas been used include
• replacement of the moving arm disk with thehard disk in the PC, and
• connection to an external network for remotestorage and processing of DCC-acquired data(i.e., an "add-on" gateway interface).
In the first case, the less reliable and lowercapacity moving arm disk is replaced by amodern standard PC hard disk for data storage ornear real-time analysis with complex programson the PC. In the second case, the PC serves as agateway to a larger plant network for remotestorage and archival of historical plant processdata in an Historical Data System (HDS), forinteractive processing of recent plant data bystation staff. At the same time, this gatewayprovides isolation between the DCC and thisnetwork in the event of network disruptions.
The upgrades of this type described to this pointhave involved minimal or no software orhardware design changes, and utilise existingsystem interfaces. Others to be consideredwhich are a little more complex and requiremeaningful system design modifications include:
• Replacement of core memory on the originalVARIAN computers with modern solid-statememory
The motivation here is two-fold: concern aboutreliability problems, particularly parity errors, inthe existing core memory; and lack ofcommercially available spare memory in theevent of failure of existing memory. Thissubstitution is difficult because of the largedifferences between the electrical interface tocore memory and the interface to solid-statememory.
• Replacement of the RAMTEK displaysystems
There are several different alternatives beingconsidered. AECL is developing a Pentium-based system that completely emulates theoriginal RAMTEK display system, requiring noDCC software changes whatsoever. However,the computing power of this system will permitthe enhancement of the available displays andcharacter sets. Point Lepreau is examining anapproach where DCC software is modified tosend the data to be displayed to a VME-basedPentium system where the final display isgenerated, emulating the equivalent RAMTEKdisplay. In this case, most of the displayprogram functionality has been transferred to theVME system. Bruce B is currently examiningseveral RAMTEK replacement systemalternatives that have been proposed by variousvendors.
• Replacement of the VARIAN CPU
Although the VARIAN CPU architecture is usedin most DCC computers (except for the PickeringA and Darlington plants), only the plantscompleted before the mid-1980s have computersbuilt by VARIAN. Later plants (Cernavoda;Wolsong 2, 3, and 4; and Qinshan) usecomputers manufactured by Second SourceComputers Inc. (SSCI). The SSCI computersimplement the VARIAN CPU instruction set, butuse more modern components and introduceseveral design improvements over the originaldesign. These improvements include solid-statememory with single-bit error correction anddouble bit error detection, better memorymapping and protection hardware, and greateraddress space.
AECL has modified the original executivesoftware to take advantage of many of thesefeatures for the DCCs in the newer plants. Whilesubstitution of the SSCI CPU for the originalVARIAN CPU is possible in older systems,substantial work would need to be done to verifythe proper operation of all plant DCC softwareon the new computer system because of thechanges to the executive software and differencesbetween the execution time for identical sets ofinstructions on the two CPUs.
In general, these incremental upgrades haveproven to be reasonably cost effective andprovide a relatively proven short-term (i.e. 5 to10 year) solution to DCC obsolescence issues.
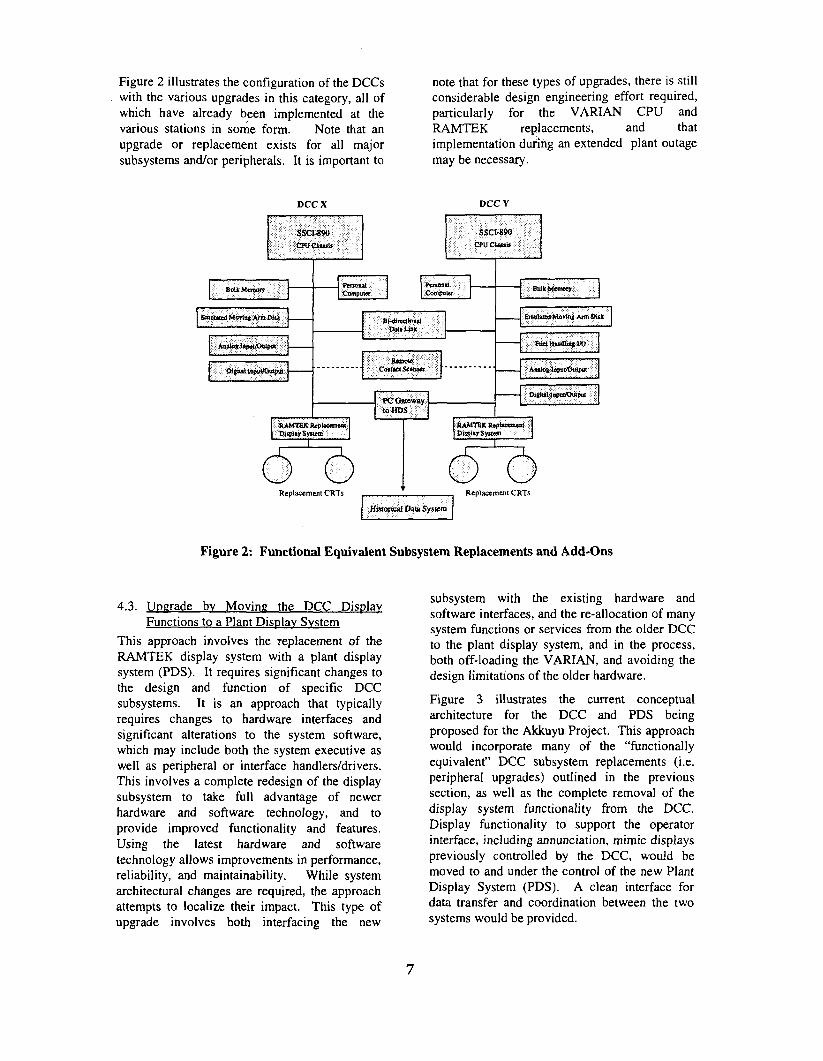
Figure 2 illustrates the configuration of the DCCswith the various upgrades in this category, all ofwhich have already been implemented at thevarious stations in some form. Note that anupgrade or replacement exists for all majorsubsystems and/or peripherals. It is important to
note that for these types of upgrades, there is stillconsiderable design engineering effort required,particularly for the VARIAN CPU andRAMTEK replacements, and thatimplementation during an extended plant outagemay be necessary.
DCCX
BuliMemn?
EmumeO Moriaj A m Dtok
:: Sitiatli>j»i|/Ootf»l:
Pttnoaat :
D C C Y
: SSCI-89P i
Tmtxaa '
RAMTEK Jfeplwenmu
Replacement CRTs
:; BnlkMcmorr
Bnwlaleo Moyttij Ann Oat
i; pfsWUopitfOwpuf s
HAMTEK RtptamentDispl«rSyH«n
Historical Dato System
Replacement CRTs
Figure 2: Functional Equivalent Subsystem Replacements and Add-Ons
4.3. Upgrade by Moving the DCC DisplayFunctions to a Plant Display System
This approach involves the replacement of theRAMTEK display system with a plant displaysystem (PDS). It requires significant changes tothe design and function of specific DCCsubsystems. It is an approach that typicallyrequires changes to hardware interfaces andsignificant alterations to the system software,which may include both the system executive aswell as peripheral or interface handlers/drivers.This involves a complete redesign of the displaysubsystem to take full advantage of newerhardware and software technology, and toprovide improved functionality and features.Using the latest hardware and softwaretechnology allows improvements in performance,reliability, and maintainability. While systemarchitectural changes are required, the approachattempts to localize their impact. This type ofupgrade involves both interfacing the new
subsystem with the existing hardware andsoftware interfaces, and the re-allocation of manysystem functions or services from the older DCCto the plant display system, and in the process,both off-loading the VARIAN, and avoiding thedesign limitations of the older hardware.
Figure 3 illustrates the current conceptualarchitecture for the DCC and PDS beingproposed for the Akkuyu Project. This approachwould incorporate many of the "functionallyequivalent" DCC subsystem replacements (i.e.peripheral upgrades) outlined in the previoussection, as well as the complete removal of thedisplay system functionality from the DCC.Display functionality to support the operatorinterface, including annunciation, mimic displayspreviously controlled by the DCC, would bemoved to and under the control of the new PlantDisplay System (PDS). A clean interface fordata transfer and coordination between the twosystems would be provided.

Removing the operator display functionality fromthe DCC also provides an opportunity to improveoverall system safety, reliability, andmaintainability. This can be achieved by:
• Isolating the control software andinterlock/safety control software functions(in a more stable DCC softwareenvironment) from incremental revisions, re-configurations, and enhancements necessaryin the annunciation and display system.
• Improving the overall defense-in-depth ofthe control room systems architecture byreducing the inter-dependencies andlocalizing the impact of a failure of thedisplay system, and minimizing its affect onthe DCC.
• Providing increased display systemfunctionality and configurability with a PDSproduct designed to accommodate these in-service changes and supported with asuitably robust maintenance and supporttoolset and environment.
This approach also allows system functions likethe print logs and the contact scanner to beinterfaced to the PDS layer of the architecture.Although not feasible in existing plants, digitaland analog input signals which are used formonitoring purposes only, could also besupported on a Data Acquisition (DAS) nodedirectly on the PDS LAN. Support for more
DCCX
Bulk Memory
Emulated Moving Aim Dlti
Analog (nput/Oulput
Digiiai loptn/Oalpti!
PersonalComputer
DCCY
PersonalComputer
Bi-directionalDauLink
Contact Scanner
Gateway toHani Display System
Gateway toPlant Display Syitem
Plant Display System
Local Area Network
Bulk Memory
tltted Moving Aim Disli
Fuel Handling I/O
Analog Enpul/Outpot
Digital Input/Output
Monitoring OnlyDAS No<fc(«>
Printerfs) Annunciation
DisplaysMimic Displays Panel Displays MCR Console
Figure 3: Migration to an Architecture with a Separate PDS
advanced displays, including flux mapping,channel temperature monitoring, fuel handling,and critical safety parameter monitoring wouldbe implemented in the new PDS system. Finally,it should be noted that although commercial PDSproducts are available, this approach involves aconsiderable DCC software re-engineering effort,and implementation of design changes to the
system would only be feasible during a majorplant outage. It does however, make good use ofthe existing and proven DCC software. Althoughthis approach does not completely eliminatelonger term DCC maintenance and obsolescenceissues, it does provide a relatively provensolution for existing stations, and for near-termfuture CANDUs.

4.4. Complete DCC replacement with DCSEquipment
The final option can be described as a completeretrofit replacement of the DCC controlcomputer with suitable commercially availableDistributed Control Systems (DCS) equipment.As in Section 4.3, this would include moving theoperator display functionality to a separate PlantDisplay System, such as AECL's ACCIS (indevelopment) or another viable commercial PDSproduct. In this approach, the generalarchitecture and system behavior of the originalDCC system can be closely "emulated", withsome improvements where appropriate. Thefunctionality of each of the main DCC controlprograms would be "migrated" to a separate dualredundant DCS X/Y "node-pair". Collectively,all of the "X" nodes behave as the originalDCCX, all of the "Y" nodes behave as the
DCCY. A similar approach is underconsideration at the Point Lepreau GeneratingStation, whereby an incremental upgrade strategyis under preliminary investigation. Thefeasibility of a gradual transition to a new systemon a program-by-program basis is beingexplored. In a typical DCS, each node (which isoften referred to as a "remote terminal unit"(RTU) or "station"), communicates with theother nodes via a dual-redundant LAN.
It is important to note that this approach doesinvolve considerable effort, and would require acomplete re-implementation of all the controlprograms, and extensive testing. Hence, thisapproach would only be considered feasibleduring a long planned outage and economicallyjustifiable for plants undergoing refurbishmentfor major life-extension. Figure 4 illustrates thisapproach.
Legend:
OCSRTUNodes
Analog Input/Output
(.
i u i Inpui/Outp at
Contact Inputs
Printers)
"DCC
—
X1
SO Pressure
Ban Power '"."'.
SGlje«!i,' , '-'- :
Hit, MIC"; -.
HCSX Gateway
AnnunciationDisplays
.+—
•#—
i _
t
—r
—f
—7
1—r
"Deer
• S0Prtsrtire
: UmtPower . .
'Sdtisver Vs
HfP,M1C -
DCS Y Gateway
Plant Display SystemLocal Area Network
Mimic Displays
,,}
n
Amioelfloul
Digital Input
Panel Displays MCR Console
Figure 4: Migration to DCS-PDS Architecture
Note that the diagram also shows that the PDSgateway, the contact scanner, and dataacquisition (DAS) nodes (used for "monitoring
only" functions), could also be implemented withstandard DCS equipment.

An advantage of this approach, is that DCSequipment is highly modular and configurable,and further system expansion or optimizationwould be possible in future. Leading DCSproducts are also provided with a graphicaldevelopment and test environment that wouldimprove overall system maintainability. Forexisting plants, it is possible the installed dataacquisition hardware could be re-used, while innew plants, the input/output boards used wouldbe the DCS vendor's standard product.
This approach offers a long term solution forexisting stations which is compatible with thedirection in future CANDUs towards the use ofsuitably qualified commercial distributed controlsystem equipment.
5. USING A COMMERCIAL DCSIt is important to note that in considering the useof any "off-the-shelf pre-developed computersystem or software product in safety-relatedCategory 2 or 3 applications, software andsystem qualification issues must be thoroughlyaddressed. A comprehensive qualificationreport is required to provide a reviewable anddefensible documentation that the product can bemade to meet the safety, reliability, andmaintainability requirements for the intendedcontext of use. A qualification should alsoestablish the stability and "proven-ness" of theproduct.
The qualification of complex system productslike a DCS or PDS may require the separateassessment of several subsystem components,and may result in significant cost and effort. Ifaddressed properly, the process will identify andaid in the resolution of technical risks early in thesystem design cycle. Qualification places anemphasis on establishing a given product versionand its usage history, and credits any inherentsafety features or fail-safe design attributes. Itshould also identify possible failure-modes,limitations, or deficiencies which must beaddressed in the intended configuration orcontext of use. Careful consideration of theproduct configuration issues, the overall systemarchitecture, and any features or functions to beavoided or guarded against is required. Theproduct qualification process does not replaceother system engineering design cycle activitiessuch as various verification and validationactivities. It does provide a degree of confidencethat the product quality is such that, for a
specified version of the product in a specificcontext of use, and provided all qualificationissues are adequately addressed in the designprocess, a level of integrity in the system designcan be achieved that is equivalent to a productdesigned in compliance to the appropriateCategory 2 or 3 standard. Qualification enablesthe use of suitable and proven products andreduces the need for costly, risky, and custom in-house designs of complex system products.
6. SUMMARY
It is clear from the previous discussion that thereare several viable options to consider withrespect to DCC upgrades. Some of the keyfactors that will determine both the technical andeconomic feasibility of alternative DCC upgradeoptions include:
• the age of the station,
• upgrades that have been implemented todate,
• the expected decommissioning date for thestation,
• when and how long any planned stationoutages provide an opportunity window toinstall and commission an upgrade,
• how much longer maintenance of theexisting DCC equipment due to partsavailability and expected failure rates will befeasible,
• the capital cost of upgrades, funds andresource availability,
• the technical and licensing risk and theability to manage these issues,
• the current maintenance costs and technicalstaff resources, and
• the benefits of the upgrade includingimprovements in system safety, reliability,performance, functionality, maintainability,and OM&A costs.
Each station will have a different set of decisionparameters which may result in differentapproaches. For stations with a longer expectedlife, the economics of a more long term solutionbecome much more attractive. The use of asuitably qualified and proven commercial "off-the-shelf DCS product is a viable option in thiscase.
10

7. REFERENCE PAPERSMelancon, P., Hubert, J. Gentillv 2 DigitalControl Computer Maintenance Strateev. HydroQuebec. 3rd International Conference on CANDUMaintenance. Nov. 1995.
Hong-Woo, K. Computer MaintenanceExperience of Wonsone 1. KEPCO. 2nd COGComputer Conf. Oct. 1995.
Walker, P., Wang, B.C., Fung, J. HardwareReplacements and Software Tools For DieitalControl Computers. AECL. CNS Conference.June 1996.
Gour, N., Rivest, J.-M., "Dieital ControlComputers' Cable Replacement at the Hydro-Quebec Gentillv 2 Nuclear Power Station".Hydro Quebec. CNS 2nd InternationalConference on CANDU Maintenance. Nov.1992.
Harber, J.E., Kattan, M.K., and MacBeth, M.J.Distributed Control System for CANDU 9.AECL. CNS Conf. June 1996.
Storey, H. Point Lepreau's LAN-Based StationControl Computer and Generic MonitoringSystem and Historical Plant Data Collection andDistribution System. NBP. 1992.
DeVerno, M., de Grosbois, J., Bosnich, M.,Xian, C , Hinton, J., Gilks, G. CanadianCANDU Plant Historical Data Systems: AReview and Look to the Future. AECL. CNSConference Paper. June 9th, 1996.
Fieguth, W., Hinton, J., Advanced ControlCentre Information System (ACC1S). AECL.CNS Conference Paper. June 9th, 1996.
Tremaine, D.R., Ahluwalia, D.S., de Grosbois,J.F.P., Echlin, E.G. Guide for the Qualificationof Software Products. COG-95-179. Oct. 1995.
11
CA0000003
HOW AND WHEN WILL SELF-ASSESSMENT IMPROVE MAINTENANCEOF CANDU PLANTS - EVALUATOR'S VIEW.
Karel Mika
Ontario Hydro, Bruce Nuclear StationBox 400, Tiverton, Ontario, NOG 2T0
Abstract
Learning organizations use self-evaluation programs to compare their actualperformance with their management'sexpectations and industry standards. In general,self-evaluations identify areas needingimprovement. Self-evaluation activities inmaintenance departments include self-assessments, management monitoringobservations, root cause analyses, eventinvestigations, benchmarking, use of operatingexperience, self-checking, and problemreporting systems. In Ontario Hydro Nuclear(OHN) we have used almost all forms of self-evaluation with mixed success. However, we didnot use self-assessments. With emphasis onexcellent maintenance this powerful form ofself-evaluation is being introduced to all ourplants. Because of its recency and relativeinexperience with it, this paper is focused onself-assessment. The paper provides the author'sperspective on how a self-assessment programwould be evaluated by an independent internalevaluation and what attributes should be in placein order for maintenance departments to succeedin the implementation and successfulcontinuation of the program.
Self-Assessment.
We in OHN are striving to improve ourperformance and achieve respectable ratingsfrom independent internal and externalevaluations. We have been adopting some newmanagement processes and programs. One ofthe most significant ones is a self-assessmentprogram. Those of you who are familiar with theOHN history know that over the years we triedto introduce many new improvement programsbut the expected results almost never met themanagement's expectations. Naturally, our staffhave developed a skeptical attitude towards any"new" management program or process. It is notthe objective of this presentation to analyze why
those programs mostly failed. However, it iscorrect to say that the introduction,implementation and management support ofthose programs were not well prepared, plannedand followed up on. Conditions in OHN havechanged. We now have a firm leadership and aclear focus. In my presentation I want to explainthe role of self-assessment programs which arebeing introduced in all three our plants: Bruce,Pickering and Darlington and I want to outlinehow an independent evaluation of theseprograms would establish if the program iseffective and has a good potential to contributeto the excellent performance of the maintenancedepartment.
My interest in this topic goes back to1996. For a number of years I have beeninvolved in Quality Assurance (QA) auditingand surveillance. I was on INPO, OHN PeerEvaluations and IIPA evaluating maintenance.The topic of self-assessment immediately raisedmy attention. The question was how self-assessment related to assessments done by theStation QA Department. I approached the INPOand was given names of three US plants thathave been assessed excellent and having astrength in the area of self-assessment. Theseplants were: B.H. Robinson NPP, Surrey NPPand Palo Verde NPP. Subsequent phoneconversations and information exchanges withthe responsible personnel gave me a solidpicture how these excellent plants deal with theself-assessment programs. That informationcoupled with my personal experience with QAassessments formed a basis for this presentation.
To have a common understanding ofthe language used in the presentation, here is alist of definitions:Assessment: A documented activity, performedby one or more qualified individuals, whichobjectively evaluates the performance anactivity, process, or program.Self-Assessment: The critical evaluation of anactivity, process, or program performed by the
12
individual or organization accountable for thework, or,Assessment of the performance, efficiency,and/or compliance of an individual or of anorganization ... for the purpose of identifyingopportunities for improvement of performance,efficiency, and/or compliance.Performance-Based Assessment: Focus onresults through the evaluation of factorsaffecting plant/organizational performance byobserving activities in progress, interviews ofpersonnel, or review of documentation fortechnical content.Compliance-Based Assessment: Focusensuring regulatory requirements are met,primarily through review of completeddocumentation.Benchmarking: A technique that comparesOntario Hydro Nuclear programs andperformance with best practices. This can beconducted outside nuclear industry' as well asinside. Benchmarking is accomplished throughuse of peer visits, WANO/INPO Good Practices,etc.Peer Visits: A form of benchmarking wherepersonnel from OHN visit another company toobserve their programs and performance, oranother company's personnel come to OHN toobserve our programs and performance and thenprovide critical feedback. This includesexchange visits between Bruce, Pickering andDarlington Personnel.Monitoring: The process all personnel use tocompare performance and programs againstexpectations. This includes managementobservations, individual observations, selfchecks, logs and status reporting.Independent Internal Assessments: Areperformed by other station group independent ofthe group accountable for the activity orprogram.Independent External Assessments: Performedby a group or organization outside the station.Examples are Atomic Energy Control Boardaudits, WANO evaluations et c.
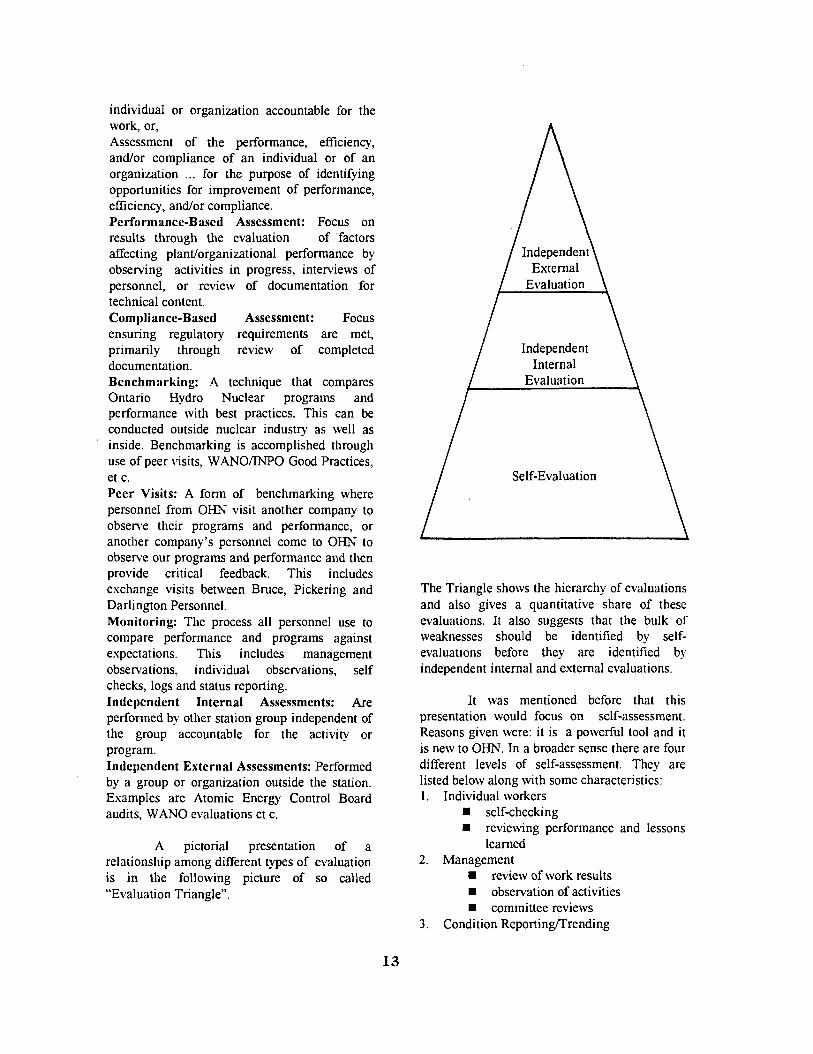
A pictorial presentation of arelationship among different types of evaluationis in the following picture of so called"Evaluation Triangle".
IndependentExternal
Evaluation
IndependentInternal
Evaluation
Self-Evaluation
The Triangle shows the hierarchy of evaluationsand also gives a quantitative share of theseevaluations. It also suggests that the bulk ofweaknesses should be identified by self-evaluations before they are identified byindependent internal and external evaluations.
It was mentioned before that thispresentation would focus on self-assessment.Reasons given were: it is a powerful tool and itis new to OHN. In a broader sense there are fourdifferent levels of self-assessment. They arelisted below along with some characteristics:1. Individual workers
• self-checking• reviewing performance and lessons
learned2. Management
• review of work results• observation of activities• committee reviews
3. Condition Reporting/Trending
13

• identifying, documenting andcorrecting apparent problems andimprovements
• identifying and correctingunderlying problems
4. Formal Self-Assessmentplans and outlinesfocus areateam approachformal reportcorrective actions/improvementstracked to closure
• follow-ups
For the remainder of the presentationthe focus will be on the Formal Self-Assessment.It is the most comprehensive and systematicmode that requires a concentrated effort fromthe whole organization. It has a broader scopethan the other modes and the experience showsit to be extremely effective in the maintenancearea.
The following is a list of attributes ofsuccessful self-assessment programs:1. Self-Assessment Is both a Corporate Value
and a Cultural Norm2. Management Displays Active Leadership
and Support of Self-Assessment3. Assessment Plans Are Prepared, Are
Proactive but Flexible Enough toIncorporate Emerging Issues
4. Assessors are provided Necessary Trainingand Resources to Conduct Assessments
5. Self-Assessments Findings Are Addressedin a Timely and Thorough Manner
6. Self-Assessment Results Are Shared WithOthers, both within the Station, with OtherOHN Stations and Interested PredeterminedExternal Organizations.
7. Follow-Up Reviews are Conducted to Verifythe Effectiveness of Corrective Actions
8. Plant Events and Regulatory Problems AreViewed and Evaluated as Failures of Self-Assessment.
In the following part the aboveattributes will be discussed one by one tohighlight their significance. The importance ofeach of these attributes cannot beoveremphasized. Without complete anddetermined adherence to these attributes, therewill not be an effective self-assessment program
in our Maintenance Departments. It is safe tosay that there would not be an effective self-assessment program anywhere in our stations ifit does not have the above attributes.
1. Self-Assessment is Both a Corporate Valueand a Cultural Norm.
If self-assessment is to become acorporate value and a cultural norm it has to beunderstood, internalized and practiced by alllevels of station staff. Coaching and trainingplay a significant role in achieving this attribute.INPO have realized the importance of self-assessment and the new revision of thePerformance Objectives and Criteria from lastyear spells out the objective and the criteria forthis area. A transcript of the pertinent section ofthis document is in the addendum to thispresentation.
2. Management Displays Active Leadershipand Support of Self-Assessment.
This attribute sounds like a platitudeand can be made of any station activity that is tosucceed. However, a new process is beingintroduced here which in the past belonged tothe QA Department and the external auditors.There was no sense of ownership on part of themaintenance staff towards evaluations. In fact,evaluations/assessments were observed with anuneasy feeling of additional burden being added.That, in essence, negative attitude towardsassessments has to be corrected. The only way tocorrect it is to have management at all levelsvisibly and convincingly supporting and leadingthe program. To achieve this attribute willrequire a concentrated effort on part of the uppermanagement to cascade the commitment to theprogram down the line.
3. Assessment Plans Are Prepared, AreProactive but Flexible Enough to
Incorporate Emerging Issues.It is essential for any management
process to be planned. In this particular case it isalso essential to have flexibility to change theplan when some new issues emerge. As anexample, the H.B. Robinson plant, Unit No. 2plan for 1997 has 23 self-assessments plannedfor their maintenance department and 150 self-assessments for the whole plant. It is a veryambitious program that will require a lot ofdetermination and resources. The staff at H.B.Robinson are convinced it is achievable and will
14

help them retain their excellent ratings by INPOand SALP. The plan for the MaintenanceDepartment should be approved by theMaintenance Manager and he should alsoapprove changes to it.
4. Assessors Are Provided Necessary Trainingand Resources to Conduct Assessments.
It is the opinion of the author that thisis the most important attribute. From hisexperience in QA it takes approximately a yearto train and develop a good evaluator. Themaintenance department would not have thatamount of time to train a number of staff whowould participate in self-assessments. Howeverthe QA experience underscores a need for somequality training and some focused experience.As a minimum, candidates from maintenanceshould receive training in field observationstechniques, interviewing and report writing. Thecandidates, as much as possible, shouldparticipate in at least one evaluation done byexperienced staff. Experience in self-evaluationsand training should be recorded.
5. Self-Assessment Findings Are Addressed ina Timely and Thorough Manner.
Any self-assessment team or individualshould produce an assessment report withclearly specified corrective actions, completiondates, and owners of the actions. An effort tocomplete the specified corrective actions must bea part of the work program and have allocatedresources. The completion dates must berealistic and the action owners must be heldaccountable for timely completion of the actionssame as for any other work assignment. If self-assessment and the resulting corrective actionsare seen as something outside the workprogram, a competition for resources will beintroduced which rarely results in correctiveactions completion.
6. Self-Assessment Actions Are Shared withOthers, both within the Station and with
Other OHN Stations.Self-assessment results have a great
potential to help other station units and alsoother OHN Stations to focus on identifiedproblems. It is quite common for various unitswithin the same organization to have similarweaknesses. To a lesser degree it can be saidabout the same industries. That is the reasonwhy there should be a formal system of sharing
self-assessment results within the station andwithin the entire organization.
7. Follow-Up Reviews Are Conducted toVerify the Effectiveness of Corrective
Actions.The author's experience from QA
suggests a formal verification of effectiveness ofcorrective actions needs to be done. It does notsuggest any ulterior motives of correction actionowners, it merely proposes an independentevaluation of the results.
8. Plant Event and Regulatory Problems AreViewed and Evaluated as Failures of Self-
Assessment.A truly effective self-assessment is a
very proactive tool. This statement does notmean that there will not be any findings madeby the independent internal and externalassessments, but they should be minimized. Along term goal of self-assessment should,indeed, be zero findings from all other forms ofassessment.
In conclusion, the author hopes, thispresentation could serve beyond thisConference. Specifically, it could be useful as astandard for terminology, at least in the OHNself-assessment programs. It can be used by theinternal independent evaluators when they facethe task of evaluating the station self-assessmentprograms. Finally, the eight attributes can beused as a yard stick for measuring the success ofself-evaluation programs.
15
CA0000004
Steam Generator Leak Detection at Bruce A Unit 1
Kevin J . MaynardSenior Research ScientistOntario Hydro Technologies800 Kipling Ave.Toronto, ON M8Z 5S4
Don E. MclnnesSenior Technical EngineerBruce NGS-A Eng. ServicesBox 3000Tiverton, ON NOG 2T0
Vic P. SinghPrincipal Research EngineerOntario Hydro Technologies800 Kipling Ave.Toronto, ON M8Z 5S4
ABSTRACT
A new steam generator leak detection systemwas recently developed and utilized at BruceA. The equipment is based on standardhelium leak detection, with the addition ofmoisture detection and several othercapability improvements. All but 1 % of theUnit 1 Boiler 03 tubesheet was inspected,using a sniffer probe which inspected tubesseven at a time and followed by individualtube inspections. The leak search period wascompleted in approximately 24 hours,following a prerequisite period of severaldays. No helium leak indications were foundanywhere on the boiler. A single water leakindication was found, which wassubsequently confirmed as a through-walldefect by eddy current inspection.
INTRODUCTION
During 1996 operation, a small (~0.5 kg/hr)D2O leak was detected on Bruce Unit 1 Boiler03. The leak rate persisted at this level until ascheduled Unit outage in Spring 1997. Due tothe difficulty in locating small boiler leaks withfluorescein solution, a more sensitive leakdetection technique was sought anddeveloped for field use on CANDU units. Themethod, called Helium Leak Detection (HLD),is an established technique for locating leakpaths in a wide variety of industrial andcommercial applications, including boilers. [1]
Past experience at Bruce A involved locatingboiler tube leaks using fluorescein solution. Inthis method, the boiler secondary is filled witha fluorescein dye solution and pressurized to200 psig (1.3 MPa). Leaks are then found by
a manual visual inspection of the primary sidetube sheet with the aid of a black light. Thepractical sensitivity limit for fluorescein leakdetection is estimated at approximately 2kg/hr of D2O, which exceeded the actual D2Oleak rate on Unit 1 in this instance. Given thissituation, the more sensitive HLD capabilitywas then developed. At present, HLD has anestimated sensitivity which corresponds toD2O leak rates of 0.01-0.1 kg/hr under typicalCANDU operating conditions. The heliumtracer gas is completely inert and does notpose any boiler or reactor chemistryconsequences. This paper describes theparticular HLD system which was designed atOntario Hydro Technologies (OHT). Alsodescribed are the leak search results andexperiences from Bruce A in Spring 1997.
HLD METHOD
The HLD method as applied to steamgenerators involves the detection of heliumgas leaking across the primary-secondaryboundary of the boiler. In the OHT system,pressurized helium gas in the boiler secondaryflows through the leak path to the primaryside. The primary side of the tube bundle ispurged with air so as to flush any helium gastoward a detector probe placed in the primaryhead of the boiler. A "sniffer" probe ispositioned within the primary head and ismanipulated by a robotic arm around thetubesheet. The sniffer samples the air fromeach tube in the boiler and a helium detectormeasures the helium concentration in this air.A leaking tube is signaled by a heliumconcentration well above background levels.Similar HLD systems have been developedelsewhere and are in use globally. [2] The
16

system utilized at Bruce A had several uniquefeatures which augmented the capabilities ofthe HLD method. These were:
• Buoyancy control of helium gas• Primary-side moisture detection• Phased leak search
Each of these is discussed more fully insections below, as well as an explanation ofthe various leak detection equipment installedon the Unit.
HLD PRIMARY SUBSYSTEMS
Figure 1 contains a diagram of the variousHLD subsystems which were installed onBruce Unit 1 during the Spring 1997 outageand prior to the leak search. An air purgesystem was located in the reactor vault at theprimary head of the boiler under test. The airpurge direction was from the primary outlettoward the primary inlet, although theopposite purge direction was judged to beequally satisfactory. Service air was used topurge the tube bundle through the cold legmanway at a rate of approximately 1500L/min (53 cfm). A simulated leak was alsoinstalled at the primary outlet into one of theboiler tubes. A small flow of helium gas couldbe introduced into this tube to act as adiagnostic aid for the leak detector. At theprimary inlet manway was placed thetubesheet sampling system. This consisted ofa sampling sniffer probe which wasmanipulated according to a predeterminedpattern across the tubesheet in search ofhelium gas leaking through from thesecondary side. The helium detector was acommercial mass spectrometer instrumentwhich had been modified for plant use. Thesniffer probe was manipulated remotelyacross the tubesheet by a Zetec SM-23robotic arm. No boiler entries were requiredusing this method.
HLD SECONDARY SUBSYSTEMS
The eight boilers on the Unit were drained ofwater to the best extent possible. Due to the
large volume of the boiler secondary systemand the difficulty in isolating the boiler undertest from the remaining boilers and steamdrums, pressurization of the secondary sidewas achieved with a combination of air andhelium/argon mixture. An air compressor wasattached near the main steam balance headerat 1-45210-NV88. A helium injection systemwas attached to the boiler wet storagerecirculation system at valve 1-36320-V10.Pressurization of the boiler secondary systemproceeded by first pressurizing to 500 kPa{60 psig) with air, followed by the injection ofa gas mixture containing approximately 5%helium and 95% argon through the boilerblowdown piping. The gas was commerciallysupplied premixed from a gas tube trailerparked just outside the Unit. The argon usedwas standard Ar-40, a stable isotope whichpresents no radiological hazards. Argon-40 ispresent in air at a concentration of 0.9%. Nosignificant amount of the argon added to theboiler can migrate into the primary side.Activation of the argon to Ar-41 is thereforenot a possibility.
To confirm the presence of sufficient heliumgas in the boiler secondary, samples of boilersecondary gas were continually flowedthrough an automated helium analysis systemlocated in the Unit 1 West boiler room. Theanalyzer was attached to the boiler secondarythrough two water lancing ports (flanges C26and C28). This helium analysis system wasalso fitted with an oxygen sensor to confirmthat the helium and argon mixture haddisplaced the air in the boiler secondary.
The central control for the leak detectionsystem was located within a portable officetrailer near the Unit. All subsystems wereconnected electronically to the control systemwith signal cables routed to each of theremote locations. In the case of the airpurging and tubesheet sampling systems,these cables were routed throughpenetrations installed in the boiler bellowsarea. The control system allowed remote datalogging and control of field devices using adigital network and a personal computer.
17

BUOYANCY CONTROL OF HELIUM GAS
For a successful leak search, the helium in theboiler secondary must remain there for theduration of the test. Helium is a light gaswhich, due to buoyant forces, tends to risewhen placed in air. Therefore, maintaining auniform helium charge in the boiler secondaryposes difficulty. The use of diaphragms orbaffles to isolate the boiler from the steamdrum is undesirable for several reasons,including the need for steam drum entry andpossibly also boiler modifications. However,when helium is pre-mixed with a heavy carriergas, the mixture is negatively buoyant in airand will remain fixed within the boilersecondary. This was the rationale and theadvantage of using argon as the carrier gas,as opposed to air or pure helium. No boilerisolation devices need be installed with thismethod. There is a gradual loss of heliumfrom the boiler due to diffusion, but thisprocess is manageably slow under the leaksearch conditions of 500 kPa. The gascomposition of 5% helium/95% argon wasarrived at through consideration of buoyancyand leak detector sensitivity.
PRIMARY-SIDE MOISTURE DETECTION
Before the leak search, the boiler secondarywas drained of water to the best possibleextent. However, at the tubesheet, severalinches of water were still present during theleak search. In cases where the through-walldefect is above water, helium will readily flowthrough the leak path to the primary side andbe detected by the helium detector. For leaksbelow water however, the helium cannotpermeate through the water layer and suchleaks would remain undetected by thistechnique. To detect tube leaks below thewater line near the tubesheet, the leakdetection system was equipped with an
additional mode of detection, a moisturedetector (dew point meter). The dew pointmeter measures the water concentration inthe purge air emerging from the tube underinspection. For leaks located under water,moisture from the secondary flowing throughto the primary side (due to the 400 kPapressure differential) will evaporate,registering as a rise in dew point. For leaksabove water, the dew point may againregister an elevated reading, depending on thehumidity of the gas in the boiler secondary.The characteristics of the helium and moisturedetection methods are summarized in Table 1,which indicates the detectability of defectsabove and below water. From thesecharacteristics, it is evident that a leakindication which registers only an elevateddew point must be an under water defect. Forcases where a helium indication is measured,the leak must be above water, regardless ofthe dew point reading.
PHASED LEAK SEARCH
In preparation for the Bruce Unit 1 leaksearch, pressurization of the secondarysystem to 500 kPa was completed inapproximately two hours. The charging ofBoiler 03 secondary with the helium mixturethen proceeded over a second two hourperiod. Once the boiler was filled with thehelium mixture, the leak search commenced.Throughout the leak search period, a slowflow of helium/argon was maintained tocounteract diffusional losses of the heliumfrom the boiler. To maximize efficiency, theleak search was divided into two phases-survey and detailed search. The surveycovered all of the tubesheet and was intendedto localize the leak within a subsection of thetubesheet. The survey phase was conductedwith a funnel device fitted to the end of theSM-23 manipulator arm installed in the
Table 1 Detectability characteristics of helium and dew point detectors.
Detector TypeHeliumDew Point
Defect Above WaterYesYes*
Defect Under WaterNoYes
"Depends on boiler secondary humidity
18

primary inlet head. The funnel, which allowedsimultaneous inspection of seven tubes, wasmoved to each desired location around thetubesheet and held there for approximately 15seconds. This allowed a sample of air to beobtained from the group of seven tubes whichwas analyzed for helium content by the leakdetector and for water content by the dewpoint meter. The helium concentration, dewpoint, SM-23 arm location and other datawere continually logged to disk. If a leakingtube was among the tubes being sampled, thelocation was flagged for closer examination inthe detailed search phase. Air samples werealso obtained on a periodic basis from theboiler head (both hot and cold legs) and thepurge air. These were routed to the leakdetector through a gas manifold, which waspart of the tubesheet sampling system. Thesemeasurements established the helium andmoisture background concentrations in theboiler primary head.
Following the leak survey phase describedabove, the detailed search commenced. Itspurpose was to positively identify any leakingtubes within the subsections already flaggedin the survey phase. The detailed searchphase was performed with a single tube probe(ie. individual tube inspections). Each tube inthe flagged subsection was individuallychecked by moving the sniffer probe (usingthe SM-23) in close proximity to thetubesheet plane at the tube exit. The detectorsignals were recorded for each tube beforemoving to the next tube. Once the leakingtube had been located, its identity wascarefully confirmed by noting the present SM-23 position on the computer monitor. Theleaking tube location was also later confirmedby a careful review of a videotape producedfrom the SM-23 camera during the leaksearch.
At the completion of the leak search, theboiler secondary helium/argon gas wasflushed out by opening the main boilerblowdown valves. Following this, thesecondary system was depressurized byopening the relief valves on the steam drums.The leak detection equipment was then
removed from the Unit to permit subsequentinspections of the boiler.
TUBESHEET SURVEY RESULTS
In this phase, 99% of the tubesheet wasinspected (a total of 4163 tubes) over aperiod of approximately 24 hours. The 37tubes not inspected were all located in Rows1 and 2. Obstructions near the boiler dividerplate prevented the funnel sniffer probe fromreaching these tubes. The dew point data forthe survey is shown in Figure 2 as atubesheet map. The ambient dew point in theboiler primary head was around -21°C, whichindicates that the boiler was well dried by theair purge prior to the leak search period. Thetubes marked as leak indications correspondto elevated dew point readings. The thresholdutilized for a leak indication on this map was-19°C, approximately 3a above the meanvalue of -21°C. When an elevated reading wasobtained using the 7 tube funnel, all 7 tubesbeing inspected were logged with the sameelevated dew point reading. The localizationof the actual tube leak indication wasperformed with the single tube probe(described below).
Approximately 120 tubes were flagged forindividual inspections. The tubes in thevicinity of rows 10-20 and columns 89-91were chosen on the basis of elevated dewpoint readings. Most of the other tubesamong the 120 were selected on the basis ofsuspected small variances of helium signals.
DETAILED SEARCH RESULTS
Following the tubesheet survey, the 7-tubesniffer probe was removed and replaced witha single tube probe. The 120 flagged tubeswere inspected individually to localize andconfirm any possible leak indications. Thedew point readings for the individual tubesincluded one prominent leak indication locatedat R16 C90 with a dew point of -4 to -3°C.The dew point indication for this tube wasmuch larger than with the 7 tube funnel(approx. -17°C) because the wet air from the
19

leaking tube was no longer diluted with dry airfrom the 6 other tubes under the snifferfunnel. No helium leak indications were foundamongst the 120 tubes flagged from thetubesheet survey. The boiler was thereforeconsidered leak tight to helium gas.
SUBSEQUENT NDE INSPECTIONS
After the leak search was conducted, Non-Destructive Examination (NDE) via boiler tubeEddy Current (ECT) was employed to inspecttube R16 C90 (identified as the leaker), aswell as other tubes in the immediate area ofthis tube. ECT analysis results confirmedtube R16 C90 to have a 100% through-wallcrack at the boiler inlet (hot leg) tubesheet.This tube sample was removed formetallurgical examination, which alsoconfirmed the leak search conclusions. Thetube removal also confirmed the existence ofwater on top of the tubesheet, which wouldhave prevented the helium from permeating tothe crack, and through to the inside diameterof the tube.
Additional ECT in Boiler 3 also reported anumber of tubes which contained 100%through-wall crack indications similar inlocation to R16 C90. These tubes, (R22 C82,R18 C90 and R34 C58) were also removedfrom the boiler, and the 100% through-wallindications were confirmed by metallurgicalexamination. The existence of these tubecracks in this area of Boiler 3 then led to aconcentrated effort of inspecting all the tubesin all the boilers in both Unit 1 and in Unit 4,to ensure that additional crack indicationswere not present.
The metallurgical examinations revealed thatall tube cracks were very tight. These wouldtend to exhibit small leak rates underoperation, a fact which was borne out by theD2O leak rate on this boiler remaining stable
and small (<1 kg/hr) throughout more than ayear of Unit operation. The position andcharacteristics of these tube cracks madetheir detection very difficult. The defects werelocated at the top of the tubesheet andsubmerged in water at the time of the leaksearch, thereby negating any possibility ofdetection with helium. The moisture detectioncapability was not sufficiently sensitive todetect three of the four tube cracks, underthe conditions used for this leak search.
CONCLUSIONS
The leak detection equipment functionedreliably throughout its field use and wassuccessful in locating one through-wall tubedefect near the tubesheet. The presence ofboth helium and moisture detectioncapabilities was essential for a complete boilerleak search. Optimizing the moisture detectionsensitivity is a future development priority.
ACKNOWLEDGMENTS
The authors would like to thank the teamwithin the Process Technologies Dept. fortheir avid participation in this program.Thanks also to Bruce A and SIMD personnelfor technical support before and at thestation. Funding for this project was providedby Bruce NGS-A, Bruce NGS-B and COG.
REFERENCES
1. "Introduction to HeliumSpectrometer Leak Detection",Associates, 1980.
MassVarian
2. "Evaluation of Sulfur Hexafluoride andHelium for Steam Generator LeakDetection", EPRI Report NP-5008 pp.4-1to 4-5, 1987.
20

I II I• •
• MHMMMBiHiMMI
• Steam Lines |
Main SteamBalance Header
CompressedAir Inlet
1•
I Helium I Boiler RoomAhJ.
BoilerBlowdown
TubesheetSampling
REACTOR VAULT
Leak SM-23Detection ControlControl
CablingPiping
Figure 1 Overview of the major components of the helium leak detection system.
21

10 15 20 25 30
Bruce A Unit 1 Boiler 3 Inlet 7 Tube Dew Point Survey
35 40 45 50 55 60 65 70 75 80 85
10 15 105 110
Column
Type Total % of TotalO Not Inspected 37 0.88• No Leak Indication 4150 98.81O Leak Indication 13 0.31
i
Figure 2 Dew Point tubesheet map for survey phase of leak search

ACOUSTIC TOOL FOR LEAK INSPECTIONS IN STEAM GENERATOR DIVIDERPLATES
John Kowalewski, Peter Maak, Mike Colbert, Ken Yiu,Rick BlackOntario Hydro Technologies800 Kipling Avenue, KB214Toronto, Ontario, Canada
M8Z 5S4 CA0000005
Abstract
Cross flow leakage through divider plates inthe primary head of steam generators, maybe a contributor to RIHT rise which can havea negative effect on the operation of a plant.A method to provide quick and reliableinspection of divider plate leakage can bevery useful in helping make timely andeffective maintenance decisions. A novelacoustic tool for performing inspections indrained steam generators during shutdownshas been developed by OH Technologiesand successfully demonstrated in a fieldapplication. The technique, referred as ALIS(acoustic leak inspection system), performsa scan of the divider plate face and presentsa graphic image of the leakage paths and anestimate of the total leakage area.
1. Introduction
Pressure differential between the inlet andoutlet sections of the primary head can forceprimary coolant to flow across the dividerplates through a number of potential leakagepaths. The main concern is divider platedesigns consisting of segmented, boltedpanels. These present indirect leakage pathssuch as between lap joints, set bars, or boltholes passing through the plate (about 3.5cm thinckness). Suspect places are all thejoints along the head, the tubesheet, andplate segments. Degradation may also takeplace along the leakage paths.
Leakage paths have been reported to vary insize, shape, and location over the dividerplate wall. Consequently it is normallydifficult to identify and to quantify thesepaths without considerable effort, particularlyin a radioactive environment. Based on
previous experience with acoustictechniques, this approach was explored.
2. Principle
Sound in an airborne medium has thecapability for propagation through smallapertures. Basically airborne sound, withselected characteristics, can "leak" throughvery small cracks of random shape anddirection similar to a fluid with pressuredifferential (AP). Such acoustic leaks havebeen studied in architectural acoustics forevaluating divider walls in buildings. Theadvantage of this approach is that a AP isnot required.
The basic principle adopted for thistechnique utilizes airborne soundtransmission through the leakage paths of adivider plate assembly. Leaks can beassessed by measuring the amount ofsound energy, of a predetermined soundsignal, that transmits through the leak pathsas illustrated in Figure 1.
3. Description
The acoustic leak inspection system (ALIS)developed thus far, for inspection of drainedsteam generators, utilizes the above basicprinciple with some custom designedequipment. The general configuration of theALIS tool, applied for inspecting a steamgenerator is illustrated in Figure 2.
ALIS comprises a sound source which isattached at a fixed position on one side ofthe primary head. This emits a series ofcontrolled sound bursts which are capable ofpropagating through air but are stopped byall metal surfaces. The sound burstscomprise three sinusoidal tones with
23
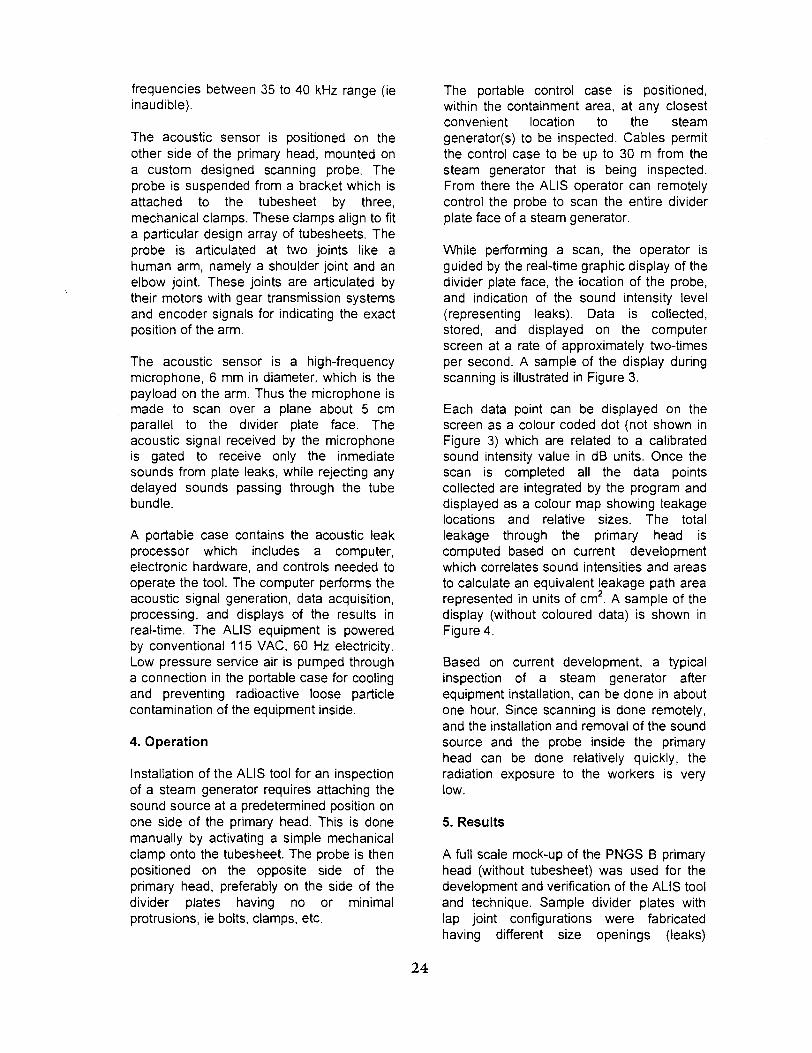
frequencies between 35 to 40 kHz range (ieinaudible).
The acoustic sensor is positioned on theother side of the primary head, mounted ona custom designed scanning probe. Theprobe is suspended from a bracket which isattached to the tubesheet by three,mechanical clamps. These clamps align to fita particular design array of tubesheets. Theprobe is articulated at two joints like ahuman arm, namely a shoulder joint and anelbow joint. These joints are articulated bytheir motors with gear transmission systemsand encoder signals for indicating the exactposition of the arm.
The acoustic sensor is a high-frequencymicrophone, 6 mm in diameter, which is thepayload on the arm. Thus the microphone ismade to scan over a plane about 5 cmparallel to the divider plate face. Theacoustic signal received by the microphoneis gated to receive only the inmediatesounds from plate leaks, while rejecting anydelayed sounds passing through the tubebundle.
A portable case contains the acoustic leakprocessor which includes a computer,electronic hardware, and controls needed tooperate the tool. The computer performs theacoustic signal generation, data acquisition,processing, and displays of the results inreal-time. The ALIS equipment is poweredby conventional 115 VAC, 60 Hz electricity.Low pressure service air is pumped througha connection in the portable case for coolingand preventing radioactive loose particlecontamination of the equipment inside.
4. Operation
Installation of the ALIS tool for an inspectionof a steam generator requires attaching thesound source at a predetermined position onone side of the primary head. This is donemanually by activating a simple mechanicalclamp onto the tubesheet. The probe is thenpositioned on the opposite side of theprimary head, preferably on the side of thedivider plates having no or minimalprotrusions, ie bolts, clamps, etc.
The portable control case is positioned,within the containment area, at any closestconvenient location to the steamgenerator(s) to be inspected. Cables permitthe control case to be up to 30 m from thesteam generator that is being inspected.From there the ALIS operator can remotelycontrol the probe to scan the entire dividerplate face of a steam generator.
While performing a scan, the operator isguided by the real-time graphic display of thedivider plate face, the location of the probe,and indication of the sound intensity level(representing leaks). Data is collected,stored, and displayed on the computerscreen at a rate of approximately two-timesper second. A sample of the display duringscanning is illustrated in Figure 3.
Each data point can be displayed on thescreen as a colour coded dot (not shown inFigure 3) which are related to a calibratedsound intensity value in dB units. Once thescan is completed all the data pointscollected are integrated by the program anddisplayed as a colour map showing leakagelocations and relative sizes. The totalleakage through the primary head iscomputed based on current developmentwhich correlates sound intensities and areasto calculate an equivalent leakage path arearepresented in units of cm2. A sample of thedisplay (without coloured data) is shown inFigure 4.
Based on current development, a typicalinspection of a steam generator afterequipment installation, can be done in aboutone hour. Since scanning is done remotely,and the installation and removal of the soundsource and the probe inside the primaryhead can be done relatively quickly, theradiation exposure to the workers is verylow.
5. Results
A full scale mock-up of the PNGS B primaryhead (without tubesheet) was used for thedevelopment and verification of the ALIS tooland technique. Sample divider plates withlap joint configurations were fabricatedhaving different size openings (leaks)
24
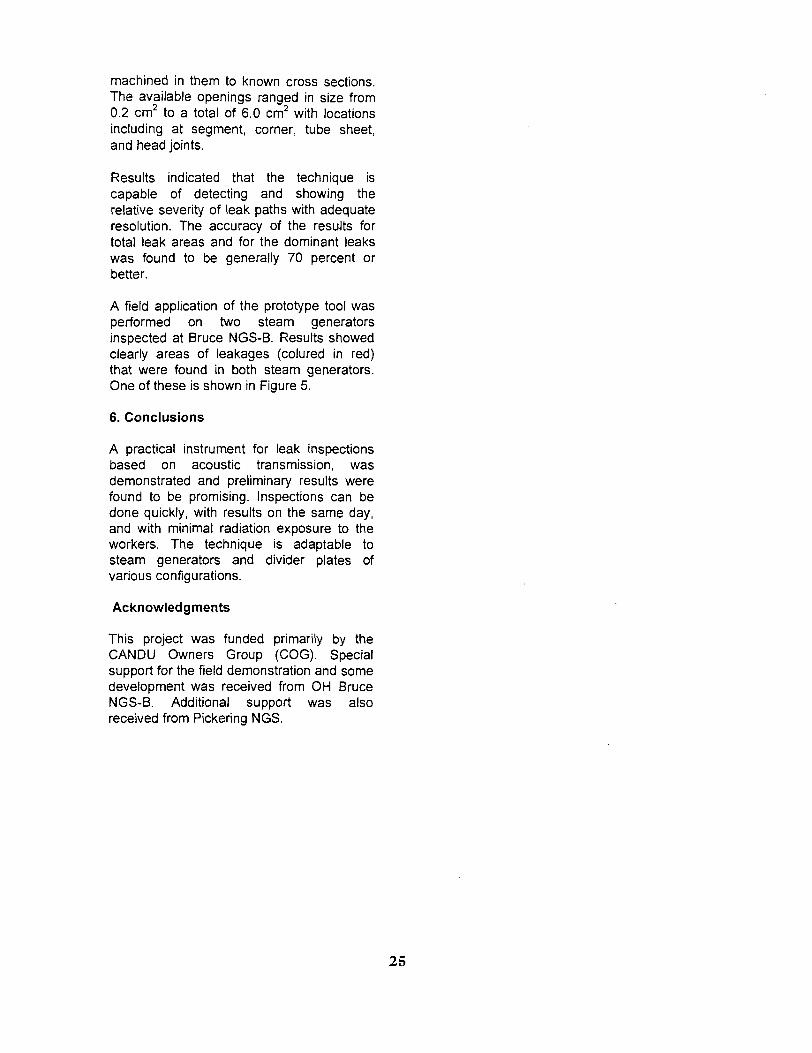
machined in them to known cross sections.The available openings ranged in size from0.2 cm2 to a total of 6.0 cm2 with locationsincluding at segment, corner, tube sheet,and head joints.
Results indicated that the technique iscapable of detecting and showing therelative severity of leak paths with adequateresolution. The accuracy of the results fortotal leak areas and for the dominant leakswas found to be generally 70 percent orbetter.
A field application of the prototype tool wasperformed on two steam generatorsinspected at Bruce NGS-B. Results showedclearly areas of leakages (colured in red)that were found in both steam generators.One of these is shown in Figure 5.
6. Conclusions
A practical instrument for leak inspectionsbased on acoustic transmission, wasdemonstrated and preliminary results werefound to be promising. Inspections can bedone quickly, with results on the same day,and with minimal radiation exposure to theworkers. The technique is adaptable tosteam generators and divider plates ofvarious configurations.
Acknowledgments
This project was funded primarily by theCANDU Owners Group (COG). Specialsupport for the field demonstration and somedevelopment was received from OH BruceNGS-B. Additional support was alsoreceived from Pickering NGS.
25

Figure 1
Basic Principle
SoundReflected
SOUNDSOURCE
Sound TransmittedT hrough Structure
ACOUSTICSENSOR
Sound Absorbed By Structure
Figure 2
Genera! Configuration of ALIS Toolin a Steam Generator
Empty
AcousticSensor
S/G Shell
S/G Tubes
Divider Plates
Tube Sheet
AcousticSource
ManwayCover
26
Acoustic Leak Processor

Figure 3 Scanning Operation Display and Control Panel
Figure 4 Leakage Calculation Panel
90.0
100.0-
107.0-
-107.0 -aoo •60.0 •«J0. «.O 60.0 HO
• - 7 5
1-35
ZOOM
107.0
Calculate -F1 ThresholdF2 P i * Up PagtOnm
STOP - F4mu-F 10 Sara Fie Nvnt
| |wict«.M
ActualEND
LnkAm Paused -F6 FILE - F5
27
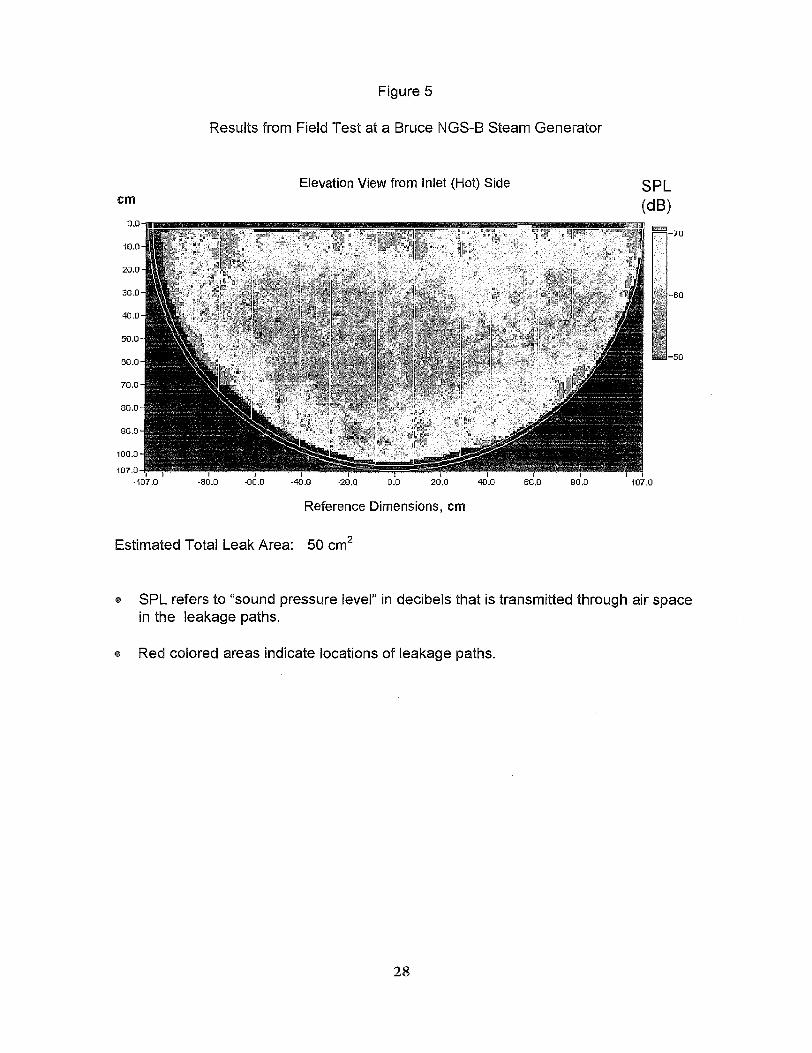
Figure 5
Results from Field Test at a Bruce NGS-B Steam Generator
Elevation View from Inlet (Hot) Side SPL(dB)
- 7 0
•80.0 -B0.0 -40.0 -20.0 0.0 20.0 40.0 00.0 80.0I i
107.0
Reference Dimensions, cm
Estimated Total Leak Area: 50 cm2
• SPL refers to "sound pressure level" in decibels that is transmitted through air spacein the leakage paths.
• Red colored areas indicate locations of leakage paths.
28
CA0000006
VALIDATING EDDY CURRENT ARRAYPROBES FOR
INSPECTING STEAM GENERATOR TUBES
S.P. Sullivan, V.S. Cecco, L.S. Obrutsky, J.R. Lakhanand A.H. Park
Atomic Energy of Canada LimitedChalk River Laboratories
Chalk River, ON KOJ 1J0
ABSTRACT
A CANDU nuclear reactor was shut down for overone year because steam generator (SG) tubes hadfailed with outer diameter stress-corrosion cracking(ODSCC) in the U-bend section. Novel, single-passeddy current transmit-receive probes, denoted as C3,were successful in detecting all significant cracks sothat the cracked tubes could be plugged and the unitrestarted. Significant numbers of tubes with SCCwere removed from a SG in order to validate theresults of the new probe. Results from metallurgicalexaminations were used to obtain probability-of-detection (POD) and sizing accuracy plots to quantifythe performance of this new inspection technique.
Though effective, the above approach of relying ontubes removed from a reactor is expensive, in termsof both economic and radiation-exposure costs. Thisled to a search for more affordable methods tovalidate inspection techniques and procedures.Methods are presented for calculating POD curvesbased on signal-to-noise studies using field data.Results of eddy current scans of tubes withlaboratory-induced ODSCC are presented withassociated POD curves. These studies appearpromising in predicting realistic POD curves for newinspection technologies. They are being used toqualify an improved eddy current array probe inpreparation for field use.
1. INTRODUCTION
Requirements for aging nuclear steam generator (SG)tube inspections are becoming increasingly stringentthroughout the world, including Canada. The effort ofremoving tubes, and the special handling required ofthese radioactive samples, makes validating aninspection with in-service tubes an extremelyexpensive exercise.
Canadian-designed CANDU reactors have SGscontaining various tube materials. The dimensionsand material composition of the tubes can greatlyaffect design features in the probes required to ensurethat eddy current inspections will be reliable. Forexample, SG tubes in the Pickering NuclearGenerating Station (PNGS) are composed of aferromagnetic copper-nickel alloy called Monel 400.Because these tubes are ferromagnetic, powerfulpermanent magnets need to be integrated into eddycurrent probe designs to magnetically saturate thetube material [1,2]. Magnetic saturation is requiredto ensure adequate eddy current depth of penetrationin order for internal probes to detect defects thatinitiate from the outer diameter (OD) surface of thetube. It is also needed to eliminate probe signaldistortions from magnetic permeability variations thatcan obscure defect signals.
Another important and unique characteristic ofCANDU SG tubes is that they all have deposits ofmagnetite on the internal diameter (ID) surfaces.These magnetic layers partially shield the tube wallsfrom the probes' electromagnetic fields, therebyweakening probe responses to defects. In addition,variations in the magnetic permeability and thicknessof the deposits can cause distortions in the signalbackground that obscure defect signals.
When validating inspection techniques, theappropriate field conditions must be considered. Inthe case of CANDU SG tubes, the effects of IDmagnetite deposits must be included in validatingeddy current inspections. For some specific CANDUsites, the effects of ferromagnetic tube material and/orelectrically conducting deposits must also be includedin validation exercises.
2. EDDY CURRENT ARRAY PROBES
Most in-service heat exchanger and SG tubeinspection is carried out using bobbin coil eddycurrent probes. These probes consist of coils of wirethat are coaxial with inspected tubes. Eddy currentsthat bobbin probes induce in the inspected tubes arecircumferentially oriented. Unfortunately,circumferential cracks do not interact with thecircumferential eddy currents generated by the bobbincoils, rendering these probes insensitive to these typesof cracks.
29

Because of this shortcoming with bobbin coil probes,mechanically rotating pancake coil (RPC) probeshave been implemented worldwide to inspect tubesthat are suspected of having circumferential cracks.Eddy currents induced by these probes havecircumferential and axial components that interactwith cracks oriented in all directions.
In 1991, Inconel 600 SG tubes at the Bruce NuclearGenerating Station (BNGS), Unit 2, developed leaksdue to circumferential OD stress-corrosion cracks(SCC). Inspection of these tubes with industry-standard RPC probes failed to detect any of thecracks except for some that had propagatedcompletely through the tube wall. The reasons for thepoor performance of these probes were that the crackswere located in deformed sections of the tubes, andvariations in the ID magnetite deposits also obscuredcrack signals.
A new transmit-receive eddy current array probe,denoted as C3 (Cecco-3), was developed for thisapplication [3]. This probe consisted of twocircumferential arrays of transmit (active) and receive(passive) coils, as shown in Figure 1. The transmit-receive configuration was chosen because computermodelling showed that transmit-receive probes wereseveral times more sensitive to cracks than lift-off(coil to tube wall proximity variations due to tubedeformation) and magnetite deposit variations.Calculated signals from cracks, lift-off and magnetitedeposits are shown in Figure 2 for pancakeimpedance and transmit-receive eddy current probes.These results clearly show that the signal (from thecrack)-to-noise (from lift-off and deposits) ratio isseveral times better when using a transmit-receiveprobe than when using a pancake impedance probewith coils of the same size.
3. QUALIFICATION USING TUBESREMOVED FROM OPERATING STEAMGENERATORS
The new C3 probe was validated by using it to scanseveral hundred SG tubes at BNGS-2, removing over100 U-bend sections of the inspected tubes, anddestructively analyzing the removed tubes in alaboratory. Probability-of-detection (POD)histograms based on the comparison of the inspectionresults with the laboratory measurements are shownin Figure 3. A depth-sizing accuracy plot is shown inFigure 4.
Though effective, the above approach of relying ontubes removed from a reactor is expensive, in termsof both economic and radiation-exposure costs. Thisled to a search for more affordable methods tovalidate inspection techniques and procedures, someof which are described in the following sections.
4. VALIDATION USING LABORATORY-PREPARED SAMPLES
One alternative to technique validation based ontubes removed from in-service SGs is to preparesamples in the laboratory with properties thatsimulate the field conditions encountered ininspections. For CANDU SG tubes, methods havebeen developed that produce ODSCC(circumferential and axial) in Inconel 600, pitting inMonel 400, and fretting wear. Figure 5 shows a dyepenetrant image and a fracture surface of an Inconel600 tube with laboratory-induced SCC. Thedarkened area on the fracture surface outlines thecircumferentially oriented crack. Figure 6 shows acomparison of a pit found in a Monel 400 tubesection removed from an in-service SG, and alaboratory-simulated pit. The two through-wall pitshave similar diameters and volumes.
A method of depositing magnetite layers on SG tubeshas been developed. Tube samples are immersed inan aqueous magnetite suspension. After theappropriate exposed surfaces of the tube have beencoated with the magnetite particles, the tube is heatedin a furnace to dry and sinter the magnetite coating.A comparison of eddy current measurements withthese laboratory-induced layers has shown that theycause as much or more distortion in eddy currentsignals as deposits encountered in the field. Copperlayers have been deposited on tube surfaces using anelectroplating method. The addition of mockupcarbon steel support plates and deformations to therealistic defects and deposits allows the production oflaboratory tube samples that properly simulate thefield conditions encountered in CANDU SG tubeinspections.
5. VALIDATION BASED ON SIGNAL-TO-NOISE COMPARISONS
Background noise in BNGS SG tubes at the HU1support plate locations was quantified in terms ofpopulation (number of tubes) plotted as a function of
30
noise amplitude. These noise population plots wereused to predict POD as a function of signal amplitude(vertical component (Vmx)) by defining a minimumsignal-to-noise ratio to determine detectability. ThePOD was calculated from the normalized area underthe population plot. This was calculated byintegrating the population function from 0 Volts tothe signal voltage (from the calibration curve) dividedby the minimum signal-to-noise ratio required fordetectability. The normalization is performed bydividing these integrals by the integral from 0 volts toinfinity.
To validate this method of calculating POD, thebackground distortion of signals from 4 transmit-receive (T/R) unit C3 probes was quantified. Figure7(a) shows a plot of the noise distribution. From thisplot, POD curves, shown in Figure 7(b), were plottedfor signal-to-noise ratios of 1.4 and 2. Superimposedis the POD curve that was derived by comparing eddycurrent predictions with destructive analysis of tubesremoved from BNGS-2 in 1992. The plot shows thatthis is a reasonable technique for making conservativeestimates of POD curves.
Cecco V.S. and Van Drunen G.,"Recognizing the Scope of Eddy CurrentTesting", in Research Techniques inNondestructive Testing, Vol. 8, 1985,pp 269-301, ed. by R.S. Sharpe, AcademicPress.
Obrutsky L.S., Cecco V.S., Sullivan S.P. andHumphrey D., "Transmit-Receive EddyCurrent Probes for Circumferential Cracks inHeat Exchanger Tubes", MaterialsEvaluation. Vol. 54, No. 1, pp 93-98, 1996January.
6. SUMMARY/CONCLUSIONS
Technique validation for SG tube inspection using in-service components is extremely expensive.However, care must be taken to ensure that validationexercises using laboratory-prepared tubes accuratelysimulate the field conditions that will be encounteredin in-service inspections. Laboratory-induceddefects, especially cracks, must closely resemble in-service defects. Equally important is the need forsignificant field-like tube deformations, expansions,deposits, and support plates that can obscure defectsignals.
A method has been proposed that may makevalidating inspections much more economical. Acomparison of defect signals with the backgroundnoise obtained from real in-service tube scans canhelp to establish the limits of defect detectability.
7. REFERENCES
1. Cecco V.S., Van Drunen G. and Sharp F.L.,"Eddy Current Testing Manual, Vol. 1",AECL Report, AECL-7523, 1981, ChalkRiver, Ontario, Canada.
31

Area ofSensitivity
D •\M_\\\\yv •.••limy \ \ v \ \ \ \. Vr-Vjfm.
ScanDirection
Figure 1: C3 probe showing coil configuration.
i
Impedance Coil Probe Transmit-Receive Probe
Lift-off ID Magnetite 50% OD Crack Lift-off ID Magnetite 50% OD Crack
ID Magnetite
7
Crack Signal
Crack Signal
ALift-off=0.1 mm ALift-off=0.1 mmID Magnetite
Figure 2: Computer modelling results comparing signal (from a crack)-to-noise (from probelift-off or ID magnetite deposit) for a pancake impedance coil probe and atransmit-receive eddy current probe.
32

co
aO
o
100
90
80
70
60
50
40-
30-
20-
10-
o-
Point Estimate Probability
Lower Bound POD (CL = 90%)
0/24
n -
0-19 20-39 40-59
11/11
/
>60
Crack Depth (% through wall)
Figure 3: POD histogram for C3 probe detecting ODSCC in Bruce A-NGS SG tubes.
1 0 0
Figure 4:
O
o
c
a
W
0 20 40 60 80
Destructive Measurement (% Through-Wall)
Sizing accuracy plot for C3 probe detecting ODSCC in CANDU SG tubes whichwere subsequently removed and analyzed destructively.
33

Figure 5:
(a)
^ y O T ^ ;
(b)
(a) Dye penetrant photograph of a SG tube sample with laboratory-inducedODSCC. (b) Fracture cross section of a circumferential ODSCC in a SG tube.
(a)(b)
Figure 6: (a) Photograph of a laboratory-induced, 100 % OD pit in a Monel 400 SG tube,(b) Photograph of a 100% OD pit in a tube removed from PNGS-B. Both pits areof similar diameter.
34

o
o
I
4 0 -
3 0 -
2 0 -
10
0.00 1.00 2.00 3.00
Noise Amplitude (Volts)
(a)
4.00
100-
8 0 -
c
oQo^ 4
2PH 2
C
CalculatedS/N Ratio >= 1.4
Measured FromBNGS-2 Pull Tubes, 1992/
•\
\
/
I
11
i
i
—-WIf
1
1J
j/j
<1///
////
\CalculatedS/N Ratio >= 2
20 40 60 80Crack Depth (% through-wall)
100
Figure 7: (a) Noise distribution plotted for 4 T/R unit C3 probes at the HUl support platelocations in BNGS-2 SG tubes, (b) POD curves for 4 T/R unit C3 probesdetecting circumferential ODSCC at the HUl support plate locations in BNGS-2SG tubes.
35

CA0000007EDDY CURRENT AND ULTRASONIC FUEL
CHANNEL INSPECTION ATKARACHI NUCLEAR POWER PLANT
W. R. MayoAtomic Energy of Canada Limited
Chalk River LaboratoriesChalk River, ON KOJ 1J0
and
Muhammad Mansur Alam (PAEC)
ABSTRACT
In November of 1993 an in-serviceinspection was performed on eight fuelchannels in the Karachi Nuclear Power Plant(KANUPP) reactor. The workscopeincluded ultrasonic and eddy currentvolumetric examinations, and eddy currentmeasurement of pressure-to-calandria tubegap-
This paper briefly discusses the planningstrategy of the ultrasonic and eddy currentexaminations, and describes the equipmentdeveloped to meet the requirements,followed by details of the actual channelinspection campaign.
The presented nondestructive examinationsassisted in determining fitness for service ofKANUPP reactor channels in general, andconfirmed that the problems associated withchannel G12 were not generic in nature.
1. INTRODUCTION
The KANUPP reactor core consists of 208 fuelchannels, each of which comprises two concentrichorizontal tubes with end fittings at each end. Thesetubes i.e., the pressure tube (heat treated, Zr-2.5%Nb;inside diameter; 82.9 mm; thickness: 4.38 mm) andthe calandria tube (Zr-2) are separated (diametricalgap: 9.2 mm) by two tight fitted spacers called gartersprings (Fig. 1). The fuel channel integrity dependson the pressure tube, as it forms the main pressureboundary. During reactor operation it experiencessevere stress & temperature variations in a highthermal and fast neutron flux environment. Inaddition to this, phenomena such as debris frets,abnormal fuel supports, localized electrical resistivity
variation, fuelling tracks with and without magneticdeposits, and material lap flaws may occur.
The reactor channel G12 at KANUPP was discoveredsagged in 1987, to the extent that its on-powerfuelling was no longer possible. This and anotherchannel F15, which too was found somewhatretracted, operated without any fuel subsequently.The cause of a phenomenally large sag of over 40 mmin the case of G12 was suspected, in the very initialstages, to be due to restriction in the horizontalmovement of the tube at the free end. The ASSETTmission of the IAEA recommended in 1989 theremoval of channel G12 and inspection of a fewadditional channels, including F15, to ascertain thecause of retraction and establish beyond reasonabledoubt whether or not the problem was generic innature.
An in-service inspection of eight fuel channels wassubsequently carried out in 1993 November as partof an assessment of KANUPP fuel channel fitness forservice. The entire scope of the site work included:
1) Ultrasonic and Eddy Current Volumetric (FlawDetection) Examinations,
2) Eddy Current Measurement of Pressure-to-Calandria Tube Gap,
3) Dimensional Gauging,4) Material Sampling,5) Removal of channel G12, 6) Post Removal
Photography and Visual Examination, and7) Post Removal Sample Cutting for return
shipment to Chalk River Laboratories, wheremetallurgical examinations took place.
This paper concentrates on the flaw detectionexaminations and pressure-to-calandria tube gapmeasurements, which provide important parametersfor the reactor fuel channel integrity assessment.
2. SELECTION OF CHANNELS FORINSPECTION
The CSA standard (CAN3-N285.4-M83) minimumrequirement is to inspect a total of five channels, fourin the high flux and one in the low flux regionrespectively [1]. Eight channels were chosen for theinspection. The increased number of channels fromfive to eight was aimed at acquiring detailedinformation for the integrity assessment, since it wasthe first KANUPP reactor channel inspection in its(over) two decades of operation.
36

3. INSPECTION PLAN
The plan called for ultrasonic flaw detection inchannels F15 and G12. Providing that the ultrasonicexamination of F15 showed no generic outsidesurface phenomena of concern, the remaining sixchannels were to be examined by eddy current flawdetection. Channel G-12 was also scheduled forultrasonic examination because of its seizedcondition. However, due to its unique nature, theresults of ultrasonics in this channel were not to beused in the decision to proceed with eddy current orultrasonic flaw detection in the remaining six. Alleight channels were to be profiled for pressure-to-calandria tube gap, since the garter springs withoutgirdle wires in the KANUPP design are not detectableusing the standard eddy current methods, and henceno dedicated spacer detection method was available.
The plan was modified during on-site actualinspection, due to the occurrence of anomalous gapprofiling results in channel J10, requiring ultrasonicflaw detection to be carried out in that channel as wellas eddy current. Thus, the actual examinationsperformed in the eight channels are summarized inTable 1.
Table 11993 KANUPP Ultrasonic, Eddy
Channel
F-15G-12F-06G-08J-10G-09K-09N-03
Gap Examinations
UT
XX
X
ET
XXXXXX
Current, and
Gap
XXXXXXXX
Notes :i. "X" denotes this type of examination was
performed,ii. The actual order of the sequence of events is not
as suggested by the table.
4. PREPARATORY WORK
The on-site inspection of fuel channels requiredextensive preparatory work. This was becauseKANUPP pressure tubes are of smaller diameter thanthe 103 mm diameter tubes for which AECL-CRLequipment was designed. Therefore necessary
equipment required modification involving re-designand fabrication.
It should be noted that AECL-CRL adopted the "drytechnique" of examination, in which inspection iscarried out with drained channels, as opposed to the"wet technique", in which channels to be inspectedremain fully flooded with D20 (CIGAR system). Abrief description of work done at AECL-CRL andKANUPP is given below:
4.1 At AECL-CRL
1. Re-design, development and fabrication ofvolumetric inspection heads for ultrasonic,eddy current and gap measurement.
2. Design and fabrication of calibration tubes forvolumetric and gap measurements.
3. Modification of the delivery unit i.e., STEM(Storable Tubular Extendible member).STEM units were chosen, due to their simplicityand size, to deliver the various inspectionheads in the channels.
4. Improvement in software for data acquisition anddisplay.
5. Fabrication and assembly of a full-size singlechannel mockup simulating G12, for prooftesting equipment.
6. Deployment of a multichannel ultrasonicinstrument (USIP-20H) for inspection.
After completion of the above modifications, thecomplete system was satisfactorily tested on themockup before dispatching it to KANUPP.
4.2 At KANUPP
1. A single channel mock-up was installed to checkthe equipment and training of KANUPPpersonnel prior to actual inspection work.
2. The reactor fuel channels were defuelled, drainedand swabbed prior to installation of inspectionsleeves. These sleeves were provided tocompensate the dimensional difference betweenpressure tube and end fitting inside diameter, sothat inspection heads could move easily. Theinlet side sleeve design had the provision ofkeeping the latch finger in its open position.
37

3. Inspection platforms were provided on bothreactor faces to position test equipment and allowmaneuverability of inspection personnel. Acontrol room was also established for dataacquisition.
5. EXAMINATION
Ultrasonic flaw detection was performed using four-direction angle beam (approximately 45°) 10 MHzshear wave examination, and 15 MHz normal beam.The head is depicted in Fig. 2. Coupling wasmaintained by low pressure pumping of water (D2O)to the transducer insert, where a pocket of water wasmaintained by the spring loading of the insert againstthe tube wall. This system is usually referred to as a"bubbler". Run-off water was collected by a dripspout and returned to the pump reservoir periodically.At the time this system was designed, spacelimitations necessitated the use of 6 mm diameter(active element) ultrasonic transducers. Other thanthis, the transducer specifications were the same asthose used in Ontario Hydro's CIGAR system.Sensitivity would thus be expected to be comparableto that of CIGAR, with some minor relative decreasein signal-to-noise. Full coverage of the tube volumerequired a spiral scan pitch of 1 mm. It took about 6hours to scan a channel.
Eddy current flaw detection was performed using aGhent 1 surface probe at 50 kHz. This type ofdifferential probe exhibits high sensitivity to shallowsurface breaking flaws in pressure tubes. The head isdepicted in Fig. 2, and consisted of a simple rotatingsection with spring-loaded probe. The central anti-wear tip of the probe was sapphire, which eliminatesany requirement for adjustment of instrument settingsdue to "lift-off variation as the scans progress. Nocouplant is required for eddy current examination,which greatly simplifies this type of head in general.For re-examination of investigatable indications, thecentral coil of the Ghent probe was used, with a built-in isolated reference coil, in absolute mode. Nochange of probe was thereby required. Underfavourable conditions this type of flaw detection hasbeen demonstrated to detect flaws of depth 0.10 mmand length less than 6 mm. Under typical KANUPPreactor conditions it was however believed that thelimit of detectability was closer to 0.15 mm deep andless than 6 mm long. Full tube coverage, with someoverlap, required a scan pitch of 2 mm. It took about50 minutes to scan a channel.
The gap measurement was performed using a largediameter send-receive eddy current device. Testing at
CRL before examination at KANUPP, using arepresentative sample of pressure tube, indicatedsufficiently low sensitivity to wall thickness variationthat wall thickness compensation was not required forthe send-receive configuration used. The head,depicted in Fig. 2, was run along the channel to plotaxial profiles at the bottom and one side of thechannel, and rotated at five equi-spaced locations toplot circumferential profiles'. For each type ofprofile, gap was typically sampled at every millimetreof axial (circumferential) travel. About half an hourwas required to scan a channel.
Set-up of the equipment is shown in Fig. 2.
6. PERFORMANCE OF EQUIPMENT
Ultrasonic signal-to-noise was judged satisfactory.This can be seen in the signals from the calibrationnotches and was evident in the data during scanning(Fig. 3). A strip chart display of the digitized datawas generated as scanning took place. After scanningof a channel was complete, an "off-line" C-scan ofthe data could be generated (Fig. 4). This tended togreatly aid the detection of low level signals thatmight be lost in the noise of the compacted strip-chart, and allowed inspectors to verify whetherechoes detected on successive rotations represented aflaw of axial extent or were simply the result ofrandom reflections. The presence of serious flaws isnot therefore expected to have gone undetected.
The eddy current equipment was quite satisfactory,and the STEM units worked very well with the eddycurrent flaw detection system. Reference signalsfrom 0.15 mm deep (typ.) EDM reference notchesgenerally showed a signal-to-noise ratio of about 3(Fig. 3). As with ultrasonics, data could be displayedin an off-line C-scan format, which aids detection andcharacterization. An X-Y (impedance plane) re-display capability also enhanced the ability tocharacterize indications from the eddy current data(Fig. 4).
Equipment for gap measurement functioned nearflawlessly, and data display was satisfied by thesimple generation of strip charts for axial andcircumferential scans. The greatest issue in gapmeasurement performance involved the discovery of
CAN3-N285.4-M83 has no requirements forpressure-to-calandria tube gap measurement. Theseare considered reasonable choices.
38
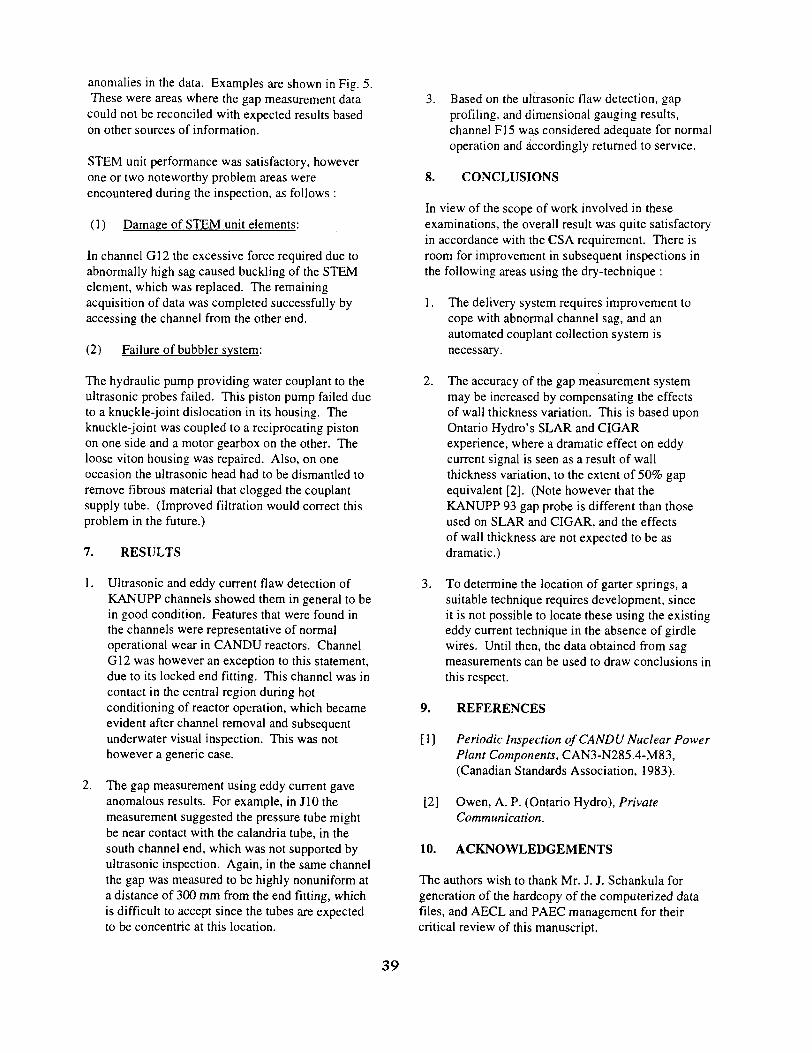
anomalies in the data. Examples are shown in Fig. 5.These were areas where the gap measurement datacould not be reconciled with expected results basedon other sources of information.
STEM unit performance was satisfactory, howeverone or two noteworthy problem areas wereencountered during the inspection, as follows :
(1) Damage of STEM unit elements:
In channel G12 the excessive force required due toabnormally high sag caused buckling of the STEMelement, which was replaced. The remainingacquisition of data was completed successfully byaccessing the channel from the other end.
(2) Failure of bubbler system:
The hydraulic pump providing water couplant to theultrasonic probes failed. This piston pump failed dueto a knuckle-joint dislocation in its housing. Theknuckle-joint was coupled to a reciprocating pistonon one side and a motor gearbox on the other. Theloose viton housing was repaired. Also, on oneoccasion the ultrasonic head had to be dismantled toremove fibrous material that clogged the couplantsupply tube. (Improved filtration would correct thisproblem in the future.)
7. RESULTS
1. Ultrasonic and eddy current flaw detection ofKANUPP channels showed them in general to bein good condition. Features that were found inthe channels were representative of normaloperational wear in CANDU reactors. ChannelG12 was however an exception to this statement,due to its locked end fitting. This channel was incontact in the central region during hotconditioning of reactor operation, which becameevident after channel removal and subsequentunderwater visual inspection. This was nothowever a generic case.
2. The gap measurement using eddy current gaveanomalous results. For example, in J10 themeasurement suggested the pressure tube mightbe near contact with the calandria tube, in thesouth channel end, which was not supported byultrasonic inspection. Again, in the same channelthe gap was measured to be highly nonuniform ata distance of 300 mm from the end fitting, whichis difficult to accept since the tubes are expectedto be concentric at this location.
3. Based on the ultrasonic flaw detection, gapprofiling, and dimensional gauging results,channel F15 was considered adequate for normaloperation and accordingly returned to service.
8. CONCLUSIONS
In view of the scope of work involved in theseexaminations, the overall result was quite satisfactoryin accordance with the CSA requirement. There isroom for improvement in subsequent inspections inthe following areas using the dry-technique :
1. The delivery system requires improvement tocope with abnormal channel sag, and anautomated couplant collection system isnecessary.
2. The accuracy of the gap measurement systemmay be increased by compensating the effectsof wall thickness variation. This is based uponOntario Hydro's SLAR and CIGARexperience, where a dramatic effect on eddycurrent signal is seen as a result of wallthickness variation, to the extent of 50% gapequivalent [2]. (Note however that theKANUPP 93 gap probe is different than thoseused on SLAR and CIGAR, and the effectsof wall thickness are not expected to be asdramatic.)
3. To determine the location of garter springs, asuitable technique requires development, sinceit is not possible to locate these using the existingeddy current technique in the absence of girdlewires. Until then, the data obtained from sagmeasurements can be used to draw conclusions inthis respect.
9. REFERENCES
[ 1 ] Periodic Inspection of CANDU Nuclear PowerPlant Components, CAN3-N285.4-M83,(Canadian Standards Association, 1983).
[2] Owen, A. P. (Ontario Hydro), PrivateComm un ication.
10. ACKNOWLEDGEMENTS
The authors wish to thank Mr. J. J. Schankula forgeneration of the hardcopy of the computerized datafiles, and AECL and PAEC management for theircritical review of this manuscript.
39
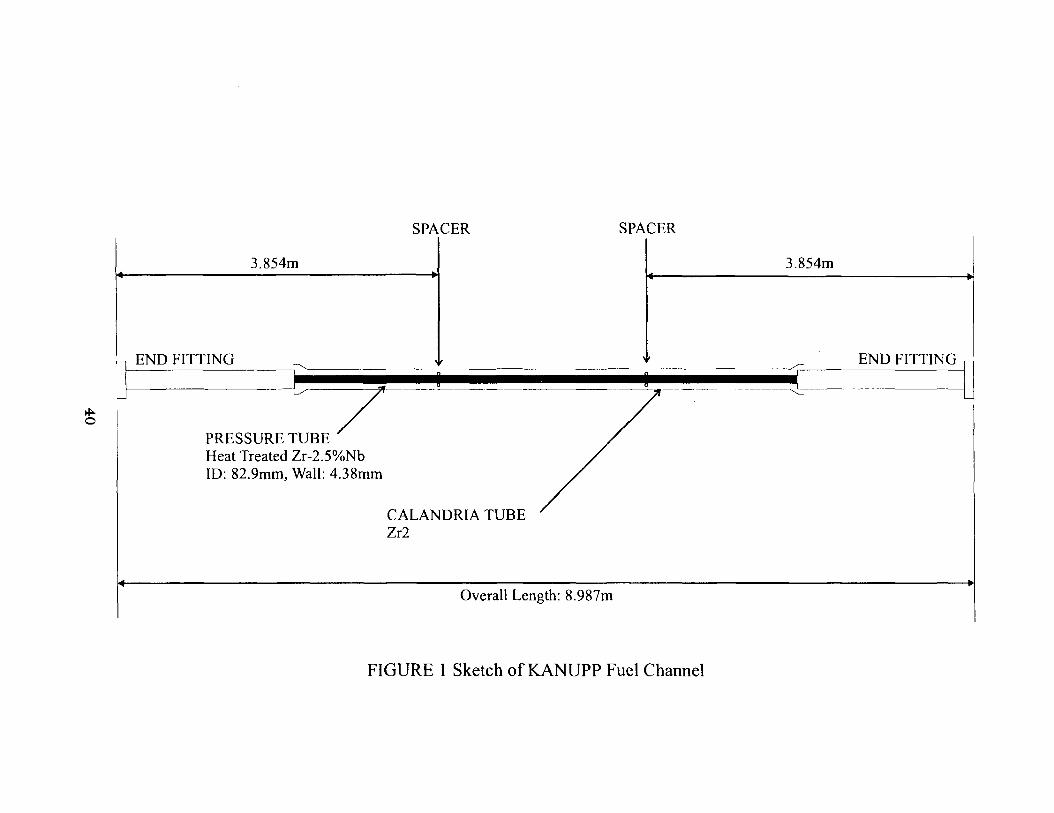
SPACER SPACER
PRESSURE TUBEHeat Treated Zr-2.5%NbID: 82.9mm, Wall: 4.38mm
CALANDRIA TUBEZr2
Overall Length: 8.987m
FIGURE 1 Sketch of KANUPP Fuel Channel

Bubbler insert\
Grc. directed beams " AxiaJiy dircctedbeams
Ultrasonic Haw Detection
r-f- Water supply ———-j| p>-Pc6ition——i
/—Rotation 1-•>UTRI :
Pump
FIGURE 2 : Heads, Delivery System, Control, and Data Acquisition
41
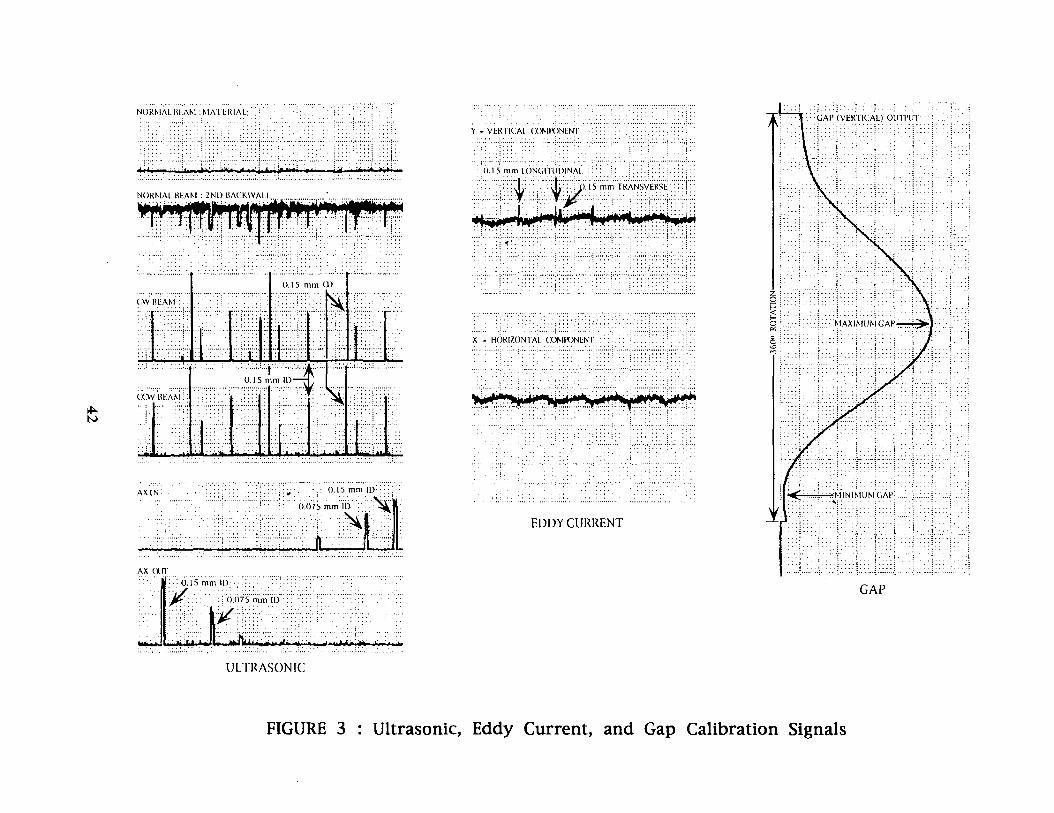
NORMAL M;AM:MATL-.RIAL: .'•
AX I N . :::• .'.'.\\'.:\:\':^-\ : j : 0 . 1 5 m m I D :
:• .. .-.: ;!"•::•. : ' : ( ) ( ) 7 5 m ' m T l i " : •. .T: .
AX cxn"0.15 mm ID:
0 07S mm II)
VJll
V - VtRTlCAl. COMPONENT
EDDY CURRENT
GAP
ULTRASONIC
FIGURE 3 : Ultrasonic, Eddy Current, and Gap Calibration Signals

IHTKASONIC
STRIP CHART
ASSOCIATED C-SCAN I \
. • 1 ' r 1 U-^ilfc • fl ^ rl *1 \t*•*• i • >n) _i.._i _'.,»
• • * • i 1 1 • ' l | i > M h ' • • • * • • - '
. I . L . . .* - - J l 1 ^ • 1 •*
CW ccw AX. IN AX. OUT
FD»Y f'DRRENT
STRIP CHART
(Ferromagnetic deposits in N03)
ASSOCIATED C-SCAN
IMPEDANCEPLANE DISPLAY
:X
FIGURE 4 : Data Display Formats43

CHANNEL G12 «OTTOM-()I:-CHANNEI. AXIAI. PRORI.E
1] mm • ..———"Anomalous results suggestingnon-concentricity near channelend.
ZERO-
CHANNKI 111) BOTTOM-Or-CHANNKl. AXIAL PROIMLI-1 ] mm : -—i
Anomalous results suggestingnon-concentricity near channelend.
Circumferential profiles (especially)suggested (anomalous) near-contactat the south end of the channel.
ZERO-
FIGURE 5 : Gap Data Anomaly Examples
44

DETAILED SIMULATION OF ULTRASONICINSPECTIONS
K.R. Chaplin, S.R. Douglas, D. Dunford,L.F.P. Lo, C.A. Daza
Atomic Energy of Canada LimitedChalk River Laboratories
Chalk River, ON KOJ 1J0
ABSTRACT
Simulations of ultrasonic inspection of engineeredcomponents have been performed at the Chalk RiverLaboratories of AECL for over 10 years. The computermodel, called EWE for Elastic Wave Equations, solvesthe Elastic Wave Equations using a novel Finite differencescheme. It simulates the propagation of an ultrasonicwave from the transducer to a flaw, the scatter of wavesfrom the flaw, and measurement of signals at a receivetransducer. Regions of different materials, water and steelfor example, can be simulated. In addition, regions withslightly different material properties from the parentmaterial can be investigated. The two major types ofoutput are displays of the ultrasonic waves inside thecomponent and the correspondingA-scans.
EPRI and other organizations have used ultrasonic modelsfor: defining acceptable ultrasonic inspection procedures,designing and evaluating inspection techniques, and forquantifying inspection reliability. The EWE model hasbeen applied to the inspection of large pipes in a nuclearplant, gas pipeline welds and steam generator tubes. Mostrecent work has dealt with the ultrasonic inspection ofpressure tubes in CANDU reactors. Pressure tubeinspections can reliably detect and size defects; however,there are improvements that can be made. For example,knowing the sharpness of a flaw-tip is crucial for fitnessfor service assessments. Computer modelling of theultrasonic inspection of flaws with different root radiushas suggested inspection techniques that provide flaw tipradius information. A preliminary investigation of thesemethods has been made in the laboratory.
The basis for the model will be reviewed at thepresentation. Then the results of computer simulationswill be displayed on a PC using an interactive programthat analyzes simulated A-scans. This software tool givesinspection staff direct access to the results of computersimulations.
1. INTRODUCTIONCA0000008
At AECL, we have developed a computer program calledElastic Wave Equations (EWE) to simulate thepropagation of elastic waves in solids and liquids[1,2,3,4,5,6,7]. EWE numerically solves the fundamentalequations governing the motion of sound in materials.EWE has been applied to ultrasonic testing both toimprove understanding and to develop new capabilities.
Although conceptually simple, ultrasonic testing producesvaried and confusing results because of the complicatedinteractions of waves with materials. There are threetypes (modes) of ultrasonic waves in solids: compression,shear, and surface. One mode of wave is converted atinterfaces into the other two modes, producing more thana dozen waves even in simple situations. The ultrasonicinspector measures many signals with sensors(transducers) outside of the inspected object; then, theinspector infers what is happening inside the inspectedobject.
As modelled by EWE, a numerically-generated pulse ofsound from the input transducer propagates through abounded region that contains areas of different materialproperties and defects of different types. The wavereflects, diffracts, refracts, mode converts, and performsother wave phenomena. EWE offers insight into theseprocesses, first, because it is based upon the fundamentalphysics, and does not adjust the results to conform withexperience. Second, EWE produces "wave displays" thatshow complex ultrasonic processes occurring inside asample during an inspection, instead of relying uponmeasurements made outside the sample.
Simulations can be performed with no defect, withdifferent size or type of defect or with send transducerswith different characteristics. Numerical A-scans, whichsimulate inspection results, can be produced for manydifferent receive transducers. The wave displays andnumerical A-scans can be compared to gain insight intohow to interpret inspection results and how to improveinspection techniques. The model can assist in issuesrelated to detection, sizing, and characterization of defectsor materials.
The model was designed to simulate the most importantfactors in ultrasonic inspections. The modelled inputtransducer can produce a pulse train with the frequency,length, width, and focussing similar to a real transducer.The theoretical beam profile can be calculated andcompared to an experimental beam profile. The model ofthe transducer can be adjusted until the amount offocussing is correct. A back-wall reflection from themodelled transducer can be compared to that from a real
45

transducer and the bandwidth can be adjusted. The inputwave is then propagated from the focussed probe to theinterface of the material, possibly through large amountsof water. At the interface, the input wave reflects,refracts, and mode converts so that a shear, compression,and a surface wave enters the inspected material. Thesimulated material can have the shape and materialproperties of the real sample. For example, thecircumferential inspection of a tube has been modelled.The receive transducer can be focussed, positioned faraway, and can have the size and orientation of a realtransducer. Typically, many different numerical A-scansare produced for each simulation.
2. APPLICATIONS
In the 1980's, laboratory A-scans and EWE generatedA-scans were compared with good results [6]. Since then,the computer model has been applied to many differentproblems. The gas pipeline industry wanted to distinguishbetween geometric problems, like high/low, in pipelinewelds and serious flaws, like cracks. A nuclear steamgenerator inspection company was interested intechniques for flaw sizing in the small diameter tubing. Inrecent years effort has been directed towards improvingthe ultrasonic inspection of pressure tubes in CANDUreactors.
Pressure tubes are thin-walled seamless tubes that hold thefuel and coolant in CANDU nuclear power reactors.There are many thousands of pressure tubes in the cores of25 operating CANDU reactors. Pressure tubes are in achallenging environment and demand a very detailedultrasonic inspection. The EWE model has been appliedtowards the three CANDU pressure tube inspectionproblems described below.
a) Ultrasonic Inspection Interpretation
Ultrasonic inspection results can be difficult tounderstand. Many signals are measured even when thereis no flaw. Furthermore, the interaction of waves withflaws is very complex. The primary focus of earlyCANDU modelling work was simulation of inspections togive inspection personnel a better understanding. Aninteractive PC program, EWEView, that animates wavedisplays and shows A-scans has been developed for thispurpose. Most importantly it allows easy identification ofwhich wave in the simulated wall of the pressure tubeproduced which signal in a simulated A-scan. Now, aCompact Disk containing simulations and EWEView canbe given to utility personnel, to allow them to view andanalyse simulations themselves.
b) Measurement of Flaw Shape
Early modelling work investigated improvements in flawsizing, for very small flaws. More recently, interest hasdeveloped in the radius of curvature of the tip of a flaw(root radius). It is required for effective application offitness-for-service guidelines in CANDU pressure tubes.This is a far more complex problem than either flawdetection or flaw depth measurement. EWE has identifiedtwo different inspection techniques that offer promise tohelp characterize the shape of a flaw from its ultrasonicsignature. The first, described briefly herein, is an on-going investigation with the following steps:
define an inspection geometry similar to pressuretube inspections in key respects, but simpler inothers, allowing easier analysis of the wave/flawinteractionsimulate the inspection of flaws with differentroot tip radiianalyse wave displays to determine waves thatscattered differently from blunt and sharp flawschoose transducers to measure these wavessimulate A-scans to determine if blunt and sharpflaws can be differentiatedrun laboratory experiments to determine if modelpredictions are accurate.
Figures 1 to 4 summarize the results of the above steps.The wave displays in the top of Figures 1 and 2 show thebasic inspection geometry. The inspection shear wave isapproaching a flaw from the bottom of the wave display.The flaw is adjacent to water and is water filled.
Figures 1 and 2 contain wave displays that compare theresults of an inspection shear wave impacting a blunt flaw(middle of each figure) and a sharp flaw (bottom of eachfigure) at different time periods. Figure 1 shows thecenter of a wave striking a flaw and producing a verylarge compression wave from the blunt flaw and a muchsmaller compression wave from the sharp flaw. Figure 2shows the edge of the same wave reflecting from thewater/pressure tube interface, striking the flaw, andproducing a barely visible compression wave from theblunt flaw and a significant compression wave from thesharp flaw.
Figure 3 shows A-scans from the above simulations. Theblunt flaw simulation produced a large signal followed bya small signal. The sharp flaw simulation produced asmall signal followed by a large signal. For the sharp flawsimulation, the first signal dropped in amplitude by morethan a factor of 3, while the second signal rose inamplitude by more than a factor of 3.
46
Laboratory experiments were performed to determine ifthese predictions were accurate. Figure 4 shows theamplitude of these two signals as an ultrasonic transducerscans over a blunt and a sharp flaw. The blunt flaw scanhad a large first signal followed by a small second signal.The sharp flaw scan showed the opposite, both aspredicted by EWE.
c) Detection of Zirconium Hydride Blisters
CANDU pressure tubes are known to absorb hydrogen(deuterium) slowly over their lifetime. Under certainconditions, the hydrogen can accumulate in a localizedregion to form what is called a zirconium hydride blister.These must be detected before cracks develop in them,which requires measuring a subtle material change.
Simulations, which were based upon previous work[5],were performed of a shear wave directed at the back-wallat an inspection angle above critical angle' for azirconium hydride blister but below critical angle fornormal pressure tube material. For the blister, thesimulations indicated that the inspection shear wavereflected as expected from simple wave theory and only asmall compression wave was produced. For normalpressure tube material however, the simulations indicatedthat the inspection shear wave shifted along the interfaceduring reflection and a high energy compression wavewas produced. The resulting A-scan from the blister hada small first signal from the compression wave followedby a larger second signal from the shear wave reflectedfrom the back-wall. The normal pressure tube materialhad the opposite.
3. CONCLUSIONS
The EWE computer model is a mature tool for simulationof ultrasonic inspections. It has been compared toexperimental results with good agreement and has beenapplied to difficult inspection problems. Interactivesoftware tools that allow detailed analysis of simulatedresults have been developed for the PC.
REFERENCES
[1] S.R. Douglas and K.R. Chaplin, "EWE: AComputer Model for Ultrasonic Inspection",Atomic Energy of Canada Limited, ReportAECL-10507, 1991 November.
[2] S. Douglas, K. Chaplin and D. Dunford,"Computer Simulation of UltrasonicInspections", Proceedings of the NDT Tools ofTomorrow, 1995 May 15-18.
[3] K.R. Chaplin, D.B. Duncan and R. Parker,"Ultrasonic Computer Model Verification",Proceedings of the 1 lth World Conference onNDT, pp. 1913-1919, Las Vegas, 1985November.
[4] K.R. Chaplin, D.B. Duncan, and V.N. Sycko,"Modelling Ultrasonic Transducer Performance",Atomic Energy of Canada Limited, ReportCRNL-4097, 1987 March.
[5] K.R. Chaplin, V.N. Sycko, and D.B. Duncan,"Computer Modelling of 60 Degree ShearWaves", Ultrasonics International 87 ConferenceProceedings, pp. 577-582, London, England,1987 July.
K.R. Chaplin and V.N. Sycko, "ComputerModeling of A-scans", Ultrasonics International87 Conference Proceedings, pp. 389-394,London, England, 1987 July.
K.R. Chaplin, D.B. Duncan, and V.N. Sycko,"Ultrasonic Modelling of the Normal BeamResponse from Notches", Proceedings of theFifth Pan Pacific Conference on NondestructiveTesting, pp. 229-242, Vancouver, 1987 April.
Wave interaction is dominated by reflection abovecritical angle. The interaction is more complex belowcritical angle.
47

WATER
PRESSURETUBE WALL
d = 1.0 mm
r= FLAW TIP RADIUS
FIRST COMPRESSION WAVE
Inspection shear wave at 2.1 microseconds
BLUNT FLAWr = 0.4 mm
First compression wave at 4.2 microseconds
SHARP FLAWr = 0.006 mm
7First compression wave at 4.2 microseconds
Figure 1: Wave displays from simulations of a blunt flaw (middle) and a sharp flaw (bottom).The first compression wave, used to discriminate blunt and sharp flaws, is emphasized.
48

WATER
PRESSURETUBE WALL
0 mm
r= FLAW TIP RADIUS
SECOND COMPRESSION WAVE
Inspection shear wave at 2.1 microseconds
BLUNT FLAWr = 0.4 mm
Second compression wave at 4.8 microseconds
SHARP FLAWr = 0.006 mm
Second compression wave at 4.8 microseconds
Figure 2: Wave displays from simulations of a blunt flaw (middle) and a sharp flaw (bottom).The second compression wave, used to discriminate blunt and sharp flaws, is emphasized.
49
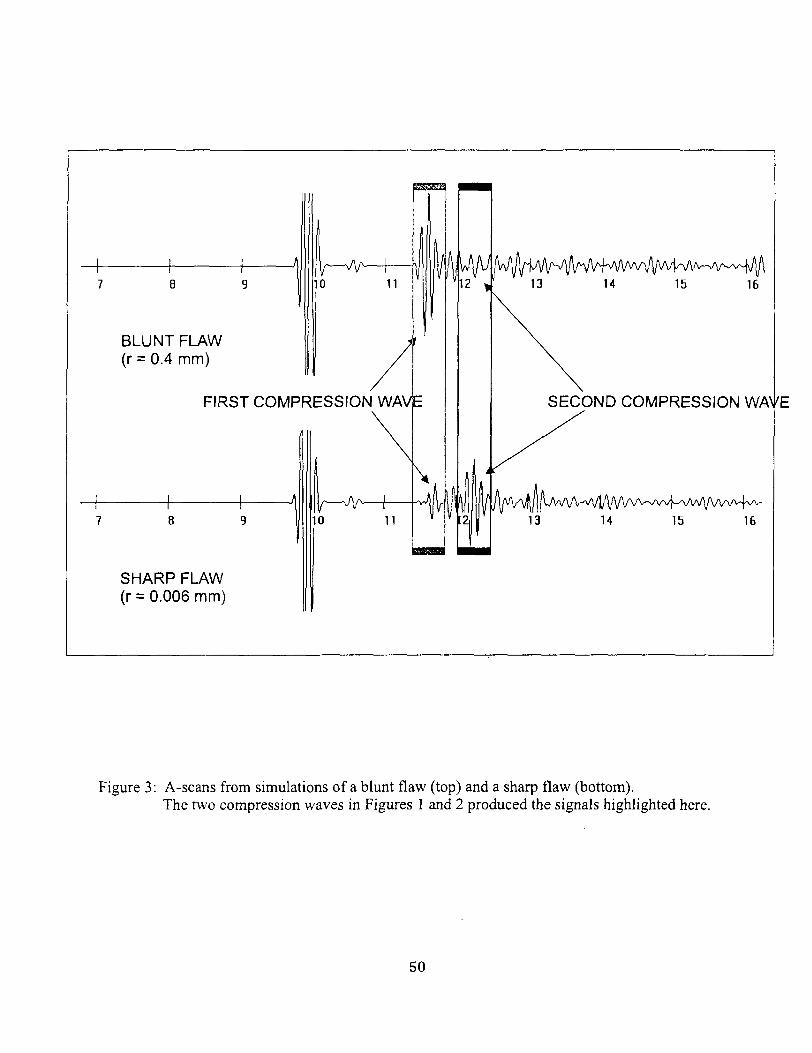
BLUNT FLAW(r = 0.4 mm)
n
FIRST COMPRESSION WAVE
SHARP FLAW(r = 0.006 mm)
11
12 14 15 16
SECOND COMPRESSION WAN
13 14 15 16
>E
Figure 3: A-scans from simulations of a blunt flaw (top) and a sharp flaw (bottom).The two compression waves in Figures 1 and 2 produced the signals highlighted here.
50

Echo Amplitude from Blunt Flaw
" 1st Compression Wave1 2nd Compression Wave
o•a3
Rotational Position
Echo Amplitude from Sharp Flaw
" 1 st Compression Wave
' 2nd Compression Wave
35 T
oo § g 2 £
CM CN CM CM
CM
CM CM
Rotational Position
Figure 4: Results of laboratory experiments in which the amplitude of the first and secondcompression wave are measured and plotted against probe rotational positionaround the tube for a blunt flaw (top) and a sharp flaw (bottom).
51

CA0000009Improving the Reliability of Stator Insulation System in Rotating Machines
Bal K. Gupta*, Howard G. Sedding, and Ian M. CulbertOntario Hydro, Toronto, Canada
•Address: 800 Kipling Avenue, Rm KR-151Toronto, Ontario, Canada, M8Z 5S4.
Abstract: Reliable performance of rotatingmachines, especially generators and primary heattransport pump motors, is critical to the efficientoperation of nuclear stations. A significantnumber of premature machine failures have beenattributed to the stator insulation problems.Ontario Hydro has attempted to assure the longterm reliability of the insulation system in criticalrotating machines through proper specificationsand quality assurance tests for new machines andperiodic on-line and off-line diagnostic tests onmachines in service. The experience gained overthe last twenty years is presented in this paper.
Functional specifications have been developed forthe insulation system in critical rotating machinesbased on engineering considerations and our pastexperience. These specifications includeinsulation stress, insulation resistance andpolarization index, partial discharge levels,dissipation factor and tip up, AC and DC hipottests. Voltage endurance tests are specified forgroundwall insulation system of full sizeproduction coils and bars. For machines withmulti-turn coils, turn insulation strength for fastfronted surges is specified and verified throughtests on all coils in the factory and on samples offinished coils in the laboratory.
Periodic on-line and off-line diagnostic tests areperformed to assess the condition of the statorinsulation system in machines in service. Partialdischarges are measured on-line using severaltechniques to detect any excessive degradation ofthe insulation system in critical machines. Novelsensors have been developed and installed inseveral machines to facilitate measurements ofpartial discharges on operating machines. Severaloff-line tests are performed either to confirm theproblems indicated by the on-line tests or to assessthe insulation system in machines which can notbe easily tested on-line. Experience with thesetests, including their capabilities and limitations,are presented.
1. INTRODUCTION
Rotating machines are essential to the operation ofa nuclear generating station. Premature failure ofa generator or an essential motor can result in largefinancial losses to a utility. Also some of themachines, eg, standby generators and emergencypower generators are mandatory for safe operationof nuclear stations. The present competitiveutility environment makes it even more imperativeto have the equipment operating reliably withoutany premature failures and the consequent forcedoutages which may severely reduce revenue.Almost a third of rotating machine failures arecaused by a breakdown of stator insulation []].Hence taking steps to improve the reliability ofthe stator insulation system in all importantmachines in a nuclear station will pay goodeconomic dividends. Ontario Hydro has had itsshare of premature failures of important machinesin its nuclear stations and has taken steps toimprove the reliability of stator insulation systemsin important rotating machines, ie, turbinegenerators (TG), standby generators, and largemotors rated 4.1 kV and above.
In Ontario Hydro, the process of assuring a longterm reliable service life of the stator insulationsystem begins with the proper functionalspecification and continues through acceptancetests during and/or after the manufacturing andcommissioning stages. Periodic diagnostic testsare also performed through the service life of themachine as discussed in the following sections. Inthis paper we summarize our experience in thisarea.
2. VENDOR QUALIFICATION
Whether purchasing the stator winding for newgenerators and motors or for the rewind of existingones, the insulation designs from prospectivevendors should be evaluated. This evaluationshould include a review of the materials used,winding design (including voltage stresses), andmanufacturing processes including sample coiltesting. The vendor's capability and experience tocomply with the acceptance criteria, to performrequired tests (eg, voltage endurance and thermal
52

cycling tests for groundwall, surge tests formultiturn coils etc, as described below), and toassure good quality control during themanufacturing process should be reviewed. Onlymanufacturers whose windings are likely to meetthe specifications consistently should be asked tobid on the job.
3. FUNCTIONAL SPECIFICATIONAND ACCEPTANCE TESTS
The functional specification for the machineshould be based on the application and theexpected performance of the machine. It shouldcontain all the tests and the associated acceptancecriteria required at various critical stages of themanufacturing process and/or after the finalassembly of the stator winding. The specificationsshould include (along other pertinentspecifications) the following important features ofthe stator winding insulation system design andquality assurance during manufacture:
a. Class of insulation and maximum temperaturerise: Ontario Hydro often specifies class Finsulation systems for class B temperature riseto ensure an adequate thermal life of criticalmachines.
b. Requirement (or not) for semi-conductingcoating on the groundwall in the slot section& stress grading treatment at the slot tooverhang transition area. Both treatments arerequired for machines rated higher than 4.1kV.
c. Various type tests to be performed on coilsrandomly selected from the production run:By nature these tests are destructive and cannot be performed on the coils or the windingto be used. These tests evaluate the adequacyof the winding design. If more than one unitof the same winding are ordered, these testscan be performed once to prove the design.
Voltage endurance tests, as described in IEEEStandard 1043 [2] are conducted on at leasttwo coils. The coils are expected to survive250 hours at 110 C and 2.5 pu voltage (eg, 35kV for 13.8 kV coils). For machines to beused in cycling duty, thermal cycling tests [3]are specified. For machines with multi-tumcoils, the turn insulation strength should bedetermined for complete coils, and it shouldexceed 3.5 pu for surges with rise times in 0.1
to 0.2 us range [4]. Although not accepted yetas a standard, a recently described endurancetest for turn insulation [5] should be specifiedfor multiturn coils of critical machines.
In some cases, Ontario Hydro has specifiedthe maximum acceptable void sizes in theinsulation system. The voids can be measuredin the coils dissected after the type testsabove.
d. Insulation resistance (IR) and polarizationindex (PI) for the coils and/or completewinding: Acceptable values and the voltage tobe used for test should be specified. IEEEStandard 43 [6] provides the requiredguidance. However, the IR values in thisstandard should be treated as bare minimumvalues; modern insulation systems have muchhigher values. This is being addressed in thenext revision of IEEE Standard 43.
e. Dissipation factor at low voltage (10 % of therated line to ground voltage) and tip up(difference in dissipation factor at 10 % andfull rated line to ground voltage) for thewinding [7]. For stator windings with moderninsulation systems, the acceptable values are 1to 2 % for the low voltage dissipation factorand less than 1 % for the tip up.
f. Hipot tests for the winding: The voltagelevels and the type of voltages used to hipotthe complete winding should be specified [8].One minute ac test at (2E+1) kV is normallyspecified for the new windings, where E is therated line-to-line voltage of the machine inkV. Whether equivalent DC hipot tests [9] orequivalent lightning surges can be used as analternative should also be specified.
g. Partial discharges: Partial discharge (pd)activity is an important parameter for judgingthe quality of an insulation system. It detectsthe imperfections like voids, contaminationetc. However, measuring pd levelsquantitatively in a stator winding is not asimple task. The measured results for awinding at a specified voltage depend on thesize and type of defects, the location of pdsites, characteristics of the measuring system,and the connections of the winding for themeasurement. There is no standard at presentfor partial discharges in rotating machines.Working groups are active in IEEE, CIGRE,and IEC in this area. Based on extensive
53

experience with measurements done on largenumber of new and old machines, OntarioHydro specifies pd levels for new machines atthe rated line to ground voltage as measuredwith its own wide band pd measurementsystem. PD measurements are made onindividual phases of a winding, with the othertwo phases connected to ground. For goodmachines with modern insulation systems, thepd levels are 100 mV or less. Another utility,Electricite de France, also specifies pdacceptance limits.
New techniques for on-line pd measurementshave been recently developed [10]. However,for such measurements the pd sensors have tobe built into the winding. Thereforespecifications should include installation ofany sensors (with necessary details) requiredfor later on-line measurements.
h. Quality assurance tests during manufacture:There are some tests which can and should beperformed at various stages of manufacturingprocess. For example hipot tests, turninsulation tests, partial dischargemeasurements, hipot tests may be specifiedfor each coil to weed out coils with defectsbefore insertion in the stator core. This iseasily specified for coils with vacuumpressure impregnated (VPI) or resin richinsulation systems; in this process the coils areeffectively finished before insertion in thestator core. However, for the global VPIinsulation system, the coils are notimpregnated before installation in the slots.The hipot test levels (including surge levelsfor the turn insulation in multiturn coils) forthis type of green coils should be lower,typically 2/3 of those for the finished coils orthe complete winding.
i. Acceptance tests for the complete winding:Insulation resistance, polarization index, hipottests, dissipation factor, and partial dischargesare specified for the whole winding and, ifpossible, for individual phases. Also testsshould be carried out to check the tightness ofwedges in all TGs and SGs before the rotor isinstalled.
4. POST COMMISSIONING TESTS
Once the new or rewound stator is installed at site,some baseline test data should be obtained to allow
monitoring of the winding for evidence ofcontinued "good health", or degradation while inservice. As the windings may settle during thefirst few months of operation, these tests shouldpreferably be performed about a year aftercommissioning and should include the following.
a. IR and PI testsb. Off-line PD and capacitance/dissipation factor
testsc. On-line PD tests (for machines fitted with PD
sensors)
5. IN-SERVICE DIAGNOSTIC TESTS
Once the stator winding is in service, tests shouldbe performed to trend the insulation condition andto detect any significant degradation. The goal isto detect a degraded condition before it leads to anunexpected premature failure and to either correctthe situation or to remove the machine fromservice before a costly forced outage. Someresearchers have reported methods to estimate theremaining life of machines [11-13]. However,their results have not been confirmed in otherstudies. A large EPRI study [14-16] concluded that(a) estimation of the remaining life was impossibleat present; (b) no single parameter gave consistentresults on the condition of stator insulationsystems, and (c) an assessment of the insulationcondition can be made by measuring multipleparameters and trending the results for the samemachine over time or comparing the results forsimilar machines.
Ontario Hydro uses both off-line and on-line teststo assess the condition of stator insulation systems.On large turbine generators, partial discharges aremeasured on line periodically. If a largedeleterious change is noticed, the machine issubjected to off-line tests and visual inspection.On other critical machines, like standbygenerators, off-line measurements are made everyfive years or so. If a problem is observed, themeasurements are repeated at shorter intervals toassess the rate of degradation.
Off-line measurements include IR and PI,capacitance and dissipation factor, and partialdischarges. The measurements are made onindividual phase windings as it provides anopportunity to compare three phases. Further,energizing one phase, with the other two phasesgrounded, produces an electric stress in theendwindings. This stress permits probing for
54

problems in these areas due to contamination orincorrect design of interphase clearances. Thehipot tests are potentially destructive and notapplied every time but only in case of suspectedweaknesses to assure survivability in operation.Performance of a hipot test requires that the utilityis prepared for the consequences of a failure. Inour tests on many machines, no single testprovided consistent assessment of the insulationcondition. However, examination of all theparameters, comparison of their values for thesame machines at different times, and acomparison between similar machines or differentphases of the same machine were used to assessthe insulation condition. The results for a numberof standby generators and emergency powergenerators were reported in earlier papers [17-18].
The IR values are a measure of moisture,contamination, or cracks in the stator insulationand tell little about the insulation aging ordegradation. PI values less than 2 are oftenindicative of aged insulation. However, for themodern insulation systems with IR values inseveral GC2 range, the values of PI are not veryrelevant. Also for such high IR values, themeasurement of PI is difficult. Most often the IRvalues are used only to decide whether highvoltage can be applied or not and not to assess theinsulation condition.
The measured values for modern insulationsystems (epoxy resin systems) in good conditionare 1 to 2 % for the dissipation factor and lessthan 1 % for the tip up. However, the measuredvalues are affected by the stress grading coatingsapplied in the machine. Hence the comparisonwith earlier measurements or baselinemeasurements is more useful than the absolutevalues of the parameters. Also for some of theolder machines with softer insulation systems, thevalues can be substantially higher. A negative tipup can be an indicator of serious degradation ofthe insulation system [19].
Partial discharge measurements are made both off-line and on-line. On good stators, using theOntario Hydro wide-band detector, measured pdmagnitudes can be expected to be 100 mV or less.Magnitudes above 400 mV indicate seriousproblem. In off-line measurements, dischargeinception voltages (DIV) and discharge extinctionvoltages (DEV) are also measured. A low DEVvalue indicates poor condition of the insulationsystem. Some machines may have high pd levelsfrom the beginning which may not increase
significantly with time. Again, a significantincrease in pd over time is a better indicator ofdegradation than the absolute value of pdmagnitudes. On-line pd measurements are used toexamine if any deleterious change has taken place.In cases where such measurements indicate aproblem, further investigations using off-line testsand inspections are warranted
Hipot tests are performed on machines in serviceto assure their serviceability. They should not beused as routine tests as they are potentiallydestructive in nature. The voltage used is (1.5E+1)ac or equivalent DC level. The relationshipbetween the ac and dc test levels is not completelyunderstood [20] and Ontario Hydro prefers the actest. The ac and dc hipot tests stress thegroundwall insulation only and not the turninsulation in multi-turn machines. For multiturnmachines in service, Ontario Hydro does not useor recommend turn insulation tests using fast risetime surges on complete windings as the detectionof a turn insulation fault is quite difficult.
6. VISUAL INSPECTIONMAINTENANCE
AND
If a problem is indicated by diagnostic tests, avisual inspection of the winding is necessary.Normally one looks for damage by overheating ordischarges, looseness of the coils in the slots,general contamination or cracks in the winding,signs of damage to semiconductive coating in theslot section and the stress grading coating, and anysoftness or puffiness in the insulation. Wedge taptests are performed on large machines to examinethe tightness of wedges. In recent years OntarioHydro has been evaluating the effectiveness ofrobotic equipment to perform tests and inspectionsin turbine generators without removing the rotor.These devices can move along the air gap toperform wedge tap tests, core insulation tests, andvisual inspection with a video camera. Some ofthe problems can not be corrected by maintenanceand a rewind of the stator is then required. Insome cases maintenance actions, like cleaningand/or drying the winding, tightening the wedges,and touching up the stress grading coating, maymake the machine serviceable with little cost.
7. CONCLUSIONS
The reliability of stator insulation systems in largerotating machines can be assured and improved by
55

proper specifications for the winding, qualityassurance during the manufacturing process,acceptance tests in the factory, proper applicationof machine, periodic on-line or off-line tests, andnecessary maintenance.
REFERENCES:
1. Improved Motors for Utility Applications,EPRI RP1763-1, Final Report, Report EL-4286, Volume 1 and 2, October 1982.
2. IEEE Standard 1043-1996, RecommendedPractice for Voltage Endurance Testing ofForm Wound Bars and Coils.
3. IEEE Standard 1310 -1996, RecommendedPractice for Thermal Cycle Testing of FormWound Stator Bars and Coils for LargeGenerators.
4. IEEE Standard 522-1992, Guide for TestingTurn-to-Tum Insulation on Form-WoundStator Coils for AC Rotating ElectricMachines.
5. A Proposed Type Test for Interturn Insulationin Multi-Turn Coils, B.K. Gupta and W.T.Fink, Paper Presented at 1996 IEEEInternational Symposium on ElectricalInsulation, Montreal, June 16-19, 1996 andpublished in the Conference Record, IEEEPublication 96CH3597-2, pp 235-238.
6. IEEE Standard 43-1974, IEEE RecommendedPractice for Testing Insulation Resistance ofRotating Machinery.
7. IEEE Standard 286-1975, IEEERecommended Practice for Measurement ofPower Factor Tip-Up of Rotating MachineryStator Coil Insulation.
8. IEEE Standard 4-1995, IEEE StandardTechiniques for High Voltage Testing.
9. IEEE Standard 95-1977, IEEE RecommendedPractice for Insulation Testing of Large ACRotating Machinery with High Direct Voltage.
10. H.G. Sedding, S.R. Campbell, G.S. Stone, andG.F. Klempner, A New Sensor for DetectingPartial Discharges in Operating TurbineGenerators, IEEE Winter Power Meeting,New York, NY, February 1991, Paper 91 WM065-3 EC.
11. H. Yoshida and K. Umemoto, InsulationDiagnosis for Rotating Machine Insulation,IEEE Transactions on Electrical Insulation,El-21,No.6, December 1986, p 1021-1025.
12. K. Kadotani, T.Hakamada and S. Yamatake,A Proposal for Insulation Diagnosis of 3 kVMotor Stator Windings, IEEE Transactions onElectrical Insulation, El-18, No.l, February1983, p 59-63.
13. M. Krecke and R. Goffaux, Attempt atEstimating the residual life of the HVInsulation of AC Rotating Machines, Cigre1988, paper 11-12.
14. G.C. Stone, H.G. Sedding, B.A. Lloyd, andB.K. Gupta, IEEE Trans, on EnergyConversion, EC-3, No.4, December 1988, pp833-841.
15. I.M. Culbert, H. Dhirani, and G.C. Stone,Handbook to Assess the Insulation Conditionof Large Rotating Machines, EPRI EL-5036,Volume 16, June 1989.
16. Motor and generator Insulation LifeEstimation, EPRI Project RP2577-1, Finalreport, Publication EPRI TR-100185,Volumes 1-3, 1992.
17. B.K. Gupta and I.M. Culbert, Assessment ofInsulation Condition in Rotating MachineStators, IEEE Trans, on Energy Conversion,EC-7, No.3, September 1992, pp 500-508.
18. B.K. Gupta, Experience with Off-LineDiagnostic Tests on Rotating Machines,CIGRE-EPRI Colloquium on Maintenanceand Refurbishment of Utility Turbogenerators,Hydrogenerators, and Large Motors, Florence,Italy, April 14-16, 1997.
19. R.W. Sillars, Electrical Insulating Materialsand Their Applications, Peter Peregrinus (onbehalf of IEE), England, p 60. Also see C.G.Garton, J.IEE, Vol 88, Pt. 3, 1941, pp 23-40.
20. B.K. Gupta, Use of AC and DC Hipot Tests toAssess Condition of Stator Insulation,Presented at the Electrical/ElectronicsInsulation Conference, Chicago, Illinois,September 18-21, 1995, and published in theProceedings, IEEE Publication 95CH35487,pp 605-608.
56

RETROFIT OF AECL CAN6 SEALS INTO THEPICKERING SHUTDOWN COOLING PUMPS
byDavid Rhodes, Ray Metcalfe & Gordon Brown
AECL, Chalk River LaboratoriesChalk River, Ontario KOJ 1J0 Phone: (613) 584-3311 ^
4Philip Kiameh & Paul Burchett
Ontario Hydro
Abstract
The existing mechanical seals in theshutdown cooling (SDC) pumps at theeight-unit Pickering Nuclear GeneratingStation have caused at least seven forcedoutages in the last fifteen years. The SDCpumps were originally intended to run onlyduring shutdowns, mostly at low pressure,except for short periods during routinetesting of SDC isolation valves while theplant is operating at full pressure to verifythat the emergency core injection systemis available. Unfortunately, in practice,some SDC pumps must be run much morefrequently than this to prevent overheatingor freezing of components in the systemwhile the plant is at power. This moresevere service has decreased seal lifetimefrom about 8000 running hours to about3000 running hours. Rather than tacklingthe difficult task of eliminating on-powerrunning of the pumps, Pickering decided toinstall a more robust seal design that couldwithstand this.
Through the process of competitivetender, AECL's CAN6 seal was chosen.This seal has a successful history insimilarly demanding conditions in boilingwater reactors in the USA. Tosupplement this and demonstrate therewould be no "surprises," a 2000-hour testprogram was conducted. Testingconsisted of simulating all the expectedconditions, plus some special tests underabnormal conditions. This has givenassurance that the seal will operate
reliably in the Pickering shutdown coolingpumps.
Seal Operating Conditions
The normal operating condition for theSDC pumps occurs when the unit is shutdown. The pumps rotate at 1200 rpm.Pressure is quite low—about 0.2 MPa.Temperature is 30 to 50°C. The pumpsare required to operate in this state for theduration of the outage, which may last amonth or two, although they must becapable of operating at these conditionsfor much longer times in unusualcircumstances. Low pressure shutdownoperation has caused relatively fewerproblems than has high pressure operationwhile the unit is at power.
There is an isolation valve on the suctionand discharge sides of each of the fourSDC loops in each unit to separate theloop from the heat transport system. If,as frequently happens, either of thesevalves leaks while the unit is operating,then hot 8.9 MPa water from the heattransport system circulates in the SDCloop and gradually heats it up. Whilestopped, SDC pumps are not well cooled,because they rely on the pumping head tocirculate water through a cooler.Therefore, to prevent overheating of theseals, station procedure has been tooperate the SDC pumps intermittentlyduring reactor operation, whenever sealtemperature rises above the 77°C alarm.This may occur once or twice a shift.{The four newer Pickering B units also
57
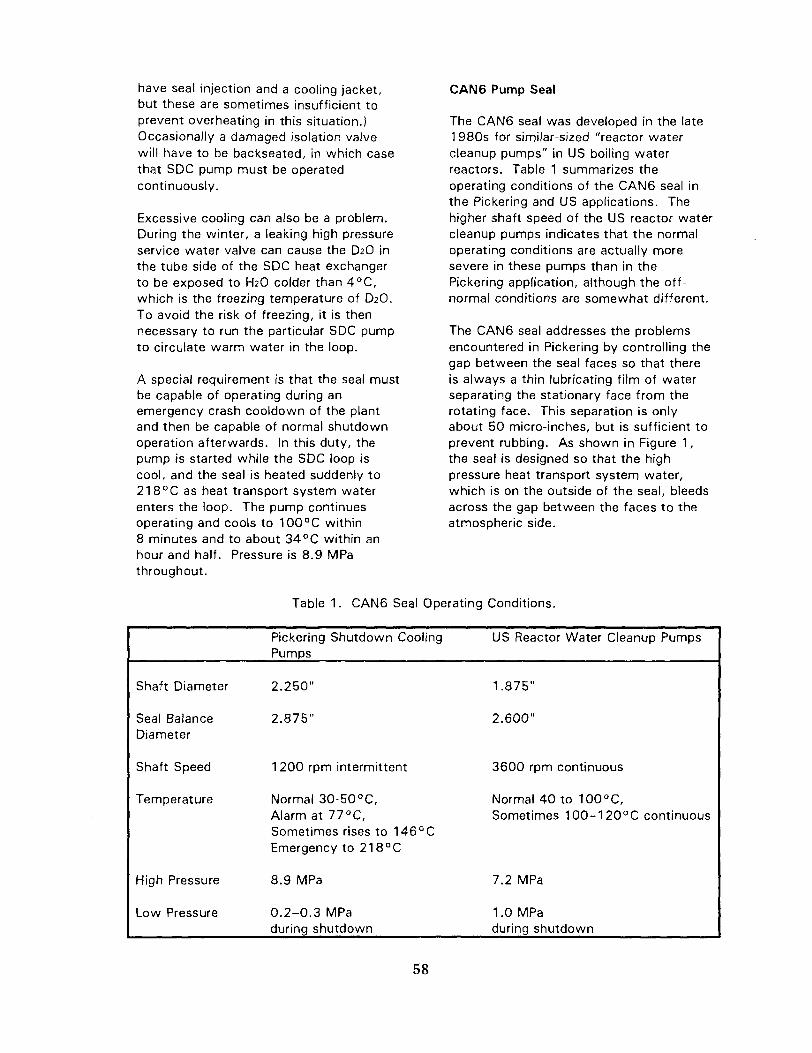
have seal injection and a cooling jacket,but these are sometimes insufficient toprevent overheating in this situation.)Occasionally a damaged isolation valvewill have to be backseated, in which casethat SDC pump must be operatedcontinuously.
Excessive cooling can also be a problem.During the winter, a leaking high pressureservice water valve can cause the D2O inthe tube side of the SDC heat exchangerto be exposed to H2O colder than 4°C,which is the freezing temperature of D2O.To avoid the risk of freezing, it is thennecessary to run the particular SDC pumpto circulate warm water in the loop.
A special requirement is that the seal mustbe capable of operating during anemergency crash cooldown of the plantand then be capable of normal shutdownoperation afterwards. In this duty, thepump is started while the SDC loop iscool, and the seal is heated suddenly to218°C as heat transport system waterenters the loop. The pump continuesoperating and cools to 100°C within8 minutes and to about 34°C within anhour and half. Pressure is 8.9 MPathroughout.
CAN6 Pump Seal
The CAN6 seal was developed in the late1 980s for similar-sized "reactor watercleanup pumps" in US boiling waterreactors. Table 1 summarizes theoperating conditions of the CAN6 seal inthe Pickering and US applications. Thehigher shaft speed of the US reactor watercleanup pumps indicates that the normaloperating conditions are actually moresevere in these pumps than in thePickering application, although the off-normal conditions are somewhat different.
The CAN6 seal addresses the problemsencountered in Pickering by controlling thegap between the seal faces so that thereis always a thin lubricating film of waterseparating the stationary face from therotating face. This separation is onlyabout 50 micro-inches, but is sufficient toprevent rubbing. As shown in Figure 1,the seal is designed so that the highpressure heat transport system water,which is on the outside of the seal, bleedsacross the gap between the faces to theatmospheric side.
Table 1. CAN6 Seal Operating Conditions.
Shaft Diameter
Seal BalanceDiameter
Shaft Speed
Temperature
High Pressure
Low Pressure
Pickering Shutdown CoolingPumps
2.250"
2.875"
1200 rpm intermittent
Normal 30-50°C,Alarm at 77°C,Sometimes rises to 146°CEmergency to 218°C
8.9 MPa
0.2-0.3 MPaduring shutdown
US Reactor Water Cleanup Pumps
1.875"
2.600"
3600 rpm continuous
Normal 40 to 100°C,Sometimes 100-120°C continuous
7.2 MPa
1.0 MPaduring shutdown
58

Gland Leakage through converging gaplubricates seal faces andand prevents them from rubbing
Rotor(fastened to shaft)
Atmosphere
Figure 1. Schematic of a stationary balance mechanical seal such as theCAN6 shutdown cooling pump seal. Note that the convergence angle andseparation between the seal faces is greatly exaggerated.
To maintain this film, it is essential thatthe seal be designed to deflect the sealfaces in such a way that the gap betweenthe faces is wider at the outside than atthe inside, so that the water can"squeeze" in, forming a lubricating filmthat is wider at the outside than theinside. (If the gap is wider on the insidethan the outside, then the faces contact atthe outside edge, no water is forcedbetween the faces to keep them apart,and they rub hard and wear.)
Elastomer problems were addressed byusing high-temperature qualified O-rings.Potential dirt problems were addressed bycreating good circulation and using hardcarbide materials for the stationary androtating seal face rings, so that any dirtthat does make its way between the faceswill not cause undue wear. The stationaryseal ring is supported on springs to take
up possible axial motion of the shaft. Theseal was designed to fit into the existinggland without requiring any modification.
Test Results
The CAN6 seal was tested in the double-ended test rig shown in Figure 2. This ispressurized in the middle and has ahorizontal shaft running all the waythrough, with a test seal in each end.Shaft speed, water pressure and watertemperature were computer-controlled tomatch predicted transient conditions in theplant. The seal faces were inspectedperiodically to determine the individualeffect of various tests. One end of the rigwas used to test the reference design forthe Pickering application while the otherwas used for other studies.
59

Figure 2. CAN6 seal test rig.
The first test was a 1000-hour run at lowpressure to simulate normal runningconditions of the seal while the plant isshut down (0.2 MPa, 30°C, 1200 rpm).Wear was insignificant (0.0001" or less),which extrapolates to a seal lifetime undernormal operating conditions exceeding thelifetime of the plant.
The remaining testing subjected the sealto abnormal conditions that could posemore of a challenge.
• Dry Starts and Seal Wear-In. First,the rig was started without any waterinside and stopped after a fewseconds to simulate an electrician"bumping" the pump to see if themotor leads were connected the rightway around. This was repeated twiceand had no effect on the seal. Next
the rig was run for 24 hours at8.9 MPa, 80°C.
• Hot Stationary Operation. This testsimulated the seal sitting stationary athigh temperature and pressure(370 hours at 0 rpm, 8.9 MPa,140°Cr with short running periodsevery 100 hours while thetemperature dropped to 34°C).
• Normal Cool-Down Transient. Thistwo-hour test simulated the SDCpumps being turned on at thebeginning of a plant shutdown. It wasrepeated 25 times. For this transient,the rig was started at 8.9 MPa,temperature slowly rose to 146°C andwas cooled back to 71 °C over thefirst hour. For the second hour, the
60

rig was run at 0.2 MPa and slowlycooled to 34°C.Cold Test (Leaking Service WaterValve). This test simulated theconditions in the seal when the pumpmust be turned on to prevent freezingof the D2O because of cold lake waterused for cooling. Test pressure was8.9 MPa. Each cycle consisted of a30-minute cool-down period with therig stationary, followed by a30-minute warm-up period (back tonormal operating temperature) withthe test rig rotating. Fifty cycles wereperformed. These are relatively benigntest conditions—cool temperatures areless damaging to the seal than hottemperatures because the water isless likely to vaporize between thefaces when cool.
Hot Test (Leaking Isolation Valve).This one-hour test (repeated300 times) simulated hot waterleaking into the shutdown coolingsystem while the plant is at power,then the pump being run to cool theseal back to normal temperature. Itconsisted of a 40-minute stationaryperiod at 8.9 MPa with temperatureslowly rising from 34°C to 110°C,then a 20-minute running period withthe rig cooling back to 34°C.
Emergency Crash Cool-Down. Thistest simulated the emergency situationof the SDC pumps being used to coolthe primary heat transport systemfrom 265°C rather than from 177°C,as occurs during a normal shutdown.This is an extremely rare event. Theseals were inspected before and afterthe first test, then after two morerepetitions.
The stationary seal face wore 0.0003"from the start of all this abnormal testinguntil the end of the first crash cool-down.The rotating sealjface wore less than onetenth of this, (the height of the raisedseal faces available to wear away is about0.060".) After the third crash cool-down,the stationary face was worn 0.005" andthe rotating face was worn 0.0004", withvery fine heat checks. Both faces werestill in serviceable condition. (Heat checksare shallow surface cracks across the sealface caused by hard rubbing.) The testinghas given assurance that the CAN6 seal issuitable for use in Pickering shutdowncooling pumps, and is capable of handlingabnormal events such as the emergencycrash cool-down without failing.
Installation Plans
Installation of a pair of CAN6 seals intoone of the Pickering B shutdown coolingpumps is scheduled for the fall of 1997.
61

Improved Operation In CANDU® Plants with CAN8 PHT Pump Seals
CA0000011
by
T. Graham1 , D. Mclnnes2 , and D. Rhodes''
Abstract
The CAN8 PHT pump seal is currently operating in twenty-one pumps, twelve at Bruce A, seven atBruce B and in both pumps at Grand Gulf Nuclear Station (GGNS). The CAN8 seal has markedlyimproved performance over the CAN2 seal previously used at the Bruce stations and the SU sealspreviously used at GGNS. Details of the performance improvements are discussed.
Prior to installation in Bruce B, the CAN8 seal was slightly modified and then demonstrated to beresistant to reverse pressurization failures, since this was a known failure mechanism with theCAN2 seal. Subsequent experience showed that Bruce A was also susceptible to reverse pressureincidents. A review of plant operating procedures at Bruce A showed reverse pressure was likelythe initiating factor for several previously unexplained seal disturbances.
The reverse pressure failure mechanism is described, as are the improved system operatingprocedures designed to prevent it. Preventative procedures have now been implemented acrossOntario Hydro Nuclear. The ability to track down seal failure mechanisms such as this is greatlyenhanced by the improved system monitoring and data retrieval now in place at Bruce A andBruce B.
Introduction
The first CANDU installation of a CAN8 PrimaryHeat Transport Pump (PHTP) seal was in Unit 3at Bruce A. An historical summary of PHT sealchangeouts at Bruce A is shown in Fig. 1 —seeRef. 1 for details up to 1986. Fig. 1 shows adramatic rise in the number of seal changeouts in1993 following the 1990 introduction of lowpressure running during the plant's start-upsequence. This accentuated the tendency of thestators in the CAN2 seal to rotate in their holders.As a result, symptoms such as rapid wear of thestator back face, overheating, andthermocracking began appearing. This weaknessin the CAN2 design led to a decision to changeseals. All operating units at Bruce A wereconverted to the CAN8 PHTP seal designbetween September 1994 and November 1995.
Although there were some early teethingproblems related to problems with the chromeoxide coatings on three seal sleeves, Ref. 2, andtwo premature changeouts in 1996, the seal hasperformed very well since its introduction at
Bruce A. As shown in Fig. 1, Bruce Ahas now operated for more than one yearwithout a PHTP seal change and if thecurrent CAN8 seal performancecontinues, 1997 will be Bruce A's firstfull calendar year without a seal change.This good performance, coupled with amodification that ensures the seal isresistant to reverse pressure, led to theinstallation at Bruce B in December 1996.At the time of writing, seven PHTP's atBruce B have had seal upgrades from theCAN2 to the CAN8.
This paper describes the CAN8 sealupgrade, the reason for the 1996replacements, and actions taken to ensurethis type of problem does not recur. Theclose co-operation between the sealsuppliers and Bruce A operating staff hasbeen instrumental in understanding thenature of the problems experienced and ineffecting a timely cost-effective solution.
® CANada Deuterium Uranium1 Atomic Energy of Canada Limited, Chalk River Laboratories2 Ontario Hydro, Bruce A Nuclear Generating Station
62

The Replacement Seal
The CAN8 design, shown in Fig. 2, replaces theAECL-designed, Byron Jackson-supplied, CAN2
PHTP seals in CANDU® plants and the earlierByron Jackson SU design in Boiling WaterReactors (BWR's). Designed in 1991 for BWR
and CANDU® service, the CAN8 seal is capableof operating at high or low pressure with no lossin performance. This capability is achievedthrough improved control over seal facedeflections derived from low hysteresis betweenthe seal rings and their supporting surfaces,Ref. 3.
The stator rotation problem of the CAN2 designhas been solved through the use of a resilientelastomer anti-rotation device. The CAN8 designalso incorporates improved cooling of the rotatingand stationary components. In addition, tofacilitate lapping and refurbishment, the CAN8seal parts have no recessed faces.
Conversion to the CAN8 from the CAN2 isrelatively simple and cost effective. Many CAN2components including seal flanges, pressurebreakdown devices, spring assemblies, and shaftsleeves are suitable for use with CAN8 seals.Often all that is required to convert thesecomponents is an inspection to verify fit; at most,only minor rework is required.
History and Performance at Grand Gulf and Bruce
The Grand Gulf BWR plant has been using theCAN8 seal since May 1992. The two sealscurrently installed have been operating withoutincident. One of the two was installed duringtheir September 1993 refuelling outage. Theother was installed in October 1996 to replace aseal that had experienced episodes oftemperature cycling giving 5000 to 10,000cycles in total since the July 1995 fuel outage.These cycles were ~17°C peak-to-peak inamplitude and had a 1 5 to 20 min. period. Thenormal expectation is for about 150 slow cycles(2 week period) over a 6-year operating life. Thetemperature cycles were caused by a problemwith the pump's internal heat exchanger, whichperiodically allowed hot water into the sealcavity. On inspection, the seal's second stagewas found to have a shot-blasted appearance onthe rotor support and spring assembly. Finemetal flakes of undetermined source were foundin the secondary seal cavity. Even in this tough
environment of numerous temperaturetransients, seal face measurements gavean extrapolated seal life of 6 years forboth stages. The metal flakes caused nodamage to the seal faces.
At Bruce A, four CAN8 seals wereinstalled in Unit 3 in September 1994. Asdiscussed in Ref. 2, three of the sleeveshad an excessively rough chrome oxidecoating, which resulted in erratic intersealpressure "spiking" problems and someelevated gland return temperatures (up to70°C) during seal operation. These sealswere replaced during outages forunrelated problems in January andFebruary 1995, and April 1996. ThePump 3 seal, installed with a smootherBruce Central Maintenance Facility (CMF)chrome-oxide-coated sleeve, remains inincident-free operation. A fifth CAN8 sealusing a CMF coated sleeve was installedfor a trial run in Unit 4 Pump 2 in mid-November 1994 following stator rotationproblems with a CAN2 seal during unitstart-up.
Bruce A Units 1 and 4 were converted toCAN8 PHTP seals in November and Junerespectively. The Pump 2 seal previouslyinstalled in Unit 4 was also changed atthis time so that a normally-operating sealcould be inspected. The inspectionresults showed very low wear, giving anextrapolated seal life in excess of 10years on the primary stage and 25 yearson the secondary.
The first two Bruce B CAN8 seals wereinstalled in December 1996 following aninability to get their CAN2 seals to meetpre-installation leakage test criteria.Since then five more have been installedand all have operated flawlessly.
The 1996 CAN8 Seal Changeouts andInspections at Bruce A
In 1996, three CAN8 seals destagedduring start-up at Bruce A: one withinterseal pressure low, the other two withinterseal pressure high.
The first of these, from Unit 1 Pump 1after - 4 months operation, experiencedsome periods of operation with slightly
63

elevated gland return temperatures (exceeding50°C) and inspection of the seal revealed thatportions of the secondary U-cup had stuck to thechrome oxide coating of the shaft sleeve alongthe line of contact. This is now thought to bethe most likely reason for the seal destaging. Atthe time, there was speculation that a No. 2stage O-ring had been displaced during operation.This theory was later dismissed because therewas no damage to the O-ring consistent withsuch a displacement, and because testingshowed that no shaft motion or pressure inputscould cause it.
The second of these, a No. 1 stage destaging inApril 1996, was the replacement for the Unit 1Pump 1 seal and did not stage properly duringstart-up. The seal inspection showed no obviousreason for the seal's destaging.
The third of these was in Unit 3 Pump 4 inAugust 1996. This seal failed due to U-cupdisplacement by the reverse pressure mechanismdescribed below.
U-Cup Displacement by Reverse Pressure
Although it was thought that U-cup displacementwas not a problem at Bruce A, it was recognizedas a frequent means of seal failure at Bruce B.There, it occurred during unit start-up and wasaccompanied by a sudden depressurization of thePHT system. Two things can happen as a result:one is a small amount of shaft motion <0.5 mmincluding thrust bearing gaps and deflection ofthe pump motor support system, the other isreverse pressurization of the primary seal. Thefirst should not cause problems if the U-cup sealslides freely, but the second can cause problemsfor a standard U-cup design such as used in theCAN2 seal or the CAN8 seal as installed inBruce A. This reverse pressure mechanism wasverified by testing reported in Ref. 4.
Consider the system shown in Fig. 3. This flowschematic is for the two-stage seal system usedat Bruce A and B. Normally the gland returnvalve is open and system pressure is dividedabout equally across the two seal stages. Ifsystem pressure suddenly drops below theinterseal pressure, the direction of pressure dropacross the primary stage will be reversed. Whensufficient energy is stored in the system, e.g. aircompressed in unvented instrument lines, glandreturn lines or the secondary seal cavity, thereverse pressure can be maintained and a reverse
flow generated through the primary stage.The reverse flow and pressure act againstthe back of the U-cup and, in the SU,CAN2 and Bruce A-CAN8 designs, if theforce generated is greater than the springforce and flow is large enough, the U-cupcan be pushed out of position as shownin Fig. 4. When the reverse pressure isrelieved, the springs will act on the U-cupfollower to close the gap. The normalresult is that the U-cup is caught betweenthe rotor support and the U-cup followerand it fails to reseal. This causes the sealto destage. The rotor support supplied toBruce B is modified to prevent this fromoccurring.
Revised Venting Procedures
The August 1996 seal failure by U-cupdisplacement provided an opportunity tostudy seal data in detail during the entireincident. The Gateway data retrievalsystem provided plots which wereexamined and found to show reversepressure across the primary stage of theseal. This led to the conclusion that theseal had failed by reverse pressuredisplacement of the U-cup. This waslater confirmed when the seal wasexamined.
The system venting procedure usedduring the unit start-up calls for the sealgland return valve to be closed while thePHT system is vented. The result is thatif the seal is not leaking appreciably, theinterseal pressure rises to near systempressure. In this condition only a smalldrop in system pressure is required toreduce it below the intersea! pressure.Opening valves to vent the PHT reducesthe system pressure, possibly quiterapidly depending on how fast the valvesare opened. This clearly was a situationwith a high probability of causing areverse pressure across the primary seal.
Accordingly, the PHT and seal ventingprocedure was revised to include thefollowing in the order given (afterchecking that the changes would notaffect any other systems):
64

• opening the gland return line valve after sealinjection is started and the seal cavity isfilled,
• after the system pressure reaches 2 MPa,venting the seals for 30 seconds via the quickvent lines,
• opening the system valves as usual to ventthe PHT piping.
This ensures that most of the air is out of theinstrument lines and that the gland return line isfree of air, and minimizes the size of any reversepressure energy source. With the system ventingdone and when the gland return valve is open,the amount the system pressure can be reducedbefore getting below the interseal pressure ismaximized.
Operating History Since the Revision of VentingProcedures
In the thirteen months since the system ventingprocedures were revised at the end of August in1996, the operation of the Bruce A CAN8 PHTPseals can only be described as uneventful. Therehave been 7 unit shutdowns and 4 unit startupswithout seal problems and no seal changes forany reason.
These procedures have been reviewed withstation personnel at both Darlington and Bruce Band station procedures have been modified thereas best suits their system configuration. Thisreduces the likelihood of reverse pressureproblems at those stations and neither havereported any problems relating to reversepressure. Both stations have gone throughseveral start-ups since that time.
At Bruce B, trends of the interseal pressure forCAN8 seals have been very flat and there hasonly been one small excursion in gland returntemperature. This tracked a large increase inpump runout and vibration and returned to normalshortly thereafter even though the vibration levelsremained higher than normal, Ref. 5.
Conclusions
The CAN8 PHTP seal, which had its successfulintroduction in main coolant pumps for BWRs atGrand Gulf, has now shown itself to be a costeffective upgrade for the CAN2 seals in CANDUservice. Initial problems associated withexcessively rough chrome-oxide-coated sleeveswere quickly eliminated.
Although the reverse pressure problemslightly extended two outages at Bruce A,no CAN8 PHTP seal has forced any of theuser plants down from full power. This isin stark contrast to the many forcedoutages caused by the CAN2 seal in thefew years between the introduction oflow pressure running and the introductionof the CAN8 seal.
The availability of data through systemssimilar to the Gateway system will paydividends by providing an accuratesequence of events during systemdisturbances. Data from this systemgreatly facilitated the effort to determinethe cause of the August 1996 seal failureby reverse pressure. The time required toprepare revised operating procedures wasalso reduced.
The close co-operation between the userand seal supplier has resulted in a productfully adapted to CANDU PHTP operation.
References:
1. Graham, T.A., Rhodes, D.B.,Metcalfe, R., and Mclnnes, D.,"Upgrading Primary Heat TransportSeals", CANDU MaintenanceConference 1995, Toronto Ont., 1995November.
2. Metcalfe, R. and Burchett, P.R.,"Primary Heat Transport Pump SealReliability, Performance andDevelopment", 14th Inter-RamConference for the Electric PowerIndustry, Toronto, Canada, 1987May, AECL Report No. AECL-9547.
3. Metcalfe, R., "Sensitivity of a ReactorCoolant Pump Seal to Changes ofOperating Conditions", Report EPRINP-4244, Electric Power ResearchInstitute, Palo Alto, CA, 1985.
4. Graham, T.A., Metcalfe, R., andGentili, H., "Test Report on Long-LifeCartridge Seal", Report COG-96-151,1996 August.
5. Komosa, Z., private communication,1997 October.
65

Acknowledgements:
The authors would like to acknowledge theefforts of the following people towards makingthe introduction of the CAN8 seal at Bruce A asuccess: T. Totten and F. Feisthauer at Bruce A;H. Gentili, L. Welch, D. MacLeod, K. Milks, and
G. Brown at AECL Chalk River. We
would also like to thank the CANDU®Owners Group (COG) for funding tests toverify the mechanism of U-cupdisplacement by reverse pressure.
Seal Changeouts at Bruce A
18
16 "•
1 4 • •
1 2 • •
1 0 • •
6 - •
4 " •
2 - •
Q4
Q3
Q2
Q1
rCO
CO
encoen
coooco
inooCD
ooCO
COCOCO
CDCO
COenen
inenen
cnen
Year of Operation
Fig. 1: Seal Changeout History at Bruce A.
1977 to 1981 — mixture of SU and CAN1 seals changeouts1982 to 1993— changeover from CAN1 to CAN2 and CAN2 to CAN2 changeouts
1994 - 5 CAN2 to CAN8 and 8 CAN2 to CAN2 changeouts1995 - 7 CAN2 to CAN8 and 3 CAN8 to CAN8 (2 with rough sleeve and 1 trial seal for
inspection)1996 — 4 CAN8 to CAN8 changeouts (1 rough sleeve, 2 reverse pressure induced and 1 sleeve
friction related)1997 — No changes to date
66

O-rings(EPDM)
No. 1 Stage
O-rings(EPDM)
Fig. 2: Two-Stage CAN8 Seal for CAN2 Replacement.
67

AtmosphericPressure
GlandReturn Flow
Leakage
No. 2Seal
No. 1Seal
(Step 3}Reverse Howthrough Sea!and Siaaing
Coil
No. 2StagingCoil
No. 1StagingCoil
GlandReturnValve Energy Source
for Reverse Pressurizatione.g., Accumulator or
Unvented Line
LineResistance
IntersealPressure
(4.3 MPa GRV open,>8 MPa GRV closed)
(Step 2)Flow Into No.2 Seal CavityWith Reverse
PressureVent Line
No. 1 Seal CavitySystem Pressure (SP)
(8.6(Step 1)System
PressureDrops
Fig. 3: Seal System for Reverse Pressure of the Primary Stage
68
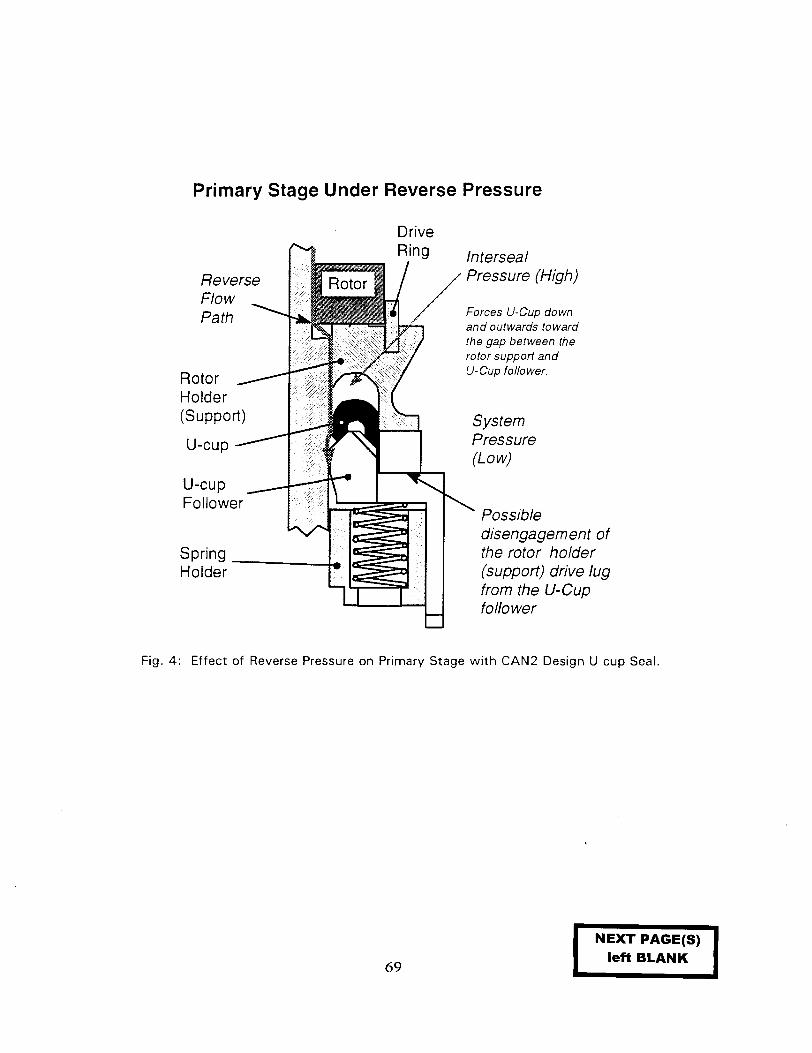
Primary Stage Under Reverse Pressure
ReverseFlowPath
RotorHolder(Support)
U-cup
U-cupFollower
SpringHolder
IntersealPressure (High)
Forces U-Cup downand outwards towardthe gap between therotor support andU-Cup follower.
SystemPressure(Low)
Possibledisengagement ofthe rotor holder(support) drive lugfrom the U-Cupfollower
Fig. 4: Effect of Reverse Pressure on Primary Stage with CAN2 Design U-cup Seal.
69
NEXT PAGE(S)left BLANK
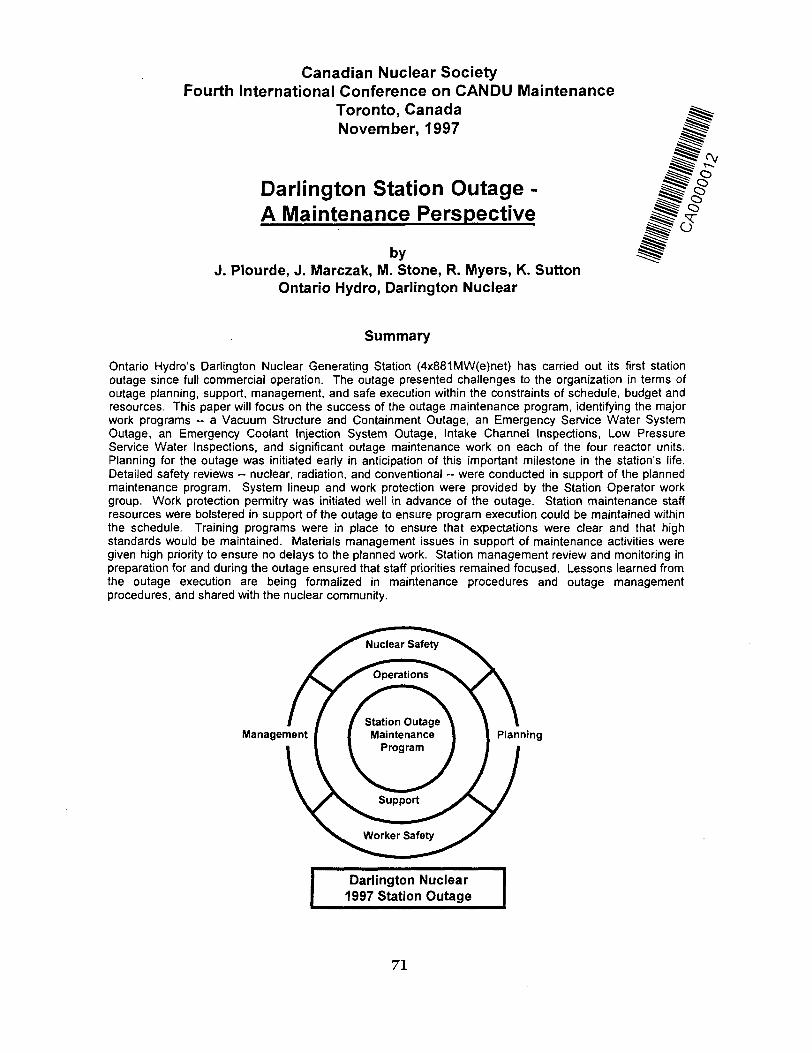
Canadian Nuclear SocietyFourth International Conference on CANDU Maintenance
Toronto, CanadaNovember, 1997
Darlington Station Outage -A Maintenance Perspective
f
#
byJ. Plourde, J. Marczak, M. Stone, R. Myers, K. Sutton
Ontario Hydro, Darlington Nuclear
Summary
Ontario Hydro's Darlington Nuclear Generating Station (4x881MW(e)net) has carried out its first stationoutage since full commercial operation. The outage presented challenges to the organization in terms ofoutage planning, support, management, and safe execution within the constraints of schedule, budget andresources. This paper will focus on the success of the outage maintenance program, identifying the majorwork programs - a Vacuum Structure and Containment Outage, an Emergency Service Water SystemOutage, an Emergency Coolant Injection System Outage, Intake Channel Inspections, Low PressureService Water Inspections, and significant outage maintenance work on each of the four reactor units.Planning for the outage was initiated early in anticipation of this important milestone in the station's life.Detailed safety reviews - nuclear, radiation, and conventional - were conducted in support of the plannedmaintenance program. System lineup and work protection were provided by the Station Operator workgroup. Work protection permitry was initiated well in advance of the outage. Station maintenance staffresources were bolstered in support of the outage to ensure program execution could be maintained withinthe schedule. Training programs were in place to ensure that expectations were clear and that highstandards would be maintained. Materials management issues in support of maintenance activities weregiven high priority to ensure no delays to the planned work. Station management review and monitoring inpreparation for and during the outage ensured that staff priorities remained focused. Lessons learned fromthe outage execution are being formalized in maintenance procedures and outage managementprocedures, and shared with the nuclear community.
Management
Nuclear Safety
>— ' —Operations
Station OutageMaintenance
ProgramPlanning
Darlington Nuclear1997 Station Outage
71

1. Introduction
The Darlington Nuclear Division Station OutageProgram was comprised of 7 distinct projects:• Vacuum Structure (VS) and Containment
inspections and maintenance.• Unit 0 common non-Containment systems
maintenance.• Unit 1 outage.• Unit 2 outage.• Unit 3 outage.• Unit 4 outage.• Fuel Handling (F/H) systems maintenance.
An overview of this program is shown in Figure1-1. To facilitate planning, the outage wasdivided into 5 phases:• Phase 1: Pre-Requisites.• Phase 2: Unit Shutdowns.• Phase 3: VS and Emergency Service Water
System (ESWS) outages.• Phase 4: VS, Containment and Emergency
Coolant Injection System (ECIS) Outages• Phase 5: Unit Startups.
The Station Outage Leadership Teamcoordinated the program, emphasizing publicand employee safety. The team was assisted bythe Unit 0 Outage Team (concentrating on VSand Containment specifics) and the StationOutage Integration Team (dealing withintegration issues between the projects).
Darlington staff were committed to completingthe Station Outage safely, on time and on budgetin the face of new challenges:• A volume of work never undertaken before
in an outage at Darlington Nuclear.• Work never performed before at Darlington.• The need to integrate all work being
performed in the station into a singleprogram.
2. Maintenance Overview
Table 2-1 outlines the major work programsundertaken during the Station Outage.
To support this, maintenance staff were dividedinto teams, each provided with solid supervisionand backfilled with temporary labour whenevernecessary. In general, these teams operated onan X-Y schedule (10h shifts - days or evenings,6 days a week), with overtime making theseextended work weeks possible. Normal staffcomplement was maintained for the duty crews.
Operator support, primarily for work protection,was also provided by similar teams, operatingaround the clock in Unit 0, and on days (7 days a
week) on the reactor units. Hours of work ruleswere relaxed temporarily to allow for thisenhanced coverage.
Major projects were also supported, around theclock if necessary, by dedicated facilitatorsnormally originating from the Technical Section.
This staffing approach is summarized in Figure2-1.
3. Success Story
Awareness of Nuclear Safety
Nuclear safety was maintained as a fundamentalfocus throughout the planning and executionstages of the outage. From upper managementto the shop floor, expectations were made clearwith respect to nuclear safety. Fundamentalswere reviewed and pre-job briefings providedimmediate reinforcement of nuclear safetyissues associated with the conduct of fieldmodifications and maintenance.
The Operations Manager provided "the 10commandments of the outage", to clarify hisexpectations of staff. The first commandmentwas to "Think Safety Culture" - nuclear andemployee safety first in every endeavour.
The success of the nuclear safety programduring the outage was evident in theperformance indicators supporting nuclearsafety.
There was one Operating Policy and Principle(OP&P) non-compliance during the outage:• Addition of unpoisoned D2O to the Unit 4
moderator system while in a GuaranteedShutdown State (GSS).
In total, sixteen reportable events occurredduring the outage, none of which were due to theunique nature of the outage. The maintenance-activity-related reportable events during theoutage were:• Pinhole leak identified in a valve weld.• HTS relief valve not properly calibrated.• Instrument Air system backup air receiver
inadequacies.• Unapproved door seals on steam protected
rooms.• Contaminated material found in scrap metal
bin.
Given the volume of work planned and executed,and considering the degree of discovery work inthe outage, these results were consideredreasonable. There is however, considerableroom for improvement in the nuclear safety
72

aspects of work execution. A true successwould be a station outage with no reportableevents. Work is progressing in this area as partof the station's maintenance improvementprograms.
Awareness of Employee Safety
Briefing of employees by the first line supervisorwas the single most effective means ofincreasing awareness of radiation andconventional safety.
Consistency was achieved through the use ofTask Safety Analysis (TSA), prepared during theplanning phase of each job to detail all safetyconcerns and precautions associated with thatjob.
Operating Experience (OPEX) wascommunicated to all staff through the 'SafetyPause', a weekly briefing session where recentevents were reviewed and a consistent messagewas communicated station-wide.
Surveillance in the field was performedindependently by:• The Safety Team, consisting of Joint Health
and Safety Committee members supervisedby Station Outage Management.
• The Conventional Safety Section• The Radiation Protection and Health Physics
Sections.
Findings were compared daily and resourceswere combined as necessary to resolve issuesquickly.
Considering the volume, novelty and complexityof the work being performed, there is a clearindication of improved performance atDarlington:• 1 Lost-Time Accident attributable to the
Station Outage (a back injury in the pre-outage phase)
• 0 High-MRPH (Maximum ReasonablePotential for Harm) accidents.
Nevertheless, there were many near-misses,particularly related to body mechanics, and fourlicense non-compliances, all associated withradiation protection:• Incorrect classification of a radioactive
shipment.• Contaminated material found in a scrap
metal bin.• Evidence of beverage consumption in
radiological zone 2.• Evidence of food/beverage consumption in a
non-zoned area of the operating island.
Awareness of Plan
The Operations Manager's secondcommandment was "Plan the Work and Workthe Plan". This concept, along with "ThinkSafety Culture", was paramount to thesuccessful planning and execution of the outage.
The challenge of integrating all projects into asingle plan and to have it used effectively in thefield, was met through the cooperation of allgroups.
At the individual project level, as few changesas possible were made to the outage planningapproach used in previous single-unit outages.Individual project schedules were issued on adaily basis, within the framework of a key plan,produced by the Unit 0 Planning Section. Thiskey plan contained all the necessary integrationinformation needed to synchronize all projects:• Outage Organization and Phone Numbers• Station Outage Overview• Inter-Unit Coordination Diagram• Individual Project Overviews• D2O Inventory Management• Nuclear Safety Overview• Shared Resources (eg, MOVATS, Scaffolds)
Figure 3-1 depicts this daily plan structure, whileFigure 3-2 outlines the daily planning andintegrating routine put in place to arrive at aquality product.
With the outage complexity requiring theintroduction of five separate "phases", each withits own set of restrictions and rules, it wasnecessary to ensure that work was planned andexecuted in the correct order within the correctoutage phase. Outage phasing wascharacterized on all outage planning logic, dailyoutage plans, etc, with STOP signs to delineatea Change of Phase. A Change of PhaseMeeting was held in advance of each change ofphase to provide assurance to the OperationsManager that work required for completion inone phase was performed successfully, thatprerequisite unit/system alignment for the nextphase was complete, and that Work Plans,operating instructions and material requirementsfor the subsequent phase were in readiness forthe transition.
4. Factors Contributing to Success
Strong Nuclear Safety Support
Nuclear Safety considerations drove the outagefrom early planning, through execution, andpost-outage reviews. Nuclear oversight aspectsof the outage are summarized in Table 4-1.
73

From the initial planning stages, operatingexperiences from earlier outages at Darlingtonand other station outages at Ontario Hydro siteswere reviewed and lessons learned were builtinto the planning program. Involvement of staffat all levels was solicited. The Station OutageLeadership team also drew on this wideexperience base for nuclear safety planning. Aseries of Nuclear Safety review meetings wereheld in advance of the outage to provideassurance that nuclear safety issues wereadequately addressed (Figure 4-1). Thisincluded a Station Outage Internal/ExternalReview Meeting where staff from all otherOntario Hydro sites, other Canadian nuclearsites, the CANDU Owners Group, WANOrepresentatives, and various supportcompanies/organizations were invited toparticipate.
Planning for the outage was built upon afundamental expectation of compliance withOP&Ps and procedural adherence. Reviews ofoperating instructions and workplans by theexecuting organizations, by line management,and by Nuclear Safety staff ensured that theseexpectations could be met.
The division of the outage into its 5 phasesfurther contributed to its success. A NuclearSafety Planning Restrictions and Prerequisiteschart was prepared to succinctly communicatethe particular requirements of a particular outagephase. Figure 4-2 is an extraction from theNuclear Safety Planning Restrictions andPrerequisites chart for illustrative purposes.Again, the STOP signs are utilized to ensure thatwork does not progress from one phase to thenext without adequate reviews and approvals.These prerequisites and restrictions weretranslated to formal outage plans, operatinginstructions, and workplans for field execution.
During the outage, nuclear safety and workprogress were reviewed daily, at unit-specificplanning meetings, the Station ManagementTeam meeting, the Nuclear Safety Oversightmeeting and the Station Outage IntegrationMeeting (Figure 3-2). The latter was the finalvehicle for communicating nuclear safety issuesto the maintenance coordinators, who in turnwould brief their staff.
Operational Decision Review Panel (ODRP)meetings were developed during the outage toaid in the resolution of Nuclear Safety issues andprovided a structured forum for presentation andreview of solutions to significant problems/issuesand for station upper management decisionmaking.
Throughout the outage, field staff wereencouraged to maintain a questioning attitude.Instances where this questioning attitude wasable to identify and correct a potential event withnegative consequences were celebrated in thedaily/weekly outage news updates.
Staff reviews of the outage after its completionhave been conducted with operating experiencebeing built into station outage planningprocedures and shared externally through formalOPEX programs.
Employee Safety Buy-In By All
Employee safety was at the forefront of alldiscussions from the very start, withrepresentatives from Maintenance, Operations,Conventional Safety, Radiation Protection,Health Physics and Joint Health & Safety on theStation Outage Leadership Team. EmergencyResponse also played an important role.
During the pre-outage phase, these people wereconstantly on the lookout for knowledge andexperiences from other locations within andoutside Ontario Hydro. They were instrumentalin the development of access strategies andassociated rescue plans for the VacuumStructure and other locations. They alsoensured that the correct procedures, tools andhuman resources were in place to ensuresuccess.
Many employees were briefed by their peers inspecial safety meetings dealing specifically withoutage issues.
During the outage, the thrust was on self-checking, attention to detail and proceduraladherence in all work undertaken.
Extraordinary Effort By All
A limit was placed on hiring of temporary staff toensure that they were adequately supervised inthe field. This forced permanent staff intoworking longer hours. This situation wasmaintained throughout the outage without anydetrimental effect on safety and performance, tothe credit of all staff.
Noteworthy contributions were also made by:• Technical support staff, including the
coordination of major projects by thefacilitators.
• Clerical support, including documentationupdates at phase changes and duplicating ofdaily plans.
• Shift Supervisors
74

• The Safety Team.• The Management Team.
Excellent Participation of Employee Reps
Employee representatives made importantcontributions in all aspects of the outage:• Member of the Station Outage Leadership
Team.• Resourcing.• Jurisdictional decisions.• The Safety Team.• Roll-out of information to staff.
Again, an open, positive relationship betweenmanagement and the unions proved to be animportant contributing factor to the success ofthe Station Outage.
Other Factors
Other factors worth noting include:• Good planning on the units, with improved
control over emergent work.• Good integration of the projects into a single
program, with personnel at all levels wellfocused.
• Excellent supervision of the trades in thefield.
• Defense in depth in all areas, be it technicalsupport, nuclear safety, employee safety.
• Excellent operator support, when taking intoconsideration the shortage of Operator staffat Darlington.
• State-of-the-art communication systems inthe Vacuum Structure, involving the use ofcompanion telephones.
5. Conclusion
The outage performance in relation to themeasures, indicates that the 1997 StationOutage at Darlington was successful. The onlyindicators to be challenged, were the durationand cost of the outage, mostly due to theShutdown System Trip Window issue, whichevolved during the outage.
However, there is room for improvement in allareas, and some key recommendations aregiven below.
Higher Priority Sooner
Good preparation is essential to an outageprogram of this complexity. At Darlington, workbegan on a small scale some 16 months prior tothe outage. Due to the heavy outage load in1996, and to other station priorities, very littleattention was paid to the pre-outage phase until
January 1997, when the outage was only 4months away.
For a subsequent station outage, it isrecommended that a full 18 months ofpreparations be considered, along with sufficientpriority to mobilize staff to focus on the project.
Work Plans Sooner
Work Plans are the basis for good jobassessment. This ensures that the right materialis ordered, the necessary resources are securedand that the supporting documentation is ready(eg, TSAs).
It is clear that in future outages, Work Plansmust be issued to the field much sooner. Thiscan be achieved through sound outagemanagement, where clear milestones aredefined, that people are held accountable tomeet.
Also, the Work Plan as it stands at Darlington, istoo inflexible, and for that reason, is likely tochange dramatically as new outagemanagement techniques are implemented.
More Resources
Resources were limited for this outage atDarlington, for a number of reasons:• Operators were short in numbers and
qualified assistance was not available fromother stations.
• Jurisdictional decisions restricted the useBuilding Trades Union (BTU) staff.
• A number of large jobs (eg, turbine outage),traditionally performed by contractors, weretaken over by Darlington staff.
• Temporary staffing was limited to 100people to ensure adequate supervision.
Thus, staff worked extensive overtime, at asignificant cost, and with the increased risk oferrors due to fatigue.
Future resourcing considerations should includebolstering our Operator numbers (already underway with Nuclear Recovery), and reviewingDarlington's position with respect to Unionjurisdictions and the use of contractors forspecialized work.
75
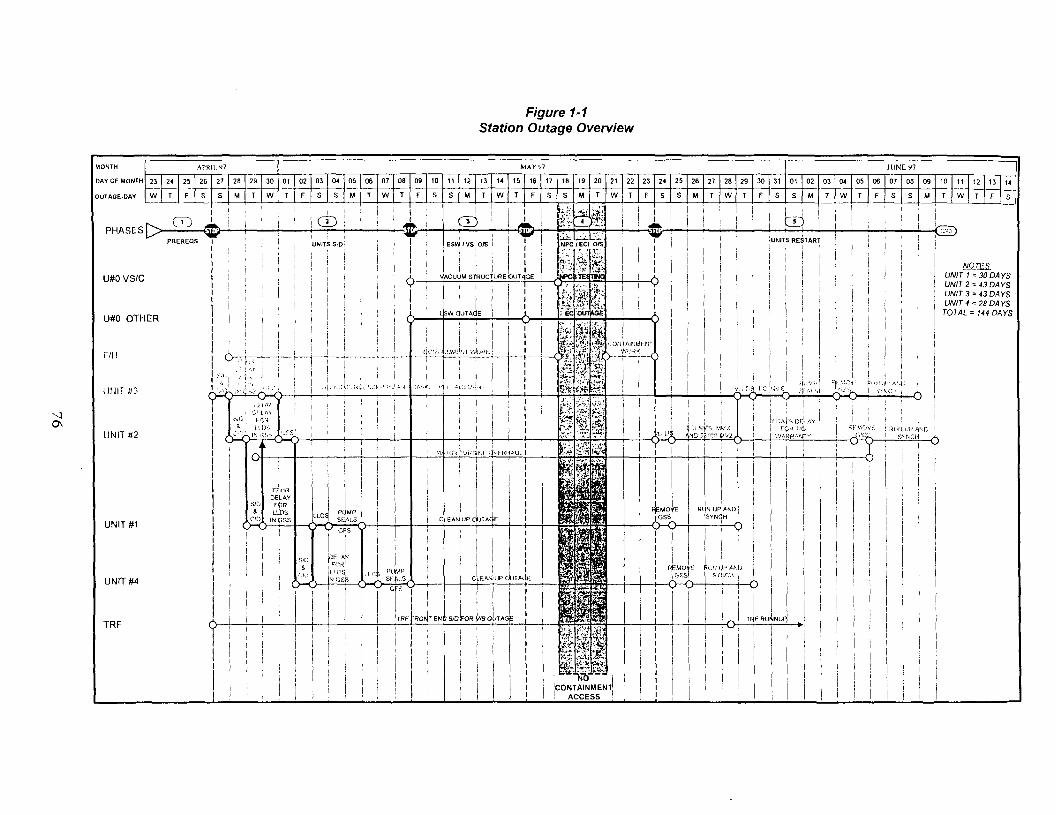
Figure 1-1Station Outage Overview
MONTH
DAY OF MONTH
OUTAGE-DAY
AI'RH. ll7
23
W
PHASES £ >
u#o vs/c
U#0 OTHER
F/H
UNIT #3
UNIT #2
UNIT#1
UNIT #4
TRF
24
T
25
F
26
S
CD „—;—5PREREQS
c\
c
27
S
(
\
28
M
<
29
T
c
^ r
i
o
&CIO
>-<
30
W
K
01
T
i
!
•)
77HRDEL AY
LJDSIN (5SS
02
F
03
S
04
S
CD
05
Ml
UNITS SIB!
—c
&
LLDSPISE
UP
f ^ GPS >
QELA
fOrli.i r«N Of
i
06
T
07
W
08 | 09
T 1 F
10
5
1
J
i ' >s
(
.-. J
j |
! j
|
\
i Li::• SE^ &
V.P.1.5
TRP
• . . - - , ' ! r
! M.1
C
RO^ TEN
11
s12
M
13
T
CD1
14
W
15
T
f f
ESWiVS O/S j
ACUUM STRUCTURE 'outf
sw c UTA< E
i
^OKt^•Ji-•::4^if d v ; Ri
j
EA^ UP CUT AC
! i
IS/D
c E.AN
E
U P !
//B OUTAG
•^Ul
.IT At.
E
Arv7
16
F
& -
GE
L _
17
S
18
S
*.'« V
c
—s
EC
t
F ^
1|
i
19
M
20
T
iTECI O
ITEt
OUT
-«* i
" Ii
t
TTNQ
*t
kAOE
V-i.
:i
mm
i
§1
i»'
21
W
22
T
j
j
M.
- —
i !CONTAINMENii1 ! ACCESS !
23
F
— *
24
S
25
s
11
s
(
—c
\
>
26
M
EMOGSS
X
a
(
=MOGSS
Rl
E
27 28
W
29
T
f
i
Si,
.. T ;
30
F
11
N UPSYNC
, H
SY
AN!)H
JCH
i
Tf lFRU
31
S
JUNEy7
01
s
b
02
M
UNITS RESTAR-
|
F<vVA
i
i
I
{ I
INUP
03
T
04
W
. MO
05
T
-j
•".MO
c
06
F
07
S
= <y. :
•i'r
i
08
S
09
M
10
T
11
w
)
N
I U
'•->• A . \ r ,
!
U
U
Ul
TO
v/r
MIT 3VIT4TAL
)
12
T
13
F
14
S
= 3004= 43 DA= 43 DA= 28 DA
= 144 D/
YSYSYSYSYS

Table 2-1Outage Work Program
ProjectVS/Containment
Common Systems
All Reactor Units
Unit 1
Unit 2
Unit 3
Unit 4
Fuel Handling
TOTAL
Scope• Vacuum Structure(VS) & Containment inspection, repairs & testing.• Vacuum, Dousing Water & Emergency Filtered Air Discharge.
System (EFADS) valve repairs.• Emergency Service Water System (ESWS) valve repairs• ESWS pump well inspections and cleaning.• Emergency Coolant Injection (EClS) valve repairs.• Mandatory callups and repairs.• Shutdown Cooling System (SDCS) motorized valve MOVATS• Low Pressure Service Water (LPSW) pump well inspections,
repairs and cleaning.• Electrical Class III Transfer Scheme tests.• Heat Transport (HT) pump seal replacement.• Generator slip ring grinding.• Major turbine overhaul• Reactor Inlet Header (RIH) EClS non-return valve inspections• Digital Control Computer (DCC) software shipment XY18
installation.• Adjuster rod re-configuration.• Bleed condenser relief valve replacement.• HT pump seal replacement.• Reactor Outlet Header (ROH) EClS non-return valve inspections• HT pump seal replacement.• Bleed condenser top cover modifications and gasket replacement.• Mandatory callups and repairs.• Computer system upgrades.• Power track inspections.
Expended Person-hours15,300
10,800
25,100
50,200
29,400
17,200
5,000
153,000
Figure 2-1Maintenance Organization
SYS RECALLCOORD
I NPC OUTAGE| FACILITATOR; IG!
ECI OUTAGEFACILITATOR
IGI
! ESW OUTAGEFACILITATOR
IGI
UNIT0DUTYSS
(HIJI
VAC BLOGCOORD(ABCDEI
I U1/2 II OUTAGE SS I
IGI i
STATIONOUTAGE SS
(G)
UNIT 1/2CRITICAL PATHFACILITATORS
EXTERNALSTAFF COORD
(G)
HVOROGENCOORD
UNIT 1/2 HEATSINKCOORO
IGI
UNIT 112 :VAULT COORD
1A8CDE) 1
SAFETY TEAM(G. XY)
UNDERWATERFACILITATOR
IGI
STATIONOUTAGE ANO
(Gl
U3/4OUTAGE SS
(G)
UNIT 3/4CRITICAL PATHFACILITATORS
IGI
UNIT 3/4 HEATSINK COORD
IGI
UNIT 3/4DUTYSSI ABCDEI
UNIT 3/4VAULT COORD
{ABCDEI
Crew Leaend
(G)(STU)
(ABCDE.HU)
(XY)
SS
OP
MM
CM
CvM
Pro) & Mods
Sh (0800-1600)
12h (O80O-2OOO)
12h(0800-2000)
12h(2000-0800)
10h (0700-1700)
10h (1630-0230)
Shift Supervisor
Operators
Mechanical Mice
Control Mtce
Civil (Service) Mtce
Projects & Modifns
UNITODUTY OP(ABCDEI
TRF/HWMBDUTY OP•ABODE)
UNIT1OUTAGE OP
(X)
UNIT 1DUTY OP IIABCDE) |
UNIT 2DUTY OPIABCOEI
i UNIT 2; OUTAGE OPI 1X1
UNIT 3OUTAGE OP
1X1
UNIT 3OUTYOP(A8COEI
UNIT 4OUTYOP(ABCDE)
UNIT 4OUTAGE OP
(X)DUTY OP(A8CDE)
UNITOOUTAGE OP
(HUI
[ UNITO 1i OUTAGE !j MM.CM.CvM II PCYI . |
TRF/KWMBMM.CM.CvM
IGI
UNIT 1/2OUTAGE
MM.CM.CvM(XY|
UN1T0 iOPERATING IMM.CM.CvM !
(G) [
DUTYMM.CM.CvM
(ABCDE)
PROOSUPMM.CM.CvM
(G)
UMT2TURBWEOUTAGE
MM CM CvM(XY>
UNIT 3PROJJUOOS
(G,XY)
OUTAGE OPISTU1
UNIT 3/4OUTAGE
MM.CM.CvM(G.XY)
F/HOUTAGE MM.CM
(G. STUI
PROJ&MOOS00
I LEAK SEARCHTEAM
! (ABCOE)
I LEAK SEARCHFACILITATOR
77

Figure 3-1Daily Plan Structure
Unit 0 OutageOverview
r
Unit 0 & F/HOutage Plan
F
Unit 1 OutageOverview
r
Unit 1Outage Plan
i
Key Plan
r
Station OutageOverview
r
Unit 2 OutageOverview
r
Unit 2Outage Plan
Unit 3 OutageOverview
r
Unit 3Outage Plan
i
Unit CoordOverview
k
r
Unit 4 OutageOverview
Unit 4Outage Plan
i
Figure 3-2Daily Planning Routine
0730 0815 0900 1345 1430
SSTurnovers
Duty SSOutage SS
Outage SSForum
Outage SSsOutage ANONS Coord
Duty ANOs/SNOsOutage ANO
Mgmt Team
Unit SpecificPlanningMeetings
Outage CoordOutage SSUnit MgrPlanning TechsTech/Eng CoordMtce Work CoordOps Work CoordNS Advisor Nuclear
SafetyOversightMeeting
Ops MgrNSMgrNS Coord
StationOutage
IntegrationMeeting
Station Outage DirectorMgmt TeamOutage Coord (all units)Mtce Coord (all units)NS Coord (all units)Ops Coord (all units)
78

Table 4-1 DNGD 1997 Station OutageNuclear Safety Oversight
ProgramGoverning Documents
Planning
Reviews
Change Control
Heat Sink Management
Operating Documentation
Training
Outage Execution
Post Outage
Particulars• OP&Ps / License• Outage Policy• Outage Procedure
• Scope Meetings• Planning Meetings• Overview for Station• Overview for Units• Reactor Safety Review Mtgs• Internal/External Review Mtg• Workplan Reviews by: Supv, NSO, Outage
SS, Mgr• Outage Leadership Team• Planning Integration Team• Permanent Change Process• Temporary Change Notice• Heat Sink Strategy Document• Maximize availability of SDC• Heat Sink Coordinators (U1/2, U3/4)• Operating Memos for major systems• Operating Memos for OP&Ps• Operating Memos for AIMs• Operating Memos for Startup/Shutdown
• Training Working Party• Authorized Staff Training• Daily Plan• Daily Planning Meetings• Reactor Safety Board• Heat Sink Strategy Board• Change of State Meetings• GSS Removal Meetings• Commitments tracking• Post - Outage Review Mtg• Post - Outage Reports
• OHN Nuclear Safety Policy• OHN Risk Mgmt Policy (Draft)• Performance Objective and Criteria
(PO&Cs)• Detailed Outage Plans• Darlington Outage Management System• Work Management System
• Manager Forums• Nuclear Safety Working Party• Outage SS / Outage ANOs• Nuclear Safety Coordinator• Accident Assessment• Safety Analysis (SOE)• Jumpers• Workplan Reviews• Heat Sink Operating Memo• IBIF availability as interim HS
• Heat Sink Operating Memo• Operating Manual revision for some
systems• Rundown Logic• Startup Logic• Other Operator Training
• Outage Director / Mgr reviews• Outage SS/ANO reviews• Duty SS/ANO reviews• Nuclear Safety (NS) reviews• Vault Coordinator reviews• NS Coordinator Mgmt updates• Event Reporting Process• OPEX - Build into procedures
Figure 4-1 DNGD 1997 Station OutageReactor Safety Review Meeting Process
C PreNnwia
Review
ry Stationactor SafetyMeeting
Unit 0 OutageRenter Safety
Review Meeting
Unit 1 OutageReactor SafetyReview Meeting
Unit 2 OutageReactor Sanity
Review Meeting
Unit 3 OutageReactor Safety
nBVfGW MftOtlfiQ
Unit 4 OutageReactor SafetyReview Meeting
Station OutageReactor Safety
Review IntegrationMeeting
Station OutageMema [External
ReviewMeeting
Station Outage
79

Figure 4-2"
Ontario HydroDarlington Nuclear Generating Division
1997 STATION OUTAGE
NUCLEAR SAFETYPLANNING RESTRICTIONS
&PRE-REQUISITES
(abbreviated sample for illustration)
Phase 2Operating Restrictions
OP1P» for Phasa 3 apply
1. Frewater supplied by temporary dwselpumps
CONTROLAll units:V InGSS2. SDS1.SDS2&RRS available
COOL1. EClSavaiabte2. ESWS recalablewrWn 36 hours3. ESWS load* supplied by LPSW intef-unit
be4. IWST temperature 27 - 32 C5. PAWCS, supplied by LPSW. available
within 2.5 hMluniU:6. Shutdown for at leutS days7. In GFS - no LLDS/VLLDS (no openiigs n
HTS)8 SDCSi/s as primary heat sink9. HT pumps, boilers and 1 ISRVs per Uoler
available as backup heat sink10. HT pump SLP tip set at 30 s11. HT temperature maintained < 130 Con
backup heat sink12. HT D2O Storage Tank 6.5 - 8.0 m13. Al 4 boilers ft* (12 m - MR)14. SGECS. ABF «. IUFT avalable to al poilera
within heat sink recal time15. SGECS. ABF & IUFT avalable for
immeriate manual operation to al boaers ifen backup heat sink
IS. Normal irit outage controls on HTS andbackup heat sink work"*
17. Unit loads suppled by own LPSWIS. Shield tank temperature < 30 C at shield
Met19. Wateriitaketemperature <16C20. Moderator temperature < 30 C21. Upgrader in service
CONTAIN1. PRVs guaranteed closed by upper piston
vent lumper2. AIRVACUsavalaolewilhn heat sink
recal tme (fl4 speed, double How)3. AIRVACUsh operation If on backup heat
sink (ful speed, double flow on affected unitwfthniSminsotLOCA)
4. EFADS available within 15 mins folowino. aLOCA. via afcemat* fiowpath
5. RV pressure -3 to -6 kPs (corKrol Q -4 to -5kPa; alarm Q -3.75 kPa)
6. No FM with IF on board7. RV temperature < 25 C(< 30 C when on
backup heat sink, affected unit only)B. Normal air rtfeakage < 100 kgmfoeowing s
LOCA (requrea contaavnent evacuation onloaaofSOCSand tVAt S/AIsolationfolowing a LOCA)
Hot GSS OP&P OPM Phase 3 OP&P OPM
HTS. ECIS. NPCS, EFADS. WRS, Vtt Clg. Moderator. ASW. ESWOPMs
LPSW OPM
F/H OPM. AIM Parts A, B. C and E
Phase 1PREREQUISITES
Phase2UNIT SHUTDOWNS
Phase 2Prerequisites
Phase 3V S 1 ESWS OUTAGES
Phase 3 Prerequisites
1. Alternate Firewater Supply Instated2. Phase 3 OP&P OPM approved by AECB
CONTROL1. S0S2 nndown testl completed (Unitt
1.2.3)
coot,1. Class 3 transfer SRSTs 9.17 to 120
completed.2. AISDCS pumps test run with HTS cokfi
depressurized3. ESW outage coordination process rt place4. HT pump SLP trip jumper instated5. (WST temperature < 32 C6. ASW NV2253 flapper removed to alow
LPSW to supply ESW loads
CONTAIN1. VS outage coordination process in place2. EFADS jumper instated3 RVACU SRSTs 4.1.25 compiled
Phase 4Prerequisites
1. ChecklistsI j J 2. Change of Phase Meeting
3. Approval to proceed to next phase
80

/
FOURTH CNS INTERNATIONAL CONFERENCE ON CANDU MAINTENANCE
NOVEMBER 1997, TORONTO, CANADA
Ice Plugs at Darlington Nuclear Generating Station:Team Work In Action
R. Chatterton, Unit 3/4 Operations CoordinatorD.H. Creates, Design Engineer - Specialist
M.T. Flaman, Corporate Business Development
Ontario HydroDarlington ND
P.O. Box 4000, Bowmanville, Ontario
Abstract
Ice plugs are used in piping for equipment isolation in cases where there are no isolationvalves designed into the process systems. The most obvious need for isolation is in thefeeders but there are other systems also incorporating pipes of various sizes that, from timeto time, require ice plugs to provide isolation during equipment maintenance activities.
Operators at Darlington Nuclear Generating Station have worked with Ontario Hydro'sCorporate Business Development unit (CBD -formerly Ontario Hydro Research), the siteEngineering Services Department (ESD), and Darlington Mechanical Maintenance to perfectthe Operator use of Ice plugs on pipe sizes up to NPS36.
Normally the Operators at a nuclear power generating station are trained to operatedesigned plant equipment in accordance with approved operating procedures, and all UnitOperators are trained to operate all equipment. Perfection in Ice Plug application isnecessary, but there is no benefit in training all operators in the use of Ice Plug equipment.As a result, training has evolved into specialized, "as required training", depending on thescope of each ice plug job and the interaction required from the rotating shift crews.
This paper will discuss both the previous operating experiences and problems with ice plugsat Darlington as well as the present team interaction approach involving the Operator, ESD,CBD, and Maintenance personnel. This has lead to the successful development andapplication of Ice Plug equipment, procedures, training and task execution at DarlingtonNuclear Generating Station. This will be of benefit for Operating and Engineering andMaintenance groups that currently have such a program or are considering developing anice plug program.
81

4T International Conference on CANDU Maintenance
CHECWORKS™INTEGRATED SOFTWARE FOR CORROSION CONTROL*
4Sf
Christopher SchefskiVIBRATION AND TRIBOLOGY UNITFluid Sealing and Dynamics BranchEngineering Technologies Division
Chalk River LaboratoriesChalk River, Ontario Canada KOJ 1 PO
John PietralikHeat Exchanger Technology BranchEngineering Technologies Division
Chalk River LaboratoriesChalk River, Ontario Canada KOJ 1 PO
Trek HazeltonSIMD-NTS
Ontario HydroPickering Nuclear Generating StationPickering, Ontario Canada L1V 2R5
Vince BitonteEngineering Services
Ontario HydroBruce A Nuclear Generating StationTiverton, Ontario Canada NOG 2T0
AbstractCHECWORKS™, a comprehensive softwarepackage for managing Flow-Accelerated Corrosion(FAC, also called erosion-corrosion and flow-assisted corrosion) concerns, is expanding toinclude other systems and other aspects ofcorrosion control in CANDU reactors. This paperwill outline CHECWORKS™ applications at variousCANDU stations and further plans forCHECWORKS™ to become a code forcomprehensive corrosion control management.
AECL is currently introducing all facets ofCHECWORKS™ into the CANDU stations. PointLepreau, Pickering, and Darlington have allbenefited from CHECWORKS™ predictive analysisof FAC on the primary and secondary sides.Darlington and Bruce A have both incorporatedCHECWORKS™ into their ongoing UT datamanagement and analysis on the secondary side.
Current plans for CHECWORKS™ include variousaspects of corrosion control management asfollows:
1) Proposed work in Ontario Hydro stations tomodel major secondary side systems forpredicting FAC.
2) Integration of CHECWORKS™ and newinspection technology developed by NTS.
3) CHECWORKS™ incorporation into theautomated chemistry control system plannedfor CANDU stations.
4) New modules presently being introduced intoCHECWORKS™ with co-operation from EPRI(Electric Power Research Institute). Thesemodules will manage corrosion concerns inService Water systems, iron transport in thesecondary side, and cavitation.
* Submitted for presentation at 4'November 16-18, 1997, Toronto
th International Conference on CANDU Maintenance,
82
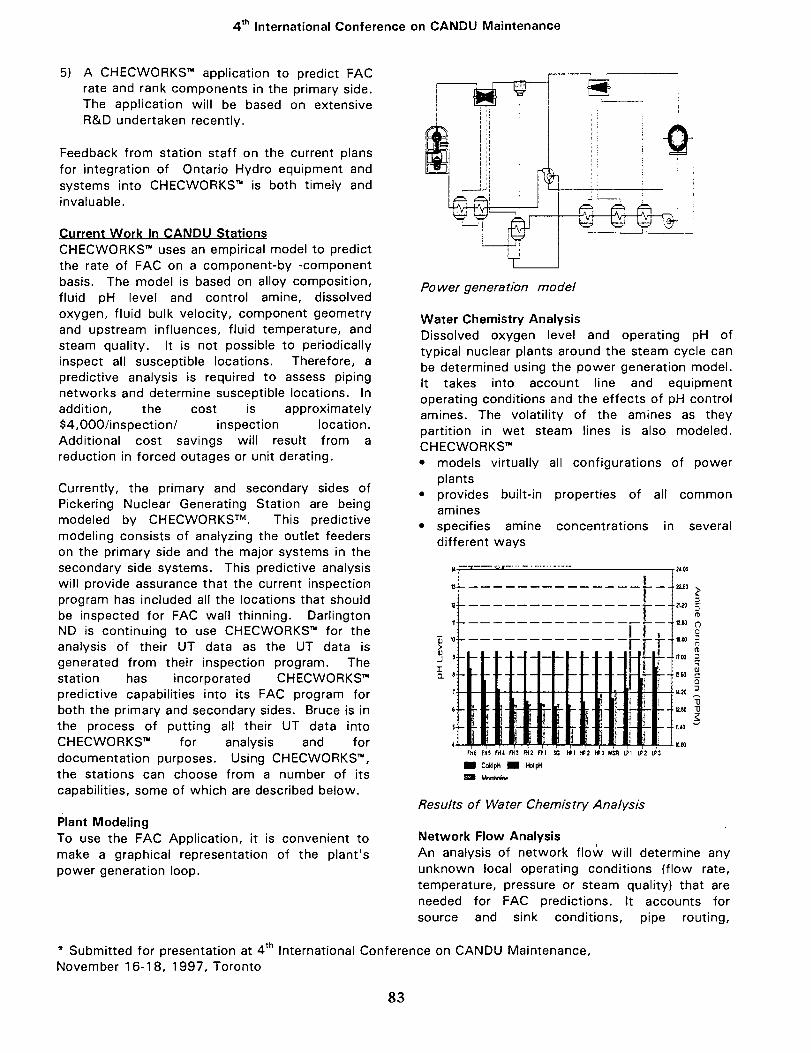
4th International Conference on CANDU Maintenance
5) A CHECWORKS™ application to predict FACrate and rank components in the primary side.The application will be based on extensiveR&D undertaken recently.
Feedback from station staff on the current plansfor integration of Ontario Hydro equipment andsystems into CHECWORKS™ is both timely andinvaluable.
Current Work In CANDU StationsCHECWORKS™ uses an empirical model to predictthe rate of FAC on a component-by -componentbasis. The model is based on alloy composition,fluid pH level and control amine, dissolvedoxygen, fluid bulk velocity, component geometryand upstream influences, fluid temperature, andsteam quality. It is not possible to periodicallyinspect all susceptible locations. Therefore, apredictive analysis is required to assess pipingnetworks and determine susceptible locations. Inaddition, the cost is approximately$4,000/inspection/ inspection location.Additional cost savings will result from areduction in forced outages or unit derating.
Currently, the primary and secondary sides ofPickering Nuclear Generating Station are beingmodeled by CHECWORKS™. This predictivemodeling consists of analyzing the outlet feederson the primary side and the major systems in thesecondary side systems. This predictive analysiswill provide assurance that the current inspectionprogram has included all the locations that shouldbe inspected for FAC wall thinning. DarlingtonND is continuing to use CHECWORKS™ for theanalysis of their UT data as the UT data isgenerated from their inspection program. Thestation has incorporated CHECWORKS™predictive capabilities into its FAC program forboth the primary and secondary sides. Bruce is inthe process of putting all their UT data intoCHECWORKS™ for analysis and fordocumentation purposes. Using CHECWORKS™,the stations can choose from a number of itscapabilities, some of which are described below.
Plant ModelingTo use the FAC Application, it is convenient tomake a graphical representation of the plant'spower generation loop.
Power generation model
Water Chemistry AnalysisDissolved oxygen level and operating pH oftypical nuclear plants around the steam cycle canbe determined using the power generation model.It takes into account line and equipmentoperating conditions and the effects of pH controlamines. The volatility of the amines as theypartition in wet steam lines is also modeled.CHECWORKS™
virtually all configurations of powermodelsplantsprovidesaminesspecifies aminedifferent ways
built-in properties of all common
concentrations in several
I .f.
6 —
S - -
"
I ,
21.00
22.60
2120
; It 00
— - EtO
D
re
OQ3na3
rat nts fflt mi m mi sc » i »2 tti MSS LPI IP2 U>3
• CoMpH • HotpH
Results of Water Chemistry Analysis
Network Flow AnalysisAn analysis of network flow will determine anyunknown local operating conditions (flow rate,temperature, pressure or steam quality) that areneeded for FAC predictions. It accounts forsource and sink conditions, pipe routing,
* Submitted for presentation at 4November 16-18, 1997, Toronto
International Conference on CANDU Maintenance,
83
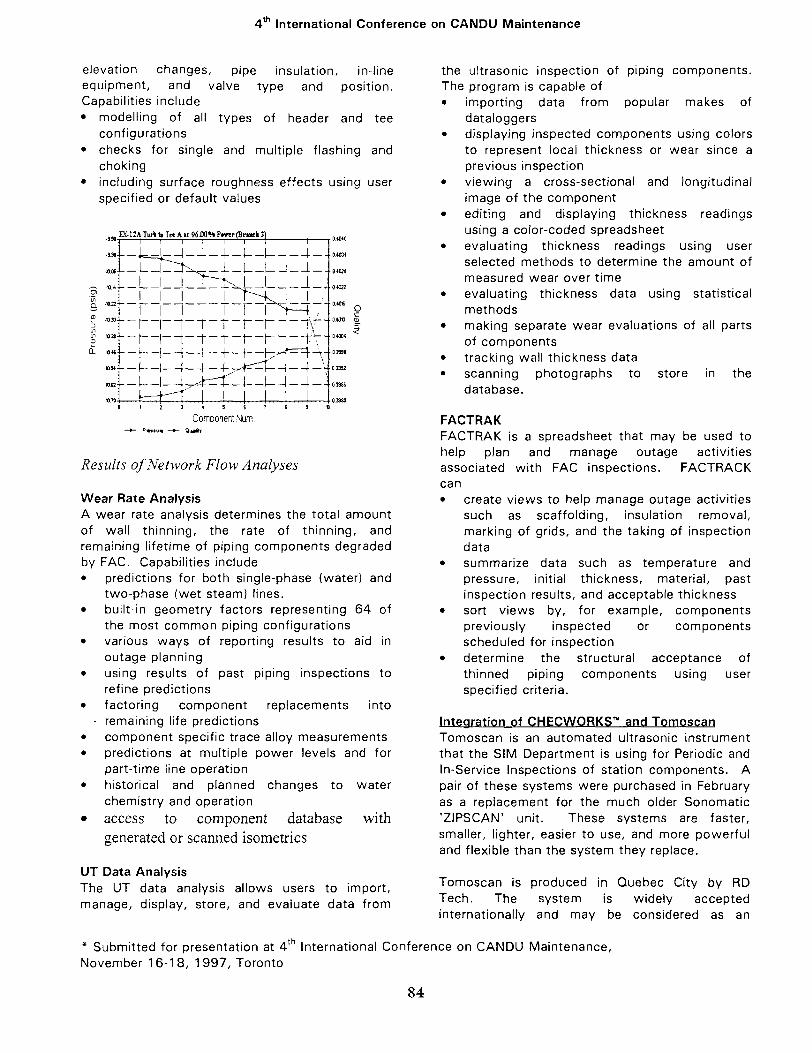
4 International Conference on CANDU Maintenance
elevation changes, pipe insulation, in-lineequipment, and valve type and position.Capabilities include• modelling of all types of header and tee
configurations• checks for single and multiple flashing and
choking• including surface roughness effects using user
specified or default values
KlIATurt a T« AH 96.00* P
„«:._) 1 [_4_4-_
Component Num.
Results of Network Flow Analyses
Wear Rate AnalysisA wear rate analysis determines the total amountof wall thinning, the rate of thinning, andremaining lifetime of piping components degradedby FAC. Capabilities include• predictions for both single-phase (water) and
two-phase (wet steam) lines.• built-in geometry factors representing 64
the most common piping configurations• various ways of reporting results to aid
outage planning• using results of past piping inspections
refine predictions• factoring component replacements into
• remaining life predictions• component specific trace alloy measurements• predictions at multiple power levels and for
part-time line operation• historical and planned changes to water
chemistry and operation• access to component database with
generated or scanned isometrics
UT Data AnalysisThe UT data analysis allows users to import,manage, display, store, and evaluate data from
of
in
to
the ultrasonic inspection of piping components.The program is capable of• importing data from popular makes of
dataloggers• displaying inspected components using colors
to represent local thickness or wear since aprevious inspection
• viewing a cross-sectional and longitudinalimage of the component
• editing and displaying thickness readingsusing a color-coded spreadsheet
• evaluating thickness readings using userselected methods to determine the amount ofmeasured wear over time
• evaluating thickness data using statisticalmethods
• making separate wear evaluations of all partsof components
• tracking wall thickness data• scanning photographs to store in the
database.
FACTRAKFACTRAK is a spreadsheet that may be used tohelp plan and manage outage activitiesassociated with FAC inspections. FACTRACKcan• create views to help manage outage activities
such as scaffolding, insulation removal,marking of grids, and the taking of inspectiondata
• summarize data such as temperature andpressure, initial thickness, material, pastinspection results, and acceptable thickness
• sort views by, for example, componentspreviously inspected or componentsscheduled for inspection
• determine the structural acceptance ofthinned piping components using userspecified criteria.
Integration of CHECWORKS™ and TomoscanTomoscan is an automated ultrasonic instrumentthat the SIM Department is using for Periodic andIn-Service Inspections of station components. Apair of these systems were purchased in Februaryas a replacement for the much older Sonomatic'ZIPSCAN' unit. These systems are faster,smaller, lighter, easier to use, and more powerfuland flexible than the system they replace.
Tomoscan is produced in Quebec City by RDTech. The system is widely acceptedinternationally and may be considered as an
* Submitted for presentation at 4 th International Conference on CANDU Maintenance,November 16-18, 1997, Toronto
84
4 International Conference on CANDU Maintenance
advanced ultrasonic data acquisition, processingand display system.
The Tomoscan unit is a multichannel unit, i.e., ithas several pulser and receiver channels that canbe configured in a number of ways via software.The instrument is capable of being configured tooperate in several ultrasonic modes such asconventional pulse echo (angled beam shear andzero degree which are used by PeriodicInspection), tip diffraction techniques, tandemtechniques, through transmission and the TOFDtechnique. The Tomoscan can record allinformation on a number of channels during theinspection for later playback and analysis. Datamay be recorded in free running mode or withencoded position information or with roboticprobe manipulators. Each of these recordingmodes increases the level of sophistication in theset up, but also yields more information uponsubsequent processing.
There are a greater number of variables that mustbe controlled with automated systems overconventional manual pulse echo techniques;however, Tomoscan records all variables andonce these variables are set they can be recalledand analyzed.
There are a number of reasons that justify theapplication of automated UT over manual UT.They may be summarized as substantial reductionin dose exposure to the inspectors, increasedrepeatability of the inspection results, a hardcopyoutput of the inspection data, quickerinspections, and most significantly, increase ininspection accuracy by an order of magnitude.Properly set up, the techniques are capable ofrepeatable sizing indications down to a fraction ofa millimetre.[1]
Ideas are being discussed to use CHECWORKS™for analyzing the data from the new Tomoscantechnology. This will allow the data fromTomoscan units to be imported directly into theCHECWORKS™ code for analysis and datamanagement.
Integration of CHECWORKS™ and COMPASThere are future plans that CHECWORKS™ will beintegrated with online chemistry input of theCANDU reactor with the use of the COMPAS(Corrosion Monitor and Prediction AnalysisSystems). COMPAS will provide reliable and
efficient operation of steam generators whileminimizing corrosion in the balance of plant, crudtransport into the steam generators, andcorrosion inside the steam generators. The goalsare to prevent performance degradation, andreduce the cost associated with unplannedoutages or extended plant outages due to repairsor maintenance of the steam generators.COMPAS will provide plant chemists withinformation such as• on-line chemistry and process monitoring
information to assess compliance with thestation chemistry guidelines,
• early detection and diagnostic capabilities toallow for quick response to chemistryexcursions, and
• corrosion and fouling predictive capabilities tooptimize secondary chemistry conditions.[2]
By incorporating this on-line chemistry capabilityinto the CHECWORKS™ platform, instant analysisof wear rates due to FAC are possible. Thistechnology will also allow accuratedocumentation of past water chemistry and itseffect on wear on the secondary side.
New Modules in CHECWORKS™The service water (SW) systems of operatingnuclear and fossil plants are being degraded by avariety of mechanisms. These includemicrobiologically induced corrosion (MIC), pitting,underdeposit corrosion, galvanic corrosion,crevice corrosion, cavitation, solid particleerosion, erosion-corrosion, and general corrosion.In addition, piping and heat exchangers aresubject to sedimentation and fouling from severalsources.
Work necessary to keep the system operable includeinspections, cleaning, repairs and replacements ofpiping and equipment, coating application andmaintenance, performance trending, selection andapplication of water treatment, and associatedengineering support. Related O&M costs can be quitehigh-several million dollars per fuel cycle in manycases.
The objective of the CHECWORKS™ SW Applicationis to transfer technology for controlling the variousforms of degradation that are affecting the servicewater system. This has been achieved bydeveloping predictive models for the most commonforms of degradation and installing the models onCHECWORKS™ in a way that the SW systems can
* Submitted for presentation at 4 th International Conference on CANDU Maintenance,November 16-18, 1997, Toronto
85

4* International Conference on CANDU Maintenance
be easily evaluated. The output of the calculations iscomponent-by-component predictions for each formof degradation as a function of system line-up andseason.
Models have been developed to predict the mostcommon forms of degradation as a function oflocal conditions. These models includemicrobiologically-induced corrosion,sedimentation, pitting, galvanic corrosion,underdeposit corrosion, crevice corrosion,cavitation, erosion-corrosion, and solid particleerosion.
Iron TransportSignificant amounts of corrosion products arebeing formed in the power generation loop ofoperating nuclear and fossil power plants. Mostof the corrosion products result from FAC duringpower generation and during shut down andstartup periods. The corrosion products aremostly iron oxides and hydroxides-primarilymagnetite and hematite. When released from theparent metal, the products are transported aroundthe steam loop and tend to deposit in the steamgenerators, condensate polishers, feedwaterheaters, and the condenser. Products depositedin the steam generators act to acceleratecorrosion of the tubes, tube support plates, andtube sheet; degrade its heat transfer capability;and increase the pressure drop across thegenerator. Products deposited in the condensatepolishers require them to be more frequentregenerated.
FAC tends to produce and release iron oxidesduring power generation at a constant rate withtime. General corrosion tends to produce ironoxides as a function of time and conditions duringplant shut-downs, but release them in a highlytransient manner after plant restart (a crud burst).The condensate polishers remove some of theoxides during regeneration of the resins, but canalso act as a capacitor-sometimes storing andsometimes releasing the oxides intothe condensate.
Most power plants are now monitoring the levelsof iron found in the final feedwater (theconcentration just prior to entering the steamgenerator). Some plants also monitor iron levelsin other locations such as condensate and heaterdrains. Depending on water chemistry, lay-up
strategy during outages, design, and materialsand time when measured, final feedwater ironlevels are typically in the range of 0.5 to 20 ppb.It is generally agreed that the ideal level of iron isessentially zero.
The objective of the Iron Transport Application isto deliver technology to the operating plants tohelp reduce the levels of iron oxides in the powergeneration loop. This is being achieved bydeveloping predictive models for the generationof iron oxides resulting from FAC during powergeneration and general corrosion during outages.The models are being installed on CHECWORKS™in a way that the sources of the iron can beeasily identified. The source predictions arequantitative on a component-by-component andline-by-line basis. The first release of the IronTransport Application assumes steady stateconditions. A later release will predict thetransient effects of iron transport around the loop(e. g., include crud bursts, deposition, and re-entrainment), and include an interface withTHIRST and SLUDGE programs for steamgenerator sludge prediction.
CavitationThis module will predict the location and intensityof any cavitation that may occur in the powergeneration loop. The predictions are based on anempirical model, developed from an extensive setof laboratory and plant data. The empiricalformulae take into account geometry, flowconditions, upstream pressure, downstreampressure, and component size. The code has fourlevels of cavitation: incipient cavitation, criticalcavitation, incipient damage cavitation, andchoking cavitation. Sufficient information existsto analyze orifices, bends, and valves: butterfly,globe, cone, ball, and gate. Release ofCHECWORKS™ with this module is planned for1998.
Primary Side ApplicationThe current version of CHECWORKS1" does notcover ranges of some parameters that exist in theprimary side of CANDU reactors. To extend therange of applicability of the code to cover theCANDU primary side, a lot of R&D projects havebeen undertaken. The results will be includedinto CHECWORKS™, which will be the tool fordealing with primary side FAC concerns for thestations and designers. To achieve that, a modelpredicting FAC rate for the components in the
* Submitted for presentation at 4 th International Conference on CANDU Maintenance,November 16-18, 1997, Toronto
86

4 International Conference on CANDU Maintenance
primary side is needed. The model can be basedon experimental evidence, mechanistic approach,or both. It can also use elements of the currentformula in CHECWORKS1".
A model for primary side FAC will include thefollowing correlations and effects:• pH. The CHECWORKS current range does
not cover pH > 10.0. A relationship for pH> 10.0 will be based on published data in theliterature and a mechanistic approach, andwill be validated by experiments.
• geometry. Experiments at room temperaturewill be done to find CANDU-specific geometryfactors, for example for non-standard elbowsand reducers attached to end fittings. Othergeometries will use factors that are now inCHECWORKS™.
• pH-controlling agent (lithium hydroxide)• Cr effect. Experiments are under way to
validate the current knowledge.• void fraction.• temperature affecting material properties and
reaction kinetics.• hydrogen concentration.• oxygen concentration. The CHECWORKS
correlation will probably be used.• velocity. The CHECWORKS™ correlation will
probably be used with heavy waterproperties.
• iron concentration. It can be calculated fromsolubility curves and simple balance equationswithin the circuit and does not need to beinput.
The code will model both the outlet and inletfeeders to have a capability for a completeanalysis of the circuit. Steam generator tubescan be treated as a black box, or on FAC rate canbe assumed. The application will use heavywater properties.
predecessorall US nuclearand utilities inJapan, Korea,
Industry AcceptanceCHECWORKS™ {and itsCHECMATE™) is being used byutilities, many US fossil plants,Canada, the Czech Republic,Slovenia, and Taiwan to help predict FAC in theirpiping systems, and assist in managing theiroverall program to control it.
User SupportCHECWORKS™ is supported by a full-timetechnical team with specialties in materials.
chemistry, corrosion, nondestructive evaluation,plant operations, stress analysis, and computerscience. The CHECWORKS™ User Group (CHUG)includes 54 members worldwide.
SummaryThe benefits of using CHECWORKS™ to predictFAC in nuclear and fossil plants include:• Capability to identify problem areas long before
a leak or rupture might occur.• Need to inspect far fewer locations than is
required using a less accurate methodology.• Ability to establish a remaining service life for
inspected and non-inspected components.• Allow the plant to optimize water chemistry
and evaluate other options to select the mostcost effective way of controlling FAC on a line-by-line basis.
• Reduce the number of personhours needed tomanage, evaluate, and store piping inspectiondata.
• Provide a useful tool to help manage FACinspection activities.
AcknowledgementsThis project was funded mostly by COG WorkingParty No. 1.
References1. Ten Grotenhuis, R., 1997, Private
Communication.
2. Khartabil, L.F., Tapping, R.L., Gendron, T.S.,Howe, P.T. (1997). COMPAS: An On-lineInformation System for Corrosion Monitoringand Predict/on (pp. 7). AECL, Chalk River,Ontario.
* Submitted for presentation at 4*November 16-18, 1997, Toronto
International Conference on CANDU Maintenance,
87
CA0000015S International Conference on CANDU Maintenance
November 16 - 18, 1997Toronto, Canada
Service Water Systems Management using CHECWORKS™
Tracy Gendron and Peter Angell,Atomic Energy of Canada Ltd., Chalk River Laboratories, Chalk River, Ontario, KOJ 1JO, Canada.
Abstract
The service water system is Commonly considered to be of lesser importance than other systems innuclear power plants. However, degradation of service water systems components has oftenresulted in forced outages, extended outages, and unit de-ratings with significant economic penaltyto the plants. To avoid these problems, the service water systems engineer must be aware of alarge variety of degradation mechanisms for an equally wide variety of materials under a broadrange of operating conditions and system designs. The variety of degradation mechanisms as wellas remedial treatments requires the service water engineer to be knowledgeable of subjects notrelevant to other systems, for example, organic coatings and corrosion by living organisms.
The CHECWORKS™ Service Water Module is a tool being developed to assist the service watersystem engineer in the following ways.
• focus inspection and maintenance activities• evaluate remedial mitigation options• organize system data• demonstrate compliance to regulators
The Service Water Module contains a set of models installed on the CHECWORKS™ platform thatpredict the susceptibility or rate of corrosion and fouling on a component-by component basis.Predictive models include, microbiologically influenced corrosion, cavitation, erosion-corrosion,galvanic corrosion, general corrosion, pitting, sedimentation, fouling (scaling, biofouling, silting),etc.. As a result of AECL's participation in the development of this module, all COG-memberutilities may obtain versions of the executable software free of charge.
88

Fourth CNS International Conference on CANDU MaintenanceNovember 1997, Toronto, Canada
THERMAL EFFICIENCY IMPROVEMENTS -AN IMPERATIVE FOR NUCLEAR GENERATING STATIONS
Dr. Sal Hassanien, P.EngTechnical Superintendent, Bruce B, Ontario Hydro
Bruce B, B01, Box 2000, Tiverton, Ont. NOG 2T0Tel: 519-361-2673 ext. 5651, Fax: 519-361-7790
Scott Rouse, P.EngIn-House Account Executive, Genco, Ontario Hydro
700 University Avenue, H10 F18, Toronto, Ont. M5G 1X6Tel: 416-592-8044, Fax: 416-592-4841, Email: [email protected]
= co
!§: OI Oo
3
Abstract
A one and a half percent thermal performanceimprovement of Ontario Hydro's operatingnuclear units (Bruce B, Pickering B, andDarlington) means almost 980 GWh areavailable to the transmission system (assumingan 80% capacity factor). This is equivalent tothe energy consumption of 34,000 electrically-heated homes in Ontario, and worth more than$39 million in revenue to Ontario HydroNuclear Generation.
Improving nuclear plant thermal efficiencyimproves profitability (more GWh per unit offuel) and competitiveness (cost of unit energy),and reduces environmental impact (less spentfuel and nuclear waste).
Thermal performance will naturally decreasedue to the age of the units unless correctiveaction is taken. Most Ontario Hydro nuclearunits are ten to twenty years old. Some commoncauses for loss of thermal efficiency are:
• fouling and tube plugging of steamgenerators, condensers, and heat exchangers.
• Steam leaks in the condenser due to valvewear, steam trap and drain leaks.
• Deposition, pitting, cracking, corrosion, etc.,of turbine blades.
• Inadequate feedwater metering resultingfrom corrosion and deposition.
This paper stresses the importance of improvingthe nuclear units' thermal efficiency. OntarioHydro Nuclear has demonstrated energy savingsresults are achievable and affordable. Between1994 and 1996, Nuclear reduced its energy useand improved thermal efficiency by over430,000 MWh.
Efficiency improvement is not automatic —strategies are needed to be effective. This papersuggests practical strategies to systematicallyimprove thermal efficiency.
89

Introduction
Business today is expected to achieve more withless. Better performance and reducedenvironmental impact with decreasing resourcesare now the norm in North America'scompetitive electricity industry. Ontario HydroNuclear is no exception. In the foreseeablefuture, competition will be based on the cost perkWh to the customer. The lower the price - thebetter the profit.
Improving nuclear plant thermal efficiency isthe fastest means to improve profitability (moreGWh per unit of fuel) as well ascompetitiveness (cost of unit energy). Lookingat it another way, the same output can beachieved with less reactor power. This translatesinto an increased life span of the majorgenerating equipment, for example, pressuretubes, steam generators, and condensers.
Thermal efficiency is also a good indicator formeasuring operation and maintenance quality.
The average thermal performance for an OntarioHydro nuclear unit is 29-31% [Ref. 1]. Thismeans that the reactor has to produceapproximately 3 MW in order to deliver 1 MWto the transmission system. Comparing thissituation with the automotive industry', it wouldmean that two out of every three cars producedwould be left to rust at the back of the plant.
A one and a half percent increase in thermalperformance for Ontario Hydro Nuclear'soperating units (Bruce B, Pickering B andDarlington) is equivalent to 980,000 MWh orover $39 million. The average "all-electric"home in Ontario consumes 28,600 kWhannually. (Energy is assumed to be worth fourcents per kWh, the average selling price to thetransmission company. See attached table). Aone and a half percent thermal efficiencyimprovement is feasible. The Electric PowerResearch Institute (EPRI) estimates thatimprovements of two to four percent arepossible at most fossil and nuclear power plants.
In September 1996, at the EPRI Workshop onPlant Performance Improvement, it wasreported that many U.S. nuclear plants hadachieved a two to three percent improvement byimplementing a specific program. In support ofEPRI, the American Council for EnergyEfficiency (ACEE) estimates that the heat rateof all fossil and nuclear plants can be improvedby three percent [Ref. 2].
In 1994, Ontario Hydro's In-House EnergyEfficiency Group spearheaded a corporate-wideprogram to improve thermal efficiency andreduce electrical consumption. The programachieved over a billion kWh annual savings inthree years, worth more than $50 million peryear [Ref. 3]. Nuclear contributed one third ofthe results - 431 GWh. Thermal performanceimprovements accounted for 59% of the energysavings achieved. The success of the In-Houseinitiative demonstrates that a one and a halfpercent improvement is not only feasible, butaffordable.
The contribution from Nuclear and from theFossil generating units suggests theopportunities are too large to overlook. Theopportunities are, in many cases, commonbetween businesses, for example, improvedmonitoring technologies, maintenance practices,employee awareness, and adopting progressivebusiness drivers that recognize and supportenergy efficiency improvement.
Most of Ontario Hydro's nuclear generatingunits are ten to twenty years old with fifteen totwenty-five year old designs. Due to age, theseunits will suffer varying degrees of loss ofthermal performance. Most of the heat lossesthat reduce the thermal efficiencies occur in thesecondary side (steam generators, turbine andcondenser, and associated equipment). Thereduction of heat transfer rates and the steamgeneration are caused by several mechanisms,e.g., plugging of leaking tubes, fouling and scalebuilding in boilers and heat exchange tubes, etc.Thermal performance loss is gradual and cannot be adequately monitored by the existing
90
plant instrumentation, which is of the samevintage and not accurate. Typically, the thermalperformance of the units is reduced by two tofive percent after ten to fifteen years ofoperation unless a program is established tooptimize operation and improve maintenance ofthe secondary side.
Although there have been several initiatives inOntario Hydro nuclear units to reduce heat lossor improve equipment on the secondary side,these efforts have been fragmented. Theinitiatives suffered as they competed forresources and priorities due to a short-termfocus on maintaining the unit's operation. Insome cases, the decisions for implementingsome of the programs to improve thermalefficiency were accepted based on the short-term impact on OM&A (as a cost) rather than asan investment. These decisions were made inspite of the fact that the typical return oninvestment for thermal improvement projects is300% to 500% with short payback periods.
The Main Causes for Thermal Losses
All heat transfer equipment such as steam gen-erators, condensers and heat exchangers sufferfrom reduction in heat transfer, steamgeneration, or energy extraction rates as theequipment ages. This loss is normally due tofouling, or loss of heat transfer area due to tubeplugging, or flow rate reduction due to sleeving[Ref. 4,5,6]. Also, steam leaks develop, forexample, to condenser, atmosphere, or lake dueto valve wear, steam traps and drains leaks. Allsteam and hot water leaks contribute to thermallosses.
Another cause for loss of performance isdeposition of corrosion material and impurities.For example, turbines experience loss inperformance due to pitting, cracking, corrosionand erosion of the turbine blades. Also,inadequate metering contributes to reducedperformance. Feedwater rates are typicallymeasured by an orifice plate or a venturi.Deposition of corrosion products results in
measured feedwater flow that is higher than theactual flows [Ref. 7,8,9,10]. Even at whatappears to be steady-state condition, there aresmall transients. After the transient, the systemmay not go back to exactly its original conditionfor a period of time. This was evident at BruceB when the power was measured with higheraccuracy by means of real-time energymonitored at a two-minute frequency. In mostexisting units, the current installed flow,temperature and pressure measurements sufferfrom similar inaccuracies.
EPRI data supports the typical averageperformance loss of three to five percent for tento twenty year old plants [Ref. 8, 10]. Toillustrate, for a 1,000 MW pressurized waterreactor (PWR) nuclear unit,
* 1 kg/s error in feedwater flow results in1.85 MW error
* 1 deg C error in feedwater flow results in7.7 MW error
* 1 PSI error in steam pressure results in0.15 MW error.
Strategies To Improve ThermalPerformance
As the existing stations age, the thermalperformance will continue to decline. Hence, itis imperative to develop strategies and toimplement systematic, long-term, continualimprovement thermal performance programs.Strategies were developed based on work atBruce B, communication with several U.S.nuclear plants that have established programs toimprove thermal performance, and EPRIresearch {Thermal Performance EngineerHandbook (under preparation) [Ref. 12]).Implementing the following seven strategieswill ensure improvement to thermal efficiency.
1. Establish Continual Improvement Program
A program with specific goals, objectives,targets and plans needs to be developed. Thecritical success factors are:
91
. Visible commitment and support fromthe station senior management.Develop the thermal improvementprogram as a profit generator rather thanas a short-term OM&A cost burden.Set clear and specific goals withmeasurable targets.Commit adequate resources.Raise energy efficiency awareness inthe plant through orientation andtraining.Integrate the program into normaloperation, maintenance, andprocurement activities.
2. Monitor Improvement and Optimization ofthe Operation
Develop an on-line, real-time heat andmass balance program (heat balancefrequency of 10 minutes) toimmediately tell the operators there aresome missing MW's so that they cantake corrective action. Many U.S.nuclear units have on-line mass andenergy balances [Ref. 11].Improve the secondary systemequipment surveillance to establishtrends and detect loss of performance orequipment degradation early. Forexample, valve leak detection program,steam trap, heat exchangers, steamgenerators monitoring and inspectionprograms.Thermography program for insulationand heat loss reduction [Ref. 4,6].Optimize boiler blow down flows toreduce unnecessary heat losses whilemaintaining the impuritiesconcentration below the allowablelimits [Ref. 1].
3. Improve Instrumentation (AdvancedMeasurements)
Replace existing critical flow tempera-ture and pressure instrumentation withaccurate, modern, digitalinstrumentation.
Rely more on ultrasonic flowmeasurement for feedwater flows.Replace present RTDs with advancedtemporary measurements (self-calibrating RTDs).Increase instrument's redundancy andcalibration frequency and precision.
4. Improve Control of the Secondary Side
Improve flow, pressure and temperaturecontrol through the use of distributeddigital control systems and diligentoperator monitoring and actions[Ref. 8,10].
5. Improve Maintenance
Improve surveillance and monitor theequipment condition.Improve leak detection and time torepair leaking valves and steam trapsexpeditiously.Perform on-line condenser tubecleaning.Periodic turbine performance testing,steam trap leak and valve eradication.Use thermography to determine heatescape.Improve insulation.Frequently calibrate feedwater flow.
6. Dedicate a Thermal Performance Group
Implement a dedicated "PerformanceGroup" that looks after day-to-daymonitoring, optimizing operations andlooking for any "missing MW's". Thisfollows the example of most of theexcellent U.S. nuclear utilities.
Also, this group would be responsiblefor long-term enhancements ofinstrumentation and maintenance anddesign modifications specific toincreasing output. Typically, the size ofthe group is from four to twelvepersons. All the modifications arenormally capitalized. The group is
92

considered a profit centre not a costcentre [Ref. 2].
7. Cost-effective Design Modifications
Replace inefficient equipment, orequipment that has reached the end ofits useful life, with more efficientdesigns.Carry out some design modifications tothe existing equipment to improvemonitoring or its operation or control.Examine each design modification onits cost effectiveness, sustained savingsand payback period [Ref. 1,2].
Conclusions
The thermal performance of the existing stationswill continue to decline because of aging.Hence, it is imperative to develop strategies andto implement systematic, long-term, continualimprovement of thermal performance programsto regain and reduce degradation in thermalperformance of the nuclear units.
Ontario Hydro's In-House initiativedemonstrates the benefits of the program bysaving over 1.2 billion kWh annually, with703 GWh directly from thermal and conversionefficiency. Industry experts, including EPRI,believe a 2-3% savings
is possible. Ontario Hydro Nuclear canrealistically save at least 1.8%.
Benefits of thermal performance improvementsto the existing nuclear stations are:
Improved competitiveness (lower cost ofunit energy).Increased profitability (more GWh to thegrid).Reduced environmental impact (less spentnuclear fuel waste to store).Increased life span of key components(pressure tubes, steam generators).Earned emission credits as energy saved isconverted to CO2, NOx, and SOx credits.
We believe the seven-element thermalefficiency program can achieve at least a oneand a half percent improvement to OntarioHydro's nuclear units. The question is notwhether we can afford to improve - but can weafford not to?
93

References
2.
Hassanien, S., Ontario Hydro. ThermalEfficiency {Performance Improvement)Imperative, Thermal EfficiencyImprovement Seminar, Tiverton, ONT,Nov. 1996
Eckert, T., EPRI. EPRI Perspective, EPRIPlant Performance Improvements Seminar,Asheville, NC ,Sep. 1996
3. Rouse, S., Ontario Hydro. Ontario HydroReport: Review of 1996 In-House EnergyEfficiency Results, Apr. 1997
4. Verdin, G., Babock and Wilcox. SteamGenerator Performance, ThermalEfficiency Improvements Seminar,Tiverton, ONT, Nov. 1996
5. White, G., Dominion Engineering. Causesfor PWR Steam Generator PerformanceDegradation, EPRI Plant PerformanceImprovements Seminar, Asheville, NC,Sep.1996
6. Bell, R., Heat Exchangers Systems. PowerPlant Heat Exchanger ConditionAssessment, EPRI Plant PerformanceImprovements Seminar, Asheville, NC,Sep. 1996
7. Sullivan, C , IES Utilities. FeedwaterVenturi Fouling Study, EPRI PlantPerformance Improvements Seminar,Asheville, NC, Sep. 1996
8. Estrada, H., Caldon Inc. An Assessment ofthe Integrity and Accuracy of Feedwaterand Temperature Measurements, EPRIPlant Performance Improvements Seminar,Asheville, NC, Sep. 1996
9. Zobin, D., Ontario Hydro. Feedwater FlowMeasurement Using UT, ThermalEfficiency Improvement Seminar, Tiverton,ONT, Nov. 1996
10. James, R.W, EPRI. Lubnow, T., MPRAssociate. Hauser, E., Caldon Inc. EPRIUltrasonic Flow and TemperatureMeasurement System for PWR, Balance ofthe Plant Performance Monitoring GroupMeeting, Asheville, NC, Sep. 1996
11. Woodword, R., IES Utilities. PlantInformation System, EPRI PlantPerformance Improvements Seminar,Asheville, NC, Sep. 1996
12. EPRI Plant Support Engineering. ThermalPerformance Engineer Handbook, InPreparation, May 1997 draft, to bepublished by EPRI by Dec. 1997
94
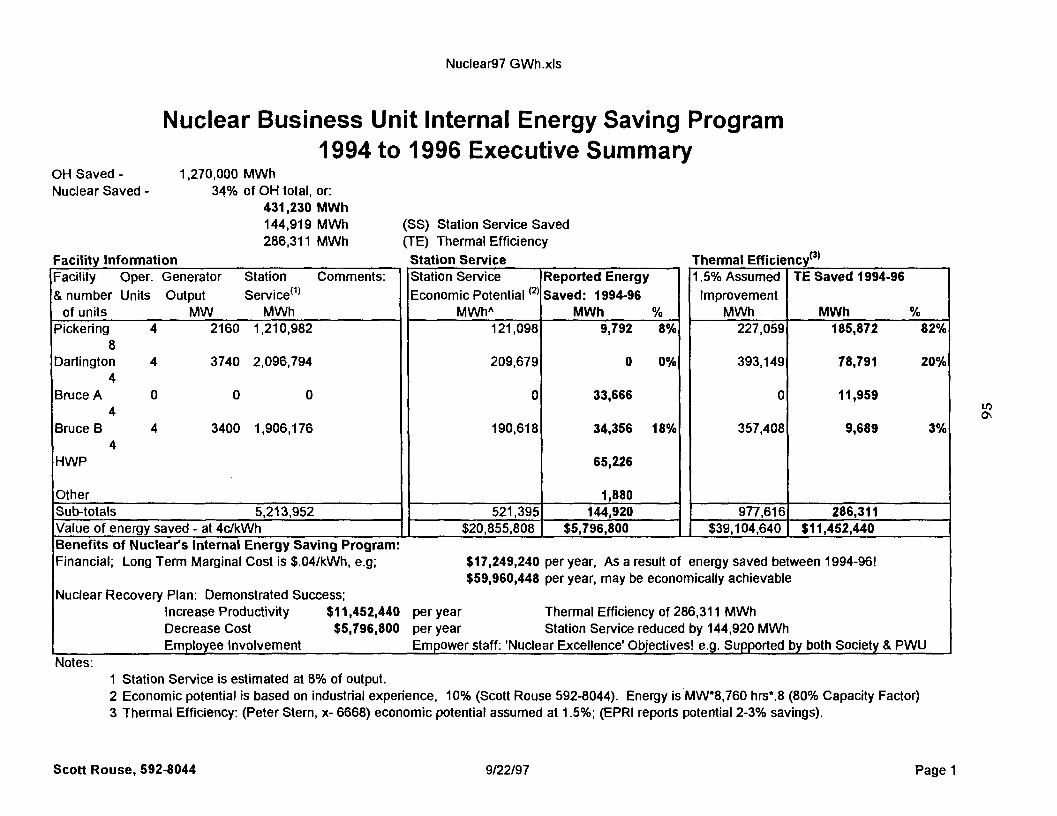
Nuclear97 GWh.xls
Nuclear Business Unit Internal Energy Saving Program1994 to 1996 Executive Summary
OH Saved -Nuclear Saved -
1,270,000 MWh34% of OH total, or:
431,230 MWh144,919 MWh286,311 MWh
(SS) Station Service Saved(TE) Thermal Efficiency
Facility InformationFacility Oper. Generator Station Comments:& number Units Output Service'1'
of units MW MWhPickering 4 2160 1,210,982
8Darlington 4 3740 2,096,794
4Bruce A 0 0 0
4Bruce B 4 3400 1,906,176
4HWP
OtherSub-totals 5,213,952Value of energy saved - at 4c/kWh
Station ServiceStation ServiceEconomic Potential(2)
MWhA
121,098
209,679
0
190,618
521,395$20,855,808
Reported EnergySaved: 1994-96
MWh %9,792 8%
0 0%
33,666
34,356 18%
65,226
1,880144,920
$5,796,800
Thermal Efficiency'3'1.5% Assumed
ImprovementMWh
227,059
393,149
0
357,408
977,616$39,104,640
TE Saved 1994-96
MWh %185,872 82%
78,791 20%
11,959
9,689 3%
286,311$11,452,440
Benefits of Nuclear's Internal Energy Saving Program:Financial; Long Term Marginal Cost is $.04/kWh, e.g; $17,249,240 per year, As a result of energy saved between 1994-96!
$59,960,448 per year, may be economically achievableNuclear Recovery Plan: Demonstrated Success;
Increase Productivity $11,452,440 per year Thermal Efficiency of 286,311 MWhDecrease Cost $5,796,800 per year Station Service reduced by 144,920 MWhEmployee Involvement Empower staff: 'Nuclear Excellence' Objectives! e.g. Supported by both Society & PWU
Notes:1 Station Service is estimated at 8% of output.2 Economic potential is based on industrial experience, 10% (Scott Rouse 592-8044). Energy is MW*8,760 hrs\8 (80% Capacity Factor)3 Thermal Efficiency: (Peter Stern, x- 6668) economic potential assumed at 1.5%; (EPRI reports potential 2-3% savings).
Scott Rouse, 592-8044 9/22/97 Page 1
CA0000017
Fourth CNS International Conference on CANDU MaintenanceNovember 16-18. 1997
Toronto, Canada
The Application of Operating Deflection Shape Analysis to Resolve StructuralVibration Problems
B. Alavi, E.P. Horton, and R.T. ZemdegsOntario HydroPickering ND
Abstract
This paper describes the application of Operating Deflection Shape (ODS) analysis for theresolution of structural vibration problems. ODS analysis is explained, and two case studiesare presented. Data collection and interpretation are described for these cases. Theeffectiveness of this analysis technique is demonstrated for pinpointing the root cause ofcomplex structural vibration problems. An evaluation of maintenance history illustrates thebenefit of applying ODS to avoid unnecessary maintenance costs.
96
CANDU MAINTENANCE CONFERENCES08: INVESTIGATION AND REPAIR OF A C A 0 0 0 0 0 1 8
CRACKED FEEDER AT POINT LEPREAU GS
by
A. Celovsky', M.D. Wright2, T.S. Gendron2, S.A. Usmani3, J. Slade4
ABSTRACTEarly in 1997 investigation of a low level leak in the Point Lepreau GS (PLGS) PHTS revealed that an outlet feeder,S08, was leaking. Ultrasonic inspection, and subsequent failure analysis, revealed that the leak was a consequence ofa crack. Given the unusual nature of this event, and current concerns over feeder thinning, a detailed and carefulremoval and examination procedure was developed. The S08 outlet feeder was removed and shipped to Chalk RiverLaboratories for examination. The examination confirmed that the failure was a through-wall crack, most likely theconsequence of stress corrosion cracking. A critical point of the analysis was to determine how the crack initiated,and subsequently propagated. High residual stresses and possibly abnormal loading in conjunction with chemistryenvironments resulted in the Stress Corrosion Cracking (SCC) of the S08 outlet feeder bend. It is recognized thatsome of the causative factors implicated in the S08 failure apply to other outlet feeders. In particular, residualstresses in the non-stress-relieved, short-radius cold bent pipes will remain relatively high over the future life of thefeeders. However, the risk of CANDU feeder failure by SCC is judged to be extremely low based on the evidence ofthe inspections carried out to date and the good performance record of feeder pipe in the CANDU industry.
The channel was restored to its locked configuration, and the failed section of feeder replaced.
'Reactor Materials Division2Heat Exchanger Technology Branch
Chalk River LaboratoriesChalk River, Ontario KOJ 1J0
3Process Engineering Branch,AECL , 2251 Spekman Drive,Mississauga, Ontario L5K 1B2
4Point Lepreau Generating StationP.O. Box 10
Point Lepreau, New Brunswick EOG 2H0
97
1. INTRODUCTION
The Point Lepreau Generating Station wasshutdown on 17 January 1997, to investigate alow level primary heat transport heavy waterleak. The leak was first detected on 1996December 19 at a rate of approximately1 kg/hour, and had increased to a rate ofapproximately 25 kg/hour by 1997 January 16.
A detailed search located the leak in the firstbend of the outlet feeder pipe of fuel channelS08. In-situ radiography and ultrasonicinspections confirmed the leak was the result of athrough-wall crack. The operating condition ofthe feeder pipe is summarized in Table 1.
To allow the reactor to be returned to service aprogram of repair and evaluation was initiated.This program included the following three majoritems:i) Removal, replacement of the cracked feeder
pipe section and other feeder inspections,ii) Investigation of the cause of the crack,iii) Stress evaluation.
2. REMOVAL & REPLACEMENT; ANDINSPECTION OF OTHER FEEDERS
2.1 Removal & Replacement
CANDU feeder pipes form a nested series ofsmall diameter pipes either supplying orreturning coolant to a fuel channel. PointLepreau has 380 inlet and 380 outlet feederpipes, arranged in an alternating supply andreturn configuration. Access of the fuelingmachine to the end of each fuel channel requiresthe feeder pipes to be connected at right angles tothe fuel channel (see Figure 1). This compactcore design, restricts access around the feederpipes.
A three-dimensional CAD mode! of variousoptions for feeder removal and replacement werestudied. The restricted access and tightclearances precluded the use of bothconventional automatic welding equipment andmanual welding. Removing the feeder at theGrayloc hub, and at a some point downstream,minimized the number of field welds. Twooptions were pursued simultaneously:
• Development of a low clearance automaticwelding machine, to allow welding justdownstream of the crack.
• Removal of a longer section of feeder pipe,thereby allowing welding to take placefurther downstream at a less restricted area.
Channels S06, S07, and S08 were all de-fueledand S08 was isolated from the heat transportcircuit using ice plugs. S07 and S08 were de-fueled in the event additional clearancerequirements necessitated their removal. Evenwithout removal of the S06 & S07 feeders,hydraulic jacking was required to spread the R08and S08 endfittings. Prior to such a jackingoperation, the maximum allowable jacking forcewas calculated to be 8 000 lbs. A jacking force of5 000 lbs: was used and this spread the endfittingby VA of an inch.
The low clearance automatic welding machineoption resulted in some initial weld porosity.While the applicability of the first option wasproven, available time in outage schedule made itpossible to select the second option. The secondoption, which had the additional benefit ofproviding extra feeder pipe for detailedexamination, was successfully used to install areplacement feeder section.
Welding was carried out in accordance withASME Sec III class NB(1974) and AECLTechnical Specifications. The resultant weldswere inspected visually, radiographically, andusing dye penetrant. Two sample welds weremade and radiographically examined. A sampleroot pass weld was also made, immediately afterthe field welds, and visually examined.
2.2 Inspection of Other Feeders
To verify other feeders did not contain similarcracks, a UT inspection program on other feederswas conducted. Feeders similar to S08 wereidentified and then inspected. Similaritiesconsidered included, pipe diameter, bend radius,unlocked channel, and feeder spacer supports(see Section 4). A total of 157 feeders,comprising both inlets and outlets, wereexamined and no other crack-like indicationswere identified.
98
3. FAILURE INVESTIGATION
A series of tests and examinations wereconducted on the failed feeder pipe elbow and ona spare elbow for comparison. The spare elbowwas fabricated at the same time, using the sameprocesses and from the same ingot material, asthe failed elbow.
3.1 Visual Inspection & Sectioning
Other than the crack, a detailed visual inspectionrevealed no unusual features on either the OD orthe ID surfaces of the pipe. No local pits, gouges,etc. were observed. The ID surface had finesurface features corresponding to local flowpatterns, with some variation from the intrados tothe extrados. Oxidation of the ID surfaceappeared uniform.
The pipe was sectioned as indicated in Figure 2,and further sectioned in and around the crack.Upon splitting the pipe into the E & F sections inFigure 2, it was noted that the pipe sprung open.This indicated high remaining residual stresseswithin the pipe. Increased hardness, within thebend section of pipe was also measured. Both thespringing open of the pipe and the increasedhardness was attributed to the cold bendingprocess used during fabrication.
3.2 Gamma Spectral Analysis
A general radiation field of 190 |i.Sv/hr wasobserved around the pipe. A gamma spectralanalysis was conducted on the pipe and issummarized in Table 2. The types and quantitiesof radionuclides present are typical of a CANDUprimary heat transport system. The radionuclidesand quantities measured, are not known to causestress corrosion cracking.
3.3 EC & UT Inspections
EC inspections conducted on the OD surfacerevealed only a single surface breaking defect.No other crack-like degradation was foundelsewhere in the pipe. This defect wasapproximately 35 mm long at the OD. ECinspections were also conducted on the IDsurface after the pipe section had been cut open.Again, only the single surface breaking defect
was revealed. The length of the flaw on the IDwas approximately 63 mm long.
A limited series of UT wall thicknessmeasurements were conducted on the failed pipesection and the spare elbow. Although the wallthickness of the failed component was thinnerthan the spare elbow, it was concluded that thedifference was due to Flow AcceleratedCorrosion, and was independent of the crackingmechanism. UT wall thickness measurementsalso indicated thinning of the pipe wall thicknessalong the pipe extrados and thickening of thewall thickness along the intrados. This wasobserved on both the spare elbow and the failedpipe section, and is consistent with the bendingprocess used during fabrication.
3.4 Chemical Analysis
A full chemical analysis of the failed pipematerial showed the material was in complianceto code of construction requirements, see Table 3[1]. Numerous elemental spectra were alsoobtained using EDX, including spectra at thefracture surface. All elemental spectra obtained,indicated elements consistent with SA 106 GradeB pipe.
3.5 Residual Stress Measurements
Measurements of residual stress were made atpositions through the wall thickness of thematerial on the spare elbow using a non-destructive neutron spectrometer. The residualstresses were measured on the spare elbow at alocation equivalent to the crack on the failedcomponent [1] (See Figure 3). The residual stressmeasurements showed that the hoop stress variedfrom compressive at the OD surface to tensile atthe ID surface. The maximum tensile stress was330 MPa, which approximates the yield point ofthe material of 350 MPa. Additional residualstress measurements were conducted after 20, 40,and 87.5 hour heat treatments at 308°C, thenominal temperature of the primary coolant. Asexpected, there was no apparent relaxation of theresidual stresses at the nominal coolant operatingtemperature [2] (see Figure 3). Residual stresseswere measured to be a maximum at the locationequivalent to the crack defect [1].
99
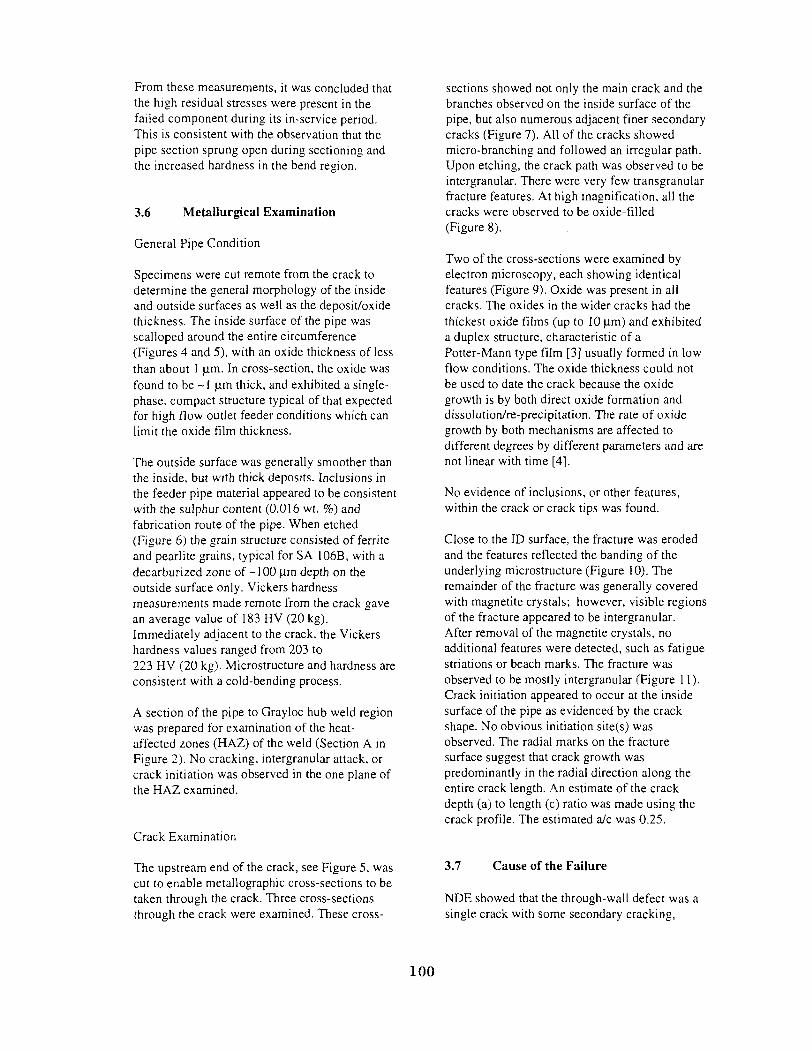
From these measurements, it was concluded thatthe high residual stresses were present in thefailed component during its in-service period.This is consistent with the observation that thepipe section sprung open during sectioning andthe increased hardness in the bend region.
3.6 Metallurgical Examination
General Pipe Condition
Specimens were cut remote from the crack todetermine the general morphology of the insideand outside surfaces as well as the deposit/oxidethickness. The inside surface of the pipe wasscalloped around the entire circumference(Figures 4 and 5), with an oxide thickness of lessthan about 1 |im. In cross-section, the oxide wasfound to be -1 u,m thick, and exhibited a single-phase, compact structure typical of that expectedfor high flow outlet feeder conditions which canlimit the oxide film thickness.
The outside surface was generally smoother thanthe inside, but with thick deposits. Inclusions inthe feeder pipe material appeared to be consistentwith the sulphur content (0.016 wt. %)andfabrication route of the pipe. When etched(Figure 6) the grain structure consisted of ferriteand pearlite grains, typical for SA 106B, with adecarburized zone of -100 urn depth on theoutside surface only. Vickers hardnessmeasurements made remote from the crack gavean average value of 183 HV (20 kg).Immediately adjacent to the crack, the Vickershardness values ranged from 203 to223 HV (20 kg). Microstructure and hardness areconsistent with a cold-bending process.
A section of the pipe to Grayloc hub weld regionwas prepared for examination of the heat-affected zones (HAZ) of the weld (Section A inFigure 2). No cracking, intergranular attack, orcrack initiation was observed in the one plane ofthe HAZ examined.
Crack Examination
The upstream end of the crack, see Figure 5, wascut to enable metallographic cross-sections to betaken through the crack. Three cross-sectionsthrough the crack were examined. These cross-
sections showed not only the main crack and thebranches observed on the inside surface of thepipe, but also numerous adjacent finer secondarycracks (Figure 7). All of the cracks showedmicro-branching and followed an irregular path.Upon etching, the crack path was observed to beintergranular. There were very few transgranularfracture features. At high magnification, all thecracks were observed to be oxide-filled(Figure 8).
Two of the cross-sections were examined byelectron microscopy, each showing identicalfeatures (Figure 9). Oxide was present in allcracks. The oxides in the wider cracks had thethickest oxide films (up to 10 |im) and exhibiteda duplex structure, characteristic of aPotter-Mann type film [3] usually formed in lowflow conditions. The oxide thickness could notbe used to date the crack because the oxidegrowth is by both direct oxide formation anddissolution/re-precipitation. The rate of oxidegrowth by both mechanisms are affected todifferent degrees by different parameters and arenot linear with time [4].
No evidence of inclusions, or other features,within the crack or crack tips was found.
Close to the ID surface, the fracture was erodedand the features reflected the banding of theunderlying microstructure (Figure 10). Theremainder of the fracture was generally coveredwith magnetite crystals; however, visible regionsof the fracture appeared to be intergranular.After removal of the magnetite crystals, noadditional features were detected, such as fatiguestriations or beach marks. The fracture wasobserved to be mostly intergranular (Figure 11).Crack initiation appeared to occur at the insidesurface of the pipe as evidenced by the crackshape. No obvious initiation site(s) wasobserved. The radial marks on the fracturesurface suggest that crack growth waspredominantly in the radial direction along theentire crack length. An estimate of the crackdepth (a) to length (c) ratio was made using thecrack profile. The estimated a/c was 0.25.
3.7 Cause of the Failure
NDE showed that the through-wall defect was asingle crack with some secondary cracking,
100

without any other crack growth elsewhere on thepipe. There was nothing unusual in themicrostructure or chemical composition of thepipe to suggest any undue susceptibility of thispipe to any cracking mechanism, with thepossible exception of the increased hardnessresulting from the cold bending process and theassociated residual stress.
Scallop markings were observed on the insidesurface of the feeder pipe consistent withcorrosion in a high flow environment. However,there was no consistent correlation between thesurface crack path and the scallop patternindicating that they had played a role in crackinitiation. The crack shape and generalmorphology were entirely consistent withinitiation from the inside surface, but no pits,grooves, cavitation marks, foreign objects, ormechanical damage that could have acted asinitiation sites were observed. However, ifinitiation occurred some time ago, the initiationsite that may have been present could have beenremoved by the same corrosion processresponsible for the scallop markings. Theevidence for a loss in wall thickness is the lack ofa decarburized zone at the ID as well as wallthickness measurement comparisons between thefailed pipe section and the spare elbow. The wallthickness comparison suggests a loss in wallthickness of approximately 1 mm in 12.4 EFPY.Another feature that may be attributed tocorrosion was the 0.7 mm deep open, river-likenature of the central region of the crack mouth.
The fracture surface away from the crack mouth,particularly remote from the through-wallportion, was not damaged by corrosion andtherefore yielded evidence for the mechanism offracture. The semi-elliptical shape of the fractureand the even, rounded crack front is consistentwith fatigue crack propagation. However, otherfeatures which usually implicate fatigue such asbeach marks and striations were absent. Inaddition, the presence of macroscopic featureswith relief on the order of 500 u.m are atypical offatigue. The strongest evidence against a fatiguecracking mechanism is the intergranular crackpath, observed in all areas, including the tip ofthe growing crack. Thus, purely mechanicalfatigue was not the cracking mechanism, eventhough cyclic stresses would have undoubtedlybeen present.
Some of the fracture features, for example theoxide-filled crack and the elliptical, even crackfront, are characteristic of corrosion fatigue.However, the intergranular crack path is notcharacteristic and neither are the multiple crackpaths (resulting from branching rather thanmultiple initiations). In addition, althoughcorrosion fatigue is described as cracking, inmost instances there is a noticeable metal lossfrom dissolution, creating parallel-sided,sometimes trench-like cracks. In the failed S08feeder pipe, the opposite fracture faces matedvery well which is inconsistent with corrosionfatigue.
The metallography and fractography showed noevidence for hydrogen embrittlement or brittlecleavage fracture, which sometimes have featuresin similar to with fatigue, and could have resultedin cracks superficially similar to this failure.There were no features observed to implicatecreep in the failure, for example, grain boundaryvoid formation. Finally, liquid or solid metalembrittlement, which can produce intergranularand branched crack paths, are not feasible sinceno embrittling species (e.g. Cu, Sb, Pb) werefound within the cracks and none are expected insufficient quantities in the steel or HTS.
The mechanism fitting the majority of the crackfeatures discussed above, is stress corrosioncracking (SCC). The most distinctive of these isthe intergranular and branched crack path. SCCcan be driven by residual stress alone andevidence suggests the high residual stress at thecrack location was a very significant factor inthis failure. The crack was tightly closed andrelatively difficult to see on the outside surface.This indicates the operating stresses were nothigh enough to cause general plastic ruptureresulting in opening of the crack, even though thecrack tips may have been propagating under highstress intensities during the final stages of crackgrowth. The low aspect ratio (a/c = 0.25) is alsoconsistent with growth dominated by residualstresses.
Although SCC driven by residual stress is themost likely failure mechanism, it must berecognized that within the broad definition ofenvironmental cracking, SCC and corrosionfatigue lie at two extremes of a continuum ofdegradation mechanisms depending on therelative contribution of cyclic stress and crack-tipstrain-rate [5, 6]. Therefore, although it is
101

thought that the mechanism is best described asstress corrosion cracking, this does not rule out acontribution from cyclic stresses. In this respect,the very even crack front and the convergingcrack planes to give a single, relatively straightcrack at the outside surface suggests a high stressdependence, possibly cyclic, which is not alwaysnecessary for SCC. In contrast, SCC moretypically produces an uneven, jagged-shapedcrack front and a tree-like cracking pattern.
SCC of carbon steel in the nuclear industry is arelatively rare event, requiring specificcombinations of stress, temperature, andchemistry that deviate from normal operatingconditions. The distribution of stresses resultingfrom the residual (Section 3.4), operating anddynamic stresses (Section 4, below), wereevaluated. The applicable temperatures wereavailable from the reactor operating history. Theexact chemistry regime during all aspects ofoperation, especially transients, were moredifficult to estimate. However, none of the classicenvironments that cause SCC of carbonsteels should be operative under CANDU HTSconditions including excursion chemistries withinthe design envelope. One possible exception iscarbonate contamination, which in alkalineaqueous solutions can cause intergranular SCCbut concentrations required are relatively high, inthe 1000 ppm range [7]. However, there aresimilarities between carbonate cracking and theobserved crack. Thus, carbonate cracking isconsidered a plausible environment and potentialsources of carbonate in the HTS are beingreviewed. An additional environmentally-assistedcracking mechanism being considered is hightemperature oxygen-assisted cracking [8]. Whilethis mechanism does not normally result inintergranular cracks, threshold oxygen levelcould be reached during start-up and fuelingtransients [9]. The threshold oxygen levels are inthe 5 and 50 ppb range. Susceptibility is greatestbetween 200°C and 250°C but failures have beenreported at temperatures up to 320°C. Themorphology of this type of cracking normally hasfeatures in common with corrosion fatigue andcracking is usually only seen when a dynamicload component is present. Despite the rareoccurrence of intergranular cracking due to hightemperature, oxygen assisted SCC, the fact thatthe necessary environmental conditions could bemet during start-up or fueling means that thismechanism is also considered plausible, and isbeing investigated further.
Additional work is required to identify preciselythe chemical environment responsible for theSCC and whether dynamic stress or residualstress alone was the dominant mechanical factor.
4. STRESS ANALYSIS
Loading of the failed S08 feeder pipe and thesimilar S15 feeder were evaluated to determinethe stress distributions. A three-dimensional,finite element computer model was created usingthe ANSYS program. The model was developedusing an 8-node brick element with three layersof elements through the pipe thickness (SeeFigure 12). The intrados and extrados pipethickness was based on the UT wall thicknessmeasurements. The model incorporated theresidual stresses from the cold-bendingoperation, operating loads, static and dynamicloads, and loads from re-fuelling operations.
Using the model developed, various scenarioswere evaluated. The principle configurationsevaluated were:• Atypical S08 feeder spacers resulting from
the 2 x/i inch diameter feeder being adjacentto a larger diameter feeder (see Figure 1).
• The normal design configuration of a singleend of the fuel channel locked in position.
• The abnormal situation were the S08 fuelchannel was left unlocked after the 1995Spacer Location and Re-positioning (SLAR)program.
The following significant results were obtained:
• For the normal design configuration of oneend of the fuel channel locked and includingthe incorporation of the atypical feederspacer assembly, the stresses in the S08 inletand outlet feeders meet the requirements ofthe ASME code. Therefore, the atypicalfeeder spacer configuration of the outletfeeder S08 (and similarly the identical outletfeeder S15) were considered acceptable.
• The piping stresses in the unlocked S08 fuelchannel in combination with the atypicalfeeder spacer results in considerably higherstresses in the outlet feeder compared to theinlet feeder.
• Without the imposition of the atypical S08feeder spacer, the stresses in the feeder are
102

only marginally increased by a resultant 12.5mm movement of the fuel channel arisingfrom an unlocked condition. Only a marginalincrease occurs because the feeder pipeassembly has sufficient flexibility toaccommodate such movements.
• With the atypical S08 feeder spacer incombination with the unlocked fuel channel,a 12.5 mm channel movement during re-fueling increases the maximum stresses inthe outlet feeder by 79% compared to thenormal design configuration.
The additional stresses due to the combination ofthe unlocked channel, atypical feeder spacer, andnormal fueling machine loads could result in alocal dynamic strain in the crack regionexceeding 0.3%. This level of strain is sufficientto initiate SCC, when the applied load producesstrain rates in a critical range, and whenappropriate environmental conditions exist.
The physical features of the crack are typical ofstress corrosion cracking (SCC), although acyclic load may have contributed to the failure.Additional work is required to identify preciselythe chemical environment responsible for theSCC.
The CANDU core design must support andrestrain the core, fuel channels, and feeder pipingwhile providing flexibility to accommodatethermal expansion and dynamic loadings fromsuch items as the fueling machine. The PointLepreau pipe restraint system indicated the S08channel and feeder were not returned to theoriginal design configuration after the 1995SLAR operation. This resulted in additionaldynamic loadings in the S08 outlet feeder duringre-fueling operations. Furthermore, theconfiguration of the unlocked S08 channel incombination with its atypical feeder spacersystem resulted in loading conditions where SCCcould occur in the outlet feeder
5. SUMMARY
The successful removal and replacement ofCANDU feeder pipes requires detailed planningdue to the restricted access and tight clearances.
In-situ inspection of other inlet and outlet feederpipes found no other crack-like defects.
Visual inspecton, NDE, and metallographyrevealed that the through-wall defect was a singlecrack with some secondary cracking, 35 mm longon the outside surface of the pipe and 63 mmlong on the inside surface. No other crack-likedegradation was found elsewhere in the pipe.The crack initiated at the inside surface of thepipe. No initiating feature was found butcorrosion may have removed evidence of aninitiation feature. Scallop markings wereobserved on the inside surface of the feeder pipeconsistent with corrosion in a high flowenvironment. However, there was no indicationthat the scollop markings played a role in crackinitiation.
The chemical composition and the microstructureof the pipe material was typical of SA 106Grade B pipe. The pipe elbow at the crack defectarea had increased hardness and high residualstresses attributed to the cold bending processused during fabrication.
8. ACKNOWLEDGEMENTS
The authors wish to acknowledge the manypeople at NBP, Ontario Hydro, and AECL whocontributed to conducting this work on a prioritybasis. Special thanks are extended to DougRogers, Steve Bushby, Doug Miller, andMalcolm Clarke, who were instrumental incompleting this work.
9. REFERENCES
1. A. Celovsky, A. and Root, J.H.,"Measurements on Point Lepreau S08 FeederPipe and Spare Elbow," AECL ReportRM-RP-22, 1997 May (Draft)
2. Price, E.G., " Stress Relaxation Creep andTensile Test on A106B Feeder Pipe Material"AECL Report IR 453, 1982.
3. Potter, E.C. and Mann, G.M.W, "Oxidationof Mild Steel in High-Temperature AqueousSystems", 1st Intl. Congress on MetallicCorrosion, London, 417-426, 1962.
103

4. Moore, J.B., and Jones, R.L., "Growth 7.Characteristics of Iron Oxide FilmsGenerated in Dilute Lithium HydroxideSolution at 300°C", J. Electrochemical Soc,115:576-583, 1968.
5. Andresen, P.L. and Ford, F.P., "Life 8.Prediction by Mechanistic Modeling andSystem Monitoring of EnvironmentalCracking of Iron and Nickel Alloys inAqueous Systems" Mat. Sci. and Eng. A103, 9.161-181,1988.
6. Parkins, R.N., "Strain Rate Effects in StressCorrosion Cracking" Corrosion 46, 178-189,1990.
Kmetz J. H. and Truax D. J., "CarbonateStress Corrosion Cracking of Carbon Steelin Refinery FCC Main FractionatorOverhead Systems" CORROSION 90, paper206, Houston TX , NACE 1990.
Scott, P.M. and Tice, D.R., "StressCorrosion in Low Alloy Steels" NuclearEngineering and Design 119,399-413, 1990.
Elliot, A.J., "Review of HTS ChemistryRelated to Possible Crack Initiation inCarbon Steel" AECL Memorandum toT. Gendron and M. Wright, 1997 January 31(Draft).
104

TABLE 1: AVERAGE S08 OUTLET FEEDEROPERATING CONDITIONS
TABLE 3: CHEMICAL ANALYSIS RESULTSON FEEDER PIPE MATERIAL
OperatingConditions
Years In-ServiceTemperatureQualityMass FlowFlow VelocityTime in Boiling
LifetimeAveragedValue for $08Outlet Feeder12.4 EFPYs310.9 °C0.82 %24.4 kg/s15.7 m/s37.8 %
TABLE 2: RADIONUCLIDE INVENTORY OFREMOVED PIPE SECTION
ISOTOPECr-51Mn-54Fe-59Co-58 JCo-60Zr-95Nb-95Ru-103Sn-113Sb-122Sb-1241-133La-140Ce-141Ce-144Hf-181
QUANITY (Bqt1.58 x 105
2.66 x 10⁴
2.73 x 10⁵
7.91 x 10J
1.49 x 10-'
1.22 x 10⁶
2.82 x 10⁶
1.46 x 10s
1.42 x 10⁴
4.79 x 10⁴
3.49 x 10⁵
4.06 x 10⁴
3.35 x 10⁴
7.99 x 10⁴
5.30 x 10⁴
2.44 x 10⁴
Concentrations in Wt %
Element
C
s
p
Mn
Ni
Cr
MoV
Cu
Si
Co
SA106Grade B
(1977 Ed.)
0.30 max.
0.058 max.
0.048 max.
0.29 to1.06
*
*
NSNS
*
0.10 min.
0.0060*
$08PipeMillCert(1975)0.19
0.011
0.022
0.65
0.020
0.030
--
0.013
0.33
0.0039
$08 Pipe(Measured
in 1997)
0.161±0.0080.0160
±0.00150.0165
±0.00200.62 ±0.02
0.0137±0.00060.0236
±0.0009<0.00150.0041
±0.00050.0119
±0.00050.295
±0.015-
NS Not Specified* Not specified for 1977 Edition of SA 106
material, but additional requirementimposed by AECL Technical Specification.
105

FIGURE 1:S08 FEEDER ARRANGEMENT
S-BANK LOWER FEEDER SUPPORTAND SPACE" ARRANGEMENT (PLAN & SECTION)(A-OI EAST-NORTH QUAORANT
3 M - 2 " 2 0 - S 9 «
3312-3
J3I2-2-I/2O-S1IA
FIGURE 2:SECTIONING DIAGRAM OF S08 PIPE SECTION
Section "D
Section "C"Section "F" Torch cut notSection containing shown for claritycrack
106

FIGURE 3:RESIDUAL STRESS SCANS OF ARCHIVED
ELBOW
CD
a.
55CLOOX
400
200
0
-200
-400
-600
OAs received• 308 C, 20 hA 308 C, 40 hX308 C, 87.5 h
FIGURE 4:SEM, SECONDARY ELECTRON IMAGE, OF
AREA REMOTE FROM THE CRACKSHOWING SCOLLOPS
a *•
0 1 2 3 4 5 6 7
Distance from Outer Surface(mm)
FIGURE 5: PHOTOGRAPH OF THE MONTAGE ASSEMBLED FROM SEM, SECONDARYELECTRON IMAGES, OF THE ENTIRE CRACK LENGTH (ID SURFACE)
2 mm
107

FIGURE 6:MICROSTRUCTURE OF FEEDER PIPE
CIRCUMFERENTIALLY ADJACENT TOTHE CRACK SHOWING BANDED
FERRITE/PEARLITE GRAINS
0.1 mm "
FIGURE 8:OXIDE FILLED INTRAGRANULAR CRACK
IN FEEDER PIPE (RADIAL-CIRCUMFERENTIAL PLANE)
FIGURE 7:INTREGRANULAR CRACK IN FEEDER PIPE
(ETCHED, RADIAL-CIRCUMFERENTIALPLANE)
•! :S#^!3SBf III t^iiM. i%
FIGURE 9:SEM, SECONDARY ELECTRON IMAGE, OF
CRACK ON CROSS SECTION
• 1 +
Pottcr-Hann
108
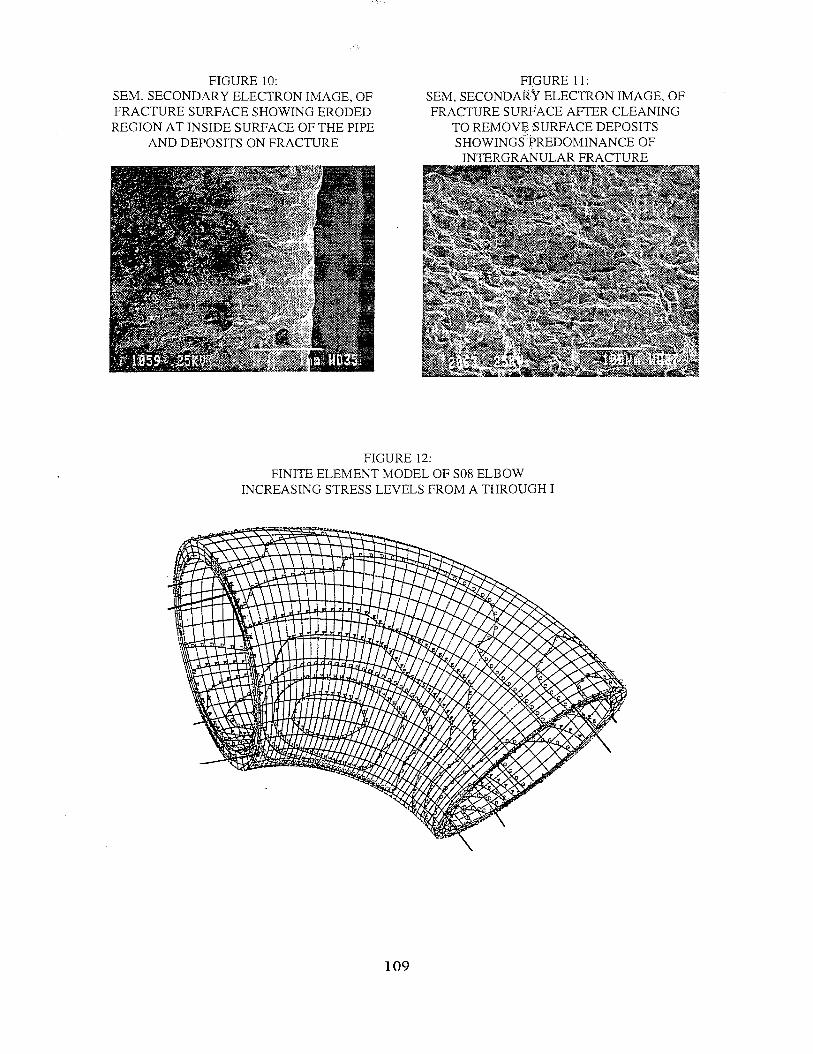
FIGURE 10:SEM, SECONDARY ELECTRON IMAGE, OFFRACTURE SURFACE SHOWING ERODEDREGION AT INSIDE SURFACE OF THE PIPE
AND DEPOSITS ON FRACTURE
FIGURE 11:SEM, SECONDARY ELECTRON IMAGE, OFFRACTURE SURFACE AFTER CLEANING
TO REMOVE SURFACE DEPOSITSSHOWINGS PREDOMINANCE OF
INTERG^ANULAR FRACTURE
\ ~^ * •
* • .
i , «
FIGURE 12:FINITE ELEMENT MODEL OF S08 ELBOW
INCREASING STRESS LEVELS FROM A THROUGH I
109
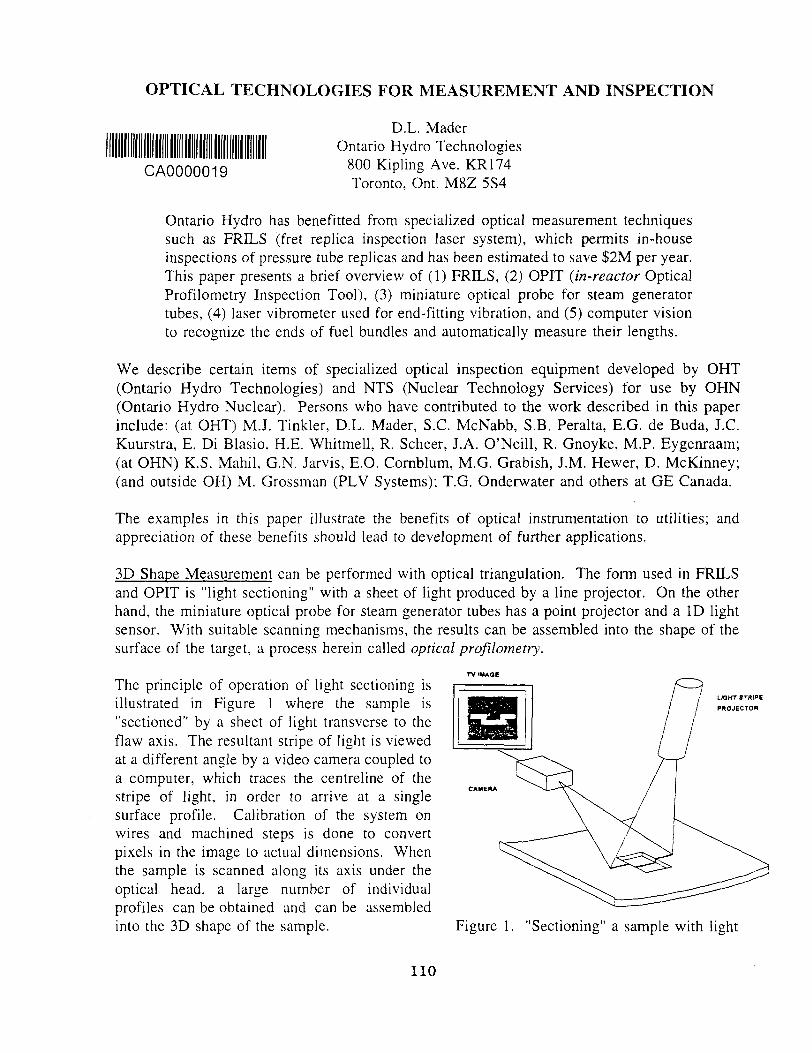
OPTICAL TECHNOLOGIES FOR MEASUREMENT AND INSPECTION
CA0000019
D.L. MaderOntario Hydro Technologies
800 Kipling Ave. KR174Toronto, Ont. M8Z 5S4
Ontario Hydro has benefitted from specialized optical measurement techniquessuch as FRILS (fret replica inspection laser system), which permits in-houseinspections of pressure tube replicas and has been estimated to save $2M per year.This paper presents a brief overview of (1) FRILS, (2) OPIT {in-reactor OpticalProfilometry Inspection Tool), (3) miniature optical probe for steam generatortubes, (4) laser vibrometer used for end-fitting vibration, and (5) computer visionto recognize the ends of fuel bundles and automatically measure their lengths.
We describe certain items of specialized optical inspection equipment developed by OHT(Ontario Hydro Technologies) and NTS (Nuclear Technology Services) for use by OHN(Ontario Hydro Nuclear). Persons who have contributed to the work described in this paperinclude: (at OHT) M.J. Tinkler, D.L. Mader, S.C. McNabb, S.B. Peralta, E.G. de Buda, J.C.Kuurstra, E. Di Blasio, H.E. Whitmell, R. Scheer, J.A. O'Neill, R. Gnoyke, M.P. Eygenraam;(at OHN) K.S. Mahil, G.N. Jarvis, E.O. Cornblum, M.G. Grabish, J.M. Hewer, D. McKinney;(and outside OH) M. Grossman (PLV Systems); T.G. Onderwater and others at GE Canada.
The examples in this paper illustrate the benefits of optical instrumentation to utilities; andappreciation of these benefits should lead to development of further applications.
3D Shape Measurement can be performed with optical triangulation. The form used in FRILSand OPIT is "light sectioning" with a sheet of light produced by a line projector. On the otherhand, the miniature optical probe for steam generator tubes has a point projector and a ID lightsensor. With suitable scanning mechanisms, the results can be assembled into the shape of thesurface of the target, a process herein called optical profilometry.
The principle of operation of light sectioning isillustrated in Figure 1 where the sample is"sectioned" by a sheet of light transverse to theflaw axis. The resultant stripe of light is viewedat a different angle by a video camera coupled toa computer, which traces the centreline of thestripe of light, in order to arrive at a singlesurface profile. Calibration of the system onwires and machined steps is done to convertpixels in the image to actual dimensions. Whenthe sample is scanned along its axis under theoptical head, a large number of individualprofiles can be obtained and can be assembledinto the 3D shape of the sample.
1.KJHT STRIPE
PROJECTOR
Figure 1. "Sectioning" a sample with light
110

The data acquisition computer digitizes the video signal and the OPIT/FRILS software developedby OHT and SSD (Simulator Services Dept) extracts the surface profile of the pressure tube.Surface profiles can be segmented, and circles can be fitted manually or automatically to highstress locations.
A particular niche for optical profilometry is its non-contact capability to take root-radiusmeasurements for flaw assessment, since "sharp" flaws are assessed differently from "blunt"flaws. Both FRILS and OPIT were designed to profile a type of pressure tube flaw calledbearing pad fret marks, caused by contact of the bearing pads on nuclear fuel bundles with theinside surface of the fuel channels (pressure tubes). These flaws among others are first detectedwith ultrasonic probes, which identify those flaws that require further characterization. A rubberreplica will be made of the flaw inside the reactor, and it is removed for flaw measurementsoutside the reactor. FRILS takes flaw measurements on replicas, including root-radiusmeasurements down to a root radius of 40 um. FRILS is used by OHN and OHT on a routinebasis. OPIT is still under development to measure bearing pad fret marks directly in the reactorwithout the need to take replicas.
The FRILS apparatus, shown in Figure 2,consists of a large turntable underlying theinclined brackets that hold the sample scanninglinear table and replica holder. A separate partholds the optical head, which positions acommercial laser line projector horizontally, anda machine vision video camera and zoom lensinclined at a steep angle. The various anglesresult in suitable angles of projection and view tocarry out optical triangulation. The largeturntable is used to change the aspect of thesample with respect to the optical head, in orderto acquire left and right rootviews. The operatormanually adjusts the zoom factor of the lens tohigh magnification to measure root-radius values.This system was designed to measure thegeometry of bearing pad fret marks as retrievedfrom fuel channels via rubber replicas. Theseflaws are oriented axially in the pressure tubes.FRILS is also pressed into service to measuredebris flaws, which may have any arbitraryorientation. Figure 2. FRILS apparatus
Flaw shape in-reactor is obtained by OPIT (Optical Profilometry Inspection Tool). This toolworks under the following constraints: tool head must fit in fuelling machine (40 inches longby 4 inches diameter), the tool delivery system supplies only 15 electrical cables, the channel isflooded, and the gamma radiation is about 0.5 MegaRad per hour. Since movement of the opticalhead relative to the flaws (as is done in FRILS) is not feasible, three separate optical systems areused to collect the overview, right rootview, and left rootview. The systems were designed to
111
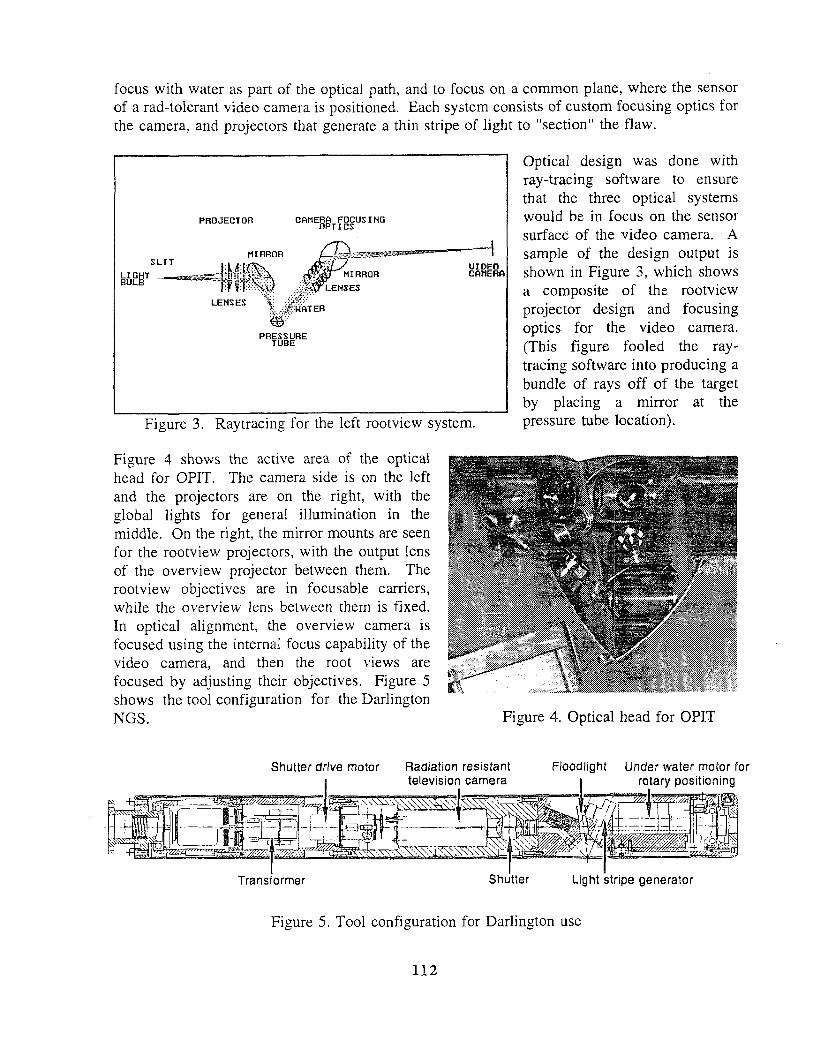
focus with water as part of the optical path, and to focus on a common plane, where the sensorof a rad-tolerant video camera is positioned. Each system consists of custom focusing optics forthe camera, and projectors that generate a thin stripe of light to "section" the flaw.
PROJECTOR CAMERA FOCUSINGOPTICS
SLITMIRRDR
LIOHTBULB im v
LENSES
UIDEOCAMERA
. .-./vUflTER
PRESSURETUBE
Figure 3. Raytracing for the left rootview system.
Figure 4 shows the active area of the opticalhead for OPIT. The camera side is on the leftand the projectors are on the right, with theglobal lights for general illumination in themiddle. On the right, the mirror mounts are seenfor the rootview projectors, with the output lensof the overview projector between them. Therootview objectives are in focusable carriers,while the overview lens between them is fixed.In optical alignment, the overview camera isfocused using the internal focus capability of thevideo camera, and then the root views arefocused by adjusting their objectives. Figure 5shows the tool configuration for the DarlingtonNGS.
Optical design was done withray-tracing software to ensurethat the three optical systemswould be in focus on the sensorsurface of the video camera. Asample of the design output isshown in Figure 3, which showsa composite of the rootviewprojector design and focusingoptics for the video camera.(This figure fooled the ray-tracing software into producing abundle of rays off of the targetby placing a mirror at thepressure tube location).
Figure 4. Optical head for OPIT
Shutter drive motor Radiation resistanttelevision camera
Floodlight Under water motor forrotary positioning
Transformer Shutter Light stripe generator
Figure 5. Tool configuration for Darlington use
112
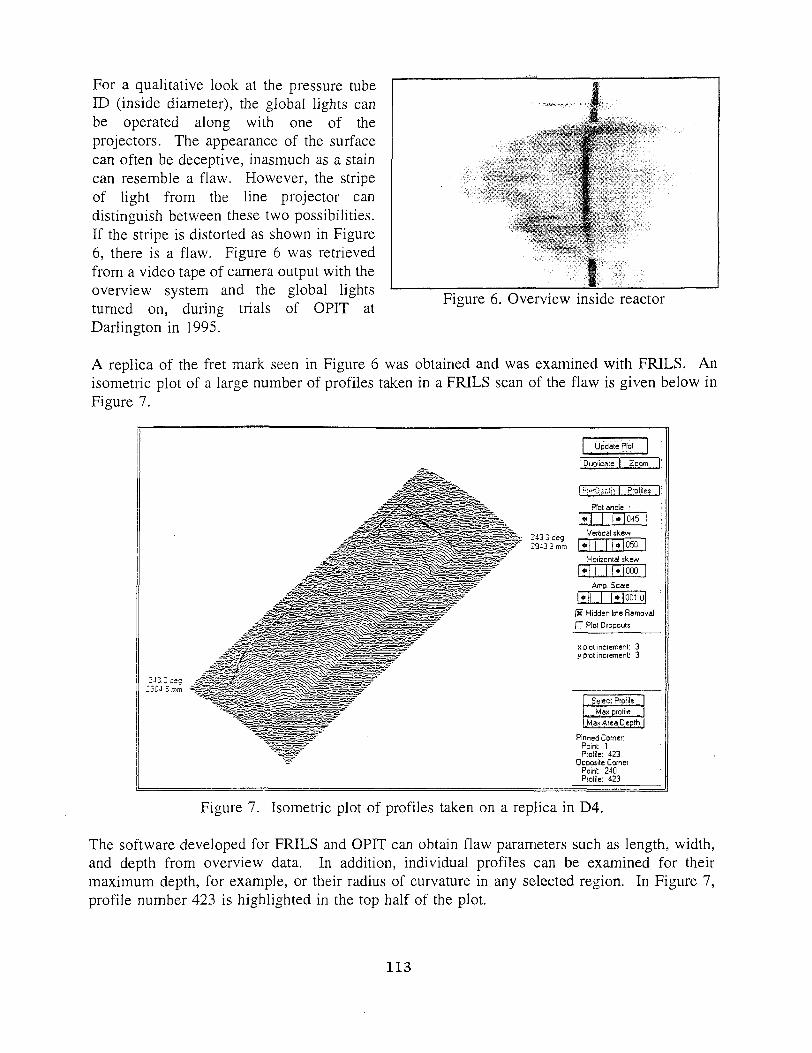
For a qualitative look at the pressure tubeID (inside diameter), the global lights canbe operated along with one of theprojectors. The appearance of the surfacecan often be deceptive, inasmuch as a staincan resemble a flaw. However, the stripeof light from the line projector candistinguish between these two possibilities.If the stripe is distorted as shown in Figure6, there is a flaw. Figure 6 was retrievedfrom a video tape of camera output with theoverview system and the global lightsturned on, during trials of OPIT atDarlington in 1995.
Figure 6. Overview inside reactor
A replica of the fret mark seen in Figure 6 was obtained and was examined with FRILS. Anisometric plot of a large number of profiles taken in a FRILS scan of the flaw is given below inFigure 7.
Update Plot
I*'•*:)*?,!:• I profiles
Rot anoie •
1<»5243.3 deg2943.3 mm
Vertical skew
« 1* 050
Horizontal skew
•1 1• |000
Amo. Scale
1*» I 1 * 1 " " ol|5f Hidden line Removal
C Plot Dtopouts
x Dlot increment: 3V plot increment: 3
Select Profile_Max prolile
K Area Depth
Pinned Comer:Point: 1Prolile: 423
OoDosite CornerPoint 240Prolile: 423
Figure 7. Isometric plot of profiles taken on a replica in D4.
The software developed for FRILS and OPIT can obtain flaw parameters such as length, width,and depth from overview data. In addition, individual profiles can be examined for theirmaximum depth, for example, or their radius of curvature in any selected region. In Figure 7,profile number 423 is highlighted in the top half of the plot.
113

Figure 8 shows profile number 391 from the above data file being analyzed for maximum depth(shown as height in the plot) and root-radius at the left side. In this case, the circle seen in thefigure was set manually to skirt the inside edge of the data points and obtain a lower-boundestimate of the actual radius.
Iso. plot Zoom Reel Fret detthJ f * ; . * •s Header S dotsJ
Data Profile14:03
profile se!ect[jr] j _ [
0240Points.0591Pfohb:Raw Data Displayed
"•10391 j Avg. I" Circle Co " Plot Limits" 1253.E
161 x 022.2 .3531.3i i Pos." 02930.50 , .^vv^t.—""j. j Pea-2*41-248.2 I E " * f | Deft'2^4.1-248.2
Zoom I
Figure 8. Root-radius estimate of 450 urn on profile number 391
Custom scanning equipment was demonstrated onpressure tube replicas in a COG-funded project.A new hardware apparatus for FRILS (calledFRILS-3) shown in Figure 9 has been built toperform a scan of a debris flaw along its majoraxis, at whatever orientation it may have. Thisapparatus has four computer-controlled motorizedmotion stages. Manual setup of the scan startpoint and end point is controlled with a joy stick;and then an automatic scan under computercontrol is done between these two points. In theapparatus, a large rotary turntable to tilt thesample is mounted on a vertical bracket. The _optical head is located on an independent mount; Figure 9. Sample tilted in FRILS-3 at 45C
and the stripe of light from the projector isalways horizontal. The tilt turntable is used to rotate the axis of the flaw perpendicular to thestripe of light.
A picture and an isometric plot of a replica of a debris flaw is given in Figure 10 below. Thepicture includes a ruler with 1 mm gradations. This flaw has a complex shape and needs to bescanned in several orientations to obtain cross sections of interest. The pressure tube axialdirection is horizontal in the figure.
114

Figure 10. Debris flaw. Left - picture, Right - isometric plot of surface profiles
A rootview scan taken with the flaw tilted to profile a high stress area provided profile #98 fordetailed analysis in Figure 11. The region of interest was set as horizontal locations 201 to 232;and a circle was automatically fitted to the data in this region, yielding a root-radius value of 78micrometres. The algorithm for analysis of error gave an expected uncertainty in this value of4 micrometres.
L" 1 -" •.•
| ?
: • ' : • ' • • . • . . • • • • . ' . • •
r - ' : . : • • •
, . . • ' . . ; .
. '•-. Iso. plot j Zoom fleet jSev-.iap'ii] Ci'.t<i'.s | .
£ 23--04/S7 ;7.?S Frofiie009£
;V Plot Options Headet
***** •* «.
inesj
1
I
•J
' • \
•
J
Plot limits: ^ T i~ Avefage - 1423.. ^ . . l 1 ! •! • m I i •
profile select "A I ' 1 •> 10098 I Avg j ' Circle Control . j- ,_ a
": Update j - l lmi iT'FlHeti^l'--^'018 l78237 1 *W:.-! ManualYScale-JpiaUj :j |^J201 | [ J232[|R,eset.
'0240Po b.0203Pjofiles . ^ p ^ ^ ^ l ' M t f i M O a i ^ - ' - ^ :/'~,.:^Ma3r*.0^^^^£.l''~Raw Data Delayed - : ? ^ ~ ' ^ ^ ^ l l 2 B M 5 j L ^ ! 5 ^ ^ 347.0348.1 .5«gL| j : : • ' . Deg= 347.3-34a0
Figure 11. Circle fitting to root data gives radius of 78 \xm.
115
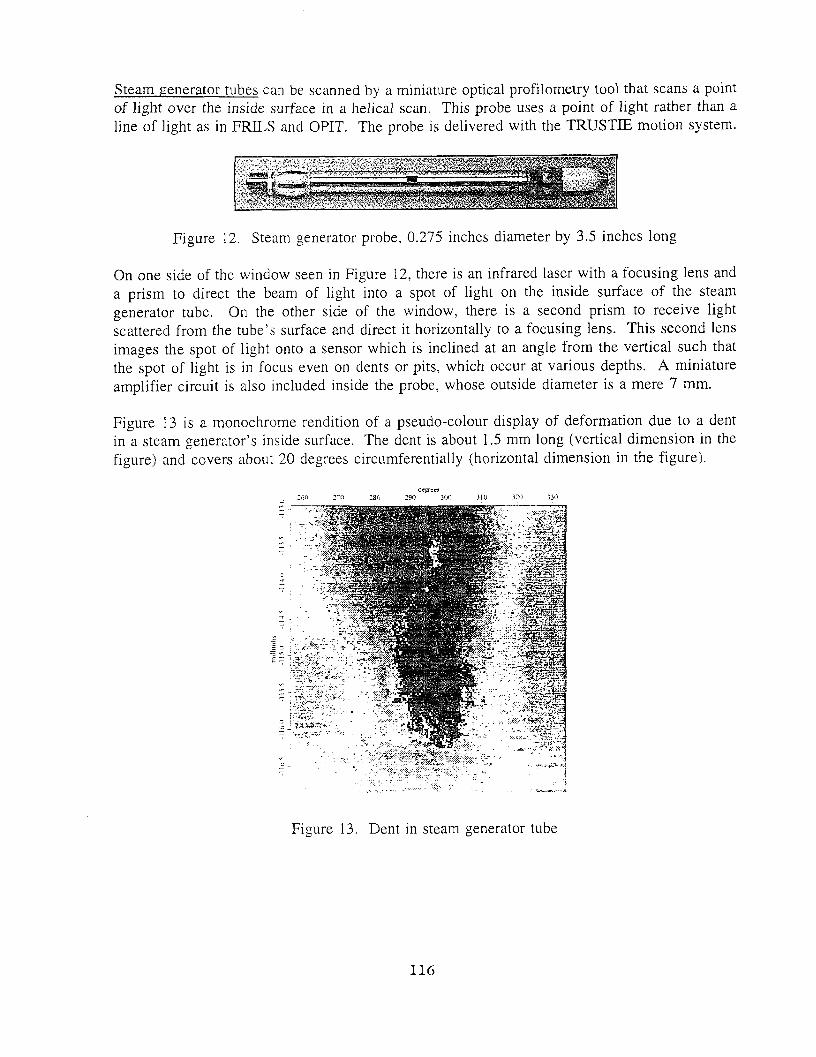
Steam generator tubes can be scanned by a miniature optical profilometry tool that scans a pointof light over the inside surface in a helical scan. This probe uses a point of light rather than aline of light as in FRILS and OPIT. The probe is delivered with the TRUSTIE motion system.
Figure 12. Steam generator probe, 0.275 inches diameter by 3.5 inches long
On one side of the window seen in Figure 12, there is an infrared laser with a focusing lens anda prism to direct the beam of light into a spot of light on the inside surface of the steamgenerator tube. On the other side of the window, there is a second prism to receive lightscattered from the tube's surface and direct it horizontally to a focusing lens. This second lensimages the spot of light onto a sensor which is inclined at an angle from the vertical such thatthe spot of light is in focus even on dents or pits, which occur at various depths. A miniatureamplifier circuit is also included inside the probe, whose outside diameter is a mere 7 mm.
Figure 13 is a monochrome rendition of a pseudo-colour display of deformation due to a dentin a steam generator's inside surface. The dent is about 1.5 mm long (vertical dimension in thefigure) and covers about 20 degrees circumferentially (horizontal dimension in the figure).
deercw290 300
Figure 13. Dent in steam generator tube
116
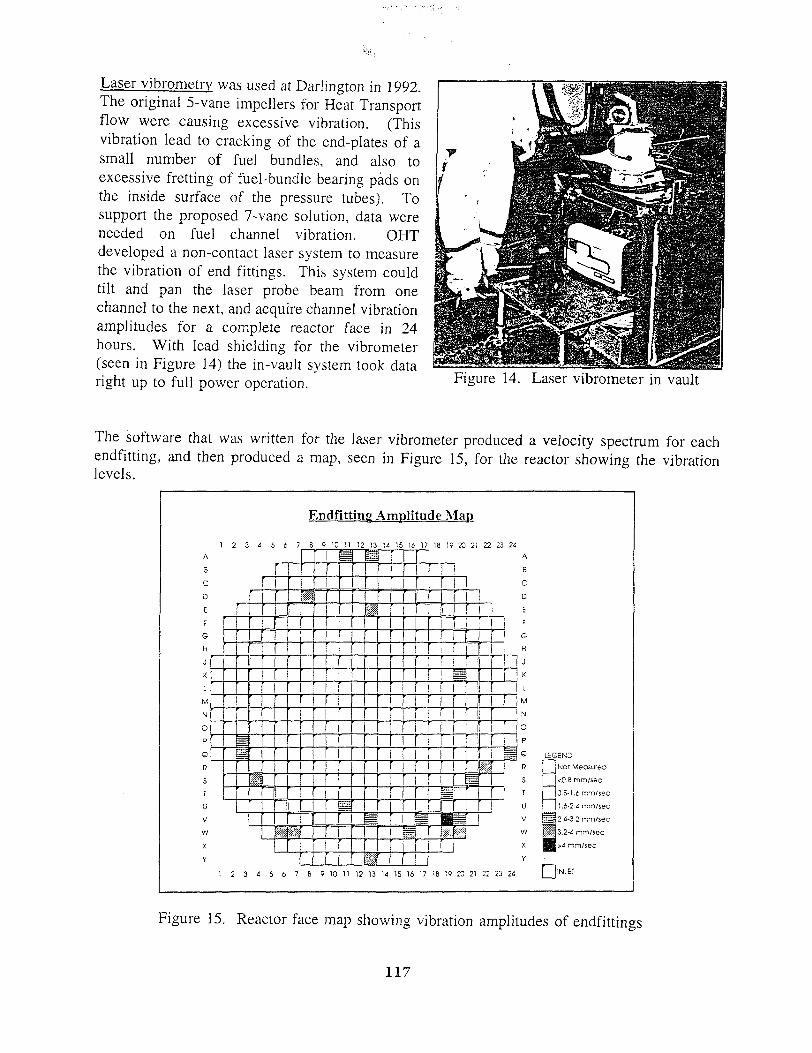
Laser vibrometry was used at Darlington in 1992.The original 5-vane impellers for Heat Transportflow were causing excessive vibration. (Thisvibration lead to cracking of the end-plates of asmall number of fuel bundles, and also toexcessive fretting of fuel-bundle bearing pads onthe inside surface of the pressure tubes). Tosupport the proposed 7-vane solution, data wereneeded on fuel channel vibration. OHTdeveloped a non-contact laser system to measurethe vibration of end fittings. This system couldtilt and pan the laser probe beam from onechannel to the next, and acquire channel vibrationamplitudes for a complete reactor face in 24hours. With lead shielding for the vibrometer(seen in Figure 14) the in-vault system took dataright up to full power operation. Figure 14. Laser vibrometer in vault
The software that was written for the laser vibrometer produced a velocity spectrum for eachendfitting, and then produced a map, seen in Figure 15, for the reactor showing the vibrationlevels.
A
8
C
D
E
F
G
h
J
K
M
N
Op
aR
si
o
V
V,'
X
Y
1 2
j
1
3 & 5 6 7
I
8
ni\
I
II
r
2 3 A 5
X
6 7
Sndfitting Amplitude Map
9 10 11 12 13 U 15 16 17
"T
r
f
m I m I
i l l
i
1
i
f
IB
ff
f *i
I1 r
!
19
[
r1
f
ii
i
20
||
2
f
22
r—I—II
' f"1
23 24
11
1
In1 N 5
BfII
InI
mi
i8 9 10 11 12 13 U 15 16 17
t f
18 19 20 21
1
22 23 24
A
B
C
D
F
G
H
J
K
L
M
N
0
P
Q
R
S
T
U
V
VJ
X
Y
—
9
3
END
NOT Measured
c0.8 mm/sec
0.8-1.6 mm/sec
1.6-2.4 mm/sec
2.4-3.2 mm/sec
3.2-£ mm/sec
>4 mm,'sec
INLET
Figure 15. Reactor face map showing vibration amplitudes of endfittings
117
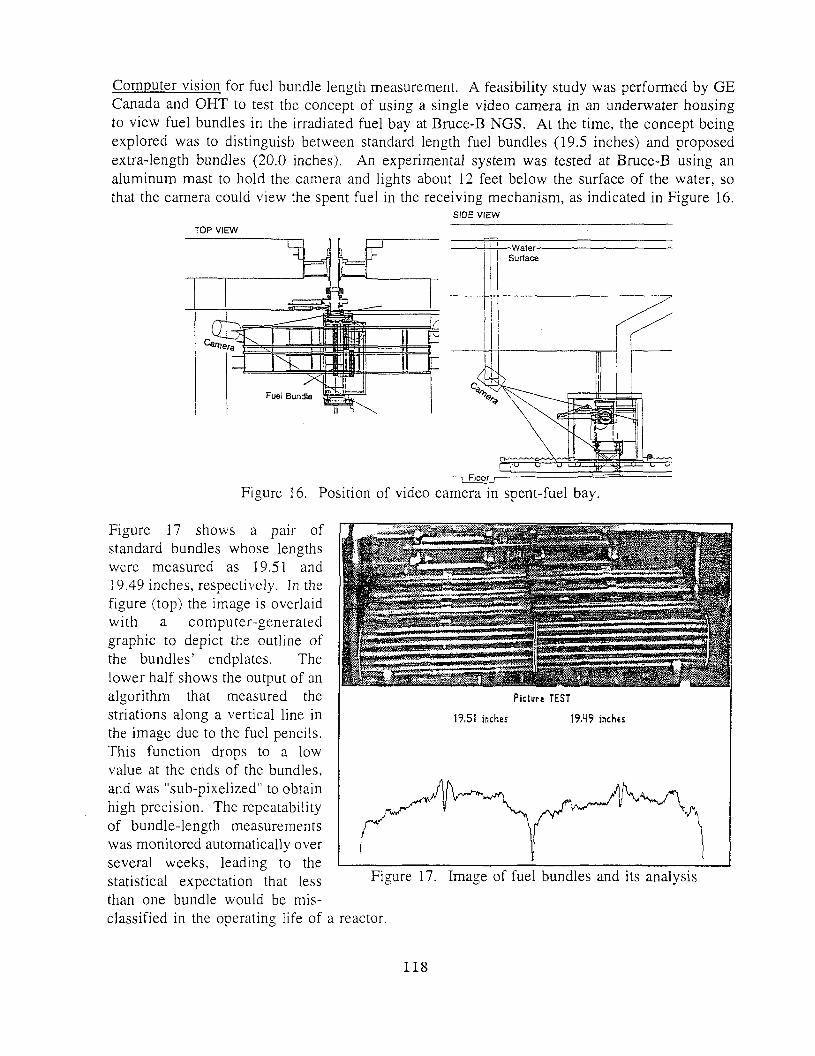
Computer vision for fuel bundle length measurement. A feasibility study was performed by GECanada and OHT to test the concept of using a single video camera in an underwater housingto view fuel bundles in the irradiated fuel bay at Bruce-B NGS. At the time, the concept beingexplored was to distinguish between standard length fuel bundles (19.5 inches) and proposedextra-length bundles (20.0 inches). An experimental system was tested at Bruce-B using analuminum mast to hold the camera and lights about 12 feet below the surface of the water, sothat the camera could view the spent fuel in the receiving mechanism, as indicated in Figure 16.
SIDE VIEW
TOP VIEW
Figure 16. Position of video camera in spent-fuel bay.
Figure 17 shows a pair ofstandard bundles whose lengthswere measured as 19.51 and19.49 inches, respectively. In thefigure (top) the image is overlaidwith a computer-generatedgraphic to depict the outline ofthe bundles' endplates. Thelower half shows the output of analgorithm that measured thestriations along a vertical line inthe image due to the fuel pencils.This function drops to a lowvalue at the ends of the bundles,and was "sub-pixelized" to obtainhigh precision. The repeatabilityof bundle-length measurementswas monitored automatically overseveral weeks, leading to the
Picture TEST
19,51 inches 19.49 inches
statistical expectation that lessthan one bundle would be mis-classified in the operating life of a reactor.
Figure 17. Image of fuel bundles and its analysis
118

CA0000020Fourth CNS International Conference on CAN
November 16 - 18, 1997Toronto, Canada
MODELING THE VIBRATION OF FUEL CHANNELS AND ADJUSTER UNITS INCANDU REACTORS TO SUPPORT IN-CORE FLUX DETECTOR NOISE
ANALYSIS
D.D. Derksen, D. Chidley and B.A.W. Smith
Fluid Sealing and Dynamics Branch, Chalk River LaboratoriesAtomic Energy of Canada Limited, Chalk River, Ontario, KOJ 1J0
0. Glb'ckler
Reactor Safety and Operational Analysis DepartmentNuclear Technology Services, Ontario Hydro Nuclear
700 University Avenue, H11-E26, Toronto, Ontario M5G 1X6
ABSTRACT
Surveillance and diagnostic systems are being increasingly used in nuclear power plants tomonitor instrument or process condition. Noise analysis of in-core flux detector (ICFD)signals is a technique under development for CANDU as a means of reducing maintenance,inspection, and calibration costs. This technique provides spectral signatures of in-corecomponent vibration.
This paper discusses a program to augment noise analysis by using finite element models ofin-core components to identify unknown frequencies in the spectral signatures, and predictthe effects of component deterioration. The vibration of fuel channels for Ontario Hydro'sDarlington Generating Station were modeled with various end fitting support and garterspring contact. Guide tube and component vibrations for the different length adjuster unitswere also examined.
These models will help the stations use noise analysis for surveillance {i.e., detecting whensomething has changed) and for diagnostics (i.e., explaining what the cause andsignificance of the change is). Furthermore, once the source of the vibrations isdetermined, these models can be used to assess the diagnostic usefulness of particularvibration peaks. In this way, the sensitivity and reliability of interpreting a given peak in thespectra can be evaluated.
Previously unidentified peaks in ICFD noise spectra and in direct vibration measurementstaken in-core have been duplicated under specific support conditions. Guidelinesconcerning changes in vibration peaks have also been written so that application expertscan discern abnormalities in the noise spectra.
119
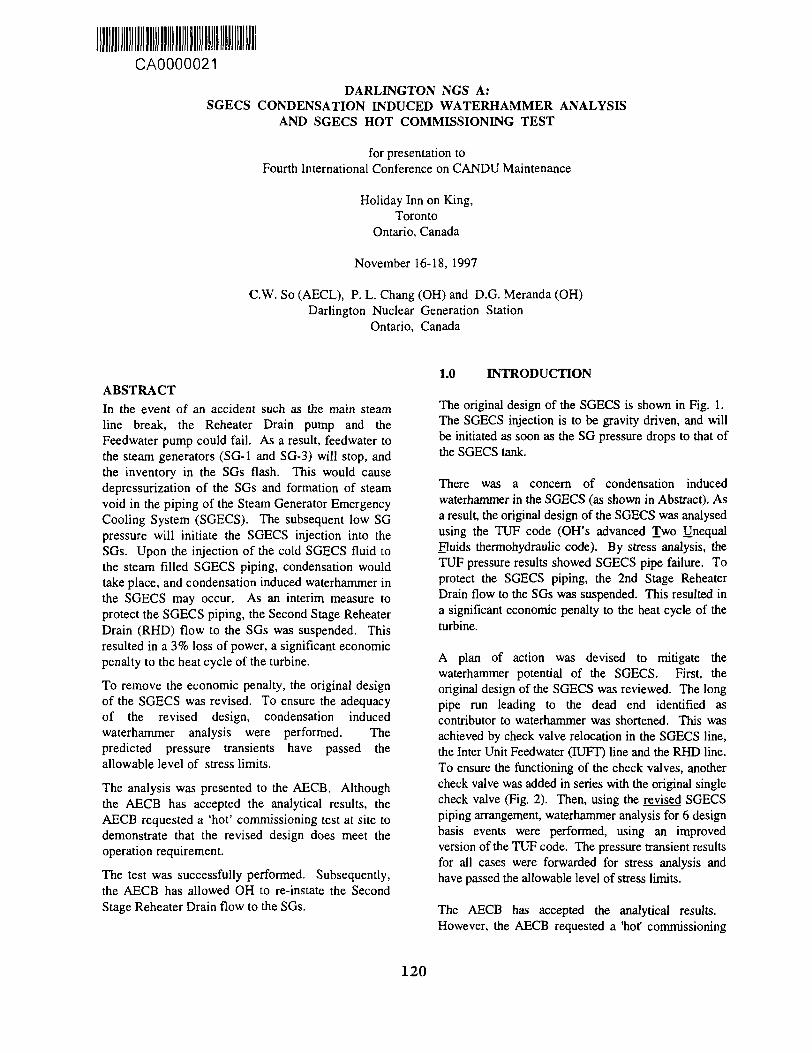
CA0000021
DARLINGTON NGS A:SGECS CONDENSATION INDUCED WATERHAMMER ANALYSIS
AND SGECS HOT COMMISSIONING TEST
for presentation toFourth International Conference on CANDU Maintenance
Holiday Inn on King,Toronto
Ontario, Canada
November 16-18, 1997
C.W. So (AECL), P. L. Chang (OH) and D.G. Meranda (OH)Darlington Nuclear Generation Station
Ontario, Canada
1.0 INTRODUCTIONABSTRACTIn the event of an accident such as the main steamline break, the Reheater Drain pump and theFeedwater pump could fail. As a result, feedwater tothe steam generators (SG-1 and SG-3) will stop, andthe inventory in the SGs flash. This would causedepressurization of the SGs and formation of steamvoid in the piping of the Steam Generator EmergencyCooling System (SGECS). The subsequent low SGpressure will initiate the SGECS injection into theSGs. Upon the injection of the cold SGECS fluid tothe steam filled SGECS piping, condensation wouldtake place, and condensation induced waterhammer inthe SGECS may occur. As an interim measure toprotect the SGECS piping, the Second Stage ReheaterDrain (RHD) flow to the SGs was suspended. Thisresulted in a 3% loss of power, a significant economicpenalty to the heat cycle of the turbine.
To remove the economic penalty, the original designof the SGECS was revised. To ensure the adequacyof the revised design, condensation inducedwaterhammer analysis were performed. Thepredicted pressure transients have passed theallowable level of stress limits.
The analysis was presented to the AECB. Althoughthe AECB has accepted the analytical results, theAECB requested a 'hot' commissioning test at site todemonstrate that the revised design does meet theoperation requirement.
The test was successfully performed. Subsequently,the AECB has allowed OH to re-instate the SecondStage Reheater Drain flow to the SGs.
The original design of the SGECS is shown in Fig. 1.The SGECS injection is to be gravity driven, and willbe initiated as soon as the SG pressure drops to that ofthe SGECS tank.
There was a concern of condensation inducedwaterhammer in the SGECS (as shown in Abstract). Asa result, the original design of the SGECS was analysedusing the TUF code (OH's advanced Two UnequalFluids thermohydraulic code). By stress analysis, theTUF pressure results showed SGECS pipe failure. Toprotect the SGECS piping, the 2nd Stage ReheaterDrain flow to the SGs was suspended. This resulted ina significant economic penalty to the heat cycle of theturbine.
A plan of action was devised to mitigate thewaterhammer potential of the SGECS. First, theoriginal design of the SGECS was reviewed. The longpipe run leading to the dead end identified ascontributor to waterhammer was shortened. This wasachieved by check valve relocation in the SGECS line,the Inter Unit Feedwater (IUFT) line and the RHD line.To ensure the functioning of the check valves, anothercheck valve was added in series with the original singlecheck valve (Fig. 2). Then, using the revised SGECSpiping arrangement, waterhammer analysis for 6 designbasis events were performed, using an improvedversion of the TUF code. The pressure transient resultsfor all cases were forwarded for stress analysis andhave passed the allowable level of stress limits.
The AECB has accepted the analytical results.However, the AECB requested a 'hot' commissioning
120

test at site to demonstrate the revised SGECS capableof meeting the operation requirement.
The design basis event of the Reference Case (undernormal operations) was used to design the test. Thetest was successfully performed, and the analyticalresults of the Reference Case and the test results werefound in good agreement. Subsequently, the AECB hasallowed OH to re-instate the 2nd Stage Reheater Drainflow to the SGs.
2.0 ANALYSIS METHODOLOGY
2.1 ANALYSIS SCOPE
The analysis covered 6 accident scenarios of designbasis events, as follows:
• 1 Reference Case:
Case 1 - No check valve failure anywhere
B 4 Single check valve failed open cases:
Case 2 - valve failed open at IUFT in SG-1 leg,Case 3 - valve failed open at IUFT in SG-3 leg,Case 4 - valve failed open at RHDL in SG-1 leg,Case 5 - valve failed open at RHDL in SG-3 leg,
• 1 Single check valve failed closed case:
Case 6 - valve failed closed at SGECS line in SG-1 leg.
2.2 ANALYSIS ASSUMPTIONS
1. The SGECS piping was liquid-filled upstreamof the double check valves, but steam-filleddownstream.
2. Conservative assumptions were used tomaximize the injection flow, and thus, thewaterhammer effect for the analysis:
a. The SGECS tank pressure was constant atmaximum achievable pressure of 820 kPa(g).
b. The check valves in the IUFT line and theRHD line were treated as dead ends. Leakageto dissipate the momentum of the SGECSinjection was not considered.
c. The warm liquid front of the injectionupstream of the double check valves in theSGECS line was not credited. In the actualsystem, the warm liquid front exists todiminish the waterhammer effect of theinjection.
d. The temperature of the SGECS liquid was 20°C, instead of 37 °C as in the actual system.Under this condition, the predictedwaterhammer effect should be worse.
e. The 6 sec. dead time resulting from theactivation of the valve was included in theanalysis. This would result in a pressure dropof 30 kPa prior to the injection, and thus,increase the injection flow rate.
f. From the safety report, the SG was to bedepressurized at about 5 kPa/s during theSGECS injection. This depressurization wasused as a pressure boundary in the SGs. Thiswould increase the pressure drop between theSGECS tank and the SG, and therefore, wouldincrease the flow rate of the SGECS.
2.3 SIMULATION CONDITIONS
• Liquid Side:
- SGECS tank pressure: constant at 820 kPa(g)- Liquid temperature: 20 °C
• Steam Side:
- The SGs were treated as steam tanks with pressureat 820 kPa(g). The steam was at saturation at 175 °C.
- A linear depressurization profile of 5 kPa/s wasimposed on the SG as a pressure boundary. Taking the6 sec dead time into consideration, the SG pressureprofile was as follows:
Simulation Time (s)
060
SGECS Control Valve:
Pressure (kPa(g))
790490
- The control valve will be 92.5% opened in 7 secand 100% opened in 14 sec.
121
2.4 TUF MODEL - SGECS
The SGECS piping circuit was nodalized into controlvolumes. In the liquid side, the nodes were about 1 to1.5 m. long. In the steam side, the nodes were morerefined, about 0.25 to 0.4 m., in order to capture thetransient behaviour of the injection.
2.5 SIMULATION TIME STEP
The maximum time step used for the simulation issmall, about 0.23 ms.
3.0 SIMULATION RESULTS
3.1 Case 1 - Reference Case
At the initiation of the SGECS, as soon as the controlvalves were opened, cold liquid from the SGECS tankwas injected into the SGECS piping. At the T-junctionnear Check Valve NV38 (Fig. 2), the injection wassplit to fill the steam void at each of the SG legs. Dueto the piping elevation, a greater portion of the SGECSliquid was initially drawn into the SG-3 leg (Fig. 3).After 4 seconds or so, the SGECS liquid has alreadyfilled the steam void in the IUFT line and the RHDline, and was moving towards the SGs at about equalflow rates of 20 kg/s. In another 10 seconds, theSGECS liquid has filled the entire piping including thering headers inside the SGs. Thereafter, the SGECSliquid was injected into the SGs steadily, andwaterhammer is no longer a concern for the SGECS.
The TUF simulation has shown insignificant pressuretransients everywhere, even at dead end locationsconsidered to be prone to waterhammer, e.g., the deadend of the IUFT line, and the dead end of the RHD line(Fig. 4, and Table 1).
3 . 2 Cases 2 ,3 ,4 and 5 - SingleCheck Valve Failed Open .
If a check valve has failed open in the downstream sideof the IUFT line or the RHD line, the pipe run leadingto the dead end will be lengthened. This wouldincrease the SGECS injection flow towards the deadend of the lengthened line, rendering this line morevulnerable to waterhammer.
The simulation results showed that this was indeed thecase, as pressure spike was predicted at the pipe wherethe check valve has failed. The maximum pressure
spike was 8.0 MPa, predicted at the RHD line in theSG-1 leg for Failure Case 4 (Table 1).
For the re-designed SGECS, the resident time of thepressure spike was rather short, just couple ofmilliseconds (Table 2). This is beneficial to the pipingsystem as the dynamic stress load on the piping wouldlast for a short duration only.
3.3 Case 6- SingleCheck Valve Failed Closed
At the initiation of the SGECS, if one of the doublecheck valves in the SGECS line is stuck closed, all ofthe SGECS liquid will be injected into the other SGleg.
In the case of check valve stuck closed in the SG-1 leg,the flow behaviour in SG-3 was predicted as shown inFig. 5 As a result, a pressure spike of 4.86 MPa waspredicted at the dead end of the IUFT line in the SG-3leg. Insignificant pressure transients would occur in therest of the piping (Table 1).
4.0 CONCLUSIONS
1 . Conservative assumptions were used for theanalysis to maximize the waterhammer effectof the SGECS injection. Under theseassumptions, the results still meet the requiredlevel of stress limits.
2 . For the Reference Case, the peak pressuresdeveloped at the dead end pipes wereinsignificant and were determined to berepresentative of the system.
3 . For the failure cases, the peak pressures wereconservative due to the use of conservativeassumptions and the TUF code which producesconservative results.
4 . The pressure transient results passed the stressanalysis, indicating that the re-design of theSGECS is effective in reducing thewaterhammer effect to acceptable stress levels.
122

APPEDK:
SGECS 'HOT' COMMISSIONING TEST
1.0 OBJECTIVES
The objectives are:
• to validate the design changes made to theSGECS,
• to demonstrate that waterhammer is not a concernfor the SGECS injection
2.0 TEST CRITERIA
The test will last for no more than 3 minutes, and itmust represent a real injection within design operatingconditions. The stress level must not exceed Level Ballowable stress limits.
3.0 RECORDING INSTRUMENTS
Recording devices were used to measure the responseof the test. Based on the results of the SGECSwaterhammer analysis, the following recording deviceswere installed in the SG-3 leg.
a. Pressure Transducers (4)b. Accelerometers (6)c. Thermocouple (1)c. Ultrasonic Flowmeter (1)d. Tape Recorder
4.0 TEST CONDITIONS -Analysis vs. Actual
The comparison is shown in Table 3.
a. Pressure Transients:
The pressure transients measured at 4 monitoringlocations were insignificant (Fig. 6). The maximumpressure load was 400 kPa, developed upstream of thedouble check valves in the SGECS line.
b. Piping Movements:
The piping movemnets recorded by the accelerometerwere insignificant.
c. Temperature:
The temperature has dropped soon after the initiationof the test, indicating that the SGECS injection reachedthis pipe location early in the test.
d. Flow
The ultrasonic flowmeter showed zero flow in most ofthe recordings, except for a flow spike of 6 1/s at about97 sec.
6 . 0 CONCLUSIONS
1. Based on the SG level measurement, the SGECSdid inject into each of the two SGs.
2. During the test, the accelerometers have recordedinsignificant piping movements, implying thatpiping stresses were small. The stress analysis ofthe Reference Case has also shown SGECS pipingstresses well within Level B Conditions. Thus,both the test and the analysis have demonstratedthe safety aspect of the revised SGECS.
5.0 TEST RESULTS
The test lasted just over 2 minutes. During this period,the SGECS tank level has dropped from 330 mm to97.6 mm, and the liquid level has risen from 9.6 m. to9.67 m. in SG-1, and from 9.6 m. to 9.68 m in SG-3.The SGECS did inject into SG-1 and SG-3.
123

TABLE 1
ANALYSIS RESULTS - DARLINGTON SGECSMAX. PRESSURE (MPa) AT DEAD END PIPES
Case
123456
Boiler 1IUFT
1.205.501.612.801.190.89
RHDL
1.171.101.408.001.100.89
Boiler 3IUFT
2.242.306.472.093.804.86
RHDL
2.001.50
1.491.626.131.37
StressLevel
BDDDDD
N.B. Pressure in bold letters indicates where a checkvalve has failed open.
TABLE 2
Pressure Pulse Duration -DarUngton SGECS SG-1/3 Circuit
•ailureDase
1234
: PipingLocation
IUFT, SG-1IUFT, SG-3RHD, SG-1RHD, SG-3
Max. Pres.(MPa)
5.506.478.006.13
Pres. PulseDuration Cms")
1.52.11.21.2
TABLE 3
TEST CONDITIONS vs. ACTUAL CONDITIONS
Analysis Actual• Liquid Side:
- Tank Pres.(kPag)
- Liquid Temp.(°C)
- SGECS TankLevel (mm)
- Pressure inSGECS Line
- Check Valve
• Steam Side:
- SG Pressure(kPag)
- Steam Temp.(°C)
- SG Pressure
- SG Liquid Level
820
20
As areservoir
820 kPa(g)-t-Elevation
On/OffbyTUF
790
175
-5kPa/s
BelowRingHeader
762
36
Level at330 mm
Depres-surized
ValveDynamic
790
175
Constant
BelowRingHeader
124

DARLINGTON SGECS (SG 1/3)- ORIGINAL DESIGN -
RHDL Fig. 1
DARLINGTON SGECS (SG 1/3)- REVISED DESIGN -
Fig. 2
125

80.0(1
70.00 -
60.00 -
50.00 -
40.00 -
"5b 30.00 —
.2 20.00 -IX,
10.00 -
.00 -
-10.00 -
-20.00
Darlington SGECS - SGl/3 Reference Case
Fig. 3
i i 1 1 1 r~.00 1.00 2.00 3.00 4.00 5.00 6.00
Time (sec)
7.00 8.00 9.00 10.00
126

X
V joooo
t/1 4UI00
.70
DARLINGTON SGECS SG-1/3 - REFERENCE CASE
IUFWT - B o i l e r 3
PRESSURE TRANSIENTS
At Dead Ends
HOW -
WO 10 -
MOM -
40000 -
MOW -
araw -
now -
to
IUFWT - Boiler 1
1.40 110 119 150 410 4 90 >» IX) 100
" 1MO
1—110
—iI JO
r410
1—5 60 «M 700
X
cd
s
KB 00 -
loom -
7CO00 -
too oo -
jcnco -
4CO0O -
ICO 00 -
10000 ~
itoco -
00
Re
1 1
heat
7 ,
v\~^—
1 1
.er 1Drain - Boi]Ler
1
1
3
I <0 1.10 110 4.10 4M 5 60 130 1(10
KBCO -
ico to -
70000 -
toooo -
xnoo -
400 DO -
1CO00 -
JO000 -
i Co oo -
to
Flehe ater Dra in -- BoHer 1
CO .70 1.40 2 10 110 110 410 4 90 5 60 4 JO 7(0
Time fsi Time CO Fig. 4
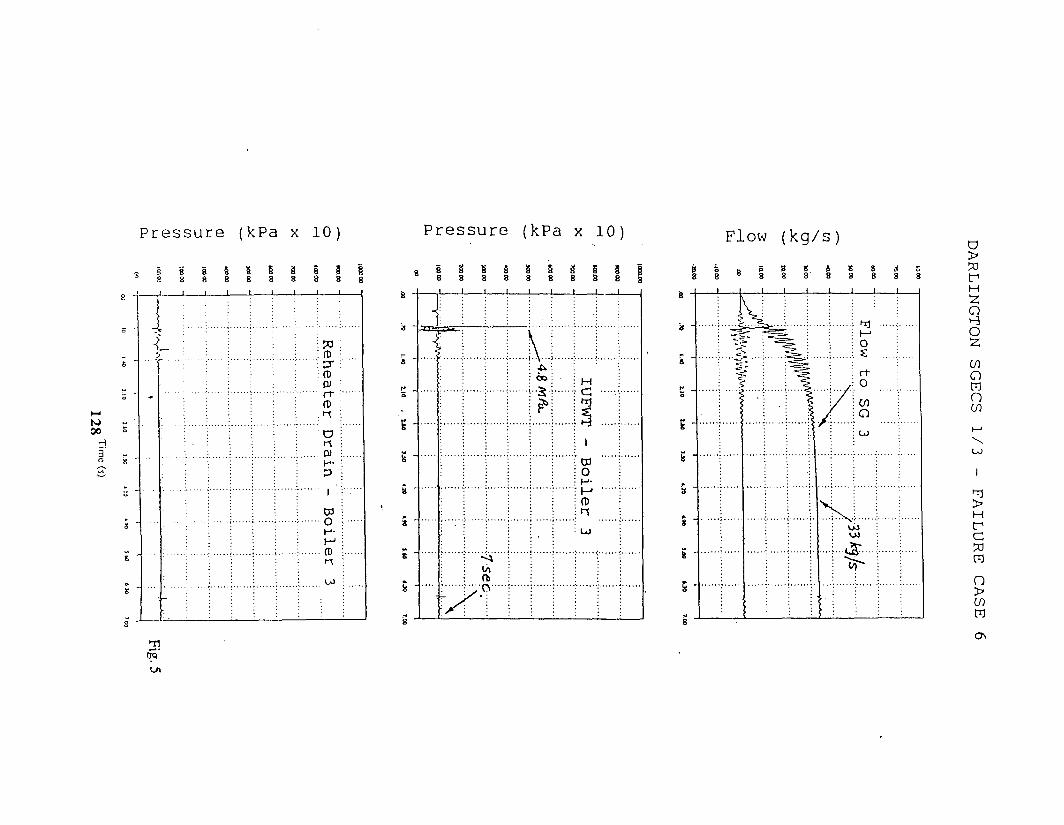
to00
P r e s s u r e (kPa x 10)
, § 8 8 8 § I & 8^ 2 8 8 8 8 8 8 8
P r e s s u r e (kPa x 10) Flow (kg/s)
£ -
<•• 8
•i
:
_J i
r
:
i i I I I I
: CD •heate
rD
ra
p
• • • • i
w
P
: uo
s § a8 8 8
P p b8 8 8 8 8 8 8 8 8 8 8
1
1
I
rb
\
6o H
c •• •••
1
Boi
ler
LO
8 "
a -
«
H _o
E -
2 -
s -
s -
i,
5
8
k....$.. >
\
1
!
f /
VN
Tl ;low
to
wo
: OJ
21
ato
H
oo"Z
CO
onCOt—'\CO
I
H
C
ra
nCO
ON

PRESSURE TRANSIENTS - SGECS HOT COMMISSIONING TEST
;PD: 50 m/s -Tir t SCALE: Eia.cw r-is/m
1-25TIME
P-7IUFWT
to
1.25
(0
£Q)
S 2.5
02.5
= 400 kPa\
0.18 s
P-8Upstream ofDb. C.V.
Piezo-Electric TypePressure Transducer
0
' Y^
1
1 1 i i " " " i f • i •
\ y \ ^ ^—^ "— *
i
i
/
P-10Ring
I
P-9RHDL
Header
0 -F.
N0 -r
ILTEFi on -ok-pic P Q
Strain Gauge Type ^Pressure Transducer
3 4•250 «ivft» -ZS 0 -FILTCR on -pk-pk
Time (s)Fig. 6
CA0000022
VALVE PACKING MANUALA MAINTENANCE APPLICATION GUIDE
J.A. AikinAECL
Chalk River LaboratoriesMechanical Equipment Development Branch
Chalk River, OntarioKOJ 1J0
R.G. McCutcheonOntario Hydro
Nuclear Technology Services
D. dimmingOntario Hydro
Bruce B Nuclear Generating Division
C.G. SpenceOntario Hydro
Darlington Nuclear Generating Division
ABSTRACT
Since 1970, AECL Chalk River MechanicalEquipment Development (MED) branch hasinvested over 175 person years in testing relatedto improving valve packing performance.Successful developments, including, "live-loading", reduced packing heights, andperformance-based packing qualification testinghave been implemented. Since 1986, MED andthe Integrated Valve Actuator Program TaskForce - Valve Packing Steering Committee(IVAP-VPSC) have been involved in thedevelopment of combination die-formed graphitepacking for use in CANDU®1 plants. Manyreports, articles, and specifications have beenissued. Due to the large amount of test data andreports, a more user-friendly document has beenprepared for everyday use. The Valve PackingManual is based on many years of MED researchand testing, as well as operating experience fromCANDU nuclear generating stations (NGS).Since 1986, packing research and testing hasbeen funded by the CANDU Owners Group(COG), the Electric Power Research Institute
1 CANDU® CANada DeuteriumUranium. Registered Trademark.
(EPRI), and participating valve packingmanufacturers.
The Valve Packing Manual (VPM) providestopical summaries of all work related to valvepacking done since 1985. It includes advances inconfiguration design, stem packing friction,materials specifications, and installationprocedures. This paper provides an overview onthe application of the VPM with a focus onqualification testing, packing configuration, andstem packing friction.
INTRODUCTION
Since 1970, the Mechanical EquipmentDevelopment (MED) branch of Chalk RiverLaboratories, AECL, has invested over 175person years in research and testing related toimproving valve packing performance.Successful developments such as live-loading,(Figure 1) reduced height stuffing boxes, andperformance based packing qualification testinghave been implemented. Since 1986, MED hasbeen involved in the development of combinationdie-formed graphite packing configurations foruse in CANDU stations. Many reports, articles,and specifications have been issued. The ValvePacking Manual (VPM) condenses a large
130

amount of test data and numerous reports into adocument suitable for everyday use. The ValvePacking Manual is based on the many years ofMED research and testing, as well as operatingexperience from CANDU nuclear generatingstations (NGS). Since 1986, packing researchand testing has been funded by the CANDUOwners Group (COG), the Electric PowerResearch Institute (EPRI), and participatingvalve packing manufacturers.
- GLAND STUD-GLANDNUT-INNER GUIDE SLEEVE
- COMPRESSION PLATE
— BELLEVILLE WASHERS
LOAD INDICATOR
GLAND PLATE
, = ^ - S ~ GLAND FOLLOWER
UPPER OR SECONDARY
PACKING SET
LEAK OFF/WATER SEAL PORT
LANTERN RING(STEEL OR GRAPHITE)LOWER OR PRIMARYPACKING SET
JUNK RING
BONNET
« STEM
FIGURE 1Cross-Section of Double-Packed Live-Loaded
Stuffing Box
WHY A VALVE PACKING MANUAL?
Prior to 1985, braided asbestos packing wasuniversally used for high pressure, hightemperature applications. Due to restrictions onthe use of asbestos, much effort has gone into thesearch to find alternative packing materials.Many of the products developed initially werenot acceptable. Deep stuffing boxes using largenumbers of packing rings (10-20), inconsistentinstallation techniques, poor gland loading, andunsuitable packing materials and componentshave all caused forced outages. The packingmaterials on the market today are less forgivingthan the braided asbestos styles. Through testingand field experience there is now a betterunderstanding of packing performance limits andapplications. The VPM is set up to be a reference
source and to provide a basic understanding ofvalve packing. When used appropriately, theVPM can enhance the communication betweenthe-Mechanical Maintainers, the PackingProgram Engineer and the Design and SystemResponsible Engineers. However, the VPM canonly be a part of the equation leading to asuccessful packing program.
INSIDE THE VPM
The VPM provides a topical summary of thevalve packing-related work since 1985, includingadvances in configuration design, stem packingfriction, specifications, and procedures. It alsoincludes an overview of pre-1985 valve packingdevelopment work. Each section contains a listof references that can be used to obtain furtherand detailed information. It is not the intent ofthe manual to provide detailed test data but ratherto summarize the results and findings. A briefsummary of the sections follows:
Introduction:This section discusses the requirements for agood stem seal, factors affecting packingperformance, and highlights from past AECLvalve packing tests (pre-1985).
Performance/Qualification Testing:Post-1985 performance testing conducted byAECL addressed the need to find suitablealternatives to replace the asbestos-based valvepacking John Crane (JC) 1871. Discussionscover the EPRI-funded test report andqualification testing of both braided and die-formed graphite packing.
Packing Configurations:Configuration testing was required to developbetter installation procedures and configurationdesign for qualified packing materials. Resultsof configuration testing, including stem leakage,friction and packing consolidation are discussed.A list of preferred packing configurations for usein most nuclear generating stations (NGS) is alsoprovided.
Stuffing Box Components:This chapter addresses design issues for thecritical components that comprise the overallpacking configuration assembly.
131
Stem Packing Friction:Stem packing friction is a significantconsideration when selecting a packingconfiguration. Studies at AECL have developedand improved the stem friction data base. Thechapter on stem friction introduces thefundamental concepts which affect stem packingfriction, discusses the basic formulas used tocalculate it and provides supporting test results.
Live-Loading:A brief outline on the application and design oflive-loading is provided.
Packing Installation:Without proper installation, the best packing willnot perform properly. This section covers effectsof gland nut torque, packing consolidation, live-loading, stuffing box components and somegeneral guidelines to follow.
Documentation:For many years, little or no documentation onvalve packing maintenance was available. Oftenit was not known what packing was in a valve. Itis now recognized that such documentation is anessential part of any successful valve packingprogram. Tracking of valve packingperformance has been shown to determine wherecorrective action is required. This sectiondiscusses essential documentation requirementsand provides samples and guidelines fromoperating CANDU NGS.
VPM HIGHLIGHTS
Clearly space does not permit a full discussion ofthe above VPM chapters. The following pageshighlight three aspects of the valve packingmanual: performance testing, packingconfigurations, including recent studies on roughstems, and stem packing friction.
PERFORMANCE TESTING
Need for Qualification:Valve packing qualification can be viewed as afirst step towards leak-free valve packingperformance. Without a universal standard forcomparing valve packing product performance orpacking tests, the end user had difficultycomparing packing recommendations from thepacking manufacturers. To verify manufacturers'claims, the Integrated Valve ActuatorPerformance Task Force Valve Packing Steering
Committee (IVAP-VPSC) establishedperformance test specifications for valve stempacking materials, including qualification testdata. All valve packings used for critical servicein Ontario Hydro (OH) NGS must now bequalified under these criteria. (Ontario Hydrostandard specification, "Graphite Valve StemPacking Materials & Associated Components",M-724-94.)
MSS Follows:The large variations in the performance ofsupposedly similar packing products has resultedin the Manufacturers Standards Society of Valvesand Fittings (MSS) recognizing the need forvalve packing standards. The MSS has issuedperformance testing guidelines for valve packingmodelled after the AECL/OH guidelines, (MSS-SP-121, "Qualification Testing Methods ForStem Packing For Rising Stem Steel Valves",1997 February). The MSS specification is basedon valve rating whereas the CANDUspecification is based on PHT design conditions.(AECL specification "Standard and Live LoadedPacking Assemblies for Valves,." 98-3O83O-TS-003.)
CANDU Qualification Criteria
• Packing rings must not induce unacceptablelevels of corrosion of the valve stem,stuffing box, and gland follower, norintroduce contaminants into the systemfluid.
• Packing rings must be compatible withheavy water at operating conditions of10 MPa (1450 psi) and 295°C (565°F).Radiation exposure is expected to exceed2 x 105 Rads.
• Packing rings must retain elasticity (notharden) when exposed to the operatingconditions given above and have no shelf-life effects.
• Packing rings must show minimumrelaxation with time. Exposure to pressure,temperature, and operating loads must notcause them to collapse.
• Packing rings must not induce excessivestem friction at operating conditions andunder effective sealing loads.
132

A list and description of the approved orrecommended packing products can be found inthe VPM.
PACKING CONFIGURATIONS
Knowing that the packing products meet givenperformance criteria is not enough. Packing setsmust also be configured in such a way that valveoperability is not affected. Hundreds of testhours on different packing configurations andprocedures have been done to find solutions tovarious packing configuration problems. TheVPM uses graphics, such as shown in Figure 2,to illustrate several different packingconfigurations applicable for use in CANDUplants including braided sets, combination die-formed, and reduced height sets. It isrecommended that packing configurationsoutside those illustrated in the VPM be properlyreviewed by station packing supervisors prior toinstallation. Testing has shown that, one packingsize or particular design does not fit allapplications, such as rough stems and oversizedstuff boxes.
1 FLAT WASHERPER STUD
GLAND FOLLOWER
GRAPHITE WASHERCARBON BUSHING
COMPOSITE END RINGTEFLON WASHERREDUCED DIE-FORMED RINGCOMPOSITE END RINGTEFLON WASHERREDUCED DIE-FORMED RINGCOMPOSITE END RING
CARBON BUSHINGGRAPHITE WASHERJUNK RING
FIGURE 2Typical Configuration Drawing
Rough Stems & Oversized Stuff Boxes:Conventional side valves in CANDU stationsoften present the maintainer with a greater rangeof clearances and stuffing box conditions thanthose found for heavy water valves. COG-funded testing has shown that combination die-formed graphite with composite end rings may
not perform well under these conditions. Newstand-alone packing products, recently evaluated,show promise of being more forgiving forcommonly found stem and stuffing boxconditions on the secondary side of CANDUstations.
Outage Dilemma:During outages, it is not uncommon to discoverproblem stuffing boxes and stems (Figure 3).Time available to repair damaged stuffing boxesand stems during the outage is limited. Anassessment must be made to determine valvecondition and any corrective actions that may be
FIGURE 3Badly Pitted Stem
required. Machining the stuffing box is difficult,time consuming and may require designapproval. Once the valve has been completelydisassembled, stem repair is reasonably fast usingspray welding techniques. Fabricatingreplacement precision components can often bethe faster repair process.
Test Program:The rough stem/stuffing box test programevaluated the following scenario:
• a stuffing box diameter that is out ofspecification (too large);
133

• a stem that is in poor condition and time doesnot allow a repair (pitted and/or scored);
• precision internal components are readilyavailable.
Clearances of test component in contact with thepacking (graphite bushings) were:
Inside Diameter:Minimum: Ds + 0.007 inch. (0.18 mm)Maximum: Ds + 0.013 inch. (0.33 mm)
Outside Diameter:Minimum: Db - 0.013 inch. (0.33 mm)Maximum Db - 0.007 inch. (0.18 mm)
whereDs = stem diameterDb = stuff box diameter (Ds + (2 x 0.375 inch.) +0.050 inch.)
The 0.050 inches represents the maximum of thediameter tolerance for 3/8 inch packing beforegoing to the next size in packing i.e., 7/16 inch.
For valves outside these tolerances it isrecommended that over-sized packing sets beused, such as the CDDCC set used where the setwas made to fit the stuffing box.
Test Results:• A 5-Ring Argo Style 5000 braided graphite
packing was the only product that providedeffective sealing with the badly pitted stem,and limited success with a scored stem.
• The triple composite configuration(CDDCC) using Argo 6000 and 6300Jprovided effective sealing performance withthe rough pitted stem, but did not seal withthe scored stem.
• A 5-Ring LATTYgraf 6117 did not meet theleakage criteria with either the pitted orscored stem.
• None of the packing sets tested willeffectively seal long axial score marks on thestem.
The test program demonstrated that for very poorstem conditions and over-sized stuffing boxes,which may be found on MOV's and manualvalves, temporary sealing solutions based on
packing configurations are available. Althoughpacking configurations for use with poorcondition stems and stuffing boxes have beenidentified, this resort is not good practice andcomponents in poor condition should be repairedat the first available opportunity. The solutionsfound from this test program are notrecommended for application on stem diameterscommonly found on AOV's. Poor stems forthese valves must be returned to designconditions prior to start-up.
STEM PACKING FRICTION
The extensive use of graphite valve packingcombined with improved valve actuatordiagnostic equipment has generated a need forbetter valve stem packing friction data.
Optimum stem friction can be viewed as thetrade-off between maintaining effective stemsealing and acceptable valve operation.
When the packing is compressed, the applied glandload generates a radial squeeze on the stem. Whenthis radial squeeze equals the fluid pressure, leakageis stopped. This radial force also results in frictionthat resists axial or rotary motion of the valve stem.
Various factors can affect packing friction, such asgland stress, packing materials, installation, andoperating conditions. For example even with correctgland bolt torques, friction may still be low if theapplied gland load is not transmitted to the packing, apossible result of a gland follower being over-sized orpoor installation techniques. Packing stress must besufficient to squeeze the packing around the stem toseal during stem actuation. Temperature, fluidviscosity, and system pressure can also affect stemfriction.
Friction Types:Friction can manifest itself in several waysduring valve actuation.
Static friction or break-away friction is the forcerequired to start movement between two surfaces atrest. It is generally the highest friction seen.
Running friction or dynamic friction is the frictionforce between packing and stem while the stem ismoving (during stem actuation). Running friction isalways less than static friction.
134
Stiction occurs when there is a high ratio betweenstatic friction and dynamic friction. (The effect ofstiction should not be confused with process control"hunting".) Stiction can be a significant problem forair operated valves. With stiction, a small change inthe input signal to the actuator results in no change instem movement. As the actuation force becomeslarger and exceeds static friction, the stem suddenlymoves and the friction load drops. This causes asudden jump, or jerky motion, of the stem. Astick/slip ratio of 1 is ideal, but as the ratio increases,the problem worsens.
It should be noted that stiction problems can beassociated with actuator sizing, binding of theactuator, improper packing design, stem finish, stemguide components, and over-torquing (loading) ofcomponents.
Friction Calculation:The packing friction load is a function of the appliedgland stress, the internal pressures in the valve andthe coefficients of friction between the packing andthe stem and bonnet. Simplified versions of morecomplex formulas can be used for estimating stempacking friction for most applications. For non-rotating linear stem movement, the stem packingfriction can be estimated by the following equation:
F = Gs • Ph • Ds • TC • Y • f (pounds force or Newtons)
For rotating non-rising stems:
T = Gs • Ph • Ds • 7i • Y • f• R,(inch-pounds or Newton-meters)
where:
Gs = applied gland stress
This is the level of gland stress (psi) applied to thepacking through the gland bolts. This stress is usuallybased on the measured torque applied to the glandstuds or nuts. The actual gland stress to the packingcan vary considerably. Depending on the stud andgland nut condition, lubrication and torquingprocedures, using the torque measurement to estimategland stress can introduce a serious discrepancy withthe true applied load. The applied stress or glandload can be more accurately determined by usingcalibrated spring stacks on the gland studs.
Ph = effective packing height
The effective packing height is the compressed heightof those rings in the packing configuration thatgenerate enough radial stem contact to cause packingfriction.
Ds = stem diameter
Rs = stem radius = Ds/2
Y = transfer ratio of axial stress to average radialstress
This ratio varies depending on the density of thepacking material, the configuration design and theinstallation procedure used.
f = friction coefficient
The coefficient of friction of the packing materialagainst the valve stem used in most calculations andin this manual is that measured during tests at ambientconditions. The aim of the packing designer is tokeep the friction coefficient as low as possible whilemaintaining appropriate sealing performance. Thecoefficient of friction is influenced by those materialand physical properties which can change withtemperature, stem conditions, and applied load.
Friction Test Highlights:Results from AECL's friction evaluation programhave provided a range of values for the non-dimensional parameter of product f-Y (fY) for one-ring up to five-ring configurations. From this data,the friction for most packing configuration used inCANDU stations can be determined. Significantresults from the program showed that:
• For gland stresses up to 41 MPa (6,000 psi),composite end-rings showed no contribution tofriction. Therefore, composite rings should notbe included in the calculation of the effectivepacking height (Ph).
• Ph can be decreased by system pressure due tothe wetting effect of the fluid on the lowerpacking rings, resulting in lower friction values.
• Stem friction from one- to five-ring sets is alinear function of the number of rings and glandstress in the range of 2,000 to 6,000 psi (limitsof test program).
135

RAIN FOREST TO DESERT
Much effort has gone into valve packing researchand the application of that knowledge byMechanical Maintainers. Typical evidence ofusing and developing good packing procedures,training and management control can been seenin the success at Bruce-B and Darlington. Bothstations have successful packing programs basedon the co-operative effort between R&D, thesuppliers, and a station commitment to eliminatepacking-related problems. Figure 4 shows aclassic examples of the "rain forest" effectwhere steam leaks were large, and Figure 5 theclean and dry view "desert".
APPLICATION GUIDE
The VPM should be viewed as a livingdocument, updated yearly as new test data andfield experience are gained. The manual is areference tool and application guide to be used tohelp maintain a successful packing program. Themanual alone, however, is not enough: acommitment to excellence, configurationmanagement and training must also beimplemented
FIGURE 48-41840-MV110
Steam Leak Prior to Implementing PracticesFrom VPM
FIGURE 58-41840-MV110
Implementing PracticesRecommended in VPM
ACKNOWLEDGEMENTS
The authors respectively acknowledge to testingsupport from MED Branch.
REFERENCES
Aikin, J.A., "Valve Packing Manual", COG-97-019, 1997 February.
Aikin, J.A. and Lade, C.R., "Evaluation ofGraphite Valve Packing Configuration on PoorStem and Stuffing Box Conditions", COG-97-183, 1997 March.
Spence, G.S., "Darlington NGD Valve PackingProgram, Third International ConferenceCANDU Maintenance, Nov. 19-21, Holiday Innon King, Toronto, Ontario.
Cumming, D, "BNGS Valve Packing Program",Third International Conference CANDUMaintenance, Nov. 19-21, Holiday Inn on King,Toronto, Ontario.
136

PACKING CONFIGURATION PERFORMANCEFOR SMALL STEM DIAMETERS
J.A. AikinAECL
Chalk River LaboratoriesMechanical Equipment Development Branch
Chalk River, OntarioKOJ 1J0
C.G SpenceOntario Hydro
Darlington Nuclear Generating Division
D. dimmingOntario Hydro
Bruce B Nuclear Generating Division
A. EyvindsonAECL
Chalk River Laboratories
CA0000023
ABSTRACT
The extensive use of graphite packing and itsexcellent track record for large isolating valves inCANDU, Primary Heat Transfer (PHT) systemshas resulted in an increased application ofgraphite packing on the conventional side. Manyof these applications are in air operated valves(AOVs) where the packing sets are used on smallstem diameters (< 1 inch) with frequent short-cycling strokes (± 10% of full stroke). The directapplication of the proven packing configurationsfor large isolating valves to control valveapplication has generated problems such asstiction, packing wear and, in isolated cases, stemstall.
To address this issue, a test program wasconducted at AECL, CRL by MED branch. Thetesting showed that by reconfiguring the packingsets and using PTFE wafers reductions in stemfriction of 50% at ambient conditions, and 3 foldat hot conditions are achievable. The testprogram also demonstrated benefits gained inpacking wear with different stem roughnessfinishes and the potential need to exercise smallstems valves that see less than full stroke cycling.The paper describes the tests results and providesfield support experience.
INTRODUCTION
The extensive use and excellent performance ofgraphite valve stem packing configurations forlarge isolating valves in CANDU® Primary HeatTransport (PHT) systems has resulted in anincreased use of these configurations on theconventional side. Many of these applicationsare in air operated valves (AOVs) with stemdiameters less than 1 inch and frequent shortcycling strokes. Problems with packing wear,unstable stem actuation due to high static frictionrelative to dynamic friction, and stem stall havebeen noted.
Limited experience indicated that the applicationof PTFE wafers would reduce stem friction andincrease packing wear. Little research has beendone with PTFE wafers and previous testing ofthe effects of different stem finishes on stemfriction gave mixed results. Tests at CRL atelevated temperature and pressure show10 % less stem friction for an 8 RMS stemcompared to a 32 RMS stem , while ambienttemperature tests showed no difference between4 and 12 RMS stems. For marginal actuators,
® CANDU CANada Deuterium Uranium,registered trademark.
137
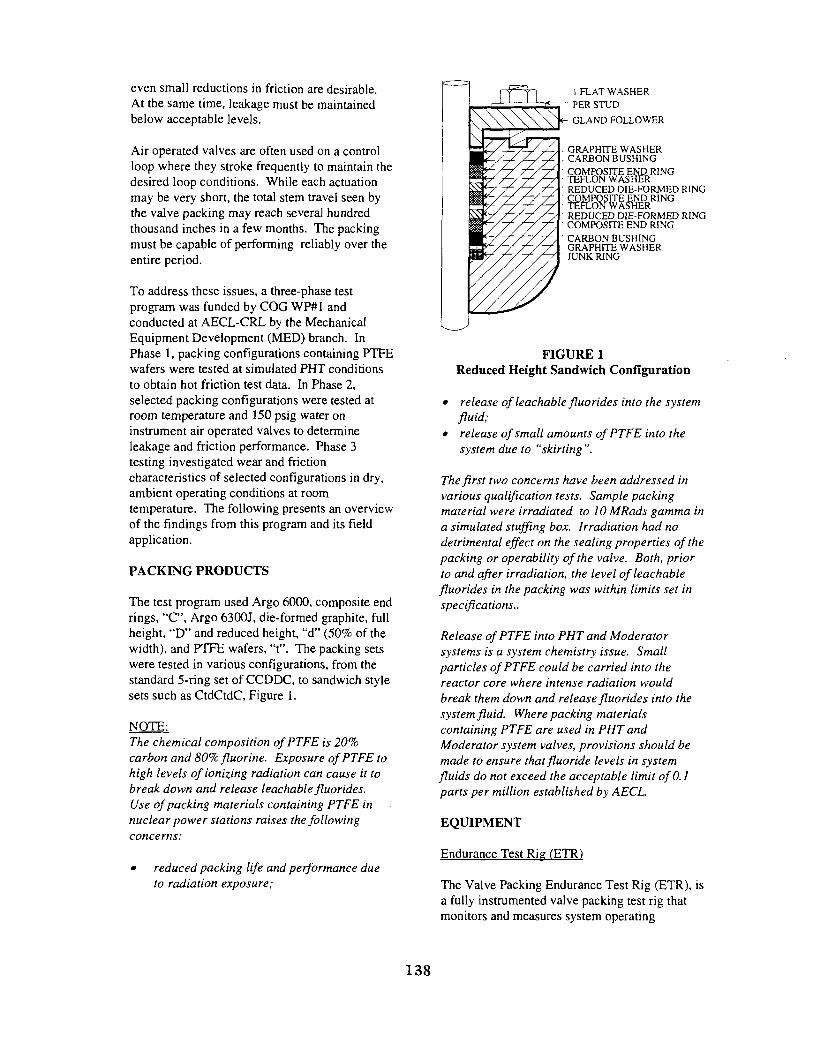
even small reductions in friction are desirable.At the same time, leakage must be maintainedbelow acceptable levels.
Air operated valves are often used on a controlloop where they stroke frequently to maintain thedesired loop conditions. While each actuationmay be very short, the total stem travel seen bythe valve packing may reach several hundredthousand inches in a few months. The packingmust be capable of performing reliably over theentire period.
To address these issues, a three-phase testprogram was funded by COG WP#1 andconducted at AECL-CRL by the MechanicalEquipment Development (MED) branch. InPhase 1, packing configurations containing PTFEwafers were tested at simulated PHT conditionsto obtain hot friction test data. In Phase 2,selected packing configurations were tested atroom temperature and 150 psig water oninstrument air operated valves to determineleakage and friction performance. Phase 3testing investigated wear and frictioncharacteristics of selected configurations in dry,ambient operating conditions at roomtemperature. The following presents an overviewof the findings from this program and its fieldapplication.
PACKING PRODUCTS
The test program used Argo 6000, composite endrings, "C", Argo 6300J, die-formed graphite, fullheight, "D" and reduced height, "d" (50% of thewidth), and PTFE wafers, "t". The packing setswere tested in various configurations, from thestandard 5-ring set of CCDDC, to sandwich stylesets such as CtdCtdC, Figure 1.
NOTE:The chemical composition of PTFE is 20%carbon and 80% fluorine. Exposure of PTFE tohigh levels of ionizing radiation can cause it tobreak down and release teachable fluorides.Use of packing materials containing PTFE innuclear power stations raises the followingconcerns:
• reduced packing life and performance dueto radiation exposure;
1 FLAT WASHERPER STUD
s- GLAND FOLLOWER
GRAPHITE WASHERCARBON BUSHING
.. _ J I T E END RING-ON WASHER
REDUCED DIE-FORMED RINGCOMPOSITE END RINGTEFLON WASHERREDUCED DIE-FORMED RINGCOMPOSITE END RINGCARBON BUSHINGGRAPHITE WASHERJUNK RING
FIGURE 1Reduced Height Sandwich Configuration
• release of leachable fluorides into the systemfluid;
• release of small amounts of PTFE into thesystem due to "skirting ".
The first two concerns have been addressed invarious qualification tests. Sample packingmaterial were irradiated to 10 MRads gamma ina simulated stuffing box. Irradiation had nodetrimental effect on the sealing properties of thepacking or operability of the valve. Both, priorto and after irradiation, the level of leachablefluorides in the packing was within limits set inspecifications..
Release of PTFE into PHT and Moderatorsystems is a system chemistry issue. Smallparticles of PTFE could be carried into thereactor core where intense radiation wouldbreak them down and release fluorides into thesystem fluid. Where packing materialscontaining PTFE are used in PHT andModerator system valves, provisions should bemade to ensure that fluoride levels in systemfluids do not exceed the acceptable limit ofO. 1parts per million established by AECL.
EQUIPMENT
Endurance Test Rig (ETR)
The Valve Packing Endurance Test Rig (ETR), isa fully instrumented valve packing test rig thatmonitors and measures system operating
138

conditions, packing leakage, consolidation andstem thrust. Hydraulic actuators move the stem,with control through a hydraulic circuit and testmonitoring by data acquisition unit.
Six combination die-formed graphite packingsets were evaluated at cold and CANDU PHTconditions of 565° F and 1,450 psig. Theconfigurations were tested through 400 stemcycles, with a static shut down period after200 stem cycles.
All the packing sets used solid rings on a 1 inchdiameter stem. Gland stress was 4,000 psiwithout live loading. Two packing cross-sectionsand stem finishes were used: 5/16 inch with a32 RMS stem finish and 1/4 inch with a 4-6 RMSstem finish.
Air Operated Valve Test Facility (AOV)
Two instrumented AOVs were used for this testprogram (Fisher Controls, Type EZ, Size 2, withType 667, Size 50 actuators). A0V1 had a4 RMS stem, while AOV2 ran the first test with a32 RMS stem and the second test with a 12 RMSstem. Each valve used a 0.75 inch diameter stemand a 1.25 inch diameter stuffing box and eachwas pressurized to 150 psig water. For themajority of the test period, the stem travel was0.31 in. for a full cycle at a stroke rate ofapproximately 7.5 strokes per minute.Depending on the test plan, full stem strokingwas done to monitor changes in packing frictionand the effects of stem wiping.
SuperCvcle Jigs (SCJ)
Three test jigs, each consisting of a stem andstuffing box, were used for the long-term weartests. Each SuperCycle Jig (SCJ) used a0.75 inch stem diameter and a 1.25 inch stuffingbox inside diameter. Stem finishes used were 32,12 or 4 RMS. The three valve stems wereconnected to a variable speed motor whichexercised them at a stroke rate of 14 cycles /minute. A cam shaft with three different offsetsprovides valve stem stroke lengths of 0.8 inches,0.33 inches, and 0.75 inches.
SUMMARY OF RESULTS
The following is an overall summary of thefindings. For additional detail see the referencedCOG reports.
Hot Testing (ETR)
Stem friction using sandwich-style configurationsat ambient conditions was reduced about 50%compared to the standard 5-ring set.
Use of PTFE at elevated temperature reducedstem friction 3-fold compared to ambientconditions.
PTFE extrusion past the in-board composite ringwas observed with all PTFE configurations usedwith the 32 RMS stem. Therefore, stems with32 RMS finish are not recommended for use inthis type of application.
Little to no PTFE extrusion was observed usingthe 4-6 RMS stem.
AOV Testing
A 32 RMS stem exhibits packing leakage wellbefore a 4 RMS stem, and is not recommendedfor use in any CANDU valves where total stemtravel will be above 10,000 inches and lowleakage is important.
Packing configurations with PTFE wafers allowabout twice as much total stem travel beforefailure as those without PTFE wafers.
Increased friction due to packing build-up on thestem can occur within 70 inches of total stemtravel when the stroke length is short relative tothe packing ring height. The build-up can lead toa doubling of stem thrust after 850 inches oftravel. A few full strokes at this point can reducethe thrust by half.
There are no obvious effects of PTFE wafers orreduced height die-formed rings on stem thrust.
SuperCvcle Jig
Composite/die-formed configurations withoutPTFE wafers show extensive wear after400,000 inches of stem travel.
PTFE wafers reduce packing wear but increasestem thrust at ambient conditions.
Increasing stem travel increases packing wear buthas no effect on stem thrust.
139
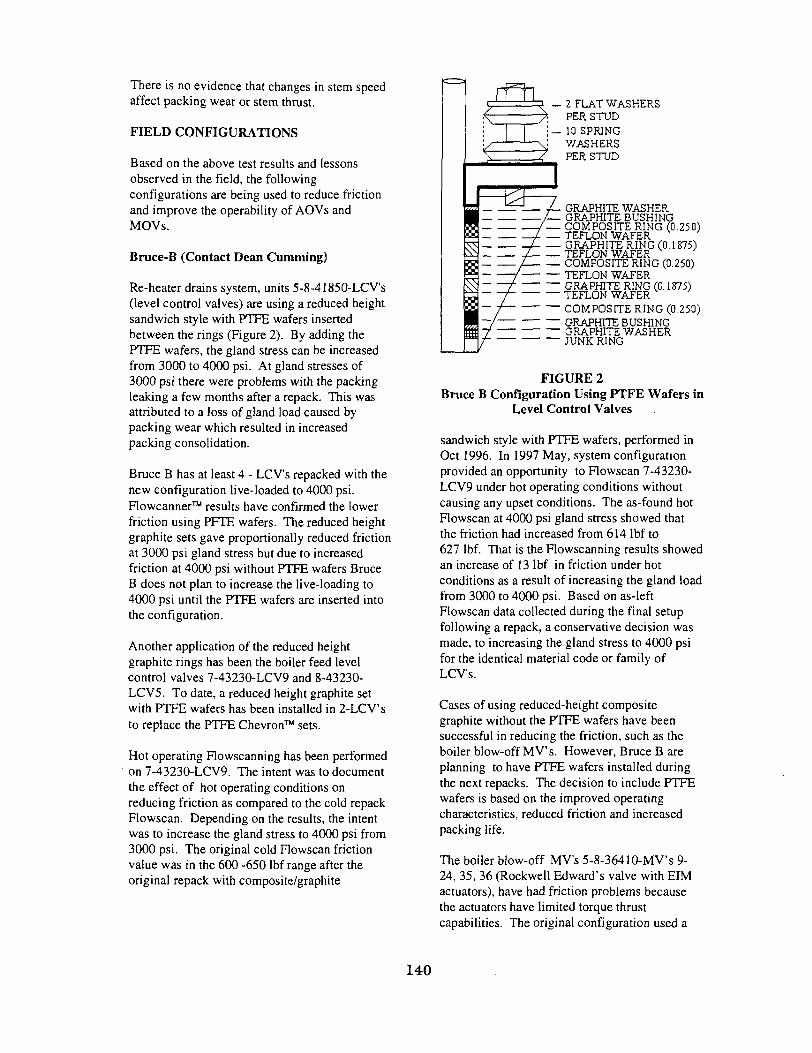
There is no evidence that changes in stem speedaffect packing wear or stem thrust.
FIELD CONFIGURATIONS
Based on the above test results and lessonsobserved in the field, the followingconfigurations are being used to reduce frictionand improve the operability of AOVs andMOVs.
Bruce-B (Contact Dean dimming)
Re-heater drains system, units 5-8-41850-LCV's(level control valves) are using a reduced heightsandwich style with PTFE wafers insertedbetween the rings (Figure 2). By adding thePTFE wafers, the gland stress can be increasedfrom 3000 to 4000 psi. At gland stresses of3000 psi there were problems with the packingleaking a few months after a repack. This wasattributed to a loss of gland load caused bypacking wear which resulted in increasedpacking consolidation.
Bruce B has at least 4 - LCV's repacked with thenew configuration live-loaded to 4000 psi.Flowcanner™ results have confirmed the lowerfriction using PFTE wafers. The reduced heightgraphite sets gave proportionally reduced frictionat 3000 psi gland stress but due to increasedfriction at 4000 psi without PTFE wafers BruceB does not plan to increase the live-loading to4000 psi until the PTFE wafers are inserted intothe configuration.
Another application of the reduced heightgraphite rings has been the boiler feed levelcontrol valves 7-43230-LCV9 and 8-43230-LCV5. To date, a reduced height graphite setwith PTFE wafers has been installed in 2-LCV'sto replace the PTFE Chevron™ sets.
Hot operating Flowscanning has been performedon 7-43230-LCV9. The intent was to documentthe effect of hot operating conditions onreducing friction as compared to the cold repackFlowscan. Depending on the results, the intentwas to increase the gland stress to 4000 psi from3000 psi. The original cold Flowscan frictionvalue was in the 600 -650 Ibf range after theoriginal repack with composite/graphite
rHi_ 2 FLAT WASHERS
PER STUD;— 10 SPRING
\J WASHERSPER STUD
GRAPHITE WASHERGRAPHITE BUSHINGCOMPOSITE RING (0.250)TEFLON WAFERGRAPHITE RING (0.1875)TEFLON WAFERCOMPOSITE RING (0.250)TEFLON WAFERGRAPHITE RING (0.1875)TEFLON WAFERCOMPOSITE RING (0.250)GRAPHITE BUSHINGGRAPHITE WASHERJUNK RING
FIGURE 2Bruce B Configuration Using PTFE Wafers in
Level Control Valves
sandwich style with PTFE wafers, performed inOct 1996. In 1997 May, system configurationprovided an opportunity to Flowscan 7-43230-LCV9 under hot operating conditions withoutcausing any upset conditions. The as-found hotFlowscan at 4000 psi gland stress showed thatthe friction had increased from 614 lbf to627 lbf. That is the Flowscanning results showedan increase of 13 lbf in friction under hotconditions as a result of increasing the gland loadfrom 3000 to 4000 psi. Based on as-leftFlowscan data collected during the final setupfollowing a repack, a conservative decision wasmade, to increasing the gland stress to 4000 psifor the identical material code or family ofLCV's.
Cases of using reduced-height compositegraphite without the PTFE wafers have beensuccessful in reducing the friction, such as theboiler blow-off MV's. However, Bruce B areplanning to have PTFE wafers installed duringthe next repacks. The decision to include PTFEwafers is based on the improved operatingcharacteristics, reduced friction and increasedpacking life.
The boiler blow-off MV's 5-8-36410-MV's 9-24, 35, 36 (Rockwell Edward's valve with EIMactuators), have had friction problems becausethe actuators have limited torque thrustcapabilities. The original configuration used a
140

5-ring set (1.125 in. ID x 2.535 in. OD x11/16 in. cross-section). The packingconfiguration now being used is a 4- ring reducedheight composite graphite set with upper andlower bushings (Figure 3). A gland stress of4000 psi can now be used where before it wasrestricted to 3000 psi to maintain operability.
rHi 2 SPRING- WASHERS
PER STUD
GRAPHITE WASHERGRAPHITE BUSHINGCOMPOSITE RING
2 GRAPHITE RINGS
COMPOSITE RINGGRAPHITE BUSHINGGRAPHITE WASHER
FIGURE 34-Ring Reduced Height Set -
Friction Reduction
Darlington (Contact Cameron Spence)
Darlington's work in the AOV packing programhas resulted in a significant effort on glandfollower and guide bushing/junk ring (stainlesssteel) changes. At this time any AOV re-packingfor the first time, the following good practicesare implemented: gland follower replacement,guide bushing removal, junk ring installation(bonnet removal required), stem polishing,installation of composite graphite set with PTFEwafers, and in many cases the addition of liveloading. The intention of the stainless steelcomponent change is to allow the graphitebushings to act as the guide mechanism insteadof the stainless steel components to reducegalling risk and allow tighter tolerances with thestem.
Darlington is now in the process of installing thiscomplete fix in several AOV's alone with the use
- FLAT WASHER""" FLANGE- 2 SPRING
WASHERSPER VALVELOAD INDICATOR
GLAND FOLLOWER
GRAPHITE WASHERGRAPHITE BUSHINGCOMPOSITE RINGTEFLON WAFERGRAPHITE RINGTELFON WAFERGRAPHITE RINGTEFLON WAFERCOMPOSITE RINGGRAPHITE BUSHINGGRAPHITE WASHERJUNK RING
FIGURE 4Configuration for Copes-Vulcan with
0.75 inch Stem Diameter
of reduced-height packing sets to assist withvalve operability and packing life. Up to 50%reduction in friction, in some cases, has beenseen by switching out the gland follower andguide bushing to graphite alone. This has beenquite successful but there have been someoperability, stiction, problems with some valves.It is expected, based on R&D testing and otherfield results, that the use of PTFE wafers whenadded to the configuration along with reducedheight sandwich sets, operability will be furtherimproved.
Figure 4 illustrates the configuration being usedfor Copes-Vulcan Valves with a 0.75 inch stemdiameter.
Figure 5 shows the configuration used on AOV'swith stem diameters primarily I inch and greater.There are some 0.75 inch valves that use thisconfiguration as well. Some of Darlington'ssmaller Copes-Vulcan AOV's use 4-ring sets asshown in Figure 5 but with normal live load of14 Belleville springs per stud.
REMARKS
The R&D support provided to the station toreduce stem friction and improve packing life is
141

being implemented. The success of the programis the combined effort from the station initiativeto install specialized packing configuration andregular contact with R&D and suppliers. Thisco-operative approach has led to stem packingfriction reductions along with improved packinglife.
2 FLAT WASHERSPER STUD
_ / •
10 SPRINGWASHERSPER STUD
! r = — A GRAPHITE WASHERGRAPHITE BUSHINGCOMPOSITE RINGTELON WAFERCOMPOSITE RINGTEFLON WAFERGRAPHITE RINGTEFLON WAFERGRAPHITE RINGTEFLON WAFERCOMPOSITE RINGGRAPHITE BUSHINGGRAPHITE WASHERJUNK RING
Eyvindson, A., Charette, P.M., "Application ofPTFE Wafers with Combination Die-FormedGraphite Configurations for Small StemDiameters - Phase 2: Ambient Temperature AirOperated Valve Testing", COG-96-546 Vol. 2),1997 January.
Eyvindson, A, and Primeau, P.D., "Applicationof PTFE Wafers with Combination Die-FormedGraphite Configurations for Small StemDiameters - Phase 3: Ambient TemperatureWear and Thrust Tests", COG-96-546 Vol. 3),1997 January.
Spence, C.G., "Darlington NGD PackingProgram", presented at the Third InternationalConference on CANDU Maintenance, November19-21, 1995.
Cumming, D., "BNGS B Valve PackingProgram", presented at the Third InternationalConference on CANDU Maintenance, November19-21, 1995.
FIGURE 5AOV Configuration for Stem Diameters
Greater Than 1 Inch
ACKNOWLEDGEMENT
The authors respectfully acknowledge the skilledtesting and instrumentation set-up provided byC.R. Lade, P.D. Primeau, and P.M. Charette ofMED branch, Chalk River.
REFERENCES
Aikin, J. A., Lade, C.R., "Application of PTFEWafers with Combination Die-Formed GraphiteConfigurations for Small Stem Diameters - Phase1: Short Term Testing at PHT Conditions",COG-96-546 Vol. 1), 1996 December.
142

Fourth CNS International Conference on CANDU CA0000024
November 1997, Toronto, Canada
RECOMMENDED AOV DIAPHRAGM REPLACEMENT FREQUENCIES
Kevin McLeod
Ontario Hydro, Bruce A, B03 MS, Box 3000 Tiverton, Ontario NOG 2T0Tel: 519-361-2673 X7834
Abstract:
Bruce A has sent out for testing over 70 used control valve diaphragms collected in 1996.The in-service life of the diaphragms range from a few months to 20 years and cover mostlocations and systems within a CANDU station. The diaphragm testing was performed bythe diaphragm manufacturer to determine if the diaphragms still meet their originalspecification criteria. The results will be compared against original QC batch test resultstaken at the time of diaphragm manufacture. Based on the trends and degradationmechanisms observed, PM frequencies for critical control valve diaphragms will beestablished in conjunction with existing industry data. Given the similar process andtemperature conditions within CANDU plants, these results should be transferable to allstations.
143

ELECTROSLEEVE™ PROCESS FOR IN-SITU NUCLEARSTEAM GENERATOR REPAIR
CA0000025
R.A. BartonOntario Hydro Technologies
800 Kipling Avenue, Toronto, ON M8Z 5S4
T.E. MoranFramatome Technologies, Inc.
Lynchburg, VA, USA 24502
E. RenaudBabcock & Wilcox Industries Ltd.
Cambridge, ON N1R 5V3
ABSTRACT
Degradation of steam generator (SG) tubing bylocalized corrosion is a widespread problem in thenuclear industry that can lead to costly forced out-ages, unit de-rating, SG replacement or even thepermanent shutdown of a reactor. In response tothe onset of SG tubing degradation at OntarioHydro's Pickering Nuclear Generating Station(PNGS) Unit 5, and the determined unsuitability ofconventional repair methods (mechanically expand-ed or welded sleeves) for Alloy 400, an alternativerepair technology was developed. Electrosleeve™ isa non-intrusive, low-temperature process thatinvolves the electrodeposition of a nanocrystallinenickel microalloy forming a continuously bonded,structural layer over the internal diameter of thedegraded region. This technology is designed toprovide a long-term pressure boundary repair, fullyrestoring the structural integrity of the damagedregion to its original state. This paper describesthe Electrosleeve™ process for SG tubing repairand the unique properties of the advanced sleevematerial. The successful installation ofElectrosleeves that have been in service for morethan three years in Alloy 400 SG tubing at thePickering-5 CANDU unit, the more recent exten-sion of the technology to Alloy 600 and its demon-stration in a U.S. pressurized water reactor(PWR), is presented. A number of PWR operatorshave requested plant operating technical specifi-cation changes to permit Electrosleeve™ SG tuberepair. Licensing of the Electrosleeve™ by the U.S.Nuclear Regulatory Commission (NRC) is expectedimminently.
1.0 INTRODUCTION
The degradation of steam generator (SG) tubing,particularly by localized corrosion, is a wide-spread problem in the nuclear industry that canElectrosieeve™ is a trademark of Ontario Hydro
lead to costly forced outages, and in severecases, may require unit de-rating, SG replacementor even the permanent shutdown of a reactor. Themandated inspection of SG tubing during mainte-nance outages is used to monitor degradation,which, if serious enough to compromise structuralintegrity, requires removing the affected tube fromservice (i.e., plugging) or repairing it. The standardmethod of tube rehabilitation involves the installationof a "sleeve," which is either mechanically expandedor welded at its axial extremities to the inside surfaceof the host tubing. The applied sleeve spans thedefect and restores the mechanical integrity of theregion. Although widely applied in the nuclear indus-try, tube repairs cause concerns about reliabilitybecause of the intrusive nature of existing installationmethods that inherently tend to produce high levels ofresidual stresses, heat-affected zones, tube defor-mation or microstructural alterations. The high-temperature, post-installation heat treatment usuallyperformed to relieve the high installation-inducedstresses for improved service life, has also beenimplicated as the cause of further compromising theintegrity of the host tube where support-platedeposits restrict thermal growth (i.e., locked-tubescenario).
An alternative, non-intrusive SG repair technology,Electrosleeve™, has recently been developed byOntario Hydro Technologies (OHT) which circumventsthe above-noted concerns while providing long-term,pressure-boundary restoration. The process involvesthe in-situ electrochemical fabrication/installation of acontinuously bonded, structural sleeve made possibleby a new generation of advanced materials and theirsynthesis techniques. The resulting Electrosleeve isillustrated in Figure 1. The proprietary Electrosleevetechnology 1, described in this paper, has been fieldimplemented in both Canadian CANDU and U.S. PWRplants and is now offered commercially under a licens-ing agreement with Framatome Technologies, Inc.(FTI) and Babcock & Wilcox Industries Ltd (BWI).
144

Inconel 600Tube
Electrosleeve
Figure 1: Cut-away view of the Electrosleeveinstalled in SG tubing.
2.0 BACKGROUND
In 1993, indications of an alarming rate of SG tubedegradation and a determined unsuitability of then-available repair methods for application to Alloy 400(Monel) tubing, resulted in Ontario Hydro being facedwith a possible de-rating of Pickering Unit 5 wellbefore the end of its design life. In response, OHT,drawing on its collaborative research achieve-ments in advanced materials, conceived, developed,and through a focused and accelerated effort,successfully delivered a new generation of SGtubing repair technology in time for the Unit 5maintenance outage in April-May, 1994. TheElectrosleeve process is based on in-situ electro-forming, which is conducted at low temperature,and is essentially non-intrusive to the host tubing,unlike welding or mechanical expansion.
Although the electroplating of SG tubes has beenused extensively in Europe by Framatome (France),only a thin coating of elemental nickel was appliedprimarily as a preventative measure against primarywater stress corrosion cracking (PWSCC) in theroll transition area or to inhibit the propagation ofexisting stress corrosion cracks 2. The relatively lowmechanical strength of conventional, pure nickelprecludes its use as a structural repair where themechanical integrity of the tube has been com-promised, as was the case at Pickering whereextensive OD pitting above the tubesheet in thesludge pile region required local pressure bound-ary replacement {i.e., a structural repair).The Hall-Petch behaviour of polycrystalline materials
indicates that a two to three order of magnitudereduction in grain size, from tens of micrometres(for conventional polycrystals) to tens or hundredsof nanometres (nanocrystalline materials), canimprove mechanical properties (e.g., hardness,tensile strength) several-fold3 (see also Table 1).Based on the pioneering work by Erb and coworkersin the electrodeposition of metals and alloys4, nickelin the nanocrystalline form, has the mechanicalstrength for pressure boundary repair applications.Electrodeposition, one of the few methods avail-able for synthesizing fully dense nanocrystallinematerials, was the technique adopted for the instal-lation/fabrication of the Electrosleeve5. Grain sizeis controlled by the appropriate selection of currentdensity, ionic concentration, temperature and currentwaveform 6.
Just as important as ultra-fine grain size, is the effectof minor solute additions of selected elements, prefer-ably phosphorous. The presence of micro-alloyedphosphorous (typically < 3000 ppm) in theElectrosleeve is critical since it has been shown toretard grain growth and ensure the stability of the nano-crystalline structure at elevated temperatures 7AWithout the stabilizing influence of the phosphorous,the mechanical strength of the Electrosleeve wouldquickly revert to that of conventional (microcrystalline)nickel at SG operating temperatures (up to 343 °C foraPWR).
In combination, these concepts enabled the develop-ment of a unique, high strength nanostructured nickelmicroalloy that is fabricated in-situ to provide a non-intrusive, continuously bonded, mechanically superiorsleeve repair. Low-temperature installation alsoensures that there are no stress relief requirements.
3.0 MATERIAL PROPERTIES
3.1 Composition
The Electrosleeve consists of > 99.5% Ni and alsocontains typically < 3000 ppm of microalloyed P. Innuclear applications, the cobalt content of the sleeveis limited to < 150 ppm by the use of chemicalreagents of suitable purity.
3.2 Microstructural Characteristics
The Electrosleeve material is fully dense (non-porous), generally free of macroscopic defects andpossesses a microstructure not resolvable by opticalmicroscopy. Based on transmission electronmicroscopy and atomic force microscopy, the aver-age grain size of typical Electrosleeve material isapproximately 100 nm 9-10.
145
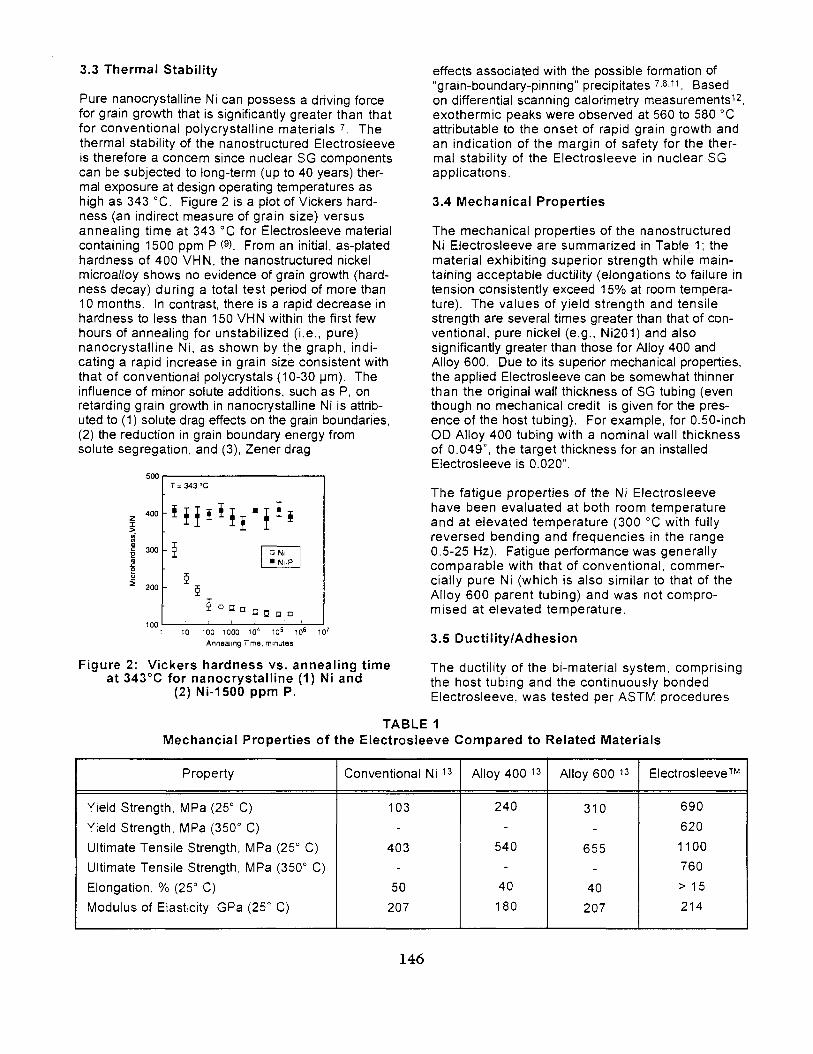
3.3 Thermal Stability
Pure nanocrystalline Ni can possess a driving forcefor grain growth that is significantly greater than thatfor conventional polycrystalline materials 7. Thethermal stability of the nanostructured Electrosleeveis therefore a concern since nuclear SG componentscan be subjected to long-term (up to 40 years) ther-mal exposure at design operating temperatures ashigh as 343 °C. Figure 2 is a plot of Vickers hard-ness (an indirect measure of grain size) versusannealing time at 343 "C for Electrosleeve materialcontaining 1500 ppm P <9). From an initial, as-platedhardness of 400 VHN, the nanostructured nickelmicroalloy shows no evidence of grain growth (hard-ness decay) during a total test period of more than10 months. In contrast, there is a rapid decrease inhardness to less than 150 VHN within the first fewhours of annealing for unstabilized (i.e., pure)nanocrystalline Ni, as shown by the graph, indi-cating a rapid increase in grain size consistent withthat of conventional polycrystals (10-30 urn). Theinfluence of minor solute additions, such as P, onretarding grain growth in nanocrystalline Ni is attrib-uted to (1) solute drag effects on the grain boundaries,(2) the reduction in grain boundary energy fromsolute segregation, and (3), Zener drag
500
1 10 100 1000 lO* 10s 106 10'Annealing Time, minutes
Figure 2: Vickers hardness vs. annealing timeat 343°C for nanocrystalline (1) Ni and
(2) Ni-1500 ppm P.
effects associated with the possible formation of"grain-boundary-pinning" precipitates 7.8.n Basedon differential scanning calorimetry measurements12,exothermic peaks were observed at 560 to 580 °Cattributable to the onset of rapid grain growth andan indication of the margin of safety for the ther-mal stability of the Electrosleeve in nuclear SGapplications.
3.4 Mechanical Properties
The mechanical properties of the nanostructuredNi Electrosleeve are summarized in Table 1; thematerial exhibiting superior strength while main-taining acceptable ductility (elongations to failure intension consistently exceed 15% at room tempera-ture). The values of yield strength and tensilestrength are several times greater than that of con-ventional, pure nickel (e.g., Ni201) and alsosignificantly greater than those for Alloy 400 andAlloy 600. Due to its superior mechanical properties,the applied Electrosleeve can be somewhat thinnerthan the original wall thickness of SG tubing (eventhough no mechanical credit is given for the pres-ence of the host tubing). For example, for 0.50-inchOD Alloy 400 tubing with a nominal wall thicknessof 0.049", the target thickness for an installedElectrosleeve is 0.020".
The fatigue properties of the Ni Electrosleevehave been evaluated at both room temperatureand at elevated temperature (300 °C with fullyreversed bending and frequencies in the range0.5-25 Hz). Fatigue performance was generallycomparable with that of conventional, commer-cially pure Ni (which is also similar to that of theAlloy 600 parent tubing) and was not compro-mised at elevated temperature.
3.5 Ductility/Adhesion
The ductility of the bi-material system, comprisingthe host tubing and the continuously bondedElectrosleeve, was tested per ASTM procedures
TABLE 1Mechancial Properties of the Electrosleeve Compared to Related Materials
Property
Yield Strength, MPa (25° C)
Yield Strength, MPa (350° C)
Ultimate Tensile Strength, MPa (25° C)
Ultimate Tensile Strength, MPa (350° C)
Elongation, % (25° C)
Modulus of Elasticity, GPa (25° C)
Conventional Ni 13
103
-
403
-
50
207
Alloy 400 13
240
-
540
-
40
180
Alloy 600 13
310
-
655-
40
207
Electrosleeve™
690
620
1100
760
> 15
214
146

E-290-92 and B-489-8514. Longitudinally splitElectrosleeved tube samples were bent with thenickel-based sleeve inside diameter in tension(reverse U-bend) over a 6.4 mm (1/4") mandrel asshown in Figure 3. After bending, Figure 4, thesleeves were visually inspected for cracks or evi-dence of disbonding. Of the hundreds of samplesthat have undergone this severe test of adhesionand ductility, no defects were observed in anyspecimen installed per normal process procedures.The ductility of the Electrosleeve material is fur-ther demonstrated by the ductile failures the mate-rial exhibited during tensile tests. Ultrasonic test-ing (UT), the preferred post-installation inspectiontechnique for correct positioning and thickness, isalso used to provide in-situ verification of bondquality (if the Electrosleeve is not continuouslybonded to the entire tube ID, the wave reflects offthe nickel outer surface) throughout the entiresleeved area.
3.6 Creep Performance
The high-temperature application of theElectrosleeve in a SG required that the creepperformance of the unique nanostructured materialbe determined. The results of a series of constantload creep tests (covering a range of stresses from
Figure 3: Reverse U-bend test of longitudinallysplit Electrosleeve sample.
180 to 450 MPa at 343 °C, as well as additionaltests at 315 °C and 288 °C to determine the effect oftemperature) demonstrate that no failures due togross distortion, creep rupture from long-term load-ing, or creep fatigue will occur under SG designoperating conditions15. In addition, no evidence ofintergranular creep cracking (the predominant modeof premature creep failure for engineering materials)
Figure 4: Typical reverse U-bend test specimenexhibiting excellent ductility and adhesion.
has been noted in any of the specimens tested,with completely ductile fracture features exclusivelyobserved. Despite the higher steady state creeprates expected with decreasing grain size, a recentstudy has shown that nanostructured materialsare highly resistant, and possibly immune to inter-granular creep failure16. This feature, togetherwith the observed time-independent elongation tofailure (to greater than 14000 hours), is likely tomanifest itself in extended creep life for nanos-tructured materials. The substantially lower creeprates for the material at 315 °C and below alsoprovide an added margin of safety in CANDU SGapplications (304 °C design temperature).
4.0 CORROSION PERFORMANCE
Due to a lack of information on the corrosionresistance, particularly localized attack, of nano-crystalline nickel, especially for material microalloyedwith phosphorous, a comprehensive corrosion testprogram was undertaken for the Electrosleeve.The technical literature does indicate, however,that at phosphorous concentrations of less than0.9% the general corrosion behaviour of the poly-crystalline alloy is similar to that of high-puritynickel17 including the nickel-plated coating that hasbeen used successfully by Framatome (with greaterthan 10 years of in-plant service) to inhibit SCC inSGs in Belgium. Due to their greater inherent grainboundary component, nanostructured mateiials aremore resistant to intergranular corrosion phenomena(e.g.. SCC and intergranular attack, IGA)1819.Therefore, the corrosion performance of theElectrosleeve is expected to be as good as, orbetter, than conventional commercially pure nickel.
147

4.1 General Corrosion Tests
Standard tests, designed to evaluate the perfor-mance of SG alloys exposed to known corrosionmechanisms in well characterized environments(ASTM G28 for susceptibility to IGA, ASTM G48for susceptibility to pitting and crevice corrosion,ASTM G35/G36/G44 for susceptibility to SCC)were conducted on Electrosleeve specimens.Test results in these extremely severe environ-ments (they do not exist directly in SGs) con-firmed that the material possesses the generalcorrosion properties of conventional nickel but isintrinsically resistant to intergranular processessuch as IGA and IGSCC10-20. The Electrosleevematerial was also resistant to pitting attack andshowed signs of only slight crevice corrosion.
4.2 Corrosion in Specific SG Environments
In general, the corrosion of nickel and nickel-basealloys is minimal during power operation due tocareful control of environmental characteristics,such as the addition of reducing agents to limitdissolved oxygen and the maintenance of a slightlyalkaline pH. A series of accelerated tests wereconducted to simulate upset conditions known tobe detrimental to steam generator materials.These tests included freshwater, acid and causticingress under a combination of oxidizing andreducing environments at 300/256 °C primary/secondary water temperatures.
The results of the freshwater ingress test revealedno attack of the Electrosleeve after a 4500 hourexposure. Excellent resistance was also demon-strated in alkaline environments, as well as inreducing acidic environments. When exposed toa combination of an oxidizing and an unbufferedacidic environment, corrosion resistance was limited,as expected. However, based on the severity ofthe test conditions (accelerated tests had 1000Xhigher acid concentration than the anticipatedevent) and that an acid ingress requires immedi-ate operator intervention, the test results indicatethat the Electrosleeve offers good corrosion resis-tance, by a large margin, in any realistic acidicexcursion scenarios in nuclear plant operation.
4.3 Crack Arrest Capability
One of the most prevalent degradation modesafflicting nuclear steam generators is IGSCC.Commercially pure nickel is a known SCC-resistantmaterial, and as previously discussed, has beensuccessfully used to inhibit or arrest such degrad-ation in an SG environment. Unlike conventionalsleeves, which are bonded at their axial extremities,creating an artificial crevice between the hosttube and the sleeve, the Electrosleeve provides a
continuous high-strength metallurgical bond to theSG tube. In most respects, a continuous metal-lurgical bond is superior to a weld or mechanicalexpansion joint at the sleeve extremities.However, there were concerns that a continuousmetallurgical bond might allow cracks to propa-gate from the host tube through the bi-materialinterface and into the Electrosleeve. However,Sugimura et al. have shown that for bi-materialsystems of similar elastic modulus, but differentplastic properties, cracks propagating toward thebi-material interface from the material of loweryield strength (the SG tube) will always tend toblunt upon encountering the interface21.Moreover, a recently developed geometric modelhas shown that the decreasing grain size of nano-structured materials should yield enhanced resis-tance to intergranular crack propagation22 23.These characteristics of nanostructured materialsensure that the long-term integrity of the Electro-sleeve is in no way compromised when used inIGSCC repair applications.
The crack-arrest capability of the Electrosleevewas confirmed experimentally by C-ring specimens(produced from Electrosleeved tubing sectionshaving a thinned outer layer of host Alloy 600 tubingand statically stressed to 2% outer surface strain)exposed to 10% sodium hydroxide solution at 350 °C,an environment commonly used to evaluate theSCC performance of nuclear SG tubing alloys.
Figure 5: Cross-sectional optical micrographshowing crack arrest/blunting capability of theElectrosleeve in a stressed (2% tensile strain)
Electrosleeved Alloy 600 C-ring exposed to 10%NaOH at 350°C for 3000 h.
Figure 5, a cross-sectional optical micrograph of aC-ring following a 3000 hour exposure, shows thatthe OD initiated, intergranular cracking that is highlyprevalent in the Alloy 600 tubing, is completelyarrested upon encountering the nanostructured NiElectrosleeve <924>. Stress corrosion cracks were
148
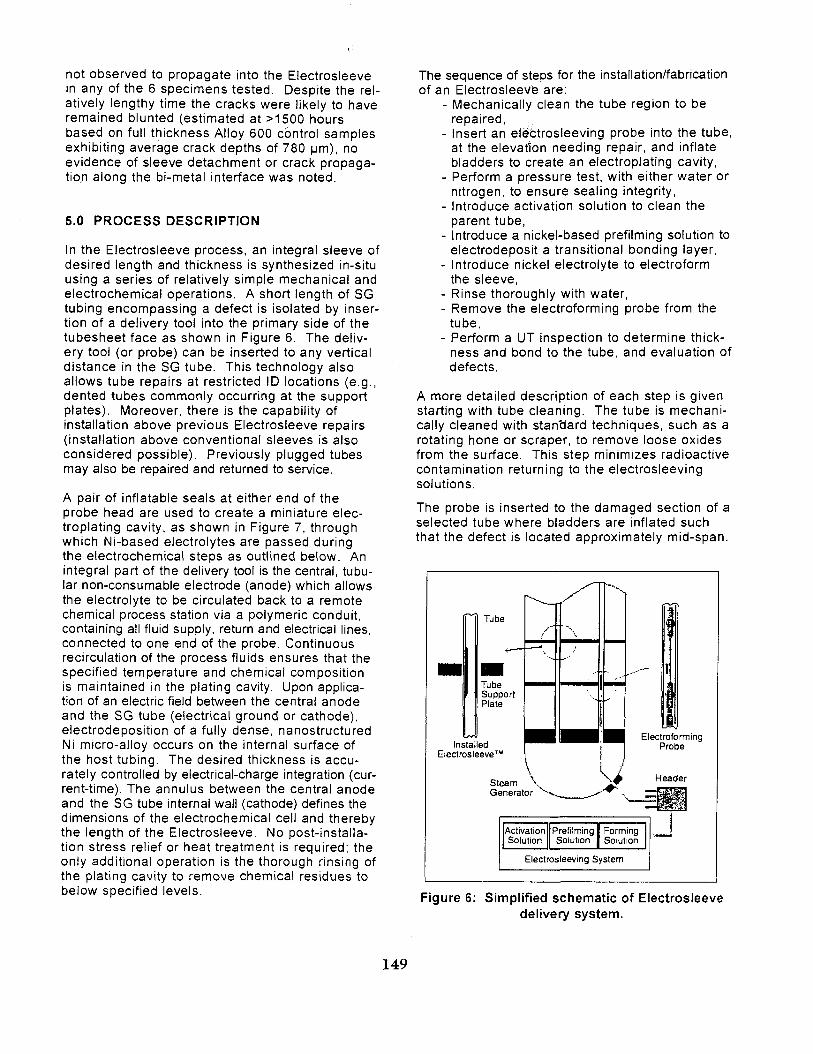
not observed to propagate into the Electrosleevein any of the 6 specimens tested. Despite the rel-atively lengthy time the cracks were likely to haveremained blunted (estimated at >1500 hoursbased on full thickness Alloy 600 control samplesexhibiting average crack depths of 780 urn), noevidence of sleeve detachment or crack propaga-tion along the bi-metal interface was noted.
5.0 PROCESS DESCRIPTION
In the Electrosleeve process, an integral sleeve ofdesired length and thickness is synthesized in-situusing a series of relatively simple mechanical andelectrochemical operations. A short length of SGtubing encompassing a defect is isolated by inser-tion of a delivery tool into the primary side of thetubesheet face as shown in Figure 6. The deliv-ery tool (or probe) can be inserted to any verticaldistance in the SG tube. This technology alsoallows tube repairs at restricted ID locations (e.g.,dented tubes commonly occurring at the supportplates). Moreover, there is the capability ofinstallation above previous Electrosleeve repairs(installation above conventional sleeves is alsoconsidered possible). Previously plugged tubesmay also be repaired and returned to service.
A pair of inflatable seals at either end of theprobe head are used to create a miniature elec-troplating cavity, as shown in Figure 7, throughwhich Ni-based electrolytes are passed duringthe electrochemical steps as outlined below. Anintegral part of the delivery tool is the central, tubu-lar non-consumable electrode (anode) which allowsthe electrolyte to be circulated back to a remotechemical process station via a polymeric conduit,containing all fluid supply, return and electrical lines,connected to one end of the probe. Continuousrecirculation of the process fluids ensures that thespecified temperature and chemical compositionis maintained in the plating cavity. Upon applica-tion of an electric field between the central anodeand the SG tube (electrical ground or cathode),electrodeposition of a fully dense, nanostructuredNi micro-alloy occurs on the internal surface ofthe host tubing. The desired thickness is accu-rately controlled by electrical-charge integration (cur-rent-time). The annulus between the central anodeand the SG tube internal wall (cathode) defines thedimensions of the electrochemical cell and therebythe length of the Electrosleeve. No post-installa-tion stress relief or heat treatment is required; theonly additional operation is the thorough rinsing ofthe plating cavity to remove chemical residues tobelow specified levels.
The sequence of steps for the installation/fabricationof an Electrosleeve are:
- Mechanically clean the tube region to berepaired,
- Insert an electrosleeving probe into the tube,at the elevation needing repair, and inflatebladders to create an electroplating cavity,
- Perform a pressure test, with either water ornitrogen, to ensure sealing integrity,
- Introduce activation solution to clean theparent tube,
- Introduce a nickel-based prefilming solution toelectrodeposit a transitional bonding layer,
- Introduce nickel electrolyte to electroformthe sleeve,
- Rinse thoroughly with water,- Remove the electroforming probe from the
tube,- Perform a UT inspection to determine thick-
ness and bond to the tube, and evaluation ofdefects.
A more detailed description of each step is givenstarting with tube cleaning. The tube is mechani-cally cleaned with stan'dard techniques, such as arotating hone or scraper, to remove loose oxidesfrom the surface. This step minimizes radioactivecontamination returning to the electrosleevingsolutions.
The probe is inserted to the damaged section of aselected tube where bladders are inflated suchthat the defect is located approximately mid-span.
Tube
TubeSupportPlate
— t
\
' • • • -
. _
InstalledElectrosleeve™
ElectroformingProbe
Header
Activation I Prefilming I FormingSolution Solution I Solution
Electrosleeving System
Figure 6: Simplified schematic of Electrosleevedelivery system.
149

The length of the anode establishes the effectivelength of the deposit, typically 10 to 20 centime-ters. As a general rule, a sleeve of 10 cm long isinstalled at the tube support plate, while thelonger sleeve is used at the tubesheet.
Electrosleeving is a three-step process, and usesa different solution (or electrolyte) for each step.The three solutions are:
• activation solution to prepare the tube surface,• prefilming solution to produce a strongly
adherent nickel layer,• electroforming solution to build up a thick
structural repair nanocrystalline nickel sleeve.
The first of these steps involves surface activationto remove the indigenous oxide from the tube sur-face. This process is relatively easy with Alloy400 as the "protective" film formed on this alloy isrelatively weak, but is quite challenging for Alloy600, which forms a very stable passive oxide film.In the later case, the activation solution is circu-lated through the sealed chamber and an electri-cal current (reverse polarity) is applied to cleanthe parent tube by dissolving the surface oxidelayer. This step leaves the tube surface in anactive state and ready for the initial bonding layerof nickel. To avoid repassivation (formation of anew oxide layer) of the tube surface, the activa-tion solution is immediately followed by the pre-filming solution from which a thin layer of nickel isdeposited to the as-cleaned surface. The prefilm-ing step leaves a strongly adherent and fullybonded layer on the tube internal diameter. Thisprefilming layer serves to immediately protect thesurface from oxidizing and provides a smooth tran-sition layer between the tube surface and theElectrosleeve. Chemical species associated withthe prefilming solution allow for optimum nickelbonding to the host tubing.
After the prefilming solution is flushed from thesystem, a sleeve-building (electroforming) solu-tion is circulated in the plating cavity. This thirdand final step involves introducing a nickel solu-tion to complete the full thickness of the sleeve.An electric current is then initiated and main-tained for several hours to yield a thick, high-strength nickel deposit.
The target sleeve thickness is determined bypressure-boundary minimum-thickness calcula-tions in accordance with the ASME Boiler andPressure Vessel Code and other design analysesbased on the material properties test results.
fI
-I- *
B"
c
I
^-«—i Leak Detector
4 — Centering/Sealing
=7 <— Return
<— Tube/Cathode
* — AnodeI
I —. Supply
4 — Centering/Sealing
Figure 7: Schematic of plating cavity created inthe SG tube by the delivery tool (probe).
6.0 FIELD TRIALS
The repair process was first applied at PNGS-BUnit 5 by an Ontario Hydro Technologies crew, withexcellent support from the station, during a pilotdemonstration in May of 1994. A total of 46 Alloy400, 1/2" SG tubes were sleeved at the site, mostof these being "witness" specimens installed in asmall mockup beside one of the Unit 5 SGs.However, 18 Electrosleeves were actually installedin one of the boilers. Of the eighteen tubes sleeved,4 tubes were immediately pulled for analysis and 14sleeves were left in the SG. Approval from theAtomic Energy Control Board (AECB) was obtainedto leave these 14 Electrosleeves in service. Thesleeved tubes were re-inspected in 1995 by ultra-sonic examination; no changes in the bond inter-face or surface characteristics were observed.
The second field application occurred at DukePower's Oconee Unit 1 in November 1995. Thecrew was made up of FTI/OHT/B&W personnel.Oconee 1 has B&W once-through-steam-generators(OTSG's) with 5/8" tubing made from Alloy 600.Nine tubes, which had been scheduled for plugging,
150
were Electrosleeved in one steam generator, aswell as 15 "witness" sleeves installed on the SGplatform. The nine SG tubes were plugged andnot left in service as the process had not beengranted a license by the NRC. However, the aimof the exercise was to apply the process to in-ser-vice Alloy 600 SG tubing under typical PWR plantconditions. Thus, the demonstration testedB&W/OHT/FTI equipment in a field environment,validated procedures and process specifications,and demonstrated the installation of Electro-sleeves under field conditions with a 100% suc-cess rate. From this perspective, the trial was acomplete success.
7.0 PRODUCTION RIG
To achieve economical production rates, a multipleprobe delivery system must be used. Based on aFTI-designed prototype delivery system, BWI andFTI have constructed and commissioned anElectrosleeving production delivery system withinthe past year. The majority of the equipment isdeployed in "Sea/Land" containers to minimizethe impact on outage activities, particularly in thereactor building. The modular design of the equip-ment allows flexibility in deployment (e.g., certainmodules may be located up to 200 m from thereactor building penetration).
The pumping and distribution system has a capacityfor installing a maximum of 18 Electrosleevessimultaneously. However, due to access andspace constraints in the SG bowl, this rate ofinstallation would necessitate the repair of tubesin two or more generators at a time. For typicalPWR applications, a maximum of 8 Electrosleeveswould be installed per SG with one (spare) channelbeing used for the production of an optional or"witness'' sleeve outside of the generator. Due tomore severe space constraints in CANDU appli-cations, a larger number of typically smaller SGswould be expected to be involved at any one time.Based on the installation of 16 Electrosleeves simul-taneously in two or more SGs and a 7-hour instal-lation cycle (including the removal and re-insertionof 8 probes), daily production rates of up to 48sleeves per day for a given system are realisticallyattainable. This rate is competitive with conven-tional, zero-leakage SG tube repair technology andapproaches the production rate for tube plugging.
During Electrosleeve installation, all critical processparameters are continuously monitored and con-trolled within specified tolerances from a remoteprocess control computer and data logging system.
8.0 WASTE MANAGEMENT
Framatome Technologies, Inc. (FTI) recentlycompleted the development of a process and theassociated mobile equipment for processing spentsolutions generated during Electrosleeving opera-tions. The total spent solution volume is segre-gated into two distinct streams of concentratedsolutions (25%) and rinse waters (75%). Theprocessing technique employs a combination ofultra filtration/reverse osmosis (UF/RO), precipita-tion technologies and concentration drying. Thecombined use of these treatment systems providesfor volume reduction, maximum water recoveryand purification, and stabilization of the spent-solution stream to render it non-hazardous. Thefinal products of the spent-solution processingsystem are liquid water effluent which is low inactivity and will meet very stringent release criteria,and a dry, stable, solid with a high nickel content.Expected volumes of both products are given inTable 2 for various size sleeving campaigns.
TABLE 2Waste Volume Projections
SleevesInstalled
#
200
500
1000
LiquidWaste
m3
6
10.6
15.5
DriedMaterial
kg
690
915
1140
45 GallonDrums for
Solids
#
3
4
5
9.0 NON-DESTRUCTIVE EXAMINATION
Following the deposition of the sleeve to the parenttube, the success of the installation is verifiedthrough the use of ultrasonic testing (UT). TheUT inspection verifies adequate sleeve thickness,sleeve length, bond quality between the sleeveand parent tube, and sleeve position. The sleeveis also inspected to verify there are no unaccept-able defects such as pits, or surface roughnessthat could impede future in-service-inspection(ISI) efforts. The ISI technique used to ensure thestructural boundary for the region repaired withthe Electrosleeve currently utilizes a UT probe.The probe has multiple transducers to collect datain both zero-degree and shear-wave orientations.This technique has been tested using samples withEDM notches, laboratory-grown indications, andtubes pulled from steam generators with variousforms of indications. The results of this testing
151
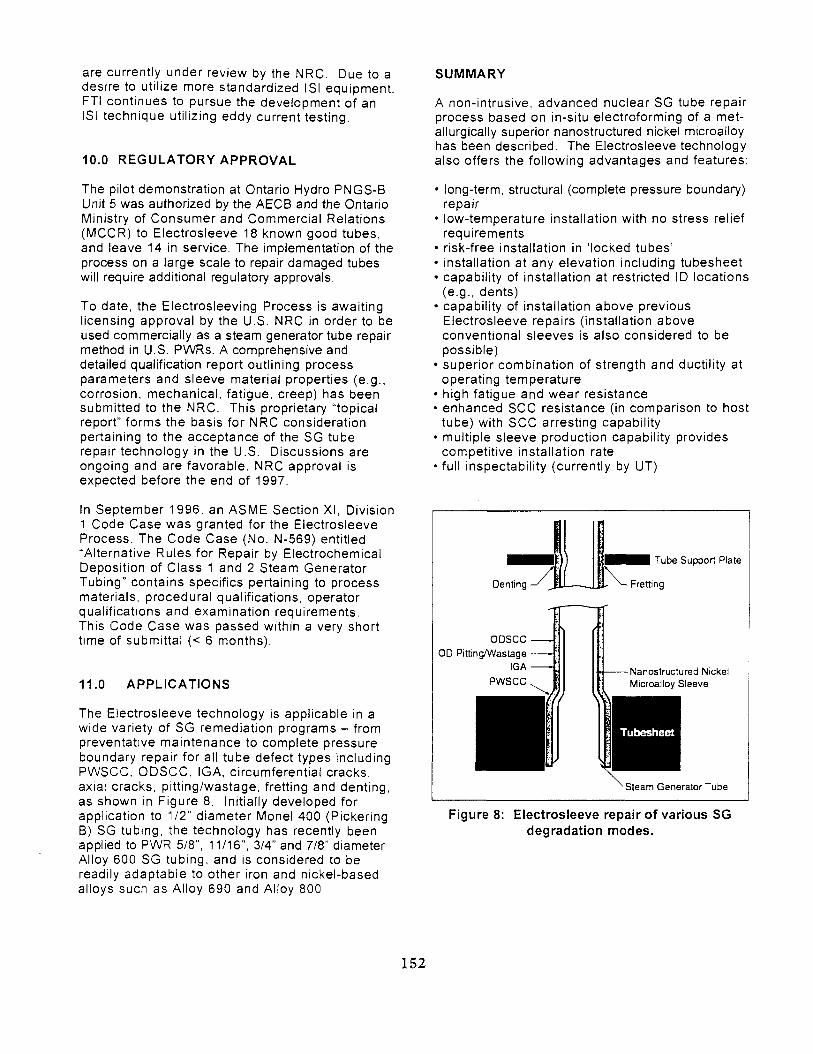
are currently under review by the NRC. Due to adesire to utilize more standardized ISI equipment,FTI continues to pursue the development of anISI technique utilizing eddy current testing.
10.0 REGULATORY APPROVAL
The pilot demonstration at Ontario Hydro PNGS-BUnit 5 was authorized by the AECB and the OntarioMinistry of Consumer and Commercial Relations(MCCR) to Electrosleeve 18 known good tubes,and leave 14 in service. The implementation of theprocess on a large scale to repair damaged tubeswill require additional regulatory approvals.
To date, the Electrosleeving Process is awaitinglicensing approval by the U.S. NRC in order to beused commercially as a steam generator tube repairmethod in U.S. PWRs. A comprehensive anddetailed qualification report outlining processparameters and sleeve material properties (e.g.,corrosion, mechanical, fatigue, creep) has beensubmitted to the NRC. This proprietary "topicalreport" forms the basis for NRC considerationpertaining to the acceptance of the SG tuberepair technology in the U.S. Discussions areongoing and are favorable. NRC approval isexpected before the end of 1997.
In September 1996, an ASME Section XI, Division1 Code Case was granted for the ElectrosleeveProcess. The Code Case (No. N-569) entitled"Alternative Rules for Repair by ElectrochemicalDeposition of Class 1 and 2 Steam GeneratorTubing" contains specifics pertaining to processmaterials, procedural qualifications, operatorqualifications and examination requirements.This Code Case was passed within a very shorttime of submittal (< 6 months).
11.0 APPLICATIONS
The Electrosleeve technology is applicable in awide variety of SG remediation programs - frompreventative maintenance to complete pressureboundary repair for all tube defect types includingPWSCC. ODSCC, IGA, circumferential cracks,axial cracks, pitting/wastage, fretting and denting,as shown in Figure 8. Initially developed forapplication to 1/2" diameter Monel 400 (PickeringB) SG tubing, the technology has recently beenapplied to PWR 5/8", 11/16", 3/4" and 7/8" diameterAlloy 600 SG tubing, and is considered to bereadily adaptable to other iron and nickel-basedalloys such as Alloy 690 and Alloy 800.
SUMMARY
A non-intrusive, advanced nuclear SG tube repairprocess based on in-situ electroforming of a met-allurgically superior nanostructured nickel microalloyhas been described. The Electrosleeve technologyalso offers the following advantages and features:
• long-term, structural (complete pressure boundary)repair
• low-temperature installation with no stress reliefrequirements
• risk-free installation in 'locked tubes'• installation at any elevation including tubesheet• capability of installation at restricted ID locations
(e.g., dents)• capability of installation above previous
Electrosleeve repairs (installation aboveconventional sleeves is also considered to bepossible)
• superior combination of strength and ductility atoperating temperature
• high fatigue and wear resistance• enhanced SCC resistance (in comparison to host
tube) with SCC arresting capability• multiple sleeve production capability provides
competitive installation rate• full inspectability (currently by UT)
Denting
ODSCCOD Pitting/Wastage
IGAPWSCC .
^ H Tube Support Plate
- Fretting
-Nanostructured NickelMicroalloy Sleeve
Tubesheet
v Steam Generator Tube
Figure 8: Electrosleeve repair of various SGdegradation modes.
152

ACKNOWLEDGEMENTS
The authors would like to acknowledge thecontributions of G. Palumbo, F. Gonzalez,A.M. Brennenstuhl, P.C. Lichtenberger,W.T. Shmayda, A. Robertson, S.M. Corazza,J.M. Cocuzzi, A. Cervoni, and K.L. McDougallof Ontario Hydro Technologies; U. Erb,G. Panagiotopoulos and T. Turi of Queen'sUniversity; J.M. Helmey, J.E. Galford,R.R. Schaefer, P.M. Mastilovic, D.R. Stewart,S.R. Wilson, M.W. Key, C.R. Schindler, andM.W. Lowry of Framatome Technologies, Inc;and D.M. Doyle of Babcock & Wilcox Industries Ltd.
REFERENCES
1. G. Palumbo, P.C. Lichtenberger, F. Gonzalezand A.M. Brennenstuhl. US Patent Nos.5,516,415; 5,527,445; 5,538,615 (1996).
2. B. Michaut, F. Steltzlen, B. Sala, Ch. Laireand J. Stubbe, in Proceedings of the 6thInternational Symposium on EnvironmentalDegradation of Materials in Nuclear PowerSystems, San Diego, CA, August 1-5, 1993.
3. E.O. Hall, Proc. Phys. Soc. London B24, 747(1951); N.J. Petch, J. Iron Steel Inst., 174, 24(1953).
4. U. Erb, A.M. El-Sherik, G. Palumbo and K.T.Aust, Nanostructured Materials, 2, 383, (1993).
5 U. Erb, G. Palumbo, B. Spunzarand K.T. Aust,Nanostructured Materials, 9, 261-270 (1997).
6. U. Erb, G. Palumbo, R. Zugic and K.T. Aust, inProcessing and Properties of NanocrystallineMaterials, (eds. C. Suryanarayana, J. Singh &F.H. Froes)TMS (1996) p. 93.
7. D. Osmola. P. Nolan, U. Erb, G. Palumbo andK.T. Aust, Phys. Stat. Sol. (a) 131, 569 (1992).
8. K. Boylan, D. Östränder, U. Erb, G. Palumboand K.T. Aust, Scripta Metall, et Mater., 25,2711 (1991).
9. G. Palumbo, F. Gonzalez. A.M. Brennenstuhl, U.Erb, W.T. Shmayda and P.C. Lichtenberger,Nanostructured Materials, 9, Nos. 1-8, (1997).
10. F. Gonzalez. A.M. Brennenstuhl, G. Palumbo, U.Erb and P.C. Lichtenberger, in InternationalSymposium on Metastable, Mechanically Alloyedand Nanocrystalline Materials (ISMANAM-95),Quebec City, Canada, July 24-28, 1995.
11. C. Zener, in private communication to C.S.Smith, Trans. AIME, 175, 15 (1948).
12. T. Turi and U. Erb, Determination of KissingerPlots Using Differential Scanning Calorimetry onElectrosleevé Samples, Dept. of Materials andMetall. Eng. Report, Queen's University,August 15, 1996.
13. ASM Metals Handbook, ASM International,Metals Park, OH, Vol. 2, pp 437-438 (1990).
14. Annual Book of ASTM Standards, ASTM, W.Conshohocken, PA, Vols. 3.01 & 2.05.
15. Framatome Technologies Inc., ElectrosleevingQualification for PWR Recirculating SteamGenerator Tube Repair, March 1996.
16. G. Palumbo, E.M. Lehockey, P. Lin, U. Erb andK.T. Aust, Mat. Res. Soc. Symp. Proc, 458, 273(1997).
17. P. Marcus and O. Oda, Mem. Sei. Rev. Metall.,715, (1979).
18. R. Rofagha, R. Langer, A.M. El-Sherik, U. Erb,G. Palumbo and K. T. Aust, Scripta Metall, etMater., 25, 1867(1991).
19. R. Rofagha, U. Erb, D. Östränder, G. Palumboand K. T. Aust, J. Nanostruct. Mater., 2, 1(1993).
20. G. Palumbo, F. Gonzalez, A.M. Brennenstuhl, U.Erb, R.A. Barton, P.C. Lichtenberger and J.E.Galford, presented at 8th InternationalSymposium on Environmental Degradation ofMaterials in Nuclear Power Systems - WaterReactors, Amelia Island, FL, August 10-14,1997.
21. Y. Sugimura, P.G. Lim, CF. Shih and S. Suresh,Acta Metall. Mater., 43, 1157 (1995).
22. G. Palumbo, P.J. King, K.T. Aust, U. Erb andP.C. Lichtenberger, Scripta Metall, et Mater, 25,1775 (1991).
23. C. Cheung, U. Erb and G. Palumbo, Mater. Sei.Eng., A185, 39(1994).
24. G. Panagiotopoulos and U. Erb, Micro-structuralCharacterization of SCC Test Specimens forCrack Depth & Morphology Part II, Dept. ofMaterials and Metall. Eng. Report, Queen'sUniversity, Feb. 15, 1996.
25. J.M. Helmey and P.C. Lichtenberger, presentedat ASME PVP Conference, Orlando, FL, July 27-31, 1997.
153

CA0000026
ZERO- REINFORCEMENT VESSEL CLOSURES
Grant McClellanNuclear Engineering
Babcock & Wilcox, A McDermott CompanyCambridge, Ontario
Canada
Yanghu MouNuclear Engineering
Babcock & Wilcox, A McDermott CompanyCambridge, Ontario
Canada
ABSTRACT
Access to the secondary side of a Nuclear Steam Generator
is required in order to properly inspect and maintain critical
components throughout the life. For the most part, it is only on
newer units that sufficient openings have been provided. Older
units must be field modified to provide access to the tube bundle
and internal lateral support components for inspection and
penetration by cleaning equipment. In order to avoid post weld
heat treatment after welding on some materials it would be
desirable to machine the opening directly into the pressure
boundary without providing weld build-up to compensate for the
material removed. In such a case, the pressure boundary may be
locally thinned below the minimum thickness required by the
ASME Code. As a result it is not possible to meet reinforcement
limits or elastic primary stress limits of the Code. However, the
ASME Code permits justification of the design by utilizing
elastic-plastic methods.
Elastic-plastic analysis can be utilized to demonstrate shake-
down to elastic action and to demonstrate that small deformations
in the region of the gasket seating surfaces, or any loss of bolt
preload, have not compromised leak tightness. Employing the
technique developed by the authors for application in ANSYS, it
is feasible to carry-out such a design analysis including the
effects of time varying thermal stress. This paper presents the
highlights of such an analysis. It is important to note that the
method also permits the analysis of openings in locations
formerly considered too restrictive, such as near supports and
major structural discontinuities.
1.0 INTRODUCTION
Advances in computer software and hardware now make it
feasible to carry out analyses that not too long ago would have
been considered far too computing intensive and prohibitive from
both a schedule and cost point of view. This computing power
can be employed to design openings that formerly were
considered unacceptable because of the proximity of attachments
and structural discontinuities and the available shell thickness.
Figure 1.0-1 shows an example of such an opening design. If an
opening is placed in a shell whose thickness is the ASME Code
minimum thickness, no reinforcement is available to compensate
for material removed. In addition, elastic analysis primary stress
limits cannot be satisfied in such a case. Elastic-plastic analysis
can, however, be employed to justify the design. In this paper a
zero-reinforcement closure is analyzed for warmup/rapid
cooldown transient. Analysis for the combined effect of thermal
transient and pressure loading is carried out in "real-time" in
order to account for the accumulation of inelastic strains and to
explore closure shake-down.
Figure 1.0-1: Zero-reinforcement Opening Example
154
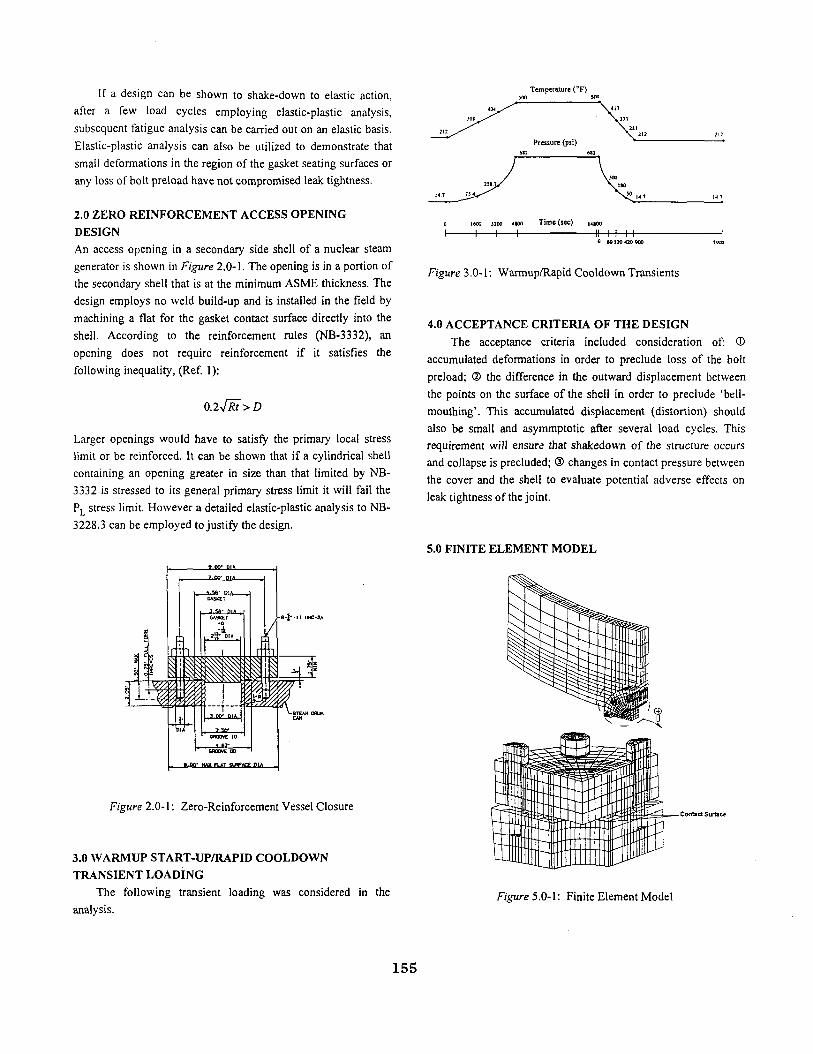
If a design can be shown to shake-down to elastic action,
after a few load cycles employing elastic-plastic analysis,
subsequent fatigue analysis can be carried out on an elastic basis.
Elastic-plastic analysis can also be utilized to demonstrate that
small deformations in the region of the gasket seating surfaces or
any loss of bolt preload have not compromised leak tightness.
2.0 ZERO REINFORCEMENT ACCESS OPENINGDESIGNAn access opening in a secondary side shell of a nuclear steam
generator is shown in Figure 2.0-1. The opening is in a portion of
the secondary shell that is at the minimum ASME thickness. The
design employs no weld build-up and is installed in the field by
machining a flat for the gasket contact surface directly into the
shell. According to the reinforcement rules (NB-3332), an
opening does not require reinforcement if it satisfies the
following inequality, (Ref. 1):
Temperature ("F)
Larger openings would have to satisfy the primary local stress
limit or be reinforced. It can be shown that if a cylindrical shell
containing an opening greater in size than that limited by NB-
3332 is stressed to its general primary stress limit it will fail the
PL stress limit. However a detailed elastic-plastic analysis to NB-
3228.3 can be employed to justify the design.
Figure 2.0-1: Zero-Reinforcement Vessel Closure
3.0 WARMUP START-UP/RAPID COOLDOWNTRANSIENT LOADING
The following transient loading was considered in the
analysis.
0 1600 3200 4800 T ime (sec)
-t- I I 1 I0 6OI3O42O9O0
Figure 3.0-1: Warmup/Rapid Cooldown Transients
4.0 ACCEPTANCE CRITERIA OF THE DESIGNThe acceptance criteria included consideration of: ©
accumulated deformations in order to preclude loss of the bolt
preload; © the difference in the outward displacement between
the points on the surface of the shell in order to preclude 'bell-
mouthing'. This accumulated displacement (distortion) should
also be small and asymmptotic after several load cycles. This
requirement will ensure that shakedown of the structure occurs
and collapse is precluded; ® changes in contact pressure between
the cover and the shell to evaluate potential adverse effects on
leak tightness of the joint.
5.0 FINITE ELEMENT MODEL
Contact Surface
Figure 5.0-1: Finite Element Model
155
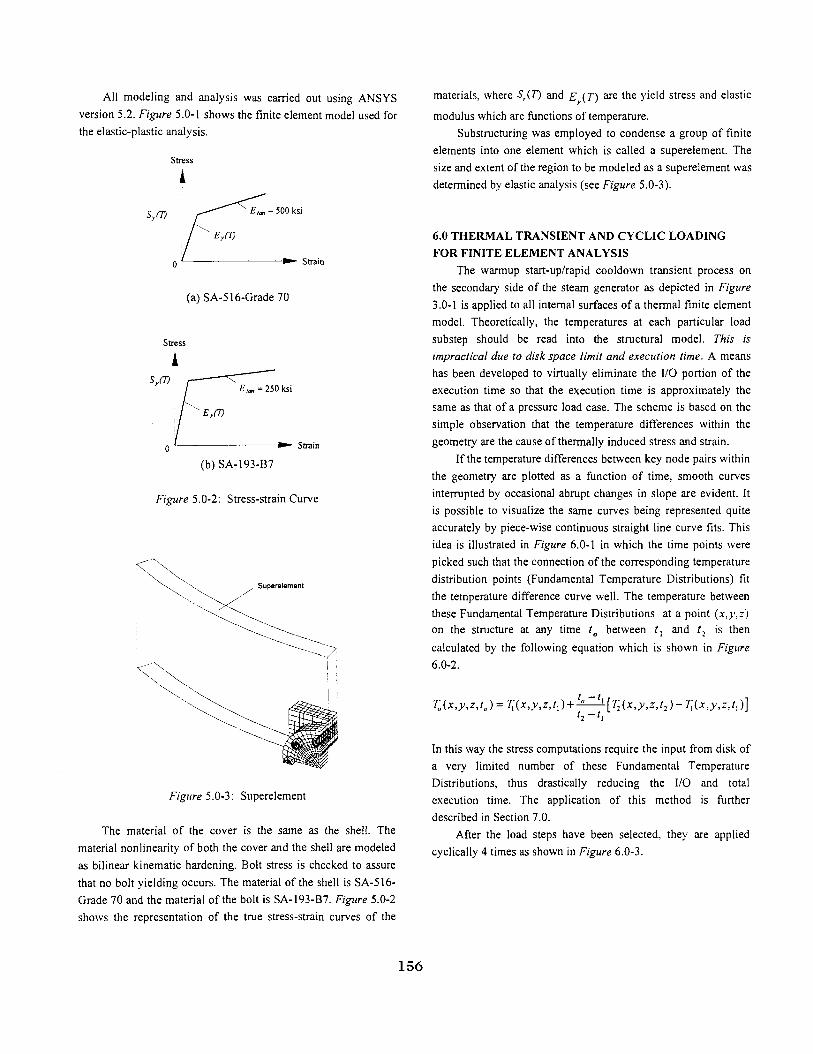
All modeling and analysis was carried out using ANSYS
version 5.2. Figure 5.0-1 shows the finite element model used for
the elastic-plastic analysis.
Stress
Sy(V £,„ = 500 ksi
Eyfl)
(a)SA-516-Grade70
Strain
Strain
(b) SA-193-B7
Figure 5.0-2: Stress-strain Curve
Superelement
Figure 5.0-3: Superelement
The material of the cover is the same as the shell. The
material nonlinearity of both the cover and the shell are modeled
as bilinear kinematic hardening. Bolt stress is checked to assure
that no bolt yielding occurs. The material of the shell is SA-516-
Grade 70 and the material of the bolt is SA-193-B7. Figure 5.0-2
shows the representation of the true stress-strain curves of the
materials, where Sr(T) and £ (7) are the yield stress and elastic
modulus which are functions of temperature.
Substructuring was employed to condense a group of finite
elements into one element which is called a superelement. The
size and extent of the region to be modeled as a superelement was
determined by elastic analysis (see Figure 5.0-3).
6.0 THERMAL TRANSIENT AND CYCLIC LOADINGFOR FINITE ELEMENT ANALYSIS
The warmup start-up/rapid cooldown transient process on
the secondary side of the steam generator as depicted in Figure
3.0-1 is applied to all internal surfaces of a thermal finite element
model. Theoretically, the temperatures at each particular load
substep should be read into the structural model. This is
impractical due to disk space limit and execution time. A means
has been developed to virtually eliminate the I/O portion of the
execution time so that the execution time is approximately the
same as that of a pressure load case. The scheme is based on the
simple observation that the temperature differences within the
geometry are the cause of thermally induced stress and strain.
If the temperature differences between key node pairs within
the geometry are plotted as a function of time, smooth curves
interrupted by occasional abrupt changes in slope are evident. It
is possible to visualize the same curves being represented quite
accurately by piece-wise continuous straight line curve fits. This
idea is illustrated in Figure 6.0-1 in which the time points were
picked such that the connection of the corresponding temperature
distribution points (Fundamental Temperature Distributions) fit
the temperature difference curve well. The temperature between
these Fundamental Temperature Distributions at a point (x,y,z)
on the structure at any time to between f, and t2 is then
calculated by the following equation which is shown in Figure
6.0-2.
'i
In this way the stress computations require the input from disk of
a very limited number of these Fundamental Temperature
Distributions, thus drastically reducing the I/O and total
execution time. The application of this method is further
described in Section 7.0.
After the load steps have been selected, they are applied
cyclically 4 times as shown in Figure 6.0-3.
156

480
400
320
240
160
80
0
-80
-160
-240
-320 3
\\
500 1000
r~—/
1500
j
|
2000
1
1
(x2500
250 750 1250 1750 2250
1620 '2070(X10)
1480 I 1 4 9 2 1522 1 5 7 ° y
480.1
Time (second)
Figure 6.0-1: Load Steps Picked and Comparison of Linearized
Temperature Difference Curves with the Original
Temperature
Ti(xo,yo,zo,t,
To(x,,,yo,zo,tc ) \i
Ti(xo.yo,zo,t, ) \
0 to tlTime
Loading
A
Figure 6.0-2: Linearization of Temperature
(1) Boll preloading
(2) - (9) 4 cyclic loads
Figure 6.0-3: Cyclic Loads
7.0 DISCUSSION OF ANALYSIS AND RESULTS
7.1 Thermal Transient
The nodes around the access hole and the contact surface are
selected to calculate the temperature difference. This is because
the distortion in these regions is of primary concern. These nodes
are plotted in Figure 7.1-1. For example Figure 6.0-1 shows the
temperature difference through the shell thickness and on the
shell outer surface.
Figure 7.1-1: Nodes Picked to Calculate the Temperature
Differences
The input-deck load steps for elastic-plastic analysis are
picked based on Figure 6.0-1. Since it is temperature differences
that drive thermal strain, fundamental temperature distributions
are selected at those time corresponding to the peak temperature
difference and others between them as well. These points have
been shown with symbol • in Figure 6.0-1.
The predicted temperature distribution (during the structural
run) were compared with the real temperature distribution from
the thermal transient analysis in Ref. 3. A high degree of
accuracy was demonstrated. Therefore, the combined effect of
the thermal transient and the pressure loading can be handled in
'real-time' by calculating all temperature distributions between
fundamental temperature distributions within the elastic-plastic
stress computations.
7.2 Bell-mouthing of the Opening
The nodal displacements around the opening in the direction
perpendicular to the contact surface are extracted to calculate the
bell mouth shape. The results are plotted in Figure 7.2-1. Note
that the bell mouth shape is inward, i.e. the nodes further away
from the opening have larger displacements (for example, node
134 has a large displacement than node 94). This is because
during the thermal transient, the opening has a lower temperature
than the surrounding area. Although the internal pressure has a
157
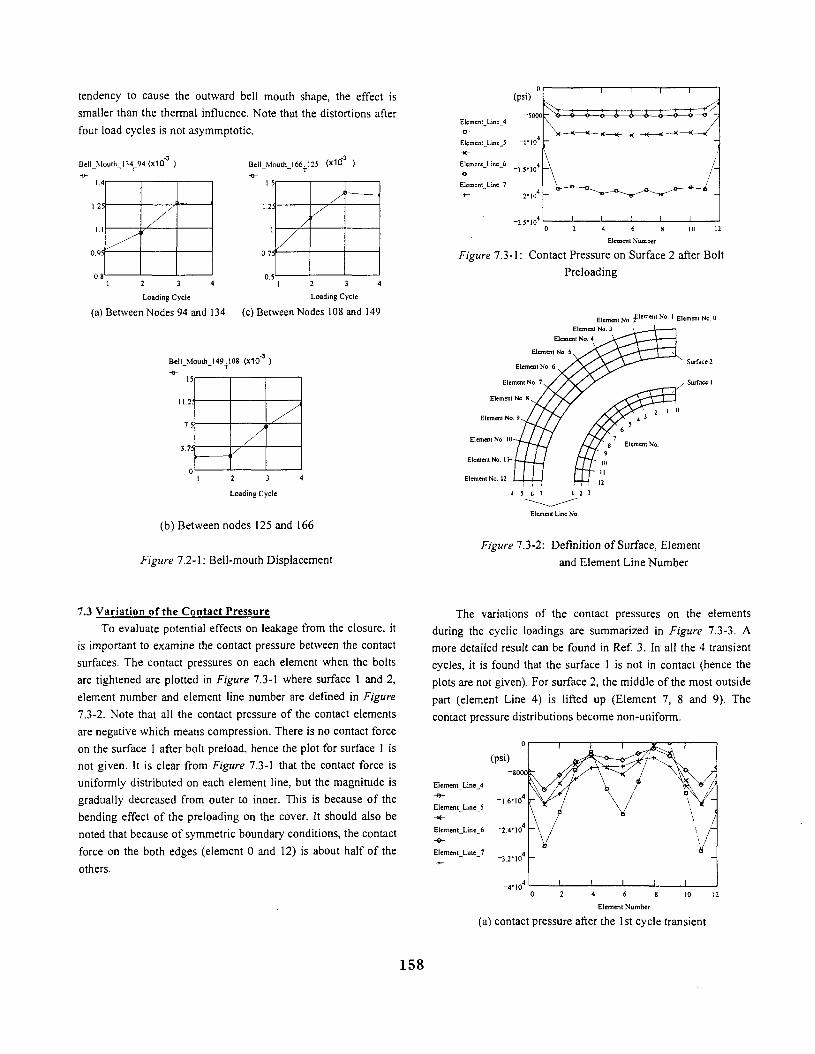
tendency to cause the outward bell mouth shape, the effect is
smaller than the thermal influence. Note that the distortions after
four load cycles is not asymmptotic.
Be!l_MouthJ34 94 (X1O'3 )
1.4
1.25
Bell Mouth 166.125 (X1U )
0.95
OS1 2 3 4
Loading Cycle
2 3 4
Loading Cycle
(a) Between Nodes 94 and 134 (c) Between Nodes 108 and 149
Bell_Mouth_149.108 (x10
11.2:
7.5
3.71
01
/
/
2
Loading C)
3 4
cle
(b) Between nodes 125 and 166
Figure 7.2-1: Bell-mouth Displacement
(psi)
-5000Elcmcnt_Line_4
Elemenl_Line_S "IMO"- * -
Elemcnt Line 6
/
1.5
1.25
1
07f
/
yElement Line 7
Figure 7.1Figure 7.3-1: Contact Pressure on Surface 2 after Bolt
Preloading
Element No. f l ema" N ° ' Bcmenl No. uElement No. 3
Figure 7.3-2: Definition of Surface, Element
and Element Line Number
7.3 Variation of the Contact PressureTo evaluate potential effects on leakage from the closure, it
is important to examine the contact pressure between the contact
surfaces. The contact pressures on each element when the bolts
are tightened are plotted in Figure 7.3-1 where surface 1 and 2,
element number and element line number are defined in Figure
7.3-2. Note that all the contact pressure of the contact elements
are negative which means compression. There is no contact force
on the surface 1 after bolt preload, hence the plot for surface 1 is
not given. It is clear from Figure 7.3-1 that the contact force is
uniformly distributed on each element line, but the magnitude is
gradually decreased from outer to inner. This is because of the
bending effect of the preloading on the cover. It should also be
noted that because of symmetric boundary conditions, the contact
force on the both edges (element 0 and 12) is about half of the
others.
The variations of the contact pressures on the elements
during the cyclic loadings are summarized in Figure 7.3-3. A
more detailed result can be found in Ref. 3. In all the 4 transient
cycles, it is found that the surface 1 is not in contact (hence the
plots are not given). For surface 2, the middle of the most outside
part (element Line 4) is lifted up (Element 7, 8 and 9). The
contact pressure distributions become non-uniform.
Element_Line_4
""- -1.6ElementJJne_5-K-Element_Line^6 -2.4-0-
Element Line 732
2 4 6 S 10 12
Element Number
(a) contact pressure after the 1st cycle transient
158
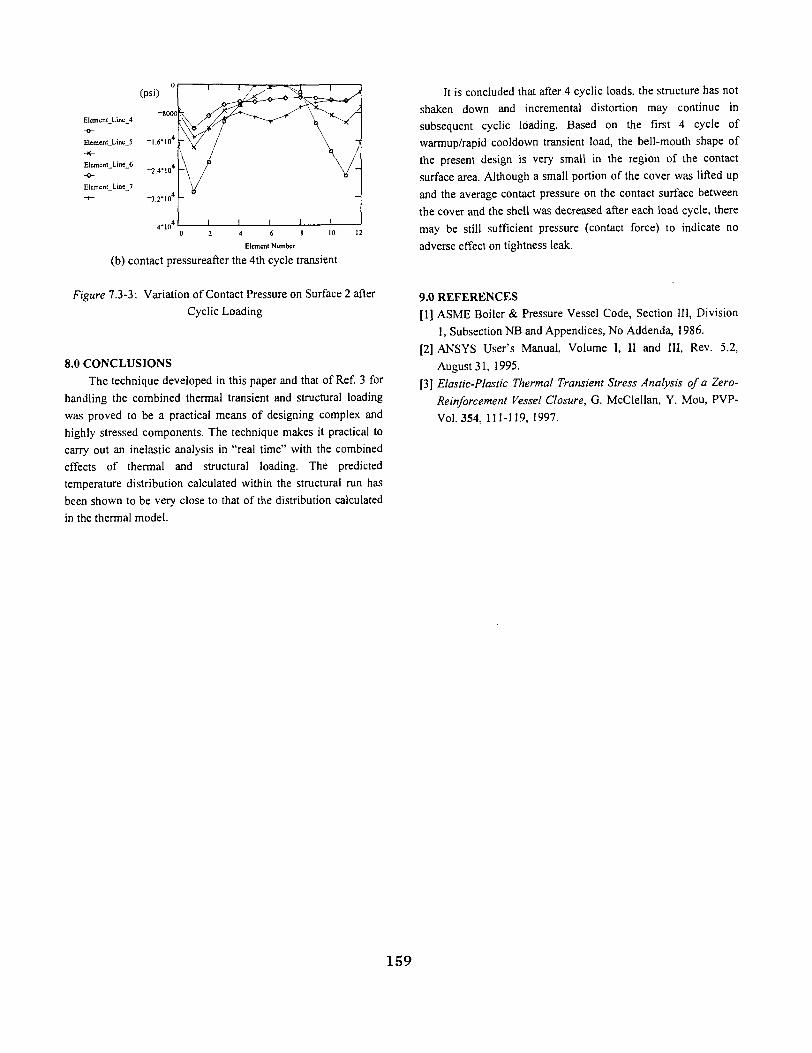
(psi)
Element-o-
Elemenl
Element
Element
_Line
J j n e
_Line
Line
4
J
6
7
-I.6M0
-2.4" 10
0 2 4 6
Element Number
(b) contact pressureafter the 4th cycle transient
Figure 7.3-3: Variation of Contact Pressure on Surface 2 after
Cyclic Loading
8.0 CONCLUSIONSThe technique developed in this paper and that of Ref. 3 for
handling the combined thermal transient and structural loading
was proved to be a practical means of designing complex and
highly stressed components. The technique makes it practical to
carry out an inelastic analysis in "real time" with the combined
effects of thermal and structural loading. The predicted
temperature distribution calculated within the structural run has
been shown to be very close to that of the distribution calculated
in the thermal model.
It is concluded that after 4 cyclic loads, the structure has not
shaken down and incremental distortion may continue in
subsequent cyclic loading. Based on the first 4 cycle of
warmup/rapid cooldown transient load, the bell-mouth shape of
the present design is very small in the region of the contact
surface area. Although a small portion of the cover was lifted up
and the average contact pressure on the contact surface between
the cover and the shell was decreased after each load cycle, there
may be still sufficient pressure (contact force) to indicate no
adverse effect on tightness leak.
9.0 REFERENCES[1] ASME Boiler & Pressure Vessel Code, Section III, Division
1, Subsection NB and Appendices, No Addenda, 1986.
[2] ANSYS User's Manual, Volume I, II and III, Rev. 5.2,
August 31, 1995.
[3] Elastic-Plastic Thermal Transient Stress Analysis of a Zero-
Reinforcement Vessel Closure, G. McClellan, Y. Mou, PVP-
Vol.354, 111-119, 1997.
159

CA0000027
PIPE SUPPORT PROGRAM at PICKERING
Lanis A. Sahazizian, P.Eng., and Zlatko Jazic, P.Eng.
Pickering Nuclear Generating Station1675 Montgomery Park Road
Pickering, ONL1V2R5
ABSTRACT
This paper describes the Pipe Support Program at Pickering. The program addresses the highestpriority in operating nuclear generating stations, safety. We present the need: safety, the process:managed and strategic, and the result: assurance of critical piping integrity. In the past,surveillance programs periodically inspected some systems, equipment, and individualcomponents. This comprehensive program is based on a managed process that assesses risk toidentify critical piping systems and supports and to develop a strategy for surveillance andmaintenance. The strategy addresses all critical piping supports. Successful implementation ofthe program has provided assurance of critical piping and support integrity and has contributed todecreasing probability of pipe failure, reducing risk to worker and public safety, improvingconfiguration management, and reducing probability of production losses.
160

Introduction
Before getting into a discussion of the Pickering Pipe Support Program, let's begin with ananalogous comparison of the foundation of a building with the supports (and hangers) of a pipingsystem. If the building's foundation is not properly designed, constructed, or is deterioratingfrom age, the integrity of the entire building is in danger. Similarly, supports are the foundationof piping systems, and if the supports are not properly designed, installed, and maintained, theentire piping system is at risk of failure. The resulting consequences of failure are injuries toworkers and public, and unit shut down.
The above conclusions are valid for all piping systems in all industries including petro-chemical,thermal generating stations, and especially in nuclear generating stations where worker and publicsafety are of paramount importance. Today there are hundreds of nuclear units in serviceproducing power, and they are aging. Given the extent of piping in nuclear stations, and thatsafety is the primary concern, the piping systems must be maintained in good condition. Toachieve this, a managed process must be in place to ensure that the supports and hangers of pipingsystems are in good condition and are performing well.
Section XI of the ASME Boiler and Pressure Vessel Code specifies rules for maintaining theplant in good operating condition, and for returning the plant to service in a safe and expeditiousway following an outage. The rules include requirements for inservice inspection of nuclearpower plant components that specify a mandatory program for examination, testing, andinspection to prove adequate plant safety. The code assigns to the plant owner the responsibilityfor developing a program that meets the requirements of section XI of the code.
The Canadian standard CSA-N285.4 specifies similar requirements. Both the ASME Code andthe CSA Standard include piping systems and their supports among components that requireperiodic inspection programs. In the past, there have been inspection programs for somecomponents such as valves, or individual supports, on some systems, but a program was neverimplemented at Pickering that would address the risk of all supports on all critical nuclear andconventional systems. Following several incidents of piping failure attributable (at least in part)to pipe supports, the Pickering Pipe Support Program was initiated in 1992-3.
Program Objective
The purpose of the pipe support program is to mitigate the impact of piping system deficiencieson station performance. Plant experience shows that support deficiencies (degradation) are aprecursor to support and piping failure. Therefore, the objective is achieved by reducing thefrequency of pipe support deficiencies, which reduces the probability of piping failure. Theimpact of piping failure to station performance is summarized as follows:
• worker safety (conventional safety concerns)• public safety (nuclear safety concerns)
161

Methodology
The basis for achieving the program's objective is by implementing a managed process thatincludes the following generic elements of component programs:
• Identifying critical piping systems based on risk to station performance. (Scope and RiskAssessment).
• Developing a strategy for critical piping system supports. (Strategy Development).• Revising the strategy as new information is obtained. (Strategy Maintenance).• Developing documentation to permanently record the program and process, including
inspection and maintenance history database, and design configuration maintenance.(Documentation).
The basic elements of the process are further described below.
ScopeTo optimize the program effectiveness, it is necessary to limit the strategy to supports in criticalpiping systems. Those systems and supports have the highest consequences of failure and posethe highest risk to station performance. All nuclear and conventional piping systems wereevaluated. The following criteria was applied to determine critical piping systems and supportsthat are included in the strategy:
1. Worker Safety: Piping failure can cause fatality or permanent disability. (EnergyRelated Consequence).
2. Public Safety: Piping failure can cause Type "A" process failure or safety systemunavailability. (Nuclear Safety Related Consequence).
Criteria with production or environmental impact were not applied. Those criteria affect onlyeconomics. Since the absolute probability of piping failure attributable to supports is very low,systems with only economic consequences do not justify the cost of being including in thestrategy. The piping system evaluation yielded the following results:
• Nuclear Piping Systems: 22 of 73 are included in the strategy.• Conventional Piping Systems: 57 of 118 are included in the strategy.• Total: 79 of 191 piping systems are included in the strategy.
Risk AssessmentRisk is the product of the consequence and probability of failure. The risk associated with thefailure of piping was qualitatively evaluated for all piping systems, and was classified as high,medium or low. Piping systems with low risk are not included in the strategy. Consequence andprobability were independently evaluated, and were defined as follows for the pipe supportprogram:
162

Consequence of Failure• The consequences of failure impact Worker Safety (Energy related consequences) or
Public Safety (Nuclear safety related consequences).• Energy is determined by type of fluid, pressure, temperature, and pipe size.• Nuclear safety relatedness is determined by nuclear safety classification (function).
Probability of Failure• The probability of pipe failure is determined from the rate and severity of degradation
occurrences observed during previous inspections.• The probability is evaluated relative to the other piping systems in the strategy. However,
even a high relative probability piping system will typically have low likelihood of pipefailure.
Strategy DevelopmentThe long term strategy is specified for all critical piping system supports. The strategy includesthe required inspection periods of pipe supports for the remaining life of the station on the basisof the assessed risk. The assessments and strategy are unique for each system and address systemspecific characteristics such as known degradation mechanisms, proximity to plant personnel andsensitive or safety related equipment, system duty cycle, and piping configuration.
For piping systems included in the strategy (critical piping), the inspections include all supports ineach system. Systems excluded from the strategy (non-critical piping) are periodically inspectedduring the SRE's system walk down inspections according to the needs determined by the SRE.
The initial inspections begin with high risk systems and are conducted during the nearest plannedoutage, and then progress to medium risk systems. All initial inspections will be completed by2001. Inspections cycles begin with the units longest in service to reveal the most advancedeffects of the degradation mechanisms. The normal periods for subsequent inspections are 2 to 4years for high risk systems and 4 to 8 years on medium risk systems, depending on initialinspection results.
The current inspection schedule completes about 3000 support inspections per year for 8 units.The schedule will peak to about 4500 inspections per year during 1998 to 2002. That rate ofinspection is expected to significantly reduce in the future for several reasons:
• The current volume of inspections is high in order to complete the initial inspections asquickly as practical. Repeat inspections are based on inspection results.
• The program was initiated after many years of accumulating service degradation.• Initial inspections include all supports on each system. Subsequent inspections will focus
on supports that are more susceptible to degradation (based on inspection results).
Strategy MaintenanceThe program strategy is revised periodically to improve overall effectiveness. The revisions mayresult from:
163

• Inspection results: Results provide feedback on program effectiveness and revealdegradation trends.
• Events: Unforeseen events may impact equipment condition and can change the assessedrisk and priority of systems. Events include internal and external operating experience.
• Operating Practices: Changes to system operating parameters or frequency can alterdegradation trends.
• Outage Schedule: Changes to outage schedule may require revisions to inspectionfrequency.
DocumentationA database was developed and is maintained to record inspection results and repair status. Thedatabase is used for reporting, program administration, and provides a source for obtaininghistoric information and trending. In addition to electronic data storage, paper records are kept ofall inspection campaigns and results. For each support inspected, the following information isfiled permanently:
• Photographs of each support to illustrate support condition and deficiencies.• Copy of inspector's field data sheets.• Marked up piping general arrangement drawing.• Pipe support drawing or design specification.• Program engineer's deficiency report (Includes WMS DR).• DR completion record (Campaign Monitoring Report).
The program's strategy and processes are described and documented as follows:
• Pickering Division Component Strategy (P-DCS) - Contains the program scope, riskassessment and strategy.
• Component Surveillance and Maintenance Program (CSMP) - Contains annually revisedschedule and resource estimates for executing the strategy.
• Pipe Support Inspection and Repair Procedure - Defines the roles and responsibilities ofindividuals and work groups for the inspection, repair, and documentation of pipesupports.
Inspection and Repair Process
The pipe support inspection and repair process includes the following key steps:
1. Scope Identification: Prior to commencing an inspection and repair campaign, the ProgramResponsible Engineer (PRE) reviews the proposed scope (as determined by program strategyand schedule) with the System Responsible Engineer (SRE) and Design Responsible Engineer(DRE). The scope is agreed upon and communicated to production.
2. Inspection: The PRE establishes an inspection contract with QC/NTS. Qualified inspectorsconduct visual examinations of the pipe supports in accordance with an approved inspectionprocedure. The inspectors record all observations on field data sheets, drawings andphotograph each support.
164-
3. Results Reporting: The inspectors submit all recorded results to the PRE for documentation,review, and processing. The PRE initiates action DRs to the SRE for all supports withdeficiencies, and issues a deficiency summary report to the SRE and DRE. At the end of thecampaign the PRE files all disposition reports, and documents DR completion.
4. Dispositions: The DRE assesses and dispositions all non-conformances before the unitreturns to service. Dispositioning consists of recommending repairs for unacceptable non-conformances, or accepting the field configuration and updating drawings and specificationsto reflect the as built condition.
5. Repairs: The SRE assess and executes repair of all supports with degradation and non-conforming supports that require repairs before the unit returns to service.
Inspection Results
The purpose of pipe support inspections is to reveal deficiencies. The following types ofdeficiencies were observed in the field:
Non-Conformances• Incorrect Initial Design: Inspections revealed non-conformance such as insufficient
number of supports, pipe vibration or movement not analysed properly, specified supporttype not suitable for application, etc.
• Incorrect Installation: Observations included supports in wrong location, missingsupports, incorrect welds, wrong configuration.
Degradation• Observed support deterioration caused by known degradation mechanisms included
loosened components, missing nuts and bolts, broken or bent components, excessiveclearances, corrosion, fretting etc.
In addition to individual deficiencies, the inspection revealed the following general findings:
• Some systems were in very good condition with minimal degradation and few non-conformances, but in general, far more degradation was observed than expected.
• The condition of most systems was consistent from unit to unit, with few exceptions.• Systems with field run piping and supports were in worse condition than systems with
engineered supports.
The results of two recent inspections campaigns are shown in Tables 1 and 2. The tables list thesystems inspected, the number of supports, deficiencies observed, and repairs completed. TheUnit 6 and Unit 8 planned outage campaigns were selected because those were the first two largescope campaigns completed under the requirements of the Pickering Pipe Support Program. Theinspections and repairs were completed, reported, and documented to a higher standard than everbefore, which achieved the most accurate results.
165

Table 1: Pipe Support Inspection - Unit 6
Nuclear SystemsNo. of systems inspected: 11No. of supports inspected: 542No. of supports not accessible: 18No. of deficiencies: 54No. of repairs required: 25System
32100 - Moderator Main Circuit32200 - Moderator Purif. Circuit33110 - Boiler Isol Valve Sppts33110 - Boiler Spring Hangers33120-PHT Main Circuit33210 - PHT Purif. Circuit33310-PHT Feed Circuit33312 - PHT Pump Supports33320 - PHT Bleed Circuit33350 - ECI Hangers33610-PHT Relief CircuitTOTAL
No. ofSupports inSystem
242624
10896472248734151
560
No. ofSupportsInspected
232624
10890362248734151
542
Deficiencies
000052651701954
RepairsRequired
000010241206
25Conventional SystemsNo. of systems inspected: 6No. of supports inspected: 547No. of supports not accessible: 0No. of deficiencies: 165No. of repairs required: 55System
71340-HPSW71310-LPSW43230 - Boiler Feed36410 - Boiler Blowdown36110 -Main Steam71320 - Recirc. Cooling WaterTOTAL
No. ofSupports inSystem
24210032591698547
No. ofSupportsInspected
24210032591698547
Deficiencies
5371165416
165
RepairsRequired
9251024555
166

Table 2: Pipe Support Inspection - Unit 8
Nuclear SystemsNo. of systems inspected:No. of supports inspected:No. of deficiencies:No. of repairs required:System
33310-PHT Feed Circuit33312 - PHT Pump Supports33320 - PHT Bleed Circuit33610-PHT Relief CircuitTOTAL
41905129
No. ofSupports inSystem
22487347190
No. ofSupportsInspected
22487347190
Deficiencies
1212121551
RepairsRequired
10487
29Conventional SystemsNo. of systems inspected:No. of supports inspected:No. of deficiencies:No. of repairs required:System
33610-PHT IntRV Piping36410 - Boiler Blowdown41130 - Reheater Drains43230 - Boiler Feed System71320 - Recirc. Cooling WaterTOTAL
52357232No. ofSupports inSystem
21403132111235
No. ofSupportsInspected
21403132
111235
Deficiencies
40120
5672
RepairsRequired
40
02832
Table 3 below summarizes the deficiencies and repairs reported in Tables 1 and 2. The valuesare in percentage of all supports inspected in the respective category. You will note that thepercentage of deficiencies and repairs on unit 8 are higher than unit 6. That occurred becausesystems with higher rates of deficiency were selected for the unit 8 campaign based on the unit 6results.
Table 3: Deficiency
System Class
Nuclear
Conventional
and Repair Summary
Unit 6
DeficiencyRepairDeficiencyRepair
10%5%
30%10%
DeficiencyRepairDeficiencyRepair
Unit 8
27%15%31%16%
167

Conclusions
The large number of deficiencies discovered, and repairs completed to correct the deficiencies,prove the program's importance. The greatest benefit achieved by the program is assurance ofcritical piping and support integrity. In addition, we conclude that the resources and effortsinvested in the pipe support program contribute to:
• Decreasing probability of piping failure, thereby, reducing risk to worker safety and publicsafety.
• Improving the configuration management of the plant by bringing documentation closer tothe physical plant configuration.
• Reducing future outage duration and decreasing radiation dose to personnel.• Reducing the rate of forced and unplanned shut downs between scheduled outages.
We recognize that the efficiency and effectiveness of the program are difficult to measure, but weare confident that program will prevent pipe supports from attributing to the failure of all criticalpiping in the future. That achievement, and the benefits listed above, have significant value, andjustify the program. Furthermore, the efficient manner in which the program is administered addsto the justification. The program's managed process and results obtained are steps towardsachieving nuclear excellence at Pickering.
We recommend to other stations to consider the importance of piping system supports, and toimplement a similar program to ensure critical piping integrity.
168

NON INTRUSIVE CHECK VALVEDIAGNOSTICS AT BRUCE A
by Steven P. Marsh, P. Eng.Bruce A Nuclear DivisionProduction-Maintenance SupportPO Box 3000Tiverton, OntarioNOG 2T0
Abstract
Bruce A purchased non intrusive check valvediagnostic equipment in 1995 to ensureoperability and availability of critical checkvalves in the Station. Diagnostics can be used tolocate and monitor check valve degradationmodes. Bruce A initiated a pilot programtargeting check valves with flow through themand ones that completed open or close cycles.Approaches to determine how to confirmoperability of passive check valves using nonintrusive techniques were explored. A samplepopulation of seventy-three check valves wasselected to run the pilot program on prior tocomplete implementation. The pilot programproduced some significant results and someinconclusive results. The program revealed amajor finding that check valve performancemodeling is required to ensure continuousoperability of check valves.
Introduction
Non intrusive check valve diagnostic equipmenthas evolved over the past few years to become aviable maintenance tool. Increased computingspeeds and storage space has made complex datacollection much easier and cheaper to do. Nonintrusive diagnostics for check valves can utilizetwo or more acoustic channels and also includeAC magnetic excitation and sensor coils tocollect magnetic flux change data. Other typesof diagnostic data can be collected too - such aspulse echo ultrasonics and DC magnetics.Acoustic data collected from temporarilyinstalled accelerometers is used to identifyinternal impacts, rubbing, rattling, or chatter.AC magnetics is used to track the disc as thecheck valve opens, closes or is moving inmidstream. Combining these techniques allowsus to detect check valve degradation modes and
CA0000028determine their severity. Comparison to similarvalves helps to determine which of the valvesrequires maintenance.
A sample population of seventy-three checkvalves was selected to run a non intrusive checkvalve pilot program in the Station. The focus ofthe pilot program was to use diagnostics on avariety of check valve applications to confirmthe existence and severity of degradation modes.The program would determine if it is possible tolocate faults in check valves that see steady stateflow conditions as well as those that areexercised during pump duty change over orwhen safety system tests are performed.Approaches to handle passive check valves thatcannot be exercised also need to be addressed.This pilot program would identify difficultiesencountered in collecting the data needed to runan effective program in a Candu Station. Anyweaknesses will be located in the pilot programenabling us to make enhancements prior to fullscale implementation of the check valveprogram.
Background
The majority of check valves at Bruce A arecategorized as swing check valves. Typically, adisc is hung on a hinge arm and the arm ispinned to the valve body to allow the disc toopen and close in the fluid flow path. As flowstops, the disc falls into the flow path and sealsagainst the seat to prevent reverse flow. If thedisc fails to close, severe transients can beexperienced such as a feedwater piping systemwater hammer that caused several milliondollars in damage and lost production at SanOnofre Nuclear Station in the US.
Advantages of swing check valves includes:simplicity and low cost, low flow resistance, alow pressure drop across the valve, it achievesseating easily, it is tolerant to contaminants(mud, solid particles) and its ease to maintainand repair due to its relatively low accuracyrequirements in seat plane orientation.Disadvantages are: a slow dynamic responseleading to higher pressure surges due to reverseflow, a high wear rate and more frequent
169

maintenance if used in continuous operation at aflow velocity below that required for full open.'
The swing check valve's potential high wearrate makes it a good candidate for performingnon-intrusive diagnostics to screen out good andbad actors in order to prioritize maintenanceactivities.
Two 166 MHz analysis computers werepurchased to speed up analysis time, playbackacoustic data and data storage. The data couldbe analyzed in a quieter environment. Onecomputer was to be used by the MechanicalMaintenance Crew and the second one was to beused by the Maintenance Support Engineer foranalyzing data.
Pilot Program Test Sample
The following check valve groups and operatingconditions were selected:a)HPECI 1/3/4-34330-NV115, 116, 117, 118(12 valves, passive)b) Liquid zone control 1/3/4/- 34810-NV35, 38,45,48,51 ( 15 valves, active)c) Boiler feedwater 1/3/4-4323O-NV5, 6, 7, 8,17, 18, 116, 117, 118, 119. (30 valves, active)d)Low pressure service Water 1/3/4- 71310-NV6, 16, 26, 36. ( 12 valves, active)
These additional valves were tested as requestedby Operations.a)Fueling Machine Auxiliaries North East andNorth West were analyzed for leakage problems.(8 valves, active)0-35230-HP-NV1O-3523O-HF-NV1O-3523O-HLL-MV10-35230-HDP-MV1
b)Moderator 32110-NV3, 4 were looked at aspart of post maintenance testing. (2 valves,active)
Resources Required
Equipment:Liberty Technologies' Quickcheck II dataacquisition system with acoustics and ACmagnetics was purchased in 1995. Theequipment was capable of collecting data oncarbon steel and stainless steel valves up tothirty inch NPS. This would be validated duringthe pilot program. The equipment was selectedbecause it appeared to be the easiest to use tocollect and interpret the data.
1 NMAC Application Guide for Check Valves inNuclear Power Plants ,Rev 1.
People:The pilot required 718 hours of Mechanicalmaintenance time to collect data and 596.5hours of service maintenance time for scaffoldand insulation requests. As the mechanicsgained experience, data collection time lowered.Approximately 280 hours of engineering timewas spent. In comparison, if valves areinspected internally, scaffold and insulationremoval would still be required. Thus, if thepilot study showed that disassembly could beavoided, the cost of replacing parts, preparingpermitry to isolate the check valve and labour toinspect the valve could be saved. Valuablemaintenance resources could be allocatedelsewhere during outages.
Training:The vendor's basic introductory course wasattended on site by four mechanical maintenancepersonnel and two maintenance supportengineers. The training familiarized us with theequipment operation and data collection. Lateron, two mechanical maintenance personnelattended a week long course sponsored by EPRIat Utah State University. The indoor flow loopin Utah allowed data collection on a variety ofvalves under various flow conditions.
Field Conditions
Testing was done under a variety of flowconditions as system availability parametersdictated. Some valves were analyzed understeady state condition. Others were looked atwhen valves were exercised from closed toopened or visa versa as pumps were stopped orstarted.
The ideal test conditions would include thecheck valve being closed, introducing full flowto it, monitor it as it opened, monitor it in its
170

steady state, stop the flow and monitor theclosing stroke, monitor its closed position andlook for backflow leakage. Realistically, boilerfeedwater pump discharge check valves couldonly be exercised against system pressure bystopping or starting a pump. Opening, closingand steady state conditions were monitored forliquid zone check valves, low pressure servicewater check valves, HPECI check valves andmoderator check valves. Steady state data wascollected on other boiler feedwater system checkvalves.
It was recognized that performing the optimumtest would be difficult to do. Creating the fieldconditions to test the valves was a newapproach. Systems may require modificationsjust to test the check valve. To remedy thissituation, a COG proposal was initiated to studythe requirements of doing a better test (strokeopen-full flow test-close-back leak check)similar to Condition Monitoring and Exercisingproposals being studied for light water reactorsby ASME OM-22. Unfortunately, the COGresearch was initiated but not completed.
Non Intrusive Test Results
FEEDWATER (steady state data)
Steam Generator inlet check valves - Fieldconditions only allowed steady state data to becollected on steam generator inlet check valvesas feedwater flow could not be interrupted onrunning Units. Magnetic and acoustic datashowed the discs to be fluttering on some of thecheck valves. The acoustic data indicated thatsome impacting was occurring between the discor hinge and valve body. Comparisons of dataindicated some check valves were being exposedto wear conditions that differed from others insimilar service. The data identified the presenceof wear mechanisms that can lead to futureinoperability if not corrected. A separateanalysis of wear rates of the internal componentsis required to establish an appropriatedisassembly frequency.
Internal inspections of the tested check valveslocated worn internals. The check valve withthe highest impact energy and magneticoscillations had the most worn internal parts.
The inspection supported the findings of the nonintrusive data.
A side result of our hon intrusive testing pilotwas determining that Unit 3 check valves werelisted as being manufactured by Hopkinson butwere actually ACME Kerotest/GuelphEngineering swing check valves. Theresponsible system supervisor was advised thatintended spare parts were incorrect prior to themechanics working on the job.
FEEDWATER(exercising)
Pump discharge check valves — Valves on Unit3 were monitored when the pump was shutdown. Acoustic data showed the flow noise todecrease as the pump coasted to a stop and thenincrease a short time later. The data appeared toshow the valves were passing and feedwaterflow was reversing through the check valve. Areview of the flowsheet revealed an alternateflow path existed through a return orifice used tokeep the standby pump ready. A manual valvewould have to be closed prior to doing the test tocheck for leakage. The magnetic trace shows achange in the magnetic flux when the valve isclosed and when flow is passing through thecheck valve. This indicates the valve internalsare moving and as a result of the movement,internal parts are wearing.
The non intrusive test analysis is consistent withthe maintenance history on these feedwatercheck valves. Hinge pins and bushings havebeen replaced periodically due to wear. AllUnits have been inspected and repaired.Improved service life can be achieved if wearanalysis is used to optimize internal geometry ordetermine a more favourable materialcombination . Periodic parts replacement maybe extended.
LIQUID ZONE
Compressors — Data was collected for liquidzone compressor discharge check valves duringthe running cycle. Start up, valve opening,steady state, shutdown and valve closure datawas collected while it compressed a mixture ofhelium and light water. Acoustic data showedsevere and frequent impacting of the disc andbackstop. Magnetic data also revealed large
171
oscillations of the disc. This would beconsidered a severe service application for aswing check valve. Wear is expected to bepresent on the hinge pin or hinge arm. Themagnetic traces show the disc motion as well assome signal drift. The vendor attributes this tothermal changes in the valve affecting itsmagnetic characteristics as it warms up.
Internal inspection revealed wear on the sides ofthe hinge arm that contacts the side of the valvebody and wear on the hinge pin locating pinholes worn locating pin holes in the hinge pin.An application review was recommended to theResponsible System Engineer — the swing checkvalve is not the best suited valve for theapplication it is in. This application has had anANSI 150 class swing check, ANSI 600 classswing check and now an ANSI 1878 class softseated swing check valve. The latest swingcheck valve has resulted in two reactor power setbacks on our Reactor Regulating System. Onewas due to the loss of the soft seat and wear, thesecond was a result of the maintenance done toreplace the soft seat.
Pumps ~ Data was collected on the liquid zonepump discharge check valves when pump dutychangeovers were done. An acoustic beatfrequency shows up when the two pumps run.One check valve has very little movement of thedisc while the second check valve has morenoticeable oscillations present.
Maintenance history reveals a pattern of repairsbeing made to these valves due wear, passing,damaged seats and also valve replacement. Themaintenance history is less for the pump checkvalves than for the compressor check valves.However, wear modeling could help determinethe appropriate maintenance interval or extendit through geometry changes or improved wearmaterial combinations.
HPECI
Data was collected on high pressure emergencycoolant injection check valves in conjunctionwith safety system testing being performed.Several new problems were encountered whentrying to collect data.
1) High radiation fields required the acquisitionequipment to be located as far away from thevalve as possible — the valve could not be heardor seen while being exercised. Long dataacquisition times were needed and events couldnot be aligned to accurately correspond with thedata.2) Cables were hung in the air in order to reachthe valves and were swinging. The movementdistorted the magnetic traces. Cables wouldhave to be secured from moving with tape.3)These check valves have a pneumatic actuatoron them for testing purposes. The mechanicshad to use a phone to contact the first operatorto coordinate stroking and data collection.Portable communication devices werediscovered to serverly disrupt the magneticsignal data.4) Only one stroke per valve was allowed sosetup could not be optimized. More testing willbe needed to locate the correct sensor positions,gains and magnetic field strength. The vendoris testing equipment to see if higher fields canbe generated without destroying the magneticcoils.
Acoustic and magnetic signals wereinconclusive due to the difficulties weencountered. We only picked up the drone ofthe heat transport motors in the backgroundacoustically and the magnetic trace did notreveal a crisp, clean open stroke on any ECIvalve tested. The reliability of the magnetictrace is suspect due to the unsecured cabling andinterference from communication devices.
More work is required to collect data on thisapplication. It could not be distinguished if theactuator stem was rising and falling with thedisc attached or if the disc was missing(unlikely). Disc seat impacts were not locatedon any valves. Filtering signals did not provideany further information. Relocation of acousticand magnetic sensors may help to obtain betterdata.
LOW PRESSURE SERVICE WATER
Thirty inch ANSI class 150 swing check valvesare in service in the low pressure service watersystem. Four similar valves were monitored.Pump starts and stops were monitored to catchthe open and close stroke of the valve. Two of
172
the four check valves had crisp magnetic tracesthat looked as if they were done under laboratoryconditions. The magnetic trace was flat, until astep change occurred due to the pump start,followed by mild oscillations and a second stepchange as the check valve opened oncedifferential pressure was overcome. Theacoustic trace showed an increase in soundenergy as the pump started followed by a largeimpact as the hinge hit the back stop and finallysome minor impacts as the disk rattled in theflow.
One check valve showed much largeroscillations in its magnetic trace. The traceshowed the valve disc or hinge arm to bemoving while the acoustics showed little changein acoustic energy or increased impacting. Apump stop was monitored to collect data as thevalve closed. The acoustic trace showed thepump noise stop, the check valve slam closed, ashort duration quite period and a slight rise inthe flow noise. The check valve was suspectedof passing flow in the reverse direction.
Internal inspection revealed the following: itssoft seat o-ring was missing and probably hadbeen for several years, one of two hinge pinbushings was missing causing misalignmentbetween the disc and seat, the seat was wiredrawn due to cavitation which confirmed thereverse flow leak path. Visual observation ofthe pump shaft did not reveal any sign of thereverse flow (backwards rotation). If the pumphad been started up while rotating backwards, itcould have been severely damaged or the startup motor current could have overloaded a powerbus.
FUELING MACHINE AUXILIARIES -NORTH EAST AND WEST
Maintenance personnel responsible for thefueling machine auxiliaries' systems knew theyhad one or more check valves passing out offour possible check valves resulting in a loss ofpressure. Normally, they would have to removeeach check valve until they found the one thatwas passing. The approach is high hazard workfrom a radiation dose point of view. Fieldconditions were set up and an accelerometer wasmounted to each check valve. One check valveout of the four showed an increase in flow noise
as a motorized globe valve was closed. Theincompressible fluid was being squeezed outpast the check valve. Since the other threecheck valves did not exhibit the samecharacteristic, it was declared as the passingvalve.
Internal inspection revealed a partial o-ring tobe stuck between the disc and seat preventingtight closure resulting in a passing valve. Noother valves required maintenance. ALARAprinciples were followed and time savingsresulted from using the diagnostic equipmentapproach to find the passing valve.
MODERATOR
Two moderator pump discharge check valveswere monitored during pump start, running andshut down after maintenance was performed.The magnetic trace revealed oscillations whilerunning indicating the valves are susceptible towear degradation.
Periodic maintenance is performed to replaceworn internals parts to prevent leakage. Wearanalysis modeling could improve internalgeometry or material combinations to extentparts replacement intervals.
Problems/Improvements
The pilot program revealed several areas whereimprovements could be made to overcomeproblems encountered in the field.
One area to improve on is how the equipment isset up. Sensor locations were selected based onvendor training input. Often the locations couldbe optimized to improve data collection.Selecting gains and current settings formagnetic field strength was all done byestimates. This would all improve as themaintenance personnel learned more about theequipment and the valves being tested. Theprogram would have to be run at the Stationlevel to take advantage of the experience andknowledge being gained. Otherwise, details willbe missed and follow up inspection activitiesmay not be documented correctly.
173
Another area for improvement is creating thefield conditions to ensure the best data can becollected. An application review is necessary todetermine if the valve can be tested during anoutage or while the Unit is operating. The datacollection would have to be coordinated to alignwith pump duty changeovers or other activitiesbeing performed. All the Station staff tried veryhard to ensure the check valve data wascollected during the pilot program.
Ideally, flow, pressure and temperature datashould also be collected. Caution is alsonecessary — some flows cannot be varied orvalves exercised to design basis conditions.Injecting light water into an operating reactor tocollect data is out of the question but simulationsto do the same during an outage may be feasibleprovided a proper risk assessment is done Theadditional data can be used to model theapplication to improve its performance.
Program Recommendations
l)An application review is a necessity to start acheck valve program. Based on the results ofthe non intrusive diagnostic pilot program,problems are going to be found. Solutions willbe more difficult to obtain. Modeling andanalysis is essential to create a technical basisfor determining periodic inspectionrequirements, material properties and valvegeometry. The answers to the followingquestions are required. Is the right type of NVin the system? Is the valve being tested toensure it meets its safety requirements?
2)An operating systems review is required todetermine values of Vmin and Vopen to screencheck valves to determine if they are stable orunstable. Non intrusives can be used to verifythe results.
3) Perform wear analysis to determine if internalgeometry can be changed to improveperformance. Actual internal dimensions andmaterial properties will have to be determined tocalculate parameters such as disc or hingeoscillation frequency. Only wear rates analysiscan be used to predict periodic inspectionfrequency. The model can be updated andvalidated with actual valve wear data andmaterial properties.
4) Ensure disc stud fatigue analysis is performedto avoid the loss of the check valve function dueto a missing disc. The fatigue failure caninvalidate the wear model if it is not checked.Constant back seat tapping can lead to studfatigue if the impacts are large enough orfrequent enough. Some swing check valvedesigns eliminate this problem.
5)Set up field conditions to test poised systemsin order to perform condition-based monitoringand exercising tests on valves that are passive.Full flow test to ensure it opens. Reverse theflow and check for leakage to ensure tightclosure and verify the disc is not missing.System modifications may be impractical toaccommodate this type of testing.
6)Build valve operabiliry information from SSTinformation, leakage surveys, surveillance,maintenance inspections, and industryexperience. Increased knowledge has been usedto extend inspection intervals.
Conclusions
1) Non intrusive check valve diagnostics is auseful tool that locates check valve degradationmodes. It can be used to prioritize work onsimilar valves, complete post maintenancetesting and it can provide data to assist inmaking improved operability decisions.
2) Additional modeling is necessary to reduce orresolve the degradation modes found due to nonintrusive diagnostics testing. Non-intrusivediagnostics is only a part of a good check valveprogram. All operabiliry aspects must beconsidered.
3) The Candu Station design must be evaluatedto determine if safety related check valves canutilize a better test and perform it lessfrequently, (full flow test and backflow leakagetest)
174

CA0000029
=•= •= •=1Pickering Nuclear Line of Business
P.O. Box 160, Pickering Ontario, L1V 2R5 Phone: (905) 839-1151
PICKERING TOOL MANAGEMENT SYSTEM
Authors : EDWIN H. WONG FIELD ENGINEERPICKERING N.D.P24ABPICA/NCD1/WONGE
ANDREW H. GREEN TECHNICAL SUPERVISORPICKERING N.D.P10SWPICD/PLT5/GREENA
TMS Desktop
175N:\WrNWORD\TMS\TMSrNTRO DOC
Past History
Over the years, tools and equipment used in Maintenance have been purchased by manydepartments. These are now being deployed in the station with no. process in effect toensure that they are maintained in good repair so as to effectively support theperformance of Maintenance activities. In addition, major delays have been encounteredin the past due to the lack of maintained or calibrated tools.1997
Todays Legal Requirements require that all employers have a process in place to ensurethat tools are maintained in a safe condition. This is specified in the Ontario Health andSafety Act, and the Canada Labour Code.
The Performance Objective and Criteria for Operating Nuclear Power Plants require thatFacilities and Equipment effectively support the performance of Maintenance activities.Tools therefore, must be controlled, maintained and calibrated so as to be ready whenrequired. The Pickering Tool Management System has been chosen as the process atPickering N.D to manage Tools.
The Pickering Tool Management System was first designed in 1994. During the pastthree years, tools throughout the station, and in the tool cribs have been identified bynumber etching and bar code labels.• The Pickering Tool Management System (PTMS) is a Windows application installed
on several file servers on the station LAN.\• The PTMS data base is installed in an Oracle database server located at the
Information Services Unit server room.• The PTMS manages all stores tool transactions.• Tool status is updated automatically for every tool transaction.• Your DISN is required for Tool issues, reservation and transfers.
Index
1.02.03.04.05.06.0
IntroductionPTMS UsersBasic OperationFeaturesDesktop ProgramSearch Module
7.08.09.010.011.012.0
Tools ModuleUser ModuleOrder ModuleCalibration/Maintenance ModuleTool Transfer ModuleClosing
176NAWINWORDVTMSYTMSINTRO DOC

1.0 Introduction
The Pickering Tool Management System (PTMS) has been implemented and operatingsince 1994.
• The PTMS system is a Windows application installed on several file serverson Pickering station LAN
• The PTMS database is installed in an Oracle database server located at theISU server room.
• The PTMS will manage all tool transactions from the stores. All tooltransactions are stored and updated instantaneously.
• The PTMS system uses bar coded labels and bar code scanners to process tooltransactions. Tool numbers can also be keyed in if necessary.
• Tool status is updated automatically for every transaction.• DISN number is required for tool issues, reservations and transfers.• Workers can transfer tools amongst themselves from the kiosk and desktop
computers.• IOP staff can also order (or reserve) tools ahead of time for job planning
purposes.• Everyone shares the same information.• Maintenance and Calibration programs including periodic frequencies,
procedures and reports are available from PTMS.• The PTMS records all tool transactions and tracking of tools including
missing and withdrawn tools.• Tool Maintenance and Calibration activities are recorded and charted monthly.
Supervisors can monitor crew tools.
2.0 PTMS Users Include
• Tool Crib Staff• Standards Lab Tech Staff• Tool Repair Shops - Mechanical and Control trades personnel• Measure and Test Equipment Labs staff• Radiation Instruments Repair Shop Staff• Planning, Engineering, Maintenance and I.O.P.Staff• Supervisors• Workers• Anyone who uses tools in the station
177N:\WINWORD\TMS\TMSINTRO.DOC

Today Pickering has approximately 12,000 tools which are identified in the database.The PTMS is user friendly and permits trades persons, engineers and planners to browsethe digital images of the tool before ordering for a job.
In 1997 the periodic inspection, maintenance and calibration program was introduced andis working extremely well. A Quality of Work Plan for 1998 and 1999 has featureswhich will support
• Improved productivity• Reduce time at the tool crib counter• Reserve tools required by IOP
• Reduce cost• Minimize tool redundancy• Reduce quantity of missing tools
• Manage Quality• Inspection, maintenance and calibration of tools on schedule• Quarantine feedback
• Improve morale• Reduce workers frustrations• Less tool hoarding by introducing controlled satellite stores.
3.0 Basic Operations
Three programs (units) are used in the station they are:
KIOSK
There are 4 options on the Kiosk touch screen namely:• Tool information• Tool orders• Tool transfers• User information
Tool details and tool pictures also available.
The Tool Order module allows users to reserve a tool that is available in the tool crib.Your DISN and PIN numbers are required. The Tool Transfer module allows users totransfer tools from one account to another. The DISN and PIN number of both parties isrequired.
178N \WINWORD\TMS\TMSINTRO DOC

STORES
There is an extension of the KIOSK with 4 additional options:• Issue records every tool• Return records every tool• Problem information• Reports on issued tools - user/supervisor
DESKTOP
Unlike the touch screen kiosk program, the desktop is available to everyone throughoutthe station on the LAN. The desktop is used for many functions in addition to the Storesand Kiosk.
The desktop is used for tool:SearchingDetailsUsersOrderingTransferringEstablishing Maintenance/Calibration requirementsStoring Maintenance/Calibration recordsSpare parts lists for tool repairPhotographs of toolsCreating tool lists for special jobs eg. Modification Pump Replacement
ADMINISTRATION MODULE
This module is used by the System Administrators and is used to maintain the systemwhile it is operating.
4.0 Features and Uses of PTMS
Tool status is updated instantaneously. All employees share the same information. Usedfor establishing maintenance programs. Used for newly purchased tool Quality Control.
Important information for IOP work planning. Regularly used for physical tool audits inorder to increase tool availability. Tool cost monitoring and control by regularmaintenance and calibration.
179N:\WINWORD\TMS\TMSINTRODOC

5.0 Basic Operations - Desktop Program
The program operates the same way as any windows program.
Starting/Exiting
After clicking on the PTMS icon you will be presented with a dialogue box, asking you tologin. You can enter your DISN and PIN numbers, or choose the 'Browse Only' option.If you enter your identification number you can enter and save changes in your account.On the other hand the 'Browse Only' option allows you to perform a search and openvarious modules, but you will noj be able to edit or enter any data.
You must first contact your LAN administrator to set up an account if you wish to loginto the system. Note that you do not need an account if you are only using the Browsemode.
Buttonbar
The buttonbar appears on the top of the screen, and it is visible in all themodules throughout the program. It consists of several command buttons, which will bedescribed later. The command buttons can be used to execute all the main functions ofthe program. All of the commands found on the buttonbar are also found in the menus.
The following are descriptions of each button found on the buttonbar.
Close - This command button closes the immediate form or moduleyou are using.
Print - This command button allows you to print a hard copy of thedescription or listing you have on the screen.
New - Press this button to begin a new record.
Save - Saves the most recent entry such as a tool transfer or order.Save
180N:\WINWORD\TMS\TMSINTRODOC

Clear Clear -Clears the screen from all entries, allows you to begin anew search, order, etc.
Query - Executes a search that you have specified in one of themodules. Press this button after you have specified your searchcriteria.
Next and Previous - Displays the next or previous user with thesame last name or a tool of the same type.
The following are command buttons used for opening various program modules. Eachmodule will later be outlined in detail
Search
Calibration
Tools
Transfer
User
Order
6.0 Search Module
The search module is probably the most useful module of the program, as it can be thestarting point of each search. It allows you to search for information according to aspecified search criteria.
To start a search, first choose the type of object you will be searching such as a tool,user, etc. You can make this selection from the list box found in the upper left part ofthe module screen.
181N:\WINWORD\TMS\TMSINTRODOC

Search Group:
1.0 Ail Tool Types1.1 All Individual Tools
Next enter your search criteria in the text boxes as shown below.
Search Criteria: 4 < • •
1:
X
3:
All Individual tools including TSO# Only tools--.,* --- T"\ - ' 1
Keyword 1 -i LIKE WRENCH
-*" ~ - - : " And %^TOr-j; %-c.;s;'"A _"- , - - "
itv. TF~"^lfttntf^
This function allows you to specify a very detailed search criteria. You can choose acriteria by scrolling through the list box. The criteria available are such as keyword,manufacturer, model, etc. From the adjacent list box you can choose from severaloperators. The two most used operators are '=' and 'like'. The '=' operator allows youto select a criteria from a predefined list, while 'like' lets you type in your own entry.The search function also can perform a search according to two criteria using the'and' and 'or' operators. Simply choose an operator, and enter a criteria just as in the
previous text boxes. To execute the search press the Query button.
After the search is complete, a listing of all the items that correspond to the searchcriteria will appear in the list, on the bottom portion of the screen. You can doubleclick on any item found in that list to see further details. A sample tool listing is shownbelow.
Search Results: : 1383
* " '
Tool No.>TSO No.
1442-005
1442-006
1443-001
1443-002
33-
33-
31-
31-
T80
40-
40-
40-
40-
No.
25-
25-
27-
27-
1
2
1
3
V • ^^r^rJeicriptfon
WRENCH,COMBINATION
WRENCH.COMBINATION
WRENCH.COMBINATION
WRENCH.COMBINATION
1-3/4'
1-3/4'
1-7/8'
1-7/8'
,<j
" .Current.:User
KING (JJ
KING (JJ
", Status '
Available
Available
issued
Issued
'"General?1 Locatiorr"
Turbine Tra ^
Turbine Trai;
Stores 25411
Stores 254 1
182N:\WINWORD\TMS\TN)S[NTRO.DOC

Sort - This command allows you to sort the search criteria items according tovarious categories. In the dialogue box that comes up. Select the categories you want toorder by, and click the right arrow to make that category active. After completing yourselection press OK, followed by Query. The Sort By dialogue box is shown below.
"Sefectedr'
TSO No5 Description: Current User1 Status| General LocationI Specific Locationi
1
i
I
; # >
N-.»'(*
^ Tool No./TSO
^ TSO No.
- ASC/DESC" i T^|
OK" Cancel
183N:\WINWORD\TMS\TMSINTRO.DOC

7.0 Tools Module
Tools module can be used to look up the status of tools. You can enter this module bydouble clicking on one of the tools found in the Search Module, or performing asearch. You can enter a Tool Type # or TSO # in one of the text boxes, and then pressQuery to execute the search.
!!$IiPiiill^MIWlCP^Jis3PJlMI^File Edit Detail Record Module Window Help ,M
Print Clear Cjusry
IS.Prev j Next Search Tools- User Order Calfe Transfei
Tool Numberr 0199-003 TSO No: 32- 40- 15- D
Description: WRENCH,COMBiNATION,1-1 /16*'Manufacturer: GRAY - ' ,
Mas: Marie," Model Mai3134-
Pickup StorerStores 274- General Bin: Stores-274-
SpecttfcBircJ300EE07F
Owner Groupie M
- * Group Uric
- CaBt)ration Due DatK!Main*. Due Date:-
^ OorM«iomOK • - -tCtffreirtUserr/ ^--f - :
?E>:p. Return Date:
Admin Remarta
Safety Remaric
More Tool Oetaiis | Tool Comments ~1K ^t3,94
floplred DatK^Warranty Days::
Cost:Maintenance Set Bate::
^ a i R S e t D a t e a
Calibration Actuab * r.n
Too/ Module is composed of two screens: details and summary. The summaryscreen contains very brief information about a tool, and a list of all the tools with thesame Tool Type #. By double clicking on a tool found in the list you can bring up thattool's details. There is also a Tool Comments list found on the bottom of the screen. Itcan be opened by pressing the Tool Comments button found in the middle of the screen.You can alternate between this button and the More Tool Details Button to bring upadditional tool information.
By dragging the mouse pointer over the tool description and clicking the right mousebutton you can bring up the full text of the tool description.
184n:\winword\tms\tmsintr2.doc

The User Module can be used to look up employees information. Informationcontained in this module is the DISN number, name, position, supervisor, crew, workgroup, preferred store, and a list of all the tools that are presently issued to thatemployee.
File Edit IJser Record Module Window Help
Oosel PM dear Prev ,Next Search Order
DISN:
Name:
141912
CURRE-MILLS, BJ (BRIAN)
, Trade: MAINTENANCEASSESSOR - , : S u p e r v i s o i t BAIJJpJ <JOp,
1 WorkGroup:>RODUCTlbNSUPPORT-MEeH i 1 * " " * ' " " " " '
; WorkUnltCOMMON
'Tools On Hand r"rr:
; , StoredStores 254- "-
v "
Tool No Descnption n "|PBdendTo ) Status*^
H
Detailed User Information
/4 search can be started from the Search Modules or within this module, by entering aDISN number or last name in one of the text boxes, followed by pressing the Querybutton.
185n:\winword\tms\tmsintr2.doc

9.0 Order Module
The Order Module is used to place tool orders. You cannot place an order while in theBrowse Only mode. You can find a tool and use the Search Module to place an orderor you can enter a tool straight into an order list through the Order Module.
10.0 Calibration Module
The Calibration Module can be used to monitor all calibration procedures for tools. Itcontains all the calibration procedures, as well as calibration dates. The main windowis titled Calibration Actuals.
Calibration Actuals
To call up a tool calibration procedure, in the Search Module choose the Calib optionfrom the criteria list box. This criteria box allows you to choose various templates foryour search. These templates allow you to look up tools according to various conditions.For example, one template could bring up all the tools with procedures, while anothertool that needs calibration. To execute a search, press the Query button. A list of all thetools will appear in the list at the bottom half of the screen. Select the tool from the listthat you are interested in. Double click on the row it is found on, or select it and press theCalib button to open the calibration module. The calibration module will be editable foronly some selected users. It will be read only for all other users.
Maintenance Module
The Tool Maintenance Module is very similar to the Calibration Module and contains allMaintenance information and records.
186n:\winword\tms\tmsintr2.doc

11.0 Transfer Module
The tool transfer module is used to change the ownership of a tool from one employeeto another. In order to transfer a tool, or a group of tools the DISN and PIN numbero both employees must be specified. Enter the seconds employee's DISN and PINnumber in the text box appearing in the middle of the screen. As soon as theidentification numbers are entered, the tools on hand for that employee will be displayed.
To transfer tools, use the mouse to select an employee's tool so that they are allhighlighted. You can transfer more that one tool at a time from the list. To transfer tools,press the Save button. You will now see the transferred tools in the other employee's list,marked in a red font.
Tool Management - (Tool Transfer]File Edit Record Module Window Help
SP,
onfi ' .! 'Due Date
m
Dae Oats .^"U' - {
r.
187n:\winword\tms\tmsintr2.doc

12.0 Closing
In closing, PTMS incorporates many necessary features which most other tool controlsystems cannot provide. An Instruction Manual is available from Pickering MaintenanceDepartment. This manual will fully explain in much greater detail the many additionalfeatures of the system. Should anyone be interested in obtaining a copy, please contactAndrew Green.
188n:\winword\tms\tmsintr2.doc

Fourth CNS International Conference on CANDU r CA0000030November 1 6 - 1 8 , 1997
Toronto, Canada
CONTINUOUS MONITORING OF STEAM GENERATOR PERFORMANCEUSING NON-INTRUSIVE DOWNCOMER FLOW MEASUREMENTS
C.E. Taylor, J.E. McGregor and C.A. Kittmer
Atomic Energy of Canada LimitedChalk River Laboratories
Chalk River, OntarioKOJ 1J0
Nuclear plant reliability depends directly on steam generator performance. Downcomer flowis a good monitor of steam generator performance. It provides information critical to theefficient and safe operation of steam generators as determined by the recirculation ratio andwater inventory. In addition, reduced downcomer flow may indicate steam generatorcrudding or inadequate chemical cleaning.
This paper describes the recent advances in the application of ultrasonic technology tomeasure flow velocity in the downcomer annulus during operation. This technique is non-intrusive since the measurements are taken with ultrasonic transducers mounted on theouter shell of the steam generator. New transducers and improved installation techniqueshave resulted in increased transducer reliability. Whereas previous installations provideddata for two to three months, a current installation has been operating for over a year.
Through on-site testing, it was determined that some CANDU steam generators areexperiencing carry-under (steam from the separators is carried into the downcomer). Tomeasure the downcomer flow under these conditions, a different ultrasonic technique wasrequired. A new technique became available in 1995 and was successfully adapted forhigh-temperature application. This Transflection method was attached to a Bruce A steamgenerator in January of 1996. This installation is still operating as this paper is beingwritten.
Options for movable measuring systems and simpler surface preparation have also beenexamined. This research has determined the several obstacles and some possibilities for theuse of magnets in temporarily holding the transducers at a given location. This wouldallow for measurements to be taken in a larger number of locations. In addition, the needfor minor welding on the surface of the steam generator shell would be eliminated.
189

CA0000031
Replacement Divider Plate Performance Under LOCA Loading
Hong M. HuynhHydro Quebec
Montreal, QuebecCanada
G. H. McClellan, W. G. SchneiderNuclear Engineering
Babcock & Wilcox, A Mcdermott CompanyCambridge, Ontario
Canada
Abstract
A primary divider plate in a nuclear steam generatoris required to perform its partitioning function with aminimum of cross leakage, without degradation inoperating performance and without loss of structuralintegrity resulting from normal and accident loading.The design of the replacement divider plate fornormal operating conditions is discussed in somedetail in reference 1 and 2. This paper describes thestructural response of the replacement divider plate tothe severe loading resulting from a burst primarypipe. The loads for which the divider plate structuralperformance must be evaluated are mild to severedifferential pressure transients resulting from severalpostulated sizes and types of pipe break scenarios. Inthe unlikely event of a severe Loss of CoolantAccident( LOCA) the divider plate or parts thereofmust not exit the steam generator nor completelyblock the outlet nozzle. For the milder LOCA loads,the integrity of the divider plate and seat bars must bemaintained. Analysis for the milder LOCA loads wascarried out employing a conservative approachwhich ignores the actual interaction between thestructure and the primary fluid. For these load cases itwas shown that the divider plate does not becomedisengaged from the seat bars. For the more severepipe breaks, the thermal-hydraulic analysis wascoupled iteratively with the structural analysis,thereby taking into account divider platedeformation, in order to obtain a better prediction ofthe behaviour of the divider plate. In this mannersubstantial reduction in divider plate response to themore severe LOCA loading was achieved. It has beenshown that, for the case of a postulated Large LOCA
(100% reactor inlet header) ,the disengagement of thedivider plate from the seat bars results in an openingsmaller than 1% of the divider plate area.
1.0 Introduction
The primary divider plate in a nuclear steamgenerator performs the function of diverting thereactor outlet D2O flow up through the U-tubebundle thereby cooling it before its return to thereactor. This function is therefore of primeimportance in transferring the heat removed from thefuel in the reactor core to the steam generatorsecondary side thereby generating steam. In carrying-out these functions the divider plate is normallysubjected to an operating pressure load equal to thatof the pressure drop through the U-tubes ofapproximately 35 PSI. To accommodate thisoperating load with sufficient margin, the dividerplate is designed for a static pressure drop of 60 PSI.The design method is discussed in the papers ofreferences 1 and 2.
Well into the design and manufacture of the leadreplacement divider plates for Hydro Quebec,additional design requirements were identified by theGentilly 2 Safety Analysis Group. The newrequirements stipulated that in the unlikely event of aburst primary pipe accident (LOCA), the dividerplate must not generate loose parts that could exit thesteam generator nor must it completely block theoutlet nozzle. For the smaller LOCA events, theintegrity of the divider plate and seat bars must bemaintained.
190

The discussion that follows briefly reviews theunique design features of the replacement dividerplate and describes in some detail the method ofanalysis developed to evaluate the replacementdivider plate behaviour under LOCA loads.
2.0 Features of the Replacement Divider Plate
The replacement divider plate is a strong, light-weight, integral construction designed for ease ofinstallation and minimum by-pass leakage. Thefeatures included in the design of the replacementdivider plate were primarily intended to reduceleakage and thereby lower RIH temperature. Becausethe design is a single piece, the flow leakage crevicearea is much smaller than the original design. Theonly leak path is around the periphery of the dividerplate at the tongue and groove joint (See Figure 1).Erosion resistant material is employed at these slidingjoints to ensure that leakage rates do not increasewith time.
DIVHR iW -
FUBEMEI SEA! 8M
QISCO SECTIDE
Fiaoiaus
Figure 1: Welded Floating Divider Plate
The original primary divider plate was a segmenteddesign 1-1/2 inches thick (See Figure 2). The
replacement divider plate is only 3/4 inches thick. Ithas been curved in order to provide the necessarystrength thereby providing a relatively lighter weightfor ease of installation, minimizing weld volume (andradiation exposure to welders) and minimumdistortion due to welding that could result in bindingof the divider plate on the seat bars. The design hasbeen patented by B& W(3).
• rtffsei sai m
Figure 2: Segmented Divider Plate
3.0 Dynamic Analysis for LOCA Loading
(i) LOCA Loads
The original divider plate transient differentialpressure loads were computed by Hydro-QuebecSafety Analysis Group by employing the thermal-hydraulic Code SOPHT-G2 version 03.02. Theseloads do not take into account divider platedeformation. Several LOCA loads were eventuallyidentified. These transient loads are shown in Figure3 through 6. As can be seen, some of the loads areclearly much more severe than the loading for whichthe replacement divider plate was originallydesigned. (Note: these pressure-time curves hereafterare referred to as original pressure versus timecurves)
(ii) Preliminary Structural Analysis
Initially a non-linear transient dynamic analysisutilizing ABAQUS EXPLICIT Version 5.5 wascarried out to determine the sensitivity of the dividerplate response to variations in the assumed frictionfactor at the tongue and groove joint and to confirmearlier dynamic analysis carried out by OntarioHydro. For simplicity, the preliminary structuralanalyses were carried out conservatively assumingthat the thermal-hydraulic solution and the structuralsolution do not affect each other.
191

1
5000 •
4500-
4000-
J5OO-
! i 2500-
ISOD
1000
500-
0
^
Ditak i l 1 ras; Vccai opcslnctLme: 1 at .)
O.C 0 ,9 0.05 ai 0.15
Tuno (a)
Figure 3: Divider Plate Loading — 5% EquivalentRIH Break
Figure 5: Divider Plate Loading — 100% PumpSuction Break
k1
f!
J
;1
1
i1
v.O 0,1 0.6 '-.C
3S0O
1000
I50O
3 2000'
I0O0
0 •
AI \11l\ / ~
0 0.0J O.I 0.13 0.! 0.23 O.J
Tonpi (•)
0.33 O.< 0.45 03
Figure 4: Divider Plate Loading — 7.5% EquivalentRIH Break
Figure 6: Divider Plate Loading — 100% RIH Break
192

Initially three load cases were considered, 5%, 7-1/2% RIH Breaks and a 100% Pump Suction. Theeffect of friction factors from 0.2 to 1.2 wasevaluated. This sensitivity study indicated that anincrease in friction factor will tend to reduced the rateof deformation of the divider plate resulting from agiven differential pressure transient.
Mixed results were obtained in the aforementionedanalyses (See section 4.0) and it became clear that ifrealistic results were to be obtained for the moresevere load cases it would be necessary to allow forthe effects of the deformation of the divider plate.
In the initial dynamic analysis two important effectsthat tend to reduce the response of the divider platewere conservatively ignored. These are, bypassleakage resulting from the open area formed whenthe divider plate starts to disengage and differentialpressure reduction resulting from the deformingdivider plate pushing primary fluid out of the steamgenerator outlet nozzle.
To take these effects into account, and therebyeffectively reduce the load on the divider plate,requires that the thermal- hydraulic solution be'coupled1 with the structural solution. To achievethis, an iterative procedure was developed thatmanually links the Hydro-Quebec thermal- hydraulicanalysis with the B&W structural analysis. How this'coupling' is achieved is included in the discussionthat follows.
(iii) Thermal-Hydraulic and Structural Coupling
The thermal-hydraulic analysis (HQ) is manuallylinked with the structural analysis (B&W) as shownin Figure 7. An original pressure versus time curve(P-T) for the first iteration was run for an intervalfrom t0 to a suitable time tj at which time a certainamount of displaced primary fluid volume, resultingfrom divider plate deformation, is reached. Thevolume reduction of the outlet side as a function oftime for this interval was provided to HQ for inputinto the thermal hydraulic analysis. The thermalhydraulic analysis was re-run for the same timeinterval taking into account the displaced volumefunction and a new pressure versus time load curvecomputed for the interval. A check is made todetermine if the P-T curve has converged bycomparing it to the prior curve. If it has notconverged the displaced volume versus time curve isrecomputed based on the current structural run and
the procedure repeated until convergence of twoserial P-T curves is achieved.
I A P{) Original Differential Pressure Curve
SOHPT-G2
A B A Q U S / E x p I i c i t R u n f r o m t i . . t o t
1
t
<^Disengaged?P>—
| Yes
r^H—•*•Send A Vj and AAjto
Hydro Quebec
forSOHPT-G2
\ i:-i+l.j»l
Figure 7: Flow Chart of the Analysis
193

At some point in time, for the more severe loads, thetubesheet seat bar and divider plate start to disengageand a by-pass leakage flow results. This by-pass flowwill tend to reduce the response of the divider platestill further so it too is included in the iterationprocedure in a similar manner to the displacedvolume. Figure 7 illustrates how this is incorporated.
The above procedure was employed to analysedivider plate response to the 100% RIH Break. Thisload case is shown in Figure 6. Again, these originalloads had been determined based on the assumptionthat the divider plate remains in place without anydeformation and does not by-pass primary fluidbeyond that predicted for normal operatingconditions.
4.0 Discussion of Results and Conclusion
The results of the initial conservative analysis for the5% and 7-1/2% RIH breaks indicate that the dividerplate remains fully engaged with the seat bars onboth the primary head and tubesheet. For the 100%Pump Suction Break the divider plate completelydisengaged. However owing to its constructiondetails, it can not exit the primary head to form aloose part. With such a high load, seat bar weldfailure was a very significant concern. If the seat barwelds fail, the seat bar becomes a loose part since itcan easily exit the primary head of the steamgenerator. The seat bar weld strains were shown to beacceptable thus precluding the loose parts concern.This conclusion can be broadened because theloading employed is conservative as discussed below.We can conclude that even for the most severeloading, the seat bar welds will not fail and thereforethe seat bars will not become loose parts.
Even though the LOCA requirements were notconsidered when setting the replacement divider platedesign, the curved divider plate concept appears to befortuitous in dealing with the large deformations thatresult from the more severe LOCA loads. Becausethe design is curved, it can deflect more than 4inches under the severe LOCA loading withoutsignificantly reducing the engagement of the dividerplate on the seat bars. Considerably more deflectionis required in order to cause the completedisengagement of the divider plate from the seat bars.This large deflection results in considerable loadreduction owing to the relatively large volume ofprimary fluid that must be displaced out the primary
outlet nozzle by the deforming divider plate and theincrease in available volume on the primary inlet sideof the steam generator. Furthermore, the significantby-pass flow area that opens up before the dividerplate becomes entirely disengaged from the seat barsalso tends to reduce the original LOCA loading.
The aforementioned means of reducing the responseof the divider plate that were not included in theinitial analysis have a very significant beneficialeffect that results in considerably less divider platedeformation. Figure 8 shows the 100 % RIH LOCAwith and without taking into account the deformationof the divider plate. As indicated, the maximumpressure load is much less severe when thedeformation of the divider plate was modelled. This,in effect, shows the load reductions achieved by theiteration technique developed to 'couple' thethermal-hydraulic and structural solutions. Figure 9shows the maximum velocity of the divider plate. Ascan be seen the divider plate has come to a stop andhas started to return to its original position.
Delta P (kPa)
\ | /
;
;I
I
s—
/
"I I I 1 I 1 M 1 M l ) 1 M 1"
v\
1 II 1
\
\
1 1 1 1
1— Delta P (Onain»l Cuive)
Delta P (New Curve)
N
• ,
I I I ) 1 1 1 > M 1 1 1 1 1 1
Time (sec)
Figure 8: Comparison of the One-Step Analysis andthe Iterative Analysis
The results confirm that for the 100% RIH break(Figure 6) the divider plate only slightly disengageswith the tubesheet seat bar(approx. 1% of dividerplate area). Figure 10 shows the deformed shape atr=80msecs. Deformation is shown with amagnification factor of 1.0.
194

Velocity (ft/sec)
--
I
-
-
- J
- /
-
jf
V
|
i ihHIV
1 1 1 1 1 1 1 1 1 I I I I i t i i i i i i
0 001 0.02 003 0.04 005 0.06 D.07 O.OB 0-09 0.1
Time (sec)
5.0 References
1. Gentillv-2 and Pt. Lepreau Divider PlateReplacement-W.Schneider, G.McClellan, S.Weston,E.Kiisel, C.Holmes, Babcock and Wilcox, J. Forest,Hydro Quebec, K.Verma, New Brunswick Power.17th Annual Canadian Nuclear Society Conference,Fredricton, New Brunswick, June 9-12,1996
2. Gentillv-2 Divider Plate Replacement- J. Forest,E.Kiisel, G.McClellan, W.Schneider. CanadianNuclear Society, Third International Conference onCANDU Maintenance, November 21,1995
3. U.S. Patent No. 5,623.763, Method of Replacing aPrimary Divider Plate in a Steam Generator,Inventors: H.G.McClellan and W.G.Schneider
Figure 9: Maximum Velocity of the Divider Plate 6.0 Acknowledgements
The authors gratefully acknowledge the contributionsof C. Hasnoui, K. Joober of Hydro-Quebec whocarried out the SOPHT-G2 runs and Yanghu Mou ,R. Sullivan of Babcock & Wilcox Canada and, whocarried out the ABAQUS runs.
DISPLACEMENT MAGNIFICATION FACTOR= 1.00
Figure 10: Deformation of the Divider Plate for100% RIH Break(t=80 msecs)
195
CA0000032Steam Generator Primary Side Fouling Determination Using the
Oxiprobe Inspection Technique
F. Gonzalez, A.M. Brennenstuhl, G. Palumbo and R.W. DyckOntario Hydro, Materials Technology Dept., Ontario Hydro Technologies
ABSTRACT
Build up of deposits on the primary side ofCANDU steam generator tubes can lead toa loss of heat transfer between primaryand secondary circuits. This foulingcontains radionuclides that cause highradiation fields around the steamgenerators. It is important to determinethe amount and nature of the depositsincluding radionuclides and theirdistribution in the tubes to assess theneed for cleaning, selection of cleaningtechnologies, disposal of cleaning residuesand other related maintenance issues.The Oxiprobe is an inspection techniquedeveloped by Ontario Hydro Technologiesthat measures the extent of primary sidefouling at various positions along thelength of a steam generator tube.Deposits are chemically removed fromselected locations by means of toolinginserted from the primary head. Depositloadings in each location can bequantitatively calculated and theirelemental composition, which includes thedetermination of alpha, beta and gammaemitting radionuclides, can be determined.
1.0 INTRODUCTION
The primary side piping in CANDUreactors is made of carbon steel. Uponexposure to the primary coolantconditions the material rapidly forms aprotective magnetite passive layer.Release rates of this oxide are very lowand in the order of 1 mg Fe/dm2.day(mdd)in flowing coolant at 250 °C, pH 10 withLiOH and saturated in dissolved iron/1/.The stable iron oxide species underCANDU normal operating conditions is
magnetite and, in the presence of othertransition metals such as cobalt andnickel, their thermodynamically stablespecies are mixed oxides. The solubilityof magnetite and the mixed oxides varieswith the redox potential of the primarycoolant and it increases when thisparameter becomes reducing. Underoxidizing conditions the most stable oxideis hematite which is significantly lesssoluble than magnetite. It is thereforedifficult to model the particulate andcorrosion product transport and depositionsince the redox potential in the primarycoolant changes especially if there isboiling in the core.
It has been postulated that steamgenerator fouling may be responsible forthe observed increases in reactor inletheader temperature at some CANDUplants. In fact, at some plants the depositbuildup has been sufficiently high toimpede access by inspection tooling.
Not only is it important to determine thetotal amount of deposits on the tube butalso their distribution along the tubewhich allows us to assess their impact onthe heat transfer coefficient.
The Oxiprobe technique was developed todetermine the accumulation of deposits onthe inside wall of the steam generatortubes, in terms of the deposit elementalcomposition, the deposit loadingdistribution along the tube length, and thetotal tube deposit loadings. An additionalobjective was to determine the identityand loadings of alpha, beta and gammaemitting radionuclides and theirdistribution along the tube length.
196

2.0 EXPERIMENTAL
The Oxiprobe hardware consists of anend effector or probe, shown in Figure 1,which is positioned at predeterminedlocations inside the steam generator tube.Solvent is delivered to the probe todissolve the deposits within the probecavity.
0.4001
Tu
Solvent -
SteamGenerator -
Tube
0.330'
o
* *SamplingLength19.5 cm
- BladderSeal
TTo. From
Delivery equipment
Figure 1: Schematic of Oxiprobe endeffector inside a steam generator tube.
Feed and return polymeric tubing connectthe end effector to a solvent /waterdelivery system which includes flowmetering equipment, solvent and waterrinsing tanks, and pumping capabilities.Figure 2 reveals the schematics of theflow delivery system.
The present setup allows two tubedeterminations to be carried outsimultaneously. This capability savessignificant time during field sampling andresults in reduced personnel dose and ashorter plan window requirement in thestation plan.
Water CleaningSolution
V1 V2
R\AIC.
V2
c6
InRSC
)
ISMX
V4VS
—txJ, V6
—» To Probe
• - From Probe
Figure 2: Oxiprobe delivery system.RWC - Return Water ContainerRSC - Return Solution Container
The Oxiprobe used in all the depositmeasurements discussed here had asampling length of 19 cm. For eachposition this distance represents thelength of steam generator tubing insidethe Oxiprobe cavity in which the oxide isdissolved by the solvent. The probelength determines the resolution of themeasurement with respect to the steamgenerator tube length. The probeconsisted of a central element with around head to minimally disturb the tubedeposits during insertion and a bottomfitting that had a bladder seal andconnections to the delivery tubing. Thetop seal was achieved by pressurizing theopposite end of the tube with air.
3.0 SOLVENT QUALIFICATION
3.1 Materials Compatibility
Oxiprobe measurements have been carriedout at Pickering A, Bruce A and Bruce B.Application of the technology to thesestations necessitated full qualification
197

testing of the solvent compatibility withalloy 400 and 600, respectively, inadvance of the fieldwork. The testinginvolved a complete corrosion assessmentwith the same solvents and materials andunder extreme simulated field conditions.Testing results showed no significantcorrosion of either alloy 400 or alloy 600during the sampling time required in theprocedure.
3.2 Deposit Dissolution Rates
Dissolution rates were evaluated inlaboratory tests using solid magnetitesamples. Additional confirmatory testingwas also performed with tubes previouslypulled from operating units. A factor offive times the laboratory time required forcomplete sample dissolution was used inthe field implementation. The errorresulting from the incomplete dissolutionof the tube deposits was thereforenegligible although no visual tubeverification was performed in thefieldwork.
4.0 FIELD PROCEDURE
The field implementation of Oxiprobemeasurements requires access tocontainment and the primary head of thesteam generator. Setup of the deliveryequipment should be carried out near thesteam generator primary head accessmanhole. The end effector is inserted intothe steam generator tube into apredetermined location.
Spill barriers are placed around thedelivery systems and in the steamgenerator primary head. The probe isconnected to the delivery systems via thepolymer tubing. After the seals have beenactivated, water is first circulated toverify the leak tightness of the wholeassembly. The solvent is then pumpedinto the probe cavity and it rapidlydissolves the deposits inside the tube.When the dissolution time has elapsed athorough rinse of the probe cavity withwater eliminates any solvent trace fromthe tube surfaces that have been exposed
to the solution. The rinse effectiveness isverified using simple pH measurements onthe effluent water. The probe is thenmoved to a different tube location and theoperation is repeated. A total of one litreof solution is collected per sampling point.
The average time required per samplelocation is approximately one hour butseveral tubes can be simultaneouslysampled. Setup time, excludinginterruptions unrelated to the process, isthree hours and the same length of time isrequired to remove the equipment fromcontainment.
5.0 ANALYTIC
The solvent solutions collected areanalyzed by ICP (Inductive CoupledPlasma Spectroscopy) to determine metalion concentrations. Gamma activitymeasurements were performed using aCanberra gamma analyzer. Alpha andbeta activity was also determined forsome samples. The analytic precisionwas approximately 10%.
6.0 WASTE DISPOSAL
One litre of solvent and four litres ofrinsing water per tube position wereproduced as waste. The rinsing waterhad undetectable gamma emittercontamination but it was slightlycontaminated with tritium. After analysis,the radioactive solutions wereconcentrated by evaporation, solidifiedand then disposed.
7.0 FIELD APPLICATIONS OF OXIPROBE
7.1 Pickering NGS-A
7.1.1 Sampling Locations
The first trial with Oxiprobe wasimplemented at Pickering A/2/. Twotubes were preselected that were judgedto be representative of the majority of thetubes in the bundle. The tubes weresituated in the centre of the bundle nearthe divider plate. The tubes had never
198
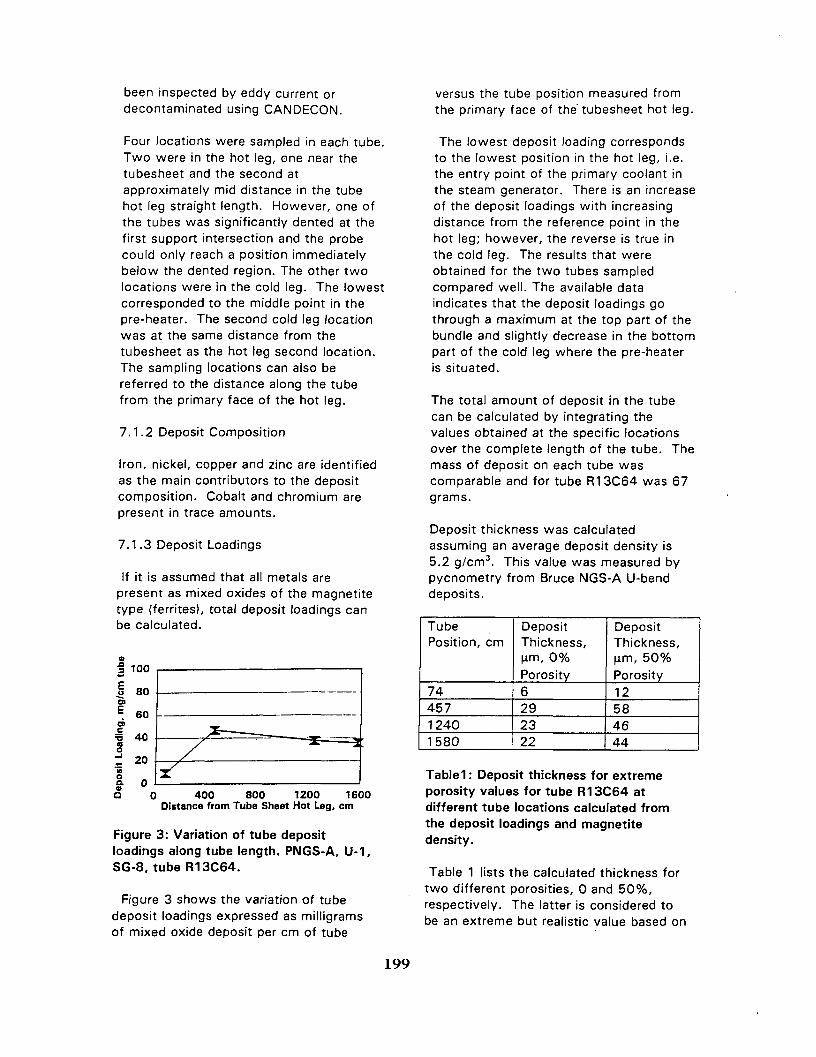
been inspected by eddy current ordecontaminated using CANDECON.
Four locations were sampled in each tube.Two were in the hot leg, one near thetubesheet and the second atapproximately mid distance in the tubehot leg straight length. However, one ofthe tubes was significantly dented at thefirst support intersection and the probecould only reach a position immediatelybelow the dented region. The other twolocations were in the cold leg. The lowestcorresponded to the middle point in thepre-heater. The second cold leg locationwas at the same distance from thetubesheet as the hot leg second location.The sampling locations can also bereferred to the distance along the tubefrom the primary face of the hot leg.
7.1.2 Deposit Composition
Iron, nickel, copper and zinc are identifiedas the main contributors to the depositcomposition. Cobalt and chromium arepresent in trace amounts.
7.1.3 Deposit Loadings
If it is assumed that all metals arepresent as mixed oxides of the magnetitetype (ferrites), total deposit loadings canbe calculated.
Q 0 400 800 1200 1600Distance from Tube Sheet Hot Leg, cm
Figure 3: Variation of tube depositloadings along tube length. PNGS-A, U-1,SG-8, tubeR13C64.
Figure 3 shows the variation of tubedeposit loadings expressed as milligramsof mixed oxide deposit per cm of tube
versus the tube position measured fromthe primary face of the tubesheet hot leg.
The lowest deposit loading correspondsto the lowest position in the hot leg, i.e.the entry point of the primary coolant inthe steam generator. There is an increaseof the deposit loadings with increasingdistance from the reference point in thehot leg; however, the reverse is true inthe cold leg. The results that wereobtained for the two tubes sampledcompared well. The available dataindicates that the deposit loadings gothrough a maximum at the top part of thebundle and slightly decrease in the bottompart of the cold leg where the pre-heateris situated.
The total amount of deposit in the tubecan be calculated by integrating thevalues obtained at the specific locationsover the complete length of the tube. Themass of deposit on each tube wascomparable and for tube R13C64 was 67grams.
Deposit thickness was calculatedassuming an average deposit density is5.2 g/cm3. This value was measured bypycnometry from Bruce NGS-A U-benddeposits.
TubePosition, cm
7445712401580
DepositThickness,|im, 0%Porosity6292322
DepositThickness,Urn, 50%Porosity12584644
Tablei: Deposit thickness for extremeporosity values for tube R13C64 atdifferent tube locations calculated fromthe deposit loadings and magnetitedensity.
Table 1 lists the calculated thickness fortwo different porosities, 0 and 50%,respectively. The latter is considered tobe an extreme but realistic value based on
199

deposit samplings from Bruce NGS-A U-bend removed tubes.
7.1.4 Radionuclide Distribution
Figure 4 reveals the variation of totalalpha, beta, and gamma activity at thedifferent tube positions. The distributionis similar to that of the deposits. Thehighest activity loadings are near the topof the hot leg, which coincides with thehigh deposit loadings.
The main radionuclides that contribute tothe gamma activity are Ce-144 and Ru-106. Each one separately accounts forapproximately 35% of the total gammaactivity. Co-60 accounts for 12%.Additional significant contributors are Ru-103, Sb-124, Sb-125, Ce-141, Eu-154,Eu-155, Zr-95 and Nb-95. The highcontributions of Ce-144 and Ru-106 arean indication of previous fuel failures inthe system. The presence of alphaemitting isotopes confirms the significantcontribution from the nuclear fuel to thetotal activity.
£ 20u5§15Iao
u< 74 457 1240 1580"
Distance from tubesheet hot leg, cm• Total gamma m Total beta B8 Total alpha I
Figure 4: Radionuclide gamma, beta, andalpha activity loading variation along tubelength. PNGS-A, U-1, SG-8, tubeR13C64.
7.2 Bruce NGS-A
7.2.1 Sampling Locations
The same criteria as in PNGS-A were usedin the tube selection. Deposits should nothave been disturbed by either inspectionor decontamination activities and the
I
!
I I I .
tubes had to be representative of the tubebundle. Four tubes were sampled at sixlocations each, three in the cold leg andthe remainder in the hot leg. A total of 24tube locations were sampled/3/.
7.2.2 Deposit Composition
Iron, nickel and chromium are the mostimportant metallic contributors to thedeposit composition. Copper, zinc andcobalt were also detected.
7.2.3 Deposit Loadings
Figure 5 shows the variation of depositloading {calculated as mixed oxide) alongthe tube length for one of the tubes. Thedistribution pattern for rest of the tubessampled was similar.
100
IISi
75
50
I 25o
70 400 800 1200 160
Distance from Tubesheet Hot Leg, cm
Figure 5: Variation of tube depositloadings along tube length. BNGS-A, U-3,SG-2, tube R50C72.
The lowest loadings correspond to thebottom of the hot leg; the loadingsincrease with increasing distance fromthat position (moving up towards the U-bend). The loadings peak at or near theU-bend and then remain approximatelyconstant moving down the cold leg.
The patterns of deposit loadingdistribution with respect to tube positionfor PNGSA and BNGSA are similar andboth indicate highest loadings in theregion of the bundle where the steamquality on the secondary side is thehighest.
200
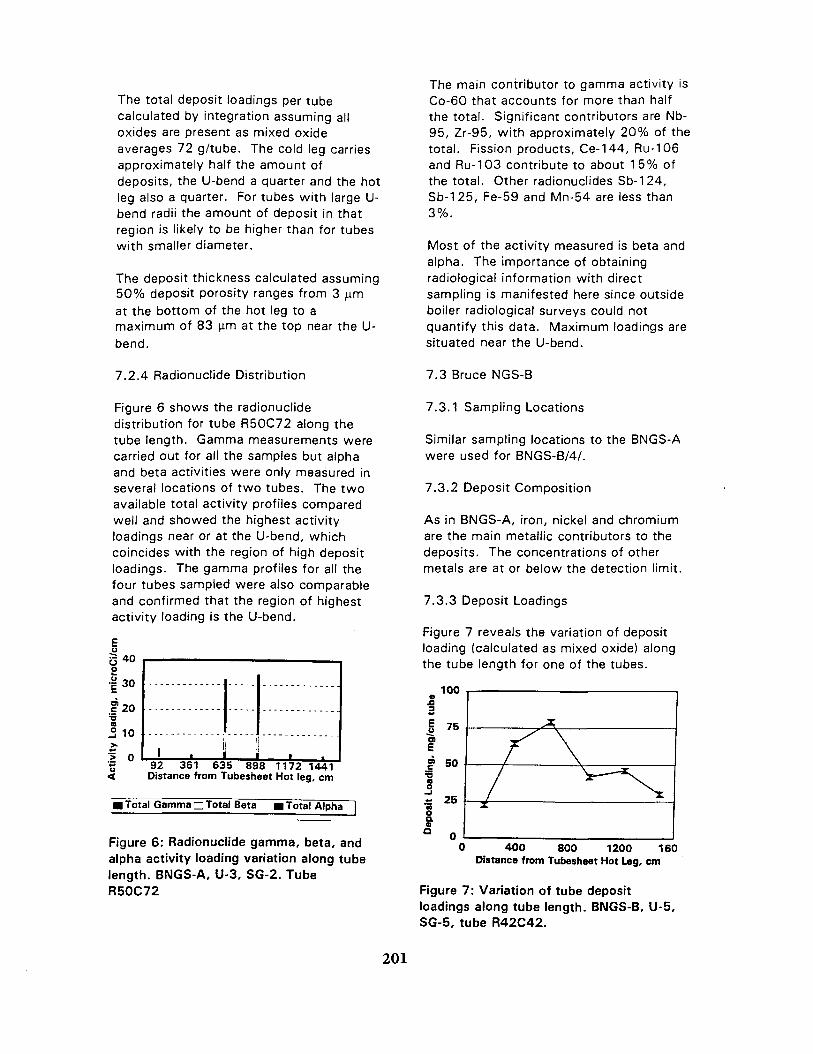
The total deposit loadings per tubecalculated by integration assuming alloxides are present as mixed oxideaverages 72 g/tube. The cold leg carriesapproximately half the amount ofdeposits, the U-bend a quarter and the hotleg also a quarter. For tubes with large U-bend radii the amount of deposit in thatregion is likely to be higher than for tubeswith smaller diameter.
The deposit thickness calculated assuming50% deposit porosity ranges from 3 ^mat the bottom of the hot leg to amaximum of 83 (irn at the top near the U-bend.
The main contributor to gamma activity isCo-60 that accounts for more than halfthe total. Significant contributors are Nb-95, Zr-95, with approximately 20% of thetotal. Fission products, Ce-144, Ru-106and Ru-103 contribute to about 15% ofthe total. Other radionuclides Sb-124,Sb-125, Fe-59 and Mn-54 are less than3%.
Most of the activity measured is beta andalpha. The importance of obtainingradiological information with directsampling is manifested here since outsideboiler radiological surveys could notquantify this data. Maximum loadings aresituated near the U-bend.
7.2.4 Radionuclide Distribution
Figure 6 shows the radionuclidedistribution for tube R50C72 along thetube length. Gamma measurements werecarried out for all the samples but alphaand beta activities were only measured inseveral locations of two tubes. The twoavailable total activity profiles comparedwell and showed the highest activityloadings near or at the U-bend, whichcoincides with the region of high depositloadings. The gamma profiles for ail thefour tubes sampled were also comparableand confirmed that the region of highestactivity loading is the U-bend.
u5 40o
| 30
?20io
| oo
i . ! i •92 361 635 898 1172 1441Distance from Tubesheet Hot leg, cm
I Total Gamma ~ Total Beta I Total Alpha
Figure 6: Radionuclide gamma, beta, andalpha activity loading variation along tubelength. BNGS-A, U-3, SG-2. TubeR50C72
7.3 Bruce NGS-B
7.3.1 Sampling Locations
Similar sampling locations to the BNGS-Awere used for BNGS-B/4/.
7.3.2 Deposit Composition
As in BNGS-A, iron, nickel and chromiumare the main metallic contributors to thedeposits. The concentrations of othermetals are at or below the detection limit.
7.3.3 Deposit Loadings
Figure 7 reveals the variation of depositloading (calculated as mixed oxide) alongthe tube length for one of the tubes.
100
§ 75"5
f 50
Jat 25
s0 400 800 1200 160
Distance from Tubesheet Hot Leg, cm
Figure 7: Variation of tube depositloadings along tube length. BNGS-B, U-5,SG-5, tube R42C42.
201

As in the BNGS-A measurements, thedistribution pattern for the rest of thetubes is similar. The depositloading/distance profile is similar to that ofBNGS-A in that the highest loadings arenear the U-bend. The correspondingdeposit thickness calculated, 1 to 84pim,and the total amount of deposit per tube,72 g, and its distribution among the hotand the cold legs and the U-bend is alsosimilar to BNGS-A.
7.3.4 Radionuclide Distribution
The main radionuclide contributor togamma activity is Co-60. Also importantand contributing each to between 8 and25% are Nb-95 and Zr-95.
Figure 8 shows the relative contributionsof radionuclides to the total activity. Thecontributing radionuclides are the same asin BNGS-A but the total gamma activitylevels are slightly higher in thismeasurement.
:= 4 0
ooo 30Ec'•utoo
20
10
I 0 145 361 635 946 1220 1489Distance from Tubesheet Hot Leg, cm
I Total Gamma ~J Total Beta I Total Alpha
Figure 8: Radionuclide gamma, beta, andalpha activity loading variation along tubelength. BNGS-B, U-5, SG-5, tube R42C42.
Data shows little contribution from fissionproducts since there are very low levels ofalpha emitting radionuclides.
8.0 CONCLUSIONS
Oxiprobe can perform successful samplingof primary side corrosion products insteam generator tubes.
Consistent data has been obtained atthree CANDU stations. Depositcomposition, loadings and distributionalong the steam generator tubes areavailable from the measurements.
Alpha, beta and gamma radionuclideloadings and distribution along the tubesare now at hand for radiologicalrequirements.
Minor process modifications and aredesign of the delivery system couldreduce the time required for Oxiprobeimplementation. This would enable thesampling of a larger number of tubes for agiven time window which would improvethe statistical confidence of themeasurements.
ACKNOWLEDGMENTS
The authors would like to acknowledgethe contributions of R. Barton, J. Cocuzzi,and A. Robertson of Ontario HydroTechnologies, and D.M. Doyle of Babcockand Wilcox Industries Ltd.
REFERENCES
1. K.A. Burrill, 1s t Meeting of IAEACoordinated Research Program onModeling of Transport of RadioactiveSubstances in the Primary Circuit ifWater-Cooled Reactor, Ontario HydroHead Office, Toronto, 1997, May 5-9.
2. F. Gonzalez, A.M. Brennenstuhl, G.Palumbo, A. Robertson and J.Cocuzzi, Ontario Hydro TechnologiesReport No. A-NSG-95-162-P.
3. F. Gonzalez, A.M. Brennenstuhl, G.Palumbo, A. Robertson and J.Cocuzzi, Ontario Hydro TechnologiesReport No. A-NSG-95-163-P.
4. F. Gonzalez, A.M. Brennenstuhl, G.Palumbo, A. Robertson and J.Cocuzzi, Ontario Hydro TechnologiesReport No. A-NGS-95-1 64-P.
202

CA0000033
Steam Generator Primary Side Fouling Determination Using theOxiprobe Inspection Technique
F. Gonzalez, A.M. Brennenstuhl, G. Palumbo and R.W. DyckOntario Hydro, Materials Technology Dept., Ontario Hydro Technologies
ABSTRACT
Build up of deposits on the primary side ofCANDU steam generator tubes can lead toa loss of heat transfer between primaryand secondary circuits. This foulingcontains radionuclides that cause highradiation fields around the steamgenerators. It is important to determinethe amount and nature of the depositsincluding radionuclides and theirdistribution in the tubes to assess theneed for cleaning, selection of cleaningtechnologies, disposal of cleaning residuesand other related maintenance issues.The Oxiprobe is an inspection techniquedeveloped by Ontario Hydro Technologiesthat measures the extent of primary sidefouling at various positions along thelength of a steam generator tube.Deposits are chemically removed fromselected locations by means of toolinginserted from the primary head. Depositloadings in each location can bequantitatively calculated and theirelemental composition, which includes thedetermination of alpha, beta and gammaemitting radionuclides, can be determined.
1.0 INTRODUCTION
The primary side piping in CANDUreactors is made of carbon steel. Uponexposure to the primary coolantconditions the material rapidly forms aprotective magnetite passive layer.Release rates of this oxide are very lowand in the order of 1 mg Fe/dm2.day(mdd)in flowing coolant at 250 °C, pH 10 withLiOH and saturated in dissolved iron/1/.The stable iron oxide species underCANDU normal operating conditions is
magnetite and, in the presence of othertransition metals such as cobalt andnickel, their thermodynamically stablespecies are mixed oxides. The solubilityof magnetite and the mixed oxides varieswith the redox potential of the primarycoolant and it increases when thisparameter becomes reducing. Underoxidizing conditions the most stable oxideis hematite which is significantly lesssoluble than magnetite. It is thereforedifficult to model the particulate andcorrosion product transport and depositionsince the redox potential in the primarycoolant changes especially if there isboiling in the core.
It has been postulated that steamgenerator fouling may be responsible forthe observed increases in reactor inletheader temperature at some CANDUplants. In fact, at some plants the depositbuildup has been sufficiently high toimpede access by inspection tooling.
Not only is it important to determine thetotal amount of deposits on the tube butalso their distribution along the tubewhich allows us to assess their impact onthe heat transfer coefficient.
The Oxiprobe technique was developed todetermine the accumulation of deposits onthe inside wall of the steam generatortubes, in terms of the deposit elementalcomposition, the deposit loadingdistribution along the tube length, and thetotal tube deposit loadings. An additionalobjective was to determine the identityand loadings of alpha, beta and gammaemitting radionuclides and theirdistribution along the tube length.
203

2.0 EXPERIMENTAL
The Oxiprobe hardware consists of anend effector or probe, shown in Figure 1,which is positioned at predeterminedlocations inside the steam generator tube.Solvent is delivered to the probe todissolve the deposits within the probecavity.
0.400'
Solvent •
SteamGenerator •
Tube
0.330'
*
N
SamplingLength19.5 cm
- BladderSeal
TTttfrom
Delivery equipment
Figure 1: Schematic of Oxiprobe endeffector inside a steam generator tube.
Feed and return polymeric tubing connectthe end effector to a solvent /waterdelivery system which includes flowmetering equipment, solvent and waterrinsing tanks, and pumping capabilities.Figure 2 reveals the schematics of theflow delivery system.
The present setup allows two tubedeterminations to be carried outsimultaneously. This capability savessignificant time during field sampling andresults in reduced personnel dose and ashorter plan window requirement in thestation plan.
—> To Probe
•— From Probe
Figure 2: Oxiprobe delivery system.RWC - Return Water ContainerRSC - Return Solution Container
The Oxiprobe used in all the depositmeasurements discussed here had asampling length of 19 cm. For eachposition this distance represents thelength of steam generator tubing insidethe Oxiprobe cavity in which the oxide isdissolved by the solvent. The probelength determines the resolution of themeasurement with respect to the steamgenerator tube length. The probeconsisted of a central element with around head to minimally disturb the tubedeposits during insertion and a bottomfitting that had a bladder seal andconnections to the delivery tubing. Thetop seal was achieved by pressurizing theopposite end of the tube with air.
3.0 SOLVENT QUALIFICATION
3.1 Materials Compatibility
Oxiprobe measurements have been carriedout at Pickering A, Bruce A and Bruce B.Application of the technology to thesestations necessitated full qualification
204

testing of the solvent compatibility withalloy 400 and 600, respectively, inadvance of the fieldwork. The testinginvolved a complete corrosion assessmentwith the same solvents and materials andunder extreme simulated field conditions.Testing results showed no significantcorrosion of either alloy 400 or alloy 600during the sampling time required in theprocedure.
3.2 Deposit Dissolution Rates
Dissolution rates were evaluated inlaboratory tests using solid magnetitesamples. Additional confirmatory testingwas also performed with tubes previouslypulled from operating units. A factor offive times the laboratory time required forcomplete sample dissolution was used inthe field implementation. The errorresulting from the incomplete dissolutionof the tube deposits was thereforenegligible although no visual tubeverification was performed in thefieldwork.
4.0 FIELD PROCEDURE
The field implementation of Oxiprobemeasurements requires access tocontainment and the primary head of thesteam generator. Setup of the deliveryequipment should be carried out near thesteam generator primary head accessmanhole. The end effector is inserted intothe steam generator tube into apredetermined location.
Spill barriers are placed around thedelivery systems and in the steamgenerator primary head. The probe isconnected to the delivery systems via thepolymer tubing. After the seals have beenactivated, water is first circulated toverify the leak tightness of the wholeassembly. The solvent is then pumpedinto the probe cavity and it rapidlydissolves the deposits inside the tube.When the dissolution time has elapsed athorough rinse of the probe cavity withwater eliminates any solvent trace fromthe tube surfaces that have been exposed
to the solution. The rinse effectiveness isverified using simple pH measurements onthe effluent water. The probe is thenmoved to a different tube location and theoperation is repeated. A total of one litreof solution is collected per sampling point.
The average time required per samplelocation is approximately one hour butseveral tubes can be simultaneouslysampled. Setup time, excludinginterruptions unrelated to the process, isthree hours and the same length of time isrequired to remove the equipment fromcontainment.
5.0 ANALYTIC
The solvent solutions collected areanalyzed by ICP {Inductive CoupledPlasma Spectroscopy) to determine metalion concentrations. Gamma activitymeasurements were performed using aCanberra gamma analyzer. Alpha andbeta activity was also determined forsome samples. The analytic precisionwas approximately 10%.
6.0 WASTE DISPOSAL
One litre of solvent and four litres ofrinsing water per tube position wereproduced as waste. The rinsing waterhad undetectable gamma emittercontamination but it was slightlycontaminated with tritium. After analysis,the radioactive solutions wereconcentrated by evaporation, solidifiedand then disposed.
7.0 FIELD APPLICATIONS OF OXIPROBE
7.1 Pickering NGS-A
7.1.1 Sampling Locations
The first trial with Oxiprobe wasimplemented at Pickering A/2/. Twotubes were preselected that were judgedto be representative of the majority of thetubes in the bundle. The tubes weresituated in the centre of the bundle nearthe divider plate. The tubes had never
205
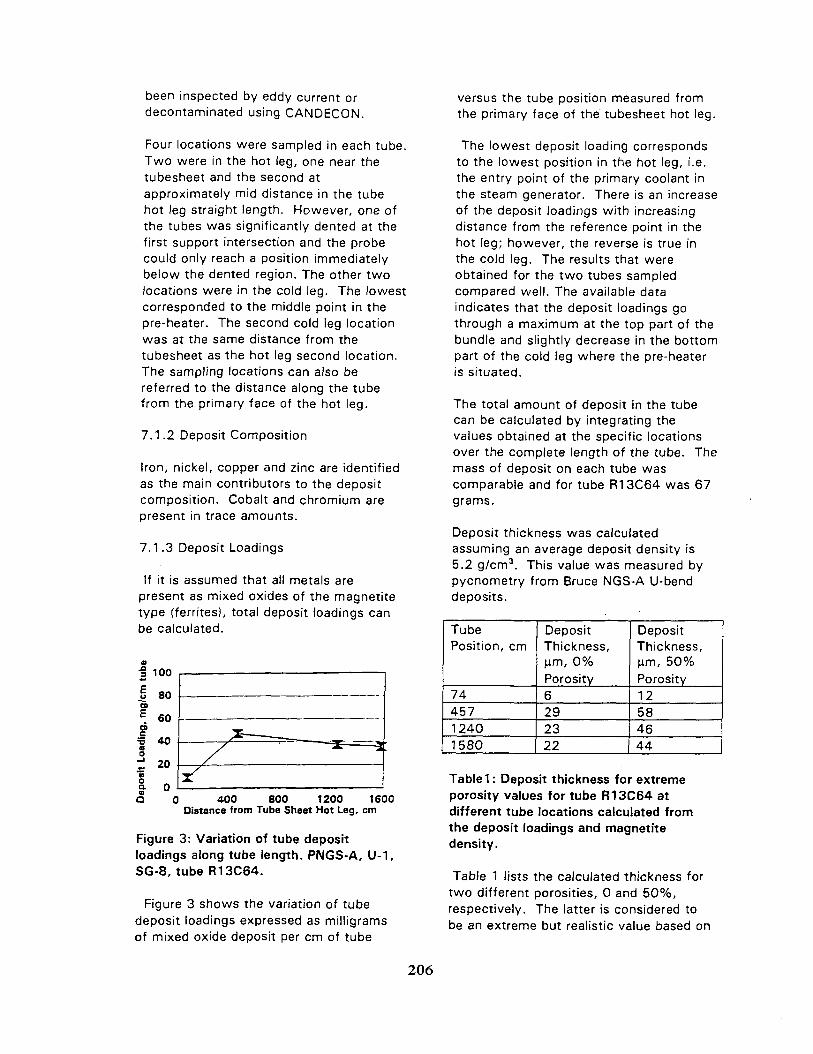
been inspected by eddy current ordecontaminated using CANDECON.
Four locations were sampled in each tube.Two were in the hot leg, one near thetubesheet and the second atapproximately mid distance in the tubehot leg straight length. However, one ofthe tubes was significantly dented at thefirst support intersection and the probecould only reach a position immediatelybelow the dented region. The other twolocations were in the cold leg. The lowestcorresponded to the middle point in thepre-heater. The second cold leg locationwas at the same distance from thetubesheet as the hot leg second location.The sampling locations can also bereferred to the distance along the tubefrom the primary face of the hot leg.
7.1.2 Deposit Composition
Iron, nickel, copper and zinc are identifiedas the main contributors to the depositcomposition. Cobalt and chromium arepresent in trace amounts.
7.1.3 Deposit Loadings
If it is assumed that all metals arepresent as mixed oxides of the magnetitetype (ferrites), total deposit loadings canbe calculated.
Q 0 400 800 1200 1600Distance from Tube Sheet Hot Leg, cm
Figure 3: Variation of tube depositloadings along tube length. PNGS-A, U-1,SG-8, tube R13C64.
Figure 3 shows the variation of tubedeposit loadings expressed as milligramsof mixed oxide deposit per cm of tube
versus the tube position measured fromthe primary face of the tubesheet hot leg.
The lowest deposit loading correspondsto the lowest position in the hot leg, i.e.the entry point of the primary coolant inthe steam generator. There is an increaseof the deposit loadings with increasingdistance from the reference point in thehot leg; however, the reverse is true inthe cold leg. The results that wereobtained for the two tubes sampledcompared well. The available dataindicates that the deposit loadings gothrough a maximum at the top part of thebundle and slightly decrease in the bottompart of the cold leg where the pre-heateris situated.
The total amount of deposit in the tubecan be calculated by integrating thevalues obtained at the specific locationsover the complete length of the tube. Themass of deposit on each tube wascomparable and for tube R13C64 was 67grams.
Deposit thickness was calculatedassuming an average deposit density is5.2 g/cm3. This value was measured bypycnometry from Bruce NGS-A U-benddeposits.
TubePosition, cm
7445712401580
DepositThickness,jim, 0%Porosity6292322
DepositThickness,Urn, 50%Porosity12584644
Tablei: Deposit thickness for extremeporosity values for tube R13C64 atdifferent tube locations calculated fromthe deposit loadings and magnetitedensity.
Table 1 lists the calculated thickness fortwo different porosities, 0 and 50%,respectively. The latter is considered tobe an extreme but realistic value based on
206

deposit samplings from Bruce NGS-A U-bend removed tubes.
7.1.4 Radionuclide Distribution
Figure 4 reveals the variation of totalalpha, beta, and gamma activity at thedifferent tube positions. The distributionis similar to that of the deposits. Thehighest activity loadings are near the topof the hot leg, which coincides with thehigh deposit loadings.
The main radionuclides that contribute tothe gamma activity are Ce-144 and Ru-106. Each one separately accounts forapproximately 35% of the total gammaactivity. Co-60 accounts for 12%.Additional significant contributors are Ru-103, Sb-124, Sb-125, Ce-141, Eu-154,Eu-155, Zr-95 and Nb-95. The highcontributions of Ce-144 and Ru-106 arean indication of previous fuel failures inthe system. The presence of alphaemitting isotopes confirms the significantcontribution from the nuclear fuel to thetotal activity.
| 20
o§ 1 5
"•5
o
i< 74 457 1240 1580
Distance from tubesheet hot leg, cm• Total gamma Z] Total beta Q Total alpha I
Figure 4: Radionuclide gamma, beta, andalpha activity loading variation along tubelength. PNGS-A, U-1, SG-8, tubeR13C64.
7.2 Bruce NGS-A
7.2.1 Sampling Locations
The same criteria as in PNGS-A were usedin the tube selection. Deposits should nothave been disturbed by either inspectionor decontamination activities and the
...'
I [""•"• • • 1
tubes had to be representative of the tubebundle. Four tubes were sampled at sixlocations each, three in the cold leg andthe remainder in the hot leg. A total of 24tube locations were sampled/3/.
7.2.2 Deposit Composition
Iron, nickel and chromium are the mostimportant metallic contributors to thedeposit composition. Copper, zinc andcobalt were also detected.
7.2.3 Deposit Loadings
Figure 5 shows the variation of depositloading (calculated as mixed oxide) alongthe tube length for one of the tubes. Thedistribution pattern for rest of the tubessampled was similar.
100
!
c 5 0
J
0 400 800 1200 160Distance from Tubesheet Hot Leg, cm
Figure 5: Variation of tube depositloadings along tube length. BNGS-A, U-3,SG-2, tube R50C72.
The lowest loadings correspond to thebottom of the hot leg; the loadingsincrease with increasing distance fromthat position (moving up towards the U-bend). The loadings peak at or near theU-bend and then remain approximatelyconstant moving down the cold leg.
The patterns of deposit loadingdistribution with respect to tube positionfor PNGSA and BNGSA are similar andboth indicate highest loadings in theregion of the bundle where the steamquality on the secondary side is thehighest.
207
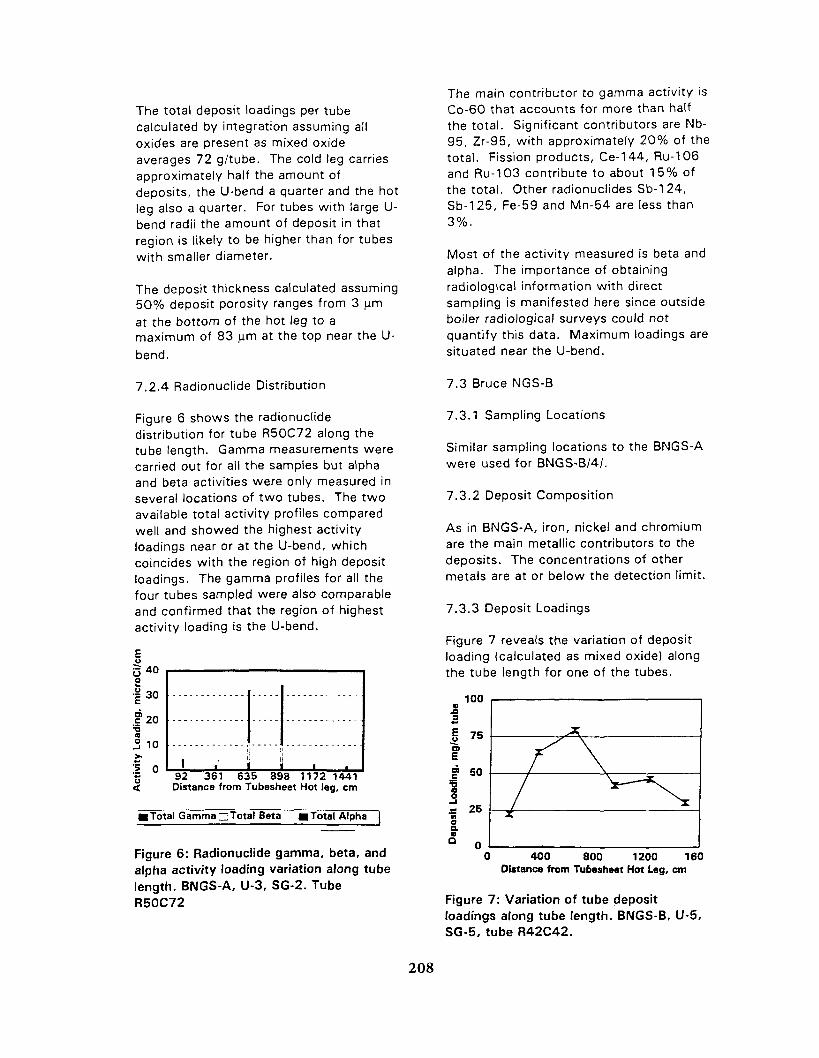
The total deposit loadings per tubecalculated by integration assuming alloxides are present as mixed oxideaverages 72 g/tube. The cold leg carriesapproximately half the amount ofdeposits, the U-bend a quarter and the hotleg also a quarter. For tubes with large U-bend radii the amount of deposit in thatregion is likely to be higher than for tubeswith smaller diameter.
The deposit thickness calculated assuming50% deposit porosity ranges from 3 j mat the bottom of the hot leg to amaximum of 83 ^m at the top near the U-bend.
7.2.4 Radionuclide Distribution
Figure 6 shows the radionuclidedistribution for tube R50C72 along thetube length. Gamma measurements werecarried out for all the samples but alphaand beta activities were only measured inseveral locations of two tubes. The twoavailable total activity profiles comparedwell and showed the highest activityloadings near or at the U-bend, whichcoincides with the region of high depositloadings. The gamma profiles for all thefour tubes sampled were also comparableand confirmed that the region of highestactivity loading is the U-bend.
2•| 30
=5a3 10>I 0
1 11 •
92 361 635 898 1172 1441Distance from Tubesheet Hot leg, cm
I Total Gamma Total Beta I Total Alpha
Figure 6: Radionuclide gamma, beta, andalpha activity loading variation along tubelength. BNGS-A, U-3, SG-2. TubeR50C72
The main contributor to gamma activity isCo-60 that accounts for more than halfthe total. Significant contributors are Nb-95, Zr-95, with approximately 20% of thetotal. Fission products, Ce-144, Ru-106and Ru-103 contribute to about 15% ofthe total. Other radionuclides Sb-124,Sb-125, Fe-59 and Mn-54 are less than3%.
Most of the activity measured is beta andalpha. The importance of obtainingradiological information with directsampling is manifested here since outsideboiler radiological surveys could notquantify this data. Maximum loadings aresituated near the U-bend.
7.3 Bruce NGS-B
7.3.1 Sampling Locations
Similar sampling locations to the BNGS-Awere used for BNGS-B/4/.
7.3.2 Deposit Composition
As in BNGS-A, iron, nickel and chromiumare the main metallic contributors to thedeposits. The concentrations of othermetals are at or below the detection limit.
7.3.3 Deposit Loadings
Figure 7 reveals the variation of depositloading (calculated as mixed oxide) alongthe tube length for one of the tubes.
100
75|
£ 50
§t 25
0 400 800 1200 160Distance from Tubesheet Hot Leg, cm
Figure 7: Variation of tube depositloadings along tube length. BNGS-B, U-5,SG-5, tube R42C42.
208

As in the BNGS-A measurements, thedistribution pattern for the rest of thetubes is similar. The depositloading/distance profile is similar to that ofBNGS-A in that the highest loadings arenear the U-bend. The correspondingdeposit thickness calculated, 1 to 84|im,and the total amount of deposit per tube,72 g, and its distribution among the hotand the cold legs and the U-bend is alsosimilar to BNGS-A.
7.3.4 Radionuclide Distribution
The main radionuclide contributor togamma activity is Co-60. Also importantand contributing each to between 8 and25% are Nb-95 and Zr-95.
Figure 8 shows the relative contributionsof radionuclides to the total activity. Thecontributing radionuclides are the same asin BNGS-A but the total gamma activitylevels are slightly higher in thismeasurement.
E
0SI
Load
inti
vity
o<
40
30
10
o
n
] 1 1145 361 635 946Distance from Tubesheet
• Total Gamma ~l Total Beta
1 11220 1489Hot Leg, cm
• Total Alpha
Figure 8: Radionuclide gamma, beta, andalpha activity loading variation along tubelength. BNGS-B, U-5, SG-5, tube R42C42.
Data shows little contribution from fissionproducts since there are very low levels ofalpha emitting radionuclides.
8.0 CONCLUSIONS
Oxiprobe can perform successful samplingof primary side corrosion products insteam generator tubes.
Consistent data has been obtained atthree CANDU stations. Depositcomposition, loadings and distributionalong the steam generator tubes areavailable from the measurements.
Alpha, beta and gamma radionuclideloadings and distribution along the tubesare now at hand for radiologicalrequirements.
Minor process modifications and aredesign of the delivery system couldreduce the time required for Oxiprobeimplementation. This would enable thesampling of a larger number of tubes for agiven time window which would improvethe statistical confidence of themeasurements.
ACKNOWLEDGMENTS
The authors would like to acknowledgethe contributions of R. Barton, J. Cocuzzi,and A. Robertson of Ontario HydroTechnologies, and D.M. Doyle of Babcockand Wilcox Industries Ltd.
REFERENCES
1. K.A. Burrill, 1s t Meeting of IAEACoordinated Research Program onModeling of Transport of RadioactiveSubstances in the Primary Circuit ifWater-Cooled Reactor, Ontario HydroHead Office, Toronto, 1997, May 5-9.
2. F. Gonzalez, A.M. Brennenstuhl, G.Palumbo, A. Robertson and J.Cocuzzi, Ontario Hydro TechnologiesReport No. A-NSG-95-162-P.
3. F. Gonzalez, A.M. Brennenstuhl, G.Palumbo, A. Robertson and J.Cocuzzi, Ontario Hydro TechnologiesReport No. A-NSG-95-163-P.
4. F. Gonzalez, A.M. Brennenstuhl, G.Palumbo, A. Robertson and J.Cocuzzi, Ontario Hydro TechnologiesReport No. A-NGS-95-164-P.
209

COooooo<
LABORATORY TESTS OF A MODIFIED 3He DETECTOR
FOR USE WITH STARTUP INSTRUMENTATION1
T. Qian2, P. Tonner2, N. Keller2, W.J.L. Buyers3
2Atomic Energy Canada Ltd, 'National Research Council Canada"Chalk River Laboratories, Chalk River, Ontario, Canada KOJ 1 JO
Key Words: startup instrumentation, neutron detectors.
ABSTRACT
Boron trifluoride (BF3) detectors arecurrently used in all CANDU®4 stations asstartup instrumentation (SUI) detectors formonitoring neutron flux during extendedoutages and startups. Experience at someCANDU stations has shown that somemodels of BF3 detectors degrade quickly,even in moderate neutron and gamma fields.
Degradation and life expectancy tests forfive models of BF3 detectors from differentmanufacturers were performed at ChalkRiver Laboratories (CRL) to investigate theproblem. The test results reveal that mostBF3 detectors have low neutron and gammadurability, and some exhibit an undesirabletime-dependent degradation followed byrecovery. As a result of this finding, otherdetector options including a modifiedhelium (3He) detector described herein wereinvestigated. Modified 3He detectors wereprocured from an established supplier andwere found to perform without degradationin neutron and gamma fields.
1. INTRODUCTION
Degradation during use and shortoperational life of BF3 detectors have longbeen recognized as a potential problem byresearchers in the area of neutron detection
1 AECL-l 1873, COG-97-436-I4 CANDU* is a registered trademark of AtomicEnergy Canada Limited (AECL).
[1-5]. BF3 detectors are currently used in allCANDU stations as startup instrumentation(SUI) detectors. Experience at someCANDU stations and subsequent laboratorytests at AECL's Chalk River Laboratorieshave shown that some models of BF3
detectors degrade quickly, even in moderateneutron and gamma fields [6].
The test results [6] reveal that most BF3
detectors have low neutron and gammadurability, and some exhibit an undesirabledegradation/recovery phenomenon. As aresult of this finding, other detector optionsincluding a modified helium (3He) detectordescribed herein were investigated.
Regular 3He detectors have been used inCANDU SUI only on rare occasions offresh-fuel conditions or very long outageswhen the greater neutron sensitivity ofregular 3He detectors is needed to obtainadequate count rates. For normal outagesand startups, neutron fields are much higher.Consequently, the high neutron sensitivity ofregular 3He detectors leads to count ratesthat are too high for the detector and theelectronics to handle. Also, typical 3Hedetectors are more sensitive to gammaradiation than BF3 detectors. This makes itdifficult to separate gammas from neutronswhen gamma fields are high. As a result ofthese operational disadvantages of regular3He detectors, only some CANDU stationshave them on hand and no station uses themroutinely [7].
210

Based on the physics of 3He detectors, it waspredicted that, by modifying the isotopic andchemical composition of the filling gas of aregular 3He detector, a reduced neutronsensitivity, equivalent to that of a normalBF3 SUI detector, can be achieved. It wasalso predicted that, because 3He gas is farmore stable than the BF3 gas, 3He detectorswould suffer less from degradation inneutron and gamma fields.
To assess the accuracy of these predictions,modified 3He detectors were procured froman established 3He detector supplier andtested in neutron and gamma fields. Thispaper discusses these tests and presents 3Hedetector test results and, for comparison,some of the results of similar tests for BF3
detectors.
In Section 2 we review the characteristics of3He and BF3 neutron detectors presently usedin CANDU SUI. Section 3 summarizes thetests conducted and Sections 4 and 5describe the test facility and test procedures,respectively. Section 6 presents test resultsfor modified 3He detectors, and comparesthem with those for the BF3 detectors.Section 7 discusses and analyzes the testresults and Section 8 concludes the paper.
2. CANDU SUI DETECTORS
Two types of neutron detectors have beenused in CANDU SUI systems: the BF3
detector and the 3He detector. Table 1 liststhe relative advantages and disadvantages ofthese two types of detectors.
The neutron sensitivity of an SUI detector isspecified by the number of counts persecond per neutron flux (cps/nv). The BF3
detectors currently used in CANDU stationsachieve a neutron sensitivity of about 4cps/nv with an overall length of 30 cm (12")and a diameter of 2.5 cm (1"). The neutronsensitivity of regular 3He detectors used inCANDU can be as high as 110 cps/nv. Thishigh sensitivity can be a problem, because of
the maximum count rate the electronics cancope with. The modified 3He detectors werespecified with different composition in thefilling gas to achieve a neutron sensitivitycomparable to that of BF3 detectors.
The thermal neutron detection mechanism inSUI detectors depends on neutron captureinteractions to convert the neutron tocharged particles, followed by thesubsequent detection of the chargedparticles. Of prime importance here is theQ-value of the reaction, which is a measureof the energy liberated following neutroncapture. The higher the Q-value, the greaterthe energy given to the charged particles,and the easier will be the task ofdiscriminating against gamma-ray eventsusing simple amplitude discrimination. The(n,p) reaction for 3He and the {n, a) reactionfor BF3 detectors are given below inequations (1) and (2), respectively [8]:
n + 3He 3H + p + 0.765 MeV
(1)
n + 10B -> 7Li* + a -> 7Li + a
+ 0.48 MeV 7 - ray + 2.31 MeV (94%)
->7Li + a + 2.79MeV(6%)
(2)
The Q-value for the 3He reaction induced bythermal neutrons is 0.765 MeV. Thedetection of neutrons in BF3 is based on 10B(n, a) reaction, which produces a reactionproduct of 7Li either in the excited state witha Q-value of 2.31 MeV, or in the groundstate with a Q-value of 2.79 MeV. Theexcited state 7Li* quickly decays (half-life of~1013 s) to its ground state with the emissionof a 0.48 MeV gamma ray.
The Q-values in (1) and (2) are indicated bythe peak locations in the spectra of 3He andBF3 detectors as seen by a multi-channelanalyzer (MCA). Figure 1 shows therepresentative MCA spectra for a 3He
211

detector and a BF3 detector. The distancebetween the spectrum peak and the gammatail also depends on the absolute gammasensitivity of the detector.
Figure 2 shows three typical spectra for agood, a degraded and a failed BF3 detector.Note that as the detector degrades, the peakin the spectrum reduces in height, broadens,shifts to the left and eventually disappearsaltogether.
3. TESTS CONDUCTED
Tests were conducted at CRL on five modelsof BF3 detectors (referred to as A, B, C, D,E), and one model of modified 3Hedetectors. For each model, three specimenswere tested to achieve statistically validresults. This paper presents mainly the testresults for the modified 3He detectors. Someof the test results for BF3 detectors are alsoincluded for comparison purposes.
Three phases of tests were conducted foreach model. The first phase was the generalmeasurement of the high-voltage plateau,tail pulse rise-time, pulse height and gasmultiplication. The second phase was theneutron test and the third phase was thegamma test. Most notable results wereobtained in the neutron and gamma tests.Therefore, only those results are presented inthis paper.
4. TEST FACILITY
In the neutron tests, the thermal neutronbeam from the N5 and E3 spectrometers atthe NRU research reactor at CRL was usedto test the degradation and life expectancy ofthe detectors under a thermal neutron flux.A schematic of the spectrometer setup isprovided in Figure 3. The neutrons from themoderator in the reactor core hit the crystalmonochromator placed at an angle to theincident neutron beam. Only the neutrons ofa certain wavelength can diffract from thecrystal, thus forming the desired thermal
neutron beam. The detectors to be tested areplaced in the thermal neutron beam in fourlocations. Removable absorbers betweenthe detectors and the incident neutron beamwere used to achieve the desired count rate,and to reduce the neutron flux temporarilywhen collecting spectra in an MCA.
In the gamma tests, the gamma irradiationswere done using an Ir-192 source with a halflife of 74 d (see Figure 4). A weak neutronsource was used to produce the spectra. Theneutron source was so weak that nodegrading effects occurred due to thissource. The energy spectrum of Ir-192 lies,for the most part, above 100 KeV and below1 MeV. In this energy range, the interactionof gamma-rays is primarily photoelectricabsorption and Compton scattering. Apolyethylene block was machined to placethe specimen detectors around the neutronand the gamma sources symmetrically. TheIr-192 was in a C-340 radiographic pigtailcapsule assembly, for use with an IriditronModel 520 radiographic exposure device(RED). With the RED, the gamma sourcewas conveniently withdrawn into theshielding flask, allowing the spectra fromthe weak neutron source to be collectedbefore and after gamma irradiation.
Standard SUI electronics modules were usedin the neutron and gamma tests. Theyincluded four preamplifiers, four shapingamplifiers, four high voltage power supplies,one single channel analyzer (SCA) and onerate meter. A multi-channel analyzer wasused to capture the pulse height spectra forthe detectors.
5. TEST PROCEDURE
The neutron tests were conducted in twostages: Stage 1 neutron flux produced aneutron count rate in the detector in theorder of 30 kHz. Stage 1 lasted 3 - 4 daysto yield a cumulative count for each detectorin excess of 1010. The 10'° counts which isequivalent to about two months exposuretime in a reactor at a count rate of 2000
212

counts per second, is specified as the lowerlimit of life expectancy for the BF3 detectorsby one manufacturer. Other manufacturersquote longer life expectancies. Stage 2neutron flux produced a much higherneutron count rate in the detectors(calculated to be in the order of 300 kHz).Stage 2 tests also lasted one to two daysachieving cumulative counts in excess of1.2E10. Throughout the neutron tests,spectra for each detector were collected oncea day, with the absorbers temporarilyinserted to reduce the count rate to a fewkHz.
The gamma tests were conducted in agamma field in the order of a few kR/h, withgradually increasing exposure time to give atotal cumulative gamma exposure of about100 ~ 500 kR.
6. TEST RESULTS
Detailed test results for all the five modelsof BF3 detectors and one model of 3Hedetector were contained in CANDU OwnersGroup (COG) reports [6, 9]. Highlights ofthe results have also been published [10, 11].In the following, the results for the 3Hedetector tests are presented and comparedwith some of the results of BF3 detectortests.
6.1 Neutron Test Results
The spectra of the modified 3He detectorbefore and after the stage 1 neutron tests(cumulative counts in excess of 1010) areshown overlapped in Figure 5. There is verylittle change in the spectrum shape. Figure 6shows the spectrum of a 3He detector at theend of stage 2 (cumulative counts in excessof 1.2E10) overlapped with the spectrumtaken at the beginning of neutron tests. Still,there is very little change in spectrum shapeindicating almost no degradation at all.
In contrast to the 3He stability, two modelsof BF3 detectors showed significant changes
even during stage 1. Figures 7 and 8 showthe spectra at the beginning and at themiddle of stage 1 neutron tests for model C.Figures 9 and 10 show the same for modelD. The degradation evident in these figuresis so bad part way through Stage 1 thatStage 2 tests were not done for models Cand D detectors.
Figure 11 shows the degradation of BF3
detector model A, with three spectraoverlapped showing the spectrum shapeevolution at the beginning of stage 1, at theend of stage 1, and at the end of stage 2.Figure 12 shows the same for model B. Asis evident from these figures the degradationdue to neutron is not as bad for these twomodels but is still quite serious.
6.2 Gamma Test Results
Gamma test results show the mostsignificant difference between the BF3 andthe modified 3He detectors, and betweendifferent models of BF3 detectors.
Figure 13 shows spectra of a 3He detector atthe beginning of the gamma test, after acumulative exposure of 3.2 kR, and after acumulative exposure of 12.6 kR. Thespectra at the beginning and end of thegamma test when an exposure of 410 kR hadbeen achieved are overlapped in Figure 14.Even for this extreme exposure there is nodetectable degradation what so ever.
Figures 15 and 16 show spectra of model CBF3 detector at the beginning of the tests andafter initial gamma exposure. Figures 17and 18 show the same for model D. As isevident from these figures, BF3 detectormodels C and D that showed low neutrondurability, even in stage 1 neutron tests, alsofailed shortly after exposure to gamma, andshowed no sign of recovery with prolongedgamma exposure.
Figure 19 shows the overlapped spectra ofmodel A BF3 at the beginning of the gammatest and after a cumulative exposure of 1.6
213

kR. Figure 20 shows the same for model B.As is evident from these figures models Aand B BF3 detectors showed significantdegradation after the initial gammaexposure. The most significant degradationwas observed during the initial exposurewith a cumulative exposure of less than 10kR. Some gradual recovery with prolongedgamma exposure was also observed (notshown here).
Comparing 3He spectra (Figures 13 and 14)with those of BF3 detectors we can see thegamma tails in the spectra of the modified3He detector are further to the right thanthose in the BF3 spectra (but similar to thatof a regular 3He). This indicates that 3Hedetectors whether modified or not have ahigher gamma sensitivity.
7. DISCUSSIONS AND ANALYSES
Throughout the tests, the modified 3Hedetectors showed the same level of neutroncount rate as the BF3 detectors in the sameradiation fields. This indicates that themodified 3He detectors achieved the samelevel of neutron sensitivity as that of BF3.
The 3He detectors showed very stableperformance throughout the neutron andgamma tests with almost no detectabledegradation, and no degradation/recoveryphenomenon as observed in some models ofBF3 detectors. This robust behavior makesthe 3He detector particularly suitable for useas a reliable removable SUI detector. Thisvery stable 3He detector is also a candidatefor a possible new design of permanentlyinstalled CANDU SUI detectors.
The gamma sensitivity of the modified 3Hedetector, like regular 3He detector, is higherthan that of BF3 detector. However, this isnot a serious limitation, the very stablespectrum of the modified 3He detector inhigh neutron and gamma fields makes itpossible to set the SCA threshold at a higherlevel than that used for BF3 detectors. It is
thus possible to provide sufficientdiscrimination against gamma radiation.
8. CONCLUSIONS
The neutron sensitivity of the modified 3Hedetector is the same as that of BF3 SUIdetectors. The modified 3He detectorsshowed superb stability during neutron andgamma tests compared to all models of BF3
detectors, and a great potential for use asCANDU SUI detectors. The gammasensitivity is somewhat higher than that ofthe BF3 detectors. However, the very stablespectrum shape of the modified 3Hedetectors, even in high neutron and gammafields, makes it possible to set the SCAthreshold at a higher level than that used forBF3 detectors so as to discriminate againstthe gamma. The modified 3He detectorshows great potential for use as CANDUSUI detectors.
ACKNOWLEDGMENTS
Don Tennant at CRL helped in doing theneutron tests. Paul Reynolds at CRL helpedin procuring and handling the radioactivesource for the gamma tests.
The work reported in this paper was fundedby the CANDU Owners Group (COG) R&DProgram:
Working Party No. 16, WPIR 1634
REFERENCES
[1] R.K. Soberman and S.A. Korff,"Deterioration of Boron TrifluorideCounters Due to High Counting Rates", TheReview of Scientific Instruments, Vol. 24,No. 11, 1953 Nov., pp. 1058-1060.
[2] A.J. Stokes, T.J. Meal and J.E. Myers,Jr., "Improved Performance of BF3 NeutronCounters in High Gamma Fluxes", IEEETrans, on Nucl. Sci., 1966 Feb, pp. 630-635.
214
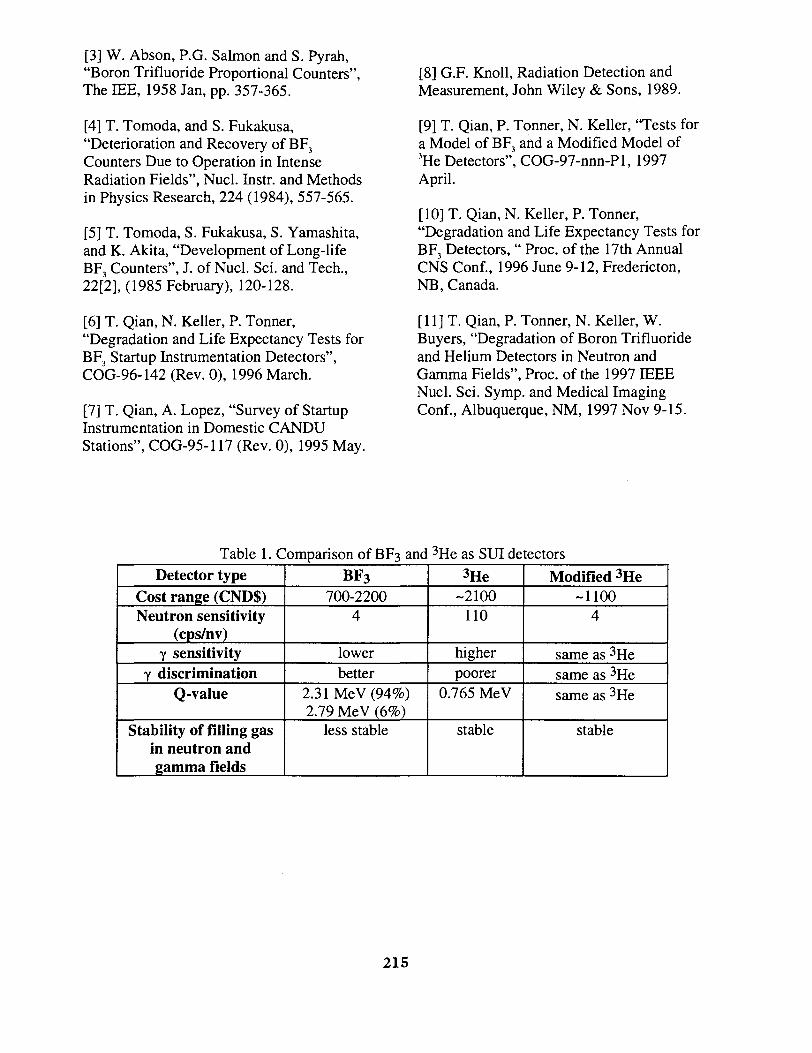
[3] W. Abson, P.G. Salmon and S. Pyrah,"Boron Trifluoride Proportional Counters",The IEE, 1958 Jan, pp. 357-365.
[4] T. Tomoda, and S. Fukakusa,"Deterioration and Recovery of BF3
Counters Due to Operation in IntenseRadiation Fields", Nucl. Instr. and Methodsin Physics Research, 224 (1984), 557-565.
[5] T. Tomoda, S. Fukakusa, S. Yamashita,and K. Akita, "Development of Long-lifeBF3 Counters", J. of Nucl. Sci. and Tech.,22[2], (1985 February), 120-128.
[6] T. Qian, N. Keller, P. Tonner,"Degradation and Life Expectancy Tests forBF3 Startup Instrumentation Detectors",COG-96-142 (Rev. 0), 1996 March.
[7] T. Qian, A. Lopez, "Survey of StartupInstrumentation in Domestic CANDUStations", COG-95-117 (Rev. 0), 1995 May.
[8] G.F. Knoll, Radiation Detection andMeasurement, John Wiley & Sons, 1989.
[9] T. Qian, P. Tonner, N. Keller, "Tests fora Model of BF3 and a Modified Model of3He Detectors", COG-97-nnn-Pl, 1997April.
[10] T. Qian, N. Keller, P. Tonner,"Degradation and Life Expectancy Tests forBF3 Detectors, " Proc. of the 17th AnnualCNS Conf., 1996 June 9-12, Fredericton,NB, Canada.
[11] T. Qian, P. Tonner, N. Keller, W.Buyers, "Degradation of Boron Trifluorideand Helium Detectors in Neutron andGamma Fields", Proc. of the 1997 IEEENucl. Sci. Symp. and Medical ImagingConf., Albuquerque, NM, 1997 Nov 9-15.
Table 1. Comparison of BF3 and 3He as SUI detectorsDetector type
Cost range (CND$)Neutron sensitivity
(cps/nv)Y sensitivity
y discriminationQ-value
Stability of filling gasin neutron andgamma fields
BF3
700-22004
lowerbetter
2.31MeV(94%)2.79 MeV (6%)
less stable
3He-2100
110
higherpoorer
0.765 MeV
stable
Modified 3He-1100
4
same as 3Hesame as 3Hesame as 3He
stable
215

. Gamma tail and low-J> amplitude noise
Spectrum of aBF3 detector
Spectrum of a3 He detector
0.765 2.31 2.79Energy (MeV)
Figure 1. Typical spectra of BF3 and 3He detectors
en4-1
3O
o
Gamma tail and low-amplitude noise
threshold
good
Energy (MeV) 2.31 2.79Figure 2. Typical spectra for a good, degraded, and failed BF3 detector
216

, Main Beam Monitor
, Incident Beam
r Diffracted Beam Monitor
Lucite Absorbers
Diffracted Beam2" x 2" beam
Monochromator Crystal 4 detectors to be testedLocations 1, 2, 3 and 4 *— Spectrometer detector
Figure 3. Neutron test facility of spectrometer at NRU reactor
lr-192 Gamma Source
A - A
Figure 4. Polyethylene block for holding the sources and the detectors
217
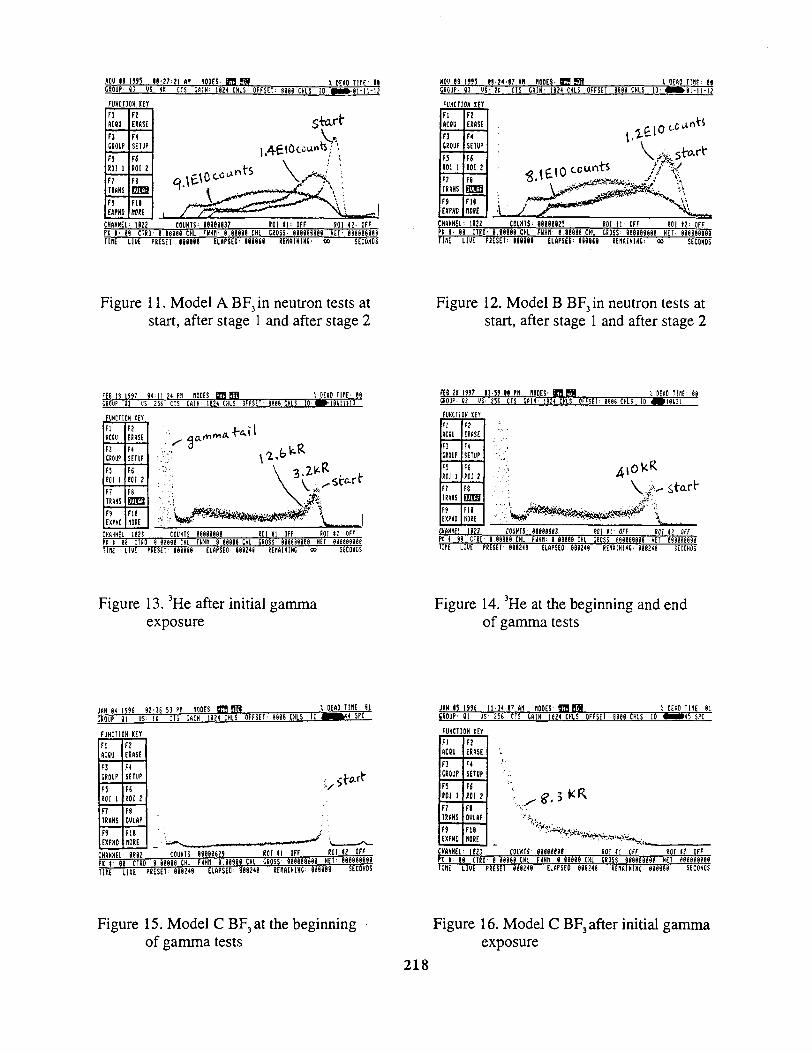
m H i?» I8^:?i un ma- m m
FUHCI10II XIIFlKW
FJCROUP
f5SOI 1
F7TRAHS
F}txm
F!EUSSE
FtSETUP
F«KOI 2
FB
sinsFitMRE
; OEHO T1HE' H H 1*55 H . J 4 ' I 7 IB BODECtOUP' 83 US' 2 t CIS CÂTFPE9= am m
' 1824 CHL5OFFSET I CKLS 10
; KM Ul\t- 18
Frøer:FIfiCtl!
F3CROUP
F5(0) 1
F?TROUS
FSEXPHO
» nrF2ERASE
F4SETUP
FS10! i
F8
suaFilmi
CHAHHEL' 1822Pt I 81 CTRD'
TlnE U U E P R E S Ë F T Ï 8 8 I 8 ELAPSED' I I U M (EltfHHIHC
COUHTS- 99896835 »01 H ' OFF BOI M OFF8.88888 CHL fMHfl 8.88888 CHl CROSS' 888888888 HET 8I8888888
~LÎÛI PÏËSÈTTÎÏm ËÛPlETTÎëÏH 8EHAIHHC' ôô~ SECONDS
Figure 11. Model A BF3 in neutron tests atstart, after stage 1 and after stage 2
Figure 12. Model B BF3in neutron tests atstart, after stage 1 and after stage 2
FEEt 18 1997 i fa HOPES- , DEflD TinE ; >8CROUP H US 25{ CIS C»IK' I82< CHLS OFfSET »888 CKLS 10 i i t i i t n
fUHCTlOM KEYFlACIUF!CIOUPF5M l 1F7TRANSF5EXPKO
nERASEFtSETUP
FSMI 2
F8Ö3J3JF18HORE
CHANNELn i a
1823C1R0 «
COUNTS8 8 8 8 i CHL
8888888BF U H n t 88888 CHL
ROI t l -S PCI 5 S
OFF81881881
(0118 HE1
12: OFF688888189
FE8 28 l » 7 » : S M M I 1 BODES= M MCROUP' K «%• 25t CTS C»IH- 1824 CKLS 0FFSÊF i CKLS 10
\JEAO TinE 88~~JHêÎ3 Ï
FUKCTIOK ( E ÏFlSCQJ
F3CMUF
F5ROI 1F7IRAKS
FSEXPNO
F2ERASEFtSETUP
F6ROI 2
F8SMSFI8KÖRE
;•;;• Ä » o y < R
\ ^ start
T InE LIVE PRESET 8 8 I 8 I 8 ELAPSED 8882« !
amii 1123K t 88 CTRlIKE L IK
COUNTS-• «^ 1 88818 CHL FPRESET' 8882*8
»mmm 8.81888 CHLELAPSED : 8882t8
NI II'CROSS
RENA
OH188181I N I N l
Ï5Î!881 HET
896216
12 OK881691898
SECOHOS
Figure 13.3He after initial gammaexposure
Figure 14.3He at the beginning and endof gamma tests
JAH 8< I W 8 2 3 6 53 Pfl HOPES M i E BCROUP t i US U CIS GftiH 182t CHLS OFFSET' 8888 CHLS
FUHCTIOHJEJLFlactu
F3CROUP
F5Ml I
nTCflHSFSEXPHO
F2ERASE
FtSETUP
FS«01 2
F8OUI»P
FI8noRE
CHAWHEL' 8882
mr"TW
801 K OFF» *AHaa CHL Y m ' Y 88888 CHL CROSS' 888888888 HET' 888888887
ElflrSEO 888248 REnAIHIHC' 888888 SECOHDS
COUHTS 68998623 »01 II' OFF8 88818 CHL FHHII- 8.88889 C...
PRESET 9682t8 ELDFSEO' 888248SEflftlHIHt 888988 SECOHDS
JAH l î i » { H '3417 an HOPES 9BBJHCROUP' 81 US 256 CTS CftlH' 1824 CHIS OFFSET
FUKCTIOH KEYFlACtU
F3CROUP
F5«01 1
F?TMHS
F9EXPND
F2ERASE
F4SETUP
F(Ml i
F80UUP
FitBORE
h I' 88 C
nsÊ LIVE
COCHIS 988888« H I II OFF ROI I? OFF88 CTItO 6 88888 CHL FHHB 9.88898 CHL CROSS 888818898 HET W8888686LIVE PRESET 988248 ELAPSEP 889248 REHAIH1HC 8 8 8 8 8 8 S E C O H O S
Figure 15. Model C BF3at the beginningof gamma tests
Figure 16. Model C BF3 after initial gammaexposure
218

M it 1W 83 <1 86 ar nooES B!H EPH i OEBO TIWEwwr K K- 2t cis cam iazt cms OFFSET 9898 CHIS IO•<
Fwiciim
Kill
CROUP
KOI 1
EKPMD
ERASE
SETUP
KOI 2
JOKE V 1CHAHHEL' 1823 COUHTS' 86888883 ROI I I ' OFF ROI 12Ft I ' 19 CTRO' 8 61888 CHL F»HH' 8.88881 CHL CROSS' 666968168 HEI "TlflE LIUE PRESET' 188241 ELAPSEO' 161961 REHAIHUC 868246
JM 12 15)7 8 8 ' 8 M 5 SB HOPES' B B E f f l I OEAO TIHE 88tP.OIIP' 82 US' 21! CTS CAIK' 1824 CHLS OFFSET' 8888 CHIS ID 1 - 8 ; l » i :
FUHCTIOH HE<FlACtU
F3CROUP
F5f 01 1
F7TRAKS
F)EKPKO
F2ERASE
F(SETUP
F6ROI 2
F8H3JH
FI8
V stwt22/
CHIIHHEL' 1823 COUHTS' 61888894 HOI II OFF88 CDiO 9.88188 C»L FMKH- 8-88891 CHL CROSS; 991991888 HET- 988819888
C M p lE i rn i te l t ELAPSED two eEnaiHinc 35 SECONDS
Figure 5.3He before and after stage 1neutron tests
Figure 6.3He before stage 1 and after stage 2neutron tests
FE8 1? 1856 13 ?8 8J M HOPES' B H M >. HEAP THE'CKOUP' 01 US' 41! CTS GftlH 1824 CHIS OFFSET'
FUHCTIOH KEY
FlACOU
F3CROUP
F5ROI 1
f?TRANS
F9EXPHO
nERASE
F«SETUP
HROI 2
F«OULAP
Fl«KORE
CHAHMCl' 8784 COUHTS' 89983118 ;oi ti' O F F 13 OFF?t t 88 CUD 9.88818 CHL FHHH- 9 89988 CHL CROSS' 888998889 HET
HUE LIUE PRESET' 888248 ELAPSED' 888868 REIialHlHt 889248 SECONDS
FE8 13 1836 88 5133 All HOPES- K B BJH I OEflD TIHE' 88CROUP' 01 US' 41! CTS CAIH' 1824 CHLS OFFSET' 8888 CHLS
FUHCTIOH KEf
.ts
F lACID
F3CROUP
F5ROI 1
F7TRAHS
F5EXPHO
F2ERASE
F4SETUP
F6RO) 2
F8OULAF
F18nORE
CHAHHELFt t' 86 CTRO 6 88888 CHL FHHn- 9.88986 CHL CROSS 888888886 HET 99e9988e8TTnE UHl PRESET 888248 ELAPSED' 8886e6 SEMIHINi 889248 SECOHOS
Figure 7. Model C BF3 at the beginningof stage 1 neutron tests
Figure 8. Model C BF3 in the middle ofstage 1 neutron tests
EELCROUf
I 1996 6 3 1 ? 36 PB81 US' 5 1 2 CTSCAli
tS' MM1824 CHLS OFFSET
FUHCTIOH tEVFlaceu
F3CROUP
F5ROI 1
F7TRAHS
FSEXPNO
F2ERASE
F4SETUP
F6ROI 2
F9OVLAP
FitItORE
CHAHHEL' 8768
Start
COUHTS' 88888472EL 8768 COUHTS 8888Ft I ' 88 CT8D 8 88888 CHL F»HH' 8.88888 CHLHUE LIUE PRESET' 8)8248 ELAPSED' 611868
• OEAO T1HE' 81
8472 ROI I I ' OFF R' 8.88888 CHL CROSS' 888888888 HELAPSED' 611868 REtlAIHINC' ! 8 t 2 «
I 12 OFF8888888888888888?
SECOHOT
US"1 8 ' 3 1 ' 3 6 AH BOOL.
I t CTS CAIH' 1824 CHLS OFFSET'
FBHCT10H 111Fl»cey
F3CROUP
F5HI 1
F7TIAHS
FJEXPHO
F2ERASE
F4SETUP
F6RO! 2
F8OVLAP
FitIIORE
HUE
COUHTS886 CHL
WHHEL' 888 COUHTS;• I 69 CTtQ 1 9 9 8 8 6 CHL I 1 .198H LIUE PRESEi'968248 ELAPSEO
--.'8541 ROI U ' OFF
»HH' 1.66888 CHL CROSS 168819986 HfTROI OFF
i«5 REMIHIHC' 898248 SECOHDS
Figure 9. Model D BF3 at the beginningof stage 1 neutron tests
Figure 10. Model D BF3 in the middle ofstage 1 neutron tests
219

m n is« i? 3S 99 n HOPES an M : OEAP TIRE
FUHCT1ON KEY
FlfiCÛU
F3GROUP
F5toi i
F?TRANS
FSEXPND
F2ERASE
F<SETUP
FS«0! 2
F8OULAP
F18HO«
.]./
CHANNEL: eseaPK 1- 88 CTROTIKE UDE
COUHTS^8 88888 CHL
PRESET 888248
88888899f'JHil 8.88898 CHL
ELAPSED 888248
RO! II OFFCROSS- 888888
ttBAlHlM
801888 KET888248
12 OFF888888888
SECONDS
-Ea 19 1996 n - n - 4 ; pn HOPES• 6CH ETH
M O P - 81 (IS- 256 CIS CAIN- 1634 CHLS OFFSET
FUHCTIOH XII
bf-
n»CBUF3CROUP
F5ROI 1
F?TRANS
FSEXPHÜ
F2ERASE
F4SETUP
FfROI 2
F8Ol'UF
FI8HORE
-NAHHEL 1823% 1- 86 UllIK LIK
COUNTSi 8 8888« CHLPRESET 881248
1888181FNHfl 1
ELAI
18l . l i'SEI
mt i) 881
.HLlit«
ROI IICROSS i
R£nai
OFF98888888SIN; 8
Cl 18 HET e8824«
: OFF
SECONDS
Figure 17. Model D BF3at the beginningof gamma tests
Figure 18. Model D BF3 after initial gammaexposure
« C 86 1S9Î I I - 3 4 : 2 9 P« HOOtS- 8BH tf i l iGBOUF: 82 US- 25< CTS M I N ' 1124 CHLS OFFSET^
FUHCTIOH KEY
>, DE«O T I K - 14
FlflCOU
F3CROUP
F5ROI 1
F?TRANS
F9EXPHO
F2ERASE
F4SETUP
F(ROI 2
F8HJJJjFii»ORE
CHAHHEL- 1823- * u a £ ^
COUNTS 8181888888881 CHL
ROI II OFF
TIDE LIUE PRESET M i . ' M8 88888 CHL CROSS 818888888 HET 888888888
ELAPSED 888248 REItalHIHC 888248 SECONDS
DEC > i » S i 8 1 3 1 8 2 PB BODES: ffB EPH X DEAD TIBE'UOUP
FUHCT
FlACtU
F3CROUP
F5ROI 1
F?TRAHS
FSEXPKD
12 V5
N «EY
F2ERASE
F4SETUP
HRO) 2
F!
(MSF18BORE
Z5b CIS GAIN: 1824 CHLS OFFSET 1888 CHLS [0 « • » ! ? - ! «
CH«HHEL 1823 COUHTS: 18181888 RDI Ih OFF ROI tl OFFH t- 18 CTRD- 8 81888 CHL F»KU 8.88188 CHL CROSS: 888888888 HET 898888888TIBE LIVE PRESET: ejjjtj EL6PSE0 188248 REBAINIHC 888241 SECDH05
Figure 19. Model A BF3 initial degradation Figure 20. Model B BF3 initial degradation
220

SELF-HEATING, GAMMA HEATING AND HEAT LOSS EFFECTS ON
RESISTANCE TEMPERATURE DETECTOR (RTD) ACCURACY1
T. Qian, W. H. Hinds, P. Tonner
AECL, Chalk River Laboratories, Chalk River, Ontario, Canada KOJ 1 JO
Key Words: self-heating, gamma heating, stem loss, RTD.
i: COi O
OOoo<
ABSTRACT
Resistance temperature detectors (RTDs) areextensively used in CANDU®2 nuclearpower stations for measuring variousprocess and equipment temperatures.Accuracy of measurement is an importantperformance parameter of RTDs and hasgreat impact on the thermal power efficiencyand safety of the plant.
There are a number of factors that contributeto some extent to RTD measurement error.Self-heating, gamma heating and the heat-loss through conduction of the thermowellare three of these factors. The degree towhich these three affect accuracy of RTDsused for the measurement of reactor inletheader temperature (RIHT) has beenanalyzed and is presented in this paper.
1. INTRODUCTION
Resistance temperature detectors (RTDs) areextensively used in CANDU power reactorsto measure various process and equipmenttemperatures. Accuracy and response-timeare the two key RTD performanceparameters. For steady-state temperaturemeasurement, the major concerns are theaccuracy and stability of the measurement.
1 AECL-11874, COG-97-437-I2 CANDU® is a registered trademark of AtomicEnergy Canada Limited (AECL).
For dynamic temperature measurement,there is also a requirement that the response-time of the RTD measurement be fastenough [1,2].
The accuracy of the RTD measurement atsome locations in the reactor directly affectsthe efficiency of reactor power generation.One such location is the reactor inlet headertemperature (RIHT) measurement. Theupper limit of the reactor inlet headertemperature is one of the parameters thataffects critical heat flux in the fuel channeland the integrity of the fuel. This is anuclear safety limit that cannot be exceeded.An increase in the accuracy of the RIHTmeasurement means a reduction in theallowance for the instrument error includedin the limit. This will allow the RIHT to becloser to the limit and will result in anincrease in reactor power output. Forexample, the reactor thermal power output iscalculated based on measurements oftemperature difference, AT, between theoutlets and the inlets of the reactor primaryheat transport system, the flows of thecoolant, and on the derived exit quality (thesteam content) of the coolant. Since AT isless than 50 °C, an improvement of only 1°Ccan mean about 2% increase in reactorpower output, and a significant increase ingenerating revenue. Consequently, accuratemeasurement of AT with a minimum marginof uncertainty is a very desirable goal. Itwas calculated that an increase of RIHT by1°C would increase the boiler pressure by 83
221

kPa, which could increase the output by 15MW per unit [3]. A study of various factorsthat affect the accuracy of RIHTmeasurement was conducted by BNGS andNTS staff [4, 5]. This paper describes acompanion study on three factors that limitaccuracy: self-heating, gamma heating, andconductive heat loss through thermowellthat houses the RTD [6].
The paper is organized as follows: Section 2introduces how self-heating affectstemperature measurement, the limitation ofan estimate of RTD self-heating based onmanufacturer specification, and a method ofmeasuring self-heating index in-situ forcalculating the self-heating error of RTDs inoperating condition. Section 3 describes theerror caused by gamma heating and anestimate of gamma heating effect on RIHTbased on the known maximum gamma fieldand the mass of the thermowell. Section 4describes how conductive heat loss willaffect accuracy of temperature measurementand provides a calculation of conductiveheat loss in the RIHT case. Section 5concludes the paper.
2. SELF-HEATING
The resistance of an RTD varies almostlinearly with the temperature it measures.Therefore it is possible to measure thetemperature by measuring the resistance ofthe RTD. The relationship of resistance withrespect to temperature of industrial RTDs isspecified in various standards including IECstandard 751 [7].
Measurement of RTD resistance requires acurrent through the RTD. This current /,though small, will produce Joule heatingproportional to I2R in an RTD of resistanceR, and result in a temperature error. Toreduce this so-called "self-heating" error,one needs to reduce the current: the smallerthe current, the smaller the self-heating
error. However, there is a lower limit incurrent because of other considerations suchas noise problems, and signal-to-noiseratios. The RTD standard recommends thatthe current used to measure steady-stateresistance of an RTD be small enough tolimit the power dissipation in the RTD tonot more than 0.1 mW [7].
The self-heating index (SHI) is an RTD self-heating characteristics normally supplied bymanufacturers. The SHI is the ratio ofresistance changes (in ohms) to unit electricpower generated in the RTD sensingelement (in mW) as the result of applicationof electric current. Sometimes the SHI isexpressed as the reciprocal, i.e., theelectrical power needed for unit resistancechange. It may also be expressed astemperature changes (as opposed toresistance change) per unit electric powergenerated in the RTD, since the relationshipbetween temperature and resistance has beenwell defined in standards. Based on the SHIthe self-heating error can be calculated foran RTD for a given current. An example isgiven below.
The SHI for Rosemount model 104-1584RTD is given as 25 mW/ °C for a bare RTD[8], which means that every 25 mW electricpower dissipated in the RTD will result in a+ 1 °C error in RTD output.
As provided in RTD resistance table in [7],the RTD resistance R. at 250 °C is:
R, = 194.10Q (1)
If a 7 mA current, /,, is applied, then thevoltage across the RTD is:
V, =/? ,*/ , =194.10*0.007
= 1.3587V «1.4V(2)
The power Pt dissipated in the RTD is:
222

pt =V,*I, =1.4*0.007
= 0.0098W = 9.8m W(3)
From the SHI specification of 25mW/ °Cand the operating temperature, thetemperature over-estimate error is about+0.4 °C.
There are several limitations in estimatingself-heating error based on themanufacturer-supplied SHI. One limitationis that the specification supplied is for bareRTDs not for RTDs housed in thermowells(see Section 4 for description of athermowell), which are common in a nuclearpower reactor. More importantly, themanufacturer's SHI is determined at room-temperature in water flowing at 1 m/s,whereas the RIHT RTDs are working at amuch higher temperature and flow rate.Also in CANDU, the thermowell is oftenimmersed in heavy water which has adifferent thermodynamic property than lightwater. Though standard methods such asthat given in IEC Standard 751 are used tomeasure the SHI, the standard method, likethe one used by the manufacturer, isspecified for specific temperature and flowconditions (an ice bath in IEC 751) only.Consequently, the +0.4 °C error estimateabove is condition-dependent and cannot beused as a correction to the RTD output.
As mentioned above, self-heating errorwould result when RTDs are calibrated inone environment and used in anotherenvironment. For example, RTDs calibratedin an oil bath and subsequently used inflowing water may have significantlydifferent SHIs [9]. Therefore the best wayto determine the self-heating error is tomeasure the SHI with the RTD in-situ. Aprocedure for measuring in-situ SHI is givenbelow based on an earlier EPRI report [10].The procedure is based on steady statemeasurement. Currents of different strength
are injected into the RTD and the steady-state resistance (and hence, temperature) dueto these currents are measured as follow:
(1) Increase the RTD current incrementallyfrom 1-6 mA to 20-60 mA.
(2) Measure the RTD resistance whensteady state is attained after eachincrement in current.
(3) Calculate the amount of power generatedin the sensor from:
P = I2R(4) Plot the values of resistance as a function
of electric power dissipated in the RTD(R vs. P).
A typical plot would show a straight linesuch as that shown in Figure 1 [10]. Theslope of the line, i.e., AR/AQ, is the SHI atthe operating temperature. It was reportedthat the value of SHI was quite differentfrom one RTD to another, even when theywere the same design [10]. This proves thethermodynamic condition dependence of theSHI. Therefore, the SHI of one RTD shouldnot be used to specify another RTD of thesame type at a different location or underdifferent conditions. However, if the SHIcan be correctly measured in situ for aparticular condition, the RTD error due toself-heating for that particular condition canbe accounted for.
3. GAMMA HEATING
When an RTD and a thermowell are exposedto a gamma field, they will absorb some ofthe energy carried by the gamma radiation.Gamma rays are a high energy form ofelectromagnetic waves. Their interactionswith other materials basically are in threeways: photoelectric effect, Comptonscattering and pair production. Theinteractions cause the temperature of theRTD assembly to increase. This will causethe RTD measurement to read higher thanthe actual ambient temperature it is
223

measuring.
The approach used in estimating the boundof RTD measurement error caused bygamma heating is based on the knowledge ofthe gamma field and the mass of the RTDassembly. In CANDU, the headers andfeeders are shielded from the accessibleareas of the reactor building by the concretewalls and roof of the fueling machine vault.Inside the vault, these components give riseto gamma fields as high as 1 Gy/h=100 R/h.
1 h -Jlkg J
3600 s • kg
W= 0.000278 —
kg(4)
This value can be used to estimate a boundof the gamma heating on the thermowell (themass of RTD is small relative to thethermowell and can be neglected).
Assuming the mass of the thermowell is 3kg and all gamma energy is deposited in thethermowell without heat-loss, then theheating power is:
0.000278 — * 3kg = O.OOO83W = 0.83m Wkg
(5)
Therefore, the energy due to gamma heatingis less than one-tenth of the energy of theestimated RTD self-heating. Thus thetemperature error due to gamma heating canbe neglected.
4. HEAT LOSS THROUGH THETHERMOWELL
The RTD thermowell is a protective jacketused to isolate the RTD from the processfluid and to permit easy replacement of theRTD. The measurement of a fluidtemperature by an RTD placed in athermowell could introduce errors due to
conductive heat loss through the thermowell,if proper consideration was not given in theinitial design. This heat-loss error issometimes referred to as stem loss [9].
The mathematical expression of the errorcaused by conductive heat-loss through thethermowell can be found in standard heattransfer texts. The authors re-derived theequation using two assumed boundaryconditions: (1) at the pipe wall, thetemperature difference is that between theambient temperature and the fluidtemperature inside the pipe, and (2) at theRTD end of the thermowell, there is zerotemperature gradient with distance along thethermowell. The difference in temperaturebetween the fluid and the well near the pointat which the RTD is located represents theapproximate error due to heat loss throughconduction from the thermowell. Thetemperature error, T, may be expressed as[12]:
T = *e cosh(ML)
(6)
where
Tw= temperature difference between theheader pipe wall (in which the well isinserted) and the fluid, °C.
L = length of the well in m, and
M=(f7iD/kA)I/2,m"' (7)
f = film conductance from the side wall ofthe well to the fluid, W/m2 K.
D = outside diameter of the well, m.
k = thermal conductivity of the well,W/mK.
A = cross sectional area of walls of the well,m2.
224

To solve equations (6) and (7), it isnecessary to obtain the film conductance f.In heat transfer theory [13], f in units ofW/m2K can be calculated using,
Nu k(8)
where Nu is the Nusselt number, k isthermal conductivity of the fluid, and D isthe well diameter. The Nusselt number canbe expressed as:
Nu = aRe Prc, (9)
where a, b, c are constants, Re is theReynolds number and Pr is the Prandtlnumber. Note that the Reynolds number andthe Prandtl number are unitless numbersgiven by:
Re =
Pr =
GD(10)
(11)
where
G = flow per unit area, kg/m2 s.
p. = dynamic viscosity of the fluid, Pa s.
cp = specific heat of the fluid, J / kg K.
k = thermal conductivity of the fluid,W/mK.
Substituting (9), (10) and (11) in (8), thefilm conductance can be expressed as:
(12)ak GDbcpji
Note that there are a number of choices forthe constants a, b, c. There seems to be no
absolute method to choose these constants inthe literature. Generally the practice is touse a few commonly used groups accordingto the range of the calculated Reynoldsnumber.
The inner zone RIH size and operationalconditions are used for calculating (6), (7),(12). The thermodynamic properties ofheavy water are also used in calculating thefilm conductance.
From these data, the total flow for each innerzone inlet header and the unit area flow arecalculated. The detailed calculation can befound in [6]. The Reynolds number, thePrandtl number and the ratio k/D are thusobtained. The group of constants a, b, c in(12) were taken from Table 12.1 in [13] forthe closest Reynolds number range.
The film conductance can thus be calculatedfrom (8).
For different lengths of the thermowell, thecalculated values of mL, cosh(mL) and Te/Tw
are listed in Table 1.
The maximum Tw (the difference of ambientand the fluid temperature) is estimated to beTw = 253 °C - 20 °C = 233 °C assuming theambient temperature is 20 °C (the actualambient temperature is much higher thanthis due to the insulation of the header andfeeder cabinet). From the last column ofTable 1 we can see that the error Te isphenomenally small even with themaximum possible Tw.
This may be because the assumed boundaryconditions do not exactly conform to the realsituation, especially if the thermowell is notlong relative to its diameter. However, theconclusion that the error due to heat lossthrough conduction along the thermowell isnegligible, is supported by calculation usinga different method (see page 244 of [13]).
225

5. CONCLUSIONS REFERENCES
The self-heating of the RTD will cause theRTD to read high. This error is in the safedirection but there is a production penalty.The estimated self-heating error for a baresensor is +0.4 °C using the self-heatingindex given in manufacturer's specificationand the BNGS RIH operating temperature.A standard method such as IEC 751 may beused to measure the self-heating index(SHI). However, the standard method, likethe one used by the manufacturer, isspecified for a specific temperature and flowcondition only. The self-heating index isheat-transfer-condition dependent.Consequently, the +0.4 °C error estimate iscondition-dependent and cannot be used as acorrection to the RTD output as a means ofreducing production penalty. A procedurethat can be used to determine in-situ SHI isgiven. By substituting the actual electricpower applied to the RTD into SHI, themeasurement error caused by the self-heating effect can be determined at operatingconditions and could be accounted for.
The bound of error caused by gammaheating was estimated using known gammafield and the mass of the RTD assembly andit is concluded that gamma heating of thethermowell causes a negligible error.
The heat loss through the thermowellconduction was also found to be negligible.
ACKNOWLEDGMENTS
Kam Aydogdu at AECL provided helpfuldiscussion on calculating the gammaheating.
The work reported in this paper was fundedby the CANDU Owners Group (COG) R&Dprogram:
Working Party No. 16 WPIR No. 1667
[1] T. Qian, "Response-Time Requirementsfor Resistance Temperature Detectors inCANDU Stations", CANDU Owners Groupreport COG-97-054, Rev. 0, 1997 March.
[2] V. Koslowsky, "Investigation of theLoop-Current Step-Response Technique forDetermining RTD Response Time", memoto A. Campbell at PNGS, CRL I&C BranchFile #5.2.17, 1997 March 31.
[3] S. Basu, D. Bruggeman, "Power RaiseThrough Improved Reactor Inlet HeaderTemperature Measurement at Bruce ANuclear Generating Station", Proc of 18thAnnual CNS/CAN Conference, 1997 June,Toronto, Canada.
[4] D. Bruggeman, "Bruce A Reactor InletHeader Temperature Measurement ErrorReduction, Phase-1" NK21-63310-P Rev. 1,NK21-63310-965127-ESSD-P, 1996September 4.
[5] D. Bruggeman, "Bruce A Reactor InletHeader Temperature Measurement ErrorReduction, Phase-2" NK21-63310-T5 Rev.0, NK21-63310-965128-ESSD-T5, 1996September 4.[6] T. Qian, "Self-Heating, Gamma Heatingand Heat Loss Effects on ResistanceTemperature Detector (RTD) Accuracy",memo to N. Sion at NTS, CRL I&C BranchFile #5.2.17, 1996 July 18.
[7] International Standard EEC 751,"Industrial Platinum ResistanceThermometer Sensors", First Edition, 1983;Amendment 2 to EEC 751, 1995-07.
[8] BNGS B Instrument DeviceSpecification, TS-29-60442-6.
[9] H.M. Hashemian, D.D. Beverly, D.W.Mitchell, K.M. Petersen, "Aging of NuclearResistance Temperature Detectors",
226

NUREG/CR-5560, 1990 June.
[10] EPRI report "In Situ Response TimeTesting of Platinum ResistanceThermometers", EPRI NP-834, Vol. 1, 1978July.
[11] C.R. Boss, "Radiation Shielding andDose Management", Session 4 of "The Roleof Reactor Physics in CANDU Power PlantEngineering", sponsored by CNS 1995 Nov6-8, Mississauga, Canada.
[12] L.M.K. Boelter, V.H. Cherry, H.A.Johnson, R.C. Martinelli, Heat TransferNotes, McGraw-Hill Book Company, 1965.
[13] R.P. Benedict, Fundamentals ofTemperature, Pressure, and FlowMeasurement, John Wiley & Sons, 3rd
edition, 1984.
Table 1. The calculated values of mL, cosh(mL) and T/Tw for different length of thermowells
L(m)2" = .0508 m4" = .1016 m6" = . 1524 m
mL33.2266.4599.67
cosh(mL)1.3373 e 143.6128 e 289.6628 e 42
T/T. = l/cosh(mL)0.7478 e - 140.2768 e - 280.1035 e -42
227

SELF HERTING PLOT
177 GTSLOPE= 18 .726 + CR- 0 . 0 3 5 ) ohms/watt
G.GCI 320.CO 400 .00
Figure 1. Typical Plot of Self-Heating Index Measurement
228

SENDING MORE PROCESS DATA WITHOUTADDITIONAL CABLES
(Networking Sensors using Existing PlantInfrastructure, COG WPIR 0172)
H. Licht, R. Roiha, M. RodychAtomic Energy of Canada Limited
Chalk River LaboratoriesChalk River, ON KOJ 1J0
ABSTRACT
The as-built data transmission capability in CANDUplants is fully employed. Long delays and high costmake it often not feasible to retrofit plant equipmentwith additional sensors and bring the data to theoffice. One of the reasons is the unavoidableaddition of data transmission cables. Thispresentation describes the results of work performedin 1996/97 to network sensors using existing plantinfrastructure.
To provide an alternative solution, a general purposedata transmission system is being developed. Itsends data over existing plant infrastructure such aspower wiring and the telephone system. Itscomponents are based on PC technology packaged ina "black box", using special hardware and softwareto appear to the user as a very simple, low cost,device. Its drawback is its rather limited transmissionspeed. This design is in marked contrast to thecomplexity of present commercial data transmissionsystems.
A point-to-point system has been demonstrated. Anetworked system is under development.
VALUE OF TRANSMITTING ADDITIONALDATA
The existing plant information system appears at firstglance to be fully capable of handling all necessarydata - until one realizes that the system for which itwas designed has undergone major modifications andprocedural upgrades, that more of these are plannedfor the future and even more will not be realizedunless made feasible. A list of potential benefits totransmit additional data follows.
- Potential for process improvements throughincreased process monitoring.
- Potential to remove some condition basedmaintenance (CBM) and other surveillance anddiagnostic tasks from outage task list.
CA0000036
- Conditions that exist only during plant operationcould be monitored.
- Reduction of labour costs and radiation dose formanual data collection.
- Improved maintenance planning throughrepresentative, rather than sampled, data.
- Improved management of imminent breakdownsthrough continuous monitoring.
- Potential for diagnostics assistance by remoteexpert.
- Correction of design oversights.
SITUATION AT HAND
Retrofitting an operating nuclear power station withincreased data transmission capability is principallydifficult for two reasons: it modifies the stationlicense and there are restrictions to access major plantareas. The list below summarizes the situation.
- Retrofitting of equipment for surveillance anddiagnostics includes data transmission capability.
- The number of data lines out of containment andother remote areas available for additionalsurveillance and diagnostics data is insufficient forboth large scale and individual monitoring systems.
- There is no realistic possibility to add low valuecontainment penetrations and data lines because:
- retrofitted cabling must meet the original stationdesign requirements,
- getting approvals is a lengthy process because acomparison with as-is, rather than as-designed,station layout and operation must be made,
- safety, operation and access restrictions makecable retrofitting costly, and
- cable retrofitting work would compete withoutage repair and maintenance work.
- Existing backfitted surveillance and diagnosticsdata transmission systems suffer from being unique.
- Neither spare computing power nor generalpurpose, generic PC technology are available incontainment to preprocess or concentrate data.
229
FACTORS USING EXISTING CABLES TOTRANSMIT ADDITIONAL DATA
It would be desirable to expand data transmissioncapability by simply adding more data to the existingtransmission facility. However, not only are thesetransmission channels already used to their fullestextent but any modifications would interfere with theintent of the original design. If one wanted to sendadditional data over any other plant infrastructuresuch as power lines or radio then one must findpractical, efficient and expeditious means that avoidthe same obstacles that prevented the conventionalsolutions. This points to three restrictions:
- Safety- No safety relevant data are to be transmitted
(cost, delays, training, documentation).- Data transmission must not interfere with any
special plant equipment to avoid the need forcertifying each installation (this factor excludeswireless transmission from the list of options).
- Cost- Initial development and demonstrations,- Designing for manufacture,- Manufacturing of initial batch of hardware,- Individual installation costs, and- Training, troubleshooting, and upgrading.
- Availability of Suitable Cables
OPTION 1: Extending LAN throughoutcontainment
If the station's Local Area Network (LAN) wouldextend into the containment then most datatransmission problems would disappear.Unfortunately, this is not the case. The option ofretrofitting the containment with a LAN may besummarized as shown below.
- RequirementsNeeds computing power in containment.Needs additional LAN cables in containment.
- Technical RiskNegligible, standard technology.
- LogisticsCommercial equipment is readily available.Laying cables in containment is very expensive
and would probably take several years toaccomplish.
- Reality CheckBest long-term solution.
Unlikely to be implemented in existing plants.
OPTION 2: Use existing 110/220 VAC power linesand spare phone lines: connect to LAN inside oroutside containment
If the containment cannot be retrofitted with a LANthen other options must be explored. The mostubiquitous cables installed in a station are power andtelephone lines. Though they could lead directly toan office where the current data could be evaluated,one must be able to review past data and relate themto plant conditions. Therefore, they have to be tiedinto the LAN and the LAN may as well transport thedata from a convenient point to the office. Figure 1shows both arrangements, where Path #3 shows thedirect connection and Path #5 shows the transferusing the LAN. A summary for both options follows.
- RequirementsNeeds computing power in containment.Needs development of generic repeater system.
- Technical RiskSmall, but technology needs development.
- LogisticsEquipment needs custom assembly of
commercial sub-systems.Consider station needs: maintenance and
warehouse stocking.
- Additional RestrictionsOnly one data path per 110 VAC circuit
(between transformers) unless wellseparated.
Spare phone lines are connected to JunctionBoxes.
- Reality CheckAdequate solution for many, but not all, data
transmission problems.Achievable in the short term.
PAST WORK
Work on this project started in 1996 for COG underWPIR 0172. The following work was performed.
- Identified requirements, see Table 1.
- Developed repeater lab prototype based on PC.
- Demonstrated transmission string consisting of:instrument PC, power line, repeater, phone line,and office (or LAN gateway) PC with the followingresults:
230

- generation of electric noise on power lineswas insignificant,
- speed was typical of phone lines (340characters/s), slowed down by plant noise,
- recovered automatically from breakdowns,- no error detected for 660 000 characters
(100 pages of text).
PRESENT WORK
The present work is concerned with the more realisticconditions under which a retrofittable datatransmission system would operate in a station. Workgoes on in the following areas:
- Assemble PC-based repeater with the followingfeatures for use in containment at 60°C (unusuallyhot):
- decontaminable (by hosing off and steam-cleaning),
- shock-proof (but not seismically qualified),- connector replacement without need for
access to inner sanctum,- enhanced reliability (no fan, no disk drive),
generic (spare capacity),- black box installation (no local controls),- runs any user software (under DOS,
Windows CE to be investigated)
- Develop first generation software for point-to-pointlink.
- remote control, automatic recovery,command string entry
- Demonstrate PC and point-to-point link to stationstaff:
- confirm causing no interference with plantequipment,
- demonstrate PC for containment use to getuser input regarding packaging.
- Develop lab prototype network for specificapplication:
- consider application at feeder pipe wallmonitoring at G-2,
- integrate system with station LAN,- build data acquisition front end and generic
user interface.
FUTURE WORK
In the next year, a prototype system will be installedin a station, for demonstration and refinement andalso to lead to the manufacture of such systems.
Thus, the capability to transmit more data wouldbecome available for widespread use. The envisagedtasks are listed below.
- Install and operate a point-to-point link in a plant.
- Advance networked transmission system tobecome field useable.
- Develop specs for manufacturing the initial batchof hardware.
SPIN OFFS
Besides adding data transmission capability, thesystem will help to realize other benefits:
- Making available a PC for general use incontainment.
- Leading the way to use spare LAN capacity forCBM data.
- Making attractive:- "guided tour troubleshooting", remote
supervision, and remote; temporarydiagnostics for commissioning and testing.
- Leading the way to retrofit remote controls.
DATA RATES
The critical question is the amount of data that maybe transferred by each system. A power or telephoneline based system employs inferior transmissionmedia than specially designed data cables but oneonly needs to employ a reduced capability for alimited number of retrofit applications. Tables 1 and2 show the following:
There exist two signal classes dependingon their data rate, see Table 1: gauges and other.
There are two classes of transmission media,depending on data rate, see Table 2:110/220 VAC, telephone in one class, and othermedia.
- Each 110/220 VAC or telephone POTS linecan accommodate dozens of gauges.
All other signals must go over othertransmission media.
231

Table 1: Typical Transmission Rate Requirements from Single Sensors
OriginGauges: temperature, pressure
Accelerometers, raw signals
Video camera (uncompressed)Computer screen dump
DataASCII or binary
ASCII or binary
videobit map
Data Generation Rate24 characters/second at 2 samplesper secondseveral kb/s (depending on upperfrequency limit)15 kb/sseveral kb/s
Table 2: Maximum Specified Data Rates of Some Transmission Media
Transmission Medium
110 VAC
Telephoneunshielded twisted pairTelephone
Coax
Standard
not applicable
POTSCategory VASDL
Ethernet
Maximum Data Rate(kb/s)
28.8 (ezPhone)
28.810 0004 400, downstream441, upstream(Aware, Inc.)10 000100 000
Maximum RepeaterSeparation
(m)70
practically unlimited1002800
100
BLOCK DIAGRAM
Figure 1 shows two options to transmit sensor data toan office, see system components in the shaded area:
over dedicated telephone line (Path #3)over a minimum number of cables throughcontainment wall (Path#4).
PC = Personal ComputerPC#1 located close to sensing instruments to
minimize cable length in Path#lPC#2 concentrates data traffic through
containment wall
PC#3 repeater, interfacing between Path#4 andPath#5, not required if Path#4 is EthernetLAN
Path#l serial communications lines (RS-232, RS-422 or RS-485)
Path#2 direct link between serial ports (RS-232) or110/220 VAC power line
Path#3 analog telephone line (POTS)Path#4 either wideband [coax (Ethernet) or
Category 5 twisted pairs], for high datarates, or110/220 VAC power line for low data rates
Path#5 coax for Ethernet LAN.
232

Reactor Building
El Equipment [H [H [~]
RDF
Sensing j—11—.Instruments L j J L j Jp a th #1
PC#1
SensingInstruments
#1 OH
PC#2
Control Equipment Room
Annunciator Module
•B03
PC#3
Main Control Room
DCC
Gateway
Data Extraction System
Office PC
n OH
Example of System Configuration
233

CA0000037
Nondestructive Elemental Analysis of Corrosion and Wear Productsfrom Primary and Secondary CANDU Water Circuits
Barbara D. Sawicka
AECL, Chalk River LaboratoriesChalk River, Ontario KOJ1J0
Abstract
The application of X-ray fluorescence (XRF) for off-line and on-line analysis of corrosion-product transport (CPT)specimens is being evaluated, to monitor corrosion and wear products in CANDU water circuits. The method issuitable for nondestructive analysis of CPT filters from both primary and secondary sides (i.e., radioactive andnonradioactive specimens). The XRF method, the portable analyzer, and the work required to optimize theirperformance for CPT specimens are described. Measurements performed on station CPT specimens are discussed.Data on crud transport and composition were obtained, in particular iron and lead transport in secondary-side water andiron and zirconium in primary-side water. The possibility and requirements for quasi on-line analysis under operatingconditions are also considered.
1. Introduction and background information
Corrosion and corrosion-product transport in both theprimary and the secondary sides of CANDU stations areimportant topics because of their role in the followingareas: corrosion of feeder pipes, fouling of steamgenerators (SGs), limits on reactor-inlet headertemperature, frequency of cleaning, radioactive waste,and maintenance costs. Analysis of corrosion-producttransport (CPT) specimens provides information thatcan be used by nuclear stations as an indicator ofsystem chemistry and that can bring a betterunderstanding of corrosion-transport phenomena and theproblems associated with these phenomena [1,2].
Stations conduct on-line sampling of CPT bycollecting specimens on filters in specially installedsamplers. After the filters have been removed from thesamplers, the deposits can be analyzed (off-line) usingvarious techniques. Depending on the type of a filterused, paniculate or ion-exchange, the specimen containseither suspended solids (paniculate or "crud") orsoluble species, obtained from circulating waterstreams. In some stations, secondary-side CPTspecimens are routinely collected and analyzed.Primary-side specimens are usually not collected oronly sporadically collected; since 1996, primary-sidespecimens have been collected regularly in DNGS, atapproximately 3-month intervals [2].
One basic method of evaluating CPT specimens iselemental analysis, which determines the presence of
various elements and measures their content. The data,normalized to the volume of water that flows throughthe filters, provide the concentration of various elementsin water circulating in the reactor piping (in mg or \igof the element per kg of water, i.e., ppm or ppb). Theelemental analysis can be, and usually is, performedusing laboratory-based wet chemistry methods, whichinvolve specimen dissolution (digestion).
In this paper, we describe development and use ofnondestructive X-ray fluorescence (XRF) methods forchemical analysis of CPT specimens, i.e.,a "nondestructive and dry" method. Part of this studywas reported previously [3 to 5]. The XRF methodoffers an advantage: because the specimens are notdestroyed in the process, they can be archived and/orused in further studies using other methods, such asMossbauer spectroscopy, X-ray diffraction analysis andscanning electron microscopy [1]. XRF is fasterbecause no digestive step is needed; it is less labour-intensive and is therefore less costly. In the case ofprimary-side specimens the nondestructive XRFtechnique provides a more practical alternative toprocessing low-level radioactive waste resulting fromdigestive chemical methods.
It is of interest to find a method that can be used toanalyze very small amounts of material, because filterdeposits may be very thin. Wet chemistry methodsprovide excellent sensitivity for many elements, butrequire sufficient sample material to give high accuracy(a sample size of 0.25 to 0.5 g is preferable; if the
234

sample weight is too low, the dilution factor is toogreat and error increases).
Because it is nondestructive and because it can be verysensitive, the XRF technique is also being consideredfor on-line or quasi-on-line analysis. The quasi on-lineexamination infers that the measurements will be takenevery 15 to 30 minutes, so that transient effects can berecorded and assessed. With XRF, such measurementscan be performed without removing the filter from thesampler, and the analytical data record is availableconcurrently with the CPT sample collection, while thefilter sample may be retained.
2. Experimental: The XRF method, the analyzer, andtheir use for CPT analysis.
XRF analysis is performed by measuring X-ray spectraand identifying energy peaks characteristic of theelements present in the sample. In XRF spectroscopy,the primary X-rays or y-rays illuminate a samplecausing it to emit X-rays characteristic of the elementspresent in the sample, Figure 1. X-rays for a specificelement are well defined, and since there are few allowedtransitions, there are relatively few X-ray peaks.
X-ray absorption andphotoelectron ejection
X-ray fluorescence transitions
Figure 1. Principle of XRF spectroscopy.
The XRF spectroscopy analyzer can be configured in anumber of different ways, but there are two basic types:wavelength dispersive XRF (WDXRF) and energydispersive XRF (EDXRF). The distinction betweenthe two techniques arises from the method by which theX-rays are sorted for measurements. In WDXRF, X-rays are separated according to wavelength by diffractingcrystals. Such analyzers offer the best resolution,shortest analysis time and highest sensitivity, but theyare element-specific and laboratory-type only.
In EDXRF analyzers, X-rays are detected by solid-stateor proportional detectors and sorted electronically toproduce an X-ray spectrum, which is thenmathematically processed to provide the requiredinformation. These detectors allow much greaterflexibility than wavelength detectors. In EDXRF, a
wide range of elements can be measured, and theelements to be measured can be easily changed,according to requirements.
The combination of improved detector resolution withadvanced microprocessor technology has resulted in anew range of EDXRF analyzers, which offer newsolutions to the problem of XRF analysis.Microprocessor-controlled XRF analyzers are currentlyavailable commercially, which offer laboratory-qualityanalysis in portable instruments.
Quantitative analysis using XRF is based on thecorrelation between the amplitude of the signal and thecontent (concentration) of the element in a specimen. Anumber of factors that contribute to line intensity haveto be taken into account. The details and accuracy ofquantitative analysis depend on the particular analyzerhardware and software solutions; it also depends on thetype of specimens, element range, geometry, lineoverlap, etc. The degree of line overlap is alsodependent on the type of the detector.
In this work, an XMET920 [6], EDXRF analyzer, wasused. Because of its sophisticated data treatmentmethods and high-resolution detection, this analyzer iscapable of achieving much higher accuracy andsensitivity than those achieved using other portableXRF instruments. The analyzer is equipped with aSi(Li) detector, installed in a small-size probe, that isconnected directly to a multichannel analyzer board(2048 channels) housed in a PC computer. Thedetector is cooled by a small, built-into the probe dewarof 0.5 L LN2 capacity. The all-directional dewarenables operation of the probe in any position. Themicroprocessor permits instrument calibration andprogramming, data collection and display, and dataevaluation. The detector active area is 30 mm2, and theenergy resolution is better than 170 eV for the Ko Mnline (5.9 keV) at 10 |xs shaping time and 1000 cps totalcount rate. The analyzer software automatically correctsfor short-term drift (gain control) or decay of the source(autonormalization). The analyzer can be used in aportable version, suitable for field work, using anindustrial-grade, portable computer (field portable XRF[6]). Using two radioactive sources, 20 mCi Cd and30 mCi Am, the analyzer is capable of measuringelements ranging from titanium to uranium in theperiodic table. The use of another source, 55Fe, wouldextend the range to lighter isotopes.
The XMET920 analyzer is programmed by themanufacturer to perform some standard, althoughcomplex, functions, such as alloy analysis on bulkspecimens. An important feature is that the analyzer isuser-programmable. This permits us to program theanalyzer for applications that require a special approach,such as high-accuracy analysis of filter deposits. The
235

geometry of the probe permits various detector-sampleconfigurations.
One can perform qualitative analysis and approximatequantitative analysis of filter deposits directly from themeasured spectra. The spectra show well-resolved X-ray lines for particular elements, such as iron, lead,nickel, copper, zinc, titanium, chromium, zirconium,tin and antimony. After spectra accumulation,background and peak overlap corrections areimplemented, and the spectra are deconvoluted. Thedata needed for deconvolution calculations are obtainedduring instrument calibration from the spectra of single-element standards. The K- or L-series lines can betaken for analysis, depending on their energies and onwhat other interfering element lines might be present.
For accurate quantitative analysis of filter deposits, theanalyzer has to be calibrated and programmed for aspecific type of study; this is performed by developingappropriate calibration "models". The models are theinstrument software and hardware configurations that arespecific for a type of study, analysis range, the numberof interfering elements, specimen characteristics,measurement geometry, etc. In the mode!, a correlationis established between the amplitude of the signal andthe concentration of the element in the specimen. Themodels are developed by the user, by measuring a set ofsuitable calibration standards (i.e., known samples thatare of the same type and physical form as theunknowns), and by implementing appropriatealgorithms and corrections. The choice of standards,which are still being tested, is very important, and thestandards should cover the range of concentrationsexpected in the measured specimens. Anotherimportant issue is that, for thin samples, an internalstandard of a backscattered peak (which is used in thespectra deconvolution process) may vary for varyingspecimen thickness; tests on its accuracy andstabilization are underway.
The development of the correct calibration models forevaluation of thin filter deposits is a critical issue forquantitative XRF analysis of CPT specimens, both off-line and on-line. We made several calibration modelssuitable for thin-film analysis, and further tests areunderway.
For XRF analysis of primary-side specimens, spectracorrection for radioactive species is required and shouldbe incorporated in the deconvolution process. TheXRF measurement was integrated over a circular area of~5 cm2 (diameter = 2.54 cm), which was assumed to berepresentative of the total CPT deposit area. Whetherthis is a valid assumption can be tested by repeatingXRF measurements for various areas of the deposit.Smaller areas of various sizes and shapes can also beexamined.
3. The specimens
A number of CPT specimens, collected during CPTsurveys in Darlington NGS and Bruce B NGS, primaryand secondary sides, were evaluated. These weresamples of particulate corrosion products ("crud"), asno ion-exchange filters were used. 0.45 |j.m thickcellulose membrane filters were used. The specimens,provided by the stations, were from various samplerlocations in the secondary side, including condensateextraction pump (CEP) discharge, feedwater, andblowdown water. In the primary side, the heavy wateris sampled at DNGS close to the reactor outlet headers.
The deposit area was circular, about 10 cm2. Thediameter of the deposit area varied from 34 mm to 38mm; i.e., the area ranged from 9 to 11.5 cm2 in variousspecimens.
4. Study #1: Comparison of nondestructive XRF anddestructive ICP techniques for Fe analysis
To test the accuracy of XRF analysis for iron in CPTspecimens, measurements were performed on a set of 19CPT specimens, and the results were compared withthe results of destructive wet chemistry analysis(inductively coupled plasma performed after specimendissolution). The specimens were from DarlingtonUnit 2, taken during a CPT survey in 1996 June. Fourspecimens were from CEP discharge, and 15 fromblowdown of boiler #1.
The XRF evaluation showed that the CEP depositscontained about 0.5 mg of iron per specimen, and theblowdown deposits between 4 and 10 mg of iron. Afternormalizing the XRF data to the volume of water thatcirculated through the filter, one obtains ironconcentrations in water equal to 1 to 3 ppb (ng/kg) forCEP locations, and 15 to 40 ppb for blowdown water.
Quantitative XRF analysis was performed usingcalibration models developed specially for thin-filmanalysis. In the measurements, care was taken tomonitor and stabilize the backscattered peak amplitude;the specimens were covered with an aluminium cup oraluminium plate. A number of elements other than ironwere also measured in the XRF analysis, but theseresults will be not discussed here.
Figure 2 compares the iron concentration data obtainedusing the two methods of iron analysis, and showsexcellent agreement between the XRF and wetchemistry data. In the evaluated range of iron contents(rather thick deposits), the XRF error that is due tostatistics and calibration was ±1 to ±3%, and could beneglected in comparison to geometrical errors. Thebiggest error in the XRF evaluation of iron content is
236

due to the possible nonuniformity of the deposit and thevariation in the deposit area (up to ±10%). The formercan be evaluated by repeating the measurements overvarious areas of the specimen; the latter can beeliminated by careful measurement of the deposit area.In this set of specimens, iron was found to be uniformlydistributed over the filter area.
SLOWDOWNWATER
D«po«i1llsa-11.34cm2 (2R.38mm)Error ban m«i» ih« potsibto icutar In t » «lttr« « covered by cnjd [2R « 36 mm to 40 mm] t
Figure 2. Comparison of XRF and ICP data on theiron concentration in water for a set of CPTspecimens collected in secondary side(Darlington Unit 2, June 1996 CPTsampling). Error of XRF measurements,±1 to ±3%, is increased to ±10% due tofluctuations in filter coverage area andspecimen nonuniformity. Error of ICPmeasurements, not shown, is about ±3 to±5%. The data are normalized to water flowand expressed in ppb (|ig/kg H2O).
The XRF error should be compared with the error of thewet chemistry evaluation. This error depends on thedetails of the analytical procedure, especially the controlof contamination during sample dissolution and thecorrection for the contribution from a substrate (i.e., the"procedural blank" measurement and correction); for therange of iron measured, this error is usually between±3 to ±5%, i.e., about 1 ppb. Iron content was wellabove the detectability thresholds of both techniques.
Good agreement between the data shows that XRF canbe used instead of wet chemistry when nondestructiveor quick analysis or both are needed.
Similar comparisons will be made for a larger numberof specimens obtained under various station conditions,and especially for low iron concentrations (i.e., thin
deposits). For thirl deposits, the geometrical error inXRF analysis will be much reduced, but the substratecontribution and detectability threshold will have to beconsidered. At the same time, for deposits thinner than~ 0.25 mg, the error of the wet chemistry method mightincrease because of the small quantity of material that isavailable for dissolution. Work continues onoptimizing calibration techniques suitable for very lowiron concentrations, and evaluation of the accuracy ofthe technique and its detectability threshold.
5. Study #2:Fe and Pb transport during the reactor work cycle
BNGS Unit S (1993 May-Oct)FeandPb
0.1 1 10 100Sampling date (days from the startup)
100
I 1
I 0.1
I 0.01
BNGS Unit 5 (1993 May-OcL)Hydrazlne and oxygen
- - • - Y—~~
c
....
.. . j -
\ ^ j _1_."~]'
—
- • * * • - . - , ! • -
. . . . &-—,
— • ; • • <
3NE-. ;
"A- -'^-....4v».#.#
"._i'-ii"!'.":"?•]'. " . : : ' " ; : : ;
! •
0.1 1 10 100Sampling date (days from the startup)
Figure 3. Data on iron and lead concentrations in ppb(Hg/kg H2O) obtained from XRFmeasurements of CPT specimens, collectedduring one reactor cycle in 1993 in Bruce B,Unit 5. The logarithmic scale clearlyseparates the reactor start-up specimens fromsteady-state operation specimens. Leadcontent follows the variation in iron. Similarbehaviour was observed in 2 other cycles inUnits 6 and 7. Bottom: hydrazine andoxygen contents for the same period.
A series of CPT secondary-side specimens from BNGSUnits 5, 6 and 7 were examined. The specimens werecollected in 1993 and 1994, in 1- to 2-h sessions
237

during the first 1 to 2 d after start-up, and then inseveral 6- or 7-d sessions during several months of thesteady-state operation. The specimens were fromvarious sampler locations, including condensateextraction pump (CEP) discharge, feedwater collectedlocally (using a mobile cart, MC; and at the samplingroom, FWSR), and blowdown (BLD) water.
The XRF analyses showed that large amounts of ironare present in the system at start-up (up to 700 ppb); itdrops down to ~ 1 ppb range during reactor steady-stateoperation. Figure 3 shows iron concentration for onestartup cycle in Unit 5. (Note the logarithmic scale thatclearly separates the start-up data from the steady-statedata.) Similar behaviour was also observed in Units 6and 7. These results are correlated with chemical formof iron measured by Mo'ssbauer spectroscopy [2].
Figure 3 also shows data for lead. Lead concentrationsare ~2 to 3 orders of magnitude lower than iron, butinterestingly, lead content follows a dependence oniron: high lead content is present at reactor start-up (upto 0.5 ppb), and is much lower during reactor steady-state operation (below 0.1 ppb). More measurementswill be performed to verify this result and to observewhether this behaviour is typical for each reactor cycle.Lead monitoring can then be conducted to establish thedatabase for evaluating possible correlations with otherparameters of SG chemistry. Figure 3 (bottom) showshydrazine and oxygen concentrations measured at thesame locations. No correlation is observed at start-up,but low iron and lead concentrations during steady-stateoperation tend to accompany low hydrazine and oxygencontents.
The data in Figure 3 also show that feedwater collectedlocally (using mobile cart) contained less crud thanwater in the sampling room. The opposite effect wasobserved in Unit 7.
6. Study #3: Primary-side specimens
An XRF evaluation of primary-side specimens wasperformed on 16 primary heat transport (PHT)specimens from DNGS, collected during samplingsessions in 1996 and 1997 (see also [2]). The heavywater is sampled using sampling lines leading fromreactor outlet common headers to modified integratedcrud samplers installed in each reactor water samplingroom. Some data on the specimens, provided by thestations, are given in Table 1, together with selectedresults of XRF evaluation. One BNGS specimen wasalso measured. These XRF measurements pose aspecial challenge because of the interfering effects ofradioactive species in the spectra.
Preliminary XRF measurements performed on primary-side specimens show the usefulness of this technique forevaluation of transport of iron and other elements in theprimary side. Iron and zirconium were the two maincomponents in all specimens. A number of minorelements were also observed and identified.Quantitative evaluation provided data on crud levels:they were highest in the February '96 samplingsession, and were much lower in the next two sessions.
Mass transport evaluated from XRF measurements iscompared with the data obtained by specimen weighingin Table 1 and Figure 4. The ratio between the XRFand weighing data varies from 1 to 7 for variousspecimens. The consistently higher values obtainedfrom weighing can be explained by the presence of waterin the specimens (probably mostly in the substrates),because the radioactive samples are not dried at elevatedtemperatures. This result indicates that the weighingmethod used to evaluate the crud level might beinaccurate and that material transport might be lowerthan originally thought on the basis of filter weighing.
Total crud mass (ppb) I Irom weighingI XRF evaluation
1
1h
1
1n
ri
r l
April •ST
If\
[
2N 2S 3N
DNGS Unit
Figure 4. Total mass of particulates (crud mass),calculated from XRF analysis and sampleweighing. Measurements concern PHTspecimens of 3 recent steady-state samplingsessions (Darlington NGS).
Large amounts of zirconium were present in thespecimens from all four DNGS units. Zirconium
238

content ranged from 5 to 30% of iron, up to 0.6 ppb,see Table 1 and Figure 5. Similarly, a high zirconiumfraction (-25%) was also measured in one Bruce B PHTspecimen.
: Zirconium and iron concentrations (ppb)
Feb'96• " i Z r
: E-JFe
Dee '96
El BApril '97
i l s1N 1S 2N 2S 3N 3S 4N
DNGS Unit
4S
Fraction of zirconium relative to iron
8 0.2
111IN 1S 2N 2S 3N 3S 4N 4S
DNGS Unit
Figure 5. Top: Concentrations of Fe and Zr in crud, asmeasured from XRF analysis in PHTspecimens of 3 recent steady-state samplingsessions (Darlington NGS). Bottom: Ratioof Zr to Fe in the same specimens.
There might be a number of reasons for the presence ofzirconium in crud. Zirconium can originate fromscratching pressure tube inner surfaces during axialmotion of fuel bundles, from fretting at the inlet ends ofthe pressure tubes by the bearing pads, and from frettingof the Zircaloy-4 bearing pads on fuel sheathing [2].Apparently the result of wear debris, the presence ofzirconium in crud is indicative of fretting and wear, and
possibly of corrosion, of either pressure tubes or nuclearfuel sheaths or both. The identification of what is themain source of zirconium and the quantification of thefraction of zirconium that comes from pressure tubes incomparison with the fraction that is due to fuel, mightbe performed by analyzing the Nb and Sn contents incrud; such XRF measurements are planned. The dataon debris can then be correlated with system chemistryparameters as well as surveillance and oxide thicknessdata.
Quantitative XRF evaluation of radioactive specimensrequired correcting the XRF spectra for radioactivespecies. Figure 6 shows a low-energy spectroscopicemission spectrum compared with an XRF spectrummeasured for the same PHT specimen. A number ofradioactive species can be identified, including 55Fe,l24Sb and "9Sn. However, because the spectroscopicemission spectrum was measured using a differentdetector geometry than that of the XRF spectrum, nodirect comparison of line amplitudes was possible.Incidentally, the presence of 5Fe in the specimensallowed us to detect chlorine in the XRF analysis.
S»Ft-~«Mn «Zr— «Nb
Sb
10 15 20 25 30 35
Figure 6. Typical XRF spectra (bottom) andspectroscopic emission spectrum (top)measured for one Darlington PHT specimen.Note a number of emission lines, includingS5Fe and 119Sn and 124Sb, as marked. In theXRF spectrum, the main elements are Fe andZr. Low-energy Cl and Sb lines are observedbecause of the presence of radioactive ssFe inthe sample.
In this work, quantitative XRF evaluation of radioactivespecimens was performed either directly from the spectraor using approximate calibration models. The accuracywas satisfactory for Zr and Fe and several otherelements. Accurate measurements for elements such as
239

Table 1.XRF and station data on PHT specimens obtained in 3 sampling sessions in DNGS
February '96 Sampling
UnitLoop
INIS
2N2S3N3S4N4S
XRF data
Feppb
6.54.23.7
6.60.43.20.7
6.5
Zrppb
0.390.570.320.050.120.530.070.06
Zr/Feratio
0.060.130.090.080.270.17
<0.1<0.1
Totalmassmg
2.02.02.90.90.62.70.30.3
Crudcone.
14.49.68.92.32.28.02.52.1
Station data
pH
10.5810.5710.5210.5410.4310.4410.5110.51
Deut.
6.326.346.246.655.234.985.875.80
Weight
mg2.34.05.01.11.45.71.81.0
Crudcone.fg*g16.419.015.32.94.9
16.617.07.9
Massratio:
iVeighingtoXRF
1.12.01.71.32.22.16.83.8
December '96 Sampling
UnitLoop
INIS2N2S3N3S4N4S
XRF data
Feppb
1.10.91.30.50.51.71.11.5
Zrppb
0.070.140.160.110.060.100.100.14
Zr/Feratio
0.070.150.120.200.100.060.080.09
Totalmassnig
0.720.561.150.520.300.880.220.20
Crudcone.HP/kg2.52.23.01.31.33.72.53.3
Station data
PH
10.4710.4910.2610.2510.4110.4110.4510.45
Deut.
4.955.001.932.465.575.454.094.23
Weight
mg1.40.62.20.71.61.30.70.2
Crudcone.Hg/kg4.82.35.81.72.55.57.93.4
Massratio:
WeighingtoXRF
2.01.01.91.32.01.53.11.0
April '97 Sampling
UnitLoop
INIS
2N2S3N3S4N4S
XRF Data *
Feppb
0.81.70.90.90.62.51.11.6
Zrppb
0.040.150.160.070.200.300.090.11
Zr/Feratio
0.050.090.170.080.330.120.080.07
Totalmasstng361720706535513
2158367
1122
Crudcone,fig/kg
1.73.92.32.01.75.72.53.5
Station Data
pH
10.4210.4510.4410.4310.3810.4710.3610.36
Deut. Weight
mg0.80.71.80.70.91.91.51.7
Crudcone.Hg/kg
3.63.85.82.62.95.1
10.25.3
Massratio:
WeighingtoXRF
2.81.23.21.62.21.15.11.9
240
Nb and Sn (with very low contents and/or overlappingX- and gamma-ray lines) require that corrections foremission lines be incorporated into the analyzercalibration process. To incorporate the appropriatecorrections into the deconvolution process and into thecalibration models, specrroscopic measurements have tobe performed using the same geometry as that used inthe XRF measurements. This will be possible aftersome modifications are made to the XRF analyzer.
7. On-line XRF analysis
There is a movement, led in the United States by theElectric Power Research Institute (EPRI), to develop asystem for a quasi-on line iron probe to monitorparticulate corrosion products. One system has beensuccessfully tried at a small number of US plants, and acompany has been set up to commercialize the units[7]. The unit consists of a flow-cell and a simple XRFanalyzer, equipped with proportional counter that is setfor Fe analysis. The measurements are to be performedwithout removing the filter from the sampler, and thesampling system is incorporated into the samplechamber of an XRF analyzer. Water is periodicallyremoved from the sample chamber to permit XRFmeasurement, and the cycles would be repeated untilthe particulate loading in the sample chamber warrants afilter change. Because of low detector resolution, theunit provides integrated data on iron and neighbouringelements in the periodic table.
CANDU stations are interested in this technique, andone EPRJ-type unit has been purchased for tests.Considerable scrutiny of the on-line work will berequired before an actual standard procedure isestablished for specific station conditions. A number ofissues should be addressed. The field analyzer has tobe calibrated, its performance and accuracy tested forspecific station conditions, and the method of datacollection established. Calibration methods andstandards developed in the laboratory work on the highresolution analyzer can be used. Line overlap will havesome detrimental effect on the accuracy of ironmonitoring; however, this is not considered significantbecause iron is by far the most prominent element incrud. Stabilization of an internal calibration peakamplitude might be critically important because verythin deposits are expected, and the measurementgeometry is more difficult to control than in off-linemeasurements. Whether the system is capable ofmonitoring elements other than iron remains to be seen,and will need to be tested for individual elements,station conditions and requirements.
The accuracy of iron (and other elements) monitoringwill also depend on mass transport in the systembecause it depends on the amount of material that is
deposited on the filter during each cycle of water flow.At an iron concentration in water of ~ 1 ppb, about 200jig of particulate material is deposited on a filter during30 min; and correspondingly, about 20 |ig at 0.1 ppb,and 2 mg at 10 ppb. Thus with a 30-min collectiontime, concentrations below ~1 ppb, or even ~5 ppb,will be below the detection limit. Sufficiently largeiron concentrations are present during reactor start-up tomonitor iron in a quantitative way. During steady-statereactor operation, when there is low material transport,on-line iron monitoring might be performed in a"digital mode"; i.e., small amounts of deposits will becollected during 15- to 60-min intervals — at normalconditions — undetectable (digital 0); however, asudden "burst" of the material will be recorded (digital1). Alternatively, longer collection times might beused. Exact detection limits have to be evaluated anddetermined. The high resolution analyzer should serveas a check for performance of the on-line unit. It can bealso be periodically used in on-line measurements (e.g.,when monitoring elements other than iron or when highaccuracy for iron is needed).
8. Summary and conclusions
• Sampling of corrosion products in both primaryand secondary sides of CANDU stations isimportant to establish and control chemistryspecifications and practices. Evaluation of CPTspecimens obtained from integrated CPT samplersinstalled at the stations helps to better understandcorrosion transport phenomena, which areimportant in many areas of reactor operation,including corrosion of feeder pipes, fouling of SGs,length of outages, reactor-inlet header temperaturelimits, frequency of chemical cleaning, radioactivewaste, etc.
• The XRF method is being developed tonondestructively determine elemental compositionand mass of CPT specimens collected as filtereddeposits. Elemental analysis is one basic methodof CPT specimen evaluation; it complements othermethods, including MOssbauer spectroscopy, X-raydiffraction analysis and electron microscopy [1].
• The XRF method offers the following benefits incomparison to wet chemistry methods:
- nondestructive analysis;- rapid analytical response and turnaround;- lower analysis cost (no digestive step is needed);- no active waste (in case of PHT specimens);- possible on-site use and potential for (quasi) on-
line analysis;- possibility of storing and re-analyzing analytical
data (e.g., to identify additional elements).
241

Measurements performed on samples of CPTspecimens showed that the XRF accuracy for ironcan be comparable to that of laboratory-based wetchemistry methods. This must be verified for alarger range of specimens, various concentrationranges and station sampling conditions. Themethod was shown to work on small amounts ofmaterial (-10 |a.g/cm2 or ~ 100 |ig per filter,possibly less).
In addition to iron analysis and monitoring, theXRF technique is suitable for measuring a widerange of other elements. Work on high-accuracynondestructive analysis of elements other than Fein CPT specimens is in progress. Elements ofinterest can include Ni, Cu, Zn, and Pb insecondary-side water and Fe, Zr, Sn, Sb, and Cl inprimary-side water.
Data on crud transport and composition wereobtained. In secondary-side water, large irontransport is observed at reactor start-up, and it is at~ 1 ppb level during steady-state operation. Leadcontent tracks that for iron (high at start-up, lowerduring steady-state operation), at the level of ~ 0.1ppb. In primary-side water, large zirconiumfractions (5 to 30%) were observed in addition toiron. The measurements are correlated with thesystem chemistry parameters in Reference [2].
These data indicate that the XRF method can besuitable for analysis of primary side specimens.Accurate analysis for other elements will beperformed to identify the main source of zirconiumin the system; to define the fraction of zirconiumthat comes from pressure tubes in comparison withthe fraction that is due to fuel.
All measurements described in this work wereperformed using a portable XRF analyzer, featuringrecent technological advances. The analyzer hasshown to be a useful and versatile tool, providinglaboratory-quality analytical capability in a portableinstrument. Methods are under development tooptimize this analyzer for high-accuracymeasurements on thin films.
Because of the need for decreasing costs andimproving accuracy, there is a growing tendencythroughout the analytical community to bring theanalytical method to the site rather than to takesamples in the field and bring them to thelaboratory. The XRF method can also be used forquasi on-line monitoring performed under operatingconditions by combining the XRF analyzer with aflow cell. There is a possibility of extending on-line monitoring to elements other than iron.
However, the use of the field instrument for on-linemeasurements needs considerable scrutiny, before astandard procedure can be established for station-specific conditions.
Acknowledgments
This work was funded by CANDU Owners Groupprojects WP19/2075 and (partly) WP15/1521.Parts of this work were performed in collaboration withJ.A. Sawicki (AECL), M. Dymarski (DNGS), M. Brett(OH-CMD), and J. Price (BNGS). The discussion ofvarious aspects of this work with a number of people isappreciated, in particular: R. Tapping, L. Green, andG. Moan (AECL); S. Pagan (OH-CMD), S. Sood(OHT); and D. Good, and J. Thompson (DNGS).Station specimens for testing were provided byM. Dymarski (DNGS) and J. Price (BNGS).
References
1. J.A. Sawicki, M.E. Brett, R.L. Tapping, PositionPaper on Secondary-Side Corrosion-ProductTransport and Oxidation State, Atomic Energy ofCanada Limited Report, COG-96-482, RC-1709.
2. J.A. Sawicki, M. Dymarski, B.D. Sawicka,"Primary Side Crud Sampling andCharacterization: How it may help to bettermaintain CANDU reactors", these proceedings.
3. B.D. Sawicka, "XRF Method for Analysis ofFilter Deposits", In Proceedings of the SecondCANDU Chemists Workshop, Toronto, 1996September 16-17.
4. B.D. Sawicka, "XRF Analysis of CPT Specimensfrom Darlington Unit 2. Comparison of XRF andICP Methods for Fe analysis", Atomic Energy ofCanada Limited Report, COG-97-300, 1997 July.
5. B.D. Sawicka, "Determination of CorrosionProducts by XRF", invited talk presented at theOn-line Analyzer Users Group Meeting, DarlingtonNGS, 1997 June 12.
6. S. Piorek, "Modern, PC based, High ResolutionPortable EDXRF Analyzer Offers LaboratoryPerformance for Field, In-situ Analysis ofEnvironmental Contaminants", NuclearInstruments and Methods in Physics Research A353 (1994) 528-533.
7. D. Connolly and P. Millett, "On-line PaniculateIron X-ray Monitor", Ultrapure Water Journal,February 1994.
242

PRIMARY SIDE CRUD SAMPLING AND CHARACTERIZATION:
HOW IT MAY HELP TO BETTER MAINTAIN CANDU REACTORSoooo°J.A. Sawicki, M. Dymarski and B.D. Sawicka ^ §
AECL, Chalk River Laboratories, Chalk River, Ontario, Canada KOJ 1J0 ^ gOntario Hydro, Darlington NGS, Bowmanville, Ontario L1C 3W2 ^ g
Abstract
The paper reports a corrosion-product transport study in the primary-side of CANDU reactors.The study is based on systematic crud sampling examinations at Darlington NGS. Emphasis is placed onthe corrosion-product transport and oxidation state as a monitor of primary water chemistry state, and as amonitor of system corrosion effects. The D2O was sampled at reactor outlet headers and the deposits col-lected on 0.45 |im membrane filters were analyzed by using y-ray spectroscopy, X-ray fluorescence andMossbauer effect techniques. In the beginning of this study in 1994 and 1995, the steady state crud con-centration used to be as high as 20 to 30 jig/kg D2O, and the crud contained large fractions of highly oxi-dized species (40 to 60% Fe), in the form of ferrihydrite, lepidocrocite, goethite and hematite. During start-up operations, the crud concentrations were as high as 8 mg/kg D2O, and contained 70 to 80% Fe in theform of oxidized iron species. However, as a result of various improvements, and especially because ofbetter oxygen control during lay-ups (nitrogen blanketing) and better pH control (lower and more stablevalues), in recent steady-state runs, the crud concentrations were found to be lower than 3 to 5 M-g/kg D2O.At present, the steady-state crud consists mostly of Fe, largely in the form of magnetite (60 to 80% Fe), andhematite (20 to 40% Fe). The steady-state concentration of crud was found to increase markedly with pHa
in the range from 10.3 to 10.7. This seems to be in accord with the trend predicted by flow-assisted solu-bility of magnetite in lithiated water at ~300°C, and is generally in accord with the model of dissolution,transport, and redeposition of iron in the primary heat transport system of CANDU reactors. The crud con-tains also significant amounts of Zr (~5 to 30 wt.% Fe), apparently in the form of zirconium oxide. Zirco-nium oxide particles may originate largely from the wear of fuel bundle pads and pressure tube fretting;which should be minimized.
1. Introduction Oxygen, hydrogen and pH are major concerns of anyprimary-side chemistry control program. In particular, a
Regular monitoring of reactor water systems by filtra- careful pH control is essential to minimize carbon steeltion and analysis of particulate corrosion products corrosion. The current chemistry control strategy in(crud), as well as dissolved species (solubles), has be- most CANDU nuclear power stations is to add hydrogencome an important element of secondary-side water (deuterium) to the primary coolant to ensure that oxygenchemistry optimization and system surveillance in most is not produced radiolytically. However, adding excessCanadian CANDU plants [1]. Recently, crud sampling hydrogen can lead to hydriding of pressure tubes,has also been investigated as a tool to assist in primary- Therefore, the hydrogen addition has to be carefullyside maintenance [2]. Primary-side crud sampling may optimized,provide useful information for improving chemistrycontrol, extending the lifetime of fuel channels and sys- Corrosion products formed in primary coolant systemtern components, lowering activity transport and steam- indicate undesirable degradation of system componentsgenerator fouling, and, possibly, for preventing outlet- and cause a wide variety of problems, such as reducedfeeder thinning. heat transfer and radioactivity transport. The reasons
243
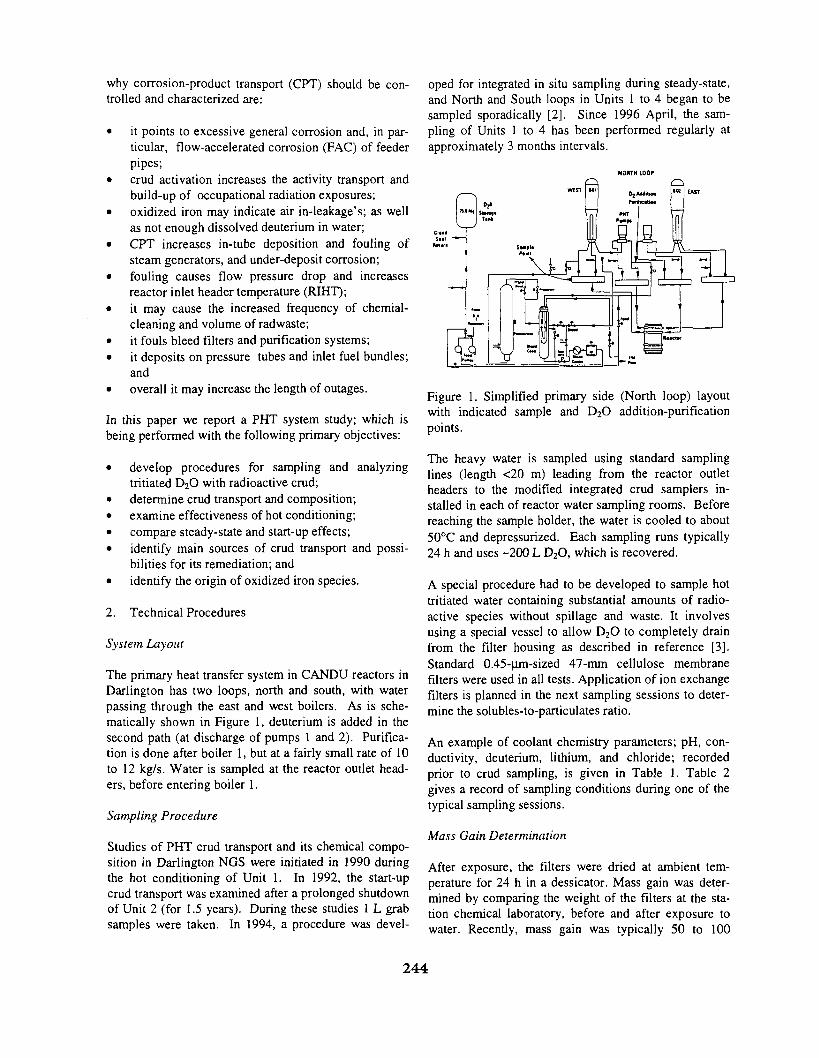
why corrosion-product transport (CPT) should be con-trolled and characterized are:
• it points to excessive general corrosion and, in par-ticular, flow-accelerated corrosion (FAC) of feederpipes;
• crud activation increases the activity transport andbuild-up of occupational radiation exposures;
• oxidized iron may indicate air in-leakage's; as wellas not enough dissolved deuterium in water;
• CPT increases in-tube deposition and fouling ofsteam generators, and under-deposit corrosion;
• fouling causes flow pressure drop and increasesreactor inlet header temperature (RIHT);
• it may cause the increased frequency of chemial-cleaning and volume of radwaste;
• it fouls bleed filters and purification systems;• it deposits on pressure tubes and inlet fuel bundles;
and• overall it may increase the length of outages.
In this paper we report a PHT system study; which isbeing performed with the following primary objectives:
• develop procedures for sampling and analyzingtritiated D2O with radioactive crud;
• determine crud transport and composition;• examine effectiveness of hot conditioning;• compare steady-state and start-up effects;• identify main sources of crud transport and possi-
bilities for its remediation; and• identify the origin of oxidized iron species.
2. Technical Procedures
System Layout
The primary heat transfer system in CANDU reactors inDarlington has two loops, north and south, with waterpassing through the east and west boilers. As is sche-matically shown in Figure 1, deuterium is added in thesecond path (at discharge of pumps 1 and 2). Purifica-tion is done after boiler 1, but at a fairly small rate of 10to 12 kg/s. Water is sampled at the reactor outlet head-ers, before entering boiler 1.
Sampling Procedure
Studies of PHT crud transport and its chemical compo-sition in Darlington NGS were initiated in 1990 duringthe hot conditioning of Unit 1. In 1992, the start-upcrud transport was examined after a prolonged shutdownof Unit 2 (for 1.5 years). During these studies 1 L grabsamples were taken. In 1994, a procedure was devel-
oped for integrated in situ sampling during steady-state,and North and South loops in Units 1 to 4 began to besampled sporadically [2]. Since 1996 April, the sam-pling of Units 1 to 4 has been performed regularly atapproximately 3 months intervals.
Figure 1. Simplified primary side (North loop) layoutwith indicated sample and D2O addition-purificationpoints.
The heavy water is sampled using standard samplinglines (length <20 m) leading from the reactor outletheaders to the modified integrated crud samplers in-stalled in each of reactor water sampling rooms. Beforereaching the sample holder, the water is cooled to about50°C and depressurized. Each sampling runs typically24 h and uses -200 L D2O, which is recovered.
A special procedure had to be developed to sample hottritiated water containing substantial amounts of radio-active species without spillage and waste. It involvesusing a special vessel to allow D2O to completely drainfrom the filter housing as described in reference [3].Standard 0.45-|im-sized 47-mm cellulose membranefilters were used in all tests. Application of ion exchangefilters is planned in the next sampling sessions to deter-mine the solubles-to-particulates ratio.
An example of coolant chemistry parameters; pH, con-ductivity, deuterium, lithium, and chloride; recordedprior to crud sampling, is given in Table 1. Table 2gives a record of sampling conditions during one of thetypical sampling sessions.
Mass Gain Determination
After exposure, the filters were dried at ambient tem-perature for 24 h in a dessicator. Mass gain was deter-mined by comparing the weight of the filters at the sta-tion chemical laboratory, before and after exposure towater. Recently, mass gain was typically 50 to 100
244

fig/cm2. Room temperature drying may introduce a bigweighing error because of remaining adsorbed waterboth in the micropores of the filter and crud deposits.Note that the weighing procedure for non-radioactivefilters from secondary-side water is different and it in-volves hot drying (usually at 80°C).
Table 1. Typical record of system chemistry parametersprior to 1996 July 24 sampling.
Table 2.session.
Gamma-spectroscopy
The PHT crud filters are radioactive and have to behandled very carefully. The filters contain a variety ofactivation products and some tritium. They may alsocontain small hot particles (fleas) from possible failuresof fuel elements.. As seen in Table 2, typical activityper filter 48 h after sampling was -10 mR/h in y-contactand up to 1000 mR/h in (J-contact.
Gamma-spectroscopy was used to determine the inven-tory of radionuclides on the filters, both at the stationand at CRL laboratory. Gamma-spectra using a high-energy (>50 keV) Ge(Li) detector have shown six majorradionuclides: 137Cs, 95Nb, 95Zr, I24Sb, I34Cs and ^Co.Corresponding activities in one of the sampling sessionsare compared in Table 3, as an example. Full lists ofradionuclides found are filed and are available on re-quest.
In addition, an intrinsic Ge detector equipped with Bewindow was used at CRL to measure a low-energy X-and y-rays (~3 to 50 keV). This allowed us to determine
Typical sampling conditions. 1996 July 24 iow.energy X-ray and y-ray emitters such as 55Fe and
Unit(Loop)
1-N1-S2-N2-S3-N3-S4-N4-S
specs.
PH
10.3410.3410.3510.3510.4110.4110.3910.39
10.3-10.7
Cond.(mS/m)
2.122.092.042.042.142.132.142.16
-
Deut.(cc/kg)
2.312.505.155.935.515.324.94'4.53
3-10
U(mg/kg)
0.760.731.041.050.990.990.980.98
-
Cl
(Hg/kg)
6.33.3
24.521.98.112.711.410.7
<200
119
Unit(Loop)
1-N1-S2-N2-S3-N3-S4-N4-S
y Contact(mR/h)
after 48 h
1010101051055
pS Contact(mR/h)
after 48 h
20040010001000400500200200
WaterVol.(L)
231171268222232315127134
Wt.(mg)
2.91.42.01.11.13.71.10.9
CrudCone.
(Ug/kg)
11.47.46.84.54.310.77.96.1
'Sn.
X-Ray Fluorescence
An X-ray fluorescence method is being optimized todetermine nondestructively the elemental compositionand mass of the filtered deposits. The development andapplications of XRF method in filter analysis have beendescribed in reports [4,5] and in a preceding paper [6].The XRF method is more practical than digestivechemical methods of analysis, which have to deal withlow level radioactive liquid waste produced during
Table 3. Gamma-spectroscopy record of six major radionuclides(1996 July 24 sampling - July 31 analysis)
Unit(Loop)
1-N1-S2-N2-S3-N3-S4-N4-S
Tlfl
TotalActivity
uCi
0.821.316.406.263.844.581.081.16
"Co
7.11.60.60.71.43.21.11.5
5.3 a
95Nb
27.516.0
8.36.3
13.323.8
9.612.4
35 d
% of Total Activity
95Zr
15.49.65.64.3
15.49.67.29.1
64 d
124Sb
14.41.7
20.512.39.5
20.76.75.2
60 d
134Cs
3.13.06.77.67.85.45.95.5
2.1a
137Cs
8.78.8
20.523.519.613.718.817.7
30.2 a
Total
(%)
76.240.762.254.763.683.549.351.4
245
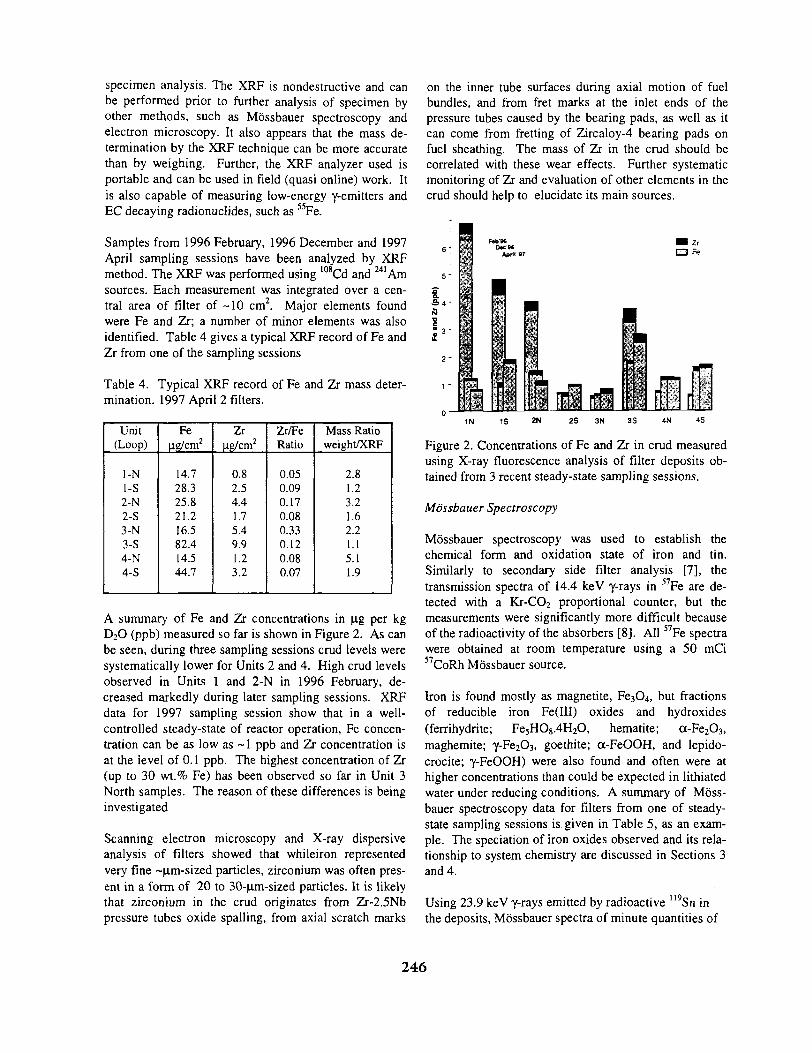
specimen analysis. The XRF is nondestructive and canbe performed prior to further analysis of specimen byother methods, such as Mossbauer spectroscopy andelectron microscopy. It also appears that the mass de-termination by the XRF technique can be more accuratethan by weighing. Further, the XRF analyzer used isportable and can be used in field (quasi online) work. Itis also capable of measuring low-energy y-emitters andEC decaying radionuclides, such as 55Fe.
Samples from 1996 February, 1996 December and 1997April sampling sessions have been analyzed by XRFmethod. The XRF was performed using l08Cd and ^'Amsources. Each measurement was integrated over a cen-tral area of filter of -10 cm2. Major elements foundwere Fe and Zr; a number of minor elements was alsoidentified. Table 4 gives a typical XRF record of Fe andZr from one of the sampling sessions
Table 4. Typical XRF record of Fe and Zr mass deter-mination. 1997 April 2 filters.
Unit(Loop)
1-N1-S2-N2-S3-N3-S4-N4-S
Feug/cm2
14.728.325.821.216.582.414.544.7
ZrUg/cm2
0.82.54.41.75.49.91.23.2
Zr/FeRatio
0.050.090.170.080.330.120.080.07
Mass Ratioweight/XRF
2.81.23.21.62.21.15.11.9
A summary of Fe and Zr concentrations in u.g per kgD2O (ppb) measured so far is shown in Figure 2. As canbe seen, during three sampling sessions crud levels weresystematically lower for Units 2 and 4. High crud levelsobserved in Units 1 and 2-N in 1996 February, de-creased markedly during later sampling sessions. XRFdata for 1997 sampling session show that in a well-controlled steady-state of reactor operation, Fe concen-tration can be as low as -1 ppb and Zr concentration isat the level of 0.1 ppb. The highest concentration of Zr(up to 30 wt.% Fe) has been observed so far in Unit 3North samples. The reason of these differences is beinginvestigated
Scanning electron microscopy and X-ray dispersiveanalysis of filters showed that whileiron representedvery fine ~|im-sized particles, zirconium was often pres-ent in a form of 20 to 30-u.m-sized particles. It is likelythat zirconium in the crud originates from Zr-2.5Nbpressure tubes oxide spalling, from axial scratch marks
on the inner tube surfaces during axial motion of fuelbundles, and from fret marks at the inlet ends of thepressure tubes caused by the bearing pads, as well as itcan come from fretting of Zircaloy-4 bearing pads onfuel sheathing. The mass of Zr in the crud should becorrelated with these wear effects. Further systematicmonitoring of Zr and evaluation of other elements in thecrud should help to elucidate its main sources.
Figure 2. Concentrations of Fe and Zr in crud measuredusing X-ray fluorescence analysis of filter deposits ob-tained from 3 recent steady-state sampling sessions.
Mossbauer Spectroscopy
Mossbauer spectroscopy was used to establish thechemical form and oxidation state of iron and tin.Similarly to secondary side filter analysis [7], thetransmission spectra of 14.4 keV y-rays in 57Fe are de-tected with a Kr-CO2 proportional counter, but themeasurements were significantly more difficult becauseof the radioactivity of the absorbers [8]. All 57Fe spectrawere obtained at room temperature using a 50 mCi57CoRh Mossbauer source.
Iron is found mostly as magnetite, Fe3O4, but fractionsof reducible iron Fe(III) oxides and hydroxides(ferrihydrite; Fe5HO8.4H2O, hematite; a-Fe2O3,maghemite; y-Fe2O3, goethite; oc-FeOOH, and lepido-crocite; y-FeOOH) were also found and often were athigher concentrations than could be expected in lithiatedwater under reducing conditions. A summary of Moss-bauer spectroscopy data for filters from one of steady-state sampling sessions is. given in Table 5, as an exam-ple. The speciation of iron oxides observed and its rela-tionship to system chemistry are discussed in Sections 3and 4.
Using 23.9 keV y-rays emitted by radioactive 119Sn inthe deposits, Mossbauer spectra of minute quantities of
246

tin in the filters were also measured [9]. Tin, presuma-bly incorporated in zirconium oxide particles, was foundto be in oxidized state Sn(IV), same as in stannic oxideSnO2, and same as observed in oxide scrapes from theZircaloy-2 pressure tube.
Table 5. Example of Mossbauer 57Fe spectroscopyanalysis of PHT specimens. 1996 July 24 samplingsession.
Unit(Loop)
1-N1-S2-N2-S3-N3-S4-N4-S
Fe3O4
81±282±281±148±241±268±135±247±1
Phase(wt.
a-Fe2O3
16+114+2
—15+7
————
Composition%>Fe)
a-FeOOH
—
—6+1——
Y-FeOOH
3+14+119±137±153+132±165±253±1
3. Chemical Form of Iron
The chemical form of iron in the crud and its oxidationstate provide an insight into its origin and PHT chemis-try.
Hot Conditioning
Before entering into service, Units 1 and 2 were hot-conditioned with EDTA and Units 3 and 4 with NH3,N2H4 and some Li(OH). During hot conditioning withlithiated light water, EDTA and 25 ppm N2H4 wereadded at the beginning of the cycle.
The set of 15 archived filters from Unit 1 EDTA condi-tioning in 1990 was examined in 1995. During condi-tioning, the system was kept at 145°C for 6 h and then at250°C for 36 h. The evolution of Fe species obtainedfrom Mossbauer spectra is plotted in Figure 3 (top) as afunction of the time. As seen, at 145°C, ferric oxyhy-droxides (a- and y-FeOOH) have quickly (-12 h) con-verted to almost totally magnetite (~90%), indicatingquick conversion (after 12 h) to a desirable so-calledblack state. The iron transport shows a rather complexbehavior, but it reaches low values (fraction of ppm) atthe end of the conditioning cycle. Figure 3 (bottom)shows, that in this case, the crud transport data obtainedby weighing and from evaluation of the Mbssbauerspectra were quite consistent.
£ 1» -
F.3O,
I »
~ > 1
23 Mar 1990
Figure 3. Results of DNGS Unit 1 hot conditioning in1990. Top: evolution of iron species with time. Bottom:crud transport as determined from mass gain of filtersand from Mossbauer spectra.
Cold Lay-ups and Preconditioning
During cold lay-ups and preconditioning, considerableamounts of ferrihydrite was found in the large D2O stor-age tank (TK1), in addition to hematite and maghemite.Ferrihydrite deposits were also observed on the end-shield carbon steel plugs in pressure tubes after pro-longed lay-up (1.5 a) of Unit 2. The formation of ferri-hydrite usually occurs by the oxidation of Fe2+ in thepresence of crystallization inhibitors, such as organics,phosphate and silicate species. Phosphates have beenobserved in primary side, for instance in Bruce A pres-surizer heater. Ferrihydrite is thermodynamically unsta-ble and with time transforms into goethite, hematite, ormixture of the two.
Start-ups
During reactor warm-ups and start-ups iron was foundmostly observed in the form of ferrihydrite and go-ethite. Measurements were performed for Unit 2 in1992 and Unit 4 in 1994. Start-up crud concentrationswere as high as 3 ppm and 8 ppm, respectively (see Fig-ure 4). The magnetite fraction increased slowly withtime in the early operational phase.
247

40
20
0
-
-
— 1.5 y
- L i=> 20p |^I ° 1 *1G0
cre
20
40
20
-
-
u I92 93
I
94
1 1
1 1
•
1
|9
TIMF
1
11
1- i
(\
11 *
|jjb
1
iiI
III
J|i
200
lll
96
BG
I T
1
II
I I I97
U-1
10NS
U-2
U-3
U-4
Figure 4. PHT crud concentration in DNGS Units 1 to 4as a function of time; in all cases crud mass was deter-mined by weighing. N and S stand for North and Southloops, respectively. Major outages and shutdowns aredepicted above each plot. BG indicates start of applica-tions of N2 blanketing gas.
Steady-state
The fractions of magnetite during steady-state reactoroperation varied widely between 50 and 80% (in %Fe)in Unit 1, 30 to 95% in Unit 2, 45 to 70% in Unit 3North, and 30 to 70% in Unit 4 (see Figure 5). The bal-ance is lepidocrocite, goethite and hematite. Note that100% magnetite is commonly expected and assumed inthe heat-transfer models.
Generally, the fraction of magnetite increased between1994 and 1997 (see Figure 5), suggesting that more andincreasingly reducing conditions were slowly estab-lished in the system. This is consistent with loop ex-periments by Allsop et al. [10], which have shown thatthe conversion of iron oxides in lithiated water, and es-pecially reduction of hematite to magnetite in CANDUprimary coolant, is very slow and may take severalweeks to convert to stable oxide form.
Since 1996 February, the N2 gas blanket has been usedduring outages, and the samples showed an absence oflepidocrocite in Units 3 and 4, and very little in Units 1
and 2. There was also no goethite in Units 1 and 3. Be-cause goethite and lepidocrocite should be unstable atPHT temperatures, their presence in the filters wouldindicate the ingress of these oxidized iron species intothe circuit from low-temperature components of thesystem, such as purifiers, storage tanks, fueling ma-chines, etc.
100
so
in r ir
T M
u-iIDNS
U-2
U-3
U-4
Figure 5. Fractions of magnetite in PHT filter depositsrecorded during various sampling sessions. The balanceof iron is made up of iron (III) oxides and oxyhydrox-ides.
It is to be noted that at present the steady-state composi-tion of iron oxides in DNGS PHT crud is quite compa-rable to the secondary-side blowdown crud composition.
4. Discussion of Results
Effects of Primary-Side Chemistry
An analysis of PHT crud transport at DNGS Units 1 to4, North and South loops indicated that there may be acorrelation between the concentration of crud and thepHa of heavy water [11]. An updated and more com-plete correlation is shown in Figure 6. The pHa valuesin Figure 6 are in most cases reported as averaged val-ues over a 4-week period prior to sampling; in caseswhen pHa in this period varied more than 0.2 units(mostly prior to 1994 and 1995 samplings), the averagevalues for 2 to 5 days before sampling were accepted.
248
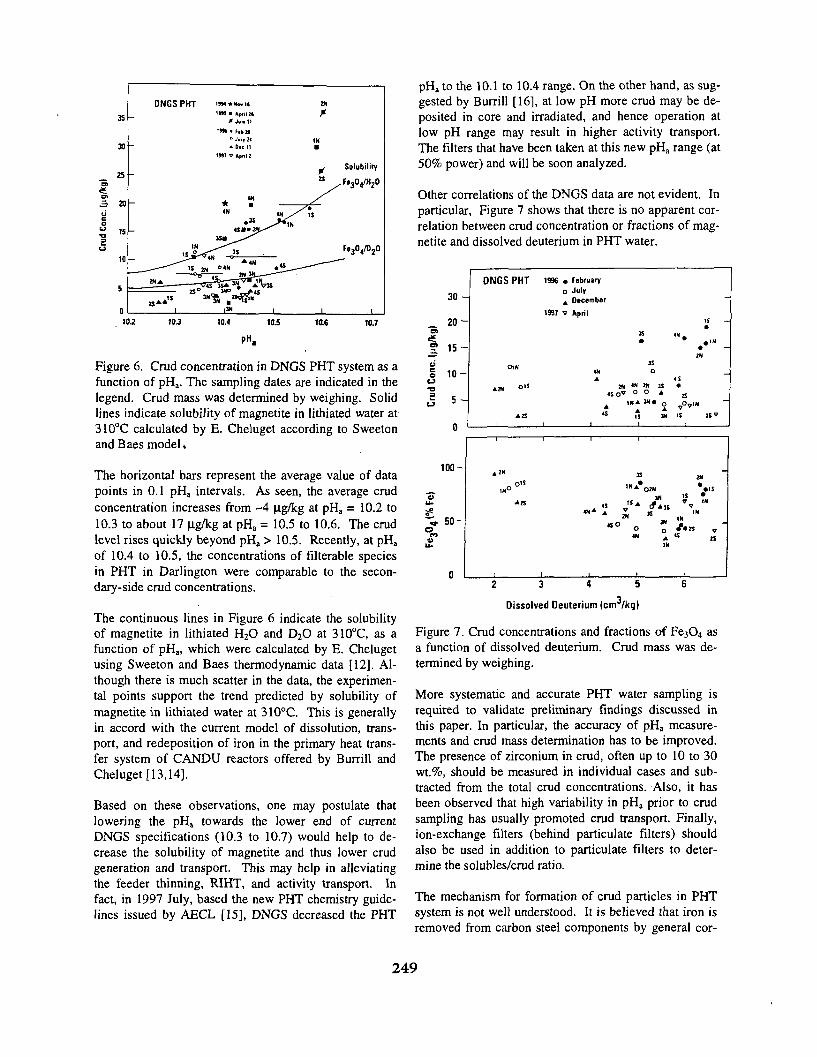
fu
ou
Cru
i
35
30
25
20
15
10
5
0
-
-
DNGS PHT
IN•s °-tf
2NA—" —n
A A t s *
1
t M • April»* J«>T »
* Die 11
4N* •4N ,
ZN
IN•
ZS
i/Ts
i
Solubility
Fe304/D20
-——
10.2 10.3 10.5 IOJ
Figure 6. Crud concentration in DNGS PHT system as afunction of pHa. The sampling dates are indicated in thelegend. Crud mass was determined by weighing. Solidlines indicate solubility of magnetite in lithiated water at310°C calculated by E. Cheluget according to Sweetonand Baes model.
The horizontal bars represent the average value of datapoints in 0.1 pHa intervals. As seen, the average crudconcentration increases from ~4 (ig/kg at pHa = 10.2 to10.3 to about 17 \igfkg at pHa = 10.5 to 10.6. The crudlevel rises quickly beyond pHa > 10.5. Recently, at pHa
of 10.4 to 10.5, the concentrations of filterable speciesin PHT in Darlington were comparable to the secon-dary-side crud concentrations.
The continuous lines in Figure 6 indicate the solubilityof magnetite in lithiated H2O and D2O at 310°C, as afunction of pHa, which were calculated by E. Chelugetusing Sweeton and Baes thermodynamic data [12]. Al-though there is much scatter in the data, the experimen-tal points support the trend predicted by solubility ofmagnetite in lithiated water at 310°C. This is generallyin accord with the current model of dissolution, trans-port, and redeposition of iron in the primary heat trans-fer system of CANDU reactors offered by Burrill andCheluget [13,14],
Based on these observations, one may postulate thatlowering the pHa towards the lower end of currentDNGS specifications (10.3 to 10.7) would help to de-crease the solubility of magnetite and thus lower crudgeneration and transport. This may help in alleviatingthe feeder thinning, RIHT, and activity transport. Infact, in 1997 July, based the new PHT chemistry guide-lines issued by AECL [15], DNGS decreased the PHT
pHa to the 10.1 to 10.4 range. On the other hand, as sug-gested by Burrill [16], at low pH more crud may be de-posited in core and irradiated, and hence operation atlow pH range may result in higher activity transport.The filters that have been taken at this new pHa range (at50% power) and will be soon analyzed.
Other correlations of the DNGS data are not evident. Inparticular, Figure 7 shows that there is no apparent cor-relation between crud concentration or fractions of mag-netite and dissolved deuterium in PHT water.
/kg
o>- V
cicou3
CJ
30 —
2 0 -
1 5 -
1 0 -
5 -
n
DNGS PHT
O1N
ATS1
1996
1997
i
• February
o July
A December
7 April
4NA
4S
4S
\
•m
o"
JS
o<N INO O
I N * W *AIS
1
ISA
oA»
IS —
• —2N
2S
IS !S"?i
100-
50-
0
i«o ° 'S
A S
I N
4S ' S
* " A 2NISO
3S
A O2N3N
A * A 1 SIS
3N° OIN °
3N
1
15
4N
•S
•
IN
2S
Dissolved Deuterium (crrr/kg)
Figure 7. Crud concentrations and fractions of Fe3O4 asa function of dissolved deuterium. Crud mass was de-termined by weighing.
More systematic and accurate PHT water sampling isrequired to validate preliminary findings discussed inthis paper. In particular, the accuracy of pHa measure-ments and crud mass determination has to be improved.The presence of zirconium in crud, often up to 10 to 30wt.%, should be measured in individual cases and sub-tracted from the total crud concentrations. Also, it hasbeen observed that high variability in pHa prior to crudsampling has usually promoted crud transport. Finally,ion-exchange filters (behind particulate filters) shouldalso be used in addition to particulate filters to deter-mine the solubles/crud ratio.
The mechanism for formation of crud particles in PHTsystem is not well understood. It is believed that iron isremoved from carbon steel components by general cor-
249

rosion and flow-assisted corrosion (dissolution), espe-cially in areas where water stream is unsaturated in iron,such as outlet feeders. On lay-ups the general corrosionprobably increases considerably. During on-power op-eration, iron may reprecipitate in areas where it is over-saturated, particularly because of temperature drop, suchas outlets of SG pipes. Thus, the deposits on the filterscan contain particles formed in two different mecha-nisms: 1. the particles precipitated on system surfacesand removed (spalled) by process streams, 2. the parti-cles precipitated from Fe dissolved in water during mi-gration (cooling) to filter. High temperature samplingwould help to distinguish between those two mecha-nisms.
A better understanding of iron oxides dissolution and re-precipitation processes in PHT system is also needed inthe context of possible depleted zinc treatment. It wasshown in reference [17] that in simulated CANDU pri-mary coolant Fe and Zn tend to co-precipitate on carbonsteel surface in the form of zinc ferrite (ZnFe2O4) parti-cles. This process may require and consume largequantities of isotopically depleted zinc.
The relationship between oxidation state of Fe and con-centration of dissolved O2 in PHT water is yet to be es-tablished. In general, reduction-oxidation of primary-side iron can be affected by:
• external sources of oxygen; and• oxygen from radiolysis.
External Sources of Oxygen
The main heavy-water storage tank has a cover gas, butcondensate and makeup water can be air saturated (atBruce B and DNGS it is). Fueling machines (FM) canintroduce some oxygen from FM water (if it is oxygen-ated), because the storage tank for FM water in DNGS isopen to air. Further, heavy water from valves, samplinglines, drains, etc., is usually collected in a tank (gravitysystem), which is open to air.
Starting from the middle of 1996, a nitrogen blanket wasused during shutdowns, both in the main circuit and inthe condensate and bleed tanks. Although its main pur-pose is to purge D2, it also helps to keep the pHa high,and, as it appears now, it facilitates establishing morereducing conditions (more magnetite) in the PHT sys-tem.
Figure 8 shows a comparison of 41Ar in reactor inletwater in DNGS Units 1 to 4. As seen, since introduc-tion of N2 blanketing procedure much lower surges of41Ar (a product of airborne ^Ar activation) have been
observed after recent start-ups. This may be the mainreason that iron in corrosion products is recently lessoxidized than it has been in the past, prior to N2 blan-keting (cf. Figure 5 for comparison).
en
o
w>.oCDO
O
3=
CO>
co
Coa.t/>c03
ro0)
YEAR
Figure 8. Activity of 4lAr in reactor inlet water in DNGSUnits 1 to 4, as a function of time.
Oxygen from Radiolysis
Oxygen production from radiolysis can be affected by:
• reactor power; and• steam quality.
Steam quality is probably the most significant. At pres-ent, the outlet steam quality is probably in the followingorder: CANDU 6 > Darlington > Bruce-B > Bruce-A >Pickering. Reactor age may play a role in determiningoutlet steam quality, largely because of the tube creep.
250

In reactors with boiling at the outlet of the channel,deuterium is stripped into the vapor phase, leaving lessdeuterium to suppress radiolysis. This is probably not acaseofDNGS.
To prevent radiolysis and O2 productions, in DNGS,deuterium is added at concentration of 3 to 10 cmVkgD2O. The addition is stopped 1 to 2 weeks beforescheduled shutdowns and then the system is degassed.
There is little experience in crud analysis and iron spe-ciation in other stations. A Gentilly-2 study showed100% magnetite (in 3 specimens examined thus far)[18]. Bruce B had orange (ferric) crud when operating at100% (with boiling); since the reactor was derated,cruds have been black (magnetite). The analysis of crudfilters from Bruce B is in progress.
5. Conclusions and Recommendations
The objectives of this work were to develop proceduresfor monitoring the corrosion product transport in theprimary side of CANDU reactors, and to gain an insightinto the composition of the transported crud. Suchmeasurements are much needed as there are few fielddata.
Regular sampling of primary side water and analysis ofcrud is important for proper maintenance of CANDUreactors. The expected goals and benefits include:
• identification of the origin of oxidized iron and zir-conium species;
• recommendations on how to lower crud and activitytransport;
• help in minimizing FAC effects and feeder degra-dation to maxime lifetime and performance of thesystem; and
• help in minimizing occupational dose and radioac-tive waste.
From our work performed until now on CPT monitoringof the PHT one can arrive at following specific recom-mendations and control actions:
• During lay-ups and shutdowns, air in-leakages maycause considerable corrosion of carbon steel com-ponents, reflected in start-up crud bursts up to -10ppm. Nitrogen blanketing is a good remedial ac-tion.
• Because iron transport in steady-state is correlatedwith pHa, and may reflect increased FAC rates, theuse of pHa lower than 10.3 to 10.4 should be con-sidered, if steady-state iron levels continue to be
above 5 ppb.of total Fe, remedial measures to en-sure more reducing conditions should be consid-ered.
• Periodic monitoring of the oxidation state of corro-sion products at steady-state is highly recom-mended. If magnetite levels are below 80% of totalFe, remedial measures to ensure more reducingconditions should be considered.
• Presence of iron oxyhydroxides in the crud indi-cates air in-Ieakage's and should be minimized byheavy-water system leak-proofing and nitrogenblanketing.
• Concentration of Zr in the crud higher than ~ 1 ppbmay indicate excessive wear of fuel bundle padsand pressure tubes, and should be avoided.
Acknowledgments
The discussions of various aspects of this work withM.E. Brett, K. Bagli, S. Pagan (OHN-CMD), J. Borro-meo, D. Goode, T. Leung, J. Thompson (DNGS), G.Kozak (BNGS), P.V. Balakrishnan, K.A. Burrill, E.L.Cheluget, L.W. Green, A.J. Elliot, G. Moan and R.L.Tapping (AECL) are acknowledged. This work wasfunded by CANDU Owners Group projects WPIR 2011and 1521, as well as by direct DNGS contracts.
References
[1] J.A. Sawicki, M.E. Brett and R.L. Tapping, Posi-tion paper on secondary-side corrosion producttransport and oxidation state, COG-96-482, RC-1709, 1997 March.
[2] J.A. Sawicki, J. Borromeo and M. Dymarski, Cor-rosion product survey in Darlington primary heattransfer system, in Proceedings of 2nd CANDUChemists Workshop, 1996 September, Toronto.
[3] J. Shaw and S. Gregoris, Darlington NGS PHTcrud sampling, in Proceedings of CANDU Chem-ists Workshop, 1994 September, Toronto.
[4] B.D. Sawicka, XRF method for analysis of filterdeposits, in Proceedings of 2nd CANDU ChemistsWorkshop, 1996 September, Toronto.
[5] B.D. Sawicka, memo to M. Dymarski, J.A.Sawicki and R.L. Tapping, XRF chemical analysisof eight Darlington PHTS crud filters (February1996 sampling), 1997 January 10.
[6] B.D. Sawicka, these Proceedings.
251

[7] J.A. Sawicki and ME. Brett, Mossbauer study ofcorrosion products from a CANDU secondarysystem, Nuclear Instruments and Methods B76(1993)254.
[8] J.A. Sawicki, memo to J. Borromeo andM. Dymarski, Mossbauer iron-phase analysis ofDarlington primary heat transfer crud samples,1996 January 11.
[9] J.A. Sawicki, Mossbauer spectroscopy of tin inunirradiated and neutron irradiated Zircaloys, to bepublished.
[10] H.A. Allsop, D.H. Lister, J.A. Sawicki and M.S.L.Godin, The effect of dissolved oxygen in lithiatedcoolant, in Proceedings of 6"1 International Confer-ence on Water Chemistry of Nuclear Reactor Sys-tems, BNES, London, 1992, Vol. 1, p. 25.
[11] J.A. Sawicki, memo to M. Dymarski,R.A. Speranzini, K.A. Burrill and R.L. Tapping,PHT crud concentration - pHa relationship,1997 February 20.
[12] F.H. Sweeton and C.F. Baes, Jr., The solubility ofmagnetite and hydrolysis of ferrous ion in aqueoussolutions at elevated temperatures,J. Chemical Thermodynamics 2 (1970) 479.
[13] K.A.Burrill and E.L. Cheluget, Flow acceleratedcorrosion and erosion corrosion of CANDU outletfeeders and steam generator divider plates, inCOG 1996 Workshop on Erosion Proceedings,COG-97-055, 1997 February, p. 89.
[14] E.L. Cheluget, Wall thinning of CANDU outletfeeder pipes; an overview of mechanistic aspects,COG-07-40 (draft)
[15] H.A. Allsop, K. Burrill, A.J. Elliot, D.W. Evans,S.R. Goodwin and E.J. Moskal, Re-evaluation ofthe pHa and dissolved deuterium concentrationspecifications for CANDU™ heat transport sys-tems under operating and shutdown conditions.COG-96-545, RC-1738, 1997 June (draft).
[16] K.A. Burrill, memo to E.L. Cheluget and A.J. El-liot, Optimum pH for CANDU PHT, 1997 March24.
[17] J.A. Sawicki, Evidence of zinc ferrite formation oncarbon steel in primary-side coolant with addedsoluble zinc, J. Nuclear Materials 240 (1996) 22.
[18] J.A. Sawicki, memo to K.A. Burrill, Mossbaueranalysis of G-2 PHT crud samples, 1995 June 13.
252

INFRARED THERMOGRAPHYPROGRAM AT DARLINGTON NGD
Prepared By: B. SpeerProduction Support Dept.Darlington NGDBox 4000Bowmanville, OntarioL1C3Z8
ABSTRACT
Infrared Thermography is a proven predictivemaintenance tool for improving equipment reliabilityand reducing maintenance costs. It has been identifiedas one of the maintenance technologies that couldcontribute to the reduction of OHN forcedincapability factor.
At Darlington NGD a program has been establishedby combining OHN and Nuclear MaintenanceApplications Center (NMAC) operating experience.This presentation outlines the development andimplementation of this program. The main point are:Roles and Responsibilities, Equipment Selection,Software Requirements, Manpower Level, InspectionEquipment, Training and a Cost / Benefit Review.
1. INTRODUCTION
An Infrared Thermography Program has beenestablished a Darlington NGD to: Improve personnelsafety, minimize forced outages, prevent catastrophicfailures by identifying equipment that is deterioratingbefore it affects station operation.
This paper will outline the key elements that wentinto establishing an effective program. The programestablished follows guidelines in the NMAC "InfraredThermography Guide" (see Reference 1) and addsstation experience. The information presented is :Responsibilities, equipment to be surveyed, conductof work and frequency of surveys.
2. DEFINITIONS
Infrared Imager - A tool capable of displaying aninfrared map of an object. This device is commonlyknown as an infrared camera.
PMEP (Preventative Maintenance EnhancementProgram) - A maintenance program based onreliability centred maintenance principles todetermine which equipment should be included inpreventative maintenance programs.
Spot Thermography Tool - Tool that is used todetermine the temperature of a spot using the emittedinfrared energy.
Thermography - The use of an infrared imager to mapout a temperature profile over the surface of anobject.
Thermography Crew - A maintenance crew set up toperform infrared scans.
3. OVERVIEW OF THE MAINTENANCEPROGRAM
The program implemented can be broken down intopreventive maintenance and troubleshooting.
For the preventive maintenance a technician receivesa list of equipment that require an infrared scan.Typically this list will be less than one day's work.The equipment is scanned and temperature datarecorded, any deviations from the normal are noted.Once the work is completed (unless the deviationrequires immediate action) the technician performs ananalysis on any deviations to determine the source ofthe problem and passes the information on toengineering and maintenance.
On the troubleshooting side a request is made to thetechnician to resolve a problem. The image is takenand analysis performed. Reporting is made directlyto the requester of the problem.
While establishing the program outline above thefollowing key elements were considered:
1. Determining the program responsibilities2. Determining equipment to be included in a
surveillance program3. Establishing an qualified crew and purchasing
the appropriate equipment.4. Developing an effective data storage and
reporting system5. Establishing a system to monitor the program's
effectiveness
Each of these topics will be discussed below.
4. PROGRAM ELEMENTS
4.1 RESPONSIBILITIES
The titles below are not the actual titles at Darlington.They have been made generic to indicate the level ofresponsibility.
o»o>o»o»o,<)O
253

Infrared Thermography Program Page 2 of 5
Maintenance Coordinators (Mechanical andI&C):
Responsible for ensuring the Thermography Crew isstaffed and equipped to a level that allows it toperform its duties.
Maintenance Engineer:
Responsible for: Supporting the equipment selectionprocess, interfacing with outside organizations,providing technical/troubleshooting support asrequired, and supporting the purchase of infraredequipment.
First Line Supervisor:
Responsible for supervision of the IR crew. Thisincludes review and setting of priority of workrequests and scheduling the routine work load.
Thermographers:
Responsible for the actual infrared scans required bythe program. This includes analysis and reporting ofresults as directed by the program. Responsible fordetermining which equipment will be surveyed asoutlined in Section 4.2. This includes selecting,checking and adding to database.
RCM Coordinator:
Responsible for passing on RCM requirements toThermography Crew.
System Responsible Engineers (SREs):
Responsible to act as required to the reports issued bythe Thermography Crew. They will also providetechnical support to RCM in identifying criticalequipment.
4.2 EQUIPMENT SELECTION
This section identifies the equipment that will bemonitored under the infrared thermographypreventative maintenance program. In general, a'piece of equipment' is identified as having Unit-System Code-Device Code. For the purposes ofthermography, this has also added 'component' sincesome devices have more than one area to besurveyed. Listed below are the criteria that will beused. All four methods are being incorporated.
4.2.1 Information From RCM
It has become recognized that to be cost effectivepreventive maintenance has to be performed on theright equipment. One of the methods of establishingpriorities is applying the principles of ReliabilityCentred Maintenance. To summarize this type ofprogram: Station equipment is analyzed to determinewhat the effect of a component failure is on safetyand production. In the simplest terms only equipmentthat have an impact above certain threshold will havePM performed. RCM is detailed in many otherreports therefore it will not be discussed any further.
Any equipment that is identified as critical by theRCM Group will have infrared thermographyperformed (where applicable). As the RCM programprogresses, this information will be passed on to theinfrared crew for addition to their routines. Thiscovers both electrical and mechanical equipment.The information from the RCM program will beentered into the routines developed for theMechanical and Electrical Equipment (listed below).This will be an ongoing process until the RCMreview for the station is complete.
4.2.2 Discussions With System Engineers
There are several areas where System Engineers(and/or Thermographers and other MaintenanceStaff) have identified the need for IR scans onequipment. Some of the areas are: Generator, TRF,Standby Generator expansion joints and FuelHandling. The process for adding this equipment tothe IR program is:
1. Meet with the System Engineer to discuss theequipment required and to determine if anIR scan is possible. Have the System Engineerjustify the need for IR scans. The need mustfollow the intent of the RCM process (preventshutdowns and equipment damage or economicgains). Have the System Engineer prepare a listof equipment (with location).
2. Prepare a routine as detailed in 4.2.3 and 4.2.4.
4.2.3 Mechanical Equipment
Since determining the temperature using the infraredimager is not time consuming the number ofcomponents that can be scanned in a day is high.This means that the exact analysis derived from RCMneed not be applied. Important systems are scannedbut the individual components may not be highlyrated by the RCM system.
254

Infrared Thermography Program Page 3 of 5
The determination of which pieces of mechanicalequipment are to be scanned is as follows:
1. Obtain a list from the RCM group that details themost critical systems in the station.
2. Examine the operational flowsheets for the RCMidentified systems and determine whichequipment can benefit from an IR inspection.Typically this will be rotating equipment andvalves (that could be passing). The list is crossreferenced with equipment lists already identifiedby RCM (to ensure nothing was missed).
3. Prepare a routine of equipment based on thesystem and a useable route.
4. Perform a trial inspection of the routine. Thisdetermines if the IR inspection will produceuseable results and determines the approximatetime for the routine. During the trial thetechnician would add equipment that did notbelong to the system but was nearby and aninfrared image easily obtained. In this mannerthe route becomes the most efficient use of time
cells and 600 V feeder breakers will be examined.The individual MCC Cells to be examined will beidentified by:
1. Examining any MCC cell or 600 V feederbreaker that appeared as critical on the RCM list.
2. Having the balance of the loads reviewed by theIR crew and the Maintenance Engineer determineif the load is important enough to be scanned.This will be a crude criticality assessment but itis felt that it will be cost effective.
A separate area of work is the inverters/rectifiers forthe Class I/II systems. It has been decided thatthermography will be performed approximately onemonth before the annual maintenance is performed.After the maintenance is performed, a follow-up scanwill be performed.
4.2.5 Test Frequencies
The test frequencies for the inspections weredetermine as follows:
4.2.4 Electrical Equipment
The determination of which pieces of electricalequipment are to be scanned is as follows:
1. The Electrical Systems Group in Engineeringidentifies the electrical distribution equipmentthat should be examined.
2. Equipment identified that can be inspected isadded to the electrical routine for that system.Presently 4 and 13 kV breakers cannot beinspected as they are explosion proof and thecabinets cannot be opened on power.
3. A routine of equipment based on the system isprepared.
4. A trial inspection of the routine is performed.This determines if the IR inspection couldproduce useable results and determines theapproximate time for the routine. During thetrial the technician would add equipment that didnot belong to the system but was nearby and aninfrared image easily obtained. In this mannerthe route becomes the most efficient use of time.
The information above is for electrical distributionsystems. This system supplies power to individualMCC's. It has been decided that not all the MCC
Electrical: Once per year based on experience atBNPD, or as requested by SRE.
Mechanical: In general, once every three months, oras suggested by SRE.
4.3 EQUIPMENT, QUALIFICATION ANDCREW COMPLEMENT
4.3.1 Equipment
The minimum to start a program is the use of aninfrared imager that has the capability of storingimages on disk. The latest generation of imagershave focal plane array detectors. While this is abetter technology and is recommended, the programcan operate with the older scanning models.
4.3.2 Qualification
The American Society of Non-destructive Testing(ASNT) has added thermography as a program theyaccredit. It is recommended that all thermographersachieve Level I within the first year of joining theprogram. Level II or other advanced study (eg,Electrical Applications) is recommended for at least50% of the crew within the first three years.
255

Infrared Thermography Program Page 4 of 5
The ASNT accreditation is required in order tocontrol thermographers offering their service to thepublic. Since the Thermography Program atDarlington is not a service to the public, thequalification should not be viewed as mandatory;rather, by using the ASNT levels, the station can beassured of receiving quality training.
4.3.3 Crew Complement
It is recommended that a Thermography Crew for afour unit station with the equipment to be scannedidentified be, at a minimum, composed of thefollowing:
Two I&C Technicians: To run the electricalequipment side of the program and provide insightregarding the results from the scans on electricalequipment. Two technicians are required in order tohave a safety person when performing scans onHV equipment (opening panels).
Two Mechanical Maintainers: To run the mechanicalequipment side of the program and provide insightregarding the results from the scans on mechanicalequipment
4.4 SOFTWARE AND REPORTING
There are two areas that software is required to run agood program.
4.4.1 Analysis Software
The first is software to analyze the IR imagesobtained from the IR camera. This software ispurchased from the suppliers of the cameras. Themain requirement is the capability to easiiy producequality reports. All suppliers of infrared imagersnow offer analysis programs.
4.4.2 Database
The second software requirement is a databasecapable of listing the routines generated. Thisdatabase will record IR data and be capable oftrending the results. Experience at Darlington hasshown that with the large number of equipmententered into routines and the large amount of datacollected from these routines a database is required.With the start of the Thermography Program in 1995work began on developing a LAN based database thatmet the requirements of this program. There are still
some enhancements required in order for thisprogram to meet the minimum needs of the program..
It seems best to illustrate the program by goingthrough the steps required of a routine:
• On the LAN a routine is requested based on thepreventive maintenance schedule.
• This routine is downloaded into a laptopcomputer.
• The computer is taken out into the field alongwith the infrared imager.
• The routine in the program identifies the piece ofequipment (and the specific component on theequipment) where the temperature is to bedetermined.
• The Thermographers determines the temperatureand determines if action is required. Thisdetermination is from a comparison to previousreadings and experience.
• The new reading is entered into the database andthe Thermographer moves onto the nextcomponent.
• Once the routine is complete the data is uploadedfrom the laptop back into the LAN.
4.4.3 Reporting
The reporting of thermography results will depend onthe type of work being performed routine or request.
4.4.3.1 Routine
The results will be entered into the thermographydatabase for each component examined in the routine.If an anomaly appears, the Thermography Crew will:
1. Initiate a work request either to a trades group torepair the problem or to the technical group todetermine a course of action.
2. Issue a Thermography Report to the SRE. Acopy of the report is filed in the ThermographyOffice.
3. Issue a second work request if a post-maintenance scan is required and/or determinethe nature of the problem for future reference.
4. For issues where root cause is not determined byThermography Crew any work reports to thework requests that have root cause informationare to be printed and filed with the report.
256

Infrared Thermography Program Page 5 of 5
4.4.3.2 Requests
1. Enter a work report against the requesting workrequest detailing the results of the scanrequested.
2. Issue a second work request as detailed above iffollow-up work is required.
been encouraging with both electrical and mechanicalfaults detected and corrected.
6. REFERENCES
1. Infrared Thermography Guide EPR1 Report NP-6973.
2. Darlington Procedure "Thermography Program"NK38-PROC-60051-001
4.5 TRENDING
Once a year, the Maintenance Engineer will initiatean action that reviews the routine results for the pastyear. This will attempt to identify components on theprogram lists that had: Failures that should have beendetected by thermography but were not, or failuresthat were undetected by an inspection.
For these components, the frequency will change tosuit the findings or they will be dropped from theprogram.
The Maintenance Engineer will also implement ayearly cost/benefit analysis of the maintenanceprogram. This will consist of reviewing thethermography reports that were issued for the for ayear. A estimate will be made of the potential savingsfrom detecting the fault based on the probability offailure x consequence of failure. The total benefitwill be compared to the cost of the program (labourand equipment).
Experience at other sites which have implementedInfrared programs shows that in the first year or twonumerous faults are found, especially in electricalequipment. However, when the first pass has beencompleted the number of faults drops dramatically.Darlington has not determined how to address thisknown problem.
5. SUMMARY
The information above outlines the program that is inplace at Darlington NGD. It is hoped that theinformation can be used by others hoping toestablished their own Infrared ThermographyMaintenance Program.
The program at Darlington is still in its infancytherefore the cost/ benefit and routine review have notbeen completed yet. They will be done after the firstfull year of the program. The results to date have
257
Fourth CNS International Conference on CANDU MaintenanceNovember 1997, Toronto, Canada
UPGRADING INFLATABLE DOOR SEALS
° T.M Sykes, R. Metcalfe and L.A. Welch
Atomic Energy of Canada LimitedChalk River Laboratories
SUMMARY
Inflatable door seals are used for airlocks allowing personnel and fuel to enter the reactor vault in
CANDU® stations. They were a significant source of unreliability and maintenance cost when theCANDU Owners Group (COG) approved a program to upgrade them in 1993. The target was forimproved performance and reliability, to be backed by environmental qualification testing to show thatthe doors would still seal during a loss of coolant and main steam line break, even after many years ofuse.
Only commercial products and suppliers existed in 1993. For historical reasons, these "existingproducts" did not use the most durable material then available. In hindsight, neither had they beenadapted or optimized to combat conditions often experienced in the plants—sagging doors, damagedsealing surfaces, and many thousands of openings and closings per year.
Initial attempts to involve the two existing suppliers in efforts to upgrade these seals were unsuccessful.Another suitable supplier had therefore to be found, and a "new," COG-owned seal developed; this wascompleted in 1997. This paper summarizes its testing, along with that of the two existing products.Resistance to aging has been improved significantly. Testing has shown that an accident can be safelywithstood after 10 years of service or 40,000 openings-closings, whichever comes first.
AECL's Fluid Sealing Technology Unit (FSTU) has invested in the special moulds, test fixtures andother necessary tooling and documentation required to begin commercial manufacture of this new quiaityproduct. Accordingly, as with FSTU's other nuclear products such as pump seals, the long-term supplyof door seals to CANDU plants is now protected from many external uncertainties—e.g., commercialproducts being discontinued, materials being changed, companies going out of business. Manufacturingto AECL's detailed specifications is being subcontracted to the new supplier. FSTU is performing thequality surveillance, inspection, testing, and customer service activities concomitant with directresponsibility for supply to the plants.
Submitted for presentation at the CANDU Maintenance Conference, CanadianNuclear Society, Toronto, 1997'November 16-18 2 5 8
RTD PROBLEMS AT DARLINGTON
D. McAIlindonAECL-Ontario Hydro ServicesDarlington NGD, PO Box 4000
Bowmanville, ON, CanadaLIE 1R6
D. SloanOntario Hydro Nuclear
Darlington NGD, PO Box 4000Bowmanville, ON, Canada
LIE 1R6
P.MayerOntario Hydro Technologies
800 Kipling AvToronto, ON, Canada
M8Z 5S4
ooooo<O
Abstract
Resistance Temperature Detectors (RTDs) and their measurement circuit components have been a significantmaintenance item at Darlington. Analysis of the problems has shown that RTDs and electrical penetrations (EPs)have been the largest sources of faults. A failure mechanism in which the RTD electrical resistance shifts upwardwas identified as a major source of RTD failures, which prompted a detailed failure investigation by Ontario HydroTechnologies (OHT). The investigation concluded that the root cause failure mechanism is chlorine contaminationof the platinum wire during manufacture which resulted in surface damage to the wire and flaking of the wiresurface during operation. Electrical penetrations in Darlington are of a pre-built modular design with two crimpsinternal to the EP. Spurious resistance in poor quality crimps in the EPs lead to errors in resistance measurement.The problem led to a complex and costly job to insert new modules in existing spare EPs.
1. Introduction
A Resistance Temperature Detector (RTD) is atemperature measuring device that consists of a thin(0.001" diameter) platinum wire with its lengthmanufactured to have a precise electrical resistance(Figure 1 showing schematic of rtd). As thetemperature of the platinum wire changes, itsresistance responds in a predictable manner.
In each unit at Darlington, there are 480 RTDs in theChannel Temperature Monitoring (CTM) System(one for each fuel channel), and 188 RTDs in theChannel Power Measurement (CPM) System for atotal of 668 RTDs per unit. CTM RTDs are placed inoutlet feeders and used to confirm flow in eachchannel while CPM RTDs are used to measure thetemperature increase across a fuel channel as a part ofthermal power measurement. CPM RTDs areconnected at the inlet and outlet feeders of a fuelchannel.
Lead wires running from the platinum wire tomeasurement electronics have resistance that, if notaccounted for, can severely affect the accuracy of themeasurement. In order to compensate for theresistance of the lead wires, a third wire is soldered toone end of the platinum wire (Figure 1 A). Then thelead-wire resistance can be measured (resistancebetween the two wires on the same end of theplatinum wire, A and B) and subtracted from themeasured resistance (B to C) to give the true platinumwire resistance.
Other elements in the RTD measurement circuit areshown in Figure 2. An RTD is connected to a cablethat runs to an electrical penetration (EP) where thecable is spliced to wires going through the EP. TheEP wires are spliced again outside the EP to a cablethat runs to the electrical measurement circuit thattransforms the resistance into a voltage. CTM RTDsare measured using a resistor bridge. The voltagegoes into an analog input (AI) card and from thereinto both the Digital Control Computers (DCCs).CPM RTDs go into a differential amplifier fortransformation to a voltage. From there, the voltagesignal goes to two separate AIs in the control room,one for each DCC
Problems can occur in any of the circuit elements andthe key to solving problems is troubleshooting. Aconsistent troubleshooting procedure has beendeveloped at Darlington that diagnoses and resolvesthe source of problems.
A review of all the problems encountered to date inDarlington has shown that RTDs, EPs, andconnectors are the main sources of our RTDproblems.
RTDs have been a significant maintenance item atDarlington. The technical specification for the RTDsspecifies a failure rate less than 5 x 10'3 failures/year,or about 3 failures per year per unit. However, for
259

example, during the station outage in 1997, 59 RTDswere replaced and in a poison outage on unit 3 earlyin 1997, another 24 RTDs were replaced.
Another significant problem is electrical penetrations.Darlington uses a pre-built style of EP that has twocrimps inside the penetration. We believe, based onoutside findings[l], that the crimps have degradedand led to increased resistance in some circuits that,though small, has a serious impact on the RTD loopaccuracy. This problem has so far been found in units1,2, and 3, with most of the problems in a specificmodule in unit 2. Three new penetration moduleswere installed in unit 2 during the 1997 stationoutage.
RTD connectors have also been a problem and 6connectors were replaced during the last outage. Thenext area to get attention after RTDs and EPs will beconnectors.
In this report, the particular type of RTD failurecausing the large failure rates and the EP replacementprogram will be discussed. To begin, however, it isimportant to understand the troubleshooting process.
2. Troubleshooting
Our first step in troubleshooting is to measure theresistances across the different pairs of RTD wiresfrom the control distribution frame (CDF). (Refer toFigure 1) A form has been developed for controlmaintenance techs to record resistance measurementsbetween all legs of the RTDs. If the resistance acrossthe RTD ( A to C, B to C) are not equal (within 0.2ohms), we know there is a problem with wiring,although this may be in the RTD itself, the connector,splices, or the penetration. If the measurements areequal, we can determine the temperature by referenceto a chart of RTD resistances versus temperature. Ifthe temperature reading does not agree (within someuncertainty) with the computer reading, then aproblem with the electrical measurement card or AIcard is suspected.
If the problem is in wiring, further troubleshootingmust wait until an outage. Connections in the circuitare opened and measurements are taken looking bothways from the connection. For example, the first stepis to disconnect the rtd and measure across its leads.Also, the connector is shorted and measurements aretaken from the CDF of the wire resistances. In thisalmost binary troubleshooting process, the source ofthe problem is tracked down with certainty.
Until a systematic troubleshooting procedure was putin place, problems with the EPs were very difficult toresolve. The standard practice was to replacecomponents until the problem went away. Also, EPswere not recognized as a potential source ofproblems. Now, opening the splices on each side ofthe poenetration and measuring the resistance of wiresacross the penetration is the final step introubleshooting.
3. RTD Failures
While the normal failure mechanisms for RTDs areopen or short circuits, a different type of failuremechanism in which the rtd reads high (3 °C or more)has caused most of the failures in Darlington.According to work management system, in the historyof Darlington, 253 RTDs have been replaced, ofwhich 109 have been suffering from this type offailure (others have been replaced as part of the"replace and see if it fixed the problem" school oftroubleshooting).
Typically, the fault is detected in one of the followingways:
1. An RTD is reading higher than the saturationtemperature (boiling point at the heat transportloop pressure), or
2. An RTD is causing spread alarms (an RTD readshigher or lower than surrounding RTDs), or
3. An RTD is reading high during zero-power hotbiasing.
We can now easily spot this type of failure during on-line troubleshooting. If the RTD is reading high andtwo resistance measurements (A to C and B to C) areequal and agree with the computer reading, then weimmediately suspect an RTD "calibration shift"problem.
Calibration checks of these RTDs have shown thatthere is an increased resistance throughout the wholerange of operation, though the increased resistance isnot constant over the whole range.
An overwhelming number of the failures haveoccurred in unit 3 and in a distinct serial numberrange, corresponding in general to a time ofproduction of the RTDs.
Another clue is that only RTDs on outlet feeders havefailed in this way. Temperature is the majordifference between the inlet feeders and outlet feeders
260

environment; therefore, temperature is thought to playa significant role in the failure. An industry study onaging reported that RTDs in continuous operation at320 °C for 18 months drifted to levels comparable tothose in Darlington [2].
Because of the large numbers of this type of failure,Darlington decided to sponsor a failure investigationof these RTDs. Ontario Hydro Technologies wascontracted to do the failure analysis [3]. (Themanufacturer was also sent a sample of failed RTDsto examine.)
OHT took some scanning electron microscopepictures of the platinum wire of the RTD elements.(Refer to Figures 3 and 4 - pictures of unfailed andfailed RTDs) The normal, unfailed RTDs haveplatinum wire with a smooth surface (Figure 3). Thefailed RTDs have platinum wires with a damagedsurface that shows flakes peeling off the surface(Figure 4). The increased resistance of these damagedwires is thought to come from the loss of cross-section caused by the flaking.
What would cause this kind of damage to the RTDsurface? Initially, oxidation was suspected, but aliterature search revealed no evidence for oxidation atthe conditions to which the RTDs are exposed. Thecurrent theory is that chlorine present on the surfaceof the platinum wire during manufacturing could havecaused damage to the platinum surface. Duringoperation, thermal stresses cause flakes to peel off thesurface and reduce the effective current-carryingdiameter of the wire. Only a 1% reduction indiameter is required to cause the resistance toincrease to the extent observed. The process maytake years of operation before an RTD resistanceincrease is noticed. (Note: we don't really knowwhether the problems show up suddenly or onlygradually. Bias measurements of RTDs during lowpower hot conditions are the only way to really telland they are not done very often.)
A meeting was to take place between themanufacturer, OHT, and Darlington NGS to discussthe findings but results were unavailable at the time ofpublishing.
4. Penetrations
Electrical penetrations are used to carry electricalsignals from inside the reactor vault to the outsideworld while still providing the required containmentbarrier.
The electrical penetrations used in Darlington are pre-built by Imaging and Sensing TechnologyCorporation (1ST), a Westinghouse company. Adrawing of a penetration is shown in Figure 5. Thepenetration structure is a carbon steel cylinder withend plates containing seven holes for modules (onlythree shown in cross-section). On the outside of thevault, the penetration nozzle is welded on in-situ.Internally, a structure of tubes supports the cables asthey cross the containment wall.
A module consists of a bundle of wires that arecrimped onto a single-strand conductor to passthrough the containment barrier. There are twocrimps on each cable internal to the module - one oneach end of the single-strand conductor (see Figure6).
Darlington has found that some crimps have degradedand a series resistance has built up (even as small aresistance as 0.1 ohms can affect the RTDmeasurement). The particular mechanism that causesthe series resistance is thought to be incompletecrimping [1].
The electrical penetrations for the RTD circuits havea small number of installed spares. In the past, whena problem was detected with the penetration wires,the RTD wires inside the vault could be spliced ontoa spare set of cables. During the 1996 outage in unit2, spare cables were tested and it was found that manyof them had developed resistance and were unusable.In order to put three CPM RTDs back into service onunit 2, more spares were required.
There were existing blank electrical penetrationsinstalled directly over the electrical penetrations forthe RTD circuits. See Figure 7 for the layout of thepenetration inside the vault. These electricalpenetrations had structure, but no modules. It wasdecided that new modules, built to a newspecification that increased the quality requirementson the crimps, would be installed in the sparepenetrations. New crimp technology is used, but themost important change is that the quality assurance ofthe modules is increased.
5. Penetration Installation Issues
There were many issues to be overcome in installingthe penetrations. These included:
261

1) maintaining or compromising the containmentboundary during installation of the newmodules
2) getting the required sand out of and back intothe penetrations
3) did the internal support structure exist in thepenetrations?
4) how many modules should be installed andwhere? (there were two spare electricalpenetrations to choose from)
These issues will be discussed in the followingparagraphs.
Originally, the plan was to use a custom flask tomaintain the containment boundary; however, theflask could not be used because cable trays blockedits access to the penetrations. Since the flask couldnot be used, opening the required hole in containmentforced us to declare the Negative PressureContainment System (NPCS) out-of-service, whichwas allowed partly because all four units were inGuaranteed Shutdown State (GSS) during theinstallation. Modules were inserted from outside thevault end and pulled through the penetration frominside the vault. See Figure 8 showing a modulebeing pulled through. There was a lot of pre-planningand prerequisites prior to declaring NPCS out-of-service and backout plans were put in place to handleail possible scenarios. In the future, if a module hasto be installed, a special, flexible flask that takesadvantage of the cabling that makes up most of thelength of the modules would be required. Then thepenetration can be opened inside the vault and themodule pulled through without compromisingcontainment.
The sand used inside the modules for fill andradiation protection is a special dense, dry sand fromRussia that pours easily and fills gaps. Replacementsand is difficult to procure, so any sand removed fromthe penetration had to be kept for replacement afterthe modules were installed. Sand was removed frominside the vault and had to be transported to anotherlevel for storage because of the great weight of sand.
Eight new modules were ordered. Since all of theproblems existing in unit 2 were in EP 2263, it wasdecided to fill EP 2260, the EP directly above EP2263, with seven modules. The additional modulewould be installed in EP 2262, above EP 2265.However, when it was discovered that the internalsupport structure did not exist in any of the sparepenetrations, it was decided not to try to install asupport structure but to install only two modules in
EP 2260 (above 2263). The modules would beinstalled at the bottom of the electrical penetrationand sand would be used to support the cables. SeeFigure 9 showing the inside of EP 2262 with onemodule installed and cables supported by sand.
Installation also included the following tasks:
1) installation of new cables between the outsideof the electrical penetration and the CDF,
2) installation of supports inside the vault tosupport the weight of the pigtails, and
3) installation of additional cable pans for theextra cables
Thanks to the hard work and cooperation of all thework groups involved, the installation wassuccessfully completed and three sets of wires are inuse for CPM deltaT measurement.
6. Conclusions
Systematic troubleshooting methods helped us findand resolve RTD faults and allowed us to target ourefforts on the most significant sources of trouble.
RTD calibration shifts are real and traceable to aphysical effect on the RTDs. The root cause of theshifts is contamination of the platinum wire or othersensor components during manufacture with chlorine,carbon and oxygen-containing compounds.
Electrical penetrations with poor quality crimps havecaused problems on three units. Spare modules builtto a new specification were successfully installedduring the recent station outage.
7. References:
1. Hashemian, H.M., D.D. Beverly, D.W. Mitchell,and K.M. Petersen, "Aging of Nuclear PlantResistance Temperature Detectors", NUREG/CR-5560, June 1990.
2. "Investigation of Containment Penetration RTDLead Feedthrough Electrical Resistance Problems", areport prepared for Tennessee Valley Authority byAltran Materials Engineering, May, 1995.
3. Mayer, P., and D. McAUindon, "Analysis ofResistance Temperature Detectors from DarlingtonNGS", B-MT-97-92-P, to be published.
262
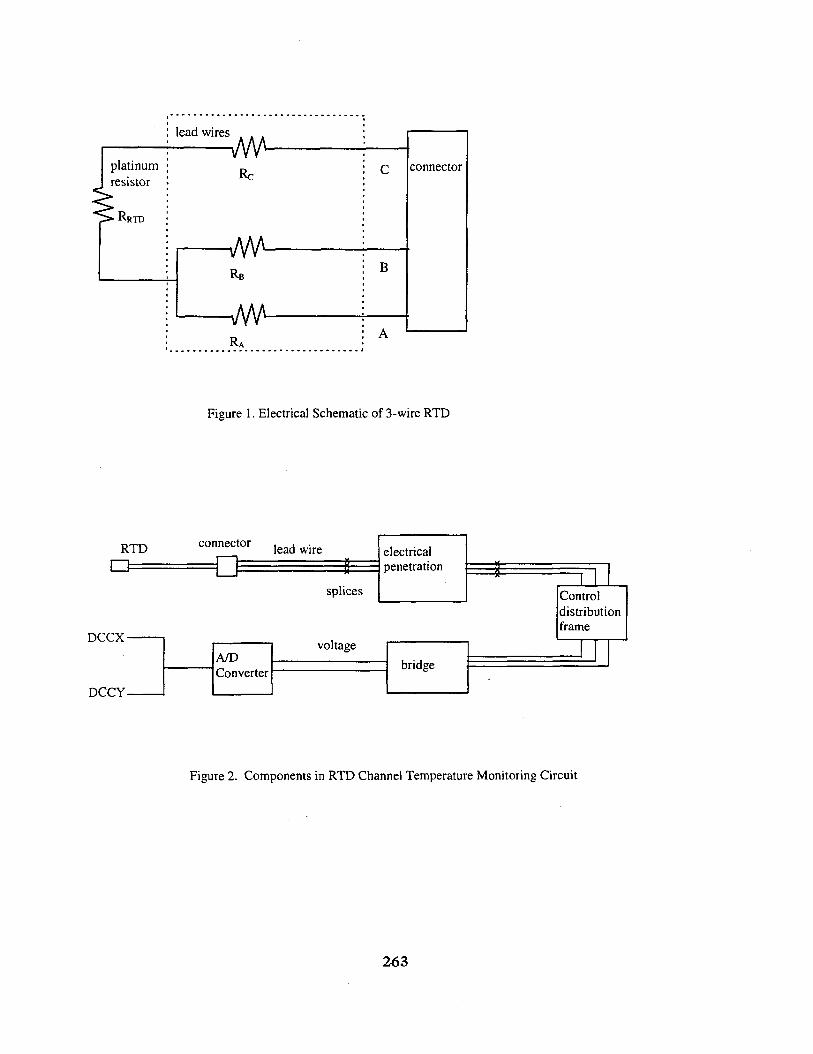
platinumresistor
RRTD
lead wires
Re
RB
-WV1
RA
B
connector
Figure 1. Electrical Schematic of 3-wire RTD
RTD
DCCX-
DCCY-
connector lead wire
a 8
A/DConverter
splices
voltage
electricalpenetration
bridge
Figure 2. Components in RTD Channel Temperature Monitoring Circuit
263

Figure 3. Scanning Electron Microscope Picture of Platinum WireSurface from Unshifted RTD
Figure 4. Scanning Electron Microscope Picture of Platinum WireSurface from Shifted RTD.
264

Penetration nozzle
Inboardpigtail
Cable tube assembly(cable support)
Containment wall
Welding neckflange
Outboard pigtail
Containmentpressureboundary
Figure 5. Electrical Penetration Diagram
SCHEMATIC ILLUSTRATION OF PENETRATION CONSTRUCTION
MICARTAGUIDE
_PLATE HEAT SHRINKABLE TUBE
RUBBER-GLASS FIBER SLEEVE
RUBBER-GLASS FIBER SLEEVEJJ STRANDEDCONDUCTORSOLID
CONDUCTOR
7 7 7^/ j 7 / /
///// I///// I / / / / / / / / / /
PRESSURE MONITORING CAVITY
STAINLESS STEELPRESSURE BOUNDARY
Figure 6. Schematic Illustration of Penetration Construction
265
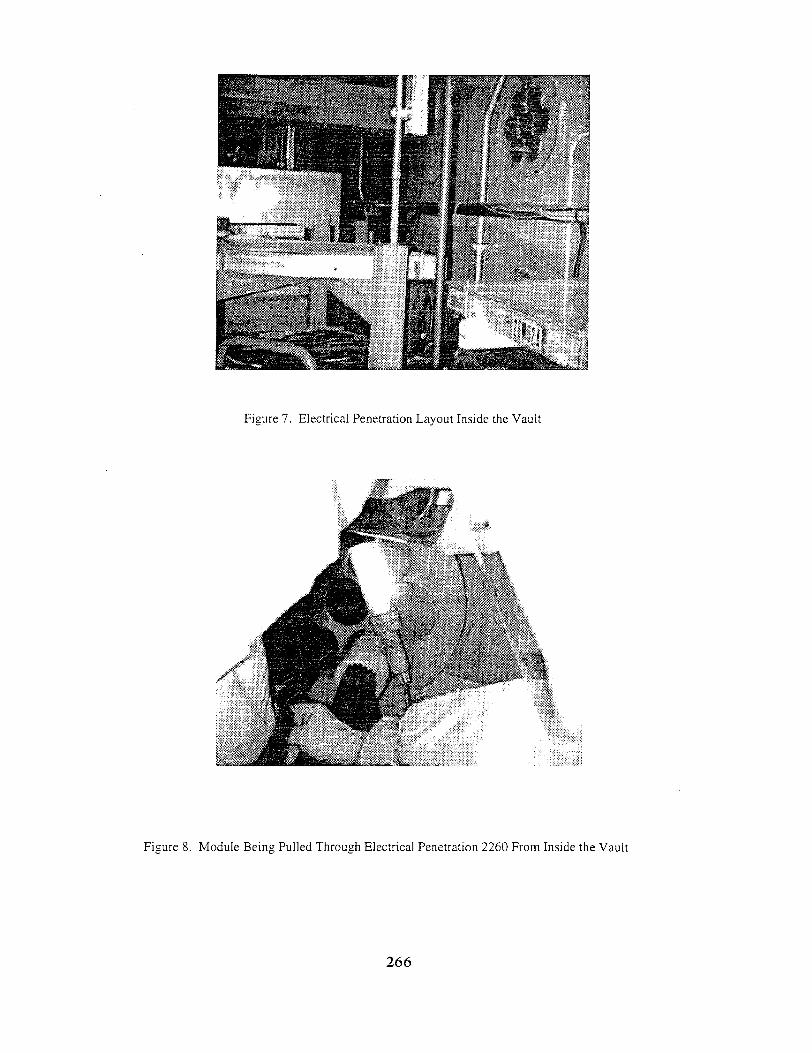
Figure 7. Electrical Penetration Layout Inside the Vault
Figure 8. Module Being Pulled Through Electrical Penetration 2260 From Inside the Vault
266

Figure 9. Inside of Electrical Penetration 2262 Showing One Moduleand Supporting Sand
267

SHIELDING AND FILTERING TECHNIQUES TO PROTECT SENSITIVEINSTRUMENTATION FROM ELECTROMAGNETIC INTERFERENCE CAUSED BY ARC
WELDING
W. KalechsteinCA0000042
AECL, Chalk River Laboratories, Chalk River, Ontario, Canada KOJ 1J0
ABSTRACTElectromagnetic interference (EMI) caused by arcwelding is a concern for sensitive CANDU®instrumentation and control equipment, especiallystart-up instrumentation (SUI) and ion chamberinstruments used to measure neutron flux at lowpower. Measurements of the effectiveness of simpleshielding and filtering techniques that may be appliedto limit arc welding electromagnetic emissions belowthe interference threshold are described. Shieldingconfigurations investigated include an arrangement inwhich the welding power supply, torch (electrodeholder), interconnecting cables and welder operatorwere housed in a single enclosure and a more practicalconfiguration of separate shields for the power supply,cables and operator with torch. The two configura-tions were found to provide 30 dB and 26 dBattenuation, respectively, for arc welder electric-fieldemissions and were successful in preventing EMI inSUI set up just outside the shielding enclosures.Practical improvements that may be incorporated inthe shielding arrangement to facilitate quick setup inthe field in a variety of application environments,while maintaining adequate EMI protection, arediscussed.
INTRODUCTIONElectromagnetic interference (EMI) caused by arcwelding is a concern for sensitive CANDUinstrumentation and control (I&C) equipment. Arcwelding has caused interference with startupinstrumentation (SUI) and normal ion-chamber-basedneutronic instrumentation on a number of occasions.Although the problem is most severe when the reactoris at low power and the flux signal is very small,there is concern about possible EMI effects wheneverarc welding near sensitive equipment is considered.This often results in restrictions on or deferral ofmaintenance work involving arc welding.
This paper describes simple shielding and filteringtechniques to mitigate electromagnetic emissionsfrom arc welding and measurements of theeffectiveness of these techniques. The techniques
discussed may be applied in the construction oftemporary shielding enclosures for arc welding toreduce concern over possible EMI to nearby I&Cequipment. The work complements previousinvestigations that are summarized below.
A literature search and discussions with personnel atnuclear power plants and with EMI consultants inCanada and the US has shown that arc-welding EMIin instrumentation is a common problem.Administrative controls are widely used to avoid arcwelding near potentially sensitive equipment [1]. Atsome plants, the use of high-frequency (HI7)stabilization is prohibited for arc welding nearsensitive equipment.
Guidelines on electromagnetic compatibility (EMC)recently published by the Electric Power ResearchInstitute (EPRI) advise that arc welding be avoided inrooms containing in-service EMI-sensitive safetyequipment, but may be permitted, provided the arcwelding equipment is contained in shielded enclosures[2, 3]. However, the authors were not able to identifyany implementation guidelines for shieldedenclosures, nor any plants that have applied shieldingto arc welding operations.
An experimental investigation of EMI effects in SUIoperating in proximity to an industrial arc welder of atype used at some CANDU stations was performed.The investigation showed a low level of disturbancethat has little effect on the SUI output when the arcwelder is operated in direct current (DC) mode withoutHF stabilization [1].
Measurements of arc welder electric and magnetic fieldemissions showed strong emissions in the frequencyrange 0.25 to 10 MHz for welder operation inalternating current (AC) mode, with or without HFstabilization, and DC mode with HF stabilization.Strong emissions were found whenever HFstabilization was selected, even in the absence of awelding arc, indicating that significant emissionsoriginate in the welding power supply. In contrast,welder operation in DC mode with HF stabilizationdisabled was found to cause peak electric and magnetic
AECL-11872, COG-97-430-I.CANDU® is a registered trademark of Atomic Energy of Canada Limited (AECL).
2 6 8
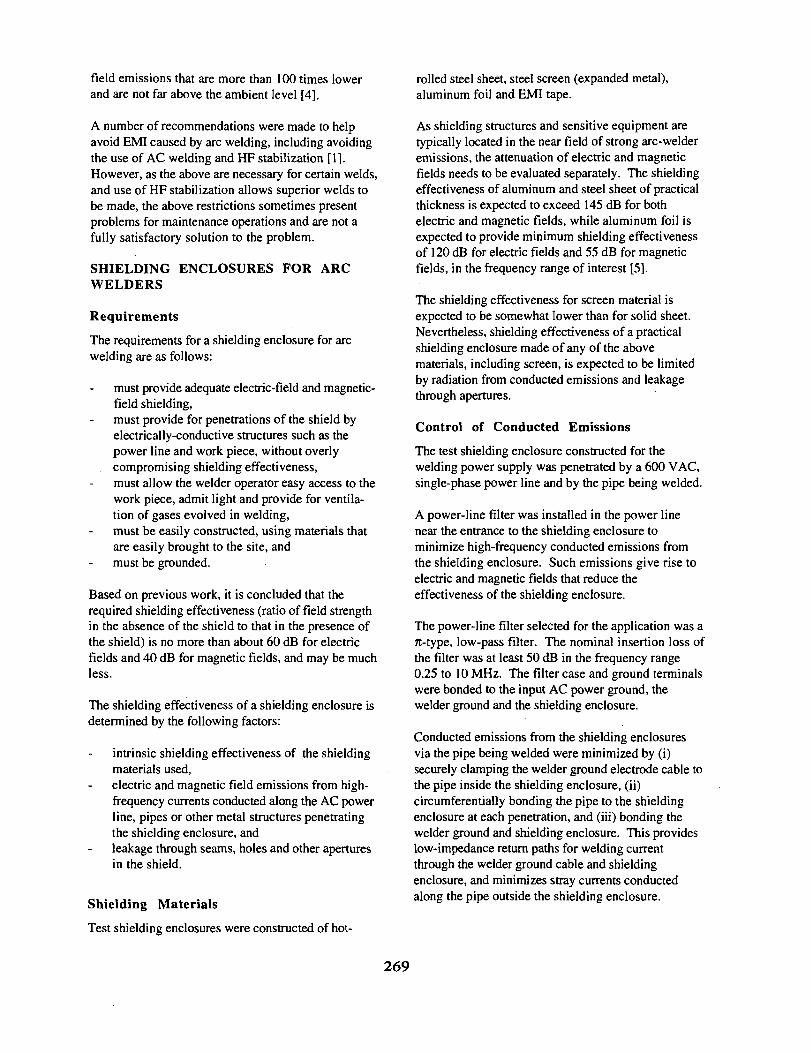
field emissions that are more than 100 times lowerand are not far above the ambient level [4].
A number of recommendations were made to helpavoid EMI caused by arc welding, including avoidingthe use of AC welding and HF stabilization [1].However, as the above are necessary for certain welds,and use of HF stabilization allows superior welds tobe made, the above restrictions sometimes presentproblems for maintenance operations and are not afully satisfactory solution to the problem.
SHIELDING ENCLOSURES FOR ARCWELDERS
Requirements
The requirements for a shielding enclosure for arcwelding are as follows:
must provide adequate electric-field and magnetic-field shielding,must provide for penetrations of the shield byelectrically-conductive structures such as thepower line and work piece, without overly
. compromising shielding effectiveness,must allow the welder operator easy access to thework piece, admit light and provide for ventila-tion of gases evolved in welding,must be easily constructed, using materials thatare easily brought to the site, andmust be grounded.
Based on previous work, it is concluded that therequired shielding effectiveness (ratio of field strengthin the absence of the shield to that in the presence ofthe shield) is no more than about 60 dB for electricfields and 40 dB for magnetic fields, and may be muchless.
The shielding effectiveness of a shielding enclosure isdetermined by the following factors:
intrinsic shielding effectiveness of the shieldingmaterials used,electric and magnetic field emissions from high-frequency currents conducted along the AC powerline, pipes or other metal structures penetratingthe shielding enclosure, andleakage through seams, holes and other aperturesin the shield.
Shielding Materials
Test shielding enclosures were constructed of hot-
rolled steel sheet, steel screen (expanded metal),aluminum foil and EMI tape.
As shielding structures and sensitive equipment aretypically located in the near field of strong arc-welderemissions, the attenuation of electric and magneticfields needs to be evaluated separately. The shieldingeffectiveness of aluminum and steel sheet of practicalthickness is expected to exceed 145 dB for bothelectric and magnetic fields, while aluminum foil isexpected to provide minimum shielding effectivenessof 120 dB for electric fields and 55 dB for magneticfields, in the frequency range of interest [5].
The shielding effectiveness for screen material isexpected to be somewhat lower than for solid sheet.Nevertheless, shielding effectiveness of a practicalshielding enclosure made of any of the abovematerials, including screen, is expected to be limitedby radiation from conducted emissions and leakagethrough apertures.
Control of Conducted Emissions
The test shielding enclosure constructed for thewelding power supply was penetrated by a 600 VAC,single-phase power line and by the pipe being welded.
A power-line filter was installed in the power linenear the entrance to the shielding enclosure tominimize high-frequency conducted emissions fromthe shielding enclosure. Such emissions give rise toelectric and magnetic fields that reduce theeffectiveness of the shielding enclosure.
The power-line filter selected for the application was a7t-type, low-pass filter. The nominal insertion loss ofthe filter was at least 50 dB in the frequency range0.25 to 10 MHz. The filter case and ground terminalswere bonded to the input AC power ground, thewelder ground and the shielding enclosure.
Conducted emissions from the shielding enclosuresvia the pipe being welded were minimized by (i)securely clamping the welder ground electrode cable tothe pipe inside the shielding enclosure, (ii)circumferentially bonding the pipe to the shieldingenclosure at each penetration, and (iii) bonding thewelder ground and shielding enclosure. This provideslow-impedance return paths for welding currentthrough the welder ground cable and shieldingenclosure, and minimizes stray currents conductedalong the pipe outside the shielding enclosure.
269

Bonding of Shielding Panels
To avoid high leakage through gaps between shieldingpanels, the maximum dimension of any holes in theshielding and gaps between shielding panels must besmall compared with a quarter wavelength. Foreffective shielding, various sources recommendlimiting maximum dimensions of holes and gaps tovalues from 0.02 to 0.1 of a wavelength. As signifi-cant arc welder emissions are limited to frequenciesbelow 10 MHz, even the more stringent criterion iseasily satisfied as it requires that the maximumdimension of holes and gaps be held to 0.6 m.
Tack welds and EMI tape were used to bond shieldingpanels in the 2 shielding enclosures constructed. TheEMI tape used is an embossed copper tape 0.035 mmthick and 5 cm wide, having adhesive applied on thehigh points. When applied to a conductive surfaceand pressed down, the copper makes contact with theconductive surface and gives a low-resistanceconnection.
Description of the Shielding Enclosures
Two shielding enclosures were constructed. ShieldingEnclosure 1 (SE1) was constructed for investigationof the shielding effectiveness that may be expected fora shielding enclosure that is penetrated by a powerline and the pipe being welded, and includes gapsbetween shielding panels consistent with quickassembly. To ensure that emissions from all parts ofthe welding apparatus are included in tests, SE1 wasmade large enough to contain the arc welding powersupply, the power-line filter, the welding electrode andground cables, the work piece and the welder operator.
Shielding Enclosure 2 (SE2) was constructed forsubsequent investigation of a more practicalarrangement involving separate shielding for thewelding power supply, welding arc and weldingcables. In this arrangement, shielding for the aboveitems was provided by SE1, SE2 and an aluminumfoil wrapping, respectively.
Figure 1 is a front view of SE1 showing the weldingpower supply inside the open door. The followingadditional features may be seen in Figure 1:
- a pipe serving as the work piece, penetrating apanel of aluminum foil at the rear of SE1;
- the welder ground cable, clamped to a strutsupporting the screen roof of SE1 (The welderground cable is normally clamped to the workpiece near the weld site.);
- the power-line filter, located on the floor justinside the door;
- the welder foot control, which is moved insidewhen welding inside SE1; and
- the rod antenna (for measuring the electric field),supported in a horizontal position above theshielding enclosure on a cardboard box.
The floor of SE1 was made from two sheets of hot-rolled steel sheet tack welded at several points. Thesides of SE1 were made using existing structures usedto partition welding work areas. These structuresconsisted of hinged sections made of steel sheetwelded to a tubular steel frame supported on casters.One partition formed the front, left side and half therear wall of SE1 and another partition formed theother half of the rear wall and the right side. A gap inthe rear wall roughly 0.4 m by 1.2 m was coveredwith aluminum foil. The foil was bonded to the steelpanels and pipe using EMI tape and a pipe clamp. Aroof of steel screen and a door of steel sheet were addedto complete the enclosure. Gaps in the shielding of afew centimetres were left around the 7 casters andlong, narrow gaps, roughly 2 mm by 1 m, were leftbetween hinged sections of the enclosure.
SE2 was constructed quickly of lightweight materialsusing very few tools. The walls of SE2 were made oftwo sheets of steel screen, each having a right anglebend. The roof was made from another sheet of steelscreen. Loosely-rolled aluminum foil was placedbetween adjacent panels to act as an EMI gasket. Theweight of the roof was used to compress the foil,while the wall panels were held together with wire.Aluminum foil was used for the floor and to cover theaccess opening of the enclosure. A pipe penetratingthe walls of SE2 was set up to serve as the workpiece.
Figure 2 shows the rear of SE1 at left and SE2 atright. The following features may be seen in Figure2:
- the welder ground and electrode cables (and gasline), wrapped in aluminum foil shielding,entering the panel covering the SE2 accessopening from the left;
- the pipe serving as the work piece, and aluminumfoil stuffed in the gap between the pipe and SE2wall to provide an electrical connection;
- a welder operator seated just behind the accessopening;
- the rod antenna, set up to measure electric-fieldemissions from SE1 and SE2; andthe back of the low cabinet containing SUI
270
equipment, situated between SE1 and SE2.
EVALUATION OF SHIELDINGENCLOSURES
Shielding enclosures for arc welding were constructedand evaluated in the high bay area of the Bldg. 412machine shop at the Chalk River Laboratories. Theeffectiveness of the shielding enclosures was evaluatedby comparing measured electromagnetic emissionscaused by an arc welder, with and without shielding inplace.
Measurements of electric and magnetic fields wereperformed using calibrated antennas and a spectrumanalyzer. The equipment used to generate and measurearc-welding electromagnetic emissions is listed inTable 1.
The electromagnetic field was generated by poweringthe arc welder and selecting HF stabilization. It wasnot necessary to strike a welding arc in order togenerate a strong broadband electromagnetic field.However, an arc was struck for most tests. Thetungsten-inert-gas (TIG) welding process was used.The welding power supply was set up for 70 A directcurrent.
Arc welder electric and magnetic field emissions werefirst measured in the frequency range 0.010-32 MHz,with and without SE1 in place around the weldingpower supply, welding cables, welding electrode andwork piece. Maximum emissions were found tooccur just above 1 MHz. Electric-field emissionswere 30 dB below emissions measured with noshielding, but still nearly 20 dB above the ambientlevel. In contrast, magnetic field emissions measuredwith SE1 in place were only slightly above theambient level. Consequently, further investigationsincluded only electric-field measurements in thefrequency range 1-2 MHz.
The effectiveness of the shielding enclosures was alsoevaluated by monitoring for EMI in SUI undervarious conditions. Excursions in the indicated countrate were used as an indication of EMI in these tests.The equipment used and its setup were very similar tothose described in reference 1. With the cabinetcontaining SUI equipment located just outside SE1,severe EMI was observed when the SUI detector anddetector cable were inserted into SE1 while HFstabilization was on, but no EMI was observed whenthe detector was withdrawn to a location just outsideSE1. The above result suggests that the shieldingeffectiveness of 30 dB achieved for SE1 is adequate to
Table 1: Equipment used in evaluation of shieldingenclosures
Equipment Description
• Industrial arc welder(CANOX model C-33OA/B SP)
• Spectrum analyzer, display unit & plotter
• Rod and loop antennas, couplers, tripod andoutput cable
• Power supply (for loop and rod antenna couplers)
• Current probe
protect SUI systems from EMI caused by arc-welding.
To investigate the effect of different shieldingmaterials and construction features, the electric fieldwas measured outside SE1 near four faces differing inthe above respects, while the arc welder was operatedinside SE1. No significant difference was found inelectric fields measured near the rear wall, which ispenetrated by the work piece, the left side, which ismade of steel sheet, the front, which has a door(closed) of steel sheet, and the roof, which is made ofsteel screen. Opening the door of SE1 caused theelectric field measured near the door to increase 3-fold,but had no effect on the electric field measured at theother locations. The above results show that adequateperformance can be achieved in shielding enclosuresmade of screen materials and having walls that arepenetrated by conductive structures.
In a further test, the welder return cable was removedfrom the work piece and clamped at the roof strut, asshown in Figure 1, thus forcing the welding currentto return via the enclosure wall. This did not affectthe shielding performance of SE1, suggesting that thework piece may form one of the walls of a practicalshielding enclosure. Note, however, that it isimportant the return cable is clamped inside theshielding enclosure. It was confirmed that a shieldingenclosure becomes ineffective if the return cableconnection is made outside the shielding enclosure.
Subsequently, the welding power supply was leftinside SE1, but the welding cables and weldingelectrode were removed, and welding was performedoutside SE1 without shielding the welding arc orcables. Then, SE2 was constructed to enclose theweld site and welder operator, and the welding cableswere wrapped in aluminum foil. Shieldingmeasurements were made at several stages, asadditional shielding was provided, ending with anarrangement where shielding material fully enclosed
271

all parts of the welding equipment (with the exceptionof the work piece and ac power line). The findings inthe above tests were as follows:
- There is no significant reduction in emissionswhen welding is performed with unshielded cablesand no shield, or an incomplete shield, around thearc, even if shielding is provided for the weldingpower supply.
- Shielding the welding power supply and cables,and partial shielding of the welding arc (no floor inSE2), results in roughly 16 dB reduction inemissions.
- Shielding the welding power supply in SE1, thewelding arc in SE2, and interconnecting cables inaluminum foil results in a 26 dB reduction inemissions.
The shielding effectiveness of SE2 and aluminum foilcovering the welding cable was not significantlydegraded in moving SE2 and rerouting the cablesaround the other side of SE1, indicating that shieldingperformance is not critically dependent on minordetails of shielding arrangement.
A low level of EMI was observed when the SUIdetector was shielded from direct emissions from thewelding power supply, but exposed to emissions fromthe welder cables and the welding arc. Thisobservation is somewhat surprising, as electric fieldmeasurements showed only a small shielding effect.
No EMI was observed in the SUI when arc weldingwas performed nearby using HF stabilization, withwelding power supply emissions shielded by SE1,welding arc emissions shielded by SE2, and weldingcable emissions shielded with aluminum foil.
A current probe was used with the spectrum analyzerto measure high-frequency conducted emissions on theAC power line. Conducted emissions measured onthe supply side of the filter outside SE1 were higherthan expected on the basis of filter specifications andemissions measured on the load side of the filter.This may be because the filter was installed such thata short length of AC power cable on the supply sideof the filter was exposed to the high-frequencyelectromagnetic field inside SE1. To minimizeconducted emissions on the AC power line, it isimportant that the filter is installed in the wall of theshielding enclosure such that there is continuousshielding between AC power cables connected at thesupply and load sides of the filter.
CONCLUSIONS
Strong electromagnetic emissions are generated whenarc welding is performed using HF stabilization. It ispossible to avoid causing EMI in nearby sensitiveequipment by providing electromagnetic shielding forthe welding power supply, cables and welding arc, andinstalling a low-pass filter at the AC power entry.All the above measures are necessary to provideconfidence that EMI will not result.
Shielding enclosures for the welding power supply,cables and welding arc were constructed and evaluated.It was shown that shielding enclosures constructedquickly, of easily available materials, and withouttaking pains to eliminate all known leakage paths,can be used to significantly reduce the risk of EMI insensitive equipment located near a prospective weldsite. The shielding effectiveness of the shieldingenclosure SE1 was measured to be at least 30 dB, andthe shielding effectiveness of the more realisticarrangement, where SE1 was used to shield thewelding power supply, SE2 was used to shield theweld site, and the welding cables were shielded usingaluminum foil, was measured to be 26 dB. The aboveshielding enclosures were shown to be effective inpreventing EMI in SUI located close to operating arcwelding equipment.
EMI tape was found very useful in bonding shieldingpanels of aluminum foil and solid sheet. It was foundless useful in bonding expanded metal screen becauseit is too stiff to conform well to the material.However, adhesion to screening material that isthinner and has larger openings may be moresatisfactory.
The investigation provided a proof-of-principledemonstration of shielding techniques to protectsensitive electronic equipment from EMI caused byarc welding. For field application, a reusableshielding enclosure for the welding power supply canbe made much smaller and lighter than the enclosureSE1 used in this investigation. The shieldingenclosure can be made of light screening and onlylarge enough to house the welding power supply andpower-line filter. Access openings or panels can beprovided for the welding power supply controls tofacilitate setup by an operator who remains outsidethe shielding enclosure. An alternate, and possiblymore attractive, solution is to upgrade the shieldingperformance of an existing welding power supplycabinet, by improving the bonding of metal panelsand installing a power-line filter.
272
Shielding for the welding cables can be improvedthrough the use of commercially-available cable-shielding products (based on metal foil and/or braidshields, combined with a fabric backing) that areeasier to apply than aluminum foil and are morerobust.
It is anticipated that the shielding enclosure for theweld site can be made much smaller than theenclosure SE2 constructed for this investigation byusing an arrangement where the welder operatorremains-outside the shielding enclosure andmanipulates the work and torch through ports in theenclosure. The shielding material is a flexible andlight mesh permitting adequate freedom of movementand viewing of the work. Such an arrangement maybe no more difficult to use than a glove box forwelding under an argon atmosphere. Where weldingis performed on a fairly large structure, the structureitself may form part of the shielding enclosure for theweld site. A concept sketch for a light, portableshielding enclosure for the weld site is provided inFigure 3.
REFERENCES
1672 for 1996/97.
The contribution of Ontario Hydro Darlington NGS,particularly Fred Shady and Dennis Cosgrove, inproviding the receiving antennas and spectrumanalyzer used in the above investigation is gratefullyacknowledged.
1. T. Qian, W. Kalechstein and U.K. Mondal, "Arc-Welding-Related Electromagnetic InterferenceEffects on Startup Instrumentation", COG-96-126, Rev. 0, 1996 June.
2. J. Shank et. al., "Guidelines for ElectromagneticInterference Testing in Power Plants", ElectricPower Research Institute Report TR-102323,Rev. 1, 1995 October.
3. Handbook For Electromagnetic Compatibility ofDigital Equipment in Power Plants, Volume 2:Implementation Guide for EMI Control, preparedby Char Services, Inc., EPRI TR-102400-V2,October 1994.
4. W. Kalechstein and D.J. Cosgrove,"Measurement of the Radiated ElectromagneticField Caused by Operating an Arc Welder of aType Used at CANDU Plants", COG-96-148,Rev. 0, 1996 October.
5. H.W. Ott, Noise Reduction Techniques inElectronic Systems. John Wiley & Sons, NewYork, 1988, Chapter 6.
ACKNOWLEDGMENTS
The work reported in this document was funded by theCOG R&D Program: Working Party No. 16, WPIR
273
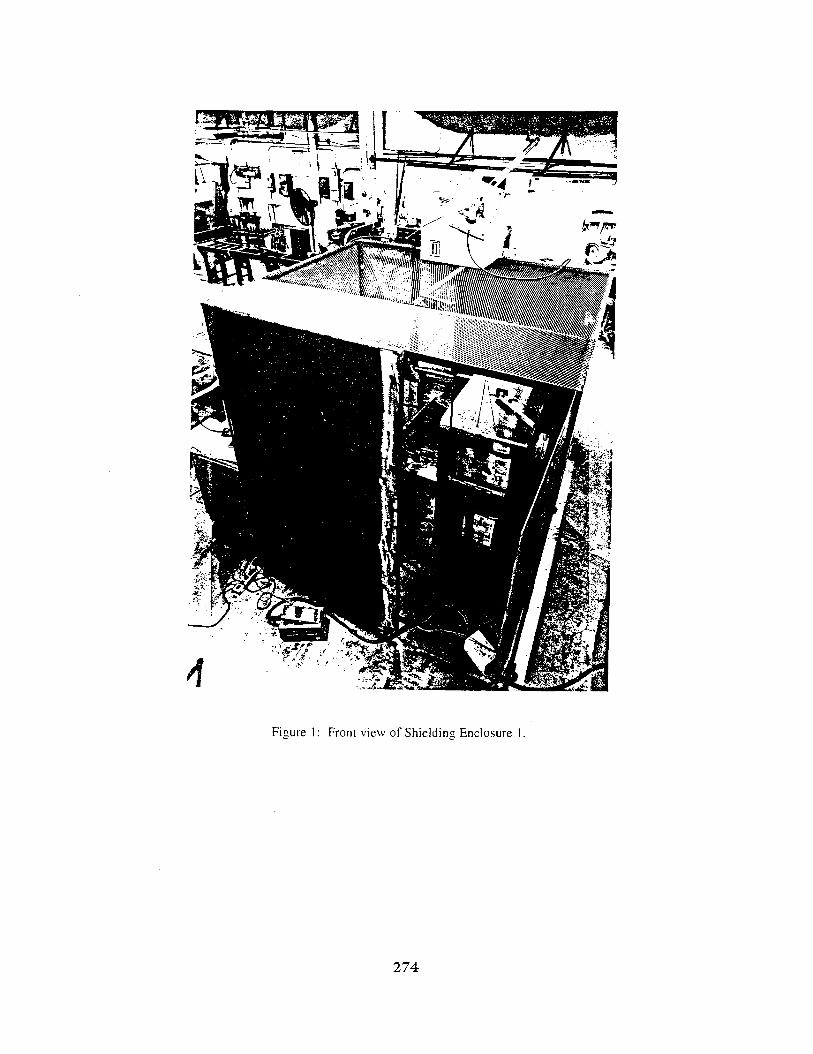
Figure 1: Front view of Shielding Enclosure
274
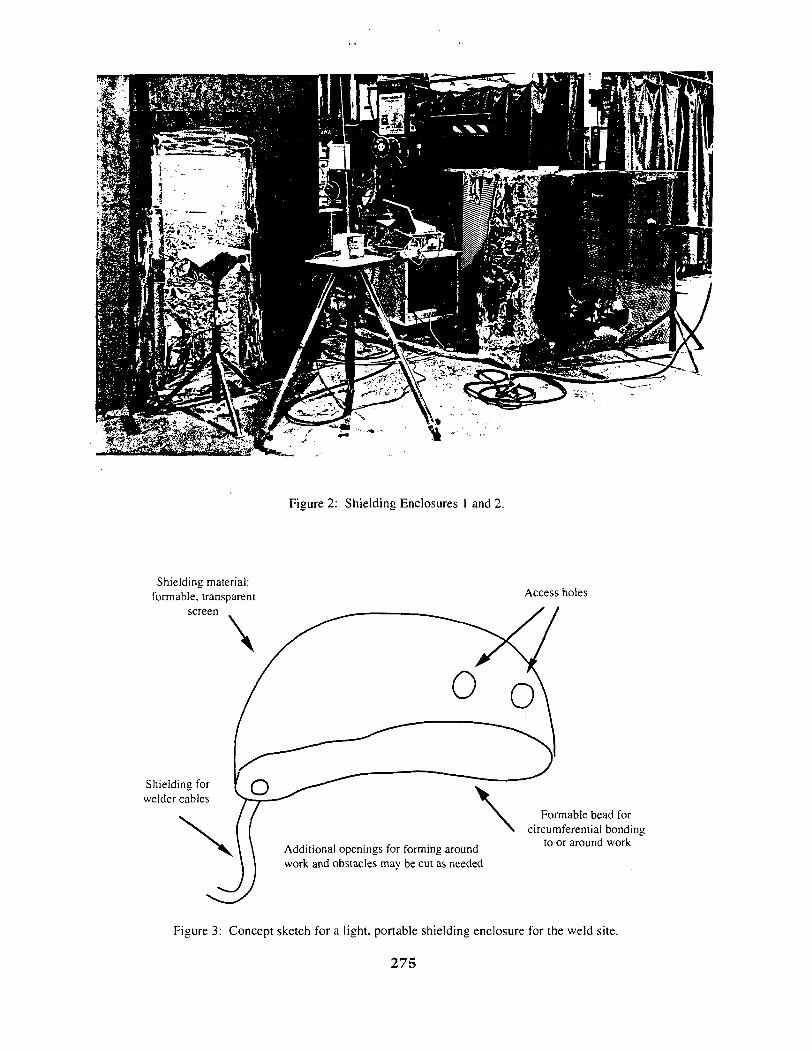
Figure 2: Shielding Enclosures 1 and 2.
Shielding material:formable. transparent
screen
Shielding forwelder cables
Additional openings for forming aroundwork and obstacles may be cut as needed
Access holes
Formable bead forcircumferential bonding
to or around work
Figure 3: Concept sketch for a light, portable shielding enclosure for the weld site.
275
APPLICATION OF THE ALARA PRINCIPLE TO THE BLEED CONDENSER RELIEF VALVE
REPLACEMENT PROJECT
Tom Wong and John KroftDarlington NGD
CA0000043October, 1997
Abstract
Darlington Nuclear Generating Division's achievements in radiation dose performance can be attributed, inpart, to adherence to the ALARA principle. The station's ALARA program, which is an integral part of thesafety culture, derives its strength from a strong and unwavering commitment by the site Vice President.This commitment is supported by performance standards and an accountability system which holds managersand supervisors responsible for dose performance. A LAN-based hazard and dose information system withsite-wide accessibility was established to facilitate work planning and exposure control. The principle ofdose optimization is fully integrated into the work management process and includes work planning ,progress monitoring and post-job review. An integrated performance assessment and reporting system alsoprovides timely feedback to management on dose performance.
An example of the ALARA program was the bleed condenser relieve valve replacement project. Pre-jobALARA review meetings for the project were held with supervisory staff and technicians to discuss jobdetails and dose reduction measures. All work groups were required to prepare a detailed step by step tasksafety analysis (TSA). The trades and engineering staff were requested to critique the TSA and suggest waysof reducing dose. Over 30 practical ALARA suggestions were received and adopted for implementation.Daily meetings were held to review job progress and the effectiveness exposure control. A post-job ALARAreview was held at the conclusion of each project to obtain feedback and lessons learned. All improvementsuggestions were review for implementation during subsequent installations. As a result of the ALARAinitiatives, significant dose savings were achieved. The normalized dose expenditure has been reduced from9.6 rem for the first installation to 6.9 rem for the fourth and last installation.
The Darlington Nuclear Generating Station consists of four CANDU reactor units eachrated at 935 MWe. All four units were in commercial service by 1993. During the pastthree years (1994 - 1996), the station operated with an average net capacity factor of86.2%.
Between 1994 to 1996, Darlington's average collective dose was 25 rem/unit. This ranksDarlington as the best of all CANDU reactors and puts it near the top among the best inthe world. The average individual dose during this time was 0.12 rem/year. In the pastthree years, there were only 7 workers with annual doses exceeding 1.0 rem. With theexception of one case involving an unplanned tritium exposure, all exposures over thislevel were carefully evaluated by the line supervisors and the ALARA Co-ordinatorbefore approvals were sought from the responsible managers.
The station's achievements in dose reduction can be attributed to:
• robust design
276
• high chemistry standards• conservative fuel handling strategies• ALARA controls
Darlington's ALARA program consists of four main components. The first and the mostimportant, is a strong and unwavering commitment by the upper management. Thiscommitment is supported by a set of dose targets benchmarked against the best in theworld and the inclusion of dose performance targets in supervisors and managersperformance contracts. The station's drive to establish a safety culture has created anenvironment in which the ALARA approach is shared and assumed by every level of themanagement chain, from the Site Vice President to the worker on the shop floor.
The second component of Darlington's ALARA program is the ready availability ofinformation tools for dose management and exposure control. The in-house informationsystems consisting of a dose management system (DMS), radiological hazardinformation system (RHIS) and electronic exposure permit system (REP), are LAN-based"Windows" applications. This ensures user friendliness and site-wide accessibility to allstation staff. The system's real-time dose and hazard tracking capability provides aninvaluable tool to planners, supervisors and workers in work planning and dosemanagement.
The third component of the ALARA program is the application of work managementtechniques in the dose optimization process. The work planning process includestechniques such as pre-job safety analysis, mock-up training, use of specialized tooling,and post-job review. To ensure that all practical dose reduction measures have beenapplied, all Zone 3 (which contains radioactive systems) work must be reviewed byRadiation Control technicians and jobs with an estimated dose of 0.5 rem or higher mustbe reviewed by the ALARA Co-ordinator. Reviews consist of discussions withengineering staff, walk-downs at the job site, and pre-job planning meetings with workgroups involved in job execution. As part of the review process, the ALARA Co-ordinator may refer the case to the site Central Safety Management Committee (CSMC),an oversight group consisting of the site Vice President and all department managers forreview and approval. Individual doses are also carefully controlled. In addition toOntario Hydro Nuclear 2 rem/year administrative dose limits, an exposure control hold-point of 1.0 rem/year is applied at the site. Department manager's approval is required toexceed this level and doses above this level without approval will be investigated. TheDMS also contains an auto-mailer feature which automatically sends out an e-mail to theresponsible supervisor and the ALARA Co-ordinator when a worker's dose exceeds 0.85rem/year.
The fourth component of the ALARA program is an assessment and reporting systemwhich provides feedback to supervisors and managers on dose performance and identifiesareas of weakness. Monthly ALARA reports are produced detailing the station's doseperformance and potential problem areas. Regular presentations are also made to the
277

CSMC on the stations overall dose performance, future trends and dose reductionstrategies.
An example of the ALARA dose optimization process was the bleed condenser reliefvalve replacement project. This project, which will be performed on all four units, wasinitiated in response to an event at Pickering NGD in December 1994 which resulted in alarge spill of D2O when the bleed condenser relief valves failed to reseat during an over-pressure event. Pre-job ALARA review meetings for the project were held withsupervisory staff and technicians to discuss details of job-task analysis and identifymethods which could be used to reduce exposures to workers. The combined work forcewas made up of Technicians, Pipe Fitters, Electricians, Carpenters, Laborers, IronWorkers, and Painters. A total of 2,150 person-hours coupled with average exposurerates of 5.6 mrem/hour led to a estimated dose of 12 rem/unit or a total dose of 48 rem forthe station. This triggered a detailed presentation by the ALARA Co-ordinator to theCentral Safety Management Committee. The committee reviewed the dose target andALARA controls and requested that the Project Manager re-examine the dose reductionmeasures, especially where more extensive use of shielding structures and better workmanagement strategies could be made to reduce time in the radiation fields. With diligentapplication of the ALARA process, the Committee felt that it should be possible toreduce the dose by a further 25%.
The project team responded to the Central Safety Management Committee's suggestionswith a unanimous decision to lower the target from 12 rem to 9.0 rem. This required allwork groups to prepare a detailed step by step Task Safety Analysis with particularattention given to job sequencing to enable logical separation of vault and non-vaulttasks. To the extent practical, only experienced staff were used and great care was takento match individuals with appropriate tasks.
The trades and engineering staff were asked to critique the TSA and make suggestions onwhich job steps could be done outside of the radiation area and what techniques andspecialized tooling could be used to lessen time in the radiation area and reduce dose.Some 30 practical ALARA suggestions were received and adopted for implementation.These included:
• Containment air dryer operating procedures were modified to ensure that all four dryerswere operational to reduce tritium concentrations from an expected average of 100MPCa to a target of 40 MPCa or less.
• Mock up training sessions were conducted with sheet metal RV's and an engineeredcart to identify interference and facilitate hoisting when moving the actual 816 kg RV'sinto place.
• Where possible, tubing was prefabricated outside of the radiation area.
278

• Radiography of components was done in the fabrication shop or in low dose locationsprior to being brought into radiation area. This greatly reduced the number of weldsthat had to be radiographed in the radiation area.
• Engineered scaffolds (2501bs/ft2) were constructed to hold lead shielding blanketssufficient to provide a 32-fold reduction in exposure rates (from 1000 mrem/hour to 30mrem/hour).
• Detailed surveys in the radiation area were conducted to identify local hot spots and lowdose rate "wait areas". Job sequencing was optimized to reduce "idle times" andworkers were not allowed into the radiation area until they were needed.
• A rubber area was set up outside of the radiation area where contaminated piping wasprepared and welded. Many pipe supports were tack welded to the required dimensionsbefore being moved into the radiation area for welding. This not only reduced timespent in radiation area to perform the welding operation but also reduced the timerequired for inspection and testing.
• The hangers attached to the RV support were changed from the underside of the tank tothe top thereby greatly improving welder access.
• A tool kit assembled for the job based on input from all the trades. This reduced clutterin the work area and eliminated tool-related delays in the work.
• Specialized tools were used to reduce time at the work site (e.g. a tool was used toaccurately and quickly prepare the carbon steel piping, a grommet gun was used tofacilitate hanging of local fire blankets, a power hacksaw with modified blades wasobtained to facilitate cutting in cramped areas).
Daily tailboard meetings were held to provide an opportunity to evaluate the ALARApractices and determine if additional exposure controls should be implemented. At theconclusion of the project, a post-job ALARA review was held with workers involved inthe hands-on installation and a list of improvement suggestions were obtained. Allimprovement suggestions were reviewed for practical implementation during subsequentinstallations in Units 2, 3 and 4.
As a result of the ALARA initiatives, significant dose savings were achieved. Thenormalized dose expenditure for the first installation (Unit 1) was 9.6 rem which isslightly above the dose target of 9.0 rem but 20% below the original dose estimate. Thedose expenditure was reduced to 8.1 rem during the second installation (Unit 4) andfurther reduced to 7.2 rem during the third installation (Unit 2). The dose target for thefourth and last installation (Unit 3) was set at 7.0 rem and our latest dose statisticsindicated that the actual dose was 6.9 rem. It is worth noting that the dose savings wereachieved with a corresponding reduction in the total person hours required for the job.
279

This clearly demonstrates that excellence in productivity is complementary rather than inconflict with radiation protection goals.
280

CONTROLLING RADIATION FIELDS IN CANDU® REACTORS USINGCHEMICAL DECONTAMINATION TECHNOLOGIES
= =D.G. Miller*, D.A. Guzonas*, R. Laporte+, T.A. Dereski* and R.A. Speranzini* | ^ o
oo
*AECL, Reactor Chemistry Branch, Chalk River Laboratories, Chalk River, Ontario, KOJ 1 JO ^s °+Hydro Quebec, GentiIly-2 NGS, 4900 Boulevard Becancour, Gentilly, Quebec, GOX 1G0 ^g O#Ontario Hydro, Nuclear Technology Services, 700 University Avenue, Toronto, Ontario, M5G 1X6 ^ =
ABSTRACT
Radiation dose to personnel during major maintenance and reactor refurbishment of CANDU reactors can becontrolled using chemical decontamination technologies. Technologies that have, and can be applied in CANDUreactors include; sub- and full-system decontaminations of the heat transport system using the CAN-DECON™,CAN-DEREM™ and CAN-DEREM Plus processes; and removal of Sb-122 and Sb-124 from the reactor core usinghydrogen peroxide.
CAN-DECON™ is a dilute chemical decontamination process that employs ion-exchange technology tocontinuously remove dissolved metals and radionuclides and regenerate the components of the CAN-DECON™formulation. Qualification of the CAN-DECON™ process, equipment requirements, process effectiveness, recentprocess improvements and future directions are discussed.
Radioantimony deposited on in-core surfaces can be released into the HTS coolant by air ingress duringmaintenance. At GentilIy-2, where large amounts of in-core antimony are present, these releases have resulted inincreased radiation fields around the reactor, making outage dose planning difficult and contributing significantly tothe radiation exposure of maintenance personnel. An antimony removal process developed by KWU for PWR's andadapted to meet CANDU specific conditions, has been successfully applied at Gentilly-2. Optimization of processconditions, and improvements in the in-core antimony removal process are described.
Introduction These technologies are discussed in this paper, with afocus on plant experience and on optimization to
Chemical decontamination technologies have been further minimize personnel dose, cost and applicationused to reduce radiation fields around the heat time.transport system (HTS) prior to major reactorrefurbishment campaigns. In addition, chemical In-core Antimony Removaldecontamination can be used to control radiationfields to minimize dose to personnel during reactor During reactor operation, antimony, present in manyoperation, routine maintenance and during unit CANDU materials of construction as a trace impurity,shutdowns. is released and transported to the core, where it is
activated. At Gentilly-2, the primary pump seals andTechnologies that have, and can be applied in bearings contain significant quantities of antimony,CANDU reactors include: and constitute a source of antimony that is not present
in other CANDU reactors. Releases of 122Sb and• sub- and full-system decontaminations of the I24Sb after oxygen excursions during shutdown at
heat transport system using the CAN- Gentilly-2 have resulted in five-fold increases in out-DECON™, CAN-DEREM™ and CAN- of-core radiation fields (during the 1993 outage atDEREM Plus processes; and Gentilly-2, the radiation fields at the steam generators
increased from 50 to 250 mR/h). Unexpected• removal of Sb-122 and Sb-124 from the increases in radiation fields have adversely affected
reactor core using hydrogen peroxide. 2 8 1 m a i l U e n a n c e P r o c e d u r e s « t 0 ^ degree where

maintenance outage actitivties have been delayed orcancelled. To prevent these antimony excursions, andminimize personnel dose during maintenance outages,an antimony removal process for the CANDU HTSwas developed. The antimony removal proces hasbeen applied during mainteneance outages since1994.
The key components for a successful antimonyremoval application are:
• mobilize the antimony in a form that can bereadily removed on an ion exchange resin;and
• control the chemistry to minimize antimonydeposition on other system surfaces.
The oxidizing antimony removal process applied atGentilly-2, most recently in 1997 February [1], is amodification of the Siemens-KWU antimony removalprocess. This process had been applied several timesat European and American nuclear generatingstations, and was adapted for use in a CANDU HTS,taking into account the differences in chemistry andmaterials between a PWR and a CANDU [1]. Theantimony removal process uses H2O2 to createoxidizing conditions in the HTS coolant at 85 °Cduring reactor shutdown. Addition of H2O2 results inthe oxidation of antimony adsorbed or ion-exchangedon in-core surfaces, which is then rapidly releasedinto solution. It is believed that the oxidation processinvolves the conversion of the reduced antimony to anSbv species. The anionic Sbv species formed are thenremoved on an anion exchange resin.
The behaviour of radioantimony during theapplication of the process is illustrated in Figure 1,which shows the solution activity of l24Sb and 122Sb inboth loops of the HTS during the course of the 1997February antimony removal. After the addition ofH2O2, the activity of antimony in solution rapidlyrises, peaking within one to two hours of peroxideaddition. The antimony concentration then decreasesafter the ion exchange resins are valved in. The rapidincrease in solution antimony activity indicates thatthe release of antimony from in-core surfaces is a fastprocess.
The four applications at Gentilly-2 have shown thatthe three critical aspects of this process are:
• injection of the appropriate amount of H2O2;
• bringing the purification system on-line assoon as an increase of radioantimony isdetected in the coolant; and
• maintaining oxidizing conditions ([O2] > 1ppm) until antimony removal is complete.
Since the purpose of the antimony removal process isto minimize increases in fields due to deposition of122Sb and 124Sb on out-of-core surfaces duringshutdown, the fields measured by the room monitorsthroughout the plant can be used to gauge the successof an application. As an example, the data from theroom field measurements for the 1997 Februaryantimony removal is plotted in Figure 2.
29X0
2000O
5115000
b
10000-
5000
,Eb122Lop1
iS>1»Lap1
AUfai „
•D
0^
• B
-f-
10 20 30
lirreanoeshLlEfcvr(ty
282
Figure 1: Behaviour of Radioantimony in theCoolant in Loops 1 and 2 of the HeatTransport System during the 1997Antimony Removal at Gentilly-2.
In Figure 2, a rapid increase in room fields wasobserved due to the large antimony release after theinitial H2O2 injection. The fields then dropped as theantimony was removed from solution by thepurification system, leaving the final field levelssimilar to those measured prior to the start of theprocess. Between 14:00 and 16:00 hours on 1997February 27, the oxygen level in the loops decreasedbelow the threshold required to keep antimony insolution, and the remaining antimony (less than 5% of

the original amount released) was deposited fromsolution.
The ion-exchange (IX) resins effectively removeantimony during the antimony removal process,although the capacity of the resin for antimony is low.Removal of roughly 10 grams of antimony (bothactive and inactive) requires about 2 m3 of resin. Thisis likely a result of the low affinity of antimony forthe anion exchange resin. Improving the capacity ofthe IX resins for antimony is the only major area foroptimization of this process.
0.6
0.5
0.4
$0.3
0.2-
0.1 .
4—4-
97-02-26 97-02-27
Figure 2: Fields measured by the room areamonitors during the 1997 AntimonyRemoval at Gentilly-2.
Chemical Decontamination
Description of the CAN-DECON™ Process:
The CAN-DECON™ process was developed andqualified for application in CANDU reactors and hasbeen applied in CANDU reactors from 1973 to 1991.
The CAN-DEREM™ process was developed andqualified in the mid 198O's for application inCANDUs and light water reactors. This process wasapplied in the first full-system decontamination of apower reactor in the U.S. (the Indian Point 2 PWR in1995).
AECL has also developed the CAN-DEREM Plusprocess for decontamination of systems and
283
components with high surface area/volume ratios andhigh deposit loadings. CAN-DEREM Plus was usedin the decontamination of the Pickering Unit 1 steamgenerators in 1994.
CAN-DECON™, CAN-DEREM™ and CAN-DEREM Plus are dilute, regenerative chemicalprocesses that employ ion-exchange technology tocontinuously remove dissolved metals andradionuclides and regenerate the components of theprocess formulation. At the completion of thedecontamination, residual dissolved metals,radionuclides and reagents are removed on deuteratedion-exchange resin; the heavy water inventory isconserved and there is no need for rinsing the heattransport system following the process application.
The basic steps in the application of the CAN-DECON™ process during a full-systemdecontamination of a CANDU heat transport systeminclude:
• lower reactor temperature to 85°C• lower system pH; remove Li+ from the heavy
water coolant• add corrosion inhibitor
add CAN-DECON™ chemicals• remove insoluble crud using filters and
regenerate the CAN-DECON™ reagentusing cation ion-exchange resin (all resinsmust be deuterated prior to use)
• add chemicals as required• remove chemicals with mixed-bed ion-
exchange resin• restore HTS chemistry
Qualification of the CAN-DECON™ Process:
The CAN-DECON™ process has been extensivelytested for use in CANDU reactors. The effectivenessof the process and the extent of corrosion of HTSmaterials has been evaluated in the qualificationprograms.
Heat transport system components such asirradiated fuel, defective irradiated fuel, valvepackings, mechanical joints, gasketed joints, endclosures, shield plugs, fuel channel rolled joints,cracked welds, and pump components have beenevaluated in the qualification programs.
A key result from the component evaluation programwas that full-system decontaminations of CANDUreactors, using the CAN-DECON™ process, could becarried out with a significant portion of the fuelin-place. The CAN-DECON™ reagent had no impact

on the integrity of the fuel (fresh, irradiated, andirradiated, defective fuel).
Process Effectiveness:
To date twelve full-system decontaminations havebeen performed at Ontario Hydro's CANDU reactors,and two were performed at the Nuclear PowerDemonstration (NPD) reactor. Process applicationtimes, decontamination factors, corrosion results andwaste volumes produced during the decontaminationof the Ontario Hydro reactors are listed in Table 1.
The effectiveness of the Pickering Unit 1decontaminations performed in 1981 November and1983 March were limited by the amount of ion-exchange resin available, the purification half-life ofthe system and precipitation of ferrous oxalate on heattransport system surfaces. An underestimate of theamount of iron oxides in the heat transport system,even with a contingency, resulted in insufficient ion-exchange capacity being available for thedecontamination. An insufficient ion-exchangecapacity leads to incomplete removal of oxide andradionuclides from the heat transport system.
Development work performed through the 1980'sshowed that the success of a decontamination inreducing fields can be improved by i) lowering theoxalic acid concentration in the CAN-DECON™reagent, ii) having sufficient ion-exchange resindeuterated and loaded into the decontaminationprocess system, and iii) ensuring that the purificationhalf-life for the system is in the 50 to 75 minuterange. Improvements in radiation field reductions inthe full-system decontaminations performed from1984 to 1991 were realized from lowering the oxalicconcentration, better estimates of oxide inventories inthe HTS and maintaining the purification half-life inthe 50 to 75 minute range. The extent of fieldreduction following a CAN-DECON™decontamination is best represented by thedecontamination factor (DF = initial activity/finalactivity). The benefits of the decontamination will berealized in future maintenance outages, for emergencypreparedness (unplanned events) and in minimizingpersonnel exposure during reactor maintenance undernormal reactor operation.
Decontamination factors at the reactor face and in thesteam generators ranged from 4 to 10, while DFs onthe feeder and headers ranged from 3 to 13.5 in full-system decontaminations performed at Pickering "A"from 1984 to 1991 (Table 1).
Decreases in gamma radiation fields resulting fromthe full-system decontaminations performed at
Pickering Unit 2 in 1984 January/April, and atPickering Unit 3 in 1985 June and 1989 July/Augustare depicted in Figures 3 and 4.
The data for the Pickering Unit 2 decontaminations(Figure 3) show that the fields at Row "B" werereduced from 1400 mR/h to approximately 100 mR/h.The DF of 14 is consistent with the DF of 13.5reported for the Pickering Unit 2 feeders (Table 1).The dose reduction observed at Row "B" reflects thecontributions of the feeders to the radiation fields atthe top of the reactor face. The radiation fields atRow "M" (the mid-point of the reactor face)decreased from 600 mR/h to 100 mR/h ( a DF of 6),while the fields at Row "V" (the bottom of thereactor) decreased from 400 mR/h to 100 mR/h. Notethat the radiation fields from the bottom to the top ofthe reactor were uniform following thedecontamination.
Similar trends were observed for Pickering 3, takingthe radiation fields prior to the 1985 Junedecontamination as the initial radiation fields. Fieldswere reduced from the 1000 to 2500 mR/h range to75 mR/h after the decontamination performed in 1989August. As observed in Figures 3 and 4, fields acrossthe reactor face were uniform following thedecontamination.
Reduction of radiation fields at the reactor face and inthe feeder cabinets have resulted in significantreductions to personnel dose during the large-scalefuel channel replacements perfonned at the Pickering"A" Units. It is estimated that 1800 and 750 man-Rem were saved during the campaigns at PickeringUnit 3 and Pickering Unit 4, respectively. Note thatthe actual man-Rem saved is dependent on theradiation field prior to the decontamination.
Note that the waste volumes produced during thePickering "A" decontaminations were in the 20 to 30m3 range. Waste volumes in decontaminationsperformed prior to 1984 were lower; however, thiswas due to under-estimation of the oxide inventory inthe heat transport system.
Corrosion data, obtained from corrosion specimensinstalled in heat transport system autoclaves, indicategeneral corrosion rates for A106 Gr. B carbon steel inthe 0.1 to 0.6 u.m/h range. The general corrosionrates for 400-series stainless steel specimens(representative of the end-fitting and liner tubes)ranged from 0.004 to 0.1 u.m/h. The 400-seriesstainless steels can exhibit active-passive behaviourduring exposure to corrosion inhibitors.
284
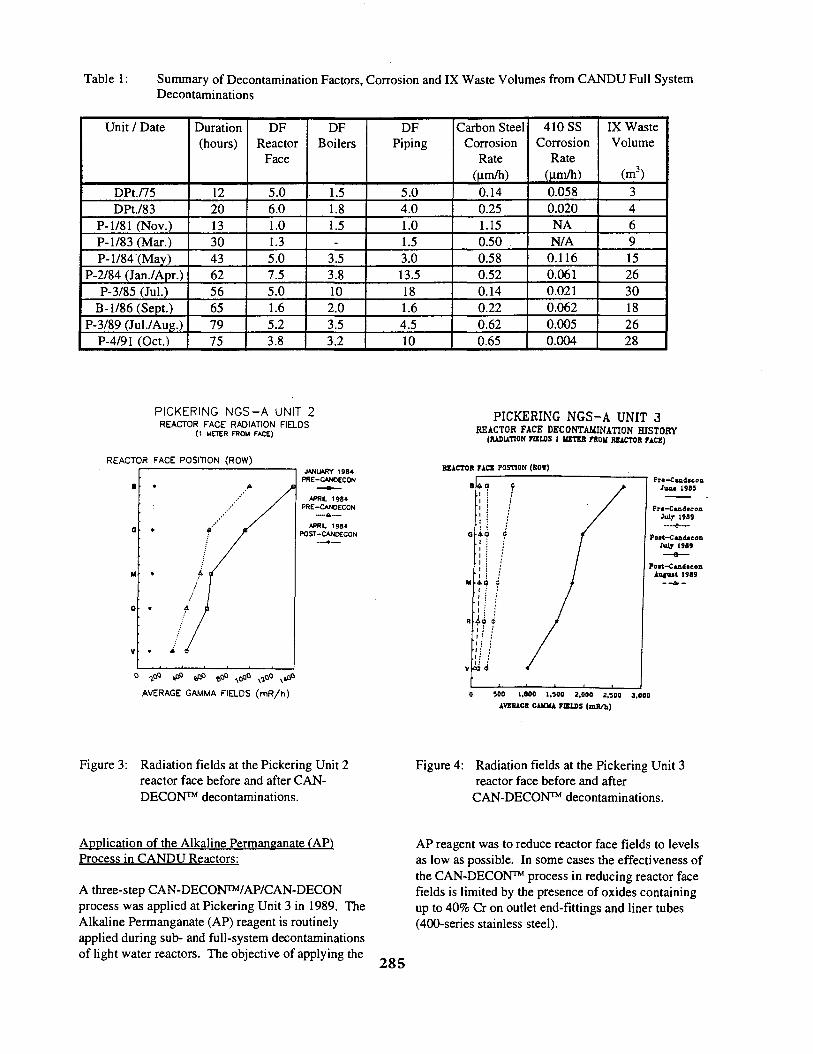
Table 1: Summary of Decontamination Factors, Corrosion and IX Waste Volumes from CANDU Full SystemDecontaminations
Unit / Date
DPt./75DPt./83
P-l/81 (Nov.)P-l/83 (Mar.)P-1/84 (May)
P-2/84 (JanVApr.)P-3/85 (Jul.)
B-l/86 (Sept.)P-3/89 (Jul./Aug.)
P-4/91 (Oct.)
Duration(hours)
12201330436256657975
DFReactor
Face
5.06.01.01.35.07.55.01.65.23.8
DFBoilers
1.51.81.5-
3.53.8102.03.53.2
DFPiping
5.04.01.01.53.013.5181.64.510
Carbon SteelCorrosion
Rate(|im/h)0.140.251.150.50 .0.580.520.140.220.620.65
410 SSCorrosion
Rate(u.m/h)0.0580.020NAN/A
0.1160.0610.0210.0620.0050.004
IX WasteVolume
(m3)3469152630182628
PICKERING NGS-A UNIT 2REACTOR FACE RADIATION FIELDS
{1 METER FROM FACE)
REACTOR FACE POSITION (ROW)JANUARY 198+
PRE-ONOECON
APRL 198*PRE-CANOECON
APRL 198*POST-CANOECON
AVERAGE GAMMA FIELDS ( m R / h )
PICKERING NGS-A UNIT 3REACTOR FACE DECONTAMINATION HISTORY
(IUIUTION rams i UETEB raou REACTOR FACE)
REACTOR M C I POSTION (ROW)
Prt-CandcconJum 19IS
0 100 1,000 1.300 2,000 2,300 3,000
1VZ1UCE GAKHA FIELDS (mH/h)
Figure 3: Radiation fields at the Pickering Unit 2reactor face before and after CAN-DECON™ decontaminations.
Figure 4: Radiation fields at the Pickering Unit 3reactor face before and afterCAN-DECON™ decontaminations.
Application of the Alkaline Permanganate (AP)Process in CANDU Reactors:
A three-step CAN-DECON™/AP/CAN-DECONprocess was applied at Pickering Unit 3 in 1989. TheAlkaline Permanganate (AP) reagent is routinelyapplied during sub- and full-system decontaminationsof light water reactors. The objective of applying the
AP reagent was to reduce reactor face fields to levelsas low as possible. In some cases the effectiveness ofthe CAN-DECON™ process in reducing reactor facefields is limited by the presence of oxides containingup to 40% Cr on outlet end-fittings and liner tubes(400-series stainless steel).
285

The oxidizing AP reagent conditions the Cr-richoxide on system surfaces so that they can be easilyremoved during the subsequent CAN-DECON™ orCAN-DEREM™ step.
The radiation fields at the east and west faces of thereactor before the Pickering Unit 3 decontaminationin 1989, after the first CAN-DECON™ step (1989July) and after the AP and second CAN-DECON™steps are listed in Table 2. The final fields at the eastand west faces of the reactor were 85 and 75 mR/h,respectively. These were the lowest reactor facefields observed after a full system decontamination ofa CANDU reactor.
Table 2: Reactor Face Radiation Fields during thePickering Unit 3 Decontamination in 1989
Pre-deconAfter 1st
CAN-DECON™Before 2nd
CAN-DECON™After AP and 2ndCAN-DECON™
Reactor Face Fields (mR/h)East Face
450192
85
West Face437196
180
75
Equipment Requirements for CAN-DECON™Decontaminations:
Equipment requirements for CAN-DECON™decontaminations of CANDU reactors are listedbelow:
• a purification (ion-exchange) system;• a high temperature filtration system;• a chemical injection system;• an ion-exchange resin
deuteration/de-deuteration system;• an ion-exchange resin loading system; and• an ion-exchange column flow
commissioning system.
The sizing of the equipment is primarily based on thevolume of ion-exchange resin required. Theion-exchange requirements are, in turn, based on theestimated deposit loading in the heat transport system.Hence, obtaining an accurate estimate of the depositloading prior to design of the decontaminationprocess equipment is critical to the success of thedecontamination. It is possible to slurry out the spentresin and load fresh, deuterated resin, but this
286
increases the complexity of the decontaminationoperation.
Key features of decontamination process equipmentdesign include:
• high reliability; through redundantcomponents (maintain high flows throughfilters and DC while adding or removingchemicals);
• sufficient IX resin capacity to accommodatesystem oxide inventory;
• compatibility with station systems;• minimal operational maintenance required;• minimized station manpower to set-up, commission
and operate equipment;• decommissioning activities minimized; and• high temperature and high flow filtration.
A block diagram of the equipment interfaces is shownin Figure 5.
Improvements in the CAN-DECON™ Process forCANDU Full-system Decontaminations:
Improvements in the CAN-DECON™ process forCANDU full-system decontaminations include:
• development of a sulphur- and halide-freecorrosion inhibitor;
• optimization of the AP Cr-rich oxideconditioning process;
• optimized decontamination processequipment design; and
• specification of strategies to minimize wastevolumes produced during sub- and full-system decontaminations.
Corrosion inhibitors are added to the CAN-DECON™ formulation to minimize waste volumesgenerated during a decontamination and to minimizecorrosion of carbon steel surfaces during thedecontamination.
Rodine 31 A, a commercially available corrosioninhibitor containing sulphur, was used in the full-system and sub-system decontaminations at thePickering NGS. However, residual sulphur andchloride can potentially induce localized corrosion insteam generator tubes with high nickel content (e.g.Alloy-600 in Bruce "A" and "B", and Alloy-800 inDarlington and CANDU-600 stations) duringsubsequent reactor operation. Hence, a sulphur- andhalide-free inhibitor was required for application insub- and full-system decontaminations ofpost-Pickering CANDUs.

Analysis Services[Laboratory]
Dedeutaration PurificationSystem
ProcessData
Resin LoadingSystem ix Column Flow
Commissioning System
Process ControlCenter
1 Radiation FieldI Dale
Ion Exchange Columns& Valve Station
Figure 5:
Decontamination SystemsInterface Block Diagram
Process equipment required for a CAN-DECON™ decontamination.
A custom formulated corrosion inhibitor free ofsulphur and halides was identified and evaluated foruse with CAN-DECON™ decontamination solutions.Development work has demonstrated that thissulphur- and halide-free inhibitor is as effective asRodine 31A for inhibiting general corrosion andprotection against pitting corrosion.
The performance of the corrosion inhibitor wasdemonstrated in a pilot-scale decontamination ofNPD feeder pipes. The results of the R&D programand the pilot scale test have been used to specify theapplication conditions for the sulphur- and halide-freeinhibitor. The presence of the inhibitor did not alterthe effectiveness of the decontamination process ashigh decontamination factors were achieved. Inaddition, the inhibitor formulation did not affect theperformance of the cationic and mixed-bedion-exchange resins used in the CAN-DECON™decontamination process.
Although application of the AP reagent in PickeringUnit 3 was successful in reducing radiation fields tolow levels, its application posed some challenges.Due to the combination of materials of construction inthe heat transport system, decomposition of the APreagent was significant. Decomposition of the APreagent increases the waste volumes produced(although still small in comparison with the volume ofwaste from removal of oxide from the heat transportsystem) and makes process control more difficult.Furthermore, the production of paniculate manganesedioxide (MnO2) may limit the effectiveness of the
following CAN-DECON™ step. Paniculate MnO2
settles in low-flow and stagnant areas during the APand AP destruction steps, blocking access of theCAN-DECON ™ reagents to system surfaces.
In addition, the AP reagent is difficult to destroy.Typically, oxalic acid is used to reduce the APreagent to soluble Mn(II). However, addition of asignificant amount of oxalic acid to the heat transportsystem results in precipitation of ferrous oxalate onsystem surfaces. The presence of ferrous oxalate onsystem surfaces may also limit oxide and activityremoval during the subsequent CAN-DECON™ step.
Process conditions to minimize decomposition of thereagent and alternate approaches for the destructionof the AP reagent have been identified and areundergoing evaluation in the COG-fundedDecontamination Process Development program.
The effectiveness of some of the earlier full-systemdecontaminations at Pickering "A" were limited bythe amount of ion-exchange resin loaded in to thedecontamination process equipment (due to physicalsize limitations). Incorporation of on-line slurrying ofion-exchange resin into the decontamination processequipment design ensures that sufficient ion-exchangeresin would be available for the decontamination.The ion-exchange system could be designed so thatresin could be deuterated and de-deuterated, andslurried in and out of the ion-exchange column whileother columns are valved-in. In addition, on-line
•yon slurrying of resin would significantly reduce the

number and size of ion-exchange columns required,the overall size of the process equipment, and theheavy water hold-up in the process circuit.
Strategies to minimize waste volumes generatedduring full-system decontaminations includeperforming two-stage decontaminations andimplementing technologies to consolidate wasteresulting from oxide removal from the heat transportsystem. A two-stage decontamination process,consisting of mechanical (or chemical)decontamination of the steam generators followed byapplication of the CAN-DECON™ process leads tosignificantly reduced process application time,minimized ion-exchange resin and heavy waterrequirements, reduced corrosion of heat transportsystem materials of construction and smallerdecontamination process equipment.
Summary
The in-core antimony removal and chemicaldecontamination technologies have served tosignificantly reduce personnel dose during major
reactor refurbishment campaigns and duringscheduled maintenance outages. The in-coreantimony removal process is particularly suited tocontrolling radiation fields at stations havingsignificant radioantimony inventories in-core.
Full-system decontaminations have significantlyreduced total dose to personnel during large-scalefuel channel replacements, enabling the operation tobe performed in a manageable period of time. Thetechnology is well established, with a history ofsuccessful reactor operation following thedecontamination.
Reference
Dundar, Y., Odar, S., Steit, K., Allsop, H., Guzonas,D., "Application of KWU Antimony RemovalProcess at Gentilly-2", 7th International Conferenceon Water Chemistry of Nuclear Reactor Systems,British Nuclear Energy Society, Bournemouth, U.K.,1996.
288

Dosimetry Results for AECL Personnel Involved in Maintenance Activities at Off-shore CANDU Stations
By
R. KhalooAECL, Sheridan Science and Technology Park,
Mississauga, Ontario, Canada L5K.1B2
CA0000045
ABSTRACT
Atomic Energy of Canada Limited(AECL) is intermittently involved inmaintenance work on domestic and off-shoreCANDU nuclear power plants. Maintenanceactivities, such as fuel-channel replacement(FCR), small-scale spacer location andrelocation (SLARETTE) and primary-sidesteam-generator tube cleaning, require work inhigh-radiation fields. This may lead toappreciable radiation doses. AECL staffexperience has been that these radiation dosesaccrue mostly from external gamma fields, witha minor internal dose component from theuptake of tritiated water vapour. There are nosignificant uptakes of other radionuclides.
AECL practice for SLARETTE andFCR work at off-shore CANDU stations hasbeen to equip AECL personnel with 1 set ofthermoluminescent dosimeters (TLDs) and 1direct-reading personal alarming dosimeter(PAD). These TLDs are read at the Chalk RiverLaboratories of AECL. In addition, off-shoresite radiation protection personnel issue AECLpersonnel with a TLD. This TLD issubsequently read at the off-shore site.Consequently, there are often three independent
measurements of dose from external fields forAECL personnel.
Internal dose assessments rely on off-shore radiation protection personnel. All off-shore CANDU stations use urine bioassaymethods for tritiated water uptakes. Most off-shore CANDU sites also have lung or whole-body gamma spectrometry capabilities or both,which, if necessary, can be used to assess dosesfrom uptakes of gamma-emitting airbornecontaminants (e.g., from '"Co, 9!Zr, wNb, etc.).
This paper discusses some internal andexternal dosimetry data for AECL personnelinvolved in recent FCR and SLARETTE work atoff-shore CANDU stations. The data show thatthe whole-body dose contribution from uptake oftritiated heavy water is small. The data alsoshow that three independent external dosimetrysystems give dose results that are in relativelyclose agreement. Such information is invaluablein promoting confidence in the variousdosimetry systems used under field conditionsand allows Sheridan Park Health Physics staff toaddress any spurious measurements. Thedosimetry data are also useful in planning futuremaintenance work.
289

INTRODUCTION:Atomic Energy of Canada's Sheridan
Park site and its affiliated sites, labelled here asAECL-SP, routinely monitors its atomicradiation workers (about 150 of its ~900employees) for radiation exposures. Thesemonitored employees are involved in a widerange of activities ranging from periodic reactor-site visits to high- radiation-field maintenancework. They typically work at reactor sites inCanada (i.e., Pickering, Darlington, Bruce, PointLepreau, Gentilly-2) and at off-shore CANDUsites in Argentina, Korea and Romania.However, on occasion, work has been done inSlovenia and Russia.
Of the -150 AECL-SP employeesmonitored for occupational radiation exposures,about one third are involved in high-radiation-field work, such as fuel-channel replacement(FCR), small-scale spacer location andrelocation (SLARETTE) and steam-generatormaintenance. The number of employeesinvolved in high-radiation-field work variesfrom year to year, depending on the maintenancework schedule. Consequently, radiationexposures also exhibit annual variations. It isalso common for the same group of employeesto perform maintenance tasks at domestic andoff-shore sites in the same year. Consequently,a small gToup of employees receive adisproportionate amount of the collectiveradiation dose.
Figures 1 and 2 show the distributionsof whole-body dose for AECL-SP employeesfor 1995 and 1996 respectively. Most of themonitored employees are in radiation fields forshort periods of time and receive little or nooccupational exposures. Typically, 90% of themonitored employees receive about 10 to 20%of the collective dose; or conversely, 10% of theemployees receive 80 to 90% of the collectivedose. Therefore, it is appropriate that attentionand effort be focused on radiation exposures toemployees involved in high-radiation-fieldmaintenance work and receiving most of theannual collective dose.
1995 AECL-SP Dose Distribution
(0.01-0.1) (0.1-1.0) (1.0-5.0) (5.0-17.0)
Whole Body Dose (mSv)
Figure 1: 1995 AECL-SP Dose Distribution
1996 AECL-SP Dose Distribution
Whole Body Dose (mSv)
Figure 2: 1996 AECL-SP Dose Distribution
At domestic CANDU sites, AECLemployees involved in radiation work aremonitored with thermoluminescent dosimeters(TLDs) and personal alarming dosimeters(PADs) for external exposures, while urinebioassays and whole-body counting are used forinternal exposures. Radiation doses fromCanadian sites are reported to AECL on amonthly and quarterly basis by site staff, and areconsolidated in employees' personal doserecords.
Radiation protection practice at off-shore sites sometimes differs from the radiationprotection practice employed at domesticCANDU stations. The adequacy of radiationprotection and monitoring offered by off-shoresites has been questioned by AECL staff. This,together with the remoteness of the worklocation, has meant that for high-radiation-fieldwork at off-shore sites, employees are routinelyissued TLDs and a PAD by AECL-SP HealthPhysics staff. Off-shore site radiation protection
290
staff also issue TLDs to AECL personnel. Thusthere are usually three independentmeasurements of external dose. Internalexposures are monitored by urine bioassay and,if necessary, by whole-body or lung counting ata site. Since the biological half-life of tritium isabout 10 d, it is impractical to perform thesebioassays on staff on their return to SheridanPark. The rest of this paper will discuss theresults of some of these dosimetricmeasurements for work at off-shore CANDUsites and the implications for future high-radiation-field radiation work.
DOSEMETRY USED FOR OFF-SHOREWORK
Employees involved in off-shore high-radiation-field maintenance work are eachissued, from AECL-SP, 2 TLD badges: onebadge is used as a control and the other badge isused as a field dosimeter. These dosimeters arekept together during travel to the site; they arekept separately when radiation work is to beperformed. Then, the control TLD badge isplaced in a background radiation fieldenvironment (such as a hotel room) and the fieldTLD badge is taken into the high-radiation fieldwhere work is to be done. On completion ofwork, the control and field TLD badges areagain kept together until they re returned toAECL-SP, and from there to AECL-CRL (ChalkRiver Laboratories) for reading. Controlreadings are subtracted from field readings toyield the accumulated dose. By doing so,radiation exposures obtained from cosmic raysduring the flight and from other backgroundsources are excluded from the occupational doserecords.
The presence of a large number ofcontrol dosimeters for maintenance projectsenables easy troubleshooting of anomalousreadings and flexibility in the assignment ofstaff. For example, background correction isperson-dependent, rather than constant for thewhole group when only one control TLD is used.Therefore, employees can have varying lengthsof stay for the project without affectingdosimetry. In addition, improper handling ofcontrol and field TLD badges can sometimes beidentified and with multiple control TLD badges,the readings could subsequently becorrected/discounted.
Each TLD badge contains 2 TLD chips,some activation foils, sulphur tablets and CR-39
plastic. The activation foils and sulphur tabletscan detect high neutron doses from criticalityevents. The CR-39 plastic detects thermalneutron fields and neutron fields of energygreater than about 100 keV. The presence of 2TLD chips in each badge enables the whole-body dose and skin dose to be estimated fromthe thick and thin TLD chips respectively. TheCR-39 track etch dosimeters are read only whenneutron exposures are suspected based onexcessively high ratio of thick to thin TLD chipmeasurements.
AECL-SP staff also issue maintenanceworkers with PADs for dose-control purposes.Currently, ALNOR 101-R units are used. Theseunits can display cumulative external whole-body dose and dose rate, and have alarm setpoints for cumulative dose and dose rate.Although, the TLD badges are the officialdosimeters of record, they are unable to provideany real-time dose measurements. PADsaccomplish this task and are invaluable for dosecontrol, work planning and prevention ofoverexposures from unexpected radiation fields.
Off-shore site staff also routinelyprovide AECL-SP staff with TLDs. These TLDsare read by off-shore site staff, and the resultsare communicated to AECL-SP Health Physicsstaff.
MAINTENANCE ACTTVITIESAECL-SP staff are involved in
periodic inspections of reactor components, fuel-channel replacements (FCR), garter-springrepositioning using SLARETTE, and primary-side steam-generator-tube cleaning (SGTC) atCANDU reactors.
Fuel-channel replacement activitiesinvolve the removal and replacement of a fuelchannel. AECL participated in selective FCRs atKANUPP in 1993, Wolsong Unit 1 in 1994, andEmbalse in 1995. However, since then, therehave been no requests from off-shore CANDUstations for FCRs. At KANUPP, AECL utilizedKANUPP staff for most of the work performedin high-radiation fields and were themselvesinvolved more in a supervisory and trainingcapacity. At Embalse in 1995, a situation similarto that at KANUPP prevailed. However, atWolsong in 1994, AECL staff were moreinvolved in most of the high-radiation-field worknear the reactor face with assistance from sitestaff. There were also some unexpectedproblems during this maintenance work.
291

Consequently, radiation exposures were higherat Wolsong.
AECL-SP staff have been involved inSLARETTE operations annually for the past 3years at Wolsong, Gentilly-2 and Embalse. It isexpected that SLARETTE work (garter-springinspections and relocations) will continue atthese sites annually or once every 2 years untilthese reactors are retubed and garter springs arereplaced with the improved spacer design.
AECL-SP staff have also been involvedin primary-side steam-generator-tube cleaning atGentilly-2 and Point Lepreau. This is high-radiation- field work that is due to corrosion-product activity in the primary side. However,remote tooling is being increasingly applied,leading to reductions in radiation exposures.Other maintenance work periodically undertakenincludes steam-generator divider-plate repairsand feeder-pipe repair. However, these areexpected to be infrequent maintenance activities.
DOSIMETRY DATAData for AECL-SP employees who
participated in the following selected projects atoff-shore CANDU stations will be discussed.1. the 1993 KANUPP Fuel Channel
Replacement Project2. the 1994 Wolsong Unit 1 Fuel Channel
Replacement Project3. the 1995 Wolsong SLARETTE project.
This cross section of data will bepresented because it is fairly representative ofrecent experiences at off-shore sites.
THE 1993 KANUPP FUEL CHANNELREPLACEMENT
Fuel-channel replacement involvesremoval of the pressure tube and end-fitting.This procedure is manpower intensive, requiringcutting and welding operations at the reactorface. The major hazard expected is fromexternal gamma radiation principally from thepressure tubes due to Zr-95/Nb-95 activationproducts. Further away from the face, generalgamma fields are due to corrosion-productactivity in the feeders (largely Co-60) and directgamma radiation from the face. In addition,there is tritiated water vapour in the atmosphere.Approximately 10 AECL employees wereinvolved in this project. This was composed oftwo managers, two team leaders and 6technologists and technicians. AECL's role,
while being supervisory in nature, did involvework in the reactor vault.
Whole-body doses (obtained with filmbadges) and internal doses from tritium,(determined by urine bioassay), were reported toAECL-SP Health Physics staff by KANUPPstaff.
These AECL employees also had TLDbadges issued from AECL-CRL. No resultsfrom direct-reading PADs were available (theseunits were acquired by AECL-SP in 1995).
Figure 3 presents the comparison ofexternal whole-body doses determined byKANUPP staff and external whole-body andskin doses determined by AECL-CRL TLDs.Figure 4 presents the internal doses (fromtritium) and the reported total whole-body dose(internal + external and from tritium).
292
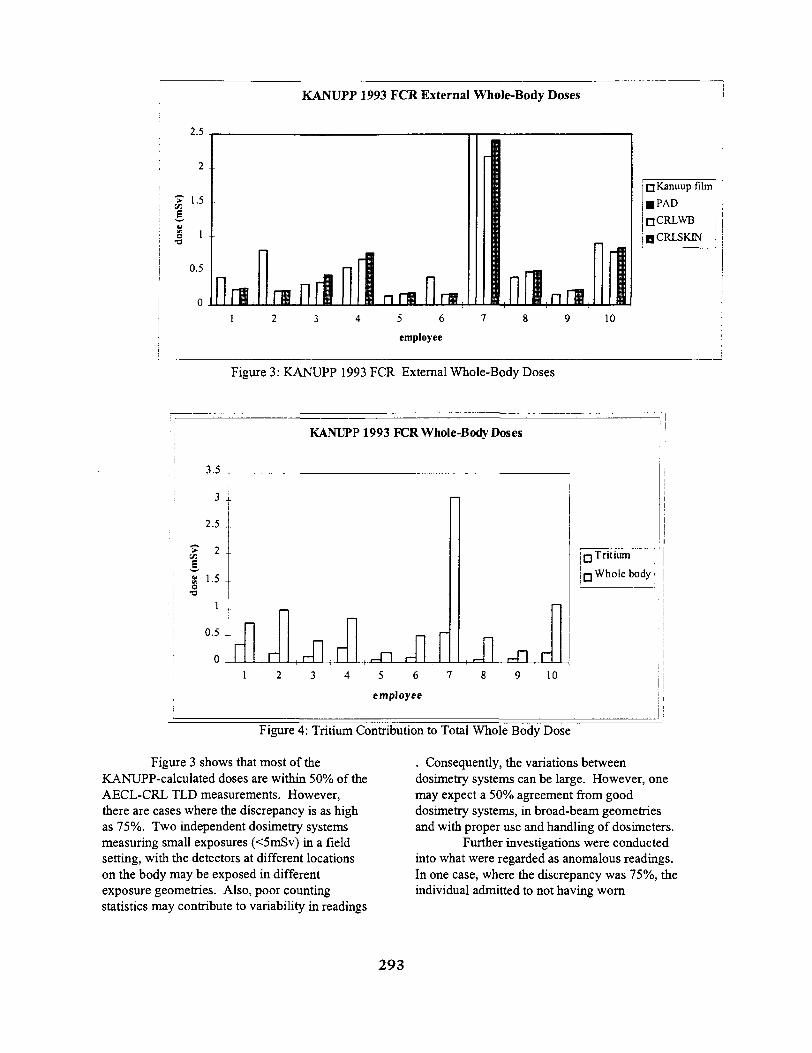
KANUPP 1993 FCR External Whole-Body Doses
2 .
1 .
0.5 .
0 Mn rinltfl I n n 11 n 111 In fl 1fjKanuup film
• PAD
• CRLWB i
BCRLSKIN I
1 2 3 4 5 6 7
employee
10
Figure 3: KANUPP 1993 FCR External Whole-Body Doses
3.5
3
2.5
3T 2
g" 1-5o•a
1
0.5
0
KANUPP 1993 FCR Whole-Body Doses
i
, r ,41 r"L jir , J 1 r-H , T
• Tritium
i Q Whole body
2 3 4 5 6 7
employee
10
Figure 4: Tritium Contribution to Total Whole Body Dose
Figure 3 shows that most of theKANUPP-calculated doses are within 50% of theAECL-CRL TLD measurements. However,there are cases where the discrepancy is as highas 75%. Two independent dosimetry systemsmeasuring small exposures (<5mSv) in a fieldsetting, with the detectors at different locationson the body may be exposed in differentexposure geometries. Also, poor countingstatistics may contribute to variability in readings
. Consequently, the variations betweendosimetry systems can be large. However, onemay expect a 50% agreement from gooddosimetry systems, in broad-beam geometriesand with proper use and handling of dosimeters.
Further investigations were conductedinto what were regarded as anomalous readings.In one case, where the discrepancy was 75%, theindividual admitted to not having worn
293
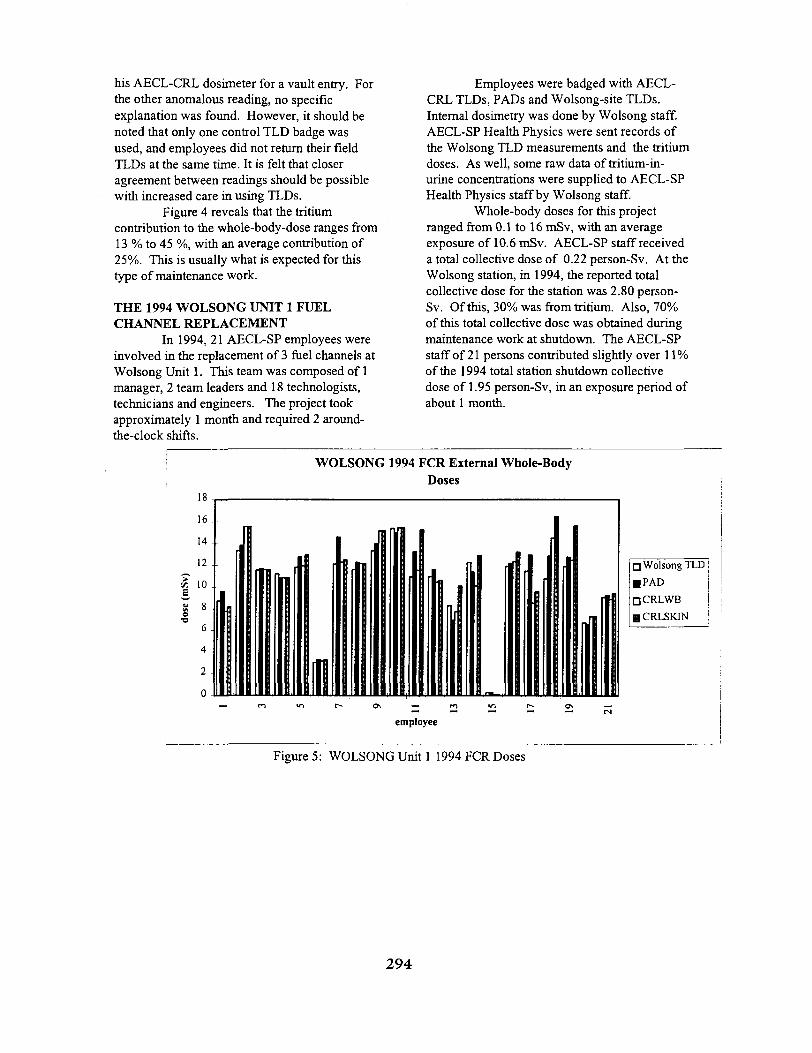
his AECL-CRL dosimeter for a vault entry. Forthe other anomalous reading, no specificexplanation was found. However, it should benoted that only one control TLD badge wasused, and employees did not return their fieldTLDs at the same time. It is felt that closeragreement between readings should be possiblewith increased care in using TLDs.
Figure 4 reveals that the tritiumcontribution to the whole-body-dose ranges from13 % to 45 %, with an average contribution of25%. This is usually what is expected for thistype of maintenance work.
THE 1994 WOLSONG UNIT 1 FUELCHANNEL REPLACEMENT
In 1994, 21 AECL-SP employees wereinvolved in the replacement of 3 fuel channels atWolsong Unit 1. This team was composed of 1manager, 2 team leaders and 18 technologists,technicians and engineers. The project tookapproximately 1 month and required 2 around-the-clock shifts.
Employees were badged with AECL-CRL TLDs, PADs and Wolsong-site TLDs.Internal dosimetry was done by Wolsong staff.AECL-SP Health Physics were sent records ofthe Wolsong TLD measurements and the tritiumdoses. As well, some raw data of tritium-in-urine concentrations were supplied to AECL-SPHealth Physics staff by Wolsong staff.
Whole-body doses for this projectranged from 0.1 to 16 mSv, with an averageexposure of 10.6 mSv. AECL-SP staff receiveda total collective dose of 0.22 person-Sv. At theWolsong station, in 1994, the reported totalcollective dose for the station was 2.80 person-Sv. Of this, 30% was from tritium. Also, 70%of this total collective dose was obtained duringmaintenance work at shutdown. The AECL-SPstaff of 21 persons contributed slightly over 11%of the 1994 total station shutdown collectivedose of 1.95 person-Sv, in an exposure period ofabout 1 month.
WOLSONG 1994 FCR External Whole-BodyDoses
(mSv
)do
se i
16..
14
12 .
10 . .
8 f6 .
4 -
2 .
0 . . .
in111
[If
Q Wolsong TLD
• PAD
• CRLWB
HCRLSKIN
employee
Figure 5: WOLSONG Unit 1 1994 FCR Doses
294
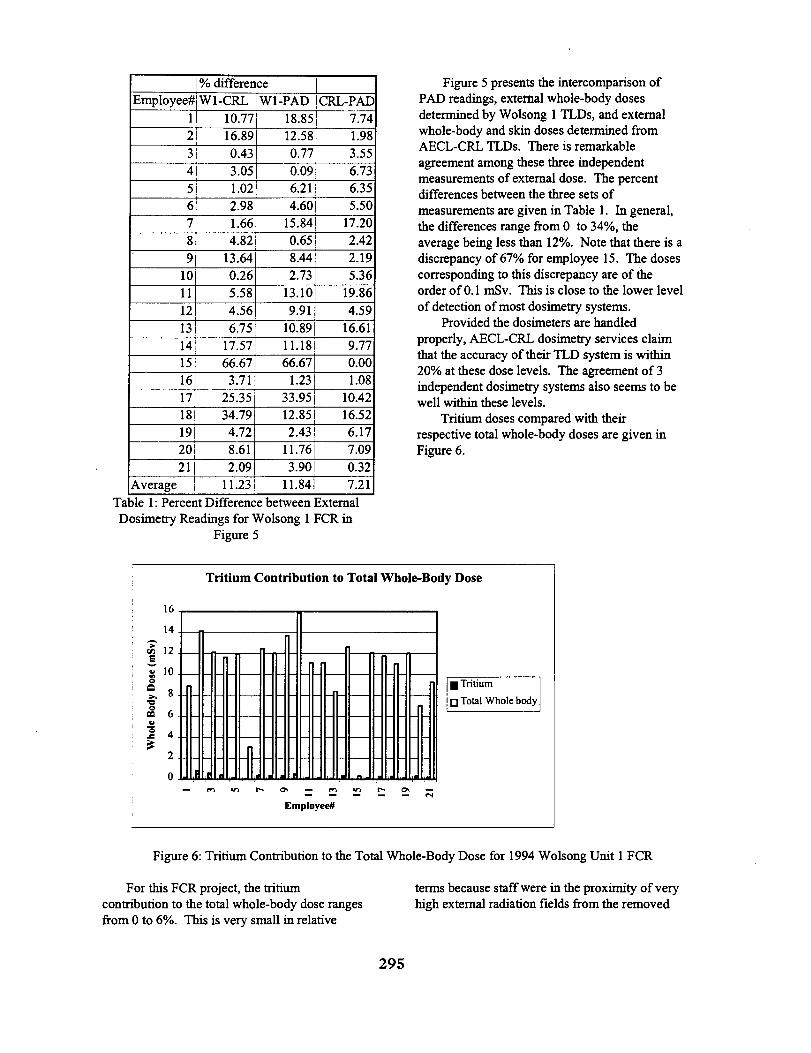
Employee#123456789
101112131415161718192021
Average
% differenceWl-CRL
10.7716.890.433.051.022.981.664.82
13.640.265.584.566.75
17.5766.67
3.7125.3534.794.728.612.09
11.23
Wl-PAD18.8512.580.770.096.214.60
15.840.658.442.73
13.109.91
10.8911.1866.67
1.2333.9512.852.43
11.763.90
11.84
CRL-PAD7.741.983.556.736.355.50
17.202.422.195.36
19.864.59
16.619.770.001.08
10.4216.526.177.090.327.21
Figure 5 presents the intercomparison ofPAD readings, external whole-body dosesdetermined by Wolsong 1 TLDs, and externalwhole-body and skin doses determined fromAECL-CRL TLDs. There is remarkableagreement among these three independentmeasurements of external dose. The percentdifferences between the three sets ofmeasurements are given in Table 1. In general,the differences range from 0 to 34%, theaverage being less than 12%. Note that there is adiscrepancy of 67% for employee 15. The dosescorresponding to this discrepancy are of theorder of 0.1 mSv. This is close to the lower levelof detection of most dosimetry systems.
Provided the dosimeters are handledproperly, AECL-CRL dosimetry services claimthat the accuracy of their TLD system is within20% at these dose levels. The agreement of 3independent dosimetry systems also seems to bewell within these levels.
Tritium doses compared with theirrespective total whole-body doses are given inFigure 6.
Table 1: Percent Difference between ExternalDosimetry Readings for Wolsong 1 FCR in
Figure 5
Tritium Contribution to Total Whole-Bod]
1*
14 .
£ 12 .e"« 10 .s° 8•aa 61 4
0 . i t i t J • ; , | r j r j
— C > « n t ^ O * — C 1 » / ^ I ^ O \ —
Employee*?
f Dose
g Tritium
• Total Whole body
Figure 6: Tritium Contribution to the Total Whole-Body Dose for 1994 Wolsong Unit 1 FCR
For this FCR project, the tritiumcontribution to the total whole-body dose rangesfrom 0 to 6%. This is very small in relative
terms because staff were in the proximity of veryhigh external radiation fields from the removed
295
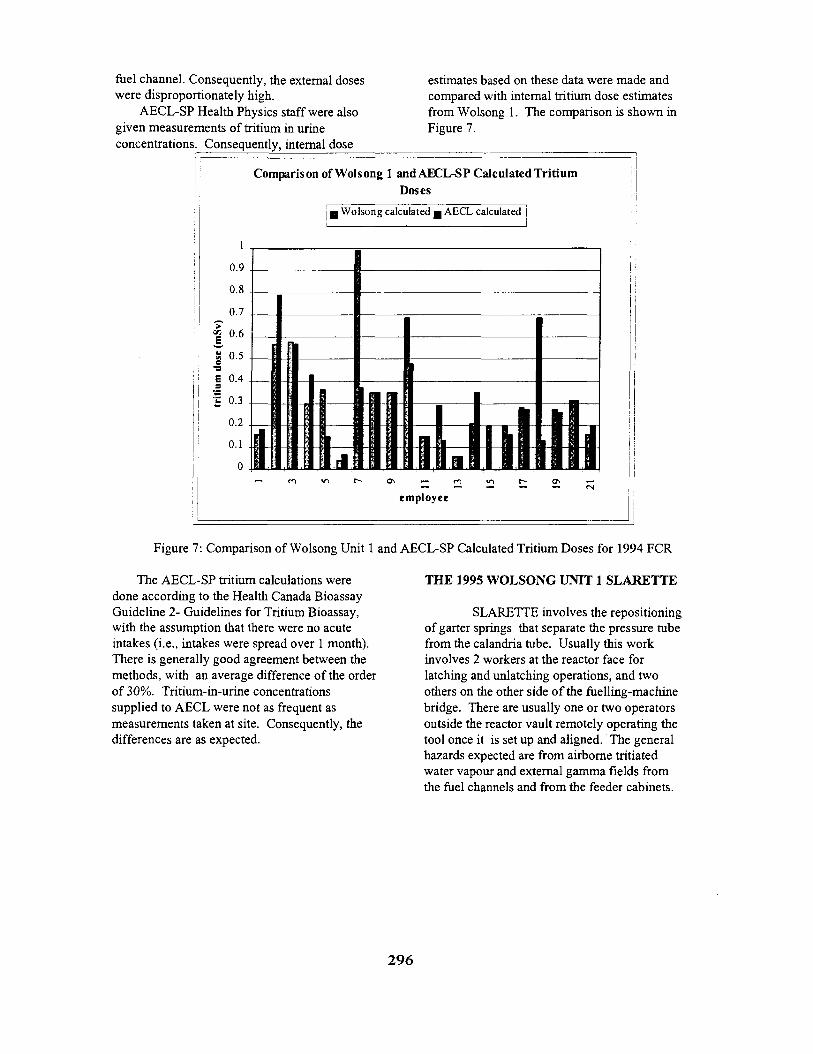
fuel channel. Consequently, the external doseswere disproportionately high.
AECL-SP Health Physics staff were alsogiven measurements of tritium in urineconcentrations. Consequently, internal dose
estimates based on these data were made andcompared with internal tritium dose estimatesfrom Wolsong 1. The comparison is shown inFigure 7.
Comparison of Wolsong 1 and AECL-SP Calculated TritiumDoses
! f: |
Ea
trit
1
0.9
0.8
0.7
0.6
0.5
0.4
0.3
0.2
0.1
0
• Wolsong calculated m AECL calculated
•T t
1 !n i
| | * a l j11Hi n
• § • • • • •
ill113 • HI • ]i n • 1111
•VflVJ
i"a^H
n i1 1 i 1
I ii nu ii in ii in inemployee
Figure 7: Comparison of Wolsong Unit 1 and AECL-SP Calculated Tritium Doses for 1994 FCR
The AECL-SP tritium calculations weredone according to the Health Canada BioassayGuideline 2- Guidelines for Tritium Bioassay,with the assumption that there were no acuteintakes (i.e., intakes were spread over 1 month).There is generally good agreement between themethods, with an average difference of the orderof 30%. Tritium-in-urine concentrationssupplied to AECL were not as frequent asmeasurements taken at site. Consequently, thedifferences are as expected.
THE 1995 WOLSONG UNIT 1 SLARETTE
SLARETTE involves the repositioningof garter springs that separate the pressure tubefrom the calandria tube. Usually this workinvolves 2 workers at the reactor face forlatching and unlatching operations, and twoothers on the other side of the fuelling-machinebridge. There are usually one or two operatorsoutside the reactor vault remotely operating thetool once it is set up and aligned. The generalhazards expected are from airborne tritiatedwater vapour and external gamma fields fromthe fuel channels and from the feeder cabinets.
296

WOLSONG Unit 1 1995 SLARETTE External Whole-Body Doses
10
9
8
7
B 5 .
•§ 4 .
3 .
2 .
1 _
0
r
n .m.QdJhn __
• Wolsong TLD
• PAD
• CRLWB
• CRLSKIN
5 6 7
employee
10 11
Figure 8: Wolsong Unit 1 1995 SLARETTE External Whole-Body Doses
Eleven AECL-SP staff, consisting of 2team leaders and 9 technicans, technologists andengineers made up this team. Each AECL-SPemployee had AECL-CRL TLDs, AECL-SPPADs and Wolsong Unit 1 TLDs. A comparisonof the external whole-body doses is given inFigure 8.
The collective dose for this project was0.03 person-Sv, with individual doses rangingfrom 0.5 mSv to 10 mSv. As can be seen, 2employees received 5 mSv or more, the otherAECL-SP staff averaged <1 mSv. The 2employees receiving higher exposures wereinvolved in latching-unlatching and tool-positioning operations. A large part of the high-field work on this project was undertaken byWolsong or subcontracted staff, hence theoverall small collective dose. There is goodagreement between the 3 different externalwhole-body dose measurements. Usuallydiscrepancies are of the order of 30% or less.When large discrepancies exist (employee 2 and6), doses from Wolsong Unit 1 TLDs are higher.Some employees got slight externalcontamination on this project, and it ispostulated that there were probably hot particleson the Wolsong dosimeter. However, noconclusive explanation was found.
Figure 9 shows the tritium contributionto the total whole-body dose. The averagetritium contribution to the total whole-body doseis 7% and ranges from 0 to 22%. The tritiumdoses range from 0 to 1.3 mSv.
Tritium contribution to Total Whole-BodyDose
| Tritium • Total whole body
I
n
8 r
4
n n 1 nil n . i n JIEmployee*
Figure 9: Tritium Contribution to the TotalWhole-Body Dose for SLARETTE at WolsongUnit 1 in 1995
297

DISCUSSION AND CONCLUSIONS
The use of multiple dosimeters forhigh-radiation-field work at off-shore CANDUstations has provided conclusive evidence thatall 3 dosimetry systems, i.e., PADs, AECL-CRLTLDs and Wolsong Unit 1 TLDs, do notsystematically overestimate or underestimateradiation exposures. It also provides anassurance that if these devices are properly usedand handled, the accuracy offered by all thesystems is quite good. The agreement is quiteimpressive for field data (see Figure 5).
At Wolsong Unit 1, staff use the Koreanice bottle respirators for tritium protection. Theefficacy of this device has been repeatedlyquestioned by AECL-SP staff. However, itclaims to have a protection factor of at least 2, ifproperly used. The data for work at Wolsong in1994 and 1995 indicate that the tritiumcontribution to the whole-body dose is typicallywithin 20% of the total whole-body dose. Thisis consistent with data for Gentilly-2 and PointLepreau reported in the CANDU stationnewsletter 96-03 (Reference 1). It is alsoconsistent with detailed data given in G2-RT-95-51 rev.O for Gentilly-2 (Reference 2), where thecontribution of tritium to the total whole-bodydose is typically less than 20%. However,because Point Lepreau operates with a very lowdewpoint in the reactor building, it is oftenpossible to work in the reactor vault withoutrespiratory protection. It is also known thatWolsong Unit 1 can have high tritium-in-airconcentrations at shutdown in the reactor vault (afew (2 to 3) derived air concentrations).Consequently, based on this circumstantialevidence, there is no indication that the Koreanice bottle respirators are not effective atproviding adequate tritium protection, providedthey are used as intended. However, this shouldbe verified by controlled field and laboratorytrials. Site staff have also been monitored forinternal contamination other than tritium. Inmost cases, no other contamination was present.In a few cases, trace amounts of 95Zr and 95Nb(contributing <0.01 mSv of the individual'sdose) have been detected. Because of their lowconcentrations, they are not of concern.
The contribution to the total whole-body dose for AECL-SP staff duringmaintenance work is dominated by externalgamma fields. Following the as-low-as-reasonably-achievable (ALARA) principle,
social and economic factors taken intoconsideration, AECL-SP employs the philosophythat radiation work should be done by the personwho is best qualified to do it while minimizingtotal radiation exposures. Hence, the higherexposures for employees 2 and 6 as shown inFigure 9, while still having overall lowexposures for the group. AECL is nowemploying more robotic equipment for high-radiation-field work, which will contribute tolower exposures.
Additional data are required forradiation work planning to become a moreeffective tool in optimizing radiation exposuresfor high-radiation-field work. For example, it isimportant to correlate radiation exposures withspecific operations. If the work undertaken iscorrelated with radiation doses, and calculationsor measurements of radiation fields, then one canassess where most of the exposures are receivedand investigate how to optimize work tominimize exposures. Such an optimization hasnot been comprehensively and systematicallydone. Such a task may offer some improvementin AECL-SP exposures. However, in the longterm, if significant gains are to be made inreducing doses during maintenance work, thenthe sources of these external fields must beidentified and addressed. AECL-SP is alsoworking towards compliance with the reduceddose limits given in ICRP Publication 60(Reference 3) for occupational exposures.ICRP-60 specifies that the effective dose shouldbe less than 100 mSv in 5 a, with no year toexceed 50 mSv. Existing radiation workpractices at AECL-SP currently demonstrate andensure that radiation exposures are well withinthis dose limit.
Acknowledgments: Discussions and reviewfrom C.R. Boss and B.E. Heinmiller areappreciated.
REFERENCES:
1. CANDU Station Chemistry Newsletter 96-03, Occupational Exposures for 1994(published 1996).
2. Lemarche, N., Centrale Nucleaire Gentilly2, Rapport Technique G2-RT-95-51, "BilanPersonne-Rem Pour la Centrale NucleaireGentilly-2" (1996-04-15).
3. Annals of the ICRP 21(1-3) (Publication60) Pergamon Press, Oxford, (1991).
298
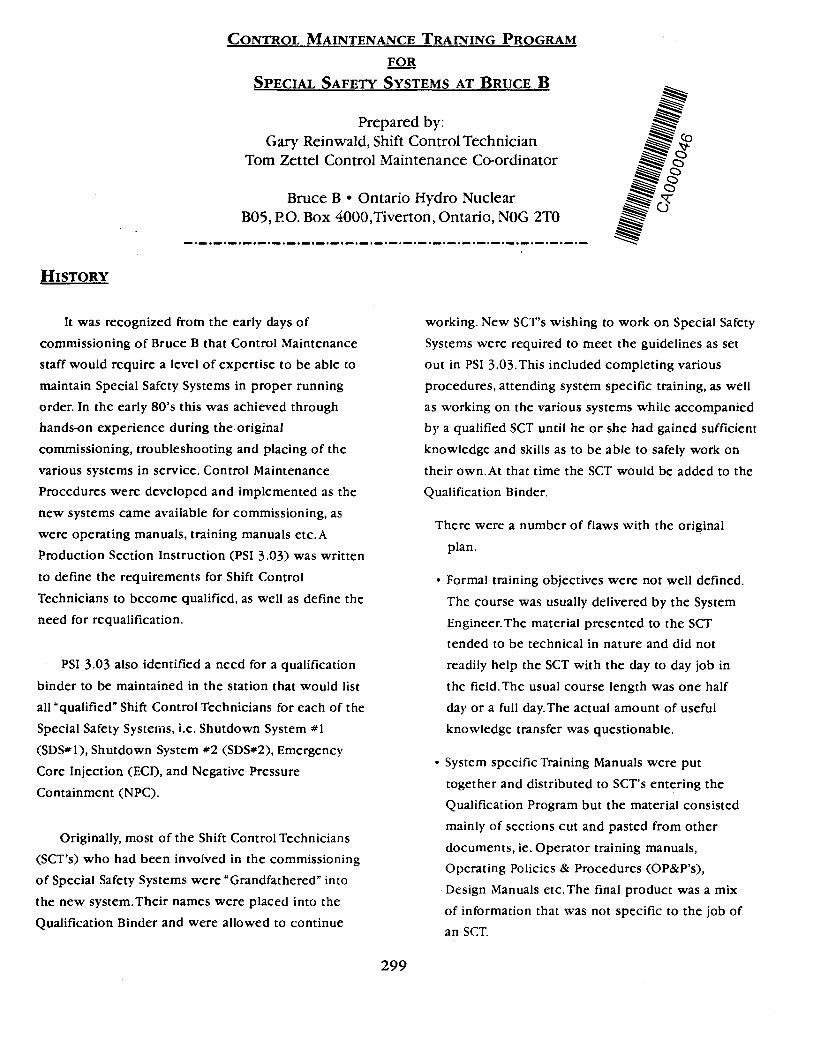
CONTROL MAINTENANCE TRAINING PROGRAM
FOR
SPECIAL SAFETY SYSTEMS AT BRUCE B
Prepared by:Gary Reinwald, Shift Control Technician
Tom Zettel Control Maintenance Co-ordinator
Bruce B • Ontario Hydro NuclearB05, P.O. Box 4000,Tiverton, Ontario, NOG 2T0
tHISTORY
It was recognized from the early days of
commissioning of Bruce B that Control Maintenance
staff would require a level of expertise to be able to
maintain Special Safety Systems in proper running
order. In the early 80's this was achieved through
hands-on experience during the original
commissioning, troubleshooting and placing of the
various systems in service. Control Maintenance
Procedures were developed and implemented as the
new systems came available for commissioning, as
were operating manuals, training manuals etc. A
Production Section Instruction (PSI 3.03) was written
to define the requirements for Shift Control
Technicians to become qualified, as well as define the
need for requalification.
PSI 3.03 also identified a need for a qualification
binder to be maintained in the station that would list
all "qualified" Shift Control Technicians for each of the
Special Safety Systems, i.e. Shutdown System #1
(SDS#1), Shutdown System *2 (SDS#2), Emergency
Core Injection (ECD, and Negative Pressure
Containment (NPC).
Originally, most of the Shift Control Technicians
(SCT's) who had been involved in the commissioning
of Special Safety Systems were "Grandfathered" into
the new system.Their names were placed into the
Qualification Binder and were allowed to continue
working. New SCT's wishing to work on Special Safety
Systems were required to meet the guidelines as set
out in PSI 3-03.This included completing various
procedures, attending system specific training, as well
as working on the various systems while accompanied
by a qualified SCT until he or she had gained sufficient
knowledge and skills as to be able to safely work on
their own. At that time the SCT would be added to the
Qualification Binder.
There were a number of flaws with the original
plan.
• Formal training objectives were not well defined.
The course was usually delivered by the System
Engineer.The material presented to the SCT
tended to be technical in nature and did not
readily help the SCT with the day to day job in
the field.The usual course length was one half
day or a full day.The actual amount of useful
knowledge transfer was questionable.
• System specific Training Manuals were put
together and distributed to SCT's entering the
Qualification Program but the material consisted
mainly of sections cut and pasted from other
documents, ie. Operator training manuals,
Operating Policies & Procedures (OP&P's),
Design Manuals etc.The final product was a mix
of information that was not specific to the job of
an SCT.
299
HISTORY ('CONTINUED')
• Although PSI 3.03 stated that each SCT must
requalify annually for each Special Safety System,
no requalification program was ever developed
or put in place.
• There was no formal way of tracking an SCT's
development through the qualification process.
Record keeping of procedures completed and
field experience obtained was the responsibility
of the individual.
Very little attention was given to the qualification
process during the mid to late 80's as units were
coming on line and commissioning was a top priority.
Priority was on production - not on training.
During this same time frame, internal and external
audits started to identify weaknesses in our
Maintenance Program. We questioned our ability to
qualify personnel, as well as maintain their
qualification.
We were not doing a good job of tracking our
program, and had no process in place that would allow
us to be able to show what was being done. We
believed we should be able to show the status of any
qualified SCT or that of an SCT in the process of
becoming qualified.This status would include
procedures completed, courses taken, requalification
dates, as well as accurate records of when the next
requalification was due.
Under the direction of the Maintenance Manager, a
Conduct of Maintenance section was organized. One
of the responsibilities of this section was to develop a
series of Maintenance Administrative Procedures
(MAPs) that set the standards for maintenance
activities including training.
QUALIFICATION PROGRAM DEVELOPMENT PROTECT
The first step in the process to a better
qualification program was to develop a MAP which
would clearly define each qualification, the process
required to obtain that qualification, as well as how
that qualification would be maintained.The MAP
would also clearly define ownership of the program.
A team was assembled in the winter of 1995 to
work on the project.The team consisted of Shift
Control Technicians, a Senior Shift Control Technician,
System Engineer, Shift Maintenance Supervisor -
Control, as well as a Shift Superintendent. Over a short
period of time, MAP 2.001, "Control Maintenance
Safety System Qualification Program" was developed.
The final product consisted of the following:
• New training manuals for SDS, NPC and ECI
• Refresher training packages for SDS, NPC and
ECI
• A fully traceable accounting system for all SCT's
in the Qualification Program
• New forms for the inputting of information from
the field supervisors to the Training Information
Management System (TIMS)
• All qualified personnel trained to meet
requalification standards
As part of the implementation plan, a program
schedule was developed which allowed all parts of the
new process to be put in place by March 31, 1997. All
training programs would be developed, training would
be presented and the TIMS accounting system would
be in place.This gave BNGS"B" roughly 18 months to
get everything in order.
300

DETAILS OF MAP 2.001
The Qualification Program is designed to provide
maintenance personnel with the highest level of
knowledge and skills so their performance can
contribute to safe and reliable plant maintenance and
operation. MAP 2.001 specifies how this will be done.
Some of the highlights are as follows:
• Before any SCT can become part of the
qualification program, he or she must meet the
following minimum requirements:
- green or yellow badge qualified
- completed level 4 station systems
- current Work Protection
- completed OP&P Training
- minimum of 2 years experience at BNGS"B"
Once the minimum requirements are met, the
candidate may be placed in the Qualification Program.
This is accomplished via Bruce B Form BBF-50 and
requires approval of the Control Maintenance
Coordinator.
There are a number of qualifications that a
candidate may work towards within the Qualification
Program including:
• SDS#l/SDS#2Tier#l,
• SDS#l/SDS#2Tier#2
• SDS#l/SDS#2Tier#3
• NPC
• ECI
• F/H-TC (This is a special qualification to allow
SCT's to do maintenance on the Fuel Handling
Transfer Chamber Doors, which constitute part
of the NPC system.)
MAP 2.001 specifically outlines the process for
each qualification including training required,
procedures to be completed, field experience required
as well as the working rights and limitations for each
qualification.The entire process is tracked through
TIMS and will be discussed later.
To make the MAP more user friendly, appendices
were included to show, in block form, the qualification
process and forms required for each specific
qualification.
301
DEVELOPMENT O F TRAINING MANUALS
The single largest task undertaken in our move to
a better Qualification Program was the development of
new Special Safety System Training Manuals, as the
existing material was outdated, poorly laid out and not
of any real value to the SCT working in the field.
To ensure the final product would meet Ontario
Hydro Nuclear Standards, we made use of the
expertise of the western Nuclear Training Department
(WNTD).They provided word processing and drafting
services, and a Training Technician to assure the final
manual for each Special Safety System would meet
TSSD standards that were developed from INPO
documents.The actual technical information within
the documents was written by experienced SCT's.
After canvassing the Control Maintenance staff,
volunteers were selected to provide the technical
content of each manual. Questionnaires were sent out
to all staff who were presently qualified asking for
their input into the final product.This feedback was
used to help determine what the final product would
look like. For example, a large number of respondents
requested that actual logic drawings be included in the
manuals.They were looking for training, and training
material that would assist them long after the course
was completed.
The SCT's writing the material were given wide
latitude in developing the final product, based on the
feedback from the questionnaires and their personal
experience.The intent was to produce a training
manual that was easy to follow, relevant to the SCT's
job in the field and most importantly, of value to the
SCT after he or she left the classroom and returned to
the actual work environment.
To accomplish this task, the following generic
format was adopted for each of the Special Safety
System manuals.
• Section 1 would consist of a general overview of
the specific Special Safety System, including the
purpose, specific definitions and terminology,
failing safe methods, testing requirements, and
generic concerns that are common to all Special
Safety Systems, (e.g. Mercury Wetted Relays)
• Each Special Safety System would then be
broken down into sizable pieces that would be
developed under the following headings:
- Reference material
- Purpose
- Failing Safe
- Circuit Operation
- Section Specific Information
-Trip and Testing
- Common Faults
Simplified process loop and elementary drawings
were drafted from the actual station documentation to
support the training material. All references to wire
numbers were deleted from the simplified drawings as
there was a fear that people might substitue training
material for approved drawings in the field, and try to
troubleshoot from them.
Also, the simplified training drawings did not
include test circuit logic, indicators, multiplying
relaying etc. as this was not considered relevant to the
concepts being discussed.
302

SPECIFIC DETAILS
Using the SDS#1/SDS#2 manual as an example,
Section 1 consists of an overview of both Special
Safety Systems, generic test circuits, definitions, etc.
Upon completion of the course, a final checkout is
given to verify the candidate has gained a basic
understanding of the concepts presented.
Section 2 is SDS#1 specific and breaks SDS*1
down into 3 specific sections which are:
• Trip Logic,
• Firing System (Shut Off Rods) and
• Individual Trip Parameters
Each section is then broken down to the trip relay
level. The material is written to give the candidate a
thorough understanding of how the individual sections
tie together and is reinforced with the simplified
drawings.
To reinforce the lessons learned, questions are
included at the end of each section.
Section 3 is SDS*2 specific and follows the same
format as SDS#1.
Section 4 is titled Compliance. Specific Operating
Policies and Procedures are reviewed, along with MAP
2.001 and details such as data cards, test equipment,
work reports, hot standby panel etc.
The courses are presented by qualified SCT's.This
facilitates the answering of questions that result from
the prepared material and gives credibility to the
training. Any questions that can not be answered are
referred to the responsible System Engineer and
resolved before the end of the training course.
Also, to support the training courses, a complete
set of overheads were developed to augment the
material being presented and assist the instructors
with their presentations.
As part of the requalification plan it was decided
to run all existing qualified SCT's through the initial
training courses, rather than through shorter refresher
training courses.This would bring all qualified staff to
a standard level, and took into consideration the fact
that many of the qualified personnel had not had any
refresher training in a number of years.
303
REFRESHER / REOUALIFICATION TRAINING
After all personnel have been brought up to a
standard level of training, a three year requalification
program will maintain competency in Special Safety
Systems. Qualified Special Safety System Technicians
will be required to periodically requalify to:
• Reinforce system knowledge and skills
• Emphasize lessons learned from plant and
operating experience to prevent the occurrence/
recurrence of errors
• Review appropriate plant modifications and
procedural changes.
• Review appropriate OP&P's and Regulatory
Commitments.
To meet the requirements of the requalification
program, a revised training package will be developed
every three years.The package will include sections of
the training manual, SER's that have occurred over the
last three years, changes to procedures as well as cover
modifications in the field.The requalification training
will be continually changing with time to help keep
the field troops current.
TRAINING INFORMATION MANAGEMENT SYSTEM ( TIMS
The final step in producing the training program
was to develop a method of tracking qualification,
requalification, and progress within the qualification
program that was accurate, simple and auditable.To do
this we used the TIMS system that is currently used at
the Western Nuclear Training Centre.
BBF-50 - Individual credits for courses, fieldexperience, and procedures completed.
BBF-51 -Application for actual qualification on the
Qualification Register.
BBF-52 - Removal from Qualification Register.
Each step in the process was assigned a number,
including courses, field experience, procedures
completed, qualification, and requalification. Using the
TIMS system, all the numbers were linked together to
create a report that would list the candidates by
qualifications held, expiration date as well as a means
of checking any candidate's progress within any of the
qualification programs.
New forms were created to allow supervisors a
means of getting access to the system as well as listing
the signing authorities required for each step. Note
that the forms are generic to all Special Safety Systems.
Once a candidate's name is recorded on the
Qualification Register, they are allowed to work on any
system they are qualified for as TIMS is our Official
Record of qualification. A copy of the Qualification
Register is kept in the Control Room for quick
reference and is updated on a regular basis.
As a means of tying everything together, reference
to TIMS credit numbering was included in MAP 2.001
text to assist the users, as well as simplified flow
charts included in the appendices which show credits
required, and forms used to obtain a desired
qualification.
304

CONCLUSION
The program is now up and running. In the 1996
WANO Peer review, this program was identified as
Strength MA. 10 -l.This doesn't come without effort
and expense. A number of people had to be released
on a full or part time basis to develop the training
material and deliver the courses. People had to be
released from regular duties to take the training and
several supervisors complained bitterly when their
people's qualification lapsed because the individuals
missed their scheduled training.
Having said that, the real benefit from the program
comes to light in an analysis of the Performance
Objectives and Criteria, MA.9. A few of the criteria are
paraphrased below;
• Maintenance is performed by personnel who
have completed formal qualification for the tasks
performed.
• Maintenance personnel understand fundamental
concepts and applications and the effect of
maintenance on plant systems.
• Continuing training effectively addresses plant
hardware and procedure changes and lessons
learned from operating experience.
3052473 • BNPD Audio Visual
1$18• o: O: O
5
DEVELOPMENT OF AN IMPROVEDLOW PROFILE HUB SEALREFURBISHMENT TOOL
Lloyd Wagg
Fuel Channel Engineering Department
Atomic Energy of Canada Limited2251 Speakman Drive,Mississauga, Ontario
L5K 1B2
ABSTRACT
The hub seal area of a fuelchannel feeder coupling can be exposedto oxygen in the atmosphere if protectivemeasures are not taken duringmaintenance outages. Exposure tooxygen can lead to pitting of the hub sealarea. Although this is a rare occurrence,the resulting possibility of the feedercoupling leakage led to the developmentof a feeder hub refurbishment tool.
To reduce time and man-remexposure during feeder hub sealrefurbishment, an improved low profilehub seat refurbishing tool has beendeveloped. The improved tool design willallow for quick and controlled removal ofmaterial, and the restoration of a roll-burnished finish equivalent to the originalrequirements.
The new tool can be used inmaintenance operations, with the endfitting present, as well as under retube-type circumstances, with the end fittingremoved.
1.0 BACKGROUND
Feeder hub refurbishing tools areused for the refurbishment of pitted ordeeply scratched feeder hub seal areas.The leak tightness of the feeder hub toend-fitting joint depends on a seal surfacehaving a high level of finish and tighttolerances on the mating parts. Thesejoints cannot be tested until after thesystem is filled with heavy water, atwhich time any repairs or replacements
are costly. Thus a high degree ofdedication and attention to detail isrequired in the hub seal refurbishmentprocess to ensure that an acceptablesealing surface is produced.
Feeder hubs exposed to air forextended periods of time can developsmall pits. These pits and otherinstallation problems, such asmisalignment, can lead to leaks in the sealarea of the feeder hubs. To return thesurface of the seal area to its designfinish, several types of hub seatrefurbishment tools have been developedover the years. The most notable amongthese tools were the feeder hub seal"Borazon" (Wet) grinding tool and the lowprofile hub seat refurbishing tool.
2.0TOOL
"BORAZON" (WET) GRINDING
The "Borazon" Tool was designedby Strite Industries for use during thePickering retube outage. This tool offeredfast and uniform material removal and theability to return the seal area to its designfinish. The tool was designed for useduring retube with the end fittingremoved. It is therefore bulky and notsuited for use during typical maintenanceoutages when the end fitting is in place.
The term "Wet" tool is usedbecause the tool utilizes Sunnen MB-30honing oil, a cutting fluid, pumped underpressure from a reservoir over thegrinding wheel. The oil is fed backthrough a filter to remove the grindingparticles from the oil. This cutting fluidalso aids in cooling the surfaces.
A grinding cone, plated withboron nitride particles, is used as thecutting head. The cone has slots to allowfor the flow of the cutting fluid. Platingof the cone was designed to a 220 gritfinish.
The tool locates on, and clampsaround, the outside diameter of the feederhub. Attached is a locating plug with two"O" rings, that enters the hub ahead of
306

the grinding wheel to locate the tool andseal the oil in the feeder hub area.
Material removal is controlled by adial micrometer similar to that of a lathe.The "Borazon" tool can remove about0.005 of an inch in approximately 7minutes and can be run continuously.Therefore, to remove 0.025 of an inchrequires only 35 minutes operating time.
The "Borazon" tool has thecapability, with a change of wheels, toroll-burnish the seal area. This restoresthe seal area to the design condition afterrefurbishment, thereby eliminating theneed for Grafoil tape and reducing thepossibility of further leakage.
3.0 THE LOW PROFILE HUB SEATREFURBISHMENT TOOL
The low profile hub seatrefurbishing tool was designed for useduring maintenance outages when theend fitting is present. Consequently, thetool must operate in the very constrainedspace between the end fitting and thefeeder hub, which is only 1.7 inchesaway.
This tool consists of a pneumaticnut runner with a "pancake" head havingremovable cones. The cones carry self-adhesive grit paper of various grades ofcoarseness, and are loaded against thefeeder hub by a compression spring.
A single hub refurbishingoperation requires many cone changes.The tool is operated dry, and materialremoved from the feeder coupling hub istaken away embedded on used up gritpaper. There are three types of cones, forlapping, polishing and cleaning.
The material removal rate isdetermined by the coarseness of the gritpaper, and with the most aggressivepaper, the removal rate is only 0.0005" to0.001" per minute. To remove 0.015"requires about 30 cone changes andapproximately one hour.
The slow material removal rateand the lack of uniformity of removal(poor control of seal area geometry)restricts this tool to the repair of onlylightly damaged hub seal areas, where theamount of material removed is less than0.015" (axial measurement). If the sea!area damage is deeper than this, thedamaged hub has to be cut off and a newhub welded on. This is time consumingand man-rem expensive.
4.0 IMPROVED LOW PROFILEREFURBISHMENT DEVELOPMENT
A project sponsored by theCANDU Owners Group (COG) hasproduced a prototype "improved" lowprofile hub seal refurbishment tool. Thisnew tool attempts to combine the bestfeatures of the previous tools, adapting acutting head and roll-burnishing head,similar to the "Borazon" tool, to work in alow profile tool. These changes improvethe quality of the sealing area and reduceoperation time (and consequentlyradiation dose received by the operator).
4.1 Current Requirements
The new tool is the result of aninvestigation into adapting a cutting headand roll-burnishing head, similar to the"Borazon" Grinding Tool, to fit a lowprofile tool, similar to the hub-seatrefurbishment tool. These changes areintended to increase the controlledremoval rate, improve the quality of thesealing area and reduce operation time(and consequently the radiation dosereceived by the operator) required by thelow profile hub seat refurbishing tool.
4.2 Design Progress
The design team was establishedwith representatives from AECL (thedesigners of the original low profile tool)and Strite Industries (the designers of the"Borazon" tool). At various stages ofdevelopment of the prototype design,review meetings were held withoperations personnel from Bruce A. This
307

helped to ensure that the new tool wasuser friendly and met as many of theprojected requirements as possible.
4.3 Details of The Improved LowProfile Hub Seal Refurbishment Tool(Prototype)
The improved low profile hub sealrefurbishment tool is a "Wet" tool.Similar to the "Borazon" tool, this toolutilizes a cutting fluid, pumped underpressure from a reservoir tank over thegrinding wheel. The oil is fed backthrough a filter to remove the grindingparticles from the oil. The cutting fluidalso aids in cooling the surfaces.
The basic design of the "Borazon"grinding cone has remained the same. Thecutting head is slotted and plated withthe same 220 grit boron nitride particles.To accommodate the size requirements,the height of the cone has been reduced.
This reduction in cone size ishelped by the advent of new, modifiedseal rings. The seal rings were designedfor use in refurbished hub seal areas. Thelip of the hub side of the seal ring has alarger pitch diameter to match thematerial removed. This allows the sealarea to remain lower, in its intendeddesign location.
The tool locates on, and clampsaround, the outside diameter of the feederhub. The clamp has been modified toallow tool mobility, reducing problems ofinterference. Flex cables and anadjustable handle were introduced toreduce interference problems. Due toheight restrictions, a separate plug andplug installation tool were developed toseal the oil in the feeder hub area.
Material removal is controlled by afeed-adjusting screw held in place by alock screw in the center of the grindingwheel. A feed-adjustment wrench andgauge plate, marked for 0.002 of an inchtravel (vertical shift), are used to controlthe depth of cut. One complete turn willallow 0.100 of an inch (vertical shift).
The maximum vertical travel is 0.104 ofan inch.
A Hooke's coupling method isused to drive the grinding cone. Timesand rates of material removal have yet tobe established, but are expected to bemuch faster than with the original lowprofile tool.
A design highlight of this tool, asit was with the "Borazon", is itscapability, with a change of wheels, toroll-burnish the seal area. This allows theseal area surface finish to be restored tothe design condition after refurbishment,thereby eliminating the need for the useof Grafoil tape and reducing the possibilityof a leak.
Another design feature of theimproved tool is a removable insert thatallows the tool to be adapted to fit thefeeder coupling of any current CANDUreactor.
4.4 Anticipated Future Direction
The anticipated future direction isto test and prove the prototype over theremainder of 1997 and the first quarter of1998. These tests will be used todetermine such things as the following:A - To redefine the operating procedure.B - To establish feed rates and materialremoval rates.C - To verify geometry at various stagesof material removal until 0.102 of an inch(vertical shift) has been removed.D - To establish a spare parts list.
SUMMARY
The Improved Low Profile FeederHub-Seal Refurbishment Tool is still in thedevelopment stage, as a prototype. Itsimproved design features will allow forquick and controlled removal of material,and the restoration of a roll-burnishedfinish. Once testing and proving iscompleted, the new tool will be availableto all CANDU operators should it becomenecessary to refurbish the feeder hub sealsurfaces during maintenance outages.
308
Fourth International Conference on CANDU MaintenanceNovember 16-18, 1997
Toronto, Canada
SS 00
Presented By. si §^= o== o
Param Grewal, P. Eng. ^ = §ATOMIC ENERGY OF CANADA LIMITED g g
STRATEGIES FOR ACCELERATING THE SLARette PROCESS =
ABSTRACT
The SLARette (Spacer Location and Repositioning) process is continuing on several CANDUreactors, where loose fitting garter springs (spacers) were used, to prevent contactbetween the calandria tube and the pressure tube for the target life. With time, the sag inthe fuel channel is increasing and consequently increasing the potential for contactbetween the pressure tube and the calandria tube. Also, due to increasing sag in thepressure tubes and increasing magnitude of the fuel channel constrictions on the eddycurrent detection system, the Spacer Location And Repositioning activities are becomingmore time consuming and difficult. For CANDU owners, during the SLARette campaigns,station outage time is the most expensive item. Therefore, it is beneficial to complete theSLARette process as early as possible and as fast as possible. New SLARette strategies cansubstantially accelerate the overall SLARette process and thus minimize the outage time.There are several strategies to perform the SLARette process. These strategies include :
• Using the SLARette Mark II Delivery System,• Using SLARette Advanced Delivery System,• Implement creative fuel handling technique,• Operate from both sides of the reactor using Mark II Delivery Systems,• Operate from both sides using Advanced Delivery Systems.
Each strategy offers different benefits, rate of fuel channel processing (SLARette Activity),and schedule constraints. This paper provides the details of each strategy and comparethem in terms of outage time, man-rem consumption, and constraints.
309

STRATEGIES FORACCELERATING THE
SLARette PROCESS
1.0 INTRODUCTION
Pressure tubes and calandria tubes inCANDU Reactors are separated by fourAnnular Spacers (Garter Springs). In themid 1980s, it was found that for theCANDU stations, where loose spacers areinstalled, the spacers may have movedfrom their original design locations. Dueto this random movement of the spacers,the pressure tube may not have adequatesupport or annular separation from thecalandria tube. Consequently, due toincreasing creep and sag, pressure tubesmay either be in contact with or areanticipated to contact the calandria tubes.
To prevent the hydrogen equivalent levelbeing equal to or higher than the blisterformation threshold, the contact betweenthe pressure tube and the calandria tubeis not desirable. To ensure the contactfree target life of fuel channels, SLARSystem, an acronym for Spacer LocationAnd Repositioning, was developed tolocate and to reposition the spacers to thenew locations. A SLAR system applicablefor a small scale Spacer Location AndRepositioning process is called SLARette.This paper discusses the possiblestrategies to accelerate SLARette system.
The SLARette system using the SLARetteTool, locates the annular spacers bymeans of Eddy Current and Ultrasonicprobes and then repositions them usingLinear Induction Motors to the newlocations. The Spacer Location AndRepositioning process is currently inprogress for the CANDU 6 NuclearGenerating Stations with loose Spacers.
As the reactor ages, the pressure tubesag increases due to thermal and radiationcreep. Consequently, the increasing sagpinches the spacer against the calandria
tube with increasing force making thespacers more difficult to move. Inaddition, severely crept pressure tubescan also limit the performance of aSLARette Tool. Aging of the reactorsmakes the SLARette process more timeconsuming and expensive. Therefore, it isbeneficial for the utilities to complete theSLARette process as soon as possible.SLARette activity is performed duringstation outages. Outages are veryexpensive for the utilities, so there isalways a push to complete as manychannels as possible in that given timeslot.
The SLARette campaign is generallycarried out by using the "Base-LineSLARette System", i.e., the Mark IIDelivery System installed on one side ofthe reactor. In 1995, the Mark II DeliverySystem was up-graded to the AdvancedDelivery System at Gentilly 2 to enhancethe SLARette performance.
This paper discusses all the possible waysto speed up the SLARette Process. Thispaper compares all the SLARettestrategies with the base line SLARetteprocess in terms of cost, schedule, man-rem consumption rate, training, man-power requirements, and channelprocessing rate.
CalandriaTub*
310

2.0 CREATIVE FUEL HANDLINGTECHNIQUE:
Fuel handling is one of the major timeconsuming activities during a SLARettecampaign. It consumes approximately10% of the overall time when theSLARette process is performed using abase-line SLARette System. This strategyis to implement a creative fuel handlingtechnique to reduce fuel handling timesubstantially.
In the beginning of a SLARettecampaign, the total targeted fuel channelsare divided usually into batches of ninechannels. In this paper, a scenario of ninechannel batch is considered fordiscussion. The fuel and the shield plugsare removed from the fuel channel beforethe delivery machine can be latched onfor the SLARette process. Fuel from allchannels of the first batch is dischargedinto the spent fuel bay. The shield plugshowever are not discharged but arestored in the fueling machine and therehearsal facility. During the fuel handlingoperations, shield plugs from threechannels are stored in two fuelingmachines and the remaining shield plugsfrom the other six channels are put backinto these channels. At the end of de-fueling of each batch, the three fuelchannels with no shield plugs are readyfor SLARette. Upon completing theSLARette activities on the first threechannels, the stored shield plugs arereinstalled into these channels and theshield plugs from the next three channelsare removed to continue SLARetteprocess. As a result, for each batch ofnine channels, the SLARette process isinterrupted at least two times for shieldplug shuffling. Shield plug shuffling takesa minimum of 1.5 hours per channel.Therefore, about 9 hours are spent forshield plug shuffling for each batch ofnine channels.
The time for shield plug shuffling can begreatly reduced if 12 shield plugs from sixchannels are discharged to the spent fuel
bay and the six shield plugs from theremaining 3 channels are stored in thefueling machines. Then the SLARetteactivities can proceed uninterrupted for allnine channels from the first batch. Uponcompletion of the first batch, 12 shieldplugs from the 2nd batch channels areremoved and installed in the six channelsof the first batch. The shield plugs fromremaining three channels of 2nd batch canbe stored in the fueling machines.Similarly, SLARette process for the entire2nd batch can proceed uninterrupted. Andso forth this process can be carried onthroughout the SLARette campaign.Therefore, by sacrificing 12 shield plugs,about 1.5 hours per channel can besaved. At the end of the SLARettecampaign, 12 new shield plugs would beinstalled.
For an outage planned to SLARette 100fuel channels, about 100 hours (4 Days)can be saved at a cost of 200K. The costof 12 shield plugs is insignificant whencompared with the cost of saved outagetime. More over it may be possible toretrieve the discharged shield plugs fromthe spent fuel bay and re-use them.
The implementation of this fuel handlingtechnique may cause higher radiation fields inthe vault due to the lack of shield plugs in sixadditional fuel channels. Therefore, it isrecommended for the SLARette campaign withAdvanced SLARette System where the vaultwork is significantly reduced.
311

2.1 CREATIVE FUEL HANDLING TECHNIQUE:
SUMMARY:
BENEFITS: ABOUT 10% INCREASE IN CHANNELPROCESSING RATE
CONSEQUENCES: LOSS OF 12 SHIELD PLUGS
312

3.0 MARK II DELIVERYMACHINE UP-GRADED/REPLACED WITHADVANCED DELIVERYMCHINE:
The SLARette Tool is positioned inthe fuel channel by the SLARette deliverymachine. This is a mechanism whichadvances, retracts, and rotates theSLARette Tool in the fuel channel andthe calibration facility. There are twomodels of SLARette delivery machine:MARK II SLARette Delivery Machine andAdvanced SLARette Delivery Machine.This strategy is to replace the Mark IIDelivery System with the AdvancedDelivery System to accelerate the channelprocessing rate and to reduce the man-rem consumption.
In the case of the Mark II DeliveryMachine, the SLARette Tool is positionedaxially and rotationally by an assembly offive push tubes and rotary and axialdrives. During the SLARette operation, ateam of trained SLARette personnel mustbe available to connect or to disconnectthe push tubes to provide adequate lengthof push-tube assembly. A significantamount of time and man-rem dose areconsumed for the manipulation of thepush tubes. To limit individual man-remconsumption, several teams of SLARetteoperators are trained and used for thistask.
The Advanced SLARette DeliveryMachine was designed to minimize theman-rem consumption and to enhance theperformance of the SLARette System.The Advanced Delivery Machine replacesthe push tubes with a 3 STAGEtelescoping ram which positions the toolin the fuel channel with a remote controlin the SLARette control room. Nooperators are required in the vault once
the Delivery Machine is latched onto thefuel channel. Therefore, by reducing thenumber of operators required for the vaultwork, man-rem consumption is reduced.The Delivery Machine latching andunlatching mechanism for the AdvancedDelivery Machine has also been modifiedto simplify the process. For a Mark IIDelivery Machine, latching and unlatchingprocess takes about one to two hours fortwo persons. The modifications made forthe Advanced Delivery Machine reducedthis time to only 30 minutes for oneperson. The Advanced Delivery Machineincorporates most of the Mark II DeliveryMachine design while adding andreplacing some systems. The AdvancedDelivery System had been successfullyused for Gentilly-2 SLARette outages1995, 1996, and 1997 with a total of134 channels completed.
The overall benefits of using theAdvanced Delivery Machine over the MarkII Delivery Machine is about 15% savingsin time per fuel channel processed and70% savings in men-rem consumption. Inaddition, due to lower Man-Remconsumption, a smaller team of operatorsis required for the vault work. Since thechannel processing is faster, theSLARette tool spends less time in thereactor per channel. This has a favorableeffect on the SLARette Tool life. Thesebenefits are mainly due to reduction ofvault work, faster latch-on and latch-offoperation, and faster positioning of theSLARette Tool during SLARetteoperations.
313

3.1 MARK II DELIVERY MACHINE UP-GRADED/REPLACEDWITH ADVANCED DELIVERY MCHINE:
SUMMARY:
Consequences:
•Additional Training
•Additional Cost
Benefits:• Over-all channel processing
time improved by 15%,
• 70% Reduction in Man-Remconsumption
• Smaller team for the Vaultwork.
• Increased SLARette Tool Life
314

4.0 Dual SLARette System usingMark II SLARette DeliveryMachines:
Conventionally, the SLARette process hasbeen performed using one SLARettesystem installed on each side of thereactor. Both sides of CANDU reactorsare identical for SLARette purposes.Therefore, it is possible to install andoperate a SLARette System on each sideof the reactor, simultaneously. With twoSLARette systems installed and operatedon opposite sides of the reactor, twochannels can be accessed and processedsimultaneously.
The implementation of this strategyrequires two Inspection systems, twoMark II delivery machines, two cablepenetration systems, two LIM PowerSupplies, two Tool Valve Stations, twoDelivery Machine Valve Stations, twocontrol rooms, and two operating crews.
Because of large capital and man-powercommitment, this strategy will requirehigher job priority from the station thanmost other jobs in progress during theoutage. It puts more pressure on the fuelhandling system and crew to work athigher efficiency level. To maximize the
productivity, it demands goodcoordination between the both SLARettecrews, the fuel handling crew, and theother supporting teams. To minimize theidle time, it will be beneficial to implementcreative channel de-fueling techniques tosome what synchronize on-channelactivities for both SLARette crews.
With two SLARette systems workingsimultaneously, the SLARette productivitycan be increased by at least 50% over asingle base line SLARette system. Theoverall typical rate for channel processingis 1.5 channels per day. With dualSLARette systems, more than two tothree channels can be completed per day.For 100 channels, 16 to 33 days ofoutage time can be saved by having anadditional base line SLARette system.
315

4.1 Dual SLARette System using Mark II SLARette Delivery Machines:
SUMMARY:
BENEFITS:
CONSEQUENCES:
•Overall Channel processing Rate At Least 50%faster.
• Additional Personnel require for operationand maintenance.
• Additional Cost.
• Additional penetration and control roomrequirement.
• Higher accumulated Man-Rem Consumption
• Higher Pressure on Fuel Handling crew andSystem
• Require higher priority
316
5.0 DUAL SLARette SYSTEMSUSING ADVANCED SLARetteDELIVERY MACHINES:
Dual SLARette System using AdvancedSLARette Delivery Machines wouldprovide the largest increase in theproductivity. This strategy is to install andoperate SLARette system on both sides ofthe reactor. This approach is identical tothe approach discussed in the previoussection but using the Advanced DeliverySystems instead of Mark II DeliverySystems.
This strategy requires two SLARetteteams, two Advanced SLARette DeliverySystems, two control rooms, twoinspection and control systemscompatible with the Advanced SLARetteDelivery Machine, two LIM PowerSupplies, and two Cable Penetrations.
To maximize the use of equipment andthe crews and to minimize the idle time,the station owner must provide specialattention and highest priority to SLARettecampaign during the outage. It will alsorequire very efficient and well plannedand organized fuel handling crews andsystems. It also requires a largersupporting team from the utility.
By performing the Advanced SLARetteprocess simultaneously on two fuelchannels, the channel processingproductivity can be increased by 100% ofthe time over the single base lineSLARette system. It means that onaverage basis, more than three channelscan be processed in a single day ofoperation. This scheme not only saves theoverall SLARette times but also saves asubstantial Man-Rem consumption. For a100 channel SLARette campaign, morethan 33 days of outage can be savedwhen compared to single Base lineSLARette system.
317

5.1 DUAL SLARette SYSTEMS USING ADVANCED DELIVERYMACHINES:
SUMMARY:
BENEFITS:
CONSEQUENCES:
Overall Channel processing time 100% faster
• Additional Personnel require for operationand maintenance.
• Additional penetration and control roomrequirement.
• Higher accumulated Man-Rem Consumption
• Higher Pressure on Fuel Handling crew andSystem
• Require higher priority
• Additional Cost
318

03
COMPARISON OF SLARette STRATEGIES FOR 100 CHANNEL OUTAGE
Section
3.0
2.0 & 3.0
5.0
5.0
2.0 & 5.0
STRATEGY
Base-Line SLARetteusing Mark II D/M
Single SLARetteusing Advanced D/M
Creative Fuel HandlingTechniques coupled withSingle Advanced SLARette
Dual Base-Lineusing Mark II D/M
Dual SLARetteusing Advanced SLARetteSystem
Creative Fuel HandlingTechniques coupledDual Advanced SLARette
* Men-Rem Consumption
TIME(DAYS) Man-Rem Reduction Consequences
65
55
51
44
33
29
Rate when compared
0%
70%
70%
0%
70%
70%
with Single
N/A
Extra TrainingExtra Cost
Extra CostExtra Training
Loss of 12 Shield Plugs
Higher PriorityLarger Team
Add'nl Penetration & Control RoomHigher Accumulated Man-Rem Consumption
Extra Cost
Highest PriorityExtra Training
Add'nl Penetration & Control RoomExtra Cost
Larger TeamLoss of 1 2 Shield Plugs
Highest PriorityLarger Team
Add'nl Penetration & Control RoomExtra Cost
Extra Training
Base-Line SLARette Operations

CA0000049
THE STRUCTURAL AGING ASSESSMENT PROGRAM:
RANKING METHODOLOGY FOR CANDU NUCLEAR GENERATING STATION CONCRETE
COMPONENTS
; 3K. E. Philipose,1 P. K. Muhkerjee,2 E.J. McColm2, C. Seni
ABSTRACT
Most of the major structural components in CANDU nuclear generating stations are constructed ofreinforced concrete. Although passive in nature, these structures perform many critical safetyfunctions in the operation of each facility. Aging can affect the structural capacity and integrity ofstructures. The reduction in capacity due to aging is not addressed in design codes. Thus aprogram is warranted to monitor the aging of safety-related CANDU plant structures and toprioritize those that require maintenance and repairs.
Prioritization of monitoring efforts is best accomplished by focusing on those structures judged tobe the most critical to plant performance and safety. The safety significance of each sub-elementand its degradation with time can be evaluated using a numerical rating system. This will simplifythe utility's efforts, thereby saving maintenance costs while providing a higher degree of assurancethat performance is maintained.
This paper describes the development of a rating system (ranking procedure) as part of the PlantLife Management of CANDU generating station concrete structures and illustrates its application toan operating plant.
1 Atomic Energy of Canada LimitedChalk River LaboratoriesChalk River, Ontario, Canada KOJ 1J0
2 Ontario Hydro Technologies800 Kipling AvenueToronto, Ontario, Canada M8Z 5S4
3 Atomic Energy of Canada LimitedSheridan Park, 2251 Speakman AvenueMississauga, Ontario, Canada L5K 1B2
320

INTRODUCTION
Aging of concrete structures is defined as the progressive loss of original mechanical and structuralproperties caused by physical loads, the effects of plant operation and exposure to the naturalenvironments. Aging may result in noticeable physical changes such as cracking or loss ofconcrete, or internal changes that require extensive testing to evaluate. Typically for nucleargenerating stations, the design safety factors and field quality control during construction result inas-built structures of substantial capacity. Even though some aspects of aging such as increase incompressive strength with time are beneficial, in general, concrete structures undergo degradationfrom severe operating conditions and exposure to aggressive natural environments.
Integrity of safety-related structures is important to the long-term performance of nucleargenerating stations. Figure 1 shows a logic diagram of the 'Plant Life Management' (PLM) Program.Safety and licensing are the two main drivers of this program. For continued operation, CANDUgenerating station (NGS) safety-related concrete structures must be well maintained.
A numerical ranking procedure is required to focus inspections, maintenance, and rehabilitation ofstructures most important to public safety. The ranking procedure is a continuous process thatinvolves monitoring of aging and numerical rating of sub-elements with respect to their aging andsafety significance. It complements the inspection procedures and prioritizes maintenance ofstructural elements. By focusing on those structures having the highest importance, availableresources for overall plant aging management may be effectively utilized. Because the rankingprocedure takes into account the safety significance and aging of the components, the higherranked sub-elements may require more frequent inspections compared to those that have a lowerranking. Structural components may be re-ranked periodically (i.e., every 3 to 5 years) to confirmor modify their relative ranking.
The report by D. J. Naus [1] provides a detailed account of the structural aging assessment workconducted for US power plants. Methodologies to assess the structural aging of concretestructures by the use of ranking procedures were developed by Hookham [2,3] for US power plantsand by R.C. Judges [4] for UK power stations. They provide a logical and sound basis forclassifying structural components based on their aging degradation and safety significance.However, these procedures involve the evaluation of a large number of parameters.
It was considered that a simplified methodology based on these procedures can be developed forCANDU structures. The modified ranking methodology described in this paper can be used forprioritizing sub-elements or components of safety related structures. It provides a logical method ofselecting components for regular inspection, maintenance and repairs. An application to a typicalCANDU 6 station illustrates the methodology.
RANKING METHODOLOGY FOR CANDU STRUCTURES
Figure 2 shows the relation of the proposed ranking procedures to Plant Life Management. As thefirst step in ranking, all safety-related structures at the particular CANDU facility are identified andsub-elements (components) are defined. An example of a safety related structure is the reactorbuilding, and its sub-elements include components such as the base slab, perimeter wall, andinternal walls, columns and floors. To rank sub-elements, a number of factors have to be evaluatedfor each sub-element that can be presented in a numerical rating system. Initially, these factors areestimated on the basis of the best information available. The source of information can be designdrawings, safety documents, inspection reports [5] and a visual examination of the sub-elements.Some of the sub-elements are shown in Figures 3 and 4 of a typical CANDU NGS reactor building.Based on these data, an initial ranking of the components can be done. The top-rankingcomponents from the initial ranking are examined further in more detail which may involve field andlaboratory testing. If the degree of damage is found to be significant, a structural evaluation may be
321

required to establish the effect of aging on the structural and functional capacity of thecomponents. If the capacities of the components have degraded below an acceptable level, repairswould be necessary.
PROCEDURE
The proposed procedure is centered on two main parameters: the extent or potential fordegradation of the sub-element and the safety significance of the structure.
If no degradation is evident for the sub-elements and if only limited likelihood of degradation existsdue to the benign service environment, the ranking procedure is not taken any further. Thestructure or sub-element may be omitted from the ranking procedure as the degradation rates willbe very slow or insignificant. Even if degradation is evident and if the structure has only minorsafety significance, it will receive a low ranking.
Each sub-element is assessed using the following ranking formula:
Sub-element ranking (SR) = Degradation Factor (Df) x Safety Significance (Ss)
1) Degradation Factor (Df)
The Degradation Factor is based on an estimate of the Extent of Degradation (De) and the Impact ofdegradation (D;) of the sub-element in terms of its reduction in structural and functional capacity.
Degradation Factor (D,) = Extent of Degradation (De) x Impact of Degradation (D,).
1a) Extent of Degradation (De):
Where degradation of concrete in a sub-element is evident, an estimate is made of the extent ofdegradation. Also, if the sub-element is located in an unfavorable (severe) service environment thatis not accessible for detailed inspection, there would be a high probability of undetecteddegradation. In this case, the sub-element would be rated for the Likelihood of Degradation basedon the severity of the environmental exposure and the type of degradation that can be presentunder such an environmental exposure condition. The rating is based on a scale of 1 to 10. Alower value is given if there is no evidence of degradation or likelihood of degradation of the sub-element based on the service condition.
A number of mechanisms or modes can cause degradation of concrete elements including thefollowing:
• Reinforcing steel corrosion;• Attack by chemicals such as chlorides, sulfates, carbon dioxide and nitrates;• Leaching of calcium from cement by rain water or ground water;• Freeze/thaw degradation;• Cracking and spalling of concrete caused by thermal effects;• Irradiation effects;• Abrasion, erosion, cavitation; and• Fatigue.
Degradation of concrete structures can be a direct result of an individual degradation mode or theeffect of two or three modes acting in concert. Methods that can be used to detect damage canbe grouped as direct techniques and indirect techniques. Direct techniques involve a visualexamination of the structure, removal of material from defined distress areas for testing or acombination of the two. Indirect techniques measure the properties of concrete in a non-intrusive
322

manner. Non-destructive techniques include ultrasonic, stress wave, surface hardness andpenetrating radar.
1b) Impact of Degradation (D,)
The impact of degradation on the sub-element may be minor, causing only a local weakening of thesub-element (such as cracking or spalling of a localized nature). On the other hand, the impact ofdegradation may be high, causing severe weakening of the sub-element and thereby affecting itsstructural capacity. Another consideration in evaluating the impact is the effect of the sub-elementweakening on the stability of the whole structure. If the weakening or loss of the sub-elementwould affect the structural stability of the whole structure, then the impact would be rated high.Table 1 shows an example of typical Impact of Degradation values (D,) assigned to variousdegradation modes. They are based on industry knowledge on the impact of the modes ofdegradation on reinforced concrete structures.
2) Safety Significance (S,)
Safety Significance values are assigned on the basis of the safety functions served by the structureand the structural significance of the sub-element. The Safety Significance is calculated as aproduct of the Safety Function (Sf): and the Component Significance (Cs).
Safety Significance (Ss) = Safety Function (S() x Component Significance (Cs).
2a) Safety Function (Sf):
The "safety-related" structures are those that are necessary to ensure the integrity of the reactorcoolant pressure boundary, to shut down the reactor, to maintain it in a safe condition, and tomitigate the consequence of a radiation release during a loss-of-coolant accident (LOCA). They areessential to the function of the safety class systems and components, and a failure of theseelements would lead to loss of function of safety systems and components housed, supported andprotected. In meeting its functional and performance requirements, a safety-related structure maybe required to perform one or more of the functions listed below:
1. Containment of radioactive liquids or airborne contamination;2. Radiation attenuation or shielding;3. Structural support of nuclear steam supply system and other safety-related equipment, and4. Protection of communication systems and functions.
If the collapse of a structural element would endanger a safety system, then that structural elementshould also be considered as a safety-related element.
The Safety Function values are assigned over a range from 1 to 10. A high value would mean thatthe structure is performing a number of functions that have major safety significance. For example,a factor of 10 is assigned to the reactor building containment structure that provides confinementof radioactive gases and liquids. The rating for the safety-related structure is applied to all its sub-elements. For example, for a containment structure, the same rating will apply to the sub-elementssuch as the base slab, the perimeter wall, the ring beam and the dome.
323
2b) Component Significance (Cs):
Each structure is composed of several sub-elements, and they are all treated as distinctcomponents of the structure. The Component Significance value takes into consideration therelative importance of each component (sub-element) to the others, and its contribution to theoverall integrity of the structure. The rating system uses a scale from 1 to 10; 10 for componentshaving the highest structural importance. The primary load-carrying sub-element for each structureis typically the foundation, which must distribute the loading to the underlying soil or rock.Because the foundation is an essential component of any structure and the loss of foundation isfatal to the integrity of the structure, it is given a rating of 10. Similarly, columns and walls aresupporting elements for floor slabs and hence they are given a higher rating compared to the slabs.
APPLICATION TO A TYPICAL CANDU 6 STATION
This methodology can be illustrated numerically by applying it to a typical CANDU NGS reactorbuilding structure. From design drawings and documents, the structural components (sub-elements) of the reactor building were identified. Figures 3 and 4 show an elevation and a plan ofthe reactor building with some of the sub-elements identified for illustration purposes.
Degradation Factor (D,):
Table 2 shows the evaluation of the Degradation Factors (Df) for a typical CANDU 6 station reactorbuilding. Sub-elements of the reactor building are identified in column 2 and relevant degradationmodes are shown in column 3 under 'Degradation', for each concrete sub-element. For example,for the base slab, the major degradation modes identified are reinforcement corrosion, chemicalattack and leaching of calcium from the concrete. All these modes can cause degradation ofconcrete; however, some of the degradation modes can cause more severe damage compared toothers. Considering the evidence or likelihood of degradation of the sub-element, the extent ofdegradation is estimated and is shown in column 4 under 'Degradation Extent (De). The impactfactor selected for each mode of degradation is given in Column 5 under 'Impact Factor' TheDegradation Factors are obtained as a product of Extent of Degradation and Impact of Degradationin columns 4 and 5. The highest of the Degradation Factors is selected as the Degradation Factor(D,) for the ranking evaluations
Safety Significance of Sub-Elements
Table 3 shows the calculations leading to the Safety Significance (Ss) and ranking of the sub-elements. Column 3 indicates the Degradation Factor as obtained from Table 2, column 7. Column4 in Table 3 indicates the factors assigned to the Safety Functions performed by the sub-elementsand the 'Component Significance' is given in column 5. Safety Significance Factors (Ss) areobtained by multiplying column 4 and 5 and dividing by 10.
Ranking
The sub-element ranking is obtained by multiplying the Degradation Factors (Df) in column 3 inTable 3 by the Safety Significance Factors in column 6. The item numbers in Table 2 are re-arranged in Table 3 to present the numerical rating of sub-elements starting from a maximum valueto the minimum. The sub-element ranking for the reactor building, is shown in column 7. Theranking values range from 90 to 448 out of a maximum possible theoretical value of 1000. Aranking value of 1000 would indicate significant degradation of a concrete sub-element. The dome,outside face, has the highest ranking value of 448. Figure 5 shows a graphical representation ofthese ranking values. Thirteen elements have a ranking higher than 160. The internal walls and
324

slabs rank lower. This is because of the favorable operating environment they are subjected to andbecause of their lower Safety Significance.
The ranking of sub-elements obtained in this analysis suggests priorities for field inspections anddamage identifications. Sub-elements with a higher rank would require subsequent detailedexamination and potential repairs compared to those with a lower ranking.
The Degradation Factors (D,) will be revised based on the results of inspection and maintenance.The (Df) rating of similar sub-elements of a structure may differ due to localized defects or exposureconditions causing the ranking the order of sub-elements to change.
CONCLUSIONS
This paper describes a technique for ranking sub-elements of a concrete structure on the basis oftheir overall importance and safety significance. The ranking procedure can be used to identify thesub-elements that need further inspection and maintenance.
It is recommended that the ranking assessment should be repeated every few years for safety-related structures to address the results of inspections and repairs. Repairs made to a sub-elementwould lower the relative ranking of that sub-element, thus bringing other sub-elements to the topof the ranking list. This procedure can also be applied to other structures of CANDU generatingstations even though they may have different configurations, and their sub-elements may havedifferent safety significance.
ACKNOWLEDGEMENTS
Funding for this investigation was provided by the CANDU Owners Group (COG), consisting ofAECL, Ontario Hydro and Hydro Quebec.
Authors like to acknowledge the technical contribution provided by Tom Yeung and Clive Alexanderof Ontario Hydro and wish to thank Michael Stephens for the technical editing of the paper.
REFERENCES
[1] D.J. Naus, B. Oland "Report on Aging of Nuclear Power Plant Reinforced ConcreteStructures", NUREG/CR-6424,0RNL/TM-13148, March 1996.
[2] C.J. Hookham, "Structural Aging Assessment Methodology for Concrete Structures in NuclearPower Plants", ORNL/NRC/LTR-90-17 Contractor Report (March 1991).
[3] C.J. Hookham "In Service Inspection Guidelines for Concrete Structures in Nuclear PowerPlants", ORNL/NRC/LTR- 95/14, Dec 1995.
[4] R.C. Judge, "Classification of Structural Component and Degradation Mechanisms forContainment Systems", Volume 2, Proceedings of the Third International Conference onContainment Design and Operation, Toronto, Ontario, Canada. (October 1994).
[5] Ontario Hydro internal reports and private communications.
325

02
u
E5!
u
B
CO
E
J Plant Life Management
Maintenance and Repair Program,Concrete Structures
Ranking
f Inspection & Testing l»—( P r i o r i t y l i s t o f sub-elementsj
Damage Identificationification 1
[ Acceptance criteria
Repairs
Material Performance Data base
Figure 1: Plant Life Management Program
326

Select a safetey related CANDUstructure
Review drawings and documents,Identify sub-elements
Field visual inspection,Damage evaluation,
Initial condition X(TO)
Present conditionX(T)
±
For three major modes ofdegradation, evaluate3- Degradation Extent ~4- Impact Factor
Impact of aging on the structural andfunctional capacity
Plant Life Management
v Program
Repair and maintenanceschedules to maintain plantintegrity and reliability
For each sub-element, assess:
1- Safety function of the structure2- Component significance
Identify major degradation mode:for each sub-element
Database
Ranking ofsub-elements
For top ranking elements- detailedvisual examination- Field testing (NDT)- Laboratory testing
Re-ranking of
sub-elements
Figure 2: Ranking Program: Tie-in With Repair And Maintenance
327

Figure 3: -A typical CANDU 6 Generating Station, Reactor Building,General Elevation
Perimeter Wall
Figure 4: A typical CANDU 6 Generating Station, Reactor Building, General Plan
328

Ranking Values
oo o
U U ^o o oo o o
(D Oo oo o
Dome CentrePlug
PerimeterWall (Exterior) M
Cf5' Boiler Support
••••
E= Beams WKHRKRnH*
Calandria,O Concrete
35". Calendria
UJ.M. HI •
•MiasBBS
o 2 Support p ^ H H
1-1 L« « Dome - Inside ^ |
• 1&- 3 • • •5* » I§ O* I— B Closure Plug H H
3 S. F™ 1
* H | REMPIugH|
^ M_ Roof Hatch K BC 1,2,3,4 ^ ^ 1
5 i"s Pressure TC Relief Duct H H?" Stub ^ ^ ^
2. I«" ti Ga>>ery HPerimeter 1
wall, Inside j ^ K ]surface ^ ^
Base Slab 1••1
1
!E]
11
• -
- : - : "
i • 1-.
: . ' - .
r3-
^ . , * r :
' * - - •
r
329

Table 1: Typical Impact Factors assigned to Degradation Modes
Degradation Mode
Reinforcement corrosion
Chemical attack
Elevated temperature
Thermal exposure/cracks
Leaching
Abrasion, erosion, cavitation
Irradiation
Impact Factor
8
7
6
6
4
3
3
330
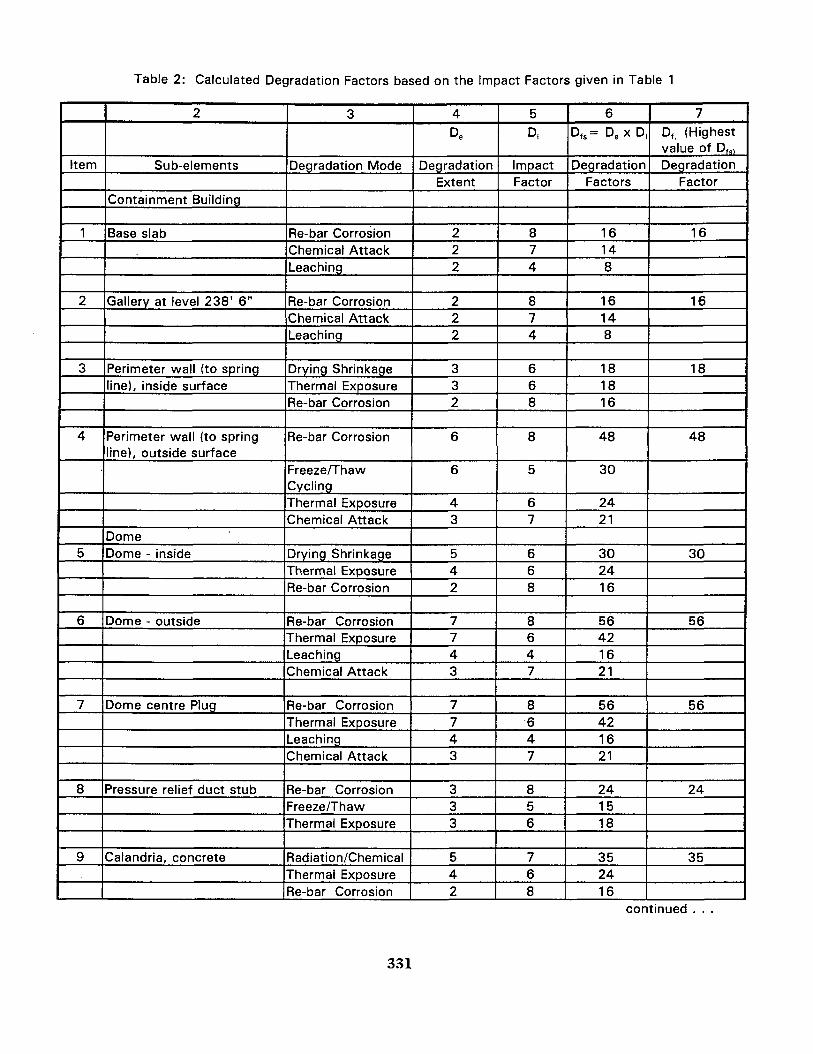
Table 2: Calculated Degradation Factors based on the Impact Factors given in Table 1
Item
1
2
3
4
5
6
7
8
9
2
Sub-elements
Containment Building
Base slab
Gallery at level 238' 6"
Perimeter wall (to springline), inside surface
Perimeter wall (to springline), outside surface
DomeDome - inside
Dome - outside
Dome centre Plug
'ressure relief duct stub
Calandria, concrete
3
Degradation Mode
Re-bar CorrosionChemical AttackLeaching
Re-bar CorrosionChemical AttackLeaching
Drying ShrinkageThermal ExposureRe-bar Corrosion
Re-bar Corrosion
Freeze/ThawCyclingThermal ExposureChemical Attack
Drying ShrinkageThermal ExposureRe-bar Corrosion
Re-bar CorrosionThermal Exposure.eachingChemical Attack
Re-bar CorrosionThermal Exposure.eachingChemical Attack
Re-bar CorrosionFreeze/ThawThermal Exposure
Radiation/ChemicalThermal ExposureRe-bar Corrosion
4
De
DegradationExtent
222
222
332
6
6
43
542
7743
7743
333
542
5
D,
ImpactFactor
874
874
668
8
5
67
668
8647
8647
856
768
6
Dfs= D e x D
DegradationFactors
16148
16148
181816
48
30
2421
302416
56421621
56421621
241518
352416
7
Dt (Highestvalue of Dfs,Degradation
Factor
16
16
18
48
30
56
56
24
35
continued
331

10
11
12
13
14
15
16
17
18
19
20
21
Calandria support
Closure plug
REM plug
Roof hatch 1,2,3,4
South cross wall
North cross walls
North Area walls1-East2- West
Control Area walls1 - East2- West
Elevation 274Room 216Room 217Room 202Room 203
Shield wall R-208R-209
Floor at level 274'
Floor at level 289'
Radiation/ChemicalThermal ExposureRe-bar Corrosion
ChemicalThermal
Chemical attackThermalRadiation/Chemical
Chemical attackThermalRadiation/Chemical
Chemical attackThermalRadiation
Chemical attackThermalRadiation
Chemical attackThermalRadiation
Chemical attackThermalRadiation
Chemical attackThermalRadiation
Chemical attackThermalRadiation
Chemical attackThermalRe-bar Corrosion
Chemical attackThermalRe-bar Corrosion
542
5 J4
542
en
42
542
542
542
542
542
542
542
542
768
76
767
767
767
767
767
767
767
676
676
676
Table 2 I
352416
3524
352414
352414
352414
352414
352414
352414
352414
302812
302812
302812
continued)
35
35
35
35
35
35
35
35
35
30
30
30
continued
332
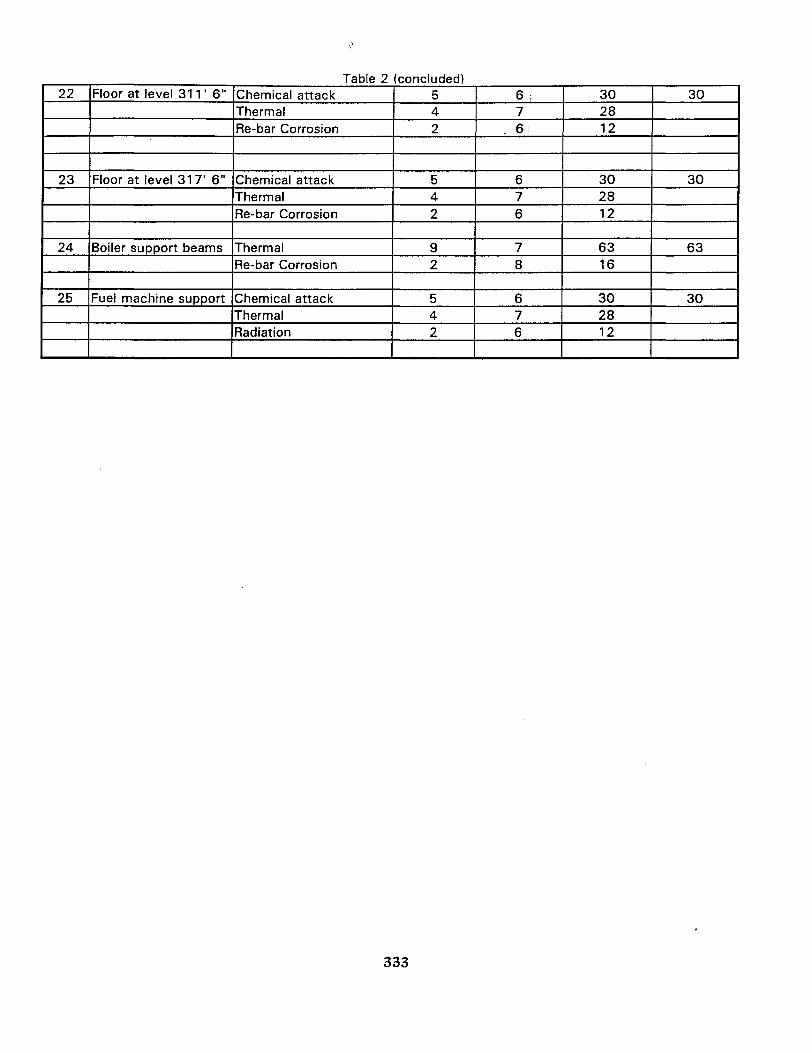
22
23
24
25
Floor at level 311 ' 6"
Floor at level 317' 6"
Boiler support beams
Fuel machine support
Table 2Chemical attackThermalRe-bar Corrosion
Chemical attackThermalRe-bar Corrosion
ThermalRe-bar Corrosion
Chemical attackThermalRadiation
(concluded)542
542
92
542
6 :76
676
78
676
302812
302812
6316
302812
30
30
63
30
333

Table 3: Ranking Values of sub-elements based on the highest Degradation Factors (Df) from Table 2 (see Note, next page)
1
Item *
1
2
3
4
5
6
7
8
9
10
11
12
13
14
15
16
17
18
2
Sub Elements
Dome - outside
Dome centre plug
Perimeter wall (to spring line, outsideface)Boiler support beams
Calandria, concrete
Calendria support
Dome - inside
Closure plug
REM plug
Roof hatch 1,2,3,4
Pressure relief duct stub
Fuel machine support
Perimeter wall (to spring line), InsidesurfaceBase slab
South cross wall
North cross walls
North Area walls, East, West
Control Area walls, East, West
3
Degradation
Factor D,
56
56
48
63
35
35
30
35
35
35
24
30
18
16
35
35
35
35
4
SafetyFunction Sf
10
10
10
8
9
9
10
8
8
8
10
8
10
10
6
6
6
6
5
Component
Significance
cs8
8
9
6
8
8
8
8
7
7
8
7
9
10
7
7
7
7
6
Safety Significance
Factor(Ss)Ss = S, x Cs/10
8
8
9
4.8
7.2
7.2
8
6.4
5.6
5.6
8
5.6
9
10
4.2
4.2
4.2
4.2
7
Ranking
SR = Df x Ss
448
448
432
302
252
252
240
224
196
196
192
168
162
160
147
147
147
147

continued.
en
1
Item
19
20
21
22
23
24
25
2
Sub Elements
Elevation 274, Room216,217,202,203Shield wall R-208, R 208
Floor at level 274'
Floor at level 289'
Floor at level 311 ' 6"
Floor at level 317' 6"
Gallery at level 238" 6"
3
DegradationFactor D,
35
30
30
30
30
30
16
4
Safety Function
of the Structure
s,
6
6
CJI
CJI
5
5
7
5
Component
Significance
cs
7
7
6
6
6
6
8
6
SafetySignificanceFactor (Ss)Ss = Sf xC 3 / 10
4.2
4.2
3
3
3
3
5.6
7
RankingSR= Df x Ss
147
126
90
90
90
90
90
* Note: The item numbers in Table 2 are re-arranged to present the numerical ranking of sub-elements given in column 7 in adescending order.
CA0000050
EVALUATION OF NUCLEAR POWER PLANTCONCRETE TO MAINTAIN CONTINUED SERVICE
E.J. McColm, P.K. Mukherjee, J.A. Sato and J.P. Krasznai
Ontario Hydro Technologies800 Kipling Avenue
TORONTO, Ontario CanadaM8Z 5S4
ABSTRACT
Nuclear power plant concrete structures in addition to satisfying structural requirements are a major part of thesafety and containment systems. As a result, the structures are required to operate satisfactorily for the life ofthe plant and until well after decommissioning. Successfullife management requires an understanding of potentialdegradation mechanisms that can impact on the performance of these structures, regular well planned inspectionprograms and the use of specialized repair and maintenance programs. These aspects of nuclear life managementare discussed with an example of inspection and repair conducted at one of Ontario Hydro' s nuclear generatingstations. The example is discussed in terms of the performance requirements of the containment concrete. Theplant referred to has been in operation for over 20 years, making it currently the oldest operating commercialnuclear power plant in Ontario, Canada. The information on the concrete containment structures included baselineconstruction data on the concrete material properties and the results of periodic scheduled and other interimspecialized inspections. Also available were the results of laboratory testing of concrete cores obtained from thestructures. The data from these inspections and laboratory testing were used to monitor the aging characteristicsof the structures and to plan appropriate repair activities.
Key Words: concrete, nuclear containment, degradation factors, aging management, service life
This paper was originally presented at the ASME Pressure Vesselsand Piping Conference held in Orlando, Floridaon July 2 7 - 3 1 , 1997.
336

EVALUATION OF NUCLEAR POWER PLANT CONCRETETO MAINTAIN CONTINUED SERVICE
INTRODUCTIONOntario Hydro is the largest owner of nuclear power plants in Canada with the electricity produced from these
plants accounting for approximately 60% of the total electrical production in Ontario. As a result, these powerplants make a significant contribution to the province's economy, and the continued serviceability of the plantsmust be maintained to ensure reliable production of electricity for the province.
Concrete is used extensively in nuclear power plants for structural applications and for radiological safety.Structurally, it is used to house reactor components and provides a significant part of the safety and containmentsystems. Concrete is also used as biological shielding to protect personnel and the public.
Hie structural requirements must be maintained for the operating life of the plant, approximately 40 years withthe possibility of extensions. The radiological safety requirements, including biological shielding and thecontainment of radioactive gases, liquids and materials, must be met for the operating life of the plant and untilthe plant is decommissioned and the radioactive components are placed in permanent storage. This may requirethe structures to maintain serviceability for 100 years or more.
FUNCTIONAL REQUIREMENTSTo maintain the serviceability of these structures, the unique functional requirements of concrete in a nuclear
application must be understood. Degradation mechanisms affecting conventional concrete structures have beenstudied; however, the combination of degradation mechanisms experienced in an operating nuclear plant and thelong-term effect on the performance of the concrete cannot be completely predicted. In addition, the uniquefunctional requirements of nuclear containment structures such as very low air and water permeability have notbeen assessed over a long term.
Therefore, nuclear power plant concrete structures must be regularly inspected to satisfy licensingrequirements, to ensure the functional requirements are maintained, and to identify any short-term deficiencies.The information from these inspections is used to identify long-term degradation processes that may affect theoperating life of the station. The results from these inspections are also used to characterise the aging of theconcrete and formulate repair programs to maintain the serviceability of the structures.
DEGRADATION PROCESSESConcrete structures in a nuclear service environment are subjected to a variety of exposure environments.
These include conditions experienced by many large industrial structures such as exposure to freezing andthawing, high structural stresses,prolonged high temperatures and aggressive liquids (eg. acids, deionized water)with the addition of high radiation levels. The effect of exposure to some of these conditions has been studiedin the laboratory and monitored in existing structures. The long-term performance of the concrete must bepredicted based on the available information which is frequently limited. The more data available on a specificexposure condition and the longer the period the data covers, the greater the accuracy of any predictions on thelong-term concrete performance.
A significant difference between concrete structures in nuclear power plant applications compared toconventional industrial applications is that the nuclear structures must possess special functional properties (eg.low air and water permeability) that must be maintained for 100 years or more. A reduction in these propertiesor evidence of concrete deterioration is not acceptable to the regulators or the public. This long service life withspecial performance requirements in a unique exposure environment mandates special monitoring of concretestructures in nuclear power plants.
337
INSPECTION PROGRAMSThe inspection of nuclear containment structures are typically carried out for two reasons:
1. To satisfy regulatory requirements for continued safe operation /I/. These inspections are generally carriedout at a regular interval with specific requirements.
2. To address unexpected operational problems caused by deterioration or damage to the containment structures.These inspections are carried out when needed and the requirements vary to address the particular problem.These inspections should identify problems with the performance of the concrete and provide information and
data to predict the long-term concrete aging characteristics. In some instances, repairs are required to return thestructure to a satisfactory operating condition.
Inspection programs are designed to concentrate on critical areas based on the required performance of thestructure or deterioration of the concrete. The preparation of the program includes a review of the structure inconsultation with the design engineer to identify and select components or areas of high stresses or severeexposure for detailed inspection.
Various techniques are employed depending on the objective of the inspection. These include visualinspection supported with a photographic record and crack mapping, nondestructive testing techniques to identifyareas of deterioration and concrete coring to obtain specimens for laboratory testing and examination to determinethe physical properties of the concrete and the condition of the cement-aggregate bonds.
Baseline data is frequently available from constructionrecords, previous inspection reports, and the literature.This data is compared to the inspection findings to identify changes in the concrete and to predict agingcharacteristics.
Ontario Hydro maintains a unique long-term exposure site used to monitor various types of concrete in anatural outdoor exposure environment to identify concrete aging and performance characteristics /2,3/. Data isavailable on concrete exposed for over 40 years. The information from monitoring specimens in this site is usedto assist in predicting the performance of concrete in-service under similar conditions. In addition, programs thataccelerate the aging process under specified exposure conditions are carried out in the laboratory. These includeexposure to high temperatures, accelerated testingforalkali-aggregatereactivityandexposure to flowing deionizedwater.
On occasion, concrete samples are obtained from the reactor containment buildings or reactor shielding vaults.These samples are frequently highly radioactive and special handling and testing procedures and facilities mustbe utilized. The concrete is typically analyzed for changes in physical properties that may indicate progressivedeterioration due to the service environment. The concrete is also analyzed to determine the radioactive inventoryincluding the nature of radioactive isotopes present and their profile through the concrete section.
REPAIR PROGRAMSBased on the results of the inspection programs and the predicted performance of the concrete, repairs may
be necessary to maintain the continued serviceability of the structure. Generic repair materials and proceduresare suitable for many applications; however, on occasion, a specialized repair may be required.
To address specialized repair requirements, suitable materials are developed and evaluated in the laboratoryto ensure they satisfy the performance requirements. This may require the construction of models and the useof environmental chambers to evaluate extremes of temperature, moisture and radiation exposure. Specializedtesting equipment is employed to evaluate the physical properties of the materials and repairs.
The repair procedures are developed based on a combination of laboratory testing and field trials. When therepair is performed, it is inspected and monitored using both specialized and established QA and QC procedures.
CASE HISTORYThe application of these inspection and monitoring programs to Ontario Hydro's oldest operating nuclear
reactor is discussed. The plant, Pickering NGS 'A' Unit 1, has been in operation for over 20 years. As a resultof these inspection programs, the need for repairs was identified to maintain the serviceability of the Unit 1containment structure.
338

BackgroundPickering NGS is located on the north shore of Lake Ontario approximately 20 miles east of downtown
Toronto (Figure 1). This was the first multi-unit nuclear power plant constructed by Ontario Hydro with the unitsplaced into service between 1971 and 1973.
Pickering NGS 'A' is a four unit (540 MW per unit) CANDU type nuclear station. Each unit (Units 1 to 4)and its associated nuclear components are housed in concrete reactor buildings. The turbine and conventionalcomponents are in a separate building. Radiological safety structures include the reactor buildings (one for eachunit), a pressure relief duct and a vacuum building which were designed to prevent the release of radioactivegases, water vapour and particles in case of a nuclear accident. The pressure relief duct connects the reactorbuildings to the vacuum building. In an emergency, such as a loss of coolant accident, gases and steam that aregenerated will be drawn via the pressure relief duct to the vacuum building and will be condensed by a waterspray system supplied from an elevated tank enclosed within the building.
All of these containment structures (ie. reactor buildings, pressure relief duct and vacuum building) areconstructed of reinforced concrete.
The reactor buildings consist of a 4 ft (1.2 m) thick circular perimeter wall supporting an 18 in (0.46 m) thickreinforced concrete dome (Figure 2).
The domes of the reactor buildings are exposed to an outdoor environment and are subjected to cycles offreezing and thawing and rain, snow and ice. At certain times of the year and depending on the operatingcondition of the reactor, the concrete can be exposed to high thermal gradients through the thickness of the domecausing high structural stresses.
Inspection ResultsAs part of the licensing requirements, the containment buildings are assessed for leak tightness by conducting
periodic pressure tests approximately every five years. The structures must be leak tight to ensure all radioactivegases, steam and particles are contained in the event of an accident.
The test consists of pressurizing the buildings to approximately 6 psi (g) (41.4 kPa (g)) and monitoring theloss of pressure with time. During these tests, critical areas of the reactor building, such as those exposed to highstructural stresses.are visually inspected to identify deterioration. The inspections concentrate on identifying leakpaths extending through the containment boundary which could contribute to an increase in containment leakageand signal concrete deterioration. Because of the nature of these tests, they provide a unique opportunity toidentify leakage paths that extend through the concrete.
During a pressure test of the Unit 1 reactor building conducted in 1992, a significant increase in buildingleakage was recorded (Figure 3). This increase was attributed to air leakage through numerous hairline cracksin the top part of the reactor building dome. Although hairline cracks had previously been identified in the dome,the extent and number had not been previously reported. These cracks were very narrow, typically less than0.005" (0.1 mm) wide, and not readily visible.
The results of this test were of concern because there was a possibility that a minor increase in containmentleakage in subsequent tests might cause the leakage limits specified in the operating licence to be exceededrequiring the unit to be shut down. Since this was the oldest unit, there was also concern that similar leakagecould develop in the other three units. The cracking could also indicate a serious problem with deterioration ofthe concrete.
As a result of these concerns, a two stage program was initiated. The first stage was to identify the cause ofthe hairline cracks and determine the probability of increased cracking in subsequent years. The second stage wasto develop a repair method to seal the cracks to allow continued operation of the unit with no concern ofexceeding the leakage limit in subsequent years.
Concrete InvestigationDetailed information was available on the concrete used in the domes of the reactor buildings. The
information was obtained from concrete inspector'sreportsprepared during construction and included informationon the ambient weather conditions, method of placement, mix proportions and fresh concrete properties. Inaddition, the density and compressive strength at 7, 28 and 90 days was recorded. This information, used as
339

Figure 1: Pickering NGS 'A' and 'B '
Figure 2: Reactor Building Wall and Dome
340

2000
1800
1600
1400
w 1200
• 1% contained mass per hour
• 1992 March
• 1993 November
30 40
Differential Pressure (kPa(g))
Figure 3: Pressure test results. The circles show the operation target of 1 % volume leakage per hour.The licensing limit is 2.7%. The triangles show the leakage during the test immediately priorto the repair and the squares show the leakage after completion of the repair.
341

baseline data, was summarized and reviewed to identify differences in the concrete between the four units.Commissioning reports were available but they did not describe the as-built condition of the concrete in detail.
As an example, the reports mention radial hairline cracks in the reactor building dome but information regardingthe length, width or number of cracks was not provided.
The results of the regular in-service inspections of Unit 1 conducted since commissioning were compared tothe results of similar inspections of Units 2 to 4. Radial cracking was identified in the domes of all the units,however the cracking was most extensive in Unit 1.To help in determining the cause of the hairline cracks and confirm the quality of the concrete, an investigationprogram consisting of nondestructive testing, concrete coring and laboratory testing was undertaken. For thisinvestigation, Units 1 and 4 were selected as they represented the first and last units built. The walls and thedomes were sampled in both units to represent concrete exposed to different structural stresses. Areas of the wallexposed to an outdoor environment versus those exposed indoors were compared to identify the effects ofexposure environment.
The nondestructive testing included ultrasonic pulse velocity readings and detailed crack mapping of selectedtest areas. Inspections were conducted at different periods of the year and with the reactor building in differentconditions (ie. unit in operation, unit shut down, building at various pressures during test). The objective of theseactivities was to identify any increase in cracking that may occur.
Specimens were prepared from the cores and tested for compressive and splitting tensile strengths and density.This testing was conducted to identify significant differences in the concrete from the different sample locations.Specimens were also examined petrographically to assess the condition of the cement-aggregate bonds and thefeatures of the cracks through the concrete. The air-void system was evaluated to ensure that it was suitable toprotect the concrete from damage due to freezing and thawing.
AssessmentThe baseline, inspection and investigation data were reviewed and compared to identify possible causes of the
cracking and identify the aging characteristics of the concrete. The properties obtained from the laboratory testingwere compared to the behaviour of long-term reference concrete to ensure that the Unit 1 dome concrete was notexhibiting any unusual aging characteristic.
A review of the construction records and the results of the laboratory testing of cores from Units 1 and 4revealed that, although the compressive strength of the concrete exceeded the required design strength, the Unit1 concrete had a significantly lower compressive strength than that in the other units. A summary of thelaboratory testing for compressive strength conducted during construction is given in Table 1 where the average28-day compressive strength of standard cured test cylinders for the dome of each unit is presented as a percentof the Unit 1 dome concrete.
The testing of concrete cores obtained from the domes and walls of Units 1 and 4 confirmed that the Unit1 dome concrete had lower strength than the other areas sampled (Table 1).
The compressiveand tensile strength of concrete are related; therefore, areduction in the compressive strengthwould indicate a reduction in the tensile strength. Cracking occurs when the tensile strength is exceeded.
A structural analysis revealed that although the domes are structurally sound, radial cracking in the top of thedome could occur under service conditions. The expected crack configuration was similar to the crackingobserved in all of the reactor building domes. The design assessment also confirmed that the difference in theextent of cracking between units could be explained by a lower concrete tensile strength in the Unit 1 dome.
Based on visual inspections and laboratory examination of the concrete cores, it was determined that thehairline cracks had likely developed soon after the domes were constructed.
Although the cracks had likely been present for some time, it was found that unique thermal conditions existedduring previous tests which prevented the hairline cracks from opening to the extent that allowed the loss of airfrom the dome recorded in 1992. These thermal conditions relate to the relative temperature of the concreteversus that of the air inside and outside the building.
342

TABLE 1
Pickering NGS 'A'Units 1 to 4
Concrete Compressive Strength of Reactor Building Domes
UnitNumber
Unit 1
Unit 2
Unit 3
Unit 4
Compressive Strength of Dome ConcreteConstruction Data
(Percent of Unit 1 Dome Concrete")
100%
. 130%
129%
117%
Compressive Strength of CoresAfter 20 Years of Service(Percent of Unit 1 Cores"")
100%
-
-
152%
• The average 28-day compressive strength of the Unit 1 dome concretewas 3450 psi. The design compressive strength was 3000 psi at 28 days.
** Based on limited test data.
Repair ProgramA number of detailed repair options were reviewed to reduce or eliminate the leakage through the dome.
These options included post-tensioning the dome, adding large masses to prevent the cracks from opening, sealingthe surface with fibre reinforced concrete, adding an additional layer of concrete, sealing the cracks by epoxyinjectionandapplyingacoating material. Basedonstructuralanalysis,laboratorytesting,economic considerationsand operational limitations, it was decided to apply a coating material to the top of the dome where most of theleakage through the cracks occurred.
The selection of a suitable material was based on an extensive laboratory evaluation and testing program.Models were constructed in the laboratory and subjected to various environmental conditions includingtemperature extremes from -25°C to 30°C. In addition to the laboratory program, a series of field trials wereconducted to optimize application procedures.
After extensive material testing of various types of polymeric coatings a single component, elastomericpolyurethane-based coating was selected to be applied to the top portion of the exterior surface of the dome(Figure 4).
SolutionBased on the review of the construction data, evaluation of the condition of the concrete and structural
analysis of the dome, the cause and future development of the cracks was established. Repairs were undertakento reduce the leakage so that the pressure test leakage would not exceed the licensing limits (Figure 3). Programsto monitor the long-term performance of this coating have been implemented in both outdoor exposure sites andunder accelerated conditions in the laboratory.
CONCLUSIONSThe performance requirements and long service life of concrete structures used in nuclear power plants
requires special inspection, monitoring and repair methods. Periodic in-service inspections are used to identifyconcrete deterioration and the need for repairs. The long-term performance of the concrete is predicted byutilizing the inspection results and information from long-term concrete studies and material databases. Whennecessary, repairs are undertaken to restore the performance of the structure to acceptable levels and therebymaintain the service life of the structure.
343
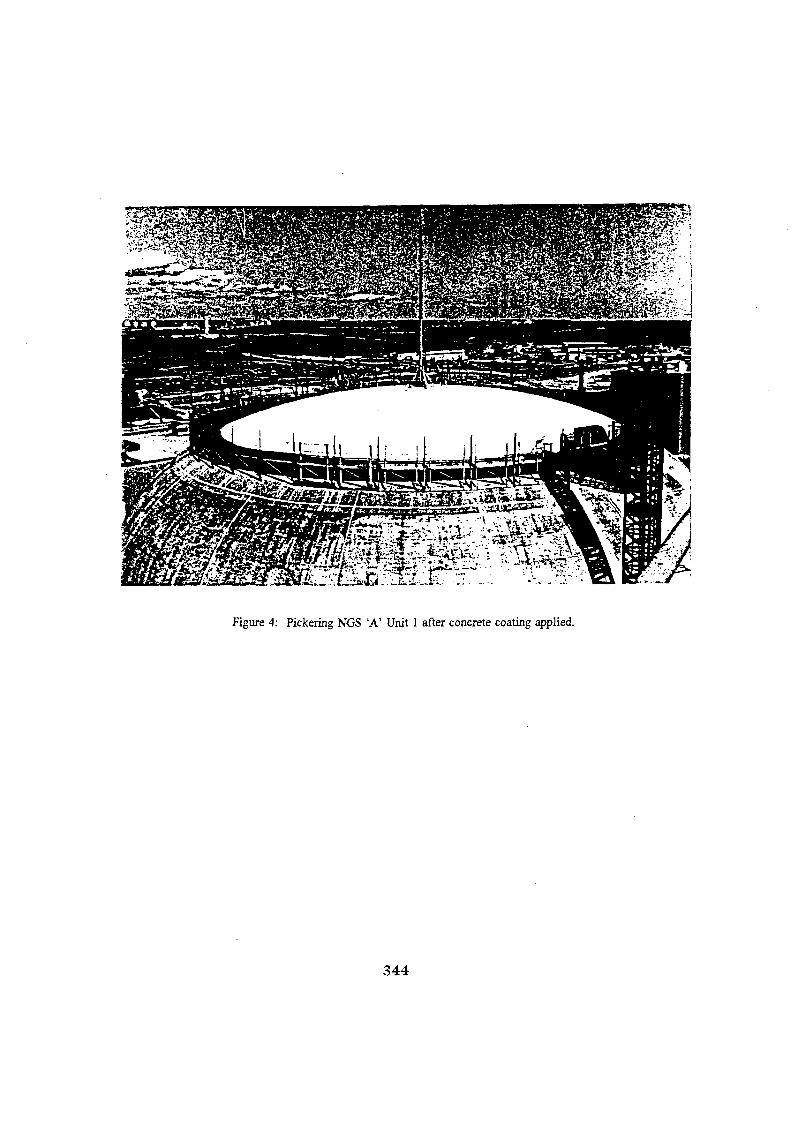
Figure 4: Pickering NGS 'A' Unit 1 after concrete coating applied.
344
ACKNOWLEDGEMENTPennission to publish this information was given by Ontario Hydro Technologies.
REFERENCESCSA CAN3-N287.1-M82, "General Requirements for Concrete Containment Structures for CANDU Nuclear
Power Plants".Mukherjee P.K..and Deans J.J., 1988, "Service Performance of Nuclear Containment Concrete", Concrete
International - Design & Construction, Vol 10, No. 12, pp 75-79.Sturrup V., Hooton R.D., Mukherjee P.K. and Carmichael T., 1987. "Evaluation and Prediction of Concrete
Durability - Ontario Hydro Experience," ACI Publication SP-IOO, Vol 2, pg 1121-1154.
345

Fourth CNS International Conference on CANDU MaintenanceNovember 1 6 - 1 8 , 1997
Toronto, Canada
Implementation of Environmental Qualification Program in Pickering NuclearDivision
Neil Mitchell
CA0000051 O n t a r i o HYd ro
Pickering ND
Abstract
Environmental Qualification [EQ] is the process of providing assurance that safety relatedequipment and systems will function as required following a Design Basis Accident whichgenerates harsh environmental conditions. The process lists all the equipment required tofunction under accident conditions, assesses ability to function under those conditions,makes modifications as required to achieve the required capability and ensures the requiredmeasures are in place to maintain qualified status for remaining Station life. The safetyrelated systems covered by the Pickering EQ Program are those required to control reactorpower, cool the fuel, contain radioactivity and monitor critical safety parameters and allassociated electrical, service water and instrument air support systems. The programconsiders Loss-of-Coolant-Accident [LOCA], Main Steam Line Break [MSLB] and all otherDesign Basis Accidents identified in the currently published Safety Analysis. Theenvironmental phenomena considered by the program include temperature, pressure,radiation, steam and flooding. The qualification methodology is based on the IEEE-323standard.
The goal of the program is to achieve full qualification status at best possible speed, provideequipment which has a high margin of safety and leave a program in place which is readilysustainable. The current target completion date is 2003; however, opportunities are beingexplored to attempt to accelerate completion. Qualification by a system oriented approachbest addresses change management requirements. Qualification by equipment typeoriented approach best addresses technical capability issues. The program uses hybridapproach to get the best mix. Equipment is qualified primarily on a system oriented basis;however, generic equipment qualification approaches are also used where significant safetybenefit or efficiencies can be achieved. An extensive up front engineering effort is requiredto list and assess equipment. Engineered changes need to be prepared well in advance ofinstallation dates. Impact on station operation is minimized by maximizing installation ofchanges on-power. Impact on station maintenance is minimized by consolidating EQ workwith existing rehabilitation programs. Margin of safety is maximized by using existing,proven solutions to qualification inadequacies to the highest extent possible. Sustainabilityis maximized by broadly applying standardized fixes.
346

ENVIRONMENTAL QUALIFICATION TESTING OF TFE VALVE COMPONENTS
by
A. Eyvindson,AECL
Chalk River LaboratoriesMechanical Equipment Development Branch
Chalk River, OntarioKOJ 1J0
CA0000052
W. Krasinski,Ontario Hydro - Bruce B ND
R. McCutcheon,Ontario Hydro - NTS
J. Aikin,AECL
Chalk River Laboratories
ABSTRACT
Valves containing tetrafluoroethylene (TFE)components are being used in many CANDU®Nuclear Generating Stations. However, someconcerns remain about the performance of TFEafter exposure to high levels of radiation.Stations must therefore ensure that such valvesperform reliably after being exposed topostulated accident radiation dose levels. Thecurrent Ontario Hydro EnvironmentalQualification (EQ) program specifies muchhigher postulated radiation exposure than theoriginal design, to account for conditionsfollowing a LOCA. Initial assessments indicatedthat Teflon components would requirereplacement. Proof of acceptable performancecan remove the need for large scale replacement,avoiding a significant cost penalty and preservingbenefits due to the superior performance of TFE-based seals.
A test program was undertaken at Chalk RiverLaboratories (CRL) to investigate theperformance of three valves after irradiation to10 Mrad. Such valves are currently used at theBruce B Nuclear Generating Station. Eachcontains TFE packing rings; one also has TFE
seats. Two of the valves are used in the ECISrecovery system, while the third is used forinstrumentation loop isolation or as drain valves.All are exposed to little or no radiation duringnormal use.
Based on the results of the tests, all the valvestested will still meet functional and performancerequirements after the TFE components havebeen exposed to 10 Mrad of irradiation.
1. INTRODUCTION
Under Ontario Hydro's EnvironmentalQualification Assessment (EQA) program,components in safety related systems must bequalified for up to 40 years of service life undernormal conditions plus a three month periodunder accident and post-accident conditions.Existing components must be tested forcumulative age, radiation, fatigue and seismiceffects, as applicable to each component'sfunction and location.
Bruce (A&B) Nuclear Generating Stations(NGS) EQA reports [1,2,3] for thetetrafluoroethylene (TFE) components inspecified Whitey, Worcester and Jamesburyvalves have qualified them for thermal aging
347

effects of 40-years plus accident conditions.However, a major concern is the ability of TFEcomponents to function as intended afterradiation exposure. The Mechanical EquipmentDevelopment (MED) branch of AECL at ChalkRiver was contracted to evaluate the performanceof these valves after irradiation, with no thermalaging involved.
This project evaluated three valve types, eachcontaining one or more TFE components, forleak-free operation at accident pressure andtemperature after varying degrees of irradiation.Each valve was leak-tested at simulated Loss ofCoolant Accident (LOCA) conditions after 0, 2,4, 6, 8, 10 and 12 Mrad of exposure. The doseincrements were selected so the effect ofincreasing dose on leak rate could be monitored.After the 12 Mrad test, samples of the irradiatedTFE materials were analyzed for leachablechlorides, fluorides and sulphates.
1.1 Equipment Tested
The tests evaluated specified models of Whitey,Worcester and Jamesburv valves.
polyetheretherketone (PEEK). The packing ringshave a rectangular cross section.
FIGURE 1: Whitey Valve
The Whitey valve (Figure 1) contains two TFEpacking rings (Chevron* style). The Worcestervalve (Figure 2) contains TFE packing and twoTFE seats. The packing consists of two rings ofpolyfill (approximately 80 % TFE and the restcarbon/graphite fill) and two rings of
FIGURE 2: Worcester Valve
The Jamesbury valve contains 5 rings of braidedTFE packing.
One each of the Worcester and Whitey valveswas available from Bruce B NGS for testing. Atest rig was fabricated to model the largeJamesbury valve.
1.1.1 Jamesbury Valve Test Rig
The Jamesbury Valve Test Rig (Figure 3) modelsthe stem seal of the Jamesbury Wafer SphereValves at Bruce NGS, including the stem andstuffing box dimensions.
The packing configuration used in the Jamesburytest rig was a double-packed set of TFE braid (3below the lantern ring and 2 above). This is thesame packing configuration used in the valves atBNGS. The packing rings were cut on a beveland the splits were staggered to ensure there wasno continuous leak path. On installation, thepacking set was live-loaded to a maximumcompressive stress of 5000 psi. Since leakagethrough the top ring to atmosphere was theprimary concern, a leak-off port from the lanternring was not provided.
348

FIGURE 3: Jamesbury Valve Test Rig
2.0 TEST SETUP ANDINSTRUMENTATION
2.1 Radiation Facilities
The valves were irradiated in stages to thenominal 10 Mrad total dose in a chamberapproximately 1.5 ft x 1.5 ft x 1,5 ft. Thechamber was shielded on all sides by lead bricksor pellets. A gamma source of !92Iridium wascontained in a pencil-shaped holder in the centreof the chamber. The valves were placed as closeto the source as required to receive the desireddose rate.
A radiation facility with a much higher dose rate(the Gammacell 220) was used for the final2 Mrad dose to the Whitey and Worcester valves.This facility consists of a series of pencil-shaped6<1Co sources positioned circumferentially arounda sample chamber.
2.1.1 Dose Monitoring
While in the l92Ir chamber, the dose to the TFEcomponents was estimated using a Microshieldcomputer model. Model inputs included sourcestrength and halflife, distance from the source tothe component, the amount of shielding due tothe valve body and the exposure time. The doseto the internal TFE components from theirexposure in the Gammacell 220 was calculatedbased on the same variables. The accuracy of thedose is estimated to be ±20%.
2.2 Leak Test Facility
The leak test facility (Figure 4) consisted of twoadjacent water columns, an oven, a compressedair cylinder and associated tubing. The twowater columns were connected through tubingcontaining an isolating valve. The primary watercolumn was open to atmosphere while the secondwas connected to the valve in the oven and, whenthe isolating valve was closed, could bepressurized by the compressed air cylinder.
The accuracy of leakage measurement dependson tube inner diameter, water temperature, andthe water column height, and is ± 0.7 mL.Measurement accuracy of the pressure andtemperature are ± 3 psig and ± 3 °C,respectively.
2.3 Chemical Analysis
Chemical analysis of TFE samples, bothunirradiated and irradiated to maximum dose,was contracted off-site to an approvedlaboratory.
3. TEST PROCEDURE
3.1 Packing Installation
In preparing the Jamesbury Valve Test Rig, thefirst three packing rings and the lantern ring wereinstalled in the stuffing box, then loaded to5000 psi packing stress by compressing thecalibrated Belleville washers. The load was thenremoved and the top two packing rings installed,followed by the gland follower. The Bellevillewashers were again compressed to give 5000 psipacking stress.
349
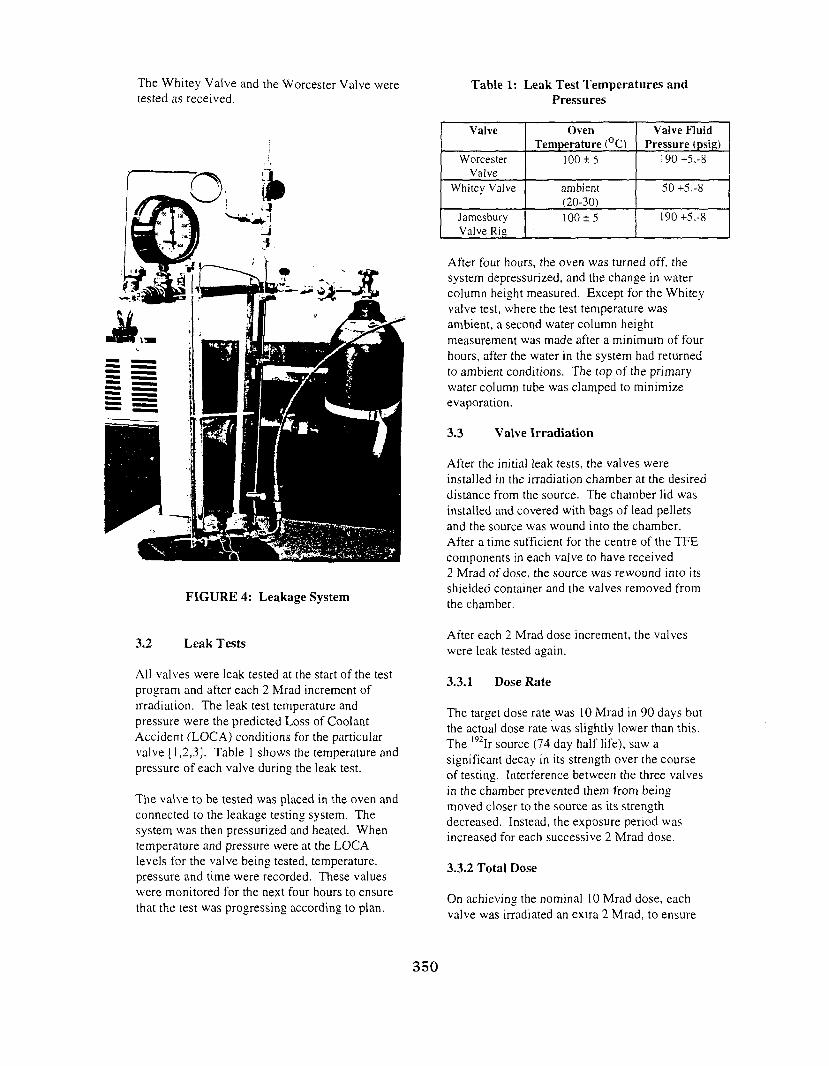
The Whitey Valve and the Worcester Valve weretested as received.
Table 1: Leak Test Temperatures andPressures
D. it
3.2
FIGURE 4: Leakage System
Leak Tests
All valves were leak tested at the start of the testprogram and after each 2 Mrad increment ofirradiation. The leak test temperature andpressure were the predicted Loss of CoolantAccident (LOCA) conditions for the particularvalve [1,2,3]- Table 1 shows the temperature andpressure of each valve during the leak test.
The valve to be tested was placed in the oven andconnected to the leakage testing system. Thesystem was then pressurized and heated. Whentemperature and pressure were at the LOCAlevels for the valve being tested, temperature,pressure and time were recorded. These valueswere monitored for the next four hours to ensurethat the test was progressing according to plan.
Valve
WorcesterValve
Whitey Valve
JatnesburyValve Ri2
OvenTemperature (°C)
100 ±5
ambient(20-30)100 + 5
Valve FluidPressure (psig)
190+5,-8
50+5,-8
190+5,-8
After four hours, the oven was turned off, thesystem depressurized, and the change in watercolumn height measured. Except for the Whiteyvalve test, where the test temperature wasambient, a second water column heightmeasurement was made after a minimum of fourhours, after the water in the system had returnedto ambient conditions. The top of the primarywater column tube was clamped to minimizeevaporation.
3.3 Valve Irradiation
After the initial leak tests, the valves wereinstalled in the irradiation chamber at the desireddistance from the source. The chamber lid wasinstalled and covered with bags of lead pelletsand the source was wound into the chamber.After a time sufficient for the centre of the TFEcomponents in each valve to have received2 Mrad of dose, the source was rewound into itsshielded container and the valves removed fromthe chamber.
After each 2 Mrad dose increment, the valveswere leak tested again.
3.3.1 Dose Rate
The target dose rate was 10 Mrad in 90 days butthe actual dose rate was slightly lower than this.The l92Ir source (74 day half life), saw asignificant decay in its strength over the courseof testing. Interference between the three valvesin the chamber prevented them from beingmoved closer to the source as its strengthdecreased. Instead, the exposure period wasincreased for each successive 2 Mrad dose.
3.3.2 Total Dose
On achieving the nominal 10 Mrad dose, eachvalve was irradiated an extra 2 Mrad, to ensure
350

that 10 Mrad had been exceeded. The Whiteyand Worcester valves underwent the finalirradiation in the Gammacell 220, while theJamesbury rig remained in the 192Ir chamber.
The total irradiation times for the three valvesranged from 118 days to 139 days.
3.4 Post-Irradiation Inspection
After the final functional tests, each valve and itsTFE components were carefully examined forchanges in appearance, cracks and colour. Inaddition, internal components of similar, non-irradiated components were inspected forcomparison with the irradiated components.
3.5 Chemical Analysis
Samples of irradiated and non-irradiated TFEcomponents from the valves was sent to anapproved off-site laboratory for testing ofleachable chlorides, fluorides and sulphates.
4. TEST RESULTS
4.1 Radiation Dose
Comparison of the predicted dose from themodel with dosimeter readings resulted in acorrection factor of 0.82 being applied to thenominal dose. Therefore, an additional nominal2 Mrad irradiation period was applied to ensurethat the total corrected dose exceeded 10 Mrad.Table 2 shows the nominal and corrected dosesfor the TFE components.
Table 2: Nominal and Corrected Dose of theTFE Components
4.2 Leakage
NominalDose
Mrad24681012
Corrected DoseWhiteyPacking
Mrad1.53.24.97.08.610.6
WorcesterPackingand Seat
Mrad1.53.34.97.08.610.6
JamesburyPacking
Mrad1.22.95.06.18.210.0
Table 3 shows the leakage for each valve as afunction of nominal dosage, from the baselineleak test to the 12 Mrad leak test.
Table 3: Valve Leakage* Over 4-Hour LeakTest
NominalDosage,Mrad
0
24681012
WhiteyValve
Leakage,mL0.6
0.30.50.43.30.20.6
WorcesterValve
Leakage,mL0
0.320.024.73.16.64.3
JamesburyRig
Leakage,mL9.8
12.6**0
4.77.52.63.44.1
* The accuracy of the leakage measurements wasestimated at ± 0.7 mL.** This test was repeated after stem movementwas observed.
4.2.1 Whitey Valve (Chevron Style TFEPacking)
The leakage from this valve remained below 1mL per 4 hours, for all tests except the 8 Mradtest, which had 3.3 mL leakage. There is noevidence of increasing leakage with increasingtotal dose.
4.2.2 Worcester Valve (Solid TFE Rings &Ball Seat)
The baseline and 2 Mrad tests for the Worcestervalve showed little or no leakage through thepacking or the seat. However, after 4 Mrad,20 mL of leakage was measured. No water wasobserved in the downstream end cap and therewas no obvious sign of leakage through thepacking. A second, one-hour leak test wasperformed, this time at 190 psig but ambienttemperature. The leakage measured was 3 mLand approximately this amount of water wasfound in the downstream end cap after this test,indicating that the leakage was through the seat.It is suspected that during the four-hour leak test,the water in the downstream end cap evaporatedthrough a slight leak to atmosphere.
351

The 6 Mrad leak test confirmed the results after4 Mrad. The leakage was 24.7 mL, and this timewater was noted in the downstream end cap afterthe test. However, the leakage dropped below7 mL for the final three leak tests; again, there isno evidence of increasing leakage withincreasing total dose.
A previous test performed at CRL on the samevalve model, but at a lower temperature andpressure, also showed no evidence of decreasedperformance with increasing dose [4].
4.2.3 Jamesbury Rig (Braided TFEPacking)
The initial baseline leak test resulted in a 9.8 mLloss in the water column. This was believed tobe a result of the relatively porous packing"soaking up" the water. This test was repeatedafter stem movement was observed, and thesecond baseline test showed 12.6 mL loss.Again, this was felt to be due to the packing"soaking up" the water. The valve was irradiatedto 2 Mrad and leak tested again. Leakageremained below 8 mL for all subsequent leaktests and did not increase with increasing totaldose.
4.3 Jamesbury Test Rig Packing Stress
The packing load was applied with two stacks ofcalibrated Belleville washers. Initial and finalpacking stresses were determined from the glandgap and spring stack heights with associatedspring calibration curve. Table 4 shows theinitial and final packing stress and consolidation.
Table 4: Jamesbury Test Rig - Packing Stress
TotalNominalDosage(Mrad)
012
PackingStress
(psi)50003170
PackingConsolidationDuring Tests
(inches)0
0.060
4.4 Post-Irradiation Visual Inspection
After the final leak test, the TFE componentswere examined. Apart from very slight extrusionof the upper Jamesbury packing ring and of theWhitey packing, there was no evidence of anypacking deterioration in any of the valves. Theslight extrusion of the Jamesbury and Whitey
packing is normal for TFE packing at highstresses and is not considered as caused by theradiation. There was also no obvious differencebetween the packing from the front (nearest theradiation source) and back sides of the valves.
The front and back TFE seats of the Worcestervalve were examined. Although there was nodifference in colouration, the front seat had asingle crack that went right through. This crackwas located at one of six small notches in theouter edge of the seat. At least one leak test musthave been performed after the break, because thecrack faces were dirty from exposure to watercontaining rust particles. No other cracks werevisible on either seat. Figure 5 shows the frontseat with the crack.
It is possible the crack developed between thenominal 2 Mrad and 4 Mrad tests when theleakage for this valve increased substantially.However, the leakage dropped again for the lastthree leak tests, although not back to the levels at0 and 2 Mrad. Regardless of when the crackdeveloped, it did not result in drastic failure ofthe valve.
Components from an identical but unirradiatedWhitey valve were compared to the irradiatedcomponents. The irradiated packing was slightlydirtier than the unirradiated packing due tocontact with the water during the leak tests. Noother differences were noticeable. The same wastrue for irradiated and unirradiated componentsof the Worcester and Jamesbury valves.
4.5 Post-Irradiation Chemical Analysis
A chemical analysis for leachable chlorides,fluorides and sulphates was performed forsamples of the irradiated TFE components andnon-irradiated components. The detection limitfor all the analyses was 1 p.g/g. Table 5 lists theresults of the analysis.
In every case, the irradiated components showhigher leachables than the unirradiatedcomponents. In many cases, the changes arequite small and within the error of the analysis.However, the increase in leachable fluorides inthe Jamesbury packing from below the detectionlimit to 143 ug/g may be of concern. TheWhitey packing also showed a large increase in
352

5. DISCUSSION
FIGURE 5: Cracked Worcester Seat(dark line @ 9:00 o'clock)
fluoride after irradiation, while the Worcesterpacking had a moderate increase in all threeleachables.
The current Ontario Hydro specification forgraphite valve packing materials [5] specifiesmaximum allowable values for leachablechlorides, fluorides and sulphates. In newcondition, all the materials pass the maximumleachables requirement. Only the Worcester seatsatisfies all three requirements after irradiation to10 Mrad. The Whitey packing is just out ofrange for leachable fluorides. Since these valvesare not exposed to radiation under normaloperating conditions, excursions beyond thespecified allowable levels of leachates after10 Mrad exposure will likely be consideredminor issues relative to other post-LOCAconditions.
Other than the Worcester seat, there is no visibleevidence of radiation damage to the TFE
Table 5: Chemical Analysis of Irradiated andUnirradiated Components
Sample
WhiteyPacking
WorcesterPacking
WorcesterSeat
JamesburyPacking
Chiu.
0Mrad
10
40
5
3
oridee/g
12Mrad*
19
86
8
4
FluorideUfi/g
0Mrad
1
5
<1
<1
12Mrad
28
17
9
143
Sulphateug/g
0Mrad
7
30
3
2
12Mrad
22
76
9
3
*The nominal total dose is referred to as 12 Mradfor this report.
components. It is unclear when and why thecrack developed in the Worcester seat but themost likely time is between the 2 Mrad and4 Mrad leak tests. Despite the crack, the valvedid not leak catastrophically.
Previous research [6] has shown that highirradiation rates can result in less damage for agiven total dose than low rates. Oxygen isrequired for the damage to occur, so for a givenoxygen supply rate, there is a radiation dose ratethat fully utilizes this oxygen to drive the damageprocess. If the dose rate is increased, the rate ofdamage will not increase unless extra oxygen ismade available. Therefore, the slower radiationrate is considered to give conservative data.Since the total irradiation period for each valveexceeded 90 days, the results are consideredconservative.
During a reference accident, the outside of thevalve is estimated to receive a maximum of10 Mrad. Interior components would receive lessbecause they are shielded by the valve body.During these tests, the TFE components receivedat least 10 Mrad, so that the conditions wereharsher than expected in the reference accident.
Despite the conservatism resulting from the doserate and total dose, there is no evidence ofincreasing leakage with increasing radiation dosefor any of the valves tested, indicating that they
353

should be able to perform acceptably during aLOCA event.
ACKNOWLEDGMENTS
The authors gratefully acknowledge theassistance of Paul Reynolds, Pat Primeau andClive Greenstock, who performed most of thelaboratory work and whose assistance wascritical to the success of the project.
REFERENCES
1. "Ontario Hydro In-Service Bruce A&BNuclear Generating StationsEnvironmental QualificationAssessment on Whitey Model SS- 1RS6Needle Valves", EQA # NK29-03651-EQA-3.WH.02, Rev. 0.
2. "Ontario Hydro In-Service Bruce A&BNuclear Generating StationsEnvironmental QualificationAssessment on Worcester Ball Valves",EQA # NK21/29-03651-EQA-3.WR.01,Rev. 0.
3. "Ontario Hydro In-Service Bruce A&BNuclear Generating StationsEnvironmental QualificationAssessment on Jamesbury Wafer-Sphere Valves", EQA # NK21/29-03651-EQA-3.JA.01, Rev. 0.
4. LaRose, R., "AECL's summary andreview of the EnvironmentalQualification Assessment for theWorcester ball valves", 1996 May.
5. Ontario Hydro, "Standard SpecificationGraphite Valve Stem Packing Materialsand Associated Components", M-724-94, 1994.
6. "Radiation Tolerance of Teflon ®Resins", The Journal of Teflon®, E.I.du Pont de Ne Nemours and Company,1969
354
STEAM GENERATOR CLEANING CAMPAIGNS AT BRUCE A: 1993 - 1996
F. V. Puzzuoli and P.J. Leinonen (Ontario Hydro Nuclear Technology Services), ^ = =G. A. Lowe and B. Murchie (Ontario Hydro Bmce A Projects and Modifications) ^ S
ABSTRACT ^s o=S o
Boiler chemical cleaning (BOCC) and high-pressure water lancing operations were performed psq oduring the Bruce A 1993 Unit 4, 1994 Unit 3,1995 Unit 1 and 1996 Unit 3 outages to remove secondary- i s i <£side deposits. High-pressure water lancing focused on three boiler areas: tube support plates (TSPs) to ^s Oremove broached hole deposits, hot leg U-bend supports (HLUBS) to dislodge deposits contributing to ^ = 1boiler tube stress corrosion cracking (SCC) and tube sheets with the aim of removing accumulated sludge ^ ^piles and post BOCC insoluble residues. The chemical cleaning processes applied were modified versions =====of the one developed by the Electric Power Research Institute/Steam Generator Owners Group(EPRI/SGOG). During these BOCC operations, corrosion for several key boiler materials was monitoredand was well below the specified allowances.
Boiler chemical cleaning and tube sheet lancing removed about 6,250 and 2,200 kg of depositrespectively from Unit 4 boilers in 1993. The BOCC process involved an initial copper removal cycle,magnetite removal step, a final copper cycle and passivation step in that order. Tube sheet lancingoperations, done after chemical cleaning, removed accumulated sludge from the cold leg and outer hot legareas down to the tube sheet. However, hard tube deposits roughly 18 cm (7 inches) above the tube sheetwere left in the hot leg central regions. High-pressure water lancing of the HLUBS, before or after BOCC,had limited success in cleaning the scallop bar surfaces of these U-Bend supports and left most hourglass(tube land) areas filled with deposit. In contrast, the combined effect of water lancing and BOCC left mostTSP broached holes in an almost "as new" condition. Minor deposits remained in the TSP land areas.
The BOCC operations performed on Unit 3 in 1994 dissolved about 6,800 kg of deposits. For thisBOCC campaign, the cleaning sequence was the same as applied in Unit 4, but the magnetite step waslengthened from 40 to 100 hours to enhance cleaning of the U-bend supports. The combination of pre andpost BOCC lancing left HLUBS scallop bars cleaner than those in Unit 4, but did not remove the hourglassdeposits. Tube sheet lancing before BOCC dislodged roughly 1,770 kg of sludge, compared with 875 kg ofmaterial after BOCC. Tube sheets were left in a similar condition to those in Unit 4 the year before; cold legand outer hot leg areas were cleaned down to the tube sheet and hard tube deposits about 15 cm (6inches) high remained in the hot leg central areas. As in Unit 4 a year earlier, water lancing and BOCC leftTSP broached holes nearly deposit-free with minor deposits in the tube land regions.
To enhance cleaning of the HLUBS hourglasses and TSP land areas, the BOCC process wasmodified for Unit 1 in 1995; the low temperature magnetite step was shortened to about 24 hours andfollowed by a 67.5-hour EPRI/SGOG-type crevice cleaning step applied at 121°C. The latter step involved-1-minute steam drum vents every hour to induce boiling and enhance crevice deposit dissolution. Thesequence of pre and post BOCC lancing activities was the same as performed during the 1994 Unit 3outage. In total, the Unit 1 BOCC process dissolved almost 8,500 kg of deposits. Post water lancinginspections of the HLUBS after BOCC showed that more scallop bar surface and hourglass deposit hadbeen removed compared with the Unit 3 operations a year earlier. However, the hourglasses were onlypartially cleaned out. About 2,000 and 520 kg of tube sheet sludge was removed by water lancing beforeand after BOCC respectively. Tube sheets were left in virtually the same condition as those in Unit 4 andUnit 3 after BOCC and water lancing; hard tube scale about 18 cm (7 inches) above the tube sheetremained in the hot leg central regions. The combined cleaning operations left TSP broached holes nearlydeposit free, but again, minor residues remained in the tube land areas.
In an effort to maximize deposit removal from the HLUBS hourglasses, a modified BOCC processwas qualified for recleaning Unit 3 in 1996. The BOCC process performed involved a copper removal step,crevice clean and a proprietary copper/passivation step in that order. The crevice solvent was applied for100 hours at 107°C while performing 2 vents per hour. Since the TSP broached holes were left nearlydeposit free after the 1994 cleaning activities, pre and post BOCC lancing was limited only to the HLUBSand tube sheet areas. Post lancing visual inspections of the HLUBS after BOCC showed scallop barsurfaces and hourglasses to be almost free of deposits; only thin residues remained in the hourglass areas.The BOCC operations removed about 2,530 kg of deposit, while the pre and post BOCC tube sheet lancingactivities dislodged approximately 162 and 46 kg of tube sheet sludge respectively. The height of the hardtube scale in hot leg central areas above the tube sheet, was reduced by 2.5-6 cm (1-4 inches) in most Unit3 boilers by the BOCC process. Hard sludge piles about 8 cm (5 inches) high were evident in some ofthese hot leg regions. As expected, TSP broached holes appeared almost "as new" and minor residuesremained in the land regions.
355

1.0 INTRODUCTION
1.1 Bruce A Steam Generator Features
The Ontario Hydro nuclear generating system currently consists of 20 pressurized heavywater (CANDU) reactors spread over three sites: the Pickering, Darlington and Bruce stations.The Bruce Nuclear Power Development, in Tiverton Ontario, is the location of eight reactors, withthe Bruce A station housing Units 1 to 4. Bruce A Unit 2 started operations in January of 1977and the remaining three units went on-line by 1979. In 1994, Ontario Hydro decided to lay up Unit2 partly due to the poor condition of its boilers and to maintain the option of returning it to service ifa future business case can justify refurbishment.
Each Bruce A unit contains eight recirculating boilers arranged in east and west banks.Boilers 1 to 4 and 5 to 8 make up the west and east banks respectively. A common steam drumconnects the four boilers in each bank, a feature unique to the Bruce A station. For each bank offour boilers, there are 2 external preheaters. Figure 1 shows a cutaway view of a Bruce A boilerand steam drum. Table 1 summarizes key boiler features including tube and tube supportmaterials.
2.0 Steam Generator Secondary-Side Deposits
During their operating lifetimes, Bruce A boilers accumulated significant quantities of secondary-side deposits that were introduced via the feed water. These impurities resulted from thecorrosion of feed water system components and condenser leaks. The deposits typically contain30-35% iron (mostly as Fe3O,,), 35-45% copper (mostly as metallic Cu), 5-10% zinc (as ZnO), 1-5% nickel (as NiO) and minor amounts of other metallic oxides.
Beginning in the late 1980s, boiler water level oscillations became a recurring problem atBruce A . In 1988, Boiler 3 in Unit 2 experienced water level oscillations which forced a Unit powerderating to alleviate the problem. Over the next few months, Unit 2 was eventually derated to72% full power operation to avoid the oscillations. Broached hole blockage in the upper tubesupport plates (TSPs) was suspected as the root cause of the problem and was confirmed laterthat year by fibrescopic visual inspections.1
High-pressure water lancing equipment, developed and operated by Babcock and Wilcox.Canada (BWC) Ltd., was used to clean the upper TSPs, enabling Unit 2 to return to full poweroperation. Around the same time, boiiers in Unit 1 began to experience similar level oscillationswhich also forced a unit derating. As in Unit 2 earlier, Unit 1 returned to full power after cleaningthe upper TSPs by high-pressure water lancing.2 Although water lancing was recognized as aneffective temporary solution, boiler chemical cleaning (BOCC) was developed as a more long-term measure.
A more serious problem associated with the build up of secondary-side deposits is stresscorrosion cracking (SCC) of boiler tubes in the area of the hot leg U-bend supports (HLUBS), dueto:
1. High local mechanical stresses due to support stack growth caused by the accumulation ofdeposits between scallop bars.
2. A boiler tube material (I-600) susceptible to SCC.3. Accumulated surface and hourglass (tube land) deposits that promote a localized corrosive
environment and scallop bar degradation.
In Unit 2, the SCC-related tube failures and scallop bar degradation were accelerated by leadcontamination from a lead shielding blanket left inside a boiler during a unit outage. These tubefailures along with overall boiler condition were major contributing factors in the decision to lay upthe unit. Scallop bar decay was also discovered in varying degrees during pre and post cleaninginspections of the Units 1, 3 and 4 HLUBS and is described in greater detail in Section 5.0.
356
The build up of secondary-side deposits also led to concerns over the long-term integrityof boiler tubes above the tube sheets. The primary concern was the possibility of under deposittube pitting and eventual tube failures in the tube sheet area where sludge piles had accumulated.Minor tube pitting has been found in this area, but more recently, circumferential tube crackingwas identified in the tube sheet regions of several Unit 1 and Unit 4 boilers.
3.0 Boiler Cleaning Methods: Chemical Cleaning and Water Lancing
Soon after the Unit 2 boiler oscillation problems began in 1988, Bruce A recognized theneed for a long-term solution. Chemical cleaning was chosen as the most viable approach, withthe initial intent of applying the process on Unit 2 boilers only. However, later inspectionsrevealed that heavy fouling on the secondary-side was common to boilers in ail four units. As aresult, the Bruce A station decided to chemically clean all boilers in Units 1 to 4 over a four-yearperiod starting in 1993.
Pickering Unit 5 boilers were chemically cleaned in 1992 using a modified version of aprocess developed by the Electric Power Research Institute/Steam Generator Owners Group(EPRI/SGOG).3 This cleaning operation demonstrated that:
1. Deposits in fully blocked broached holes were not removed by chemical cleaning. However,partially blocked broached holes could effectively be cleaned out by the BOCC process.
2. The chemical cleaning solvents did not significantly penetrate hard and thick tube sheetsludge piles not removed by water lancing.
3. Tube scale and deposits on large surfaces were effectively removed.
After reviewing the Pickering Unit 5 BOCC operations, the Bruce A boiler cleaningstrategy was subsequently revised to include high-pressure water lancing to help remove as muchdeposit as possible before BOCC. High-pressure water lancing operations focused on threeboiler areas: HLUBS, TSPs and the tube sheets. At first, chemical cleaning was carried out withthe aim of dissolving bulk secondary-side and broached hole deposits. Later, the importance ofcleaning the U-bend areas became more evident. Combined chemical cleaning and lancingoperations were carried out on Unit 4 in 1993, Unit 3 in 1994, Unit 1 in 1995 and again in Unit 3 in1996. Section 4.0 describes the BOCC and lancing equipment used for these cleaningcampaigns. The strategies, rationale for changes made for each cleaning operation and resultsare detailed in Section 5.0
4.0 Cleaning Processes and Equipment
4.1 Chemical Cleaning
To meet the 4-year schedule for cleaning boilers in all four Bruce A Units, the stationissued tenders for the design, supply and operation of BOCC equipment and a corrosionmonitoring system (CMS) in 1990. PN Services (then Pacific Nuclear and later VECTRATechnologies) and Babcock and Wilcox Nuclear Services (BWNS) (later FramatomeTechnologies Inc., FTI) received the contracts for the BOCC equipment and CMS respectively thefollowing year.
The Bruce A station owns the BOCC and CMS equipment, but purchasedoperation/refurbishment services from the individual vendors for each clean. Table 2 summarizesseveral features of the BOCC equipment and CMS. Figure 2 depicts the lay out for the BOCCsystem components outside the Bruce A power house, while Figure 3 shows a flow diagram of thesystems' boiler attachments and components inside the Power House. To minimize maintenanceand lay-up requirements between cleans, the BOCC systems' wetted parts were constructed ofstainless steel.
The contract for process qualification was awarded to BWNS, with the aim of removing an
357

estimated deposit loading of about 25,000 kg for all eight boilers in each Bruce A unit. Thisdeposit estimate was based on:
1. Density measurements performed on deposit flake samples.2. Tube deposit thickness measurements made from an inspection port aligned with the no-tube-
lane.
The EPRl/SGOG cleaning method was chosen for qualification over the highertemperature cleaning processes, which use primary side heat, for several reasons:
1. The EPRl/SGOG process was well developed and had a large corrosion data base.2. The high temperature processes were felt to be inadequate for removing high copper levels in
secondary-side deposits.3. High corrosion rates even at low copper levels were suspected at the higher temperatures.4. There were concerns over delayed hydride cracking of pressure tubes and stresses resulting
from steam drum temperature differentials, if a high temperature process employing primaryside heat was used.
The EPRl/SGOG process uses separate solvents to remove copper and magnetite,cleaning crevices and passivation. Table 3 lists the solvents applied at Bruce A along with theapplication conditions. The qualification program was carried out to determine the sequence ofcleaning steps best suited to dissolve Bruce A boiler deposits without exceeding preset corrosionlimits for the following key materials (corrosion limits are shown in parenthesis):
• 'AISI-1018 - U-bend supports (3.0 mils, later 6.0 mils for Unit 1 in 1995 and Unit 3 in 1996)• "SA-515, Gr.70-TSPs (3.0 mils, later 6.0 mils for Unit 1 in 1995 and Unit 3 in 1996)• "Shielded Metal Arc Weld (SMAW) E7018 A1 - Welds(27.5 mils)• "AISI-1015- Internals (27.5 mils)
Critical Materials" Most Susceptible Materials
Corrosion limits for AISI-1018 and SA-515, Gr.70 were based on Flow Induced Vibration analysisof post BOCC scenarios and carried out by Ontario Hydro Technologies (OHT).
From the qualification tests, it was expected that the cleaning sequence for Unit 4 boilersin 1993 would be:
1. An initial copper cycle with multiple copper steps; the number of steps depended on thecopper loading.
2. Low volume rinses followed by a full volume rinse.3. A magnetite removal step (40 hours max.)4. Low volume rinses followed by a full volume rinse.5. Repeated copper and magnetite cycles, as well as low/full volume rinses as necessary.6. Low volume rinses followed by a final full volume rinse and passivation.
4.2 Water Lancing
Babcock and Wilcox Canada (BWC) Ltd. received the contract to supply the high-pressure water lancing systems to clean the HLUBS and TSPs. The automated tube sheetlancing system was designed and built by Foster Miller Inc. (FMI) and is based on theirConsolidated Edison Combined Inspection and Lancing (CECIL®) technology. Table 4summarizes several key features of the HLUBS, TSP and tube sheet lancing systems.
Water lances used to clean the upper TSPs in Unit 1 and 2 boilers in 1989 and 1990 wereoriginally designed, built and qualified by BWC to remove broached hole deposits in the upperTSPs. These thin, flexible intertube lances were constructed of stainless steel tubes encased in a
358

rigid plastic body (See Figure 4) and typically operated at a qualified nozzle pressure of 10,000psig. Since the lances had limited flexibility, they could only be inserted into 30° tube lanes withthe help of an adjustable guide, placed in the no-tube-lane through an external port, that allowedaccess through the boiler shell and shroud. At best, up to 65% of the TSP areas could beaccessed by this method.1'2
In 1992 and 1993, BWC supplied equipment for tube sheet cleaning operations performedon Pickering Unit 5 and 6 boilers. Water lances used for these cleans were modified versions ofthe ones used for the Bruce A Unit 1 and 2 operations and were designed to enter 90° as well as30° tube lanes from the no-tube-lane. Two design improvements made this possible:
1. Replacing stainless steel tubing with Kevlar™ wrapped flexible tubing.2. Substituting the rigid plastic around the tubing with a more pliant material.
These types of lances were used in cleaning the HLUBS and TSPs in Bruce A boilers byaccessing 90° tube lanes through external lancing/inspection ports to provide the maximumcoverage possible. By this method, roughly 83% of the total TSP area could be water lanced,compared with approximately 65% by accessing the 30° tube lanes only. The remaining 17%cannot be accessed due to tie rod interference in the NTL and within the tube bundle (Refer toTable 1). Up to 100% coverage of the HLUBS top or bottom sides is theoretically possible bylancing via the 90° tube lanes.
The key components of the tube sheet lancing system are described in Table 4.Figure 5 depicts several CECIL® components as they would appear within the boiler.
5.0 STEAM GENERATOR CLEANING RESULTS
Table 5 provides a summary of the chemical cleaning operations performed over 1993 to1996, while Table 6 summarizes the corrosion data.4"7
Corrosion was measured on-line during BOCC using zero resistance ammetry (ZRA) andlinear polarization techniques. On-line measurements were used for process surveillance andcontrol. All final reported corrosion values were determined from coupons mounted inside theboilers during BOCC and removed afterwards.
Waste quantities for each clean are shown in Table 5. Except for the Unit 1 operations,the amount of waste produced in successive cleans was reduced. Additional waste wasproduced during the 1995 Unit 1 clean compared with the Unit 3 operation the year beforebecause of the additional crevice cleaning step. The radiation levels in BOCC waste were alwayslow (<2 uCi/kg gross p and y radiation), allowing transfer to the site Spent Solvent TreatmentFacility (SSTF) under Unconditional Transfer Permits. Two transfers of rinse water producedduring the Unit 4 BOCC required Conditional Transfer Permits because of tritium contamination inthe building steam used to heat the solvents and rinse water.
A brief summary of the pre and post BOCC water lancing operations is given in Table 7.8~18 Sections 5.1-5.4 further describe the BOCC and lancing operations and modifications made insuccessive cleaning campaigns. The 1994 Unit 1 TSP and 1995 Unit 4 HLUBS lancing activitiesare not discussed in detail but are briefly summarized in Table 7.
5.1 Unit 4 -1993
Throughout 1992, several Unit 4 boilers experienced minor level oscillations relative to those seenin Units 1 and 2 during the late 1980s. The initial plan for the 1993 Unit 4 outage involvedinspecting and, if necessary, water lancing TSPs 3-7 only. During this outage, the water lancingscope was expanded when a decision was made to develop and use equipment to clean theHLUBS top and bottom sides. This required installation of a special lancing/inspection portaligned with the gap between tube rows 14 and 15 (See Table 1). Due to outage scheduling
359

difficulties, the HLUBS lancing nozzles could only be installed on the west bank boilers afterBOCC and on east bank boilers prior to BOCC. As a result, HLUBS in the west bank were onlywater lanced after BOCC, while those in the east bank were lanced before and after BOCC.
The scope of the lancing operations was further increased to include tube sheet cleaningwhen access to these areas became possible through the use of temporary bellows containmentseals. However, these seals became available only after chemical cleaning. Once the seals werein place, access man ways could be cut into the boiler bellows without breaching containment,allowing the installation of TSP 1&2 and tube sheet lancing/inspection ports.
Boiler chemical cleaning operations were performed on the west bank, east bank and onthe preheaters in that order. Section 5.1.1 describes the results of these BOCC operations, whileSection 5.1.2 details the Unit 4 water lancing activities.
5.1.1 Chemical Cleaning
The BOCC operations removed 6,254 of deposits from the boilers, compared with 190 kg ofmaterial from the preheaters. Boiler tube surfaces and TSP broached holes were left with an "asnew" appearance.19 Actual deposit removal was only about a quarter of the estimated 25,000 kgloading (See Section 4.1). The preheater clean, not summarized in Table 5, involved two coppersteps followed by a magnetite step. Most of the material removed from the preheaters containedmagnetite and corrosion for this cleaning operation was well within allowance.20 In both the westand east bank boilers, only the initial copper step achieved a high loading, while the subsequentcopper steps used up only a fraction of the solvent capacity.
From both on-line and actual coupon weight loss measurements, a corrosion gradienteffect was noticeable during chemical cleaning; the highest corrosion occurred in the lower boilerregions near the tube sheet sludge piles. This behavior had not been observed during chemicalcleans carried out elsewhere and a definitive explanation is not available. One possibility is thisphenomenon may have occurred in cleans done in other stations, but was not observed becauseof the relatively fewer numbers of corrosion probes installed. Another conceivable reason is thathigh local deposit loadings near the tube sheet resulted in higher, local dissolution rates, causingmore corrosion.
During the west bank clean, the magnetite step was stopped after about 8 hours since themagnetite dissolution had nearly plateaued and the indicated corrosion for the critical material(SA-515) approached its limit. Since this was the first BOCC campaign at Bruce A, it was notknown how much corrosion would occur during the final copper and passivation steps. Byterminating the magnetite step at that stage, it was felt there would be enough of the remainingcorrosion allowance to permit carrying out the final two steps. In reality, corrosion during the finalcopper and passivation steps was low and overall corrosion remained well within allowance.
After reviewing the results from the west bank operations, the magnetite step for the eastbank clean was extended to the full 40 hours. Subsequently, more magnetite was removed fromthe east bank boilers and, as described in Section 5.1.2, there was reduced blockage of broachedholes in TSPs 1&2 after chemical cleaning.
Although the 1993 Unit 4 cleaning operations were successful, two major operationalproblems occurred. The first event occurred after the stainless steel hydrogen peroxide "daytank", containing about 5,000 L of 35% peroxide, became contaminated with copper solvent dueto a passing check valve. Exothermic peroxide decomposition accelerated due to the catalyticeffects of dissolved copper and, after about 5 hours, the contents of the tanks were violentlyreleased into the environment. Fortunately, the peroxide handling system was designed to handlesuch an event and equipment damage was minimal. The main impact from this incident was aseveral-day delay while a root cause investigation was carried out and procedures were modifiedto prevent a recurrence.
360

The second incident was the discovery of a white residue which coated the steam drumafter the east bank operations. Analysis of this residue revealed it was a component of CCI-801corrosion inhibitor. Nitrogen sparge rates during the east bank clean had been increased greatlyand it was believed that magnetite solvent droplets containing inhibitor were entrained anddeposited on the steam drum. Industrial hygiene concerns made work inside the steam drummuch more difficult and time consuming due to additional protective equipment required. Spargerates were greatly reduced during future cleans to minimize this problem.
5.1.2 Water Lancing
The strategy for cleaning the TSPs was to limit water lancing to those plates showing only >40%broached hole blockage. Where possible, 2 TSPs were simultaneously cleaned through a portsituated at the mid span between them and aligned with the NTL. Lancing ports were installedbetween TSPs 6&7, 4&5 and later (post BOCC) for TSPs 1&2. The decision to install ports forTSP 3 depended on the pre lancing inspection results on one boiler in each bank. If required, theTSP 3 lancing/inspection ports was installed closer to this TSP because of interference from theblowdown header (See Figure 1).
Before chemical cleaning, water lancing reduced broached hole blockage from up to100% to 0-10% (10-20% at worst) for TSPs 4 to 7 in the west bank, and TSPs 3 to 7 in the eastbank. Post BOCC visual inspections of these same support plates showed these support platesto be virtually deposit free with 0-5% blockage. The post BOCC inspections of TSPs 1 and 2 inthe east and west banks showed a marked difference. In the west bank, where a shortermagnetite step was performed, up to 100% broached hole blockage was still present in severalareas. Water lancing of these regions reduced blockage to 20% or less. In contrast, broachedholes in TSPs 1 & 2 in the east bank boilers, which underwent a 40-hour magnetite step, had only0-5% blockage. Tube land deposits were evident in all TSPs after water lancing and chemicalcleaning.
During the HLUBS water lancing activities, access to the HLUBS top and bottom sidesvaried from 65-95% due to misaligned tubes. This was caused by a combination of stack growth,broken forks and scallop bar deterioration.21 Lancing operations done in the east bank beforeBOCC removed enough surface deposit to expose some of the scallop bar surfaces but left thehourglass regions with residual deposit. The post BOCC operations left these same areas withless surface deposit but did not clean the hourglass areas (See Table 7). Except for Boiler 1,which showed 60-90% HLUBS surface exposure, the lancing operations in the west bank wereunable to achieve the same surface cleanliness seen in the east bank.8 Two factors likelycontributed to this difference:
1. West bank boiler HLUBS were not lanced before BOCC. As a result, deposits probablyremained thick enough to prevent effective penetration and removal by BOCC solvents.
2. The magnetite step during the west bank clean lasted only about 8.5 hours, compared with 40hours for the east bank.
Post BOCC tube sheet inspections of Boiler 7, before lancing, showed maximum sludgeheights of roughly 36 and 31 cm (14 and 12 inches) in the center of the hot and cold leg sidesrespectively. Repeated passes with the 90° barrel spray unit cleaned the cold leg and outer hotleg areas down to the tube sheet. The remaining shadow deposits were removed with a side-shooting lance.
Hard, tenacious tube scale prevented lances from fully entering the hot leg central regionsof Boiler 7, with access limited to about 18 cm (7 inches) above the tube sheet. Sludge piles werenot evident and tube sheet assessments could not be done in this area due to the fibrescopes'limited visual range. This finding was consistent for all Unit 4 boilers. The hard tube scale in thehot leg regions remained intact despite repeated attempts at removal with either the straight-ahead lance or lances fitted with offset nozzles.
361

On average, the CECIL® tube sheet lancing system removed about 275 kg of wet sludgeper boiler.811 The percentage of chemical cleaning insolubles could not be determined since alltube sheet lancing operations were performed post BOCC.
5.2 Unit 3-1994
After reviewing the 1993 Unit 4 experiences, several changes were made to the water lancing andBOCC procedures:
1. The magnetite step was qualified for and extended to 100 hours to enhance cleaning of the U-bend supports.
2. Unit 3 preheaters were not chemically cleaned. This decision was based on the previousefforts required to remove the relatively small quantity of deposit from the preheaters in Unit 4.
3. TSP lancing was limited only to areas with >60% broached hole blockage before BOCC,compared with the >40% blockage criterion used during the 1993 Unit 4 operations. It wasexpected that the longer magnetite step applied in Unit 3 would enhance deposit removal frombroached holes.
4. Tube sheets were water lanced before and after chemical cleaning to allow access to the hardtube deposits by the chemical cleaning solvents.
5. All boiler HLUBS were lanced before and after BOCC to maximize deposit removal from thescallop bar surfaces and hourglass regions. An automated HLUBS lancing system wasdeveloped by BWC for this purpose and to reduce dose uptake inside the boiler room.
Sections 5.2.1 and 5.2.2 describe the impacts of these modifications.
5.2.1 Chemical Cleaning
The chemical cleaning operations removed about 6,800 kg of deposit from Unit 3 boilers (SeeTable 5). Visual inspections done after BOCC showed tube surfaces and TSP broached holes tobe virtually free of deposit. In addition, inspections of the HLUBS were carried out immediatelyafter BOCC from inside the steam drum. It was apparent from these inspections that the HLUBSsurfaces were much cleaner than those in Unit 4 a year earlier, but deposits remained in mosthourglass areas. The improvement in overall cleaning effectiveness was mainly due to the longermagnetite step. In addition, there was no inhibitor deposits found in the steam drum after BOCC.
Corrosion was within the allowances for all key boiler materials. As in Unit 4 a yearearlier, corrosion rates were higher in the lower boiler regions, but less in magnitude. This waslikely the result of removing loose tube sheet deposit before BOCC. Examination of the SMAWcorrosion coupons, which were located close to the tube sheet during BOCC, showed severelocalized "worm-hole" like corrosion up to 750 urn (30 mils) deep. Visual examinations done onactual boiler SMAW welds located close to the coupons revealed minimal corrosion. Onepossible explanation for this discrepancy was that the coupons were partially buried in loose tubesheet deposits, or that some other localized conditions caused the observed localized pitting ofthe coupons. The SMAW corrosion reported in Table 6 was determined from the weight lossmeasurements made on pitted coupons.
5.2.2 Water Lancing
Boiler TSP inspection/lancing nozzles were installed in the same locations as in Unit 4. Pre waterlancing visual inspections revealed TSPs in Unit 3 boilers to be much cleaner than found in Unit 4the year before. Only TSPs 1, 2 & 7 in a few Unit 3 boilers had >60% broached hole blockageand were water lanced to reduce blockage to 10-20% or less. Post chemical clean inspections ofTSPs that were either lanced or had <60% blockage and did not require lancing, revealedblockages has been reduced to 0-5% (10-20% in the worst case). Deposits were found in mostTSP land areas examined.10
Water lancing of the HLUBS before BOCC removed enough deposit to expose part of the
362

scallop bar surfaces including a few scallop divisions, but did not clean hourglass regions. Accessto the target 90° lanes ranged from about 63 to 99% of the available tube lanes before BOCC dueto restrictions. However, average access after BOCC increased to about 98% due to the removalof tube deposits by the BOCC process.
As mention in Section 5.2.1, a general inspection done inside the steam drum just afterchemical cleaning, but before water lancing, revealed the Unit 3 boiler HLUBS to be much cleanerthan those in Unit 4 after the 1993 chemical clean. This was attributed to the longer magnetitestep performed in Unit 3. Visual inspections of selected tube lanes after chemical cleaning, butbefore water lancing, showed clean tube surfaces except for the areas just above the scallop barswhere dark deposits covered most hourglasses and scallop bar surfaces.
Post lancing visual inspections after BOCC revealed:
1. Roughly 50% surface exposure on the top sides, compared with 80% surface visibility on thebottom. As expected, the scallop bars appeared much cleaner than after the pre chemicalclean lancing operations.
2. A light, red surface oxide coating on most scallop bar surfaces on both sides. This oxidelikely formed after water lancing.
3. Small tube collars that filled most hourglasses and extended a few millimeters above thescallop bar surfaces.
4. No sign of scallop bar degradation as seen in Unit 4 the previous year. This was notsurprising since the Unit 3 HLUBS stack growths were far less than those for measured forUnit4in1993.22
Before chemical cleaning, pre lancing tube sheet inspections of Boiler 5 showed maximumsludge heights of roughly 23-25 cm (9-10 inches) on the hot and cold leg sides. The combinationof the 90° and 30°/150° barrel sprays effectively cleaned the cold leg and outer hot leg areas downto the tube sheet, with thin deposits left in the original location of the pile. Hard tube deposits,similar to those left in Unit 4, were found in the hot leg central area; this limited lance insertion tono more than 8-15 cm (3-6 inches) above the tube sheet and prevented tube sheet visualinspections in this area. Hard sludge piles were not evident in the restricted hot leg area.
The post lancing tube sheet condition of the remaining Unit 3 boilers closely resembledthat of Boiler 5. Although hard tube scale was also found about 2.5-5 cm (1-2 inches) above thetube sheet in some cold leg areas, the tube sheet was clearly visible in these regions. The prechemical cleaning water lancing operations removed about 222 kg of wet sludge per boiler.
Tube sheet lancing operations after BOCC dislodged about 109 kg of residue per boiler.Although the cold leg and outer hot leg areas were cleaned down to the tube sheet, hard tubedeposits about 8-15 cm (3-6 inches) above the tube sheet remained in the hot leg central areas.The persistence of hard tube collars most likely resulted from a rapid build up of insoluble BOCCresidues around the tubes and on top of the tube sheets, possibly during the initial copper step.Once the insolubles settled on the tube sheet, they became an effective barrier between thechemical cleaning solvents and the hard deposits.
5.3 Unit 1 -1995
Deterioration of the U-bend support structures in all Bruce A Units, along with the inability of thelow temperature EPRI/SGOG BOCC solvents to remove the U-bend deposits in Units 3 and 4,raised concerns over the effect on the remaining boiler life. The focus of BOCC operations atBruce A consequently changed from bulk deposit removal and broached hole cleaning toremoving deposits from the U-bend supports. It was recognized that a more aggressive processwas required and a new cleaning sequence incorporating an EPRI/SGOG crevice clean at 121°Cwas qualified.
A crevice cleaning process involves heating the solvent above its normal boiling point with
363

periodic depressurizing to induce boiling in the upper solvent region. Deposit dissolution isenhanced over the conventional magnetite removal step by the higher application temperatureand turbulence caused by boiling. The periodic boiling cycles are believed to force fresh solventinto crevices thereby allowing deposit dissolution to continue. Under non-boiling conditions, thesolvent inside the crevices rapidly becomes spent and deposit dissolution ceases. Without anactive mechanism to replenish solvent within crevices, deposits in these regions remain intact.
The chemical cleaning application sequence qualified for the Bruce A Unit 1 was similarto the one applied on Unit 3 in 1994 except:
1. The magnetite step was shortened to 24 hours. Data from the previous Unit 4 and Unit 3cleans showed that iron loading in the magnetite solvent plateaued after about 10 hours.
2. A boiling crevice cleaning step followed the magnetite step. A standard EPRI/SGOG crevicecleaning process (See Table 3) was selected for Bruce A since the 120-125°C applicationtemperature could be achieved with the BOCC equipment then available. Vents wereplanned for about 1 minute each hour and performed by opening steam drum relief valves thatdischarged directly to the atmosphere through a stack located on the station roof.23
Due to concerns over SMAW corrosion, the CCI-801 inhibitor concentration in themagnetite solvent was increased from 1 to 2.5%. The specification for inhibitor concentration inthe crevice solvent was set at 3% owing to similar concerns.
Solvent and process qualification testing for the Unit 1 clean showed that AtSI-1018 U-bend scallop bar material and, to a lesser extent, SA-515 Gr.70 TSP material were susceptible tohigh aspect ratio pitting in the crevice solvent. One possible explanation was that the crevicesolvent attacked the manganese sulfide "stringers" created during the rolling process of AISI-1018carbon steel. Maximum exposure duration for AISI-1018 was found to be 50 hours, comparedwith 75 hours for SA-515 and other boiler materials. Pitting was found to be excessive beyondthese times and the total process time was therefore limited to 67.5 hours. The solvent level wasmaintained above the top of the U-bend for a maximum permissible exposure of 50 hours.Afterwards, the level was lowered below TSP 5 to allow cleaning of the lower boiler regionsincluding the tube sheet for the remaining 17.5 hours, without further impact on the U-bendsupports.
During field application, AISI-1018 and SA-515 Gr. 70 coupons were removed on-line andsubjected to metallographic examination for pitting. On-line coupon removals started at 25 hoursand were repeated at 35 and 45 hours into the crevice cleaning step.
Before the Unit 1 clean, corrosion allowances for the critical U-bend support and TSPmaterials were reevaluated. Based on FIV analyses, the corrosion allowances for these materialswere raised from 75 urn (3.0 mils) to 150 urn (6.0 mils).24
Water lancing operations carried out during the 1995 Unit 1 outage closely paralleledthose performed in Unit 3 the year before. However, the upper TSPs in Unit 1 were water lancedlate in 1994 to provide temporary relief for level oscillations until a full scale lancing and BOCCcampaign was executed in 1995 (See Table 7). The 1995 TSP lancing activities before BOCCwere restricted to TSPs with >60% broached hole blockage, but carried out with a newlydeveloped automated system to reduce dose uptake inside the boiler rooms (See Table 4). As inUnit 3, tube sheets and HLUBS were lanced before and after chemical cleaning.
5.3.1 Chemical Cleaning
The Unit 1 BOCC operations removed about 8,500 kg of deposit, compared with roughly 6,250and 6,800 kg of material dissolved by the 1993 Unit 4 and 1994 Unit 3 cleans respectively.Corrosion of all materials monitored was well within their allowances, as shown in Table 6.
Forty-nine and 51 vents were performed during the crevice cleaning steps for the west
364

and east banks respectively. Each vent lasted about 1/4-2 minutes and resulted in boiiingdepths of around 14 feet. The recovery time between vents ranged from roughly 30 to 90minutes, with an average time of approximately 75 minutes. Most of this time was spent reheatingthe crevice solvent to 121°C by direct steam injection. Since the steam was at relatively lowtemperature, larger volumes of steam were required to reheat between vents relative to the steamlost during venting resulting in solvent dilution.
Metallographic evaluations of AISI-1018 U-bend coupons removed from boilers during thecrevice step showed the onset of pits toward the end of the 50-hour duration at full height. Thecrevice solvent level was then dropped to below TSP 5 for the remaining 17.5 hours according toplan.
After BOCC, visual inspections of the HLUBS were performed and revealed that theHLUBS in Unit 1 were cleaned better than those in either Unit 3 or 4. In some cases, tubedeposits present before BOCC were removed and the hourglass edges were clearly visible.However, these land regions were not completely cleaned out. Section 5.3.2 to follow describesthe HLUBS condition assessments in further detail, along with TSP and tube sheet visualinspections
Although the Unit 1 clean was successfully executed, several operational problemsoccurred. During the initial 121°C hot rinse preceding the crevice step in each bank, thetemperature differential between the top and bottom of the steam drum exceeded the permissiblelimit. Subsequent temperature data analysis from both events revealed that allowable stresseswere not exceeded and the procedures for subsequent cleans were revised to avoid a recurrence.
During the west bank clean, a copper solvent spill occurred inside the Power House. Thenitrogen gas supply was lost when high winds toppled over liquid nitrogen evaporators which weresituated behind Unit 1 outside the station. Once the nitrogen pressure dropped to zero, coppersolvent flowed back into the nitrogen sparging system pulse tank. A brass fitting at the bottom ofthe tank, which normally contained dry nitrogen, corroded and opened a spill path. The spill wasquickly contained and the BOCC system was isolated from the leak point, allowing the copperstep to continue without further incident. Brass fittings were replaced with stainless steel onesbefore the east bank operations.
5.3.2 Water Lancing
As in Units 3 and 4 previously, the combined effect of chemical cleaning and water lancing leftTSP broached holes virtually deposit free. The amount of land deposits in the TSPs after BOCCappeared to be significantly less than in observed in Units 3 or 4 during visual inspections. Thiscan be attributed to the addition of the crevice cleaning step in the BOCC process.13
Pre chemical cleaning lancing operations left about 50-80% of the HLUBS surfacesexposed on the top and bottom sides, but did not remove any hourglass deposits. In contrast,inspections done after chemical cleaning and water lancing showed 80-90% surface exposureand partial penetration into the hourglass deposits.
Further HLUBS condition assessments for each Unit 1 boiler after BOCC showed scallopbar degradation in varying degrees. This degradation followed the same trend found in Unit 4 afew months earlier; decay was found primarily in the HLUBS central regions, with the most severedegradation apparent in the hourglass areas (See Table 7). In contrast, the outer HLUBS areasappeared to be intact.13'14
Before chemical cleaning, about 2,000 kg of loose sludge was removed from the tubesheets through a combination of 90° and 30°/150° low-pressure barrel sprays. Hard tube scale,about 23-37 cm (9-15 inches) above the tube sheet, prevented lance insertion into the hot legcentral regions and tube sheet assessments in these areas. Roughly 2.5-7.5 cm (1-3 inches) oftube scale was also found in a few cold leg areas examined.15
365

The post chemicai clean tube sheet lancing activities dislodged roughly 520 kg of BOCCinsoluble residues. Inspections done afterwards showed that the height of the tube scale wasreduced to a maximum of about 15 cm (6 inches) in six boilers. Roughly 2.5-5 cm (1-2 inches) oftube deposit remained in a few cold leg areas inspected. It is believed that the reduction in hardtube scale, not observed in Unit 3 a year before, resulted from:
1. Addition of the boiling crevice step to the BOCC sequence, and2. The more effective tube sheet rinses after each cleaning cycle. These more vigorous rinses
flushed out more of the undissolved particulates which settled on the tube sheet and sludgepiles, and provided an effective barrier between the hard tube deposits and the cleaningsolvents. Post BOCC tube sheet flushes in Unit 3 removed roughly 450 kg more of depositcompared with the same operations carried out in Unit 1.
5.4 Unit 3 -1996
By 1996, Unit 2 had been laid up partly due to the poor condition of its boilers. Because ofheightened concerns over degradation caused by crevice corrosion in the U-bend area, a case toperform crevice cleaning on Unit 3 and 4 boilers was submitted and approved in 1995.
Although the 1995 Unit 1 BOCC campaign resulted in significantly cleaner scallop barsand hourglass regions, further improvements in the cleaning process were clearly required toensure the recleaning of Units 3 and 4 could be justified. To this end, the various parametersaffecting the crevice solvents' potency were reviewed and a process qualification/optimizationprogram for Units 3 and 4 undertaken. The susceptibility of AISI-1018 scallop bar material topitting in the crevice solvent continued to be a major concern throughout the new qualificationprogram and was closely monitored.
The test program focused on varying application parameters for the crevice solvent, butnot for the copper solvent which was considered relatively benign. The three crevice solventapplication scenarios were:
1. The same crevice solvent composition and application temperature, 121°C, as used in Unit 1but with 2 vents per hour instead of 1. This test clearly showed the benefits of more frequentventing cycles. As a result, the crevice solvent was qualified for application for the sameexposure duration as used during the previous Unit 1 clean: 67.5 hours total, with 50 hours atfull height.
2. The same solvent and venting frequency as above, but applied at 107°C. It was hoped thatthe lower temperature would permit a longer exposure to the crevice solvent and moreventing cycles before the onset of pitting in AiSI-1018. This was found to be the case and thecrevice solvent was qualified for application at 107°C with 2 vents per hour for up to 110 hours(maximum field duration = 100 hours).
3. The Babcock and Wilcox (B&W)/FTI high temperature process applied at 143°C. Thisprocess was successfully applied at several US utilities using primary heat to maintain thesolvent temperature. During the Bruce A qualification tests, the high temperature processeffectively cleaned experimental crevices but corrosion of AISI-1018 was unacceptably high.As a result, this high temperature process was not qualified for use at Bruce A. It was alsounclear whether the BOCC equipment had the capabilities of reaching and maintaining therequired process temperature in the permitted duration of the high temperature step.
A 3-step process was ultimately selected for use in Units 3 and 4. The cleaning sequenceincluded a single copper step, followed by the 107°C crevice step with 2 vents per hour for 100hours at full height, and finally, the B&W/FTI low temperature passivation step. Bruce A licensedthe latter process from B&W/FTI.25 Units 3 and 4 had been previously cleaned and the copperbearing components in the feed trains replaced. None-the-less, it was expected that there wouldbe residual copper in the remaining tube sheet deposits. This necessitated an initial copper stepto avoid excessive copper plate out and corrosion during the crevice step. In addition, the
366
B&W/FTI passivation process was selected to reduce outage critical path time and BOCC solventwaste. As in Unit 1 the year before, AISI-1018 and SA-515 Gr. 70 coupons were periodicallyexamined during the crevice step to watch for the onset of pitting.
Free EDTA concentration was also identified as an important factor in the crevicesolvents' effectiveness. During the Unit 1 clean, the use of direct steam injection heaters resultedin solvent dilution and free EDTA concentrations less than 100 g/L. For Units 3 and 4, a minimumfree EDTA concentration of 170 g/L was specified. To avoid solvent dilution, a plate-type heatexchanger, heated by building steam, was installed in the BOCC system. Use of the new heatexchanger required removal of large condensate volumes due to the low quality building steamutilized for supplying heat.
Water lancing operations, before and after chemical cleaning, were limited only to theHLUBS and tube sheets. Lancing of the TSPs was not carried out since the supports were leftvirtually deposit free in 1994 and, by that time, BOCC was a proven method for cleaning partiallyblocked broached holes.
5.4.1 Chemical Cleaning
About 2,500 kg of deposits, primarily magnetite, were dissolved during the recleaning of Unit 3,compared with approximately 6,800 kg in 1994. The total corrosion measurements from bothcleans were within the permitted allowances (Refer to Table 6).
For the east bank clean, the crevice step was executed as planned, i.e., at full height for100 hours at 107°C and two 1-minute vents per hour. Visual inspections done after chemicalcleaning showed broached holes and HLUBS scallop bar surfaces to be almost free of deposit.Nearly all hourglass areas examined were cleaned out and only thin residues were left behind inthese land regions. From these inspections, it was evident that the crevice step applied in Unit 3was much more effective than the one carried out in Unit 1 a year earlier. However, most tubesheet deposits remained intact, as described later in Section 5.4.2.
The crevice step for the west bank clean was modified in an attempt to enhance tubescale removal at the tube sheet. After 100 hours at 107°C and full height, the crevice solvent levelwas lowered to below TSP 2 and the temperature raised to 121°C. The 121°C phase of thecrevice step lasted only about 5 hours because of free EDTA depletion and schedule constraints.As described Section 5.4.2 below, this process modification did not result in better tube scaleremoval in the hot leg area. Results from the post BOCC visual inspections of the west bankHLUBS were nearly identical to those of the east bank; hourglasses and scallop bar surfaceswere nearly deposit free.
Operational difficulties during the second Unit 3 clean included a steam drum temperaturedifferential event during the heat up rinse prior to applying the crevice step on the first (east) bank.Procedures were again revised prior to cleaning the second bank to avoid a recurrence.
A second upset occurred during the first vent cycle in the east bank crevice step. A smallquantity of crevice solvent was ejected out of the safety relief when it was opened. This wasunexpected since there was no similar occurrence during the 1995 Unit 1 clean, which involved a121°C crevice step. The most likely explanation is that the crevice solvent tends to produce astable foam at the lower application temperature of 107°C. To avoid this problem, the ventduration was reduced, which resulted in less vigorous boiling. In addition, the lower solventinjection nozzle was used to reduce nitrogen entrapment at the solvent surface.
A comment is warranted about the post BOCC start up chemistry. After the Unit 3 restart,boiler sulphate levels remained at elevated levels for an extended period. Increased blowdownkept the sulphate level within specification, but only at the expense of high demineralized waterusage and lower Unit power output. It appears likely that the crevice solvent containing a sulfur-
367

bearing corrosion inhibitor was left behind in numerous cut boiler tubes and other steam drum andboiler dead legs. The inhibitor sulfur is rapidly converted to sulphate at operating temperatures,but diffusion back into the boiler water during operation could have caused the chronically highsulphate levels experienced. Another contributing factor was that virtually all boiler deposits inwhich the sulphate could previously hide out were removed from the Unit 3 boilers.
5.4.2 Water Lancing
Post BOCC inspections of the TSPs could only be performed in a few selected boilers due toschedule constraints. The inspections showed TSP broached holes to be virtually deposit free, asexpected, with thin residues remaining in the land areas.16
Pre BOCC visual inspections done before lancing showed the HLUBS to be lightly coatedwith black deposits with many scallop divisions clearly visible. All hourglass areas were filled withdeposits. The lancing operations carried out before BOCC cleaned the HLUBS top and bottomsides well enough to expose 70-100% of the scallop bar surfaces, but did not change thecondition of the hourglass areas. At the end of the BOCC and lancing operations, 95-100% of thescallop bar surfaces were visible on both sides and nearly all hourglass land areas inspected wereessentially free of deposits.
Tube sheet lancing operations before BOCC dislodged roughly 162 kg of sludge for alleight Unit 3 boilers, compared with 46 kg after BOCC (Refer to Table 7). Tube deposit profilemaps generated before chemical cleaning and after water lancing were nearly identical to thoseproduced at the end of the 1994 cleaning operations. The cold leg and outer hot leg areas werecleaned down to the tube sheet, but hard tube deposits remained about 13-15 cm (5-6 inches)above the tube sheet in.the hot leg central areas preventing tube sheet inspections in theseareas.18 However, several differences were observed during inspections after BOCC and lancing:
1. The height of the hot leg tube scale in seven boilers had been reduced by 2.5-10 cm (1-4inches). There were no discernible differences between the east and west bank boilers.
2. Roughly 7.5-15 cm (3-6 inches) of hard sludge was evident in some hot leg areas which werepreviously inaccessible before BOCC.
3. The minor tube scale seen in a few cold leg areas before BOCC was removed.
Considering these findings, it is unlikely that the modified crevice step performed on west bankboilers enhanced tube scale removal in the tube sheet areas. The overall improvement in tubescale removal likely resulted from fewer insoluble residues being generated during the 1996BOCC, thereby leaving more of the hard tube deposits exposed to the chemical cleaning solvents.
6.0 Review of BOCC and Water Lancing Operations
Plans to reclean Unit 4 boilers in 1998 were well advanced when the decision to shutdown the Bruce A Units by March 31, 1998, was announced in August of this year. All four Unitswill remain shutdown until at least 2003. To restart, the Bruce A Units may require new boilersand pressure tubes. As a result, the Unit 4 BOCC operations were recently canceled.
None-the-less, it is important to mention the successes and lessons learned from BOCCand lancing operations carried out at Bruce A from 1993 to 1996. One of the most notablesuccesses of these cleaning campaigns was the removal of about 30,700 kg of boiler secondary-side deposits from the three units over this period by the combination of water lancing andchemical cleaning. Several other noteworthy experiences gained from these cleaning operationsare:
1. The combination of water lancing and chemical cleaning effectively rendered TSP broachedholes deposit free. As a result, boilers in all three Bruce A units are expected to run until thescheduled shutdown without concerns over level oscillations.
2. The most effective crevice cleaning step to date was applied on Unit 3 boilers in 1996. As a
368
result, HLUBS degradation rates are expected to be significantly reduced for this Unit over itsremaining life.
3. The tube sheet lancing system efficiently removed large quantities of loose sludge. However,improvements to the system are required to breakup hard sludge deposits.
7.0 References
1. "High-pressure Water Lancing Application at Ontario Hydro Nuclear Generating Stations," byJ. Malaugh, M. Upton, S. Ryder (Ontario Hydro) and D. St. Louis (BWC Canada), Jet CuttingTechnology-Proceedings of the 10th International Conference, p.449-471, Elsevier PublishersLtd., 1991.
2. "BNGS-A Unit 1 Short-Term Cleaning Program," by D. Andrew and S. Chan (Ontario Hydro),Ontario Hydro Report No: CPS-N-33110-0002, April 4, 1991.
3. "Chemical Cleaning of Pickering Unit 5 Boilers, September-November 1992, Summary ofChemistry and Corrosion," by J.M. Smee (Niagara Consultants Ltd.), Ontario Hydro ReportNo: NOCD-IR-01840-0001, November 1992.
4. "Bruce A Unit 4 Chemical Cleaning Corrosion Monitoring Final Report," by M.L. McGinnis(BWNT), BWNT Document No. 51-125061-00, August 22, 1994.a
5. "BNGS-3 Chemical Cleaning Corrosion Monitoring Final Report," by M.L. McGinnis (BWNT),BWNT Document No. 51-1235061-00, July 17, 1995.a
. 6. "Bruce A Unit 1 Chemical Cleaning Corrosion Monitoring Final Report," by CD. Palmer(BWNT), BWNT Document No. 51-1244857-00, January 25, 1996."
7. "Bruce A Unit 3 Chemical Cleaning Corrosion Monitoring Final Report," by CD. Palmer andLA. Brennen (FTI), FTI Report No. 51-12244890-00, September 15, 1996.a
8. "Bruce A Unit 4 Boiler Water Lancing Operations, February-October 1993, Summary ofSupport Plate, U-bend and Tube Sheet Water Lancing," by F. V. Puzzuoli (Ontario Hydro),Ontario Hydro Report No: NK21-33110-94004, January 1994.
9. "Ontario Hydro Bruce Nuclear Generating Station "A" Unit 4 - CECIL® System Tube SheetWater Lancing Field Operation, August-October 1993," Foster-Miller Inc. Report issuedNovember 5, 1993.
10. "Bruce A Unit 3 Water Lancing Operations, May-August 1994, Summary of Support Plate, U-Bend and Tube Sheet Water Lancing," by F. V. Puzzuoli (Ontario Hydro), Ontario HydroReport No: NK21-33110-0004 Rev.0, November 26, 1994.
11. Ontario Hydro Bruce Nuclear Generating Station "A" Unit 3 - CECIL® Tube Sheet WaterLancing Field Operation, April to August 1994," Foster-Miller Inc. Report issued November1994.
12. "Bruce A U4 33110 In-Service Inspection of Boiler Secondary-side Components," by D.McCabe (Ontario Hydro), Ontario Hydro Report No: NK21-33110-955113.
13. "U1 1995 In-Service Inspection of Secondary-Side Components," by D. McCabe (NTS),Ontario Hydro Report No: NK21-33110-955236, March 12, 1996.
a References 4-7 are available only with the written permission of FTI.
369

14. "Bruce Nuclear Generating Station "A" Unit 1: Steam Generator U-bena and Tube SupportPlate Water Lancing Report." BabcocK and Wilcox (Canada) Ltd. Report No: BWi-TR-96-04,Rev.O, April 4, 1996.
15. "Ontario Hydro Bruce Nuclear Generating Station. Unit 1 - CECIL® System Steam GeneratorTubesheet Water Lancing Services," submitted by Foster-Miller Canada Ltd. to Bruce AProjects and Modifications Department. March 20,1996.
16. "In-Service Inspection of Boiler Secondary-Side Components," by D. McCabe (NTS), OntarioHydro Report No: NK21-33110-965545, September 5, 1996.
17. "Bruce Nuclear Generating Station "A": Steam Generator U-bend Water Lancing Report,"Babcock and Wilcox (B&W) Canada Ltd. Report: BWI-TR-96-33, September 1996.
18. "Ontario Hydro Bruce Nuclear Generating Station A Unit 3: CECIL® System Tube SheetWater Lancing Services, Field Operation Report May to July 1996," Foster-Miller Inc. Reportsubmitted to Bruce A Projects and Modifications, November 1996.
19. "Chemical Cleaning of the Bruce A Unit 4 Steam Generators and Preheaters, April-July 1993,Summary of Chemistry and Corrosion," by S. J. Persi (Ontario Hydro), Ontario Hydro NTSReport No: N-IR-01840-0033.
20. "Recent Experience in Boiler Chemical Cleaning in Ontario Hydro," by P.J. Leinonen, CM.Daniel, W.A Harper, A. Lowe and K.R. Brennenstuhl (Ontario Hydro), Proceedings of the CNSSteam Generator Heat Exchanger Conference, Toronto, Ontario, June 1994.
21. " Bruce NGS-A Unit 4 Restart- Boiler Condition Assessment: Attachment 3 - ConditionAssessments of Unit 4 Boiler U-Bend Supports," memo to P.G. Hawley (AECB) from K.H.Talbot (BNGS-A), File: BGA-00531, November 3,1993.
22. "Bruce NGS-A Unit 3 Steam Generator Inspection and Refurbishment: Attachment 1 - U-bend Inspection, Modification and Installation of Anti-Vibration Bars," memo to P.G. Hawley(AECB) from K.H. Talbot (BNGS-A), File: BGA-00531 (P), August 24, 1994.
23. "Including a Crevice Step in Boiler Chemical Cleaning for Unit 1," memo from K.H. Talbot(BNGS-A) to P.G. Hawley (AECB), File: BGA-00531 (P), September 5, 1995.
24. "Thermohydraulic and Flow Induced Vibration Analysis: Bruce "A" Unit 1 Steam GeneratorAfter Chemical Cleaning," by R. Sauve and M. Tabatabai, Ontario Hydro Technologies ReportNo: A-NSG-95-97-CON, August 4, 1995.
25. "Technical Requirements for Application of FTI/B&W Passivation Process at BNPD," memofrom C. Meyer (FTI) to P. Leinonen (Ontario Hydro), FTI Document No. 51-1244888-00, June7, 1996.
370

TABLE 1 BRUCE A STEAM GENERATOR DATA
Steam Generator Type:No. of Tubes/Boiler:Boiler Tube Material:Hot Leg Temperature:Cold Leg Temperature:No. of Tube Support Plates(TSPs)/Boiler:TSP Material:TSP Design features:
No of U-bendSupports/Boiler:
U-bend Material:U-bend Support DesignFeatures:
No-Tube-Lane:
Tube Sheet:
Weld Material:
Babcock and Wilcox inverted U design.4,200I-600304°C (579°F)265°C (509°F)Seven 2.54 cm (1-inch) thick TSPs spacedabout 89 cm (35 inches) apart.SA-515, Gr. 70 carbon steel.• Trefoil broached holes.• -0.47 cm (0.18 inch) wide tube lanes at 90°,
30° and 150° to the no-tube-lane (NTL).• 4 tie rods located in NTL between TSP 1&7.
Additional 20 tie rods located within the tubebundle.
3 sets of stacked scallop bars: one at 90° andthe others on the hot and cold leg sides at 40° tothe horizontal.AISI-1018 carbon steel.• Individual bars have half-tube scallops
alternated from top to bottom.• Hourglass shaped land areas around each
tube.• Supports held together at edges by studs
and through the middle by forks (6 forks persupport).
• 90° support holds tube rows 15 to 95. *• Both 40° supports hold tube rows 42 to 95.*• Separates hot and cold leg sides.• ~6.85 cm (2.7 inches) wide.• 4 tie rods along the center.• 2.52 m (99 inches) in diameter.• 36.8 cm (14.5 inches) thick in the tube
region.• Weld overlaid with I-82 on the primary side to
facilitate tube welding.Shielded Metal Arc Weld (SMAW) E7018, A1
Small gap present between tube rows 14 and 15 in the U-bend region. Rows 1-14 are unsupported.
371

TABLE 2 BOCC AND CMS SYSTEM DESIGN FEATURES
System Feature DescriptionBOCC Location Process modules located and tanks outside on the North side of the Bruce
A Power House (See Figure 2).Process skids located inside the power house.
Designers/Registration
Designed by AECL and PN ServicesRegistered as a Class 6 non-nuclear system.
Cleaning Capacity System can clean 4 steam generators at a time.Process Control Manually operated system.
Critical valves & pumps can be controlled with computer located in ControlModule.Computer controlled by "In Touch" software and contains preprogrammedshutdown criteria for safe operation.
Chemical Handling 35% or 50% (wtA/vt) H2O2 and 99% EDA stored in rented road tankersfitted with temporary containment dikes.40% (wt/wt) EDTA stored in one of four frac tanks.CCI-801 inhibitor and 35% (wt/wt) hydrazine delivered in 350-550 gallonsteel totes and off-loaded in the drum module.30% (wt/wt) ammonium hydroxide delivered in 45 imp. gallon drums andoff-loaded in drum module or from rental tanker (Unit 3, 1996).Air powered diaphragm pumps used to transfer chemicals from the drummodule to mix tanks.
Solvent Preparation& Recirculation
Copper, iron and rinse solvents prepared in 3 separate 136,000 liter tanks.Recirculation pump can be valved to other solvent preparation systems if apump failure occurs.Up to 110,000 liters needed to fill 4 boilers and BOCC system lines.Solvent can be recirculated up to 80 liters/second, i.e., ~1 system volumeevery 30 minutes.Solvent introduced at top of boilers via 3" nozzle above U-bend area.Solvent drained out through boiler blow down lines.-100 kPa(g) nitrogen blank maintained inside boilers and steam drum toensure adequate NPSH.Constant nitrogen purge through steam drum to avoid hydrogen build upfrom carbon steel corrosion.
Heating Initially through a combination of electric heaters and plant steam (-600kPa(g)).Plate-type heat exchanger installed prior to 1996 Unit 3 clean to achievequick heat up and avoid solvent dilution by steam injection.
Level Measurement Pressure difference between cover gas and nitrogen bubbles introducedinto blow down box header is translated to level readings.Static levels confirmed by sight glasses.
Waste Handling Two main tanks enclosed in a containment dike receive waste. (Totalcapacity = 650,000 liters).3 of 4 frac tanks act as backup for waste transfer."Non active" waste must have <2uCi/kg total U & y radiation. Spent SolventTreatment Facility (SSTF) on site can only hold a limited quantity of activematerial.Active waste can be transferred to contingency waste facility inside thestation fence.
372

TABLE 2 (Continued)
System
CorrosionMonitoring(CMS)
Feature
On-linemeasurement
Locations
Description
• Combination of Linear Polarization (LP) and Zero Resistance Ammetry(ZRA) methods to measure general and galvanic corrosion respectivelyon-line.
• Weight loss measurements for coupons and dimensional changes onmockups provide the official corrosion results.
• LP, ZRA and coupons located at various boiler elevations to track andmeasure differences in corrosion.
373
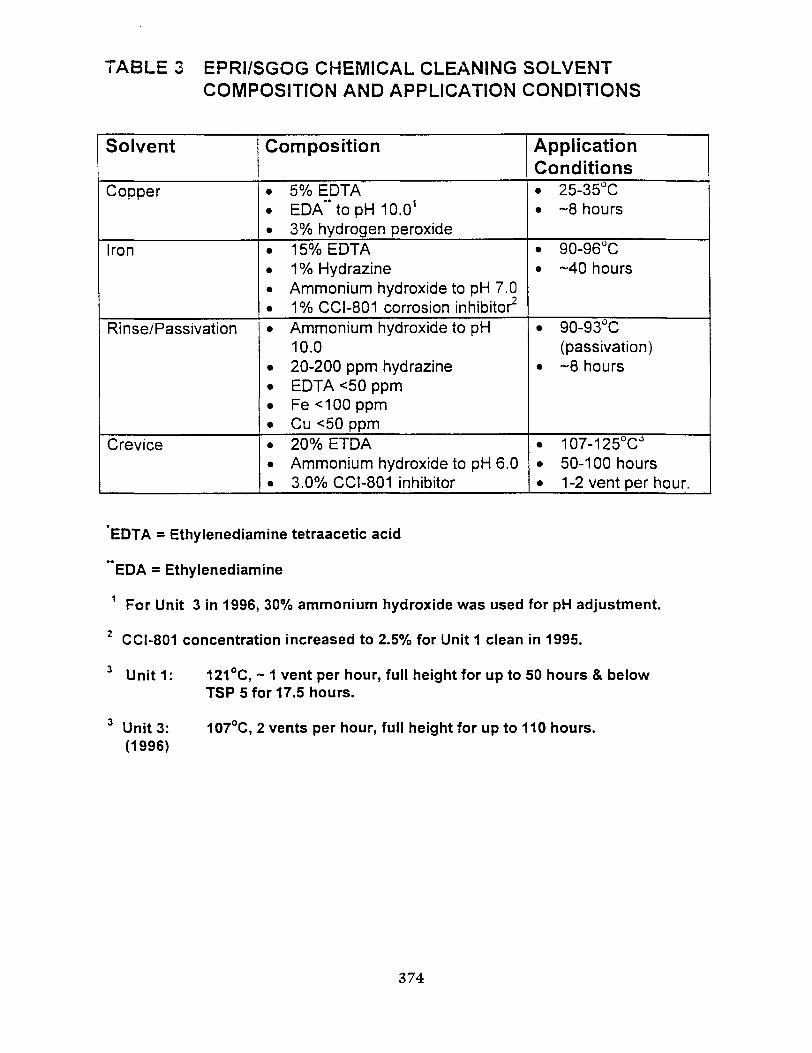
TABLE 3 EPRI/SGOG CHEMICAL CLEANING SOLVENTCOMPOSITION AND APPLICATION CONDITIONS
Solvent
Copper
Iron
Rinse/Passivation
Crevice
Composition
• 5% EDTA• EDA"*topH 10.01
• 3% hydrogen peroxide. 15% EDTA• 1 % Hydrazine• Ammonium hydroxide to pH 7.0• 1% CCI-801 corrosion inhibitor2
• Ammonium hydroxide to pH10.0
• 20-200 ppm hydrazine• EDTA <50 ppm• Fe<100ppm• Cu <50 ppm• 20%ETDA• Ammonium hydroxide to pH 6.0• 3.0% CCI-801 inhibitor
ApplicationConditions• 25-35°C• ~8 hours
• 90-96°C• ~40 hours
• 90-93°C(passivation)
• ~8 hours
• 107-125°CJ
• 50-100 hours• 1-2 vent per hour.
EDTA = Ethylenediamine tetraacetic acid
**EDA = Ethylenediamine
1 For Unit 3 in 1996, 30% ammonium hydroxide was used for pH adjustment.
2 CCI-801 concentration increased to 2.5% for Unit 1 clean in 1995.
3 Un i t i : 121°C, - 1 vent per hour, full height for up to 50 hours & belowTSP 5 for 17.5 hours.
3 Unit 3: 107°C, 2 vents per hour, full height for up to 110 hours.(1996)
374

TABLE 4 WATER LANCING SYSTEM FEATURES
LancingSystem
(Designer)TSP
(BWC)
HLUBS(BWC)
Tube Sheet(FMI)
Type
Semi-manual
Automated
Semi-Manual
Automated
Automated
Key Features
• Used for 1993 Unit 4, 1994 Unit 3 and 1994 Unit 1 TSPcleaning operations.
• Flexible intertube lances with the following typical dimensions:294.6 cm X 0.29 cm X 3.81 cm (116 in. X 0.115 in. X 1.50 in)
• Lances contain 6-8 flexible Kevlar™ wrapped tubes.• Water jets from lance directed parallel to boiler tubes.• 90° tube lanes accessed through a manually operated lance
guide inserted in a port aligned with the NTL.• Lance movement controlled with an air drive.• Water supplied by high-pressure pump located outside the
boiler room.• Water removed from boilers with a suction pump hooked up to
1-inch boiler blow down line and filters.• Used for Unit 1 operations in 1995.• Lances, lance guides and water supply/removal systems similar
to those in semi-manual system.• 90° tube lanes accessed through port aligned with NTL.• Lance/guide drive assembly controlled by computer outside
boiler room and has separate lance and guide drives.• System designed for remote operation of high-pressure pumps.• Used during 1993 Unit 4 U-bend lancing campaign.• Designed to enter gap between tube rows 14&15 through a port
above TSP 7.• Lances, lance guides and pump/filtration assembly similar to
semi-manual TSP system.• Lance guides built to rotate allowing access to the HLUBS top
and bottom sides through 90° tube lanes.• Movement of lance controlled with an air drive.• Used during 1994 Unit 3, 1995 Unit 4, 1995 Unit 1 and 1996
Unit 3 cleaning operations.• Access to 90° tube lanes through gap between rows 14&15.• Lances, lance/guide drive assemblies and control similar to that
of the automated TSP lancing system.• Used during 1993 Unit 4, 1994 Unit 3, 1995 Unit 1 and 1996
Unit 3 lancing campaigns.• Separate skids contain surge tank, filter housings, water
storage tank, lance and barrel spray supply pumps.• High-pressure lance, for hard sludge removal, made of
segmented metal pieces and fitted with 4 Kevlar™ pressuretubes and a fibrescope.
• Access to 90° tube lanes through a port aligned with NTL.• 90° and 30°/150° barrel spray units used for low pressure tube
sheet flushing operations.• Lances and barrel spray units were remotely controlled from a
computer outside the boiler room.
375

TABLE 5 SUMMARY OF CHEMICAL CLEANING CAMPAIGNS
Unit 4(1993)
Unit 4(1993)
StepNo.
1
234
5
Step
Cu1-1
Cu1-2Cu1-3Fe1-1
Cu2-1
ApplicationTemperature
<35
"-93
<35
Duration(hours)
-5
-5-5
8.5 - west bank40 - east bank
-8TOTAL
Unit 3(1994)
StepNo.
1234
Step
Cu1-1Cu1-2Fe1-1Cu2-1
ApplicationTemperature
<35
-93<35
Duration(hours)
<5-8100-8
TOTALUniti(1995)
StepNo.
12345
Step
Cu1-1Cu1-2Fe1-1CM
Cu2-1
ApplicationTemperature
<35u
-93-121<35
Duration(hours)
<10
-2067.5<10
TOTALUnit 3(1996)
StepNo.
123
Step
Cu1-1CM
Cu2-1
ApplicationTemperature
<35107<35
Duration(hours)
-8100-110
-8TOTAL
DepositRemoved
(kg)2,303
627250
2,841
2336,254
DepositRemoved
(kg)2,359412
3,859175
6,809Deposit
Removed(kg)
2,563506
3,4341,686287
8,476Deposit
Removed(kg)31
2,292204
2,527
Total WasteVolume (liters)
-1,744,000
Total WasteVolume (liters)
-990,000
Total WasteVolume (liters)
-1,108,000
Total WasteVolume (liters)
-717,000
For brevity, the rinse steps between the copper (Cu) and iron (Fe)/crevice (Cr) cycles andpassivation steps are not shown.
" Individual steps are denoted by the type (Cu, Fe or Cr), followed by the cycle and stepnumbers. For example, Cu2-1 refers to the first copper step in the second copper cycle.
~50 hours at full height and 17.5 hours between TSP 5 and the tube sheet.
376

TABLE 6 SUMMARY OF CORROSION DATA FOR BRUCE ABOILER CHEMICAL CLEANS
Material
SA-515,Gr.70
(TSPs)AISI-1018(U-bends)AISI-1015(Internals)
SMAWE7018, A1
(welds)
CorrosionAllowance
(mils)*6
6
27.5
27.5
Unit 4(1993)
0.70
0.53
2.90
4.20
Unit 3(1994)
1.26
1.71
2.20
9.70
Uniti(1995)
1.13
1.03
1.53
6.44
Unit 3(1996)
0.60
0.49
0.64
3.30
% Total ofAllowance for Both
Unit 3 Cleans31
37
10
47
1 mil = 0.001 inch = 25.4 urn
" Corrosion allowance for SA-515, Gr.70 and AISI-1018 carbon steels was revised from 3.0to 6.0 mils before the 1995 Unit 1 clean, based on Flow Induced Vibration (FIV) analysis.
"Corrosion penetration for the SMAW material during the 1994 Unit 3 clean wasdetermined from weight loss measurements performed on severely pitted coupons.Maximum pit depth was <30 mils, but inspections of boiler internal welds did not reveallocalized attack as found on coupons.
377

TABLE 7 WATER LANCING RESULTS: 1993 -1996
Unit(Year)Unit 4(1993)
Unit 3(1994)
AreaLanced
TSPs
HLUBS
Tube Sheet
TSPs
HLUBS
Tube Sheet
OperatingPressure10,000 psig
(pump)
7,500 psig(pump)
5,000 psig(nozzle) forstraight-aheadand side-shooting lance
3,000 psig(nozzle) for 90°and 30°/150°barrel sprayunits.
10,000 psig(pump)
8,000 psig(pump)
5,000 psig(nozzle) forstraight-aheadlance.
3,000 psig(nozzle) for 90°and30°/150°barrel sprayunits
Pre BOCCLancing
TSPs 3-7. Limited toareas where
broached holeblockage was >40%.
East bank only.
Not done due totiming ofcontainment sealinstallations.
East and west bank.Limited to someareas of TSP 1, 6and 7 wherebroached holeblockage >60%.East and west bank.
East and west bank.
Post BOCC Lancing
Only some areas of TSP1&2 in the west bankwhere broached hole
blockage was up to 100%.
East and west bank.
East and west bank.
Not required asdetermined from visual
inspections.
East and west bank.
East and west bank.
Key Results
• Water lancing reduced broacned holeblockage to 0-10% (10-20% atworst).
• BOCC operations left TSP broachedholes "as new" with 0-5% blockage(0-10% at worst).
• Shorter magnetite step during westbank BOCC left some areas in TSP1&2 up 100% blocked. Waterlancing reduced blockage in theseregions to 20% or less.
• Tube land deposits left on all TSPsat the end of the cleaning operations.
• Pre BOCC lancing of east bankremoved some surface deposit butleft hourglass areas dirty.
• Post BOCC operations on the eastbank left 30-60% surface exposed onthe top side, compared with 60-80%on the bottom side.
• Boiler 1 HLUBS left cleaner thanthose in Boilers 2, 3 & 4, TheHLUBS in the latter boilers were leftwith 0-10% and 0-50% surfaceexposure on the top and bottomsides respectively.
• 2.201 kg of tube sheet depositremoved.
• Cold leg and outer hot leg centralareas cleaned down to the tubesheet.
• Hard tube scale left in the hot legareas about 15-18 cm (6-7 inches)above the tube sheet. Tube sheetinspections were not possible inthese regions.
• Hard sludge piles were not evident inthe restricted hot leg zones.
• Combination of lancing and BOCCleft broached holes virtually depositfree with 0-5% blockage (10-20% atworst).
• Tube land deposits remained in mostTSP areas inspected after BOCC.
• Lancing before BOCC exposedscallop bar surfaces but lefthourglasses filled with deposit.
• Post BOCC lancing left about 50%and 80% of surface exposed on topand bottom sides respectively.
• Most hourglasses left filled withdeposit at the end of lancing andBOCC activities.
• Pre BOCC lancing dislodged about1.770 ko of deposits, while postBOCC operations removed roughly875 kg of BOCC insoluble residues.
• Final tube sheet condition similar tothat of Unit 4 after water lancing.
• Cold leg and outer hot leg areascleaned down to tube sheet.
• 7.5-15 cm (3-6 inches) of hard tubedeposit left in hot leg central areas.
378

TABLE 7 (Continued)
Unit(Year)Unit 1(1994)
Unit 4(1995)
Uniti(1995)
AreaLanced
TSPs
HLUBS
CLUBS(Boiler 2 only)
TSPs
HLUBS
Tube Sheet
OperatingPressure10,000 psig
(pump)
10,000 psig(pump)
10,000 psig(pump)
10,000 psig(pump)
10,000 psig(pump)
5,000 psig(nozzle) forstraight-aheadlance.
3,000 psig(nozzle) for 90°and30°/150°barrel sprayunits
Pre BOCCLancing
Not applicable.
Not applicable.
Not applicable
East and west bank.Restricted to areasof TSPs 1-5 wherebroached holeblockage was >60%.
East and west bank.
East and west bank.
Post BOCC Lancing
Not applicable.
Not applicable.
Not applicable
Not required asdetermined from visual
inspections.
East and west bank.
East and west bank.
Key Results
• Lancing of TSPs 6&7 in all eightboilers reduced broached holeblockage to 20% or less.
• Water level oscillation problemstemporarily relieved.
• Lancing of HLUBS hourglass areas.removed most of surface deposit leftbehind after the 1993 cleaningactivities.
• Hourglass areas left filled withdeposit on top and bottom sides.
• HLUBS visual inspections showedsevere degradation in Boilers 2&7over 2 years and relatively minordegradation in other Unit 4 boilers.
• Scallop bar degradation more severein central HLUBS areas and insidehourglass regions.
• Most surface deposit removed.• Hourglasses left filled with deposit.• No evidence of scallop bar
degradation during visualinspections.
• Combined BOCC and water lancingoperations left broached holesvirtually deposit free (0-5%blockage).
• Tube lands cleaned to a greaterextent than in Units 3 & 4 previously.
• Thin residues left in the tube landareas.
• Lancing before BOCC exposed 50-80% of the scallop bar surfaces onthe top and bottom sides.
• Post BOCC lancing left 80-90% ofscallop bar surfaces clean on bothsides.
• Hourglass deposits were partiallyremoved by crevice cleaning step.
• Scallop bar degradation patternsimilar to that seen in Unit 4 earlier in1995.
• Roughly 2.000 kg of depositdislodged before BOCC, comparedwith about 520 kg after BOCC.
• Post lancing inspections beforeBOCC showed:1. Cold leg and outer hot leg areas
cleaned down to tube sheet.2. 2.5-7.5 cm (1-3 inches) of hard
scale in a few cold leg areasinspected.
3. 23-37 cm (9-15 inches) of hardtube scale in hot leg centralareas.
• Similar inspection results after postBOCC water lancing except height ofhard tube scale reduced by 2.5-10cm (1-4 inches) in 6 of 8 boilers.
379
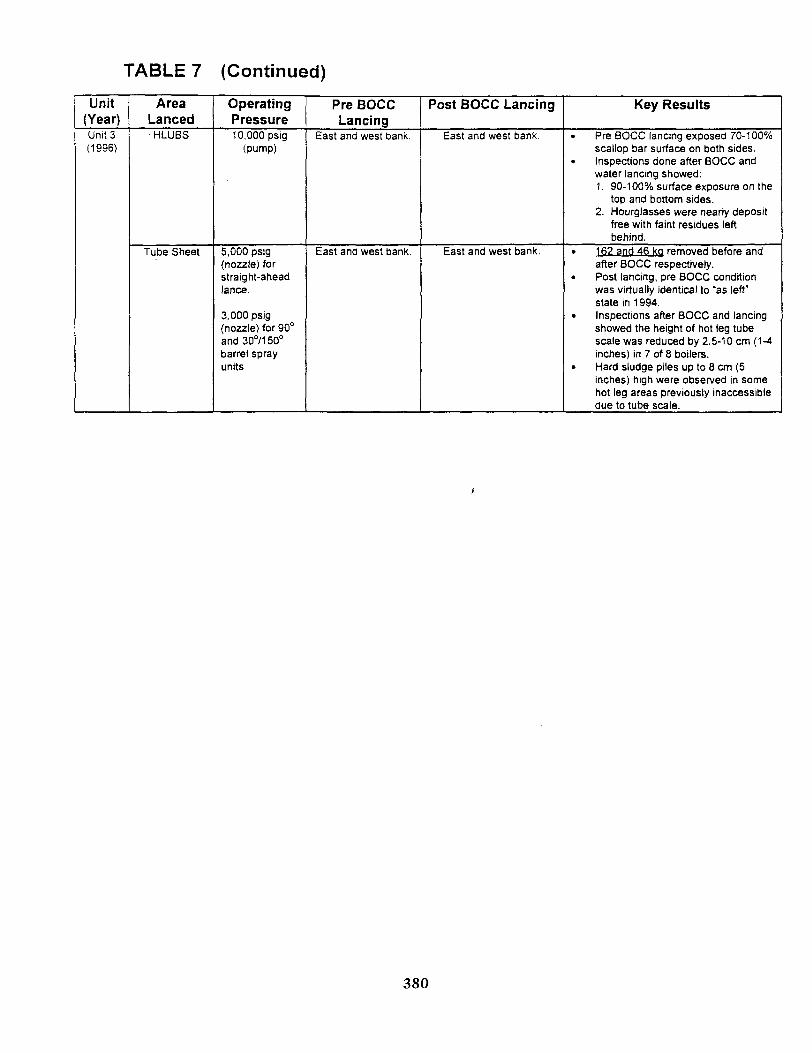
TABLE 7 (Continued)
Unit(Year)Unit 3(1996)
AreaLancedHLUBS
Tube Sheet
OperatingPressure10,000 psig
(pump)
5,000 psig(nozzle) forstraight-aheadlance.
3,000 psig(nozzle) for 90°and30°/150°barrel sprayunits
Pre BOCCLancing
East and west bank.
East and west bank.
Post BOCC Lancing
East and west bank.
East and west bank.
Key Results
• Pre BOCC lancing exposed 70-100%scallop bar surface on both sides.
• Inspections done after BOCC andwater lancing showed:1. 90-100% surface exposure on the
top and bottom sides.2. Hourglasses were nearly deposit
free with faint residues leftbehind.
• 162 and 46 ka removed before andafter BOCC respectively.
• Post lancing, pre BOCC conditionwas virtually identical to "as left"state in 1994.
• Inspections after BOCC and lancingshowed the height of hot leg tubescale was reduced by 2.5-10 cm (1-4inches) in 7 of 8 boilers.
• Hard sludge piles up to 8 cm (5inches) high were observed in somehot leg areas previously inaccessibledue to tube scale.
380
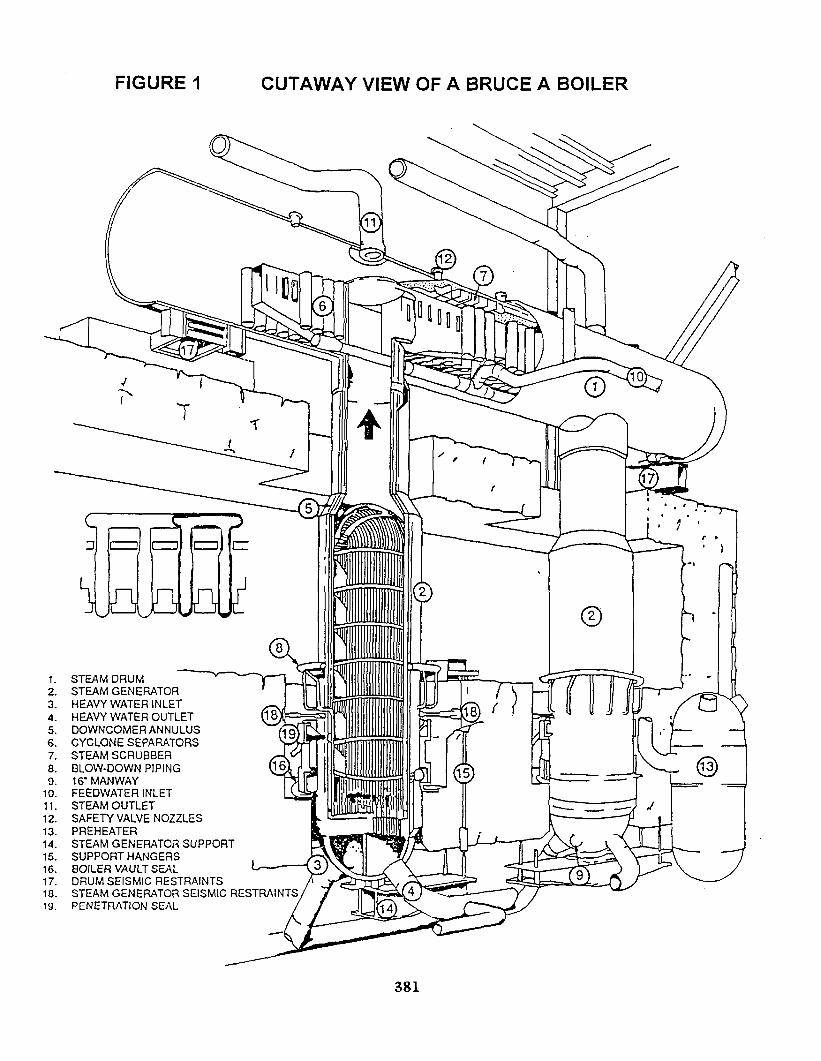
FIGURE 1 CUTAWAY VIEW OF A BRUCE A BOILER
1. STEAM DRUM2. STEAM GENERATOR3. HEAVY WATER INLET4. HEAVY WATER OUTLET5. DOWNCOMERANNULUS6. CYCLONE SEPARATORS7. STEAM SCRUBBER8. BLOW-DOWN PIPING9. 16-MANWAY
10. FEEDWATER INLET11. STEAM OUTLET12. SAFETY VALVE NOZZLES13. PREHEATER14. STEAM GENERATOR SUPPORT15. SUPPORT HANGERS16. BOILER VAULT SEAL17. DRUM SEISMIC RESTRAINTS10. STEAM GENERATOR SEISMIC RESTRAINTS19. PENETRATION SEAL
381

FIGURE 2 BOILER CHEMICAL CLEANING SYSTEM LAYOUT
00
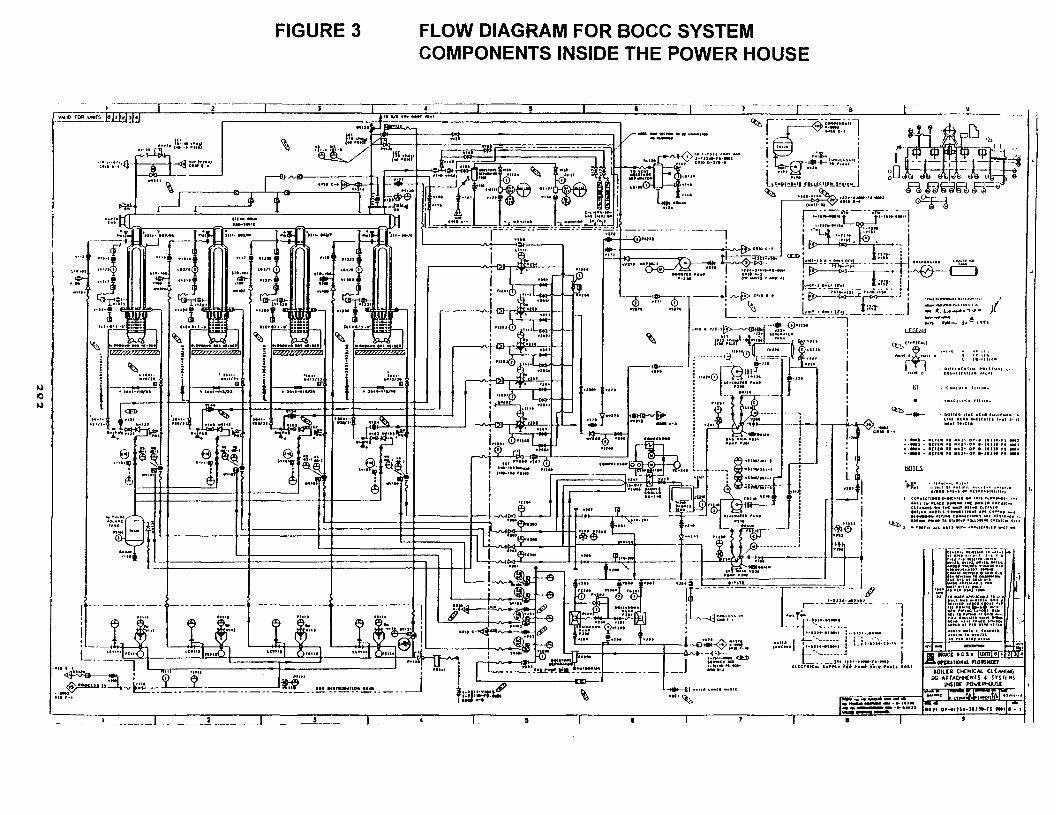
FIGURE 3 FLOW DIAGRAM FOR BOCC SYSTEMCOMPONENTS INSIDE THE POWER HOUSE
...... ! 1

FIGURE 4 TSP LANCE DESIGN FEATURES
Connection for HighPressure Hose
Lance Body With 8SS Tubes Encased inRigid Plastic Lance
Nozzle(0.040"drilledhole)
FrontManifol
Rear Lance Manifold Offsetting Water Jets-(Parallel to BoilerTubes)
TYPICAL LANCE DIMENSIONS: 9 ft, 6 in long.0.115 in thick1.5 in wide
384

FIGURE 5 CECIL® TUBE SHEET LANCING COMPONENTSINSIDE THE STEAM GENERATOR
Tilt Module
Lance Barrel
Flexible Lance(Fitted withFibrescope)
From Reference 9
385

B&W/FTI HIGH TEMPERATURE CHEMICAL CLEANING PROCESS
CA0000054
ABSTRACT
J. Jevec, McDermott Technology, IncJ. Remark, Framatome Technologies, Inc
W. Schneider, B&W Canada
Alliance Research Center1562 Beeson Street
Alliance, OH (USA) 44601
The B&W/ FTI Chemical Cleaning program hasa long history marked by many successful fieldapplications. These include development of amagnetite dissolution solvent in the early1970's, participation in the EPRI/SGOGchemical cleaning process developmentprogram, and participation in numerousapplications of the EPRI process in PWR reactorunits. The B&W/FTI chemical cleaning programalso includes the development and qualificationof the Bruce and Pickering chemical cleaningprocesses, and execution of that process onfour reactor units at Pickering. The Pickeringapplication included both the EPRI lowtemperature process and a modified version ofthe EPRI elevated temperature crevice process.A high temperature cleaning process has alsobeen developed by B&W/FTI for iron-baseddeposit removal from CANDU and PWR reactorunits. It has been successfully applied at twoPWR plants. Application of the hightemperature iron process is based on plant heatusing a reduced process equipmentconfiguration. The paper describes the hightemperature B&W/FTI chemical cleaningprocess, with emphasis on the testing of steamgenerator tubing materials, and includes asummary of the results of one field application.
INTRODUCTION
Corrosion products and other feedwatercontaminants from the preboiler cycle of thenuclear steam plant will be transported, duringoperation, to the secondary side of the steamgenerator where deposition will occur. As thedeposits increase in thickness and loading, theycan produce detrimental effects on the steamgenerator operation. The danger of tubingfailures due to corrosion also increases asdeposits accumulate . As depositionincreases, chemical cleaning becomes anindispensable tool to establish steam generator
reliability and availability.
The B&W/FTI chemical cleaning program has along history dating back to work on fossilboilers in the early 1950's. Building on thisfossil experience, Babcock & Wilcox (B&W)presented data (1) in 1971 showing that asolvent composition of 10% EDTA, 1 %hydrazine at an initial room temperature pH of7.0 will satisfactorily and safely removemagnetite from nuclear steam generators. In1978, the Electric Power Research Institute(EPRI) initiated a program to further thedevelopment of a nuclear steam generatorchemical cleaning process. The B&W solventbecame the basis for the current EPRI lowtemperature magnetite dissolution solvent. Inaddition B&W was one of the major contractorsin the EPRI chemical cleaning program(References 2, 3, 4).
The B&W/FTI chemical cleaning programincludes the development and qualification ofthe Bruce and Pickering chemical cleaningprocesses, and execution of that process onfour reactor units at Pickering (Reference 5).The Pickering application included both theEPRI low temperature process and a modifiedversion of the EPRI elevated temperaturecrevice process.
Through joint research and development, B&Wand Framatome have developed a hightemperature process that can be used toremove deposits from the secondary side ofCANDU and PWR steam generators. This R&Dwas funded by B&W and Framatome but wasoverseen and guided by U.S. and Canadianutilities pursuing chemical cleaning. Through aseries of customer review meetings, utilitiesprovided their input, expressed their concerns,witnessed testing, reviewed raw data and even
386
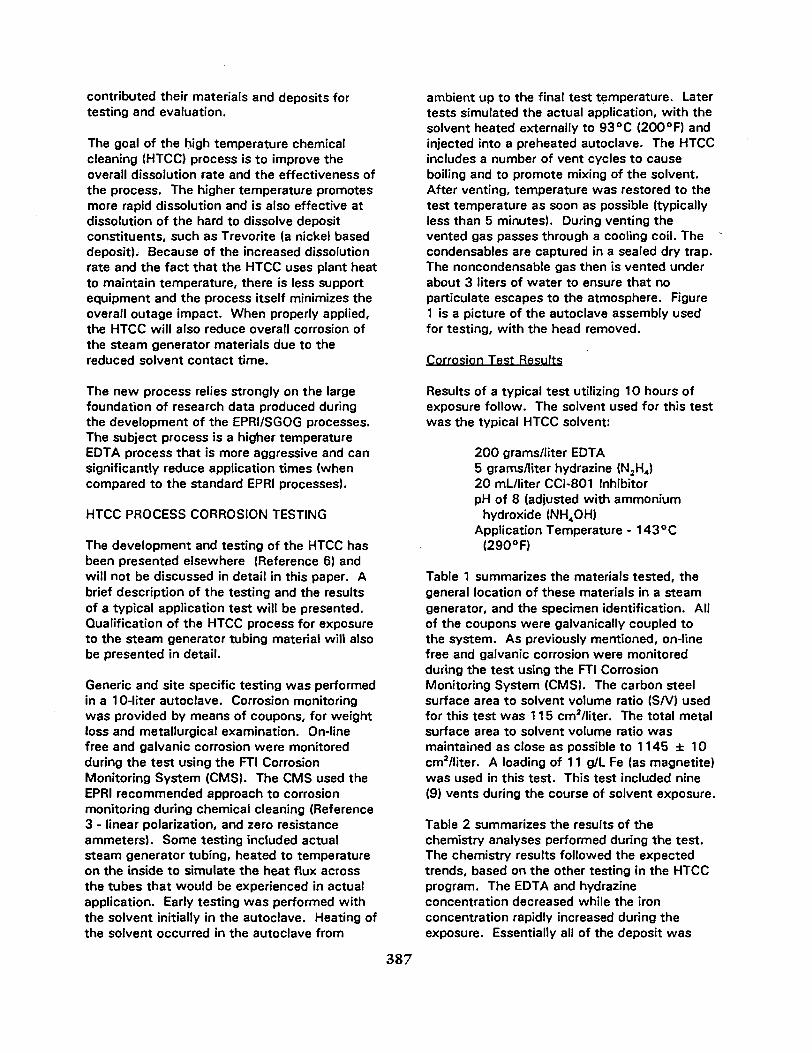
contributed their materials and deposits fortesting and evaluation.
The goal of the high temperature chemicalcleaning (HTCC) process is to improve theoverall dissolution rate and the effectiveness ofthe process. The higher temperature promotesmore rapid dissolution and is also effective atdissolution of the hard to dissolve depositconstituents, such as Trevorite (a nickel baseddeposit). Because of the increased dissolutionrate and the fact that the HTCC uses plant heatto maintain temperature, there is less supportequipment and the process itself minimizes theoverall outage impact. When properly applied,the HTCC will also reduce overall corrosion ofthe steam generator materials due to thereduced solvent contact time.
The new process relies strongly on the largefoundation of research data produced duringthe development of the EPRI/SGOG processes.The subject process is a higher temperatureEDTA process that is more aggressive and cansignificantly reduce application times (whencompared to the standard EPRI processes).
HTCC PROCESS CORROSION TESTING
The development and testing of the HTCC hasbeen presented elsewhere (Reference 6) andwill not be discussed in detail in this paper. Abrief description of the testing and the resultsof a typical application test will be presented.Qualification of the HTCC process for exposureto the steam generator tubing material will alsobe presented in detail.
Generic and site specific testing was performedin a 10-liter autoclave. Corrosion monitoringwas provided by means of coupons, for weightloss and metallurgical examination. On-linefree and galvanic corrosion were monitoredduring the test using the FTI CorrosionMonitoring System (CMS). The CMS used theEPRI recommended approach to corrosionmonitoring during chemical cleaning (Reference3 - linear polarization, and zero resistanceammeters). Some testing included actualsteam generator tubing, heated to temperatureon the inside to simulate the heat flux acrossthe tubes that would be experienced in actualapplication. Early testing was performed withthe solvent initially in the autoclave. Heating ofthe solvent occurred in the autoclave from
ambient up to the final test temperature. Latertests simulated the actual application, with thesolvent heated externally to 93 °C (200 °F) andinjected into a preheated autoclave. The HTCCincludes a number of vent cycles to causeboiling and to promote mixing of the solvent.After venting, temperature was restored to thetest temperature as soon as possible (typicallyless than 5 minutes). During venting thevented gas passes through a cooling coil. Thecondensables are captured in a sealed dry trap.The noncondensable gas then is vented underabout 3 liters of water to ensure that nopaniculate escapes to the atmosphere. Figure1 is a picture of the autoclave assembly usedfor testing, with the head removed.
Corrosion Test Results
Results of a typical test utilizing 10 hours ofexposure follow. The solvent used for this testwas the typical HTCC solvent:
200 grams/liter EDTA5 grams/liter hydrazine (N2H4)20 mL/liter CCI-801 InhibitorpH of 8 (adjusted with ammonium
hydroxide <NH40H)Application Temperature - 143°C
(290 °F)
Table 1 summarizes the materials tested, thegeneral location of these materials in a steamgenerator, and the specimen identification. Allof the coupons were galvanically coupled tothe system. As previously mentioned, on-linefree and galvanic corrosion were monitoredduring the test using the FTI CorrosionMonitoring System (CMS). The carbon steelsurface area to solvent volume ratio (S/V) usedfor this test was 115 cm2/liter. The total metalsurface area to solvent volume ratio wasmaintained as close as possible to 1145 ± 10cm2/liter. A loading of 11 g/L Fe (as magnetite)was used in this test. This test included nine(9) vents during the course of solvent exposure.
Table 2 summarizes the results of thechemistry analyses performed during the test.The chemistry results followed the expectedtrends, based on the other testing in the HTCCprogram. The EDTA and hydrazineconcentration decreased while the ironconcentration rapidly increased during theexposure. Essentially all of the deposit was
387

Table 1Summary of Tested Materials
Material
SA-106 GrB
AISI-1018
E7018 SMAW
SA533 GrA
SA533/8018SMAW/HAZ
ERNiCrT3GTAW/HAZ
SA-240 Type 405
SA-176 Type 409
E7018 SMAW
AISI-1018
SA533 GrA
SA533 GrA
Alloy 600
E7018 SMAW"
GenericSteam Generator Part
Pressure Boundary and Piping
Internals
Pressure Boundary and Internal Welds
Pressure Boundary
Pressure Boundary and Internal Welds
Carbon Steel To InconelInternal Welds
Flow Distribution Plate
Lattice Support Plate
Pressure Boundary and Internal Welds
Internals
Pressure Boundary
Pressure Boundary
Tubing
Pressure Boundary and Internal Welds
SpecimenType
Coupon
Coupon
Coupon
Coupon
Coupon
Coupon
Coupon
Coupon
ZRA Electrode
ZRA Electrode
ZRA Electrode
LP Electrode
LP Electrode
LP Electrode
SpecimenIdentification
RC106-9
C1018-16
RC7018-8
RC533-8
RH533-1
RHGTA-1
RC405-4
RC409-4
ZSMW-25
Z1018-4
Z533-18
L533-17
L600-50
LSMW-19Key for welds: SMAW = Shielded Metal Arc Weld: GTAW =in test to examine potential for increased heat affected zone
Electrode monitored by linear polarization during the test
= Gas Tungsten Arc Weld:attack
HAZ = Coupon
dissolved within the first hour of exposure.Also as expected when dissolving magnetitewith the HTCC solvent, the pH elevates andbuffers at about 8.7. At the completion oftesting, the autoclave was inspected andessentially no deposit remained.
The corrosion results, based on weight loss for thecoupons are presented in Table 3. The corrosionresults, based on weight loss, of the electrodes arepresented in Table 4. Included in Table 4 are theCMS predicted values for the various electrodes.Predicted CMS values for ZRA electrodes requiresthe addition of a free corrosion correction factor(References 3 and 7). For the Table 4 CMSindicated galvanic values, the free corrosioncorrection was made using the on-line LSMAW datafor ZSMAW-25 and Z1018-4. The free corrosioncorrection for Z533-18 used the final weight losscorrosion value from the L533-17 electrode. The
CMS indicated versus weight loss values areconsidered to be in very good agreement. The CMSalso showed the correct order of susceptibility toattack in the HTCC when compared to the coupons.Note from Table 3 that all materials experienced acorrosion loss of 51 fjm (2 mils) or less, with theAISI-1018 material being the most susceptible tocorrosion attack during application of the HTCC.Also note the minimal corrosion experienced by thetube support structures (RC405-4 and RC409-4).
388

Table 2Summary of Chemistry Results
HTCC Solvent Testing
Time(Hours)
Initial
0 *
1
2
5
10
N2H4
(fl/L)
5.1
4.0
2.9
2.5
1.4
0.9
EDTA(g/U
195
132
129
124
122
107
Fe(g/D
0
11.1
11.5
11.6
12.4
12.7
* - Time 0 = time at test temperature(143°C for this test)
Table 3Summary of Coupon Corrosion
HTCC Solvent Testing
SpecimenIdentificatio
n
RC106-9
RC405-4
RC409-4
RC7018-8
C1018-16
RH533-1
RC533-8
RHGTA-1
CorrosionU/m)
27.5
0.4
0.9
14.5
51.0
13.6
15.9
16.6
Corrosion(mils)
1.08
0.02
0.04
0.57
2.00
0.54
0.63
0.66
The CMS output for the ZRA electrodes is shown inFigure 2. There was a sharp increase in corrosionrate on the 1018 carbon steel during the first vent.This is apparently due to a disruption of theinhibitor film that has not yet fully stabilized at theonset of the first vent. Corrosion rates fell wi thtime. When the autoclave was cooled for thetermination of the test, the corrosion rate droppedvery quickly. This is typical with the HTCCapplications.
No pitting or localized attack was observed on thecoupons exposed during this test. There was noaccelerated galvanic heat affected zone (HAZ)attack in the ERNiCr-3 GTAW coupon (RHGTA-1) orthe SA-533 GrA/8018 SMAW coupon (RH533-1).This is typical for a 10-hour exposure to the HTCC.Longer exposure times or utilizing the HTCC todissolve deposits wi th elevated levels of copper,have led to pitting type attack in some carbonsteels.
HTCC Solvent Velocity Testing
The HTCC solvent was also tested under variousflow conditions to verify that, in the presence ofmagnetite, it would not cause erosion corrosion.Concentrated HTCC solvent was pumped through atest loop containing standard piping materials (SA-106 piping and a SA-105 elbow) at 93°C (200°F)for one hour. This configuration simulated injectionof concentrated chemicals impinging on a commonbase metal, SA-515 Gr70, and an Alloy 600 tubespecimen at 5.5 m/s (18 ft/s). The solvent wasthen diluted to the normal application conditionsand circulated through the loop at 149°C (300 °F)for an additional 30 hours at 5.5 m/s. Thecorrosion experienced by the specimens in the testloop was not significantly higher than specimenstested in static autoclaves.
Table 4Summary of Electrode Corrosion
SpecimenIdentification
ZSMW-25
Z1018-4
Z533-18
LSMW-19
L533-17
L600-50
Weight Loss Corrosionin //m (Mils)
6.7 (0.26)
28.4 (1.12)
8.0 (0.32)
8.5 (0.34)
5.9 (0.23)
0.00 (0.00)
CMS Indicated Corrosionin fjm (Mils)
10.4(0.41)
36.3 (1.43)
14.0(0.55)
6.6 (0.26)
Not Applicable
Not Applicable
389
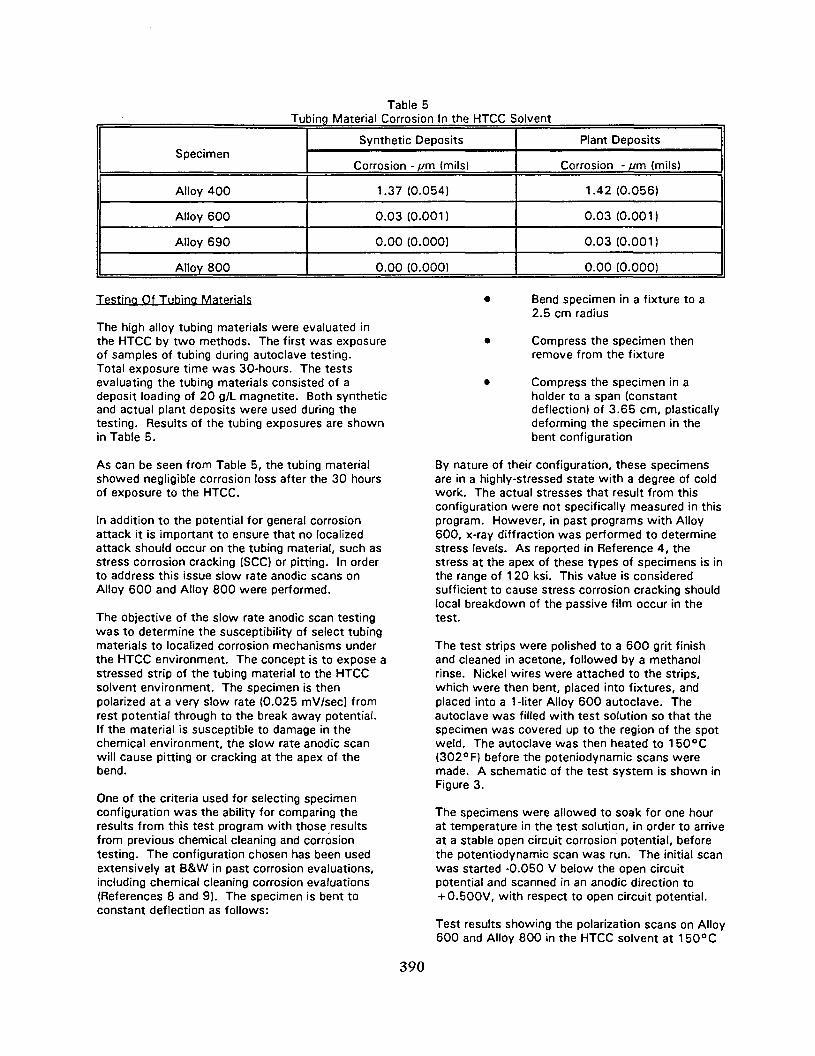
Table 5Tubing Material Corrosion In the HTCC Solvent
Specimen
Alloy 400
Alloy 600
Alloy 690
Alloy 800
Synthetic Deposits
Corrosion - fjm (mils)
1.37 (0.054)
0.03 (0.001)
0.00 (0.000)
0.00 (0.000)
Plant Deposits
Corrosion -//m(mils)
1.42 (0.056)
0.03 (0.001)
0.03 (0.001)
0.00 (0.000)
Testing Of Tubing Materials
The high alloy tubing materials were evaluated inthe HTCC by two methods. The first was exposureof samples of tubing during autoclave testing.Total exposure time was 30-hours. The testsevaluating the tubing materials consisted of adeposit loading of 20 g/L magnetite. Both syntheticand actual plant deposits were used during thetesting. Results of the tubing exposures are shownin Table 5.
As can be seen from Table 5, the tubing materialshowed negligible corrosion loss after the 30 hoursof exposure to the HTCC.
In addition to the potential for general corrosionattack it is important to ensure that no localizedattack should occur on the tubing material, such asstress corrosion cracking (SCO or pitting. In orderto address this issue slow rate anodic scans onAlloy 600 and Alloy 800 were performed.
The objective of the slow rate anodic scan testingwas to determine the susceptibility of select tubingmaterials to localized corrosion mechanisms underthe HTCC environment. The concept is to expose astressed strip of the tubing material to the HTCCsolvent environment. The specimen is thenpolarized at a very slow rate (0.025 mV/sec) fromrest potential through to the break away potential.If the material is susceptible to damage in thechemical environment, the slow rate anodic scanwill cause pitting or cracking at the apex of thebend.
One of the criteria used for selecting specimenconfiguration was the ability for comparing theresults from this test program with those resultsfrom previous chemical cleaning and corrosiontesting. The configuration chosen has been usedextensively at B&W in past corrosion evaluations,including chemical cleaning corrosion evaluations(References 8 and 9). The specimen is bent toconstant deflection as follows:
• Bend specimen in a fixture to a2.5 cm radius
• Compress the specimen thenremove from the fixture
• Compress the specimen in aholder to a span (constantdeflection) of 3.65 cm, plasticallydeforming the specimen in thebent configuration
By nature of their configuration, these specimensare in a highly-stressed state with a degree of coldwork. The actual stresses that result from thisconfiguration were not specifically measured in thisprogram. However, in past programs with Alloy600, x-ray diffraction was performed to determinestress levels. As reported in Reference 4, thestress at the apex of these types of specimens is inthe range of 120 ksi. This value is consideredsufficient to cause stress corrosion cracking shouldlocal breakdown of the passive film occur in thetest.
The test strips were polished to a 600 grit finishand cleaned in acetone, followed by a methanolrinse. Nickel wires were attached to the strips,which were then bent, placed into fixtures, andplaced into a 1-liter Alloy 600 autoclave. Theautoclave was filled with test solution so that thespecimen was covered up to the region of the spotweld. The autoclave was then heated to 150°C(302°F) before the poteniodynamic scans weremade. A schematic of the test system is shown inFigure 3.
The specimens were allowed to soak for one hourat temperature in the test solution, in order to arriveat a stable open circuit corrosion potential, beforethe potentiodynamic scan was run. The initial scanwas started -0.050 V below the open circuitpotential and scanned in an anodic direction to+ 0.500V, with respect to open circuit potential.
Test results showing the polarization scans on Alloy600 and Alloy 800 in the HTCC solvent at 150°C
390
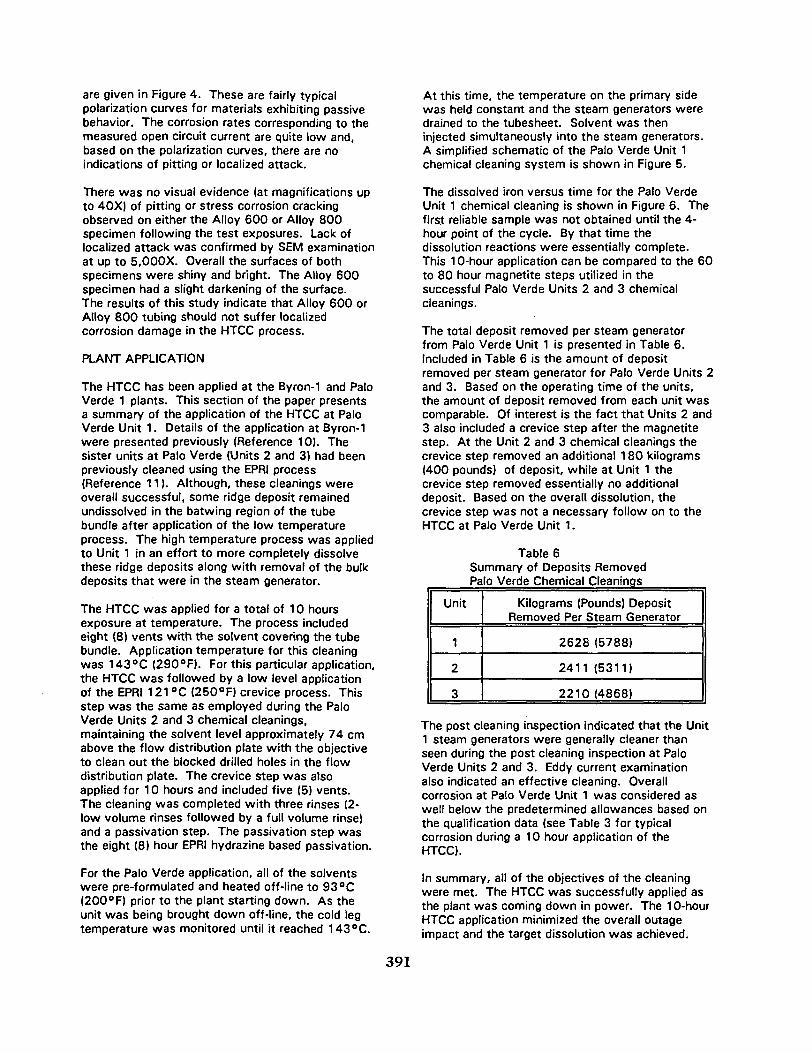
are given in Figure 4. These are fairly typicalpolarization curves for materials exhibiting passivebehavior. The corrosion rates corresponding to themeasured open circuit current are quite low and,based on the polarization curves, there are noindications of pitting or localized attack.
There was no visual evidence (at magnifications upto 40X) of pitting or stress corrosion crackingobserved on either the Alloy 600 or Alloy 800specimen following the test exposures. Lack oflocalized attack was confirmed by SEM examinationat up to 5.000X. Overall the surfaces of bothspecimens were shiny and bright. The Alloy 600specimen had a slight darkening of the surface.The results of this study indicate that Alloy 600 orAlloy 800 tubing should not suffer localizedcorrosion damage in the HTCC process.
PLANT APPLICATION
The HTCC has been applied at the Byron-1 and PaloVerde 1 plants. This section of the paper presentsa summary of the application of the HTCC at PaloVerde Unit 1. Details of the application at Byron-1were presented previously (Reference 10). Thesister units at Palo Verde (Units 2 and 3) had beenpreviously cleaned using the EPRI process(Reference 11). Although, these cleanings wereoverall successful, some ridge deposit remainedundissolved in the batwing region of the tubebundle after application of the low temperatureprocess. The high temperature process was appliedto Unit 1 in an effort to more completely dissolvethese ridge deposits along with removal of the bulkdeposits that were in the steam generator.
The HTCC was applied for a total of 10 hoursexposure at temperature. The process includedeight (8) vents with the solvent covering the tubebundle. Application temperature for this cleaningwas 143°C (290°F). For this particular application,the HTCC was followed by a low level applicationof the EPRI 121 °C (250°F) crevice process. Thisstep was the same as employed during the PaloVerde Units 2 and 3 chemical cleanings,maintaining the solvent level approximately 74 cmabove the flow distribution plate with the objectiveto clean out the blocked drilled holes in the flowdistribution plate. The crevice step was alsoapplied for 10 hours and included five (5) vents.The cleaning was completed with three rinses (2-low volume rinses followed by a full volume rinse)and a passivation step. The passivation step wasthe eight (8) hour EPRI hydrazine based passivation.
For the Palo Verde application, all of the solventswere pre-formulated and heated off-line to 93°C(200 °F) prior to the plant starting down. As theunit was being brought down off-line, the cold legtemperature was monitored until it reached 143°C.
At this time, the temperature on the primary sidewas held constant and the steam generators weredrained to the tubesheet. Solvent was theninjected simultaneously into the steam generators.A simplified schematic of the Palo Verde Unit 1chemical cleaning system is shown in Figure 5.
The dissolved iron versus time for the Palo VerdeUnit 1 chemical cleaning is shown in Figure 6. Thefirst reliable sample was not obtained until the 4-hour point of the cycle. By that time thedissolution reactions were essentially complete.This 10-hour application can be compared to the 60to 80 hour magnetite steps utilized in thesuccessful Palo Verde Units 2 and 3 chemicalcleanings.
The total deposit removed per steam generatorfrom Palo Verde Unit 1 is presented in Table 6.Included in Table 6 is the amount of depositremoved per steam generator for Palo Verde Units 2and 3. Based on the operating time of the units,the amount of deposit removed from each unit wascomparable. Of interest is the fact that Units 2 and3 also included a crevice step after the magnetitestep. At the Unit 2 and 3 chemical cleanings thecrevice step removed an additional 180 kilograms(400 pounds) of deposit, while at Unit 1 thecrevice step removed essentially no additionaldeposit. Based on the overall dissolution, thecrevice step was not a necessary follow on to theHTCC at Palo Verde Unit 1.
Table 6Summary of Deposits RemovedPalo Verde Chemical Cleanings
Unit
1
2
3
Kilograms (Pounds) DepositRemoved Per Steam Generator
2628 (5788)
2411 (5311)
2210(4868)
The post cleaning inspection indicated that the Unit1 steam generators were generally cleaner thanseen during the post cleaning inspection at PaloVerde Units 2 and 3. Eddy current examinationalso indicated an effective cleaning. Overallcorrosion at Palo Verde Unit 1 was considered aswell below the predetermined allowances based onthe qualification data (see Table 3 for typicalcorrosion during a 10 hour application of theHTCC).
In summary, all of the objectives of the cleaningwere met. The HTCC was successfully applied asthe plant was coming down in power. The 10-hourHTCC application minimized the overall outageimpact and the target dissolution was achieved.
391

CONCLUSIONS
The B&W/FTI high temperature chemical cleaningprocess is the result of a long history of chemicalcleaning developments. The HTCC process hasbeen developed and qualified for application to PWRand CANDU steam generators. It has beensuccessfully applied in two full scale applications.In the two applications, solvent was applied in aconcentrated form (Reference 10) and mixed in thesteam generators, and in the final concentration,pre-mixed external to the steam generators. Bothapproaches are considered as fully qualified.Deposit removal rates and overall deposit removaleffectiveness were high in both applications.
Corrosion tests have been performed on materialsrepresentative of CANDU and PWR steamgenerators. The overall corrosion experienced bythese materials was confirmed by these test to below. In addition, localized pitting and stresscorrosion cracking was confirmed to not be aproblem for steam generator tubing materials duringapplication of the HTCC process.
The process provides the advantages of shortcleaning times, crevice cleaning capability, andreduced equipment requirements, when comparedto the traditional EPRI/SGOG processes. Theprocess is considered as qualified and field provenfor application to the cleaning of CANDU or PWRsteam generators that have a variety of iron baseddeposits.
REFERENCES:
1. W.S. Leedy and F.J. Pocock, 'ChemicalCleaning Of Nuclear Steam Generators,"Proceedings of the 32nd InternationalWater Conference p. 67, 1971.
2. J.M. Jevec and W.S. Leedy, 'ChemicalCleaning Solvent and Process Testing,"Electric Power Research Institute (EPRI)Report NP-2976, April 1983.
3. P.C. Hildebrandt, et. al., 'Weld RegionCorrosion During Chemical Cleaning ofPWR Steam Generators," EPRI Report NP-5267, July 1987.
4. J.L. Barna, et. al., "Assessment of Sulfur inChemical Cleaning of PWR SteamGenerators," EPRI Report NP-5026,February 1987.
5. C M . Daniel et al., "Recent Experience withChemical Cleaning of Ontario HydroCANDU Steam Generators," Proceedings ofthe 1994 Steam Generator and HeatExchanger Conference sponsored by theCanadian Nuclear Society, p 3.57, 1994.
6. P. Knollmeyer, "B&W NT/Framatome HighTemperature Chemical Cleaning ProcessDevelopment,".Proceedings of EPRI TheSteam Generator Sludge ManagementWorkshop, Norfolk, Virginia, p.40-1, 1994.
7. B.P Miglin, et. al., "Galvanic CorrosionMonitoring During Chemical Cleaning,'CORROSION/87 Paper Number 384, NACEInternational, 1987.
8. J.M. Jevec and W. S. Leedy, 'ANO-1/Oconee-1 Chemical CleaningQualification Program - Final Report,"Babcock & Wilcox R&D Division ReportRDD:83:5260-18-01:01, December 1983.
9. R.P. Dow, "Final Report - PNGS-B ChemicalCleaning Qualification Program,* BWNSReport 51-1213799-00 prepared forOntario Hydro, November 1992.
10. W.A. Scheffler et. al. "Byron Unit 1 HighTemperature Chemical Cleaning,"Proceedings of the Seventh InternationalSymposium of Environmental Degradationof Materials in Nuclear Power Systems,NACE International, p.435, 1995..
11. J.M. Jevec, et. al. "Steam GeneratorChemical Cleaning at the Palo VerdeNuclear Generating Station,"CORROSION/95, Paper Number 443, NACEInternational, 1995.
392

Figure 1 - Autoclave assembly used for HTCC process testing
393

Corrosion Rate Versus Time - HTCC Solvent Exposure2,000
2 4 6 8 10 12 14Elapsed Time (Hours)
Figure 2 - ZRA corrosion rate versus time for a typical HTCC solvent exposure test
TherrnocouptaW
Figure 3 - Schematic of slow rate anodic scan test system
394

-0.1
-0.2
w -0.3OCO
1TB -0.4
-0.5
-0.6
-0.7
Bern R I M • 0.023 mVrt|T«mpentur» . 30?F H50t:)
|SpeanenM-CM6No VcuUe PMr« or CnaaOpwiCiicuitPolenlial.
Specimen U-0*SNo VciUe Pining or CodaSome EtchingOpen Circuit PoMetial. -osa V,»
10 10-=
Current (A/cm2)
10
Figure 4 - Slow rate anodic scan of Alloy 600 and Alloy 800 in the HTCC at 150°C
Figure 5 - Simplified schematic of the Palo Verde-1 chemical cleaning system
14
12
4 6 8Elapsed Time (Hours)
10 12
Figure 6 - Dissolved iron versus time for the Palo Verde-1 HTCC step
395