2016 michigan hunting access program survey
TRANSCRIPT

A contribution of Federal Aid in Wildlife Restoration, Michigan Project W-147-R
Equal Rights for Natural Resource Users The Michigan Department of Natural Resources provides equal opportunities for employment and access to Michigan's natural resources. Both State and Federal laws prohibit discrimination on the basis of race, color, national origin, religion, disability, age, sex, height, weight or marital status under the U.S. Civil Rights Acts of 1964 as amended, 1976 MI PA 453, 1976 MI PA 220, Title V of the Rehabilitation Act of 1973 as amended, and the 1990 Americans with Disabilities Act, as amended. If you believe that you have been discriminated against in any program, activity, or facility, or if you desire additional information, please write: Human Resources, Michigan Department of Natural Resources, PO Box 30473, Lansing MI 48909-7973, or Michigan Department of Civil Rights, Cadillac Place, 3054 West Grand Blvd, Suite 3-600, Detroit, MI 48202, or Division of Federal Assistance, U.S. Fish & Wildlife Service, 4401 North Fairfax Drive, Mail Stop MBSP-4020, Arlington, VA 22203. For information or assistance on this publication, contact Michigan Department of Natural Resources, Wildlife Division, P.O. Box 30444, MI 48909. This publication is available in alternative formats upon request.
Michigan Department of Natural Resources Wildlife Division Report No. 3640 July 2017
2016 MICHIGAN HUNTING ACCESS PROGRAM SURVEY Brian J. Frawley
ABSTRACT A survey of HAP hunters was conducted following the 2015 fall and 2016 spring hunting seasons to determine the number of people hunting on HAP lands and to determine hunter satisfaction and opinions about the administration of HAP. An estimated 7,500 hunters took about 49,414 hunting trips on HAP. Among the people hunting on HAP lands, 36% of their overall hunting was done on HAP lands. About 8% of HAP hunters would not have hunted if HAP did not exist. The primary reasons hunters selected HAP lands were (1) they did not have access to private lands [65%], (2) the HAP lands were located near their residence [63%], (3) they had previously experienced good hunting on HAP lands [58%], and (4) they had limited time to locate alternative hunting sites [53%]. The primary species hunted on HAP lands was deer; 67% of the hunters hunted deer and 57% of HAP hunters reported that deer was the primary species they sought on HAP lands. About 62% of the hunters were satisfied with their overall hunting experiences on HAP lands. In general, hunters pursuing waterfowl, turkey, and squirrel were most satisfied with their overall hunting experience on HAP lands. About 53% of deer hunters were satisfied with their overall hunting experience. Hunters most frequently (>76% of hunters) indicated that leasing additional land and improving the habitat and wildlife numbers were the most important changes to HAP that could be done to improve hunter’s experience. About 76% of the HAP hunters indicated they planned to hunt on HAP lands in the future. The average HAP hunter devoted 7.1 hunting trips during the year to hunt on HAP. Among hunters that reported their expenditures, active hunters spent an average of $247 per year on hunting trips. Collectively, HAP hunters spent $1.85 million on hunting trips primarily to hunt on HAP.
2
INTRODUCTION Michigan's Hunting Access Program (HAP) was created in 1977 to lease private lands for public hunting in southern Michigan, where 97% of the land base is privately owned (Squibb and Hill 1989). HAP enrollment peaked in 1981 when 792 farms totaling nearly 189,000 acres were enrolled (Figure 1). Enrollment declined steadily from the peak levels and reached its lowest level in 2010 (47 farms totaling about 7,500 acres). Enrollment declined partly because the DNR lease payments were inadequate to maintain or attract participation (Oliver 2005). In 2010, the DNR was awarded $900,000 from the U.S. Department of Agriculture through the Voluntary Public and Incentive Program for three years to expand HAP. The grant allowed the DNR to attract new landowners by offering increased lease payments. The DNR also expanded the types of hunting rights it leased from landowners. In the past, landowners were required to allow all types of hunting on the property. Beginning in 2011, landowners were offered leases for either all hunting rights or a subset of the hunting rights (e.g., youth or apprentice only, small game only, deer only or turkey only). The highest rates were paid to landowners who leased all rights. Farms already enrolled in cropland diversion programs such as the Conservation Reserve Program were targeted for enrollment in HAP because they frequently had pre-existing high-quality wildlife habitat. Acreage enrolled in Conservation Reserve Program or other Farm Bill program received a bonus to encourage enrollment in HAP. The HAP program was expanded in 2014 to include a portion of the eastern Upper Peninsula (UP). This expansion provided hunters access to private lands where sharp-tail grouse could be hunted in the eastern UP. The DNR and the Natural Resources Commission have the authority and responsibility to protect and manage the wildlife resources of the state of Michigan. Opinion surveys are a management tool used by the Wildlife Division to accomplish its statutory responsibility. Estimating hunter participation, hunter satisfaction, and opinions about administration of HAP were the primary objectives of this survey.
METHODS All hunters using HAP land were requested to report their contact information (name and mailing address) prior to hunting. A self-service box was located at HAP properties for hunters to report this information. On some properties, the landowner also required hunters to directly obtain permission from them before hunting. Contact information was collected from 3,977 hunters using HAP during fall 2015 through spring 2016. The list of hunters did not represent every person that had hunted on HAP properties because not all hunters provided contact information and others provided incomplete or illegible information. Squibb and Hill (1989) reported an average of 45.6 and 45.9 hunters per 100 acres of HAP in 1980 and 1988, respectively. The

3
number of hunters in Michigan has declined by about 18% since the 1980s. Assuming usage of HAP had declined by a comparable amount (i.e., 37.4 hunters per 100 acres in 2015), an estimated 7,500 hunters were expected to use the 20,089 acres of HAP in 2015. Thus, it was assumed that contact information was collected from about 53% of the hunters using HAP during fall 2015 through spring 2016. Estimates were calculated using a simple random sampling design (Cochran 1977). A 95% confidence limit (CL) was calculated for each estimate. This CL could be added to and subtracted from the estimate to calculate the 95% confidence interval. The confidence interval was a measure of the precision associated with the estimate and implies the true value would be within this interval 95 times out of 100. Estimates were based on information collected from random samples of hunting license buyers. Thus, these estimates were subject to sampling errors (Cochran 1977). Estimates were not adjusted for possible response or nonresponse biases. Statistical tests are used routinely to determine the likelihood that differences among estimates are larger than expected by chance alone. The overlap of 95% confidence intervals was used to determine whether estimates differed. Non-overlapping 95% confidence intervals was equivalent to stating the difference between the means was larger than would be expected 995 out of 1,000 times (P<0.005), if the study had been repeated (Payton et al. 2003). The questionnaire used to gather data was largely the same as used for a similar survey done in 2013 (Frawley 2014). Questionnaires (Appendix A) were mailed initially during mid-September 2016, and nonrespondents were mailed up to two follow-up questionnaires. Although 3,977 people were sent the questionnaire, 131 surveys were undeliverable resulting in an adjusted sample size of 3,846. Questionnaires were returned by 1,619 people, yielding a 42% adjusted response rate. Hunters using HAP lands have been surveyed in 2013 (Frawley 2014) and 2016 (current survey), and results from these surveys were generally similar. This report focuses primarily on the results from the 2016 survey; however, important differences between 2013 and 2016 surveys were highlighted.
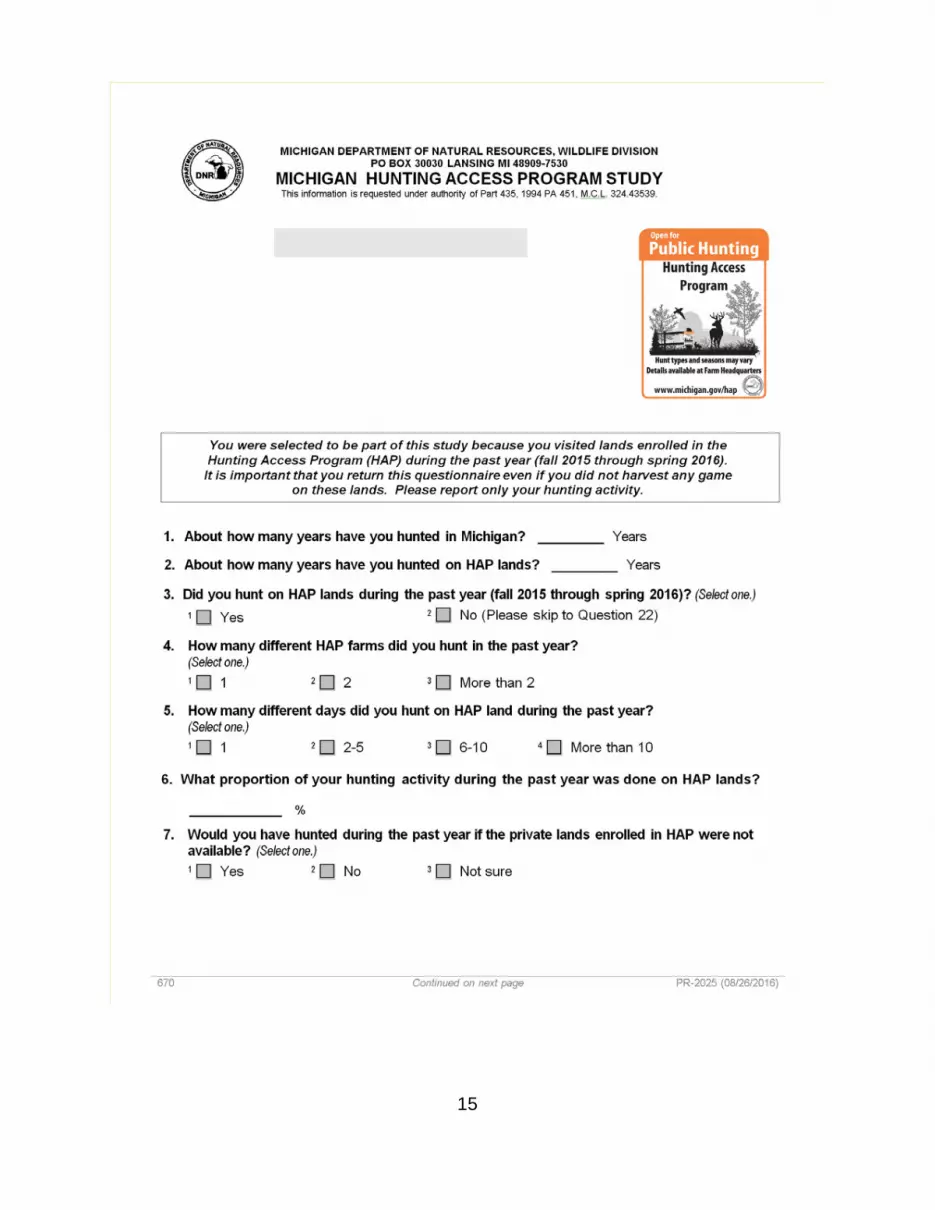
RESULTS AND DISCUSSION Hunters using HAP lands during fall 2015 through spring 2016 had hunted an average of 25.9 years (±0.8), and they had hunted on HAP lands an average of 5.9 years (±0.4). In contrast, the average HAP hunter in 1988 had hunted 18.5 years (Squibb and Hill 1989). The increased age of HAP hunters likely represented the rising share of older people in the population as the baby-boom generation aged. Most HAP hunters (54 ± 2%) hunted on only one HAP property, while 24 ± 2% hunted on two properties and 22 ± 2% hunted on more than two properties. About 14 ± 2% of HAP hunters hunted only one day on HAP properties, while 45 ± 2% hunted 2-5 days, 22 ± 2% hunted 6-10 days, and 19 ± 2% hunted more than ten days on HAP properties.

4
Among the people hunting on HAP lands, 36 ± 2% of their hunting was done on HAP lands. About 80 ± 2% of the HAP hunters indicated they would have hunted even if HAP did not exist. However, 8 ± 1% of hunters would not have hunted, and 11 ± 1% of hunters were not sure if they would have hunted if HAP did not exist. Providing access to quality hunting lands close to urban properties was a key component to offering additional hunting opportunities on HAP lands. About 23 ± 2% of HAP hunters traveled less than 10 miles, and 31 ± 2% of hunters traveled 11-25 miles. About 16 ± 2% of hunters traveled 26-40 miles, 7 ± 1% of hunters traveled 41-50 miles, and 22 ± 2% of hunters traveled more than 50 miles. About 30 ± 2% of the HAP hunters resided in rural areas, 25 ± 2% lived in suburbs, and 22 ± 2% lived in small towns. In addition, 15 ± 2% of HAP hunters resided on farms, and 5 ± 2% of hunters lived in large cities. The residence of 2 ± 1% of the hunters was unknown. The distribution of hunters among rural and suburban areas was similar to proportions reported for HAP hunters in 1988. Squibb and Hill (1989) reported 66% of HAP hunters in 1988 were from rural areas and 34% from suburban areas. Nearly 33 ± 2% of HAP hunters usually hunted alone, while 49 ± 2% hunted with one partner, 12 ± 2% of hunters hunted with two other people, and 5 ± 1% of hunters hunted with three or more other hunters. Attracting new hunters was a key component of creating HAP. About 21 ± 2% of adult HAP hunters (at least 21 years) hunted with a youth hunter (less than 16 years old). In addition, about 11 ± 2% of adult hunters accompanied an apprentice hunter (a hunter without hunter safety certification) on HAP lands. The primary species hunted on HAP lands was deer (Table 1 and Figure 2); 67% of the hunters hunted deer and 57% of HAP hunters reported that deer was the primary species they sought on HAP lands. The next most popular species hunted on HAP lands were rabbit, squirrel, turkey, and pheasant, although these species were generally not the primary species sought by HAP hunters. Deer and small game have traditionally been the most popular animals pursued by hunters in Michigan (Frawley 2009). However, deer hunting has generally increased in popularity and small game hunting has declined during the last fifty years. This trend also appears among hunters using HAP. In 1988, 52% of HAP hunters most sought deer (Squibb and Hill 1989), while 57% of hunters in 2015 primarily wanted to hunt deer. In 1988, 32% of HAP hunters most sought rabbits (Squibb and Hill 1989), while in 2015, 23% of hunters hunted rabbits and only 6% of hunters primarily targeted rabbits to hunt. Friends were the primary source of information about HAP lands for the hunters using HAP (Table 2 and Figure 3); 38% of hunters reported they learned of HAP from their friends. Other frequently cited sources of information included HAP boundary signs (25%), HAP digest published by the DNR (20%), and HAP website developed by the
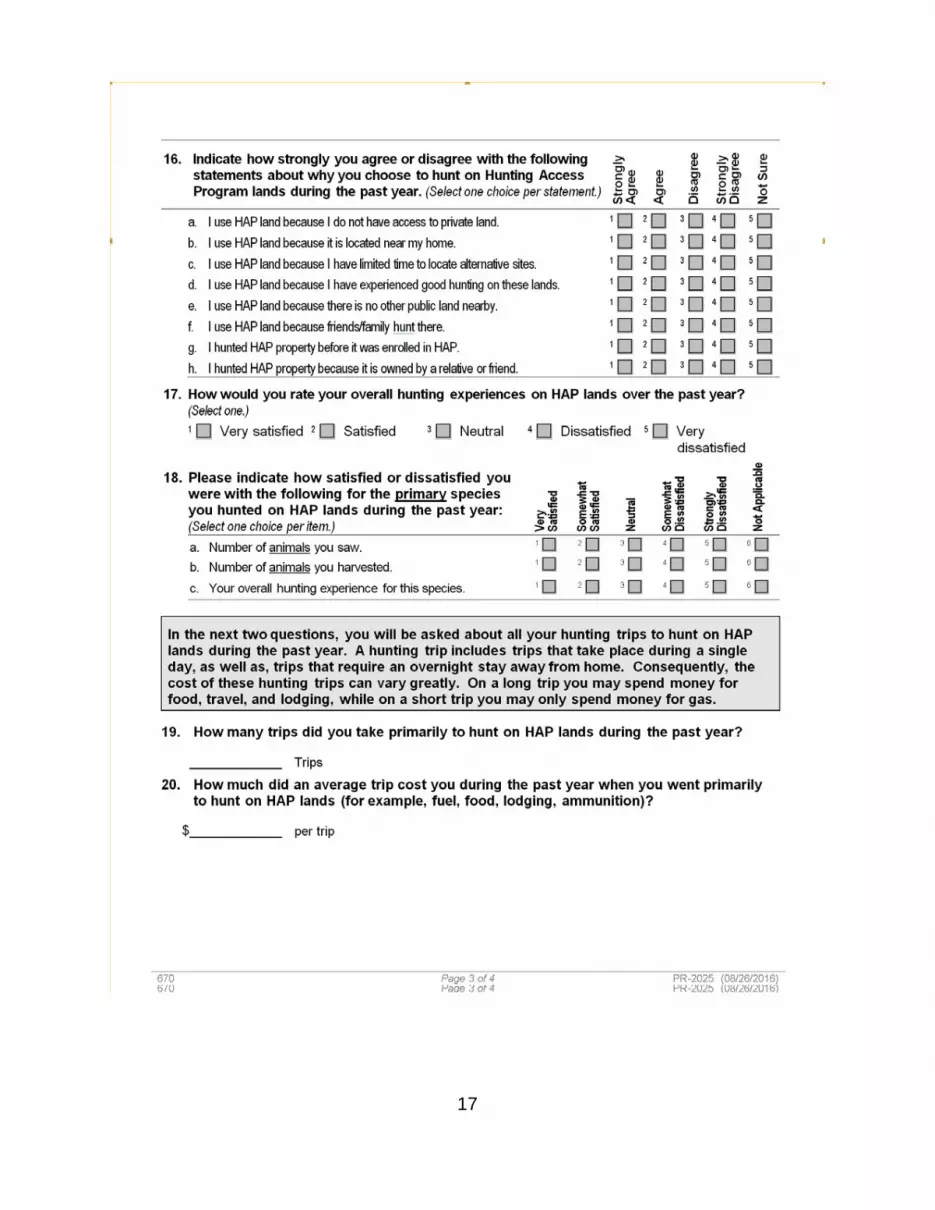
5
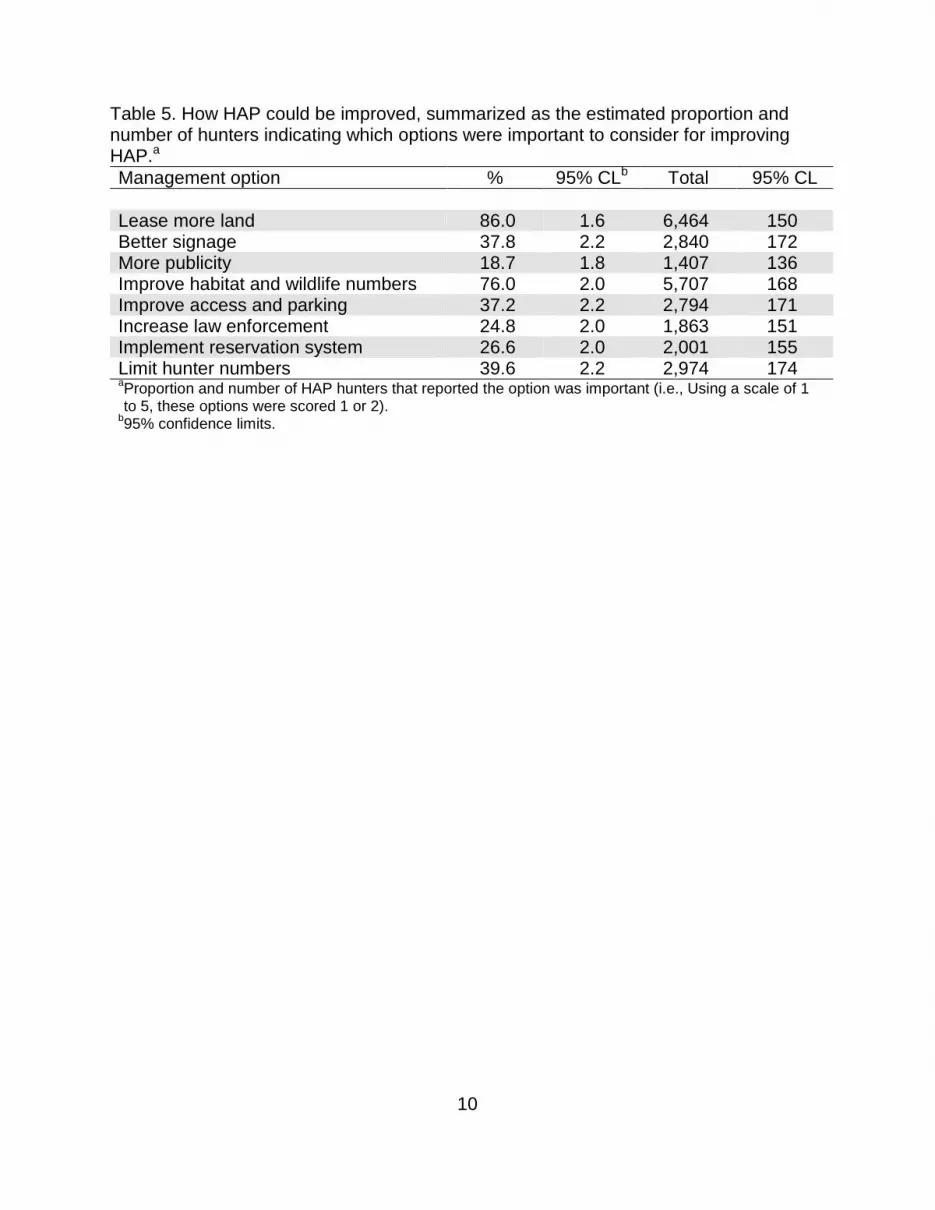
DNR (20%). Compared to 2013 (Frawley 2014), significantly more hunters in 2016 relied on the internet (i.e., Mi-Hunt and HAP website) as a source of information about HAP lands (Figure 3). Furthermore, fewer hunters relied on the HAP digest and HAP signs as a source of information in 2016. The primary reasons hunters selected HAP lands were (1) they did not have access to private lands [65%], (2) the HAP lands were located near their residence [63%], (3) they had previously experienced good hunting on HAP lands [58%], and (4) they had limited time to locate alternative hunting sites [53%] [Table 3 and Figure 4]. Most of these reasons were also reported as important reasons for explaining why hunters selected to use HAP lands in 1988 (Squibb and Hill 1989) and in 2013 (Frawley 2014). About 62 ± 2% of the hunters were satisfied with their overall hunting experiences on HAP lands (21 ± 2% were very satisfied and 41 ± 2% were somewhat satisfied). In contrast, 26 ± 2% of HAP hunters were neutral about their hunting experience and 11 ± 1% were dissatisfied with their hunting experience. In general, hunters pursuing waterfowl, turkey, and squirrel were most satisfied with their overall hunting experience on HAP lands (Table 4 and Figure 5). Although most hunters sought deer, about 53% of deer hunters were satisfied with their overall hunting experience. Satisfaction among deer hunters on HAP lands was slightly higher than among all deer hunters statewide; 45 ± 1% of hunters statewide were satisfied with their overall deer hunting experience in 2015 (Frawley and Boon 2016). HAP hunters were presented eight potential changes to HAP (Table 5) and were asked to indicate the importance of these changes on a scale from one (most important) to five (least important). The importance of each option was gauged by comparing how often HAP hunters indicated the option was important (i.e., scored a value of 1 or 2). Hunters most frequently (>76% of hunters) indicated that leasing additional land and improving the habitat and wildlife numbers were the most important changes to HAP that could be done to improve hunter’s experience (Table 5 and Figure 6). Limiting hunter numbers, improving access and parking, and better signage were considered important for about one-third of hunters. About 76 ± 3% of the HAP hunters indicated they planned to hunt on HAP lands in the future. In contrast, 3 ± 1% of hunters did not plan to hunt on HAP lands in the future, and 19 ± 2% of hunters were not sure whether they would hunt on HAP lands again. The average HAP hunter devoted 7.1 ± 0.5 hunting trips during the year to hunt on HAP during fall 2015 through spring 2016. The trips included hunts that took place during a single day and hunts that required an overnight stay away from home. HAP hunters took an estimated 49,414 ± 3,667 hunting trips on HAP. Among hunters that reported their expenditures, active hunters spent an average of $247 ± $40 per year on hunting trips. Expenditures on long trips included the costs of food, travel, and lodging, while short trips may have only included the cost of fuel. Collectively, HAP hunters spent about $1.85 million (±$0.3 million) on hunting trips primarily to hunt on HAP during fall 2015 through spring 2016.

6
ACKNOWLEDGEMENTS I thank all the hunters that provided information. Theresa Riebow completed data entry. Monique Ferris, Mike Donovan, Pat Lederle, Russ Mason, and Mike Parker reviewed a draft version of the questionnaire and this report.
LITERATURE CITED Cochran, W. G. 1977. Sampling techniques. John Wiley & Sons, New York. USA. Frawley, B. J. 2009. Demographics, recruitment, and retention of Michigan hunters:
2008 update. Wildlife Division Report 3462. Michigan Department of Natural Resources, Lansing, USA.
Frawley, B. J. 2014. 2013 Michigan hunting access program survey. Wildlife Division
Report 3586. Michigan Department of Natural Resources, Lansing, USA. Frawley, B. J. and C.E. Boon 2016. Michigan deer harvest survey report, 2015 seasons.
Wildlife Division Report 3621. Michigan Department of Natural Resources, Lansing, USA.
Oliver, T. E. 2005. Program history and evaluation of landowner incentives for
Michigan’s hunting access program. Wildlife Division Report 3446. Michigan Department of Natural Resources, Lansing, USA.
Payton, M. E., M. H. Greenstone, and N. Schenker. 2003. Overlapping confidence
intervals or standard error intervals: what do they mean in terms of statistical significance? Journal of Insect Science 3:34.
Squibb, H. W. and H. R. Hill. 1989. Evaluation and recommendations for the Michigan
Hunter Access Program. Wildlife Division Report 3166. Michigan Department of Natural Resources, Lansing, USA.

7
Table 1. The estimated proportion and number of hunters on HAP land during fall 2015 through spring 2016, summarized by species hunted. Species % 95% CLa Total 95% CL Species hunted
Deer 66.6 2.2 5,000 177 Turkey 16.8 1.7 1,264 130 Rabbit 23.3 1.9 1,750 148 Squirrel 24.5 2.0 1,837 150 Pheasant 15.2 1.6 1,141 125 Waterfowl 6.9 1.2 522 88 Furbearers 2.7 0.7 205 56 Sharp-tailed grouse 5.7 1.1 425 80
Primary species huntedb
Deer 57.0 2.3 4,284 181 Turkey 6.3 1.1 471 84 Rabbit 5.8 1.1 435 81 Squirrel 6.1 1.1 461 83 Pheasant 9.8 1.4 737 103 Waterfowl 4.0 0.9 297 67 Furbearers 1.7 0.6 128 45 Sharp-tailed grouse 4.0 0.9 302 68 Other 1.6 0.6 118 43
a95% confidence limits. bPrimary animal hunted is the species that was primarily targeted by the hunter.

8
Table 2. The primary source of information about HAP, summarized as the estimated proportion and number of hunters using the each source of information. Source of information % 95% CLa Total 95% CL HAP digest 15.1 1.6 1,136 125 From friends 34.9 2.2 2,626 168 HAP website 26.6 2.0 1,996 155 HAP signs 17.8 1.8 1,341 133 Mi-Hunt 20.0 1.8 1,500 139 DNR contacts 5.2 1.0 394 77 HAP landowner 5.0 1.0 374 75 Other 8.7 1.3 650 97 a95% confidence limits.
Table 3. The reasons HAP hunters selected to hunt on HAP lands, summarized as the estimated proportion and number of hunters agreeing with each statement.a Statement % 95% CLb Total 95% CL No access to private land 65.0 2.2 4,883 178 HAP near residence 63.4 2.2 4,760 179 Limited time to locate alternatives 53.1 2.3 3,992 181 Experienced good hunting on HAP 58.0 2.3 4,361 181 No public lands nearby 34.7 2.2 2,605 168 Friends/family hunt HAP 34.1 2.2 2,564 167 Hunted land before enrolled in HAP 12.1 1.5 906 113 HAP owned by friend/family 6.3 1.1 471 84 aProportion and number of HAP hunters that reported they strongly agreed or agreed with the statement.
b95% confidence limits.

9
Table 4. Level of satisfaction with the number of animals seen, number of animals harvested, overall hunting experience on HAP lands.a
Species
Animals seen Animals harvested Overall satisfaction
% 95% CLb Total
95% CL %
95% CL Total
95% CL %
95% CL Total
95% CL
Deer 44.0 3.0 1,883 152 19.8 2.4 850 110 52.2 3.0 2,237 161 Turkey 67.4 8.6 317 70 39.1 9.0 184 53 71.7 8.3 338 72 Rabbit 43.5 9.5 189 54 28.2 8.6 123 44 55.3 9.5 241 61 Squirrel 52.2 9.3 241 61 40.0 9.1 184 53 62.2 9.0 287 66 Pheasant 35.4 7.0 261 63 19.4 5.8 143 47 44.4 7.3 328 71 Waterfowl 75.9 10.0 225 59 51.7 11.6 154 49 70.7 10.6 210 57 Furbearers 40.0 17.6 51 28 24.0 15.3 31 22 48.0 17.9 61 31 Sharp-tailed grouse 47.5 11.5 143 47 25.4 10.1 77 35 55.9 11.5 169 51
aProportion of hunters that rated their satisfaction as very satisfied or somewhat satisfied. Satisfaction was estimated from only hunters that had hunted species.
b95% confidence limits.
10
Table 5. How HAP could be improved, summarized as the estimated proportion and number of hunters indicating which options were important to consider for improving HAP.a Management option % 95% CLb Total 95% CL Lease more land 86.0 1.6 6,464 150 Better signage 37.8 2.2 2,840 172 More publicity 18.7 1.8 1,407 136 Improve habitat and wildlife numbers 76.0 2.0 5,707 168 Improve access and parking 37.2 2.2 2,794 171 Increase law enforcement 24.8 2.0 1,863 151 Implement reservation system 26.6 2.0 2,001 155 Limit hunter numbers 39.6 2.2 2,974 174 aProportion and number of HAP hunters that reported the option was important (i.e., Using a scale of 1 to 5, these options were scored 1 or 2).
b95% confidence limits.

11
01002003004005006007008009001,000
020,00040,00060,00080,000
100,000120,000140,000160,000180,000200,000
1977
1979
1981
1983
1985
1987
1989
1991
1993
1995
1997
1999
2001
2003
2005
2007
2009
2011
2013
2015
Num
ber o
f far
ms
Num
ber o
f acr
es le
ased
Year
Acres Farms
0%
20%
40%
60%
80%
Prop
ortio
n of
HA
P hu
nter
s
Animal
Animal hunted Primary animal sought
Figure 1. Number of farms and acres enrolled in HAP in Michigan, 1977-2015.
Figure 2. The animals sought by hunters on HAP land during fall 2015 through spring 2016. Primary animal hunted is the species that was primarily targeted by the hunter. Vertical bars represent the 95% confidence interval.

12
0% 10% 20% 30% 40% 50%
HAP digestFrom friendsHAP website
HAP signsMi-Hunt
DNR contactsHAP landowner
Other
Hunters learning about HAP from source
Sour
ce o
f inf
orm
atio
n 2013 2016
0% 20% 40% 60% 80% 100%
No access to private landHAP near residence
Limited time to locate alternativesExperienced good hunting on HAP
No public lands nearbyFriends/family hunt HAP
Hunted land before enrolled in HAPHAP owned by friend/family
HAP hunters agreeing with statemen why they hunted HAP
Stat
emen
t
Figure 3. The source of information about HAP lands for HAP hunters. Horizontal bars represent the 95% confidence interval.
Figure 4. The reasons HAP hunters selected to hunt on HAP lands. Horizontal bars represent the 95% confidence interval.

13
0%
20%
40%
60%
80%
100%Sa
tisfie
d H
AP
hunt
ers
Primary animal sought
Overall satisfaction Animals seen Animals harvested
0% 20% 40% 60% 80% 100%
Lease more landBetter signageMore publicity
Improve habitat & wildlife numbersImprove access and parking
Increase law enforcementImplement reservation system
Limit hunter numbers
Proportion of HAP hunters indicating that an issue was important
Issu
e
Figure 5. Estimated proportion of HAP hunters satisfied by their overall hunting experience, animals seen, and animals harvested on HAP lands. Estimates summarized by primary species sought by HAP hunters. Vertical bars represent the 95% confidence interval.
Figure 6. Estimated proportion of HAP hunters indicating which issues were important (i.e., on the scale of 1 to 5, these options were scored 1 or 2) to consider to improve their hunting experience on HAP lands. Horizontal bars represent the 95% confidence interval.

14
APPENDIX A. QUESTIONNAIRE USED TO EVALUATE HAP.
15

16
17

18