2014 om quality management
TRANSCRIPT
1Prof N. Balasubramanian
Chapter 2
Quality Management
2Prof N. Balasubramanian
What Is Quality:Customer’s Perspective
• Fitness for use• how well product or service does what it is supposed to
• Quality of design• designing quality characteristics into a product or service
• A Mercedes and a Ford are equally “fit for use,” but with different design dimensions.
3Prof N. Balasubramanian
Dimensions of Quality:Manufactured Products
Performance basic operating characteristics of a product; how well a car
handles or its gas mileage
Features “extra” items added to basic features, such as a stereo CD or
a leather interior in a car
Reliabilityprobability that a product will operate properly within an
expected time frame; that is, a TV will work without repair for about seven years
Conformance degree to which a product meets pre–established standards
4Prof N. Balasubramanian
Dimensions of Quality:Manufactured Products
Durabilityhow long product lasts before replacement; with care, L. L.
Bean boots may last a lifetime
Serviceabilityease of getting repairs, speed of repairs, courtesy and
competence of repair personAesthetics
how a product looks, feels, sounds, smells, or tastesSafety
assurance that customer will not suffer injury or harm from a product; an especially important consideration for automobiles
Perceptionssubjective perceptions based on brand name, advertising, etc.
5Prof N. Balasubramanian
Dimensions of Quality: Services
Time and timeliness
how long must a customer wait for service, and is it completed on time?
is an overnight package delivered overnight?
Completeness:
is everything customer asked for provided?
is a mail order from a catalogue company complete when delivered?
Courtesy:how are customers treated by employees?are catalogue phone operators nice and are their voices pleasant?
Consistencyis same level of service provided to each customer each time?is your newspaper delivered on time every morning?
6Prof N. Balasubramanian
Dimensions of Quality: Services
• Accessibility and convenience• how easy is it to obtain service?
• does service representative answer you calls quickly?
• Accuracy• is service performed right every time?
• is your bank or credit card statement correct every month?
• Responsiveness• how well does company react to unusual situations?
• how well is a telephone operator able to respond to a customer’s questions?
7Prof N. Balasubramanian
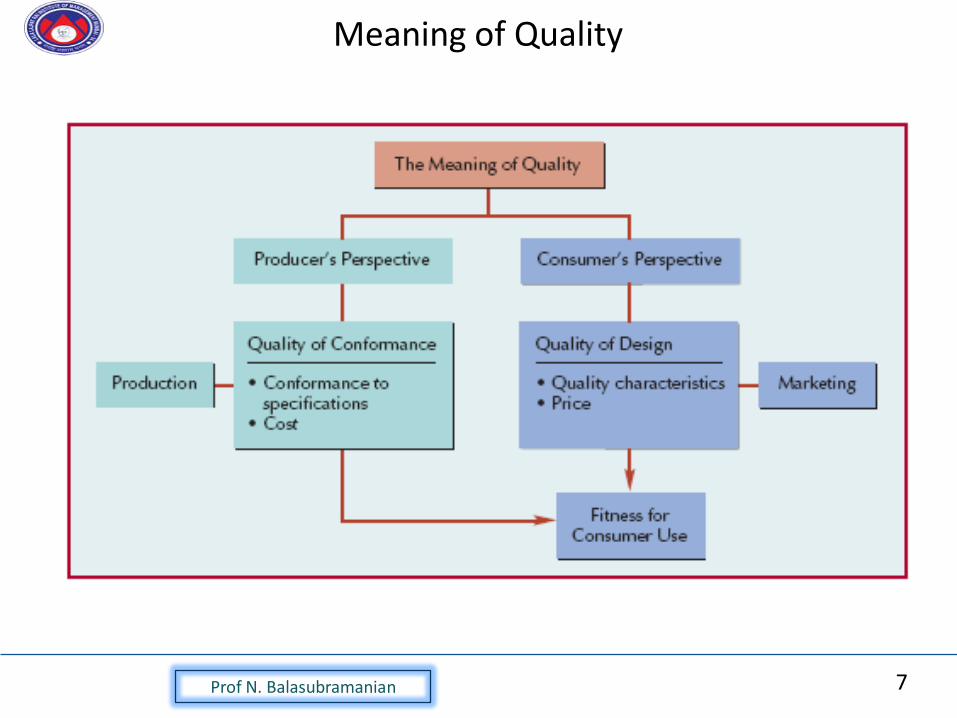
Meaning of Quality
8Prof N. Balasubramanian
What Is Quality:A Final Perspective
• Customer’s and producer’s perspectives depend on each other
• Producer’s perspective:• production process and COST
• Customer’s perspective:• fitness for use and PRICE
• Customer’s view must dominate
9Prof N. Balasubramanian
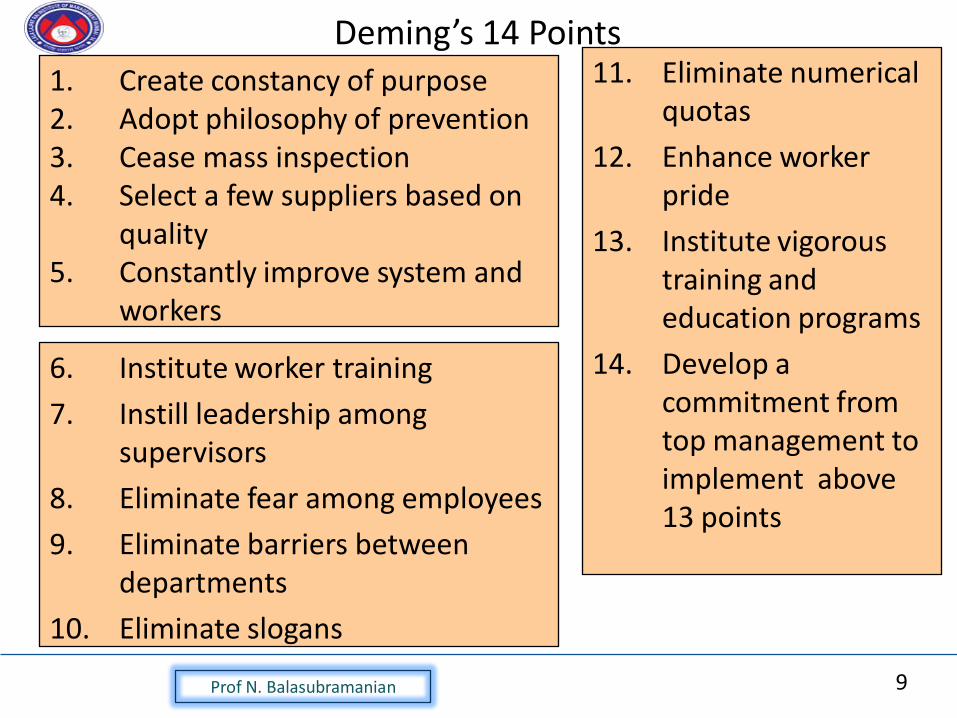
Deming’s 14 Points1. Create constancy of purpose2. Adopt philosophy of prevention3. Cease mass inspection4. Select a few suppliers based on
quality5. Constantly improve system and
workers
6. Institute worker training
7. Instill leadership among supervisors
8. Eliminate fear among employees
9. Eliminate barriers between departments
10. Eliminate slogans
11. Eliminate numerical quotas
12. Enhance worker pride
13. Institute vigorous training and education programs
14. Develop a commitment from top management to implement above 13 points
10Prof N. Balasubramanian
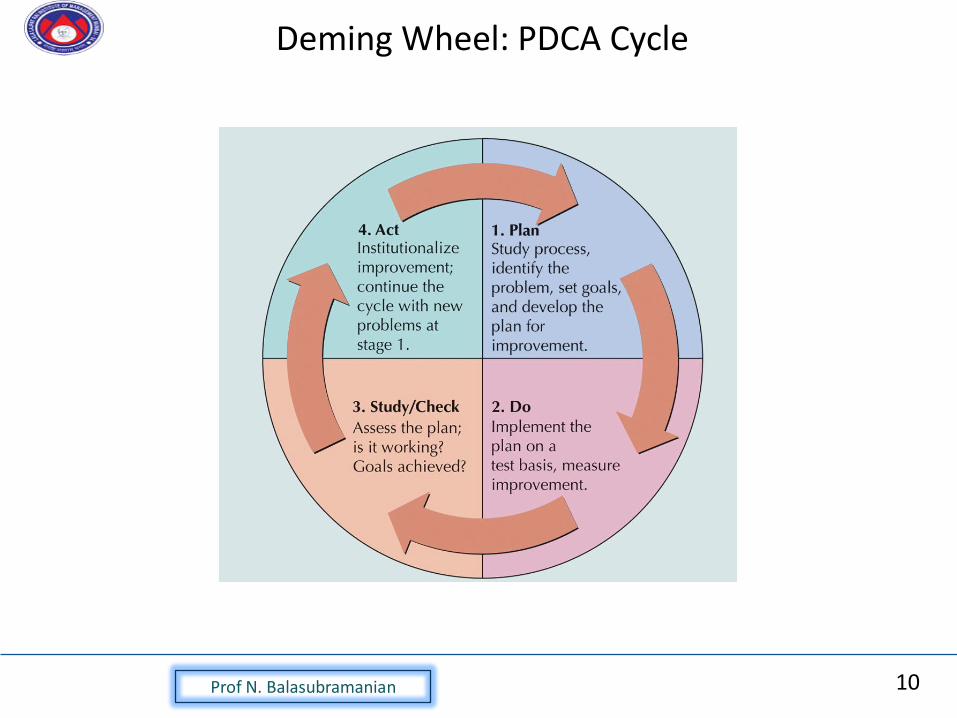
Deming Wheel: PDCA Cycle
11Prof N. Balasubramanian
Quality Tools
• Process Flow Chart
• Cause-and-Effect Diagram
• Check Sheet
• Pareto Analysis
• Histogram
• Scatter Diagram
• Statistical Process
Control Chart
12Prof N. Balasubramanian
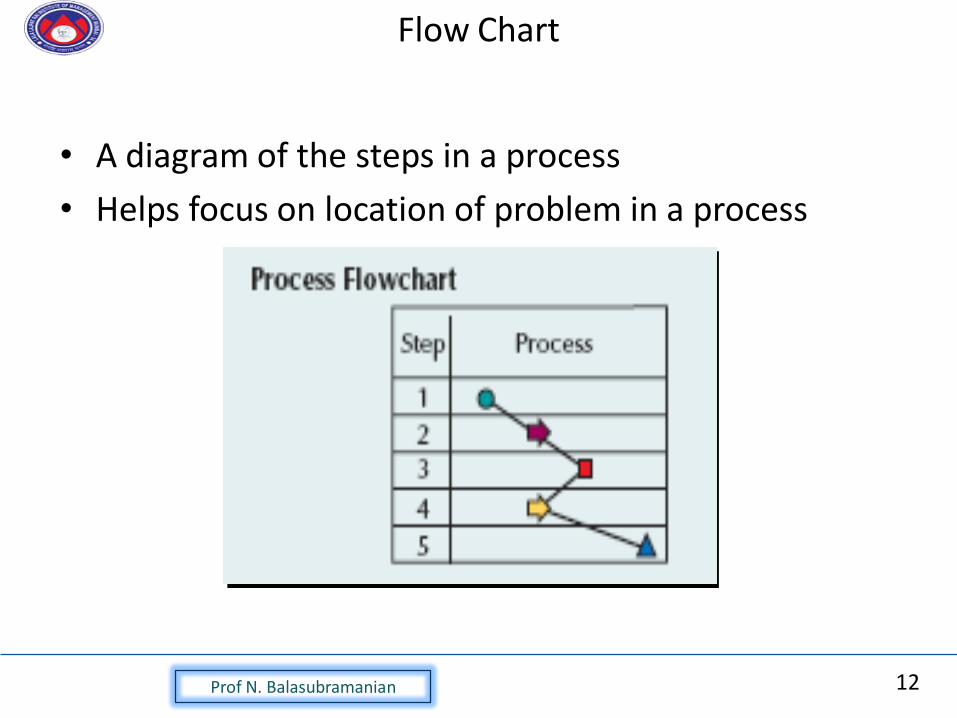
Flow Chart
• A diagram of the steps in a process
• Helps focus on location of problem in a process
13Prof N. Balasubramanian
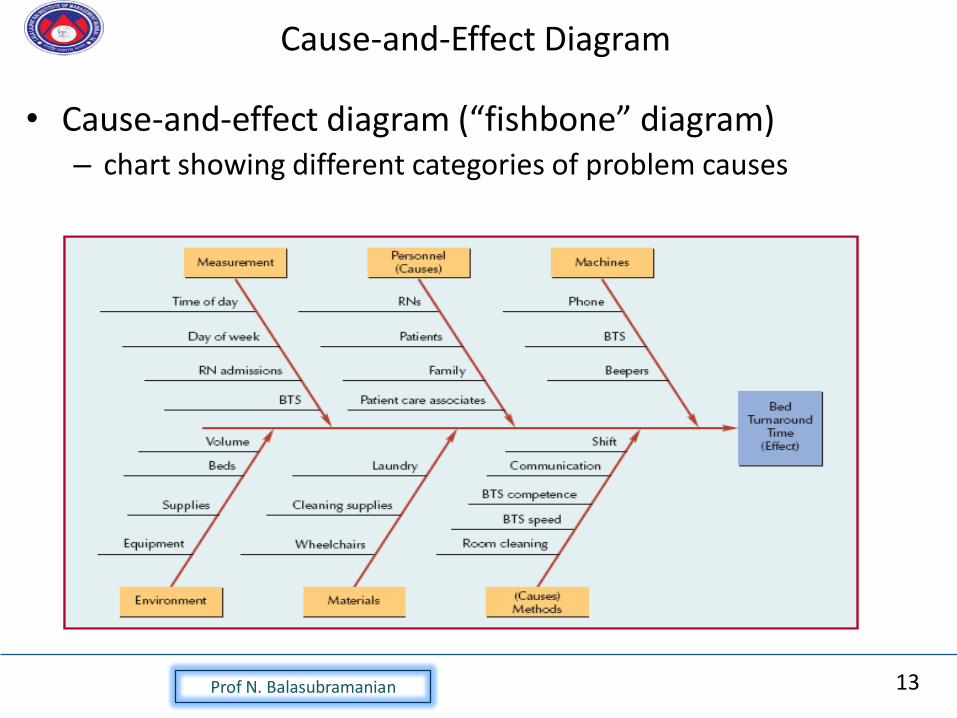
Cause-and-Effect Diagram
• Cause-and-effect diagram (“fishbone” diagram)– chart showing different categories of problem causes
14Prof N. Balasubramanian
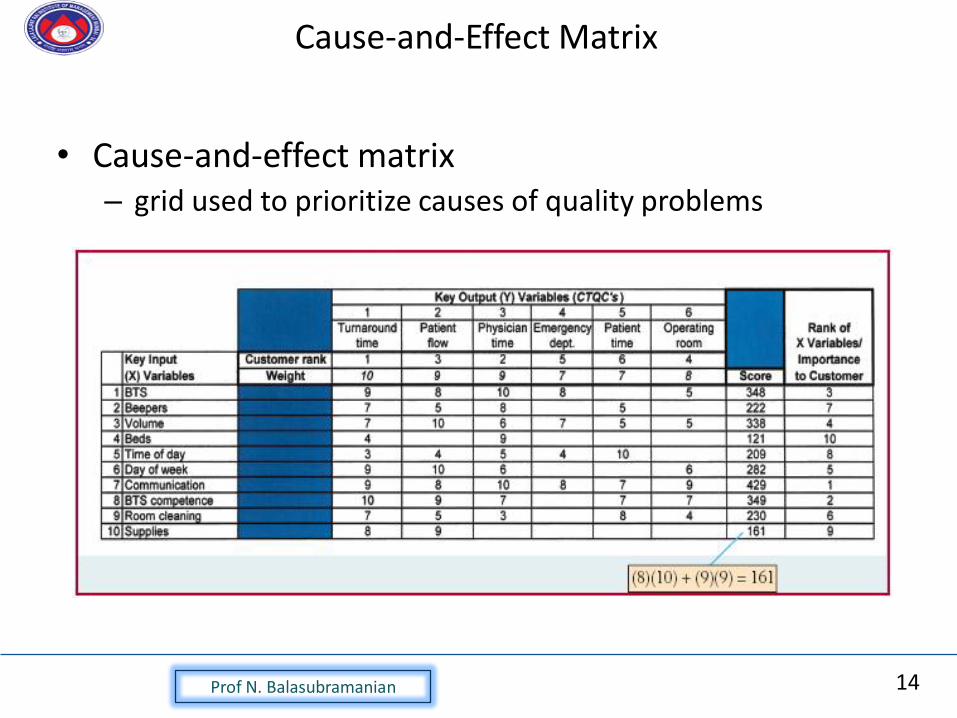
Cause-and-Effect Matrix
• Cause-and-effect matrix– grid used to prioritize causes of quality problems
15Prof N. Balasubramanian
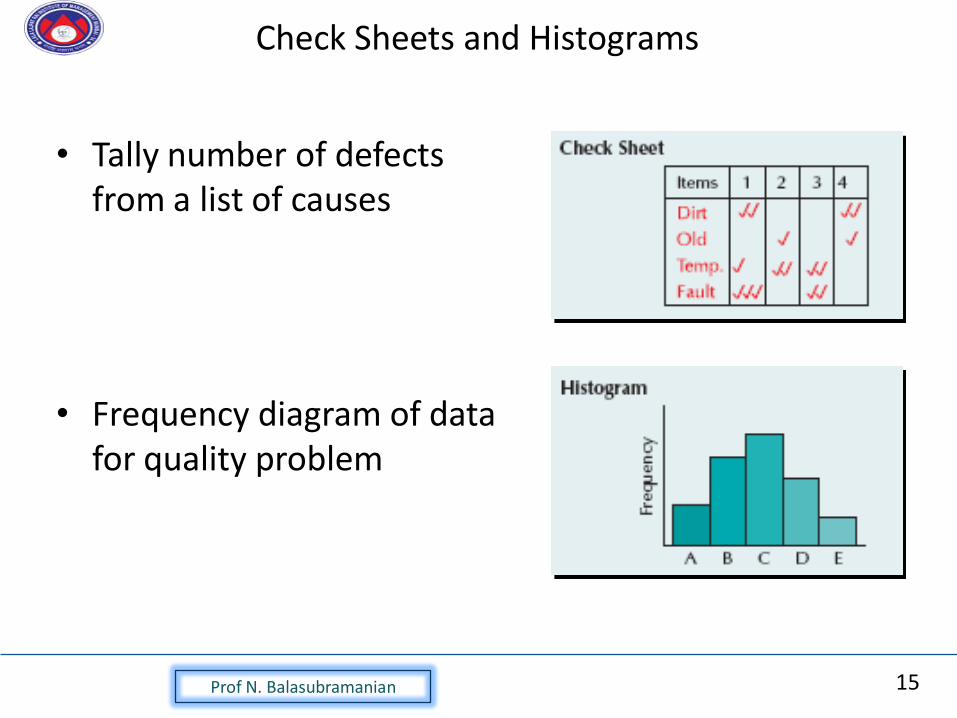
Check Sheets and Histograms
• Tally number of defects from a list of causes
• Frequency diagram of data for quality problem
16Prof N. Balasubramanian
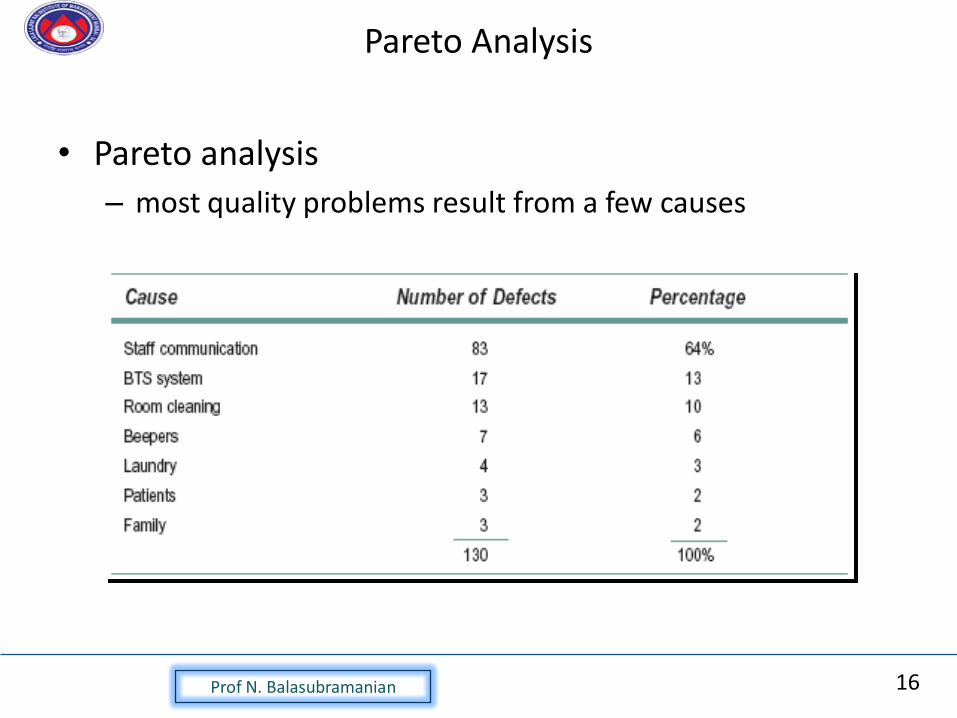
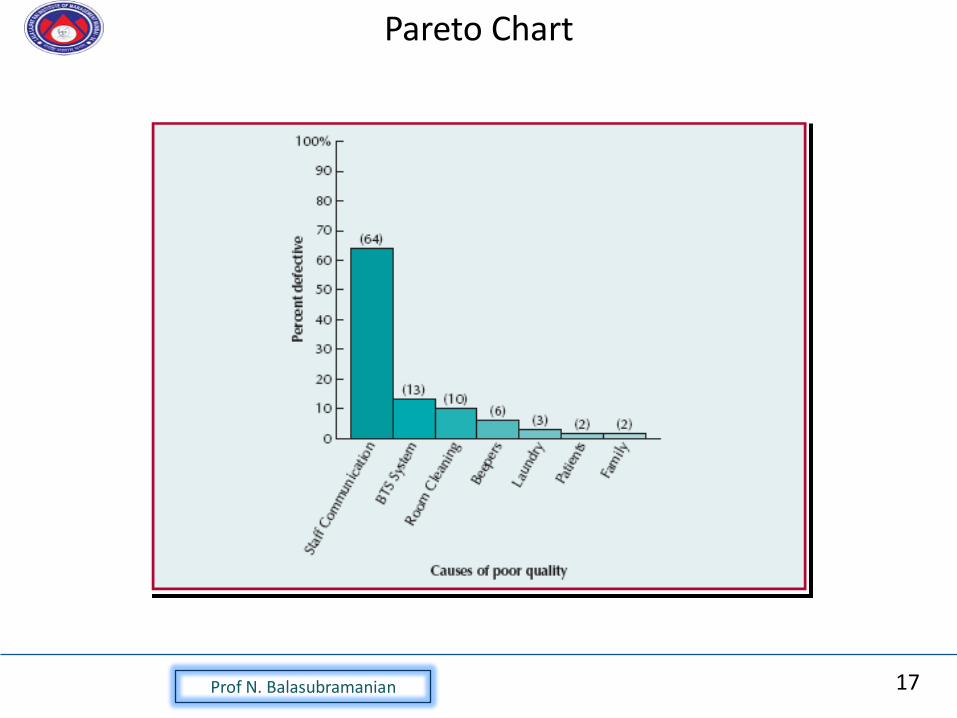
Pareto Analysis
• Pareto analysis
– most quality problems result from a few causes
17Prof N. Balasubramanian
Pareto Chart
18Prof N. Balasubramanian
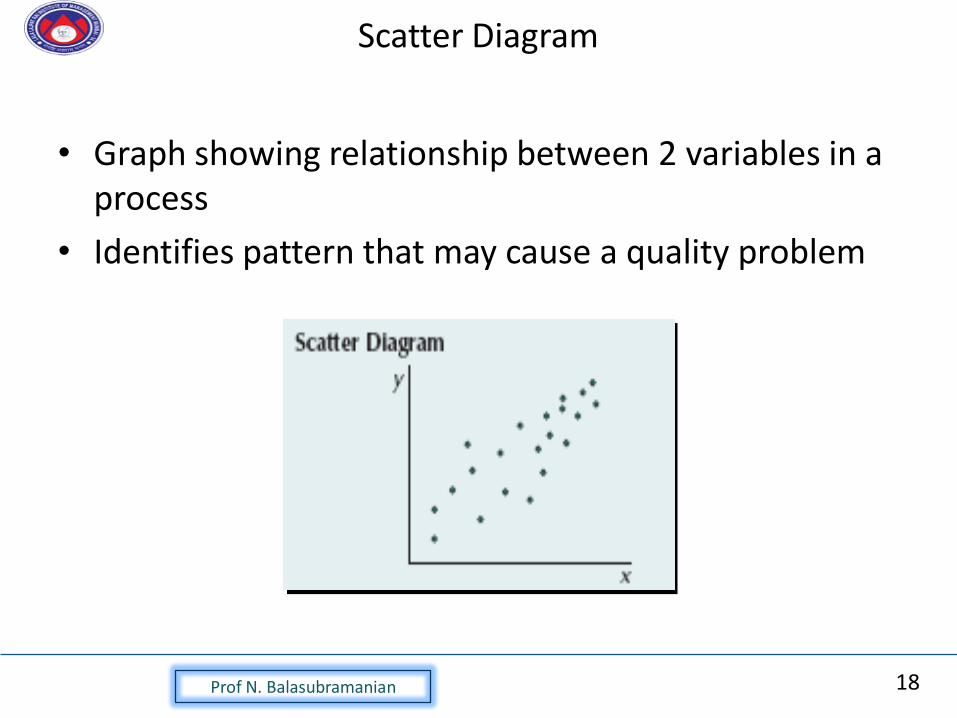
Scatter Diagram
• Graph showing relationship between 2 variables in a process
• Identifies pattern that may cause a quality problem
19Prof N. Balasubramanian
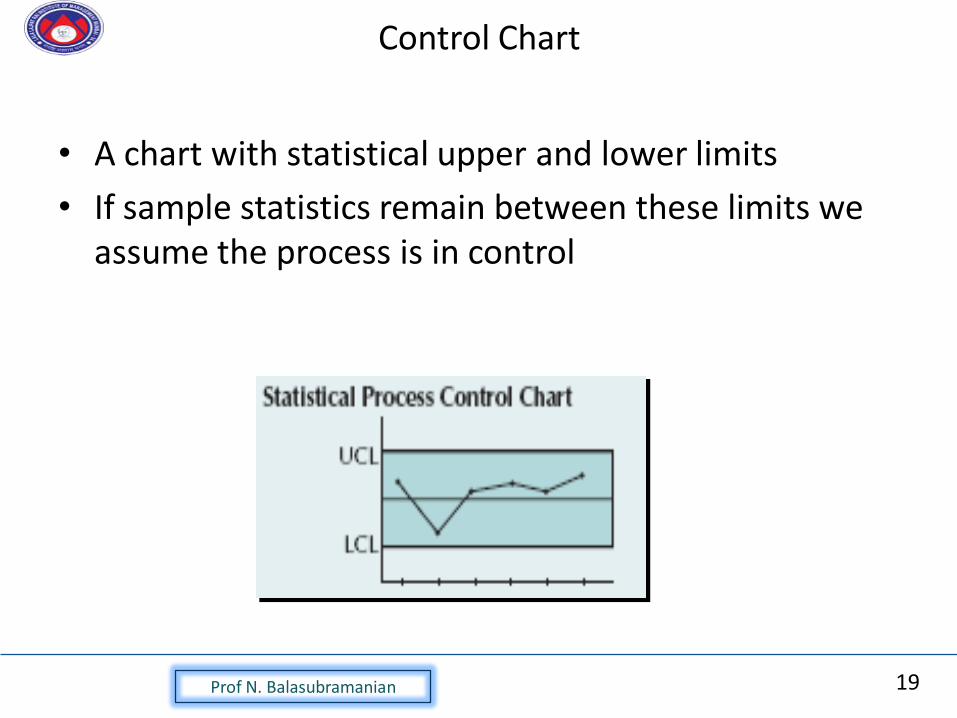
Control Chart
• A chart with statistical upper and lower limits
• If sample statistics remain between these limits we assume the process is in control
20Prof N. Balasubramanian
TQM and QMS
• Total Quality Management (TQM)• customer-oriented, leadership, strategic planning,
employee responsibility, continuous improvement, cooperation, statistical methods, and training and education
• Quality Management System (QMS)• system to achieve customer satisfaction that complements
other company systems
TQM and QMS