18th national award for excellence in energy management
TRANSCRIPT
18th National Award for Excellence in Energy Management 2017
1
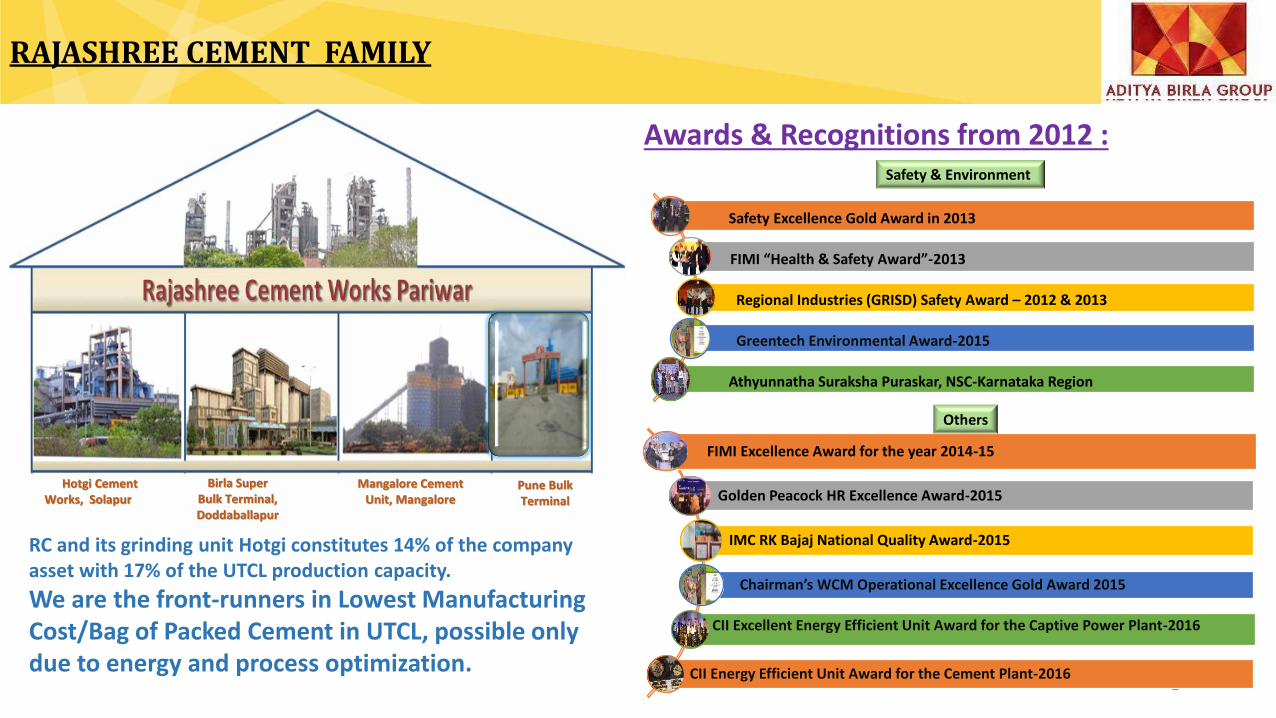
RAJASHREE CEMENT FAMILY
Hotgi Cement Works, Solapur
Birla Super Bulk Terminal, Doddaballapur
Mangalore Cement Unit, Mangalore
Pune Bulk Terminal
RC and its grinding unit Hotgi constitutes 14% of the company asset with 17% of the UTCL production capacity.
We are the front-runners in Lowest Manufacturing Cost/Bag of Packed Cement in UTCL, possible only due to energy and process optimization.
2
Awards & Recognitions from 2012 :
Safety Excellence Gold Award in 2013
FIMI “Health & Safety Award”-2013
Regional Industries (GRISD) Safety Award – 2012 & 2013
Greentech Environmental Award-2015
Athyunnatha Suraksha Puraskar, NSC-Karnataka Region
Safety & Environment
FIMI Excellence Award for the year 2014-15
Golden Peacock HR Excellence Award-2015
IMC RK Bajaj National Quality Award-2015
Chairman’s WCM Operational Excellence Gold Award 2015
CII Excellent Energy Efficient Unit Award for the Captive Power Plant-2016
CII Energy Efficient Unit Award for the Cement Plant-2016
Others
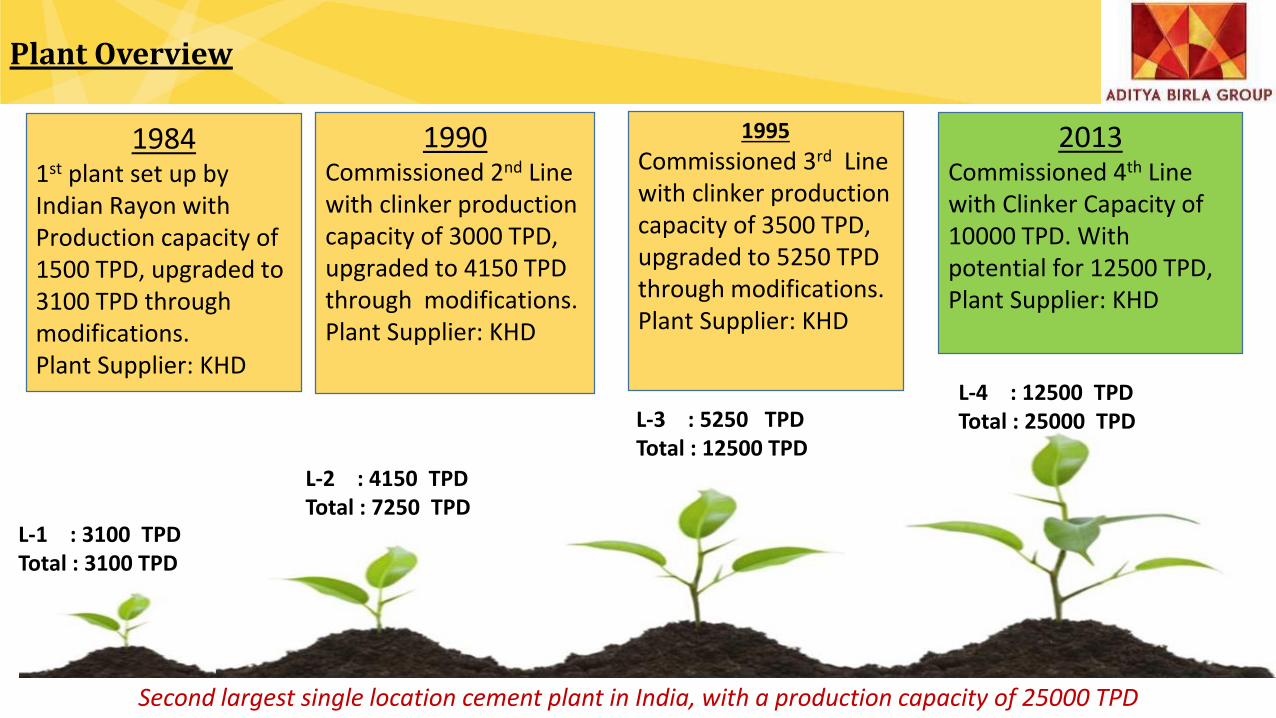
Plant Overview
19841st plant set up by Indian Rayon with Production capacity of 1500 TPD, upgraded to 3100 TPD through modifications. Plant Supplier: KHD
1990Commissioned 2nd Line with clinker production capacity of 3000 TPD, upgraded to 4150 TPD through modifications.Plant Supplier: KHD
1995
Commissioned 3rd Line with clinker production capacity of 3500 TPD, upgraded to 5250 TPD through modifications.Plant Supplier: KHD
2013Commissioned 4th Line with Clinker Capacity of 10000 TPD. With potential for 12500 TPD, Plant Supplier: KHD
Second largest single location cement plant in India, with a production capacity of 25000 TPD
L-1 : 3100 TPDTotal : 3100 TPD
L-2 : 4150 TPDTotal : 7250 TPD
L-3 : 5250 TPDTotal : 12500 TPD
L-4 : 12500 TPDTotal : 25000 TPD
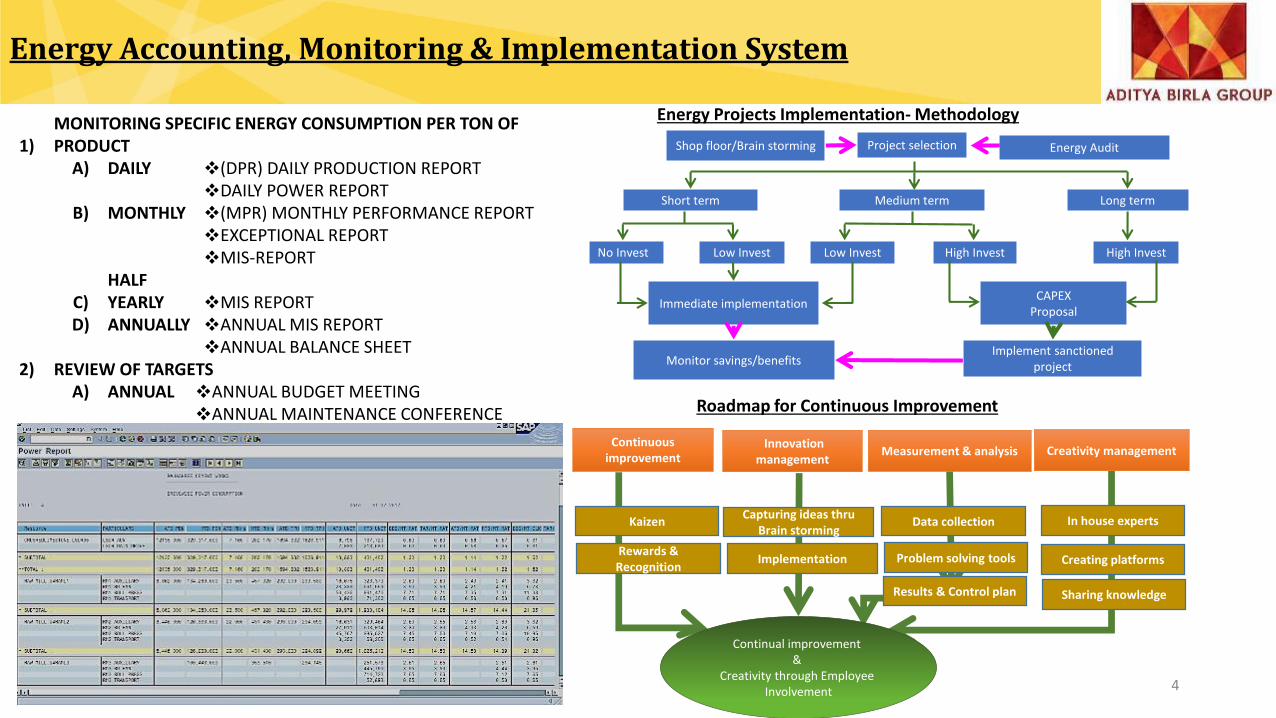
Energy Accounting, Monitoring & Implementation System
1)MONITORING SPECIFIC ENERGY CONSUMPTION PER TON OF PRODUCT
A) DAILY ❖(DPR) DAILY PRODUCTION REPORT❖DAILY POWER REPORT
B) MONTHLY ❖(MPR) MONTHLY PERFORMANCE REPORT❖EXCEPTIONAL REPORT❖MIS-REPORT
C)HALF YEARLY ❖MIS REPORT
D) ANNUALLY ❖ANNUAL MIS REPORT❖ANNUAL BALANCE SHEET
2) REVIEW OF TARGETSA) ANNUAL ❖ANNUAL BUDGET MEETING
❖ANNUAL MAINTENANCE CONFERENCE
4
Continual improvement &
Creativity through Employee Involvement
Continuous improvement
Innovation management
Measurement & analysis Creativity management
KaizenCapturing ideas thru
Brain storming
Implementation
Data collection
Problem solving tools
In house experts
Creating platformsRewards & Recognition
Sharing knowledgeResults & Control plan
Roadmap for Continuous Improvement
No Invest Low Invest High InvestLow Invest High Invest
Project selection Energy AuditShop floor/Brain storming
Long termMedium termShort term
Immediate implementationCAPEX
Proposal
Implement sanctioned projectMonitor savings/benefits
Energy Projects Implementation- Methodology
S No. Project TitleAnnual power
saving (Million kWh)
Annual cost saving
(Rs Million)
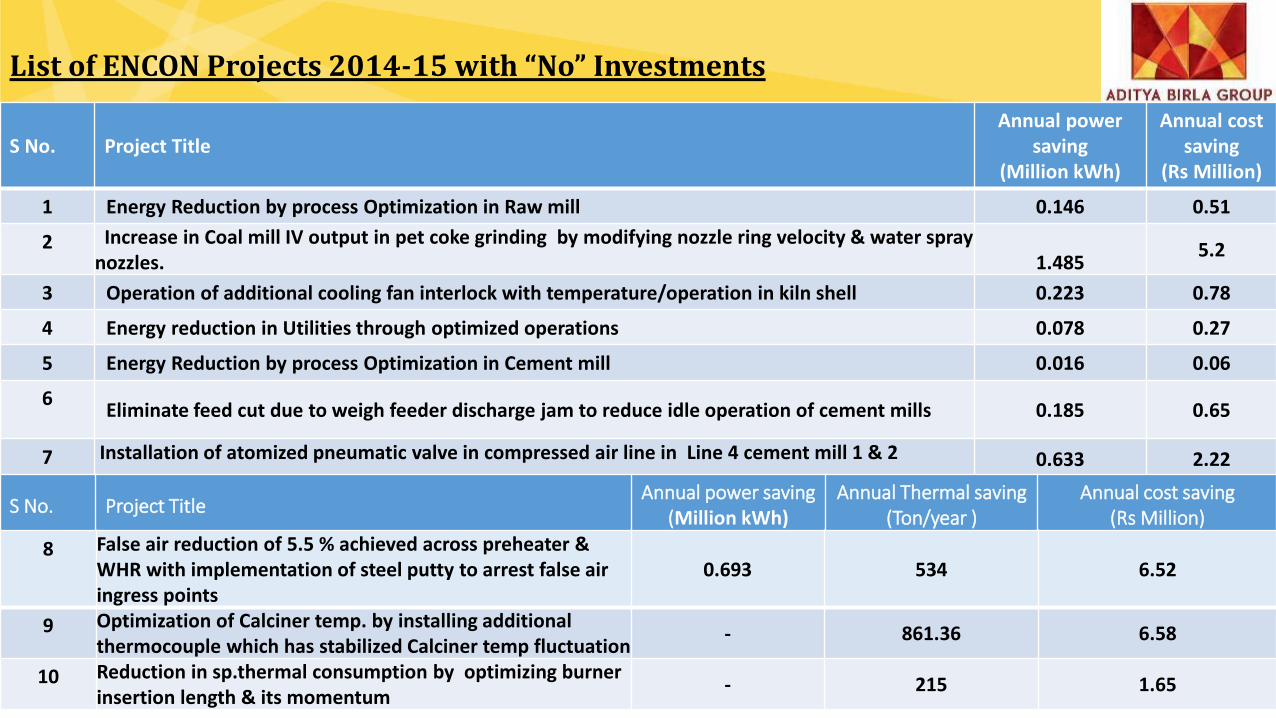
1 Energy Reduction by process Optimization in Raw mill 0.146 0.51
2 Increase in Coal mill IV output in pet coke grinding by modifying nozzle ring velocity & water spray nozzles. 1.485
5.2
3 Operation of additional cooling fan interlock with temperature/operation in kiln shell 0.223 0.78
4 Energy reduction in Utilities through optimized operations 0.078 0.27
5 Energy Reduction by process Optimization in Cement mill 0.016 0.06
6Eliminate feed cut due to weigh feeder discharge jam to reduce idle operation of cement mills 0.185 0.65
7 Installation of atomized pneumatic valve in compressed air line in Line 4 cement mill 1 & 2 0.633 2.22
List of ENCON Projects 2014-15 with “No” Investments
S No. Project TitleAnnual power saving
(Million kWh)Annual Thermal saving
(Ton/year )Annual cost saving
(Rs Million)
8 False air reduction of 5.5 % achieved across preheater & WHR with implementation of steel putty to arrest false air ingress points
0.693 534 6.52
9 Optimization of Calciner temp. by installing additional thermocouple which has stabilized Calciner temp fluctuation
- 861.36 6.58
10 Reduction in sp.thermal consumption by optimizing burner insertion length & its momentum
- 215 1.65
S No. Project TitleAnnual power
saving (Million kWh)
Annual cost saving(Rs Million)
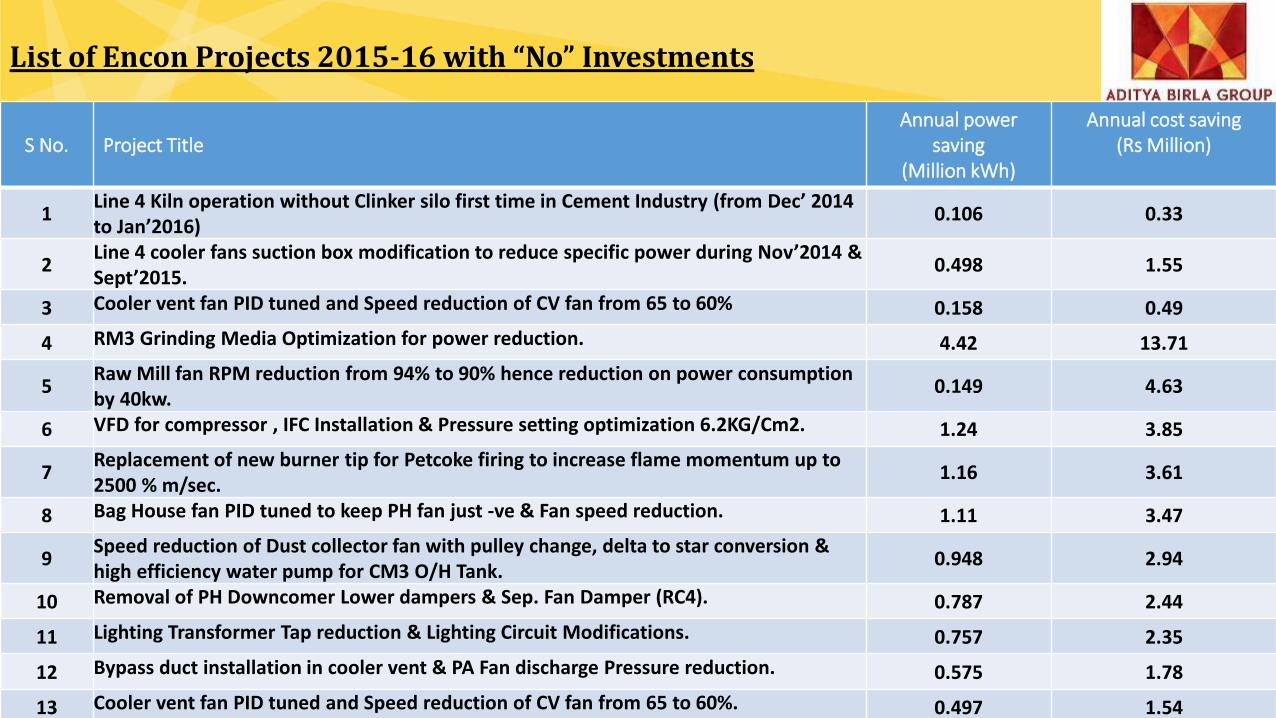
1Line 4 Kiln operation without Clinker silo first time in Cement Industry (from Dec’ 2014 to Jan’2016)
0.106 0.33
2Line 4 cooler fans suction box modification to reduce specific power during Nov’2014 & Sept’2015.
0.498 1.55
3 Cooler vent fan PID tuned and Speed reduction of CV fan from 65 to 60% 0.158 0.49
4 RM3 Grinding Media Optimization for power reduction. 4.42 13.71
5Raw Mill fan RPM reduction from 94% to 90% hence reduction on power consumption by 40kw.
0.149 4.63
6 VFD for compressor , IFC Installation & Pressure setting optimization 6.2KG/Cm2. 1.24 3.85
7Replacement of new burner tip for Petcoke firing to increase flame momentum up to 2500 % m/sec.
1.16 3.61
8 Bag House fan PID tuned to keep PH fan just -ve & Fan speed reduction. 1.11 3.47
9Speed reduction of Dust collector fan with pulley change, delta to star conversion & high efficiency water pump for CM3 O/H Tank.
0.948 2.94
10 Removal of PH Downcomer Lower dampers & Sep. Fan Damper (RC4). 0.787 2.44
11 Lighting Transformer Tap reduction & Lighting Circuit Modifications. 0.757 2.35
12 Bypass duct installation in cooler vent & PA Fan discharge Pressure reduction. 0.575 1.78
13 Cooler vent fan PID tuned and Speed reduction of CV fan from 65 to 60%. 0.497 1.54
List of Encon Projects 2015-16 with “No” Investments
S No. Project Title
Annual power saving (Million kWh)
Annual cost saving(Rs Million)
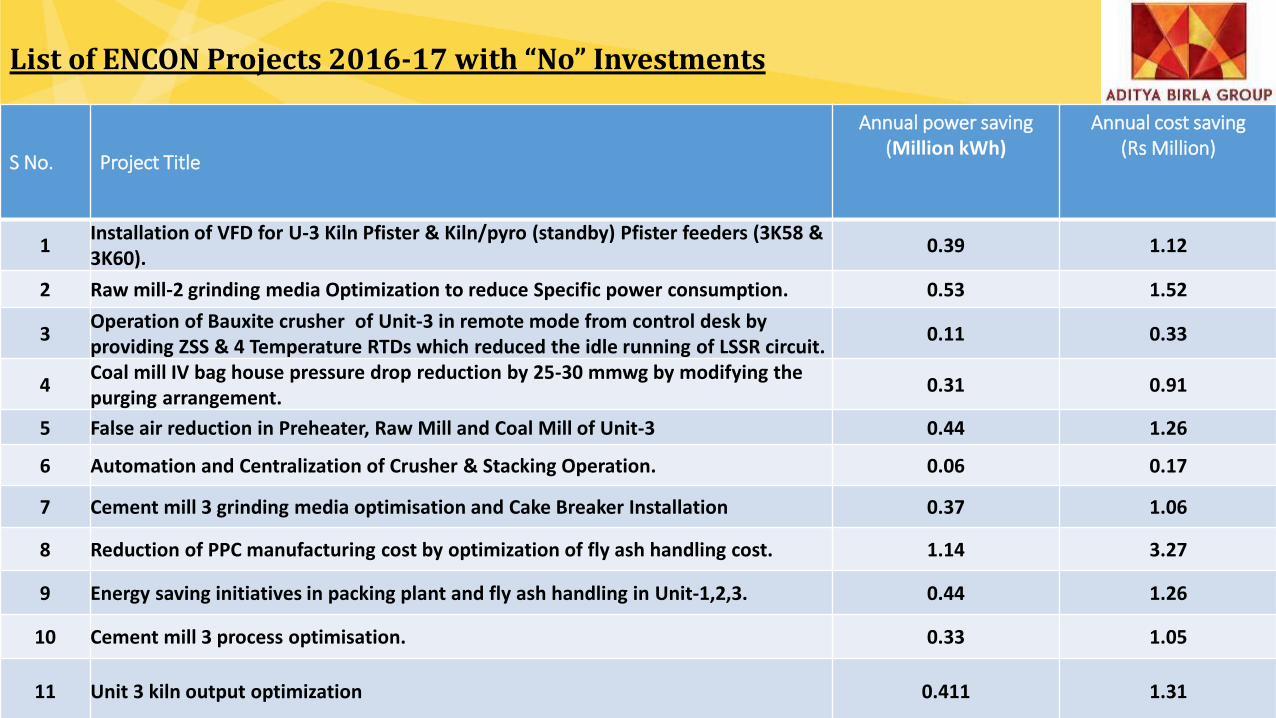
1Installation of VFD for U-3 Kiln Pfister & Kiln/pyro (standby) Pfister feeders (3K58 & 3K60).
0.39 1.12
2 Raw mill-2 grinding media Optimization to reduce Specific power consumption. 0.53 1.52
3Operation of Bauxite crusher of Unit-3 in remote mode from control desk by providing ZSS & 4 Temperature RTDs which reduced the idle running of LSSR circuit.
0.11 0.33
4Coal mill IV bag house pressure drop reduction by 25-30 mmwg by modifying the purging arrangement.
0.31 0.91
5 False air reduction in Preheater, Raw Mill and Coal Mill of Unit-3 0.44 1.26
6 Automation and Centralization of Crusher & Stacking Operation. 0.06 0.17
7 Cement mill 3 grinding media optimisation and Cake Breaker Installation 0.37 1.06
8 Reduction of PPC manufacturing cost by optimization of fly ash handling cost. 1.14 3.27
9 Energy saving initiatives in packing plant and fly ash handling in Unit-1,2,3. 0.44 1.26
10 Cement mill 3 process optimisation. 0.33 1.05
11 Unit 3 kiln output optimization 0.411 1.31
List of ENCON Projects 2016-17 with “No” Investments
S.No. Project Title Annual power
saving ( Million kWh)
Investment Made (Rs, Million)
Total Annual cost saving
(Rs, Million)
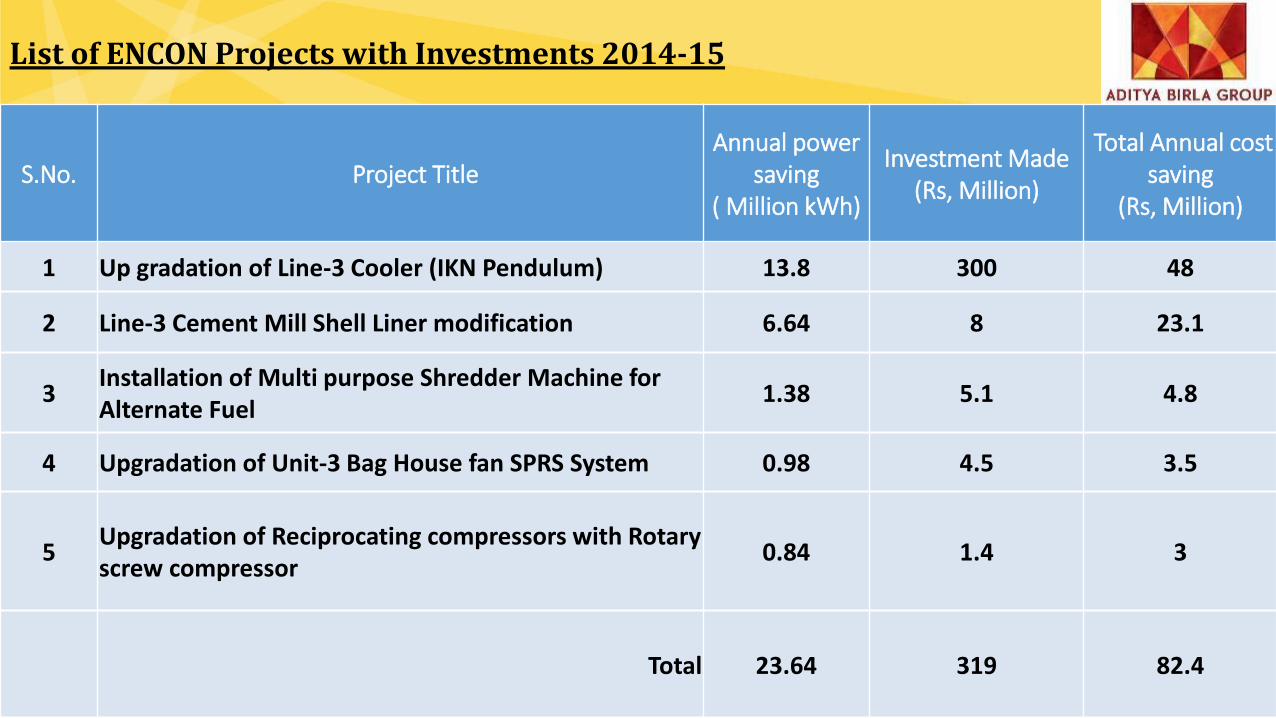
1 Up gradation of Line-3 Cooler (IKN Pendulum) 13.8 300 48
2 Line-3 Cement Mill Shell Liner modification 6.64 8 23.1
3Installation of Multi purpose Shredder Machine for Alternate Fuel
1.38 5.1 4.8
4 Upgradation of Unit-3 Bag House fan SPRS System 0.98 4.5 3.5
5Upgradation of Reciprocating compressors with Rotary screw compressor
0.84 1.4 3
Total 23.64 319 82.4
List of ENCON Projects with Investments 2014-15
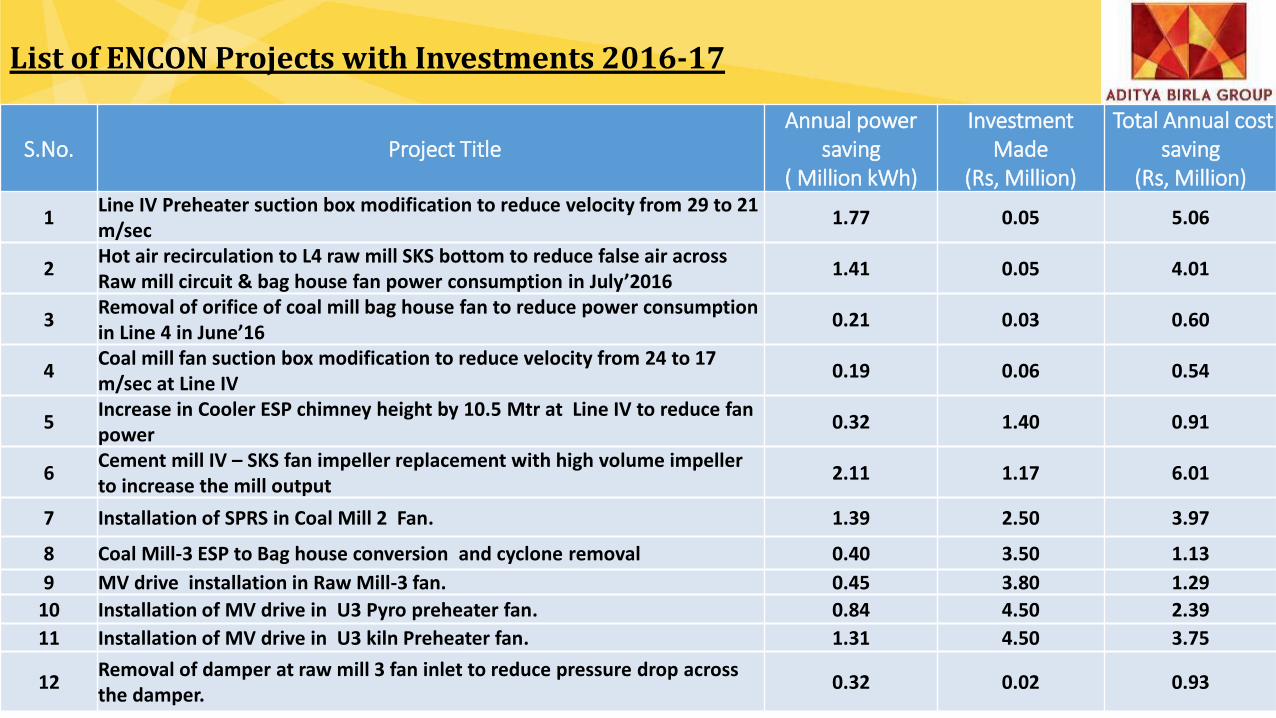
List of ENCON Projects with Investments 2016-17
S.No. Project Title Annual power
saving ( Million kWh)
Investment Made
(Rs, Million)
Total Annual cost saving
(Rs, Million)
1Line IV Preheater suction box modification to reduce velocity from 29 to 21 m/sec
1.77 0.05 5.06
2Hot air recirculation to L4 raw mill SKS bottom to reduce false air across Raw mill circuit & bag house fan power consumption in July’2016
1.41 0.05 4.01
3Removal of orifice of coal mill bag house fan to reduce power consumption in Line 4 in June’16
0.21 0.03 0.60
4Coal mill fan suction box modification to reduce velocity from 24 to 17 m/sec at Line IV
0.19 0.06 0.54
5Increase in Cooler ESP chimney height by 10.5 Mtr at Line IV to reduce fan power
0.32 1.40 0.91
6Cement mill IV – SKS fan impeller replacement with high volume impeller to increase the mill output
2.11 1.17 6.01
7 Installation of SPRS in Coal Mill 2 Fan. 1.39 2.50 3.97
8 Coal Mill-3 ESP to Bag house conversion and cyclone removal 0.40 3.50 1.13
9 MV drive installation in Raw Mill-3 fan. 0.45 3.80 1.29
10 Installation of MV drive in U3 Pyro preheater fan. 0.84 4.50 2.39
11 Installation of MV drive in U3 kiln Preheater fan. 1.31 4.50 3.75
12Removal of damper at raw mill 3 fan inlet to reduce pressure drop across the damper.
0.32 0.02 0.93
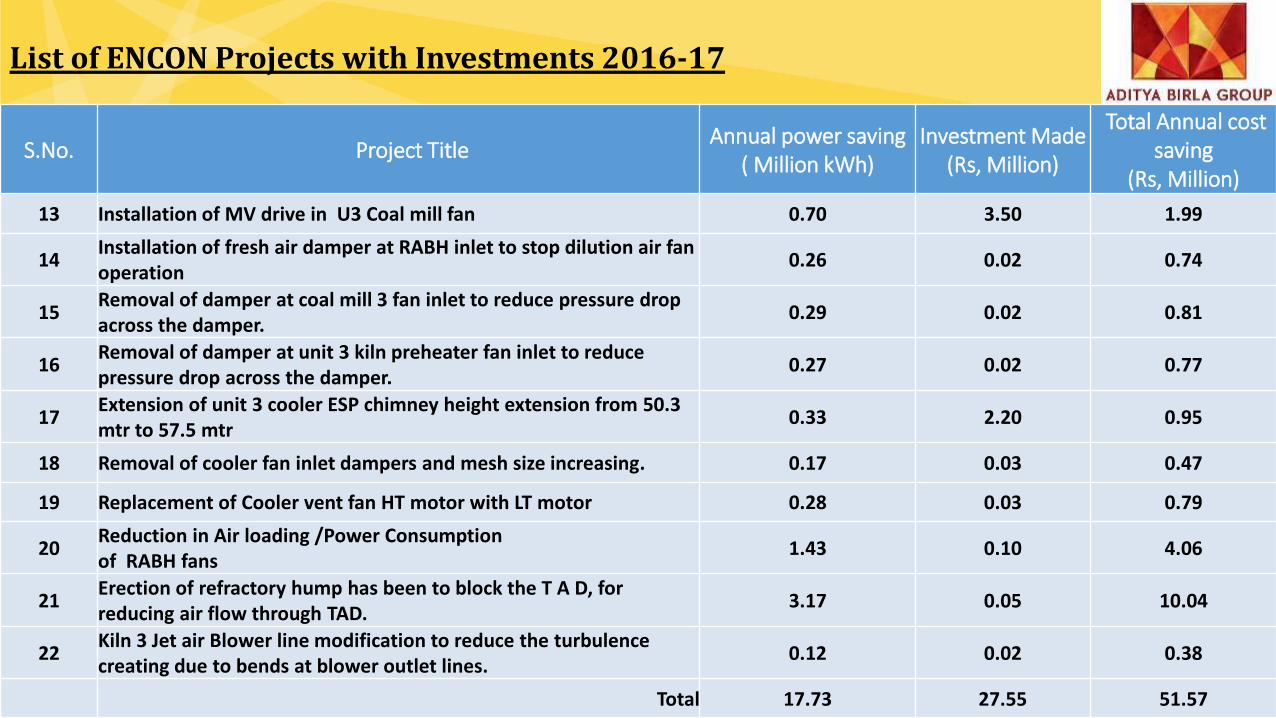
List of ENCON Projects with Investments 2016-17
S.No. Project Title Annual power saving
( Million kWh) Investment Made
(Rs, Million)
Total Annual cost saving
(Rs, Million)
13 Installation of MV drive in U3 Coal mill fan 0.70 3.50 1.99
14Installation of fresh air damper at RABH inlet to stop dilution air fan operation
0.26 0.02 0.74
15Removal of damper at coal mill 3 fan inlet to reduce pressure drop across the damper.
0.29 0.02 0.81
16Removal of damper at unit 3 kiln preheater fan inlet to reduce pressure drop across the damper.
0.27 0.02 0.77
17Extension of unit 3 cooler ESP chimney height extension from 50.3 mtr to 57.5 mtr
0.33 2.20 0.95
18 Removal of cooler fan inlet dampers and mesh size increasing. 0.17 0.03 0.47
19 Replacement of Cooler vent fan HT motor with LT motor 0.28 0.03 0.79
20Reduction in Air loading /Power Consumption of RABH fans
1.43 0.10 4.06
21Erection of refractory hump has been to block the T A D, for reducing air flow through TAD.
3.17 0.05 10.04
22Kiln 3 Jet air Blower line modification to reduce the turbulence creating due to bends at blower outlet lines.
0.12 0.02 0.38
Total 17.73 27.55 51.57
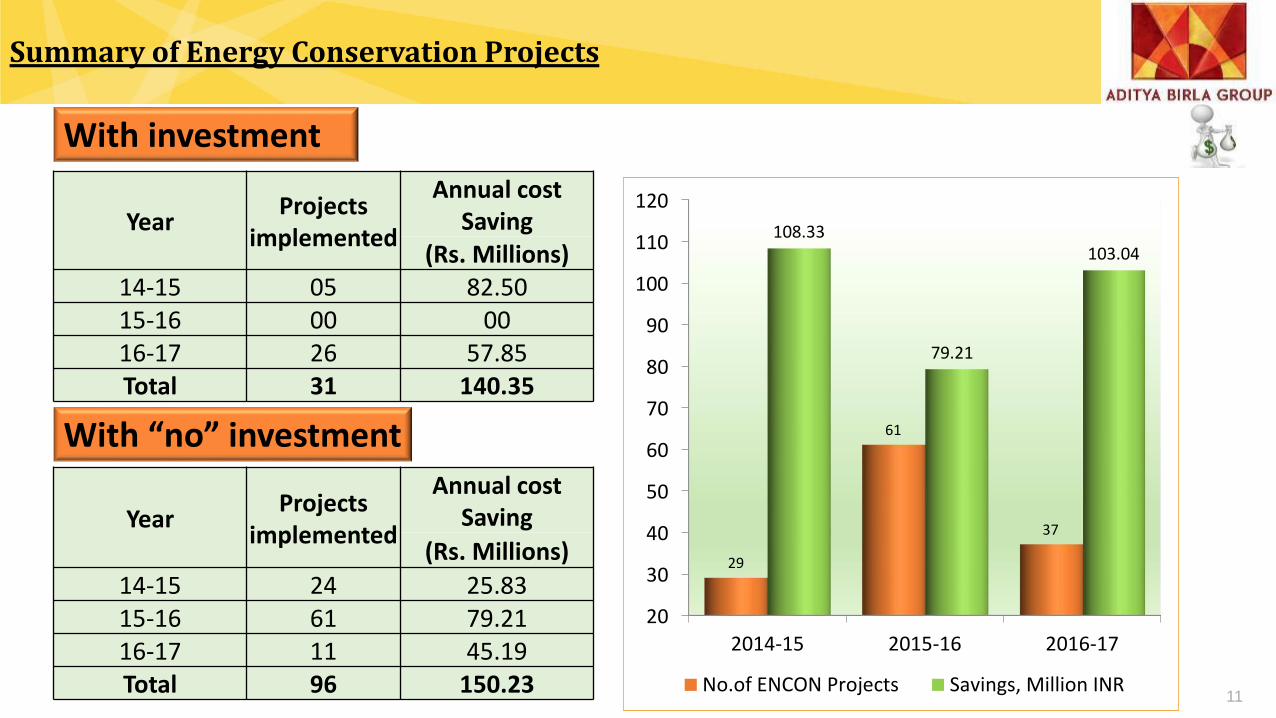
Summary of Energy Conservation Projects
11
With investment
Year Projects
implemented
Annual cost Saving
(Rs. Millions)
14-15 24 25.8315-16 61 79.2116-17 11 45.19Total 96 150.23
Year Projects
implemented
Annual cost Saving
(Rs. Millions) 14-15 05 82.5015-16 00 0016-17 26 57.85Total 31 140.35
With “no” investment
20
30
40
50
60
70
80
90
100
110
120
2014-15 2015-16 2016-17
29
61
37
108.33
79.21
103.04
No.of ENCON Projects Savings, Million INR
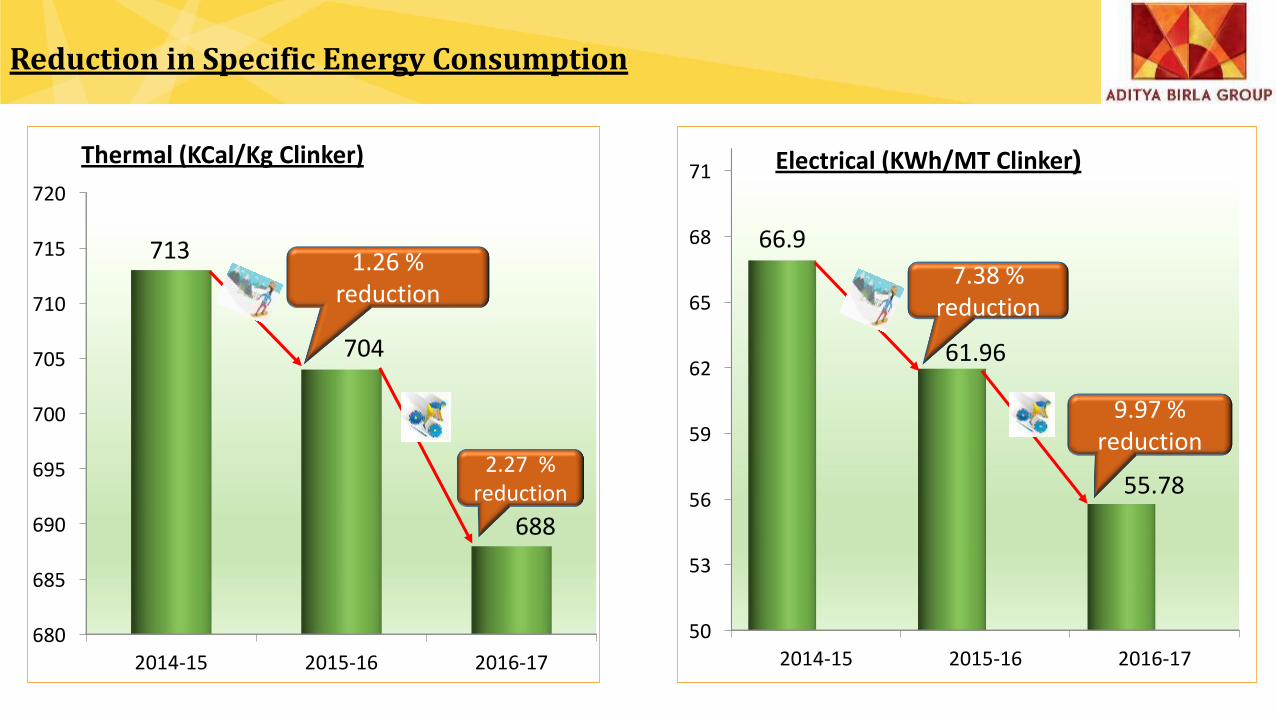
Reduction in Specific Energy Consumption
680
685
690
695
700
705
710
715
720
2014-15 2015-16 2016-17
713
704
688
2.27 % reduction
1.26 % reduction
Thermal (KCal/Kg Clinker)
50
53
56
59
62
65
68
71
2014-15 2015-16 2016-17
66.9
61.96
55.78
9.97 % reduction
7.38 % reduction
Electrical (KWh/MT Clinker)
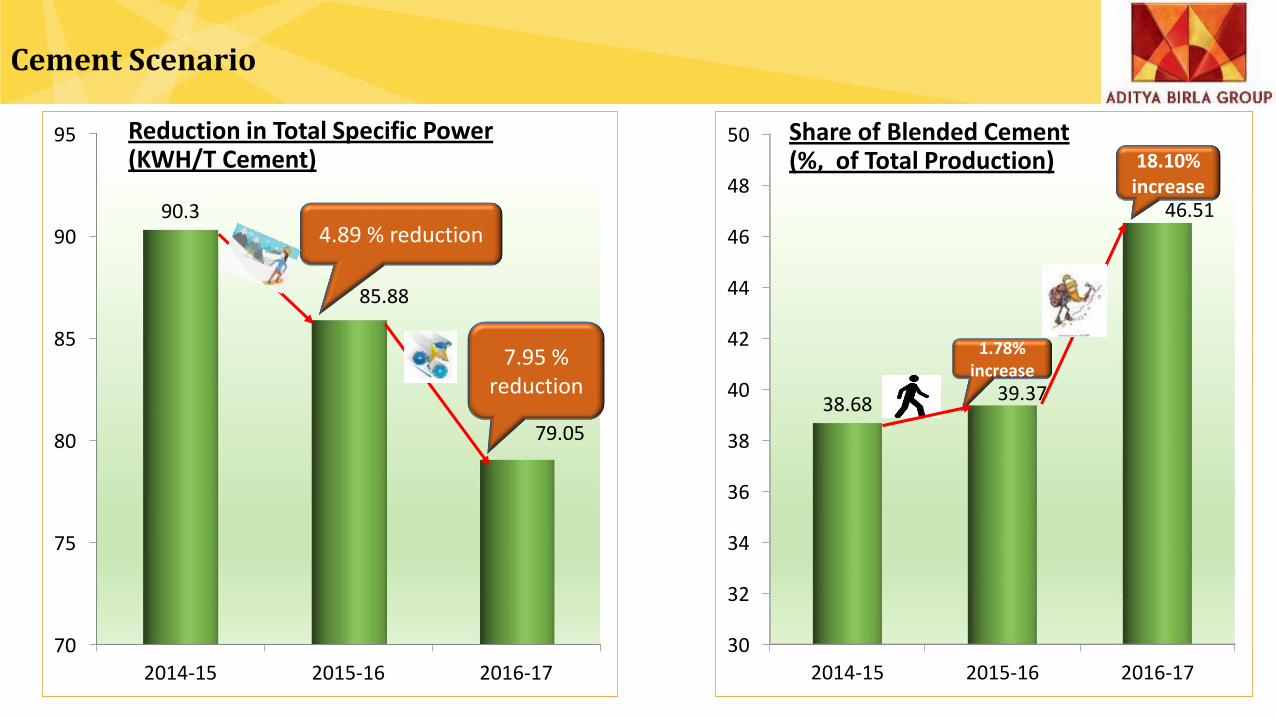
70
75
80
85
90
95
2014-15 2015-16 2016-17
90.3
85.88
79.05
7.95 % reduction
4.89 % reduction
Reduction in Total Specific Power (KWH/T Cement)
Cement Scenario
30
32
34
36
38
40
42
44
46
48
50
2014-15 2015-16 2016-17
38.6839.37
46.51
18.10% increase
1.78% increase
Share of Blended Cement (%, of Total Production)
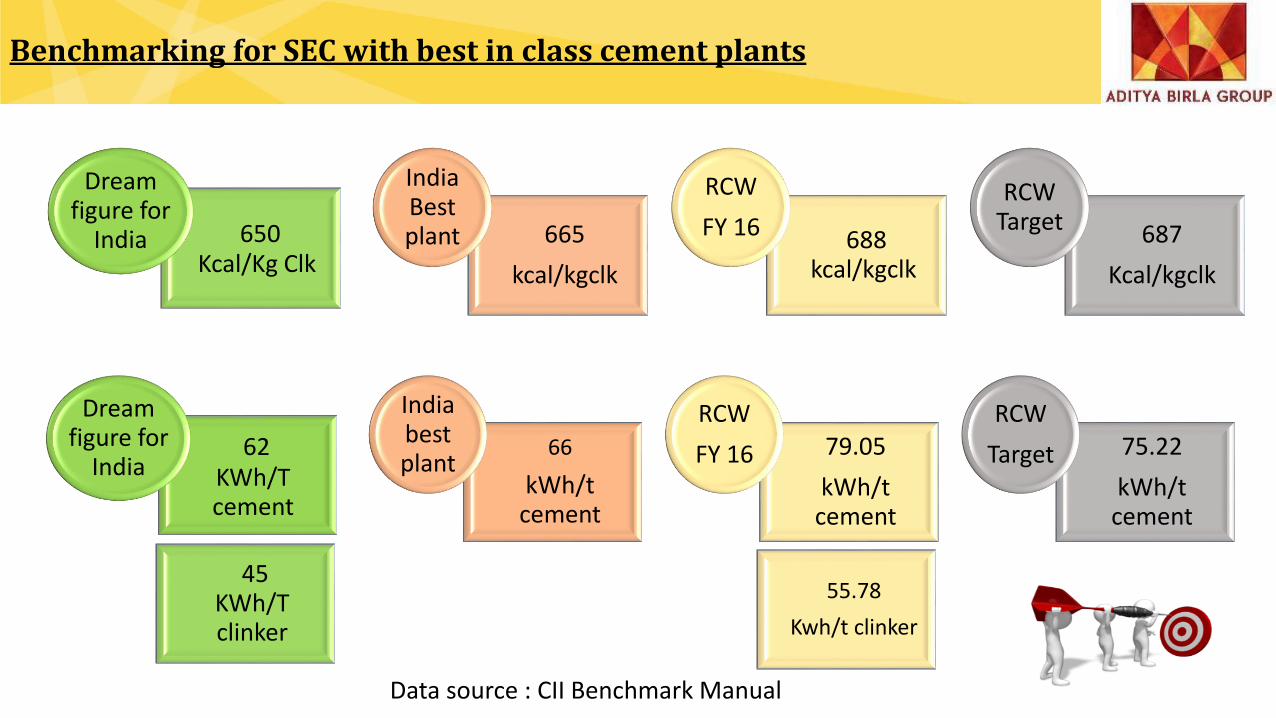
62 KWh/T cement
45 KWh/T clinker
Dream figure for
India66
kWh/t cement
55.78
Kwh/t clinker
India best plant
79.05
kWh/t cement
RCW
FY 16 75.22
kWh/t cement
RCW
Target
650 Kcal/Kg Clk
Dream figure for
India 665
kcal/kgclk
India Best plant 688
kcal/kgclk
RCW
FY 16 687
Kcal/kgclk
RCW Target
Benchmarking for SEC with best in class cement plants
Data source : CII Benchmark Manual
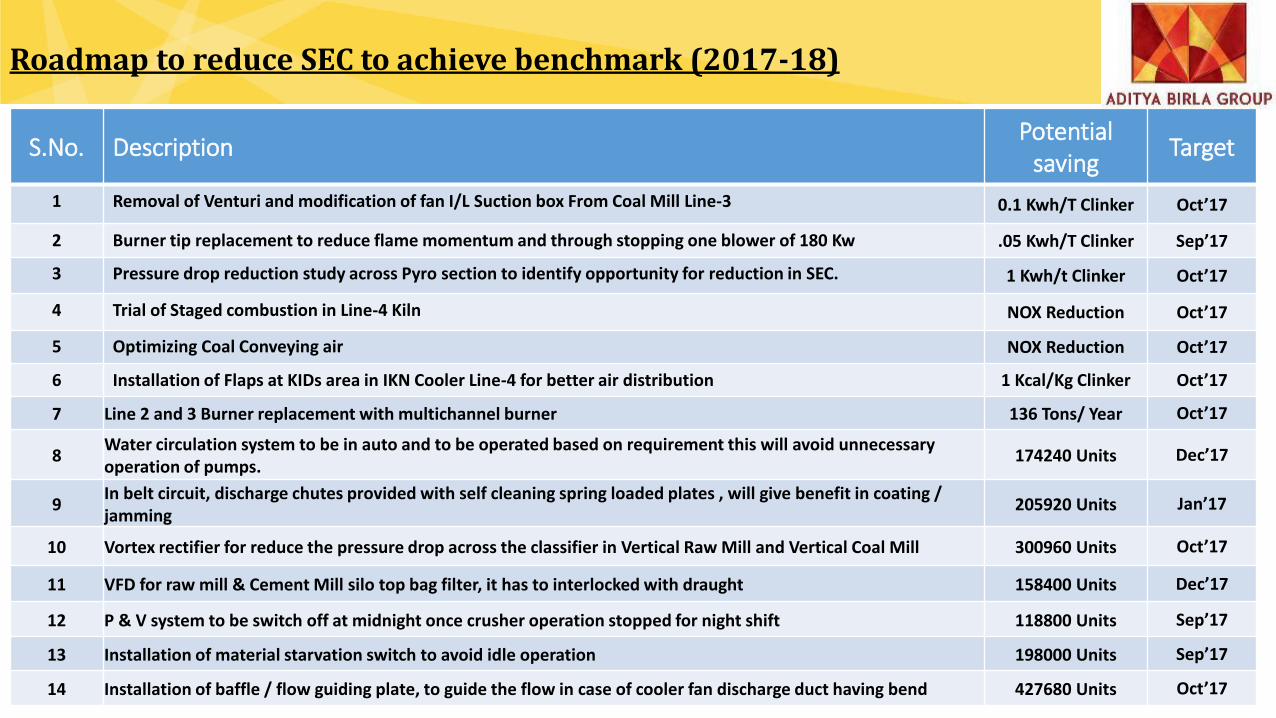
S.No. DescriptionPotential
savingTarget
1 Removal of Venturi and modification of fan I/L Suction box From Coal Mill Line-3 0.1 Kwh/T Clinker Oct’17
2 Burner tip replacement to reduce flame momentum and through stopping one blower of 180 Kw .05 Kwh/T Clinker Sep’17
3 Pressure drop reduction study across Pyro section to identify opportunity for reduction in SEC. 1 Kwh/t Clinker Oct’17
4 Trial of Staged combustion in Line-4 Kiln NOX Reduction Oct’17
5 Optimizing Coal Conveying air NOX Reduction Oct’17
6 Installation of Flaps at KIDs area in IKN Cooler Line-4 for better air distribution 1 Kcal/Kg Clinker Oct’17
7 Line 2 and 3 Burner replacement with multichannel burner 136 Tons/ Year Oct’17
8Water circulation system to be in auto and to be operated based on requirement this will avoid unnecessary operation of pumps.
174240 Units Dec’17
9In belt circuit, discharge chutes provided with self cleaning spring loaded plates , will give benefit in coating / jamming
205920 Units Jan’17
10 Vortex rectifier for reduce the pressure drop across the classifier in Vertical Raw Mill and Vertical Coal Mill 300960 Units Oct’17
11 VFD for raw mill & Cement Mill silo top bag filter, it has to interlocked with draught 158400 Units Dec’17
12 P & V system to be switch off at midnight once crusher operation stopped for night shift 118800 Units Sep’17
13 Installation of material starvation switch to avoid idle operation 198000 Units Sep’17
14 Installation of baffle / flow guiding plate, to guide the flow in case of cooler fan discharge duct having bend 427680 Units Oct’17
Roadmap to reduce SEC to achieve benchmark (2017-18)
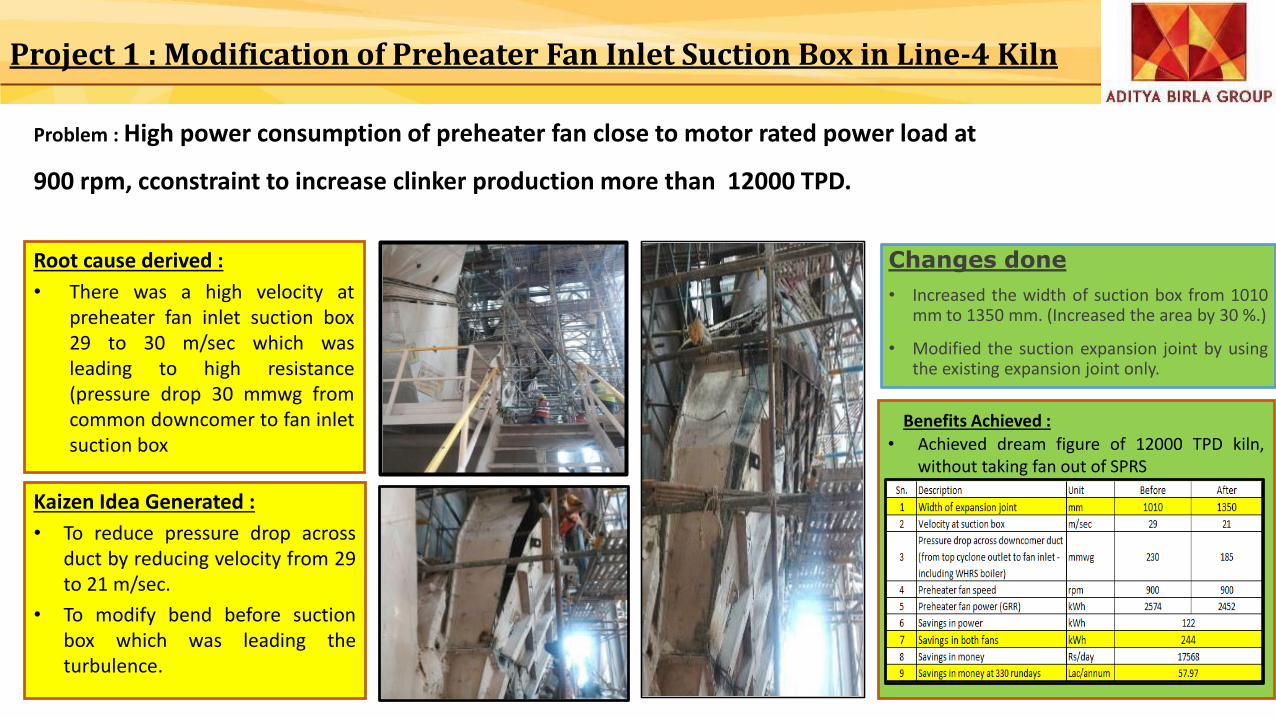
Problem : High power consumption of preheater fan close to motor rated power load at
900 rpm, cconstraint to increase clinker production more than 12000 TPD.
Project 1 : Modification of Preheater Fan Inlet Suction Box in Line-4 Kiln
Kaizen Idea Generated :
• To reduce pressure drop acrossduct by reducing velocity from 29to 21 m/sec.
• To modify bend before suctionbox which was leading theturbulence.
Root cause derived :
• There was a high velocity atpreheater fan inlet suction box29 to 30 m/sec which wasleading to high resistance(pressure drop 30 mmwg fromcommon downcomer to fan inletsuction box
Changes done
• Increased the width of suction box from 1010mm to 1350 mm. (Increased the area by 30 %.)
• Modified the suction expansion joint by usingthe existing expansion joint only.
Benefits Achieved :• Achieved dream figure of 12000 TPD kiln,
without taking fan out of SPRS
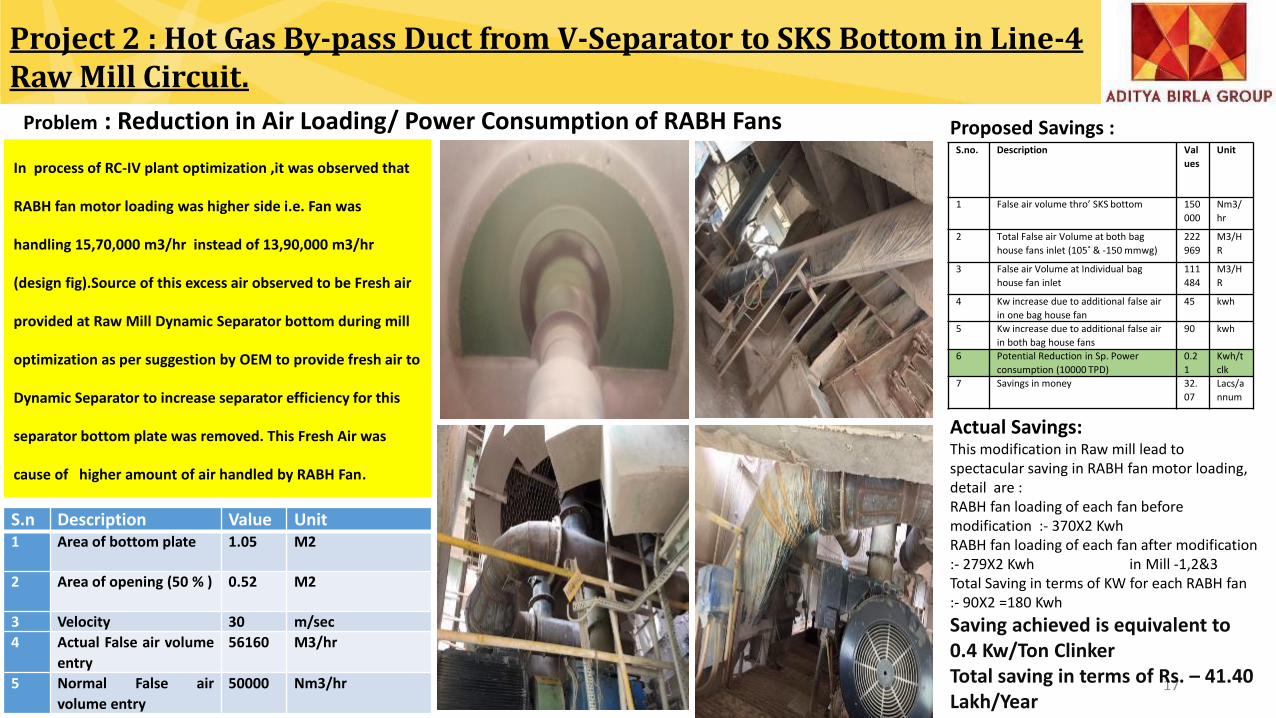
Project 2 : Hot Gas By-pass Duct from V-Separator to SKS Bottom in Line-4 Raw Mill Circuit.
17
Problem : Reduction in Air Loading/ Power Consumption of RABH Fans
In process of RC-IV plant optimization ,it was observed that
RABH fan motor loading was higher side i.e. Fan was
handling 15,70,000 m3/hr instead of 13,90,000 m3/hr
(design fig).Source of this excess air observed to be Fresh air
provided at Raw Mill Dynamic Separator bottom during mill
optimization as per suggestion by OEM to provide fresh air to
Dynamic Separator to increase separator efficiency for this
separator bottom plate was removed. This Fresh Air was
cause of higher amount of air handled by RABH Fan.
S.n Description Value Unit1 Area of bottom plate 1.05 M2
2 Area of opening (50 % ) 0.52 M2
3 Velocity 30 m/sec
4 Actual False air volume
entry
56160 M3/hr
5 Normal False air
volume entry
50000 Nm3/hr
Proposed Savings :S.no. Description Val
ues
Unit
1 False air volume thro’ SKS bottom 150
000
Nm3/
hr
2 Total False air Volume at both bag
house fans inlet (105˚ & -150 mmwg)
222
969
M3/H
R
3 False air Volume at Individual bag
house fan inlet
111
484
M3/H
R
4 Kw increase due to additional false air
in one bag house fan
45 kwh
5 Kw increase due to additional false air
in both bag house fans
90 kwh
6 Potential Reduction in Sp. Power
consumption (10000 TPD)
0.2
1
Kwh/t
clk
7 Savings in money 32.
07
Lacs/a
nnum
Actual Savings: This modification in Raw mill lead to spectacular saving in RABH fan motor loading, detail are :RABH fan loading of each fan before modification :- 370X2 KwhRABH fan loading of each fan after modification :- 279X2 Kwh in Mill -1,2&3 Total Saving in terms of KW for each RABH fan :- 90X2 =180 Kwh
Saving achieved is equivalent to 0.4 Kw/Ton ClinkerTotal saving in terms of Rs. – 41.40 Lakh/Year
18
Replication potential if necessary
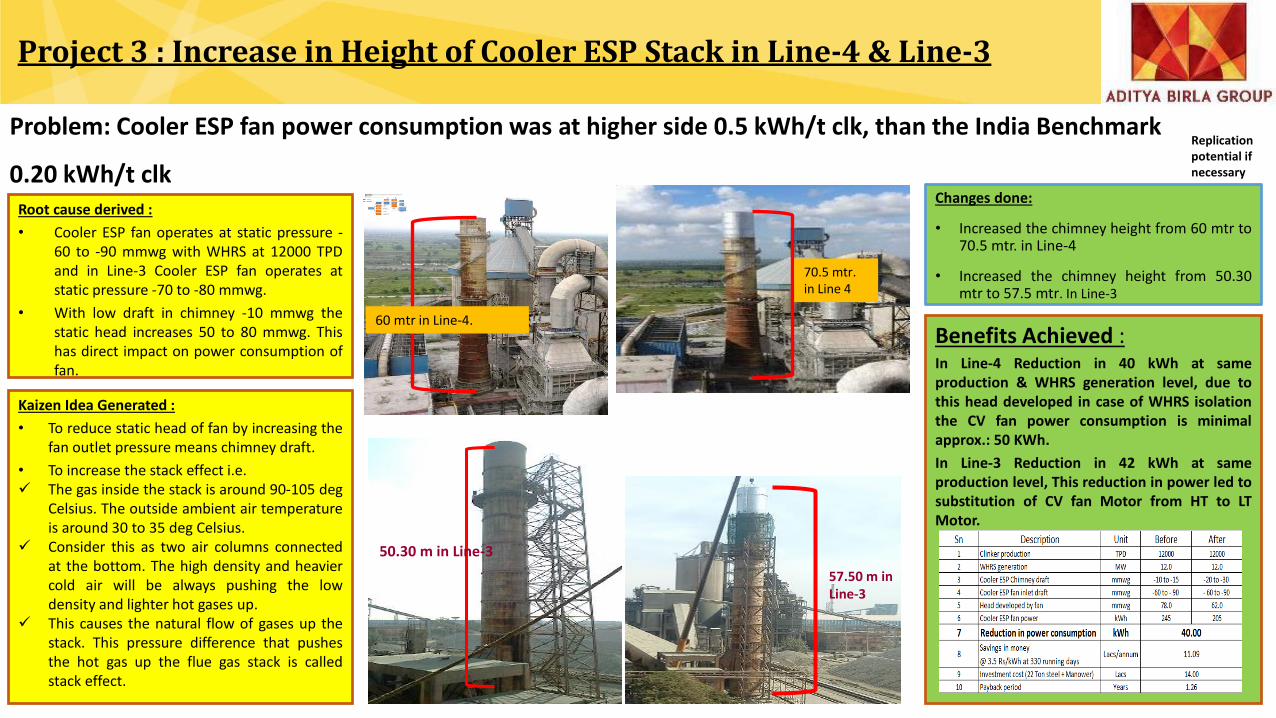
Project 3 : Increase in Height of Cooler ESP Stack in Line-4 & Line-3
Problem: Cooler ESP fan power consumption was at higher side 0.5 kWh/t clk, than the India Benchmark
0.20 kWh/t clk
Kaizen Idea Generated :
• To reduce static head of fan by increasing thefan outlet pressure means chimney draft.
• To increase the stack effect i.e.✓ The gas inside the stack is around 90-105 deg
Celsius. The outside ambient air temperatureis around 30 to 35 deg Celsius.
✓ Consider this as two air columns connectedat the bottom. The high density and heaviercold air will be always pushing the lowdensity and lighter hot gases up.
✓ This causes the natural flow of gases up thestack. This pressure difference that pushesthe hot gas up the flue gas stack is calledstack effect.
Root cause derived :
• Cooler ESP fan operates at static pressure -60 to -90 mmwg with WHRS at 12000 TPDand in Line-3 Cooler ESP fan operates atstatic pressure -70 to -80 mmwg.
• With low draft in chimney -10 mmwg thestatic head increases 50 to 80 mmwg. Thishas direct impact on power consumption offan.
60 mtr in Line-4.
50.30 m in Line-3
Changes done:
• Increased the chimney height from 60 mtr to70.5 mtr. in Line-4
• Increased the chimney height from 50.30mtr to 57.5 mtr. In Line-3
57.50 m in Line-3
70.5 mtr. in Line 4
Benefits Achieved :In Line-4 Reduction in 40 kWh at sameproduction & WHRS generation level, due tothis head developed in case of WHRS isolationthe CV fan power consumption is minimalapprox.: 50 KWh.
In Line-3 Reduction in 42 kWh at sameproduction level, This reduction in power led tosubstitution of CV fan Motor from HT to LTMotor.
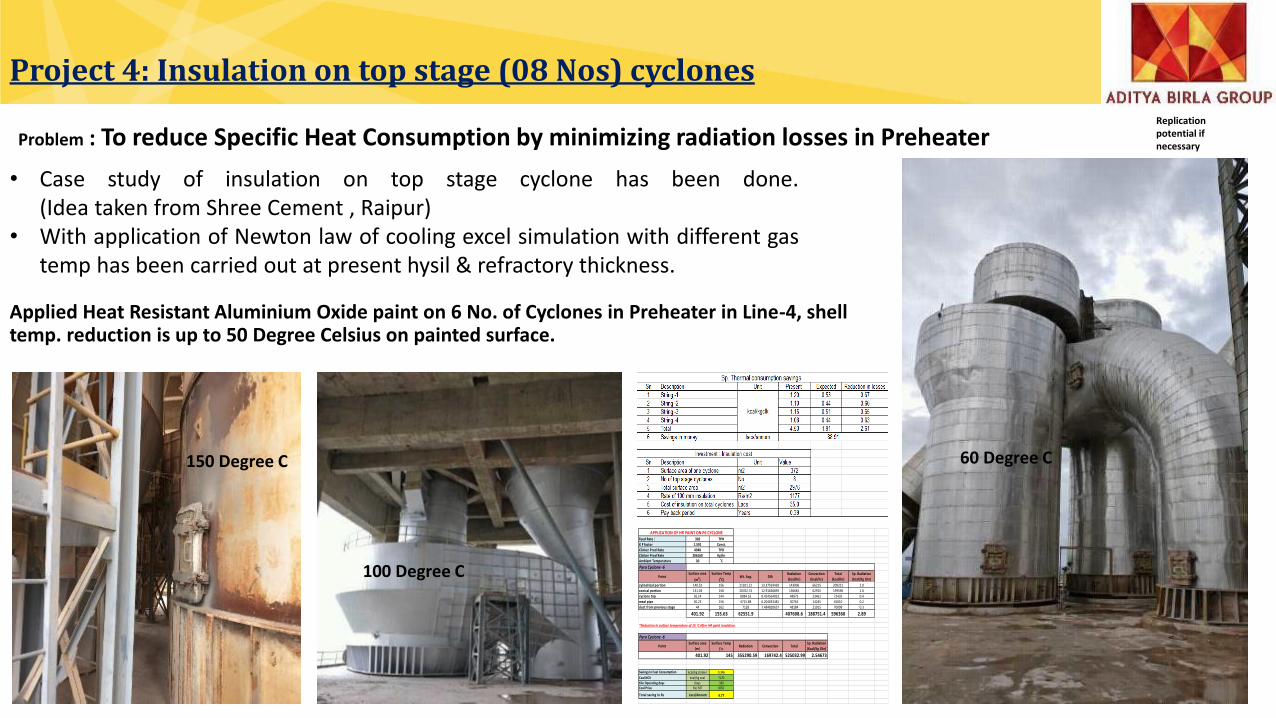
Project 4: Insulation on top stage (08 Nos) cyclones
19
Replication potential if necessaryProblem : To reduce Specific Heat Consumption by minimizing radiation losses in Preheater
• Case study of insulation on top stage cyclone has been done.(Idea taken from Shree Cement , Raipur)
• With application of Newton law of cooling excel simulation with different gastemp has been carried out at present hysil & refractory thickness.
Feed Rate : 328 TPH
K F factor 1.591 Const.
Clinker Prod Rate 4948 TPD
Clinker Prod Rate 206160 Kg/hr
Ambient Temperature 30 ˚C
Pyro Cyclone -6
PointSurface area
(m2)
Surface Temp
(oC)Wt. Avg. DIA
Radiation
(kcal/hr)
Convection
(kcal/hr)
Total
(kcal/hr)
Sp. Radiation
(Kcal/Kg Clin)
cylindrical portion 140.52 156 21921.12 13.37593439 143006 66215 209221 1.0
conical portion 131.03 158 20702.74 12.91636859 136681 62915 199596 1.0
cyclone top 56.14 144 8084.16 8.454564923 48973 23461 72435 0.4
meal pipe 30.23 156 4715.88 6.204033481 30765 14245 45010 0.2
duct from previous stage 44 162 7128 7.484820637 48184 21915 70099 0.3
401.92 155.63 62551.9 407608.6 188751.4 596360 2.89
*Reduction In surface temperature of 15 ˚C After HR paint insulation.
Pyro Cyclone -6
PointSurface area
(m2)
Surface Temp
(oC)
Radiation Convection TotalSp. Radiation
(Kcal/Kg Clin)
401.92 145 355290.59 169742.4 525032.99 2.54673
Savings In Fuel Consumption kcal/kg clinker 0.346
Coal NCV kcal/kg coal 7170
Kiln Operating days Days 330
Coal Price Rs/ MT 6052
Total saving in Rs Lacs/Annum 4.77
APPLICATION OF HR PAINT ON P6 CYCLONE
Applied Heat Resistant Aluminium Oxide paint on 6 No. of Cyclones in Preheater in Line-4, shell temp. reduction is up to 50 Degree Celsius on painted surface.
150 Degree C
100 Degree C
60 Degree C
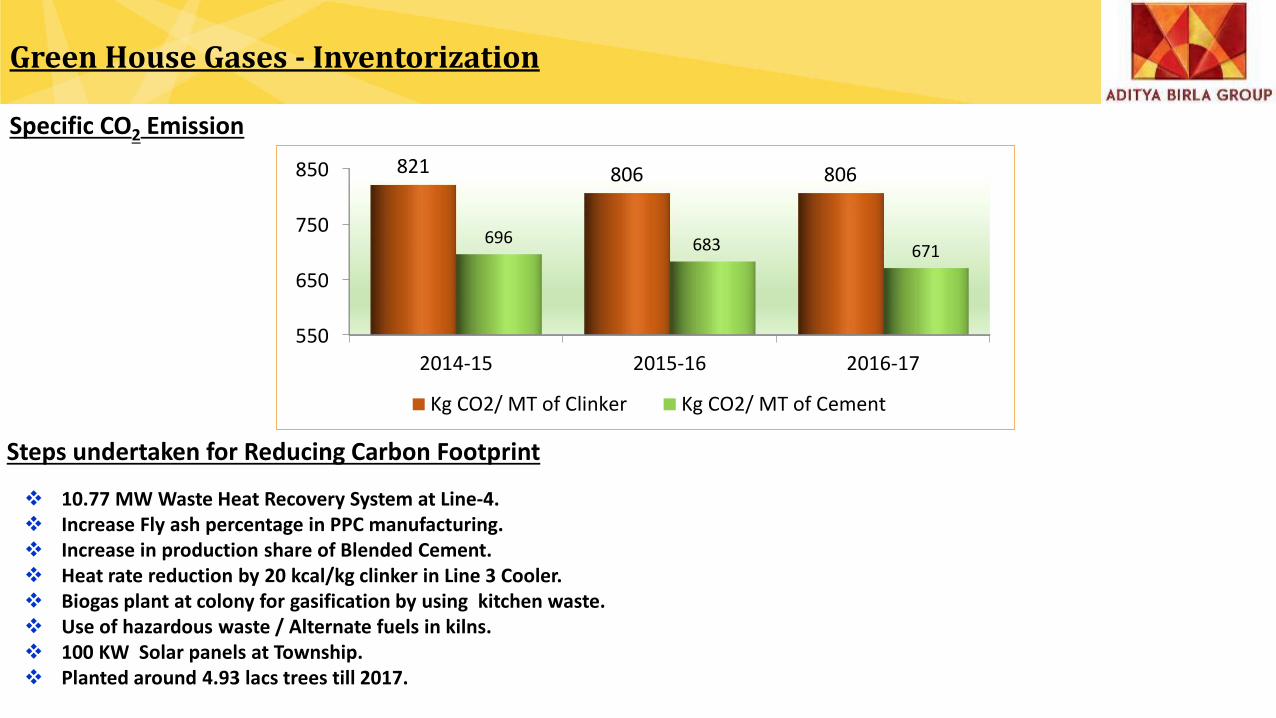
❖ 10.77 MW Waste Heat Recovery System at Line-4.❖ Increase Fly ash percentage in PPC manufacturing.❖ Increase in production share of Blended Cement.❖ Heat rate reduction by 20 kcal/kg clinker in Line 3 Cooler.❖ Biogas plant at colony for gasification by using kitchen waste.❖ Use of hazardous waste / Alternate fuels in kilns.❖ 100 KW Solar panels at Township.❖ Planted around 4.93 lacs trees till 2017.
Green House Gases - Inventorization
Steps undertaken for Reducing Carbon Footprint
Specific CO2 Emission
550
650
750
850
2014-15 2015-16 2016-17
821 806 806
696 683 671
Kg CO2/ MT of Clinker Kg CO2/ MT of Cement
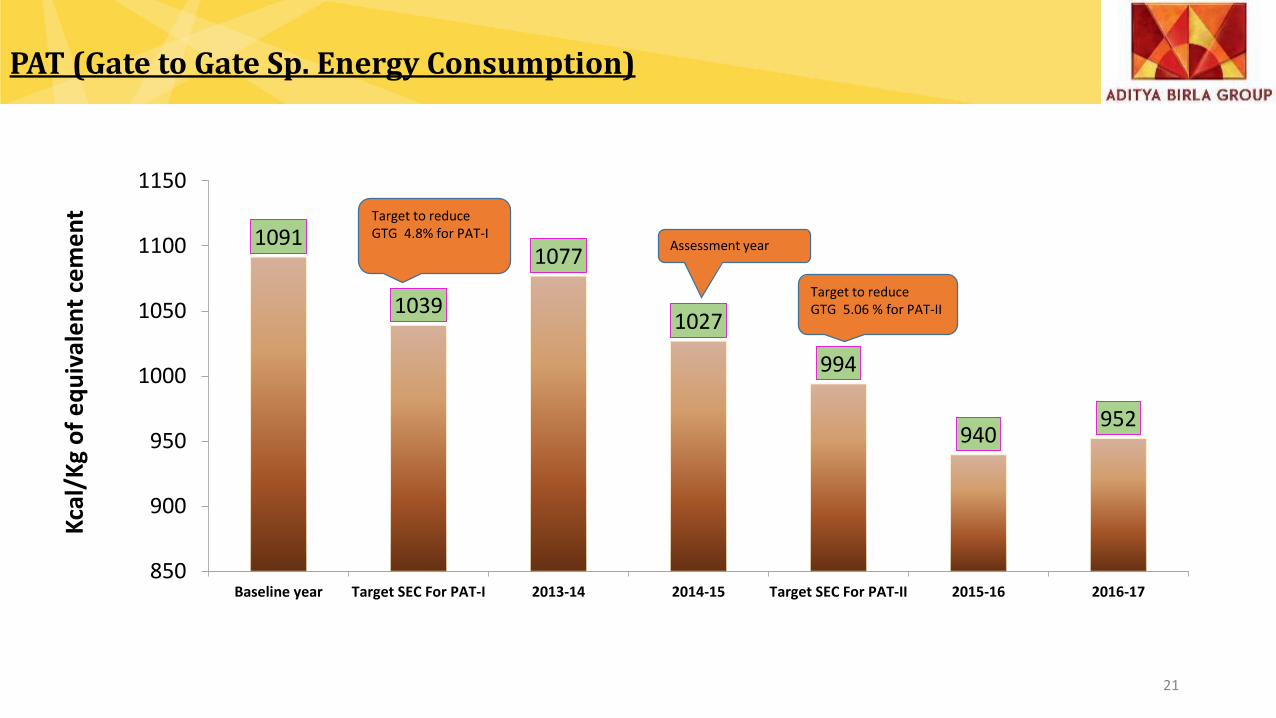
1091
1039
1077
1027
994
940952
850
900
950
1000
1050
1100
1150
Baseline year Target SEC For PAT-I 2013-14 2014-15 Target SEC For PAT-II 2015-16 2016-17
Target to reduce GTG 4.8% for PAT-I
Target to reduce GTG 5.06 % for PAT-II
Assessment year
Kca
l/K
g o
f e
qu
ival
en
t ce
me
nt
PAT (Gate to Gate Sp. Energy Consumption)
21
22
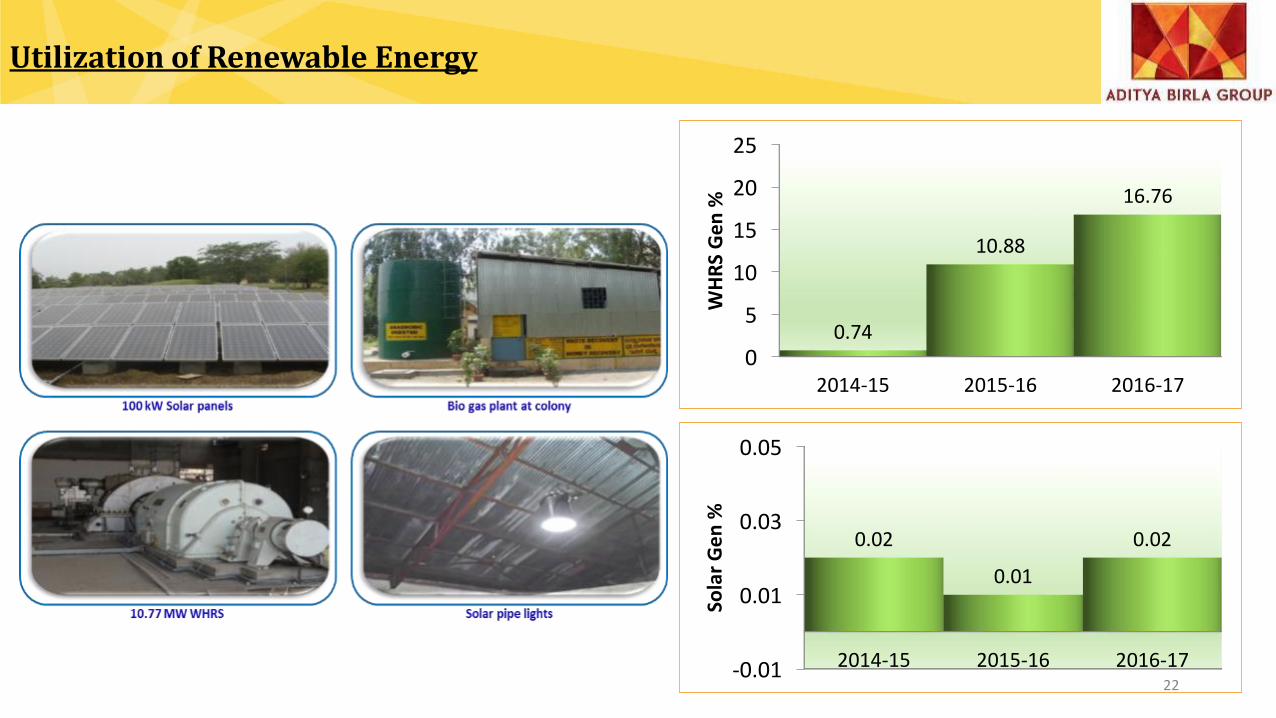
0
5
10
15
20
25
2014-15 2015-16 2016-17
0.74
10.88
16.76
WH
RS
Ge
n %
-0.01
0.01
0.03
0.05
2014-15 2015-16 2016-17
0.02
0.01
0.02
Sola
r G
en
%
Utilization of Renewable Energy
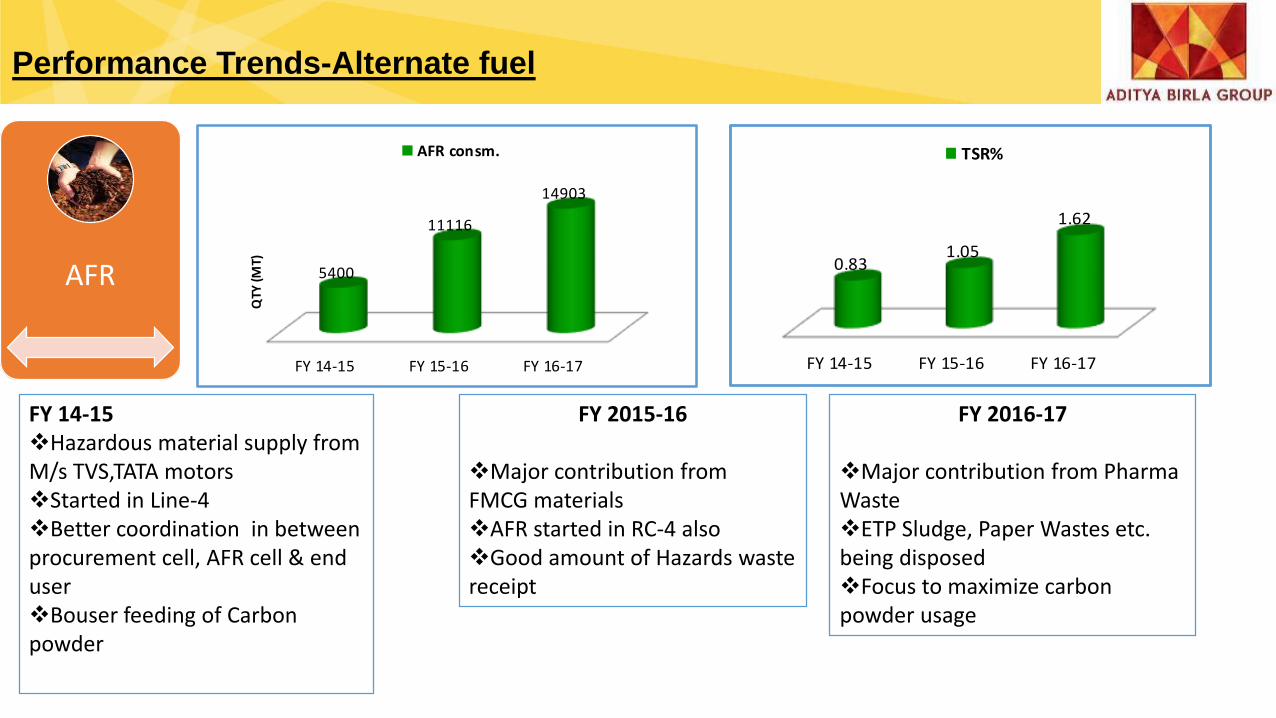
AFR
FY 14-15 FY 15-16 FY 16-17
5400
11116
14903
QTY
(MT)
AFR consm.
FY 14-15❖Hazardous material supply from M/s TVS,TATA motors❖Started in Line-4 ❖Better coordination in between procurement cell, AFR cell & end user❖Bouser feeding of Carbon powder
FY 14-15 FY 15-16 FY 16-17
0.831.05
1.62
TSR%
FY 2015-16
❖Major contribution from FMCG materials❖AFR started in RC-4 also ❖Good amount of Hazards waste receipt
Performance Trends-Alternate fuel
FY 2016-17
❖Major contribution from Pharma Waste❖ETP Sludge, Paper Wastes etc. being disposed ❖Focus to maximize carbon powder usage
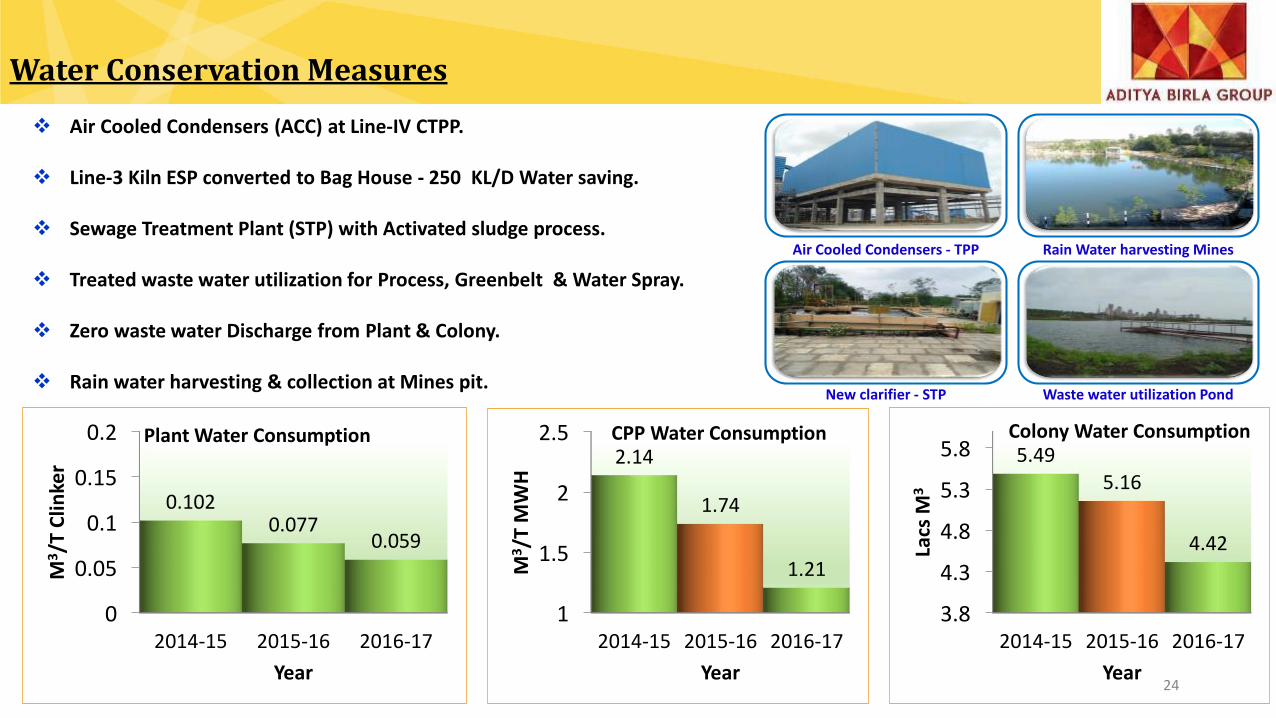
Water Conservation Measures
Air Cooled Condensers - TPP Rain Water harvesting Mines
New clarifier - STP Waste water utilization Pond
24
❖ Air Cooled Condensers (ACC) at Line-IV CTPP.
❖ Line-3 Kiln ESP converted to Bag House - 250 KL/D Water saving.
❖ Sewage Treatment Plant (STP) with Activated sludge process.
❖ Treated waste water utilization for Process, Greenbelt & Water Spray.
❖ Zero waste water Discharge from Plant & Colony.
❖ Rain water harvesting & collection at Mines pit.
0
0.05
0.1
0.15
0.2
2014-15 2015-16 2016-17
0.1020.077
0.059
M3/T
Clin
ker
Year
Plant Water Consumption
1
1.5
2
2.5
2014-15 2015-16 2016-17
2.14
1.74
1.21M3/T
MW
H
Year
CPP Water Consumption
3.8
4.3
4.8
5.3
5.8
2014-15 2015-16 2016-17
5.495.16
4.42Lacs
M3
Year
Colony Water Consumption
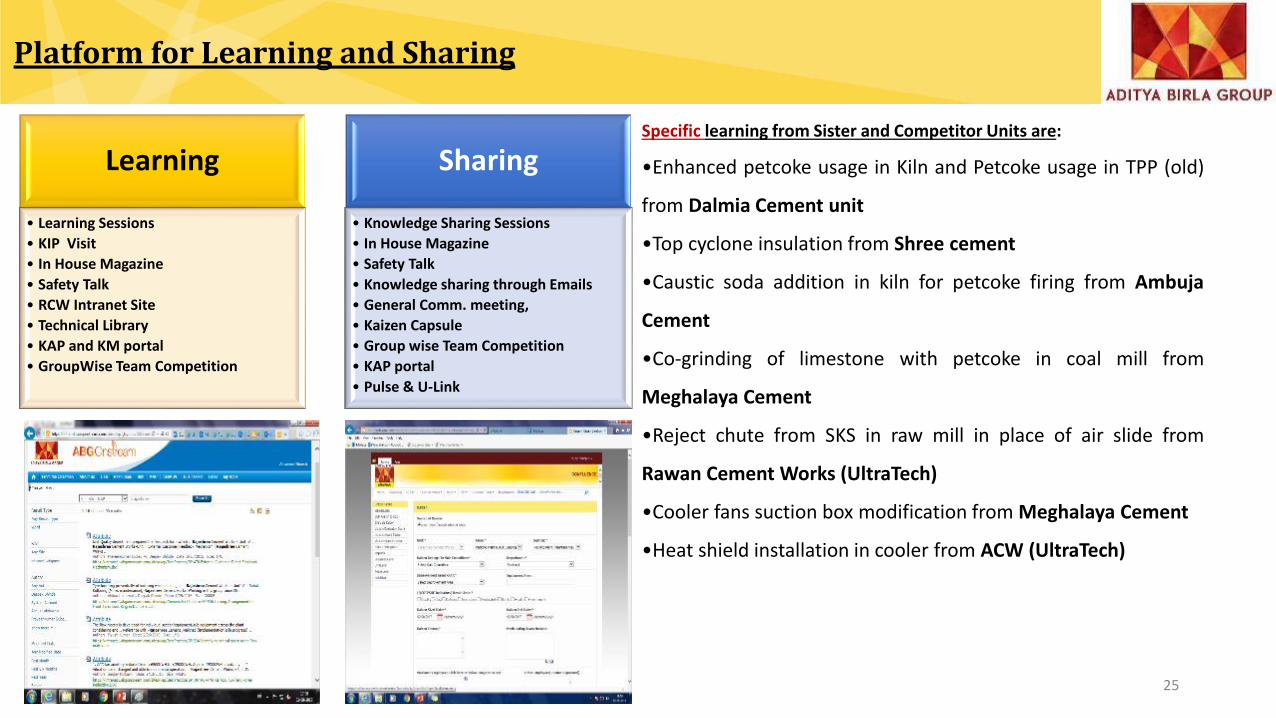
Learning
• Learning Sessions
• KIP Visit
• In House Magazine
• Safety Talk
• RCW Intranet Site
• Technical Library
• KAP and KM portal
• GroupWise Team Competition
Sharing
• Knowledge Sharing Sessions
• In House Magazine
• Safety Talk
• Knowledge sharing through Emails
• General Comm. meeting,
• Kaizen Capsule
• Group wise Team Competition
• KAP portal
• Pulse & U-Link
Platform for Learning and Sharing
25
Specific learning from Sister and Competitor Units are:
•Enhanced petcoke usage in Kiln and Petcoke usage in TPP (old)
from Dalmia Cement unit
•Top cyclone insulation from Shree cement
•Caustic soda addition in kiln for petcoke firing from Ambuja
Cement
•Co-grinding of limestone with petcoke in coal mill from
Meghalaya Cement
•Reject chute from SKS in raw mill in place of air slide from
Rawan Cement Works (UltraTech)
•Cooler fans suction box modification from Meghalaya Cement
•Heat shield installation in cooler from ACW (UltraTech)

Excellence is Nothing But A Passionate Journey
driven by Positive Attitude.....
26