131i-tositumomab radioimmunotherapy: initial tumor dose-response results using 3-dimensional...
TRANSCRIPT
131I-Tositumomab Radioimmunotherapy:Initial Tumor Dose–Response Results Using3-Dimensional Dosimetry IncludingRadiobiologic Modeling
Yuni K. Dewaraja1, Matthew J. Schipper2, Peter L. Roberson2, Scott J. Wilderman1, Hanan Amro2, Denise D. Regan1,Kenneth F. Koral1, Mark S. Kaminski3, and Anca M. Avram1
1Department of Radiology, University of Michigan, Ann Arbor, Michigan; 2Department of Radiation Oncology, University ofMichigan, Ann Arbor, Michigan; and 3Department of Internal Medicine, University of Michigan, Ann Arbor, Michigan
For optimal treatment planning in radionuclide therapy, robusttumor dose–response correlations must be established. Here,fully 3-dimensional (3D) dosimetry was performed couplingSPECT/CT at multiple time points with Monte Carlo–based voxel-by-voxel dosimetry to examine such correlations. Methods:Twenty patients undergoing 131I-tositumomab for the treatmentof refractory B-cell lymphoma volunteered for the study. Sixty tu-mors were imaged. Activity quantification and dosimetry wereperformed using previously developed 3D algorithms for SPECTreconstruction and absorbed dose estimation. Tumors were out-lined on CT at multiple time points to obtain absorbed dose dis-tributions in the presence of tumor deformation and regression.Equivalent uniform dose (EUD) was calculated to assess thebiologic effects of the nonuniform absorbed dose, including thecold antibody effect. Response for correlation analysis was de-termined on the basis of the percentage reduction in the productof the largest perpendicular tumor diameters on CT at 2 mo.Overall response classification (as complete response, partial re-sponse, stable disease, or progressive disease) used for predic-tion analysis was based on criteria that included findings on PET.Results: Of the evaluated tumor-absorbed dose summary mea-sures (mean absorbed dose, EUD, and other measures fromdose-volume histogram analysis), a statistically significant corre-lation with response was seen only with EUD (r 5 0.36 and P 5
0.006 at the individual tumor level; r 5 0.46 and P 5 0.048 atthe patient level). The median value of mean absorbed dose forstable disease, partial response, and complete response pa-tients was 196, 346, and 342 cGy, respectively, whereas the me-dian value of EUD for each of these categories was 170, 363, and406 cGy, respectively. At a threshold of 200 cGy, both meanabsorbed dose and EUD had a positive predictive value for re-sponders (partial response 1 complete response) of 0.875 (14/16) and a negative predictive value of 1.0 (3/3). Conclusion: Im-proved dose–response correlations were demonstrated whenEUD incorporating the cold antibody effect was used insteadof the conventionally used mean tumor-absorbed dose. Thiswork demonstrates the importance of 3D calculation and radio-
biologic modeling when estimating absorbed dose for correla-tion with outcome.
Key Words: patient-specific dosimetry; dose–response; radio-immunotherapy; SPECT/CT; radiobiology
J Nucl Med 2010; 51:1155–1162DOI: 10.2967/jnumed.110.075176
There has been recent interest in developing dosimetry-based patient-specific treatment planning to optimize therapywith internal emitters as is routine in external-beam therapy.Because of the inherent heterogeneity of radiopharmaceuti-cal distribution in tumor and normal organs, the preferredmethodology for absorbed dose estimation is imaging-based3-dimensional (3D) calculation (1). The recent advances inhybrid imaging and computational power have made suchcalculations possible in a research environment and a realisticclinical goal for the future.
At present, the common approach for 131I anti-CD20radioimmunotherapy of lymphoma is to deliver 65–75 cGyto the whole body based on estimates from a tracer study.Although this conservative approach has produced promis-ing results (2,3), there is much room for improving efficacyby tailoring the treatment on a patient-by-patient basis todeliver the therapeutic absorbed dose to the tumor whileavoiding critical organ toxicity. Apart from treatmentplanning, tumor-absorbed dose estimates from a tracerstudy can potentially be used for improved clinical man-agement by timely initiation of alternative treatment.
To make advances toward tumor dosimetry–based radio-nuclide therapy, robust tumor dose–response correlationsmust be established. Studies on tumor dosimetry in radio-immunotherapy of lymphoma are limited and have notestablished strong dose–response correlations for either ofthe 2 Food and Drug Administration–approved radiophar-maceuticals, 90Y-ibritumomab or 131I-tositumomab (4–7). In
Received Jan. 21, 2010; revision accepted Mar. 19, 2010.For correspondence or reprints contact: Yuni K. Dewaraja, Department
of Radiology, Division of Nuclear Medicine, University of Michigan, 1301Catherine, 2276 Medical Science I/5610, Ann Arbor, MI 48109.
E-mail: [email protected] ª 2010 by the Society of Nuclear Medicine, Inc.
131I RADIOIMMUNOTHERAPY: DOSE AND RESPONSE • Dewaraja et al. 1155

these past studies, the mean absorbed dose to the tumor wasthe only dose measure that was calculated, except in thestudy by Sgouros et al., in which correlations were alsoinvestigated with minimum absorbed dose, maximum ab-sorbed dose, and a uniformity index. Although the equivalentuniform dose (EUD) model has been proposed for assessingthe biologic effect of a nonuniform tumor-absorbed dosedistribution (8), it has not been used in past studies evaluatingdose–response correlations. Past tumor dosimetry studieshave also relied on planar imaging methods or methodscombining SPECT at a single time point with planar imagingat multiple time points to determine pharmacokinetics. Thesuperiority of SPECT over planar methods for activityquantification is well established.
Here, we present tumor dosimetry results from a fully 3Dapproach coupling hybrid SPECT/CT at multiple timepoints with Monte Carlo radiation transport–based voxel-by-voxel absorbed dose calculation. Past radioimmunother-apy studies have shown dramatic regression of malignantlymphomas within days of the therapeutic administration(9–11). In the present study, the anatomic CT informationfrom multiple time points allowed us to incorporate tumorregression and deformation into the calculation to estimatespatial absorbed dose distributions at the voxel level. Inaddition, EUD was calculated to assess the biologic effectsof the nonuniform absorbed dose, including the effects ofthe cold antibody administered with the 131I-labeled anti-body and the effects of cell proliferation (12). Tumor dose–response correlations were investigated using mean absorbeddose and EUD as well as other measures from dose-volumehistogram analysis.
MATERIALS AND METHODS
PatientsPatients were recruited from those scheduled for 131I-tositumo-
mab therapy of relapsed or refractory (previously treated withchemotherapy) B-cell lymphoma at the University of Michigan.The treatment protocol, which includes administration of 450 mgof the unlabeled antibody (tositumomab) before both the di-agnostic (tracer) and the therapeutic administration of 131I-tositumomab has been described (2). From planar g-camerameasurements after tracer administration (185 MBq), the amountof radioactivity necessary to deliver 65–75 cGy to the whole bodyis determined for each patient and is administered 8 d after thetracer. For the present research study, this protocol was un-changed, but the patients gave their separate informed consentfor the SPECT/CT examination, which was not part of thetreatment protocol. This imaging examination received separateapproval by the University of Michigan Internal Review Board.Data are presented here for 20 patients (13 men and 7 women; agerange, 33–81 y; median age, 53 y). Eighteen of the volunteers hadfollicular lymphoma, and 2 had marginal zone lymphoma. Theadministered therapy activity ranged from 2.15 to 5.68 GBq (58–153 mCi).
SPECT/CT and Tumor DefinitionThe imaging protocol on the Symbia TruePoint SPECT/CT
scanner (Siemens) has been described (11). The SPECT camera
field of view was 39 cm in the axial direction. Hence, only part ofthe body was imaged, focusing on the region with the largesttumors. In most patients, multiple (up to 7) tumors were includedin the field of view. Patients were imaged 3 times after the tracerhad been administered (days 0, 2, and 6) and 3 times after thetherapy had been administered (days 2, 5, and 7–9). At each timepoint, the tumor volumes of interest were defined on CT, plane byplane, by a nuclear medicine specialist with radiology CT training.These volumes of interest were used for activity quantification anddosimetry and also provided information on initial tumor shrink-age, which was used to determine radiosensitivity and cold proteinsensitivity parameters for the EUD calculation.
Activity QuantificationFor SPECT reconstruction and quantification, software pre-
viously developed at the University of Michigan was used.Posttherapy SPECT projection data were corrected for dead timeusing a paralyzable model (13). Projection data were recon-structed with 35 iterations (6 subsets) of 3D ordered-subsetsexpectation maximization including triple-window–based scattercorrection, CT-based attenuation correction, and compensation fordepth-dependent detector response (14,15).
It was necessary to use a counting rate–dependent calibrationfactor to convert reconstructed counts to activity. The need wasdue to the observed shift in the 131I energy spectra at highcounting rates, which was attributed to pulse pile-up effects (13).The calibration experiment using a phantom of known activitywas performed at 3 different counting rates (21, 9, and 2 kcps) asthe activity decayed over 1 mo. The validity of the corrections forhigh-counting-rate imaging is evident from the robust correlations(r . 0.9) reported previously between tracer and therapy resi-dence times for a subset of the present patients (16). To accountfor partial-volume effects, recovery coefficients were determinedfrom phantom measurements. The measured recovery coefficientsranged from 99% to 58% for spheres ranging from 100 to 4 mL.Activity in tumor voxels was corrected for partial-volume effectsby applying CT-volume–dependent recovery coefficients uni-formly to all voxels within a tumor.
After activity quantification, rest-of-body time–activity datawere fitted by a monoexponential function, and tumor-time–activity data were fitted by a biexponential, to model the uptakeand clearance phases. Tumor time–activity fitting was performedvia maximum likelihood within a mixed model incorporatingtumor-level random effects (17).
Patient-Specific 3D Tumor DosimetryDosimetry was performed using a version of the Dose Planning
Method Monte Carlo program (adapted for internal emittertherapy (18)) in conjunction with MATLAB (MathWorks)-basedroutines. Key features were voxel-by-voxel absorbed dose calcu-lation coupled to deformable image registration, which relatestumor voxels that are changing from one time point to the next dueto deformation or regression. At each time point, SPECT activitymaps and CT-based density maps were input to the Dose PlanningMethod program. The SPECT maps were sampled to provideantibody uptake sites (in 3 dimensions), after which 131I decay andradiation transport were simulated to determine 3D self-dose-rateand rest-of-body dose-rate maps (in units of mGy/MBq-s origi-nating in tumor and rest of body, respectively) at each of the 6imaging points. The first tracer scan (at which tumor volumeswere almost always largest) was used as the reference scan. After
1156 THE JOURNAL OF NUCLEAR MEDICINE • Vol. 51 • No. 7 • July 2010
cropping all maps to the size of the largest tumor, maps for theother 5 time points were deformed and registered to the referencetumor shape and size. First, the tumor centers of masses werealigned. Each voxel was then mapped into the reference scan byconserving its fractional distance along a radius from the tumorcenter to the tumor edge (uniform radial deformation). Interpola-tion and extrapolation were applied as appropriate to complete thedeformed maps, and total absorbed dose rates were preserved. Theregistered tumor self-dose-rate maps were then multiplied bythe total tumor activity as a function of time (taken from the fittedtumor time–activity mentioned in the previous section) andintegrated (over time) to obtain the self-component of thetumor-absorbed dose distribution (in mGy). Similarly, the rest-of-body component of the tumor-absorbed dose distribution wasobtained. Here we are assuming that the registered absorbed dose-rate maps are piecewise constant over the times between scans,which permits analytic integration of the time–activity fits overeach of the numeric steps in the integration. (Note that we chooseto account for the variations in voxel-by-voxel time–activity in themanner described here because voxel-level fitting can be signif-icantly noisier than the tumor-level fitting of the present approach,especially with deforming tumors.) Finally, the self- and rest-of-body components of the absorbed dose distribution were addedto obtain the total 3D distribution for the tumor, which representsthe total delivered absorbed dose from the tracer and therapyadministrations.
The EUD is defined as the spatially-uniform biologicallyeffective absorbed dose that would result in a level of cellinactivation equivalent to that of the nonuniform biologicallyeffective absorbed dose (8). Our EUD model was describedpreviously (12) and is summarized here. The model is based ontracking the surviving fraction of clonogenic subunits (voxels, v)over time, S(v,t). The minimum of the surviving fraction averagedover the subunits, ,Sðv; tminÞ.V , can be defined as the desiredtherapeutic endpoint and is related to EUD as
EUD 5 21
aln½,Sðv; tminÞ.V �; Eq. 1
where Sðv; tÞ 5 expfð2a · BEDðv; tÞg and a is the linear sensi-tivity coefficient of the linear-quadratic dose–response model. Thespatial and time-varying biologically effective dose (BED) foreach voxel was calculated as the sum of relevant quantitiesaffecting therapeutic outcome, in this case the absorbed doseeffect, the cell proliferation effect, and the cold antibody effect,
BEDðv; tÞ 5 Dðv; tÞ � REðv; tÞ 2 ð1=aÞ � lt � t1ð1=aÞ � lp � Pðv; tÞ;
Eq. 2
where D(v,t) is the 3D cumulative absorbed dose delivered overtime, RE(v,t) is the relative effectiveness, lt is the proliferationcoefficient, lp is the cold protein sensitivity coefficient, and P(v,t)is the cumulative distribution of cold protein residence time perunit mass. Parameters a and lp were determined based on modelfits to initial changes in tumor volumes measured on SPECT/CTfollowing both tracer and therapy. Average parameters for patientsshowing cold effect were obtained separately from those forpatients not showing cold effect. For the present patients, averageparameters used in the biologically effective dose calculation werea 5 0.22 Gy21, lp 5 0, for no cold effect and a 5 0.41 Gy21,
lp 5 0.10 gT/mgp-h, with cold effect. For the proliferation effect,the effective cell-doubling time was set to be 150 d, representingapproximately 12 mo to recurrence (2). Details of the calculationof RE(v,t) and P(v,t) from the decay-corrected activity distributionwere given by Amro et al. (12).
ResponseAs part of the clinical protocol, patients were followed up with
diagnostic CT or PET/CT at around 2 mo. In the present study,response was determined on the basis of these data because mostnonresponders or partial responders go on to have alternativetreatment after the initial follow-up. Tumors initially imaged onSPECT/CT were evaluated on the follow-up CT by the samespecialist who defined the tumors for dosimetry. Unlike on theinitial images, where volumes were defined for dosimetry, hereperpendicular diameters were defined as this measure is routinelyused in lymphoma response criteria. For each tumor, the longestdiameter was defined on a transverse slice and a second, perpen-dicular, measurement was made on the same slice. At the tumorlevel, response was calculated by the percentage change in theproduct of perpendicular diameters at 2 mo, compared with thatproduct for the baseline scan, which was the first SPECT/CT scanimmediately after the tracer administration. At the patient level,response was calculated by the percentage change in the sum ofthe product of diameters for all tumors, compared with baseline.In addition, an overall response classification as progressivedisease, stable disease, partial response, or complete responsewas made for each patient by evaluating all lesions based on therevised response criteria for malignant lymphoma (19). Thesecriteria incorporate findings from PET/CT (when available).
Statistical AnalysisPearson correlations were computed along with P values
corresponding to a test for whether the correlation was signifi-cantly different from zero (P , 0.05 was considered statisticallysignificant). These were computed using log(dose) as correlates ofresponse. All analyses presented are exploratory in nature, andthus no multiplicity adjustments were made to P values. Corre-lation was assessed both at the tumor level and at the patient level.When evaluating correlation at the patient level, we calculated themean value of each absorbed dose summary measure across alltumors within a subject. Positive or negative predictive valueswere calculated as simple proportions of subjects with absorbeddose values above or below a threshold that were responders ornonresponders. For this analysis, complete and partial responderswere lumped together as responders.
RESULTS
SPECT/CT
Typical SPECT/CT images are shown in Figure 1. Theinitial tumor volumes and shrinkage during SPECT/CT aresummarized in Table 1 (values for individual tumors arelisted in Table 1 of the supplemental material [availableonline only at http://jnm.snmjournals.org]). For most tu-mors, significant shrinkage was measured on CT withindays of the therapy administration and in some cases withindays after the tracer administration.
131I RADIOIMMUNOTHERAPY: DOSE AND RESPONSE • Dewaraja et al. 1157

Tumor Dosimetry
Nineteen subjects (with 57 tumors) had datasets com-plete enough for dosimetric evaluation, whereas 1 patientwho developed human-antimouse antibodies had too fewSPECT counts for dosimetry. Typical tumor dose-volumehistograms are shown in the supplemental material dem-onstrating the nonuniformity of the absorbed dose distri-bution. Tumor dosimetry results (total delivered from thetracer and therapy) are summarized in Table 1, with valuesfor individual tumors listed in the supplemental material.The maximum absorbed dose refers to the maximum valueto any voxel within the tumor volume of interest. Minimumabsorbed dose is not listed; instead, we have defined themeasure D99 (or D80) as the absorbed dose received orexceeded by 99% (or 80%) of the tumor volume. Thesemeasures are more reliable than the minimum absorbeddose, which is based on the value at a single voxel and ishighly susceptible to registration error and reconstructionartifacts at tumor boundaries.
The EUD is higher than the mean absorbed dose whenthe cold antibody effect is higher than the nonuniformityeffect plus the cell proliferation effect. For comparison, wealso calculated the EUD without the cold antibody effect.EUD (without cold) ranged from 77 to 550 cGy, with
a median of 298 cGy. In the present study, the loss ofeffectiveness due to nonuniformity was not severe (ratio ofEUD without cold to mean absorbed dose ranged from 0.72to 0.94 with a median of 0.87) because tumor-absorbeddose values were relatively low. The loss of effectivenessincreases as the mean absorbed dose increases (8).
Response
The response at 2 mo is summarized in Table 1. Responsefor individual tumors and patient response classifications aregiven in Supplemental Table 1. Complete responses wereobserved in 10 patients, partial responses in 4 patients, andstable disease in 6 patients. No patients met the criteria forprogressive disease at 2 mo. PET data were available for 14of 20 patients. At the time of this report, 6 mo of follow-updata were available for 18 of 20 patients. Of these, 7 of 9patients who did not achieve a complete response hadundergone alternative treatment (salvage chemotherapy orexternal-beam therapy). In 8 of 9 of the remaining patients,the 2-mo complete response classification was confirmed bythe 6-mo imaging data. The one exception was patient 5,who relapsed at 6 mo.
Correlation Analysis Using Initial Shrinkage DuringSPECT/CT
We evaluated the relationship between the percentagereduction in tumor volume measured on SPECT/CT duringtherapy and each of the absorbed dose parameters of Table1 (mean, maximum, D99, D80, and EUD). A statisticallysignificant correlation was seen with D99 (r 5 0.318; P 5
0.016), D80 (r 5 0.299; P 5 0.024), and EUD (r 5 0.473;P 5 0.0002). When EUD was calculated without the coldeffect term, the correlation was less robust (r 5 0.292; P 5
0.028).
Correlation Analysis Using Response at 2 Months
At the individual-tumor level, dose–response correlationswere evaluated between the percentage reduction in theproduct of perpendicular diameters at 2 mo and the variousabsorbed dose measures of Table 1. The results are given in
FIGURE 1. SPECT/CT images showing uptake in aninguinal tumor at day 0 after tracer, day 2 after therapy,and day 8 after therapy.
TABLE 1. Summary of Tumor Dosimetry Results and Response
Parameter Sample size Median Range
Initial tumor volume (mL) 60 34 2 to 423
Volume decrease during tracer SPECT/CT* (%) 60 12 210 to 49
Volume decrease during therapy SPECT/CTy (%) 60 30 2 to 76Decrease in product of diameters at 2 moz (%) 60 72 245 to 100
Average dose (cGy) 57 341 102 to 711
EUD (cGy) 57 391 113 to 764
Maximum dose (cGy) 57 508 162 to 1,404D99 (cGy) 57 203 35 to 373
D80 (cGy) 57 269 58 to 466
*Difference in volumes defined on first and last posttracer scans (6 d).yDifference in volumes defined on first and last posttherapy scans (;6 d).zDifference in product of largest perpendicular diameters at 2 mo compared with the first posttracer imaging time point.Results for individual tumors are given in the supplemental material.
1158 THE JOURNAL OF NUCLEAR MEDICINE • Vol. 51 • No. 7 • July 2010
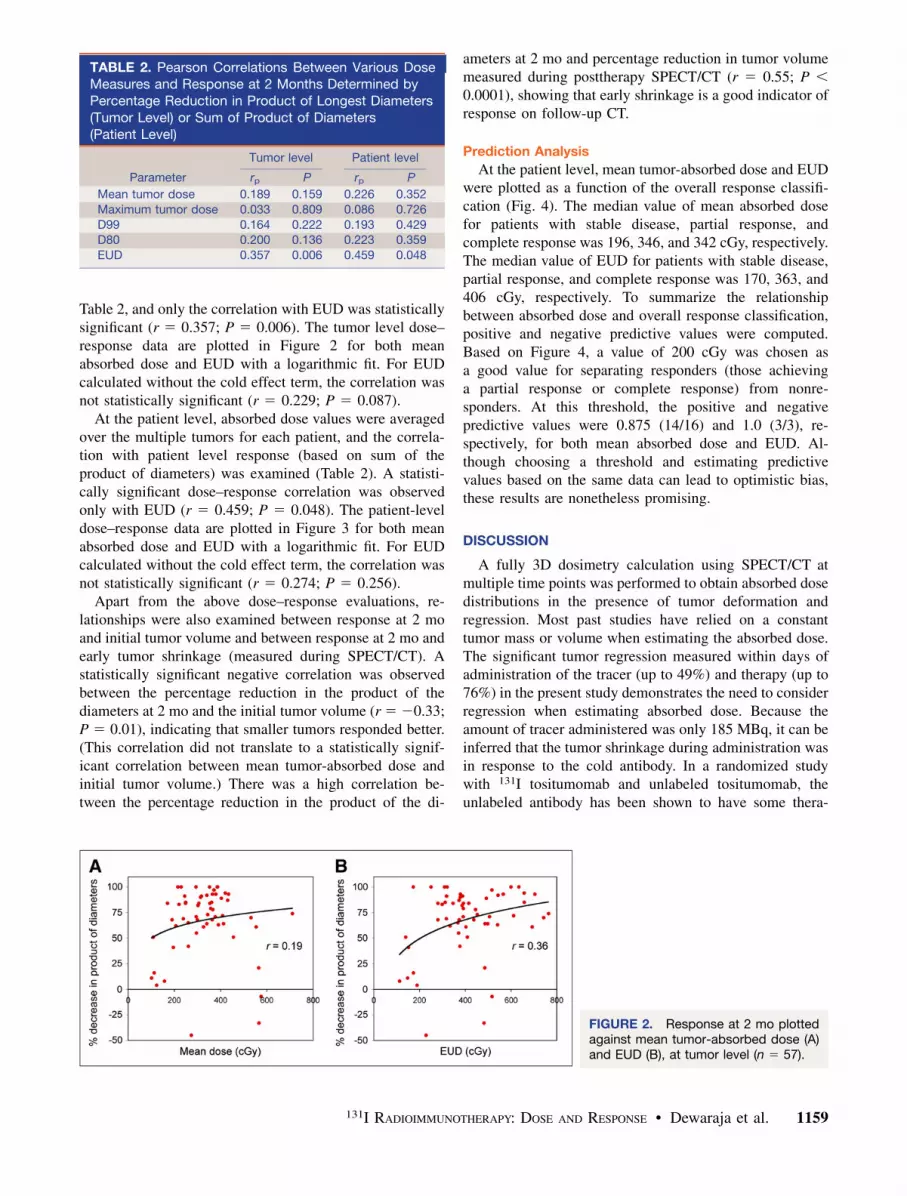
Table 2, and only the correlation with EUD was statisticallysignificant (r 5 0.357; P 5 0.006). The tumor level dose–response data are plotted in Figure 2 for both meanabsorbed dose and EUD with a logarithmic fit. For EUDcalculated without the cold effect term, the correlation wasnot statistically significant (r 5 0.229; P 5 0.087).
At the patient level, absorbed dose values were averagedover the multiple tumors for each patient, and the correla-tion with patient level response (based on sum of theproduct of diameters) was examined (Table 2). A statisti-cally significant dose–response correlation was observedonly with EUD (r 5 0.459; P 5 0.048). The patient-leveldose–response data are plotted in Figure 3 for both meanabsorbed dose and EUD with a logarithmic fit. For EUDcalculated without the cold effect term, the correlation wasnot statistically significant (r 5 0.274; P 5 0.256).
Apart from the above dose–response evaluations, re-lationships were also examined between response at 2 moand initial tumor volume and between response at 2 mo andearly tumor shrinkage (measured during SPECT/CT). Astatistically significant negative correlation was observedbetween the percentage reduction in the product of thediameters at 2 mo and the initial tumor volume (r 5 20.33;P 5 0.01), indicating that smaller tumors responded better.(This correlation did not translate to a statistically signif-icant correlation between mean tumor-absorbed dose andinitial tumor volume.) There was a high correlation be-tween the percentage reduction in the product of the di-
ameters at 2 mo and percentage reduction in tumor volumemeasured during posttherapy SPECT/CT (r 5 0.55; P ,
0.0001), showing that early shrinkage is a good indicator ofresponse on follow-up CT.
Prediction Analysis
At the patient level, mean tumor-absorbed dose and EUDwere plotted as a function of the overall response classifi-cation (Fig. 4). The median value of mean absorbed dosefor patients with stable disease, partial response, andcomplete response was 196, 346, and 342 cGy, respectively.The median value of EUD for patients with stable disease,partial response, and complete response was 170, 363, and406 cGy, respectively. To summarize the relationshipbetween absorbed dose and overall response classification,positive and negative predictive values were computed.Based on Figure 4, a value of 200 cGy was chosen asa good value for separating responders (those achievinga partial response or complete response) from nonre-sponders. At this threshold, the positive and negativepredictive values were 0.875 (14/16) and 1.0 (3/3), re-spectively, for both mean absorbed dose and EUD. Al-though choosing a threshold and estimating predictivevalues based on the same data can lead to optimistic bias,these results are nonetheless promising.
DISCUSSION
A fully 3D dosimetry calculation using SPECT/CT atmultiple time points was performed to obtain absorbed dosedistributions in the presence of tumor deformation andregression. Most past studies have relied on a constanttumor mass or volume when estimating the absorbed dose.The significant tumor regression measured within days ofadministration of the tracer (up to 49%) and therapy (up to76%) in the present study demonstrates the need to considerregression when estimating absorbed dose. Because theamount of tracer administered was only 185 MBq, it can beinferred that the tumor shrinkage during administration wasin response to the cold antibody. In a randomized studywith 131I tositumomab and unlabeled tositumomab, theunlabeled antibody has been shown to have some thera-
FIGURE 2. Response at 2 mo plottedagainst mean tumor-absorbed dose (A)and EUD (B), at tumor level (n 5 57).
TABLE 2. Pearson Correlations Between Various DoseMeasures and Response at 2 Months Determined byPercentage Reduction in Product of Longest Diameters(Tumor Level) or Sum of Product of Diameters(Patient Level)
Tumor level Patient level
Parameter rp P rp P
Mean tumor dose 0.189 0.159 0.226 0.352
Maximum tumor dose 0.033 0.809 0.086 0.726
D99 0.164 0.222 0.193 0.429D80 0.200 0.136 0.223 0.359
EUD 0.357 0.006 0.459 0.048
131I RADIOIMMUNOTHERAPY: DOSE AND RESPONSE • Dewaraja et al. 1159

peutic effect, but the effect was greatly enhanced by theaddition of labeled antibody (20).
The mean tumor-absorbed dose values of the presentstudy (102–711 cGy, with a median of 341 cGy) areconsistent with those reported previously for 131I radio-immunotherapy of non-Hodgkin lymphoma (5,6). Themean tumor-absorbed dose did not have a statisticallysignificant correlation with response, as is also consistentwith previous reports (5–7). As recognized previously,evaluating correlations is more difficult for radioimmu-notherapy than for other radiopharmaceuticals because ofthe intrinsic therapeutic efficacy of the unlabeled anti-body (21,22). Limited clinical studies with other radio-pharmaceuticals have demonstrated a statisticallysignificant correlation between mean tumor-absorbeddose and response in radiopeptide therapy of neuroen-docrine tumors with 90Y-somatostatin analogs (23) and131I-metaiodobenzylguanidine therapy of neuroblastoma(24). In these 2 studies, there was no confounding effectdue to cold antibody, and significantly higher tumor-absorbed doses were delivered by administering higheractivities.
The relevance of radiobiologic modeling in absorbeddose estimation has been well recognized (8,21), but to ourknowledge this is the first time that EUD was used forpatient dose–response evaluation in radionuclide therapy.The present EUD not only assessed the biologic effects ofthe nonuniform absorbed dose but also incorporated both
the cold antibody and cell proliferation effects. Of thevarious absorbed dose measures considered here, a statisti-cally significant correlation with response at 2 mo wasdemonstrated only with EUD. In the present work, corre-lations with dose-volume histogram summary measuressuch as D99 and D80 were also examined because it hasbeen postulated that underdosing a part of the tumor resultsin treatment failure (8).
Although correlations were improved by using EUD,there was considerable scatter in the dose–response dataand overlap in dose values for patients with stable disease,partial response, and complete response. One possiblereason for the scatter and overlap is inaccuracies inmethods used to quantify activity and estimate absorbeddose. To improve estimates, we used state-of-the-arthybrid imaging and in-house–developed algorithms forSPECT reconstruction and Monte Carlo–based dosimetry.However, inaccuracies can remain because of uncertaintyin tumor volume determination, misregistration, limitedimaging time points, assumption of uniform radial de-formation when correlating changing tumor voxels, andapproximations made when correcting for SPECT resolu-tion effects. Even with 3D detector response compensa-tion, partial-volume effects are a significant source ofSPECT quantification error (15). In the present work, CT-volume–based recovery coefficients were applied to re-cover total target activity, but this does not correct forresolution effects at the voxel level. The finite SPECT
FIGURE 3. Response at 2 mo (basedon sum of products (SPDs) of perpen-dicular tumor diameters) plotted againstmean tumor-absorbed dose (A) andEUD (B), at patient level (n 5 19). Dosevalues were averaged over multipletumors of each patient.
FIGURE 4. Mean tumor-absorbeddose (A) and EUD (B) as function ofpatient response as assessed byCheson et al. (19).
1160 THE JOURNAL OF NUCLEAR MEDICINE • Vol. 51 • No. 7 • July 2010

resolution will tend to reduce any nonuniformities in thecalculated tumor-absorbed dose distribution; however, theimpact of this on EUD will be small in the present studybecause nonuniformity effects are more pronounced whenthe mean absorbed dose is high (8). It is difficult toestimate the overall error in tumor dosimetry due to thevarious inaccuracies, but we can expect the errors to belarger for smaller tumors. For example, quantificationerrors in 131I phantom studies with reconstruction methodssimilar to those used here were 4%, 11%, and 24% fortarget volumes of 60, 16, and 7 mL, respectively (25). Inthe present study, although tumors as small as 2 mL wereanalyzed, most were much larger (range, 2–423 mL;median, 34 mL). As more patients are enrolled in thisongoing study, we will investigate whether excludingsmaller tumors from the analysis improves dose–responsecorrelations.
Another possible reason for the scatter is that the studycombined patients whose disease is diverse. When exam-ining the dose–response plots of Figure 3, it is apparent thatthe 2 data points with negative response (tumor growth) at 2mo are outliers. The correlation with response for bothmean absorbed dose and EUD can be considerably im-proved if these 2 data points are excluded from the analysis.Although cell proliferation was included in the EUDmodel, an average value was used for the proliferationcoefficient since data were not available to determinepatient-specific values. If more information on diseasestatus can be obtained for each patient, it may be beneficialto separate patients into subgroups when evaluating corre-lations. We also plan to use regression models to simulta-neously evaluate the effect of multiple factors on response.For example, we can assess the correlation of absorbeddose with response while accounting for patient leveldifferences in tumor burden (e.g., number of tumors andsize). A model-based predictor may do much better atpredicting response than the univariate analyses presentedhere.
Although promising, patient-level dose–response corre-lations and predictive values were estimated from data ononly 19 patients and will need to be confirmed using morepatients. Previously, we reported the strong correlation (r .
0.9) between tracer-predicted and therapy-delivered tumor-absorbed dose values for a subset of patients in the presentstudy (16). If the dose–response correlations demon-strated in the present report hold or improve as morepatients are enrolled in this ongoing study, the combinedresults will have important implications for tumor dosim-etry–based treatment planning and also for improvedclinical management.
CONCLUSION
Improved tumor dose–response correlations were dem-onstrated in 131I-tositumomab radioimmunotherapy pa-tients when EUD incorporating the cold antibody effect
was used instead of the conventionally used mean tumor-absorbed dose. This work demonstrates the importance of3D calculation and radiobiologic modeling when estimat-ing absorbed dose for correlation with outcome.
ACKNOWLEDGMENTS
This work was supported by grant 2R01 EB001994awarded by the National Institute of Health, United StatesDepartment of Health and Human Services. Technicalsupport from Ingo Schmuecking and Venkat Raghavanfrom Siemens Healthcare is acknowledged.
REFERENCES
1. Stabin M. Nuclear medicine dosimetry. Phys Med Biol. 2006;51:R187–R202.
2. Kaminski MS, Tuck M, Estes J, et al. 131I-tositumomab therapy as initial
treatment for follicular lymphoma. N Engl J Med. 2005;352:441–449.
3. Vose JM, Wahl RL, Saleh M, et al. Multicenter phase II study of iodine-131
tositumomab for chemotherapy-relapsed/refractory low-grade and trans-
formed low-grade B-cell non-Hodgkin’s lymphomas. J Clin Oncol. 2000;18:
1316–1323.
4. DeNardo GL, DeNardo SJ, Shen S, et al. Factors affecting 131-I-Lym-1
pharmacokinetics and radiation dosimetry in patients with non-Hodgkin’s
lymphoma and chronic lymphocytic leukemia. J Nucl Med. 1999;40:1317–
1326.
5. Koral KF, Dewaraja YK, Li J, et al. Update on hybrid conjugate-view-SPECT
tumor dosimetry and response in 131I-tositumomab therapy of previously-
untreated lymphoma patients. J Nucl Med. 2003;44:457–464.
6. Sgouros G, Squeri S, Ballangrud AM, et al. Patient-specific, 3-dimensional
dosimetry in non-Hodgkin’s lymphoma patients treated with 131I-anti-B1
antibody: assessment of tumor dose-response. J Nucl Med. 2003;44:260–
268.
7. Sharkey RM, Brenner A, Burton J, et al. Radioimmunotherapy of non-Hodgkin’s
lymphoma with 90Y-DOTA humanized anti-CD22 IgG (90Y-epratuzumab): do
tumor targeting and dosimetry predict therapeutic response? J Nucl Med. 2003;
44:2000–2018.
8. O’Donoghue JA. Implications of non-uniform tumor dose for radioimmuno-
therapy. J Nucl Med. 1999;40:1337–1341.
9. Hindorf C, Linden O, Stenberg L, Tennvall J, Strand SE. Change in tumor
absorbed dose due to decrease in mass during fractionated radioimmunotherapy
in lymphoma patients. Clin Cancer Res. 2003;9:4003s–4006s.
10. Hartmann Siantar CL. Impact of nodal regression on radiation dose for
lymphoma patients after radioimmunotherapy. J Nucl Med. 2003;44:1322–
1329.
11. Dewaraja YK, Wilderman SJ, Koral KF, Kaminski M, Avram AM. Use of
integrated SPECT/CT imaging for tumor dosimetry in I-131 radioimmunother-
apy: a pilot patient study. Cancer Biother Radiopharm. 2009;24:417–426.
12. Amro H, Wilderman SJ, Dewaraja YK, Roberson PL. Methodology to
incorporate biologically effective dose and equivalent uniform dose in patient-
specific 3-dimensional dosimetry for non-Hodgkin lymphoma patients targeted
with 131I-tositumomab therapy. J Nucl Med. 2010;51:654–659.
13. Dewaraja YK, Ljungberg M, Koral KF. Effects of dead time and pile up on
quantitative SPECT for I-131 dosimetric studies [abstract]. J Nucl Med. 2008;49
(suppl):47P.
14. Koral KF, Yendiki A. Qiang Lin, Dewaraja YK. Comparison of 3-D OSEM
versus 1-D SAGE for focal total-activity quantification in I-131 SPECT with HE
collimation. IEEE Trans Nucl Sci. 2005;52:154–158.
15. Dewaraja YK, Wilderman SJ, Ljungberg M, Koral KF, Zasadny K, Kaminiski M.
Accurate dosimetry in I-131 radionuclide therapy using patient specific,
3-dimensional methods for SPECT reconstruction and absorbed dose calculation.
J Nucl Med. 2005;46:840–849.
16. Dewaraja YK, Avram AM, Schipper M, et al. Quantitative SPECT/CT for
radioimmunotherapy (RIT) treatment planning: comparison of tracer and therapy
dosimetry [abstract]. J Nucl Med. 2009;50(suppl):98P.
17. Pinheiro JC, Bates DM. Approximations to the log-likelihood function in the
nonlinear mixed-effects model. J Comput Graph Statist. 1995;4:12–35.
131I RADIOIMMUNOTHERAPY: DOSE AND RESPONSE • Dewaraja et al. 1161

18. Wilderman SJ, Dewaraja YK. Method for fast CT/SPECT based 3D Monte Carlo
absorbed dose computations in internal emitter therapy. IEEE Trans Nucl Sci.
2007;54:146–151.
19. Cheson BD, Pfistner B, Juweid ME, et al. Revised response criteria for malignant
lymphoma. J Clin Oncol. 2007;25:579–586.
20. Davis TA, Kaminski M, Leonard J, et al. The radioisotope contributes
significantly to the activity of radioimmunotherapy. Clin Cancer Res. 2004;10:
7792–7798.
21. Sgouros G. Dosimetry of internal emitters. J Nucl Med. 2005;46(suppl):18S–
27S.
22. Brans B, Bodei L, Giammarile F et al. Clinical radionuclide therapy dosimetry:
the quest for the ‘‘Holy Gray.’’ Eur J Nucl Med Mol Imaging. 2007;34:772–786.
23. Pauwels S, Barone R, Walrand S, et al. Practical dosimetry of peptide receptor
radionuclide therapy with 90Y-labeled somatostatin analogs. J Nucl Med. 2005;
46(suppl):92S–98S.
24. Matthay KK, Panina C, Huberty J, et al. Correlation of tumor and whole-body
dosimetry with tumor response and toxicity in refractory neuroblastoma treated
with 131I-MIBG. J Nucl Med. 2001;42:1713–1721.
25. Koral KF, Yendiki A, Dewaraja YK. Recovery of I-131 activity within focal
volumes using SPECT and 3D OSEM. Phys Med Biol. 2007;52:777–790.
1162 THE JOURNAL OF NUCLEAR MEDICINE • Vol. 51 • No. 7 • July 2010