10800551.pdf - enlighten: theses
TRANSCRIPT

https://theses.gla.ac.uk/
Theses Digitisation:
https://www.gla.ac.uk/myglasgow/research/enlighten/theses/digitisation/
This is a digitised version of the original print thesis.
Copyright and moral rights for this work are retained by the author
A copy can be downloaded for personal non-commercial research or study,
without prior permission or charge
This work cannot be reproduced or quoted extensively from without first
obtaining permission in writing from the author
The content must not be changed in any way or sold commercially in any
format or medium without the formal permission of the author
When referring to this work, full bibliographic details including the author,
title, awarding institution and date of the thesis must be given
Enlighten: Theses
https://theses.gla.ac.uk/

THE GENES FOR MOUSE GLOBIN
AND THE POST-TRANSCRIPTIONAL
CONTROL OF THEIR EXPRESSION
Stephen E. Humphriesis
A Thesis submitted for the Degree of Doctor
of Philosophy in the Faculty of Medicine,
The University of Glasgow*
Beatson In stitu te for Cancer Research,
Glasgow. October, 197** •

ProQuest Number: 10800551
All rights reserved
INFORMATION TO ALL USERS The quality of this reproduction is dependent upon the quality of the copy submitted.
In the unlikely event that the author did not send a com p le te manuscript and there are missing pages, these will be noted. Also, if material had to be removed,
a note will indicate the deletion.
uestProQuest 10800551
Published by ProQuest LLC(2018). Copyright of the Dissertation is held by the Author.
All rights reserved.This work is protected against unauthorized copying under Title 17, United States C ode
Microform Edition © ProQuest LLC.
ProQuest LLC.789 East Eisenhower Parkway
P.O. Box 1346 Ann Arbor, Ml 48106- 1346

f(* t nCopy I-

CONTENTS
Page
Acknowledgments 1
Summary 2
Introduction k
Materials and Methods k5
Results 70
Discussion 96
Abbreviations 126
Bibliography -28
Publi cations

ACKNOWLEDGMENTS
During the course of this work, my supervisor
Dr. Bob Williamson has given me a great deal of encouragement
and advice, and I thank him for this, as well as for his
example.
Also over the past three years I have received help with
many aspects of this work from a ll members of the Beatson
In stitu te . For this I thank them sincerely, especially the
Director, Dr. J. Paul, and my collaborators, Drs. G. D. Birnie,
R. S. Gilmour, P. R. Harrison, A. Hell and B. D. Young.
I would specifically like to thank Mrs. J. Crossley for help
in running the fingerprints, Dr. I . B. Pragnell for assistance
with the Krebs ascites cell—free system, my collaborator
Dr. M. Doel for his help with the rabbit cell—free system, and
Dr. M. Getz for advice in using polynucleotide phosphorylase,
and for many helpful discussions. I also acknowledge and
thank the assistance and cheerful co-operation of Mrs. Alice
Walker and her animal house staff, Mrs. June Peffer, who
typed this manuscript, and Susie, my wife, whose support
and understanding has been invaluable to me.

SUMMARY
In th is work I have investigated the possible role of
gene reiteration, amplification or deletion, as a means of
regulating the expression of the globin gene during tissue
differentiation in the mouse. This has employed a probe of
complementary DNA ( cDNA) prepared by copying reticulocyte 9S
RNA using avian myeloblastosis virus reverse transcriptase.
Since this RNA contains the messenger RNAs for a and (3 globin,
the cDNA produced is complementary to the a and 0 globin genes.
The fid e lity of th is cDNA and i t s use as a probe for globin
sequences in DNA and RNA are rigorously justified . The rates
of hybridisation of th is probe to whole mouse embryo DNA, mouse
erythroid DNA from 1!» day foetal livers, and mouse germ line
DNA from sperm are compared. The small corrections required
for the size differences of the hybridising molecules, and
the slight mismatching in the cDNA are estimated.
The study demonstrates that there are 1 —2 copies of
the globin a and 3 genes in a ll tissues studied, and thus
mechanisms other than gene amplification or deletion are
required to explain the control of globin gene expression.
The existence of post—transcriptional mechanisms by
which th is regulation may occur was then investigated. The
f i r s t of these is the translational role of the poly(A) segment
found on the 3f ©**d of eukaryotic mRNAs. This segment was
removed from reticulocyte 9S RNA, using polynucleotide
phosphorylase. Several experiments were performed to
demonstrate the absence of the poly(A) sequence from the mRNA.
The ab ility of th is mRNA to code for a and 6 globin chain
synthesis in several cell—free protein synthesising systems

was compared with intact mRNA* The results demonstrate
that the poly(A) segment is not required for efficient
in itia tio n , elongation, termination or re in itia tion of
protein synthesis in a cell—free system.
The role of the poly(A) sequence in determining the
nuclear metabolism of globin RNA was then investigated.
Low levels of globin RNA sequences were detected using cDNA
in the nucleus of several non—erythroid tissues, adult mouse
brain and liver, and a cultured lymphoma cell line, L5 1 7 &Y•
Very much lower levels of globin RNA sequences were detected
in the cytoplasm of these cells. In contrast, in the
erythroid I k day foetal mouse liver, the amounts of globin
RNA sequences found in the cytoplasm were very much higher
than that in the nucleus. This indicates the operation of
a post—transcriptional regulatory mechanism, whereby the
nuclear and cytoplasmic levels of globin RNA sequences are
regulated independently. However, th is mechanism appears
not to be mediated through association of nuclear globin
RNA sequences with poly(A) since in both erythroid and non—
erythroid tissues, where the fraction of to tal cell globin
RNA sequences in the cytoplasm varies considerably, the
proportion of polyadenylated nuclear globin RNA sequences
is the same.
At the present time, the possible functions of this
low—level transcription of the globin gene in noiu-erythroid
tissues are unclear.

INTRODUCTION
Control of gene expression at the DNA level
Deletion of gene sequences
Amplification and reiteration
Ribosomal RNA genes
Histone genes
Globin genes
Immunoglobulin genes
Silk fibroin genes
Transcriptional control
Post—transcriptional control mechanismsof gene expression
Cytoplasmic control processes
General characteristics of mRNAs
Poly(A) sequences
mRNA si ze
mRNA—protein complexes
Nuclear control processes
The size of nuclear RNA
Poly(A) sequences
Role of poly(A) in nuclear post transcriptionalregulation
Direct evidence for the presence in HnRNA ofmRNA sequences
Sequence differences between HnRNA and mRNA
The organisation of unique and repetitivesequences in the genome

INTRODUCTION
1. In recent years, the isolation of mRNAs coding for
specific proteins has enabled considerable advances to be made
in the understanding of the control of eukaryotic gene
expression. Using these probes, i t has been possible to
examine the arrangement of specific gene sequences in the DNA,
and to study the control of nuclear and cytoplasmic RNA
metabolism, during cellular d ifferentiation. In these ways,
i t is hoped to gain an insight into the molecular events in
pathological disorders such as cancer or v iral infections, as
well as inherited defects such as mongolism or thalassaemia.
2. Control of gene expression at the DNA level
One possible mechanism by which the expression of the
information encoded in the DNA may be regulated, is by changing
the relative amounts of specific DNA sequences in the cell
genome. Thus, during differentiation, some of the sequences
that are not required in the new cell type may be deleted from
the DNA, or other required sequences may be specifically
amplified.
a) Deletion of gene sequences
I t is now accepted that in a ll but a few situations, the
informational content of the DNA is the same in a ll the cell
types of a particular species. Evidence has been accumulating
for th is since 1892 when Driesch showed that the nuclei from
the endoderm region of developing sea urchin embryos, could be
successfully manipulated to direct the synthesis of normal
mesoderm development. Recent woik by Gurdon (1 9 6 2 ) and Gurdon
et a l . (1 9 6 6 ) has extended th is . Nuclei from the fully
differentiated in testinal cells of adult Xenopus toads can

support the complete development of the fe rtile adult when
stimulated by the correct environment — in this case the
cytoplasm of an enucleate Xenopus egg.
McCarthy and Hayer (196Jj) have obtained evidence for the
genomic equivalence of differentiated tissues, by the
application of DNA hybridisation techniques. Their experiments
involved the immobilisation of denatured mouse embryo DNA in
agar. I t was found that a significant amount of labelled
mouse L cell DNA was able to form a stable hybrid with th is
DNA, and in subsequent experiments, the hybridisation of the
labelled DNA could be equally well 'competed out1, by the
addition of increasing amounts of DNA from a wide variety of
tissues such as brain, thymus or liver.
These results demonstrate that eukaryotic cellular
differentiation does not involve the obligatory loss of
Informational content of the DNA. Some exceptions to th is
are known, such as Ascaris. or the Gall midge, where most of
the chromosomes are lost during somatic differentiation, and
only the cells of the gonads in the adult have a full
complement of DNA (Wilson, 1925) •
b) Amplification and reiteration
As well as the possibility of specific gene sequences
becoming amplified during the differentiation of certain
tissues, i t has been suggested that some genes may be present
as multiple copies in the genome of a ll cells. Reiterated
genes may be necessary where cellular functions demand the
rapid production of large amounts of specific protein or RNA
molecules. There are, however, several genetic arguments
against the existence of reiterated genes in the genome, one
of which is the requirement for a mechanism to maintain
uniformity between these many copies.

Several alternative evolutionary schemes for groups of
reitera ted genes have been proposed, including the master—slave
hypothesis (Callan 1 9 6 7 ), and the saltatory replication
theories (Britten and Kohne, 1968,* Amaldi et a l .. 1973)*
A more likely mechanism of crossover fixation has recently
been suggested by Smith (197**)•
The re iteration frequency, and the possibility of specific
amplification have now been investigated for several gene
sequences. The most widely used technique for measurement
of th is value f i r s t requires the isolation of the RNA
transcribed from the gene. This probe is either l) isolated
from cells grown in the presence of a radioactive label, 2)
chemically labelled in v itro , usually by methylation with
tr i t ia te d dimethyl sulphonate, or iodinated with 1 ^^ , 3 ) copied
enzmatically to produce a highly labelled 'anti-strand ' probe
of RNA or DNA.
I t is possible to estimate the number of copies of a gene
either from the amount of DNA that is complementary to the
probe (saturation analysis), or from the rate at which the
probe hybridises with i t s complement (kinetic analysis)•
In the f i r s t of these, the probe, usually RNA, is in
excess and 'drives' the reaction. In the second only trace
amounts of the probe are added, with the DNA being in vast
excess (at least 100 times more gene sequences thah the probe),
(l) Ribosomal RNA genes
Probably the best example of a reiterated gene is that of
the sequences coding for the ribosomal RNA (rRNA). The
redundancy of information, which is the same for both the
18s and 28s rRNA species appears to be 5 — 10 copies in the
bacteria studied ( Yankofsky and Spiegelman, 1 9 6 2 ) and between

one and several hundred copies per haploid genome in
eukaryotes (Brown and Weber, 1968a; Jeanteur and Attardi, 196 9 ;
Ritossa et a l .. 1 9 6 6 b )• Several studies have demonstrated
that these gene sequences found in any one species are
identical (Dawid, Brown and Reeder, 1970; B im stiel et a l ..
1 9 6 9 , Brown, Wensink and Jordan, 1972).
The genes coding for both the 5S and hS RNA species
are also reiterated (Brown et a l .. 1971; Ritossa et a l ..
1 9 6 6b), but some heterogeneity appears to exist in the 5S
genes of somatic cells (Wegnez et a l . . 1972; Ford and Southern,
1973)-
Calculations based on known transcription rates of RNA, have
demonstrated that the observed redundancy of ribosomal genes
is necessary to produce the amount of rRNA detected in normal
cells (Attardi and Amaldi, 1970)• In agreement with th is is
the fact that some Drosophila mu taints (bobbed) with a large
reduction in the number of ribosomal genes, show a
characteristically slow growth rate (Ritossa et a l .. 1 9 6 6 a) .
I t is known that the gene copies for the rRNA are
clustered together in the genome (Brown and Weber, 1 9 6 8 b;
B im stiel et a l .. 1968). They are arranged in a repeating
pattern of gene and spacer (Miller and Beatty, 1 9 6 9 a and b;
Wensink and Brown, 1971) and because of the ir high G + C
content, can be isolated by centrifugation on buoyant density
gradients (B im stiel et a l., 1 9 6 6 ; Brown and DaTdd, 1968).
Cytological evidence from both anucleolate Xenopus (Brown and
Gurdon) and bobbed Drosophila (Rlttossa et a l . . 1 9 6 6 a) also
indicates that the ribosomal genes are clustered, and are
located in the DNA associated with the nucleolus.

The ribosomal genes are also the only known genes that
undergo amplification. This has been found to occur at the
pachytene stage of oogenesis, and has been studied in amphibia
(Gall 1968; MacGregor, 1 9 6 8 ) and beetles (Gall and Rochaix,
197*4)• This amplification results in the formation of about
*4,000 extra chromosomal nucleoli in the nucleus of*Xenopus
oocytes (Brown and David, 1 9 6 8 ; Perkowska et a l . t1968).
These are similar to somatic cell nucleoli in ultrar-structure
and are active in rRNA production un til the f i r s t meiotic
division. I t is known that very high numbers of ribosomes are
required to support the early stages of Xenopus embryogene sis,
and i t appears that amplification of the ribosomal genes is
necessary for the synthesis of th is large amount of ribosomal
RNA. In a ll other tissues the number of ribosomal genes is
found to be constant (Brown and Weber, 1 9 6 8 a).
( 2) Hi stone frenes
Reasonably pure histone mRNA was f i r s t isolated from
developing sea urchins (Kedes and Gross, 1960 and 196 9 ; Kedes
et a l .. 1 9 6 9 ). This 9 ” 10S RNA becomes rapidly labelled in
the dividing cells of the embryo, and can be resolved by
polyacrylamide gel electrophoresis into 5 major species, of
the expected sizes to code for sea urchin hi stones (Weinberg
et a l .. 1972). Recently th is RNA has been translated into
histones in a cell—free protein synthesising system (Gross
et a l .. 1 9 7 3 ).
Trace amounts of th is labelled histone mRNA were used to
probe reannealing sea urchin sperm DNA. The label becomes
RNase resistant at a lower CQt than either the bulk of the DNA
sequences, or to tal sea urchin mRNA. Kedes and B im stiel
(1971) interpret this data as showing that the hi stone genes
are reiterated about *j00 times per haploid genome. This

labelled probe hybridises in a similar manner with Xenopus
and Rhynchosciara DNA, indicating that the genes in these
species are also reiterated*
More recently, histone mRNA has been isolated from dividing
HeLa cells and translated in a cell—free system (Jackobs—Lorena,
et a l .. 1972,* Gallwitz and Breindl, 1972). This RNA has
been copied and used to probe reannealing human placental DNA*
Preliminary evidence suggests that the hi stone genes in the
human genome are reiterated 50 — 100 times (Getz, Borun and
Bimle, unpubli shed) .
Because of their high G + C content, i t has proved
possible to isolate the hi stone genes from the bulk of the DNA
(Kedes and B im stiel, 1971,* Bim stiel et a l .. 197*4) • The
gene sequences are clustered in the DNA, in a similar manner to
the ribosomal genes, end there are several studies that indicate
that the hi stone gene copies are identical, within a given
species (Weinberg et a l .. 1972; DeLange et a l .. 1 9 6 8 a, b;
Grunstein et a l .. 1973)*
(3) Globin genes
One of the f i r s t mammalian mRNAs to be isolated in a
pure form was the message coding for globin. Globin is almost
the only protein being synthesised in immature blood cells
(Kruh and Borsook, 1956; Dintzis et a l .. 1 9 5 8 )• These cells
are easily isolated from anaemic animals, and a 9 “ 10S RNA
component purified from the reticulocyte polysomes (Bumy and
Marbaix, 1965 J Marbaix et a l .. 1 9 6 6 ; Huez et a l .. 1967J
Williamson et a l .. 1971)* This component has been shown
unequivocally to be the messenger RNA for globin, coding for
both a and 0 globin chains in cell-?free systems (Lingrel et al *.
Lanyon e t a l .. 1972) and in the Xe nopus oocyte (Lane e t a l ..
1971)•

The f ir s t attempt to measure the reiteration frequency
of the globin gene was made by Williamson et a l . (1970).
Mouse globin mRNA methylated in vitro was used in saturation
experiments with DNA immobilised on f i l te r s . Large amounts
of RNA rapidly hybridised to the DNA, giving a calculated gene
reiteration frequency of 50,000. However, the low Tm of th is
hybrid, and the ab ility to compete out the hybridisation with
poly(A) (Morrison et a l .. 1972), suggested that the poly(A)
segment of the mRNA was hybridising to the poly(dT) tracts
detected in mouse DNA by Shenkin and Burdon (1972). Similar
values were obtained by de Jiminez et a l . (1971) using in vitro
labelled chicken globin mRNA.
In vivo labelled globin mRNA can be easily isolated using
avian nucleated reticulocytes and Bishop et a l . (1972) have used
this RNA to estimate the number of globin genes in the duck
genome. Their kinetic method of analysis (Meli et a l .. 1971)
gave a reiteration frequency of 10 copies, by comparison with
the rates of hybridisation of DNA and RNA standards. Since
corrections are required for both the G + C content of the mRNA,
and the different rates of reaction of RNA—DNA and DNA—DNA
hybridisation, the best interpretation of their data is that
there are no more than 5 copies of the globin gene per haploid
duck genome•
The isolation of an RNA dependent DNA polymerase (reverse
transcriptase) from avian myeloblastosis virus (Packman et a l .«
1972,* Verma et a l .. 1972; Kacian et a l .. 1972) has enabled
highly labelled DNA copies of mRNAs to be synthesised.
Trace amounts of these complementary DNAs ( cDNA) can be
followed in hybridisation reactions.

Harrison et ail* (1972a) used cDNA copied from mouse
globin mRNA in a kinetic analysis to estimate the number of
mouse globin genes in mouse embryo DNA, and obtained values
of 1 — 2 copies per haploid genome. Similar low figures
were also obtained by Bishop and Rosbash (1973) and Packman ejb
(1972) for the number of globin genes in the duck using a
cDNA technique. These las t authors also compared the number
of globin genes in DNA from adult duck liver and from
reticulocytes. Their preliminary data indicated no
amplification of the globin genes in the reticulocyte DNA.
In the work reported here, the observations of Harrison
et a l .(l972) have been confirmed and extended. I have
compared the number of globin genes in the mouse germ line
(sperm) DNA, and DNA from an erythropoietic tissue (foetal
liver) with to tal mouse embryo DNA (Harrison et a l .. 197*»a) •
The corrections required for the effects of mismatching of
bases in the hybrid, and the base composition and size of the
hybrid have been determined. The results show that the
globin genes are present in 1 —2 copies per haploid genome
and are not amplified or lost during differentiation.

(*4) Immunoglobulin genes
Mammals have a highly developed immune system, and
respond to a wide diversity of antigens by the production
in specialised cells of large amounts of specific immuno
globulin (ig) proteins. These proteins d iffer by only a few
amino acids and are made up of heavy (H) chain and light (l)
chain subunits. Each of these chains is encoded by one
variable ( v ) and one constant ( c ) gene ( Dreyer and Bennet, 1965 )*
Heavy chains of a ll classes share the same Vjj—gene pool and
different C —genes can be linked to the same VH gene. I t is
possible that every cell contains a ll immunoglobin (ig) genes
(germ line theory, Dreyer et a l .. 1 9 6 7 ), or that variability
is created somatically, so different antibody producing cells
have different (and only a few) Ig genes (Brenner and Milstein,
1969 Gaily and Edelman, 1970).
These hypotheses have been tested by several workers.
The mRNA for a single specific Ig can be labelled in vivo, and
isolated from myeloma cell lines. Using this probe,
Premkumar et a l .. 197*4 have shown that the mRNA coding for a
heavy chain protein hybridises to mouse DNA in a biphasic
manner. The f ir s t component (assumed to be the VH gene pool),
appears to be reiterated in the genome about 5 ,0 0 0 times;
the second ( Cjj gene pool) component about *4 times. Since
widely divergent Vjj sequences would not be expected to cross—
hybridise, th is represents a minimum estimate of gene number.
I f the L chain variable region gene pool is of the same size,
the information present in the germ line would be enough for 7
2.5 x 10 antibodies. These hybridisation values are the
same for DNA from mouse embryos, lymphoid and myeloma cells,
and indicate that specific loss or amplification of the Ig genes
does not occur.

(5) Silk fibroin genes
The posterior silk gland of the larvae of the silk moth
Bombyx mori is involved in the synthesis of large amounts of
the silk fibroin protein (Tashiro et al *. 1968) . The **5S
mRNA for silk fibroin is very stable in these cells (Suzuki
and Brown, 1972) and has been isolated in a highly labelled
form. This probe hybridises to whole larvae DNA and silk
gland DNA, at a saturation level indicating that in both
there are 1 —3 silk genes per haploid complement of DNA
(Suzuki et a l . . 1972).
However, In development of the silk gland, as in many
other terminally differentiated tissues of dipteran larvae,
extensive DNA synthesis occurs, without cellular division
(Tashiro et al •. 1968; Gall et a l .. 1971; Dickson, et a l ..
1971)* The chromatids become paired and the euchromatic
portion of each is replicated several hundred times (Bridges,
1935; Painter and Griffin, 1937,* Beerman, 1956). This
resu lts in large banded structures visible under the light
microscope — polytenised giant chromosomes. Thus, although
the reiteration frequency of the silk gene remains the same
in whole larvae and silk gland DNA, there is a very high
number of silk genes in each cell. Suzuki et a l . (1972)
calculate that transcription of th is large number of genes
l€is necessary to explain the observed number of 10 fibroin
molecules present in the cells of the silk gland.
These conclusions for the low reiteration frequencies of
specific genes have also been substantiated for to tal cell
mRNAs in several studies. The rates of hybridisation of
in vivo labelled mRNA from mouse L cells (Greenberg and Perry,
1971), sea urchins (Goldberg et a l .. 1973) or HeLa cells (Klein
et a l .. 197!i) are as predicted for non—repetitive transcripts.

A similar conclusion has been reached from the observed
rate of annealing of a cDNA copied from the poly(A) containing
RNA of mouse M2 cell polysomes (Biroie et a l .. 197**), or from
HeLa cell mRNA (Bishop et a l .. 197**) •
However, most of these studies cannot exclude the
presence of short repetitive sequences in the mRNAs. These
sequences could be between 30 and several hundred nucleotides
long, and may be located in the untranslated region of the
mRNA,where they may fu lf i l a regulatory function. Using
techniques whereby partia lly hybridised molecules can be
isolated on hydroxyapatite, Goldberg et a l . (1973) have
demonstrated that sea urchin gastrula mRNA is transcribed
almost exclusively from single copy DNA, and contains no
detectable, rapidly hybridising tags. Similarly for HeLa
mRNA, Klein et a l . (197*») have shown that more than 90$ of
the RNA contains no repetitive tags. However, about 6$ of th is\J
mRNA appears to be transcribed entirely from repetitive DNA
sequences. Controls demonstrate that th is cannot be explained
by HnRNA, or rRNA contamination, and since i t contains poly(A),
is unlikely to be histone mRNA* This indicates the presence
of low levels of repetitive sequences coding for mRNA in the
HeLa DNA.
I t thus appears that for most structural genes, germ line
reiteration, or amplification during differentiation does not
occur. In addition a quantitative consideration (Kafatos
1972a,b) has demonstrated that even the relatively large
accumulations of specific proteins that occur in some terminally
differentiated tissues, such as the silk gland, or red blood
cell, can be explained by the known rates of transcription and
translation, assuming a fa irly high s tab ility of the mRNAs.
Only the histone genes are known to be reiterated. Histone

mRNAs are only synthesised during the short DNA replication
phase of the cell cycle, after which they are rapidly broken
down (Robbins and Borun, 1 9 6 7 ) • This compares with other
mRNAs, which are quite stable, and may accumulate over several
cell generation times (Greenberg 1972; Perry and Kelly, 1973;
Murphy and Attardi, 1973)• Gene reiteration may also be
necessary for production of the large amounts of histones
required during the stages of rapid cell division in early
embryogene si s •
The only other known informational sequences that are
reiterated are the genes coding for the ribosomal RNAs.
Here too the large numbers of ribosomes necessary for cell
growth requires the transcription of many gene copies. Also,
there is no translational "amplification" of the gene product,
since the RNA is used directly by tho cell.
I t is of in terest that both these classes of reiterated
genes are known to be grouped together in the genome. Since
the products of these gene clusters are homogeneous in any
one species, the ir similar arrangement in the DNA may reflect
the mechanism by which the uniformity of the reiterated
sequences is maintained.
Since i t appears that gene expression is not regulated
at th is level of DNA arrangement, other mechanisms of gene
control must be investigated.

3• Transcriptional control of gene expression
There is considerable evidence that the transcriptional
availability of sequences is the major site of the control
of gene expression in eukaryotes. The theoretical basis
of these controls was worked out in prokaryotic systems, where
the regulation of the lac operon by the negative control of
gene activity is best understood (Jacob and Monod, 19^1;
Gilbert and Muller—Hill, I 9 6 7 J Beckworth and Zipser, 1970)*
Transcription of the lac genes will occur unless the
operator site of about 30 base pairs (Gilbert and Maxara, 1973)
is occupied by the repressor molecule. This molecule has
recently been shown to be a tetrameric protein of about
150,000 molecular weight (Adler et a l .. 1972; Steitz et a l ..
197**) • The operator site is situated 51 to the coding
sequence. Inducer molecules bind with the repressor protein
and prevent i t s binding to the DNA, thus allowing transcription
of the genes (Jacob and Monod, 1 9 6 1 ) . A polycistronic mRNA
transcript of the 3 genes in the operon ensures co-ordinate
expression of the information required.
In eukaryotic cells, the f i r s t line of evidence for the
regulation of transcription comes from a comparison of the
RNA sequences found in the nuclei of different tissues. I t is
assumed that this will approximate to the population of RNA
molecules being transcribed. Examples of results from these
studies are that there is less than 10$ homology between the
RNA sequences stored in Xenopus oocytes and synthesised in the
blastulae (Davidson et a l .. 1 9 6 8 ), while there is up to 30$
homology between the RNA sequences of mouse brain liv er and
spleen (Brown and Church, 1972). Precise interpretations of
these experiments are doubtful because of several technical
d ifficu lties , but the conclusion that the cell can regulate

the information i t transcribes is d ea r.
D ifficulties also exist in the second line of evidence,
which comes from the in vitro transcription of cell chromatin.
In eukaryotic cells, the DNA is complexed with both histone
and nonhistone proteins. This material stains with basic
dyes in situ and is termed chromatin. During cell division
the chromatin can be seen as condensed super coiled chromosomes,
but in th is form no transcription can occur (Johns, 1 9 6 9 ) •
Interphase chromosomes are only visible as d istinct en titie s
in a few examples, such as the polytenised chromosomes of
dipterans.
Several workers have shown that the RNA sequences
transcribed from chromatin in vitro by E♦ coli or homologous
RNA polymerase, reflects the differences found in the in vivo
nuclep.r RNA (Paul and Cilmour, 19 68; Gilmour and Paul, 1969,’
Flickinger et a l .. 1965; Marushige and Bonner, 196 6 ; Marushige
and Ozaki, 1967) • In experiments where the chromatin from
several tissues was dissociated into i t s constituents and
then re associated, Paul and Gilmour pointed to the involvement
of non—histone proteins in regulating th is d ifferen tial gene
activity . However, in much of th is work only the hybridisation
of repetitive sequences was followed and the results may be
explained by contamination with endogenous RNA sequences.
I t is only recently with the use of specific gene probes,
such as cDNA, that the general validity of these ideas has been
substantiated.
Using these probes, i t has been shown that globin sequences
are transcribed by E* coli polymerase from reticulocyte
chromatin and not liv e r chromatin (Axel et a l ., 1973) and
from mouse foetal liv e r chromatin and not brain chromatin
(Gilmour and Paul, 1973)• Others have used mammalian

polymerase to the same effect (steggles et a l*. 197*0*
Although these data show that most of the genome Is
Inactive in any particular tissue, the number of regulatory
events involved in this control is very large. For example,
Davidson and Britten (1973) calculate that i f the complexityQ
of the RNA transcribed in mouse brain is approximately 2 x 10
nucleotides (Hahn and Laird, 1971), th is may represent theO ||
regulation of between lO-' to 10 separate and diverse loci in
the mouse genome (assuming the size of the transcripts to beI M
between 10 to 10 nucleotides)* Paul (1973) has suggested
that the number of molecules involved in this regulation may
be even higher* A single regulator protein of 20,000 —
50,000 molecular weight, would probably bind to a length ofo
DNA of between 50 — 100 A* This constitutes less than one
third of the DNA—histone supercoil (Ris 1961 and 1 9 6 2 ), and
indicates that more than one sequence length may be required
to destabilise the nucleohistone sufficiently to allow
transcription to start* Crick (1971) has proposed that
these recognition sites may exist as single stranded regions
of DNA, held open by a hairpin structure in the compact
nucleohi stone •

U• Post—transcriptional control mechanisms of gene expression
Scherrer and Marcaud, (1968) in their cascade hypothesis,
suggested that, superimposed on transcriptional regulation,
were other nuclear and cytoplasmic mechanisms to ensure the
s tab ility of the differentiation processes* These
mechanisms may impose both quantitative and qualitative
control on the expression of the transcribed information.
Darnell et a l . (1973) have pointed out that post—transcriptional
regulation requires the overproduction of potential mRNA
sequences. Different cellular conditions will then a lte r
the probability of a potential mRNA exiting from the pool of
transcribed sequences, and functioning in the cytoplasm.
Thus, the specificity of post—-transcriptional control must lie
in the sequences of the RNA*
Some insight into the mechanisms by which this control
is exerted in the cytoplasm can be gained by a study of the
structure and functioning of the messenger RNAs.
U(i) Cytoplasmic control processes
a) General characteristics of Messenger RNAs
Messenger RNA was f ir s t identified in bacterial systems,
by i t s rapid labelling with radioisotopes, a rapid turnover
relative to rRNA, and i t s 'DNA lik e 1 base composition (Gross
et a l .. 1961; , Jacob and Monod, 196 l) . In eukaryotes the
s tab ility of many messenger RNAs is much greater than in
bacteria, where decay constants of less than 5 minutes have
been recorded (Levinthal et a l .. 1 9 6 2 ). Functional mRNA
is located on polysomes during protein synthesis (Rich et a l ..
1 9 6 3 ) when i t is very sensitive to RNase degradation. I t is
dissociable from the polysomes by chelating agents such as
EDTA, and is usually released as an RNA—protein particle (mRNP)
(Chantrenne et a l .. 1 9 6 7 )*

The definitive proof that am RNA can function as a
message is i t s ab ility to direct the synthesis of a specific
protein in a cell—free protein synthesising system. In
several instances, other c rite ria have been used to
identify mRNAs, for example, the large size (30S) of the
myosin mRNA in muscle cells (Heywood et a l .. 196 7 ), or the
distinctive base composition of the silk fibroin mRNA
(Suzuki and Brown, 1972).
b) Poly(A) sequences
One major distinguishing feature of most eukaryotic
mRNAs is the presence on the 3 1 end of the molecule of a poly
adenylic acid sequence (poly(A)). The ability of this poly(A)
sequence to hybridise to poly deoxythymidylate oligomers
(poly(dT)) covalently bound to cellulose, enabled Edmonds
et a l . (1971) to isolate messenger like RNA from HeLa cells.
Several other similar techniques have been employed to
purify mRNAs. I t has been found that the poly(A) containing
RNA will stick to millipore (nitrocellulose) f i l te rs
(Brawerman et a l«. 1972* Rosenfeld et a l .. 1972) and will
hybridise to polyuridilic acid (poly.(u)) that has been
immobilised on sepharose (Wagner et a l .. 1972), or glass fibre
discs (Sheldon et a l .. 1972b).
At the present time the only known eukaryotic mRNA that
does not contain these sequences are the histone messenger
RNAs (Adesnik et a l .. 1972; Adesnik and Darnell, 1972;
Schochetman and Perry, 1972). Thus, when labelled
polysomal preparations are fractionated by poly(A) selection
techniques, between 60 — 85$ of the mRNA behaves like poly(A)
containing material (Lindberg and Person, 1972; Lee et a l ..
1971; Adesnik et a l .. 1972). This suggests that the
majority of mRNAs contain a poly(A) sequence, but the
occurrence of some mRNA species, other than the histone mRNA

that lack poly(A), cannot b© excluded.
The poly(A) segment consists of a pure poly(A) sequence,
as indicated by i t s resistance in high salt conditions to
pancreatic and RNase digestion. Poly(A) isolated in this
way from HeLa cells contains 1 adenosine per 200 AMP residues,
and no other nucleotides. This indicates that the poly(A)
segment is 200 nucleotides long and is terminated by a free
3' OH group (Molloy and Darnell, 1973)* Similar results
have been obtained with mouse sarcoma mRNA (Mendecki et a l ..
1972) •
A segment of th is configuration could only originate
from the 3f terminus of the mRNA, and this location of the
sequence has been recently confirmed by digestion of mRNA
with an exonuclease that requires a free 3’ OH. This rapidly
reduces the ability of the RNA to bind to poly^U) sepharose
(Molloy et a l .. 1972), or nitrocellulose f i l te r s (Sheldon
et a l .. 1972b). Also a considerable fraction of the poly(A)
sequence becomes labelled when the 31 terminus of the mRNA3
is oxidised with periodate and reduced with H borohydride
(Nakazato et a l .. 1973)*
The poly(a) isolated from newly synthesised mRNA
migrates as a relatively homogeneous component in polyacrylamide
gels, and with the mobility expected of a molecule of about
200 nucleotides in length (Edmonds et a l .. 1971,* Adesnik
et a l .. 1972; Sheiness and Darnell, 1973; Mendecki et a l ..
1972). mRNA from lower eukaryotes has been demonstrated
to contain a shorter 3* P°ly(A) segment of about 100 nucleotides
in Pictyostelium (F irte l et a l .. 1972) and about $0 nucleotides
in yeast (McLaughlin et a l*. 1973)*

Several studies with cells grown in culture have
indicated that the size of the messenger poly(A) sequence,
decreases in the cell cytoplasm.
Thus, the poly(A) sequence Isolated from to tal HeLa
cell mRNA has been shown to migrate as a heterogeneous band
of RNA on acrylamide gels (Darnell et a l .. 1971a, Mendecki
et a l .. 1972). This heterogeneity in size cannot be
explained by aggregation of the molecules (Sheiness and
Darnell, 1973) and these authors suggest i t might result from
the metabolic processing of an originally uniform sequence
length.
In several pulse chase experiments i t has been shown
that the poly(A) sequence of labelled HeLa mRNA becomes
progressively shorter and more heterogeneous over a period
of several hours. After 6 hours the size of the poly(A)■f X
has decreased from 190 — 20 nucleotides to 100 — 20, with
some molecules of only 50 nucleotides occurring after longer
chase periods. Similar results have been found using mouse
L cells (Brawerman 1973)*
These data suggest that the shortening of the poly(A)
in the cytoplasm may be related to the u tilisa tio n of mRNA
during protein synthesis. A ticketing hypothesis to
regulate mRNA half l ife has been suggested by Sussman (1970) •
However, i t has been found that the shortening of poly(A) is
not prevented when protein synthesis is inhibited (Sheiness and
Darnell, 1973,* Brawerman, 1973) • Also, in a 6 hour period,
a mRNA is probably translated at least 3,000 times. Clearly
the removal of one nucoeltide per rlbosomal transit is not
tenable•
These ideas have been substantiated by a study of the

poly(a) sequence of several specific mRNAs. Rapidly
labelled duck reticulocyte 9S globin mRNA has been found to
contain a poly(A) sequence of about 190 nucleotides, by a
comparison of the migration on acrylamide gels of the RNase
resistant fragment, with **S and 5S (Pemberton and Baglloni,
1972) • Similarly, calf lens has been shown to have a poly(A)
sequence of about 150 nucleotides (Favre et a l«. 197*») as
does chick myosin (Mondel et a l •. 197**) and collagen
(Harwood et al *. 197**) •
However, a shorter poly(A) sequence has been described
for the long lived reticulocyte globin mRNA* Thus, Lim
and Cannelekis (1970) described a poly(A) sequence of between
50 — 70 nucleotides in rabbit globin mRNA, but Burr and
Lingrel (1971) found a poly(A) sequence no longer than
10 nucleotides at the 3* end of this mRNA, and Hunt (1973)
of between 30 — **0 long. The poly(A) segment of mouse
globin mRNA has been shown to be 50 — 70 nucleotides long,
and by *H borohydride studies, to be on the 3' en<i 0** the
RNA (Morrison et a l .. 1973,* Mansbridge et a l .. 197**) •
Sequencing studies have shown that there are no other bases
present in th is fragment (Mansbridge et a l .. 197**) •
The only well characterised eukaryotic message to lack
poly (a) is the hi stone mRNA. Several differences in the
metabolism of th is mRNA may be related to the absence of
poly(A)• Histone mRNAs are only made during the DNA
synthesis phase of the cell cycle, when other mRNA production
is minimal (Bonin et a l .. 19^7; Gallwitz and Mueller, 1 9 6 9 )*
After being synthesised, histone mRNAs exit' rapidly from
the nucleus (Schochetman and Perry, 1972), in contrast to the
10 — 20 minute lag observed for other mRNAs (Penman et a l ..
1968; Jelenik et a l .. 1973)* This suggests that bypassing

the normal. poly(A) pathway may be related to a cell
requirement for rapid histone synthesis* The hlstone
mRNA has a similar short h a lf-life to the noiu-adenylated
bacterial mRNAs, implying a role for poly(A) in mRNA s tab ility
However, both this s tab ility , and the rapid appearance of the
mRNA in the cytoplasm may also be explicable by general
changes in the cell metabolism during th is stage of the
cell cycle.
The possible translational role of poly(A) has been
investigated in this work. The poly(A) sequences of mouse
globin mRNA was removed enzymatically, and the ab ility of th is
RNA to direct the synthesis of globin protein, studied in
various cell—free systems. By comparison with in tact mRNA,
in itia tio n , elongation, termination and re in itia tion on th is
mRNA is not impaired. This ha3 also been demonstrated for
to ta l mouse L cell mRNA by Bard et a l .. (197**)*
However, recent work by Huez et a l . (197**), has indicated
a role for poly(A) in the s tab ility of the mRNA. In these
experiments the poly(A) sequence was enzymatically removed
from rabbit globin, and the translational ab ility of th is
message followed over several hours by injection into Xenopus
oocytes. The amount of globin synthesised on the treated
mRNA as compared with native mRNA was found to be the same
for the f i r s t hour of translation, but to decrease a fte r th is .
The mechanism by which poly(A) may confer this s tab ility is
unknown,
c) mRNA si ze
A feature of a ll mRNAs so far studied is that their
sequence length is greater than required for coding of the
polypeptide, though not long enough to allow the possibility
of polycistronic mRNAs (Paul et a l .. 1972; Murphy and Attardi

1973) • Thus, mouse or rabbit globin mRNA is about +
220,000 — 10,000 molecular weight, approximately equal to
660 bases (Williamson et a l .. 1971,’ Gaskill and Kabat, 1971,*
Labrie, 1 9 6 9 )* Since in the mouse, **23 — **35 bases are
required to code for a or 3 globin, and the size of the
poly(A) segment is 50 — 70 bases (Mansbridge et a l . . 197**),
there may be up to 180 untranslated bases in the globin message.
Some of these sequences are known to be located at the
3' end of human globin mRNA. An a globin chain variant is
known (Haemoglobin Constant Spring) which exceeds the normal
polypeptide length by 31 residues (Clegg et a l .. 1971)•
From sequence studies of these amino acids, i t appears that
a mutation in the normal termination codon has resulted in
read—through of these usually untranslated sequences, t i l l a
further termination codon is reached 93 bases la te r . This
interpretation is substantiated by a second 'frame s h if t1
variation (Haemoglobin Wayne), which has 5 additional carboxyl
amino acids (Flatz et a l .. 1971)*
Computer studies (Hunt and Dayhoff, 1972) have suggested
that these extra sequences may have evolved by the duplication,
and subsequent mutation of a protein sequences.
Recent sequencing work by Proudfoot and Brownlee (197**)
on a mixture of rabbit a and 3 globin mRNA, have revealed the
same sequence of AUUGC poly(A) at the 3 1 ©nd of both
messages. Since the poly(A) sequence is not transcribed by
RNA polymerase but added by a different enzyme, this sequence
may represent the recognition site for the enzyme.
L ittle is known about possible untranslated sequences
at the 5 * ©nd of the mRNA* From studies on the events leading
to the in itia tio n of protein synthesis in prokaryotes, i t is

thought that the secondary structure of a messenger RNA
molecule must signal that a particular AUG tr ip le t is an
in itia tio n codon* This tr ip le t is recognised by a charged
f—met—tRNA, and an mRNA — ribosome complex is formed.
The segment of mRNA in this complex that is protected from
RNase digestion, has been isolated and sequenced by several
workers, (s te itz 1969; Staples et al *. 1971,* Robertson
et a l .. 1973) using mRNAs from viral and prokaryotic sources.
Between 9 and 25 bases 5* to the AUG codon, are found to be
protected (Maizels, 197*0 •
In bacteria, ribosome associated factors have been
described, that act at the level of in itia tion , by affecting
ribosomal recognition of individual mRNAs (Revel et a l ..
1970; Lee—Huang and Ochoa, 1971) • The presence of similar
factors in differentiated mammalian cells was f i r s t described
by Heywood (1970)• These factors have now been clearly
demonstrated for myosin and myoglobin translation in a rabbit
reticulocyte cell—free system (Heywood et a l .. 197*0 a11** Tor
the efficien t translation of several mRNAs in the Krebs ce ll-
free system (Nudel et a l .. 1973; Wgij© and Smith, 1973)* c tSL
These factors may recognise a specif3Tc sequence at the 5* ©nd
of the mRNA molecule, which may not be translated.
Another possibility is that these factors may recognise
a secondary structure feature of the RNA. Several of the
well characterised mRNAs such as globin or ovalbumin are
known to exhibit considerable secondary structure (Williamson
et a l ., 1971; Lingrel et a l .. 1971; Palacios et a l ., 1973)*
RNA secondary structure has been demonstrated in tRNAs (Holley
et a l .. 1 9 6 5 ) and in v iral RNAs (Min Jow et a l .. 1972). These
structural features may increase the RNase resistance of the

molecule or may be essential for the correct functioning of
the molecule.
d) Messenger RNA—protein particles
When messenger RNA is released from polysomes by EDTA
treatment (Bumy et a l .. 19^9), or by reaction with
puroraycin (Bloebel, 1972), i t is found associated with protein
as an mRNP partic le .
Globin mRNA released from rabbit reticulocyte polysomes
by the puromycin treatment contains 2 types of proteins with
molecular weights of 78,000 and 52,000 (Bloebel, 1972).
Other minor components may also be present. These proteins
appear to be tightly associated with the RNA, and remain bound
in conditions which dissociate many of the ribosomal proteins
(Bloebel, 1972). This suggests a specific and functional
interaction cf theso proteins. Similar sized proteins have
been found on the mRNA of duck and mouse reticulocytes, as
well as to tal mRNAs from mouse liver or L cells (Morel et a l ..
1971; Sampson et a l .. 1972; Perry and Kelly, 1 9 6 8 ).
Electron microscope studies indicate regular location of these
proteins along the mRNA (Dubochet et a l .« 1973), with an RNAl
protein ratio of about 1?3 (Lissitzky et a l .. 1970)*
Considerable evidence now exists for the association of the
78,000 MW proteins with the poly(A) sequence of mRNAs
(Kwan and Brawerman, 1972; Bloebel, 1973) • The other major
protein component may be located at the 5 1 ©nd of the mRNA.
These proteins could be involved in protecting the
untranslated ends of the message from nuclease digestion —
the rest of the mRNA being protected by ribosomes. I t is
known that mRNA and mRNP are equally well translated in ce ll-
free systems (Lingrell et a l .. 1971; Sampson et a l♦. 1972),
indicating that they are not involved in the translation

process i ts e l f .
The post—trainscriptional functioning of messenger—
protein particles has been clearly implicated in several
systems such as the eggs of sea urchins (Denny and Tyler,
1 9 6 3 ), loach embryos (Spirin 1 9 6 9 ), Xenopus oocytes
(Rosbash and Ford, 197*0 • In these cells, maternally
derived mRNA (Davidson 1 9 6 8 ; Rosbash and Ford, 197*0 I s
stored as an mRNP, probably both to prevent accidental
translation, and to protect the mRNA against degradation
(Spirin, 1 9 6 6 ). I t has been suggested that in the sea urchin,
the activation of th is stored message may be triggered by
polyadenylation of the mRNA (Slater et a l .. 197*0 •
In differentiating cells, mRNAs may also accumulate
in a stored form, to subsequently allow the rapid, co-ordinated
synthesis of large amounts of particular proteins such as
haemoglobin (Wilt 196 5 ) or pancreas enzymes (Vessels and Wilt,
1 9 6 5 ) • Similarly^ proteins may also be involved in a rapid
and co-ordinated switching—off of a set of translating mRNAs.
Clearly the association of protein with mRNA in these
ways, represents a powerful method by which the cytoplasmic
regulation of gene expression may occur.

*jii) Nuclear post^transcriptional control mechanisms
Several features of nuclear RNA metabolism may be
involved in regulating the appearance of transcribed sequences
in the cytoplasm.
a) The size of nuclear RNA
Heterogeneous RNA of a high molecular weight (HnRNA)
has been found in the nuclei of many eukaryotic cells.
The original estimates of the size of th is RNA, using sucrose6gradients or acrylamide gel electrophoresis exceeded 10
nucleotides in length (Attardi et a l .. 1966; Scherrer et a l ..
1 9 6 6 ; Warner et a l .. 1 9 6 6 ). However, aggregation, or in te r-
strand partia l duplex formation of RNA has been demonstrated
to occur under non—denaturing conditions (Mayo and deKloet
1971; Bramwell, 1972), and recent experiments using denaturing
agents such as formamide or dimethyl sulphoxide give size ranges
for nuclear RNA of mouse kidney cells of 0.5 — 1 • ** x 10**
nucleotides (Acheson et a l .. 1971), and 2 — Z* x 10** nucleotides
in rat ascites cells (Holmer and Bonner, 1973)• These
molecules are s t i l l considerably larger than the average size of
mRNA molecules, 1 — 3 x 10 nucleotides (Murphy and Attardi,
1973; Fan and Penman, 1970).
Electron microscope studies substantiate these values
(Holmes and Bonner, 1973; Granboulan and Scherrer, 196 9 )
for HeLa and duck erythroblast HnRNA. RNA transcripts larger
than th is have been observed in Triturns lampbrush loops
(up to several hundred thousand nucleotides (Miller and
Bakken, 1972)), and in the transcript of a puffed band of a
Chironomus polytene chromosome (approximately 5 x 10**
nucleotides (Beerman, 1 9 6 7 ,* Lambert, 1973)*

I t has long been thought that HnRNA may represent the
primary gene transcript, and that these large molecules are
the precursors to the mRNA found in the cytoplasm (Scherrer
et a l .. 1 9 6 3 Penman et a l». 1 9 6 3 )* A precedent for this
exists in the cleavage of 18s and 28s ribosomal RNA from a
large precursor molecule. This precursor forms a large
part of the nuclear RNA synthesised under certain growth
conditions, can be isolated as a discrete Z»5S molecule
(Scherrer e t a l .. 1963; Penman, 1 9 6 6 ; Jeanteur e t a l .. 1968),
and is processed in discrete stages to the rRNA found in the
cytoplasm. The base composition of rRNA is distinctive and
contains modified bases, that have been u tilised to prove
detailed sequence sim ilarities (Scherrer et a l .. 1 9 6 3 ;
Maden 1971; Jeanteur et a l .. 1 9 6 8 ). The enzymes involved in
this processing have not been identified, but both the
conserved and discarded sequences at a ll stages, have now
been isolated and visualised using the electron microscope
(Wellauer and Dawid, 1973) •
The proof of a similar precursor—product relationship
for HnRNA and mRNA is complicated by the high number of genes
normally expressed in the ce ll. Several early studies on
general sequence sim ilarities of HnRNA and mRNA were
compatible with a precursoi>-product relationship, (Georgiev
et a l .. 1 9 6 3 , 1972 and Scherrer et a l .. 1970). The base
sequence homology between the two populations is mainly at
the 3* ®nd of the HnRNA (Georgiev et a l .. 1 9 6 3 ; Ryskov et a l ..
1972).
However, experiments u tilis in g drugs such as actinomycin D
to repress rRNA synthesis, gave values for HnRNA half life of
approximately 3 minutes (Soeiro et a l .. 1 9 6 8 ) .
Since the time for transcription of an average HnRNA

molecule approaches 3 minutes, and no simultaneous
transcription—translation complexes (such as are found in
prokaryotes) have been detected in eukaryotic chromatin
(Miller and Bakken, 1972), this would indicate that most of
the HnRNA is degraded as i t is made, and is never exported
to the cytoplasm (Harris, 1 9 6 2 ).
Recently Brandhorst and McConkey have circumvented the
use of drug inhibitors, and estimated a much longer f i r s t -
order decay rate for L cell HnRNA of 23 minutes. This
compares with an mRNA half life in these cells of 600 minutes
(Greenberg, 1972). Similar estimates of HnRNA half l ife have
been made in HeLa cells (Penman et a l . . 1968) and duck
reticulocytes (Attardi et a l .. 1 9 6 6 ). These values would
allow processing of a portion of the HnFNA to the cytoplasm,
and Brandhorst and McConkey (197*0 estimate that about 2
of labelled HnRNA may exit to the cytoplasm during long
chase periods.
b) The poly(a) sequence of nuclear RNA
One of the best indirect pieces of evidence for the
precursor—product relationship of HnRNA and mRNA, has been the
detection of a poly(A) segment in both molecules. The HnRNA
poly(a) sequence has been found to be the same size as the
cytoplasmic sequence and also on the 3 1 ©nd °T the RNA
(Edmonds et a l .. 1971,* Darnell et a l .. 1971b,* Jelenik et a l ..
1973).
Poly(a) was f i r s t discovered during the studies by
Edmonds and Abrams ( i9 6 0 , 1 9 6 3 ) of a nuclear enzyme that
specifically incorporates adenylic acid into RNA, without
a DNA template. Three findings suggest that, rather than
having a transcriptional origin, a similar enzyme may be

responsible for the polyadenylation of HnRNA molecules.
1. When added to cultured HeLa cells, the drug actinomycin D
almost completely prevents DNA dependent RNA synthesis in less
than 2 minutes. However, i t has no effect on poly(A)
synthesis for several minutes after this, indicating that the
poly(A) sequence is not added by RNA polymerase (Jelenik
et a l .. 1 9 7 3 ).
2. Adenovirus 2 DNA sequences, which are found integrated
into host cell DNA, are transcribed into HnRNA and processed
into mRNA. Both these molecules contain a poly(A) sequence
of 200 nucleotides at their 3' end. However, adenovirus DNA
has been shown not to contain thymidine stretches from which
these poly(a) sequences could have been transcribed (Philipson
et a l .. 1971).
3* I t is possible to isolate deoxypyrimidine nucleotide
stretches from DNA because of their resistant to acid
hydrolysis (Burton and Peterson, 1957)* Oligo(dT) stretches
can be isolated from HeLa DNA (Bimboim et a l .. 1972), or from
mouse DNA (Mansbridge, unpublished observations), but these
tracts are too small, and not present in large enough amounts
to account for the to tal number of poly(A) sequences found on
different mRNAs. However, in the slime mould Pictyostelium.
F irte l et a l . (1972) and Jacobson et a l . (l97*») have demonstrated
that a short oligo(A) sequence is transcribed at the 31 en<*
of the HnRNA, and this sequence length is then increased by a
different enzyme. The (dT) tracts found in eukaryotic DNA
are large enough to f i t th is hypothesis but no direct proof
for this has yet been obtained.
The poly(a) segments are rapidly synthesised, and kinetic
evidence, and the inability to find unattached nuclear poly(A)

molecules, indicate that they are formed by the stepwise
addition of adenylate residues to the end of the HnRNA
(jelen ik . et a l . f 1 9 7 3 )*
c) The role of poly(A) in nuclear post—transcriptionalregulation
3In HeLa cells, after the addition of H adenosine,
labelled poly(A) is confined to the nucleus for the f ir s t
1 —2 minutes (jelenik: et a l .. 1 9 7 3 ), showing that the
nucleus is the major site of poly(A) synthesis. After this,
labelled poly(A) begins to accumulate in the cytoplasm, while
the majority of labelled HnRNA remains in the nucleus.
This implies that during nuclear processing, a greater
proportion of the poly(A) sequences are conserved than the
HnRNA - sequences.
Information about the role of poly(A) has been obtained
with the drug cordycepin (3' deoxyadenosine)• In HeLa cells,
th is drug terminates RNA chains prematurely, and rRNA
synthesis rapidly ceases (Penman et a l .. 1970)* Although
HnRNA synthesis is not affected, the appearance of newly
synthesised mRNA in polysomes is reduced by more than 80$.
This is apparently due to an inhibition of the enzyme that
adds the poly(A) sequence, and those mRNAs that do appear in
the cytoplasm have either no poly(A) sequences and are
probably histone mRNAs, or have a considerably shorter poly(A)
sequence (jelenik; et a l .. 1 9 7 3 )*
These authors have found labelled poly(A) attached to
a ll size classes of HeLa HnRNA, seconds after the addition
of H adenosine. I f RNA synthesis is then blocked by
actinomycin D, this addition of poly(A) to a ll size classes
of RNA s t i l l occurs, and even i f cordycepin is added,
previously synthesised poly(A) appears in the cytoplasm in

mRNA after 10 to 15 minutes. After another 15 minutes about
30 — ZjO$ of the previously labelled poly(A) can be found in the
cytoplasm.
I t has been estimated that between 30 to UOtfo of the
largest HeLa HnRNA molecules contain poly(A) (jelenik et a l ..
1973) • Several possib ilities that cannot be distinguished
may give rise to the molecules that do not contain poly(A).
Some HnRNA molecules may not contain RNA sequences to be
expressed in the cytoplasm, are thus not adenylated, and turn
over in the nucleus. 5’ RNA sequences produced by the
processing of mRNAs from HnRNAs as well as sequences from
molecules artifactually cleaved during preparation, and
incomplete HnRNA molecules, will not contain poly(A)• I t is
also possible, that precursor molecules are f i r s t cleaved
and the revealed site then polyadenylated, although th is is
not consistent with a short lag period between the termination
of transcription and polyadenylation (jelenik et a l .« 1973)*
From this data i t has been suggested that the addition
of poly(a) to an HnRNA sequence is a post—transcriptional
control mechanism, poly(A) being a 'tag ' for the conservation
and subsequent processing of the adjacent sequence to
cytoplasmic mRNA (jelenik e t a l . > 1973,* Darnell e t a l .. 1973)*
These views have been challenged by Perry and his
colleagues, based on their work in mouse L cells (Latore and
Perry, 1973; Perry et a l .. 197*4)* They find that only a
small fraction of nuclear poly(A) exits to the cytoplasm,
indicating a significant amount of nuclear poly(A) turnover.
The appearance of poly(A) in the cytoplasm is very rapid,
which is inconsistent with polyadenylation being an early step
in mRNA processing. They further suggest from experiments
using cordycepin, that a large pool of polyadenylated HnRNA

molecules may turn over In the nucleus, while a separate,
smaller pool of polyadenylated HnRNA serves as a precursor
to cytoplasmic mRNA* The conclusion from these results is
that poly(A)does not have an early regulatory role in post-
transcriptional processing,as suggested by Darnell and his
colleagues.
In th is work I have investigated the association of
poly(a) with nuclear globin RNA sequences in erythroid and
non—erythroid tissues. The results are consistent with the
views of Perry et a l . (197*<), and indicate that polyadenylation
of a nuclear RNA molecule is not in i ts e l f sufficient to ensure
that the RNA will be processed and transported to the cytoplasm
At the present time, the nuclear function of the poly(A)
segment is unclear. However, the polyadenylation pathway
appears to be obligatory, since when i t is blocked, most mRNAs
are not processed to the cytoplasm (jelenik; e t a l .. 1 9 7 3 )*
The fact that histone mRNA is not adenylated may be
related to the requirement for rapid histone synthesis during
division, with the mRNA bypassing the slower poly(A) pathway
(Perry and Kelly, 1968; Schochetman and Perry, 1972).
The mechanism by which this occurs may be related to the 3 1
nucleotide sequence, or secondary structure of the histone mRNA
or be a function of i t s production at a particular time in the
cell cycle (Robbins and Borun, 1 9 6 7 )*
The fact that some viruses which replicate in the
cytoplasm also contain poly(A) (Yogo and Wimmer, 1972;
Johnston and Bose, 1972), does not conflict with a nuclear role
for these sequences — virus mRNAs may encounter similar problem
as that of the cell mRNA in getting from the site of
manufacture to the site of translation. For example, the
replication of polio virus occurs on smooth membranes, and the
translation of v ira l poly(A) containing mRNA, on the rough

membranes of the cell (Caliguiri and Tamm, 1970).
d) Direct evidence for the presence In HnRNA of mRNAsequences
This requires identification of a specific mRNA, either
by i t s sequence, or by i t s ab ility to code for a specific
protein. A translational approach has been followed by several
workers. R. Williamson et a l . (1973) bave micro—injected
HnRNA from mouse foetal liver cells into Xenopus oocytes and
obtained globin synthesis. The RNA used for these experiments
sediments faster than 35S in sucrose gradients, but aggregation
of the RNA could not be excluded. However, brain HnRNA
prepared in the presence of reticulocyte polysomes did not
cause globin synthesis in oocytes.
I t should be pointed out that the detection of mRNA
sequences in large nuclear RNA does not prove that these
sequences are a precursor to cytoplasmic RNA* The best known
evidence for such a precursor—product relationship for a
specific gene comes from the work of Stevens and A. Williamson
(1 9 7 3 ) ‘wbo have purified from a mouse myeloma cell line, the
HnRNA and the mRNA coding for an antibody heavy chain.
This antibody protein binds tightly to i t s mRNA, and can be
then immunologically precipitated. Using this method, a
discrete nuclear RNA of about 2 x 10 daltons has been isolated,
and found to direct the synthesis of heavy chain proteins when
injected into oocytes. Pulse—chase experiments show that this
precursor, which is polyadenylated, is processed to the mRNA
size of about 6 x 10 daltons, and then transported to the
polysomes. After extended chase periods more than 9 6 $ of the
labelled, antibody precipitable RNA, has le f t the nucleus and
is present in the cytoplasm, confirming a precursoi>-product
relationship. However, when the cells are not growing, more

than 80$ of the precipitable RNA remains in the nucleus, most
of which is mRNA sized, indicating a block at, or just before,
the transport of the RNA from the nucleus. The authors
calculate that in a rapidly growing cell, about 90 pre—mRNA
molecules exist in the nucleus, and about 5,000 mRNA molecules
in the cytoplasm (a* Williamson, 197*l), and point out that a
larger transcript may have escaped detection i f i t is
processed rapidly, or i f some processing of the transcript is
required to make the protein binding site available.
A rigorous proof of the presence of mRNA sequences in
HnRNA has recently been published by Ruiz—Carillo et a l . (1973)*
Total RNA prepared from duck erythroblasts was sedimented
through dimethyl sulphoxide — a solvent known to break hydrogen
bonds (Strauss, et a l .. 1968), and the RNA sedimenting faster
than [j5S added to a Krebs cell—free system. This RNA codes
quite efficien tly for duck globin, and was shown not to code
for rabbit globin when rabbit 9S RNA was cosedimented with the
sample • This makes contamination of the large RNA with mature
9S mRNA very unlikely.
This data is in agreement with the ea rlie r observations
of Imaizami et a l . (1973) vho used cDNA prepared from duck 9S
RNA, to demonstrate the presence of globin sequences in HnRNA6
of up to 10 x 10 daltons. This material was recovered
from denaturing DMSO gradients, which were found to break down
a high proportion of the large HnRNA isolated from sucrose
gradients. Newly synthesised HnRNA did not appear to be as
labile to DMSO denaturation as the to tal HnRNA. The authors
suggest that th is is indicative of the presence in the RNA of
hidden processing nicks.

In contrast with t h e s e results, MacNaughton et a l . (197*0 >
using duck globin cDNA and nuclear RNA from duck erythroblasts,
cannot find nuclear globin RNA sequences sedimenting faster
than 12*S in denaturing formamide gradients. They conclude5
that the molecular weight of the precursor is 6 - 7 x 10
daltons — 3 times larger than the mRNA*
Although there is evidence for the existence of precursor
molecules for globin and immunoglobin, searches for the
precursors to several larger mRNAs have proved negative.
McKnight and Shimke (197*0» have not been able to find evidence
for a precursor to ovalbumin 18s mRNA in oestrogen stimulated
chick oviduct. Using cDNA, these woikers calculate they
could have detected less than one molecule of precursor per
cell •
Similarly Suzuki and Brown (unpublished) have not been
able to find a precursor to the giant 2*5 S silk fibroin mRNA
using sequencing techniques.
Although these studies clearly demonstrate that HnRNA
molecules contain mRNA sequences, most of the HnRNA synthesised
never leaves the nucleus, and thus cannot be a precursor of
cytoplasmic mRNA (Penman et a l .. 1968; Soiero et a l .. 1968;
Brandhorst and McConkey, 197*0 • This may be because only a
small number of the nuclear RNA molecules are mRNA precursors,
or because only a small fraction of each HnRNA molecule is
destined to appear as cytoplasmic mRNA.
Many of the early experiments to distinguish between these
possib ilities attempted to compare the complexity of nuclear
and cytoplasmic RNA using f i l t e r hybridisation techniques.
Since mainly only repetitive sequences hybridise in these
experiments, the results, though indicating a high nuclear RNA

complexity, are not definitive (Scherrer et a l .. 1970; Hahn
and Laird, 1971J Church and Brown, 1972) • In a more recent
analysis, Getz et a l .(l97*i) have estimated the complexity of
the poly(A) associated nuclear RNA of mouse M2 cells* This
nuclear RNA can be copied by reverse transcriptase into a
cDNA, and the complexity of the template RNA measured by a
kinetic analysis of the hybridisation of the RNA and cDNA*
A similar analysis has been carried out on the polysomal
mRNA o f t h e c e l l s ( B i r a i e e t a l . . 1 9 7 * 0 , f r o m t h e s e s t u d i e s ,
several points emerge.
1. Both the nuclear and cytoplasmic RNA sequences adjacent
to the poly(A) segment are transcribed from non—repetitive
DNA in the mouse genome•
2. The complexity of the nuclear RNA sequences is about
3 times higher than that of the mRNA sequences, being
complementary to about 3$ (as compared with 0.l6$") of unique
mouse DNA. Within th is nuclear RNA, 2 frequency classes of
sequences can be distinguished, with the majority of the RNA
being represented by only a few copies per nucleus.
3* A large proportion of the sequences in nuclear RNA that
are next to the poly(A) segment, are also found in polysomal
mRNA. However, the relative proportions of the two classes
of nuclear RNA, appear to be different in the cytoplasm.
These data are thus consistent with the hypothesis that
only a small fraction of each HnRNA molecule — the sequence
adjacent to the 3* poly(A) segment — are transcribed from
structural gene sequences, and are conserved and processed to
the cytoplasm where they function as mRNAs. I t would also
appear that superimposed upon this process, a post—transcriptional
mechanism is operating that controls the cytoplasmic expression

of the nuclear RNA.
The existence of similar post—transcriptional regulation has been recently indicated by work on the nuclear and cytoplasmic RNA of developing sea urchin embryos (Galau et al.. 197*», Hough, Smith and Davidson, unpublished).e) Sequence differences between HnRNA and mRNA.
I t has been demonstrated by several workers that many
or a ll HnRNA molecules contain sequences that are transcribed
from reiterated DNA. These sequences become RNase resistan t
after very short incubations with homologous DNA, while the
rest of the RNA hybridises to unique DNA sequences (Darnell
and Balint, 1970* Meli et al ■. 1971,* Church and McCarthy,
1 9 6 7 )* RNA can be fragmented to different lengths by
sonication or brief alkali treatment, and the rate of
hybridisation of these fragments, and their association with
poly( a ) studied.
From several studies i t appears that sequences transcribed
from reiterated DNA are present in a ll HnRNA molecules longer
than the expected mRNA size ( l — 3 x 10 nucleotides)(Holmes
and Bonner, 197**,* Jelenik et a l .. 197**J Molloy et a l .. 197U,
Smith et a l .. 197**) • Such reiterated sequences have not been
found in either HeLa mRNA (Klein et a l .. 197**) or sea urchin
mRNA (Goldberg et a l .. 1973)* Reiterated sequences, which
may be 200 — 300 nucleotides long (Holmes and Bonner, 197**;
Jelenik : et a l .. 197**), appear to be finely interspersed with
sequences of 1000 — 50 0 0 nucleotides, transcribed from unique
DNA (Holmes and Bonner, 197*»J Molloy et a l . . 197**) • Sequences
next to the 3* P°ly(A) segment, appear to be entirely non—
repetitive (Molloy et a l .. 197**,' Getz et a l .. 197**) • The
reiterated RNA may represent transcription regulatory
molecules (Britten and Davidson (1 9 6 9 ) or may reflect

transcription of sequences involved in DNA synthesis, or
recombination (Holmes and Bonner, 197**) •
Some of these reiterated sequences are present in
HnRNA as double stranded regions (jelenik . and Darnell, 1972).
When HnRNA is denatured, these self complementary sequences
reform very rapidly, and, following considerable RNA
fragmentation, are available to hybridise to reiterated
DNA sequences* The double stranded regions isolated by their
RNase resistance, appear to be about 300 nucleotides long
but are very heterogeneous in size (jelenik: and Darnell, 1972)
The distances between these self complementary regions varies
widely between a few hundred and several thousand nucleotides
(Jelenik et al *. 197**,* Molloy et a l*. 197**) •
Molloy et a l* (1972b) have discovered an oligo(u) rich
sequence in HeLa cell HnRNA that is absent from the mRNA.
This fragment is about 30 nucleotides long, contains about
80$ uridylic acid and hybridises rapidly to HeLa DNA.
Mammalian DNA has been shown to contain poly(A) rich stretches
that when copied, may give rise to oligo(u) (Burdon and
Shenkin, 1972; Shenkin and Burdon, 1972). Recent data
demonstrates that every completed HnRNA may contain 2 —3 such
oligo(u) sequences located in the 5 'reg io n of the molecule
(Molloy et a l . . 197**).
Nakazato et a l . (197**) have recently described an oligo(A)
sequence of similar length to th is in the 5 1 region of HeLa
HnRNA* The distribution of this sequence among different
HnRNA molecules, is not known.
I t has been suggested that the reiterated sequences, and
the other distinctive regions discovered, may be involved in
the post—transcriptional processing of the RNA (jelenik . et a l .
197**) * One example of th is is that the enzyme that rapidly
processes ribosomal RNA in E.. coli has been shown to act
specifically at double stranded sites (Dunn and Studier, 1973)
However, i t has been suggested that in the cell, these
regions may normally be complexed with proteins (Jelenik:
e t a l*. 197*0*
Although RNA can form a r tif ic ia l complexes with cellular
proteins in high salt (Girard and Baltimore, 1966; Baltimore
and Huang, 1970), recent experiments by Pederson (l97**a) have
employed stringent controls to establish the identity of
HnRNA protein (nRNP) particles in HeLa cells* These
particles have been observed in cytological studies (Gall,
1956; Call an and Loyd, i 9 6 0 ; Stevens arid Swift, 1 9 6 6 ;
Miller and Bakken, 1973), and can be isolated from different
cell nuclei (Niessings and Sekeris, 1971b; Spirin 1 9 6 9 )•
Although the complexity of nRNP proteins is s t i l l in doubt
(Kriekevskaya and Georgiev 1969; Faiferman et a l*. 1971J
Albrecht and Van Zyl, 1973), both poly(A) synthetase activity
(Niessing and Sekeris, 1973) and endonucleolytic activity
(Niessing and Sekeris, 1970) have been found associated with
the nRNP particle*
I t is thus possible that either certain regions of the
HnRNA, or proteins associated with these regions, may serve
as site—specific signals, and direct the action of processing
endonucleases, or be involved in the selection of certain
RNA sequences for transport to the cytoplasm (Pederson, 197**b)
f ) The organisation of unique and repetitive sequences inthe genome
The information on the interspersion of unique and
repeated sequences, is in close agreement with recent data on
sequence organisation in the eukaryotic genome (Davidson et al
1973,’ Graham et a l .. 197**)* Partially hybridised DNA
fragments of differing lengths can be bound to hydroxyapatite

after low CQt incubations, and the melting behaviour, and
nuclease sensitivity of these molecules studied. I t appears
that in both the sea urchin and Xenopus. just over half of
the genome consists of alternating repetitive sequences of
about 300 nucleotides long and non—repetitive sequences of
700 — 1100 nucleotides long. These non—repetitive sequences
are long enough to code for many of the polypeptides that
occur in the cell, and the repetitive sequences may be
represented in the HnRNA, and subsequently degraded during
nuclear processing.
5 to 1 5^ of the genome consists of clustered, precisely
repeated, sequences, that are probably located in the
chromosome centromeres (Jones, 1970; Pardue and Gall, 1970) .
These sequences have been observed in many eukaryotic DNAs, and
are sufficiently different i n base composition from the bulk of
the cell DNA, to appear as a separate ’satellite* band in a
caesium chloride density gradient (Flamm et a l .. 1 9 6 7 )*
S atellite DNA appears to be of recent evolutionary origin
(Walker and McLaren, 196 5 ) and is not transcribed into RNA
(Flamm e t a l ., 1969)*
The remaining of the flp| consists of long unique
sequences, with very few interspersed repetitive sequence
elements. These regions may be the location of other
structural genes, and will also be transcribed*
These data are in substantial agreement with portions
of the model for the regulation of gene activation proposed by
Britten,and Davidson (1 9 6 9 ) and la te r expanded by them
(Davidson and Britten, 1971, 1973)* A major feature of the
model is that the reiterated 'receptor1 sequences will be
adjacent in the DNA to gene sequences. Co-ordinated
activation of non—contiguous genes may then occur by a single

activator molecule that can bind to these many receptor
sequences*
This model does not require the transcription of large,
polycistronic HnRNA, and a complete explanation for the size
of the transcribed RNA has not yet been put forward.
Recently Paul (1972) has suggested that the f i r s t part of the
transcribed RNA may act as a polyanion, and assist in the
unwinding of the nucleohi stone super coil as the RNA polymerase
proceeds•

MATERIALS AND METHODS
Materials
Isotopes
Chromatography
Buffers
Nucleic Acids
Enzymes
Ele ctrophoresis
Methods
Pagek5
2.1 Determination of radioactivity U7
2.2 Estimation of DNA and RNA **7
2*3 Preparation of mouse reticulocytes **8
2*k Preparation of RNA from reticulocytes **8
Total RNA
Polysomal RNA
2.5 Preparation of RNA from mouse foetal livers k9
Total RNA
Cytoplasmic and nuclear RNA
Polysomal RNA
2.6 Preparation of RNA from adult mouse livers 52
2.7 Preparation of RNA from adult mouse brains 52
2.8 Removal of salt from RNA samples 32
2.9 Purification and analysis of globin mRNA 53
Affinity chromatography on poly(u) sepharose
Affinity chromatography on oligo(dT) cellulose

2.10 Separation of RNA species by sucrose densitygradient centrifugation
P a g e
5k
2.11
2.12
2.13
2 . 1 /*
2.15
2 .1 6
2.17
2.18
Centrifugation in swing—out rotors
Centrifugation in the zonal rotor
Recovery of RNA 55
Separation of RNA species by polyacrylamide 55gel electrophoresis
Estimation of radioactivity in gels
Detection of mRNA activity 56
By means of a duck reticulocyte cell—free system
By means of a rabbit reticulocyte cell—free system
By means of a Krebs ascites cell—free system
Use of polynucleotide phosnhorylase 58
Preparation of poly(A)
Assay of polynucleotide phosphorylasedegradative activity
Digestion of globin mRNA with polynucleotide 59phosphorylase
Fingerprint analysis of RNA 59
Preparation of DNA 60
From foetal livers
From mouse sperm
Sucrose density gradient fractionation of DNA 62
In swing—out rotors
In zonal rotors

P a g e
2.19
2.20
2.21
2.22
2.23
2 . 22*
Purification of reverse transcriptase from 63avian myeloblastosis virus
Purification of virus
Isolation and purification of enzyme
Assay of enzyme activity
Preparation of cDNA complementary to globin 65mRNA
RNA—DNA hybridisation 66
Analysis of hybridisation using a single—strand 66specific nuclease
Preparation of nuclease
Assay of enzyme activity
Assay of hybridisation of cDNA
Annealing of cDNA to DNA ana analysis on 68hydroxyapatite
Melting behaviour of hybrids 69
Using hydroxyapatite
In solution

MATERIALS
A ll chem icals used were supplied by B r i t i s h Drug Houses
( AR grade) u n le s s otherw ise s ta te d .
I sotope s
A ll i s o to p e s were obtained from the Radiochemical Centre,
Amersham, England.
Chro matography
Sephadex and Sepharose g e l f i l t r a t i o n media were obta ined
from Pharmacia, U p sa lla , Sweden. Carboxymethyl c e l lu lo s e ,
CM52, Carboxymethyl Sephadex C50 and d ie th y l-am in oeth y l c e l lu lo s e ,
DE5 2, and DE23 were supplied by Whatman, Maidstone, England.
Buffers
Trizma-IICl and Trizma base, IffiPES ( N-2-Hydroxyethyl-
p ip era z in e -N '-2 -e th a n esu lp h o n ic acid) and PIPES (P ip era z in e -
N-N’- b i s [2-ethanesulphonic acid] ) were obtained from Sigma
Chemical Co., S t . Louis, M issouri.
N u c le ic Acids
E. c o l i DNA, c a l f thymus DNA and p o ly (u) were obtained
from Sigma, and Ay and A^q from Bohringer, Germany. Poly(rA)
and p o ly (r A )- ( dT) were obtained from M iles, I l l i n o i s , U .S .A .,
and o ligo(dT )^ £ ^ from P.L. B iochem icals, Milwaukee, W isconsin.
Enzymes
RNase free DNase, B a c te r ia l a lk a lin e phosphatase and
p o ly n u c le o t id e phosphorylase were obtained from Worthington
Biochem. Co., Freehold, New Jersey , U .S.A. Ribonuclease T1 was

obtained from Sankyo Co* L td ., Tokyo, Japan. P o lyn u cleo tid e
kinase was a kind g i f t from Dr. K. Murray (U n iv e r s ity o f
Edinburgh). Bovine serum albumin, ca ta la se and p an crea tic
RNaso A were obtained from Sigma.
Ele ctrophoresi s
Acrylamide and N.N’M ethylenebisacrylamide were purchased
from Serva, l le id leb erg , N.N *N1N'-tetram ethylethylenediarnine
(TMSD) from Kodak L td ., London, and ammonium persulphate from
May & Baker, Dagenham, England.
Sucrose was purchased from Hopkins & W illiams, E ssex ,
England.
D iethyl pyrocarbonate (DEP) ’Baycovin’ was a g i f t from
Bayer Co. L td ., London.

METHODS
2.1 Determ ination o f r a d io a c t iv i t y
R a d io a c t iv ity was measured in a Beckman LS-100 l iq u id
s c i n t i l l a t i o n counter, a Nuclear Chicago Mark I s c i n t i l l a t i o n
counter or a Packard Tri-Carb l iq u id s c i n t i l l a t i o n counter.
- F was measured by Cerenkov r a d ia t io n . The e f f i c i e n c y o f
counting was almost 3O/0.
R adioactive samples on f i l t e r s were dried , then counted in
10 mis to luene based s c i n t i l l a t o r (TBS) conta in ing 0.5/*, 2 ,5 “
d ip h en y loxazo ly l (PPO, s c i n t i l l a t i o n grade, Nuclear E n terp r ises
Edinburgh) and 0 .0 3/? 1,J| b is ( 2- ( 5“ ( p h en y lo x a zo ly l) benzene
(POPOP, s c i n t i l l a t i o n grade, Nuclear E n terp r ises , Edinburgh)
in to luene ( sulphur free from May & Bakery Dagenham, E ngland).
Samples in aqueous so lu t io n were made up to 1 ml with
w ater. 10 mis TB3/Triton X-100 (Lennig Chemicals, Croydon)
in the r a t io 2:1 were added (TXBS). The m ixtures were shaken
then counted. C orrections were made for counting e f f i c i e n c y
u sin g standard quench curves. The e f f i c i e n c y o f counting o f
was 25 - 30/o for the Beckman and Nuclear Chicago and 6 y p in
the Packard counter. Aqueous samples o f g rea ter than 6 mis
were counted in I n s ta g e l (Packard, Zurich, Switzerland) at an
e f f i c i e n c y o f 15 - 20^.
2 .2 E stim ation o f DNA and RNA
A m odified v ers io n o f the Schmidt & Tannhauser method was
used (Hutchinson & Munro, 1961) . T issue was ex tra cted 3 tim es
with 0 .6 M PCA, and l i p i d s removed with e th an o l, e th a n o l/
chloroform (3 + l ) , e th a n o l /e th e r (3 + l ) and e th er . The p e l lo
thus obtained was hydrolysed in 0 . 3 N NaOH at 37 far 90 minutes

and the DNA and denatured p ro te in p r e c ip i ta te d by the ad d ition
o f concentrated PCA. RNA was estim ated by measuring the A ^ q
p f the supernatant. The p e l l e t was ex tra cted in 0 .6 M PCA at
90° fo r 20 minutes, spun, and the DNA estim ated by measuring
the A2£0 o f t h i s supernatant.
2.3 Preparation of mouse reticulocytes
In order to promote production o f r e t ic u lo c y t e s , anaemia
was induced in Porton s t r a in mice by one subcutaneous in j e c t io n
o f 0 .1 ml o f 2*5^ phenylhydrazine hydrochloride (Sigma),
0 .1 6 M sodium a ce ta te (pH 7*0) (V introbe, 1961) . A fter 5 days
the blood was c o l le c te d in to s t e r i l e balanced s a l t s o lu t io n s
(BSS) at 0° (Paul, 1965) conta in ing 0 .1 ml heparin/200 ml
(P u la r in heparin ^ 0 0 0 I .U ./m l; Evans Medical L td ., L iverp oo l) ,
f i l t e r e d through g la s s wool and cen tr ifu ged at 800 g fo r 10 mins.
The plasma and buffy coat were removed by a sp ir a t io n . The
c e l l s were resuspended in BSS and th ese s tep s repeated tw ice
more, before s to r in g the c e l l s at - 70°C.
A sample o f the blood was taken for determ ination o f the
r e t ic u lo c y t e count. 10 drops o f Vf> b r i l l i a n t cre sy l blue in
normal sa l in e were incubated with one drop o f blood fo r 15 mins.
at 37°• A s l id e was prepared and the blue s ta in in g
r e t i c u lo c y t e s counted under o i l immersion (Mag.x 1000) (DacLe,
1956)# The count was u s u a l ly between 50 - 70$>»
2. Zj Preparation o f RNA from r e t ic u lo c y t e s
During RNA p rep aration , care must be taken to prevent the
a c t io n o f contaminating r ib on u clease (RNase).
Mammalian r e t i c u lo c y t e s contain l i t t l e endogenous RNase
(Mathias e t a l . . 196?i) . RNase contamination o f the s o lu t io n s
on glassware used was in a c t iv a te d by pretreatm ent with 0 .05 /«

b) Polysomal RNA
The p ost 20,000 g supernatant from the ly sed r e t ic u lo c y te
was cen tr ifu g ed at 150,000 g fo r 1 hour. The polysome p e l l e t
was are suspended in ANE, 0 .5^ SLS, and ex tra cted as above.
A lte a m a tiv e ly , the polysomes were suspended in 10 mM T ris
(pH 7 .0 ) , 10 mM KC1 and d is s o c ia te d by the ad d ition o f a h a l f
volume o f 0 .1 M EDTA, (pH 7*0} •
2•5 Preparation o f RNA from Mouse Foetal L ivers
1/a day pregnant mice were k i l l e d by d is lo c a t io n o f theo
neck. The embryos were removed in to Hanks BSS at 0 , and
the l i v e r s e x c ise d (Paul, 1965)*
a) T otal RNA
The l i v e r s were homogenised in ANE/SLS b u ffer and
ex tra c ted w ith pheno1 / chioroform as above.
b) Cytoplasmic and nuclear RNA
Two methods for t h i s were used:
1• Using a non^ionic detergen t
The l i v e r s were d isaggregated and the c e l l s ly se d by
g en t le homogenisation in DEP tr ea ted 0 .1 J* M NaCl; 10 mM T£is
(pH 7 * 4); 1 .5 mM magnesium a ce ta te ; 0 .5/j Nonidet NP-ZjO
(Boorun e t a l . . 1967)* N uclei and membranes were p e l l e t e d at
20,000 g fo r 10 m inutes. M icroscopic examination o f the
p e l l e t showed that most o f the c e l l s had been ly se d by t h i s
pamcedure. The supernatant was removed, and t o t a l cytoplasm!
RNA ex tra c ted from t h i s w ith phenol/ch ioroform . The nuclear
p e l l e t was homogenised in ANE/SLS b u ffer and n u clear n u c le ic
acid ex tr a c te d w ith phenol/ch loroform .

D ieth y l pyrocarbonate (DEP). DEP was removed by b o i l in g fo r
10 minutes or le a v in g fo r 16 hours at room temperature
(F ed or isac e t a l . . 1969)*
The r e t i c u lo c y t e s were ly se d by the addi.tion o f 2 volumeso
o f DEP tr e a te d 1 mM MgC^ at 0 . C ell d eb ris and remaining
white c e l l s were p e l l e t e d at 20,000 g fo r 10 minutes and
d iscard ed ,
a) T ota l RNA
The supernatant was made 0*5$ w ith resp ec t to sodium
la u r y l su lphate (SLS) and shaken with an equal volume o f a
p h en o l/ch i oro form m ixture. (Equal volumes o f 90 $ phenol,
0 . 1$ 8—hydroxyquinoline, and chloroform, w ith the mixture
sa tu rated w ith 0 .1 M sodium acetate* 0 .1 M NaCl* 10 mM EDTA,
(pH 6 .0 ) (ANE b u ffe r , P e r ry ,e t a l . . 1972). A fter c e n tr ifu g a t i
at 20,000 g fo r 5 minutes, the aqueous phase was removed, and
re—e x tr a c te d w ith phenol/chioroform u n t i l there was no v i s i b l e
p ro te in at the i n t e r f a c e . To the f i n a l aqueous phase was
added 1 /10 volume o f 30$, NaCl and 2 volumes o f e th an o l, and
the RNA p r e c ip i ta te d by standing fo r 16 hours at —20° .
The RNA was p e l l e t e d by c e n tr ifu g a t io n at 20,000 g fo r
15 minutes, washed tw ice w ith 95$ e th an o l, and rec en tr ifu g e d .
This p e l l e t was d r ied w ith 95$ n itr o g e n /5 $ oxygen and d is so lv e d
in 0 .1 M NaCl; 10 mM-'Tris HC1, (pH 7*M,* 1 EDTA,* 0 .5 $
SLS, (NETS) and a sample scanned in the Uni cam SP 800
spectrophotom eter, to determine the con centration o f RNA*
I t was assumed that a s o lu t io n o f 35 RNA/ml g iv e s an_ o
absorbance o f 1 .0 at 260 nm. The RNA was stored at —20 .

2» Using c i t r i c ac id
The l i v e r s were homogenised i n $ .0 mM T^is (pll 7*5);
50 mM KC1; 1*5 mM MgCl2; 0 .25 M Sucrose (TICM - sucrose) and
n u c le i ; membranes and unbroken c e l l s p e l l e t e d at 20,000 g fo r
10 m inutes. A fter a d d it ion o f SLS to the supernatant,
cytoplasm ic UNA was e x tr a c te d . The p e l l e t was re suspended
by homogenisation in 5 ral s o f 1 . 5$ c i t r i c ac id , 0 .25 M sucrose
and la yered over 5 mis o f 1 .5 $ c i t r i c acid^ 0 .88 M sucrose
(Busch and Smetana, 1970) . This was cen tr ifu ged at Z*00 g for
10 minutes to p e l l e t the dense n u c le i , and unbroken c e l l s and
membranes d iscarded in the supernatant. This procedure was
repeated tw ice or u n t i l n u c le i were free o f cytoplasm ic tags
and c e l l d eb r is , as v i s u a l i s e d by p h ase-con trast microscopy.
The p e l l e t was then homogenised in ANE/SLS b u ffer , and n u clear
n u c le ic ac id ex tra c ted with phenol/ch ioroform •
The n u clear n u c le ic acid ex tra cted by e i t h e r method was
resuspended by homogenisation in 10 mM magnesium a ce ta te ;
25 mM NaCl; 2 mM CaCl2 ; 0 .1 M HEPES (pH 7*0) (lIMC) (B irn ie
e t a l . . 1973) . 10 |j.g/ml DNase was added and incubated fo ro
7 minutes at l\ . The so lu t io n was made 0 .5 C> with resp ect to
SLS, ex tra cted once w ith phenol/chioroform , and the RNA
p r e c ip i ta t e d . Fragments and n u c le o t id e s o f DNA were removed
by g e l f i l t r a t i o n through Sephadex G50 e q u il ib r a te d in NETS.
The excluded m ateria l was r e p r e c ip ita te d w ith ethanol and NaCl.
c) Polysomal RNA
Because o f the h igh l e v e l s o f RNase presen t in l i v e r s i t
was found n ecessary to modify the techniques fo r the preparation
of polysom es. The c e l l s were ly se d in the Nonidet NP-/4O
b u ffer as b efore , but w ith the a d d it ion o f 2 mg/ral y e a s t RNA
(K. Light & Co. L td ., Colnbrook, England). The 20,000 g
supernatant was layered over a cushion o f t h i s b u ffer conta in ing

2.5/r> sucrose and then spun at 150,000 g Tor 90 m inutes.
RNA was ex tra cted from the p e l l e t s as b efore .
2•6 Preparation o f RNA from adult mouse l i v e r s
Adult male mice were k i l l e d by c e r v ic a l d i s lo c a t io n .
The l i v e r s were perfused in vivo w ith 10 mis o f TKM - sucrose o
at 37 , by in j e c t io n from the p o r ta l v e in . Any lo b e s that
were not com pletely perfused were d iscarded . The l i v e r s were
ex c ise d , cut in to small p ie c e s and xvashed 3 times with
TKM - sucrose at 0 ° .
The p ie c e s were then homogenised in TKM - sucrose , and
cytoplasm ic and n u c lea r RNA prepared by the c i t r i c ac id method
as b e fo re .
2.7 Preparation o f RNA from adult mouse brain
Adult male mice were killed by cervical dislocation.oThe brains were e x c i s e d in to Hanks BSS at 0 , cut in to p ie c e s
and washed 3 t im es . The p ie c e s were g e n t ly homogenised in
1 mil Tr is (pH 8.0)f | 5 mM MgCl2; 0 .5 M D i t h i o t h r e i t o l (DTT)
(Sigma, U . S .A . ) | 3 mM CaCl2 and l e f t at 0° fo r 5 minutes.
The s o lu t io n was then made i s o t o n ic by the a d d ition o f l / h
volume o f 1 .0 M sucrose , and spun at 1 ,000 g fo r 10 minutes
(Gilmour and Paul, 197M • SLS was added to the supernatant
and cytoplasm ic RNA e x tr a c te d .
The p e l l e t was homogenised in 2 .2 M sucrose and spun in
a swing out ro tor at 20,000 g fo r 1 hr . The p e l l e t was
homogenised in ANE/SLS b u ffer and n u clear RNA e x tra c ted .
2 .8 Removal o f s a l t from RNA samples
A column o f G2 Sephadex, sw ollen in DEP trea ted water,
was poured in a 10 ml syringe b arrel ( G i l l e t t e Scim itar,
Middlesex, England). A GF/B and GF/C f i l t e r (Whatman) cut to

the correct s i z e , were used to hold the column. Water was
removed by spinning at 1 ,000 g for 15 m inutes. The RNA, in a
maximum volume o f 1 ml and maximum s a l t concentration o f 0 .1!| M,
was layered on, and the column re spun at 0° at 1,000 g fo r
15 minutes u s in g a DEP tr ea ted tvibe. The s a l t free sample
was scanned in the SP800 and ly o p h i l i s e d i f required . Between
95 - 98^ o f the ^ 2 6 0 was recovered*
2.9 P u r i f i c a t io n and a n a ly s i s o f g lob in mRNA
a) A f f i n i t y chromatography on Poly(u)-Sepharose
Sepharose 6b was a c t iv a te d by s t i r r in g at 0° w ith cyanogen
bromide (Koch-Light L td ., Colnbrook, England). The pH was kept
constant during t h i s step by the ad d ition o f NaOH. The
sepharose was washed free o f unreacted CnBr and then s t ir r e d
overnight at l\° w ith p o ly (u ) ( a v e . Mol Wt. ^ 100,000) at
10 mg/ml in NETS and an equal volume o f 0 .1 M PIPES pH 6 . 0 .
After washing in NETS the poly(u) sepharose was stored in 50 /'j
g ly c e r o l and NETSAR (as NETS, but with sodium la u ry l sarcos ine
r ep la c in g the SLS) at -2 0 ° (Wagner e t a l . . 1971; Adesnik e t a l .
1972). This materia l has a binding capacity o f approximately
175 MC mRNA/ml sepharose.
The sepharose was poured as a s lu rry in to a column packed
with g la s s wool and washed e x te n s iv e ly with NETS. RNA was
applied to the column in t h i s b u ffe r , and unreta ined m ateria l
washed o f f . Bound m ater ia l was e lu te d in formamide;
10 mM T ris HC1 (pH 7*h)s 0 .2 SLS and p r e c ip i ta te d with NaCl
and e th a n o l. The coltimn was regenerated by washing in NETS.
Later work was carried out with commercially a v a i la b le po ly (u )
sepharose, u s in g the same technique.

b) A f f in i t y chromatography on o l ig o dT c e l lu lo s e
Oligo dT c e l lu lo s e (C o lla b o ra tiv e Research, Waltham, Mass
columns were poured as above and washed with 0 .5 M NaCl;
10 mM T ris (pH 7 -5 ); 0 . Zcjo sodium la u r y l sa r c o s in e . Samples
were app lied in t h i s b u ffer and unretained m ateria l washed o f f
Bound RNA was e lu te d u s in g 10 mM T ris (pH 7*5) » 0 . 2?o
sa r c o s in e . The column was washed with 0 .1 N NaOH and
r e -e q u i l ib r a te d in b inding b u ffe r (Aviv and Leader, 1972).
2.10 Separation o f RNA sp e c ie s by sucrose d en s ity grad ientcen tr i fu ga tion
a) C en tr ifu gation in swings out ro tors
10 - 30/£ grad ien ts were prepared by la y e r in g 10, 17, 2h
and 3 0 su croses in TKM in the cen tr ifu ge tube and le a v in g
overnight at h° before u s e . 15 ” 30/« gra d ien ts in NETS, were
layered as 15 , £0 , 25 and 30 % sucroses and l e f t fo r 16 hrs at
room temperature. 6 .5 ml tubes were layered with a sample
volume o f 50 jil and 25 nil tubes with a sample volume o f 300 |il
Gradients were analysed by upward displacem ent w ith
or 6 0 j t sucrose conta in ing phenol red. Absorbance was
continuously monitored at 25^ nm u sin g a Uvicord I I
absorptiom eter (L.K.B. Instrum ents L td ., London) and f r a c t io n s
c o l le c te d w ith an U ltrorac (L .K .B).
b) C entr ifu gation in the zonal ro tor
For handling large amounts o f m a ter ia l , a titanium B-XIV
zonal ro to r was used in the MSE 65 superspeed u l t r a c e n tr i fu g e .
I t liras loaded as descr ibed by Anderson ( 1966) and the MSE
p u b lic a t io n , No.!*9» Convex and l in e a r sucrose grad ien ts were
formed by an LKB u l t r o g r a d , . and pumped in to the ro tor , l i g h t
end f i r s t . A hOcp. sucrose ’ cushion' was then introduced u n t i l
the ro to r was f u l l . The sample, in 2*5/® sucrose , was pumped
in to the centre o f the ro to r and p o s it io n e d by an 'overlay*

o f b u ffe r . The ro to r was sea led and a c ce lera ted from i t s
load in g speed o f 2,500 rpm. Unloading was achieved by pumping
/*0$ sucrose in from the edge o f the ro to r . The e f f lu e n t from
the centre pipe was monitored by p a ss in g through a v a r ia b le
path le n g th f low c e l l ( Perkin-Elmer L td ., London) in a
Uni cam SP-800 spectrophotom eter, w ith an attached servoscr ib e
chart recorder.
B-XIV ro to r content volumes (Capacity: 650 ml)
Gradient 5 6 0 ml
Sucrose cushion 30 ml
Sample 8 ml
Overlay 5 2 ml
R ibonucleoprotein p a r t i c l e s from EDTA-treated polysomes
were separated in a 15 - 30$ (w/v) sucrose grad ient in 10 mM
T ris; 10 mM FC1, (pH 7 - 0 ) .
2.11 Recovery o f RNA
8lRNP f r a c t io n s were made 3$ w ith resp ect to NaCl, and then
p r e c ip i ta te d by the ad d it io n o f 2 volumes o f e th a n o l. A fter
standing at -2 0 ° fo r 16 h r s . , the mRNP was then p e l l e t e d at
20,000 g fo r 15 minutes and RNA ex tra cted as b e fo re .
2 .12 Separation o f RNA s p e c ie s by polyacrylam ide g e le le ctrophore s i s
E le c tr o p h o r e s is o f RNA was carried out according to the
method o f Loening ( 1967) * Gels were run in 0 . 7 x 7 cm or
0*7 x 12 cm perspex tu bes, w ith a b u ffe r o f I4O mM T ris (pH 7*8)
36 raM sodium dihydrogen phosphate; 1 mM M EDTA; 0 • 2$ SLS.
For 2 .6$ g e l s the m ethylenebisacrylam ide was 5$ that o f the
acrylamide. For h igh er concentration g e l s t h i s was reduced
to 2*5$» 2 . 6$ g e l s contained 0 .2 6 gm acry l amide; 0 . 013 gm
bi sacry l ami d e ; 0 .008 ml TMED and 0 .0 8 ml 10$ ammonium
persulphate in 10 mis b u f fe r . 6$ g e ls contained 0 .6 gm

acrylam ide, 0 .015 gm b i s acry l amide, 0 .016 ml TMED and 0 .0 7 ml
10$ ammonium persu lphate i n 10 mis b u ffe r .
Samples were made up in 2*5$ sucrose in b u f fe r . Gels
were pre—run f o r 1 hour at 17 v/cm. A fte r sample a p p l ic a t io n ,
e le c tr o p h o r e s is was carr ied out fo r 20 minutes at 3 v/cm then
f o r the required time at 17 v/cm. E le c tr o p h o r e s is was
performed at room tem perature. The g e l s were scanned at
260 nm w ith the Joyce—Loebel UV scanner u s in g a l iq u id f i l t e r
(0 .0 0 1 $ p—dime th y l amino—benzaldehyde, ( Sigma) in m ethanol). u\
t t e l s im m e s ta in e d i n 0 .2 $ to lu id in e blue (W illiam son e t a l . .
1971) in water fo r 1 hour ,* ^ 'W a m y were d esta in ed o v ern ig h t .
E stim ation o f r a d io a c t iv i t y in g e l s
Gels were s l i c e d d i r e c t ly in to v i a l s , u s in g a Gibson
autom atic g e l s l i c e r ( V i l l i e r s —l e —B el, F ra n ce )•
For counting, 1 ml o f 10$ p ip e r id in e in water ( v /v )
was added to each v i a l which was incubated at 60°C to evaporate
the p ip e r id in e . 1 ml o f d i s t i l l e d water was added to sw e ll the
g e l s , fo llow ed by 10 ml o f TXBS.
2.13 D etec t io n o f mRNA a c t i v i t y
( a) by means o f a duck r e t ic u lo c y te c e l l —fr e e system
The duck r e t ic u lo c y t e ly s a t e system d escr ib ed by L in g re l
( 1971) was used to measure the in corp oration o f (^ C ) L—le u c in e
and ( ^H) L—le u c in e in to mouse a and 0—g lo b in ch a ins. Two ly s a t e
in cu b ation m ixtures, one con ta in in g (-%) le u c in e and RNA under
t e s t , the o th er con ta in in g (^ C ) le u c in e but without added RNA,
were incubated f o r 2 h at 25°C. Between 1 — 10 pg o f mRNA were
added, which i s w ith in the l in e a r response range to mRNA f o r t h i s
system (L in gre l 1971) • The m ixtures were then cooled i n i c e
and combined,* k0 mg o f mouse c a r r ie r g lo b in was added and the
p ro te in ex tra cted w ith acid—acetone at 20°, (0 .1 5 N HCl),

p e l l e t e d , and washed tw ice w ith acetone. The p e l l e t was
dried under vacuum, and d is so lv e d in a b u ffer conta in ing 8 M
u reaj 50 mM mercaptoethanol to d is s o c ia te the mouse a and
8- g lob in su bu nits , which were then separated on a carboxymethyl
c e l lu lo s e column (Whatman, CM 52 microgranular) u s in g a gradient
o f 0 .0 1 -0 .1 M Na IIPO , (pH 6 .9 •) The e f f lu e n t ( 30 ral/hour) was
monitored w ith an LKB Uvicord I I absorptiom eter, at 280 nm, and
10 ml f r a c t io n s c o l le c t e d . One drop o f a 2$ so lu t io n o f bovine
serum albumin was added to each fr a c t io n to aid p r e c ip i ta t io n
o f the p r o te in s a f t e r the ad d ition o f an equal volume o f 20^
t r ic h lo r o a c e t i c acid (TCA) . The p r e c ip i t a t e s were trapped on
g la s s f ib r e d is c s (Whatman, GF/A), washed with l o TCA then dried o
at 80 C fo r 1 hour. The p r o te in s on each d is c were s o lu b i l i s e d
by the a d d it ion o f 0 .05 ml o f water fo llow ed by 0 .5 ml o f NCS
reagent ( Amersham/Searle Corporation), and incubated overnight
at 37°C. To each v ia l was added 10 ml o f TBS and the f i l t e r
counted in a Nuclear Chicago Mark I l iq u id s c i n t i l l a t i o n counter,^ i
adjusted fo r minimum overlap o f C in to the II channel.
( b) by means o f a rabbit r e t ic u lo c y te c e l l - f r e e system
The rabbit ly s a te was prepared as described by Palm iter
(1973)* Assays were carried out in a rea c t io n mixture o f
250 m ic r o l i t r e s conta in ing 100 jjJL o f a mixture o f e s s e n t ia l
amino ac id s , ATP and an ATP generat ing system and 2.5 m icrocuries 3
o f 11 i s o le u c in e , 100 |jl o f ly s a t e and 50 |il the RNA so lu t io n
under t e s t . Between 2 - 6 p icom oles o f g lo b in mRNA were added
to each assay mixture, which i s known to be in the l in e a r
response range o f the system fo r added mRNA.
A fter in cu bation fo r 6 or 90 minutes at 26°, n on -rad ioactive
mouse g lob in was added as c a r r ie r , and t o t a l g lob in ex tra cted and
chromatographed on carboxym ethylcellu lose w ith a 10 mM - 50 mM
phosphate g ra d ien t . F ractions were analysed as b efo re .

( c) by means o f a Krebs a s c i t e s c e l l —free system
A preincubated a s c i t e s c e l l fr e e system was prepared as
d escr ib ed by Mathews and Korner (1970),* Mathews e t a l . . 1972*
Mathews 1972. Routine assays o f 50 |il contained 15 pi
preincubated a s c i t e s &— 30, 10 pi o f a c o c k ta i l , con ta in in g ATP,
an ATP gen eratin g system, amino a c id s , and 5 pCi o f -'H le u c in e
(30-60 Ci/mMole), 10 pi o f 12 .5 “M MgCl2 and 0 .5 M KC1, and
15 pi o f the RNA s o lu t io n being tr e a te d .
The dependence o f in co rp o ra tio n on added g lo b in mRNA was
determined by in cu b ation fo r 60 min at 37° fo llow ed by 10 min
d ig e s t io n w ith a l k a l i . P ro te in was p r e c ip i ta te d w ith lO o
CCl^COOH a f t e r a d d it io n o f 50 pg o f bovine serum albumin and
the p r e c ip i t a t e s were c o l le c te d onto Whatman GF/C f i l t e r s ,
washed, d r ied ,and counted in TBS.
Product a n a ly s is was performed on 100 pi in cu b ation
m ixtures each con ta in in g 5 pg/ml o f mRNA, incubated fo r 60 min
at 37°* C arrier mouse g lo b in was added, the p r o te in e x tr a c te d
w ith ac id acetone at —20° , and the a and 3 chains separated on
CM c e l lu lo s e as b e fo r e .
2.11* Use of polynucleotide phosphorylase
(a) Preparation of 3h Poly(A)
ADP ( l mC/mMole) was incubated w ith 1 .25 mg/ml
p o ly n u c leo t id e phosphorylase (from Micro coccus l y s o d ie k t i c u s .
EC 2.7*7*8) in 1I» mM MgCl2; 0 .15 M T r is (pH 9*0); 28 mM ADP
fo r 2 h at 37° (Grunberg—Manago, 1963) • The r e a c t io n was
stopped by the a d d it io n o f SLS, the RNA d ep r o te in ise d w ithO
p h en o l/ch i oro form, and p r e c ip i ta te d w ith e th a n o l. H poly(A)q
o f a s p e c i f i c a c t i v i t y o f 3*3 x 10 cpm/pg was ob ta in ed .

( b) Assay o f p o ly n u c leo t id e phosphorylase degredative a c t i v i t y
Assays were carr ied out in 200 p i, conta in ing 3 pg o f
3H p o ly (A ); 50 mM T r is (pH 7*5),* 15 mM MgClg, u s u a l ly in
15 mM potassium phosphate. A fte r in cu b ation at 37°, undegraded
p o ly (a ) was p r e c ip i ta t e d by the a d d it io n o f 50 pi o f bovine
serum albumin (10 pg/ml) and 2 mis o f 5$ p e r c h lo r ic ac id (PCA)
at 0 ° . The assays were kept at 0° fo r 20 minutes, and then
f i l t e r e d through Whatman GF/A d i s c s . Each f i l t e r was washed
w ith 20 mis o f 5$ PCA, d r ied , and counted in TBS.
2.15 D ig e s t io n o f g lo b in mRNA w ith p o ly n u c leo t id e phosphorylase
Mouse g lo b in mRNA (100 pg/ml) was incubated w ith 500 pg/ml
o f p o ly n u c leo t id e phosphorylase ( Mi crococcus ly s o d ie k t i cus.
(EC 2 . 7*7.3) in 50 mM T r is (pH 7*5); 15 mM MgCl2 ,* 15 mM
potassium phosphate at 37° Tor 7 min. The r e a c t io n was stopped
by adding one—ten th volume o f 10$ SLS and the r e a c t io n mixture
was d e p r o te in ise d by shaking w ith a h a l f—volume o f p h en o l/
chloroform. The RNA was p r e c ip i ta te d w ith e th a n o l.
2*16 F ingerprin t a n a ly s is o f RNA
Two-dimensional f in g e r p r in t a n a ly s is o f RNA was
performed a f t e r d ig e s t io n fo r k 5 min at 37° w ith p a n crea tic
and T1 r ib o n u c lea se s each at 0 .05 mg/ml in 10 pi o f 10 mM
T ris (pH 7*^). The d ig e s t io n was term inated by a d d it io n o f
an equal volume o f water—satu rated phenol—chloroform ( l t l ) and
the aqueous phase was dried down a f t e r d e p r o te in is a t io n .
The o l ig o n u c le o t id e mixture wall d is s o lv e d in 1$ sodium dodecyl
sulphate conta in ing 0 .1 mg/ml o f b a c te r ia l a lk a l in e phosphatase
and incubated fo r 30 min at 37° • The r e a c t io n mixture was
d ep ro te in ised , dr ied down, and then taken up in 1 pi o f 0 .1 M
T ris , 11 mM m ercaptoethanol, 11 mM MgClgJ 0 .2 7 mM 32P ATP,
and 2 u n i t s o f p o ly n u c leo t id e k in a s e . Incubation was carried

O 82out at 37 f o r k5 min. The mixture was d r ied , and the J P—
l a b e l l e d o l ig o n u c le o t id e s were taken up in 0*7 pi o f dye
mixture and separated by e le c tr o p h o r e s is on c e l lu lo s e a ce ta te
s t r ip s in the f i r s t dimension and by chromatography on PEI—
c e l lu lo s e th in —la y e r p la t e s in the second dimension (Southern
and M itc h e l l , 1971J C rossley e t a l . . 197*0 •
A fte r the p la t e s had run they were auto—radiographed,
u s in g Kodirex X—ray f i lm (Kodak). In d iv id u a l o l ig o n u c le o t id e
sp o ts were cut out and counted.
2.17 Preparation of DNA
DNA was prepared u s in g a method adapted by H ell e t a l . .
(1972) from the e a r l i e r woxk o f B r it te n e t a l . ( 1969) •
a) From f o e t a l l i v e r s
F o eta l l i v e r s were suspended in 20 v o l 8 M urea* 0.2** M%
sodium phosphate b u ffe r , (pH 6 .8 ) (MUP), conta in ing 1$ ( w/v)
SLS and 10 mM EDTA. This was blended in a sea led , f i l l e d
con ta in er w ith an MSE homogenizer run at II*, 000 rpm f o r 6 p er iod s
o f 11* a each, a l t e r n a t in g w ith 30 s co o lin g i n i c e . The
homogenate was poured in to a th ick s lu rry o f hydroxyapatite
(HAP)( Bio—Rad Bio—Gel HTP, Richmond, C a lifo rn ia ) in MUP, and
the mixture was s t i r r e d g e n t ly and allowed to stand at room
temperature f o r about 1 h r . (The amount o f HAP used var ied
according to the cap acity o f the p a r t ic u la r batch o f HAP
a v a i la b le ) • The s lu rry was poured in to Pyrex N o.3 s in te r e d —
g la s s fu n n e ls (approxim ately 30 gm HAP per funnel o f diam eter
9*5 cm) and the l iq u id was drawn o f f under a vacuum o f 5 p s i .
The HAP was washed fr e e o f RNA and p r o te in w ith MUP u n t i l no
fu r th e r m a ter ia l was e lu te d as judged by A2£q ^280
measurements on the e f f lu e n t (approxim ately 1 ,500 ml/3 0 gm HAP),

then w ith a fu r th er 500 ml o f MUP. Urea was removed by .washing
with 1!* mM sodium phosphate, (pH 6 • 8 ) ( approximately 500 ml
required /30 gm HAP). The removal, o f urea was monitored by
r e fr a c t iv e index measurements on the e f f lu e n t . The DNA was
e lu te d with 0 • M sodium phosphate, (pH 6 . 8 ) .
The DNA so lu t io n was d ia ly se d fo r 3 x 1 6 hours aga in sto
10 volumes o f 0 .0 1 M NaCl at l\ and then d e c a lc i f i e d by passage
through Dowex 5° Na+ (Bio-Rad, a n a ly t ic a l-g r a d e ca tion exchange
r e s in AG 5°¥ - X8 , 1 gm r e s in /5 0 mg DNA). The preparation was
fr e ez e dried and taken up in water to g ive a DNA concentration
o f about 2*5 mg/ml and NaCl concentration o f 0 .1 M. A liquots
o f 5 nils were son ica ted in a Dawe so n ic a to r u s in g the microprobe,
( 6 , 10- s treatm ents punctuated by 30- s coo lin g p er iod s at 0° c ) .
A fter p r e c ip i t a t io n w ith a lco h o l, the DNA fragments were
f r a c t io n a te d on an a lk a l in e surcose grad ient in an MSE BXIV
zonal ro to r or a 3 x 25 ml ro tor , and fragments o f the
appropriate s i z e were obtained and p u r i f ie d ,
b) DNA from mouse sperm
Mouse vasa d e fe r e n t!a were e x c ise d in to balanced s a l t s
s o lu t io n (Paul, 1965) • The sperm were freed by g en tly
strok in g the vasa d e fe r e n t ia w ith a g la s s rod. The sperm
were counted in a counting chamber (x 250 m a g n if ic a t io n ) . .
I n i t i a l i s o l a t i o n o f the DNA req u ires reduction o f the
p ro te in -su lp h u r l in k a g e s o f the k e r a t in - l ik e membrane o f the
sperm head (Borenfreund e t a l . . 1961) . The sperm were
cen tr ifu ged at 8 ,000 g fo r twenty minutes and washed tw ice with
0.15 M NaCl; 15 mM sodium c i t r a t e , once w ith ethanol and
once w ith a l s l e th an o l, e th er m ixture. A fter each wash the
sperm were p e l l e t e d by c e n tr ifu g a t io n at 8 ,000 g fo r t h ir t y
m inutes. To each 100 mg sample was added 20 mis 0 .15 M NaCl;
15 mM sodium c i t r a te ; 0 .25 M m ereaptoethanol. The sample
was incubated fo r 2 hours at J °C w ith g e n t le s t i r r in g .

10 mg tr y p s in were added and the in cu b ation continued fo r
1 hour at room temperature.
The p e l l e t obtained a f t e r the sample was cen tr ifu ged
at 12,000 g fo r 1 hour was r e -e x tr a c te d w ith 10 mis b u ffe r
and 5 mg tr y p s in as b e fo r e . DNA and p r o te in were p r e c ip i ta te d
from the combined supernatants by the a d d it ion o f two volumes
o f e th a n o l . . The p e l l e t was d is s o lv e d in MUP conta in ing SLS
and EDTA, and DNA p u r i f ie d as fo r the f o e t a l l i v e r .
2 .18 Sucrose d e n s ity grad ient f r a c t io n a t io n o f DNA
a) In swing-out ro to rs
A lk a lin e g ra d ien ts fo r denatured DNA contained 0 .9 M
NaCl, 0 .1 M NaOH. To determine the m olecular weight o f small
DNA fragm ents, 5 - 10$ (w/w) sucrose grad ien ts were u sed .
Samples were sedimented through e i t h e r II* ml gra d ien ts in the
MSE 6 x 15 swingout ro tor , or through 25 ml grad ien ts in the
MSE 3 x 25 swingout ro to r , in MSE superspeed 65 or 50
u l t r a c e n t r i fu g e s . F ra ctio n s (0 .7 5 or 1 .0 ml, r e s p e c t iv e ly )
were c o l le c t e d by upward displacem ent by 20$ (w/w) sucrose
in 1 M NaCl. The sedim entation c o e f f i c i e n t s were determined
u s in g ta b le s o f McEwen ( 1967) and, from them, m olecular w eights
were c a lc u la te d u s in g equations g iven by S tu d ier , ( 1965)*
F raction s were n e u tr a l is e d , a f t e r the a d d it io n o f l / l*0 th volume
o f 1 .0 M HEPES (pH 7*0), and one drop o f phenol red, by the
dropwise a d d it io n o f IN HC1. DNA was p r e c ip i ta te d w ith
ethanol and d e sa lte d through Sephadex G25*
b) L arge-sca le f r a c t io n a t io n in a zonal ro to r
A titan iu m BXIV zonal ro to r was loaded with a 500 ml 5” 20$
(w/w) sucrose grad ien t , l in e a r w ith ro tor ra d iu s . The grad ient
was prepared in apparatus s im ila r to that d escr ibed by B im ie

and Harvey ( 1968)• The mixing v e s s e l contained 600 ml 5$
(w/w) sucrose to which was added 500 ml (w/w) su crose .
The sucrose s o lu t io n s contained 0 .9 M NaCl,* 0 .1 M NaOH.
The sample (10 ml) o f fragmented DNA in 0 .9 M NaCl; 0 .1 M NaOH
was o v e r la id w ith 100 ml 0 .9 M NaCl; 0 .1 M NaOH. The ro to r
was spun at 25,000 rpm fo r 17 hr at 20°. 20 ml f r a c t io n s were
c o l le c t e d , n e u tr a l i s e d and tr e a ted as above.
2.19 Purification of reverse transcriptase from avianmyeloblastosis virus
The method i s e s s e n t i a l l y as d escr ibed by Kacian e t a l . .
( 1971) •
a) P u r i f ic a t io n o f v ir u s
The v ir u s was p u r i f ie d from chicken plasma by spinning
the p a r t i c l e s onto a g ly c e r o l pad. These were suspended in
0 .15 M NaCl, 10 mM T r is HC1 (pH 8 .8 ) and the procedure repeated
tw ice , d isca rd in g the supernatant each tim e. The p a r t i c l e s
were then taken up in a minimum volume o f 0 .15 M NaCl, 10 mM
T ris—HCl (pH 8 . 5 ) , 1 mM EDTA and the volume adjusted to g ive a
p r o te in con cen tration o f 1*—5 mg/ml.
b) Isolation and purification of enzyme
The v ir u s p a r t i c l e s were ly s e d by the a d d it io n o f
1 /1 0 th volume Nonidet NF—1*0, l / l 0 t h volume o f 10$ deoxycholate
in water and 3 /lO tb volume o f M KC1 • The d eb r is was removed
by c e n tr i fu a t io n and d iscard ed . The supernatant was d i lu te d
10—f o ld w ith 10 mM potassium phosphate, (pH 7*2), 2 mM
d i t h i o t h r e i t o l (DTT), 10$ g ly c e r o l , and loaded onto a DE52
column e q u i l ib r a te d w ith the same b u f fe r . The column was
washed w ith three volumes o f the load in g b u ffe r and then
w ith four column volumes o f 50 mM phosphate (pH 7*2), DTT,
g ly c e r o l , before being e lu te d w ith two volumes o f 0 .3 M

phosphate (pH 7*2), DTT, g ly c e r o l . The e lu a te was monitored
with an LKB Uvicord absorptiom eter at 280 nm and fr a c t io n s
conta in ing p ro te in were pooled . The p ro te in washed o f f with
50 mM phosphate was d iscarded . The p ro te in e lu te d w ith 0 .3 M
phosphate was d i lu te d w ith two volumes o f 10 mM phosphate
(pii 8#0),DTT, g ly c e r o l , before being loaded on a carboxyme th y l
Sephadex column, C50, e q u i l ib r a te d in t h i s b u ffe r .
This column was washed with 0 .1 M phosphate (pH 8 .0 ) ,
DTT, g ly c e r o l . The column was then e lu te d w ith 0 .3 M phosphate,
(pH 8 .0 ) , DTT, g ly c e r o l . F ractions were c o l le c te d , made 501/
w ith resp ect to g ly c e r o l and assayed fo r enzyme a c t i v i t y .
A ctive f r a c t io n s were pooled , and stored at -2 0 ° .
c) Assay o f enzyme a c t i v i t y
Assays were performed in a t o t a l volume o f 120 pi
conta in ing: ( l ) 1 pig poly( rA )-p o ly ( dT) being used as a
template fo r 10 pd o f enzyme so lu t io n ; ( 2) 5 P-Ci o f dTTP;
( 3) 200 pM dTTP, dATP, dCTP and dATP (Bohringer, London);
( h ) 10 pg c a t a la s e ; ( 5 ) 50 mM KC1, 50 mM Tris-IICl, (pll 8 . 2 ) .o
A fter in cu b ation at 37 fo r 30 minutes the mixture, to
which EDTA and E. c o l i DNA were added to g ive f in a l con cen tration s
o f 2 mM and 50 pg/ml r e s p e c t iv e ly , was chromatographed on a
Sephadex G50 column above a pad o f Chelex 100 (Bio-Had
L ab orator ies) , e q u i l ib r a te d with 0 .1 M NaCl. The excluded
peak was pooled and counted.
The a c t i v i t y o f the enzyme so lu t io n was c a lcu la ted as
fo llo w s:
A c t iv i ty = t o t a l d.p.m. in product x 100 u n it s /m l .h .h x 10*
(Kacian e t a l . . 1972).

2.20 Preparation o f cDNA complementary to g lob in mRNA
cDNA was prepared as descr ibed by Harrison e t a l *.
( 1972a, b) by in cu b atin g fo r 90 min at 37°C the fo llo w in g
mixture: 1*0 pM-d TPP (8 to 10 Ci/mmol; k0 pM-d -CTP
(8 to 10 Ci/mmol); 500 pM-dATPj 500 pM-dGTP,* 20 pg actinoraycin
D/ml (s igm a); 1 to 2 pig oligo (dT) 22—l 8 / m- ( PL Biochem icals)J
5 to 10 pg 9 S RNA/ml; 100 pg cata lase /m l* 50 m>t-Tris (pH 8 .2 )*
50 mM—KC1; 10 mM d i t h i o t h r e i t o l ; 5 mMr-magnesium acetate*
0 .2 v o l . reverse tr a n sc r ip ta se in 50$ g lycero lJ 0 .15 M potassium
phosphate (pH 8 . 0 ) . The s p e c i f i c a c t i v i t i e s o f d *H TTP and3
d H CTP were always adjusted to be equal.
Tritium —la b e l le d deoxyribonucleoside tr iph osp h ates were
su pp lied in 50$ e thanol con ta in in g 1$ ammonium bicarbonate
and stored at —20°. Bicarbonate was removed from these
r a d io a c t iv e s o lu t io n s , a f t e r adding the r e q u is i t e u n la b e lle d
deoxyribonucleoside tr ip h o sp h a tes , by mixing them with an
e x c e ss o f Dowex r e s in ( hydrogen—form, AG 50W x 8, which has been
washed e x te n s iv e ly w ith 50$ e t h a n o l ) .a t 0 ° , fo llow ed by removal
o f the r e s in by c e n tr ifu g a t io n (Harrison e t a l . . 1972b).
The r e s u l ta n t supernatant so lu t io n was evaporated to dryness
under vacuum. All these m anipulations, and incu b ation o f
enzyme with su b s tr a te s , were performed in glassware coated
twice w ith Repelcote (Hopkins & W illiam s, E ssex, England) and
then r in sed with d i s t i l l e d water.
A fter in cu b ation the mixture was chromatographed on
Sephadex G50 as in a normal reverse tr a n sc r ip ta se assay .
The excluded fr a c t io n was adjusted to conta in 100 pg/ml
E. c o l i DNA and p r e c ip i ta te d w ith e th a n o l. The p r e c ip i ta t e
was then d is s o lv e d in 1 ml o f 0 .9 M NaClJ 0 .1 M NaOH and
layered on a l in e a r 25 ml 5—10$ (w/w) sucrose grad ient conta in ing
0 .9 M NaCl and 0 .1 M NaOH.
The grad ient was cen tr ifu ged at 29,000 rpm in an MES 3 x 25

swing-out ro to r at 20 C fo r 2l\ h; 1 ml f r a c t io n s were
c o l le c t e d in tubes conta in ing 10 pg o f E. c o l i DNA.
5 m ic r o l i t r e s o f each f r a c t io n were counted in TXBS, and the
m olecular weight o f cDNA in each fr a c t io n was determined from
S v a lu es c a lc u la te d according to McEwen. The h igher
m olecular weight f r a c t io n s were pooled , n e u tr a l is e d and passed
through Sephadex G- 50 - Chelex 100 e q u il ib r a te d in d i s t i l l e d
w ater.
Amounts o f cDNA were ca lc u la te d on the b a s is o f the
quoted s p e c i f i c a c t i v i t i e s o f the tr ip h o sp h a tes , assuming
th at cDNA c o n s i s t s o f 50$ (C + T) .3
In l a t e r experiments only H dCTP was used and the
s p e c i f i c a c t i v i t y c a lc u la t io n s adjusted accord in g ly .
2 . 2 1 R N A _ - _ D N A ^ h y b r i d i s a t i o n
cDNA was mixed with the appropriate amount o f s a l t free
RNA and incubated at Jf3° in h y b r id isa t io n b u ffe r - 0 .5 M NaCl;
25 mM HEPES; 0 .5 mM EDTA; (pH 6 .8 ) ; 50$ forraamide ( Fluka,
Sw itzerland) (Harrison e t a l . . 19 7 *4 a) •
The s a l t s o lu t io n s , before a d d it ion o f formamide, were
passed through Chelex 100 and then DEP tr e a te d . U su a lly the
h y b r id isa t io n s o lu t io n contained 500 pg/ml E. c o l i RNA.
The mixture was incubated fo r the appropriate period
at H 3° in a sea led rep e lco ted c a p i l la r y , u s u a l ly in a volume o f
1 0 p i .
2.22 A n a lysis o f h y b r id isa t io n u s in g a s in g le —strand s p e c i f i cnuclease
a) Preparation o f n u clease {s-\ )
n u clease was obtained as descr ib ed by Sutton ( l 9 7 l ) f
1 g o f Takadiastase powder (Park Davis L td ., London) was
d isso lv e d in 5 ml o f d i s t i l l e d water and d ia ly se d overn ight at

a g a in st two hundred o f 10 mM phosphate b u ffe r , (pH 7*0) •
The s t ic k y p r e c ip i ta t e was d iscarded , while the d ia ly se d
Takadiastase so lu t io n was applied to a 2 cm x 1 cm diameter
column o f DEAE—c e l lu lo s e (Whatman DE—23) p rev io u s ly
e q u i l ib r a te d at k ° w ith 10 mM sodium phosphate b u ffe r , (pH 7*0)
( s t a r t in g b u f f e r ) . This column was immediately r in sed at
with su c c e ss iv e 50—ml p o r t io n s o f s ta r t in g b u ffer supplemented
w ith (a) no a d d ition ; (b) 50 mM NaCl; 10 mM KH2P0^; ( c) 0 .1 M
NaCl; 20 mM KH2P0^; (d) repeat o f ( c ) , and (e ) 0 .2 M NaCl;
hO mM KHoPO, .
b ml f r a c t io n s were c o l le c te d from the f in a l r in s e , each
being immediately supplemented w ith gm equal volume o f c h i l l e d
50$ (v /v ) g ly c e r o l and cooled to 0 ° . Each f r a c t io n was ra p id ly
assayed fo r p ro te in concentration ( a 2qo nm) 2111(1 nuc le a se
a c t i v i t y , and then stored at —20°.
b) Assay o f enzyme a c t i v i t y
A liq u ots o f denatured -hi DNA from mouse LS c e l l s (a g i f t
from Dr. G. D. B im ie ) were incubated at 37° w ith d i lu t io n s
o f each enzyme f r a c t io n , in nuclease assay b u ffer ; 50 —
sodium a ce ta te (pH J|*5); 2 mM ZnSO ; 0 .1 M NaCl and 10 pg
denatured c a l f thymus DNA/ml. A fter 30 minutes a p o r t io n o f
the in cu b ation mixture was taken to, determine the t o t a l
r a d io a c t iv i ty ; a fu r th er p o rtio n was a c id i f i e d ( l N—HCIO^) at
h°C a f t e r a d d it ion o f mouse DNA and bovine serum albumin
(5 (ig and 5 0 pg, r e s p e c t iv e ly ) and then cen tr ifu ged fo r 15 min
at 2500 revs/m in . A p o rt io n o f the supernatant f lu id was then
taken to determine the acid—so lu b le r a d io a c t iv y .
c) Assay o f h y b r id isa t io n o f cDNA
Before use in the h y b r id isa t io n assay , each fr a c t io n o f
enzyme was d i lu te d w ith 0 .2 M NaCl, J4O mM KH^PO , 50$ g ly c e r o l ,
so that 20 pi would render 50$ o f the H DNA acid s o lu b le , in
30 minutes (G. B irn ie , personal communication).

The h y b r id isa t io n r e a c t io n was stopped by f lu sh in g out
the c a p i l l a r i e s w ith 250 pi o f mi c l ease assay b u ffe r . This
was incubated with 100 pi o f S^-nuclease fo r 2 h at 37° •
100 pi o f the incu b ation mixture was counted to determine
t o t a l r a d io a c t iv i t y and 200 jjuL was p r e c ip i ta te d by the addition
o f 50 pi o f 6 .0 N PCA, and 50 pi o f c a r r ie r bovine serum
albumin (2 mg/ml) . This was cen tr ifu g ed fo r 15 niin at
2500 revs/m in . and 200 pi counted, to determine the proportion
o f ac id so lu b le counts.
For h y b r id isa t io n r e a c t io n s la r g e r than 10 p i, the
volumes used were adjusted , reducing the f in a l formamide
concentration to below 5 /*, to prevent in a c t iv a t io n o f the
enzyme•
2 '23 ^nnealirg o f cPNA to DNA. and a n a ly s is on hydroxyapatite
The appropriate amounts o f cDNA and mouse or E. c o l i DNA
(a t about 2 mg/ml) were mixed in water, ly o p h i l iz e d and
re d is so lv e d at 10 mg/ml before adding 0 .2 v o l . 0 .7 2 M-sodium
phosphate (pH 6 . 8 ) . DNA co n cen tra tion s were ca lc u la te d on
the b a s is o f absorption measurements on acid -hydrolysed
p o rtio n s o f the d i lu t e DNA s o lu t io n s . The cDNA/DNA m ixtures,
e i th e r u n d ilu ted or 100 fo ld d i lu te d , were denatured in a
b o i l in g water bath fo r 10 m in ,a f te r which they were annealed
at 60°. The rea c tio n was stopped by the ad d ition o f 10 v o ls
o f 0 .1 M KC1 and the samples stored at - 2 0 ° .
A n alysis was carr ied out on hydroxyapatite (Bio-Rad,
Bio g e l IITP batch IO936) u s in g a r a t io o f 1 mg DNA to 3 ml
packed hydroxy a p a t i t e , as descr ib ed by Harrison e t a l . . 1972a.
Colums were e lu ted w ith 8 ml o f 30 mM-phosphate, tw ice with
8 ml o f 0 . l 6 M-pho sp h ate , and f i n a l l y tw ice w ith ml o f 0 • M-
phosphate. Absorbance measurements o f the fr a c t io n s o f
e lu a te were made, before counting in I n s t a g e l .

2. 2b M elting behaviour o f hybrids
a) Using hydroxy a p a t ite
A fter load in g the hydroxyapatite w ith the reannealed
duplexes and washing w ith "}0 mM-phosphate, the column was
e lu te d 3 tim es w ith 8 ml o f 0 .1 6 M-phosphate, at 5 degree
in t e r v a l s from 60 to 95° C. F in a l ly , the column was e lu te d
w ith 0 • k M-phosphate; t h i s removed a n e g l ig ib le amount o f
DNA and r a d io a c t iv i t y . The absorbance at 260 nm was measured
and the samples then counted in I n s t a g e l .
b) In so lu t io n
A fter a su ita b le period o f annealing, in a sea led
c a p i l la r y , the so lu t io n con ta in in g hybrid was d i lu te d sev era l
fo ld w ith form am ide/hybrid isation b u ffer , and a l iq u o ts
r e se a led in c a p i l l a r i e s . These were heated fo r 5 minutes at
the appropriate temperature, before being rap id ly cooled and
d ilu te d with 25 volumes o f n u c lease assay b u ffe r . an a ly s i
o f th ese samples was then as p r e v io u s ly d escr ib ed .

RESULTS
Isolation and characterisation of 9S RNA frommouse reticulocytes
Preparation of to ta l RNA
Isolation of 9S RNA using affin itychromatography
Isolation of the 1J*S mRNP containing 9S RNA using zonal ultracentrifugation
Assay for messenger activity
Synthesis and characterisation of complementaryDNA
Synthesis of cDNA
Hybridisation of cDNA to 9S RNA
Analysis of cDNA—RNA titra tio n curves
Annealing of cDNA to DNA
Preparation of DNAs
Annealing of cDNA to DNA
Treatment of raRNA with polynucleotidephosphorylase
Phosphate dependence
Enzyme concentration
Time of incubation
Characterisation of treated non—retained 9S RNA
Fingerprint analysis
Template activity with reverse transcriptase
Translational ab ility of treated non—retained mRNA
Using the Krebs ascites cell—free system
Using the rabbit reticulocyte lysate cell—freesystem

3.8
3-9
3.10
3.11
3 . 1 2
Quantitation of poly(u) sepharose 85
With reticulocyte polysomal RNA
With retained RNA
With mRNP RNA
Using oligo(A) of different lengths
With nuclear RNA
Identification of globin mRNA in mouse foetal 88livers
Presence of globin mRNA in 12* day foetalliv er polysomes
Messenger activity of foetal liv er RNA
Retention of foetal liv e r globin RNA sequences 89by poly(u) sepharose
Polysomal RNA
Cytoplasmic RNA
In to tal nuclear RNA
Presence of globin RNA sequences in other tissues 90
Preparation of nuclear and cytoplasmic RNAs
Gel analysis of RNA
Analysis of globin RNA sequence content of RNA
Retention of the globin RNA sequences by poly(u)sepharose
Estimation of the reticulocyte contamination of 93the nuclei . preparations
Analysis of hybrids 92*
Melting analysis of hybrids
Size analysis of hybrid molecules
3.13 Absolute amounts o f g lo b in RNA sequences ind i f f e r e n t t i s s u e s
95

RESULTS
3 • 1 I s o la t io n and c h a r a c te r isa t io n o f 9S RNA f r o mouser e t lc u lo cyte s
a ) Preparation o f t o t a l RNA
500 mice r o u t in e ly gave a y i e ld o f 90 ml o f packed c e l l s ,
a f t e r washing 3 times in BSS. This a lso removed the m ajority
o f white blood c e l l s * The 1 mM MgC^ used to ly se the
r e t ic u lo c y t e s le a v e s most o f the remaining white c e l l s in t a c t ,
and RNA prepared from the 20,000 g supernatant was e s s e n t i a l l y
free o f DNA contam ination. 30 - 2»0 mg o f t o t a l RNA was
i s o la t e d from ?»0 mis o f packed red blood c e l l s .
Figure 1(a) shows the banding p a ttern o f t o t a l RNA when
run on 2 . 6$ polyacrylam ide g e ls ; the major bands correspond
to the 28s, 18s and hS and .53 RNA f r a c t io n s . Between the
±8S and 5S two minor bands o f 12S and 9S RNA can be d is t in g u is h e d .
A th ird minor band running at 7S can sometimes a lso be seen.
9S RNA accounts fo r between 1 - 2$ o f the t o t a l RNA o f the
r e t i c u lo c y t e s .
b) I s o la t io n o f 9S RNA u sin g a f f i n i t y chromatography
Both a f f i n i t y chromatography methods used during t h i s
work gave e s s e n t i a l l y s im ila r r e s u l t s . The RNA that was
reta in ed by the po ly (u ) sepharose or o ligo (d T ) c e l lu lo s e was
high ly enriched in 9S RNA, as shown in Figure l ( c ) . U sually
the percentage o f 93 RNA was in crea sed to 2*0 - 50$ by one
passage through a column, and t o > 90$ by a second p assage .
A sample o f t h i s p u r if ie d 9 3 RNA when run on 2 .6$ acrylamide
g e ls m igrates as a s in g le d i f fu s e peak (Figure 1 ( d ) ) . The
m olecular weight o f t h i s RNA i s 220,000, (about 630 n u c le o t id e s ) .
This value was obtained by comparison w ith standard RNAs on g e l
e le c tr o p h o r e s is in denaturing co n d it io n s , or by a n a ly t ic a l

2 . 6 $ p o l y a c r y l a m i d e g e l e l e c t r o p h o r e s i s o f t
*0 90 |jg of to ta l reticulocyte polysomal RNA.
h) 90 pg of polysomal RNA not—retained by poly(u)
sepharose ( f i r s t cycle).
c) 30 MG of retained UN A ( f i r s t cycle).
d) 5 MS °f retained RNA (second cycle).
Gels were 0.7 cm diameter, and 7 cm long.
Electrophoresis was for 15 minutes at 2 mA/gel, and
then 70 minutes at 6 mA/gel, 17 v/cm. Gels (a) and
(b) were scanned at one half times magnification,
and gels ( c) and (d) at two times magnification on
a Joyce—Loebe 1 XJV scanner.

Figure t
(a)ovoCM 12S 9S
(b) 8CVJ
(o)
gSCM
(a)g8CM
■*4
Distance (cm)

c e n tr i fu g a t io n (Williamson e t a l . . 1971)• About 80^ o f the
t h e o r e t i c a l y i e l d o f 9S RNA was recoverable from polysomal
KNA us in g these techniq ues .
E lu t io n o f some batches o f po ly (u) sepharose with
formamide r e su l te d in the re le a se o f small amounts o f p o l y ( u ) .
I t i s known that the add it io n o f poly(u) to polysome systems
r e s u l t s in the sy n th e s i s o f polyphenyla lanine (Nirenberg and
Matthaei 19 6 l; Arnstein e t a l . t 1962) and the reduction in
the sy n th e s i s o f endogenous p ro te in s (Weinstein e t a l . . 1963;
Marcus e t a l . . 1 9 6 3 ) . Thus for some experiments o l igo(dT)
c e l l u l o s e was used for the p u r i f i c a t i o n o f 9S HNA.
c ) I s o l a t i o n o f the l^S mRNP conta in ing 9S RNA \is ing ‘zonalu l t r a c e n t r i fu g a t io n
KDTA treatment o f polysomes r e s u l t s in t h e i r d i s s o c i a t i o n
in to ribosomal subunits with r e le a se o f a l?-tS mRNA-protein
(mRNP) complex. The sedimentation p r o f i l e o f EDTA trea ted
mouse polysomes in the 13-XIV zonal ro tor i s shown in Figure 2.
Three main peaks were r e so lv ed . These w^re haemoglobin,
the /)0S ribosomal subunit , and the 60S ribosomal subunit .
The mRNP can be i s o l a t e d as a small peak sedimenting between
haemoglobin and the fyOS subunit , at about 1/jS. Between 0 .25 ~
0. J* mg; 9S RNA was recovered from 3 0 - fyO mg polysomes
centr ifuged in the B-XIV ro to r .
d) Assay fo r messenger a c t i v i t y
The a b i l i t y o f 9S RNA to d ir e c t the sy n th e s is o f mouse
a and 9 g lobin was t e s t e d in a duck r e t i c u lo c y t e c e l l - f r e e
system. Figure 3 shows the 280 nm absorbance p r o f i l e from
a-CMC column with mouse a and 9 g lo b in r e so lv in g c l e a r ly from
the two duck g lo b in s .

FI GU lt'5
Zonal u lt racentri fix Ration of EOT A- treated mouse
reticulocyte polyson:e s .
hO of polysomes in 10 inM KC1; 10 mM Tri s
(pit 7 * h ) ; 0.1 M EDTA, layered on to a 10 - 30^1
sucrose gradient in TKM buffer, in an M.S.15. E-.XIY
titanium rotor, spun at Jf6,000 rpm for 3 ^rs 7 •

Figure 2
60Ssubunit
direction of
sedimentation
40Ssubunit
haemoglobin
14SmRNP
VOHJME

FIGTTRTD 3 .
Product analysis of the globin chains syntliesised
in a duck reticulocyte cell-free system, with
added mouse globin in RNA.
7 ps of mouse reticulocyte 9S RNA were incubated3
in a 250 pi assay, with leucine. A parallell h
250 |il assay was incubated with C leucine, without
added mouse message. The incubations were combine!,
the globin extracted, and the sample chroniatographe!
on carboxymethy1 cellulose, as described. The
absorbance* of the column eluate was monitored at
at 280 nnl (-----------) . The fractions were prepared for
counting as described!

Figure 3
mouse p globin
mouse a globin
duckglobin
duckglobin200Q
1000
30 ifO25 50
Fraction number
Absorbance
260

A st im u la t io n o f le u c in e in corp oration in to mouse a and 8
g lo b in can be seen on a d d it ion o f 9S RNA to the duck l y s a t e .
3 .2 S y n th es is and chara c t e r i s a t io n o f complementary DNAi— M i l — i — i W f c — M — — — W W P * w iw m l mg •' m
a) In the presence o f o ligo(dT ) primer and actinomycin D,
the ra te o f sy n th e s is o f cDNA by reverse tr a n sc r ip ta se was
p rop ortion a l to the concentration o f 9S RNA in the range o f
1 - 10 |ig per ml. Under the con d ition s r o u t in e ly used, the/ 6 6 y i e l d o f h igh s p e c i f i c a c t i v i t y cDNA (25 x 10 to J4O x 10
d is in t s /m in per jig) was about 20^ o f the amount o f 9S RNA
u sed . No la b e l l e d DNA was sy n th es ised when reverse
tr a n sc r ip ta se was incubated with the o ligo(dT ) primer a lone,
u s in g a l l four la b e l le d deoxyribonucleoside tr ip h osp h ates as
p recu rso rs . This in d ic a te s that the dependence o f reverse
tr a n sc r ip ta se on added template i s a b so lu te . When sedimented
on a 5 - 10^ a lk a l in e sucrose grad ien t, the mean m olecular
weight o f cDNA was found to be 110,000 (330 bases) which i s
about 50 - 60fj o f the le n g th o f 9S RNA (5^0 - 660 bases;
Williamson e t a l . . 1971) ( Figure Jj) .
For most experim ents, on ly the h igher m olecular weight
cDNA fragments (g r e a te r than about 2J4O bases) were i s o l a t e d
and ch aracter ised fu r th e r . The s iz e d is t r ib u t io n o f the cDNA
used in most o f the experiments i s shown in Figure 10.
P u r if ie d cDNA was incubated at /43° fo r two weeks in
h y b r id isa t io n b u ffe r . The product was v i r t u a l ly a l l degraded
( 9 5 9 ) by n u c le a se . Therefore, cDNA contained a n e g l ig ib l e
fr a c t io n o f self-com plem entary sequences.
b) H yb rid isation o f complement airy DNA to 9 5 RNA
In order to minimise degradation o f RNA during
h y b r id isa t io n , cDNA was annealed (u su a l ly at /|3°) with. 9S

FIGURE U.
Sedimentation profile of crude cDNA on 5 - 10$.
alkaline sucrose gradients.
Samples were centrifuged at 29,000 rpm in an
M.S.E. 3 x 25 svdLng—out rotor, for 18.5 hours at 2C°.
1 ml fractions were collected, and 5 \iX of each
counted -------------- . The ^ 2 6 0 0 ^ mar^er run
a parallel gradient was read-------------. The molecular
weight was calculated from the S value — ----- — ard
fractions 5“ ■15 pooled.

Abs
orba
nce
260
Figure 4
5.0
4.0
3.0
-10.0
6.0
1.0
2.0
G.OJ
CO
rooS3
-400
-300
-2001— 1
ai_i
o
&
-100
1.0
pooled fractions

RNA in hybridisation buffer containing formamide and excess
B. coli RNA. Under these conditions, the T of a h0%
(G + C) RNA-DNA hybrid i s 58° (Bishop, 1972 ) . No
h y b r id is a t io n o f cDNA to S . c o l i RNA was d e tec ted (Figure 5)«
However, about 80 to 8 o f the cDNA was converted in to
hybrid by in cu b ation with ex cess 9S RNA (Figure 5) • N either
the amount o f cDNA hybrid ised nor the rate o f r ib on u c lease -
r e s i s t a n t hybrid formation was g r e a t ly a f fe c te d by annealing
at d i f f e r e n t temperatures (37 , U3 or ^8° ) . Furthermore, the
s e n s i t i v i t y o f the hybrids to r ibonuclease was not a f fe c te d
by annealing at d i f f e r e n t tem peratures. Thus, the annealing
co n d it io n s chosen appear to be w ith in the optimum range and
are s u f f i c i e n t l y s tr in g e n t .
In order to t e s t the q u a l i ty o f the 9S RNA-cDNA hybrid
d ir e c t ly , the s iz e o f the cDNA in such hybrids was estim ated
before and a f t e r treatment o f the hybrids w ith S n u c le a se .
The s iz e d i s t r ib u t io n o f cDNA was not a f f e c te d by the annealing
con d it io n s them selves (Figure 6) . Under con d ition s in which
cDNA alone was com pletely degraded, cDNA in the 9S RNA-cDNA
hybrid was reduced to about h a l f i t s i n i t i a l s iz e by such
treatm ent, in d ic a t in g that on average about one nick per hybrid
molecule was introduced by the treatment w ith nuclease
(Figure 6) . This in d ic a t e s that there are no e x ten s iv e
reg io n s o f n u c le a s e - s e n s i t iv e cDNA d is tr ib u te d throughout the
CDNA-9S RNA hybrid. However, t h i s hybrid had a Tm o f 69° in
0 .1 6 M phosphate (Figure 7 ) , somewhat lower (3 °) than p red ic ted
fo r a p e r fe c t hybrid.

F I G U R E 5 .
Hybridisation of cDNA to reticulocyte 9S RNA,
•—• , reticulocyte polysomal RNA + — + , and
E. coli ribosomal RNA 0—0.
0.001 |jg of cDNA was incubated with increasing
amounts of HNA, in 10 pj_ of formamide/hybridisatisn-1 , x
buffer to a DQt of 0.2 mol 1 sec. (7 days) ato
h3 • Analysis of the hybrids was as described.

Figure 5
1100
80
60
20
0
---7—150
A-100
RNA / o DKA

FIGURE 6 .
Sedimentation of cDNA before and after hybridisation,
on a 5 — 10$ alkaline sucrose gradient.
Samples were centrifuged at 29,000 in an M.S.E. 3 x 25
swing—out rotor for 2k hours at 20°. 1 ml fractions
were collected and 0*5 ml counted*—A—A—, cDNA from
cDNAr-9S RNA hybrid; - O — O cDNA from cDNA-9S RNA
hybrid after treatment of hybrid with S nuclease,*
—A—A—, cDNA before hybridisation.
A marker DNA of (about 200 nucleotides) was
included in one of the gradients. The molecular
weight was calculated as described in the text — • — # —

Rad
ioac
tivi
ty
/ fr
action
($
)jrigure o
marker
- 1 5
12
- 10
8
4
0
4 240 16 2012
H
a
-jkO
Fraction number

F I G U R E 7 •
Melting behaviour of reannealed duplexes.
Melts were carried out on HAP and unretained material
eluted with 0.16 M pho sphate * , cDNA““9S RNA
hybrid , native foetal l ive r DNA (33° nucleo
tides long)*—0—0 — reannealed foetal l iv e r DNA*— 0-0
cDNA annealed to foetal l ive r DNA.
Reannealed DNA samples were incubated in 0.12 M
phosphate to a CQt value of 20,000.

Figure 7
Temperature ( °C

c) A n a ly s is o f complementary DNA-RNA t i t r a t i o n curves
H yb rid isa tion o f cDNA to RNA may be used as a general
technique to estim ate the f r a c t io n o f an RNA preparation that
i s complementary to cDNA. The s im p lest approach i s to
t i t r a t e cDNA with in c r e a s in g amounts o f RNA, under con d ition s
that a llow completion o f h y b r id isa t io n r e a c t io n s . I f cDNA
were o f homogeneous s i z e , the t i t r a t i o n curve, namely the p lo t
o f the f r a c t io n o f dDiNA h yb rid ised versu s the RNA/cDNA r a t io ,
would c o n s is t o f a l i n e through the o r ig in fo r cDNA ex cess and
a h o r iz o n ta l l in e fo r RNA e x c e s s . The proportion o f the RNA*
p reparation that i s complementary to cDNA could be found from
the RNA/cDNA r a t io at the p o in t o f in t e r s e c t io n , because at
that value there would be an equal number o f cDNA and
complementary RNA m olecu les p r e se n t . In p r a c t ic e , however,
cDNA i s iieterogonaous in s i z e , so that in cDNA ex cess there
i s a g r e a te r p r o b a b i l i ty o f h y b r id isa t io n to la r g e r cDNA
mole c u le s •
Young e t a l . (197^) have shown that the k in e t i c s o f the
h y b r id isa t io n o f cDNA to 9S RNA are in agreement w ith second-
order r e a c t io n theory . However, the conclu sion s drawn from
such t i t r a t i o n experiments are v a l id on ly i f a l l r ea c tio n s
used to e s t a b l i s h the p lo t s are complete. I t i s , th ere fo re ,
an important p r e d ic t io n o f second-order k i n e t i c s that the
slow est r e a c t io n occurs when*equal amounts o f the two components
are p r e se n t . M t - dor in terms o f D0t , where DQ i s
the i n i t i a l cDNA con centration , and t i s the time o f in cu b ation
in seconds.
Data presented by Young e t a l . . in d ic a te s that the
slow est cDNA-RNA r e a c t io n has Drtt i = 5*5 x 10“ - mol l ”^ .u 2

This is the value of DQt when half of the cDNA is converted
to duplex, and, hence, incubation to JjO times this value
(0.22 mol l “^s) should ensure completion of a ll hybridisation
re actions•
In order to establish that sufficiently large incubation
periods were used, two t i t r a t io n curves using reticulocyte 93
HNA were obtained by annealing to DQt = 0.22 and DQt = 1.7*
The t i t r a t io n curves were identical to that obtained in
Figure 5, and i t i s apparent that incubation to D t = 0.22 is
sufficient to ensure completion of the hybridisation reactions.
This result also demonstrates that RNA degradation is not a
problem during hybridisation up to DQt = 1»7» This is
important, because i t i s assumed for the theoretical analysis
that a ll RNA molecules remain larger than the largest cDNA
molecules. No appreciable degradation of cDNA occurs during
hybridisation (Figure 6).
Figure 5 shows t i t r a t io n curves in which constant amounts
of cDNA (O.OOl (j.g) were hybridised to increasing amounts of
reticulocyte 9S RNA and reticulocyte polysomal RNA.
With 93 RNA maximum levels of hybridisation wore obtained at
input HNA/c ON A ratios of 1-1. Ji, consistent with the finding
that about 60??> of the 9 3 sequence is represented in cDNA.
With reticulocyte polysomal RNA maximum hybridisation is
obtained at input ra tios of about 50 which is consistent with
the known 9S content of reticulocyte polysomal RNA ( 2?b) .
A small fraction of cDNA ( about 10?') was apparently
incapable of forming a hybrid with 93 RNA (Figure 5)* Data
from Harrison et a l . (l97^a) demonstrates that this fraction
also does not hybridise i f isolated and rehybridised. I t is
thought that transcriptional errors by the reverse transcriptase,
results in the formation of these sequences, which are not
found in 93 ItNA (Harrison et a l ., 197^a) .

3•3 Annealing o f complementary DNA to DNA
a) Preparation o f DNA
In order to simplify the interpretation of the results
of these experiments, the various mouse and E. coli DNAs were
each sonicated and fractionated to give a size distribution
of fragments similar to that of cDNA i ts e lf (Figure 10).
90 mg of foetal liver DNA were fractionated using a 10 — Jj0$
alkaline sucrose gradient in the BXIV zonal rotor, as shown
in Figure 8. The size of DNA from the fractions indicated
were checked in analytical gradients. From these data,
fractions were pooled and 50 mg of DNA were obtained, with
a size range between ^.9 — 7*7S and a peak size of 6.6s
( Figure 10) .
10 mg of DNA were obtained from approximately 0.5 gm
(dry weight) of mouse sperm. This was fractionated on
5 — 10$ alkaline sucrose gradients in a 3 x 25 swing—out
rotor (Figure 9)* 5 mg of DNA, with a size range between
k '9 — 7.7S and a peak size of 6.6S (Figure 10), were pooled
from the gradient fractions.
b) Annealing of cDNA to DNA
Samples of these DNAs were mixed with cDNA in a ratio
(cDNASDNA) of 1:8 x 10 or l il6 x 10 (w/w), denatured and
allowed to anneal to various CGt values.
These experiments used DNA fragments with an average
length of 330 bases (Figure 10). Under these conditions,
E. coli DNA reassociated with a C0t . value of about 6
(Figure 11a). Using mouse (foetal liver and sperm) DNA
fragments of the same size, a small fraction (about 10$)
reassociated at a low CQt value, whereas the bulk of the foetal
liver and sperm DNA fragments reassociated with a C t, value ofo -5-
about 800 (Figure 11, a & b )•
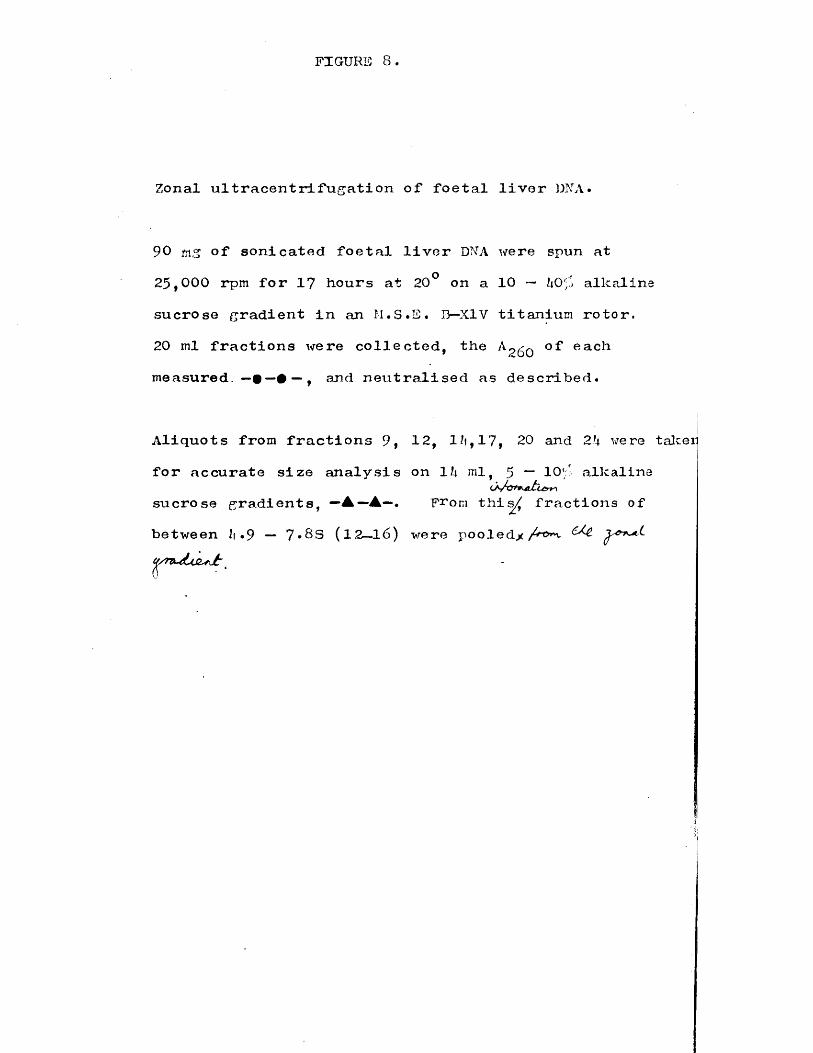
FIGURE 8 .
Zonal u l t r a c e n tr i fu g a t io n o f fo e t a l l i v e r UNA.
90 mg o f son ica ted f o e t a l l i v e r DNA were spun at
25,000 rpm fo r 17 hours at 20° on a 10 — alkaline
sucrose grad ient in an M.S.E. B—XIV titanium rotor.
20 ml f r a c t io n s were c o l le c te d , the ^ 260 °** each
m easured.—# —# — , and n e u tr a l is e d as descr ibed .
A liq u ots from f r a c t io n s 9, 12, lJt,17, 20 and 2k were taker
fo r accurate s iz e a n a ly s is on U ml, 5 10'.' a lkaline
sucrose g ra d ien ts , —A —A—. F^om this^ fr a c t io n s of
between Jj . 9 — 7*8S ( 12—16) were p oo led jt/^ v
t

Figure 8
10.04.0
3.0
6.02.0
4.00
2.00.0
pooled fractions
20 W

FIGURE 9 .
Sedimentation o f so n ica ted sperm DNA on a 5 “ 10(/,
a lk a lin e sucrose g ra d ien t .
5 rri:I o f DNA were cen tn ifuged at 29,000 rpm in ano
M.S.ID. 3 x 25 swing—out ro to r fo r 17 hours at 20 •
1 ml f r a c t io n s were c o llec ted ^ and the A ^ q measured.
The Sorv va lu e was cal cul ated —A—A—t and 2 0 *
f r a c t io n s 7 — 11 were pooled .
The peak sed im entation o f a h»5S marker DNA fun in a
p a r a l l e l grad ient i s shown.

Abs
orba
nce
260
Figure 9
markerDM
4.0
9.02.0
8.0
6.0
2.0
0*0 0.0
pooled fractions
20 W

FIGURE 1 0 .
Sedimentation of cDNA and mouse DNA fragments in
5 “ alkaline sucrose gradients.
Samples were centrifuged at 29,000 in an M.S.E.
o .3 x 25 ml swing-out rotor for 19 hours at 20 ,
—------— f 70 |j.g o f sperm DNA* —“ 60 jjg o f fo e ta l
l iv e r DNA*................. 1500 cpm of cDNA* molecular
weight —A — A —

R a d i o a c t i v i t y ( c t s / m i n p e r f r a c t i o n ) ro 4^o o oo o o oi------ r~— i------1— n ----- 1------1A b s o r b a n c e ( 2 6 0 n m )
o o• •
o
\ V v
O
01
rooro
M o l . w t ( x I O " 5 )

FIGURE 1 1 .
Incubation o f cDNA with EA c o l i and mouse DNA, and
re annealing o f _Ej c o l i and mouse DNA fragments,
measured by chromatography o n .h yd roxyap atite .
a) O re annealing o f E_, c o l i DNA/fragments, ^ incubation
o f cDNA with j£j c o l i DNA,* ^ in cu bation o f poly ( dT)
w ith mouse DNA fragments* A A reannealing o f fo e t a l
l i v e r DNA fragments* o • annealing o f cDNA to f o e t a l
l i v e r DNA fragments. jI
b) A reannealing o f sperm DNA fragments* # annealing j
o f cDNA to sperm DNA fragments.
7.In a) the r a t io o f mouse DNA to cDNA was 1 .6 x 10 *.1£ CoS)
(w/w), and in b) 8 x 1 0 1 1 (w/w). Open symbol s^refer
to experiments in which the cDNA con centrations were
d i lu te d 100—f o ld .

100
80
60
40
20
0
100
80
60
40
20
0
Figure 11
■ mI—t— / / ■
C t o

From the data in Figure 11, and knowing the complexity
o f the cDNA, the complexity o f the sequences in mouse DNA
th at anneal to cDNA can be c a lc u la te d . This w i l l g ive an
independent estim ate o f the number o f g lob in genes in each
t i s s u e s tu d ied . The approach assumes that the cDNA that
remains unannealed at high CQt va lu es rep resen ts ex cess cDNA
sequences, above the number o f complementary sequences p resent
in mouse DNA.
The r a t io s o f cDNA I f o e t a l l i v e r DNA, or sperm DNA that
7 5were used, were, 1 I 1 .6 x 10 and 1 I 8 x 10 r e s p e c t iv e ly .
Hov/ever, s in ce 5/ ° f the cDNA i s Sq r e s i s t a n t a f t e r low CQt
in cu b a tio n s , and 10$> o f the cDNA never forms a hybrid, 85^
o f the cDNA added can take part in the r e a c t io n . From t h i s
va lu e , and the proportion o f cDNA unannealed at high C0t value
(Figure l l ) , the proportion o f the genome complementary to
cDNA can be ca lc u la te d to be*
0 .85 85-201 .6 X 1 0 ' X 20 = 1 .7 3 X l o - 7 fo r f o e t a l l i v e r
2 ^ 1 7 85-35 n0 .8 x 10 x 35 = 1.5*t x 10 fo r sperm DNA.
Since the double-stranded m olecular weight o f the hap lo id
12mouse genome i s 1 .8 x 10 , th ese va lu es in d ic a te that cDNA
i s complementary to 310,800 d a lton s o f f o e t a l l i v e r DNA, and
271,800 d a lto n s o f sperm DNA.
The cDNA has a complexity o f between 700—800 bases
(210,000-2^(0,000 d a lton s) (Young e t a l . . 1 9 7 0 • Thus, the
cDNA could be complementary to between 1*5 ” 1*3 cop ies o f
the g lob in gene in the f o e t a l l i v e r DNA, and 1 .3 1*1 cop ies
in the sperm DNA. The cDNA i s thus h y b r id is in g to a s im ila r ,
low number o f complementary sequences in both DNAs s tu d ied .

As a control experiment, cDNA was incubated with E. coli
D N A . Only about 10s of the cDNA annealed by a G t of 1000,o
during the period when all the E. coli DNA reassociated
(Figure l i b ) . However, af ter incubation to a C t of 80,000
a further 20' of the cDNA was not eluted from hydroxy apatite
by 0.16 M phosphate. Evidence that this is not due to self-
annealing of the cDNA sequences has been given in a previous
section. Csaition must be exercised in interpreting this
result , since when high specific activity poly (dT) was
incubated ivd-th mouse DNA to a CQt value of 80,000, about 3O'u
of the poly(dT) behaved similarly.fefrH
Vith DNA from mamin mouse t i ssue* studied, cDNA annealed
at a C tt value identical to that for the reannealing of theO f
bulk of the mouse DNA sequences (Figure 11, a & b) . These
relative rates of annealing of c D N a to mouse DNA, and
reannealing of mouse DNA fragments would be distorted i f : -
(l) there were preferential degradation of cDNA during
annealing, re la tive to the mouse DNAs, or (2) i f mismatching
of cDNA sequences occurred with respect to the globin genes
in the mouse DNA.
(l) Samples of cDNA and mouse DNA fragments ( in i t i a l size
330 bases) were taken for size determinations af ter incubation
to a CQt value of 8000, when the annealing reaction was
essentially complete. Negligible degradation of e ither cDNA
or mouse DNA fragments was detected at this time (Figure 12),
although af ter incubation to a C t value of 80.000, someo “ "
degradation of cDNA and mouse DNA fragments occurred. Thus,
neither the observed rate of annealing of cDNA to mouse DNA
nor rate of annealing of mouse DNA fragments requires correction
for changes in size of fragments during annealing.

F I G U R E 1 2 .
Sedim entation o f DNA and cDNA before and a f t e r
h y b r id !s a t io n .
, oH yb rid isa tion was carried out fo r 7 days at 60 in
0.12M phosphate ( to a CQt o f 8000). Samples were
cen tr ifu g ed at 29,000 in an M.S.S. 3 x 25 swing—out/- oro to r fo r 16 hours at 20 . 1 ml f r a c t io n s were
c o l le c t e d , an a l iq u o t counted, and the measured}
f o e t a l l i v e r DNA before h yb rid isa tion ,* -----------
cDNA before h y b r id i s a t io n , ' -----------------f o e t a l l i v e r DNA
a f t e r hybrid isation ,' ................ cDNA a f t e r hybridisation,*
—A —A -m o lecu la r w eight.
A marker DNA o f 66,000 m olecular weight was centrifuge
in a p a r a l le l g ra d ien t .

Figure 12
800 ~
600
400
200
markerDNA.
0.8
0.6oVuCVI
0 .2
0.00 10
i- 4
Fraction number

(2) For f o e t a l l i v e r DNA, the T o f the cDNA-mouse DNA* m
annealed duplexes was about 3° lower than that o f the
reannealed nouse DNA duplexes them selves (Figure 7)•
A fter co rrec t in g fo r the s l ig h t d i f f e r e n c e s in (G + C)
content o f cDNA and mouse DNA (Gnienwedel e t a l . , 1971), t h i s
im p lie s no more than about 2!p mismatching between cDNA and
the mouse DNA sequences to which cDNA annealed in these
experim ents (Laird e t a l . . 1069; Ullman and McCarthy, 1 9 7 3 a ,b ) .
T h is mismatching would reduce somewhat the rate o f annealing
o f cDNA to mouse DNA. The magnitude o f t h i s e f f e c t i s
d i f f i c u l t to estim ate p r e c i s e ly . On the b a s is o f data fo r
the e f f e c t o f mismatching on the rate o f r e a s s o c ia t io n o f
s a t e l l i t e DNA, the rate o f annealing o f cDNA to mouse DNA
might be reduced to 60^ o f the rate i f there was no mismatching
(Southern, 1971; Sutton and McCallum, 1971)• However,
s im ila r s tu d ie s on the e f f e c t o f mismatching on the rate o f
r e a s s o c ia t io n o f b a c te r ia l DNAs (B r it t e n and Bonner, 197 l)
suggest that t h i s co rrec t io n to the observed rate o f annealing
o f cDNA to mouse DNA might be much sm aller .
This means that the sequences in mouse DNA to which
cDNA anneals are as frequent ( c e r t a in ly not more than tw ice
as frequent) as the bulk o f the mouse sequences.
3 . fy Treatment o f mRNA with p o ly n u c leo t id e phosphorylase
Conditions fo r p o ly m ic leo tid e pho sphorylase d ig e s t io n
o f p o ly (A) were optim ised u s in g poly(A) as su b stra te ,
a) Phosphate dependence
Figure 13 shows the e f f e c t o f d i f f e r e n t concen tration s o f
potassium phosphate on the degradation o f p o ly (A ) . The
con d ition s were 10 pg/ml^II poly(A) ; 1 .0 pg/ml enzyme; 30

F I G U R E 1 3 .
Phosphate dependance o f p o ly n u c leo t id e phosphorylase
d ig e s t io n o f 11 poly(A) .
Each 200 pi incubation contained 2 ug *H poly(A)*
200 ug iDolynucleo t id e pho sphorylase* 50 mM T ris
(ph 7 . 5 ) ; 15 mM M^Cl2, and varying concentrations cf
potassium phosphate. D ig e s t io n was carried out foi
1 hour at 37°.

fo po
ly
(A)
Acid
pre
cipit
able
Figure 13
70
60
50
40
10
00
Phosphate concentration (mM)

T ris (pH 7»5)> 15 mM MgCl0, fo r 60 minutes at 37°
(Grunberg-Manago,. 1963)* I t can be seen that 15 mM
phosphate i s required fo r complete degradation during t h i s
p er iod .
b) Enzyme con cen tra tio n
Figure l! i shows the rate o f d ig e s t io n with enzyme:
su b strate r a t io s o f 60:1 , 30•1 6:1. I t was known from
Mansbridge e t a l . . 19 7h that the poly ( A) sequence in 9S RNA
rep resen ts between 10 - 15 * ° f the molecule le n g th . Thus,
enzyme : 9S RNA r a t io s o f 30*6 were used fo r the d ig e s t io n
of mRNA.
c) Time o f incu b ation
A liq u ots o f 9S mRNA were incubated with p o ly n u c leo t id e
phosphorylase fo r in c r e a s in g len g th s o f time, u s in g the
con d ition s described above. The rea c tio n was stopped by
the ad d ition o f SLS, and a sample taken fo r s iz e a n a ly s is
on polyacrylam ide g e l s . The remainder was d ep ro te in ised
with phenol/ch loroform , and RNA p r e c ip ita te d w ith e th a n o l.
The p e l l e t was taken up in NETS, and chromatographed on
poly(u ) sepharose. The RNA that was reta in ed on the column
was e lu te d .
The percentage o f RNA th at bound to the column decreased
rap id ly during the f i r s t 7 minutes o f in cu b ation , and only
slow ly a f t e r t h i s (F igure 15)*
The s iz e o f the re ta in ed and unretained RNAs were
compared with that o f the o r ig in a l mRNA on 6Lfo polyacrylam ide
g e l s , with added marker l\S and 5S RNA from mouse r e t ic u lo c y t e s
(Loening, 1969)* (Figure 16, a -e , and Figure 17)*

FIGURE l h .
oRate of di-jestion of II poly(A) with different
concentrations of polynucleotide phosphorylase
Each 200 pi assay contained 1.5 UG ^ P°ly(A),
wi th,' —O — O — , 0.1 ngs enzyme/ml *— • —# — t
0.5 mgs/ml*— A — A —, 1*0 rn^s/ml. Digestion '
for 1 hour at 37°•
as

fo po
ly
(A)
Acid
pre
cipit
able
Figure 14
100
80
60
20
0
Time (minutes)

FIGURE 1 5 .
Effect of increasing periods of polynucleotide
phosphorylase digestion on the retention of 9S
by poly(u) sepharose.
20 pig 93 RNA were incubated at 37° with 100 pig
enzyme in each 200 pi assay. Other conditions
as described.
RNA
of
were

of gl
o'bi
n mR
NA.
reta
ined
Figure 15
100
80
60
40
20
0
40 600 3020 50
Time (minutes)

6l/o polyacrylamide gel electrophoresis of globin
mRNA, following incubation with polynucleotide
pho sphorylase.
a) 10 pp; retained RNA, 0 minutes incubation.
b) 12 jig nonretained RNA, 7 minutes incubation.
c) 11 jig retained RNA, 7 minutes incubation.
d) 15 jig non-retained RNA, 30 minutes incubation.
e) 13 MS non—retained RNA, 60 minutes incubation.
Migration from le f t to right* gels 12 cm long, and
0 . 7 cm diameter* electrophoresis at 2.5 mA/gel for
30 minutes, and then 10 mA/gel for hours. Gels were
scanned at tx o times magnification, using a Joyce—Loebel
UV scanner.

(a)
Figure 16
0 0
(o)
goV OCO
sCO
(a)
gsCM
(•>
Distance (cm)

FIGURE 17*
6 (';> polyacrylam ide g e l e le c tr o p h o r e s is o f g lob in
mRNAs fo l lo w in g incu b ation with p o ly n u c leo t id e
pho sp h o ry la se .
a) 15 jig 9S mRNA.
b) 6 {ig retained RNA, 7 minutes incubation.
c) 12 jig non—retained RNA, 7 minutes incubation.
d) 35 jig mouse 5S and US RNA.
Conditions o f e le c tr o p h o r e s is were as fo r Figure 16 .
Gels were sta in ed with to lu id in e blue as descr ibed by
W illiamson. e t a l . ( l 9 7 l ) »

t31i fTUT>e 1*7
(a) (b) (c) (d)
.t .
; J 'C
' *•f
“ IV
*

The m olecular weight o f the peak o f unbound
p h osp h ory lase-trea ted mRNA v a r ied in f iv e p reparations between
.185,000 and 200,000 (Ave. mol• w t• 190,000) tak in g the
m olecu lar weight o f the un treated mRNA as 220,000 (Figure 1 8 ) .
The tr e a ted bound mRNA m igrates to the same p o s i t io n as
untreated mRNA. A second sm aller peak ( o f ave. mol. wt'.
1 7 5 , 0 0 0 ) was u s u a l ly seen in the tr e a ted unbound p rep aration s ,
as was small amounts o f m ater ia l m igrating in the US-5S
reg ion .
9S mRNA, incubated fo r 7 minutes under phosp h oro lysis
con d it io n s but in the absence o f p o ly n iic leo tid e pho sphorylase ,
was found to be 100$ re ta in ed by a po ly (u ) sepharose •
column. This m ater ia l behaves in an e x a c t ly s im ila r manner
to the o r ig in a l 9S mRNA in g e l and sequence a n a ly se s .
Thus, in the con d it io n s used, in cu b ation o f the mRNA w ith
p o ly n u c leo t id e pho sphorylase fo r 7 mins, resu l.ts in removal
o f enough o f the adenosine res id u es from a proportion o f
the m olecules to prevent t h e ir r e te n t io n by p o ly (u )
sepharose. N eith er th ese unreta ined m olecu les , nor the
reta in ed RITA s u f f e r s i g n i f i c a n t degradation by exon u cleases
(Figure 16 , b & c) • These in cu b ation con d it io n s were used
in subsequent work.
Because o f the p o s s i b i l i t y o f contamination o f the
RNAs w ith small fragments o f p o ly (u ) , the preparation o f
tr e a ted mRNA fo r the a n a ly s is o f messenger a c t i v i t y , was
carr ied out u s in g o ligo (d T ) c e l lu lo s e a f f i n i t y chromatography.

FIGURE 1 8 .
Determination of the molecular weight of treated
globin mRNA.
The treated non—retained mRNA was run on 6<$> poly
acrylamide gels with markers of untreated 9S globin
mRNA (mol* wt. 2*20 x 10"*, Williamson et a l». 1971),
mouse 5S RNA (mol. wt. Jj.l x 10 \ Williamson and
Brownlee, 196 9 ) mouse RNA (mol. wt. 2*6 x 10 \
Staehelin et a l .. 1 9 6 8 ) .

_________________ Figure 18
9SImRNA
1 t re a te d
2*10
5SRNA
10 126 80 2
d is tance migrated (cms)

3*5 Charncterisation of trentod, non-retnined PvNA
■a) Fingerprint pnalynls
Pancreatic RNase hydrolyses Internucleotide bonds in
RNA specifically af ter cytidine and uridine residues, giving
f i r s t a : 3l~cyclic phosphate and then in turn hydrolysing
this to the 31 “pb°sphate • Poly( A) sequences are also
hydrolysed slowly to give oligo(A) fragments by pancreatic
UNase, or by a minor contaminating enzyme activity ,
particularly in solutions of low ionic strength (Beers, i 9 6 0 ) .
RNase hydrolyses internucleotide bonds specifically after guanosine residues, giving oligonucleotides terminating in the 3*-phosphate . Bacterial alkaline phosphatase will hydrolyse 3'"Pkosphate groups (as well as 5'”Pkosphate groups), but id.ll not attack 2l:3l_cyclic phosphates or phosphodiester bonds. Bacteriophage pho sphokinase transfers a phosphate group from the Y'“P°sition of ATP to the 5 f-en<i of an oligonucleotide or a mononucleotide, but not to a nononucleoside.
Therefore, depending on whether the term inal phosphate
i s c y c l i c or n ot, and whether phosphatase i s used, s e r ie s o f
o l ig o n u c le o t id e s o f the form (pA)np 1-1*0H and (pA) pNp w i l l be
generated a f t e r treatment o f RNA with T p lu s p an crea tic
RNases where N can be any o f the four r ib o n u c le o s id e s .
Two-dimensional f in g e r p r in t s o f T p lu s p a n crea tic RNase-
trea ted 9-S RNA, p h osp h ory lase-trea ted non-reta in ed mRNA and
poly(A) are shown in Figure 19* Since p a n crea tic RNase
h yd rolyses c y c l i c purine n u c le o t id e s to 3 f phosphate only s low ly ,
i f at a l l (Markham, 1957), two s e r ie s o f o l ig o n u c le o t id e spots
are seen fo r p o ly (A ), corresponding to (pA)n*-p and (pA)n-0Ik
(Figure 1 9 a ) . For 93 111RNA, the proportion o f the t o t a l

FIGURE 1 9 .
Fingerprints of commercial poly(A), untreated 9S
mRNA and phosphorylase—treated non—retained nRNAt
a) Commercial poly(A) treated with pancreatic RNas
and labelled with phosphokinase.
b) 9S globin mRNA, treated with plus pancreatic
ribonucleases followed by phosphatase and then
labelled at the 5 f end with phosphokinase.
c) Phosphorylase—treated non-rotained nRNA, treate
as in (b) .
3 -=.5 PG of each RNA was used.

>ar
o
SECONO DIMENSION
P O
G Oh %
a-SECOND DIMENSION
&
¥ > -
0 o ? ° 2e1 o 0
^ _ > >;£r” ♦•-O -O O <?
0ioloST--ono .
• t #
%
HrJH *
?3
VO
SECONO DIMENSION

r a d io a c t iv i t y found in these two o l ig o n u c le o t id e i s o p l i t h s
derived from p o ly (a ) (but not in c lu d in g pAp, which i s a lso
found in f in g e r p r in ts o f rRNA) i s approximately 20 - y-/*.
(Figure 19b). The proportion o f r a d io a c t iv i t y in the o lig o (A )
t r a c t s fo r the tr e a ted non-bound mRNA i s 1 • ?* - 0.2',' and the
great m ajority i s found in the sm a lle s t o l ig o n u c le o t id e s .
(Figure 19 c ) .
Tills demonstrates the absence o f at l e a s t 9 0 f i o f the
o ligo (A ) sequences derived from the poly(A) t r a c t , in the
tr ea ted non-reta in ed RNA.
b) Template a c t i v i t y w ith reverse tr a n sc r ip ta se
I t i s known that reverse tr a n sc r ip ta se req u ires a double
stranded primer to commence tr a n sc r ip t io n on the template RNA.
In an experiment in which both u n treated and tr e a ted n on -rcta in ed
g lob in mRNA were copied by reverse tr a n s c r ip ta s e , u s in g
oligo(dT )^^ ^ as primer, the in corp ora tion obtained i s shown
in Table I .
The low l e v e l o f t r a n s c r ip t io n o f the tr e a ted non-reta in ed
mRNA - l e s s than lf> o f the u ntreated mRNA - in d ic a te s that the
preparation conta ins few, i f any, m olecules w ith a poly(A)
sequence long enough to form a s ta b le hybrid with o l ig o ( d rf ) ^ 2-17
under these c o n d it io n s .
3 •6 T ra n s la t io n a l a b i l i t y o f tr e a ted n on-reta ined RNA
a) Using the Krebs I I a s c i t e s c e l l - f r e e system
The dependence o f amino ac id in corp oration on added
trea ted bound and treated- non-bound g lo b in mRNA i s shown in
Figure 20. For both EX As the s t im u la t io n o f in corp oration
i s l in e a r and s im ila r up to Zj picornoles o f mRNA added per
50 pi o f in cu b ation m ixture. The amount o f added mRNA was
c a lc u la te d u s in g m olecular w eights o f 220,000 (c o n tr o l) and

TABLE I
Transcription of untreated and treated non-bound globin mRKA with
reverse transcriptase in the presence of oligo(T) primer*
Cpm/pg of Template
Control globin mRNA
Treated globin mRNA (non-bound)
7.4 i 106 4
4.9 i 10

FIGURE 2 0 .
Dependence o f in corp oration upon concen tration o f added
g lo b in mRNA, in the Krebs a s c i t e s c e l l - f r e e system.
Assays were carr ied out as d escr ib ed in the t e x t .
— O—O—, re ta in ed mRNA, —X ~X n on-reta ined mRNA.
R egression a n a ly s is g iv e s s lo p es o f 1^,900 ( non—retained)
and l / i ,700 (r e ta in e d , o m itt in g one low p o in t ) .

COUN
TS
/MIN
*1
0-4
Figure 20
pMOLES mRNA/REACTION

185,000 ( t r e a te d , non-bound).
The e lu t io n p r o f i l e o f g lo b in chains sy n th es ised a f t e r
ad d ition o f tr ea ted bound and non-bound mllNAs in t h i s l in e a r
range to the Krebs a s c i t e s system i s shown in Figure 21.
The counts recovered in each g lo b in peak and in the breakthrough
peak are g iven in Table I I . The non-bound mRNA i s approximately
h a l f as a c t iv e as the contro l mRNA judged by product a n a ly s is ,
and there i s a g rea ter depression o f a -ch a in sy n th e s is than
p-chain synthe s i s .
b) Using the rabb it r e t ic u lo c y t e ly s a t e c e l l - f r e e system
Figure 22 shows the sep aration o f the g lo b in chains
sy n th es ised in the presence o f added mouse g lo b in mRNA a f t e r
6 minutes in cu b a tio n . Only the mouse 0 -g lo b in chain i s
reso lv ed from the rabbit g lo b in s (L in gre l e t a l . T 197l ) •
I t has been shown (P a lm iter , 1973) that the rabbit ly s a t e
con tr ib u tes 5 nM o f i s o le u c in e to each 2 5 0 pi. assay , and thus
1 . 6 ) ,> o f the i s o le u c in e incorporated w i l l be la b e l l e d .
Mouse 0 -g lo b in con ta in s h i s o le u c in e s /c h a in and rab b it g lob in
an average o f 2 / chain (Dayhoff, 1972) . I t can be c a lc u la te d
that an in co rp o ra tio n o f approximately 2,000 dpm rep resen ts
one picomole o f mouse 8 - g lo b in . A n a lysis o f the t r a n s la t io n
o f mRNA in the Krebs c e l l - f r e e system suggested th a t the mouse
a -g lo b in mRNA was tr a n s la te d at about 50^ o f the e f f i c i e n c y o f
the 0 mRNA, and a small co rrec t io n to the counts in the rab b it
g lob in peak has been made fo r t h i s (Table I I I ) •
The amount o f mouse message added was known, and P alm iter
has estim ated that the rabbit ly s a t e conta ins 10 .9 picom oles
o f rabb it mRNA/assav. The number o f tim es each message was
tr a n s la te d was c a lc u la te d , and the data norm alised fo r the
d i f f e r e n t amounts o f rabb it g lo b in made in each a ssay .

FIGURE 2 1 .
Product a n a ly s is o f the g lo b in chains sy n th es ised in
the Krebs a s c i t e s c e l l —free system, w ith added mOuse
glo b in mRNAs.
5 p i comoles o f mRNA in 100 \jX assays were incubated. o
fo r 60 minutes at 37 • Two urea^-phosphate, CM c e l lu lo s e
columns were run, and the r e s u l t s p lo t te d t o g e t h e r O — O -
re ta in ed mRNA*““X “"X"", non re ta in ed mRNA.

COUN
TS/M
IN
*1
0-
Figure 21
B-GLOBIN
12-
10*
C <- GLOBIN
FRACTION NUMBER
I

TABLE I I
Amino acid incorporation into separated globin chains in the Krebs
ascites system
CC13C00H-
Precipitable Counts in Peak Bound 9S
Eon-bound9S
Eon-bound: Bound ($)
<v-Globin 15,370 3,890 25
p-Globin 24,435 15,513 63
Breakthrough 60,000 70,756
a + p 39,803 19,203 48
Total 100,552 89,959 89.5

FIGURE 2 2 .
Product a n a ly s is o f the g lob in chains sy n th es ised in
a rabbit r e t ic u lo c y te c e l l —free system, w ith added
mouse g lo b in mliNA.
2 .3 p i comoles o f contro l mouse g lo b in mRNA were
incubated in a 250 ul assay, and ex tra cted g lob in
chromatographed on carboxymethyl c e l lu lo s e as described
The absorbance was monitored at 280 nm (------------) and the
f r a c t io n s counted at l\ e f f i c i e n c y ( -------— ~ —) •

c.p.m
.x 10
~3
Figure 22* _ —
Rabbit Giobms
Mouse <x Globin
Mouse P Globin
Fraction

Amino acid incorporation into separated globin chains made in the rabhit
reticulocyte cell-free system*
dpm in each
fraction
picomoles globin chain
made
picomoles of mRNA added
Number of globin chains made per mRNA added
corrected number of chains made. •
6 minute incubation with added deadenylated mRNA
mouse (3 globin 16,080 3.81 2.6 1.46 1.9
total rabbit
glob ins209,400 99.17 10.9 9.1 10.5
6 minute incubation with added control mRNA
mouse p globin 24,803 5.87 2.3 2.55 2.8
totalrabbit
globins241,763 114.47 10.9 10.5 10.5
90 minute incubation with added deadenylated mRNA
mouse p globin 59,280 14.01 1.3 10.78 11.2
totalrabbitglobins
918,130 434,72 10.9 39.88 41.53
90 minute incubation with added control mRNA
mouse p globin 85,160 20.16 1.15 17.53 17.53totalrabbitglobins
956,140 452.72 10.9 41.53 41.53
Thus the amount of globin chains made by the deadenylated mRNA is:
1*9 = 68$ after 6 minutes2.8
an 11*2 “ 64$ after 90 minutes.17.53
The amount of (3 globin mRNA in both the control and deadenylated mRNA was
assumed to be 50$ of the total RNA.
The figures in the last column have been corrected for small differences
(i 10$) in the amount of rabbit globin made in each assay.

A fter s ix minutes the deadenylated mouse mRNA had been
tr a n s la te d tw ice per molecule on average and the trea ted bound
mRNA 2»8 tim es per m olecule on average; a f t e r 90 minutes
the deadenylated mRNA had been tr a n s la te d 1 1 . 2 tim es on average
and the tr e a ted bound mRNA 19*2 tim es on average. The
deadenylated mRNA c o n s is t e n t ly showed only 60 - 70$ the
a c t i v i t y o f the contro l mRNA. However, t h i s f ig u re was
s im ila r at 6 and 90 m inutes.
3•7 Q u an tita tion o f p o ly(u ) sepharose
The a b i l i t y o f poly(u) sepharose to r e ta in poly(A)
con ta in in g sequences q u a n t i ta t iv e ly and reproducibly , i s
important fo r the in te r p r e ta t io n o f the data d iscu ssed in
l a t e r s e c t io n s . Several experiments were dev ised to t e s t t h i s ,
a) With r e t ic u lo c y te nolysomal RNA
.1 mg o f r e t ic u lo c y te polysomal RNA were chromatographed
on 5 mis o f p o ly (u )-sep h a ro se , and the RNA in both re ta in ed
and n on -reta in ed fr a c t io n s was p r e c ip i ta t e d . The non-reta in ed
m ater ia l was recy c led through p o ly (u ) - sepharose 3 tim es.
Small amounts o f RNA were re ta in ed on the column at each c y c le .
Samples o f these RNAs were t i t r a t e d w ith cDNA, and the
percentage o f each th at was complementary to cDNA was
ca lc u la te d , by comparison with a t i t r a t i o n curve o f cDNA and
9S RNA.
80$ o f the g lo b in sequences presen t in the polysomal RNA
are re ta in ed by p o ly (u ) sepharose, on the f i r s t cycle (Figure
23 and Table IV) • Some o f the g lo b in RNA sequences th a t are
not re ta in ed by the f i r s t passage, are reta in ed in second or
subsequent c y c le s . A fter k c y c le s through po ly(u ) sepharose
more than 90$ o f the g lo b in mRNA sequences have been re ta in ed
by the column.

FIGURE 2 3 .
R etention o f g lo b in mRNA sequences by p o l y ( A)
sepharo s e .
The RNA that was not reta in ed by the column was
recy c led , and the amounts o f g lob in RNA sequences
estim ated by cDNA t i t r a t i o n . The percentage o f the
t o t a l g lob in liNA sequences that was^/retained by the
column at each, stage i s p l o t t e d .

%
of gl
obin
m
RM
/ret
aine
d
Figure 23
100
80
60
40
20
0
430 21
Number of passages through poly (U) sepharose

b) With retained TINA
210 jig of the material that was retained by the column
on the f i r s t cycle, vfas rechrornatographcd over 2 mis of poly(u)
sepharose. The RNA in the retained and non-retained fractions
was t i t ra te d with cDNA. The percentage of RNA sequences
complementary to cDNA was calculated by comparison with a
9S - cDNA t i t r a t io n curve.
More than 9 7cb °f "the globin RNA sequences were retained
by the column, in this second cycle (Table V).
c) With mRNP RNA
Globin mliNP was prepared from anaemic mouse reticulocyte
polysomes, by taking a crude INS cut from a 71XTV zonal
sucrose gradient (Figure 2). RNA was extracted from th is ,
and a proportion analysed on 2. acrylamide gels (Figure 2N).
About 20 o of the RNA ran in the 9S region, by comparison with
standard RNA markers. 15 Jig of this RNA was chromatographed
on 1 ml of poly(u) sepharose, and the retained and non-retained
fractions t i t r a te d with cDNA. The proportion of sequences
complementary to globin cDNA, was calculated by comparison
with a 9S :1ZNA-cDNA t i t r a t io n curve (Table VI) .More than ty&fo of the globin RNA sequences prepared from
INS mRNP were retained by poly(u) sepharose.
d) Using oligo(A) of different lengths
Known amount is of poly(A) (mol. \\Tt . greater than 100,000),
oligo (A)10 and oligo(A)^ were applied to 2 ml columns of
poly(u) sepharose. Non-retained material was washed off with
a known volume of NETS, and the absorbance at 260 nm was
measured. The amounts of each RNA that were not retained by
the column, were expressed as a percentage of the loading
sample (Table VII).
Under these conditions, only oligo(A)^ was not
appreciably retained by the column.

Retention of retained globin mRNA.
Amount of RNA. in each fraction
(jig ).
Percentage of RNA. complementary to globin cDNA
Amount of globin mRNA in each fraction (jig).
Percentage of Total globin mRNA sequences
Retained RNA. First oyole 217 62 134.5 -
Retained RNA. second cycle 153 91 139.2 97.3
Non-retained RNA. second cycle
64 5.9 3.8 2.7

FIGURE 2h •
2.6/j polyacrylamide gel analysis of RNA extracted
from INS mllNP.
6 jig of RNA were layered on to gels 0.7 cm in
diameter, and 7 cm long. Electrophoresis was for
20 minutes at 2 mA/gel, and then 70 minutes at
6 mA/gel.
The gel was scanned at 2 times magnification on
a Joyce—Loebel gel scanner. The positions of 1 8 s ,
9 3 and 5 3 PITA bands that were run on a parallel gel,
are shown by arrows.

Figure 24
18S
4 61 32 5
Distance (cm)

TABLE VI
Retention of mRNP globin mRNA by poly(U) sepharose
Amount of RNA in each fraction
(us)
Percentage of RNA complementary to globin cDNA
Amount of globin mRNA in each fraction (jig)
Percentage of total globin mRNA sequences
RetainedRNA. 3.3 48.2 1.591 98.4
Non-retainedRNA 3.7 0.7 0.026 1.6

TABLE YU
Retention of Adenosine oligomers by poly(U) sepharose
Amount of RNA Percentage of RNA(ug) not retained
poly(rA) 133 15.8
oligo(rA)10 102 <3
oligo(rA)y 112 >98
Samples applied to a 1 ml po!y(u) sepharose column.

c) With nuclear RNA
q-hi adenosine labelled nuclear RNA prepared from cells
of the Friend erythroleukaernic line (clone M2) was kindly
donated by Dr. M. Getz. Cells were harvested in mid log-phase
growth, af te r labelling for 16 hrs ( l mCi, 1 jjmole of II
adenosine per l i t r e ) (Gilmour et a l . 4 197,0 • Nuclei were
prepared using the c i t r ic acid procedure, and nuclear UNA
isolated as previously described. This RNA was fractionated
on 2 mis of poly(u) sepharose. 22 of the labelled RNA
was retained by the column (Table V III) .
The retained and non-retained RNAs were digested in
high salt with a mixture of pancreatic and T DNases, as
described before,and the reaction stopped by the addition of
SLS• The long poly(A) sequences were separated from
nucleotides and other oligo nucleotide sequences, by
chroniaography on poly(u) sepharose. The small amounts ofqII poly(A) were eluted from the column with buffer containing
oligo(rA)^Q and mouse JjS and 5S RNA. The RNA was precipitated
with ethanol, taken up in NETS, and a proportion counted.
The amounts of RNA binding to poly(u) sepharose at th is
stage are shown in Table V III. The remainder of the sample
was run on 12^ polyacrylamide gels (Figure 25) • About
of the nuclear poly(A) seqtiences are found in the RNA that binds
to poly(u) sepharose before digestion. This poly(A) is
heterogeneous in size, with material running between IjS and 5S
RNA markers. Digestion releases an additional 2% of j:>oly(A)
that can be retained by poly(u) sepharose. This material
consists entirely of small sequences of 10 - 20 residues in
length.

Retention of nuclear RNA. by poly(U) sepharose before and after
RNase digestion*
Percentage of RNA in each fraction
•Amount of RNA retained after digestion (cpm)
Amount of RNA non-retained after digestion (cpm)
Percentage of RNA retained after digestion
Retained nuclear RNA 22.2 3,672 447,645 0.82
Bon-retained nuclear RNA* 77.6 360 1,564,797 0.02

12/0 polyacrylamide gel electrophoresis of nuclear
p ° i y ( a ) .
After digestion with a mixture of and pancreatic
RNases, the res is tan t material that was retained by
poly(u) sepharose, was subjected to electrophoresis
along with markers of 5S and US RNA, (Al0 ) and
bromophenol blue. Electrophoresis was at 1»5 mA/gel
for 30 minutes, and then at 8 mA/gel for hours, on
0.7 cm by 12 cm gels. The gels were scanned at one
half magnification, and then sliced and counted.
The positions of the marker RNAs were used to alignthe two experimental samples: -------------, absorbance at
260 nm* —0“ 0 “ , cpm per 3 slices for the retained
nuclear R N A ’ — # — cpm per 3 slices for the nonrr.
retained R N A .

Figure 25
0 5 10 t5 20 25 30 35
\J LU>J_number

3 . 8 Identification of globin mRNA in mouse foetal l ivers
During the 11th to the l 6 th day of foetal mouse
development, the l ive r becomes the main erythropoietic organ,
and the synthesis of adult globin chains occurs in the
cytoplasm of the cells (Kovach et a l .. 1967; Cole fit a l ..
1068). RNA sequences coding for globin have been previously
detected in the nuclear RNA from IJ4 day foetal l ivers
(Williamson et a l .. 1973)*
a) Presence of globin niRNA in lfy day rfoetal l ive r polysomes
220 & 260 un^^s polysomes were prepared from 68
lJj day foetal l ivers . ' 3 ^ 0^0 un-*- s °f .polysomes were
analysed on a 10 - 30‘g sucrose gradient 'in TKM (Figure 26) .v
The majority of the material consists of polysomes of greater
than Zi ribosomes/message.
RNA was prepared from the 3RiHt «£ tttBe polysomes, and
chromatographed on poly(u) sepharose. Approximately V p of
the RNA was retained by the column. The RNA was analysed
on 2 » 6 <fo acrylamide gels (Figure 27)* The foetal l ive r
polysomal RNA shows 3 minor peaks running between 18S and 58
(Figure 27a), as does the RNA that is not retained by the
column (Figure 2 6b). The retained material shows a considerable
enrichment of RNA in the 9S region (Figure 27c), as compared
with a reticulocyte 9S RNA (Figure 27d) . About 15Vy the
retained RNA i s in the 9S region, with most of the other RNA
running at 28s and 1 8 s .
b) Messenger activity of foetal l ive r RNA
30 (jig of retained RNA was tested for globin messenger
ac tiv ity in a duck cell-free system. Figure 28 shows the
elution profile of globin chains from a CM cellulose column,
and the stimulation of mouse a and 3 globin chain synthesis by
the RNA sample. This stimulation i s approximately one quarter

rj.ouitu .
Sedimentation of l h day foetal l iver polysomes.
0 . 7 5 ^260 units of foetal l ive r polysomes were
layered onto a 10 — 3& r sucrose gradient in TKM
and spun in the M.S.J5. 3 * 6 . 5 ml titanium swing—out
rotor at 60,000 rpm for 20 minutes at Ji° . The
absorbance at 260 nm was monitored (----------) and the
percentage sucrose (-----—) estimated from the refractive
index of each 0 . 5 ml fraction.

Figure 26
Direction of
sedimentation
30
25
20
15
10
4 6
Fraction number
10 12
'Sucrose concentration
( %
,)

2.6'?, polyacrylamide gel analysis of foetal l iver
polysornal RNA.
Electrophoresis was in 0.7 cm by 7 cm gels, for
15 minutes at 2 mA/gel, and then 70 minutes at
6 mA/gel. Gels were scanned at two times magnification
on a Joyce—Loebj l UV scanner I
a) 60 jj.g foetal l iv e r polysornal RNA •
t>) 70 |j.g foetal l iv e r non— retained polysornal RNA.
c) 17 MG retained polysornal RNA.
d) ff Rg reticulocyte 9d globin mRNA.

Figure 27
(a)
t o
(o)
(a)
OvoCO
gVOCVJ
ovoCO LA/Acj>VOCVJ A
3 4Distance (cm)

CM cellulose chromatogram of globins from a duck
reticulocyte cell—free system, to which was added
poly(u) sepharose retained polysornal UNA from 1/t day
mouse foetal l ive rs .
The absorbance a 280 nm was monitored -------------- *
—"O—’0 “, endogenous incorporation of ^ 'c—leucine *O
O GT~ incorporation of il—leucine in the presence
of 3 .0 MG of retained foetal l iver polysornal UNA.

OPTI
CAL
DENS
ITY
AT 28
0 nm
Figure 28
1 4 0 0
1000
8 0 0
6 0 0
4 0 0
o-o- 200
10 20
F R A C T I O N N U M B E R
C.P.M
PE
R FR
ACTI
ON
14C
(*—
•) 8
3H (0
—o)

to one f i f t h that o f pure 9S RNA prepared from r e t ic u lo c y t e s .
This value i s in agreement with the p u r ity o f the RNA
as estim ated from 2 .6$ acrylamide g e l a n a ly s is . T ran sla tion a l
s tu d ie s thus in d ic a te that 0 .20 - 0 . 25$ o f the f o e t a l l i v e r
polysornal RNA i s g lo b in mRNA. This i s approximately one
ten th o f the amount o f g lob in mRNA found in anaemic mouse
r e t i c u lo c y t e s .
3.9 R etention o f f o e t a l l i v e r g lob in sequences by p o ly (u )sepharo so
a) Polysornal RNA
Samples o f the polysornal RNA, and the re ta in ed and
non-reta in ed UNA were t i t r a t e d with cDNA. 0*/j8$ o f the
sequences in polysornal RNA are complementary to g lob in cDNA,%
by comparison with a cDNA - 9S RNA t i t r a t i o n (Table I X ) .
This value i s approximately two fo ld h igher than in d ic a te d by
t r a n s la t io n a l work. The RITA that i s re ta in ed by the po ly (u )
sepharose, i s considerably enriched in g lob in sequences.
About 38$ the RNA i s complementary to g lob in cDNA • Since
1$ o f the t o t a l RNA was re ta in ed by the column, i t can be
c a lc u la te d that 80$ o f the polysome a sso c ia te d g lob in sequences,
are re ta in ed by p o ly(u ) sepharose (Table IX) . This f ig u re
i s in good agreement with the value obtained fo r the r e te n t io n
o f r e t ic u lo c y t e polysome a sso c ia te d g lob in sequences.
b) Cy to p i asmi c RNA
T otal cytoplasm ic RNA was prepared u sing Nonidet NP-JjO.
CytOTjlasmic RNA conta ins a s l i g h t l y g rea ter proportion o f
and 5S RNA than f o e t a l l i v e r polysornal RNA, but appears
o the rwise id e n t i c a l on 2 .6$ acryl amide g e l a n a ly s is (F igure 29 a)
This RNA was chromatographed on poly(u) sepharose, and the
s ta r t in g RNA, and the re ta in ed and non-reta ined RNA t i t r a t e d
with cDNA. By comparison with a cDNA-OS RNA t i t r a t i o n curve,

cDNA estimation of globin mRNA sequences in the RNA. of 14 day foetal liver
polysomes, and the retention of the globin RNA. sequences by poly(U) sepharose*
Proportion of Total RNA in each fraction
Percentage of RNA complementary to globin cDNA
Column 1 z Column 2
Percentage of total globin sequences
Total foetal liver polysornal RNA.
1.0 0.48 0.48 -
RetainedRNA. 0.01 38.0 0.38 78
Non-retainedRNA 0.99 0.11 0.109 22
0.489

2.6‘;> polyacrylamide electrophoresis of nuclear and
cytoplasmic UNAs from erythroid and non—erythroid
t i s sue s .
Electrophoresis was in 0.7 cm by 7 cm cels for
15 minutes at 2 m A / g e l and then 70 minutes at 6 m A / g e l .
Gels were scanned at two times macnification, on a
Joyce Loebel UV scanner.
a) 70 US of 1h day foetal l iver cytoplasmic UNA.
b) 15 MG of 1 day foetal 1 iver nuclear RNA •
c) 60 UG of adult brain cytoplasmic RNA.
d) 18 UG of adult brain nu clear RNA.
e) 70 UG of adult l ive r cytoplasmic RNA.
f ) 15 UG of adult l ive r nuclear RNA.
c ) 80 UG of L Y cell cytoplasmic RNA.
h) 50 UG of L Y cell nuclear RNA.

F ig u re 29
( a )
lb)
( c )
8CM
OvoCM
OV OCM
5s 4 s

(©)
( n
(s)
F ig u r e 297&Z 4-s
&C v l
voCvl
U/

0 .3 $ o f the s ta r t in g RNA i s complementary to g lo b in cDNA
(Figure 30a) • About 0*7$ o f the RITA was re ta in ed by the
column. This RNA was considerably enriched in g lob in RNA
sequences, and contained 69$ o f the t o t a l g lob in sequences
presen t in cytoplasm ic RNA (Table X) . This f ig u re i s about
10$ lower than the amount o f re ta in ed g lob in RNA sequences
in f o e t a l l i v e r polysornal RNA.
In other p rep aration s , between 67 - 72$ o f the cytoplasm ic
glob in RNA sequences are re ta in ed by po ly(u ) sepharose,
whether the RNA i s made by Nonidet NP-J}0, or by the c i t r i c
acid method ( l y s i s in TK!I-sucrose) • However, the abso lute
l e v e l s o f g lo b in RNA sequences in RNA prepared by NP-^0 are
approximately tw ice that o f RNA prepared by l y s i s in TKM-sucrose,
c) In t o t a l n u c lea r RNA
N uclei were i s o la t e d from 11* day f o e t a l l i v e r s u s in g
e i t h e r c i t r i c ac id or Nonidet NP-JiO. The y i e l d o f RNA u sin g
the c i t r i c ac id procedure was about one h a l f th a t o f the
Nonidet NP-?iO tech n ique. RNA prepared by e i t h e r method
e x h ib i t s sharp ribosomal and ribosomal precursor peaks on
2 .6$ acrylamide g e l s (Figure 29b), and shows no d e te c ta b le s ig n s
o f degradation . M aterial m igrating slower them. 32S can be
seen on the g e l scan s. Approximately 10$ o f the t o t a l n u c lear
RNA prepared in t h i s way sediments at g r e a ter than 35S in
NETS/sucrose g ra d ien ts (Dr. M. Getz, personal communication).
Samples o f both RNAs were t i t r a t e d w ith cDNA. By
comparison w ith a cDNA-9S RNA t i t r a t i o n (Figure ^Oa) t 0 .1 5 $
( i O.O2/0) o f the RNA i s complementary to g lob in cDNA (average
o f four d i f f e r e n t p rep arations) • The RNA was chromatographed
on poly (u ) sepharose, and the re ta in ed and n on -reta in ed m ater ia l
t i t r a t e d w ith cDNA. Between 1 .6 - 2 .0$ o f the RNA was reta in ed

cl.)NA t i t r a t i o n o f RMAs f r o m e r y t h r o i d and. n o n —e r y t h r o i d
t issues.
0.3 ng of cDNA were incubated with increasing amounts of
tes t RNA to a 1)Gt of 0.12 mol. I (for l/i days), and
hybrids analysed as described. The t i t r a t io n curve
for the 9 3 RNA— cDNA was calculated, and the scale for the
other RNAs adjusted for the values to f i t th is curve.
a) $ 93 RNA-cDNA.
flU foetal l ive r cytoplasmic RNA—cDNA.
A foetal l iver nuclear RNA—cDNA.
b) 9 9 3 RNA—cDMA •
A adult l iver nu clear 1 IN A—c I)N A •
O adult brain nuclear RNA—c3)NA .
X L Y cell nuclear RNA—cDNA.
O 33 • Coli ribosomal RNA—cDNA.

RN
A/cD
NA
P E R C E N T c D N A H Y B R I D I S E D
> ■ •
Figure 30
(a)

f
P E R C E N T c D N A H Y B R I D I S E D .
Oi
Figure 30
("b)

t a ble x .
eDNA estimation of the globin mRNA. sequences present in 14 day
foetal liver total cytoplasmic RNA., and the retention of these
sequences by poly(U) sepharose.
Proportion of RNA in each fraction
Percentage of RNA complementary to globin cDNA
Column 1 x Column 2.
Percentage of total globin sequences
Total cytoplasmic RNA. 1.0 0.30 0.30 -
Retained cytoplasmic RNA. 0.7 35 0.245 69.2
No n-retained cytoplasmic RNA. 0.993 0.105 0.104 29.8
0.349

by tlie column. This RNA was enriched in g lo b in RNA sequences,
and contained about 50$ o f the t o t a l n u clear g lo b in sequences
(Table X I ) .
2 .10 Presence o f g lob in RNA sequences in o th er t i s s u e s
a) Preparation o f n u c lear and cytoplasm ic RNA
The method o f preparation o f RNA was m odified fo r
d i f f e r e n t t i s s u e s .
1 . Adult mouse l i v e r s
Nuclear and cytoplasm ic RNA was made from perfused l i v e r s
o f adult male mice u s in g e i t h e r the c i t r i c a c id , or the
Nonidet NP—U0 method. In one preparation , u s in g the c i t r i c
ac id method, 8 mg o f cytoplasm ic RNA, and 100 pg o f G50 —
excluded n u c lear RNA were obtained from *3 perfused l i v e r s .
In s im ila r p rep arations u s in g Nonidet NP— Z*0, 5 — 10 tim es
more n u c lear RNA was obta ined . Adult l i v e r n u c le i are
known to be f r a g i l e during preparation (Dr. Gilmour, personal
communication)•
2. Adult mouse brains
20 b ra in s were used to prepare 3 mS ° f cytoplasm ic RNA
and 0 .6 mg o f G50 excluded n u clear RNA u sin g an osm otic
shock technique to ly s e the c e l l s . N uclei were p e l l e t e d
from dense sucrose to reduce l i p i d contam ination.
3• From mouse lymphoma L5178Y c e l l s
Z* x 10^ c e l l s (a kind g i f t o f G. Lanyon) were grown as
described in Gilmour e t a l ». 197*1, and used to prepare 9 mS
o f cytoplasm ic RNA and 2 mg o f n u clear RNA by the c i t r i c
acid method.

TABLE XI.
cDNA estimation of the globin RNA sequences in the nuclear RNA of
14 day foetal livers, and the retention of the globin RNA sequences
by poly(U) Sepharose.
Proportion of Total RNA in each fraction
Percentage of RNA complementary to globin cDNA
Column 1 x Column 2.
Percentage of total globin sequences.
Total nuclear RNA. 1.0 0.15 0.15
Retained nuclear RNA
0.017 3.0 0.051 49
Non-retained nuclear RNA. 0.983 0.055 0.054 51
0.105
These results are the average of 3 different preparations.

b) Gel a n a ly s is o f RNA
These cytoplasm ic and n u c lea r RNAs were run on 2 .6$
acrylamide g e l s (F igure 29, o - h ) . The cytoplasm ic RNAs
contain d i s t i n c t 28S, 18s and Z»S and 5S RNA, and show
l i t t l e evidence o f breakdown. The n u c lear RNAs are s l i g h t l y
contaminated with m ater ia l m igrating in the kS reg ion o f the
g e l . This may be fragments o f DNA, or represent some
breakdown o f n u c lea r RNA. Small amounts o f 28s and 18S RNA
are p resen t which may r e f l e c t a degree o f contamination o f
the n u c le i w ith cytoplasm ic RNA. However, d i s t i n c t 32S
ribosomal precursor RNA can be seen, as w e ll as a considerab le
amount o f RNA m igrating slow er than 32S, or not en ter in g
the g e l •
c) A n a ly s is o f g lo b in RNA sequence content o f RNA
These RNAs were t i t r a t e d with cDNA. The l e v e l s o f g lo b in
RNA sequences in each were c a lc u la te d by comparison w ith a
9S RNA—cDNA t i t r a t i o n curve (Figure 30h and Table X II) .
H yb rid isa tion o f cDNA to RNA sequences can be d e tec ted
i n a l l cytoplasm ic and n u c lear RNAs. However, cDNA does
not become r e s i s t a n t i f incubated to DQt o f O.O33 w ith
large amounts o f E . c o l i RNA (Figure 3 0 b )• The l e v e l s o f
g lo b in RNA sequences in the n u c lear RNAs o f brain , adult l i v e r
and L Y c e l l s , are 30 — 70 tim es lower than those found in
the n u c lear RNA o f f o e t a l l i v e r . The amounts found in the
cytoplasm ic RNA o f th ese t i s s u e s are lower than th a t found in
the n u c le i by a f a c t o r o f 2 — 10, and lower than that found
in the f o e t a l l i v e r cytoplasm by g r e a ter than a fa c to r o f 3 00*
Very low l e v e l s o f g lo b in RNA were d e tec ted in the cytoplasm ic
RNA o f L Y c e l l s , and an accurate t i t r a t i o n curve was not ob ta ined .

cDNA estim ation o f the lev e ls o f globin RNA sequences in the RNA of
adult mouse t is s u e s , and a mouse c e l l l in e .
Percentage of RNA complementary to globin cDNA
Adult liver nuclear RNA 0.005
Adult liver cytoplasmic RNA 0.0009
Adult brain nuclear RNA 0.002
Adult brain cytoplasmic RNA 0.0015
L5178Y cell nuclear RNA 0.002
L5178Y cell cytoplasmic RNA
not greater than 0.00005
c l) Retention of the globin RNA sequences from brain andi ivor RNA by noly(u) sepharoso
A sample of the nuclear and cytoplasmic RNAs from these
tissues was chromatographed on poly(u) sepharose, and the
retained and non-retained RNAs t i t ra te d with cDNA• The
percentage of sequences complementary to cDNA was calculated
by comparison with a cDNA-95 RNA t i t r a t io n curve. The
retained RNAs are enriched in globin sequences. °T "the
l iver nuclear globin RNA, and hVfo of the brain nuclear globin
RNA sequences are retained by the column (Table XIII).
These values are slightly lower than that found in foetal
l iver nuclear RNA. Less than hO^l of the globin sequences
found in l ive r cytoplasmic RNA are retained by poly(u)
sepharose, but more than SO';, of those found in brain cytoplasmic
RNA are retained.
3 . 1 1 Estimation of the reticulocyte contamination of thenuclei preparations
The levels of globin sequences found in the cytoplasm
of the adult tissues can be partly explained by contamination
with circulating reticulocytes. In normal adult mice, about
2 »0 fo of the circulating blood cells are reticulocytes
(Wintrobe, 1 9 6 1 ) . However, contamination of nuclear material
with intact reticulocytes seems unlikely.
This was tested by homogenising the blood cells from
anaemic mice in TKM-sucrose, followed by the normal c i t r ic -
acid procedure. The amount of nucleic acid in each fraction
was estimated from the absorbance at 260 nm of the sample,
af ter phenol extraction and precipitation with ethanol (Table
XIV). The fraction normally used to prepare cytoplasmic RNA
contains 59, of the possible reticulocyte RNA, and the nuclear
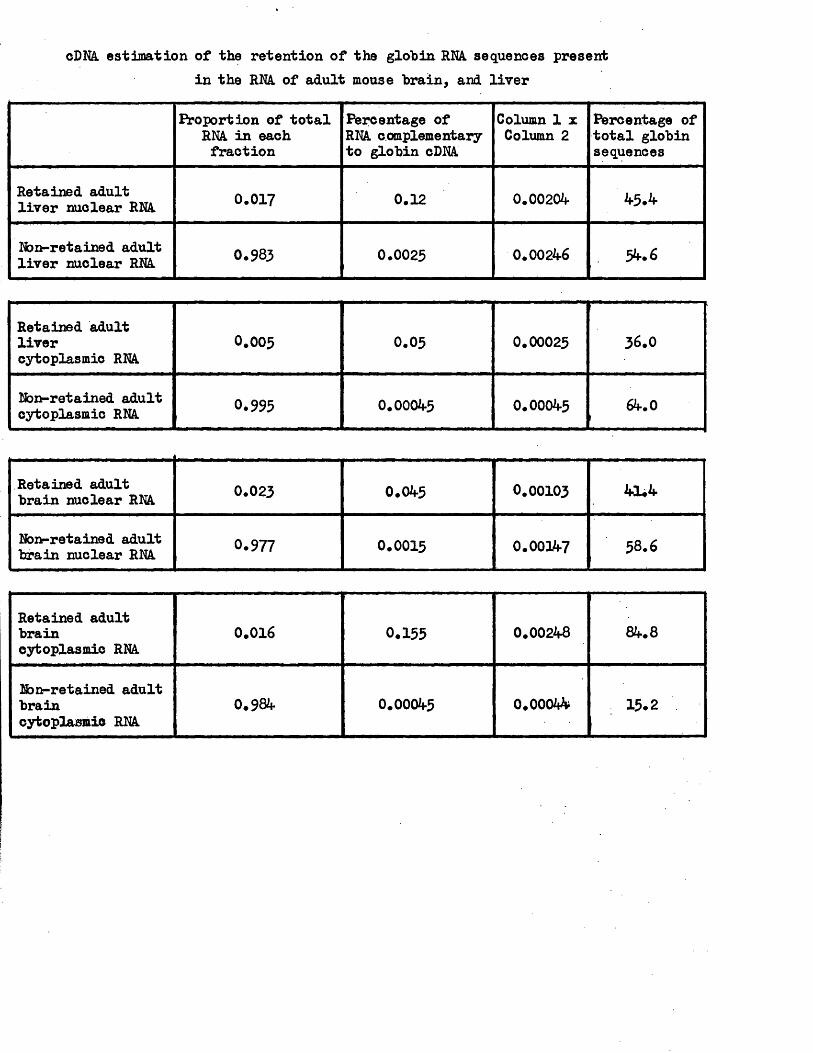
cDNA estim ation o f the retention o f the glohin RNA. sequences presentin the RNA. o f adult mouse brain, and liv e r
Proportion of total RNA in each fraction
Percentage of RNA complementary to globin cDNA
Column 1 x Column 2
Percentage of total globin sequences
Retained adult liver zxuolear RNA. 0.017 0.12 0.00204 45.4
Non-retained adult liver nuclear RNA. 0.983 0.0025 0.00246 54.6
Retained adult livercytoplasmic RNA
0.005 0.05 0.00025 36.0
Non-retained adult cytoplasmic RNA 0.995 0.00045 0.00045 64.0
Retained adult brain nuclear RNA 0.023 0.045 0.00103 41*4
Non-retained adult brain nuclear RNA 0.977 0.0015 0.00147 58.6
Retained adult braincytoplasmic RNA
0.016 0.155 0.00248 84.8
Non-retained adult braincytoplasmic RNA
0.984 0.00045 0.00044 15.2

TABLE XIV
Distribution of globin mRNA sequences from anaemic mouse
reticulocytes following extraction by citric acid procedure.
Amount of nucleic acid in each fraction (jig)
Percentage of total nucleio acid in each fraction
TKM/sucrose homogenisat ion 298 5.!
Combined supernatants of citric acid washes 5,600 94.7
Pellet after 3 X citric acid washes 12.6 0.2

fraction 0.2$. Gel analysis of these fractions showed that
the nucleic acid in the nuclear pe l le t was DNA, presumably
from white cells in the blood. The material in a l l other
fractions was indistinguishable from normal reticulocyte
cytoplasmic RNA.
3*12 Analysis of hybrids
The f ide l i ty of the hybrids formed between globin cDNA,
and the sequences present in brain, adult l ive r and LY cell
nuclear RNA, and foetal l ive r nuclear and cytoplasmic RNA,
were compared with a globin RNA-cDNA hybrid,
a) Ilelting analysis of hybrids
An estimate of mismatching in the hybrid formed between
cDNA, and sequences in the RNA of different sources, can be
obtained by comparing the Tm of the hybrid with that of a
cDNA-9S RNA hybrid. Hybrids were melted in 50$ formamide/
hybridisation buffer. The Tm of cDNA-9S RNA under these
conditions is 69° (Figure 3l) ♦ The T of the other hybrids
i s slightly lower than this (Figure 31, Table XV) . This
difference represents at most 3$ mismatching of sequences in
the hybridising RNA (Laird et a l .. 1969; Ullman and McCarthy,
1973a, b) as compared with 9S RNA-cDNA. This i s not
significantly greater than the expected experimental error,
to) Size analysis of hybrid molecules
A sample of each hybrid was treated with nuclease.
Any short single stranded regions in the RNA-cDNA hybrid will
be nicked. Recent data suggests that nuclease may nick
a single mismatched base in a hybrid molecule (Dr. P. Harrison,
personal communication)• Carrier RNA was added, and the sample
desalted through {*25 sephadex. Each sample was then mixed
M e lt in g b e h a v io u r o f cDNA—RNA h y b r id s from e r y t h r o id
and non—e r y t h r o id c e l l s .
20,000 cpm of globin cDNA were incubated in 30 pi of
formamide—hybridisation buffer with test RNA to 14 times
D0t . ( 5 days) . This solution was diluted 10 fold with
formamide—hybridisation buffer, and incubated in sealed
capillaries containing 20 jxl for 5 minutes, at the
appropriate temperature. Analysis of hybrids was then
as described in the text. The ratios ofRNA/cDNA during
annealing were the lowest necessary to convert 80$ of
cDNA into hybrid form. The data were normalised to
correct for the amount of cDNA which failed to form
nuclease resistant hybrid (10 — 1 5$) and for the Si
resistant fraction of cDNA at 96° (about 5$)*
O • 9S RNA-cDNA.
A, adult liver nuclear RNA— cDNA.
■ foetal liver nuclear RNA—cDNA.
Q adult brain nuclear RNA-cDNA.
X L Y cell nuclear RNA—cDNA.
A foetal liv er cytoplasmic RNA—cDNA.

PER
CENT
HY
BRID
RE
SIST
ANT
TO Si
N
UC
LEA
SE.
F ig u re 31
7 0
6 0TEMPERATURE

TABLE XV
Analysis of hybrids of cDNA, and RNA. from erythroid and non-
erythroid tissues
Melting Temperature °C
MaximumPercentageMismatching
Mo.wt of cDNA after Si treatment
Daltons
Possible Number of Nicks/laybrid
9S RNA. 69.2 - 49,000 1
Brain nuclear RNA. 66*6 35s 33,000 2
Liver nuclear RNA. 66.5 3J2 34,000 2
Foetal liver nuclear RNA. 68.2 49,000 1
Foetal liver cytoplasmic RNA 61.0 2% 29,000 2
L T cellnuclear RNA 69.0 0% -
The original size of the cDNA used in this experiment was 100,000 daltons*

with, a marker DNA of known size, and layered onto a 5 ~
alkaline sucrose gradient.
After centrifugation, the DNA was fractionated by upward
displacement with 20<p sucrose, the refractive index and
rfosorbance at 260 nm measured, and an aliquot of each fraction
counted (Figure 32). The sedimentation profile of the
marker DNA was the same in each tube.
From the calculated peak molecular weight of each cDNA
(Table NV) i t can be seen that a f te r nuclease treatment,
the cDNA hybridised to 9S RNA and foetal l ive r nuclear RNA
has been nicked on average once, and the hybrid from foetal
l iv e r cytoplasmic RNA, and brain and adult l iv e r nuclear RNA,
has been nicked twice.
3.13 Absolute amounts of globin RNA sequences in differenttissues
Using a modified Schmidt-Tannhauser method, the relative
amounts of DNA and RNA were estimated in the erythroid and
non-erythroid tissues, and in nuclei isolated from these
t issues . From this the relative amounts of DNA in the
nucleus and cytoplasm can be calculated (Table XVI) .
Combining this wd.th data in Table XXI, the absolute
concentration of globin sequences in the tissue studied was
calculated (Table XVII).
There i s a 25 - 75 Told difference in globin sequences
in the nucleus of the erythropoietic tissue, when compared
with the other tissues, but a much greater difference of 200-
/l,000 fold in the cytoplasm. A higher percentage of the
cellular globin sequences are thus found in the cytoplasm of
foetal livers , than adult l ivers or brains.

FIGURE 32-
Size analysis of* the Sj_ nuclease resistant cDNA
hybridised to RNA from erythroid and non—erythroid
cells •
Samples were centrifuged on 5 — 10% alkaline sucrose
gradients in an M.S.E. 6 x 15 ml swing—out rotor, at
2 ^ ,0 0 0 rpm for 38 hours at 20°. 0 . 7 5 ml fractions
were collected, an aliquot counted and the A
measured. The peak absorbance of the !*S marker DNA
was the same in each gradient. The refractive index
of each fraction was measured, and the molecular weight
calculated—• — •-£ The size of cDNA from a 9S RNA
hybrid adult liver nuclear RNA—A—A— foetal
liv er nuclear RNA ” B ~ H a d u l t brain nuclear RNA“□
and foetal liver cytoplasmic RNA *" A ~ i s shown.
The peak fraction of unhybridised cDNA, centrifuged in
a parallel gradient is shown by an arrow.

3H
c.p.
m./F
ract
ion
f ig u r e 32
300
200
100
MarkerDNA cDNA
1 1 1 1 1 I I
10
12
10
8
1
Fraction No.
MoL wt. (x10“4)

Estimation of the relative amounts of RNA. in the nucleus and
cytoplasm of mouse brains, and adult and foetal livers*
RNA. : DNA. ratio of total
material
RNA : DNA ratio of nuclear
material
Ratio of cytoplasmic RNA:
nuclear RNA
Percentage of Total cell RNA in cytoplasmic and nuclear RNA
Mult mouse brain 1.065 : 1 0.155 : 1 0.91 : 0.155 85.4 : 14.67
Mult mouse liver 3 .8 2 : 1 0.187 s 1 3.633 : 0.187 95.1 • 4.9
Mouse foetal liver 1.04 : 1 0.148 : 1 0.892 : 0.148 85.6 : 14.4

TABLE XVII
Estimation of the number of molecules of globin RNA present in the
nucleus and cytoplasm of erythroid and non-erythroid tissues.
RNA content in pg/cell
Fraction of RNA complementary to cDNA x 106
Number of molecules of 9S mRNA per cell
Percentage of total globin
RNA.
Adult Liver nuclear RNA 1.12 50 150 38
Adult Liver cytoplasmic RNA 21.8 4 240 62
Adult Brain nuclear RNA 0.93 20 50 17
Adult Brain cytoplasmic RNA 5.46 16 240 83
L51787 cell nuclear RNA 0.9 20 50 83
151787 cell cytoplasmic RNA 5.1 0.5 10 17
14 day foetal liver nuclear RNA 0.89 1,500 3,700 8
14 day foetal liver cytoplasmic RNA 5.35 3,000 44,000 92
Reticulocyte cytoplasmic RNA 2.6 20,000 140,000 -
Number o f m olecu les 9S RNA = Avogadros Number w eight RNAMol. w t. 9S mRNA ° ° mP ^ “ e n ta ry

DISCUSSIONPage
it.l Evidence that 9S RNA comprises a and £globin mRNA
Evidence that cDNA is a faithful transcriptof 9S RNA
k .2 Factors affecting hybridisation reactions
The specificity of the hybridisation reactions
Factors affecting the rate of hybridisation
*♦•3 Estimation of the number of globin genes in themouse genome
If.4 Translation of mouse globin mRNA from which thepoly (a) sequence has been removed
Demonstration of removal of poly(A)
Translation of deadenylated mRNA in cell—freesystems
Quantitation of poly(u) sepharose
I*.6 Globin RNA metabolism in the mouse foetal liv er
Detection of globin mRNA in the 1J» day foetal liv er cytoplasm by translational studies
Detection of globin RNA sequences in the cytoplasm of foetal livers using cDNA
cDNA estimation of globin RNA sequences in thenucleus of foetal liver
k * l Presence of globin RNA sequences in the RNA ofnon—erythropoietic tissues
96
97
100
10
107
113
lli*
121
The nuclear post—transcriptional regulation of 123globin gene expression

DISCUSSION
l|.l Before attempting to draw conclusions from the work
presented here, two fundamental assumptions must be c ritica lly
examined. They are I—
a) That mouse reticulocyte 9S RNA comprises mainly the
messenger RNAs for a and 3 globins.
b) That cDNA is a faithfu l transcript of most of the
sequences present in 9S RNA*
a) Evidence that 9S RNA comprises a and 8 globin mRNA
l) Since about 90$ of protein synthesis in reticulocytes
is represented by globin, i t i s assumed that the purity of
the mRNA prepared from reticulocytes must approach this value.
2») The 9S RNA is selected by i t s retention by poly(u)
sepharose, and must therefore contain poly(A) • This excludes
contamination with rion—messenger RNA molecules, such as
fragments of ribosomal RNA* This retained RNA runs as a
diffuse 9S peak in 2.6$ (Figure l) and 6$ (Figure l6a)
polyacrylamide gels, with l i t t l e other contaminating RNAs.
The peak molecular weight of this RNA has been calculated
to be 220,000, with a molecular weight range in the band of
Z|0,000. This represents 660 bases — 120 (Williamson et a l ..
1971) • When run on denaturing formamide gels, only two peaks
of RNA can be resolved (Morrison et a l . T 197*0 •
Thus, by these .physical c rite ria , 9S RNA contains enough
information to code for two proteins of about 1 6 ,0 0 0 molecular
weight•
3 ) 9S RNA directs the synthesis of mouse a and 3 globin in
the duck and rabbit reticulocyte cell—free system, and the
Krebs I I ascites cell—free system (Figure 3, 22 and 21
respectively). Lane et a l . (1971) have studied the tryptic

peptides released from non—oocyte proteins synthesised after
injection of rabbit reticulocyte 9S RNA into oocytes.
No peptide was observed that did not correspond to peptides
obtained by tryptic digests of carrier haemoglobin.
These three points are strong evidence that 9S RNA
comprises mainly the messages for a and b globin.
b) Evidence that complementary DNA is a faithfu l transcriptof 9S RNA
1) cDNA is about 60$ of the size of the 9S RNA molecule
and contains about (G + C) (Harrison et a l . . 197*»a) .
Moreover, a fter depurination, only about **$ of the nucleotides
in cDNA bind to poly(A) sepharose under conditions in which
poly(dT) binds completely ( j . Manabridge, personal communication).
cDNA contains, therefore, a very small proportion of poly(dT)
sequences. About 8 5$ of cDNA sequences hybridise to excess
9S RNA at a temperature 15° below the T of a *»0$ (G + C)
RNA—DNA hybrid under these conditions (Bishop, 1972 )•
2) The bulk of the cDNA sequences represent reasonably
faithfu l transcripts of the 9S RNA sequences. This is shown
by the fact that only about one nick per 9S RNA—cDNA hybrid
molecule is introduced by treatment with Sj_ nuclease (Figure 6) •
Any regions of mismatching, therefore, must be either too small
for nuclease to recognise or be clustered. An independent
estimate of mismatching in the cDNA—9S RNA hybrid can be obtained
by comparing i t s Tm (6 9 °) with that of reannealed mouse DNA
fragments (77 to 78°) (Figure 7)* After correcting for slight
differences in (G + C) content, this means that the Tm of
cDNA—9S RNA hybrid is 9 — 10° below that of the reannealed DNA
duplex of the same (G + C) content (Gruenwedel et a l .. 1971)*
This difference in Tm is 3 — k° more than that reported for

perfect RNA—DNA hybrids (Kohne, 1969; Gelderman et a l .. 1971),
which implies at most 2$ mismatching of sequences in cDNA
with respect of 9S RNA (Laird et a l». 1969; Ullman and
McCarthy, 1973a, b) • One explanation of this mismatching is
that cross—hybridisation of a and 3 globin cDNAs to 3 and a
globin mRNAs in 9S RNA might occur. However, th is appears
most unlikely from consideration of the amino acid sequences
of a and 3 mouse globins (Dayhoff, 1972). The most likely
explanation of the mismatching is that reverse transcriptase
introduces a low frequency of mistakes during transcription
of 9S RNA in v itro .
The results show that most of the cDNA represents a
faith fu l, but partia l, transcript of sequences present in
the purest preparations of 9S RNA available, which contain
mainly.globin mRNAs. Nevertheless, i t is conceivable that
cDNA might represent transcripts of contaminant RNA sequences
in 9S RNA that do not specify globins.
3) The titra tio n of a fixed amount of cDNA with increasing
amounts of 9S RNA can be used to determine whether cDNA consists
of copies of a ll or some of the classes of molecules present
in 9S RNA« The result of such a titra tio n experiment is
shown in Figure 5 •
The concentration of cDNA used for each point on the
titra tio n curve was determined from the specific activity of
cDNA, which in turn was estimated from the specific activity
of the nucleotide precursor, assuming a 50$ (C + T) content
in cDNA. With such small amounts of cDNA i t is not
possible to confirm independently the assumed specific
activity , and hence any errors in the estimate will affect
the RNA/cDNA ratios. This ratio is similarly affected by

errors in the RNA concentrations, which were obtained by
serial dilution.
Maximum levels of hybridisation were obtained at RNA/cDNA
ratios oi 1 — 1 . J*. This indicates that the cDNA is\
complementary to 60$ of the RNA sequences, a finding that is
consistent with the size of the cDNA*
In a more rigorous theoretical analysis, Young et a l .
(197*4) include the assumption that in cDNA excess, there is
a greater probability of hybridisation of the larger fragments
of cDNA* Predictions from this are in close agreement with
the observed data in Figure 5, and i t can be concluded that
experimental errors in the RNA/cDNA ratios are minimal, and
also that v irtually a ll classes of molecUles in 9S RNA are
transcribed.
*4) Young et a l . (197*4) have measured the complexity of this
cDNA* The kinetics of the hybridisation of cDNA to 9S RNA
are in agreement with second—order reaction theory. Hence,
the time—course of the hybridisation of cDNA to an equal amount
of 9S RNA can be converted, using the appropriate factor, to
the DNA—DNA reaction of the same base composition and complexity.
By comparison with the renaturation of E. coli DNA, i t was
estimated that cDNA was transcribed from a to tal RNA sequence
of between 700 and 800 bases, i .e . longer than a single mRNA
molecule. This suggests that cDNA consists of partia l copies
of two different raRNAs, giving a to ta l complexity of 700 — 800
bases, with a mean fragment size of 330 bases. Since the
titra tio n experiment shows that cDNA consists of copies of
virtually a ll classes of molecules present in 9S RNA, i t is
probable that cDNA includes transcripts of both a and 3 mRNAs.
I f cDNA transcripts of a and 3 mRNA are sufficiently different
to prevent cross—reaction (Dayhoff, 1972), the most likely

interpretation of these results is that cDNA comprises partia l
transcripts of both a and 3 globin mRNA. Furthermore, the
requirement for poly(dT) primer for 9S RNA transcription and
the presence of adenine—rich sequences at the 3' terminal
(Mansbridge et a l .. 197*1,* Burr and Lingrel, 1971J Dim and
Cane 11 aids, 1970) strongly suggests that such partia l transcripts
are in itia ted at the 3f end of the mRNA.
The results from these experiments thus support the
conclusion that cDNA represents transcripts of both a and 0
globin mRNAs, each transcript being a p artia l, non—random
copy of i ts template 9S RNA molecule.
Although there is as yet no proof, i t is assumed that
any slight imbalance of a and b globin mRNAs, as noted by
Morrison et a l . (197*0, will be reflected by a similar imbalance
in the cDNA transcript.
k .2 Factors affecting hybridisation reactions
The use of cDNA as a probe for globin sequences in DNA
and RNA f ir s t requires a knowledge of the factors affecting
(l) the specificity of the reaction between cDNA and sequences
complementary to i t , and (2) the rate at which this reaction
will occur.
l) The specificity of the hybridisation reactions
The related problems here are the complementarity required
of 2 reacting molecules before a stable duplex between them
can form, and the proportion of non—complementary base pairs that
can be accommodated before the partia l hybrid will be detected
as single stranded. With respect to this la tte r point, the
two methods of detection used in these studies d iffer considerably
in their stringency. The f ir s t , the binding of hybridised
molecules on hydroxyapatite is relatively non—stringent, and
probably a region of about 17 base pairs may allow the retention

of a large, partially-hybridised molecule (Wilson and Thomas,
1973)• The second method, the recognition of unhybridised
sequences by nuclease, is highly specific, with both single-
stranded ends, and internal regions of mis—matching (possibly
as l i t t l e as one mis—matched base pair (Dr. P. Harrison,
personal communication), being degraded by the enzyme.
The properties of a hybrid molecule are most easily
defined by i ts mean thermal dissociation (Tm), and using this
parameter, the effect of several factors on the stringency of
reaction can be determined.
The temperature of incubation and the cation concentration
considerably affect the rate and specificity of reaction.
The reaction proceeds most rapidly at high cation concentrations
and at elevated temperatures up to 20 — 25° below the Tm of the
hybrid (Marnrur and Doty, 1962; Wetraur and Davidson, 1 9 6 8 ).
Short, or highly mis—matched duplexes have a low Tm, and thus
will not form at high temperatures or low salt concentrations.
Such conditions are thus used for experiments with cDNA, where
the formation of mis—paired hybrids is not desired. For studie
using heat—labile RNA, similar stringent conditions at lower
temperatures have been worked out with organic solvents such as
formamide (McConaughy et a l .. 1 9 6 9 )*
From several studies i t appears that the minimum stable
length of a hybrid may be about 10 — 20 base pairs, with a G — C
rich fragment requiring a shorter minimum length, than an A — T
rich fragment. Above this length, the s tab ility of the
oligomer approaches that of the polymer of similar base
composition (Lipsett, 196**; Niyogi and Thomas, 1 96 7 ,' Ruger and
Bautz, 1 9 6 8 ). The effect of mis—matching on the Tm of a hybrid
has been determined from studies using synthetic polymers and

modified bacterial polynucleotides, and indicates that theoTm of the resulting duplexes is reduced by about 0.7 C per
1$ base modification (Bautz and Bautz, I 9 6 Z*; Laird et a l ..
1 9 6 9 ; Ullman and McCarthy, 1973a and b ).
Thus even under stringent conditions of incubation, a
considerable degree of mismatched bases may not significantly
reduce the ab ility of two molecules to form a hybrid. I f the
minimum stable length of hybridisation is 20 nucleotides, i t can
be estimated (Walker, 196 9 ) that up to 1**$ random base change
in a molecule of 500 nucleotides, will not greatly reduce the
proportion of hybridising molecules which have less than one
of these 20 nucleotide regions. All these molecules will thus
be detected as hybrids by hydroxyapatite. The proportion of
molecules that can form a hybrid rapidly decreases as further
base changes accumulate, and about 1*0 $ base changes will
prevent hybrid formation completely.
The effect of unhybridised free ends on the Tm appears to
be smaller than for internally unhybridised regions (Subirana,
1966; Manmir et a l .. 1 9 6 3 ) .
Finally, the sugar backbone of the reacting molecules
will affect the s tab ility of the hybrid. The greater range
of s tab ilitie s of RNA—DNA hybrids is reflected by a greater
breadth of thermal transition (Chamberlin and Patterson, 1 9 6 5 ),
but for natural polynucleotides, the RNA—DNA hybrids are less
stable than DNA—DNA hybrids (Bolton and McCarthy, 196**) .
Factors affecting the rate of hybridisation
I t has now been well established that the renaturation of
DNA follows second order kinetics (Nygaard and Hall, 1969;
Britten and Kohne, 1968,* Wetmur and Davidson, 1 9 6 9 ) • The
rate limiting step in th is reaction appears to be the formation

of one, or a few, correct base pairs at some in—register
point along the two strands, and is followed by a rapid
zippering reaction of the rest of the base pairs. Although the
rate of reaction will thus increase with fragment size, a steric
effect of large molecules results in the observation that the
rate is proportional to the square root of the length (Wetmur
and Davidson, 196 8 ) • The rate is a maximum at a temperature
25° below the hybrid Tm (Marmur and Doty, 1 9 6 2 ), and is reduced
by solvent viscosity (Subirana, 1966) . High G — C content
and high ionic conditions will also increase the rate of reaction
(Wetmur and Davidson, 196 8 ; Schildkraut et a l .. 196l) •
Thus for any unique DNA (such as a v iral or prokaryotic
DNA) the rate of re as so ciation is inversely proportional
to the sequence complexity (Marmur and Doty, 196l)• In higher
organisms, both fast, intermediate and slowly annealing
sequences have been observed (Britten and Kohne, 1 9 6 8 ) •
However, interpretation of these annealing classes depends on
the effect of mismatching on the rate of annealing of these
sequences. During the formation of a duplex, the in stab ility
introduced by a mismatched base appears to have a large
effect on the rate of hybrid formation (Southern 1971,*
Sutton and McCallum, 1971; Britten and Bonner, 1971) • Thus
i f base sequences d iffer only by 10$, the rate of the
heterologous hybridisation reaction between them is so reduced
that the reaction with the exactly complementary partner wi'
Clearly for experiments where the rate of DNA annealing
is being measured, the presence of mismatched sequences must
be taken into account.
occur.

*1*3 Estimation of the number of globin genes in the mousegenome
As can be seen from Figure 11, the rate of annealing of
cDNA to mouse DNA is the same as that for the reassociation
of mouse DNA, whether mouse DNA is isolated from erythroid cells
(foetal liver) or sperm. The sizes of cDNA and the mouse
DNA fragments are not reduced significantly during the period
of annealing (Figure 12), and l i t t l e correction is required
for mismatching in the cDNA-mouse DNA duplexes (Figure 7)*
Since the slight extent of mismatching in cDNA—9S RNA hybrids
is the same as that in cDNA-mouse DNA duplexes, cDNA must
anneal only to those globin genes expressed in mouse reticulocyte
9S RNA, or to very closely related variants. In the mouse,
the only globin genes that might possibly be sufficiently
similar in th is respect are the 3 and z chains (l**$ amino acid
differences). Mouse a and x chains are quite dissimilar (36$
amino acid differences)(Steinheider et a l .. 1971)*
These facts taken together show that in a ll the mouse
tissues studied, the sequences in their DNA complementary to
cDNA — the a and 3 globin genes — are about as frequent as the
most slowly re as so elating DNA sequences.
However, by comparison with E. coli DNA the observed rate
of hybridisation of mouse DNA is about five times as high as
predicted, suggesting that the ttunique sequences" are present
as five copies in the mouse genome. Harrison et a l . (l97**a)
have compared the rates of re as so elation of mouse DNA fragments
of various sizes. They observed that with fragments of larger
or smaller size, the bulk of the DNA reassociates more quickly
or slowly respectively, as predicted by Wetmur and Davidson (1 9 6 8 )
and Sutton and McCallum (1971)• Th& discrepancy between
observed and predicted values decreased with decreasing fragment

size, and with, the smallest fragment size (120 bases) the
bulk of the mouse DNA sequences appear to be unique. This
is almost certainly explained in terms of the greater
separation of unique and rep e titite sequences in mouse DNA
with very small fragments.
Other workers using DNA fragments of about 500 nucleotides
have also observed th is faster rate of reassociation. Thus,
Melli et a l . (1971) observed a fourfold faster reassociation
of sonicated rat DNA fragments than predicted for single—copy
sequences. Bishop et a l . (1972) and Bishop and Rosbash (1973)
have reported a similar, though slightly smaller, discrepancy
for duck RNA fragmented by sonication, whether duplex formation
was assayed optically, by hydroxyapatite chromatography or
resistance to single—strand—specific nuclease. This eliminates
the possibility that the method for assay of duplex is the
explanation of the discrepancy.
From the data in Figure 11, and the complexity of the
cDNA (Young et a l .. 197**) s n estimate can be made of the amount
of DNA per haploid mouse genome, that is complementary to the
cDNA* These calculations substantiate the conclusion that
the cDNA is hybridising to only a single copy of the a and |3
genes in the DNA from the mouse tissue^ studied (Page 77) •
In a study of DNA made from whole 1** day mouse embryos,
similar values for the rates of hybridisation of cDNA to the
DNA, and for the number of copies of globin genes per genome,
have been observed (Harrison et a l . . 197**a) .
I t can thus be concluded that in the mouse! (a) there are
probably only single, but not more than four to five copies each
of the a and 3 globin genes in the mouse germ line* (b) that
there is no globin gene amplification in erythroid cells, since

foetal liver in this stage of development contains 80$
erythroid cells, of which a ll but the most immature contain
detectable amounts of globin mRNA (Harrison et al *. 1973),*
said ( c) that there is no widespread elimination of globin genes
during non—erythroid somatic differentiation, since the globin
gene dosage in sperm, to tal embryos and erythroid cells is the
same. This conclusion concerning the numbers of genes in
various mouse tissues would be valid even i f episomal copies
of the globin gene existed. Since we prepared a ll DNAs by
the hydroxyapatite method (which would retain even gene—size
fragments of DNA), the DNAs used in these experiments should
include any nuclear DNA sequences, whether of chromosomal
origin or otherwise.
These findings are in agreement with other recent reports,
which compare the rate of annealing of cDNA or in vivo labelled
duck reticulocyte 10S RNA to excess duck DNA,with that
expected theoretically for reassoelation of unique duck DNA
sequences. These reports show that the globin genes in the
duck may be slightly reiterated (two to three copies; Bishop
et a l .. 1972; Packman et a l .. 1972; Bishop and Rosbash,
1 9 7 3 ), and that there is no globin gene amplification in duck
erythroid cells (Packman et a l«. 1972)* These studies did not
investigate whether degradation of cDNA or mismatching of cDNA
with respect to duck DNA introduced any correction to these
quoted values.
These results imply that transcriptional and post-
transcriptional mechanisms must be entirely capable of regulating
the levels of globin gene expression in mouse tissues.
Different transcriptional availability of the globin genes has
been clearly shown by several workers (Axel et a l .. 1973;

Gilmour and Paul, 1973? Steggles et a l .. 197**) • Post-
transcriptional mechanisms for the regulation of gene
expression are less clearly documented, although control
processes at the level of mRNA translation have been
demonstrated (Nudel et a l .. 1973; Wiggle and Smith, 1973J
Heywood et a l .. 197**) •
The poly(a) sequence of eukaryotic nuclear RNA, and
cytoplasmic mRNA has been implicated in both nuclear and
cytoplasmic mechanisms for the control of gene expression at
the RNA level (jelenik et a l .. 1972; Adesnik et a l .. 1973;
Darnell et a l .. 1973; Perry et a l .. 197**; Sheiness and
Darnell, 1973; Brawerraan, 1973)* The possible cytoplasmic
role of the globin mRNA poly(A) sequence has f ir s t been
inve stigated.
I*. *» Translation of mouse reticulocyte globin mRNA from whichthe poly(A) sequence has been removed
a) Demonstration of removal of poly(A)
Optimisation of the conditions of polynucleotide
phosphorylase digestion was important for several reasons I—
(l) In order to minimise endonucleitic attack of 9S mRNA, i t
was desirable for the incubation time to be short, and the
amount of protein added to be small. (2) I t was also thought
possible that a high salt concentration might result in artefacts
of degradation due to secondary structure of the RNA.
The isolation of the treated mRNA used in these experiments
depends upon i t s nonbinding to oligo(dT)—cellulose. This
material migrates at a maximum molecular weight of 200,000 and
an average molecular weight of 185,000 (Figure l6b), at least
20,000 below the molecular weight of intact mouse globin mRNA.

The uncertainty as to the exact molecular weight of mouse
globin mRNA does not affect the calculation of the difference
in molecular weights, which depends upon the relative
mobility of the intact and treated 9S RNA*
Only small amounts of absorbing material migrate other
than in the major component of mol. wt. 185,000 after
phosphorylase treatment (Figure 16b). At least 80$ of the
RNA is in this peak, and there is l i t t l e i f any material
migrating in the position of intact 9S mRNA.
I t can be seen from the stained gels (Figure 17) that
removal of the poly(A) sequence modifies the behaviour of
9S RNA, with a considerable reduction in the heterogeneity
of migration of the RNA* With this sharp peak of molecular
weight 185,000, a faster moving species of average molecular
weight 175,000 is frequently seen (Figures l6b and 17).
The relative proportion of this smaller molecule increases
with the length of the digestion period. Since neither
molecule is retained by oligo(dT) cellulose, th is smaller
RNA must represent a second distinct digestion product.
The poly(a) sequence of mouse globin mRNA is approximately
50—70 residues in length (Lim and Canellakis, 1970; Morrison
et a l .. 1973; Mansbridge et a l .. 197*0 and therefore the
molecular weight reduction is calculated to be sufficient to
remove a ll of the poly(A) sequence. I t is of in terest that
after fractionation of the treated mRNA the bound material s t i l l
migrates at a position identical with untreated mRNA. This
may be due to a to tal lack of degradation by the enzyme, or to
a secondary structure which is dependent for i t s maintenance on
the existence of at least a short poly(A) sequence. When the
entire poly(A) sequence is removed, the secondary structure
and migration properties may change considerably. Further

analysis of the poly(A) sequence and i t s interaction with the
rest of the mRNA molecule will be necessary to resolve this
point•
The phosphokinase fingerprint of the pancreatic RNase T
digest (Figure 19), demonstrates the absence of at least
90$ of the oligo(A) sequences derived from the poly(A) tract
in intact globin mRNA* Therefore i t can be concluded from
the lack of binding to oligo(dT)—cellulose, the reduction in
molecular weight, the lack of template activity with reverse
transcriptase and the absence of oligo(A) isop liths,that the
treated preparation is essentially free of poly(A) sequences
on the 3 ' end.
Since human globin mRNA, which migrates to the same
position as mouse globin mRNA on gels, is known to contain
long untranslated nucloetide sequences between the normal
termination codon and the poly(A) sequence of both a— and
3—globin mRNAs (Clegg et a l .. 1971J Flatz et a l .. 1971),
similar sequence may occur in other mammals. The reduction
in size obtained after enzyme treatment would not be
sufficient to affect the globin coding sequence of minimum mol.
wt. 1 J|3 ,0 0 0 (a chain) and 1 8 , 0 0 0 ( 3 chain).
Polynucleotide phosphorylase attacks RNA from the 3* ®nd
and is particularly active in digesting homopolymers,
including poly(A) (Grunberg—Manago, 1 9 6 3 ).
With 9S mRNA, digestion by the enzyme does not proceed
rapidly beyond the f i r s t hundred nucleotides or so. This
may be because of the rapid rate of digestion of homopolymer
as compared with RNA, or due to secondary structure of the
RNA molecule. Globin mRNA is known to have a high hyper—
chromicity, indicating considerable secondary structure
(Williamson e t a l .. 1971,* Lingrel et a l .. 1971)*

b) Translation of deadenylated mRNA in cell—free systems
I t can be seen from Table II that in the Krebs ascites
cell-*-free system, the incorporation into mous<$ 0, and 0 globin
directed by the treated, non—bound mRNA is about 50$ that of
the control RNA* A similar observation is made for 0 globin
chain synthesis in the rabbit reticulocyte system (Table I I I ) .
This value is similar after 6 minutes and 90 minutes incubation.
The amount of mouse globin synthesis obtained with added mouse
mRNA is that expected for the rabbit lysate system, as Palmi ter
has previously shown a transit time of approximately three
minutes for translation of a globin pdlypeptide chain.
The somewhat lower globin synthesis directed by the
deadenylated as compared to the control mRNA may reflect an
Inherent effect due to the removal of the poly(A) sequence,
but i t is more likely to reflect contamination of the deadenylated
mRNA by small fragments of RNA broken by contaminating endo
nucleases, which contribute to the optical density of the
sample but cannot contribute to polypeptide synthesis.
This incorporation seen is s t i l l very much more than
could be accounted for by contamination with in tact globin
mRNA. The fingerprint data demonstrate that the treated mRNA
contains less than 10$ of the oligo(A) fragments derived from
poly(A) in intact globin mRNA. This small amount of material
which could be derived from poly(A) sequences in the mRNA is
very short in fragment length and shows a different distribution
from that obtained with untreated mRNA, making i t unlikely that
i t is obtained from a proportion of the in tact mRNA molecules.
The incorporation experiments were carried out in a
response range where amino acid incorporation is linear with
added mRNA* Even 10$ contamination with in tact globin mRNA
would at most account for 20$ of the observed incorporation into
globin chains •

The Krebs cell—free protein synthesis system used to
assay for globin synthesis in these experiments is much less
effic ien t than in vivo protein synthesis and i t is unlikely
that each exogenous mRNA molecule is translated more than
once (Mathews et a l . . 1972).
In Figure 20, the dependence of incorporation upon the
concentration of added globin mRNA is shown for the Krebs
system. The in i t ia l slopes of the lines are the same,
demonstrating that the messenger activity of the treated and
untreated mRNA is the same. I f removal of the poly(A)
sequence had reduced the ability of the RNA preparation to
in itia te protein synthesis, the slope of this line for the
treated RNA would be lower.
There is , however, a puzzling discrepancy between the
fact that CCl COOH—precipitable counts for treated and control
mRNAs are equal, but globin chain synthesis is less for the
treated messenger (Figure 21). This may be due to an
increased number of incomplete polypeptide chains; analysis
of the "break—through" peak of the CM-^cellulose column showed
more counts for the treated than control mRNA, which increase
the measured incorporation to an approximately equal level
(Table I I )• However, although this peak contains polypeptide
material (Mathews and Osborn, 1971), which may represent
incomplete globin chains, i t is not clear i f i t is globin mRNA
directed, and further work is required to elucidate the reason
for th is difference.
The difference in ratio of a— to (3—globin chains for the
treated mRNA may be due to the characteristics of the cell-free
system, in which a factor required for the specific synthesis
of a—globin has been demonstrated (Wiggleand Smith, 1972).

phospborylase digestion, possibly because of i t s secondary
structure. Gorski et a l . (197**) have demonstrated that although
the poly(A) sequence of mouse globin mRNA is heterogeneous, the
size range of the sequence is similar On both a and 0 messages.
The translational ability of the 175,000 d ail tons band was not
tested separately, but i t s molecular weight makes i t unlikely
that i t lacks the codons for the terminal region of the
globin protein.
These experiments thus demonstrate that globin chain
synthesis is primed in a heterologous cell—free system by
deadenylated globin mRNA* They also show that the efficiency
of re in itia tion of this mRNA is not significantly lower than
control mRNA* This indicates that the poly(A) sequence, is
not involved directly in the processes of translation, namely,
initiation,elongation, termination or re in itia tion . These
results are in agreement with those of Bard et a l . (197U ) •
Recently however, Huez et a l . (197**) have studied the fate
of deadenylated rabbit globin mRNA during translation in Xenopus
oocytes. Although in itia lly this mRNA is translated efficiently ,
after a few hours the rate of haemoglobin synthesis decreases
considerably, as compared with the synthesis by control,
adenylated globin mRNA. I t thus appears that although the
poly(A) sequence is not necessary for mRNA translation, i t is
required to sustain high functional s tab ility and repeated
translation.
I t is not yet known how the poly(A) sequence may function to
increase mRNA stab ility . I t has been suggested that poly(A)
secondary structure may reduce the effect of exonucleitic
degradation of the coding sequences. I t may also serve as a
site of attachment for a protecting protein (Kwan and Brawerman,
1972,* Bloebel, 1973)* The very low stab ility of the only known
eukaryotic mRNAs to lack poly(A) — the histone messengers —
suggests such a role for the poly(A) sequence.

*♦•5 Quantitation of poly(u) sepharose
For interpretation of the results discussed in la te r
sections, the ab ility of the poly(u) sepharose colums to retain
a ll poly(A) containing RNA was crucial. The experiments
carried out to test this can be summarised as follows.
a) About 80$ of the globin RNA sequences present in
reticulocyte polysomal RNA are retained by the column on the
f i r s t cycle. The length of the poly(A) sequence on retained
molecules in 50 — 70 nucleotides (Mansbridge et a l .. 197**) •
In subsequent passages through poly(u) sepharose, small amounts
of globin RNA are additionally retained by the column (Table IV).
After four passages through poly(u) sepharose 90$ of the globin
RNA sequences have been retained.
b) More than 97$ of* globin RNA sequences that have been once
retained on poly(u) sepharose, are retained when rechromato—
graphed on the column (Table V).
c) More than 98$ of globin RNA sequences made from 1**S mRNP
are retained on poly(u) sepharose (Table Vi).
d) 22$ of labelled nuclear RNA from growing cells is retained
by poly(u) sepharose (Table VIII). This agrees well with
published figures of Jelenik et a l .(l972) and others. 0 .8 2$
of this RNA is resistant to digestion by RNase, and migrates as
several heterogeneous peaks in polyacrylamide gels. 0 .0 2$ of
the RNA that is not retained by poly(u) sepharose is RNase
resistant (Table VIII)♦ This material is approximately 10
nucleotides long (Figure 25). I t thus appears that in the
loading buffer used, the secondary structure of the nuclear RNA
does not prevent the retention of poly(A) containing RNA by
poly(u) sepharose.
e) In conditions where more than 97$ of oligo A(iq) is retained
by poly(u) sepharose, less than 2$ of oligo A^j is retained
(Table VII). This shows that the minimum stable length of hybrid

between poly(u) and poly r( A), In 0.1M NaCl at 21°C is about
10 nucleotides* This is in agreement with published figures
(Lipsett, 1 9 6 /4).
From the values given in Tables IV and V i t can be
calculated that a 1 ml column of poly(u) sepharose will
retain at least 50 — 70 pg of globin mRNA. This value is
in agreement with published data (Lindberg and Persson, 1972) •’
The results summarised above demonstate the validity
of using poly(u) sepharose as a means of isolating the vast
majority of the poly(A) containing RNA molecules from both
nuclear and cytoplasmic RNAs.
k *6 Globin RNA metabolism in the mouse foetal liver
The 1/* day mouse foetal liver was chosen to study other
possible mechanisms of post—transcriptional control at the
RNA level. A large proportion of the cells of th is tissue
are actively synthesising a and 0 globin in the cytoplasm
(Kovach et a l .. 1 9 6 7 ; Cole et a l .« 1 9 6 8 ). I t has also been
demonstrated that the HnRNA of these cells contain globin
RNA sequences (Williamson et a l .. 1973)*
a) Detection of globin mRNA in the 1/4 day foetal livercytoplasm by translational studies
In several of the early attempts to make cytoplasmic RNA
from foetal livers, considerable degradation of the RNA
occurred. The modified method described circumvents these
problems, as can be seen by the polysome profile obtained
(Figure 2 6 ) and the bands observed in gel analysis (Figure 27)*
A large proportion of the foetal liver RNA that is
retained by poly(u) sepharose runs as a heterogeneous peak
between 18s and 5S, with a peak at about 9S, by comparison
with a standard RNA preparation (Figure 27)• This retained
material contains the messenger RNA for mouse a and 0 globin,

as seen by i t s ab ility to prime for a and 0 globin chain
synthesis in the duck reticulocyte cell—free system (Figure 2 8 ).
These translational studies indicate that the amount of
globin mRNA in the to tal polysomes of I k day foetal livers,
is about one tenth of the amount found in anaemic mouse
re ti culocytes•
b) Detection of globin RNA sequences in the cytoplasm ofl*t day foetal livers using cDNA
The amount of globin RNA sequences in. foetal livers can
most easily be quantitated using a cDNA probe. The cDNA
forms a stable hybrid with the sequences present in foetal
liv er cytoplasmic RNA, and the hybrid melts 2.2° below the Tm
of a cDNA—9S RNA hybrid (Figure 31). A similar decrease in
the Tm of a foetal liver cytoplasmic RNA“ cDNA hybrid has been
noted by other workers in this laboratory (Harrison et a l ., 197**c) •
A possible explanation for th is decrease would be the
hybridisation of cDNA to RNA sequences coding for other globin
chains. However, the synthesis of non—adult haemoglobins
has not been observed in foetal livers (Kovach et a l .. 1967,*
Cole et a l .. 1968) . After treatment of the- oDNA—foetal liver
RNA hybrid with nuclease, the size of the cDNA is only
reduced 3 Told (Figure 32), indicating a maximum of 2 regions
of mismatching.
These observations make i t highly unlikely that
hybridisation of cDNA to sequences other than a and 0 globin
mRNAs is occurring.
Titration of 12* day foetal liv er polysomal RNA with
globin cDNA demonstrates that about 0.2*8$ of the RNA is
complementary to globin cDNA (Table IX) • This is about one
quarter of the value observed for reticulocyte polysomes.

80$ of the foetal liv er polysome—associated globin mRNA
sequences are retained by poly(u) sepharose. This value is
similar to those obtained by Adesnik et a l . (1972) in HeLa
cells, and Greenberg and Perry (1972) in L cells. Since most
mRNAs are thought to be polyadenylated, these low values may
result from the action of nucleases during RNA extraction, as has
been observed in the removal of the poly(A) sequence from
globin mRNA extracted from anaemic mouse spleen (Cheng et a l ..
197**) • However, a similar value of 80$ retention has been
obtained using the polysomes of anaemic mouse reticulocytes
(Table IV) which are known to be low in nucleases (Mathias
et a l .. 196**). This makes th is explanation unlikely.
I t has been suggested that a decrease in the length of the
poly(A) sequence of cytoplasmic mRNAs may be part of the
messenger ageing processes of the cell (Sheiness and Darnell,
1973)• This would result in a considerable heterogeneity
in the length of the messenger poly(A) sequences especially in
long-lived messengers such as globin mRNA. Since oligo(A)
sequences shorter than (a)iq will not be retained by poly(u)
sepharose (Table VII) th is ageing process would result in
the non—retention of a proportion of the globin mRNA present
in both reticulocyte and foetal liver polysomes.
The message that is no longer being translated will bepresent in the cytoplasm of the cell un til i t is degraded.
These sequences will represent a class of cytosol mRNAs that'-will not be retained by poly(u) sepharose. Other mRNAs freein the cytoplasm will be newly synthesised molecules that
have just exited from the nucleus. These messages will allcontain a long poly(A) sequence; and will be retained by poly(u) sepharose•

This scheme of mRNA turnover in the cytosol and polysomes
is in agreement with the observation that a lower proportion
(70$) of the globin RNA sequence in the to tal cytoplasmic
RNA than in polysomal RNA, are retained by poly(u) sepharose
(Table X).
The level of globin RNA sequences in the cytoplasm of
1*4 day foetal livers in about 0 . 3$ (Figure 30a)* However,
since erythroid cells contain more RNA than reticulocytes
(Table XVII) this value can be calculated to represent about
30$ of the number of globin mRNA molecules found in
reticulocytes (Table XVII) •
At this stage of foetal development the liver comprises
of up to 70$ erythroid cells, made up of both stem cells , and
recognisable erythroid cell types, from immature proerythroblasts
to mature erythrocytes (Paul et a l .. 1 9 6 9 ). In situ
hybridisation of globin cDNA to these cells has demonstrated
the presence of globin RNA sequences in the cytoplasm of a ll
erythroid cells, with the exception of the proerythroblasts
(Harrison et a l .. 197**c) . The to tal percentage of cells in
the foetal liver that do not contain cytoplasmic globin mRNA
can be estimated to be about 2|0$ (data from Harrison et a l •.
197 hc). This will increase the relative proportion of globin
mRNA in the cytoplasm of the erythropoietic cells from 0.3$
to 0 .5$. From this i t can be estimated that the number of
globin mRNA molecules in a foetal liver erythroid cell is about
75,000. This value is about half the calculated number of
messages present in the reticulocyte (Table XVII).

c ) cDNA e s t i m a t i o n o f g l o b i n RNA s e q u e n c e s i n t h e n u c l e u s o ff o e t a l l i v e r
Globin RNA sequences have been identified in the nuclear
RNA of 1/4 day foetal livers by hybridisation with globin cDNA.
By a comparison of the melting behaviour of the hybrids, and
the size of the cDNA isolated from the nuclease—treated
hybrids, these RNA sequences are indistinguishable from the
a and 0 globin mRNAs found in the adult reticulocyte (Table XV) •
About 0.15$ of 1/| day foetal liver nuclear RNA is complementary
to cDNA, by comparison with a titra tio n curve of cDNA—9S RNA
(Figure 30a)* This value is about 10 times higher than is
found in the nuclear RNA of DMSO induced Friend erythro—
leulcaemic cells (Harrison et a l .. 197**b; Gilmour et a l ..
1 9 7 k ) f but is similar to the estimate obtained by cDNA
hybridisation to adult human bone marrow nuclear RNA (Lanyon
et a l . . 1 9 7 **)*
When mouse foetal liver nuclear RNA is chromatographed on
poly(u) sepharose, about 50$ of the globin RNA sequences are
retained by the column (Table XI). There are several ways in
which nuclear processes might combine to generate th is value,
l) Cleavage of RNA during preparation
I t is d ifficu lt to prevent completely nuclease action
during the preparation of nuclear RNA* This may cause random
RNase breaks, following distruption of the cells by homo
genisation. I f these nicks occur between the globin RNA
sequences, and the poly(A) sequence, the amount of globin RNA
retained by poly(u) sepharose will be reduced. However, i t
is thought that the protein coding sequences are usually found
on the 3 1 end of the HnRNA molecule, next to the poly(A)
sequence (Edmonds et a l .. 1971; Darnell et a l .. 1971;
Jelenik; et a l . T 1973)* Because of this proximity, the

probability of a random cleavage occurring between these
sequences is low.
However, i t is possible that there is more than one
globin—coding sequence in each polyadenylated HnRNA molecule.
Qleavage of this molecule during processing will release 5 '
globin RNA sequences from association with poly(A). Although
these sequences may be rapidly readenylated or degraded, the
occurrence of either processing, or random nuclease breaks
during preparation of the nuclear RNA, will increase the
proportion of non—retained globin RNA sequences. However,
recent data on the transcription of the linked human beta
and delta globin genes (Lanyon et a l .. 197**) and the low
reiteration frequency of the mouse globin genes makes this
explanation unlikely.
Apart from these possib ilities of artifactual RNA
cleavage during preparation, there are two major alternatives
of nuclear RNA metabolism that will effect the value for the
retention of globin RNA sequences by poly(u) sepharose.
2) Time of polyadenylation
The addition of poly(A) to nuclear RNA molecules is a
post—transcriptional event (Philipson et a l .. 1971; Jelenik’:
et a l .. 1973)* Estimates of the time that elapses between the
end of transcription and the addition of poly(A) vary between
a few minutes (jelenik e t a l .. 1973) in He La cells, to
13 minutes (Perry et a l .. 197**) in L cells. This la s t figure
would indicate that polyadenylation is a relatively late post-
transcriptional event, occurring just prior to the appearance
of the mRNA in the cytoplasm, and would be consistent with the
presence in the foetal liver nucleus of a large proportion
of non—adenylated globin RNA sequences*

However, the value obtained from L cells depends
critica lly on the cell pool sizes for poly(A) precursors,
and some doubt has recently been expressed about the
accuracy of this approach (Darnell 197**) • Although some of
the non—retained globin RNA sequences will certainly represent
HnRNA molecules that have not yet been adenylated, other
explanations for the non—retention of these sequences must be
considered.
3) Other mechanisms of poly(A) metabolism.
I t has long been known that HnRNA has a short half l ife ,
with the majority of the RNA being broken down in the nucleus.
However, a much higher proportion of the nuclear poly(A)
appears to be conserved (jelenik et a l .. 1973)* These
authors suggest that the addition of poly(A) to nuclear RNA
sequences may serve as a 'ta g 1 for their conservation, and
processing to cytoplasmic mRNAs. This pathway is thought to
be obligatory for the majority of mRNAs, since most mRNAs
contain poly(A). Also, the prevention of poly(A) addition
by cordycepin blocks the appearance of mRNAs in the
cytoplasm (Adesnik: et a l .. 1972; Jelenik: et a l ., 1973)*
There is however considerable doubt as to whether a ll
the nuclear poly(A) is conserved during processing. Values
for the fraction of nuclear poly(A) that enters the cytoplasm
over long chase periods, varies between 80$ (Jelenik et a l ..
1973) Tor He La cells, to 25$ (Perry et a l .. 197**) Tor L cells.
Turnover of poly(A) sequences on nuclear globin RNA would
reduce the amount of globin RNA retained by poly(u) sepharose.
Also a pool of globin RNA sequences may exist which are
destined never to become associated with poly(A) and are
turned over in the nucleus.

Both these possibilities would indicate that a distinct regulatory mechanism exists in the processing of HnRNA molecules, independent of poly(A) addition. In this, only a proportion of the nuclear globin RNA sequences are selected for transport to the cytoplasm and the rest would turn over in the nucleus. Over production of the required RNA sequences is a necessary prerequisite for post—transcriptional modulation of the levels of these sequences in the nucleus or cytoplasm.
At the present time it is not possible to distinguish v between these explanations. However, some clarification can be obtained by a study of the fate of globin RNA sequences in the nucleus and cytoplasm of other, non—erythropoietic tissues.
• 7 Presence of globin RNA sequences in the RNA of non—erythropoietic tissues
Globin RNA sequences have been detected in the nuclear and cytoplasmic RNA of adult mouse brain and liver, and a mouse lymphoma cell line L51787 (LY) . The fidelity of the hybrids between globin cDNA, and nuclear RNA from these tissues has been demonstrated by their melting behaviour (Figure 31) ^ d the size of the cDNA after treatment of the hybrid (Figure 32).By comparison with a cDNA—9S RNA hybrid, these RNAs contain sequences coding for mouse a and 0 globin.
The levels of globin RNA sequences detected in the nuclear RNA of the non—erythropoietic cells is between 20—90 fold less than that found in the foetal liver, when the calculated number of molecules of globin RNA in each is compared (Table XVII) • These values will reflect both the relative availability of the globin genes to transcription, and the rate at which these transcribed sequences are processed to mRNA and exported to the cytoplasm, or are degraded in the nucleus.

Gilmour and Paul (1973) and Gilmour et a l . (197**) have
studied the in vitro transcription of chromatin prepared from
adult mouse brain, foetal livers, and L Y cells* They have
demonstrated a clear difference in the transcription of the
globin genes in these tissues, with high levels of globin
sequences being only detected in the chromatin primed RNA from
foetal livers. Differences in the s tab ility of these nuclear
RNA sequences are d ifficu lt to assess. However, the data in
Table XIII demonstrate that these differences are not related
to the association of the sequences with poly(A), since the
proportion of the nuclear globin RNA sequences that is retained
by poly(u) sepharose is similar in brain, and adult and foetal
liv er.
The amounts of globin RNA detected in the cytoplasm of
these tissues is 200 fold lower for brain and adult liver, and
Z*000 fold lower for L Y cells than is found in the foetal liver
cytoplasm (Table XII) • Although the majority of these
sequences from brain and foetal liv er cytoplasm are retained
by poly(u) sepharose, the value is about 2 fold lower for
adult liver (Table X III)• The reason for th is difference
is unknown.
An estimate of the effect of reticulocyte contamination,
on the levels of globin RNA sequences detected in the nuclear
and cytoplasmic preparations of adult brain and liv er can be
made. I t was assumed that blood cells may represent a
maximum of 10$ of the cells in a tissue. I f 2$ of these cells
are reticulocytes, with each reticulocyte containing 1*»0 , 000
globin messenger RNA molecules (Mathias et a l .. 196** and
Table XVII), i t can be calculated that the cytoplasmic
preparation of an adult mouse tissue could be contaminated with
^80 reticulocyte mRNA molecules per cell, and the nuclear
preparation with about 0 . 2$ of this — 0 . 5 molecules per nucleus.

Thus, although the levels of globin RNA detected in the
cytoplasm of adult tissues may be explained by reticulocyte
contamination, the levels detected in the nuclear RNA could not
come from this source. In agreement with th is, the amount of
globin RNA sequences detected in the cytoplasm of L Y cells
is very low, but the nuclear levels are similar to those
observed in the adult brain and liver.
k .8 The nuclear post-transcriptional regulation of globin geneexpression
The operation of several d istinct post—transcriptional
control mechanisms can be inferred from the data in Tables
XIII and XVII. I t can be seen that the amount of nuclear
globin RNA does not in i ts e l f determine the amount of globin
messenger RNA in the cytoplasm (Table XVII). This implies
that the levels of globin RNA sequences in the two compartments,
though related in a precursor — product manner, are under
independent regulatory mechanisms. These mechanisms may
operate through the nuclear processing of the sequences, or
at the level of cytoplasmic s tab ility , or both.
Messenger s tab ility might be altered through factors that
are required for the translation of the specific mRNA, with
the free message being rapidly degraded. Harrison et a l .
(l97**h) and Gilmour et a l .. (l97**)haire recently suggested that
such a mechanism may explain the observed levels of globin
mRNA in a non—erythroid cell l in e .
The way in which nuclear control processes may act is
unknown but the data (Table XIII) demonstrate that i t is
unlikely to be mediated through the post—transcriptional
association of globin sequences with poly(A)• Thus, although
the relative amounts of nuclear globin RNA that appear in the
cytoplasm are very different in erythroid and non—erythroid

cells, the proportion of nuclear globin sequences associated
with poly(A) in these tissues is the same (Table XIII) •
This strongly indicates that although the addition of poly(A)
to a potential mRNA sequence in the nucleus may be obligatory
for i t s processing to the cytoplasm, polyadenylation is not
a sufficient event for th is processing to occur.
I t is d ifficu lt to explain the high levels of globin
RNA sequences detected in brain, adult liver and L Y nuclei,
since these are not erythropoietic tissues. I f this amount of
background transcription of a ll genes occurred, the sequences
found in nuclear RNA would be similar in a ll tissues, and the
complexity of the RNA would approach that of the mouse genome.
Although the complexity of nuclear RNA from any tissue is7 8
known to be high (10 — 10 nucleotides) (Hahn and Laird, 1971,*' 'Holmes and Bonner, 1973,’ Getz e t a l .. 197**), th is iro ^jBawewlbfld
fima* only 1—5$ of the tissues’unique DNA. Also, several, studies
have demonstrated clear differences between the sequences
present in the nuclear RNA of different tissues (Brown and
Church, 1972; Church and Brown, 1972; Liarfekos, et a l .. 1973)*
In mouse M2 cells, Getz et a l . (197**) have described
2 classes of poly(A) containing nuclear RNA. About 25$ of
nuclear RNA appears to be transcribed from about 0.06$ of the
genome, with about 300 RNA copies of each gene sequence being
present per nucleus. The majority of the nuclear RNA has a
much higher complexity (being transcribed from about 3$ of the
genome), but is only present at a level of about 5 copies per
nucleus. The levels of globin RNA sequences detectable in
non—erythroid cells are thus similar to that of the high
frequency class of nuclear RNAs. Both classes of nuclear RNAs
can be detected in M2 cell polysome associated mRNA (Bimie
et a l .. 1 9 7 **) though in a different ratio from their nuclear
levels (Getz et a l .. 197**)*
The possibility must therefore be considered that either
the production of globin RNA, or the production of globin
protein, may be necessary for the functioning of the cell.
Perhaps low levels of haemoglobin are required in the cell
cytoplasm. Several examples are known where proteins that
occur in high amounts in certain differentiated cell types,
such as actin, myosin and tropomyosin, have been detectable
in many other cell types (ishikawa et a l .. 1969,* Adelstein
et a l .. 1972; Cohen and Cohen, 1972).
However, the possibility cannot be discounted that the
globin RNA sequences themselves are involved in a nuclear
function. Another less likely possibility is that the globin
genes are linked to genes that are expressed in a ll tissues,
with the globin gene sequence being 0 0 transcribed, or having
a high probability of being transcribed.
Although at the present time, the reasons for the
expression of the jglo^in genes in non—erythroid tissues are
unclear, the system lends i ts e l f well to further study.
Denaturing formamide gradients can be used to isolate RNA
molecules of different sizes, and coupled with the extreme
sensitiv ity of the cDNA assay for globin RNA sequences, i t
should be possible to follow the nuclear processing of globin
RNA sequences in both erythroid and non—erythroid cells.
A comparison of these processes in the two classes of tissues
should help to elucidate the ,function of the non—erythroid
globin RNA sequences. I t may also indicate the location of
the metabolic blocks that appear to occur in some human diseases
such as 0 *T thalassaemia, where the 0 genes are present
(Ottolenghi, Williamson and Weatherall, unpublished) and may
be transcribed, but where 0 globin mRNAs do not appear in the cytoplasm.

ABBREVIATIONS
RNA Ribonucleic acidDNA Deoxyribonucleic acidmRNA Me s s enge r RNAtRNA Transfer RNArRNA Ribosomal RNAmRNP Messenger ribonucleoprotein particlecDNA Complementary DNA
A, C,G,U,T The bases adenine, cytosine, guanine, uraciland thyamine respectively.
EDTA Ethylenediamine tetra—acetic acidTri s 2—amino— 2—(Hydroxymethyl)—propane—1: >-diol.ANE 0.1 M sodium acetate* 0.1 M NaCl; 10 mM EDTATKM 5 mM Tris (pH 7*5); 50 mM KC1,* 1.5 mM MgCl2
NETS 0.1 M NaCl; 10 mM Tris (pH 7 *5) ,* 1 mM EDTA;0.5$ SLS
H.M.C. 0.1 M HEPES (pH 7*0); 10 mM magnesium acetate;25 mM NaCl; 2 mM CaCl2
HEPES N—2-Hydro xye thy 1—pipe razine—N 1 —2—e thane sulphoniacid
PIPES Piperazine—N—N 1—bis (2—ethane sulphoni © acid )C.M.C. Carboxymethyl celluloseDEC Diethyl—aminoethyl celluloseBSS Hank’s balanced salts solution (Paul 19^5)PCA Perchloric acidTCA Trichloroacetic acidTBS Toluene—based scintillantTXBS Toluene—based scintillant, plus Triton X 100.DMSO Dimethyl sulphoxideSLS Sodium lauryl sulphateDTT Dithiothreitol

DNase Deoxyribonuclease
RNase Ribonuclease
A260 Absorbance 260 11m
DEP Diethyl pyrocarbonate
Tm Mean thermal denaturation
Co Concentration of DNA in moles nucleotides/l,in reannealing experiments
Do Concentration of cDNA in moles nucleotides/lin cDNA—RNA hybridisation experiments
t i time (seconds) for 50$ of the reaction to2 take place

BIBLIOGRAPHY
Ache son, N.H., Buetti, E., Scherrer, K. and Weil, R. (l97l)«
Proc. Nat. Acad. Sci. U.S.A. 6 8 , 2231.
Adelstein, R.S., Conti, M.A., Johnstone, G.S., Pastan, I . and
Pollard, T.D. (1972). Proc. Nat. Acad. Sci. U.S.A.
62 , 3693.
Adesnik, M. and Darnell, J.C* (1972). J. Mol. Biol. 6^, 397*
Adesnik, M., S a l d i l t , M., Thomas, W. and Darnell, J. (1972).
J. Mol. Biol. 71, 21.
Adler, K., Beyruther, K., Fanning, E», Geisler, N.,
Gronenborn, B., Klemm, A., Mullei>-Hill, B., Pfahl, M.
and Schmitz, A*. (1972). Nature 237. 322.
Albrecht, C. and Zyl, I.M. van. (1973)* Exptl. Cell Res. 76. 8 .
Amaldi, F., Lava-Sanchez, P.A* and Buongiorno—Nardelli, M.
(1973). Nature 2**2, 6 1 5 .
Anderson, N.G. (1 9 6 6 ). Science, 15*4. 103*
Arnstein, H.R.V., Cox, R.A and Hunt, J.A. (1 9 6 2 ). Nature,
1 2A , 1 0 * 4 2 .
Attardi, G. and Amaldi, F. (1970). Ann. Rev. Biochem. J22, 216.
Attardi, G., Parnas, H., Hwang, M.—I.H. and Attardi, B. (1 9 6 6 ).
J. Mol. Biol. 20, 1*45*
Aviv, H. and Leder, P. (1972). Proc. Nat. Acad. Sci. U.S.A.
69. 1 *4 0 8 .
Axel, R., Cedar, H. and Felsenfeld, G. (1973)* Proc* Nat. Acad.
Sci. U.S.A. 22.1 2029.
Baltimore, D. and Huang, A. S. (1970). J. Mol. Biol. 2Z» 2 6 3 .
Bard, G., Efron, D., Marcus, A. and Perry, R.P. (197**) •
Cell 1, 101.
Bautz, E.F.K. and Bautz, F.A* (1 9 6 *4). Proc. Nat. Acad. Sci.
U.S.A. 22, 1*476 .

Beckworth, J.R. and Zipser, D. (eds.) (1970). "The Lactose
Operon". (Cold Spring Harbour Laboratory, Cold Spring
Harbour, N.Y.).
Beerman, W. (1956). Cold Spring Harbour Symposium 21mt 217*
Beerman, W. (1 9 6 7 ). In R. A. Brink (ed.) "Heritage from
Mondel". 179* (Univ. of Wisconsin Press, Madison).
Beers, R.F. ( i 9 6 0 ). J. Biol. Chem. 235 . 2393*
Birnboim, H.C., Mitchel, R.E.J. and Strauss, N.A. (1973)•
Proc. Nat. Acad. Sci. U.S.A. 22* 2189*
Birnie, G.D., Delcour, J ., Angus, D., Threlfall, G. and
Paul, J. (I9 7 3 ). In Cold Spring Harbour Monograph
"Control of Proliferation in Animal cells".
Birnie, G.D. and Harvey, D.R. (1 9 6 8 ). Anal. Biochem. 2 2 , 171*
Birnie, G.D., MacPhail, E.,Young, B.D., Getz, M.J. and
Paul, J. (I97*l). Cell Different. 2, in press.
B irnstiel, M.L., Grunstein, M., Speirs, J. and Hennig, W.
(1969). Nature, 223. 1 2 6 5 .
B irnstiel, M., Speirs, J., Purdom, I . , Jones, K. and Loening, U
(1968). Nature, 219. *45*4.
B irnstiel, M.L., Telford, J . , Weinberg, E. and Stafford, D.
(197**). Proc. Nat. Acad. Sci. U.S.A. (in press).
B irnsteil, M.L., Wallace, H., S irlin , J.L. and Fischberg, M.
(1966). Nat. Cancer In st. Monog. 2 ^ 9 *431*
Bishop, J.O. (1972). Biochem. J. 126.171.
Bishop, J.O., Morton, J.G., Rosbash, M. and Richardson, M.
(1 9 7 *4). Nature, 2%0, 199*
Bishop, J.O., Pemberton, R. and Baglioni, C. (1972). Nature
New Biol. 235. 231.
Bishop, J.O. and Rosbash, M. (1973)* Nature New Biol. 2*4! . 20*4

Blobel, G. (1972). Biochem. Biophys. Res. Comraun. 22> 8 8 *
(Blobel, G. (1973). Proc. Nat. Acad. Sci. U.S.A. 22* 921*.
Boedtker, H. (1 9 6 8 ). J . Mol. Biol. J2, •Bolton, E.T. and McCarthy, B.J. (1 9 6 *4). J . Mol. Biol. 201.
Borenfreund, E., F itt, E. and Bendich, A. (1 9 6 1 ). Nature,
191. 1375.
Borun, T.W., Scharff, M.D. and Robbins, E. (1 9 6 7 ) * Biochira.
Biophys. Acta, 302.
Brarawell, M.E. (1972). Biochim. Biophys. Acta. 281. 329*
Brandhorst, B.P. and McConkey, E.M. (197*4). J* Mol. Biol. 8^, **51
Braverman, G. (1973)* Mol. Biol. Rep. JL, 7*
Brawerman, G., Mendecki, J. and Lee, S.Y. (1972). Biochemistry,
11, 637.
Brenner, S. and Milstein, C. (1 9 6 9 ) • Nature. 211. 2*42.
Bridges, C.B. (1935)• Hered. 26, 60.
Britten, R.J. and Bonner, T. (1971). "Yearb. Carneg. Instn."20, 373.
Britten, R.J. and Davidson, E.H. (1 9 6 9 ). Science, 1 6 5 . 3*49*
Britten, R.J. and Davidson, E.H. (1971) • Quart. Rev. Biol.
*4 6 . 1 1 1 .Britten, R.J. and Kohne, D.E. (1968), Science, l6 l . 529*
Britten, R.J., Pavich, M. and Smith, J . (1 9 6 9 ). "Carnegie
In s t, of Washington Yearb. 68, *4 0 0 .
Brown, D.D* and Dawid, I.B. (1 9 6 8 ). Science, l60. 272.
Brown, D.D. and Weber, C.S. (1 9 6 8 a). J . Mol. Biol. 2JL* 661.
Brown, D.D. and Weber, C.S. (1 9 6 8b). J . Mol. Biol. 21k* 681.
Brown, D.D., Wensink, P.C. and Jordan, E. (1971)* Proc. Nat.
Acad. Sci. 68, 3175*
Brown, D.D.,Wensink, P.C. and Jordan, E. (1972). J . Mol.
Biol. 6 3 , 57.

Brown, I.R. and Church, R.B. (1972), Develop. Biol. 2 , 73*
Burdon, R.H. and Shenkin, A. (1972) . FEBS Letters, 2*£, 11.
Burny, A., Huez. G., Marbaix, G* and Chantrenne, H. (1 9 6 9 ).
Biochim. Biophys. Acta. 190. 228.
Burny, A. and Marbaix, G. (1 9 6 5 ) . Biochim. Biophys. Acta.
103. *409.
Burr, M. and Lingrell, J.B. (1971)* Nature New Biol. 233. I4X•
Burton, K. and Peterson, G.B. (1957) • Biochim. Biophys. Acta.
2 6 , 6 6 7 .
Busch, H. and Smetana, K. (1970) • "The Nucleolus". (Academic
Press, N.Y.) .
Caliguiri, L.A. and Tamra, I . (1 9 7 0 ) . Virology 2, 112.
Calien, H.G. (1 9 6 7 ). J. Cell Sci. 2, 1.
Callen, H.G. and Lloyd, L. ( i 9 6 0 ) . Phil. Trans. Rog. Soc.
ser. B. 2 k3. 135*
Chamberlin, M.J. and Patterson, D.L. (1 9 6 5 )• J* Mol. Biol.
1 2 . I4IO.Chantrenne,H., Burny, A. and Marlbaix, G. (1 9 6 7 ). Prog.
Nuc. Acid Res. and Mol. Biol, 2, 173•
Cheng, T., Polmar, S.K. and Kazajian, H.H. (197*4)* J* Biol.
Chem. 2*49. 1781.
Church, R.B* and Brown, I.R. (1972). In Results and Problems
of Differentiation (ed. H. Ursprung) (Springer—Verley,
New York), 2* 11•
Church, R.B. and McCarthy, B.J. ( 1 9 6 7 ). J* Mol. Biol. 2 2 9 k l l •
Clegg, J.B ., Weatherall, D.J. and Milner, P.F. (1971).
Nature. 23*4. 337.
Cohen, I . and Cohen, C. (1972). J . Mol. Biol. &8, 383*
Cole, R.J., Hunter, J . and Paul, J. (1 9 6 8 ). Brit. J. Haeraat.
M, 77*

Crick, F. (1971) • Nature 23*4. 25*
Crossley, J ., Mansbridge, J. and Williamson, R. (197*4).
Biochem. J. 137. 299*
Dacie, J.V. (1956). Ih4 "Practical Haematology", ( j . and A.
Churchill, Ltd., London).
Darnell, J.E. (197*4). reported at Biochem. Soc. Meeting
(Glasgow) .
Darnell, J.E. and Balint, R. (1970). J* Cell. Physiol. 76.
3**9.
Darnell, J.E ., Jelinek, W.R. and Molloy, G.R. (1973).
Science 181. 1215.
Darnell, J.E ., Philipson, L., Wall, R. and Adesnick, M.
(1971b). Science 17*4. 507.
Darnell, J.E ., Wall, R. and Tushinski, R.J. (1971a). Proc.
Nat. Acad. Sci. U.S.A. 6 8 , 1321.
Davidson, E.H. (1968). Gene Activity in Early Development,
(Academic Press, New York)•
Davidson, E.H. and Britten, R.J. (1971). J* Theoret. Biol.
21* 123.
Davidson, E.H. and Britten, R.J. (1973)* Quart. Rev. Biol.
M, 565*
Davidson, E.H., Crippa, M. and Mivsky, A.E. (1 9 6 8 ) .Proc. Nat
Acad. Sci. 60, 152.
Davidson, E.H., Hough, B.R., Amenson, C.S. and Britten, R.J.
(1973). J * Mol. Biol. 2 2 , 1 *
Dayhoff, M.O. (1972). (ed.) "Atlas of Protein Sequence and
Structure". 2 (National Biomedical Research Foundation)
Dawid, I.B ., Brown, D.D. and Reeder, R.H. (1970). J. Mol.
Biol. 2 1 , 3*41.
Denny, P.C. and Tyler, A. (1 9 6 *4). Biochem. Biophys. Res.
Commun. 1_*£, 2*45*

DeLange, R .J., Farnbrough, D.M., Smith, E.L. and Bonner, J.
(1968). J. Biol. Chem. 2*4 3. 5906.
DeLange, R.J., Farnbrough, D.M., Smith, E.L. and Bonner, J.(1969). J. Biol. Chem. 2*4*4. 5 6 6 9 .
Dickson, E., B0yd, J.B. and Laird, C.D« (1971)* J* Mol.Biol. 61, 6 1 5 .
Dintzis, H.M., Borsook, H. and Vinograd, J . (1958). i n
"Microsomal particles and Protein Synthesis11. (Roberts,
R.B. Ed.). 95* Pergamon Press, London.
Dreyer, W.J. and Bennet, J.C. (1 9 6 5 )* Proc. Nat. Acad. Sci.
U.S.A. 8 6 *4.D r e y e r , W .J . , G ra y , W.R. and Hood, L . ( 1 9 6 7 ) . C o ld S p r in g
H a r b o u r Symposium Q u a n t . B i o l . ^ 2 , 353*
Dries ch, H. (1 8 9 2 ) Entwicklungsmechanik An at. Anz.2, 58*4.
Dubochet, J ., Morel, C., Lebjleu, B. and Henzberg, M. (1973)*
Eur. J . Bio chem. J 6 , *465.
Dunn, J .J . and Studier, F.V. (1973)* Proc. Nat. Acad. Sci.
U.S.A. 22> 3 2 9 6 .
Edmonds, M. and Abrams, R. ( i9 6 0 ). J. Biol. Chem. 235. 1 1 *42 .
Edmonds, M. and Abrams, R. (1 9 6 3 ). J . Biol. Chem. 238. 1186.
Edmonds, M., Vaughan, M.M. and Nakazato, H. (1971). Proc.
Nat. Acad. Spi. U.S.A. 6 8 , 1336.
Faiferman, I . , Hamilton, M.G. and Pogo, A.O. (1971). Biochim.
Biophys. Acta. 232. 6 8 5 .
Fan, H. and Penman, S. (1970). J . Mol. Biol. ^0, 655*
Favre, A., Bertazzoni, V., Berns, A.J.M. and Bloemendal, H.
(197*0* B iochem . B io p h y s . R e s . Commun. 5 6 . 273*
Faust, G.H., Diggelmann, H. and Mach, B. (197*0 • Proc. Nat.
Acad. Sci. U.S.A. 2L 2*491.
Fedorisak, I . , Natarajan, A.T. and Ehrenberg, L. (1 9 6 9 ).
Eur. J . Biochem. 10, *450 .

F irte l, R.A., Jacobson, A. and LvOdish, H.F. (1972). Nature
New Biol. 239, 225*
Flamm, W.G., McCallum, M. and Wailker, P.M.B. (1 9 6 7 ). Proc.
Nat. Acad. Sci. U.S.A. SuL9 1729.
Flamm, W.G., Walker, P.M.B. and McCallum, M. (1 9 6 9 ). J. Mol.Biol. ZjO, *»23-
Flatz, G., Kinderlever, J . , Kilnuartin, J.V. and
Lehmann, H. (l9 7 l)• Lancet, 732.
Flickinger, R.A., Coward, S .J., IMiyagi, M., Moser, C. and
Rollins, F. (1 9 6 5 ). Proc. Niat. Acad. Sci. U.S.A. 789*
Ford, P.J. and Southern, E.M* (l$973)- Nature New Biol. 2*il. 7-
Gall, J.G. (1956). J . Biochem. BHophys. Cytol. 2 ( suppl.) 393*
Gall, J.G. (1968). Proc. Nat. Acad. Sei. U.S.A. 60, 553-
Gall, J.G., Cohen, E.H. and Polam, M.L. (1971)- Chromosoma,
2 1 t 319.
Gall, J.G. and Rochaix, J.D. (1977*0- Proc. Nat. Acad* Sci-
U.S.A. 2L 1819.
Gallau, G-, Britten, R. J. and Davidson, E.H. (197*0 - Cell 2, 9-
Gallwitz, D. and Breindl, M. (19772). Biochem. Biophys. Res.
Commun. * 2, 1106.
Gallwitz, D. and Meuller, C. (196S9 ) • J. Biol. Chem. 2h&. 59 **7-
Gaily, J.A. and Edelman, G.M. (l9>70). Nature 227. 3*»1-
Gaskill, P. and Kabot, D. (l97 l)- Proc. Nat. Acad. Sci. U.S.A.
68, 72.
Gelderman, A.H., Rake, A.V. and B3ritten, R.J. (1971)- Proc.
Nat. Acad. Sci. U.S.A. 68, 1-72.
Georgiev, G.P. (1 9 6 9 )- J* Theoret;. Biol. 25. *»73-
Georgiev, G.P. (1972). Curr. Topi.cs Develop. Biol. !•

Georgiev, G.P., Ryskov, A.P., Coutelle, C., Mantieva, U. L.
and Avakyan, E.R. (1972). Biochem. Biophys. Acta.
2 5 2., 2 5 9 .Georgiev, G.P., Samarina, O.P., Leman, M.I., Smirnov, M.N.,
and Severitzov, A.N. (1 9 6 3 )* Nature, 200. 192.
Getz, M.J., Birnie, G.D., Young, B.D., MacPhail, E. and
Paul, J. (197**) Cell, in press.
Gilbert, W. and Maxam, A. (1973)* Proc. Nat. Acad. Sci. U.S.A
70, 3581.
Gilbert, W. and Mulleav-Hill, B. (1 9 6 7 ). Proc. Nat. Acad* Sci.
U.S.A. $ 8 , 2k h5 .
Gilmour, R.S., Harrison, P.R., Windass, J.D., Affara, N.A.,
and Paul, J. (197*0* Cell Diff*. JJ, 9.
Gilmour, R.S. and Paul, J . (1 9 6 9 ). J* Mol. Biol. JjO, 137*
Gilmour, R.S. and Paul, J . (1973)* Proc. Nat. Acad. Sci.
20, 3 W .
Girard, M. and Baltimore, D. (1 9 6 6 ). Proc. Nat. Acad. Sci.
U.S.A. ^6, 999.
Goldberg, R.B., Galou, G.A*, Britten, R.J. and Davidson, E.H.
(1973). Proc.Nat. Acad. Sci. U.S.A. 70, 3517*
Gorski, J., Morrison, M.R., Merkel, C.G. and Lingrel, J.B.(197**) • J. Mol. Biol.
Graham, D.E., Neufeld, B.R., Davidson, E.H. and Britten,
R.J. (197*0 • Cell. 1, 127.
Granboulan, N. and Scherrer, K. (1 9 6 9 ). Europ. J. Biochem. j9,
Greenberg, J. (1972). Nature, 2*t0. 102.
Greenberg, J.R. and Perry, R.P. (1971)- J* Cell Biol. ^0, I l k
Greenberg, J.R. and Perry, R.P. (1972). J . Mol. Biol. 2is, 3*
Gross, F., Hiatt, H., Gilbert, W., Kurland, C.G., Risebrough,
R.W. and Watson, J.O. (1 9 6 1 ). Nature, 190. 581.
Gross, K., Rudermstn, J . , Jacobs—Lorena, M., Baglioni, L. and
Gross, P.R. (1973)* Nature New Biol. 2*»1. 272.

Gruenwedel, D.W., Hsu, C.H. and Lu, D.S. (1971)• Biopolymers
10, h i .
Grunberg Manago, M. (1 9 6 3 ). Progr. Nucl. Acid* Res. 1, 93*
Grunstein, M., Levy, S., Schedl, P. and Kedes, L. (1973).
Cold Spring Harb. Symp. Quant. Biol. 3 8 .
Gurdon, J.B. (1 9 6 2 ). Develop. Biol. 2 5 6 .
Gurdon, J.B. and Vehlinger, U. (1 9 6 6 ). Nature, 210. 12**0.
Hahn, W.E. and Laird, C.D. (1971). Science, 173r 158.
Haldane, J.B.S. (1957)* Genet. 55,511.
Harris, H. (1 9 6 2 ). Biochem. J. 8 i|. 60.
Harrison, P.R., Bimie, G.D., Hell, A., Humphries, S., YOung
B.D. and Paul, J . (l97*»a) J.M.B. 8 *£, 539*
Harrison, P.R., Conkie, D., Affara, N. and Paul, J. (l97**c).
J. Cell. Biol, in press.Harrison, P.R., Conkie, D., Paul, J . and Jones, K. (1973)-
FEBS. Letters, £2, 109.
Harrison, P.R., Gilmour, R.S«, Affara, N., Conkie, D. and
Paul, J. (I97*»b). Cell. Diff. 2, 23*
Harrison, P.R., Hell, A., Bimie, G.D. and Paul, J . (1972a).
Nature, 239. 219.
Harrison, P.R., Hell, A. and Paul, J . (1972b). FEBS Letters,
2*£> 73*
Harwood, R., Connelly, A.D., Grant, M. and Jackson, D.S.(l97*l) • FEBS Letters, .£1, 8 5 .
Hell, A., Bimie, G.D*, Slimming, T.K. and Paul, J. (1972).
Anal. Biochem. ^8 . 3 9*
Heywood, S.M. (1970). Proc. Nat. Acad. Sci. U.S.A. &£, 1782.
Heywood, S.M., Dowben, R.M. and Rich, A. (1 9 6 7 ) * Proc. Nat.
Acad. Sci. U.S.A. 52, 1002.
Heywood, S.M., Kennedy, D.S. and Bester, A.J. (197*0* Proc.
Nat. Acad. Sci. U.S.A. J l , 2 **2 8 .

Holley, R.N., Apgar, J ., Everett, G.A., Madison, J.T .,
Marquisee, M., Merrill, S.M.„ Penswick, R. and Zamir, A*
(1 9 6 5 ). Science, lfr7. 1*»62.
Holmes, D.S. and Bonner, J . (1973!)* Biochemistry 1^, 2330.
Holmes, D.S. and Bonner, J. (197*3]) • Proc. Nat. Acad. Sci. U.S
71. 1 1 0 8 .
Huang, R.C. and Bonner, J. (1 9 6 2 ).. Proc. Nat. Acad. Sci. U.S.
*18. 1 2 1 6 .
Huez, G., Burny, A., Marbaix, G. and Schram, E. (1 9 6 7 )*
Europ. J. Biochem. 1, 179*
Huez, G., Marbaix, G., Hubert, E.„ Lecherq, M., Nudel, U.,
Soreq, H., Salomen, R., Lebleu, B., Revel, M. and
Lillauer, U.Z. (197*0* Proc. Nat. Acad. Sci. U.S.A. 71
Hunt, J.A. (1973)* Biochem. J . 13k. 327-
Hunt, L.T. and Dayhoff, M.O. (1972). Biochem. Biophys. Res.
Commun. ^2, 699*
Hutchison, W.C. and Munro, H.N. (k96l). Analyst. 8(S, 7 6 8 .
Imaizumi, T., Diggelmann, H. and Scherrer, K. (1973)* Proc.
Nat. Acad. Sci. U.S.A. 70, lk22.
Ishikawa, H., Bischoff, ,R. and Hoktzer, H. (19^9) • J* Cell.
Biol. 312.
Jacob, F. and Monod, J. (1 9 6 1 ). J - Mol. Biol, 2* 31®•
Jacobs—Lorena, M., Baglioni, C. and Borun, T.W. (1972). Proc.
Nat. Acad. Sci. U.S.A. 6£, 2095*
Jacobson, A., F irte l, R.A. and Lodlish, H.F. (197*0* Proc. Nat
Acad. Sci. U.S.A. 21, 1 6 0 7 .
Jeanteur, P., Amaldi, F. and Attaardi, G. (1 9 6 8 ) . J. Mol. Biol
2 1 , 757-
Jeanteur, P. and Attardi, G. (1 9 6 9 )* J* Mol. Biol. 305*

Jelinek, W., Adesnik, M., Saldiltt, M., Sheiness, D., Wall, R.,
Molloy, G., Phillipson, L. and Darnell, J.E. (1973)*
J. Mol. Biol. 2 1 , 515*
Jelinek, W. and Darnell, J.E. (JL972) . Proc* Nat. Acad. Sci.
U.S.A. 62., 2537*
Jelinek, W., Molloy, G., Fe rn ancle z—Munoz, R., Salditt, M. and
Darnell, J.E. (197*0 • J • Mol. Biol. 82, 3 6 1 .
deJiminez, E.S., Dominguez, J.L», Webb, F.H. and Bock, R.M.
(1971). J . Mol. Biol. 61, 59.
Jones, K.W. (1970). Nature. 225> 912.
Johns, E.W. (1 9 6 9 ). Ciba SymposdLura on Homeostatic Regulators,
(ed it, by Wolstenholme, G.E.W. and Knight, I .J . ) 128.
( Churchill,London)•
Johnston, R.E. and Bose, H.R. (3L972). Proc. Nat. Acad. Sci.
U.S.A. 62., 151*» •
Kacian, D.L., Spiegelman, S., Bank, A., Terada, M., Melafora,
S., Dow, L. and Marks, P.A- (1972). Nature New Biol.
2 5 5 , 1 6 7 .
Kacian, D.L., Watson, K.F., Bumy, A. and Spiegelman, S.
(1971). Biochem. Biophys. Acta. 2fr6. 3 5*
Kafatos, F.C. (1972a). Acta. Enocrinologica. Suppl. 168. 319*
Kafatos, F.C* (1972b). Curr. Topics in Develop. Biol. 2 , 125*
Kedes, L.H. gind B im stiel, M.L. (1971) • Nature New Biol.
220, 1 6 5 .Kedes, L.H. and Gross, P.R. ( i9 6 0 ). J. Mol.Biol. * 2, 559*
Kedes, L.H. and Gross, P.R. (196 9 ). Nature 223. 1335*
Kedes, L.H., Gross, P.R., Cogneltti, G. and Hunter, A.L.
(1969). J . Mol. Biol. 337-
Klein, W.H., Murphy, W., Attarddl, G., Britten, R.J. and
Davidson, E.H. (l97*l) • Proc. Nat. Acad.Sci. U.S.A.
2 1 , 1 7 8 5.

Kohne, D.E. (1 9 6 9 )* Biophys. J • 8 f 110**.
Kovach, J.S., Marks, P.A*, Russel, E.S. and Elper, H. (1 9 6 7 )-
J. Mol. Biol. 2 5 , 131.
Kruk, J. and Borsook, H. (1956). J. Biol. Chera. 220, 905*
Kwan, S. and Brawerman. (1972). Proc. Nat. Acad. Sci. U.S.A.
6 2 , 32^7.
Labrie, F. (1 9 6 9 ). Nature, 221. 1217-
Laird, C.D.,McConaughty, B.L. and McCarthy, B.J. (1 9 6 9 )-
Nature, 2 2 h , l*l9-
Lambert, B. (1973)- Nature, 2h2. 51-
Lane, C.D., Marbaix, G. and Gurdon, J.B. (1971)- J- Mol. Biol.
6 1 , 73-
Lanyon, G., Paul, J . and Williamson, R. (1972). Eur. J. Biochem.
31, 38.
Lanyon, G., Ottolenghi, S. and Williamson, W. (1 9 7 * 0 - Proc.
Nat. Acad. Sci. U.S.A. in press.
La Torre, J. and Perry, R.P. (1973)- Biochim. Biophys. Acta.
2 1 1 , 93-
Lee, S.Y., Mendecki, J. and Brawerman, G. (1971)• Proc- Nat.
Acad. Sci. U.S.A. 68, 1331-
Lee—Huang, S. and Ochoa,S. (1971)- Nature New Biol. 23h. 2 3 6 .
Levinthal, C., Keynan,' A. and Higa, A. (1 9 6 2 ). Proc. Nat. Acad.
Sci. U.S.A. ]& , 1631.
Liarakos, G.D., Rosen, J.M. and O’Malley, B.W. (1973)-
Biochemistry, 12, 2809*
Lim, L. and Canellakis, E.S. (1970)- Nature, 227. 710-
Lindberg, U. and Persson, T. (1972). Eur. J. Biochem. 2 1 , 2*j6.
Lingrell, J.B ., Lockard, R.E., Jones, R.F., Burr, H.E. and
Holder, J . W. (1971)- in ”Series Haematologica, Vol. **•
(Jenson, K.G., and Killman, S., Ed., Munksgaard, Copenhagen).
37-

Lipsett, M.N• (196*0 - J. Biol.Chem. 239. 1256.
Lissitzky, S., Poiree, J. C., Carttouzou, G. and Gregoire, J.
(l97P) .Eur. J. Biochem.12, 1(0*4*
Loening, U.E. (1 9 6 7 ). Biochem. J . , 102 . 251.
Loening, U.E. (1 9 6 9 ). Biochem. J. 113. 131-
London, J.M., Shemin, D. and Ritteenberg, D. (1950)- J- Biol.
Chem. I 8 3 . 7*49 •
MacGregor, H.C. (1968) . J. Cell. Sci. 2 , *»37-
MacNaughton, M., Freeman, K.B. ancd Bishop, J.O. (197*4)- Cell,
1, 117.
Maden, B.E.H. (1971)- Progr. Bioplhys. Mol. Biol. 22, 129-
Maizles, N. (1 9 7 *4). Nature, 2*49. 6*47.
Mansbridge, J.N., Crossley, J .A. , Lanyon, W.G. and Williamson,
R. (1 9 7 *4)- Eur. J. Biochem. Uth. 261.
Marbaix, G., Bumy, A., Huez, G. «and Chantrenne, H. (1 9 6 6 ).
Biochem. Biophys. Acta. 1 1 *4. *40*4.
Marcus, L., Bretthauer, R.K., Boclk, R.M. and Halvorson, H.O.
(1 9 6 3 ). Proc. Nat. Acad. Sci.. 5 0 , 782.
Markham, R. (1957)- Methods Enzymol. 5 , 8 0 5 .
Marmur, J. and Doty, P. (1 9 6 2 ). J .. Mol. Biol. 2 , 109-
Mannur, J. and Dpty, P. (1 9 6 1 ). J .. Mol. Biol. 2 » 585-
Marmur, J . , Rownd, R. and Schildkiraut, C.L. (1 9 6 3 ). Progr.
Nucleic Acid Res. 1, 231-
Marushige, K. and Bonner, J. (19665) . J. Mol. Biol. 3J5, 160.
Marushige, K- and Ozaki, M. (1 9 6 7 ))- Develop. Biol. JL6, *47*4-
Mathews, M.B. (1972). Biochem. Biophys. Acta. 272. 108.
Mathews, M.B. and Komer,A. (1970)) • Eur. J . Biochem. 17. 328.
Mathews, M.B. and Osborn, M. (l97k). Nature New Biol. 233. 206.
Mathews, M.B., Pragnell, X.B., Oslbom, M. and Amstein, H.R.V.
(1972). Biochim. Biophys. Actta. 287, *113-

Mathias, A.P., Williamson, R., Hiuxley, M.E. and Pago, S.
(19 6 k ) * J- Mol. Biol. 2, 1 5 **4.
Mayo, U.S. and DeKloet, S.R. (l9r? l) . Biochem. Biophys. Acta.
jzhjL, 7*4-
McCarthy, B.J. and Hoyer, B.H. (3 .9 6 *4). Proc. Nat. Acad. Sci.
U.S.A. 5 2 , 915.
McConaughy, B.L., Laird, C.D. ancd McCarthy, B.J. (1 9 6 9 ).
Biochemistry 8 f 3 2 8 9 .
McEwen, C.R. (1 9 6 7 ). Anal. Biocheem. 20, 1 1 *4.
McKnight, G.S. and Schimke, R.T. (197*4). Proc. Nat. Acad.
Sci. U.S.A.
McLaughlin, C.S., Warner, J.R., lEdmonds, M. Nakazato, M. and
Vaughn, M.H. (1973). J * BioIL. Chem. 2 *48. IZ466.
Melli, M., Whitfield, C., Rao, K..V., Richardson, M. and
Bishop, J.O. (1971). Nature New Biol. 231. 8 .
Mendecki, J . , Lee, Y. and Brawenman, G. (1972). Biochemistry,
11, 792.
Miller, O.L., and Bakken, A.M. (3.972). Acta. Endocrinologica,
Suppl. 168. 1 5 5 .
Miller, O.L. and Bakken, A.M. (1973). Fifth Karolinska
Symposium on Res. Methods im Reproductive Endocrinology
(Diczfalusy, E. Ed. ).155* ((Bogtrykkerit Forum, Copenhagen) •
Miller, O.L. and Beatty, B.R. (1 9 6 9 a). Science, l 6 *j. *455 •
Miller, O.L. and Beatty, B.R. (1 9 6 9 b). Genetics, Supply.
6 1 , 1, 1 3 3 .
Min- Jou, W., Haegerman, G., Ysebaeerl, M. and Friers, W. (1972).
Nature, 237. 82.
Molloy, G.R. and Darnell, J.E. (IL973). Biochemistry, 12, 2 3 2 *4*
Molloy, G.R., Jelenick, W., Saldktt, M. and Darnell, J.E.
(197U). Coll 1, (t3.

Molloy, G.R., Spom, M.B., Kelle^y, D.E. and Perry, R.P.
(1972a). Biochemistry, 11, 13256.
Molloy, G.R., Thomas, W.L. and Diamell, J.E. (1972b) •
Proc. Nat. Acad. Sci. U.S.A. 62, 3 6 8 )14,
Mondel, M., Sutton, A., Chen. V.„and Sarkou, S. (197*4).
Biochim. Biophys. Res. Commum. 5 §., 988.
Morel, L., Kayibandu, B. and Sch<errer, K. (1971). FEBS
Letters 18, 8 *4.
Morris, G.E., Buzash, E.A., Rouiike, A.W., Tepperman, K.,
Thompson, W.C. and Heywood, S.M. Cold Spring
Harb. Quant. Biol. 2 1 , 535«
Morrison, M.R., Brinkley, S.A., (Gorshi, J . and Lingrel, J.B.,
(197*4). J. Biol. Chem.
Morrison, M.R., Merkel, C.G. and Lingrel, J.B. (1973)* Mol.
Biol. Rept. 1, 55*
Morrison, M.R., Paul, J. and WillLiamson, R. (1972). Eur. J.
Biochem. 27. 1.
M.S.E. Technical publications. (JL966) • No . 1*9 *
Murphy, W. and Attardi, G. (1973])* Proc. Nat. Acad. Sci. U.S.A
2 0 , 1 1 5 .
Nakazato, Hj, Edmonds, M. and Kojpp, D.W. (197*4). Proc. Nat.
Acad. Sci. U.S.A. 2i» 200 •
Nakazato, H., Kopp, D.W. and Edmonds, M. (1973)* J. Biol.
Chem. 2 *48. 1 *472.
Niessing, J . and Sekeris, C.E. (3.970). Biochim. Biophys. Acta.
209. *48*4.
Niessing, J. and Sekeris, C.E. (lL971h) . Biochim. Biophys. Acta
2*47. 391.
Niessing, J. and Sekeris, C.E. (ZL973) * Nature New Biol. 2 *43. 9
Niyogi, S.K. and Thomas, C.A. (1 9 6 7 ). Biochem. Biophys. Res.
Commun. 26 , 51*
Nirenberg, M.W. and Matthaei, J.IH. (1 9 6 1 ). Proc. Nat. Acad.
Sci. HZ, 1588._______________________

Nudel, U., Lebleu, B. and Revel, M. (1973)- Proc. Nat. Acad.
Sci. U.S.A. 70, 2139.
Nygaard, A.P. and Hall, B.D. (1 9 6 *4). J. Mol. Biol. 2, 125*
Packman, S., Aviv, H., Ross, J. and Leder, P. (1972). Biochem.
Biophys. Res. Commun. J$2, 8 1 3 .
Painter, T.S. and Griffen, A.B. (1937) • Genetics, 22, 612.
Palacios, R., Sullivan, D., Summers, N.M., Kiely, M.L. and
S chi rake, R.T. (1973)* J* Biol. Chem. 2^8, 5*»0.
Palmiter, D. (1973). J* Biol.Chem. 2 *48. 209 5.
Pardue,M.L. and Gall, J.G. (1970). Science, 168. 1356.
Paul, J. (1 9 6 5 ). "Cell and Tissue CultureM 8 3 . (E. auid S.
Livingstone Ltd., Edinburgh and London).
Paul, J. (1972). Nature, 238. *4*4*4.
Paul, J . , Conkie, D. and Freshney, R.I. (1 9 6 9 ). Cell Tissue
Kinet. 2 2 8 3 .
Paul, J. and Gilmour, R.S. (1 9 6 8 ). J. Mol. Biol. 2 1 , 305.
Paul, M., Goldsmith, M.R., Hunsley, J.R. and Kafatos, F.C.
(1972). J. Cell. Biol. 2 1 , 653*
Pederson, T. (I97**a). J. Mol. Biol. 8 5 , 1 6 *4.
Pederson, T. ( l9 7 *4b). Proc. Nat. Acad. Sci. 71.
Pemberton, R.E. and Baglioni, C. (1972). J. Mol. Biol. 235. 99•
Penman, S. (196 6 ). J. Mol. Biol. 1 7 , 1 7 7 .
Penman, S., Rosbash, M. and Penman, M. (1970). Proc. Nat. Acad.
Sci. U.S.A. 62, I 8 7 8 .
Penman, S., Sherrer, K., Becker, Y. and Darnell, J.E. (19^3)-
Proc. Nat. Acad. Sci. U.S.A. *49. 6 5 *4.Penman, S., Vesco, C. and Penman, C.(l968) J. Mol. Biol. 2 1 , **9 •
Perkowska, E., MacGregor, H.L. and Birnstiel, M.L. (1 9 6 8 ).
Nature, 217, 6 *49.
Perry, R.P. andt Kelly, D.E. (1 9 6 8 ). J. Mol. Biol. 2 1 , 37*

Perry, R.P. and Kelly, D.E. (1973) • J» Mol. Biol. 22.* 681 •
Perry, R.P., Kelly, D.E. and LaTorre, J. (197**).J» Mol. Biol.
8 2 , 315.
Perry, R.P. , LaTorre, J . , Kelly, D.E. and Greenberg, J .R .(1972).
Biochim. Biophys. Acta. 262. 220.
Philipson, L., Wall, R., Glickman, G. and Darnell, J.E.
(1971). Proc. Nat. Acad. Sci. U.S.A. 6 8 , 2 8 0 6 .
Premhumer, E., Shoyab, M. and Williamson, A.R. (197**) • Proc.
Nat. Acad. Sci. U.S.A. 2 1 * 99.
Proudfoot, N.J. and Brownlee, G.G. (1 9 7 *4). FEBS Letters 5 8 , 179
Revel, M. , Aviv, H. , Groner, Y. and Pollack, V. (1970) . FEBS
Letters, __9, 2 1 3 .
Rich, A., Warner, J.R. and Goodman, H.M. (1 9 6 3 ). Cold Spring
Harbor Symp. Mol. Biol. 258, 2 6 9 .
Ris, H. (I9 6 0 ). *ith Int. Conf. Electron Micros. 2 f 199*( Springer—Verlay, Berlin).
Ris, H. (1961). Can. J. Genet. Cytol. 2 , 95*
Ritossa, F.M., Atwood, K.C.', Kindsley, D.L# and Spiegelman, S.
(1 9 6 6 b). Natl. Cancer Inst. Monograph, 2 2 f hh9 •
Ritossa, F.M., Atwood, K.C. and Spiegelman, S. (1 9 6 6 a).
Genetics, 5 *4. 6 6 3 .
Robertson, H.D., Barrell, B.G., Weith, H.L. and Donelson, J.E.
(1973)* Nature New Biol. 2*il. 3 8 .
Robbins, E. and Bonin, T.W. (1 9 6 7 ). Proc. Nat. Acad. Sci. U.S.A
52, *409 .
Rosbash, M. and Ford, P.J. (197**) • J* Mol. Biol. 8 5 , 8 7 .
Rosenfeld, G.C., Conistock,J.P., Mears, A.R. and O'Malley, B.W.
(1972). Biochem. Biophys. Res. Commun. Jj2» 387*
Ross, J . , Aviv,,H., Scolnick, E. and Leder, P. (1972b). Proc.
Nat.Acad. Sci. U.S.A. 6^, 26 *4.
Ruger, W. and Bautz, E.K.F. (1 9 6 8 ). J. Mol. Biol. 31. 8 3 .

Ruiz—Carrillo, A., Beato, M., Schultz, G., Feigelson, P. and
Allfrey, U.G. (1973)* Proc. Nat. Acad. Sci. U.S.A. 22, 3 *41
Ryskov, A.P., Farashyan, V.R. and Georgiev, G.P. (1972).
Biochim. Biophys. Acta. 262. 5 6 8 .
Sampson, J . , Mathews, M.B., Osborn, M. and Borghetti, A.F.
(1972). Biochemistry, 11, 3 6 3 6 .
Scherrer, K., Latham, H. and Darnell, J.E. (1 9 6 3 )* Proc. Nat.
Acad. Sci. U.S.A. h9., 2**0.
Scherrer, K. and Marcaud, L. (1 9 6 8 ). J . Cell. Physiol. 72.
Suppl.l, 181.
Scherrer, K., Marcaud, L., Zajdela, F., London, I.M. and
Gros, F. (1966). Proc. Nat. Acad. Sci. U.S.A. 5 6 , 1571.
Scherrer, K., Spokr, G., Granboulan, N., Morel, C., Groselaude,
J. and Chezzi, C. (1970). Cold Spring Harbor Symp. Quant.
Biol. 2 1 , 539.
Schochetman, G. and Perry, R.P. (1972). J . Mol. Biol. 6 5 * 591.
Sheiness, D. and Darnell, J.E. (1973)- Nature New Biol. 2M.
265 .
Sheldon, R., Jarale, C. and Kates, J. (1972a) Proc. Nat. Acad.
Sci. U.S.A. 62., hl7.
Sheldon, R., Kates, J . , Kelly, D.E. and Perry, R.P. (1972b).
Biochemistry, 1JL, 38 29*
Shenkin, A. and Burdon, R.H. (1972). FEBS Letters, j22, 157*
Slater, I . and Slater, D.W. (197*4)* Proc. Nat. Acad. Sci. U.S.A.
2 i , 1 1 0 3 .
Smith, G.P. (1973)* Cold Spring Harb. Symp. Quant. Biol. 3 8 .
507*
Smith, M.J., Hough, B.R., Chamberlin, M.E. and Davidson, E.H.
(197*4). J* Mol. Biol. 8 *£,
Soeiro, R., Vaughan, M.H., Warner, J.R. and Darnell, J.E. (1 9 6 8 )
J. Cell. Biol. 22., 112*

Southern, E.M. (1 9 7 1 ). Nature New B io l. 232. 82.
Southern, E.M. and M itc h e ll, A.R. (1 9 7 1 ). Biochem. J . 123f 61I 1
S p ir in , A. S. ( 1 9 6 6 ) . In Current T opics in Developmental B io lo lj
(Eds. A.A. Moscona and A. Monroy, Academic P ress, New Yojfcl
1 , 1 .
Spir in , A. S. ( 1 9 6 9 ) . Eur. J . Biochem. ID, 20.
S ta e k e lin , M., Rogg, H ., B agaley, B .C ., Grunsberg, T. and
W eholi, W. (1 9 6 8 ). Nature, 219. 1363-
S ta p le s , D .H ., H indley, J . , B i l l e t e r , M.A. and Weissmann, C.
(1 9 7 1 ). Nature New B io l. 23k. 202.
S te g g le s , A.W., W ilson, G.N., K a n to r ,J .A ., P icc ia n o , D.J.,
F alvey, A.K. and Anderson, W.F. (l9 7 k )« Proc. Nat. Acad.B
S c i. U .S .A . 2 i» 1219.
S te in h e id e r , G., M ed leris, H. and O stertag , W. (1 9 7 1 ). i n
S yn th eses, Struktur and Funktion des Hamoglobins
(Martinand Nowichi, E ds.) 225* J* F. Lehmans, Verlag,
Munchen.
S t e i t z , J.A. (1 9 6 9 ). Nature, 22k. 957.
S teven s, B .J . and S w ift, H. ( 1 9 6 6 ) . J . C e ll . B io l. £ 1 , 55*
S teven s, R.H. and W illiam son, A.R. (1 9 7 3 ). Nature New B iol.
2 1 0 1 . I
Storb, U. ( 197k) • Biochem. Biophys. Res. Commun. 2 JL1 *
S tra u ss, J .H ., K e lly , R.B. and Sinsheim er, R.L* ( 1 9 6 8 ) .
B iopolym ers, 6 , 79 3*
S tu d ier , F.W. ( 1 9 6 5 ) . J . M o l.-B io l. 11, 3 7 3 .
Subirana, J .A . ( 1 9 6 6 ) . B iopolym ers, 171.
Sussman, M. (1 9 7 0 ) . Nature, 225. 12k5*
Sutton , W.D. (1 9 7 1 ). Biochim. Biophys. Acta, 2k0. 522.Q rtf 9k
Sutton, W.D. and McCallum, M. ( l 9 7 l ) . Nature New B io l. 2^2, |
Suzuki, Y. and Brown, D.D. (1 9 7 2 ). J . M o l.,B io l. 6 ^, k09 •

Suzuki, Y., Gage, L.P. and Browm, D.D. (1972). J. Mol. Biol.
70, 637.
Tashiro, Y., Morimoto, T., Matsuiura, S. and Nagata, S. (1 9 6 8 ).
(1968), J. Cell Biol. ^8, 5>7k*
Ullman, J.S. and McCarthy, B.J. (1973a). Biochim. Biophys.
Acta. 291,
Ullman, J.S. and McCarthy, B.J. (l973b) Biochim. Biophys.
Acta. 29 U. kl6.
Verma, I.M., Temple, G.F., Fan, :H. and Baltimore, D. (1972).
Nature New Biol. 235, 1 6 3 .
Wagner, A.F., Bugianesi, R.L. anid Shen, T.Y. (1971). Biochem.
Biophys. Res. Coramun. 118*4.
Walker, P.M.B. (1 9 6 9 ). Prog. Nac:. Acad. Res. £.» 301.
Walker, P.M.B. and McLaren, A. (11965). * Mol. Biol. 12, 39k*
Warner, J.R., Soeiro, R., Birnbojim, H.C., Girard, M. and
Darnell, J.E. (1 9 6 6 ). J. Moil. Biol. 1^, 3k9*
Wegnez, M., Monier, R. and Denisi, H. (1972) . FEBS Letters, 2^, 13
Weinberg, E.S., Birastiel, M.L., Purdom, D.R. and Williamson, R.
(1972). Nature 2fj0, 225*
Weinstein, B.I., Schechter, A.N. , Burka, E.R. and Masses, P.
(1963). Science, JJjO, 31k*
Wellauer, P.K. and Dawid, I.B. (1973)* Proc. Nat. Acad. Sei.
u .s .a . 2 2 * 2 8 2 7 .
Wensink, P.C. and Brown, D.D. ( l ‘,97l). J* Mol.Biol. 60, 253*
Wessels, N. and Wilt, F.H. (1 9 6 5 ;) . J . Mol. Biol. 1£, 7 6 7 .
Wetmur, J.G. and Davidson, W. (l!.968). J. Mol. Biol, 3k9*
Wiggly,D.T. and Smith, A.E. (l97'3)* Nature New Biol. 2U2. 136 .
Williamson, A.R. (197k). Reporte»d at Biochem. Soc. Meeting,
Glasgow.
Williamson, R.and Brownlee, G.G. (1 9 6 9 ). FEBS Letters, 306.

Williamson, R., Drewienkiewicz, C.E. and Paul, J. (1973)*
Nature New Biol. 2kl. 6 6 .
Williamson, R., Morrison, M., Lanyon, W.G., Eason, R. and
Paul, J. (1971). Biochemistry, 10, 3°lk-
Williamson, R., Morrison, M. and Paul, J . (1970) • Biochem.
Biophys. Res. Commun. JjO, 7k0.
Wilson, D.A. and Thomas, C.A. (1973)* Biochim. Biophys. Acta.
221, 333.
Wilson, E.B.(l965). The Cell in Development and Heredity,
3rd ed. Macmillan, New York.
Wilt, F.H. (1 9 6 5 ). J. Mol. Biol. 12, 331.
Wintrobe, M.M. (1 9 6 1 ). in ’Clinical Haematology1 5 th ed.
(Kimpton, H. Ed.) 116, London.
Yankofsky, S.A. and Spiegelman, S. (1 9 6 2 ). Proc. Nat. Acad.
Sci. U.S.A. Ji8, 12*66.
Yogo, Y. and Wimmer, E. (1972) . Proc. Nat. Acad. Sci. U.S.A.
62, 1877-
Young, B.D., Harrison, P.R., Gilmour, R.S., Bimie, G.D.,
Hell, A., Humphries, S. and Paul, J. (197k). J* Mol.
Biol. 8 k, 555.

TRANSCRIPTION OF THE GLOBIN GENE
R.S . GILMO UR, S.E. H U M P H R IE S , E.C. HALE and J. PAU L
Beatson Institute for C ancer R esearch 132, Hill S t re e t , G l a s g o w G 3 6 U D
INTRODUCTION
Previous reports from this laboratory (1-3) have provided evidence that there exists in animal ce lls a control mechanism which provides for the transcription of tissue specific RNA sequences® In these studies the overall spectrum of RNA. sequences transcribed in vitro from chromatin by a bacterial polymerase was analysed by a low C0 t , RNA driven hybridisation reaction, where only annealing to the relatively reiterated DNA sequences takes place* It has also been reported recently (4,3) that globin raRNA, a tissue specific messenger, is transcribed from a unique DNA,, sequence, and therefore would not have been detected by the previous type of analysis* The recent use of the RNA dependent polymerase (reverse transcriptase) from avian myeloblastosis virus to obtain DNA copies (cDNA) of globin mRNA from., reticulocytes ( 6- 8 ) offers a hybridisation method for analysing RNA transcribed in vitro from chromatin for a specific type of RNA sequence derived from the unique fraction of the genome* In the present report chromatin of foetal mouse liv er , a haemopoietic tissu e, is examined using this new approach.
RESULTS(a) The detection of globin mRNA in embryonic mouse liv ers .
Total polysomal RNA was isolated from 14 day embryonic mouse livers, a tissue that contains greater than 70$ nucleated erythropoietic c e lls . Cytoplasmic extracts were prepared with NP-40 (9) and polysomes sedimented at 60,000 g x 90 mins. Messenger RNA was fractionated from the total RNA on Sepharose-bound polyU columns as described by Darnell et a l* (10). RNA bound to the column was analysed on polyacrylamide gels and tested for the a b ility to direct globin synthesis in a duck lysate c e l l free system as described by Lanyon et a l . ( l l ) and Lockard and Lingrel (12).
Pig. 1 shows the analysis "of polyU bound polysomal RNA' on a 2.6$ polyacrylamide gel. Small amounts of 28S and 18S ribosomal RNA were present in addition to a substantial peak of material running in the 9S region as judged by co-chromatography with known globin mRNA isolated from mouse reticulocytes. When tested in a duck reticulocyte lysate c e l l free system it could be demonstrated that the 9S RNA contained mRNA for mouse globin (Pig® 2) • Clearly, the appearance of haemoglobin in the developing embryonic mouse liver can be correlated with presence of 9S globin mRNA in the cytoplasm.
(b) The detection of globin mRNA sequences in RNA synthesised from chromatin.
It is of considerable interest to ask whether the globin mRNA of embryonic liver exists as presynthesised RNA or whether i t is actively transcribed from the chromatin. Because of the relative longevity of mRNA in the cytoplasm amounts large enough to be detected by a c e ll free system w ill accumulate.This favoured situation w ill not obtain to RNA synthesised in vitro from chromatin. Here a much more sensitive analysis has been adopted.
9S RNA was purified from the reticulocytes of phenylhydrazine anaemic mice by passing polysomal RNA twice through a polyU-Sepharose column. The bound RNA ran as a single 9S component on polyacrylamide gels and directed the synthesis of globin in the duck lysate c e ll free system. A complementary DNA copy (cDNA) of 9S RNA was prepared using the reverse transcriptase as described by Harrison et a l . (13). [-^3 -dTTP andpHj -dCTP were incorporated into

op
tic
al
d
en
sit
y
at
28
0nm
A
BSO
RBA
NC
E AT
26
0 nm
2B s 18s 9 s
DISTANCE OF MIGRATION Fig. ]
FIS. 1 . Electrophoresis o f polyU-Sepharoae bound embryonic mouse liv e r polysomal RNA. on a 2.6^S polyacrylamide g e l.
1400
■ 1200
■ 1000
800
6 0 0
400
o-o- 200
10 20
L>V
100
8 0
Qtli(VI
ooeco>x
60
40<zou 20
o320 41
Fig. 2FR A CTIO N N U M B E R Fig. 3
5 0 100R N A / c D N A
150 200
FIS. 2 . C1C chromatogram of globins from a duck reticulocyte o e l l free system to which was added poljtJ-Sepharose bound polysomal RNA from embryonic mouse l iv e r .Solid lin e is the OD p ro file . p and a carrier mouse globin peaks elute f i r s t followed by minor and major duck peaks.
( • ——• ) Endogenous incorporation o f ^C -leucine.Incorporation o f ^H-leucine in the presence o f polyU-Sepharose bound RNA.
FIS. 3. Hybridization to cDNA o f 9S reticulocyte globin mRNA ( ° ----------- )and reticulocyte polysomal RNA ( • —— • ) .

cDNA to give a final specific activity of 20 x 10 d.p.m./pg. Titration curves were carried out with varying amounts of test RNA. by hybridising in 10 |al 50% formamide, 0.5 M NaCl; 0.025 M HEPES pH 7; 0.01 M EDTA at 43 C for 3.5 days.The hybrid formed was assayed using the single stranded nuclease of Sutton (14) prepared from Takadiastase.
Fig. 3 shows titration curves in which constant amounts of cDNA (0.001 jug) were hybridised to increasing amounts of reticulocyte 9S RNA and reticulocyte polysomal RNA. With 9S RNA, maximum levels of hybridisation were obtained at input RNA/cDNA ratios of 1-1.4, consistent with the finding that about 60 of the 9S sequence is represented in cDNA. With reticulocyte polysomal RNA maximum hybridisation is obtained at input ratios of about 50 which is consistent with the known 9S content of reticulocyte polysomal RNA ( 2$) •
RNA was transcribed in vitro from embryonic mouse liver and mouse brain chromatin using E .coli RNA polymerase prepared according to the method of Burgess (15).
Hybridisation to cDNA of RNA obtained in this way is shown in Fig. 4.RNA from brain chromatin did not show significant hybridisation while that from embryonic liver chromatin hybridised to about 40^ of the cDNA at input ratios above 25,000. It is important to eliminate the possib ility that the hybridising BtNA from liver chromatin was derived from endogenous RNA and not from RNA transcribed de novo by the bacterial polymerase. This was confirmed by preparing RNA from liver chromatin as before with polymerase and nucleoside triphosphates one of which was highly labelled with P. After hybridisation of thg RNA to cDNA the reaction mixture was treated with ribonuclease for 1 h at 37 C, passed through Sephadex G.75 and the excluded material centrifuged to equilibrium in a CsCl gradient. Hybridised and unhybridised cDNA can be separated by this technique while remaining RNA fragments are pelleted. Pig. 5 shows the distribution of H and P label obtained. The majority of the H label appeared in the lower half of the gradient normally expected for hybridised material while unhybridised cDNA formed a smaller less dense band.
labelled RNA was found to be associated with the hybrid material such, that it comprised at least 80 of hybridised RNA. These experiments show that the a b ility of embryonic liver chromatin to synthesis globin mRNA sequences remains intact in the isolated chromatin.
(c) Reconstitution studies with chromatin
Previous studies (16) suggest that the specificity of transcription in chromatin is an inherent property in that i f the chromatin components are dissociated in high salt/urea solutions and then gradually reconstituted by gradient dialysis to low salt concentrations, the resulting chromatin s t i l l possesses its original specific ity . This was re-investigated by dissolving embryonic liver chromatin at 0.5 mg/ml in 2 M NaCl; 5 M urea; 0.01 M Tris, pH 8.3 and dialysing against 5 M urea, 0.01 M Tris containing 0.6 M, 0.4 M and 0.2 M NaCl for 16 h, 2 h and 2 h respectively. RNA was synthesised in vitro from the reconstituted chromatin and compared by hybridisation to cDNA with RNA from untreated embryonic liver chromatin and reconstituted brain chromatin (Fig. 6). Globin sequences were transcribed from both control and reconstituted
I liver chromatins while background levels were obtained with RNA from brain [chromatin. It was also suggested from previous work that the non-histone [protein fraction of the chromatin was responsible for conferring specific ity of transcription in chromatin. A non-histone protein fraction was obtained from
[embryonic liver chromatin using the hydroxylapatite method of MacGillivray, et a l . (17). This fraction was added to brain chromatin in high salt/urea and
[the chromatin reconstituted as before. The RNA transcribed from this chromatin

40
3 0
2 0 -
10
0 10 20 3 0
RNA/cDNA x10*3
Fig. 4
400
3 00
zOt—St 200O'ii.
So100FRACTION NUMBER
Fig. 5
40f
30
20
30 5 020 4 010
RNA/CDNA X10*3
Fig. 6
30
iu20
5010 20 30 400RNA/C DNA x1<5"3
Fig. 7
F3E-. A-. Hybridization to cDNA of RNA. transcribed in vitro fromembryonic mouse liv e r chromatin ( • ■■■•) and mouse brainchromatin (O' o ) .
FI&. 5. Caesium chloride gradient analysis o f hybridization o f RNA(x x) transcribed in v itro from embryonic mouse liv erchromatin end 3 h - c D N A ( o o ) . The larger, more densep e a k r e p r e s e n t s h y b r i d i z e d c D N A .
FIG-. 6 . Hybridization to cDNA o f RNA transcribed in v itro from native embryonic liv e r chromatin ( ♦ ■" ‘ • ) reconstituted embryonic liv e r chropatin (o■■■— O) reconstituted brain chromatin (x—— x)
FIG-. 7 . Hybridization to cDNA. o f RNA transcribed in v itro from reconstituted brain chromatin (o - o)and brain chromatin reconstituted with liv e r non histone proteins.
(• •).

now showed a significant ability to hybridise with cDNA when compared with brain chromatin which had been reconstituted in the absence of liver non-histone material.
REFERENCES
1. Paul, J. and Gilmour, R.S., J. Mol. Biol. (1966) 16, 242
2. Pdul, J. and G-ilmour, R.S., J. Mol. Biol. (1968) 134. 305
3. Gilmour, R.S. and Paul, J., FEBS Letts. ,(1970) 242
4. Harrison, P.R., Hell, A., Birnie, G.D. and Paul, J . , Nature (1972) 259. 219
3. Bishop, J.O., Pemberton, R. and Baglioni, &., Nature (1972) 235. 231
6. Verma, I.M., Temple, G.F., Fan, H.and Baltimore, D., Nature (1972) 235. 163
7. Ross, J., Aviv, H., Scolnick, E. and Leder, P., Proc. Natl. Acad. Sci. U.S.(1972) 62, 264
8. Kacian, D.L., Spiegelman, S., Bank, A., Terada, M., Metafora, S., Dow, L. and Marks, P.A., Nature (1972) 235. 167
9. Borun, T.W., Robbins, E. and Scharff, M.D., Proc. Natl. Acad. Sci. U.S. (1967) £8, 1977
10. Darnell, J.E., Phillipson, L., Wall, R. and Adensik, M., Science (1971)174. 507
11. Lanyon, W.G., Paul, J. and Williamson, R., Eur. J. Biochem. (1972) jjil, 38
12. Lockard, R.E. and Lingrel, J.B., J. biol. Chem. (1972) 247. 4174
13. Harrison, P.R., Hell, A. and Paul, J., FEBS Letts. (1972) 24, 73
14. Sutton, W.D., Biochim. biophys. Acta (1971) 240. 522
15. Burgess, R.R., J. biol. Chem. (1969) 244. 6160
16. Gilmour, R.S. and Paul, j . , J. Mol. Biol. (1969) 40, 137
17. Mac&illivray, A.J., Cameron, A., Krauze, R.J., Rickwood, D. and Paul, J., Biochim. biophys. Acta (1972) 227. 384

— 94 —
Summary
This report provides a more rigorous proof of previous findings that the RNA transcribed in vitro from the chromatins of different organs shows different
■ sequence specificities. Here the particular case of the globin gene is considered for a comparison of embryonic mouse liver chromatin and mouse brain chromatin using the reverse transcriptase cDNA copy of globin 9S mRNA as a definitive probe. I t can be shown that globin sequences are transcribed in vitro from embryonic liver chromatin and not brain chromatin. This specificity in liver chromatin can be reconstituted after dissociation of the structural elements of the chromatin. I t can be shown that the non-histone protein fraction of liver chromatin can confer specificity for the transcription of globin sequences from brain chromatin which othei>- wise lacks this ability .
ResumbTranscription du gene de la globine
Ce rapport fournit une preuve plus rigoureuse des resultats precedents, que les RNAs transcrits in vitro des chromatines d ’organes divers montrent des differentes specificites de sequences. Ici, pour la comparaison des chromatines du foie d fembryon de souris et du cerveau de souris, on considere le cas special du gene pour 1 Themoglobine, en utilisant comme source definitive le cDNA, copie synthetisee a l ’aide de transcriptase-reverse, du mRNA 9S pour la globine. On peut montrer que des sequences de la globine sont transcrites in vitro a partir de la chromatine du foie embryonnaire, mais pas a partir de la chromatine de cerveau. Cette specificite de la chromatine de foie peut etre reconstitute apres la dissociation des elements de structure de la chromatine. On peut montrer que la fraction de proteine non-histone de la chromatine de foie transmet la specificite de transcription de sequences de globine a la chromatine de cerveau, un tissu qui en est autrement incapable.

[Reprinted from Biochem istry, (1974) 13, 703.]Copyright 1974 by the Am erican Chem ical Society and reprin ted by perm ission of the copyright owner.
Translation of Mouse Globin Messenger Ribonucleic Acid from Which the Poly(adenylic acid) Sequence Has Been Removedt
Robert Williamson,* Jennifer Crossley, and Stephen Humphries
w r a c t : Mouse globin mRNA was isolated using oligo(dT)- idlulose and treated with Micrococcus polynucleotide phos- jiiorylase to remove nucleotides from the 3' end. The ma- trial which no longer bound to oligo(dT)-cellulose was then prated from that which still bound. The molecular weight jfthe major peak of the nonbinding mRNA was reduced iom 220,000 to 185,000, as calculated from mobility in poly- wylamide gel electrophoresis. The treated mRNA which 111 bound to oligo(dT)-cellulose migrated at the same mo- Ity as untreated globin mRNA. The treated mRNA did lot function as a template for reverse transcriptase. Two-
I oly(adenylic acid) sequences have been demonstrated to occur at the 3' termini of all mRNAs from higher cells (Edmonds et al., 1971; Darnell et al., 1971; Lee et al., 1971) with 4e exception of histone mRNAs (Adesnik et al., 1972; Adesnik and Darnell, 1972; Schochetman and Perry, 1972). Various roles may be suggested for these sequences: (a) markers for the processing of heterogeneous nuclear RNA IHnRNA) to messenger RNA (mRNA) (Edmonds et al., 1971; Mipson et al., 1971; Jelinek et al., 1973; Darnell et al.,1972); (b) transport from nucleus to cytoplasm (Philipson Hal., 1971); (c) regulation of mRNA half-life (Sheiness and Darnell, 1973; Sussman, 1970); and (d) binding of poly(A)- specific proteins (Kwan and Brawerman, 1972; Blobel,1973).Histone mRNAs contain no poly(A) sequences yet migrate
io the cytoplasm and are translated (Adesnik et al., 1972; Adesnik and Darnell, 1972; Schochetman and Perry, 1972; Jacobs-Lorena et al., 1972). On the other hand, viral mRNAs may contain poly(A) sequences although synthesized in the cytoplasm (Yogo and Wimmer, 1972; Johnston and Bose, 1972). We have used polynucleotide phosphorylase to remove the poly(A) sequence from mouse globin mRNA and lasted the product in the Krebs ascites protein synthesis sys- tem for its ability to direct mouse globin synthesis.
Materials and M e th o d s
Mouse reticulocyte polysomal RNA was prepared as previously described (Williamson et al., 1971) and the globin mRNA was isolated using oligo(dT)-cellulose (Aviv and Le- der, 1972). 01igo(dT)-cellulose was purthased from Collaborative Research, Waltham, Mass. The purity of the mRNA preparation was confirmed by 2.6% polyacrylamide gel electrophoresis and by its ability to direct mouse globin synthesis in a duck reticulocyte lysate cell-free system, both as previously described (Williamson et al., 1971; Lingrel et al.,
tThe Beatson Institu te for C ancer R esearch, Glasgow, G3 6U D , Scotland. Received July 30, 1973. This w ork was supported by grants io the Beatson Institu te for C ancer R esearch from the Medical Research Council and the Cancer R esearch Cam paign.
dimensional fingerprint analysis of phosphokinase-labeled fragments from a combined pancreatic T1 ribonuclease digest demonstrated the absence of any large oligo(A) fragments from the nonbound mRNA; at least 90% of the poly(A) region had been removed. The treated nonbound mRNA stimulated globin synthesis in the Krebs ascites cell system, but the nonbound mRNA was only approximately 50% as efficient as treated bound mRNA as judged by product analysis on carboxymethylcellulose columns. In the case of mouse globin mRNA the presence of a long poly(A) sequence is not required for successful translation.
1971; Lanyon et al., 1972). [3H]- and [14C]leucine and [y-32P]- ATP were purchased from the Radiochemical Centre, Amer- sham.
Micrococcus lysodiekticus polynucleotide phosphorylase (EC 2.7.7.8) was purchased from Worthington Biochemicals. Mouse globin mRNA (100 /xg/ml) was incubated with 500 Mg/ml of polynucleotide phosphorylase in 50 mM Tris (pH7.5)—15 m M MgCl2-15 m M potassium phosphate at 37° for 7 min (Grunberg-Manago, 1963). The reaction was stopped by adding one-tenth volume of 10% sodium dodecyl sulfate and the reaction mixture was deproteinized by shaking with a half-volume of phenol-chloroform. The RNA was precipitated with ethanol, dissolved in 0.5 m NaCl-0.01 m Tris (pH7.5)-0.1% sodium laurylsarcosine, and passed through a dT-cellulose column. The material which was not retained was collected and ethanol precipitated; the proportion of unretained RNA varied from preparation to preparation but was of the order of 80 %. The size of the treated mRNA was compared with that of the original mRNA on 6% polyacrylamide gels, with added marker 4S and 5S RNA from mouse reticulocytes.
The ability of the treated nonbound mRNA to be copied by reverse transcriptase with an oligo(dT) primer was compared with that of untreated mouse globin mRNA. The enzyme was prepared and the assay carried out as described by Harrison et al. (1972).
Two-dimensional fingerprint analysis of treated and untreated mRNA was performed after digestion for 45 min at 37° with pancreatic and T1 ribonucleases each at 0.05 mg/ml in 10 n\ of 0.01 m Tris (pH 7.4). The digestion was terminated by addition of an equal volume of water-saturated phenol- chloroform (1:1) and the aqueous phase was dried down after deproteinization. The oligonucleotide mixture was dissolved in 1% sodium dodecyl sulfate containing 0.1 mg/ml of bacterial alkaline phosphatase and incubated for 30 min at 37°. The reaction mixture was deproteinized, dried down, and then taken up in 1 /d of 0.1 m Tris, 11 mM mercaptoetha- nol, 11 m M MgCb, 0.27 m M [y-32P]ATP, and 2 units of polynucleotide kinase (a gift from Dr. Ken Murray, University of Edinburgh). Incubation was carried out at 37° for 45 min,
B I O C H E M I S T R Y , V O L . 13, N O . 4, 1974 703

W I L L I A M S O N , C R O S S L E Y , A N D H U M P H R I E S
EC
*r\C48
ss■<
figure 1 :6 % polyacrylamide gel electrophoresis o f globin m R N A s following incubation with polynucleotide phosphorylase. M igration from left to right; gels 12 cm long and 0.7 cm diam eter; electrophoresis a t 2.5 m A/gel for 30 min and then 10 m A/gel for 4 hr (William son et al., 1971): (a) 13 jug o f untreated 9S globin m R N A ; (b) 13 jug o f phosphorylase-treated nonbound m R N A ; (c) 15 jug of phosphorylase-treated bound m RNA.
the mixture was dried, and the 32P-labeled oligonucleotides were taken up in 0.7 jul of dye mixture and separated by electrophoresis on cellulose acetate strips in the first dimension and by chromatography on PEI-cellulose thin-layer plates in the second dimension, as described elsewhere (Southern and Mitchell, 1971; Crossley et al., 1974).
The ability of the treated mRNA to direct protein synthesis was assayed in a preincubated Krebs ascites cell-free system (Mathews and Korner, 1970; Mathews et al., 1972; Mathews, 1972). The dependence of incorporation on added globin mRNA was determined by incubation for 60 min at 37° followed by 10-min digestion with alkali. Protein was precipitated with 10% CCI3COOH after addition of 50 ng of bovine serum albumin and the precipitates were collected onto Whatman GFC glass fiber filters, washed, dried, and counted in toluene-based scintillator. Product analysis was performed on 100-jul incubation mixtures each containing 5 Mg/ml of mRNA, incubated for 60 min at 37°. Carrier mouse globin was added and the protein was extracted with acid acetone at —20°, pelleted, and washed twice with acetone. The globin was then chromatographed on carboxymethyl- cellulose (Whatman, CM-52) using a gradient of 0.01-0.1 M disodium phosphate (pH 6.8) in 8 m urea-0.05 m mercapto- ethanol. Fractions of 5 ml were collected, precipitated onto glass fiber disks, solubilized with NCS (Nuclear-Chicago Corp.), and counted in toluene-based scintillator.
Results
The profiles obtained after electrophoresis on 6% acryl- amide gels for untreated mRNA, treated mRNA which does not bind to oligo(dT)-cellulose, and treated mRNA which
9SmRNA
1 treatad mRNA
2*10
01ouincno
RNA
RNA
<ztr0 2 6 8 10 12
distance migrated (cms)
figure 2: Determ ination of molecular weight of treated globin m RN A . The treated nonbound mRNA was run on 6% polyacrylam ide gels with m arkers of untreated 9S globin mRNA (mol wt 2.20 X 10⁵, W illiamson et al., 1971), mouse 5S RNA (mol wt 4.1 X 10⁴, W illiamson and Brownlee, 1969), and mouse 4S RNA (mol wt 2.6 X 1 0 \ Staehelin et al., 1968).
still binds to oligo(dT)-cellulose are shown in Figure 1. The molecular weight determination for the treated unbound mRNA is shown in Figure 2.
The molecular weight of the peak of unbound phosphorylase-treated mRNA varied in five preparations between185,000 and 200,000 (av mol wt 190,000) taking the molecular weight of the untreated mRNA as 220,000. The treated bound mRNA migrates to the same position as untreated mRNA. A second smaller peak (of av mol wt 175,000) was usually seen in the treated unbound preparations, as was small amounts of material migrating in the 4S-5S region.
9S mRNA, incubated for 7 min under phosphorolysis conditions but in the absence of polynuceotide phosphorylase, was found to be 100% retained by a dT-cellulose column. This material behaves in an exactly similar manner to the original 9S mRNA in gel and sequence analyses.
Two-dimensional fingerprints of T1 plus pancreatic RNase- treated 9S RNA, phosphorylase-treated nonbound mRNA and poly(A) are shown in Figure 3. Since pancreatic RNase hydrolyzes cyclic purine nucleotides to 3'-phosphate only slowly if at all (Markham, 1957), two series of oligonucleotide spots are seen for poly(A), corresponding to (pA)„-p and (pA)re-OH. For 9S globin mRNA, the proportion of the total radioactivity found in these two oligonucleotide isopliths derived from poly(A) (but not including pAp, which is also found in fingerprints of rRNA) is approximately 20 ± 3%. (A full quantitative analysis of these data for untreated 9S mRNA is in preparation and will appear elsewhere.> ) he proportion of radioactivity in the oligo(A) tracts for he treated nonbound mRNA is 1.4 ± 0.2%, and the great majority is found in the smallest oligonucleotides.
In an experiment in which both untreated and treated nonstuck globin mRNA were copied by reverse transcriptase, the incorporation obtained is shown in Table I.
The dependence of amino acid incorporation on added treated bound and treated nonbound globin mRNA is shown in Figure 4. In both cases the stimulation of incorporation is linear and similar up to 4 pmol of mRNA added per 50/ilof incubation mixture. The amount of added mRNA was cal-
704 B I O C H E M I S T R Y , V O L . 13, N O . 4, 1974

T R A N S L A T I O N O F m R N A M I N U S P O L Y ( a )
,3- gfl
y-*1. V.FIR ST DIMENSION
FIRST DIMENSION
oOlp*),p
C W o<pAU0HC W O(pA)50H
O pap O(pA)20H
o(pa)2pcp o
° O ■2 ° ° 0° o
pApG-OH Q ( P AV
O Q ( p A ) 2 pC- 0H
opApC-OH
O(PAhP
O<PAU-0H
Q (P % -°H
O(PA)3PC-0H ,-OH
p Ap Ll-OH
0(pA)4PcP0(P A)3PCP
Q °(pA)3p O W pA pC p
OO O .
(PA)2P (^J)
OpApU-OH
FIRST DIMENSION
Of pAhpC-OH pApG-OH
O (pA)2pc °H
opApC-OH
figure 3: Fingerprints o f comm ercial poly(A), untreated 9S m R N A , and phosphorylase-treated nonbound m R N A : (a) com m ercial poly(A) treated with pancreatic RN ase and labeled with phosphokinase; (b) 9S globin m R N A ; (c) phosphorylase-treated nonbound m R N A -treated withTl plus pancreatic ribonucleases followed by phosphatase and then labeled at the 5 ' end with phosphokinase. N ote the complete absence in(c) of the isoplith (pA)„-OH and the absence o f any spots larger than (pA )3-p in the isoplith (pA)„-p.
table i: Transcription of Untreated and Treated Nonbound Globin mRNA with Reverse Transcriptase in the Presence ofOligo(T) Primer.
Cpm//ug of Template
Control globin mRNA 7 .4 X 106Treated globin mRNA (nonbound) 4 .9 X 104
culated using molecular weights of 220,000 (control) and185.000 (treated, nonbound).The elution profile of globin chains synthesized after addi
tion of treated bound and nonbound mRNAs in this linear range to the Krebs ascites system is shown in Figure 5. The counts recovered in each globin peak and in the breakthrough peak are given in Table II. The non bound mRNA is approximately half as active as the control mRNA'judged by product analysis, and there is a greater depression of a-chain synthesis than /3-chain synthesis.
Discussion
The isolation of the treated mRNA used in these experiments depends upon its nonbinding to oligo(dT)-cellulose. This material migrates at a maximum molecular weight of200.000 and an average molecular weight of 185,000, at least
table ii : Amino Acid Incorporation into Separated Globin Chains.
c c 13c o o h -Precipitable
Counts in Peak Bound 9 SNonbound
9 SNonbound: Bound (%)
a-Globin 15,370 3,890 25/3-Globin 24,435 15,513 63Breakthrough 60,000 70,756« + (3 39,805 19,203 48
Total 100,552 89,959 89.5
20,000 below the molecular weight of intact mouse globin mRNA. The uncertainty as to the exact molecular weight of mouse globin mRNA does not affect the calculation of the difference in molecular weights, which depends upon the relative mobility of the intact and treated 9S RNA.
Only small amounts of absorbing material migrate other than in the major component of mol wt 185,000 after phosphorylase treatment. We estimate that at least 80% of the RNA is in this peak, and there is little if any material migrating in the position of intact 9S mRNA,
The poly(A) sequence of mouse globin mRNA is approximately 50-70 residues in length (Lim and Canellakis, 1970; Morrison et a!., 1973), and therefore the molecular weight reduction is calculated to be sufficient to remove all of the
BIOCHEMISTRY, VOL. 13, NO. 4, 1974 705

T R A N S L A T I O N O F m R N A M I N U S P O L Y ( a )
Acknowledgments
We thank Dr. M. Getz for advice on the use of polynucleotide phosphorylase and Dr. I. Pragnell for performing the assays with the Krebs ascites cell-free system.
References
Adesnik, M., and Darnell, J. E. (1972), J. Mol. Biol. 67, 397. Adesnik, M., Salditt, M., Thomas, W., and Darnell, J. (1972),
Mol. Biol. 71,21.Aviv, H., and Leder, P. (1972), Proc. Nat. Acad. Sci. U. S. 69,1408.
Bloebel, G. (1973), Proc. Nat. Acad. Sci. U. S. 70,924.Clegg, J. G., Weatherall, O. J., and Milner, P. F. (1971), Mature (London) 234, 337.
Crossley, J., Mansbridge, J., and Williamson, R. (1974), Biochem. J. (in press).
Darnell, J. E., Wall, R., Adesnik, M., and Philipson, L. (1972), in Molecular Genetics and Developmental Biology, Suss- man, M., Ed., Engelwood Cliffs, N. J., Prentice-Hall, p 201.
Darnell, J. E., Wall, R., and Tushinski, R. J. (1971), Proc. Nat. Acad.Sci. U.S. 6 8 ,1321.
Edmonds, M. P., Vaughan, Jr., M. H., and Nakazato, H. (1971), Proc. Nat. Acad. Sci. U. S. 6 8 ,1336.
flatz, G., Kinderlerer, J., Kilmartin, J. V., and Lehmann, H. (1971), Lancet, 732.
Grunberg-Manago, M. (1963), Progr. Nucl. Acid Res. 1,93. iarrison, P. R., Hell, A., Birnie, G. D., and Paul, J. (1972), Nature (London) 239, 219.
lacobs-Lorena, M., Baglioni, C., and Borun, T. W. (1972), Proc. Nat. Acad. Sci. U. S. 69,2095.
Jelinek, W., Adesnik, M., Salditt, M., Sheiners, D., Wall, R., Molloy, G., Philipson, L., and Darnell, J. E. (1973), J. Mol. Biol. 75, 515.
Johnston, R. E., and Bose, H. R. (1972), Proc. Nat. Acad. Sci. ' V. S. 69,1514.Kwan, S., and Brawerman, G. (1972), Proc. Nat. Acad. Sci. U.S.69, 3247.
Lanyon, G., Paul, J., and Williamson, R. (1972), Eur. J.Biochem. 31, 38.
Lee, S. Y., Mendecki, J., and Brawerman, G. (1971), Proc.Nat. Acad. Sci. U. S. 6 8 ,1331.
Lim, L., and Canellakis, E. S. (1970), Nature (London) 227, 710.
Lingrel, J. B., Lockard, R. E., Jones, R. F., Burr, H. E., and Holder, J. W. (1971), in Series Haematologica, Vol. 4, Jenson, K. G., and Killman, S., Ed., Munksgaard, Copenhagen, p 37.
Markham, R. (1957), Methods Enzymol. 3m 805.Mathews, M. B. (1972), Biochim. Biophys. Acta 272,108. _ . Mathews, M. B., and Korner, A. (1970), Eur. J. Biochem. 17,
328.Mathews, M. B., and Osborn, M. (1971), Nature {London),
New Biol. 233,206.Mathews, M. B., Pragnell, I. B., Osborn, M., and Arnstein,
H. R. V. (1972), Biochim. Biophys. Acta 287,113.Morrison, M. R., Merkel, C. G., and Lingrel, J. B. (1973),
Mol. Biol. Rept. 1, 55.Philipson, L., Wall, R., Glickman, G., and Darnell, J. E.
(1971), Proc. Nat. Acad. Sci. U. S. 68,2806.Schochetman, G., and Perry, R. P. (1972), J. Mol. Biol. 63,
591.Sheiness, D., and Darnell, J. E. (1973), Nature {London),
New Biol. 241, 265.Southern, E. M., and Mitchell, A. R. (1971), Biochem. J.
123,613.Staehelin, M., Rogg, H., Bagaley, B. C., Grinsberg, T., and
Weholi, W. (1968), Nature {London) 219,1363.Sussman, M. (1970), Nature {London) 225,1245.Wigle, D. T., and Smith, A. E. (1973), Nature {London), New
Biol. 242,136.Williamson, R., and Brownlee, G. G. (1969), FEBS {Fed. Eur.
Biochem. Soc.) Lett. 3, 306.Williamson, R., Morrison, M., Lanyon, G., Eason, R., and
Paul, J. (1971), Biochemistry 10, 3014.Yogo, Y., and Wimmer, E. (1972), Proc. Nat. Acad. Sci.
U. S. 69, 1877.
B I O C H E M I S T R Y , V O L . 13, N O . 4, 1974 707

8 8 6 PAUL ET AL.
1 0 0
75
50
25
75
_i 50
75
50-v
25
CotF ig u re 1. Annealing o f mouse globin cD N A to mouse D N A in the presence o f a great excess o f the latter. (Top) Total embryo D N A /cD N A = 107 (w/w); (middle) fetal liver D N A /cD N A = 107 (w/w); (bottom) sperm D N A / cD N A = 5 X 10® (w/w). T otal D N A shown by continuous lines and triangles; cDNA shown by interrupted lines and circles. General conditions for preparation o f D N A and cD N A and estim ation o f single- and double-stranded DN A were as described in Harrison et al. (1972).
incubating [3H]deoxynucleoside triphosphates with globin mR/NA in the presence of AMV reverse transcriptase. The titrations were performed by incubating a standard amount of cDNA with increasing amounts of BN A in conditions that should lead to complete hybridization; the amount of cDNA hybridized was then estimated by measuring the fraction that resisted digestion by SI nuclease, which attacks single-stranded but not doublestranded DNA (Sutton, 1971). The results of typical titrations are shown in Figure 2, from which it can be seen that the RNA isolated from the incubation mixture containing chromatin from erythropoietic tissue included sequences complementary to the cDNA, whereas the RNA isolated from the mixture containing brain chromatin did not.
Chromatin always contains some RNA. Therefore, the possibility always exists, especially when
minute amounts of transcripts from the globin genes are being detected, that these could arise entirely from RNA originally present in the chromatin. To investigate this possibility we performed the following experiments. First, RNA was isolated from fetal liver chromatin and hybridized with cDNA; this was not found to contain detectable amounts of globin mRNA in concentrations equivalent to those used in the experiments illustrated in Figure 2. Second, control incubations, complete except for the omission of GTP, did not yield RNA containing measurable amounts of globin mRNA in similar concentrations. Finally, to demonstrate that the RNA which formed a hybrid with globin cDNA was actually made in the reaction, an incubation mixture was prepared with chromatin from fetal liver as before, but 32P-labeled ATP was included. After hybridization of the purified RNA with cDNA, the hybrid was isolated and banded in a cesium gradient (Fig. 3). This revealed cDNA with the same buoyant density as an RNA-DNA hybrid between globin mRNA and its cDNA (1.78); associated with this were 32P counts. The most likely explanation of this finding was the formation of a hybrid between globin cDNA and the RNA made in the reaction. An alternative, though exceedingly unlikely, explanation was the formation of a complex between poly(A) and cDNA. We excluded this possibility by hybridizing poly (A) (mol. wt. 100,000) to cDNA and isolating and banding the nucleic acids from the reaction mixture as described in Figure 3. Most of the cDNA then banded at 1.71; there was no evidence for the formation of a complex of significantly higher buoyant density. It can therefore be concluded that cDNA was indeed hybridized to RNA that had been made during the incubation. The relative amounts of labeled and unlabeled RNA in the hybrid could be calculated at approximately 4:1; hence, about 80% of the globin mRNA sequences isolated from the incubation mixture appear to be present in newly synthesized RNA. These experiments show that RNA is transcribed from globin genes in fetal liver chromatin but not in brain chromatin, thereby substantiating the conclusion we had previously drawn that there is an organ-specific “masking” of DNA in chromatin.
In previous work we showed that the specificity of chromatin templates could be altered by transferring the nonhistone components (Gilmour and Paul, 1970). We therefore explored this phenomenon in the present series of experiments. As shown in Figure 4, when brain chromatin was dissociated and reassociated in the presence of nonhistone proteins from fetal liver, evidence was obtained that this gave a nucleoprotein from which globin mRNA sequences could be transcribed, although

THE GLOBIN GENE 887
F igu re 2. Titrations o f chromatin- primed R N A against globin cDNA .( • ------ # ) Mouse fetal liver chromatin;(O O ) mouse brain chromatin.Globin mRNAwas purified from mouse reticulocytes by passing polysomal R N A twice through a poly(XJ)-Sepha- rose column; its activ ity was measured in a duck reticulocyte lysate system . cD N A was prepared as described by Harrison e t al. (1972), w ith a specific activ ity o f 20 X 10® dpm /^g. Chromatin was prepared from nuclei isolated in 0.25 m sucrose by successive washing with 10 vol 0.1 m Tris pH 7.4 and 10 vol 0.14 m NaCl. This was incubated with E . coli R N A polymerase and nucleoside triphosphates using in cubation conditions previously described (Paul and More, 1972), and the ' R N A was isolated by the m ethod of Penm an (1966). Different am ounts of this R N A were m ixed w ith 0.001 fig cDNA in 10 fd 50% formamide, 0.5 m NaCl, 0.025 k H E PE S pH 7, 0.01 M EDTA at 43°C for 3 -4 days. The hybrid was assayed by measuring the am ount o f cD N A resistant to the SI nuclease described by Sutton (1971).
50
40
> 30
20
RNA/cDNA x 10" 5
reconstituted brain chromatin did not by itself exhibit this property. This provides an indication that the nonhistone proteins of fetal liver can “unmask” the globin genes in brain chromatin. Moreover, by experiments similar to those described
400 1*71 1-78
300
<200
o_ 100
x-x
O 10 2 0FRACTION NUMBER
F igu re 3. Isopycnic banding in CsCl of a hybrid formed between [3H ]cD N A and [32P]R N A transcribed from mousefetal chromatin (x x) 3H counts; ( # ------ # ) 32P counts.Chromatin was prepared and R N A transcribed from it as described in the legend to Figure 2, except that [32P]ATP (1 Ci/mmole) was included in the incubation m ixture. After hybridization w ith cDNA, the reaction mixture was diluted to 1 ml w ith 0 . 1 m NaCl and treated w ith 20 (Mg/ml ribonuclease for 1 hr a t 37°C. I t was then passed through a Sephadex G-75 column in 0.1 m NaCl and the excluded material centrifuged to equilibrium in a CsCl gradient. The fractions were collected and analyzed.
above evidence was obtained that the hybrid was composed of cDNA and newly made RNA. Hence, an element of the transcriptional control in ery- throid cells would seem to be of the “gene-masking” type. We have previously presented evidence that the specific regulation of RNA synthesis in chromatin is due to nonhistone proteins (Paul and
40Qcr
30I10 < 20
! •
RNA / cDNA x 1C)5F igu re 4. Titration of globin cDNA against R N A transcribed from reconstituted chromatin. (O O ) R e constituted brain chromatin; ( □ ------ □ ) reconstitutedliver chromatin; (■ ------- ■) brain chromatin reconstitutedin the presence o f nonhistone proteins from fetal liver. Reconstitution was performed by taking up the chromatin or other components in 5 m urea—2 m NaCl (which produces dissociation) and then progressively lowering the concentrations of urea and salt (Gilmour and Paul, 1970). Nonhistone proteins from fetal liver were obtained by fractionation o f chromatin on hydroxyapatite (MacGilliv- ray et al., 1971). These were m ixed w ith brain chromatin in the ratio 1 N H P ;2 D N A (w/w). RN A was transcribed, isolated, and hybridized as in the legend to Figure 2.

8 8 8 PAUL ET AL.
T a b le 1. Concentration o f Globin m RN A Sequences in R N A Pools in Friend Erythroleukemic Cells Induced or
N ot Induced to Synthesize Hemoglobin
Fraction of RNA asGlobin mRNA X 10s Fraction
of CellsTotal Hemo
Polysomal Cytosol Nuclear globinizedRNA RNA RNA (%)
Uninduced 3-5 4 18 < 1Induced 50-70 15-18 20 50-70
Friend erythroleukemic cells, clone 707, were grown in suspension in H am ’s F12 medium and MEM nonessential amino acids + 16-5% horse serum. DMSO was added to the induced set o f cultures to 1.5% v /v . Samples were harvested a t intervals. The table shows findings from cells grown for 4 days in these conditions. The fraction o f cells hemoglobinized was determined by benzidine staining. The cells were fractionated and R N A extracted from the fractions. This was titrated against cDNA in the manner outlined in the legend to Figure 2, in comparison w ith an authentic sample o f purified mouse globin m RNA.
Gilmour, 1968; Gilmour and Paul, 1970) and a considerable amount of evidence has now accumulated in support of this view (MacGillivray et al., 1972). These preliminary experiments not only reinforce earlier work but offer a technical approach of considerable power.
T he T ra n scr ip tio n P rod u ct in th e C ellThe speculation that high molecular weight
RNA might be a precursor of mRNA has now been tested. Williamson et al. (1973) injected high molecular weight RNA (> 30 S) from mouse fetal liver into Xenopus oocytes and demonstrated the synthesis of mouse a- and ^-globin chains. Imaizumi et al. (1973) have more recently shown that nuclear HnRNA contains globin mRNA sequences by hybridization with cDNA, and we have made similar observations (Table 1). This result has been anticipated for some time, but an important piece of information likely to be obtained from current studies is the size of the largest molecule containing globin mRNA sequences, since this may set a lower limit on the size of the transcriptional unit. This is probably at least 50 S, equivalent to a molecular weight of several million. There is a possibility that some of these very large molecules may be aggregates. They could even be formed by the ligation of smaller molecules. However, present evidence suggests, on the contrary, that the larger molecules are precursors of the smaller. It seems very likely, therefore, that the transcriptional unit is very much larger than the sequences coding for globin chains.
G lob in m R N A S y n th esis and P ro cess in g d u rin g In d u ction o f H em o g lo b in S y n th esis
Friend and her colleagues have demonstrated that lines of cells isolated from DBA/2 mice,
rendered leukemic by inoculation with Friend virus, are capable of hemoglobin synthesis (Scher et al., 1971). Moreover, when these cells are treated with 1.5-2% dimethyl sulfoxide (DMSO), they can be induced to form hemoglobin at a much higher rate (Friend et al., 1971). Ostertag et al. (1972) and Ross et al. (1972a) have made similar observations, and the latter group has demonstrated that the increased hemoglobin synthesis is accompanied by accumulation of globin mRNA in the treated cells.
In studies with this system, we have measured separately the concentrations of mRNA sequences in nuclear, cytosol, and polysomal RNA. As summarized in Table 1, we found that the concentration of mRNA sequences was not very different in the nucleus and only moderately greater in the cytosol in induced cells in comparison with uninduced ones, but that there was a dramatic increase in polysomes. These findings strongly suggest the intervention of a factor (a translation initiation factor?) which results in incorporation of globin mRNA into polysomes.
Chromatin from cells induced to synthesize hemoglobin was examined for its capacity to act as a template for synthesis of globin mRNA. As shown in Figure 5, evidence could be obtained for new synthesis of RNA, which formed a hybrid molecule with cDNA. (This hybrid had a slightly lower buoyant density than might have been expected of a pure cDNA/mRNA hybrid.) At the time of writing, experiments to compare chromatin from induced and uninduced cells are incomplete. Hence, although evidence for translational control of hemoglobin synthesis in these cells is good, it is not yet possible to state whether there is also some control at the level of transcription. However, taken together with the evidence outlined earlier,
3 0 0 171 1-78
A
2 100
0 10 20FRACTION NUMBER
F ig u re 5. Isopycnic banding in CsCl o f hybrid formed between [3H ]cD NA and [32P]R N A transcribed fromchromatin from induced Friend cells, (x x) 3H counts;( # -------• ) 32P counts. Cell cultures were prepared asdescribed in Table 1 and [32P]R N A prepared from chromatin, hybridized to cDNA , and banded as described in the legend to Figure 3.

THE GLOBIN GENE 889
that the globin gene can be transcribed from fetal liver chromatin but not brain chromatin, it seems likely that both transcriptional and translational controls are involved in the differentiation and maturation of erythroid cells.
From our own findings and those of other investigators the following points are reasonably well established. First, in the mouse the genes for a- and /3-globin chains are represented a very small number of times, probably once, in the genome. Second, the initial transcriptional product is of much greater molecular weight (possibly > 1 0 7) than globin mRNA (220,000); hence, the transcriptional units are presumably much bigger than the regions coding for globin chains. Third, the globin genes are accessible to bacterial RNA polymerase in chromatin from erythropoietic tissue but not in chromatin from brain. Finally, nonhistone factors, probably proteins, seem to be instrumental in determining this accessibility.
These findings are generally compatible with Paul’s (1972) model of the transcriptional unit. This proposes that, possibly for physicochemical reasons, there is a constraint on the minimum size of the transcriptional unit in chromatin, and that where a very small number of functional gene copies is demanded, most of the DNA in a transcriptional unit may be “nonsense DNA,” in that it conveys no information in its nucleotide sequences. It also proposes that nonhistone proteins cause a partial unwinding of nucleohistone which, in their absence, probably forms a highly compact, supercoiled structure. Special DNA configurations, termed “address sites,” that serve as binding sites for nonhistone proteins are envisaged as being adjacent to or a component of polymerase binding sites; they correspond roughly to promoter loci. In the original model no proposal was made about specificity of address sites and the corresponding proteins. However, this is clearly called for by the findings in these and other experiments. If the model has any validity, it also may be necessary to postulate a secondary modification of the nucleo- protein in the address sites. This could occur by an allosteric modification of the protein bound there, which in turn could be achieved in a number of ways, including interaction with other proteins such as effector binding proteins.
If specificity were to be ascribed to “address sites,” it would seem likely that the same address sites might be common to several genes, for example, the a- and /?-globin genes, to achieve coordination. Moreover, each gene might obviously have several different address sites, so that different sets of genes with common components (e.g., a- and /?-globin in the adult and a- and y-globin in the fetus) could be operated independently.
Some of the evidence presented by other speakers in this symposium strongly suggests that unique and moderately repetitive DNA sequences alternate within chromomeres and that the moderately repetitive sequences represent clusters of different sequences. It is perhaps worth pointing out that these findings, too, are clearly compatible with Paul’s model, although, of course, both they and the findings which we have described above fall far short of providing strong evidence for it.
A ck n ow led gm en tsWe wish to acknowledge the help of our col
leagues, especially Drs. R. Williamson, A. J. MacGillivray, and D. Rickwood for collaboration and discussions and Mr. A. C. McKirdy, Miss Elizabeth McPhail, and Miss Claire Hale for skilled technical assistance. We are very grateful to Dr. Charlotte Friend of the Mount Sinai Hospital, N.Y. for providing us with inocula of the cells used in the experiments and to Dr. J. W. Beard of Duke Univeristy, N.C. for supplies of avian myeloblastosis virus. The work was supported by grants from the Medical Council and Cancer Research Campaign.
R eferen cesB e n z , E . J . and B . G. F o r g e t . 1971. D efect in messenger
R N A for human haemoglobin synthesis in beta- thalassemia. J . Clin. Invest. 5 0 : 2755.
B i s h o p , J. and M . R o s b a s h . 1973. Reiteration frequency o f duck haemoglobin genes. Nature N ew B iol. 2 4 1 : 204.
B i s h o p , J. O., R . P e m b e r t o n , and C. B a g l i o n i . 1972. R eiteration frequency of haemoglobin genes in the duck. Nature New Biol. 2 3 5 : 231.
C h a n t r e n n e , H ., A. B u r n y , and G. M a r b a i x . 1967. The search for the messenger R N A of haemoglobin. Progr. Nucleic A cid Res. M ol. Biol, 7 : 173.
F r i e n d , C., W . S c h e r , J. G. H o l l a n d , and T. S a t o .1971. Hem oglobin synthesis in murine virus-induced leukemic cells in v itro : Stim ulation o f erythroid differentiation by dim ethyl sulfoxide. Proc. N at. Acad. Sci. 68: 378.
G i l m o u r , R. S. and J . P a u l . 1969. R N A transcribed from reconstituted nucleoprotein is similar to natural RNA. J . M ol. B iol. 4 0 : 137.
---------- . 1970. Role of non-histone com ponents in determ ining organ specificity o f rabbit chromatin. F E B S Letters 9 : 242.
H a r r i s o n , P. R ., A. H e l l , G. D . B i r n i e , and J . P a u l .1972. Evidence for single copies o f globin genes in the mouse genome. Nature 2 3 9 : 219.
I m a i z u m i , T., H . D i g g e l m a n , and K . S c h e r r e r . 1973. Dem onstration of globin messenger sequences in giant nuclear precursors of messenger R N A of avian erythro- blasts. Proc. N at. Acad. Sci. 7 0 : 1122.
K a c i a n , D . L. and S. S p i e g e l m a n . 1972. In vitro synthesis o f D N A components o f hum an genes for globins. N ature N ew Biol. 2 3 5 : 167.
L i n g r e l , J. B ., R . E . L o c k a r d , R. F . J o n e s , H . E. B u r r , and J. W . H o l d e r . 1971. Biologically active messenger- R N A for haemoglobin. Series Haemat. 4 : 337.

890 PAUL ET AL.
M a c G i l l i v r a y , A. J ., D . C a r r o l l , and J . P a u l . 1971. The heterogeneity o f the non-histone chromatin proteins from mouse tissues. F E B S Letters 1 3 : 204.
M a c G i l l i v r a y , A. J ., J . P a u l , and G . T h r e l f a l l . 1972. Transcriptional regulation in eukaryotic cells. Advanc. Cancer Res. 1 5 : 93.
M o r r i s o n , M . R ., J . P a u l , and R . W i l l i a m s o n . 1972. The D N A -R N A hybridization of 3H -m ethylated m ouse-globin m R N A in conditions of R N A excess. Eur. J . Biochem. 2 7 : 1 .
O s t e r t a g , W ., H . M e l d e r i s , G. S t e i n h e i d e r , N. K l u g e , and S. D u b e . 1972. Synthesis o f mouse haemoglobin and globin m R N A in leukaemic cell cultures. N ature N ew Biol. 2 3 9 : 231.
P a u l , J . 1972. A general theory of chromosome structure and gene activation in eukaryotes. N ature 2 3 8 : 444.
P a u l , J . and R . S. G i l m o u r . 1968. Organ-specific restriction o f transcription in mammalian chromatin. J . M ol. B iol. 3 4 : 305.
P a u l , J . and I. A . R . M o r e . 1972. Properties o f reconstituted chromatin and nucleohistone complexes. Nature N ew Biol. 2 3 9 : 134.
P e n m a n , S. 1966. R N A m etabolism in the H eLa cell nucleus. J . M ol. B iol. 1 7 : 117.
R oss, J ., Y . I k a w a , and P. L e b e r . 1972a. Globin mes- senger-RNA induction during erythroid differentiation of cultured leukemia cells. Proc. N at. Acad. Sci. 6 9 : 3620.
R o ss, J ., H . A viv, E . S c o l n i c k , and P. L e d e r . 1972b. In vitro synthesis of D N A com plem entary to purified rabbit globin m RNA. Proc. N at. Acad. Sci. 6 9 : 264.
S c h a p i r a , G., J . C. D r e y f u s , and N . M a l e k n i a . 1968. The ambiguities in rabbit haem oglobin; evidence for a messenger R N A translated specifically into haem oglobin. Biochem. B iophys. Res. Commun. 3 2 : 558.
S c h e r , W ., J . G. H o l l a n d , and C. F r i e n d . 1971. H aem oglobin synthesis in murine virus-induced leukaemic cells in vitro. I. Partial purification and identification o f haemoglobin. Blood 3 7 : 428.
S u t t o n , W . D. 1971. A crude nuclease preparation suitable for use in D N A reassociation experim ents. Biochim. B iophys. Acta 2 4 0 : 552.
S u z u k i , Y ., L. P. G a g e , and D . D . B r o w n . 1972. Genes for silk fibroin in Bombyx mori. J . M ol. Biol. 7 0 : 637.
V e r m a , I. M., G. F . T e m p l e , H . F a n , and D. B a l t i m o r e .1972. In vitro synthesis o f D N A com plem entary to rabbit reticulocyte 10S RN A. N ature New Biol. 2 3 5 : 163.
W i l l i a m s o n , R., C. E. D r e w i e ^ t k i e w i c z , and J. P a u l .1973. Globin messenger sequences in high molecular weight RN A from embryonic mouse liver. Nature New B iol. 2 4 1 : 6 6 .
W i l l i a m s o n , R ., M. M o r r i s o n , G. L a n y o n , R . E a s o n , and J . P a u l . 1971. Properties o f mouse globin m essenger R N A and its preparation in milligram quantities. Biochemistry 1 0 : 3014.

Vol. 5 8 , N o. 4 ,1 9 7 4 BIOCHEMICAL AND BIOPHYSICAL RESEARCH COM MUNICATIONS
THE TRANSLATION OP MOUSE GLOBIN mRNA PROM WHICH THE POLYADENYLIC ACID SEQUENCE HAS BEEN REMOVED IN A
REINITIATING PROTEIN SYNTHESIS SYSTEM
t>y1 2 1Stephen Humphries , Michael Doel and Robert Williamson
1. The Beatson Institute for Cancer Research,132 Hill Street, Glasgow G3 6UD, Scotland*
2* Searle Research Laboratories,High Wycombe, Bucks, England*
Received April 9,1974SUMMARY: The translation of mouse globin messenger RNAfrom which the polyA sequence had been removed enzymatically was compared with the translation of control globin mRNA in a rabbit reticulocyte lysate cell-free protein synthesis system* Re-initiation of synthesis occurs on average eleven times for mouse (3-globin, demonstrating that the polyA sequence is not required for repeated initiation on the same mRNA molecule*
Recent work from this laboratory with mouse globin mRNA (1) and by others using total L cell mRNA (2) has demonstrated that the polyA sequence found on the 3 •-terminus of most eukaryotic mRNAs is not required for the initiation of at least a single round of protein synthesis in a heterologous cell-free system* However, neither of these results definitively demonstrated reinitiation of protein synthesis on deadenylated mRNA. The experiment described.below shows that reinitiation is possible on an mRNA from which the polyA sequence has been removed. This was done using a hetero- . logous system derived from rabbit reticulocytes, which is known to translate added mRNA many times during a 90 minute period of incubation (3)*
MATERIALS AND METHODS
Polysomal mouse globin messenger RNA was prepared using oligo-dT cellulose (Searle Ltd., High Wycombe, Bucks.) and incubated with polynucleotide phosphorylase to remove the polyA sequence as described previously (1). After this treat-
Copyright © 1974 by A cadem ic Press, Inc.A ll rights of reproduction in any form reserved.
927

Vol. 5 8 , N o. 4 ,1 9 7 4 BIOCHEMICAL AND BIOPHYSICAL RESEARCH COMMUNICATIONS
raent, between 60-80$ cfthe mRNA was no longer retained by oligo-dT cellulose* This deadenylated mRNA is free of 3'- terminal polyA sequences as judged by non-retention by oligo-dT cellulose, fingerprint analysis, template ability with oligo—dT primer and reverse transcriptase, and molecular weight reduction on polyacrylamide gel electrophoresis (1). The RNA retained by the column is identical in sequence and behaviour to untreated mRNA and was used as a control in the protein synthesis experiments*
The activity of the mRNA in directing mouse globin synthesis was measured using a rabbit lysate system as described by Palmiter (3)* Assays were carried out in a reaction mixture of 250 microlitres containing 2,5 microcuries of %-isoleucine (30 Ci/mM, Radiochemical Centre,Amersham), Between 2-6 picomoles of globin mRNA were added to an assay mixture, which is known to be in the linear response range of the system for added mRNA.
After incubation for 6 or 90 minutes at 26°, nonradioactive mouse globin was added as carrier, and total globin extracted and chromatographed on carboxymethyl- cellulose with a 0.01M - 0*05M phosphate gradient as described by Lingrel et al* (4).
RESULTS
Figure 1 shows a typical separation of mouse p—globin from mouse a-globin and rabbit globin after 6 minutes in- . cubation. Palmiter has shown that for this system 1.6$ of the isoleucine incorporated is radioactive under these conditions (3), Mouse p-globin contains twice as much isoleucine as rabbit globin and it can be calculated that an incorporation of approximately 2,000 dpm represents one picomole of rabbit globin and 0*5 picomole of mouse p-globin*The amounts of mouse p-globin made in each assay is shown in Table 1.
After six minutes the deadenylated mouse mRNA has been translated twice per molecule on average and the control mRNA 2.8 times per molecule on average; after 90 minutes the deadenyl-
928
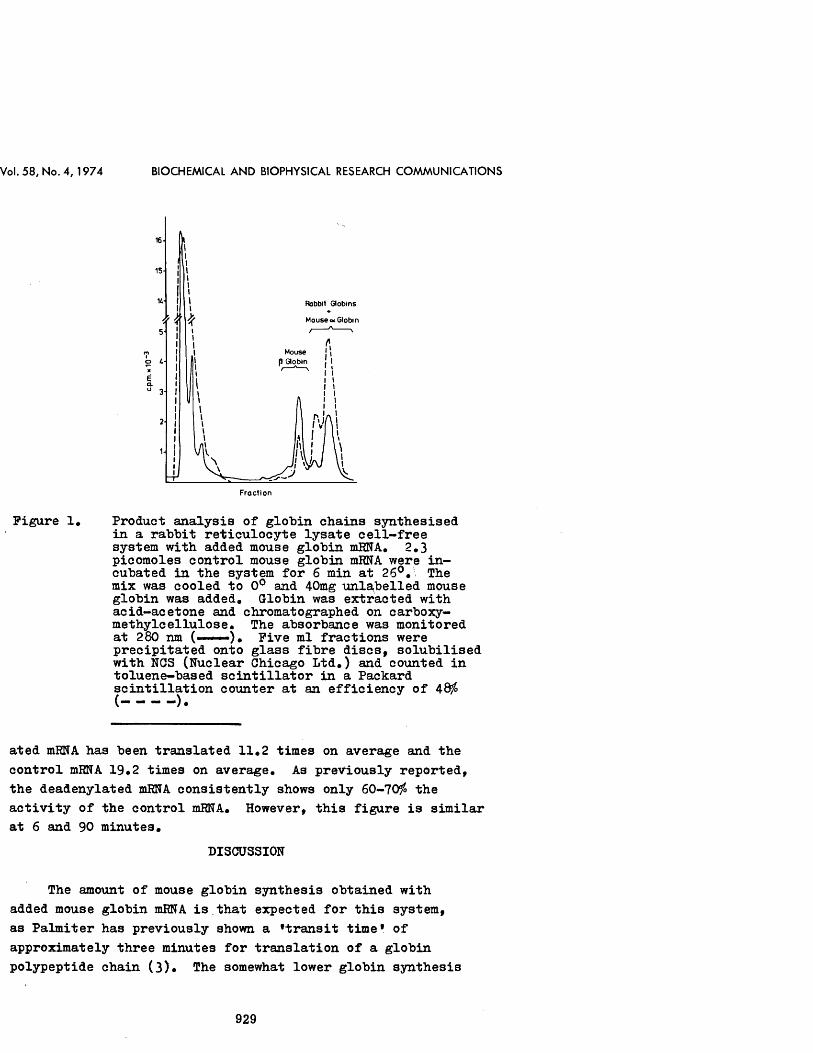
Vol. 5 8 , N o. 4 , 1 9 7 4 BIOCHEMICAL AND BIOPHYSICAL RESEARCH COM MUNICATIONS
Rabbit G lobins
M ouse oc Globin
M ouseGlobin
ioXEcLo
F r a c t io n
Figure 1. Product analysis of globin chains synthesised in a rabbit reticulocyte lysate cell-free system with added mouse globin mRNA, 2,3 picomoles control mouse globin mRNA were incubated in the system for 6 min at 26°, The mix was cooled to 0° and 40mg unlabelled mouse globin was added, Globin was extracted with acid-acetone and chromatographed on carboxy- methylcellulose. The absorbance was monitored at 280 nm (■ ..■■■), Five ml fractions were precipitated onto glass fibre discs, solubilised with NOS (Nuclear Chicago Ltd,) and counted in toluene-based scintillator in a Packard scintillation counter at an efficiency of 48$
ated mRNA has been translated 11,2 times on average and the control mRNA 19*2 times on average. As previously reported, the deadenylated mRNA consistently shows only 60-70$ the activity of the control mRNA, However, this figure is similar at 6 and 90 minutes,
DISCUSSION
The amount of mouse globin synthesis obtained with added mouse globin mRNA is that expected for this system, as Palmiter has previously shown a ’transit time* of approximately three minutes for translation of a globin polypeptide chain (3), The somewhat lower globin synthesis
929

Vol. 5 8 , N o. 4 ,1 9 7 4 BIOCHEMICAL AND BIOPHYSICAL RESEARCH COMMUNICATIONS
Table 1. The amount of mouse p-globin synthesised at6 and 90 minutes in a rabbit reticulocyte cell free system.
Added mRNA Time pMoles mouse p-globin made
pMoles mRNA added
No. oftimeseachmessagetranslated
deadenylated 6 min. 3.81 5.2 1.9control 6 min. 5.87 4.6 2.8deadenylated 90 min. 14.01 2.6 11.2control 90 min. 20.16 2.3 19.2
The picomoles of mRNA added was calculated from the molecular weight of the control (220,000) and deadenylated (185,000) HNAs as determined by gel electrophoresis (1).It was assumed that in both cases 50$ of the added mRNA was R-globin message. After 6 minutes each rabbit message had been translated about 10 times, and after 90 minutes about 40 times. The figures in the last column have been corrected for small differences (-10$) in the amount of rabbit globin made in each assay.
directed by the deadenylated as compared to the control mRNA may reflect an inherent effect due to the removal of the polyA sequence, but we feel it is more likely to reflect contamination of the deadenylated mRNA by small fragments of RNA broken by contaminating endonucleases, which contribute to the optical density of the sample but cannot contribute to polypeptide synthesis.
These experiments and others (1,2) demonstrate that the polyA sequence is not obligatory for initiation, reinitiation, translation or termination. However, it is known that the length of the polyA sequence of total HeLa cell cytoplasmic mRNA decreases with time during in vivo translation (5)# It is therefore likely that polyA is involved in the determination of the lifetime of a messenger RNA in the cytoplasm.
930

Vol. 5 8 , N o. 4 ,1 9 7 4 BIOCHEMICAL AND BIOPHYSICAL RESEARCH COMMUNICATIONS
Acknowledgments: This work was carried out at Searle ResearchLaboratories, High Wycombe, Bucks. The authors would like to thank Dr. Norman Oarey for his co-operation in arranging this collaboration and Dr. Mike Getz and Mrs. Jenny Crossley for helpful discussions. The Beatson Institute is supported . by the Medical Research Council and the Cancer Research Campaign.REFERENCES:
1. Williamson, R., Crossley, J. and Humphries, S. (1974) Biochemistry 13* 703-707.
2. Bard, E., Efron, 0., Marcus, A. and Perry, R.P. (1974) Cell 1, 101-106.
3. PalmiTer, R.D. (1973). J . Biol. Chem. 248, 2095-2106.4. Lingrel, J.B., Lockard. R.E., Jones, RTPT* Burr, H.E.
and Holder, J.W. (1971) in: Series Haematologica, Vol. 4* Hemoglobin Synthesis, K.G. Jenson and S. Killman, Eds., Munksgaard, Copenhagen, p.p. 37-69.
5. Sheiness, D. and Darnell, J#e . (1973) Nature New. Biol. 241, 265-268.
931

Reprinted from J. Mol. Biol. (1974) 84, 539-554
K inetic Studies o f Gene Frequency
I. Use of a DNA Copy of Reticulocyte 9 S RNA to Estimate Globin Gene Dosage in Mouse Tissues
P. R. H a r r i s o n , G. D. B i r o t e , A n n a H e l l , S. H u m p h r ie s
B . D . Y o u n g a n d J. P a u l

J. Mol. Biol. (1974) 84, 539-554
K inetic Studies o f Gene Frequency
I. Use of a DNA Copy of Reticulocyte 9 S RNA to Estimate Globin Gene Dosage in Mouse Tissues
P . R. H a r r i s o n , G. D. B i r n i e , A n n a H e l l , S. H u m p h r ie s
B. D. Y o u n g a n d J. P a u l
The Beatson Institute for Cancer Research 132 Hill Street, Glasgow, G3 6UD, Scotland
(Received 4 May 1973, and in revised form 10 January 1974)
This and the accompanying paper justify rigorously the use of a reverse transcriptase-prepared complementary DNA copy of mouse reticulocyte 9 S RNA to estimate globin gene dosage in mouse tissues. It is demonstrated that globin cDNAf is a faithful, but partial, transcript of reticulocyte 9 S RNA, which contains both a and /9 globin messenger RNAs. Detailed calculations suggest that, at most, 2% base errors are introduced into globin cDNA during transcription of 9 S RNA in vitro.Globin cDNA is used to estimate the reiteration frequency of the globin genes
by annealing to germ-line or somatic mouse DNA obtained under conditions that extract total DNA, including any small gene-size fragments (e.g. episomal gene copies). After fragmentation to about 120 bases, the bulk of the mouse DNA reassociates at the rate predicted for unique sequences, by comparison with the rate of reassociation of Escherichia coli DNA under the same conditions. With somewhat larger fragments (180 to 330 bases), the bulk of the mouse DNA sequences reassociate as if they were repeated four to five times. We interpret these data in terms of intimate interspersion of repetitive and unique sequences.The rate of annealing of globin cDNA to mouse DNA is the same as that of
reannealing of the bulk of the mouse DNA sequences, with fragments with a mean size of 180 or 330 bases. This is true whether germ-line DNA (sperm), predominantly erythroid DNA (14-day foetal liver) or total embryo DNA is studied. Neither cDNA nor the mouse DNA fragments are degraded during annealing; and only a slight correction for the effect of mismatching on the rate of annealing of cDNA to mouse DNA is necessary. Three conclusions therefore follow: (1) there are probably only single, but at most four to five, copies of the globin genes in the mouse germ line; (2) there is no globin gene amplification in mouse erythroid cells; and (3) there is no widespread elimination of globin genes in non-erythroid somatic mouse tissues.
1. IntroductionIt is of crucial importance in biology to determine the extent of reiteration of specific genes in eukaryotes. Whilst genetic evidence in general argues for a single copy of each gene, the size of the haploid genome in eukaryotes is very much larger than could reasonably be expected if it consisted entirely of single copies of genes (e.g. King & Jukes, 1969; Ohno, 1971; Ohta & Kimura, 1971; O’Brien, 1973; Beermann,
t Abbreviation used: cDNA , complementary DN A.
5 3 9

540 P . R. H A R R I S O N E T A L .
1972). In fact, the large DNA complement of eukaryotes consists of a diversity of sequences, some of which are reiterated hundreds or thousands of times, but the majority of which are unique. By annealing very highly labelled RNA molecules of specific types with excess eukaryotic DNA (Melli et al., 1971), estimates of the reiteration frequencies of specific genes have been possible. Some genes, for example those specifying the immunoglobulin fight chain (Delovitch & Bagfioni, 1973), histones (Kedes & Bimstiel, 1971; Weinberg et al. 1972) and ribosomal RNA (Bimstiel et al., 1969) are reiterated tens, hundreds or thousands of times. However, fibroin genes (Suzuki et al., 1972) and globin genes (Bishop et al., 1972) are reiterated infrequently, if at all. Similar studies have shown that in amphibians, amplification of ribosomal genes occurs specifically in the oocyte (Attardi & Amaldi, 1970; Bimstiel et al., 1971). On the other hand, in the silkworm not only the fibroin genes but the whole of the genome is amplified during polytenization (Suzuki et al., 1972). However, no amplification of immunoglobulin fight chain genes has been observed in antibody- producing cells (Delovitch & Bagfioni, 1973).
It has been well understood for some time that hybridization of labelled RNA molecules in DNA-excess experiments of this type involves certain theoretical and technical problems (Bishop, 1972a). Therefore, in a previous report (Harrison et al., 1972a) we extended this approach by using reverse transcriptase to prepare a singlestranded DNA copy of mouse reticulocyte 9 S RNA (which contains a and /? globin mRNAs) and then determined the reiteration frequency of the globin genes by annealing cDNAf to excess mouse DNA in the usual way. Other workers have subsequently used the same approach to determine the reiteration frequency of the globin genes in the duck (Packman et al., 1972; Bishop & Rosbash, 1973). The present papers justify rigorously the general validity of conclusions drawn from the use of cDNA to determine gene frequency, with specific reference to globin genes in the mouse. The biological conclusions that emerge from this work are, that there are very few (probably single but not more than about four) copies of the globin gene either in the mouse germ fine, or in erythroid cells; and that the globin genes are not eliminated during differentiation of non-erythroid somatic tissues.
2. Materials and Methods(a) Reverse transcriptase
Reverse transcriptase was isolated from avian myeloblastosis virus as described by Kacian et al. (1971). The enzyme solution obtained had an activity of 100 units/ml (Kacian et al., 1972).
(b) Preparation of D N AMouse embryo, foetal mouse liver and Escherichia coli DNAs were isolated by the
hydroxyapatite method described previously (Hell et al., 1972). Mouse sperm were obtained as described previously (Borenfreund et al., 1961), and sperm DNA was prepared similarly. Isolated DNAs (dissolved in 0d M-NaCl at about 2*5 mg/ml) were sonicated in 5-ml portions in a Dawe sonicator using the microprobe (6, 10-s treatments punctuated by 30-s cooling periods at 0°C) or fragmented by treatment with deoxyribonuclease I (Hell et al., 1972). After precipitation with alcohol, the DNA fragments were fractionated on an alkaline sucrose gradient in an MSE BXIV zonal rotor or a 3 X 25 ml rotor, and fragments of the appropriate size were obtained and purified as described previously (Hell et al., 1972). Sizes of DNA fragments were estimated by sedimentation in 5% to 10% (w/w) alkaline sucrose gradients (Hell, 1972). The s2o,w values (McEwen, 1967) andf Abbreviation used: oDNA, complementary DNA.

GL O B I N G E N E F R E Q U E N C Y I N MOUSE T I S S U E S . I 541
molecular weights (Studier, 1965) were calculated. A marker DNA (s2oiW = 4-3) was included in each rotor load. The sedimentation coefficient of this marker DNA has also been determined independently by sedimentation in the analytical ultracentrifuge by Dr Ailsa Campbell of the Department of Biochemistry, University of Glasgow. Both estimates of the size of the marker agreed.
E. coli 14C-labelled DNA was isolated from a thymine-less strain of E. coli (NC1B 8583) grown in [14C]thymine (56 fiCi/fimol).
(c) Preparation of 9 S R N A 9 S RNA was isolated from mouse reticulocytes, either from EDTA-treated polysomes
(Williamson et al., 1971) or from total polysomal RNA by the poly(U)- Sepharose method (Adesnik et al., 1972); it was tested for biological activity in the duck lysate (Lingrel, 1972) or oocyte (Lane et al., 1971) systems. Both preparations of 9 S RNA ran as single bands on either 2-6% or 6% polyacrylamide gels (G. Lanyon, personal communication).
(d) Preparation of 3H-labelled cDNA and 3H-labelled poly(dT) cDNA was prepared as described previously (Harrison et al., 1972a,6) by incubating
for 90 min at 37°C the following mixture: 40 fiM-d[3H]TTP (8 to 10 Ci/mmol); 40 /tM-d[3H]- CTP (8 to 10 Ci/mmol); 500 M-dATP; 600 /iM-dGTP; 20 fig actinomycin D/ml; 1 to 2 fig oligo(dT)12_ia/ml (PL Biochemicals); 5 to 10 fig 9 S RNA/ml; 100 fig catalase/ml; 50 mM-Tris (pH 8*2); 50 mM-KCl; 10 mM-dithiothreitol; 5 mM-magnesium acetate; 0-2 vol. reverse transcriptase in 50% glycerol; 0*15 M-potassium phosphate (pH 8*0). The specific activities of d[3H]TTP and d[3H]CTP were always adjusted to be equal. cDNA was fractionated and purified as described previously (Harrison et al., 1972a), and fractions in the desired range of molecular weight were isolated. Amounts of cDNA were calculated on the basis of the quoted specific activities of the triphosphates, assuming that cDNA consists of 50% (C + T).3H-labelled poly(dT) was prepared in the same way as 3H-labelled cDNA, except that
poly(A) (Miles-Seravac) replaced 9 S RNA, and 500 /xM-dCTP (unlabelled) replaced the 3H-labelled dCTP. The resultant poly(dT) had a mean mol. wt of about 10,000 to 20,000.
(e) Preparation of R N A -D N A hybrids of known (O + C) contents These were prepared by transcribing heat-denatured E. coli or mouse DNA with RNA
polymerase from E. coli, followed by treatment with single-strand-specific nuclease from Neurospora crassa, as described previously (Birnie, 1972).
(f) R N A -D N A hybridization cDNA was mixed with the appropriate amount of RNA and incubated, usually at
43°C, in hybridization buffer, either (a) 0*3 M-sodium phosphate (pH 6-8), 50% formamide (Fluka); or (b) 0*5 M-NaCl, 25 mM-HEPES, 0-5 mM-EDTA (pH 6-8), 50% formamide. The salt solutions (before addition of formamide) were all passed through Chelex-100 resin (Bio-Rad Laboratories), then treated with diethylpyrocarbonate (Baycovin, a gift from Bayer Chemicals, Ltd, Glasgow) and autoclaved. Usually the hybridization solutions also contained 500 fig E. coli RNA/ml, which had been passed through Chelex. Where appropriate, the hybridization mixtures were treated with pancreatic ribonuclease (20 /xg/ml; Worthington) for 1 h at 20°C, after dilution about 20 times with 0-15 or 0-3 M-NaCl.(g) Annealing of complementary D N A or poly(dT) to D N A and analysis on hydroxyapatite The appropriate amounts of cDNA or poly(dT) and mouse or E. coli DNA (at about
2 mg/ml) were mixed in water, lyophilized and redissolved at 10 mg/ml before adding 0-2 vol. 0*72 M-sodium phosphate (pH 6*8). DNA concentrations were calculated on the basis of absorption measurements on acid-hydrolysed portions of the dilute DNA solutions. The cDNA/DNA mixtures were annealed for the appropriate times at 60°C (either undiluted or 100-fold diluted) and analysed on hydroxyapatite (Bio-Rad, Biogel HTP batch 10936, using a ratio of 1 mg DNA to 3 ml packed hydroxyapatite) essentially as described previously (Harrisou et al., 1972a), With this batch of hydroxyapatite, the best resolution

542 P . R. H A R R I S O N E T A L .
of native and denatured DNA at 60°C was obtained by eluting the single-stranded material with 0*16 M-phosphate. At this phosphate concentration, about 85% of heat-denatured mouse DNA (size 330 bases), but only 5% of native mouse DNA of the same size, was eluted. Therefore, the 3-ml hydroxyapatite columns were eluted with 8 ml of 0-03 m -
phosphate, twice with 8 ml of O'16 M-phosphate, and finally twice with 4 ml of 0-4 M-phosphate. Absorbance measurements of the fractions of eluate were made, before counting in Instagel (Packard, Ltd).
M easurem ents o f th e m eltin g tem p erature, T m, w ere m ade sim ilar ly ; a fter loading the h y d ro x y a p a tite w ith th e reannealed d u p lexes an d w ash in g w ith 0-03 M -phosphate, the co lu m n w as e lu ted 3 t im es w ith 8 m l o f O'16 M -phosphate a t 5 deg. in terva ls from 60 to 95°C. F in a lly , th e co lu m n w as e lu ted w ith 0-4 M -phosphate; th is rem oved a negligible a m ou n t o f DNA and ra d io a ctiv ity .
(h) Equilibrium centrifugation in caesium chloride and sodium iodideSamples were dissolved in 4-6 ml caesium chloride (p2o = 1*751 g/cm3) or sodium iodide
(P2 0 = 1*546 g/cm3) containing 0-1 M-Tris, 0-01 m-EDTA (pH 8-0) and 2 to 10 /xg native and denatured mouse DNA as carrier, and centrifuged to equilibrium for about 66 h at 20°C at 45,000 revs/min in the MSE titanium 10X 10 ml rotor; fractions of 0-2 ml were unloaded, refractive indices measured and samples counted as described previously (Birnie, 1972). Labelled, heat-denatured LS cell (a substrain of mouse NCTC strain L929, which grows in suspension) DNA was also centrifuged as a marker in each rotor load.
(i) Nuclease assaySI nuclease was obtained as described by Sutton (1971). Samples were incubated for
2 h at 37°C in 0-05 M-sodium acetate (pH 4-5), 2 mM-ZnS04, 0*1 M-NaCl, 10 /xg denatured mouse DNA/ml. Sufficient enzyme was added to ensure complete degradation of cDNA alone. A portion of the incubation mixture was taken to determine the total radioactivity; a further portion was acidified (1 n-HC104) at 4°C after addition of mouse DNA and bovine serum albumin (5 /xg and 50 fig, respectively) and then centrifuged for 15 min at 2500 revs/min. A portion of the supernatant fluid was then taken to determine the acid-soluble radioactivity.
3. Results(a) Characteristics of complementary DNA
In the presence of oligo(dT) primer and actinomycin D, the rate of synthesis of cDNA by reverse transcriptase was proportional to the concentration of 9 S RNA in the range of one to ten /xg per ml. Under the conditions routinely used, the yield of high specific activity cDNA (25 X 106 to 40 X 106 disints/min per /xg) was about 20% of the amount of 9 S RNA used. No labelled DNA was synthesized when reverse transcriptase was incubated with the oligo(dT) primer alone, using all four labelled deoxyribonucleoside triphosphates as precursors. This indicates that the dependence of our preparations of reverse transcriptase on added template is absolute (compare Kacian et al., 1971). The mean molecular weight of cDNA was about 110,000 (330 bases), about 60% of the length of 9 S RNA (600 bases; Williamson et al., 1971). For most experiments, only the higher molecular weight cDNA fragments (greater than about 240 bases) were isolated and characterized further. The size distribution of the cDNA used in most of the experiments is shown in Figure 5.
Purified cDNA was incubated at 43°C for two weeks in hybridization buffer (to a _D0ff of 0-3). The product banded in sodium iodide gradients as denatured DNA and was virtually all degraded (95%) by SI nuclease. Therefore, cDNA contained a
f D0t, Product of concentration of cDNA and time of incubation (mol s l-1).D0<|, Value of D0t when half of hybridizable cDNA is converted to hybrid.

544 P . R. H A R R I S O N E T A L .
ooV \
coo2s>>'>oooT3Otr
_ a - a . a . A - * ^ ^ |
Fraction no.
F i g . 2. Sedim entation of cD N A from 9 S R N A -cD N A hybrid in 6-ml 6% to 20% (w/w) alkaline sucrose gradients. M, marker D N A , s20 >w = 4-3 (200 nucleotides); — A — A — » cDNA from cDNA- 9 S R N A hybrid; — O — O — > cD N A from cD N A -9 S R N A hybrid after treatm ent of hybrid with SI nuclease; — A — A — * cD N A before hybridization. The cD N A used in this experiment was of somewhat smaller size than in the other experim ents described in this paper. Direction of sedim entation is from left to right.
100
80
60
40
20
g£-A—■^ 100
60
20
60 70 80 90 100Temperature (°C)
F ig . 3. T m values o f reannealed duplexes in 0-16 M-phosphate.(a): — A — A — > N ative mouse embryo D N A (330 base pairs); — □ — □ — , reannealed mouse
embryo D N A ; — O — O — > cD N A annealed to mouse embryo DN A ; — A — A — > cD N A -9 S RNA hybrid obtained as in Fig. 1.
(b): — A — A — > N ative foetal liver D N A (330 base p a irs);— □ — n — » reannealed foetal liver D N A ; — O — O — » cD N A annealed to foetal liver DN A. Reannealed D N A samples were incubated in 0-12 M-phosphate to a G0t value o f 20,000. The T m o f reannealed mouse DN A sequences is about 6 deg. C lower than that o f native mouse DN A. This difference m ay be partially due to the fact that the T m values were determined on hydroxyapatite in 0-16 M-phosphate, rather than in 0*12 M-phosphate, for the reasons given in Materials and Methods.

G L O B I N G E N E F R E Q U E N C Y I N MOUSE T I S S U E S . I 545
In order to test the quality of the 9 S RNA-cDNA hybrid directly, the size of the cDNA in such hybrids was estimated before and after treatment of the hybrids with SI nuclease. The size distribution of cDNA was not affected by the annealing conditions themselves (Fig. 2). Under conditions in which cDNA alone was completely degraded, cDNA in the 9 S RNA-cDNA hybrid was reduced to about half its initial size by such treatment, i.e. on average about one nick per hybrid molecule was introduced by the treatment with SI nuclease (Fig. 2). This indicates that there are no extensive regions of SI nuclease-sensitive cDNA distributed throughout the cDNA-9 S RNA hybrid. However, this hybrid had a Tm of 69°C in 0-16 M-phosphate (Fig. 3(a)), somewhat lower (3 deg. C) than predicted for a perfect hybrid (see Discussion).
-(b)
marker A marker C
co
c<2Clo
20 0 Fraction no.
20
F ig. 4. Hybridization o f cDNA to 9 S RNA.(a) cD N A annealed to 14 x excess poly(U)-Sepharose-prepared 9 S R N A as described in M ate
rials and M ethods (to D 0t = 0 3) and treated with ribonuclease was banded in CsCl. cDNA banding in 3 regions of the gradient (arrows) was recovered free from 9 S RN A , reannealed to excess 9 S R N A , treated w ith ribonuclease and banded again in CsCl.
(b) Annealing to excess 9 S R N A of cDNA from region A in (a ); (c) annealing to excess 9 S R N A o f cD N A from region C in (a); (d) annealing to excess 9 S R N A o f cD N A from region D in (a). Characteristics of CsCl gradient are as in Fig. 3. Markers are those described in Fig. 1.
A small fraction of cDNA was apparently incapable of forming a ribonuclease- resistant hybrid with 9 S RNA. To investigate this, cDNA was incubated with excess 9 S RNA, treated with ribonuclease and banded in CsCl. About 8% of the cDNA banded as DNA, 17% as hybrid of low density, and 75% as hybrid of high density (Fig. 4(a)). cDNA from each of these fractions of the gradient was recovered separately, reincubated with excess 9 S RNA and treated with ribonuclease. The results obtained after banding each of these fractions of cDNA in CsCl are shown in Fig. 4

5 4 6 P. R. H A R R I S O N E T AL .
((b) to (d)). Almost all the cDNA isolated from the ribonuclease-resistant hybrid formed in the first annealing formed ribonuclease-resistant hybrid in a second annealing to 9 S RNA; whereas about half of the cDNA that failed to hybridize to 9 S RNA in the first annealing did not hybridize at the second stage. About one-third of the cDNA isolated from the intermediate part of the gradient failed to re-hybridize to 9 S RNA. These results indicate, therefore, that about 10% of the total cDNAis not capable of forming ribonuclease-resistant hybrid during annealing to 9 S RNA.
(c) Annealing of complementary DNA to DNA(i) Reannealing of E. coli and mouse DNA fragments
Most experiments used DNA fragments with an average length of 330 bases (Fig. 5). Under these conditions, E. coli DNA reassociated with a C0ti f value of about 6 (Fig. 6(a)). Using mouse DNA fragments of the same size, a small fraction (about 10%) reassociated at a low CQt value, whereas the bulk of the mouse embryo, foetal liver and sperm DNA fragments reassociated with a CQt\ value of about 800 (Fig. 6(a) to (c)). With mouse embryo DNA fragments of larger or smaller size, the bulk of the
600 r
0-4
400 - g
0-2;! 200
20Fraction no.
4 o
F ig . 5. Sedimentation o f cD N A and mouse D N A fragments in 20-ml 5% to 10% alkaline sucrosegradient. (..................... ) cD N A ; (---------------- ) foetal liver D N A fragments; (-----------------) mouseembryo D N A fragments; ---------•-) sperm D N A fragments; — A — A — > molecular weight.
DNA reassociated more quickly or more slowly, respectively (Table 1). With the exception of the smallest fragment, the rate of reassociation of mouse DNA fragments is roughly proportional to the square root of the fragment size, as observed also by Wetmur & Davidson (1968) and by Sutton & McCallum (1971). By comparison with E. coli DNA, the predicted rates of reassociation of unique sequences in mouse DNA fragments of different sizes are calculated (Table 1). These calculations show that the discrepancy between observed and predicted values decreased with decreasing fragment size. With the smallest fragment size (120 bases), the bulk of the mouse DNA sequences appear to be unique. This is almost certainly explained in terms of the greater separation of unique and repetitive sequences in mouse DNA with very small fragments (see Discussion).
f C Product o f mouse or E . coli D N A concentration and incubation time (mol s i -1).Cot, Value of C0t -when half of DNA (or cDNA) is converted to duplex.

GL O BI N G E N E F R E Q U E N C Y IN MOUSE T I S S U E S . I 547
100
80
60
40
20
100 8—'80
40
20
100
80 -
60
40
20
F i g . 6 . Incubation of cDNA with E . coli and mouse D N A and reannealing of E . coli and mouse D N A fragments, measured by chromatography on hydroxyapatite, as described in Materials and Methods.
(a) ( A)> ( A) Reannealing of mouse embryo DN A fragments; ( # ) , ( O) annealing o f cD N A to mouse embryo D N A fragments; ( ■ ) reannealing of E . coli D N A fragments; ( A ) incubation of cD N A w ith E . coli D N A ; (▼ ) incubation of poly(dT) w ith mouse D N A fragments.
(b) ( A)» ( A) Reannealing of foetal liver D N A fragments; ( # ) , ( O) annealing o f cDNA to foetal liver D N A fragments.
(c) (A ) Reannealing of sperm DN A fragments; ( # ) annealing of cD N A to sperm D N A fragments.
In (a) and (b) the ratio of mouse D N A to cDNA was 1-6 X 10⁷ (w/w), but in (c), 8 X 10⁶ (w/w). Open sym bols refer to experiments in which the D N A concentrations were diluted 100-fold.
(ii) Annealing of complementary DNA and poly(dT) to E. coli and mouse DNAsIn order to simplify the interpretation of the results of these experiments, the
various mouse and E. coli DNAs were each sonicated and fractionated to give a size distribution of fragments similar to that of cDNA itself (Fig. 5). Samples of these DNAs were mixed with cDNA in a ratio of 8 x 10⁶ to 16 X106 (w/w), denatured and allowed to anneal to various CQt values. As a control experiment, cDNA was incubated

548 R. R. H A R R I S O N E T A L .
■with E. coli DNA. Only about 10% of the cDNA annealed by a CQt of 1000, during the period when all the E. coli DNA reassociated (Fig. 6(a)). However, after incubation to a G0t of 80,000, a further 20% of the cDNA was not eluted from hydroxyapatite by 0-16 M-phosphate. Evidence that this is not due to self-annealing of the cDNA sequences has been given in a previous section. Caution must be exercised in interpreting this result, since when high specific activity poly(dT) was incubated with mouse DNA to a CQt value of 80,000, about 30% of the poly(dT) behaved similarly.
With DNA from each mouse tissue studied, cDNA annealed at a C0ti value identical to that for the reannealing of the bulk of the mouse DNA sequences (Fig. 6(a) to (c)). This was observed with cDNA and DNA fragments with lengths of 180 and 330 bases (Table 1). These relative rates of annealing of cDNA to mouse DNA and reannealing of mouse DNA fragments would be distorted if there were preferential degradation of cDNA during annealing relative to the mouse DNAs, or if mismatching of cDNA sequences occurred with respect to the globin genes in the mouse DNA. (1) Samples of cDNA and mouse DNA fragments (initial size 330 bases) were taken for size determinations after incubation to a CQt value of 8000, when the annealing reaction was essentially complete. Negligible degradation of either cDNA or mouse DNA fragments was detected at this time, although after incubation to a C0t value of 80,000, some degradation of cDNA and mouse DNA fragments occurred. Thus, neither the observed rate of annealing of cDNA to mouse DNA nor rate of annealing of mouse DNA fragments requires correction for changes in size of fragments during annealing. (2) For both total embryo and foetal fiver DNA, the Tm of the cDNA- mouse DNA annealed duplexes was about three degrees lower than that of the reannealed mouse DNA duplexes themselves (Fig. 3). After correcting for the slight differences in (G + C) content of cDNA and mouse DNA (Gruenwedel et al., 1971), this implies no more than about 2% mismatching between cDNA and the mouse DNA sequences to which cDNA annealed in these experiments (Laird et al., 1969; Ullman & McCarthy, 1973a,b). This mismatching would reduce somewhat the rate of annealing of cDNA to mouse DNA. The magnitude of this effect is difficult to estimate precisely. On the basis of data for the effect of mismatching on the rate of reassociation of satellite DNA, the rate of annealing of cDNA to mouse DNA might be reduced to 60% of the rate if there was no mismatching (Southern, 1971; Sutton & McCallum, 1971). However, similar studies on the effect of mismatching on the rate of reassociation of bacterial DNAs (Britten & Bonner, 1971) suggest that this correction to the observed rate of annealing of cDNA to mouse DNA might be much smaller. This means that the sequences in mouse DNA to which cDNA anneals are as frequent (certainly not more than twice as frequent) as the bulk of the mouse sequences.
4. Discussion(a) Evidence that complementary DNA represents a replica of globin genes
All conclusions from the present work concerning the number of globin genes are based on the belief that most of the cDNA is a faithful replica of part of the a and globin genes. This stems from the evidence (1) that mouse reticulocyte 9 S RNA comprises mainly the messenger RNAs for a and j8 globins and (2) that cDNA is a faithful transcript of most of the sequences present in 9 S RNA.

GL O B I N G E N E F R E Q U E N C Y I N MOUSE T I S S U E S . I 5 4 9
(b) Evidence that 9 8 B N A comprises a and j8 globin messenger BN AsUsing the duck lysate and oocyte systems devised by Lingrel (1972) and by Gurdon
and co-workers (Lane et al., 1971), our colleagues have demonstrated that the preparations of polysome-derived 9 S RNA used in the present experiments direct the synthesis of both a and jS globin chains (Lanyon et al., 1972; Williamson et al., 1973). Since about 90% of protein synthesis in reticulocytes is represented by globin, it is generally assumed that the purest preparations of 9 S RNA available contain mainly globin mRNAs. Since these preparations of 9 S RNA are selected by their ability to bind poly(U)-Sepharose and by size, any mRNA contaminants must contain poly(A) regions and specify proteins about the same size as globin. Lane et al. (1971) have studied the tryptic peptides released from non-oocyte proteins synthesized after injection of rabbit 9 S RNA into oocytes. No peptide was observed that did not correspond to peptides obtained by tryptic digestion of carrier haemoglobin. This argues strongly that 9 S RNA contains mainly globin mRNAs.
These experiments do not indicate the ratio of mRNAs specifying a and j8 globin. Since mouse reticulocyte 9 S RNA can be only partially resolved into the components specifying a and jS globin (Lanyon et al., 1972), it has not yet proved possible to answer this question directly.
(c) Evidence that complementary DNA is a faithful transcript of 9 8 BN AcDNA is about 60% of the size of the 9 S RNA molecule and contains about 40 to
45% (G C). Moreover, after depurination, only about 4% of the nucleotides in cDNA bind to poly(A)-Sepharose under conditions in which poly(dT) binds completely (J. Mansbridge, personal communication). cDNA contains, therefore, a very small proportion of poly(dT) sequences. About 85% of cDNA sequences hybridize to excess 9 S RNA at a temperature 15 degrees C below the T m of a 40% (G + C) RNA-DNA hybrid under these conditions (Bishop, 19726).
The bulk of the cDNA sequences represent reasonably faithful transcripts of the 9 S RNA sequences. This is shown by the fact that only about one nick per 9 S RNA-cDNA hybrid molecule is introduced by treatment with SI nuclease. Any regions of mismatching, therefore, must be either too small for SI nuclease to recognize or be clustered. An independent estimate of mismatching in the cDNA-9 S RNA hybrid can be obtained by comparing its Tm (69°C) with that of reannealed mouse DNA fragments (77 to 78°C). After correcting for slight differences in (G + C) content, this means that the Tm of cDNA-9 S RNA hybrid is nine to ten degrees C below that of a reannealed DNA duplex of the same (G + C) content (Gruenwedel et al., 1971). This difference in Tm is three to four degrees C more than that reported for perfect RNA-DNA hybrids (Kohne, 1969; Gelderman et al., 1971), which implies at most 2% mismatching of sequences in cDNA with respect to 9 S RNA (Laird et al., 1969; Ullman & McCarthy, 1973a,6). One explanation of this mismatching is that cross-hybridization of a and j8 globin cDNAs to j8 and a globin mRNAs in 9 S RNA might occur. However, this appears most unlikely from consideration of the amino acid sequences of a and /? mouse globins (Dayhofif, 1972). The most likely explanation of the mismatching is that reverse transcriptase introduces a low frequency of mistakes during transcription of 9 S RNA in vitro.
The results discussed above show that most of the cDNA represents a faithful, but partial, transcript of sequences present in the purest preparations of 9 S RNA

550 P. R . H A R R I S O N E T A L .
available, which contain mainly globin mRNAs. Nevertheless, it is conceivable that cDNA might represent transcripts of contaminant RNA sequences in 9 S RNA that do not specify globins. For this reason, we have devised and proved the method of titrating cDNA with increasing amounts of 9 S RNA (see accompanying paper, Young et al., 1974). In the same paper, we also determine the sequence complexity of cDNA. The results from both experimental approaches support the conclusion that cDNA represents transcripts of both a and j8 globin mRNAs, each transcript being a partial, non-random copy of its template 9 S RNA molecule.
(d) Estimation of the number of globin genes(i) Reassociation of mouse D NA
The bulk of the mouse DNA sequences reassociate at a rate that depends on the fragment size (Table 1). A comparison of experimental C0t j values with those predicted on the basis of the observed C^t^ value for reassociation of E. coli DNA, the
T a b l e 1
Rates of annealing of mouse embryo DNA, E. coli DNA and complementary D NA fragments
Initial mean DN A fragment size (bases) Mouse cDNA Mouse DN A
C0t cDNA—mouse
DN AMouse DNA
predicted
Apparentreiterationfrequency
120 6000 _ 6100 1180f 240f 1400f 1600t 5000 4330 330 800 800 3700 5900 — 500 — 2200 4
The experimental C0t i value for E. coli D N A reassociation (300 bases) was 6. The predicted C0t i value is calculated from the relation between the rate of reassociation and the genetic complexity established by Britten & Kohne (1968), assuming the genome sizes of E. coli and the mouse to be 2-8 x 10⁹ and 1-8 X 10¹², respectively, and assuming that the rate of reassociation of E. coli DN A is proportional to the square root o f mean fragment size (Wetmur & Davidson, 1968). The apparent reiteration frequency is obtained by dividing the predicted C0t i value for mouse D N A sequences by the observed C0t i value. Fragments of 120 or 180 nucleotides were obtained by degradation w ith deoxyribonuclease I, whereas those of 330 or 900 nucleotides were obtained by sonication. Sizes of D N A fragments were checked as described in Materials and Methods.
t D ata from Harrison et al. (1972a).
observed dependence of rate of reassociation on fragment size and the genetic complexities of the mouse and E. coli show good agreement only for the smallest fragments (120 nucleotides). This may mean th a t it is necessary (using sonication or enzymic methods of fragmentation) to reduce the size of mouse DNA fragments to about 120 nucleotides in order to obtain nearly complete separation of unique and repetitive sequences. Alternatively, the result for the smallest DNA fragments could be peculiar, for example, due to a marked change in the stringency of binding of very small duplexes by hydroxyapatite (Martinson, 1973a,b). However, this interpretation would imply that most DNA sequences are reiterated four to five times in the mouse genome.

G L O B I N G E N E F R E Q U E N C Y I N MOUSE T I S S U E S . I 551
Other workers, using sonication to fragment DNA to about 500 nucleotides in length, have obtained results similar to our own: namely, that the most slowly reassociating sequences reassociate more quickly than predicted for single-copy sequences. Thus Melli et al. (1971) observed a fourfold faster reassociation of sonicated rat DNA fragments than predicted for single-copy sequences. Bishop et al. (1972) and Bishop & Rosbash (1973) have reported a similar, though slightly smaller, discrepancy for duck RNA fragmented by sonication, whether duplex formation was assayed optically, by hydroxyapatite chromatography or resistance to single-strand- specific nuclease. This eliminates the possibility that the method for assay of duplex is the explanation of the discrepancy. However, the method of fragmenting DNA may be important: Mori et al. (1972) have found that the rate of reassociation of rat DNA fragmented by sonication is markedly faster than that of similar sized fragments produced by digestion with deoxyribonuclease II.
Britten & Smith (1969) and Grouse et al. (1972) found that (using hydrodynamic shearing) it was necessary to fragment eukaryotic DNAs at to least 400 to 500 nucleotides in order to prepare unique sequences in reasonable yield. However, such fragments of total DNA are reported still to contain interspersed some repetitive sequences with the unique sequences (Hoyer & Van de Velde, 1971; Davidson et al.,1973). Nevertheless, the rates of reassociation of sequences in total DNA fragmented in this way correspond quite closely with those predicted for unique sequences in the calf (Britten & Kohne, 1968; Britten & Smith, 1969), in the mouse (Hahn & Laird, 1971), in the Zenopus oocyte (Davidson & Hough, 1971) and in Chironomus tentans (Sachs & Clever, 1972). Britten & Smith (1969) have argued that in calf DNA at least, it is unlikely that sequences exist that are repeated only a few times. However, in a recent analysis of the interspersion of repetitive and unique DNA sequences in Xenopus, Davidson et al. (1973) conclude that about 10% of the total DNA comprises sequences repeated about 20 times. Similar intimate interspersion of unique and slightly repetitive sequences in mouse DNA would explain our own data.
(ii) Annealing of complementary DNA to mouse DNAsUsing fragments of 180 or 330 nucleotides, cDNA anneals to excess mouse DNA at
the same rate as reassociation of mouse DNA itself, which by comparison with E. coli DNA is that expected if most of the sequences in mouse DNA are reiterated four to five times. We have not attempted to determine whether, using very small fragments, the rate of annealing of cDNA to mouse DNA corresponds to that expected for unique sequences (as is the case for the bulk of the mouse sequences themselves), owing to the complications introduced by the significant proportion of poly(dT) sequences in cDNA of such small size.
In principle, as we indicated in a previous report (Harrison et al., 1972a), it should be possible to clarify this issue by determining the complexity of the sequences in mouse DNA that anneal to cDNA, from the fraction of cDNA that anneals to mouse DNA at high C0t values. In the experiments described in Figure 6(a) and (b), or (c), it can be calculated (assuming the value for the complexity of cDNA given in the accompanying paper) that 28 or 43%, respectively, of the cDNA should remain unannealed at high C0t values if there were single copies of the a and jS globin genes. In fact, the experimental values are 20% and 35%, respectively. We have attempted to investigate systematically how the proportion of cDNA annealed after “ high C0t ” incubation varies with the ratio of mouse DNA/cDNA, and have attempted to
36

552 P . R . H A R R I S O N E T A L .
rationalise the result in terms of a titration theory that could he used to determine the complexity of the mouse DNA sequences that anneal to cDNA. However, the results of these experiments have not been consistent and we have not pursued this method further.
With fragments of 330 nucleotides, the rate of annealing of cDNA to mouse DNA is the same as that for the reassociation of mouse DNA, whether mouse DNA is isolated from total embryos, erythroid cells (foetal liver) or sperm. The sizes of cDNA and the mouse DNA fragments are not reduced significantly during the period of annealing, and little correction for mismatching in cDNA-mouse DNA duplexes is required. These facts taken together show that in all the mouse tissues studied, the sequences in their DNA complementary to cDNA are about as frequent as the most slowly reassociating DNA sequences. Since the slight extent of mismatching in cDNA-9 S RNA hybrids is the same as that in cDNA-mouse DNA duplexes, cDNA must anneal only to those globin genes expressed in mouse reticulocyte 9 S RNA, or to very closely related variants. In the mouse, the only globin genes that might possibly be sufficiently similar in this respect are the j8 and z chains (14% amino acid differences). Mouse <x and x chains are quite dissimilar (36% amino acid differences) (Steinheider et al., 1971).
In view of the arguments developed so far, it can be concluded that in the mouse: (a) there are probably only single, but not more than four to five copies each of the a and j8 globin genes in the mouse germ fine; (b) that there is no globin gene amplification in erythroid cells, since foetal fiver in this stage of development contains 80% erythroid cells, of which all but the most immature contain detectable amounts of globin mRNA (Harrison et al., 1973); and (c) that there is no widespread elimination of globin genes during non-erythroid somatic differentiation, since the globin gene dosage in sperm, total embryos and erythroid cells is the same. This conclusion concerning the numbers of genes in various mouse tissues would be valid even if episomal copies of the globin gene existed. Since we prepared all DNAs by the hydoxy- apatite method (which would retain even gene-size fragments of DNA), the DNAs used in these experiments should include any nuclear DNA sequences, whether of chromosomal origin or otherwise.
These conclusions extend the findings reported in less detail in a previous paper (Harrison et al., 1972a) and are broadly in agreement with other recent reports, which compare the rate of annealing of cDNA or in vivo labelled duck reticulocyte 10 S RNA to excess duck DNA with that expected theoretically for reassociation of unique duck DNA sequences. These reports show that the globin genes in the duck may be slightly reiterated (two to three copies; Bishop et al., 1972; Packman et al., 1972; Bishop & Rosbash, 1973), and that there is no globin gene amplification in duck erythroid cells (Packman et al., 1972). These studies did not investigate whether degradation of cDNA or mismatching of cDNA with respect to duck DNA introduced any corr jction to these quoted values.
Both our own and these other estimates of the reiteration frequency of the globin genes in mouse and duck cells are markedly different to those obtained by hybridizing exce 5s chemically labelled mouse or chicken reticulocyte 9 S RNA to mouse or chicken DNA (about 50,000: Williamson et al., 1970; Morrison et al., 1972; de Jiminez et al., 1971). These results have been interpreted in terms of the hybridization of labelled poly(A) regions in the 9 S RNA to repetitive DNA sequences (Morrison et al., 1972), which implies that about 0*4% of mouse DNA sequences (presumably

G L O B I N GENE F R E Q U E N C Y I N MOUS E T I S S U E S I 553
poly(dT)) are complementary to the poly (A) regions in 9 S RNA. This value is approximately the same as that obtained for the proportion of poly(dA) regions in mouse DNA by Shenkin & Burdon (1972).
The authors are indebted to the following people: Dr J. W. Beard, Duke University, U.S.A., for continuing supplies of avian myeloblastosis virus; Dr Ailsa Campbell of the Department of Biochemistry, Glasgow University, for checking the size of DNA fragments on the analytical ultracentrifuge; Dr G. Threlfall for preparating synthetic RNA- DNA hybrids; Dr R. Williamson, Mr G. Lanyon and Miss S. Laird for supplies of 9 S RNA; and Miss E. MacPhail, Mr A. McPhee and Mr A. McNab for technical assistance. We are grateful to other members of staff for useful discussion and criticisms, especially to Drs R. Wilhamson and R. S. Gilmour. This work was supported by grants from the Medical Research Council and the Cancer Research Campaign.
REFERENCESAdesnik, M., Salditt, M., Thomas, W. & Darnell, J. E. (1972). J. Mol. Biol. 71, 21-30. Attardi, G. & Amaldi, F. (1970). Annu. Rev. Biochemistry, 39, 183-226.Beermann, W. (1972). In Results and Problems in Cell Differentiation (Beermann, W.,
ed.), vol. 4, pp. 1-33, Springer-Verlag, Berlin, Heidelberg and New York.Birnie, G. D. (1972). F E B S Letters, 27, 19-22.Birnstiel, M. L., Grunstein, M., Speirs, J. & Hennig, W. (1969). Nature (London), 223,
1265-1267.Birnstiel, M. L., Chipcase, M. & Speirs, J, (1971). Prog. Nucleic Acid Res. Mol. Biol. 1 1 ,
351-389.Bishop, J. O. (1972a). Karolinska Symp. on Res. Methods in Reproductive Endocrinology
(Diczfalusy, E., ed.), pp. 247-276, Karolinska Institutet, Stockholm.Bishop, J. O. (19726). Biochem. J. 126, 171-185.Bishop, J. O. & Rosbash, M. (1973). Nature New Biol. 2 4 1 , 204-207.Bishop, J. O., Pemberton, R. & Baglioni, C. (1972). Nature New Biol. 235, 231-234. Borenfreund, E., Fitt, E. & Bendich, A. (1961). Nature (London), 1 9 1 , 1375-1377. Britten, R. J. & Bonner, T. (1971). Yearb. Cameg. Instn, 7 0 , 373-374.Britten, R. J. & Kohne, D. E. (1968). Science, 1 6 1 , 529—540.Britten, R. J. & Smith, J. (1969). Yearb. Carneg. Instn, 68, 378-386.Davidson, E. H. & Hough, B. R. (1971). J. Mol. Biol. 5 6 , 491-506.Davidson, E. H., Hough, B. R., Amenson, C. S. & Britten, R. J. (1973). J. Mol. Biol.
7 7 , 1-23.Dayhoff, M. O. (1972). Editor of Atlas of Protein Sequence and Structure, vol. 5, National Biomedical Research Foundation,
de Jiminez, E. S., Dominguez, J. L.,. Webb, F. H. & Bock, R., M. (1971), J. Mol. Biol. 6 1 , 59-71.Delovitch, T. L. & Baglioni, C. (1973). Proc. Nat. Acad. Sci., U .S.A . 7 0 , 173-178.
Gelderman, A. H., Rake, A. Y. & Britten, R. J. (1971). Proc. Nat. Acad., U .S.A. 68, 172-176.Grouse, L., Chilton, N. D. & McCarthy, B. J. (1972). Biochemistry, 1 1 , 798-805.
Gruenwedel, D. W., Hsu, C. H. & Lu, D. S. (1971). Biopolymers, 1 0 , 47-68.Hahn, W. E. & Laird, C. D. (1971). Science, 173, 158-161.Harrison, P. R., Hell, A., Bimie, G. D. & Paul, J. (1972a). Nature (London), 239, 219-221. Harrison, P. R., Hell, A. & Paul, J. (19726). F E B S Letters, 24, 73-76.Harrison, P. R., Conkie, D., Paul, J. & Jones, K. (1973). F E B S Letters, 32, 109-112.Hell, A. (1972). M SE Application Information Sheet A6/6/72.Hell, A., Birnie, G. D., Slimming, T. K. & Paul, J. (1972). Anal. Biochem. 48, 369-377. Hoyer, B. H. & van de Velde, N. W. (1971). Yearb. Carneg. Instn, 7 0 , 375-376.Kacian, D. L., Watson, K. F., Burny, A. & Spiegelman, S. (1971). Biochim. Biophys. Acta,
246, 365-383.Kacian, D. L., Spiegelman, S., Bank, A., Terada, M., Metafora, S., Dow, L. & Marks, P. A.
(1972). Nature New Biol. 235, 167-169.

554 P . R . H A R R I S O N .ET AL .
Kedes, L. H. & Birnstiel, M. L. (1971). Nature New Biol. 230, 165-169.King, J. L. & Jukes, T. H. (1969). Science, 164, 788-798.Kohne, D. E. (1969). Biophys. J . 8, 1104-1118.Laird, C. D., McConaughty, B. L. & McCarthy, B. J. (1969). Nature {London), 224,
149-154.Lane, C. D., Marbaix, G. & Gurdon, J. B. (1971). J . Mol. Biol. 61, 73-91.Lanyon, W. G., Paul, J. & Williamson, R. (1972). Eur. J . Biochem. 31, 38-43.Lingrel, J. B. (1972). Methods in Protein Biosynthesis, Methods in Molecular Biology
Series, vol. 2 (Laskin, A. E. & Last, J. A., eds), Marcel Dekker, New York.Martinson, H. G. (1973a). Biochemistry, 12, 139-146.Martinson, H. G. (19736). Biochemistry, 12, 145-150.McEwen, C. R. (1967). Anal. Biochem. 20, 114-149.Melli, M., Whitfield, C., Rao, K. V., Richardson, M. & Bishop, J. O. (1971). Nature New
Biol. 231, 8-12.Mori, K., Winterith, M. & Mandel, P. (1972). Biochimie, 54, 1427-1434.Morrison, M. R., Paul, J. & Williamson, R. (1972). Eur. J . Biochem. 27, 1-9.O’Brien, S. J. (1973). Nature New Biol. 242, 52-54.Ohno, S. (1971). Nature {London), 234, 134-137.Ohta, T. & Kimura, M. (1971). Nature {London), 233, 118-119.Packman, S., Aviv, H., Ross, J. & Leder, P. (1972). Biochem. Biophys. Res. Commun. 49,
813-819.Sachs, R. I. & Clever, U. (1972). Expt. Cell Res. 74, 587-591.Shenkin, A. & Burdon, R. H. (1972). F E B S Letters, 22, 157-160.Southern, E. M. (1971). Nature New Biol. 232, 82-83.Steinheider, G., Medleris, H. & Osterlag, W. (1971). In Syntheses, Struktur und Funktion
des Hamoglobins (Martin & Nowicki, eds), p. 225, J. F. Lehmans, Verlag, Munchen. Studier, F. W. (1965). J . Mol. Biol., 11, 373-390.Sutton W. D. (1971). Biochim. Biophys. Acta, 240, 522-531.Sutton, W. D. & McCallum, M. (1971). Nature New Biol. 232, 83-85.Suzuki, Y., Gage, L. P. & Brown, D. D. (1972). J . Mol. Biol., 70, 637-649.Ullman, J. S. & McCarthy, B. J. (1973a). Biochim. Biophys. Acta, 294, 405-415.Ullman, J. S. & McCarthy, B. J. (19736). Biochim. Biophys. Acta, 294, 416-424. Weinberg, E. S., Birnstiel, M. L., Purdom, I. F. & Williamson, R. (1972). Nature {London),
240, 225-228.Wetmur, J. G. & Davidson, W. (1968). J . Mol. Biol., 31, 349-370.Williamson, R., Morrison, M. & Paul, J. (1970). Biochem. Biophys. Res. Commun. 40,
740-745.Williamson, R., Morrison, M., Lanyon, G., Eason, R. & Paul, J. (1971). Biochemistry, 10,
3014 3021.Williamson, R., Drewienkiewicz, C. E. & Paul, J. (1973). Nature New Biol., 241, 66-68. Young, B. D., Harrison, P. R., Gilmour, R. S., Birnie, G. D., Hell, A., Humphries, S. &
Paul, J. (1974). J . Mol. Biol. 84, 555-568.

Reprinted from J. Mol. Biol. (1974) 84, 555-568
K inetic Studies o f Gene Frequency
n . Complexity of Globin Complementary DNA and its Hybridization Characteristics
B . D . Y o u n g , P . R. H a r r i s o n , R. S. G ilm o u r , G . D . B i r n i e
A n n a H e l l , S. H u m p h r ie s a n d J. P a u l

J. Mol. Biol. (1974) 84, 555-568
K inetic Studies o f Gene Frequency
n . Complexity of Globin Complementary DNA and its Hybridization Characteristics
B . D. Y o u n g , P . R. H a r r i s o n , R. S. G ilm o u r , G . D. B i r n i e
A n n a H e l l , S. H u m p h r ie s a n d J. P a u l
The Beatson Institute for Cancer Research 132 Hill Street, Glasgow G3 6UD, Scotland
{Received 4 May 1973, and in revised form 10 January 1974)
Single-stranded complementary DNA and double-stranded complementary DNA were synthesized on a template of mouse reticulocyte 9 S RNA using reverse transcriptase from avian myeloblastosis virus. cDNAsf (mean size 330 nucleotides) was 95% sensitive to single-strand-specific nuclease (SI) after extensive incubation, indicating that there were very few complementary sequences in cDNA3.On the other hand, cDNAd (mean denatured size 105 nucleotides) was only 35% sensitive to SI nuclease after being denatured and incubated for a similar period, indicating that there were many complementary sequences in cDNAd.The kinetics of the hybridization of cDNA8 to 9 S RNA are in agreement with
second-order reaction theory. Hence, the time-course of the hybridization of cDNA8 to an equal amount of 9 S RNA can be converted, using the appropriate factor, to the DNA-DNA reaction of the same base composition and complexity.By comparison with the renaturation of Escherichia coli DNA, it was estimated that cDNA8 had been transcribed from RNA sequences totalling 700 to 800 bases. After correction for fragment size and base composition, the reassociation of denatured cDNAd was also compared with the E. coli DNA renaturation curve and it was estimated that cDNAd was transcribed from RNA sequences totalling 330 bases.The titration of cDNA8 with increasing amounts of 9 S RNA has been analysed
by taking into account the cDNA8 size distribution. This analysis indicates that all classes of molecules present in 9 S RNA are partially transcribed into cDNA8.The most likely interpretation of all our results is that cDNA8 and cDNAd both contain sequences transcribed from a limited region of two such classes, probably those messenger RNA molecules coding for a and /3 globin chains.
1. IntroductionReverse transcriptase has been used to synthesize radioactive complementary DNA on a template of reticulocyte 9 S RNA (Ross et al., 1972; Verma et al., 1972; Kacian et al., 1972). Since there is good evidence (Lockard & Lingrel, 1969; Mathews et al., 1971; Housman et al., 1971) that reticulocyte 9 S RNA consists largely of messenger RNA coding for globin, it has been implied that cDNAf comprises at least partial copies of globin genes. Harrison et al. (1972a,1974) have established that cDNA transcribed from mouse reticulocyte 9 S RNA anneals with the slowest renaturing
t Abbreviations used: oDNA', single-stranded com plem entary D N A ; cD N A d, double-stranded complementary DN A.
555

5 5 6 B. D . Y O U N G E T AL.
fraction of mouse DNA, implying that globin genes are reiterated infrequently, if at all, in the mouse genome, even in erythroid tissue. Similarly, by comparing the rate of annealing of cDNA transcribed from duck reticulocyte 9 S RNA with the expected renaturation kinetics of unique duck DNA, Packman et al. (1972) and Bishop & Rosbash (1973) have concluded that globin genes may be reiterated no more than two or three times in the duck genome.
Mouse reticulocyte 9 S RNA is known to contain both a and j8 globin mRNA (Lanyon et al., 1972; Williamson et al., 1973) and, therefore, it is important to establish conclusively that cDNA has been transcribed from these mRNAs and is not merely a copy of a minor contaminant RNA. Since this information cannot be obtained from the kinetics of annealing cDNA to mouse DNA, it has been necessary to examine in detail the hybridization characteristics of cDNA. Our strategy has been, first, to determine the base sequence complexity of both cDNA8 and cDNA3, and second to demonstrate that cDNA8 is transcribed from all classes of molecules present in 9 S RNA.
2, Materials and MethodsDetails of all methods, including the preparation of cDNA3, are described fully in the
accompanying paper (Harrison et al., 1974), except as indicated below.(a) Preparation of double-stranded complementary D N A
cDNAa was prepared by incubating mouse reticulocyte 9 S RNA with reverse transcriptase exactly as described by Harrison et al. (1974), except that actinomycin D was omitted. The reaction mixture was chromatographed on Sephadex G50 in 0*1 M-NaCl and the excluded fraction collected. The size of the labelled DNA so obtained was determined by sedimentation of a sample in alkaline sucrose (Fig. 1). The remainder of the excluded fraction was adjusted to contain 0-05 m -sodium acetate (pH 4*5), 2 mM-ZnS04, 0'1 M-NaCl, 10 /xg denatured mouse DNA/ml, and 60 ng pancreatic ribonuclease/ml, incubated for 2 h at 37°C with SI nuclease (sufficient to degrade denatured DNA completely within 30 min), and chromatographed on Sephadex G50 in 0-1 M-NaCl. The excluded fraction was sedimented in alkaline sucrose (Fig. 1); both strands of the cDNAd were obtained from gradient fractions 6 to 14 by neutralization, chromatography on Sephadex G50 equilibrated with distilled water and lyophilization.
(b) Treatment with Neurospora craSsa nuclease N . crassa nuclease was obtained as described by Linn & Lehman (1965) omitting the
phosphocellulose and hydroxyapatite steps. Samples were incubated for 2 h at 37°C in 0*1 M-Tris (pH 7*5), 0-01 M-MgCl2> 10 Mg native DNA/ml after addition of sufficient enzyme to ensure complete degradation of denatured DNA within 30 min. The extent of nuclease degradation was then determined as for SI nuclease (Harrison et al., 1974).
(c) Preparation of [14C]DNA from L S cells [14C]DNA was prepared (Hell et al., 1972) from the nuclei of LS cells (a substrain of
mouse NCTC strain L929, which grows in suspension) that had been grown in the presence of [a-14C]thymidine (59 /tCi/ mol; 2 jtCi/ml) for 5 days.
3. Theory(a) Analysis of complementary D N A-9 S ENA hybridization kinetics
It is well established that the renaturation of DNA follows second-order kinetics (Britten & Kohne, 1968; Wetmur & Davidson, 1968), the rate-constant being dependent on temperature, fragment size, viscosity and base composition. For DNA of

G L O B I N G E N E F R E Q U E N C Y I N MOUSE T I S S U E . I I 557
uniform complexity, the parameter Cottf has been shown to be proportional to the unique base sequence complexity. This relation may be deduced from the facts that(a) for a fixed amount of DNA the concentration of unique sequences is inversely proportional to genome size, and (b) for an ideal second-order reaction with equal initial concentrations of the two reactants, CQt± is constant.
The dependence of the initial rate of hybridization on the concentrations of RNA and DNA observed by Nygaard & Hall (1964) indicates that the initial part of the hybridization time-course can be explained in terms of second-order reaction theory. There is also evidence from the experiments of Laird & McCarthy (1968), Bishop (1969) and Birnstiel et al. (1972) that the rate of hybrid formation is approximately inversely proportional to the complexity of the complementary RNA and DNA sequences that take part in the reaction. We consider, therefore, cDNA-9 S RNA hybridization to be represented by an irreversible bimolecular reaction, where D 0 and R 0 are the initial concentrations of cDNA and RNA, respectively, H is the concentration of hybrid and k is the rate-constant.
The general rate equation for such a system may be written in the form:
^ = k(D0 - II){R0 - B). (1)at
If the initial concentrations R 0 and D 0 are unequal, by integration, the time-course of this reaction is given by:
BJ>
If, however, the initial concentrations are equal, a condition always fulfilled by native DNA, the time-course is described by:
D a2JctH = l + D J d ' (3)
This equation describes the “C0t ” curves used by Britten & Kohne (1968) to interpret DNA renaturation. By analogy with the parameter CQt±, it is convenient to characterize the hybridization reaction using the parameter D 0t±. The dependence of this term on the concentration ratio of the two species (I20/D 0) can be demonstrated by considering three cases, namely R 0 > D 0, R 0 = D 0 and R 0 < D 0. It can be shown from equations (2) and (3) that for
iog-( 2 “ £ ) . *o> D o h — Tip x- »
(§-■>
(4)\ itn /
R0 > D(
R q — D 0, D Qt± — - ; (5)
f C0 is used here to denote concentration of DNA in moles nucleotides/1 in DNA reannealing experiments. D0 and 7?0 are used to denote concentrations of DNA and RNA, respectively, in moles nucleotides/1 in DNA-RNA hybridization experiments, tj is the time (s) for 50% of the reaction to take place.

558 B . D . Y O U N G E T A L .
Mq <C Dot
The terms D 0h and R QjD 0 can he experimentally determined and thus an estimate of the rate-constant for cDNA-9 S RNA hybridization can be obtained. With appropriate correction factors it is possible, therefore, to estimate the base sequence complexity of cDNA8. Another feature of equations (4), (5) and (6) is that it can be shown (see Fig. 3) that the slowest reaction, measured in terms of D 0t±, occurs for R0 = D0. The importance of this result is that it allows conditions to be chosen such that all hybridization reactions are complete.
(b) Analysis of single-stranded complementary D N A-RN A titration curves
Hybridization of cDNA8 to RNA may be used as a general technique to estimate the fraction of an RNA preparation that is complementary to cDNA8. The simplest approach is to titrate cDNA8 with increasing amounts of RNA, under conditions that allow completion of hybridization reactions. If cDNA8 were of homogeneous size, the titration curve, namely the plot of the fraction of cDNA8 hybridized versus the RNA/cDNA8 ratio, would consist of a line through the origin for cDNA8 excess and a horizontal line for RNA excess. The proportion of the RNA preparation that is complementary to cDNA8 could be found from the RNA/cDNA8 ratio at the point of intersection, because at that value there would be an equal number of cDNA8 and complementary RNA molecules present. In practice, however, cDNA8 is heterogeneous in size, so that in cDNA8 excess there is a greater probability of hybridization to larger cDNA8 molecules.
In order to analyse the effect on titration curves of the size of cDNA8 molecules, it is necessary to consider cDNA8 as being composed of a number of discrete size classes (m). We define the ith class as the total number nt of molecules of length Z( nucleotides, where i = 1, 2, . . . m. It can be assumed that the hybridizing RNA molecules have a constant length r nucleotides, which is larger than the largest cDNA molecules. We also define / t as the number of hybridized cDNA molecules of the ith class. Hence 0 < f i < nt is true for i = 1 ,2 , . . . m. Provided that only one cDNA8 molecule can hybridize to each RNA molecule, the number of RNA molecules (when in cDNA excess) is given by / t. Hence the RNA/DNA ratio (R 0jD0) is given by
Similarly, the ratio of hybridized cDNA to the initial amount is given by
It may be assumed that the probability that an RNA molecule will hybridize to a cDNA molecule of the ith class is proportional to the number of possible nucleation

G L O B I N G E N E F R E Q U E N C Y I N MOUSE T I S S U E . I I 5 5 9
sites, lx, and to the number of unhybridized cDNA molecules present, nx — f x. Hence the probability of hybridization to the ith class is proportional to (nt — f x)lx. We consider the hybridization of a small amount of RNA which produces small changes, Afx, in /j. It follows th at:
4f t (n i ~ fi)h rJi J for i = 1, . . . m. (9)24ft 2 (% -/*)*/3 3
Hence we define Aa. by
j , 4fi 4f, V S‘(wi fiWi (n2 f 2) 2 2 (nJ fj)h
jWe let A a. -> da and Afx -> df 1} etc. and then we have
- d = d 1 = d^2 m \(n l /l) l in 2 /2 2
It can be shown by integration that the above equations are satisfied if
ft = »i(l ~ eIia)- (12)
Thus we have from equations (7) and (8):
r 2 ~ elia )
R°IDq = "* ^2 Mi hi
2 ^^(1 — eliCt)
BI D- (14)»
Both E 0ID0 and H jD0 are expressed above as functions of the independent variable a, which ranges from 0(RQjD Q = H /D0 = 0) to — 00 (H /D 0 = 1). The titration curve expected theoretically for any cDNA size distribution can be obtained by selecting appropriate values of a in the range 0 to — 00, and calculating the corresponding values of R qIDq and H/ D0 from the above equations. In such calculations the experimental size distributions are equivalent to plots of n f x versus lu and the difference betweenthe ith and the (i + l)th class has 'the minimum value of one nucleotide. Thus thenumber of terms (m) in the above summations corresponds to the difference in nucleotides between the largest and smallest cDNA8 molecules.
4. Results(a) Characteristics of complementary DNA
The characteristics of cDNA8 have been fully described elsewhere (Harrison et al.,1974). It has been shown (McDonnell et al., 1970) that without actinomycin D in the incubation mixture, reverse transcriptase synthesizes both RNA-DNA hybrids and single and double-stranded DNA. In order to prepare cDNAd, it is necessary to

560 B . D . Y O U N G E T A L .
Table 1Nuclease sensitivity of mouse DNA and reverse transcriptase product after
120 minutes
Nuclease Denatured LS DNA (%)Reverse transcriptase product (%)
SI 93 17SI + RNAase — 32N. crassa 90 20N. crassa + RNAase — 40
remove hybrid molecules by simultaneous treatment ■with ribonuclease and nuclease specific for single-stranded DNA molecules. The action of SI and N. crassa nucleases on the reverse transcriptase product and on denatured LS cell DNA is compared in Table 1. It can be seen that the addition of ribonuclease to the reverse transcriptase reaction product increases the degradation of cDNA by releasing cDNA8 from hybrid molecules, but that there is little difference in the proportion degraded in 120 minutes by SI and N. crassa nucleases. SI nuclease was used for the analysis of the annealing reactions because, unlike N. crassa nuclease, it is not inhibited by low concentrations of formamide. Sedimentation in an alkaline sucrose gradient (Fig. 1) shows that
2500
2000
C
E 1500COO '
¥ 1000
500
5 10 20F ra c tio n no.
F i g . 1 . Alkaline sucrose sedimentation of labelled DNA produced by reverse transcriptase without actinomycin D, as described in Materials and Methods. — O— O— > Labelled product excluded from Sephadex G50; — #— #— , labelled product treated with ribonuclease and SI nuclease and excluded from Sephadex G50. The arrow indicates the position of a 4-3 S marker. (-- ) Molecular weight.
treatment with ribonuclease and SI nuclease reduced the mean fragment size of cDNA from 80,000 (240 nucleotides) to 35,000 (105 nucleotides). The buoyant density in CsCl of cDNAd prepared in this way was 1’705 g/cm3 ,whioh, if it is double-stranded DNA (see below), corresponds to a base composition of about 45% (G -f- C). Furthermore, sedimentation in alkaline CsCl did not reveal any inter-strand bias in base composition.

G L O B I N G E N E F R E Q U E N C Y I N MOUSE T I S S U E . I I 561
The thermal denaturation of cDNAd was studied by elution from hydroxyapatite and a sharp melting temperature {Tm) of 76°C was obtained. This value may have been depressed because of the very small size of the duplex resulting in premature elution of partially melted cDNAd (Martinson, 1973a,6). However, the Tm of cDNAd that had been denatured and allowed to reanneal was 75°C. If these are true melting temperatures, the small change in Tm suggests that the increase in base mispairing produced by reannealing thermally denatured cDNAd is not more than 1-5% (Laird et al., 1969; Ullmann & McCarthy, 1973a,6).
(b) Hybridization time-courses
The SI nuclease assay was used to determine hybridization time-courses with 9 S RNA/cDNA3 concentration ratios in the range of 100 to 0-1. The normalized time-courses for the ratios of 100, 10, 1 and 0*1 are plotted in Figure 2(a) as functions of D 0t. At the start of each reaction, 5 to 10% of the cDNA3 is nuclease resistant, and under conditions of 9 S RNA excess, the final amount of cDNA8 incorporated into nuclease-resistant hybrids is not more than 80%. About half of the final 20% nuclease sensitivity can be explained by cDNA sequences that cannot hybridize
20
40
60
80
| l0n10'6 IQ15j|?Cl \£ \ o \u 2 0 - \
I0"1
40
60
80
100 r4
Fig. 2. (a) Hybridization of cDNA® to reticulocyte 9 S RNA determined using the SI nuclease assay. Four initial concentration ratios (R0/.D0) were used: (O ) Ro/Ro = 100; (•) Ro/Ro = 10; (A) Ro/Ro = 1; ( □ ) Ro/Ro = 0-1. The results have been normalised to remove the initial 5 to 10% nuclease resistance and the final 20 to 30% nuclease sensitivity.(b) Theoretical time-courses for hydridization of cDNA to its template RNA, assuming that the formation of hybrid molecules is a second-order reaction with a rate-constant of 1. The 4 time- courses, A, B, C and D have initial RNA to DNA concentration ratios of 100, 10, 1 and 0*1, respectively.

562 B. D . Y O U N G E T A L .
(Harrison et al., 1974), and the remainder may be due to digestion of cDNA “tails”. For cDNA3 excess, the amount remaining unannealed is dependent on the 9 S RNA concentration. There is good general agreement between these experimental time- courses and the theoretical curves (Fig. 2(b)) that were computed for the same values of E 0ID0 using the second-order equations (2) and (3) with the rate constant k = 1. In particular, it is evident that, as predicted by equations (4), (5) and (6), the slowest reaction is that for which R 0jD 0 = 1.
The effect of the initial concentration ratio, R QjD Q, on the rate of hybridization is shown in Figure 3, where it can be seen that equal amounts of 9 S RNA and cDNA8 react with a D 0ti of approximately 5*5 X 10“3 mol I-1 s. From equation (5) we have the rate constant k = 1/D0£$ = 182 1 mol-1 s _1. Furthermore, the experimental data fit the theoretical curve, also shown in Figure 3, which was derived from equations (4), (5) and (6) using k — 182 1 mol-1 s _1. Hence these results confirm our assumption that cDNA-9 S RNA hybridization can be described adequately by second-order kinetics,
C?
100R atio 9 S R N A /cD N A s (R0/Dq)
F ig . 3. Experimental variation of D0ti with the 9 S RNA/cDNA8 ratio. The superimposed curve is theoretically derived, assuming that cDNA8-9 S RNA hybridization is an ideal second-order reaction with a rate-constant of 182 1 mol-1 s-1.(c) Renaturation of complementary DNA
When cDNA8 was incubated to 0*1 mol l -1 s, (Fig. 4) only 5% was found to be resistant to SI nuclease, thus confirming that cDNA8 contained few complementary sequences and little secondary structure. However, when denatured cDNAd was incubated to 0-05 mol I-1 s, 65% was resistant to SI nuclease, and hence this preparation of cDNA included a large proportion of complementary sequences. As shown in Figure 4, renaturation of the cDNAd followed a typical DNA C0t curve, with a C0ti of 10-3 mol I-1 s.
It cannot necessarily be assumed that cDNA8 and cDNAd are transcribed from the same RNA sequences. The addition of cDNA8 to an equal amount of denatured cDNAd will only increase the rate of renaturation if the cDNAd sequences are represented in cDNA8. It can be shown from equation (4) that, if cDNAd consists solely

GL O BI N G E N E F R E Q U E N C Y I N MOUSE T I S S U E . I I 663
20
<
40T30)"Oc:o'—o
3 60OQ
80
I0'1 10° 10'CrJ
F ig . 4. The rates of DNA reassociation at 43°C were determined using the SI nuclease assay. Labelled E. coli DNA (#) and cDNAa (A) were denatured and allowed to reanneal. cDNA8 (□) that had been denatured showed little double-stranded structure by a C0t of (H mol l-1 s. A mixture of equal proportions of cDNA8 and cDNA a was denatured and allowed to reanneal (O)-of equal proportions of cDNA® sequences and their anti-strand sequences, the C 0ti (C0 = concentration of cDNAd) will be reduced to 0*25 of its former value. The renaturation curve shown in Figure 4 indicates that the addition of an equal amount of cDNA3 to cDNAd reduces the C0ti from 10“3 mol l -1 s to 0*3 XlO”3 mol l”1 s. This result suggests that a large proportion of the sequences transcribed into cDNAd are also present in cDNA3. A more precise interpretation is not possible because of the difference in base sequence complexity observed for cDNA3 and cDNAd (see below).
The renaturation of E. coli DNA (mean denatured size 330 nucleotides) was followed using the SI nuclease assay (Fig. 4) in order to provide a standard against which the reassociation of cDNA could be compared. The CQt* was estimated to be 7 mol l -1 s.
(d) Single-stranded complementary DNA-9 S RNA titration curvesThe titration of a fixed amount of cDNA3 with increasing amounts of 9 S RNA
can be used to determine whether cDNA3 consists of copies of all or some of the classes of molecules present in 9 S RNA. The results of several titration experiments are shown in normalized form in Figure 5, where it can be seen that the titration curves are similar whether the hybrid is assayed by resistance to SI nuclease or by banding in CsCl. Normalization corrected for about 5% of self-annealing in cDNA3 with no RNA present and about 15 to 20% of the cDNA3 that does not hybridize, even in large 9 S RNA excess. The concentration of cDNA3 used for each point on the titration curve was determined from the specific activity of cDNA3, which in turn was estimated from the specific activity of the nucleotide precursor, assuming a 50% (C + T) content in cDNA3. With such small amounts of cDNA3 it is not possible to confirm independently the assumed specific activity, and hence any errors in our estimate will affect the RNA/cDNA3 ratios. This ratio is similarly affected by errors in the RNA concentrations, which were obtained by serial dilution. A theoretical

564 B. D . Y O U N G E T A L .
100T><uNjo80
<z 60 aoa>2 40Njg
20
• 0 5 6 0R a tio 9 S R N A /h y b r id iz a b le cD N A s
Fia. 5. Titration of cDNA8 with 9 S RNA prepared by the poly(U)-Sepharose method. The hybrid was assayed by resistance to SI nuclease (open symbols) or by banding in CsCl (closed symbols) and the results have been normalized to include only hybridizable cDNA8 (about 80% of total cDNA8). Each set of symbols represents a separate experiment. The solid line indicates the theoretical titration curve calculated from the size distribution of cDNA8.
titration curve was computed by applying equations (13) and (14) to the size distribution of cDNA8 (Harrison et al., 1974) and assuming (a) that all the 9 S RNA molecules (approximate size 570 nucleotides) remain larger than the cDNA molecules, and(b) that all classes of 9 S RNA molecules are transcribed into cDNA8. The close agreement between experiment and theory (Fig. 5) indicates, first, that our experimental errors in the RNA/cDNA8 ratios are minimal and, second, that virtually all classes o f molecules in 9 S RNA are transcribed. We discuss evidence below (see Discussion) that transcription is partial and non-random in the sense that only a particular region of each class is transcribed.
The conclusions drawn from such titration experiments are valid only if all reactions used to establish the plots are complete. It is, therefore, an important prediction of second-order kinetics that the slowest reaction, measured in terms of D0t, occurs when equal amounts of the two components are present. The data in Figure 3 indicate that the slowest cDNA-RNA reaction has D Qt± — 5-5 x 10⁻³ mol I-1 s and, hence, incubation to 40 times this value (0-22 mol l -1 s) should ensure completion of all hybridization reactions. In order to establish that sufficiently large incubation periods were used, two titration curves using reticulocyte 9 S RNA were obtained by annealing to D 0t .= 0*22 and D 0t = 1-7. The titration curves were identical, and it is apparent that incubation to D Qt = 0'22 (used for results in Fig. 5) is sufficient to ensure completion of the hybridization reactions. This result also implies that RNA degradation is not a problem during hybridization up to D 0t = 1-7. This is important, because it is assumed for the theoretical analysis that all RNA molecules remain larger than the largest cDNA molecules. It has already been demonstrated (Harrison et al., 1974) that no appreciable degradation of cDNA8 occurs during hybridization.
The theoretical analysis is based on the assumption that, in cDNA8 excess, there is a greater probability of hybridization to the larger fragments of cDNA3. Direct evidence for this assumption has been obtained by determining the mean sizes of cDNA8 hybridized at 9 S RNA/cDNA8 ratios of 0*3 and 3. It was found that the mean size of cDNA8 hybridized at a ratio of 0-3 was 60% larger than that for a ratio

GL O B I N G E N E F R E Q U E N C Y I N MOUSE T I S S U E . I I 565
of 3. Finally, in order to demonstrate the effect of cDNA8 size, two different size ranges of cDNA3 were used to establish the titration curves shown in normalized form in Figure 6. As would be expected theoretically, the cDNA3 with the larger mean size of 210 nucleotides produced a “ steeper” titration curve than th a t for the smaller cDNA8 (150 nucleotides).
100
is 80 ’• o
S 40
P 20
Ratio 9 S RNA/hybridizable cDNA5
F ig . 6. Titration of cD N A a of mean size 2 1 0 nucleotides ( # ) and of mean size 1 5 0 nucleotides 1(0) With 9 S RNA.
5. Discussion
(a) Estimation of complexity of single-stranded and double-stranded complementary D NA
i With appropiate correction factors for fragment size and base composition, the rates of renaturation and hybridization may be used to estimate the base sequence complexity of cDNAd and cDNA8. Under identical conditions, the C0t i of E. coli DNA (mean size 330 base pairs) was 7 mol I-1 s, and the C0ti of cDNAd (mean size 105 base pairs) was 10-3 mol I -1 s. According to the relation between DNA chain- length and rate of reassociation determined by Wetmur & Davidson (1968), the lC0ti value of a DNA with a mean size of 330 nucleotides is 0-56 times the C0ti value of DNA of mean size 105 nucleotides. Although there is some disagreement in the literature on the effect of base composition on the rate of renaturation (Bak et al., 1969; Gillis et al., 1970), we have used a correction factor of 1-8% of the observed
5C0ti for every mole per cent (G + C) difference from 51% (G + C) (Seidler & Mandel, 1971; Wetmur & Davidson, 1968). On this basis, the C0ti value of a DNA with a
(base composition of 50% (G -f- C) is 0-91 times the C0ti value of a DNA with 45% i(G + C), such as cDNAd. Hence, taking the complexity of E. coli DNA as 4-5 X 10⁶ libase pairs (Cairns, 1963) and applying both correction factors, the complexity of ecDNAd may be estimated as: (10-3/7) X4-5X 106 X 0-56 x 0-91 =330 nucleotide pairs. 5 The kinetics of the hybridization reaction between cDNA8 and 9 S RNA fit second- order reaction theory. However, in order to estimate the complexity of cDNA8,
3> it is necessary to convert the DNA-RNA reaction to the equivalent DNA-DNA ^reaction of the same complexity. By hybridizing RNA synthesized in vitro to excess template DNA, Bishop (1972) has estimated the rate-constants for both hybridiza
tio n and renaturation under the same conditions. Interpolation of the data provided t suggests that the ratio of hybridization rate-constant to renaturation rate-constant

566 B. D . Y O U N G E T A L .
at 43°C in 3 X SSC/50% formamide is approximately 0*25 (SSC is 0-15 M-NaCl, 0-015 M-sodium citrate). I f this value is applicable to 9 S RNA-cDNA8 hybridization, the C0ti value of the equivalent DNA-DNA reaction of the same complexity and base composition may be estimated as 0-25/182=1-37X10-3 mol l -1 s. cDNA3 had a mean fragment size of 330 nucleotides and a base composition of 40 to 45% (G + C) (Harrison et al., 1974). On the assumption that no correction factor for size is required, the complexity of cDNA8 may he estimated by comparison with E. coli DNA renaturation kinetics: [(1-37X 10_3)/7 ]x 4-5X106X (0-82—0-91)=700 to 800 nucleotides.
(b) Transcription of 9 8 RNAOn the basis of the fragment size of the cDNA product, it has been reported (Ross
et al., 1972; Verma et al., 1972; Kacian et al., 1972) that reverse transcriptase copies all or most globin genes. However, the use of highly labelled deoxyribonucleoside triphosphates to produce cDNA with a high specific activity has been shown to inhibit transcription of 9 S RNA (Harrison et al., 19726). cDNA8 had a mean fragment size of approximately 330 nucleotides (Harrison et al., 1974). This could imply that about 60% of the 9 S RNA template (540 to 600 bases; Williamson et al., 1971) was transcribed or that fragmentation of cDNA to a mean size of 330 nucleotides occurred after complete transcription. However, our results indicate that cDNA3 was transcribed from a total RNA sequence of between 700 and 800 bases, i.e. longer than a single mRNA molecule, suggesting that cDNA8 consists of partial copies of two different mRNAs, giving a total complexity of 700 to 800 bases, with a mean fragment size of 330 bases. Since we have also shown, by titration experiments, that cDNA® consists of copies of virtually all classes of molecules present in 9 S RNA, it is probable that cDNA8 includes transcripts of both a and j8 mRNAs. If cDNA transcripts of a and j8 mRNA are sufficiently different to prevent cross-reaction (Dayhoff, 1972), the most likely interpretation of our results is that cDNA8 comprises partial transcripts of both a and j8 globin mRNA. Furthermore, the requirement for poly(dT) primer for 9 S RNA transcription and the presence of adenine-rich sequences at the 3' terminal (Burr & Lingrel, 1971; Lim & Canellakis, 1970) strongly suggests that such partial transcripts are initiated at the 3' end of the mRNA.
The evidence concerning the transcription of cDNAd from 9 S RNA is less conclusive. Because of the relatively low complexity of cDNAd (about 330 base pairs), it is possible that cDNAd consists of sequences (mean size 105 nucleotides) transcribed randomly from a restricted region (330 bases) of a single mRNA. However, the increase in the rate of renaturation of cDNAd that is caused by the addition of cDNA3, suggests that most of the cDNAd sequences are represented in the same ratio as in cDNA8. It is more likely, therefore, that cDNAd consists of partial copies of more than one mRNA.
When reverse transcriptase product is treated with ribonuclease and SI nuclease, the mean size of denatured cDNA fragments is reduced from 240 to 105 nucleotides. This suggests that the nuclease-resistant parts of cDNA duplexes are shorter than the nuclease-sensitive cDNA molecules, and that the former also contain singlestranded cDNA tails. This result, together with our estimates of complexity and fragment size, is consistent with the conclusion of McDonnell et al. (1970), that in the absence of actinomycin D, transcription of RNA into DNA is a two-stage process. In our conditions, the first stage would appear to involve the synthesis of a cDNA

GL O B I N G E N E F R E Q U E N C Y I N MOUSE T I S S U E . I I 5 6 7
strand complementary to about 60% of the mRNA template with which it forms a hybrid duplex. The second stage involves the synthesis, on this hybrid molecule, of a cDNA strand complementary to about 30% of the first cDNA transcript. Treatment with ribonuclease and SI nuclease would remove hybrid molecules and single-stranded cDNA tails, leaving only the relatively short cDNAd duplexes. The presence of actinomycin D appears to prevent the second stage of transcription, resulting in larger cDNA3 molecules.
(c) Single-stranded complementary D N A -R N A titration curvesWe have titrated cDNA3 with 9 S RNA in order to demonstrate that all classes of
molecules in 9 S RNA are transcribed. Our kinetic analysis of hybridization indicates that incubation to a D 0t value of 0-22 mol I-1 s is sufficient to ensure the completion of all reactions, irrespective of the quantity of RNA present. Hence, provided this minimum value of D 0t is achieved for all ratios, the titration method can equally well be applied to any RNA preparation that is thought to contain a fraction of sequences complementary to cDNA8. The total RNA/cDNA8 ratio required for 100% hybridization is inversely proportional to the size of this fraction, and hence the cDNAs-9 S RNA titration curve (Fig. 5) can be used as a standard against which other titration curves may be compared. Thus, it is merely necessary to estimate the abscissa scale factor required to superimpose the titration curve on the standard cDNA8-9 S RNA titration curve. This technique provides a sensitive assay for the presence of globin mRNA in any RNA preparation.
The authors are indebted to Dr J. W. Beard, Duke University, U.S.A., for supplies of avian myeloblastosis virus and to Miss E. MacPhail and Mr A. McPhee for technical assistance. This work was supported by grants from the Medical Research Council and the Cancer Research Campaign.
REFERENCESBak, A. L., Black, F. T., Christiansen, C. & Freundt, E. A. (1969). Nature (London), 224,
1209-1210.Birnstiel, M. L., Sells, B. M. & Purdom, I. F. (1972). J. Mol. Biol. 63, 21-39.Bishop, J. O. (1969). Biochem. J . 113, 805-811.Bishop, J. O. (1972). Biochem. J . 126, 117-185.Bishop, J. O. & Rosbash, M. (1973). Nature New Biol. 241, 204-207.Britten, R. J. & Kohne, D. E. (1968). Science, 161, 529-540.Burr, M. & Lingrel, J. B. (1971). Nature New Biol. 233, 41-43.Cairns, J. (1963). Cold Spring Harbor Symp. Quant. Biol. 28, 43-46.Dayhoff, M. O. (1972). Editor of Atlas of Protein Sequence and Structure, vol. 5, National
Biomedical Foundation, Washington, D.C.Gillis, M., DeLey, J. & DeCleen, M. (1970). Eur. J. Biochem. 12, 143-153.Harrison, P. R., Hell, A., Birnie, G. D. & Paul, J. (1972a). Nature (London), 239, 219-221. Harrison, P. R., Hell, A. & Paul, J. (19726). F E B S Letters, 24, 73—76.Harrison, P. R., Birnie, G. D., Hell, A., Humphries, S., Young, B. D. & Paul, J. (1974).
J . Mol. Biol. 84, 539-554.Hell, A., Birnie, G. D., Slimming, T. K. & Paul, J. (1972). Anal. Biochem. 48, 369-377. Housman, D., Pemberton, R. & Taber, R. (1971). Proc. Nat. Acad. Sci., U .S.A. 68,
2716-2719.Kacian, D. L., Spiegelman, S., Bank, A., Terada, M., Metafora, S., Dow, L. & Marks, P. A.
(1972). Nature New Biol. 235, 167-169.Laird, C. D. & McCarthy, B. J. (1968). Genetics, 60, 303-322.Laird, C. D., McConaughy, B. L. & McCarthy, B. J. (1969). Nature (London), 224, 149-154.
37

5 6 8 B. D. Y O U N G E T AL .
Lanyon, G., Paul, J. & Williamson, R. (1972). Eur. J . Biochem. 31, 38-43.Lim, L. & Canellakis, E. S. (1970). Nature {London), 227, 710-712.Linn, S. & Lehman, I. R. (1965). J. Biol. Chem. 240, 1287-1293.Lockard, R. E. & Lingrel, J. B. (1969). Biochem. Biophys. Res. Commun. 37, 204-212. Martinson, H. G. (1973a). Biochemistry, 12, 139-145.Martinson, H. G. (19736). Biochemistry, 12, 145-150.Mathews, M., Osborn, M. & Lingrel, J. (1971). Nature New Biol. 233, 206-209. McDonnell, J. P., Garapin, A., Levinson, W. E., Quintrell, N., Fanshier, L., & Bishop, J. M.
(1970). Nature {London), 228, 433-435.Nygaard, A. P. & Hall, B. D. (1964). J. Mol. Biol. 9, 125-142.Packman, S., Aviv, H., Ross, J. & Leder, P. (1972). Biochem. Biophys. Res. Commun.
49, 813-819.Ross, J., Aviv, H., Scolnick, E. & Leder, P. (1972). Proc. Nat. Acad. Sci., U.S.A. 69,
264 268.Seidler, R. J. & Mandel, M. (1971). J . Bacteriol. 106, 608-614.Ullmann, J. S. & McCarthy, B. J. (1973a). Biochim. Biophys. Acta, 294, 405-415. Ullmann, J. S. & McCarthy, B. J. (19736). Biochim. Biophys. Acta, 294, 416-424. Verma, I. M., Temple, G. F., Fan, H. & Baltimore, D. (1972). Nature New Biol. 235,
163-167.Wetmur, J. G. & Davidson, W. (1968). J . Mol. Biol. 31, 349-370.Williamson, R., Morrison, M., Lanyon, G., Eason, R. & Paul, J. (1971). Biochemistry,
10, 3014-3021.Williamson, R., Drewienkiewicz, C. E. & Paul, J. (1973). Nature New Biol. 241, 66-68.