10992242.pdf - enlighten: theses
TRANSCRIPT

https://theses.gla.ac.uk/
Theses Digitisation:
https://www.gla.ac.uk/myglasgow/research/enlighten/theses/digitisation/
This is a digitised version of the original print thesis.
Copyright and moral rights for this work are retained by the author
A copy can be downloaded for personal non-commercial research or study,
without prior permission or charge
This work cannot be reproduced or quoted extensively from without first
obtaining permission in writing from the author
The content must not be changed in any way or sold commercially in any
format or medium without the formal permission of the author
When referring to this work, full bibliographic details including the author,
title, awarding institution and date of the thesis must be given
Enlighten: Theses
https://theses.gla.ac.uk/
FACTORS AFFECTING SUBMAXiMAL RUNNING ECONOMY IN CHILDREN
A thesis presented for the degree of Doctor of Philosophy
VIswanath B. Unnithan MSc
May 1993
Department of Child Health,University of Glasgow Royal Hospital for Sick Children
Yorkhill Glasgow, Scotland
ProQuest Number: 10992242
All rights reserved
INFORMATION TO ALL USERS The qua lity of this reproduction is d e p e n d e n t upon the qua lity of the copy subm itted.
In the unlikely e ve n t that the au tho r did not send a co m p le te m anuscrip t and there are missing pages, these will be no ted . Also, if m ateria l had to be rem oved,
a no te will ind ica te the de le tion .
uestProQuest 10992242
Published by ProQuest LLO (2018). C opyrigh t of the Dissertation is held by the Author.
All rights reserved.This work is protected aga inst unauthorized copying under Title 17, United States C o de
M icroform Edition © ProQuest LLO.
ProQuest LLO.789 East Eisenhower Parkway
P.Q. Box 1346 Ann Arbor, Ml 4 81 06 - 1346

96 '5' ^
/
GLASGOWUNIVERSITYLIBRARY
ABSTRACT
The research conducted in this study has helped to clarify a number of important
methodological and physiological questions in submaximal paediatric exercise
physiology. The work was sub-divided into three major sections: methodological
aspects of measuring submaximal running economy, factors affecting
submaximal running economy and possible methods of manipulation of
submaximal running economy.
The three major methodological concerns addressed were the validity and
stability of measurements of submaximal performance and the suitability of
submaximal paediatric exercise testing. Data obtained from the validation study
demonstrated that it was possible to use a biological calibration to assess the
validity of the S2900Z metabolic cart. Of the selected cardio-respiratory
variables studied, FeC 02 represented the only variable to demonstrate any bias
between the computerised data collection and the reference system (Douglas
Bag). The confirmation of the validity of these measurements allowed the
subsequent body of work to be developed.
For true treatment effects to be noted in the manipulation of submaximal running
economy, the level of natural variability needed to be measured. Results from
the second methodological study demonstrated the level of variability associated
with repeated submaximal testing (standard error of the mean + 1.25 ml/kg/min)
and peak testing (standard error of the mean ±2.25 ml/kg/min). It was concluded
that single economy test sessions were valid for estimating the group stability of
running economy. However, if individual profiles were required then multiple
submaximal and maximal exercise testing would be necessary.
The determination of the shortest submaximal steady state stage is important in
the development of continuous submaximal protocols in children. Minimising the
amount of time a child has to be on a treadmill lessens the overall stress placed
upon the child at submaximal exercise intensities. The third methodological
study addressed this issue. The results demonstrated that stable submaximal
oxygen values were attained by the third minute of the steady state stage. Very
little variation occurred between 3 and 6 minutes. Hence, the use of steady state
stages between 3 and 6 minutes was considered acceptable.
Profiling the physiological differences between a group of run-trained and control
boys indicated that some form of physiological adaptation had occurred, either
as a result of pre-selection or training. At submaximal exercise intensities
differences in blood lactate, fractional utilisation, ventilatory equivalent, heart
rate, ventilation and respiratory exchange ratio were noted. Confounding data
obtained in the run-trained group indicated that the submaximal oxygen cost of
running appeared to be similar to the controls in one study and higher in the
second study. Inferences with regard to enhanced free fatty acid oxidation in the
trained boys were postulated. The influence of kinematic factors upon
submaximal running economy was investigated and found to be minimal with no
significant differences evident in gait characteristics between the two
populations. It appeared that gait adjustment was a product of running velocity
rather than training status. On the basis of these results the use of submaximal
running economy as a marker for physiological differences between trained and
untrained populations is valid.
The one clear index that differed throughout all the studies was peak VO j, with
run-trained boys demonstrating superior aerobic power. The source of this
difference could have been either as a result of training or as a consequence of
genetic pre-selection for running. The nature of the studies undertaken prevent
us from answering this question .
In an attempt to manipulate submaximal running economy, a high intensity
aerobic training intervention study was conducted. Ergogenic manipulation of
submaximal running economy was also attempted using an agent suggested to
have ergogenic potential, a p2-agonist. The inhalation of a p2-agonist
(Terbutaline), however, was found to have no effect upon submaximal running
economy. In contrast, training led to striking improvements in submaximal
running economy of the order of 7%. The possible sources of this improvement
are many : increased glycolytic potential, enhanced cardiovascular and
ventilatory responses, substrate utilisation shifts and possible body composition
changes. The possibility of altering submaximal running economy through
training remains the most striking aspect of this work into submaximal running
economy. This work suggest that submaximal running economy is an
appropriate and sensitive marker for assesing the impact of training in a pre
pubertal population.
ACKNOWLEDGEMENTS
I would like to pay my sincere thanks to Mr John Duff of Kelvinside Academy and
Mrs Christine Reid of Milngavie County Primary School for their co-operation
over the last three years in allowing the children to participate. I would like to
thank Mr Wallace Crawford (Victoria Park Athletics Club), Mr Bill Scally
(Shettleston Harriers) and Mr John Tonner for their invaluable help in the
recruitment of the trained runners. Special thanks is extended to all the boys
who took part in this project. Your patience, cheerfulness and unstinting co
operation made the data collection a most positive and pleasurable experience.
I would like to pay special thanks to several people who have inspired, assisted
and motivated me towards the completion of the Ph.D. Jamie Timmons , I am
utterly indebted for the support, friendship and totally unselfish efforts in
assisting with all aspects of this Ph.D. Dr. T. W. Rowland, thank you for being
the true motivating and inspirational force behind my efforts here in Scotland,
despite being in Springfield, Mass, USA I!!. To Dr Steve Siconolfi, Dr Roger
Eston and Dr Phil Jakeman thank you for your guidance throughout the last three
years.
Tom Aitchison, Duncan Buchanan and Dr. Robert Brogan many thanks for your
statistical assistance throughout the last three years. Many thanks to John
Wilson in the department of Physiology for his support, assistance and
encouragement. To Alan and Kevin at Sensormedics BV thanks for all your help
with the S2900Z. Thanks to all the under-graduate students who assisted with
the paediatric testing. Many thanks to all in the departments of Cardiology and
Medical Illustration for their help over the last three years.
To all the companies and individuals who have sponsored projects over the last
three years: Gatorade UK Ltd, Run-a-way Sports, Di-Maggios and Seagrams
International many, many thanks for your generosity.
A sincere thanks to Professor F. Cockburn for allowing me to use the facilities in
the Respiratory Function Laboratory to conduct my research and thanks also to
Dr J. Y. Paton for his supervision.
To all those who doubted and to all those who believed. Thank you for giving
me the strength and determination to reach my goals.
VBU 1993
A u t h o r 's d e c l a r a t io n
All work conducted in this thesis represents my own work. However, the final
section of this body of research: manipulation of submaximal running economy
represents collaborative research. The conception of the project idea and the
inception of the testing was conducted by myself. However, data collection
during the test sessions was jointly accomplished by myself and students J. A.
Timmons and K. J. Thomson respectively.
Abstract............................................................................................................................... 2
Acknowledgements................................................................................................5
Author's declaration...............................................................................................7
General Introduction 10
Introduction............................................................................................................11
Methodological concerns related to running economy 20
Biological validation of exercise testing systems in children................................21Introduction................................................................................................................. 21M ethods........................................................................................................23Results..........................................................................................................28Discussion ....................................................................................................................30Tables...........................................................................................................33
Reproducibility of cardio-respiratory measurements........................................... 35Introduction..................................................................................................35Methods........................................................................................................37Results...........................................................................................................................41Discussion....................................................................................................45Tables...........................................................................................................50
Attainment of steady state during exercise in children......................................... 55Introduction..................................................................................................55M ethods........................................................................................................57Results..........................................................................................................60Discussion....................................................................................................................61Tables...........................................................................................................63
Factors influencing running economy in children 64
Kinematic factors....................................................................................................65Introduction..................................................................................................65M ethods........................................................................................................68Results...........................................................................................................................71Discussion....................................................................................................73Tables...........................................................................................................77
Submaximal running economy in run-trained children......................................... 83Introduction............................................................ .....................................83M ethods........................................................................................................87Results..........................................................................................................90Discussion....................................................................................................91Tables...........................................................................................................99
Influence of steady state blood lactate.................................................................. 101Introduction..................................................................................................101M ethods........................................................................................................103
Results...........................................................................................................107Discussion.....................................................................................................108Tables............................................................................................................113
Factors influencing running performance...............................................................115Introduction...................................................................................................115M ethods.........................................................................................................118Results...........................................................................................................123Discussion.....................................................................................................125Tables............................................................................................................129
Manipulation of submaximal running economy 133
Longitudinal training study......................................................................................134Introduction...................................................................................................134M ethods.........................................................................................................137Results...........................................................................................................142Discussion.....................................................................................................144Tables............................................................................................................150
p2 agonists and running performance.................................................................... 159Introduction...................................................................................................159M ethods.........................................................................................................161Results...........................................................................................................164Discussion.....................................................................................................165Tables............................................................................................................169
General discussion 174
General discussion....................................................................................................175
References 179
References............................................................................................................... 180
Appendices 195
Appendix 1 .............................................................................................................. 196
Appendix 2 .............................................................................................................. 197
Appendix 3 .............................................................................................................. 199

10
GENERAL INTRODUCTION
11
INTRODUCTION
The energy efficiency of muscular work is defined as the ratio of work
accomplished to the total amount of energy expended (Rowland et al. 1990).
During treadmill running, efficiency is less readily defined, since the work load is
more difficult to quantify. Body weight, elastic tendon recoil of leg muscle-tendon
units, arm motion, transfer of energy between body segments and running gait all
contribute to variability in the total work accomplished. Efficiency of movement
during treadmill running has therefore been expressed as oxygen uptake at a
given speed, so called running economy.
In 1985 a symposium entitled "The efficiency of human movement - a statement
of the problem" was published in Medicine and Science in Sports and Exercise
(Cavanagh and Kram, 1985). The relationship between running economy and a
series of variables (biomechanical, psychological and physiological) was
discussed. This forum represented the first collective attempt to synthesise
factors affecting submaximal running performance. Given the performance
implications associated with being an economical runner it was surprising how
little attention this topic had received from exercise and sports scientists.
The concluding themes of the 1985 forum addressed three main areas:
biomechanics, psychology and physiology. In the area of biomechanics more
multi-disciplinary research on trained and untrained performers was needed in
order to isolate both individual and global parameters of running style.
Determining those factors responsible for a more efficient running style and
implementing strategies that would help coaches and runners to improve
efficiency was promoted as a major bio-mechanical directive. In order that the
established relationship between cognitive activity and submaximal oxygen
12
consumption could be developed further a significantly greater amount of
research was also suggested within the psychological realm.
Two major questions were formulated with regard to the physiology of economy:
(i) Why do certain runners consume less oxygen than others and (ii) can
economy be positively modified through training?
It was interesting to note that even by 1991 an American College of Sports
Medicine symposium on running economy was still addressing many of the
similar questions that had been put forward in 1985. The aim of the 1991
symposia was to stimulate investigators to formulate testable hypotheses with
regard to running economy. It was also hoped that a multi-disciplinary approach
could be applied to the investigation of submaximal running economy. This type
of approach would enhance the possibility of identifying and manipulating those
variables associated with economical running. Through the process of
identification and manipulation of those variables the aim was to identify
precisely those mechanisms responsible for the development of an economical
running pattern. It was somewhat surprising to note that by 1991 there still
remained a general lack of consensus and a paucity of knowledge with regard to
factors affecting submaximal running economy. A major directive issued by
ACSM in 1991 was to attempt to determine which factors governing submaximal
economy could be manipulated and which were innate properties of the
individual.
Consequently, based upon the directives issued from the American College of
Sports Medicine the current body of work was formulated. Determining the
factors responsible for submaximal running performance while important in the
adult population has an added significance for the paediatric population. The
emergence of the elite pre-pubertal runner has led to the need to quantify the
13
exercise response precisely in order to provide important feed-back to both
athlete and coach. The physiological requirements of the coach remain specific
and geared to the performance demands of the pre-pubertal athlete. Information
from the paediatric sports scientist may assist in determining optimal intensity,
frequency and duration of training. Helping to bring the elite pre-pubertal athlete
to peak performance represents only one facet of the role of the paediatric sports
scientist. Ensuring that the child remains in good physical health and
minimising the risk of injury throughout a critical phase of development must
have equal priority for both coach and scientist. In a wider context isolating
those factors responsible for economical locomotion has longer term implications
for children. If the ability to develop an economical pattern of locomotion in
childhood can be sustained to adulthood then an array of physiological fitness
benefits might accrue such as lower resting heart rate, reduced resting blood
pressure, lower submaximal exercising heart rate and higher maximal oxygen
carrying capacity.
The work described in this thesis falls in to three major sections;
1. Methodological concerns related to running economy.
2. Factors affecting submaximal running economy in pre-pubertal children and
3. Manipulation of submaximal running economy
14
Methodological concerns related to running economy
With the constant up-grading of computerised exercise testing equipment the
need to be fully confident of the data generated is critical. Consequently, the
development of a validation protocol that could be easily implemented and
adapted to the specific demands of a paediatric population represented the first
stage of the study.
A good deal of attention is focused upon research strategies designed to
manipulate running economy. It is, therefore, of great interest to quantify normal
variability in the assessment of submaximal running. The knowledge of within
subject stability in running economy is also important in determining the number
of tests required to obtain stable measurements. The measurement of stability of
maximal and submaximal oxygen consumption, therefore, represented the
second methodological concern addressed.
Within paediatric exercise testing a number of submaximal steady state protocols
have been used. The third methodological aspect considered was the length of
submaximal protocol most appropriate for the assessment required.
Having established the factors necessary to make valid and reproducible
measurements in children the study proceeded to examine two questions relating
to submaximal running economy in children.
15
Factors affecting submaximal running economy in pre-pubertal
children
The emergence of the trained pre-pubertal runner was the basis for the
subsequent body of work. A multi-disciplinary approach was used to investigate
the factors affecting submaximal running between two groups of subjects. These
groups were of similar age, height and weight, but differed in that one group had
experienced formal running training. A series of 4 studies addressed the
fundamental differences that exist between groups with respect to cardio
respiratory, kinematic, blood lactate and echocardiographic status of the
children. The final study in this sequence investigated the association between
selected laboratory variables and race performance.
Manipulation of submaximal running economy
In an attempt to challenge the hypothesis that submaximal running economy
cannot be manipulated, two strategies were adopted: The first involved the
implementation of a longitudinal training study in an attempt to see whether 10
weeks of high intensity aerobic training could improve submaximal running
economy in a group of moderately trained runners. The second strategy
attempted to assess the effect of drug manipulation upon submaximal running
economy. A (32-agonist commonly used in the treatment of childhood asthma
had been demonstrated to enhance submaximal running economy in asthmatic
children (Zanconato et al. 1990). With the current wide-spread use of inhalers in
children, it was considered appropriate to investigate the impact of a (32-agonist
on submaximal running economy in normal healthy children.
16
One of the most critical and significant elements of research into performance is
the homogeneity of the sample being studied. Studying pre-pubertal populations
allows the researcher to unwind some of the physiological factors responsible for
running performance at a time when the confounding effects of growth are less
manifest.
This work, therefore, addresses a number of fundamental questions in paediatric
exercise science. It is hoped that the results will provide the basis for future
discussion and guidelines.
17
Hypotheses
Three major hypotheses formed the basis of this research:
1. Valid, reliable and appropriate exercise protocols can be developed for
a pre-pubertal population.
2. Potential factors influencing submaximal running economy could be
isolated in a pre-pubertal population.
3 Submaximal running economy has the capacity to be manipulated
through training or ergogenic means.
Aims
Before investigating the above hypotheses it was necessary to establish that
valid and reliable studies of exercise performance could be performed in pre
pubertal children. The first series of methodological studies were designed to
investigate this. The aims of these studies were:
1. To determine the validity of the computerised data obtained by the
Sensormedics (S2900Z) metabolic cart in children and to develop a validation
protocol specific for this population.
2. To assess the stability of repeated submaximal and maximal exercise
testing in children.
3. To determine the most appropriate steady state submaximal protocols
applicable to a paediatric population.
18
Once it had been established that valid and reliable measurements were
possible with the equipment available and in the targeted population. The aims
of the investigations into factors affecting submaximal running economy were:
1. To assess whether kinematic differences existed between a
group of moderately trained pre-pubertal boys and a group of control boys at
submaximal running speeds.
2. To assess whether there were differences in submaximal
economy between a group of moderately run-trained pre-pubertal boys and a
group of control boys at submaximal running speeds.
3. To investigate the contribution of steady state lactate production
to submaximal running economy in a group of moderately trained pre-pubertal
runners.
4. To examine the relationship between running economy, peak
oxygen consumption and fractional utilisation to running performance in run-
trained pre-pubertal boys.
The final part of the study was designed to investigate whether submaximal
running economy was amenable to manipulation either by training or by drugs:
1. To assess the impact of a 10 week high intensity aerobic
training programme upon submaximal running economy.
2. To assess the effect of a p2-agonist upon submaximal running
economy in a group of pre-pubertal boys.

19
Ethical Approval
All studies were approved by the Ethics Committee of the Royal Hospital for Sick
Children, Yorkhill, Glasgow.
20
METHODOLOGICAL CONCERNS RELATED TO RUNNING ECONOMY
21
BIOLOGICAL VALIDATION OF EXERCISE TESTING SYSTEMS IN CHILDREN
Introduction
The development of the microprocessor has been of considerable benefit to the
exercise specialist. These developments have led to the increased application
of computerised on-line gas analysis systems in adult and, more recently,
paediatric exercise testing. Two broad categories of exercise testing protocols
are employed in these populations; (i) submaximal steady state testing and (ii)
progressive incremental exercise tests. With the use of these systems it is
necessary and important to ensure that data generated by these systems at both
high and low exercise intensities are both valid and reliable.
Despite the steady development of on-line computerised exercise testing
systems, the importance of quality control procedures appears to have been
neglected. The need to make quality control, protocol and population specific is
highlighted by the fact that using machines to simulate volumes and flows
generated by children would never fully mimic their responses. Equally, asking
an adult to work at low work outputs to mimic a paediatric response is also
inadequate as ventilation, tidal volume, oxygen consumption and ventilatory
efficiencies cannot be sustained in the way that a child would.
Jones (1984) developed confidence intervals for a micro-processor controlled
exercise testing system (Horizon MMC metabolic cart) based on the measured
accuracy of the computer measurement of oxygen consumption VOg, ventilation
(Ve), fraction of expired oxygen (Fe02) and fraction of expired carbon dioxide
22
(FeC02) compared to a reference system. In this study, Jones used a Douglas
bag measurement technique as the reference system against which to compare
the computer generated values. Based upon the results generated from this
study a confidence interval of + 3% was derived. For computer generated
cardio-respiratory values to be considered valid, the percent difference between
the Douglas bag values and the computer value had to lie within + 3% of the
Douglas bag generated value. Jones used adult subjects for his study. There
are no similar data for children although their smaller size may place greater
technical demands on a system. The Sensormedics S2900Z computerised
exercise testing was tested using children as part of the present study.
The environment in which the exercise testing system is used should determine
the type of validation that is employed. One of the aims of this study was to
design a "biological" validation protocol using healthy children that could be
implemented easily within paediatric exercise testing laboratories. "Biological"
validation reduces the need for the employment of artificial systems to mimic the
exercise response, but raises the problem of the natural variability associated
with a biological calibration. However, this type of calibration is likely to be of far
greater relevance to on-line exercise testing of children.
The aim of this study was to assess the validity of the cardio-respiratory
variables generated by the S2900Z metabolic cart against those generated by a
reference system (Douglas bag) in a group of children and in so doing develop
and evaluate a biological validation protocol suitable for children.
23
Methods
Subjects
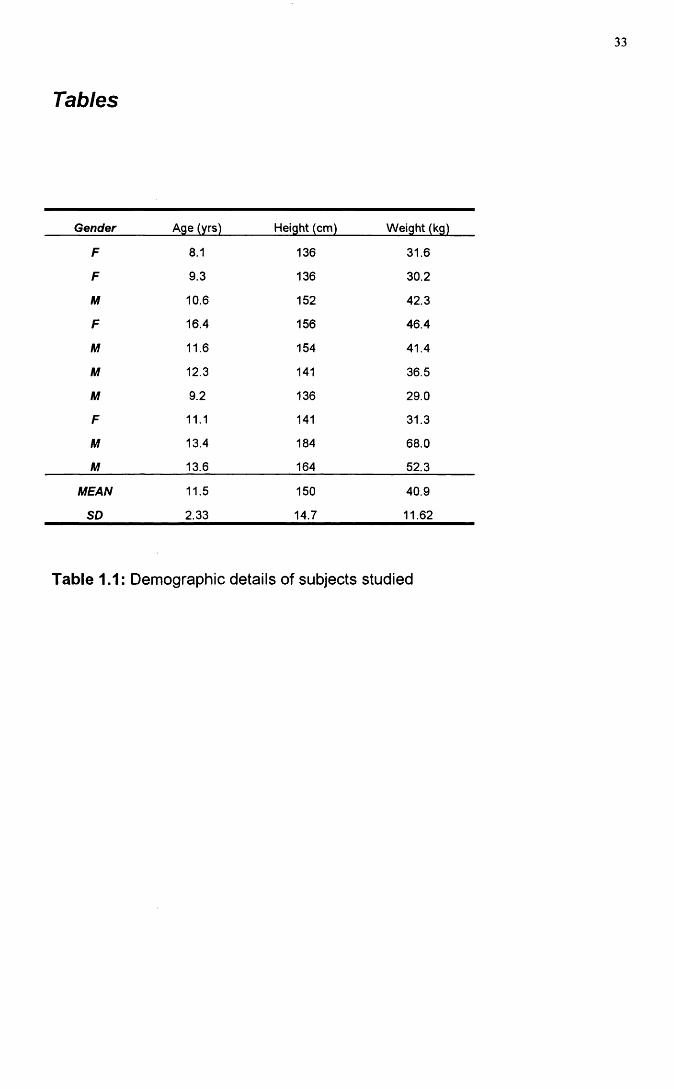
10 active healthy children volunteered to take part in the study. The subjects
represented both sexes and a range of ages (Table 1.1). The study was
approved by the Ethics committee of the Royal Hospital for Sick Children.
Informed consent was obtained from the parents/guardians of the subjects. All
testing took place in the Paediatric Respiratory Function Laboratory which has a
controlled environment with a temperature of 22 degrees Celsius and a relative
humidity of 50%. Prior to the start of the testing, all the subjects were
familiarised with walking and running on the treadmill and were introduced to all
the equipment involved in the collection of cardio-respiratory data.
In order to assess the validity and reliability of the S2900Z across a range of
ventilation rates that might be expected in children, two exercise protocols were
generated: a Low Ventilation Rate (LVR) and a High Ventilation Rate (HVR).
The length of each protocol (11 minutes) was chosen on the expectation that both
metabolic and cardiovascular steady state would be attained (Krahenbuhl et al.
1979). The two protocols were designed to ensure that the work intensities
would represent approximately 60 and 80% respectively of the predicted heart
rate maximum. The on-line S2900Z generated cardio-respiratory values were
compared against values obtained by the Douglas bag technique for expired
gas collection.
24
Exercise Protocols
(i) Low Ventilation Rate (LVR);
All children performed the LVR protocol on 2 separate occasions. This involved
an 11 minute walk with gas collections taken from minutes 6 - 7 and 10-11 using
the Douglas bag collection technique and from minutes 8 - 9 using the metabolic
cart. Heart rate data was monitored throughout. Eight of the children walked at
a speed of 4.2 km/h at 0% gradient, the two youngest children at 3.7 km/h at 0%.
Each child performed the test twice with a minimum of 48 hours separating each
test.
(ii) High Ventilation Rate (HVR):
This involved an 11 minute run at a speed of 8 km/h and 0% gradient. Cardio
respiratory and heart rate data were measured at identical time intervals to that
of the LVR protocol. 8 of the 10 children performed the HVR protocol on two
occasions.
Experimental Procedure
During the period of exercise the subject was fitted with a nose clip and breathed
through a mouthpiece connected to a low resistance paediatric valve.
Interposed between the bag and one end of the plastic tubing was a three-way
aluminium tap. This allowed the subject to expire either into the bag or to the
atmosphere. Between 6 - 7 min and 1 0 - 1 1 min the subject's expired air was
directed through a 25mm bore flexible plastic tube to the Douglas Bag.
After completion, a sample of expired air was introduced into the gas analysers
of the reference system through a sample tube attached to the Douglas Bag.
One minute was allowed for the reading on the analysers to stabilise. The
displayed readings were recorded and were taken as representing the 0 0 2 and
25
0 2 content of the expired air. The side valve was shut off and the volume of
expired air was measured using the gas meter. The temperature of expired air
was recorded using a thermistor attached to the gas meter. The volume of
expired air (pulmonary ventilation) was then corrected for the amount of water
vapour at STPD using a correction factor from a standard nomogram
(Consolazio et a i 1963).
From minutes 8-9, while still breathing through the low resistance paediatric
valve and mouthpiece, the expired air from the subject was directed through to
the S2900Z via small bore paediatric tubing (25mm). Appropriate low dead
space valves (16ml, Hans Rudolph 141 OB) were used to minimise dead space
ventilation during the gas collection phases. The cardiorespiratory variables
measured were VOg, Ve(STPD), VC 02, Fe02 and FeC02. Heart rate was
monitored throughout by a Sport Tester PE3000 heart rate monitor (Kempe,
Finland).
Test System
The S2900Z system uses a hot wire pneumotachograph to measure the mass of
expired air. The relationship between mass of air and volume is non-linear.
Therefore, subsequent linearisation of the output current generated from the
mass-flow anemometer occurred to generate a volume of the expirate.
Calibration of the volume output involved the delivery of a fixed volume using a
calibration syringe (3 Litres), which was flow rate independent. This procedure
was monitored by the microprocessor and adjustments for room temperature and
pressure were made.
The S2900Z utilises an infra-red carbon dioxide analyser and a Zirconium Oxide
oxygen analyser to measure expired 0 2 and C 02. The manufacturer's accuracy
of the single beam non-dispersive infra-red analyser was stated to be +
26
0.04% C02 (within the range of 0 to 10%). The inherent accuracy of the 0 2
sensor was +0.02%( within a 0 2 range of 0 to 25%). For calibration of the gas
analysers the processor samples two calibration gases (26% 02, 0%CO2) and
(16% 02, 4% C02). The concentration of the calibration gases were verified by
the manufacturers using the double Scholander technique The processor sets
the zero and gain of the 0 2 and C 02 channels. These factors are used for the
subsequent measurements.
Reference System
The reference system consisted of a turbine gas meter ( Parkinson-Cowan Ltd,
London, England) to measure the volume of air. The gas meter was calibrated
from 50-150 litres/minute using a Tissot spirometer. During measurement of the
expirate, a vacuum pump was used to ensure that a constant flow of air was
drawn through the dry gas meter. Oxygen and Carbon Dioxide analysers
(Paramagnetic 0 2 analyser, Servomex type 570 SYBRON, Servomex Ltd,
Crowborough, Sussex, England; Infra-red C 02 analyser, P.K. Morgan Ltd,
Chatham, Kent, England) were calibrated each day prior to the start of the test.
They were first set at zero by introducing oxygen free nitrogen and then
calibrated using standard gas mixtures (4.09% C02, 16.03%O2 or 6 .17% C 02
and 15.68%02). All gas concentrations were analysed by the Scholander
method to verify their composition. The span of the 0 2 analyser was set at
20.93% using fresh dried atmospheric air. Oxygen Free Nitrogen (OFN) was
introduced again to reset the analysers at zero. The inherent accuracies of the
two sensors were +0.1 % for the paramagnetic 0 2 analyser and +1 % over the
range of reading for the infra-red C 02 analyser.
27
Statistical Methods
Initially, a general linear model was used to investigate whether or not there
were significant biases between the S2900Z and Douglas Bag values as well as
any order effects. This was achieved by means of a repeated measures analysis
of variance. The biases were then quantified in terms of the percentage
difference of the S2900Z value relative to the Douglas Bag value i.e. [100
*(S2900Z-Douglas Bag)/Douglas Bag). All data analysis was performed using
Minitab version 8.
28
RESULTS
The S2900Z was tested against the reference system (Douglas Bag) using two
exercise regimes: Low Ventilation Rate (LVR) and High Ventilation Rate (HVR).
10 children completed 2 visits at LVR and 8 completed 2 visits at (HVR). On
each visit 3 readings were recorded at different time points for five cardio
respiratory variables (V02,Ve(STPD), VC 02, Fe02 and FeC02). At 6 and 10
minutes Douglas Bag (DB) readings were taken while at 8 minutes a S2900Z
reading was recorded. There was a potential of 48 (6x8) readings per variable,
but this number was not always achieved due to missing values. Three missing
values existed for FeC02 at LVR, two missing values for VOg, Fe02 and FeC02
at HVR and three missing values for Ve and V C 02 at HVR.
(i) Low Ventilation Rates (LVR)
The study design raises the possibility of a possible confounding effect between
testing the bias of the S2900Z and an order effect due to the timing of the
reading. To investigate the possibility of such an order effect, an initial analysis
was conducted comparing the first and second Douglas bag readings using a
generalised linear model. Significant (P<0.05) subject effects were noted for
Ve,VC02, Fe02 and FeC02 and a significant visit effect was noted for Ve.
Having corrected for both subject and visit effects, fitted means for the Douglas
Bag at low ventilation rates were generated (Table 1.2). There was no evidence
to suggest an order effect for any variable at the low ventilation rates.
(ii) High Ventilation Rates (HVR)
A similar assessment of order effects was conducted for each variable at the
HVR. Significant (P<0.05) subject effects were noted for all cardio-respiratory
variables. Also significant (P<0.05) Douglas bag order effects were noted for
29
VO j and Ve (i.e. the Douglas Bag values were significantly higher at 10 mins
compared to 6 minutes). Again, having corrected for subject and visit effects the
fitted means at the HVR were calculated (Table 1.2). Evidence of an increase in
VOg and Ve between minutes 6 to 10 of the exercise at HVR were noted. Such
an order effect in the Douglas Bag readings complicates the investigation of an
S2900Z effect for VOg and Ventilation. If a single discrete Douglas Bag reading
were to be chosen to act as the reference, the increasing VOg and Ve with time
confounds this analysis. However, the rationale of the present analysis was
based upon the presence of an S2900Z effect over and above the mean Douglas
Bag reading.
Using a generalised linear model, tests of significance were made between the
average Douglas Bag value and the S2900Z value. Having corrected for these
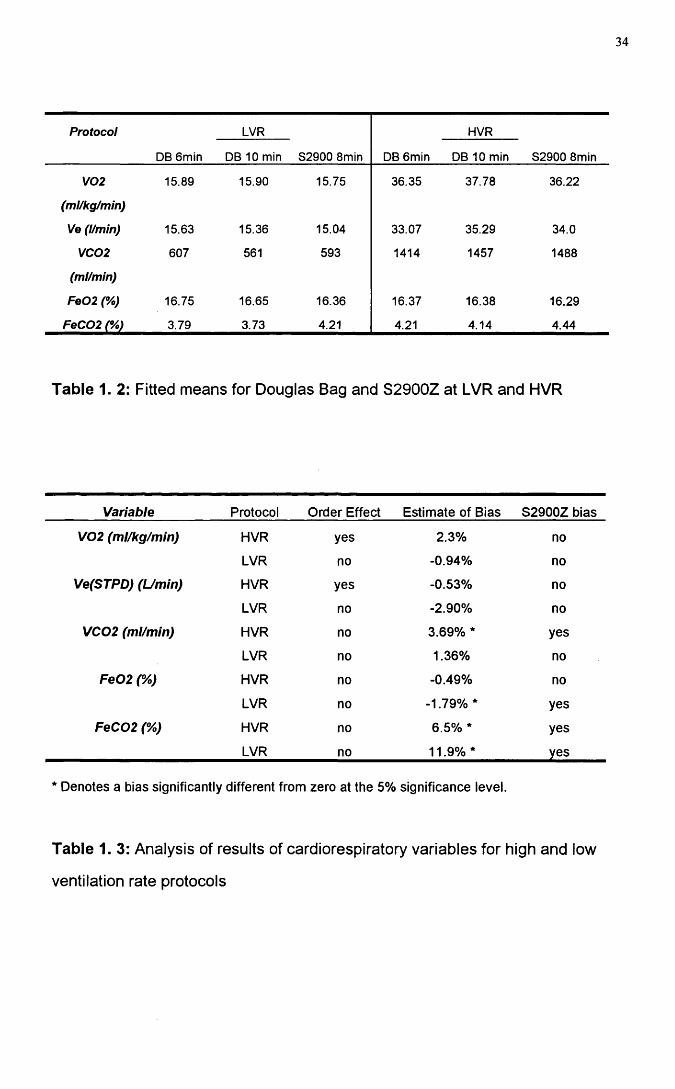
biases fitted means were applied for the S2900Z values at both HVR and LVR
(Table 2). Significant positive biases were noted for V C 02 (3.6%) and FeC 02
(6.2%) at HVR and at LVR a significant positive bias for FeC 02 (11.9%) and a
negative bias for Fe02 (-1.9%). These estimates of bias are expressed relative
to the average Douglas Bag reading. All estimates of bias are listed in Table1.3.
30
DISCUSSION
The rationale for the 11 minute protocols used in this study relied on the
attainment of steady state from 6-11 minutes during the period of exercise. The
absence of an order effect between minutes 6 - 7 and 1 0 -1 1 during the LVR
protocol suggested that for the protocol used this assumption was true.
However, at HVR an order effect did exist The intensity and the duration of the
HVR protocol led to a slight cardiovascular drift with time. The effect was small
and for VOg from 6 to 10 minutes represented only a 4% overall increase.
However, to compensate for this the analysis of the HVR data used the mean
Douglas bag values and consequently the presence of this order effect had a
negligible effect on the overall findings.
Based on the data generated from this study it appears that the Sensormedics
System 2900Z is an adequate instrument for exercise testing of children.
However, despite the general adequacy of the results a number of limited
sources of variability were evident.
In the case of VOg it would appear that any such errors were minimal and no
systematic bias was noted between the two systems at either ventilation rate.
The only source of variability with respect to oxygen analysis was the slight
downscale drift in Fe02 (-1.8%) and this could be attributed to possible
accumulated water vapour in the test system sample line not completely
removed during transit through the drying tube. The bias subsequently
generated is not of a sufficient magnitude to be of concern.
31
The only major source of bias between the two systems lay in the measurement
of FeC02 and this was reflected at both LVR (11.9%) and HVR (6.5%). In each
instance the S2900Z systematically over-estimated the FeC 02 concentration.
However, despite these biases minimal fluctuation in V C 02 was noted at the two
workloads. The small systematic differences between the test and reference
system for FeC02 concentration measurements resulted in a systematic bias of
measurement in V C 02 at HVR (3.7%). This positive bias in the measurement of
V C 02 at HVR while significant, lay only marginally outside the ±3% confidence
interval suggested by Jones (1984).
The inability of the infra-red sensors to cope with the water vapour could have
contributed to the greater variability in FeC02. The manufacturers of the
S2900Z claim that ventilation can be accurate to within + 3% of the reading and
the fraction of expired C 02 can be measured to within + 0.05% across a
concentration span of ( 0 to 10%). Yet these inherent specifications can
themselves give rise to variability in V C 02 measurement.
Consider the following, single individual sample data for the S2900Z:
True VC 02 = (Ve x FeC 02) xIO
True V C 02 = ( 14.8 x 4.09/100) x 10
TV C 02 = 605mls/min, but the potential range of data may lay from 579-631 mis.
This demonstrates the limitations that the S2900Z imposes in a study of this
nature.
During mixed expired gas collection, gas collects in the baffled mixing chamber
within the housing of the S2900Z and is sampled through one of three ports.
Which sampling port is used, is based upon the ventilation rates. Sample port 1
is recruited for resting ventilation, port 2 is used for low ventilation rates and port
3 for high ventilation rates. With the progressive increase in ventilation the
32
volume of the mixing chamber is increased. This enhances the mixing of gases,
improves the optimal response time and should minimise 0 2 and C 02
fluctuations due to tidal volume. The pattern of response, demonstrating a
higher C 02 concentration coupled with a lower 0 2 value is indicative of the
analysis of an end-tidal volume sample. This pattern noted for Fe02 and FeC 02
specifically at LVR and possibly at HVR suggests that insufficient mixing of the
expired gases may have occurred. Confirmation of this theory could be achieved
by simultaneously collecting the Douglas Bag expirate at the exhaust port of the
S2900Z (Rayfield Validation).
The reference system used in this study differed from other validation studies
(Jones 1984 ). Douglas bag collections were taken at discrete intervals either
side of the S2900Z analysis and air was not sampled simultaneously from the
exhaust port of the S2900Z. Despite this difference in technique, the only major
source of bias to arise from this study was in the measurement of FeC02. It
appears that the biological validation of exercise testing systems in children is
both feasible and appropriate. Further, using this approach our data suggest
that the Sensormedics S2900Z is suitable for use as an exercise testing system
in children.
33
Tables
Gender Age (yrs) Height (cm) Weight (kg)
F 8.1 136 31.6
F 9.3 136 30.2
M 10.6 152 42.3
F 16.4 156 46.4
M 11.6 154 41.4
M 12.3 141 36.5
M 9.2 136 29.0
F 11.1 141 31.3
M 13.4 184 68.0
M 13.6 164 52.3
MEAN 11.5 150 40.9
SD 2.33 14.7 11.62
Table 1.1: Demographic details of subjects studied
34
Protocol
DB 6min
LVR
82900 8min DB 6min
HVR
82900 8minDB 10 min DB 10 min
V02 15.89 15.90 15.75 36.35 37.78 36.22
(ml/kg/min)
Ve (l/min) 15.63 15.36 15.04 33.07 35.29 34.0
VC02 607 561 593 1414 1457 1488
(ml/min)
Fe02 (%) 16.75 16.65 16.36 16.37 16.38 16.29
FeC02 (%) 3.79 3.73 4.21 4.21 4.14 4.44
Table 1. 2: Fitted means for Douglas Bag and S2900Z at LVR and HVR
Variable Protocol Order Effect Estimate of Bias S2900Z bias
V02 (ml/kg/min) HVR yes 2.3% no
LVR no -0.94% no
Ve(STPD) (Umin) HVR yes -0.53% no
LVR no -2.90% no
VC02 (ml/min) HVR no 3.69% * yes
LVR no 1.36% no
Fe02 (%) HVR no -0.49% no
LVR no -1.79%* yes
FeC02 (%) HVR no 6.5% * yes
LVR no 11.9% * yes
Denotes a bias significantly different from zero at the 5% significance level.
Table 1. 3: Analysis of results of cardiorespiratory variables for high and low
ventilation rate protocols
35
REPRODUCIBILITY OF CARDIO-RESPIRATORY MEASUREMENTS
Introduction
The variability of cardio-respiratory measurements at submaximal and maximal
exercise intensities is of considerable importance to the paediatric sports
scientist and to the paediatrician. Intervention, rehabilitation and training
strategies are based on data from physiological testing and a knowledge of the
level of natural variability both between and within individuals is critical to an
understanding of the efficacy of a treatment or training effect.
The variability of submaximal exercise performance in adults has been
investigated in a number of studies (Armstrong and Costill 1985, Daniels et al.
1984, Morgan et al. 1987, Morgan et al. 1991 and Williams et al. 1991). These
studies have found significant differences in the submaximal energy cost of
running both between and within moderately and well trained runners on
repeated submaximal exercise testing. A number of variables have been
identified that could influence submaximal treadmill running performance
including circadian variation, footwear, training status and treadmill
accommodation (Morgan et a/. 1991).
Training status also has the capacity to influence the degree of variability
associated with repeated submaximal testing. Williams et al. (1991) and Morgan
etal. (1991) addressed this question in an assessment of submaximal running
economy in runners. Their two studies indicated that the more highly trained
subject the lower the variability between testing sessions. This led Morgan et al.
(1991) to conclude that a stable measure of running economy could be
36
obtained in a single data collection session involving trained, non-elite male
runners if the testing environment was controlled to minimise non-biological
variability.
The limited number of reproducibility studies in children has focused mainly on
the reliability and reproducibility of maximal oxygen consumption tests. For
example, Cunningham et al. 1976 demonstrated a reliability coefficient of 0.76
for two maximal oxygen consumption tests within a four week period where the
reliability coefficient represents the proportion of the total variability explained by
between subject variability This value is below the 0.90 value found in most
adult studies (Morgan et al. 1991, Williams et al. 1991 ). However, the coefficient
of variation in the paediatric studies was only 3%. Thus, while the coefficient of
variation was low, the measurements were calculated to be reproducible
average mean difference, 3%). This emphasises the general weakness of the
use of the coefficient of variation, as it is incapable of accounting for the
repeatability of a measurement.
No studies to date have assessed the stability of submaximal running
performance in children. The primary aim of this study was to evaluate the
variability of cardio-respiratory measurements at three submaximal exercise
intensities in pre-pubertal children. For comparison, we also measured the
variability associated with maximal treadmill exercise performance. A secondary
aim of the study was to predict the optimal number of visits that would be
necessary to obtain stable submaximal and peak oxygen consumption values.
37
Methods
Subjects
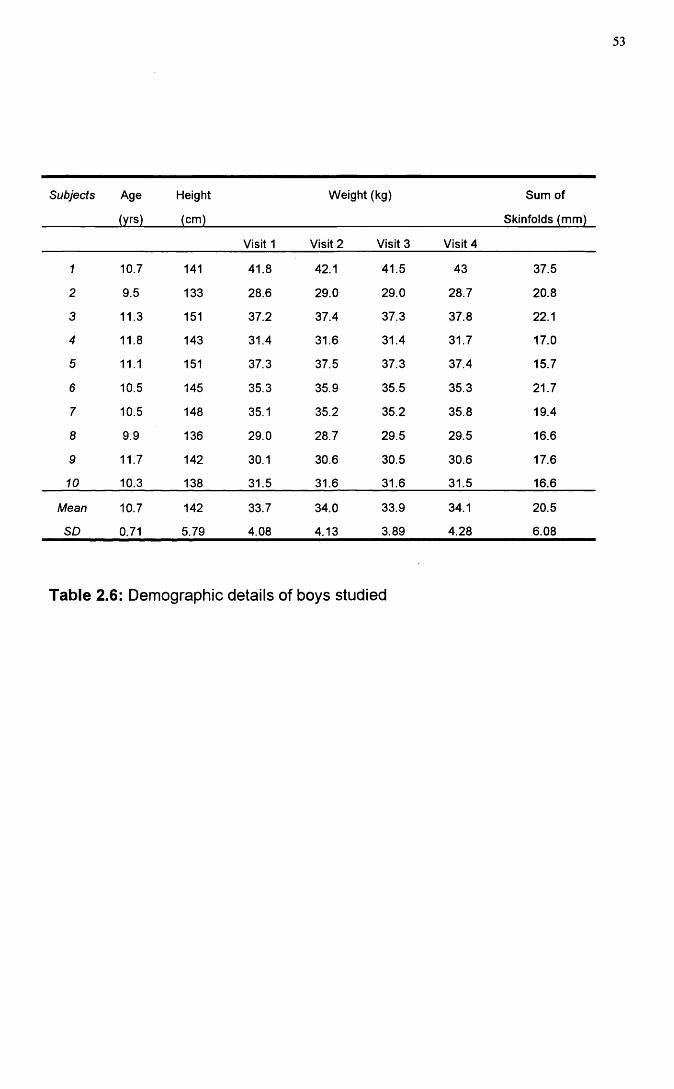
Ten boys were studied ( age 10.7 + 0.71 yrs, mean + SD, Table 2.6). All were
pre-pubertal. Tanner stage 1, based on parental reporting . Of the 10 boys, 5
were rated as active and 5 very active on data obtained from a physical activity
questionnaire completed.
Accommodation Visit
All subjects underwent an habituation / accommodation visit prior to the start of
the testing, (Shephard 1984). At this visit all subjects were introduced to the
treadmill with a short period of walking and running. In addition the children
were familiarised with all the equipment to be used in the cardio-respiratory
testing.
Measurement of cardio-respiratory parameters
Expired gas measurements were made using a computerised metabolic cart
(Sensormedics S2900Z, Bilthoven, Netherlands). Measurement of cardio
respiratory variables were made every 20 seconds throughout the test collection
period. The Sensormedics S2900Z uses a mass-flow anemometer for volume
measurement. Pre-test calibration of the anemometer was achieved by the use
of a three litre calibration syringe (Sensormedics, Bilthoven, Netherlands). The
oxygen and carbon dioxide analysers were calibrated by the introduction of two
calibration gases. (26% 02, 0% C02, balance Nitrogen) and (16% 02, 4% C02,
balance Nitrogen) both immediately prior to, and just after the completion of
each exercise test. Previous work from this laboratory has demonstrated the
validity of the Sensormedics S2900Z metabolic cart in paediatric exercise
testing. (Unnithan ef a/. 1992).
38
To facilitate the expired gas analysis and minimise dead space ventilation, all
subjects were tested using paediatric mouthpieces and valves (Hans-Rudolph
141 OB, dead space 16mls, Hans-Rudolph Incorporated, Kansas City, USA). The
valve and mouthpiece was supported by a head support (Hans-Rudolph , Model
Number 1426). Small bore tubing assisted in minimising dead space ventilation
between the outflow of the valve and the entry port of the S2900Z metabolic cart.
Heart rate data was obtained by means of the PE3000 Sport Tester heart rate
monitor( Polar Sports Ltd, Kempe, Finland.). The treadmill (Power Jog MIG,
Cardinal Sports, Edinburgh) speed was calibrated for each submaximal steady
state stage. The testing was carried out in an air conditioned laboratory with an
environmental temperature between 21 and 26 degrees Celsius and a relative
humidity of between 43 and 54%. In an attempt to control for possible circadian
variations in submaximal running economy (Morgan et al. 1991), the time of
testing remained constant for 8 of the ten subjects (i.e. submaximal and peak
V 0 2 tests were conducted at the same time of day). All subjects were advised to
wear the same footwear each visit and all testing was completed within a 2-4
week period.
Test Protocols
Submaximal economy runs:
Two submaximal economy tests were administered within a 2-4 week period.
The tests consisted of 3 x 6 minute runs at 7.2, 8.0 and 8.8 km/h. Each 6 minute
run was preceded by a 2 minute walk at 4.2 km/h in order to introduce gradually
the subject to exercise at the onset and between submaximal exercise stages. It
also provided an indication of any drift in baseline oxygen consumption as a
result of external factors (temperature, fatigue and learning). In order to ensure
that no residual effect existed between one submaximal economy stage and the
39
next, the protocol was discontinuous in nature with passive recoveries of 8
minutes between each. On-line oxygen consumption measurements were taken
throughout the 8 minute submaximal stages using the Sensormedics S2900Z
metabolic cart (Bilthoven, Netherlands) and confirmed the return to baseline
oxygen consumption. Based upon work generated in this laboratory (Unnithan et
al. 1992, unpublished observations) cardio-respiratory steady state was found to
be achieved between three and six minutes within submaximal exercise testing.
Therefore, data from the final 20s in each 6 minute submaximal stage was used
for the subsequent analysis.
Peak VO2 Test
Two peak VO 2 tests were also administered within the 2 - 4 week period. The
test protocol was a modified incremental test devised for paediatric testing
(Unnithan and Eston 1990). After a 2 minute warm-up walk at 4.2 km/h and 0%
gradient, the speed was then increased to 8.8 km/h at 0% gradient and recording
on the Sport Tester receivers and S2900Z was initiated. Throughout the test the
speed remained constant at 8.8 km/h, but the gradient was increased 2.5% every
2 minutes until volitional fatigue was achieved. The subjects were given
extensive verbal encouragement to achieve their maximal exercising capacity.
Attainment of peak VO 2 was used as the maximal index ( Williams and
Armstrong 1991 ) and was judged to have been achieved when two of the four
following criteria were attained: (i) Heart rate within lObpm of 200bpm or a (ii)
heart rate plateau (plateau was defined as less than a 5 beat increase from the
penultimate to the final stage), (iii) Respiratory exchange ratio value of greater
than 1.0. (iv) Approximate plateau for VO 2 values (defined as the difference
between the final VO 2 value and the penultimate stage V O 2 being less than or
equal to the mean difference of the preceding stages). Practically, termination of
the test occurred when, despite strong verbal encouragement from the
researchers the subject was unwilling or unable to continue.
40
Statistical Methods
Standard descriptive statistics (mean and standard deviations ) were used to
summarise the data. A two way repeated measures analysis of variance statistics
was used to test for visit and speed effects. After adjusting for significant visit,
subject and speed effects the coefficient of reliability was calculated as follows:
Coefficient of Reliability (C.R.) = + a^w
Where = between patient variance and = within patient variance.
To provide the best estimate of the coefficient of reliability, the data were pooled
across all three speeds for each boy. An hypothesis test was used to check that
the same physiological trends existed across speeds for each boy, ensuring that
this statistical manipulation was valid. All statistical calculations were performed
using Minitab version 7.1 and a significance level of 0.05 was used.
41
Results
Submaximal Running Economy
The mean change in body mass of the 10 subjects over the 4 testing periods
was 0.57 kg (Table 2.6). Accordingly, any variation in the submaximal energy
cost of running was unlikely to be attributable to fluctuation in weight.
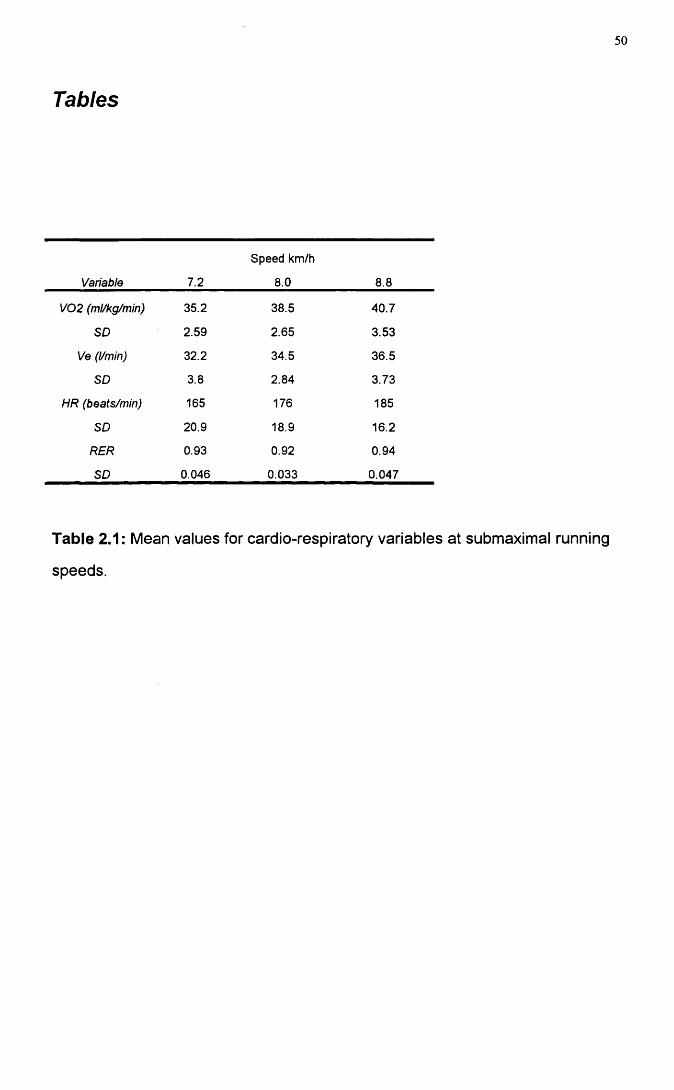
Four variables were measured across the three submaximal speeds: Oxygen
consumption, (VOg, ml/kg/min), ventilation (Ve, l/min), heart rate (HR, bpm), and
respiratory exchange ratio (RER). For all 4 variables there was a significant
increase with increasing speed (Table 2.1). There was no evidence of a
significant visit effect. Two variables, ventilatory equivalent for Oxygen (VeV02)
and fractional utilisation (FU), were measured only across the three submaximal
running speeds . For both there was a significant drop in levels between visits 1
and 2 (VeV02: 27.33 vs 26.56 and FU: 67.39 vs 64.01) indicating a possible
learning effect. FU exhibited the expected increase with speed confirming the
boys used a higher proportion of their peak VOg at each submaximal work load.
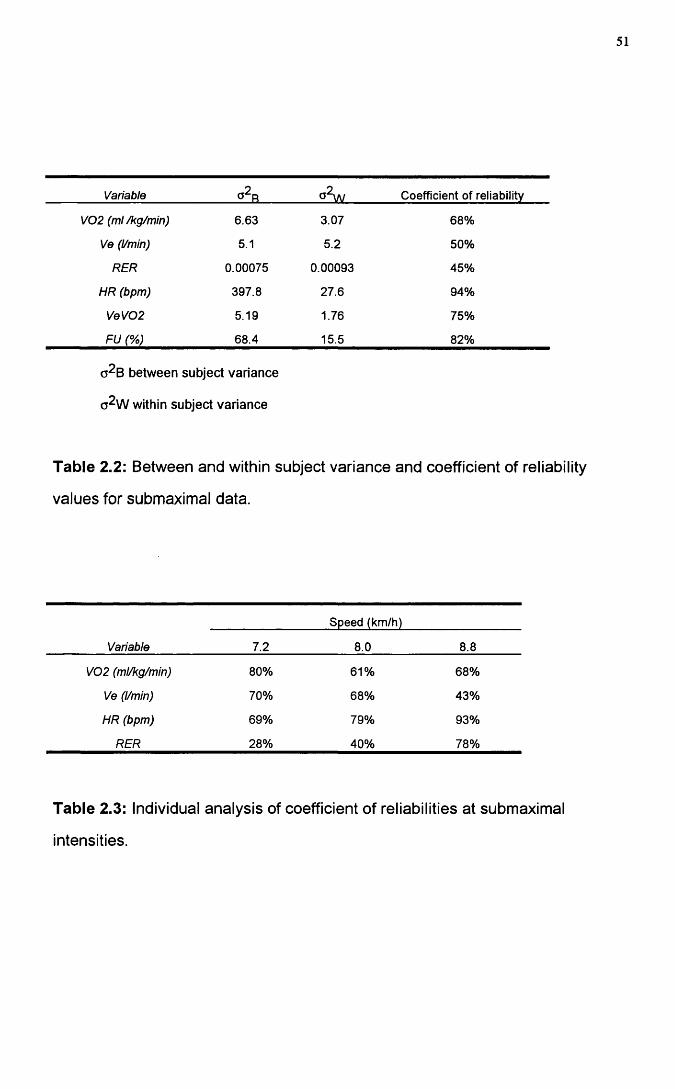
Coefficient of reliability (CR) describes the relationship between two aspects of
variance: between subject and within subject variance. In any assessment of
variability the major expectation is that variability between subjects dominates
over the variability within subjects for any given dependent variable . The
coefficient of reliability describes the ratio of the between subject variance to the
total variance. The CR percentages derived, express how much of the total
variation is accounted for by between person variability.
It appeared based upon the data generated that between and within subject
variances differed at maximal compared to submaximal work loads for different
42
indices. Consequently, CR values were calculated separately. For submaximal
speeds VO j, HR, VeV02, and FU, were the most reliable with between subject
variation accounting for over 2/3 of the total variance. Ventilation and RER
appeared only moderately reliable accounting for less than half the total variance
(Table 2.2, Figure 2.1).
Both an individual and an overall analysis were conducted for the submaximal
running speeds. The overall analysis was undertaken to account for the
particular variability of certain individual subjects. Since each speed involves
fewer observations it was more likely to be affected by excessive random
variability in a few subjects and hence distort the estimation of the coefficient of
reliabilities for the group. At increasing submaximal running speeds, heart rate
and RER coefficient of reliability progressively increased. In contrast, ventilation
demonstrated a systematic decrease in the reliability coefficient with increasing
running speed. Submaximal oxygen consumption demonstrated no significant
trend with increased treadmill running speed. However, the highest coefficient of
reliability (0.80) was noted at the first running speed (7.2 km/h. Table 2.3). At
the three submaximal running speeds the coefficients of reliability for FU were
87.0%, 86.5% and 89.3% respectively.
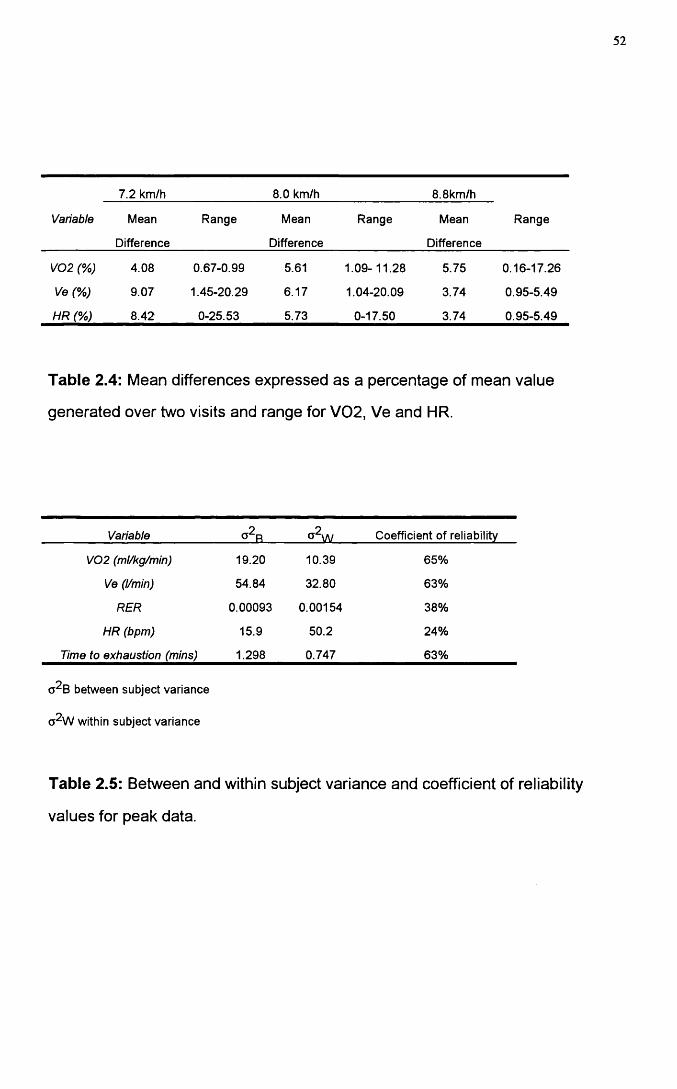
Within subject differences were investigated for ventilation, heart rate and
oxygen consumption at all three running speeds. At 7.2 km/h, the group mean
difference in VOg, expressed as a percentage of each individual's mean VOg
calculated from the two visits, was 4.08%. However, this moderate fluctuation
obscured a wide range of intra-individual variation (range = 0.67-7.99%). At 8.0
km/h the value was 5.61% (range 1.09 -11 .28% ) and at 8.8 km/h , 5.75 (0.16 -
17.26%). Similar values were generated for Ve and HR ( Table 2.4).
43
Based upon the results in this study, the accuracy for the mean VOg level of an
individual derived from a 2 test assessment would give a standard error of the
mean of +1.25 ml/kg/min. The standard error of the mean based upon a
predicted 4 visits would be +0.9ml/kg/min. This predicted value is derived from
the formula:
k2 = 12.07/n where n is the number of visits and k^ represents the standard
error of measurement.
Peak VO2 Analysis
At maximal exercise VO 2 , ventilation and time to exhaustion appeared to be the
most reliable responses with between person variability accounting for
approximately 2/3 of total variance (Table 2.5). The mean A V O 2 expressed as a
percentage of the mean V O 2 from visits 1 to 2 was 5.3%. However, this low
intra-individual variation masked a high degree of between subject variation
(range 0.17 -1 7 .7 8% ). Results from the analysis of peak ventilation
demonstrated a similar range (AVe, mean= 10.27, range 1.94 to 19.48%). The
same trend was noted with HR ( mean = 3.15%, range from 0 to 14.14).
Of the 10 boys tested in this study 3 demonstrated plateaux at both peak V O 2
tests. However, AVO 2 expressed as a percentage of the mean V O 2 was low in
one individual (0.58%) and high in the other two (11.63 and 12.2%). Of the
remaining 7 boys, 6 demonstrated a plateau with respect to peak V O 2 at one of
the two visits. Their AVO 2 values expressed as a percentage of the mean V O 2
was 4.97% (range 0.17 to 17.78). One subject failed to attain a plateau at either
of the two visits, attaining a value of 0.79. Therefore, there appeared to be no
significant pattern linking the presence or absence of a V O 2 plateau with the
test-retest reliability within an individual.
44
Within this testing environment a two visit assessment of an individual was
capable of estimating the mean peak VOg with a standard error of the mean of +
2.28 ml/kg/min. To achieve an estimate of mean peak VOg with a standard error
of + 0 .5 ml/kg/min would require a predicted 40 peak VOg assessments. The
predicted number of visits was calculated in the same manner as for the
submaximal assessment (k^ = 12.07/n).
45
Discussion
Results from the submaximal running performance analysis demonstrated that
VOg, HR, VeV02 and FU were the most reliable submaximal parameters,
accounting for over 67% of the total variance. Ventilation and RER were only
moderately reliable accounting for less than half of the total variation. At
maximal exercise VOg, ventilation and time to exhaustion appeared to be the
most reliable measurements, each accounting for over 67% of the total variance.
Between subject variability dominated in the assessment of these variables,
accounting for approximately 67% of the total variance. In many adult studies
coefficient of reliabilities of the order of 90% have been generated. It would be
hoped that the variability between individuals would dominate over that seen
within individuals. Hence, in the case of adults the ratio of between to within
person variability is in the order of 9:1. In the present study the ratio of between
to within person variability is approximately 2:1. A possible reason for this
difference could be due to the homogeneity of the group being tested.
The homogeneous nature of the group with respect to submaximal and maximal
running physiological criteria (i.e.Peak VOg) had a significant bearing upon the
CRs generated. The smaller inter-individual distribution of physiological data
resulted in a lower between subject variance. Consequently, the subsequent
estimations of coefficients of reliabilities are likely to be underestimated
(assuming within person variability stays the same) because of the
homogeneous nature of the subject population being tested. In a wider fitness,
spectrum the between person variability would have been larger and again
assuming that within person variability remained constant this would have given
rise to estimations of coefficients of reliability which would be too high.
Accordingly, our conclusions on reliability of repeated submaximal and maximal
46
exercise testing can only be applied to fairly homogeneous childhood
populations . This highlights the need for each laboratory to determine the
number of test sessions specific to the nature of their particular population.
Submaximal and maximal running performance is the product of both
physiological and psychological interaction (Crews 1992). The contribution of
motivation towards physiological variation was not measured in this study.
However, in attempt to control this variable all the boys were motivated in a
similar manner throughout all the testing sessions.
A significant visit effect was noted for V eV 02 (Table 2.2). The pattern of
breathing was more efficient at the second visit, possibly reflecting greater
familiarity with the test apparatus. This suggests that despite careful and
extensive efforts a degree of accommodation was occurring during the test
procedures.
In the present study there was no pattern in the CRs for VOg with increased
treadmill running speed. These findings are consistent with the data generated
by Morgan et al. (1987). Armstrong and Costill (1985) also demonstrated that
certain submaximal treadmill speeds (Table 2.3) represented "inefficient" work
loads for their specific population. It is possible that all the submaximal treadmill
speeds selected for the boys in the present study represented relatively
inefficient running speeds and that this bio-mechanical inefficiency contributed
toward the lack of pattern in VOg reliability.
The influence of training status on VOg variability was considered by Katch et
al. (1982) and Williams et al. (1991). These authors hypothesised that
biological variation would be larger in untrained subjects due to the greater
variation in both the transport and extraction of oxygen at the cellular level. The
47
group of boys used in this study would be classed as active, but not highly run
trained. Therefore, the greater variability compared to adult studies could arise
as a product of their differing metabolic profiles during exercise or as a
consequence of their lack of training. In keeping with the latter, Williams et al.
(1991 ) calculated higher estimates of variability than those obtained by Morgan
et al. (1991), who had used well trained runners.
The magnitude of coefficient of reliabilities generated in this present study at
maximal exercise are of the same order as those obtained by Cunningham et al.
1976 and Cunningham et al. 1977. In the present study there was no evidence
to link the presence (9 boys) or absence(1 boy) of a plateaux in VOg with the
reliability of peak VOg. This contradicts the data derived by Cunningham et al.
1977 who traced a greater reliability in peak VOg to those subjects who reached
a plateaux and attributed this greater reliability to those boys being more capable
of generating energy from anaerobic sources. These authors hypothesised that
the enhanced anaerobic capacity would allow a sustained work output at peak
exercise.
Results from the present analysis of submaximal and maximal VOg reliability
also indicated that the degree of reliability was not related to the exercise
intensity (See Tables 2.2 and 2.5). There is conflicting evidence with respect to
the impact of exercise intensity upon the coefficient of reliability. Armstrong and
Costill (1985) demonstrated that within subject day to day variation was lower at
submaximal rather than maximal levels while Taylor 1944 reported the opposite.
The possible psychological implications of attaining peak exercise intensities
could have contributed to the differences between the two populations.
Ventilatory data generated from this present study is in agreement with that
generated by Armstrong and Costill (1985) and Davies etal. (1970). Higher
48
coefficient of reliabilities were obtained at maximal compared to submaximal
exercise. Davies et al. 1970 hypothesised that an increased muscle mass
recruitment at maximal exercise resulting in altered proprioceptive reflexes from
joints and muscles generally led to more stable ventilation patterns at maximal
exercise. However, in absolute terms the magnitude of the coefficient of
reliabilities was low in agreement with Taylor (1944). He demonstrated low
reliabilities for Ve at both submaximal and maximal workloads. RER
demonstrated low coefficients of reliability at both maximal (38%) and
submaximal exercise (45%) intensities due of the multiple substrate and
ventilatory factors that influence this parameter. Consequently, it should not be
regarded as a reliable index. The high CR(75%) of the derived variable V eV02
at submaximal exercise intensities indicated that the ventilatory pattern remained
stable. This lends support to the theory that the major source of VOg variability
lies at the level of oxygen extraction.
The lack of change in submaximal heart rate from visitsi to 2 (CR, 94%) imply
that no apparent training effects have occurred in the circulatory system at
submaximal exercise. Davies et al. (1970) demonstrated a decreased
submaximal heart rate for constant VOg with repeated testing mediated perhaps
through adjustments in stroke volume and/or 0 2 extraction at the cellular level.
This would not appear to be the case with the submaximal heart rate profiles
obtained in the present study. The short duration of the project (2-4) weeks
effectively controlled for any training effects that may have been present.
However, the small number of maximal heart rate recordings obtained made any
conclusions tentative.
The high coefficients of reliability obtained for fractional utilisation overall - (82%)
and at the three submaximal speeds (87.0%, 86.5% and 89.3%) have significant
implications. Exercise intensities are prescribed for both clinical and sporting
49
assessments based upon treadmill testing. Therefore, the data from the present
study indicate that prescribing an exercising range relative to a percentage of
peak VO 2 is a reasonably robust approach within a laboratory setting. The visit
effect, while statistically significant, has minimal implications in the prescription
of exercise intensities for laboratory based training and rehabilitation.
The aim of this study was to quantify the degree of reproducibility that exists with
submaximal and maximal exercise testing and to predict the optimal and most
practical number of visits that would be necessary to achieve stable
physiological data. At the submaximal level, to achieve an estimate of
submaximal VOg with a standard error of + 0.9 ml/kg/m in 4 submaximal tests
would be required for a given individual. This would be an impractical and
unrealistic test schedule for most children. If the same rationale is applied to
peak VO 2 testing, to achieve an estimate of mean peak V O 2 with a standard
error of + 0.5 ml/kg/m in 40 peak V O 2 tests would be required.
In conclusion , based upon the results single economy testing sessions are valid
for estimating group stability of running economy in non-elite active boys. If
individual profiles are required then multiple submaximal and maximal testing will
be necessary.
Daniels (1984) stated " Even when controlling for the multiple external factors
that influence running economy (circadian variation, footwear, training and length
of treadmill accommodation), significant differences still exist in the aerobic
demands of running between and within well trained runners." The need for a
multi-disciplinary approach incorporating metabolic, structural and mechanical
factors to explain fully within subject variation in paediatric running economy is
clear.
50
Tables
Variable 7.2
Speed km/h
8.0 8.8
V02 (ml/kg/min) 35.2 38.5 40.7
so 2.59 2.65 3.53
Ve (l/min) 32.2 34.5 36.5
SO 3.8 2.84 3.73
HR (beats/min) 165 176 185
SO 20.9 18.9 16.2
RER 0.93 0.92 0.94
SO 0.046 0.033 0.047
Table 2.1: Mean values for cardio-respiratory variables at submaximal running
speeds.
51
Variable Coefficient of reliability
V02 (ml/kg/min) 6.63 3.07 68%
Ve (l/min) 5.1 5.2 50%
RER 0.00075 0.00093 45%
HR (bpm) 397.8 27.6 94%
VeV02 5.19 1.76 75%
FU (%) 68.4 15.5 82%
o^B between subject variance
(j2w within subject variance
Table 2.2: Between and within subject variance and coefficient of reliability
values for submaximal data.
Variable
Speed (km/h)
7.2 8.0 8.8
V02 (ml/kg/min) 80% 61% 68%
Ve (l/min) 70% 68% 43%
HR (bpm) 69% 79% 93%
RER 28% 40% 78%
Table 2.3: Individual analysis of coefficient of reliabilities at submaximal
intensities.
52
Variable
7.2 km/h 8.0 km/h 8.8km/h
RangeMean
Difference
Range Mean
Difference
Range Mean
Difference
V02 (%) 4.08 0.67-0.99 5.61 1.09-11.28 5.75 0.16-17.26
Ve (%) 9.07 1.45-20.29 6.17 1.04-20.09 3.74 0.95-5.49
HR (%) 8.42 0-25.53 5.73 0-17.50 3.74 0 95-5.49
Table 2.4: Mean differences expressed as a percentage of mean value
generated over two visits and range for V 02, Ve and HR.
Variable Coefficient of reliability
V02 (ml/kg/min) 19.20 10.39 65%
Ve (l/min) 54.84 32.80 63%
RER 0.00093 0.00154 38%
HR (bpm) 15.9 50.2 24%
Time to exhaustion (mins) 1.298 0.747 63%
between subject variance
a^W within subject variance
Table 2.5: Between and within subject variance and coefficient of reliability
values for peak data.
53
Subjects Age
(yrs)
Height
(cm)
Weight (kg) Sum of
Skinfolds (mm)
Visit 1 Visit 2 Visit 3 Visit 4
1 10.7 141 41.8 42.1 41.5 43 37.5
2 9.5 133 28.6 29.0 29.0 28.7 20.8
3 11.3 151 37.2 37.4 37.3 37.8 22.1
4 11.8 143 31.4 31.6 31.4 31.7 17.0
5 11.1 151 37.3 37.5 37.3 37.4 15.7
6 10.5 145 35.3 35.9 35.5 35.3 21.7
7 10.5 148 35.1 35.2 35.2 35.8 19.4
8 9.9 136 29.0 28.7 29.5 29.5 16.6
9 11.7 142 30.1 30.6 30.5 30.6 17.6
10 10.3 138 31.5 31.6 31.6 31.5 16.6
Mean 10.7 142 33.7 34.0 33.9 34.1 20.5
SO 0.71 5.79 4.08 4.13 3.89 4.28 6.08
Table 2.6: Demographic details of boys studied
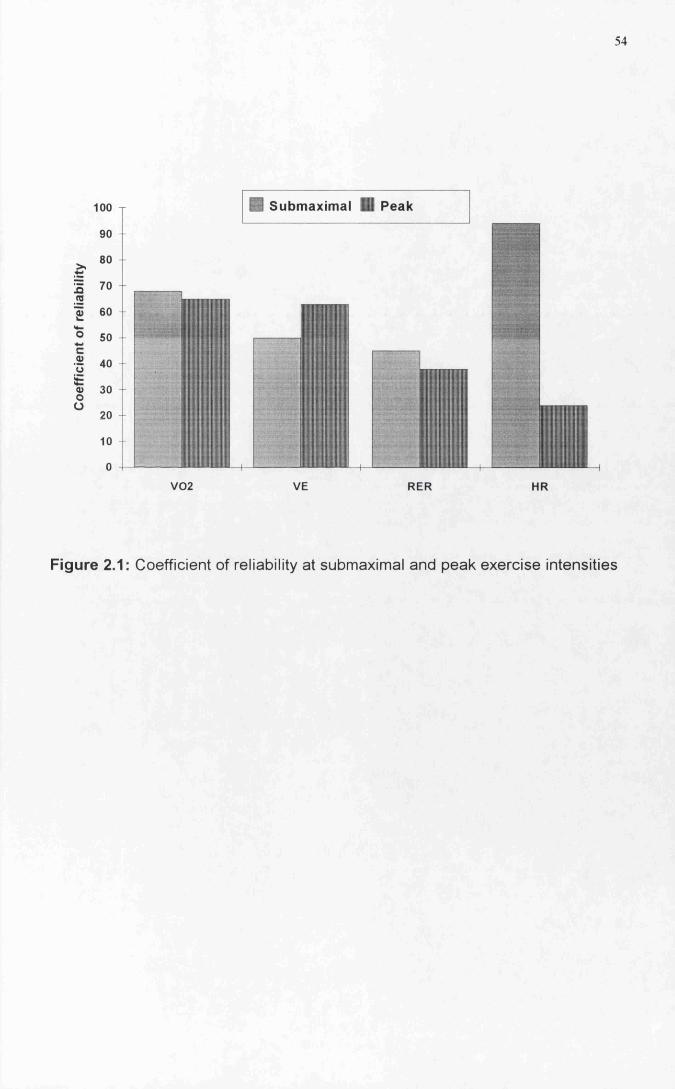
54
100 B Submaximal il Peak
0) 60
0> 30
V02 VE RER HR
Figure 2.1: Coefficient of reliability at submaximal and peak exercise intensities
55
ATTAINMENT OF STEADY STATE DURING EXERCISE IN CHILDREN
Introduction
The duration of submaximal steady state protocols in paediatric exercise testing
has been varied. Krahenbuhl et al. (1979) utilised a 6 minute protocol to obtain
submaximal oxygen consumption data in children, whereas, Rowland at a/.
(1987), (1988) and Unnithan and Eston (1990) all utilised three minute protocols
to estimate submaximal steady state oxygen consumption. Steady state was
defined by Krahenbuhl at si. (1979) as stable readings in oxygen consumption
and respiratory exchange ratio measured over the last two minutes of each run.
Three distinct phases have been identified in the oxygen consumption response
to exercise. Phase I is the cardiodynamic phase and represents the rapid
increase in oxygen consumption observed in the first 20 seconds of exercise.
This increase has been associated with the sudden increase in cardiac output
and specifically stroke volume at the onset of exercise (Whipp and Ward 1982).
The phase II response represents the increase in cardiac output and a widening
of the arterial-venous difference. Phase III represents the steady state response
to a constant work load with response characteristics that appear linear and first
order. Any drift in steady state oxygen consumption beyond three minutes is
only noted at work loads above the anaerobic threshold of the individual.
(i) The primary aim of this study was to investigate the difference in
submaximal oxygen consumption at 3 minutes and 6 minutes within a 6
minute protocol. Oxygen consumption kinetics were not considered and
Phase III steady state values were the only values being assessed. The
significance of attaining the optimal conditions for submaximal steady stage
56
measurements in the shortest possible time is of considerable importance
in most paediatric testing. Since in a progressive continuous submaximal
protocol the shorter the submaximal stages the less stress is placed upon
the child.
(ii) A secondary aim of the study was to determine whether the order of the
speeds had any significant effect upon submaximal oxygen consumption.
57
Methods
Subjects
Ten boys were studied (age 12.5 + 0.35yrs, mean j^SD, Table 3.1). Of the 10
boys , 8 were rated as active and 2 moderately active on data obtained from a
physical activity questionnaire completed. All subjects underwent an
habituation/accommodation visit prior to the start of the testing, Shephard
(1984). At this visit all subjects were introduced to the treadmill (Powerjog MIG,
Cardinal Sports, Edinburgh) with a short period of walking and running. In
addition the children were familiarised with all equipment to be used in the
cardio-respiratory testing.
Measurement of Cardio-respiratory variables
Expired gas measurements were made using a computerised metabolic cart
(Sensormedics S2900Z, Bilthoven, Netherlands). Measurement of cardio
respiratory variables were made using the pseudo -breath-by-breath option
throughout the test collection period. The Sensormedics S2900Z uses a mass-
flow anemometer for volume measurement. Pre-test calibration of the
anemometer was achieved by the use of a 3 litre calibration syringe. The
oxygen and carbon dioxide analysers were calibrated in breath-by-breath mode
by the introduction of two calibration gases (26% 02 and 0%CO2) and (16% 02
and 4% C02) both immediately prior to, and just after the completion of each
exercise test. Previous work from this laboratory has addressed the validity of
the Sensormedics S2900Z metabolic cart in paediatric exercise testing
(Unnithan et al. 1992). To facilitate the breath by breath gas analysis and
minimise dead space ventilation, all subjects were tested using paediatric
mouthpieces and valves (Hans Rudolph 141GB). The valves were modified to
accommodate the breath by breath line.
58
The treadmill speed was calibrated for each submaximal steady state stage. The
testing was carried out in an air conditioned laboratory with an environmental
temperature between 21 and 26 Celsius and a relative humidity of between 43
and 54%. All subjects were advised to wear the same footwear at each visit and
all testing was completed in a four day period.
Study design
Test Protocols;- submaximal economy runs
One submaximal economy test was administered within the four day period. The
test consisted of 2 x 6 minute runs at 7.2 and 8.0 km/h. The order of the speeds
was randomised for each boy. Each 6 minute run was preceded by a 2 minute
walk at 4.2 km/h in order to introduce the subject to exercise at the onset and
between the two submaximal stages. This also served to provide an indication of
any drift in baseline oxygen consumption as a result of external factors
(temperature, fatigue and learning). In order to ensure that no residual effect
existed between one submaximal economy stage and the next, the protocol was
discontinuous in nature with a 10 minute passive recovery between each stage.
On-line breath by breath oxygen consumption measurements were taken
throughout the 6 minute submaximal stages using the S2900Z.
Peak VO2 test
One peak VO 2 test was administered within the four day period. Using a
modified version of the protocol designed by Unnithan and Eston (1990). The
running speed was customised to fit the individual requirement of each child.
Once baseline speed was established the gradient was increased 2.5% every 2
minutes until voluntary exhaustion was attained, submaximal testing. The child
was judged to have reached peak VO 2 when any two of the following four criteria
59
were met (Williams and Armstrong, 1991); heart rate within 10 beats of 200
beats per minute or a heart rate plateau, respiratory exchange ratio value of
greater than 1.0 and an approximate plateau of VOg values.
Physiological Analysis
The S2900Z generated discrete data points for every breath during the gas
collection phases. These discrete values were averaged to produce a mean
value for minutes 2-3 and minutes 5-6. AVOg was calculated by subtracting VOg
at (5-6) from V02(2-3). The calculation of the delta value provided an indirect
estimation of the attainment of a plateau from minute 3.
Statistical Methods
standard descriptive statistics (mean,SD) were used to summarise the data.
Paired t-test statistics were used to assess the effect of time upon submaximal
oxygen consumption. A paired t-test was also used to investigate the effect of
speed order upon submaximal oxygen consumption. All statistical calculations
were performed using Minitab version 7.1 and a significance level of 0.05 was
used.
60
Results
The demographic, physical activity data and peak VOg value (58.9+ 5.14)
demonstrated that all the boys in this study were of a good level of aerobic
fitness (Table 3.1).
Paired t-test analysis demonstrated no significant difference in submaximal
oxygen consumption at either 7.2 or 8.0 km/h (30.13+2.51 at 3 mins versus
30.45+3.49 at 6 mins @ 8 km/h, ) and (28.04+2.07 at 3 mins versus 27.84+3.15
at 6 mins @ 7.2 km/h, mean+SD) (Table 3.2).
Within the context of the two submaximal speeds chosen , relative intensity
appeared to have no effect upon submaximal oxygen consumption. For these
boys, a speed of 7.2 km/h represented an approximate mean fractional utilisation
of 48% while 8 km/h represented 51 %. Further comparison of the absolute mean
differences at 8 km/h and 7.2 km/h demonstrated no significant difference
between absolute differences at the two speeds (-0.20+1.47 @ 7.2 km/h vs
0.31+1.65 @ 8.0 km/h) (Table 3.2). No systematic difference existed in the sign
of the absolute differences at either submaximal running speed.
To assess the impact of order upon submaximal oxygen consumption a paired t-
test was conducted using the absolute differences at 3 and 6 minutes. No
significant difference was noted for speed order. These, results indicate that the
order of speed had no impact upon submaximal oxygen consumption.
61
Discussion
The two speeds selected for this analysis represent two submaximal speeds
within a range of speeds commonly used for submaximal exercise testing in
children . For example, these two speeds had been previously used by Unnithan
and Eston (1990) to assess submaximal running economy. The results from this
study indicate that a range of optimal submaximal steady state stages could be
employed. It would appear that no systematic or significant drift in submaximal
oxygen consumption occurred from minutes three to minute 6. Therefore, the
use of submaximal steady state stages ranging from three to six minutes appears
to be valid.
Thee data from this study demonstrated that no apparent difference in
submaximal oxygen consumption existed at 3 and 6 minutes at either running
speed investigated. Even expression of the data as AV02(3-6)mins showed no
significant difference across time and between the two seeds.
These data show that submaximal oxygen consumption is stable by three
minutes of exercise in prepubertal boys and measurements can be made.
A limitation of this study is the fact that two speeds studied were quite close
together. It is not therefore possible to comment on the effects of relative
intensity upon the time to achieve steady state.
A number of submaximal protocols are commonly used within this laboratory. In
order to assess the need to randomise the order of the speeds an assessment of
the effect of speed was conducted. Results from the paired t-test demonstrated
no significant order effect for the two submaximal work loads chosen. Therefore,
62
it was concluded that an ascending order of speeds could be chosen for the
submaximal protocols. The majority of the cardio-respiratory assessments
performed in this laboratory employ mixed expired gas analysis. This type of
analysis has the facility to smooth individual variability in submaximal oxygen
consumption. The present study used breath by breath (averaged) in attempt to
perform the most rigorous assessment of AVOg (3-6) minutes. This type of data
collection exposes VOg variability to its widest range, as discrete breath by
breath measures vary far more significantly than the discrete 20 second
measures generated by mixing chamber analysis. Within the context of the
conditions that applied to this study (i.e. breath-by-breath analysis and a
discontinuous protocol), the results obtained suggest that submaximal protocols
ranging from three to six minutes are suitable for making measurements of
steady state submaximal oxygen consumption.
Tables
63
Subject Age (yrs) Ht (cm) Wt (kg) Sum of Skinfolds (mm) Peak V02 (ml/kg/min)
1 12.8 161.0 51.8 32.6 49.4
2 12.9 181.0 64.1 20.0 64.9
3 12.0 139.0 35.2 - 57.7
4 12.1 150.0 44.5 39.1 54.9
5 12.7 161.0 50.0 24.4 58.1
6 12.9 158.0 47.5 - 62.6
7 12.2 147.6 38.2 - 65.1
8 12.4 149.4 39.7 26.3 59.6
9 12.9 155.8 38.9 18.2 62.7
10 12.2 146.0 38.2 24.9 53.8
Mean 12.5 154.9 44.8 26.5 58.9
SD 0.35 10.97 8.34 6.69 5.14
Table 3.1 : Demographic and Peak VOg data
7.2km/h 8.0 km/h
3 minutes 6 minutes 3 minutes 6 minutes
V02 (ml/kg/min) 28.0 27.8 NS 30.1 30.4 NS
(SD) 2.07 3.15 2.51 3.15
AV02 (ml/kg/min) -0.20 0.31 NS
(SD) 1.47 1.65
Table 3.2: Summary of means and standard deviations of paired t-test analysis
64
FACTORS INFLUENCING RUNNING ECONOMY IN CHILDREN
65
KINEMATIC FACTORS
Introduction
It has long been thought that the combination and magnitude of stride frequency
and stride length are important determinants of running economy. A number of
authors (Cavanagh and Williams (1982), Hogberg (1952), Kaneko etal. (1987),
Powers etal. (1982) and Knuttgen (1961)) have demonstrated a 'U' shaped
quadratic relationship between running economy and stride length in adults.
Minimising the submaximal energy cost of running has been linked with the
selection of a freely chosen stride length and stride frequency combination for
any individual at any given submaximal running speed. The closer the freely
chosen stride length to that of the optimal stride length, the lower the energy cost
of running (Cavanagh and Williams 1987).
Functional adaptations of the cardio-respiratory system that occur through long
term training have been well documented (Costill 1967, Costill et al. 1973 and
Conley and Krahenbuhl (1980). However, there is a lack of data on the impact of
long-term training upon simple kinematic factors. Stride length and running
economy have been shown to differ between experienced and novice adult
runners, with experienced runners possessing longer stride lengths and
enhanced running economy (Bailey and Pate 1991 ). Whether the attainment of
this optimal stride length-oxygen consumption relationship is a result of training
or an inherent characteristic of the individual has yet to be evaluated in any
longitudinal study with experienced athletes.
66
Cavanagh and Williams (1982), tested the hypothesis that running economy and
optimisation of stride length could occur through training in a group of novice
male runners and demonstrated that neither stride length nor running economy
changed significantly over the seven week training period. If training adaptations
are postulated to arise from an iterative process based upon perceived exertion
and repeated physiological stimuli of high training intensities (Conley and
Krahenbuhl 1980) such a process might occur over many years of training and
be well beyond the scope of all of the studies conducted to date.
In the absence of evidence from long term studies, is there any proof that
specific biomechanical training can alter or achieve the same result in a shorter
time span? To date, results from 3 studies have failed to arrive at a consensus
on how the effects of biomechanical training influence gait, economy and
technique (Petray and Krahenbuhl 1985, Messier and Cirillo 1989 and Williams
et al. 1991b). Further, cross-sectional analysis between good and elite adult
runners has demonstrated no significant difference with respect to a range of
gait descriptors including stride length, Cavanagh (1977). Only one of these
studies investigated the impact of specific biomechanical training in children.
Petray and Krahenbuhl (1985) demonstrated that after an eleven week
instruction programme in running technique no significant improvements were
observed in submaximal running economy or gait characteristics in a group of 10
year old boys.
These results appear to indicate that both general run training and specific bio
mechanical training have little impact upon gait characteristics and submaximal
running performance. Little manipulation of gait appears to be required to match
the freely chosen stride length with an optimal stride length in experienced adult
runners.
67
The primary aim of this study was to asses whether differences in simple gait
characteristic existed between a group of boys involved in long-term running
training and a group of active but non run-trained controls at two submaximal
running speeds and to determine how this related to submaximal running
economy. A secondary aim of the study was to investigate whether the two
groups responded to speed increments in a similar manner.
68
Methods
Subjects
Thirty three male pre-pubertal boys (Tanner stage 1) volunteered to take part in
the study. The first group consisted of 15 run-trained subjects [age 11.7 ± 1.06
years, mean ± SD, Table 4.1]. The second group consisted of 18 control
subjects [age 11.3 ±0.90 years. Table 4.2]. The two groups were similar in terms
of age and height (Tables 4.1 and 4.2). Table 4.5 shows details of the training
and race performance for the trained subjects. Within the context of this study,
run training was defined as involvement in a formal, structured, training
programme for a minimum of one year. The parents of the control subjects
completed a physical activity questionnaire to allow determination of their
children's physical activity profile. The level of the child's habitual physical
activity was assessed as either; (A) Inactive, (B) Active, (C) Moderately active,
(D) Active and (E) Very active (Appendix ). Seven of the control subjects were
rated as active and the remainder were rated as moderately active. None were
taking part in regular training.
All but three of the subjects were familiar with exercise testing . Despite this, all
subjects were asked to attend for a habituation visit to accustom them to the
equipment being used for cardio-respiratory testing. At this visit the subjects
were familiarised to the treadmill by a period of walking and running
(Shephard, 1984). i 68 0
Study Design
Two separate submaximal protocols were used for the trained and untrained
groups with each submaximal protocol consisting of four submaximal running
stages each of three minutes in duration. The four running speeds used for the
trained group were 8, 9.6, 11.2 and 12.8 km/h. 7.2, 8.0, 8.8 and 9.6 km/h for the
69
controls with the two overlapping speeds of 8.0 and 9.6 km/h allowing kinematic
and physiological comparison.
All metabolic data measurements were made using a computerised metabolic
cart (Sensormedics S2900Z, Bilthoven, Netherlands), which was calibrated prior
to each test. This instrument has previously been validated for use in children
(Unnithan etal., 1992). A low dead space valve ((16ml, Hans-Rudolph 1410B)
was used to minimise dead space ventilation during the gas collection phases.
Heart rate was monitored using a Sport Tester PE3000 heart rate monitor
(Kempe, Finland). Two Sport Tester watches were fixed, one on the subject and
one attatched to the front bar of the treadmill. Two simultaneous recordings were
obtained for each subject in order to asess accuracy of the heart rate
measurements.
Kinematic and Physiological Analysis techniques
Stride frequency was measured during the final minute of each submaximal
running stage using a JVC KYI 7 Camcorder positioned perpendicular to the
treadmill. Calculation of stride length (SL), stride frequency (SF), oxygen cost
per stride (02/str), stride frequency/stride length and stride length/leg length
ratios were derived from the following formulae:
VOg per stride (ml/kg/stride) = V02 (ml/kg/min) / SF (Strides per second) •
SL (metres) = Treadmill speed (metres/second) / SF (Strides per second)
Leg length was measured as the distance from the greater trochanter to the base
of the calcaneus and SF was determined by video analysis using a right foot to
right foot strike as one stride.
70
Statistical Methods
A two-tailed unpaired t-test was used to investigate between group differences at
the two comparison speeds in each protocol (8 and 9.6 km/h). In addition, linear
regression analysis was used to assess the trends of the kinematic variables
with speed within each group. Statistics were performed using the statistical
functions in Microsoft Excel version 4 and a significance level of 0.05 was used.
71
Results
Comparison of the demographic data demonstrated that no significant
differences existed for height and weight between the run-trained and control
groups. Only the skinfold measurements were significantly different between the
two groups . Mean peak VOg value for the run trained group was 60.5+3.3
ml/kg/min compared to 51.1+4.3 ml/kg/min for the control group , (P<0.001).
Significant differences were found at 8 km/h between the trained and control
groups for fractional utilisation (%VOgmax) and submaximal heart rate. At 9.6
km/h significant differences arose between the two groups for fractional
utilisation (%VOgmax), submaximal heart rate and respiratory exchange ratio
(RER). At both speeds and for all significant dependent variables the trained
group generated significantly lower values (Table 4.3).
Despite the differences in cardio-respiratory variables, there were no significant
differences between the two groups with respect to economy (VOg), oxygen cost
per stride, stride length, stride frequency, SF/SL and SL/LL at the two common
speeds (Table 4.3, Figures 4.1 and 4.2).
In order that the influence of speed increments upon stride length and stride
frequency could be assessed, individual regression lines were generated for
each boy across the four submaximal treadmill speeds. The gradients and
intercepts of these individual regression lines were plotted for each boy. No
evidence existed for differences between the two groups for both stride length
and stride frequency. In effect the population was homogeneous with respect to
these two variables. Based upon the results obtained from the linear regression
analysis, ASL and ASF were calculated for both groups with respect to the speed
increments. The control group had speed increments of 0.8 km/h and the run-
72
trained 1.6 km/h across the four submaximal speeds. Therefore, the change in
stride length and stride frequency from running stage to the next was expressed
as a ratio of the increment of speed.
Unpaired t-test analyses demonstrated that no significant differences existed
between groups with respect to ASL across the first three speeds in each group.
However, significant differences existed in ASL across the final two submaximal
running speeds. The run-trained group increased their stride length significantly
to adjust to the increase in running speed from stage 3 to stage 4 (Figure 4.4).
No significant differences between groups were noted for A SF with respect to
speed increment across all four submaximal speeds (Table 4.4 and Figure 4.3).
The pattern for both groups was slightly different with respect to the combination
of stride length and stride frequency across the speed continuum. The control
group progressively increased stride length over the four submaximal speeds
with a progressive decline in stride frequency, whereas the trained group had
stable stride length values over the first 3 submaximal running speeds. The
highest stride frequency was achieved at the transition from submaximal speeds
2 to 3 for both trained and control groups.
No significant correlations were obtained between stride length and/or stride
frequency and submaximal running economy at both overlap submaximal
running speeds for both the trained and untrained groups.
73
Discussion
Peak VOg, fractional utilisation, RER, submaximal heart rate (table 4.3) and
performance criteria (Table 4.5) provided evidence the trained boys had a higher
level of functional adaptation to exercise. Despite this, no significant differences
were noted between groups with respect to any of the gait descriptors used in
this study. Differences in submaximal gait do not therefore appear to contribute
to submaximal performance in these boys.
Within the context of the present study the absences of any gait differences
between the two groups might be attributed to several factors. If the enhanced
biomechanics of running are coupled to height (Rowland et al. 1987) the
absence of a significant difference in height between the two groups could
account for the lack of kinematic differences. Also, the training undertaken in the
runners was not specifically designed to promote or enhance running form in
these junior athletes.
If the selection of optimal SL/SF combinations is an inherent, self-selective
process then our results suggest that both groups had attained optimal SL/SF
combinations. This view is substantiated by the lack of significant differences
between the groups in the submaximal energy cost of running at the two
comparison speeds.
The influence of stride length and stride frequency to running economy may be
subtle and beyond the level of sensitivity used in this assessment. However,
some evidence exists to suggest that stride length and stride frequency may be
resistant to specific bio-mechanical training manipulation (Petray and
Krahenbuhl 1985, Messier and Cirillo 1989 and Williams et al. 1991 b). In
74
addition, there is increasing evidence to suggest that the direct significance of
these two determinants to running economy may be minimal. Cavanagh and
Kram (1985), Williams and Cavanagh (1987), Martin and Morgan (1992) and
Morgan and Martin (1986) all demonstrated that slight alterations from the freely
chosen stride length/stride frequency had no effect upon the energy cost of
submaximal walking and running. The SL/SF ratio had to vary greatly from
optimal to cause an increase in the submaximal energy cost of running. In
addition, day to day variations in stride length have also been shown not to
account for day to day variations in running economy (Morgan et al. 1989a ).
The criteria which dictate optimal stride lengths are unknown. A number of
theories have been put forward to explain the optimisation of SL/SF. It may arise
as a result of the relationship between the efficiency of muscular contraction and
the velocity at which muscles contract (Cavanagh and Kram 1985). The elastic
properties of muscle may also dictate the optimal SL and SF. McMahon (1984)
demonstrated that the resonant frequency of the elastic component in kangaroo
tendon determines the hopping speed in the kangaroo at which VOg is
minimised.
The linear regression analysis indicated that with respect to SL/SF adjustments
to increased running velocity, the group was homogeneous. The SL/SF linear
regression data represented a descriptor of a single speed continuum.
Subsequent analysis of ASL and ASF confirmed this theory. At the lower end of
the speed spectrum the control boys made adjustments through increased stride
length and decreased stride frequency to increments in running speed that were
not significantly different to those of the run-trained. Only at the upper end of the
speed range did the run-trained boys exhibit significantly higher SL than the
controls. Across the speed continuum, the pattern of adjustment to speed
increments appeared to be through stride frequency at slow transitional speeds,
75
a combination of SL/SF at intermediate speeds and primarily SL at the upper
end. These adjustments appeared to be totally independent of training status
and a product of running velocity alone.
Significant adjustments of stride length have been linked to enhanced
submaximal running economy. The possible mechanisms underlying these
adjustments were addressed by Kaneko et al. (1981 ). These authors noted the
greater contribution from stride frequency as opposed to stride length to
submaximal economy. At low stride frequencies, the muscles need to develop a
high external power to achieve a longer stride length. Equally at high stride
frequencies the mechanical power associated with moving limbs increases. At
either extreme, greater reliance is placed upon less economical fast twitch fibres
than at more intermediate stride length/stride frequency combinations.
Increasing stride length with increased treadmill running speed is indicative of a
greater contribution from eccentric muscle contraction and approximately 40%
less oxygen is consumed than for an equivalent concentric muscle contraction
minimising the submaximal energy cost of running.
In summary, despite a high level of aerobic fitness and running performance in
the trained group, we found no evidence that at the same speed significant
differences existed between the run-trained and control boys with respect to any
of the gait descriptors analysed in this study. Also, despite the functional
adaptations in the trained boys there appeared to be no interaction between the
cardio-respiratory variables and the kinematic factors assessed. Both groups
adjusted to increments in speed by optimising their stride length/stride
frequency patterns.
A limitation of any gait analysis study in children is the inability to totally exclude
habituation effects influencing performance. Thorough treadmill habituation and
76
accommodation procedures were performed on all the children. However it is
impossible to rule out that these factors could have had a confounding effect
upon the kinematic factors generated. The data on pre-pubertal males points to
the optimisation of stride length and stride frequency ratio being an inherent
characteristic of a given individual and a product of running velocity rather than
training status.
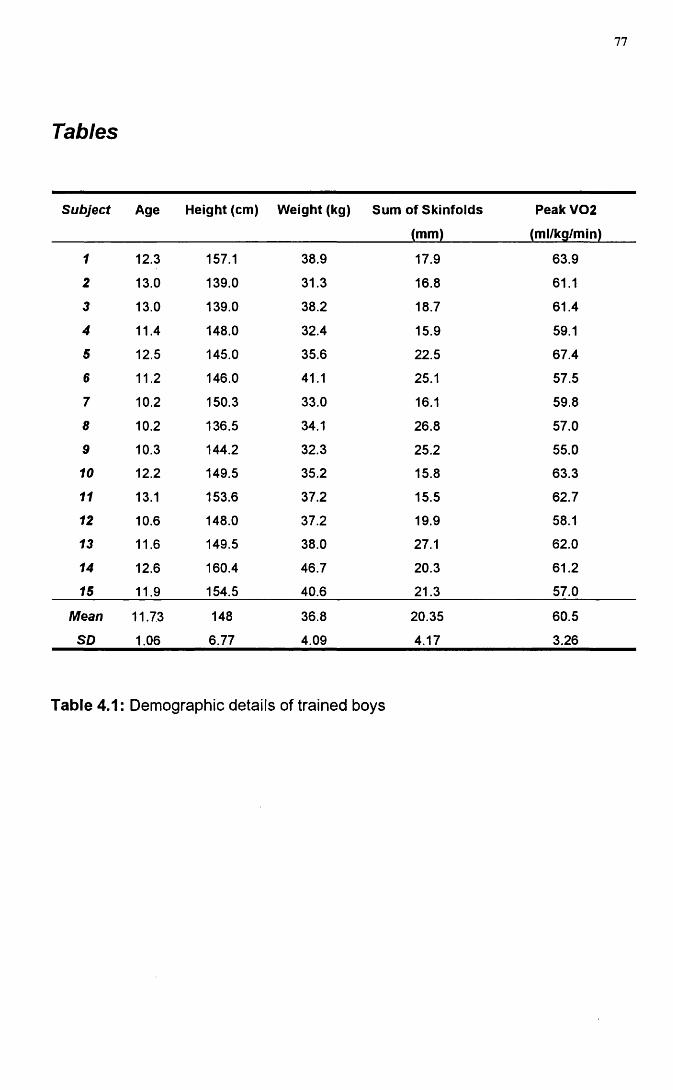
77
Tables
Subject Age Height (cm) Weight (kg) Sum of Skinfolds
(mm)
Peak V02
(ml/kg/min)
1 12.3 157.1 38.9 17.9 63.9
2 13.0 139.0 31.3 16.8 61.1
3 13.0 139.0 38.2 18.7 61.4
4 11.4 148.0 32.4 15.9 59.1
5 12.5 145.0 35.6 22.5 67.4
6 11.2 146.0 41.1 25.1 57.5
7 10.2 150.3 33.0 16.1 59.8
8 10.2 136.5 34.1 26.8 57.0
9 10.3 144.2 32.3 25.2 55.0
10 12.2 149.5 35.2 15.8 63.3
11 13.1 153.6 37.2 15.5 62.7
12 10.6 148.0 37.2 19.9 58.1
13 11.6 149.5 38.0 27.1 62.0
14 12.6 160.4 46.7 20.3 61.2
15 11.9 154.5 40.6 21.3 57.0
Mean
SO
11.73
1.06
148
6.77
36.8
4.09
20.35
4.17
60.5
3.26
Table 4.1: Demographic details of trained boys
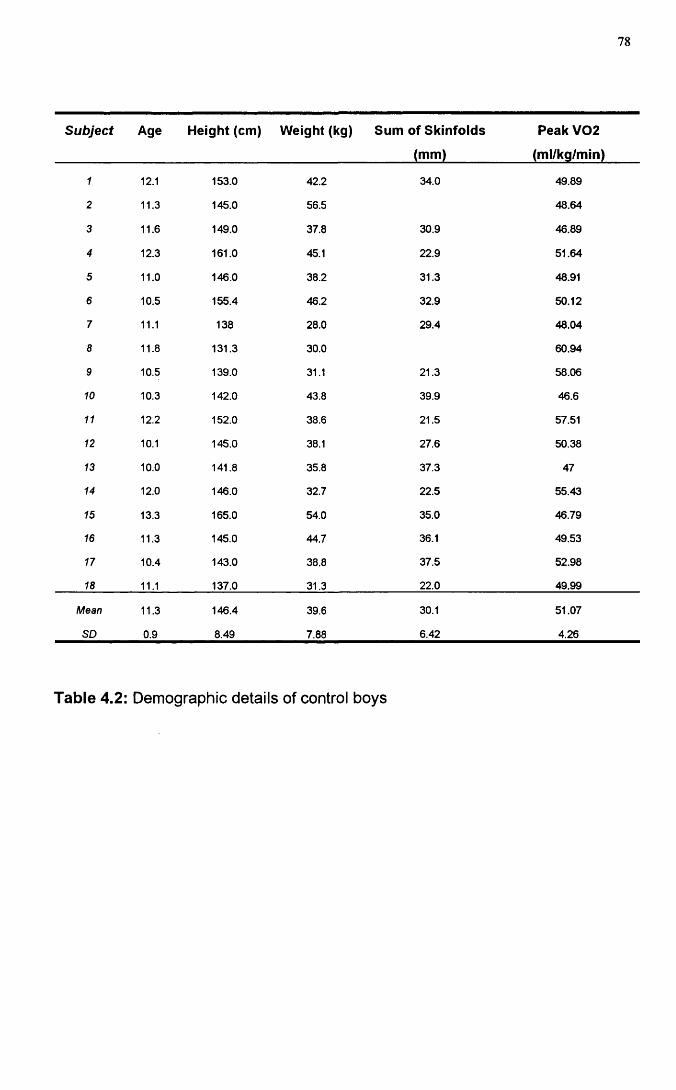
78
Subject Age Height (cm) Weight (kg) Sum of Skinfolds
(mm)
Peak V02
(ml/kg/min)
1 12.1 153.0 42.2 34.0 49.89
2 11.3 145.0 56.5 48.64
3 11.6 149.0 37.8 30.9 46.89
4 12.3 161.0 45.1 22.9 51.64
5 11.0 146.0 38.2 31.3 48.91
6 10.5 155.4 46.2 32.9 50.12
7 11.1 138 28.0 29.4 48.04
8 11.6 131.3 30.0 60.94
9 10.5 139.0 31.1 21.3 58.06
10 10.3 142.0 43.8 39.9 46.6
11 12.2 152.0 38.6 21.5 57.51
12 10.1 145.0 38.1 27.6 50.38
13 10.0 141.8 35.8 37.3 47
14 12.0 146.0 32.7 22.5 55.43
15 13.3 165.0 54.0 35.0 46.79
16 11.3 145.0 44.7 36.1 49.53
17 10.4 143.0 38.8 37.5 52.98
18 11.1 137.0 31.3 22.0 49.99
Mean
SO
11.3
0.9
146.4
8.49
39.6
7.88
30.1
6.42
51.07
4.26
Table 4.2: Demographic details of control boys
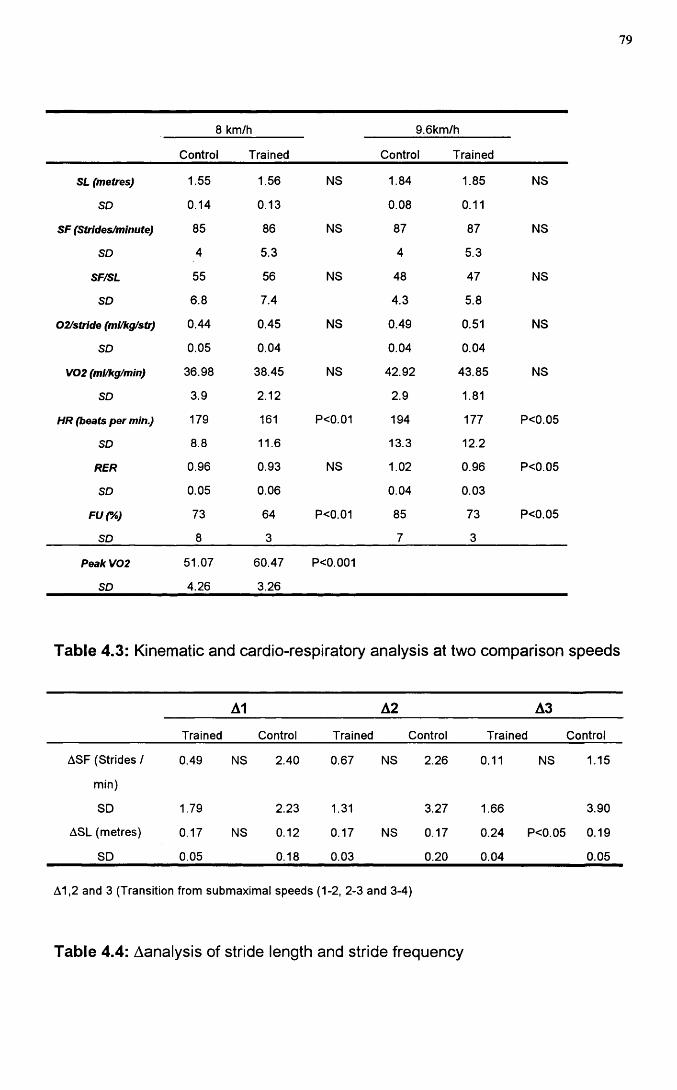
79
8 km/h 9.6km/h
Control Trained Control Trained
SL (metres) 1.55 1.56 NS 1.84 1.85 NS
SD 0.14 0.13 0.08 0.11
SF (Strides/minute) 85 86 NS 87 87 NS
SD 4 5.3 4 5.3
SF/SL 55 56 NS 48 47 NS
SD 6.8 7.4 4.3 5.8
02/stride (ml/kg/str) 0.44 0.45 NS 0.49 0.51 NS
SD 0.05 0.04 0.04 0.04
V02 (ml/kg/min) 36.98 38.45 NS 42.92 43.85 NS
SD 3.9 2.12 2.9 1.81
HR (beats per min.) 179 161 P<0.01 194 177 P<0.05
SD 8.8 11.6 13.3 12.2
RER 0.96 0.93 NS 1.02 0.96 P<0.05
SD 0.05 0.06 0.04 0.03
Fur/o) 73 64 P<0.01 85 73 P<0.05
SD 8 3 7 3
Peak V02
SD
51.07
4.26
60.47
3.26
P<0.001
Table 4.3: Kinematic and cardio-respiratory analysis at two comparison speeds
A1 A2 A3
Trained Control Trained Control Trained Control
ASF (Strides / 0.49 NS 2.40 0.67 NS 2.26 0.11 NS 1.15
min)
SD 1.79 2.23 1.31 3.27 1.66 3.90
ASL (metres) 0.17 NS 0.12 0.17 NS 0.17 0.24 P<0.05 0.19
SD 0.05 0.18 0.03 0.20 0.04 0.05
A1,2 and 3 (Transition from submaximal speeds (1-2, 2-3 and 3-4)
Table 4.4: Aanalysis of stride length and stride frequency
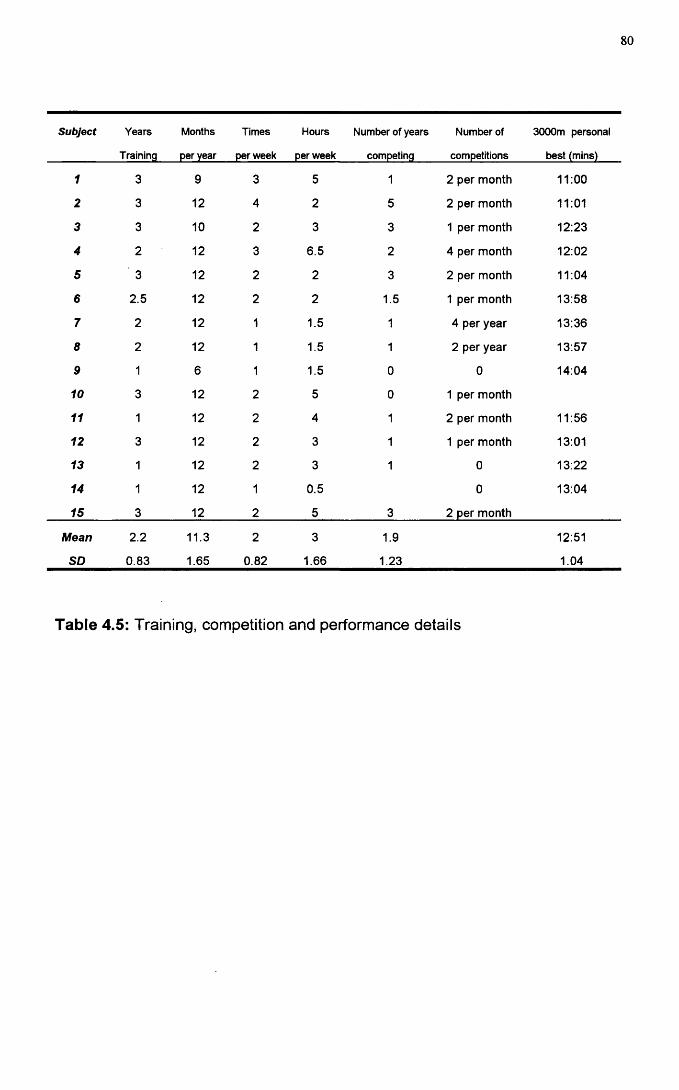
80
Subject Years Months Times Hours Number of years Number of 3000m personai
Training per year per week per week competing competitions best (mins)
1 3 9 3 5 1 2 per month 11:00
2 3 12 4 2 5 2 per month 11:01
3 3 10 2 3 3 1 per month 12:23
4 2 12 3 6.5 2 4 per month 12:02
5 3 12 2 2 3 2 per month 11:04
6 2.5 12 2 2 1.5 1 per month 13:58
7 2 12 1 1.5 1 4 per year 13:36
8 2 12 1 1.5 1 2 per year 13:57
9 1 6 1 1.5 0 0 14:04
10 3 12 2 5 0 1 per month
11 1 12 2 4 1 2 per month 11:56
12 3 12 2 3 1 1 per month 13:01
13 1 12 2 3 1 0 13:22
14 1 12 1 0.5 0 13:04
15 3 12 2 5 3 2 per month
Mean 2.2 11.3 2 3 1.9 12:51
SD 0.83 1.65 0.82 1.66 1.23 1.04
Table 4.5: Training, competition and performance details
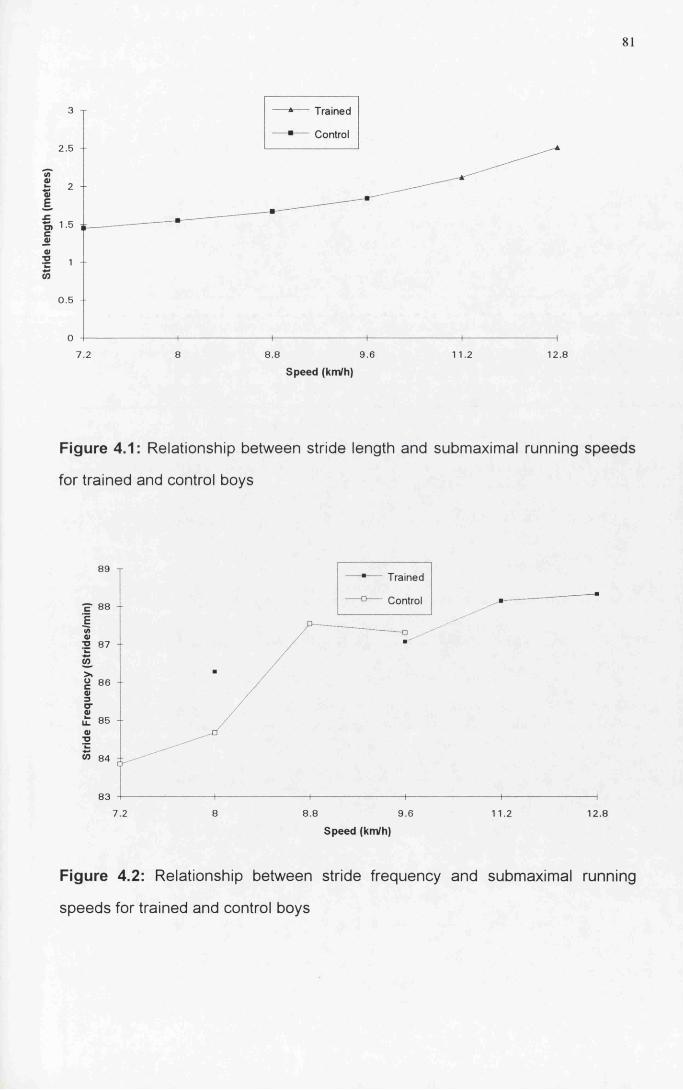
81
Trained
Control2.5
E£o>s01
■o
O)
0.5
7.2 9.6 11.2 12.88 8.8
Speed (km/h)
Figure 4.1: Relationship between stride length and submaximal running speeds
for trained and control boys
89 T
88 - -
013 87
àg 86 01 3 O’0)
85
W 84 dt
83
Trained
Control
7.2 8.8 9.6
Speed (km/h)11.2 12.8
Figure 4.2: Relationship between stride frequency and submaximal running
speeds for trained and control boys
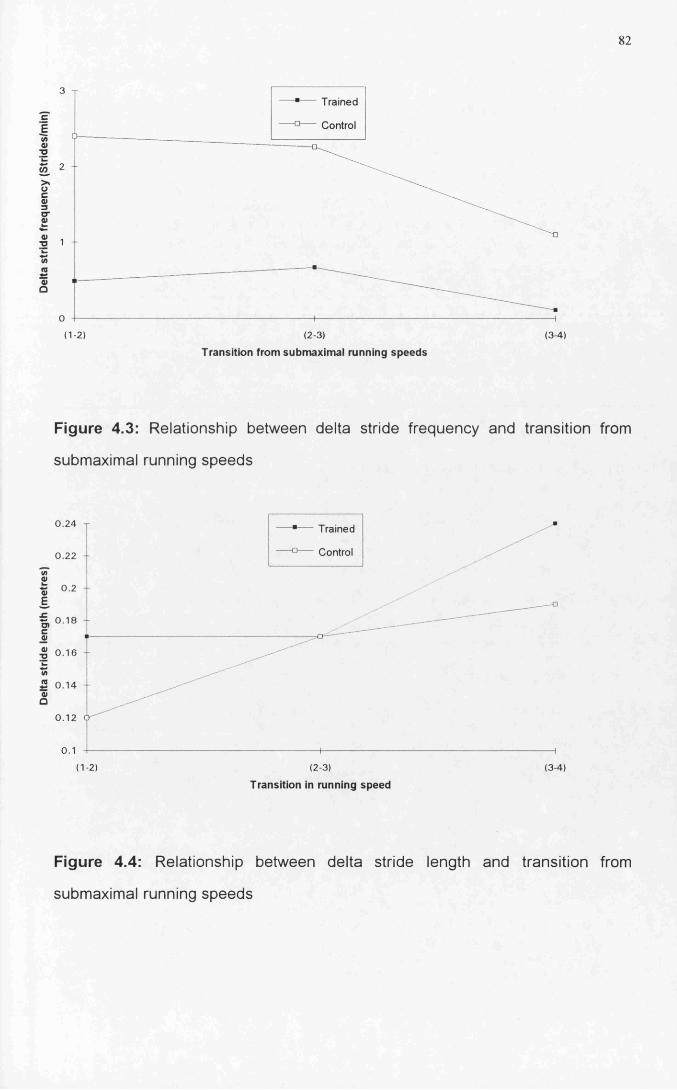
82
3Trained
Control
2
>*
1
0
( 1-2 ) (2-3) (3-4)
Transition from submaximal running speeds
Figure 4.3: Relationship between delta stride frequency and transition from
submaximal running speeds
0.24 Trained
Control0.22
I0»
E0.2
I, 0 18caj<u■D
2 0.14Q
0.12
( 1 -2 ) (2-3) (3-4)
Transition in running speed
Figure 4.4: Relationship between delta stride length and transition from
submaximal running speeds
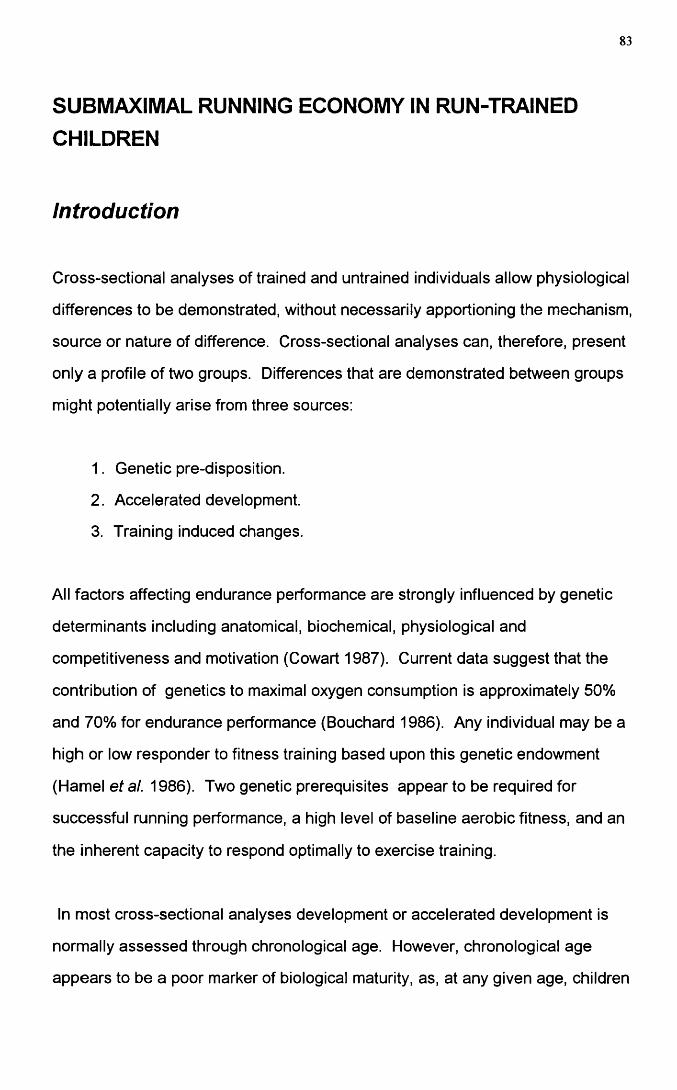
83
SUBMAXIMAL RUNNING ECONOMY IN RUN-TRAINED CHILDREN
Introduction
Cross-sectional analyses of trained and untrained individuals allow physiological
differences to be demonstrated, without necessarily apportioning the mechanism,
source or nature of difference. Cross-sectional analyses can, therefore, present
only a profile of two groups. Differences that are demonstrated between groups
might potentially arise from three sources:
1. Genetic pre-disposition.
2. Accelerated development.
3. Training induced changes.
All factors affecting endurance performance are strongly influenced by genetic
determinants including anatomical, biochemical, physiological and
competitiveness and motivation (Cowart 1987). Current data suggest that the
contribution of genetics to maximal oxygen consumption is approximately 50%
and 70% for endurance performance (Bouchard 1986). Any individual may be a
high or low responder to fitness training based upon this genetic endowment
(Hamel et al. 1986). Two genetic prerequisites appear to be required for
successful running performance, a high level of baseline aerobic fitness, and an
the inherent capacity to respond optimally to exercise training.
In most cross-sectional analyses development or accelerated development is
normally assessed through chronological age. However, chronological age
appears to be a poor marker of biological maturity, as, at any given age, children
84
may differ significantly in work capacity and motor proficiency. Skeletal age as
indicated by bone X-ray is the most valid measure of biological maturity
(Hebbelinck, 1978). Gumming etal. (1972) illustrated that bone age predicted
running performance better than chronological age, height or weight. During
biological development, factors that contribute to physical fitness mature and
performance in exercise tests improves. The rate of exercise-related maturation
does not parallel chronological age, consequently significant inter-subject
variability can exist (Mirwald and Bailey, 1986). The ability to differentiate true
training effects from the confounding effects of accelerated development
represents a major limitation of any form of cross-sectional analysis. The
possibility always exists that the "athletic group" merely represent children who
may have matured early in factors responsible for efficient submaximal running.
Physiological differences profiled in cross-sectional studies may indeed be the
product of training induced changes. In adult runners, the available data is
contradictory as to whether improvements in VOgmax and submaximal running
economy can be obtained through training. A considerable number of both
cross-sectional and longitudinal studies have been equivocal demonstrating that
training has increased, left unchanged or decreased the submaximal energy cost
of running. A wide range of improvements in submaximal oxygen consumption
were noted in training studies that employed a combination of distance, interval
and hill training over a wide spectrum of training periods (14 weeks to 5 years)
(Conley etal. 1981, Conley et al. 1984, Daniels etal. 1978, Patton and Vogel
1977 and Svendenhag and Sjodin 1985)
Several researchers have demonstrated that physiological adaptation can occur
across the spectrum of running fitness levels. For example, Conley et al. 1984,
Daniels 1974 and Svendenhag and Sjodin 1985 all demonstrated improvements
in submaximal running economy in elite, middle and long distance runners. In
85
addition Ramsbottom etal. 1989 and Bransford and Howley 1977 demonstrated
the capacity for improvement in recreational runners.
Whether the same level of physiological adaptation can occur through training in
a pre-pubertal population has been addressed by a number of researchers. A
number of cross-sectional studies have demonstrated that trained pre-pubertal
boys have peak VOg values beyond the normal expected values at this age
range (Brown etal. 1972, Ekblom 1969, Kellet etal. 1978, Lussier & Buskirk
1977, Massicote & McNab 1974, Mayers and Gutin 1979, Sundberg and
Elovainio 1982, Vaccaro et al. 1980 and Mirwald et al. 1981). However, the
difference between the trained and untrained child with respect to peak VOg is
only 20-30% higher than the 70% plus seen in trained to untrained adult
populations. The nature of the training stimuli has been demonstrated to dictate
the capacity for improvement in peak VOg Rowland (1985) stated that if adult
exercise intensity criteria were applied to children the capacity to improve peak
VOg existed. However, in pre-pubertal athletes the impact of exercise training
appears to be negligible (Daniels and Oldridge 1971).
Controversy exists as to the impact of training on submaximal running economy .
In a cross-sectional study, Mayers and Gutin (1979) found that submaximal
running economy was superior in a group of elite pre-pubertal runners compared
to a group of control subjects at submaximal running speeds. However, when
the oxygen consumption data were controlled for height no significant difference
was seen between the groups for submaximal running economy. Short-term
specific running training has also seemed to be ineffective in improving
submaximal running economy (Petray and Krahenbuhl 1985). Krahenbuhl and
Williams (1992) concluded that over the short-term little or no improvement in
running economy would occur through training.
86
The stimulus of growth alone appears to be the major factor mediating
improvements in submaximal running economy. Krahenbuhl, Morgan and
Pangrazi (1989) demonstrated a 13% improvement in submaximal running
economy with no change in peak oxygen consumption over a seven year period
in a group of male subjects (mean age at start 9.9yrs, mean age at end
16.8years). This group of boys underwent no form of training in the seven years.
Therefore, improvements in running economy were attributed to growth alone.
To a lesser extent Daniels and Oldridge (1971) demonstrated similar findings.
These authors concluded that a combination of growth and training contributed
to improved submaximal running economy over a 22 month training period.
These two studies remain to date the only two that attribute improvements in
submaximal running economy to training and/ or growth.
The possibility exists that over a period of years, the augmentation of improved
running economy achieved through growth could be assisted through
participation in running training programmes.
The present study was undertaken to characterise the cardio-respiratory
differences between a group of run-trained pre-pubertal boys and a group of
control boys. It aimed to assess the influence that training, genetic pre
disposition and accelerated development had upon submaximal and maximal
running performance in a group of moderately trained pre-pubertal boys.
87
Methods
Subjects
Thirty three male pre-pubertal boys (Tanner stage 1 ) volunteered to take part in
the study. The subjects were in two groups: 15 run-trained subjects [age 11.7 ±
1.06years, mean ± SD, Table 4.1 ] and 18 control subjects [age 11.3 ±0.90years.
Table 4.2 ]. The two groups were similar in terms of age, height, weight and
skinfold measurements (biceps, triceps, subscapular and suprailliac). Table 4.5
shows details of the training and race performance for the trained subjects.
Within the context of this study, run training was defined as involvement in a
formal, structured, training programme for a minimum of one year. The parents
of the control subjects completed a physical activity questionnaire to allow
determination of their children's physical activity profile. Seven of the control
subjects were rated as active and the remainder were rated as moderately
active. None was taking part in regular running training. However, seven of
these boys were involved in organised sports (football, rugby, basketball and
karate).
All but three of the subjects were familiar with treadmill exercise testing. Despite
this, all subjects were asked to attend for a habituation visit to accustom them to
the equipment being used for cardio-respiratory testing. At this visit, the subjects
were familiarised with the treadmill (Powerjog M10, Cardinal Sports, Edinburgh)
by a period of walking and running (Shephard, 1984).
Study Design
Two separate submaximal protocols were used for the trained and untrained
groups. Each submaximal protocol consisted of four submaximal running stages
each of three minutes in duration with running speeds of 8, 9.6, 11.2 and 12.8
88
km/h and 7.2, 8.0, 8.8 and 9.6 km/h for the controls with the two overlapping
speeds (8.0 and 9.6 km/h) allowing kinematic and physiological comparison. At
all submaximal treadmill speeds the treadmill belt was calibrated before use.
All the boys performed a peak VOg test within seven days of the submaximal
testing. The peak VOg test involved running at a constant speed of 8.8 km/h for
the control group and 9.6 km/h for the run-trained group with an increase in
gradient of 2.5% every 2 minutes until voluntary exhaustion was attained. Heart
rate and cardio-respiratory variables were measured throughout the test. The
child was judged to have reached peak VOg when any two of the following four
criteria were met (Williams and Armstrong, 1991): i) heart rate within 10 beats
per minute of 200 beats per minute or ii) a heart rate plateau, iii) respiratory
exchange ratio value greater than 1.0 and iv) an approximate plateau of VOg
values.
Metabolic data measurements were made using a computerised metabolic cart
(Sensormedics S2900Z, Bilthoven, Netherlands), which was calibrated prior to
and following each test using two reference gases. This instrument has
previously been validated for use in children (Unnithan et al., 1992). A low dead
space valve (16mls; Hans-Rudolph 141 OB) was used to minimise dead space
ventilation during the gas collection phases. Heart rate was monitored using a
Sport Tester PE3000 heart rate monitor (Kempe, Finland).
Physiological Analysis
The S2900Z generated discrete data points every 20 seconds during the gas
collection phases. These discrete values were averaged to produce a mean
value for each minute of the submaximal running stages. The final minute of
each submaximal running stage was taken to represent the steady state value.
The following cardio-respiratory variables were assessed: relative oxygen
89
consumption (VOg rel), absolute oxygen consumption (V O 2 abs), fractional
utilisation (FU), ventilatory equivalent for oxygen (Ve02), ventilatory equivalent
for carbon dioxide (VeC02), heart rate (HR), tidal volume (Tv), respiratory rate
(RR), respiratory exchange ratio (RER), ventilation (Ve abs) and rating of
perceived exertion (RPE).
Statistical Methods
Data was summarised using standard descriptive indices for normally distributed
data (mean, SD). Comparisons between the groups were made using a two-
tailed unpaired t-test with a P value of <0.05 being regarded as significant.
Statistics were performed using Microsoft Excel version 4.
90
Results
All boys taking part in the study were classified as pre-pubertal using the Tanner
pubertal grading scale. There were no significant differences between the two
groups of boys for age, height or weight. Only the skinfold measurements were
significantly different between the two groups (P<0.05), with the run-trained boys
possessing lower sum of skinfolds [Run-trained: 20.35+4.17 vs Control: 30.1 +
6.42].
At the two comparison speeds selected, physiological differences existed
between the two groups. At 8 km/h, FU and HR were significantly lower in the
run trained group ((P<0.01, Table 5.1). At 9.6 km/h FU, V e02, VeC 02, HR,
RER, Ve and RPE were also all significantly lower in the run trained boys (Table
5.1). No significant differences were found in submaximal running economy
(VOgrel) at either comparison speed (Table 5.1 ).
Comparisons of the two groups at peak exercise intensity demonstrated that
significant differences only existed with respect to V02(rel). Mean peak VO 2
value for the run trained group was 60.5+3.3 ml/kg/min compared to 51.1+4.3
ml/kg/min (P<0.001) for the control subjects. All other cardio-respiratory
variables did not differ significantly at peak exercise intensity (Table 5.2).
91
Discussion
Despite the absence of any significant differences in age, height or weight
between the two groups significant physiological differences were present at
both submaximal and peak exercise intensities (Tables 5.1 and 5.2 ).
During treadmill running efficiency is not readily used, as total work
accomplished is difficult to quantify. Body weight, elastic tendon recoil, arm
motion, transfer of energy between body segments and running gait all
contribute to variability in work accomplished. Consequently, with respect to
treadmill running, efficiency of movement is usually expressed simply as oxygen
consumption at a given speed (running economy).
The mechanical efficiency of contracting skeletal muscle is determined by the
fraction of energy released from the pyrophosphate bonds of ATP
(phosphorylative coupling) and the percentage of the energy used by muscle to
create external work (contraction coupling). Rowland et al. (1990) demonstrated
that no significant difference existed in mechanical efficiency between a pre
pubertal and adult population suggesting that muscular efficiency would appear
not to be a factor in submaximal economy differences between adults and
children. The lack of differences in submaximal running economy within the
present study probably demonstrates the fact that muscular efficiency is both
independent of age and training status.
A number of factors can potentially influence submaximal running economy
including: vertical displacement, lateral motion, stride length, fuel utilisation
patterns, energy transfer between body segments, body composition, co
ordination, strength and muscle elasticity, muscle fibre types and vascularisation.
92
pacing , heat dispersion and shoe factors. Within the context of the present
study, the relationship of substrate utilisation, heart rate, ventilation and
perception of effort to submaximal running economy were assessed.
The submaximal running economy results generated at the two comparison
speeds demonstrated an interesting trend. The results from the present study
agree with the majority of previous studies conducted which suggest that
submaximal running economy does not differ on comparing run-trained and non
run-trained individuals (Krahenbuhl etal. 1989, Petray and Krahenbuhl 1985
and Krahenbuhl and Williams 1992).
Heart rate and ventilation are two indices that reflect the oxygen supply to the
active musculature. Pate et al. (1992) demonstrated that both variables were
significantly and positively correlated with oxygen consumption . Bailey and
Pate (1991) theorised that training induced reductions in submaximal heart rate
and ventilation (Zauner 1989, Nudel 1989 and Bailey and Pate 1991) produce an
overall lowering of submaximal aerobic demand. Based upon data extrapolated
from animal studies, meaningful reductions in submaximal oxygen consumption
arose primarily from decreases in ventilation resulting from a reduced respiratory
rate and an increased tidal volume.
At 9.6 km/h significant differences existed with respect to ventilation between the
two groups. The run-trained group demonstrated a significantly lower
submaximal ventilation. No significant differences were noted with respect to the
tidal volume and respiratory rate . However, respiratory rate was lower in the
run-trained boys although not significantly so. Consequently, the product of
respiratory rate and tidal volume generated a significantly lower submaximal
ventilation in the run-trained boys.
93
At submaximal exercise intensities, maintenance of ventilation is achieved
primarily through respiratory rate rather than tidal volume in children (Rowland
and Green 1990). The respiratory rate/tidal volume combination is optimised to
minimise the total ventilatory work required to achieve an appropriate ventilation
and is determined primarily by limiting factors in the chest wall. Increasing tidal
volume in children is prohibitively expensive as the ventilatory muscules are
required to oppose the elastic recoil forces of the lung.
The choice of optimal respiratory rates rather than tidal volume in children is a
direct result of the higher lung recoil forces. These forces are generated as a
result of increased pulmonary elastic fibre density (Zapletal et al. 1971).
Consequently, to sustain ventilation through tidal volume adjustments would
require increased work by the ventilatory musculature. The mechanical
disadvantage of optimising tidal volume would negate any saving in submaximal
energy cost as described by Bailey and Pate (1991). Therefore, it was not
surprising that no significant differences were noted in submaximal oxygen
consumption at the two comparison speeds.
Bailey and Pate (1992) theorised that the lower blood lactate accumulation and
higher blood pH in trained athletes could contribute to the reduced submaximal
ventilation in trained athletes. At submaximal exercise the generation of less
lactate ensures that the bicarbonate buffer system is less taxed and
consequently less C 02 is removed leading to reduced stress on the ventilatory
system. As, Millic-Emili et al. (1962) demonstrated the total work of ventilation
constitutes 7-8% of the total energy cost of exercise. Therefore, minimising the
ventilatory response at submaximal exercise may act to decrease the whole body
oxygen cost. Whatever, the source of the ventilatory differences at 9.6 km/h, no
94
significant differences in submaximal oxygen consumption existed between the
two groups.
Significant differences also existed at 9.6 km/h with respect to V e 0 2 and VeC 02.
For both variables, the run-trained group demonstrated lower ratios than the
control group. Lower V e02 responses in adult endurance athletes have been
attributed to the high aerobic capacity of these individuals. This physiological
adaptation enables the athlete to rely primarily on aerobic sources of energy,
thereby reducing the contribution from anaerobic sources and the resulting
reduction in respiratory metabolic stimuli.
The impact of training upon the submaximal heart rate response in exercise has
been addressed by a number of authors (Bar-Or and Zwiren 1973, Stewart and
Gutin 1976, Nudel etal. 1989) who all reported lower submaximal heart rates in
good or elite child runners compared to non-runners. At 9.6 km/h in the present
study, the run trained group demonstrated significantly lower (P<0.05) heart
rates than the control group. Eriksson et al. (1973) demonstrated an increase in
stroke volume after training in boys but theorised that this increase was less
related to heart size and more likely caused by enhanced contractility or
improved left ventricular filling.
Work in this laboratory (Rowland et al. 1993-Appendixl ) demonstrated that no
significant differences were seen in EGG intervals, axes and precordial voltages
between the runners and controls at rest. No significant differences were noted
between echocardiographic chamber sizes, wall thickness and mass indexed to
body surface area. This study demonstrated overall no evidence of the "athlete's
heart" at rest in the run-trained boys defined as cardiac enlargement, resting
bradycardia, heart murmurs, third and fourth heart sounds and
electrocardiographic alterations The results are in line with data obtained by
95
Other authors (Shepherd et al. 1988, Telford et al. 1988 and Nudel et al. 1989)
on pre-pubescent athletes. Bielen et al. 1990 found no genetic effect upon left
ventricular end diastolic dimension or wall thickness in a study of 6-8 year old
twins. These authors concluded that the presence of the "athlete's heart" at rest
was not an inherited factor and suggested that inheritance of aerobic power may
be related to the genetic transmission of non-aerobic factors. However, the
results from these studies tell us little with regard to cardiac dynamics during
exercise. Further research is required to isolate factors responsible for the lower
submaximal heart rates in trained boys during submaximal exercise.
Two assumptions underpin the relationship between submaximal running
economy and heart rate and ventilation. If muscle oxygen extraction remains
constant, then the differences that may arise in submaximal oxygen consumption
may occur directly from heart rate and ventilation. However, if peripheral oxygen
extraction varies the increase in heart rate, ventilation and oxygen consumption
are secondary to the maintenance of an adequate oxygen gradient at the
mitochondrial level.
Respiratory exchange ratio values were significantly lower in the run -trained
boys. This might arise from preferential fat substrate utilisation in the trained
boys. However, in the absence of any invasive measurements and with the
confounding effects of possible hyperventilation, this interpretation remains
speculative.
The perception of exercise stress for the run-trained boys was assessed by the
rating of perceived exertion. At 8 km/h no significant difference was found with
regard to the perception of effort. However, at 9.6 km/h the run-trained group
perceived the effort to be significantly lower than the control group. It would be
interesting to speculate that the impact of training at high exercise intensities
96
enabled these run-trained boys to perceive the exercise stimulus as lower. The
perceived exertion results are in line with the results obtained for fractional
utilisation at 9.6 km/h. The run-trained group were exercising at a significantly
lower percentage of their peak aerobic power for both comparison speeds. At
present, the significance of fractional utilisation to submaximal running economy
remains unclear in paediatric populations and it still remains unclear whether
fractional utilisation in children represents anything more than an expression of
relative exercise intensity.
Peak oxygen consumption reflects the combination of cardiac output and
peripheral oxygen extraction. In well trained pre-pubertal athletes peak VOg can
be 20-25% higher than non-athletes (Rowland 1985 ). In the present study, peak
VOg of the run-trained boys was 18% higher than the controls. The values
generated in the current study [Controls: 51.07+4.26 versus Run-trained:
60.47+3.26 ml/kg/min, mean+SD] are similar to those found in other studies
(Nudel etal. 1989, Sundberg and Elovainio 1982, Mayers and Gutin 1979 and
Krahenbuhl and Pangrazi 1983).
The cross-sectional nature of the present study prevents the partitioning of the
training effect from the influence of hereditary factors. Thus, it may be equally
true that a genetic pre-disposition towards participation in athletic events may
account for the peak VOg differences between the run-trained and control
groups rather than any influence of training (Nikolic and Hie 1992)
While it may not be possible to partition the genetic effect from the training effect
with respect to peak oxygen consumption, considerable evidence exists to
suggest that a background of regular physical activity cannot stimulate above
average peak aerobic power (Rowland 1985). Cunningham et al. 1981 have
also shown no association between daily activity and peak oxygen consumption.
Gilliam et al. 1981 demonstrated over a 12 hour period of heart rate monitoring
97
the infrequency with which sustained exercise is maintained in a group of young
children and concluded that moderately active children seldom exercise to levels
sufficient to improve cardiovascular fitness. Thus habitual physical activity is
unlikely to produce functional physiological adaptations.
The presence of well matched controls, adequate sample size, maturationally
well-matched boys and fully laboratory habituated subjects has allowed us to
demonstrate physiological differences between the two groups. The major
limitation of a study of this nature is in the cross-sectional nature of the design.
However, within the limitations of this design significant physiological differences
were noted. The peak VOg results obtained in this study parallel those obtained
in the often quoted study of Mayers and Gutin 1979. Although, it was not
possible to account for the genetic influence, results from the literature seem to
indicate that the enhanced aerobic power seen in the present study could have
resulted from the impact of training.
In summary, at peak exercise intensities the run-trained group exhibited superior
aerobic power compared to the control group perhaps as a result of pre
selection, training or a combination of both. The run-trained group demonstrated
no form of superior submaximal running economy at either comparison speed. .
Yet, at 9.6 km/h measurable physiological differences existed between the run-
trained and control groups. The lack of multiple physiological differences at 8.0
km/h was probably an artefact of the submaximal treadmill running speed
chosen.
Despite the lack of difference in submaximal running economy between the two
groups at the two comparison speeds, significant physiological functional
adaptations appear to have occurred in the run-trained. The source of these
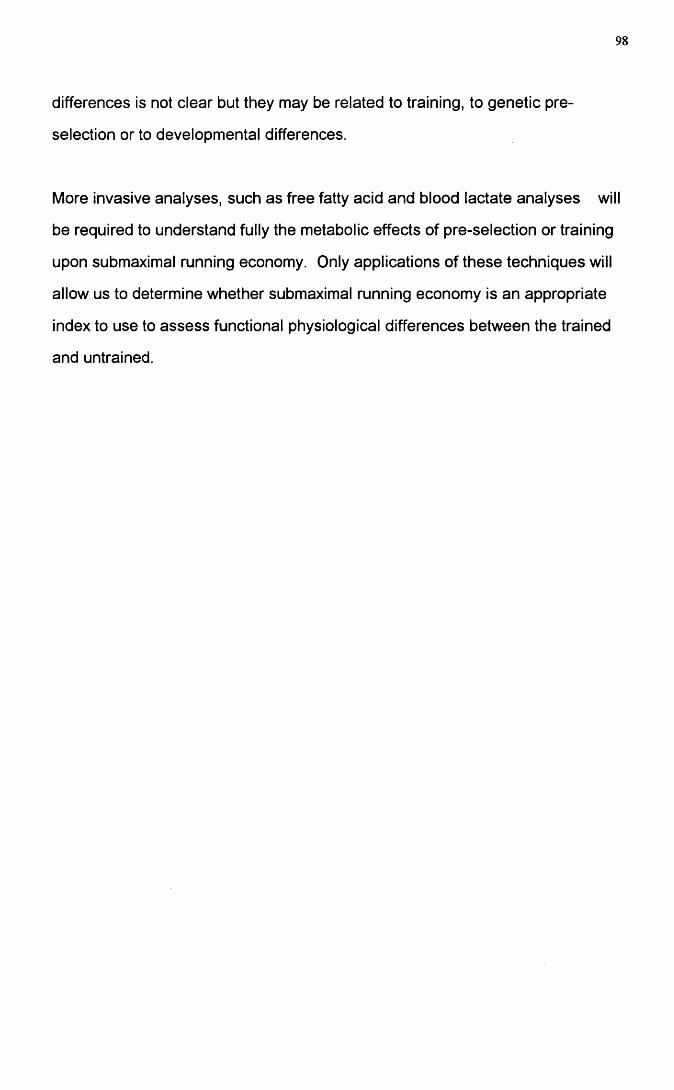
98
differences is not clear but they may be related to training, to genetic pre
selection or to developmental differences.
More invasive analyses, such as free fatty acid and blood lactate analyses will
be required to understand fully the metabolic effects of pre-selection or training
upon submaximal running economy. Only applications of these techniques will
allow us to determine whether submaximal running economy is an appropriate
index to use to assess functional physiological differences between the trained
and untrained.
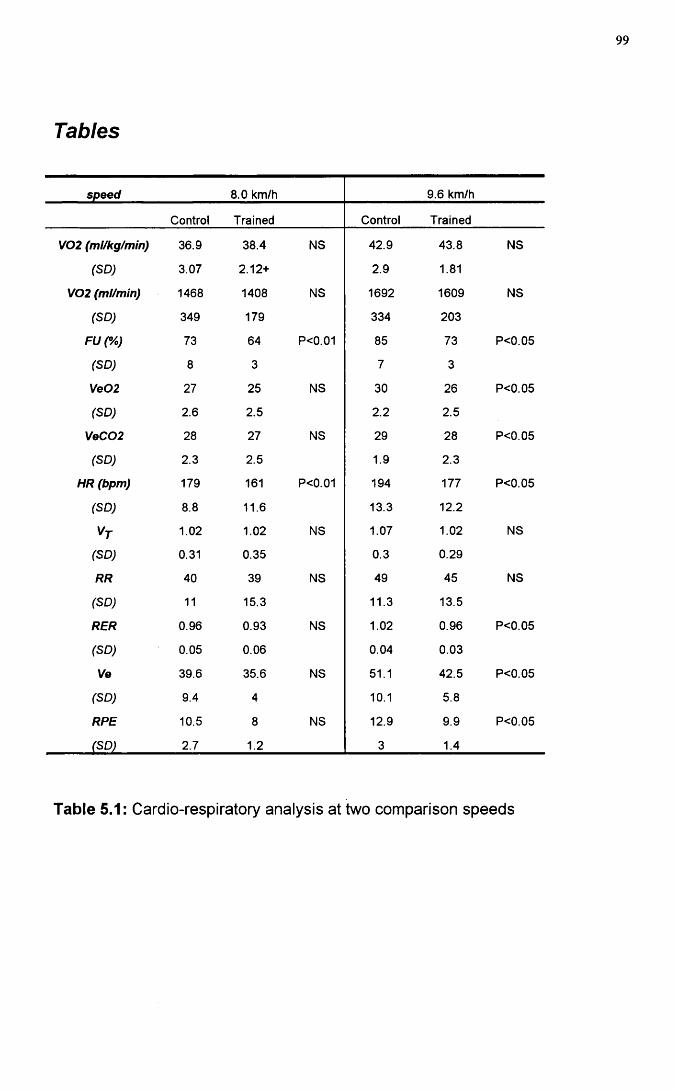
Tables
99
speed 8.0 km/h 9.6 km/h
Control Trained Control Trained
V02 (ml/kg/min) 36.9 38.4 NS 42.9 43.8 NS
(SD) 3.07 2.12+ 2.9 1.81
V02 (ml/min) 1468 1408 NS 1692 1609 NS
(SD) 349 179 334 203
FUC/o) 73 64 P<0.01 85 73 P<0.05
(SD) 8 3 7 3
Ve02 27 25 NS 30 26 P<0.05
(SD) 2.6 2.5 2.2 2.5
VeC02 28 27 NS 29 28 P<0.05
(SD) 2.3 2.5 1.9 2.3
HR (bpm) 179 161 P<0.01 194 177 P<0.05
(SD) 8.8 11.6 13.3 12.2
1.02 1.02 NS 1.07 1.02 NS
(SD) 0.31 0.35 0.3 0.29
RR 40 39 NS 49 45 NS
(SD) 11 15.3 11.3 13.5
RER 0.96 0.93 NS 1.02 0.96 P<0.05
(SD) 0.05 0.06 0.04 0.03
Ve 39.6 35.6 NS 51.1 42.5 P<0.05
(SD) 9.4 4 10.1 5.8
RPE 10.5 8 NS 12.9 9.9 P<0.05
(SD) 2.7 1.2 3 1.4
Table 5.1: Cardio-respiratory analysis at two comparison speeds
100
Control Trained
y02 (ml/kg/min) 51.07 60.47 P<0.001
(SD) 4.26 3.26
V02 (ml/min) 2026 2234 NS
(SD) 352 276
FU(%) - -
(SD) - -
Ve02 32 32 NS
(SD) 3.3 3
VeC02 29 29 NS
(SD) 2.6 2.6
HR (bpm) 200 205 NS
(SD) 7.0 7.2
(litres) 1.27 1.27 NS
(SD) 0.24 0.24
RR 54 57 NS
(SD) 9.1 9.4
RER 1.12 1.13 NS
(SD) 0.05 0.04
Ve (litres) 64.7 71.43 NS
(SD) 8.97 9.19
RPE 10.5 8 NS
(SD) 2.7 1.2
Table 5.2: Peak data analysis
101
INFLUENCE OF STEADY STATE BLOOD LACTATE
Introduction
Endurance training studies in adults have in the main used changes in VOgmax
as an indicator of changes in endurance capacity. However, it is increasingly
suggested that submaximal variables may be more valid indicators of training
status (Daniels et al. 1978, Katch et al. 1978). The major criticism of the use of
V02m ax is its lack of sensitivity as a marker of adaptation to endurance training.
In highly conditioned athletes, the lack of improvement in VOgmax coupled with
improved endurance performance has led to the use of the submaximal exercise
model in an attempt to unwind factors responsible for enhanced running
performance.
In the paediatric population lower lactate levels have been demonstrated
compared to adults (Macek and Vavra 1985). Several theories have been
projected to explain these findings. Astrand (1952) indicated these findings do
not necessarily indicate any impairment of the anaerobic capacity but rather
reflect the net result of accumulation and clearance. It is possible, for example,
that reduced sympathetic activity in children allows significant blood flow to be
maintained to the liver allowing the liver to remove lactate at higher rates than
adults during exercise. Whether training is capable of modifying this lactate
response in pre-pubertal athletes has yet to be evaluated. It is tempting to
speculate that a combination of enhanced aerobic power and reduced
sympathetic drive achieved through training could have implications for
submaximal steady state lactate production.
102
Mayers and Gutin (1979) demonstrated no significant difference in submaximal
running economy in a group of elite pre-pubertal runners compared to a group of
control boys, but did not report any evidence of blood lactate levels in these
trained runners. In this often quoted study there was no linking of submaximal
running performance and submaximal blood lactate production.
In this study our aim was to investigate the relationship between steady state
lactate production and submaximal oxygen consumption in a group of run-trained
pre-pubertal compared to a group of healthy control boys not engaged in any
formal run training.
103
Methods
Subjects
Twenty four pre-pubertal male subjects (based upon pubertal grading by physical
examination (Tanner 1962), Table 1) volunteered to take part in the study. The
subjects were divided into two groups. The first group consisted of 11 run-
trained subjects [Table 6.1] while the second consisted of 13 control subjects
[Table 6.1]. The two groups were similar in terms of age, height and weight
(Table 6.1). Table 4.5 shows details of the training and race performance for
the trained subjects. Within the context of this study, run training was defined as
involvement in a formal, structured, training programme for a minimum of one
year. The parents of the control subjects completed a physical activity
questionnaire to allow determination of their children's physical activity profile.
Of the control subjects, 10 were rated as active and the remainder were rated as
moderately active. None were taking part in regular training.
All but two of the subjects were familiar with the laboratory environment.
Nevertheless, all subjects were asked to attend for a habituation visit to
accustom them to the equipment being used for cardio-respiratory testing. At
this visit, the subjects were familiarised with treadmill exercise (Powerjog M10,
Cardinal Sports, Edinburgh) by a period of walking and running
(Shephard, 1984).
Study Rationale
Eleven of the 15 run-trained boys who took part in the previous investigation
(Submaximal running economy in run-trained children ) returned to take part in
the present investigation. The present study was conducted at the mid-way point
of the boys' winter training programme. The boys were all selected on the basis
104
of their summer performance times and on their willingness to undergo further
laboratory measurements. Based upon these two criteria a sub-set of 11 of the
original 15 boys were studied in the present investigation.
study Design
A single test session protocol was used for both the run-trained and control
groups. The submaximal protocol differed for both the run-trained and the
control group. The run trained group completed three four minute running
stages at 9.6, 11.5 and 13.1 km/h. These absolute speeds corresponded to
approximately 75, 85 and 95% peak VOg for the run-trained group. The running
stages were interspersed with 7 minutes of passive and 3 minutes of active
recovery (walking at 4 km/h). The control group performed only one 4 minute
submaximal stage at 9.6 km/h). One of the submaximal speeds overlapped,
allowing lactate and cardio-respiratory comparison at 9.6 km/h. At all
submaximal treadmill speeds the treadmill belt was calibrated.
All the boys performed a peak oxygen consumption test 20 minutes after the end
of the final running stage using a modified version of the protocol designed by
Unnithan and Eston (1990). The running speed was customised to fit the
individual requirement of each child. Once baseline speed was established the
gradient was increased 2.5% every 2 minutes until voluntary exhaustion was
attained. The child was judged to have reached peak VOg when any two of the
following four criteria were met (Williams and Armstrong, 1991): i. heart rate
within 10 beats per minute of the age predicted maximum or ii. a heart rate
plateau or iii. respiratory exchange ratio value of greater than 1.0 an iv. an
approximate plateau of VOg values.
105
Metabolic data measurements were made using a computerised metabolic cart
(Sensormedics S2900Z, Bilthoven, Netherlands), which was calibrated prior to
and following each test using two reference gases. This instrument has
previously been validated for use in children (Unnithan et al., 1992). A low dead
space valve (IGmIs; Hans-Rudolph 141 OB) was used to minimise dead space
ventilation during the gas collection phases. Heart rate was monitored using a
Sport Tester PE3000 heart rate monitor (Kempe, Finland).
Physiological Analysis
The S2900Z generated discrete data points every 20 seconds during the gas
collection phases. These discrete values were averaged to produce a mean
value for each minute of the submaximal running stages. The final minute of
each submaximal running stage was taken to represent the steady state value.
At peak exercise intensity the average VOg over the last three readings was
taken to represent peak VOg The following cardio-respiratory variables were
assessed: relative oxygen consumption, (V02)rel; fractional utilisation (FU);
ventilatory equivalent for oxygen (Ve02); heart rate (HR); respiratory exchange
ratio (RER) and Ventilation (Ve). In addition four site skinfold measurements
were taken (bicep, tricep, subscapular and suprailliac).
Whole blood lactate samples were obtained from the fingertip at rest and 1
minute post exercise. The distal epidermal puncture was obtained using the
Mumford Autolet-lite capillary blood sampler (AT0207). Duplicate blood samples
were collected in heparinised lOOpI whole blood analysis capillary tubes
(GMRD-053) supplied by Analox Instruments, London, UK. The GM7 Analox
lactate analyser was calibrated at the beginning and end of each test session
with a range of lactate standards (2mMol/L-8mMol/L). All lactate values are
expressed as Alactate from rest for each individual subject.
106
Statistical Methods
A two-tailed unpaired t-test was used to investigate between group differences at
the single comparison speed used in this study ( 9.6 km/h) and at peak exercise
intensities. Statistics were performed using Microsoft Excel version 4 and a
significance level of 0.05 was used.
107
Results
Comparison of the demographic data demonstrated that no significant
differences existed for height, weight and age between the run-trained and
control groups. Only the skinfold measurements were significantly different
between the two groups', with the run-trained boys possessing lower sum of
skinfolds. Based upon the physical examination and Tanner rating scale 23 of
the boys were pre-pubertal, with only one boy in early puberty.
The submaximal lactate concentrations were 117% greater in the control group
(control: 1.5mM/L vs run-trained: 0.69mM/L, P<0.03) than in the run-trained
group. At the one comparison speed selected (9.6 km/h), the trained boys
exhibited a significantly (P<0.01) higher submaximal energy cost of running with
respect to the control boys. The trained boys were generating submaximal
oxygen consumption values that were 5.84% higher than the controls. At the
same comparison speed the trained boys also generated significantly (P<0.03)
lower submaximal lactate, RER (P<0.05), FU (P<0.05) and submaximal heart
rate values (P<0.01 ). No significant differences were noted for ventilation or
V e02 at the comparison speed (Table 6.2).
At peak exercise intensity a highly significant (P<0.0003) difference in aerobic
power was noted between the two groups. The run-trained boys demonstrated
higher peak oxygen consumption (control: 51.1 vs run-trained: 60.3 ml/kg/min).
No significant (P>0.05) differences were noted with respect to any of the other
cardio-respiratory variables at peak exercise intensity.
108
Discussion
Despite the absence of significant differences in height, weight and age between
the two groups significant physiological differences existed at both submaximal
and peak exercise intensities (Table 6.2). The submaximal running economy
results generated at the comparison speed were particularly interesting . At 9.6
km/h the run-trained boys demonstrated 'poor' economy, manifest as a higher
submaximal energy cost at a given submaximal workload.
Three theories have been postulated to account for these differences: limb
segment theory, fat substrate theory and test protocol artefact.
The limb segment theory suggests that use of body weight may not be the most
appropriate ratio standard for the expression of submaximal oxygen
consumption. Body weight distribution varies from trunk to limbs and this
distribution is not controlled for by the use of body weight as the ratio standard.
Individuals who have a greater fraction of the body weight in the limbs (increased
muscle mass per se) have a tendency to have a larger V02m ax because of the
recruitment of a greater active muscle mass. Equally, at submaximal exercise
intensities the same individuals would have higher submaximal oxygen
consumptions because of the extra cost of moving relatively heavier limbs. Both
Cavanagh and Kram (1985) and Myers and Struedel (1985) suggested that
runners with proportionately smaller body mass in the extremities (particularly
legs) would perform less work moving these body segments during running than
those with a greater proportion of body mass in the extremities.
The higher submaximal oxygen consumption values in the run-trained group
suggest that more of the energy needs of the muscle are being met by aerobic
109
metabolism. Within the context of the present study the lower RER and
submaximal lactate values provide evidence to support this.
The fat substrate theory suggests that the increased oxygen consumption may
reflect increased utilisation of free fatty acids or intramuscular triglycerides
and/or a more efficient oxidation of blood borne and muscle carbohydrates. The
lower RER values obtained in this study are in accord with data obtained by
(Mayers and Gutin 1979 and Nudel etal. 1989).
Enhancement of the aerobic metabolism through training has been shown to
occur through muscle morphology changes, enhanced muscle blood flow,
enzymatic changes and preferential substrate utilisation. Du Plessis etal. (1985)
demonstrated that adolescent boys have three times (13%) more transitional
Type lie fibres than adults (4%). Therefore, the potential for muscle
morphological adaptation is present in adolescent populations. In fact specific
sports training has been demonstrated to cause adaptation in muscle cell ultra
structure and metabolic capacity. However, the significance of muscle
morphology to running performance in young athletes remains uncertain.
Melichna et al. 1988 demonstrated that successful young 800m runners
exhibited Type I muscle fibre distributions ranging from (23-83%). The most
successful of these young athletes had fibre type ratios of 1:1 for Type I and
Type II muscle fibres. Therefore, while evidence exists for muscle adaptation in
this population, the relationship between muscle fibre composition and aerobic
performance has yet to be established.
Similar equivocal evidence exists with regard to the role of enhanced muscle
blood flow and its implications for enhanced aerobic metabolism. Koch (1974)
demonstrated increased local muscle blood flow in children compared to adults.
The capacity for adaptation through training in children is unknown, due to the
110
invasive techniques required. Yost et al. (1981 ) have demonstrated an
increased pulmonary capilliarisation with training in an animal model and
hypothesised that this may parallel training induced capillary proliferation in
muscle. The critical question is whether enhanced perfusion of muscle tissue
either through capillary proliferation or enhanced muscle blood flow has any
impact upon muscle cell substrate utilisation and ultimately aerobic performance.
Some evidence from Eriksson (1980) in children with coarctation of the aorta
suggests that the impact of blood perfusion upon substrate levels is minimal.
The enhancement of aerobic metabolism through enzyme changes with training
was illustrated by Eriksson (1972). Phosphofructokinase levels and Succinate
dehydrogenase levels were increased 83% and 30% respectively after 6 weeks
of training in a group of 11 year old boys. NADH staining was more pronounced
after training in this group of boys. However, despite the magnitude of these
change only an 8% increase in VOgmax was noted bringing into question the
significance of the oxidative capacity of muscle on whole body oxygen
consumption.
The question of preferential utilisation of fat as opposed to carbohydrate in
children has been addressed by a number of authors. In contrast to adults, Berg
& KeuI 1980 demonstrated no significant difference in blood glucose
concentrations during step-wise treadmill tests in 12-14 year olds. This
enhanced glucose homeostasis was attributed to an increase in lipolysis and
free fatty acid utilisation. Increased rates of lipolysis and elevated glycerol levels
occurred at an earlier time threshold in the children. As Rowland et al. (1987)
stated the utilisation of fatty acids in aerobic metabolism is reciprocally related to
anaerobic glycolysis and lactate production. The enzymatic capacity of muscle
tissue in children is designed for the breakdown of Acetyl-CoA compounds and
can, through training be enhanced to maximise free fatty acid oxidation.
I l l
The 'poor' economy has also been attributed to an artefact of the specific test
protocol chosen. Pate et al. 1992 theorised that runners with a high V02m ax
utilised a lower percentage of their V02m ax at the submaximal speeds. This
was demonstrated in the present study (control; 82.4% vs run-trained; 73.8%). If
this intensity represented less than training pace the runners were less
comfortable and subsequently less economical due to neural and mechanical
factors. Within the context of the present study, the run-trained boys were
exercising at around an average of 73% FU at 9.6 km/h. This exercise intensity
represents the expected minimum boundary for training intensities for these
runners. While the submaximal workload did represent a low exercise intensity
for these runners a simple kinematic analysis indicated that there were no
significant gait characteristic differences between the two groups at the
comparison speed.
The impact of training upon the submaximal heart rate response in exercise has
been addressed by a number of authors. (Bar-Or and Zwiren 1973, Stewart and
Gutin 1976, Nudel et al. 1989) all reported lower submaximal heart rates in good
or elite child runners compared to non-runners. At 9.6 km/h in the present study
the run trained group demonstrated significantly lower (P<0.01) heart rates than
the control group. Despite significantly lower FU and lactate values in the run-
trained group compared to the control group, the two variables appear not to be
related, as the within group correlations between FU and lactate were very weak.
The only significant variable at peak exercise intensity was relative oxygen
consumption. The run-trained boys exhibited higher V02(rel), demonstrating
their superior aerobic power (Controls: 51.1+3.3 versus Run-trained: 60.3+2.8
ml/kg/min, mean+SD). These results are commensurate with those generated by
112
Other studies ( Nudel etal. 1989, Sundberg and Elovainio 1982, Mayers and
Gutin 1979 and Krahenbuhl and Pangrazi 1983).
In summary, the 'poor' economy demonstrated by the run-trained boys and the
lower submaximal lactate and RER levels generated by these individuals lends
credence to the theory that this 'poor' economy was most likely a reflection of
enhanced Free Fatty Acid oxidation. If free fatty acid oxidation and glycolysis
are reciprocally related then the superior aerobic power of the run-trained
individuals allows them to monopolise fat as a primary energy source. Whether
this is innate or arises as a consequence of long term moderate training remains
to be determined.
The interpretation of a higher submaximal energy cost of running as 'poor'
economy requires reviewing in light of the results generated in this study.
Increased numbers of subjects and a longitudinal study design would help us to
understand the mechanism which underpins this phenomenon.
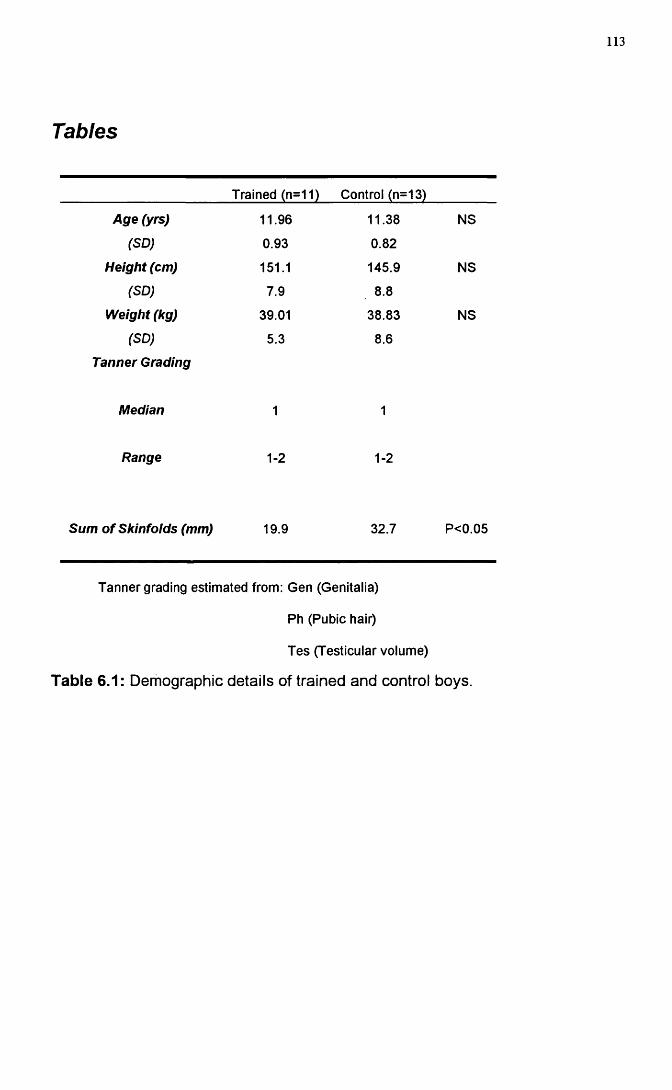
Tables
113
Trained (n=11) Control (n=13)
Age (yrs) 11.96 11.38 NS
(SD) 0.93 0.82
Height (cm) 151.1 145.9 NS
(SD) 7.9 8.8
Weight (kg) 39.01 38.83 NS
(SD)
Tanner Grading
5.3 8.6
Median 1 1
Range 1-2 1-2
Sum of Skinfolds (mm) 19.9 32.7 P<0.05
Tanner grading estimated from: Gen (Genitalia)
Ph (Pubic hair)
Tes (Testicular volume)
Table 6.1: Demographic details of trained and control boys.
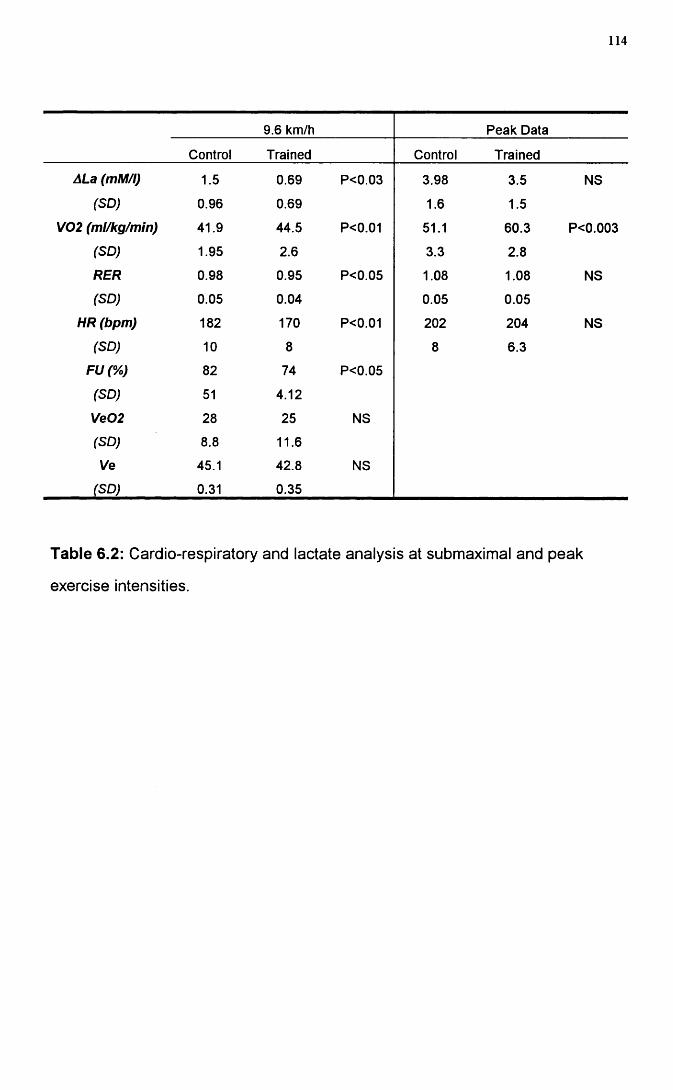
114
9.6 km/h Peak Data
Control Trained Control Trained
ALa (mM/l) 1.5 0.69 P<0.03 3.98 3.5 NS
(SD) 0.96 0.69 1.6 1.5
V02 (ml/kg/min) 41.9 44.5 P<0.01 51.1 60.3 P<0.003
(SD) 1.95 2.6 3.3 2.8
RER 0.98 0.95 P<0.05 1.08 1.08 NS
(SD) 0.05 0.04 0.05 0.05
HR (bpm) 182 170 P<0.01 202 204 NS
(SD) 10 8 8 6.3
FU(%) 82 74 P<0.05
(SD) 51 4.12
Ve02 28 25 NS
(SD) 8.8 11.6
Ve 45.1 42.8 NS
(SD) 0.31 0.35
Table 6.2: Cardio-respiratory and lactate analysis at submaximal and peak
exercise intensities.
115
Fa c t o r s in f l u e n c in g r u n n in g p e r f o r m a n c e
Introduction
In adults, three variables have been shown to influence success in distance
running performance: running economy, peak oxygen consumption and fractional
utilisation (defined as the percentage of peak aerobic power utilised at a given
submaximal running speed). When differences in VOg max values between
athletes are narrow (Daniels and Daniels 1992, Morgan 1989a and Conley &
Krahenbuhl 1980), differences in submaximal running economy may be
important in distance running success. For example. Costill and Winrow (1970)
attributed performance variability in 2 ultra-marathon runners with similar
VOgmax values to individual differences in running economy. Conley and
Krahenbuhl (1980) and Fay etal. (1989) both obtained significant correlations
between running economy and 10K and 16K performance times in trained adult
runners. Differences in submaximal running economy were also thought to be
responsible for almost identical 2 mile run times in 2 champion male distance
runners whose VOgmax values differed by greater than 10 ml/kg/min (Daniels
1974). However, some evidence is contradictory, demonstrating poor
correlations between running economy and endurance performance. A number
of studies have demonstrated poor correlations with respect to running economy
and endurance performance (10k race times) within adult populations (Morgan
(1987): r= 0.30, Morgan (1989b): r= 0.64 and Powers (1983), r= 0.51).
All the data in children refute the economy/performance relationship, except a
single study of Rowland et al. (1988). These researchers related treadmill
endurance time but not peak VOg to running economy. Cunningham (1990b)
116
demonstrated that running economy was poorly correlated (r=-0.05) to 5K race
performance in a group of high school females. These results are in agreement
with Krahenbuhl (1983) and Krahenbuhl etal. (1979) who demonstrated no
correlation between submaximal aerobic economy and performance field tests.
Peak or maximal oxygen consumption has been demonstrated to correlate highly
with adult endurance performance. Costill et al. (1967) and (1973), Pareil et al.
(1979), Foster etal. (1977) and Maughan and Leiper (1983) have all
demonstrated correlations in the range -.82 to -.91 between VOgmax and
endurance running performance in well trained experienced athletes. However,
despite this evidence the influence of VOgmax upon endurance running appears
to be governed by the range of performance times and aerobic power (VOgmax)
within each subject group. Daniels and Daniels (1992) illustrated that VOgmax
correlates highly with distance running performance in a group who possess high
VOgmax values, but whose aerobic power and performance times vary across
the group . The more homogeneous the group with respect to maximal aerobic
power and running ability the lower the correlation between VOgmax and
distance running performance. This trend has been demonstrated in a number
of studies. Conley and Krahenbuhl (1980), Morgan etal. (1989b), Powers
(1983) and Tanaka (1984) all produced low correlations with running
performance when the range of maximal aerobic power and performance times
was narrow.
Fractional utilisation or the ability to sustain a high percentage of VOgmax for a
given period has been well related to race performance in adults ( Conley et al.
(1981). Costill et al. (1973), Pollock (1977), Sparling (1984) and Peronnet etal.
(1987)). However, Cunningham (1990a) demonstrated that fractional utilisation
at race pace was not linked to performance differences between male and
female adolescent runners. This present investigation represents the first study
117
of its kind to attempt to correlate laboratory based variables to running
performance in a pre-pubertal population. Isolating those factors responsible for
successful running performance at the pre-pubertal age could lay the foundation
for the long term enhancement of successful running performance.
The primary aim of this study was to describe and relate the performances of
run-trained pre-pubertal boys to these three major determinants of distance
running success at both 3000m and 1500m
118
Methods
Subjects
Fifteen run-trained male pre-pubertal boys [age 11.7 + I.OGyrs, mean + SD,
Table 7.3 ] volunteered to take part in a 3000m time trial and laboratory
assessment. Within the context of this study, run training was defined as
involvement in a formal, low intensity, aerobic training programme for a minimum
of one year. The boys' training sessions had consisted primarily of endurance
work with an element of interval training and amounted to 3 + 1.66 hours per
week. Ten boys returned for a 1500m time trial and laboratory assessment [age
11.9 + 0.93yrs, Table 7.4]. Tables 7.3 and 7.4 give details of the demographic
and race performance of the subjects. At both initial and return testing sessions,
height, weight and skinfold measurements were taken.
The 3000m time trial was conducted at the end of the competitive racing season
on a 200m indoor track at the Kelvin Hall International Sports Arena. The 1500m
time trial was completed on the same track approximately half way through the
winter season. For the time trials, the boys each had staggered starts. Thus
while they were not competing directly against each other, they had the
motivation of other boys being present during the run.
All but one of the subjects was familiar with exercise testing within the respiratory
function laboratory. Despite this, all subjects were asked to attend for a
habituation visit to accustom them to the equipment being used for cardio
respiratory testing. At this visit, the subjects were familiarised with the treadmill
(Powerjog M10, Cardinal Sports, Edinburgh) by a period of walking and running
(Shephard, 1984).
119
Study Rationale
The initial study conducted in the summer racing season attempted to correlate
submaximal and maximal physiological variables with 3000m race performance.
This race distance was selected as one would tax the aerobic system of children
of this age. Submaximal laboratory protocols were designed to attain steady
state within each stage and allowed for the correlation of a range of submaximal
speeds with race performance. Four submaximal speeds were selected for study
representing a range of speeds from a slow submaximal run to approximate race
pace.
In an attempt to partition factors responsible for successful pre-pubertal running
performance at a slightly shorter distance (1500m), a second
laboratory/performance investigation was undertaken. Adult 1500m running
requires a significantly greater contribution from "anaerobic" sources.
Consequently, in an attempt to quantify this contribution the intensity and
duration of the submaximal protocols were re-structured. The length of each
submaximal stage (4mins) and the treadmill speeds were re-designed to facilitate
steady state lactate sampling. The 10 boys who took part in this second study
were selected purely on the basis of their willingness to co-operate in further
cardio-respiratory and capillary blood lactate sampling.
Study Design
The initial group of 15 run-trained boys underwent both a laboratory and field
test. The laboratory based test consisted of submaximal and peak oxygen
consumption tests. The submaximal protocol consisted of four running stages
each of three minutes in duration with running speeds of 8, 9.6, 11.2 and 12.8
km/h respectively. The subjects then returned within seven days to complete a
peak oxygen consumption test using a modified version of the protocol designed
120
by Unnithan and Eston (1990). The running speed was customised to fit the
individual requirement of each child. Once baseline speed was established the
gradient was increased 2.5% every 2 minutes until voluntary exhaustion was
attained. The child was judged to have reached peak VOg when any two of the
following four criteria were met (Williams and Armstrong, 1991):
1. Heart rate within 10 beats per minute of the age predicted maximum.
2. A heart rate plateau
3. Respiratory exchange ratio value greater than 1.0.
4. An approximate plateau of VOg values
The field test consisted of an indoor 3000m time trial.
Ten of the boys returned to undergo further laboratory tests and the 1500m time
trial. The laboratory based test again incorporated submaximal and peak oxygen
consumption testing within the same session. The submaximal protocol
consisted of three four minute stages at 9.6, 11.5 and 13.1 km/h These absolute
speeds corresponded to approximately 75, 85 and 95% peak VOg for the run-
trained group. The running stages were interspersed with 7 minutes of passive
and 3 minutes of active recovery (walking at 4 km/h) 20 minutes after the end of
the final submaximal stage a peak oxygen consumption test was conducted.
Whole blood capillary lactates were drawn at rest and 1-2 minutes following the
end of each exercise stage including at the end of peak effort. Again a modified
Unnithan and Eston (1990) protocol was used to achieve peak oxygen
consumption. Criteria for the attainment of peak oxygen consumption as defined
by Williams and Armstrong (1990) were used.
All laboratory based metabolic data measurements were made using a
computerised metabolic cart (Sensormedics S2900Z, Bilthoven, Netherlands),
121
which was calibrated prior to and following each test using two reference gases.
This instrument has previously been validated for use in children (Unnithan et
al., 1992). A low dead space valve (IGmIs, Hans-Rudolph 141 OB) was used to
minimise dead space ventilation during the gas collection phases. Heart rate
was monitored using a Sport Tester PE3000 heart rate monitor (Kempe,
Finland). At all submaximal treadmill speeds the treadmill belt was calibrated by
pre-marking the belt, measuring the belt length, noting the time taken for 20
revolutions and calculating the resulting speed.
Physiological Analysis
The S2900Z generated discrete data points every 20 seconds during the gas
collection phases. These discrete values were averaged to produce a mean
value for each minute of the submaximal running stages. The final minute of
each submaximal running stage was taken to represent the steady state value.
At peak exercise intensity, the average VOg over the last minute was taken to
represent peak VOg The following cardio-respiratory variables were measured :
relative oxygen consumption (V02)rel, Fractional Utilisation(percentage of peak
VOg) (FU), heart rate (HR), respiratory exchange ratio (RER).
Whole blood lactate samples were obtained from the fingertip at rest and 1
minute post exercise. The distal epidermal puncture was obtained using a
capillary blood sampler (Mumford Autolet-lite, AT0207). Duplicate blood
samples were collected in heparinised lOOpI whole blood analysis capillary
tubes (GMRD-053, Analox Instruments, London, UK). The GM7 Analox lactate
analyser was calibrated at the beginning and end of each test session with a
range of lactate standards (2mMol/L-8mMol/L). All lactate values are expressed
as the change in lactate from rest for each individual subject ( Alactate).
122
Statistical Methods
Pearson Product Moment correlation coefficients were calculated for the
selected physiological variables and performance times. Using a confidence
interval of 5% and a two-tail analysis, r was considered to be significant (r>
0.514) Macin & Cambell (1987). Both simple and multiple linear regression
analysis were used to analyse performance variability. Statistics were performed
using the statistical functions in Microsoft Excel version 4 and a significance
level of 0.05 was used throughout.
123
Results
3000m Analysis
The demographic characteristics of the run-trained group in the 3000m study are
listed in Table 7.3. Two of the trained boys were unable to complete the 3000m
time trial due to illness, hence times on 13 boys were available for analysis.
Correlations between submaximal oxygen consumption and 3000m time ranged
from -0.59 to -0.30 across the four submaximal running speeds. The only
significant economy correlation was that between VOg at 8 km/h and 3000m time
trial (r= -0.59). In contrast, peak oxygen consumption was significantly
correlated with 3000m run time (r= -0.83, Table 7.1, Figure 7.1). Submaximal
running economy was found to be significantly correlated with peak oxygen
consumption at three (8, 9.6 and 12.8 km/h) of the four submaximal speeds.
However, although significant, the correlations were low, ranging from 0.52 to
0.66
Fractional utilisation was significantly but weakly correlated with running
performance at the final two (11.2 and 12.8 km/h) submaximal running speeds
(r= 0.61 and 0.67 respectively). Thus , the lower percentage peak VOg utilised
at these submaximal speeds the faster the finishing time on the time trial.
Submaximal HR was only significantly correlated with 3000m performance at
12.8 km/h (r= 0.59). HR at peak effort was also significantly correlated with
3000m performance time (Table 7.1).
Multiple linear regression analysis for the five most highly correlated variables
(VOg at 8 km/h. Peak HR, Peak VOg, FU at 12.8 km/h and HR at 12.8 km/h) was
conducted to try to explain the source of variability in 3000m race performance
124
time. The coefficient of determination (r 2) illustrated that the combined
variances of all five variables accounted for 73% of the total variability in 3000m
race performance. However, single linear regression analysis for peak VOg
alone accounted for 69% of the variance. It would appear that, with respect to
3000m race performance time, VOgmax accounts for the majority of variability in
running performance in this group.
1500m Analysis
Physiological correlates of 1500m race performance were assessed in the
second study often boys (age 11 .9+ 0.93yrs, ht 151 .1+ 7.74cm, wt 38.7+ 5.04
kg). Table 7.2 details the correlations obtained at submaximal and peak
exercise intensities. V e02 and VeC 02 at 9.6 km/h were significantly correlated
with 1500m time. At 11.5 km/h A[La]blood, RER, HR and VeC 02, V e 02 and
RPE were all significantly correlated with 1500m time. At the final submaximal
running speed (13.1 km/h) the A [La] blood, RER, HR, VeC 02, V e 0 2 and RPE
variables were all significantly correlated with 1500m race time. Again, peak
VOg was highly correlated with 1500m race performance (r = -.78 ).
125
Discussion
Running economy defined as the submaximal energy cost of running was only
significantly correlated with 3000m performance time at one of the submaximal
running speeds (8 km/h r = -.59) indicating that the higher the submaximal
oxygen consumption the lower (ie faster) the 3000m performance time. This
relationship might arise from enhanced oxidation of intra-muscular tri-glycerides
or more efficient oxidation of blood borne carbohydrates in these trained runners.
The greater energy cost of fat oxidation could have contributed to the higher
submaximal energy cost of running but the resulting increase inefficiency of
substrate utilisation could enhance 3000m race performance. However, multiple
and single linear regression analysis illustrated that VOg at 8 km/h contributed
minimally to the variability in 3000m race performance (coefficient of
determination, r 2= 35%). The low but significant correlations between
submaximal oxygen consumption and VOgmax at three (8, 9.6 and 12.8 km/h) of
the four submaximal speeds indicates that those runners having a high VOgmax
are less economical at the submaximal speeds. This lends further support to the
idea of enhanced aerobic power being coupled to a shift in substrate utilisation.
Several further theories have been postulated to explain the lack of correlation
between running economy and performance time. The runners in this group
were reasonably homogeneous in terms of age, running ability and training, all
variables thought to influence running economy. Consequently, homogeneity
amongst factors thought to relate to running economy would negate any possible
relationship with running performance. The most critical factor appears to be the
wide range of VOgmax (55 to 67 ml/kg/min). Daniels (1985), Morgan et al.
(1989b), Noakes (1988) and Sjodin and Svendenhag (1985) all reported that
when performance levels were reasonably homogeneous, high VOgmax values
126
were associated with poor running economy. Equally, it was noticed that runners
with lower VOgmax values compensated by reducing their submaximal energy
costs of running. The only other comparable paediatric performance research
was conducted by Cunningham 1990b. He demonstrated that running economy
was not correlated with running time at 5000m race distance in a group of female
cross-country runners (age 15.9 yrs).
Conley and Krahenbuhl (1980) demonstrated similar performance times in a 10k
race among highly trained experienced adult male runners. The association
between race times and submaximal oxygen consumption ranged from 79 to .83.
Fay (1989) demonstrated increasing correlation coefficients (-.40, -.55 and -.62)
at 12.9 km/h for submaximal oxygen consumption and race times at 5, 10 and
16k. This suggests that running economy may be more important for longer
distance races. In keeping with this, Svendenhag and Sjodin (1984)
demonstrated that running economy was important for success at marathon
running levels.
VOgmax in the present study was found to correlate very highly with distance
running time at 3000m (r= -0.83). These data are in line with the r values of -
0.78 to -0.91 obtained by a number of authors (Costill et al. 1973, Pareil et al.
1979, Foster et al. 1977, Maughan and Leiper 1983 and Sjodin and Svendenhag
1985) when the range of abilities within each subject pool was large. When
running abilities were narrowed little relation with running performance was
noted (r= 0.01 to 0.355) ( Sjodin and Svendenhag 1985, Conley and Krahenbuhl
1980 and Tanaka and Matsuura 1984). Cunningham 1990b also demonstrated a
significant relationship between running time and VOgmax (r= -.69) in a group of
female adolescent cross country runners. On the basis of multiple linear
regression analysis VOg peak accounted for 69% of the total multiple linear
regression variance (73%) and is therefore the single most important
127
characteristic associated with running success in moderately trained pre-pubertal
runners.
Fractional utilisation is the ability to sustain a high percentage of VOg for a given
period and is another variable that has been associated with running
performance (Costill et al. 1973). In the present study FU was poorly correlated
to 3000m time trial at the lower two submaximal running speeds. Multiple and
single linear regression analysis demonstrated that FU contributed minimally to
3000m performance variance. These results are in agreement with Cunningham
(1990b) who demonstrated a poor association between FU and actual running
time in female high school runners (r=0.18). To date the ability to sustain a high
proportion of VOgmax has been linked to successful running performance only in
adults (Costill et a i 1973, Pollock 1977, Sparling 1984 and Peronnet et a i 1987].
Submaximal HR at 12.8 km/h and at HR at peak exercise were both significantly
correlated with 3000m race performance. It is tempting to speculate that the high
correlation between peak HR and 3000m race performance is an artefact of the
high correlation between VOgmax and race performance . This relationship
could also reflect an enhanced peripheral oxygen extraction in the faster runner.
Multiple linear regression analysis indicated that HR (submax and max )
accounted for only a small part of the total 3000m performance variability.
In an attempt to determine other possible determinants of endurance
performance a 1500m time trial was conducted. Consistent with the results
generated from the 3000m study, submaximal oxygen consumption was poorly
correlated with 1500m race time. Peak VOg was significantly correlated with
race performance. However, the magnitude of the correlation was slightly lower
(r= -.78 ). RER, HR, [La]blood, Ve02, VeC 02 and RPE were all highly
correlated to 1500m race performance. Both the positive RER and [La]blood
128
correlations at submaximal exercise indicate that successful 1500m race
performance could be mediated by two possible mechanisms : the ability to
oxidise blood borne carbohydrates more efficiently or to metabolise lactate more
effectively. Palgi et al. (1984) examined physiologic correlates of 2k run-times in
10-14 year old children. Anaerobic capacity measured by the Wingate test was
the most highly correlated variable accounting for 60% of the variance in 2k time
in this study.
Two other variables demonstrated a significant relationship with running
performance, rating of perceived exertion and Ventilatory equivalent for oxygen
and carbon dioxide. The faster runners perceived the intensity of submaximal
exercise to be lower at submaximal running speeds. This lower perception of
effort could be coupled to the ability to withstand high levels of stress as a result
of training or might be related to the lower lactate levels generated in the faster
runner (0.7mM vs 1.75mM, fastest vs slowest 3k time trialist at 9.6km/h).
Ventilatory equivalent data is compatible with the possibility that as a result of
the enhanced aerobic power of the trained individual less anaerobic metabolic
stimuli were applied to the respiratory system.
The evidence from both the 3000m and 1500m profiles indicates that children do
have the metabolic capacity to adopt to the different demands of specialised
running distances. Of the three major determinants of distance running
performance examined in this study, VOg max appears to be the single most
important factor for superior performance at either 1500m or 3000m.
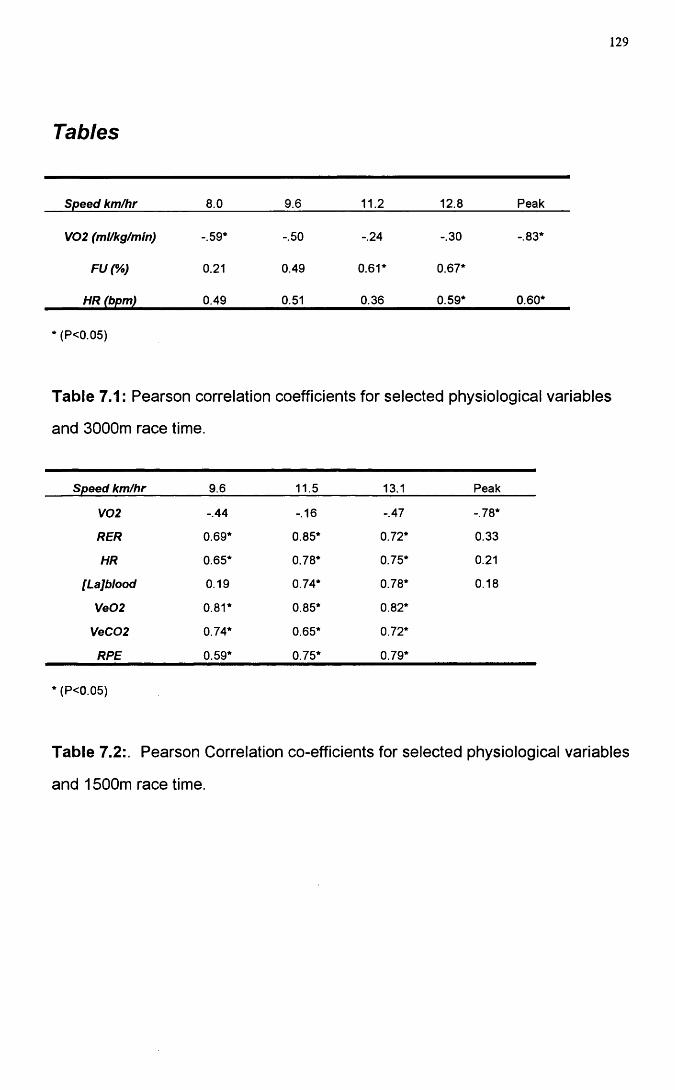
129
Tables
Speed km/hr 8.0 9.6 11.2 12.8 Peak
V02 (ml/kg/min) -.59* -.50 -.24 -.30 -.83*
FU(%) 0.21 0.49 0.61* 0.67*
HR (bpm) 0.49 0.51 0.36 0.59* 0.60*
(P<0.05)
Table 7.1: Pearson correlation coefficients for selected physiological variables
and 3000m race time.
Speed km/hr 9.6 11.5 13.1 Peak
V02 -.44 -.16 -.47 -.78*
RER 0.69* 0.85* 0.72* 0.33
HR 0.65* 0.78* 0.75* 0.21
[Lajblood 0.19 0.74* 0.78* 0.18
Ve02 0.81* 0.85* 0.82*
VeC02 0.74* 0.65* 0.72*
RPE 0.59* 0.75* 0.79*
* (P<0.05)
Table 7.2: Pearson Correlation co-efficients for selected physiological variables
and 1500m race time.
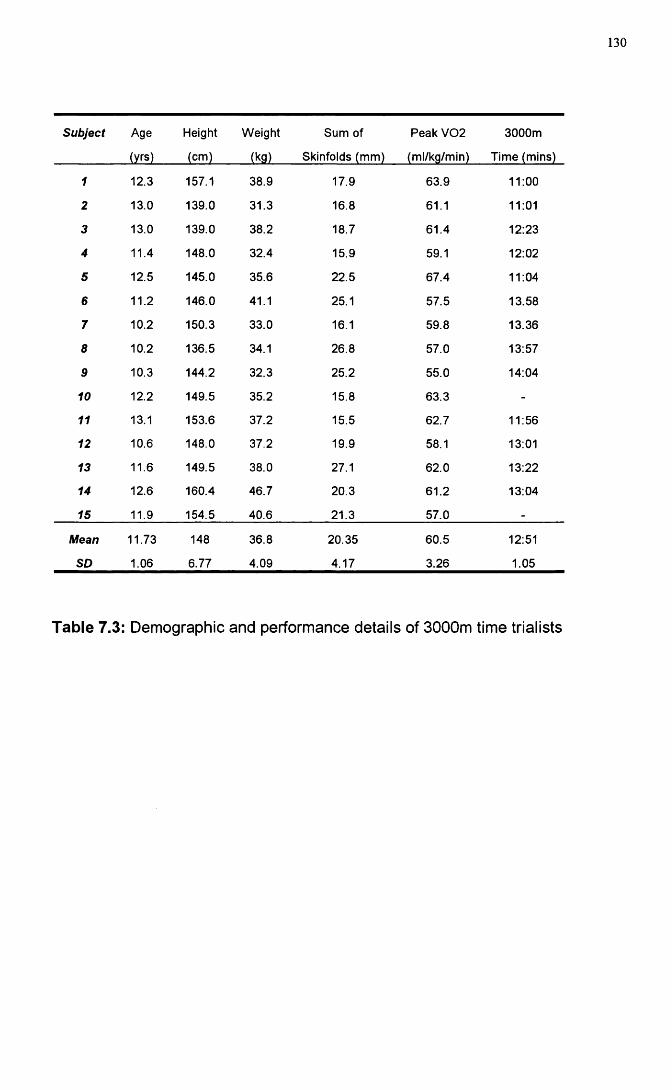
130
Subject Age
(yrs)
Height
(cm)
Weight
(kg)
Sum of
Skinfolds (mm)
Peak V02
(ml/kg/min)
3000m
Time (mins)
1 12.3 157.1 38.9 17.9 63.9 11:00
2 13.0 139.0 31.3 16.8 61.1 11:01
3 13.0 139.0 38.2 18.7 61.4 12:23
4 11.4 148.0 32.4 15.9 59.1 12:02
5 12.5 145.0 35.6 22.5 67.4 11:04
6 11.2 146.0 41.1 25.1 57.5 13.58
7 10.2 150.3 33.0 16.1 59.8 13.36
8 10.2 136.5 34.1 26.8 57.0 13:57
9 10.3 144.2 32.3 25.2 55.0 14:04
10 12.2 149.5 35.2 15.8 63.3 -
11 13.1 153.6 37.2 15.5 62.7 11:56
12 10,6 148.0 37.2 19.9 58.1 13:01
13 11.6 149.5 38.0 27.1 62.0 13:22
14 12.6 160.4 46.7 20.3 61.2 13:04
15 11.9 154.5 40.6 21.3 57.0 -
Mean
SD
11.73
1.06
148
6.77
36.8
4.09
20.35
4.17
60.5
3.26
12:51
1.05
Table 7.3: Demographic and performance details of 3000m time trialists
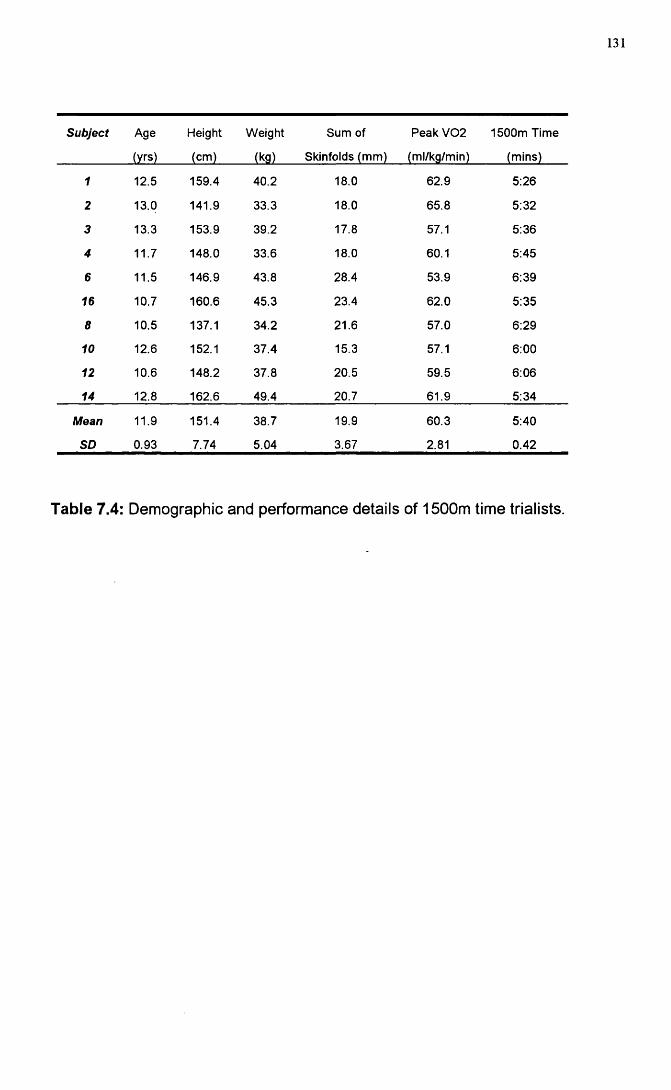
131
Subject Age Height Weight Sum of Peak V02 1500m Time
(yrs) (cm) (kg) Skinfolds (mm) (ml/kg/min) (mins)
1 12.5 159.4 40.2 18.0 62.9 5:26
2 13.0 141.9 33.3 18.0 65.8 5:32
3 13.3 153.9 39.2 17.8 57.1 5:36
4 11.7 148.0 33.6 18.0 60.1 5:45
6 11.5 146.9 43.8 28.4 53.9 6:39
16 10.7 160.6 45.3 23.4 62.0 5:35
8 10.5 137.1 34.2 21.6 57.0 6:29
10 12.6 152.1 37.4 15.3 57.1 6:00
12 10.6 148.2 37.8 20.5 59.5 6:06
14 12.8 162.6 49.4 20.7 61.9 5:34
Mean 11.9 151.4 38.7 19.9 60.3 5:40
SD 0.93 7.74 5.04 3.67 2.81 0.42
Table 7.4: Demographic and performance details of 1500m time trialists.
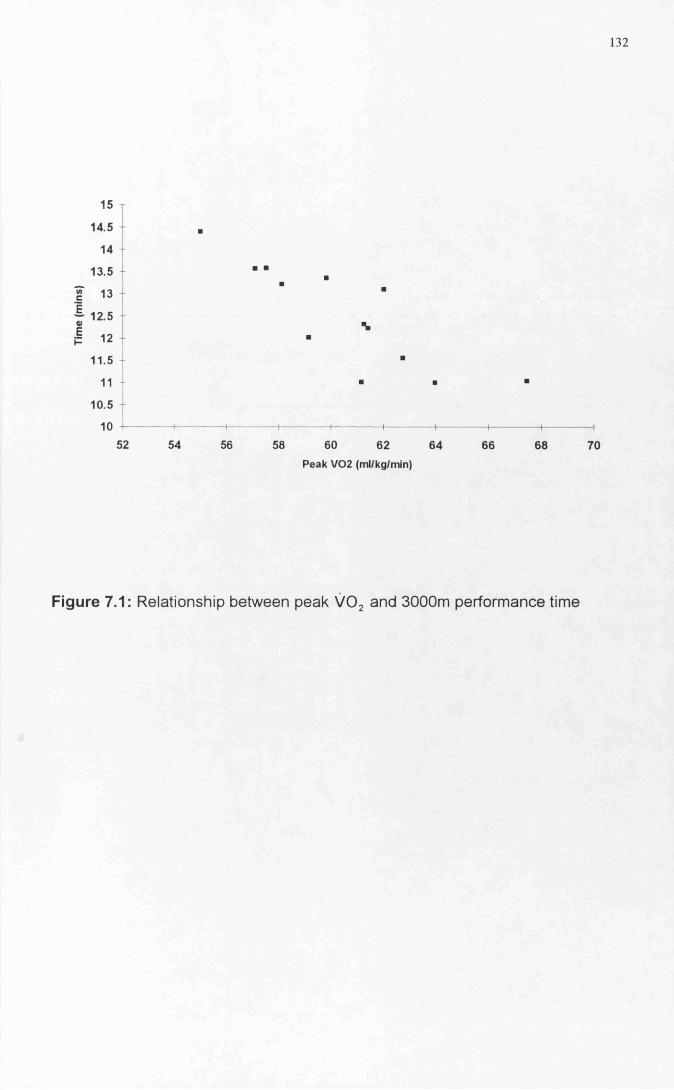
132
15
14.5 +
14
13.5
13
12.5 -
12
11.5
11
10.5
1052 54 56 58 60 62 64
Peak V02 (ml/kg/min)
66 68 70
Figure 7.1: Relationship between peak VO , and 3000m performance time

133
MANIPULATION OF SUBMAXIMAL RUNNING ECONOMY
134
L o n g it u d in a l t r a in in g s t u d y
Introduction
Longitudinal training studies provide one of the most powerful methods of
unravelling factors responsible for running economy in adults and children.
However, studies of this nature are fraught with problems. Common weaknesses
of previous studies in this field have included : inadequate sample sizes
(Rowland 1985), the lack of assessment of intra-individual variability (Rowland
1985) and a failure to control potential factors which can affect running economy,
such as fatigue, training status, circadian variation and treadmill accommodation
(Morgan (1989a)). Consequently, many such studies do little more than "profile"
differences between two groups of subjects. Even in cross-sectional studies ,
major sources of error can arise. The heterogeneity of selected sample
populations can quickly confound subsequent data collection. Similarly, the
absence of adequate control subjects, inadequate sample sizes and improperly
designed testing protocols can all contribute to the misinterpretation of cross-
sectional data.
The criteria for subject selection into both control and run-trained groups were
the most difficult aspects of these studies. The criteria for selection into a run-
trained group is normally based upon previous running history and race
performance, which can be difficult to precisely quantify (Shephard 1992).
However, Daniels et al. (1978) demonstrated no change in submaximal running
economy in 15 adult recreational runners over a shorter 8 week time period.
Patton and Vogel (1977) demonstrated a significant improvement in a shorter
time frame (6 months), in a group of fit (non run-trained) military personnel.
Svendenhag and Sjodin (1985), Sjodin et al. 1982 and Conley et al. (1981) all
135
demonstrated significant improvements in running economy in even elite athletes
over 22 months, 14 weeks and 18 weeks respectively. This suggests a capacity
for improvement in running economy even in we 11-trained subjects.
Results from several studies have demonstrated that high intensity aerobic
training is necessary to bring about improvements in running economy. Conley
et al. (1981) & (1984), Svendenhag and Sjodin (1985) and Sjodin etal. (1982) all
included components of high intensity aerobic training as part of their training
programmes. In the case of Conley et al. (1981 ) most of the improvements in
running economy were noted during or immediately after a period of increased
interval training. The major benefit of interval training is the promotion of
economical running at the pace demands of competition.
In children, Daniels and Oldridge (1971) using a group of male athletes aged IQ-
15 years with previous running experience demonstrated improved submaximal
running economy over a two year period. The only study that has attempted to
directly manipulate submaximal running economy in children was conducted by
Petray and Krahenbuhl (1985). No significant difference was noted in
submaximal running economy following an 11 week training programme that
involved steady state running training and biomechanical running instruction.
This has led to a general consensus that, in children, submaximal running
economy is resistant to manipulation through training (Krahenbuhl etal. 1989
and Krahenbuhl and Williams 1992).
W e hypothesised that a high intensity training programme would promote an
improvement in submaximal running economy within a pre-pubertal population
and that failure to observe this in previous studies arose because of a failure to
control for potential confounding factors. The primary aim of this study was to
complete a longitudinal training study of 10 weeks in duration in a group of
136
moderately trained pre-pubertal runners. The impact of growth upon selected
cardio-respiratory variables was assessed by the physiological investigation at
week 0 and week 10 in a comparison group of boys.
137
Methods
Subjects
Twenty boys volunteered to take part in this study (Appendix 2). The subjects
were in two groups. The first group consisted of 10 run-trained subjects [age:
11.8 + 1 .03yrs, mean + SD, Ht: 150.9 + 8.25 cm and Wt: 39.5 + 5.25 kg, Table
8.1]. For comparison a second group consisting of 10 subjects was studied [age:
11.3 + 0.78 yrs, mean + SD, Ht: 146.5 + 8.56 cm and Wt: 39.3 + 8.4 kg. Table
8.1]. The run trained subjects had each undergone on average one year of
structured running training prior to the commencement of the present training
study. The parents of the comparison subjects completed a physical activity
questionnaire to allow determination of their children's physical activity profile
(Appendix 3). Seven were rated as moderately active, but none was taking part
in regular running training. All the boys taking part in the study were
experienced in exercise testing having taken part previously in maximal and
submaximal testing within the exercise laboratory. Despite this, all subjects were
asked to attend for a habituation visit to re-accustom them to the equipment
being used for cardio-respiratory testing. At this visit, the subjects were re
familiarised to the treadmill (Powerjog M10, Cardinal Sports, Edinburgh) by a
period of walking and running (Shephard, 1984).
study design
Prior to the commencement of the 10 week training study both groups of boys
(comparison and run-trained) attended the laboratory for a physical examination
and physiological testing. Pubertal status was assessed using pubic hair, genital
development and testicular size (Tanner 1962). Four site skinfold
measurements were measured (biceps, triceps, subscapular and supra-iliac).
Pubertal gradings and growth measurements were repeated in both groups at
138
week 10. One of the major limitations of a study of this nature is the choice of
the control subjects. The control boys who volunteered for this study were very
physically active, despite being non run-trained. Hence, the use of the term
comparison rather than control group represented a more accurate description of
the boys who took part in this study.
Training details
The boys in the training group trained three times a week with each session
lasting 1 hour. To ensure full compliance with the training programme and to
maintain enthusiasm and motivation, all training sessions were supervised by a
senior British Amateur Athletic Federation coach. The composition of each
session followed a similar pattern each week:
1. A 15 minute warm-up run was followed by 10 minutes of stretching and
callanetics. The next stage was a hill session of 4 sets of 5 repetitions up a
60 metre incline, with a jog recovery. Four minutes rest was allowed between
each set. The repetitions were designed in the main to be maximal efforts.
The session was concluded by a 10 minute cool down run.
2. Session 2 was preceded by the standard warm-up run and Callanetics.
This was followed by a 300m/500m/300m session with adequate recovery
periods between each. Short recovery relays were conducted for a further 15
minutes and a 10 minute cool down run concluded the one hour session.
3. The third session of the week took the form of a race or a 30 minute
fartlek run. Heart rates were palpated during the session in order to assess
the approximate training intensity. Heart rates in the range (180-190 beats
per minute) were recorded.
139
A 1500m time trial was conducted at week 0 and week 10 to assess
improvements in performance after the training.
Test protocols
A single test session protocol was used for both the run-trained and comparison
groups. The submaximal protocol differed for both the two groups. The run
trained group completed three four minute running stages at 9.6, 11.5 and 13.1
km/h, corresponding to approximately 75, 85 and 95% peak VOg . The three
running stages were interspersed with 7 minutes of passive and 3 minutes of
active recovery (walking at 4 km/h). The comparison group performed only one
4 minute submaximal stage at 9.6 km/h). The treadmill belt speed was
calibrated at each submaximal speed.
All the boys also performed a peak oxygen consumption test 20 minutes after the
end of the final running stage using a modified version of a protocol designed by
Unnithan and Eston (1990). In this protocol, the running speed was customised
to each child . Once baseline speed was established the gradient was increased
2.5% every 2 minutes until voluntary exhaustion was attained. Each child was
judged to have reached peak VOg when any two of the following four criteria
were met (Williams and Armstrong, 1991): 1. heart rate within 10 beats per
minute of the age predicted maximum or 2. a heart rate plateau; 3. respiratory
exchange ratio value of greater than 1.0 or 4. an approximate plateau of VOg
values.
Metabolic data measurements were made using a computerised metabolic cart
(Sensormedics S2900Z, Bilthoven, Netherlands), which was calibrated prior to,
and following each test using two reference gases. This instrument has
previously been validated for use in children (Unnithan et al., 1992). A low dead
space valve (Hans-Rudolph 141 OB) was used to minimise dead space ventilation
140
during the gas collection phases. Heart rate was monitored using a Sport Tester
PE3000 heart rate monitor (Kempe, Finland).
Physiological analysis
The S2900Z generated discrete data points every 20 seconds during the gas
collection phases. These discrete values were averaged to produce a mean
value for each minute of the submaximal running stages. The final minute of
each submaximal running stage was taken to represent the steady state value.
At peak exercise intensity the average VOg over the last three readings was
taken to represent peak VOg and the following cardio-respiratory variables were
measured : relative oxygen consumption (VOg)rel, fractional utilisation (FU),
heart rate (HR), respiratory exchange ratio (RER) and ventilation (Ve) at both
submaximal and peak exercise intensities.
Whole blood lactate samples were obtained from the fingertip at rest and 1
minute post exercise. The distal epidermal puncture was obtained using a
capillary blood sampler (Mumford Autolet-lite AT0207). Duplicate blood samples
were collected in heparinised 100pl whole blood analysis capillary tubes
(GMRD-053, Analox Instruments, London, UK). The lactate analyser (GM7
Analox) was calibrated at the beginning and end of each test session with a
range of lactate standards (2mMol/L-8mMol/L). All lactate values were
expressed as Alactate from rest for each individual subject.
Statistical methods
A two-tailed paired t-test was used to investigate the difference in pre- and post
training variables within the run-trained group. A similar analysis was conducted
with the comparison group in order to assess the influence of growth over the
same time period. The power of the t-test enabled us to examine the delta(A)
change in variables with training. A cross sectional between groups analysis was
141
conducted in the section " Influence of Steady State Lactate". Statistics were
performed using Microsoft Excel version 4 and a significance level of 0.05 was
used.
142
Results
Demographic comparison of the run-trained and comparison boys from week 0 to
week 10 indicated that no change in maturational status had occurred over the
ten weeks for any of the boys. There was also no significant increase in height
over the period of study for either group. However, statistically significant
differences (P<0.05) were noted for Aweight and Asum of skinfolds in the trained
boys. The trained boys became significantly heavier than the comparison boys
and this was also associated with a significant reduction in the sum of skinfold
measurements over the ten week period (Tables 8.2, 8.3 and 8. 4).
In order to control for the effects of growth upon submaximal running economy
both groups were tested at an overlap speed of 9.6 km/h at week 0 and week 10.
No significant differences were noted for any of the selected physiological
variables measured (Table 8.5).
Previous work produced in this laboratory (Reproducibility of cardio-respiratory
measurements) measured within subject variability for submaximal exercise
testing. Mean variability in submaximal oxygen consumption from test 1 to test 2
for a group of 10 pre-pubertal boys was 5.75% at 8.8 km/h. For both ventilation
and heart rate the mean test-retest variability was 3.74%. Within the context of
the present study three trained boys were selected to be tested twice at the start
of the study. Submaximal oxygen consumption varied by a mean of 2.1 % across
the three speeds and ventilation by 3.9%. Consequently, both variables lay
within the previously measured range of normal variability for submaximal
testing. Within the context of the present study improvements in submaximal
oxygen cost of economy of 7.6% at 9.6 km/h, 5.9%at 11.5 km/h and 7.2% at 13.1
km/h were noted. These improvements are well above the normal level of
143
variability and indicate a systematic improvement. No effect was observed in the
comparison group. The training schedule used, therefore, appeared to have
brought about a significant improvement in submaximal economy.
Of the three submaximal speeds used, the smallest effects over the 10 weeks
training were noted at 9.6 km/h. Nevertheless significant reductions in relative
oxygen consumption (P<O.Olj Figure 8.1), absolute oxygen consumption,
submaximal heart rate and fractional utilisation were all present (Table 8.6). At
11.5 km/h significant reductions also occurred in ALactate, VOg(abs) and FU
(P<0.01) along with V02(rel); Figure 8.2 and HR (P<0.05) over the ten weeks of
the study. The same variables including V02(rel), Figure 8.3 were also
significant at the final submaximal running speed (13.1 km/h). RER at any of the
three running speeds did not change over the course of the training. The only
variable to demonstrate a more significant reduction was FU (P<0.01). In light
of the significant reductions in the other related physiological variables, the lack
of change in RER should be treated with caution.
At peak exercise intensity, no significant difference was noted for any of the
selected variables (Alactate, Peak V02(rel) and Peak V02(abs) from week 0 to
week 10 (Table 8.7) for either the trained or the comparison group.
144
Discussion
Three important findings were noted in this longitudinal study: ten weeks of high
intensity aerobic/interval training stimulated an improvement in submaximal
running economy, reduced blood lactate accumulation but had no effect upon
peak aerobic power.
That the changes observed were the result of training rather than growth was
supported by two lines of evidence. Firstly, the lack of change in the cardio
respiratory and lactate data within the comparison group provided powerful
evidence that the significant physiological adaptations seen in the trained group
resulted from the training undertaken. Further, quantification of intra-individual
variability within the trained group established clearly that significant
physiological change beyond normal test-retest variability had occurred .
The sources of improvements in submaximal running economy were potentially
multiple and complex as relationships exist between submaximal running
economy and a number of variables including heart rate, ventilation, substrate
utilisation and lean body mass.
Two variables that have previously been shown to be significantly related to
running economy are heart rate and ventilation. Pate et al. 1992 demonstrated
positive relationships between heart rate and ventilation with running economy.
However, within the context of the present study, significant reductions in
ventilation following training were only noted at 13.1 km/h. It would appear that
any "training effect" for ventilation manifested itself only at the final submaximal
running speed Ventilation has been demonstrated to be 7 to 8% of the total
oxygen cost of exercise (Milic-Emili et al. 1962). The potential, therefore, exists
145
that a manipulation of ventilation could alter overall running economy. The
enhanced buffering capacity, reduced lactate production and higher blood pH
adaptations to training (Koch and Rocker 1980) all could contribute to a reduced
metabolic ventilatory demand and the energy saved by reduced metabolic
demand may act to decrease the whole body oxygen cost. The evidence from
the present study suggests that in practise, the contribution to sub-maximal
economy is minimal.
Significant reductions in submaximal heart rates following training were noted.
Such improvements have potentially been linked to a reduction in whole body
oxygen consumption through a reduction in myocardial oxygen consumption
which constitutes a significant fraction of whole body oxygen consumption during
exercise (Kitamura 1972). Again reductions in myocardial oxygen consumption
could theoretically reduce whole body oxygen consumption and therefore
improve running economy. Assuming that haemoglobin concentrations,
haematocrit and oxygen demand of the muscles remain constant the rate at
which blood is supplied to the working muscles and cardiac output would be
constant at a given submaximal workload. Any reduction in myocardial oxygen
consumption would then result from a reduced heart rate and increased stroke
volume.
Evidence exists in animal models that if cardiac output is held constant,
myocardial oxygen consumption is reduced in isolated canine hearts when the
heart rate was slowed. Manipulation of heart rate and it's effect on whole body
oxygen consumption has been assessed in humans by the use of p-blockers.
Kalis et al. (1988) demonstrated that a reduction of submaximal heart rate of 35
beats per minute was associated with a reduction in whole body oxygen
consumption of 0.1 l/min. However, the interpretation of the p-blockade response
is masked by the complexity of its multiple interactions, p-blockers have the
146
capacity to inhibit lipolysis leading to a greater carbohydrate contribution to
energy. This effect in itself could reduce submaximal oxygen consumption. The
preceding line of argument indicates that the manipulation of submaximal heart
rate could have implications for submaximal running economy. Training
adaptations noted in the present study demonstrate a significant reduction in
submaximal heart rate across all three speeds following training of the order of 8
bpm. Whether this training induced reduced submaximal heart rate response is
the result of a training stimulated enhanced contractility or enhanced left
ventricular filling response remains to be investigated and its contribution to the
improved submaximal running economy has yet to be fully established.
Another theoretical mechanism potentially capable of altering submaximal
running economy is the alteration of substrate utilisation. When carbohydrate is
used as a primary substrate 5.05 kcal of energy are generated for every litre of
oxygen consumed; fats, in contrast, generate 4.70 kcal per litre of oxygen. The
preferential usage of carbohydrates as a primary substrate for exercise is also
linked to the more direct and faster functioning pathway for carbohydrate
metabolism. In addition, Acetyl-CoA generated from carbohydrate metabolism
also acts to inhibit p-oxidation (Brookes and Fahey 1984).
Consequently, the manipulation of substrate utilisation through diet or training
should contribute to a reduced submaximal oxygen cost of running. However,
Davis etal. (1988) demonstrated that carbohydrate dietary manipulation had no
significant effect upon submaximal running economy in adults . It has been
documented that children have lower concentrations of the glycolytic rate limiting
step enzyme, Phosphofructokinase (PFK) (Rutenfranz 1986). This bio-chemical
difference in children would alter the balance towards fat oxidation in preference
to carbohydrate metabolism.
147
Only one study has demonstrated the capacity to alter the glycolytic potential in
children through training. 6 weeks of interval training in 11 year old boys
stimulated an 83% increase in PFK, a 30% increase in Succinate
dehydrogenase and an overall higher lactacid capacity( Errikson et al. 1973). It
is tempting to speculate that the high intensity aerobic training conducted in the
present study increased the glycolytic capacity of the trained boys and this
increased glycolytic potential then contributed to the reduced submaximal
running economy seen following training.
The increased potential glycolytic capacity and the reduced submaximal blood
lactate levels post training might at first appear contradictory. However, it has
been well documented that children possess several physiological adaptations
that allow for more effective clearance of blood lactate, adaptations which may
possibly be enhanced through training. Sympathetic activity during exercise is
less in pre-pubertal children, consequently lessened hepatic vasoconstriction
might allow for more rapid liver metabolism of lactate (Macek 1986). Higher local
muscle blood flow might also contribute to enhanced lactate clearance (Koch &
Rocker 1980). Reported changes as a result of aerobic training, such as
capillary and mitochondria proliferation, both would assist in enhancing lactate
clearance Brookes & Fahey (1984).
The relationship between submaximal running economy, training and enzyme
profiles were demonstrated by Sjodin et al. 1982. These researchers
documented illustrated increases in heart specific Lactate dehydrogenase (H-
LDH) enzyme in adult middle and long distance runners . Improvements in
submaximal running economy were found to be highly correlated with increased
levels H-LDH. It has been demonstrated that H-LDH bound to the inner
membrane of the mitochondria will facilitate the oxidative translocation lactate in
the presence of NAD (Skilleter and Kun 1972). The net result of this adaptation
148
would be lower blood lactate accumulation at absolute or relative exercise
intensities. The possibility of such a change in the present study is speculative
but it highlights questions that future paediatric training studies may need to
address using magnetic resonance spectroscopy (Zanconato et al 1993).
The alterations noted in the body composition of the trained boys could also
contribute to enhanced submaximal running economy. Body weight increased
over the ten week training period by a mean of 1.44 kg accompanied by a
reduction in mean skinfold measurements of -0.71 mm could have subtle
influences upon submaximal running economy. An increase in weight coupled
with a reduction in sum of skinfolds implies an increase in lean body mass
(muscle mass). Improved muscular efficiency as a result of increased muscle
mass recruitment could have the capacity to improve submaximal running
economy.
The lack of change in peak VOg following the ten week training programme has
been addressed by a number of authors. Pate and Ward (1990) stated that as in
adults paediatric subjects with high fitness levels might not demonstrate a large
improvement in peak oxygen consumption with training. In fact, Koch & Rocker
(1980) suggested that the upper limit of trainability for maximal oxygen
consumption is 60 ml/kg/min in boys aged 12-15 years. While initial fitness
levels may be a determinant of the capacity to improve maximal oxygen
consumption, so too is the nature of the training programme. Krahenbuhl &
Williams 1992 reviewed several studies in which pre-pubertal children improved
running performance times with little or no improvement in maximal oxygen
consumption. In 5 of these studies there was little or no steady state endurance
running. Consequently, the lack of change in peak VOg may reflect both the
high fitness levels of our subjects and the lack of significant endurance
component in their ten week training programme.
149
In summary, we would speculate that the improvements in submaximal running
economy seen in the present study could be the product of improved mechanical
and biochemical efficiency stimulated through training. Incorporation of pre and
post training kinematic and kinetic analyses would have allowed us to assess
any improvement in mechanical efficiency. Daniels et a i (1978) suggested that
factors representing local muscular metabolic characteristics should be
considered when attempting to evaluate the adaptation to training in trained
subjects. This has particular relevance in instances where no significant
alterations in peak oxygen consumption were noticed.
Whatever the origin, stimulating improvements in running economy through
training manipulations appears to be a most productive path to follow. More
research experimenting with different combinations of training stimuli will help to
refine the nature of the most appropriate stimuli.
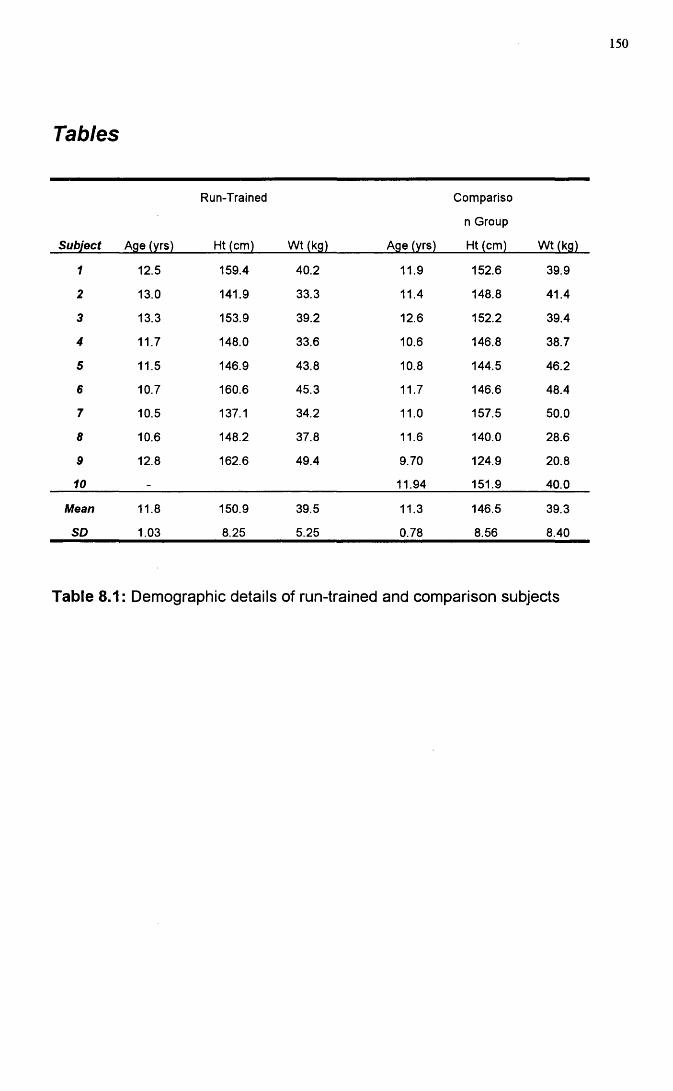
150
Tables
Subject Age (yrs)
Run-Trained
Ht (cm) Wt (kg) Age (yrs)
Compariso
n Group
Ht (cm) Wt (kg)
1 12.5 159.4 40.2 11.9 152.6 39.9
2 13.0 141.9 33.3 11.4 148.8 41.4
3 13.3 153.9 39.2 12.6 152.2 39.4
4 11.7 148.0 33.6 10.6 146.8 38.7
5 11.5 146.9 43.8 10.8 144.5 46.2
6 10.7 160.6 45.3 11.7 146.6 48.4
7 10.5 137.1 34.2 11.0 157.5 50.0
8 10.6 148.2 37.8 11.6 140.0 28.6
9 12.8 162.6 49.4 9.70 124.9 20.8
10 - 11.94 151.9 40.0
Mean 11.8 150.9 39.5 11.3 146.5 39.3
SO 1.03 8.25 5.25 0.78 8.56 8.40
Table 8.1: Demographic details of run-trained and comparison subjects
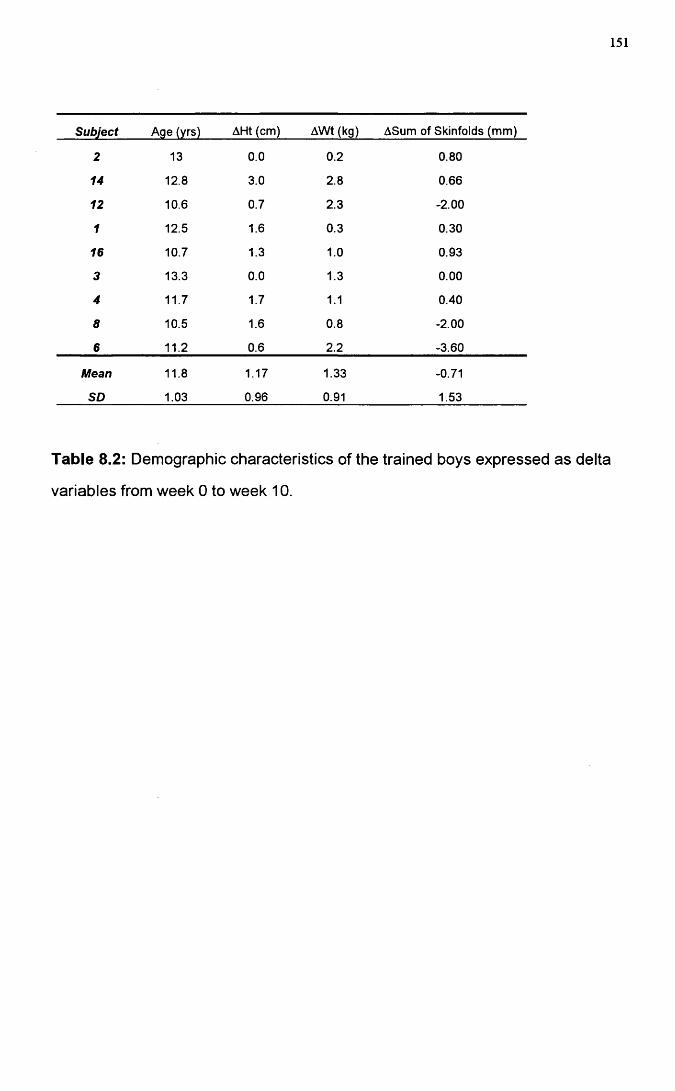
151
Subject Age (yrs) AHt (cm) AWt (kg) ASum of Skinfolds (mm)
2 13 0.0 0.2 0.80
14 12.8 3.0 2.8 0.66
12 10.6 0.7 2.3 -2.00
1 12.5 1.6 0.3 0.30
16 10.7 1.3 1.0 0.93
3 13.3 0.0 1.3 0.00
4 11.7 1.7 1.1 0.40
8 10.5 1.6 0.8 -2.00
6 11.2 0.6 2.2 -3.60
Mean 11.8 1.17 1.33 -0.71
SD 1.03 0.96 0.91 1.53
Table 8.2: Demographic characteristics of the trained boys expressed as delta
variables from week 0 to week 10.
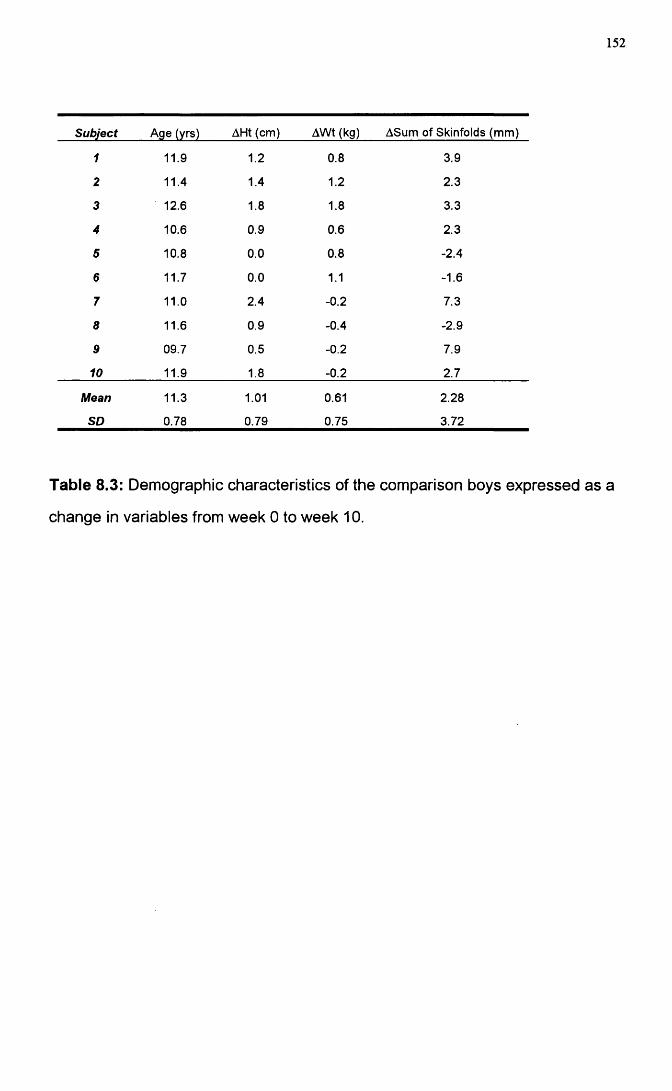
152
Subject Age (yrs) AHt (cm) AWt (kg) ASum of Skinfolds (mm)
1 11.9 1.2 0.8 3.9
2 11.4 1.4 1.2 2.3
3 12.6 1.8 1.8 3.3
4 10.6 0.9 0.6 2.3
5 10.8 0.0 0.8 -2.4
6 11.7 0.0 1.1 -1.6
7 11.0 2.4 -0.2 7.3
8 11.6 0.9 -0.4 -2.9
9 09.7 0.5 -0.2 7.9
10 11.9 1.8 -0.2 2.7
Mean 11.3 1.01 0.61 2.28
SD 0.78 0.79 0.75 3.72
Table 8.3: Demographic characteristics of the comparison boys expressed as a
change in variables from week 0 to week 10.
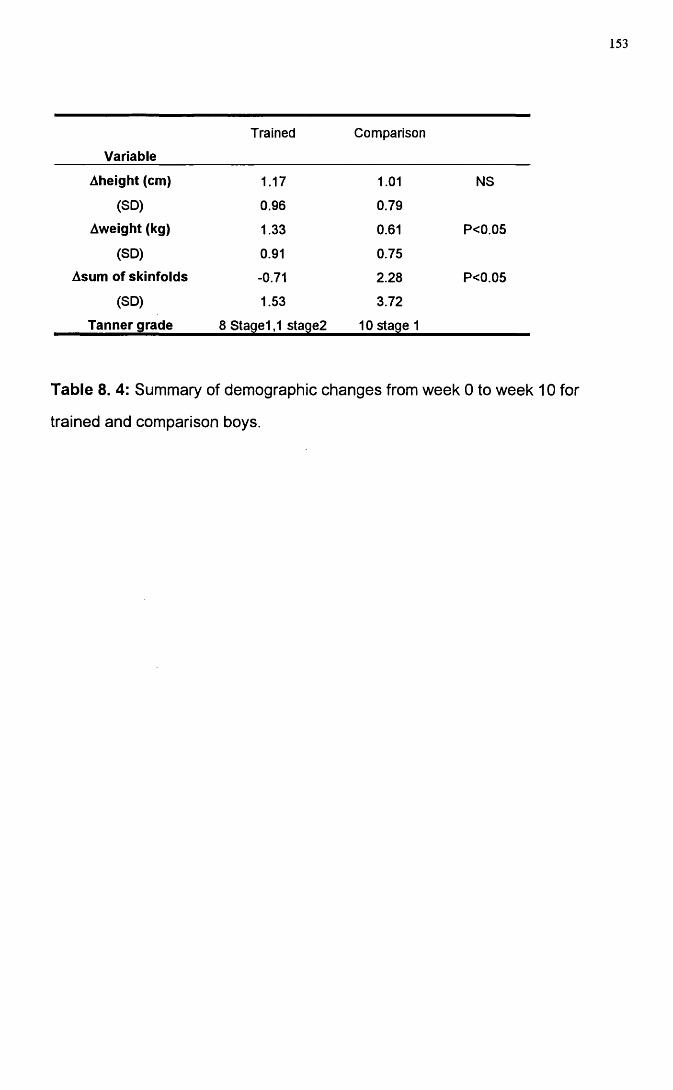
153
Variable
Trained Comparison
Aheight (cm) 1.17 1.01 NS
(SD) 0.96 0.79
Aweight (kg) 1.33 0.61 P<0.05
(SD) 0.91 0.75
Asum of skinfolds -0.71 2.28 P<0.05
(SD) 1.53 3.72
Tanner grade 8 Stage1,1 stage2 10 stage 1
Table 8. 4: Summary of demographic changes from week 0 to week 10 for
trained and comparison boys.
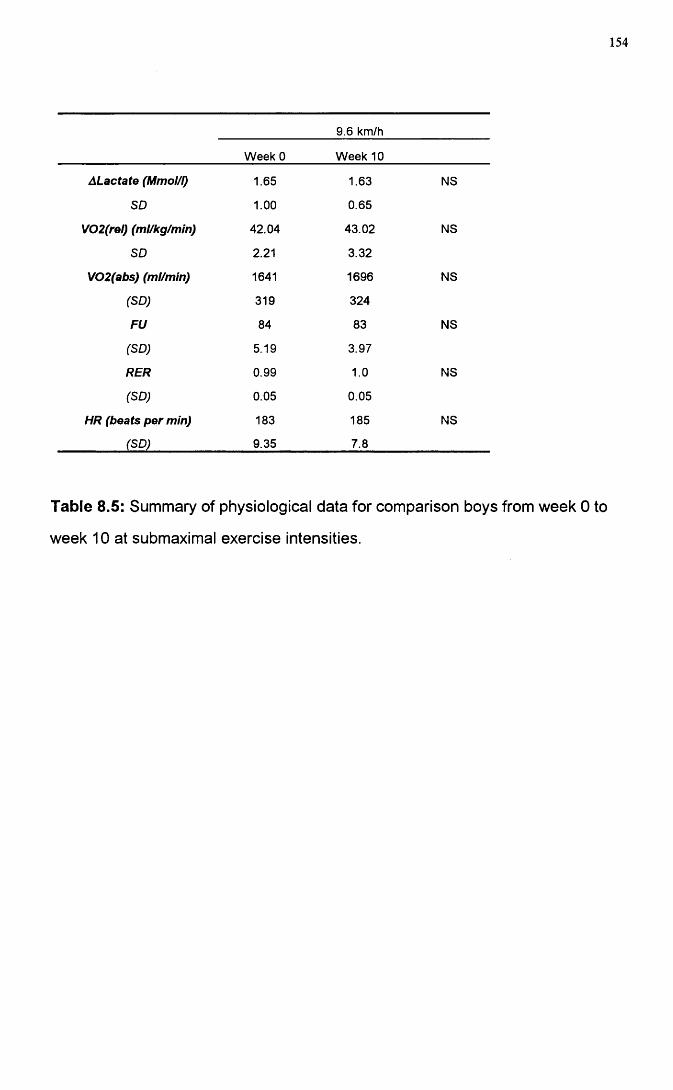
154
9.6 km/h
Week 0 Week 10
ALactate (Mmol/I) 1.65 1.63 NS
SD 1.00 0.65
V02(rel) (ml/kg/min) 42.04 43.02 NS
SD 2.21 3.32
V02(abs) (ml/min) 1641 1696 NS
(SD) 319 324
FU 84 83 NS
(SD) 5.19 3.97
RER 0.99 1.0 NS
(SD) 0.05 0.05
HR (beats per min) 183 185 NS
(SD) 9.35 7.8
Table 8.5: Summary of physiological data for comparison boys from week 0 to
week 10 at submaximal exercise intensities.
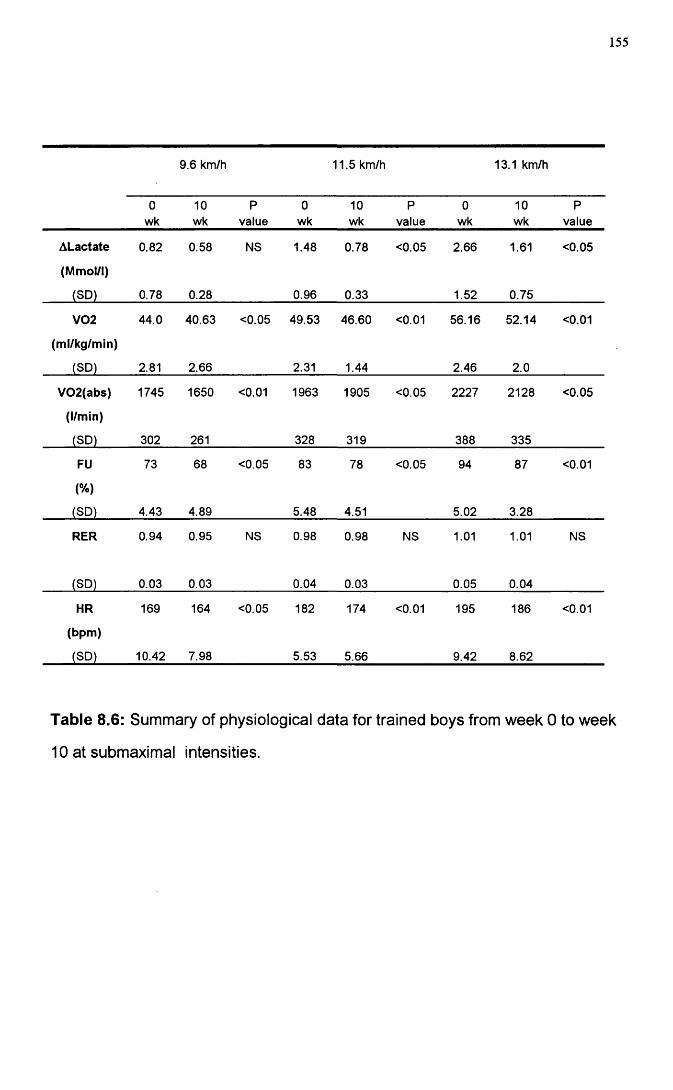
155
9.6 km/h 11.5 km/h 13.1 km/h
0wk
10wk
Pvalue
0wk
10wk
Pvalue
0wk
10wk
Pvalue
ALactate 0.82 0.58 NS 1.48 0.78 <0.05 2.66 1.61 <0.05
(Mmol/i)
(SD) 0.78 0.28 0.96 0.33 1.52 0.75
V02 44.0 40.63 <0.05 49.53 46.60 <0.01 56.16 52.14 <0.01
(ml/kg/min)
(SD) 2.81 2.66 2.31 1.44 2.46 2.0
V02(abs) 1745 1650 <0.01 1963 1905 <0.05 2227 2128 <0.05
(l/min)
(SD) 302 261 328 319 388 335
FU 73 68 <0.05 83 78 <0.05 94 87 <0.01
(%)
(SD) 4.43 4.89 5.48 4.51 5.02 3.28
RER 0.94 0.95 NS 0.98 0.98 NS 1.01 1.01 NS
(SD) 0.03 0.03 0.04 0.03 0.05 0.04
HR 169 164 <0.05 182 174 <0.01 195 186 <0.01
(bpm)
(SD) 10.42 7.98 5.53 5.66 9.42 8.62
Table 8.6: Summary of physiological data for trained boys from week 0 to week
10 at submaximal intensities.
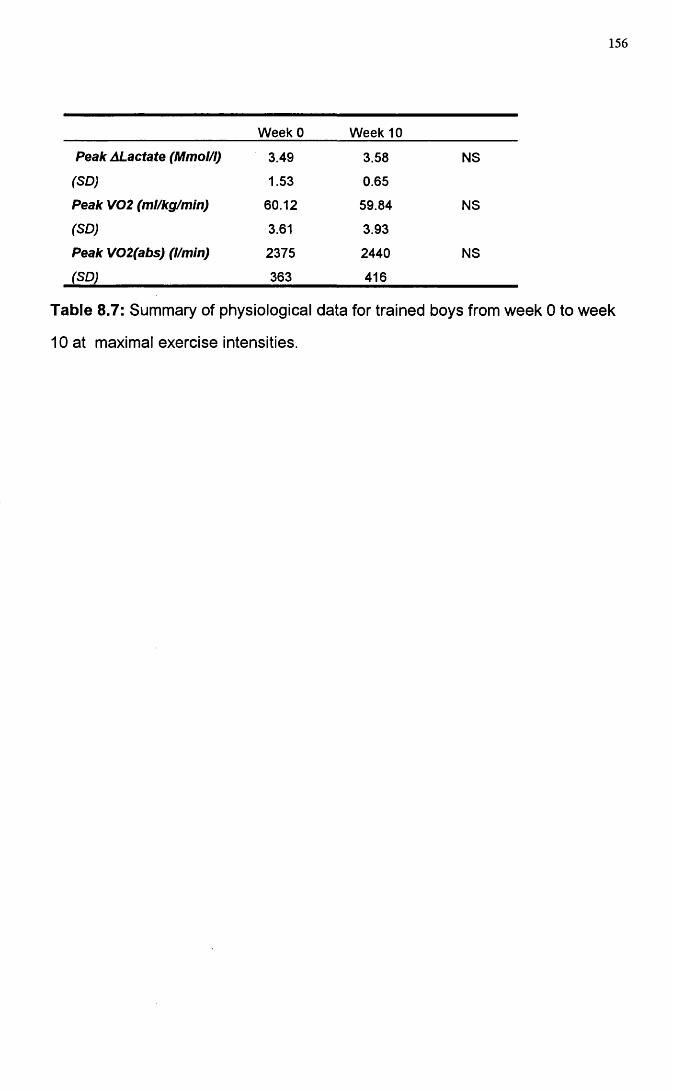
156
Week 0 Week 10
Peak ALactate (Mmol/I) 3.49 3.58 NS
(SD) 1.53 0.65
Peak V02 (ml/kg/min) 60.12 59.84 NS
(SD) 3.61 3.93
Peak V02(abs) (l/mln) 2375 2440 NS
(SD) 363 416
Table 8.7: Summary of physiological data for trained boys from week 0 to week
10 at maximal exercise intensities.
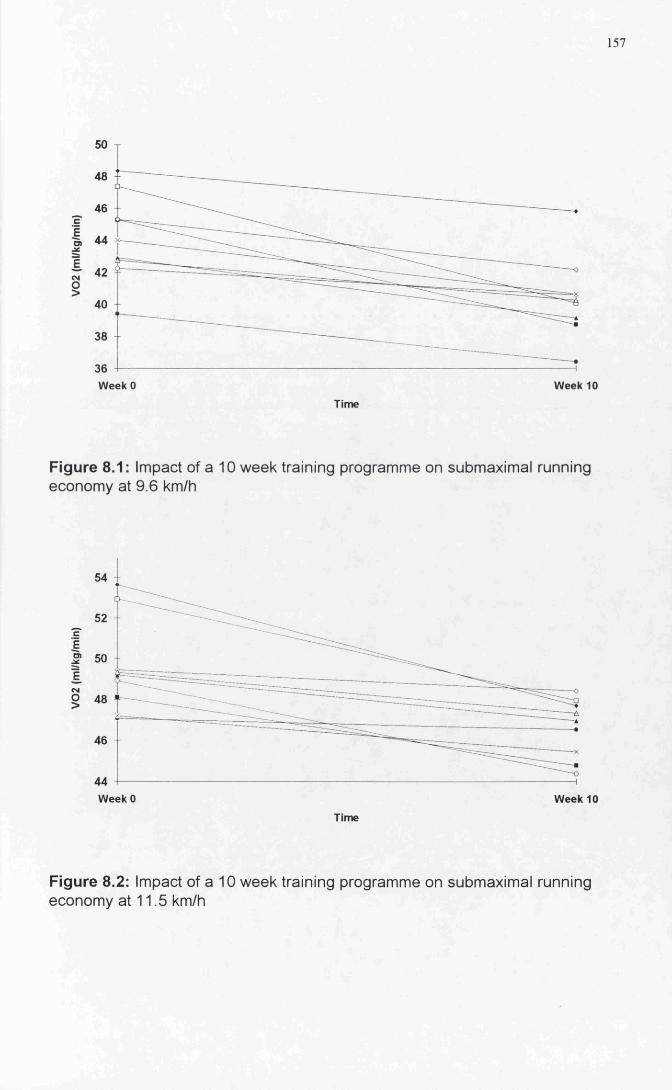
157
46c
44
E
§42
40
36 4-----Week 0 Week 10
Time
Figure 8.1: Impact of a 10 week training programme on submaximal running economy at 9.6 km/h
54
cE5*
ECM
§
46
44 -I-----Week 0 Week 10
Time
Figure 8.2: Impact of a 10 week training programme on submaximal running economy at 11.5 km/h
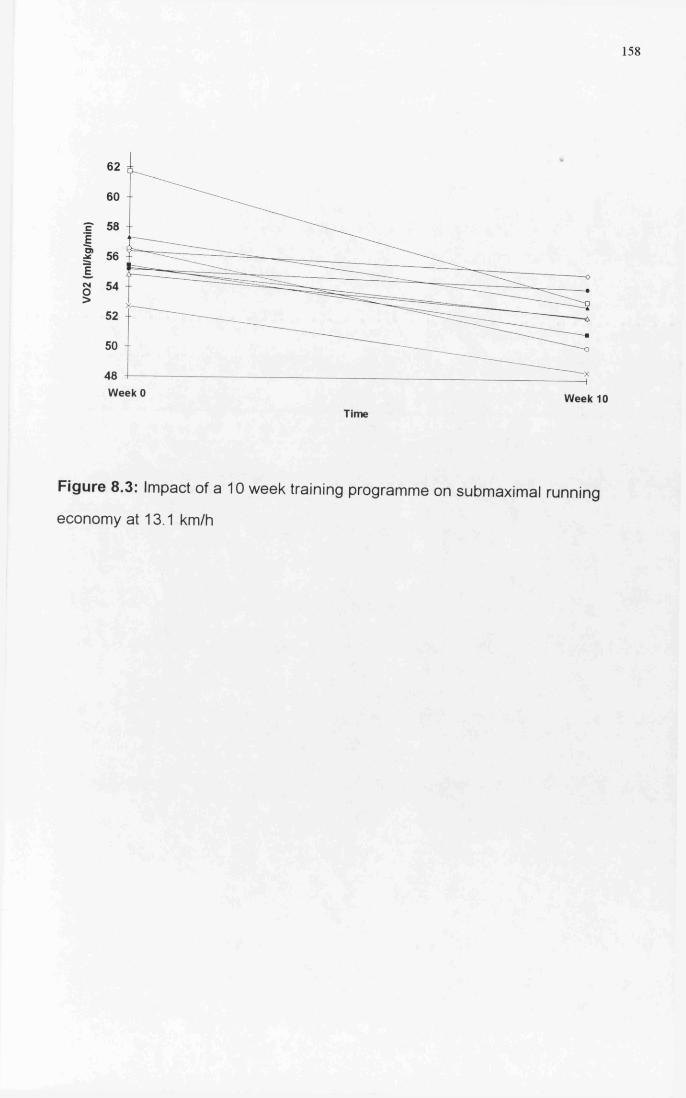
158
62
60
EI 54
52 4-
50 I
48 4-----Week 0 Week 10
Time
Figure 8.3: Impact of a 10 week training programme on submaximal running
economy at 13.1 km/h
159
Be t a 2 - a g o n is t s a n d r u n n in g p e r f o r m a n c e
Introduction
Two key components of submaximal running economy are heart rate and
ventilation. Bailey and Pate (1991 ) demonstrated that the two were positively
correlated with running economy (i.e. an increase in submaximal oxygen
consumption was accompanied by an increase in heart rate and ventilation).
Consequently, the hypothesis was framed that any variation in submaximal heart
rate and ventilation could have implications for whole body submaximal oxygen
consumption. In an attempt to test this hypothesis, we administered inhaled
therapeutic dosages of a (32-agonist (Terbutaline) in a group of normal healthy
pre-pubertal boys.
Recently, there has been concern that p2-agonists may be ergogenic and
actually improve athletic performance (Bedi et al. 1988 and Signorile etal. 1991.)
In asthmatic adults, the possible ergogenic effect of p2-agonists have been
addressed in a number of studies. These studies have shown that the p2-
agonist Salbutamol did not alter the VOgmax in trained asthmatics (Freeman et
al. 1989). In this particular study, the dosage administered was described as the
regular metered dosage for each individual from an aerosol inhaler. Trained
non-asthmatics were also non-responders to p2 stimulation (McKenzie et ai.
1983). In untrained asthmatics a dosage of 5mg in 2ml of saline produced no
enhancement of VOgmax again using an aerosol inhaler (Ingerman-Hanson et
ai. 1980). Schmidt etal. (1988) assessed the response in normal non-asthmatic
adults and again found no significant differences with respect to maximal oxygen
consumption, ventilation, lactate threshold and total run time. In adults,
therefore, it appears, that pre-medication with approximately physiological
160
doses of p2-agonists leads to no significant improvement in maximal exercise
performance in either asthmatic or non-asthmatic, trained or untrained adults.
In children, there is some evidence that the response to p2-agonists may be
different. Zanconato et al. (1990) examined the effects of pre-treatment with a p
2-agonist (Salbutamol) on the energy cost of running at submaximal and
maximal intensities in a group of asthmatic children. Pre-medication with 200pg
of salbutamol via a metered dose inhaler led to lower maximal ventilation and a
lower energy cost of running at submaximal stages compared to placebo. These
data suggested that pre-medication enhanced the submaximal running
performance of an asthmatic child. The use of this drug has other implications in
the light of evidence that suggested that this group of drugs may have ergogenic
properties in children. Asthmatic children are encouraged to participate in a
wide range of sporting activities. However, their ability to take part fully in sport
often depends upon pre-medication with p2-agonists. Removing its use in
competitive sport would prevent the participation of considerable numbers of
junior competitors.
To date, no studies have assessed the possible ergogenic effects of p2-agonists
in normal children. This is of importance because p2-agonists have been
demonstrated to be safe, effective and easily administered. The aim of this
study was to attempt to manipulate submaximal running economy through the
administration of a standard pharmacological dosage of a P2-agonist
(Terbutaline) in normal non-asthmatic pre-pubertal boys and evaluate any
possible ergogenic effects.
161
Methods
Subjects
10 pre-pubertal boys (Tanner stage 1) volunteered to take part in the study (age
10.4+ 0.48yrs, mean + SD, Table 9.1) The study was approved by the Ethics
Committee of the Royal Hospital for Sick Children and informed consent was
obtained from the parents or guardians before the start of the study.
All testing took place in the Respiratory Function Laboratory of the Royal
Hospital for Sick Children. A preliminary familiarisation visit was organised
before the first test. At this visit the subjects were introduced to treadmill walking
and running in order to reduce subsequent test anxiety.
Study Design
The study was a single blind study, with subjects randomly assigned to either a
drug or a placebo group before their first test. Prior to each exercise test, 2 puffs
(SOOpg) of Terbutaline or placebo were administered via a Nebuhaler (Astra,
Herts) using a standard "five breath" technique. The submaximal exercise
protocol was performed first and peak VOg testing was conducted second with
48 hours separating each session. The sequence was paired for both drug and
placebo.
All metabolic data measurements were made using a computerised metabolic
cart (Sensormedics S2900Z , Bilthoven, Netherlands), which was calibrated prior
to each test. This instrument has previously been validated for use in children
(Unnithan etal. 1992). Low dead space valves (Hans-Rudolph 141 OB) and
narrow bore tubing were used to minimise dead space ventilation during the gas
collection phases. Heart rate was monitored using a Sport Tester PE 3000 heart

162
rate monitor (Kempe, Finland). The laboratory temperature was maintained at
21 Celsius and 50% relative humidity for the duration of the study.
Submaximal Economy Testing
All ten boys performed two submaximal economy runs over a 4 week period.
The submaximal protocol involved exercise at 3 submaximal running speeds
(7.2, 8.0 and 8.8 km/h). The submaximal exercise test was discontinuous in
nature. With each 6 minute running stage ended with an 8 minute passive
recovery.
Peak Oxygen Consumption testing
The ten boys also performed two peak VOg tests within the four week period with
drug or placebo administered in the same way as for the submaximal testing.
The peak VOg test involved running at a constant speed of 8.8 km/h with an
increase in gradient of 2.5% every 2 minutes until voluntary exhaustion was
attained. Heart rate and cardio-respiratory variables were measured throughout
the test. The child was judged to have reached peak VOg when any two of the
following four criteria were met (Williams and Armstrong (1991 ):heart rate within
10 beats per minute of the age predicted maximum, a heart rate plateau,
respiratory exchange ratio value of greater than 1.0 and an approximate plateau
of VOg values.
Pulmonary Function Tests
Pulmonary function tests (PFT) were performed using a calibrated pneumotach
system (Screenmate, Jaeger, Germany). Each subject performed three trials for
the assessment of F E V i. PEER was measured using a Wright peak flow meter.
All PFT's were measured prior to the administration of drug or placebo,
immediately post-administration and 2, 8 and 15 minutes post exercise for both
submaximal and maximal exercise testing.
163
Statistical Methods
The sample size was determined by a power calculation based upon an
assumed magnitude of standardised expected differences in oxygen
consumption between treatments of 0.85 and a significance level of 0.05 for a 2-
sided test. Standardised differences (0.85), two-sided alpha error of 0.05 and a
chosen power of 70% determined the selection of 10 subjects for the study (
Statistical Tables for the Design of Clinical trials. Machin and Campbell 1987).
Data were summarised using standard descriptive measures (mean and
standard deviations). Analysis of Variance (ANOVA) was used to investigate
any drug and or speed effects for each variable separately and to compare the
selected variables. Statistics were performed using Minitab version 7 and a
significance level of 0.05 was used.
164
Results
Cardio-respiratory Variables
No significant differences were found after pre-medication for VOgg and heart
rate at both submaximal and maximal exercise intensities (Table 9.2, Figures 9.1
and 9.2). Further AN OVA analysis demonstrated no significant visit effect. A
treatment effect was noted, as pre-medication with Terbutaline resulted in higher
Respiratory Exchange Ratio (drug: 0.94, 0.93, and 0.94 vs placebo: 0.91, 0.92
and 0.91, P<0.05, Figure 9.3). Fractional utilisation values at submaximal
intensities were also elevated with pre-medication (drug: 66, 72 and 77% vs
placebo: 63, 69 and 75%, P<0.05, Figure 9.4).
Pulmonary Function Tests (PFT's)
All children demonstrated normal lung function profiles confirming the absence of
any exercise induced asthmatics within the subjects. Terbutaline and placebo
produced a small but significant pre to post exercise increase in FEV-j
(P<0.001). The small but significant increase in FEV^ was not dependent upon
the exercise intensity. ( Table 9.3)
Pre-treatment with Terbutaline produced a small but significant increase
(P<0.001) in the post-exercise PEFR values. This increase was intensity
dependent: post-maximal values were significantly higher (P<0.001) than post
sub-maximal values. Analysis of the two main effects demonstrated no drug
effect, but a significant visit effect was noted. The PEFR values were
consistently lower at the first visit (all submaximal) than at the second visit
(maximal tests. Table 9.3).
165
Discussion
In this single blind placebo controlled study, a normal pharmacological dose (500
|ig) of Terbutaline had no effect upon the maximal exercise capacity of the non
asthmatic child. In addition, inhalation of the drug produced only small changes
in the cardio-respiratory responses to submaximal steady state exercise.
No significant differences were noted with respect to oxygen consumption at any
of the submaximal running stages. Thus, running economy defined as the
energy cost at a given submaximal work load was unaffected by the inhalation of
the drug. Lung function data generated by this study demonstrated that all
children had normal lung function and pre-medication produced no
physiologically significant enhancement of PEFR and FEV i.
The increased RER in the absence of any significant ventilatory changes with
pre-medication could be attributed to a possible shift in substrate utilisation. An
increased relative contribution of carbohydrate ( Persson et al. 1970) could have
led to the elevation in the RER. The use of RER as an estimation of substrate
utilisation is a crude index. However, in the absence of blood analysis and with
the lack of ventilatory change, only tentative substrate inferences can be made.
Terbutaline has the capacity to stimulate both lipolysis and to enhance
glycogenolysis in the liver. It also has the capacity to influence potassium
uptake into the cells. The higher RER values demonstrated with pre-medication
might, therefore, indicate a possible shift towards an increased carbohydrate
contribution in exercise. This would have been expected to be associated with a
lower oxygen consumption at submaximal exercise (Bailey and Pate (1991).
While statistical significance was obtained for the RER shift, the magnitude of
these changes are small, therefore the interpretation of substrate changes
should be treated with caution.
166
Direct manipulation of carbohydrate levels during exercise were conducted by
Davis et a i (1988), who demonstrated, that an increased carbohydrate ingestion
during submaximal exercise while increasing the RER had no significant effect
upon reducing the submaximal oxygen consumption. Alternatively, increased
recruitment of fast-twitch fibres would lead to greater glycogen depletion and
hence an elevated RER. However, it would appear unlikely that a change in
muscle fibre recruitment could be stimulated by the acute administration of a [32-
agonist.
Fractional utilisation has been found to be closely related to running
performance in adults ( Conley & Krahenbuhl 1980), but its significance in
children is not yet established. Consequently, the elevated fractional utilisation
values with pre-medication are of uncertain significance with respect to running
performance in children. The cause of this increased fractional utilisation may
be due to the impact of the drug elevating resting metabolic rate. Imai et a i
(1975) stated that the cardiovascular changes seen with the inhalation of a p2-
agonist in situ or in isolation would have minimal significance under the normal
physiologic conditions of exercise, as the response would be completely
masked by the systemic response of the body to an increased oxygen demand.
Consequently, a rigorous analysis of resting metabolism would be required to
fully understand the mechanisms of the observed changes.
Whether chronic long-term usage of the drug would systematically alter the
child's response has yet to be evaluated. The improved submaximal energy cost
of running seen with pre-medication with Albuterol in mild asthmatics, Zanconato
et a i (1990). could have been influenced by the fact that several subjects were
on long-term medication. The impact that these drugs may have upon long-term
metabolic adaptations to exercise have yet to be elucidated. However,
McKenzie et a i (1983) demonstrated that a 1 week administration of inhaled
167
salbutamol produced no improvement in V02m ax or pulmonary function in non
asthmatic adults.
It was not possible to estimate the effective dosage of the of the drug
administered. However, it is clearly documented in the literature that the
nebuhaled route of administration has the greatest local effect and the least
systemic toxicity Katzung (1989). Terbutaline also has a longer duration of
action than other sympathiomimetics. Therefore it is assumed that optimal
effective dosages were attained for all the children.
It would appear based upon cardio-respiratory and pulmonary function data that
Terbutaline was not capable of modifying whole body oxygen consumption. The
use of a p2-agonist enabled us to re-examine the relationship established by
Zanconato et al. 1990 between enhanced submaximal performance and the
administration of the drug in asthmatic children. Based upon the relationship
established by Bailey and Pate (1991) the expected outcome for the
administration of a p2-agonist should have been a higher energy cost of running.
This was not achieved in the present study, possibly as a result of the less
systemic nature of the drug.
The lack of change in heart rate and ventilation following pre-medication could
have been a product of the specific nature of the drug. Consequently, the use of
a more systemic, less specific p2-agonist could potentially have modified heart
rate and ventilation responses. The absence of any change in submaximal
running economy following pre-medication may be an indication of the
robustness of this variable to manipulation. Alternatively it may indicate the
subtle interplay of variables such as heart rate, ventilation and substrate
utilisation.
168
From the evidence of this study it appears that the acute use of a p2-agonist
pre-exercise confers no significant ergogenic benefits on submaximal and
maximal running performance in non-asthmatic children. However, further
investigations utilising more invasive techniques (blood substrate analysis) will
be necessary to fully understand the mechanism of action of this drug and its
interaction with children and exercise.
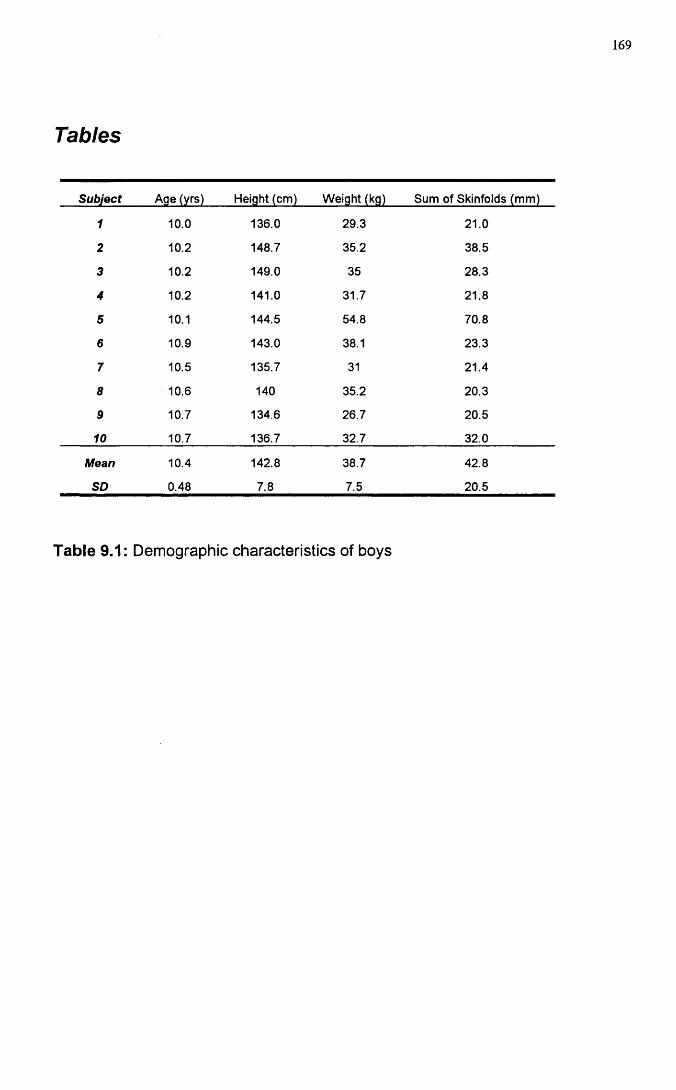
169
Tables
Subject Age (yrs) Height (cm) Weight (kg) Sum of Skinfolds (mm)
1 10.0 136.0 29.3 21.0
2 10.2 148.7 35.2 38.5
3 10.2 149.0 35 28.3
4 10.2 141.0 31.7 21.8
5 10.1 144.5 54.8 70.8
6 10.9 143.0 38.1 23.3
7 10.5 135.7 31 21.4
8 10.6 140 35.2 20.3
9 10.7 134.6 26.7 20.5
10 10.7 136.7 32.7 32.0
Mean 10.4 142.8 38.7 42.8
SD 0.48 7.8 7.5 20.5
Table 9.1: Demographic characteristics of boys
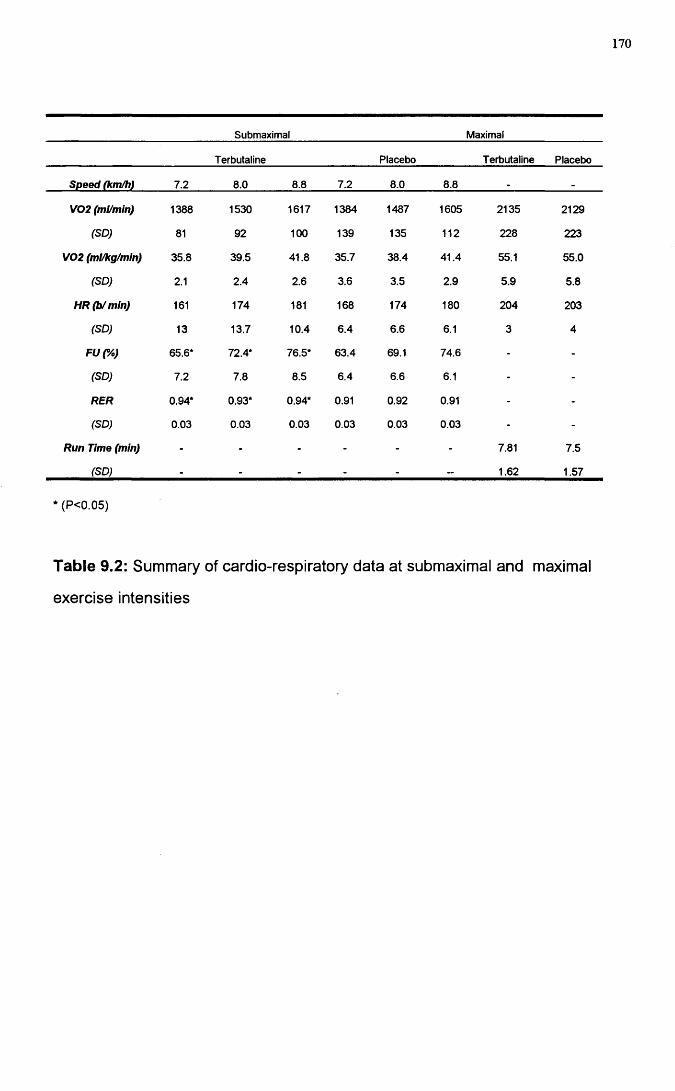
170
Submaximal Maximal
Terbutaline Placebo Terbutaline Placebo
Speed (km/h) 7.2 8.0 8.8 7.2 8.0 8.8 .
V02 (ml/min) 1388 1530 1617 1384 1487 1605 2135 2129
(SD) 81 92 100 139 135 112 228 223
V02 (ml/kg/mln) 35.8 39.5 41.8 35.7 38.4 41.4 55.1 55.0
(SD) 2.1 2.4 2.6 3.6 3.5 2.9 5.9 5.8
HR(b/mln) 161 174 181 168 174 180 204 203
(SD) 13 13.7 10.4 6.4 6.6 6.1 3 4
FUC/o) 65.6* 72.4* 76.5* 63.4 69.1 74.6 - -
(SD) 7.2 7.8 8.5 6.4 6.6 6.1 - -
RER 0.94* 0.93* 0.94* 0.91 0.92 0.91 - -
(SD) 0.03 0.03 0.03 0.03 0.03 0.03 - -
Run Time (mln) - - - - - - 7.81 7.5
(SD) - - - - - - 1.62 1.57
*(P<0.05)
Table 9.2: Summary of cardio-respiratory data at submaximal and maximal
exercise intensities
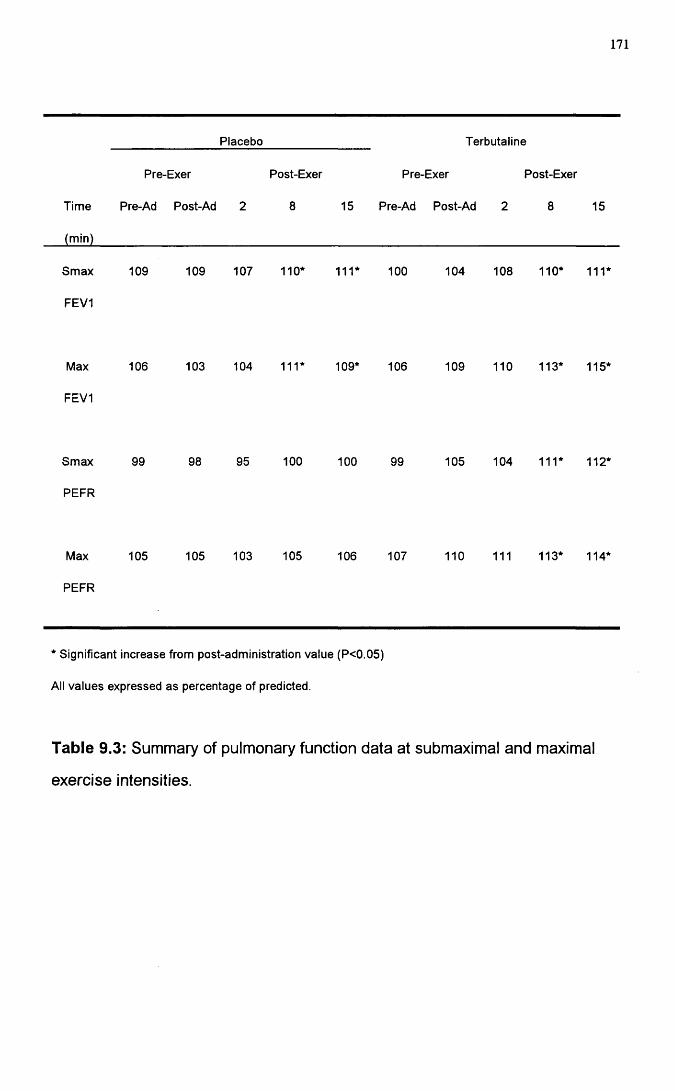
171
Placebo Terbutaline
Pre-Exer Post-Exer Pre-Exer Post-Exer
Time Pre-Ad Post-Ad 2 8 15 Pre-Ad Post-Ad 2 8 15
Smax
FEVI
109 109 107 110* 111* 100 104 108 110* 111*
Max
FEVI
106 103 104 111* 109* 106 109 110 113* 115*
Smax
PEFR
99 98 95 100 100 99 105 104 111* 112*
Max
PEFR
105 105 103 105 106 107 110 111 113* 114*
* Significant increase from post-administration value (P<0.05)
AH values expressed as percentage of predicted.
Table 9.3: Summ ary o f pulm onary function data at subm axim al and maximal
exerc ise intensities.
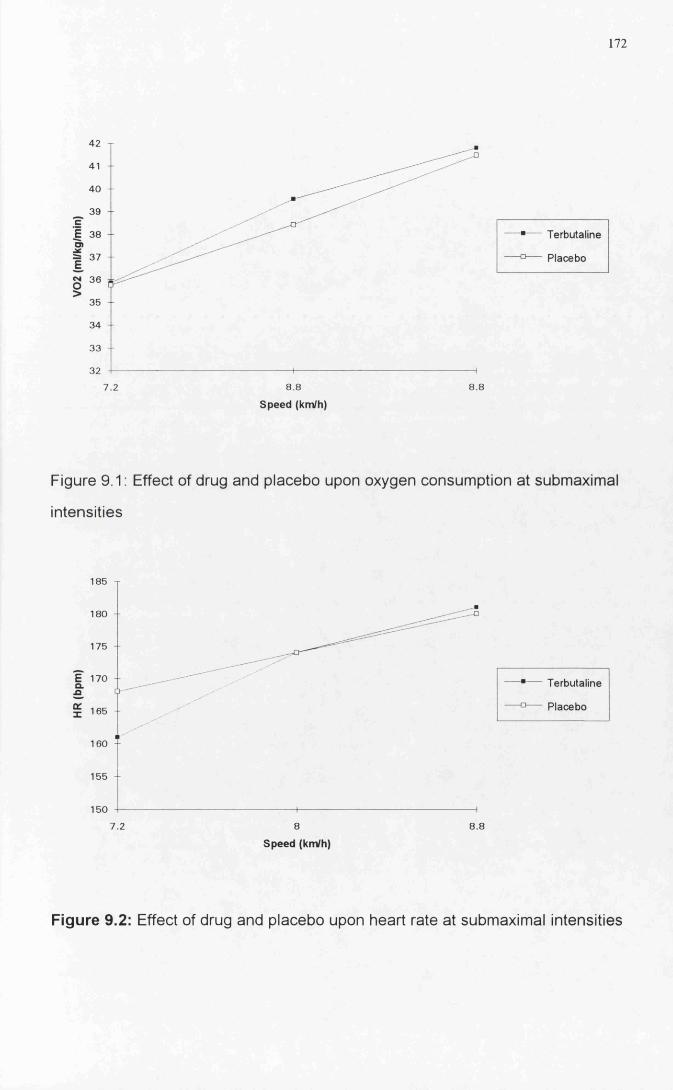
172
42
41
40 - -
39
en37
35
34 - -
33
32
8 8 8 87.2
Terbutaline
Placebo
Speed (km/h)
Figure 9.1: Effect o f drug and placebo upon oxygen consum ption at submaximal
in tensities
o..o
185
180
175
170
165
160
155
150
7.2 8 8.8
Terbutaline
Placebo
Speed (km/h)
Figure 9.2: Effect of drug and placebo upon heart rate at subm axim al in tensities
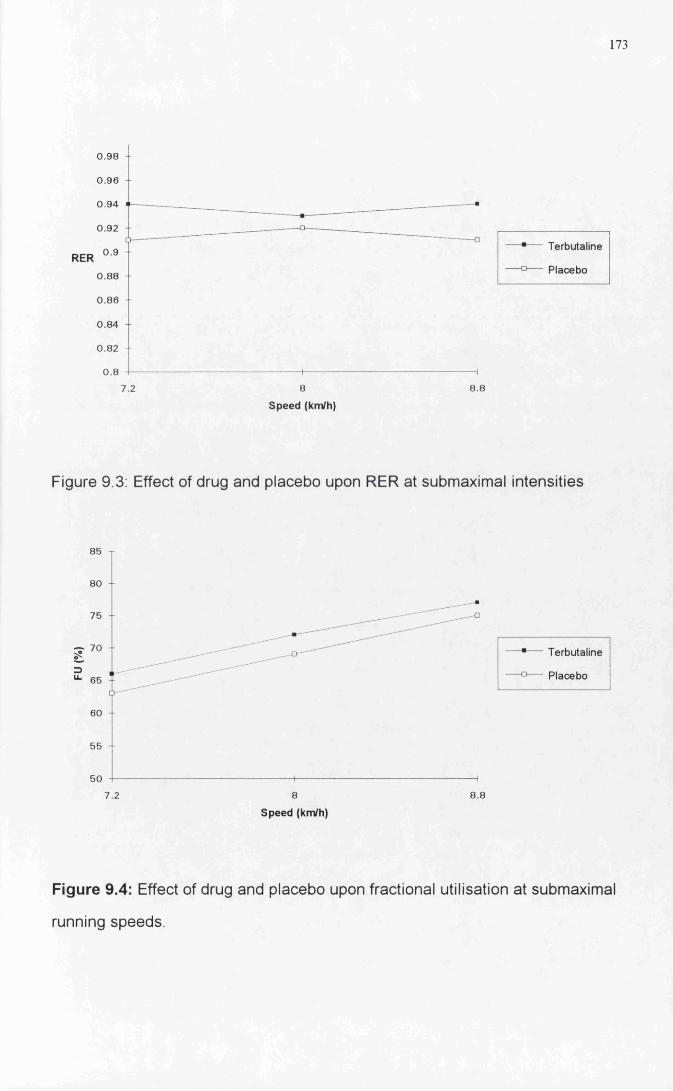
173
RER
0.98
0.96
0 94
0.92
0.9
0 .8 8
0 .8 6
0.84
0.82
0 .8
Terbutaline
Placebo
7.2
Speed (km/h)
Figure 9.3; Effect of drug and placebo upon RER at submaximal intensities
85
80
75
g "=)
65
Terbutaline
Placebo
60 +
55
50
7.2 8.8
Speed (km/h)
Figure 9.4: Effect of drug and placebo upon fractional utilisation at submaximal
running speeds.

174
GENERAL DISCUSSION
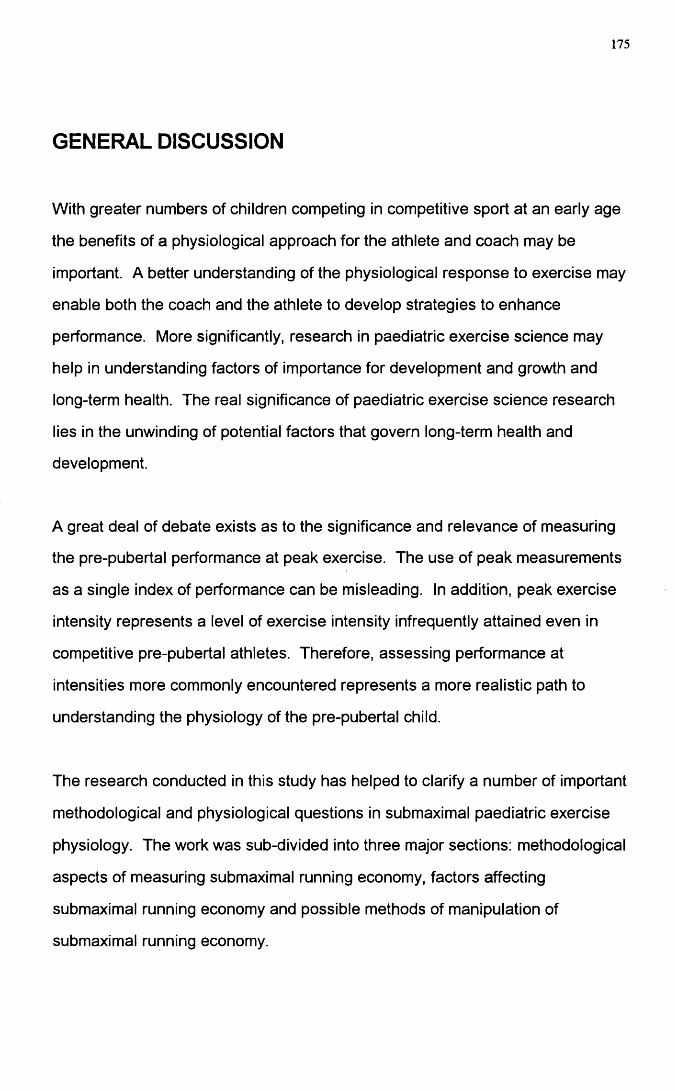
175
GENERAL DISCUSSION
With greater numbers of children competing in competitive sport at an early age
the benefits of a physiological approach for the athlete and coach may be
important. A better understanding of the physiological response to exercise may
enable both the coach and the athlete to develop strategies to enhance
performance. More significantly, research in paediatric exercise science may
help in understanding factors of importance for development and growth and
long-term health. The real significance of paediatric exercise science research
lies in the unwinding of potential factors that govern long-term health and
development.
A great deal of debate exists as to the significance and relevance of measuring
the pre-pubertal performance at peak exercise. The use of peak measurements
as a single index of performance can be misleading. In addition, peak exercise
intensity represents a level of exercise intensity infrequently attained even in
competitive pre-pubertal athletes. Therefore, assessing performance at
intensities more commonly encountered represents a more realistic path to
understanding the physiology of the pre-pubertal child.
The research conducted in this study has helped to clarify a number of important
methodological and physiological questions in submaximal paediatric exercise
physiology. The work was sub-divided into three major sections: methodological
aspects of measuring submaximal running economy, factors affecting
submaximal running economy and possible methods of manipulation of
submaximal running economy.
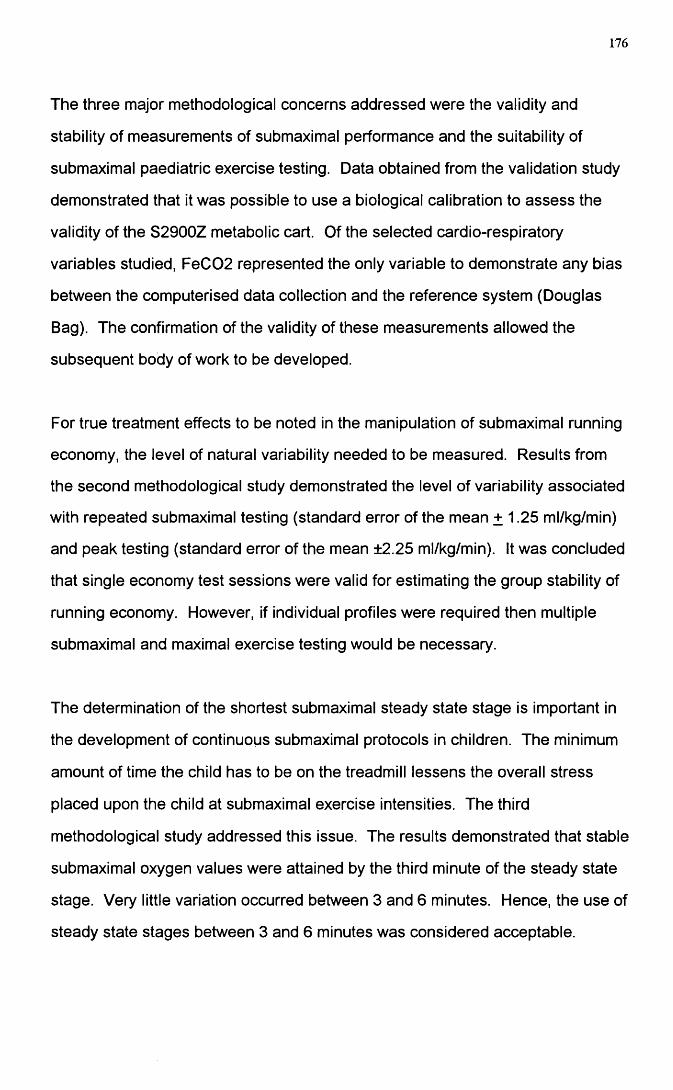
176
The three major methodological concerns addressed were the validity and
stability of measurements of submaximal performance and the suitability of
submaximal paediatric exercise testing. Data obtained from the validation study
demonstrated that it was possible to use a biological calibration to assess the
validity of the S2900Z metabolic cart. Of the selected cardio-respiratory
variables studied, FeC 02 represented the only variable to demonstrate any bias
between the computerised data collection and the reference system (Douglas
Bag). The confirmation of the validity of these measurements allowed the
subsequent body of work to be developed.
For true treatment effects to be noted in the manipulation of submaximal running
economy, the level of natural variability needed to be measured. Results from
the second methodological study demonstrated the level of variability associated
with repeated submaximal testing (standard error of the mean + 1.25 ml/kg/m in)
and peak testing (standard error of the mean ±2.25 ml/kg/min). it was concluded
that single economy test sessions were valid for estimating the group stability of
running economy. However, if individual profiles were required then multiple
submaximal and maximal exercise testing would be necessary.
The determination of the shortest submaximal steady state stage is important in
the development of continuous submaximal protocols in children. The minimum
amount of time the child has to be on the treadmill lessens the overall stress
placed upon the child at submaximal exercise intensities. The third
methodological study addressed this issue. The results demonstrated that stable
submaximal oxygen values were attained by the third minute of the steady state
stage. Very little variation occurred between 3 and 6 minutes. Hence, the use of
steady state stages between 3 and 6 minutes was considered acceptable.
177
Profiling the physiological differences between a group of run-trained and control
boys indicated that some form of physiological adaptation had occurred, either
as a result of pre-selection or training. At submaximal exercise intensities
differences in blood lactate, fractional utilisation, ventilatory equivalent, heart
rate, ventilation and respiratory exchange ratio were noted. Confounding data
obtained in the run-trained group indicated that the submaximal oxygen cost of
running appeared to be similar to the controls in one study and higher in the
second study. Inferences with regard to enhanced free fatty acid oxidation in the
trained boys were postulated. The influence of kinematic factors upon
submaximal running economy was investigated and found to be minimal with no
significant differences evident in gait characteristics between the two
populations. It appeared that gait adjustment was a product of running velocity
rather the training status. On the basis of these results, the use of submaximal
running economy as a marker for physiological differences between trained and
untrained populations is valid. One limitation of the profile studies conducted in
this thesis lay in the composition of the groups. The control boys in this study
represented very active boys and the run-trained boys varied in their training
history. Thus, there is the possibility of physiological overlap between the two
groups. Consequently, negative findings on subsequent statistical findings must
be treated with caution.
The one clear index that differed throughout all the studies was peak VOg, with
run-trained boys demonstrating superior aerobic power. The source of this
difference could have been as a result of training or a consequence of genetic
pre-selection for running. The nature of these studies undertaken prevent us
from answering this question fully.
In an attempt to manipulate submaximal running economy, a high intensity
aerobic training intervention study was conducted. Ergogenic manipulation of
178
submaximal running economy was also attempted using an agent whose
ergogenic potential has been suggested. The inhalation of a [32-agonist
(Terbutaline), however, was found to have no effect upon submaximal running
economy. In contrast, the training led to striking improvements in submaximal
running economy of the order of 7%. The possible sources of this improvement
are many: increased glycolytic potential, enhanced cardiovascular and
ventilatory responses, substrate utilisation shifts and possible body composition
changes. The possibility of altering submaximal running economy through
training remains the most striking aspect of this work into submaximal running
economy. Following training, the indications are that submaximal running
economy is an appropriate and sensitive marker to assess the impact of training
in a pre-pubertal population.

179
REFERENCES
180
REFERENCES
Armstrong, L E. & Costill, D.L. (1985) Variability of respiration and metabolism: Responses to submaximal cycling and running. Research Quarterly for Exercise and Sport, 56(2), 93-96.
Astrand, P.O. (1952) Experimental studies of physical working capacity in
relationship to sex and age. Copenhagen, Munksgaard.
Bailey, S.P. & Pate, R. R. (1991) Feasibility of improving running economy. Sports Medicine, 12 (4), 228-236.
Bar-Or, O. & Zwiren, L. D. (1973) Physiological effects of frequency and
content variation of physical education classes and of endurance conditioning on
9 to 10 year old boys, pp 198-208. In Paediatric Work Physiology, ed. Bar- 0 r ,0 , Israel, Wingate press.
Bedi, J.F., Gong, H. & Horvath, S.M. (1988) Enhancement of performance with
inhaled albuterol. Canadian Journal of Sports Science, 13, 144-148.
Berg, A. & KeuI, J. (1980) Serum alanine during long-lasting physical exercise. International Journal of Sports Medicine, 1, 199-202.
Bielen, E., Fagard, R. & Amery, A, (1990) Inheritance of heart structure and
physical exercise capacity: a study of left ventricular structure and exercise
capacity in 7 year old twins. European Heart Journal, 11, 7-16.
Bouchard, C. (1986) Genetics of aerobic power and capacity. In Sport and
Human Genetics, ed. Malina, R. M. & Bouchard C. pp 59-88, Champaign
Illinois, Human Kinetics.
Bransford, D. R. & Howley, E. T. (1977) Oxygen cost of running in trained
and untrained men and women. Medicine and Science in Sports and Exercise, 9, 41-44.
181
Brookes, G. A. & Fahey, T. D. (1984) Exercise Physiology: Human
bioenergetics and its applications. pp117-139. New York, MacMillan.
Brown, C H., narrower, J. R. & Deeter, M. S. (1972) The effects of cross
country running on pre-adolescent girls. Medicine and Science in Sports and
Exercise, 4, 1-5.
Cavanagh, P. & Kram, R. (1985) The efficiency of human movement-a
statement of the problem. Medicine and Science in Sports and Exercise, 17, 304-308.
Cavanagh, P R. & Kram, P. (1985) Mechanical and muscular factors affecting
the efficiency of human movement. Medicine and Science in Sports and
Exercise, 17, 326-331.
Cavanagh, P R. & Williams, K.R. (1982) The effect of stride length variation on
oxygen uptake during distance running. Medicine and Science in Sports and
Exercise, 14, 30-35.
Cavanagh, P, R., Pollock, M.L & Landa, J. (1977) A biomechanical comparison
of elite and good distance runners. Annals of New York Academy of Science, 301, 328-333.
Conley, D., Krahenbuhl, G., Burkett, L. & Millar, A. (1984) Following Steve
Scott: physiological changes accompanying training. The Physician and Sports
Medicine, 12, 103-106.
Conley, D., Krahenbuhl, G., Burkett, L. & Millar, A. (1981) Physiological correlates of female road racing performance. Research Quarterly for Exercise
and Sport, 52, 441-448.
Conley, D.L. & Krahenbuhl, G.S. (1980) Running economy and distance
running performance of highly trained athletes. Medicine and Science in Sports
and Exercise, 12, 357-360.
Consolazio, C F., Johnson, R E. & Pecora, L. J. (1963) Physiological measurements of metabolic functions in man. New York: McGraw-Hill.
182
Costill, D., Thomason, H. & Roberts, E. (1973) Fractional utilisation of the
aerobic capacity during distance running. Medicine and Science in Sports and
Exercise, 5, 248-252.
Costill, D. & Winrow, E. A. (1970) A comparison of two middle-aged ultramarathon runners. Research Quarterly for Exercise and Sport, 41, 135-139.
Costill, D.L. (1967) The relationship between selected physiological variables
and distance running performance. Journal of Sports Medicine and Physical Fitness, 7, 61 -66.
Cowart, V. S. (1987) How does heredity affect athletic performance. The
Physician and Sports Medicine, 15, 134-140.
Crews, D. J. (1992) Psychological state of running economy. Medicine and
Science in Sports and Exercise, 24 (4), 475-482.
Cumming, G. R., Garand, T. & Borysyk, L. (1972) Correlation of performance
in track and field events with bone age. Journal of Paediatrics, 80, 970-973.
Cunningham, D. A., Stapleton, J. J., MacDonald, I. C. & Paterson, D. H.(1981 ) Daily energy expenditure of young boys as related to maximum aerobic
power. Canadian Journal of Applied Sports Science, 6, 207-211.
Cunningham, D.A., MacFarlane Van Waterschoot, B., Paterson, D.H., Lefcoe,M. & Sangal S P. (1977) Reliability and reproducibility of maximal oxygen
uptake measurement in children. Medicine and Science in Sports and Exercise , 9 (2 ), 104-108.
Cunningham, D.A., Telford D. & Swart, G T. (1976) The cardio-pulmonary
capacities of young hockey players age 10. Medicine and Science in Sports and Exercise, 8, 23-25.
Cunningham, L. N. (1990a) Physiologic comparison of adolescent female and
male cross-country runners. Paediatric Exercise Science, 2, 313-321.
183
Cunningham, L.N. (1990b) Relationship of running economy, ventilatory
threshold and VOgmax to running performance in high school females.
Research Quarterly for Exercise and Sport, 61, 369-374.
Cureton, K. J., Boileau, R. A., Lehman, T. G. & Misner, J. E. (1977) Determinants of distance running performance in children: Analysis of a path
model. Research Quarterly for Exercise and Sport, 48, 270-279.
Daniels, J. & Daniels, N. (1992) Running economy of elite male and elite
female runners. Medicine and Science in Sports and Exercise, 24 (4 ) , 483-489.
Daniels, J. T. A physiologist's view of running economy. (1985) Medicine and
Science in Sports and Exercise, 17 (3), 332-338.
Daniels, J., Scardina, N., Hayes, J & Foley, P. (1984) Variations in VOg
submax during treadmill running. Medicine and Science in Sports and Exercise, 16, 108.
Daniels, J.T., Yarbrough, R. A. & Foster, C. (1978) Changes in VOg max and
running performance with training. European Journal of Applied Physiology, 39, 249-254.
Daniels, J. (1974) Physiological characteristics of champion male athletes. Research Quarterly for Exercise and Sport, 45, 342-348.
Daniels, J. & Oldridge, N. (1971) Changes in oxygen consumption of young
boys during growth and running training. Medicine and Science in Sports and
Exercise, 3, 161-165.
Davies, C.T. M., Tuxworth, W. & Young, J .M . (1970) Physiological effects of repeated exercise. Clinical Science, 39, 247-258.
Davis, J.M., Lamb, D R., Pate, R.R., Slentz, C.A. & Burgess, W.A. (1988) Carbohydrate electrolyte drinks; effects of endurance cycling in the heat. American Journal of Clinical Nutrition, 48, 1023-1030.
Ekblom, B. (1969) Effect of physical training in adolescent boys. Journal of Applied Physiology, 27, 350-355.
184
Eriksson, B.O. (1980) Muscle metabolism in children - a review. Acta
Paediatrica Scandinavica, Supplement, 283, 20-27.
Eriksson, B.O. & Koch, G. (1973) Effect of physical training on hemodynamic
response during maximal and submaximal exercise. Acta Physiologica
Scandinavica, 87, 27-39.
Eriksson, B.O. (1972) Physical training, oxygen supply and muscle metabolism
in 11-13 year old boys. Acta Physiologica Scandinavica, 384, 1 -48.
Farrell, P. A., Wilmore, J. H., Coyle, E. F., Billing, J. E. & Costill, D. L. (1979) Plasma lactate accumulation and distance running performance. Medicine and
Science in Sports and Exercise, 11, 338-334.
Fay, L.. Londeree, B.R., La Fontaine, T.P. & Volek, M R. (1989) Physiological parameters related to distance running performance in female athletes.Medicine and Science in Sports and Exercise, 21, 319-324.
Foster, C., Daniels, J.T & Yarbrough, R. A. (1977) Physiological and training
correlates of marathon running performance. Australian Journal of Sports
Medicine, 9, 58-61.
Freeman, W., Pache, G.E. & Clayton, R.M. (1989) Effects of nebulised
salbutamol on exercise performance in men with mild asthma. Thorax, 44, 940- 947.
Gilliam, T. B., Freedson, P. S., Greenan, D. L. & Shahraray, B. (1981)Physical activity patterns determined by heart rate monitoring in 6-7 year old
children. Medicine and Science in Sports and Exercise, 13, 65-67.
Gutin, B., Keith, R. & Stewart, B. (1976) Relationship among submaximal heart rate, aerobic power and running performance in children. Research Quarterly for Exercise and Sport, 47, 537-539.
Hamel, P., Simoneau, J., Lortie, G., Boulay, M. R. & Bouchard, C. (1986) Heredity and muscle adaptation to endurance training. Medicine and Science in
Sports and Exercise, 18, 690-696.
185
Hebbelinck, M. (1978) Methods of biological maturity assessment. Medicine
and Science in Sports and Exercise, 11,108-117.
Hogberg, P. (1952) How do stride length and stride frequency influence the
energy output during running. Arbeitphysiologie, 14, 437-441.
Imai, S., Otorii, T., Takeda, K. & Katano, Y. (1975) Coronary vasodilation and
adrenergic receptors in the dog heart and coronary. Japanese Journal of Pharmacology, 25.
Ingerman-Hanson, I., Bundgaard, A., Halkjaeer-Kristensen, J., Siggard- Anderson, J. & Weeke, B. (1980) Maximal oxygen consumption rate in patients with bronchial asthma - the effects of p2-adrenoceptor stimulation. Scandinavian
Journal of Clinical Laboratory Investigation, 40, 99-104.
Jones, N. L. (1984) Evaluation of a microprocessor controlled exercise testing
system. Journal of Applied Physiology, 57 (5), 1312-1318.
Kalis, J. K., Freund, B.J., Joyner, M.J., Jilka, S.M. & Nittolo, J. (1988) Effect of p-blockade on the drift in 0 2 consumption during prolonged exercise. Journal of
Applied Physiology, 64, 753-758.
Kaneko, M., Ito, A., Fuchimoto, T. & Toyooka J. (1981) Mechanical work and
efficiency of young distance runners during level running. In Biomechanics VII- B, ed. Morecki, A.. Fidelus, K., Kedzior, K. & Wit, A.234-240, Baltimore, University Park Press.
Katch, V.L., Sady, S. S., & Freedson, P. (1982) Biological variability in
maximum aerobic power. Medicine and Science in Sports and Exercise, 14 (1), 21-25.
Katch, V., Weltman, A., Sady, S. & Freedson, P. (1978) Validity of the relative
percent concept for equating training intensity. European Journal of Applied
Physiology, 39, 219-227.
Katzung, B.C. (1989) Basic and Clinical Pharmacology. Fourth Edition, Appleton and Lange, Conneticut, USA.
186
Kellet, D. W., Willan, P. L. T. & Bagnall, K. J. (1978) A study of potential Olympic swimmers, part 2. Changes due to 3 months of intensive training.British Journal of Sports Medicine, 12, 87-92.
Kitamura, K., Jorgenson, C. R., Gobel, F. L , Taylor, H. L. & Wang, Y. (1972) Haemodynamic correlates of myocardial oxygen consumption. Journal of Applied Physiology. 32,516-522.
Knuttgen, H.G. (1961) Oxygen uptake and pulse rate while running with
undetermined and determined stride lengths at different speeds. Acta
Physiologica Scandinavica, 52, 366-371.
Koch, G. & Rocker, L. (1980) Total amount of haemoglobin, plasma and blood
volume and intraventricular protein masses in trained boys. In Children and
Exercise I, ed Berg, K. & Eriksson, B.O. pp 109-115, Baltimore, University
Park Press.
Koch, G. (1974) Muscle blood flow after ischaemic work and during bicycle
ergometer work in boys aged 12 years. Acta Paedatrica Belgica, (Supplement), 28, 29-39.
Krahenbuhl, G. S. & Williams, T. (1992) Running economy. Changes with
age during childhood and adolescence. Medicine and Science in Sports and
Exercise, 24 (4), 462-466.
Krahenbuhl, G. S., Morgan, D.W. & Pangrazi, R. P. (1989) Longitudinal changes in distance running performance of young males. International Journal of Sports Medicine, 10 (2), 92-96.
Krahenbuhl, G. & Pangrazi, R. (1983) Characteristics associated with running
performance in young boys. Medicine and Science in Sports and Exercise, 15,
486-490.
Krahenbuhl, G.S., Pangrazi, R. P. & Chomokas, E.A. (1979) Aerobic
responses of young boys to submaximal running. Research Quarterly for Exercise and Sport, 50 (3), 413-421.
187
Krahenbuhl, G. S., Pangrazi, R. P., Peterson, G. W., Burkett, L. N. &
Schneider, M. J. (1978) Field testing of cardio-respiratory fitness in primary
school children. Medicine and Science in Sports and Exercise, 10 (3), 208-213.
Lussier, L. & Buskirk, E.R. (1977) Effect of an endurance training regimen on
assessment of work capacity on pre-pubertal children. Annals of the New York
Academy of Science, 301, 734-747.
Macek, M. (1986) Aerobic and anaerobic energy output in children. In Children
and Exercise XII, ed. Rutenfranz, J., Mocellin, R. & Klimt, F. pp3-9.Champaign, Illinois: Human Kinetics.
Macek, M. & Vavra, J. (1985) Anaerobic threshold in children. \n Children and
Exercise XI, ed. Binkhorst, R.A., Kemper, H,C,G. & Saris, W.H.M. pp 110-118. Champaign, Illinois: Human Kinetics.
Machin, D. & Campbell, M.J. (1987) Statistical tables for the Design of Clinical trials. Blackwell, London.
Martin, P.E. & Morgan, D.W. (1992) Biomechanical considerations for economical walking and running. Medicine and Science in Sports and Exercise, 24, (4), 467-474.
Massicotte, D. R., Gauthier, R. & Markon, P. (1985) Prediction of V O 2 max
from the running performance in children aged 10-17 years. Journal of Sports
Medicine, 25, 10-17.
Massicotte, D. R. & McNab, R. B. J. (1974) Cardio-respiratory adaptations to
training at specified intensities in children. Medicine and Science in Sports and
Exercise, 6, 242-246.
Maughan, R. & Leiper, J. (1983) Aerobic capacity and fractional utilisation of aerobic capacity in elite and non-elite male and female marathon runners. European Journal of Applied Physiology, 52, 80-87.
Mayers, N. & Gutin, B. (1979) Physiological characteristics of elite pre-pubertal cross country runners. Medicine and Science in Sports and Exercise, 11 ,172- 176.

188
McKenzie. D.R., Rhodes, E.C., Stirling, D R., Wiley, J.P., Dunwoody, D.W., Filsinger, I.B., Jang, F. & Stevens, A. (1983) Salbutamol and treadmill performance in non-atopic athletes. Medicine and Science in Sports and
Exercise, 15, 520-522.
McMahon, T.A. (1984) Muscles, Reflexes and Locomotion. Princeton New
Jersey, Princeton University Press.
Melichna, J., Mackova, E., Fric, J., Novak, J. & Zauner, C. (1988) Muscle
morphology and biochemistry in relation to anaerobic and aerobic work
capacities of athletes. FASEB Journal, 2, A713.
Messier, S. P. & Cirillo, K.J. (1989) Effects of a verbal and visual feedback
system on running technique, perceived exertion and running economy in female novice runners. Journal of Sports Science, 7, 113-126.
Millic-Emili, G., Petit, J. M. and Deroanne, R. (1962) Mechanical work of breathing during exercise in trained and untrained subjects. Journal of Applied
Physiology, 17, 43-49.
Mirwald, R. L. & Bailey, D. A. (1986) Maximal aerobic power. A longitudinal analysis. London, Ontario, Sports Dynamics.
Mirwald, R. L., Bailey, D. A., Cameron, N. & Rasmussen, R. L. (1981) Longitudinal comparison of aerobic power in active and inactive boys aged 7 to
17 years. Annals of Human Biology, 8, 405-414.
Morgan, D. W. & Craib, M. (1992) Physiological aspects of running economy. Medicine and Science in Sports and Exercise, 24 (2), 456-461.
Morgan, D. W., Martin, P. E., Krahenbuhl, G.S., & Baldini, F. D. (1991) Variability in running economy and mechanics among trained male runners. Medicine and Science in Sports and Exercise, 23 (3), 378-383.
Morgan, D.W., Martin, P.E. & Krahenbuhl, G.S. (1989a) Factors affecting
running economy. Sports Medicine, 7, 310-330.
189
Morgan, D.W., Baldini, F. D., Martin, P. E. & Kohrt, W. M. (1989b) Ten
kilometer performance and predicted velocity at VOgmax among well trained
male runners. Medicine and Science in Sports and Exercise, 21 (1), 78-83.
Morgan, D. W., Baldini, F.D. and Martin, P.E. (1987) Day to day stability in
running economy and step length among well-trained male runners. InternationalJournal of Sports Medicine (Abstract), 8, 242.
Morgan, D.W. & Martin, P.E. (1986) Effects of stride length alteration on race- walking economy. Canadian Journal of Applied Sports Science, 11, 211-217.
Myers, M. & Struedel, K. (1985) Effect of limb mass and its distribution on the
energy cost of running. Journal of Experimental Biology, 116, 363-373.
Nikolic, Z. & Hie, N. (1992) Maximal oxygen uptake in trained and untrained 15 year old boys. British Journal of Sports Medicine, 26 (1), 36-38.
Noakes, T. D. (1988) Implications of exercise testing for prediction of athletic
performance: a contemporary perspective. Medicine and Science in Sports and
Exercise, 20, 319-330.
Nudel, D. B., Hassett, I., Gurian, A., Diamant, S., Weinhouse, E. & Gootman, N. (1989) Young long distance runners: Physiological and Psychological characteristics. Clinical Paediatrics, 28 (11), 500-505.
Palgi, Y., Gutin, B., Young, J. and Alejandro, D. (1984) Physiologic and
anthropometric factors underlying endurance performance in children. International Journal of Sports Medicine, 5, 67-73.
Pate, R, R., Macera, C.A., Bailey, S. P., Bartoli, W. P. & Powell, K.E. (1992) Physiological, anthropometric and training correlates of running economy. Medicine and Science in Sports and Exercise, 24 (10 ) , 1128-1133.
Pate, R. R. & Ward, D. S. (1990) Endurance exercise trainability in children
and Youth. In Advances in Sports Medicine and Fitness, ed. Grana, W. A., Lombardo, J. A., Sharkey, B. J. and Stone, J. A. Vo! 3, 37-55. Yearbook
Medical Publishers.
190
Patton, J. & Vogel, J. (1977) Cross-sectional and longiudinal evaluations of an
endurance training programme. Medicine and Science in Sports and Exercise, 9, 100-103.
Peronnet, P., Thibault, G., Rhodes, E.G. & McKenzie, D C. (1987) Correlation
between ventilatory threshold and endurance capability in marathon runners. Medicine and Science in Sports and Exercise, 19 (6), 610-615.
Persson, H. & Olsson, T. (1970) Some pharmacological properties of Terbutaline (INN) 1-(3,5-Dihydroxyphenyl)-2-(T-butylamino)-ethanol. A new sympathomimetic P-receptor stimulating agent. Acta Medica Scandinavica
supplement, 512, 11-119.
Petray, C. K. & Krahenbuhl, G.S. (1985) Running training, instructions on
running technique and running economy in 10 year old males. Research
Quarterly for Exercise and Sport, 56, 251-255.
du Plessis, M.P., Smit, P.J., Du Plessis, L.S.C., Geyer, M. J., Matthews, G. &
Louw, H. N. J. (1985) The composition of muscle fibres in a group of adolescents. In Children and Exercise XI. ed. Binkhorst, Kemper, H.C.G. &
Saris, W. H. M. pp 323-328. Champaign, Illinois: Human Kinetics.
Pollock, M.L. (1977) Submaximal and maximal working capacity of elite
distance runners. Annals of the New York Academy of Science, 301, 310-322.
Powers, S.K., Dodd, S., Deason, R., Byrd, R. & McKnight, T. (1983) Ventilatory
threshold, running economy and distance running performance of trained
athletes. Research Quarterly for Exercise and Sport, 54 (2), 179-182.
Powers. S.K., Hopkins, P. & Ragsdale, M, R. (1982) Oxygen uptake and
ventilatory responses to various stride lengths in trained women. American
Corrective Therapy Journal, 36, 5-8.
Ramsbottom, R., Williams, C., Fleming, N., Nute, M. L. G. (1989) Training
induced physiological and metabolic changes associated with improvements in
running performance. British Journal of Sports Medicine, 23 (3), 171-176.
Rowland, T. W. & Green, G. M. The influence of biologic maturation and
aeribic fitness on ventilatory response to treadmill exercise. In Exercise
191
Physiology, ed. Dotson, C. O. & Humphrey, J. H. pp 51-59, New York, AMS
press.
Rowland, T. W., Staab, J. S., Unnithan, V.B., Rambusch, J. M. & Siconolfi, S.F. (1990) Mechanical efficiency during cycling in pre-pubertal and adult males. International Journal of Sports Medicine, 11 (6), 452-455.
Rowland, T.W ., Auchinachie, J.A., Keenan, T.J & Green, G. M. (1988) Submaximal aerobic running economy and treadmill performance in pre-pubertal boys. International Journal of Sports Medicine, 9, 201-204.
Rowland, T.W., Auchinachie, J.A., Keenan, T.J & Green, G. M. (1987) Physiologic responses to treadmill running in adult and prepubertal males. International Journal of Sports Medicine, 8, 292-297.
Rowland, T. W. (1985) Aerobic response to endurance training in
prepubescent children: a critical analysis. Medicine and Science in Sports and
Exercise, 17 (5), 493-497.
Rutenfranz, J., Mocellin, R. Klimt, F. (1986) Children and Exercise XII, Champaign, Illinois, Human Kinetics.
Saltin, B. & Gollnick, P,D. (1983) Skeletal muscle adaptability significance for metabolism and performance. In Handbook of physiology, skeletal muscle, section 10, ed. Peachy, T., pp 555-631. Baltimore: Williams and Wilkins.
Schmidt, A., Diament, B., Bungaard, A. & Madson, P.L. (1988) Ergogenic effect of inhaled B2-agonists in asthmatics. International Journal of Sports Medicine, 9,
338-340.
Shephard, R. (1992) Effectiveness of training programmes for pre-pubescent children. Sports Medicine, 13(3), 194-213.
Shephard, R.J. (1984) Tests of maximal oxigen uptake - a critical view. Sports
Medicine, 1, 99-124.
Shepherd, T. A., Eisenman, P. A., Ruttenberg, H. D., Adams, T. D. &Johnson, S. C. (1988) Cardiac dimensions of highly trained pre-pubescent boys. Medicine and Science in Sports and Exercise, 20, Supplement S53.
192
Signorile, J., Kaplan, T., Applegate, B. & Perry, A. (1991) Effects of acute
inhalation of the bronchodilator, albuterol on power output in a non-asthmatic
population. 38th Annual Meeting of the American College of Sports Medicine, Orlando, Florida.
Sjodin, B. & Svendenhag, J. (1985) Applied physiology of marathon running. Sports Medicine, 2, 83-99.
Sjodin, B. & Shele, R. (1982) Oxygen cost of treadmill running in long distance
runners. \n Exercise and Sport Biology, ed. Komi, P. V. pp 61-67, Champaign
Illinois. Human Kinetics.
Skilleter, D. N. & Kun, E. (1972) The oxidation of L-Lactate by liver mitochondria. Archives of biochem biophys, 152, 92-104.
Sparling, P.B. (1984) Physiological determinants of distance running
performance. The Physician and Sportsmedicine, 3, 68-77.
Stewart, K. J. & Gutin, B. (1975). Effects of physical training on
cardiorespiratory fitness in children. Research Quarterly for Exercise and Sport, 47, 110-120.
Sundberg, S. & Elovainio, R. (1982) Cardio-respiratory function in competitive
endurance runners aged 12-16 years compared with ordinary boys. Acta
Paediatrica Scandinavica, 71, 987-992.
Svendenhag, J. & Sjodin, B. (1985) Physiological characteristics of elite male
runners in and off season. Canadian Journal of Applied Sports Science, 10, 127- 133.
Svendenhag, J. & Sjodin, B. (1984) Maximal and submaximal oxygen uptakes
and blood lactate levels in elite male middle and long distance runners. International Journal of Sports Medicine, 5 (5), 255-261.
Tanaka, K , Matsuura, Y., Matsuzaka, A., Hirakoba, K., Kumagai, Sun, S.O. &
Asano, K. (1984) A longitudinal assessment of anaerobic threshold and
distance -running performance. Medicine and Science in Sports and Exercise, 16(3), 278-282.
193
Tanner, J. M. (1962) Growth at adolescence, 2nd edition. Oxford: Blackwell Scientific Publications.
Taylor, C. (1944) Some properties of maximal and submaximal exercise with
reference to physiological variation and the measurement of exercise tolerance. American Journal of Physiology, 142, 200-212.
Telford, R. D., McDonald, I. G., Ellis, L. B., Chennells, M. H. D., Sandstrom, E.R. and Fuller, P. J. (1988) Echocardiographic dimensions in trained and
untrained 12 year old boys and girls. Journal of Sport Science, 6, 49-57.
Unnithan, V,B., Wilson, J., Aitchison, T.C. & Paton J.Y. (1992) Validation of microprocessor controlled exercise testing system (Sensormedics S2900Z) in
children. In Children and Exercise XVI, Paediatric Work Physiology, ed.Coudert, J. & Van Praagh, E. p51.
Unnithan, V.B. & Eston, R.G. (1990) Stride frequency and submaximal running
economy in adults and children. Paediatric Exercise Science, 2, 149-155.
Unnithan, V. B., Rowland, T.W., Staab, J.S., Rambusch and Siconolfi, S.F. (1988) Rest and maximum salivary lactates in children and adults. Medicine
and Science in Sports and Exercise, 20 (2), Supplement S64.
Vaccaro, P., Clarke, D. H. & Morris, A. F. (1980) Physiological characteristics
of young well trained swimmers. European Journal of Applied Physiology, 44, 61-66.
Whipp, B.J. & Ward, S. A. (1982) Cardiopulmonary coupling during exercise. Journal of Experimental Biology, 100, 175-193.
Williams, J R. & Armstrong, N. (1991) The influence of age and sexual maturation on children's blood lactate response to exercise. Paediatric Exercise
Science, 3, 111-120.
Williams, K.R., Jones, J.E. & Snow, R E. (1991) Mechanical and physiological adaptations to alterations in running stride length. Medicine and Science in
Sports in Exercise, 23, S6.
194
Williams, K. & Cavanagh, P. (1987) Relationship between distance running
mechanics, running economy and performance. Journal of Applied Physiology, 63, 1236-1245.
Williams, T.J., Krahenbuhl, G.S. & Morgan, D.W. (1991) Daily variation in
running economy of moderately trained male runners. Medicine and Science in
Sports and Exercise, 23 (8), 944-948.
Yoshida, T., Ishiko, T. & Muraoka, I. (1983) Cardio-respiratory functions in
children with high and low performances in endurance running. European
Journal of Applied Physiology, 51, 313-319.
Yost, I. J., Zauner, C.W. & Jaeger, M. J. (1981) Pulmonary diffusing capacity
and physical working capacity in swimmers and non-swimmers during growth. Respiration, 42, 8-14.
Zanconato, S., Cooper,D.M., Buchthal, S., & Barstow, T. J. (1993) 31P
Magnetic resonance spectroscopy of leg muscle metabolism during exercise in
children and adults. Medicine and Science in Sports and Exercise, 25 (5), Supplement S I 06.
Zanconato, S., Baraldi, E., Santuz, P., Magagnin, G. & Zacchello, F. (1990) Effect of inhaled Disodium Cromoglycate and Albuterol on energy cost of running
in asthmatic children. Paediatric Pulmonology, 8, 240-244.
Zapletal, A., Misur, M. & Samanek, M. (1971) Static recoil pressure of the
lungs in children. Bulletin Physiopath Respiration, 7, 139-143.
Zauner, C. W., Maksud, M. G. & Melichna, J. (1989). Physiological considerations in training young athletes. Sports Medicine, 8 (1), 15-31.

195
APPENDICES
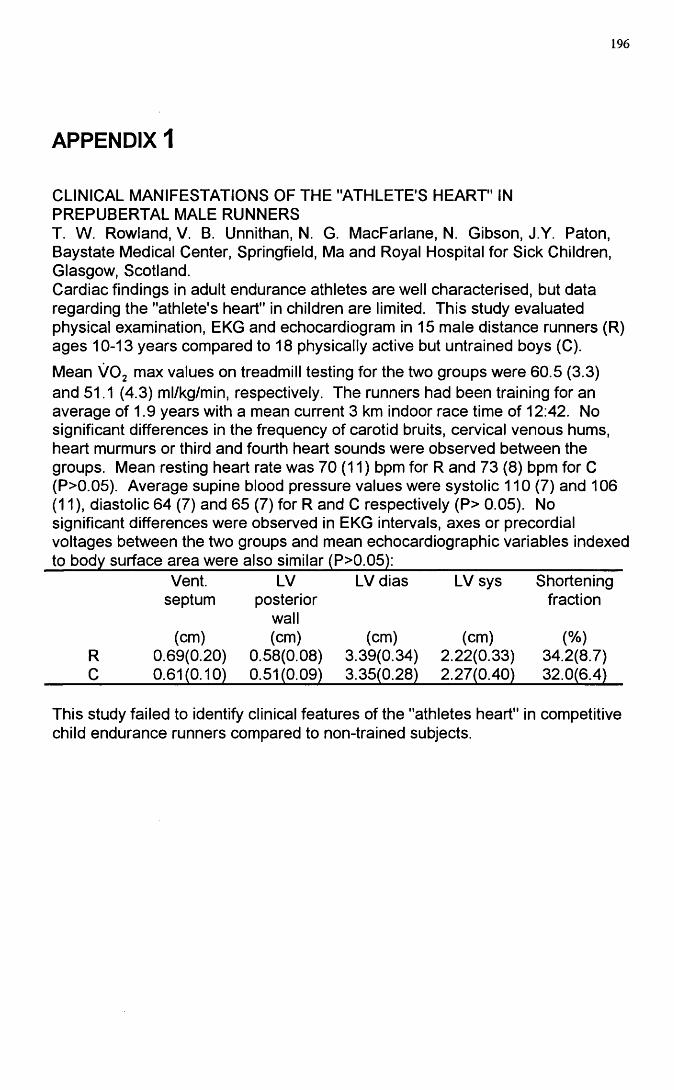
196
APPENDIX 1
CLINICAL MANIFESTATIONS OF THE "ATHLETE'S HEART" IN PREPUBERTAL MALE RUNNERST. W. Rowland, V. B. Unnithan, N. G. MacFarlane, N. Gibson, J.Y. Paton, Baystate Medical Center, Springfield, Ma and Royal Hospital for Sick Children, Glasgow, Scotland.Cardiac findings in adult endurance athletes are well characterised, but data regarding the "athlete's heart" in children are limited. This study evaluated physical examination, EKG and echocardiogram in 15 male distance runners (R) ages 10-13 years compared to 18 physically active but untrained boys (C).
Mean VOg max values on treadmill testing for the two groups were 60.5 (3.3) and 51.1 (4.3) ml/kg/min, respectively. The runners had been training for an average of 1.9 years with a mean current 3 km indoor race time of 12:42. No significant differences in the frequency of carotid bruits, cervical venous hums, heart murmurs or third and fourth heart sounds were observed between the groups. Mean resting heart rate was 70 (11) bpm for R and 73 (8) bpm for C (P>0.05). Average supine blood pressure values were systolic 110 (7) and 106 (11 ), diastolic 64 (7) and 65 (7) for R and C respectively (P> 0.05). No significant differences were observed in EKG intervals, axes or precordial voltages between the two groups and mean echocardiographic variables indexed
Vent.septum
LVposterior
wall
LV dias LV sys Shorteningfraction
(cm) (cm) (cm) (cm) (%)R 0.69(0.20) 0.58(0.08) 3.39(0.34) 2.22(0.33) 34.2(8.7)C 0.61(0.10) 0.51(0.09) 3.35(0.28) 2.27(0.40) 32.0(6.4)
This study failed to identify clinical features of the "athletes heart" in competitive child endurance runners compared to non-trained subjects.
197
APPENDIX 2INFORMED CONSENT FOR PARTICIPATION IN A STUDY OF THE EFFECTS OF A PERIOD OF TRAINING ON MODERATE AND MAXIMUM RUNNING.
Investigators; Mr. Viswanath B. Unnithan MSc. ( Extn 4729 / 4238)Dr J. Y Paton
Title of the study:
A COMPARISON OF THE RUNNING ECONOMY BETWEEN CHILDREN INVOLVED IN RUNNING TRAINING AND NORMAL CHILDREN AT 3 SUBMAXIMAL TREADMILL RUNNING SPEEDS.
Background and Purpose of the Study
In this study we want to compare the efficiency of running in children before and after a period of running training and a group of control children.
Your participation will involve four separate visits to the laboratory over a period of two months.
The following tests will be completed :
1. During the four visits to the laboratory, data will be collected during periods of light exercise and during short periods of the maximum exercise your child can achieve. For all exercise tests, chest electrodes will be attached to monitor your child's heart rate. Your child will be fitted with a snorkel type mouthpiece to obtain the air that he breathes out while doing the running to allow us to make the necessary measurements.
During the periods of light exercise, he will have to run at three different speeds at the same incline on the treadmill. For the maximal exercise test, the speed will be increased until your child is running on the treadmill, and then held constant. The incline will be gradually increased every 3 minutes with a 1 minute rest between each incline raise. The test will be terminated when the child feels that he cannot run any longer or further. At this point the study stops although we continue to take readings until you are back to normal breathing, about 5 minutes later.
In addition, during the exercise studies small finger prick blood samples will be taken from the tip of your child's fingers. These samples will be taken at rest, three times during the light exercise and at 3 minute intervals during the maximal exercise test.
Potential Benefits of the study

198
If your child takes part in the study we will be able to give you and them an estimate of their fitness . Otherwise the results of the study will be of no direct benefit to your child. This information may allow us to design better exercise programmes for children involved in running training and normal healthy children.
Potential Risks of the study
During the testing an occasional child may feel light headed, become short of breath, or even may develop slight irregularities of the heart beat. There will be a small amount of discomfort in the fingertips as a result of the finger prick blood sampling. In the event of an emergency there will be members of staff present available, capable of dealing with any problems.
Confidentiality
Case histories, the results of treatment, laboratory data, photograps and X-rays may be published for scientific purposes, but neither your child's nor your identity will be disclosed and confidentiality will be maintained.
You are free to withdravy from this project at any time without any penalty. W e do not expect any unusual risks as a direct result of this project. Should an unforeseen physical injury occur, appropriate medical treatment will be provided, but no financial compensation will be given.
., agree that my child
Parent/Guardian
may participate in the study as detailed above. I understand that I may withdraw my consent at any time.
Parent's Signature
Witness' Signature
Investigator's Signature
_ / /_Date

199
APPENDIX 3
PHYSICAL ACTIVITY QUESTIONNAIREChild's Name:_________________________
1. During the past three months , what would best describe your child's usual level of
physical activity ? ( circle letter )A. Inactive
watches television, reads, or does homework after school, has a ride to school; no sports outside school.B. O c casio nally ACTIVEprefers sedentary activities, but sometimes plays outside.C. Mo d era tely A ctive
takes opportunities to become involved in physical activity when available and enjoys it.D. A ctive
takes initiative to participate in physical exercise and prefers this to sitting activities; at least three times a week involved in vigorous exercise.E. V ery ACTIVEparticipates regularly in out of school sports; great deal of energy ; dislikes sitting activities.2. During the last six months was your child involved in an organised sports or
exercise programme ( Youth Club, Rugby, Football and Athletics leagues, gymnastics, dancing classes, etc. ) outside of regular physical education ?
Yes Describe
No_________3. During the last six months was your child involved in regular athletic training
running, bicycling, swimming, etc. ?
Yes________ Describe____________________________________No_________4. Has your child ever had any serious medical / surgical illness ?
Yes________ Describe____________________________________No
5. Is your child taking any medications ? Yes List
No
GLASGOWUNIVLkjiTYLIBRARY