10391372.pdf - enlighten: theses
TRANSCRIPT

https://theses.gla.ac.uk/
Theses Digitisation:
https://www.gla.ac.uk/myglasgow/research/enlighten/theses/digitisation/
This is a digitised version of the original print thesis.
Copyright and moral rights for this work are retained by the author
A copy can be downloaded for personal non-commercial research or study,
without prior permission or charge
This work cannot be reproduced or quoted extensively from without first
obtaining permission in writing from the author
The content must not be changed in any way or sold commercially in any
format or medium without the formal permission of the author
When referring to this work, full bibliographic details including the author,
title, awarding institution and date of the thesis must be given
Enlighten: Theses
https://theses.gla.ac.uk/
Studies of a Brassica napus gene encoding a putative lipid transfer
protein
by
Awinder K. Sohal
A thesis submitted in accordance with the requirements for the degree of
Doctor of Philosophy
University of Glasgow
Division of Biochemistry and Molecular Biology
September 1997
Awinder K. Sohal

ProQuest Number: 10391372
All rights reserved
INFORMATION TO ALL USERS The quality of this reproduction is dependent upon the quality of the copy submitted.
In the unlikely event that the author did not send a com p le te manuscript and there are missing pages, these will be noted. Also, if material had to be removed,
a note will indicate the deletion.
uestProQuest 10391372
Published by ProQuest LLO (2017). Copyright of the Dissertation is held by the Author.
All rights reserved.This work is protected against unauthorized copying under Title 17, United States C ode
Microform Edition © ProQuest LLO.
ProQuest LLO.789 East Eisenhower Parkway
P.Q. Box 1346 Ann Arbor, Ml 48106- 1346

GLASGOWUNIVERSITYÏIBEARY
( ( /! ^ % )
vjü>iGCiii üJur/cw
SummaryThe epidermis is an extremely important plant tissue because it is at the
interface of the plant with its environment. To isolate genes expressed in the epidermis,
a cDNA library constmcted from leaves of Brassica napus was screened with an
unidentified B. napus epidermis-specific, partial cDNA clone, pLFSA, which was
isolated previously. Several fiill length cDNA clones were isolated, one of which was
fully sequenced. This clone, designated BnLTP, encoded a putative non-specific lipid
transfer protein (LTP) of 118 amino acids. Two other closely related cDNA clones,
p2A4 and p5A9, were isolated and sequenced partially at the 3' ends. Sequence
comparison of the three clones with pLF3A indicated the presence of four closely
related but non-identical cDNA species. Based on this observation and previous
Southern blot analysis of B. napus genomic DNA, it was concluded that BnLTP, p2A4,
p5A9 and pLF3A were four members of a small closely related multigene family
encoding putative LTPs.
A genomic clone, designated 13.2A, homologous to BnLTP was isolated. A
4.8 kb Eco RI fragment from 13.2A, which hybridised strongly to the cDNA, was
subcloned and sequenced. The fragment contained the full length gene, designated
BnLTP. BnLTP encoded a 118 amino acid putative LTP, which differed at five amino
acids from the cDNA. It consisted of two exons of 116 and 2 amino acids, respectively,
intenmpted by a 269 bp intron. The gene contained a 2.3 kb 5’ upstream region that
contained a TATA box and several cis-acting elements conserved in other LTP genes
and genes involved in phenylpropanoid biosynthesis.
B. napus LTP transcripts exhibited an organ-specific pattern of expression.
They were expressed at high levels in leaves, stems, and floral tissues but were not
detected in roots. In addition, endogenous LTP transcripts were induced in response to
high white, blue and red light in B. napus and Arabidopsis leaves but not in response
to UV-B light treatment.
The BnLTP promoter was regulated in a spatial and temporal manner during
development, as demonstrated by histochemical localisation of P-glucuronidase (GUS)
in transgenic Arabidopsis plants carrying a 2.3 kb BnLTP promoter-GI/5' fusion
t
{BnLTP~GUS). GUS was expressed at higher levels in younger developing leaves
compared to older leaves. Cross-sections of transgenic leaf and stem tissue indicated
that BnLTP~GUS was expressed predominantly in the epidermal cells. GUS activity
was observed in the trichomes, epidermal pavement cells and guard cells. However,
expression was also observed in the vascular bundles (xylem and phloem of leaves) and
in response to high white, blue and red light but not following UV-B light treatment of
leaves. BnLTP-GUS was moderately induced in cold treated leaves and upon infection
in the lateral root initials. In floral tissue, GUS was localised in sepals, stigmas, petals
and stamens, but as the flower matured, it was expressed only at low levels in the
stigma and sepal/petal abscission zone. However, GUS was not detected in mature
petals but persisted in the stamens (pollen sacs and the filament).
Expression of BnLTP-GUS in transgenic Arabidopsis was moderately induced
:,with CaMV but not in response to wounding. LTP expression increased in transgenic
Arabidopsis plants constitutively expressing the CaMV Gene VI, which is essential for
viral replication and disease symptoms.
In Arabidopsis mutants altered in trichome development, glabrous J (gll) and
2 igl2) and transparent testa glabra (ttg), endogenous LTP expression was not altered,
and in each case expression was induced in response to high white light similar to wild
type plants. However, in the photoregulation mutant icxl (increased chalcone synthase
expression), which is characterised not only by enhanced light stimulation of the
epidermis-specific gene, CHS, but also by altered epidermal development, endogenous
LTP expression was increased. In the double mutant ttg/icxl, which has phenotypic
characteristics of both parents, endogenous LTP expression was similar to icxl.
1I
■

Acknowledgements
I would like to thank Dr. Gareth I. Jenkins for his excellent supervision,
support and advise throughout the course my PhD and for the critical reading of my
thesis. I would also like to thank Professor Gordon Lindsey and Professor Chris
Wheeler for the use of facilities in the Davidson and Bower Buildings, and Dr. Ian
Montgomery for help with the cryostat sectioning and light microscopy. Thanks also to
Mr. Trevor Graham and members of the photographic unit for their excellent service.
I would particulaiiy like to thanlc Dr. Jennie Jackson and Dr. Geeta Fuglevand
for their invaluable advice on plant growth and transformation, Mr. Jim Jardine for
carrying out the initial genomic library screening experiments, Mr. Bobby Brown for
looking after my transgenic plants. Dr. John Christie for help with figures and Dr.
Morag MacDonald for making the eftbrt to proof-read part of my thesis. Thanks are
also extended to Dr. Edi Cecchini and Dr. Joel Milner for helpful advice on the viral
experiments. Thanks also to members of the Hooker lab, past and present for their
encouragement, tolerance and friendship throughout my time there. I acknowledge the
financial support of the B.B.S.R.C.
Special thanks go to my family for their encouragement and kindness especially
during the lonely periods of writing up. And finally, thanks to Alan, for his sense of
humour, generosity, motivation and patience, which were a source of strength
throughout the course of my PhD, particularly during the final stages of writing up.

For my family
S
A
■I
Is
,'î.
Is
J
''::3

“The most beautiful thing we can experience is the mysterious. It is the source o f all
true art and science. He to whom this emotion is a stranger, who can no longer
wonder and stand rapt in awe, is as good as dead: his eyes are closed. To know that
what is impenetrable to us really exists, manifesting itself as the highest wisdom and
the most radiant beauty which our dull facilities can comprehend only in the most
primitive forms- this knowledge, this feeling is at the centre o f true religiousness. In
this sense, and in this sense only, I belong to the ranks o f devoutly religious men. ”
Albert Einstein,
What I Believe (1930)
3:1:S-ti.
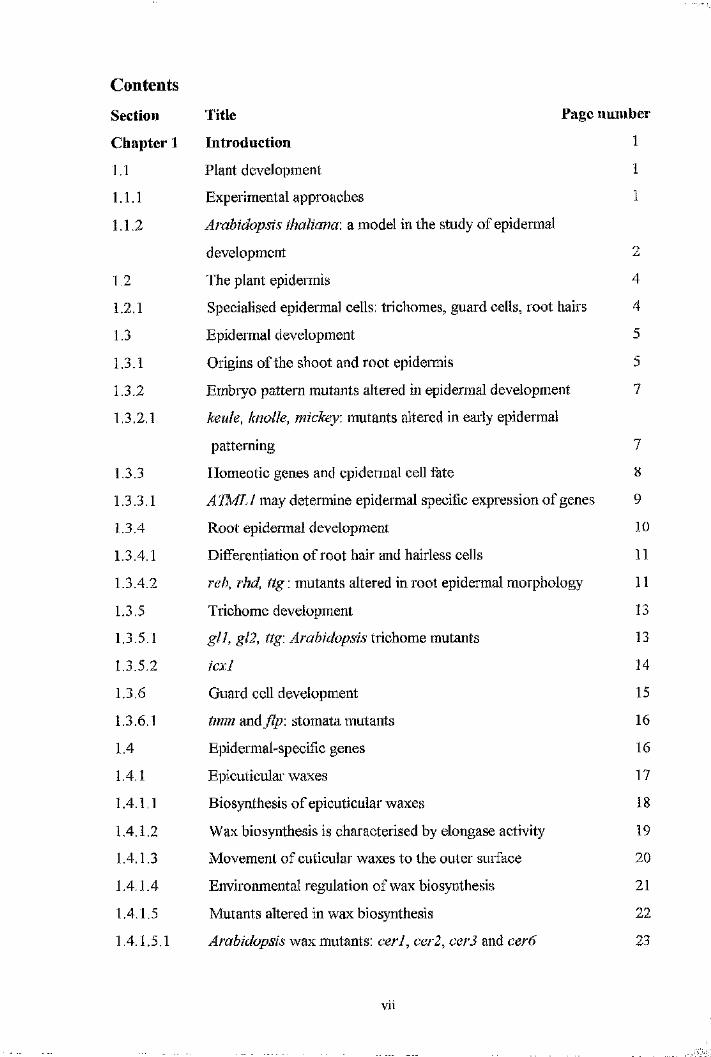
ContentsSection Title Page number
Chapter 1 Introduction 1
1.1 Plant development 1
1.1.1 Experimental approaches 1
1.1.2 Arabidopsis thaliana: a model in the study of epidermal
development 2
1.2 The plant epidermis 4
1.2.1 Specialised epidermal cells: trichomes, guard cells, root hairs 4
1.3 Epidermal development 5
1.3.1 Origins of the shoot and root epidermis 5
1.3.2 Embiyo pattern mutants altered in epidermal development 7
1.3.2.1 keule, knolle, mickey, mutants altered in early epidermal
patterning 7
1.3.3 Homeotic genes and epidermal cell fate 8
1.3.3.1 A TMLl may determine epidermal specific expression of genes 9
1.3.4 Root epidermal development 10
1.3.4.1 Differentiation of root hair and hairless cells 11
1.3.4.2 reb, rhd, iig : mutants altered in root epidermal morphology 11
1.3.5 Trichome development 13
1.3.5.1 gll, gl2, ttg: Arahidopsis trichome mutants 13
1.3.5.2 icxl 14
1.3.6 Guard cell development 15
1.3 . 6 . 1 tmm and flp : stomata mutants 16
1.4 Epidermal-specific genes 16
1.4.1 Epicuticular waxes 17
1.4.1.1 Biosynthesis of epicuticular waxes 18
1.4.1.2 Wax biosynthesis is characterised by elongase activity 19
1.4.1.3 Movement of cuticular waxes to the outer surface 20
1.4.1.4 Environmental regulation of wax biosynthesis 21
1.4 .1.5 Mutants altered in wax bio synthesis 22
1.4.1.5.1 Arabidopsis wax mutants: cerl, cer2, cerS and cer6 23
Vll
1.4.1.5.2 Maize wax mutants: gll, gl8 and g ll5 24
1.4.2 Genes involved in flavonoid biosynthesis 25
1.4.2.1 Flavonoids accumulate in epidermal cells 25
1.4.2.2 CHS, PAL and 4CL are expressed in epidermal cells 26
1.4.3 Lipid transfer proteins (LTPs) 27
1.4.3.1 Lipid binding and transfer assays of LTPs 27
1.4.3.2 Structure and mode of action of LTPs 29
1.4.3.3 Isolation of LTP genes 30
1.4,3.4 Organ-, cell- and tissue- specific expression of LTPs 30
1.4.3.5 LTPs are localised in the cell wall 32
1.4.3.6 Environmental regulation o ïLTP expression 33
1.4.3.7 LTPs implicated as plant defence proteins 34
1.5 Aims of project 35
1.5.1 Isolation and characterisation of an epidermis-specific gene from
Brassica napus 36
Chapter 2 Materials and Methods
2.1 Materials 37
2.1.1 Chemicals 37
2.1.2 Radiochemicals 37
2.1.3 Restriction enzymes 37
2.1.4 Antibiotics, IPTG, X-Gal 37
2.1.5 Bacterial strains 37
2.1.6 Plasmids and DNA probes 38
2.1.7 Plant virus strains 38
2.1.8 Libraries 38
2.1.9 Seeds 39
2.1.10 Potting compost 39
2.1.11 Transgenic plants 39
2.2 General experimental procedures 40
2.2.1 Glassware 40
2.2.2 Autoclaving 40
V lll
I
2.2.3 Filter sterilisation 40
2.2.4 pH measurement 40
2.2.5 Silicon-coating of sequencing gels 40
2.3 Buffers 40
2.4 Preparation of phenol and extraction of nucleic acids 41
2.4.1 Phenol/chloroform extractions 41
2.5 Culture media 41
2.5.1 Liquid media 42
2.5.2 Solid media 42
2.6 Preparation of competent bacteria 42
2.6.1 Preparation of competent £. co// 42
2.6.2 Preparation of competent 43
2.7 Transformation of bacteria with plasmid DNA 43
2.7.1 Transformation of£. co// 43
2.7.2 Transformation ofXgroôacfônw/w 44
2.8 Isolation of DNA from bacteria and plants 44
2.8.1 Small scale plasmid preparation 44
2.8.2 Large scale plasmid preparation 45
2.8.3 Isolation of plasmid DNA from Agrobacterium 46
2.8.4 Isolation of plant genomic DNA 47
2.8.5 Purification of oligonucleotides 47
2.9 Ethanol precipitation and quantification of nucleic acids 48
2.10 Restriction digestion of DNA 48
2.11 Agarose gel electrophoresis 48
2.11.1 Electrophoresis of DNA 48
2.11.2 Denaturing formaldehyde gel electrophoresis of RNA 49
2.12 Gel purification of DNA 49
2.12.1 PhenoVCFICls method 49
2.12.2 GENECLEAN® 50
2.13 Ligation of restriction fragments into plasmid 50
2.14 Shotgun cloning of restriction fragments 51
2.15 Radio-labelling DNA 51
IX
I
2.15.1 Removal of unincorp orated radionucleotides 51
2.15.2 Measurement of incorporation of radiolabel into DNA probes by
TCA precipitation 52
2.16 DNA sequencing 52
2.16.1 Dideoxy sequencing of double-stranded DNA 52
2.16.1.1 Annealing of primer to DNA template 52
2.16.1.2 Labelling and termination reactions 53
2.16.2 Hot Tub DNA sequencing for double-stranded DNA template 53
2.16.2.1 Annealing 53
2.16.2.2 Labelling and termination reactions 54
2.16.3 Sequencing gel electrophoresis 54
2.17 Isolation of RNA from plants 5 5
2.18 Blotting nucleic acids onto nylon filter 5 5
2.18.1 Northern blotting 5 5
2.18.2 Southern blotting 56
2.19 Hybridisation analysis 56
2.19.1 Northern hybridisation 56
2.19.2 Washing northern blots 57
2.19.3 Southern hybridisation 57
2.19.4 Washing of Southern blots 57
2.19.5 Autoradiography 58
2.19.6 Stripping filters bound with radiolabelled probes 58
2.20 Primer extension analysis 58
2.20.1 Primer labelling with [y~^^P]ATP 58
2.20.2 Primer extension reaction 59
2.21 Screening libraries 59
2.21.1 Preparation of plating cells 59
2.21.2 Titration of phage library 59
2.21.3 Plating the phage library 60
2.21.4 Plaques lifts 60
2.21.5 Selection of positive plaque 61
2.22 In vivo excision of recombinant pBluescript® from Uni-Zap XR 61
I
I
2.23 Isolation of lambda DNA from genomic clones 62
2.23.1 Preparation of plate lysates 62
2.23.2 Removal of Phage Coat 62
2.24 Polymerase chain reaction (PCR) 63
2.25 Surface sterilisation and germination of seed 64
2.26 Transformation o îArabidopsis by vacuum infiltration 65
2.26.1 Preparation of Arabidopsis plant s 65
2.26.2 Analysis of progeny from transformed plants 65
2.27 Electroporation of Brassica napus stem sections with GUS
constructs 66
2.28 Plant growth conditions 66
2.28.1 General growth conditions 66
2.28.2 Light treatments 67
2.28.3 Cold treatment and wounding of leaves 67
2.28.4 Viral infection 68
2.29 Analysis of GUS activity 68
2.29.1 Histochemical localisation of GUS expression 68
2.29.2 Fluorometric GUS assays 68
Chapter 3 Isolation of a full length Brassica napus epidermis-specific
cDNA
3.1 Introduction 70
3.1.1 Characteristics of pLF3 A 70
3.2 Screening of a cDNA library 71
3.2.1 Primary, secondary and tertiary screening of cDNA library 72
3.3 Amplification of inserts with T3 and T7 primers by PCR 73
3.4 In vivo excision of the recombinant pBluescript® II SK (-)
phagemid 73
3.5 Sequencing 3’ termini with T7 primer 78
3.6 Analysis of the p2A7 sequence 81
3.7 p2A7 encodes a putative non-specific lipid transfer protein 86
3.8 Analysis of the BNLTP protein 91
XI
.............
'3#
3.9 Comparison of BnLTP with pLF3 A 94i
3.10 Comparison of BnLTP, p2A4 and p5A9 DNA sequences 94
3.11 Discussion 99'i
Chapter 4 Isolation and characterisation of the genomic clone gBnLTP
4.1 Introduction 104
4.2 Preliminary experiments 104
4.2.1 Preliminary sequence analysis of genomic clone 1.7B 105
4.3 Rescreening of 8 genomic clones with BnLTP 105
4.4 Restriction digestion and Southern blot analysis of the
genomic clones 106
4.5 PCR of genomic clones using primers 1689/1919 109
4.6 Restriction mapping of clone A,3.2A 109'
4.7 Subcloning of Eco RI fragments of genomic clone 13 .2A into
pBluescript® SK II (-) 117 14.8 Analysis of p3.2Ai5 124
4.8.1 Restriction digestion and PCR 124
4.8.2 Sequencing of genomic clone p3.2Ai5 127 333#
4.8.3 Analysis of the BnLTP gene sequence 127 ■I4.8.4 Determination of transcription initiation in the BnLTP gene by primer
extension 135I
4.9 Comparison of the BnLTP gene and BnLTP cDNA nucleotide and
amino acid sequences 1381
4.10 Discussion 1421
Chapter 5 Generation and characterisation of Arabidopsis transgenic plants
expressing the BnLTP promoter-G'C/iS' fusion I5.1 Introduction 145 A'5.2 Isolation of the putative promoter 146 S
»5.3 Generation of Arabidopsis plants expressing the heterologous BnLTP- 1GUS transgene 147 i5.3.1 BnLTP promoter-GGS' constmct formation 147
xii
: |
5.3.2 Subcloning the BnLTP-GUS cassette into pBluescript® SK II (-) 150
5.3.3 Electroporation of pBS-LTP-GUS4 i n t o s t e m sections 155
5.3.4 Transformation of Agî^obacteriiim tumefaciens with the
BnLTP-GUS^ûon 158
5.4 PCR of Agi'obacterium transformants with primer pairs 2285/2257
and2285/GUSl 158
5.5 Restriction digestion of pBnLTP-GUS2 isolated from
A grobacierium 161
5.6 Agrobacterium-mQAmtcd transformation of Arabidopsis thaliana
with pBnLTP“GUS2 by vacuum infiltration 166
5.7 Selection and analysis of transformants 166
5.8 Molecular characterisation of lines 1C, 2D and 3B 169
5.8.1 PCR with primers 2285IGUS1 169
5.8.2 Determination of transgene copy number by Southern blot
analysis 169
5.9 GUS expression driven by the BnLTP promoter 174
5.10 Discussion 174
Chapter 6 Analysis of LTP expression
6.1 Introduction 183
6.2 Analysis of the BnLTP promoter sequence 183
6.3 Organ-specific expression of 7? 187
6.4 expression is confined to the epidermis 187
6.5 The BnLTP promoter is moderately light-induced 192
6.6 Expression of BnLTP and BnLTP~GUS in response to cold and
wounding 201
6.7 The BnLTP promoter is induced upon viral infection 206
6.7.1 Endogenous LTP expression is enhanced in Arabidopsis plants
constitutively expressing the CaMV Gene VI 209
6.8 LTP expression in epidermally altered mutants, gll, gl2, tig, icxl and
icxl/ttg 214
6.9 Discussion 220
XllI
6.9.1 Analysis of the BnLTP promoter 223
6.9.2 Spatial regulation of BnLTP expression 223
6.9.3 Environmental regulation o îBnLTP expression 226
6.9.4 Viral induction o ïBnLTP expression 229
6.9.5 LTP expression in epidermally altered Arabidopsis mutants 232
Chapter 7 General discussion
7.1 BnLTP represents a member of a small multigene family
encoding a putative LTP 234
7.2 BnLTP expression is subject to strong developmental and
spatial regulation 236
7.3 BnLTP expression displays a complex response to environmental
stresses 240
#3
Sri:
References 242
XIV
f
A'I,3î'
;
£
List of Figures and Tables Page number
Fig. 3.1 Amplification of putative positives by PCR using
primers T3 and T7 74
Fig. 3.2 Southern blot analysis of PCR-amplified putative
positive clones 76
Fig. 3.3 In vivo excision and restriction digestion of recombinant
pBluescript® II SK (-) 79
Table 3.1 Primers used to sequence the cDNA p2A7 82
Fig. 3.4 Nucleotide and predicted amino acid sequence of p2A7 84
Fig. 3.5 Restriction digestion of p2A7 87
Fig. 3.6 Comparison of BNLTP with other plant LTPs 89
Fig. 3.7 Hydropathy profile of the deduced BNLTP sequence 92
Fig. 3.8 Comparison of BnLTP cDNA sequence with pLF3A 95
Fig. 3.9 Sequence comparison of the 3’ ends of BnLTP, p5A9
and p2A4 97
Fig. 4.1 Southern blot analysis oîEco RI digested genomic clones 107
Fig. 4.2 Amplification of purified genomic clones with 1689
and 1919 110
Fig. 4.3 A Restriction digest of genomic clone X2.2A 112
Fig. 4.3B Southern blot analysis of clone X3.2A 115
Fig. 4.4 Restriction digestion of clone 7,3.2 A with Eco RI
and Sal I 118
Fig. 4.5 Restriction map of genomic clone 7,3.2A 120
Fig. 4.6 Subcloning of 7,3.2 A Eco Rl-digested fragments
into pBluescript® II SK (-) 122
Fig. 4.7 Restriction digestion analysis of clone p3,2Ai5 125
Table 4.1 Primers used for sequencing and PCR of genomic clones 128
Fig. 4.8 Schematic diagram depicting the strategy used to
sequence clone p3.2Ai5 130
Fig. 4.9 Nucleotide and deduced amino acid sequence of the
BnLTP gmQ 132
I
XV
II4
: i
3
Fig. 4.10 Mapping of the transcription start site of the BnLTP
mRNA by primer extension 136
Fig. 4.11 Comparison of the BnLTP gene and cDNA nucleotide
and amino acid sequences 139
Fig. 5.1 Schematic diagram of the constmction of the BnLTP
promoter-GUS transcriptional fusion 148
Fig. 5.2 Isolation and restriction digestion of the putative
BnLTP-GUS fiisions 151
Fig. 5.3 Subcloning the BnL TP-GUS fusion from pBnLTP-GUS2
into pBluescript® II SK (-) 153
Table 5.1 Electroporation of Brassica napus leaf and stem tissue with
the pBS-LTP-GUS4 and 35S-GUS plasmid constructs 156
Fig. 5.4 PCR of putative Agrohacterium tumefaciens transformants
of the pBnLTP-GUS2 plasmid sNithBnLTP promoter-specific
primers, 2285 and 2257 159
Fig. 5.5 PCR of putative Agrobacterium transformants of plasmid
pBnLTP-GUS2 with primers 2285 and GUSl 162
Fig. 5.6 Comparison of restriction digestion patterns
of pBnLTP-GUS2 before and slûqy Agrobacterium
tumefaciens transformation 164
T able 5.2 Analysis of progeny of Arabidopsis thaliana transformants 167
Fig. 5.7 PCR of genomic DNA isolated from transgenic lines
1C, 2D and 3 A with primers 2285 and GUS 1 170
Fig. 5.8 A Southern blot analysis of transgenic lines 1C, 2D and 3 A
with 0 0 5 172
Fig. 5.8B Southern blot analysis of transgenic lines 1C, 2D and 3 A
with the BnL TP-GUS fragment 175
Fig. 5.9 GUS expression in transgenic lines IB, 2D and 3C 177
Fig. 6.1 Sequence analysis of the BnLTP promoter 184
Fig. 6.2 Organ-specific expression of^nATP 188
Fig. 6.3 Spatial regulation of BnLTP-GUS expression in
transgenic Arabidopsis 190
Fig. 6.4 Expression of GUS is restricted mainly to epidermal cells 193
Fig. 6.5 Light induction o f LTP transcripts 199
Fig. 6.6 Effect of light on the expression of LTP promoter-G05
fusions in transgenic Arabidopsis 202
Fig. 6.7 Effect of low temperature on levels of LTP transcripts in
B. napus and BnLTP-GUS expression in transgenic
Arabidopsis 204
Fig. 6.8 BnLTP~GUS expression is not affected by wounding 207
Fig. 6.9 Induction of BnLTP-GUS in transgenic Arabidopsis by viral
infection 210
Fig. 6.10 GUS expression in virally infected leaf and root tissue 212
Fig. 6.11 LTP expression in transgenic Arabidopsis plants expressing
the CaMV 35S promoior-Gene VI fusion 215
Fig. 6.12 LTP expression in the Arabidopsis epidermally altered
mutants icxl, ttg, g ll and gl2 218
Fig. 6.13 LTP expression in Arabidopsis wild type, icxl and
icxl/ttg mutants in response to blue, red, UV-B
and UV-A light treatment 221
il:.
X V ll
Abbreviations
ABA Abscisic acid
BSA Bovine serum albumin
bp base pairs
cDNA complementary deoxyribonucleic acid
dATP ; ddATP deoxy-; dideoxyadenosine triphosphate
DEPC diethyl pyrocarbonate
dCTP; ddCTP deoxy-; dideoxycytidine triphosphate
dGTP: ddGTP deoxy-; dideoxyguanosine triphosphate
DMF dimethylformamide
DMSO dimethyl sulphoxide
dNTP deoxynucleotide triphosphate
dTTP; ddTTP deoxy-; dideoxythymidine triphosphate
d p i days post inoculation
DNA deoxyribonucleic acid
DNAase deoxyribonuclease
DTT dithiothreitol
EDTA ethylene diaminetetracetate
ER endoplasmic reticulum
EtBr ethidium bromide
8 standard acceleration of gravity
GUS p-glucuronidase
IPTG isopropyl (3-D-thiogalactopyranoside
kD kiloDalton
kb kilobase or kilobase pairs
MES N-morpholino ethanesulfonic acid
M-MLV Moloney murine leukemia virus
MOPS 3-pSl-morpholino]propanesulfonic acid
mRNA messenger RNA
4-ivnj 4-methylumbelliferone
MUG 4-methylumbeliiferyl glucuronide
X V lll
n
NaOAc
NaPPi
NH4OAC
O.D.
PC
PCR
PE
p.f.u.
PI
PVP
RNAse
rRNA
RT
SDS
sscTAB
TCA
TE
TEMED
Tris
UV
(v/v)
(w/v)
X-Gal
X-Gluc
nucleotide(s)
sodium acetate
sodium pyrophosphate
ammonium acetate
optical density
phosphatidylcholine
polymerase chain reaction
phosphatidyethanolamine
plaque-forming units
phosphatidylinositol
polyvinylpolypyrrolidone
ribonuclease
ribosomal RNA
reverse transcriptase or room temperature
sodium dodecyl sulphate
standard saline citrate
Tris-acetate
trichloroacetic acid
Tris-EDTA
N,N,N ' ,N' -tetramethylethylene diamine
N-tris(hydroxymethyl)amino-methane
ultraviolet
volume/volume
weight/volume
5-bromo-4-chloro-3-indolyl {3-D-galactoside
5 -bromo-4-chloro-3 -indolyl glucuronide
■It
Î
.AXIX
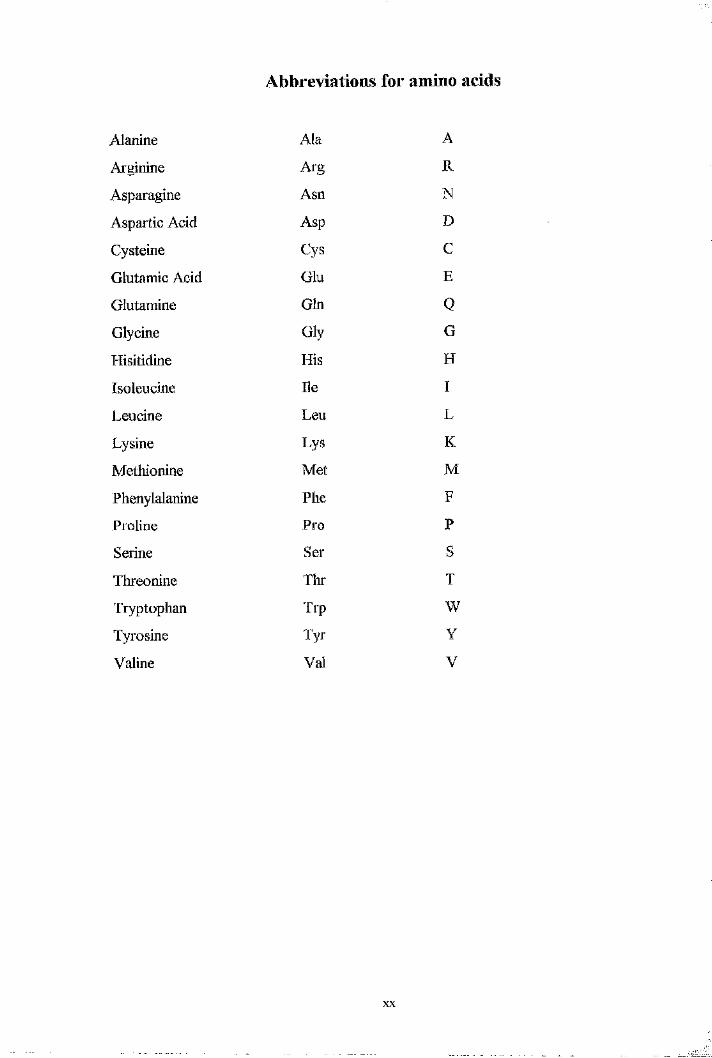
Abbreviations for amino acids
Alanine Ala A
Arginine Arg R
Asparagine Asn N
Aspartic Acid Asp D
Cysteine Cys C
Glutamic Acid Glu E
Glutamine Gin QGlycine Gly G
Hisitidine His H
Isoleucine He I
Leucine Leu L
Lysine Lys K
Methionine Met M
Phenylalanine Phe F
Proline Pro P
Serine Ser S
Threonine Thr T
Tryptophan Trp W
Tyrosine Tyr Y
Valine Val V
XX
Chapter 1 Introduction
1.1 Study of plant developmentThe coordinated control of cell division, cell expansion and cell differentiation
which leads to many morphologically diverse forms in the plant kingdom, has for many
years been a keen interest for plant molecular biologists. Recent studies involving gene
transfer techniques for the generation of transgenic plants and isolation of mutants,
indicate that the major control point is at the molecular level (Stitte, 1992). Indeed, the
fundamental aspect of normal development is the determination of cell fate, and the
control of cell fate in a multicellular organism is no doubt complex. Furthermore, in
higher plants it is estimated that during plant development, approximately 16,000 to
33,000 genes are expressed depending on the plant species (Gibson and Somerville,
1993). In addition, a high proportion of these are present in multigenic families. A
deeper understanding of how selective expression of these genes comes about would
greatly enhance our understanding of how a diverse array of plant stmctures are
generated. Although there are many fondamental similarities between the regulation of
gene expression in plants and animals, there are clear differences in the cell biology.
Plants are sedentary organisms with semi-rigid cell walls and so, in contrast to animal
cells, direct membrane-membrane interaction during morphogenesis is limited. Unlike
mammalian cells, the fate of plant progenitor cells has been shown for a long time to be
determined by their position and the local environment and, a single plant cell taken
from cultured cells can be induced to produce a multicellular plant (Henshaw et al.,
1982).
1.1.1 Experimental approachesPlant development has been extensively studied by a combination of
histological (Barton and Poethig, 1993; Dolan et a l, 1993) and chimera analyses
(Satina et a l, 1940), genetic mosaics and cell lineage analysis (Hake, 1987),
immunofluorescence techniques (Webb and Gunning, 1991), scanning electron
microscopy and dye-coupling (Scott et a l, 1958; 1991; Duckett et a l, 1994), the
production of transgenic plants (Vroemen et a l, 1996) and mutant analysis
(Koornneef, 1991; Marx, 1983). The introduction of easily assayable, tissue-specific
and cell-specific molecular markers into transgenic plants has provided a vital tool for
the study of epidermal cell fate (Jefferson et a i, 1987; Vroemen et a l, 1996).
1.1.2 Arabidopsis thaliana : a model in the study of epidermal
developmentOne of the most important model systems to emerge in the study of plant
developmental biology in the last twenty years has been the proverbial weed,
Arabidopsis thaliana (L.) Heynh (Meyerowitz, 1987). The main advantage of its use
has been the relative ease with which it can be used in classical and molecular genetic
studies. It has a small genome size of approximately 100 Mb, very few repetitive DNA
sequences and a rapid rate of reproduction, around 4-6 weeks. Furthermore it has a
small size with small seeds which enables a large number of mutagenized seed (around
10,000 per Petri dish) to be screened. A relatively poweiful approach in the study of
developmental processes has been through the generation of Arabidopsis mutants
(Koornneef, 1991). A number of mutagenic processes have been employed in the
generation of Arabidopsis mutants including chemical treatment of seeds with ethyl
methyl sulphonate (EMS), by radiation with X-rays and gamma rays (Koornneef,
1982) and by insertional mutatagenesis with T-DNA (Feldmann, 1991) from
Agrobacterium tumefaciens (Zambryski et a l, 1989; Walbot, 1992) or by transposon
insertion (Chandler and Hardeman, 1992) such as the Mu or the Ac/Ds transposon
from maize (Bancroft et a l, 1992). Its remarkable use as a genetic and molecular
model in the study of plant development is discussed throughout tliis review. Indeed
several Arabidopsis mutants altered in various aspects of epidermal development have
already been generated in this way. Some of them will be discussed in greater detail
later. By identifying the mutated genes and determining their expression patterns we
can begin to build a molecular picture as to how epidermal development is achieved.
A wealth of knowledge exists for the study of developmental processes in
Arabidopsis organs such as the seed (Jurgens et a l, 1991), root (Schiefelbien and
Benfey, 1991; Dolan, 1993), shoot meristem (Medford et a l, 1992), leaf (Pyke et a l,
1991) and flower (Smyth et a l, 1990). However, very little definitive information on
the development of the plant epidermal layer is available. Its study has many potentially
important implications as it forms the protective outer surface of the plant and is
2
I
constantly in contact with diverse environmental stresses such as extreme light and
temperatures, pathogen attack, physical damage, drought and man-made chemicals.
The isolation and characterisation of epidermal-specific genes would be extremely
useful in the characterisation of the molecular processes central in epidermal
development and epidermal-specific gene expression. By identifying those genes
expressed, if not exclusively, but mainly in the epidermis and comparing their common
sequence elements, we can begin to build a molecular picture inter-relating epidermal
development to gene expression and ultimately to transcription factors. However, one
of the main problems in identifying such genes is that they are expressed in a restricted
cell type and the transcript or protein level may be extremely low and/or expressed
only transiently during development. Although differential screening of cDNA libraries
enables the identification of tissue-specific genes, it is ofi;en the case that these are only
easily detected due to the relatively high abundance of transcripts in a given organ or
tissue. Furthermore, in many cases these genes represent structural or metabolic
proteins.Conversely, genes that encode regulatory proteins that play a central role in
cell differentiation and development, are often expressed at very low levels. Although
cDNA and genomic subtractive hybridisation techniques based on a modifications of
the methods originally described by Bautz and Reilly (1966), can be employed, it has
often proven to be technically difficult. A more powerful approach is that of insertional
mutagenesis of genes using T-DNA (Feldmann, 1991). The strategy is relatively simple
but extremely informative. Once a gene is disrupted and cannot be complemented by
other genes, such as closely related members of a multigenic family, progeny
homozygous for the mutation appear abnormal either morphologically or
biochemically. Although mutants can be generated by chemical or physical treatment, a
distinct advantage of T-DNA insertional mutagenesis is the use of known sequences
that are inserted into the target gene enabling the gene to be subsequently cloned.
The engineering of T-DNA to contain selectable and/or screenable markers
such as the nptU gene, which confers resistance to kanamycin (Reynaerts et a l, 1988)
and uidA (Jefferson et nr/., 1987), which encodes the bacterial P-glucuronidase (GUS)
enzyme, enables the tagged gene to co-segregate with these additional markers in
crossing experiments. This greatly improves the selection process. Furthermore, with
technical advances in gene transfer techniques, we can begin to identify the regulatory
networks of isolated genes and determine the interaction of their encoded products
during plant development. More recently, a number of transcription factors known to
be involved in plant growth and development, as well as those known to determine
environmental regulation, have been characterised at the molecular and biochemical
level (Ramachandran et a l, 1994; Batschauer et a l, 1994; Terzaghi and Cashmore,
1995).
1.2 The plant epidermisThe epidermis of plants is a single cell layer which covers the entire body of the
plant. With the exception of stomatal guard cells, epidermal cells lack chlorophyll and
are characterised by anticlinal divisions which give them an elongated appearance. The
main fiinction of the epidermis is to protect the plant from biotic and abiotic stresses.
These include pathogen (Jenks el a l, 1994a) and insect attack (Eigenbrode and
Espelie, 1995), water loss (Hall and Jones, 1961) and cold acclimation (Thomas and
Barber, 1974). As a result the outer walls of epidermal cells are often thicker compared
to the inner walls. The epideimis also regulates the uptake of gases and water through
special pores present on the surface of the epidermis.
The shoot epidermal layer is often covered by a hydrophobic amorphous layer
known as the cuticle which plays a central role in the plant’s survival. It is composed of
insoluble high molecular weight lipid polyesters known as cutins which are formed
following intermolecular estérification between the carboxylic and hydroxyl groups of
long chain (C l6 and 018) polyhydroxylated fatty acids (Kolattukudy, 1975).
The root epidermis (section 1.3.4) on the other hand is involved in the uptake
of ions and water and in some cases forms a symbiotic relationship with various fungal
and bacterial organisms (Peterson, 1992). It is generally accepted that roots do not
synthesize cutin (Buvat, 1989).
1.2.1 Specialised epidermal cells: trichomes, guard cells and
root hair cellsEpidermal cells can be differentiated into specialised epidermal cells such as
trichomes and guard cells, wlrich are located on the aerial surfaces of the plant, and
root-hair cells found on the mature root. Trichomes are single cell hairs that cover the
epidermis of leaves, petioles, sepals and stems. They are between 200 and 500 pm in
height with a thickened cell wall, and are generally not essential for viability as mutant
plants lacking these stuctures are viable. During early epidermal cell (protoderm)
development, a subset of epidermal cells differentiate to produce an enlarged cell that
protrudes from the surface of the epidermis. This then develops into a branched hair or
trichome. This complex morphogenesis of a relatively simple epidermal cell has made
trichome development an attractive model for the study of epidermal cell fate and
differentiation in plants (see section 1.3.5). The fonction of trichomes varies between
species but in general their fonction is protection against environmental stresses. In
some desert plants, trichomes are thought to moderate leaf surface temperature as well
as photosynthetic and respiration rates (Ehkeringer, 1984). Also, some trichomes
located on leaves and stems have glandular properties and are capable of synthesizing
secondary metabolites that protect plants from herbivores (Wagner, 1991).
The opening and closing of the stomata or pores on the surface of leaves and
stems is regulated by a pair of specialised epidermal cells known as guard cells. They
are found on the aerial surface of leaves, stems and reproductive organs. The opening
and closing of guard cells is regulated by signals such as turgor pressure, light, abscisic
acid and Ca treatment (Assmann, 1993). The spacing between the stomata (and
trichomes) is often regular, suggesting a tightly controlled developmental pattern. Very
little is known about the mechanism of stomatal patterning and guard cell
differentiation. Furthermore, genes that control these mechanisms are unknown.
The relative simplicity of epidermal root cells has made them an ideal model in
the study of epidermal development (Scliiefelbien and Benfey, 1991; Dolan et a l,
1993). The root epidermis consists of two cell types; root-hair cells or trichoblasts and
hairless cells or atrichoblasts. The main fonction of root hairs is to aid in anchoring
roots in soil to interact with soil micro-organisms and to increase the surface area of
roots which aids water and nutrient uptake (Cormack, 1962; Clarkson, 1985).
1.3 Epidermal development
1.3.1 Origins of the shoot and root epidermisThe main part of the plant body plan of flowering plants such as Arabidopsis is
laid down during embryogenesis (Steeves and Sussex, 1989; Jurgens et a l, 1991),
which is one of the most complex developmental processes that takes place in higher
plants. A large number of genes, up to 4000, are thought to be involved in the
embryogenesis process (Jurgens et ah, 1991; Meinke, 1991). Following fertilisation,
the diploid zygote within the embryo sac of the flower begins a number of cell divisions
until a 16 cell stage is reached. The first cell division of the fertilised zygote gives rise
to an apical-basal pattern of development which is clearly visible in the developing
zygote which elongates three-fold in the apical direction. The asymmetry generates a
small upper apical cell which is entirely surrounded by the dermatogen and a lower
basal cell. The apical cell develops into the embryo shoot meristem, cotyledons,
hypocotyl and part of the embryonic root. The larger basal cell forms the suspensor
and the root meristem (West and Harada, 1993; Goldberg et a l, 1994; Jurgens, 1995).
The radial pattern of development is characterised by three concentric layers of
tissue of the apical cell when the eight cell stage is reached (Satina et al., 1940; Irish,
1991; Jurgens et a l, 1991). The outer layer known as the protoderm gives rise to the
epidermal cell line and is characterised by anticlinal divisions, the next layer gives rise
to the main body of the plant and the central layer gives rise to the vasculature (West
and Harada, 1993; Goldberg et a l, 1994; Jurgens, 1995). Further divisions of the
embiyo then lead to the globular stage of embryogenesis which is followed by the
torpedo and finally the heart stage in which the two cotyledons begin to form. The
mature embryo is encased in the seed until germination is stimulated.
Upon seed germination, the shoot and root meristems maintain embryonic
characteristics to produce postembryonic shoot and root systems of the adult plant
(Sussex, 1989). Schmidt (1924) first observed that shoot apical meristems had two
distinct regions, the tunica and the corpus. The tunica region was characterised by
anticlinal divisions that increased the apex length whereas the cells in the corpus region
had irregular divisions that increased the volume of the shoot apex. The shoot
meristem was subsequently described as having three layers, the upper LI layer fi'om
which the epidermis is derived, a sublayer known as the L2 from which the ground
tissue was derived and finally the central L3 layer winch gave rise to the vasculature
(Satina et a l, 1940). However, in Arabidopsis the shoot apical meristem consists of
two tunica layers equivalent to the LI and L2 covering a corpus layer (Medford et a l,
1992). An analysis of several pattern mutants in Arabidopsis (see section 1.3.2) have
.■
suggested that the development of the shoot and root meristems are under different
mechanistic controls. For example in the shoot meristemless mutant, stni (Barton and
Poethig, 1993), root growth is normal whereas the shoot meristem is absent.
1.3.2 Embryo pattern mutants altered in epidermal
developmentThe isolation and characterisation of genes involved in embryogenesis, in
particular during differentiation of epidermal cells, has been technically difficult due to
the lack of sufficient tissue which is embedded in floral embryo sacs. However, several
Arabidopsis embryo mutants altered in various aspects of epidermal development have
been characterised (Meinke, 1986; Jurgens et al., 1994). Genetic analysis of
Arabidopsis embryo development showed they consisted of independently patterned
regions along the apical-basal and radial axes (Mayer et ah, 1991). Three main classes
of mutant phenotypes were identified: those altered in cotyledon number, in apical-
basal patterning and in radial patterning. Several Arabidopsis mutants altered in the
radial pattern of morphology have been isolated and between 15 and 50 genes have
been estimated to control pattern formation in Arabidopsis embryos (Jurgens et ah,
1991).
"''il1.3.2.1 keule knolle knopf mickey: mutants altered in early
epidermal patterningThe keule {keu) mutant embryos at the globular stage of development have
enlarged, bloated epidermal cells but relatively normal imier cells (Mayer et ah, 1991,
1993; Jurgens, 1991). The keule gene appears to control both epidermal cell
differentiation and growth since both ground tissue and vasculature are normal. The
knolle {kn) mutant embryos on the other hand have enlarged cells from the point when
the epidermal primodium would normally be established. At the globular stage of
knolle mutants there is no clear difference between the outer cell layer destined to
become the epidermis and the inner cells. The product of the KNOLLE (KN) gene
resembles a secretory pathway protein like the animal and yeast syntaxins (Lukowitz et
a l, 1996) which are thought to act as transport vesicle receptors. To determine
A
!■
whether the enlarged outer layer cells in the kn mutants were of epidermal origin,
Lukowitz et al. (1996) used the fusca (fus) mutant (Misera et al., 1994), which
normally accumulates anthocyanins in the inner cell layers but not in the epidermal
cells, and genetically crossed it with a kn mutant. In kn/fiis double mutants only a
fraction of the outer cells in the embryos accumulated anthocyanins which suggested
KNOLLE normally determines cell identity along the radial axis. Furthermore,
Vroemen et al. (1996) observed that a lipid transfer protein (section 1.4.3) that is
normally expressed only in the protoderm of young developing embryos was expressed
only in internal cells but not in the abnormal epidermal progenitor cells of the kn
mutant.
Other mutants altered in the radial pattern of epidermal development include
the knopf and mickey (Mayer et al., 1991) mutants. The Awo/?/mutants contain tightly
stacked epideimal cells in the hypocotyl whereas the mickey mutants have veiy large,
disc-shaped cotyledons with enlarged epidermal cells. Analysis of these mutant
phenotypes amongst others suggested that pattern formation was independent of cell
shape but that the cell position in the young embryo was a major factor in determining
cell fate (Mayer et al., 1991).
1,3.3 Homeotic genes and epidermal cell fateCell type characteristics in plants are acquired in a progressive process
involving positional cues, enviromnental signals and internal genetic programs. Several
plant homeobox genes have been implicated in determining cell fate, in positional
morphogenetic cues and pattern formation in the shoot apical meristem and embryo
(Gehiing et al., 1994; Lawerence and Morata, 1994). Homeobox genes are
characterised by a common 180 bp sequence, known as the homeobox, that encodes a
60 amino acid homeodomain which comprises the DNA-binding domain (Komberg,
1993). In plants, four different types of homeodomain proteins have been identified;
the Arabidopsis homeodomain protein GLABRA2 (GL2) (Rerie et al., 1994),
homeodomain zipper proteins that posses a leucine zipper adjacent to the
homeodomain (Ruberti et al., 1991; Mattson et al., 1992; Schena and Davis, 1992,
1994), plant homeodomain finger proteins that share a conserved cysteine-rich motif
(Korfhage et al., 1994) and KNOTTEDl {KNl) and related proteins (Volbrecht et a l,
1991; Lincoln et a l, 1994; Ma et a l, 1994).
The GL2 gene in Arabidopsis is required for normal trichome and root
development (see section 1.3.5.1). The SHOOT MERISTEMLESS {STM) gene, a
ATW-like gene in Arabidopsis, and the KNI gene in maize are thought to be involved in
shoot apical meristem formation in the embryo (Smith et a l, 1995; Long et a l, 1996).
Plants that are mutated in the STM locus failed to develop a shoot apical meristem
during embryogenesis (Long et a l, 1996). In maize shoot apical meristems, KNl
mRNA was expressed in the L2 and L3 corpus layers but not in the LI layer
suggesting a role in establishing a boundary for the meristem from the rest of the shoot
and thus enabling the meristem to remain in an undetermined state (Jackson et a l,
1994).
1.3.3.1 ATMLl may determine epidermal-specificity of genesAn LI layer-specific gene in Arabidopsis that expressed a new class of
homeodomain protein designated ATMLI {Mabidopsis thaliana meristem LI layer)
was isolated by Lu et a l (1996). This protein was shown to be highly similar to the
Arabidopsis GL2 homeodomain protein and the Phalaenopsis 039 (Nadeau et a l,
1996) proteins within and outside the homeodomain regions. This protein was
therefore classed as a plant homeodomain-containing protein (HD-GL2). ATMLl
mRNA was restricted to the protoderm layer. However, at the torpedo stage of
embryogenesis, ATMLl was no longer expressed but reappeared in the LI layer of the
shoot apical meristem. Following germination, the LI-specific pattern of expression
was maintained in the vegetative shoot apical meristem as well as the floral meristem,
inflorescence and in young floral organ primodia. However, ATMLl accumulated only
in the undifferentiated actively dividing cells and not in the mature epidermal cells.
Unlike other LI-specific genes such as those that encode lipid transfer proteins (see
section 1.5.3), tomato polyphenoloxidase (Shahar et a l, 1992) and several unknown
sequences isolated from Pachyphytum (Clark et al., 1992), ATMLl was not expressed
in mature epidermal cells. Therefore, ATMLl has been implicated as a transcriptional
regulator determining the epidermal-specific expression pattern of downstream target
genes such as those mentioned above.
A!
-
:: A
1.3.4 Root epidermal developmentThe simplicity of the root epidermis (Schiefelbien and Benfy, 1991; Dolan et
al., 1993) makes it an ideal model to study cell differentiation in higher plants as
differentiation of specific epidermal cells into root hair cells can be easily observed.
The development of the root epidermis has been studied histologically (Dolan et al.,
1993), by clonal analysis (Scheres et al., 1994), in mutants altered in various aspects of
root development (Baskin et al., 1992; Benfey et a l, 1993) and by dye-coupling
(Duckett, a/., 1994).
The Arabidopsis root has a simple, radial structure with four distinct cell
layers; the epidermis, the cortex, endodermis and pericycle consisting each of a single
layer of cells with the vascular tissue at the centre. The developing epidermal cells are
derived from a set of 16 initials that are located in a ring. Each of the 16 cells gives rise
to clones of cells that are arranged into columns or files along the length of the root.
The growing root can be divided into three distinct zones: the meristematic zone, the
elongation zone and the cell differentiation zone. Newly formed epidermal cells are
located near the root meristem whereas more advanced ones are located further from
the tip. Duckett et al. (1994) used a number of dye-loading methods to show that
undifferentiated, meristematic cells and cells in the elongation zone are symplastically
connected. However, cells in the differentiated zone become symplastically isolated,
and as the root hair begins to grow, the cells of the epidermis are completely isolated.
This process is similar to the pattern of gap-junction connections observed in animal
systems where cells are coupled during cell patterning but gradually become isolated as
they differentiate. As mentioned previously, the root epidermis differentiates into two
cell types: root-hair bearing cells (trichoblasts) and hairless cells (atrichoblasts)
(Btinning, 1951; Cutter, 1978). Eight of the files develop as root hairs and between 8
and 13 differentiate into hairless cells. Hair cells are always located between two
underlying cortical cells while the hairless cells are located next to a single cortical cell
file.
Sussex (1995) identified more than 40 genes whose mRNA expression levels
were increased in the lateral root primodium during lateral root development. Around
14 pericycle cells are founder cells of lateral root primodia m. Arabidopsis. The rate of
lateral root formation could be increased by exposure to auxin and the main class of
10
genes which displayed increased expression upon exposure to auxin were ribosomal
proteins. By in situ hybridisation, one protein, RPL16A (Sussex, 1995) was shown to
be expressed transiently in pericycle cells that are involved in the initiation of lateral
root primodia. Keller et a l (1994) identified a cell wall protein expressed specifically in
lateral root initials.
1.3.4.1 Differentiation of root hair and hairless cellsThe production of root hair and hairless cells in the Arabidopsis root has been
shown to be affected by five loci: TRANSPARENT TESTA GLABRA (TTG),
GLABRA2 (GL2), ROOT HAIR DEFECT1VE6 {RHD6), CONSTITUTIVE TRIPLE
RESPONSE 1 (CTRI) and AUXIN RESISTANT2 {AXR2\ as well as the two plant
hormones, ethylene and auxin. By a combination of reporter gene studies and the si
epistatic interaction of the genes in double mutants, Masucci and Schiefelbein, (1996)
demonstrated that TTG and GL2, which established hairless cells, act early to
negatively regulate the ethylene and auxin pathways. Furthermore, auxin and ethylene
pathways promoted root hair outgrowth once cell-type identity had been established.
Masucci and Schiefelbein (1996) proposed a model where patterning of root-epidermal
cells in Arabidopsis is regulated by the cell position-dependent action of the TTG/GL2
pathway, and the auxin and ethylene pathways promote hair outgrowth at relatively
later stages of cell differentiation.
In pea, Mylona et al. (1994) revealed the existence of at least ten proteins
expressed at high levels in root hairs by two-dimensional gel electrophoresis of root
and root hair proteins. However, these proteins have not been fully characterised.
Furthermore, in situ hybridisation revealed the existence of a root epidermis-specific
gene, RH2 that had 95 % amino acid identity to the pea pathogenesis-related gene,
I49a (Mylona c/a/., 1994).
1.3.4.2 Mutants altered in root epidermal morphology: reb
rhd ttgSeveral Arabidopsis mutants altered in root development have been
characterised. Baskin et al. (1992) isolated a mutant with altered epidermal cells. The
root epidermal 6ulger {rebi) plants were characterised by epidermal cells that bulged
11
and became large and inflated. These larger cells were observed only at the region
where cells were expanding. In addition, root hair development was not repressed.
Another mutant allele, rehl~2, was temperature-sensitive, displaying a similar mutant
phenotype at This mutation, unlike the ttg mutation (see below), was specific to
the root epidermis and did not affect the shoot epidermal development. Baskin et al.
(1992) speculated that a change in the arrangement of the cortical microtubules may be
the cause of bulged epidermal cells.
Several Arabidopsis mutants altered in specialised epidermal root hair cell
differentiation have also been isolated (Schiefelbien and Sommerville, 1990). Four
different genes were identified as playing a role in root hair development. These genes
were termed RHD for root //air development. The rhdl mutant had normal root hairs
but a bulged base. The rhd2 mutant produced shorter root hairs whereas the rhdS
mutants produced short root hairs with a wavy and sometimes branched appearance.
The rhdS mutants were also much smaller and had shorter roots. Conversely, the rhd4
mutants produced slightly shorter root hairs with bulges along the length of the root
hair. Both the rhd3 and rhd4 mutants are thought to result fi’om aberrant deposition of
cell wall components. Epistatic anâlysis of several double mutants indicated RHD 1 was
involved early in root hair cell differentiation by softening and pushing out the root
hair. All double mutants of rhdl had bulbous root hair bases. RHD2 appeared to be
involved in activating root hair growth whereas RHD3 and RHD4 were involved in
controlling the hair tip growth.
In Arabidopsis ttg {transparent testa glabra) mutants that lacked trichomes,
anthocyanins and seed coat mucilage, root epidermal cells in all positions differentiated
into root-hair cells. This mutant phenotype could however be rescued by the maize R
gene (Lloyd et al., 1992). Also, over-expression of R driven by the CaMV35S
promoter in transgenic Arabidopsis plants produced plants completely devoid of root-
hair s. Therefore, the normal function of the TTG product was to respond to positional
signals and hence, to cause neighbouring cells to adopt different fates, either becoming
root-hair producing or hairless cells (Galway et a l, 1994). The Arabidopsis icxJ
(Jackson et a l, 1995, see section 1.3.5.2) mutant also showed abnormal root growth.
The roots were shorter in length and had root hair development in adjacent files.
12
'I::'
1,3.5 Trichome development
1,3.5.1 Arabidopsis trichome mutants: gll gl2 and ttgThe first stage of wild type trichome development is characterised by swelling
of the progenitor cell which comes about as a result of three rounds of endoreplication
of the nuclear DNA (Larkin et a/., 1994). The young trichome then protmdes from the
leaf epidermal base and forms the branched structures that require a final round of
endoreplication. In Arabidopsis, more than 70 trichome mutants have been isolated
and characterised representing 21 genes (Koomneef et at., 1982; Marks and Feldmami
1989; Hiilskamp et al., 1994). Trichome initiation has been shown to be controlled by
two genes, TRANSPARENT TESTA GLABRA {TTG) and GLABRAl {GLJ)
(Oppenheimer et al., 1991; Larkin et a l, 1994), since recessive mutations in these
genes block the initiation of trichomes. Mutations at the TTG locus are pleiotrophic;
mutant plants lack not only trichomes but also seed coat mucilage and seed coat
colour, and are also affected in root development (section 1.3.4.1). Mutations at the
GLl locus on the other hand affect only trichome development. GLl encodes a myb-
like transcripitional factor which is expressed at a low level throughout the developing
epidermis (protoderm) of leaves and stems and is upregulated as trichomes begin to
develop (Larkin et a/., 1994). Arabidopsis mutants that lack the GLl gene do not
produce any trichomes. Transgenic Arabidopsis plants expressing GLl constitutively
under the control of the CaMV35S promoter showed a decrease in trichome density:
and number compared to wild type. Over-expression also resulted in ectopic
expression of trichomes on the abaxial surface of the cotyledon and of the first leaf,
locations where trichome development normally do not occur, It was clear from these
experiments that GLl expression alone was not enough to commit all epidermal cells
to form trichomes.
Like gll, ttg mutants that lack the TTG gene are devoid of trichomes.
However, they can be complemented with the maize R gene (Bodeau and Walbot,
1992; Goff et a l, 1992) under the constitutive control of the CaMV35S promoter
which suggested TTG in Arabidopsis either encoded an R homologue or a factor that
activates the R gene homologue (Larkin et a l, 1994). The authors also generated
transgenic Arabidopsis plants that constitutively expressed the GLl gene but in a /(g
background. In this way it was possible to determine their relative times of expression
1 3
Jii
during development. These plants did not form any trichomes suggesting that GLl did
not act downstream of TTG. Also, Larkin et al. (1994) generated transgenic g ll plants
expressing the R gene constitutively and showed that these plants did not form any
trichomes. Collectively, these results suggested that TTG was not downstream of GLl
and that both genes acted independently but at the same position in the trichome
development pathway. Therefore, Larkin et al. (1994) suggested that TTG may be
inhibiting differentiation of neighbouring cells into trichomes by possibly acting as a
diffusible signalling component. For example, if one epidermal cell becomes
determined to become a trichome, it can signal to the neighbouring cell to inhibit
trichome differentiation. This hypothesis was supported by experiments where
Arabidopsis plants hemizygous for the 35S-GLI construct and heterozygous for the
TTG locus, ie, 35S~GLl/~;+/ttg, produced clustered trichomes. Another mutation
implicated in lateral inhibition of trichome development was found at the TRY locus
(Hülskamp et al., 1994) since try (triptychon) mutants displayed clusters of trichomes.
The gl2 {glabra2) mutant (Rerie et a l, 1994) is characterised by the
production of very few or underdeveloped trichomes that still undergo initial rounds of
endoreplication. The GL2 transcript was shown by in situ hybridisation to be expressed
in the epidermal progenitor cells and at stages associated with trichome development.
Mutations in the GL2 gene seem to interfere specifically with the local outgrowth of
the trichome cell. However, in addition to GL2 expression, the size of the trichome cell
also influences the local outgrowth. In general, a smaller than normal trichome cell size
influences the gl2 phenotype. The gene encodes a homeodomain-containing protein
required for transcription of genes necessary for normal trichome development in
Arabidopsis (Rerie et al., 1994).
1.3.5.2 icx 1 (increased chaicone synthase expression)”
The icxl mutant was derived from transgenic Arabidopsis thaliana ecotype
Landsberg erecta plants canying the Sinapsis alba (white mustard) CHS promoter-
GUS transgene (Batschauer et al., 1991) in an attempt to isolate mutants altered in
light signal transduction (Jackson et a l, 1995). The CHS-GUS transgene was
regulated by UV-B, UV-A, blue and high intensity white light treatment in
Arabidopsis, but was barely active in low white light and red light, which is similar to
1 4
the endogenous CHS gene (Jackson et at., 1995; Fuglevand et al., 1996). Seed from
these plants were mutagenized by EMS treatment and then screened for mutants withItaltered light-induction of the transgene by growing the seedlings under low white light
conditions. Several mutant lines were selected and one, A12, was selected which had
elevated levels of not only GUS activity but also endogenous CHS expression. This
implied that A12 was a true mutant altered in the regulation of the CHS promoter. The
A12 line was designated icxl (increased chaicone synthase expression) as it had
enhanced light-stimulation of CHS-GUS expression. The mutant, however, behaved in
a similar manner to wild type plants in the dark and under low intensity white light
conditions. As well as increased chaicone synthase {CHS) expression, chaicone
isomerase {CHI) and dihydroflavonol reductase {DFR) gene expression were enhanced
in the mutant, which correlated with a 2-3-fold increase in anthocyanin production.
Interestingly, the mutant was also altered pleiotropically in several aspects of epidermal
development. It had fewer trichomes, smaller seed, narrow leaves, shorter roots with
disorganised root hairs and was generally smaller than wild type plants (Jackson et al.,
1995; J. A. Jackson and G. I. Jenkins, unpublished). A closer look at the epidermal
layer by SEM indicated the epidermal pavement cells were abnormal in shape. From
these observations it was concluded that the ICXl gene product normally functioned as
a repressor of the CHS, CHI and DFR genes and that it was also involved in the
development of the epidermis.
1.3.6 Guard cell developmentAs described previously in section 1.2.1, guard cell pairs control the pore size
of stomata. The guard cells are derived from epidermal cells known as ‘meristemoids’
(Biinning and Sagromsky, 1948; Biinning, 1953). In the Brassicaceae family, which
includes Arabidopsis, stomatal development is dependent on meristemoid formation
and activity (Pant and Kidwai, 1967). The meristemoid is formed during aysmmetric
division of the protodermal cell. The larger of the two daughter cells gives rise to a
non-stomatal epidermal cell whereas the smaller cell gives rise to the meristemoid. The
latter then undergoes several asymmetric divisions whereupon the larger ones
differentiate into epidermal cells. After the last epidermal cell is produced the-■
meristemoid is converted into a guard mother cell which undergoes symmetric division
1 5 3
to produce two guard cells at which point cell division is arrested. A striking feature of
stomata formed in this way is the tightly ordered spacing between each stoma (Sachs,
1991).
1.3.6.1 Stomata mutants tmm and ftpUnlike trichome and root hair development, where more than 30 different loci
have been identified by mutation, very few mutants affected in stomata development
have been identified. Zeiger and Stebbins (1972) described a stomata-defective mutant
in barley, eceriferiim-g vA\\ch. has double and triple adjacent stomatal complexes. More
recently, Yang and Sack (1995) isolated two Arabidopsis mutants, tmm {too many
mouths) and ftp (four lips) which contained extra adjacent stomata, by screening
cotyledons fi’om ethylmethanesulfonate-mutagenized seed by light microscopy. The
tmm mutation resulted in stomatal clustering and increased meristemoid cell formation
whereas the ftp mutation was charcterised by several paired stomata and a few
unpaired guard cells in the cotyledons. Furthermore, the double mutant tmmlflp
displayed characteristics fi'om both mutants. However, the genes involved in these
processes have not been identified.
1.4 Epidermal-specific genesA number of genes have been reported to be expressed in the epidermis of
plants. These include anti-fixngal proteins such as thionins (Florack and Stiekema,
1994), cell wall proteins such as hybrid proline-rich proteins (Wyatt et al., 1992), the
tomato polyphenoloxidase gene (Shahar et al., 1992) and the carrot EPl glycoprotein
gene which shows homology to the Brassica napus S-locus glycoprotein (Van Engelen
et al., 1993). Mylona et al. (1994) identified a root epidermal-specific gene, RH2
which is 95 % identical to the pea pathogenesis-related (PR) gene, I49a. The gene was
switched on during post-embryonic development after the transition of protoderm into
epidermis. Also, Clark et al. (1992) described several unidentified epidermal-specific
transcripts in Pachyphytum in an attempt to characterise epidermis-specific gene
expression. Furthermore, the GLl and GL2 (sections 1.3.5 and 1.3.4.1) genes that
control trichome development were expressed at low levels in the epidermis but were
upregulated in regions of trichome differentiation. Other epidermal-specific genes
1 6
discussed in this review include those involved in the epicuticular wax biosynthetic
pathway (section 1.4.1), genes involved in flavonoid biosyhthesis (section 1.4.2) and
genes encoding plant lipid transfer proteins (section 1.4.3).
-3'"" .
I f
■i
1.4.1 Epicuticular waxesThe plant epidermis is almost always covered with a waxy layer known as the
epicuticular waxy layer and, as would be expected, is the main site of wax biosynthesis
(Kolattukudy, 1968; Lessire, 1982). The waxes interact with a relatively insoluble lipid
polymer of hydroxy and epoxy fatty acids known as cutin which is the main structural
component of the cuticular membrane and, as a result, form a continuous amorphous
covering on the outer surface of the plant. In underground tissues and regions of
wound healing waxes are associated with the suberin matrix which is another polymer
related to cutin. Suberin has both aliphatic and aromatic domains located between the
plasmalemma and walls of the outermost one or two cell layers. The epidermal cell
walls are linked together and to the cuticle by pectic cuticular components that attach
to the outer cell. Furthermore, the outer cell wall is linked to a polymeric carbohydrate
layer. It is on these carbohydrate fibres that the cuticular and epicuticular waxes are
deposited. Plants with this layer usually have a glaucous or grey appearance
(Kolattukudy, 1975).
Epicuticular waxes are found on leaves, stems, fimit, seeds, seed coat, flowers,
bark and husks. The composition of waxes varies considerably not only between plants
of the same and different species, but also within the same plant such that organ-
specific and tissue-specific waxes exist. For example, in Arabidopsis, the leaf (Jenks et
al, 1995), stem (Hannoufa et a l, 1993), pollen (Preuss et a l, 1993) and silique
(Koorneef et a l, 1989) have different wax compositions and contents. The major
classes of wax components in different plant species vary considerably. For example,
the Cruciferae family which includes the Brassica napus and Arabidopsis thaliana
species contain acids, alcohols, aldehydes, (3-diketones, esters and hydrocarbons as the
major classes of wax components, whereas others such as the Gramineae family which
includes species such as O. sativa, Z. mays and S. vulgare contain in addition to the
compounds already mentioned, alkenes, phytosterols, polycyclic triterpines and
triglycerides. Wax composition also varies considerably during development. For
1 7
example, in young maize leaves primary alcohols predominate (63%) whereas older
leaves have mainly wax esters (42%) (Avato et al., 1990; Bianchi et al., 1979).
The main function of the epicuticular waxy layer is to prevent water loss
through the epidermis which contributes to drought tolerance (Jordan et al., 1984).
Waxes also protect plants from pathogen and insect attack (Eigenbrode and Espelie,
1995). Some plant epicuticular lipids can also contribute to insect resistance
(Eigenbrode et al., 1991). Furthermore, leaf epicuticular waxes have been implicated in
protection against mechanical damage (Eglinton and Hamilton, 1967) and agricultural
chemical sprays (Schreiber and Schonherr, 1992). Also, Preuss et al. (1993) found wax
composition and structure are important factors in pollen/pistil interaction.
1.4.1.1 Biosynthesis of epicuticular waxesCuticular wax biosynthesis occurs almost exclusively in epidermal tissue
(Lessire, 1982) despite the fact that the wax precursors which are fatty acids are
derived from de novo synthesis in plastids which occurs throughout the plant. Fatty
acid synthesis is catalysed by a number of enzymatic steps known as the fatty acid
synthase (FAS) (Post-Beittenmiller, 1996). Acetyl-CoA carboxylase (ACCase)
catalyses the first committed step in fatty acid synthesis, namely the formation of
malonyl-CoA. Two forms of the enzyme, the prokaryotic and eukaiyotic forms, have
been found in plants (Sasaki et al., 1993; Konishi and Sasaki, 1994; Sasaki, et al.,
1995; Alban etal., 1994). The prokaryotic form is composed of several subunits and is
located in plastids whereas the eukaryotic ACCase, which is composed of a single
multifunctional polypeptide, is located in the cytosol. Malonyl-CoA is also used for
flavonoid biosynthesis (see section 1.4.2). The first step in fatty acid synthesis is the
condensation of malonyl-acyl carrier protein (ACP) with acetyl-CoA (Jaworski et al.,
1993), followed by the sequential reduction of 3-ketoacyl-ACP, the dehydration of 3-
hydroxyacyl-ACP and the reduction of trans-delta^-enoyl-ACP. The fatty acyl primer
remains esterified to the ACP cofactor and is further extended, two carbons at a time,
by the donor, malonyl-ACP. For each two carbon addition, there is a sequential round
of condensation, reduction, dehydration, and second-reduction steps. NAD(P)H serves
as a reductant for the two reductases. The long chain products (C l6, €18) are
subsequently processed by hydrolases including stearoyl-ACP desaturase, plastidial
1 8■S'
î
acyi-transferases and acyl-ACP thioesterases. The fatty acids produced are then
partitioned to synthesise glycerolipids, waxes or cutin and suberin depending on the
tissue types and the particular developmental stage.
1.4.1.2 Wax biosynthesis is characterised by elongase activityFollowing de novo fatty acid biosynthesis, partitioning occurs that delivers
C l6:0 and C l8:1 hydroxy fatty acids to the glycerolipid or cutin/suberin biosynthetic
pathways and the C l8:0 to wax biosynthetic pathways in the ER (Post-Beittenmiller,
1996). This partitioning mechanism is not clearly understood, but it is likely that the
mechanism is dependent either on precursor availability and elongase specificity or on
the relative fatty acid pool levels in individual cells. Several experimental data support
the idea that epicuticular plant waxes are derived from stearate and that elongases are
involved in lengthening the chain followed by several reactions responsible for making
other derivatives such as aldehydes, ketones and alkane wax esters (Liu et a/., 1995).
The main enzyme activity characterising wax biosynthesis is fatty acid elongation. The
majority of wax components are derived from very long chain fatty acids (VLCFAs)
which are 20-32 carbons in length. Also, fatty acids esterified to alcohols can be 40-60
carbons in length (von Wettstein-Knowles, 1995). The VLCFAs are derived from the
C l6 or C l8 fatty acids that are elongated extraplastidially by microsomal enzymes
similar to de novo fatty acid biosynthesis. The acyl chains undergo four basic reactions
for every two carbon addition. These are, condensation, reduction, dehydration and
second reduction. Together, these four activities are known as elongases (von
Wettstein-Knowles, 1992). Multiple elongation systems are present in wax
biosynthesis that produce a variety of lipid classes. These can be split into three
diflFerent pathways: decarbonylation, acyl-reduction and p-ketoacyl-elongation all of
which are found in epidermal cell layer (Cheesbrough and Kolattukudy, 1984). The
different pathways were elucidated by a combination of inhibitor studies (for example,
Agrawal et al., 1984) and isolation of wax-deficient mutants (see section 1.4.5). The
decarbonylation pathway gives rise to aldehydes, odd-chain alkanes, secondary
alcohols and ketones whereas the acyl-reduction pathway is characterised by the
production of aldehydes, primary esters and wax esters which are produced following
estérification of elongated fatty acids and primary alcohols. The p-ketoacyl-elongation
1 9
pathway gives rise to p-diketones and their derivatives. However, different organs of
the same plant and different species utililize the components of these pathways in
different ways. As in the FAS reaction, NAD(P)H provides the reducing power for the
elongase associated reduction processes (Post-Beittenmiller, 1996). The main
differences between the FAS and elongase processes are that for the elongase process,
VLCFA elongation is ATP dependent (Cassagne et al., 1987; Evenson et al., 1995), it
does not occur on ACP and manoyl-CoA (not malonyl-ACP) provides the carbon
source. In addition, elongases are membrane-associated and extra-plastidial rather than
stromal and soluble (Cassagne etal., 1987). However, the regulation of this elongating
activity, the specific elongase substrates and cofactors involved in the process and the
number of elongases catalysing VLCFA biosynthesis are poorly understood. Although
an epidermis-specific elongase has been isolated from leek {Allium porrum L.)
(Bessoule et. a l, 1989), characterisation of elongases has been a slow process mainly
due to the low enzyme activity, enzyme instability in detergents and the problem of
isolating elongases from membrane (Lessire et. a l, 1985).
Cutin is the major component of plant aerial surfaces and is made exclusively in
the epidermis whereas suberin is a polymer associated with roots and wound sites in
the suberin pathway. Both cutin and suberin form the initial barrier to the environment
and are part of the cuticle. Both are polymers of C l6:0 and Cl 8:1 hydroxy fatty acids
(Kolattukudy, 1987). They are produced by a family of oxidases which have similar
activities to those of the decarbonylation and p-diketoacyl-elongation pathways for
wax biosynthesis (von Wettstein-Knowles, 1995).
1.4.1.3 Movement of cuticular waxes to the outer surfaceThe mechanism by which lipids are transported from their main site of
synthesis, the endoplasmic reticulum, and the chloroplast to other cellular organelles is
unknown. Furthermore, there is no evidence of vesicular trafficking between the ER
and the chloroplast. Although extensive research has been carried out to identify the
components of the wax biosynthetic pathway, the mechanism by which the wax
products are transferred to the surface of the plants is still not clearly understood.
Early SEM work carried out by Jefree et a l (1976) suggested general diffusion of wax
components through small spaces in the cell wall, based on the observation of an
2 0
' Iamorphous coating of wax throughout the cuticle. This also suggested that the
cuticular wax was deposited at regular intervals or continuously. Furthermore,
epicuticular wax is secreted to the plant surface after cell-wall and cuticle layers are
well developbed (Jenks et al., 1994b). Another proposed hypothesis was that the
transport of wax components may occur thi'ough well defined pores in the cell wall,
which are found on the surface of some plants (von Wettstein-Knowles, 1995).
However, a particular epicuticular crystalline structure probably arises from the
physical and chemical properties of the wax as well as external, environmental
influences, rather than the nature of the transport process. For example, in
recrystallisation studies of wax on spruce needles that were mechanically damaged the
wax structures reformed on the original crystalline structure even on dead needles, in
the absence of new synthesis or export of wax components (Bermadinger-
Stabentheiner, 1995).
Several people have shown that lipid transfer proteins (LTPs) can enter the
secretory pathway and are located extracellularly (Mundy and Rogers, 1986; Sterk et
al., 1991) (discussed in section 1.4.3). An Arabidopsis LTP1 (Thomas et a l, 1993)
and barley and maize LTPs (Molina et a l, 1993; Sossountzov et a l, 1991) were:
shown to be located in epidermal cell walls and a Brassica oleracea LTP (WAX9D)
was found to be the major protein in the surface wax of broccoli leaves (Pyee and
Kolattukudy, 1994). Furthermore, di Brassica napus LTP was able to bind acyl-CoA in
vitro (0stergaard et a l, 1995). This led to the hypothesis that LTPs may be involved in
transporting cuticular lipid components such as wax and cutin or suberin monomers to
the surface. However, the LTP:lipid ratio does not correlate with this postulated role
of LTPs (Molina and Garcia-Olmeda, 1993). Moreover, it has not been demonstrated
whether LTPs can recycle for additional lipids fi'om the ER lumen. This would clearly
limit the number of lipids that could be transported to the surface.
1.4.1.4 Environmental regulation of wax biosynthesisWax biosynthesis has been shown to be controlled by light and photoperiod
(Reicosky and Hanover, 1978), humidity, chilling, seasonal variation (Sutter, 1982),:
and developmental regulation (Rhee et a l, 1997). Analysis of wax biosynthesis in leek
leaves indicated a differential accumulation of total wax along the length of the leaf
I
2 1 I"
y<(Rhee et al., 1997). A C31 ketone was used as a marker to monitor wax content
during leaf development since it was found to be the major component in the leaf wax.
Furthermore, the presence of the C31 ketone indicated that the decarbonylation
pathway was the dominant pathway in leek. Light microscopic analysis indicated that
initiation of wax accumulation in leek leaves occurred after cell elongation was
complete. The lower section of the leaf had very little wax compared to the upper
portion, which suggested that rapidly expanding tissue generated more wax than older .tissue.
1,4.1.5 Mutants altered in wax biosynthesisThe main site of cuticular wax biosynthesis is the epidermis (Kolattukudy,
1968; Lessire et al., 1982). It is generally difficult to isolate and characterise genes.controlling the wax biosynthetic pathway as plant epidermal tissue is difficult to obtain
:.in large quantities (Kolattukudy et al., 1976). However, mutant plants with altered
wax composition and wax ultrastructure have been isolated from Brassica napus and
Pisum sathnim (Holloway et al., 1977), Brassica oleracea (Eigenbrode et al., 1991),
and Zea mays (Bianchi, 1979) and with the recent isolation of Arabidopsis eceriferiim
(cer) and maize glossy (gl) mutants obtained either by T-DNA or transposon tagging
(Koomneef et al., 1989; Walbot, 1992), the isolation of genes that regulate wax
biosynthesis has been made relatively easy. In both cases the normal accumulation of
cuticular waxes was altered. The mutants isolated include the cer-cqu, cer-yy, cer-n
from barley, g ll , gl2, gl4, gl6, gl3, gl5, gl6, gl7, gl8, gl9, g il l , gll2, g ll5 from
maize, bm22 from Sorghum and from Arabidopsis, cer 1 to cer 21 and tt5 (all reviewed
in Post-Beittenmiller, 1996). Mutants completely devoid of waxes have not been
reported probably due to the essential role waxes play in protection against theI
environment. Furthermore, to date only the Glossy 15 (section 1.4.1.5.2) and CER2
(section 1.4.1.5.1) genes have been reported to be epidermal-specific. Moreover,
Glossy 1 (section 1.4.1.5.2) from maize showed strong homology to an epidermal-
specific cDNA from Kleinia odora which encodes a receptor-like integral membrane
protein.
2 2
1.4.1.5.1 Arabidopsis wax mutants: cerl, cer2, cer3 and cer 6In Arabidopsis thaliana 22 gene products (CERl to CER2J) and TT5 have
been shown to be involved in wax biosynthesis (Koomneef et al., 1989). Mutations in
these loci were identified by their bright, dark green stems when compared to their
more glaucous wild type counterparts. Several of the cer mutants also exhibited
reduced fertility which was thought to be due to a lack of wax deposits on the pollen
surface resulting in abnormal pollen-stigma interaction (Preuss et ah, 1993).
CERl was predicted to encode an aldehyde decarbonylase (Aarts et al., 1995),
an enzyme required for the production of the alkane fraction of the epicuticular waxes
specific to Arabidopsis. Mutations in the CERl locus {cerl) caused enrichment of
aldehydes and a depletion of the alkanes and alkane-derived ketones and secondary
alcohols. cer2 was defective in the elongation of C28 to C30 fatty acids (Hannoufa et
al., 1993). In two mutant T-DNA insertion lines, BRL5 and BRL9, T-DNA was found
to be inserted in the second exon of the CER2 gene and in the intron of the gene,
respectively, and in both cases CER2 was not expressed (Negruk et al., 1996). CER2
encoded a 47.3 kD polypeptide and transcripts were differentially expressed in the
flowers and stems and specifically accumulated in the epidermis. A separate CER gene
in Arabidopsis, CER6 also appeared to be involved in the elongation of 28 carbon
saturated fatty acids (Lemieux et al., 1994). Both cer2 and cer6 appeared to be
defective in the synthesis of pollen lipids and a number of mutant alleles of the cer6
locus have a reduced fertility because of reduced lipid concentration (Preuss et al.,
1993). Interestingly, fertility could be rescued under humid conditions (Koorraeef et
a l, 1989). Jenks et al. (1995) suggested cer2 may have a regulatory role based on
diflferences in the wax composition between leaf and stem, although this can also be
attributed to differential expression patterns of CER2.
Hannoufa et a l (1996) cloned the CER5 gene through the isolation of a T-
DNA insertion mutant line designated BRLl. They showed the gene was composed of
nine introns and 10 exons and encoded a 90 kD protein. However, the second exon of
CER3 encoded a nuclear localisation sequence (NLS). The gene did not share
extensive homology with any other genes in the database. CER3 transcripts were
shown to be expressed in leaves, stems, flowers, roots, and apical meristems but were
not present in the insertion mutant BRLl line, cer3, unlike most of the other cer
2 3
mutants was found to have significantly lower levels of leaf wax compared to wild type
plants (Jenks et a l, 1995). The mutant also had a lower level of free fatty acids and
long chain length alkanes on the stems compared to the wild type plants (McNevin et
al., 1993). These observations led to the hypothesis that the CER3 product may be
involved in the hydrolysis of fatty acyl-CoA into free fatty acids and Co A (Jenks et al.,
1995). However, CER3 did not display any sequence homology with fatty acyl-ACP
thioesterases (Dormann et al., 1995). It was more likely therefore that CER3 encoded
a factor that regulated acyl-CoA thioesterase activity or a protein that transported acyl-
CoAs to a cytoplasmic thioesterase. The gene has also been implicated in pollen-stigma
recognition in Arabidopsis.
1.4.1.5.2 Maize wax mutants: gll^ gl8 and g ll5Hansen et al. (1997) cloned the Glossy 1 {GLl) locus of maize by insertional
mutagenesis by the Mutator 1 (Mul) transposon which resulted in the reduction of
waxes on the surface of maize seedlings to about one-fourth that of wild-type levels
(Bianchi et al., 1989). The GLl protein showed sequence homology to the epidermis-
specific EPI23 protein from Senecio odora {Kleinia odora). The two proteins also
showed sequence similarilarity to the Arabidopsis EST 178C3T7 and rice EST
RICS2751A. Aarts et a l (1995) have shown that the Arabidopsis EST 178C3T7 is the
product of the CERl locus, a gene that affects cuticular wax biosynthesis. Comparison
of the NH2-termini of the four proteins indicated strong seqence conservation whereas
the COOH-termini were less conserved. Furthermore, 40 amino acids of the NH2-
terminus of the proteins had features similar to membrane-targeted signal peptides. An
interesting feature of the predicted secondary structure of GLl was its distinct
similarity to the mammalian superfamily of (5~chemokine receptors (Raport et al.,
1996) including the HIV co-receptor fusin (CXCR4) (Loetscher et al., 1994), all of
which consist of seven transmembrane helices similar to CERl, E P l23 and
RICS2751A. However, GLl was smaller, which suggested it possibly had five
transmembrane helices. Based on hydrophobicity profiles, the COOH-terminus of all
these proteins had a globular, water-soluble domain located on the cytosolic side of the
membrane. In mammals such receptors bind ligands at their extracellular domains and
transduce signals via G-protein interactions with their cytosolic-oriented domains.
2 4
s.sM
Despite strong homology with CERl, it is unlikely that GLl encodes an aldehyde
decarbonylase, based on the observation that only 1 % of alkanes were found in
cuticular waxes of wild type maize seedlings. Furthermore, mutations in the Glossy 1
locus affected fatty aldehydes, alcohols and fatty esters of cuticular waxes.
The GlossyS gene was also isolated by transposon tagging with the Mul
transposon (Hansen et a l, 1997). The 327 amino acid GL8 protein had a predicted
molecular mass of 36 kD and showed homology to p-ketoacyl reductases suggesting
that it is part of the membrane-bound fatty acid elongase system which generates the
VLCFAs required for cuticular wax biosynthesis. Conversely, the Glossyl5 gene
encodes an APETALA2-\]k.Q gene that regulates leaf epidermal cell identity (Moose and
Sisco, 1996). In maize the transition from young to adult shoot development affects
several epidermal traits including epicuticular waxes, leaf hairs and cell wall
characteristics, and GL15 is required for the expression of young epidermal cell traits
after the development of the second leaf.
1.4.2 Genes involved in flavonoid biosynthesis
1,4.2.1 Flavonoids accumulate epidermal cellsFlavonoids are a large family of secondary metabolites found in all higher
plants. These are phenolic compounds which include the flavonoids such as flavonols,
flavonones, isoflavonoids and anthocyanins. Synthesis of flavonoids initiates with the
condensation of one molecule of 4-coumaroyl CoA and three molecules of malonyl-
CoA resulting in naringenin chaicone. This reaction is carried out by chaicone synthase
{CHS). Coumaroyl-CoA is derived from the general phenylproponoid pathway where
it is synthesised from the amino acid phenylalanine by the action of three enzymes,
phenylalanine ammonialyase {PAL), cinnamate 4-hydroxylase {C4H) and 4-coumaroyl-
coenzyme A ligase {4CL). The general phenylpropanoid pathway is so called due to
the formation of a myraid of phenylpropane-based structures used to synthesise
compounds such as Hgnin, coumarins, stilbenes and flavonoids. Malonyl-CoA is
synthesised by the carboxylation of acetyl-CoA and is also required in fatty acid
metabolism (section 1.4.1). Chaicone is further isomerised by the enzyme chaicone
flavone isomerase {CHT) to generate flavonone and subsequent actions by
2 5
'
Idihydroflavonol 4-reductase (DFR), isoflavonoid synthase (IFS) and flavanone 3p-
hydroxylase (F3H), amongst others, generate a myraid of flavonoids.
Flavonoids have been proposed to have a number of different functions,
including protection against harmful effects of UV-B radiation as they are potent
absorbers of UV wavelengths. In response to UV-B irradiation the flavonoid
biosynthetic genes are induced and consequently flavovoids accumulate in the vacuoles
of epidermal cells (Sclimelzer et al., 1988). Other functions of these compounds
include protection against pathogen invasion and fungal elicitors, and roles in sexual
reproduction and pollination. In addition they have been shown to play a structural role
(Dixon and Paiva, 1995). The genes are regulated in a tissue-specific manner during
plant development at least in part at the level of transcription.
-j'l
I
1.4.2.2 CHS PAL and 4CL are expressed in epidermal cells.. . .By a combination of in situ hybridisation and immunolocalization studies,
flavonoids, CHS, PAL and 4CL transcripts and the CHS enzyme were shown to
accumulate in epidermal cells following UV-irradiation in parsley (Schmelzer et a i,
1988; Wu and Hahlbrock, 1992). However, whereas CHS was exclusively epidermal-
specific, PAL and 4CL were expressed in the vascular bundles of leaves, although 4CL
was present at a much lower level. In addition, levels of all three transcripts were
greatly enhanced in response to light treatment. None of the transcripts were detected
in root apical meristem but all three were expressed at high levels in root caps and
regions where root hairs emerge (Yang et a l, 1992; Wu and Hahlbrock, 1992).
Furthermore, CHS mRNAs were most abundant in the epidermal cells of young leaves
and petioles. Similarly, in Arabidopsis, flavonoids such as kaempferol and phytoalexins
also accumulated in the epidermis in response to stress (Li et a l, 1993). In peas,
flavonoids and CHS are present in the epidermis and CHI was distributed in epidermal
/ I
I
and parenchyma tissue (Hrazdina et a l, 1982).
The flavonoid biosynthetic pathway in Arabidopsis was well characterised by a
combination of genetic, biochemical and molecular studies (Shirley et a l, 1995). The
flavonoid group can be flirther subdivided into other compounds such as tannins and
anthocyanins that are responsible for the red, brown and puiple pigments of flowers.
2 6 .1
fruit and seeds (Dixon and Paiva, 1995). Flavonoid regulatory genes have been isolated
from maize and Antirrhinum and shown to have homology to the mammalian
transcription regulators, myc and myb (Goff et at., 1992; Paz-Ares el at., 1987;
Sablowski et a l, 1994). A similar mechanism of flavonoid biosyntheic gene regulation
is thought to occur’m Arabidopsis (Mol et al., 1996).
1.4.3.1 Lipid binding and transfer assays of LTPsIn order to class a protein as a lipid transfer protein, it must have the ability to
transfer lipids between membranes. The principal assay devised was the monitoring of
the transfer of radiolabelled (Yamada et al., 1978), spin-labelled (Nishida et al., 1985)
2 7
1.4.3 Lipid transfer proteins (LTPs)Plant lipid transfer proteins (LTPs) have been shown by a number of people to
be expressed predominantly in the epidermal cells of leaf, stem and floral tissue in a.number of species. LTPs are small (90 to 93 amino acids), soluble, basic proteins with
.
a pi of around 9 or 10 and were first isolated by Kader et al. (1975). Their in vivo
function is as yet unknown and they were so called due to their ability to transfer
phospholipids between membranes in vitro as well as having the ability to bind acyl-
CoA esters and fatty acids (Kadar et al., 1984; Arondel and Kader, 1990). Based on
these observations, LTPs were thought to participate in membrane biogenesis and
regulation of intracellular fatty acid pools. However, nearly all plant LTPs described to
date possess a signal peptide sequence which suggests a membrane-bound and/or
extracellular location. This led a number of people to believe that their biological role
was something other than the transfer of lipids between membranes. Because they lack
the ER retention signal H/KDEL (Mum*oe and Pelham, 1987), LTPs are thought to
enter the secretory pathway. With the finding that they were located in the cell wall of
Arabidopsis (Thoma et al., 1994) and waxy layer of broccoli leaves (Pyee and
Kolattukudy, 1994, 1995) it was speculated their function may be that of cutin
formation (Sterk et al., 1991). Furthermore, their innate anti-pathogenic properties
suggested a possible role in defence against invading pathogens (Terras et al., 1992;
Cammue et al., 1995; Garcia-Olmedo et a l, 1995; Molina and Garcia-Olmedo, 1993;
Molina e/a/., 1993, 1996; Segura e / (3/., 1993; Pyee and Kolattkudy, 1994, 1995).
I.
or fluorescent (Moreau et a l, 1994) lipids from donor to acceptor membranes.
Acceptor membranes were either natural membranes such as the plasma membrane or
those of mitochondria, chloroplasts and microsomes, or artificial membranes such as
liposomes or lipid vesicles. Donor membranes are either natural membranes or
liposomes (Kader et a l, 1984). In assays involving radioactively labelled substrates,
the donor membranes are prepared from ^H-phosphatidylcholine (PC), the lipid to be
transferred, and a separate non-transferrable compound such as ^"^C-trioleoylglycerol..The acceptor and donor membranes are mixed and incubated in the presence of
purified lipid transfer proteins. The extent of H-PC transfer can be estimated from the
"H/"C ratio.
Plant LTPs have been purified by gel-filtration, cation exchange
chromatography and reverse-phase HPLC (Douady et a l, 1986; Kader et al., 1984;
Neumann et aï., 1995; Terras et a l, 1992). Several peaks of LTP activity were
detected suggesting the presence of several isoforms. However, Pyee and Kolattukudy
(1995) extracted an LTP fi’om broccoli leaves following a brief wash in chloroform.
Subsequent purification showed that at least 90 % of total protein in the surface wax
was LTPs. Analysis of LTPs by gel-filtration or SDS-PAGE indicated a molecular
mass of 9 or 10 kDa, although several LTPs with a lower molecular mass have also
been isolated (Kalla et al., 1994).
Plant LTPs are able to transfer phosphatidylcholine (PC), phosphatidylinositol
(PI) and phosphatidylethanolamine (PE) from liposomes to mitochondria but the
specificity can vary between different LTPs and even between different isoforms. The
binding of fatty acids or acyl-CoA esters to LTPs was determined by gel filtration or
by temperature dependent ligand affinity (Tsuboi et a l, 1992). LTPs isolated from
sunflower and spinach had affinity for oleoyl-CoA (Arondel and Kader, 1990; Rickers
et a l, 1985), A carrot LTP was able to bind not only oleoyl-CoA but also had affinity
for palmitic acid (Meyer et a l, 1993). Furthermore, LTPs from castor bean (Tsuboi et
a l, 1992) were able to bind acyl-CoA. Several LTP isoforms from oilseed rape
separated by cation exchange chromatography had the ability to transfer PC and bind
oleoyl-CoA (0stergaard et a l, 1995). In contrast, mammalian acyl-CoA binding
proteins are unable to transfer phospholipids (Hills et. a l, 1994).
2 8
Guerbette et al. (1997) compared the binding of lyso-PC and acyl-CoA to a
maize LTP isoform. After incubating the maize LTP with lyso-PC and separating on a
Sephadex GlOO column, the radioactivity corresponding to lyso-PC was observed.
in LTP- containing fractions detected by ELISA. 58 % of the initial radioactivity of' I
lyso-PC was found associated with LTP. The elution peak was divided into two where
the LTP:lyso-PC complex was more retained than free LTP. This pattern of elution
was also observed with LTP.PC complexes (Grosbois et aL, 1993). However, PC
transfer activity was impaired by 83 % following pretreatment by lyso-PC. This
suggested that lyso~PC:LTP complexes were more stable than LTP PC complexes. In
another study only 33 % of the initial radioactivity of oieoyl-CoA was found associated
with the maize LTP and only 25 % inhibition of PC transfer activity was observed. In
contrast a rapeseed LTP was unable to transfer PC after oleoyl-CoA binding
(0stergaard, et ah, 1995). Taken together, these results suggest that different LTPs
display different binding affinities for lipid chains and may therefore perform different
functions. Although lipid transfer proteins are in some cases classed as non-specific
lipid transfer proteins, these observations suggest some degree of specificity.
1.4.3.2 Structure and mode of action of LTPsNon-specific lipid transfer proteins have been isolated from maize (Douady et
aL, 1982), spinach (Kadar et al., 1984), castor bean (Takishima et al., 1986), barley
(Breu et a l, 1989; Mundy and Rogers, 1986), wheat (Désormeaux et a l, 1992),
oilseed rape (0stergaard et a l, 1995) and broccoli (Pyee and Kolattukudy, 1995).
They exhibit strong structural homologies with each other. For example, they all
contain eight conserved cysteine residues that form four disulphide bridges as
determined by tryptic digestion of castor bean LTP (Takishima et a l, 1986). The
conformation of a wheat LTP was determined by infi*a-red and Raman spectroscopy
(Desormeaux et a l, 1992). The protein was made up of 41 % a-helices and 19 % p-
sheets and 40 % of the structure was undefined or composed of turns. The importance
of the disulphide bonds was demonstrated by the reduction of a maize LTP with DTT
which led to loss of lipid-transfer activity (Grosbois et a l, 1993) and a 15 % reduction
of the a-helices and a 13 % increase of p-sheets. Furthermore, the transfer process of
LTPs can be disrupted in the presence of ions which indicates the importance of
2 9
' î
electrostatic interaction between LTPs and membranes (Désormeaux et al, 1992).
NMR and X-ray crystallography have shown that the proteins are comprised of a
single compact domain with four alpha-helices and a long COOH-tenninus. They
posses a hydrophobic cavity which is capable of binding acyl chains.
1.4.3.3 Isolation of LTP genesThe first LTP cDNA to be cloned was from maize (Tchang, 1988). A cDNA
.library was constructed from mRNA isolated from maize seedlings, which was then
screened with a polyclonal antibody made from purified maize LTPs. Furthermore, a
barley protein previously identified by Mundy and Rogers (1986) as a probable
amylase/protease inhibitor was found to have strong homology to the maize LTP. To
date, over 40 cDNAs and gene sequences encoding plant LTPs have been published.
Several of the sequences were identified as a result of partial sequencing of anonymous
cDNA clones and expressed sequence tags (ESTs) from amongst others Arabidopsis,
castor bean, maize, tobacco, and oilseed rape (Kader, 1996).
One prominent feature of LTP genes is that almost all that have been identified
exist as small multigenic families with up to four or five closely related members. For
example, cDNAs isolated from castor bean (Weig and Komor, 1992), barley (Molina
and Garcia-Olmedo, 1993), broccoli (Pyee and Kolattkudy, 1995) and Arabidopsis
(Thoma et al., 1994) showed very strong sequence similarities. Hybridisation to
genomic Southern blots revealed the presence of several gene copies; for example, four
copies in broccoli (Pyee and Kolattukudy, 1995) and two in tomato (Torres-Schumann
et al., 1992). However, in carrot (Sterk et. al., 1991) and spinach (Bernhard et al.,
1991) only one gene was detected. This was attributed to high stringeny washing of
the Southern blot.
11.4.3.4 Organ, cell and tissue-specific gene expression of LTPs
Several experimental approaches have been adopted in the study of lipid
transfer protein expression. These include, northern blot analysis, in situ hybridisation
and expression of a reporter gene such as GUS driven by an LTP promoter. Several of
the LTP genes studied were developmentally regulated in a temporal and spatial
manner. Expression was predominantly in the epidermal cells of aerial organs of the
3 0
plant (leaves, stems, shoot meristem and floral tissue) with very little or no expression
in the roots in spinach, tobacco, barley, cotton fibres, broccoli, rapeseed, tomato,
castor bean, winter barley and Arabidopsis (Bernhard et a i, 1991; Fleming et. al.,
1993; Causing et al., 1994; Ma et al., 1995; Molina et a l, 1993; Pyee and
Kolattukudy, 1995; Soufleri et a l, 1996; Torres-Schumann et a l, 1992; Weig and
Komor, 1992; White et a l, 1994; Thoma et a l, 1994). Also, expression of the LTP
genes was found to be higher in young rapidly developing tissue compared to older
tissues (Fleming et a l, 1992). Three cDNAs, {Itpl, ltp2 and ltp3) isolated from
germinating Brassica napus cotyledons by rapid amplification of cDNA ends (3’
RACE) (Soufleri et a l, 1996), exhibited an expression pattern indicative of strong
developmental, hormonal and environmental regulation. The corresponding transcripts
were expressed only in the cotyledons and hypocotyls of germinating seedlings and
were induced upon treatment with abscisic acid (ABA) and NaCl. However, they were
not detected in mature leaves, stems or flowers. Itp2 and ltp3 started to accumulate on
the second day of germination reaching maximum expression levels on the third day
and began to fall after this. Itpl expression however, was very low throughout,
increasing on the third day. Itp3 was equally expressed in cotyledons and hypocotyls
whereas ltp2 was expressed at a higher level in cotyledons. None were expressed in
roots. LTP genes were also shown to be expressed in developing embryos in
Arabidopsis (Thoma et a l, 1994) and carrot (Sterk et a l, 1991). However,
Canevascini et al. (1996) reported that a tobacco LTP, Ntltpl was expressed at high
levels in the root hairs and root epidermis at the stage where the first true leaves were
forming. In cross-sections of roots of transgenic plants expressing the Ntltpl
promoter-GUS gene, Canevascini et a l (1996) showed that GUS was expressed
predominantly in the root epidermal cells. These observations conflicted with earlier
data showing that Ntltpl was expressed at low levels in root tissue. (Fleming et a l,
1992)..
A different pattern of LTP expression was observed in other species. For
example, in castor bean two LTP genes, LTP A and LTPC were found exclusively in.the cotyledons, whereas LTPB was expressed in the endosperm and LTPD was only i
expressed in the axis (Watanabe and Yamada, 1986; Tsuboi et a l, 1991). In barley, at
least six LTPs were identified (Molina and Garcia-Olmedo, 1993). Expression of three,
?3 1
Ltp2, Ltp3 and L p 4 was detected in stem, shoot, apex, and kernel but not in the
endosperm. Very little expression was detected in the roots. However, Ltpl, was
expressed only in the aleurone cell layer (Mundy and Rogers, 1986). Similarly, Kalla etSI
at. (1994) described an aleurone-specific gene, Ltp2, from barley expressed shortly.
after aleurone cell differentiation. The transcript was not detected in the embryonic and
vegetative tissue unlike those mentioned previously. Analysis of the Ltp2 promoter
demonstrated the presence of myb (CAACTA) and myc (CAGCTG) binding sites
previously identified in the promoter of the maize Bzl gene (Roth et at., 1991). One
possible role of aleurone-specific LTPs in barley and wheat could be the formation of.an amorphous waxy layer on the outside of the testa in wheat grains.
During flower development LTP genes were expressed at liigh levels in
inflorescences (Fleming et al., 1992; Pyee and Kolattukudy, 1995; Sterk et al., 1991),
in the sepals of unopened flowers in Arabidopsis (Thoma et al., 1994), in flower buds
of broccoli (Pyee and Kolattukudy, 1995), in the microspores and tapetum of rapeseed
flowers (Foster et al., 1992) and the tapetum layer of the tobacco anther (Koltunow et
a l, 1990).
LTPs exhibit strong epidermal cell specificity. A maize LTP was expressed in.the epidermis of coleoptiles (Sossountzov et a l, 1991) and in the epidermis of the
tobacco shoot apical meristem (Fleming et a l, 1992). LTP expression was also
detected in the epidermal cells of floral organs m Arabidopsis (Thoma et a l, 1994) and
G. hybrida (Kotüainen et a l, 1994). In carrot (Sterk et a l, 1991) and Arabidopsis
(Thoma et a l, 1994) embryos, an LTP was expressed in protodermal cells which give
rise to the epidermis. In adult Arabidopsis plants, an LTP gene was shown to be
expressed in the leaf and stem epidermal cells, guard cells and flowers (Thoma et a l,
1994).
1.4.3.5 LTPs are localised in the cell wallWith the exception of castor bean (Tsuboi et a l, 1992), all LTP cDNAs
isolated to date possess a leader sequence. In a spinach LTP, the signal peptide is able
to insert co-translationaliy into the lumen of the ER in vitro (Bernhard et a l, 1991).
However, the proteins do not contain an ER retention signal, K/HDEL and are thought
therefore to be secreted (Sterk et a l, 1991; Mundy and Rogers, 1986). The
3 2
extracellular location of LTPs was confirmed by immunocytochemical studies using
polyclonal antibodies. For example, the Arabidopsis LTP protein was shown to be
located in the cell wall of epidermal cells (Thoma et al., 1994). Also, in maize
coleoptiles, LTP-immunogold complexes were observed in the cell walls of epidermal
cells (Sossountzov et al., 1991). The broccoli WAX9D protein was also located
predominantly in the epidermal and mesophyll cell walls (Pyee and Kolattukudy,
1994). Another LTP gene was found to be expressed during tracheary element
differentiation in Z. elegans (Ye et a l, 1993) which is related to cell wall thickening.
1.4.3.6 Environmental regulation of LTP expressionLipid transfer proteins show a diverse and complicated mode of expression.
They are regulated by environmental stimuli as well as in a spatial and temporal manner
during development. A number of LTP genes have been shown to be regulated by cold
treatment, drought, salt and mannitol (osmotic stress), abscisic acid (ABA), high
temperature and following pathogen attack (see section 1.4.3.7). Transcripts
corresponding to three germination-specific cDNAs {Itpl, ltp2 and ltp3) isolated from
B. napus (Soufieri et. al., 1996) were induced upon treatment with ABA and NaCl.
The expression of a different germination-specific LTP gene from tomato (TSW12)
was also shown to be induced upon NaCl, mannitol, high temperatures and ABA
treatment (Torres-Schumann et al., 1992). A cold-induced barley LTP gene, blt4.1,
was also induced following treatment with ABA (White et al., 1994). A putative ABA
response element (ABRE) GTACGTGG and a putative low-temperature response
element ACACGTCA were found in some barley LTP genes (White et al., 1994). An
ABRE was common in genes responding to low-temperature and drought (Hughes et.
al., 1992). Interestingly, White et. al. (1994) observed a winter barley LTP gene to be
induced in roots and stems following drought-stress. As previously mentioned, very
few LTPs were shown to be expressed in roots.
3 3
-1.4.3.7 LTPs implicated as plant defence proteins
LTPs have been shown to have potent anti-fungal and anti-bacterial activities
(Garcia-Olmedo et al., 1995; Cammue et ah, 1995; Molina and Garcia-Olmedo, 1993;
Terras et al., 1992; Molina et al., 1993, 1996; Segura et a l, 1993; Pyee and
Kolattukudy, 1994). Transgenic plants expressing LTPs show enhanced tolerance to a
variety of pathogens (Molina et a l, 1996) and LTP-sensitive mutants of bacterial
pathogens were shown to be avirulent (Molina et a l, 1996). The ability of the waxy
layer to protect against environmental stresses such as pathogen attack may therefore
be aided by the presence of LTPs (Garcia-Olmedo et a l, 1995). The ability of plant
lipid transfer proteins to inhibit ftmgal and bacterial growth in vitro was reported by
Terras et al. (1992), Molina et al. (1993) and Cammue et a l (1995). Four proteins
from barley leaves (LTP2-LTP5) were active against the bacterial pathogen
Clacibacter michiganansis subsp. sepedonicus (Molina et a l, 1993). LTPs isolated
from radish (Terras et a l, 1992), onion (Cammue et a l, 1995) and broccoli (Pyee et
a l, 1994) all exliibited antibiotic activity. However, the relative activities of the
different LTPs varied between pathogens indicating some specificity (Molina et a l,.1993). They were also shown to be more active than thionins (Florack and Stiekema,
■. ■
1994) (another large group of plant-defence proteins) against C. michiganensis subsp.
sepedonicus. However, when both proteins were tested together, an additive response.was observed. Interestingly, thionins were more active than LTPs against a different
fimgus, Fusarium solani but when the two proteins were used in concert, a synergistic
response was observed.
It was postulated that one mechanism of anti-pathogenic activity was the
binding of essential cations such as Ca^ required in bacterial and fungal activities.
Indeed, CaCL addition has been shown to antagonize LTP activity (Terras et a l,
1992). This, however, would not explain the difference in activity of a given LTP to
different strains of a pathogen as well as to different pathogens. The high concentration
of LTPs at the surface of organs (Molina and Garcia-Olmeda, 1993) probably enables
the formation of a re-inforced protective barrier against invading pathogens rather than
responding exclusively as anti-frmgal components.
LTP genes have been shown to respond to pathogen infection in a complex
manner. The expression of three barley LTPs, Ltp2, Ltp3 and Ltp4, was studied in
3 4
Î
response to several pathogens (Molina et al., 1993, 1996; Garcia-Olmedo et al., 1995)
and compared to the response to a thionin gene and the barley pathogenesis-related
protein PRHv-1 (Garcia-Olmedo et al., 1995) expression. The results confirmed that
expression of LTP genes was either induced considerably above the basal level, or
switched off, and that each member of the LTP gene family responded differently
depending on the cultivar and pathogen strain. Following infection of barley cv.
Atlas46, with the fungal pathogen Rhynchosporium secalis, which is an incompatible
interaction, L p 4 expression is greatly induced concomitant with the PrHv~J gene. Ltp2
and thionin expression was also induced although at a lower level. The barley cv.
Atlas46 contains the Rh3 gene which confers resistance to R. secalis. A nearly isogenic
line. Atlas which lacks the Rh3 gene does not display the same response. Instead only
the thionins were induced at low levels. These results suggest that Ltp4, Ltp3 and.PrHv-1 are regulated by the Rh3 gene and are involved in conferring resistance to the
fungus. They also indicate multiple elicitation pathways. Furthermore, a successful
compatible infection of the barley Bomi cultivar with Pseudomonas syringae pv.
japonica switched off the expression of all three LTP genes whereas both thionin and
PrHv-I genes were induced (Garcia-Olmeda et al., 1995). In each of the pathogen
interactions studied, the pattern of Ltp4 expression suggested a role in plant defence.
Furthermore, the expression and distribution of Ltp4 resembles the LTPl gene from
Arabidopsis (Thoma et al., 1993, 1994) and the WAX9D from broccoli (Pyee et al.,
1994, 1995). However, LTP expression in response to viral pathogens has not been
reported.
1.5 Aims of the projectThe overall aim of this project was the investigation of epidermal-specific
expression of genes and their possible role in epidermal cell differentiation in higher
plants. At the time the project was initiated, very few epidermal-specific genes had
been identified and very little definitive information on the process of epidermal
development was available. The isolation of epidermal-specific genes would provide
valuable additional markers to monitor epidermal development. In addition, by
identification of common regulatory elements in the promoter regions of different
3 5 •4
epïdermally-expressed genes we can begin to fonctionally define the molecular
processes central to epidermal development.
1.5.1 Isolation and characterisation of an epidermis-specific
gene from Brassica napusThe initial objective was to screen a Brassica napus cDNA library with an
unknown partial cDNA clone previously shown to be expressed at high levels in the
epidermal cells o f Brassica napus leaf, stem and floral tissue (Pallas, 1992) in order to
isolate the full length clone. The full length clone was fully sequenced and compared to
other sequences in the data base. The expression of transcripts corresponding to the
full length cDNA clone was studied using northern blot analysis to define their organ-
specificity. The coixesponding Brassica napus gene was cloned and sequenced. Its
expression pattern was examined by generating transgenic Arabidopsis plants
expressing the gene promoter-GUS' fusion. The tissue- and cell-specific expression
pattern of the gene was examined by histochemically localising GUS activity.
Furthermore expression of the gene in response to a number of environmental stimuli
was examined by a combination of northern blot analysis and fluorometric GUS assays.
3 6
Chapter 2 Materials and Methods
2.1 Materials
2.1.1 ChemicalsAll general chemicals were purchased from BDH (Analar® grade), Poole,
Dorset unless otherwise stated.
2.1.2 RadiochemicalsRadiochemicals were purchased from Amersham International pic., Amersham,
UK.
2.1.3 Restriction enzymesAll restriction enzymes were purchased from Promega Ltd., Southampton, UK.
2.1.4 Antibiotics, IPTG and X-GalAll antibiotics were purchased from Sigma Chemical Co., Dorset, UK.
Stock solutions were prepared according to Sambrook et a l (1989).
Ampicillin, kanamycin and gentamydn stock solutions were prepared in distilled H2O
at 25, 20, and 10 mg/ml, respectively, and were used at a final concentration of 50
pg/ml. Tetracycline was prepared in 50% EtOH at 12.5 mg/ml and used at a final
concentration of 12.5 pg/ml. Rifampicin was prepared in MeOH at 20 mg/ml and used
at a final concentration of 100 |ig/ml. All stock solutions were filter sterilised and
stored at -20"C. Isopropyl thiogalactoside (IPTG, Life Technologies, Gaithersburg,
USA) was prepared in H2O as a 1 mM stock and used at a final concentration of 0.1
mM. 5-bromo-4-chlorO"3-indolyl p-D-galactoside, (X-Gal, Life Technologies) was
made as a 20 mg/ml stock in dimethylformamide (DMF) and used at a final
concentration of 50 jig/ml.
2.1.5 Bacterial strainsE. coli XL-1 Blue (Bullock et a l, 1987) and DH5a cells were used to maintain
and amplify plasmids (purchased from Stratagene, Cambridge, UK) and for plating the
3 7
cDNA library. E. coli SOLR't^ (Hay and Short, 1992, Stratagene) cells were used for
the rescue and in vivo excision of cDNA clones from the Uni-Zap™XR cDNA library
(Stratagene). DL491 cells (supplied by Mr. J. Jardine, Division of Biochemistry and
Molecular Biology, University of Glasgow) were used for plating the genomic library
and subsequent amplification of isolated clones.
Agrobacterium tumefaciens GV3101 (Koncz and Schell, 1986) containing the
helper plasmid pMP90 (Ri^Gn^Kan^), was provided by Dr. Mark Hooks, Division of
Biochemistry and Molecular Biology, University of Glasgow, and was used for plant
transformations.
The Brassica napus cDNA library was constructed by Dr. William
Goodwin, University of Glasgow, in the bacteriophage vector Uni-ZAP^XR (
■s
i
I.
2,1.6 Plasmids and DNA probesThe pBluescript® II SK (-) phagemid (Short et a l, 1988, Stratagene) was used
to clone DNA fragments for sequencing and restriction digest analysis. The pBIlOl .l
binary vector (Jefferson et a l, 1987) which contains the promoterless bacterial
reporter gene, ^-glucuronidase (GUS) and the nos 3’ terminator, was used to;
construct the promoter-GUS fusion. The B, napus partial cDNA probe, pLF3A
(Pallas, 1993), was provided by Dr. Jackie A. Pallas, University of Leeds. The
Arabidopsis LTP 1 cDNA probe (CD3-11) (Thoma et a l, 1994) was obtained from the
Arabidopsis Biological Resource Centre at Ohio State University (Columbus, OH).
The Arabidopsis CHS cDNA probe (Feinbaum and Ausubel, 1988; Trezzini et a l,
1993) was provided by Dr. Geeta Fuglevand, University of Glasgow. A Phaseolus
vulgaris cDNA fragment encoding H I was obtained from Dr. John M. Christie,
University of Glasgow.
2.1.7 Plant virus strainsCauliflower Mosaic Virus (CaMY) isolate BARI (Covey, 1991) was obtained
from Dr. Edi Cecchini and Dr. Joel J. Milner, Division of Biochemistry and Molecular
Biology, University of Glasgow.
2.1.8 Libraries4
I3 8
Stratagene). The Brassica napus genomic libraiy constructed in the EMBL-3 vector
(Clontech, California, U.S.A) was provided by Dr. A. Greenland, Zeneca Seeds,
Bracknell, Berkshire.
2.1.9 SeedsBrassica napus L. cv ‘Cobra’ (winter oilseed rape) seeds were purchased from
Booker Seeds, Sleaford, Lincolnshire. Arabidopsis thaliana Landsberg erecta wild
type and the mutants ttg (Koornneef, 1981), g ll (Marks and Feldmann, 1989) and gl2
(Rerie et a l, 1994) were obtained from the Nottingham Arabidopsis Stock Centre.
The icxl/ttg seed was provided by Dr. Jennie A. Jackson, University of Glasgow.
2.1.10 Potting compostPotting compost (S. A. I. Horticulture Ltd., Stirling), was sterilised by
autoclaving in individual autoclave bags.
2.1.11 Transgenic plantsNM4 plants were obtained from Jackson et al. (1995). These were constructed
by transforming the Sinapsis alba (white mustard) SA-CHS promoter-GUS construct
(Batschauer et a l, 1991; Frohnmeyer et a l, 1992) into wild type Arabidopsis thaliana
Landsberg erecta plants by root transfoixnation with Agrobacterium tumefaciens based
on the method described by Valvekens et a l (1988). 35S~GVS plants (Jackson et al.,
1995) were generated by transforming Arabidopsis thaliana Landsberg erecta plants
with pBI121 (Jefferson et a l, 1987), a binary vector containing the GUS reporter gene
under constitutive control of the cauliflower mosaic virus 35S promoter and the nos
terminator. These plants were used as positive controls in fluorometric MUG assays
and during histochemical localisation of GUS activity.
A12 plants were derived from EMS mutagenized NM4 seeds and were selected
for increased CHS-GUS expression (Jackson et a l, 1995). These were designated icx 1
(increased chalchone ^nthase expression). Transgenic plants, Baji-Al, Bari-B6 and
Bji-C3 which constitutively expressed the CaMV Gene VI were produced by
transforming g ll (Rerie et a l, 1994) plants with the 35S~Gene VI transgene (obtained
from Dr. Edi Cecchini and Dr. Joel Milner, University of Glasgow).
3 9
2.2 General experimental procedures
2.2.1 GlasswareGlassware for RNA work was sterilised by baking at 180” C for at least four
hours.
2.2.2 AutoclavingSterilisation of solutions, bottles and plasticware was achieved by autoclaving
at 15 psi for 15 min.
2.2.3 Filter sterilisationHeat-labile solutions were sterilised by passing through a Nalgene® syringe
filter (pore size 0 .2 |_im) into a sterile container.
2.2.4 pH measurementSolutions were measured for the correct pH using a Corning pH meter 220 and
combination electrode. The pH of phenol was determined by Whatman Narrow Range
pH paper (pH 6.0 - pH 8.0).
2.2.5 Silicon-coating of sequencing glass platesOne of the two sequencing plates was siliconised with dimethyldichlorosilane
solution (BDH, AnalaR® grade). A few drops of the solution were sprinkled onto the
plate in a fume hood and spread evenly over the surface of the plate with a paper
towel. The plates were then washed thoroughly with sterile H2O.
i
2.3 BuffersAll routinely used buffers were prepared as a 10 X stock solution essentially as
described in Sambrook et a l (1989). The buffers were diluted to the desired
concentration with sterile H2O. 1 X TBE (90 mM Tris-b orate, 2 mM EDTA) was used
to resolve DNA agarose and acrylamide sequencing gels. 1 X TAE (40 mM Tris HCl,
2 mM EDTA, pH to 8 with acetic acid) was used to run agarose gels prior to gel-
purification of DNA fi-agments. 1 X MOPS (3-[N-Morpholino]propanesulphonic acid)
4 0

(20 mM MOPS, 5 mM NaOAc, 1 mM EDTA pH 7.0) was used to resolve denaturing
formaldehyde RNA gels. Restriction digestion buffers were provided with the
restriction enzyme. DNA and RNA sample buffers were prepared essentially as
described in Sambroock et a l (1989).
2.4 Preparation of phenol and extraction of nucleic acidsPhenol was prepared as described in Sambrook et al. (1989).
Essentially, 500 g of solid phenol (BDH, Analar® grade) was heated at 6 8 ”C
until it dissolved fully after which 0 .1% 8 -hydroxyquinoline (w/v) was added which
acts as an RNase inhibitor, antioxidant and metal ion chelator. An equal volume of 0.5
M Tris-HCl, pH 8.0 was added and mixed thoroughly. The aqueous and organic
phases were allowed to separate and the upper aqueous phase removed via aspiration.
This was then repeated with the addition of an equal volume of 0.1 M Tris-HCl pH 8 .0
until the pH was >7.8. The phenol was then stored under 1 X TE (100 mM Tris-HCl,
pH 8.0, 1 mM EDTA) at 4° C in a light-tight container for up to 1 month.
2.4.1 Phenol/chloroform extractionsAn equal volume of phenol was added to the nucleic acid solution and the
whole mixture was mixed by inverting the tube a few times. Organic and aqueous
phases were separated by brief microcentrifugation at liigh speed. The aqueous
supernatant was transferred to a fresh tube and the extraction repeated with an equal
volume of phenol supplemented with 48% chloroform (v/v) and 2% isoamyl alcohol
(v/v) (phenol/CHCls/IAA). The aqueous nucleic acid phase was transferred to a fresh
tube and extracted with an equal volume of chloroform to remove any residual phenol.
The nucleic acid was EtOH precipitated as described in section 2.9.
2.5 Culture mediaThe media were prepared essentially as described in Sambrook et a l (1989).
Bacto-tryptone, yeast extract and bacto-agar were purchased from Difco
Laboratoraties, Michigan, USA. NZ amine, casamino acids and maltose were
purchased from Sigma, Dorset, UK.
I"4:
4 1
2.5.1 Liquid mediaL-Broth (1% (w/v) bacto-tryptone, 1% (w/v) NaCl and 0,5% (w/v) yeast
extract, pH 7.3 in H2O) supplemented with antibiotic(s) (where appropriate) was used
to culture E. coli in the preparation of competent cells and for amplification of plasmid
DNA. L-Maltose (L-Broth supplemented with 0.2% (w/v) maltose and 10 mM
MgS0 4 ) was used for plating the cDNA library. NZCYM broth (1% NZ amine (w/v),
0.1% casamino acids (w/v), 0.5% yeast extract (w/v), 0.5% NaCl (w/v), 10 mM
MgS0 4 ) supplemented with 0.2% (w/v) maltose was used to culture DL491 cells for
plating the genomic library. 2 X YT media (1.6% (w/v) bacto-tryptone, 1% (w/v) yeast
extract and 1% (w/v) NaCl in H2O was used to culture SOLR® cells to rescue the
recombinant pBluescript® II SK (-) phagemid from the Uni-Zap® XR vector. YEP
(1% bactotiyptone, 1% yeast extract, 0.5% NaCl) media was used to culture
Agiobacterium.
2.5.2 Solid mediaL-agar (1.5% (w/v) bacto-agar in L-Broth or NZCYM) was used to culture E.
coli. Top agarose was prepared by adding agarose at an appropriate concentration
(0.5-1%) and 10 mM MgS0 4 to L-Broth or NZCYM media. Agrohacterium
tumefaciens was grown on YEP-agar (1.5% agar (w/v) (Difco) in YEP media).
2.6 Preparation of competent bacteria
2.6.1 Preparation of competent E, coliA single colony of bacteria was grown overnight at 37”C in 5 ml L-Broth with
.continuous shaking in a 10 ml bijou. This was used to inoculate 100 ml of L-Broth
contained in a 500 ml conical flask and grown at 37”C with continuous shaking for 1.5-
2 h until the OD550 = 0.48. The cells were chilled on ice for 5 min and then split into 2
X 50 ml Falcon tubes and spun at 3000 x g for 10 min at 4”C. The L-Broth was
decanted off and each pellet was resuspended in 20 ml ice-cold buffer 1 (30 mM
KOAc, 100 mM RbCk. 10 mM CaCk, 50 mM MnCk. 15% glycerol, pH 5.8). The
cells were chilled on ice and spun again as before. Each pellet was resuspended in ice-
cold buffer 2 (10 mM MOPS, 75 mM CaCk, 10 mM RbCh, 15% glycerol, pH 6.5).!■4
42
■"if;
.The ceils were chilled on ice for 15 min and then immediately dispensed into pre
cooled Eppendorf® tubes in 100 |il aliquots. The cells were flash fi-ozen in liquid
nitrogen and stored at -80”C.
2.6.2 Preparation of competentThis method was based on that of Holsters et a l (1978).
A single colony of Agrobacterium containing the appropriate helper Ti plasmid
was grown overnight in 5 ml of YEP media at 28”C. 2 ml of this culture was added to
50 ml of YEP media in a 250 ml flask and shaken vigourously at 28°C until the ODeoo
was between 0.5 and 1.0. The culture was chilled on ice and then centrifuged at 3000 x
g for 5 min at 4”C. The resulting pellet was resuspended in 1 ml of ice-cold 20 mM
CaCE and 1 0 0 \x\ aliquots dispensed immediately into pre-chilled Eppendorf® tubes.
The cells were either flash-frozen in liquid nitrogen and stored at -70”C or used
immediately to transform the appropriate plasmid (see section 2.7).
2.7 Transformation of bacteria with plasmid DNA
2.7.1 Transformation of E.coli i'!'1 0 0 111 of competent cells described in section 2 .6 .1 were allowed to thaw on
ice and 25-250 ng of DNA in a total volume of 5 p,l was added. The cells were mixed
gently by flicking the bottom of the tube. The mixture was incubated on ice for 15-30
min after which they were heat-shocked at 42”C for 90 s and returned immediately to
ice for a further 2 min. 200 pi of L-Broth was added to the celEDNA mixture and
incubated at 37”C with shaking for 30 min to allow expression of the antibiotic
resistance gene. The cells were then spun briefly in a microcentrifuge and the pellet
resuspended in 100 pi of warm L-Broth. Aliquots of 1, 5, 20 and 50 pi of the cell
suspension were plated onto L-agar containing the appropriate antibiotic. The plates
were incubated at 37”C overnight to allow the transformed bacteria to grow. A control
transformation containing no DNA was also carried out.
4 3
2.7.2 Transformation qî AgrobacteriumThe method used was as described by Holsters et a l (1978),
Essentially, 1 pg of plasmid DNA in a total volume of 5 pi was added to 100 pi
of competent Agi'obacterium (see section 2.6.2) in an Eppendorf® tube. If the cells
were already frozen the cells/DNA mixture was thawed by incubating at 37”C for 5
min. If the cells were freshly prepared, the cells/DNA mixture was quick fr ozen in
liquid nitrogen prior to thawing at 37”C. 1 ml of YEP medium was then added to the
mixture and incubated at 28”C for a further 2-4 h with gentle shaking to allow the
bacteria to express the antibiotic resistance genes. The tube was then microcentrifuged
for 30 s and the supernatant discarded. The pelleted cells were resuspended in 100 pi
of YEP medium and spread onto YEP-agar plates containing the appropriate
antibiotics and incubated at 28”C for 2-3 d to allow the transformed colonies to appear.
2.8 Isolation of DNA from bacteria and plants
2.8.1 Small scale plasmid preparationThe Wizard^^ Plus Minipreps DNA Purification kit from Promega (Madison,
USA) was used.
A single colony of bacteria was picked and used to inoculate 5 ml of L-Broth
supplemented with the appropriate antibiotic in a 10 ml sterile bijou. The culture was
grown overnight at 37”C with continous shaking. 3-5 ml of cells was transferred to a
1.5 ml Eppendorf® tube and pelleted by centrifugation at 10,000 x g for 10 min. The
supernatant was discarded and the pellet resuspended in 300 pi of cell resuspension
solution (50 mM Tris-HCl, pH 7.5, 10 mM EDTA, 1 0 0 pg/ml RNase A, provided in >
30 units/mg, [Boehringer Mannheim]). The cells were lysed with the addition of 300 pi
of cell lysis solution (0.2 M NaOH, 1% SDS) and mixed by inverting the tube 4 times.
Complete lysis resulted in a clear solution. 300 pi of neutralisation solution (1.32 M
KOAc, pH 4.8) was then added and the tube mixed by inversion. After centrifugation
at 10,000 x g for 5 min the supernatant was transferred to a disposable Wizard^^
Miniprep column which consisted of a 1 ml syringe barrel, containing 1 ml of DNA
purification resin, attached to the Luer-Lok® extension of a minicolumn. The column
was attached to a vacuum manifold and a vacuum applied to allow the DNA/resin
4 4
sluiTy to pass through the column. The vacuum was broken after which 2 ml of wash
solution (55% EtOH, 80 mM KOAc, 8.3 mM Tris-HCl, pH 7.5, 40 pM EDTA) was
added and the vacuum reapplied. The resin was dried by continuing to draw the
vacuum for a further 30 s. The syringe barrel was detached from the minicolumn and
discarded. The minicolumn was then attached to a 1.5 ml Eppendorf® tube and
centrifuged at 10,000 x g for 2 min to remove any residual column wash solution. The
minicolumn was then transferred to a fresh 1.5 ml Eppendorf® tube and DNA was
eluted by the addition of 50 pi of sterile H2O for 1 min followed by centrifugation at
10,000 X
or -20”C
10,000 X g for 2 0 s. The minicolumn was discarded and the plasmid DNA stored at 4
2.8.2 Large scale plasmid preparationA single colony of bacteria harbouring the appropriate plasmid was inoculated
into 5 ml of L-Broth supplemented with the appropriate antibiotic. This was then used
to inoculate 100-500 ml of L-Broth/antibiotic and grown overnight at 37”C with
continuous shaking. The cells were then pelleted by centrifijgation at 5000 x g for 10
min at 22”C in 250 ml centrifuge tubes (Beckman). The supernatant was discarded and
the pellet resuspended in 15 ml of cell resuspension buffer (50 mM Tris-HCl, pH 7.5,
10 mM EDTA, 100 pg/ml RNase (provided in kit). After complete resuspension, 15
ml of cell lysis solution (0.2 M NaOH, 1% SDS) was added and the cells were mixed
gently by inverting the tube several times. Once the solution became clear and viscous,
15 ml of neutralisation solution (1.32 M KOAc, pH 4.8) was added and the contents of
the tube were mixed again by inverting several times. The solution was centrifuged at
14,000 X g for 15 min at 2 2 ”C after which the clear supernatant was filtered through a
Whatman® #1 filter paper to remove any residual white precipitate. Plasmid DNA was
precipitated by the addition of 0.5 volumes of isopropanol and mixing by inversion.
Plasmid DNA was then recovered by centrifugation at 14,000 x g at 22”C for 10 min,
the supernatant was discarded and the DNA-containing pellet resuspended in 2 ml of
TE buffer (10 mM Tris-HCl pH 7.5, 1 mM EDTA). 10 ml of Wizard™ Maxipreps
DNA Purification Resin was added to the DNA solution and, the whole solution was
mixed by swirling. The DNA/resin mix was then transfeixed to a Wizard^" Maxicolumn
which had been attached to a vacuum manifold. The vacuum was applied and the
4 5
DNA/resin mix drawn into the maxicolumn. The column was washed sequentially with
13 and 12 ml of column wash (85 mM NaCl, 8 mM Tris-HCl pH 7.5, 2 mM EDTA,
55% EtOH). The column was then desalted by washing with 80% EtOH. Once the
EtOH had passed through, the vacuum was drawn for a further 1 min to diy the
column. The maxicolumn was then inserted into a 50 ml Falcon tube and centrifuged in
a benchtop swinging rotor at 1,300 x g for 5 min to remove any residual EtOH. The
column was then reattached to the vacuum manifold and the vacuum drawn for a
further 5 min to ensure that the column was completely dry. It was then placed into a
fresh Falcon tube, 1.5 ml of pre-heated H2O applied and the DNA eluted after 1 min by
centrifuging the maxicolumn/Falcon tube at 1,300 x g for 5 min in a Beckman
benchtop centrifuge with a swinging rotor. The plasmid DNA concentration was
determined as described in section 2.9. The plasmid solution was stored at 4 or -20”C.
2.8.3 Isolation of plasmid DNA from AgrobacteriumThis method was based on that described by Birnboim et al. (1979).
A single colony of Agt'obacterium was grown overnight in 1 ml of YEP
medium containing the appropriate antibiotic in a 5 ml sterile bijou at 28”C with
vigorous shaking. The culture was then transferred to a 1.5 ml Eppendorf® tube and
centrifuged for 30 s at 10,000 x g. The supernatant was discarded and the pellet
resuspended in 0.1 ml of ice-cold solution I (25 mM Tris-HCl pH 8.0, 50 mM glucose,
1 0 mM EDTA, 4 mg/ml lysozyme). The cells were incubated at room temperature for
1 0 min after wliich 0.2 ml of solution II (0.2 M NaOH, 1% SDS) was added in order
to lyse the cells. After a 10 min incubation at room temperature, 30 }il of phenol
equilibrated with two volumes of solution II, was added and the cells vortexed gently
for a few seconds. Chromosomal DNA was then precipitated by the addition of 0.15
ml of 0.3 M NaOAc pH 4,0 and recovered by centrifugation for 3 min. Plasmid DNA
was recovered from the supernatant by precipitation with 95% EtOH. After a 15 min
incubation at -80”C the tube was centrifiiged for 3 min, the supernatant discarded and
the pellet resuspended in 0.5 ml 0.3 M NaOAc, pH 7.0. The EtOH precipitation step
4 6
was repeated and the resulting pellet was washed in 70% EtOH. The plasmid DNA
pellet was resuspended in 50 pi of TE and restriction digestion of the DNA was carried
out essentially as described in section 2 .1 0 except for the addition of 1 0 0 pg/ml of
RNase A 30 units/mg, Boehringer Mannheim) in the reaction mix.
2.8.4 Isolation of plant genomic DNA0 .1 - 1 .0 g of plant tissue was ground under liquid nitrogen into a fine powder
with a pestle and mortar and transferred to 15 ml of DNA extraction buffer (100 mM
Tris-HCl pH 8 .0 , 50 mM EDTA, 500 mM NaCl) in a 50 ml Falcon tube. 1 ml of 20%
SDS was then added and the mixture vortexed for 20 s. The tube was incubated at
65”C for a minimum of 1 h after which it was cooled on ice for 2-5 min. 5 ml of 5 M
NH4OAC was added and the tube shaken gently to mix. The solution was centrifuged
for 20 min at 3000 x g in a benchtop centrifiige, the supernatant was removed into a
fi-esh Falcon tube containing 14 ml of iso-propanol and mixed several times. The tube
was then centrifuged at 3000 x g for 20 min and the supernatant discarded. The pellet
was desalted by washing in 70% EtOH and centrifuged as before. It was then air-dried
for a minimum of 15 min. 500 pi of sterile HgO was added to the pellet and incubated
at 4°C overnight to aid resuspension. The DNA was RNase-treated by the addition of 2
pi of DNAse-fiee RNase A (10 mg/ml, ^ 30 units/mg, Boehringer Mannheim) per 100
pi of DNA solution at 37°C for 1 h. The RNase A was denatured by heating at 65”C
for 10 min. The DNA was EtOH precipitated as described in section 2.9 and stored at
4”C.
i2.8.5 Purification of oligonucleotides
'200 pi of oligonucleotide in 0.88 M NH4OH was lyophilised then resuspended
in 200 pi of sterile H2O. The DNA was phenol/chloroform extracted, and ethanol
precipitated as described in sections 2.4.1 and 2.9. The oligonucleotide was
resuspended in 2 0 pi of sterile H2O and the concentration determined as described in
section 2.9. It was then diluted to give a final concentration of 0.5 pmol/pl for
sequencing, 20 pmoFpl for primer extension or 100 pmoFpl for PCR.
It
s
I4 7
2.9 Ethanol precipitation and quantification of nucleic acidsNucleic acids were precipitated by the addition of 0.1 vol. of 3 M NaOAc, pH
5.2 for plasmid DNA and oligonucleotide preparations or 5 M NH4OAC for genomic
DNA and 2.5 vol. of ice-cold EtOH. The mixture was incubated at -20”C for a
minimum of 20 min or at -80”C for a minimum of 15 min. DNA was recovered by
centrifugation at 10,000 x g for 10 min. The pellet was then washed in ice-cold 70%
EtOH, briefly centrifuged, air-dried and resuspended in H2O.
The concentration of nucleic acids was determined by measuring the
absorbance at 260 and 280 nm in a 1 ml quartz cuvette. An absorbance unit of 1 at 260
nm was taken to be equivalent to 50 pg/ml double-stranded DNA, 40 pg/ml single
stranded DNA and RNA and 20 pg/ml oligonucleotides. Nucleic acid purity was
assessed by the 260/280 ratio (Sambrook et a l, 1989).
2.10 Restriction digestion of DNADNA was digested in a total volume of 10-80 pi containing 1 X the
appropriate restriction digestion buffer and 1-20 units of restriction enzyme. The
reactions were incubated for 2 to 24 h at 37”C unless otherwise stated. A small aliquot
was then subjected to agarose gel electrophoresis as described in section 2 .1 1 .
2.11 Agarose gel electrophoresis
2.11.1 Electrophoresis of DNAAgarose {ultraVlME^^) was purchased from Life Technologies, Gaithersburg,
USA.
0.7-2% (w/v) agarose was boiled in 1 X TBE or TAE buffer until it was
completely dissolved. The agarose solution was allowed to cool to 50-60”C. Ethidium
bromide (EtBr) was added to a final concentration of 0.5 pg/ml before the solution
was poured into a horizontal gel mould and allowed to set for 20-30 min. After the
addition of one-tenth volume of loading buffer (0.25% (w/v) xylene cyanol FF, 0.25%
(w/v) bromophenol blue, 1 mM EDTA pH 8.0, 50% glycerol) the DNA sample was
subjected to electrophoresis in the appropriate 1 X running buffer at 5 V/cm. DNA
was visualised using a UV transilluminator.
4 8
2.11.2 Denaturing formaldehyde-gel electrophoresis of RNAThis method was based on that described by Sambrook et al. (1989).
1.5 g of agarose was dissolved in 73 ml of H2O by boiling for 3 min after which
10 ml of 10 X MOPS buffer (200 mM MOPS, 50 mM NaOAc, 10 mM EDTA, pH
7.0) was added. Once the agarose solution had cooled to 55° C, 17 ml of formaldehyde
(37%, v/v; Sigma) was added and the mixture swirled around ensuring no bubbles
were formed. The agarose solution was poured into a horizontal gel mould and
allowed to set for a period of 30 min. The gel was placed into a gel tank containing
enough 1 X MOPS running buffer to cover the gel. RNA samples were then prepared
in a total volume of 20 pi containing 10 pg of total RNA, 50% (v/v) formamide (Fluka
Biochemicals, Gillingham, UK), 1 X MOPS, 5.92%.(v/v) formaldehyde and 2.5 pg/ml
EtBr. The RNA was heated at 65° C for 15 min then placed immediately on ice, after
which 0.1 vol. of RNA loading buffer (50% glycerol (v/v), 1 mM EDTA pH 8.0,
0.25% (w/v) bromophenol blue, 0.25% (w/v) xylene cyanol FF) was added. The
sample was loaded onto the gel and electrophoresed at 5 V/cm until the dye front
migrated approximately three quarters of the way down the gel. The gel was then
washed in distilled H2O to remove the formaldehyde and the RNA was visualised
under UV light.
2.12 Gel purification of DNA
2.12.1 Phenol/CHCL methodThe DNA fragment of interest was visualised briefly under UV light, sliced out
of a 1% low-melting point, TAE-run agarose gel and fragmented into small pieces
using a clean scalpel blade and then placed into a sterile Eppendorf® tube containing
500 pi of phenol. The tube was vortexed for 2 min until the mixture became cloudy
and then placed into liquid nitrogen for 1 0 s and spun immediately at 14,000 x g for 1 0
min in a microcentrifrige. The aqueous layer was transferred to a fresh tube and an
equal volume of phenol/CHCE mixture added. After vortexing for a few seconds and
centrifugation at 1 0 ,0 0 0 x g for 2 min the aqueous layer was transferred to a fresh tube
and the DNA was EtOFI precipitated as described in section 2.9. The pellet was
resuspended in 2 0 pi of sterile H2O and the concentration determined as described in
y :,» .
4 9
section 2.9. The DNA was diluted to a final concentration of 25 ng/pl for ligations and
probes.
2.12.2 GENECLEANII®The GENECLEAN® kit was purchased from Stratech Scientific, Luton, UK.
The DNA fragment of interest was excised out of a TAE-run gel (1 g of gel
slice was approximately 1 ml) and placed into an Eppendorf® tube containing 3
volumes of 6 M Nal. The DNA/gel-slice was incubated at 45-5 5°C for 10 min until the
agarose dissolved after which 5 pi of a silica matrix, GLASSMTLK®, was added per 5
pg of DNA rnixed and incubated at room temperature for 5 min. The
GLAS SMILK®/DNA mix was then centrifuged at 10,000 x g for 5 s, the supernatant
discarded and the pellet washed 3 times with 1 ml of ice-cold NEW
wash(NaCl/ethanol/H2 0 mix provided in the kit). After centrifiiging briefly, the pellet
was air-dried and the DNA eluted by resuspending the pellet in 10-50 pi of H2O and
incubating at 55”C for 3 min. After a brief centrifiigation the supernatant containing the
DNA was transfeiTed to a new Eppendoii® tube. Approximately 60-80% of the
applied DNA was recovered by this method.
2.13 Ligation of restriction fragment into plasmidLigations were carried out for 16 h at 15°C or 2 to 4 h at room temperature.
Plasmid DNA and insert DNA, with compatible cohesive ends or blunt ends, were
mixed together at a 3:1 insert:plasmid ratio in a reaction volume of 20 pi containing 1
X ligation buffer ( 6 6 mM Tris-HCl pH 7.5, 1 0 mM MgCE 1 0 mM DTT, 0.3 mM ATP,
1 mM spermidine), and 1 unit T4 DNA ligase (Promega). Control ligations of vector
DNA alone with and without ligase were also set up with every ligation. The efficiency
of ligation was monitored by transforming 1-5 pi of the ligation reaction into
competent bacteria essentially as described in section 2.7.1. The ligations were stored
at -20”C.
5 0
2.14 Shotgun cloning of restriction fragmentsThe DNA of interest was digested with an appropriate restriction enzyme as
described in section 2.10. A small volume of the digest was run on an agarose gel to
check for complete digestion. The digestion mix was then phenol/CHCls/IAA extracted
(see section 2.4), EtOH precipitated (see section 2.9) and the DNA resuspended in
sterile H2O. The concentration of the DNA fragments was estimated by
electrophoresing in a 0.8~l%(w/v) agarose gel in 1 X TAE buffer. Ligations were set
up as described in section 2.13 and the clone of interest selected after restriction
digestion analysis.
2.15 Radio-labelling DNAThe DNA fragment to be labelled was purified as described in section 2.12.
DNA (25 ng) was made up to a total volume of 45 pi with sterile H2O. After boiling
for 5 min the DNA was snap-cooled on ice for a few minutes and added to the
Rediprime labelling mix (Amersham International pic). 5pi of [a^^P] dCTP (3000
Ci/mmol, 10 mCi/ml) was added and the mixture incubated at 37°C for 10 min. The
reaction was terminated by the addition of 5 pi of 0.2 M EDTA, pH 8.0.
Unincorporated label was removed by spinning the probe through a glassîf;
bead/sephadex G50 column as described in section 2.15.1. The specific activity was
determined by TCA precipitation as described in section 2.15.2. Prior to use, the probe
was denatured by boiling for 5 min and then snap-cooled on ice for five min.
2.15.1 Removal of unincorporated radio-nucleotidesA sterile 0.5 ml Eppendorf® tube was pierced at the base with a syringe
needle. The tube was then plugged with sterile glass beads and filled with Sephadex
G50 resin (Pharmacia, Milton-Keynes, UK) equilibrated in TESN (10 mM Tris-HCl
pH 7.5, 1 mM EDTA 01 M NaCl, 0.05% (w/v) SDS). The tube was placed into a 1.5
ml Eppendorf® which had also been pierced at the base and centrifuged at 2000 x g
for 4 min at room temperature. The tube was filled again with Sephadex G50 and
respun until the packed resin volume was 0.5 ml. 200 pi of 1 X TE was loaded onto
the column and was centrifiiged again at 2000 x g for a further 4 min. The labelled
I
I
5 1 I:
DNA was made up to a 50 pi volume with 1 X TE and loaded onto the column which
was placed into a fresh 1.5 ml Eppendorf® and centrifuged again at 2000 x g for 4
min. The unincorporated label remained in the Sephadex beads whilst the labelled
DNA eluted into the fresh tube. The labelled DNA was denatured and added to the
pre-hybridisation solution or stored at -20°C.
2.15.2 Measurement of incorporation of radiolabel into DNA
probes by TCA precipitationThis method was essentially as described in Sambrook et a l (1982).
Briefly, 1 to 2 pi of labelled sample was spotted onto 2 x 25 mm Whatmann
GF/C filter discs and allowed to dry. One filter was placed in 20 ml of ice-cold 10%
TCA and chilled on ice for 10-15 min. It was then washed twice in 20 ml 10% TCA
and twice in 20 ml 95% ethanol and was dried thoroughly. The unwashed (total;
unincorporated plus incorporated label) and washed (incorporated label) filters were
then placed in separate scintillation vials and counted in the Cherenkov channel. Label
incorporation was then expressed as a% of total cpm.
2.16 DNA SequencingDNA was sequenced using either the Sequenase® Version 2.0 sequencing kit
(Amersham International pic., Amersham, UK) or the Hot Tub DNA sequencing.system (Amersham International pic.). DNA was prepared as described in section
2 . 8 . 1.
4
2.16.1 Dideoxy sequencing of double stranded DNA
2.16.1.1 Annealing of primer to DNA templateTemplate DNA (3-5 pg) in a total volume of 18 pi was denatured in 0.2 M
NaOH and 0.2 mM EDTA for 30 min at 37”C. The DNA was EtOH precipitated as
described in section 2.9. The pellet was air-dried and resuspended in 7 pi H2O, 2 pi
Sequenase® reaction buffer (0.2 M Tris-HCl pH 7.5, 0.1 M MgCE, 0.25 M NaCl) and
1 pi (0.5 pmol) primer. The primer and DNA were annealed by heating at 65°C for 2%
I
5 2
min then cooled to 30“C over 15-30 min. The tube was incubated on ice (for up to 2 h)
before proceeding with the labelling reaction.
2.16.1.2 Labeliing and termination reactionsTo the annealed DNA, 1.0 \x\ 0.1 M DTT, 2.0 pi diluted (1:5) dGTP mix (1,5
pM dGTP, 1.5 pM dCTP, 1.5 pM dTTP), 0.5 pi [a-^'S]dATP (10 pCi/pl, 1000
Ci/mmol) and 2 pi of diluted (1:8, enzyme:Sequenase® dilution buffer) Sequenase®
2.0 were added. The mixture was incubated at room temperature for 2-5 min after
which 3.5 pi was transferred to four separate tubes each containing 2.5 pi of the
appropriate dideoxynucleotide termination mix (ddA, ddC, ddG and ddT) preheated to
37“ C. The termination mix was incubated at 37“C for 5 min. The reaction was
terminated by the addition of 4 pi of stop solution (95% formamide, 20 mM EOT A,
0.05% (w/v) bromophenol blue, 0.05% (w/v) xylene cyanol FF). The samples were
heated at 75“C for 5 min prior to loading on an 8% (w/v) acrylamide sequencing gel as
described in section 2.16.3.
2.16.2 Hot Tub DNA sequencing for double-stranded DNA
templateRegions of DNA that had gross secondary structures or compressions were
sequenced using the Hot Tub DNA sequencing system (Amersham International pic ).
The Hot Tub DNA polymerase is extremely thermostable with a half life of 90 min at
95“C. It was therefore possible to carry out sequencing reactions at higher
temperatures. Also, the labelling mix and termination mixes contained the analog, 7 -
deaza 2' deoxyguanosine triphosphate, instead of dGTP which also aided in eliminating
the compression zones (Mizusawa et al., 1986).
2.16.2.1 AnnealingTo a 1.5 ml Eppendorf® tube 4.5 pi of reaction buffer (260 mM Tris-HCl, pH
8.8, 26 mM MgCb, 67% (v/v) formamide), 2 pmol of double-stranded template DNA,
10 pmol of primer and sterile distilled H2O to 13 pi were added. The contents were
mixed and centrifuged briefly. The reaction mix was boiled for 5 min to denature the
5 3
#
DNA and placed immediately on an ice-water slurry for 30 min. Meanwhile, four
separate tubes containing 2.5 pi of the appropriate termination mix, ddA, ddC, ddG or
ddT were prepared.
2.16.2.2 Labelling and termination reactionsThe annealed mix was centriliiged briefly after which 1 (rl of labelling mix (7.5
HM dCTP, 7.5 nM 7-deaza dGTP, 7.5 nM dTTP and 15% (v/v) formamide) and 1 |.d
of p^SjdATPaS (10 pCi/pl, 1000 Ci/mmmol) were added. The mixture was vortexed
and centrifuged briefly after which 2 units of Hot Tub DNA polymerase were added.
The reactions were incubated at room temperature for 5 min. 3.5 pi of the labelled mix.was then transferred to each of the tubes containing the termination mix, mixed well
and incubated at 65“C for 5 min. The reactions were terminated by the addition of 4 pi
of formamide stop buffer (19 mM EDTA, 0.1% (w/v) bromophenol blue, 0.1% (w/v)
xylene cyanol FF, 95% (v/v) formamide). The terminated reactions were either stored
overnight at -20“C or denatured at 95“C for 5 min and 3 pi loaded onto an 8% (w/v)
denaturing polyacrylamide/urea sequencing gel as described in section 2.16.3.
V3
Î
2.16.3 Sequencing gel electrophoresisSequencing gel plates which measured 20 cm x 40 cm were washed with
detergent and one of the two plates was siliconised as described previously in section
2.2.5. 40 cm spacers with a 4 mm thickness were placed between the plates, which
were then taped together. 50 ml of de-gassed sequencing solution (6%
aciylamide:bisacrylamide, (38:2 w/v), 7 M urea, 1 X TBE) supplemented with 300 pi
of 10% ammonium persulphate (w/v) (Sigma) and 50 pi of TEMED (Sigma) was
poured between the plates. After placing a 24-well comb in place, the gel was allowed
to set at room temperature for a minimum of 2 h. The gels were then pre-run for a
minimum of 30 min at 35 W in 1 X TBE buffer. Aluminium plates were fixed to the
sequencing plates to ensure even heat distribution. When the gel reached 55 to 60“C
samples were loaded onto pre-washed wells. The gel was electrophoresed for the .appropriate time period (usually 2, 4 or 6 h) at a constant wattage of 35 to 40 W. After
electrophoresis, the plates were prised apart carefully ensuring that the gel remainedV
■i
5 4
stuck to the unsiliconised plate. The plate/gel was placed into fixing solution
containing 10% acetic acid (v/v), 10% MeOH (v/v) for a minimum of 20 min. The gel
was carefully drained and transferred onto Whatman 3 MM paper, covered with
SaranWrap^” and dried on a slab-drier at 80“C for 2 h. After removing the
SaranWrap™, the gels were autoradiographed for 24 h to 72 h at room temperature.
2.17 Isolation of RNA from plantsIn a fiame hood, 0.5 g of plant tissue was frozen in liquid N2 in a mortar and
ground to a fine powder and transferred to 5 ml of RNA extraction buffer (guanidine
thiocyanate, N-lauryl sarcosine, sodium citrate and p-mercaptoethanol [added fresh
each time] in a DEPC-treated 8 ml polycarbonate tube (Beckman). The tube was
inverted several times to mix, after which 0.5 ml of 2 M NaOAc, pH 4, 5 ml of phenol,
pH 8 and 3 ml of CHCI3 were added and the contents mixed thoroughly by inverting
several times. The tubes were centrifuged at 6000 x g for 30 min at 15“C and the
aqueous layer transferred to a fresh tube containing 5 ml of phenol and 3 ml of CHCI3.
After mixing briefly and centrifuging at 6000 x g for 10 min at 15“C, the aqueous layer
was transferred to a fresh tube and extracted with an equal volume of CHCI3. The
tubes were centriftiged again as before and the supernatant transferred to 15 ml
Corex® tubes containing an equal volume of ice-cold isopropanol. The tubes were
inverted once and the RNA allowed to precipitate for 30 min to 2 h at -20“C. RNA
was recovered by centrifugation at 7000 x g for 20 min at 4“C. The RNA was washed
by swirling gently in 80% (v/v) EtOH : 20% (v/v) DEPC-treated H2O and air-dried for
15 min. The RNA pellet was resuspended in 50 pi of DEPC-treated H2O, transferred
to an Eppendorf® tube and stored at -70“C.
2.18 Blotting of nucleic acid onto nylon filter
2.18.1 Northern blottingRNA was electrophoresed in a formaldehyde denaturing gel as described in
section 2.11.2. The gel was washed briefly in distilled H2O and then placed well side
down on top of a support, which consisted of a wick of Whatman 3 MM paper soaked
in a reservoir of 20 X SSC (3M NaCl, 0.3 M trisodium citrate). Air bubbles were
: i
55
rolled out using a sterile plastic pipette. A small volume of 20 X SSC was then poured
onto the gel to create a film of liquid. A piece of nylon membrane (Hybond N,
Amersham) the exact size of the gel was then placed onto the gel ensuring again that
no air bubbles formed between the gel and membrane. Two pieces of Whatman 3 MM
paper the same size as the gel were soaked in 20 X SSC and placed on top of the nylon
membrane. The wick area surrounding the gel was covered with cling film to prevent a
short circuit and a quantity of absorbant paper towels placed on top of the 3 MM
papers. A glass plate was placed on top of the towels and finally a 250 g weight on
top of the glass plate. The gel was blotted for a minimum of 16 h after which the nylon
membrane was rinsed briefly in 2 X SSC and air-dried for a few minutes. The RNA
was fixed onto the membrane by a UV cross-linker for a 10-15 s.
2.18.2 Southern blottingDNA was separated on an agarose gel as described in section 2.11.1. The gel
was placed for 15 min in 0.25 N HCl to depurinate the DNA fragments. This would
enable larger fragments of DNA to be transferred more efficiently. The gel was then
rinsed briefly in distilled H2O and placed in an excess volume of dénaturation buffer
(0.5 M NaOH, 1.5 M NaCl) for 45 min. The gel was then placed in neutralisation
buffer (1 M Tris-HCl pH 8, 1.5 M NaCl) for a further 45 min. After rinsing briefly in
distilled H2O the gel was blotted and fixed essentially as described above except that
Hybond N+ (Amersham) was used rather than of Hybond N.
2.19 Hybridisation analysis
2.19.1 Northern hybridisationThis technique is based on the method described by Denhardt (1966).
Nylon filters blotted as described in section 2.18 were pre-hybridised for a
minimum of 4 h in a sealed plastic bag containing 1 ml per cm of filter of pre
hybridisation buffer (0.5 M sodium phosphate, pH 7.2, 7% SDS (v/v), 10 mg/ml BSA
for homologous probes or 5 X SSC, 50% formamide (v/v), 10 X Denhardf s solutionI:
[0.1% Ficoll 400 (w/v), 0.1% PVP 360 (w/v), 0.1% SDS, (w/v), 0.1% BSA (w/v), 50
pg/ml denatured herring sperm DNA (Boehringer Mannheim), 0.1% SDS (w/v)] for
heterologous probes) and placed in a shaking H2O bath inside a plastic tupperware
5 6
box. The probe was prepared as described in section 2.15, denatured by boiling for 5
min, snap-cooled on ice and added to the pre-hybridisation buffer. Hybridisation was
carried out for 16 h at 55“C and at 37“C to 42“C for homologous and heterologous
probes, respectively.
2.19.2 Washing Northern blotsAfter hybridisation the filters were washed in 2 X SSC;0.1% (w/v) SDS at
55“C or 60“C for 5 min. The washing was then repeated in 1 X SSC;0.1% SDS (w/v)
for 5-10 min. Both washes were in 200-300 ml volumes. The filters were then wrapped
in SaranWrap" * and autoradiographed for up to 24 h at -70“C. The filters were then
developed in an X-OMAT (Kodak) automatic developer.
2.19.3 Southern hybridisationNylon filters blotted as described in section 2.18, were pre-hybridised for a
minimum of 4 h in a sealed plastic bag or H20 tight box containing 1 ml per cm of
filter of pre-hybridation buffer (4 X SET [0.6 M NaCl, 4 mM EDTA, 80 mM Tris-HCl
pH 8.0], 0.5% NaPPi (w/v), 0.1% SDS (w/v), 100 pg/ml denatured, sonicated herring
sperm DNA (Boehringer Mannheim), 10 X Denhardt’s solution [0.1% Ficoll 400
(w/v), 0.1% PVP 360 (w/v), 0.1% BSA (w/v) (all Sigma)]). After pre-hybridisation,
the denatured probe (2 x 10 cpm) was added and hybridisation was carried out for a
further 16 h. All filters were pre-hybridised and hybridised at 55“C in a shaking water
bath unless otherwise stated.
2.19.4 Washing of Southern blotsThe filters were washed based on the stability of the DNA/DNA hybrids
(Anderson and Young, 1985). They were washed once for 1 min in 2 X SSC:0.1%
SDS at room temperature, twice at 65“C in 2 X SSC:0.1% SDS, for 10 min each, once
at 65“C in 0.5 X SSC;0.1% SDS for 10 min and finally once at 65“C in 0.1 X
SSC:0.1% SDS for 10 min. The filters were air dried for a few minutes before
autoradiography.
5 7
2.19.5 AutoradiographyWashed filters were wrapped in cling film and exposed to Fuji X-ray film type
RX in an autoradiography cassette with an intensifying screen for the appropriate time
period at -80“C for ^^P-radiolabelled probes. For sequencing gels autoradiography was
carried out at room temperature without intensifying screens. The films were
developed in an X-OMAT (Kodak) automatic developer.
2.19.6 Stripping filters bound with radiolabelled probesProbes bound to nylon filters were removed by pouring a boiling solution of
0.5% (w/v) SDS onto the filters and allowing them to cool to room temperature. The
filters were checked with a Geiger counter for any residual radioactivity and if required
the process was repeated. The filters were then checked by autoradiography to ensure
none of the probe remained. This procedure allowed the filter to be reprobed for up to
five times.
2.20 Primer extension analysis
2.20.1 Primer labelling with ATPThe 5’ transcriptional start site was determined using the AMV Reverse
Transcriptase Primer Extension System (Promega).
The primer to be used for the primer extension reaction was phosphorylated at
the 5’ end in a reaction mix containing 2 pi (10 pmol/pl) of primer, 1 pi of 10 X
Forward Exchange buffer (500 mM Tris-HCl pH 7.5, 100 mM MgCE, 50 mM DTT, 1
mM spermine), 30 pCi [y- P]ATP (10 Ci/mi, 3000 Ci/mmol,), 1 pi T4 polynucleotide
kinase (8-10 U/pl) and DEPC-treated H2O to a final volume of 10 pi. The reaction mix
was incubated at 37“C for 10 min, after which the T4 polynucleotide kinase was
inactivated by heating to 90“C for 2 min. The end-labelled primer was diluted to 100 .
fmol/pl by the addition of an appropriate volume of DEPC-treated H2O. The .percentage incorporation of radiolabel into primer was determined as described in
section 2.15.2. The labelled primer was stored at ~20“C.
5 8
2.20.2 Primer extension reaction1 pi (100 fmol/pl) of ^P-end-labelled primer was added to Eppendorf® tubes
each containing 1, 2, 5 and 10 pg of total RNA in 5 pi aliquots. In addition a ‘no
RNA’ control tube was also set up containing 5 pi of DEPC-treated H2O. To these, 5
pi of 2 X AMV Primer Extension (PE) Buffer (100 mM Tris-HCl pH 8.3, 100 mM
KCl, 20 mM MgClz, 20 mM DTT, 2 mM each of dATP, dCTP, cGTP, dTTP and 1
mM spermine) was added. The components were mixed thoroughly. The primer was
allowed to anneal to the RNA by incubating the reaction mix at the appropriate
temperature (Tm of the primer minus 5“C) for 1-2 h. 9 pi of the extension mix
containing 5 pi of AMV PE 2 X buffer, 1.4 pi (40 mM) NaPPi, 1 pi AMV reverse
transcriptase (5 U/pl) and DEPC-treated H2O to volume was added to the annealed
2,21 Screening libraries
2.21.1 Preparation of plating cellsThe same protocol was used for screening both the cDNA and genomic
libraries. A single colony of XL 1-Blue cells (for cDNA library) or DL491 cells (for
genomic library) was used to inoculate 5 ml of L-Broth and NZCYM media
respectively, containing 12.5 pg/ml of tetracycline. The culture was grown overnight at
37“C in a shaking incubator. 1ml of the culture was then used to inoculate 100 ml of
the appropriate medium and grown for approximately 2 h until the ODsoowas 0.5. The
cells were centrifuged at 3000 x g for 5 min, and the pellet resuspended in 10 ml of ice-
cold 10 mM MgS0 4 . The cells were split into 100 pi or 200 pi aliquots in pre-cooled
Eppendorf® tubes, flash-frozen in liquid nitrogen and stored at -80” C.
2.21.2 Titration of phage libraryA serial logarithmic dilution of phage was prepared in SM buffer (0.1 M NaCl,
2% gelatine, 50 mM Tris-HCl, pH 8.0 and 8 mM MgS0 4 ); 10 pi of phage stock was
5 9
primer/RNA. After incubating the reaction mix at 42”C for 30 min, 20 pi of loading
dye was added, the samples heated to 90”C for 10 min and loaded onto a sequencing
gel. The gel was run for 1-2 h until the dye-front reached 3 cm from the bottom of the
20 cm X 40 cm gel. The gel was dried and autoradiographed for up to 72 h at -80” C.
■'ti
added to 990 pi of SM buffer to give a 10' dilution. Serial dilutions were then made
up to 10" in SM buffer and 100 pi of each phage dilution was added to 100 pi of
plating cells and incubated at room temperature or 37”C for 20 min to allow the phage
to adsorb to the cells. 5 to 8 ml of Top-agarose (kept warm at 55”C) was added to the
phage/cells mix and immediately poured onto thoroughly dried L-agar plates. The Top
agarose was allowed to set and the plates placed upside down in a 37”C incubator
overnight to allow plaque formation.
2.21.3 Plating the phage libraryPetri dishes with a diameter of 150 mm were used in the primary screen and 90
mm diameter plates were used for subsequent secondary and tertiary rounds of
screening. 200 pi of the appropriate phage dilution (approx. 2 x 10 pfu per plate for
the primary screen and 50-500 pfu for subsequent rounds) was added to 200 pi of
plating cells (prepared as described in section 2.21.2). The phage was allowed to
adsorb to the cells for 20 min at room temperature after which 8 ml of Top agarose
(pre-warmed to 55”C) was added to the tube, and was briefly mixed and poured
immediately onto dried agar plates. The plates were placed upside down at 37”C
overnight to allow plaques to form. The next day the plates were placed at 4”C for
three days to enable the Top agarose to harden. Plaque lifts were carried out as.■
described in section 2.21.4
2.21.4 Plaque liftsThis method was based on that of Benton and Davis (1977).
Hybond N filters (Amersham International pic., Amersham, UK) were placed
for 30 s onto the plates and the filters marked asymmetrically at three positions with a
syringe needle to orientate the plaques. The plates were also marked at the same
positions with a marker pen. After removing carefully with forceps the filter was
placed immediately, DNA side up, into dénaturation solution (1.5 M NaCl, 0.5 M
NaOH) for 4 min. The filter was briefly dried on Whatman 3MM paper and then
immersed twice for 3 min each in neutralisation buffer (1.5 M NaCl, 0.5 M Tris-HCl,
pH 8) prior to washing in 0.1% SDS;2 X SSC. The filter was dried on Whatman 3MM
6 0
paper prior to baking for 2 h at 80”C. The plaque lift was duplicated by placing a
second filter on the plate for 60 s and processing as the first filter.
2.21.5 Selection of positive plaquesThe filters fi'om each round of screening were hybridised to a radiolabelled
probe and washed as described for Southern blots in section 2.19.3 and 2.19.4.
Following each round of screening the resulting autoradiograph was placed onto the
plate and the pattern of dots aligned with the plaques. The orientation of the plaqes
was determined by aligning the asymmetric marks on the filters and plates produced by
the syringe needle. The plaques of interest were cored out of the agar using the wide
end of a pasteur pipette and the agar/agarose/plaque(s) were placed into a 1.5 ml
Eppendorf® tube containing 1 ml of SM buffer and 50 pi of cliloroform. The tube was
vortexed briefly and incubated at room temperature for 1 h or at 4”C overnight in order
to allow the phage to diffuse out of the agarose into the buffer. The phage was then
titered as described in section 2.21.2. The phage was then plated out at a lower density
and the screening process repeated until plaque purity was achieved. This normally
took up to three rounds of screening.
2.22 In vivo excision of recombinant pBluescript® from Uni-
Zap XRThis was carried out essentially as described in the manufacturer’s manual.
The plaque of interest was cored and placed into a sterile Eppendorf® tube
containing 1 ml of SM buffer and 50 pi of chloroform and vortexed to release the
phage. The phage was allowed to diffijse into the buffer for 1 to 2 h at room
temperature. In a 50 ml conical flask 200 pi of XL 1-Blue plating cells [O D eoo = 1], 100
pi of phage (containing approximately 1x10^ phage particles) and 1 pi of ExAssist
helper phage (Stratagene) (containing > 1 x 10® pfu/ml) were combined and the
mixture incubated at 37”C for 15 min. 3 ml of 2 X YT medium was then added and the
mixture incubated for a fiirther 2 to 2.5 h with continuous shaking. The tube was
heated at 70”C for 20 min and centrifuged in a bench top centrifuge for 15 min at 4000
6 1
" 1*
X g. The supernatant which contains the Bluescript® II SK (-) phagemid packaged as a
filamentous phage particle was decanted into a sterile Falcon tube and stored at 4” C.
1 pi and 50 pi of the supernatant was mixed with 200 pi of SOLR® cells
[O D goo = 1] in 2 X 1.5 ml sterile Eppendorf® tubes and incubated for 15 min at 37”C.
100 pi of phage/SOLR® mix from each tube were plated onto L-agar plates containing
50 pg/ml of ampicillin and incubated at 37”C overnight. Single bacterial colonies
appearing on the plates the next day were grown in L-Broth/ampicillin and the
phagemid purified using the Promega Wizard^* miniprep kit (section 2.8.1).
2.23 Isolation of Lambda DNA from genomic clones
2.23.1 Preparation of plate lysatesThe Wizard^* Lambda preps DNA purification system (Promega) was
used.
For each genomic clone 7 x 90 mm NZCYM plates were prepared. 10® pfu of
phage stock was mixed with 100 pi of competent DL491 cells and allowed to adsorb
at 37”C for 20 min. 2 to 3 ml of NZCYM Top agarose was heated to 45”C, added to
the phage/cell mixture and plated immediately onto previously prepared NZCYM
plates. The Top agarose was allowed to set and the plates incubated upside down at
37”C overnight. The next day 3 ml of SM buffer was added to each plate. The Top
agarose was carefully scraped off with a sterile spatula and transferred to a high speed
50 ml centrifuge tube. The agarose was broken up and the tubes incubated at RT for
30 min with regular shaking. The agarose was centrifuged at 10,000 x g for 10 min at
4”C and the supernatant transferred to a 50 ml Falcon tube to which was added 0.3%
of CHCI3. The phage lysates were either stored at 4°C or used immediately as
described in the next section.
2.23.2 Removal of Phage Coat10 ml of lysate was transferred to a 30 ml Corex® tube to which was added 40
pi of nuclease mix (250 pg/ml each of RNase A and DNase I solution, 150 mM NaCl,
50% glycerol, supplied in kit) and the mixture was incubated at 37”C for 15 min. The
lambda DNA was precipitated with the addition of 4 ml of Phage Precipitant (33%
6 2
(w/v) polyethylene glycol (PEG-8000), 3.3 M NaCl) and incubated on ice for 30 min.
The phage DNA was pelleted by centrifugation at 10,000 x g for 10 min. The
supernatant was decanted off and the pellet resuspended in 500 pi of Phage Buffer
(150 mM NaCl, 40 mM Tris-HCl, pH 7.4, 10 mM MgS0 4 ). The resuspended lambda
DNA was proteinase K (Boehringer Mannheim) treated at 37”C for 5 min at a final
enzyme concentration of 0.5 mg/ml (20 units/mg, Boehringer Mannheim) to remove
any residual nuclease mix. The DNA was then transferred to a 1.5 ml Eppendorf®
tube, centrifuged at 12,000 x g for 10 s to remove insoluble debris and the supernatant
transferred to a fresh Eppendorf® tube containing 1 ml of Purification Resin. The
DNA/resin was mixed by inverting the tube and then transferred to a disposable
Wizard'' ' Minicolumn which consisted of a 3 ml syringe barrel attached to the Luer-
Lok® extension of the minicolumn attached to a vacuum manifold. The vacuum was
applied and the DNA/resin mix drawn into the minicolumn. The vacuum was broken
and the column washed with 2 ml of 80%(v/v) iso-propanol. The vacuum was
reapplied and the column wash drawn through. The minicolumn was dried thoroughly
by drawing the vacuum for a further 2 min. The syringe barrel was discarded, the
minicolumn attached to a 1.5 ml Eppendorf® tube and centrifuged at 12,000 x g for 20
s to discard any residual isopropanol. The minicolumn was attached to a new
Eppendorf® tube, 100 pi of H2O, preheated to 80”C, applied and the lambda DNA
eluted by centrifugation at 12,000 x g for 20 s.
2.24 Polymerase chain reaction (FCR)Up to 200 ng of in vivo excised cDNA phagemid, genomic clones or genomic
DNA were placed into a 0.5 ml Eppendorf® containing 5 pi of 10 X PCR buffer (500
mM KCl, 100 mM Tris-HCl, pH 9, 1% Triton X-100), 8 pi ofdNTP mix (Pharmacia,
2.5 mM each of dATP, dCTP, dGTP, dTTP), 5 pi of 2.5 mM MgCla, 1 pi each of 100
pmol/pl of T3 and T7 or gene-specific primer (see Tables 3.1 and 4.1) and 0.5 pi of
Taq DNA polymerase (Promega, 2.5 U/pl). The reaction was made up to 50 pi with
sterile H2O, mixed thoroughly and overlayed with 50 pi of light mineral oil (Sigma).
The reaction was placed in a thermal cycler (Omnigene, Hybaid Ltd., Middlesex, UK)
under the following conditions: 95”C for 1 min (dénaturation), 50”C for 2 min (primer
6 3
The seeds were sprinkled evenly onto germination medium in Petri dishes under sterile
conditions, sealed with surgical tape, cooled at 4”C for 2 days then placed under the
appropriate light conditions.
annealing) and 72”C for 2 min (extension), cycled 30 times. The reactions were left to
extend at 72”C for a further 7.5 min at the end of the cycle.
The promoter region of the BnLTP gene was amplified using Pfu polymerase
(Stratagene) in a reaction mix containing the same reagents as described above except
using a different 10 X buffer (200 mM Tris-HCl pH 8.2, 100 mM (NH4)2S0 4 , 20 mM
MgClz, 1 mg/ml BSA, 1% Triton X-100 (v/v)) and cycled as above except the
annealing and extenstion times were increased to 5 min. Agrobacterium transformed
with the binary vector containing the BnLTP-GUS construct was boiled for a few
minutes in sterile H2O before being subjected to PCR with Taq DNA polymerase. The
PCR conditions were the same as those described for amplification of genomic clones.
2.25 Surface sterilisation and germination oî Arabidopsis
seedGermination medium (GM) containing 1 X Murashige and Skoog salt mixture
(Flow Labs, Irvine, Scotland, UK), 1% (w/v) sucrose, 100 mg/1 inositol, 1 mg/1
thiamine, 0.5 mg/1 pyridoxine, 0.5 mg/1 nicotinic acid and 0.5 g/1 N-morpholino
ethanesulfonic acid (MES) in H2O was adjusted to pH 5.7 with 1 M KOH. The medium
was autoclaved and allowed to cool to 55”C before pouring into Petri dishes." i f
Seed was placed onto small Whatman 3MM filter paper, folded twice and fixed
into place with paper clips. These were then soaked in 70 % ethanol for 2 min then
placed immediately in 10 % (v/v) hypochlorite solution (BDH, AnalaR® grade, Poole,.
Dorset) containing 1 % (v/v) Triton X-100 (Sigma-Aldrich) for 20 min. Under sterile
conditions (in a flow hood), the seed was washed thoroughly in sterile H%0 to remove. .the bleach. It was then dried thoroughly under sterile conditions for a minimum of 4 h.
*
f
6 4
harvested from individual plants and screened for putative transformants.
2.26,2 Analysis of progeny from transformed plantsSeed was harvested from vacuum infiltrated plants, surface sterilised and plated
out on germination media supplemented with 50 pg/ml kanamycin. Wild type and
NM4 seed were plated as negative and positive controls, respectively. Seed were
65
2.26 Transformation of Arabidopsis by Vacuum Infiltration
2.26.1 Preparation of Arabidopsis plantsArabidopsis thaliana ecotype Landsberg erecta were grown under continuous
white light to a stage where bolts were just emerging. Approximately 10 plants per 3.5
inch pot were prepared. The emerging bolts were clipped four to eight days prior to
infiltration in order to encourage multiple bolting. The soil was also kept dry in order
to maximise infiltration (usually from the point when the bolts were clipped).
Two days prior to transformation, a single colony of Agrobacterium GV3101
transformed with the appropriate construct was inoculated into a 25 ml culture of YEP
medium containing 50 pg/ml of kanamycin and 25 pg/ml of gentamycin. The culture
was grown overnight at 30”C with continuous shaking. The next day the 25 ml culture
was added to 400 ml of YEP/kanamycin/gentamycin in a 1 litre conical flask and .grown with continuous shaking at 30”C until the ODeoo was > 2.0. The bacteria were
pelleted by centrifuging at 5000 x g for 10 min at room temperature and resuspended
in 3 volumes of vacuum infiltration medium (0.5 X Murashige & Skoog salts, 1 X B5
vitamins, 5 % sucrose, 0.044 pM benzylamino purine) until the ODeoo was approx. 0.8.
A 400 ml culture was enough to infiltrate six pots. 200 ml of Agrohacterium\r
resuspended in infiltration medium was placed into a 1 litre beaker. The plants were
inverted into the medium ensuring that all the bolts, leaves and soil were fully
submerged. The beaker was placed into a bell jar attached to a vacuum pump and
vacuum drawn until bubbles formed around the submerged leaf, stem and bolts. After 2
to 3 min the vacuum was released very rapidly ensuring the medium was completely
absorbed by the soil. At this stage the leaves had a very dark green appearance. The
entire plant and pot was covered with cling film to maintain humidity and was placed
on its side. The next day the cling film was removed and the pots placed upright and
grown for four weeks until siliques were fully developed and completely dry. Seed was
It
15
___
vernalised for a few days at 4”C and placed under continuous white light. Within seven
to ten days, seedlings that appeared dark green with fully expanded cotyledons with
emerging secondaiy leaves were selected. Kanamycin-sensitive seedlings bleached and
died within seven days. Seedlings were transferred to soil and transformed plants (T1
generation) were allowed to grow and self fertilise. Seed were harvested and the
segregation ratio (kanamycin resistant: kanamycin sensitive) of the progeny was
calculated. A segregation ratio of 3:1 in the T2 generation indicated that the transgene
was located at a single locus.
2.27 Electroporation of Brassica napus stem sections with GUS
constructsThree to four week old B. napus stems were cut into 1-2 mm sections and
washed thoroughly in sterile H2O on ice for 1 h. 6-10 sections were placed into a
plastic cuvette (Bio-Rad, Gene Puiser cuvette) with a 0.4 cm electrode gap containing
300 pi of sterile H2O (everything was kept on ice). 25 pg of plasmid DNA to be
electroporated was added to the sections and mixed thoroughly by inverting the
cuvette several times. Plasmid containing the 35S-GUS fusion and ‘no DNA’ controls
were also set up. The stem sections were electroporated at different conditions using
the Bio-Rad Gene Zapper (see Chapter 5, section 5.3.3, Table 5.1). The stem sections
were then immersed in 500 pi of a solution containing 400 mM mannitol, 8 mM CaCb,
5 mM MES pH 5.6, and mixed thoroughly and incubated at room temperature under
high intensity white light for 24 h. The next day the stem sections were washed several
times in 50 mM sodium phosphate and incubated for 24 h at 37”C in 1 mg/ml of 5-
bromo-4-chloro-3-indolyl glucuronide (X-Gluc; BioGene Ltd., Bedfordshire, UK) in
50 mM sodium phosphate. The stems were cleared in 80% EtOH and observed for
GUS activity (formation of a blue precipitate).
2.28 Plant growth conditions
I2.28.1 General growth conditionsSeeds were sown onto moist, sterile potting compost, covered with cling film
and vernalised at 4”C for two to five days prior to germination. Plants were grown5'::tJ:
6 6
under continuous low intensity white (LW) light (35 ± 5 pmol/m^ /s) or high intensity
white (HW) light (100-200 pmol/mVs) using 45 Watt warm white fluorescent tubes
(Osram, Munich, Germany) at 22”C unless otherwise stated. Plants to be infected with
CaMV were grown in a 10 h light (45 pmol/m^/s)/ 14 h dark photoperiod until the first
two leaves emerged.
2.28.2 Light treatmentsLight qualities (intensity and wavelengths) were measured by a
spectroradiometer (model SR9910; Macam Photometries, Livingston, UK). UV-B was
obtained fi’om TL 40W/12 UV fluorescent tubes (Philips, London, UK) covered with
cellulose acetate, which was changed every 24 h. Blue light was provided by 40W T12
blue fluorescent tubes (GTE Sylvania, Shipley, UK.) with a Imax 430 nm covered
with a UV226 filter (Lee Filters, Andover, UK.) which removes wavelengths < 400
nm. Red light was obtained by covering white fluorescent tubes with orange cinemoid;
no emisson <500 nm was detected. Plants were grown under LW light for 3 weeks and
then transferred for 24 h to either HW (100-200 pmol/mVs), UV-B (3 pmol/mVs;
fluence rate between 280 and 320 nm), blue (80-90 pmol/m^/s) or red (80-90
pmol/mVs) light conditions at 22”C. The plants were then either harvested into liquid
nitrogen and used for DNA or RNA extractions or used for fluorometric GUS assays.
2.28.3 Cold treatment and wounding of leavesFor cold treatments, 21 day old plants LW-grown at 22”C were placed at 4”C
for the appropriate time period under the same light conditions. Plants were then
haivested for RNA isolation or GUS assays.
Plants to be wounded were grown under LW light conditions for three weeks.
The fifth or sixth leaf was then wounded by piercing with a sterile syringe needle
numerous times or by cutting the leaf into several sections with a blade. The wounded
and control plants (unwounded) were then placed for a further 3 days under LW light
prior to GUS assays.
I
'76 7
2.28.4 Viral infectionThe cauliflower mosaic virus (CaMV) isolate BAEI was used to infect plants.
Plants were grown in a dark/light photoperiod (10 h light (45 pmol/mVs) and 14 h
dark) until the first two leaves began to emerge. The virus was mixed with a small
amount of abrasive powder and 100 ng of virus applied to the surface of each leaf with
a small glass spectre. The abrasive enabled the surface of the leaf to be scratched
slightly to allow the virus to enter. Inoculated plants were placed back into the growth
chamber. After the appropriate time period the first inoculated leaf and/or a secondary
leaf were assayed for GUS activity or used to extract RNA or DNA.
2.29 Analysis of GUS activity
2.29.1 Histochemical localisation of GUS expressionPieces of tissue were placed in fixative solution (0.3% formaldehyde, 10 mM
MES, pH 5.6 (Sigma), 0.3 M D-mannitol for 1 min under vacuum. The fixative was
replaced and the tissue fixed for a further 45 min at room temperature after which it
was washed thoroughly in 50 mM sodium phosphate pH 7.0. The tissue was then
incubated in 1 mg/ml X-Gluc in 50 mM sodium phosphate pH 7.0 for 24 h at 37”C.
The next day the tissue was washed several times in 50 mM sodium phosphate, cleared
in EtOH and photographed or embedded in OCT compound (BDH, Gurr®) and
sectioned at -20”C using a cryostat microtome (Bright Instrument Company Ltd., UK).
The 10-12 pm sections were placed onto polylysine coated slides and photographed
under a light microscope (Axiophot Zeiss).
■if
2.29.2 Fluorometric GUS assaysGUS activities were assayed quantitatively essentially as described by Jefferson
et a l (1987). After the appropriate treatment 1 or 2 leaves were homogenised in 50 pi
of GUS extraction buffer (50 mM sodium phosphate pH 7.0, 10 mM EDTA, 0.1%
(v/v) Triton X-100, 0.1% (w/v) sarkosyl, 0.07% (v/v) P-mercaptoethanol) in a 1.5 ml
Eppendorf® tube. Eight to ten plants were harvested for each treatment or time point.
The homogenate was placed on ice and 450 pi of 1 mg/ml 4-methylumbelliferyl,
glucuronide (MUG; BioGene Ltd.) in GUS extraction buffer was added. The
6 8i
, . . s l
homogenate/buffer was mixed by inverting the tube four times and then incubated at
37”C for 15 min (T15). After the 15 min incubation period GUS activity was
terminated by placing 100 pi of the assay mixture into 900 pi of 0.2 M NazCOg. The
remaining mixture was incubated for a further 45 min (T45) at 37”C after which
another 100 pi aliquot was added to 900 pi of NazCOs (T60). The T15 and T60
samples were measured for production of the fluorescent product 4-
methylumbelliferone (4-MU). The fluorescence was measured in a Perkin-Elmer LS5
luminometer (excitation 365 nm, emission 455 nm) against a series of known 4-MU
concentration standards. The remaining 300 pi of the assay mixture was used to
determine protein concentrations using the Bradford (1976) protein assay as described
in Sambrook et al. (1989). GUS activity is expressed as the number of nmols of 4-MU
produced per min per mg of protein.
I
6 9
Chapter 3 Isolation of a full length Brassica napus epidermis»
specific cDNA
3.1 IntroductionPreviously, an epidermis-specific partial cDNA clone, designated pLF3A
(Pallas, 1992), was isolated following a differential screen of a Brassica napus cv.
Cobra cDNA library. This library was constructed fi*om poly (A)+ RNA isolated from
shoot apices with floral buds and sepal primodia. The aim was to isolate genes
expressed early during floral morphogenesis. The cDNA library was constructed in the
vector, XNM1149 (Murray, 1983), using a method previously described by Dorssers
and Postmes (1987). Essentially, the cDNAs were ligated to linkers containing an
internal EcoR I site and four base pairs of a Hind III site, which resulted in the
formation of a unique Hind III site adjacent to the poly (A) tail. The library was
screened differentially using cDNA probes from two distinct developmental stages,
vegetative and floral buds with sepal primodia only. XLF3 was one of several clones.isolated. pLF3 A was derived firom A.LF3, which upon digestion with EcoR I and Hind
III generated two insert fragments. The larger of the two fragments of 376 bp was
subcloned into pBluescript® II SK (-) and was designated pLF3 A.
3.1.1 Characteristics of pLF3AIt had already been shown by Pallas (1992) that pLF3A hybridised to a single
transcript of approximately 700 nucleotides from total RNA isolated from Brassica
napus cv. Cobra leaf, stem and floral tissue. Expression was not evident in root tissue.
In Southern blots of Brassica napus genomic DNA digested with EcoR I, Hind III and
Bam HI, pLF3A hybridised to at least four bands, suggesting the presence of several
copies of closely related genes. The cDNA also cross-hybridised to Arabidopsis
thaliana genomic DNA. Transcripts complementary to pLF3A were localised in the■
epidermal cells of leaf and floral tissue using in situ hybridisation experiments.
Transcripts hybridising to pLF3A were not affected upon wounding, cold treatment or
heat shock (Pallas, 1992). Preliminary sequence analysis of pLF3A did not reveal a
characteristic poly (A) tail which is present at the 3’ termini of most eukaryotic genes.
7 0 !
This implied that the clone probably represented the 5’ region of the ÀLF3 cDNA.
Preliminary sequence comparison of the cDNA to other sequences in the database did
not reveal homology to any other plant genes.
The initial aim of the project was to use pLF3A as a probe to isolate the full
length clone. This chapter describes the isolation of a cDNA clone from a Brassica
napus cDNA library constructed in the Uni-Zap^^ XR vector where the inserts were
cloned directionally into thsXho I and Eco RI sites.
3.2 Screening of a cDNA libraryGoodwin et al. (1996) used the ZAP-cDNA® synthesis kit (Stratagene) to
construct the cDNA libraiy as described in the manufacturer’s manual. Poly (A)+ RNA
was isolated from cold-treated Brassica napus cv. Cobra leaf tissue and reverse
transcribed. The resulting cDNAs were then cloned directionally into the Xho I and
EcoR I sites of the Uni-ZAP '^ XR vector.
The first strand cDNA synthesis was primed using a 50 base oligonucleotide
containing a “GAGA” repeat sequence at the 5’ terminus followed by a Xho I
restriction site and an 18 base poly dT sequence. The GAGA sequence protected the
Xho I restriction site. The poly dT was annealed to the poly (A) tail on the mRNA
template then reverse transcribed with the Moloney-Murine Leukemia Virus Reverse
Transcriptase (M-MuLVRT; Zeef, 1987). The Xho I restriction site at the 3’ end
allowed the completed cDNA to be cloned into the Lamda Zap® vector (Short, 1988)
in a sense orientation in relation to the Lac Z promoter. During the first strand
synthesis, 5-methyhdCTP was used in the nucleotide mix instead of dCTP, whereas
during the second strand synthesis with DNA polymerase I, dCTP was incorporated
which reduced the probability of 5-methyl dCTP being incorporated in the second
strand. This enabled only the restriction sites in the primer-linker to be susceptible to
the cDNA-adapters released the Eco RI adapter. The cDNAs were then size
fractionated and ligated directionally into the Uni-ZAP '^ XR vector arms. The library
was then packaged in a high efficiency Gigapack® II packaging extract which was
71
restriction enzyme digestion. The termini of the cDNAs were blunt-ended with T4
DNA polymerase and ligated to the Eco RI adapters. Subsequent Xho I digestion of
___
mer A", mcrB" and mrr~ (Kertz et al., 1989) and plated on the E. coli cell line SURE "
which was also mcrA-, mcrB- and mrr-. Use of this bacterial strain was preferred at
this stage because it did not destroy the hemi-methylated cDNAs. After the initial
plating on SURE ' cells the library was subsequently plated on other bacterial strains
such as XL 1-Blue.
The cDNA library was titred to estimate the number of plaque forming units
(p.fu.) required for plating. Basically the number of plaques that appear on a lawn of
bacteria is directly proportional to the amount of phage. This can be represented by the
equation; n = y/vx, where y represents the number of plaques produced by plating a
volume V (ml) of a dilution x of phage giving a titre « of p.fu. per ml.
The library was diluted in SM buffer and added to XL 1-Blue plating cells in a
total volume of 200 pi. The plates were confluent at 10'" to 10' dilution. At dilutions
of 10'^ 10' and 10" , 240, 26 and 2 plaques were formed resulting in titres of 2.4 x
10®, 2.6 X 10® and 2x10® p.f.u./ml, respectively.
3.2.1 Primary, secondary and tertiary screening of the cDNA
libraryThe pLF3A cDNA clone was excised from the pBluescript® II SK (-)
phagemid by restriction digestion with EcoR I and Hind III, purified and used as a
probe to screen the cDNA library. In the primary screen the library was plated at 10”®
dilution ( > 2 x 10®p.f.u./ml) on six, 150 mm plates which enabled the screening of
>1.2 X 10 plaques. As B. napus is a close relative of Arabidopsis, which is estimated
to have approximately 20,000 genes (Gibson and Sommerville, 1993), this number of
plaques was considered sufficient in order to isolate at least one of the four putative
pLF3A gene homologues. Duplicate filters were hybridised to the radio-labelled
pLF3A cDNA. A total of 30 putative positive plaques (four positives fi'om plate 1
(lA l to 1A4), fifteen plaques from plate 2 (2A1 to 2A15), two plaques from plate 4
(4A1 and 4A2) and finally nine plaques from plate 5 (5A1, 5A2, 5A3, 5A4, 5A5, 5A6,
5A7, 5A8 and 5A9) were observed. There was no significant difference in the intensity
of the radioactive signal among the putative positives. After secondaiy and tertiary
I72
i
rounds of screening at lower plaque densities (described in section 2.21), sixteen of the
thirty putative positives were plaque purified and characterised further by PCR and
sequencing.
3.3 Amplification of inserts with the T3 and T7 primers by
PCRThe approximate size of inserts in the sixteen putative positive plaques was
estimated by PCR using the primer pair T3 and T7 that flank the multiple cloning site
of the pBluescript® II SK (-) phagemid contained within the linear Lamda Zap®
vector. Essentially, each plaque was boiled for a few minutes in a total volume of 20 pi
of sterile water, centrifuged briefly at 10,000 x g and the supernatant was subjected to
PCR, the conditions for which are detailed in section 2.24. The products were resolved
on a 1% agarose gel along with DNA size markers (Fig. 3.1).
Nine clones, À2A4, A,2A6,12A7, A.2A8, X2A15, A,5A6, X5A4, X5A8 and X5A9
were positive, amplifying a strong band of approximately 700 bp. One clone, A,2A11
amplified a smaller band of around 600 bp. A faint band of around 700 bp was
detected for the three clones, 12Al, 12A10 and 15A7, whereas three clones, 12A3,
12A5 and 12A9 were negative. The ten clones that amplified a high intensity band
were rerun on a 1% agarose gel. Southern blotted onto Hybond N+ nylon and
hybridised to pLF3A (Fig. 3.2). pLF3A was included as a positive control. The
conditions for pre-hybridisation and hybridisation were essentially the same as that
described for Southern blots (described in 2.19.3 and 2.19.4). Only four clones, 12A4,
12A6, 12A7 and 12A8, hybridised to pLF3A. A faint band was detected for 12A11
and 12A15, whereas clones 15 A4,15A 6 ,15 A8 and 15A9 were negative.
3.4 In vivo excision of the recombinant pBluescript® II SK
(") phagemidThe Uni“ZAP^“ XR vector is designed so that the clone of interest can be
isolated easily by a method known as in vivo excision, which bypasses the restriction
digestion and subcloning of the insert into a new vector. The helper phage, fl, was
7 3
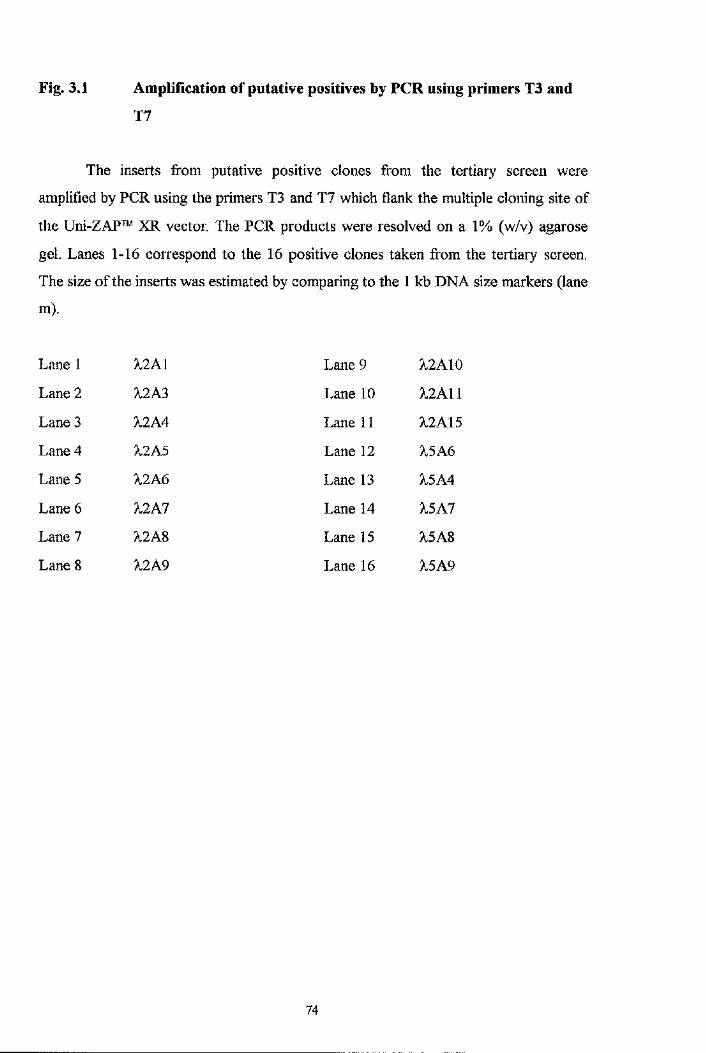
Fig. 3.1 Amplification of putative positives by PCR using primers T3 and
T7
The inserts from putative positive clones from the tertiary screen were
amplified by PCR using the primers T3 and T7 which flank the multiple cloning site of
the Uni-ZAP '^ XR vector. The PCR products were resolved on a 1% (w/v) agarose
gel. Lanes 1-16 correspond to the 16 positive clones taken from the tertiary screen.
The size of the inserts was estimated by comparing to the 1 kb DNA size markers (lane
m).
Lane 1 12A1 Lane 9 12 AID
Lane 2 12A3 Lane 10 12A11
Lane 3 12A4 Lane 11 12A15
Lane 4 12A5 Lane 12 15A6
Lane 5 12A6 Lane 13 15A4
Lane 6 12A7 Lane 14 15A7
Lane 7 12A8 Lane 15 15 AS
Lane 8 X2A9 Lane 16 15 A9
7 4
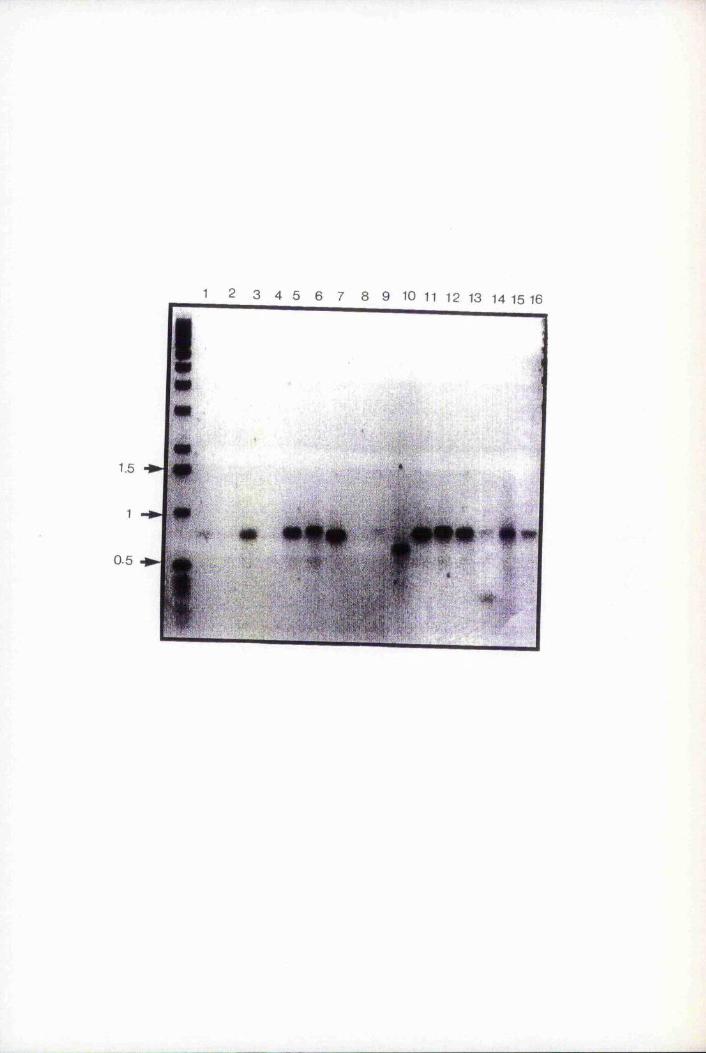
1 2 3 4 5 6 7 8 9 10 11 12 13 14 15 16
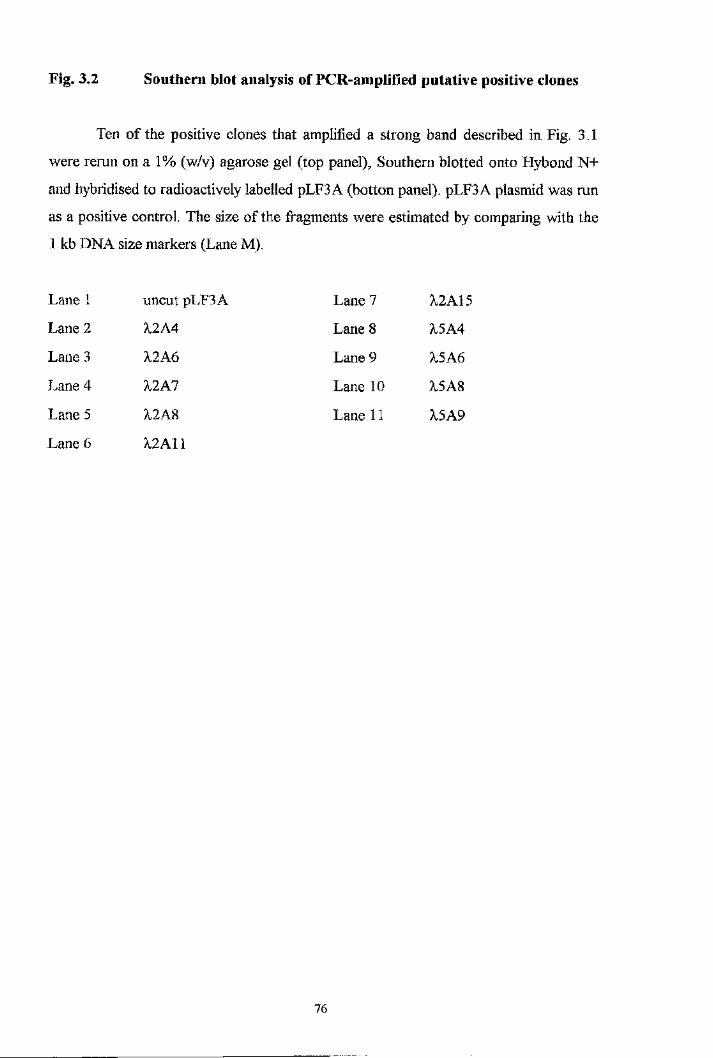
Fig. 3.2 Southern blot analysis of PCR-amplified putative positive clones
Ten of the positive clones that amplified a strong band described in Fig. 3.1
were rerun on a 1% (w/v) agarose gel (top panel). Southern blotted onto Hybond N+
and hybridised to radioactively labelled pLF3 A (botton panel). pLF3 A plasmid was run
as a positive control. The size of the fragments were estimated by comparing with the
1 kb DNA size markers (Lane M).
Lane 1 uncut pLF3 A Lane 7 12A15
Lane 2 12A4 Lane 8 15A4
Lane 3 12A6 Lane 9 15A6
Lane 4 12A7 Lane 10 15A8
Lane 5 12A8 Lane 11 15 A9
Lane 6 12A11
7 6
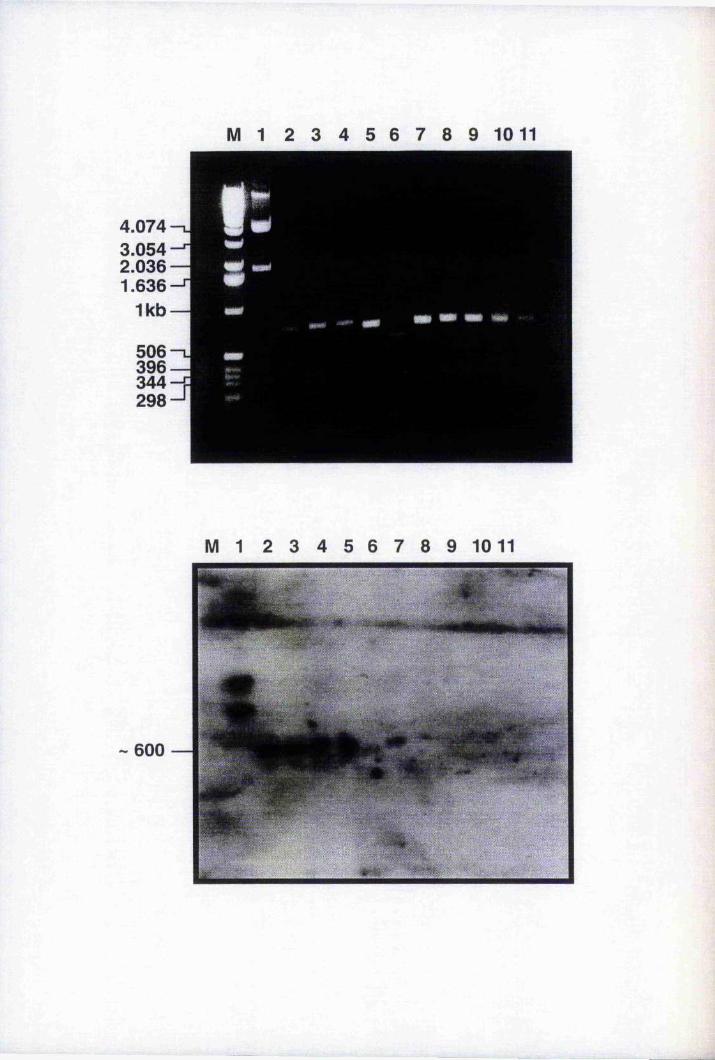
M 1 2 3 4 5 6 7 8 9 1011
4.074-3 .054- 2.036 —I 1.636-
I k b —I
P»
5 0 6 - 396- j 344 298-^1
M l 2 3 4 5 6 7 8 9 10 11
600 —
iiM HHJLaaai
78
■I
required for the in vivo excision process. Essentially, the phage and the Uni-ZAP '^
vector which contained the fragment of interest were co-transfected into bacterial cells
where the fl phage expressed helper proteins that bound to sites on the Uni-ZAf^^
vector that enabled DNA synthesis of the positive strand to begin. These proteins also
recognised a terminator sequence further downstream where the synthesis of the new
strand was completed. The newly synthesised single-stranded DNA which contained
the pBluescript® II SK (-) phagemid and the insert, if one was present, was then
circularised by the gene II product of the fl helper phage. The recombinant phagemid
was then packaged using signals contained within the terminator sequence, secreted
from the bacteria and subsequently rescued when mixed with fresh bacteria. The
phagemid/bacteria mixture was plated immediately onto selective L-Broth agar plates
containing 50 pg/ml ampicillin.
The nine clones (with the exception of p2A ll) described in Fig 3.2 were in
vivo excised. Approximately 100 to 200 putative positive colonies were observed for
each of the rescued recombinant phagemids. The colonies were inoculated into L-
Broth supplemented with ampicillin and the phagemid was isolated using the Promega
plasmid DNA isolation kit. The recircularized, rescued phagemids were digested with
Eco RI and Xho I to excise the insert and the products were separated on a 1%
agarose gel along with 1 kb size markers (Fig. 3.3). All nine clones contained an insert
of approximately 650 bp. Interestingly those clones that did not hybridise to pLFSA in
the Southern blot described in Fig. 3.2 also contained the right sized insert. The clones
that did hybridise to pLF3A were considered to be the full length clones based on
previous northern blots of total B. napus RNA, where pLF3A hybridised to a single
transcript of approximately the same size (Pallas, 1992).
3.5 Sequencing 3’ termini with T7 primerThe in vivo excised, recombinant pBluescript® II SK (-) clones were
designated p2A4, p2A6, p2A7, p2A8, p2A15, p5A6A, p5A4, p5A8 and p5A9. They
were sequenced using the dideoxynucleotide chain termination method of Sanger et al.
(1977). Initial sequencing reactions were carried out using primer T7. As previously
mentioned, the cDNAs were cloned directionally into the Uni-ZAPT' XR vector such
.
Fig.3.3 In vivo excision and restriction digestion of recombinant
pBluescript® II SK {-)
Phage from the positive plaques from the tertiary screen that amplified the
correct sized band was used to infect XL 1-Blue cells. These cells were then
superinfected with the ExAssist helper phage which excised the pBluescript® SK II (-)
phagemid from the Uni-ZAP’’' XR vector. The excised phagemid was rescued into
SOLR' '^ cells and transformed bacteria were selected on LB/amp agar plates.
Phagemid minipreps were carried out with the Promega DNA miniprep kit. The inserts
were excised by restriction digestion with Eco RI and Xho I and sized on a 1% (w/v)
agarose gel. (p:phagemid)
Lane M 1 kb ladder
Lane 1 p2A4
Lane 2 p2A6
Lane 3 p2A7
Lane 4 p2A8
Lane 5 p2AI5
Lane 6 p5A4
Lane 7 p5A6
Lane 8 p5A8
Lane 9 p5A9
7 9
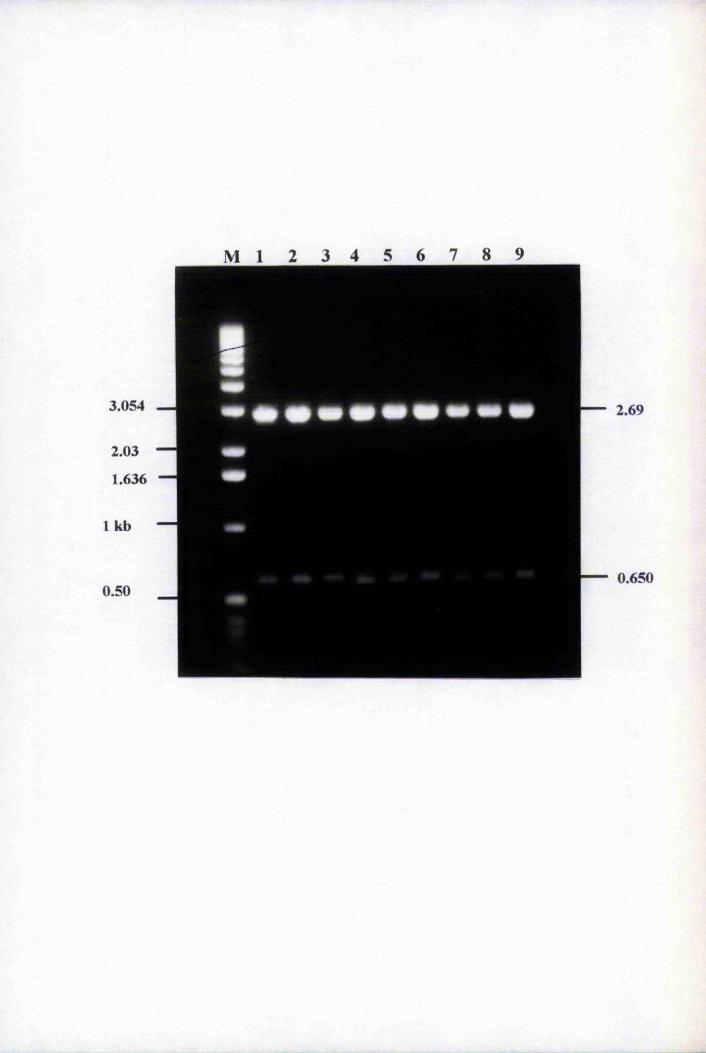
M 1 2 3 4 5 6 7 8 9
3.054
1.636
1 kb
0.50
2.69
0.650
that the 5’ termini of the cloned cDNAs were adjacent to the T3 promoter and the 3"
termini were adjacent to the T7 promoter. Therefore, it was relatively easy to
determine the orientation of the clones and the coding strand. Subsequent sequencing
reactions were carried out using synthetic primers complementary to the newly derived
sequences (Table 3.1).
A characteristic poly (A) tail was observed in all of the clones confirming they
represented expressed genes. The length of poly (A) tail as well as the sequences
immediately flanking the poly (A) tail differed in the clones. However, due to
substantial secondary structure which produced compression zones in these regions, it
was not possible to fully sequence all the clones. Similarly, clones sequenced at the 5'
termini with the T3 primer also contained several compression zones. Those clones
that contained differences in the regions flanking the compression zones were selected
and sequenced further. Both DNA strands of one clone, p2A7 were fully sequenced
using the dideoxynucleotide chain termination method of Sanger et a l (1977), and
regions with compression zones were sequenced using the Hot Tub sequencing method
(Amersham). The remaining clones were sequenced only partially from the 3 ' termini
with T7.
3.6 Analysis of the p2A7 sequenceThe primers used to sequence p2A7, their sequences and the region in the
cDNA where they hybridised are described in Table 3.1. The complete sequence of
p2A7 is shown in Fig. 3.4. The cDNA was 651 bp in length. The EcoRI and Xho I
restriction sites at the 5' and 3" termini, respectively, are shown as well as the relative
positions and orientations of the T3 and T7 primers. The clone contained one open
reading fi'ame of 118 amino acids which is shown below the putative codons along
with the the TGA stop signal designated by an asterix (*). A putative translation start
site (ATG) with the consensus sequence AAAC/ATG/GC (Joshi, 1987) is shown at
position 69. The 5’ untranslated region upstream of the ATG start site was 62 bp in
length. The length of the 3’ untranslated region prior to the first adenine of the poly
(A) tail was 201 bp. A putative polyadenylation signal, AAATAA, was located at
nucleotides 488 to 493 in the 3’ untranslated region. An internal Hind III site,
AAGCTT, is shown at nucleotides 286 to 291. Positions of the internal sequencing and
8 1
Table 3,1 Primers used to sequence the cDNA p2A7
The synthetic oligonucletides used to sequence the cDNA clone p2A7 are
shown along with the target sequences. The clone was initially sequenced with primers
T3 and T7 that hybridised to pBluescript® II SK (-) at target sequences that flank the
multi-cloning site. Subsequent primers were then designed from the newly derived
sequences. The cDNA nucleotide positions where several of the primers hybridised are
also shown. F and R refer to forward and reverse primers, respectively.
8 2
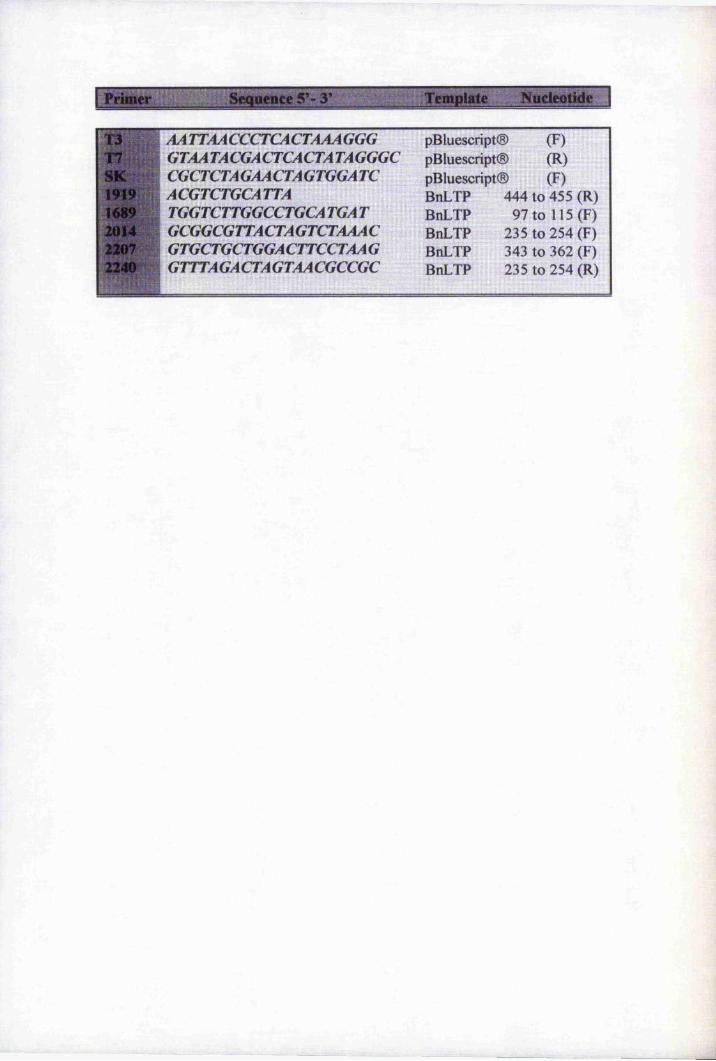
1
“jüîTn"
Î|.a?lais
i
Fig. 3.4 Nucleotide and predicted amino acid sequence of p2A7
The 651 bp nucleotide sequence of the p2A7 cDNA is shown. The 118 amino
acid polypeptide sequence is shown below the putative codons. The Eco RI
(GAATTC) and Xho I (CTCGAG) sites at the 5’ and 3’ termini, respectively, are
underlined. The putative translation start site with the consensus sequence
AAAC/ATG/GC (Joshi, 1987) is shown in bold at position 69. The asterisk (*)
indicates the stop codon (TGA). An internal Hind III (AAGCTT) site is underlined
(nucleotide 286-291). The orientations and relative positions of the T3, T7, 1689 and
1919 sequencing and PCR primers are indicated by an arrow. A putative
polyadenylation signal, AAATAA (shown in bold) is located 62 bp from the stop codon
at nucleotides 488 to 493 in the 201 bp 3’ untranslated region. The poly (A) tail
initiates at nucleotide 627. The arrow following the alanine residue at amino acid 25
depicts the putative signal cleavage site.
8 4
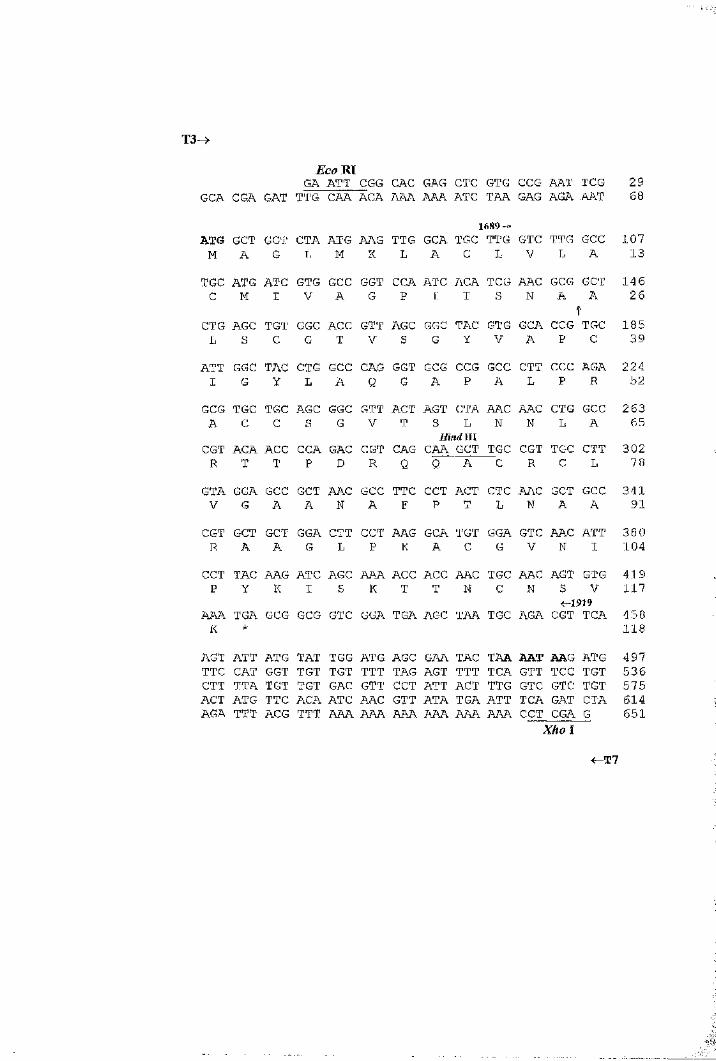
T 3 ->
Ecom
GCA CGA GATGA
TTGATTCAA
CGGACA
CACAAA
GAGAAA
CTCATC
GTGTAA
CCGGAG
AATAGA
TCGAAT
2968
ATG GCT GGT CTA ATG AAG TTG GCA1689 »
TGC TTG GTC TTG GCC 107M A G L M K L A C L V L A 13
TGC ATG ATC GTG GCC GGT CCA ATC ACA TCG AAC GCG GCT 146C M I V A G P I T S N A A 26
CTG AGC TGT GGC ACC GTT AGC GGC TAC GTG GCA CCG1TGC 185
L S C G T V S G Y V A P C 39
ATT GGC TAC CTG GCC CAG GGT GCG CCG GCC CTT CCC AGA 224I G Y L A Q G A P A L P R 52
GCG TGC TGC AGC GGC GTT ACT AGT CTA AAC AAC CTG GCC 263A C C S G V T S L N N L A 65CGT ACA ACC CCA GAC CGT CAG
HmdinCAA GCT TGC CGT TGC CTT 302
R T T P D R Q Q A C R C L 78
GTA GGA GCC GCT AAC GCC TTC CCT ACT CTC AAC GCT GCC 341V G A A N A F P T L N A A 91
CGT GCT GCT GGA CTT CCT AAG GCA TGT GGA GTC AAC ATT 380R A A G L P K A C G V N I 104
CCT TAC AAG ATC AGC AAA ACC ACC AAC TGC AAC AGT GTG 419P Y K I S K T T N C N S V 117
AAA TGA GCG GCG GTC GGA TGA AGC TAA TGC AGA<-1919
CGT TCA 458K
AGT
*
ATT ATG TAT TGG ATG AGC GAA TAC TAA AAT AAG ATG
118
497TTC CAT GGT TGT TGT TTT TAG AGT TTT TCA GTT TCC TGT 536CTT TTA TGT TGT GAC GTT CCT ATT ACT TTG GTC GTC TGT 575ACT ATG TTC ACA ATC AAC GTT ATA TGA ATT TCA GAT CTA 614AGA TTT ACG TTT AAA AAA AAA AAA AAA AAA CCT CGA G 651
Xhoî<-T7
PCR primers, 1689 (upstream, nucleotides 97 to 115) and 1919 (downstream,
nucleotides 444 to 455) are also shown. Arrows indicate the direction of sequencing
and PCR.
Restriction digestion of p2A7 with Eco RI and Hind III yielded two fragments,
of approximately 290 bp and 3.3 kb (Fig. 3.5). The 290 bp Eco BJJHind III fragment
most probably corresponded to the 5’ terminus of the cDNA clone and the 3.3 kb
fragment corresponded to the 2.69 kb pBluescript® II SK (-) plus the remaining 3’
terminus of the cDNA clone.
3.7 p2A7 encodes a putative non-specific lipid transfer
proteinThe nucleotide and deduced protein sequences of cDNA p2A7 were compared
to known sequences in the EMBL database using the UWGCG programs, FASTA and
tFASTA, respectively. The putative protein encoded by p2A7 was highly similar to a
large class of small molecular weight plant proteins known as non-specific lipid transfer
proteins (nsLTPs) (Fig. 3.6A) and was therefore designated a Brassica napus lipid
transfer protein (BNLTP). Comparison of the deduced protein sequence to other LTPs
indicated a high degree of similarity that ranged from 40% to 95%. The highest degree
of similarity (94.8%) was observed with a 118 amino acid Brassica oleracea cv.
italica lipid transfer protein designated WAX9D (Pyee, et al., 1994, 1995). WAX9D
was found to be the major protein associated with the surface wax of broccoli leaves.
The amino acid sequence was also highly similar to three Brassica napus germination-
specific (gs) cDNAs which also encoded putative lipid transfer proteins, designated
g slp l (91%), gsltp2 (93%) and gsltp3 (92%) isolated from young Brassica napus cv
Darmar germinating seedlings (Soufieri et al., 1996). BNLTP was 70% identical to the
Arabidopsis LTPl cDNA (Thoma et al., 1994), 52% identical to a tobacco LTP
(Fleming et al., 1992), 47% identical to a tomato LTP (Torres-Schumann et al., 1992),
47% identical to a maize LTP (Tchang et al., 1988), 52% identical to a spinach LTP
(Bernhard et al., 1991) and only 42% identical to another Brassica napus LTP, E2
isolated from developing microspores (Foster et al., 1992). A common feature
amongst all LTPs is the conservation of eight cysteines (Fig. 3.6B).
8 6
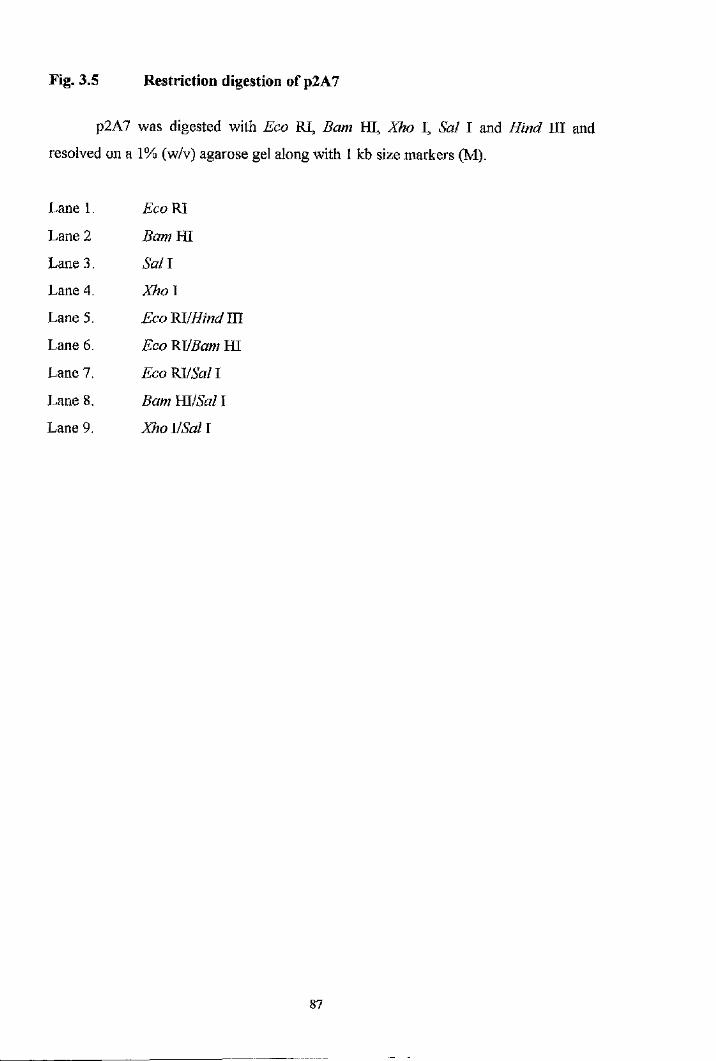
Fig. 3.5 Restriction digestion of p2A7
p2A7 was digested with Eco RI, Bam HI, Xho I, Sal I and Hind III and
resolved on a 1% (w/v) agarose gel along with 1 kb size markers (M).
Lane 1. Eco RI
Lane 2 Bam HI
Lane 3. Sa il
Lane 4. Xho I
Lane 5. E c o m Hind m
Lane 6. Eco m S a m HI
Lane 7. E c o m Sal I
Lane 8. Bam m i Sal I
Lane 9. Xho VSal I
8 7
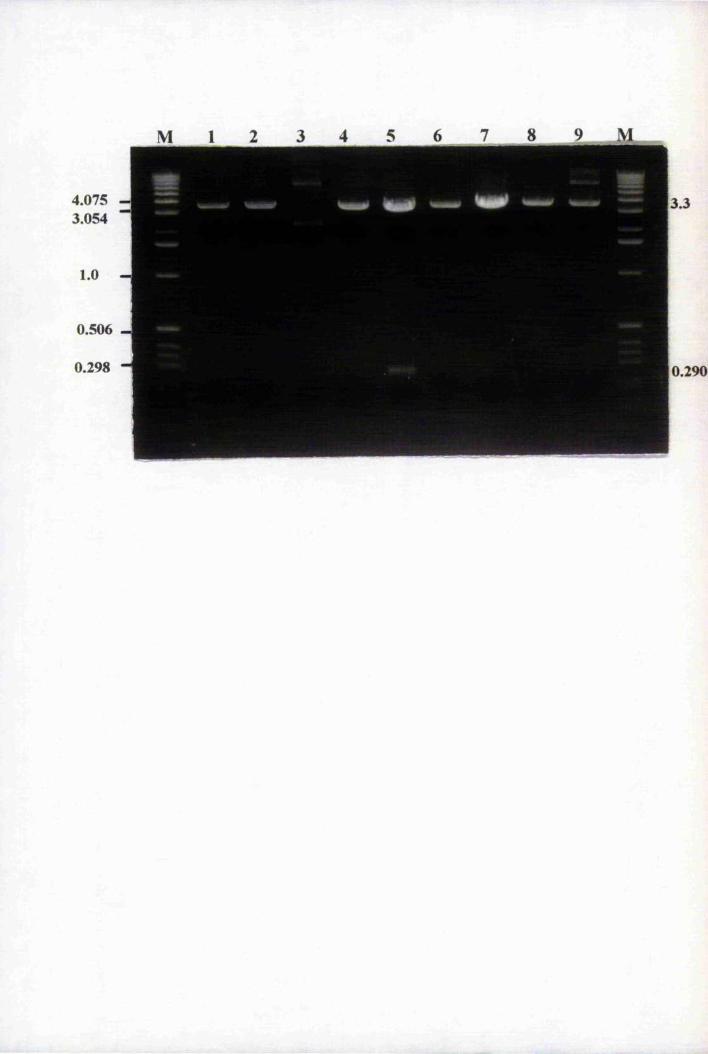
4.0753.054
0.506
0.298 0.290
Fig. 3.6 Comparison of BNLTP with other plants LTPs
A. The protein sequences were aligned using the UWGCG PILEUP program.
The small dots (.) indicate gaps. The star at the end o f the sequence indicates the stop
codon. The conserved cysteine residues are shown below the sequence. The line
depicts the putative signal peptide. Accession numbers are indicated in brackets:
Brassica napus AB/LTP II (0stergaard et a l, 1995); broccoli LTP, WAX9D (L33907)
(Pyee and Kolattkudy, 1995); oilseed rape, gsltpl (U22174) (Soufieri et al, 1996);
Arabidopsis, LTPl (M80567) (Thoma et al, 1994); tobacco, Ltpl (X62395) (Fleming
ei a l, 1992); tomato, TW12 (X56040) (Torres-Schumann et al, 1992); spinach,
PW132 (M58635) (Bernhard et al, 1991); barley, LTP4 (X68656) (Molina and
Garcia-Olmeda, 1993); maize, 9c2 (104176) (Tchang et al, 1988), oilseed rape, E2
(Foster et a l, 1992). BNLTP is 100% identical to AB/LTP II, 96.6% to WAX9D,
88.9% to gsltpl, 70% to Arabidopsis LTPl, 52.1% to tobacco Ltpl, 47.4% to TW12,
52.6% to PW132, 40.3% identical to LTP4, 47% to 9c2 and 42.2% identical to E2. B.
Alignment of cysteine residues in BNLTP and the Brassica napus cold-inducible hybrid
proline-rich protein, BNPRP (Goodwin et a l, 1996) and the Medicago sativa salt-
inducible chimeric proline-rich cell wall protein, MsPRP2 (Deutch and Winicov, 1995).
8 9
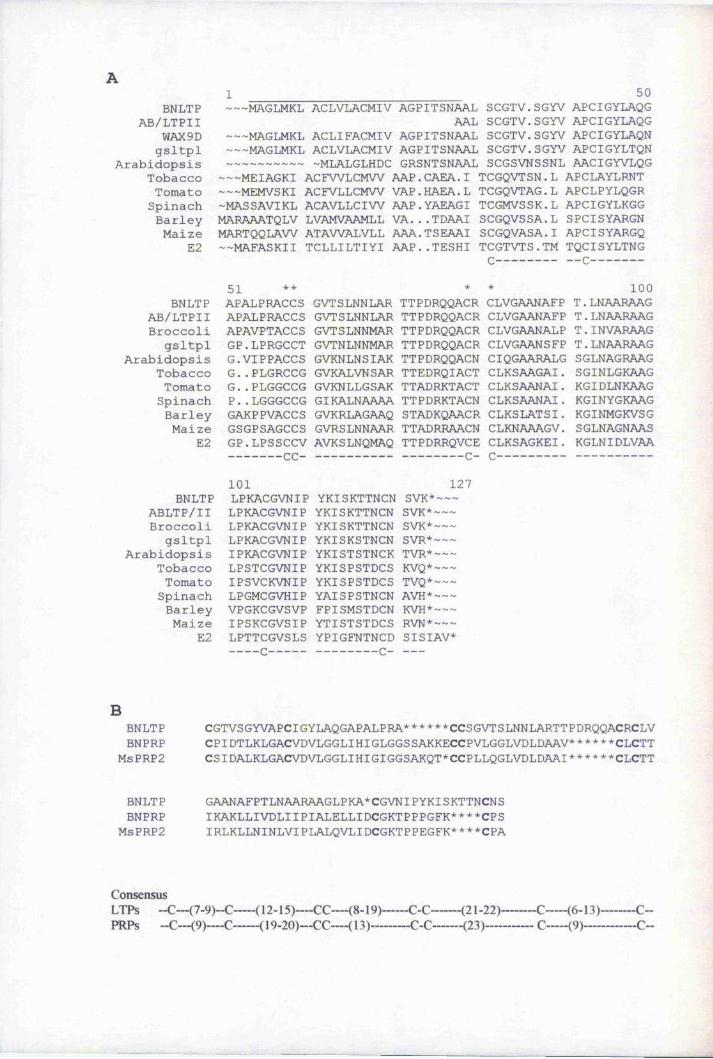
1 50BNLTP MAGLMKL ACLVLACMIV AGPITSNAAL SCGTV.SGYV APCIGYLAQG
AB/LTPII AAL SCGTV.SGYV APCIGYLAQGWAX9D MAGLMKL ACLIFACMIV AGPITSNAAL SCGTV.SGYV APCIGYLAQNgsltpl MAGLMKL ACLVLACMIV AGPITSNAAL SCGTV.SGYV APCIGYLTQN
Arabidopsis ---------- -MLALGLHDC GRSNTSNAAL SCGSVNSSNL AACIGYVLQGTobacco MEIAGKI A C F W L C M W AAP.CAEA.I TCGQVTSN.L APCLAYLRNTTomato MEMVSKI ACFVLLCMW VAP.HAEA.L TCGQVTAG.L APCLPYLQGRSpinach -MASSAVIKL ACAVLLCIW AAP.YAEAGI TCGMVSSK.L APCIGYLKGGBarley MARAAATQLV LVAMVAAMLL VA. ..TDAAI SCGQVSSA.L SPCISYARGNMaize MARTQQLAW ATAWALVLL AAA.TSEAAI SCGQVASA.I APCISYARGQ
E2 — MAFASKII TCLLILTIYI AAP..TESHI TCGTVTS.TM TQCISYLTNG
BNLTPAB/LTPIIBroccoli
gsltplArabidopsis
TobaccoTomatoSpinachBarleyMaize
E2
51 **APALPRACCS APALPRACCS APAVPTACCS GP.LPRGCCT G.VIPPACCS G..PLGRCCG G..PLGGCCG P..LGGGCCG GAKPPVACCS GSGPSAGCCS GP.LPSSCCV
GVTSLNNLARGVTSLNNLARGVTSLNNMARGVTNLNNMARGVKNLNSIAKGVKALVNSARGVKNLLGSAKGIKALNAAAAGVKRLAGAAQGVRSLNNAARAVKSLNQMAQ
TTPDRQQACRTTPDRQQACRTTPDRQQACRTTPDRQQACRTTPDRQQACNTTEDRQIACTTTADRKTACTTTPDRKTACNSTADKQAACRTTADRRAACNTTPDRRQVCE
CLVGAANAFP CLVGAANAFP CLVGAANALP CLVGAANSFP CIQGAARALG CLKSAAGAI. CLKSAANAI. CLKSAANAI. CLKSLATSI. CLKNAAAGV. CLKSAGKEI.
100 LNAARAAG LNAARAAG INVARAAG LNAARAAG
SGLNAGRAAG SGINLGKAAG KGIDLNKAAG KGINYGKAAG KGINMGKVSG SGLNAGNAAS KGLNIDLVAA
BNLTPABLTP/IIBroccoli
gsltplArabidopsis
TobaccoTomatoSpinachBarleyMaize
E2
101LPKACGVNIPLPKACGVNIPLPKACGVNIPLPKACGVNIPIPKACGVNIPLPSTCGVNIPIPSVCKVNIPLPGMCGVHIPVPGKCGVSVPIPSKCGVSIPLPTTCGVSLS
YKISKTTNCNYKISKTTNCNYKISKTTNCNYKISKSTNCNYKISTSTNCKYKISPSTDCSYKISPSTDCSYAISPSTNCNFPISMSTDCNYTISTSTDCSYPIGFNTNCD
127SVK*---S VK* — —SVK*---SVR*——TVR*--KVQ*--TVQ*---AVH*— - KVH*— ~ RVN* ~~~ SISIAV+
BBNLTPBNPRP
MSPRP2
CGTVS GYVAPCIGYLAQGAPAL P RA** * * * *CCSGVTSLNNLARTTPDRQQACRCLV CPIDTLKLGACVDVLGGLIHIGLGGSSAKKECCPVLGGLVDLDAAV* * * * * *CLCTT CSIDALKLGACVDVLGGLIHIGIGGSAKQT*CCPLLQGLVDLDAAI***** * CLCTT
BNLTP GAANAFPTLNAARAAGLPKA*CGVNIPYKISKTTNCNSBNPRP IKAKLLIVDLIIPIALELLIDCGKTPPPGFK* * **CPS
MSPRP2 IRLKLLNINLVIPLALQVLIDCGKTPPEGFK****CPA
ConsensusLTPs ~“C"“ (7”9)““C"“"( 12“ 15)“””“CC“” “(8”I9)” ”“““C“C” “"“(21 -22)———C™—(6-13 —C—PRPs -*C—(9)— C------- ( 19“20)—CC— ( 13)*-------C~C—*— (23 )-----------C— - 9)-----------C-“
I■S
3.8 Analysis of the BNLTP proteinThe BNLTP protein of 118 amino acids was high in alanine content comprising
16% of the protein; 10% of the residues were cysteines, whereas histidine, tryptophan
and glutamine residues were absent from the protein, a feature observed in other LTPs
(0stergaard et ah, 1995). The predicted amino acid sequence of BNLTP was analysed
using the Kyte and Doolittle programme (Kyte and Doolittle, 1982) which measures
the average hydrophobicity of the amino acids (Fig. 3.7). The first 25 amino acids were
extremely hydrophobic and were followed by a region in the middle of the protein that
comprised a high proportion of hydrophilic amino acids. This profile is comparable to
proteins that are either membrane associated or secreted, suggesting the first 25 amino
acids probably represented a signal peptide sequence. Furthermore, BNLTP lacked the
carboxy-terminal H/KDEL endoplasmic reticulum retention signal (Munroe and
Pelham, 1987). Indeed, the sequence conformed to the ‘--3,-1 mle' typical of naturally
occuring cleavage sites (von Heijne, 1988). Generally the -1 and -3 positions
(upstream of the cleavage site) must be small and uncharged residues such as Ala, Gly,
Cys and Thr whereas the -2 position is a large bulky and charged residue. The BNLTP
putative signal peptide cleavage (arrow in Fig. 3.4) had the sequence Ser-Asn-Ala>LAla
where the serine residue was at position -3 and the alanine residue was at position -1.
After removal of the putative signal peptide BNLTP was 100% identical to one of the
three Brassica napus acyl-binding / lipid transfer proteins (AB/LTP II) of 93 amino
acids (Mr of 9408) purified from germinated Brassica napus seedlings by HPLC
(0stergaard et al., 1995) (data not shown). The AB/LTP II protein sequence was
determined by automated Edman degradation of intact proteins and peptides, wliich
suggested that AB/LTP II was purified as the mature protein where the signal peptide
had already been cleaved. Two other LTP isoforms, AB/LTP I and AB/LTP III were
also isolated but were not completely sequenced.
An interesting feature of all LTPs isolated to date (reviewed in Kader, 1996)
including BNLTP, is the spacing between the conserved cysteine residues which is
almost identical to the cysteine residues located at the COOH-terminus of plant cell
wall hybrid proline-rich proteins (hyPRPs). These include the B. napus cv. Bridger
hyPRP, BNPRP, (Goodwin et al., 1996) and the Medicago sativa
91
Fig. 3.7 Hydropathy profile of the deduced BNLTP sequence
The hydropathy value of each amino acid was calculated by the Kyte and
Doolittle (1982) programme. Values above the horizontal line indicate the hydrophobic
regions and values below the horizontal line indicate the hydrophilic regions. The
region marked with SP denotes the putative signal peptide sequence.
9 2
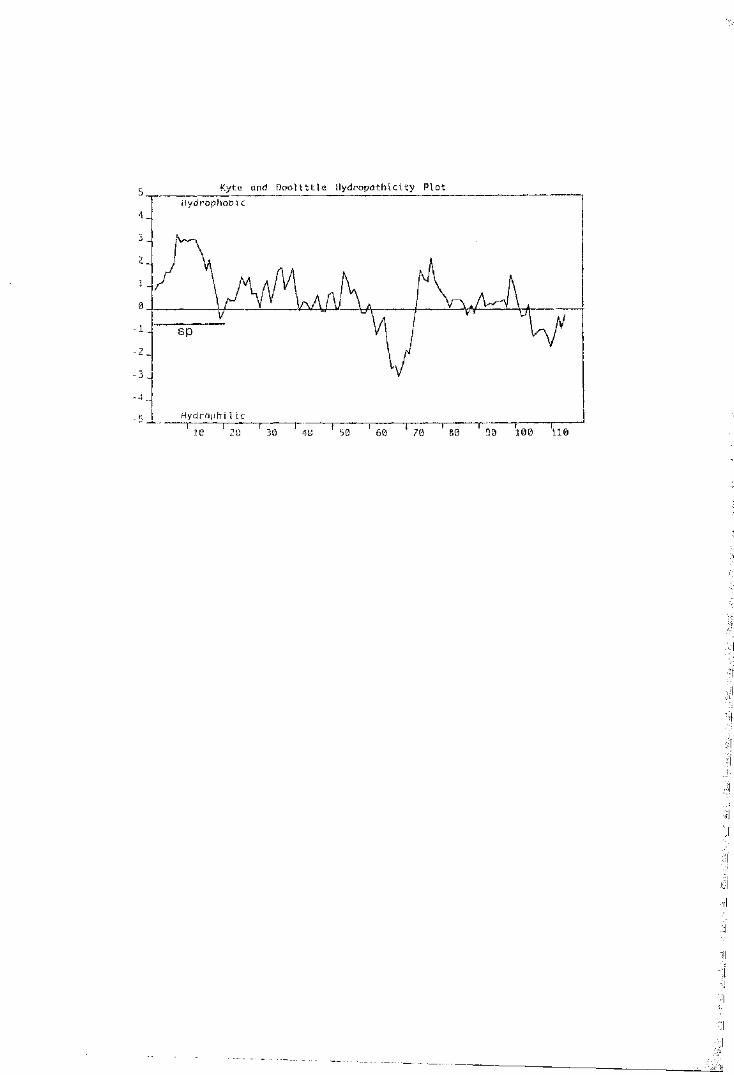
Kyte and D o o lit tle H ydropath icity P lo t
s p
- 3 _
H y d r o p h i I i c
100 110
hyPRP, MsPRP2, (Deutch and Winicov, 1995) shown in Fig. 3.6B. This region of the
PRPs is thought to represent three membrane spanning domains (Goodwin et al.,
1996).
3.9 Comparison of BnLTP with pLF3AThe DNA sequences of pLF3A and BnLTP (p2A7) were compared using the
UWGCG BESTFIT programme (Fig.3.8). The clones were 99% similar over a region
of 241 bp covering nucleotides 38 to 277 of BnLTP (5’-terminus) and nucleotides 136
to 372 of pLF3A, which represented most of the coding regions in both clones. The
previous prediction that pLF3A represented the 5’ terminus of the clone was shown to
be true. The sequence alignment introduced five gaps. Bases 38 to 68 of BnLTP,
which represented the putative untranslated region, aligned with bases 136 to 164 of
pLF3A after the introduction of two gaps in pLF3A. A putative translation start site
was located at position 165 in pLF3A which corresponded to the ATG in BnLTP at
position 69. A single base difference (C to G) is indicated at position 263 of BnLTP.
The 5’ untranslated region represented by bases 7 to 37 of BnLTP diverged
considerably from the putative 5’ untranslated region represented by bases 1 to 135 of
pLF3A (data not shown). These observations demonstrated that BnLTP was closely i
related but not identical to pLF3 A.
3.10 Comparison of BnLTP, p2A4 and p5A9 DNA sequencesThe 3’-untranslated regions of cDNAs BnLTP, p2A4 and p5A9 were aligned
and compared using the UWGCG programm PILEUP (Fig. 3.9). The BnLTP
nucleotide sequence was 93% (10 gaps) and 95% (1 gap) identical to p2A4 and p5A9,
respectively, over a region of 390 bp. The clones differed at several bases indicated by
(*). The partially sequenced coding regions flanking the 3’ untranslated region were
compared for any amino acid differences. Four amino acid substitutions were.observed: an alanine (BNLTP) to serine (p5A9) at amino acid 84 (codon at position
318-320; GCC to TCC), a phenylalanine (BNLTP) to a leucine (p2A4) at amino acid
85 (codon at position 321-323; TTC to TTG), a leucine (BNLTP) to an isoleucine
(p2A4) at amino acid 88 (codon 330-332; CTC to ATC) and an alanine (BNLTP) to a
valine (p2A4) at amino acid 90 (codon 336-338; GCT to GTT). All
9 4
Fig 3.8 Comparison of BnLTP cDNA sequence with pLF3A
The DNA sequences of the cDNA clones pLF3A and BnLTP (shown in bold)
were aligned using the UWGCG program BESTFIT. The clones were 99% identical
over a region of 241 bp. Bases shown in lower case correspond to the 5’ untranslated
region of BnLTP. The putative 5’ untranslated regions corresponding to the first 135
bp of pLF3A and the first 37 bp of BnLTP diverged considerably and therefore were
not aligned. 5 gaps were introduced for the alignment. The putative translational start
sites (ATG) in both clones are underlined.
9 5
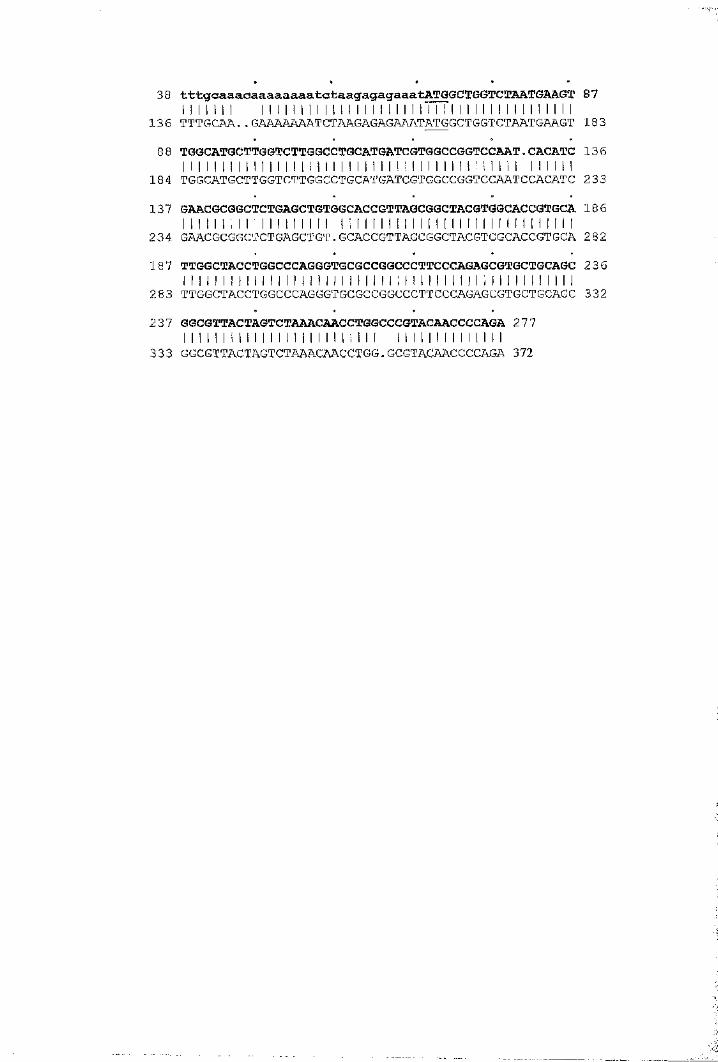
. . . I
38 tttgoaaaaaaaaaaaatctaagagagaaatA T O G C T G G T C T A A T G A A G T 87I I I I I I I I I I I I I I I I ! 1 i I I I I I I I I I M I ! I I I I I ! I M I I I I I I
136 TTTGCAA. . GAAAAAAATCTA?VGAGAGAAATATGGCTGGTCTAATGAA.GT 183
8 8 TGGCATGCTTGGTCTTGGCCTGCATGATCGTGGCCGGTCCAAT. CACATC 1361 1 1 1 1 1 1 1 1 1 1 1 1 1 ! 1 1 i 1 1 1 1 1 I I 1 1 1 1 1 1 1 1 I I i I I i 1 1 I I 1 1 1 1 1 1
184 TGGCATGCTTGGTCTTGGCCTGCATGATCGTGGCCGGTCCAATCCACATC 233
137 GAACGCGGCTCTGAGCTGTGGCACCGTTAGCGGCTACGTGGCACCGTGCA 186I I I I I I t I I I I I I I I I I I I I I I I I I I I I I I I I I I I I I I I I I I I I I I I I I
234 GAACGCGGCTCTGAGCTGT . GCACCGTTAGCGGCTACGTGGCACCGTGCA 282
187 TTGGCTACCTGGCCCAGGGTGCGCCGGCCCTTCCCAGAGCGTGCTGCAGC 236I I ! I I I I I I I I I I I I 1 i l I I I I I I I I I I I I I I I I I I ) i t I I I I I I I I M I
283 TTGGCTACCTGGCCCAGGGTGCGCCGGCCCTTCCCAGAGCGTGCTGCAGC 332
237 GGCGTTACTAGTCTAAACAACCTGGCCCGTACAACCCCAGA 277I I I I I I I I I I I I I I I I I I I I I I I I I I I I I I I I I I I I I I I
333 GGCGTTACTAGTCTAAACAACCTGG. GCGTACAACCCCAGA 372
Fig. 3.9 Sequence comparison of the 3’ ends of BnLTP, p5A9 and p2A4
The partially sequenced 3’ ends of p5A9 and p2A4 were aligned with BnLTP
(p2A7) using the UWGCG PILEUP programme. The amino acid substitutions are
indicated. The putative polyadenylation signal, AAATAA, is underlined and the TGA
stop signal is shown. Base differences are indicated by (*).
9 7
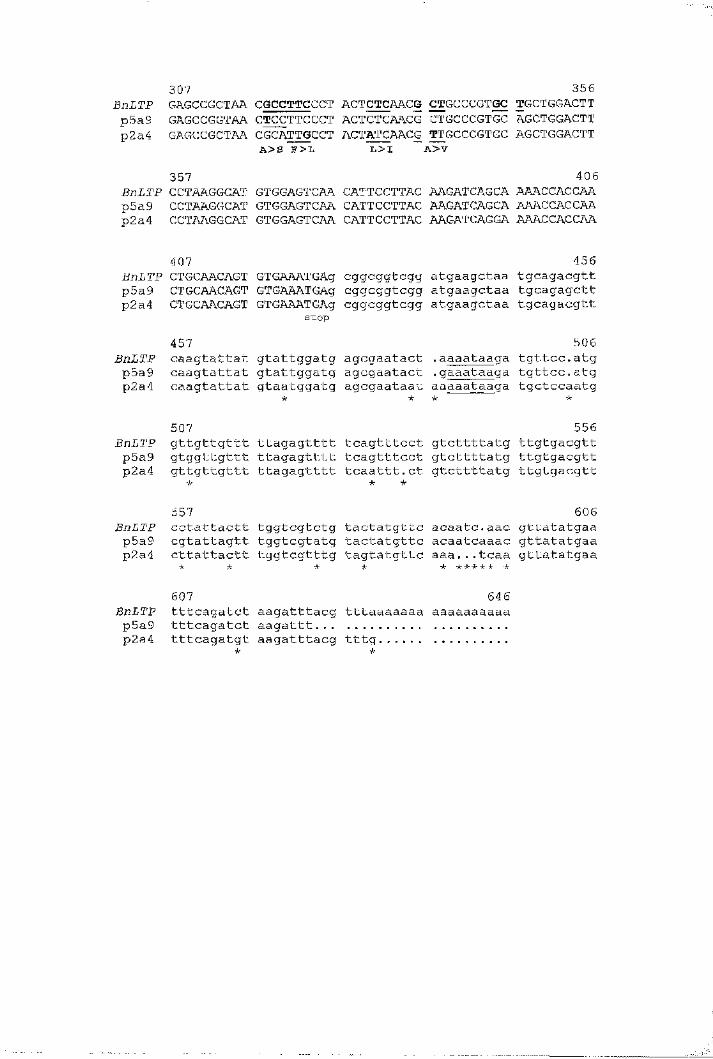
307 356GAGCCGCTAA CGCCTTCCCT ACTCTCAACG CTGCCCGTGC TGCTGGACTTGAGCCGGTAA CTCCTTCCCT ACTCTCAACG CTGCCCGTGC AGCTGGACTT
BnLTP p5a9p2a4 GAGCCGCTAA CGCATTGCCT ACTATCAACG TTGCCCGTGC AGCTGGACTT
A > S F > L L > I A > V
3 5 7 4 0 6BnLTP CCTAAGGCAT GTGGAGTCAA CATTCCTTAC AAGATCAGCA AAACCACCAAp5a9 CCTAAGGCAT GTGGAGTCAA CATTCCTTAC AAGATCAGCA AAACCACCAAp2a4 CCTAAGGCAT GTGGAGTCAA CATTCCTTAC AAGATCAGCA AAACCACCAA
407 456BnLTP CTGCAACAGT GTGAAATGAg cggcggtcgg atgaagctaa tgcagacgttp5a9 CTGCAACAGT GTGAAATGAg cggcggtcgg atgaagctaa tgcagagcttp2a4 CTGCAACAGT GTGAAATGAg cggcggtcgg atgaagctaa tgcagacgtt
s to p
457 506BnLTP caagtattat gtattggatg agcgaatact .aaaataaga tgttcc.atgp5a9 caagtattat gtattggatg agcgaatact .gaaataaga tgttcc.atgp2a4 caagtattat gtaatggatg agcgaataat aaaaataaga tgctccaatg
507 556BnLTP gttgttgttt ttagagtttt tcagtttcct gtcttttatg ttgtgacgttp5a9 gtggttgttt ttagagtttt tcagtttcct gtcttttatg ttgtgacgttp2a4 gttgttgttt ttagagtttt tcaattt.ct gtcttttatg ttgtgacgtt
557 606BnLTP cctattactt tggtcgtctg tactatgttc acaatc.aac gttatatgaap5a9 cgtattagtt tggtcgtatg tactatgttc acaatcaaac gttatatgaap2a4 cttattactt tggtcgtttg tagtatgttc aaa...tcaa gttatatgaa
607 646BnLTP tttcagatct aagatttacg tttaaaaaaa aaaaaaaaaap5a9 tttcagatct aagattt........................p2a4 tttcagatgt aagatttacg tttg................
I
three cDNA used TGA as the putative stop signal. The AAT AAA polyadenylation
signal was located at identical positions in all three clones. Several nucleotide
substitutions and insertions were observed in the 3’ non-coding region (denoted with a
There was not enough sequence overlap between clones p5A9 and p2A4 and
pLF3 A for a reasonable DNA and amino acid sequence comparison. However, in view
of the differences observed between the four cDNAs it is likely that sequences of at
least four of the possible five or six members of the B. napus cv Cobra multigene
family encoding putative non-specific lipid transfer proteins were isolated.
3.11 DiscussionA partial cDNA clone designated pLF3A isolated from a Brassica napus
cDNA library had previously been shown to be expressed specifically in the epidermis
of leaf, stem and floral tissue using in situ hybridisation. The clone lacked a poly (A)
tract and it hybridised to a single transcript of 700 nt. It was therefore thought to
represent the 5’ end of the original full length cDNA. This chapter describes the
isolation and characterisation of a full length cDNA homologous to pLF3A. A
Brassica napus cv. Cobra cDNA library constructed in the Uni-Zap '^ XR vector
(Goodwin et al., 1996) was screened with the partial clone.
A total of 30 positive clones were observed in the primary screen, sixteen of
which were plaque purified following subsequent rounds of screening. PCR of each
clone with the T3/T7 primer pair that flanked the insert in the Uni-Zap '^ XR vector
amplified a fragment ranging from 600 to 700 bp (Fig. 3.1) which was the expected
fragment size based on previous northern blot analysis. In Southern blots of the PCR
products, only four clones hybridised at high stringency to pLF3A (Fig. 3,2) which
suggested some of the PCR products were either artefactual or represented fragments
with less homology to pLF3A. However, a 600-650 bp fiagment was produced in nine
clones following Eco RI and Xho I digestion of the in vivo excised Uni-Zap '^ XR
vector including those that did not hybridise to pLF3A in Southern blots (Fig. 3.3).
Sequence analysis with T7 revealed a characteristic poly (A) tract in all nine
clones which suggested that expressed genes were isolated. By using a combination of
manual sequencing using the dideoxynucleotide chain termination method of Sanger et
9 9
___
al. (1977) and the Hot Tub Sequencing method which enabled sequencing of regions
with compression zones, one clone p2A7 was fully sequenced (Fig. 3.4).
The 651 bp cDNA contained one putative open reading, of 118 amino acids
with an ATG start site at position 69 in the consensus sequence AAAC/ATG/GC
(Joshi, 1987) and a stop signal (TGA) at position 423. The length of the V
untranslated region prior to the first adenine of the poly (A) tail was 201 bp. A putative
polyadenlyation signal AAATAA, was present, which is the same as that found in both
animal and viral pre-mRNAs (Nevins, 1983). Comparison of the deduced protein
sequences with others in the database indicated that p2A7 encoded a putative non
specific lipid transfer protein and was designated a Brassica napus /ipid /ransfer
protein, BNLTP (Fig. 3.6A).
Lipid transfer proteins were first defined by their ability to facilitate the transfer
of phospholipids between membranes in vitro (Kader, 1975). However, an in vivo
function has not been assigned. BNLTP was high in alanine residues (16%), and 10%
of the residues were cysteines; it lacked tryptophan, histidine and glutamine residues
which was similar to other LTPs (0stergaard et al., 1995). A Kyte-Doolittle
hydropathy profile of the protein sequence indicated that the first 25 amino acids were
highly hydrophobic and had characteristics of a signal peptide sequence (von Heijne,
I
1988). Signal peptides are typically 15 to 30 amino acids in length and generally have.three distinct regions, the first, n-region, is typically 1 to 20 amino acids in length with
a net positive charge (von Heijne, 1988). The next region (h-region) is rich in apolar■; ;■
residues such as Phe, He, Leu, Met, Val and Trp and generally ranges from 7 to 16
amino acids in length (von Heijne, 1988). The final c-region which is close to the
cleavage site has a distinct pattern of amino acids. Nearly all cleavage sites follow the -
3,-1 rule where the -1 and -3 regions are small uncharged amino acids and the -2'
region is characterised by a large, bulky, charged ammo acid. The putative BNLTP
signal sequence confonned to this rule; the -3, -2 and -1 residues were Ser-Asn-Aa,
respectively. Furthermore, the protein lacked the carboxy-terminal K/HDEL sequence
associated with proteins retained in the lumen of the endoplasmic reticulum (Munroe
and Pelham, 1987). The hydropathy profile of BNLTP was similar to the carrot LTP,
EP2 (Sterk et al., 1991), Arabidopsis LTPl (Thoma et al., 1995) and broccoli LTP
(Pyee and Kolattukudy, 1995) all of which are located extracellularly (Fig. 3.6A).
.. 'S i
'I1 0 0
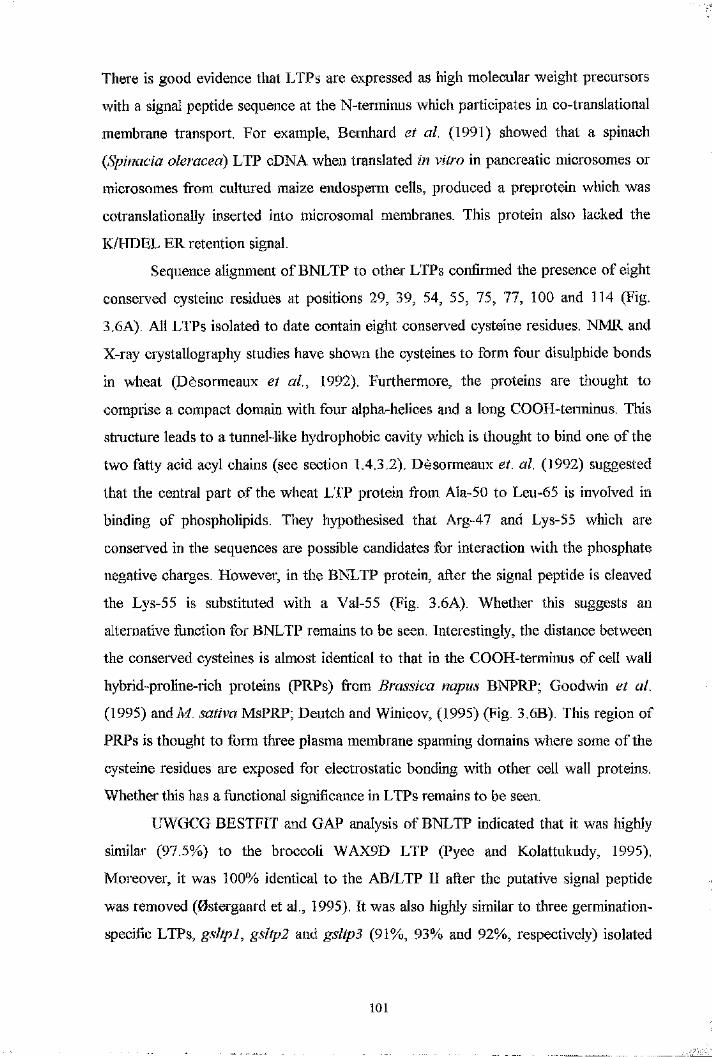
1
There is good evidence that LTPs are expressed as high molecular weight precursors
with a signal peptide sequence at the N-terminus which participates in co-translational
membrane transport. For example, Bernhard et al. (1991) showed that a spinach
(Spinacia oleracea) LTP cDNA when translated in vitro in pancreatic microsomes or
microsomes from cultured maize endosperm cells, produced a preprotein which was
cotranslationally inserted into microsomal membranes. This protein also lacked the
K/HDEL ER retention signal.
Sequence alignment of BNLTP to other LTPs confirmed the presence of eight
conserved cysteine residues at positions 29, 39, 54, 55, 75, 77, 100 and 114 (Fig.
3.6A). A l LTPs isolated to date contain eight conserved cysteine residues. NMR and
X-ray crystallography studies have shown the cysteines to form four disulphide bonds
in wheat (Dèsormeaux et al., 1992). Furthermore, the proteins are thought to
comprise a compact domain with four alpha-helices and a long COOH-terminus. This
structure leads to a tunnel-like hydrophobic cavity which is thought to bind one of the
two fatty acid acyl chains (see section 1.4.3.2). Dèsormeaux et. al. (1992) suggested
that the central part of the wheat LTP protein from Aa-50 to Leu-65 is involved in
binding of phospholipids. They hypothesised that Arg-47 and Lys-55 which are.conserved in the sequences are possible candidates for interaction with the phosphate
.negative charges. However, in the BNLTP protein, after the signal peptide is cleaved
the Lys-55 is substituted with a Val-55 (Fig. 3.6A). Whether this suggests an
alternative function for BNLTP remains to be seen. Interestingly, the distance between
the conseiwed cysteines is almost identical to that in the COOH-terminus of cell wall
hybrid-proline-rich proteins (PRPs) from Brassica napus BNPRP; Goodwin et al.
(1995) and M. sativa MsPRP; Deutch and Winicov, (1995) (Fig. 3.6B). Tliis region of
PRPs is thought to form three plasma membrane spanning domains where some of the
cysteine residues are exposed for electrostatic bonding with other cell wall proteins.
Whether this has a fimctional significance in LTPs remains to be seen.
UWGCG BESTFIT and GAP analysis of BNLTP indicated that it was highly
similar (97.5%) to the broccoli WAX9D LTP (Pyee and Kolattukudy, 1995)..Moreover, it was 100% identical to the AB/LTP II after the putative signal peptide
was removed (0stergaard et al., 1995). It was also highly similar to three germination- "specific LTPs, gsltpl, gsltp2 and gsltp3 (91%, 93% and 92%, respectively) isolated
Ls
1 0 1
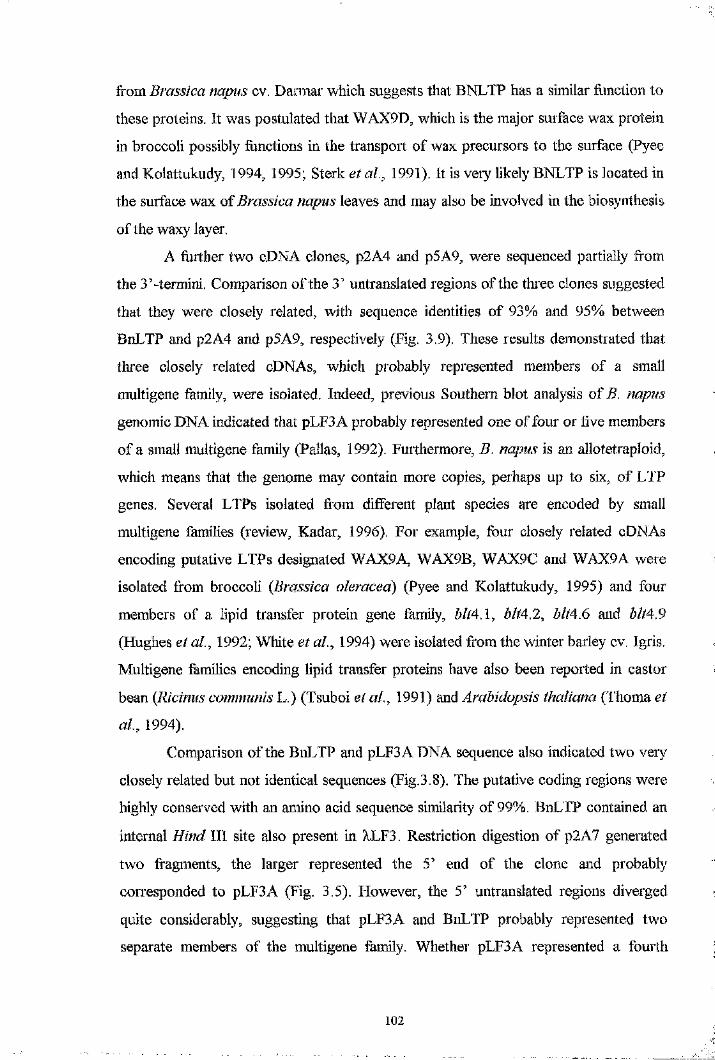
from Brassica napus cv. Darmar which suggests that BNLTP has a similar function to
these proteins. It was postulated that WAX9D, which is the major surface wax protein
in broccoli possibly fimctions in the transport of wax precursors to the surface (Pyee
and Kolattukudy, 1994, 1995; Sterk et a l, 1991). It is very likely BNLTP is located in
the surface wax of Brassica napus leaves and may also be involved in the biosynthesis
of the waxy layer.
A further two cDNA clones, p2A4 and p5A9, were sequenced partially from
the 3’-termini. Comparison of the 3’ untranslated regions of the three clones suggested
that they were closely related, with sequence identities of 93% and 95% between
BnLTP and p2A4 and p5A9, respectively (Fig. 3.9). These results demonstrated that
three closely related cDNAs, which probably represented members of a small
multigene family, were isolated. Indeed, previous Southern blot analysis of B. napus
genomic DNA indicated that pLF3 A probably represented one of four or five members
of a small multigene family (Pallas, 1992). Furthermore, B. napus is an allotetraploid,
which means that the genome may contain more copies, perhaps up to six, of LTP
genes. Several LTPs isolated fi'om different plant species are encoded by small
multigene families (review, Kadar, 1996). For example, four closely related cDNAs
encoding putative LTPs designated WAX9A, WAX9B, WAX9C and WAX9A were
isolated from broccoli {Brassica oleracea) (Pyee and Kolattukudy, 1995) and four
members of a lipid transfer protein gene family, blt4.l, blt42, blt4.6 and blt4.9
(Hughes et a l, 1992; White et a l, 1994) were isolated from the winter barley cv. Igris.
Multigene families encoding lipid transfer proteins have also been reported in castor5' :
bean {Ricinus communis L.) (Tsuboi et a l, 1991) and Arabidopsis thaliana (Thoma et
a l, 1994).
Comparison of the BnLTP and pLF3A DNA sequence also indicated two very
closely related but not identical sequences (Fig.3.8). The putative coding regions were
highly conserved with an amino acid sequence similarity of 99%. BnLTP contained an
internal Hind III site also present in ZLF3. Restriction digestion of p2A7 generated
two fragments, the larger represented the 5’ end of the clone and probably
corresponded to pLF3A (Fig. 3.5). However, the 5’ untranslated regions diverged
quite considerably, suggesting that pLF3A and BnLTP probably represented two
separate members of the multigene family. Whether pLF3A represented a fourth
1 0 2
3

member was not possible to determine with certainty, as sufficient overlap between
p2A4 and p5A9 with pLF3 A sequences was not achieved.
103
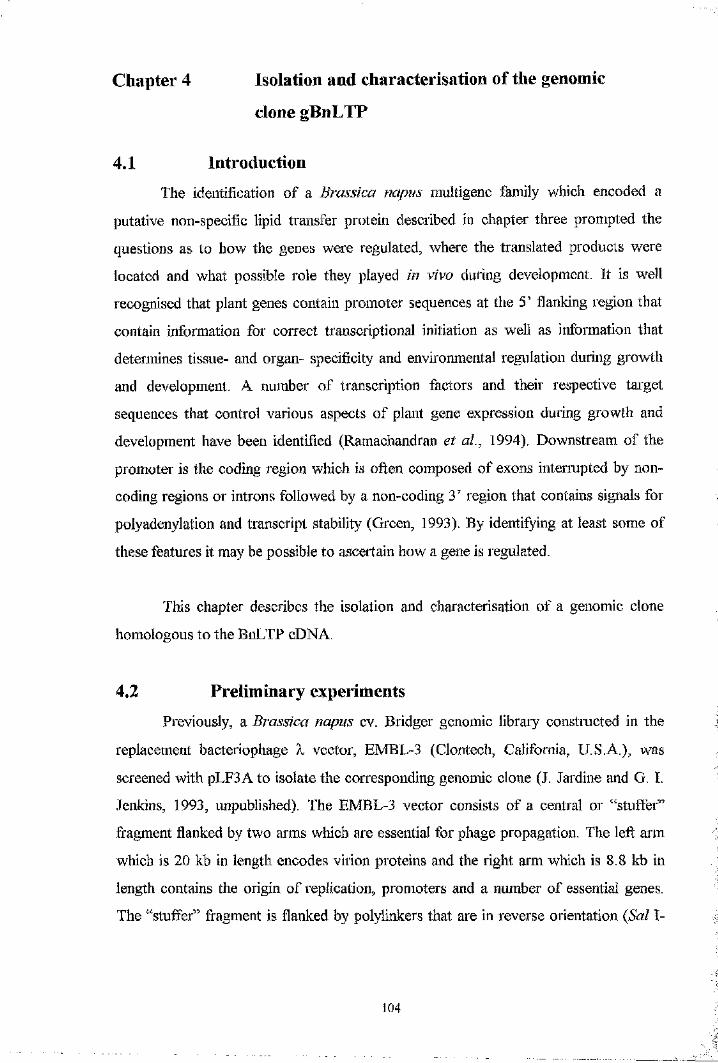
Chapter 4 Isolation and characterisation of the genomic
clone gBnLTP
4.1 IntroductionThe identification of a Brassica napus multigene family which encoded a
putative non-specific lipid transfer protein described in chapter three prompted the
questions as to how the genes were regulated, where the translated products were
located and what possible role they played in vivo during development. It is well
recognised that plant genes contain promoter sequences at the 5’ flanking region that
contain information for correct transcriptional initiation as well as information that
determines tissue- and organ- specificity and environmental regulation during growth
and development. A number of transcription factors and their respective target
sequences that control various aspects of plant gene expression during growth and
development have been identified (Ramachandran et a l, 1994), Downstream of the
promoter is the coding region which is often composed of exons interrupted by non
coding regions or introns followed by a non-coding V region that contains signals for
poly adénylation and transcript stability (Green, 1993). By identifying at least some of
these features it may be possible to ascertain how a gene is regulated.
This chapter describes the isolation and characterisation of a genomic clone
homologous to the BnLTP cDNA.
4.2 Preliminary experimentsPreviously, a Brassica napus cv. Bridger genomic library constructed in the
replacement bacteriophage X vector, EMBL-3 (Clontech, California, U.S.A.), was
screened with pLF3 A to isolate the corresponding genomic clone (J. Jardine and G. I.
Jenkins, 1993, unpublished). The EMBL-3 vector consists of a central or “stuffer”
fragment flanked by two arms which are essential for phage propagation. The left arm
which is 20 kb in length encodes virion proteins and the right arm which is 8.8 kb in
length contains the origin of replication, promoters and a number of essential genes.
The “stufiFer” fiagment is flanked by polylinkers that are in reverse orientation (Sal I-
104
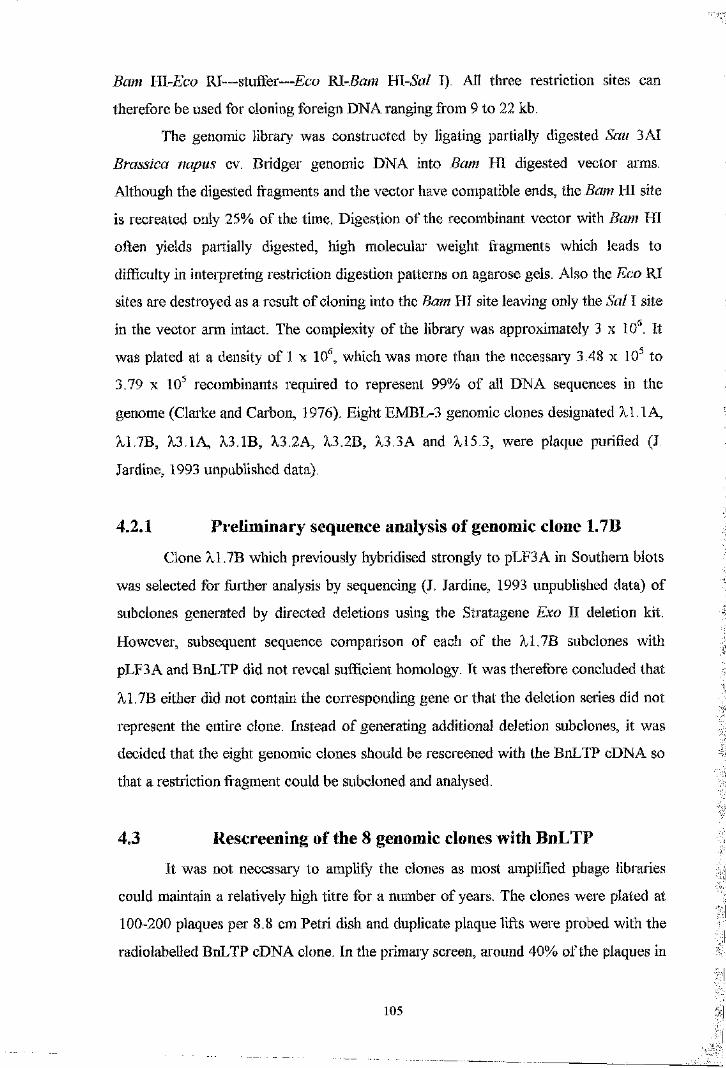
Bam HI-Eco RI—stuffer—Eco ^ -B a m HI-5d/ I). All three restriction sites can
therefore be used for cloning foreign DNA ranging from 9 to 22 kb.
The genomic library was constructed by ligating partially digested Sau 3 AI
Brassica napus cv. Bridger genomic DNA into Bam HI digested vector arms.
Although the digested fragments and the vector have compatible ends, the Bam HI site
is recreated only 25% of the time. Digestion of the recombinant vector with Bam HI
often yields partially digested, high molecular weight fragments which leads to
difficulty in interpreting restriction digestion patterns on agarose gels. Also the Eco RI
sites are destroyed as a result of cloning into the Bam HI site leaving only the Sal I site
in the vector arm intact. The complexity of the library was approximately 3x10^. It
was plated at a density of 1 x 10 , which was more than the necessary 3.48 x 10 to
3.79 X 10 recombinants required to represent 99% of all DNA sequences in the
genome (Clarke and Carbon, 1976). Eight EMBL-3 genomic clones designated Àl.lAi,
11.7B, 13.1 A, 13.IB, 13.2A, 13.2B, 13.3A and 115.3, were plaque purified (J.
Jardine, 1993 unpublished data).
4.2.1 Preliminary sequence analysis of genomic clone 1.7BClone 11.7B which previously hybridised strongly to pLF3A in Southern blots
was selected for further analysis by sequencing (J. Jardine, 1993 unpublished data) of
subclones generated by directed deletions using the Stratagene Exo II deletion kit.
However, subsequent sequence comparison of each of the 11.7B subclones with
pLF3A and BnLTP did not reveal sufficient homology. It was therefore concluded that
11.7B either did not contain the corresponding gene or that the deletion series did not
represent the entire clone. Instead of generating additional deletion subclones, it was
decided that the eight genomic clones should be rescreened with the BnLTP cDNA so
that a restriction fragment could be subcloned and analysed.
4.3 Rescreening of the 8 genomic clones with BnLTPIt was not necessary to amplify the clones as most amplified phage libraries
could maintain a relatively high titre for a number of years. The clones were plated at
100-200 plaques per 8.8 cm Petri dish and duplicate plaque lifts were probed with the
radiolabelled BnLTP cDNA clone. In the primary screen, around 40% of the plaques in
105
each case were positive. A second and final round of screening at a lower plaque
density (approximately 50 plaques per 8.8 cm Petri dish) was carried out and plaque
purity was achieved. Individual plaques were picked at random, placed into SM/CCh^
buffer and allowed to diffuse overnight at 4°C. The resuspended phage was titred and
plated at 10 p.f.u./ml to isolate phage DNA (described in section 2.23).
4.4 Restriction digestion and Southern blot analysis of
the genomic clonesTen micrograms of phage DNA isolated from each genomic clone was digested
with Eco RI, Bam HI and Sal I. The fragments were resolved on a 0.8% (w/v) agarose
gel along with DNA size markers (data not shown). As expected, Bam HI digestion
yielded very large fragments that did not resolve efficiently in low percentage agarose
and it was therefore difficult to estimate the size of the fragments (data not shown).
However, Sal I digestion of each clone yielded thi'ee fragments ranging from
approximately 10 to 30 kb. Eco RI digestion on the other hand proved to be the most
informative enzyme as fragments ranging from 0.5 kb to 30 kb were generated. The
Eco RI restricted fragments were Southern blotted onto Hybond N+ and hybridised to
the radiolabelled BnLTP cDNA probe (Fig. 4.1).
Clones À1.7B and 13.3A had an identical restriction pattern. A 2.8 kb Eco RI
fragment and a larger fragment which co-migrated with the 20 kb lambda arm strongly
hybridised to the probe as did clones 13.2A and 13.2B which generated a single Eco
RI fragment of 4.8 kb which hybridised strongly to the BnLTP cDNA probe. Clone
115.3 also yielded a 4.8 kb Eco RI restriction fragment but it hybridised at a much
lower intensity. Another band which co-migrated in the 20-30 kb range was also
observed which probably represented an incompletely digested fragment from which
the 4.8 kb fragment was derived. Conversely, clones 13.2A and 13.2B were digested
to completion and so did not contain the larger 20-30 kb fragments. Clones 11.1 A,
13.1 A and 13.IB were also partially digested and yielded a band in the 20-30 kb
region, which hybridised strongly to the cDNA probe.
1 0 6
Fig. 4.1 Southern blot analysis of Eco RI digested genomic clones
DNA was isolated from the eight plaque-purified genomic clones and 10 pg
was digested with Eco RI. The restriction fragments were resolved on a 0.8% (w/v)
TAE agarose gel. Southern blotted onto Hybond N+ and hybridised to ^^P-
radioactively labelled BnLTP. The blots were hybridised and washed as described
previously in sections 2.19.3 and 2.19.4.
The lanes containing the clones, 11.1 A, 11.7B, 13.1 A, 13.IB, 13.2A, 13.2B, 13.3A
and 115.3 are labelled accordingly. The 4.8 kb Eco RI restriction fragment which
hybridised to the cDNA probe is indicated.
107
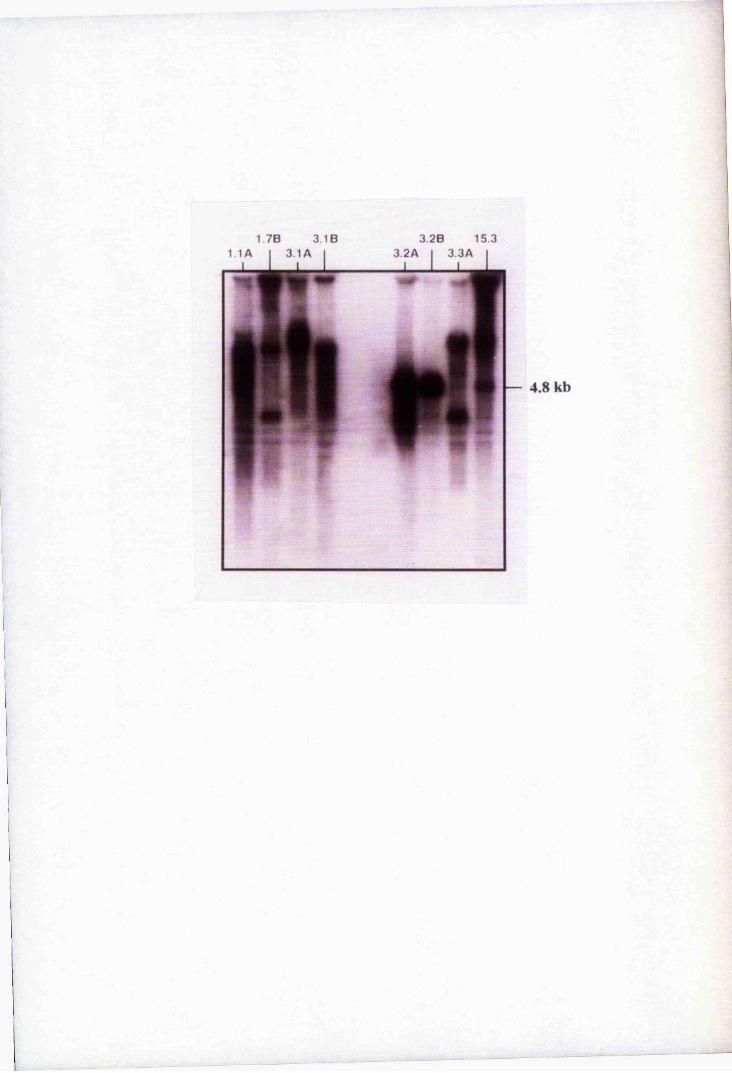
3 2 8 15 .33 .2 A I 3 .3 A
4.8 kb
4.5 PCR of genomic clones using primers 1689/1919To determine whether the genomic clones contained the full length or part of
the cDNA sequence, PCR reactions were performed with primers designed from the
BnLTP DNA sequence (shown in Fig.3.4). The upstream primer (forward), 1689, is
located in the 5’ coding region (nucleotides 97 to 115) and the downstream (reverse)
primer, 1919, is located in 3’ non-coding region (nucleotides 444 to 455) of the
cDNA. Positive controls were also set up; one containing the BnLTP cDNA template
cloned into pBluescript® II SK (-) (p2A7) along with primer pairs 1919/1689 and
T3/T7. The expected PCR products of the latter two reactions were 359 bp and 769
bp, respectively. The T3/T7 amplified fragment included an extra 138 bp of the vector
sequence where the primers hybridised 84 bp and 42 bp upstream of the Eco RI and
Xho I sites, respectively. The PCR conditions were dénaturation at 95°C for 1 min,
annealing at 55‘’C for 2 min, extension at IT C for 3 min, cycled 30 times. A further
extension at 72°C for 7.5 min was included. The amplified products were resolved on a
1.2% (w/v) agarose gel along with 1 kb molecular weight markers (Fig 4.2).
Two genomic clones, A,3.2A and ?il5.3 were positive. Both amplified a single
fragment of 650 bp. As expected the 359 bp and 769 bp Fragments were amplified in
reactions containing the BnLTP cDNA template. The intensity of the 359 bp fragment
was relatively low compared to the 650 bp and 769 bp fragments possibly due to non-
optimal PCR conditions. The amplification of a 650 bp fragment in the reactions
containing the genomic clones À3.2A and 115.3 with primer pair 1689/1919 compared
to the 359 bp fiagment produced in the amplification of the cDNA clone suggested
either non-specific annealing or a sequence insertion in the genomic clone of
approximately 200 bp. The remaining six genomic clones, 11.1 A. 11.7B, 13.1 A,
13. IB, 13.2B and 13.3 A were negative.
4.6 Restriction mapping of clone X3.2ABased on Southern blot and PCR analyses, 13.2A was characterised further. A
restriction map was generated based on restriction digestion with Eco RI, Sal I and
Bam HI. Digests in each case were terminated at 1 min, 10 min, 30 min, 1 h and 2 h
time points to generate an array of partial and complete digest fragments (Fig. 4.3A).
109
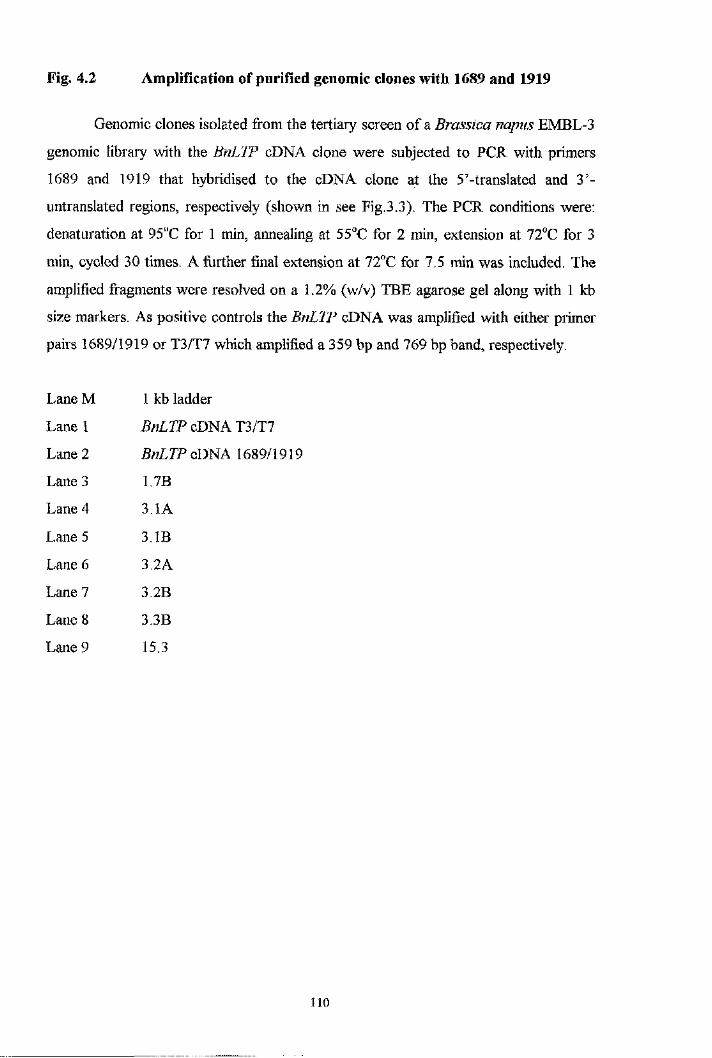
Fig, 4.2 Amplification of purified genomic clones with 1689 and 1919
Genomic clones isolated from the tertiary screen of a Brassica napus EMBL-3
genomic library with the BnLTP cDNA clone were subjected to PCR with primers
1689 and 1919 that hybridised to the cDNA clone at the 5’-translated and 3’-
untranslated regions, respectively (shown in see Fig.3.3). The PCR conditions were:
dénaturation at 95“C for 1 min, annealing at 55°C for 2 min, extension at 72”C for 3
min, cycled 30 times. A further final extension at 72”C for 7.5 min was included. The
amplified fragments were resolved on a 1.2% (w/v) TBE agarose gel along with 1 kb
size markers. As positive controls the BnLTP cDNA was amplified with either primer
pairs 1689/1919 or T3/T7 which amplified a 359 bp and 769 bp band, respectively.
Lane M 1 kb ladder
Lane 1 BnLTP cDNA T3/T7
Lane 2 BnLTP cDNA 1689/1919
Lane 3 1.7B
Lane 4 3.1 A
Lane 5 3.IB
Lane 6 3.2A
Lane 7 3.2B
Lane 8 3.3B
Lane 9 15.3
1 1 0
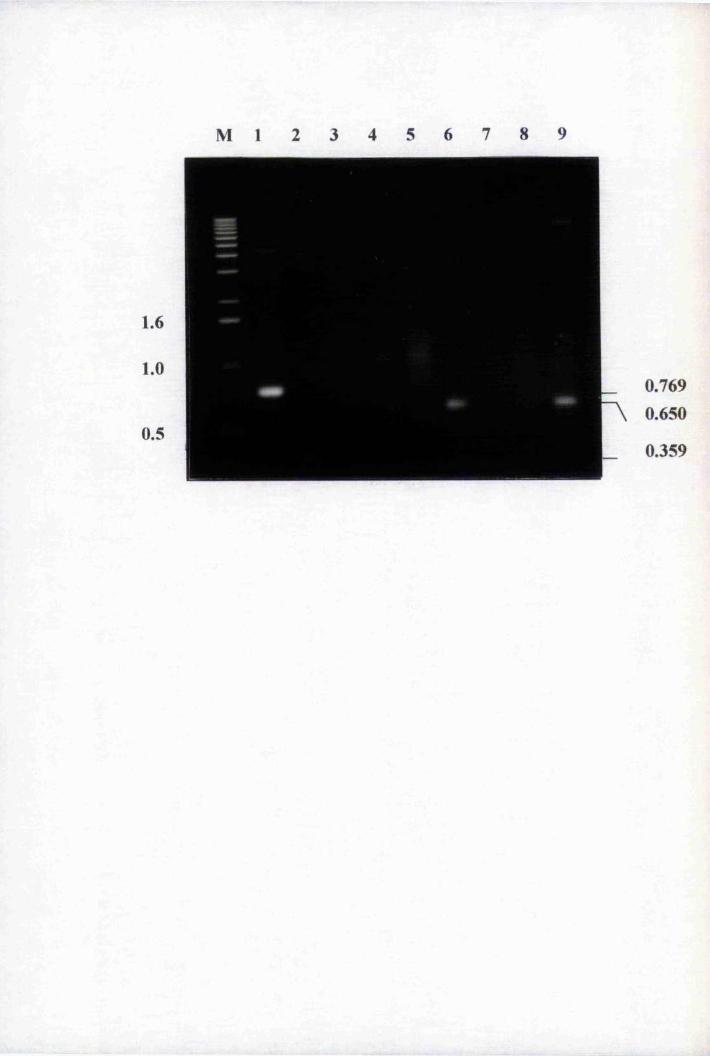
M 1 2 3 4 5 6 7 8 9
1.6
1.0
0. 5
0.7690.650
0.359
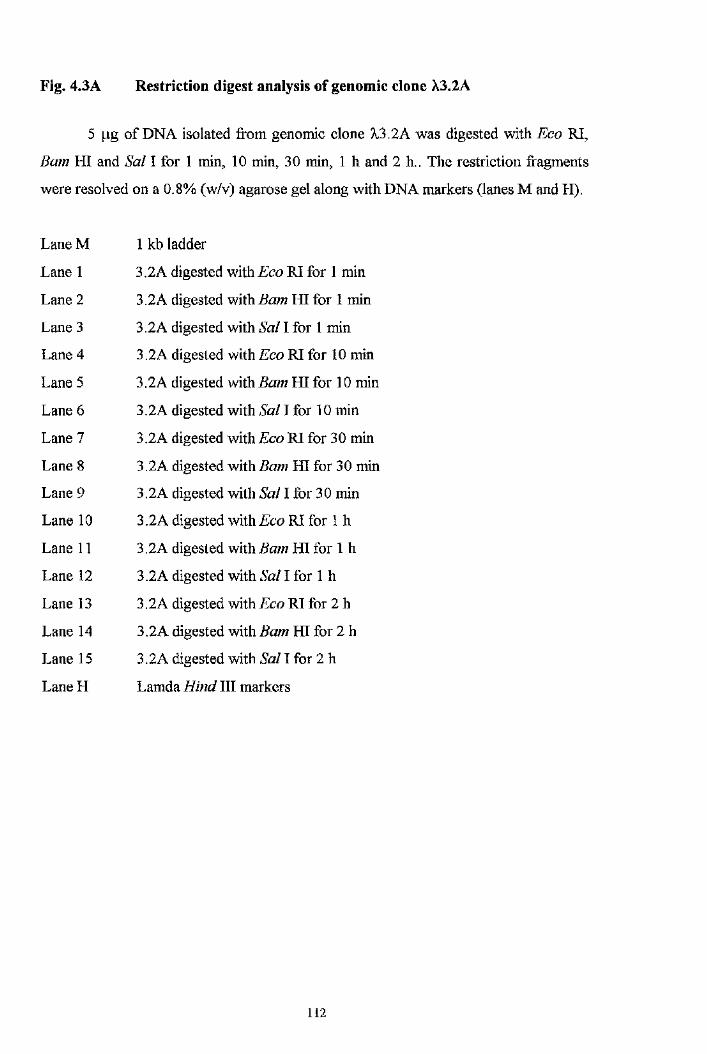
Fig. 4.3A Restriction digest analysis of genomic clone X3.2A
5 pg of DNA isolated from genomic clone X3.2A was digested with Eco RI,
Bam HI and Sal I for 1 min, 10 min, 30 min, 1 h and 2 h.. The restriction fragments
were resolved on a 0.8% (w/v) agarose gel along with DNA markers (lanes M and H).
Lane M 1 kb ladder
Lane 1 3.2A digested with Eco RI for 1 min
Lane 2 3.2A digested WxXhBam HI for 1 min
Lane 3 3.2A digested with Sal I for 1 min
Lane 4 3.2A digested with Eco RI for 10 min
Lane 5 3.2A digested with Bam HI for 10 min
Lane 6 3.2A digested with Sal I for 10 min
Lane 7 3.2A digested with Eco RI for 30 min
Lane 8 3.2A digested with Bam HE for 30 min
Lane 9 3.2A digested with Sal I for 30 min
Lane 10 3.2A digested with Eco RI for 1 h
Lane 11 3.2A digested with Bam HE for 1 h
Lane 12 3.2A digested with Sal I for 1 h
Lane 13 3.2A digested with Eco RI for 2 h
Lane 14 3.2A digested with Bam HI for 2 h
Lane 15 3.2A digested with Sal I for 2 h
Lane H Lamda Hind III markers
1 1 2
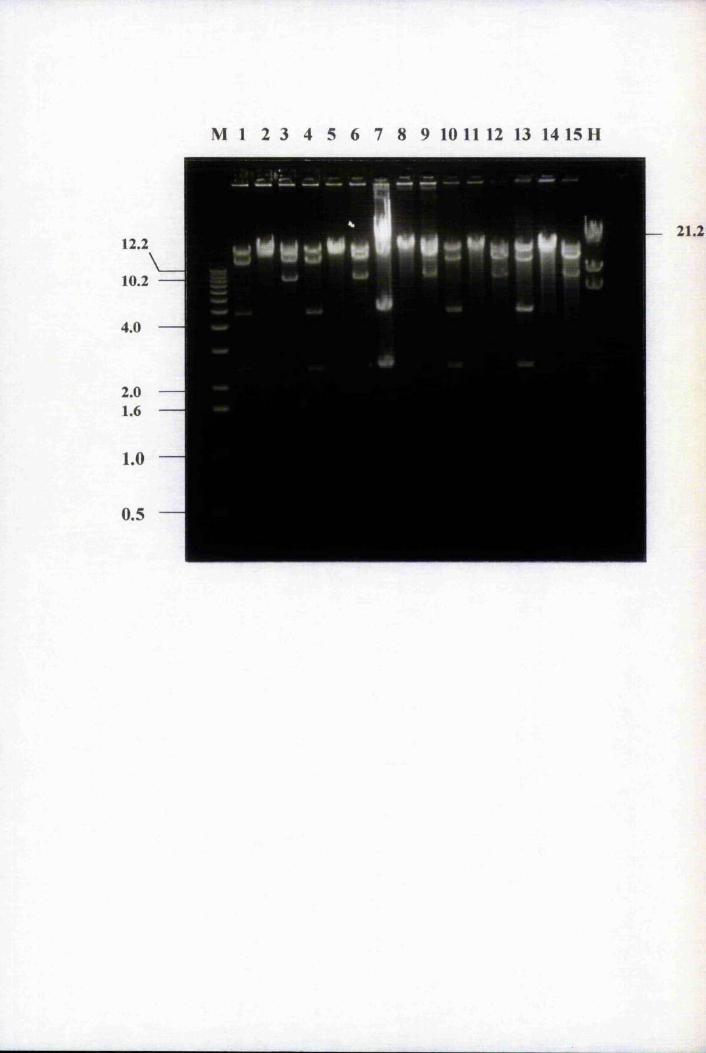
2.01.6
1.0
0.5
M l 2 3 4 5 6 7 8 9 10 11 12 13 14 15 H
12.2>
10.2
4.0
V21.2
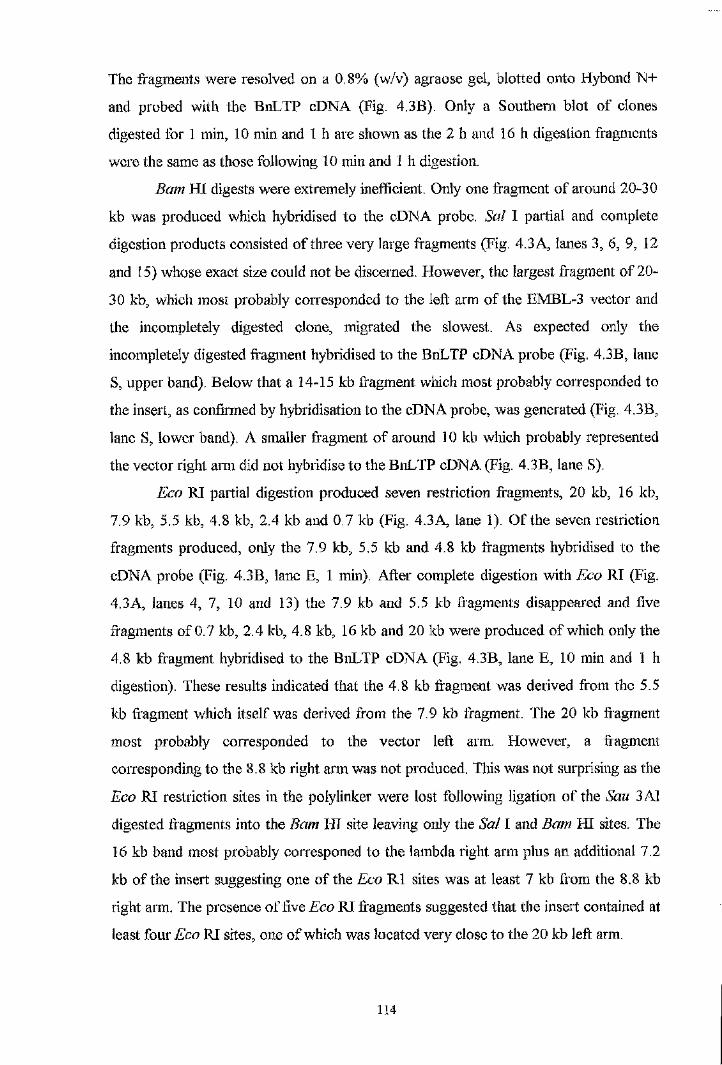
The fragments were resolved on a 0.8% (w/v) agraose gel, blotted onto Hybond N+
and probed with the BnLTP cDNA (Fig. 4.3B). Only a Southern blot of clones
digested for 1 min, 10 min and 1 h are shown as the 2 h and 16 h digestion fragments
were the same as those following 10 min and 1 h digestion.
Bam HI digests were extremely inefficient. Only one fragment of around 20-30
kb was produced which hybridised to the cDNA probe. Sal I partial and complete
digestion products consisted of three very large fragments (Fig. 4.3 A, lanes 3 ,6 ,9 , 12
and 15) whose exact size could not be discerned. However, the largest fragment of 20-
30 kb, which most probably corresponded to the left arm of the EMBL-3 vector and
the incompletely digested clone, migrated the slowest. As expected only the
incompletely digested fr agment hybridised to the BnLTP cDNA probe (Fig. 4.3B, lane
S, upper band). Below that a 14-15 kb fragment which most probably corresponded to
the insert, as confirmed by hybridisation to the cDNA probe, was generated (Fig. 4.3B,
lane S, lower band). A smaller fragment of around 10 kb which probably represented
the vector right arm did not hybridise to the BnLTP cDNA (Fig. 4.3B, lane S).
Eco RI partial digestion produced seven restriction fragments, 20 kb, 16 kb,
7.9 kb, 5.5 kb, 4.8 kb, 2.4 kb and 0.7 kb (Fig. 4.3A, lane 1). Of the seven restriction
fragments produced, only the 7.9 kb, 5.5 kb and 4.8 kb fragments hybridised to the
cDNA probe (Fig. 4.3B, lane E, 1 min). After complete digestion with Eco RI (Fig.
4.3A, lanes 4, 7, 10 and 13) the 7.9 kb and 5.5 kb fragments disappeared and five
fragments of 0.7 kb, 2.4 kb, 4.8 kb, 16 kb and 20 kb were produced of which only the
4.8 kb fragment hybridised to the BnLTP cDNA (Fig. 4.3B, lane E, 10 min and 1 h
digestion). These results indicated that the 4.8 kb fragment was derived from the 5.5
kb fragment which itself was derived from the 7.9 kb fragment. The 20 kb fragment
most probably corresponded to the vector left arm. However, a fragment
corresponding to the 8.8 kb right arm was not produced. This was not surprising as the
Eco RI restriction sites in the polylinker were lost following ligation of the Sau 3 AI
digested fragments into the Bam HI site leaving only the Sal I and Bam HE sites. The
16 kb band most probably corresponed to the lambda right arm plus an additional 7.2
kb of the insert suggesting one of the Eco RI sites was at least 7 kb from the 8.8 kb
right arm. The presence of five Eco RI fragments suggested that the insert contained at
least four Eco RI sites, one of which was located vei*y close to the 20 kb left arm.
114
Fig. 4.3B Southern blot analysis of done X3.2A
5 pg of DNA isolated from clone X3.2A was digested with Eco RI (E), Bam
HI (B) or Sal I (S) for the appropriate time period, resolved on a 0.8% (w/v) agarose
gel and blotted onto nylon filters. The fragments were hybridised to ^^P-radioactively
labelled BnLTP cDNA. The blots were hybridised and washed as described previously
in sections 2.19.3 and 2.19.4. The partially digested 7.9 kb and 5.5 kb Eco RI
fragments are indicated. The 4.8 kb Eco RI fragment was subcloned into pBluescript®
II SK (-) (see Fig. 4.6).
115
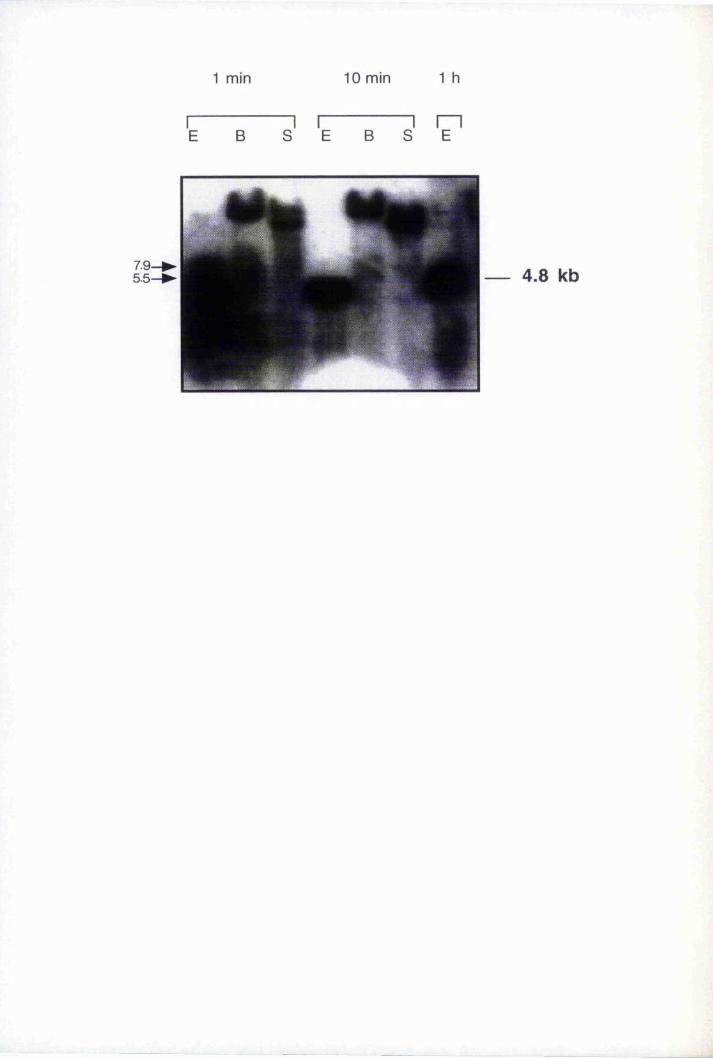
1 min 10 min 1 h
E B S E B S E
7.9-5.5- 4.8 kb
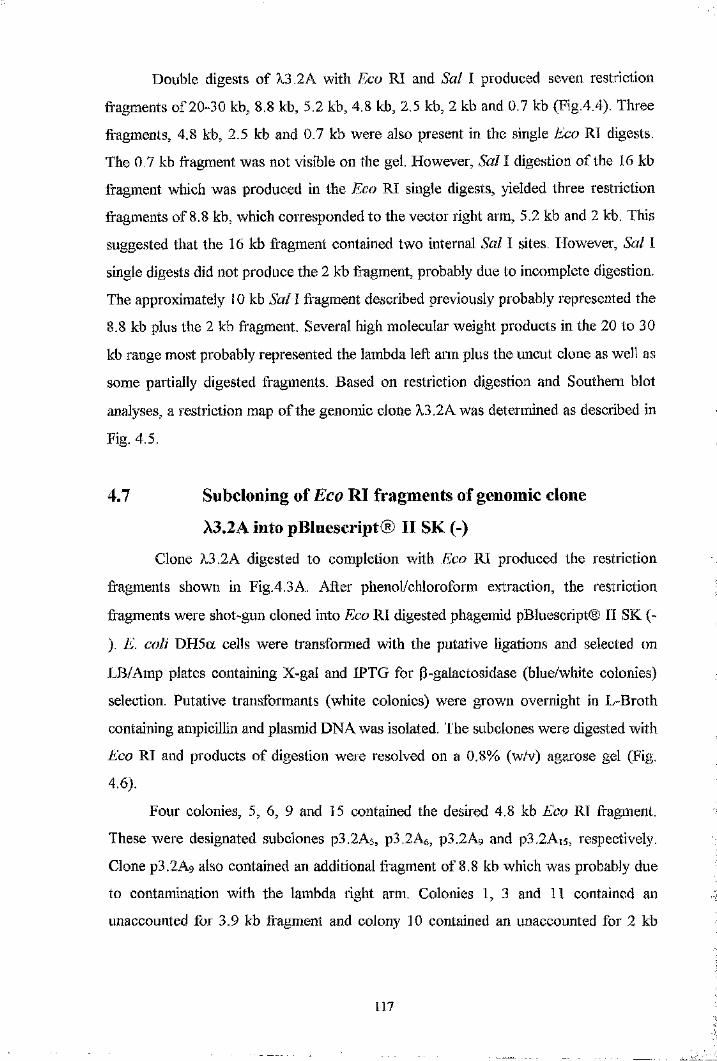
Double digests of X3.2A with Eco RI and Sal I produced seven restriction
fragments of 20-30 kb, 8.8 kb, 5.2 kb, 4.8 kb, 2.5 kb, 2 kb and 0.7 kb (Fig.4.4). Three
fragments, 4.8 kb, 2.5 kb and 0.7 kb were also present in the single Eco RI digests.
The 0.7 kb fragment was not visible on the gel. However, Sal I digestion of the 16 kb
fragment which was produced in the Eco RI single digests, yielded three restriction
fragments of 8.8 kb, which corresponded to the vector right arm, 5.2 kb and 2 kb. This
suggested that the 16 kb fragment contained two internal Sal I sites. However, Sal I
single digests did not produce the 2 kb fragment, probably due to incomplete digestion.
The approximately 10 kb Sal I fragment described previously probably represented the
8.8 kb plus the 2 kb fragment. Several high molecular weight products in the 20 to 30
kb range most probably represented the lambda left arm plus the uncut clone as well as
some partially digested fragments. Based on restriction digestion and Southern blot
analyses, a restriction map of the genomic clone X3.2A was determined as described in
Fig. 4.5.
4.7 Subcloning of Eco RI fragments of genomic clone
A3.2A into pBluescript® II SK (-)Clone X3.2A digested to completion with Eco RI produced the restriction
fragments shown in Fig.4.3A. After phenol/chloroform extraction, the restriction
fragments were shot-gun cloned into Eco RI digested phagemid pBluescript® II SK (~
). E. coli DH5a cells were transformed with the putative ligations and selected on
LB/Amp plates containing X-gal and IPTG for (I-galactosidase (blue/white colonies)
selection. Putative transformants (white colonies) were grown overnight in L-Broth
containing ampicillin and plasmid DNA was isolated. The subclones were digested with
Eco RI and products of digestion were resolved on a 0.8% (w/v) agarose gel (Fig.
4.6).
Four colonies, 5, 6, 9 and 15 contained the desired 4.8 kb Eco RI fragment.
These were designated subclones p3.2As, p3.2Aô, p3.2Ag and p3.2Ai5, respectively.
Clone p3.2Ag also contained an additional fragment of 8.8 kb which was probably due
to contamination with the lambda right arm. Colonies 1, 3 and 11 contained an
unaccounted for 3.9 kb fragment and colony 10 contained an unaccounted for 2 kb
117
_____
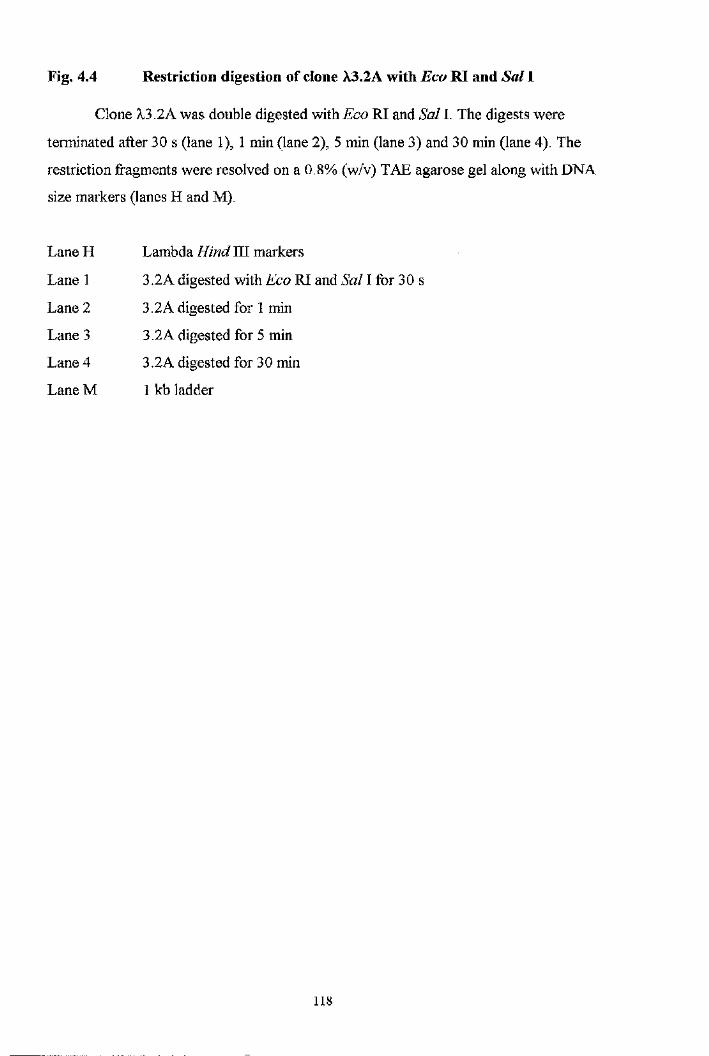
Fig, 4.4 Restriction digestion of clone X3.2A with Eco RI and Sal I
Clone X3.2A was double digested with Eco RI and Sal I. The digests were
terminated after 30 s (lane 1), 1 min (lane 2), 5 min (lane 3) and 30 min (lane 4). The
restriction fragments were resolved on a 0.8% (w/v) TAE agarose gel along with DNA
size markers (lanes H and M).
Lane H Lambda Hind III markers
Lane 1 3.2A digested with Eco RI and Sal I for 30 s
Lane 2 3.2A digested for 1 min
Lane 3 3.2A digested for 5 min
Lane 4 3.2A digested for 30 min
Lane M 1 kb ladder
1 1 8
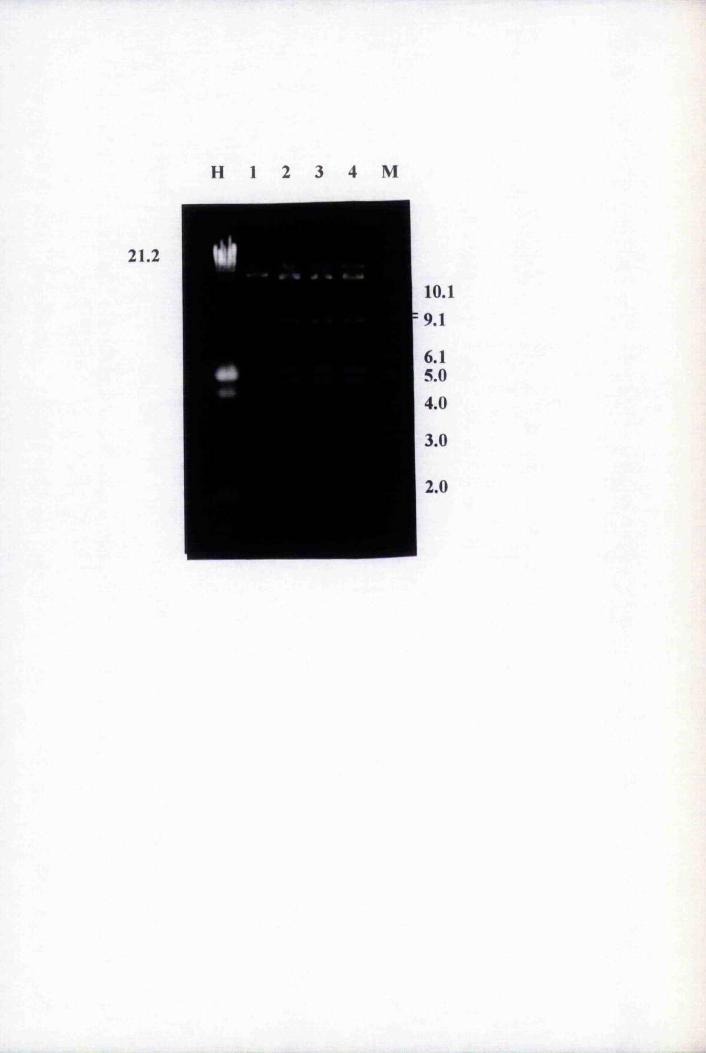
H 1 M
21.2
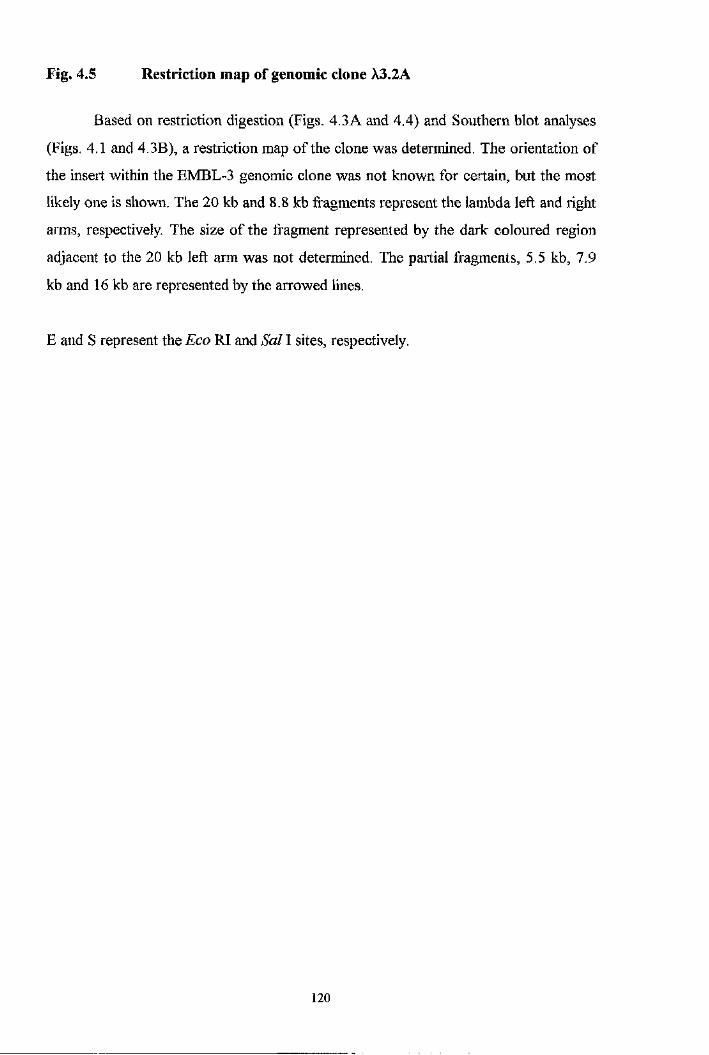
Fig. 4.5 Restriction map of genomic clone X3.2A
Based on restriction digestion (Figs. 4.3A and 4.4) and Southern blot analyses
(Figs. 4.1 and 4.3B), a restriction map of the clone was determined. The orientation of
the insert within the EMBL-3 genomic clone was not known for certain, but the most
likely one is shown. The 20 kb and 8.8 kb fragments represent the lambda left and right
arms, respectively. The size of the fragment represented by the dark coloured region
adjacent to the 20 kb left arm was not determined. The partial fragments, 5.5 kb, 7.9
kb and 16 kb are represented by the arrowed hnes.
E and S represent the Eco RI and Sal I sites, respectively.
120
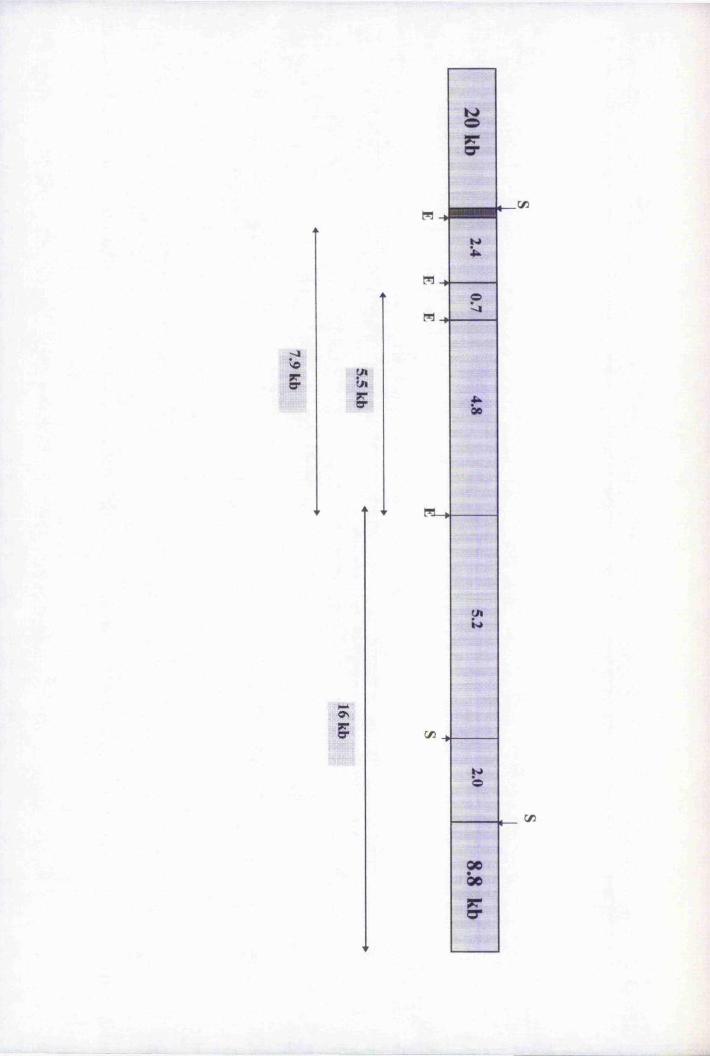
,s.
. » > E
o
:
K»
oe00
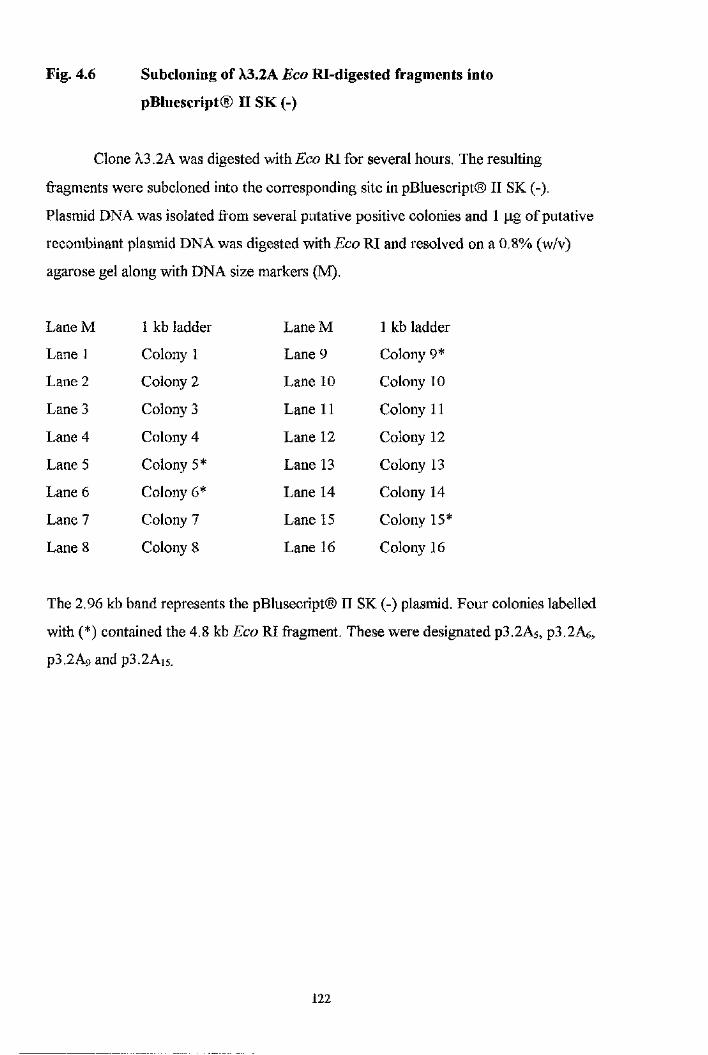
Fig. 4.6 Subcloning of X3.2A Eco Rl-digested fragments into
pBluescript® If SK (-)
Clone X3.2A was digested with Eco RI for several hours. The resulting
fragments were subcloned into the corresponding site in pBluescript® II SK (-).
Plasmid DNA was isolated from several putative positive colonies and 1 pg of putative
recombinant plasmid DNA was digested with Eco RI and resolved on a 0.8% (w/v)
agarose gel along with DNA size markers (M).
Lane M i kb ladder LaneM 1 kb ladder
Lane 1 Colony 1 Lane 9 Colony 9*
Lane 2 Colony 2 Lane 10 Colony 10
Lane 3 Colony 3 Lane 11 Colony 11
Lane 4 Colony 4 Lane 12 Colony 12
Lane 5 Colony 5* Lane 13 Colony 13
Lane 6 Colony 6* Lane 14 Colony 14
Lane 7 Colony 7 Lane 15 Colony 15*
Lane 8 Colony 8 Lane 16 Colony 16
The 2.96 kb band represents the pBlusecript® II SK (-) plasmid. Four colonies labelled
with (*) contained the 4.8 kb Eco RI fragment. These were designated p3.2As, p3,2Ae,
p3.2A9 and p3.2Ai5.
1 2 2
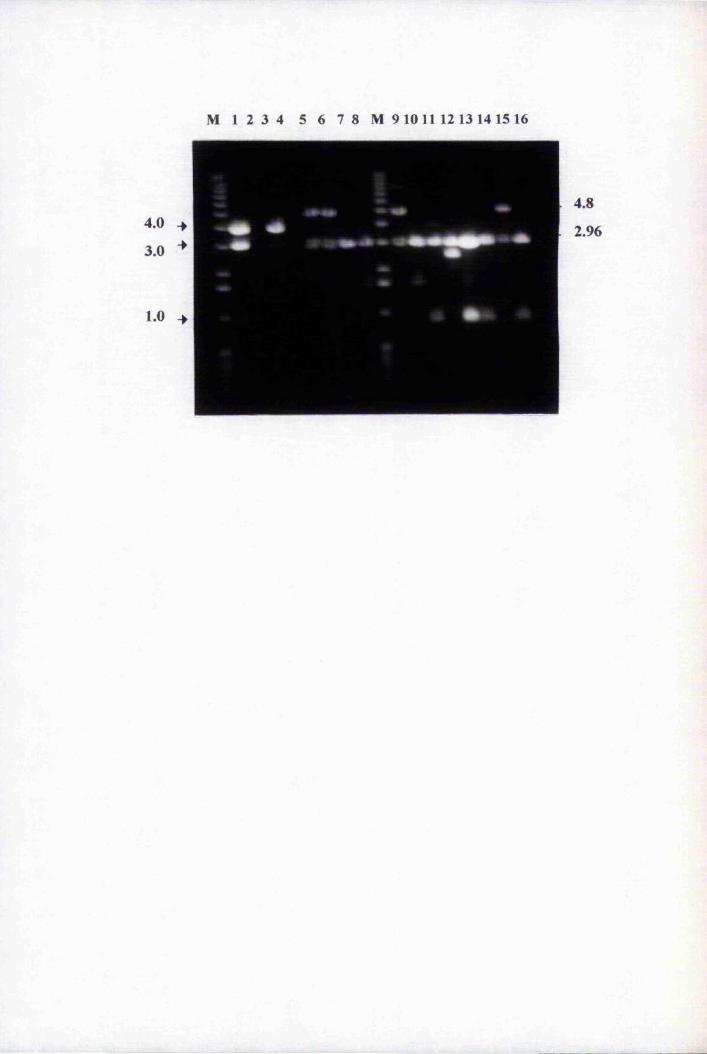
M 1 2 3 4 5 6 7 8 M 9 10 11 12 13 14 15 16
4.0 _k
1.0
4.8
2.96
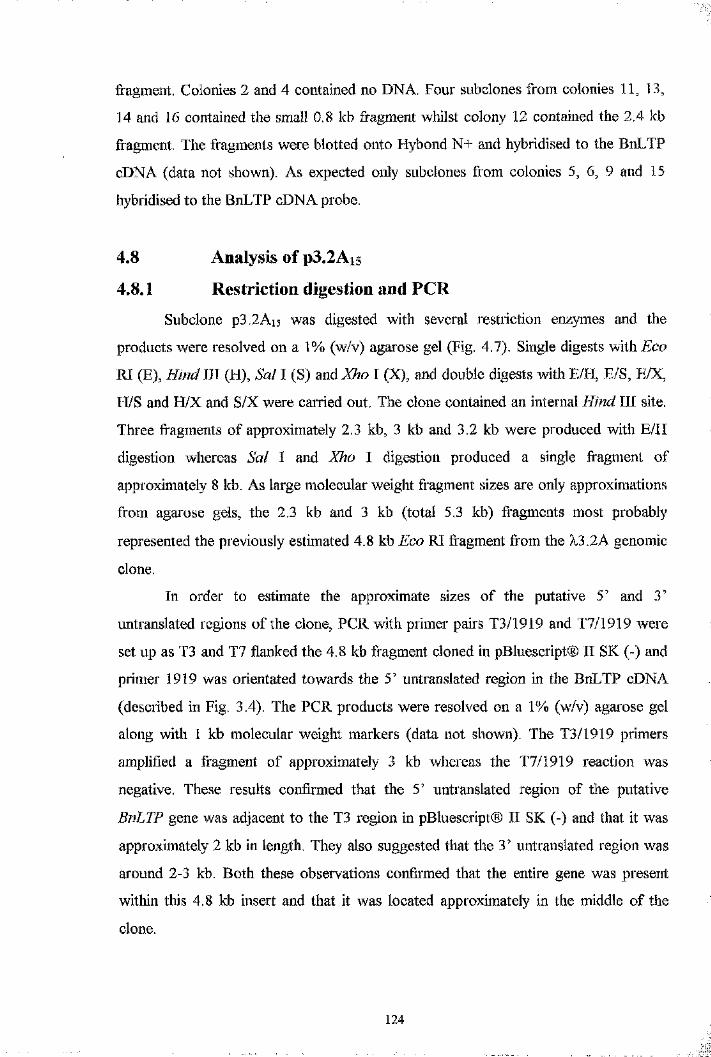
fragment. Colonies 2 and 4 contained no DNA. Four subclones from colonies 11, 13,
14 and 16 contained the small 0.8 kb fragment whilst colony 12 contained the 2.4 kb
fragment. The fragments were blotted onto Hybond N+ and hybridised to the BnLTP
cDNA (data not shown). As expected only subclones from colonies 5, 6, 9 and 15
hybridised to the BnLTP cDNA probe.
4.8 Analysis of p3.2Ais
4.8.1 Restriction digestion and PCRSubclone p3.2Ai5 was digested with several restriction enzymes and the
products were resolved on a 1% (w/v) agarose gel (Fig. 4.7). Single digests with Eco
RI (E), Hind III (H), Sal I (S) and Xho I (X), and double digests with E/H, E/S, E/X,
H/S and H/X and S/X were carried out. The clone contained an internal Hind III site.
Three fragments of approximately 2.3 kb, 3 kb and 3.2 kb were produced with E/H
digestion whereas Sal I and Xho I digestion produced a single fragment of
approximately 8 kb. As large molecular weight fragment sizes are only approximations
from agarose gels, the 2.3 kb and 3 kb (total 5.3 kb) fragments most probably
represented the previously estimated 4.8 kb Eco RI fragment from the X3.2A genomic
clone.
In order to estimate the approximate sizes of the putative 5" and 3'
untranslated regions of the clone, PCR with primer pairs T3/1919 and T7/1919 were
set up as T3 and T7 flanked the 4.8 kb fragment cloned in pBluescript® II SK (-) and
primer 1919 was orientated towards the 5' untranslated region in the BnLTP cDNA
(described in Fig. 3.4). The PCR products were resolved on a 1% (w/v) agarose gel
along with 1 kb molecular weight markers (data not shown). The T3/1919 primers
amplified a fragment of approximately 3 kb whereas the T7/1919 reaction was
negative. These results confirmed that the 5’ untranslated region of the putative
BnLTP gene was adjacent to the T3 region in pBluescript® II SK (-) and that it was
approximately 2 kb in length. They also suggested that the V untranslated region was
around 2-3 kb. Both these observations confinned that the entire gene was present
within this 4.8 kb insert and that it was located approximately in the middle of the
clone.
124
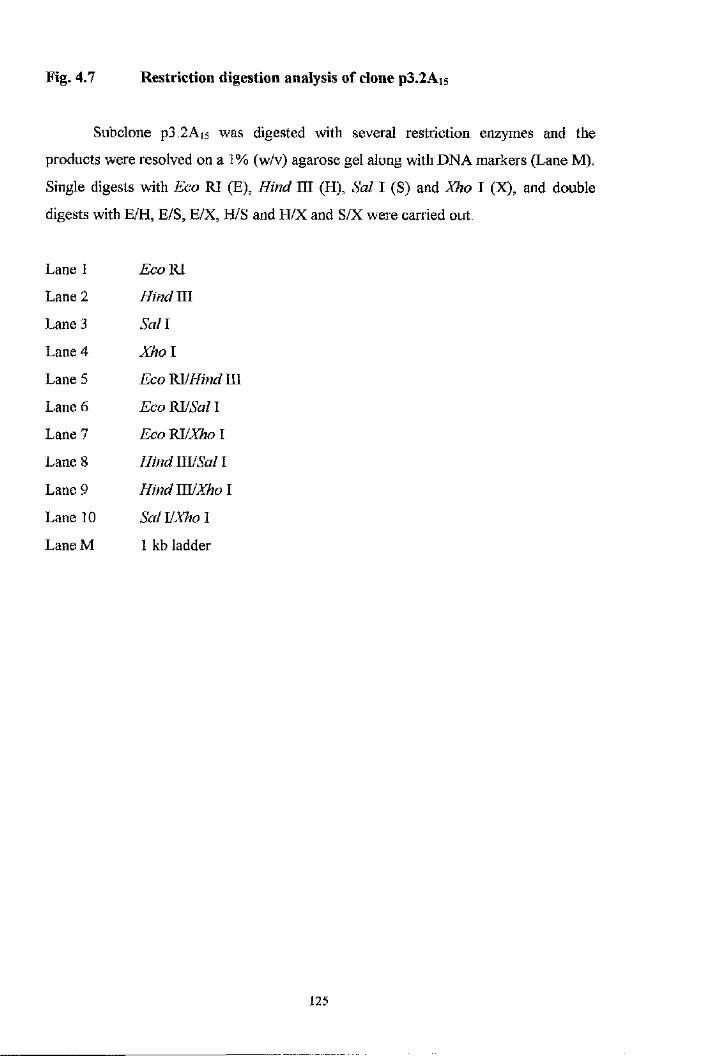
Fig. 4.7 Restriction digestion analysis of clone p3.2Ais
Subclone p3.2Ai5 was digested with several restriction enzymes and the
products were resolved on a 1% (w/v) agarose gel along with DNA markers (Lane M).
Single digests with Eco RI (E), Hind III (H), Sal I (S) and Xho I (X), and double
digests with E/H, E/S, E/X, H/S and H/X and S/X were carried out.
Lane 1 E c o m
Lane 2 H m dlll
Lane 3 S a il
Lane 4 Xho I
Lane 5 Eco RI/ÆW III
Lane 6 Eco m jSal I
Lane 7 Eco ^ fX h o I
Lane 8 Hind m i Sal I
Lane 9 H indllVXhol
Lane 10 Sal VXho I
LaneM 1 kb ladder
125
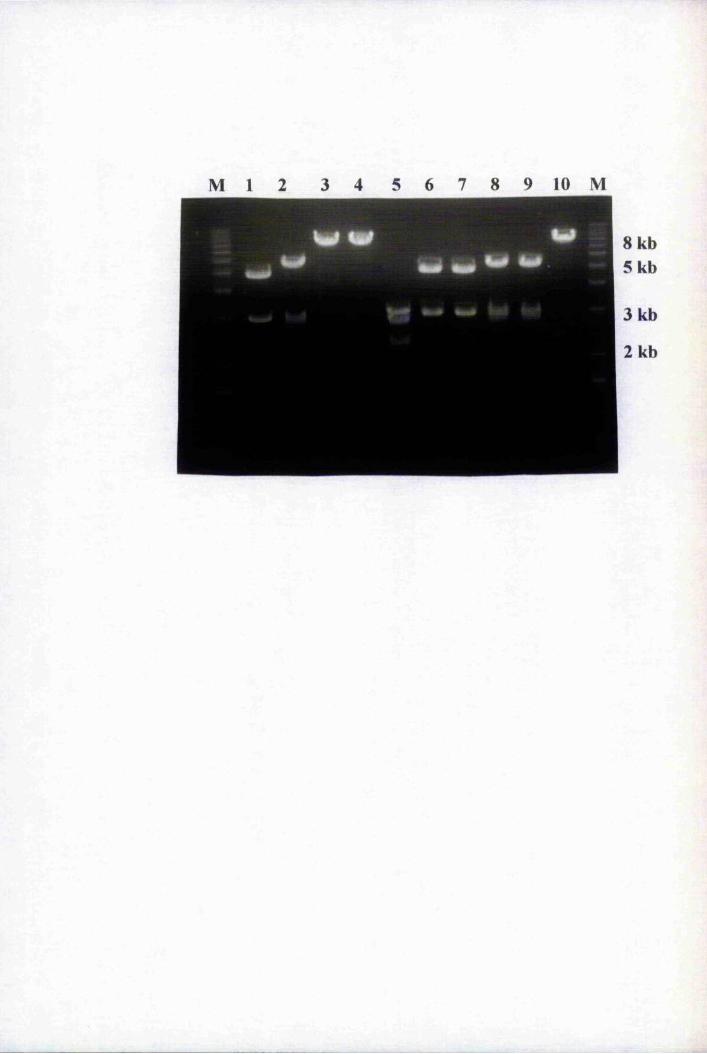
M 1 2 3 4 5 6 7 8 9 10 M
Clone p3.2Ai5 amplified a fragment of 650 bp with the primer pair 1689/1919
as described previously (Fig. 4.2) (data not shown). A positive control containing the
BnLTP cDNA clone was also set up with primer pairs 1689/1919 and T3/T7. The
resulting amplified fragments were the same size as those produced previously with
X3.2A (section 4.5 and Fig. 4.2).
4.8.2 Sequencing of genomic clone p3.2AisClone p3.2Ai5 was sequenced using the Sanger dideoxynucleotide chain
termination method (Sanger, 1977). Primers 1919 and 1689 were used in the initial
sequencing reactions. New synthetic oligonucleotides were then designed from the
newly derived sequence. Primers were designed, depending on the available sequence,
at least 50 bp from the end of the previously sequenced region to ensure no gaps were
present. The primers, their sequence and the region to which they hybridised are shown
in Table 4.1. A schematic diagram showing the relative positions and direction of the
primers used for each sequencing reaction is shown in Fig. 4.8.
4.8.3 Analysis of the BnLTP gene sequenceClone p3.2Ai5 contained the full length gene with high sequence similarity to
the BnLTP cDNA. 1,750 bp of the 4.8 kb insert was sequenced which included 905 bp
of the 5’ non-coding region from the putative translation initiation codon, ATG.
Similarly, 269 bp of the 3’ non-coding region was sequenced. The nucleotide and the
deduced amino acid sequences are shown in Fig. 4.9. The gene, designated BnLTP
contained one open reading frame encoding a polypeptide of 118 amino. The intron
was integrated after the second base of codon 116. The intron was 72% AT-rich which
was within the 42 to 89% range found in most dicots (Simpson et al., 1993). The AT-
richness has been shown to be required for intron processing (Goodall et al., 1989).
Also, the GT-AG rule applied to the intron boundaries (Padgett et al., 1986). The
transcription initiation site was determined by primer extension analysis (see section
4.8.4 and Fig. 4.10). Two putative transcription initiation sites were located 56 and 59
bp, respectively, upstream of the ATG start codon. Comparison of the 5’ untranslated
127
Table 4.1 Primers used for sequencing and PCR of genomic clones
The primer sequences are shown in the 5’ to 3’ orientation. The target
templates are indicated as well as the region of hybridisation. Primers marked with a
(*) were also used to sequence the BnLTP cDNA.
1 2 8
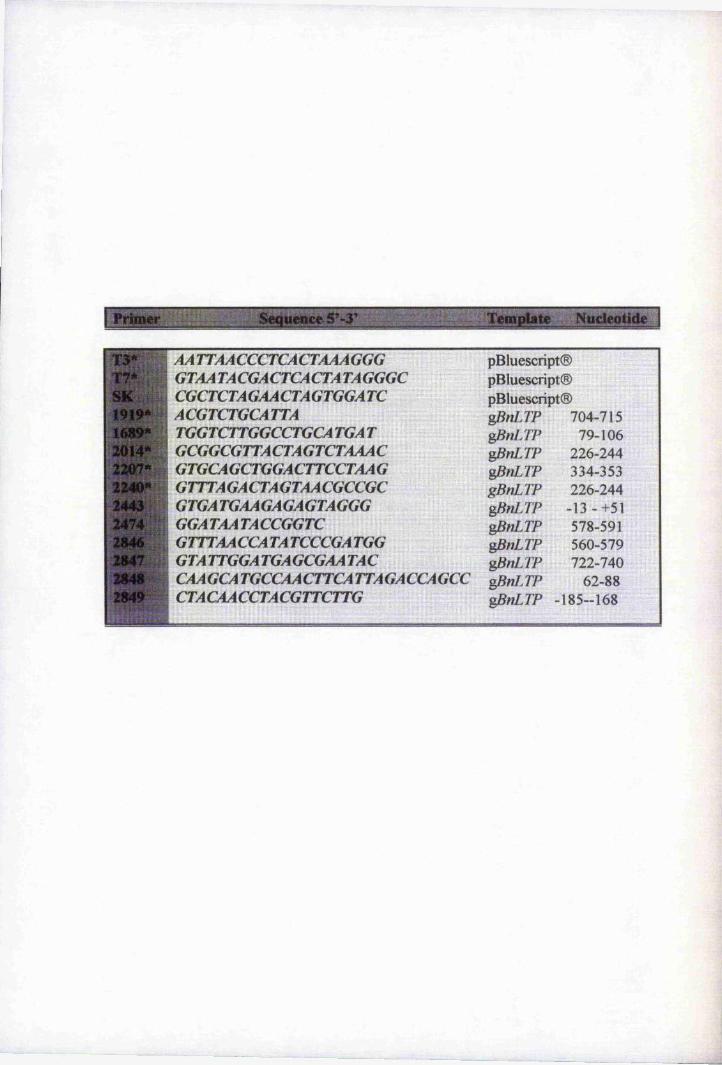
1 ' " L
ils®
- l i
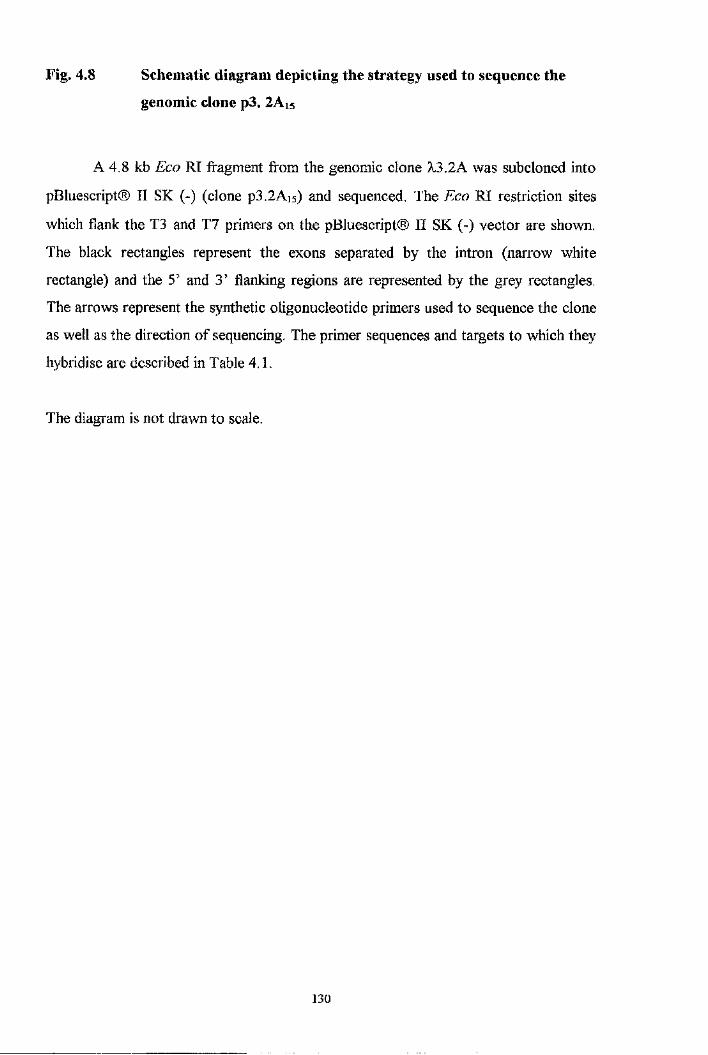
Fig. 4.8 Schematic diagram depicting the strategy used to sequence the
genomic clone p3. 2Ais
A 4.8 kb Eco RI fragment from the genomic clone X3.2A was subcloned into
pBluescript® II SK (-) (clone p3.2Ai5) and sequenced. The Eco RI restriction sites
which flank the T3 and T7 primers on the pBluescript® II SK (-) vector are shown.
The black rectangles represent the exons separated by the intron (narrow white
rectangle) and the 5’ and 3’ flanking regions are represented by the grey rectangles.
The arrows represent the synthetic oligonucleotide primers used to sequence the clone
as well as the direction of sequencing. The primer sequences and targets to which they
hybridise are described in Table 4.1.
The diagram is not drawn to scale.
130
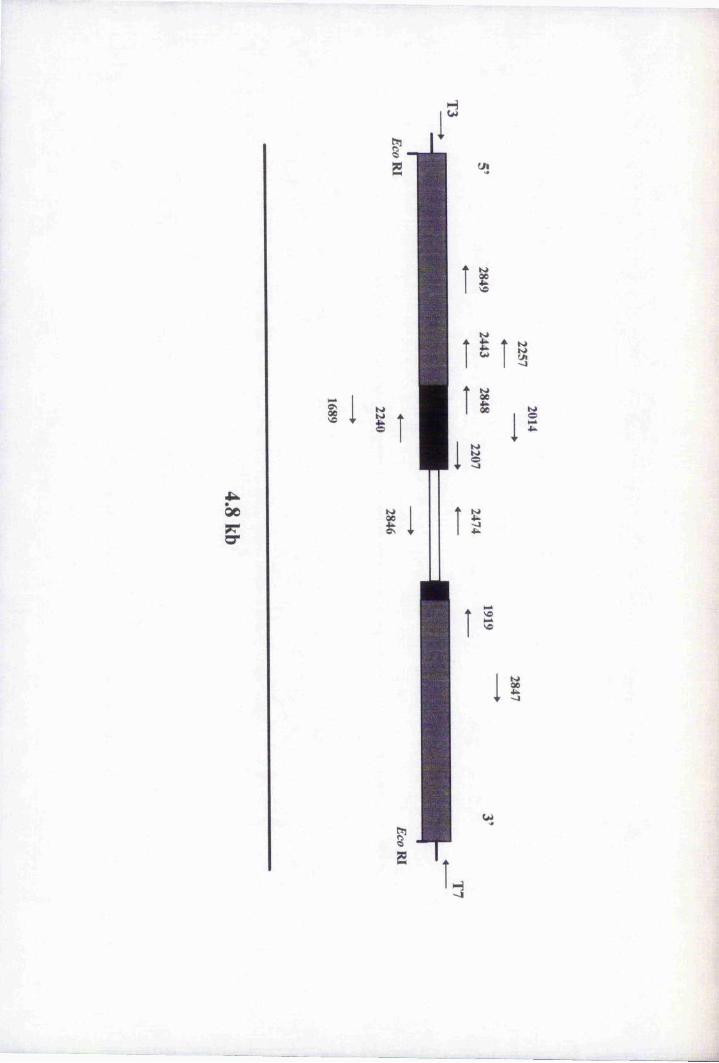
d
00
5
s’ J L in
%
I M
I I
%
i
-j4
s’
\oVO
I
w
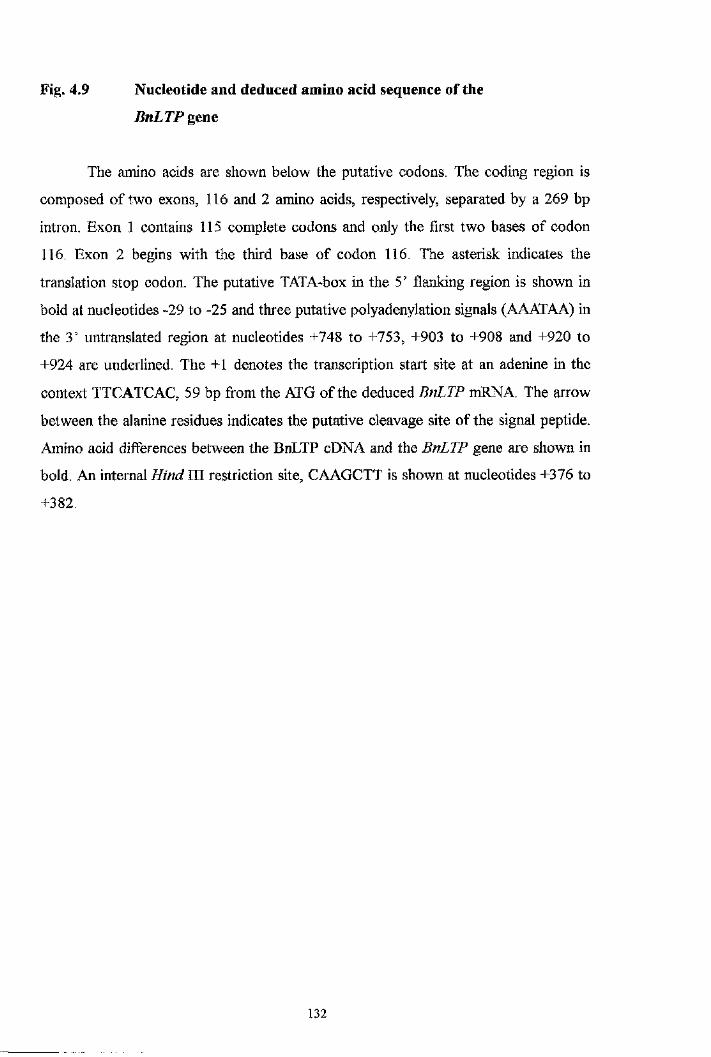
Fig. 4.9 Nucleotide and deduced amino acid sequence of the
BnLTP gene
The amino acids are shown below the putative codons. The coding region is
composed of two exons, 116 and 2 amino acids, respectively, separated by a 269 bp
intron. Exon 1 contains 115 complete codons and only the first two bases of codon
116. Exon 2 begins with the third base of codon 116. The asterisk indicates the
translation stop codon. The putative TATA-box in the 5’ flanking region is shown in
bold at nucleotides -29 to -25 and three putative polyadenylation signals (AAATAA) in
the 3’ untranslated region at nucleotides +748 to +753, +903 to +908 and +920 to
+924 are underlined. The +1 denotes the transcription start site at an adenine in the
context TTCATCAC, 59 bp from the ATG of the deduced BnLTP mRNA. The arrow
between the alanine residues indicates the putative cleavage site of the signal peptide.
Amino acid differences between the BnLTP cDNA and the BnLTP gene are shown in
bold. An internal HindJTL restriction site, CAAGCTT is shown at nucleotides +376 to
+382.
132
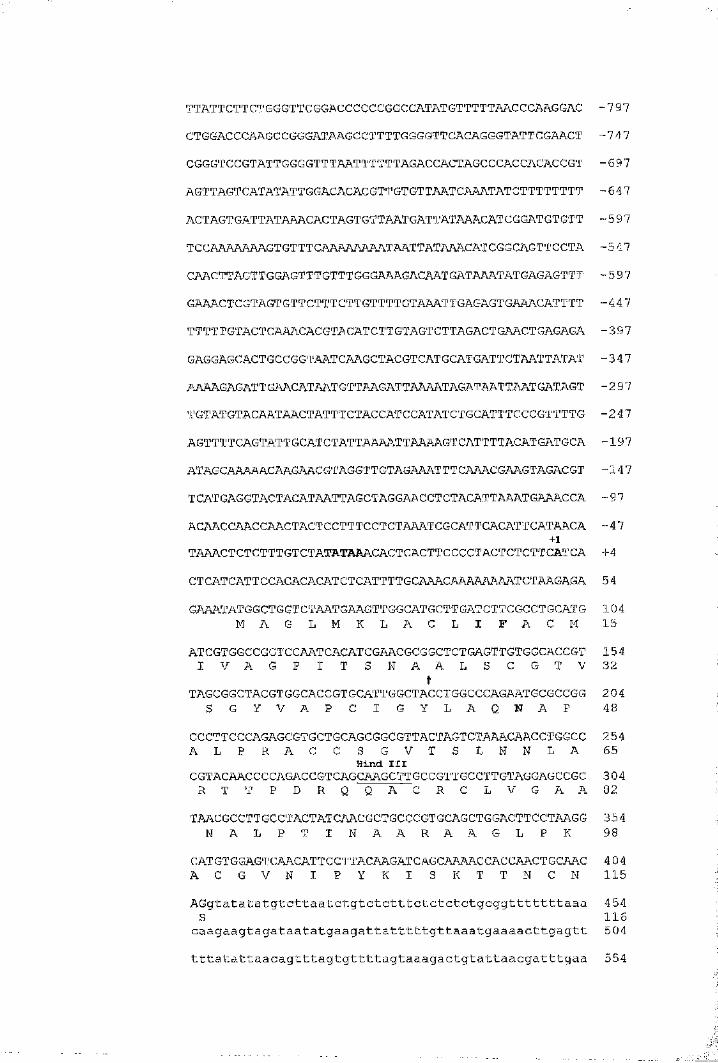
TTATTCTTCTGGGTTCGGACCCCCCGGCCATATGTTTTTAACCCAAGGAC -7 97CTGGACCCAAGCCGGGATAAGCCTTTTGGGGTTCACAGGGTATTCGAACT -747CGGGTCCGTATTGGGGTTTAATTTTTTAGACCACTAGCCCACCACACCGT -697AGTTAGTCATATATTGGACACACGTTGTGTTAATCAAATATCTTTTTTTT -647ACTAGTGATTATAAACACTAGTGTTAATGATTATAAACATCGGATGTGTT -597
T CCAAAAAAAGT GTTTCAAAAAAAATAATTATAAACAT CGGCAGTT CCTA -547CAACTTAGTTGGAGTTTGTTTGGGAAAGACAATGATAAATATGAGAGTTT -597GAAACTCGTAGTGTTCTTTCTTGTTTTGTAAATTGAGAGTGAAACATTTT -447TTTTTGTACTCAAACACGTACATCTTGTAGTCTTAGACTGAACTGAGAGA -397GAGGAGCACTGCCGGTAATCAAGCTACGTCATGCATGATTCTAATTATAT -347AAAAGAGATTGAACATAATGTTAAGATTAAAATAGATAATTAATGATAGT -2 97TGTATGTACAATAACTATTTCTACCATCCATATCTGCATTTCCCGTTTTG -247AGTTTTCAGTATTGCATCTATTAAAATTAAAAGTCATTTTACATGATGCA -197ATAGCAAAAACAAGAACGTAGGTTGTAGAAATTTCAAACGAAGTAGACGT -147T CAT GAGGT ACTACAT AATT AGCTAGGAAC CT CTACAT TAAAT GAAACCA -97ACAACCAACCAACTACTCCTTTCCTCTAAATCGCATTCACATTCATAACA -47
+1TAAACTCTCTTTGTCTATATAAACACTCACTTCCCCTACTCTCTTCATCA +4CTCATCATTCCACACACATCTCATTTTGCAAACAAAAAAAATCTAAGAGA 5 4GAAATATGGCTGGTCTAATGAAGTTGGCATGCTTGATCTTCGCCTGCATG 104
M A G L M K L A C L I F A C M 15ATCGTGGCCGGTCCAATCACATCGAACGCGGCTCTGAGTTGTGGCACCGT 154 I V A G P I T S N A A L S C G T V 3 2
ÎTAGCGGCTACGTGGCACCGTGCATTGGCTACCTGGCCCAGAATGCGCCGG 204
S G Y V A P C I G Y L A Q N A P 48
CCCTTCCCAGAGCGTGCTGCAGCGGCGTTACTAGTCTAAACAACCTGGCC 254 A L P R A C C S G V T S L N N L A 65
Hind IIICGTACAACCCCAGACCGTCAGCAAGCTTGCCGTTGCCTTGTAGGAGCCGC 304 R T T P D R Q Q A C R C L V G A A 8 2
TAACGCCTTGCCTACTATCAACGCTGCCCGTGCAGCTGGACTTCCTAAGG 354 N A L P T I N A A R A A G L P K 98
CAT GT GGAGT CAACATT CCT TAG AAGAT CAGCAAAACCACCAACT GCAAC 4 04 A C G V N I P Y K I S K T T N C N 115AGgtatatatgtcttaatctgtctctttctctctctgcggtttttttaaa 454 S 116caagaagtagataatatgaagattatttttgttaaatgaaaacttgagtt 504tttatattaacagtttagtgttttagtaaagactgtattaacgatttgaa 554

gttctgtttaaccatatcccgatggataataccggtcaacaagtatatac 604taaaaaaatttttaatggagatttgagtattttattataacggtgttatg 654tttatttgtatgtggttgcagTGTGA?\ATGAgcggcggtcggatgaagct 704
V K * 118aatqcagacqttcaagtattatgtaatggatgagcgaatactaaaataag 754atgctccaatggttgttgtttttagagtttttcaatttGctgtcttttat 804gttgtgacgttcctattactttggtcgtttgtactatgttcacaatcaac 854gttatatgaatttcagatcataaaatatacgcatatgaatttttatttaa 904taaatattctttcgaaataatatatatatatatatatatatatatatata 954
regions of a number of genes indicate that transcription initiates at an adenine in the
context CTCATCAA (Joshi, 1988), which closely resembles the adenine located 59 bp
from the ATG, in the sequence context TTCATCAC. This adenine was therefore
designated as the transcription start site. A TATA-box (positions -29 to -25 relative to
the transcription start site) was located in the 5’ flanking region and three putative poly
(A) signals, AAATAA (positions +748 to +753, +902 to +907 and +919 to +924)
(Wahle et a l, 1992), were identified at the 3’ untranslated region. An internal Hind III
restriction site is shown at position +376 to +382. Several putative cis-acting
regulatory elements were also identified in the promoter region. These are discussed in
more detail in chapter six.
4.8.4 Determination of transcription initiation in the BnLTP
gene by primer extensionThe transcription initiation site of the BnLTP gene was determined by primer
extension analysis (Fig. 4.10) (Ausubel et al., 1987). A 27 bp synthetic oligonucleotide
(2848, see Table 4.1 and Fig. 4.9) that corresponded to the putative translated region
starting from the ATG codon (position 62) up to the tenth codon (position 88) was
used ill the primer extension reaction. Leaf tissue fi*om Brassica napiis cv. Cobra
grown under continuous high intensity white light was used to isolate total RNA. The
same primer was used to sequence the gBnLTP clone. The sequencing primer was not
end-labelled with y^^P-ATP prior to the sequencing reaction. Instead, ^^S-dATP was
used in the sequencing extension reaction by using the standard sequencing protocol.
This should have minimal effect on the mobility of fragments greater than 50 bp in
length (Trapper and Clayton, 1981).
There were two major primer extension products both of equal intensity
generated in the analysis of the BnLTP mRNA. The intensity of the bands increased as
the corresponding mRNA concentration was increased. Two larger products which
corresponded to a cytosine nucleotide, located above each of the smaller doublets,
were also produced, but the intensity of these bands did not increase with increasing
amounts of RNA eliminating these bands as possible transcription start sites. These
bands, however, served as an internal control rendering the smaller bands as tme
initiation start sites. As expected, no primer extension product was observed in the “no
135
Fig. 4.10 Mapping of the transcription start site of the BnLTP mRNA
by primer extension
A 27-nucleotide primer (2848: see Table 4.1) was annealed to increasing
amounts (0, 2, 5 and 10 pg, respectively) of total RNA extracted from Brassica napus
cv. Cobra leaf tissue and extended with reverse transcriptase. The products indicated
by the arrows were resolved on an 8% (w/v) denaturing polyacrylamide sequencing
gel. The same primer was used to sequence the BnLTP gene. The sequencing ladder
was run adjacent to the primer extension products. The coding strand DNA sequence
corresponding to the region flanking the extended product (position -35 to +11 in Fig.
4.9) is shown to the right of the ladder. The putative transcription start sites at adenine
residues are indicated by an arrow.
1 3 6
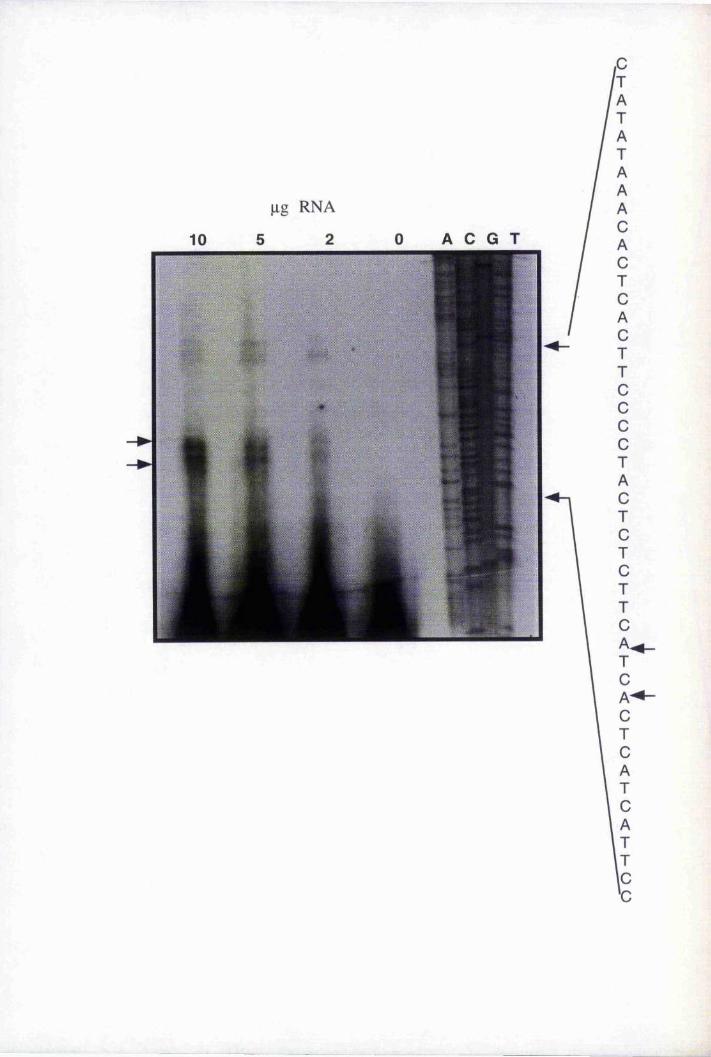
jxg RNA
138
RNA” control. The two primer extension products corresponded to adenine residues in
the sequence context 5'-TTCATCA-3' located 56 and 59 nucleotides upstream of the
ATG start codon. Comparison of this sequence to the transcription start sites of
several plant genes closely resembled the CTCATCA consensus sequence (Joshi,
1987). Approximately 85% of genes studied initiated transcription from an adenine
(bold) in this context. The adenine located 59 bases from the ATG was therefore
considered as the start site and marked (+1) (Fig. 4.9). Taking into consideration the
transcription start site and the first polyadenylation signal, the BnLTP mRNA was
calculated to be 600 bases long, which is in agreement with the transcript size observed
in previous northern blots (Pallas, 1992).
4.9 Comparison of the BnLTP gene and cDNA nucleotide and
amino acid sequencesThe nucleotide and amino acid sequences of gBnLTP were compared with
those of BnLTP cDNA described in chapter three (Fig. 4.11 A and Fig. 4.1 IB). The
gene and cDNA both encoded proteins of 118 amino acids and were highly similar
(98%) at the amino acid level. Five amino acid substitutions were observed at amino
acids 11 (I to V), 12 (F to L), 46 (N to G), 85 (L to F) and 88 (I to L) (Fig. 4.1 IB).
The putative protein sequence of gBnLTP had a high alanine content (comprising
16%) and 10% of the residues were cysteines, which was identical to BNLTP.
Similarly, the deduced gBNLTP protein lacked glutamate, histidine and tryptophan
residues. A Kyte and Doolittle (1982) hydropathy profile of the predicted amino acid i
sequence revealed a 25 amino acid hydrophobic region at the N-terminus with
characteristics of a signal sequence (von Heijne, 1986) very similar to BNLTP. The
potential cleavage site following an alanine residue at position 25 (Fig. 4.1 IB) was
identical in both sequences. The gene contained three putative polyadenylation signals
with the consensus AAATAA, 63, 218, and 234 bp downstream of the stop codon
whereas the cDNA sequence contained a single polyadenylation signal 62 bp from the
stop codon. However, it is unlikely that the first polyadenylation signal in the gene is
used in preference to the other two based on the size of the transcript in northern blots.
The 3" untranslated region also differed at a number of bases. These results confirmed
that the BnLTP gene and cDNA sequences were not homologous but highly similar.
Fig. 4.11 Comparison of the BnLTP gene and cDNA nucleotide and
amino acid sequences
The nucleotide (A) and amino acid (B) sequences of the BnLTP gene and
cDNA were aligned using the UWGCG PILEUP program. The five codon differences
between the two sequences are shown (underlined); codon 90-92, ATC (gene)->GTC
(cDNA) (residue 11,1 to V); codon 93-95, TTC (gene)->TTG (cDNA) (residue 12, F
to L); codon 195-197, AAT (gene)-+ GGT (cDNA) (residue 46, N to G), codon 321-
323, TTG (gene)-> TTC (cDNA) (residue 85, L to F) and at codon 328-330, ATC
(gene)->CTC (cDNA) (residue 88 ,1 to L). Several nucleotide changes were observed
in the 3’ untranslated region. Two degenerate codons were also present at nucleotide
141-143, AGT (gene) to AGC (cDNA) (Ser) and at nucleotide 336-338 GCA (gene)
to GCT (cDNA) (Ala).
139
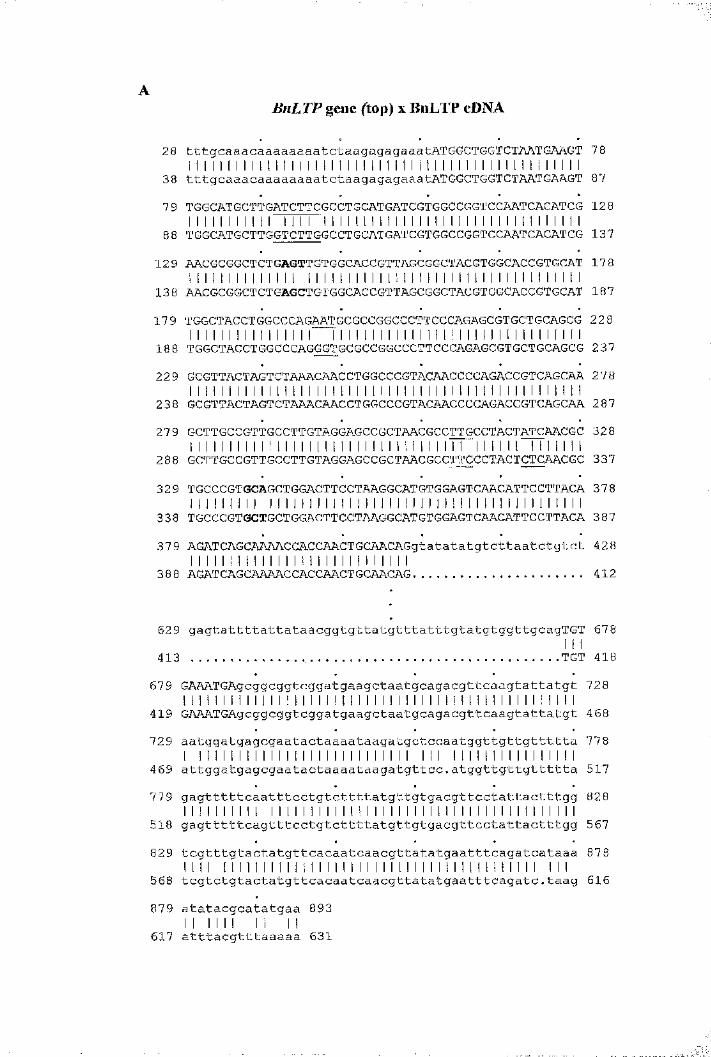
■■- Ï r i s
BnLTP gene (top) x BnLTP cDNA
28 tttgcaaacaaaaaaaatctaagagagaaatATGGCTGGTCTAATGAAGT 78I I I I i I I I I I i i I I I I I I I I I I I I I I I i I 1 i I I I I I I I I I M I I I I I I I I
38 tttgcaaacaaaaaaaatctaagagagaaatATGGCTGGTCTAATGAAGT 87 7 9 TGGCATGCTTGATCTTCGCCTGCATGATCGTGGCCGGTCCAATCACATCG 128
I I I I I I I I I I I I I I I I I I I I I I I I I I I I I I I I I I I I I I I I I I I I I I I I88 TGGCATGCTTGGTCTTGGCCTGCATGATCGTGGCCGGTCCAATCACATCG 137
129 AACGCGGCTCTGAGTTGTGGCACCGTTAGCGGCTACGTGGCACCGTGCAT 17 8I I I I I I I I I I I I I I I I I I I I I I I I I I I I I I I I I I I I I I I I I I I I I I I I I
138 AACGCGGCTCTGAGCTGTGGCACCGTTAGCGGCTACGTGGCACCGTGCAT 187 179 TGGCTACCTGGCCCAGAATGCGCCGGCCCTTCCCAGAGCGTGCTGCAGCG 228
1111111111111111 111111111111111II111111111111111188 TGGCTACCTGGCCCAGGGTGCGCCGGCCCTTCCCAGAGCGTGCTGCAGCG 23722 9 GCGTTACTAGTCTAAACAACCTGGCCCGTACAACCCCAGACCGTCAGCAA 278
11111111111111111111111111111111111111111111111111 238 GCGTTACTAGTCTAAACAACCTGGCCCGTACAACCCCAGACCGTCAGCAA 2 8727 9 GCTTGCCGTTGCCTTGTAGGAGCCGCTAACGCCTTGCCTACTATCAACGC 328
I I I I I I I I I I 1 I I I I I I I I I I I I I I I i i I I I I I I I I I I I I I I I I I I I I288 GCTTGCCGTTGCCTTGTAGGAGCCGCTAACGCCTTCCCTACTCTCAACGC 337
32 9 TGCCCGTGCAGCTGGACTTCCTAAGGCATGTGGAGTCAACATTCCTTACA 378I I I I I I I I I I I I I I I I I I I I I I I I I I I I I I I I I I I I I I I I I I I I I I I I I
338 TGCCCGTGCTGCTGGACTTCCTAAGGCATGTGGAGTCAACATTCCTTACA 387 379 AGATCAGCAAAACCACCAACTGCAACAGgtatatatgtcttaatctgtct 428
I I I I I I I I I I I I I I I I I I I I I I I I I I I I38 8 AGATCAGCAAAACCACCAACTGCAACAG.................... 412
629 gagtattttattataacggtgttatgtttatttgtatgtggttgcagTGT 678I I I
413 .............. .TGT 418679 GAAATGAgcggcggtcggatgaagctaatgcagacgttcaagtattatgt 728
I I I I I I I I I I I I I I I I I I I I I I I I I I I I I I I I I I I I I I I I I I I I I I I I I I419 GAAATGAgcggcggtcggatgaagctaatgcagacgttcaagtattatgt 468 729 aatggatgagcgaatactaaaataagatgctccaatggttgttgttttta 778
I I I I I I I I I I I I I I I I I I I I I I I I I I I I I I I I I I I I I I I I I I I I I I I 469 attggatgagcgaatactaaaataagatgttcc.atggttgttgttttta 517779 gagtttttcaatttcctgtcttttatgttgtgacgttcctattactttgg 828
I I I I I I I I I I I I I I I I I I I I 1 I I I I I I I I I I I I I I I I I I I I I I I I I I I I 518 gagtttttcagtttcctgtcttttatgttgtgacgttcctattactttgg 567829 tcgtttgtactatgttcacaatcaacgttatatgaatttcagatcataaa 878
I I I I I I I I I I I I I I I I I I I I I I I I I I I I I I I I I I I I I I I I I I I I I I I568 tcgtctgtactatgttcacaatcaacgttatatgaatttcagatc.taag 616
879 atatacgcatatgaa 893 I I I I I I 1 1 I I
617 atttacgtttaaaaa 631
I' r * .
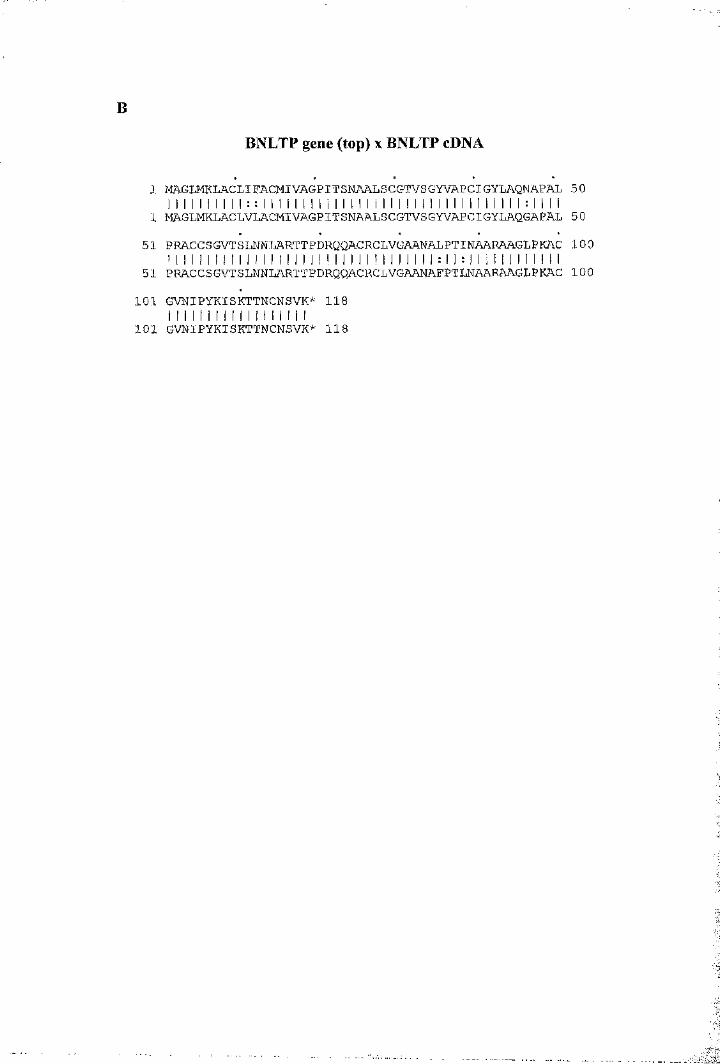
B
BNLTP gene (top) x BNLTP cDNA
1 MAGLMKLACLIFACMIVAGPITSNAALSCGTVSGYVAPCIGYLAQNAPAL 50I I I I I I i I I ! : ■■ I I I I I I ! i i I I I I I I I I I I I I I I I I I I I I I I I I : I I I I
1 MAGLMKLACLVLACMIVAGPITSNAALSCGTVSGYVAPCIGYLAQGAPAL 50 51 PRACCSGVTSLNNLARTTPDRQQACRCLVGAANALPTINAARAAGLPKAC 100
I I I I I I I I I I I I I I I I I I I I I I I I I I ! I l I I I I I : I h I I i l I I I I I I I I51 PRACCSGVTSLNNLARTTPDRQQACRCLVGAANAFPTLNAARAAGLPKAC 100
101 G W IPY K ISK T T N C N SV K * 118I I I I I I I I I I I I I I I I I I
101 GVNIPYKISKTTNCNSVK* 118
1. t
i :
However, analysis of a number of LTP gene sequences, including those members of the
same multigene family (see for example Molina et ah (1996), has shown that non
coding regions have diverged considerably during evolution compared to coding
regions.
4.10 DiscussionEight B. napus EMBL-3 genomic clones designated 11.lA, 11.7B, 13.1 A,
13.IB, 13.2A, 13.2B, 13.3A and 115.3, isolated from a previous screen with pLF3A
were rescreened with the BnLTP cDNA. The clones were characterised further by a
combination of restriction digestion, hybridisation to Southern blots and PCR.
Bam HI and Sal I digestions of all eight clones were extremely inefficient
yielding very large molecular weight fragments that did not resolve well in agarose
gels. These results suggested that the insert fragments did not contain any Bam HI and
Sal I sites. The insert size in all eight clones ranged from 10 kb to 20 kb (data not
shown).
However, Eco RI digestion produced fragments ranging from 0.5 kb to 30 kb
and as the Eco RI restriction site was lost during the construction of the library, these
results indicated that the restriction sites were all present in the insert fragment. Eco RI
digested fragments of all eight clones hybridised strongly to the BnLTP cDNA (Fig.
4.1, section 4.4), indicating that the genomic clones were closely related to the BnLTP
cDNA. However, PCR analysis of the clones with primers designed from the 5’
untranslated (primer 1689) and 3' untranslated (primer 1919) regions of the BnLTP
DNA indicated that only two clones, L3.2A and 7,15.3 were positive (Fig. 4.2), which
suggested that these two clones were more similar to the cDNA than the other six
clones. A larger than expected PCR product was amplified compared to the cDNA.
This suggested that clones 7,3.2A and 7,15.3 contained an extra region between the
primer annealing regions, compared to the cDNA and that they were identical. In
agreement with the PCR data, it was observed that the two clones had an identical Eco
RI restriction map (Fig. 4.1). However, clone 7,3.2B, which also had the same Eco RI
restriction pattern did not amplify a PCR fragment, winch suggested that it may only
differ in the nucleotides of the primer-annealing regions or that optimal PCR conditions
were not achieved. It therefore appears that amongst the eight genomic clones, 7,3.2A
142
and 7,15.3 were identical and most closely related to the BnLTP cDNA and clone
7,3.2B, compared to the remaining five clones.
Based on the above results, the 4.8 kb Eco RI fragment from clone 7,3.2A was
subcloned into pBluescript® II (SK (-) and sequenced. The clone contained the full
length gene with high sequence similarity to the BnLTP cDNA (Fig. 4.11). The BnLTP
gene contained a single open reading frame encoding a protein of 118 amino acids,
which consisted of two exons, comprising 116 and 2 amino acids, respectively,
interrupted by a 269 bp intron (Fig. 4.9). This was consistent with the PCR results
(Fig. 4.2) where a larger than expected PCR jfragment was amplified. The extra 269 bp
coiTesponded to the intron region. Genes isolated from other species including
Arabidopsis (Thoma et ah, 1994) tobacco (Fleming et al., 1992) and broccoli (Pyee
and Koluttukudy, 1995), all contain an intron in the region corresponding to the C-
terminus of the protein, two codons fi om the stop signal. The intron is in the same
location in the BnLTP gene. Whether the conservation of this gene structure has a
functional significance remains to be elucidated. However, the intron length varies
between different genes (Thoma et a l, 1994; Pyee and Koluttukudy, 1995; Fleming et
al., 1992).
There were only five amino acid differences between the deduced BnLTP gene
and oDNA amino acid sequences (V to I at position 11, L to F, 12, G to N, 46, F to L,
85 and L to I, 88) (Fig. 4.1 IB). The putative polypeptide was high in alanine and
cysteine residues, comprising 17% and 10%, respectively, and lacked histidine,
tryptophan and glutamate residues. In addition, the eight cysteine residues were at
conserved positions, identical to the BnLTP cDNA amino acid sequence.
The 4.8 kb subclone contained a 2.3 kb region 5’ of the first ATG codon, 905
bp of which was sequenced. Primer extension analysis revealed the presence of two
putative transcription start sites (Fig. 4.10), in the sequence context TTCATCAC.
Comparison of the 5’untranslated regions of a number plant genes indicates that
transcription initiates at an adenine in the sequence context CTCATCAA (Joshi,
1987), which closely resembles the adenine located in the sequence context,
TTC ATC A. This adenine was therefore designated the transcription start site (+1)
1 4 3
(Fig. 4.9). A TATA box at positions -29 to -25, relative to the transcription start site,
was located in the 5’ flanking region and three putative polyadenylation signals
(AAATAA) were observed in the 3’ untranslated region at nucleotides +748 to +753,
+903 to +908 and +920 to +924.
A Kyte and Doolittle (1982) hydropathy profile of the predicted protein
revealed a hydrophobic N-terminal region of 25 amino acids, which had the
characteristics of a signal peptide sequence (von Heijne, 1986). In addition, the protein
lacks an ER retention signal, K/HDEL (Vitale et al., 1993), which indicates that the
protein probably enters the secretory pathway. Both these characteristics were found in
the deduced amino acid sequence of the BnLTP cDNA.
In summary, a gene encoding a putative lipid transfer protein was isolated,
which was highly similar but not identical to the BnLTP cDNA. Although a number of
characteristics were common to both proteins (discussed above), it is clear that the two
represent different members of the B. napus LTP gene family. It is possible that
members of the gene family are regulated differently.
1 4 4
Chapter 5 Generation and characterisation of Arabidopsis
transgenic plants expressing the BnLTP promoter-
GUS fusion
5.1 IntroductionTo be able to use the BnLTP gene as a molecular marker for the study of cell
fate it was necessary to develop a simple and quick method of determining the cellular
location of the gene product. Although conventional methods such as northern blotting
and in situ hybridisation are usefiil in determining temporal and spatial expression
patterns of genes, they have some disadvantages. Total RNA isolated from an organ or
tissue contains a myriad of transcripts expressed in each of the cell types which make
up the organ or tissue such as epidermal, mesophyll and parenchyma cells, which
results in difficulty in determining expression at the cellular level. In situ hybridisation
requires gene-specific probes to distinguish between transcripts of closely related genes
such as members of a multigene family. As described in chapter 3, BnLTP may
represent a small multigenic family with several closely related genes. This would
require sequencing the entire gene family and designing gene-specific probes in order
to distinguish between different gene members. The method, although extremely
informative, is very time consuming. Also, conventional histological techniques often
distort the tissue and therefore it is difficult to distinguish between the different cell
types.
The putative BnLTP promoter (described in chapter 3) was therefore used to
drive the expression of an easily quantifiable reporter gene, namely the bacterial
enzyme, j3-glucuronidase (GUS) (Jefferson et al., 1987). Transgenic host plants
expressing the BnLTP-GUS transgene would enable the promoter activity to be
characterised in vivo. As GUS activity is easily quantifiable by a simple and extremely
sensitive fluorometric assay using MUG as a substrate, small changes in promoter
activity under different environmental conditions could easily be detected. Moreover, it
would serve as a molecular 'marker’ to follow the spatial and temporal expression
patterns of the BnLTP gene throughout development. The fate of those cells
145
expressing GUS could be visualised easily by histochemical analysis. On addition of the
substrate X-Gluc, a blue precipitate is formed in cells expressing GUS. In this way the
tissue specificity of the BnLTP promoter would be established. By correlating the
expression patterns with the known sequence elements present in the promoter region
we can begin to functionally define these elements in the promoter.
This chapter describes the generation and characterisation of transgenic
Arabidopsis thaliana expressing the BnLTP promoter-GUS' fusion.
5.2 Isolation of the putative promoterThe BnLTP promoter contains a well characterised and highly conserved
TATA-box at position -29 (described in Fig. 4.9), which determines transcriptional
initiation and in some cases tissue-specificity in a number of eukaryotic genes (Aso et
a l, 1994). Also primer extension analysis of the gene revealed a putative transcription
initiation site at an adenine residue located 59 bp from the first ATG of the coding
region (see Fig. 4.9 and 4.10). The BnLTP promoter was isolated fi*om the 4.8 kb Eco
RI fi'agment cloned in pBluescript® II SK (-) (clone p3.2Ai5) by PCR. The 5’ non
coding region of the gene was approximately 2 to 3 kb based on PCR with T3 and
1919 primers described in section 4.8.1. The 5’ end of the clone was adjacent to the
T3 region of pBluescript® II SK (-) and was therefore partially sequenced with this
primer. The newly derived sequence was used to design the upstream (forward) primer
designated 2285, (5’gggttG TCG ACC CCA CTA ACT TCC GCG ATA ATC ATG-
3’), designed so that it introduced a unique Sal I site (underlined) at the 5’ end of the
amplified fi-agment. Previous restriction digestion analysis of the clone indicated that
the 4.8 kb fragment did not possess Sal I and Bam HI sites. The downstream (reverse)
primer, 2257 (5’ ggnccGG ATC CTG TTT GCA AAA ATG AGA TGT GTG TGG
3’) was designed from the 5’ untranslated region 21 bp from the ATG start site at
positions +14 to +38 (see gene sequence, Fig.4.9). A unique Bam HI site (underlined)
adjacent to the GC-overhang was introduced at the 3’ end of the PCR-amplified
fragment. The gggtt and gggcc overhangs adjacent to the Sal I and Bam HI sites,
respectively, were included as many restriction enzymes do not cut restriction sites that
are present at the end of a PCR product, but will cut when a few extra bases are added
146
(Kaufman and Evans, 1990). A PCR reaction was set up with primers 2285 and 2257
and plasmid p3.2Ai5 as the template. The putative promoter region was amplified by
PCR with the Pfu DNA Polymerase (Stratagene, Lundberg et a l, 1991). The PCR
product containing the putative promoter was approximately 2.3 kb. The fragment was
gel purified, digested with Sal I and Bam HI and cloned upstream of GUS contained in
the vector pBI 101.1 (Fig. 5.1).
5.3 Generation qî Arabidopsis plants expressing the
heterologous BnLTP-GUS transgene
5.3.1 BnL TP promoter-GC/A construct formationThe 2.3 kb putative promoter described above was cloned into the Bam HI and
Sal I sites in the multiple cloning site (MCS) upstream of the GUS gene in the vector
pBIlOl.l (Fig. 5.1). The ‘promoterless’, 1.87- kb GUS 'cassette’ in pBIlOl.l was
cloned in the Agrobacterium binary vector pBIN 19 (Jefferson et a l, 1987).
Downstream of the GUS gene was a 260 bp fragment which contained the
polyadenylation signal from the nopaline synthase gene (NOS-ter) of the
Agrobacterium Ti plasmid (Zambryski et a l, 1989). Upstream of GUS is the MCS
where fragments can be inserted directionally to produce transcriptional GUS gene
fusions. The vector is kanamycin resistant due to the npt II coding sequence cloned
upstream of the MCS. The gene is driven by the NOS promoter and terminated by
NOS terminator. The product of npt-II confers kanamycin resistance to transformed
plant cells. However, a separate npt II gene contained within the pBIN 19 vector (not
shown in Fig. 5.1) enabled selection of kanamycin resistance in bacterial cells. The
pBIlOl.l vector is 12.2 kb. The distal ends of the cassette contained the left (LB) and
right (RB) borders derived from the T-DNA (Walden et a l, 1991). Breaks in the
chromosomal DNA enable insertion of the T-DNA strand, initially at the right border
region.
The single 2.3 kb PCR product was excised from the agarose gel, purified and
restriction digested with Sal X and Bam HI for a minimum of 4 h. The digested PCR.product was phenol/chloroform extracted and ligated to the corresponding restriction
sites in pBIlOl.l (Fig. 5.1). The putative ligations were transformed into XL-1 blue•i I
cells and the transformants were selected on L-Broth agar plates containing 50 pg/ml
147
■■iS
Fig. 5.1 Schematic diagram of the construction of the BnLTP promoter-
GUS transcriptional fusion
A putative promoter region of 2.3 kb upstream of the start codon in the
gBnLTP gene was amplified with primers tagged with restriction enzyme sites for Sal I
m àBam HI at the 5’ and 3’ ends, respectively, and cloned into the corresponding sites
upstream of the promoterless p-glucuronidase {GUS) reporter gene in pBIlOl.l. The
ATG start and TGA stop codons of GUS are indicated. Downstream of GUS is a 260
bp fragment which contains the polyadenylation signal from the nopaline synthase gene
(NOS-ter) of the Agrobacterium Ti plasmid. Upstream of the GUS gene is a multiple
cloning site (MCS) where fragments can be inserted directionally to produce
transcriptional GUS gene fusions. The vector is kanamycin resistant due to the npt II
coding sequence cloned upstream of the MCS. This gene is driven by the NOS
promoter (NOS-pr) and terminated by NOS terminator (NOS-ter). LB and RB refer to
the left and right borders, respectively. Arrows indicate the direction of integration.
The Sal I, Bam HI and Eco RI restriction sites are shown. The resulting plasmid
construct is designated pBnLTP-GUS.
148
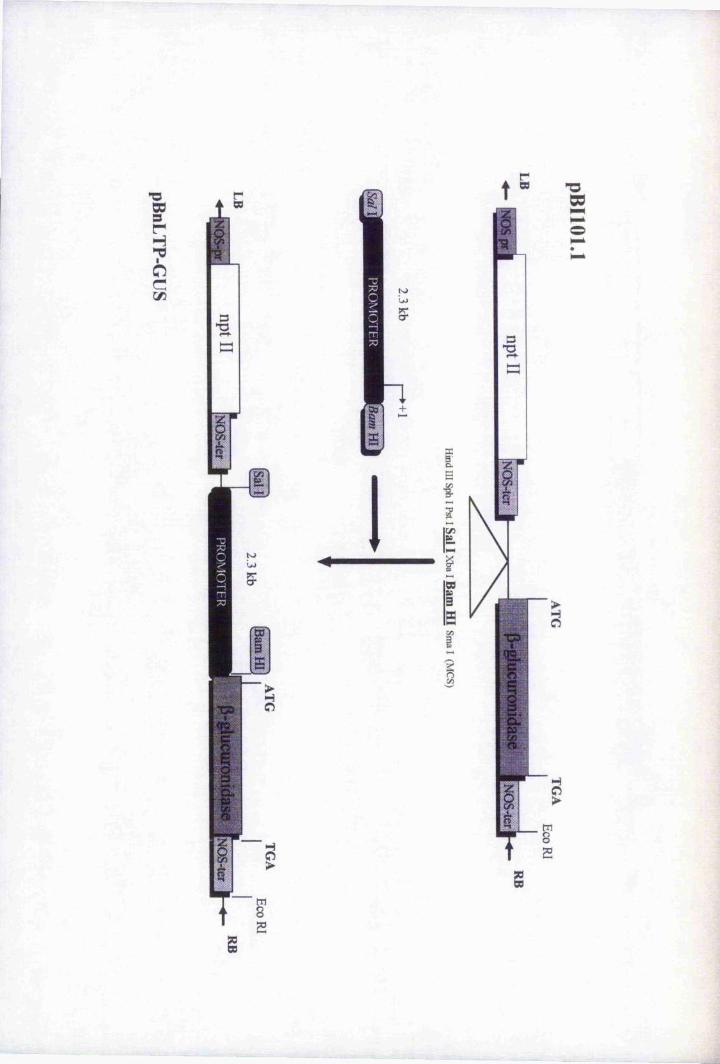
•ogrHyoGc/5
g
h
wu»5 :
"O00
f
î|(/5
F
m
X
■§
kanamycin. Appropriate controls were also set up. Plasmid preparations were carried
out from the positive colonies. The plasmids were digested with Sal I and Bam HI and
the resulting fragments were resolved by agarose gel electrophoresis. Two colonies
generated the correct sized fragments, a 12.2 kb fragment which corresponded to the
pBIlOl.l vector and a 2.3 kb fragment which represented the putative BnLTP
promoter (Fig. 5.2).
An Eco RI site was situated downstream of the GUS gene as shown in Fig. 5.1.
Sal I and Eco RI digestion of the positive clones produced two fragments (data not
shown), a 4,17 kb fragment which represented the BnLTP~ptom.otQv-GUS fusion (i.e.
2.3 kb promoter plus the 1.87 GUS cassette) and the 8 kb vector. These results
confirmed the presence of a single copy of the putative promoter in the GUS cassette.
The two plasmid constructs were designated pBnLTP-GUSl and pBnLTP-GUS2.
5.3.2 Subcloning the BnLTP-GUS cassette into pBluescript(B) II
SK(-)It was necessary to sequence the construct to check for any sequence changes
in the promoter region following the PCR reaction and also to check the promoter-
GUS junction. The pBIN19 vector contains a low copy number RK2 origin of
replication which results in low concentrations of the pBnLTP-GUS plasmids. A higher
concentration of DNA was required for sequencing. The Sal VEco RI fragment
described previously was therefore excised from pBnLTP-GUS2 and subcloned into a
high copy number vector, pBluescript® II SK (-). The ligations were transformed into.DH5a cells and selected on L-Broth agar plates containing 50 pg/ml ampicillin. A
number of colonies were picked for plasmid purification which were then checked by.restriction digestion with Eco RI and Sal I shown in Fig. 5.3. Out of thirteen plasmids.
two displayed the correct restriction pattern. Clones pBS4 and pBSll contained the
4.17 kb BnLTP-GUS Sal VEco RI fragment. These constructs were named pBS-LTP-
GUS4 and pBS-LTP-GUSll. The pBS-LTP-GUS4 plasmid was sequenced with a 22-
nucleotide primer GUSl (S' GAT TTC ACG GGT TGG GTT TOT 3’) which was
complementary to the GUS coding strand and terminated 14 bp downstream of the A
of the initiator ATG. It was also sequenced with primers 2443 and 2849 that spanned
I
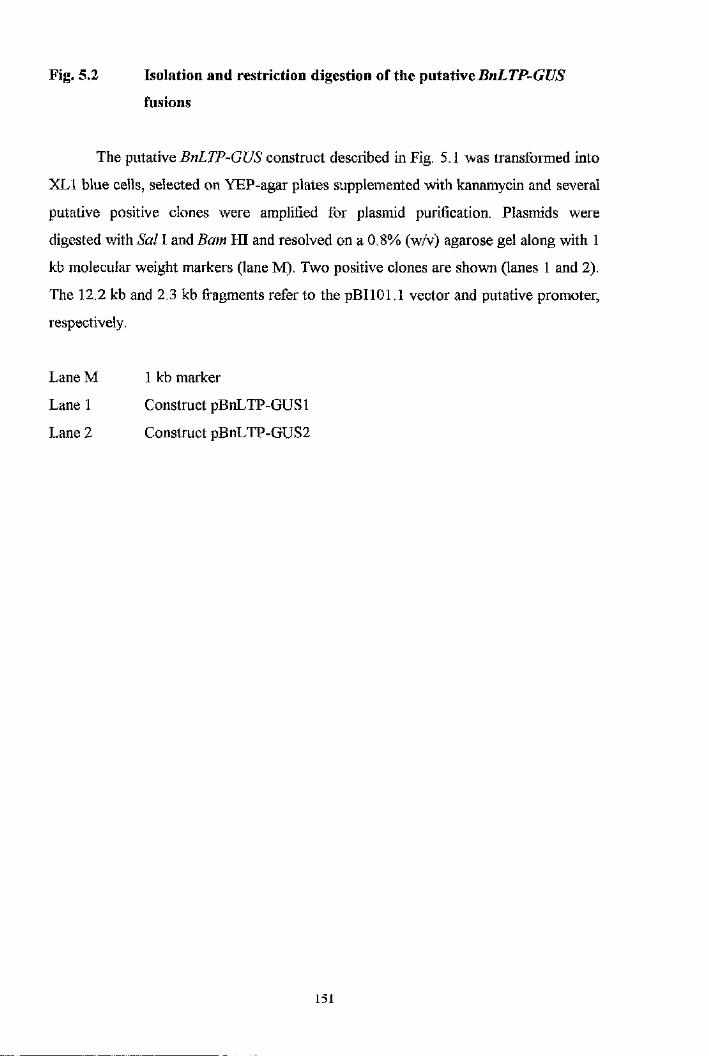
Fig. 5.2 Isolation and restriction digestion of the pvkt2Ai\t BnLTP-GUS
fusions
The putative BnLTP-GUS construct described in Fig. 5.1 was transformed into
XLl blue cells, selected on YEP-agar plates supplemented with kanamycin and several
putative positive clones were amplified for plasmid purification. Plasmids were
digested with Sal I and Bam HI and resolved on a 0.8% (w/v) agarose gel along with 1
kb molecular weight markers (lane M). Two positive clones are shown (lanes 1 and 2).
The 12.2 kb and 2.3 kb fragments refer to the pBIlOl.l vector and putative promoter,
respectively.
Lane M 1 kb marker
Lane 1 Construct pBnLTP-GUSl
Lane 2 Construct pBnLTP-GUS2
151
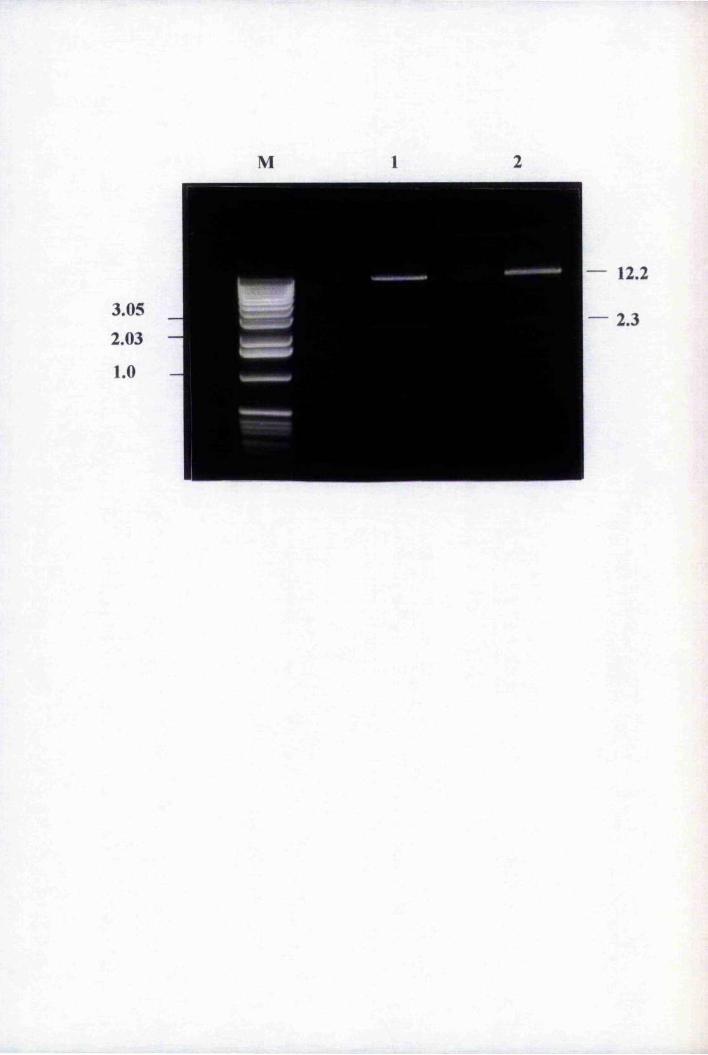
M
3 .0 5
2 .0 3
1.0
12.2
2 .3
t
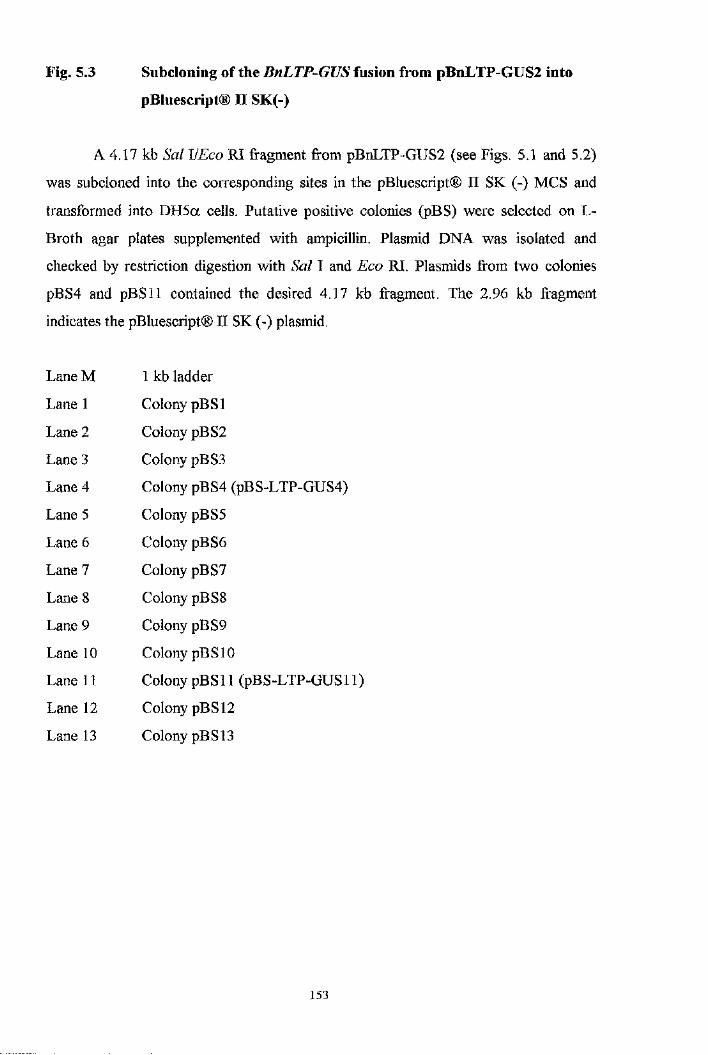
Fig. 5.3 Subcloning of the BnLTP-GUS fusion from pBnLTP-GUS2 into
pBluescript® II SK(-)
A 4.17 kb Sal UEco RI fragment from pBnLTP-GUS2 (see Figs. 5.1 and 5.2)
was subcloned into the corresponding sites in the pBluescript® II SK (-) MCS and
transformed into DH5a cells. Putative positive colonies (pBS) were selected on L-
Broth agar plates supplemented with ampicillin. Plasmid DNA was isolated and
checked by restriction digestion with Sal I and Eco RI. Plasmids from two colonies
pBS4 and pBSll contained the desired 4.17 kb fragment. The 2.96 kb fragment
indicates the pBluescript® II SK (-) plasmid.
Lane M 1 kb ladder
Lane 1 Colony pB SI
Lane 2 Colony pBS2
Lane 3 Colony pBS3
Lane 4 Colony pBS4 (pBS-LTP-GUS4)
Lane 5 Colony pBS5
Lane 6 Colony pBS6
Lane 7 Colony pBS7
Lane 8 Colony pBS8
Lane 9 Colony pBS9
Lane 10 Colony pBSlO
Lane 11 Colony pB Sll (pBS-LTP-GUSll)
Lane 12 Colony pBS12
Lane 13 Colony pBS13
153
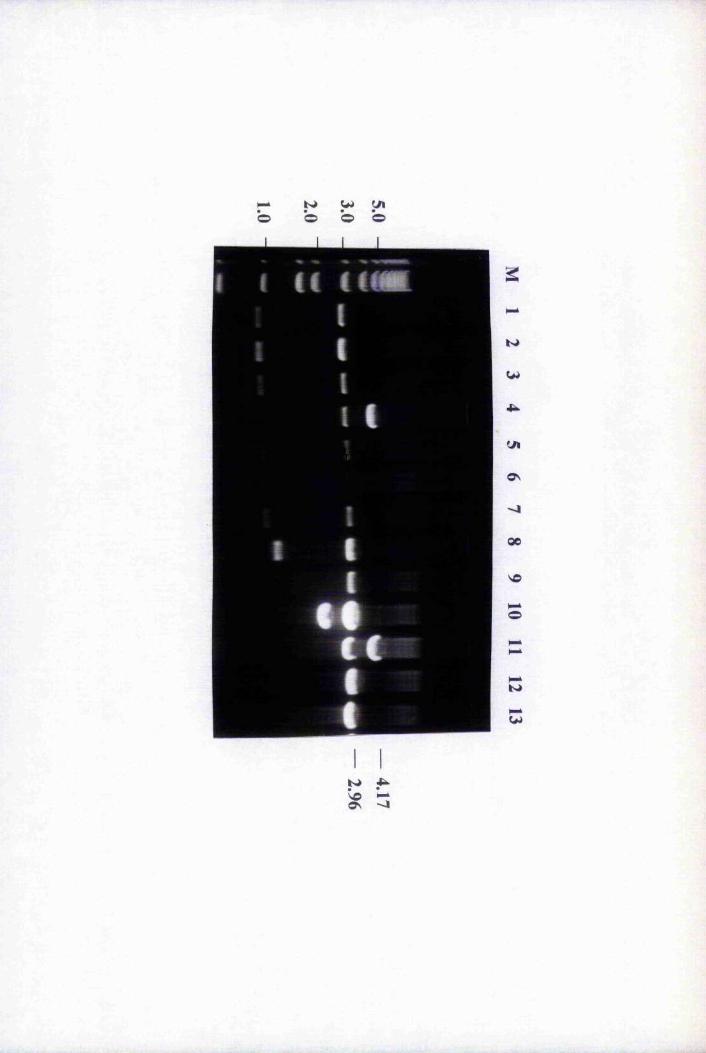
oI
b b
If l i e I II
I I
I I
itc c
I I
w
Ut
ON
-J
00
NO
H*O
>—*
K>
w
the promoter region as shown in Fig.4.9. The sequences were compared with those of
p3.2Ai5 and no differences were detected.
5.3.3 Electroporation of pBS-LTP-GUS4 intoB. napus stem
sectionsTransformation of plants with promoter-GUS constructs is a process that
requires several months’ work before promoter activity can be detected. A relatively
quicker method to determine whether the promoter is active is transformation of the
construct of interest into B. napus tissue sections by electroporation (Fromm et a l,
1985). A small amount of B. napus tissue and the plasmid of interest were mixed
together and an electric charge was applied across them using the Bio-Rad Gene
Puiser® for a few seconds to allow the plasmid to enter the cell. The process was
quick, taking less than a few seconds and required a minimum amount of tissue, about
five or six 2 mm tissue sections. After electroporation the sections were washed
thoroughly in phosphate buffer and incubated overnight in the appropriate buffer
containing X-Gluc. GUS activity was detected by the presence of a blue-indigo
precipitate.
Table 5.1 details the conditions and resulting relative GUS expression following
electroporation of the plasmids into B, napus tissue sections. The expression level was
estimated by the relative intensity of the blue precipitate. pBS“LTP-GUS4 was used in
the electroporations. A positive control plasmid, pBI121 which expressed GUS
constitutively under the control of the CaMV 35S promoter (35S-GUS) was also set
up. Under all the electroporation conditions used the ‘no DNA’ control was negative.
Similarly, GUS activity in 35S-GUS and pBS-LTP-GUS4 was not present in the leaf
sections under all the conditions used. However, under condition A where a voltage,
resistance and capacitance of 1.8 kV, 1000 ohms and 250 pF, respectively, were
applied, only the 35S-GUS plasmid was active in B. napus stem sections whereas pBS-
LTP-GUS4 was negative. However, following electroporation of stem sections under:
condition B, where the voltage was altered from 1.8 kV to 1.6 kV, pBS-LTP-GUS4
activity was extremely high estimated by the level of blue precipitate. 35S-GUS on the
other hand was negative under these conditions. Under condition C (voltage; 1.8 kV,
resistance: 1000 ohms, capacitance: 7 pF) GUS activity was detected for both
1 5 5 %:S.
Table 5.1 Electroporation of Brassica napus leaf and stem tissue with the
pBS-LTP-GUS4 and 35S-GUS plasmid constructs
Young Brassica napus leaves and stems were sliced into small 1-2 mm sections
with a sterile blade and washed thoroughly in ice-cold sterile water for 1 h. Several
sections were placed into a Bio-Rad Gene Puiser cuvette in a total volume of 300 pi of
ice-cold water and 25 pg of the plasmid to be electroporated was mixed with the tissue
sections ensuring everything was kept on ice. The 35S~GUS plasmid constitutively
expresses the GUS gene driven by the CaMV 35S promoter and is used as the positive
control. The sections were electroporated using the conditions shown. Electroporated
sections were washed thoroughly as described in section 2.27 and incubated in X-Gluc
to monitor GUS activity for up to 24 h. GUS activity was estimated qualitatively by
the level of blue precipitate. The voltage (kV), resistance (ohms) and capacitance (pF)
values are indicated.
(-) refers to no GUS activity (no blue precipitate)
(+) refers to low GUS expression (faint blue precipitate)
(-H-+) refers to strong GUS activity (strong blue preciptate)
1 5 6
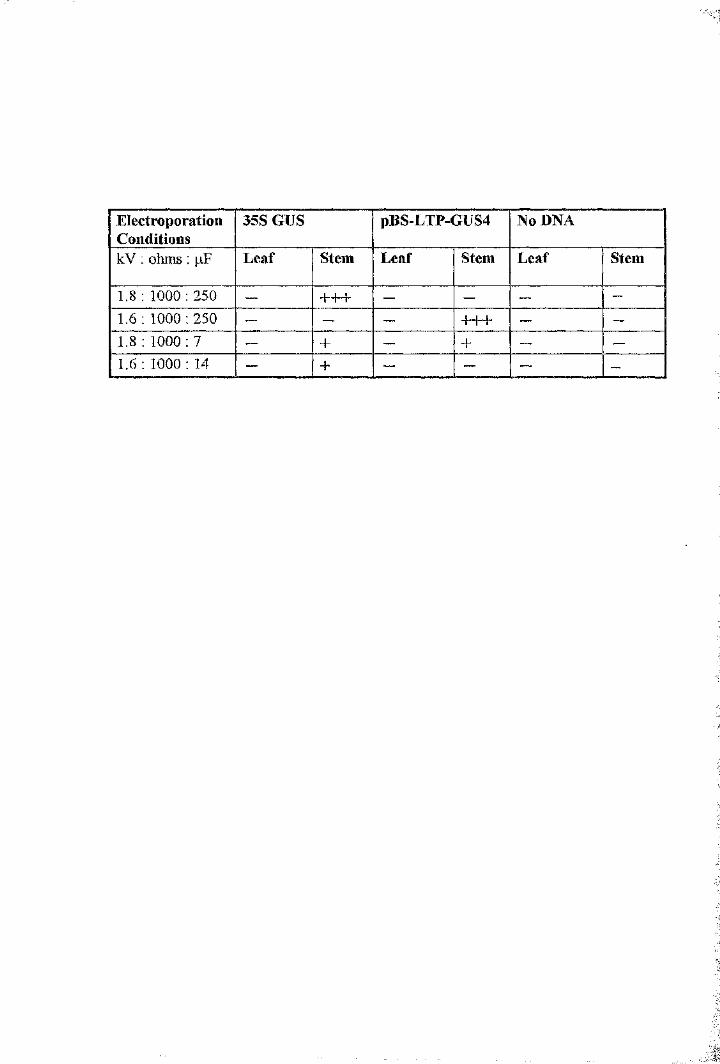
ElectroporationConditions
35S GUS pBS-LTP-GUS4 No DNA
kV : ohms ; pF Leaf Stem Leaf Stem Leaf Stem
1.8 ; 1000 : 250 — +++ “ — — —1.6: 1000:250 — — "FH—h — --
1.8: 1000:7 — + -- + — "—1.6: 1000: 14 — + — — —
plasmids but was very low, whereas under condition D (1.6 kV, 1000 ohms, 14 pF)
only 35S~GUS was active. These experiments indicated that the BnLTP promoter-GUS'
fusion contained within the pBS-LTP-GUS4 plasmid was functional.
5.3.4 Transformation of Agrobacterhim tumefaciens with the
BnLTP-GUS fusionThe pBnLTP-GUS2 plasmid was transformed into Agrobacterium tumefaciens
strain GV3101 by direct ffeeze-thaw as described in section 2,7.2. Essentially, 1 pg of
plasmid was mixed with competent Agrobacterium prepared as described in section
2.6.2. The AgrobacteriaflAHA mixture was flash-frozen in liquid nitrogen and then
immediately incubated at 37“C for 5 min. Warm YEP media was added to the whole
mixture was incubated at 28^C for 2 to 4 h with gentle shaking to allow the antibiotic
resistance genes to be expressed. The cells were then plated onto YEP agar plates
supplemented with gentamycin {Agrobacterium selection) and kanamycin (plasmid
selection). The plates were incubated for 2 to 4 days at 28°C. A total of ten putative
transformants were picked. Prior to plasmid preparations each colony was subjected to
PCR analysis with primers specific to the BnLTP 2.3 kb putative promoter and the
GUS coding region.
5.4 PCR with primer pairs 2285/2257 and 2285/GUSlTo check whether the transformed Agrobacterium tumafaciens contained the
binary vector pBnLTP-GUS2, the colony of interest was directly subjected to PCR
with primers that hybridised to the promoter region and part of the GUS coding
sequence. The primer pairs used were 2257/2285 that hybrisised to the promoter
region, and 2285/GUSl that spanned the promoter region and the first 14 bp of the
GUS coding strand. The colony of interest was placed into a microfrige tube containing
2 0 pi of distilled water, boiled for a few minutes and the crude supernatant extract was
subjected to the PCR reaction. In this case Taq DNA polymerase was used instead of
Pfu. Appropriate control PCR reactions containing the pBnLTP-GUS2 plasmid,
p3 .2 Ai5 which contained the original 4.8 kb genomic fragment along with
untransformed Agrobacterium were also set up. The amplified fragments were
resolved on an agarose gel along with the 1 kb size markers (Fig. 5.4). Colonies.
1 5 8
Fig. 5.4 PCR of putative Agrobacterium tumefaciens transformants of the
pBuLTP-GUS2 plasmid with BnLTP promoter-specific primers,
2285 and 2257
Putative positive colonies were directly subjected to PCR with primers 2285
and 2257 that amplified a 2.3 kb 5’ upstream region of the BnLTP promoter. The PCR
conditions were dénaturation 95”C, 1 min; annealing 50°C, 5 min; extension, 72“C, 5
min, cycled 35 times (see section 2.24 and 5.4). The PCR products were resolved in
0.8% (w/v) agarose gels along with DNA size markers.
Lane M 1 kb ladder
Lane 1 Untransformed Agrobacterium (negative control)
Lane 2 Putative positive Colony A
Lane 3 Putative positive Colony B
Lane 4 Putative positive Colony C
Lane 5 Plasmid pBnLTP-GUS2 (positive control)
Lane 6 Plasmid p3.2Ais (positive control)
1 5 9
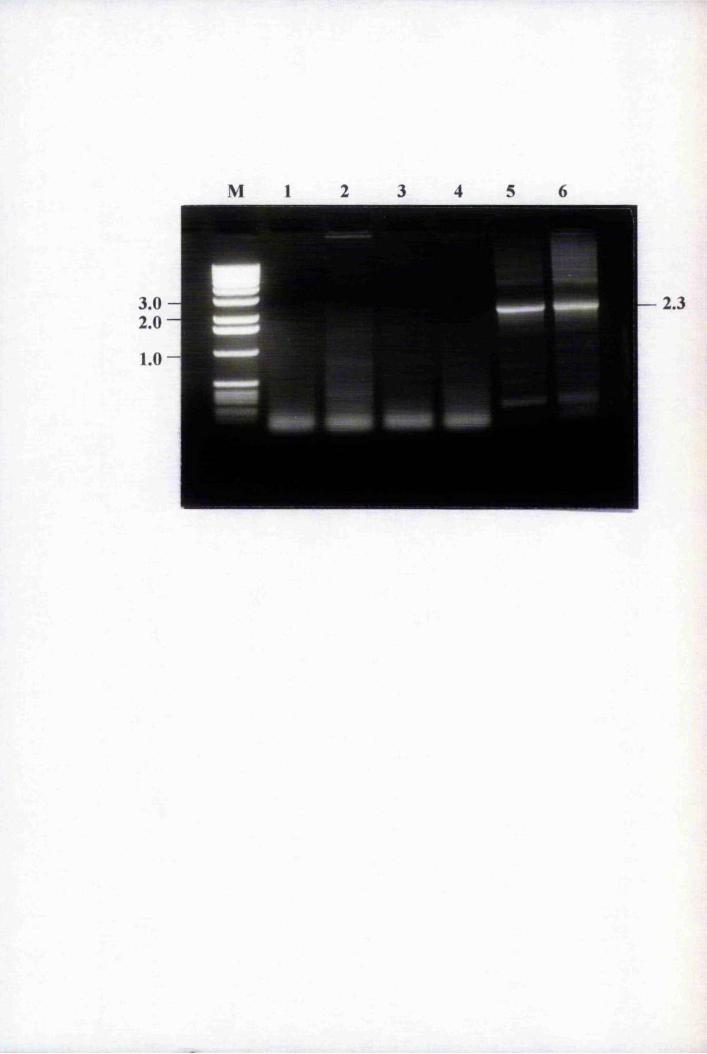
M
3.0 —2.0 -
— 2.3
A and B (lanes 2 and 3, respectively) amplified a faint band of 2.3 kb with primers
2285 and 2257. Untransformed Agfvbacterium, as expected, did not amplify a band
(Lane 1). Conversely, Colony C (Lane 4) either did not amplify the appropriate sized
fragment or produced a fainter band than that produced in Colonies A and B. This may
be attributed to a difference in copy number of plasmid in these bacteria. pBnLTP-
GUS2 (Lane 5) and p3.2Ais (Lane 6 ) both amplified a relatively stronger band of 2.3
kb.
A band of approximately 2.3 kb amplified with primers 2285 and GUSl is
shown in Fig. 5.5. Lane 1 contained plasmid pBnLTP-GUS2, Lane 2 contained
Argobacterium Colony A transformed with pBnLTP-GUS2, Lane 3 contained
untransformed Agrobacterium, Lane 4 contained plasmid p3.2Ais and Lane 5
contained a 2.3 kb 2285/2257 amplified fragment from pBnLTP-GUS2. As expected
the untransformed Agt^obacierium and p3.2Aig did not amplify the appropriate band.
The latter did however amplify non-specific bands, ranging from 1.0 to 3 kb. These
results confirmed that the pBnLTP-GUS2 plasmid was present in Agrobacterium
Colony A.
5.5 Restriction digestion of pBnLTP-GUS isolated from
AgrobacteriumPlasmid preparations were also carried out fi'om pBnLTP-GUS2 transformed
Agrobacterium Colony A. However, the concentration of the isolated plasmid was
extremely low and it was difficult to interpret the restriction digestion pattern. The
Agrobacterium~ho\nX&6. pBnLTP-GU2 plasmid was therefore retransformed into
DH5a cells, amplified and the plasmid isolated. Although plasmid concentrations were
still relatively low owing to the low copy number origin of replication, RK2, enough
was isolated for restriction digestion. 0.5 to 1 pg of plasmid DNA was digested with
Hind III, Eco RI, Bgl II and Sau 3A (Fig. 5.6). The restriction pattern of the
transformed plasmid was identical to the original untransformed plasmid. The PCR and
restriction digestion analyses therefore confirmed that the pBnLTP-GUS2 plasmid
transformed into Agrobacterium had not undergone any gross sequence
rearrangements.
161
Fig. 5.5 PCR of putative Agrobacterium transformants of plasmid pBnLTP-
GUS2 with primers 2285 and GUSl
The PCR reactions described in Fig. 5.4 were repeated using primers 2285
(upstream) and GUSl (5’GAT TTC ACG GGT TGG GTT TCT3’) which is
complementary to the GUS coding strand and terminates 14 bp from the adenine
residue of the initiator ATG. The PCR conditions were dénaturation 95°C, 1 min;
annealing 50°C, 5 min; extension, 72"C, 5 min, cycled 35 times (see sections 2.24 and
5.4). The PCR products were resolved in 0.8% (w/v) agarose gels along with DNA
size markers.
Lane M 1 kb ladder
Lane 1 Plasmid pBnLTP-GUS2 (positive control)
Lane 2 Putative postive Colony A
Lane 3 Untransformed Agrobacterium (negative control)
Lane4 Plasmid p3 .2 A i5 (negative control)
Lane 5 2285/2257 amplified fi*agment (from PCR reaction in lane 5, Fig. 5.4)
1 6 2
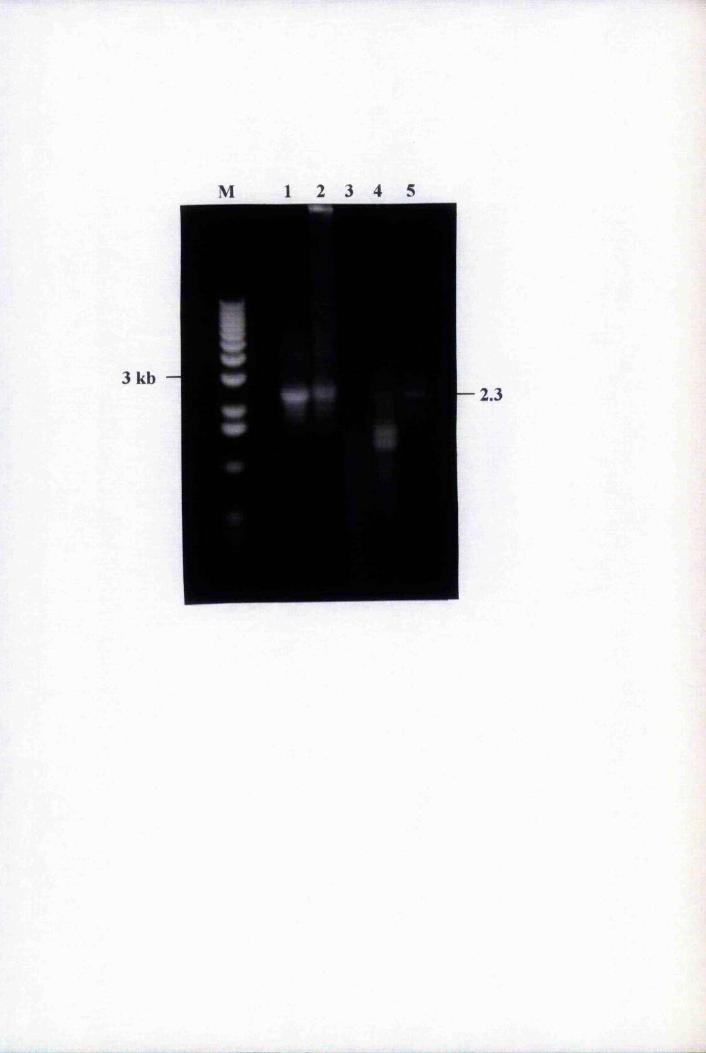
1 2 3 4 5
3 kb
Fig. 5.6 Comparison of restriction digestion patterns of pBnLTP-GTJS2
before and utter Agrobacterium tumifaciens transformation
Plasmid pBnLTP-GUS2 was isolated from Agrobacterium Colony A using the
method described in section 2.8.3. The plasmid was then re-transformed into DH5a
cells, amplified and isolated using the Promega Wizard^^* Plus Minipreps plasmid
purification kit (see section 2.8.1). 0.5 to 1 pg of purified pBnLTP-GUS2 and the
original untransformed plasmid were digested with Hind III, Eco RI, Bgl II, and Sau
3A and resolved in a 0.8% (w/v) agarose gel along with 1 kb markers (Lane M).
Lane 1 Purified pBnLTP-GUS2 cut w i t h I I I
Lane 2 Untransformed pBnLTP-GUS2 cut WAhHind III
Lane 3 Purified pBnLTP-GUS2 cut with Eco RI
Lane 4 Untransformed pBnLTP-GUS2 cut with Eco RI
Lane 5 Purified pBnLTP-GUS2 cut with Eg/ II
Lane 6 Untransformed pBnLTP-GUS2 cut with Eg/ II
Lane 7 Purified pBnLTP-GUS2 cut withEow 3 A
Lane 8 Untransformed pBnLTP-GUS2 cut with Sau 3 A
1 6 4
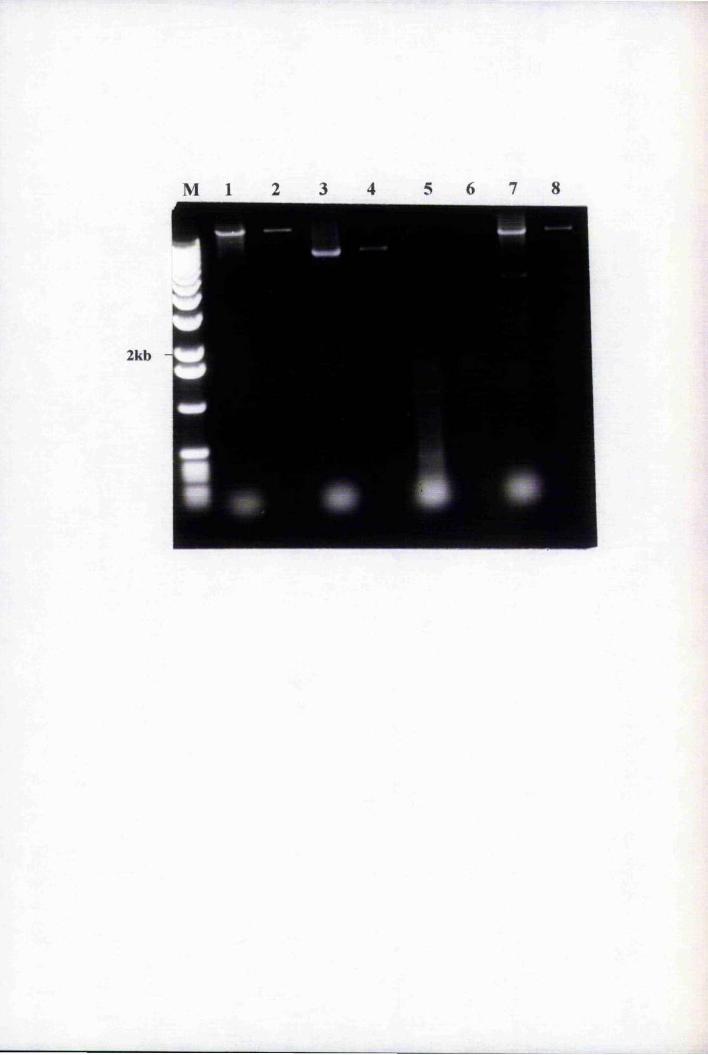
M l 2 3 4 5 6 7 8
2kb -
1
5.6 Agrobacterium-meamteA transformation oî Arabidopsis
thaliana with pBnLTP-GUSl by vacuum infiltrationWild type Arabidopsis thaliana ecotype Landsberg erecta (To) were
transformed with the Agrobacterium Colony A containing the pBnLTP-GUS2 plasmid
using the vacuum infiltration method described by Bechtold et ah (1993). The bacteria
were allowed to penetrate the developing embryos, normally at the stage where the
flower buds were just beginning to open. This plant cell and bacterium interaction was
achieved by immersing the floral buds in a solution of the Agt'obacterhim (Colony A)
and a vacuum was applied for several minutes. The rapid release of the vacuum
ensured that the plant tissue was penetrated with the bacterium. Seed was harvested
from each transformed plant and selected for kanamycin resistance on germination
media containing 50 pg/ml kanamycin.
«5.7 Selection and analysis of transformants
Seven kanamycin resistant plants (Tl) were selected in the primary screen.
Seed from T2 and T3 generations were analysed further with respect to segregation of
the kanamycin-resistance phenotype. Results of the segregation analysis are presented
in Table 5.2. Wild type and NM4 {CHS promoter-GfAS) seed were also sown as
negative and positive controls, respectively. After ten days on selective germination
media, 1 0 0 % of the wild type seed were completely bleached and died within a few
days whereas 1 0 0 % of the NM4 seed were dark green and had started to produce
secondary leaves. Around 40% of the pBnLTP-GUS2 transformed seedlings were dark
green, some of which had started to produce secondary leaves. They were transferred
to soil and T2 seed was collected.
T2 seedlings that produced a segregation ratio of 3:1, kanamycin resistant:
kanamycin sensitive were selected. T3 seedlings that did not show a 3:1 segregation
pattern and were 1 0 0 % kanamycin-resistant were considered to be homozygous for
the transgene. Three putative T3 homozygous lines, line 1C, line 2D and line 3 A were-
selected for further molecular analysis.
:
1 6 6
Table 5.2 Analysis of progeny of Arabidopsis thaliana transformants
Primary transformed plants were selfed and seed collected. The seeds were
grown on germination medium supplemented with 50 pg/ml kanamycin. The number
of kanamycin-resistant (KnR) and kanamycin-sensitive (KnS) plants were counted and
the KanR:KanS ratio was calculated. Seed was collected from each KnR plant (T2
generation) and replated on selective media and the seedlings (T3 generation) analysed
for kanamycin resistance. Wild type and NM4 seed were plated as negative and
positive controls, respectively.
167
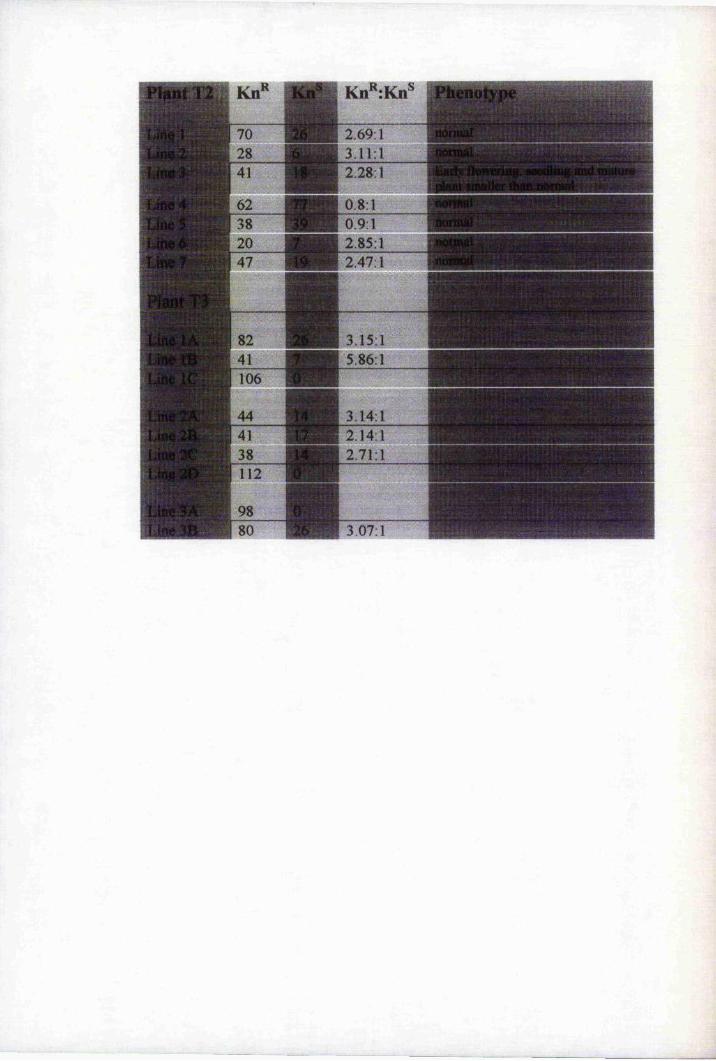
•nP.1JÏ£1trS»*T!-
tw. .? ..(..t .• . . :............... ,•. .1 h •• .-II-. •.# • i.(ît!»3»i^ %
'■'''‘‘ __ . "ItLwi
I*' rlr
i#. r' 7'!" ‘'J: I
3.14:1 r > “‘
«©•îsawp~'. '• . f.,* y.
5.8 Molecular characterisation of Lines 1C, 2D and 3 A
5.8.1 PCR with primers 2285/GUSlGenomic DNA was isolated from each of the three lines and subjected to PCR
with primers 2285 and GUSl that spanned the entire BnLTP promoter and the 5’
coding region of the GUS gene. DNA fr om wild type untransformed Agrobacterium
and pBnLTP-GUS2 was also amplified. In each case Taq DNA polymerase was used.
The fragments were resolved on agarose gel along with DNA molecular weight
markers as shown in Fig.5.7. A band was not amplified when genomic DNA from
untransformed plants was used (Lane 1). However, lines 1C, 2D and 3A (Lanes 2, 3
and 4, respectively) all amplified the predicted 2.3 kb band corresponding to the
BnLTP promoter along with two other bands of approximately 1.4 kb and 1.2 kb,
respectively. As expected, pBnLTP-GUS2 amplified a single band of 2.3 kb (Lane 5).
Lane 6 contained the 2.3 kb fragment amplified by PCR with primers 2285 and 2257 of
p3.2Ai5.
5.8.2 Determination of transgene copy number by Southern
blot analysisTransgene insertion sites and therefore copy number were revealed by Southern
hybridisation with the firll length GUS DNA probe. Genomic DNA isolated from the
T3 transgenic lines was digested with Bam HI and Hind III, both of which did not
digest within the GUS coding region and the resulting fragments were hybridised to the
full length GUS DNA probe. Untransformed Arabidopsis DNA and transgenic plants
carrying the 35S-GUS transgene were used as controls (Fig. 5.8A).
Hind III digestion of line IB produced three hybridising bands of
approximately 10 kb, 8 kb and 6kb (LI). Line 2D (L2) also produced three bands of
approximately 12 kb, 10 kb and 7 kb. Four Hind 111 fragments of approximately 12.2
kb, 10 kb, 8 kb and 6 kb hybridised to GUS in Line 3 A (L3) whereas a single Hind III
fragment of 3.2 kb was produced from 35S-GUS genomic DNA and as expected no
bands were detected in untransformed wild-type genomic DNA (WT). The site of
integration of the transgene was different in each case, as evident from the different
restriction patterns produced. These results also suggested that multiple copies of the
1 6 9
Fig. 5.7 PCR of genomic DNA isolated from transgenic lines 1C, 2D and
3A with primers 2285 and GUSl
Genomic DNA was isolated from untransformed Arabidopsis and putative
transgenic lines 1C, 2D and 3 A using the method described in section 2.8.4 and used in
PCR reactions with primers 2285 and GUSl. The PCR conditions were dénaturation
95“C, 1 min; annealing 50‘ C, 5 min; extension, 72®C, 5 min, cycled 35 times (see
section 2.24 and 5.4). The PCR products were resolved on 0.8% (w/v) agarose gels
along with a DNA size marker.
Lane M 1 kb ladder
Lane 1 \]nXxdimtovmQ& Arabidopsis
Lane 2 Transgenic line 1C
Lane 3 Transgenic line 2D
Lane 4 Transgenic line 3 A
Lane 5 Plasmid pBnLTP-GUS2
Lane 6 2285/2257 amplified fragment (from PCR reaction in lane 5, Fig. 5.4)
170
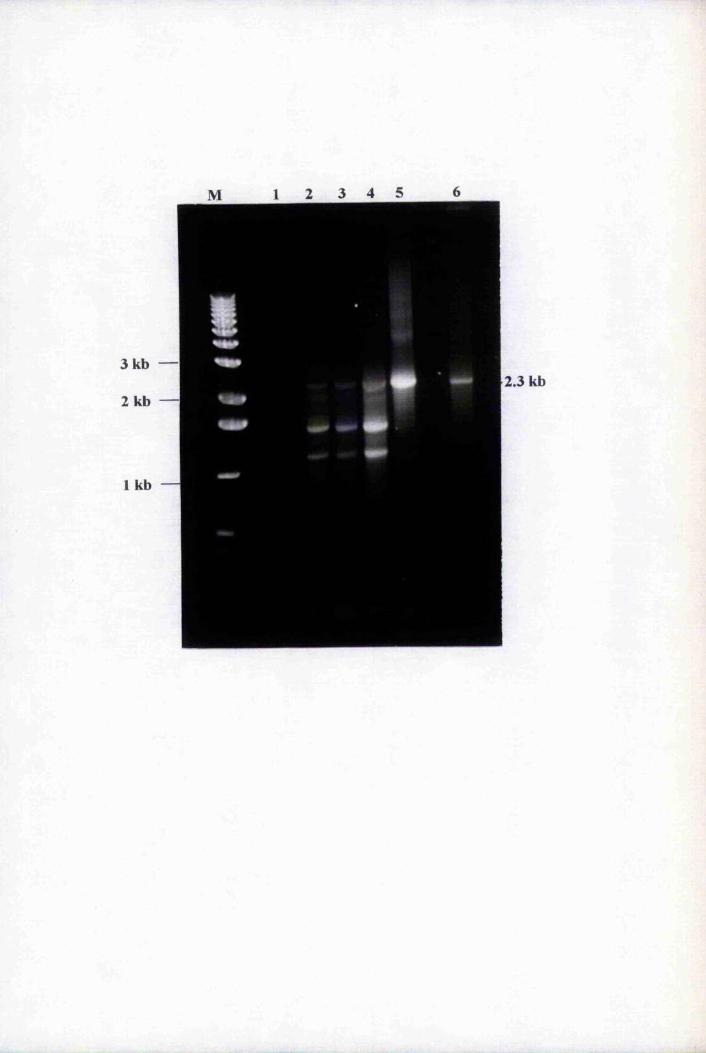
2.3 kb
i
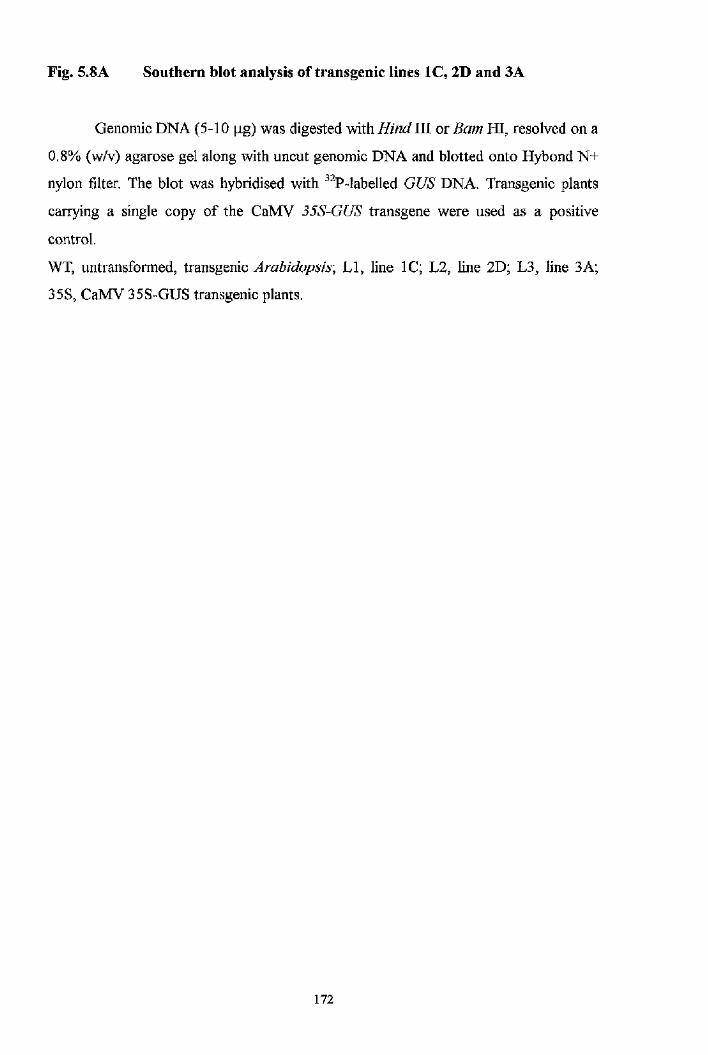
Fig. 5.8A Southern blot analysis of transgenic lines 1C, 2D and 3A
Genomic DNA (5-10 pg) was digested with Hind III or Bam HI, resolved on a
0.8% (w/v) agarose gel along with uncut genomic DNA and blotted onto Hybond N+
nylon filter. The blot was hybridised with ^^P-labelled GUS DNA. Transgenic plants
carrying a single copy of the CaMV 35S-GUS transgene were used as a positive
control.
WT, untransformed, transgenic Arabidopsis; LI, line 1C; L2, line 2D; L3, line 3A;
35S, CaMV 35S-GUS transgenic plants.
1 7 2
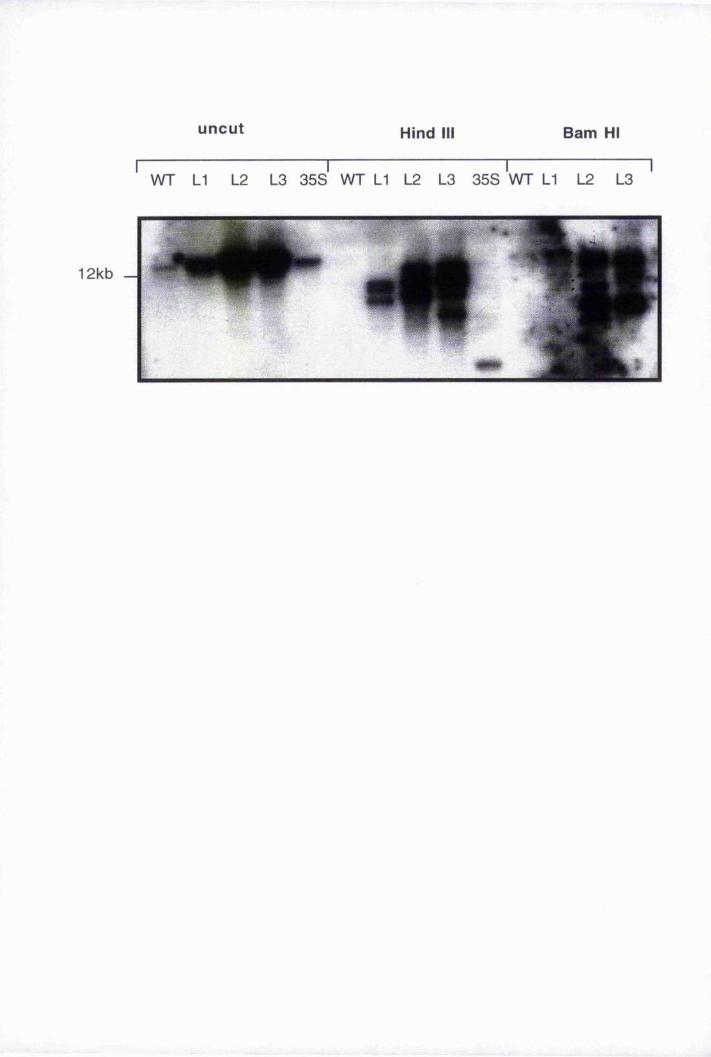
uncut Hind III Bam HI
WT L1 L2 L3 35S WT LI L2 L3 35S WT LI L2 L3
1 2 k b —
il■à
transgene were present in the three lines (3 copies in line IB and 2D and 4 copies in
line 3 A) and did not correlate with the previous segregation analysis (3:1), which
indicated that the transgene was present at a single locus in each line. However, there
was a strong possibility that the transgene was fragmented during the integration event.
Southern hybridisation with the 2.3 kb 2285/GUSl PCR-amplified fragment from
pBnLTP-GUS2 which spanned the entire BnLTP promoter and GUS junction produced
relatively fewer bands (Fig. 5.8B). A single H indlll fragment in line IB and two in line
2D and three bands from line 3 A hybridised to this PCR probe. The upper band in lines
2D and 3 A represented undigested DNA. Based on these results it was concluded that
a single full length transgene was present in lines IB and 2D and that two full length
copies were present in line 3 A. The multiple bands produced in the GUS-probed
Southern (Fig.5.8A) were probably due to fragmented transgene copies.
5.9 GUS expression driven by the BnLTP promoterPhenotypically, lines IB and 2D were like wild type untransformed Arabidopsis
in terms of growth and development. Line 3A however, appeared to be relatively.
smaller. It had a shorter and thinner stem and the leaves were rounder and smaller.""I
Also, it flowered one week earlier than lines IB and 2D. In order to test whether the
BnLTP promoter was active in these plants, 2 to 3 week old seedlings from each of the
three T3 lines were incubated in phosphate buffer containing the GUS substrate, X-
Gluc. The seedlings were incubated between 2 to 24 h at 37”C. As shown in Fig.5.9 all
three seedlings produced the blue precipitate in the leaves, stems, petioles and flower
buds which was indicative of GUS activity. Younger leaves had higher GUS activity
compared to older leaves. The level of background GUS expression was estimated by
incubating wild type untransformed Arabidopsis seedlings in X-Gluc. Although GUS
appeared to be expressed in all organs it was not clear whether it was expressed in a
cell-specific manner.
5.10 DiscussionTransformation of Arabidopsis thaliana using Agf'obacterium tumefaciens can
be achieved in a number of ways: inoculation of cotyledons and leaf tissue, inoculation
of roots, seeds and wounded inflorescence meristems and a relatively new and quicker
1 7 4
Fig. 5.8B Southern blot analysis of transgenic lines 1C, 2D and 3A with the
BnLTP-GUS fragment
Genomic DNA (5-10 pg) was digested withH indBl, resolved on a 0.8% (w/v)
agarose gel and blotted onto Hybond N+ nylon filter. The blot was hybridised to the
BnLTP-GUS VCK amplified fragment (see section 5.8.2).
Untransformed plants, WT; LI, transgenic line 1C; L2, transgenic line 2D; L3,
transgenic line 3 A.
1 7 5

L I L2 L3 WT
1
IIIaI i
I
I1II
Fig. 5.9 GUS expression in transgenic lines IB, 2D and 3C
Four week old seedlings were incubated in 50 mM sodium phosphate, pH 7.0
containing 1 mg/ml X-Gluc at 37“C for up to 24 h until a blue precipitate was formed.
Background GUS activity was estimated by incubating non-transformed Arabidopsis
plants in X-Gluc. Plants were washed thoroughly in 50 mM sodium phosphate, cleared
in EtOH and viewed using a dissecting microscope. Magnification X 1.5
a. Non transformed Arabidopsis
b. Transgenic line IB
c. Transgenic line 2D
d. Transgenic line 3C
1 7 7
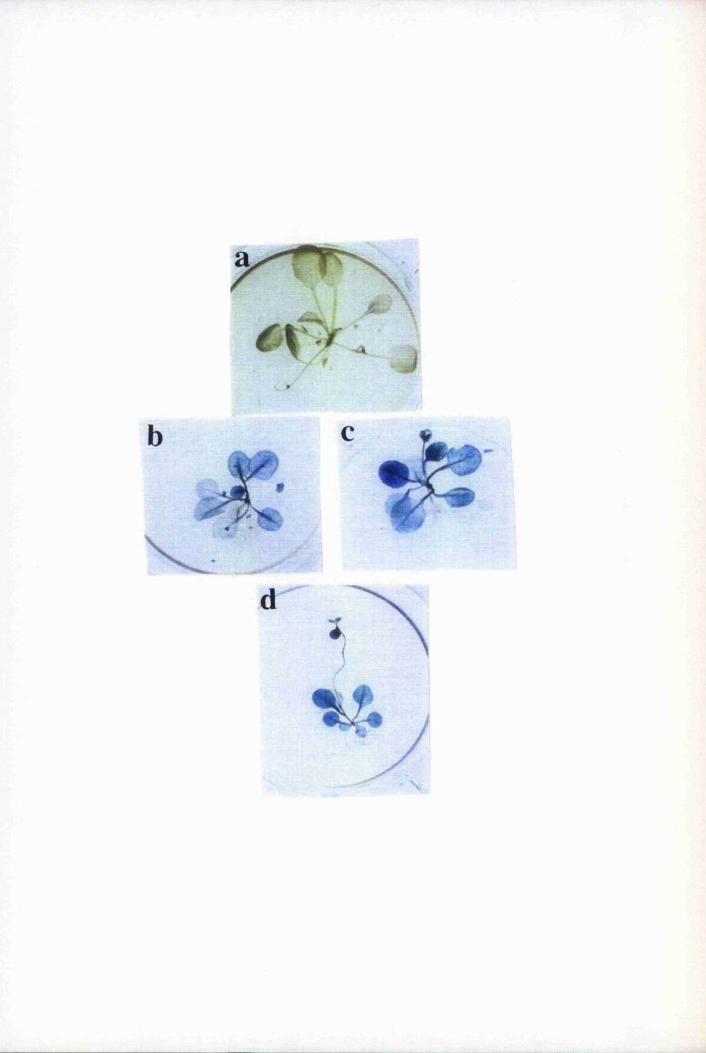
.ri%
7
method of vacuum infiltration of flowering plants in a liquid suspension of
Agrohacteriim (Schmidt and Willmitzer, 1988; Valvekens et al., 1988; Feldmann and
Marks, 1987; Chang et a l, 1994; Betchold et a l, 1993). This chapter describes the
transformation by vacuum infiltration and characterisation o i Arabidopsis plants with a
promoter-GfTS' fusion.
A 2.3 kb upstream region of the BnLTP gene was amplified by PGR with a high
fidelity DNA polymerase, Pfu, and cloned upstream of the GUS reporter gene in the
binary vector pBIlOl.l to produce the BnLTP■‘promoter~GUS fusion. Pfu polymerase
was used in preference to Taq poylmerase since it has a lower mutation rate during
replication (approximately 1 in 100,000) due to its proofi*eading ability (Lundberg et
a l, 1991; Eckert and Kunkel, 1991). This property of the enzyme was important
especially when amplifying larger regions of DNA (> 1000 bp), and in particular in the
amplification of putative promoter regions. Any mutations in the promoter elements
required for transcription may lead to altered promoter activity.
The promoter-GCTS fusion was introduced into Arahidopsis plants via
Àgrobacterium-mQ^miQà transformation by vacuum infiltration in an attempt to study
the spatial and temporal expression pattern of the gene. Although this system involved
the introduction of a heterologous B. napus promoter into Arahidopsis it was
considered a suitable approach. First of all, Kowalski et a l (1994) have shown that
Arahidopsis and Brassica have similar developmental processes and high sequence
homology of several genes. Moreover, Arahidopsis is an ideal model for studying a
myriad of developmental processes (discussed in section 1.1.2). In addition the
successful use of reporter genes driven by heterologous promoters has been described
by a number of authors (for example, Pyee and Kolattukudy, 1995). Although
homologous systems are ideal in the studies of foreign gene expression, heterologous
systems have some advantages. For example, there is often the danger of gene
silencing by DNA méthylation and a phenomenon known as repeat sequence induced
point mutations (RIP) (Matzke and Matzke, 1993; Finnegan and McElroy, 1994) in
plants carrying several homologous gene copies. However, it has to be stressed that
these phenomena have been reported for coding rather than promoter sequences
(Matzke and Matzke, 1993).
1 7 9
The 2.3 kb putative PCR-amplified promoter fragment was sequenced and no
sequence differences were observed when compared to the original genomic clone,
p3.2Ai5. The putative promoter was cloned upstream of the promoterless GUS gene in
pBIlOl.l. Prior to tranformation of host plants the BnLTP-GUS cassette was
subcloned into pBluescript® II SK (-) and electroporated into Brassica napus stem
sections, a process that takes a few seconds. The stems were then incubated overnight
in X-Gluc to monitor GUS activity. This was a quick and simple method for testing
whether the promoter was active prior to plant transformation. Several of the stem
sections under different electroporation conditions produced a blue precipitate
suggesting that the 2.3 kb PCR-amplified fragment was driving GUS expression.
The pBnLTP-GUS2 plasmid was transformed into Ap^obacterium using the
quick freeze-thaw method. To check for any rearrangement of the construct during the
transformation process, pBnLTP-GUS2 was isolated from Agrobactermm and analysed
by restriction digestion. No gross sequence rearrangements were observed. The fusion
was then transformed into Arahidopsis developing flowers by vacuum infiltration.
Around 40% of the primary transformed seed tested were kanamycin resistant, which
suggested the method was extremely efficient and relatively quicker than other
methods described in the literature.
Several putative positive lines were selected and those that segregated in a
typical 3:1 (Kn^ :Kn ) ratio in the T2 generation were selected. This observation
suggests that the BnLTP~GUS transgene was present at a single locus and segregated
in a true Mendelian fashion. It was therefore expected that one third of the T2 resistant
lines from one segregation event would be homozygous for the transgene, whereas
two thirds would be heterozygous. The putative homozygotes and heterozygotes
appeared to be equally resistant to kanamycin based on their rates of development on
kanamycin selective media.
Three T3 lines, IB, 2D and 3A were selected and analysed fiirther by PCR with
promoter-Gf/5 gene specific primers and by Southern blot analysis. In Southern blots
of Hind III and Bam HI digested genomic DNA isolated from each of the putative
transgenic lines, several bands hybridising to GUS were observed (Fig. 5.8A), which
suggested several integration events. At least three copies of the transgene were
180
present in line 1C, three in line 2D and four in line 3A, which contradicted the 3:1
(KnR:KnS) segregation pattern of the transgene. However, hybridisation of the same
fragments with the BnLTP-GUS PCR-amplified fragment that spanned the entire
promoter and part of the GUS gene at the 5’ end reduced the number of hybridising
fi*agments iwBam HI digested lines (Fig. 5.8B); one in line 1C, one in line 2D and two
in line 3 A, which indicated that some of the Gt/5-hybridising bands were fragmented
transgenes. This may also explain the presence of smaller bands when the promoter
region was amplified with primers 2285 and GUSl (Fig. 5.7). It is therefore likely that
some of the transgene copies were non-functional, accounting for the presence of a
single, functional locus in the segregation analysis.
The level of GUS expression did not vary considerably between the different
lines (Fig. 5.9). Line 3 A had a slightly higher level of GUS expression compared to the
other two lines. This variation in transgene expression may be attributed to positional
effects, copy number, transgene configuration (Hobbs et a l, 1993), various gene
silencing (epigenetic) phenomena (Matzke and Matzke, 1993; Finnegan and McElroy,
1994) and transgene rearrangements or deletions induced in the host during the
integration process (Gheysen et a l, 1987). It is inevitable that genetic transformation
of plants leads to a large and random variation in the expression of the newly
introduced transgene between individual transformants (Nap et. a l, 1993). This
observation is most likely due to different integration sites of the transgene, the
expression of which can be influenced by the surrounding chromatin. It is often the
case that transgenes can integrate in tandem arrays at a single or multiple loci, become
inverted or integrate as direct repeats (Spielmann and Simpson, 1986). Indeed, the
three transgenic lines described in this work had different restriction digest patterns
indicating different integration events. In addition. Line 3A had a different phenotype
from the other two lines which indicates the difference in transgene integration in this
line. Mlynarova et a l (1995) overcame this variability in transgene expression by
including chromatin boundary elements at the borders of the Apobacterhim T-DNA.
They introduced the chicken lysozyme matrix-associated region (MAR) or the A
element at the T-DNA borders which is thought to protect the transgenes from the
influences of the surrounding chromatin (Laemmli et a l, 1992) or to prevent
1 8 1
mislocalization of the genes in the heterochromatin (Dorer and Henikoff, 1994) by
virtue of their affinity for the nuclear matrix.
1 8 2
Chapter 6 Analysis of LTP expression
expression was also quantified by a fluorometric assay in response to a variety of
1 8 3
| l
6,1 IntroductionIn order to study tissue-specific and environmental regulation of BnLTP
expression, a 2.3 kb 5’ flanking region directly upstream of the translation start site of
the gene was fused to the GUS reporter gene and introduced into Arahidopsis plants
(described in Chapter 5). A closer analysis of the promoter region (Fig. 6.1, section
6.2) indicated that it contained a number of putative regulatory elements implicated in
tissue-specific and environmental regulation. Expression of the BnLTP promoter- GUS
fusion in transgenic plants was examined throughout development by a combination of
histochemical localisation of GUS in whole organs and in tissue cross-sections. GUS
environmental stimuli. In parallel experiments, endogenous LTP transcript levels were
examined by northern blot analysis in wild type B. napus and Arahidopsis plants and in
epideimally altered Arahidopsis mutants.
6,2 Analysis of the BnLTP promoterThe BnLTP promoter region was analysed and several putative transcriptional
regulatory cis-acting elements were identified (Fig. 6.1). A putative cis-acting element,
designated box D l, implicated in epidermal-specific expression of the tobacco LTP
gene (NtltpJ) (Canevascini et a l, 1996) was observed at nucleotide -129 in the BnLTP
promoter. The sequence (ATAGCTAG) differed at a single nucleotide (C-^A
substitution) from the eight-nucleotide palindromic sequence CTAGCTAG located in
the Ntltpl leader sequence (Canevascini et a l, 1996). Deletion analysis of the Ntltpl
promoter from its 5’ end indicated that the 148 bp preceding the translation start site
was sufficient for epidermal-specific expression. This element is conserved in other
LTP genes (Fleming et a l, 1992; Pelese-Siebenburg et a l, 1994; Kalla et a l, 1994).
Several sequences with the core ACGT (or TGCA) were identified. This core :
sequence is common to several light and abscisic acid (ABA) response elements in a
number of genes including the Arahidopsis CHS and PAL genes, cold and ABA-
induced barley Z7F genes, ghltp4.2, ghltp4,6 and ghltp4.9 (White et a l, 1994) and the
Fig, 6,1 Sequence analysis of the BnLTP promoter
The putative ATG translation start site (ATG:met) is underlined. The TATA-
box, Dl element, I-box, GT-1 motifs and the MYB-like elements are shown in bold.
The ACGT and TGCA elements are underlined. The +1 above the adenine residue (in
bold) refers to the transcription start site. The numbers shown on the left hand side of
the sequence indicate the nucleotide position relative to the transcription start site.
Other putative cis-acting regulatory elements are discussed in section 6.1.
1 8 4
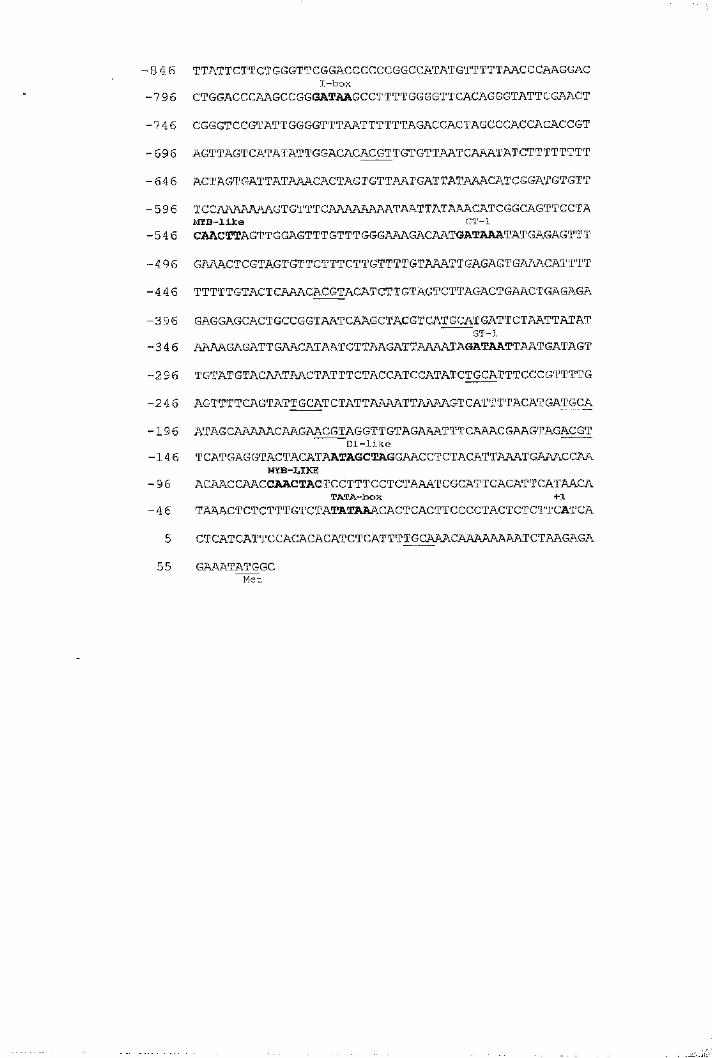
-846 TTATTCTTCTGGGTTCGGACCCCCCGGCCATATGTTTTTAACCCAAGGACI-box
-796 CTGGACCCAAGCCGGGATAAGCCTTTTGGGGTTCACAGGGTATTCGAACT
-74 6 CGGGTCCGTATTGGGGTTTAATTTTTTAGACCACTAGCCCACCACACCGT - 696 AGTTAGTCATATATTGGACACACGTTGTGTTAATCAAATATCTTTTTTTT -646 ACTAGTGATTATAAACACTAGTGTTAATGATTATAAACATCGGATGTGTT -596 TCCAAAAAAAGTGTTTCAAAAAAAATAATTATAAACATCGGCAGTTCCTA
MYB-like GT-l-546 CAACTTAGTTGGAGTTTGTTTGGGAAAGACAATGATAAATATGAGAGTTT
-496 GAAACTCGTAGTGTTCTTTCTTGTTTTGTAAATTGAGAGTGAAACATTTT-446 TTTTTGTACTCAAACACGTACATCTTGTAGTCTTAGACTGAACTGAGAGA
-396 GAGGAGC ACT GCCGGTAAT CAAGCTAC GT CAT GCAT GAT TCTAATT AT ATGT-l
-346 AAAAGAGATTGAACATAATGTTAAGATTAAAA.TAGATAATTAATGATAGT
-296 T GT AT GTACAATAACTAT T T CT ACCAT CCATAT CT GC ATT T CCC GTTTT G
55 GAAATATGGCMet
1 -Si■246 AGTTTT CAGTATT GCATCTATT AAAATTAAAAGT CATTTTACATGATGCA—
t■196 ATAGCAAAAACAAGAACGTAGGTTGTAGAAATTTCAAACGAAGTAGACGTDl-like
-14 5 tcatgaggtactacataatagctaggaacctctacattaaatgaaaccaaMYB-LIKE
■ 9 6 acaaccaaccaactactcctttcctctaaatcgcattcacattcataacaTATA-box +1
- 4 6 taaactctctttgtctatataaacactcacttcccctactctcttcatca 5 ctcatcattccacacacatctcattttgcaaacaaaaaaaatctaagaga
At.
I
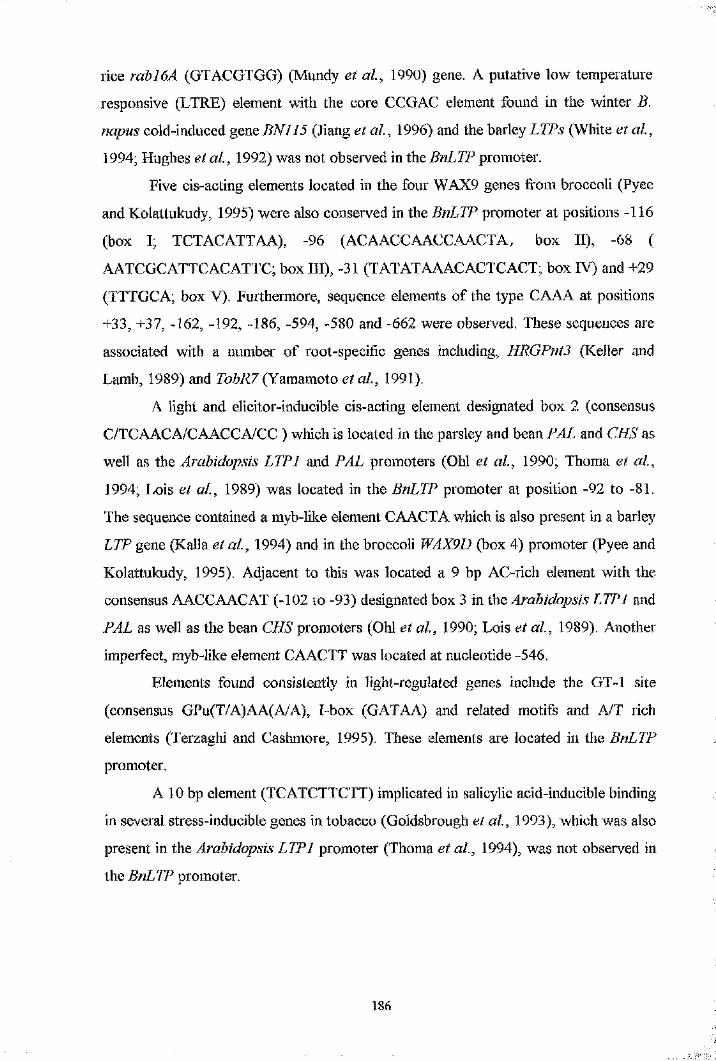
I
rice rahl6A (GTACGTGG) (Mundy et a l, 1990) gene, A putative low temperature
responsive (LTRE) element with the core CCGAC element found in the winter B.
napus cold-induced gene BN115 (Jiang et a l, 1996) and the barley LTPs (White et a l,
1994; Hughes et a l, 1992) was not observed in the BnLTP promoter.
Five cis-acting elements located in the four WAX9 genes from broccoli (Pyee
and Kolattukudy, 1995) were also conserved in the BnLTP promoter at positions -116
(box I; TCTACATTAA), -96 (ACAACCAACCAACTA, box II), -68 (
AATCGCATTCACATTC; box III), -31 (TATATAAACACTCACT; box IV) and +29
(TTTGCA; box V). Furthermore, sequence elements of the type CAAA at positions
+33, +37, -162, -192, -186, -594, -580 and -662 were observed. These sequences are
associated with a number of root-specific genes including, HRGPntS (Keller and
Lamb, 1989) and TobR7 (Yamamoto et a l, 1991).
A light and elicitor-inducible cis-acting element designated box 2 (consensus
C/TCAACA/CAACCA/CC ) which is located in the parsley and bean PAL and CHS as
well as the Arahidopsis LTP I and PAL promoters (Ohl et a l, 1990; Thoma et a l,
1994; Lois et a l, 1989) was located in the BnLTP promoter at position -92 to -81.
The sequence contained a myb-like element CAACTA which is also present in a barley
LTP gene (Kalla et a l, 1994) and in the broccoli WAX9D (box 4) promoter (Pyee and
Kolattukudy, 1995). Adjacent to this was located a 9 bp AC-rich element with the
consensus AACCAACAT (-102 to -93) designated box 3 in the Arahidopsis LTP I and
PAL as well as the bean CHS promoters (Ohl et a l, 1990; Lois et a l , 1989). Another
imperfect, myb-like element CAACTT was located at nucleotide -546.
Elements found consistently in light-regulated genes include the GT-l site
(consensus GPu(T/A)AA(A/A), I-box (GATAA) and related motifs and A/T rich
elements (Terzaghi and Cashmore, 1995). These elements are located in the BnLTP
promoter.
A 10 bp element (TCATCTTCTT) implicated in salicylic acid-inducible binding
in several stress-inducible genes in tobacco (Goldsbrough et a l, 1993), which was also
present in the Arahidopsis LTPl promoter (Thoma et al., 1994), was not observed in
the BnLTP promoter.
Î1 8 6
6.3 Organ-specific expression of BnLTP
Spatial regulation was initially studied by hybridising the BnLTP cDNA to blots
of total RNA isolated from Brassica napus organs. The probe hybridised to a 700 nt
transcript present in mature leaves, stems, petals, carpels, sepals and stamens, but not
detectable in roots (Fig. 6.2). This pattern of LTP expression was in part verified by
histochemical staining of GUS activity in transgenic Arahidopsis seedlings expressing
ih.t BnLTP-GUS fusion (Figs. 6.3 and 6.4D). GUS expression was detected in leaf and
stem tissue. Younger developing leaves expressed GUS at a higher level compared to
mature leaves in four week old plants (Fig. 6.3A). GUS activity was localised in the
lignified tip of cotyledons (Fig. 6.3 A). In floral tissue (Fig. 6.3B), GUS expression was
present only in stigmas, stamens and in the sepal-petal abscission zone, and was not
detected in the mature petals. Although L.TP transcripts were not detected in root
tissue on RNA blots (Fig. 6.2) GUS activity was clearly present in lateral root initials
(Fig. 6.3C) and the root tip (data not shown) in the transgenic plants. As the lateral
root developed GUS expression remained at the tip (data not shown). GUS expression
was not evident in the root hairs (Fig. 6.3C). The same pattern of expression was
observed in the transgenic lin<
Figures shown are for line 2D
observed in the transgenic lines 1C and 3A (see Chapter 5, sections 5.7 and 5.8). The
6.4 BnLTP expression is largely confined to the epidermisPreviously, single-stranded pLF3A anti-sense probes were used for in situ
hybridisation of the corresponding mRNAs in tissue cross-sections of Brassica napus
organs. Transcripts were detected predominantly in epidermal cells of leaf, stem and
floral buds (Pallas, 1992). A distinct disadvantage of using anti-sense probes for in situ
hybridisations is the problem with cross-hybridisation with closely related transcripts.
Furthermore, as described previously, BnLTP and pLF3A probably represent two of
several closely related members of a small multigene family of lipid transfer proteins in
oilseed rape and it was not possible to distinguish between the different gene members
in relation to spatial expression patterns. However ssfiXhLTP-GUS fusions it is possible
to follow the expression pattern of a single gene.
In tissue cross-sections of four week old BnLTP-GUS2 (line 2D) transgenic
plants, GUS activity was present predominantly in epidermal cells of the leaf blade (Fig
1 8 7I
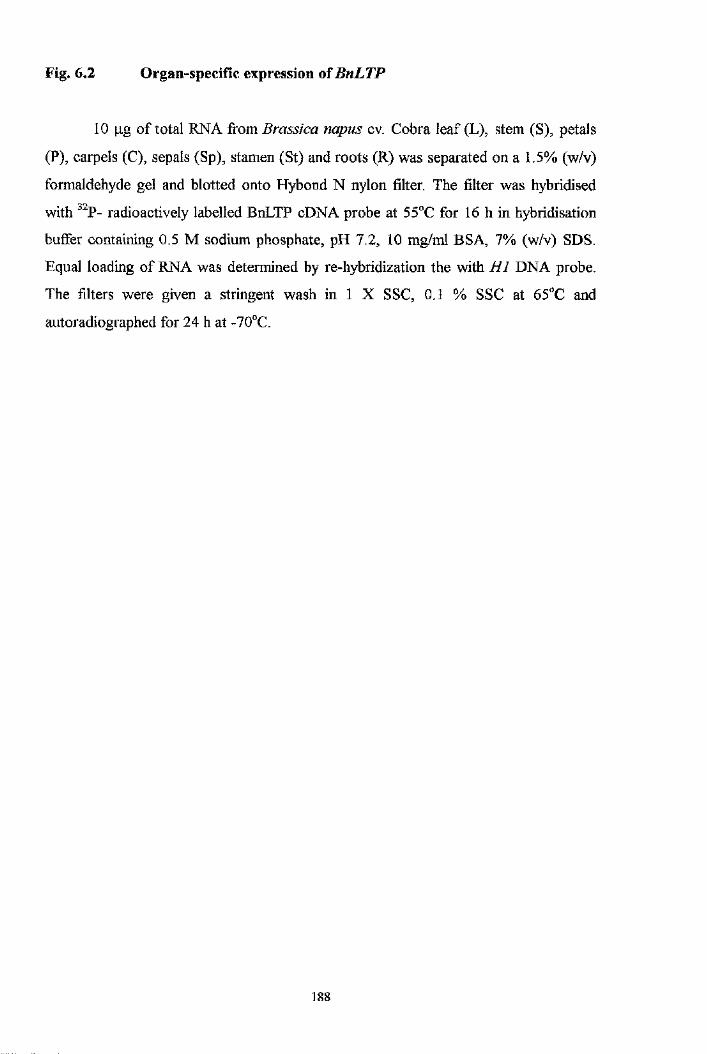
Fig. 6.2 Organ-specific expression of BnLTP
10 fxg of total RNA from Brassica napus cv. Cobra leaf (L), stem (S), petals
(P), carpels (C), sepals (Sp), stamen (St) and roots (R) was separated on a 1.5% (w/v)
formaldehyde gel and blotted onto Hybond N nylon filter. The filter was hybridised
with ^^P- radioactively labelled BnLTP cDNA probe at 55“C for 16 h in hybridisation
buffer containing 0.5 M sodium phosphate, pH 7.2, 10 mg/ml BSA, 7% (w/v) SDS.
Equal loading of RNA was determined by re-hybridization the with H I DNA probe.
The filters were given a stringent wash in 1 X SSC, 0.1 % SSC at 65*’C and
autoradiographed for 24 h at -70°C.
1 8 8
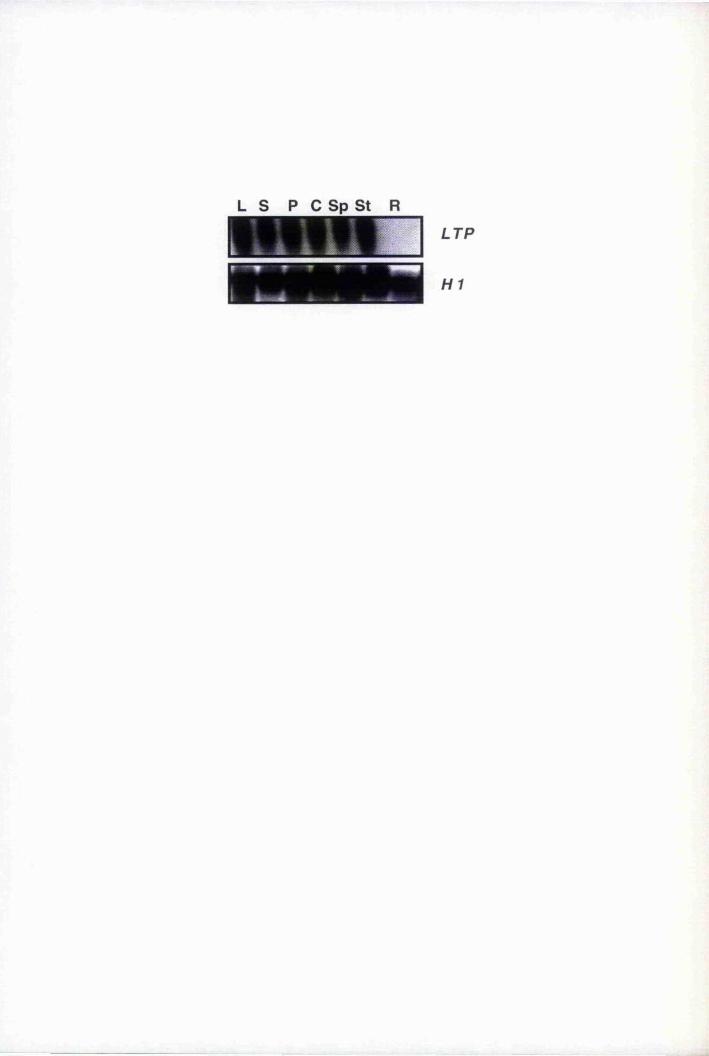
L s P C Sp St R
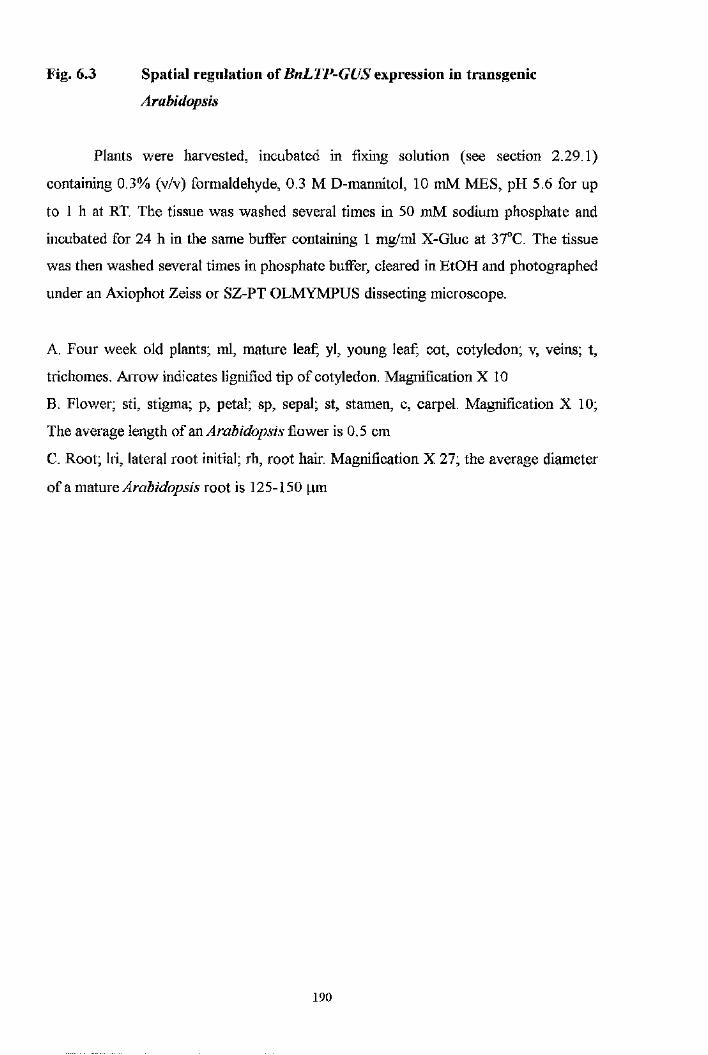
Fig. 6.3 Spatial regulation of BnLTP-GUS expression in transgenic
Arahidopsis
Plants were harvested, incubated in fixing solution (see section 2.29.1)
containing 0.3% (v/v) formaldehyde, 0.3 M D-mannitol, 10 mM MES, pH 5.6 for up
to 1 h at RT. The tissue was washed several times in 50 mM sodium phosphate and
incubated for 24 h in the same buffer containing 1 mg/ml X-Gluc at 37”C. The tissue
was then washed several times in phosphate buffer, cleared in EtOH and photographed
under an Axiophot Zeiss or SZ-PT OLMYMPUS dissecting microscope.
A. Four week old plants; ml, mature leaf; yl, young leaf; cot, cotyledon; v, veins; t,
trichomes. Arrow indicates lignified tip of cotyledon. Magnification X 10
B. Flower; sti, stigma; p, petal; sp, sepal; st, stamen, c, carpel. Magnification X 10;
The average length of m Arahidopsis flower is 0.5 cm
C. Root; Iri, lateral root initial; rh, root hair. Magnifieation X 27; the average diameter
of a xî\2iXmQ Arahidopsis root is 125-150 pm
190
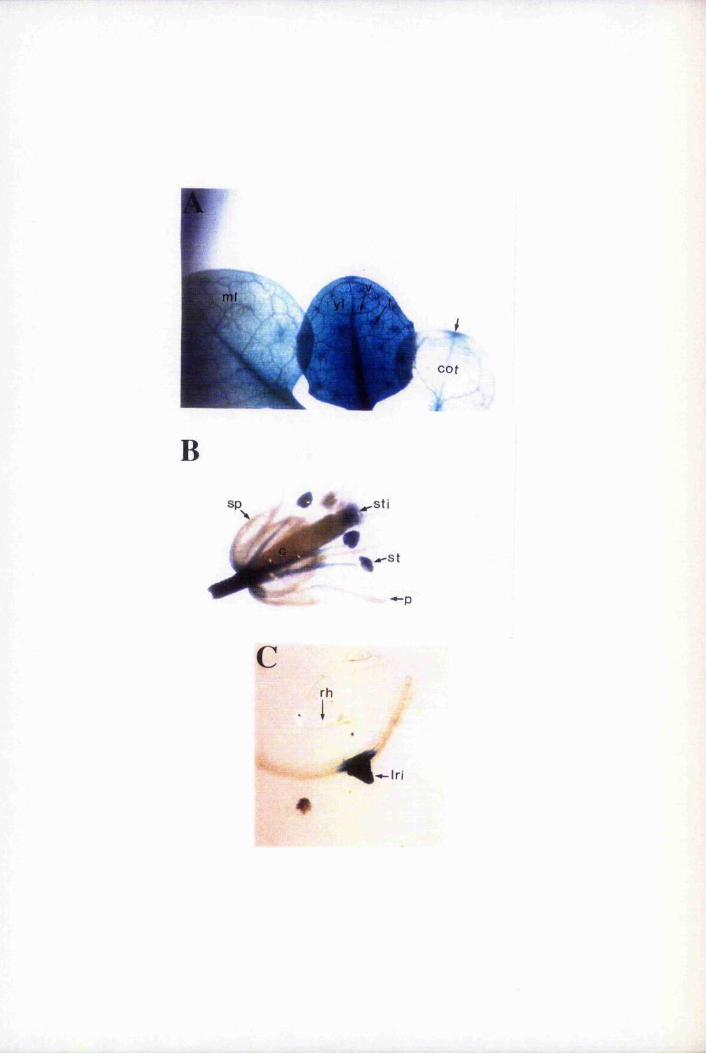
1
cot
à
Bé é
' * - p
rh
< Iri
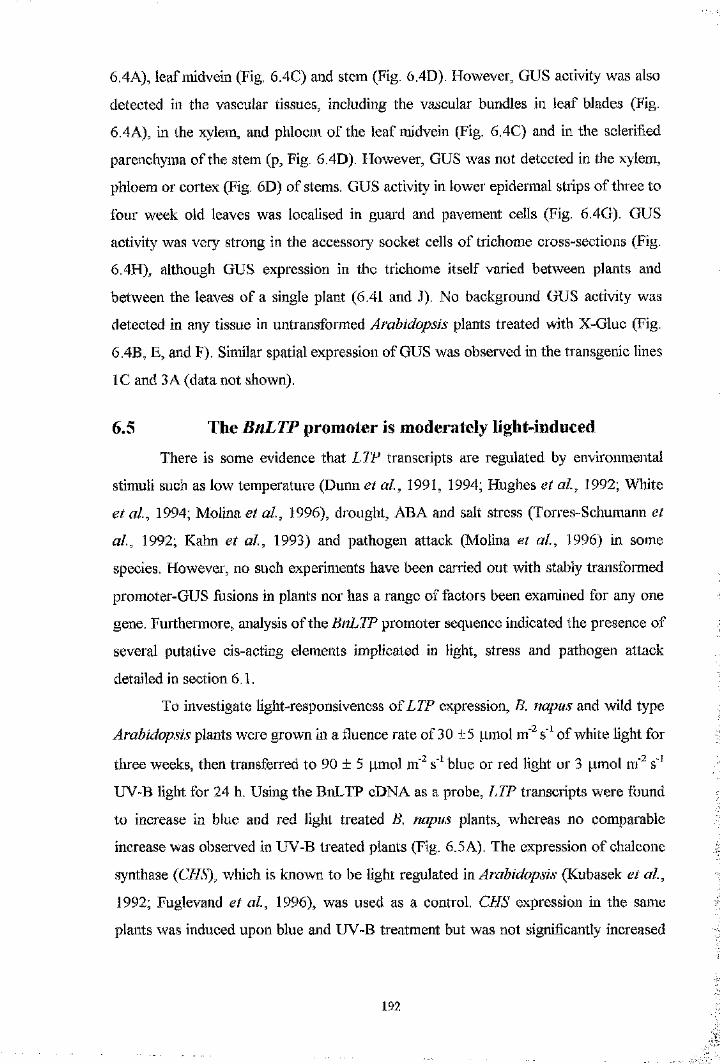
6.4A), leaf midvein (Fig. 6.4C) and stem (Fig. 6.4D). However, GUS activity was also
detected in the vascular tissues, including the vascular bundles in leaf blades (Fig.
6.4A), in the xylem, and phloem of the leaf midvein (Fig. 6.4C) and in the sclerified
parenchyma of the stem (p. Fig. 6.4D). However, GUS was not detected in the xylem,
phloem or cortex (Fig. 6D) of stems. GUS activity in lower epidermal strips of three to
four week old leaves was localised in guard and pavement cells (Fig. 6.4G). GUS
activity was veiy strong in the accessory socket cells of trichome cross-sections (Fig.
6.4H), although GUS expression in the trichome itself varied between plants and
between the leaves of a single plant (6.41 and J). No background GUS activity was
detected in any tissue in untransformed Arahidopsis plants treated with X-Gluc (Fig.
6.4B, E, and F). Similar spatial expression of GUS was obseiwed in the transgenic lines
1C and 3 A (data not shown).
6.5 The BnLTP promoter is moderately light-inducedThere is some evidence that LTP transcripts are regulated by environmental
stimuli such as low temperature (Dunn et a l, 1991, 1994; Hughes et a l, 1992; White
et a l, 1994; Molina et a l, 1996), drought, ABA and salt stress (Torres-Schumann et
a l, 1992; Kahn et a l, 1993) and pathogen attack (Molina et a l, 1996) in some
species. However, no such experiments have been carried out with stably transformed
promoter-GUS fusions in plants nor has a range of factors been examined for any one
gene. Furthermore, analysis of the BnLTP promoter sequence indicated the presence of
several putative cis-acting elements implicated in light, stress and pathogen attack
detailed in section 6.1.
To investigate light-responsiveness oîLTP expression, B. napus and wild type
Arahidopsis plants were grown in a fluence rate of 30 ±5 pmol m' s' of white light for
three weeks, then transferred to 90 ± 5 pmol m" s' blue or red light or 3 pmol m' s'
UV-B light for 24 h. Using the BnLTP cDNA as a probe, LTP transcripts were found
to increase in blue and red light treated B. napus plants, whereas no comparable
increase was observed in UV-B treated plants (Fig. 6.5A). The expression of chalcone
synthase {CHS), which is known to be light regulated in Arahidopsis (Kubasek et a l,
1992; Fuglevand et a l, 1996), was used as a control. CHS expression in the same
plants was induced upon blue and UV-B treatment but was not significantly increased
192
Fig. 6.4 Expression of GUS is restricted mainly to epidermal cells
Three to four week old transgenic Arahidopsis plants expressing the BnLTP-
GUS fusion were harvested and fixed according to section 2.29.1. The tissue was then
incubated in X-Gluc overnight at 37“C, washed and embedded in OCT and sectioned
using a freezing microtome. The 20 pm sections were photographed using a Zeiss
Axiophot microscope.
A. Cross-section of leaf blade of transgenic plants, ue, upper epidermis; m, mesophyll
cell; V, vascular, bundle. Bar = 72 pm.
B. Cross-section of leaf blade of wild type, untransformed Arahidopsis (control), e,
epidermis. Bar = 84 pm
C. Cross-section of leaf midvein of transgenic plants, ue, upper epidermis; m,
mesophyll cell; le, lower epidermis; xy, xylem; ph, phloem. Bar = 42 pm
D. Cross-section of transgenic stem, e, epidermis; xy, xylem; ph, phloem; cor, cortex;
p, parenchyma; pi, pith. Bar = 24 pm
E. Cross-section of untransformed Arahidopsis stem (control). Bar = 24 pm
F. Abaxial epidermal strip of wild type, untransformed leaf, gc, guard cell; pc,
pavement cell. Bar = 1.7 pm.
G. Abaxial epidermal strip of transgenic leaf, gc, guard cell; pc pavement cell. Bar -
1.7 pm.
H. Cross-section through trichome of transgenic leaves, ue, upper epidermis; t,
trichome; sc, socket cell. Bar = 84 pm.
I. and J. Trichomes from two different leaves from the same transgenic plant. Bar = 21
pm.
193
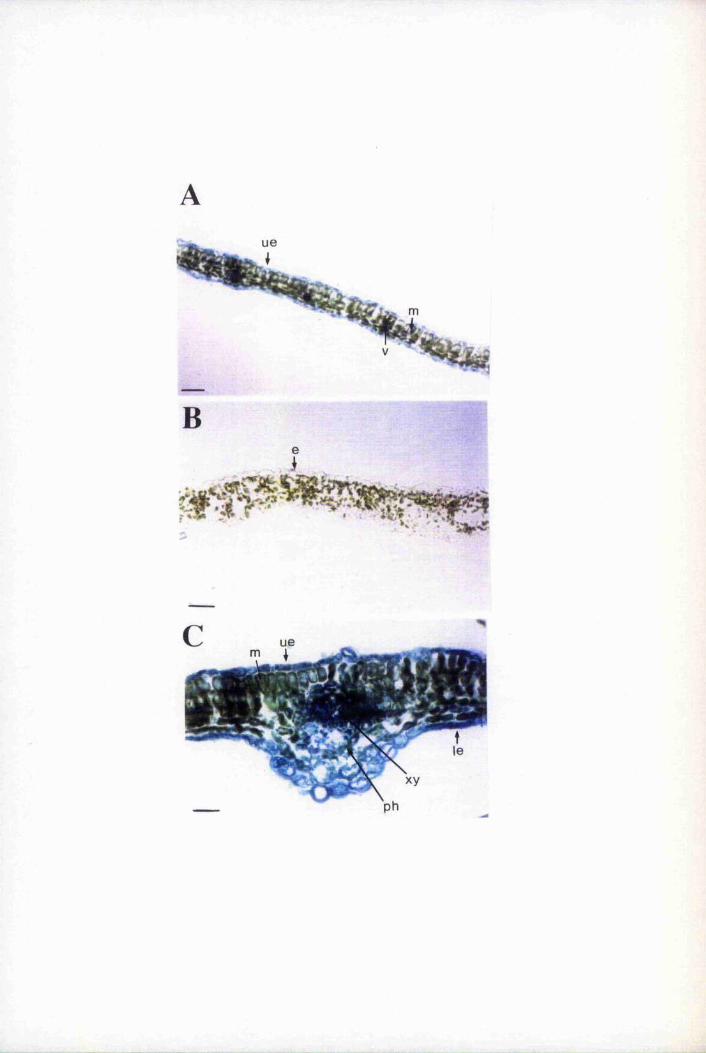
B
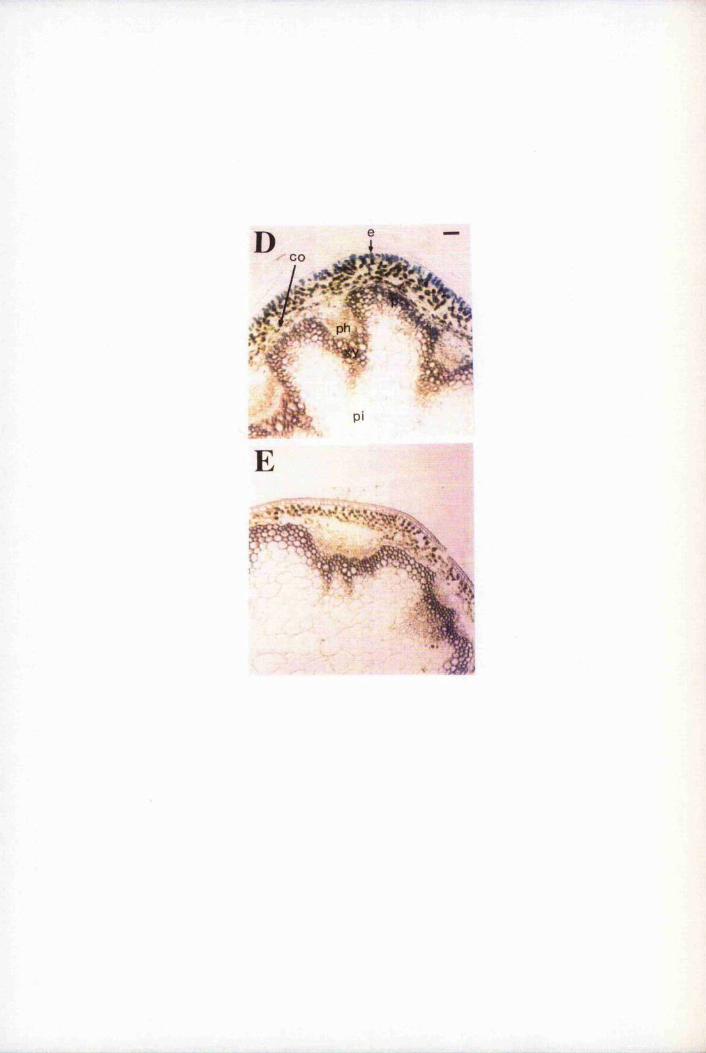
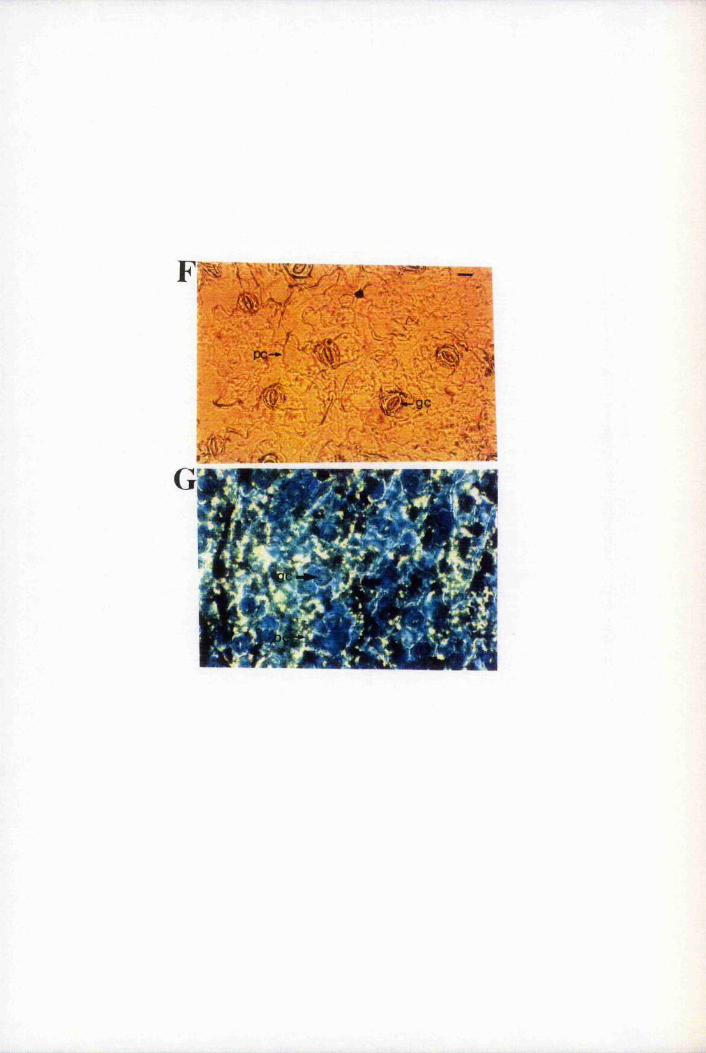
w
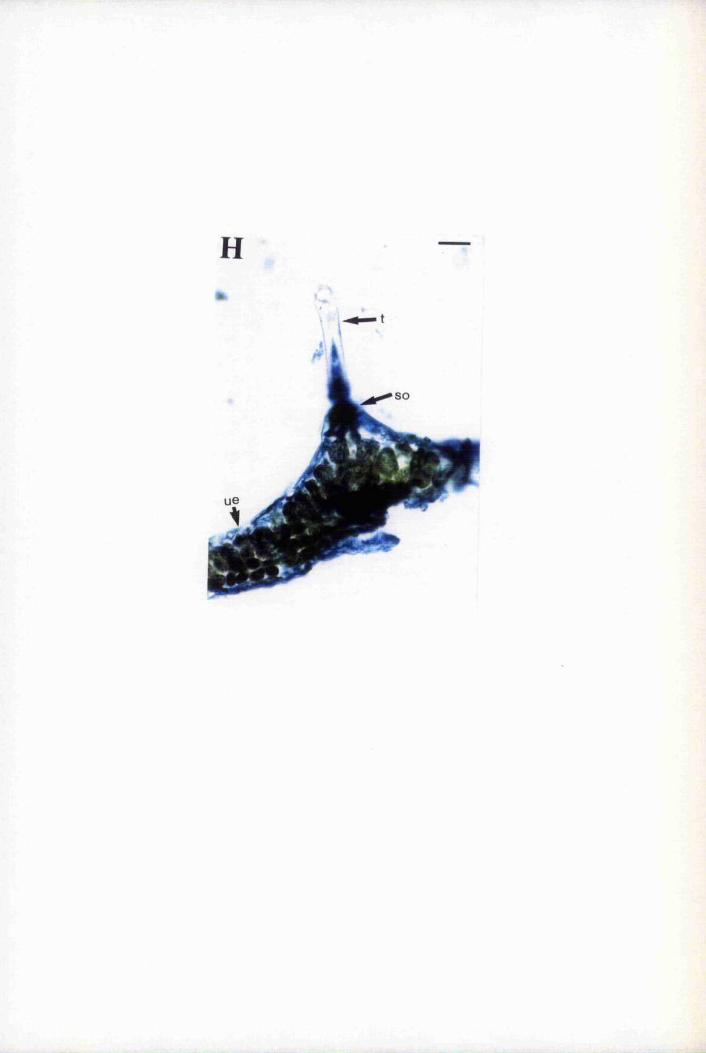
H
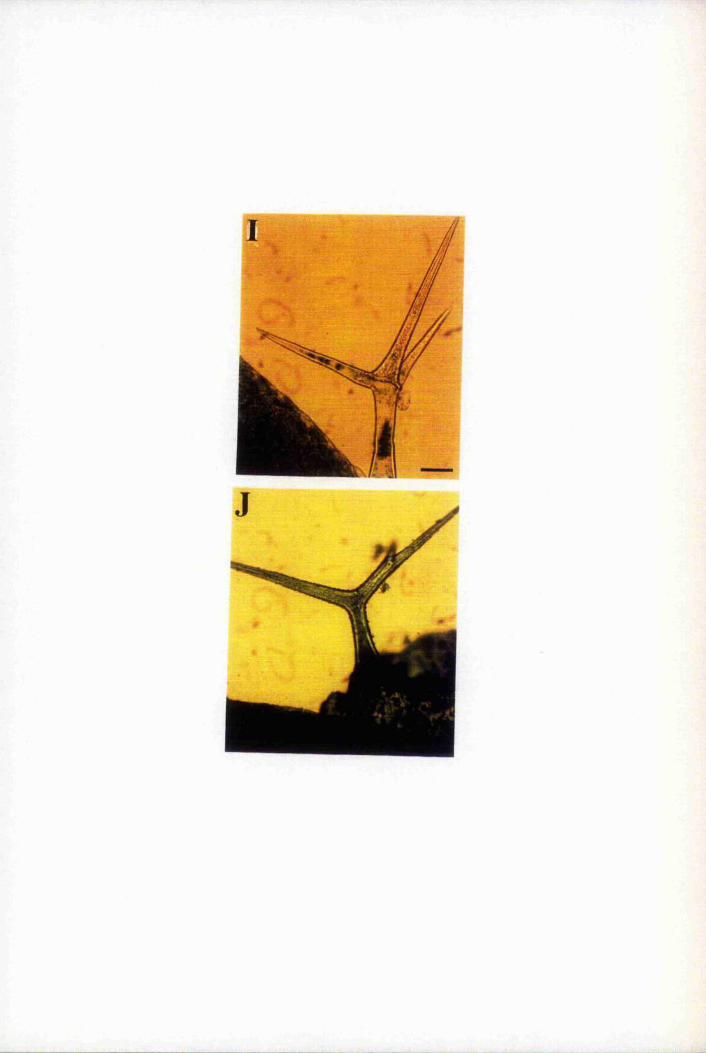
a
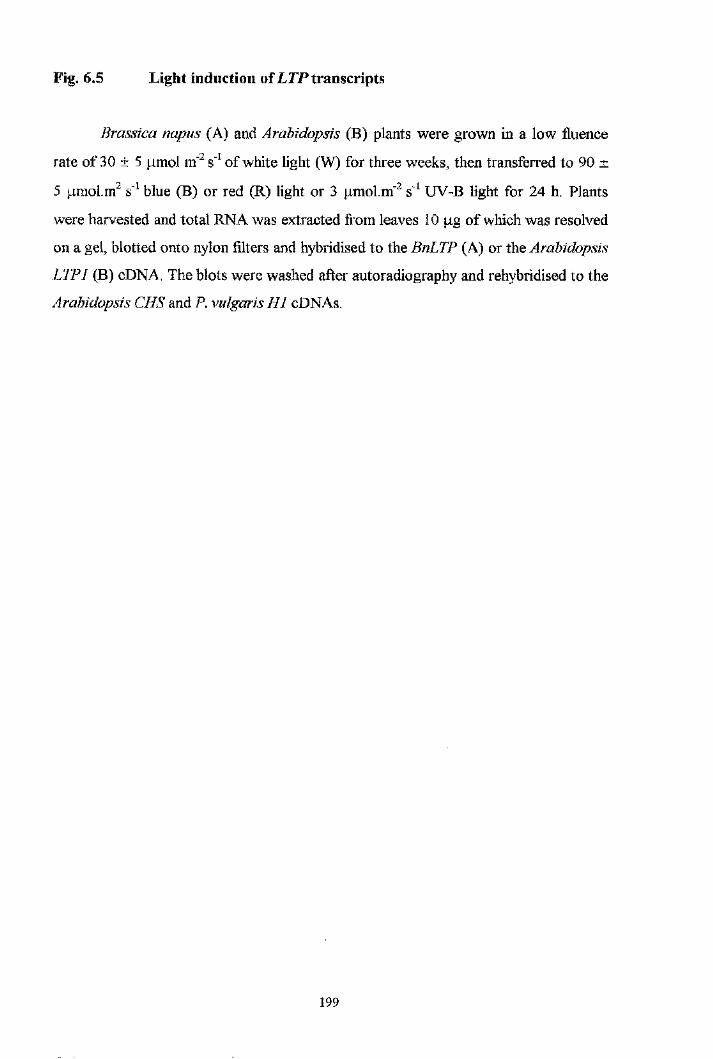
Fig. 6.5 Light induction of LZP transcripts
Brassica napus (A) and Arahidopsis (B) plants were grown in a low fluence
rate of 30 ± 5 pmol m' s“ of white light (W) for three weeks, then transferred to 90 ±
5 pniol.m^ s' blue (B) or red (R) light or 3 pmol.m'^ s‘ UV-B light for 24 h. Plants
were harvested and total RNA was extracted from leaves 10 pg of which was resolved
on a gel, blotted onto nylon filters and hybridised to the BnLTP (A) or the Arahidopsis
LTPl (B) cDNA. The blots were washed after autoradiography and rehybridised to the
Arahidopsis CHS and P. vulgaris H I cDNAs.
1 9 9
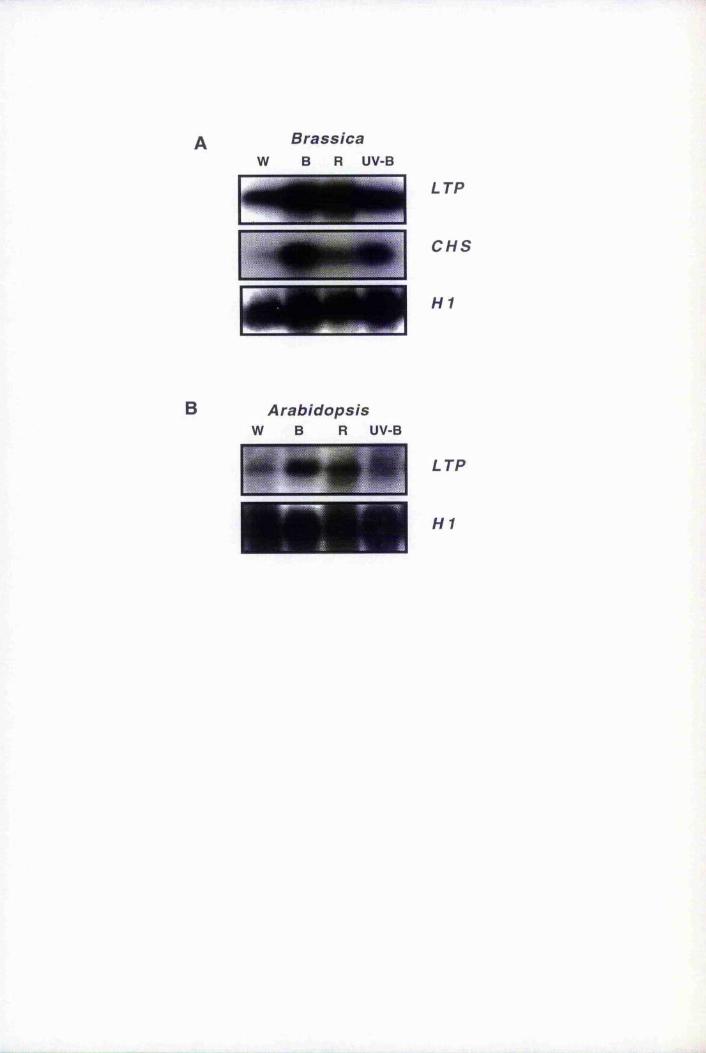
Brassica w B R UV-B
LTP
CHS
H 1
B Arahidopsisw B R UV-B
LTP
H1
in red light treated plants, as reported previously for mature Arahidopsis leaf tissue
(Jackson et a l, 1995; Fuglevand et a l, 1996). Expression of control H Î transcripts
(Lawton and Lamb, 1987) was unaltered under each condition. A similar pattern of
expression was seen \n Arahidopsis (Fig. 6.5B). The endogenous LTP transcript levels,
measured by hybridisation to the homologous LTPl probe, CD3-11 (Thoma et a l,
1994), increased following blue and red light treatment, but not UV-B.
To determine whether induction of LTP expression by light was mediated by
transcription, transgenic Arahidopsis plants carrying the BnLTP-GUS fijsion were
given the same light treatments as described above. Transgenic Arahidopsis plants
containing the CHS promoier-GUS fusion (line NM4; Jackson et a l, 1995) were
treated similarly and used as a control. Following blue and red light treatments, but not
UV-B, BnLTP-GUS was moderately induced (Fig. 6.6A). Induction of CHS-GUS in
response to blue and UV-B light was greater compared to BnLTP-GUS, In transgenic
Arahidopsis plants carrying the homologous Arahidopsis LTPl promoter-GUS fiision
(LTP-GUS lA; Thoma et a l, 1994), GUS activity increased only slightly following
blue light treatment whereas the increase in response to red light was not evident (Fig.
6.6B). A similar response was observed in the transgenic lines 1C and 3 A.
6.6 Expression of BnLTP and BnLTP-GUS in response to
cold and woundingFig. 6.7A shows the endogenous LTP transcript levels following a 72 h low-
temperature treatment of Brassica napus leaf and root tissue. Cold treatment was at
4"C under 30±5 pmol m‘ s" white light. Control plants were placed at 22”C for the
same time period under identical light conditions. Expression levels in leaves were
unaltered by the low temperature treatment and the transcript was at the limit of
detection in root tissue. Similarly, LTP transcripts levels were unaltered following a 24
h and 48 h cold treatment (data not shown).
Under the same conditions, the expression of the BnLTP-GUS fusion in
transgenic Arahidopsis was moderately induced in leaf tissue following a 72 h cold
treatment (Fig. 6.7B). There was a small, significant increase in CHS-GUS expression
in control plants, consistent with previous studies of CHS expression (Leyva et a l .
201
Fig. 6.6 Effect of light on the expression of LTP promoter-GUS fusions in
transgenic Arahidopsis
Transgenic plants containing either the BnLTP promoter-GUS' fusion (A, dark
columns), the Arahidopsis LTPl promoter-GUS' fusion (B, dark columns) or the CHS
promoter-GUS" fusion (A and B, light columns) were grown and illuminated as in
Figure 6.5. GUS activity was measured in leaf tissue using MUG as a substrate in a
fluorimetric assay and is expressed as units of 4-MU produced per unit leaf protein as
described in section 2.29.2. Error bars indicate the standard error of the mean of at
least three experiments; the absence of bars on some columns indicates that the error
was very small.
202
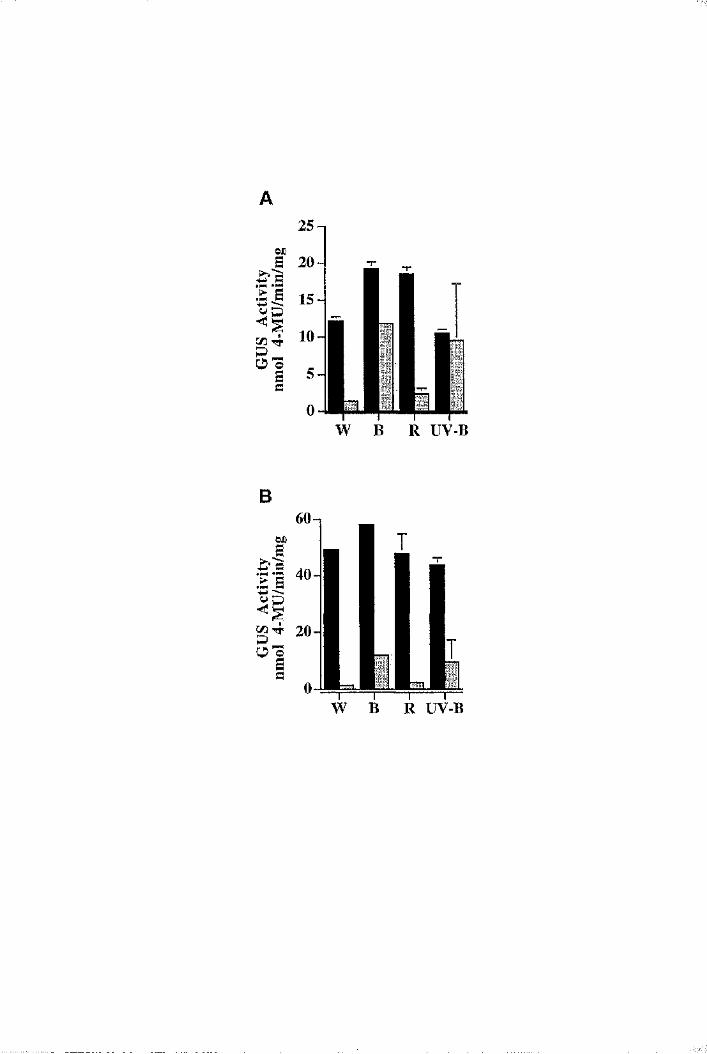
A25 n
W B R UV-B
B
UV-B
Fig. 6.7 Effect of low temperature on levels of LTP transcripts in B. napus
and BnLTP-GUS expression in transgenic
A. B. napus plants grown for three weeks in 30 ± 5 pmol s' white light
were transferred to 4°C or kept at 22°C for 72 h. Total RNA was isolated from leaves
and root tissue, resolved on a gel, blotted onto nylon filters and hybridised to the
BnLTP cDNA. To ensure equal loading of RNA the blot was washed and rehybridised
to the E vulgaris H I cDNA. B. Transgenic Arabidopsis plants carrying the BnLTP
promoter-GOT fusion (dark columns) or the CHS promoter-GOT fusion (light
columns) were grown and treated as in A. GUS activity was measured in leaf tissue as
in Fig. 6.6 (see section 2.29.2). Error bars represent the standard error of the mean of
three experiments.
2 0 4
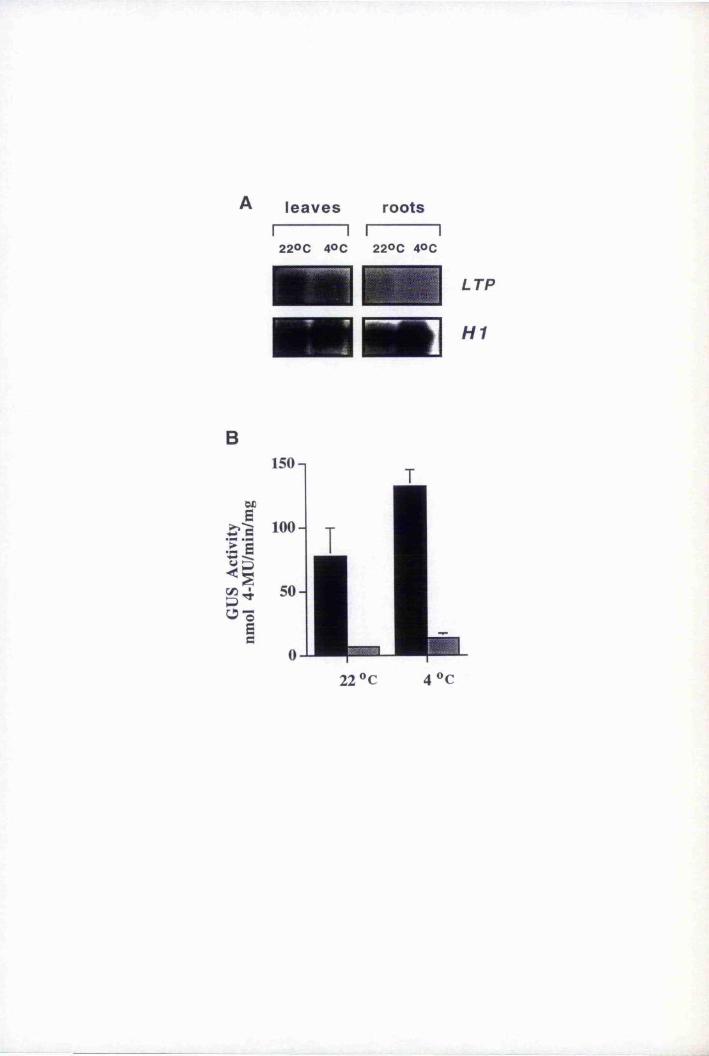
leaves roots
2 2 0 C 4 0 c 2 2 0 c 4 0 c
LTP
H 1
B150 n
ocB
! i0*3
Bc
22 ®C 4 ®C
1995). Transgenic plants cold-treated for 24 and 48 h were not altered in transgene
expression (data not shown).
The BnLTP-GUS transgene was not induced upon wounding and neither was
CHS-GUS (Fig. 6.8). Three week old leaves were pierced numerous times with a
2 0 6
..syringe needle and incubated for a further three days under 30+5 pmol m‘ s' white
light and GUS expression was quantified in each wounded leaf. In addition, there was
no evidence of local expression around the wound site (data not shown). Previously,
endogenous transcripts isolated from B. napus leaf, stem and floral tissue, hybridised
to the pLF3A cDNA, showed no effect in response to wounding and cold treatment
(Pallas, 1992).
6.7 The BnLTP promoter is induced upon viral infectionThere is growing speculation that LTPs play an important role in plant defence
against invading pathogens. Indeed, there have been several reports of LTP transcript
accumulation following bacterial and fungal infection (Garcia-Olmeda et u/., 1996;
Pyee and Kollattukudy, 1995). However, no such experiments have been undertaken
following viral infection. To determine whether LTP expression was affected following
invasion by a virus, the cauliflower mosaic virus (CaMV) BARI isolate (Stratford et
a l, 1988) was used. This isolate establishes a compatible interaction with members of
the Cruciferae (Covey, 1991) characterised by local lesions and chlorosis on
inoculated leaves, and vein clearing, enhanced greening of secondary leaves and
stunted growth following systemic infection (Covey, 1991). However, in contrast to
some isolates (Stratford et a l , 1988), BARI produces very mild symptoms. BARI
infected plants are also slower in developing vein clearing symptoms compared to
some severe isolates. There is no evidence of CaMV viral resistance in the ecotype
Landsberg erecta.::
The first and second emerging leàves of BnLTP-GUS2 (line 2D) transgenic
Arabidopsis plants grown in a 10 h light, 14 h dark photoperiod, were inoculated with
BARI. GUS assays were carried out on the inoculated leaf (leaf 1 or 2) plus a
secondary leaf (leaf 3 or 4) after 0, 3, 7 and 14 days post inoculation (d p i). On 0, 3
and 7 d.p.i., GUS activity in the mock and virally infected leaves was unaltered.
However, on day 14, when the virus is thought to start replicating in the systemically
i
i ' ï i j
Fig. 6.8 BnLTP-GUS expression in not afTected by wounding
Transgenic Arabidopsis plants containing either the BnLTP promoter-Gt/*S'
frision (dark columns) or the CHS promoter-GGS fusion (light columns) were grown
as in Figure 6.5 and leaves were wounded numerous times with a needle. GUS activity
was measured in wounded and control leaf tissue after 72 h as in Figure 6.6 and
section 2.29.2. Error bars represent the standard error of the mean of three
experiments.
2 0 7
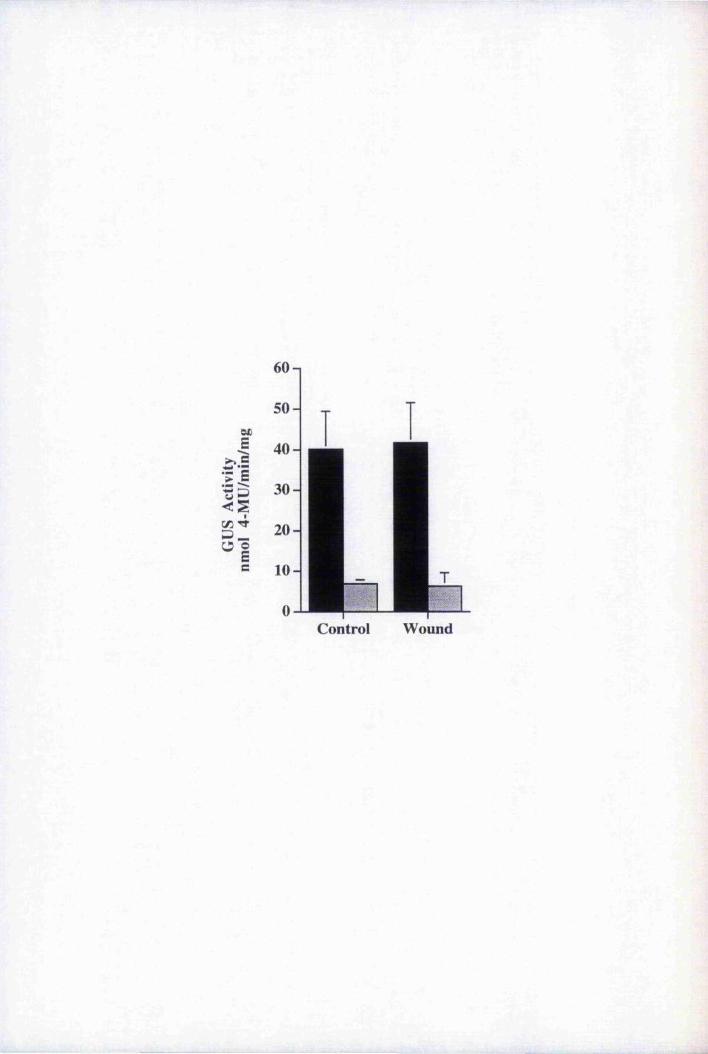
0£
IICZ3 TT
O o S s
Control Wound
infected leaves (Covey, 1991; J. J. Milner, personal communication), GUS expression
in leaves was elevated approximately 2 fold (Fig. 6.9). GUS expression in control
NM4 plants was unaltered. The presence of vims in infected plants was demonstrated
by PCR of genomic DNA isolated from virally infected leaves with virus specific
primers (data not shown).
The virally and mock infected transgenic plants were also incubated with X-
Gluc (Fig. 6.10). GUS activity in virally infected plants was enhanced in all the leaves
and was activated in the root hairs (6.10A), where previously GUS expression was
absent (6.1 OB). CHS-GUS expression in NM4 plants on the other hand was unaffected
in both leaves and roots (data not shown).
6.7.1 LTP expression in Arabidopsis plants constitutively
expressing the CaMV Gene VIAlthough LTP expression was enhanced in response to viral infection it was not
clear whether this was due to a specific interaction between viral components and the
transgene. It has previously been shown that the 62 kD CaMV Gene VI product
(PGVI) is a multifunctional polypeptide, which plays a central role in viral protein
synthesis and DNA replication. The protein acts as a translational activator and
contains an RNA-binding domain and a zinc finger domain (Turner et ah, 1996), Its
expression is essential for symptom expression; this is supported by the observation
that transgenic Arabidopsis plants that constitutively express Gene VI develop
symptoms similar to plants infected with the native vims.
To determine whether LTP expression was enhanced as a direct result of
CaMV Gene VI expression and therefore directly correlated with disease symptoms,
endogenous LTP expression was examined in transgenic Arabidopsis plants expressing
Gene VI. Three lines that constitutively expressed Gene VI at different levels, Baji-Al,
Bari“B6 and Bji-C were examined. LTP expression was compared with that in
untransformed plants. Phenotypically Bari-B6 exhibited very severe symptoms
characterised by stunted growth and chlorosis of leaves (yellow leaves as a result of
chloroplast bleaching). Bji-C3 and Baji-Al on the other hand had less severe
symptoms, the latter having very mild symptoms with a phenotype similar to non-
transformed plants. Severe symptoms were correlated with enhanced Gene VI
2 0 9
Fig. 6.9 Induction of BnLTP-GUS expression in transgenic Arabidopsis
by viral infection.
Transgenic Arabidopsis plants containing either the BnLTP promoter-GC/*S'
fusion (dark columns) or the CHS promoter-GG5' fusion (light columns) were grown in
a light/dark cycle as described in sections 2.28 and 2.28.4 and leaves were inoculated
with the CaMV BARI isolate. GUS activity was measured as described in Figure 6.6 in
leaves of BARI-and mock- inoculated plants, 7 and 14 days post inoculation (d.p.i.).
Error bars represent the standard error of the mean of three experiments.
2 1 0
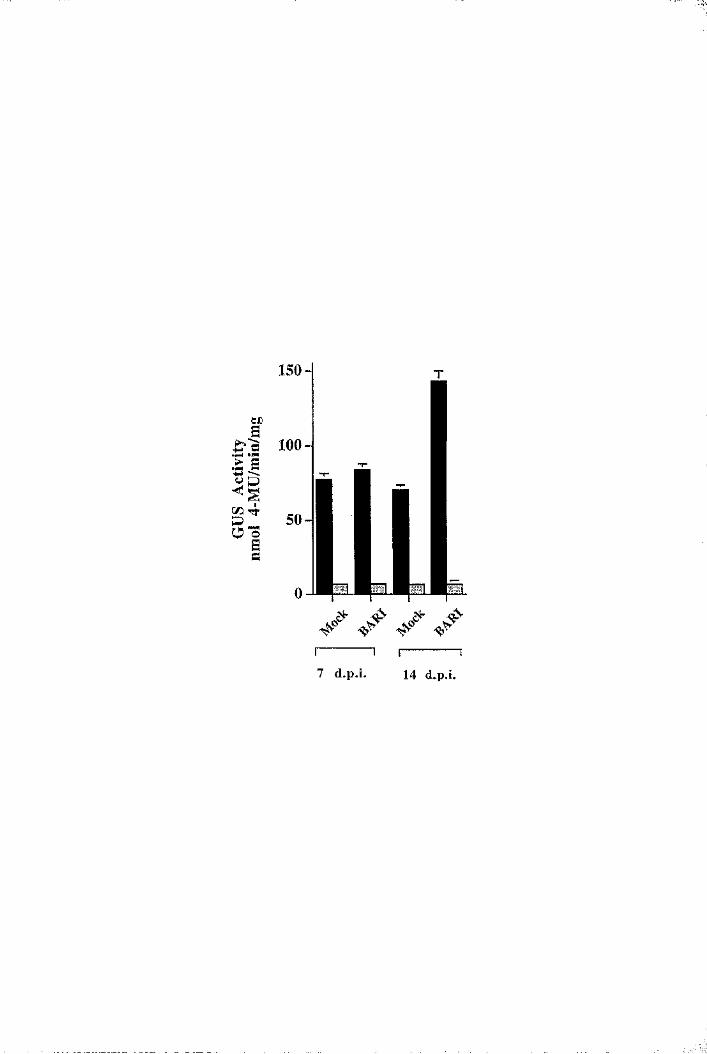
f
WD
B 100
c /}4
O ©
7 d.p.i. 14 d.p.i.
Fig. 6.10 GUS expression in virally infected leaf and root tissue
Plants infected with virus for 14 days were incubated in X-Gluc to estimate
overall GUS expression in BARI- (A, top panel) and mock- (B, bottom panel) infected
leaves and roots.
L, leaves; R, roots; rh, root hair.
2 1 2
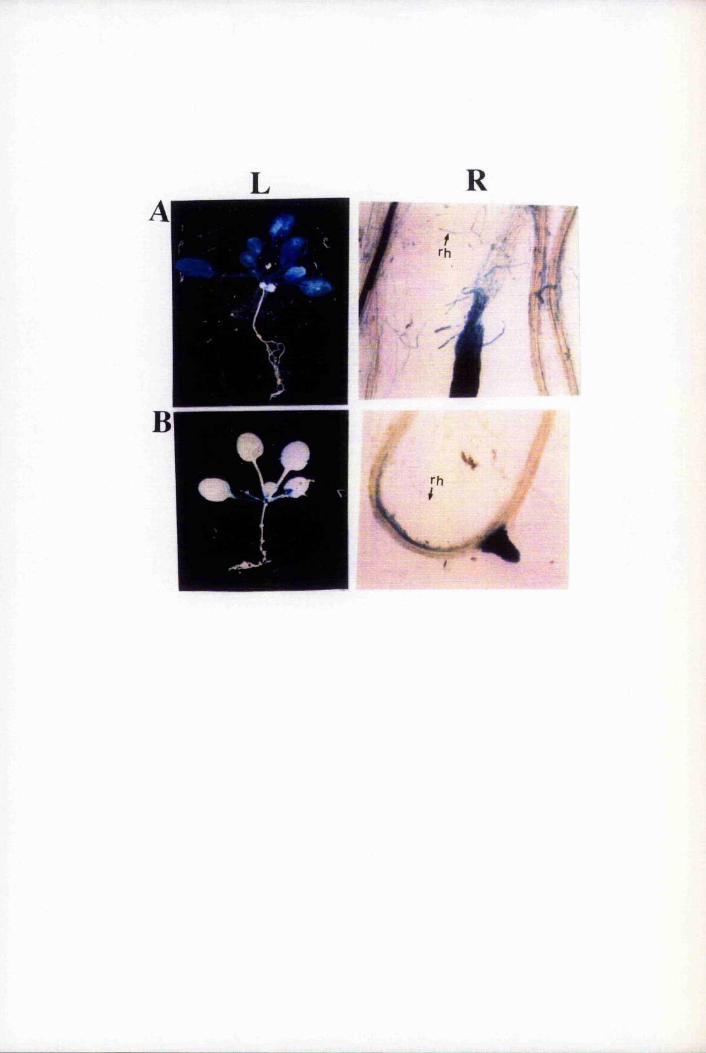
i l
Iexpression as indicated by increased Gene VI protein levels in ELIS As (E. Cecchini
and J. J. Milner, unpublished data).
LTP expression was greatly enhanced in Bari-B6 (high Gene VJ expressor)
compared to Bji-C3 and Baji-Al, both of which have relatively lower levels of Gene VI
expression (Figs. 6.H A and B). However, LTP expression in the latter plants was
higher than that in non-transformed plants. It can be clearly seen that LTP and Gene VI,:k<
expression levels show a direct correlation in that they are increased in plants V
exhibiting severe symptoms (Fig. 1 IB).
J6.8 LTP expression in epidermally altered mutants, ^/i, gl2
icxl and icxl/ttgThe glabrous g ll and gl2 mutants (Koorneef et al., 1983) are altered in trichome
development, g ll is completely devoid of trichomes whereas gl2 has very few
trichomes. The ttg mutant not only lacks trichomes but is also altered in anthocyanin
production (seeds are yellow), seed mucilage production and lacks DFR expression
(Shirley et al., 1995). The photoregulation mutant, icxl (see section 1.3.5.2, Jackson,
et a l, 1995), is altered not only in epidermal development but also in the light-
regulation of CHS expression, which is an epidermal-specific gene. The gene products
altered in these mutants are therefore concerned with the regulation of gene expression
and development in the epidermis. Since BnLTP is expressed predominantly in
epidermal tissue, as described in Fig. 6.4A, endogenous LTP expression was examined M
in these mutants.
Wild-type Arabidopsis and each of the mutants icxl, ttg, g ll and gl2, were
grown at a fluence rate of 30 ±5 pmol m' s' white light (low white light, LW) for |2 -1three weeks, then transferred to 100 + 5 pmol m" s’ white light (high white light, HW)
’ 'Wfor 24 h. Total RNA isolated from leaf tissue was hybridised to the Arabidopsis LTP 1
%cDNA probe. LTP expression in g ll, gl2 and ttg was identical to wild type plants |
under LW light and HW light grown plants, whereas icxl showed a considerable
increase in LTP expression in response to HW (Fig. 6.12). Endogenous CHS"È
expression was barely detectable in wild type and each of the mutants, including icxl, : |
in LW light, whereas following 100 ± 5 p,mol m‘ s’ light treatment, expression was
I214 «
Fig. 6.11 LTP expression in transgenic plants expressing the
CaMV 35S promoter-Ge/ie VI fusion
A. Non-transformed Arabidopsis (NT), Bari-B6, Bji-C3 and Baji-Al were
grown under 50 pmol s‘ white light for three weeks. Total RNA was isolated from
leaves, resolved on a gel, blotted onto nylon and hybridised to the Arabidopsis LTPl
cDNA. The blot was washed after autoradiography and rehybridised to the P. vulgaris
H I cDNA. B. Relative levels of the endogenous Gene VI and LTP transcripts in non-
transgenic and each of the transgenic lines, Bji-C3, Bari-B6 and Baji-Al normalised for
differences in RNA loading.
2 1 5
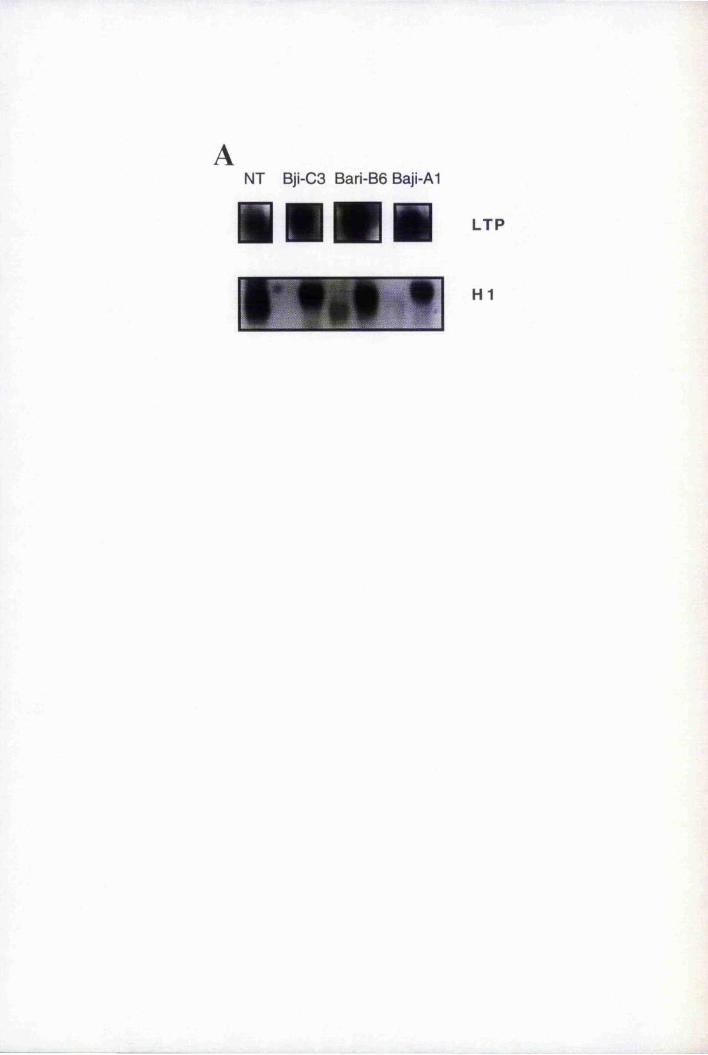
N T B ji-C 3 B ari-B 6 Baji-A1
■ ■LTP
H1
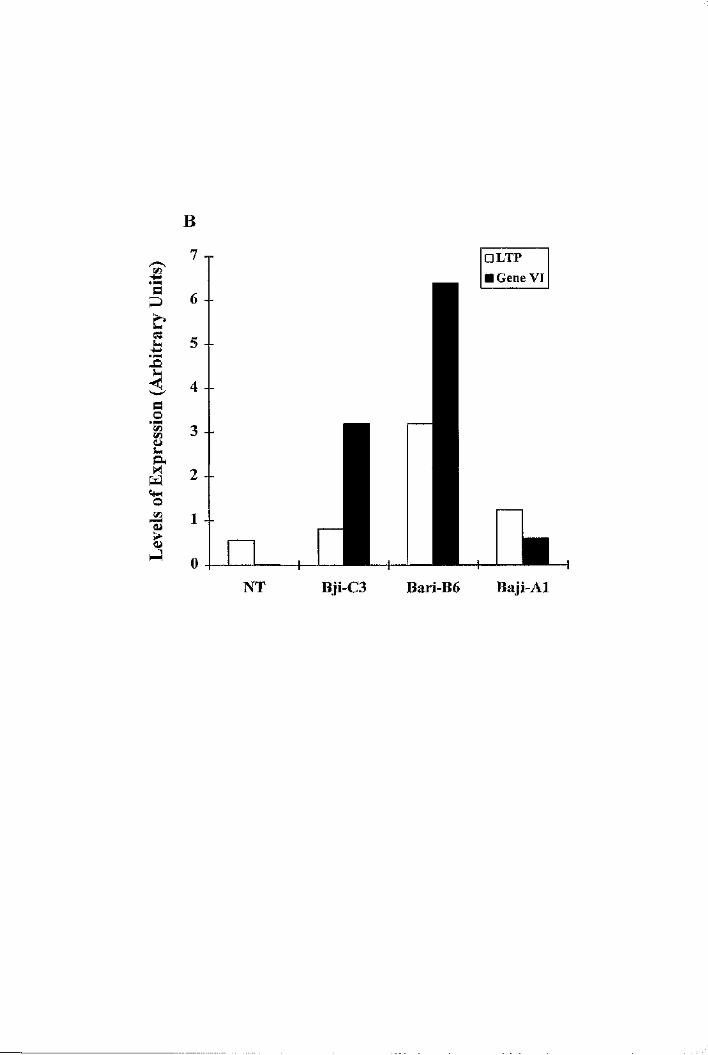
B
.1Ia
I
io■s3
□ LTP ■ Gene VI
6 -
3 -
2 -
ILNT Bji-C3 Bari-B6 Baji-Al
Fig. 6.12 LTP expression in th t Arabidopsis epidermally altered mutants
icxl, ttg, g ll and gl2
Plants were grown in a low fluence rate of 30 ± 5 \imol m'^ s' white light (LW)
for three weeks, then transferred to 100 + 5 pmol m' s" white light (HW) for 24 h.
Plants were harvested and total RNA was extracted from leaves, resolved on a gel,
blotted onto nylon filters and hybridised to the Arabidopsis LTPl cDNA. The blot was
washed after autoradiography and rehybridised to the Arabidopsis CHS and P. vulgaris
H I cDNAs (WT, wild type).
2 1 8
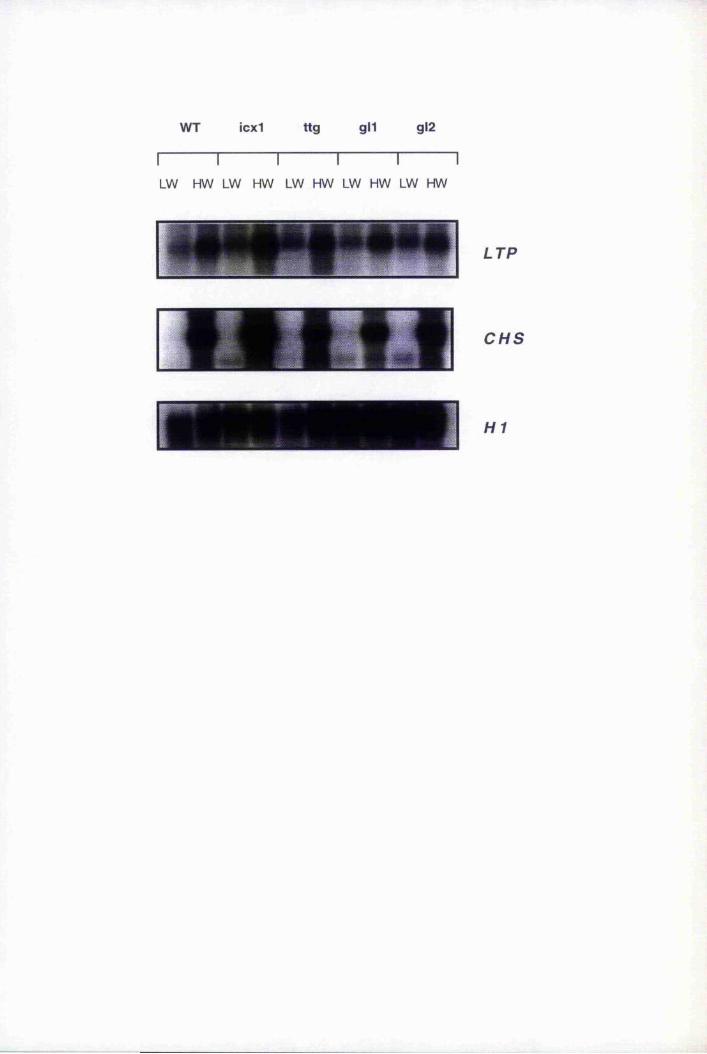
WT icx1 ttg gl1 gl2
I 1----------- 1----------- 1----------- 1-----------1L W H W L W H W L W H W L W H W L W H W
LTP
CHS
H I
considerably induced. Again, icxl displayed a higher induction of CHS expression
which was similar to previous obsei*vations (Jackson etal., 1995).
An important observation was that icxl behaved like wild type plants in 30 ±5
timol m' s' white and red light (data not shown), which suggested that the ICXl
product affected only the light regulation of the genes discussed. Also as discussed
previously (section 1.3.5.2), icxl is not only characterised by enhanced expression of
genes regulating the flavonoid biosynthetic pathway including CHS, DFR and CHI, it
is also altered in epidermal development. Analysis of icxl leaf epidermal strips by light-
microscopy indicated the epidermal pavement cells were altered in shape (data not
shown). They have an elongated, more disorganized appearance. Similarly, analysis of
the epidermis by SEM displayed a rougher appearance (J. A. Jackson and G. I.
Jenkins, personal communication). It is therefore likely that the normal function of
ICXl is the regulation of epidermal-specific genes, some of which are subject to light
regulation and some of which are concerned with epidermal development.
The icxl/ttg double mutant, which has phenotypic characteristics of both
parents, was also examined for endogenous LTP expression. In wild type Arabidopsis,
icxl and the icxl/ttg double mutant, LTP and CHS expression was determined in
response to blue, red, UV-A and UV-B light (Fig. 6,13). In response to each light
treatment with the exception of UV-B, LTP expression was induced. A striking
observation was that LTP expression in the icxl and icxl/ttg double mutant was
enhanced in response to blue, red and UV-A treatment; this was similar to the 100 ± 5
pmol m' s' white light results described previously (Fig. 6.12). In 30 ±5 timol m' s“
white and red light treated plants, CHS transcripts were barely present, whereas in
response to blue and UV-A, CHS expression was enhanced considerably. The level of
induction was higher than that observed for LTP. Expression of CHS was moderately
induced in response to UV-B although it was not as high as observed in previous
experiments (Fig. 6.5; Fuglevand e ta l , 1996).
6.9 Discussion
There is some evidence that LTP expression is regulated in a spatial and
temporal manner during development (Fleming et a l, 1993) and by environmental
stimuli such as low temperature (Dunn et a l, 1991, 1994; Hughes et a l, 1992; White
2 2 0
;
Fig. 6.13 LTP expression in Arabidopsis wild type, icxl and icxl/ttg mutants
in response to blue, red, UV-B and UV-A light treatment
Plants were grown in a low fluence rate 30 ± 5 |_tmol m’ s' of white light (LW)
for three weeks, then transferred to 90 ± 5 pmoLm^ s" blue (B), red (R), and UV-A
light or 3 pmol.m"^ UV-B light for 24 h. Plants were harvested and total RNA was
extracted from leaves, resolved on a gel, blotted onto nylon filters and hybridised to
the Arabidopsis LTPl cDNA. The blot was washed after autoradiography and
rehybridised to the Arabidopsis CHS and P. vulgaris H I cDNAs. (WT, wild type
plants).
2 2 1
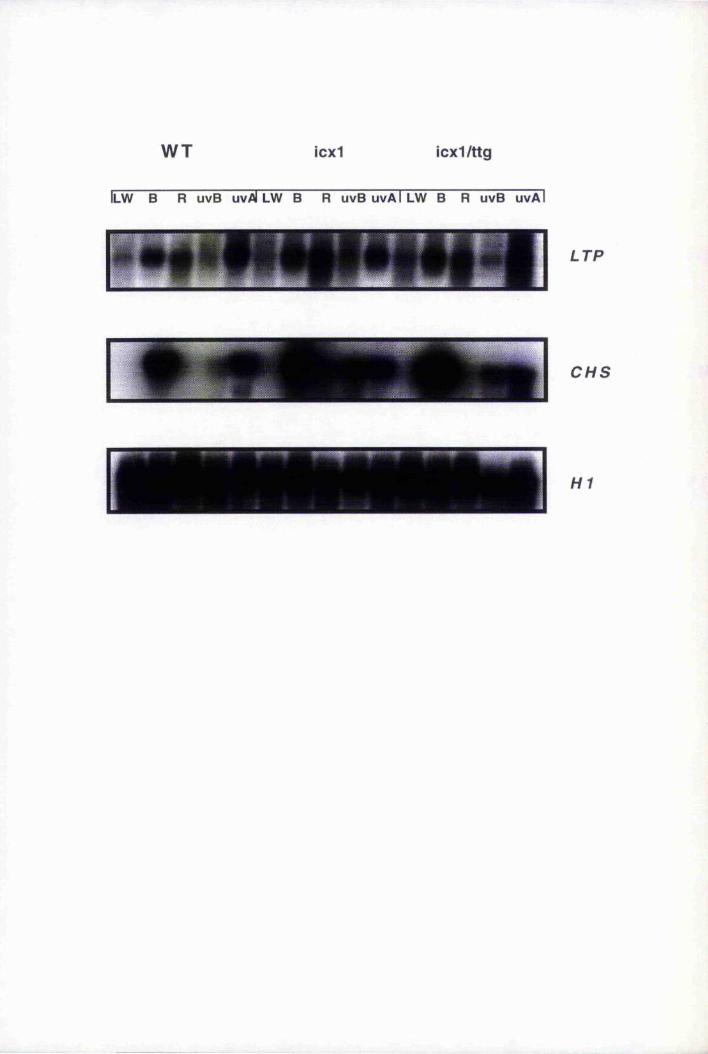
WT icx1 icx1/ttg
ILW B R uvB uvAl LW B R uvB uvAl LW B R uvB uvAl
LTP
CHS
H1
■1
6.9.2 Spatial regulation of BnLTP expression
Endogenous B. napus LTP transcripts were highly regulated and responded to
organ-specific signals (Fig. 6.2). In all aerial organs including leaf, stem and floral
■IIet a l, 1994; Molina et a l , 1996), drought, ABA and salt stress (Plant et a l, 1991;
Torres-Schumann et a l, 1992; Kahn et a l, 1993) and in response to bacterial and
fungal invasion (Terras et a l, 1992; Molina et a l, 1993, 1996; Segura et a l, 1993).
However, no such studies have been conducted with stably transformed promoter-
GUS fusions nor has the expression of LTP genes been studied in response to light
treatment and viral infection.
6.9.1 Analysis of the BnLTP promoter
Analysis of the BnLTP promoter sequence (Fig. 6.1) indicated the presence of
a previously identified cis-acting element designated box 2 (consensus
C/TCAACA/CAACCA/CC) implicated in light and stress inducibility of the bean and
parsley PAL and the Arabidopsis PAL and LTPl promoters (Ohl et al., 1990; Lois et
a l, 1989; Thoma et a l, 1994). In addition, several sequence elements with the core
sequence, ACGT (or TGCA) were identified. This core sequence is common to several
light and ABA response elements in several genes including the Arabidopsis PAL and
CHS genes, the barley LTP genes, gbltp4.2, gbltp4.6 and gbltp4.9 (White et a l, 1994)
and the rice ràblôA gene (Mundy et a l, 1990). Furthermore, in contrast to the parsley
PAL gene which is stimulated by light and fungal elicitors, CHS expression is strongly
induced by light and following light induction is strongly repressed by elicitor (Lozoya
et al., 1991). Such CHS responses are thought to be controlled by a promoter region
designated Unit 1, which contains an ACGT element (Box II) (Lozoya et a l, 1991)
and a myb recognition element (Feldbriigge et ah, 1997). A putative transcription.
factor, CPRF, which has high affinity for Box II and several other ACGT-containing
elements, was shown to regulate the CHS gene (Feldbriigge et a l, 1994; Weiflhaar et
1.
a l, 1991). It is possible that this factor may also regulate expression of LTP genes.
However, while sequence similarities are interesting to note and may be functionally
significant, no definitive conclusions can be drawn until detailed promoter analyses
have been undertaken to identify critical fianctional elements.
2 2 3
s
tissue (sepals, petals, carpels, stamens), LTP transcripts were expressed at high levels,
but no expression was detected in roots. This pattern of expression was similar to
other LTP genes, including those o f Arabidopsis (Thoma et a l , 1993, 1994), broccoli
(Pyee et a l, 1995) spinach (Bernhard et a l, 1991), barley (Causing, 1994; White et
a l, 1994; Molina et a l, 1993) cotton (Ma et a l, 1995) tomato (Torres-Schumann et
a l, 1993) and castor bean (Weig and Komor, 1992). An exception is the tobacco LTP
gene, N tlp l described by Canevascini et a l (1996), where expression was detected in
young root and root hairs. Sequence elements of the type, CAAA, wliich have been
found in several root-specific promoters including the HRGPnt3 (Keller and Lamb,
1989) and TobR7 (Yamamoto et a l, 1991) genes, were observed in several regions of
the BnLTP promoter (see Fig. 6.1 and section 6.1).
To determine the tissue and cellular location of expression, transgenic
Arabidopsis plants expressing the BnLTP promoter-GUS' fusion were examined. GUS
was expressed from early germination in developing cotyledons, young leaves, stems
and flower buds. As the plant matured, GUS expression decreased in mature leaves
and cotyledons and became confined to the tips (Fig. 6.3A). In mature flowers GUS
expression was very low in the sepals and no expression was detected in the petals
(Fig. 6.3B). It was however present in the stamens and pollen. A flower-specific
expression pattern was demonstrated for the Brassica napus E2 LTP (Foster et a l,
1992) which was shown to be expressed in developing microspores. E2 was expressed
specifically in the tapetal cells. Foster et a l (1992) proposed that E2 may be involved
in the transfer of lipids in both the tapetum and developing microspores of B. napus,
functioning in the formation of new membranes and storage lipids. A similar suggestion
was made by Sossountzov et a l (1991). However, amino acid sequence comparison of
E2 with BNLTP indicates only a 40% identity which suggests BNLTP may have a
different function in floral tissue. These observations clearly indicate that the BnLTP
promoter is developmentally regulated being highly expressed in young developing
tissues and less so in mature leaves.
In tissue cross-sections, GUS activity was shown to be predominantly
epidermis-specific in mature leaves and stems (Fig. 6.4). This was similar to previous
in situ experiments where pLF3A transcripts were detected predominantly in the
epidermal cells of leaf, stem and sepal in Brassica napus plants (Pallas, 1992).
2 2 4
Interestingly, analysis of the BnLTP promoter indicated the presence of a putative
sequence element (ATAGCTAG) implicated in epidermal-specific expression of a
tobacco LTP, Ntltpl (Canevascini et a l, 1996). However, whether this element is
functionally important in BnLTP remains to be determined. Epidermal-specific
expression of LTPs in mature leaves and stems was also detected in other species
including maize (Sossountzov et a l 1991), tobacco (Fleming et a l, 1993; Canevascini
et a l, 1996) and barley (Molina and Garcia-Olmedo, 1993) and in other Crucifer ae
species including Arabidopsis (Thoma et a l, 1994) and broccoli (Pyee and
Kolattukudy, 1994, 1995). However, epidermal specificity o f BnLTP-GUS expression
was not exclusive. Strong expression was observed in the vascular tissue (in the xylem
and phoem) in leaves and in the cortical cells of the stem, which was similar to the
Arabidopsis LTPl (Thoma et a l , 1994). Very faint expression was also observed in
the spongy mesophyll and palisade cells, similar to the broccoli WAX9D (Pyee and
Kolattukudy, 1995). This may however be attributed to physical damage of the tissue
when sectioning was carried out. In addition, the specialised epidermal cells,
trichomes, had particularly strong GUS expression suggesting that transcription factors
that control trichome differentiation (Koorneef et a l, 1983; Hülskamp et al., 1994)
may act as positive regulators of the BnLTP promoter.
In contrast to the northern blot results (Fig. 6.2), GUS activity was also
observed in the main root tip and the lateral root initials and remained confined therein
as the initial extended. Failure to detect transcripts in root tissue in northern blots may
reflect the small area in which the LTP gene was expressed. Also, in northern blots,
LTP transcripts were highly abundant in petals whereas BnLTP-GUS expression was
absent. This implies that other closely related members of the Brassica napus LTP
gene family are upregulated in petals whereas the BnLTP promoter is not. This is not
surprising, as a common characteristic of closely related genes is that their non-coding
regions diverge extensively during evolution compared to coding regions, exemplified
by the HvLTP4 gene from barley (Molina et a l, 1996), which suggests that their
expression patterns may be different. It seems that the BnLTP promoter is subject to
organ-specific expression resulting from positively acting elements in young and green
organs (leaves, stems, sepals) or from a negatively acting element leading to
transcriptional repression in non-green organs (petals and roots). The above
■i225
observations are consistent with the hypothesis that LTPs are involved in wax/cuticle
biosynthesis (Sterk et a l, 1991) as younger, developing organs (which express GUS at
a much higher level than mature organs) synthesise more wax than mature organs
(Bianchi et a l, 1985; Moose and Sisco, 1990). In addition, wax biosynthesis is
predominantly epidermal-specific (section 1.4.1), similar to BnLTP expression, and the
BNLTP protein is highly similar to the broccoli WAX9D protein, which was found to
be the major surface wax-associated protein in broccoli leaves. Furthermore,
expression of BnLTP-GUS in stigmas may be related to the deposition of surface lipids
other than cuticular waxes (Thoma et a l, 1994).
LTP expression was not observed in the Arabidopsis cell cultures (data not
shown) as these cells do not possess an epicuticular waxy layer, although Sterk et a l
(1991) did observe expression of an LTP gene, EPl, in carrot cell culture. However,
LTP expression is observed in non-epidermal cells (e.g. vascular tissue) and strongly in
root initials, neither of which are likely to be highly active in wax biosynthesis. The
purpose of this expression is less obvious.
6.9.3 Environmental regulation of BnLTP expression
Light plays an important role in the environmental regulation of plant
development and gene expression (Jenkins, 1991; Chory, 1991). Light also influences
the development and morphology of plant surfaces including the epicuticular waxy
layer and leaf thickness (Caldwell et a l, 1983). Furthermore, with the isolation of
several light-response mutants it is clear that many important aspects of growth and
development are regulated by a range of photoreceptors including the well-
characterised phytochrome family which absorb red and far-red parts of the spectrum
(Furuya, 1993), the UV-A/blue photoreceptors (cryptochromes) one of which has been
recently cloned (Ahmad and Cashmore, 1993) and the elusive UV-B-absorbiiig
receptor(s) (Britt e ta l , 1993; Jenkins e ta l , 1995).
BnLTP-GUS expression and endogenous XTP transcripts in Arabidopsis and B.
napus were induced in response to increased white light, blue and red light treatment
but not UV-B. This suggests that the gene may be regulated by phytochrome and
cryptochrome but not by the UV-B photoreceptor. The lack of induction of LTP
expression by UV-B light was surprising as it is quite clear from a number of reports
2 2 6
(Reicosky and Hanover, 1978) that cuticular waxes play an important protective role
against UV radiation and that LTPs are implicated very strongly in wax biosynthesis
(Sterk et a l, 1991; Pyee and Kolattukudy, 1995; Thoma et aï., 1994). Therefore, one
may have expected LTP expression to be induced by UV-B light. The low level X7P
and BnLTP-GUS in response to UV-B light may be due to the damaging effect of UV-
B to the plants.
The increase in LTP expression in response to light possibly reflects a general
increase in metabolism and gene expression, including LTP gene expression, since the
increase in light, specifically red and blue light, could stimulate photosynthesis. The
consequent increase in energy and carbon skeletons for biosynthesis, including
cuticular wax formation, may promote LTP expression. On the other hand, application
of light in excess to plants grown in low light may saturate photosynthesis and act as a
stress factor. One consequence of light-stress is the formation of free-radicals and
oxidative stress which is harmfiil to chloroplasts (Aro et a l, 1992). In addition, BnLTP
is expressed in the dark (data not shown), albeit at lower levels, which suggests it is
not a truly light regulated gene, and high expression is associated with green,
photosynthetically active tissues compared to non-green tissues as discussed
previously. Analysis of the BnLTP promoter indicates the presence of light and stress:
inducible elements which are also present in the promoter of the light, stress and
elicitor inducible gene PAL (Lois et a l , 1989; Ohl et a l, 1990). Moreover, in contrast
to CHS and CHS-GUS expression, which are regulated by blue, UV-A and UV-B light
but not by red light, and are not expressed in the dark or under low white light
conditions (Jackson et a l, 1995; Fuglevand et a l, 1996), BnLTP and BnLTP-GUS
were induced by red light.
Both CHS and BnLTP are epidennal-specific, suggesting that factors which
determine epidermal-specificity recognise common sequence elements in their
respective promoters despite the difference in their light regulation. Although a
putative sequence element (CTAGCTAG) implicated in epidermal-specific expression
of a tobacco LTP, Ntltpl (Canevascini et a l, 1996) was observed in the BnLTP
promoter (ATAGCTAG), this elment was not observed in the Araidopsis CHS .promoter suggesting additional elements may be required for epidermal-specificity.
I
2 2 7
. .11
"S,;.-5
SThe low level of BnLTP~GUS and CHS-GUS transgene induction in GUS
assays (Figs. 6.6A and 6.6B) compared to endogenous LTP and CHS transcripts (Figs.
6.5A and 6.5B) may reflect greater stability of the GUS transcript compared to the
LTP and CHS transcripts. However, this may also be due post-transcriptional
regulation of the genes. That is to say, the level of induction of the promoters may not.be the same as the level of transcript accumulation. Also, the regulation of the BnLTP
gene may be different from the other genes that give rise to the LTP transcript level.
Moreover, the BnLTP promoter activity may differ in B. napus and in the transgenic
Arahidopsis plants. Interestingly, BnLTP~GUS expression in Arabidopsis, which is a
heterologous system, showed a similar developmental pattern of expression to the
homologous Arabidopsis LTP 1-GUS transgene system described by Thoma et a l
(1994), which suggests that both Arabidopsis and Brassica napus express
transcription factors that recognize common sequence elements. The Arabidopsis
LTP 1 promoter appears to be more active than BnLTP under 30+5 pmol m' s" white
light (Figs. 6.6A and 6.6B) which may reflect positional effects on the transgene.
Unlike light induced expression of both endogenous LTP transcripts and the
BnLTP-GUS fusion in transgenic plants, a different response was observed following
cold treatment. BnLTP-GUS was induced in transgenic leaves whereas endogenous
LTP transcripts did not show a response under the same conditions. This may be
attributed to post-transcriptional regulation of the endogenous transcripts that alter
transcript accumulation regardless of the level of promoter induction. However, a
moderate increase of endogenous LTP expression was observed in Brassica napus
stems (data not shown). This may be attributed to the accumulation of transcripts of
other gene family members or due to differential post-transcriptional regulation of the
transcript in stems. The increase in BnLTP-GUS expression observed (Fig. 6.7B)
supports the hypothesis that LTPs are involved in the synthesis of the cuticle (Sterk et
al., 1991) as the waxy layer is important in protection against water loss. •i
Cell walls also play an important role in plant protection against cold
temperatures. They play an important role in excluding ice from cells, which is very
much dependent on cell-wall pores (Burke et a l, 1976). These pores have an
important function in the movement of water from cells during freezing temperatures
(Wisniewski et a l, 1987). In addition, the lipid composition of plant cell membranes is
2 2 8
altered in response to cold treatment (Johnson-Flanagan and Singh, 1987). As LTPs
have been shown to be located in the epidermal cell wall (Thoma et al., 1994) and the
epicuticular waxy layer (Pyee and Kolattukudy, 1995), their induction in response to
cold treatment may reflect their possible in vivo role in forming a protective barrier
from dehydration in response to cold treatment. As LTPs transfer lipids between
2 2 9
membranes in vitro (Arondel and Kader, 1990), the increase in LTP expression may
reflect the alteration in membrane lipid composition in response to cold treatment.
There are several lines of evidence suggesting that ABA levels rise in response
to cold treatment (Zeevaart and Creelman, 1988). Also, White et a l (1994) reported
the induction of a barley LTP gene family in response not only to cold but also to ABA
treatment. Two putative low-temperature response elements (LTRE) (ACCGACA)
and an ABA-response element (ABRE) (GTACGTGG) with an ACGT-core sequence
were located in the barley gblt4.9 promoter (White et a l, 1994). Several sequence
elements with the core ACGT or TGCA sequences were observed in the BnLTP
promoter. These sequences are also located in the promoter region of two barley cold-
and pathogen-induced LTP genes, HvLTP4.2 and HvLTP4.3 (Molina et a l, 1996). The
sequences flanking the ACGT core in each case differed, which is possibly the
mechanism for altering the specificity of transcription factor binding in response to
different stimuli. The CHS-GUS expression (Fig. 6.7B) and endogenous CHS
transcripts (data not shown) were also induced in response to cold treatment, which
may reflect the presence of common regulatory elements in the two promoters that
mediate cold perception.
Both the Arabidopsis LTPI-GUS and B. napus BnLTP-GUS transgene
expression were not affected upon wounding (Fig. 6.8). This observation was
unexpected as one would have expected an increase in LTP expression and increased
extracellular wax deposition in the regions of wound repair. However, one camiot
exclude the possibilty that the expression of other members of the LTP gene family
may be increased in response to wounding.
6.9,4 Viral induction of BnLTP expression
The induction of BnLTP-GUS expression in response to viral infection (Fig.
6.9) supports the previously postulated theory (Garcia-Olmedo et a l, 1995) that LTPs
are involved in plant defence against pathogen attack. The first contact between
pathogens and plants is with the epidermis. How this interaction affects host gene
expression has many potential implications with particular emphasis on protection of
economically important plants. Blocking the initial interaction of pathogen at the
epidermis would require additional knowledge of epidermal-specific gene expression in
response to viral invasion.
The host range of CaMV is mainly the Cruciferae family, which includes
Arabidopsis and the Brassicas. A compatible infection is characterised by local lesions
in the inoculated leaf and subsequent systemic infection. 2 to 3 weeks post inoculation
infection is observed (depending on the strain) in secondary leaves, characterised by
vein clearing and dark green, curly leaves (Covey, 1991). The virus is thought to move
to the apical meristem where it infects cells of the leaf primodia. It is also thought to
spread by cell-cell interaction via plasmodesmata. As plasmadesmata formation
requires an increase in lipid metabolism (Lucas and Wolf, 1993), BnLTP-GUS
expression induction in response to CaMV infection may reflect this phenomenon.
Under optimal infection conditions, that are probably dependent on environmental
conditions, the virus is thought to start replicating 14 days post inoculation (dpi). Non-
replicating viral minichromosomes are also detected in the roots (E. Cecchini and J. J.
Milner, unpublished data). In agreement with these observations, BnLTP-GUS
expression was induced in CaMV infected plants 14 days post infection which suggests
that viral replication and viral gene expression affects LTP gene expression.
It has been shown that the CaMV Gene VI product plays a central role in viral
replication and symptom formation (Covey, 1991). Several Arabidopsis transgenic
plants constitutively expressing the CaMV Gene VI display disease-like symptoms
similar to plants infected with the native virus. More severe symptoms were correlated
with elevated Gene VI expression. The Gene VI protein is a 62 kD translational
activator, which has an RNA binding domain and a zinc finger domain (Turner et a l,
1996). Whether Gene VI expression directly affected LTP expression was examined by
determining endogenous LTP expression in these plants. The high Gene VI expressers
had higher LTP expression compared to low expressers (Fig. 6.11A and 6.1 IB). These
results suggest that Gene VI may act as a translational activator of the BnLTP-GUS
transgene. However, it is also possible that the Gene VI product regulates a different
2 3 0
component in the cell that affects BnLTP-GUS expression. It is also possible that
factors which control Gene VI expression also control LTP expression.
These results support the previous hypothesis that LTPs may play an active
role in plant defence against pathogens because the increase in BnLTP-GUS and
endogenous LTP expression is conelated with Gene VI expression and therefore with
disease symptoms. In addition, the high Gene VI expressers were also associated with
severe symptoms, including chloroplast bleaching. These results suggest that the Gene
VI product interferes with the normal chloroplast development pathway (possibly
chlorophyll synthesis pathway).
The induction of BnLTP-GUS in virally infected root hairs (Fig. 6.10A) may
reflect an osmotic stress response in the presence of viral minichromosomes in the
root. Interestingly, White et a l (1994) also observed that a barley LTP whose
expression was normally absent in roots was induced in response to drought, ABA and
salt stress. Whether the virus minichromosomes located in the roots cause some form
■:î
of osmotic stress remains to be seen. It has been postulated that a pea root epidermis-
specific gene RH2 that has 95 % homology to the pea PR protein 149a (Mylona et a l,
1996) contributes to a constitutive defense barrier in the root epidermis. A similar role
has been proposed for chitinase pathogenesis-related proteins that are constitutively
expressed in certain epidermal tissues (Mylona et a l, 1994). Also, PR expression in the
pea root was shown to be induced in response to CaMV infection. It is possible that
LTP expression utilizes the same defence pathway. The CAAA-like elements in the
BnLTP promoter could mediate expression in roots in the presence of additional
stimuli such as pathogen attack or osmotic stress.
Cramer et a l (1996) have shown that in Arabidopsis roots, both NaCl and
ABA treatments influence internal Ca^ levels. By using the Ca^^'sensitive dye, Fura-2,
and ratiometric techniques, Ca^ levels were measured in cells of the root meristematic
region. Results showed that by increasing external NaCl and ABA concentrations, Ca^
levels in the meristem decreased. In addition, an Arabidopsis root-specific kinase
homolog, ARSKl, was shown to be induced by dehydration, ABA and NaCl (Hwang-I
and Goodman, 1995). This protein was shown to be expressed predominantly in the
root epidermal cells and has been proposed to have a role in the signal transduction of
osmotic stress. It is possible that the induction of BnLTP-GUS in root hairs in response
2 3 1
. î
to CaMV infection may be mediated by Ca and/or ARSKl. Related to this, Neumann
et al. (1993), showed that several LTP-like proteins present in wheat and barley, were
substrates of wheat Ca^^'dependent protein kinases. They possessed several
phosphoiylation sites.
6.9.5 LTP expression in epidermally altered Arabidopsis mutants
A major problem in epidermal development studies is the lack of sufficient
tissue for the isolation of genes expressed in the epidermis. With such a restricted cell
type, the relative level of transcripts and protein products would be extremely small.
Although differential and subtractive screening methods are useful, both depend on
abundantly expressed genes which is certainly the case for many structural genes
including LTP. However, regulatory genes are often expressed at low abundance and
their isolation therefore requires a different experimental approach. A more informative
approach is the isolation of genetically altered mutants. Several Arabidopsis mutants
altered in various aspects of epidermal development have been isolated. An indication
of altered expression in these mutants would not only enable us to correlate LTP
expression with epidermal development but also enable us to isolate/characterise other
genes (both regulatory and structural) implicated in epidermal cell differentiation.
Amongst the five epidermally altered mutants studied (Fig. 6.12 and 6.13), only two,-
icxl and icxl/ttg showed an altered LTP expression pattern. The icxJ mutation is
characterised by enhanced CHS expression in white light (Jackson et al., 1995). In
addition, the icxl mutation affects epidermal development, including trichome
development. Because CHS is expressed predominantly in the epidermis, this suggests
that ICXl controls not only epidermal development but also epidermal-specific gene
expression. Both icxl and icxl/ttg mutants were enlianced in endogenous LTP
expression. The level of expression was even more elevated in response to blue and red
light compared to wild type plants. Since LTP is an epidermally expressed gene, it is
possible that ICXI encodes a factor that recognises a common sequence element in the
CHS and LTP promoters that determines epidermal specificity. ICXI may function as a
transcriptional repressor because the expression of other genes, including DFR and
CHI, also showed enhanced expression in response to high white light in the icxl
mutant (Jackson et al., 1995). However, the expression of these genes is similar to
■1f
2 3 2
:
«1
wild type under low intensity white light, suggesting that ICXI expression may be
dependent on light. It seems that the normal function of ICXI is repression o l LTP
gene expression in response to high white, blue, red and UV-A light and, blue, UV-A
and high white light in the case of CHS expression.
The similarity between the icxl and icxl/ttg in LTP and CHS expression
suggests that the ICXI and TTG gene products do not interact in affecting the
expression of these genes. The double mutant has phenotypic characteristics of both
parents, suggesting that the two genes function independently and possibly at the same■
time during development.-t;3
,1
I?
2 3 3 I
Chapter 7 General DiscussionLTPs have been shown to be expressed predominantly in the epidermal layer of
a number of plant species including tobacco (Fleming et a l, 1992; Canevascini et a l,
1996), Arahidopsis (Thoma et a l, 1993, 1994), tomato (Fleming et a l, 1993) and
broccoli (Pyee and Kolattukudy, 1994, 1995). The data presented in this thesis
strongly supports the above observations, in that a Brassica napus gene encoding a
putative non-specific lipid transfer protein, BNLTP, is active predominantly but not
exclusively in the epidermal cells of leaf and stem tissue. The recent finding that LTPs
are expressed very early on in the protoderm (progenitor of epidermal cells) during
embryogenesis, and throughout development in mature epidermal cells (Sterk et a l,
1991; Thoma et a l, 1994), makes them ideal molecular markers for the study of
epidermal cell differentiation and patterning as demonstrated by Vroemen et a l (1996).
7.1 BnLTP represents a member of a small multigene family encoding a
putative LTP
Analysis of the BnLTP cDNA, (Fig.3.6), showed that it encodes a putative
LTP. It represented one member of a multigene family consisting of at least four genes.
This conclusion was based on sequence analysis of the 3’ non-coding regions of
several full length cDNA clones (Fig. 3.9). This conclusion was also supported by
previous Southern blot analysis (Pallas, 1992) where several Brassica napus genomic
fragments hybridised to pLF3A. LTP gene families have been reported in other species
including castor bean (Tsuboi et a l , 1991), broccoli, (Pyee and Kolattukudy, 1995),.tobacco (Fleming et a l, 1992) and Arabidopsis (Thoma et a l, 1994).
The BNLTP protein satisfied all the structural features of a typical LTP (see■
chapter 3). It is likely that BNLTP is either membrane associated or secreted. The
protein contained the characteristic eight conserved cysteine residues, which are
thought to form four disulphide bonds (Désormaux et a l, 1992). The predicted
tertiary structure of LTPs is thought to be that of a compact domain with four a -
helices and a long COOH-terminus and a hydrophobic pocket that is able to
accommodate acyl chains of lipid substrates (0stergaard e ta l , 1995; section 1.4.3.2).
Further understanding of the structure of LTPs and the role of the cysteines is likely to
come from detailed X-ray ciystallographic studies of the proteins. The conservation of
2 3 4I'
spanning domains, which suggests that the protein is not fully secreted but is anchored
in the plasma membrane. According to the hyPRP function model described by
Goodwin et ah (1996), some of the cysteine residues of the protein would be exposed
at the surface of cells having the potential to form disulphide bonds with other cysteine
residues in the carboxy terminus or indeed with proteins in the vicinity. Whether LTPs
anchored in the cell wall function in interacting with other cell wall components
extracellularly is not yet known but may indicate a structural role for LTPs in
protection against environmental stresses.
'1:the cysteines in BNLTP indicates that it is functionally important. Hybrid-proline-rich
cell wall proteins, (hyPRPs), some of which are also expressed in the epidermis (Wyatt
et a l, 1992) and possess a signal peptide, also contain eight consei'ved cysteine
residues in the carboxy terminus. Curiously, the distances between these are almost
identical to those in LTPs (Fig. 3.6), which suggests a common function. The carboxy
terminus of a Brassica napus hyPRP (Goodwin et a l, 1996) contains three membrane-
.
In order to isolate the promoter region of the BnLTP gene, several genomic
clones were isolated from a Brassica napus cv. Bridger genomic library using the
BnLTP cDNA as a probe (described in chapter 4). A 4.8 kb Eco RI fragment from one
clone, 3.2A, contained the full length gene (Fig. 4.9). The structure of the gene was
similar to that of other LTP genes, including in Arabidopsis (Thoma et a l, 1994). The
deduced protein sequence of the gene differed at five amino acids from that encoded
by the BnLTP cDNA (Fig.4.1 IB).
Primer extension analysis of the BnLTP promoter indicated a transcription start
site at an adenine residue in the context CTCATCA, 59 bp from the TATA box
(Fig. 10). Most importantly the gene contained a 2.3 kb 5’ upstream region which
contained several elements that were conserved in the broccoli LTP genes and several
elements found in light and stress induced genes (Fig.6.1; section 6.1). This region was
cloned upstream of the GUS gene and the fusion was introduced into Arabidopsis
plants (described in Chapter 5). The localisation of GUS would inevitably provide
clues to the possible function of BNLTP in vivo.
é"I
Ii■:î:
2 3 5Ï
7.2 BnLTP expression is subject to strong developmental and spatial
regulation
The in vivo function of plant LTPs is open to debate. In animals at least three
types of lipid transfer proteins are present. The first two classes have specific lipid
binding properties whereas the third group has the ability to bind a wide range of lipids
(Wirtz, 1991). This latter property is common to all plant LTPs analysed to date. They
appear to have very little substrate specificity and are able to transfer a broad range of
lipids substrates between membranes in viù'o (Kader et a l, 1984). There is very little
sequence homology between plant and mammalian LTPs.
In BnLTP promoter-Gt/6' transformants, expression of GUS was regulated in
an organ-specific manner (Fig. 6.3A), where younger developing organs had a higher
GUS activity than mature organs. During flower development (Fig. 6.3B), BnLTP-
GUS displayed differential expression, being associated with organs active in lipid
biosynthesis (for example the anthers and stigmas). In contrast to indications from
northern blots (Fig. 6.2), GUS activity was not observed in petals (6.3B) and was
present in root tissues (Fig. 6.3C). These differences may be attributed to differential
expression among LTP gene family members in B. napus. A more accurate approach in
determining the spatial regulation and expression of individual gene family members
would be to use gene-specific oligonucleotides and perform RT-PCR using RNA from
different organs (Simpson et a l, 1992). The method requires minimum amounts of
tissue, and the organ-specifc expression of each gene member can be determined.
Furthermore, the cell specific expression of each family member could be determined
by isolating the individual gene promoters and locating GUS activity of each promoter-
GUS fijsion.
One clear difference between the in situ hybridisation and the histochemical
localisation of GUS expression was the failure to detect LTP transcripts in the vascular
tissue during in situ hybridisation experiments (Pallas, 1992). This can be attributed to
the fundamental difference in the two techniques. In situ hybridisation determines
mRNA distribution at a given time whereas GUS histochemistry reveals the
accumulation of the GUS protein over a period of time. Furthermore, GUS transcripts
have a relatively longer half life, of around 60 h, and will therefore remain longer in a
2 3 6
given cell compared to most endogenous transcripts. It is possible that the BnLTP
transcripts in the vascular tissue are not very stable and therefore were not detected
during the in situ hybridisation experiments. It is also likely that the two different
transcripts may be subject to different post-transcriptional regulation. A similar
argument can be applied, in part, to the lack of detection of LTP transcripts in roots
(Fig. 6.2). Also, during in situ hybridisation it is difficult to distinguish between closely
related, highly similar transcripts as would be the case for the LTP gene family,
whereas analysis of promoter-GOT fusions focuses on a single promoter.
The high level of GUS in the epidermal cells of leaf (Fig. 6.4A and 6.4C) and
stem tissue (6.4D) is consistent with the speculation that BNLTP is involved in the
transport of cuticular components to the surface (Sterk et a l , 1991; Thoma et a l,
1994). This is supported by the observation that BNLTP is highly similar to a broccoli
leaf major surface protein, WAX9D (Pyee and Kolattukudy, 1995) (see chapter 3, Fig.
3.6), which suggests that BNLTP has a similar fimction to WAX9D. Pyee and
Kolattukudy (1995) hypothesised that the WAX9D protein functions in the transport
of cuticular monomers to the surface of the plant. They also demonstrated that
WAX9D was present in the cell wall of epidermal and mesophyll cells as well as in the
phloem. In addition, Thoma et a l (1993, 1994) and Sossountzov et a l (1991)
demonstrated the location of LTPs in the cell wall.
2 3 7
LTPs appear to be important components in the formation of a “normal”
epidermal cell wall. For example, Vroemen et a l (1996) demonstrated that the
Arabidopsis LTP displayed a position-specific expression pattern in the epidermal layer
of Arabidopsis embryos. However, this spatial expression was altered in the
Arabidopsis mutant knolle (see section 1.3.2.1), which is altered in epidermal cell
development. KNOLLE (Lukowitz e ta l , 1996) encodes a protein similar to syntaxins,
which are involved in vesicular trafficking. Furthermore, knolle mutants contained
many incomplete cell walls and walls with small holes, which suggested that KNOLLE
controls the transport of a variety of cell wall components to the surface. In view of
these observations, it is unlikely that LTPs are involved in the intracelluar transfer of
lipids between membranes as previously thought, as this would require a predominantly
cytoplasmic location. The expression of BnLTP-GUS in the stigmas (Fig.6.3B) is
I
Îa
consistent with the idea that LTPs are involved in lipid mobilization such as secretion
of stigma lipids (Thoma et a l, 1994).
BnLTP-GUS expression, like WAX9D-GUS, was observed at low levels in
mesophyll cells of leaves and stems (Fig. 6.3A, 6.3C and 6.3D) whereas strong
expression was observed in the vascular tissue of leaves and stems (Fig. 6.4C and
6.4D) and in the lignified tips of cotyledons (Fig. 6.3A). The role of BNLTP and
WAX9D in the latter two tissues is less obvious. However, these observations suggest
that transcription factors which control genes involved in the lignin biosynthesis may
also regulate the BnLTP gene by recognizing specific elements in the promoter region.
Lignification is a process that occurs through a series of enzymatic steps
initiated by a PAL-catalysed reaction to produce lignin precursors, the cinnamyl
alcohols, which are derived from phenylalanine. The lignin monomers are polymerised
into a complex phenolic polymer that forms a matrix in plant cell walls particularly in
the vascular bundles (Lewis and Yamato, 1990). PAL and 4CL are expressed in
lignified xylem and in the vascular bundles (see section 1.4.2.2). If indeed BnLTP
expression is coordinately expressed with the lignin biosynthetic pathway, which is a
branch of the general phenylpropanoid biosynthetic pathway, it would be expected that
genes such PAL and 4CL, which are key enzymes in the lignin biosynthesis, would
show a similar spatial expression pattern to BnLTP. Indeed both PAL and 4CL
transcripts are readily detected in the epidermal tissue (Wu and Hahlbrock, 1992;
Jahnen and Hahlbrock, 1988), and BnLTP-GUS expression is observed in the xylem
and vascular bundles. It is likely that several common elements that determine tissue-
specificity may be identified in these promoters.
Canevascini et al. (1996) identified an element designated the D1 box
(CTAGCTAG) in the promoter region of several LTP genes including those of tobacco
(Canevascini et a l, 1996), H. vulgare cv. Bond (Linnestad et a l, 1991; Kalla et a l,
1994) and S. vulgare (Pelese-Siebenburg et a l, 1994). This element is implicated in
epidermal-specific expression. In the BnLTP promoter, an imperfect element with the
sequence ATAGCTAG was identified at position -191 (Fig. 6.1), which may be
involved in epidermal-specificity. Whether this element detennines epidennal
specificity of BnLTP expression could be tested by generating promoter deletions of
2 3 8
'Il
the transgene and expressing them in transgenic plants. How the expression of these
genes is maintained throughout epidermal development and how the expression
patterns in young and mature tissue are differentiated is not known, although
differential screening and the isolation of mutants altered in candidate gene expression,
may point us in the right direction. Also, protein extracts from young and old
epidermal tissue can be used in gel-retardation experiments as an attempt at isolating
developmental- and tissue-specific transcription factors and identifying the
corresponding target sequences of the BnLTP promoter.
,BnLTP expression appears to be associated with young, rapidly dividing cells
and is demonstrated by the high level of BnLTP-GUS expression in developing
trichome cells (Fig. 6.4H), although the expression of GUS in mature trichomes varied
considerably (Fig. 6.41 and J). These observations suggest that trichome progenitor
cells contain transcriptional activators that upregulate BnLTP-GUS expression. The
Arahidopsis GLI and GL2 genes are known to be upregulated in progenitor cells (see
section 1.3.5.1) that are committed to form trichomes and in the meristematic region of
the root (Galway et a l, 1994), GLî and TTG are necessary for trichome formation
(Hülskamp et a l, 1994). The GLI gene product encodes a member of the myb family
of transcription factors (Oppenheimer et a l, 1991) and like several other plant myb .proteins contains two repeats of the myb DNA-binding domain at the NH2-terminus
and an acidic COOH-terminus with no similarity to other myb proteins. The GL2 gene
encodes a homeodomain protein (see section 1.3.5,1), The TTG gene has not been
fully characterised, although its expression is essential for trichome development. The
Arabidopsis ttg mutants, which lack trichomes can be complemented by the maize R
gene which encodes a myc-like transcription factor (Lloyd et a l, 1992). Therefore,
TTG may encode an R gene homolog. It is possible that as TTG and GLI promote
trichome development, they may also promote BnLTP-GUS expression. Moreover,
two myb-binding elements CAACTA, (-146 to -141) and CAACTT (-610 to -605), are
located in the BnLTP promoter (Fig. 4.9). However, in the Arabidopsis mutants g ll
gl2 and ttg, all of which lack trichomes, endogenous LTP expression was similar to
that in wild type plants, which suggests that other transcription factors are responsible
for the basal level of LTP expression.
2 3 97:'}
7.3 BnLTP expression displays a complex response to environmental stresses
It is clear from the above discussion and from Chapter 6, Figs. 6.2, 6.3 and 6.4,
that BnLTP gene expression is under tissue- and cell-specific developmental regulation.
However, data presented in Figs. 6.5 to 6.13, demonstrates that there is also complex
environmental regulation of the BnLTP gene.
The gene is induced in response to light, in particular high white, red, blue and
UV-A, but not in response to UV-B (Figs. 6.5 and 6.6). The transgene, but not
endogenous LTP transcripts, was induced in response to cold treatment (Fig. 6.7).
Moreover, GUS activity was enhanced in response to viral infection in both leaf tissue
(Figs. 6.9 and 6.10A) and root hairs (Fig. 6.1 OB), but not in response to wounding
(Fig. 6.8). Although several sequence elements implicated in stress responses are
present in the BnLTP promoter (Fig. 6.1), additional experiments are required to
elucidate the cis-acting elements implicated in the different responses. To do this,
BnLTP promoter deletion constructs can be expressed transiently in cell cultures or
stably in transgenic plants. Furthermore, expression could be assayed in the presence of.r~
pharamacological inhibitors that are known to inhibit various components of the
signalling pathways (see for example, Christie and Jenkins, 1996). In this way, we can
begin to functionally define biochemically and molecularly the various components of
the signalling pathway during LTP expression.
The function of BNLTP in response to light stresses is not immediately
obvious, although responses such as thickening of the leaf and the development of a
more glaucous appearance (possibly due to increased wax biosynthesis) may indicate a.role in the formation of a protective waxy layer. In addition, the icxl mutant (section
.1.3.5.2), which displays an altered epidermal surface, is altered in LTP expression in
response to light (Fig. 6.10). In order to investigate the reason for this alteration, icxl’
plants expressing the BnLTP-GUS transgene can be generated by genetically crossing
icxl with the BnLTF-GUS2 transgenic plants, and following GUS activity
histochemically. For example, the increase in LTP expression in icxl may be due to
other cell types, such as the spongy and palisade mesophylls, displaying an increase in
LTP expression. Similarly, protein extracts taken from low and high light treated icxl
and wild type plants, can be used in gel-retardation experiments to evaluate the
differences in binding activities between the two extracts to IhQ BnLTP promoter.
2 4 0I
expressing LTPs.
the study of epidermal cell fate of aerial organs. However, their use in the study of root
epidermal cell fate is questionable due to the lack or low level of expression observed
2 4 1
Although BnLTP expression was not induced in response to cold, some LTPs
are clearly induced in response to low temperature (Hughes et at., 1992). Freezing can
induce dehydration, which can result in the collapse of the protoplasm (Pearce and ^
Ashworth, 1990). As the waxy layer is important in reducing water loss and LTPs have
been implicated in fonnation of the cuticle, it is possible that in response to cold
treatment, LTPs function in reinforcing the waxy layer. It is also possible that LTPs
strengthen the epidermal cell wall by physical interaction with each other and with
other cell wall proteins expressed in the epidermis, possibly similar to hyPRPs ,
(Goodwin et al., 1996). This could be investigated by the constitutive over-expression
of LTPs in transgenic plants and measuring whether the plants with this phenotype
become more cold tolerant. Indeed, similar experiments can be carried out to
investigate tolerance to other environmental stresses. Related to this, Molina et al.T
(1996) demonstrated an increased resistance to pathogens of plants constitutivelyi
In view of their ability to inhibit bacterial and fungal pathogens in vitro and
their distributions at high concentrations on aerial, exposed surfaces and in the vascular
tissue, LTPs may play an active role in plant defence (see section 1.4.3.6). The data
presented in this work also supports this view, demonstrated by the induction of
BnLTP-GUS expression in response to infection with the CaMV BARI isolate (Fig.
6.9). The mechanism of anti-pathogenic activity in vivo, if any, is not known. i
However, direct assays of the effects of purified LTPs on pathogen growth and
metabolism would be informative in this respect.
In summary, the isolation o f BnLTP and its expression studies described in this
thesis are a step forward in understanding the in vivo function of a gene implicated in a
myriad of complex functions including, cuticle formation, wax biosynthesis, lipid
mobilization and protection against environmental stresses. Furthermore, the early
expression of some LTP genes during embryogenesis in the protoderm and during later
stages of epidermal development, render them ideal candidates as molecular markers in
in this tissue. |
ReferencesAarts. M. G. M., Keijzer, C. J., Steikema, W. J. and Pereira, A. (1995). Molecular
characterisation of the CERl gene of Arabidopsis involved in epicuticular wax
biosynthesis and pollen fertility. Plant Cell 7, 2115-2127
Ahmad, M. and Cashmore, A. R. (1993), HY4 gene of A. thaliana encodes a protein
with the characteristics of a blue-light photoreceptor. Nature 366, 162-166
Alban, C., Baldet, P., Douce, R. (1994). Localisation and characterisation of 2
structurally different forms of acetyl-CoA carboxylase in young pea leaves, of which
one is sensitive to aryloxyphenoxypropionate herbicides. Biochem. J. 300, 557-565
Aro, E-M., Virgin, I. and Andersson, B. (1992). Photoinhibition of photosystem II.
Inactivation, protein damage and turnover. Biochem. Biophys. Acta 1143, 113-134
Arondel, V. and Kader, J-C. (1990). Lipid transfer in plants. Experientia 46, 579-585
Aso, T., Conaway, J. W. and Conaway, R. C. (1994). Role of core promoter structure
in assembly of the RNA polymerase II preinitiation complex. J. Biol. Chem. 269,
26575-26583
Assmann, S. M. (1993). Signal transduction in guard cells. Annu. Rev. Cell. Biol. 9,
345-375
Ausubel, F. M., Brent, R., Kingston, R. E., Moore, D. D., Seidman, J. G., Smith, J. A.
and Struhl, K. (eds.) (1987). Current Protocols in Molecular Biology. 1st ed.. New
York
Bancroft, I., Bhatt, A , Sjodin, C., Scofield, S., Jones, J. and Dean, C. (1992).
Development of an efficient two-element transposon tagging system in Arabidopsis
thaliana. Mol. Gen. Genet. 233, 449-461
2 4 2
Barlow, P. W. (1984). Positional controls in root development. In Positional Controls
in Plant Development. P. W. Barlow and D. J. Carr, (eds.), Cambridge University
Press, 281-318
Barton, M. K., Poethig, R. S. (1993). The function of the shoot apical meristem in
Arabidopsis thaliana, an analysis of development in the wild type and in the shoot
meristem less mutant. Development 119, 823-831
Batschauer, A., Gilmartin, P. M., Nagy, F. and Schafer, E. (1994). The molecular
biology of photoregulated genes. In Photomorphogenesis in Plants. R E Kendrick, G.
H. M. Kronenberg, (eds.), Ed, 2, Kluwer Academic, Dordrecht, The Netherlands, The
Netherlands, pp. 559-599
Batschauer, A., Ehmann, B. and Schafer, E. (1991). Cloning and characterisation of a
chalcone synthase gene from mustard and its light-dependent expression. Plant M ol
Biol. U , 175-185
Batschauer, A., Rocholl, M., Kaiser, T., Nagatani, A., Furuya, M. and Schafer, E.
(1996). Blue and UV-A light-regulated CHS expression m At^abidopsis independent of
phytochrome A and phytochrome B. Plant J. 9, 63-69
Bautz, E. K. F. and Reilly, E. (1966), Gene-specific messenger RNA: isolation by the
deletion method. Science 151, 328-330
Bechtold, N., Ellis, J. and Pelletier, G. (1993). In planta Agrobacterium mediated gene
transfer by infiltration of adult Arabidopsis thaliana plants. C R. Acad. Sci. Paris,
Sciences de la Vie 316, 1194-1199 I3
Benton, W. D. and Davis, R. W. (1977). Screening lambda gt recombinant clones by
hybridisation to single plaques in vittv. Science 196, 180-1827
-Ï
2 4 3
Bernhard, W. R., Thoma, S., Botella, J., Somerville, C. R (1991). Isolation of a
cDNA clone for spinach lipid transfer protein and evidence that the protein is
synthesised by the secretory pathway. Plant Physiol, 95, 164-170
Bermadinger-Stabentheiner, E. (1995). Physical injury, re-crystallization of wax tubes
and artefacts, identifying some causes of structural alteration to spmce needle wax.
New Phytol 130, 67-74
Bessoule, T, Lessire, R. and Cassagne, C. (1989). Partial purification of the acyl-CoA
elongase from Allium porrum leaves. Arch. Biochem. Biophy. 268, 475-484
Birnboim, H. C. and Doly, J. (1979). A rapid alkaline extraction procedure for
screeming recombinant plasmid DNA. Nucleic Acids Res. 7, 1513-1523
Bianchi, A., Bianchi, G., Avato, P. and Salamini, F. (1985). Biosynthetic pathways of
epicuticular wax in maize as assessed by mutation, light, plant age and inhibitor
studies. Maydica 30, 179-198
Bodeau, J. P. and Walbot, V. (1992). Regulated transcription of the maize Bronze-2
promoter electroporated in protoplasts requires the C l and R gene products. Mol Gen
Genet 233, 379-387
Bradford, M. M. (1976). A rapid and sensitive method for the quantitation of
microgram quantities of protein utilizing the principle of protein-dye binding. Anal.
Biochem, 72, 248-254■4;
Bray, E. A. (1993). Molecular responses to water deficit. Plant Physiol. 103, 1035-
1040
Breu, V., Guerbette, E., Kader, J-C., Kanangata, C. G , Svensson, B , von Wettstein
Knowles (1989). A 10-kDa barley basic protein transfers phosphatidylcholine from
liposomes to mitochondria. Carlsberg Res. Commun. 54, 81-84
2 4 4■
Britt, A. B., Chen, J-J., Wykof, D. and Mitchell, A. (1993). A UV~sensitive mutant of
Arabidopsis defective in the repair of pyrimidine-pyrimidinone (6-4) dimers. Science
261, 1571-1574
Britten, R. J. and Davidson, E. H. (1985). Hybridisation strategy. In Nucleic Acid.Hybridisation: A Pratical Approach. B. D Hames and S. J. Higgins (eds.), IRL Press,
Oxford, pp. 3-16
Bullock, W. O , Fernandez, J. M. and Short, J. M. (1987). XLl-Blue-: A high-
efficiency plasmid transforming reca Escherichia coli strain with (3-galactosidase
selection. Biotechniques. 5, 376
Burke, M. J., Gusta, L. V., Quamme, H. A., Weiser, C. J. and Li, P. H. (1976).
Freezing and injury in plants. Annu. Rev. Plant Physiol. 27, 507-528
Buvat, R. (1989). Protective tissues. In Ontogeny, Cell Differentiation and Structure
o f Vascular Plants. Springer-Verlag, Berlin, pp. 242-286
ACaldwell, M. M., Robberecht, R. and Flint, S. D. (1993). Internal filters: Prospects for
UV-acclimation in higher plants. Plant Physiol. 58, 445-450
Cammue, B. P. A., Thevissen, K., Hendriks, M., Eggermont, K.,Goderis, I. J., Proost,
P., Van Damme, J., Osborn, R. W., Guerbette, F., Kader, J-C. and Broekaert, W. F.
(1995). A potent antimicrobial protein from onion seeds showing sequence homology .to plant lipid transfer proteins. Plant Physiol. 109, 445-455
■■■■ i
Canevascini, S., Caderas, D., Mandel, T., Fleming, A. J., Dupuis, I. and Kuhlemeier,
C. (1996). Tissue-specific expression and promoter analysis of the tobacco Itpl gene.
Plant Physiol. 112, 513-524
I
I245
Chandler, V. L. and Hardeman, K. J. (1992). The Mu elements of Zea mays. Ad\>.
Genet 30, 77-122
Chang, S. S., Park, S. K., Kim, B. C e t al. (1994). Stable genetic transformation of
Arabidopsis thaliana by Agrobacterium inoculation in planta. Plant J. 5, 551-558
Cheesbrough, T. M. and Kolattukudy, P. E. (1994). Alkane biosynthesis by
decarbonylation of aldehydes catalyzed by a particulate preparation from Pisum
sativum. Proc. Natl. Acad. Sci. USA 81, 6613-6617
Chory, J. (1991). Light signals in leaf and chloroplast development: photoreceptors
and downstream responses in search of a transduction pathway. New Biol. 3, 538-548
Christie, J. M. and Jenkins, G. I. (1996). Distinct UV-B and UV-A/blue light signal
transduction pathways induce chalcone synthase gene expression in Arabidopsis cells.
Plant Cells, 1555-1567
2 4 6
Cassagne, C , Lessire, R., Bessoule, J-J. and Moreau, P. (1987). Plant elongases. In
The Metabolism, Structure and Function o f Plant Lipids. P. K Stumpf, J. B Mudd,
W. D., Ness (eds.). New York, Plenum, pp. 481-488 i
I
Castagnaro, A. and Garcia-Olmedo, F. (1994). A fatty acid binding protein from wheat
\iQvn2i\ . FEBS Lett. 349, 117-119
Chomczynski, P., and Sacchi, N. (1989). Single-step method of RNA isolation by acid
guanidinium thiocyanate-phenol-chloroform extraction, rtwa/. Biochem. 162, 156-159
1
Chory, J. and Peto, C. A. (1990). Mutations in tboD ETl gene affect cell-type specific
expression of light-regulated genes and chloroplast development in Arabidopsis. Proc.
Neal. Acad. Sci. USA 87, 8776-8780
Ï
.
Clark, A. M., Verbeke, J. A. and Bonhert, H. J. (1992). Epidermis-specfîc gene
expression in Pachyphytum. Plant Cell 4, 1189-1198
Clark, L. and Carbon, J. (1976). A colony bank containing synthetic Col El hybrid
plasmids representative of the entire E. Coli genome. Cell 9, 91-99
Clarke, M. C , Wei, W. and Lindsey, K. (1992). High frequency transformation of
Arabidopsis thaliana by Agi^obacterium tiimefaciens. Plant M ol Biol Rep. 10, 178-
189
Clarkson, D. T. (1985). Factors affecting mineral nutrient acquisition by plants. Annu.
Rev. Plant Physiol. 36, 77-115
Cormack, R. G. H. (1962). Development of root hairs in angiosperms. Bot. Rev. 15,
583-612
Covey, S. N. (1991). Pathogenesis of a plant pararetrovirus, CaMV. Virology 2, 151-
159
Cramer, G. R. and Jones, R. L. (1996). Osmotic stress and abscisic acid reduce
cytosolic calcium activities of Arabidopsis thaliana. Plant Cell and Development 19,
1291-1298
Deka, R. K. and Post-Beittenmillar, D. (1997). Modification of Plant Epicuticular
Waxes. In Phsiology, Biochemisteiy and Molecular Biology o f Plant Lipids. J. P.
Williams, M. U. Kahn and N. W. Lem (eds ), Kluwer Academic Publishers, The
Netherlands, pp. 48-50
Denhardt, D. T. (1966). A membrane filter technique for detection of complementary
DNA. Biochem. Biohys. Res. Commun. 23, 641-646
2 4 7
Désormeaux, A., Blochet, J. E., Pézolet, M. and Marion, D. (1992). Amino acid
sequence of a non-specific wheat phospholipid transfer protein and its conformation as
revealed by infrared and Ramam spectroscopy; role of disulphide bridges and
phospholipids in the stabilization of the a-helix structure. Biochem. Biophys. Acta.
112, 137-152
Deutch, C. E. and Winicov, I. (1995). Post-transcriptional regulation of a salt-
inducible alfafa gene encoding a putative chimeric proline-rich cell wall protein. Plant
Mol. Biol 27, 411-418
Dixon, R. A. and Paiva, N. L. (1995). Stress-induced phenylproponoid metabolism.
Plant C elll, 1085-1097
Dolan, L., Janmaat, K., Willemsen, V., Linstead, P., Poethig, S., Roberts, K. and
Scheres, B. (1993). Cellular organisation of the Arabidopsis thaliana root.
Developement 119, 71-84
Dorer, D. R. and Henikoff, S. (1994). Expansions of transgene repeats cause
heterochromatin formation and gene silencing in Drosophila. Cell 77, 993-1002
Dormann, P., Voelker, T. A. and Ohlrogge, J. B. (1995). Cloning and expression in
Escherichia coli of a novel thioesterase from Arabidopsis thaliana specific for long
chain acyl-acyl earner proteins. Arch. Biochem. Biophys. 316, 612-618
Dorssers, L. and Postmes, A. M. E. A. (1987). A simplified, orientation-specific cDNA
cloning strategy. Nucl. Acids Res. 15, 3629
Douady, D., Grosbois, M. Guerbette, F. and Kader, J-C. (1982). Purification of a basic
phospholipid transfer protein from maize seedlings. Biochim. Biophys. Acta 710, 143-
153
2 4 8
Dunn, M. A., Hughes, M., A., Zhang, L., Pearce, R. S., Quigley, A. S., Jack, P. L.
(1991). Nucleotide sequence and molecular analysis of the low temperature induced
cereal gene, RL7V. M?/. Gen. Genet. 229, 389-394
Dunn, M. A., Goddard, N. J., Zhang, L., Pearce, R. S., Hughes, M. A. (1994). Low
temperature-responsive genes have different control mechanisms. Plant Mol. Biol. 24,
879-888
Eckert, K. A. and Kunkel, T. A. (1991). The fidelity of DNA polymerases used in the
polymerase chain reactions. In PCR, A Practical Approach. M. J. McPherson, P.
Quirke, G. R. Taylor (eds.), Oxford University Press, pp. 225-244
Eglinton, G. and Hamilton, R. J. (1967). Leaf epicuticular waxes. Science 156, 1322-
1335I
Ehkeringer, J. (1984). Ecology and ecophysiology of leaf pubescence in North
American desert plants. In Biology and chemistry o f plant ttichomes. E. Rodriguez, P.
L. Healey, I. Mehtal (eds.). Plenum Press, New York, pp. 113-132
Eigenbrode, S. D , Stoner, K., Shelton, A. M. and Kain, W. C. (1991). Characteristics
of glossy leaf waxes associated with diamondback moth {Lepidoptera Plutellidae) in
Brassica oleraceae. J. Econ. Entomol. 84, 1609-1618
Eigenbrode, S. D., Espelie, K. E. and Shelton, A. M. (1991). Behaviour of neonate
diamondback moth larvae [Plutella xylostella (L.).] on leaves and on extracted leaf.waxes of resistant and susceptible cabbages. J. Chem. Ecol. 17, 1691-1704
Eigenbrode, S. D. and Espelie, K. E. (1995). Effects of plant epicuticular lipids on
herbivores. Ann. Rev. Entomol. 40, 171-194
.Evenson, K. J. and Post-Beittenmiller, D. (1995). Fatty acid elongating activity in
rapidly-expanding leek epidermis. Plant Physiol, 109, 707-716
I2 4 9
S
Feinbaum, R. L. and Ausubel, F. M. (1988). Transcriptional regulation of the
Arabidopsis thaliana chalcone synthase gene. M ol Cell Biol. 8, 1985-1992
Feldbrügge, M., Sprenger, M., Dinklebach, M., Yaazaki, K., Harter, K. and
Weisshaar, B. (1994). Functional analysis of a light-responsive bZEP transcriptional
regulator. P/a?? C c//6, 1607-1621
Feldbrügge, M., Sprenger, M., Hahlbrock, K. and Weisshaar, B. (1997). PCMYBl, a
novel plant protein containing a DNA-binding domain with one MYB repeat, interacts
with a light-regulatory promoter unit. Plant J. 11, 1079-1093
Feldmann, K. A. and Marks, M. D. (1987). Agrobacterium mediated transformation of
germinating seeds of Arabidopsis thaliana, a non-tissue culture approach. M ol Gen,
Genet. 208, 1-9
Feldmann, K. A. (1991). T-DNA insertion mutagenesis of Arabidopsis, mutational
spectrum. The Plant Journal 1, 71-82
Finnegan, J. and McElroy, D. (1994). Transgene inactivation: Plants fight back!
Bio/Technology 12, 883-888
Fleming, A. J., Mandel, T., Hofmann, S., Sterk, P., Devries, S. C , Kuhlemeier, C,
(1992), Expression pattern of a tobacco lipid transfer protein gene within the shoot
apex. Plant J. 2, 855-862
Florack, D. E. A. and Stiekema, W. J. (1994). Thionins, properties, possible biological
roles and mechanisms of action. Plant Mol B iol 26, 25-37
Foster, G. D., Robinson, S. W., Blundell, R. P., Roberts, M. R., Hodge, R., Draper, J.,
Scott, R. J., (1992). A Brassica napus messenger RNA encoding a protein
homologous to phospholipid transfer proteins, is expressed specifically in the tapetum
and developing microspores. Plant Sci. 84, 187-192
2 5 0
Fromm, M., Taylor, L. P. and Walbot, V. (1985). Stable transformation of maize after
gene transfer by electroporation. Nature 319, 791
Fuglevand, G., Jackson, J. A. and Jenkins, G. I. (1996). UV-B, UV-A, and blue light
signal transduction pathways interact synergistically to regulate chalcone synthase gene
expression iw Arahidopsis. Plant Cell 8, 2347-2357
Furuya, M. (1993). Phytochromes: their molecular species, gene families, and
functions. Annu. Rev. Plant Physiol. Plant Mol. Biol. 44, 617-645
Galbraith, D W., Harkins, K. R. and Knapp, S. (1991). Systemic endopolyploidy in
Arabidopsis thaliana. Plant Physiol. 96, 985-989
Galway, M. E., Masucci, J. D., Lloyd, A. M., Walbot, V., Davis, R. W., and
Schiefelbein, J. W. (1994). The TTG gene is required to specify epidermal cell fate and
cell patterning in tho Arabidopsis root. Dev. Biol. 166, 740-754
Garcia-Olmedo, F., Molina, A , Segura, A and Moreno, M. (1995). The defensive role
of non-specific lipid-transfer proteins in plants. Trends in Microbiology 3, 72-74
Gausing, K. (1994). Lipid transfer protein genes specifically expressed in barley leaves
and coleoptiles. Planta 192, 574-580
2 5 1
: 'Ù
Gehring, W. J., Affblter, M. and Burglin, T. (1994). Homeodomain proteins. Annu.
Rev. Biochem. 63, 487-526
Gheysen, G., Van Montagu, M. and Zambryski, P. (1987). Integration of
Agrobacterium tiimefaciens transfer DNA (T-DNA) involves rearrangements of target
plant DNA sequences. Proc. Natl. Acad. Sci. USA 84, 6169-6173
Gibson, S. and Somerville, C. (1993). Isolating plant genes. Trends Biotechnol. 11,
306-313
Goff, S. A., Cone, K. C. and Chandler, V. L. (1992). Functional analysis of the
transcriptional activator encoded by the maize B gene, evidence for a direct functional
interaction between two classes of regulatory proteins. Genes Devel. 6, 864-875
Goldberg, R. B , Paiva, G. D., and Yadegari, R. (1994). Plant embryogenesis; Zygote
to seed. Science 266, 605-614
Goldsbrough, A. P., Albrect, H. and Stratford, R. (1993). Salicylic acid-inducible
binding of tobacco nuclear proteins to a 10-bp sequence which is highly conserved
amongst stress-inducible genes. Plant J. 3, 563-571
Goodall, G. J. and Filipowicz, W. (1989). The AU-rich sequences present in the
introns of plant nuclear pre-mRNAs are required for splicing. Cell 58, 473-883
Goodwin, W., Pallas, J. A. and Jenkins, G. I. (1996). Transcripts of a gene encoding a
putative cell wall-plasma membrane linker protein are specifically cold-induced in
Brassica napus. Plant M ol Biol 31, 771-781
Green, P. J. (1993). Control of mRNA stability in higher plants. Plant Physiol 102,
Guerbette, F., Jolliot, A , Kader, J-C. and Grosbois, M. (1997). Binding of lipids on
lipid transfer proteins. In Phsiology, Biochemistery and Molecular Biology o f Plant
Lipids. J. P. Williams, M. U. Kahn, N. W. Lem (eds.), Kluwer Academic Publishers,
The Netherlands, pp. 128-130
Hake, S. (1987). Tissue interactions in plant development. Bioassays 6, 58-60
2 5 2
4%1065-1070
Grosbois, M., Guerbette, F., Jolliot, A., Quintin, F. and Kader, J-C. (1993). Control of
maize lipid transfer protein activity by oxido-reducing conditions. Biochim. Biophys.
Acta 1170, 197-203
Si
;#""IiiÏ
I
Hannoufa, A., MeNevin, J. and Lemieux, B. (1993). Epicuticular wax of ecerifemm
mutants o îArabidopsis thaliana. Phytochemistry 33, 851-855
proteins required for the normal accumulation of cuticular waxes. Plant Physiol 113,
1091-1100
Hay, B. and Short, J. M. (1992). ExAssist helper phage and SOLR® cells for Lambda
Brassica napus L. homolog of acyl-CoA-binding proteins. Plant M ol B iol 25, 917-
920
Hall, D. M. and Jones, R. L. (1961). Physiologcal significance of surface wax on
leaves. Nature 191, 95-96
.;.4'
I'%
Hansen, J. D., Dietrich, C , Xia, Y., Xu X., Wen, T-J., Delledonne, M., Robertson, D..S., Schnable, P. S. and Mkolau, B J. (1997). Molecular biology of genes involved in
cuticular wax biosynthesis. In Phsiology, Biochemistery and Molecular Biology o f
Plant Lipids. J. P. Williams, M. U. Kahn, N. W. Lem (eds.), Kluwer Academic
Publishers, The Netherlands, pp. 336-338■li
%
Hansen, J. D , Pyee, J., Xia, Y., Wen, T-J., Robertson, D. S., Kolattukudy, P. E.,
Nikolau, B. J. and Schnable, P. S. (1997). The glossy 1 locus of maize and an
epidermal-specific cDNA fi-om Kleinia odor a define a novel class of receptor-like
ZAP II Excisions. Sùategies 5, 16-18
Henshaw, G. G , O’Hara, J. F. and Webb, K. J (1982). In Differentiation in vitro, M.
M. Yeoman and D E S. Truman (eds.), Cambridge University Press, pp. 231-251
Hills, M. J., Dann, R., Lydiate, D. and Sharep, A. (1994). Molecular cloning of a
■a
Holloway, P. J., Hunt, G. M., Baker, E. A. and Macey, M. J. K. (1977). Chemical
composition and ultrastructure of the epicuticular wax in four mutants of Pisum
sativum (L ). Chem. Phys. Lipids 2Q, 141-155
2 5 3
■■■■
IHolsters M., de Waele, D , Depicker, A., Messens, E., Van Montagu, M. and Schell, J.
(1978). Transfection and transformation of A. tumefaciens. M ol Gen. Genet. 163,
181-178
'IHughes, M.A., Dunn, M. A., Pearce, R. S., White, A. J., Zhang, L. (1992). An
abscisic-acid-responsive, low-temperature barley gene has homology with a maize
phospholipid transfer protein. Plant Cell Environ. 15, 861-865
development m Arabidopsis. Cell 76, 555-566
Hrazdina, G., Marx, G. A. and Hoch, H. C. (1982). Distribution of secondaiy plant
metabolites and their biosynthetic enzymes in pea {Pisum Sativum) leaves. Plant
Physiol. 70, 745-748
Hwang, I. W. and Goodman, H. M. (1995). An Arabidopsis thaliana root-specific
kinase homolog is induced by dehydration, ABA and NaCl. Plant Journal 8, 37-43
2 5 4
Hülskamp, M., Misera, S., and Jurgens, G. (1994). Genetic dissection of trichome cell: : r
Irish, V. F. (1991). Cell lineage in plant development. Curr. Opin. Genet. Devel. 1,
169-173
Jackson, D , Veit, B. and Hake, S. (1994). Expression of the maize KNOTTEDl
related homeobox genes in the shoot apical meristem predicts patterns of
morphogenesis in the vegetative shoot. Development 120, 405-413
Jackson, J. A., Fuglevand, G., Brown, B. A., Shaw, M. J. and Jenkins, G. I. (1995).
Isolation of Arabidopsis mutants altered in Ught-regulation of chalcone synthase gene
expression using a transgenic screening approach. Plant J. 8, 369-380
Jahnen, W. and Hahlbrock, K. (1988). Cellular localization of nonhost resistance
reactions of parsley {Petroselinum crispum) to fungal infection. Planta 173, 197-204
Jaing, C., lu, B. and Singh, J. (1996). Requirement of a CCGAC cis-acting element for
cold induction of the BN115 gene from winter Brassica napus. Plant M ol Biol 30,
679-684
James , D , Lim, E., Keller, J., Plooy, I., Ralston, E. and Dooner, H. (1995). Directed
tagging of the Arabidopsis fatty acid elongation {FAEl) gene with the maize .
transposon activator. Plant Cell 7, 309-319
:.
Jeffee, C. E., Baker, E. A. and Holloway, P. J. (1976). Origins of fine stmcture of
plant epicuticular waxes. In Microbiology o f Aerial Plant Surfaces. CH. Dickinson, T.
F. Preece (eds ). Academic Press, London, pp. 118-158
Jefferson, R. A. (1987). Assaying chimeric genes in plants: The GUS gene fusion
system. Plant M ol Biol Rep. 5, 387-405
Jefferson, R. A., Kavanagh, T. A. and Bevan, M. W. (1987). GUS fusions: d~
glucuronidase as a sensitive, versatile gene fusion marker in higher plants. EMBO J. 6,
3901-3907
(1994a). Chemically induced cuticle mutation affecting epidermal conductance to
water vapor and disease susceptibility in Sorghum bicolor (L.) Moench. Plant Physiol.
105, 1239-1245
2 5 5
Jenks, M. A. Rich, P. J,, Peters, P. J , Axtell, J. D. and Ashworth, E. N. (1992).
Epicuticular wax morphology of bloomless {bm) mutants in Sorgham bicolor. Int. J.
Plant Set 153,311-319
Jenks, M. A., Joly, R. J., Peters, P. J., Rich, P. J., Axtell, J. D. and Ashworth, E. A.
f
Jenks, M. A., Rich, P. J. and Ashworth, E. N. (1994b). Involvement of cork cells in the
secretion of filaments on Sorgham bicolor (L.) Moench. Int. J. Plant Sci. 155, 506-
518
Jenks, M. A., Tuttle, H. A., Eigenbrode, S. D. and Feldmann, K. A. (1995). Leaf
epicuticular waxes of the eceriferum mutants m Arabidopsis. Plant Physiol. 108, 369-
377
Jenkins, G. I. (1991). Photoregulation of plant gene expression. In Developmental
Regulation o f Plant Gene Expression. D. Grierson (ed.), Blackie, pp. 1-41
Jenkins, G. I , Christie, J. M., Fuglevand, G , Long, J. C. and Jackson, J. A. (1995).
Plant responses to UV and blue light: Biochemical and genetic approaches. Plant Sci.
112, 117-138
Johnson-Flanagan, A. M. and Singh, J. (1986). Membrane deletion during plasmolysis
in hardened and non-hardened plant cells. Plant Cell Envir. 9, 299-305
Jordan, W. R., Shouse, P. J., Blum, A., Miller, F. R. and Monk, R. C (1994).
Environmental physiology of sorgham II. Epicuticular wax load and cuticle
transpiration. Crop Sci. 24, 1168-1173
Joshi, C. P. (1987). An inspection of the domain between putative TATA box and
translation start site in 79 plant genes. Nucleic Acids Res. 15, 6643-6653
in flowering plants. Annu. Rev. Genet. 28, 351-371
Joshi, C. P. (1987). Putative polyadenylation signals in nuclear genes of higher plants,
a compilation and analysis. Nucl. Acids Res. 15, 9627-9639
Jürgens, G., Mayer, U., Ruiz, R. A. T., Berleth, T. and Misera, S. (1991). Genetic
analysis of pattern formation in the Arabidopsis embryo. Development Suppl. 91, 27-
38
.Jürgens, G., Torres Ruiz, R. A. and Berleth, T. (1994). Embryonic pattern formation
I' ï i "2 5 6
Jürgens, G. (1995). Axis formation in plant embryogenesis: Cues and clues. Cell 81,
467-470
Kadar, J-C. (1975). Proteins and intracellular exchange of lipids, stimulation of
phospholipid exchange between mitochondria and microsomal fractions by proteins
isolated from potato tuber. Biochim. Biophys. Acta 380, 31-44
Kader, J-C., Douady, D. and Mazliak, P. (1984). Purification and characterisation of a
spinach leaf protein capable of transferring phospholipids from liposomes to
mitochondria or chloroplasts. Eur. J. Biochem. 139, 411-416
Kader, J-C. (1993). In Plant lipid metabolism. T. S. Moore (ed.), CRC Press, pp. 303-
330
Kader, J-C. (1996). Lipid-transfer proteins in plants. Annu. Rev. Plant Physiol. Plant
Mol. Biol. 47, 627-654
Kahn, T. L., Fender, S. E., Bray, E. A. and O’Conell, M. A. (1993). Characterisation
of expression of drought and abscisic acid-regulated tomato genes in the drought-
resistant Lycopersicon pennellii. Plant Physiol. 103, 597-605
Kalla, R , Shimamoto, K., Potter, R , Neilsen, P. S., Linnestad, ad, C. and Olsen, O. A.
(1994). The promoter of a barley aleurone-specific gene encoding a putative 7-kDa
lipid transfer protein confers aleurone cell-specific expression in transgenic rice. Plant
J. 6, 849-860
Kaufinan, D. L. and Evans, G. A. (1990). Restriction endonuclease cleavage at the
termini of PCR products. Biotechniques 9, 304-306
Keller, B. and Lamb, C. J. (1989). Specific expression of a novel cell wall
hydroxyproline-rich glycoprotein gene in lateral root initiation. Genes Devel. 3, 1639-
1646
2 5 7
Kertz, P. L (1989). Effect of lambda packaging extract mcr restriction activity on
DNA cloning. Nucleic Acid Res.11, 5409
Kolattukudy, P. E. (1968). Further evidence for an elongation-decarboxylation
mechanism in the biosynthesis of paraffins in leaves. Plant Physiol 43, 375-383
Kolattukudy, P. E. (1971). Enzymatic synthesis of fatty alcohols in Brassica oleracea.
Arch. Biochem. Biophys. 142, 701-709
Kolattukudy, P. E. (1975). Biochemistry of cutin, suberin, and waxes, the lipid barriers
on plants. In Recent Advances in Chemistiy and Biochemistry o f Plant Lipids. T.
Gallard, E. I. Mercer (eds.). Proceedings of Phytochemical Society, Academic Press,,
New York, pp. 203-246
,Kolattukudy, P E., Croteau, R. and Buckner, J. S. (1976). Biochemistry of plant
waxes. In Chemistry and Biochemistry o f Natural Waxes. P. E. Kolattukudy (ed.),
Elsevier Press, New York, pp. 235-287
.Kolattukudy, P. E. (1981). Structure, biosynthesis and biodégradation of cutin and
suberin. Ann. Rev. Plant Physiol. 32, 539-567
Kolattukudy, P. E. (1987). Lipid derived defensive polymers and waxes and their role
in plant-microbe interaction. In The Biochemistry o f Plants. P. K. Stumpf, E. E. Conn
(eds ). New York, Academic, pp. 291-314
Koltunow, A. M., Tmettner, J., Cox, K. H., Wallroth, M. and Goldberg, R. B. (1990).
Different temporal and spatial gene expression patterns occur during anther
development. Plant Cell 2 , 1201-1224
Konishi, T. and Sasaki, Y. (1994). Compartmentalization of two forms of acetyl-CoA
carboxylase in plants and the origin of their tolerance tolerance toward herbicides.
Proc. Natl Acad. Sci. USA 91, 3598-3601
ÏÏ'2 5 8
Koncz, C and Schell, J. (1986). The promoter of TL-DNA gene 5 controls the tissue-
specific expression of chimeric genes carried by a novel type of Agiobactermm binary
vector. Mol. Gen. Genet. 204, 383-396
2 5 9
iKorfhage, U., Trezzini, G. F., Meier, I., Hahlbrock, K. and Somssich, I. E. (1994).
Plant homeodomain protein involved in transcriptional regulation of a pathogen
defence-related gene. Plant Cell 6, 695-708
.Kornberg, T. B. (1993). Understanding the homeodomain, J. Biol. Chem. 268, 26813-
26816
.Koornneef, M., Dellaert, L. and Veen, Jvd. (1982). EMS- and radiation-induced
mutation frequencies at individual loci in Arabidopsis thaliana (L.) Heynh. Mutation
Research 93, 109-123
Koornneef, M., Hanhait, C. J. and Thiel, F. (1989). A genetic and phenotypic
description of eceriferum (cer) mutants in Arabidopsis thaliana. J. Hered. 80, 118-
122
Koornneef, M. (1991). Isolation of higher plant development mutants. In Molecular
Biology o f Plant Development. G. I. Jenkins, W. Schulz (eds.), Cambridge University
Press, pp. 1-19
Kotilainen, M., Helariutta, Y., Elomaa, P. and Teeri, T. H. (1994). A corolla- and
carpel-abundant, nonspecific lipid transfer protein gene is expressed in the epidermis
and parenchyma of Gerbear hybrida var Regina {Compositae). Plant Mol. Biol. 26,
971-978
Kubasek, W. L., Shirley, B. W., McKillop, A., Goodman, H. M., Briggs, W. and
Ausubel, F. M. (1992). Regulation of flavonoid biosynthetic genes in germinating
Arabidopsis seedlings. Plant Cell 4, 1229-1236
Î4
character of a protein. J. Mol. Biol. 157, 105-132
Laemmli, U. K., Kas, E., Poljak, L. and Adachi, Y. (1992). Scaffold-associated
regions, cis-acting determinants of chromatin structural loops and hmctional domains.
Curr Opin. Genet. Dev. 2, 275-285
Larkin, J. C., Oppenheimer, D. G , Lloyd, A. M., Paparozzi, E. T. and Marks, M. D.
(1994). Roles of the GLABROUSl and TRANSPARENT TESTA GLABRA genes in
Arabidopsis trichome development. Plant Cell 6, 1065-1076
11357-11367
Lewis, N. G. and Yamamoto, E. (1990). Lignin, occurrence, biogenesis and
biodégradation. Ann. Rev. Plant Physiol. Plant Mol. Biol. 41, 455-496
2 6 0
Kyte, J. and Doolittle, R F. (1982). A simple method for displaying the hydropathy
II
II '
I4
Laughton, A. (1991). DNA binding specificity of homeodomains. Biochemistry 30,
Lawerence, P. A. and Morata, G. (1994). Homeobox genes: Their function in
Drosophila segmentation and pattern formation. Cell 78, 181-189
Lawton, M. A. and Lamb, C. J. (1987). Transcriptional activation of plant defence
genes by fungal elicitor, wounding, and infection. Mol. Cell Biol. 7, 335-341
Lessire R , Hartraann-Bouillon, M. A. and Cassagne, C. (1982). Very long chain fatty
acids: occurrence and biosynthesis in membrane fractions from etiolated maize
coleoptiles. Phytochemistry 21, 55-59
Lessire R , Bessoule, J. and Cassagne, C (1985). Solubilization of CIS CoA and C20
Co A elongases fi'om Allium porrum L. epidermal cell microsomes. FEBS Lett. 187,
314-320
Li, L, Ou-Lee, T-M., Raba, R., Amundson, R G. and Last, R.L. (1993). Arabidopsis
flavonoid mutants are hypersensitive to UV-B irradiation. Plant Cell 5, 171-179
Linnestad, C., Lonneborg, A., Kalla, R. and Olsen, O-A. (1991). Promoter of a lipid
transfer protein gene expressed in barley aleurone cells contains similar myb and myc
recognition sites as the mmzQ Bz~McC allele. Plant Physiol. 97, 841-843
2 6 1
Leyva, A., Jarillo, J. A., Salinas, J. and Martinez-Zapater, J. M. (1995). Low
temperature induces the accumulation of phenylalanine ammonia-lyase and chalcone
synthase mRNAs of Arabidopsis thaliana in a light-dependent manner. Plant Physiol
108, 39-46i'
I
Limieux, B., Koomeef, M. and Feldmann, K. A. (1994). Epicuticular wax and
eceriferum mutants. In Arabidopsis, E. M. Meyerowitz, C. R. Sommerville (eds.).
Cold Spring Harbour, NY pp. 1031-1041
Lincoln, C. Long, J., Yamaguchi, J., Serikawa, K. and Hake, S. (1994). A knottedl-.
like homeobox gene in Arabidopsis is expressed in the vegetative meristem and
dramatically alters leaf morphology when overexpressed in transgenic plants. PlantM.Celle, 1859-1876
Liu, D. and Post-Beittenmiller, D. (1995). Discoveiy of an epidermal stearoyl-acyl
carrier protein thioesterase, its potential role in wax biosynthesis. J. Biol Chem. 270,
16962-16969
Lloyd, A. M., Walbot, V. and Davis, R. W. (1992). Arabidopsis and Nicotiana
anthocyanin production activated by maize regulators R and Cl. Science 258, 1773-
1775
:5
Loetscher, M., Geiser, T., O’Reilly, T., Zwahlen, R , Baggiolini, M. and Moser, B.
(1994). Cloning of a human seven-transmembrane domain receptor, LESTR, that is
highly expressed in leukocytes. J. B iol Chem. 269, 232-237
Lois, R., Dietrich, A., Hahlbrock, K. and Schulz, W (1989). A phenylalanine
ammonia-lyase gene from parsley, structure, regulation and identification of elicitor
and light responsive cis-acting elements. EMBO J. 8, 1641-1648
Long, J. A., Moan, E. I., Medford, J. I. and Barton, M. K. (1996). A member of the
KNOTTED class of homeodomain proteins encoded by the STM gene o ï Arabidopsis.
Nature 379, 66-69
Lozoya, E., Block, A., Lois, R., Hahlbrock, K. and Scheel, D. (1991). Transcriptional
repression of light-induced flavonoid synthesis by elicitor treatment of cultured parsley
cells. Plant J. 1, 227-234
Lu, P., Porat, R , Nadeau, J. A. and O’Neill, S. D. (1996). Identification of a meristem
LI layer-specific gene in Arabidopsis that is expressed during embryonic pattern
formation and defines a new class of homeobox genes. Plant Cell 8, 2155-2168
Lucas, W. J., Wolf, S. (1993). Plasmodesmata: the intercellular organelles of green
plants. Trends Cell Biol 3, 308-315
Lundberg, K. S., Schoemaker, D. D., Adams, M. W. (1991). High fidelity
amplification using a thermostable DNA polymerase isolated from Pyrococcus
furiosus. Gene 108, 1
Marx, G. A. (1983). Developmental mutants in some annual seed plants. Annu. Rev.
Plant Physiol 34, 3 89-418
■
&
Ma, H., McMullen, M. D., and Finer, J. J. (1994). Identification of a homeobox-
containing gene with enhanced expression during soybean {Glycine max L.) somatic
embryo development. Plant M ol B iol 24, 465-473
iMarks, M. D., Feldmann, K. (1989). Trichome development m Arabidopsis thaliana I.
T-DNA tagging of the GLABROUSl gene. Plant Cell 1, 1043-1050
a
2 6 2
Masucci, J. D., Rerie, W G., Foreman, D. R., Zhang, M., Galway, M. E., Marks, M.
D. and Schiefelbein, J. W. (1996). The homoeobox gene GLABRA2 is required for
position-dependent cell differentiation in root epidermis of Arabidopsis thaliana.
Development 122, 1253-1260
Mattsson, T, Soderman, E., Svenson, M., Borkird, C. and Engstrom, P. (1992). A new
homeobox-leucine zipper gene ûom Arabidopsis thaliana. Plant Mol. Biol. 18, 1019-
1022
■Matzke, M. A. and Matzke, A. J. M. (1995). How and why do plants inactivate
homologous (trans) genes? Plant Physiol. 107, 679-685
Mayer, U., Torres Ruiz, R A., Berleth, T., Misera, S. and Jurgens, G. (1991).
Mutations affecting body organization in the Arabidopsis embryo. Nature 353, 402-
407
Meijer, E. A., De Vries, S. C , Sterk, P., Gadella, D. W. J., Wirtz, K. W. A. and
Hendriks, T. (1993). Characterisation of the non-specific lipid transfer protein EP2
from carrot {Daucus carota L.). M ol Cell Biochem. 123, 159-166
Meinke, D. W. (1991). Embryonic mutants of Arabidopsis thaliana. Dev. Genet. 12,
382-392
Meyerowitz, E. M. (1987). Arabidopsis thaliana. Annu. Rev. Genet. 21, 93-111
2 6 3
McNevin, J. P., Woodward, W., Hannoufa, A., Feldmann, K. A. and Lemieux, B.
(1993). Isolation and characterisation of eceriferum {cer) mutants induced by T-DNA
insertions \n Arabidopsis thaliana. Genome 36, 610-618
Medford, J. I , Behringer, F. J., Gallos, J. D. and Feldmann, K. A. F. (1992). Normal
and abnormal development in the Arabidopsis vegetative shoot apex. Plant Cell 4,
631-643
Misera, S., Muller, A. J., Weilandheidecker, U. and Jurgens, G. (1994). The FUSCA
genes of Arabidopsis, negative regulators of light responses. M ol Gen. Genet 244,
242-252
Mizusawa, S., Nishimura, S. and Seela, F. (1986). Improvement of the chain dideoxy
chain termination method of DNA sequencing by use of deoxy-7-deazaguanosine
triphosphate in place of dGTP. Nucleic Acids Research 14, 1319-1324
Mlynarova, L., Paul Keizer, L. C., Stiekema, W. J. and Nap, J-P. (1996). Approaching
the lower limits of transgene variability. Plant Cell 8, 1589-1599
Mol, J., Jenkins, G. I., Schafer, E. and Weiss, D. (1996). Signal perception,
transduction and gene expression involved in anthocyanin biosynthesis. Crit Rev.
Plant Set 15, 525-557
Molina, A. and Garcia-Olmeda, F. (1993). Developmental and pathogen induced
expression of three barley genes encoding lipid transfer proteins. Plant J. 4, 983-991
Molina, A., Segura, A. and Garcia-Olmeda, F. (1993). Lipid transfer proteins (nsLTPs)
from barlay and maize leaves are potent inhibitors of bacterial and fungal plant
FEBS Lett. 316, 119-122
Molina, A., Diaz, I., Vasil, I. K., Carbonero, P. and Garcia-OImedo, F. (1996). Two .cold-inducible genes encoding lipid transfer protein LTP4 from barley show differential
responses to bacterial pathogens. Mo/. Gen. Genet. 252, 162-168
Moreau, F., de Virville, D., Hoffekt, M., Guerbette, F. and Kader, J-C. (1994). Use of
a fluorometric method to assay the binding and transfer of phospholipids by lipid
transfer proteins from maize seedlings and Arabidopsis leaves. Plant Cell Physiol 35,
267-274
I
2 6 4
Munroe, S. and Pelham, H. R. B. (1987). A C-terminal signal prevents secretion of
395-432
Moose, S. P. and Sisco, P. H. (1996), GL0SSY15, an apetala2-XikQ gene from maize
that regulates epidermal cell identity. Genes and Development 10, 3018-3027
Mundy, J. and Rogers, J. C. (1986). Selective expression of a probable
amylase/protease inhibitor in barley aleurone cells, comparison to the barley
amylase/subtilisin inhibitor. Planta 169, 51-63
luminal ER proteins. Cell 48, 899-907
:Murashige, T., and Skoog, F. (1962). A revised medium for rapid growth and
:bioassays with tobacco tissue cultures. Plant. Physiol IS, 473-497
Murray, N. E. (1983). Phage lambda and molecular cloning. In The Bacteriophage
Lambda II. W. R. W. Hendrix (ed.). Cold Spring Harbor Laboratory, New York, pp.
Mylona, P., Moerman, M., Yang, W. C., Gloudemans, T., Vandekerckhove, L,
Vankammen, A., Bisseling, T. and Franssen, H. J. (1994). The root epidermis-specific
pea gene RH2 is homologous to a pathogenesis-related gene. Plant M ol Biol 26, 39-
50
Nadeau, J. A., Zhang, X. S., Li, J., and O’Neill, S, D. (1996). Ovule development:
Identification of stage-specific and tissue-specific cDNAs. Plant Cell 8, 213-239
Nap, J-P., Keizer, P. and Jansen, R. (1993). First-generation transgenic plants and
statistics. Plant M ol Biol Rep, 11, 156-164S:
Negruk, V., Yang, P., Subramanian, M., McNevin, J. P. and Lemieux, B, (1996).
Molecular cloning and characterisation of the CER2 gene of Arabidopsis thaliana.
Plant J, 9, 137-145
2 6 5
Neumann, G. M., Condron, R., Svensson, B. and Polya, G M. (1995). Purification,
characterisation and sequencing of a family of Petunia petal lipid transfer proteins
phosphorylated by plant calcium-dependent protein kinase. Plant Sci. 107, 129-145
Nishida, I. and Yamada, M. (1985). Semisynthesis of a spin-labelled
monogalactosyldiacylglycerol and its application in the assay for galactolipid transfer
activity in spinach leaves. Biochim. Biophys. Acta 813, 298-306
Ohl, S., Hedrick, S. A., Chory, J., Lamb, C. J. (1990). Functional properties of a
phenylalanine ammonialyase promoter from. Arabidopsis. Plant Cell 2, 837-848
0stergaard, J., Hojrup, P. and Knudsen, J. (1995). Amino acid sequence of three acyl-
binding/lipid-transfer proteins from rape seedlings. Biochem. Biophys. Acta 1254, 169-
179
Padgett, R. A., Grabowski, M., Konarska, M. M., Seiler, S. and Sharp, P. A. (1986).
Splicing of messenger RNA precursors. Annu. Rev. Biochem. 55, 1119-1150
Pallas, J. A. (1992). PhD thesis. University of Glasgow
J., 6, 3553-3558
2 6 6
Paz-Ares, J., Ghosal, D., Wienand, U., Peterson, P. and Saedler, H. (1987). The
regulatory c l locus of Zea mays encodes a protein with homology to myb proto
oncogene products and with structural similarities to transcriptional activators. EMBO
Pearce, R. S. and Ashworth, E. N. (1992). Cell shape and localisation of ice in leaves
of overwintering wheat during fi’ost stress in the field. Planta 188, 324-331
Pelèse-Siebenbourg, F., Caelles, C , Kader, J. C., Delseny, M. and Puigdomenech, P.
(1994). A pair of genes coding for lipid transfer proteins in Sorgham vulgare. Gene
148,305-308
Peterson, R. L. (1992). Adaptations of root structures in relation to biotic abiotic
factors. CanJ. Bot. 70, 661-675
Plant, A. L., Cohen, A., Moses, M. S. and Bray, E. A. (1991). Nucleotide sequence
and spatial expression pattern of a drought- and abscisic-acid-induced gene in tomato.
Plant Physiol 97, 900-906
Post-Beittenmiller, D. (1996). Biochemistry and molecular biology of wax production
in plants. Annu. Rev. Plant Physiol Plant M ol Biol.41, 405-430
Pyke, K. A., Marrison, J. L. and Leech, R. M. (1991). Temporal and spatial
Pyke, K. (1994). Tansley Review No. 75. Arabidopsis - its use in the genetic and
molecular analysis of plant morphogenesis. New Phytol 128, 19-37
2 6 7
Preuss, D , Lemieux, B , Yen, G. and Davis, R. W. (1993). A conditional sterile
mutation eliminates surface components from Arabidopsis pollen and disrupts cell
signalling during fertilization. Genes Dev. 7, 974-985
Pyee, J. and Kolattukudy, P. E. (1994). Identification of a lipid transfer protein as the
major protein in the surface wax of broccoli {Brassica oleraceae) leaves. Archives o f
Biochemistry and Biophysics 311, 460-468
Pyee, J. and Kolattukudy, P. E. (1995). The gene for the major cuticular wax-
associated protein and tliree homologous genes from broccoli {Brassica oleraceae)
and their expression patterns. The Plant Journal 7(1)., 49-59
development o f the cells of the expanding first leaf of Arabidopsis thaliana (L.)'
Heynn. Journal o f Experimental Botany 42, 1407-1416.
$3
Ramachandran, S., Hiratsuka, K. and Chua, N-H. (1994). Transcription factors in plant
growth and development. Curr. Opin. Genet. Dev. 4, 642-646
Raport, C J., Gosling, J., Schweichart, V. I , Gray, P. W. and Charo, I. F. (1996).
Molecular cloning and functional characterisation of a novel human CC chemokine
receptor (CCR5) for RANTES, M IP-ip and M IP-la. J. Biol Chem. 271, 17161-
17166
Reicosky, D. A. and Hanover, J. W. (1978). Physiological effects of surface waxes. I.
Light reflectance for glaucous and nonglaucous Picea pimgens. Plant Physiol. 62,
101-104
Rerie, W. G , Feldmann, K. A., and Marks, M. D. (1994). The GLABRA2 gene
encodes a homeodomain protein required for normal trichome development in
Arabidopsis. Genes Dev. 8, 1388-1399
Reynaerts, A., De Block, M., Hernasteens, J-P. and Van Montagu, M. (1988).
Selectable and screenable markers. In Plant Molecular Biology Manual S. B. Gelvin,
R. A Schilperoort (eds.), Kluwer Academic Publishers, Dordrecht, pp. 1-16
Rhee, Y., Hlousek-Radojicic, A., Jayakkumar, P. S., Liu, D. and Post-beittenmiller, D.
(1997). Expression of genes involved in wax biosynthesis. Molecular biology of genes
involved in cuticular wax biosynthesis. In Physiology, Biochemistery and Molecular
Biology o f Plant Lipids. J. P. Williams, M. U. Kahn, N. W, Lem (eds.), Kluwer
Academic Publishers, pp. 339-341
Rickers, J., Spencer, F. and Kader, J-C. (1985). A phospholipid transfer protein that
binds fatty acids. FEBS Lett. 180, 29-32
Roth, B. A., Goff, S. A., Klein, T. M. and Fromm, M. E. (1991). Cl~ and /(-dependent
expression of the maize B zl gene requires sequences with homology to mammalian
myb and myc binding sites. Plant Cell 3, 317-137
2 6 8
€
Ruberti, I., Sessa, G., Lucchetti, S., and Morelli, G. (1991). A novel class of plant
proteins containing a homeodomain with a closely linked leucine zipper motif. EMBO
J. 10, 1787-1791
Sablowski, R. W.M., Moyano, E., Culianez-Macia, A., Schuch, W., Martin, C. and
Bevan, M. (1994). A flower-specific Myb protein activates transcription of
phenylpropanoid biosynthetic genes. EMBO J. 13, 128-137
Satina, S., Blakslee, A. F. and Avery, A. G. (1940). Demonstration of the three germ
layers in the shoot apex of Datura by means of induced induced polyploidy periclinal
chimeras. Am. J. Bot. 44, 311-317
2 6 9
Sanger, F , Nicklen, S. and Coulson, A. R. (1977). DNA sequencing with chain-
terminating inhibitors. Proc. Natl. Acad. Sci. USA 74, 5463-5467
ISambrook, J., Fritsh, E. F. and Maniatus, T. (eds). (1989). Molecular Cloning, a
ALaboratory^ Manual. Cold Spring Harbour Laboratory Press, New York.
Sasaki, Y., Hakamada, K., Suama, Y., Nagano, Y., Furusawa, 1., Matsuno, R. (1993).
Chloroplast-encoded protein as a subunit of acetyl-CoA carboxylase in pea plant. J.
Biol. Chem. 268, 25118-25123
Sasaki, Y , Konishi, T., Nagano, Y. (1995). The compartmentation of acetyl-
Coenzyme-A carboxylase in plants. Plant Physiol. 108, 445-449
Sasaki, Y. and Konishi, T (1997). Two forms of acetyl-CoA carboxylase in higher
plants and effects of UV-B on the enzyme levels. In Phsiology, Biochemistery and
Molecular Biology o f Plant Lipids. J. P. Williams, M. U. Kahn, N. W. Lem (eds.),
Kluwer Academic Publishers, pp. 32-34
Schena, M. and Davis, R. W. (1992). HD~Zip proteins: Members of an Arabidopsis
homeodomain supeiiamily. Proc. Natl Acad. Sci. USA 89, 3894-3898
responses in root hairs o f Arabidopsis thaliana. Plant Physiol. 100, 216-218
Schreiber, L. and Schonherr, J. (1992). Analysis of foliar uptake of pesticides in barley
leaves: role of epicuticular waxes and compartmentation. Pestic. Sci. 36, 213-221
*1
:
Scheres, B., Wolkenfelt, H., Willemsen, V., Terlouw, M., Lawson, E., Dean, C., and
Weisbeek, P. (1994). Embryonic origin of the Arabidopsis primaiy root and root
meristem initials. Development 120, 2475-2487
1:Schiefelbien, J. W., Benfey, P. N. (1991). The development of plant roots, new
approaches to underground problems. Plant Cell 3, 1147-1154
Schmelzer, E., Jahnen, W. and Hahlbrock, K. (1988). In situ localisation of light-
induced chalcone synthase mRNA, chalcone synthase and flavonoid end products in
epidermal cells of parsley leaves. Proc. Natl. Acad. Sci. USA 85, 2989-2993
ÏSchmidt, A. (1924). Histologische studien an phanerogamen vegetationspunkten. Bot
Arch. 8, 345-404
Schmidt, R. and Willmitzer, L. (1988). High efficiency Agrobacterium tumefaciens-
mediated transformation of Arabidopsis thaliana leaf and cotyledon explants. Plant'
Cell Rep. 7, 583-586
Schnall, J. A., and Quatrano, R. S. (1992). Abscisic acid elicits the water-stress
II'Ï
IScott, F. M., Hammer, K. C , Baker, E. and Bowler, E. (1958). Electron microscope
studies of the epidermis o f Allium cepa. Am. J. Bot. 45, 449-461
■■
. ' 4
270
Segura, A., Morena, M. and Garcia-Olmeda, F. (1993). Purification and
antipathogenic activity of lipid transfer proteins (LTPs) from leaves o f Arabidopsis and
spinach. FEBS Lett 332, 243-246
Shahar, T., Hennig, N., Hareven, D. and Lifscliitz, E. (1992). The tomato 66.3-kDa
polyphenoloxidase gene, molecular identification and developmental expression. Plant
Cell 4, 135-147
Shirley, B. W., Kubasek, W. L., Storz, G , Bmggemann, E., Koornneef, M., Ausubel,
F. M. and Goodman, H. M. (1995). Analysis of Arabidopsis mutants deficient in
flavonoid biosynthesis. Plant J. 8, 659-671
Short, J. M., Fernandez, J. M., Sorge, J. A., Huse and W. D. (1988). Lambda ZAP, a
bacteriophage lambda expression vector with in vivo excision properties. Nucleic
Acids Res. 16, 7583-7600
Smith, L. G., Jackson, D , and Hake, S. (1995). Expression of Knotted 1 marks shoot
meristem formation during maize embryogenesis. Dev. Genet 16, 344-348
Simpson, C. G , Leader, D. J., Brown, J. W. S. and Franklin, T. (1993). Characteristics
of plant pre-mRNA introns and transposable elements. In Plant Molecular Biology
Labfax. R. R. D. Croy, (ed.), Oxford, UK BIOS Scientific Publishers, pp. 183-251
Simpson, C. G , Sawbridge, T. I. and Jenkins, G. I. and Brown, J. W. S. (1992).
Expression analysis of multigene families by RT-PCR. Nucl. Acids. Res. 20, 5861-
5862
Sossountzov, L., Ruiz-Avila, L., Vignois, F , Jolliot, A., Arondel, V., Tchang, F.,
Grosbois, M., Guerbette, F., Mignaic, E., Delseny, M., Puigdonmench, P. and Kader,
J-C (1991). Spatial and temporal expression of a maize lipid transfer protein gene.
Plant Cell 3. 923-933
271
Soufleri. I. A., Vergtiolle, C., Miginiac, E. and Kadar, J-C. (1996). Germination-
specific lipid transfer protein cDNAs in Brassica napus L. Planta 199, 229-237
111
Spielmann, A. and Simpson, R. B. (1986). T-DNA structure in transgenic tobacco
plants with multiple independent integration events. Mol Gen. Genet. 205, 34-41
Sleeves, T. A. and Sussex, I. M. (1989). Patterns in plant development. 2nd ed.
Cambridge, Cambridge University Press.
Sterk, P., Booij H., Scheleekens, G. A., Van Kammen, A., de Vries, S. C. (1991).
Cell-specific expression of the carrot EP2 lipid transfer protein gene. Plant Cell 3,
907-921
Stitte, P. (1992). A modern concept of the ‘cell theory’; A perspective on competing
hypotheses of structure. International Journal o f Plant Science 153, supplement SI-
S3
Stratford, R , Plaskitt, K. A., Turner, D. S., Markham, P. G. and Covey, S. N. (1988).
Molecular properties of Bari-1, a mild strain of cauliflower mosaic virus. J. Gen. Virol.
69, 2375-2386
Sussex, I, M. (1989). Developmental programming of the shoot meristem. Cell 56,
225-229
Sutter, E. and Langhans, R.W. (1982). Formation of epicuticular wax and its effect on
water loss in cabbage plants regenerated from shoot-tip culture. Can. J. Bot. 60, 2896-
902
Is
Symth D., Bowman, J. and Meyerowitz, E. (1990). Early flower development in
Arabidopsis. Plant Cell 2, 755-767
Thomas, D. A. and Barber, H. N. (1974). Studies on leaf characteristics of a clone of
2 7 3
Takishima, K., Watanabe, S., Yamada, M. and Mamiya, G. (1986). The amino acid
sequence of the nonspecific lipid transfer protein from germinated castor bean
endosperms. Biochem. Biophys. Acta 870, 248-255
Tapper, D. P., and Clayton, D. A. (1981). Altered mobility of
polydeoxyribonucleotides in high resolution polyacrylamide gels due to removal of
terminal phosphates. Nucleic Acids Res. 9, 6787-6794
Tchang, F., This, P., Stiefel, V., Arondel, V., Morch, M-D., Pages, M.,
Puigdomenech, P., Grellet, F., Delseny, M., Bouillon, P., Huet, J-C., Guerbette, F,,
Beauvais-Cante, F., Duraton, H., Pernollet, J. C., Kader, J-C. (1988). Phospholipid
transfer protein: Full-length cDNA and amino acid sequence in maize. J. Biol. Chem.
263, 16849-16855
Terras, F. R. G., Goderis, I. J., Leuven, F. V., Vanderleyden, J., Cammue, B. P. A. and
Broekaert, W. F. (1992). In vitro antifungal activity of a radish (Raphanus sativus L.)
seed protein homologous to non-specific lipid transfer proteins. PlaiU Physiol. 100,
1055-1058
Terzaghi, W. B. and Cashmore, A. R. (1995). Light-regulated transcription. Annu.
Rev. Plant Physiol. Plant Mol. Biol. 46, 445-474
Thoma, S., Hecht, U., Kippers, A., Botella, J., De Vries, S. and Somerville, C. (1994).
Tissue-specific expression of a gene encoding a cell wall-localised lipid transfer protein
from Arabidopsis. Plant Physiol. 105, 35-45
Eucalyptus urnigera from Mount Wellington, Tasmania. I. Water repellency and the
freezing of leaves. Aust. J. Bot. 22, 501-512
Tijan, R and Maniatis, T. (1994). Transcription activation: A complex puzzle with few
easy pieces. Cell 77, 5-8
j
Torres-Schumann, S., Godoy, J. A., Pintor,-Toro, J. A, (1992). A probable Hpid
transfer protein gene is induced by NaCl in stems of tomato plants. Plant M ol Biol.
18, 749-757
Trezzini, G. F., Horrichs, A. and Somssich, I. E. (1993). Isolation of putative defence-
related genes from Arabidopsis thaliana and expression in fiingal elicitor-treated cells.
Plant M ol Biol 21, 385-389
Tsuboi, S., Osafiime, T., Tsugeki, R., Nishimura, M., Yamada, M. (1992). Non
specific lipid transfer protein in castor bean cotyledon cells, subcellular localization and
a possible role in lipid metabolism. J. Biochem. I l l , 500-508
Tsuboi, S., Suga, T., Takishima, K., Mamiya, G., Matsui, K. (1991). Organ-specific
occurrence and expression of the isoforms of non-specific lipid transfer protein in
Turner, D. S., McCallum, D. G. and Covey, S. N. (1996). Roles of the 35S promoter
and multiple overlapping domains in tl
mosaic virus. Y. Virol 70, 5414-5421
Valvekens, D., van Montagu, M. and van Lijsebettens, M. (1988). Agiobacterium
tumefaciens-mQdiated transformation of Arabidopsis thaliana root explants by using
kanamycin selection. Proc. Natl. Acad. Sci. USA 85, 5536-5540
Vitale, A., Ceriotti, A., Denecke, J. (1993). The role of endoplasmic reticulum in
protein synthesis, modification and intracellular transport. J. Exp. Bot. 44, 1417-1444
castor bean seedlings and molecular cloning of a full-length cDNA for a cotyledon-,
specific isoform. J. Biochem. 110, 823-831
and multiple overlapping domains in the pathogenicity of the parai etrovirus cauliflower
:van Engelen, F. A., Hartog, M. V., Thomas, T. L., Taylor, B., Strum, A., van
Kammen, A. and de Vries, S. C. (1993). The carrot secreted glycoprotein gene ÆP7 is
expressed in the epidermis and has sequence homology to Brassica S-locus
glycoproteins. Plant J. 4, 855-862
i
274
Volbrecht, E., Veit, B., Sinha, N. and Hake, S. (1991). The developmental gene
Knotted 1 is a member of the maize homeobox gene family. Nature 350, 241-243
von Heijne, G. (1986). A new method for predicting signal sequence cleavage sites.
Nucleic Acids Res. 14,4683-4690
von Wettstein-Knowles, P. M. (1992). Biosynthesis of epicuticular lipids as analyzed
with the aid of gene mutations in barley. In Biochemistry and Metabolism o f Plant
Lipids. J. F. G. M. Wintermans, P. J. C. Kuiper (eds.), Elsevier Biomedical Press,
Amsterdam, The Netherlands, pp. 69-70
von Wettstein-Knowles, P. M. (1995). Biosynthesis and genetics of waxes. In Waxes,
Chemistry, Molecular Biology and Functions. R. J. Hamilton (ed.), Allowry, Ayr,
Scotland, Oily Press 6, pp. 91-130
Vroemen, C. W., Langevald, S., Mayer, U., Ripper, G , Jurgens, G., Van Kammen, A.
and De Vries, S. C. (1996). Pattern formation in the Arabidopsis embryo revealed by
position-specific lipid transfer protein gene expression. Plant Cell 8, 783-791
Wagner, G J. (1991). Secreting glandular trichomes: More than just hairs. Plant
Physiol 96, 675-679
Wahle, E. and Keller, W. (1992). The biochemistry of 3’-end cleavage and
polyadenylation of messenger RNA precursors. Annu. Rev. Biochem. 61, 419-440
Walbot, V. (1992). Strategies for mutagenesis and gene cloning using transposon
tagging and T-DNA insertional mutagenesis. Annu. Rev. Plant Physiol Plant M ol
Biol. 43, 49-82
Walden, R., Hayashi, H. and Schell, J, (1991). T-DNA as a gene tag. Plant J. 1, 281-
288
2 7 5
Wantanabe, S. and Yamada, M. (1986). Purification and characterisation of a non
specific lipid transfer protein from germinating castor bean endosperms which transfers
phospholipids and galactoHpids. Biochem. Biophys. Acta 876, 116-123
Webb, M. C. and Gunning, B. E. (1991). The microtubular cytoskeleton during
development of the zygote, embryo and fiee-nuclear endosperm in Arabidopsis
thaliana. Planta 184, 187-195
Weig, A. and Komor, E. (1992). The lipid transfer protein C of Ricinus communis L:
isolation of two cDNA sequences which are strongly and exclusively expressed in
cotyledons after germination. Planta 187, 367-371
West, M. A. L. and Harada, J. J. (1993). Embryogenesis in higher plants; An overview.
Plant Cell 5, 1361-1369
White, A. J., Dunn, M. A., Brown, K,, Hughes, M. A. (1994). Comparative analysis of
genomic sequence and expression of a lipid transfer protein gene family in winter
barley. J. Exp. Bot. 45, 1885-1892
Weisshaar, B., Armstrong, G. A., Block, A., da Costa e Silva, O. and Hahlbrock, K.
(1991). Light-inducible and constitutively expressed DNA-binding proteins
recognizing a plant promoter element with functional relevance in light-responsiveness.
EMBOJ. 10, 1777-1786
Welch, R. M., Norvell, W. A., Schaefer, S. C., Shaff, J. E., and Kochian, L. V. (1993).
Induction of iron (III) and copper (II) reduction in pea {Pisum sativum) roots by Fe
and Cu status; Does root-cell plasmalemma Fe (Ill)-chelate reductase perform a
general role in regulating cation uptake. Planta 190, 555-561
I
«Iifl
Ï
Wirtz , K. W. A. (1991). Phospholipid transfer proteins. Annu. Rev. Biochem. 60, 73-
99. 1
2 7 6■
I
Wisniewski, W., Ashworth, E. and Schaffer, K. (1987). The use of lanthanum to
characterise cell wall permeability in relation to deep supercooling and extracellular
freezing in woody plants II. Intrageneric comparisons between Betula lenta and Betula
papyrifera. Protoplasm 141, 160-168
Wu, S-C. and and Hahlbrock, K. (1992). In situ localisation of phenylpropanoid-
related gene expression in different tissues of light- and dark-grown parsley seedlings.
Z Naturforsch. 47C, 591-600
Xia, Y., Nikolau, B. J. and Schnable, P. S. (1996). Cloning and characterisation of
CER2, an Arabidopsis gene that affects cuticular wax accumulation. Plant Cell 8,
1291-1303
Yadegari, R., de Paiva, G. R., Laux, T., Koltunow, A. M., Apuya, N., Zimmerman, J.
L., Fischer, R L., Harada, J. J. and Goldberg, R. B. (1994). Cell differentiation and
morphogenesis are uncoupled in Arabidopsis raspberry embryos. Plant Cell 6, 1713-
1729
1
Yamada, M., Tanaka, T., Kader, J-C. and Mazliak, P. (1978). Transfer of
phospholipids from microsomes to mitochomdria in germinating castor bean
Plant Cell Physiol 19, 173-176
Yang, W. C., Canter Cremers, H. C. J., Hogendijk. P., Katinakis, P., Wijffelman, C■ :
A., Franssen, H , Van Kammen, A. and Bisseeling, T. (1992), In situ localisation of
chalcone synthase mRNA in pea root nodule developement. Plant J. 2, 143-151
Yang, M., and Sack, F. D. (1995). The too many mouths and four lips mutations affect
stomatal production in Arabidopsis. Plant Cell, 7, 2227-2239
Yanofsky, M/ F., Ma, H , Bowman, J. L. et. al. (1990). The protein encoded by the
Arabidopsis homeotic gene agamous resembles transcription factors. Nature 346, 35-
39
111
Ye, Z. H. (1993). Gene-expression patterns associated with with in vitro tracheary
elements formation in isolated single mesophylhcells of Zinnia elegans. Plant Physiol.
103, 805-813
Zambryski, P., Tempe, J. and Schell, J. (1989). Transfer and function of T-DNA genes
fvom Agt'obacterhm Ti and Ri plasmids in plants. Cell 56, 193-201
Zeiger E.and Stebbins, G. L. (1972). Developmental genetics in barley: A mutant for
stomatal development. Am. J. Bot. 59, 143-148
Zeevaart, J. A. D. and Creelman, R. A. (1988). Metabolism and physiology of abscisic
acid. Annu. Rev. Plant Physiol. Plant M ol Biol. 39, 439-473
I1
..if
:I
1
278
-1