) pastor, lester, scoggins why regions jua
TRANSCRIPT

WHY REGIONS? WHY NOW? WHO CARES?
MANUEL PASTORUniversity of Southern California
T. WILLIAM LESTERUniversity of California, Berkeley
JUSTIN SCOGGINSUniversity of Southern California
ABSTRACT: This article examines the emergence of the region as a platform for achieving eco-nomic competitiveness and social equity. We use a combination of empirical exercises to examine thetiming and degree of actor interest, including convergence regressions and coefficients of variationanalysis to see if regional economic and social performance is more heterogeneous, and logisticalanalysis to determine what metropolitan-level factors can explain the rise of regionalist interestby business organizations and/or social justice organizations. We find that performance is, in fact,generally more heterogeneous, that different actors are motivated by different factors, and thatinterest by business groups seems to trigger a “reactive regionalism” by equity proponents (but notthe other way around).
The past decade has seen a resurgence of interest in the idea of regionalism, that is, thebasic notion that economic trends, social challenges, and environmental problems are not neatlycontained by city jurisdictions and thus solutions must incorporate coalitions and constituenciesfrom across the metropolitan landscape. Such interest is not entirely novel: discussions aboutthinking, planning, and acting regionally have waxed and waned since Daniel Burnham’s 1909Plan for Chicago stressed the need for infrastructure improvements and transportation investmentsat the regional rather than urban scale. But part of what seems to make the “new regionalism”both new and real is that the rising interest is not confined to planners and academics: alongsidethe scholarly literature has come a body of practice, including the engagement of business andpolitical leadership in metropolitan organizations like the business-oriented Chicago 2020, theevolution of community-oriented metropolitan groups like the Los Angeles Alliance for a NewEconomy, and the growing presence of new regionally focused intermediaries like PolicyLink,Smart Growth America, and many others.
Direct correspondence to: Manuel Pastor, Department of Geography, University of Southern California, 3620 VermontAvenue, KAP-462, Los Angeles, CA 90089. E-mail: [email protected].
JOURNAL OF URBAN AFFAIRS, Volume 31, Number 3, pages 269–296.Copyright C© 2009 Urban Affairs AssociationAll rights of reproduction in any form reserved.ISSN: 0735-2166.

270 II JOURNAL OF URBAN AFFAIRS II Vol. 31/No. 3/2009
Why the revitalization of interest in the regional scale? Is it because the region has actuallybecome a more salient unit—perhaps because the U.S. economy has become more regionalized,and suburbs and central cities have become more interconnected (see, for example, Barnes &Ledebur, 1998)? Or, is it that the region has simply become a more promising venue for policyaction—perhaps because polarized national politics means that tough questions about economicstrategies and antipoverty policy can be better addressed in the face-to-face interactions typicalof the metropolitan level (Henton, Melville, & Walesh, 1997)?
This article tries to tease out the empirical bases for these “objective” and “subjective” rationalesfor the new regionalism. For example, some scholars have argued that the networked nature ofinformation economies makes the region the new unit of the international economy (Benner,2002; Saxenian, 1994) and others have argued that geographic location in the regional economyis more important than ever to the possibility of escaping low-income status (Jargowsky, 1997;Orfield, 1997, 2002). In this case, it makes sense that economic and social actors should be moreinterested in regionalism—their engagement is driven by an “objective” change in the nature ofunderlying economic and other relationships.
Others suggest that actors who have traditionally pursued their agendas at state and nationallevels are now choosing to pursue them at the regional level because certain issues can be better“framed” and won at that scale. The implicit objective–subjective distinction may be overdrawn:those actors who pursued a series of living wage laws at the local and regional level over the late1990s and early 2000s were responding to the objective fact that the federal government had notraised the minimum wage since 1997 and was not likely to do so with a Republican president(Pollin & Luce, 1998). But the condition they sought to address—low wages—was due more toglobal competition and the shifting industry-service mix in the U.S. economy (see Appelbaum,Annette, & Murnane, 2003) than it was to metropolitan peculiarities. The decision to organize ata metropolitan scale thus had to do with a “subjective” sense of political conditions—it was, in asense, “venue-shopping.”1
To get at these objective and subjective dimensions, we organize our analysis around the threequestions in our title: why regions? why now? and who cares? We thus begin with a brief reviewof the scholarly arguments for the salience of regions and highlight recent practitioner attemptsto promote both economic competitiveness and social equity at the regional scale (i.e., whyregions?). We then ask whether economic growth and social inequality are problems that are infact becoming more regional in scope (i.e., why now?). To do this, we test for changes in the rateof economic convergence and examine the changing relationship between economic growth andpoverty over time in U.S. metropolitan areas. After concluding that there are indeed “objective”reasons why regions are more important to growth and equity, we then use an innovative logitanalysis that utilizes proxies of attendance at regionalist gatherings to explain the patterns ofbusiness and social actor interest in regionalism (i.e., who cares?).
A few caveats are in order. First, we recognize that there is also an environmentally drivenrationale for the “new regionalism” based partly on the notion that metropolitan sprawl is comingup against looming resource constraints (see Cieslewicz, 2002; Wolch, Pastor, & Dreier, 2004).However, we explicitly limit our focus here to issues of economic growth and social equity, partlyfor analytical convenience and partly because we were less sure how to develop appropriate testsregarding the rise of environmental issues over time or proxies for the degree of metropolitan-level interest in the environment. Second, while there are a series of statistical tests shown below,we do not claim to be offering, say, the most complete set of convergence regressions; rather,we develop a serviceable set along with a series of other tests to see whether regions haveincreasingly divergent performances. Third, we acknowledge that the rise of regions is likely tiedto globalization and is a worldwide phenomenon but, for ease (and particularly to maintain someinstitutional consistency as we do our empirical tests), we confine our discussion and analysis inthis article to regions and regional actors in the United States.
II Why Regions? Why Now? Who Cares? II 271
Finally, this exercise is part of a larger effort being organized by the Institute for Urban andRegional Development at UC Berkeley called “Building Resilient Regions;” our thought wasthat it might be useful to know whether regions were, in fact, more important as either structuresor venues before examining efforts to make them resilient. The punch line of this effort isstraightforward: they are more important, different actors have different reasons for deemingthem so, and we are, we think, likely to see even more regional action in the future.
PART I: WHY REGIONS?
There has long been a political rationale for regionalism—for example, Robert Wood’s 1961book, 1400 Governments, made an important and early case that the fragmentation of metropolitanareas in the United States by cities, townships, villages, boroughs, counties, and special districtswas irrational and inefficient. What is new about the new regionalism, however, is that theargument is less about the economic efficiencies that might be introduced by consolidatingmetropolitan services and more about the economic competitiveness that would be furthered byregional collaboration.
Part of this competitiveness argument stems from traditional notions of agglomeration. Butmany geographers and urban planners have also argued that the spatial implications of recentindustrial restructuring processes (e.g., deindustrialization, globalization of production) leavefirms with two choices: either relocate to low-cost locations (often in the developing world) orpursue a flexible business strategy focused on product innovation and specialization.2 For thelatter, it is suggested, the network effects embodied in a regional economy are crucial.
For example, in her in-depth comparison of Silicon Valley and Route 128 in Boston, AnnaleeSaxenian (1994) notes that networks of high-tech entrepreneurs and innovative small firms locatein large metropolitan regions that tend to have larger numbers of the technology end-users (suchas large firms in other sectors) and interfirm knowledge spillovers.3 Echoes of this are seen inRichard Florida’s argument (1995: 532) that “in this new economic environment, regions buildeconomic advantage through their ability to mobilize and to harness knowledge and ideas. In fact,regionally based complexes of innovation and production are increasingly the preferred vehicleused to harness knowledge and intelligence across the globe.”
The importance of regions is not confined to high-tech centers and “creative” economies.Based on rich case studies of regions in advanced industrial economies that added manufacturingjobs against the tide of deindustrialization in the 1970s and 1980s, Piore and Sabel (1984)attribute regional competitiveness to the existence of dense networks of small and medium sizedfirms who practice just-in-time production methods in small runs. Firms within these industrialdistricts depend on one another and share resources such as a highly skilled workforce andcommon infrastructure that help firms choose a flexible-specialization model needed to survive.In addition to the direct technical benefits of localized industrial districts, Sabel (1989) and Amin(1999) argue that social institutions—that is, business and other organizations—at a regionallevel help foster higher degrees of trust and cooperation, enabling greater risk-taking and leadingto higher levels of innovation.
The regional proof may be in the empirical pudding—and by the mid 1990s, a variety of analystswere suggesting that widening variations in metropolitan growth rates indicated that the regionhad emerged as a significant economic unit (Drennan, Tobier, & Lewis, 1996; DRI/McGraw-Hill,1998; Phillips, 1992). Barnes and Ledebur (1998) went so far as to argue that the U.S. economyshould no longer be conceived as a single entity but rather as a “common market” of localeconomic regions competing with each other as well as with other regions in other parts of theworld.
272 II JOURNAL OF URBAN AFFAIRS II Vol. 31/No. 3/2009
While the salience of regions was being debated by academics, practitioners were moving morerapidly. Through the 1990s, journalist Neal Peirce began writing about “citistates” and proceededto conduct a series of regional audits helping metropolitan areas both understand their issuesand trigger civic consensus (Peirce, Johnson, & Hall, 1993). In Silicon Valley, businesses cametogether to organize Joint Venture: Silicon Valley Network, a group whose loose and ill-definedstructure mimicked informal networks but still helped restart a Valley economy wounded bydefense cutbacks, partly through such mundane efforts as persuading city governments across theValley to adopt a uniform building code (Joint Venture, 1995; Pastor, Dreier, Grigsby, & Garza,2000). The idea of regional business-based collaboratives spread across California and then toother states, often assisted by a new national organization, the Alliance for Regional Stewardship(Henton et al., 1997, 2004).
Even as the competitiveness argument was gaining ground, another rationale for paying atten-tion to regions was emerging: that this was the scale at which a significant share of the nation’sincome inequality was generated and experienced. This sense was fueled in part by Jargowsky’s(1997) finding that poverty had become more spatially concentrated in the 1980s, and that thespatial effects were most significant for African Americans and Latinos. At the same time, anew slew of studies were suggesting that “neighborhood effects” were extensive: if poverty wasbad for your economic and social health, concentrated poverty was worse because it tended tosignal spatial mismatch in terms of job opportunities, weaker social networks for employment,and difficult conditions for urban education (Ihlanfeldt & Sjoquist, 1989; Wilson, 1996).
Moreover, some argued that the metropolitan character of this set of phenomena—including thevery distinct experiences of city dwellers and suburbanites—was leading to a fractured politicsin which reducing poverty had fallen off the national agenda (Dreier, Mollenkopf, & Swanstrom,2001). Reacting to this, a new vision of political change began to emerge, one that stressedorganizing at the metropolitan level to tackle issues of spatial and racial inequality. MyronOrfield, for example, developed a whole analytical approach focused on bringing together centralcities and older suburbs to change the rules of the game that allowed jobs, economic development,and tax revenues to drift further and further away from the former centers of metropolitan regions(Orfield, 1997, 2002). David Rusk, first in Cities Without Suburbs (1993) and later in InsideGame, Outside Game (1999), argued that issues of social inequality would only be addressed byschemes that would share tax revenues and decision-making at a regional level—and urged urbanactivists to cast their organizing net more widely.4
This is yet another area in which the practitioners soon outran the theorists. By the mid1990s, unions were starting to organize new economic sectors at a regional level, something bestcaptured by the Justice for Janitors campaigns that gained ground in California and elsewhere.The aforementioned living wage movements also took off even as housing advocates shiftedfrom creating even cheaper housing in distressed areas to considering zoning and other changesthat would allow for affordable homes in the more opportunity-rich suburbs. Even interfaithsocial justice efforts seemed to jump on board, with an Industrial Areas Foundation group inSan Antonio, Texas launching a model regional job training program called Project Quest andthe entire network of the Gamaliel Foundation, groups based in a mix of African-American andimmigrant churches, declaring that one of its guideposts for future organizing would be “regionalequity”—and then quickly going on to fight for the regional consolidation of transportationsystems in and around Gary, Indiana (see Pastor, Benner, & Matsuoka, 2009).
That regional equity had caught the imagination of these and other urban activists was evidencedin 2002 when a relatively new national intermediary, PolicyLink, organized a “national summit”on the topic and managed to attract over 600 attendees; a subsequent conference in 2005 drewover 1,300 participants from around the country and the most recent conference, held in 2008in New Orleans, attracted nearly 2,000. Meanwhile, a series of foundations banded together
II Why Regions? Why Now? Who Cares? II 273
Objective Reasons Subjective Reasons
The Economy Do we find evidence of divergence or convergence over time?
What drives civic action among business and economic leaders?
Social Equity Is there growing variation in inequality and poverty across regions – or a changing link between poverty and regional growth?
What explains participation by civil society actors in the regional equity movement?
FIGURE 1
Summary of Empirical Questions
as the Funders’ Network for Smart Growth and Livable Communities and offered an initial“translation paper” focused on the intersection of smart growth planning principles and regionalequity (Blackwell & McCullough, 1999). There was, in the words of a famous song from the1960s, “something happening here.”
PART II: WHY NOW?
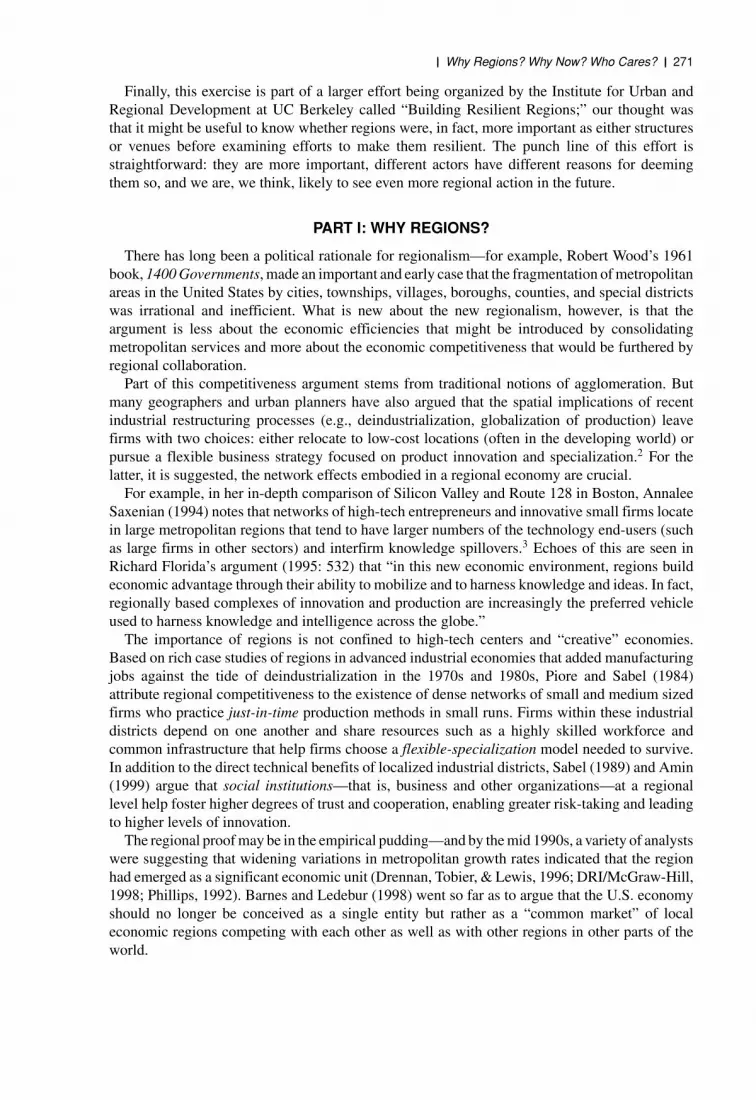
But why is it happening now? Is it that regions have become more important to determiningeither economic or equity outcomes, or is it that the region has become a more suitable scale forpolitical action by either economic agents or equity-oriented organizers? To make these broadquestions more researchable, we offer a two-by-two matrix (Figure 1) in which the verticalaxis offers dimensions of concern (economic or equity) while the horizontal axis distinguishesbetween objective and subjective reasons for the concern. We fill in the resulting boxes with theempirical questions that might be investigated.
For example, traditional economic theory suggests that metropolitan incomes should convergeover time, as poorer regions catch up and wealthier regions slow down; if the rate of thisconvergence process has changed, it might be evidence that regions are a more important economicunit. Similarly, if there is more regional variation in income distribution or poverty performance,we think this suggests that the region is a more important unit for considering issues of equity—and if the relationship between regional growth and poverty has changed at a regional level, thatmight also suggest that the metropolitan scale is critical for those concerned about social justice.
As for the subjective side, we can investigate which factors might explain why business or socialjustice proponents decide to pursue their goals at a regional level. We are specifically interested inwhether the objective factors explaining the interests of business or equity proponents differ—andwhether one sector might be reacting to the agenda-setting of the other, something that wouldsuggest the venue-shopping we might associate with a subjective interest.
We tackle each of these research tasks with a quantitative tool specific to the question athand: we test the economic and equity importance of regions with a combination of convergence

274 II JOURNAL OF URBAN AFFAIRS II Vol. 31/No. 3/2009
regressions, analyses of coefficients of variation, and a time-sensitive analysis of growth andequity, and we tackle the subjective side of the equation with a set of logistic regressions that seekto predict business and community interest in regionalism as proxied by attendance at nationalgatherings devoted to this subject. The database that underlies all of the analysis was developedby the Building Resilient Regions research network, funded by the John D. and Katherine T.MacArthur Foundation. The BRR database contains a broad spectrum of measures of economic,demographic, and social change across all U.S. metropolitan statistical areas for three decades(1970–2000). The database draws on various sources including the U.S. Census Bureau and theBureau of Economic Analysis; an Appendix at the end of this article provides a fuller descriptionof the data sources for each variable.
Is Regional Economic Performance Converging or Diverging?
If the regional scale is more important today than in the past for determining economicoutcomes, we might expect that some regions will prosper and grow at a rate well above otherregions, leading to divergence in outcomes and potentially new patterns of inequality across space(e.g., Castells, 1996; Storper, 1997). However, this conjecture runs counter to one standard tenetin the economic development field: the convergence thesis. This thesis predicts that low-incomeregions will exhibit faster growth rates as they eventually “catch up” to more developed areas andthat the rate of growth in high-income regions will similarly slow in a process of convergence tothe mean. While the conditions for this to occur are somewhat strict—capital and other factors ofproduction are assumed to be freely mobile and production must be characterized by diminishingreturns to scale5—the theory has spawned a large empirical literature aimed at measuring andtesting economic convergence between countries and subnational regions.
While an exhaustive empirical literature review is not possible here (see Rey & Janikas, 2005for an excellent review), the typical approach to measuring the rate of “catch-up” or convergenceis to run a simple regression of economic growth, measured as the change in per capita incomefrom one period to the next, on the initial level of per capita income. A negative regressioncoefficient (β or beta) on initial income is taken as evidence of convergence, indicating thateconomic units with lower initial income levels have higher growth rates.
Early research on counties in Europe and North America supported the convergence hypothesis,finding beta convergence coefficients close to −0.02, indicating that poorer countries catch upto the per capita income levels of richer countries at a rate of 2% per year. The evidence forconvergence was less strong when researchers considered both “developed” and “developing”nations in the same pooled sample, and economists thus revised the convergence thesis: Instead ofassuming that all countries would ultimately converge to the same level of income, analysts arguedthat a country’s overall level of development was heavily influenced by long-term differences intechnical capacity, natural resources, human capital, and political institutions. The revised modelis referred to as conditional convergence: each country is supposed to converge to its unique levelof development, but lower-income countries are still expected to grow faster after the effects ofsuch external variables are taken into account.
As for regions within the same country, there are no barriers to trade and less variation inpolitical structure, technological capacity, and consumer preferences, and so analysts expectconvergence to be even faster.6 Barro, Sala-I-Martin, Blanchard, and Hall (1991) use state-leveldata for the United States between 1880 and 1988 and find strong evidence in favor of convergence.Higgins, Levy, and Young (2006) use county-level data from 1969 to 2000 and find high rates ofbeta convergence (ranging from 2% to 8%) after controlling for up to 41 conditioning variablesincluding age, educational attainment, and industry structure. But despite the growing literature
II Why Regions? Why Now? Who Cares? II 275
that metropolitan regions are becoming the critical scale for economic transactions, relatively fewresearchers have examined convergence at the metropolitan scale.
In one such effort, Drennan and Lobo (1999) find small negative convergence rates in theirstudy of 273 MSAs between 1969 and 1995. However, the authors note that it is possible to findnegative beta coefficients (i.e., evidence of convergence) even while some regions are pullingaway from the pack. Specifically, they argue that the overall distribution of per capita incomelevels between regions has become more diffuse even as most regions “regress to the mean” aftershort term negative or positive shocks. This second dimension of convergence is referred to assigma convergence and can be measured using coefficients of variation.
Starting with the beta convergence approach, we estimate the following standard regressionmodel of conditional convergence for U.S. metropolitan economies
gi = α + β ln(yit ) + λjXij + μi (1)
in which the annual average growth rate of per capita income (gi) between the time t (start period)and t + 1 (end of decade) for each metropolitan area (i) is regressed on the natural log of initial percapita income (yit ) and a vector of j control variables Xij. In contrast to previous studies, we splitour panel into two periods in order to assess how the rate of convergence has changed over time.Specifically, we compare the beta convergence estimate obtained in the 1980s to that obtainedfor the 1990s. Our sample consists of all U.S. metropolitan areas with a population greater than200,000 in 2000; this amounts to 192 metropolitan regions.
The key independent variable for making inferences regarding the rate of convergence is thelevel of per capita income in the initial period, yit . If the economic growth rates of these largermetropolitan regions in the United States were determined by a set of exogenous factors thataffected all regions in the same manner, such as globalization or national fiscal policy, we wouldexpect the rate of convergence to at least remain stable over the two time periods examined. Ifregions are becoming more important over time, we would instead expect the beta coefficient todecline.
We also use a simple set of conditioning variables consisting of the following characteristicsmeasured at the start of each decade: (1) median age of the population, (2) the percent foreignborn, (3) the share of the workforce with a bachelors degree or higher, and (4) the proportion ofregional employment in the manufacturing and finance, insurance and real estate (FIRE) sectors,respectively. While our regional database includes many other potential conditioning variables,we prefer a parsimonious final model that includes relatively few variables that are stable overtime.7 This restriction is reasonable since our interest is in the change in the beta coefficienton initial per capita income over time. A relatively simple set of conditioning variables reducesthe potential for bias stemming from arbitrary interactions between the control variables and percapita income in a given year.
In Table 1, we present the results of our conditional convergence regressions separately forthe 1980s and 1990s. Again, if regions “matter more now” than in the past, we should expectthe rate of convergence to fall between the two decades. As it turns out, our estimate of the betaconvergence rate is −0.026 for the 1980s, implying that metropolitan areas “converged” at a rateof roughly 2.6% per year over this period. This figure is very close to the consensus estimateof 2% in the cross-national literature and within the range obtained by Higgins et al. (2006)and Drennan and Lobo (1999). As can also be seen in the table, the conditioning variables aregenerally significant at conventional levels and signed appropriately.
However, by the 1990s, the rate of convergence fell by nearly half, from 2.6% to 1.4%, a shiftthat we take as support for the hypothesis that the regional scale has become more important.While some might worry that the overall explanatory value of the model also falls from the

276 II JOURNAL OF URBAN AFFAIRS II Vol. 31/No. 3/2009
TABLE 1Conditional Beta Convergence by Decade for 192 U.S. Metropolitan Areas
1980s 1990sVariable All All
Constant 0.220∗∗∗ 0.132∗∗∗6.742 3.658
Ln per capita income −0.026∗∗∗ −0.014∗∗∗−7.385 −3.455
Median age 0.001∗∗∗ 0.0006.304 0.621
% Foreign born −0.013 −0.020∗∗−1.147 −2.493
% W/BA or higher 0.093∗∗∗ 0.073∗∗∗7.696 6.790
% Manufacturing employment 0.032∗∗∗ 0.020∗∗∗4.870 2.782
% FIRE employment 0.060∗ 0.074∗∗1.922 2.538
Adj R-sq 0.365 0.261N 192 192
Notes: Each variable is for the base year in the decade (e.g., 1980 or 1990); the dependent variables are the annual averagegrowth rate in per capita income between 1980 and 1990, and 1990 and 2000, respectively. T-stats appear below estimatesin italics. ∗ indicates significance at the .10 level; ∗∗ indicates significance at the .05 level; ∗∗∗ indicates significance at the .01 level.
1980s to the 1990s (with the adjusted r-squared dropping from .365 to .261), this actually alsosuggests that region-specific factors—such as specific industry clusters, intangible networks, andbusiness and civic institutions not captured by our standard regressors—were more important inthe 1990s.8 Regions matter and they seem to matter more in recent years.
What About Convergence or Divergence for Equity Measures?
While the standard approach, as above, is to look at the beta coefficient for per capita income,Drennan and Lobo (1999) also suggest that it is useful to look at sigma convergence. This requireslooking at coefficients of variation (the ratio of the standard deviation of a variable to its mean)over time, with a falling coefficient indicating centralization and a rising coefficient indicatingdispersion. This analytical shift also conveniently allows us to look at a wider array of data,including measures that are central to those concerned with social equity.
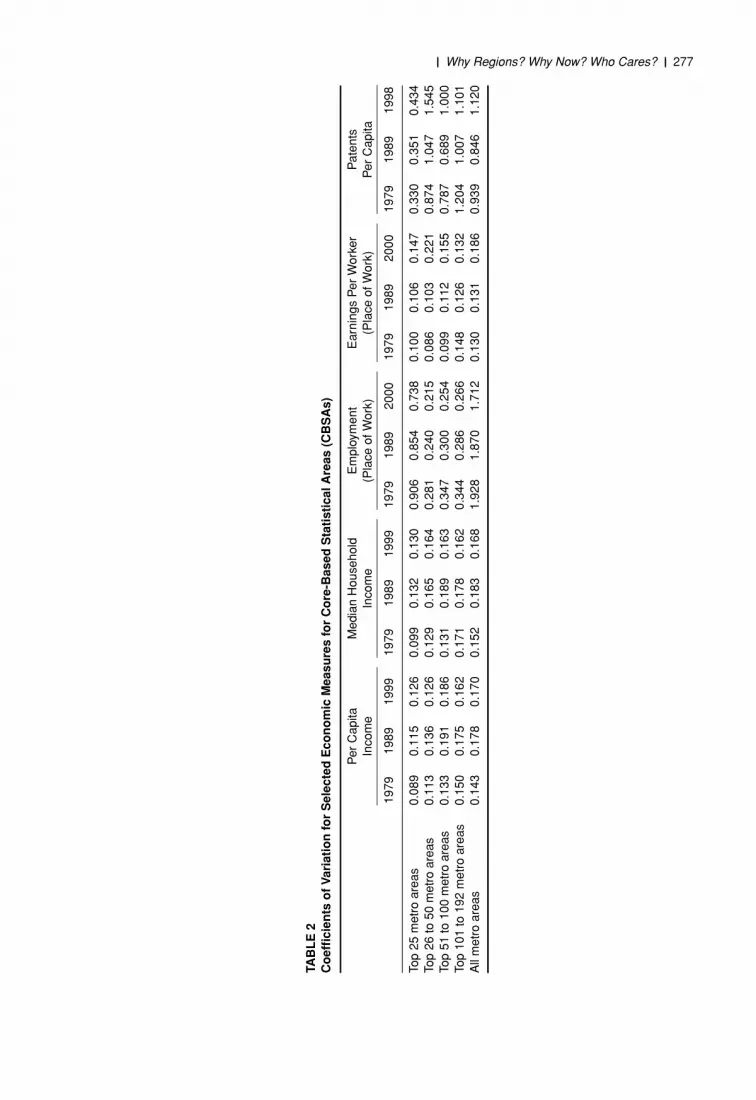
Table 2 looks at such coefficients of variation (CoVs) for a defined set of economic variableswhile Table 3 looks at what might be termed equity variables. After some initial exploration, wediscovered interesting differences in the coefficients by metro size and therefore calculated andshow separate coefficients of variation for four different size classes by 2000 population (top25 metro areas, top 26–50 metros, top 51–100 metros, and top 101–192 metros). To look atchanges over time, we include calculations for the years 1980, 1990, and 2000; conveniently,these were all peak or near-peak years for the U.S. economy.9
Beginning with per capita income, one of the most common measures of economic per-formance, the CoV results are more or less consistent with those from the convergence testabove: there has been an overall trend of increasing dispersion (or decreasing rate of central-ization) across metro areas between 1980 and 2000. For the top 25, the CoV of per capitaincome increased with each decade. However, when all metro areas are considered together
II Why Regions? Why Now? Who Cares? II 277
TAB
LE
2C
oef
fici
ents
of
Var
iati
on
for
Sel
ecte
dE
con
om
icM
easu
res
for
Co
re-B
ased
Sta
tist
ical
Are
as(C
BS
As)
Per
Cap
itaM
edia
nH
ouse
hold
Em
ploy
men
tE
arni
ngs
Per
Wor
ker
Pat
ents
Inco
me
Inco
me
(Pla
ceof
Wor
k)(P
lace
ofW
ork)
Per
Cap
ita
1979
1989
1999
1979
1989
1999
1979
1989
2000
1979
1989
2000
1979
1989
1998
Top
25m
etro
area
s0.
089
0.11
50.
126
0.09
90.
132
0.13
00.
906
0.85
40.
738
0.10
00.
106
0.14
70.
330
0.35
10.
434
Top
26to
50m
etro
area
s0.
113
0.13
60.
126
0.12
90.
165
0.16
40.
281
0.24
00.
215
0.08
60.
103
0.22
10.
874
1.04
71.
545
Top
51to
100
met
roar
eas
0.13
30.
191
0.18
60.
131
0.18
90.
163
0.34
70.
300
0.25
40.
099
0.11
20.
155
0.78
70.
689
1.00
0To
p10
1to
192
met
roar
eas
0.15
00.
175
0.16
20.
171
0.17
80.
162
0.34
40.
286
0.26
60.
148
0.12
60.
132
1.20
41.
007
1.10
1A
llm
etro
area
s0.
143
0.17
80.
170
0.15
20.
183
0.16
81.
928
1.87
01.
712
0.13
00.
131
0.18
60.
939
0.84
61.
120

278 II JOURNAL OF URBAN AFFAIRS II Vol. 31/No. 3/2009
TAB
LE
3C
oef
fici
ents
of
Var
iati
on
for
Sel
ecte
dE
qu
ity
Mea
sure
sfo
rC
ore
-Bas
edS
tati
stic
alA
reas
(CB
SA
s)
Hou
seho
ldIn
com
eIn
equa
lity
Rat
ioof
80th
toR
atio
of90
thto
Pov
erty
Con
cent
ratio
nP
over
tyR
ate
20th
Per
cent
ile10
thP
erce
ntile
(Dis
sim
ilarit
yIn
dex)
1979
1989
1999
1979
1989
1999
1979
1989
1999
1979
1989
1999
Top
25m
etro
area
s0.
153
0.17
90.
220
0.07
10.
091
0.10
10.
101
0.14
80.
156
0.15
80.
165
0.13
8To
p26
to50
met
roar
eas
0.29
70.
297
0.23
10.
109
0.12
70.
100
0.15
10.
171
0.13
80.
158
0.16
50.
138
Top
51to
100
met
roar
eas
0.38
10.
474
0.42
50.
086
0.12
40.
098
0.13
10.
173
0.16
60.
181
0.17
20.
158
Top
101
to19
2m
etro
area
s0.
342
0.38
20.
355
0.09
80.
154
0.12
80.
148
0.19
10.
196
0.22
80.
225
0.22
7A
llm
etro
area
s0.
338
0.39
00.
356
0.09
40.
136
0.11
30.
139
0.17
80.
176
0.21
60.
210
0.20
0

II Why Regions? Why Now? Who Cares? II 279
or attention is restricted to any of the other groupings by size, the results show a large in-crease in the CoV of per capita income between 1979 and 1989 (which is consistent withDrennan and Lobo, 1999) followed by a decrease (albeit often very small) between 1989 and1999. This may initially seem contradictory to the results of our conditional convergence testabove, which indicate a decrease in convergence in the 1990s (i.e., an increase in dispersion)as compared to the 1980s. However, the tests here do not take into account the condition-ing variables and it remains striking that the dispersion of per capita income at the regionalscale is particularly pronounced in the largest metro areas, which see an increase over eachperiod.
Table 2 also shows that median household income generally behaves like per capita income,albeit with the same level of variation for the top 25 metro areas in 1989 and 1999 rather than anincrease. In our view, this suggests that the dispersion of per capita income seen over the 1990smay have been driven more by the higher-income bands than the middle of the distribution, asuspicion that squares with subsequent results on the worsening of the income distribution. Wealso test a measure of economic innovation, patents per capita, and find a pattern of divergencefor all metro size bands, with a much more pronounced shift in what might be termed theup-and-coming metros (the second size band).
Employment behaves in a decidedly different fashion, showing a decrease in variation, or atightening of the distribution of employment levels across metro areas over time. But the re-sults for earnings per worker show increasing variation over time, particularly between 1989and 1999 and for the larger metro areas (the top 100), which is suggestive of dispersionand is supportive of the conditional convergence test results described above. Indeed, thefact that the increase in the variation of earnings per worker was far more pronounced be-tween 1989 and 1999 than it was between 1979 and 1989 intersects well with the notionthat there has been a bifurcation of employment, with increases in both high- and low-wagejobs in the United States over the 1990s. Moreover, the observation of declining disper-sion of employment levels alongside a rising dispersion of income and wage levels over the1990s suggests that perhaps the new jobs created over the decade that allowed regions withlower initial employment levels to “catch up” did not allow them to “catch up” in terms ofincome.
This drives us quickly to questions of social equity and Table 3 considers several variablesin this vein, including variations in the distribution of income and the level and geographicconcentration of poverty across regions. Here, the findings are a bit more mixed. The top25 metro areas show steadily increasing variation in the poverty rate, the 80/20 household incomeratio (the ratio of the 80th percentile of household income to the 20th percentile of householdincome), and the 90/10 household income ratio. For other size groups, the pattern is less stable,with several variables peaking in their variation in 1989 and declining afterward, even as concernsabout regional equity seemed to be reaching a new peak.
Interestingly, the one equity indicator that exhibits a steady pattern of convergence is the degreeof poverty concentration (as measured by the dissimilarity index of poverty calculated using citiesor other Census Designated Places (CDP) as the sub-geography). Such an index ranges from 1 to100, and in this case indicates the percentage of a region’s impoverished population that wouldhave to move to another city or CDP within the region in order to achieve an even distribution ofpeople below and above the federal poverty line across the cities (and CDPs) in the region. Thiswould seem to square with hypotheses regarding the suburbanization of poverty, a rationale Orfield(1997, 2002) and others have offered as a reason for building regional antipoverty coalitions. Thisis one case where converging experiences might be consistent with making the region more, notless, important for equity actors.10

280 II JOURNAL OF URBAN AFFAIRS II Vol. 31/No. 3/2009
What About Poverty, Employment Growth, and Wages?
Both our beta and sigma analyses suggest that the region may be a more important unit foranalysis and action regarding economic revitalization.11 On the other hand, the evidence that theregion is more important for equity outcomes is a bit mixed. For those concerned with socialequity, however, there may be another reason to think regionally: if the relationship betweenmetropolitan employment growth and metropolitan poverty levels has shifted such that a risingtide lifts fewer boats, then a new regional approach that promotes higher-wage metro clustersand uses regional organizing to raise basic labor standards is necessary (Benner, 2002; Luria &Rogers, 1997).
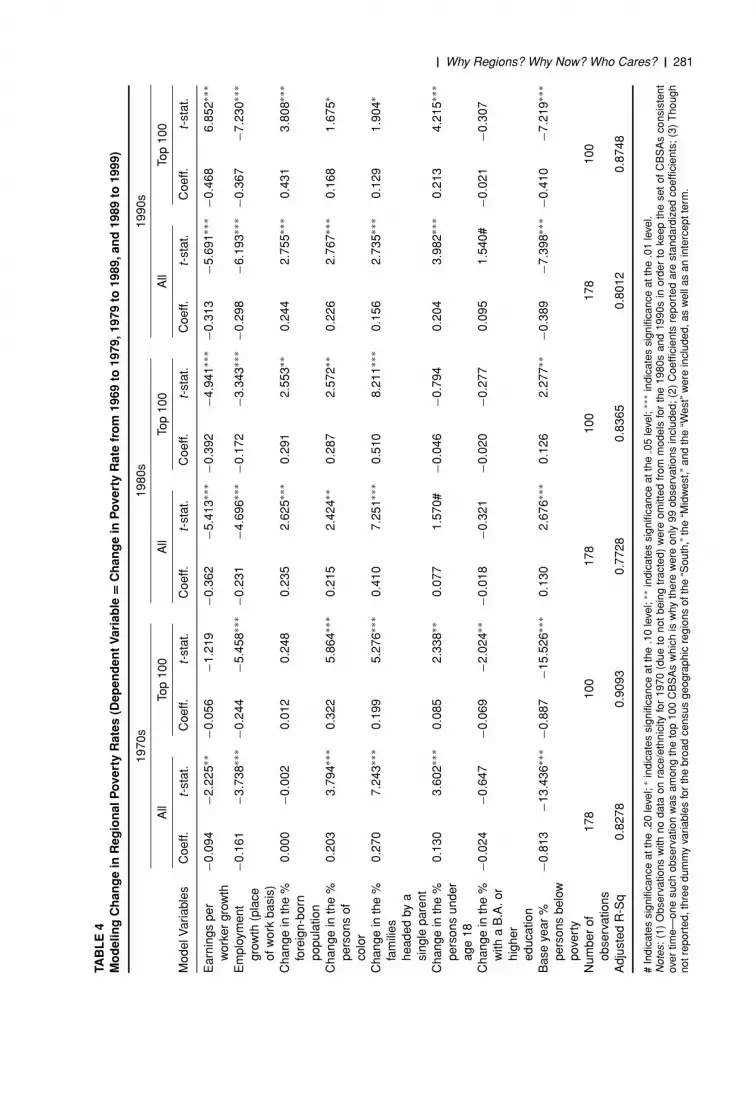
To look at this issue, we used regression techniques to model change in the poverty rate (at theregional level) as a function of the initial poverty rate, employment growth, change in earningsper worker, and several other conditioning variables.12 The results are in Table 4, in which wereport coefficients, significance levels, and model fit for each decade examined. We also provideseparate results for the top 100 metro areas to identify any nuances in the relationships related tothe size of the region.
The key relationship of concern is between the dependent variable—the change in the povertyrate from one decade to the next—and the change in levels of employment and earnings perworker. We find that in the 1970s, employment growth had a much larger dampening effect onpoverty rates than did growth in earnings per worker, particularly for the top 100 core-basedstatistical areas (CBSAs). By the 1980s, however, earnings growth had superseded employmentgrowth as the more important antipoverty factor—and the shift to earnings as the driving factorwas more pronounced for the top 100 metro areas. By the 1990s, the two poverty-alleviatingforces struck a balance when all metros were considered together but the change in earningsremained the more important factor for the top 100 metros.
As for the conditioning variables, they generally have signs that one would expect and arestable across the three decades: an increase in the percentage foreign born of the total populationincreases the poverty rate, though the effect is not significant until the 1980s and 1990s whenmore substantial waves of largely unskilled immigrants arrived in metropolitan areas across thecountry; an increase in the percentage of people of color has a positive and highly significanteffect across all decades; an increase in the percentage of families headed by a single parent hasa large positive and highly significant effect on shifts in the poverty rate; an increase in childrenas a share of the overall population generally has a positive and significant effect on changes inthe poverty rate, except in the 1980s when the effect was largely insignificant;13 an increase inthe shares of persons over 25 years holding a B.A. or higher level of education is associated witha significant negative impact on changes in the poverty rate during the 1980s, but the measurebecomes insignificant in the latter two decades, perhaps because the educational structure isbeing captured by the other conditioning variables or perhaps because such high-skill workersalso attract low-skill workers to provide basic services; and finally, the base year poverty rate,for which the coefficient measures what can be thought of as a “convergence” effect, shows anegative and significant association with changes in poverty rates (as expected), except duringthe 1980s where the effect is actually positive (suggesting some degree of path-dependence inthat difficult decade).
In any case, the key finding here is that over the past two decades, poverty reduction, particularlyfor the larger metro areas, has indeed become more about job quality than job quantity. Whilethis suggests that equity proponents should have an affirmative agenda to improve employmentconditions, it also suggests that they should be wary of a business-oriented regionalism focusedpurely on growth. It would thus be unsurprising to find, as we do below, that equity-oriented
II Why Regions? Why Now? Who Cares? II 281
TAB
LE
4M
od
elin
gC
han
ge
inR
egio
nal
Po
vert
yR
ates
(Dep
end
ent
Var
iab
le=
Ch
ang
ein
Po
vert
yR
ate
fro
m19
69to
1979
,197
9to
1989
,an
d19
89to
1999
)
1970
s19
80s
1990
s
All
Top
100
All
Top
100
All
Top
100
Mod
elV
aria
bles
Coe
ff.t-
stat
.C
oeff.
t-st
at.
Coe
ff.t-
stat
.C
oeff.
t-st
at.
Coe
ff.t-
stat
.C
oeff.
t-st
at.
Ear
ning
spe
rw
orke
rgr
owth
−0.0
94−2
.225
∗∗−0
.056
−1.2
19−0
.362
−5.4
13∗∗
∗−0
.392
−4.9
41∗∗
∗−0
.313
−5.6
91∗∗
∗−0
.468
6.85
2∗∗∗
Em
ploy
men
tgr
owth
(pla
ceof
wor
kba
sis)
−0.1
61−3
.738
∗∗∗
−0.2
44−5
.458
∗∗∗
−0.2
31−4
.696
∗∗∗
−0.1
72−3
.343
∗∗∗
−0.2
98−6
.193
∗∗∗
−0.3
67−7
.230
∗∗∗
Cha
nge
inth
e%
fore
ign-
born
popu
latio
n
0.00
0−0
.002
0.01
20.
248
0.23
52.
625∗
∗∗0.
291
2.55
3∗∗
0.24
42.
755∗
∗∗0.
431
3.80
8∗∗∗
Cha
nge
inth
e%
pers
ons
ofco
lor
0.20
33.
794∗
∗∗0.
322
5.86
4∗∗∗
0.21
52.
424∗
∗0.
287
2.57
2∗∗
0.22
62.
767∗
∗∗0.
168
1.67
5∗
Cha
nge
inth
e%
fam
ilies
head
edby
asi
ngle
pare
nt
0.27
07.
243∗
∗∗0.
199
5.27
6∗∗∗
0.41
07.
251∗
∗∗0.
510
8.21
1∗∗∗
0.15
62.
735∗
∗∗0.
129
1.90
4∗
Cha
nge
inth
e%
pers
ons
unde
rag
e18
0.13
03.
602∗
∗∗0.
085
2.33
8∗∗
0.07
71.
570#
−0.0
46−0
.794
0.20
43.
982∗
∗∗0.
213
4.21
5∗∗∗
Cha
nge
inth
e%
with
aB
.A.o
rhi
gher
educ
atio
n
−0.0
24−0
.647
−0.0
69−2
.024
∗∗−0
.018
−0.3
21−0
.020
−0.2
770.
095
1.54
0#−0
.021
−0.3
07
Bas
eye
ar%
pers
ons
belo
wpo
vert
y
−0.8
13−1
3.43
6∗∗∗
−0.8
87−1
5.52
6∗∗∗
0.13
02.
676∗
∗∗0.
126
2.27
7∗∗
−0.3
89−7
.398
∗∗∗
−0.4
10−7
.219
∗∗∗
Num
ber
ofob
serv
atio
ns17
810
017
810
017
810
0
Adj
uste
dR
-Sq
0.82
780.
9093
0.77
280.
8365
0.80
120.
8748
#In
dica
tes
sign
ifica
nce
atth
e.2
0le
vel;
∗in
dica
tes
sign
ifica
nce
atth
e.1
0le
vel;
∗∗in
dica
tes
sign
ifica
nce
atth
e.0
5le
vel;
∗∗∗
indi
cate
ssi
gnifi
canc
eat
the
.01
leve
l.N
otes
:(1
)O
bser
vatio
nsw
ithno
data
onra
ce/e
thni
city
for
1970
(due
tono
tbe
ing
trac
ted)
wer
eom
itted
from
mod
els
for
the
1980
san
d19
90s
inor
der
toke
epth
ese
tof
CB
SA
sco
nsis
tent
over
time—
one
such
obse
rvat
ion
was
amon
gth
eto
p10
0C
BS
As
whi
chis
why
ther
ew
ere
only
99ob
serv
atio
nsin
clud
ed;(
2)C
oeffi
cien
tsre
port
edar
est
anda
rdiz
edco
effic
ient
s;(3
)T
houg
hno
trep
orte
d,th
ree
dum
my
varia
bles
for
the
broa
dce
nsus
geog
raph
icre
gion
sof
the
“Sou
th,”
the
“Mid
wes
t,”an
dth
e“W
est”
wer
ein
clud
ed,a
sw
ella
san
inte
rcep
tter
m.

282 II JOURNAL OF URBAN AFFAIRS II Vol. 31/No. 3/2009
activists may get more engaged in regional discussions when business itself is engaged; in thiscase, a good defense may be the best offense lest important constituencies get left behind.
PART III: WHO CARES?
So who is actually interested in regionalism, and why? One approach to answering this two-partquestion would be to construct a history of the various regionalist organizations that have emergedand chart their evolution. Henton et al. (2004) and FutureWorks (2004) do this for a variety ofbusiness and civic organizations and Pastor et al. (2009) do this for an array of “social movement”groups. Although such qualitative characterizations are important, they do introduce an elementof subjective judgment about the subjective choice to take up the regionalist mantle—how canone be sure that the cases authors chose are actually representative as well as illustrative, and howdoes one account for the structural factors that trigger constituency interest even as one focuseson the most compelling stories of leadership “epiphanies” and regionalist conversions?
In this section of the article, we try what we hope is a useful complement to such qualitativeanalysis: we collect attendance information from a series of conferences put on by the business-oriented Alliance for Regional Stewardship (ARS), over the years 2000–2005, and suggest thatthis is a proxy for business interest in regionalism. To measure equity interest, we gather attendancedata from the two Regional Equity Summits organized by PolicyLink held in 2002 and 2005. Weregress such attendance on various structural features of the metro region, and also attempt to testwhere equity proponents are, for example, responding to business interest in regionalism (or theother way around). The results suggest that business advocates are indeed moved by efficiencyconcerns and equity proponents moved by sharper levels of inequality; they also suggest thatsocial justice proponents tend to respond to business agenda-setting regarding the region whilebusiness is less reactive.
We anticipate some empirical and methodological objections to our approach. The first has todo with our characterization of the organizations. While few would argue that PolicyLink is notfocused on regional equity—the organization was an early proponent of the concept (Blackwell &McCullough, 1999; PolicyLink, 2000) and its summits have had “regional equity” in the title—the early leaders of the ARS saw themselves as a more neutral organization promoting civicleadership. We would argue that appearances there were self-deceiving: the organization drewmore from business than community leadership and the regional alliances that comprised ARStended to focus on economic competitiveness (although some of its members, such as Chicago2020, also raised affordable housing and efficient regional transportation for workers as part ofa full competitiveness package). For those still unpersuaded of our labeling, we would point outthat in 2007 the ARS decided to disincorporate as a separate entity and instead become a programof the American Chamber of Council Executives (ACCE), suggesting at least a strong leaning inone direction of the economy-equity balance.
A second objection may be that the number of attendees at each type of meeting is an imperfectmeasure of economic or equity interest at the regional scale. We agree, but the beauty of thismeasurement is that it does not require a brand new sampling process, does not involve any priorson our part, and would certainly seem to be at least correlated with economic or equity interestat the regional level. And while there is certain to be substantial statistical “noise” in such achoice of measurement—some regions may have large numbers of attendees because they areseeking to meet funders in attendance or because a friend or colleague happened to be going,while some regions in which there is genuine interest in working at the regional scale may nothave any representation (perhaps due to timing, travel costs, or other factors)—on average wewould expect such noise to balance out, in which case any statistically significant findings doindicate some real underlying trends.

II Why Regions? Why Now? Who Cares? II 283
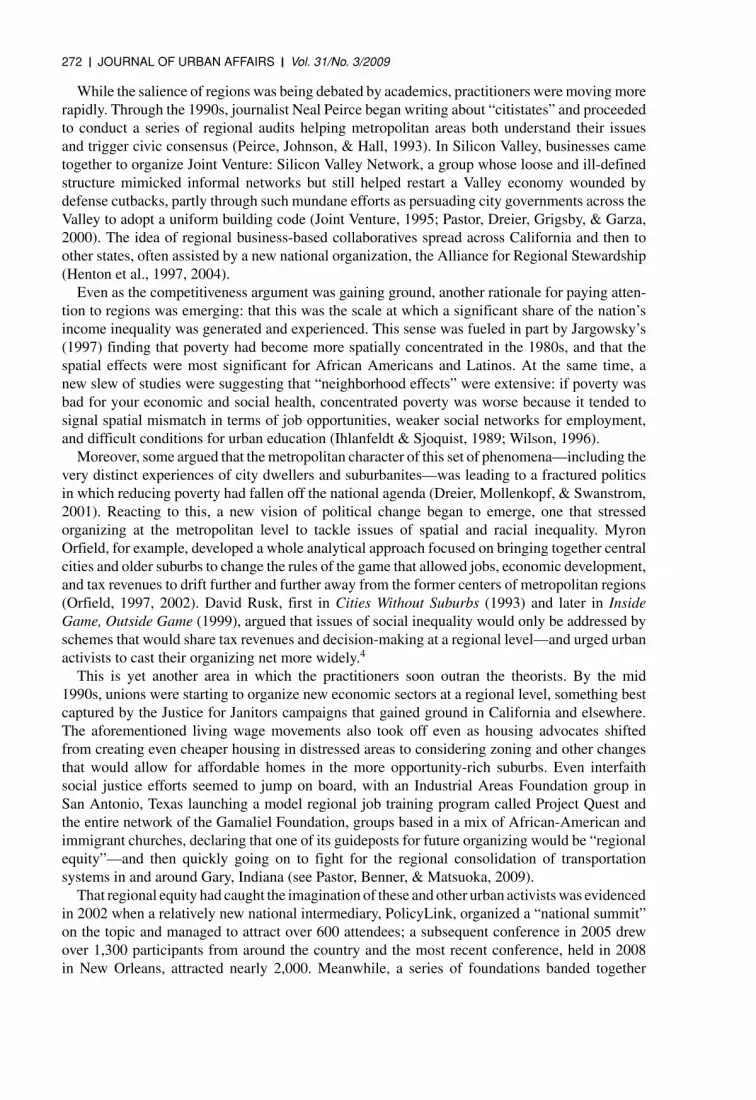
FIGURE 2
Total Number of Attendees at the 2002 and 2005 Regional Equity Summits (by CBSA or ZIP code)
A third and more philosophical objection might simply be that such statistical tests cannotreveal the depth of motivations and interests of social actors and thus cannot tell a full story ofhow these emerge and evolve. We concur, and for that reason, at least one of the authors hascowritten a book on the topic (Pastor et al., 2009). However, this article is a starting point fora much larger project that will examine the ways in which business and other actors perceive,“frame,” and act on regional challenges like increasing immigration, economic shocks, and thesuburbanization of poverty. Given the qualitative work that is soon to follow, we confess to abelief that the data approach taken here may provide a useful platform.
What are Defining Interests?
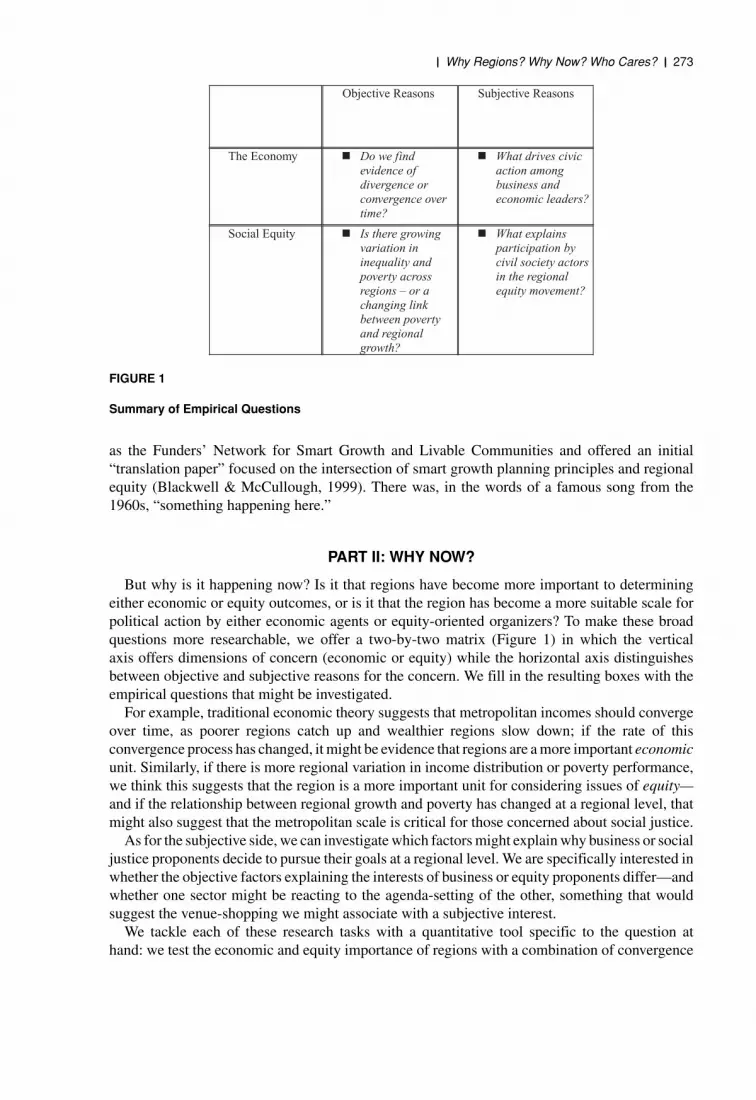
The proxies of “business interest” and “equity interest” in the regional scale are derived fromattendance information for the aforementioned ARS and PolicyLink meetings. We matched upthe postal ZIP codes for each of the attendee home addresses to CBSAs, and then aggregated toget the total number of attendees by the year of the particular meeting and the total for all meetingscombined by CBSA. The CBSAs that were represented at the two venues and their relative levelsof representation are shown as a series of different-sized dots in Figures 2 and 3; the categoriesfor number attended were derived through a Jencks natural breaks procedure within ArcGIS andvary between the two types of gatherings, mostly because the Regional Equity Summits weremuch better attended (which, we suppose, tells one something right there!).

284 II JOURNAL OF URBAN AFFAIRS II Vol. 31/No. 3/2009
FIGURE 3
Total Number of Attendees at the Alliance for Regional Sterwardship Conferences, 2000–2005 (byCBSA)
We then developed a series of logistical models, entering both dichotomous and polychotomousformations of each measure of interest (business and equity) as the response variable. Thedichotomous response variables took on a value of zero if the region had no attendees or one ifthe region had some positive number of attendees, while the polychotomous formations of theresponse variable took on a value of zero if the region had no attendees, and values of one, two,or three depending on the region’s particular ranking in a distribution of the number of attendeesper capita.14 As such, the three positive discrete values of the polychotomous response variablecould, for example, be broadly interpreted as “low interest,” “some interest,” and “high interest,”respectively, while the zero value—meaning no attendees—could be interpreted as “no interest.”
To give an idea of the structure of response variables, we have included two cross-tabulationsin Tables 5 and 6—one describing the relationship between the two dichotomous variables(business interest and equity interest) and the other describing the relationship between the twopolychotomous variables (which capture the degree of business and equity interest). Beginningwith Table 5, we can see that a very similar number of the 192 CBSAs in our sample of metroswere represented at the regional equity summits (90) as were represented at the ARS conferences(87); this makes for two well-behaved response variables for the logit testing since just underhalf of all metros considered are represented at each type of meeting. However, only about two

II Why Regions? Why Now? Who Cares? II 285
TABLE 5Relationship Between the Two Dichotomous Response Variables
Alliance for Regional Stewardship Conferences
No Attendees Some Attendees Total
PolicyLink Regional No attendees 76 26 102Equity Summits Some attendees 29 61 90
Total 105 87 192
TABLE 6Relationship Between the Two Polychotomous Response Variables
Alliance for Regional Stewardship Conferences
High Interest Some Interest Low Interest No Interest Total
PolicyLink Regional High interest 7 6 8 9 30Equity Summits Some interest 7 6 5 12 30
Low interest 7 7 8 8 30No interest 8 10 8 76 102Total 29 29 29 105 192
thirds of those metros represented at either meeting are represented at both meetings (61), withthe remainder being represented at only one or the other venue. This conveniently means thatthose factors that predict one sort of attendance do not necessarily predict the other. Moreover,since there is some overlap, we will also be able to see whether the existence of a regional-mindedcontingent in one arena (economy or equity) has a “pulling” effect on interest in the other arenain action at the regional scale, perhaps because one group is setting a new regional “stage” inwhich the other can pursue conversations and agendas.
Table 6 could get at that issue of “reactive regionalism” since it relates the degree of interestin each of the two agendas. Unfortunately, the simple comparison does not yield a clear pattern:Metro areas with “high representation” in one arena have degrees of representation in the otherarena that range from “high” to “none” and everything in between with a relatively even distri-bution. Thus, we need to turn to a logistical analysis that can paint a multivariate picture of thefactors that are associated with a region being represented at each of the two types of meetings.
What Does a Logistic Analysis Tell Us?
The basic logit regression results for the probability of a region being represented at one of thePolicyLink regional equity summits or one of the Alliance for Regional Stewardship conferencesare reported in Tables 7 and 8, respectively.15 In each table, we first present a base specificationthat includes as regressors a parsimonious set of variables that would seem to have an impact oninterest in regional equity or regional economy in theory, followed by the same specification butwith the natural log of the number of attendees of the other meeting type (e.g., ARS attendees inthe cases of the regional equity logit and regional equity attendees in the case of the ARS logit)to examine any indication of cross effects between the two types of meetings.16 For each model,we report the estimated marginal effect of each of the explanatory variables along with theirsignificance levels, as well as information about model fit, including a pseudo r-square value andthe percent predicted correctly.17 In both regressions, we also include a series of dummy variablesfor the three broad Census regions of the South, the Midwest, and the West.

286 II JOURNAL OF URBAN AFFAIRS II Vol. 31/No. 3/2009
TABLE 7Modeling the Probability of a Region being Represented at the PolicyLink Regional Equity Summits,2002 and 2005
(Logit Model)
Model Variables Marginal Effect Wald Stat. Marginal Effect Wald Stat.
ln(population), 2000 3.02% 15.282∗∗∗ 2.25% 6.906∗∗∗Relative per capita income,
1999−0.64% 1.671# −0.59% 1.398
Per capita income growth,1979–1999
2.19% 9.878∗∗∗ 2.03% 8.340∗∗∗
Ratio of 80th to 20thpercentile of householdincome, 1999
0.18% 1.988# 1.89% 2.212#
Dissimilarity Index fornon-Hispanic whites,2000
0.98% 2.772∗ 0.86% 2.136#
% Recent immigrants,2000
3.44% 5.585∗∗ 3.51% 5.661∗∗
Number of labor CBOs per10,000 people, 2004
1.15% 5.024∗∗ 1.01% 3.777∗
Relative (city/suburb)rental unaffordability
9.15% 5.100∗∗ 8.94% 4.885∗∗
ln(number of alliance forregional stewardshipattendees)
1.28% 3.213∗
Number of observations 187 187Nagelkerke R-Sq 0.453 0.469Percentage predicted
correctly0.754 0.770
# Indicates significance at the .20 level; ∗ indicates significance at the .10 level; ∗∗ indicates significance at the .05 level;∗∗∗ indicates significance at the .01 level.Notes: (1) Though not reported, three dummy variables for the broad census geographic regions of the “South,” the “Midwest,”and the “West” were included, as well as an intercept term. (2) Relative per capita income is figured as the ratio of eachCBSA’s level of per capita income to the average across all 192 CBSAs.
Table 7 starts the analysis with a look at what factors predicted attendance at the PolicyLinksummits. As can be seen in the first set of columns in Table 7, all variables in the regression aresignificant at better than the .20 level. In addition, the model fit appears to be quite good with aNagelkerke r-square value of 0.453 and about 75% of outcomes for the response variable predictedcorrectly. The natural logs of population and per capita income growth have positive and highlysignificant effects, while the relative level of per capita income has a negative and less significanteffect, indicating that larger and more rapidly growing regions economically (but with relativelylower-income levels) were more likely to be represented at the regional equity summits. In ourview, both of these outcomes make sense as we expect larger areas to have deeper organizinghistories and have argued elsewhere that many regional equity proponents have actually beenmotivated by the need to deal with the consequences of growth (such as gentrification; see Pastoret al., 2009).
Income inequality, as measured by the ratio of the 80th percentile of household income to the20th percentile, has a positive effect that is significant at better than the .20 level (p-value of.16) indicating that regions with wider income gaps (more inequality) are more likely to haverepresentation at a regional equity summit. The marginal effects of the dissimilarity index fornon-Hispanic whites (a measure of residential segregation) and the percentage recent immigrants

II Why Regions? Why Now? Who Cares? II 287
TABLE 8Modeling the Probability of a Region being Represented at the Alliance for Regional StewardshipConferences, 2000–2002
(Logit Model)
Model Variables Marginal Effect Wald Stat. Marginal Effect Wald Stat.
ln(population), 2000 4.59% 22.244∗∗∗ 4.47% 19.279∗∗∗Relative per capita income,
1999−0.64% 1.412 −0.62% 1.307
Per capita income growth,1979–1999
0.73% 1.194 0.71% 1.111
Change in jurisdictionalcomplexity, 1990–2000
1.73% 2.073# 1.67% 1.945#
% working outside countyof residence, 2000
1.43% 6.453∗∗ 1.37% 5.683∗∗
Change in suburban % ofregional employment,
1990–2000 1.83% 2.231# 1.89% 2.302#Ratio of total jobs to total
population, 20003.40% 8.914∗∗∗ 3.27% 7.827∗∗∗
% Owner occupiedhousing units, 2000
3.66% 5.405∗∗ 3.63% 5.304∗∗
Median gross rent as a %of household income,1999
5.51% 3.074∗ 5.26% 2.709∗
Change in % high-techemployment, 1990–2000
7.41% 2.341# 7.10% 2.085#
ln(number of RegionalEquity SummitAttendees)
2.93% 0.177
Number of observations 187 187Nagelkerke R-Sq 0.568 0.569Percentage predictedcorrectly
0.824 0.824
# Indicates significance at the .20 level; ∗ indicates significance at the .10 level; ∗∗ indicates significance at the .05 level;∗∗∗ indicates significance at the .01 level.Notes: (1) Though not reported, three dummy variables for the broad census geographic regions of the “South,”, the“Midwest,” and the “West” were included, as well as an intercept term. (2) Relative per capita income is figured as the ratio ofeach CBSA’s level of per capita income to the average across all 192 CBSAs.
(those who arrived in the 1980s and 1990s) are positive and significant, indicating that moreracially segregated and immigrant regions tend to have more interest in regional equity.
Because some proponents have focused so much on housing equity, we include a measurethat compares rental affordability between the central city and suburbs of a region.18 This showsa positive and highly significant effect, indicating that regions in which central city renters arerelatively more financially strapped than those in the suburbs—that is, where housing equity was abigger issue—were more likely to attend the equity summits. Finally, the population normalizednumber of labor-affiliated community based organizations in 2004—a measure related to thedegree of political mobilization for workers in the region—has a large positive effect (as expected)that is significant at better than the .05 level.
When the logged number of ARS conference attendees is added to the set of explanatorymeasures (the second set of columns in Table 7), we see a slight increase in the measures ofmodel fit and small changes in the other regression coefficients and significance levels, all signsof a relatively stable model. The added variable itself is significant at better than the .10 level(p-value of .073) with the estimated marginal effect indicating that a 10% increase in the number
288 II JOURNAL OF URBAN AFFAIRS II Vol. 31/No. 3/2009
of ARS attendees from any particular region will lead to about a 1.3% increase in the probabilityof representation at the Regional Equity Summits from that region. While the effect is clearlysmall, the fact that it is significant—even in the midst of several other measures with high degreesof explanatory power—is interesting, and suggests that there may be some degree of “venueshopping” or “reactive regionalism” among equity proponents, who may have become aware ofthe utility of acting regionally by observing the opportunities for regional conversation createdby actors with very different interests.19
Results for the ARS logit model appear in Table 8. Once again, a set of parsimonious measuresseem to yield a reasonably good explanation of the probability of a region being represented atthe ARS conferences. As with the equity equation, the log of population is highly significant—indicating that it tends to be the larger regions that have representation at the ARS conferences—but the insignificance of per capita income growth indicates that it is not necessarily regions thathave had strong economic growth that are represented at the ARS meetings. This suggests thatthe regional discussion tends to attract both business leaders hoping to stir growth as well as thosedealing with the consequences of growth—a pattern that squares with the mix we ourselves haveseen at these meetings.
What is significant is the change in jurisdictional complexity between 1990 and 2000—ameasure of the number of census-designated “places” (made up of cities and unincorporatedareas) normalized by population. This suggests that perhaps business actors are looking to theregion as an efficient geographic scale to organize an array of municipalities that has become morecomplex over the past decade. It also helps to explain to us the seemingly odd fact (highlightedearlier) that one of the premier business regionalist alliances, Joint Venture: Silicon ValleyNetwork, boasted the most often about a seemingly mundane achievement: persuading so manycities to adopt the same building code in an effort to speed up the process of developing newplants and office parks.
Two related measures—the percentage of workers working outside of their county of residenceand the change in the suburban percentage of regional employment—turn out to be significant andpositive, which might be related to interest in cohesive transportation strategies at the regionallevel.20 The ratio of total jobs in a CBSA to total population—a measure of labor market“tightness” that is better than unemployment as it better captures whether discouraged workershave also been drawn out into the labor market—shows a positive and highly significant effect onthe probability of a CBSA being represented at the ARS conferences, with the estimated marginaleffect indicating that an increase in this ratio of 1% (or 0.01) in a region will lead to about a 3%increase in the probability of that region being represented at the ARS conferences. In our view,this suggests that regions where labor shortages might be developing would be more likely tosearch for a business voice on workforce development and other matters.
Two variables that are related to housing, the home ownership rate and median gross rent asa percentage of household income (a measure of [un]affordability), have positive and significanteffects on the probability of a CBSA being represented at the ARS conferences. The positive effecton the level of home ownership may be a result of greater interest in a strong regional economyin areas where people have more at stake in the region (perhaps to keep home values high). Asfor our gross rent measure, note that this is not an indicator of housing equity but rather of overallstress; its positive effect on business interest may suggest that firms are worried about keepingthe region attractive to workers who ultimately fuel the regional economy through their laborand consumption. Certainly, there is no shortage of business voices now calling for “workforcehousing” and this has been a central issues for groups like the Silicon Valley Leadership Groupand Chicago 2020.
Finally, because some have suggested that business regionalism is mostly the provinceof the information industry, we include the change in percentage of workers in what are
II Why Regions? Why Now? Who Cares? II 289
considered “high-tech” occupations. This has a positive effect on the probability of a regionhaving representation at the ARS conferences that is significant at better than the .20 level(p-value = .136)—having more of these sorts of knowledge workers does seem to introducea broader concern in quality of life and regional collaboration (Florida, 2002; Henton et al.,2004).21 The important fact, however, is that other variables are significant: business interest inregionalism is not confined to high-tech areas of the nation.
Interestingly, when we enter the logged number of PolicyLink Regional Equity Summit atten-dees to the model, there is essentially no improvement in the fit of the model and the variableitself is highly insignificant. While there was some evidence of “reactive regionalism” amongregional equity proponents, the same is not true for those focused on the regional economy.Thus, it appears that while taking conversations to the regional level may be induced by several“objective” rationales for business interests, such as the health of the regional economy, regionaltransportation efficiency, housing affordability, and cultivation of the high-tech sector, for equityinterests, “objective” reasons (such as income inequality, housing equity, the degree of politicalmobilization among labor proponents, immigration and residential segregation) are not the fullexplanation. Rather, the existence of a regional platform in the first place—even if the motivationsbehind the conversation on that platform are not exactly consistent with the conversation equityproponents may want to have—stirs interest.
When we tested the four logit models above under an ordered logit specification (for which thedependent is the polychotomous response variables described above and in Table 6), we foundlargely the same pattern. The indication is that the set of explanatory variables included in themodels not only explains the probability of a region having any representation at the two typesof regionally focused gatherings, but also the degrees of representation at those meetings, or theprobability of moving from one category of representation to the next highest category. While wedo not report the results here, as they are largely redundant, we briefly describe the differencesbetween the two model specifications (logit vs. ordered logit) below.
In the ordered logit model for the degree of representation at the PolicyLink Regional EquitySummits, the differences we find include an increase in the significance of the income inequalityand relative rental unaffordability measures and a decrease in the significance of the dissimilarityindex for non-Hispanic whites (from a p-value of .10 to a to a p-value of .20), indicatingthat the economically based equity measures are better at explaining the degree of representationat the equity summits than is the measure of racial segregation. For the ARS-ordered logit model,the significance of the percentage of owner-occupied housing units drops (from significance atthe .05 level to significance at only the .20 level), and a few variables become insignificant. Theseinclude the change in jurisdictional complexity, median gross rent as a percentage of householdincome, and the change in the percentage of workers employed in high-tech occupations (recallthat these measures were significant at the .20, .10, and .20 levels, respectively, in the basic logitspecification). This suggests that while these measures are important in explaining representationversus nonrepresentation at the ARS conferences, they are not important in the explaining thedegree of representation at these conferences in terms of the number of attendees.22
Finally, in this series of tests that try to account for the degree of interest, we found an increase inthe significance of the logged number of ARS conference attendees on the probability of regionalattendance at a PolicyLink summit (from a p-value of .07 to a p-value of .03). However, the effectof PolicyLink regional equity summit attendees on the likelihood of attending an ARS gatheringbecomes even less significant in the ordered logit specification, and the sign of the coefficientactually becomes negative. Thus, while equity proponents do seem to react to business interest insetting regional tables, business leaders seem to care less about what the equity proponents areup to.
290 II JOURNAL OF URBAN AFFAIRS II Vol. 31/No. 3/2009
CONCLUSION
The key goal of this article is to investigate the empirical bases that underlie contemporary callsfor regionalism among scholars and practitioners. Through four distinct exercises, we exploredwhether the regional scale is objectively more important today than in the past two decades andexamined what seems to drive subjective interest in regionalism. While the results of any oneanalysis do not make a conclusive case, the overall pattern suggests that regions do matter moretoday for both economic competitiveness and social equity, but that the interest of regional equityproponents may, as in the case of the living wage, reflect some degree of venue shopping in favorof more favorable political and policy outcomes.
The results of OLS models of metropolitan convergence for the 1980s and 1990s, for example,indicate that the rate of convergence for per capita income was cut in half in the 1990s, a trendthat suggests a rising differentiation in regional performance. This pattern is consistent with ananalysis that made use of coefficients of variation for per capita and median household incomegrowth; we found mixed evidence of rising dispersion in many distributional measures, suggestingsome rationale for the regional scale as a way to address issues relevant to social equity. Therationale for regionalism is even stronger when we look at a set of regression models examiningthe relationship between poverty and the rates of employment and wage growth; we find thatwhile job growth was critical to reducing poverty in the 1970s, by the 1980s and 1990s wagegrowth was a more important factor than just jobs alone. If simply adding more jobs is no longersufficient, equity proponents must have a regional agenda distinct from simply supporting growthper se—and this drives an objective interest in getting engaged in regional conversations andplanning, even when these processes have been initiated by business and not community.
When we test for the factors that in fact drive such interest in regionalism, we find that efficiencyconcerns—such as high levels of government fragmentation, concerns about coordinating trans-portation systems, higher levels of suburban employment—tend to drive business engagement.Such interest seems to be less sensitive to past income growth—business leaders will get engagedif growth is slow or fast—although there is more interest where labor markets are tighter andhousing is less affordable, both clear collective action problems for business. On the equity side,more unequal regions, as measured by income distribution, residential segregation or geographicdifferences in housing affordability tend to produce more equity proponents, and interest seemsto be higher when past income growth is faster and hence there is something to redistribute.Perhaps what is most striking is that equity proponents do seem to react to business interest insetting regional tables but business leaders have little reaction to the regionalist activities of socialjustice proponents.
Ultimately, this empirical work may open up more questions than it answers. Regions may bemore important economically but we do not clearly know whether this is due to social networkeffects, new forms of clustering, or the reconfiguration of political space. Regions may be moreimportant for equity, particularly for those efforts that seek to change the quality and not simplythe quantity of employment, but we have offered here no assessment of which pro-equity strategiesare most successful. Business and social actors may be interested in regionalist conversations,but we have offered only brief hints of how this plays out in particular regions and advanced noanalysis of why equity proponents are reacting to the business regional agenda but not the otherway around.
We are blessed, however, by being part of a larger project that intends to address these and otherquestions in a multiyear and multiregion study of which metropolitan areas are most resilientand what are the economic, institutional, and cultural factors that make them so. We offer thisthen as a starting point and wish our colleagues and other researchers well as we all continue toexplore why new regionalism has gained adherents in both the academic and practitioner world,

II Why Regions? Why Now? Who Cares? II 291
whether such regionalist thinking and organizing can actually improve the future for metropolitanAmerica, and how we might promote the best and most inclusive of these efforts in the yearsahead.
APPENDIX
The data in this article come from a comparative metros database that is being constructedas part of the Building Resilient Regions project. The basic unit of analysis is the core-basedstatistical area (CBSA), a set of metropolitan definitions officially adopted in June 2003. In somecases, variables were obtained from sources which have already aggregated the information tothe 2003 CBSA level. For example, in the convergence regressions, median age, percent foreign-born, percent with a BA or higher, were taken from HUD’s State of the Cities Data System(SOCDS) and per capita income and percent manufacturing and FIRE (nonfarm) employmentwere taken from the BEA’s Regional Employment Information System (REIS). However, wealso sometimes “reshape” data to the CBSA level using underlying tract data. For example, ourmeasures of household inequality were obtained from data from the U.S. Census Summary TapeFiles; here we take tract-level data for these measures, reallocate the data to 2000 tract shapes,and add up to calculate CBSA levels.
Thus, in the analysis of coefficients of variance, per capita and median household incomeare taken from the census tract-level data, and reallocated and aggregated to the CBSA levelas indicated above. However, employment and earnings per worker are taken from RegionalEconomic Information System (REIS), 1969–2004, with the income and earnings variablesadjusted for inflation using the Consumer Price Index–Urban. Patents per capita is figured as thenumber of use patents granted by the U.S. Patent Office in 1979, 1989, and 1999 per capita fora metro region, with individual patent records geocoded according to the city of residence (datafrom the NBER; see Hall, Jaffe, and Tratjenberg, 2001). The poverty rate is from the reshapedCensus data as are the poverty concentration and the income ratios; the dissimilarity index forpoverty is figured using the standard formula and the income distribution ratios are determinedby adding up the households (by tract) in each metro area in a series of income categories andusing a Pareto interpolation procedure to estimate the income of those at the 10th, 20th, 80th, and90th percentiles.
For the determinants of poverty regression, we use the employment and earning variablesindicated above. The other variables in that regression include the change in the percent foreign-born, the change in the percent with a B.A. or higher, the percent of families headed by a singleparent, and the percent persons in poverty from the State of the Cities Data Systems (SOCDS athttp://socds.huduser.org/); the percent of the population under the age of 18 years and the percentpeople of color from various Geolytics and Census data sets (with original 1970, 1980, and 2000data reshaped into 2000 tracts and aggregated as described above, and the 2000 data taken directlyfrom the Summary Files).
For the logit tests on equity interest, nearly all the independent variables come from the Censuswith tract-level data aggregated up to obtain CBSA-level variables; the derivation of the ratio of80th to 20th percentile of household income is described above in the discussion of coefficientsof variation. The number of labor CBOs per one million persons is from the National Center ofCharitable Statistics for 2004.
For the logits on business interest, the change in jurisdictional complexity comes from theState of the Cities Data Systems, the percent working outside the county of residence comes fromtract-level census data aggregated up to the CBSA level as does the percent of owner-occupiedhousing and median gross rent as a percent of household income. For the change in high-tech

292 II JOURNAL OF URBAN AFFAIRS II Vol. 31/No. 3/2009
employment, we rely on the U.S. Bureau of Labor Statistics, Quarterly Census of Employmentand Wages (ES-202) and aggregate employment in NAICS industry codes based on the AmericanElectronics Association’s (AEA) published definition for high-tech. In both equations, the logof population and log of attendees from the other conference (the only logged variables in theseregressions) are multiplied by 10 so that the resulting coefficients line up better with the rest ofthe variable coefficients.
ACKNOWLEDGEMENT: We thank participants at the 2008 Urban Affairs Association Meetings and two anony-mous reviewers for their comments on earlier drafts. This work has been supported by the MacArthur FoundationResearch Network on Building Resilient Regions, and we thank the members of that Network for their commentsand support as well.
ENDNOTES
1 We should note that specifying the exact boundaries of the regional scale is itself a “subjective” question—some regional leaders may define the region to include many metropolitan areas (as with the business-orientedBay Area Council in California or the philanthropic multimetro Fund for Our Economic Future in NortheastOhio). To keep the empirics tractable, our tests are based on one standard definition of regions: the currentmetropolitan area definitions set by the OMB under the rubric of core-based statistical areas (CBSAs) but weacknowledge that the very definition of a region is up for grabs in the new regional framework.
2 See Gereffi and Korzeniewicz (1994) and Henderson, Dicken, Hess, Coe, and Wai-Chung Yeung (2002). Thereis a related argument that large global city-regions are the optimal location for the management of increasinglycomplex global production networks (Sassen, 1991; Scott, 2001). We suspect that this argument is correct butits empirical implication is mostly that some regions are becoming more important than others; our focus hereis whether the regional level matters more for most metropolitan economies.
3 Scholars from a variety of disciplines have examined the economic transition to the Information Economy andits spatial implications. Manuel Castells (1996) provides the most complete explanation.
4 There were also a set of authors, including Savitch, Collins, Sanders, and Markham (1993) and Voith (1992),who argued for a complementarity of city and suburban incomes and offered supportive empirical evidence.Hill, Wolman, and Ford (1995) provided an early critique of this complementarity hypothesis, raising importantissues of simultaneity that both Pastor et al. (2000) and Voith (1998) sought to address.
5 For a less simplistic approach, see the literature on endogenous growth theory such as Romer (1990). In thisframework, increasing returns, technological change, and other factors matter greatly.
6 There are some complexities as to whether the traditional neo-classical growth model—which assumes a closedeconomy and investment from local savings—is truly applicable but the heuristic implication is that of fasterconvergence, something supported by the data. See Higgins, Levy, & Young (2006) for a discussion of thisissue.
7 Previous conditional convergence studies include variables that measure the relative size of racial and ethnicminority populations. We tested models that included both the percent Latino and percent African Americanbut found a high level of collinearity with the percent foreign born in the case of percent Latino, and a somewhatunstable effect of percent African American between the two time periods. Since the inclusion of such variableshad less purely economic rationale and had little impact on the central finding regarding the change in thebeta coefficient on initial per capita income, we instead present the most parsimonious model with consistentvariables in each decade.
8 See Storper’s (1997) discussion of “untraded interdependencies”—formal associations and informal networksin which information, business tips, and technological innovations are exchanged. Such factors do not show

II Why Regions? Why Now? Who Cares? II 293
up easily in multiregion databases, and a declining significance of other more traditional factors can signal arising significance of these regionalist “intangibles.”
9 Note that for all income measures derived from the decennial census, the data are for the years 1979, 1989,and 1999 since measures of income are taken in the census from the previous year.
10 At least one reader of an early draft of this work expressed concern that the particular definition of metropolitanareas used for this investigation—the CBSA—was too geographically specific in the larger metro areas becauseit sometimes separated out what was formerly considered a single “Consolidated Metropolitan Statistical Area(CMSA)” under the 1999 Census definitions into two or more CBSAs under the 2003 Census definitions. This,it was suggested, allowed some large regions to be represented as more than a single observation and thus carrymore than their share of influence over the CoV calculations. Due to this concern, we made a separate set ofall CoV calculations in which we compared the experience of those CBSAs falling inside what was formerlya CMSA (of which there were 17 in 1999) to those falling outside such an area, and found that the dispersionin our measures of economic growth and equity over the period was even more pronounced for those fallinginside than for those falling outside a CMSA—a result that held (and even became more pronounced) whenattention was restricted to the top 100, top 50, and top 25 CBSAs. The indication, we think, is that there hasbeen dispersion in outcomes within the CMSAs themselves. This finding was supported when we inspectedthe variation in our measures across the CBSAs falling within several particular CMSAs over the two decades,and that result is supportive of the use of the CBSA to define regions given such observed heterogeneity withinCMSAs.
11 As a comparison, we also calculated coefficients of variation for earnings and employment at the state level—both for all states, and for those containing any CBSA and any CBSA of the particular size categories brokenout above—and found similar, but less pronounced results. This suggests that it is the metropolitan areas (inthis case measured by CBSAs) rather than states as a whole that are driving the dispersion of outcomes thathas been observed over the past two decades—and this is why organizing and intervention at the metropolitanlevel, albeit supplemented by state policy changes, might be useful.
12 The model is akin to the income convergence model presented earlier; it is of similar design to that found inCrandall and Weber (2004), but uses regional rather than census tract-level measures.
13 This is perhaps due to collinearity with the single-parent-family and percentage foreign-born measures, whosecoefficient rises sharply in the 1980s as compared to the 1970s while the other covariates remain relativelystable.
14 We tested out other formations of the polychotomous response variables and results were similar. This spec-ification was chosen because it seemed to best capture regional interest relative to the size of the region (orCBSA), which can vary greatly.
15 For each regression, we also inspected the results obtained when the particular regions hosting the PolicyLinkregional equity summits and ARS conferences were omitted, out of concern that they might have representationor stronger representation simply because such meetings would be so much more convenient to attend for peopleliving in the hosting region. All such results are essentially the same as those reported in Tables 7 and 8, so westuck with reporting the results for the full sample of regions.
16 We tested other specifications of business or equity attendance, including simple dummy and more complexcategorical variables. We also conducted a residual analysis to see, for example, whether business interestgreater than that predicted by business attendance regression was correlated with attendance by equity pro-ponents at the PolicyLink conference; the idea here was that this was a very good signal of active regionalagenda-setting by the business class. All these formulations yield the same result as that obtained with thesimpler measure in the text—equity proponents are motivated by business attendance but not the other wayaround—and so we stick in the text with the more straightforward approach.
17 The marginal effects were calculated using a standard formula that is perhaps the most common approach toestimating marginal effects: marginal effect = β(P )(1 − P ). In this formula, β is the estimated logit regression

294 II JOURNAL OF URBAN AFFAIRS II Vol. 31/No. 3/2009
coefficient for the explanatory variable and P is the mean value of the response variable (or the percentage ofcases that take on a value of one). Also, note that the number of observations included in the regression (whichis the same for all logits reported), 187, is five short of our overall sample of CBSAs considered (192). This isbecause a few variables—one from the regional equity logits and one from the ARS logits—are not observedfor all CBSAs in our sample. To make the set of CBSAs in the regressions consistent across all specifications,we restricted the sample to the set of CBSAs with observed values for all variables in all specifications. Wealso tested the separate models without placing such a restriction on the sample and the results were essentiallythe same.
18 We thank an anonymous referee for pointing us in this direction by noting the emphasis of equity proponentsin general and PolicyLink in particular on housing. The measure we used is figured as the ratio of theshare of central city renters spending more than 30% of household income on rent to the suburban share.Other measures of straightforward rental unaffordability were tested (such as the regional and central citypercentages of renter-occupied households spending more than 30% of income on rent) were not as significantas the relative measure—but that makes sense since the summits are about regional equity and not simplya shared regional burden of high housing costs, something that seems to drive business concerns. It may beuseful to note that introduction of this measure reduces the significance of the income distribution measureslightly, a pattern that makes sense given that this variable reflects a geographic dimension of inequity.
19 This, for example, was the case with the Social Equity Caucus (SEC) in the Bay Area which was originallycreated by an environmental justice intermediary, Urban Habitat, as a way of responding to a series of “sus-tainability” conversations sponsored by a business organization, the Bay Area Council. The SEC subsequentlyevolved into a fuller coalition with its own agenda, including advocacy for mass transit throughout the SanFrancisco region and organizing for better urban planning in distressed areas like Richmond, California. “Re-active regionalism” is not confined to simply reacting but can develop an independent program; we are simplytrying to see which sector tends to lead the other.
20 Out of concern that the measure capturing the percentage of workers working outside their county of residencewas related to the geographic size of counties—which tend to be much larger in the western states of thenation than the remainder (particularly the South and East)—we inspected its mean value across the four majorregions of the U.S. delineated by the Census. We found the mean value for CBSAs in the West of 15.65% wasnot too different from those in the other four regions, which it ranged from 20.82% to 22.46%, so we kept thismeasure in the final model. We are also reassured by the fact that the reported specifications include broadregional dummy variables for three of the four regions, which should capture the differences in county sizesince they are quite strongly related to the broad census regions.
21 The definition of “high-tech” occupations was borrowed from the 6-digit NAICS-based definition specified bythe American Electronics Association (AEA). See http://www.aeanet.org/Publications/idmk_naics_pdf.asp.
22 On the other hand, the ARS attendees were fewer than the PolicyLink attendees altogether and so the breakswere tighter; as a result, perhaps we are simply trying to tease too much significance from too little variationin the data, and the dichotomous logistic results are more sensible.
REFERENCES
Amin, A. (1999). An institutionalist perspective on regional economic development. International Journal ofUrban and Regional Research, 23, 365–378.
Appelbaum, E. B., Annette, D., & Murnane, R. J. (2003). Low-wage America: How employers are reshapingopportunity in the workplace. New York: Russell Sage.
Barnes, W., & Ledebur, L. C. (1998). The new regional economies: The U.S. common market and the globaleconomy. Thousand Oaks, CA: Sage Publications.
Barro, R. J., Sala-I-Martin, X., Blanchard, O., & Hall, R. E. (1991). Convergence across states and regions.Brookings Papers on Economic Activity, 107–182.
Benner, C. (2002). Work in the new economy: Flexible labor markets in Silicon Valley. Oxford: Blackwell.
II Why Regions? Why Now? Who Cares? II 295
Blackwell, A. G., & McCullough, H. (1999). Opportunities for smarter growth: Social equity and the smart growthmovement. Prepared for the Funders’ Network on Smart Growth and Livable Communities. Oakland, CA:PolicyLink.
Castells, M. (1996). The rise of the network society. Cambridge, MA: Blackwell Publishers.Cieslewicz, D. J. (2002). The environmental impacts of sprawl. In G. D. Squires (Ed.), Urban sprawl: Causes,
consequences, and policy responses. Washington, DC: Brookings Institution.Crandall, M. S., & Weber, B. A. (2004). Local social and economic conditions, spatial concentrations of poverty,
and poverty dynamics. American Journal of Agricultural Economics, 86(5), 1276–1281.Dreier, P., Mollenkopf, J., & Swanstrom, T. (2001). Place matters: Metropolitics for the twenty-first century.
Lawrence: University of Kansas Press.Drennan, M. P., & Lobo, J. (1999). A simple test for convergence of metropolitan income in the United States.
Journal of Urban Economics, 46(3), 350–359.Drennan, M., Tobier, E., & Lewis, J. (1996). The interruption of income convergence and income growth in large
cities in the 1980s. Urban Studies, 33(1), 63–82.DRI/McGraw-Hill (1998). The role of metropolitan areas in the national economy. Washington, DC: Report
prepared for the Joint Center for Sustainable Communities of the United States Conference of Mayors andthe National Association of Cities.
Florida, R. L. (1995). Toward the learning region. Futures, 27, 527–536.Florida, R. L. (2002). The rise of the creative class and how it’s transforming work, leisure, community and
everyday life. New York: Basic Books.FutureWorks (2004). Minding their civic business: A look at the new ways regional business-civic organizations
are making a difference in metropolitan North America. Arlington, MA: FutureWorks.Gereffi, G., & Korzeniewicz, M. (1994). Commodity chains and global capitalism. Westport, CT: Greenwood
Press.Hall, B. H., Jaffe, A. B., & Tratjenberg, M. (2001). The NBER patent citations data file: Lessons, insights and
methodological tools. NBER (National Bureau of Economic Research) Working Paper No. 8498.Henderson, J., Dicken, P., Hess, M., Coe, N., & Wai-Chung Yeung, H. (2002). Global production networks and
the analysis of economic development. Review of International Political Economy, 9, 436–464.Henton, D., Melville, J., & Walesh, K. (1997). Grassroots leaders for a new economy: How civic entrepreneurs
are building prosperous communities. San Francisco: Jossey-Bass Publishers.Henton, D., Melville, J., & Walesh, K. (2004). Civic revolutionaries: Igniting the passion for change in America’s
Communities. San Francisco: Jossey-Bass.Higgins, M. J., Levy, D., & Young, A. T. (2006). Growth and convergence across the U.S.: Evidence from
county-level data. Review of Economics and Statistics, 88(4), 671–681.Hill, E., Wolman, H., & Ford, C. (1995). Can suburbs survive without their central cities? Examining the suburban
dependence hypothesis. Urban Affairs Review, 31(2), 147–174.Ihlanfeldt, K., & Sjoquist, D. (1989). The impact of job decentralization on the economic welfare of central-city
blacks. Journal of Urban Economics, 26, 110–130.Jargowsky, P. A. (1997). Poverty and place: Ghettos, barrios, and the American city. New York: Russell Sage
Foundation.Joint Venture: Silicon Valley Network (JV:SVN) (1995). The Joint Venture way: Lessons for regional rejuvenation.
San Jose, CA: Joint Venture: Silicon Valley Network.Luria, D. D., & Rogers, J. (1997). New urban agenda. Boston Review, February/March.Orfield, M. (1997). Metropolitics: A regional agenda for community and stability. Washington, DC: Brookings
Institution Press.Orfield, M. (2002). American metropolitics: The new suburban reality. Washington, DC: Brookings Institution
Press.Pastor, M., Benner, C., & Matsuoka, M. (2009). This could be the start of something big: Regional equity organizing
and the future of metropolitan America. Ithaca, NY: Cornell University Press.Pastor, M., Dreier, P., Grigsby III, J. E., & Garza, M. L. (2000). Regions that work: How cities and suburbs can
grow together. Minneapolis: University of Minnesota.Peirce, N. R., Johnson, C. W., & Hall, J. S. (1993). Citistates: How urban America can prosper in a competitive
world. Washington, DC: Seven Locks Press.

296 II JOURNAL OF URBAN AFFAIRS II Vol. 31/No. 3/2009
Phillips, H. R. (1992). Regional wage divergence and national wage inequality: Economic review. Dallas: FederalReserve Board of Dallas.
Piore, M. J., & Sabel, C. F. (1984). The second industrial divide: Possibilities for prosperity. New York: BasicBooks.
PolicyLink (2000). Community-based initiatives promoting regional equity: Profiles of innovative programs fromacross the country. Oakland, CA: PolicyLink.
Pollin, R., & Luce, S. (1998). The living wage: Building a fair economy. New York: New Press.Rey, S. J., & Janikas, M. V. (2005). Regional convergence, inequality, and space. Journal of Economic Geography,
5(2), 155–176.Romer, P. M. (1990). Endogenous technological change. Journal of Political Economy, 98, S71–S102.Rusk, D. (1993). Cities without suburbs. Washington, DC: Woodrow Wilson Center Press.Rusk, D. (1999). Inside game, outside game: Winning strategies for saving urban America. Washington, DC:
Brookings Institution Press.Sabel, C. F. (1989). Flexible specialization and the re-emergence of regional economies. In J. Zeitlin & P. Hirst
(Eds.), Reversing industrial decline (pp. 17–70). New York: Berg.Sassen, S. (1991). The global city: New York, London, Tokyo. Princeton, NJ: Princeton University Press.Savitch, H.V., Collins, D., Sanders, D., & Markham, J. (1993). Ties that bind: Central cities, suburbs, and the new
metropolitan region. Economic Development Quarterly, 7(4), 341–357.Saxenian, A. (1994). Regional advantage: Culture and competition in Silicon Valley and Route 128. Cambridge,
MA: Harvard University Press.Scott, A. J. (2001). Global city-regions: Trends, theory, policy. Oxford: Oxford University Press.Storper, M. (1997). The Regional world: Territorial development in a global economy. New York: Guilford.Voith, R. (1992). City and suburban growth: Substitutes or compliments. Philadelphia: Federal Reserve Bank of
Philadelphia.Voith, R. (1998). Do suburbs need cities? Journal of Regional Science, 38(3), 445–465.Wilson, W. J. (1996). When work disappears: The world of the new urban poor. New York: Alfred A. Knopf.Wolch, J., Pastor, M., & Dreier, P. (2004). Up against the sprawl: Public policy and the making of Southern
California. Minneapolis: University Of Minnesota Press.