document resume ed 396 388 ea 027 612 author …official credentials offered by a school. the...
TRANSCRIPT

DOCUMENT RESUME
ED 396 388 EA 027 612
AUTHOR Fowler, Frances C.TITLE Meaningful Competition? A Study of Student Movement
under Interdistrict Open Enrollment in Ohio.PUB DATE 96NOTE 47p.; Paper presented at the Annual Meeting of the
American Educational Research Association (New York,NY, April 8-12, 1996).
PUB TYPE Speeches/Conference Papers (150) ReportsResearch/Technical (143)
EDRS PRICE MF01/PCO2 Plus Postage.DESCRIPTORS Access to Education; Admission (School); *Educational
Economics; Educationally Disadvantaged; ElementarySecondary Education; Free Choice Transfer Programs;*Free Enterprise System; *Open Enrollment; RuralSchools; *School Choice; School Districts; SuburbanSchools; Urban Schools
IDENTIFIERS *Ohio
ABSTRACTThis paper presents findings of a study that analyzed
participation patterns and the movement of students and state fundsin Ohio during the 1993-94 school year, the first year during whichOhio's interdistrict open-enrollment law was fully implemented. Thetheoretical framework for the study was drawn from economics andbusiness theories of markets and competition. Methodology includedanalysis of government records based on Ohio Department of Educationdata. The findings suggest that the "educational market" is animperfect one in which it will be difficult to achieve meaningfulcompetition in certain contexts. One of the major effects of Ohio'sinterdistrict open-enrollment policy was to move state funds awayfrom school districts that served relatively larger percentages ofpoor and minor;ty children. The study raises serious doubts about thepotential for underfunded school-choice policies to bring aboutmeaningful competition in large metropolitan areas. It also suggeststhat the most vulnerable districts under such choice policies may besmall and medium-sized city districts that have higher percentages ofpoor and minority children than their neighbors Meaningfulcompetition and education improvement may, however, occur in ruralareas. There is a need for longitudinal studies of school choice in avariety of contexts, similar to those that have been conducted in theUnited Kingdom. Ten tables are included. The appendix lists thegovernment records used in the analysis. (Contains 28 references.)(LMI)
Reproductions supplied by EDRS are the best that can be made *
from the original document.***********************************************************************

f
CO00t^r)
C\rr)
C-1)
Meaningful Competition? A Study of Student
Movement Under Interdistrict Open Enrollment in Ohio
Frances C. FowlerMiami University
Oxford, Ohio
U.S. DEPARTMENT OF EDUCATIONOffice of Educabonal Research aryl Improvement
EDUCATIONAL RESOURCES INFORMATIONCENTER (ERIC)
/This document has been reproduced asreceived from the person or organilationori,,inating it.
Minor changes have been made toimprove reproduction quality
Points of view or opinions slated in thisdocument do not necessarily representofficial OERI position or policy
"PERMISSION TO REPRODUCE THISMATERIAL HAS BEEN GRANTED BY
)4-7
TO THE EDUCATIONAL RESOURCESINFORMATION CENTER (ERIC)."
A Paper Presented at the Annual Meeting of theAmerican Educational Research Association
April, 1996New York, New York
BEST COPY AVAILABLE

Introduction
For more than a decade, American public education has been pressured to restructure.
One commonly recommended form of restructuring is the introduction of market competition into
education through school choice. Advocates of such policies often claim that if schools have to
compete for students (and funds), the result will be higher quality education. For example, in a
typical discussion of the merits of market competition, Finn (1990) asserts:
[Alny principal or superintendent worth his or her salt will be influenced by the
'management information' yielded by marketplace preferences. . . .and will do
something about the situation (p. 11).
Some scholars have responded to these rationales for choice by questioning the validity of
applying the marketplace metaphor to education. (See, for example, Cookson, 1994; Henig,
1994; & Wells, 1993). Others have argued that competition between schools will not work as '4
expected because of the characteristics of the existing system (Carnegie Foundation for the
Advancement of Teaching, 1992; Fossey, 1994; Glenn, 1992; Pearson, 1993; Weeres, 1990;
Willms & Echols, 1992; Woods, 1994). It is indeed important to reflect seriously on the
appropriateness of the market model for education, but political leaders have not let philosophical
considerations slow their choice agendas. In many states, including Ohio, interdistrict open
enrollment policies have become law surrounded by the rhetoric of market competition (Fowler,
1994). It is also important, therefore, to study the responses of school districts and families to
choice policies to see how the "education market" really functions. It is the purpose of this paper
to analyze participation patterns and the movement of students and state funds in Ohio during the
1993-94 school year. This was the first year of full implementation of Ohio's interdistrict open

enrollment law. This analysis will be informed by theories of competition and competitive
strategy drawn from economics and business. An attempt will be made to suggest to what extent
the initial patterns of participation and movement in Ohio are consistent with the long range
improvements in educational quality anticipated by the policymakers who supported the policy.
Theoretical Framework
The following theoretical framework is drawn from economics and business. The topics
competition, industry structure, products, and responses to competitive forces will be briefly
discussed. Each concept will also be applied to education, although most of the writers cited limit
their discussions to firms in the private sector.
Competition
Choice advocates who are inspired by market models often seem to assume that public
education currently is a pure monopoly in which no competition occurs. They also apparently
assume that the introduction of the right kind of market reforms would lead to what economists
call "perfect competition." A study of theories of competition, however, suggests a more
complex view of both the current situation and the probable future under market reforms.
"Perfect competition" can occur only if five conditions are met: (1) there must be numerous
buyers and sellers of the product; (2) buyers and sellers must be free to both enter and leave the
market; (3) all sellers' products must be identical; (4) buyers and sellers must have complete
knowledge of the market; and (5) limitless amounts of the good must be available for sale and
purchase (Beardshaw, 1989). Obviously, such conditions are never met in the real world. As the
economist Beardshaw (1989) observes, "All markets are to a greater or lesser extent imperfect"
2
4

(p. 180). One form of imperfect competition is "pure monopoly," under which one seller totally
dominates the market. It is by no means clear, however, that public education is currently a
monopoly, especially in metropolitan areas. Fifty years of suburbanization have created a highly
differentiated market for public services around most American cities (Weeres, 1987; Weeres,
1990; Weeres & Cooper, 1992). For the price of a house mortgage or a monthly rent payment,
"customers" can purchase educational services. This type of situation is called "monopolistic
competition." Although there are many "sellers" in such a market, the "products" are so distinct
from each other that each appeals to only a segment of the market.
Industry Structure
According to theory, firms do not develop competitive strategy in a vacuum. Rather,
"competition. . .is. . .strongly affected by the structures of the industry in which it takes place"
(Easton, et al., p. 2). Education is a "fragmented industry." A fragmented structure is common in
the service sector, especially if transportation costs are high, local image and control are
important, barriers to exit are considerable, and government regulation is substantial (Porter,
1980). For school districts, then, the "competitive forces" which shape a market are mediated
through a highly fragmented structure. This fact is especially important in respect to the
"competitive force" having to do with suppliers. Often a firm can gain competitive advantage by
negotiating better terms with its suppliers. However, in fragmented industries suppliers are in a
very strong position. School districts have little leverage with the suppliers of their labor force
and even less with the suppliers of their "raw materials," or students. In advancing their
arguments for more competition in education, school choice advocates usually ignore the issue of
suppliers and focus on other "competitive forces." For example, they recommend (1) lowering

entry barriers to the market (e.g., letting districts recruit students from outside their boundaries);
(2) increasing the bargaining power of buyers (e.g., letting parents choose schools); or (3) putting
substitutes on the market (e.g., home schooling). However, the fragmented structure of the
education "industry" and the strong position in which fragmentation places suppliers may restrict
the ability of school districts to respond competitively to the alteration of other forces.
Products
In business, competitive strategies often focus on altering the "product" to make it more
appealing to consumers. Products have three dimensions according to the marketing literature.
The "core product" is the basic benefit which the product offers purchasers. The basic benefits of
education might be described as the opportunities to learn skills and knowledge as well as the
official credentials offered by a school. The "formal product" consists of its visible and
measurable features, including styling, quality, and brand name. In education the "formal
product" includes such things as distinctive features of a school's program, its facilities, and
quality indicators such as test scores and drop-out rates. The "augmented product" is intangible;
a major component of the "augmented product" is a product's image or reputation. Schools and
school districts have images, both negative and positive. A competitive strategy can involve
modifying any dimension of the product.
Responses to Competitive Pressures
School choice advocates assume that competition is the only response in a market
environment. However, economic theorists identify several possible responses, of which
competition is only one. In a competitive situation, a firm's goal is not to compete. Rather, its
goal "is to find a position in the industry where [it] can best defend itself against. . .competitive

forces or. . . influence them in its favor" (Porter, 1980, P. 4). Easton et al. (1993) identify five
responses to competitive pressure. In addition to competition, they describe: (1) conflict (firms
seek to destroy each other); (2) coexistence (firms act independently while ignoring each other);
(3) cooperation (firms share information and other resources insofar as this is legal); and (4)
collusion (firms cooperate, often illegally, to thwart consumer interests). Full-blown collusion
leads to cartel formation. In a cartel, participating firms often divide up a market, usually
geographically, agreeing not to "poach" in each other's territory (Telser, 1988). Under traditional
methods of student assignment, school districts simply coexisted for the most part. Choice
proponents assume that by altering the competitive forces in their environment, they will stimulate
districts to compete, especially by improving the "formal" dimension of their "product." The
theory of competition, however, suggests that other options will also be available in the
"education marketplace."
Review of Relevant Interdistrict Choice Literature
This review has been limited in two ways. First, only empirical studies of interdistrict
open enrollment have been included. Second, the discussion is limited to findings relevant to
issues of patterns of district participation and to patterns of student movement.
Open enrollment legislation was passed in the United Kingdom in the early 1980s. Since
the effects of the policy have been thoroughly studied, considerable knowledge has been gained
about how open enrollment functions over time, at least in the British context. For example, in a
longitudinal study conducted in Scotland, Willms and Echols (1992) found that chosen schools
had both a significantly higher mean SES level and significantly higher examination scores than

assigned schools. School policies and teaching practices, however, did not play a significant role
in whether or not a school was frequently chosen. Willms and Echols (1992) concluded that,
although individual children probably benefited somewhat from transferring under open
enrollment, the policy was detrimental to Scottish education as a whole. As they explained:
Schools serving pupils in disadvantaged areas will be receiving incorrect signals
many of them will lose pupils to higher SES schools despite effective teaching
practices. Some high SES schools will also receive incorrect signals. . . . (p. 347)
In another longitudinal Scottish study, Willms (1994) found that transfer requests were most
common in urban areas. Moreover, the most frequently chosen schools tended to be older
schools which had once been selective grammar schools; in the eyes of many parents they still had
an aura of prestige about them. Finally, he presented evidence that over the time period covered
by his study, segregation by social class had increased in Scottish schools.
In the PASCI Study, a longitudinal study of open enrollment in England, Woods (1994)
found that there were three "core factors" influencing parental choice of a school. They were :
(1) the school's reputation; (2) the school's examination results; and (3) the fact that some of the
child's friends already attended the school. In addition, he concluded that parental choices were
shaped both by their resources (such as cultural capital, wealth, and information) and by the
environment within which they exercised choice. Rural parents, for example, chose within severe
constraints.
Minnesota passed the first American open enrollment law in 1987; 12 other states
followed suit within a few years. The Minnesota policy has been the subject of several research
projects. In a series of studies carried out for the Minnesota Legislature, Urahn (1990, 1991)

identified trends which emerged in the early years of implementation. Both district and student
participation were low at first. Only 22% of districts and 137 schools were involved during the
first year. By the third year, however, 80% of districts and 3,218 students were participating. In
the Twin Cities area, participation of students was disproportionately low. In part this was
because Minneapolis is under a desegregation plan, so the transfer of white students was
restricted. St. Paul, however, lost 201 students in 1989-90, the second largest enrollment loss in
the state. In a survey of Minnesota parents, 40% mentioned "convenience" reasons for
transferring and 20% cited academic reasons (Urahn, 1990). In the metropolitan areas of the
state, gaining districts had the following characteristics when compared to losing districts: (1) a
higher adjusted gross tax capacity per pupil; (2) higher per pupil expenditure; (3) higher pupil-
teacher ratio; and (4) a lower percentage of minority enrollment. In aonurban areas, gaining
districts, when compared to losing districts, had: (1) a higher adjusted gross tax capacity per
pupil; (2) lower per pupil expenditure; (3) the same pupil-teacher ratio, and (4) a lower
percentage of minority enrollment (Urahn, 1991).
In 1994, Funkhouser and Colopy published a report of their study of the impact of open
enrollment on Minnesota districts, using 1990-91 data. They found that the districts which had
gained substantial numbers of new students under open enrollment were all rural or suburban.
They had a lower percentage of minority enrollment than did losing districts, but a higher
percentage of students eligible for free or reduced lunches. District administrators perceived
proximity issues as by far the most important reason for student transfers, followed at some
distance by academics and "learning climate." The researchers concluded that their evidence in
support of the idea that school choice will improve education was "mixed."

Massachusetts implemented an interdistrict open enrollment plan in 1991-92. Fossey
(1994) analyzed patterns of participation and student movement during that year. He found that
students tended to transfer into districts which had: (1) higher average incomes; (2) higher per
pupil expenditure; (3) higher test scores; and (4) lower dropout rates. Perhaps because of the
demographic characteristics of the Massachusetts context, Fossey did not include racial statistics
in his analysis. Like Willms and Echols (1992) he suggested that the wrong signals were being
sent to school district leaders by these patterns of student transfer. Moreover, he found that there
had been virtually no movement of students in the metropolitan Boston area. Fossey dbserved
that "no suburban town within convenient commuting distance of Boston participated in open
enrollment" (p. 330).
Fowler (1995) surveyed Ohio superintendents about their participation in open enrollment
during 1993-94, the first year of full implementation of that state's policy. She found that the
districts which were most likely to participate by accepting transfers were small, rural districts
which had low per pupil expenditure.and had been losing enrollment. Suburban districts and
districts with above average per pupil expenditure were the most unlikely to accept transfers. In
23% of the nonparticipating districts, the superintendents indicated in response to an open-ended
question that political pressure from the community had been a major reason for the decision by
school district leaders not to accept transfer students from outside.
In terms of theories of competition, the literature suggests that in the "education market,"
the "augmented product" (i.e., the image and social status of schools/districts) is at least as
important as the "formal product" (school programs and quality indicators). Urban districts may
be particularly vulnerable in a competitive arena because the student populations which they serve
8
-$

tend to be "low status," consisting largely of members of racial minority groups and the lower
socioeconomic classes. The literature also suggests that while some districts willingly enter into
competition for students and funds, others prefer to remain on the sidelines if they can.
The Research Context
The State
Education policies are never implemented in a vacuum. The purpose of this section is to
provide pertinent demographic information about Ohio and also to situate it demographically in
comparison to Massachusetts and Minnesota.
Ohio is the easternmost Midwestern state. According to the 1990 U. S. census, it had a
population of almost 11 million. Thirteen per cent of Ohioans belong to a racial minority (11%
African-American, 1% Asian, and 1% Hispanic). This compares with 12% of Massachusetts
residents (5% African-American, 5% Hispanic, and 2% Asian) and 6% of Minnesotans (2%
African-American, 2% Asian, 1% Hispanic, and 1% Native American). Ohio's African-American
citizens are concentrated in the urban areas of the state, especially in the Cleveland, Cincinnati,
Dayton, and Columbus metropolitan areas. Hispanics are concentrated in several counties in the
northeastern part of the state; Defiance, Sandusky, and Lorain counties are more than 5%
Hispanic (Ohio: Fact Summary, 1995; Facts About Ohio, 1995; The Software Toolworks US
Atlas MPC, 1992; The World Almanac and Book of Facts, 1993).
Ohio is a major manufacturing state, and 79% of its population lives in metropolitan areas.
It has six cities with populations above 100,000 (Akron, Cincinnati, Cleveland, Columbus,
Dayton, and Toledo). It also has 13 cities with populations between 50,000 and 100,000.
9
11

However, much of Ohio is rural and agricultural. Corn and soybeans are major crops in some
portions of the state, and the Farm Bureau is a major force in Ohio politics. In contrast,
Massachusetts is more heavily urbanized, with 91% of its population living in metropolitan areas
Agriculture is unimportant. Minnesota, on the other hand, is one of the top ten farm states in the
U.S. Even so, 70% of its population lives in metropolitan areas, being concentrated in the Twin
Cities and Duluth (Grolier Multimedia Encyclopedia, 1993; The Software Toolworks US Atlas
MPC, 1992; The World Almanac and Book of Facts, 1993).
Ohio has 610 school districts. Most of them are small and rural. However, the large
majority of the state's children attend school in urban areas since metropolitan districts tend to
have considerably larger enrollments than rural ones. Ohio's local government is very fragmented;
most urban districts are ringed by numerous suburban ones. The state has one of the most
inequitable school finance systems in the nation. In 1991, the average expenditure per pupil was
$4390, with a range from $2,882 to $25,535. Since the early 1990s a coalition of approximately
500 districts has been cooperating in a legal challenge of the constitutionality of this system
(Crim, Maxwell, Baughman, & Overly, 1994).
The Policy
Inspired by Minnesota's example, in 1989 the Ohio General Assembly passed an Omnibus
Education Reform Act which included three choice policies. One of these was interdistrict open
enrollment. Politicians argued for the choice policies on the grounds that they would encourage
greater accountability among the state's educators because from now on they would have to
compete for students and state funds. Under the interdistrict open enrollment policy, students
may transfer only to districts which are adjacent to their district of residence. No school district is
10

required to accept transfer students. However, districts cannot block transfers of their own
students to another district. Transfer students bring with them the state basic aid amount plus or
minus a cost of doing business factor. In 1993-94 this sum averaged $2900. The legislature did
not appropriate any extra money to aid in the implementation of the policy or to permit students
who might be unappealing as open enrollment transfers to bring larger amounts of money with
them. This means that no extra funding has been available to help district leaders develop projects
such as parent information programs or self-studies to analyze relative competitiveness. If district
leaders decide to accept students from outside, they cannot discriminate on the basis of such
criteria as disability, race, English proficiency, or academic talent. Under the law, every Ohio
school board had to adopt a policy on open enrollment by July 1993, declaring itself "open"
(willing to accept transfers) or "closed" (unwilling to accept them). However, the law required
the Ohio Department of Education [ODE] to pilot the policy prior to the 1993-94 school year
(Fowler, 1994, 1995).
The Pilot Program
The pilot program and its outcomes are important because they communicated the first
"market signals" to Ohio's school leaders. The pilot program began in 1990-91 with three
nonurban districts participating and 23 students transferring. In 1991-92, the number of
participating districts increased to ten, with 115 students transferring. One small city district,
Fostoria, participated as well as two districts in the Akron suburbs. By 1992-93, the year before
full implementation, 49 districts and 595 students were involved. By this point the pilot districts
included one large city (Akron) and one medium-sized one (Mansfield). The two districts which
sustained the greatest net losses were both city districts: Akron (a net loss of 40 students) and
11

Fostoria (44 students). ODE research revealed that 97% of the transferring students were white.
Moreover, all of the students who left Akron City Schools were white although 41% of its
enrollment was African-American. In an ODE survey conducted in 1992-93, school leaders
indicated that they thought most transfer requests were unrelated to academic quality. The most
common reason given was "geographic proximity," followed at some distance by "previous tuition
students now coming free," and "school environment" (FY 1990-91 Interdistrict Open
Enrollment, n.d.; Interdistrict Open Enrollment, 1993; Open Enrollment Survey, n.d.).
Research Questions
Based on the theoretical framework, the literature review, and the research context, the
following questions were developed about patterns of district participation and the movement of
students and funds in Ohio during the 1993-94 school year:
1. To what extent did Ohio districts participate in open enrollment by accepting transfer
students from outside?
2. In what ways, if any, did levels of district participation in open enrollment differ in
heavily urbanized, moderately urbanized, and relatively nonurbanized areas?
3. How did districts which experienced substantial net gains of students and money differ
from districts which experienced substantial net losses in terms of these demographics: enrollment
size, test scores, dropout rates, percentage of college preparatory graduates, per pupil
expenditure, average income in the district, average per pupil property valuation, percentage of
students receiving AFDC, percentage of African-American students, percentage of Hispanic
students, and overall percentage of minority students?
12

4. In what ways, if any, did these patterns differ in heavily urbanized, moderately
urbanized, and relatively unurbanized areas?
Methods and Procedures
This study was based on a secondary analysis of goverament records which were based on
data gathered by the Ohio Department of Education [ODE]. Secondary research is widely used in
the social sciences because using existing records can save both time and money. It is especially
appropriate for early investigations of a subject. Preliminary analyses of existing records can
permit the researcher to gain an overview of a phenomenon and develop hypotheses and questions
for future studies (Stewart & Kamins, 1993).
According to Stewart and Kamins (1993) and also Johnson and Joslyn (1986), researchers
who use existing written records for their data should assess them in relationship to several
criteria. The discussion of the records which follows conforms to their standards of evaluation.
All of the records used for this research project were produced by and obtained from the ODE.
(See the Appendix for a complete list.) For the most part they are part of the "running record"
(Johnson & Joslyn, 1986) developed by the ODE as it wrote the regulations which amplified on
the open enrollment legislation, implemented a pilot interdistrict open enrollment program in
1990, and fully implemented the program in the fall of 1993. The only exception is the Ohio
Educational Directory [Directory], a handbook which is published annually for the use of
educators throughout the state. For the most part, the documents are photocopied reports or
computer printouts. They included one computer disk. Data for the running record were
gathered both by the ODE and by individual Ohio school districts. The demographic data on
13

school districts which is included in this study derives from annual reports submitted by district
superintendents to the ODE. Since 1991 these data have been submitted via a statewide
computer network system. One problem encountered by the researcher was that the various
reports were not organized in parallel fashion. For example, the Open Enrollment Revision
Report [Revision Report] presented Ohio's 610 districts in alphabetical order; the Open
Enrollment Payment Report [Payment Report] presented them by county; and the Directory
grouped them according to their legal status (i. e, city, exempted village, or local). There were
also some inconsistencies. -School Districts That Have Adopted Interdistrict Open Enrollment, for
instance, included considerably fewer "open" districts than did the Revision Report and the
Payment Report. The latter reports, however, agreed completely. Because they were consistent
and because they had been used to transfer funds from the state to local districts, the researcher
considered them especially reliable. She depended heavily on them in developing the statistical
portions of the study and in verifying material in other records.
In order to answer the research questions, the researcher used the Directory, Payment
Report, and Revision Report to determine how many districts were in the state, which districts
received transfer students and how many transfers were accepted. Means were calculated for the
numbers of transfers. Next, the districts were divided into four categories: (1) districts located in
the six counties containing the six largest cities in the state; (2) districts located in counties
adjacent to those six counties; (3) districts located in counties where a medium-sized city were
located; and (4) all other districts. In instances where a medium-sized city was located in the
same county as a large city, it was included in the first category. Similarly, in instances where a
medium-sized city was located in a county adjacent to one of the six large urban counties, it was
14
16

included in the second category. Only districts located in counties which neither included a large
city nor bordered on a county which included one were placed in category 3. For each category,
the Directory, Payment Report, and Revision Report were used to determine how many districts
received transfer students and how many transfers were accepted. Means were calculated. The
results were displayed in a table.
Next, the Payment Report and Revision Report were used to identify the 25 districts
which gained the most state money through open enrollment and the 25 which lost the most.
Demographic data about these districts were transferred from a computer diskette and printout
which contained the ODE's statistical reports for the fiscal year 1994. Next, these data were
entered into a computerized statistical program, SPSS (1993). Using this program, means were
calculated for the group of gainers and the group of losers. In order to determine whether or not
the differences were statistically significant, a t-test for independent samples was applied to the
data, using SPSS (1993). The results were displayed in three tables.
Finally, the Payment Report and Revision Report were used to identify every instance in
which a district suffered a net loss of 20 or more students to a single adjacent district. The
number 20 was used in order to permit comparison to Fossey's (1994) study in Massachusetts.
The members of each ofthe 50 pairs thus identified were compared on each demographic variable
included in research question 3, using a +, -, and = system. Then, for the total group, the
percentage of +'s, -'s, and ='s was determined for each variable. The results were displayed in a
table. Finally, each pair was assigned to one of the four categories described above. In two
cases, the districts were located in counties which were in different categories. These pairs were
eliminated, leaving 48 pairs. For the pairs in each category, the same +, -, and = analysis was
15
17

conducted for each demographic variable in research question 3. The results were displayed in
four tables.
Findings
This study showed that slightly less than half of Ohio districts, or 44.35%, participated in
open enrollment in the 1993-94 school year by accepting at least one transfer student. In all,
7012.16 students changed districts under the policy. This means that the average number of
transfer students accepted by participating districts was 25.88. All participation figures are
summarized in Table 1.
When the districts were disaggregated on the basis of their level ofurbanization,
interesting differences emerged. A total of 110 districts were located in the six counties where
Akron, Cincinnati, Cleveland, Columbus, Dayton, and Toledo are found. Of these, only 11--or
10%accepted transfer students under open enrollment. Moreover, seven of these were in
Summit County, the Akron metropolitan area. In the other five major urban areas, three patterns
of response (or nonresponse) to the policy were apparent. In metropolitan Cincinnati, Cleveland,
and Columbus, none of the large city districts accepted students; and suburban participation was
nonexistent or minimal. Toledo accepted 28.02 students under interdistrict open enrollment, but
none of the suburban districts in Lucas County accepted transfers. In Montgomery County,
Dayton lost a large number of students to Trotwood-Madison, the only participating district in the
county.
The moderately urbanized districts--the 236 districts located either in counties adjacent to
large urban counties or in counties containing a medium-sized cityparticipated at similar levels.
16
18

These were 33.52% and 35.00% respectively. The highest level of participation occurred among
the 265 counties districts found in the relatively unurbanized parts of the state. More than two-
thirds of them, or 67.92%, accepted transfer students under interdistrict open enrollment.
The 25 districts which gained the most state fundsunder interdistrict open enrollment and
the 25 which lost the most were compared. These districts and the amount they gained or lost are
listed in Tables 2 and 3. They were compared in relation to 11 variables. The districts which
gained a great deal differed considerably from the ones which lost. Three differences reached
statistical significance. Gaining districts had significantly lower enrollments, a significantly lower
percentage of African-American students, 3nd a significantly lower percentage of minority
students overall. Several differences did not reach statistical significance, but were rather large.
Gaining districts had a higher percentage of students who had passed the state proficiency test by
the second time they took it, a lower dropout rate, and a lower percentage of students on AFDC.
The districts in which they were located had higher average incomes but lower per pupil property
valuations. All findings appear in Table 4.
Fifty pairs of districts were identified in which one district lost twenty or more students to
a single adjacent district. They are listed in Table 5. The direction of these large transfers was
determined in relationship to the 11 variables. These are summarized in Table 6. Several trends
were especially strong. In 86% of the cases, districts lost 20 or more students to a district with
lower enrollment. In 76% of the cases, large transfers were to districts with a lower percentage
of AFDC students. In 74% of the cases, large transfers were to districts with a higher percentage
of students passing the state proficiency tests and a lower percentage of African-American
students.
17
19

When the 50 pairs were disaggregated on the basis of level of urbanization, some interesting
differences emerged, as shown in Tables 7, 8, 9, and 10. The most important difference is that in
urbanized areas, the tendency for transfers to be made to smaller districts with fewer poor and
minority children was quite pronounced. In the relatively unurbanized areas of the state, this
trend was less pronounced although it appeared there also. These findings should be interpreted
cautiously because of the low number of N's in each urbanized category.
Discussion
This discussion will focus on three issues raised by the findings of this study. These issues
are: the importance of context in the response to Ohio's interdistrict open enrollment, the
plausibility of claims that school choice will improve education in large urban areas, and the
importance of the racial composition of the school districts
In her book, Myths of Choice, Judith Pearson (1993) writes:
The impacts of choice in an urban or inner city setting are significantly different
from the impacts of choice in a rural or small town setting. . . .It would be helpful
if the national debate would distinguish between the two. (p. 13)
The findings of this study support her observation. This study suggests that interdistrict open
enrollment policies structured like that adopted by the Ohio General Assembly do indeed have
differential impacts, depending on the context in which they are implemented. Three different
types of impact can be distinguished in Ohio.
In the four largest metropolitan areas of the state, the policy had no impact at all in 1993-
94. Cincinnati, Cleveland, Columbus, and Toledo--as well as their surrounding suburban districts-

-were, in essence, able to avoid implementing it. Fossey (1994) described a similar phenomenon
in the Boston metropolitan area. How can such a thing happen? In the researcher's conversations
with ODE employees, the latter voiced suspicions that in the large urban areas, district leaders had
colluded in order to avoid competing with each other. Such a response would be consistent with
the theories of competition developed by economists. After all, a firm's major goal is not to
compete, but rather "to find a position in the industry where [it] can best defend itself against. .
.competitive forces or. . . influence them in its favor" (Porter, 1980, p. 4). When firms believe
that they cannot compete effectively in an arena, they will seek other alternatives. One possibility
is the formation of a cartel, a solution which is especially likely in highly differentiated markets.
As Weeres (1987) points out, a differentiated market for public services, including education, has
existed in the suburbs which surround big American cities for some time. In Ohio's four largest
urban areas, therefore, school district leaders seem to have moved this market one step farther, by
forming educational cartels. The evidence suggests that they have divided up their "markets" on
the basis of product differentiation and geography. The Dayton metropolitan area may represent
a failed attempt at an educational cartel. Only one district in Montgomery County accepted
students under interdistrict transfer.' It does not, however, necessarily represent an important
exception to the trend elsewhere. That district--Trotwood-Madison--is itself exceptional among
suburban districts in that it has a slightly higher percentage ofAfrican-American students than
does Dayton City Schools. In fact, it is possible that Trotwood-Madison should be considered the
most "urban" district in Montgomery County, rather than Dayton. Further research might
illuminate this issue. Only the Akron metropolitan area either did not attempt or was unable to
achieve a cartel. This study does not suggest any reasons for the different reaction to the policy in
19
2

the Akron area.
Akron, however, was the only large urban district which participated in the pilot study.
The results of the ODE's reports on student transfers in the Akron area were probably among the
"market signals" which convinced other large urban districts that competition would be an unwise
course of action. The signals sent by patterns of student movement across the state during the
1993-94 school year will surely reinforce that message. This study suggests that in Ohio, as in the
United Kingdom and Massachusetts, the "augmented" educational product is at least as important
as the "core" and "formal" products in appealing to "customers." In other words, parents seem to
choose school districts on the basis of their social status as well as (and perhaps instead of) the
quality of their academic programs. In Ohio this meant that parents tended to choose districts
with lower percentages of minority students, especially African-Americans; lower percentages of
stude its on AFDC; and higher average district incomes. It must not be forgotten that they also
chose districts with higher percentages of students passing the state proficiency test by the second
time they took it. However, the linkage between scores on standardized tests and socioeconomic
class is well documented. Well informed school leaders would be unlikely to isolate test scores
from the demographics of the student population as they interpret the market signals. Instead,
urban school leaders who scan the ODE reports would be likely to conclude that parent choices
are based to a large extent on demographic variables which are beyond their control, particularly
the size of their enrollment and the racial and class composition of their student population. As a
result, they would probably seek ways to minimize competition.
The formation of education cartels in metropolitan areas requires the cooperation of the
suburban districts, however. The literature suggests a reason for such cooperation on their part.
20
2 '12

Fowler (1995) found that many suburban superintendents in Ohio had decided not to participate
in open enrollment because of political pressure from their communities. After all, suburbs were
established in large part to permit people to escape the big cities and their problems. Therefore,
the big city districts and their suburbs might well discover a community of interest in avoiding the
implementation of interdistrict open enrollment. One possible outcome--and the apparent
outcome in Ohio--would be cartel formation.
Discussions of interdistrict open enrollment often focus on its probable impact on large
urban districts. However, this study suggests that the most vulnerable urban districts are not the
large ones, but rather those which are located in small (under 50,000) and medium-sized (50,000-
100,000) cities. There is some evidence of cartelization in the moderately urbanized parts of
Ohio. However, many small and medium-sized city districts experienced substantial losses; in
fact, they figure prominently among the 25 major financial losers. One can hypothesize that in
these areas, the "market of public services" is not yet highly differentiated. Also, urban problems
may not yet be at a crisis stP ge. As a result, such cities may not be able to persuade adjacent
districts to form a cartel. They are therefore forced to compete with their suburbs. It is, of
course, possible that after losing considerable funding in the first year of implementation, they will
decide to make changes in their programs to attract more parents and to retain the ones they have.
It is possible that they will be successful in these endeavors. It is also possible, however, that like
the leaders of the large urban districts they will conclude that since they cannot control their
"supply" of residential students, they cannot compete effectively with their suburbs. Future
research needs to be carried out in order to clarify which courses of action such districts decide to
pursue and why.
21

Although Pearson (1993) believed that interdistrict open enrollment was especially hard
on small rural districts in Minnesota, Ohio's rural areas accepted the new policy rather well.
Moreover, although some rural districts appear on the list of major financial losers, by and large
the financial impact of open enrollment was less extreme in rural Ohio than in the more urbanized
areas. Student transfers were rather balanced, and for most districts things evened out.
Theoretically, this is probably because the educational "product" is less differentiated in rural
areas. Since the rural population is relatively homogeneous, in terms of both race and class,
parents probably do not perceive marked distinctions between the "images" of area schools.
Where the "augmented" product is relatively unimportant, the market is less imperfect, and school
leaders are apparently more willing to participate in it.
Ironically, many of the supporters of school choice have based their arguments on the
importance of improving the quality of education in America's urban areas. Their argument is
twofold. Improvement will allegedly occur at the collective level because of increased
competition for school funds. It will allegedly occur at the individual level when urban families
can choose better private or suburban schools for their children. Yet this study raises serious
questions about the potential of school choice policies similar to Ohio's to achieve this policy goal.
The arguments of choice supporters are often based on numerous assumptions about the behavior
of school leaders, the behavior of parents, the behavior of state legislatures in the 1990s, and the
nature of markets. For the most part, they are not based on research or even on a thoughtful
understanding of the market whose metaphors they freely borrow. Conceivably, choice policies
could be designed which would have a chance of improving urban schools. Choice supporters as
philosophically different as Chubb and Moe (1990) and Glenn (1992) have made it clear that
22

responsible choice policies must include several components. First among these are financial
incentives to encourage suburban, private, or parochial schools to accept urban transfer students
in the first place. Other important components include sufficient funding to provide reliable
information to parents and improved transportation for pupils. This means that well constructed,
responsible school choice plans are likely to cost more than the traditional method of student
assignment. Yet a "low tax" mentality permeates today's policy environment. As far as this
researcher knows, no one has yet explained what political strategies can be successfully used to
pressure contemporary state legislatures to adopt expensive choice policies.
But when "cheap choice" plans are passed which include no financial incentives for more
"prestigious" schools or districts to accept difficult (and costly) students, one can anticipate that
suburban and private schools will be reluctant to accept them. And when "cheap choice" plans
are passed which do not include additional funding to permit districts to develop realistic
competitive strategies, one can anticipate that vulnerable districts will seek ways to avoid
competition. In short, one can anticipate outcomes similar to those in most of Ohio's large urban
areas and in Metropolitan Boston. Poorly designed, "cheap choice" policies probably will not be
fully implemented in large urban areas. Even if participation were made obligatory, it would be
easy for the more "prestigious" schools to find ways to refuse undesirable students. It would also
be easy for large urban districts to quietly discourage student transfers. "Cheap choice" seems to
have little potential for bringing about meaningful educational improvement in major .netropolitan
areas.
Finally, the most troubling finding of this study must be discussed. Only three differences
between the 25 biggest gainers of state funding and the 25 biggest losers were statistically
23

significant. Two of the three had to do with race. The analysis of transfers to 20 or more
students to a single adjacent district suggested that race was especially important in urban areas
However, it also emerged as an important factor even in small towns and rural regions. The
presence of a relatively higher percentage of African-American students in a district was especially
crucial. Even when the percentage was low, districts appeared to be likely to lose students to
adjacent districts with even lower percentages. Moreover, in some parts of the state, the presence
of numerous Hispanic students also seemed to play a major role. When one adds to these findings
the fact that districts with large percentages of children on AFDC were also disproportionately
represented among the 25 biggest losers, an extremely troubling picture emerges. To put it
bluntly, one of the major effects of Ohio's interdistrict open enrollment policy in 1993-94 was to
move state funds away from districts which serve relatively larger percentages of poor and
minority children. It is, of course, possible that this trend will be reversed during the first few
years that the policy is in effect. Perhaps those districts which lost students during the first year
will become more competitive, attracting students from outside. But what if one of the things
which parents seek in a school district is a more racially homogeneous educational setting for their
children? In his 1994 book, Henig refers to "the purging of race from the public dialogue about
educational reform" (p. 115). This study suggests that perhaps it is time to return race to the
educational policy agenda when school choice policies are under discussion.
Conclusion
This study looked at patterns of participation and student movement under Ohio's
interdistrict open enrollment policy from the perspective of theories of competition. The behavior
24
2t;

of both students and districts was consistent with the theories. However, this study suggests that
the "educational market" is an imperfect one in which it will be difficult to achieve meaningful
competition in certain contexts. This study raises serious doubts about the potential for under
funded school choice policies to bring about meaningful competition in large metropolitan areas.
It also suggests that the most vulnerable districts under such choice policies may be small and
medium-sized city districts which have higher percentages of poor and minority children than their
neighbors. Meaningful competition and education improvement may, however, occur in rural
areas. There is a need for longitudinal studies of school choice in a variety of contexts, similar to
those which have been carried out in the United Kingdom.

1 . I
Author's Note. I would like to thank Matthew Cohen, Warner Sippola, and Susan Tavakolian of
the Ohio Department of Education for their assistance with this piece of research.

I I
Endnote
I. Data issued by the ODE in the fall of 1995 indicate that in all five of these metropolitan areas,
"cartelization" continued in the second year of full implementation of the policy.

References
Beardshaw, J. (1989). Economics. London: Pitman Publishing.
Carnegie Foundation for the Advancement of Teaching. (1992). School choice. Princeton, NJ:
Carnegie Foundation. [ED 352 727]
Chubb, J. M., & Moe, T. (1990). Politics, markets and America's schools. Washington, D.
The Brookings Institute.
Cookson, P. W., Jr. (1994). School choice. New Haven, CT: Yale University Press.
Crim, K., Maxwell, R. E., Baughman, C. D., & Overly, D. E. (1994). Ohio school finance.Cincinnati: Anderson Publishing Co.
Easton, G., Burrell, G., Rothschild, R., & Shearman, C. (1993). Managers and competition.
Oxford, UK: Blackwell Publishers.
Finn, C. E., Jr. (1990). Why we need choice. In W. L. Boyd & H. J. Walberg (Eds.), Choice in
education, pp. 3-19. Berkeley, CA: McCutchanPublishing Co.
Fossey, R. (1994). Open enrollment in Massachusetts: Why families choose. EducationalEvaluation and Policy Analysis, 16, 320-334.
Fowler, F. C. (1994). Education reform comes to Ohio: An application of Mazzoni's arenamodels. Educational Evaluation and Policy Analysis. 16, 335-350.
Fowler, F. C. (1995, April), Participation in Ohio's Interdistrict Open Enrollment Option:Exploring the Supply-Side of Choice. A paper presented at the Annual Meeting of the
American Educational Research Association, San Francisco, CA.
Funkhouser, J. E., & Colopy, K. W. (1994). Minnesota's open enrollment option: Impacts onschool districts. Report prepared for the U. S. Department of Education. Contract LC
89089001
Glenn, C. L. (1992). Creating an irresponsible choice plan. In C. Marshall (Ed.), The newpolitics of race and gender, pp. 128-139. Washington, D.C.: Falmer Press.
Grolier Multimedia Encyclopedia [CD-ROM]. (1993). Grolier Electronic Publishing, Inc.
Henig, J. R. (1994). Rethinking school choice. Princeton, NJ: Princeton University Press.
Ohio Department of Education. (n.d.). FY 1990-91 Interdistrict open enrollment. (Unpublished
28
30

f
document available from the Ohio Department of Education, Division of School Finance,
65 S. Front Street, Columbus, OH 43215)
Ohio Department of Education. (1993). Interdistrict open enrollment. (Unpublished document
available from the Ohio Department of Education, Division of School Finance, 65 S. Front
Street, Columbus, OH 43215)
Ohio Department of Education. (1985). Maps of Ohio School Districts. Columbus, OH: Ohio
Department of Education.
Ohio Department of Education. (1994). Open enrollment payment report for fiscal year 1994.
(Photocopied document available from the Ohio Department of Education, Division of
School Finance, 65 S. Front Street, Columbus, OH 43215).
Ohio Department of Education. (n.d.). Open enrollment survey. (Unpublished document
available from the Ohio Department of Education, Division of School Finance, 65 S. Front
Street, Columbus, OH 43215)
Ohio Department of Education. (n.d.). School Districts That Have Adopted Interdistrict Open
Enrollment. (Unpublished document available from the Ohio Department of Education,
Division of School Finance, 65 S. Front Street, Columbus, OH 43215)
Ohio: Fact Summary. (1995, January). Compton's Encyclopedia, Online Edition.(Downloaded from America Online, January 28, 1995).
Ohio: Facts about Ohio. (1995, January). Compton's Encyclopedia. Online Edition.
(Downloaded from America Online, January 28, 1995).
Pearson, J. (1993). Myths of choice. Westport, CT: Praeger.February 10, 1996
Porter, M. E. (1980). Competitive strategy. New York: The Free Press.
SPSS: SPSS for Windows Release 6.0. Student Version. [Computer Software]. Englewood
Cliffs, NJ: SPSS, Inc.
Telser, L. G. (1988). Theories of compeitition. New York: Elsevier Science Publishers.
The Software Toolworks US Atlas MPC. Version 3.1.2 [CD-ROM]. (1992). [N.p].:TheSoftware Toolworks, Inc.
Urahn, S. (1991). Open enrollment study: Patterns of student transfer 1989-1990. Working
Paper #3. Minnesota House of Representatives.
29
31

Urahn, S. (1990): Open enrollment study: Student and district participation 1989-1990.Working Paper #1. Minnesota House of Representatives.
Weeres, J. G. (1987). Economic choice and the dissolution of community. Journal of Education
Policy, 2 (5), 117-129.
Weeres, J. G. (1990). Is more or less choice needed? In W. L. Boyd & H. J. Walberg (Eds.),
Choice in education, pp. 225-240. Berkeley, CA: McCutchan Publishing Co.
Weeres, J. G., & Cooper, B. (1992). Public choice perspectives on urban schools. In J. G.
Cibulka, R. J. Reed, & K. K. Wong (Eds.), The politics of urban education in the United
States, pp. 57-69. Washington, D. C.: The Falmer Press.
Wells, A. S. (1993). The sociology of school choice: Why some win and others lose in theeducational marketplace. In E. Rasell & R. Rothstein (Eds.), School choice, pp. 29-48.
Washington, D. C: Economic Policy Institute.
Woods, P. (1994, April). Parents and choice in local competitive arenas: First findings n vin themain phase of the PASCI study. A paper presented at the ANnual Meeting of the
American Educational Research Association, New Orleans, LA.
World Almanac and Book of Facts. (1993). New York: World Almanac.
Willms, J. D. (1994, April). Ten years later: The effects of school choice in Scottishcommunities. A paper presented at the Annual Meeting of the American EducationalResearch Association, New Orleans, LA.
Willms, J. D., & Echols, F. (1992). Alert and inert clients: The Scottish experience of parentalchoice of schools. Economics of Education Review, 11, 339-350.

Table 1
Participation* in Interdistrict Open Enrollment in Ohio. 1993-1994
Region Percentage Number of Mean Mean
of Districts Students Number of Number of
Participating Transferred Students StudentsReceived Received(All Districts (Participatingin Region) Districts
Only)
All Ohio 44.35% 7012.16 11.48 25.88
Large 10.00% 588.15 5.35 53.47
UrbanCounties
Counties 33.52% 1582.86 9.04 23.98
Adjacent toLargeUrbanCounties
Counties 35.00% 702.94 11.91 33.47
ContainingMediumSized Cities
Nonurban 67.92% 4138.21 15.62 22.99
Counties
*Participation is defined as receiving at least one transfer student through interdistrict openenrollment in 1993-94.

0
Table 2
Twenty-five Ohio Districts Which Gained the Most State Funding Under Interdistrict Open
Enrollment, 1993-1994
District Amount Gained*
Coventry LSD** $650,789
Clearview LSD (Lorain)*** $635,642
Madison LSD (Richland) $358,232
Northeastern LSD (Clark) $335,826
Steubenville CSD $331,398
Trotwood-Madison CSD $328,375
Springfield LSD (Summit) $255,275
Ridgedale LSD $247,941
Lowellville LSD $233,182
Peny LSD $231,128
Springfield LSD (Clark) $228,217
Crooksville EVSD $211,229
Amherst EVSD $171,811
Old Fort LSD $153,683
Ayersville LSD $148,748
Scioto Valley LSD $148,154
Hopewell-Loudon LSD $136,426
3 4

PettiSville LSD $133,245
Cardinal LSD $132,926
Fairfield Union LSD $126,497
Mt. Vernon CSD $121,478
Tuslaw LSD $119,368
Arcadia LSD $113,960
Bethel LSD $110,408
Clay LSD $108,096
*Amounts are rounded to the nearest whole dollar.
**CSD=City School District; EVSD=Exempted Village School District; LSD=Local School
District
***The name of the county is given in cases where two or more Ohio districts have the same
name.
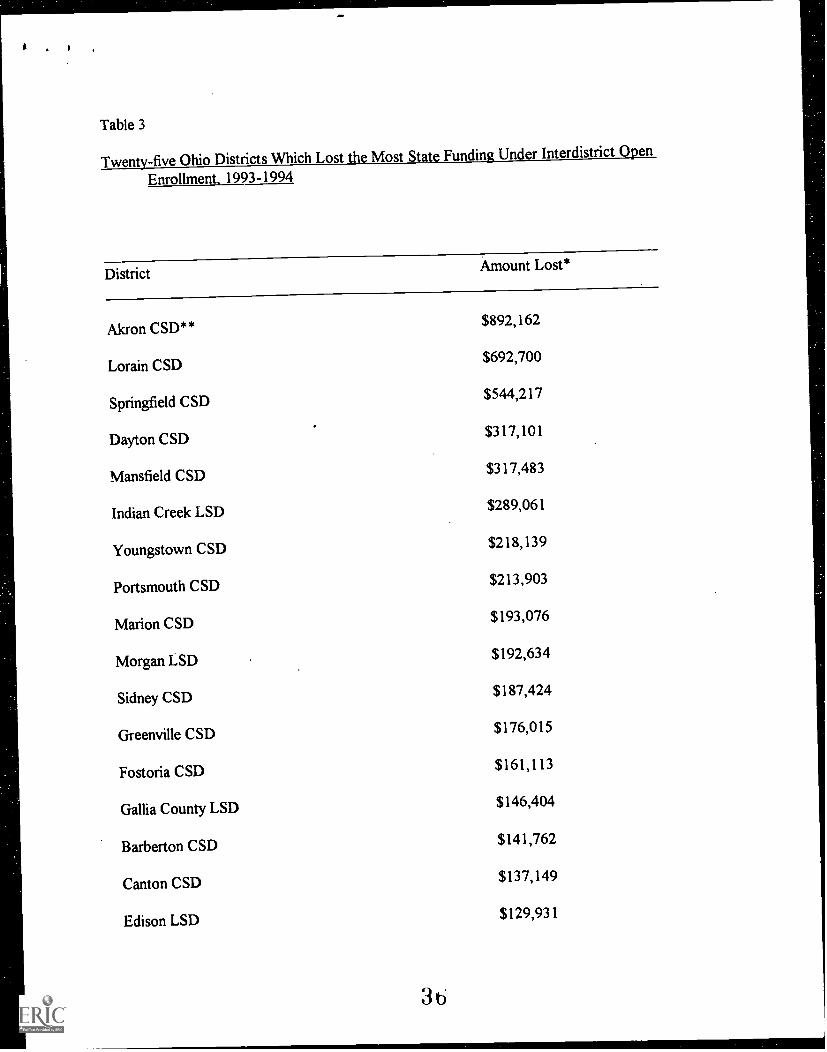
Table 3
Twenty-five Ohio Districts Which Lost the Most State Funding Under Interdistrict Open
Enrollment. 1993-1994
DistrictAmount Lost*
Akron CSD**$892,162
Lorain CSD $692,700
Springfield CSD$544,217
Dayton CSD $317,101
Mansfield CSD $317,483
Indian Creek LSD $289,061
Youngstown CSD $218,139
Portsmouth C SD $213,903
Marion CSD $193,076
Morgan LSD $192,634
Sidney CSD $187,424
Greenville CSD $176,015
Fostoria CSD $161,113
Gallia County LSD $146,404
Barberton CSD $141,762
Canton CSD $137,149
Edison LSD $129,931

Elyria C SD $118,057
Lakota LSD (Sandusky)*** $112,764
Lancaster CSD $106,308
Jackson LSD $104,640
Zanesville CSD $104,470
River Valley LSD $103,331
Ashtabula Area CSD $98,533
Vinton County LSD $97,671
*Amounts are rounded to the nearest whole dollar.
**CSD=City School District; EVSD=Exempted Village School District; LSD=Local School
District
***County names are given only if two or more Ohio districts have the same name.

Table 4
Comparison of the 25 Ohio Districts Which Gained the Most State Funding to the 25 Ohio
Districts Which Lost the Most
Variable Mean for Mean for
Gaining Districts Losing Districts
Enrollment 1910.00 7743.72*
Students passing statetest second time
42.60% 28.16%
College prepgraduates
43.78% 43.36%
Dropout rate 1.65 2.83
Per pupil expenditure $4523.08 $4729.92
Per pupil property valuation $58,370.36 $75,262.8
Average district income $25,891.80 $24,697.72
Students on AFDC 10.61% 22.85%
African-American students 5.23% 15.42%**
Hispanic students 1.91% 2.12%
Total minority stvdents*** 7.55% 18.05%**
*Statistically significant at the .01 level.
**Statistically significant at the .05 level.
***Includes African-American, Hispanic, Asian, and Native American students.

Table 5Sending and Receiving Districts Involving a Net Total Transfer of 20 or More Students
(N=50)
Akron CSD* to Barberton CSD
Akron CSD to Coventry LSD
Akron CSD to Springfield LSD (Summit Co.)**
Alliance CSD to West Branch LSD
Ashtabula Area CSD to Geneva Area CSD
Barberton CSD to Coventry LSD
Barberton CSD to Norton CSD
Bellaire CSD to Shadyside LSD
Bloomfield-Mespo LSD to Cardinal LSD
Canton CSD to Perry LSD (Stark Co.)
Dayton CSD to Trotwood-Madison CSD
Defiance CSD to Ayersville LSD
Delaware CSD to Buckeye Valley LSD
East Knox LSD to Mt. Vernon CSD
Eastern LSD (Meigs Co.) to Meigs LSD
Edison LSD to Steubenville CSD
Fostoria CSD to Arcadia LSD
Fostoria CSD to Hopewell-Loudon LSD
Franklin LSD to Crooksville EVSD
Fremont CSD to Old Fort LSD
Gallia LSD to Gallipolis CSD

Hardin-Houston LSD to Russia LSD
Huber Heights CSD to Bethel LSD
Indian Creek LSD to Steubenville CSD
Lakota LSD (Sandusky Co.) to Bettsville LSD
Lancaster CSD to Fairfield Union LSD
Lorain CSD to Amherst EVSD
Lorain CSD to Clearview LSD
Mansfield CSD to Madison LSD (Richland Co.)
Marion CSD to Elgin LSD
Marion CSD to Ridgedale LSD
Massillon CSD to Tuslaw LSD
Mechanicsburg EVSD to Urbana CSD
Miami East LSD to Troy CSD
Morgan LSD to Crooksville EVSD
Perry LSD to Massillon CSD
Portsmouth CSD to Clay LSD
Portsmouth CSD to New Boston LSD
River Valley LSD to Marion CSD
Rolling Hills LSD to Cambridge CSD
Sidney CSD to Fairlawn LSD
Southern LSD (Columbiana Co.) to Lisbon EVSD
Springfield CSD to Northeastern LSD (Clark Co.)
Springfield CSD to Springfield LSD (Clark Co.)
40

Springfield LSD (Summit Co.) to Mogadore LSD
Van Wert CSD to Crestview LSD (Van Wert Co.)
Vinton LSD to Scioto Valley LSD
Wauseon EVSD to Pettisville LSD
Youngstown CSD to Lowellville LSD
Zanesville CSD to Franldin LSD
*CSD=City School District; LSD=Local School District; EVSD=Exempted Village School
District**The county in which a district is located is given only when there are two or more districts in
Ohio with the same name.

Table 6
Demographic Direction of Net Transfers of 20 or More Students from One District to Another--
All Ohio (N=50)
Net transfers todistricts with. . .
Percentage of nettransfers
Smaller total enrollment 86%
Lower percentage of AFDC students 76%
Lower percentage of minority* students 76%
Higher percentage of students 74%
passing state test second time
Lower percentage of African-American 74%
students
Lower dropout rate 66%
Lower percentage of Hispanic students 64%
Higher mean income in district 60%
Higher percentage of college prep 56%.
graduates
Lower per pupil expendituie 56%
Lower per pupil property value 56%
*Includes African-American, Asian, Hispanic, and Native American students
42

1
Table 7
Demographic Direction of Net Transfers of 20 or More Students from One District to Another--
Districts in Large Urban Counl 'es (N=7)
Net transfers todistricts with. . .
Percentage of nettransfers
Smaller total enrollment 100%
Higher percentage of students 100%
passing state test second time
Lower percentage of AFDC students 100%
Lower percentage of African-American 86%
students
Lower percentage of minority students* 86%
Lower dropout rate 86%
Higher percentage college prep 71%
graduates
Higher average income 71%
Higher per pupil expenditure 71%
Lower percentage of Hispanic students 71%
Higher per pupil property value 57%
*Includes African-American, Asian, Iliapanic, and Native American students.

1
Table 8
Demographic Direction of Net Transfers of 20 or More Students from One District to Another--
Districts Adjacent to Large Urban Counties (N=9)
Net transfers todistricts with.. .
Percentage of nettransfers
Lower dropout rate 89%
Lower percentage of AFDC students 89%
Lower percentage of African-American 89%
students
Lower percentage of Hispanic students 89%
Smaller total enrollment 78%
Lower per pupil expenditure 78%
Lower percentage of minority* students 78%
Higher percentage of students 67%
passing state test second time
Higher average income
Higher 7nrcentage of college prepgraduates
67%
56%
Higher per pupil property value 56%
*Includes African-American, Asian, Hispanic, and Native American students.

1 a P
Table 9
Demographic Direction of Net Transfers of 20 or More Students from One District to Another--
Districts Located in Counties Containing a Medium-Sized City (N=6)
Net transfers todistricts with.. .
Percentage of nettransfers
Smaller total enrollment
Higher percentage of studentspassing state test second time
100%
83%
Lower per pupil expenditure 83%
Lower percentage of AFDC students 83%
Lower percentage of African-American 83%
students
Lower percentage of Hispanic students 83%
Lower percentage of minority* students 83%
Higher average income 67%
Lower dropout rate 67%
Lower per pupil property rate 67%
Higher percentage of college prep 50%
graduates
*Includes African-American, Asian, Hispanic, and Native American students.

Table 10
Demographic Direction of Net Transfers of 20 or More Students from One District to Another--
Districts Located in Nonurban Counties (N=26) .
Net transfers todistricts with...
Percentage of nettransfers
Smaller total enrollment
Higher percentage of studentspassing state test second time
81%
69%
Lower percentage of African-American 65%
students
Lower percentage of minority* siudents 65%
Lower percentage of AFDC students 62%
Lower per pupil property value 58%
Higher percentage college prepgraduates
Higher average income
Lower percentage of Hispanic students
Lower dropout rate
Higher per pupil expenditure
54%
54%
54%
54%
50%
*Includes African-American, Asian, Hispanic, and Native American students.

Appendix
Government Records Used*
A Report on Interdistrict and Intradistrict Open Enrollment in Ohio. (July 1991)
ASCII.RAW. [Computer diskette containing selected information for Ohio schooldistricts, FY 87-92]
Interdistrict Open Enrollment. (February 1993)
Interdistrict Open Enrollment School District Participation.
Interdistrict Open Enrollment Summary. School Year 1992-1993.
Ohio Educational Directory: 1994-1995 School Year.
Open Enrollment Payment Report: For Fiscal Year 1994.
Open Enrollment Revision Report: School Year 1993-1994.
School Districts That Have Adopted Interdistrict Open Enrollment.
Selected Information for Ohio Public School Districts, FY 92.
3301-48-02 Interdistrict Open Enrollment Programs. [Stamped June 1990]
*All records were obtained from the Ohio Department of Education in Columbus, Ohio.