digitization of profile meter photographs
TRANSCRIPT
L. E. Wagner. ~ s s o c . MEGBER
ASAE
ABSTRACT The Profile Meter Program (PMP) automates
acquisition of soil surface, elevation data from pin meter photographs and reduces operator error.* This PC-based program uses simple image analysis techniques to determine pin tip locations from pin meter photos scanned with a digitizing scanner. The PMP simplifies digitization, reduces by up to one-fourth the time required to obtain elevation data from a pin meter photo, and eliminates many operator-induced errors prevalent in hand digitizing techniques. This program is cost effective when compared to other automated or semi-automated methods of obtaining surface elevation data. KEYWORDS. Soil profile meter, Image analysis, Wind erosion, Soil erosion, Random roughness.
INTRODUCTION
T he effects of soil surface roughness on wind erosion processes are well documented (Chepil and Milne, 1941; Woodruff and Siddoway, 1965; Fryrear, 1984;
Fryrear and Skidmore, 1985). Roughness parameters are computed from surface elevation data (Allmaras et al., 1966 and Potter et al., 1990). Soil surface elevation data can be obtained through a variety of methods that use image analysis techniques (Rice et al., 1988), contain microprocessors (Radke et al., 1981 and Van Ouwerkerk et al., 1982). employ laser systems (Romkens et al.. 1988 and Huang and Bradford, 1990). or use photogrammetric methods (Welch et al., 1984).
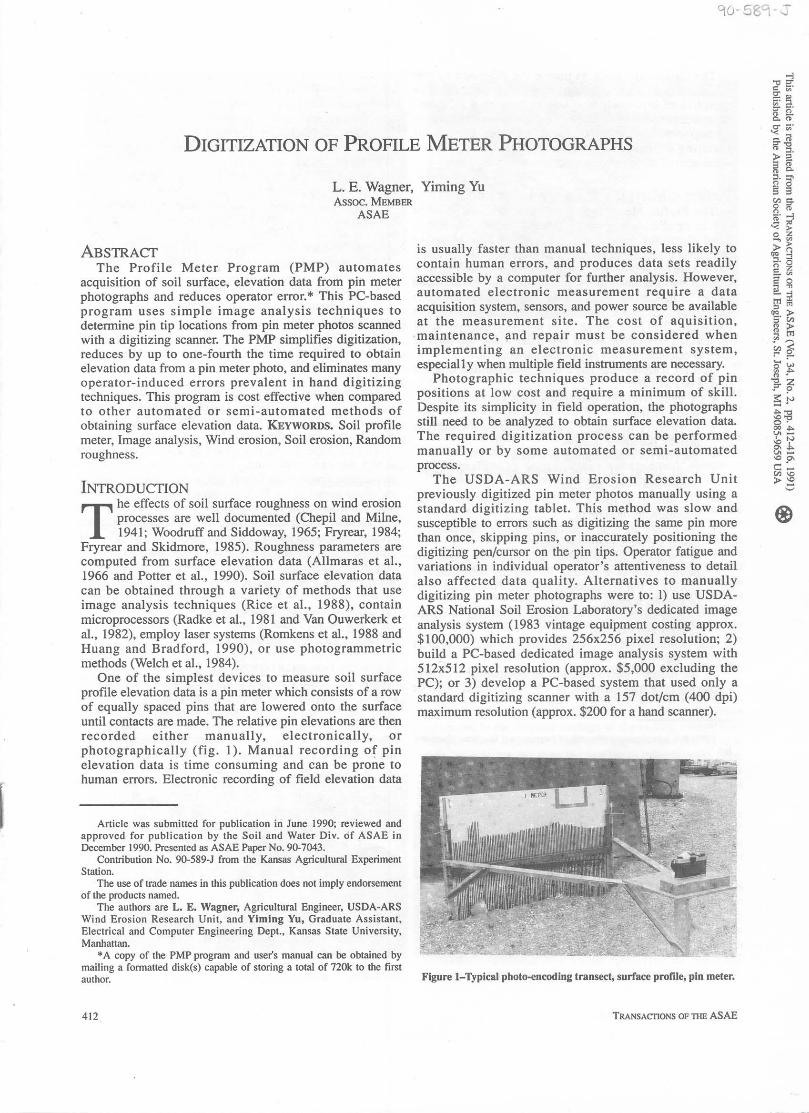
One of the simplest devices to measure soil surface profile elevation data is a pin meter which consists of a row of equally spaced pins that are lowered onto the surface until contacts are made. The relative pin elevations are then recorded either manually, electronically, or photographically (fig. 1). Manual recording of pin elevation data is time consuming and can be prone to human errors. Electronic recording of field elevation data
Anicle was submitted for publication in June 1990: reviewed and approved for publication by the Sail and Water Div. of ASAE in December 1990. Presented as ASAE Paper No. 90-7043.
Contribution No. 90-589-1 from the Kansas Agricultural Experiment Station.
The use of wade names in this publication does not imply endorsement of the pmducts named.
The authors are L. E. Wagner, Agricultural Engineer, USDA-ARS Wind Erosion Research Unit, and Yiming Yu, Graduate Assistant, Electrical and Computer Engineering Depl., Kansas State University. Manhattan.
*A copy of the PMP program and usefs manual can be obtained by mailing a formatted disk($) capable of storing a tom1 of 720k to the tint author.
, Yiming Yu
is usually faster than manual techniques, less likely to contain human errors, and produces data sets readily accessible by a computer for further analysis. However, automated electronic measurement require a data acquisition system, sensors, and power source he available at the measurement site. The cost of aquisition, maintenance, and repair must be considered when implementing an electronic measurement system, especial1 y when multiple field instruments are necessary.
Photographic techniques produce a record of pin positions at low cost and require a minimum of skill. Despite its simplicity in field operation, the photographs still need to be analyzed to obtain surface elevation data. The required digitization process can be performed manually or by some automated or semi-automated process.
The USDA-ARS Wind Erosion Research Unit previously digitized pin meter photos manually using a standard digitizing tablet. This method was slow and susceptible to errors such as digitizing the same pin more than once, skipping pins, or inaccurately positioning the digitizing penfcursor on the pin tips. Operator fatigue and variations in individual operator's attentiveness to detail also affected data quality. Alternatives to manually digitizing pin meter photographs were to: 1) use USDA- ARS National Soil Erosion Laboratory's dedicated image analysis system (1983 vintage equipment costing approx. $100,000) which provides 256x256 pixel resolution; 2) build a PC-based dedicated image analysis system with 512x512 pixel resolution (approx. $5,000 excluding the PC); or 3) develop a PC-based system that used only a standard digitizing scanner with a 157 dotlcm (400 dpi) maximum resolution (approx. $200 for a hand scanner).
Figure I-Typical photo-enwding transect, surface profile, pin meter.
412 TRANSACTIONS OF THE ASAE
The choice was made to pursue the PC-based system which would use a standard digitizing scanner. The objective of this work then was to develop a PC-based computer program to automate the digitizatiin of pin meter photographs. The description and implementation of the resulting digitization program follows along with a discussion of its detection and measurement accuracy
PROFILE NIETER PROGRAM DESCRIPTION The Profile Meter Program (PMP) was designed to
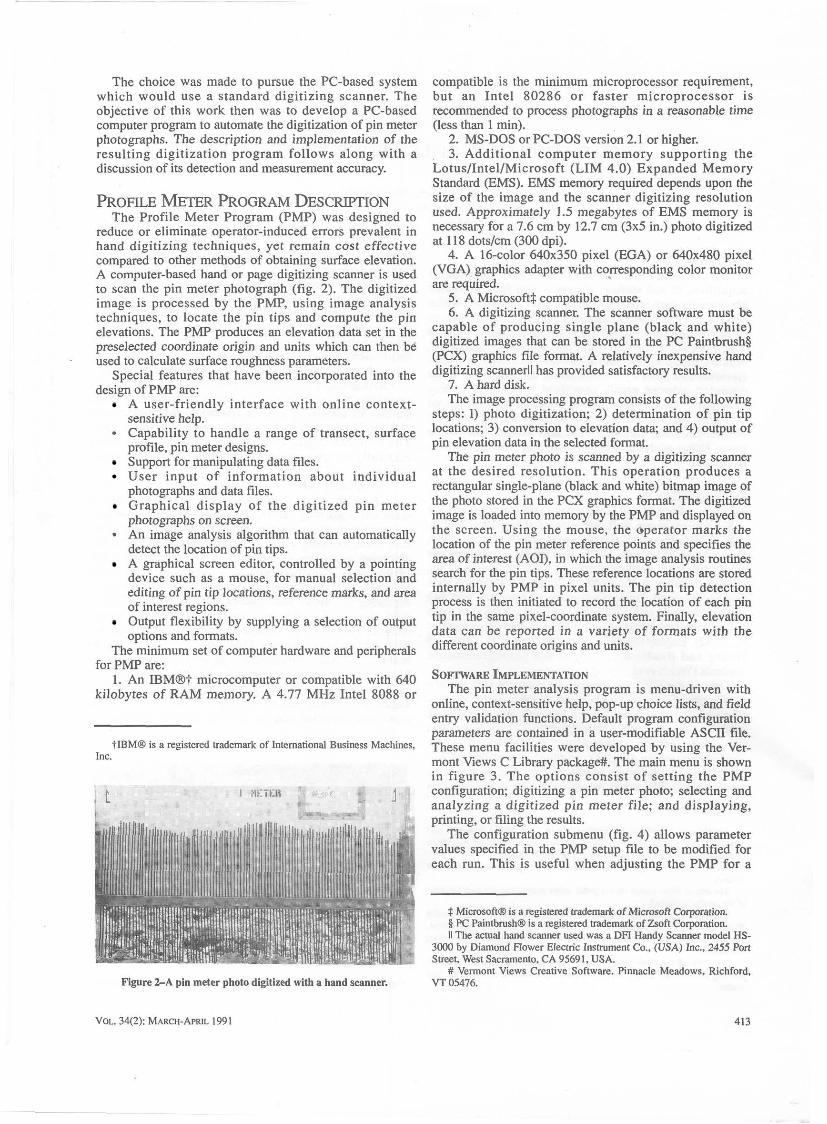
reduce or eliminate operator-induced errors prevalent in hand digitizing techniques, yet remain cost effective compared to other methods of obtaining surface elevation. A computer-based hand or page digitizing scanner is used to scan the pin meter photograph (fig. 2). The digitized image is processed by the PMP, using image analysis techniques, to locate the pin tips and compute the pin elevations. The PMP produces an elevation data set in the preselected coordinate origin and units which can then be used to calculate surface roughness parameters.
Special features that have been incorporated into the design of PMP are:
A user-friendly interface with online context- sensitive help. . Capability to handle a range of transect, surface profile, pin meter designs. Support for manipulating data files. User input of information about individual photographs and data files. Graphical display of the digitized pin meter photographs on screen. . An image analysis algorithm that can automatically detect the location of pin tips. A graphical screen editor, controlled by a pointing device such as a mouse, for manual selection and editing of pin tip locations, reference marks, and area of interest regions. Output flexibility by supplying a selection of output options and formats.
The minimum set of computer hardware and peripherals for PMP are:
1. An IBMBT microcomputer or compatible with 640 kilobytes of RAM memory. A 4.77 MHz Intel 8088 or
tIBM@ is a registered wadernark of International Business Machines, Inc.
Figure 2-A pin meter photo digitized with a hand scanner.
compatible is the minimum microprocessor requirement, but an Intel 80286 or faster microprocessor is recommended to process photographs in a reasonable time - . (less than 1 min).
2. MS-DOS or PC-DOS version 2.1 or higher. 3. Additional computer memory supporting the
Lotus/Intel/Microsoft (LIM 4.0) Expanded Memory Standard (EMS). EMS memory required depends upon the size of the image and the scanner digitizing resolution used. Approximately 1.5 megabytes of EMS memory is necessary for a 7.6 cm by 12.7 cm (3x5 in.) photo digitized at 11 8 dots/cm (300 dpi).
4. A 16-color 640x350 pixel (EGA) or 640x480 pixel (VGA) graphics adapter with corresponding color monitor are required.
5. A Microsoft$ compatible mouse. 6. A digitizing scanner. The scanner software must be
capable of producing single plane (black and white) digitized images that can be stored in the PC Paintbrush5 (PCX) graphics file format. A relatively inexpensive hand digitizing scannerll has provided satisfactory results.
7. A hard disk. The image processing program consists of the following
steps: 1) photo digitization; 2) determination of pin tip locations; 3) conversion to elevation data; and 4) output of pin elevation data in the selected format.
The pin meter photo is scanned by a digitizing scanner at the desired resolution. This operation produces a rectangular single-plane (black and white) bitmap image of the photo stored in the PCX graphics format. The digitized image is loaded into memory by the PMP and displayed on the screen. Using the mouse, the operator marks the location of the pin meter reference points and specifies the area of interest (AOI), in which the image analysis routines search for the pin tips. These reference locations are stored internally by PMP in pixel units. The pin tip detection process is then initiated to record the location of each pin tip in the same pixel-coordinate system. Finally, elevation data can be reported in a variety of formats with the different coordinate origins and units.
SOFTWARE IMPLEMENTATION The pin meter analysis program is menu-driven with
onIine, context-sensitive help, pop-up choice lists, and field entry validation functions. Default program configuration parameters are contained in a user-modifiable ASCII file. These menu facilities were developed by using the Ver- mont Views C Library package#. The main menu is shown in figure 3. The options consist of setting the PMP configuration; digitizing a pin meter photo; selecting and analyzing a digitized pin meter file; and displaying, printing, or filing the results.
he-configuration submenu (fig. 4) allows parameter values specified in the PMP setup file to be modified for each run. This is useful when adjusting the PMP for a
t Microsoft@ is aregisrered tradernark of Microsoff Corpaation. O PC Paintbrush@ is a registered wadernark of Zsoft Corporation. II The actual hand scanner used was a DFI Handy Scanner model HS-
3WO by Diamond Flower Eienric Inswarnent Co., (USA) Inc, 2455 Port Street, West Sacramento, CA 95691, USA.
# Vermont Views Creative Software. Pinnacle Meadows. Richford, VT 05476.

Figure F P M P Main Menu.
specific pin meter, camera setting, and digitizing scanner combination. The setup file also contains information about the pin meter and its associated calibration information, video screen setup, location and naming convention of data files, and output format to be used.
The pin meter calibration file is constructed from reference pin meter photos with the pins set at known, uniform heights. The reference photos are processed by the PMP program. The results are compiled into a PMP calibration file, which contains compensations for optical distortions from camera lens, variations in pin meter pin lengths, and digitizing scanner resolution. A new PMP calibration file is needed if the pin meter-camera-scanner combination is changed.
Pm TIP DETECTION PROCESS The pin tip detection process consists of graphically
displaying the digitized pin meter photo on the video screen, manually labeling the reference marks and pin tip detection region with the mouse pointer, and executing the detection algorithm.
The graphics display.was implemented using the PCX Programmer's Toolkit**. This C library package provided the capabilities to uncompress and load an image into memory, display a portion of the image on the screen, and allow both horizontal and vertical scrolling. An example of the video screen showing a digitized pin meter photo is shown in figure 5. Because the mouse acts as an editor for
**GENUS Microprogramming, Inc. 113115 Meadow Lake. Houston. TX 77077.
Figure 5-PMP Graphics screen displaying digitized pin meter photo.
deleting and adding symbols to the graphics screen, it can be used to detect pin tip positions manually. This provides the operator with the ability to correct errors made by the pin tip detection algorithm or to perform a completely manual pin tip detection analysis.
The pin tip detection procedure operates on each line (row of pixels) within an area of interest region labeled by the user. First, a simple image enhancement operation (Theodosios, 1982) is performed. If the pixel values on both the left and right side of the current pixel are the same, the current pixel is set equal to their value otherwise it's value is unchanged. This step enhances the image contrast for the pin tip detection algorithm.
Each line is scanned for a sequence of adjacent pixels containing the foreground color (parts of a possible pin). If the sequence length is greater than the minimum pin length (in pixel units) specified in the PMP configuration it is considered part of a possible pin. The ending pixel location of any such sequence is retained. If the number of adjacent lines having such pixel sequences is greater than the minimum pin thickness (in pixel units) specified in the PMP configuration, the adjacent pixel sequences are considered to be a pin.
Each line containing a sequence of pixels that may he part of a pin has the ending sequence pixel location compared to the running average of the ending values from the previous adjacent lines making up that pin. If that difference is meater than the pin noise tolerance (in pixel units) speciced in the ~ ~ ~ ' c o n f i ~ u r a ~ i o n , that line is rejected fmm consideration in determining the tip location
Figure 4-PMP Configuration menu.
414
for that pin. If the number of adjacent lines exceeds twice the
average pin thickness (in pixel units) specified in the PMP configuration, the algorithm assumes two pins have been found which could not be distinguished from each other and labels them accordingly.
Each time a pin tip is located, the pin detection status screen is updated to display the number of pins found from the total number of pins for the pin meter. When the pin tip detection process is complete, the PMP graphics screen (fig. 5) is redisplayed with the pin tip locations shown with crosshair symbols in a color specified in the PMP configuration.
TRANSAC~ONS OF THE ASAE
From the description of the pin tip detection algorithm, it is evident that pin meter photos must be scanned such that the pin meter pins are parallel to the pixel lines. Also, the pin detection parameters (specified in pixel units), such as noise tolerance, minimum pin length and thickness, etc., depend upon the size of photo being scanned, scanning resolution, and the actual thickness of the pin meter pins. This usually requires a trial and error process to determine the parameter values for a different photograph size or pin meter-camera-scanner setting combination.
The time required to scan and digitize a pin meter photo is dependent upon the type of scanner and microcomputer/video system used. With our development hardware??, a 101-pin pin meter photo takes 2-3 min to process with the scanning operation requiring 10-15 seconds of that time. About 20 s is required for the actual pin tip detection process to complete (approx. 45 s with an Intel 8MHz 80286 processor). The remaining time is spent entering information into the PMP such as date, location, and plot identification. A manual digitization would require about 8 min to complete. Thus, a substantial savings in time is achieved.
PIN TIP DETECTION AND MEASUREMENT REPEATABLITY About 500 photographs, from two different pin meters,
have been scanned and processed with the PMP. If the picture contrast was good, the PMP pin tip detection algorithm located more than 95% of the pins. However, if the photo was poor, it usually took several tries with the scanner at different light settings to obtain a good scan. Even then, the PMP usually would locate about 40-45% of the total pins. This required the operator to manually label the pin tips that were not found by PMP.
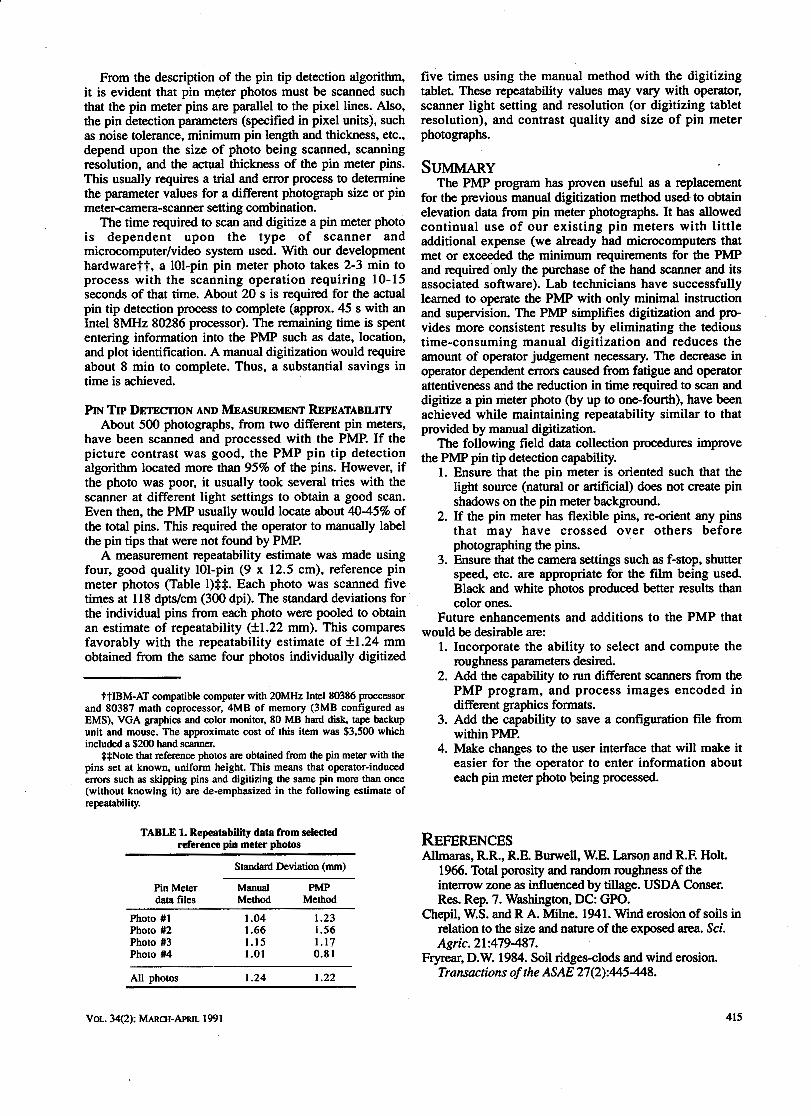
A measurement repeatability estimate was made using four, good quality 101-pin (9 x 12.5 cm), reference pin meter photos (Table I)$$. Each photo was scanned five times at 118 dpts/cm (300 dpi). The standard deviations for the individual pins from each photo were pooled to obtain an estimate of repeatability (f 1.22 mm). This compares favorably with the repeatability estimate of f 1.24 mm obtained from the same four photos individually digitized
PtIBM-AT compatible computer with 20MHz lntel80386 proccessor and 80387 math coprocessor, 4MB of memory (3MB configured as EMS), VGA graphics and color monitor. 80 MB hard disk, tape backup unit and mouse. The approximate cost of this item was $3.500 which included a $200 hand scanner.
$$Note that reference photos are obtained from the pin meter with the pins set at known, uniform height. This means that operator-induced emrs such as skipping pins and digitizing the same pin more than once (without knowing it) are de-emphasized in the following estimate of repeatability.
TABLE 1. Repeatability data from selected reference pin meter photos
Standard Deviation (mm)
Pin Meter Manual PMP data files Method Method
Photo #1 1.04 1.23 Photo #2 1.66 1.56 Photo #3 1.15 1.17 Photo #4 1.01 0.81
All ~hotos 1.24 1.22
five times using the manual method with the digitizing tablet. These repeatability values may vary with operator, scanner light setting and resolution (or digitizing tablet resolution), and contrast quality and size of pin meter photographs.
SUMMARY The PMP program has proven useful as a replacement
for the previous manual digitization method used to obtain elevation data from pin meter photographs. It has allowed continual use of our existing pin meters with little additional expense (we already had microcomputers that met or exceeded the minimum requirements for the PMP and required only the purchase of the hand scanner and its associated software). Lab technicians have successfully learned to operate the PMP with only minimal instruction and supervision. The PMP simplifies digitization and pro- vides more consistent results by eliminating the tedious time-consuming manual digitization and reduces the amount of operator judgement necessary. The decrease in operator dependent errors caused from fatigue and operator attentiveness and the reduction in time required to scan and digitize a pin meter photo (by up to one-fourth), have been achieved while maintaining repeatability similar to that provided by manual digitization.
The following field data collection procedures improve the PMP pin tip detection capability.
1. Ensure that the pin meter is oriented such that the light source (natural or artificial) does not create pin shadows on the pin meter background.
2. If the pin meter has flexible pins, re-orient any pins that may have crossed over others before photographing the pins.
3. Ensure that the camera settings such as f-stop, shutter speed, etc. are appropriate for the film being used. Black and white photos produced better results than color ones.
Future enhancements and additions to the PMP that would be desirable are:
1. Incorporate the ability to select and compute the roughness parameters desired.
2. Add the capability to run different scanners from the PMP program, and process images encoded in different graphics formats.
3. Add the capability to save a configuration file from within PMP.
4. Make changes to the user interface that will make it easier for the operator to enter information about each pin meter photo being processed.
REFERENCES Allmaras, R.R., R.E. Burwell, W.E. Lakson and R.F. Holt.
1966. Total porosity and random roughness of the interrow zone as influenced by tillage. USDA Conser. Res. Rep. 7. Washington, DC: GPO.
Chepil, W.S. and R A. Milne. 1941. Wind erosion of soils in relation to the size and nature of the exposed area. Sci. Agric. 21 :479-487.
Fryrear, D.W. 1984. Soil ridges-clods and wind erosion. Transactions of the ASAE 27(2):445448.
Fryrear, D.W. and E.L. Skidmore. 1985. Methods of controlling wind erosion. In Soil Erosion and Crop Productivity, eds. R.F. Follet and B.A. Stewart, 443-457. Madison, WI: ASA-CSSA-SSSA.
Huang, C. and J.M. Bradford. 1990. Portable laser scanner for measuring soil surface roughness. Soil Sci. Soc. Am. J. 54: 1402-1407.
Potter, K.N., T.M. Zobeck and L.J. Hagen. 1990. A microrelief index to estimate soil erodibility by wind.
t Transactions of the ASAE. 33(1): 151-155. Radke, J.K., M.A. Otterby, R.A. Young and C A. Onstad.
198 1. A microprocessor automated rillmeter. L Transactions of the ASAE 24(2):401-404,408.
Rice, C., B.N. Wilson and M. Appleman. 1988. Soil topography measurements using image processing techniques. Computers and Electronics in Agric. 3:97- 107.
Romkens, M.J.M., J.Y. Wang and R.W. Darden. 1988. A laser microreliefmeter. Transactions of the ASAE 31(2):408-413.
Theodosios, P. 1982. Algorithms for Graphics and Image Processing. Rockville, MD: Computer Science Press.
Van Ouwerkerk, C., M. Pot and K. Boersma. 1982. Electronic microreliefmeter for seedbed characterization. Soil lillage Res. 2:81-90.
Welch, R., T.R. Jordan and A.W. Thomas. 1984. A photogrammatic technique for measuring soil erosion. J. Soil Water Conserv. 39: 19 1 - 194.
Woodruff, N.P. and F.H. Siddoway. 1965. A wind erosion equation. Soil Sci. Soc. Am. Proc. 29:602-608.
TRANSACTIONS OF THE ASAE