dhammika dharmapala and vikramaditya khanna j.j. prescott, uday rajan, roberta romano, gautam...
TRANSCRIPT

Item # 06 SEMINAR IN LAW AND ECONOMICS Professors Louis Kaplow & Steven Shavell Tuesday, October 14, 2008 Griswold 110, 5:00 p.m.
CORPORATE GOVERNANCE, ENFORCEMENT, AND FIRM VALUE:
EVIDENCE FROM INDIA
Dhammika Dharmapala and Vikramaditya Khanna
Work in progress: Do not circulate or cite without permission

CORPORATE GOVERNANCE, ENFORCEMENT, AND FIRM VALUE: EVIDENCE FROM INDIA
Dhammika Dharmapala∗ & Vikramaditya Khanna**
October 2008
Abstract
This paper examines the causal impact of corporate governance on firm value, using a sequence of corporate governance reforms in India. Our results, taken together, present a strong case for a causal effect of the reforms on firm value. They also underscore the importance of the enactment of severe sanctions, though it is not entirely clear whether this effect operates through formal enforcement alone or in conjunction with some additional channel. The reforms (referred to as Clause 49 of the listing agreement) were phased in over the period 2000‐2003, and severe financial penalties for violations were subsequently introduced in 2004. The exemption of a large number of firms from the new rules and the complex criteria for their application give rise to treatment and control groups of firms with overlapping characteristics. Using a large sample of over 4000 firms from 1998‐2006, a difference‐in‐difference approach (controlling for various relevant factors and for firm‐specific time trends) reveals a large and statistically significant positive effect (amounting to over 10% of firm value) of the Clause 49 reforms in combination with the 2004 sanctions. A regression discontinuity approach focusing on the thresholds for the application of these reforms leads to similar conclusions. In addition, the estimated effect of the initial announcement of Clause 49 in 1999 is weaker than the effect of the 2004 sanctions, highlighting the importance of sanctions. Some channels through which the 2004 effect may have occurred are explored, but the results are preliminary because there are only two years of post‐2004 reform data. There is some evidence of improvements in accounting performance and increases in foreign institutional investment, but this is not robust across specifications. The 2004 reforms are not associated with a reduction in tunneling within business groups, as measured using an approached developed by Bertrand, Mehta & Mullainathan (2002).
Acknowledgments: We thank John Armour, Sugato Bhattacharya, Bernie Black, Dominic Chai, Brian Cheffins, Jay Dahya, Kevin Davis, Simon Deakin, Han Kim, Roy Kouwenberg, Kate Litvak, Ronald Masulis, J.J. Prescott, Uday Rajan, Roberta Romano, Gautam Tripathi and seminar participants at the University of Cambridge, the European Financial Management Meetings, the Conference on Empirical Legal Studies, the Canadian Law & Economics Meetings, Michigan Business School, Michigan Law School, and ___ for helpful discussions and comments, and Don Eckford for outstanding research assistance. Any remaining errors are, of course, our own.
∗ Associate Professor of Economics, University of Connecticut. Ph.D University of California at Berkeley. Email: [email protected] ** Professor of Law, University of Michigan Law School. S.J.D. Harvard Law School. Email: [email protected] or [email protected].

1
I. INTRODUCTION
The connections among corporate governance, stock market development and
firm value have become subjects of intense debate within and across law, finance and
economics. Despite this widespread interest, finding evidence that corporate
governance causes changes in firm value has posed a significant challenge. One
influential strand of scholarship uses the historical origins of a country’s legal system to
address the question of causation.1 An alternative approach uses quasi‐experiments
within a single country. However, most governance reforms in the US have applied to
all firms, making it difficult to isolate a credible control group.2 For this reason, and
because of the relatively limited variation in governance practices in an economy such
as the US, attention has increasingly been directed to the relationship between
governance and firm value outside the US, especially in emerging markets. Moreover,
attention has also broadened from the analysis of substantive laws to a consideration of
their enforcement.
This paper analyzes these questions using a sequence of reforms to India’s
corporate governance regime as a source of exogenous variation. The analysis employs
financial statement and other data from the Prowess database for a large sample of over
4000 Indian firms from 1998‐2006. Our results, taken together, present a strong case for
a causal effect of the reforms on firm value. By exploiting an unusual feature of the
reforms (namely, that severe sanctions were introduced years after the substantive law
was enacted), our results also underscore the importance of sanctions. However, it is 1 This literature begins with the seminal work of La Porta, Lopez‐de‐Silanes, Shleifer and Vishny (1998) on the impact of legal origins. However, the role of legal origins has recently been questioned (e.g. Roe, 2006; Armour et al., 2007). Much of the literature on stock market development undertakes cross‐country analysis (e.g. Durnev and Kim, 2005; La Porta, Lopez‐de‐Silanes and Shleifer, 2006); however, single‐country studies such as this paper can avoid some of the methodological challenges associated with cross‐country analysis. 2 However, the literature on the US has used various other sources of identification, including the adoption of anti‐takeover provisions (Gompers, Ishii & Metrick, 2003; Bebchuk, Cohen & Ferrell, 2004), state antitakeover laws (Bertrand and Mullainathan, 2003), variation in disclosure requirements for smaller firms (Greenstone, Oyer and Vissing‐Jorgensen, 2006), and foreign firms cross‐listed in the US (Litvak, 2007).
2
not entirely clear whether this effect operates through formal enforcement alone or in
conjunction with some additional channel.
In 2000, Clause 49 (of the stock exchange listing agreement for publicly‐traded
corporations) was introduced in India, mandating greater board independence,
enhancing disclosure requirements, and increasing the power of audit committees for
affected firms. Importantly, however, not all Indian corporations were subject to Clause
49. Even among affected firms, not all were immediately subject to the new provisions.
A small number of very big firms were expected to comply by 2001, a larger number of
medium‐sized firms were expected to comply by 2002, and the remainder of the
affected firms (which were mostly quite small in size) were expected to comply by 2003.
In addition, firms that listed for the first time in 2000 (or later) were expected to comply
from the time of listing.
Firms that were outside all of these groups were not expected to comply with
Clause 49. The unaffected firms were generally smaller than the affected firms.
However, the legal criteria for being subject to Clause 49 were framed primarily in
terms of firms’ paid up share capital (at the time the shares were issued), which is only
imperfectly correlated with size as measured, for instance, by the book value of assets.
Thus, there was considerable overlap in terms of size and other characteristics between
the smaller firms subject to Clause 49 and the larger firms amongst those that were not
subject to the new rules. This provides us with our treatment and control groups of
firms.
As Clause 49 was framed as a change to the listing agreement, the initial penalty
for violations was delisting. However, in 2004, India’s securities laws were amended to
introduce large financial penalties for violations of Clause 49. The introduction of these
severe sanctions was quite separate in time from the dates on which firms became
subject to the new rules (2000‐2003). This provides an unusual opportunity to not only
3
test the effects of the substantive law on firm value, but also to test the effects of
changes in sanctions and enforcement on firm value (independently of the effect of the
substantive law).3
The paper’s primary hypothesis concerns the impact of the 2004 sanctions on
firm value (as measured by Tobin’s q). The analysis uses a difference‐in‐difference
approach, comparing a treatment group of firms that were subject to Clause 49 (and
hence to the new sanctions from 2004 onwards) with a control group of firms that were
not subject to Clause 49 (or to its sanction and enforcement regime). The regression
specification controls for various relevant factors and for firm‐specific time trends in q,
so that the estimated effect represents the extent to which a Clause 49 firm’s value
deviates from its underlying trend following the introduction of the sanctions, relative
to the corresponding deviation for unaffected firms. Using this approach, the paper
finds a large and statistically significant positive effect (amounting to over 10% of firm
value) of the Clause 49 reforms in combination with the 2004 sanctions. This result is
robust to various checks, and in particular continues to hold when comparing only the
smaller firms that were subject to Clause 49 and the larger firms amongst those that
were not subject to Clause 49. The sharp discontinuity created by the applicability of the
new rules above a specific level of paid up share capital also enables the use of a
regression discontinuity approach, which leads to very similar results. Our results,
taken together, present a strong case for a causal effect of the reforms on firm value.
Further, we find that the effects of the 2004 reforms are statistically stronger and larger
than those associated with the initial announcement of the Clause 49 reforms in 1999.
This underscores the importance of the 2004 sanctions.
3 For expositional ease we sometimes refer to these interchangeably as changes in sanctions or enforcement. Strictly speaking, the changes were sanction increases, but the literature on enforcement and stock market development often treats sanction increases as changes in enforcement or a way to measure enforcement (Jackson and Roe, 2008; Coffee, 2007). Of course, changes in sanctions and enforcement both affect expected sanctions.
4
The paper also explores the channels through which this increase in firm value
may have occurred. Over the (relatively short) post‐reform sample period, there is
some evidence of improvements in accounting performance and increases in foreign
institutional investment (which may be associated with better monitoring), but these
results were not robust across specifications. Further, there is no discernible effect of
the 2004 reforms on tunneling within business groups (as measured using the approach
developed by Bertrand, Mehta and Mullainathan (2002)).4 Intriguingly, although the
estimated effect on q of the 1999 announcement of Clause 49 is weaker than the effect of
the 2004 sanctions, the 1999 announcement appears to be associated with a reduction in
tunneling within business groups. Overall, it appears that the increase in firm value in
2004 capitalized expectations of longer‐term benefits of the reforms, but whether this is
attributable to formal enforcement alone or in conjunction with an additional channel
may have to await further study once there are more years of data to examine.
This paper is most closely related to studies that exploit the Korean corporate
governance reforms of the 1990’s as a source of exogenous variation. Black, Jang and
Kim (2006) construct a Korean corporate governance index (KCGI) for a cross‐section of
Korean firms. They examine the effect of the KCGI on firm value, instrumenting for the
KCGI using an asset size variable that captures the threshold (at 2 trillion won) for the
application of the reforms. They also use a regression discontinuity analysis around this
threshold. Both approaches yield a positive effect. Black, Kim, Jang, and Park (2005) use
a panel of Korean firms, and exploit within‐firm variation over time in the KCGI to find
a positive effect on firm value (also instrumenting with the asset size dummy).
However, as the asset size instrument is not time‐varying, their panel analysis does not
allow for firm fixed effects.
4 However, it should be remembered that tunneling is only one particular form of insider diversion, and it is possible that the market reaction in 2004 capitalized expected reductions in other forms of diversion.

5
This paper uses panel data, and allows not only for year and firm fixed effects,
but also for firm‐specific time trends. The latter is especially important because
differential time trends in value for the larger firms affected by a reform, relative to the
smaller unaffected firms, is an important concern in both the Korean and Indian
reforms. We do not use a firm‐level governance index like the KCGI,5 but in some
respects this may be an advantage as it eliminates potentially endogenous changes in
firms’ governance choices. Furthermore, while Black, Jang and Kim (2006) use a
regression discontinuity analysis, the panel dataset here permits a first‐differenced
version of this approach that controls for unobserved heterogeneity (see the discussion
in Part V below).
Finally, this paper also contributes more specifically to the empirical evaluation
of the Indian governance reforms. Black and Khanna (2007) conduct an event study of
the adoption of Clause 49 using the phased implementation schedule described above.
They find positive abnormal returns around the first important legislative
announcement for firms expected to comply early, relative to firms expected to comply
later. This paper uses a very different approach, examining the effects of the reforms on
firm value over a longer time horizon, and incorporating later reforms such as the
sanctions introduced in 2004.
Part II details the development of corporate governance reform in India while
laying out the groundwork for our empirical tests. Part III describes the data. Part IV
elaborates on the empirical specifications and hypotheses. Part V reports the results and
robustness checks. Part VI interprets the results and describes a number of extensions.
Part VII concludes.
5 Balasubramanian, Black & Khanna (2008) conduct a detailed survey of Indian firms, and find that better governed firms tend to have higher value.
6
II. CORPORATE GOVERNANCE REFORM IN INDIA: THE RISE OF CLAUSE 49.
India, unlike a number of emerging markets, has had actively functioning stock
markets since 1875 and a fairly detailed corpus of corporate and securities laws
(Khanna, 2008a). However, prior to the governance reforms described below, Indian
corporate governance in practice was considered weak and quite dysfunctional.
Inconsistent disclosure and largely ineffective boards of directors led to a failing system
of governance in which insider diversion was not uncommon. Indeed, Indian firms
looking for capital had to rely primarily on internal sources or on the capital provided
by various arms of the government, rather than the stock market (for more details see
Khanna (2008a)).
This situation formed the background to the promulgation of Clause 49 of the
stock exchange listing agreement in 2000 by the Securities & Exchange Board of India
(SEBI – India’s securities markets regulator).6 The first tentative steps toward Clause 49
occurred in 1998 when the Confederation of Indian Industry (CII) – a large industry
association – proposed a voluntary code of corporate governance for Indian firms. This
was followed in quick measure by SEBI forming the Kumar Mangalam Birla Committee
(KMBC) to suggest changes in the listing agreement of the stock exchanges to address
corporate governance concerns. The KMBC’s draft set of recommendations came out on
October 1, 1999 and became effective as Clause 49 of the listing agreement with the
Exchanges on February 21, 2000. Firms failing to meet the requirements of Clause 49
could be delisted. The details of Clause 49 are provided in Appendix 1, but a brief
overview is provided below (see also Khanna (2008a)).
Clause 49 had both requirements and recommendations. In the required
category were a number of reforms designed to enhance the independence of boards.
6 Earlier reforms started almost with the creation of the Securities & Exchange Board of India (SEBI) in 1992; some of the key regulations were the SEBI Takeover Code 1997 (dealing primarily with acquisitions of control) and the SEBI Disclosure & Investor Protection Guidelines 1999 (addressing public issuances of securities).
7
This involved prescribing minimum percentages of independent directors (50% or 33%
depending on whether the Chairman was an executive director) and providing a fairly
stringent definition of “independence”. In addition to this, Clause 49 mandated the
number of meetings per year, expected boards to develop a code of conduct and
imposed limits on the number of directorships a director could simultaneously hold.
Clause 49 also enhanced the power of the audit committee by requiring financial
literacy, experience and independence of its members, and by expanding the scope of
activities on which the audit committee had oversight. Executives were also expected
to be more personally involved in corporate affairs as seen by the requirements for
certification by the Chief Executive Officer (CEO) and Chief Financial Officer (CFO) of
financials and overall responsibility for internal controls. This was combined with
considerably enhanced disclosure obligations (on many things including accounting
treatment and related party transactions) and enhanced requirements for holding
companies when overseeing their subsidiaries. These series of changes appear aimed at
making Boards and Audit Committees more independent, powerful and focused
monitors of management. Moreover, the enhanced disclosures would aid institutional
and foreign investors in monitoring management as well.
Clause 49’s provisions were not expected to be implemented immediately;
rather, it provided a phased‐in implementation schedule where certain firms
(essentially large ones) were expected to comply earlier than mid sized firms which
were expected to comply earlier than small sized firms.7 Specifically, firms that were
listed on the Bombay (Mumbai) Stock Exchange (BSE) under the listing flag “A” were
expected to comply by March 31, 2001. These are generally the largest corporations in
the Indian economy, and are referred to in the remainder of the paper as “Group 1”
firms.
7 Note, however, that firms that listed for the first time from 2000 onwards were expected to comply immediately, regardless of whether they fell into any of the categories described below.

8
Firms that were outside this group, but had paid up share capital of at least Rs.
10 crores (roughly US$2,500,000)8 or net worth of at least Rs. 25 crores (roughly
US$6,250,000) at any time in the companyʹs history, were expected to comply by March
31, 2002. Paid‐up share capital is the number of shares outstanding, multiplied by the
“face value” of the shares (i.e. the price at which the share certificates were originally
issued). Net worth is a similar concept, but also incorporates the face value of preferred
stock, and adjusts for the firm’s retained earnings and various reserves. The fact that
these criteria were primarily backward‐looking helps to address the concern that firms
may have endogenously chosen whether or not to be subject to the new rules. The firms
expected to comply in 2002 are referred to below as “Group 2” firms.
Finally, other firms with paid up share capital of at least Rs. 3 crores (roughly
US$750,000) were expected to comply by March 31, 2003; these firms are referred to
below as “Group 3” firms. Importantly, Clause 49 was not intended to apply to all
publicly traded and listed firms in India, with those firms with paid up share capital
below Rs. 3 crores being completely exempt from its provisions.9 This sequence of
reforms is illustrated by the timeline in Figure 1.
These reforms established how governance was to change in India and their
violation could lead to de‐listing, but no other financial penalties. Although potentially
significant, de‐listing is less personally painful for executives than direct financial
penalties and the threat of imprisonment.10 Thus, for our purposes, the next important
reforms were the adoption of direct financial penalties for violation of Clause 49’s
requirements. In 2004 the Securities Contracts (Regulation) Act 1956 was amended to
include Section 23E that imposed significant financial penalties for violations of the
8 In India a crore means 10 million Rupees; thus, for instance, 10 crores is identical to 100 million Rupees (roughly US$2,500,000) and 25 crores is 250 million Rupees (roughly US$6,250,000). 9 In this respect, Clause 49 differs from the Sarbanes‐Oxley reforms in the US. The unaffected firms play a crucial role in this paper’s empirical strategy, as described below. 10 Moreover, de‐listing is not a remedy that many shareholders would want visited on their firm as it reduces their ability to liquidate their interest in the firm by freezing the public market for their shares.

9
listing agreement (up to Rs. 25 crore (roughly USD 6,250,000) for a violation).11 Since
2005, there has not been much in the way of significant corporate governance changes
to either the listing agreement or the statute.12
III. DATA
The data for this study is obtained from Prowess, a database that is maintained
by the Center for Monitoring the Indian Economy (CMIE). Prowess reports financial
statements, share prices, and other relevant data for publicly traded Indian
corporations. Prowess data is typically available only for a limited window of years;
this analysis uses data for the period 1998‐2006. While the estimating samples are
generally smaller due to missing values for some variables, the basic sample includes
28,672 observations at the firm‐year level over this period, on 4335 firms. Prowess
variables are reported as of December 31 of each year; thus, any legal changes occurring
during a given calendar year are assumed to be reflected in that same year’s financial
data (e.g. the sanctions introduced in October, 2004 are assumed to affect Prowess
variables reported for 2004).13
The primary dependent variable of interest in this analysis is Tobin’s q, used (as
is standard in the corporate finance literature) as a proxy for firm value. For firm i in
year t, Tobin’s q is defined as:
11 Inserted by Securities Laws (Amendment) Act, 2004, S.11 (which takes effect from Oct. 12, 2004). 12 There were no enforcement actions under Section 23E or Clause 49 until September 2007 – see the discussion in Part VI below. 13 This relies on the premise that the Indian stock market fairly rapidly incorporates new information into share prices. Evidence for this is provided in Griffin, Kelly & Nardari (2007). More generally, this evidence also provides some support for inferring the long‐term value of Indian firms from market responses, as reflected in Tobin’s q. It is possible that market responses may be influenced by irrational investor sentiment (“fads”). Our results, however, would not be confounded by a general fad for Indian firms, because of the difference‐in‐difference approach described in Section IV below. They are also robust to the existence of a fad for large Indian firms, as our results survive when comparing smaller firms that were differentially affected by the reforms. A fad that closely tracked the precise legal criteria for the application of Clause 49 – which is what would be required to explain our results – is extremely unlikely.
10
it
ititititq
)assets of Book value()stockcommon of ueMarket val()stock preferred of Book value()debt of Book value( ++
=
(1)
The book value of debt is proxied by the Prowess variable “borrowings,” and the book
value of preferred stock by the Prowess variable “preference capital.” The book, rather
than market, value of preferred stock is used because preferred stock is very thinly
traded, if at all. The market value of common stock uses data from Prowess on share
prices and on the number of common shares outstanding. The share price is calculated
as the 365‐day average of the daily stock prices reported in Prowess.14 The denominator
uses the Prowess variable “total assets.”
The formulation in Eq. (1) corresponds closely to standard definitions of q in the
literature (e.g. Kaplan and Zingales, 1997; Gompers, Ishii, and Metrick, 2003; Desai and
Dharmapala, 2008), with some caveats. First, deferred tax liability is omitted in Eq. (1);
however, a definition of q incorporating deferred tax liability is used in robustness
checks (and leads to similar results). Second, it is possible that some recently‐issued
debt is omitted by Prowess in its “borrowings” variable and reported instead as
“current liabilities.” To address this possibility, the basic analysis uses current liabilities
as a control variable, and a definition of q incorporating current liabilities is used in
robustness checks (again, this leads to similar results). The values of q (as defined in Eq.
(1)) calculated from the Prowess data include some obvious outliers; for instance, the
maximum observed value is 1009.2. Thus, in the basic analysis below, q is Winsorized
14 The 365‐day average is used because using the December 31 price (to correspond to the Prowess financial statement variables) may be subject to seasonal factors, or to a high degree of randomness due, for instance, to infrequent trading. The use of the 365‐day average tends to bias against the paper’s findings – e.g., the estimated response of q to a legal change in October of 2004 would understate the effect, as q is averaged over all of 2004, while investors could only respond to the change (if it was unanticipated) in or after October.

11
from above at the 5% level; however, alternative formulations of q lead to similar
results.15
The central independent variable of interest captures the application of the
Clause 49 rules and enforcement provisions. As was pointed out in the discussion
above, the implementation of Clause 49 took place through a number of steps
(illustrated in Figure 1). In 1999, the set of firms that would eventually be subject to
Clause 49 was identified. However, compliance was not expected to be immediate as
noted in Part II. The largest firms (those listed under flag “A” at the BSE) were
expected to comply in 2001 (Group 1). A group of medium‐sized firms were expected to
comply in 2002 (Group 2). The remaining Clause 49 firms (the smallest in size) were
expected to comply in 2003 (Group 3).16 While implementation was phased in for
existing firms, all firms that listed for the first time in 2000 or subsequent years were
expected to comply from the time of listing (regardless of their size). The date of listing
is not reported in Prowess.17 However, it is possible to identify those firms that enter the
Prowess dataset in 2000 or a subsequent year; these firms can be presumed to be newly‐
listed, and so are classified as being subject to Clause 49 from the first year in which
they enter the dataset.18 The results are robust, however, to omitting these new firms, or
to reclassifying them as not being subject to Clause 49.
Given the sequence described above, it is possible to construct a “reform”
variable (denoted Rit) capturing the applicability of Clause 49 that is time‐varying for a
15 In particular, Winsorizing q at 1% rather than 5%, using the log of q, defining q to include current liabilities or deferred tax liabilities, excluding the book value of preferred stock, and using the market‐to‐book ratio all lead to highly consistent results. 16 These various groups of firms are readily identified using the Prowess variables for “net worth” and “paid‐up share capital.” Prowess also reports the BSE listing flag. 17 Prowess reports the “year of incorporation,” but this does not necessarily correspond to the year in which the firm first became a publicly traded corporation. The firm may have been formed (“incorporated”) in one year and the promoters may have decided to list it at a later point in time. 18 This assumption is justified to the extent that Prowess is genuinely exhaustive in its scope. Admittedly, this introduces some possibility of misclassification; however, the results do not depend on how these new firms are treated in the analysis.
12
given firm, taking on the value 1 when firm i is subject to Clause 49 in year t, and zero
otherwise. Thus, for instance, a Group 2 firm (expected to comply in 2002) would have
Rit = 0 for 1998‐2001 and Rit = 1 for 2002‐2006. However, the enforcement provisions
(involving severe financial penalties) were introduced in 2004, after Groups 1, 2 and 3
were all supposed to be in compliance. Thus, while Rit is used in some supplementary
analyses, the basic analysis uses a simpler, non‐time‐varying indicator (denoted CL49i)
that takes on the value 1 if firm i was subject to Clause 49 by 2003, and 0 otherwise.19
This variable is used to construct a proxy for the applicability of severe penalties for
violation of Clause 49 (namely, the interaction between CL49i and an indicator for the
years 2004‐2006 – see Eq. (2) below).20
An obvious concern with this paper’s empirical design is the comparability of
those firms that were subject to Clause 49 and those that were not. To address this issue,
Figure 2 depicts the average size of Clause 49 firms and non‐Clause 49 firms (those that
were not subject to the reforms at any stage of the sample period).21 While the legal
criteria for the application of Clause 49 were defined in terms of paid‐up share capital
and net worth, Figure 2 uses a simpler and more intuitive summary characteristic of
firms – total assets. The Clause 49 criteria are positively correlated with total assets, but
only imperfectly so; thus, there is a considerable amount of overlap in asset size
between smaller firms subject to Clause 49 and those not subject to it. As shown in
19 A caveat to this characterization is that there are a few firms that experienced changes in paid‐up share capital that caused them to become subject to Clause 49 after 2003 (e.g. a firm whose paid‐up share capital increased from 2 to 3.5 crores in 2005 – typically due to a seasoned equity offering ‐ would have become subject to the new rules in 2005, but would not have been subject in 2004 or previous years). For this reason, CL49i (or more precisely CL49it) varies over time to a limited degree. However, there is relatively little change in paid‐up share capital over time for a given firm, so this issue only affects a very small number of firms. Omitting these firms from the sample leads to substantially similar results. 20 The variable representing the applicability of the reforms is thus a deterministic function of a number of observable variables – net worth, paid‐up share capitalization, year and whether the firm is newly‐listed. Thus, it is not feasible to use a nonparametric matching procedure to analyze the impact of the reforms, as there is no variation in “treatment” when controlling for these observable variables. 21 Note that Figure 2 uses all observations for which data on total assets exists, not just the estimating sample for the regression analysis.
13
Figure 2, Clause 49 firms are indeed considerably larger in terms of mean asset size.
This is primarily attributable, however, to Group 1 and Group 2 firms, rather than to
Group 3 firms (defined by Clause 49 as those with paid‐up share capital exceeding Rs. 3
crores (roughly US$750,000)). If attention is restricted to the non‐Clause 49 firms that fall
just below the Rs. 3 crore cutoff (specifically, those with maximum paid‐up share capital
between Rs. 1.5 and 3 crores),22 then these firms and the Group 3 firms have essentially
identical mean asset size. Similar patterns hold for sales and exports as for assets. The
analysis below uses this overlap in size to construct more precise tests of the central
hypothesis, focusing only on firms of similar size.
Figure 3 shows the average value of Tobin’s q for Clause 49 firms and non‐Clause
49 firms for each year of the sample period. Prior to the introduction of Section 23E in
2004, Clause 49 firms had somewhat lower q than did unaffected firms. Around the
time of the introduction of stronger penalties, however, the Clause 49 firms experienced
a substantial increase in q (relative to the control group of non‐Clause 49 firms). While
this increase appears to persist into the subsequent year (2005), it is not unreasonable to
expect that the market may have adjusted somewhat slowly to the new regime, as new
information appeared about the seriousness of the authorities. By 2006, the increase in q
appears to level off. Thus, the general pattern in Figure 3 is broadly consistent with the
paper’s hypothesis; however, the underlying growth in q for both groups of firms over
this period highlights the need to control for other relevant factors and, in particular, for
firm‐specific time trends.
Summary statistics for the basic estimating sample, which consists of 28,672
observations at the firm‐year level over the period 1998‐2006 on 4335 firms, are reported
22 In Figure 2 (and the analysis below), the cutoff for defining “larger” non‐Clause 49 firms is formulated to include all firms that had a maximum value of paid‐up share capital (at any point in the sample period) exceeding Rs. 1.5 crores but below 3 crores. Note, though, that there is relatively little change in paid‐up share capital over time for a given firm.

14
in Table 1. Note that this represents only about half the observations in Prowess for
financial statement data, because of the more limited availability of the share price data
used to construct q. Also, missing values for many of the control variables reduce the
sample size further in many of the regressions. Note also that the regressions (as
described below) are implemented in first differences, leading to the loss of the first
year’s observations even in the most basic specification.
IV. EMPIRICAL SPECIFICATION
The central hypothesis of the paper concerns the interaction between corporate
governance reforms and sanctions or enforcement provisions. As described above,
different groups of firms became subject to the Clause 49 reforms over the period 2000‐
2003. By 2003, all firms that were affected by the 2000 Clause 49 reforms were expected
to be in compliance with its provisions. However, there was no enforcement of these
rules, except through the threat of delisting. The aim of the basic analysis is to test the
impact of the stronger enforcement provisions that took effect in 2004 (involving severe
financial penalties). These penalties applied to all Clause 49 firms (but not of course to
firms that were not expected to comply with Clause 49).
In testing the hypothesis that stronger enforcement of Clause 49 provisions led to
an increase in firm value, the basic empirical specification is the following:
qit = β(CL49i*S23Et) + Xitγ + μi + git + δt + νit (2)
where qit is Tobin’s q (defined as in Eq. (1) above) for firm i in year t. CL49i is an
indicator variable for those firms that were subject to Clause 49 by 2003, as defined in
Part III above. S23Et is an indicator for years following 2003 (i.e. 2004‐2006), in which
Section 23E was applicable. The terms μi and δt are firm and year fixed effects,
respectively, and νit is the error term.

15
The basic approach used in Eq. (2) is a differences‐in‐differences approach where
the hypothesis is that β > 0, with Clause 49 firms constituting the “treatment” group and
unaffected firms the “control” group. An important class of alternative explanations for
any increase in firm value among Clause 49 firms is that, being larger and presumably
more successful, these firms may have experienced more rapid growth in value for
reasons unrelated to the reforms. Thus, it is vital to include (in addition to firm fixed
effects and year effects) the firm‐specific time trends git; here, gi represents the firm‐
specific growth rate in q for firm i.23 Hence, the estimated effect β represents the extent
to which a Clause 49 firm’s value deviates from its underlying trend following the
reforms, relative to the corresponding deviation for unaffected firms.
Xit is a vector of control variables. In the basic specification, it includes the
following. Changes in firm size over time are controlled for using sales. Revenue from
exports is often viewed as a particularly powerful sign of successful performance by
Indian firms, so total exports are included as a further control. A number of variables
are included to correct for potential mismeasurement of q. Given the issue of whether
the full book value of debt is captured by the “borrowings” variable in Prowess (see
above), current liabilities are included as a control. Intangible assets may be poorly
measured in the book value of assets (the denominator in Eq. (1)), so the two measures
of research and development (R&D) expenditures provided in Prowess (R&D on the
capital account and R&D on the current account) are included, along with advertising
expenses. Finally, to control for changes over time in the risk associated with a firm’s
23 The specification in Eq. (2) is sometimes described as a “random growth” or “random trend” model. It might be thought that in many contexts, q (being essentially a ratio of market to book valuation) would not exhibit a time trend, tending to converge towards one. However, in this dataset, there is a marked tendency for q to increase over time; for instance the mean (Winsorized) q in 1998 is about 0.7, while that in 2006 is about 1.2.

16
stock, a measure of stock price volatility is also included.24 A number of additional
control variables are used in robustness checks, as described below.
The specification in Eq. (2) can be implemented using estimation in first
differences (see Wooldridge, 2002, pp. 315‐316). This involves estimating:
Δqit = βΔ(CL49i*S23Et) + ΔXitγ + gi + ζt + ηit (3)
where Δqit = qit ‐ qi,t‐1, and other changes are defined analogously; ζt is the year effect and
ηit the error term in the first‐differenced model (representing the changes in δt and νit ,
respectively). Note that the firm effect μi in Eq. (2) drops out of Eq. (3). However, the
firm‐specific trend gi can be estimated by including a firm effect in the estimation of Eq.
(3).
V. RESULTS
V.1) Basic Results and Robustness Checks
The results using the specification described above are reported in Table 2. In the
first column, the specification is that in Eq. (3), excluding the firm‐specific trend gi (and
hence essentially equivalent to a model with firm and year effects). Using the full
dataset of over 4000 firms over the period 1998‐2006, there is a positive and statistically
significant association between the 2004 reforms and firm value (this and all subsequent
results use robust (White, 1980) standard errors that are clustered at the firm level).25
Adding firm‐specific time trends (Column 2) does not substantively change this result.
In Column 3, the basic set of controls is added. While this reduces the sample size
considerably due to the unavailability of data on some of the controls,26 the basic result
24 The volatility measure uses monthly data on firms’ stock prices. For firm i in year t, it represents the standard deviation of firm i’s monthly price across the months of year t; this is annualized, and scaled by firm i’s mean (annual) stock price in year t. 25 Clustering the standard errors also helps to address issues arising from serial correlation (Bertrand, Duflo and Mullainathan, 2004). 26 For instance, the monthly stock price data used to compute the volatility measure is unavailable for 2006, so including this control eliminates that year from the estimating sample.
17
is strengthened: stronger enforcement appears to lead to a positive effect on the value of
affected firms (relative to unaffected firms), and this effect is statistically significant at
the 1% level. The magnitude of this effect is also substantial: the estimated coefficient of
0.09278 implies an increase in q of over 0.09, which is over 10% of the mean value of q
(0.87) in the dataset.27
Moreover, the effect appears to be specifically related to the reforms in 2004, as
opposed to the wider environment associated with Clause 49. The initial announcement
of Clause 49 occurred in 1999, when the Birla Committee (KMBC) report specified
which categories of firms would be subject to the new rules. Column 4 shows that
Clause 49 firms seem to have experienced an increase in value in 1999 (relative to non‐
Clause 49 firms).28 However, this effect is only of borderline statistical significance;
moreover, adding the KMBC variable does not change the large and significant
coefficient on the Section 23E variable. Thus, while the initial announcement of the
reforms in 1999 may have had some impact on firm value, there was an additional effect
of the enactment of the 2004 sanctions that was larger in magnitude and stronger in
significance.
The basic result is robust to a variety of checks. The set of firms in the basic
sample includes government‐owned firms (SOEs) and firms in which foreign
corporations own controlling stakes (as the reforms in theory applied to them as well).29
However, it might be the case that foreign‐controlled firms follow home country
27 The “average treatment effect on the treated” (ATT) is even larger, as the mean q for Clause 49 firms in 2003 is 0.79. 28 This effect is broadly consistent with the findings of the event study of Black and Khanna (2007). Adding the time‐varying variable Rit, which reflects the nominal applicability of Clause 49 provisions to firm i in year t, also does not affect the large and significant coefficient on the Section 23E variable. Furthermore, the coefficient on Rit is indistinguishable from zero, suggesting that the nominal duty to comply with Clause 49 had little impact on firm value. This is not surprising, given that the initial impact of Clause 49 designation is likely to have been capitalized in 1999. Thereafter, the difference between e.g., Group 1 and Group 2 firms (which amounts to only one year’s difference in the date by which the firm is expected to comply) is unlikely to be important. 29 Foreign‐controlled firms are identified as those reported as “Private (Foreign)” in the business group data, while government‐owned firms are reported as either “Central Govt. ‐ Commercial Enterprises” or “State Govt. ‐ Commercial Enterprises.”

18
governance rules, and so are unlikely to be affected by the reforms. Further, SOEs may
in practice be insulated from the reforms or from their enforcement,30 and in any event
may not solely be motivated by profit maximization (Goswami, 2003). However, as
shown in Column 1 of Table 3, the results are robust to omitting foreign‐controlled and
government‐controlled firms from the sample.
Table 2 only includes a basic set of controls, but the results are robust to the
addition of a variety of other controls, such as additional measures of accounting
performance. For instance, adding profits before depreciation, interest and taxes
(PBDIT; a standard measure of accounting performance used for instance by Bertrand et
al. (2002)) or a measure of accounting returns (PBDIT divided by the book value of
assets) does not affect the basic results. A concern with any regression modeling firm
value is that q may be affected by forward‐looking information about firms’ future
prospects that is observable to investors but not to the researcher. These unobservable
factors can be proxied by future sales growth (computed as the change in sales from
year t to year (t + 1), divided by sales in year t). Adding this variable to the specification
leads to highly consistent results.31
It was noted earlier that Clause 49 applied to all newly‐listed firms from the date
of listing. However, these new firms cannot be identified with certainty in the Prowess
data. In the basic analysis, all firms that enter the dataset after 1999 are classified as
Clause 49 firms; however, this introduces the possibility of misclassification. Thus,
Column 2 of Table 3 reports the results from a sample excluding these new firms. The
30 The recent enforcement proceedings in India suggest that SOEs will not be exempt from enforcement (see Ashish Rukhaiyar, Navratnas Join Listing Rule Violators, THE ECONOMIC TIMES, 13 Sept., 2007; SEBI Pulls up 20 Clause 49 Violators, THE ECONOMIC TIMES, 12 Sept., 2007). 31 Another possible explanation for an increase in q for Clause 49 firms may be a decline in the book value of assets for these firms in 2004 (possibly induced by the reforms, if firms were previously exaggerating their book value). However, the book value of assets did not fall differentially in 2004 for Clause 49 firms (indeed, the difference‐in‐difference point estimate is positive, albeit insignificant). Another possible explanation could be that the non‐Clause 49 firms are more debt dependent than Clause 49 firms and that may influence q. We add debt/assets as a control as well as debt/equity and the results are qualitatively similar.

19
estimated effect is almost identical to that in Table 2 (and in any event the number of
firms involved is only 30, out of 2642 in the sample in Column 3 of Table 2). Moreover,
the results are also robust to reclassifying these firms as part of the non‐Clause 49
group.
VI.2) The Role of CalPERS
The identification of the Section 23E treatment effect relies on there being no
other confounding events that occurred in 2004. One potential violation of this
assumption arises from the role of foreign institutional investors. In April, 2004, the
California state employees’ pension fund (known as CalPERS) announced that India’s
stock market met its criteria for undertaking investment.32 CalPERS is well‐known (in
the US setting) as an activist shareholder with a keen interest in corporate governance
issues. Thus, it is possible that governance may have improved from 2004 not because
of the interaction of Clause 49 and Section 23E, but rather because of activism (or the
threat of activism) on the part of CalPERS and other foreign institutional investors. To
test for this possibility, we hand‐collect the Indian firms in which CalPERS invested
over the period 2004‐2006, using newspaper reports and CalPERS’ own annual
reports.33 This yields a list of 77 firms in which CalPERS had invested by 2006.
Excluding these firms34 from the analysis leads to results that are very similar to the
basic findings, as reported in Column 3 of Table 3 (the results are also robust when
using the full sample of firms with a time‐varying indicator for CalPERS ownership).
It is nonetheless possible, however, that CalPERS’ entry may have encouraged
other foreign institutional investors to follow suit. If these foreign institutions are better 32 See “India Gets Nod from Major US Fund”, BBC News, http://news.bbc.co.uk/go/pr/fr/‐/1/hi/business/3646781.stm, April 21, 2004; Omkar Goswami, “What CalPERS Should Mean to India Inc”, THE FINANCIAL EXPRESS, April 27, 2004. 33 CalPERS annual reports are available on their website: http://www.calpers.ca.gov/. See also “CalPERS in India: It’s $1bn & Counting”, THE ECONOMIC TIMES, April 18, 2007. 34 We exclude all these firms, rather than just the smaller group of firms in which CalPERS invested in 2004. This takes account of the possibility that the market anticipated in 2004 that CalPERS would invest in additional firms in the future, and capitalized the corporate governance benefits of these future acquisitions immediately.
20
monitors than the investors they replaced, then we might expect them to have a positive
governance effect on those firms they invested in from 2004‐2006. Prowess reports the
ownership structure of the firms in its dataset, including the percentage of a firm’s
shares owned by foreign institutional investors. In Column 4 of Table 3, we include in
the model the percentage of foreign institutional ownership, along with an interaction
between the percentage of foreign institutional ownership and those years (2004‐2006)
in which CalPERS invested in the Indian stock market. Clearly, the estimated effect of
Section 23E remains highly significant and is of even larger magnitude. Combined with
the evidence (discussed later in the paper) that foreign institutional ownership did not
increase significantly for Clause 49 firms in or after 2004, this suggests that the increase
in the value of Clause 49 firms is not attributable to the entry of CalPERS or other
foreign institutions into the Indian market.
V.3) Alternative Treatment and Control Groups
The central challenge associated with inferring the causal impact of the reforms
is of course the ability to identify a valid comparison group for those firms subject to the
reforms. The control group of unaffected firms in the analysis so far includes all non‐
Clause 49 firms. As shown in Figure 2, however, these firms are on average much
smaller than the Clause 49 firms. For a variety of reasons, these smaller firms may not
constitute good controls for the Clause 49 firms. One approach to addressing this
problem is to restrict attention to those non‐Clause 49 firms that are relatively close to
the cutoff for the applicability of Clause 49. Column 1 of Table 4 reports the results
using a sample that excludes all firms with a maximum value of paid‐up share capital
below Rs. 1.5 crores (roughly US$375,000). The basic result remains significant, and the
coefficient is even larger than in the basic specification.
As discussed above, there were three groups of firms subject to Clause 49: a
small group of very large firms (with listing flag “A” on the BSE) that were expected to

21
comply in 2001 (Group 1), a larger group of medium‐sized firms that were expected to
comply in 2002 (Group 2), and a large group of smaller firms that were expected to
comply in 2003 (Group 3). Group 3 firms were defined as having a value of paid‐up
share capital exceeding Rs. 3 crores. As shown in Figure 2, Group 3 firms (while subject
to Clause 49) are quite comparable in terms of asset size to those firms that were not
subject to Clause 49, but which have a maximum value of paid‐up share capital above
Rs. 1.5 crores. Column 2 of Table 4 reports the results of a specification that excludes the
Group 1 firms (i.e. 165 very large corporations). The comparison group remains the
non‐Clause 49 firms with a maximum value of paid‐up share capital above Rs. 1.5
crores. Again, the results are highly robust. Finally, Column 3 of Table 4 also excludes
the medium‐sized firms (Group 2). This reduces the sample by a further 1000 firms (in
addition to the 165 Group 1 firms that are already excluded), and leaves a remaining
group of Clause 49 firms (Group 3) that is highly comparable in terms of asset size to
the control group. Even in this setting, the basic result is robust, and indeed the
coefficient is larger in magnitude than in Table 2.
Notwithstanding the robustness of the results in Table 4, there remains a
potential concern about differences between Clause 49 and non‐Clause 49 firms in terms
of the criteria used in the law. Specifically, even among a set of firms with roughly
similar asset sizes, does the fact that some of these firms have larger paid up share
capital confound the results? Recall that paid up share capital is essentially the product
of the number of shares outstanding and the “face value” at which shares were
originally issued. These were determined at the time of incorporation in the past or
when the shares were originally issued (often decades before the sample period in this
analysis). Thus, for this to confound the results, it would have to be the case that firms
that had higher paid up share capital at the time of incorporation or when shares were
issued would have therefore experienced an increase in q (unrelated to the Clause 49
22
reforms) in 2004, relative to firms that had lower original paid up share capitalization,
but similar asset size as of 2004. Clearly, this seems highly unlikely, especially given the
various controls employed for changes in firm characteristics in 2004.35
V.4) A Regression Discontinuity Approach
As described above, the difference‐in‐difference analysis shows a large and
robust positive effect of the combination of Clause 49 and the strong penalties
embodied in Section 23E on firm value. The sharp discontinuity created by the rules
governing whether a firm is subject to Clause 49 enables the use of an alternative
technique: a regression discontinuity approach. This focuses more specifically on the
year in which the reform occurred and on the effect around the cutoffs for Clause 49.
Thus, the regression discontinuity approach can address any remaining concerns about
whether the effect primarily occurred in years after 2004, or whether it was driven by
firms that are far from the cutoffs at which the reforms were applied.
A basic regression discontinuity analysis would focus on the cross‐section of firm
values in 2004. A graphical illustration of this is shown in Figure 4.36 However, as we
have longitudinal data, it is possible to construct a stricter test of the hypothesis by
estimating a first‐differenced regression discontinuity (FD‐RD) model (e.g. Lemieux and
Milligan, 2008). The advantage of the first‐differenced specification is that it effectively
controls for unobservables that may affect a firm’s average level of q. The specification
is:
Δqi,2004 = βCL49i + f(si,2004, wi) + ΔX i,2004γ + Indi + εi,2004 (4)
35 Moreover, it should be remembered that the analysis allows for firm‐specific trends in q, and so even firms of very different sizes can serve as reasonable controls, as long as their trends in q are not affected by some other confounding factor that coincides with the reforms. 36 Figure 4 shows q in 2004 for the set of firms with net worth in the 0‐50 Rs. crores range that do not qualify for Clause 49 on the paid‐up share capital criterion (i.e. for which si,2004 < 3 in terms of Eq. (5) below). For these firms, net worth of 25 results in qualification for Clause 49; as expected, there is a substantial difference in q for firms above and below this threshold in Figure 4.

23
Here, Δqi,2004 = qi,2004 ‐ qi,2003. CL49i is the indicator variable for Clause 49 firms defined
above. In this context, it can be interpreted as the “treatment” associated with the
introduction of Section 23E penalties for Clause 49 firms in 2004. Thus,
CL49i = 1 if si,2004 ≥ 3 or wi ≥ 25 (5)
and 0 otherwise; si,2004 is firm i’s paid‐up share capitalization in 2004, and wi is the
maximum observed value of firm i’s net worth in years up to and including 2004 (both
measured in Rs. crores). Xi,2004 is a vector of controls, Indi is an indicator for firm i’s
industry,37 and εi,2004 is the error term.
The central identifying assumption of the FD‐RD approach is that f(si,2004, wi) is a
smooth function of paid‐up share capital and net worth. That is, f(si,2004, wi) controls for
any continuous impact of si,2004 or wi on the change in a firm’s value in 2004, while β
captures the discontinuous effect of the treatment (i.e. of becoming subject to Clause 49
and Section 23E at the thresholds specified in Eq. (5)).38 In the reported results in Table
5, f(si,2004, wi) is assumed to be linear in si,2004 and wi; however, the results are similar when
using a flexible polynomial functional form for f(si,2004, wi).39
Table 5 reports the results of the FD‐RD analysis. In Column 1, the estimated
treatment effect (corresponding to β in Eq. (4)) is approximately 0.05, which is
somewhat smaller but nonetheless comparable in magnitude to the difference‐in‐
difference estimate, and is statistically significant. This is especially notable because the
FD‐RD analysis only uses data from 2004; thus, it appears that the difference‐in‐
difference estimate is not driven by changes in q in subsequent years (which may
37 Firms are classified into 181 industry groups, based on Prowess data on industries. 38 There is some possibility of misclassification of newly listed firms, which may be subject to Clause 49 and Section 23E even if they do not satisfy the share capital or net worth thresholds. However, the results in Table 5 are robust to the omission of new firms. Also, adding a variable representing the first year in which a firm appears in the dataset (the proxy used to determine whether a firm is newly listed) to the arguments of f(.) leads to essentially identical results. 39 The flexible polynomial form includes quadratic and cubic (as well as linear) functions of si,2004 and wi.

24
potentially be unrelated to Section 23E). Moreover, this effect does not exist for other
years – for “false experiments” in 2003 (Column 2) and 2005 (Column 3), the estimated β
is statistically indistinguishable from zero, as would be expected if the 2004 effect is
indeed caused by the enactment of Section 23E.40
The sample in Column 1 includes all firms, including very large and very small
firms that are far from the Clause 49 thresholds. Thus, a possible concern is that the
results are driven by these types of firms. In Column 4, Clause 49 firms in Group 1 (the
very large firms with listing flag “A”) and non‐Clause 49 firms with maximum paid‐up
share capital below 1.5 crores are omitted; the estimated effect, however, increases in
both size and significance. In Column 5, Clause 49 firms in Group 2 are also omitted,
leaving treatment and control groups that are highly comparable in terms of asset size
(see Figure 2). Here, the effective sample size becomes quite small (while there are 670
observations, the estimated effect is within‐industry, and there are 129 industry groups
in Column 5). Nonetheless, the estimate is still large, and is of borderline statistical
significance.
VI. INTERPRETATION AND EXTENSIONS
VI.1) Discussion
The sequence of corporate governance reforms undertaken in India over the
2000‐2004 period, in particular the change in the sanctions regime in 2004, provides a
highly unusual opportunity to identify the causal effect of corporate governance
institutions on firm value. While the set of firms affected by the reforms was, on
average, very different along dimensions such as size from the unaffected firms (as
depicted in Figure 2), close examination of the rules for the application of the reforms
40 The years 2003 and 2005 are of particular interest because the set of firms subject to Clause 49 was the same in those years as in 2004. For earlier years, estimated β’s are also generally insignificant using the appropriate classification of Clause 49 firms for each year. For 2006, some controls are missing, but using the available control variables leads to an insignificant β.
25
enables the construction of treatment and control groups that appear to be quite
comparable. The difference‐in‐difference estimate reported in Table 2 is highly robust to
a variety of checks along these lines. In addition, an alternative approach – a regression
discontinuity analysis – also leads to very similar conclusions. Overall, the results
suggest that the stronger sanctions established in 2004 led to a significant increase in the
value of affected firms relative to that of unaffected firms.
This conclusion leads to the question of the mechanism through which the
enactment of sanctions affected firm value. The most obvious possibility is that the
prospect of public enforcement actions deterred insiders from engaging in various
forms of diversion. However, there were no enforcement or investigation proceedings
under Section 23E or Clause 49 until September 2007.41 These proceedings are still in
progress and, as of yet, no sanctions have been imposed. Of course, it is possible that
the threat of enforcement may affect behavior even if there are no actual enforcement
actions. Nonetheless, the paucity of enforcement actions casts some doubt on whether
the prospect of formal enforcement alone fully explains the results. However, it is not
uncommon in India for enforcement efforts to occur a few years after the promulgation
of new rules (Khanna, 2008b). Indeed, this pattern suggests that the absence of
enforcement until 2007 does not necessarily undercut the notion that the 2004 response
is in anticipation of enforcement coming at some point in the future. Moreover, in light
of this, it is possible that investors anticipated in 1999 (at the time of the initial
announcement of Clause 49) that enforcement would follow after a few years, and
capitalized the effects of this anticipated future enforcement into share prices. This
would, however, only make it more difficult to detect any effect in 2004, when penalties
were strengthened. 41 See Ashish Rukhaiyar, Navratnas Join Listing Rule Violators, THE ECONOMIC TIMES, 13 Sept., 2007; SEBI Pulls up 20 Clause 49 Violators, THE ECONOMIC TIMES, 12 Sept., 2007. Khanna (2008b) also argues that the support for the reforms among many Indian firms and the CII may have led investors to expect compliance with the new rules, even with relatively sparse public enforcement (relative to a scenario in which the reforms were imposed on unwilling firms).

26
Another possible explanation is that the enactment of severe sanctions may have
signaled an increase in reputational sanctions – i.e., that investors were more concerned
with governance issues and would punish poor governance practices more severely
than before.42 Anticipating these stronger reputational sanctions, insiders may have
been deterred from engaging in diversion. In this view, corporate governance has a
causal impact on firm value, but its effect need not operate through the formal
enforcement of sanctions. However, the crucial role of the precise thresholds for Clause
49 applicability – especially in the regression discontinuity analysis – seems to support
the importance of formal enforcement. Nonetheless, it is possible that reputational
sanctions may also be closely tied to these thresholds, if for instance disclosures
required by Clause 49 enable investors to obtain the information necessary to monitor
firms’ governance practices. Thus, formal and informal enforcement mechanisms may
interact and complement each other; disentangling their separate effects remains a task
for future research.
The rest of this section explores some possible additional consequences of the
reforms, focusing on the effects on cross‐listed firms, accounting performance,
tunneling within business groups, and foreign institutional investment. It should be
emphasized, however, that the post‐reform sample period is short, and the increase in
firm value does not necessarily imply that these types of changes would occur in the
short run. Rather, it is possible that the increase in q reflected a capitalization of longer‐
term improvements in the environment facing minority shareholders.
42 It is also possible that the enactment of the new sanctions may have had purely “expressive” effects ‐ involving the internalization of the Clause 49 rules as social norms, or facilitating coordination among firms on governance practices ‐ independently of enforcement. However, Khanna (2008b) argues that in the specific context of the Clause 49 reforms, these types of expressive effects are unlikely to have been important.

27
VI.2) Cross‐Listed Firms
A significant number of Indian firms were listed on European or US stock
markets in the years prior to the Clause 49 reforms. If the aim behind cross‐listing is to
signal or commit to superior governance practices, then it would seem that cross‐listed
firms should not be included within the treatment group of firms affected by the
reforms. We identify a list of 207 firms in the Prowess dataset that are known to have
cross‐listed in Europe or the US by the end of 2004.43 The basic results of this paper are
robust to the exclusion of these cross‐listed firms. Thus, this subsample does not appear
to be driving the results.
There are some additional issues of interest surrounding these cross‐listed firms.
Because they were subject to a stronger set of corporate governance rules prior to
Clause 49, it might be expected that their value would be unaffected by the reforms in
India. On the other hand, however, it is possible that complementarities between the
foreign governance regimes and Clause 49 might enhance the value of these firms – e.g.
if the foreign regimes stress disclosure while Clause 49 also addresses other issues such
as board structure, power, and enforcement, the combination of these rules may be
more beneficial than Clause 49 alone. Examining the effect of Section 23E for the cross‐
listed firms (using non‐Clause 49 firms as a control group) suggests an increase in q,
consistent with the latter story. However, as cross‐listed firms tend to be large and well‐
established, the non‐Clause 49 firms are not likely to be a good control group.
Addressing this problem by, for instance, excluding the largest firms (with listing flag
A) from the analysis leads to insignificant results. Thus, little can be said with any
degree of confidence about the effect of the reforms on cross‐listed firms.
43 See www.adr.com (maintained by JP Morgan Chase and Thompson Financial) and www.adrbnymellon.com/dr_directory.jsp (maintained by The Bank of New York Mellon).

28
VI.3) The Impact of the Reforms on Accounting Performance
An obvious channel through which firm value may increase is through
improvements in accounting performance. Table 6 reports the results of specifications
that test the impact of the introduction of Section 23E on accounting profits (defined as
“profits before depreciation, taxes and interest” or PBDIT) and on the return on assets
(PBDIT scaled by total assets, denoted ROA). The specification used is essentially that of
Eq. (3), with q replaced by the profit variables (the reported results also omit the control
variables, but the conclusions are not substantively changed when they are included). If
the firm‐specific time trends are omitted (Column 1), then it appears that profits rose
significantly in affected firms (relative to unaffected firms). However, this result does
not survive the inclusion of firm‐specific trends (Column 2). The effect on ROA is also
positive, but not significant either with or without time trends. Thus, while the point
estimates are positive, there is no robust evidence that accounting performance
improved significantly for affected firms, relative to unaffected firms, over the sample
period.
VI.4) The Impact of the Reforms on Tunneling
Many Indian firms belong to business groups. Consequently, a focus of the
literature on Indian corporate governance has been the possibility of tunneling, a form
of diversion that involves the controlling shareholders in a business group moving
funds from group firms in which their ownership stakes (and hence their cash flow
rights) are relatively low to group firms in which their ownership stakes are relatively
high. Bertrand, Mehta and Mullainathan (2002; hereafter BMM) develop a number of
tests for identifying tunneling within business groups. The simplest of these is the
following. Consider a given exogenous shock to the earnings of firms in a given
industry. This shock should affect the reported earnings of a stand‐alone (non‐group)
firm more than it does the reported earnings of a group firm. Suppose that the group
29
firm is one in which the controlling shareholders have low cash flow rights; then, they
will have an incentive to tunnel money out of the firm (through high‐interest loans, the
manipulation of transfer prices, or various other means). Similarly, if the group firm is
one in which the controlling shareholders have high cash flow rights, it will also have
reduced sensitivity to industry‐level shocks, as money is tunneled into the firm
regardless of its industry’s performance.
BMM implement their test using the following specification:
yit = β0ŷit + β1(GRPi* ŷit) + Xitγ + μi + δt + νit (6)
where yit is firm i’s income in year t; ŷit is a measure of the exogenous shock experienced
by firm i in year t, calculated as the mean income for firms (other than i itself) in firm i’s
industry in year t. GRPi is an indicator variable for firms that are reported by Prowess as
belonging to a business group, Xit is a vector of controls,44 μi is a firm effect, δt is a year
effect, and νit is the error term. Tunneling is inferred to exist under this approach if β1 <
0. Column 1 of Table 7 reports the results from estimating Eq. (6) over the 1998‐2006
sample period. The negative estimate of β1 is consistent with tunneling, but (unlike in
BMM’s 1989‐1999 sample) it is not statistically significant.
The Clause 49 reforms might be expected to have reduced the prevalence of
tunneling. The following specification, based on Eq. (6), can be used to test this
formally:
yit = β0ŷit + β1(GRPi*ŷit) + β2(CL49i*S23Et) + β3Rit + β4((CL49i*S23Et)*(GRPi* ŷit)) + β5Rit
+ β6Rit*(GRPi* ŷit)) + β7(CL49i*KMBCt) + β8((CL49i*KMBCt)*(GRPi* ŷit)) + Xitγ
+ μi + δt + νit (7)
44 The controls in BMM are the natural log of total assets, an interaction between the log of assets and ŷit, and an interaction between the firm’s year of incorporation and ŷit.

30
Here, CL49i*S23Et is the interaction term that represents whether firm i in year t is
subject to the Section 23E financial penalties for Clause 49 violations. Rit is the (time‐
varying) variable that captures whether firm i was expected to comply with Clause 49
in year t. CL49i*KMBCt is an interaction term between the indicator for Clause 49 firms
and an indicator for those years (1999‐2006) after the initial announcement of the
reforms by the Birla Committee (KMBC).45 The basic question is whether the relative
under‐response of group firms to industry‐level shocks is reduced by Section 23E
sanctions (i.e. β4 > 0), by the nominal application of Clause 49 (i.e. β5 > 0), and/or by the
announcement of Clause 49 (i.e. β8 > 0). Column 2 of Table 7 reports the results from
estimating Eq. (7); all the parameters of interest have the expected sign (suggesting that
the reforms reduced the prevalence of tunneling), but only β8 is significant at the 5%
level.
Another test for tunneling developed by BMM rests on the idea that, among
group firms, those in which controllers or insiders have large ownership stakes will
respond more positively to earnings shocks than will group firms in which controllers
or insiders have lower ownership stakes. If the corporate governance reforms had the
effect of reducing tunneling, then the extent to which firms in which insiders own large
stakes would react more positively would have decreased following the reforms. More
formally, this test uses the following specification:
yit = β0ŷit + β1InsOwnit + β2(CL49i*S23Et) + β3Rit + β4(CL49i*KMBCt) + β5InsOwnit*ŷit
+ β6(InsOwnit*ŷit)*(CL49i*S23Et) + β7(InsOwnit*ŷit)*Rit
+ β8(InsOwnit*ŷit)*(CL49i*KMBCt) + Xitγ + μi + δt + νit (8)
45 Note that the effects on tunneling of sanctions, legal rules, and the announcement are all of independent interest, and so are all included in this test.
31
Here, InsOwnit is the percentage of inside ownership in firm i in year t, based on the
Prowess variable measuring total “promoter” ownership.46 The test examines whether
β6 < 0 (i.e. whether Section 23E reduced tunneling) or β7 < 0 (i.e. whether the application
of Clause 49 reduced tunneling). Unfortunately, ownership data is available in Prowess
on a consistent basis only from 2001, so β8 (the effect of the announcement of Clause 49
in 1999) cannot be estimated. The results in Column 3 of Table 7 show that β7 is indeed
negative; however, the estimated β6 is indistinguishable from zero.
BMM also propose that if tunneling occurs, then firms should respond to
earnings shocks experienced by other firms within the same business group. If
tunneling were affected by the reforms, then it would be expected that this tendency
would be reduced as a result of Clause 49. This can be tested using:
yit = β0ŷit + β1ĝŷit + β2(CL49i*S23Et) + β3Rit + β4(CL49i*KMBCt) + β5ĝŷit*ŷit
+ β6(ĝŷit*ŷit)*(CL49i*S23Et) + β7(ĝŷit*ŷit)*Rit + β8(ĝŷit*ŷit)*(CL49i*KMBCt) + Xitγ
+ μi + δt + νit (9)
where ĝŷit is the mean income for firms (other than i itself) in firm i’s business group in
year t. The hypotheses are that β6 < 0 (i.e. Section 23E reduced tunneling), β7 < 0 (i.e. the
application of Clause 49 reduced tunneling), and/or β8 < 0 (i.e. the announcement of
Clause 49 reduced tunneling). As shown in Column 4 of Table 7, the estimates of both β5
and β6 in Eq. (9) are indistinguishable from zero. However, the estimate of β8 is negative
and statistically significant.
Thus, there appears to be some evidence that the initial announcement of Clause
49 (in 1999) was associated with a reduction in tunneling for affected firms. However,
there is no statistically significant evidence for tunneling (using the BMM tests) overall
for the 1998‐2006 period. Thus, it is difficult to detect any changes in tunneling behavior
46 Note that the term “promoter” in the Indian context differs from standard US usage, and refers to firm insiders.

32
as a result of the subsequent application of the Clause 49 reforms, or the enactment of
Section 23E in 2004. Hence, it appears unlikely that the increase in q for Clause 49 firms
in 2004 was driven by changes in tunneling within business groups. However, it should
be remembered that this is only one particular form of insider diversion, and it is
possible that the market reaction capitalized expected reductions in other forms of
diversion after 2004. We leave further exploration of this for future research.
VI.5) The Impact of the Reforms on Foreign Institutional Investment
As argued above, the Indian corporate governance reforms were not externally
imposed, but rather driven by the affected firms themselves. In seeking governance
reforms, firms appear to have been motivated in large part by the desire to gain greater
access to capital, and especially to foreign institutional investment (Khanna, 2008a).
Thus, a natural question to address is whether the reforms had the desired impact – i.e.
whether foreign institutional investment (FII) rose in those firms affected by Section 23E
(relative to unaffected firms) and whether that might affect firm value by bringing in
potentially better monitors.
As Prowess reports the ownership structure of many of the firms in its dataset,
including the fraction of the firm owned by foreign institutional investors, this
hypothesis can be tested using a specification analogous to Eq. (3). In Columns 1 and 2
of Table 8, FII is measured as a fraction of the total ownership by non‐insiders; in
Columns 3 and 4, FII is measured as a fraction of the total ownership by non‐insider
(foreign and Indian) institutional investors. Using the former definition, there appears
to be an increase in FII for affected firms when firm‐specific time trends are omitted
(Column 1); however, this is not robust to the inclusion of firm‐specific trends (Column
2). For the second measure, the effect is indistinguishable from zero both with and
without trends. Thus, there is no robust evidence to suggest that the corporate
governance reforms caused an increase in FII over the sample period.

33
VII. CONCLUSION
While there has been extensive discussion across the fields of economics, law and
finance of the effects of corporate governance, the central challenge has been to find
credible evidence of a causal impact of governance practices on firm value, financial
development, and the wider process of economic development. This paper uses a
sequence of corporate governance reforms in India as a source of exogenous variation.
These reforms had several unusual features that facilitate identification of this causal
effect. In particular, a large group of firms was exempted from the reforms, and the
complex rules for the application of the reforms created considerable overlap in the
characteristics of affected and unaffected firms. Moreover, the introduction of severe
financial penalties for the violation of the new corporate governance rules took place
after the rules were already in force, thus decoupling the effects of substantive legal
rules and of enforcement.
Using this set of reforms, this paper finds a large and statistically significant
positive effect (amounting to over 10% of firm value) of the governance reforms in
combination with the sanctions. The primary contribution of the paper is thus to add to
the very limited body of causal evidence for the proposition that corporate governance
affects firm value. Moreover, the paper also highlights the role of enforcement – the
substantive legal rules are shown to have little effect until the enactment of severe
sanctions. However, it is unclear whether the effect of the sanctions occurred through
the anticipation of formal enforcement alone, or in conjunction with some other
mechanism (such as a signal of stronger reputational penalties). Further research is
required to distinguish between these possible explanations.
34
References
Armour, J., S. Deakin, P. Sarkar, M. Siems and A. Singh (2007) “Shareholder Protection and Stock Market Development: An Empirical Test of the Legal Origins Hypothesis” Centre for Business Research, University of Cambridge, Working Paper No. 358. Balasubramanian, N., B. S. Black and V. Khanna (2008) “Firm‐level Corporate
Governance in Emerging Markets: A Case Study of India” working paper. Bebchuk, L. A., A. Cohen, A. and A. Ferrell (2004) ʺWhat Matters in Corporate Governance?ʺ Harvard Law School John M. Olin Center Discussion Paper No. 491. Bertrand, M., E. Duflo and S. Mullainathan (2004) “How Much Should We Trust
Difference‐in‐Difference Estimators?” Quarterly Journal of Economics, 119, 249‐275. Bertrand, M., P. Mehta and S. Mullainathan (2002) “Ferreting out Tunneling: An Application to Indian Business Groups” Quarterly Journal of Economics, 117, 121 ‐148. Bertrand, M. and S. Mullainathan (2003) “Enjoying the Quiet Life? Corporate Governance and Managerial Preferences” Journal of Political Economy, 111, 1043‐ 1075. Black, B. S., H. Jang and W. Kim (2006) “Does Corporate Governance Affect Firms’
Market Values? Evidence from Korea” Journal of Law, Economics & Organization, 22, 366‐413.
Black, B. S. and V. Khanna (2007) “Can Corporate Governance Reforms Increase Firm Market Values? Event Study Evidence from India” Journal of Empirical Legal Studies, 4, 749‐796.
Black, B. S., W. Kim, H. Jang, and K. S. Park (2005) “Does Corporate Governance Predict Firms’ Market Values: Time‐Series Evidence from Korea” University of Texas Law and Economics Working Paper #51.
Coffee, J. C., Jr. (2007), “Law and the Market: The Impact of Enforcement” Working paper, at http://papers.ssrn.com/paper.taf?abstract_id=967482. Desai, M. and D. Dharmapala (2008) “Corporate Tax Avoidance and Firm Value” Review of Economics and Statistics, forthcoming. Durnev, A., and E. H. Kim (2005) “To Steal or Not to Steal: Firm Attributes, Legal
Environment, and Valuation” Journal of Finance, 60, 1461‐1493. Gompers, P. A., J. Ishii and A. Metrick (2003) “Corporate Governance and Equity
Prices” Quarterly Journal of Economics, 118, 107‐155. Goswami, O. (2003) “India: The Tide Rises Gradually” in C. P. Oman (ed.) Corporate Governance in Development, OECD Development Centre, 105‐160. Greenstone, M., P. Oyer and A. Vissing‐Jorgensen (2006) “Mandated Disclosure, Stock
Returns, and the 1964 Securities Act Amendments” Quarterly Journal of Economics,
35
121, 399‐460. Griffin, J.M., P.J. Kelly and F. Nardari (2007), “Measuring Short‐Term International
Stock Market Efficiency” Working paper, at http://ssrn.com/abstract=959006. Jackson, H. E. and M. J. Roe (2008), “Public and Private Enforcement of Securities Laws:
Resource‐Based Evidence”, working paper, at: http://ssrn.com/abstract=1000086. Kaplan, S. N. and L. Zingales (1997) “Do Investment‐Cash Flow Sensitivities Provide Useful Measures of Financing Constraints?” Quarterly Journal of Economics, 112,
169‐216. Khanna, V. (2008a), “The Anatomy of Corporate Governance Reform in Emerging
Markets: The Case of India”, working paper. Khanna, V. (2008b), “Law Enforcement & Stock Market Development: Evidence from India”, working paper. La Porta, R., F. Lopez‐de‐Silanes, A. Shleifer and R. W. Vishny (1998) “Law and Finance” Journal of Political Economy, 106, 1113‐1155. La Porta, R., F. Lopez‐de‐Silanes and A. Shleifer (2006) “What Works in Securities Laws?”Journal of Finance, 61, 1‐32. Lemieux, T. and K. Milligan (2008) “Incentive Effects of Social Assistance: A Regression Discontinuity Approach” Journal of Econometrics, 142, 807‐828. Litvak, K. (2007) “The Effect of the Sarbanes‐Oxley Act on Non‐US Companies Cross‐
Listed in the US” Journal of Corporate Finance, 13, 195‐228. Roe, M. J. (2006) “Legal Origins, Politics, and Modern Stock Markets” Harvard Law Review, 120, 460‐527. White, H. (1980) “A Heteroskedasticity‐Consistent Covariance Matrix Estimator and a
Direct Test for Heteroskedasticity” Econometrica, 48, 817‐830. Wooldridge, J. M. (2002) Econometric Analysis of Cross‐Section and Panel Data, MIT Press.

36
Figure 1: A Timeline of Clause 49 Reforms
Figure 2: Asset Size of Clause 49 and Non‐Clause 49 Firms
020
040
060
080
0M
ean
of th
e B
ook
Val
ue o
f Ass
ets
Clause 49 Firms Non-Clause 49 FirmsAll Small All Large
Note: This graph represents the mean book value of assets for four subgroups of firms, using the data on “total assets” in Prowess. Clause 49 firms are defined as all those that became subject to Clause 49 at some point over the sample period (including newly listed firms from 2000 and subsequent years). All other firms are classified as “Non‐Clause 49” firms. “Small” Clause 49 firms are defined as Group 3 firms (those with net worth < 25 crores and paid‐up share capital < 10 crores, but with paid‐up share capital ≥ 3 crores; these became subject to Clause 49 in 2003). “Large” non‐Clause 49 firms are those with maximum paid‐up share capital > 1.5 crores, but less than 3 crores.
Oct. 1, 1999:
KMBC report
Feb. 21, 2000: Clause 49 added to listing agreement; new firms expected to comply from date of listing
Oct. 12, 2004: Section 23E imposes significant financial penalties
March 31, 2001: Group 1 firms (listing flag “A”) expected to comply
March 31, 2002: Group 2 firms (paid up share capital ≥ 10 crores or net worth ≥ 25 crores) expected to comply
March 31, 2003: Group 3 firms (paid up share capital ≥ 3 crores) expected to comply

37
Figure 3: Tobin’s q for Clause 49 and Non‐Clause 49 Firms, 1998‐2006
.7.8
.91
1.1
1.2
Tobi
n's
q
1998 2000 2002 2004 2006Year
q (Clause 49 firms) q (non-Clause 49 firms)
Note: This graph depicts annual mean Tobin’s q (Winsorized at 5% from above) for Clause 49 and non‐Clause 49 firms for each year of the sample period (1998‐2006). Clause 49 firms are defined as all those that became subject to Clause 49 at some point over the sample period (including newly listed firms from 2000 and subsequent years). All other firms are classified as “Non‐Clause 49” firms.
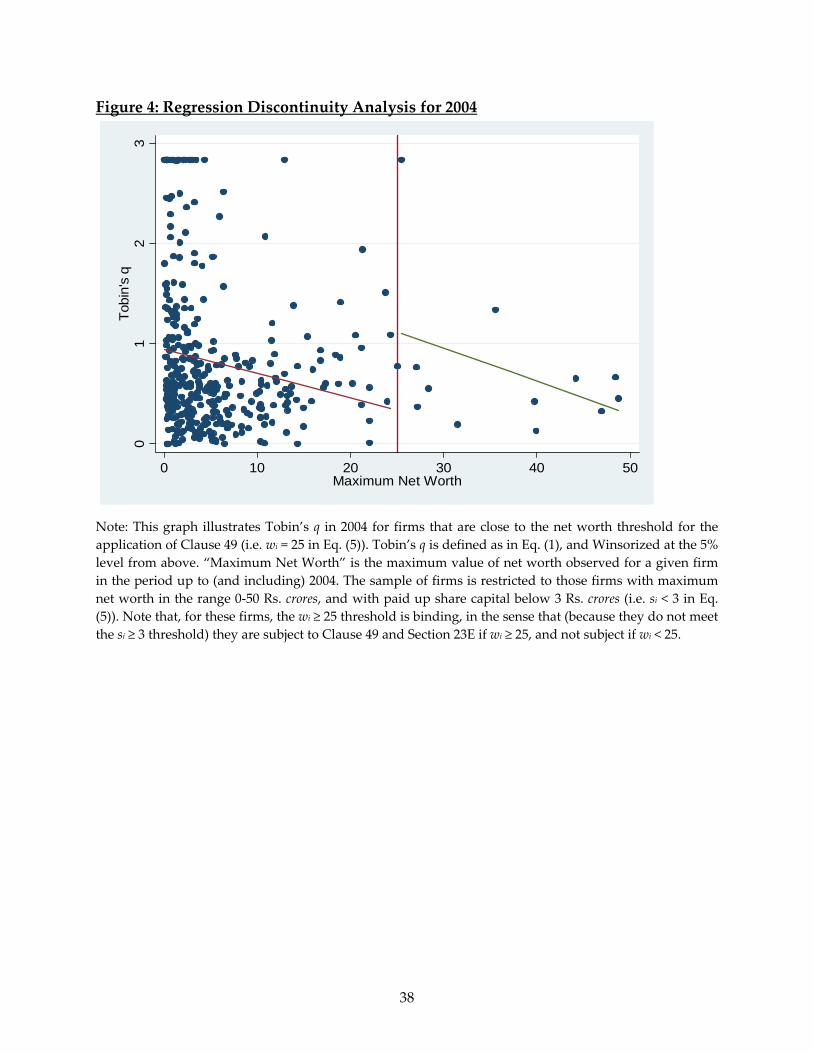
38
Figure 4: Regression Discontinuity Analysis for 2004
01
23
Tobi
n's
q
0 10 20 30 40 50Maximum Net Worth
Note: This graph illustrates Tobin’s q in 2004 for firms that are close to the net worth threshold for the application of Clause 49 (i.e. wi = 25 in Eq. (5)). Tobin’s q is defined as in Eq. (1), and Winsorized at the 5% level from above. “Maximum Net Worth” is the maximum value of net worth observed for a given firm in the period up to (and including) 2004. The sample of firms is restricted to those firms with maximum net worth in the range 0‐50 Rs. crores, and with paid up share capital below 3 Rs. crores (i.e. si < 3 in Eq. (5)). Note that, for these firms, the wi ≥ 25 threshold is binding, in the sense that (because they do not meet the si ≥ 3 threshold) they are subject to Clause 49 and Section 23E if wi ≥ 25, and not subject if wi < 25.

39
Table 1: Summary Statistics
Variable
Mean
Standard Deviation
Number of (Firm‐Year) Observations
Tobin’s q (Winsorized at 5% from above)
0.87 0.67 28672
(Clause 49)*(Section23E)
0.30 0.46 28672
Sales (Rs. crores)
356.56 3261.19 25415
Exports (Rs. crores)
36.26 352.77 25415
Current Liabilities (Rs. crores)
92.61 943.50 28672
R & D, capital account (Rs. crores)
0.32 5.18 28672
R & D, current account (Rs. crores)
18.80 506.44 28512
Advertising Expense (Rs. crores)
1.82 15.66 28672
Volatility
1.08 1.10 18550
Note: These descriptive statistics refer to the set of observations at the firm‐year level for which the market price data required to compute Tobin’s q exists (and which is used as the basic estimating sample in the regression analysis). Tobin’s q is defined as in Eq. (1), and is Winsorized at the 5% level from above. “(Clause 49)*(Section23E)” is an interaction term between an indicator for those firms that were subject to Clause 49 at any stage (including newly listed firms from 2000 onwards) and an indicator for the years in which Section 23E applied (2004‐2006). The volatility measure uses monthly data on firms’ stock prices. For firm i in year t, it represents the standard deviation of firm i’s monthly price across the months of year t; this is annualized, and scaled by firm i’s mean (annual) stock price in year t. All other variables are as described in the text.

40
Table 2: Corporate Governance Reforms, Enforcement, and Firm Value – Basic Results
(1)
(2)
(3)
(4)
Dependent variable: Change in Tobin’s q Changes in: (Clause49‐firm) 0.07174 0.06339 0.09278 0.09038 *(Section23E) (0.02141)*** (0.02401)*** (0.03461)*** (0.03316)*** (Clause49‐firm) 0.06376 *(KMBC) (0.03562)* Sales ‐0.00001 ‐0.00001 (0.00001) (0.00001) Exports ‐0.00002 ‐0.00002 (0.00002) (0.00002) Current ‐0.00004 ‐0.00004 Liabilities (0.00002)* (0.00002)* R & D (capital ‐0.00105 ‐0.00104 account) (0.00067) (0.00067) R & D (current ‐0.00001 ‐0.00001 account) (0.00001) (0.00001) Advertising ‐0.00036 ‐0.00036 Expense (0.00028) (0.00028) Volatility ‐0.00226 ‐0.00223 (0.00440) (0.00439) Year Effects? Y Y Y Y Firm‐Specific N Y Y Y Time Trends? No. of Obs. 22964 22964 12869 12869 No. of Firms 4087 4087 2642 2642 R‐squared 0.08 0.10 0.19 0.19 Note: The dependent variable is the change in Tobin’s q; q is defined as in Eq. (1), and Winsorized at the 5% level from above. The independent variable of interest is an interaction term between an indicator for those firms that were subject to Clause 49 at any stage (including newly listed firms from 2000 onwards) and an indicator for the years in which Section 23E applied (2004‐2006). “(Clause 49‐firm)*(KMBC)” is an interaction term between an indicator for those firms that were subject to Clause 49 at any stage (including newly listed firms from 2000 onwards) and an indicator for the years after the Birla Committee report (1999‐2006). Robust standard errors (clustered at the firm level) are in parentheses; * significant at 10%; ** significant at 5%; *** significant at 1%.
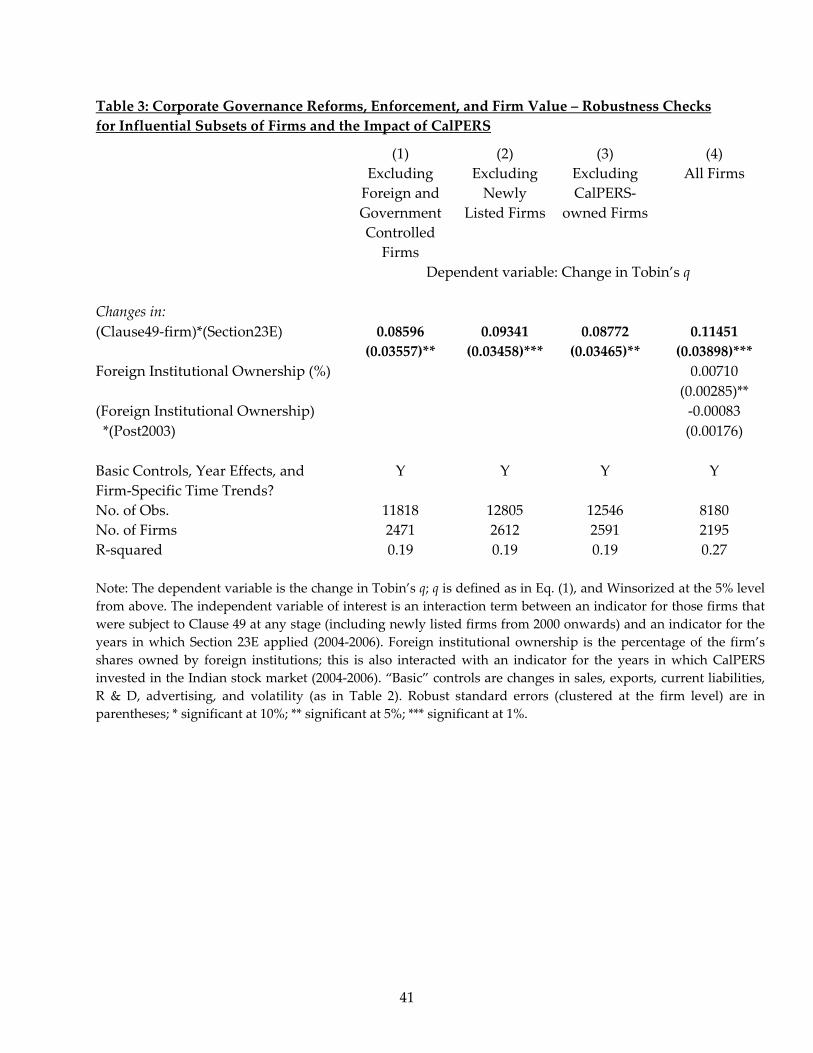
41
Table 3: Corporate Governance Reforms, Enforcement, and Firm Value – Robustness Checks for Influential Subsets of Firms and the Impact of CalPERS
(1) Excluding Foreign and Government Controlled
Firms
(2) Excluding Newly
Listed Firms
(3) Excluding CalPERS‐
owned Firms
(4) All Firms
Dependent variable: Change in Tobin’s q Changes in: (Clause49‐firm)*(Section23E) 0.08596 0.09341 0.08772 0.11451 (0.03557)** (0.03458)*** (0.03465)** (0.03898)*** Foreign Institutional Ownership (%) 0.00710 (0.00285)** (Foreign Institutional Ownership) ‐0.00083 *(Post2003) (0.00176) Basic Controls, Year Effects, and Firm‐Specific Time Trends?
Y Y Y Y
No. of Obs. 11818 12805 12546 8180 No. of Firms 2471 2612 2591 2195 R‐squared 0.19 0.19 0.19 0.27 Note: The dependent variable is the change in Tobin’s q; q is defined as in Eq. (1), and Winsorized at the 5% level from above. The independent variable of interest is an interaction term between an indicator for those firms that were subject to Clause 49 at any stage (including newly listed firms from 2000 onwards) and an indicator for the years in which Section 23E applied (2004‐2006). Foreign institutional ownership is the percentage of the firm’s shares owned by foreign institutions; this is also interacted with an indicator for the years in which CalPERS invested in the Indian stock market (2004‐2006). “Basic” controls are changes in sales, exports, current liabilities, R & D, advertising, and volatility (as in Table 2). Robust standard errors (clustered at the firm level) are in parentheses; * significant at 10%; ** significant at 5%; *** significant at 1%.

42
Table 4: Corporate Governance Reforms, Enforcement, and Firm Value – Robustness Checks Using Alternative Groups of Firms
(1) (2) (3) Dependent variable: Changes in Tobin’s q Treatment Group: All Clause 49
Firms Medium‐Sized and Small Clause
49 Firms
Small Clause 49 Firms
Control Group: Non‐Clause 49 Firms with Max Share Cap > 1.5
crores
Non‐Clause 49 Firms with Max Share Cap > 1.5
crores
Non‐Clause 49 Firms with Max Share Cap > 1.5
crores Changes in: (Clause49‐firm) 0.15299 0.13575 0.12367 *(Section23E) (0.04805)*** (0.04788)*** (0.05348)** Basic Controls, Year Effects, and Firm‐Specific Time Trends?
Y
Y
Y
No. of Obs. 12553 11461 4889 No. of Firms 2565 2400 1316 R‐squared 0.19 0.21 0.21 Note: The dependent variable is the change in Tobin’s q; q is defined as in Eq. (1), and Winsorized at the 5% level from above. The independent variable of interest is an interaction term between an indicator for those firms that were subject to Clause 49 at any stage (including newly listed firms from 2000 onwards) and an indicator for the years in which Section 23E applied (2004‐2006). “Basic” controls are changes in sales, exports, current liabilities, R & D, advertising, and volatility (as in Table 2). The control group of firms consists of those firms that were never subject to Clause 49, but for which the maximum observed value (over the sample period) of paid up share capital exceeded 1.5 crores. In Column 1, the treatment group consists of all firms that were subject to Clause 49 at any stage (as in Table 2). In Column 2, the treatment group consists of these Clause 49 firms, excluding those (generally very large firms) with Bombay (Mumbai) stock exchange listing flag “A”. In Column 3, the treatment group consists of Clause 49 firms, excluding those with listing flag “A” and those in Group 2 (i.e. with net worth ≥ 25 crores or paid up share capital ≥ 10 crores). That is, the Column 3 treatment group consists only of Group 3 firms (as defined in the text), along with a small number of newly‐listed firms. Robust standard errors (clustered at the firm level) are in parentheses; * significant at 10%; ** significant at 5%; *** significant at 1%.
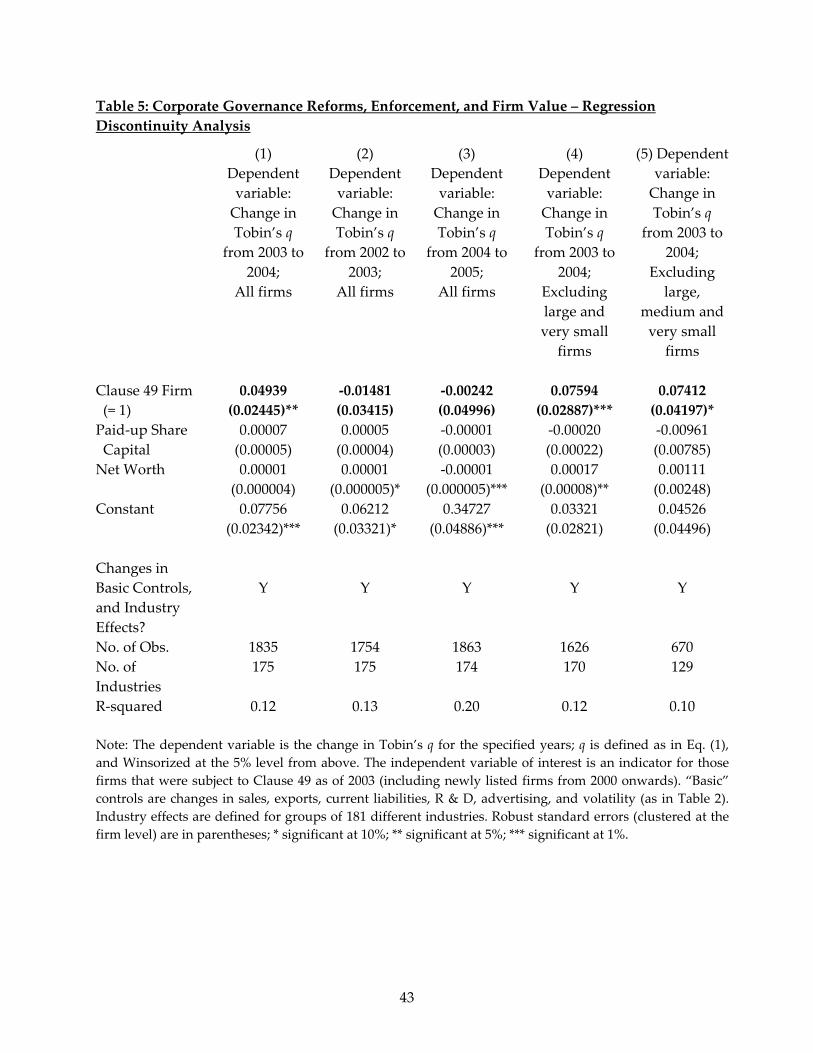
43
Table 5: Corporate Governance Reforms, Enforcement, and Firm Value – Regression Discontinuity Analysis
(1) Dependent variable: Change in Tobin’s q
from 2003 to 2004;
All firms
(2) Dependent variable: Change in Tobin’s q
from 2002 to 2003;
All firms
(3) Dependent variable: Change in Tobin’s q
from 2004 to 2005;
All firms
(4) Dependent variable: Change in Tobin’s q
from 2003 to 2004;
Excluding large and very small
firms
(5) Dependent variable: Change in Tobin’s q
from 2003 to 2004;
Excluding large,
medium and very small
firms Clause 49 Firm 0.04939 ‐0.01481 ‐0.00242 0.07594 0.07412 (= 1) (0.02445)** (0.03415) (0.04996) (0.02887)*** (0.04197)* Paid‐up Share 0.00007 0.00005 ‐0.00001 ‐0.00020 ‐0.00961 Capital (0.00005) (0.00004) (0.00003) (0.00022) (0.00785) Net Worth 0.00001 0.00001 ‐0.00001 0.00017 0.00111 (0.000004) (0.000005)* (0.000005)*** (0.00008)** (0.00248) Constant 0.07756 0.06212 0.34727 0.03321 0.04526 (0.02342)*** (0.03321)* (0.04886)*** (0.02821) (0.04496) Changes in Basic Controls, and Industry Effects?
Y
Y
Y
Y
Y
No. of Obs. 1835 1754 1863 1626 670 No. of Industries
175 175 174 170 129
R‐squared 0.12 0.13 0.20 0.12 0.10 Note: The dependent variable is the change in Tobin’s q for the specified years; q is defined as in Eq. (1), and Winsorized at the 5% level from above. The independent variable of interest is an indicator for those firms that were subject to Clause 49 as of 2003 (including newly listed firms from 2000 onwards). “Basic” controls are changes in sales, exports, current liabilities, R & D, advertising, and volatility (as in Table 2). Industry effects are defined for groups of 181 different industries. Robust standard errors (clustered at the firm level) are in parentheses; * significant at 10%; ** significant at 5%; *** significant at 1%.

44
Table 6: Corporate Governance Reforms, Enforcement, and Accounting Performance
(1) Dependent variable: Change in Profits
(2) Dependent variable: Change in Profits
(3) Dependent variable: Change in Return on Assets
(4) Dependent variable: Change in Return on Assets
Changes in: (Clause49‐firm) 8.13592 2.26844 0.02198 0.01763 *(Section23E) (1.69381)*** (1.98376) (0.02054) (0.02462) Year Effects? Y Y Y Y Firm‐Specific Time Trends?
N Y N Y
No. of Obs. 45180 45180 44949 44949 No. of Firms 8956 8956 8945 8945 R‐squared 0.0012 0.0014 0.0018 0.0020 Note: The dependent variable in Columns 1 and 2 is profits before depreciation, interest and taxes (PBDIT). The dependent variable in Columns 3 and 4 is the return on assets, computed as PBDIT divided by total assets. The independent variable of interest is an interaction term between an indicator for those firms that were subject to Clause 49 at any stage (including newly listed firms from 2000 onwards) and an indicator for the years in which Section 23E applied (2004‐2006). Robust standard errors (clustered at the firm level) are in parentheses; * significant at 10%; ** significant at 5%; *** significant at 1%.
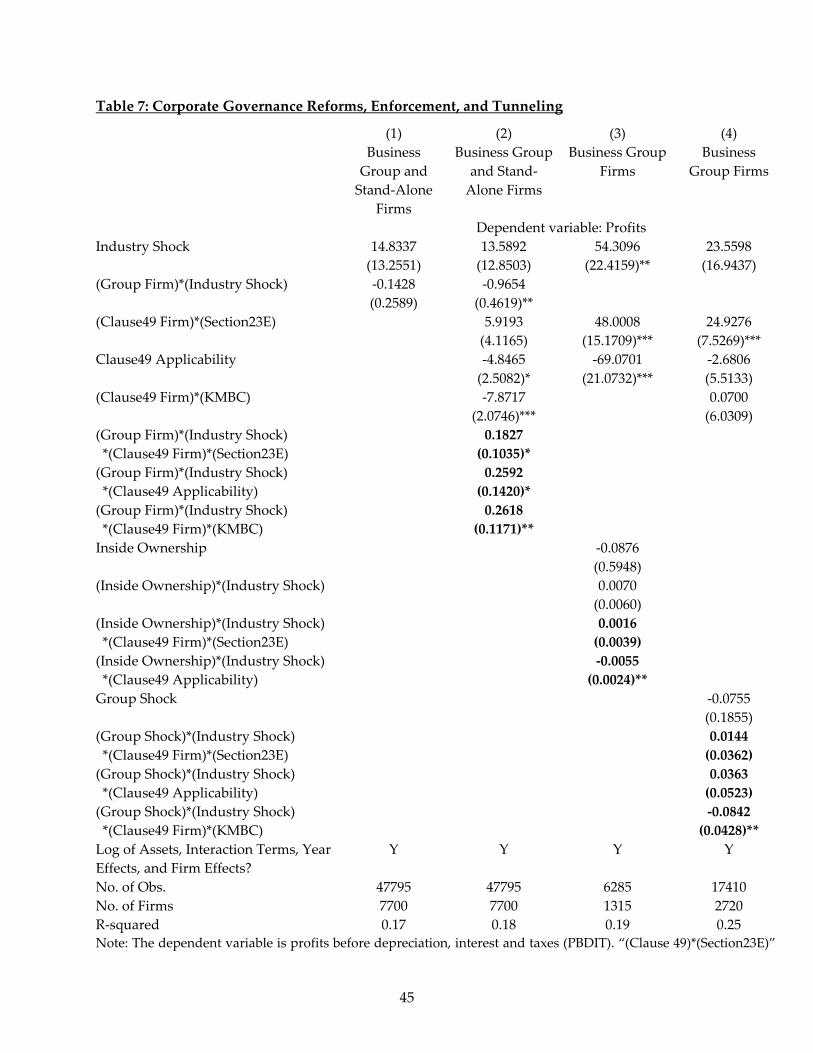
45
Table 7: Corporate Governance Reforms, Enforcement, and Tunneling
(1) Business Group and Stand‐Alone
Firms
(2) Business Group
and Stand‐Alone Firms
(3) Business Group
Firms
(4) Business
Group Firms
Dependent variable: Profits Industry Shock 14.8337 13.5892 54.3096 23.5598 (13.2551) (12.8503) (22.4159)** (16.9437) (Group Firm)*(Industry Shock) ‐0.1428 ‐0.9654 (0.2589) (0.4619)** (Clause49 Firm)*(Section23E) 5.9193 48.0008 24.9276 (4.1165) (15.1709)*** (7.5269)*** Clause49 Applicability ‐4.8465 ‐69.0701 ‐2.6806 (2.5082)* (21.0732)*** (5.5133) (Clause49 Firm)*(KMBC) ‐7.8717 0.0700 (2.0746)*** (6.0309) (Group Firm)*(Industry Shock) 0.1827 *(Clause49 Firm)*(Section23E) (0.1035)* (Group Firm)*(Industry Shock) 0.2592 *(Clause49 Applicability) (0.1420)* (Group Firm)*(Industry Shock) 0.2618 *(Clause49 Firm)*(KMBC) (0.1171)** Inside Ownership ‐0.0876 (0.5948) (Inside Ownership)*(Industry Shock) 0.0070 (0.0060) (Inside Ownership)*(Industry Shock) 0.0016 *(Clause49 Firm)*(Section23E) (0.0039) (Inside Ownership)*(Industry Shock) ‐0.0055 *(Clause49 Applicability) (0.0024)** Group Shock ‐0.0755 (0.1855) (Group Shock)*(Industry Shock) 0.0144 *(Clause49 Firm)*(Section23E) (0.0362) (Group Shock)*(Industry Shock) 0.0363 *(Clause49 Applicability) (0.0523) (Group Shock)*(Industry Shock) ‐0.0842 *(Clause49 Firm)*(KMBC) (0.0428)** Log of Assets, Interaction Terms, Year Effects, and Firm Effects?
Y Y Y Y
No. of Obs. 47795 47795 6285 17410 No. of Firms 7700 7700 1315 2720 R‐squared 0.17 0.18 0.19 0.25 Note: The dependent variable is profits before depreciation, interest and taxes (PBDIT). “(Clause 49)*(Section23E)”

46
is an interaction term between an indicator for those firms that were subject to Clause 49 at any stage (including newly listed firms from 2000 onwards) and an indicator for the years in which Section 23E applied (2004‐2006). “Clause 49 Applicability” is an indicator variable that takes on the value 1 for firm‐years in which firms were supposed to be complying with Clause 49. “(Clause 49)*(KMBC)” is an interaction term between an indicator for those firms that were subject to Clause 49 at any stage (including newly listed firms from 2000 onwards) and an indicator for the years after the Birla Committee report (1999‐2006). The industry shock is the mean PBDIT in that year for the firm’s industry (excluding the firm’s own PBDIT from the calculation). “Group Firm” is an indicator variable = 1 for firms that belong to business groups. The group shock is the mean PBDIT in that year for the firm’s group (excluding the firm’s own PBDIT from the calculation). All other variables are as defined in the text. The sample excludes foreign‐controlled and government‐controlled firms. Robust standard errors (clustered at the firm level) are in parentheses; * significant at 10%; ** significant at 5%; *** significant at 1%.
Table 8: Corporate Governance Reforms, Enforcement, and Foreign Institutional Investment
(1) Dependent variable: Foreign
Institutional Ownership as a Fraction of Outside
Ownership
(2) Dependent variable: Foreign
Institutional Ownership as a Fraction of Outside
Ownership
(3) Dependent variable: Foreign
Institutional Ownership as a Fraction of Institutional Ownership
(4) Dependent variable: Foreign
Institutional Ownership as a Fraction of Institutional Ownership
Changes in: (Clause49‐firm) 0.00442 ‐0.00277 0.01578 ‐0.00159 *(Section23E) (0.00141)*** (0.00176) (0.00998) (0.01303) Year Effects? Y Y Y Y Firm‐Specific Time Trends?
N Y N Y
No. of Obs. 13205 13205 9308 9308 No. of Firms 3585 3585 2526 2526 R‐squared 0.01 0.01 0.01 0.01 Note: The dependent variable in Columns 1 and 2 is foreign institutional ownership as a fraction of all outside (“nonpromoter”) ownership. The dependent variable in Columns 3 and 4 is foreign institutional ownership as a fraction of all institutional outside (“nonpromoter”) ownership. The independent variable of interest is an interaction term between an indicator for those firms that were subject to Clause 49 at any stage (including newly listed firms from 2000 onwards) and an indicator for the years in which Section 23E applied (2004‐2006). Robust standard errors (clustered at the firm level) in parentheses; * significant at 10%; ** significant at 5%; *** significant at 1%.

47
Appendix 1: Summary of Clause 49
Characteristic Clause 49
Director Independence
• Requirement – 50% independent directors if Chairman is executive director or 33% if Chairman is a nonexecutive.
• Definition – no material pecuniary relationship with company, not related to Board or one level below Board and no prior relationship with the Company for the last 3 years.
• Nominee Directors of Financial Institutions ‐ considered independent.
Board Requirements & Limitations
• Meet 4 times a year (maximum 3 months between meetings) • Limits on number of committees a director can be on (10), but only 5 for
which director can be Chair of committee. • Code of Conduct (Ethics) required.
Audit Committee Composition
• At least 3 directors (two‐thirds must be independent). • All financially literate. • At least one having accounting or financial management experience.
Audit Committee Role & Powers
• minimum 4 meetings/year (gap between meetings not exceed 4 months). • broad role – review statutory and internal auditors as well as internal audit
function, obtain outside legal or other professional advise, and review whistleblower program if one exists amongst other things.
Disclosures
• Related party transactions, • Accounting treatments and departures, • Risk management, • Annual report include discussion of internal controls adequacy, significant
trends, risks, and opportunities, • Proceeds from offerings, • Compensation for directors (including nonexecutives and obtain
shareholders’ approval), • Details of compliance history for last 3 years. • Corporate governance reports (and disclose adoption, if any, of mandatory
and non‐mandatory requirements).
Certifications
• CEO & CFO: financial statements effectiveness of internal controls inform audit committee of any significant changes in the above.
• Auditor or Company Secretary: Compliance with corporate governance
Subsidiary Companies
• At least one Independent director of Holding Company should sit as a director on Board of material non‐listed Indian subsidiary.
• Significant transactions report to Holding Company Board (along with subsidiary board’s minutes).
Other
Recommendations: • Whistleblower policy is optional • Independent directors loses status as “independent” if served 9 years at
company • Training board members • Evaluate nonexecutive board performance.