vikramaditya jakkula washington state university [email protected] first international workshop...
Post on 19-Dec-2015
226 views
TRANSCRIPT

Vikramaditya Jakkula
Washington State University
Prediction Models for Smart Home Based
Health Care System
First International Workshop on Smart Homes for Tele-Health

Smart Environments
Adapt to needs
Cost effective and Reliable
Maximize comfort and security

MavHome: Smart Home ProjectProject Unique
Focus on entire homeHouse perceives and acts
SensorsControllers for devicesConnections to the mobile user and Internet
Unified project incorporating varied AI techniques, cross disciplinary with mobile computing, databases, multimedia, and others.
VJ AI@WSU © 2007 3

MavHome: Core Technologies1
Minimal Sequential Patterns Using “ED”
Given an input stream S of event occurrences O, ED: Partitions S into Maximal Episodes, Pmax. Creates Itemsets, I, from the Maximal Episodes. Creates a Candidate Significant Episode, C, for each
Itemset I, and computes one or more Significance Values, V, for each Candidate.
Identifies Significant Episodes by evaluating the Significance Values of the candidates.
VJ AI@WSU © 2007 4
MavHome: Core Technologies2
Decision Making using ProPHeT
ProPHeT is the main controlling component of the system.
It uses data filtered through Episode Discovery (ED) to create a Hierarchical Hidden Markov Model (HHMM).
HHMM represents a user model that includes all of the
episodes (e.g., entering a room, watching TV, sitting in a chair and listening to music, and so forth) that a person performs in the environment.
VJ AI@WSU © 2007 5

Experimentation Environment1
6VJ AI@WSU © 2007

Experimentation Environment2
MavHome Environment
MavLabMavKitchenMavPad
7VJ AI@WSU © 2007
Experimentation Environment3
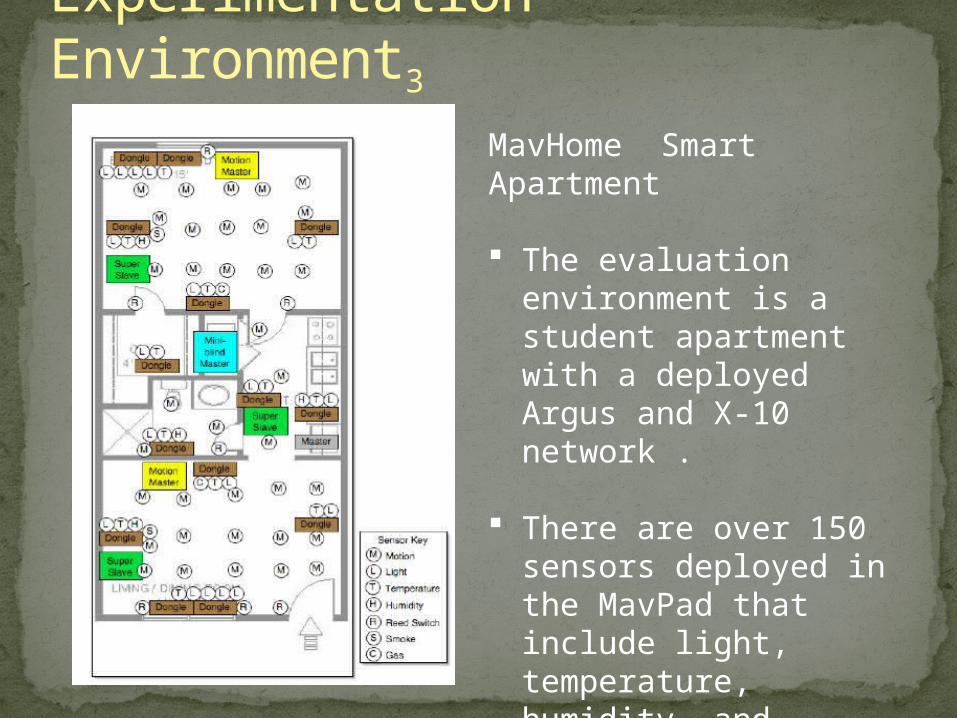
MavHome Smart Apartment
The evaluation environment is a student apartment with a deployed Argus and X-10 network .
There are over 150 sensors deployed in the MavPad that include light, temperature, humidity, and switches.

Earlier Work
Monitoring Health by Detecting Drifts and Outliers for a Smart Environment Inhabitant • help us gain information about different types of drifts
and outliers that are part of the inhabitant’s lifestyle• anomalies in inhabitants health such as blood pressure,
pulse and temperature values.• Gives information about sudden changes observed in
inhabitants health
Identification of Lifestyle Behavior Patterns with Prediction of the Happiness of an Inhabitant in a Smart Home• Identify correlations among everyday activity in smart
home.• we use the machine learning technique, the k-nearest
neighbor algorithm, to predict the state of wellness the inhabitant will experience on the following day.
• Show that a simple sensor network in smart home can be used to detect lifestyle patterns

Basic overall goal is to build a forecasting system for healthcare system in smart home.
Used 40 days data for training and 20 days data for testing.
Experiment 1: Use support vector machine algorithm found in Weka to predict whether health trends are increasing, decreasing or constant.
Experiment 2: Use automated forecasting tools, such as Phicast, which enables us to use Box-Jenkins method for forecasting the range of health data values.
Experimentation Overview

We are looking to prediction an increasing, decreasing or constant trend over time.
Data values range is very small and close to each other. (Look at the figure).
In a 2-D plot let us try to classify the trend. Whichtechnique do you think isbetter to use here?SVM! Oh yes!
Experiment 1: Why SVM?
0 5 10 15 20 25 30 35 40110
130
150
Sample Systolic Data
Sample Systolic DataMoving average (Sample Systolic Data)Linear (Sample Systolic Data)

Inst No. Actual Predicted Error1 2:decrease 2:decrease No2 1:increase 1:increase No3 1:increase 1:increase No4 2:decrease 2:decrease No5 2:decrease 2:decrease No6 2:decrease 2:decrease No7 1:increase 1:increase No8 1:increase 1:increase No9 1:increase 1:increase No10 2:decrease 2:decrease No11 2:decrease 2:decrease No12 1:increase 1:increase No13 2:decrease 1:increase Yes14 1:increase 1:increase No15 2:decrease 2:decrease No16 2:decrease 2:decrease No17 2:decrease 2:decrease No18 2:decrease 2:decrease No19 1:increase 2:decrease Yes20 2:decrease 2:decrease No
Results1 : Predicted systolic trend observations
Predicted systolic trend using test set
1 3 5 7 911 13 15 17 19
0
0.2
0.4
0.6
0.8
1
1.2
1.4
1.6
1.8
2
ActualPredicted
ActualPredicted
Dataset Correctly classified Instances
Incorrectly Classified Instances
Mean Absolute Error
Test Set 19 1 0.2
Cross Validation 19 1 0.2333
Plot of Predicted systolic trend [test set]

Result2: Predicted diastolic trend
observations InstNo. Actual Predicted Error1 2:decrease 1:increase Yes2 1:increase 1:increase No3 1:increase 1:increase No4 2:decrease 1:increase Yes5 2:decrease 1:increase Yes6 3:constant 1:increase Yes7 1:increase 1:increase No8 1:increase 1:increase No9 1:increase 1:increase No10 2:decrease 1:increase Yes11 2:decrease 1:increase Yes12 3:constant 1:increase Yes13 1:increase 2:decrease Yes14 1:increase 1:increase No15 2:decrease 1:increase Yes16 1:increase 1:increase No17 2:decrease 1:increase Yes18 2:decrease 1:increase Yes19 2:decrease 1:increase Yes20 1:increase 1:increase No
Predicted diastolic trend using test setPlot of Predicted diastolic trend [test set]
1 3 5 7 911 13 15 17 19
0
0.5
1
1.5
2
2.5
3
Actual
Predicted
ActualPredicted
Dataset Correctly classified Instances
Incorrectly Classified Instances
Mean Absolute Error
Test Set 8 12 3.635
Cross Validation
15 5 0.3111

Result3 : Predicted pulse trend observations
Instance No
Actual Predicted Error
1 2:decrease 2:decrease No2 1:increase 1:increase No3 1:increase 1:increase No4 2:decrease 2:decrease No5 2:decrease 2:decrease No6 2:decrease 2:decrease No7 1:increase 1:increase No8 1:increase 1:increase No9 1:increase 1:increase No10 2:decrease 2:decrease No11 2:decrease 2:decrease No12 1:increase 1:increase No13 1:increase 2:decrease Yes14 1:increase 1:increase No15 2:decrease 2:decrease No16 2:decrease 2:decrease No17 2:decrease 2:decrease No18 2:decrease 2:decrease No19 1:increase 1:increase No20 2:decrease 2:decrease No
Predicted pulse trend using test set
1 3 5 7 911 13 15 17 19
0
0.2
0.4
0.6
0.8
1
1.2
1.4
1.6
1.8
2
Actual
Predicted
ActualPredicted
Plot of Predicted pulse trend [test set]
Dataset Correctly classified Instances
Incorrectly Classified Instances
Mean Absolute Error
Test Set 19 1 0.2333
Cross Validation 19 1 0.2333

Box-Jenkins forecasting models are based on statistical concepts and principles.
Box-Jenkins forecasting models regarded to be the efficient forecasting technique.
Box-Jenkins forecasting provides some of the most accurate short-term forecasts.
Other tools such as SAS, SPSS, Demeter needed more data for running similar experiment, where as Phicast had a successful run.
Experiment 2: Why Phicast tool?

Results1 : Predicted systolic range valuesInstance #
Actual Recorded Systolic
Lower Predicted Value
Upper Predicted Value
Error [Yes/No]
1 134 126.4 142.1 No2 129 127.93 144.52 No3 132 128.13 144.44 No4 134 128.32 144.56 No5 126 128.1 144.7 Yes6 123 130.11 144.8 Yes7 119 129.32 145.34 Yes8 122 128.2 145.37 Yes9 135 129.33 145.6 No10 139 127.76 145.45 No11 133 126.63 145.44 No12 132 129.11 145.78 No13 134 128.21 146.34 No14 124 129.34 146.37 Yes15 153 129.57 146.45 Yes16 140 129.76 146.76 No17 137 130.95 146.95 No18 135 131.2 147.15 No19 102 131.34 147.34 Yes20 145 131.53 147.5 No21 123 131.73 147.73 Yes
No of Correctly Classified
No of Incorrectly Classified Percent Accuracy
Test Set 13 8 62%

Results2 :Predicted diastolic range valuesInstance #
Actual Recorded Diastolic
Lower Predicted Value
Upper Predicted Value
Error [Yes/No]
1 76 69 73.5 Yes2 73 68.88 73.56 No3 80 68.45 74.15 Yes4 72 68.13 74.04 No5 69 67.78 73.92 No6 68 67.56 73.8 No7 68 67.5 73.68 No8 72 67.43 73.56 No9 73 67.38 73.44 No10 84 67.32 73.32 Yes11 72 67.21 73.21 No12 73 67.09 73.09 No13 73 66.97 74.93 No14 78 66.85 74.78 Yes15 91 66.73 74.73 Yes16 80 66.61 74.45 Yes17 112 66.49 74.36 Yes18 71 66.37 74.27 No19 76 66.26 75.22 No20 75 66.14 75.18 No21 78 66.02 76.08 Yes
No of Correctly Classified
No of Incorrectly Classified Percent Accuracy
Test Set 13 8 62%
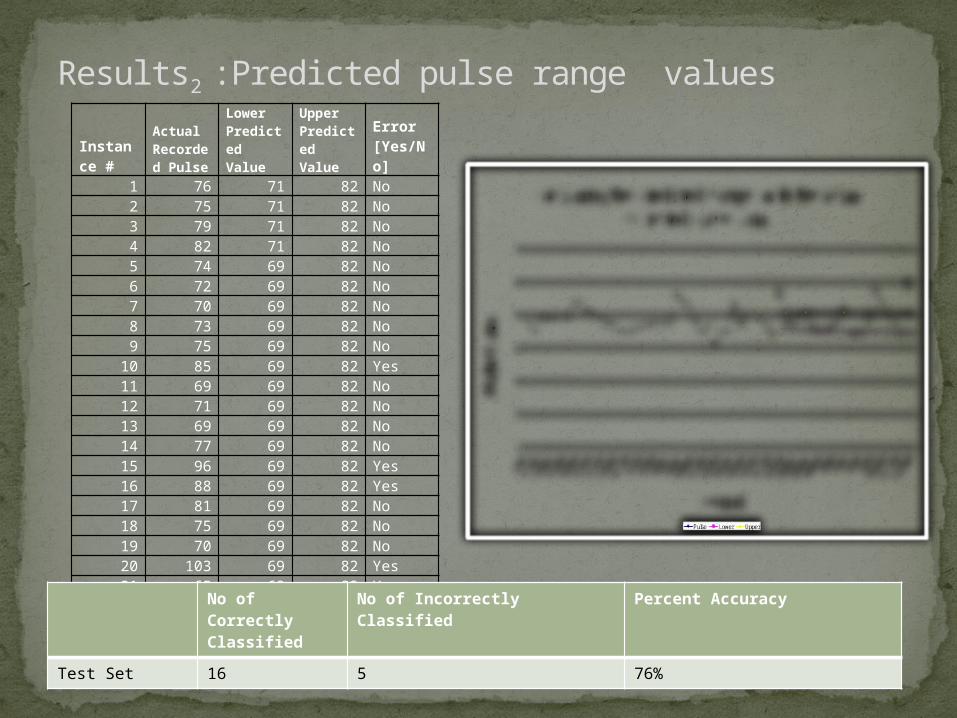
Results2 :Predicted pulse range valuesInstance #
Actual Recorded Pulse
Lower Predicted Value
Upper Predicted Value
Error [Yes/No]
1 76 71 82 No2 75 71 82 No3 79 71 82 No4 82 71 82 No5 74 69 82 No6 72 69 82 No7 70 69 82 No8 73 69 82 No9 75 69 82 No10 85 69 82 Yes11 69 69 82 No12 71 69 82 No13 69 69 82 No14 77 69 82 No15 96 69 82 Yes16 88 69 82 Yes17 81 69 82 No18 75 69 82 No19 70 69 82 No20 103 69 82 Yes21 65 69 82 Yes
No of Correctly Classified
No of Incorrectly Classified Percent Accuracy
Test Set 16 5 76%

Predicting time series data is difficult Continue performance on more larger
datasets.We observe that the prediction models act as
useful components to the health care system in smart homes.
Future work would include improving the prediction, collecting more data over time.
Anomaly detection based prediction for health care system and activities associated with healthcare.
Conclusions and future work

Questions!
Thank You