development of methods to evaluate hoof conformation and
TRANSCRIPT

Copyright is owned by the Author of the thesis. Permission is given for a copy to be downloaded by an individual for the purpose of research and private study only. The thesis may not be reproduced elsewhere without the permission of the Author.
Development of methods to evaluate hoof conformation and
lameness in New Zealand dairy goats and the effects of
trimming regimes on goat hoof health
A thesis
presented in complete fulfilment
of the requirements for the degree of
Doctor of Philosophy
in
Veterinary Science
at Massey University (Manawatu)
New Zealand
by
Laura Elizabeth Deeming
2020

ii
iii
Abstract
Lameness is a debilitating and painful condition. It is considered a major welfare
and economic issue in the dairy industry, due to its high prevalence and associated
production losses, and the serious impact it has on individual animals. One major
risk factor for lameness is hoof overgrowth and consequently poor hoof
conformation. Dairy goats in New Zealand are largely housed indoors; such
environments offer limited opportunity for natural hoof wear, therefore hoof
overgrowth is likely to be common. However, there are few data in New Zealand
evaluating hoof conformation, lameness, or how we can best maintain a normally
structured hoof and minimise lameness in commercially housed dairy goats.
The overarching aim of this thesis was to examine the hoof conformation and gait
of New Zealand dairy goats and to evaluate how these factors are impacted by hoof
trimming. Specifically, I aimed to develop and validate a hoof conformation
assessment for use in dairy goats, and to develop a reliable gait scoring system that
would allow detection of an uneven gait as a potential precursor to clinical lameness.
Furthermore, I aimed to use these methods to evaluate the immediate impacts of
hoof trimming and the longer-term impacts of early life hoof trimming and
subsequent trimming frequency on anatomical (e.g., hoof conformation, joint
positions, hoof growth) and behavioural (e.g., lying behaviour, gait) variables.
The hoof conformation assessment was determined to be reliable following
considerable training of observers; both the objective measures and subjective
scores could be used to accurately assess aspects of hoof conformation from
photographs. As the subjective scores are less time-consuming and do not require
technical equipment, I suggest they should be trialed for on-farm use.
A reliable 5-point gait scoring system was developed in a controlled setting at the
AgResearch Goat Research Facility. It included an “uneven gait” category,
allowing identification of goats which may be predisposed to developing clinical
lameness. However, whether it is feasible to detect an uneven gait from live
observations on commercial farms is still to be determined.
In an observational study conducted on 16 farms (n = 1099 goats; mean ± SD: 64 ±
9 goats/farm), goats that had not been trimmed prior to first mating (8.0 ± 0.70
months) had greater odds of poor hind hoof conformation at that time compared
with goats on farms that had already trimmed prior to mating. In the longer term,
goats on farms that had not trimmed before first kidding (14.8 ± 0.86 months) had
greater odds of having dipped heels on the hind hooves at the end of second
lactation (34.1 ± 0.90 months). In contrast, in a controlled experimental study

iv
conducted on one farm (n = 80 goats), only minor effects of early life trimming
(before first kidding) on hoof conformation were found, and these were not
consistent at assessments completed at the end of the first (13 months) and second
lactations (25 months). In the experimental study, as poor conformation was
observed in both the early and late trimmed treatments, it suggests that the
subsequent hoof trimming (3 times per year) was not frequent enough to prevent
overgrowth; the early life trimming treatment was not effective at this trimming
frequency. In the observational study, trimming frequency following first kidding
had no observable effects on hoof conformation. However, differences in the
housing environment and management may be strongly impacting hoof
conformation across the 16 farms.
In the short term, immediate beneficial effects of hoof trimming were observed in
the experimental study, with aspects of hoof conformation and joint positions
restored to more anatomically correct shapes and positions. There was also some
evidence of a transient effect of trimming on lying behaviour, with lying time
increasing the day after hoof trimming at 3 out of 4 assessments over the first two
years of life. An increase in lying time may be indicative of a pain response.
However, daily lying behaviour was highly variable so should be interpreted with
caution.
High proportions of dipped heels, misshaped claws and splayed claws, particularly
in the hind hooves, were recorded on 16 farms in the observational study and before
trimming in the goats on the experimental study. Interestingly, on the latter farm,
the prevalence of clinical lameness (scored from videos) in the same goats was
lower than expected over the 2-year study period, though prevalence of an impaired
gait (either uneven gait or clinical lameness) peaked after both kidding events. In
addition, the rate of hoof growth changed across the goats’ first two years of life,
slowing when the goats were in kid.
Overall, my findings suggest that the trimming regimes evaluated in these studies
were not adequate to prevent poor hoof conformation in goats housed in indoor
environments that do not promote hoof wear. In order to achieve good conformation
and long-term hoof health, dairy goat hoof management strategies should include
consideration of the timing of first hoof trimming and subsequent trimming
frequency, as well as providing an environment that promotes hoof wear.

v
Acknowledgements
There have been several times over the last few years that this mountain has seemed
insurmountable. I therefore have many people to thank, whom without their support
the completion of this thesis would not have been possible.
Firstly, I would like to give sincere thanks to my supervisors, Dr Jim Webster, Dr
Gosia Zobel, Assoc. Prof. Ngaio Beausoleil and Prof. Kevin Stafford for their
guidance, advice and valuable contributions to this research. I am certainly a better
researcher and scientist thanks to you all. Ngaio, thank you for your patience and
support, especially during this last year. I may not have reached the finish line
without you.
To the AgReserarch Animal Welfare team, you have all played a role in me
completing this thesis. The wonderful technicians, Frankie Huddart, Trevor Watson,
Amanda Turner, Sam Juby, Suzanne Dowling, and Briar Murphy, thank you all for
your help over the years with my trial work. I apologise again for the many hours
spent scrubbing goats’ hooves. To the scientists, Cheryl O’Connor and Mhairi
Sutherland, you have been there to offer guidance and a listening ear when I needed
it, thank you. Special thanks go to Cindy Todd for her advice and help this last year,
thank goodness you are a SAS merging whizz!
A huge thank you to the amazing AgResearch statisticians, particularly Vanessa
Cave and Maryann Staincliffe, thank you for your support and patience with my
many questions.
I am incredibly grateful to the vets that helped with my trial work, Ali Cullum I am
sure your back will never be the same again after trimming all those goats’ hooves.
Alex from Cambridge Equine Hospital, together we discovered that a goat can be
far trickier to get to stand square than a 17h thoroughbred!
To the Dairy Goat Co-operative thank you for the funding provided to assist in the
completion of the research in this thesis. To the farmers that have been involved in
my research, thank you for kindly and enthusiastically allowing me onto your farms
to complete my trial work.
Thank you for the financial assistance from the Helen E Akers PhD Scholarship for
helping to support me through the final year of my PhD. Travel to regional and
international conferences was made possible by grants from Massey University
Institute of Veterinary, Animal and Biomedical Sciences, the New Zealand Society
of Animal production, and the Ron Kilgour Memorial Trust.

vi
To all my friends here in Aotearoa and back home in the UK, thank you for your
support over the last few years and sharing this journey with me. To my friends in
the UK, I promise that now I can escape from the PhD-ing I will skype more often!
There are however a few friends that deserve a special mention: Elodie Ganche,
thank you for supplying numerous cups of tea and your amazing gluten free crepes.
You have been a true friend and a great pillar of support throughout the last few
difficult years, it means more than you will ever know. Gemma Lowe (a.k.a thesis
buddy), you have kept me sane over this last year (especially these last few weeks).
Our occasional glass of wine and cheese and crackers may not have helped the
productivity, but certainly helped the stress levels. Mel Hempstead, my fellow crazy
goat lady. We started off as office buddies and have ended up as firm friends. I am
looking forward to some adventures now you’re back in Aotearoa. Canadian Laura,
thank you for your friendship and support, I will miss our code cracker sessions at
lunchtime. Finally, Jess Poole, you knew long before me that I would one day
become Dr Deeming, thank you for believing in me.
Lastly, my overwhelming gratitude goes to my family. Mum, thank goodness you
were here (in New Zealand). There are not words enough to thank you for all you
have done for me, I would not have made it through the last few years without you.
Dad, for your never-ending support (including the SYF!) and words of wisdom.
The last few years and the PhD certainly lived up to our “Deeming’s don’t do easy”
motto. Amy, my older sister, thank you for always believing in me. My twin sister
Sarah, your trips out to New Zealand have given me something to look forward to.
The many study packages with goodies from home have made the hours at the
laptop a little easier to bear. We can now hopefully get planning that adventure.
And last but not least, Molly Moo, you
were a source of company and comfort
even on the darkest of days.

vii
Publications
Publications related to this thesis
Peer reviewed journal articles
Deeming LE, Beausoleil NJ, Stafford KJ, Webster J, Zobel G. 2019. The
development of a hoof conformation assessment for use in dairy goats. Animals 9,
973. (Chapter 2).
Deeming LE, Beausoleil N., Stafford KJ, Webster JR, Zobel G. 2018. Technical
note: The development of a reliable 5-point gait scoring system for use in dairy
goats. Journal of Dairy Science 101, 4491-4497 (Chapter 3).
Peer reviewed conference abstracts (appendix 2)
Deeming LE, Beausoleil NJ, Stafford KJ, JR Webster JR, Zobel G. 2018. The
importance of hoof trimming in maintaining normal joint angles in the hooves of
dairy goats. Universities Federation for Animal Welfare, Hong Kong. 25th–26th
November.
Deeming LE, Beausoleil NJ, Stafford KJ, JR Webster JR, Zobel G. 2016. Can a
workshop alter dairy goat farmers’ views on lameness. Interntational Society for
Applied Ethology, Auckland. 27th October.
Confidential client report
Zobel G, Deeming LE, Counsell L, Turner A, Bruce B, Wester J. 2018. Hoof care
and lameness in New Zealand dairy goats. Dairy Goat Cooperative (DGC) Client
Summary.
Other publications completed in parallel with thesis research
Peer reviewed journal articles (appendix 3)
Todd CG, Bruce B, Deeming LE, Zobel G. 2019. Short communication: Survival
of replacement kids from birth to mating on commercial dairy goat farms in New
Zealand. Journal of Dairy Science 10, 9382-9388.
viii
Peer reviewed conference proceedings (appendix 4)
Deeming LE, Beausoleil NJ, Stafford KJ, JR Webster JR, Zobel G. 2016.
Variability in growth rates of goat kids on 16 New Zealand dairy goat farms.
Proceedings of the New Zealand Society of Animal Production 137–138.
Zobel G, Tan BL, Deeming LE. 2016. The success of immediate removal of dairy
goat kids from the doe as a colostrum management strategy. Proceedings of the
New Zealand Society of Animal Production 169–171.

ix
Table of Contents
Abstract ................................................................................................................. iii
Acknowledgements .................................................................................................v
Publications .......................................................................................................... vii
Chapter One: Introduction ...................................................................................1
The New Zealand dairy goat industry ................................................................. 2
Animal welfare .................................................................................................... 3
Lameness ............................................................................................................. 5
Prevalence of lameness ....................................................................................... 7
Assessing lameness ............................................................................................. 9
Causes of lameness ............................................................................................ 13
Hoof conformation ............................................................................................ 19
Assessing hoof conformation ............................................................................ 24
Hoof trimming ................................................................................................... 27
Conclusion ......................................................................................................... 32
Rational for research and aims .......................................................................... 33
Thesis structure .................................................................................................. 33
Ethical statement ............................................................................................... 35
Declaration ........................................................................................................ 35
References ......................................................................................................... 35
Chapter Two: The development of a hoof conformation assessment for use in
dairy goats .............................................................................................................51
Abstract ............................................................................................................. 52
Introduction ....................................................................................................... 53
Materials and Methods ...................................................................................... 56
Results ............................................................................................................... 68
Discussion ......................................................................................................... 77
References ......................................................................................................... 81

x
Chapter Three: The development of a five-point gait scoring system for use
in dairy goats ........................................................................................................ 87
Abstract .............................................................................................................. 88
Technical Note ................................................................................................... 89
References ........................................................................................................ 103
Chapter Four: An observational study investigating the effects of early life
trimming regimes and subsequent trimming frequency on hoof conformation
of dairy goats ...................................................................................................... 107
Abstract ............................................................................................................ 108
Introduction ...................................................................................................... 109
Materials and Methods ..................................................................................... 112
Results .............................................................................................................. 118
Discussion ........................................................................................................ 127
References ........................................................................................................ 133
Chapter Five: Evaluating the immediate and long term-effects of hoof
trimming regimes on the structure and function of the hooves of dairy goats
............................................................................................................................. 139
Abstract ............................................................................................................ 140
Introduction ...................................................................................................... 141
Materials and methods ..................................................................................... 145
Results .............................................................................................................. 159
Discussion ........................................................................................................ 174
References ........................................................................................................ 185
Chapter Six: General Discussion ..................................................................... 193
Main findings and implications ....................................................................... 195
Management and animal welfare implications ................................................ 207
Limitations ....................................................................................................... 209
Future work ...................................................................................................... 212
Final conclusions ............................................................................................. 219
References ........................................................................................................ 219

xi
Appendix One: R code used in the development of the hoof conformation
assessment (Chapter 2) ......................................................................................227
Appendix Two: Conference abstracts ..............................................................235
Appendix Three: Survival of replacement kids from birth to mating on
commercial dairy goat farms in New Zealand ................................................239
Appendix Four: Conference proceedings ........................................................247
Appendix Five: Statements of contribution .....................................................253


1
Chapter One
Introduction

1
Lameness is a serious welfare issue in dairy animals due to its high prevalence
(Clarkson et al., 1996), and the serious impacts it has on individual animals (von
Keyserlingk et al., 2009). Lameness is associated with hoof overgrowth and
consequently poor conformation (Ajuda et al., 2014; Ajuda et al., 2019); thus, it is
important that overgrowth is minimised. The housing environment of dairy goats
however offers limited opportunity for natural hoof wear, resulting in hoof
overgrowth (Anzuino et al., 2010). This necessitates hoof trimming to correct the
overgrowth, restore conformation and reduce the risk of lameness.
Methods to accurately and reliably assess hoof conformation and gait are important
due to the negative impact poor conformation and lameness may have on animal
welfare (Capion et al., 2008), and production (Green et al., 2002). Because of the
impact of lameness on animal welfare, the New Zealand government has employed
new regulations focusing on preventing the transport of lame animals (MPI, 2018).
However, there is a dearth of research specifically investigating lameness or hoof
conformation in dairy goats anywhere in the world, and no data specific to New
Zealand. My PhD aimed to develop methods of assessing hoof conformation and
lameness in dairy goats, and to evaluate how hoof trimming regimes impact on them.
This introductory chapter provides background information that is relevant to the
experimental work described in this thesis. It includes a brief overview of the New
Zealand dairy goat industry and introduces animal welfare. There is a
comprehensive review of relevant literature on lameness, hoof conformation and
hoof trimming in dairy goats. Finally, the rationale for the research aims of this
thesis and the structure of the thesis is outlined including the main objectives of
each chapter.
2
A caveat to keep in mind when reading this introductory chapter and subsequent
chapters is due to the lack of published data available in dairy goats, the literature
available is largely from veterinary textbooks or non-peer reviewed conference
proceedings, and therefore reflects opinions based on clinical experience rather than
the findings of primary research. I therefore acknowledge that a number of
references used within this thesis are not evidenced based. Furthermore, because of
the scarcity of relevant goat-based literature I have had to extrapolate from other
species (mainly dairy cows). Although caution has been taken when making
assumptions from data in other species, I acknowledge that dairy goats are not small
cows and therefore the referenced literature needs to be considered in a circumspect
manner.
1.1. The New Zealand dairy goat industry
Dairy goat farming is a growing industry in New Zealand. Most of the dairy goat
farms in New Zealand are part of one cooperative, the Dairy Goat Co-operative (NZ)
Ltd. (DGC) and are based in the Waikato region of the North Island. The
cooperative comprises 72 farms, with herd size ranging from 210 to 1800 lactating
goats (average 650 goats) (Stafford and Prosser, 2016). The DGC is one of the
world’s leading manufacturers of goat milk nutritional powders for infants and
young children (Stafford and Prosser, 2016).
Dairy goats are commonly indoor housed as this allows for greater milk production
due to easy access to feed and shelter and a reduction in parasite infection (Stafford
and Prosser, 2016). In New Zealand, dairy goats are typically housed in open-sided
barns and bedded on wood shavings (Solis-Ramirez et al., 2011). Most farms
3
typically feed a fresh cut pasture based forage (Solis-Ramirez et al., 2011; Ganche
et al., 2015).
The majority of dairy goats (97.5%) in the Waikato region of New Zealand are
Saanen or Saanen Toggenburg crosses (Solis-Ramirez et al., 2011). Milking does
are typically milked twice a day and on average produce 81kg of milk solids per
lactation, with an average (mean ± SD) of 289 ± 26 days in milk (Ganche et al.,
2015). Kidding takes place in winter in New Zealand. The kidding start date ranges
from 15th June to the 1st August (data from kidding season 2013), with 80% of
kidding completed in 36 ± 25 days (Ganche et al., 2015).
1.2. Animal welfare
Animal welfare has been conceptualised into three overlapping areas of focus; 1)
basic health and functioning, 2) affective state, and 3) natural living (Fraser et al.,
1997). Biological health and function refers to an animal’s physical state and is
concerned with their health and ability to function, grow and develop (Fraser et al.,
1997). Affective state refers to how the animal feels and how it perceives its
environment. An animal can experience both positive and negative affective states,
with positive states (e.g. excited, playful) experienced as being either rewarding or
pleasurable, and negative states (e.g. pain, fear, hunger) experienced as aversive
and punishing (Mellor, 2015). There is an acknowledged overlap between the
physical and affective state of an animal. Sensory inputs that reflect the animal’s
internal physical state will influence the animal’s affective state (Hemsworth et al.,
2015). For example, tissue injury from hoof lesions cause neural impulses to the
brain which may then be converted into the experience of pain (Mellor and
Beausoleil, 2015). Natural living refers to whether the animal is provided with an

4
environment that enables natural behaviours to be performed (Fraser, 2003). Pain
may result in avoidance or withdrawal behaviour (Mellor, 2012) impacting natural
behaviours, but also impairing behavioural responsiveness to potentially positive
experiences (Mellor and Beausoleil, 2015). Due to the overlap between biological
function, affective state and natural living they need to be considered collectively
if the major concerns about animal welfare are to be addressed (Fraser et al., 1997;
von Keyserlingk et al., 2009).
Commercial animal production systems have traditionally focused on good
biological functioning, and using outcomes such as growth, reproduction and health
as indicators of good welfare. However, meeting the basic needs of food and water
to ensure survival and good biological function is no longer considered enough to
ensure that an animal has good welfare. “Indeed, what use is there in satisfying an
animal’s vital needs if the life the animal then lives is devoid of any enjoyment”
(Yeates and Main, 2008). There is general acknowledgement that good welfare
involves not only the absence of negative experiences, but also promotes
opportunities for positive experience (Mellor and Beausoleil, 2015). In addition,
high production does not necessarily equal good welfare, for example, there is
strong evidence demonstrating that lameness is a disease associated with high
production in dairy cows (Barkema et al., 1994; Alban et al., 1996; Green et al.,
2002).
Specifically for dairy goat welfare, the commercial housing systems do not
typically promote opportunity for positive experiences or a full range of natural
behaviours to be expressed (Zobel et al., 2019). For instance, climbing is in a goat’s
natural behavioural repertoire, however housing systems are generally devoid of
climbing opportunities. This impacts the goat’s ability to perform natural

5
behaviours and may therefore impact the animal’s affective state. Additionally, the
biological function of housed goats may be impacted as there are limited
opportunities for hoof wear and therefore hooves become overgrown.
1.3. Lameness
Lameness is a debilitating and painful condition (Whay et al., 1997) that impedes
normal walking gait due to the animal attempting to reduce weight on the affected
limb (Leach et al., 2009). A pain response represents an awareness by an animal of
potential damage to its body; the pain changes the animal’s physiology and
behaviour to reduce or avoid the damage and to promote recovery (Molony, 1997).
In the early stages of lameness a lame animal may present with an uneven gait, such
that there is decreased symmetry of limb movement (Winckler and Willen, 2001;
Flower and Weary, 2006). In the most severe case of lameness, an animal may be
unwilling or unable to bear any weight on an affected limb (Flower and Weary,
2006; Dyer et al., 2007). Lameness therefore has implications for both animal
welfare and productivity.
1.3.1. Animal welfare implications of lameness
Lameness is considered to be one of the most serious welfare issues faced by
the dairy industry, due to the considerable negative impacts it has on animals
(von Keyserlingk et al., 2009). Lameness is therefore one of the most important
animal-based welfare indicators (Whay et al., 2003) and is frequently
incorporated into animal welfare assessments (cows: Whaytt et al., 2003; sheep:
Phythian et al., 2012; goats: AWIN, 2015). When considering lameness, it has
the potential to impact all three areas of welfare concern mentioned above.

6
Lame animals may have reduced biological functioning, which can have serious
economic implications. For example, lameness is associated with decreased
milk production (cows: Warnick et al., 2001; goats: Christodoulopoulos, 2009),
fertility (cows: Melendez et al., 2003) and longevity (cows: Booth et al., 2004).
As lameness is generally indicative of a pain response (Whay et al., 1997), a
lame animal will be experiencing a negative affective state. Additionally, as
lameness limits the mobility of an animal, its ability to express some natural
behaviours is reduced. For example, lame cows are reported to lie for longer
and graze less than sound cows (Hassall et al.,1993), which may have
subsequent effects on welfare status (e.g. hunger, Norring et al., 2014).
1.3.2. Economic implications of lameness
As well as impacting animal welfare, lameness is reported to be one of the costliest
health problems affecting dairy cows (Shearer et al., 2005). It may be the second
most costly disease after mastitis in the dairy industry (Kossaibati and Esslemont,
1997). It is reported that 87% of the costs associated with lameness are due to
reduced milk yield, culling costs and reduced fertility, with the remaining 13% of
costs being attributed to labour, treatment and veterinary costs (Willshire and Bell,
2009). In cows, though milk yield decreases following lameness diagnosis
(Warnick et al., 2001), clinically lame cows can have a reduction in milk yield for
up to four months prior to diagnosis, and up to five months following treatment
(Green et al., 2002). This highlights the long-term impacts lameness can have on
milk production in dairy cows.
Lameness can reduce the reproductive performance of an animal in several ways.
For example, lameness is associated with a longer interval between calving and
7
conception in cows (Hernandez et al., 2001; Chapinal et al., 2013), and with an
increased number of services per pregnancy (Sprecher et al., 1997). Moreover a
lame dairy cow is 8.4 times more likely to be culled (Sprecher et al., 1997). Culling
costs include the loss of the lame animal, and the rearing cost of the replacement
heifer (Willshire and Bell, 2009). There are few data investigating the economic
implications of lameness in dairy goats, however a reduction in annual milk yield
has been reported in lame goats, specifically those with hoof lesions
(Christodoulopoulos, 2009; O'Malley, 2019).
1.4. Prevalence of lameness
Lameness is a serious animal welfare and economic concern in part due to the large
number of animals it affects worldwide. The average herd lameness prevalence in
dairy cows is around 20% (UK: Clarkson et al., 1996; Whay et al., 2002; US: Cook,
2003b; Espejo et al., 2006), but, much higher prevalence levels of 39% (Haskell et
al., 2006), 52% (Cook, 2003a) and 55% (von Keyserlingk et al., 2012) have been
reported.
The variation in reported lameness prevalence in dairy cow herds may be due to
high variability in environmental and management factors between farms (Clarkson
et al., 1996; Whitaker et al., 2000). The high variability will also be due in part to
whether estimates are based on data from trained researchers, veterinary surgeons
or farmers (Clarkson et al., 1996). For example, UK farmers estimated lameness
prevalence within their dairy cow herds to be 5%, but the prevalence when assessed
by trained researchers was 22% (Whay et al., 2002). Similarly, a study in the U.S
found cow herd managers significantly underestimated lameness, with the

8
prevalence of clinical lameness being 3.1 times greater, on average, than the
prevalence estimated by the herd managers (Espejo et al., 2006).
The reported lameness prevalence in sheep (8-10%) reared on pasture for meat
(Kaler and Green, 2008) is lower than in cows. However, it should be noted that the
data were farmer determined, and therefore may be an underestimation. Previous
observations on indoor housed dairy goat farms in the UK estimated the prevalence
of lameness to be between 9.1% (Hill et al., 1997) and 19.2 % (Anzuino et al., 2010).
A lameness prevalence of only 1.7% was reported on Norwegian dairy goat farms
(Muri et al., 2013). However, the authors of that study cautioned that crowded pens
made observations difficult and therefore some lame animals may have gone
unrecognised. Groenevelt et al. (2015b) reported high lameness prevalence (37%
and 67%) on two dairy goats farms in the UK, but these researchers intentionally
visited farms with high lameness levels.
In the only industry survey of prevalence of lameness on New Zealand dairy goat
farms (n = 30 farms), 57% of farms had lameness levels of 2% or less, 40% of farms
had 2-5% lameness and 3% of farms had over 5% lameness (Ganche et al., 2015).
It is important to note that these data were farmer reported and therefore lameness
may be underestimated. Reported prevalence will also depend on the gait scoring
system used to assess lameness and how sensitive it is to detect lower levels of
lameness. As the New Zealand survey did not provide a standardised definition of
lameness, these results must be cautiously interpreted.

9
1.5. Assessing lameness
Reduction and prevention of lameness is an important step in mitigating negative
animal welfare and economic implications in the dairy livestock industries (Mill
and Ward, 1994). Therefore, it is important that the lameness status of animals is
quickly and reliably identified as the early treatment of lame animals reduces the
prevalence of severe lameness and aids faster recovery (sheep: Kaler and Green,
2009; cows: Leach et al., 2012). There are two principal subjective gait scoring
methods used to assess the gait of dairy animals and therefore detect lameness.
1.5.1. Gait scoring
Subjective systems are typically used to assess gait in dairy animals. A numerical
rating scale (NRS) is the most commonly used subjective approach for ranking an
animal's walking ability by evaluating locomotory behaviours and postures
indicative of lameness. Generally, the higher the assigned gait score, the more
severe the lameness. The other main subjective approach is visual analogue scales
(VAS), which involve the observer making a score somewhere on a continuous line
with descriptions of extreme states at either end (Flower and Weary, 2009).
However, VAS are less commonly used than NRS, possibly due to reduced
reliability as they do not have clearly defined categories as with the NRS (Flower
and Weary, 2006). This review will focus on the use of NRS systems of gait
assessment.
Prey species such as cattle and goats are considered to be stoic animals, meaning
that it is unlikely they will show obvious behavioural response to pain until the
condition is advanced (Weary et al., 2006). A limp may be considered as an obvious
10
behavioural response, suggesting the lameness is in an advanced stage as the animal
has an apparent reluctance to bear weight on the affected limb. As lameness
commonly develops over time (de Mol et al., 2013), subtle signs of lameness such
as an uneven gait could be a precursor to a limp.
An animal should be considered lame if it fails to move in a sound manner on all
four limbs (Sprecher et al., 1997). Therefore, it is important that gait scoring
systems enable the more subtle signs of lameness (e.g. “uneven gait”) to be detected.
The 5-point NRS frequently used in dairy cows includes an “uneven gait” category,
which allows the discrimination of a slight variation from a “normal gait” (O
Callaghan et al., 2003; Espejo et al., 2006; Flower and Weary, 2006). A detailed (7-
point) scale including categories to detect an uneven gait was developed and
reliably used in sheep (Kaler et al., 2009). In that study observers were able to
identify sheep with an uneven gait; however, this was done entirely from recorded
video clips; these authors did not test the scoring system in a live, on-farm setting.
Generally, NRSs with fewer categories are used to assess gait in small ruminants in
an on-farm setting. For example, the fast speed with which goats exit the milking
parlour has resulted in a simple binary score (lame vs not lame) being used.
(Crosby-Durrani et al., 2016). This is due to the difficulties in detecting subtle signs
of lameness when the animal does not walk at a steady pace. Using NRS with fewer
categories will result in better observer agreement (Schlageter-Tello et al., 2014).
However, fewer categories mean that the system is not sensitive enough to detect
subtle signs of lameness.
An uneven gait may be recognised as a shortening of stride, the animal not “tracking
up” (i.e., the hind hoof not stepping into the placement of the front hoof) when

11
walking, or a swinging of the affected leg inwards or outwards at each stride (Van
der Waaij et al., 2005; Haskell et al., 2006). An uneven gait is not necessarily
indicative of lameness. For example, conformation, posture, and udder fill of the
animal may affect gait (Flower and Weary, 2009). However, using a gait scoring
system that includes this category provides an opportunity to investigate the cause
of the unevenness. Then if deemed necessary, these animals may be targeted for
treatment, rather than waiting until the lameness becomes more severe (Nalon et al.,
2014; Thomas et al., 2015).
There are limited data informing the development of an NRS for use in goats. The
AWIN (AWIN, 2015) system is commonly used in goat welfare assessments
(Battini et al., 2016; Can et al., 2016), and involves binary scoring (not lame vs
lame). However, this only recognises the most severe cases of lameness (i.e. not
weight bearing, moving on knees). A 4-point NRS has also commonly been used to
assess gait in goats (Hill et al., 1997; Anzuino et al., 2010). However, these are not
sensitive enough to detect subtle signs of developing lameness (e.g. an uneven gait).
Four-point NRS usually require a definite limp to be recognised for an animal to be
identified as lame and scores are then assigned based on limp severity. Mazurek et
al. (2007) used a 4-point system that did not require a definite limp to be recognised,
however the categories are poorly defined, making reproducibility difficult.
Additionally, the 4-point NRS described by Mazurek et al. (2007) and Hill et al.
(1997) did not offer a description of a “normal gait”. If clear definitions of both
normal and abnormal gait are not provided accurate and reliable assessments may
be difficult (Van Nuffel et al., 2015). Future work should focus on developing a
more detailed NRS system in dairy goats. This will enable more subtle signs of

12
developing lameness (i.e. an uneven gait) to be detected and at-risk animals
identified.
1.5.2. Monitoring behaviour to identify lameness
NRS are the most common method used to assess the gait of individual animals and
therefore herd lameness prevalence (Flower and Weary, 2009). However, NRS are
time consuming (Thomsen, 2009) and subjective (Channon et al., 2009). The
experience (Flower and Weary, 2009) and occupation (Kaler and Green, 2008) of
observers impacts the results of NRS. As herd size increases the use of an NRS to
individually assess the gait of all animals may not be feasible. Therefore,
monitoring behavioural changes other than changes in gait may offer alternative
ways of detecting lameness. For example, lame cows have an unequal weight
distribution on their limbs when walking and this can be detected by measuring
ground reaction forces using a force plate (Rajkondawar et al., 2002).
Changes in animal behaviour are often indicative of poor health (Weary et al., 2009).
For instance lame cows feed less (Norring et al., 2014) and ruminate less (Van
Hertem et al., 2013). Lying behaviour is a particularly sensitive indicator of poor
health and disease. Lame animals can lie up to 2.1 hours a day longer than none
lame cows (Blackie et al., 2011), with greater lying times, longer lying bouts and
more variability in the duration of lying bouts all associated with lameness (Ito et
al. 2010).
Accelerometers are non-invasive devices that are commonly used to monitor lying
behaviour (Chapinal et al., 2010c; Ito et al., 2010; Thomsen et al., 2012), feeding
behaviour (Mattachini et al., 2016; Pereira et al., 2018) and rumination (Schirmann

13
et al., 2009). Accelerometers are a reliable way of measuring lying behaviour in
dairy cows (Ito et al. 2010) and are validated for use in dairy goats (Zobel et al.,
2015b). In goats they have been used to identify lying behaviour changes associated
with metabolic diseases, such as ketosis (Zobel et al., 2015a) and have been used to
show the impact of hoof overgrowth on lying behaviour (Zobel et al., 2016), but
they have not been used to identify lameness in dairy goats.
1.6. Causes of lameness
Lameness is often a complex and multifactorial problem (Shearer et al., 2005). Most
cases of lameness are associated with claw horn lesions, with lesions in the hind
hooves causing 92% of lameness in dairy cows (Murray et al., 1996). Claw horn
lesions may affect the sole, wall, heel and white line (van Amstel and Shearer, 2006),
and are broadly categorised into infectious (e.g., digital dermatitis) and non-
infections (e.g., sole ulcers) lesions. Non-infectious lesions such as sole ulcers and
white line disease are some of the most prevalent lesions associated with lameness
in dairy cattle. Of 8645 lesions observed by Murray et al. (1996), 28% were sole
ulcers, 22% were white line lesions and 13% were associated with digital dermatitis.
Similar proportions of lesions were reported by Whay et al. (1998), with sole ulcers,
white line disease and digital dermatitis being the most prevalent lesions observed.
However, both these studies were completed in dairy cows in the UK and the most
common types of lesions will vary between countries depending on whether an
extensive or intensive management system is used (Vermunt, 2004). To illustrate,
in the Northern American tie and free stall intensive cow housing systems infectious
diseases (digital dermatitis) are the most prevalent claw lesions, as the cows would
have increased exposure to manure and moisture (Cramer et al., 2008).

14
The main lesion types differ among ruminant species. In sheep, claw lesions caused
by bacterial disease are the most common cause of lameness in sheep (Winter, 2008;
Kaler and Green, 2009). Footrot caused by the bacterium Dichelobacter nodosus is
responsible for approximately 90% of all lameness in sheep (Kaler and Green,
2008). However, other lesions such as contagious ovine digital dermatitis, white
line lesions and granulomas lesions have been reported in sheep (Winter, 2004).
Lesion categorisation and aetiology are yet to be extensively described in dairy
goats. There are no published data describing claw horn lesions in dairy goats in
New Zealand. One study in the UK reported that the common claw lesions in dairy
goats were horn separation (30%), white line lesions (13 %) slippering (10%),
abscess of the sole (4%), foreign body, and granulomatous lesions (1%) (Hill et al.,
1997). However, this was only on four farms and used a claw lesion identification
scheme originally described for cattle. A study completed on one dairy goat herd in
Greece reported 15% of the goats had claw lesions caused by bacterial disease
(digital dermatitis) from wet bedding material (Christodoulopoulos, 2009). More
recently, studies have reported infectious claw lesions in dairy goats and the role of
treponeme bacteria (Sullivan et al., 2014; Groenevelt et al., 2015a). The aetiology
of these lesions was not clear and the authors suggested lesions may have first
developed as a white line lesion or sole ulcer, with the treponeme infections being
secondary (Groenevelt et al., 2015b).
There are a number of risk factors that are associated with the development of hoof
lesions and therefore lameness (Vermunt, 2004). These may be environmental and
management risk factors or animal related risk factors, and there are often complex
interactions between both (Figure 1).

15
Figure 1. Risk factors associated with the development of hoof lesions and lameness
in dairy cows (adapted from: Chesterton et al., 1989; Solano et al., 2015).
1.6.1. Environmental risk factors
The purpose of this section is to discuss some of the risk factors for lameness in
dairy cows that are relevant to dairy goats. For a more detailed discussion on
environmental risk factors associated with dairy cow management and lameness see
Barker et al. (2010) and Cook and Nordlund (2009).
Environmental and management risk factors in dairy cows include flooring surface
(Somers et al., 2005), cleanliness (Bergsten and Pettersson, 1992), stocking density

16
(Leonard et al., 1996), season (Rowlands et al., 1983), animal handling (Ranjbar et
al., 2016), and access to pasture (Haskell et al., 2006). Management risk factors can
also include diet, as nutrition is associated with lameness due to laminitis (reviewed
by: Lean et al., 2013). Additionally, hoof trimming, particularly inadequate
trimming is a common risk factor of lameness (Manson and Leaver, 1989; Manske
et al., 2002a). Hoof trimming will be discussed in detail later in the review.
In dairy cows one of the main environmental risk factors is flooring substrate
(Somers et al., 2003; Dippel et al., 2009; Telezhenko et al., 2009). Substrate plays
an important role in the development of injuries such as hock lesions (Mowbray et
al., 2003) and in the development of claw horn lesions (Vanegas et al., 2006).
Flooring substrate directly influences standing and lying times (Singh et al., 1993),
with the risk of lameness increasing with decreased lying comfort (Dippel et al.,
2009). Dairy cows prefer soft bedding materials such as straw and wood shavings
(Lowe et al., 2001; Tucker et al., 2009). Increased standing time, particularly on
concrete is a significant risk factor of lameness (Somers et al., 2003), as
compression of the solar corium is directly associated with the amount of time dairy
cows spend standing, particularly on concrete (Vermunt, 2004). To illustrate,
Haskell et al. (2006) report a lameness prevalence of 15% in dairy cow herds housed
in free stall and grazed part of the year, compared with a 39% lameness prevalence
in herds housed in free stalls all year round.
There are few published data on the risk factors of lameness in dairy goats. However,
as they are typically housed on straw or wood shavings rather than concrete, the
prevalent risk factors may be different to dairy cows. For instance, in contrast to
dairy cows exposed to concrete, the bedding materials (e.g. straw or wood shavings)
used in housed dairy goats do not promote hoof wear, therefore high rates of

17
overgrowth are reported (Anzuino et al., 2010). This results in more frequent hoof
trimming being required in dairy goats compared to dairy cows (Smith and Sherman,
2009). Additionally, flooring substrate is not just important in terms of comfort and
hoof wear, but also in terms of hygiene and moisture content. Organic bedding
material (i.e., straw and wood shavings) result in a higher moisture content and
bacteria count than non-organic material (i.e., sand) (Hogan et al., 1989). When
cattle stand in a wet environment or in slurry (i.e., faeces plus urine) there is an
increased risk of lameness, as the hoof softens and swells as it absorbs moisture and
is then more susceptible to bacterial infection (Bergsten and Hultgren, 2002;
Gregory, 2004). Therefore, cattle housed in wet, slurry contaminated conditions are
more likely to suffer from infectious claw horn lesions (Bergsten and Hultgren,
2002). The bedding of dairy goats frequently becomes wet, especially in the winter
months (Christodoulopoulos, 2009). This may explain why infectious diseases are
suggested to play a major role in the cause of lameness in goats (Groenevelt, 2017).
Treponeme bacterial species have been reported to be involved in lesions causing
lameness in dairy goats (Sullivan et al., 2014; Groenevelt et al., 2015a; Groenevelt
et al., 2015b), highlighting the importance of clean, hygienic housing conditions.
1.6.2. Animal Related Risk Factors
Animal related risk factors may include parity (cows: Alban, 1995), stage of
lactation (cows: Boettcher et al., 1998), body condition score (BCS) (cows: Wells
et al., 1993), milk production (cows: Green et al., 2002) and hoof conformation
(cows: Distl et al., 1990; cows: Boettcher et al., 1997; sheep: Kaler et al., 2010).
BCS is reported to be a risk factor for lameness (Wells et al., 1993; Randall et al.,
2015) as cows with lower BCS have reduced thickness of the digital cushion (Green

18
et al., 2014). A thinner digital cushion has less capacity to absorb the pressure from
the distal phalanx and therefore increases the risk of claw horn lesions and lameness
(cows: Bicalho et al., 2009). However, the loss of body weight might be the result
of lameness rather than being a causative factor for lameness. Due to the cross-
sectional design of the Bichalho et al (2009) study, it is not possible to conclude a
cause and effect relationship.
An animal related risk factor that has received attention in recent years is the
association between parturition and lameness. There is evidence in dairy cows that
lameness risk significantly increases following calving (Offer et al., 2000; Tarlton
et al., 2002; Knott et al., 2007). For example, in a study that evaluated clinical
lameness in 24 dairy cow herds, it was determined that lameness was most common
during the first 50 days of lactation (Boettcher et al., 1998). It is proposed that
metabolic and hormonal changes associated with calving weaken the connective
tissue of the hoof suspensory apparatus, leading to an increased risk of lameness
due to sole ulcers and white line disease (Tarlton et al., 2002).
There is limited evidence of a similar parturition effect in dairy goats. Groenevelt
et al. (2015b) report lameness prevalence in lactating does of 37% and 70% on two
UK dairy goat farms, while no lameness was detected in the youngstock (between
2 and 12 months of age) on either farm. The authors of that study suggested that as
the housing and feeding were similar between adults and youngstock, the
differences in lameness were due to a parturition effect similar to that seen in cows.
However, the youngstock were assessed for lameness in the pens, whereas the adult
lactating does were assessed for lameness exiting the parlor in a concrete
passageway. As goats often do not show lameness until walking on a solid hard

19
flooring substrate (Groenevelt, 2017), lameness in the youngstock may have been
missed.
Hoof conformation and hoof overgrowth are considered to be major animal related
risk factors that impact lameness (Ajuda et al., 2014; Ajuda et al., 2019). These are
also influenced by complex interactions between environmental and management
related factors and animal related factors (Figure 1). This will be discussed in detail
in the next section of this review.
1.7. Hoof conformation
1.7.1. Anatomy of the hoof
The ruminant hoof comprises two digits, the lateral (outside) claw and the medial
(inside) claw. The weight bearing surface of the claws consist of the hoof wall, the
sole, the heel bulb and the white line. The junction where the hoof wall meets the
sole is called the white line, and is considered a point of weakness (Blowey, 1992a)
(Figure 2a) The internal structure within the lower leg and claw horn capsule are
the distal part of the proximal phalanx (P1), the middle phalanx (P2), the distal
phalanx (P3) and the distal sesamoid bones. The distal phalanx is attached to the
hoof wall by laminae and supported by the digital cushion which sits above the sole
(Lischer et al., 2002) (Figure 2b).

20
Figure 2. (a) Anatomy of the external underside of the ruminant hoof. (b)
Anatomy of the external and internal structures of the ruminant hoof. Adapted
from Dairy Australia (2019).
a)
b)

21
1.7.2. Relationship of hoof conformation to claw horn lesions and
lameness
Hoof conformation is important due to its recognised relationship with the
biomechanical function of the hoof (O'Grady and Poupard, 2001). Desirable hoof
conformational traits include a short toe and steeply angled hoof, a straight fetlock
(Häggman and Juga, 2013), an upright heel (van Amstel and Shearer, 2006) and
even claws (Boettcher et al., 1997), enabling even weight distribution between the
medial and lateral claws (Van der Tol et al., 2002). McDaniel (1994) concluded
from three separate comprehensive studies that higher claw angles were positively
correlated with increased herd life. Poor hoof conformation is associated with an
animal’s susceptibility to claw horn lesions and lameness (cows: Distl et al., 1990;
cows: Boettcher et al., 1997; sheep: Kaler et al., 2010). For instance, non-infectious
lesions such as sole ulcers are caused by changes in pressure, from deviations in
hoof conformation in dairy cows (Mahendran and Bell, 2015). Additionally, poor
conformation is associated with decreased reproductive performance (cows: Pérez-
Cabal et al., 2006), reduced milk production (Warnick et al., 2001) and a greater
risk of being culled (cows: Sewalem et al., 2005; sows: de Sevilla et al., 2008).
1.7.3. Factors that impact hoof conformation
There are environmental and animal related factors that impact hoof conformation.
Management factors such as flooring substrate (Faull et al., 1996; Telezhenko et al.,
2009), bacterial disease due to poor hygiene (Gomez et al., 2015), and trimming
frequency (Manske et al., 2002a) have been shown to affect aspects of hoof
conformation in dairy cows. Animal related factors such as age (Andersson and

22
Lundström, 1981), parity and stage of lactation (Offer et al., 2000), can also affect
hoof conformation in dairy cows.
Improving hoof conformation in the short term may be achieved by management
factors such as hoof trimming (Manske et al., 2002a). However, genetics may need
to be considered for long term improvement to be achieved. Claw traits can vary
considerably among animals on the same farm, suggesting that genetic variation
may have an impact on conformation (Vermunt and Greenough, 1995). For
example, breed significantly influences traits such as toe length, hoof width, horn
growth and toe angle in Swedish dairy cattle (Ahlstrom et al., 1986). Studies in
dairy goats have focused on genetic parameters for milk production (e.g. Bélichon
et al. 1999), however to my knowledge there are no published data investigating
genetic parameters for hoof conformation. Furthermore, in order to assess genetic
influence on, and heritability of, hoof conformation in dairy goats, methods of hoof
evaluation need to be developed and standardised.
For a detailed review of risk factors that impact dairy cow conformation see
Vermunt and Greenough (1995). As hoof overgrowth is reported to be the main
cause of poor conformation and lameness in dairy goats (Ajuda et al., 2014; Ajuda
et al., 2019), this will be discussed in detail in the next section .
1.7.3.1. Hoof growth and conformation
Overgrown hooves are those, that due to lack of opportunity for hoof wear and
inadequate trimming practices, have excess horn tissue potentially resulting in
deformation of the hoof (AWIN, 2015). As hooves become overgrown and toes
become long, claw shape becomes abnormal (cows: Manske et al., 2002b), claws
23
become splayed (cows: van Amstel and Shearer, 2006), the fetlocks may become
hyperextended (cows: Shearer et al., 2012) and heel depth is reduced (cows:
Glicken and Kendrick, 1977; Gitau et al., 1997). Prolonged periods of hoof
overgrowth increase the risk of hoof deformation in dairy goats (Ajuda et al., 2014),
with chronic overgrowth resulting in a slippered hoof, where the toe curls up and
the weight bearing surface transfers to the heel (Hill et al., 1997). In dairy cows,
this dipped heel conformation reduces the shock absorbing effect of the digital
cushion, resulting in damage to the solar corium and an increased risk of sole ulcers
and lameness (Blowey, 1992b). Hoof overgrowth is a main area of concern when
assessing the welfare of dairy goats (Can et al., 2016). However, to date there are
no data evaluating the impacts of the conformation changes caused by hoof
overgrowth on the functionality of dairy goats’ hooves.
If the housing environment does not provide opportunity for natural wear then hoof
overgrowth can become a health and welfare issue (chamois: Wiesner, 1985; sheep:
Bokko et al., 2003; goats: Anzuino et al., 2010). As with lameness, flooring
substrate is the main environmental factor affecting hoof wear and conformation
characteristics (cows: Vermunt and Greenough, 1996a). Hoof wear increased by 35%
in cattle housed on abrasive concrete compared with cows kept on pasture (Hahn et
al., 1986). Therefore, abrasive flooring substrates can result in altered hoof
conformation with a shorter toe length and steeper toe angle (Telezhenko et al.,
2009).
In their natural environment goats populate hilly and rugged environments and
often rest directly on rocks in steep terrain (reviewed by Zobel et al., 2019),
suggesting a preference for harder surfaces (Zobel et al., 2018). This is supported
by research that suggests dairy goats prefer to lie on hard surfaces (Bøe et al., 2007).
24
Indeed, Sutherland et al. (2017) report that goats preferred rubber mats and plastic
slats to lie on, while wood shavings were used mainly for elimination rather than
lying. The typical commercial housing environment of dairy goats offers very
limited opportunity to naturally wear hooves, therefore a high prevalence of hoof
overgrowth is common (84 - 100%: Hill et al., 1997; 79%: Anzuino et al., 2010).
However, to date there are limited data assessing hoof overgrowth or other aspects
of conformation in dairy goats.
1.8. Assessing hoof conformation
Due to the association of hoof conformation with hoof lesions and lameness
accurate assessment of hoof conformation is imperative for the identification of at-
risk animals. Aspects of hoof conformation can be assessed using objective
measures or subjective scores.
1.8.1. Objective methods
Objective measures are suggested to provide superior assessments as they are
accurate and repeatable (Vermunt and Greenough, 1995), allowing for thorough
assessment of hoof conformation traits. However, objective measures are time
consuming, require technical equipment (Flower and Weary, 2009) and require
restraint of the animal (cows: Telezhenko et al., 2009; goats: Koluman and Göncü,
2016).
Objective methods of assessing hoof conformation used in dairy cows often include
measurements of toe length (Somers et al., 2005; Telezhenko et al., 2009), claw
length (Vermunt and Greenough, 1995; Gomez et al., 2015) and heel height
(Vermunt and Greenough, 1995; Somers et al., 2005; Gomez et al., 2015) using

25
callipers, and claw angle (Vermunt and Greenough, 1995; Somers et al., 2005;
Gomez et al., 2015) using an angle gauge. Claw length and width have recently
been objectively measured in 38 dairy goats on one farm in Portugal (Ajuda et al.,
2019). However, prior to this there is only one study that has objectively measured
other aspects of hoof conformation in dairy goats (Koluman and Göncü, 2016).
Koluman and Göncü (2016), used the methodology described by Vermunt and
Greenough (1995), however did not report any validation to support the use of the
cow measurements in goats. Additionally, although the authors state that hooves
were rescored to assess variance amongst observers, interobserver reliability was
not reported.
1.8.2. Subjective methods
Subjective assessments of hoof conformation involve visual allocating a categorical
score for aspects of conformation. They are quick to use, require no technical
equipment, can allow assessment of a large number of animals and are therefore
commonly used for live animal scoring on farm (Flower and Weary, 2009).
Subjective scoring systems have been used to assess a number of aspects of hoof
conformation such as abnormal overgrowth and splayed feet in sows (de Sevilla et
al., 2008), misshaped hooves in sheep (Kaler et al., 2010) and fetlock shape in cows
(Häggman and Juga, 2013). In dairy goats, subjective scores of hoof overgrowth
(Anzuino et al., 2010; Muri et al., 2013) and claw deformation (Ajuda et al., 2019)
have been reported, however to my knowledge no other aspects of hoof
conformation have been subjectively assessed.
Potential limitations of subjective scores are poor inter- and intra-observer
reliability as they are affected by both the scoring system used and previous

26
experience (Flower and Weary, 2009). Therefore, intensive training is often
required to achieve acceptable levels of reliability using subjective methods of
assessment (March et al., 2007).
1.8.3. Radiographic assessments for evaluating aspects of internal hoof
conformation
The changes in conformation associated with hoof overgrowth impacts on the
internal structures of the hoof (Meimandi-Parizi and Shakeri, 2007). As previously
described several objective and subjective methods have been developed to assess
the external traits of the hoof, particularly in dairy cows. However, evaluating the
shape and structure of the outer hoof capsule is not sufficient to be able to assess
the impact of overgrowth on joint angles and bones within the hoof. Radiographic
images are required to objectively determine the height and angles of joints, and the
length of bones within the hoof (Kummer et al., 2006).
Research work has used radiographs to assess bovine foot disorders, such as new
bone formation (exostosis), arthritis and solar penetration (Nigam and Singh, 1980)
and to evaluate the impact of septic arthritis on the distal interphalangeal joint (DIPJ)
of cows (Desrochers and Jean, 1996). Additionally, radiographic changes of bones
and joints of cattle with claw abnormalities due to hoof overgrowth have been
assessed (Meimandi-Parizi and Shakeri, 2007). In that study, rotation of the distal
phalanx bone was reported in nearly 20% of hooves due to overgrowth, however
the degree of rotation was not measured because it was a post-mortem study. For
joint angles and conformation to be accurately determined they need to be assessed
on live, weight-bearing animals (Meimandi-Parizi and Shakeri, 2007).
27
In goats, radiographs have been used to evaluate arterial patterns of the goat distal
limb (Dehghani Nazhvani et al., 2007), and the impact of severe claw lesions on the
remodelling of the distal phalanx (Crosby-Durrani et al., 2016). However, joint
angles have not been assessed as a measure of hoof conformation in cows or goats.
Radiographic images are a common veterinary diagnostic tool used in horses to help
determine causes of lameness and conformation issues (Colles, 1983). However,
radiographs are not commonly used for this purpose in dairy animals outside of
research applications (Tranter and Morris, 1991; Vermunt, 2004). Additionally,
radiographs have been used to assess the variability in trimming procedure in horses
(Kummer et al., 2009). A significant difference in measured hoof parameters were
reported, highlighting that trimming technique can impact joint angles and positions
within the hoof (Kummer et al., 2009). Radiographs have also been used in horses
to evaluate the changes in conformation of the internal distal limb between
trimming intervals, with frequent hoof trimming (every four to six weeks)
recommended to avoid excessive loading and to reduce the risk of long term injury
(Leśniak et al., 2017). This highlights the importance of avoiding prolonged periods
of hoof overgrowth through frequent hoof trimming. However, to my knowledge
radiographs have not been used to evaluate the impact of hoof trimming on the
internal conformation of joint positions in either dairy cows or goats.
1.9. Hoof trimming
The aims of hoof trimming are to improve conformation by removing hoof
overgrowth and to restore the hoof to an anatomically correct position and shape
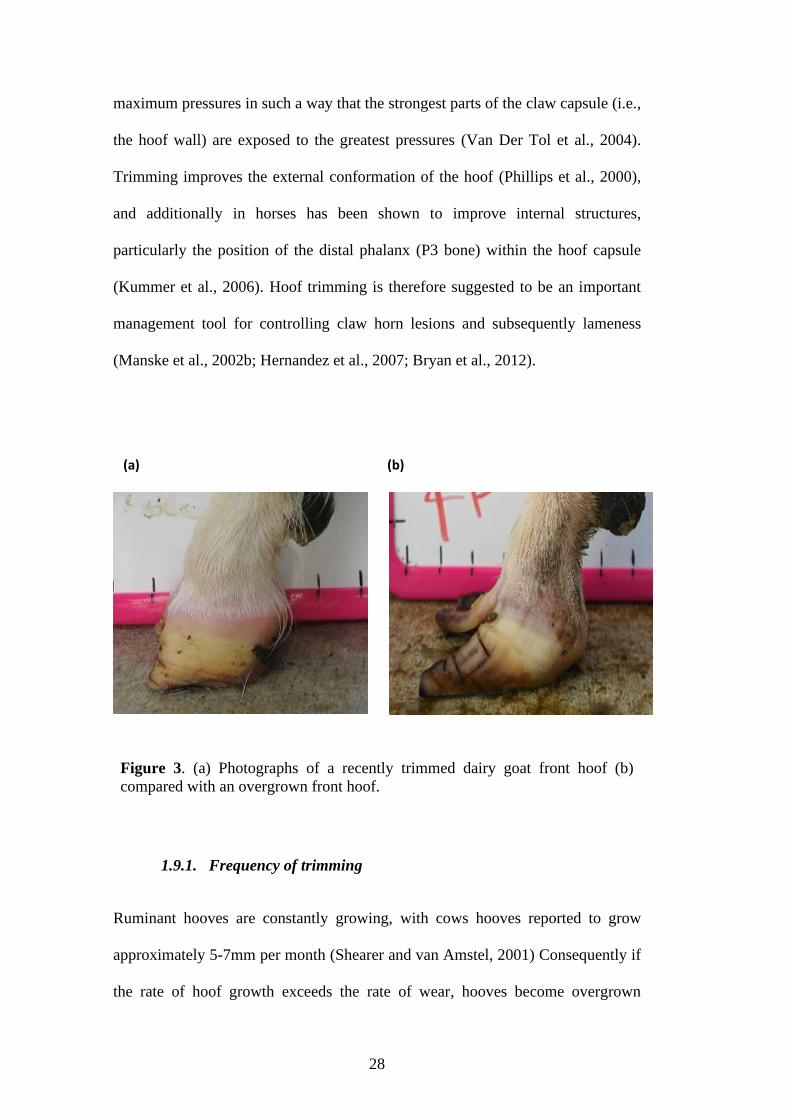
(Phillips et al., 2000; Bryan et al., 2012) (Figure 3). Hoof trimming should promote
balanced weight distribution between the two claws, and target a reduction of local
28
maximum pressures in such a way that the strongest parts of the claw capsule (i.e.,
the hoof wall) are exposed to the greatest pressures (Van Der Tol et al., 2004).
Trimming improves the external conformation of the hoof (Phillips et al., 2000),
and additionally in horses has been shown to improve internal structures,
particularly the position of the distal phalanx (P3 bone) within the hoof capsule
(Kummer et al., 2006). Hoof trimming is therefore suggested to be an important
management tool for controlling claw horn lesions and subsequently lameness
(Manske et al., 2002b; Hernandez et al., 2007; Bryan et al., 2012).
Figure 3. (a) Photographs of a recently trimmed dairy goat front hoof (b)
compared with an overgrown front hoof.
1.9.1. Frequency of trimming
Ruminant hooves are constantly growing, with cows hooves reported to grow
approximately 5-7mm per month (Shearer and van Amstel, 2001) Consequently if
the rate of hoof growth exceeds the rate of wear, hooves become overgrown
(a) (b)
29
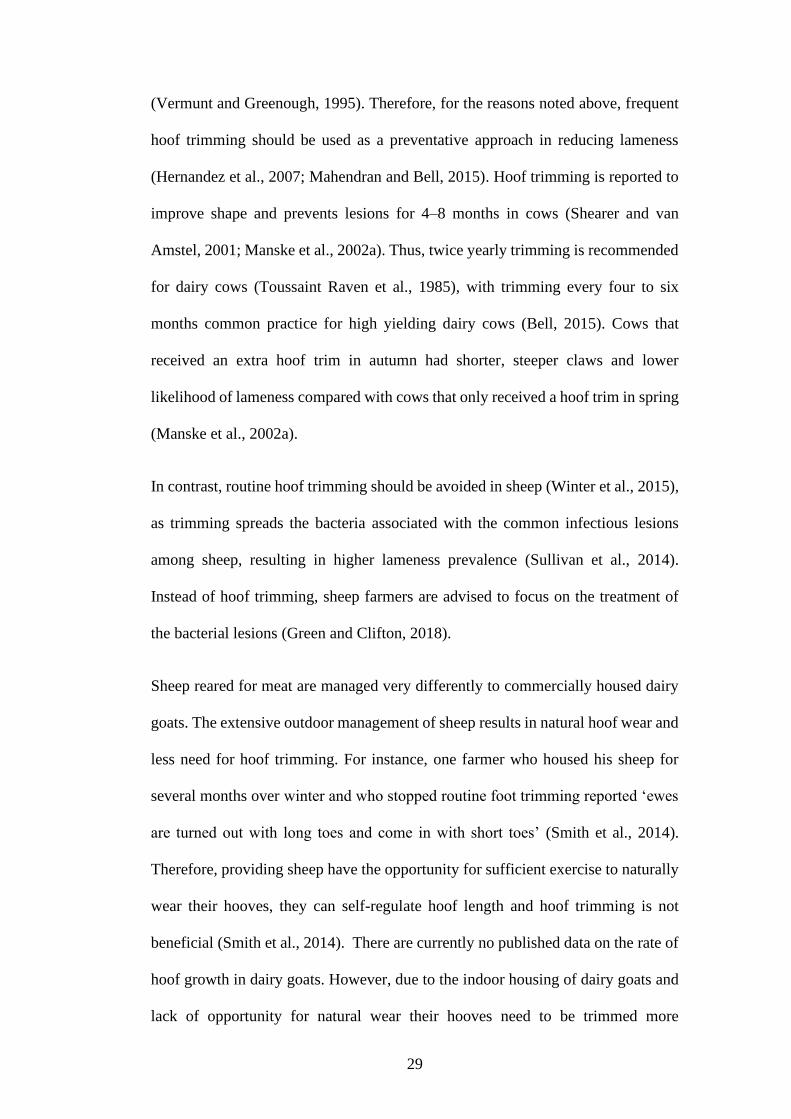
(Vermunt and Greenough, 1995). Therefore, for the reasons noted above, frequent
hoof trimming should be used as a preventative approach in reducing lameness
(Hernandez et al., 2007; Mahendran and Bell, 2015). Hoof trimming is reported to
improve shape and prevents lesions for 4–8 months in cows (Shearer and van
Amstel, 2001; Manske et al., 2002a). Thus, twice yearly trimming is recommended
for dairy cows (Toussaint Raven et al., 1985), with trimming every four to six
months common practice for high yielding dairy cows (Bell, 2015). Cows that
received an extra hoof trim in autumn had shorter, steeper claws and lower
likelihood of lameness compared with cows that only received a hoof trim in spring
(Manske et al., 2002a).
In contrast, routine hoof trimming should be avoided in sheep (Winter et al., 2015),
as trimming spreads the bacteria associated with the common infectious lesions
among sheep, resulting in higher lameness prevalence (Sullivan et al., 2014).
Instead of hoof trimming, sheep farmers are advised to focus on the treatment of
the bacterial lesions (Green and Clifton, 2018).
Sheep reared for meat are managed very differently to commercially housed dairy
goats. The extensive outdoor management of sheep results in natural hoof wear and
less need for hoof trimming. For instance, one farmer who housed his sheep for
several months over winter and who stopped routine foot trimming reported ‘ewes
are turned out with long toes and come in with short toes’ (Smith et al., 2014).
Therefore, providing sheep have the opportunity for sufficient exercise to naturally
wear their hooves, they can self-regulate hoof length and hoof trimming is not
beneficial (Smith et al., 2014). There are currently no published data on the rate of
hoof growth in dairy goats. However, due to the indoor housing of dairy goats and
lack of opportunity for natural wear their hooves need to be trimmed more

30
frequently than twice a year (Smith and Sherman, 2009). Christodoulopoulos (2009)
reported that goats trimmed every 6 months suffered from hoof overgrowth,
suggesting that trimming twice a year is not frequent enough to prevent hoof
overgrowth. Indeed, it is suggested that hooves may require trimming as often as
every 6 weeks to 2 months depending on the housing environment (Pugh and Baird,
2002), as the required frequency is determined by exercise and opportunity to wear
hooves (Smith and Sherman, 2009).
There are almost no data on the frequency of hoof trimming in dairy goats and how
this may impact hoof conformation. In a survey of dairy goat farms in Ontario,
Canada, nearly 80% of farmers reported trimming only 1 or 2 times a year (G. Zobel,
unpublished data). If this finding is more broadly representative of dairy goat hoof
management, it may explain why high prevalence of hoof overgrowth is common.
In New Zealand specific data of trimming frequency and hoof conformation are
needed.
1.9.2. Early life trimming regimes
Early life hoof management may be of particular importance as the hooves of young
ruminants grow faster when compared to those of older animals (cows: Tranter and
Morris, 1992; sheep: Dekker et al., 2005). Changes in hoof conformation because
of hoof overgrowth in early life may have long term consequences (horses: Greet
and Curtis, 2003), particularly in terms of increased injury and lameness risk (horses:
Kroekenstoel et al., 2006). High numbers of dairy heifers become lame early in
their first lactation (Webster, 2002). Therefore early life management including
adequate hoof care is important to reduce the risk of initial lameness (Bell et al.,
2009). In dairy cows lameness prevention needs to begin during heifer rearing

31
(Maxwell et al., 2015; Cook, 2016) as it may have beneficial effects on hoof
conformation (Phillips et al., 2000), and prevent claws disorders and improve hoof
health in older lactating cows (Offer et al., 2000; Kofler et al., 2011). However, to
my knowledge there are currently no published data evaluating early life trimming
management in dairy goats.
In this thesis, the term ‘early life trimming’ is used to describe whether goats were
trimmed before first kidding; when cow literature is discussed, it refers to trimming
heifers prior to first calving.
1.9.3. Possible negative effects of hoof trimming
While frequent hoof trimming is necessary in dairy goats, it is important to note that
the process may cause stress or pain to the animal. Pain is difficult to evaluate
because it is a complex and individualistic experience (Viñuela-Fernández et al.,
2007). However, behavioural and physiological measures may provide some insight
into the impacts of hoof trimming on animals. In cows, hoof trimming was
associated with a decrease in milk yield on the day of hoof trimming and the day
after, and increased faecal cortisol metabolites for 24 hours (Pesenhofer et al., 2006),
suggesting a stress response. However, inclusion of lame cows in the study
prevented the authors from concluding that the physiological changes were due to
the trimming.
In terms of behaviour, an increase in lying time and gait score indicative of
lameness have been reported in dairy cows following hoof trimming and may be
interpreted as a pain response (Chapinal et al., 2010a; Van Hertem et al., 2014). For
instance, the proportion of lame animals doubled from 16% to 32% in the first 2

32
weeks post trimming, but returned to pre-trimming levels by day 70 post trimming.
(Van Hertem et al., 2014), suggesting the trimming process may have been painful.
Chapinal et al. (2010b) reported that trimmed cows lay more than sham handled
cows. As lame cows are reported to lie for longer (Ito et al., 2010) this may be a
pain response. However, Chapinal et al. (2010b) included lame cows in the trimmed
treatment groups, but not in the sham handling group. As the presence of hoof
lesions and lameness may affect how an animal responds to hoof trimming (Van
Hertem et al., 2014), it may be difficult to draw definitive conclusions about the
reason for the difference in lying behaviors observed in that study. Additionally,
poor trimming techniques have resulted in lameness in dairy cows (Shearer and van
Amstel, 2001). Over trimming is reported to be an issue in sheep (Winter, 2008)
and associated with granulomas toe lesions (Hodgkinson, 2010). Finally, the
process of trimming can transmit disease between animals, therefore, disinfection
of hoof trimming equipment between each animal is important (Sullivan et al.,
2014).
1.10. Conclusion
There are few scientific publications on hoof conformation and lameness in dairy
goats and virtually no New Zealand specific data. Lameness is prevalent in the dairy
cow and dairy goat industry and is a significant concern to animal welfare. As dairy
goats are typically permanently indoor housed on soft bedding, and with limited
opportunities for exercise, their hooves can easily become overgrown; therefore,
frequent hoof trimming is needed. However, there are currently no data
investigating hoof trimming regimes in dairy goats. Additionally, there are no
validated systems to assess hoof conformation or lameness in dairy goats. Lameness

33
is currently evaluated using scales that do not include an uneven gait, a precursor
to lameness, therefore prevalence in goats might be underestimated. Assessing the
scope of the problem through the application of validated reliable scoring systems
is the first step in developing treatment plans to manage poor conformation and
lameness in dairy goats.
1.11. Rational for research and aims
As dairy goat milk production has grown in New Zealand, a need for science-based
best management practices has followed. It is important to understand the factors
that impact hoof conformation and lameness and to identify how we can best
maintain a normally structured and functioning hoof in indoor-housed dairy goats.
The overall objective of this thesis was to examine the hoof conformation and gait
of New Zealand dairy goats and to evaluate how these factors are impacted by hoof
trimming. Specifically, the aims of this thesis were to develop methods to assess
hoof conformation and lameness in dairy goats. These methods were then used to
facilitate an investigation into the immediate and long-term impacts of hoof
trimming regimes on hoof conformation and lameness in dairy goats. Additionally,
the impacts of hoof trimming on hoof growth, joint positions and lying behaviour
were investigated.
1.12. Thesis structure
This thesis consists of a series of studies that were completed to meet the aims as
outlined above. Chapter 2 and 3 have been published in peer-reviewed international
journals. Chapter 4 and 5 are currently being finalised in preparation for submission
to international journals.
34
Chapter 2: The aim of this study was to develop and validate a method to assess
hoof conformation in dairy goats using objective measures and subjective scores.
The assessment developed allowed toe length, heel shape, fetlock shape, claw shape
and claw splay to be reliably assessed from photographs.
Chapter 3: This study aimed to develop the first 5-point gait scoring system to be
reliably used in dairy goats. The system was adapted from the 3 and 4-point systems
previously used in dairy goats and the 5-point systems commonly used in dairy
cows. The system developed allowed detection of a full range of lameness from the
early signs of an uneven gait to the more severe cases of lameness.
Chapter 4: This observational study applied the method for assessing hoof
conformation developed in chapter 2. The aim of this study was to investigate the
effect of different hoof trimming regimes on the hoof conformation of dairy goats
on 16 New Zealand farms.
Chapter 5: The aim of this experimental study was to investigate the immediate
and longer-term effects of early life hoof trimming on the structure and function
(i.e., lameness) of the hooves of dairy goats. The study included assessing the
impacts of trimming on hoof conformation, joint positions, hoof growth, lameness
and lying behaviour.
Chapter 6: This chapter integrates the results from the experimental chapters and
will provide a brief discussion of the main findings and their implications for dairy
goat management in New Zealand. Additionally, limitations of the work and areas
of future research are discussed.

35
1.13. Ethical statement
Approval from the AgResearch Animal Ethics Committee was sought prior to the
commencement of any of the studies included in this thesis. Power analyses were
completed to ensure the minimum number of animals were used while still ensuring
any biologically relevant differences in the dependent variables being tested could
be detected.
1.14. Declaration
Some of the chapters contained in this thesis are presented as papers following the
style and formatting requirements of the journals in which they have been published.
1.15. References
Ahlström, G., Ral, G., Berglund, B., Swensson, C., 1986. Hoof and Leg Traits of
Swedish Dairy Cattle I. Objective Measurements. Journal of Veterinary
Medicine Series A 33, 561-587.
Ajuda, I.G., Battini, M., Stilwell, G.T., 2019. The role of claw deformation and
claw size on goat lameness. Veterinary and Animal Science 8, 100080.
Ajuda, I., G , Vieira, A., Stilwell, G.T., 2014. Are there differences in dairy goats
claws' temperature, before and after trimming?, 2014 IEEE International
Symposium on Medical Measurements and Applications (MeMeA), Lisbon,
Portugal pp. 1-5.
Alban, L., 1995. Lameness in Danish dairy cows: frequency and possible risk
factors. Preventive Veterinary Medicine 22, 213-225.
Alban, L., Agger, J., Lawson, L., 1996. Lameness in tied Danish dairy cattle: the
possible influence of housing systems, management, milk yield, and prior
incidents of lameness. Preventive Veterinary Medicine 29, 135-149.
Andersson, L., Lundström, K., 1981. The influence of breed, age, body weight and
season on digital diseases and hoof size in dairy cows. Transboundary and
Emerging Diseases 28, 141-151.
Anzuino, K., Bell, N.J., Bazeley, K.J., Nicol, C.J., 2010. Assessment of welfare on
24 commercial UK dairy goat farms based on direct observations.
Veterinary Record 167, 774-780.

36
AWIN, 2015. AWIN welfare assessment protocol for goats. DOI:10.13130/AWIN_
goats_2015
Barkema, H.W., Westrik, J.D., Van Keulen, K.A.S., Schukken, Y.H., Brand, A.,
1994. The effects of lameness on reproductive performance, milk
production and culling in Dutch dairy farms. Preventive Veterinary
Medicine 20, 249-259.
Barker, Z.E., Leach, K.A., Whay, H.R., Bell, N.J., Main, D.C.J., 2010. Assessment
of lameness prevalence and associated risk factors in dairy herds in England
and Wales. Journal of Dairy Science 93, 932-941.
Battini, M., Barbieri, S., Vieira, A., Stilwell, G., Mattiello, S., 2016. Results of
testing the prototype of the AWIN welfare assessment protocol for dairy
goats in 30 intensive farms in Northern Italy. Italian Journal of Animal
Science 15, 283-293.
Bélichon, S., Manfredi, E., Piacère, A., 1999. Genetic parameters of dairy traits in
the Alpine and Saanen goat breeds. Genetics Selection Evolution, 31, 529-
534.
Bell, N.J., 2015. Evidence-based claw trimming for dairy cattle. Veterinary Record
177, 220-221.
Bell, N., Bell, M., Knowles, T., Whay, H., Main, D., Webster, A., 2009. The
development, implementation and testing of a lameness control programme
based on HACCP principles and designed for heifers on dairy farms. The
Veterinary Journal 180, 178-188.
Bergsten, C., Hultgren, J., 2002. Effects of a rubber-slat system on cleanliness, foot
health, and behaviour in tied dairy cows, Proceedings of the 12th
International Ruminant Lameness Symposium, Orlando, Florida, pp. 284-
287.
Bergsten, C., Pettersson, B., 1992. The cleanliness of cows tied in stalls and the
health of their hooves as influenced by the use of electric trainers.
Preventive Veterinary Medicine 13, 229-238.
Bicalho, R.C., Machado, V.S., Caixeta, L.S., 2009. Lameness in dairy cattle: A
debilitating disease or a disease of debilitated cattle? A cross-sectional study
of lameness prevalence and thickness of the digital cushion. Journal of
Dairy Science 92, 3175-3184.
Blackie, N., Amory, J., Bleach, E., Scaife, J., 2011. The effect of lameness on lying
behaviour of zero grazed Holstein dairy cattle. Applied Animal Behaviour
Science 134, 85-91.
Blowey, R., 1992a. Diseases of the bovine digit: Part 1 Description of common
lesions. In Practice 14, 85-90.

37
Blowey, R., 1992b. Diseases of the bovine digit: Part 2 Hoof care and factors
influencing the incidence of lameness. In Practice 14, 118-124.
Bøe, K.E., Andersen, I.L., Buisson, L., Simensen, E., Jeksrud, W.K., 2007. Flooring
preferences in dairy goats at moderate and low ambient temperature.
Applied Animal Behaviour Science 108, 45-57.
Boettcher, P., Dekkers, J., Warnick, L., Wells, S., 1998. Genetic analysis of clinical
lameness in dairy cattle. Journal of Dairy Science 81, 1148-1156.
Boettcher, P., Jairath, L., Koots, K., Dekkers, J., 1997. Effects of interactions
between type and milk production on survival traits of Canadian Holsteins.
Journal of Dairy Science 80, 2984-2995.
Bokko, B., Adamu, S., Mohammed, A., 2003. Limb conditions that predispose
sheep to lameness in the arid zone of Nigeria. Small Ruminant Research 47,
165-169.
Booth, C.J., Warnick, L.D., Gröhn, Y.T., Maizon, D.O., Guard, C.L., Janssen, D.,
2004. Effect of lameness on culling in dairy cows. Journal of Dairy Science
87, 4115-4122.
Bryan, M., Tacoma, H., Hoekstra, F., 2012. The effect of hindclaw height
differential and subsequent trimming on lameness in large dairy cattle herds
in Canterbury, New Zealand. New Zealand Veterinary Journal 60, 349-355.
Can, E., Vieira, A., Battini, M., Mattiello, S., Stilwell, G., 2016. On-farm welfare
assessment of dairy goat farms using animal-based indicators: the example
of 30 commercial farms in Portugal. Acta Agriculturae Scandinavica,
Section A—Animal Science 66, 43-55.
Capion, N., Thamsborg, S.M., Enevoldsen, C., 2008. Conformation of hind legs
and lameness in Danish Holstein heifers. Journal of Dairy Science 91, 2089-
2097.
Channon, A.J., Walker, A.M., Pfau, T., Sheldon, I.M., Wilson, A.M., 2009.
Variability of Manson and Leaver locomotion scores assigned to dairy cows
by different observers. Veterinary Record 164, 388-392.
Chapinal, N., De Passille, A., Rushen, J., 2010a. Correlated changes in behavioral
indicators of lameness in dairy cows following hoof trimming. Journal of
Dairy Science 93, 5758-5763.
Chapinal, N., De Passillé, A., Rushen, J., Wagner, S., 2010b. Effect of analgesia
during hoof trimming on gait, weight distribution, and activity of dairy cattle.
Journal of Dairy Science 93, 3039-3046.
Chapinal, N., de Passillé, A.M., Rushen, J., Wagner, S., 2010c. Automated methods
for detecting lameness and measuring analgesia in dairy cattle. Journal of
Dairy Science 93, 2007-2013.

38
Chapinal, N., Koeck, A., Sewalem, A., Kelton, D.F., Mason, S., Cramer, G.,
Miglior, F., 2013. Genetic parameters for hoof lesions and their relationship
with feet and leg traits in Canadian Holstein cows. Journal of Dairy Science
96, 2596-2604.
Chesterton, R.N., Pfeiffer, D.U., Morris, R.S., Tanner, C.M., 1989. Environmental
and behavioural factors affecting the prevalence of foot lameness in New
Zealand dairy herds—A case-control study. New Zealand Veterinary
Journal 37, 135-142.
Christodoulopoulos, G., 2009. Foot lameness in dairy goats. Research in Veterinary
Science 86, 281-284.
Clarkson, M.J., Downham, D.Y., Faull, W.B., Hughes, J.W., Manson, F.J., Merritt,
J.B., Murray, R.D., Russell, W.B., Sutherst, J.E., Ward, W.R., 1996.
Incidence and prevalence of lameness in dairy cattle. Veterinary Record 138,
563-567.
Colles, C.M., 1983. Interpreting radiographs 1: The foot. Equine Veterinary Journal
15, 297-303.
Cook, N., 2016. A lesion oriented, life cycle approach to preventing lameness in
dairy herds., World Buiatric Congress., Dublin, Ireland, pp. 51-51.
Cook, N.B., 2003a. The impact of freestall barn design on lameness and mastitis in
wisconsin. Proceedings of Minnesota Veterinary Medical Association,
Minneapolis.
Cook, N.B., 2003b. Prevalence of lameness among dairy cattle in Wisconsin as a
function of housing type and stall surface. Journal of the American
Veterinary Medical Association 223, 1324-1328.
Cook, N.B., Nordlund, K.V., 2009. The influence of the environment on dairy cow
behavior, claw health and herd lameness dynamics. The Veterinary Journal
179, 360-369.
Cramer, G., Lissemore, K.D., Guard, C.L., Leslie, K.E., Kelton, D.F., 2008. Herd-
and Cow-Level Prevalence of Foot Lesions in Ontario Dairy Cattle. Journal
of Dairy Science 91, 3888-3895.
Crosby-Durrani, H.E., Clegg, S.R., Singer, E., Angell, J.W., Evans, N.J., Carter,
S.D., Blundell, R.J., Duncan, J.S., 2016. Severe foot lesions in dairy goats
associated with digital dermatitis treponemes. Journal of Comparative
Pathology 154, 283-296.
Dairy Australia., 2019. Healthy hooves: The complete guide to preventing and
managing lameness. Keep your dairy herd on a healthy footing.
de Mol, R.M., André, G., Bleumer, E.J.B., van der Werf, J.T.N., de Haas, Y., van
Reenen, C.G., 2013. Applicability of day-to-day variation in behavior for

39
the automated detection of lameness in dairy cows. Journal of Dairy Science
96, 3703-3712.
de Sevilla, X.F., Fàbrega, E., Tibau, J., Casellas, J., 2008. Effect of leg
conformation on survivability of Duroc, Landrace, and Large White sows.
Journal of Animal Science 86, 2392-2400.
Dehghani Nazhvani, S., Abbasi, S., Tadjalli, M., 2007. Arteriographical evaluation
of normal digit and hoof in goat. Iranian Journal of Veterinary Surgery 2,
43-48.
Dekker, A., Moonen, P., Pol, J., 2005. Linear hoof defects in sheep infected with
foot-and-mouth disease. Veterinary Record 156, 572-575.
Desrochers, A., Jean, G.S., 1996. Surgical Management of Digit Disorders in Cattle.
Veterinary Clinics of North America: Food Animal Practice 12, 277-298.
Dippel, S., Dolezal, M., Brenninkmeyer, C., Brinkmann, J., March, S., Knierim, U.,
Winckler, C., 2009. Risk factors for lameness in cubicle housed Austrian
Simmental dairy cows. Preventive Veterinary Medicine 90, 102-112.
Distl, O., Koorn, D.S., McDaniel, B.T., Peterse, D., Politiek, R.D., Reurink, A.,
1990. Claw traits in cattle breeding programs: Report of the E.A.A.P.
working group; Claw quality in cattle. Livestock Production Science 25, 1-
13.
Dyer, R.M., Neerchal, N.K., Tasch, U., Wu, Y., Dyer, P., Rajkondawar, P.G., 2007.
Objective Determination of Claw Pain and Its Relationship to Limb
Locomotion Score in Dairy Cattle. Journal of Dairy Science 90, 4592-4602.
Espejo, L.A., Endres, M.I., Salfer, J.A., 2006. Prevalence of lameness in high-
producing Holstein cows housed in freestall barns in Minnesota. Journal of
Dairy Science 89, 3052-3058.
Faull, W.B., Hughes, J.W., Clarkson, M.J., Downham, D.Y., Manson, F.J., Merritt,
J.B., Murray, R.D., Russell, W.B., Sutherst, J.E., Ward, W.R., 1996.
Epidemiology of lameness in dairy cattle: The influence of cubicles and
indoor and outdoor walking surfaces. Veterinary Record 139, 130-136.
Flower, F.C., Weary, D., 2009. Gait assessment in dairy cattle. Animal 3, 87-95.
Flower, F.C., Weary, D.M., 2006. Effect of hoof pathologies on subjective
assessments of dairy cow gait. Journal of Dairy Science 89, 139-146.
Fraser, D., 2003. Assessing animal welfare at the farm and group level: the interplay
of science and values. Animal Welfare, 187-205.
Fraser, D., Weary, D.M., Pajor, E.A., Milligan, B.N., 1997. A scientific conception
of animal welfare that reflects ethical concerns. Animal Welfare, 187-205.

40
Ganche, E., Hutchinson, K., Burggraaf, V., Johnson, M., King, W., 2015. Dairy
goat farm management practices. An industry survey. Report for Dairy Goat
Co-operative. AgResearch Publication No 398.
Gitau, T., Mbiuki, S., McDermott, J., 1997. Assessment of bovine hoof
conformation and its association with lameness, animal factors and
management practices on small-scale dairy farms in Kiambu district, Kenya.
The Onderstepoort Journal of Veterinary Research 64, 135-140.
Glicken, A., Kendrick, J.W., 1977. Hoof overgrowth in Holstein - Friesian dairy
cattle. Journal of Heredity 68, 386-390.
Gomez, A., Cook, N., Rieman, J., Dunbar, K., Cooley, K., Socha, M., Döpfer, D.,
2015. The effect of digital dermatitis on hoof conformation. Journal of Dairy
Science 98, 927-936.
Green, L., Clifton, R., 2018. Diagnosing and managing footrot in sheep: an update.
In Practice 40, 17-26.
Green, L.E., Hedges, V.J., Schukken, Y.H., Blowey, R.W., Packington, A.J., 2002.
The impact of clinical lameness on the milk yield of dairy cows. Journal of
Dairy Science 85, 2250-2256.
Green, L.E., Huxley, J.N., Banks, C., Green, M.J., 2014. Temporal associations
between low body condition, lameness and milk yield in a UK dairy herd.
Preventive Veterinary Medicine 113, 63-71.
Greet, T.R.C., Curtis, S.J., 2003. Foot management in the foal and weanling.
Veterinary Clinics: Equine Practice 19, 501-517.
Gregory, N.G., 2004. Swelling of cattle heel horn by urine. Australian Veterinary
Journal 82, 161-163.
Groenevelt, M., 2017. Foot lameness in goats: like sheep, like cattle or completely
different? Livestock 22, 98-101.
Groenevelt, M., Anzuino, K., Langton, D., Grogono-Thomas, R., 2015a.
Association of treponeme species with atypical foot lesions in goats.
Veterinary Record, 626.
Groenevelt, M., Anzuino, K., Smith, S., Lee, M.R., Grogono-Thomas, R., 2015b.
A case report of lameness in two dairy goat herds; a suspected combination
of nutritional factors concurrent with treponeme infection. BMC Research
Notes 8, 791.
Häggman, J., Juga, J., 2013. Genetic parameters for hoof disorders and feet and leg
conformation traits in Finnish Holstein cows. Journal of Dairy Science 96,
3319-3325.
Hahn, M.V., McDaniel, B.T., Wilk, J.C., 1986. Rates of hoof growth and wear in
holstein cattle. Journal of Dairy Science 69, 2148-2156.

41
Haskell, M.J., Rennie, L.J., Bowell, V.A., Bell, M.J., Lawrence, A.B., 2006.
Housing system, milk production, and zero-grazing effects on lameness and
leg injury in dairy cows. Journal of Dairy Science 89, 4259-4266.
Hassall, S.A., Ward, W.R., Murray, R.D., 1993. Effects of lameness on the
behaviour of cows during the summer. The Veterinary Record 132, 578-
580.
Hemsworth, P.H., Mellor, D.J., Cronin, G.M., Tilbrook, A.J., 2015. Scientific
assessment of animal welfare. New Zealand Veterinary Journal 63, 24-30.
Hernandez, J., Shearer, J.K., Webb, D.W., 2001. Effect of lameness on the calving-
to-conception interval in dairy cows. Journal of the American Veterinary
Medical Association 218, 1611-1614.
Hernandez, J.A., Garbarino, E.J., Shearer, J.K., Risco, C.A., Thatcher, W.W., 2007.
Evaluation of the efficacy of prophylactic hoof health examination and
trimming during midlactation in reducing the incidence of lameness during
late lactation in dairy cows. Journal of the American Veterinary Medical
Association 230, 89-93.
Hill, N.P., Murphy, P.E., Nelson, A.J., Mouttotou, L.E., Green, L.E., Morgan, K.L.,
1997. Lameness and foot lesions in adult British dairy goats. Veterinary
Record 141, 412-416.
Hodgkinson, O., 2010. The importance of feet examination in sheep health
management. Small Ruminant Research 92, 67-71.
Hogan, J.S., Smith, K.L., Hoblet, K.H., Todhunter, D.A., Schoenberger, P.S.,
Hueston, W.D., Pritchard, D.E., Bowman, G.L., Heider, L.E., Brockett, B.L.,
1989. Bacterial counts in bedding materials used on nine commercial dairies.
Journal of Dairy Science 72, 250-258.
Ito, K., Von Keyserlingk, M., LeBlanc, S., Weary, D., 2010. Lying behavior as an
indicator of lameness in dairy cows. Journal of Dairy Science 93, 3553-3560.
Kaler, J., Green, L., 2008. Naming and recognition of six foot lesions of sheep using
written and pictorial information: a study of 809 English sheep farmers.
Preventive Veterinary Medicine 83, 52-64.
Kaler, J., Green, L.E., 2009. Farmers’ practices and factors associated with the
prevalence of all lameness and lameness attributed to interdigital dermatitis
and footrot in sheep flocks in England in 2004. Preventive Veterinary
Medicine 92, 52-59.
Kaler, J., Medley, G., Grogono-Thomas, R., Wellington, E., Calvo-Bado, L.,
Wassink, G., King, E., Moore, L., Russell, C., Green, L., 2010. Factors
associated with changes of state of foot conformation and lameness in a
flock of sheep. Preventive Veterinary Medicine 97, 237-244.

42
Kaler, J., Wassink, G.J., Green, L.E., 2009. The inter-and intra-observer reliability
of a locomotion scoring scale for sheep. The Veterinary Journal 180, 189-
194.
Knott, L., Tarlton, J.F., Craft, H., Webster, A.J.F., 2007. Effects of housing,
parturition and diet change on the biochemistry and biomechanics of the
support structures of the hoof of dairy heifers. The Veterinary Journal 174,
277-287.
Kofler, J., Hangl, A., Pesenhofer, R., Landl, G., 2011. Evaluation of claw health in
heifers in seven dairy farms using a digital claw trimming protocol and claw
data analysis system. Berliner und Münchener Tierärztliche Wochenschrift
124, 10-19.
Koluman, N., Göncü, S., 2016. Measurements of healthy hooves, their interrelation
and correlation with body mass in some improved goats breeds.
International Journal of Agriculture, Environment and Biotechnology 1, 109
- 116.
Kossaibati, M.A., Esslemont, R.J., 1997. The costs of production diseases in dairy
herds in England. The Veterinary Journal 154, 41-51.
Kroekenstoel, A., Heel, M.v., Weeren, P.v., Back, W., 2006. Developmental
aspects of distal limb conformation in the horse: the potential consequences
of uneven feet in foals. Equine Veterinary Journal 38, 652-656.
Kummer, M., Geyer, H., Imboden, I., Auer, J., Lischer, C., 2006. The effect of hoof
trimming on radiographic measurements of the front feet of normal
Warmblood horses. The Veterinary Journal 172, 58-66.
Kummer, M., Gygax, D., Lischer, C., Auer, J., 2009. Comparison of the trimming
procedure of six different farriers by quantitative evaluation of hoof
radiographs. The Veterinary Journal 179, 401-406.
Laursen, M.V., Boelling, D., Mark, T., 2009. Genetic parameters for claw and leg
health, foot and leg conformation, and locomotion in Danish Holsteins.
Journal of Dairy Science 92, 1770-1777.
Leach, K. A., S. Dippel, J. Huber, S. March, C. Winckler, and H. R. Whay. 2009.
Assessing lameness in cows kept in tie-stalls. J. Dairy Sci. 92:1567–1574.
Leach, K., Tisdall, D., Bell, N., Main, D., Green, L., 2012. The effects of early
treatment for hindlimb lameness in dairy cows on four commercial UK
farms. The Veterinary Journal 193, 626-632.
Lean, I.J., Westwood, C.T., Golder, H.M., Vermunt, J.J., 2013. Impact of nutrition
on lameness and claw health in cattle. Livestock Science 156, 71-87.
Leonard, F.C., O'Connell, J.M., O'Farrell, K.J., 1996. Effect of overcrowding on
claw health in first-calved Friesian heifers. British Veterinary Journal 152,
459-472.
43
Leśniak, K., Williams, J., Kuznik, K., Douglas, P., 2017. Does a 4–6 week shoeing
interval promote optimal foot balance in the working equine? Animals 7, 29.
Lischer, C., Ossent, P., RKBER, M., Geyer, H., 2002. Suspensory structures and
supporting tissues of the third phalanx of cows and their relevance to the
development of typical sole ulcers (Rusterholz ulcers). Veterinary Record
151, 694-698.
Lowe, D.E., Steen, R.W.J., Beattie, V.E., 2001. Preferences of housed finishing
beef cattle for different floor types. Animal Welfare 10, 395-404.
Mahendran, S., Bell, N., 2015. Lameness in cattle 2. Managing claw health through
appropriate trimming techniques. In Practice 37, 231-242.
Manske, T., Hultgren, J., Bergsten, C., 2002a. The effect of claw trimming on the
hoof health of Swedish dairy cattle. Preventive Veterinary Medicine 54,
113-129.
Manske, T., Hultgren, J., Bergsten, C., 2002b. Prevalence and interrelationships of
hoof lesions and lameness in Swedish dairy cows. Preventive Veterinary
Medicine 54, 247-263.
Manson, F.J., Leaver, J.D., 1989. The effect of concentrate: Silage ratio and of hoof
trimming on lameness in dairy cattle. Animal Production 49, 15-22.
March, S., Brinkmann, J., Winkler, C., 2007. Effect of training on the inter-observer
reliability of lameness scoring in dairy cattle. Animal Welfare 16, 131-133.
Mattachini, G., Riva, E., Perazzolo, F., Naldi, E., Provolo, G., 2016. Monitoring
feeding behaviour of dairy cows using accelerometers. Journal of
Agricultural Engineering 47, 54-58.
Maxwell, O., Hudson, C., Huxley, J., 2015. Effect of early lactation foot trimming
in lame and non-lame diary heifer: a randomised controlled trial. Veterinary
Record 177.
Mazurek, M., Marie, M., Desor, D., 2007. Potential animal-centred indicators of
dairy goat welfare. Animal Welfare 16, 161-164.
McDaniel, B., 1994. Feet and leg traits of dairy cattle, Proceedings of the 8th
International Symposium on Disorders of the Ruminant Digit and
International Conference on Bovine Lameness, Banff, Canada, pp. 102-109.
Meimandi-Parizi, A., Shakeri, M.A., 2007. Abattoir study of radiographic changes
of bones and joints of digital region in cattle with abnormal claws.
Veterinarski Arhiv 77, 187-194.
Melendez, P., Bartolome, J., Archbald, L.F., Donovan, A., 2003. The association
between lameness, ovarian cysts and fertility in lactating dairy cows.
Theriogenology 59, 927-937.

44
Mellor, D., 2012. Animal emotions, behaviour and the promotion of positive
welfare states. New Zealand Veterinary Journal 1-8.
Mellor, D., 2015. Enhancing animal welfare by creating opportunities for positive
affective engagement. New Zealand Veterinary Journal 63, 3-8.
Mellor, D.J., Beausoleil, N.J., 2015. Extending the ‘Five Domains’ model for
animal welfare assessment to incorporate positive welfare states. Animal
Welfare 24, 241-253.
Mill, J.M., Ward, W.R., 1994. Lameness in dairy cows and farmers' knowledge,
training and awareness. The Veterinary Record 134, 162-164.
Molony, V., 1997. Comments on Anand and Craig, PAIN, 67 (1996) 3-6: PAIN
3273. Pain 70, 293.
Morris, S.T., Kenyon, P.R., 2014. Intensive sheep and beef production from pasture
— A New Zealand perspective of concerns, opportunities and challenges.
Meat Science 98, 330-335.
Mowbray, L., Vittie, T., Weary, D., 2003. Hock lesions and free-stall design: effects
of stall surface, Fifth International Dairy Housing Conference for 2003,
American Society of Agricultural and Biological Engineers, p. 288.
MPI, 2018. Animal Welfare Regulations. Goats. Ministry for Primary Industries.
Muri, K., Stubsjøen, S., Valle, P., 2013. Development and testing of an on-farm
welfare assessment protocol for dairy goats. Animal Welfare 22, 385-400.
Murray, R., Downham, D., Clarkson, M., Faull, W., Hughes, J., Manson, F., Merritt,
J., Russell, W., Sutherst, J., Ward, W., 1996. Epidemiology of lameness in
dairy cattle: description and analysis of foot lesions. The Veterinary Record
138, 586-591.
Nalon, E., Maes, D., Van Dongen, S., van Riet, M.M., Janssens, G., Millet, S.,
Tuyttens, F., 2014. Comparison of the inter-and intra-observer repeatability
of three gait-scoring scales for sows. Animal 8, 650-659.
Nigam, J.M., Singh, A.P., 1980. Radiography of bovine foot disorders. Modern
Veterinary Practice 61, 621-624.
Norring, M., Häggman, J., Simojoki, H., Tamminen, P., Winckler, C., Pastell, M.,
2014. Short communication: Lameness impairs feeding behavior of dairy
cows. Journal of Dairy Science 97, 4317-4321.
O'Grady, S.E., Poupard, D., 2001. Physiological horseshoeing: an overview. Equine
Veterinary Education 13, 330-334.
O'Malley, P., 2019. Lameness control in a UK dairy goat herd. Livestock 24, 189-
192.

45
O Callaghan, K., Cripps, P., Downham, D., Murray, R., 2003. Subjective and
objective assessment of pain and discomfort due to lameness in dairy cattle.
Animal Welfare 12, 605-610.
Offer, J., McNulty, D., Logue, D., 2000. Observations of lameness, hoof
conformation and development of lesions in dairy cattle over four lactations.
The Veterinary Record 147, 105-109.
Pereira, G.M., Heins, B.J., Endres, M.I., 2018. Technical note: Validation of an ear-
tag accelerometer sensor to determine rumination, eating, and activity
behaviors of grazing dairy cattle. Journal of Dairy Science 101, 2492-2495.
Pérez-Cabal, M.A., García, C., González-Recio, O., Alenda, R., 2006. Genetic and
Phenotypic Relationships Among Locomotion Type Traits, Profit,
Production, Longevity, and Fertility in Spanish Dairy Cows. Journal of
Dairy Science 89, 1776-1783.
Pesenhofer, G., Palme, R., Pesenhofer, R., Kofler, J., 2006. Comparison of two
methods of fixation during functional claw trimming-walk-in crush versus
tilt table-in dairy cows using faecal cortisol metabolite concentrations and
daily milk yield as parameters. Veterinary Medicine Austria 288-294.
Phillips, C.J.C., Chiy, P.C., Bucktrout, M.J., Collins, S.M., Gasson, C.J., Jenkins,
A.C., Paranhos da Costa, M.J.R., 2000. Frictional properties of cattle hooves
and their conformation after trimming. Veterinary Record 146, 607-609.
Phythian, C.J., Cripps, P.J., Michalopoulou, E., Jones, P.H., Grove-White, D.,
Clarkson, M.J., Winter, A.C., Stubbings, L.A., Duncan, J.S., 2012.
Reliability of indicators of sheep welfare assessed by a group observation
method. The Veterinary Journal 193, 257-263.
Prentice, D.E., 1973. Growth and Wear Rates of Hoof Horn in Ayrshire Cattle.
Research in Veterinary Science 14, 285-289.
Pugh, D.G., Baird, N.N., 2002. Sheep & Goat Medicine. 1st Edition ed. W. B.
Saunders Company, Philadelphia, US.
Rajkondawar, P.G., Tasch, U., Lefcourt, A.M., Erez, B., Dyer, R.M., Varner, M.A.,
2002. A system for identifying lameness in dairy cattle. Applied
Engineering in Agriculture 18, 87.
Randall, L.V., Green, M.J., Chagunda, M.G.G., Mason, C., Archer, S.C., Green,
L.E., Huxley, J.N., 2015. Low body condition predisposes cattle to lameness:
An 8-year study of one dairy herd. Journal of Dairy Science 98, 3766-3777.
Ranjbar, S., Rabiee, A.R., Gunn, A., House, J.K., 2016. Identifying risk factors
associated with lameness in pasture-based dairy herds. Journal of Dairy
Science 99, 7495-7505.

46
Rowlands, G.J., Russell, A.M., Williams, L.A., 1983. Effects of season, herd size,
management system and veterinary practice on the lameness incidence in
dairy cattle. The Veterinary Record 113, 441-445.
Schirmann, K., von Keyserlingk, M.A.G., Weary, D.M., Veira, D.M., Heuwieser,
W., 2009. Validation of a system for monitoring rumination in dairy cows.
Journal of Dairy Science 92, 6052-6055.
Schlageter-Tello, A., Bokkers, E.A.M., Koerkamp, P.W.G.G., Van Hertem, T.,
Viazzi, S., Romanini, C.E.B., Halachmi, I., Bahr, C., Berckmans, D.,
Lokhorst, K., 2014. Effect of merging levels of locomotion scores for dairy
cows on intra-and interrater reliability and agreement. Journal of Dairy
Science 97, 5533-5542.
Sewalem, A., Kistemaker, G.J., Van Doormaal, B.J., 2005. Relationship Between
Type Traits and Longevity in Canadian Jerseys and Ayrshires Using a
Weibull Proportional Hazards Model. Journal of Dairy Science 88, 1552-
1560.
Shearer, J.K., van Amstel, S.R., 2001. Functional and corrective claw trimming.
Veterinary Clinics of North America: Food Animal Practice 17, 53-72.
Shearer, J.K., van Amstel, S.R., Brodersen, B.W., 2012. Clinical Diagnosis of Foot
and Leg Lameness in Cattle. Veterinary Clinics: Food Animal Practice 28,
535-556.
Shearer, J.K., van Amstel, S.R., Gonzalez, A., 2005. Manual of foot care in cattle.
Hoard's Dairyman Books, Fort Atkinson, Wisconsin.
Singh, S., Ward, W., Lautenbach, K., Murray, R., 1993. Behaviour of lame and
normal dairy cows in cubicles and in a straw yard. The Veterinary Record
133, 204-208.
Smith, E.M., Green, O.D.J., Calvo-Bado, L.A., Witcomb, L.A., Grogono-Thomas,
R., Russell, C.L., Brown, J.C., Medley, G.F., KilBride, A.L., Wellington,
E.M.H., Green, L.E., 2014. Dynamics and impact of footrot and climate on
hoof horn length in 50 ewes from one farm over a period of 10 months. The
Veterinary Journal 201, 295-301.
Smith, M.C., Sherman, D.M., 2009. Goat medicine. John Wiley & Sons,
Philadelphia, PA.
Solano, L., Barkema, H.W., Pajor, E.A., Mason, S., LeBlanc, S., Zaffino Heyerhoff,
J., Nash, C., Haley, D., Vasseur, E., Pellerin, D., Rushen, J., de Passille,
A.M., Orsel, K., 2015. Prevalence of lameness and associated risk factors in
Canadian Holstein-Friesian cows housed in freestall barns. Journal of Dairy
Science 98.
Solis-Ramirez, J., Lopez-Villalobos, N., Blair, H., 2011. Dairy goat production
systems in Waikato, New Zealand, Proceedings of the New Zealand Society
of Animal Production, Invercargil, New Zealand, pp. 86-91.

47
Somers, J.G.C.J., Frankena, K., Noordhuizen-Stassen, E.N., Metz, J.H.M., 2003.
Prevalence of Claw Disorders in Dutch Dairy Cows Exposed to Several
Floor Systems. Journal of Dairy Science 86, 2082-2093.
Somers, J.G.C.J., Schouten, W.G.P., Frankena, K., Noordhuizen-Stassen, E.N.,
Metz, J.H.M., 2005. Development of Claw Traits and Claw Lesions in Dairy
Cows Kept on Different Floor Systems. Journal of Dairy Science 88, 110-
120.
Sprecher, D.J., Hostetler, D.E., Kaneene, J.B., 1997. A lameness scoring system
that uses posture and gait to predict dairy cattle reproductive performance.
Theriogenology 47, 1179-1187.
Stafford, K.J., Prosser, C., 2016. Chapter 5 Goat production, in: Stafford, K. (Ed.),
Livestock production in New Zealand, Massey University Press, pp. 148-
169.
Sullivan, L.E., Blowey, R.W., Carter, S.D., Duncan, J.S., Grove-White, D.H., Page,
P., Iveson, T., Angell, J.W., Evans, N.J., 2014. Presence of digital dermatitis
treponemes on cattle and sheep hoof trimming equipment. Veterinary
Record, 201-205.
Sutherland, M.A., Lowe, G.L., Watson, T.J., Ross, C.M., Rapp, D., Zobel, G.A.,
2017. Dairy goats prefer to use different flooring types to perform different
behaviours. Applied Animal Behaviour Science 197, 24-31.
Tarlton, J., Holah, D., Evans, K., Jones, S., Pearson, G., Webster, A., 2002.
Biomechanical and histopathological changes in the support structures of
bovine hooves around the time of first calving. The Veterinary Journal 163,
196-204.
Telezhenko, E., Bergsten, C., Magnusson, M., Nilsson, C., 2009. Effect of different
flooring systems on claw conformation of dairy cows. Journal of Dairy
Science 92, 2625-2633.
Thomas, H.J., Miguel-Pacheco, G.G., Bollard, N.J., Archer, S.C., Bell, N.J., Mason,
C., Maxwell, O.J.R., Remnant, J.G., Sleeman, P., Whay, H.R., 2015.
Evaluation of treatments for claw horn lesions in dairy cows in a randomized
controlled trial. Journal of Dairy Science 98, 4477-4486.
Thomsen, P.T., 2009. Rapid screening method for lameness in dairy cows.
Veterinary Record 47, 689-690.
Thomsen, P.T., Munksgaard, L., Sørensen, J.T., 2012. Locomotion scores and lying
behaviour are indicators of hoof lesions in dairy cows. The Veterinary
Journal 193, 644-647.
Toussaint Raven, E., Halstra, R.T., Peterse, D.J., 1985. Cattle footcare and claw
trimming. Farming Press Ltd, Ipswich, UK.
48
Tranter, W.P., Morris, R.S., 1991. A case study of lameness in three dairy herds.
New Zealand Veterinary Journal 39, 88-96.
Tranter, W.P., Morris, R.S., 1992. Hoof growth and wear in pasture-fed dairy cattle.
New Zealand Veterinary Journal 40, 89-96.
Tucker, C.B., Weary, D.M., Von Keyserlingk, M.A.G., Beauchemin, K.A., 2009.
Cow comfort in tie-stalls: Increased depth of shavings or straw bedding
increases lying time. Journal of Dairy Science 92, 2684-2690.
van Amstel, S.R., Shearer, J.K., 2006. Manual for treatment and control of lameness
in cattle. Blackwell Publishing Professional, Iowa, US.
Van der Tol, P., Metz, J., Noordhuizen-Stassen, E., Back, W., Braam, C., Weijs,
W., 2002. The pressure distribution under the bovine claw during square
standing on a flat substrate. Journal of Dairy Science 85, 1476-1481.
Van der Tol, P.P.J., Van der Beek, S.S., Metz, J.H.M., Noordhuizen-Stassen, E.N.,
Back, W., Braam, C.R., Weijs, W.A., 2004. The effect of preventive
trimming on weight bearing and force balance on the claws of dairy cattle.
Journal of Dairy Science 87, 1732-1738.
Van der Waaij, E.H., Holzhauer, M., Ellen, E., Kamphuis, C., De Jong, G., 2005.
Genetic parameters for claw disorders in Dutch dairy cattle and correlations
with conformation traits. Journal of Dairy Science 88, 3672-3678.
Van Hertem, T., Maltz, E., Antler, A., Romanini, C.E.B., Viazzi, S., Bahr, C.,
Schlageter-Tello, A., Lokhorst, C., Berckmans, D., Halachmi, I., 2013.
Lameness detection based on multivariate continuous sensing of milk yield,
rumination, and neck activity. Journal of Dairy Science 96, 4286-4298.
Van Hertem, T., Parmet, Y., Steensels, M., Maltz, E., Antler, A., Schlageter-Tello,
A.A., Lokhorst, C., Romanini, C.E.B., Viazzi, S., Bahr, C., Berckmans, D.,
Halachmi, I., 2014. The effect of routine hoof trimming on locomotion score,
ruminating time, activity, and milk yield of dairy cows. Journal of Dairy
Science 97, 4852-4863.
Van Nuffel, A., Zwertvaegher, I., Pluym, L., Van Weyenberg, S., Thorup, V.,
Pastell, M., Sonck, B., Saeys, W., 2015. Lameness detection in dairy cows:
Part 1. How to distinguish between non-lame and lame cows based on
differences in locomotion or behavior. Animals 5, 838-860.
Vanegas, J., Overton, M., Berry, S.L., Sischo, W.M., 2006. Effect of Rubber
Flooring on Claw Health in Lactating Dairy Cows Housed in Free-Stall
Barns. Journal of Dairy Science 89, 4251-4258.
Vermunt, J., 2004. Herd Lameness - A Review, Major Causal Factors, and
Guidelines for Prevention and Control, Proceedings of 13th International
Symposium and Fifth Conference on Lameness in Ruminants Maribor,
Slovenija, pp. 3-18.

49
Vermunt, J., Greenough, P., 1996. Claw conformation of dairy heifers in two
management systems. British Veterinary Journal 152, 321-331.
Vermunt, J.J., Greenough, P.R., 1995. Structural characteristics of the bovine claw:
Horn growth and wear, horn hardness and claw conformation. British
Veterinary Journal 151, 157-180.
Viñuela-Fernández, I., Jones, E., Welsh, E.M. and Fleetwood-Walker, S.M., 2007.
Pain mechanisms and their implication for the management of pain in farm
and companion animals. The Veterinary Journal, 174, 227-239.
von Keyserlingk, M.A.G., Barrientos, A., Ito, K., Galo, E., Weary, D.M., 2012.
Benchmarking cow comfort on North American freestall dairies: Lameness,
leg injuries, lying time, facility design, and management for high-producing
Holstein dairy cows. Journal of Dairy Science 95, 7399-7408.
von Keyserlingk, M.A.G., Rushen, J., de Passillé, A.M., Weary, D.M., 2009.
Invited review: The welfare of dairy cattle—Key concepts and the role of
science. Journal of Dairy Science 92, 4101-4111.
Warnick, L., Janssen, D., Guard, C., Gröhn, Y., 2001. The effect of lameness on
milk production in dairy cows. Journal of Dairy Science 84, 1988-1997.
Weary, D., Huzzey, J., Von Keyserlingk, M., 2009. Board-invited review: Using
behavior to predict and identify ill health in animals. Journal of Animal
Science 87, 770-777.
Weary, D.M., Niel, L., Flower, F.C., Fraser, D., 2006. Identifying and preventing
pain in animals. Applied Animal Behaviour Science 100, 64-76.
Webster, A., 2002. Effects of housing practices on the development of foot lesions
in dairy heifers in early lactation. Veterinary Record 151, 9-12.
Wells, S., Trent, A., Marsh, W., McGovern, P., Robinson, R., 1993. Individual cow
risk factors for clinical lameness in lactating dairy cows. Preventive
Veterinary Medicine 17, 95-109.
Whay, H., Main, D., Green, L., Webster, A., 2003. Assessment of the welfare of
dairy caftle using animal-based measurements: direct observations and
investigation of farm records. Veterinary Record 153, 197-202.
Whay, H., Waterman, A., Webster, A., O'brien, J., 1998. The influence of lesion
type on the duration ofhyperalgesia associated with hindlimb lameness in
dairy cattle. The Veterinary Journal 156, 23-29.
Whay, H.R., Main, D.C.J., Green, L.E., Webster, A.J.F., 2002. Farmer perception
of lameness prevalence, Proceedings. 12th International Symposium of
Lameness in Ruminants Orlando, Florida, pp. 355-358.
Whay, H.R., Waterman, A.E., Webster, A.J.F., 1997. Associations between
locomotion, claw lesions and nociceptive threshold in dairy heifers during
the peri-partum period. Veterinary Journal 154, 155-161.
50
Whaytt, H.R., Main, D.C.J., Greent, L.E., Webster, A.J.F., 2003. Animal-based
measures for the assessment of welfare state of dairy cattle, pigs and laying
hens: consensus of expert opinion. Animal Welfare 12, 205-217.
Whitaker, D.A., Kelly, J.M., Smith, S., 2000. Disposal and disease rates in 340
British dairy herds. Veterinary Record 146, 363-367.
Wiesner, H., 1985. Problems in the management of chamois in captivity. Croom
Helm London.
Willshire, J., Bell, N., 2009. An economic review of cattle lameness. Cattle Practice
17, 136-141.
Winckler, C., Willen, S., 2001. The reliability and repeatability of a lameness
scoring system for use as an indicator of welfare in dairy cattle. Acta
Agriculturae Scandinavica, Section A-Animal Science 51, 103-107.
Winter, A. C., 2004. Lameness in sheep 1. Diagnosis. In Practice 26, 58-63.
Winter, A.C., 2008. Lameness in sheep. Small Ruminant Research 76, 149-153.
Winter, J.R., Kaler, J., Ferguson, E., KilBride, A.L., Green, L.E., 2015. Changes in
prevalence of, and risk factors for, lameness in random samples of English
sheep flocks: 2004–2013. Preventive Veterinary Medicine 122, 121-128.
Yeates, J.W., Main, D.C., 2008. Assessment of positive welfare: a review. The
Veterinary Journal 175, 293-300.
Zobel, G., Freeman, H., Schneider, D., Henderson, H., Johnstone, P., 2018.
Behaviour of dairy goats managed in a natural alpine environment,
Proceedings if the 52nd Congress of the International Society for Applied
Ethology, Prince Edward Island, Canada, p. 229.
Zobel, G., Leslie, K., Von Keyserlingk, M.A.G., 2016. Hoof overgroth affects lying
behaviour of dairy goats near parturition, IGA 12th International conference
on goats Antalya, Turkey.
Zobel, G., Leslie, K., Weary, D.M., Von Keyserlingk, M.A.G., 2015a. Ketonemia
in dairy goats: Effect of dry period length and effect on lying behavior.
Journal of Dairy Science 98, 6128-6138.
Zobel, G., Neave, H.W., Webster, J., 2019. Understanding natural behavior to
improve dairy goat (Capra hircus) management systems. Translational
Animal Science 3, 212-224.
Zobel, G., Weary, D., Leslie, K., Chapinal, N., Von Keyserlingk, M., 2015b.
Validation of data loggers for recording lying behavior in dairy goats.
Journal of Dairy Science 98, 1082-1089.

51
Chapter Two
The development of a hoof conformation
assessment for use in dairy goats
Authors note: Chapter two is presented in the style of the journal
Animals where it has been published.
Deeming, LE., Beausoleil, NJ., Stafford, KJ., Webster, JR., Zobel, G.
2019. The development of a hoof conformation assessment for use in
dairy goats. Animals. 9, 973.
52
Abstract
The assessment of hoof conformation is important due to its recognised relationship
with the biomechanical functionality of the hoof. Hoof conformation can be
assessed using objective measures or subjective scores. However, to date there are
limited data using either method in dairy goats. Therefore, the aims were to 1)
develop a reliable method of assessing hoof conformation in dairy goats, and 2)
compare two aspects of a subjective assessment against corresponding objective
measures as a means of validation. A total of 1035 goats contributed photographs
across sixteen commercial dairy goat farms. Photographs were taken of the left front
and left hind hoof in the lateral and dorsal aspect at five assessments across the
goats’ first two lactations. Hoof conformation was assessed using five subjective
scores (toe length, heel shape, fetlock shape, claw splay and claw shape) and two
objective measures (toe length ratio, and claw splay distance). Following training
of two observers, high levels of inter and intra-reliability were achieved for both
the subjective scores (>0.8 weighted kappa) and objective measures (>0.8 Lin’s
Concordance Correlation Coefficient). Two aspects of the subjectively assessed
ordinal scores were compared with the objective measures with high levels of
accuracy (>0.8). This suggests that the subjective scores may be a suitable
alternative to more time-consuming objective measures when assessment is
completed using photographs.
Keywords: toe length; heel shape; claw splay; claw shape; subjective scores;
objective measures; lameness; welfare
53
Introduction
Assessment of hoof conformation is important due to its recognised relationship
with the biomechanical functionality of the hoof [1]. Hoof conformation refers to
the physical dimensions and shape of the hoof. In dairy cows, desirable hoof
conformational traits include a short toe and steeply angled hoof, a straight fetlock
[2], an upright heel [3] and even claws [4], thus enabling even weight distribution
between the medial and lateral claws of the hoof [5]. Poor hoof conformation is
associated with an animal’s susceptibility to hoof lesions and lameness [4,6,7],
decreased reproductive performance [8], reduced milk production [9] and a greater
risk of being culled [10,11]. Therefore, accurate assessment of hoof conformation
is imperative for the identification of at-risk animals.
Hoof conformation can be assessed using either subjective scores or objective
measures. Aspects of the objective hoof conformation assessment described by
Vermunt and Greenough [12] are often used in dairy cows [12-14]. Features
assessed commonly include measurements of claw/sole length, heel height and
dorsal wall length using calipers, and claw angle using an angle gauge or protractor.
Claw/sole length, is determined based on the length of the abaxial wall and bulb
that are in contact with the floor [12,13]. Heel height is defined as the distance from
the floor to the skin-horn junction [14,15], and dorsal wall length is measured as
the distance from the tip of the toe to the dorsal skin-horn junction [12,14,16,17].
Claw angle is measured as the slope of the dorsal border of the claw with respect to
the floor surface [14,15]. An animal with good conformation, will have even claw
length, greater heel height, shorter dorsal wall length, and greater claw angle [2-4].
However, it should be noted that the naming of the different objective measures can

54
vary between authors, for instance the dorsal wall length has previously been
referred to as toe length [15,18] or claw length [19].
Objective measures are suggested to provide superior assessments compared to
subjective scores as they are accurate and repeatable [12], allowing for thorough
assessment of hoof conformation traits. However, objective measures can involve
some subjective judgement by the observer. For instance, concave dorsal hoof walls
are reported in dairy heifers [20], therefore when measuring the angle of the claw it
results in the observer having to decide on the placement of the protractor. Bhardwaj
et al. [13] report intra-observer (repeatability) and inter-observer (reproducibility)
reliability when assessing hoof conformation in sheep using the Vermunt and
Greenough method. Bhardwaj et al. [13] concluded that due to difficulties in
defining measurement points, claw angle and heel height were aspects of hoof
conformation that were unreliable for measurement in sheep. Despite the possible
difficulties in defining measurement points, inter- and intra-observer reliability are
rarely reported in studies using objective measures of hoof conformation in dairy
cows.
To our knowledge there is only one previous study that has objectively measured
hoof conformation in dairy goats [21], which also used the methodology described
by Vermunt and Greenough [12]. Koluman and Göncü [21] did not report any
validation to support the use of the cow measurements in goats. Additionally,
although the authors state that hooves were rescored to assess variance amongst
observers, inter-observer reliability was not reported.
Subjective assessments of hoof conformation involve visual assessments to allocate
a categorical score for particular aspects of conformation [2,6,11]. They are quick
55
and easy to use, require no technical equipment, can allow assessment of a large
number of animals and are therefore commonly used for live animal scoring on
farm [22]. Subjective scoring systems have been used to assess a number of aspects
of hoof conformation such as abnormal overgrowth and splayed feet in sows [11],
misshaped hooves in sheep [6] and heel height, toe overgrowth and fetlock shape
in cows [2,23]. In dairy goats, subjective scores of hoof overgrowth [24,25] and
claw deformation have been reported [26], however no other aspects of hoof
conformation have been subjectively assessed. Potential limitations of subjective
scores are poor inter- and intra-observer reliability as they are affected by both the
scoring system used and previous experience [22]. Therefore, intensive training is
often required for high levels of reliability to be achieved using subjective methods
of assessment [27].
It is important that reliability testing is conducted for conformation scoring systems
to ensure accurate and reliable results are obtained. Without evaluating repeatability
and reproducibility, conclusions made from the results may be misleading [23].
Additionally, assessments of hoof conformation need to be validated to ensure
results are accurately indicating how the allocated scores relate to poor
conformation. A way to validate a subjective assessment is to compare allocated
subjective scores against objective measures. This has been carried out in pain and
lameness assessments [28] and body condition scores in dairy cows [29]. However,
validation of many hoof conformation assessment methods has not been reported.
Therefore, the aims were to 1) develop a reliable method of assessing hoof
conformation in dairy goats, and 2) compare two aspects of the subjective scoring
assessment against corresponding objective measures as a means of validation.
56
Materials and Methods
This study was approved by AgResearch Ltd, Ruakura Animal Ethics Committee
(#13478, approved 07/05/2015) as part of a large longitudinal study of dairy goat
longevity. Sixteen commercial dairy goat farms in the Waikato region of New
Zealand participated (see Todd et al., 2019 for farm information) [30]. The number
of farms was the maximum number that could be achieved through voluntary
participation. The main variables of interest for the longitudinal study were IgG
level during the first 24 hours of life and liveweight gain of doe kids. A power
analysis could not be completed as there were no treatments to compare, however
a regression of the two variables of interest (IgG and liveweight gain) was obtained.
The analysis indicated 1200 animals (approx. 80 per farm) would detect a
significant relationship between these variables at the 10% level.
On 12 of the farms, the goats were permanently housed in barns and bedded on
wood shavings. One farm provided the goats with access to outdoor pasture up to
first kidding (Assessment 2) but goats were permanently housed and bedded on
wood shavings thereafter. On two farms the goats were housed in barns and bedded
on shavings, however an outdoor area was provided for their adult goats once they
were part of the milking herd. One farm housed the goats up to weaning and they
were outdoors on pasture thereafter. All farms milked twice daily.
Farms were visited at five assessments throughout the goats’ first two lactations
(2016 – 2017) (Table 1). As part of these visits, photographs of hooves were taken.
The goats were all born in the previous season (May - August 2015) and were
therefore of a similar age at the first assessment (mean ± SD: 8.0 ± 0.7 months of
age). The first assessment was made near the time of first mating, at which point
57
1099 goats were still present in the longitudinal study; however, due to issues with
hooves being dirty, poor photo quality and missing goat identification 1035 goats
were included in the first assessment of the present study. By assessment 2, the
goats had kidded and entered the milking herd; the number of goats contributing
photographs decreased throughout the study due to culling and ID issues. Each
farm’s housing and husbandry management protocol was maintained throughout
the study, including their specific hoof management and trimming regimes.
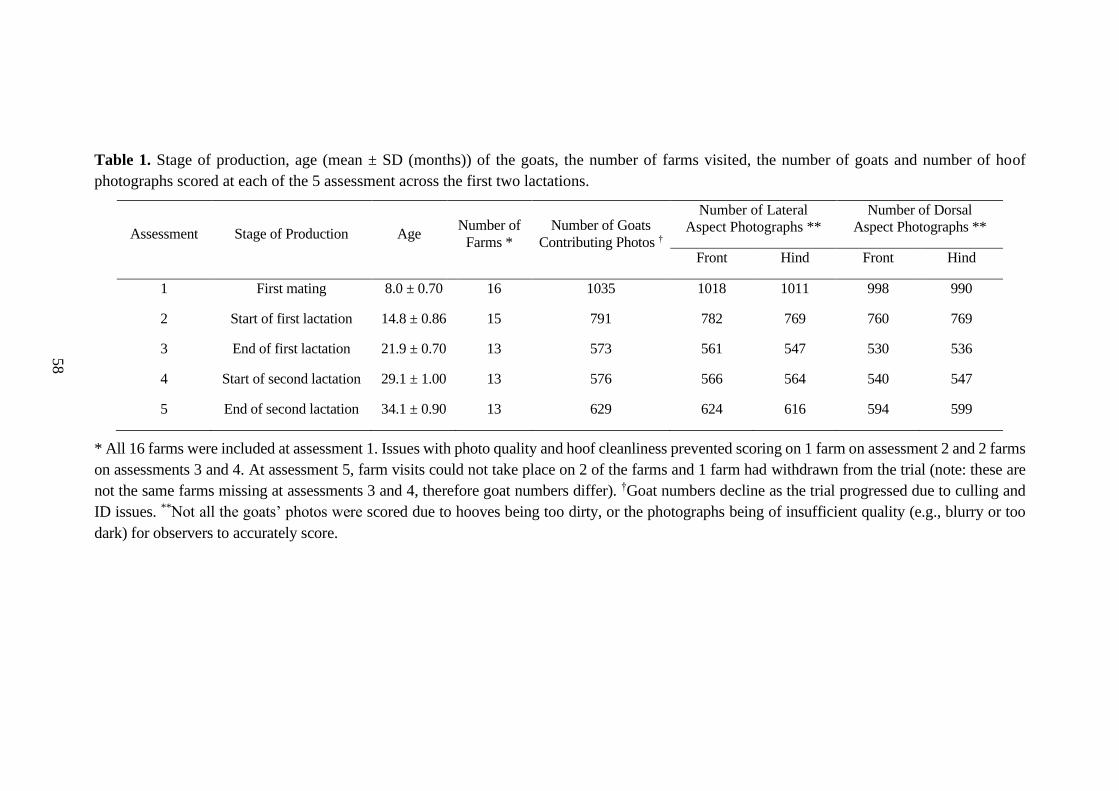
58
Table 1. Stage of production, age (mean ± SD (months)) of the goats, the number of farms visited, the number of goats and number of hoof
photographs scored at each of the 5 assessment across the first two lactations.
Assessment Stage of Production Age Number of
Farms *
Number of Goats
Contributing Photos †
Number of Lateral
Aspect Photographs **
Number of Dorsal
Aspect Photographs **
Front Hind Front Hind
1 First mating 8.0 ± 0.70 16 1035 1018 1011 998 990
2 Start of first lactation 14.8 ± 0.86 15 791 782 769 760 769
3 End of first lactation 21.9 ± 0.70 13 573 561 547 530 536
4 Start of second lactation 29.1 ± 1.00 13 576 566 564 540 547
5 End of second lactation 34.1 ± 0.90 13 629 624 616 594 599
* All 16 farms were included at assessment 1. Issues with photo quality and hoof cleanliness prevented scoring on 1 farm on assessment 2 and 2 farms
on assessments 3 and 4. At assessment 5, farm visits could not take place on 2 of the farms and 1 farm had withdrawn from the trial (note: these are
not the same farms missing at assessments 3 and 4, therefore goat numbers differ). †Goat numbers decline as the trial progressed due to culling and
ID issues. **Not all the goats’ photos were scored due to hooves being too dirty, or the photographs being of insufficient quality (e.g., blurry or too
dark) for observers to accurately score.

59
Hoof Conformation Assessment
The hoof conformation assessment was adapted from subjective scores and
objective measures previously reported for several species (Table 2). A digital
camera (Canon Powershot, SX530) was used to take photographs of the left front
and left hind hoof. For practicality and to reduce handling of the goats, only the left
hooves were assessed. Photographs were taken in the yards outside of the milking
parlour where goats were standing on a horizontal level concrete surface, which
ensured they were bearing weight evenly on all four limbs. Two photographs per
hoof were taken: 1) lateral aspect, and 2) dorsal aspect. Photographs were taken at
approximately 50cm from the goat, ensuring the hoof up to the knee/hock was in
view. The hooves were photographed against a whiteboard which had 2cm scale
markers along the vertical and horizontal edges to allow the objective measures to
be calculated.
Table 2. Aspects of hoof conformation adapted from previous subjective and
objective assessments to create the current approach of assessment for dairy goats.
Species Assessment
type Aspects of hoof conformation References
Cows Objective Toe length, heel height [15,18,31]
Sheep
Subjective
Shape of hoof
[6]
Sows Subjective
Abnormal hoof growth, splayed feet,
dipped pastern/fetlock
[11]
Goats
Subjective
Hoof overgrowth
[24,25,26]
The assessment included five subjective scores: 1) toe length, 2) heel shape, 3)
fetlock shape, 4) claw splay, and 5) claw shape (Table 3 and 4). Each aspect was
60
scored on a 3-point ordinal scale (0, 1, and 2), except for fetlock shape, which was
scored on a binary scale (0 or 1); a 0 was ‘normal’ in all cases. Two objective
measures were also made: 1) toe length ratio (i.e., the toe length compared with the
length of the rest of the hoof (Figure 1a), and 2) claw splay distance (i.e., distance
between the axial edge of the distal tip of both claws (Figure 1b). Claw splay was
scored, and claw splay distance measured, only when claw shape was scored as a 0
(i.e., both claws were straight).
Two observers scored the photographs. Individual photographs were randomly
allocated to each observer ensuring that both observers scored photographs from
each farm at each assessment. Observers completed scoring in a cyclical manner: a
set of 20 photographs from one farm were completed and then the observer moved
on to the next set, to ensure photographs from several farms were scored on any
given day. The subjective scoring and objective measures were performed in R
3.5.0 statistical software (R Core Team, 2018) [32]. An R code was developed using
packages jpeg and tcltk2 to load and read the photographs, and packages zoo and
latticeExtra for distance calibrations (see appendix one for a copy of the full R code
used). The developed code streamlined the assignment of each subjective score at
the same time as the objective measures were completed.
Using the developed code, a set of 20 photos were uploaded into R, the user firstly
entered whether it was a lateral or dorsal aspect photograph they were viewing. A
distance calibration was then completed using the scale bar marker on the
whiteboard in the photographs. Four calibration points were selected on the scale
bar. Two consecutive horizontal markers (x-distance) were firstly selected (cal1,
cal2) and then two consecutive vertical markers (y-distance) were selected (cal3,
cal4) (Figure 1a). The user input the width and height of the selected points as 2cm,

61
allowing the distance in pixels to be converted to a distance in cm. A linear
regression was then fit for both the x-distance ((0, width) ~ intercept + slope*(cal1,
cal2)) and the y-distance ((0, width) ~ intercept + slope*(cal3, cal4)). The estimated
slopes and intercepts from the linear regressions for the x-distance and y-distance
were then used to calibrate selected points on the hooves.
For the objectively measured toe length ratio, three points were selected on a lateral
aspect hoof photograph; one point on the end of the toe (point 1), one point in line
with the front edge of the coronet band (point 2), and one point at the back edge of
the heel where the heel meets the ground (point 3) (Figure 1a). The distance
between point 1 and point 2 was divided by the distance between point 2 and point
3 as follows:
𝑇𝑜𝑒 𝑙𝑒𝑛𝑔𝑡ℎ 𝑟𝑎𝑡𝑖𝑜 =sqrt((x[2] − x[1])2 + (y[2] − y[1])2)
sqrt((x[2] − x[3])2 + (y[2] − y[3])2)
where (x[2]- x[1]) is the calibrated difference of the x-position of point 2 on the
hoof minus the x-position of point 1, (y[2]- y[1]) is the calibrated difference of the
y-position of point 2 on the hoof minus the y-position of point 1. Likewise, (x[2]-
x[3]) is the calibrated difference of the x-position of point 2 on the hoof minus the
x-position of point 3 and (y[2]- y[3]) is the calibrated difference of the y-position
of point 2 on the hoof minus the y-position of point 3.
For claw splay distance, two points were selected on a dorsal aspect hoof
photograph; one on the axial side of the distal tip of both claws, with the medial
claw (inside) selected first (point 1) (Figure 1b). These two points were calibrated

62
as described above and then the distance between the two points was calculated as
follows:
𝐶𝑙𝑎𝑤 𝑠𝑝𝑙𝑎𝑦 𝑑𝑖𝑠𝑡𝑎𝑛𝑐𝑒 = sqrt((x[2] − x[1])^2 + (y[2] − y[1])^2)
where (x[2]- x[1]) is the calibrated difference of the x-position of point 2 on the
hoof minus the x-position of point 1 and (y[2]- y[1]) is the calibrated difference of
the y-position of point 2 on the hoof minus the y-position of point 1.

63
Table 3. Hoof conformation aspects subjectively assessed from photographs taken of the
lateral aspect of the left front and left hind hooves of dairy goats across their first 2
lactations, at up to 16 farms and 5 assessments: 1) 1st mating, 2) Start of 1st lactation, 3)
End of 1st lactation, 4) Start of 2nd lactation, 5) End of 2nd lactation (n = 1035 contributing
goats (median = 629, min = 573, Q1 = 576, Q3 = 791, max = 1035 contributing goats per
assessment); n = 7058 total lateral hoof photographs (median = 1240, min = 1108, Q1 =
1130, Q3 = 1551, max = 2029 total of front and hind photographs per assessment); not all
the goats’ photos were scored due to hooves being too dirty, or the photographs being of
insufficient quality (e.g., blurry or too dark) for observers to accurately score).
Hoof
aspect Ordinal score
0 1 2
Toe
length
Toe is not overgrown
Length of the toe is less
than half of the length of
rest of the hoof
Toe is moderately
overgrown
Length of the toe is
greater than half, but less
than the full length of the
rest of the hoof
Toe is severely
overgrown
Length of the toe is
greater than the full length
of the rest of the hoof
Heel
shape
Heel is upright
Not walking on heel,
coronet band parallel to
ground
Heel is moderately
dipped
Not walking on heel, but
coronet band is angled
towards the ground
Heel is severely dipped
Walking on heel, coronet
band angled sharply
towards the ground
Fetlock
shape *
Fetlock is upright and
straight
Fetlock is dipped
towards
the ground
Bony lump on pastern
may be apparent
* Fetlock scored as binary 0 or 1
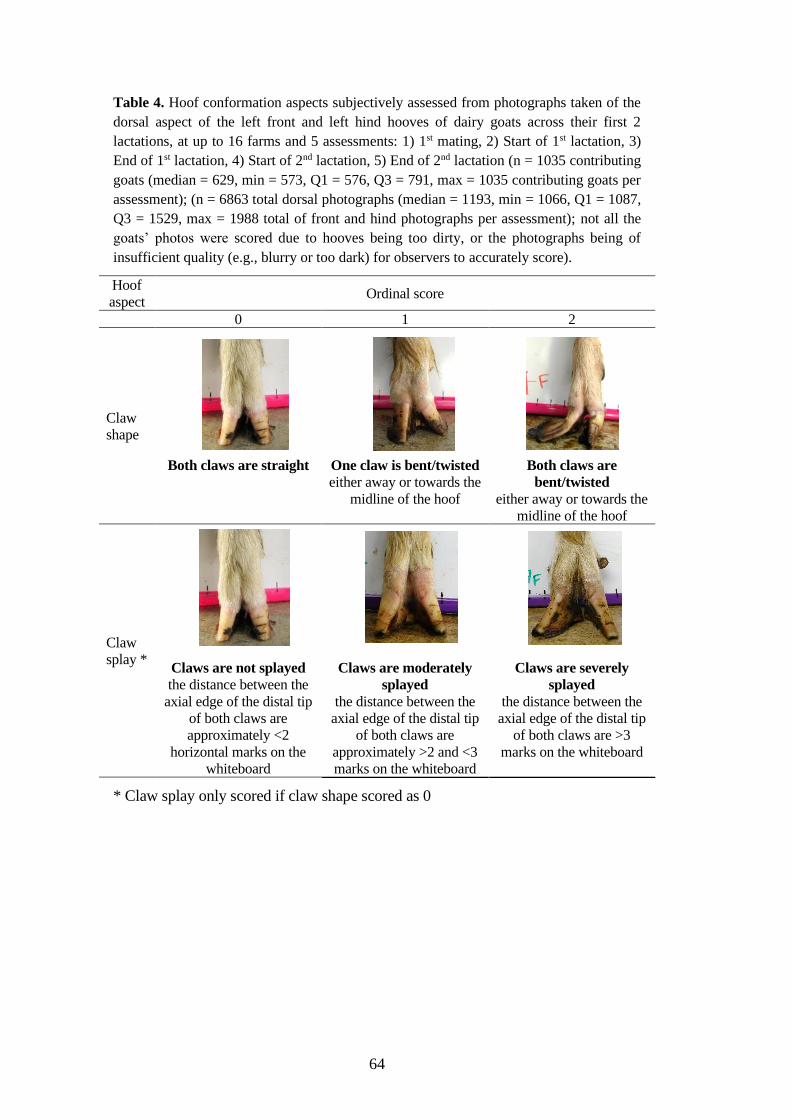
64
Table 4. Hoof conformation aspects subjectively assessed from photographs taken of the
dorsal aspect of the left front and left hind hooves of dairy goats across their first 2
lactations, at up to 16 farms and 5 assessments: 1) 1st mating, 2) Start of 1st lactation, 3)
End of 1st lactation, 4) Start of 2nd lactation, 5) End of 2nd lactation (n = 1035 contributing
goats (median = 629, min = 573, Q1 = 576, Q3 = 791, max = 1035 contributing goats per
assessment); (n = 6863 total dorsal photographs (median = 1193, min = 1066, Q1 = 1087,
Q3 = 1529, max = 1988 total of front and hind photographs per assessment); not all the
goats’ photos were scored due to hooves being too dirty, or the photographs being of
insufficient quality (e.g., blurry or too dark) for observers to accurately score).
Hoof
aspect Ordinal score
0 1 2
Claw
shape
Both claws are straight One claw is bent/twisted
either away or towards the
midline of the hoof
Both claws are
bent/twisted
either away or towards the
midline of the hoof
Claw
splay *
Claws are not splayed
the distance between the
axial edge of the distal tip
of both claws are
approximately <2
horizontal marks on the
whiteboard
Claws are moderately
splayed
the distance between the
axial edge of the distal tip
of both claws are
approximately >2 and <3
marks on the whiteboard
Claws are severely
splayed
the distance between the
axial edge of the distal tip
of both claws are >3
marks on the whiteboard
* Claw splay only scored if claw shape scored as 0
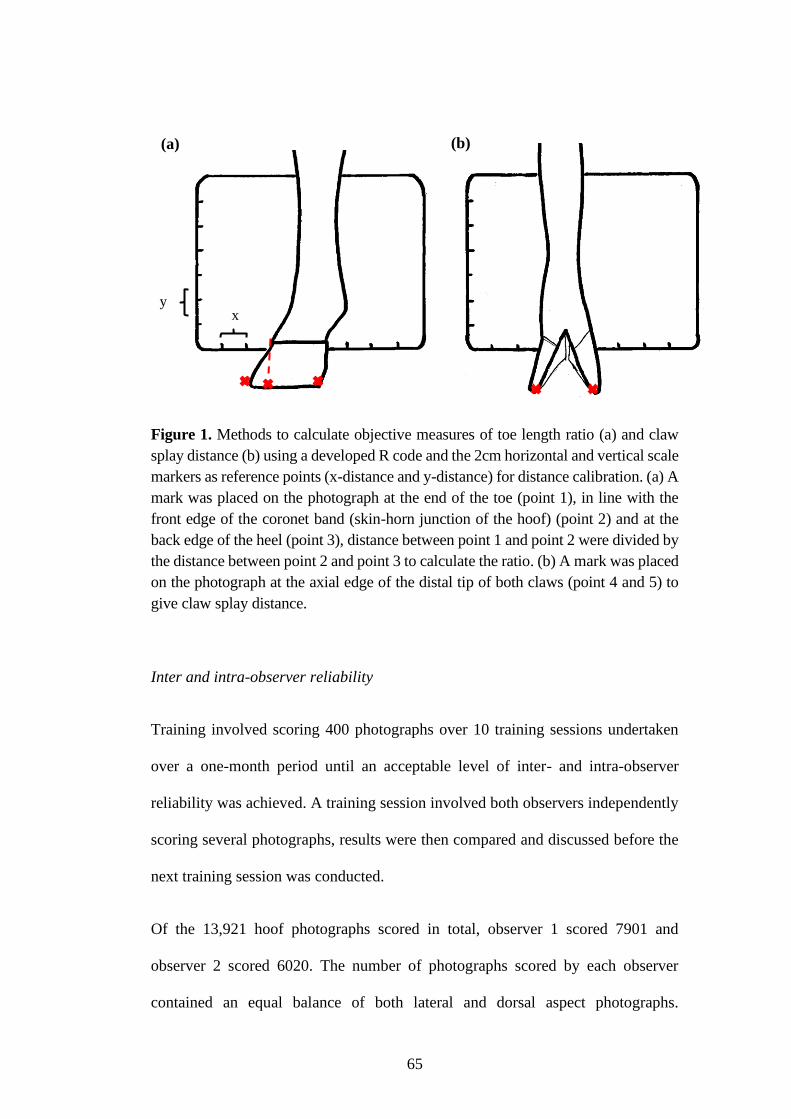
65
Figure 1. Methods to calculate objective measures of toe length ratio (a) and claw
splay distance (b) using a developed R code and the 2cm horizontal and vertical scale
markers as reference points (x-distance and y-distance) for distance calibration. (a) A
mark was placed on the photograph at the end of the toe (point 1), in line with the
front edge of the coronet band (skin-horn junction of the hoof) (point 2) and at the
back edge of the heel (point 3), distance between point 1 and point 2 were divided by
the distance between point 2 and point 3 to calculate the ratio. (b) A mark was placed
on the photograph at the axial edge of the distal tip of both claws (point 4 and 5) to
give claw splay distance.
Inter and intra-observer reliability
Training involved scoring 400 photographs over 10 training sessions undertaken
over a one-month period until an acceptable level of inter- and intra-observer
reliability was achieved. A training session involved both observers independently
scoring several photographs, results were then compared and discussed before the
next training session was conducted.
Of the 13,921 hoof photographs scored in total, observer 1 scored 7901 and
observer 2 scored 6020. The number of photographs scored by each observer
contained an equal balance of both lateral and dorsal aspect photographs.
(a) (b)
y
x
66
Throughout the photograph scoring, on-going inter-observer reliability tests were
completed after both observers had scored approximately 400 photographs. This
resulted in 15 inter-observer reliability tests being completed. Intra-observer
reliability was tested by observers re-scoring 10% of photographs from each farm
at each assessment.
For the subjectively scored aspects of hoof conformation (toe length, heel shape,
fetlock shape, claw shape, claw splay) weighted kappa (kw) statistics were used to
measure agreement. Acceptability was deemed as being above 0.8 (almost perfect
agreeement; Dohoo et al., 2003).
For the objectively measured aspects of hoof conformation (toe length ratio and
claw splay distance), the Bland-Altman method was used to graphically assess
agreement (Bland and Altman, 1986). This involved plotting the average of the two
observers’ measurements (x-axis) against their difference (y-axis), as well as the
95% confidence interval around the mean differences (± 1.96 SD (standard
deviation)). It is recommended that 95% of the data points on the Bland-Altman
plot fall within ± 1.96 SD of the mean difference (Giavarina, 2015). Additionally,
a Lin’s Concordance Correlation Coefficient (CCC) (Lawrence and Lin, 1989) was
calculated for the objective measures as this method contains measures of both
accuracy and precision to determine how far the observed data deviate from the line
of perfect concordance (Lawrence and Lin, 1989). Acceptability of CCC was
deemed as being above 0.8 (high level of agreement; Altman, 1990).
At each inter-observer reliability test, if reliability went below a threshold of 0.8 for
either kw or CCC, further training was completed to ensure reliability was 0.8 or
above before scoring of the photographs could continue.

67
Comparison of objective measures and subjective ordinal scores
Data processing and descriptive statistical analysis was performed using R 3.5.0
statistical package (R Core Team 2018). The objective measures of toe length ratio
and claw splay distance were checked for outliers. If data points were 3 or more
times the interquartile range away from the first and third quartile, they were
considered outliers. There were 40 photographs identified as outliers for toe length
ratio and 5 photographs identified for claw splay distance. One observer rescored
these photographs and if the original measurement was accurate the data point
remained in the data set. After rescoring, 34 outliers were deemed as accurate for
toe length ratio and 4 for claw splay distance and thus remained in the data set.
To evaluate whether subjective scores were correctly assigned, thresholds were set
for toe length ratio as follows: If ratio < 0.5 (length of toe was less than half of the
length of the rest of the hoof) score = 0; if ratio > 0.5 and < 1 (length of the toe was
greater than half, but less than the full length of the rest of the hoof) score = 1; if
ratio > 1 (length of the toe was greater than the full length of the rest of the hoof)
score = 2) (Table 3). Thresholds were set for claw splay distance as follows: If
distance between claws < 4cm score = 0, distance >4cm and <6cm score = 1;
distance >6cm score = 2 (Table 4).
Contingency tables were produced to examine the assigned subjective scores for
toe length and claw splay to the actual scores (calculated using the above thresholds)
for the front and hind hooves across all assessments and farms. An overall accuracy
was calculated for each of the ordinal categories (0, 1, and 2) for the front and hind
hooves. Accuracy was calculated at the level of each farm across the 5 assessments.

68
Box plots were used to visually assess the consistency of scoring across the five
period assessments for the front and hind hooves.
Accuracy was calculated as follows using the number of true positive (TP), true
negative (TN), false negative (FN) and false positive (FP) assessments (Zhu et al.,
2010):
𝐴𝑐𝑐𝑢𝑟𝑎𝑐𝑦 = (𝑇𝑁 + 𝑇𝑃)
(𝑇𝑁 + 𝑇𝑃 + 𝐹𝑁 + 𝐹𝑃) =
𝑁𝑢𝑚𝑏𝑒𝑟 𝑜𝑓 𝑐𝑜𝑟𝑟𝑒𝑐𝑡 𝑎𝑠𝑠𝑒𝑠𝑠𝑚𝑒𝑛𝑡𝑠
𝑁𝑢𝑚𝑏𝑒𝑟 𝑜𝑓 𝑎𝑙𝑙 𝑎𝑠𝑠𝑒𝑠𝑠𝑚𝑒𝑛𝑡𝑠
Results
Training
Over the 10 training sessions, inter-observer reliability increased. For subjective
scores over training sessions 1 – 4, kw ranged from 0.32 - 0.86 (median = 0.59, Q1:
0.46, Q3 = 0.73). Over training sessions 5 – 7, kw ranged from 0.53 – 0.88 (median
= 0.71, Q1= 0.62, Q3 = 0.79). From session 8 – 10, kw was consistently over 0.8.
For the objective measures, over training sessions 1 – 4, CCC ranged from 0.52 –
0.79 (median = 0.79, Q1 = 0.66, Q3 = 0.84) for toe length ratio and 0.24 – 0.95
(median = 0.81, Q1 = 0.53, Q3 = 0.88) for claw splay distance. Over training
sessions 5 – 7, CCC ranged from 0.79 – 0.91 (median = 0.79, Q1 = 0.73, Q3 = 0.85)
for toe length ratio and 0.82 – 0.89 (median = 0.85, Q1 = 0.84, Q3 = 0.87) for claw
splay distance. Over training session 8 – 10, CCC ranged from 0.79 – 0.92 (median
= 0.86, Q1 = 0.83, Q3 = 0.89) for toe length ratio and 0.93 – 0.95 (median = 0.93,
Q1 = 0.93, Q3 = 0.94) for claw splay distance. The Bland-Altman plots for the
measures of toe length ratio and claw splay distance showed a random scatter of
points with the majority of points falling within the limits of agreement (Figure 2).
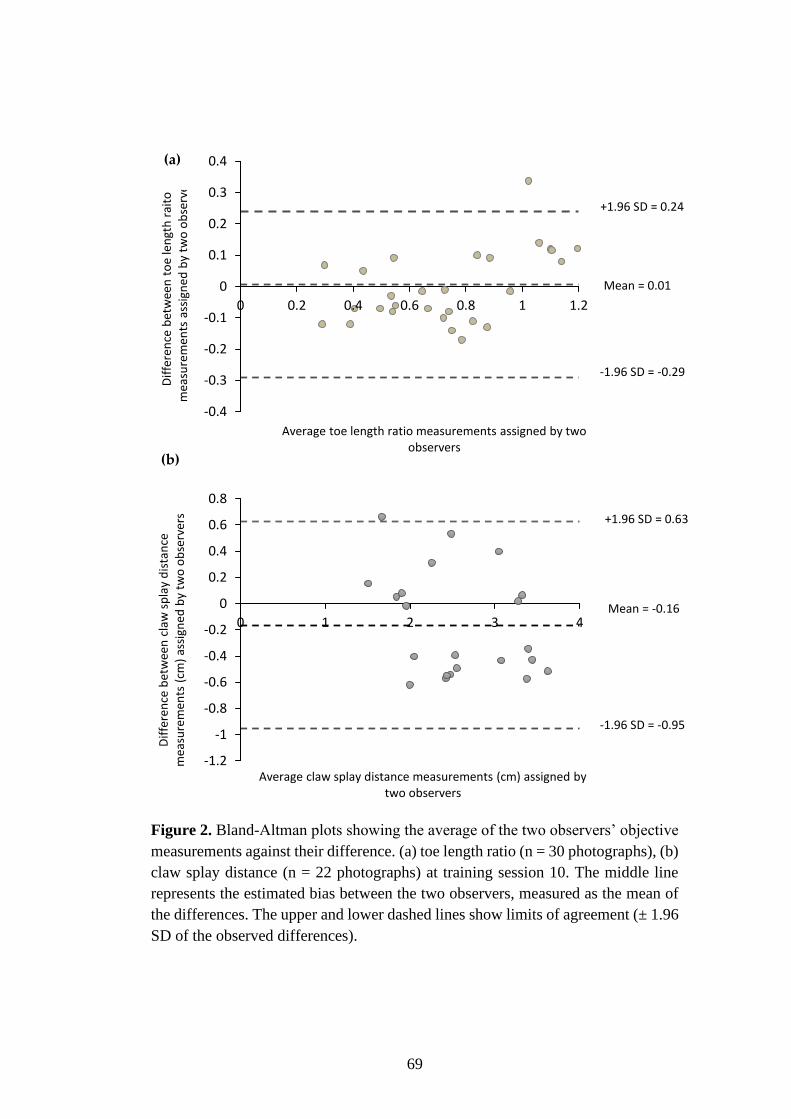
69
Figure 2. Bland-Altman plots showing the average of the two observers’ objective
measurements against their difference. (a) toe length ratio (n = 30 photographs), (b)
claw splay distance (n = 22 photographs) at training session 10. The middle line
represents the estimated bias between the two observers, measured as the mean of
the differences. The upper and lower dashed lines show limits of agreement (± 1.96
SD of the observed differences).
-0.4
-0.3
-0.2
-0.1
0
0.1
0.2
0.3
0.4
0 0.2 0.4 0.6 0.8 1 1.2
Dif
fere
nce
bet
wee
n t
oe
len
gth
rai
to
mea
sure
men
ts a
ssig
ned
by
two
ob
serv
ers
Average toe length ratio measurements assigned by two observers
-1.2
-1
-0.8
-0.6
-0.4
-0.2
0
0.2
0.4
0.6
0.8
0 1 2 3 4
Dif
fere
nce
bet
wee
n c
law
sp
lay
dis
tan
ce
mea
sure
men
ts (
cm)
assi
gned
by
two
ob
serv
ers
Average claw splay distance measurements (cm) assigned by two observers
(a)
(b)
+1.96 SD = 0.24
Mean = 0.01
-1.96 SD = -0.29
+1.96 SD = 0.63
Mean = -0.16
-1.96 SD = -0.95
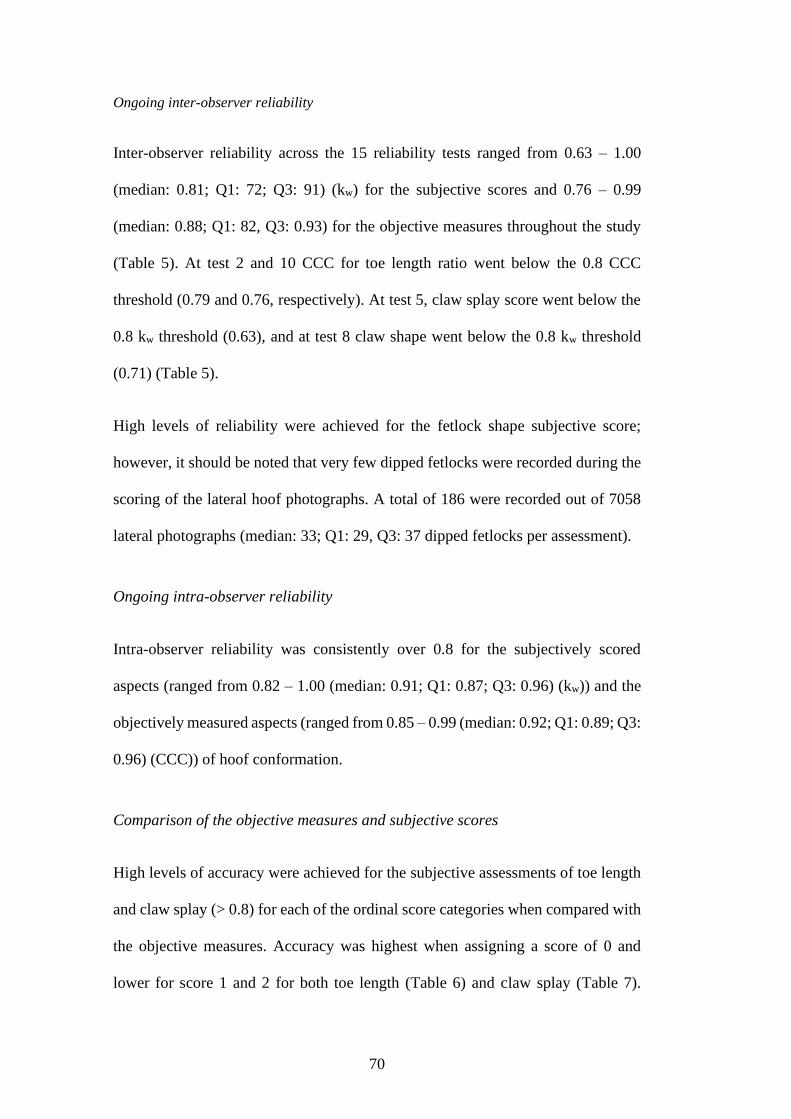
70
Ongoing inter-observer reliability
Inter-observer reliability across the 15 reliability tests ranged from 0.63 – 1.00
(median: 0.81; Q1: 72; Q3: 91) (kw) for the subjective scores and 0.76 – 0.99
(median: 0.88; Q1: 82, Q3: 0.93) for the objective measures throughout the study
(Table 5). At test 2 and 10 CCC for toe length ratio went below the 0.8 CCC
threshold (0.79 and 0.76, respectively). At test 5, claw splay score went below the
0.8 kw threshold (0.63), and at test 8 claw shape went below the 0.8 kw threshold
(0.71) (Table 5).
High levels of reliability were achieved for the fetlock shape subjective score;
however, it should be noted that very few dipped fetlocks were recorded during the
scoring of the lateral hoof photographs. A total of 186 were recorded out of 7058
lateral photographs (median: 33; Q1: 29, Q3: 37 dipped fetlocks per assessment).
Ongoing intra-observer reliability
Intra-observer reliability was consistently over 0.8 for the subjectively scored
aspects (ranged from 0.82 – 1.00 (median: 0.91; Q1: 0.87; Q3: 0.96) (kw)) and the
objectively measured aspects (ranged from 0.85 – 0.99 (median: 0.92; Q1: 0.89; Q3:
0.96) (CCC)) of hoof conformation.
Comparison of the objective measures and subjective scores
High levels of accuracy were achieved for the subjective assessments of toe length
and claw splay (> 0.8) for each of the ordinal score categories when compared with
the objective measures. Accuracy was highest when assigning a score of 0 and
lower for score 1 and 2 for both toe length (Table 6) and claw splay (Table 7).

71
Scoring was relatively consistent across assessments (Figure 3 and 4) and over
farms. Over the farms accuracy for toe length score ranged from 0.90 – 0.96 for
score 0 (median = 0.95, Q1 = 0.95, Q3 = 0.96), 0.89 – 0.95 for score 1 (median =
0.93, Q1 = 0.92, Q3 = 0.93), and 0.88 – 0.98 score 2 (median = 0.93, Q1 = 0.90, Q3
= 0.94). Over the farms accuracy for claw splay score ranged from 0.90 – 0.97 for
score 0 (median = 0.94, Q1 = 0.94, Q3 = 0.95), 0.78 – 0.95 for score 1 (median:
0.90, Q1: 0.89, Q3: 0.93), and 0.86 – 0.98 score 2 (median = 0.92, Q1 = 0.89, Q3 =
0.98).

72
Table 5. Results of 15 inter-observer reliability tests completed by the two observers for the subjective scores and objective measures of the hoof
conformation assessment.
Subjective scores
(Weighted Kappa (95% CI)
Objective measures
(Lin’s Concordance Coefficient (95% CI)
Test Toe length Heel Fetlock Claw shape Claw splay
Toe length ratio
Claw splay
distance
1 0.84 (0.72-1.00) 1.00 (1.00-1.00) 0.83 (0.73-1.00) 1.00 (1.00-1.00) 1.00 (1.00-1.00)
0.86 (0.70-0.97) 0.97 (0.87-0.99)
2 0.91 (0.73-1.00) 0.92 (0.77-1.00) 0.83 (0.73-1.00) 1.00 (1.00-1.00) 0.90 (0.71-1.00)
0.79 (0.46-0.93)* 0.97 (0.81-1.00)
3 0.83 (0.70-1.00) 0.85 (0.78-1.00) 0.87 (0.61-1.00) 0.92 (0.76-1.00) 1.00 (1.00-1.00)
0.80 (0.62-0.93) 0.99 (0.94-1.00)
4 0.83 (0.69-1.00) 0.83 (0.71-1.00) 1.00 (1.00-1.00) 0.82 (0.72-1.00) 1.00 (1.00-1.00)
0.94 (0.82-0.98) 0.89 (0.79-0.99)
5 0.91 (0.75-1.00) 1.00 (1.00-1.00) 1.00 (1.00-1.00) 0.87 (0.71-1.00) 0.63 (0.39-1.00)*
0.83 (0.67-0.91) 0.88 (0.63-0.96)
6 1.00 (1.00-1.00) 0.89 (0.68-1.00) 1.00 (1.00-1.00) 0.88 (0.64-1.00) 0.82 (0.60-1.00)
0.84 (0.64-0.94) 0.99 (0.95-1.00)
7 1.00 (1.00-1.00) 1.00 (1.00-1.00) 1.00 (1.00-1.00) 0.85 (0.68-1.00) 0.84 (0.72-1.00)
0.95 (0.82-0.98) 0.99 (0.86-0.99)
8 1.00 (1.00-1.00) 0.88 (0.77-1.00) 1.00 (1.00-1.00) 0.71 (0.49-1.00)* 0.86 (0.73-1.00)
0.80 (0.53-0.92) 0.97 (0.90-0.98)
9 0.88 (0.65-1.00) 0.89 (0.74-1.00) 1.00 (1.00-1.00) 0.88 (0.65-1.00) 1.00 (1.00-1.00)
0.97 (0.92-0.99) 0.97 (0.81-0.99)
10 0.87 (0.72-1.00) 0.95 (0.88-1.00) 1.00 (1.00-1.00) 0.87 (0.71-1.00) 0.83 (0.59-1.00)
0.76 (0.64-0.84)* 0.93 (0.83-0.97)
11 0.88 (0.74-1.00) 1.00 (1.00-1.00) 1.00 (1.00-1.00) 0.84 (0.74-1.00) 1.00 (1.00-1.00)
0.81 (0.69-0.92) 0.91 (0.78-0.97)
12 0.89 (0.78-1.00) 1.00 (1.00-1.00) 1.00 (1.00-1.00) 0.86 (0.81-1.00) 1.00 (1.00-1.00)
0.84 (0.66-0.95) 0.95 (0.73-0.99)
13 0.89 (0.78-1.00) 0.88 (0.75-1.00) 1.00 (1.00-1.00) 1.00 (1.00-1.00) 1.00 (1.00-1.00)
0.89 (0.72-0.96) 0.96 (0.84-1.00)
14 0.87 (0.72-1.00) 0.96 (0.88-1.00) 1.00 (1.00-1.00) 0.86 (0.71-1.00) 0.83 (0.79-1.00)
0.86 (0.67-0.94) 0.93 (0.79-0.98)
15 0.92 (0.77-1.00) 0.93 (0.80-1.00) 1.00 (1.00-1.00) 0.92 (0.75-1.00) 0.81 (0.74-1.00)
0.94 (0.88-0.97) 0.97 (0.88-1.00)
* Occasions where reliability went below 0.8

73
Table 6. The number of correctly assigned scores (in bold), the number of incorrectly assigned scores, and accuracy for toe length ordinal scores
(0, 1, and 2) for the left front and hind hooves as compared with the measured toe length ratio (toe length (end of the toe to the abaxial edge of hoof
in line with the front edge of the coronet band) compared with the length of the rest of the hoof (abaxial edge of hoof in line with the front edge of
the coronet band to the back edge of the heel)). Scored from hoof photographs taken from a lateral aspect at up to 16 farms and 5 assessments (n =
1035 contributing goats (median = 629, min = 573, Q1 = 576, Q3 = 791, max = 1035 contributing goats per assessment); n = 7058 total lateral
hoof photographs (median = 1240, min = 1108, Q1 = 1130, Q3 = 1551, max = 2029 total front and hind photographs per assessment)).
Assigned
scores
Front hooves Hind hooves
Actual toe length scores a Accuracy
Actual toe length scores a Accuracy
0 1 2 0 1 2
0 2359 148 0
0.93 1586 80 1
0.96 (98.6%) (15.1%) (0.0%) (96.0%) (5.9%) (0.2%)
1 34 808 33
0.91 63 1247 53
0.93 (1.4%) (82.3%) (22.9%) (4.0%) (92.2%) (11.8%)
2 0 5 111
0.88 0 25 395
0.94 (0.0%) (0.6%) (77.1%) (0.0%) (1.8%) (88.0%)
Total scores 2393 981 144 1649 1352 449
a Toe length scores: 0) Toe is not overgrown - the length of the toe is less than half of the rest of the hoof, 1) Toe is moderately overgrown - the length of the toe
is greater than half, but less that the full length of the hoof, 2) Toe is severely overgrown – the length of the toe is greater than the full length of the rest of the
hoof. Actual scores were calculated using the measured toe length ratios. If ratio <0.5 score = 0, ratio >0.5 and <1 score = 1, ratio >1 score = 2.
Table 7. The number of correctly assigned scores (in bold), the number of incorrectly assigned scores, and accuracy for claw splay ordinal scores
(0, 1, and 2) for the left front and hind hooves as compared with the measured claw splay distance. Scored from hoof photographs taken from a
dorsal aspect at up to 16 farms and 5 assessments. Claw splay was only scored if claws were not misshaped, therefore not all photographs/goats
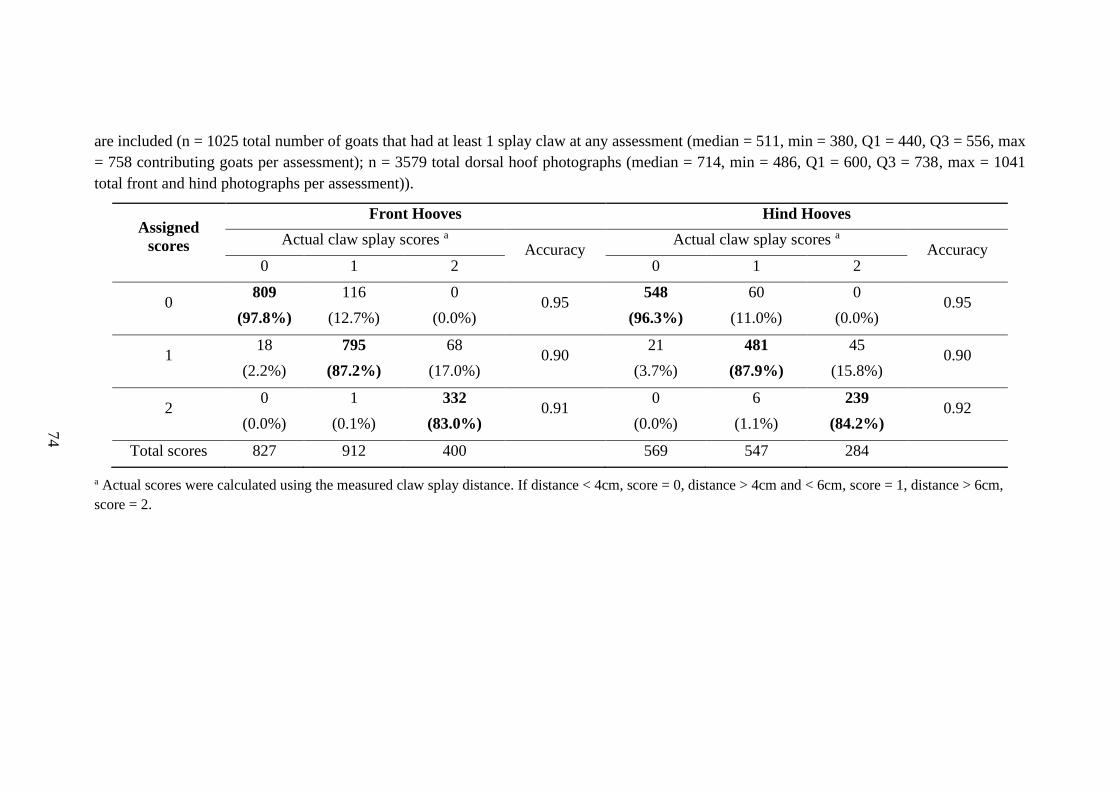
74
are included (n = 1025 total number of goats that had at least 1 splay claw at any assessment (median = 511, min = 380, Q1 = 440, Q3 = 556, max
= 758 contributing goats per assessment); n = 3579 total dorsal hoof photographs (median = 714, min = 486, Q1 = 600, Q3 = 738, max = 1041
total front and hind photographs per assessment)).
Assigned
scores
Front Hooves Hind Hooves
Actual claw splay scores a Accuracy
Actual claw splay scores a Accuracy
0 1 2 0 1 2
0 809 116 0
0.95 548 60 0
0.95 (97.8%) (12.7%) (0.0%) (96.3%) (11.0%) (0.0%)
1 18 795 68
0.90 21 481 45
0.90 (2.2%) (87.2%) (17.0%) (3.7%) (87.9%) (15.8%)
2 0 1 332
0.91 0 6 239
0.92 (0.0%) (0.1%) (83.0%) (0.0%) (1.1%) (84.2%)
Total scores 827 912 400 569 547 284
a Actual scores were calculated using the measured claw splay distance. If distance < 4cm, score = 0, distance > 4cm and < 6cm, score = 1, distance > 6cm,
score = 2.

75
(a)
(b)
Figure 3. Box plots showing the distribution of assigned toe length scores (0, 1, 2) and the
measured toe length ratio (toe length measurement relative to the length of the rest of the
hoof) across 5 assessments for the left front (a) and hind (b) hooves. Box plots show the
25th and 75th percentile (box), median (centre line) and extreme values (whiskers).
Possible outliers (dots) had been checked to ensure they fell within 3 interquartile ranges
away from the first and third quartile (n = 1035 contributing goats (median = 629, min =
573, Q1 = 576, Q3 = 791, max = 1035 contributing goats per assessment); n = 7058 total
lateral hoof photographs (median = 1240, min = 1108, Q1 = 1130, Q3 = 1551, max = 2029
total front and hind photographs per assessment)).
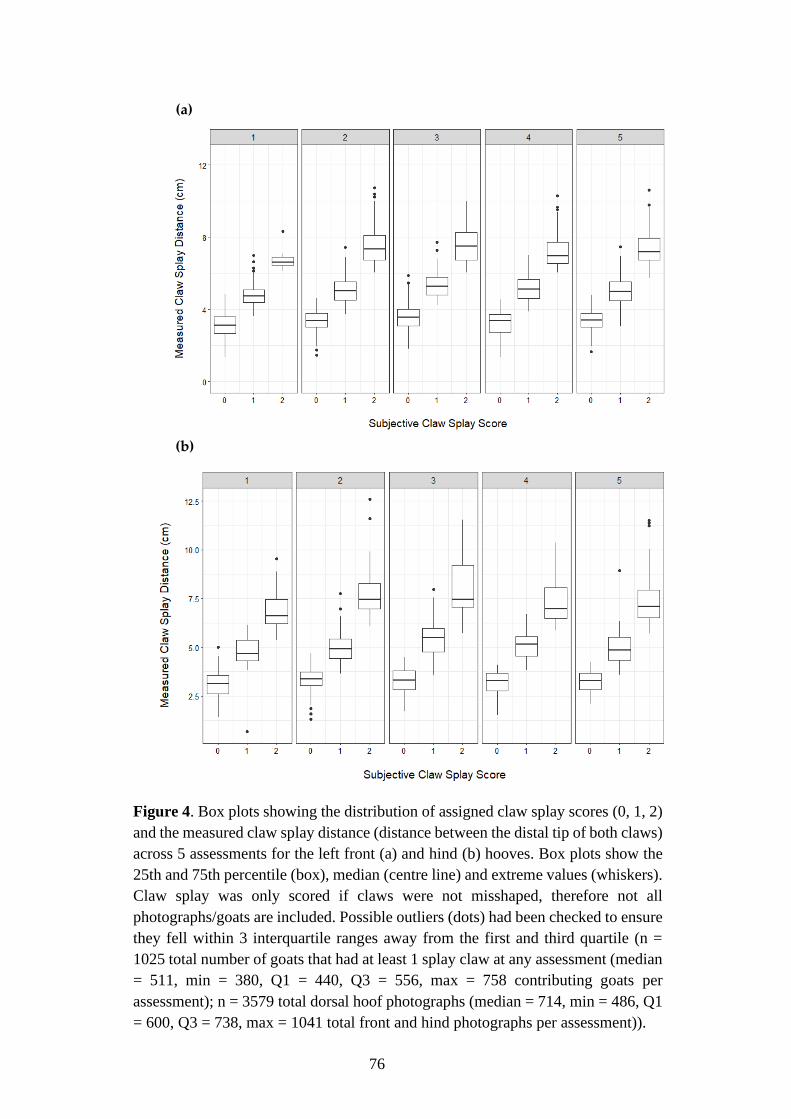
76
(b)
(a)
Figure 4. Box plots showing the distribution of assigned claw splay scores (0, 1, 2)
and the measured claw splay distance (distance between the distal tip of both claws)
across 5 assessments for the left front (a) and hind (b) hooves. Box plots show the
25th and 75th percentile (box), median (centre line) and extreme values (whiskers).
Claw splay was only scored if claws were not misshaped, therefore not all
photographs/goats are included. Possible outliers (dots) had been checked to ensure
they fell within 3 interquartile ranges away from the first and third quartile (n =
1025 total number of goats that had at least 1 splay claw at any assessment (median
= 511, min = 380, Q1 = 440, Q3 = 556, max = 758 contributing goats per
assessment); n = 3579 total dorsal hoof photographs (median = 714, min = 486, Q1
= 600, Q3 = 738, max = 1041 total front and hind photographs per assessment)).

77
Discussion
The aim of this study was to develop a reliable method to assess hoof conformation
in dairy goats. The results suggest that the assessment method developed is a
suitable and reliable way to assess hoof conformation in dairy goats using
photographs. After extensive training, both the subjective scores and objective
measures were assessed reliably by the two observers. Two aspects of the subjective
scores were compared with the corresponding objective measures and were found
to be accurate. This suggests that the subjective scores, particularly the 0 and 2
scores, alone may be adequate to assess hoof conformation in dairy goats.
Toe length, as a proxy for hoof overgrowth, is the aspect of hoof conformation that
has previously been focused on in dairy goats [24,25]. This is likely because hoof
overgrowth is suggested to the be the most common cause of hoof deformation in
goats [26,39]. However, other aspects of hoof conformation are also important due
to the potential implications to the goat. For example, lower heel angles may
significantly increase stress and deformation of the hoof capsule [horses: 40], and
misshaped claws can result in local pressure concentrations, resulting in tissue
overloading and increased risk of claw horn lesions [cows: 41]. Therefore, other
aspects of conformation that were deemed as potentially impacting the welfare of
the goat were also included in the current assessment, such as heel shape, fetlock
shape, claw splay and claw shape.
Potential limitations of subjective methods of hoof conformation assessment are
poor reliability between observers [18]. Previous subjective approaches to assess
hoof conformation are commonly dichotomous (i.e., normal or abnormal; good or
bad) [6,11]. This is likely because fewer scoring categories result in higher levels

78
of agreement [42], due to less ambiguity. In the present study, high and consistent
levels of reliability were achieved for the 3-point ordinal subjective scores of toe
length, heel shape, and fetlock shape; however, consistent with previous research,
the middle score (1) had overlap with the others (0 or 2). It should be noted that
very few instances of dipped fetlock were reported in the present study; nevertheless,
it is important to include fetlock shape in hoof conformation assessments, as dipped
fetlocks have the potential to increase tension of the suspensory apparatus in the
lower leg and hoof [43]. However, work demonstrating this association in
ruminants is lacking. The claw shape and claw splay subjective scores in the present
study were less reliable and intermittently required further training. This training
involved observers discussing the disagreements and completing further reliability
tests. Assessments of the photographs did not continue until agreement of over 0.8
between the observers was achieved. This ensured ongoing reliability in the
following tests. When photographs were being taken, efforts were made to ensure
that the goat was standing squarely and bearing weight on all four legs. However,
care was also needed with the placement of the camera, particularly with the dorsal
aspect view photographs. If the camera was not placed squarely in front of the hoof
the angle of the photograph may make it more difficult to accurately score.
Therefore, this may explain why lower reliability was achieved for claw shape and
claw splay subjective scores.
Two aspects of hoof conformation, toe length and claw splay could be both
subjectively scored and objectively measured, allowing comparisons between the
two methodologies. When comparing the subjective scores and objective measures
of toe length and claw splay, the observers in the present study were more accurate
at assigning a score of 0 compared to 1 or 2, resulting in some overlap when looking
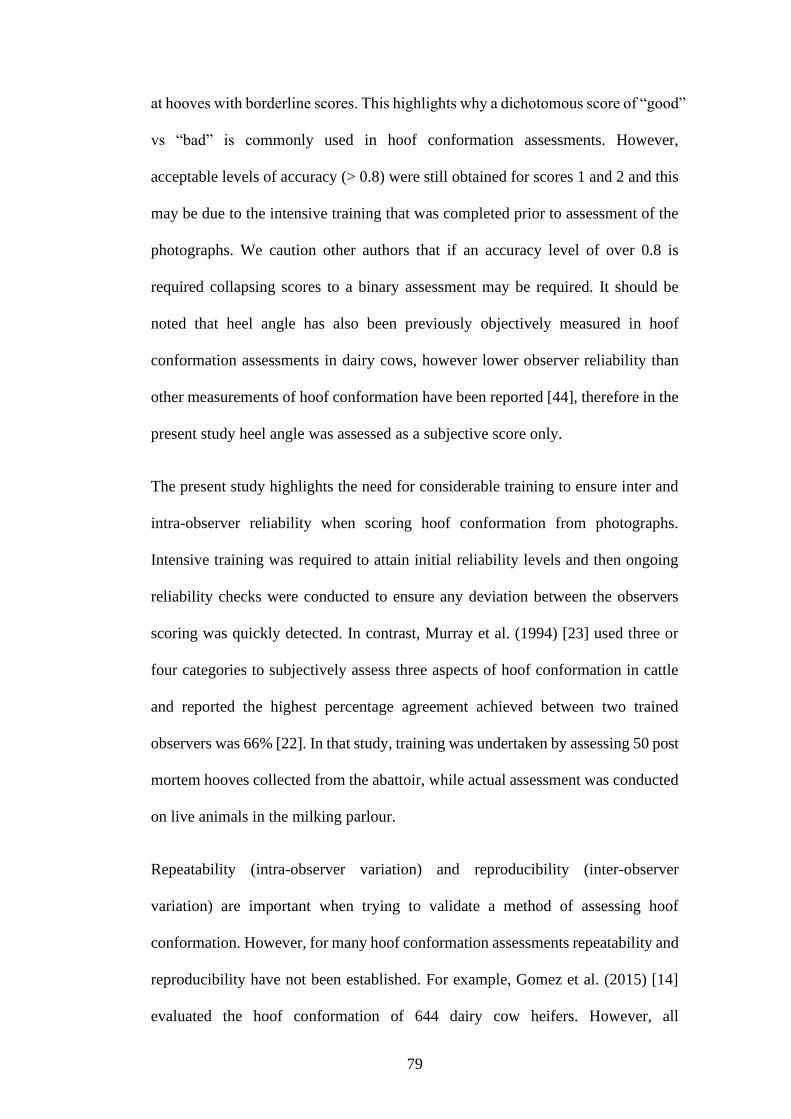
79
at hooves with borderline scores. This highlights why a dichotomous score of “good”
vs “bad” is commonly used in hoof conformation assessments. However,
acceptable levels of accuracy (> 0.8) were still obtained for scores 1 and 2 and this
may be due to the intensive training that was completed prior to assessment of the
photographs. We caution other authors that if an accuracy level of over 0.8 is
required collapsing scores to a binary assessment may be required. It should be
noted that heel angle has also been previously objectively measured in hoof
conformation assessments in dairy cows, however lower observer reliability than
other measurements of hoof conformation have been reported [44], therefore in the
present study heel angle was assessed as a subjective score only.
The present study highlights the need for considerable training to ensure inter and
intra-observer reliability when scoring hoof conformation from photographs.
Intensive training was required to attain initial reliability levels and then ongoing
reliability checks were conducted to ensure any deviation between the observers
scoring was quickly detected. In contrast, Murray et al. (1994) [23] used three or
four categories to subjectively assess three aspects of hoof conformation in cattle
and reported the highest percentage agreement achieved between two trained
observers was 66% [22]. In that study, training was undertaken by assessing 50 post
mortem hooves collected from the abattoir, while actual assessment was conducted
on live animals in the milking parlour.
Repeatability (intra-observer variation) and reproducibility (inter-observer
variation) are important when trying to validate a method of assessing hoof
conformation. However, for many hoof conformation assessments repeatability and
reproducibility have not been established. For example, Gomez et al. (2015) [14]
evaluated the hoof conformation of 644 dairy cow heifers. However, all

80
measurements were completed by one observer and no intra-observer reliability
testing was reported. Intra-observer reliability is commonly more consistent than
inter-observer reliability [23,45]. This is supported by the findings from the present
study where intra-observer reliability was consistently above the 0.8 threshold for
both kw and CCC. However, variance within an observer still needs to be reported.
It is difficult to make definitive conclusions from studies where no evidence is
provided to determine if the method is repeatable or reproducible.
Hoof conformation has previously been objectively assessed using photographs
with scale markers included for other species [31,46], and with similar methods
used in the present study. With the methodology used, the objective measures used
in the present study would not be possible to apply on live animals; thus, their use
is restricted on farm. Additionally, for objective measures to be completed on farm,
animals are often restrained [21], using a crush and their hooves tied [15] or a tilt
table [47]. Furthermore, lifting and tying hooves for objective measures to be
completed may not give a true assessment of hoof conformation. The shape of the
hoof is influenced by weight-bearing and load [48], therefore if the animal is not
weight bearing on a limb it may not accurately reflect the animal’s true
conformation. In the present study, the use of photographs to obtain objective
measures reduced the need for such restraint, and ensured the goats were weight
bearing to give a true reflection of conformation.
The objective measure for claw splay distance was consistently reliable throughout
the scoring of the hoof photographs. There were two occasions when the reliability
for the objective measure of toe length ratio went below 0.8. This may have been
due to difficulties in placing a point on the hoof in line with the front edge of the
coronet band, especially if the hooves were particularly hairy or dirty. Due to time

81
restrictions around milking and attempting to minimize the amount of time the goats
were out of their pens; it was not feasible for hooves to be washed. However, if
possible, we recommend cleaning of the hooves prior to photographs being taken
to improve reliability. As the reliability for the subjective score for toe length was
consistently high throughout the assessments, it suggests that the subjective score
is more appropriate to use rather than the time-consuming objective measure;
however, this needs to be validated on farm.
Conclusion
We successfully developed a reliable method of assessing hoof conformation in
dairy goats using photographs. Two aspects of hoof conformation that were
subjectively assessed were validated by the comparison of the subjective scores
with objective measures. The use of photographs with scale markers allowed for
objective measures to be completed, however, this was time consuming and
required technical equipment. As two of the subjective scores were shown to
correspond to objective measures, they are suitable methods for conformation
assessment. High levels of accuracy and reliability (>0.8) were achieved on the
photographs in this study; if higher levels were required than collapsing the scores
into a binary method should be considered. Nevertheless, further work is required
to test the reliability and practicality of subjective hoof conformation assessment on
live animals and to determine if it is applicable in an on-farm setting.
References
1. O'Grady, S.E.; Poupard, D. Physiological horseshoeing: An overview. Equine
Vet. Educ. 2001, 13, 330–334.

82
2. Häggman, J.; Juga, J. Genetic parameters for hoof disorders and feet and leg
conformation traits in Finnish Holstein cows. J. Dairy Sci. 2013, 96, 3319–
3325.
3. Van Amstel, S.R.; Shearer, J.K. Manual for Treatment and Control of
Lameness in Cattle; Blackwell Publishing Professional: Lowa, IA, USA, 2006.
4. Boettcher, P.; Jairath, L.; Koots, K.; Dekkers, J. Effects of interactions between
type and milk production on survival traits of Canadian Holsteins. J. Dairy Sci.
1997, 80, 2984–2995.
5. Van der Tol, P.; Metz, J.; Noordhuizen-Stassen, E.; Back, W.; Braam, C.; Weijs,
W. The pressure distribution under the bovine claw during square standing on
a flat substrate. J. Dairy Sci. 2002, 85, 1476–1481.
6. Kaler, J.; Medley, G.; Grogono-Thomas, R.; Wellington, E.; Calvo-Bado, L.;
Wassink, G.; King, E.; Moore, L.; Russell, C.; Green, L. Factors associated
with changes of state of foot conformation and lameness in a flock of sheep.
Prev. Vet. Med. 2010, 97, 237–244.
7. Distl, O.; Koorn, D.S.; McDaniel, B.T.; Peterse, D.; Politiek, R.D.; Reurink, A.
Claw traits in cattle breeding programs: Report of the E.A.A.P. working group;
Claw quality in cattle. Livest. Prod. Sci.1990, 25, 1-13.
8. Pérez-Cabal, M.A.; García, C.; González-Recio, O.; Alenda, R. Genetic and
Phenotypic Relationships Among Locomotion Type Traits, Profit, Production,
Longevity, and Fertility in Spanish Dairy Cows. J. Dairy Sci. 2006, 89, 1776–
1783.
9. Warnick, L.; Janssen, D.; Guard, C.; Gröhn, Y. The effect of lameness on milk
production in dairy cows. J. Dairy Sci. 2001, 84, 1988–1997.
10. Sewalem, A.; Kistemaker, G.J.; Van Doormaal, B.J. Relationship Between
Type Traits and Longevity in Canadian Jerseys and Ayrshires Using a Weibull
Proportional Hazards Model. J. Dairy Sci. 2005, 88, 1552–1560.
11. De Sevilla, X.F.; Fàbrega, E.; Tibau, J.; Casellas, J. Effect of leg conformation
on survivability of Duroc, Landrace, and Large White sows. J. Anim. Sci. 2008,
86, 2392–2400.
12. Vermunt, J.J.; Greenough, P.R. Structural characteristics of the bovine claw:
Horn growth and wear, horn hardness and claw conformation. Br. Vet. J. 1995,
151, 157–180.
13. Bhardwaj, V.; Dhungyel, O.P.; de Silva, K.; Dhand, N.K.; Whittington, R.J.
An objective method for assessment of foot conformation in sheep. Small
Rumin. Res. 2018, 167, 22–28.
14. Gomez, A.; Cook, N.; Rieman, J.; Dunbar, K.; Cooley, K.; Socha, M.; Döpfer,
D. The effect of digital dermatitis on hoof conformation. J. Dairy Sci. 2015, 98,
927–936.

83
15. Telezhenko, E.; Bergsten, C.; Magnusson, M.; Nilsson, C. Effect of different
flooring systems on claw conformation of dairy cows. J. Dairy Sci. 2009, 92,
2625–2633.
16. Nuss, K.; Paulus, N. Measurements of claw dimensions in cows before and
after functional trimming: A post-mortem study. Vet. J. 2006, 172, 284–292.
17. Laven, L.J.; Wang, L.; Regnerus, C.; Laven, R.A. Measuring Claw
Conformation in Cattle: Assessing the Agreement between Manual and Digital
Measurement. Animals 2015, 5, 687–701.
18. Somers, J.G.C.J.; Schouten, W.G.P.; Frankena, K.; Noordhuizen-Stassen, E.N.;
Metz, J.H.M. Development of Claw Traits and Claw Lesions in Dairy Cows
Kept on Different Floor Systems. J. Dairy Sci. 2005, 88, 110–120.
19. Offer, J.; McNulty, D.; Logue, D. Observations of lameness, hoof
conformation and development of lesions in dairy cattle over four lactations.
Vet. Rec. 2000, 147, 105–109.
20. Capion, N.; Thamsborg, S.M.; Enevoldsen, C. Conformation of hind legs and
lameness in Danish Holstein heifers. J. Dairy Sci. 2008, 91, 2089–2097.
21. Koluman, N.; Göncü, S. Measurements of healthy hooves, their interrelation
and correlation with body mass in some improved goats breeds. Int. J. Agri.
Environ. Biotech. 2016, 1, 109–116.
22. Flower, F.C.; Weary, D. Gait assessment in dairy cattle. Animal 2009, 3, 87–
95.
23. Murray, R.D.; Downham, D.Y.; Merritt, J.R.; Russell, W.B.; Manson, F.J.
Observer variation in field data describing foot shape in dairy cattle. Res. Vet.
Sci. 1994, 56, 265–269.
24. Anzuino, K.; Bell, N.J.; Bazeley, K.J.; Nicol, C.J. Assessment of welfare on 24
commercial UK dairy goat farms based on direct observations. Vet. Rec. 2010,
167, 774–780.
25. Muri, K.; Stubsjøen, S.; Valle, P. Development and testing of an on-farm
welfare assessment protocol for dairy goats. Anim. Welf. 2013, 22, 385–400.
26. Ajuda, I.G.; Battini, M.; Stilwell, G.T. The role of claw deformation and claw
size on goat lameness. Vet. Anim. Sci. 2019, 8, 100080.
27. March, S.; Brinkmann, J.; Winkler, C. Effect of training on the inter-observer
reliability of lameness scoring in dairy cattle. Anim. Welf. 2007, 16, 131–133.
28. O Callaghan, K.; Cripps, P.; Downham, D.; Murray, R. Subjective and
objective assessment of pain and discomfort due to lameness in dairy cattle.
Anim. Welf. 2003, 12, 605–610.
84
29. Domecq, J.; Skidmore, A.; Lloyd, J.; Kaneene, J. Validation of body condition
scores with ultrasound measurements of subcutaneous fat of dairy cows. J.
Dairy Sci. 1995, 78, 2308–2313.
30. Todd, C.G.; Bruce, B.; Deeming, L.E.; Zobel, G. Survival of replacement kids
from birth to mating on commercial dairy goat farms. J. Dairy Sci. 2019, 102,
9382–9388.
31. Vermunt, J.; Greenough, P. Claw conformation of dairy heifers in two
management systems. Br. Vet. J. 1996, 152, 321–331.
32. R Core TEAM. A Language and Environment for Statistical Computing; R
Foundation for Statistical Computing: Vienna, Austria, 2018.
33. Dohoo, I.R.; Martin, W.; Stryhn, H. Veterinary Epidemiologic Research; AVC
Incorporated Charlottetown: PEI, Canada, 2003.
34. Bland, J.M.; Altman, D. Statistical methods for assessing agreement between
two methods of clinical measurement. Lancet 1986, 327, 307–310.
35. Giavarina, D. Understanding bland altman analysis. Biochem. Med. Biochem.
Med. 2015, 25, 141–151.
36. Lawrence, I.; Lin, K. A concordance correlation coefficient to evaluate
reproducibility. Biometrics 1989, 255–268.
37. Altman, D.G. Practical Statistics for Medical Research; Chapman and Hall:
London, UK, 1990.
38. Zhu, W.; Zeng, N.; Wang, N. Sensitivity, specificity, accuracy, associated
confidence interval and ROC analysis with practical SAS implementations. In
NESUG Conference Proceedings: Health Care and Life Sciences, Baltimore,
Maryland, MD, USA, 2010; Volume 19, pp. 67.
39. Ajuda, I.G ; Vieira, A.; Stilwell, G. Are there differences in dairy goats claws'
temperature, before and after trimming? In Proceedings of the 2014 IEEE
International Symposium on Medical Measurements and Applications
(MeMeA), Lisbon, Portugal, 11–12 June 2014; pp. 1–5.
40. Hinterhofer, C.; Stanek, C.; Haider, H. The effect of flat horseshoes, raised
heels and lowered heels on the biomechanics of the equine hoof assessed by
finite element analysis (FEA). J. Vet. Med. Series A 2000, 47, 73–82.
41. Van der Tol, P.; Metz, J.; Noordhuizen-Stassen, E.; Back, W.; Braam, C.; Weijs,
W. The vertical ground reaction force and the pressure distribution on the claws
of dairy cows while walking on a flat substrate. J. Dairy Sci. 2003, 86, 2875–
2883.
42. Brenninkmeyer, C.; Dippel, S.; March, S.; Brinkmann, J.; Winckler, C.;
Knierim, U. Reliability of a subjective lameness scoring system for dairy cows.
Anim. Welf. 2007, 16, 127–129.

85
43. Gibson, K.; Steel, C. Conditions of the suspensory ligament causing lameness
in horses. Equine Vet. Educ. 2002, 14, 39–50.
44. Hahn, M.V.; McDaniel, B.T.; Wilk, J.C. Description and Evaluation of
Objective Hoof Measurements of Dairy Cattle1. J. Dairy Sci. 1984, 67, 229–
236.
45. Nalon, E.; Maes, D.; Van Dongen, S.; van Riet, M.M.; Janssens, G.; Millet, S.;
Tuyttens, F. Comparison of the inter-and intra-observer repeatability of three
gait-scoring scales for sows. Animal 2014, 8, 650–659.
46. White, J.M.; Mellor, D.; Duz, M.; Lischer, C.; Voute, L. Diagnostic accuracy
of digital photography and image analysis for the measurement of foot
conformation in the horse. Equine Vet. J. 2008, 40, 623–628.
47. Kremer, P.V.; Nueske, S.; Scholz, A.M.; Foerster, M. Comparison of Claw
Health and Milk Yield in Dairy Cows on Elastic or Concrete Flooring. J. Dairy
Sci. 2007, 90, 4603–4611.
48. Dyson, S.J.; Tranquille, C.A.; Collins, S.N.; Parkin, T.D.; Murray, R.C.
External characteristics of the lateral aspect of the hoof differ between non-
lame and lame horses. Vet. J. 2011, 190, 364–371.

86
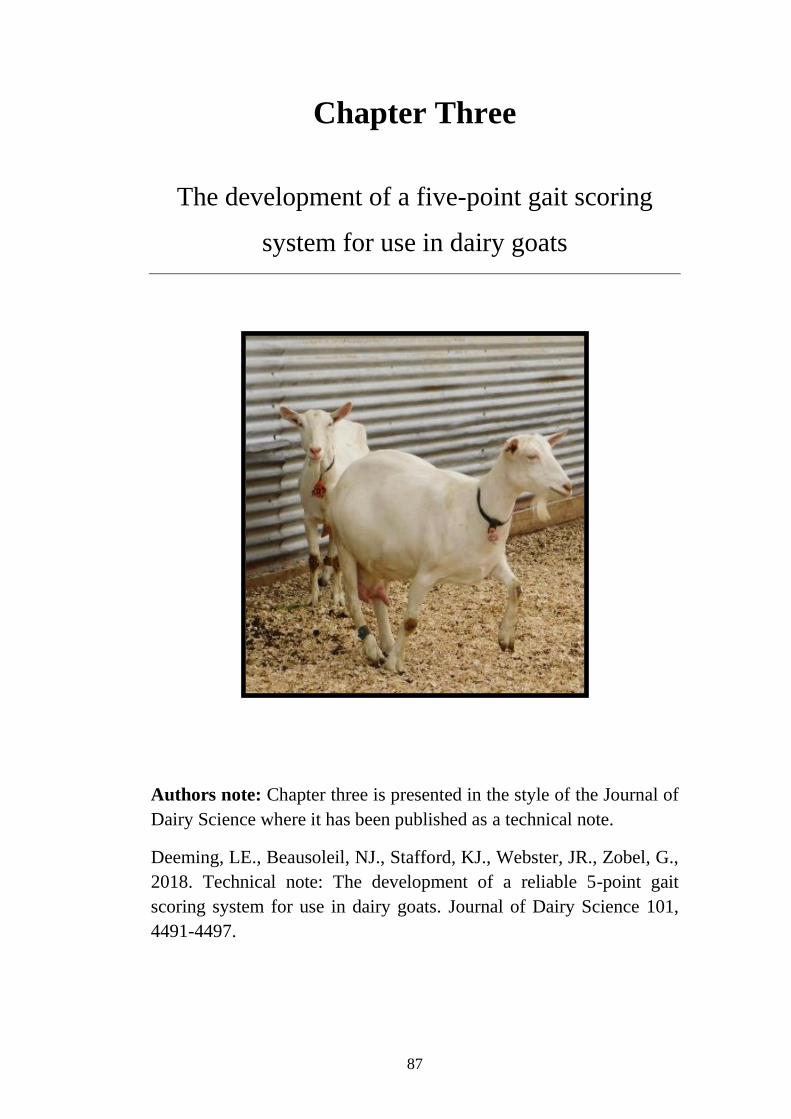
87
Chapter Three
The development of a five-point gait scoring
system for use in dairy goats
Authors note: Chapter three is presented in the style of the Journal of
Dairy Science where it has been published as a technical note.
Deeming, LE., Beausoleil, NJ., Stafford, KJ., Webster, JR., Zobel, G.,
2018. Technical note: The development of a reliable 5-point gait
scoring system for use in dairy goats. Journal of Dairy Science 101,
4491-4497.

88
Abstract
Numerical rating scales are frequently used in gait scoring systems as indicators of
lameness in dairy animals. The gait scoring systems commonly used in dairy goats
are based on 4-point scales that focus on detecting and judging the severity of a
definite limp. An uneven gait, such as a shortened stride or not “tracking up,” is
arguably the precursor to the development of a limp; thus, identifying such changes
in gait could provide opportunity for early treatment. The objectives of this study
were (1) to develop a 5-point gait scoring system that included an “uneven gait”
category and compare the distribution of gait scores generated using this system to
scores generated using a 4-point system, and (2) to determine whether this system
could be reliably used. Forty-eight Saanen cross 2- and 3-yr-old lactating does were
enrolled from a commercial dairy goat farm. Two observers carried out weekly live
gait scoring sessions for 7 wk using the developed 5-point scoring system. The first
2 wk were used as training sessions (training sessions 1–2), with the subsequent 5
wk completed as gait assessments (assessments 1–5). In addition to training session
1 being lived scored, the goats were also video-recorded. This allowed observer 1
to re-score the session 4 times: twice using the developed 5-point system and twice
using the previously used 4-point system. Comparisons of score distributions could
then be made. Using the 4-point system, 81% of the goats were assigned score 1
(normal gait). Using the 5-point system, only 36% of the goats were assigned score
1 (normal gait), with 50% assigned score 2 (uneven gait). High levels of intra-
observer reliability were achieved by observer 1 using both gait scoring systems
[weighted kappa (κw) = 1.00: 4-point, κw = 0.96: 5-point]. At training session 1
(wk 1), inter-observer reliability was only moderate (κw = 0.54), but this was
improved during the subsequent training session 2 (κw = 0.89). Inter-observer
89
reliability was high among assessments 1 to 5 (κw = 0.90–1.00). During the training
sessions, sensitivity for gait scores 1 and 2 was 77 and 65% (training session 1) and
89 and 94% (training session 2), respectively. Sensitivity was high among
assessments 1 to 5 (score 1: 83–100%, score 2: 97–100%). This highlights the likely
reason why existing gait scoring systems for dairy goats do not include an “uneven
gait” category, as distinguishing it from a normal gait was challenging without
training. In conclusion, with training, a 5-point gait scoring system could be reliably
used. The 5-point system was found to be more sensitive than the 4-point system,
allowing for a potential precursor to lameness to be identified. Further work is
needed to determine whether the score can be reliably used in an on-farm setting.
Key words: welfare; lame; uneven gait; limp
Technical Note
Lameness, a painful condition (Whay et al., 1997) that impedes a normal walking
gait, is one of the most serious welfare issues faced by dairy animals (von
Keyserlingk et al., 2009). As lameness compromises animal welfare (Whay et al.,
2003), it is essential that the lameness status of dairy animals can be quickly and
reliably identified to facilitate the prompt detection and treatment of lame animals.
Gait scoring systems, which use a numerical rating scale to rank an animal's
walking ability, are commonly used as an indicator of lameness presence and
severity. Systems assessing gait have been established for several species (sheep:
Ley et al., 1989; chickens: Weeks et al., 2000; cows: Flower and Weary, 2006;
goats: Anzuino et al., 2010; pigs: Nalon et al., 2014).
90
The 4-point gait scoring systems frequently used for dairy goats require a definite
limp to be recognized (Hill et al., 1997; Anzuino et al., 2010; Muri et al., 2013) for
an animal to be identified as lame. Gait scores are then assigned based on limp
severity (Table 1). A limp can be defined as an altered gait due to reluctance to bear
weight on the affected limb (Leach et al., 2009). This reluctance results in an uneven
foot fall because a sound limb will be moved more quickly than the lame limb
(Leach et al., 2010). With the exception of injuries, many cases of lameness develop
over time (de Mol et al., 2013). Therefore, the development of an uneven gait could
be a precursor to a limp developing. An uneven gait may be recognized as a
shortening of stride, the animal not “tracking up” (i.e., the hind hoof not stepping
into the placement of the front hoof) when walking, or as swinging of the affected
leg inwards or outwards at each stride (van der Waaij et al., 2005; Haskell et al.,
2006).
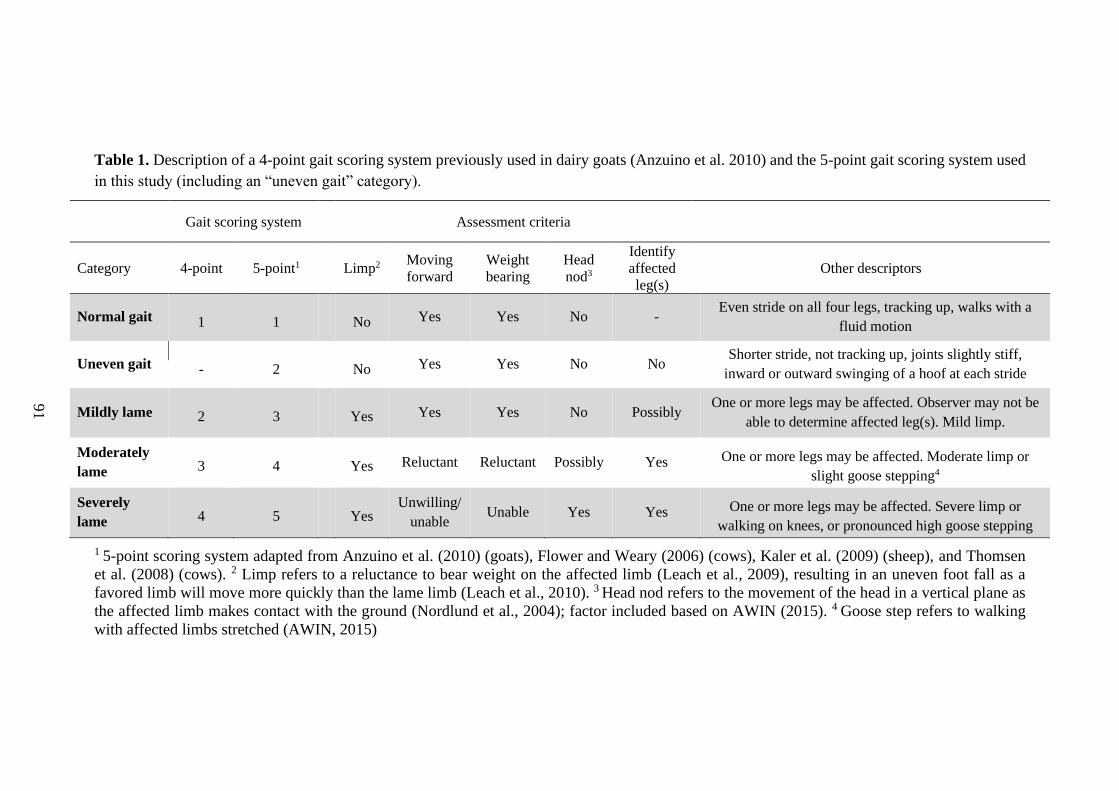
91
Table 1. Description of a 4-point gait scoring system previously used in dairy goats (Anzuino et al. 2010) and the 5-point gait scoring system used
in this study (including an “uneven gait” category).
Gait scoring system Assessment criteria
Category
4-point
5-point1
Limp2 Moving
forward
Weight
bearing
Head
nod3
Identify
affected
leg(s)
Other descriptors
Normal gait
1
1
No Yes Yes No - Even stride on all four legs, tracking up, walks with a
fluid motion
Uneven gait
-
2
No Yes Yes No No Shorter stride, not tracking up, joints slightly stiff,
inward or outward swinging of a hoof at each stride
Mildly lame
2
3
Yes Yes Yes No Possibly One or more legs may be affected. Observer may not be
able to determine affected leg(s). Mild limp.
Moderately
lame
3
4
Yes Reluctant Reluctant Possibly Yes One or more legs may be affected. Moderate limp or
slight goose stepping4
Severely
lame
4
5
Yes Unwilling/
unable Unable Yes Yes One or more legs may be affected. Severe limp or
walking on knees, or pronounced high goose stepping
1 5-point scoring system adapted from Anzuino et al. (2010) (goats), Flower and Weary (2006) (cows), Kaler et al. (2009) (sheep), and Thomsen
et al. (2008) (cows). 2 Limp refers to a reluctance to bear weight on the affected limb (Leach et al., 2009), resulting in an uneven foot fall as a
favored limb will move more quickly than the lame limb (Leach et al., 2010). 3 Head nod refers to the movement of the head in a vertical plane as
the affected limb makes contact with the ground (Nordlund et al., 2004); factor included based on AWIN (2015). 4 Goose step refers to walking
with affected limbs stretched (AWIN, 2015)
92
A 5-point gait scoring system is frequently used as an indicator of lameness in dairy
cows (O'Callaghan et al., 2003; Espejo et al., 2006; Flower and Weary, 2006). The
dairy cow 5-point scoring system includes an “uneven gait” category, which allows
for discrimination of slight variation from a “normal gait,” and therefore may
facilitate earlier detection of developing lameness. Not including an “uneven gait”
category in scoring systems such as the 4-point system often used in goats (Hill et
al., 1997; Anzuino et al., 2010; Muri et al., 2013) may result in animals that have a
slight variation from a normal gait being scored as “normal.” These animals will
only be detected once a definite limp has developed.
An uneven gait is not necessarily indicative of lameness. For example,
conformation, posture, and udder fill of the animal may affect gait (Flower and
Weary, 2009). However, using a gait scoring system that includes this category
provides an opportunity to investigate the cause of the unevenness. Then, if deemed
necessary, interventions such as remedial hoof trimming or veterinary treatment can
be administered, potentially preventing deterioration of the condition (Leach et al.,
2012).
Simplifying a gait scoring system by reducing the number of categories may
improve inter-observer reliability and repeatability (Schlageter-Tello et al., 2014).
This could explain why the previously used dairy goat gait scoring systems have
fewer than 5 categories and often focus on identifying severe lameness. However,
for cows, it is reported that with extra training, similar inter-observer reliability can
be achieved using a 5-point system and a 4-point system (Brenninkmeyer et al.,
2007). This suggests that the repeatability of a gait scoring system is determined
not just by the sensitivity of the score, but also by the observers and their level of
training and experience.
93
This study had 2 objectives: (1) to develop a 5-point gait scoring system for goats
that includes a category for “uneven gait” with no limp, and to compare the
distribution of gait scores generated using this system to scores generated using a
4-point system that focuses on identifying a limp; and (2) to determine whether the
5-point system can be reliably used.
The study was conducted at the AgResearch Goat Research Facility (Hamilton,
New Zealand) and was approved by the AgResearch Ltd. Animal Ethics Committee
(#13700). Forty-eight Saanen cross 2- and 3-yr-old lactating does were enrolled in
October 2016 and represented the total available population. The goats were housed
singly or in pairs on rubber matting and shavings in the indoor facility as part of a
larger feeding trial.
The same 2 observers carried out weekly gait scoring sessions for 7 consecutive
weeks: the first 2 wk were training sessions, followed by 5 assessment sessions. All
gait scoring sessions were conducted at approximately 1600 h, following the
afternoon milking, to reduce any effect of milk fill and udder distention on gait
(Flower et al., 2006). Goats were assessed while walking from the milking parlor
back to their pens on a combination of hard rubber matting and concrete flooring.
They left the milking parlor and walked toward the observers, passed them laterally
at a distance of 3 to 5 m, and then continued away from the observers to their home
pen. This allowed for at least 4 full strides of walk to be viewed. Efforts were made
by the observers to keep an equal distance from the goats. However, due to the
layout of the housing facility relative to the milking parlor, this was not always
possible. Goats exited the parlor one at a time, enabling the observers to view and
score each before another was allowed to exit. They exited in an indiscriminate

94
order at each gait scoring session, which would have minimized the risk of
observers becoming familiar with the order and recognizing individual goats.
In the first week, the 2 observers live scored the goats using the 5-point scale (see
below) to evaluate reliability. This session was completed with the observers
scoring independently, allowing an initial inter-observer reliability to be calculated.
Inter-observer agreement was only moderate [weighted kappa (κw) = 0.54; Table
2]. The observers aimed to achieve almost perfect agreement (0.81–0.99; Viera and
Garrett, 2005) before assessments could begin; therefore, further training was
needed. Thus, training session 2 was completed, with the observers being able to
discuss scores being assigned; this improved agreement (κw = 0.89; Table 2).
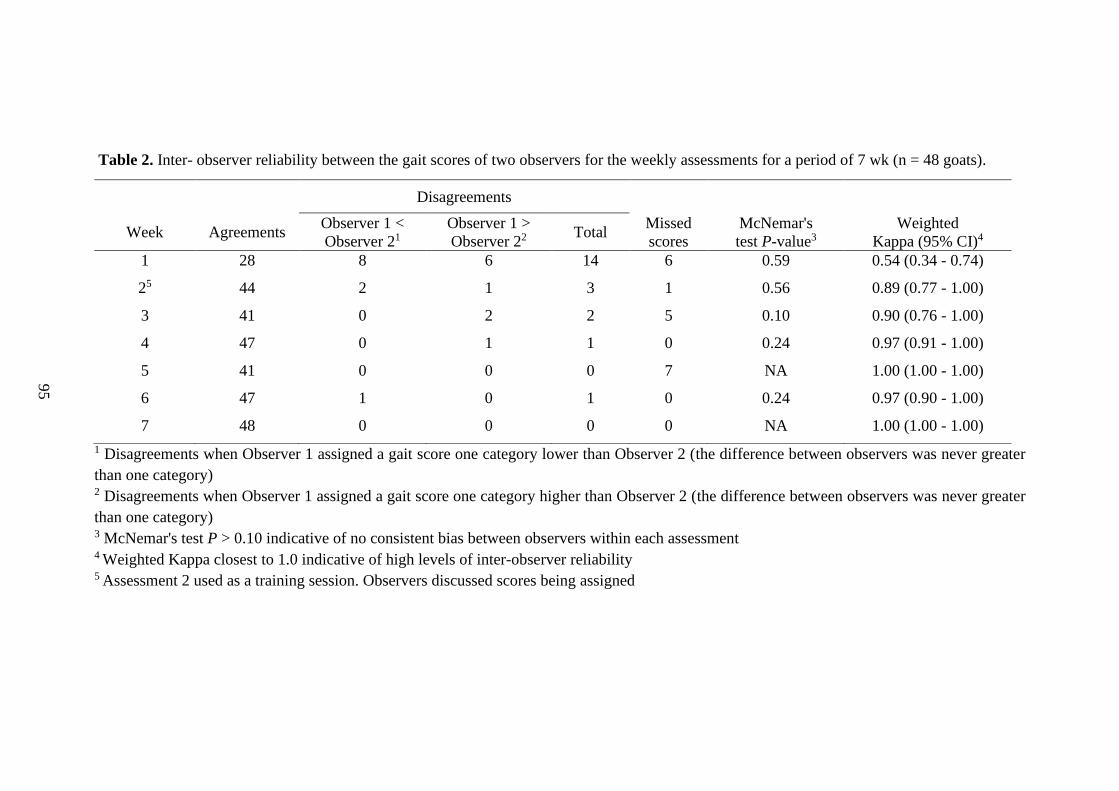
95
Table 2. Inter- observer reliability between the gait scores of two observers for the weekly assessments for a period of 7 wk (n = 48 goats).
1 Disagreements when Observer 1 assigned a gait score one category lower than Observer 2 (the difference between observers was never greater
than one category) 2 Disagreements when Observer 1 assigned a gait score one category higher than Observer 2 (the difference between observers was never greater
than one category) 3 McNemar's test P > 0.10 indicative of no consistent bias between observers within each assessment 4 Weighted Kappa closest to 1.0 indicative of high levels of inter-observer reliability 5 Assessment 2 used as a training session. Observers discussed scores being assigned
Disagreements
Week Agreements Observer 1 <
Observer 21
Observer 1 >
Observer 22 Total
Missed
scores
McNemar's
test P-value3
Weighted
Kappa (95% CI)4
1 28 8 6 14 6 0.59 0.54 (0.34 - 0.74)
25 44 2 1 3 1 0.56 0.89 (0.77 - 1.00)
3 41 0 2 2 5 0.10 0.90 (0.76 - 1.00)
4 47 0 1 1 0 0.24 0.97 (0.91 - 1.00)
5 41 0 0 0 7 NA 1.00 (1.00 - 1.00)
6 47 1 0 1 0 0.24 0.97 (0.90 - 1.00)
7 48 0 0 0 0 NA 1.00 (1.00 - 1.00)
96
In wk 1, the goats were also video-recorded (n = 42; 6 missed due to goats rushing;
HC-V270, Panasonic Camcorder, Osaka, Japan) to allow comparison of the
distribution of scores generated using the 4- and 5-point systems. At the completion
of the 7-wk trial, observer 1 scored these video recordings 4 times: twice using the
5-point system and then twice using a 4-point system (Anzuino et al., 2010). Each
scoring occurred 1 wk apart to minimize the risk of observer 1 being familiar with
the goats and the order they appeared on the video.
The PROC FREQ procedure of SAS (version 9.3, SAS Institute Inc., Cary, NC)
was used to calculate κw and sensitivity (%). This enabled inter-observer reliability
at each gait scoring session to be evaluated, as well as intra-observer reliability of
observer 1 when training session 1 video was re-scored. McNemar's test was
performed to evaluate disagreements between the 2 observers within each training
session and within each assessment session to establish whether there was
consistent bias between the observers (e.g., one observer always scoring higher than
the other).
The 5-point gait scoring system was developed using key descriptors (Table 1) from
a previously used goat gait scoring system (Anzuino et al., 2010), combined with
features from published scoring systems used for other species (e.g., cows: Flower
and Weary, 2006; sheep: Kaler et al., 2009). These features include the quality of
the gait, such as whether it is normal or uneven or a limp is present. They also
include the animal's ability to move forward, its ability to bear weight, and the
observer's ability to identify the affected leg(s). For moderate and severe lameness,
features such as head nodding, “goose stepping” (walking with affected limbs
stretched; AWIN, 2015), and walking on their knees have been included. The
current study had a relatively small proportion of goats with moderate to severe

97
lameness; therefore, the inclusion of these factors was done in accordance with the
Animal Welfare Indicators (AWIN) welfare assessment protocol (AWIN, 2015),
which focuses entirely on the identification of severe lameness.
High levels of intra-observer reliability were achieved by observer 1 using the
developed 5-point gait scoring system and the previously used 4-point system (κw
= 0.96, 5-point; κw = 1.00, 4-point). Using the 4-point system, the majority of the
goats (34/42, 81%; average of the 2 re-scores) were assigned score 1 (normal gait).
However, using the 5-point scoring system, only 15 of 42 goats (36%) were
assigned score 1, and 21 of 42 goats (50%) were assigned score 2 (uneven gait;
Figure 1). The difference in the distribution of the assigned gait scores when using
the 2 systems indicates that several goats did not have a definite limp but also did
not have a normal gait. When using the 4-point system, these “in-between” goats
must be assigned a score 1 (normal gait). It should also be noted that 2 of the goats
(5%) scored as having a definite limp using the 4-point system were scored as
having an uneven gait when the 5-point system was used. The observer considered
these goats to be toward the higher end of the “uneven gait” category. Therefore,
when using the 4-point system, it was considered more appropriate to assign a “mild
lameness” category, rather than “normal gait.”

98
Figure 1. The distribution of gait scores assigned by observer 1 when re-scoring
session 1 (wk 1) videos using the 5-point gait scoring system (including “uneven
gait” category) system and the 4-point gait scoring system (no “uneven gait”
category; Anzuino et al., 2010) (n = 42, 6 goats missed scoring). No goats were
severely lame. Four-point score: 1 = normal gait, 2 = mildly lame, 3 = moderately
lame, 4 = severely lame. Five-point score: 1 = normal gait, 2 = uneven gait, 3 =
mildly lame, 4 = moderately lame, 5 = severely lame.
Study goats that were assigned a gait score of 2 (5-point scale; “uneven gait”) or
above at any of the assessments were investigated and promptly treated by a
veterinarian if necessary. Therefore, it was not possible to monitor lameness
progression across the 7-wk period. Prompt treatment also reduced the possibility
of observers being able to recognize individual goats by their gait score. Observers
could not assume that a high gait score at one gait scoring session would result in a
high gait score at the subsequent gait scoring session.
Nearly half of the goats (19/42; 44%) characterized as having a normal gait using
the 4-point system were recognized as having an uneven gait using the 5-point
system. Although this prevalence appears high, other studies have suggested that

99
an uneven gait can be very common in dairy animals. For example, of 183 dairy
cows, 93% presented with the mildest lameness, considered equivalent to the
“uneven gait” category in the 5-point system (Thomas et al., 2015). This highlights
the potential lack of discrimination of low levels of lameness when fewer categories
are included in a gait scoring system. It is important that the system enables
precursors of an obvious limp to be detected, as these animals should be targeted
for treatment, rather than waiting until the lameness becomes more severe (Nalon
et al., 2014; Thomas et al., 2015).
The 5-point system frequently used to assess gait in cows includes variables other
than limping. For instance, the “uneven gait” category uses the presence of an
arched back while walking as a criterion to assign the cow to this category
(Thomsen et al., 2008). In the present study, back arching did not become obvious
until goats were moderately lame (score 4 on the 5-point scale). Indeed, when goats
presented with an uneven gait, the observers viewed no other physical changes
besides the slight deviation from normal walking. This extra challenge in
identifying these goats may help to explain why the scoring systems previously
used for dairy goats do not include the “uneven gait” category.
Several different gait scoring systems have been used as indicators of lameness in
small ruminants. Similar to our findings for goats, 4-point scoring systems
developed for use in sheep are not sensitive enough to detect lower degrees of
lameness (Angell et al., 2015). Although 5-point scoring systems have also been
developed for use in sheep, the categories are not well defined. They either use
subjective descriptors, such as “obvious lameness” (Welsh et al., 1993), or do not
give full descriptions of the categories used (Ley et al., 1989), making
reproducibility difficult. Interestingly, a more detailed (7-point) scale including
100
categories to detect an uneven gait was developed and reliably used in sheep (Kaler
et al., 2009). In that study, the 3 observers were already familiar with gait scoring
of sheep and received one training session using 10 video clips. Although they were
able to identify the sheep with uneven gait, it should be noted that this was done
entirely from recorded video clips; these authors did not test the scoring system in
a live, on-farm setting.
In contrast, simplification of scoring by the use of a 4-point scale, or to a greater
degree, the binary approach (i.e., severely lame or not lame) used in the AWIN
protocol, may allow scoring to be achieved readily on farm with less training
(AWIN, 2015). A binary score is reported to be used in the AWIN protocol because
of the challenges of gait scoring dairy goats, such as husbandry constraints and
differences in management and resources at farms (AWIN, 2015). Although even
binary systems may have consistency issues over time (Can et al., 2017), they may
be the best option for large-scale on-farm work, because they allow the prevalence
of severe lameness to be identified quickly and easily during welfare assessments.
The drawback of utilizing scoring systems with reduced categories is that, in large
studies, the prevalence of less severe lameness may be underestimated.
Early detection and treatment are reported to reduce the prevalence of severe
lameness and aid faster recovery (sheep: Kaler and Green, 2009; cows: Leach et al.,
2012). In addition, lameness is known to negatively affect milk production (cows:
Warnick et al., 2001; goats: Christodoulopoulos, 2009), fertility (cows: Melendez
et al., 2003), and longevity (cows: Booth et al., 2004). Therefore, being able to
detect an uneven gait, a potential indicator of early lameness, allows for further
investigation and early treatment if necessary. This may reduce the negative effect
on animal welfare and productivity.

101
Our second objective was to determine the reliability of the gait scoring system
developed. Of the possible 240 scores from the weekly assessments (assessments
1–5 completed in wk 3–7), 227 observations were recorded. High inter-observer
reliability was achieved using the 5-point scale for assessments 1 to 5 (κw = 0.90
to 1.00; Table 2). We detected no difference in the disagreements of the 2 observers
within any of the assessments (McNemar's P-value range: 0.10–0.24; Table 2). This
indicates no consistent bias between observers; that is, one observer did not
consistently score higher or lower than the other observer.
Most (82%) of the live scores assigned using the 5-point scale over the 5 assessment
sessions were scores 1 and 2. Scores 3, 4, and 5 comprised 13% of the total assigned
scores, with 5% of goats missed. There were only 2 goats across the 5 assessments
that each presented with severe lameness (score 5; 5-point system) at one of the
assessments. The sensitivity between the 2 observers for scores 1 and 2 during the
training sessions was 77 and 65% (training session 1) and 89 and 94% (training
session 2), respectively. During assessments 1 to 5, sensitivity was high (score 1:
83–100%, score 2: 97–100%).
The low initial sensitivities during training highlights the likely reason that existing
scoring systems do not include “uneven gait,” because both observers found that
distinguishing “uneven gait” from “normal gait” was challenging. Identifying an
uneven gait, the intermediate category between normal gait and a definite limp, is
also challenging in other small ruminants. For example, the greatest disagreement
between observers scoring sheep was found between the “normal gait” category
and the “slight abnormal gait” category (Kaler et al., 2009). Nonetheless, in the
current study, following 2 training sessions, the observers could use the 5-point gait
scoring system reliably.
102
The 13 missing scores were attributed to goats rushing after exiting the milking
parlor. Although we attempted to reduce this behavior by having an assistant walk
in front of the goats, it was still not possible to achieve a steady walking pace for
all goats to assign an accurate gait score. This is pertinent because rushing was
found, on at least one occasion, to almost entirely mask a score 4 (moderately lame;
5-point scale) goat. The ability to assign an accurate gait score is reduced if goats
move faster than a walk. This is particularly relevant for animals with lower levels
of lameness because subtler changes in gait are more difficult to detect as speed
increases. Gait scores were only assigned by the 2 observers if the goats walked at
a steady pace to ensure scoring was not biased by the speed of the goat. Difficulties
in assigning accurate gait scores due to the speed that goats exit the milking parlor
have previously been reported and resulted in a simple binary scoring system
(lame/not lame) being used (Crosby-Durrani et al., 2016). Therefore, we suggest
that controlling the speed of goats and ensuring goats walk at a steady consistent
speed is essential to ensure accuracy of the 5-point score. However, we
acknowledge that this would not necessarily be feasible in all on-farm settings.
The observers developed the 5-point gait scoring system presented here and were
therefore very familiar with the system before gait scoring was completed. However,
further training sessions were required to improve inter-observer reliability. March
et al. (2007) also found that considerable training, involving at least 5 farm visits
and the scoring of between 200 and 300 live animals, was required to achieve high
inter-observer repeatability when using a 5-point system to score gait in dairy cows.
Less intensive training was required in the present study (2 training sessions
comprising 42 and 47 animals, respectively). Although training can be time
consuming, the result is a reliable 5-point gait scoring system. Nonetheless, it

103
should be noted that the present study focused on a small number of animals in a
controlled environment. Therefore, we caution that due to the challenges of gait
scoring dairy goats, large-scale farm work needs to be completed to determine
whether the 5-point gait scoring system presented here is applicable to on-farm
settings and prevalence assessments.
In conclusion, we successfully developed a 5-point gait scoring system. After 2
training sessions, reliability was achieved between 2 observers scoring a small
group of goats. Nearly half of the goats characterized as having a normal gait using
a previously reported 4-point system were recognized as having an uneven gait
using the developed 5-point system. Using a scoring system that enables the
identification of an uneven gait could facilitate detection of early signs of lameness,
allowing for early investigation and treatment if necessary. We encourage the
testing of this 5-point gait scoring system in large, on-farm settings.
References
Angell, J. W., P. J. Cripps, D. H. Grove-White, and J. S. Duncan. 2015. A
practical tool for locomotion scoring in sheep: Reliability when used by
veterinary surgeons and sheep farmers. Vet. Rec. 176:521–523.
Anzuino, K., N. J. Bell, K. J. Bazeley, and C. J. Nicol. 2010. Assessment of welfare
on 24 commercial UK dairy goat farms based on direct observations. Vet.
Rec. 167:774–780.
AWIN. 2015. Animal Welfare Indicators (AWIN) welfare assessment protocol for
goats. ttps://doi.org/10.13130/AWIN_goats_2015.
Booth, C. J., L. Warnick, Y. Gröhn, D. Maizon, C. Guard, and D. Janssen. 2004.
Effect of lameness on culling in dairy cows. J. Dairy Sci. 87:4115–4122.
Brenninkmeyer, C., S. Dippel, S. March, J. Brinkmann, C. Winckler, and U.
Knierim. 2007. Reliability of a subjective lameness scoring system for dairy
cows. Anim. Welf. 16:127–129.

104
Can, E., A. Vieira, M. Battini, S. Mattiello, and G. Stilwell. 2017. Consistency
over time of animal-based welfare indicators as a further step for developing
a welfare assessment monitoring scheme: The case of the Animal Welfare
Indicators protocol for dairy goats. J. Dairy Sci. 100:9194–9204.
Christodoulopoulos, G. 2009. Foot lameness in dairy goats. Res. Vet. Sci. 86:281–
284.
Crosby-Durrani, H. E., S. R. Clegg, E. R. Singer, J. W. Angell, N. J. Evans,
S. D. Carter, R. J. Blundell, and J. S. Duncan. 2016. Severe foot lesions
in dairy goats associated with digital dermatitis treponemes. J. Comp. Pathol.
154:283–296.
de Mol, R. M., G. André, E. J. B. Bleumer, J. T. N. Van Der Werf, Y. De Haas, and
C. G. Van Reenen. 2013. Applicability of day-to-day variation in behavior
for the automated detection of lameness in dairy cows. J. Dairy Sci.
96:3703–3712.
Espejo, L. A., M. I. Endres, and J. A. Salfer. 2006. Prevalence of lame-ness in high-
producing Holstein cows housed in freestall barns in Minnesota. J. Dairy
Sci. 89:3052–3058.
Flower, F. C., D. Sanderson, and D. M. Weary. 2006. Effects of milking on dairy
cow gait. J. Dairy Sci. 89:2084–2089.
Flower, F. C., and D. M. Weary. 2006. Effect of hoof pathologies on subjective
assessments of dairy cow gait. J. Dairy Sci. 89:139–146.
Flower, F. C., and D. M. Weary. 2009. Gait assessment in dairy cattle. Animal
3:87–95.
Haskell, M. J., L. Rennie, V. Bowell, M. Bell, and A. Lawrence. 2006. Housing
system, milk production, and zero-grazing effects on lameness and leg
injury in dairy cows. J. Dairy Sci. 89:4259–4266.
Hill, N. P., P. E. Murphy, A. J. Nelson, L. E. Mouttotou, L. E. Green, and K. L.
Morgan. 1997. Lameness and foot lesions in adult British dairy goats. Vet.
Rec. 141:412–416.
Kaler, J., and L. E. Green. 2009. Farmers’ practices and factors associated with the
prevalence of all lameness and lameness attributed to interdigital dermatitis
and footrot in sheep flocks in England in 2004. Prev. Vet. Med. 92:52–59.
Kaler, J., G. J. Wassink, and L. E. Green. 2009. The inter- and intra-observer
reliability of a locomotion scoring scale for sheep. Vet. J. 180:189–194.
Leach, K. A., S. Dippel, J. Huber, S. March, C. Winckler, and H. R. Whay. 2009.
Assessing lameness in cows kept in tie-stalls. J. Dairy Sci. 92:1567–1574.
Leach, K. A., D. A. Tisdall, N. J. Bell, D. C. J. Main, and L. E. Green. 2012. The
effects of early treatment for hindlimb lameness in dairy cows on four
commercial UK farms. Vet. J. 193:626–632.
105
Leach, K. A., H. R. Whay, C. M. Maggs, Z. E. Barker, E. S. Paul, A. K. Bell, and
D. C. J. Main. 2010. Working towards a reduction in cattle lameness: 1.
Understanding barriers to lameness control on dairy farms. Res. Vet. Sci.
89:311–317.
Ley, S. J., A. Livingston, and A. E. Waterman. 1989. The effect of chronic
clinical pain on thermal and mechanical thresholds in sheep. Pain 39:353–
357.
March, S., J. Brinkmann, and C. Winkler. 2007. Effect of training on the inter-
observer reliability of lameness scoring in dairy cattle. Anim. Welf.
16:131–133.
Melendez, P., J. Bartolome, L. F. Archbald, and A. Donovan. 2003. The association
between lameness, ovarian cysts and fertility in lactating dairy cows.
Theriogenology 59:927–937.
Muri, K., S. M. Stubsjøen, and P. S. Valle. 2013. Development and testing of
an on-farm welfare assessment protocol for dairy goats. Anim. Welf.
22:385–400.
Nalon, E., D. Maes, S. Van Dongen, M. M. Van Riet, G. Janssens, S. Millet, and F.
Tuyttens. 2014. Comparison of the inter-and intra-observer repeatability of
three gait-scoring scales for sows. Animal 8:650–659.
Nordlund, K. V., N. B. Cook, and G. R. Oetzel. 2004. Investigation strategies for
laminitis problem herds. J. Dairy Sci. 87: E27–E35.
O’Callaghan, K. A., P. J. Cripps, D. Y. Downham, and R. D. Murray. 2003.
Subjective and objective assessment of pain and discomfort due to lameness
in dairy cattle. Anim. Welf. 12:605–610.
Schlageter-Tello, A., E. A. M. Bokkers, P. W. G. Groot, T. Koerkamp, T. Van
Hertem, S. Viazzi, C. E. B. Romanini, I. Halachmi, C. Bahr, D.
Berckmans, and K. Lokhorst. 2014. Effect of merging levels of locomotion
scores for dairy cows on intra- and interrater reliability and agreement. J.
Dairy Sci. 97:5533–5542.
Thomas, H. J., G. G. Miguel-Pacheco, N. J. Bollard, S. C. Archer, N. J. Bell, C.
Mason, O. J. R. Maxwell, J. G. Remnant, P. Sleeman, H. R. Whay, and J.
N. Huxley. 2015. Evaluation of treatments for claw horn lesions in dairy
cows in a randomized controlled trial. J. Dairy Sci. 98:4477–4486.
Thomsen, P. T., L. Munksgaard, and F. A. Tøgersen. 2008. Evaluation of a
lameness scoring system for dairy cows. J. Dairy Sci. 91:119–126.
van Der Waaij, E. H., M. Holzhauer, E. Ellen, C. Kamphuis, and G. De Jong. 2005.
Genetic parameters for claw disorders in Dutch dairy cattle and correlations
with conformation traits. J. Dairy Sci. 88:3672–3678.
106
Viera, A. J., and J. M. Garrett. 2005. Understanding interobserver agreement:
The kappa statistics. Fam. Med. 37:360–363.
von Keyserlingk, M. A. G., J. Rushen, A. M. De Passillé, and D. M. Weary. 2009.
Invited review: The welfare of dairy cattle—Key concepts and the role of
science. J. Dairy Sci. 92:4101–4111.
Warnick, L. D., D. Janssen, C. L. Guard, and Y. T. Gröhn. 2001. The effect of
lameness on milk production in dairy cows. J. Dairy Sci. 84:1988–1997.
Weeks, C. A., T. D. Danbury, H. C. Davies, P. Hunt, and S. C. Kestin. 2000. The
behaviour of broiler chickens and its modification by lameness. Appl. Anim.
Behav. Sci. 67:111–125.
Welsh, E. M., G. Gettinby, and A. M. Nolan. 1993. Comparison of a visual analogue
scale and a numerical rating scale for assessment of lameness, using sheep
as a model. Am. J. Vet. Res. 54:976–983.
Whay, H. R., D. C. J. Main, L. E. Green, and A. J. F. Webster. 2003. Assessment
of the welfare of dairy cattle using animal-based measurements: Direct
observations and investigation of farm records. Vet. Rec. 153:197–202.
Whay, H. R., A. E. Waterman, and A. J. F. Webster. 1997. Associations between
locomotion, claw lesions and nociceptive threshold in dairy heifers during
the peri-partum period. Vet. J. 154:155–161
107
Chapter Four
An observational study investigating the effects
of early life trimming regimes and subsequent
trimming frequency on hoof conformation of
dairy goats
108
Abstract
Frequent hoof trimming promotes an anatomically correct hoof shape and balanced
weight-bearing between the two claws. This reduces the risk of hoof lesions and
lameness. There are limited data on the optimal frequency of hoof trimming for
dairy goats, or the appropriate timing of first trimming in early life and how these
factors affects hoof conformation. Therefore, the aims of this study were 1) to
investigate if trimming before first mating affected hoof conformation (farms
categorised into trimmed (n = 3) or untrimmed (n = 13)) and 2) to investigate if
trimming before first kidding and the frequency of subsequent hoof trimming
affected hoof conformation at the end of second lactation (farms categorised as 1)
Early trimmed, ≥ 4 trims per year thereafter (n = 4), 2) Early trimmed, 2-3 trims per
year thereafter (n = 6), 3) Late trimmed, 2-3 trims per year thereafter (n = 3). Sixteen
dairy goat farms in the Waikato region of New Zealand were included as part of a
4-year longitudinal study. Hoof conformation was assessed from photographs taken
at first mating (8.0 ± 0.70 months of age) (n = 1030 contributing goats, 16 farms)
and end of second lactation (34.1 ± 0.90 month of age) (n = 627 contributing goats,
13 farms). Aspects were subjectively assessed using a binary system (good vs poor)
for toe length, heel shape, claw shape and claw splay. Additionally, two objective
measures (toe length ratio and claw splay distance) were completed. At first mating
(8.0 ± 0.70) the toe length ratio was greater in the untrimmed hooves compared to
trimmed hooves in the front (0.44 (95% CI: 0.30-0.53) vs. 0.27 (0.17-0.29),
respectively; F1, 13.52 = 6.41, P < 0.05), and hind hooves (0.64 (0.53– 0.77) vs. 0.31
(0.21-0.45), respectively; F1, 13.52 = 13.58, P < 0.01). In addition, the hind hooves of
goats that had not been trimmed before first mating had greater odds of being
overgrown (odds ratio and 95% CI: 3.00 (1.41-6.38) P < 0.01) and having dipped

109
heels ( 8.94 (4.89-16.32) P < 0.001) and misshaped claws (1.68 (1.08-2.65) P < 0.05)
than those that had been trimmed. At the end of second lactation the hind hooves of
goats on farms that had not trimmed prior to first kidding (regime 3) had greater
odds of having dipped heels compared to the other two regimes that did trim before
first kidding (regime 1: 2.38 (1.23-4.60), P < 0.01) and 2.27 (regime 2: (1.22-4.21)
P < 0.01), regardless of frequency of trimming thereafter. The present study was
observational; however, the findings suggest that trimming before first mating is
beneficial to hoof conformation in the short term. The functional significance of the
differences in hoof conformation at first mating in terms of an increased risk of
lameness should be considered in future studies. Trimming before first kidding had
a long-term effect on the heel conformation of the hind hooves at the end of second
lactation, and the subsequent frequency of hoof trimming had no observable effects.
However, regardless of trimming regime high proportions of poor hoof
conformation were observed at the end of second lactation, suggesting that
management factors other than trimming may be strongly impacting hoof
conformation of dairy goats.
Introduction
Hoof trimming aims to correct hoof overgrowth and improve conformation through
the restoration of the claws to an anatomically correct shape (cows: Shearer and van
Amstel, 2001). This promotes symmetry and balanced weight bearing between the
claws (Bryan et al., 2012) and reduces the risk of hoof lesions and lameness
(Hernandez et al., 2007) in dairy cows. Ideal hoof conformation should include a
short toe with a steep angled claw, a high upright heel (van Amstel, 2017), a straight
fetlock (Häggman and Juga, 2013), and both claws on the same hoof should be even
sized (van Amstel, 2017).
110
Hoof and leg disorders become more prevalent with more confined management
systems, as environmental conditions such as flooring substrate and poor hygiene
can influence hoof conformation (cows: Bergsten, 2001). Commercial dairy goat
systems are typically fully indoors, and are bedded with straw (UK: Anzuino et al.,
2010; Italy: Battini et al., 2014) or wood shavings (New Zealand: Solis-Ramirez et
al., 2011). Therefore, due to limited opportunities for housed dairy goats to naturally
wear their hooves, a high prevalence of hoof overgrowth is common (84-100%: Hill
et al., 1997; Anzuino et al., 2010).
Hoof overgrowth in dairy goats can have significant impacts on the conformation
of the hoof resulting in deformation of the claws (Ajuda et al., 2014), with chronic
overgrowth causing a slippered hoof where the toe curls up and the weight bearing
surface transfers to the heel (Hill et al., 1997). In a recent study, hoof overgrowth
and claw deformation were shown to be associated with lameness prevalence and
lameness severity in dairy goats (Ajuda et al., 2019); therefore, frequent hoof
trimming is necessary to prevent prolonged overgrowth and poor conformation
(Smith and Sherman, 2009; Ajuda et al., 2019).
Frequent hoof trimming results in a shorter more upright hoof conformation; such
hooves are associated with reduced risk of lameness (cows: Boettcher et al., 1998;
Manske et al., 2002b). In dairy cows it is suggested that hoof trimming should be
completed at least once a year (Manson & Leaver 1988), with twice yearly trimming
generally recommended (Toussaint Raven, 1985, Manske et al., 2002a). Indeed,
Manske et al. (2002a) report that trimming twice per year is beneficial to hoof health
and conformation, with cows that received an extra hoof trim in autumn having
shorter and steeper claws compared to cows that only received a hoof trim in spring.

111
In contrast, routine hoof trimming should be avoided in sheep (Winter et al., 2015),
as trimming spreads the bacteria associated with the common infectious lesions
among sheep, resulting in higher lameness prevalence (Sullivan et al., 2014).
Additionally, providing sheep have the opportunity for sufficient exercise to
naturally wear their hooves, they can self-regulate hoof length and hoof trimming
is not beneficial (Smith et al., 2014). This highlights the need for species specific
hoof management and trimming protocols.
The frequency of trimming in adulthood is important in dairy cows, however the
timing of first trimming in early life (before first calving) also needs to be
considered. It is recommended that heifers should receive their first trim prior to
first calving (Hulsen, 2006; Cook, 2016). However, these claims are based on the
authors’ clinical experience and are not established from primary research.
Nevertheless, there is some research evidence that trimming in early life may
improve conformation and thus enable the hoof to better adapt to post calving
changes such as new time budgets and walking surfaces (Gomez et al., 2013). For
instance, trimming in early life reduced claw lesions during first lactation (Gomez
et al., 2013), while trimming as early as first insemination in dairy heifers reduces
claw disorders in later life (Kofler et al., 2011).
There are few data investigating the appropriate frequency of hoof trimming in
dairy goats. Due to the indoor housing of dairy goats hoof trimming should be a
priority (Ajuda et al., 2019), with hooves needing to be trimmed more frequently
than twice a year (Smith and Sherman, 2009). This is in agreement with
Christodoulopoulos (2009) who report that goats trimmed every 6 months suffered
from hoof overgrowth. Goats’ hooves may require trimming as often as every 6 to
8 weeks depending on the housing environment (Pugh and Baird, 2002).

112
Furthermore, there are no studies investigating timing of first trimming in dairy
goats. Therefore, the aims of this observational study were 1) to investigate if there
was a difference at first mating in the hoof conformation of goats that had been
trimmed compared with goats that had not yet been trimmed, and 2) to investigate
if hoof trimming before first kidding and subsequent hoof trimming regime
impacted hoof conformation at the end of second lactation.
Materials and Methods
This work was approved by the AgResearch Ltd, Ruakura Animal Ethics Committee
(#13478, approved 07/05/2015) as part of a 4-year dairy goat longevity study on 16
participating farms in the Waikato region of New Zealand (see Todd et al., 2019, for
farm information). The number of farms was the maximum number that could be
achieved through voluntary participation. The main variables of interest for the
longitudinal study were IgG level within 24 hours of life and liveweight gain of doe
kids. A power analysis could not be completed as there were no treatments to
compare, however a regression of the two variables of interest (IgG and liveweight
gain) was obtained. The analysis indicated 1200 animals (approx. 80 per farm)
would detect a significant relationship between these variables at the 10% level. Of
the total 1262 dairy goat kids enrolled at birth on the 16 participating commercial
dairy goat farms, only those that stayed in the herd until mating were included in the
present dataset (n = 1099 goats; mean ± SD: 64 ± 9 goats/farm).
Data were collected from farmers about the age at which they first trimmed their
goats’ hooves and the number of hoof trims per year thereafter. Farms were visited
at five assessment periods throughout the goats’ first two lactations for scheduled
weighing. Hoof photographs were taken as part of these visits. Data from
113
assessment 1 (First mating: 8.0 ± 0.70 months of age) (n = 1030 contributing goats,
16 farms) and assessment 5 (End 2nd lactation: 34.1 ± 0.90 month of age) (n = 627
contributing goats, 13 farms) were used to address the objectives of the present
study. Due to issues with hooves being too dirty, or the photographs being of
insufficient quality (e.g., blurry or too dark) not all goats could be scored.
Additionally, the number of goats contributing photographs decreased from
assessment 1 to assessment 5 due to culling and identification issues. At assessment
5, farm visits could not take place on two of the farms and one farm had withdrawn
from the study.
Each farm’s housing and husbandry management protocol was maintained
throughout the study, including their specific hoof management and trimming
regimes.
Hoof conformation assessment
Photographs of the left front and left hind hooves were taken using a digital camera
(Canon Powershot, SX530), while the goats stood on a horizontal level surface,
ensuring they were bearing weight evenly on all four limbs. For practicality and to
reduce handling of the goats, only the left hooves were assessed. Two photographs
were taken per hoof, one of the lateral aspect and one of the dorsal aspect. The
hooves were photographed against a whiteboard which had 2cm scale markers
along the vertical and horizontal edges.
The assessment included five subjective scores: 1) toe length, 2) heel shape, 3)
fetlock shape, 4) claw splay, and 5) claw shape (Table 1). Each subjective score
was made on a 3-point ordinal scale (0, 1, and 2), except for fetlock shape which
114
was scored on a binary scale (0 or 1), with a 0 being ‘normal’ in all cases. Two
objective measurements were also made: 1) toe length ratio (the toe length
compared to the length of the rest of the hoof and 2) claw splay distance (distance
between the axial edge of the distal tip of both claws (Chapter 2).
The scoring and measurements were completed in R 3.5.0 statistical software (R
Core Team, 2018) using methods described in Chapter 2.
Inter and intra observer reliability
The hoof photographs were scored by two trained observers. Inter and intra
reliability were determined using the methods described in Chapter 2.
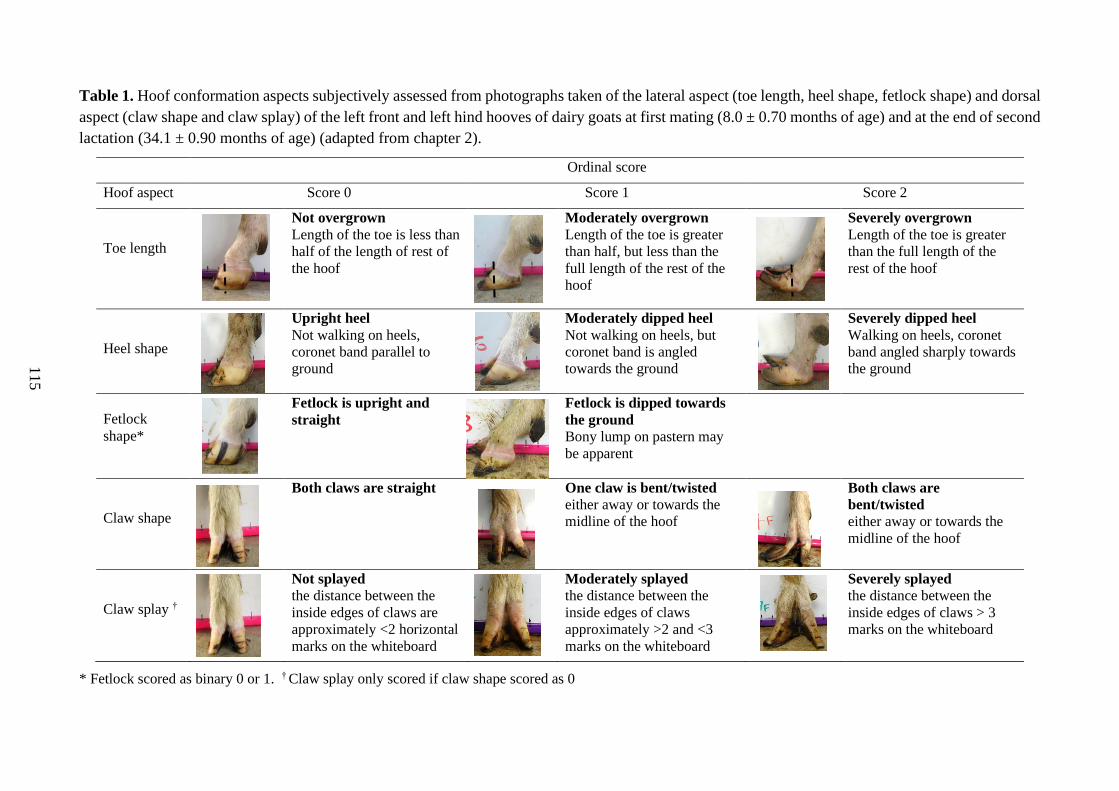
115
Table 1. Hoof conformation aspects subjectively assessed from photographs taken of the lateral aspect (toe length, heel shape, fetlock shape) and dorsal
aspect (claw shape and claw splay) of the left front and left hind hooves of dairy goats at first mating (8.0 ± 0.70 months of age) and at the end of second
lactation (34.1 ± 0.90 months of age) (adapted from chapter 2).
Ordinal score
Hoof aspect Score 0 Score 1 Score 2
Toe length
Not overgrown
Length of the toe is less than
half of the length of rest of
the hoof
Moderately overgrown
Length of the toe is greater
than half, but less than the
full length of the rest of the
hoof
Severely overgrown
Length of the toe is greater
than the full length of the
rest of the hoof
Heel shape
Upright heel
Not walking on heels,
coronet band parallel to
ground
Moderately dipped heel
Not walking on heels, but
coronet band is angled
towards the ground
Severely dipped heel
Walking on heels, coronet
band angled sharply towards
the ground
Fetlock
shape*
Fetlock is upright and
straight
Fetlock is dipped towards
the ground
Bony lump on pastern may
be apparent
Claw shape
Both claws are straight One claw is bent/twisted
either away or towards the
midline of the hoof
Both claws are
bent/twisted
either away or towards the
midline of the hoof
Claw splay †
Not splayed
the distance between the
inside edges of claws are
approximately <2 horizontal
marks on the whiteboard
Moderately splayed
the distance between the
inside edges of claws
approximately >2 and <3
marks on the whiteboard
Severely splayed
the distance between the
inside edges of claws > 3
marks on the whiteboard
* Fetlock scored as binary 0 or 1. † Claw splay only scored if claw shape scored as 0
116
Data handling and analysis
All data processing and statistical analysis were performed using R 3.5.0 statistical package (R
Core Team, 2018). A binary variable indicating poor conformation (overgrown toes, dipped
heels, misshaped claws and splayed claws) was formed for each of toe length, heel shape, claw
shape and claw splay, by reclassifying the scores into a binary system of good conformation
(score 0) vs poor conformation (score 1 and 2). Fetlock shape was not included in the analysis
because few dipped fetlocks (at first mating: 60 dipped fetlocks; end of second lactation: 34
dipped fetlocks) were observed. Toe length ratio and claw splay distance were treated as
continuous outcome variables. These variables were checked for outliers, ensuring all data
points fell within 3 times the interquartile range away from the first and third quartile.
Objective 1: Effect of trimming before first mating on hoof conformation
Farms were categorised into one of two groups based on farmer-reported trimming status at
assessment 1: 1) untrimmed before first mating (n = 13 farms, 822 goats), 2) trimmed before
first mating (n = 3 farms, 208 goats). Of the three farms that had trimmed before mating, one
farm trimmed at approximately 7 months of age and the other two farms trimmed at
approximately 8 months of age.
For toe length ratio and claw splay distance box plots were used to explore differences within
and between farms in the two different trimming groups. The LMER procedure was used to test
the effect of trimming before mating on toe length ratio and claw splay distance at assessment
1, with goat within farm as the experimental unit. Trimming group was included as fixed effect,
goat weight as a covariate, and farm as a random effect. Results are presented as mean and 95%
confidence intervals.

117
The GLMER procedure was used to test for an effect of trimming before mating on the odds of
a goat having poor conformation (overgrown toes, dipped heels, misshaped claws and splayed
claws) between the two trimming groups, with goat within farm as the experimental unit.
Trimming group was included as a fixed effect and farm as a random effect. An attempt was
made to include weight as a covariate, however as it was being largely explained by farm, the
models would not converge with weight included. A binomial distribution and logit link
function were applied to the models. The results are presented as odds ratio and 95% confidence
intervals.
In addition to the LMER and GLMER models the proportion of goats with poor conformation
were calculated for each farm and then averaged for each trimming group; proportions are
presented as overall mean and range (min – max).
Objective 2: Effect of trimming before first kidding and subsequent regime on hoof
conformation
For the data collected at assessment 5, the 13 remaining farms were categorised into one of
three different trimming regimes depending on whether they first trimmed before or after first
kidding (14.8 ± 0.86 months of age) and then by the number of trims performed per year
thereafter. The regimes were: 1) Trimmed before 1st kidding then ≥ 4 times per year thereafter
(n = 4 farms, 183 goats), 2) Trimmed before 1st kidding, then 2 to 3 times per year thereafter (n
= 6 farms, 287 goats), 3) Trimmed after 1st kidding, then 2 to 3 times per year thereafter (n = 3
farms, 157 goats).
For toe length ratio and claw splay distance box plots were used to explore differences within
and between the trimming regimes. The LMER procedure was used to test the effect of
trimming regime on toe length ratio and claw splay distance at assessment 5, with goat within
farm as the experimental unit. Trimming regime was included as fixed effect, goat weight as a

118
covariate, and farm as a random effect. Results are presented as mean and 95% confidence
intervals.
The GLMER procedure was used to test for an effect of trimming regime on the odds of a goat
having poor conformation (overgrown toes, dipped heels, misshaped claws and splayed claws)
between the three trimming regimes, with goat within farm as the experimental unit. Trimming
regime was included as a fixed effect and farm as a random effect. An attempt was made to
include weight as a covariate, however as it was being largely explained by farm, the models
would not converge with weight included. A binomial distribution and logit link function were
applied to the models. The results are presented as odds ratio and 95% confidence intervals.
Additionally, the proportion of goats with poor conformation was calculated for each farm and
then averaged for each of the three trimming regimes; proportions are presented as overall mean
and range (min – max).
Model assumptions
All LMER models were evaluated for assumptions of homoscedasticity and normality of
residuals. Homoscedasticity was assessed by visually examining a scatterplot of residuals
against predicted values. Normality was assessed using histogram and normal probability plots,
as well as checking the residuals for skewness and kurtosis. A log transformation was applied
to the toe length ratio and claw splay distance LMER models for both objectives to improve
homoscedasticity and to help normalize distribution of residuals. Results are presented as back-
transformed means and 95% confidence intervals.
Results
Objective 1: Effect of trimming before first mating on hoof conformation
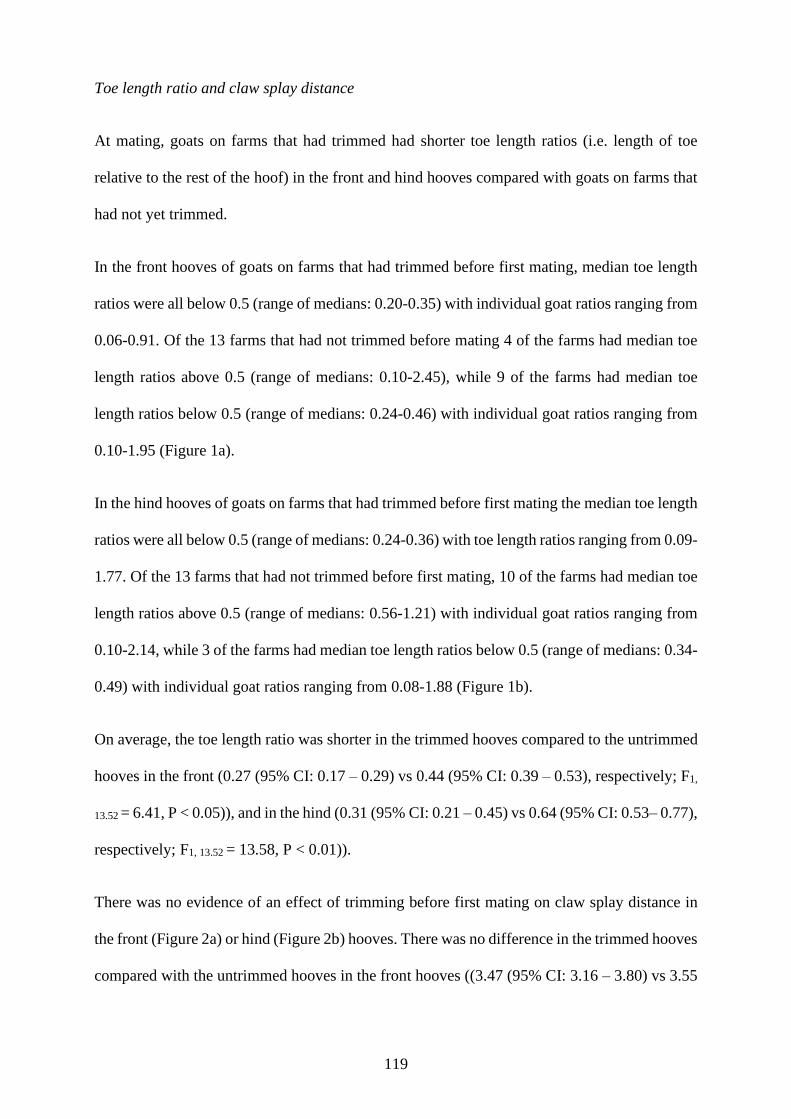
119
Toe length ratio and claw splay distance
At mating, goats on farms that had trimmed had shorter toe length ratios (i.e. length of toe
relative to the rest of the hoof) in the front and hind hooves compared with goats on farms that
had not yet trimmed.
In the front hooves of goats on farms that had trimmed before first mating, median toe length
ratios were all below 0.5 (range of medians: 0.20-0.35) with individual goat ratios ranging from
0.06-0.91. Of the 13 farms that had not trimmed before mating 4 of the farms had median toe
length ratios above 0.5 (range of medians: 0.10-2.45), while 9 of the farms had median toe
length ratios below 0.5 (range of medians: 0.24-0.46) with individual goat ratios ranging from
0.10-1.95 (Figure 1a).
In the hind hooves of goats on farms that had trimmed before first mating the median toe length
ratios were all below 0.5 (range of medians: 0.24-0.36) with toe length ratios ranging from 0.09-
1.77. Of the 13 farms that had not trimmed before first mating, 10 of the farms had median toe
length ratios above 0.5 (range of medians: 0.56-1.21) with individual goat ratios ranging from
0.10-2.14, while 3 of the farms had median toe length ratios below 0.5 (range of medians: 0.34-
0.49) with individual goat ratios ranging from 0.08-1.88 (Figure 1b).
On average, the toe length ratio was shorter in the trimmed hooves compared to the untrimmed
hooves in the front (0.27 (95% CI: 0.17 – 0.29) vs 0.44 (95% CI: 0.39 – 0.53), respectively; F1,
13.52 = 6.41, P < 0.05)), and in the hind (0.31 (95% CI: 0.21 – 0.45) vs 0.64 (95% CI: 0.53– 0.77),
respectively; F1, 13.52 = 13.58, P < 0.01)).
There was no evidence of an effect of trimming before first mating on claw splay distance in
the front (Figure 2a) or hind (Figure 2b) hooves. There was no difference in the trimmed hooves
compared with the untrimmed hooves in the front hooves ((3.47 (95% CI: 3.16 – 3.80) vs 3.55

120
(95% CI: 2.95 – 4.17), respectively; F1, 12.04 = 0.04, P = 0.85)) and hind hooves ((3.72 (95% CI:
3.24 – 4.37) vs 3.39 (95% CI: 2.69 – 4.27), respectively; F1, 11.95 = 0.49, P = 0.50)).
Figure 1. Box plots showing the 25th and 75th percentile (box), median (centre line), and
extreme values (whiskers) for toe length ratio of the (a) front hooves and (b) hind hooves at
assessment 1 of goats on farms that had been trimmed (Trimmed: n = 3 farms, 208 goats)
and goats on farms that had not yet been trimmed (Untrimmed: n = 13 farms, 822 goats).
Possible outliers (dots) had been checked to ensure they fell within 3 interquartile ranges
away from the first and third quartile.
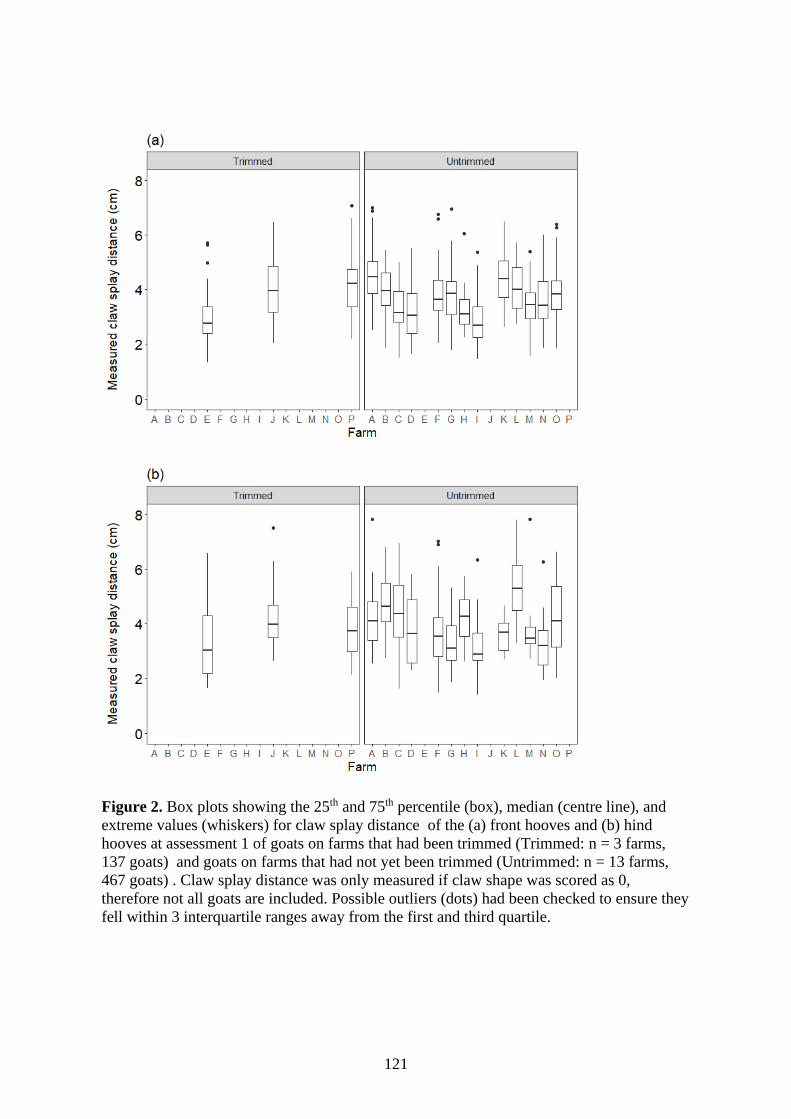
121
Figure 2. Box plots showing the 25th and 75th percentile (box), median (centre line), and
extreme values (whiskers) for claw splay distance of the (a) front hooves and (b) hind
hooves at assessment 1 of goats on farms that had been trimmed (Trimmed: n = 3 farms,
137 goats) and goats on farms that had not yet been trimmed (Untrimmed: n = 13 farms,
467 goats) . Claw splay distance was only measured if claw shape was scored as 0,
therefore not all goats are included. Possible outliers (dots) had been checked to ensure they
fell within 3 interquartile ranges away from the first and third quartile.

122
Toe length, heel shape, claw shape, claw splay
There were no differences in the odds of poor conformation in the front hooves of goats that
had not been trimmed before first mating compared to those that had been trimmed. The odds
of goats having overgrown hind hooves, dipped heels, and misshaped claws were greater by a
factor of 3.00, 8.94 and 1.69 respectively, when they had not been trimmed prior to first mating
(Table 2).
Table 2. The odds ratio (OR) and 95% confidence interval (CI) of goats’ hooves having poor
conformation (determined using a binary system comparing good vs poor conformation) on
farms that had not trimmed (n = 13 farms, 822 goats) compared with farms that had trimmed (n
= 3 farms, 208) before first mating (assessment 1).
OR (95% CI)
Front hooves
Overgrown 0.57 (0.25-1.28)
Dipped heels 0.39 (0.27-0.56)
Misshaped 0.64 (0.48-0.84)
Splayed 1.35 (0.98-1.86)
Hind hooves
Overgrown 3.00 (1.41-6.38)**
Dipped heels 8.94 (4.89-16.32)***
Misshaped 1.69 (1.08-2.65)*
Splayed 0.53 (0.33-0.85)
Significance level: * P < 0.05, ** P < 0.01, *** P < 0.001
The highest proportions of poor conformation were observed in the hind hooves of the goats
that had not been trimmed before first mating, with over 50% of hind hooves showing poor
conformation for all variables (Table 3).
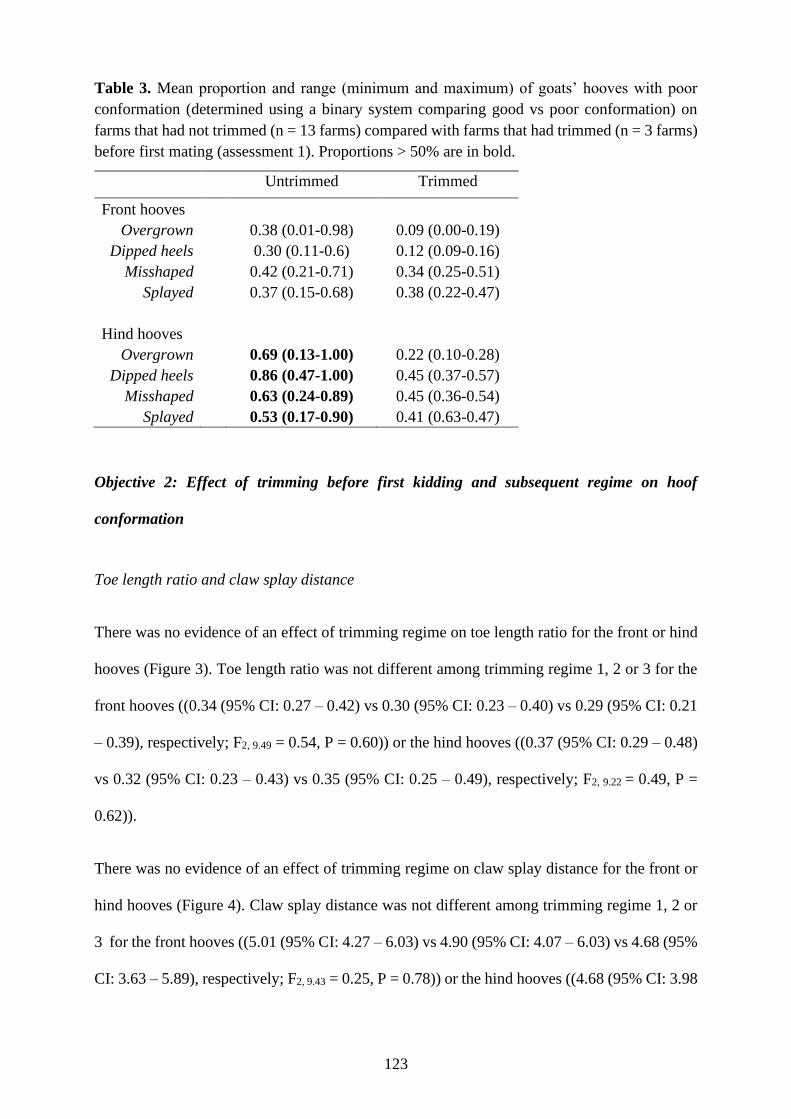
123
Table 3. Mean proportion and range (minimum and maximum) of goats’ hooves with poor
conformation (determined using a binary system comparing good vs poor conformation) on
farms that had not trimmed (n = 13 farms) compared with farms that had trimmed (n = 3 farms)
before first mating (assessment 1). Proportions > 50% are in bold.
Untrimmed Trimmed
Front hooves
Overgrown 0.38 (0.01-0.98) 0.09 (0.00-0.19)
Dipped heels 0.30 (0.11-0.6) 0.12 (0.09-0.16)
Misshaped 0.42 (0.21-0.71) 0.34 (0.25-0.51)
Splayed 0.37 (0.15-0.68) 0.38 (0.22-0.47)
Hind hooves
Overgrown 0.69 (0.13-1.00) 0.22 (0.10-0.28)
Dipped heels 0.86 (0.47-1.00) 0.45 (0.37-0.57)
Misshaped 0.63 (0.24-0.89) 0.45 (0.36-0.54)
Splayed 0.53 (0.17-0.90) 0.41 (0.63-0.47)
Objective 2: Effect of trimming before first kidding and subsequent regime on hoof
conformation
Toe length ratio and claw splay distance
There was no evidence of an effect of trimming regime on toe length ratio for the front or hind
hooves (Figure 3). Toe length ratio was not different among trimming regime 1, 2 or 3 for the
front hooves ((0.34 (95% CI: 0.27 – 0.42) vs 0.30 (95% CI: 0.23 – 0.40) vs 0.29 (95% CI: 0.21
– 0.39), respectively; F2, 9.49 = 0.54, P = 0.60)) or the hind hooves ((0.37 (95% CI: 0.29 – 0.48)
vs 0.32 (95% CI: 0.23 – 0.43) vs 0.35 (95% CI: 0.25 – 0.49), respectively; F2, 9.22 = 0.49, P =
0.62)).
There was no evidence of an effect of trimming regime on claw splay distance for the front or
hind hooves (Figure 4). Claw splay distance was not different among trimming regime 1, 2 or
3 for the front hooves ((5.01 (95% CI: 4.27 – 6.03) vs 4.90 (95% CI: 4.07 – 6.03) vs 4.68 (95%
CI: 3.63 – 5.89), respectively; F2, 9.43 = 0.25, P = 0.78)) or the hind hooves ((4.68 (95% CI: 3.98
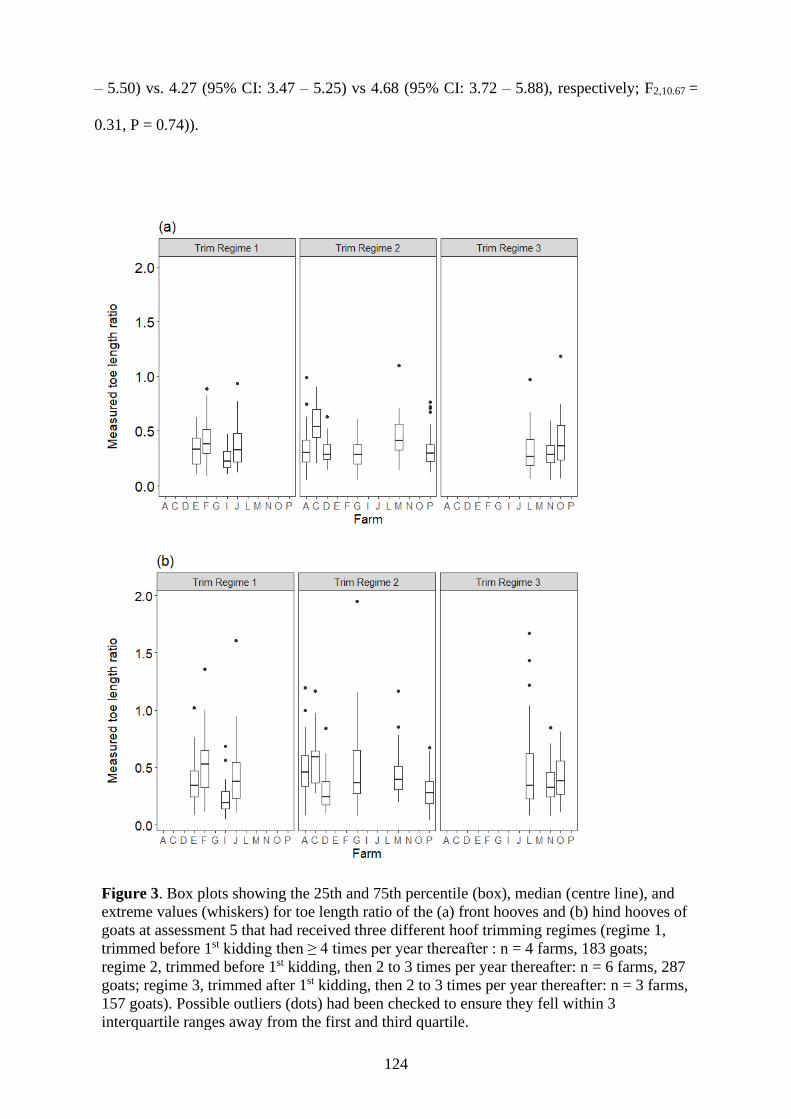
124
– 5.50) vs. 4.27 (95% CI: 3.47 – 5.25) vs 4.68 (95% CI: 3.72 – 5.88), respectively; F2,10.67 =
0.31, P = 0.74)).
Figure 3. Box plots showing the 25th and 75th percentile (box), median (centre line), and
extreme values (whiskers) for toe length ratio of the (a) front hooves and (b) hind hooves of
goats at assessment 5 that had received three different hoof trimming regimes (regime 1,
trimmed before 1st kidding then ≥ 4 times per year thereafter : n = 4 farms, 183 goats;
regime 2, trimmed before 1st kidding, then 2 to 3 times per year thereafter: n = 6 farms, 287
goats; regime 3, trimmed after 1st kidding, then 2 to 3 times per year thereafter: n = 3 farms,
157 goats). Possible outliers (dots) had been checked to ensure they fell within 3
interquartile ranges away from the first and third quartile.
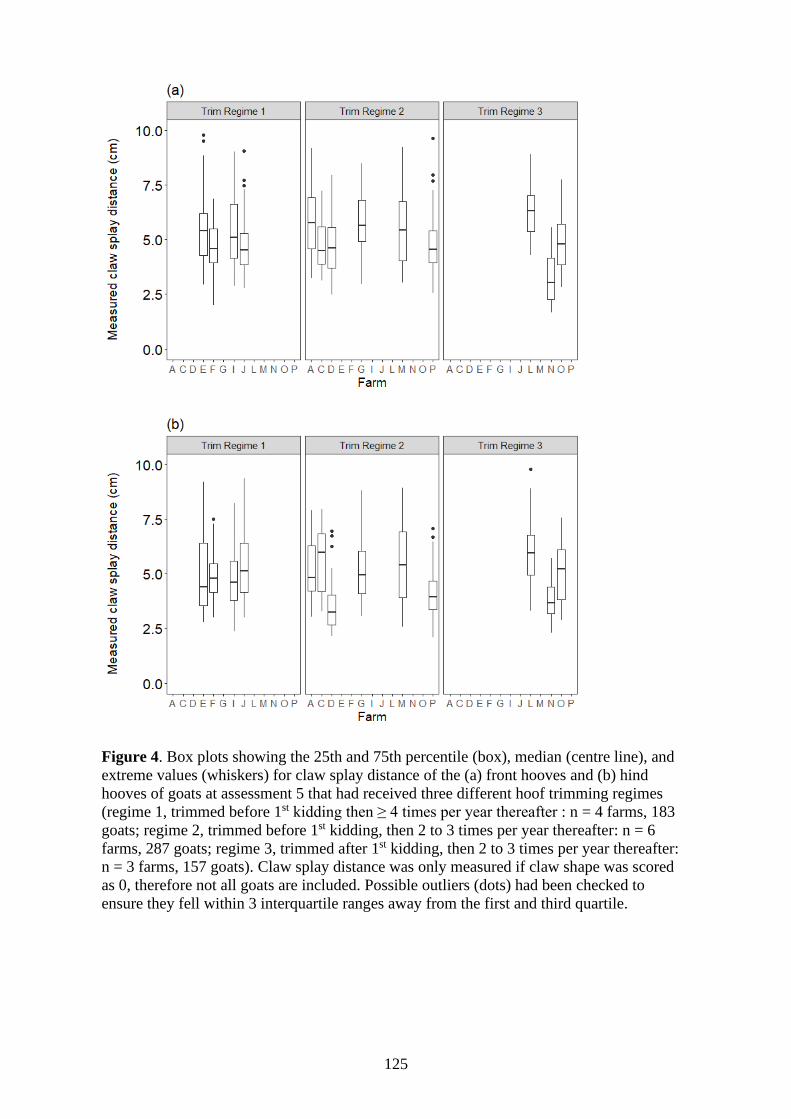
125
Figure 4. Box plots showing the 25th and 75th percentile (box), median (centre line), and
extreme values (whiskers) for claw splay distance of the (a) front hooves and (b) hind
hooves of goats at assessment 5 that had received three different hoof trimming regimes
(regime 1, trimmed before 1st kidding then ≥ 4 times per year thereafter : n = 4 farms, 183
goats; regime 2, trimmed before 1st kidding, then 2 to 3 times per year thereafter: n = 6
farms, 287 goats; regime 3, trimmed after 1st kidding, then 2 to 3 times per year thereafter:
n = 3 farms, 157 goats). Claw splay distance was only measured if claw shape was scored
as 0, therefore not all goats are included. Possible outliers (dots) had been checked to
ensure they fell within 3 interquartile ranges away from the first and third quartile.
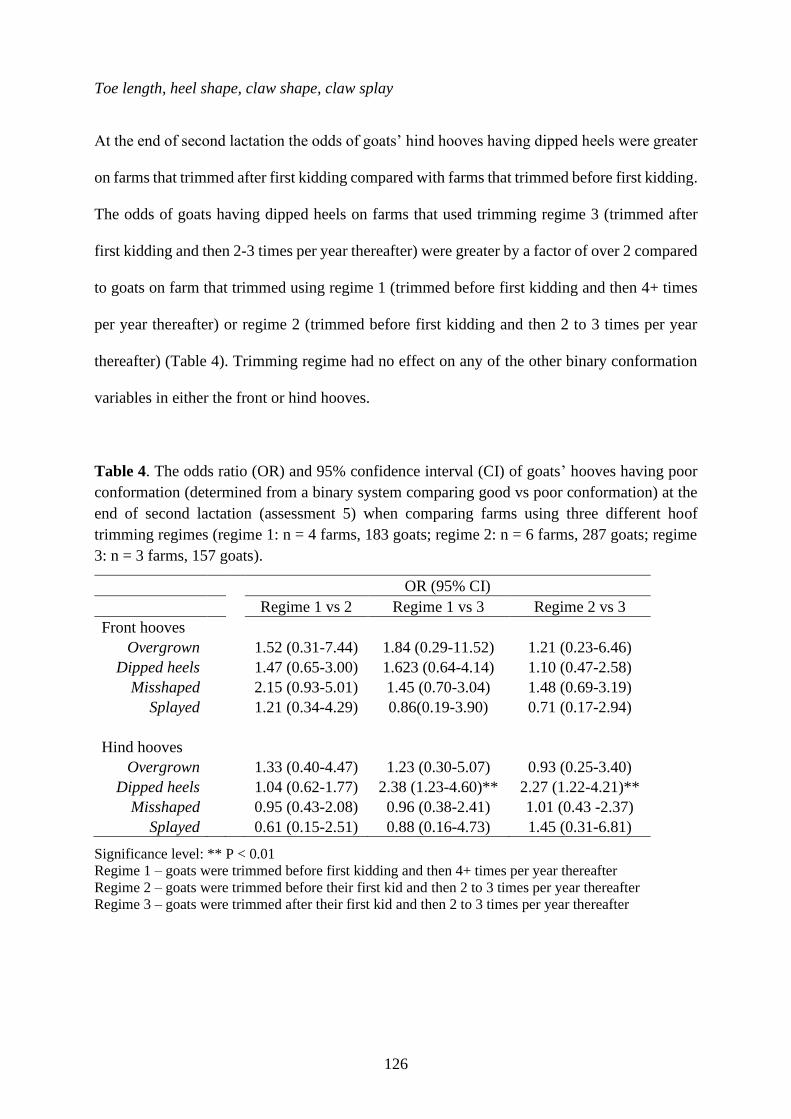
126
Toe length, heel shape, claw shape, claw splay
At the end of second lactation the odds of goats’ hind hooves having dipped heels were greater
on farms that trimmed after first kidding compared with farms that trimmed before first kidding.
The odds of goats having dipped heels on farms that used trimming regime 3 (trimmed after
first kidding and then 2-3 times per year thereafter) were greater by a factor of over 2 compared
to goats on farm that trimmed using regime 1 (trimmed before first kidding and then 4+ times
per year thereafter) or regime 2 (trimmed before first kidding and then 2 to 3 times per year
thereafter) (Table 4). Trimming regime had no effect on any of the other binary conformation
variables in either the front or hind hooves.
Table 4. The odds ratio (OR) and 95% confidence interval (CI) of goats’ hooves having poor
conformation (determined from a binary system comparing good vs poor conformation) at the
end of second lactation (assessment 5) when comparing farms using three different hoof
trimming regimes (regime 1: n = 4 farms, 183 goats; regime 2: n = 6 farms, 287 goats; regime
3: n = 3 farms, 157 goats).
OR (95% CI) Regime 1 vs 2 Regime 1 vs 3 Regime 2 vs 3
Front hooves
Overgrown 1.52 (0.31-7.44) 1.84 (0.29-11.52) 1.21 (0.23-6.46)
Dipped heels 1.47 (0.65-3.00) 1.623 (0.64-4.14) 1.10 (0.47-2.58)
Misshaped 2.15 (0.93-5.01) 1.45 (0.70-3.04) 1.48 (0.69-3.19)
Splayed 1.21 (0.34-4.29) 0.86(0.19-3.90) 0.71 (0.17-2.94)
Hind hooves
Overgrown 1.33 (0.40-4.47) 1.23 (0.30-5.07) 0.93 (0.25-3.40)
Dipped heels 1.04 (0.62-1.77) 2.38 (1.23-4.60)** 2.27 (1.22-4.21)**
Misshaped 0.95 (0.43-2.08) 0.96 (0.38-2.41) 1.01 (0.43 -2.37)
Splayed 0.61 (0.15-2.51) 0.88 (0.16-4.73) 1.45 (0.31-6.81)
Significance level: ** P < 0.01
Regime 1 – goats were trimmed before first kidding and then 4+ times per year thereafter
Regime 2 – goats were trimmed before their first kid and then 2 to 3 times per year thereafter
Regime 3 – goats were trimmed after their first kid and then 2 to 3 times per year thereafter

127
On average there was a high proportion of goats that had splayed claws on the front (≥ 70%)
and hind (≥ 68%) hooves at the end of second lactation irrespective of which hoof trimming
regime they had received. Additionally, there was a high proportion of goats with dipped hind
heels (≥ 66%) and over half of all goats had misshaped hind claws irrespective of trimming
regime (Table 5).
Table 5. Mean proportion and range (minimum and maximum) of goats’ hooves with poor
conformation (determined from a binary system comparing good vs poor conformation) at the
end of 2nd lactation (assessment 5) on farms using three different hoof trimming regimes
(regime 1: n = 4 farms, 183 goats; regime 2: n = 6 farms, 287; regime 3: n = 3 farms, 157 goats).
Proportions > 50% are in bold.
Trimming regime1 1 2 3
Front hooves
Overgrown 0.11 (0.09-0.25) 0.18 (0.02-0.55) 0.16 (0.01-0.25)
Dipped heels 0.18 (0.10-0.34) 0.23 (0.05-0.41) 0.27 (0.20-0.40)
Misshaped 0.26 (0.11-0.38) 0.35 (0.23-0.55) 0.42 (0.38-0.49)
Splayed 0.75 (0.66-0.97) 0.78 (0.60-0.95) 0.70 (0.40-0.97)
Hind hooves
Overgrown 0.25 (0.05-0.49) 0.30 (0.05-0.54) 0.27 (0.16-0.32)
Dipped heels 0.66 (0.59-0.76) 0.67 (0.56-0.82) 0.83 (0.75-0.90)
Misshaped 0.55 (0.32-0.73) 0.54 (0.35-0.65) 0.55 (0.46-0.72)
Splayed 0.78 (0.65-0.98) 0.68 (0.31-0.87) 0.75 (0.57-0.96)
1Regime 1 – goats were trimmed before first kidding and then 4+ times per year thereafter; Regime 2 –
goats were trimmed before their first kid and then 2 to 3 times per year thereafter; Regime 3 – goats
were trimmed after their first kid and then 2 to 3 times per year thereafter
Discussion
This was an observational study with the aim of investigating whether there were any
biologically relevant patterns in the hoof conformation of dairy goats on farms with different
hoof trimming management. At first mating, goats on farms that had not yet trimmed had
greater odds of poor hind hoof conformation compared with goats on farms that had already
trimmed. At the end of second lactation, goats on farms that had not trimmed before first
kidding had greater odds of dipped heels on the hind hooves compared to farms that had

128
trimmed before first kidding. The results indicate that trimming before mating offers some
temporary benefit for the hoof conformation of dairy goats, while trimming before first kidding
may offer some long-term benefits.
Trimming before first mating improved hind hoof conformation. The hind hooves of goats on
farms that had not yet trimmed had longer toe length ratios and an increased risk of hoof
overgrowth, dipped heels and misshaped claws. Hoof overgrowth is linked to hoof deformation
in dairy goats (Ajuda et al., 2019), therefore it is likely that the dipped heels and misshaped
claws in the hind hooves may have been caused by the observed overgrowth. For example, an
overgrown toe has a lever effect where the toe becomes rotated dorsally, and the heel depth is
reduced (cows: Blowey, 1992; Gitau et al., 1997; goats: Hill et al., 1997). This long toe-shallow
heel conformation increases the risk of lesions and lameness in dairy cows (Blowey, 1992;
Gitau et al., 1997), and may influence functional herd life. For instance, shorter hooves with
higher claw angles are associated with increased herd longevity (McDaniel, 1994), while low
hoof angles decrease herd longevity (Sewalem et al., 2005). Additionally, hoof overgrowth
increases the risk of hoof lesions such as sole ulcers (cows: Manske et al., 2002b). Preventing
hoof overgrowth is therefore imperative, with hoof trimming a priority in dairy goats (Ajuda et
al., 2019) to restore “normal” hoof shape and weight distribution between the claws (Pugh and
Baird, 2002).
It was not within the scope of this study to investigate if the observed conformation traits at
first mating were associated with an increased risk of lesions and lameness. However, the results
indicate that overgrowth is an issue particularly in the hind hooves for commercially housed
dairy goats as early as first mating (8.0 ± 0.70 months of age). Furthermore, proportions of
dipped hind heels and misshaped hind claws were high (between 0.37 and 0.57, and 0.36 and
0.54, respectively) even in goats that had their hooves trimmed before first mating. This may
be because commercially housed dairy goats have little opportunity to naturally wear their
129
hooves (Zobel et al., 2019) hence, trimming early in life may be required to prevent hoof
overgrowth and poor conformation. Indeed, the hooves of dairy heifers should be examined and
trimmed as early as 6 months of age, especially if they are confined on soft bedding offering
limited opportunities for exercise and hoof wear (Amstutz, 1985).
At first mating, goats on farms that had not trimmed had longer toe length ratios in the front
and hind hooves compared with goats on farms that had trimmed. This pattern was seen in the
hind hooves when assigned a binary score (overgrown or not), with goats on farms that had not
trimmed having greater odds of overgrown hooves. However, this pattern was not seen when
the front hooves were assigned a binary score (overgrown or not). The binary score considered
hooves as overgrown if the toe length was over half of the rest of the hoof. This would
correspond to a measured toe length ratio over 0.5. The average toe length ratio of the front
hooves of goats on farms that had not trimmed yet was still below 0.5 (0.44, 95% CI: 0.39 –
0.53), and therefore they would not be scored as overgrown. Hoof overgrowth is associated
with abnormal claw shape (Manske et al., 2002b), splayed claws (van Amstel and Shearer, 2006)
and reduced heel depth (Gitau et al., 1997). Therefore, as hoof overgrowth was not observed in
the front hooves, this may explain why there were no difference in the odds of dipped heels,
misshaped claws and splayed claw in goats on farms that had not trimmed before first mating
compared to goats on farms that had.
In chapter 5, I report similar growth rates in the front (4.39 ±0.04 mm/month) and hind hooves
(4.20 ±0.03 mm/month) of dairy goats. This is supported by evidence in cows (Tranter and
Morris, 1992) and sheep (Shelton et al., 2012) that report no difference in the growth rates of
the front and hind hooves. I did not measure hoof wear in chapter 5, and to my knowledge there
are no data evaluating the hoof wear of dairy goats. However, the rate of hoof wear may need
to be considered to explain the reduced hoof overgrowth observed in the front hooves at first
mating. In nonlactating animals, greater body weight is born by the front hooves compared to

130
the hind (sheep: Kim and Breur, 2008; cows: Atkins, 2009). The greater weight carried by the
front hooves may encourage greater wear (horses: Stachurska et al., 2008), resulting in less
overgrowth. However, no difference in wear has been reported between the front and hind
hooves of dairy cows (Tranter and Morris 1992). Therefore, I suggest work is required to
determine the rate of wear of the front and hind hooves in dairy goats.
The results from the assessment at the end of the second lactation demonstrated that hoof
trimming before first kidding may provide some longer term benefits on the conformation of
the hind hooves. The odds of goats’ hind hooves having dipped heels was higher on farms that
had not trimmed before first kidding. The shape of the heel is important as it is the first part of
the hoof that makes contact with the ground during locomotion, and its digital cushion is an
important shock absorber, at least in cows (Atkins, 2009). However, dipped heels have an
altered weight bearing surface, reducing the shock absorbing capacity of the digital cushion,
which may result in damage to the solar corium and an increased risk of sole ulcers (cows:
Blowey, 1992). Additionally, dipped heels are associated with stress on the suspensory
apparatus of the hoof (horses: Hinterhofer et al., 2000).
Not trimming hooves until after first kidding means that the heels may have been dipped, and
the suspensory apparatus under stress for a prolonged period. It is possible that the subsequent
hoof trimming may not be able to recover the heels to a more upright position. Indeed, it is
reported that for horses to recover from dipped heels, a long-term animal-specific hoof care
treatment is required including frequent trimming alterations to facilitate regrowth and
reorientation of the heels (Hunt, 2012). Farms that did not trim until after first kidding only
trimmed 2-3 times per year thereafter, which may not have been frequent enough to re-orientate
the heels to a more upright position by the end of second lactation.
Other factors may impact heel depth, for example, digital dermatitis reduces heel (cows: Laven,
2007; Gomez et al., 2015). Improper trimming may also result in low heel height in dairy cows

131
(Fjeldaas et al., 2006). In Chapter 5, I report lower heels angles in the hind hooves of dairy
goats, a finding supported by Shearer et al (2005) who suggest that the hind hooves of dairy
cows may naturally have a lower angle than the front hooves. However, as heel depth is a
predisposing factor of lameness (Phillips and Schofield, 1994) further work would need to
investigate if this conformation trait impacts the functionality (e.g. hoof lesions and lameness)
of goats’ hooves.
At the end of the second lactation high proportions of poor conformation particularly in the
hind hooves were observed across all three trimming regimes. The dipped heels and misshaped
claws are of particular concern as this conformation trait is frequently associated with hoof
lesions and lameness (cows: Blowey, 1992; Gitau et al., 1997). Additionally, high proportions
of splayed claws were observed in both the front and hind hooves irrespective of trimming
regime. Hooves that are adapted to softer surfaces are more splayed (Zuba, 2012) and therefore
claw splay may be determined by the environment, rather than hoof trimming regime. In dairy
heifers confinement and lack of exercise can cause splayed claws (Amstutz, 1985). Therefore,
providing goats with the opportunity to exercise, ideally on hard surfaces in early life may
reduce the high claw splay observed.
When considering the three regimes included in the present study, trimming prior to first
kidding had limited effects on hoof conformation, and the frequency of subsequent hoof
trimming had no effect. However, it should be noted that time since last hoof trim was not taken
into consideration. Of the 13 farms assessed at the end of second lactation, 9 trimmed between
2-3 times per year and 4 trimmed ≥ 4 times per year. Therefore, depending on when the
assessment was completed, the goat’s hooves could have potentially been trimmed within the
same week, or 6 months prior. Furthermore, there may be variation in the time since last trim
among farms within the same trimming regime. As time since last trim will influence the
amount of hoof overgrowth and therefore conformation, I suggest that this is considered when
132
interpreting the results. For example, goats on farms that had trimmed recently will have less
overgrowth and better conformation than goats on farms that trimmed 3 months ago.
There was high variability in hoof conformation among farms in the same trimming group at
assessment 1 (first mating) and among farms in the same trimming regime at assessment 2 (end
of second lactation). Additionally, the boxplots highlight high levels of variability within and
among farms for toe length ratio and claw splay distance at both assessments. The high
variability indicates that factors other than hoof trimming are impacting hoof conformation.
Due to the observational nature of the present study, my inability to access farm records to get
accurate information, and the small number of farms included, farm-level housing and
management factors could not be included in the statistical models. Additionally, weight was
the only goat related factor measured and included in the statistical models; age was not
included as all goats were of a similar age. Due to a number of the goats being Saanen cross,
establishing breed was not within the scope of this study. However, I acknowledge that factors
such as breed and milk production may have had an impact and it would be useful to include
such goat-level factors in future research investigating hoof conformation in dairy goats.
It is important to note that management factors may have more effect on hoof health than
trimming in dairy cows (Mahendran et al., 2017). For instance, Vermunt and Greenough (1996)
report that the ground surface is the main environmental factor affecting claw conformation
characteristics, with the abrasiveness of the flooring impacting both hoof wear and
conformation (Hahn et al., 1986; Telezhenko et al., 2009). In the present study, some of the
farms had access to a concrete strip in front of the feed rail, which may explain some of the
variability in hoof conformation. Nutritional factors may also impact hoof conformation as
higher protein diets are reported to increase hoof growth (Manson and Leaver, 1988).
Information on diet was not recorded in the present study, however the composition of diets fed
by dairy goat farmers in New Zealand differs among farms (Solis-Ramirez et al., 2011).

133
Furthermore, at the end of the second lactation, the goats were part of the milking herd and
factors such as the distance walked to the milking parlour (Tranter and Morris, 1992) and time
since parturition (Offer et al., 2000) may have impacted hoof conformation. Individual farm
factors would need to be taken into consideration in future studies.
It is worth noting that the current study is exploratory in nature and limitations of the study
discussed above should be considered when interpreting the results. In addition to the small
sample size of farms, it should be noted that farms were not randomly selected and therefore
may not be truly representative of the wider population of New Zealand goat farms. However,
the results do provide evidence of a relationship between hoof trimming and hoof conformation
in dairy goats that warrants further investigation.
Conclusion
This observational study provides preliminary evidence that trimming before first mating may
provide at least some temporary benefit for dairy goat hoof conformation. The odds of goats
having overgrown toes, dipped heels and misshaped claws on the hind hooves were lower on
the farms that had trimmed before first mating compared to farms that had not trimmed.
Additionally, trimming before first kidding reduced the odds of dipped heels in the hind hooves
at the end of second lactation. However, high levels of variability were observed within and
among farms at the second lactation assessment, and high proportions of hooves with poor
conformation particularly in the hind hooves were observed regardless of trimming regime.
This indicates that other animal and management factors may be strongly impacting the hoof
conformation of dairy goats and the results should be interpreted with caution.
References
Ajuda, I.G., Battini, M., Stilwell, G.T., 2019. The role of claw deformation and claw size on
goat lameness. Veterinary and Animal Science 8, 100080.

134
Ajuda, I.,G , Vieira, A., Stilwell, G.T., 2014. Are there differences in dairy goats claws'
temperature, before and after trimming?, 2014 IEEE International Symposium on
Medical Measurements and Applications (MeMeA), Lisbon, Portugal pp. 1-5.
Amstutz, H.E., 1985. Prevention and Control of Lameness in Dairy Cattle. Veterinary Clinics
of North America: Food Animal Practice 1, 25-38.
Anzuino, K., Bell, N.J., Bazeley, K.J., Nicol, C.J., 2010. Assessment of welfare on 24
commercial UK dairy goat farms based on direct observations. Veterinary Record 167,
774-780.
Atkins, G., 2009. The importance of genetic selection in dairy cows for reducing lameness and
improving longevity, Canadian Western Veterinary Conference, Banff, Canada, pp. 10-
20.
Battini, M., Vieira, A., Barbieri, S., Ajuda, I., Stilwell, G., Mattiello, S., 2014. Invited review:
Animal-based indicators for on-farm welfare assessment for dairy goats. Journal of
Dairy Science 97, 6625-6648.
Bergsten, C., 2001. Effects of conformation and management system on hoof and leg diseases
and lameness in dairy cows. Veterinary Clinics of North America: Food Animal Practice
17, 1-23.
Blowey, R., 1992. Diseases of the bovine digit: Part 2 Hoof care and factors influencing the
incidence of lameness. In Practice 14, 118-124.
Boettcher, P., Dekkers, J., Warnick, L., Wells, S., 1998. Genetic analysis of clinical lameness
in dairy cattle. Journal of Dairy Science 81, 1148-1156.
Bryan, M., Tacoma, H., Hoekstra, F., 2012. The effect of hindclaw height differential and
subsequent trimming on lameness in large dairy cattle herds in Canterbury, New
Zealand. New Zealand Veterinary Journal 60, 349-355.
Christodoulopoulos, G., 2009. Foot lameness in dairy goats. Research in Veterinary Science 86,
281-284.
Cook, N., 2016. A lesion oriented, life cycle approach to preventing lameness in dairy herds.,
World Buiatric Congress., Dublin, Ireland, pp. 51-51.
Fjeldaas, T., Sogstad, Å., Østerås, O., 2006. Claw trimming routines in relation to claw lesions,
claw shape and lameness in Norwegian dairy herds housed in tie stalls and free stalls.
Preventive Veterinary Medicine 73, 255-271.
Gitau, T., Mbiuki, S., McDermott, J., 1997. Assessment of bovine hoof conformation and its
association with lameness, animal factors and management practices on small-scale
dairy farms in Kiambu district, Kenya. The Onderstepoort Journal of Veterinary
Research 64, 135-140.
Gomez, A., Cook, N., Gaska, J., Dopfer, D., 2013. Should we trim heifers before calving?
American Association of Bovine Pracitioners Conference Proceedings, Milwaukee,
United States, pp226.
Gomez, A., Cook, N., Rieman, J., Dunbar, K., Cooley, K., Socha, M., Döpfer, D., 2015. The
effect of digital dermatitis on hoof conformation. Journal of Dairy Science 98, 927-936.
135
Häggman, J., Juga, J., 2013. Genetic parameters for hoof disorders and feet and leg
conformation traits in Finnish Holstein cows. Journal of Dairy Science 96, 3319-3325.
Hahn, M.V., McDaniel, B.T., Wilk, J.C., 1986. Rates of hoof growth and wear in holstein cattle.
Journal of Dairy Science 69, 2148-2156.
Hernandez, J.A., Garbarino, E.J., Shearer, J.K., Risco, C.A., Thatcher, W.W., 2007. Evaluation
of the efficacy of prophylactic hoof health examination and trimming during
midlactation in reducing the incidence of lameness during late lactation in dairy cows.
Journal of the American Veterinary Medical Association 230, 89-93.
Hill, N.P., Murphy, P.E., Nelson, A.J., Mouttotou, L.E., Green, L.E., Morgan, K.L., 1997.
Lameness and foot lesions in adult British dairy goats. Veterinary Record 141, 412-416.
Hinterhofer, C., Stanek, C., Haider, H., 2000. The effect of flat horseshoes, raised heels and
lowered heels on the biomechanics of the equine hoof assessed by finite element
analysis (FEA). Journal of Veterinary Medicine Series A 47, 73-82.
Hulsen, J., 2006. Hooves: A practical guide for hoof health, Roodbont.
Hunt, R.J., 2012. Farriery for the hoof with low or underrun heels. Veterinary Clinics: Equine
Practice 28, 351-364.
Kim, J., Breur, G.J., 2008. Temporospatial and kinetic characteristics of sheep walking on a
pressure sensing walkway. Canadian Journal of Veterinary Research 72, 50-55.
Kofler, J., Hangl, A., Pesenhofer, R., Landl, G., 2011. Evaluation of claw health in heifers in
seven dairy farms using a digital claw trimming protocol and claw data analysis system.
Berliner und Münchener Tierärztliche Wochenschrift 124, 10-19.
Laven, R.A., 2007. The relationship between hoof conformation and digital dermatitis in dairy
cattle. Cattle Practice 15, 93-95.
Mahendran, S., Huxley, J., Chang, Y.-M., Burnell, M., Barrett, D., Whay, H., Blackmore, T.,
Mason, C., Bell, N., 2017. Randomised controlled trial to evaluate the effect of foot
trimming before and after first calving on subsequent lameness episodes and
productivity in dairy heifers. The Veterinary Journal 220, 105-110.
Manske, T., Hultgren, J., Bergsten, C., 2002a. The effect of claw trimming on the hoof health
of Swedish dairy cattle. Preventive Veterinary Medicine 54, 113-129.
Manske, T., Hultgren, J., Bergsten, C., 2002b. Prevalence and interrelationships of hoof lesions
and lameness in Swedish dairy cows. Preventive Veterinary Medicine 54, 247-263.
Manson, F.J., Leaver, J.D., 1988. The influence of dietary protein intake and of hoof
trimming on lameness in dairy cattle. Animal Science 47, 191-199.
McDaniel, B., 1994. Feet and leg traits of dairy cattle, Proceedings of the 8th International
Symposium on Disorders of the Rominant Digit and International Conference on
Bovine Lameness, Banff, Canada, pp. 102-109.
Offer, J., McNulty, D., Logue, D., 2000. Observations of lameness, hoof conformation and
development of lesions in dairy cattle over four lactations. The Veterinary Record 147,
105-109.
136
Phillips, C.J.C., Schofield, S.A., 1994. The effect of cubicle and straw yard housing on the
behaviour, production and hoof health of dairy cows. Animal Welfare 3, 37-44.
Pugh, D.G., Baird, N.N., 2002. Sheep & Goat Medicine. 1st Edition ed. W. B. Saunders
Company, Philadelphia, US.
R Core TEAM., 2018. A Language and Environment for Statistical Computing; R Foundation
for Statistical Computing: Vienna, Austria.
Sewalem, A., Kistemaker, G.J., Van Doormaal, B.J., 2005. Relationship Between Type Traits
and Longevity in Canadian Jerseys and Ayrshires Using a Weibull Proportional Hazards
Model. Journal of Dairy Science 88, 1552-1560.
Shearer, J.K., van Amstel, S.R., 2001. Functional and corrective claw trimming. Veterinary
Clinics of North America: Food Animal Practice 17, 53-72.
Shearer, J.K., Van Amstel, S.R., Gonzalez, A., 2005. Manual of foot care in cattle. Hoard's
Dairyman Books, Fort Atkinson, Wisconsin.
Shelton, J., Usherwood, N.M., Wapenaar, W., Brennan, M.L., Green, L.E., 2012. Measurement
and error of hoof horn growth rate in sheep. The Journal of Agricultural Science, 150,
373-378.
Smith, E.M., Green, O.D.J., Calvo-Bado, L.A., Witcomb, L.A., Grogono-Thomas, R., Russell,
C.L., Brown, J.C., Medley, G.F., KilBride, A.L., Wellington, E.M.H., Green, L.E., 2014.
Dynamics and impact of footrot and climate on hoof horn length in 50 ewes from one
farm over a period of 10 months. The Veterinary Journal 201, 295-301.
Smith, M.C., Sherman, D.M., 2009. Goat medicine. John Wiley & Sons, Philadelphia, PA.
Solis-Ramirez, J., Lopez-Villalobos, N., Blair, H., 2011. Dairy goat production systems in
Waikato, New Zealand, Proceedings of the New Zealand Society of Animal Production,
Invercargil, New Zealand, pp. 86-91.
Stachurska, A., Kolstrung, R., Pieta, M., Silmanowicz, P., Klimorowska, A., 2008.
Differentiation between fore and hind hoof dimensions in the horse (Equus caballus).
Archives Animal Breeding 51, 531-540.
Sullivan, L.E., Blowey, R.W., Carter, S.D., Duncan, J.S., Grove-White, D.H., Page, P., Iveson,
T., Angell, J.W., Evans, N.J., 2014. Presence of digital dermatitis treponemes on cattle
and sheep hoof trimming equipment. Veterinary Record, 201-205.
Telezhenko, E., Bergsten, C., Magnusson, M., Nilsson, C., 2009. Effect of different flooring
systems on claw conformation of dairy cows. Journal of Dairy Science 92, 2625-2633.
Todd, C.G., Bruce, B., Deeming, L.E., Zobel, G., 2019. Survival of replacement kids from birth
to mating on commercial dairy goat farms. Journal of Dairy Science 10, 9382-9388.
Toussaint Raven, E., Halstra, R.T., Peterse, D.J., 1985. Cattle footcare and claw trimming.
Farming Press Ltd, Ipswich, UK.
Tranter, W., Morris, R., 1992. Hoof growth and wear in pasture-fed dairy cattle. New Zealand
Veterinary Journal 40, 89-96.
137
van Amstel, S.R., 2017. Corkscrew Claw. Veterinary Clinics: Food Animal Practice 33, 351-
364.
van Amstel, S.R., Shearer, J.K., 2006. Manual for treatment and control of lameness in cattle.
Blackwell Publishing Professional, Iowa, US.
Vermunt, J.J., Greenough, P.R., 1996. Sole haemorrhages in dairy heifers managed under
different underfoot and environmental conditions. British Veterinary Journal 152, 57-
73.
Winter, J.R., Kaler, J., Ferguson, E., KilBride, A.L., Green, L.E., 2015. Changes in prevalence
of, and risk factors for, lameness in random samples of English sheep flocks: 2004–
2013. Preventive Veterinary Medicine 122, 121-128.
Zobel, G., Neave, H.W., Webster, J., 2019. Understanding natural behavior to improve dairy
goat (Capra hircus) management systems. Translational Animal Science 3, 212-224.
Zuba, J.R., 2012. Hoof disorders in nondomestic artiodactylids, Fowler's Zoo and Wild Animal
Medicine, Elsevier Saunders, St. Louis, Missouri.

138
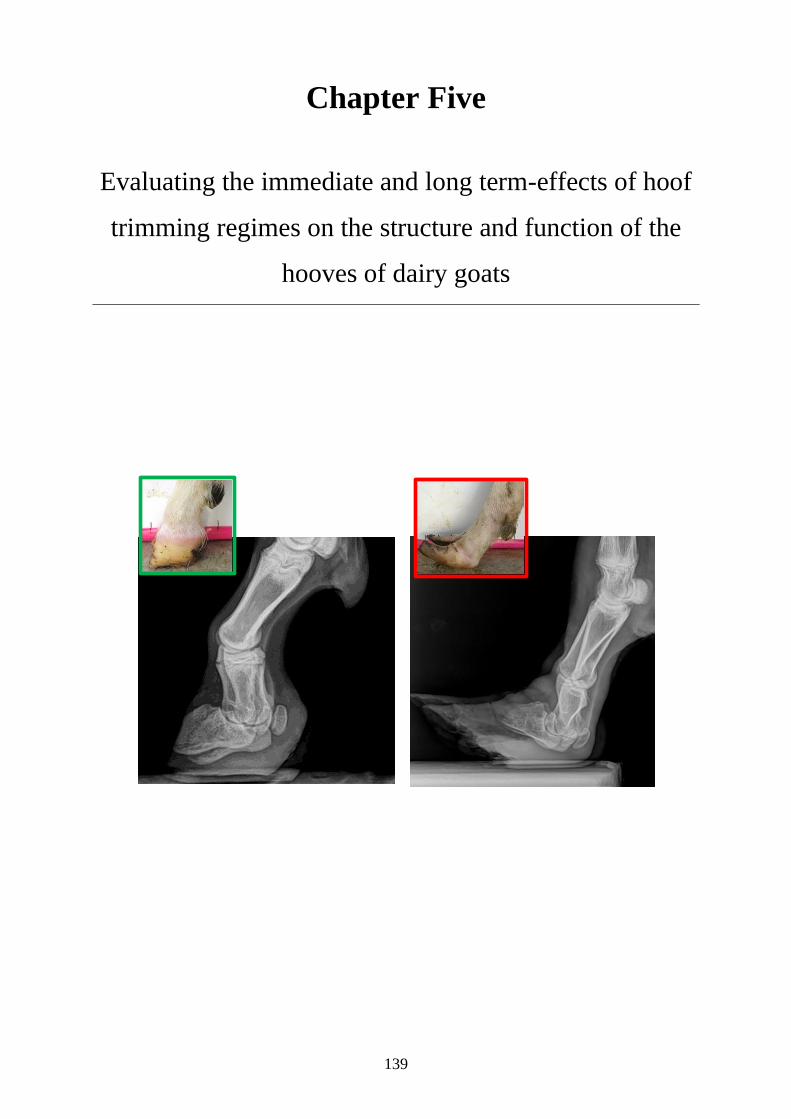
139
Chapter Five
Evaluating the immediate and long term-effects of hoof
trimming regimes on the structure and function of the
hooves of dairy goats

140
Abstract
Hoof overgrowth is associated with poor conformation and an increased risk of lameness.
Therefore, preventing hoof overgrowth through appropriate trimming regimes may have
immediate and long-term effects on the structure and function of dairy goats’ hooves. The
aims of this study were: 1) to evaluate the immediate effects of trimming on hoof
conformation, joint positions and lying behaviour in dairy goats, 2) to evaluate the long-term
effects of early life trimming regimes on conformation and joint positions, and 3) to
investigate the pattern of gait score and hoof growth across the first two years of life in
relation to trimming. Eighty female goats (approx. 5 months of age) from one New Zealand
farm were randomly allocated to one of two treatments: A) Early trimmed (trimmed at 5, 9,
13, 17, 21 and 25 months) or B) Late trimmed (13, 17, 21 and 25 months). Aspects of hoof
conformation and lying behaviour were assessed before and after trimming at 13, 17, 21-
and 25-months. Joint positions in the distal limbs were determined from radiographs taken
before and after trimming at 13- and 25-months. Pre-trimming gait scores were completed
at each assessment, while hoof growth was evaluated every 12 weeks from 9 months of age.
Immediate effects of trimming were observed, with aspects of hoof conformation and joint
positions being restored to a more anatomically correct state. The percentage of goats with
overgrown toes decreased following trimming in the front and hind hooves at all four
assessments (P <0.001). In the hind hooves, fewer goats had dipped heels (P <0.001) and
misshaped claws (P <0.05) after trimming at all assessments. Joint positions were altered
following trimming in the front and hind hooves. Proximal interphalangeal joint (PIPJ) angle
increased (P <0.001), distal interphalangeal (DIPJ) angle decreased (P <0.001), distal
interphalangeal joint height (JH) decreased (P <0.001), while heel angle (HA) increased (P
<0.001). At three out of four assessments, there was an increase in lying time on the day
after trimming compared to the day before in both treatment groups (P <0.05).

141
There were only minor long-term effects of early life trimming regimes, however these were
not consistent across assessments. For instance, goats in the late trimmed treatment had
greater HA in the hind hooves compared to the early trimmed treatment at the 13-month
assessment (P <0.01), however this effect was not observed at the 25-month assessment.
There was no effect of treatment on the prevalence of impaired gait (uneven gait or clinical
lameness), however prevalence changed over the two-year study period (range: 13.6-47.5%).
Compared to the 9-month assessment, the odds of a goat having an impaired gait were greater
at the two assessments following kidding (Odds ratio, 95% CI: 13 months: 2.15, 1.02 - 4.54,
P <0.05; 25 months: 3.79, 1.90 - 7.57, P <0.001), suggesting a parturition effect. Additionally,
hoof growth slowed in the front and hind hooves between 19 and 22 months of age when the
goats were in kid.
High proportions of poor conformation were observed before trimming at all assessments
(e.g. 55-97% overgrown hooves, 85-98% dipped heels, on hind hooves). Prevalence of an
impaired gait was low across the two-year study period. Trimming immediately improved
many aspects of conformation and joint angles, but caused a transient increase in lying
behaviour. There were minor and inconsistent longer-term effects of early trimming on
conformation and, joint positions. As poor conformation was observed in both the early and
late trimmed treatments, it suggests the subsequent hoof trimming (3 times per year) was not
frequent enough to prevent overgrowth. Dairy goat hoof trimming protocols should include
consideration of the timing of first hoof trimming and subsequent trimming frequency.
Introduction
Ruminant hooves are constantly growing. Consequently if the rate of hoof growth exceeds
the rate of wear, hooves become overgrown (Vermunt and Greenough, 1995). It is important
that prolonged periods of hoof overgrowth are prevented due to the association with changes

142
in hoof conformation (Baggott, 1982) and increased risk of hoof lesions and lameness (Hill
et al., 1997). However, it is reported in a number of ruminant species that if the housing
environment does not provide opportunity for natural wear, then hoof overgrowth can
become a health and welfare issue (chamois: Wiesner, 1985; sheep: Bokko et al., 2003; goats:
Anzuino et al., 2010). Dairy goats are commonly permanently indoor housed, and bedded
on straw (UK: Anzuino et al., 2010) or wood shavings (New Zealand: Solis-Ramirez et al.,
2011), therefore a high prevalence of hoof overgrowth is common (84 - 100%: Hill et al.,
1997; 79%: Anzuino et al., 2010).
The aims of hoof trimming are to improve conformation, restore the hoof to an anatomically
correct shape by removing hoof overgrowth (Phillips et al., 2000; Shearer and van Amstel,
2001) and promote symmetry and weight bearing between the claws (Bryan et al., 2012). In
dairy cows, overgrown hooves are associated with longer toe length, decreased heel depth
( Glicken and Kendrick, 1977; Gitau et al., 1997), misshaped claws ( Manske et al., 2002b)
and splayed claws (van Amstel and Shearer, 2006); these changes in conformation may
cause biomechanical stress on the hoof, altering the weight bearing surface and increasing
the risk of hoof lesions and lameness (Manske et al., 2002b; van Amstel and Shearer, 2006).
Similarly, in dairy goats, overgrowth and the resulting claw deformation negatively impact
overall hoof conformation (Ajuda et al., 2014, Ajuda et al., 2019). For instance, chronic
overgrowth in dairy goats results in a slippered hoof where the toe curls up and the weight
bearing surface transfers to the heel (Hill et al., 1997). Frequent hoof trimming is important
to maintain claw shape, and to promote shorter and steeper claws (cows: Manske et al.,
2002a), and should be considered a priority in dairy goats (Ajuda et al., 2019) .
Changes in hoof conformation commonly caused by hoof overgrowth may result in
significant changes to joint angles and positions (horses: Moleman et al., 2006). The external
conformation of the hoof can be assessed from the exterior using subjective (sows: de Sevilla

143
et al., 2008; sheep: Kaler et al., 2010) or objective methods (cows: Vermunt and Greenough,
1995; Somers et al., 2005). However, assessing the external conformation of the hoof is not
sufficient to evaluate how the position and angles of the bones within the hoof are being
impacted. Radiographic images are required to objectively determine the height and angles
of joints within the distal limb and to determine the effects of hoof trimming on these
measurements (Kummer et al., 2006). Radiographic images are a common diagnostic tool to
help determine the impact of bone and joint positions on lameness and conformation issues
in horses (Colles, 1983). However, radiographs are less commonly used in dairy animals as
veterinarians not often involved in lameness diagnosis and treatment (Tranter and Morris,
1991; Vermunt, 2004), likely due to the high cost relative to the value of the animal. The
impact of hoof trimming on the external conformation or the internal position of the joints
within the distal limb of dairy goats has yet to be investigated.
The immediate effects of hoof trimming are associated with improved conformation and
joint angles (horses: Kummer et al., 2006). However, the process of hoof trimming is also
associated with immediate behavioural effects in dairy cows, such as a change in activity
(Van Hertem et al., 2014) and lying behaviour (Chapinal et al., 2010b). For example,
following hoof trimming by two trained trimmers the activity of dairy cows was significantly
reduced the day after, returning to baseline levels by one week after trimming (Van Hertem
et al., 2014). While this work does not elucidate whether behavioural disturbance occurred
due to the trimming itself or because of the related animal handling, it does highlight that
trimming has the potential to impact more than just the external and internal structures and
function (i.e. lameness) of the hoof.
Early life hoof management may be of particular importance as the hooves of young
ruminants grow faster when compared to those of older animals (cows: Tranter and Morris,
1992; sheep: Dekker et al., 2005). It is reported that high numbers of dairy heifers become

144
lame early in their first lactation (Webster, 2002) and that animals that have previously been
lame are more likely to go lame in the future (Hirst et al., 2002; Randall et al., 2015). As
management failures such as inadequate hoof care are associated with claw lesions and
lameness in heifers, early life trimming is suggested to reduce the initial lameness risk (Bell
et al., 2009).
Hoof trimming of heifers prior to first calving is recommended (Bell et al., 2009; Cook,
2016). Trimming prior to first calving may improve the hoof conformation of heifers and
thus enable the hoof to better adapt to post calving changes such as new time budgets and
walking surfaces (Gomez et al., 2013). However, caution should be exercised when
considering these recommendations as they are not based on primary research or peer
reviewed studies. Indeed, Mahendran et al., (2017) found no beneficial effect of hoof
trimming heifers pre-calving on lameness prevalence. However, this study focused solely on
lameness as an outcome and did not consider conformation benefits. Furthermore, this study
was based on a farm with high hoof wear and over-trimming of already thin soles may have
resulted in some of the observed lameness.
Dairy goat farmers in New Zealand commonly begin hoof trimming between first mating
(approx. 8 months of age) and first kidding (approx. 13 months of age). Of 16 farms surveyed,
4 delayed trimming until after first kidding (see chapter 4 for more details). It is unknown
whether there are long-term implications of delaying trimming until after first kidding in
goats. Therefore the aims of this study were to 1) to evaluate the immediate effects of hoof
trimming, 2) to evaluate the long-term effects of an earlier start to hoof trimming , and 3) to
investigate the pattern of gait score and hoof growth across the first two years of life in
relation to trimming.

145
Materials and methods
Study design
A randomised controlled trial was designed to evaluate the immediate and long-term effects
of two different hoof trimming practices on hoof growth, hoof conformation, joint positions
and the behaviour of dairy goats. Based on a primary outcome measure (joint angle changes
between trimming events), a power calculation suggested that treatment group sizes of 20
would detect a difference in joint angles between trimming practices (power value of 0.9, P
= 0.05). The study was positively controlled (i.e., no animals were left untreated) and
approved by AgResearch Ltd, Ruakura Animal Ethics Committee (#13686, approved
17/12/2015).
Primary objective
The primary objective was to evaluate the immediate impacts of hoof trimming using hoof
conformation, joint positions and lying behaviour as outcome measures. The primary null
hypothesis was that trimming would not affect these outcome measures.
Secondary objectives
The secondary objectives were twofold: 1) to evaluate the long-term effects of starting hoof
trimming earlier in life (5 months of age) using hoof conformation and joint positions as
outcomes measures. 2) to investigate patterns of the outcome measures gait score and hoof
growth in relation to trimming across the first two years of life. The secondary null
hypotheses were that trimming in early life would not affect hoof conformation and joint
positions, and that hoof trimming would not impact gait score or hoof growth.

146
Animals and Housing
In December 2015, 80 female goats of approximately 5 months of age from one commercial
dairy goat farm in the Waikato region of New Zealand were enrolled in the study. The 80
goats were randomly selected from a potential of 109 animals available to use. This was
completed prior to the researchers visiting the farm and having any interactions with the
goats. The farm had approximately 700 Saanen cross milking does. The herd was maintained
indoors in four separate groups and bedded on wood shavings, with a concrete strip in front
of the feed rail. The milking parlour was attached to the housing barn; therefore, the goats
walked a short distance (< 50m) on a concrete surface twice a day to be milked.
The enrolled goats were randomly assigned to one of two trimming treatments with 40 goats
per treatment: A) Early trimmed: beginning at 5 months of age, hooves were trimmed every
4 months thereafter, and B) Late trimmed: beginning at 13 months of age, hooves were
trimmed every 4 months thereafter. Due to the nature of the intervention the operators were
not blind to the treatment administered. Goats in both treatments were monitored until 25
months of age. Housing and husbandry management was maintained as per the farm’s
standard protocol. Goats were first mated at approximately 8 months of age and first kidded
at approximately 13 months of age, at which point they entered the milking herd. Goats were
dried off at approximately 21 months of age and had their second kidding at 25 months.
Hoof trimming
A veterinarian experienced in hoof trimming of goats completed all trimming. Each hoof
was lifted and trimmed according to the technique described by Pugh and Baird (2012). Any
dirt that had become packed into the toe was removed to determine the amount of overgrowth
to be removed and the hoof wall was trimmed parallel to the coronary band. As the outer
147
wall is a weight bearing surface, it was left slightly longer than the inner hoof wall. If the toe
was starting to curl upwards due to overgrowth, the solar surface was carefully trimmed to
keep it level, rather than “dubbing” or shortening the toe. The rubbery heel was trimmed if
it was excessively long or overgrown. At the assessments at 13 and 25 months of age,
trimming was completed following kidding.
Data collection
Goats were weighed at each of the 6 assessments prior to trimming and any of the other
measures being completed. Hoof conformation, joint positions and hoof growth of the left
front and left hind hooves were assessed at various time points (Table 1). Radiographs were
taken on a subset of animals (20 goats per treatment, randomly selected at the beginning of
the study). For practicality and to reduce handling of the goats, only the left hooves were
assessed. In addition to the variables detailed in Table 1, hoof growth was measured.

148
Table 1. Details of each trimming treatment and the measurements that were completed at each of the six assessments.
Assessment Trimming treatment Measurements n*
Age
(months)
Early
Trimmed
Late
Trimmed
Radiographs Hoof photographs Gait scores Lying behaviour Weight
1 5 ✓ Pre-trim Pre-trim 80
2 9 ✓ Pre-trim Pre-trim 78
3 13 ✓ ✓ Pre and post trim Pre and post trim Pre-trim Pre and post trim Pre-trim 67
4 17 ✓ ✓ Pre and post trim Pre-trim Pre and post trim Pre-trim 66
5 21 ✓ ✓ Pre and post trim Pre-trim Pre and post trim Pre-trim 63
6 25 ✓ ✓ Pre and post trim Pre and post trim Pre-trim Pre and post trim Pre-trim 61
* Numbers declined due to goats being removed from the herd for health and production reasons
149
Hoof conformation
A digital camera (Canon Powershot, SX530) was used to take photographs of the
hooves immediately prior to and one day following hoof trimming. Photographs of
the left front and left hind hooves were taken while the goats were standing in a
holding pen of the milking parlour on a flat concrete surface, ensuring they were
bearing weight evenly on all four limbs. Two photographs per hoof were take: 1)
lateral aspect, and 2) dorsal aspect. The hooves were photographed against a
whiteboard which had 2cm scale markers along the vertical and horizontal edges.
The assessment included five subjective scores: 1) toe length, 2) heel shape, 3)
fetlock shape, 4) claw splay, and 5) claw shape (see Table 1 from Chapter 4). Each
subjective score was made on a 3-point ordinal scale (0, 1, and 2), except for fetlock
shape which was scored on a binary scale (0 or 1), with a 0 being ‘normal’ in all
cases. Two objective measurements were also made: 1) toe length ratio (the toe
length compared with the length of the rest of the hoof, and 2) claw splay distance
(distance between the axial edge of the distal tip of both claws (see Figure 1,
Chapter 2 for methods to calculate objective measures).
The subjective scoring and objective measurements were completed in R 3.5.0
statistical software (R Core Team 2018), using methods previously described in
Chapter 2. The R code enabled a distance calibration to be completed using the
scale bar marker on the whiteboard in the photographs. This allowed for distances
between selected points on the hooves to be calculated and the objective
measurements determined (see Chapter 2 for full description).
150
Two observers scored the photographs. High inter-reliability and intra-reliability
levels were achieved prior to scoring of the hoof photos and confirmed following
completion of the sets of photos from each assessment. For the subjectively scored
aspects of hoof conformation, weighted kappa (Kw) statistics were used to measure
agreement, ensuring Kw ≥ 0.8 (almost perfect agreement; Dohoo et al., 2003) was
achieved. For the objectively measured aspects of hoof conformation, a Lin’s
Concordance Correlation Coefficient (CCC) was calculated ensuring CCC ≥ 0.8
(high level of agreement, Altman, 1990).
Radiograph measurements – joint positions
All radiographs were taken by an equine veterinarian immediately prior to, and one
day after hoof trimming at the 13-month assessment and again at the 25-month
assessment. A wooden platform was used to ensure that goats were in a square
standing position, with their heads straight and forward. Standardised radiographs
of the left front and left hind distal limb in a lateromedial direction including the
proximal phalanx (P1), the middle phalanx (P2) and the distal phalanx (P3) were
taken, with the x-ray beam aimed through the fetlock.
The digital radiographs were analysed using eFilm 3.3.0 software (Merge
Healthcare, Heartland, WI) to determine internal joint positions of the distal part of
the lateral claw. The following parameters of the lateral claw were determined: 1)
proximal interphalangeal joint (PIPJ) angle 2) distal interphalangeal joint (DIPJ)
angle, 3) distal interphalangeal joint height (JH), 4) heel angle (HA). These were
adapted from methods previously used in the analysis of equine hoof radiographs
(DIPJ and PIPJ angle: Kroekenstoel et al., 2006; JH: Kummer et al., 2006; heel
angle: Drumond et al., 2016). Firstly, centres of rotation of the PIPJ and DIPJ were

151
determined. This was achieved by placing a circle on the end of the P1 and P2 bone,
ensuring the circle passed through the most palmar and dorsal aspects of the bone
(Kroekenstoel et al., 2006). The centre of rotation was determined as the central
point of the drawn circle. The parameters were then determined as follows:
PIPJ angle: A line was drawn through the middle of the P1 bone passing through
the centre of rotation of P1. A line was drawn linking the centre of rotation of the
P1 and P2 bone and the angle of the intersecting lines calculated (Figure 1a).
DIPJ angle: A 180o vertical reference line was drawn through the centre of rotation
of the P2 bone. A line was then drawn from the tip of the toe through the reference
line at the centre rotation of the P2 bone and the angle of the intersecting lines
calculated (Figure 1b).
JH: The distance from the bottom of the hoof to the lowest point on the circle of
the P2 bone was measured (Figure 1c).
HA: A horizontal line was placed at the bottom of the hoof; a line was then drawn
following the following shape of heel and the angle of the intersecting lines
calculated (Figure 1d).
All radiograph analysis was completed by one observer. Intra-reliability was
assessed prior to analysis commencing, using a random selection of approximately
15% (n = 43 radiographs) of the radiographs ensuring CCC ≥ 0.8 (high level of
agreement, Altman, 1991) was achieved. To ensure on-going reliability CCC was
assessed again halfway through analysis using a random subset of approximately
12% (n = 34 radiographs) of the radiographs.
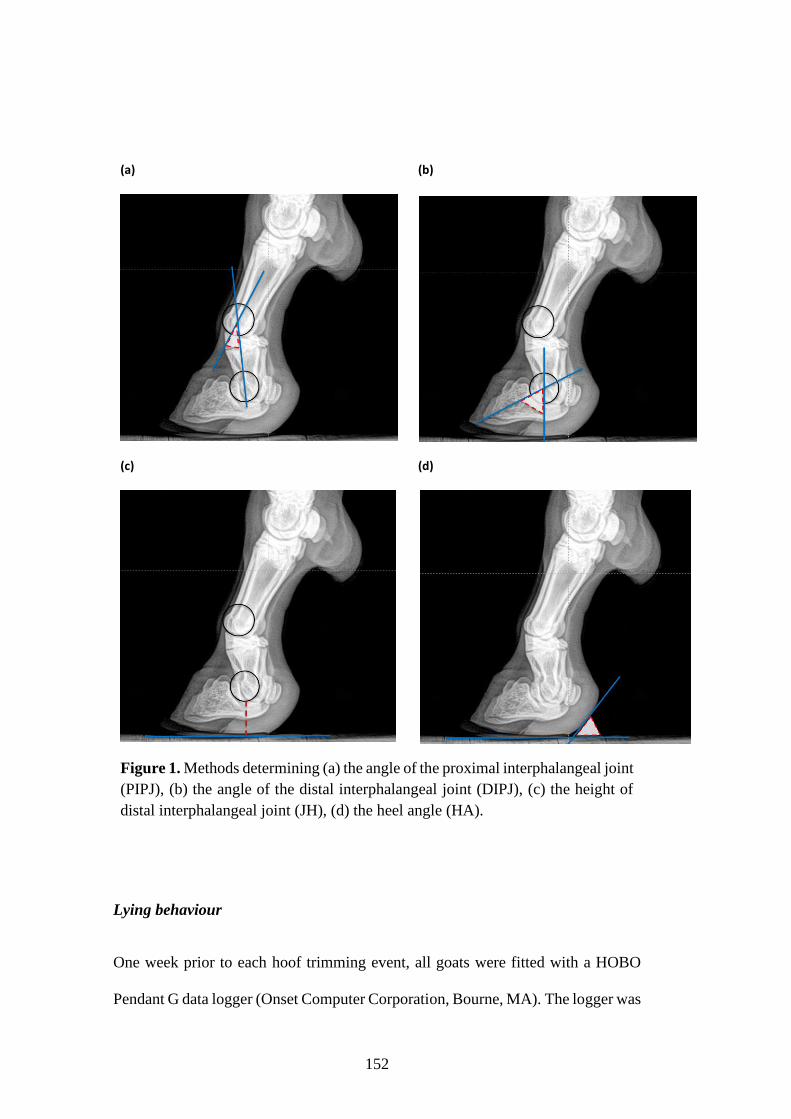
152
(a)
(b)
(c)
(d)
Figure 1. Methods determining (a) the angle of the proximal interphalangeal joint
(PIPJ), (b) the angle of the distal interphalangeal joint (DIPJ), (c) the height of
distal interphalangeal joint (JH), (d) the heel angle (HA).
Lying behaviour
One week prior to each hoof trimming event, all goats were fitted with a HOBO
Pendant G data logger (Onset Computer Corporation, Bourne, MA). The logger was
153
placed into a durable padded fabric pouch and attached to the left hind leg above
the metatarsophalangeal joint using a velcro strap. Loggers were set to record x and
z-axis at 1-minute intervals. The loggers were removed approximately 8 days
following hoof trimming, ensuring 7 full days of post trimming data were recorded.
The HOBO data were downloaded using Onset HOBOware Pro software (Onset
Computer Corporation, version 3.4.1). Data were summarised in SAS 9.2 (SAS
Institute Inc., Cary, NC) following the methodology described in Zobel et al. (2015)
for use in dairy goats. The summarised data were used to calculate total daily lying
time and number of lying bouts per day for each goat.
Gait score
Gait scoring was completed one week prior to hoof trimming at each of the six
assessments. Scoring was completed following morning milking, to reduce any
effect of milk fill and udder distention on gait. Goats were video recorded (HC-
V270, Panasonic Camcorder, Osaka, Japan) walking along a concrete raceway from
the milking parlour back to towards their pens. The video camera was set up on a
tripod to allow an area of approximately 4.5m of the walkway to be in view. This
allowed at least 4 full strides of walk to be recorded. Each of the videos were
watched separately by two trained observers and gait scores assigned using a 5-
point gait scoring system (Numerical Ranking Scale; where 1 = normal gait, 2 =
uneven gait, 3 = mildly lame, 4 = moderately lame, 5= severely lame (for full
description of gait scoring system used see Chapter 3). Inter-observer and intra-
observer reliability was determined following the completion of each assessment to
ensure Kw ≥ 0.80 (almost perfect agreement; Dohoo et al., 2003). As both observers
scored every goat, all data from each assessment was included in the reliability tests.
154
Hoof growth measurement
Hoof growth was measured using similar methods to that described by Manson and
Leaver (1988). Briefly, at approximately 6 months of age a hacksaw was used to
make a small mark under the periople. Every 12 weeks another mark was made,
and callipers used to measure the distance between the new mark and the previous
mark. The same veterinarian marked all hooves at each assessment. To avoid the
mark growing out, hoof growth was measured approximately every twelve weeks
rather than every four months like the other measurements. The measurements were
used to calculate hoof growth rate (mm/month).
Data handling
The joint positions (PIPJ, DIPJ, JH and HA), toe length ratio and claw splay
distance were treated as continuous outcome variables. As there were a low number
of 2s assigned the subjective aspects of conformation were reclassified and treated
as binary outcome variables. Scores of 1 and 2 from the original ordinal scale of 0,
1, 2 were collapsed for toe length, heel shape, claw shape and claw splay. This
allowed comparison of “good” (score 0) to “poor” (scores 1 and 2). Therefore,
classifications were as follows: toe length (not overgrown or overgrown), heel
shape (upright heel or dipped heel), claw shape (straight claws or misshaped claws),
claw splay (not splayed or splayed). Fetlock shape was not included in analysis due
to only three dipped fetlocks being observed across the four assessments. As there
were a low number of 3, 4 or 5 gait scores assigned this was also reclassified and
treated as a binary outcome variable comparing non-lame (score 1) to an impaired
gait (score 2-5). Due to goats moving faster than a walk at the 5-month assessment
this was excluded from the analysis. Lying behaviour data included 10 days in total,

155
the three days immediately prior to hoof trimming and the seven days following
hoof trimming. Day of trimming (day 0) was excluded. Due to goats being removed
for health and production reasons throughout the study, the n value for all variables
measured decreased over time.
Data analysis
All statistical analyses were performed using SAS 9.2 (SAS Institute Inc., Cary,
NC). Statistical analyses were completed separately for the front and hind hooves
due to the acknowledged differences between the limbs (Andersson and Lundström,
1981).
Objective 1: To evaluate the immediate effects of hoof trimming on hoof
conformation, joint position and lying behaviour.
The data from the 13, 17, 21, and 25-month assessments were used to address this
objective. As radiographs were only taken at 13 and 25 months, just these two
assessments are included when evaluating joint positions. The main effect for all
models was the hoof trimming event (pre vs post trimming), however, trimming
treatment was forced into models regardless of significance. Linear mixed models
(PROC MIXED) were used to assess the effects of hoof trimming (pre vs post
trimming) on toe length ratio (n = 67 goats), PIPJ, DIPJ, JH, HA (n = 37 goats for
all x-ray variables) and lying behaviour (lying time and lying bouts) (n = 67 goats).
A repeated measures statement with hoof trimming event (pre vs post trimming)
nested within assessment was specified in these models to account for the
correlation among multiple assessments. Goat was included as a random effect to

156
account for within-goat correlation. Interactions between assessment and trimming
treatment and hoof trimming event (pre vs post trimming) were tested.
Claw splay distance measurements were conditional on claw shape being scored 0,
resulting in a different number of goats with claw splay measurements at each
assessment. Therefore, separate models were constructed for each assessment (no
repeated statement was included in these models).
For subjectively scored hoof conformation, frequency tables (PROC FREQ) were
generated to compare pre and post trim scores. The proportions of poor
conformation scores (overgrown toes, dipped heels, misshaped claws and splayed
claws) at pre vs post trimming were tested using the Chi-squared (X2) test or
Fisher’s exact test (if expected count was less than 5 in any category).
Objective 2: To evaluate the long-term effects of early life hoof trimming
treatment on hoof conformation and joint positions
The data from the 13- and 25-month assessments were used to address this objective,
with separate models constructed for each assessment. Firstly, differences by
trimming treatment at 13 months were examined, as this was the assessment
predicted to have the greatest differences (n = 67 goats for toe length ratio and claw
splay distance, n = 37 goats for the radiograph measurements). Secondly,
differences at the 25-month assessment were examined to investigate the longer-
term effects of trimming treatment (n = 61 goats for toe length ratio and claw splay
distance, n = 37 goats for the radiograph measurements). The main effect was
trimming treatment. Analyses were completed for the pre and post trimming data
separately due to anticipated differences in hoof conformation and joint positions

157
following hoof trimming (Kummer et al., 2006). Linear regression analyses (PROC
MIXED) were used to model the effects of trimming treatment on the objectively
measured aspects of hoof conformation (toe length ratio and claw splay distance)
and on radiograph measurements (PIPJ, DIPJ, JH, HA).
For subjectively scored hoof conformation, frequency tables (PROC FREQ) were
generated to compare the scores between the two hoof trimming treatments. The
proportions of poor conformation scores (overgrown toes, dipped heels, misshaped
claws and splayed claws) for the early vs late trimming treatment were tested using
the Chi-squared (X2) test or Fisher’s exact test (if expected count was less than 5 in
any category) for each assessment separately.
Objective 3: To investigate the pattern of lameness prevalence and hoof growth
across the first two years of life and to determine if there was an effect of trimming.
A logistic regression (PROC GLIMMIX) was used to model the effects of
assessment and trimming treatment on the binary gait score variable (n = 78 goats,
as data were included from the 9-month assessment onwards). A binary distribution
and a logit link function was used to test if there was a difference in the proportion
of goats with an impaired gait between trimming treatments and among the
assessments. Goat within assessment was included as a random effect. The 9-month
assessment was used as the reference category. The results are presented as odds
ratios and 95% confidence intervals. In addition to the logistic regression, the
number and percentages of goats with a none lame gait (score = 1), an uneven gait
(score = 2) and lame gait (score > 3) at each assessment are presented.

158
Linear regression analyses (PROC MIXED) was used to model the effects of
assessment and trimming treatment on hoof growth (n = 78 goats, as data were
included from the 9-month assessment onwards, goat numbers decreased over the
course of the study as per table 1). A repeated measures statement of goat nested
within assessment was specified. Interactions between assessment and trimming
treatment were tested.
Procedures for building and assessing the fit and assumptions of models
Univariable screening was first carried out, applying a liberal p-value (P < 0.2). A
backwards stepwise method was then used to determine variables to be included in
the models, whilst still considering the biological relevance of the factors.
Trimming treatment was treated as a fixed effect and forced into all models
regardless of significance. All biologically relevant interactions were considered
but removed from the model if not significant (significance set at P < 0.05 for
significant and P < 0.1 for a tendency). Weight was included as a covariate in all
models regardless of significance. No other goat level factors were included in the
models. Age was not included as all goats were of the same age, additionally there
was high collinearity between age and assessment. Model fit for objective 1 and 3
(repeated measures models) was examined by identifying the correlation structure
that resulted in the smallest Akaike Information Criterion. All models were
evaluated for assumptions of homoscedasticity and normality of residuals.
Homoscedasticity was assessed by visually examining a scatter-plot of residuals
against predicted values. Normality was assessed using histogram and normal
probability plots, as well as checking the residuals for skewness and kurtosis. A
log transformation was applied to improve homoscedasticity and to help normalize
159
distribution of residuals for claw splay distance of the hind hoof models at the 13-
month, 17-month and 25-month assessments. Results for these assessments are
presented as back-transformed means and 95% confidence intervals (CI). The claw
splay distance data of the hind hooves at the 21-month assessment were normally
distributed. For consistency all claw splay distance results are presented as means
and 95% CI.
All continuous outcome variables were checked for outliers. As all data points fell
within 3 times the interquartile range away from the first and third quartile none were
considered outliers.
I did consider the construction of one model to address both objective 1 and 2
simultaneously. However, due to complex models and contrast statements being
required it was decided to address each objective separately.
Results
Objective 1: To evaluate the immediate effects of hoof trimming on hoof
conformation, joint position and lying behaviour in dairy goats
Hoof conformation – toe length ratio and claw splay distance
Toe length ratio of the front hooves decreased following hoof trimming at all four
assessments (P <0.001), and there was also an interaction with assessment (F3, 320
= 13.48, P <0.001). Pre-trimming toe length ratio was consistent across the four
assessments; however, post trimming between toe length ratio was greater at 17
months than at 13 months (Figure 2a). For hind hooves, trimming (P <0.001) and
assessment (P <0.05) affected toe length ratio and there was an interaction between

160
these factors (F3, 328 = 7.79, P <0.001). Pre-trimming, toe length ratio was greater
at 13 months than at 17 or 25 months; however, post-trimming toe length was
consistent across assessments (Figure 2b).
Claw splay distance in the front hooves decreased following hoof trimming at the
13-month and 25-month assessments and tended to decrease at the 17-month
assessment. In the hind hooves claw splay distance decreased at all four assessments
following hoof trimming (Table 3).

161
Figure 2. Mean ± SEM of toe length ratio pre and post trimming for (a) front hooves
and (b) hind hooves at four assessments across the goats first two lactations.
Different letters (a, b, c) indicate significant differences between or within
assessments (n = 67 goats).
0
0.2
0.4
0.6
0.8
1
1.2
13 months 17 months 21 months 25 months
Mea
sure
d t
oe
len
gth
rat
io
Pre
Post
a b
c c cc
0
0.2
0.4
0.6
0.8
1
1.2
13 months 17 months 21 months 25 months
Mea
sure
d t
oe
len
gth
rat
io
Pre
Postb
a
c
a
b c
a
b c
(a)
(b)
a
b b
a

162
Table 3. Means and 95% CI of measured claw splay distance (cm) at pre and post hoof trimming at four assessments
a Claw splay distance was only measured if claw shape was score as 0, therefore not all goats are included b Back transformed means and 95% confidence intervals for hind hooves at the 13, 17- and 25-month assessment
Front hooves Hind hooves na
Assessment Age
(months)
Pre Post F-value P-value Pre Post F-value P-value
3 13 5.32
(4.88-5.75)
4.50
(4.10-4.91)
10.72 < 0.01 4.79
(4.27-5.37)b
3.39
(3.16-3.63)b
48.06 < 0.001 47
4 17 5.26
(4.84-5.66)
4.75
(4.38-5.14)
3.91 0.05 4.57
(4.07-5.13)b
3.55
(3.24-3.98)b
12.99 < 0.01 55
5 21 4.97
(4.54-5.39)
4.60
(4.20-5.01)
2.68 0.11 5.25
(4.75-5.76)
4.36
(3.91-4.82)
8.91 < 0.01 51
6 25 5.62
(5.17-6.08)
5.13
(4.69-5.58)
4.95 < 0.05 5.75
(5.25-6.31)b
4.68
(4.27-5.01)b
31.53 < 0.001 44

163
Hoof conformation – toe length, heel shape, claw shape and claw splay scores
Table 4 summarizes the proportion of goats with poor hoof conformation pre- and
post-trimming across assessments. The majority of goats had overgrown toes on
both front and hind hooves prior to trimming at each assessment; hoof trimming
decreased this proportion
Dipped heels were uncommon on the front hooves. At each assessment, the
proportion of goats with dipped heels on their hind hooves decreased following
hoof trimming, however, this poor hoof conformation characteristic remained in
over 40% of the goats.
The proportion of goats with misshaped claws on their front hooves decreased
following hoof trimming at the 21-month assessment and tended to decrease at the
13-month and 25-month assessment. Hoof trimming reduced the proportion of
goats with misshaped claws on their hind hooves. While trimming had an impact
on reducing splayed claws at some assessments, the proportion of goats with
splayed claws on front and hind hooves remained high.

164
Table 4. Proportion (%) of goats with aspects of poor conformation (overgrown
toes, dipped heels, misshaped claws, splayed claws) pre and post trimming at four
assessments.
Front hooves Hind hooves n
Conformation
Variable
Assessment Pre
(%)
Post
(%)
P-value Pre
(%)
Post
(%)
P-value
Overgrown
toes
13 months
79 3 < 0.001a 97 12 < 0.001b 67
17 months
55 7 < 0.001b 82 13 < 0.001b 66
21 months
63 3 < 0.001a 93 15 < 0.001b 63
25 months
56 5 < 0.001a 92 15 < 0.001b 61
Dipped heels 13 months
19 0 < 0.001a 98 45 < 0.001b 67
17 months
2 1 1.00a 92 68 < 0.01b 66
21 months
2 0 1.00a 85 42 < 0.001b 63
25 months
5 2 0.61a 89 52 < 0.001b 61
Misshaped
claws
13 months
33 22 0.06b 67 17 < 0.001b 67
17 months
17 11 0.11b 45 33 < 0.01b 66
21 months
23 10 < 0.05b 38 19 < 0.05b 63
25 months
34 18 0.06b 39 21 < 0.05b 61
Splayed
clawsc
13 months
76 64 0.08b 66 29 < 0.01b 47
17 months
75 68 0.13b 57 35 < 0.05b 55
21 months
67 60 0.51b 74 54 0.06b 51
25 months
81 63 < 0.05b 84 78 0.49b 44
a Fisher’s exact test bChi-squared test c Claw splay only scored if claw shape scored as 0, therefore, not all goats are included

165
Joint positions
There was an effect of hoof trimming (pre- vs post-trimming) (P <0.001) on the
PIPJ angle of the front hooves, however, this was dependent on assessment (F1,96 =
11.21, P <0.01; Figure 3), no assessment effect was noted. Trimming also affected
the PIPJ angle of the hind hooves (F1,98 = 53.04, P <0.001); no assessment effect or
assessment by trimming interaction were noted. On average the PIPJ angle of the
front hooves was 30.9 ± 1.04o pre trimming and 38.5 ± 1.03o post trimming, while
the PIPJ angle of the hind hooves was 38.5 ± 1.32o pre trimming and 46.4 ± 1.32o
post trimming. Trimming decreased the DIPJ joint angle and joint height in the front
and hind hooves, while heel angle increased (Table 5). There were no assessment
effects or interactions with pre- vs post-trimming.
Figure 3. Mean ± SEM of the proximal interphalangeal joint (PIPJ) joint angle of
the front hooves pre and post trimming at the 13-month and 25-months assessment.
Different letters (a, b and c) in the graph indicate significant differences between
assessments and pre vs post trimming (n = 37 goats).
0
5
10
15
20
25
30
35
40
45
Pre Post Pre Post
13 months 25 months
Join
t an
gle
(o)
aa b
cb c
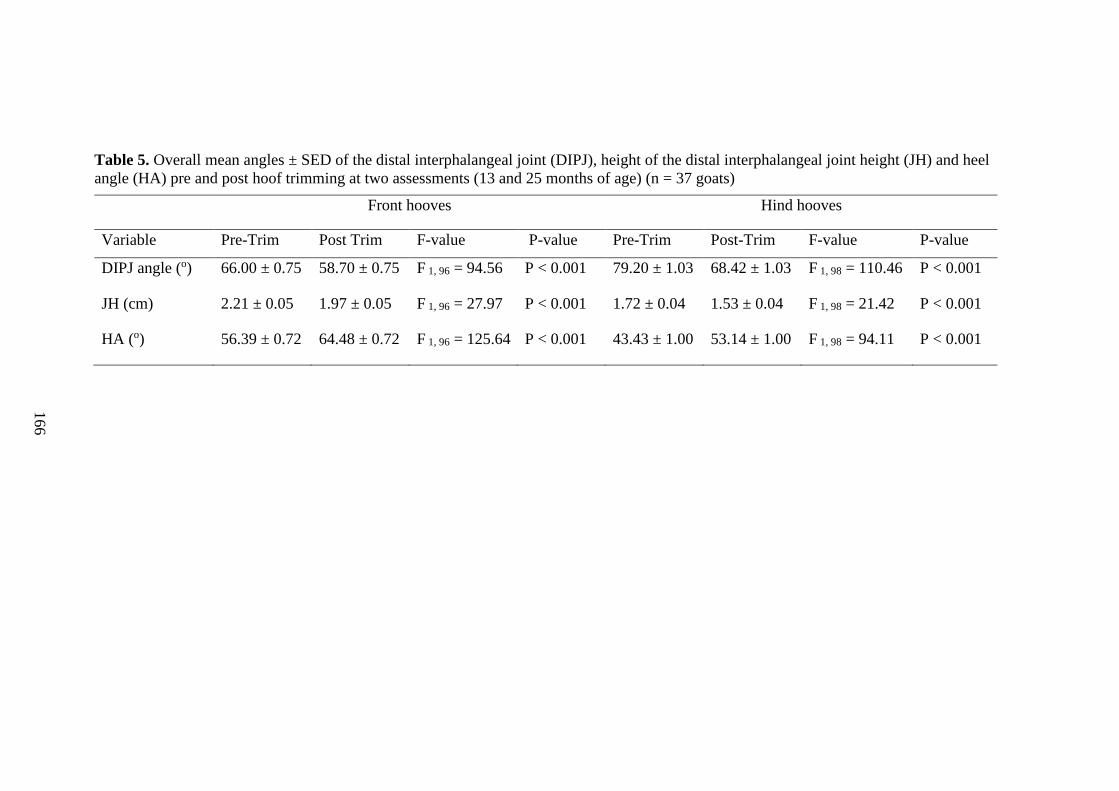
166
Table 5. Overall mean angles ± SED of the distal interphalangeal joint (DIPJ), height of the distal interphalangeal joint height (JH) and heel
angle (HA) pre and post hoof trimming at two assessments (13 and 25 months of age) (n = 37 goats)
Front hooves Hind hooves
Variable Pre-Trim Post Trim F-value P-value Pre-Trim Post-Trim F-value P-value
DIPJ angle (o) 66.00 ± 0.75 58.70 ± 0.75 F 1, 96 = 94.56 P < 0.001 79.20 ± 1.03 68.42 ± 1.03 F 1, 98 = 110.46 P < 0.001
JH (cm) 2.21 ± 0.05 1.97 ± 0.05 F 1, 96 = 27.97 P < 0.001 1.72 ± 0.04 1.53 ± 0.04 F 1, 98 = 21.42 P < 0.001
HA (o) 56.39 ± 0.72 64.48 ± 0.72 F 1, 96 = 125.64 P < 0.001 43.43 ± 1.00 53.14 ± 1.00 F 1, 98 = 94.11 P < 0.001
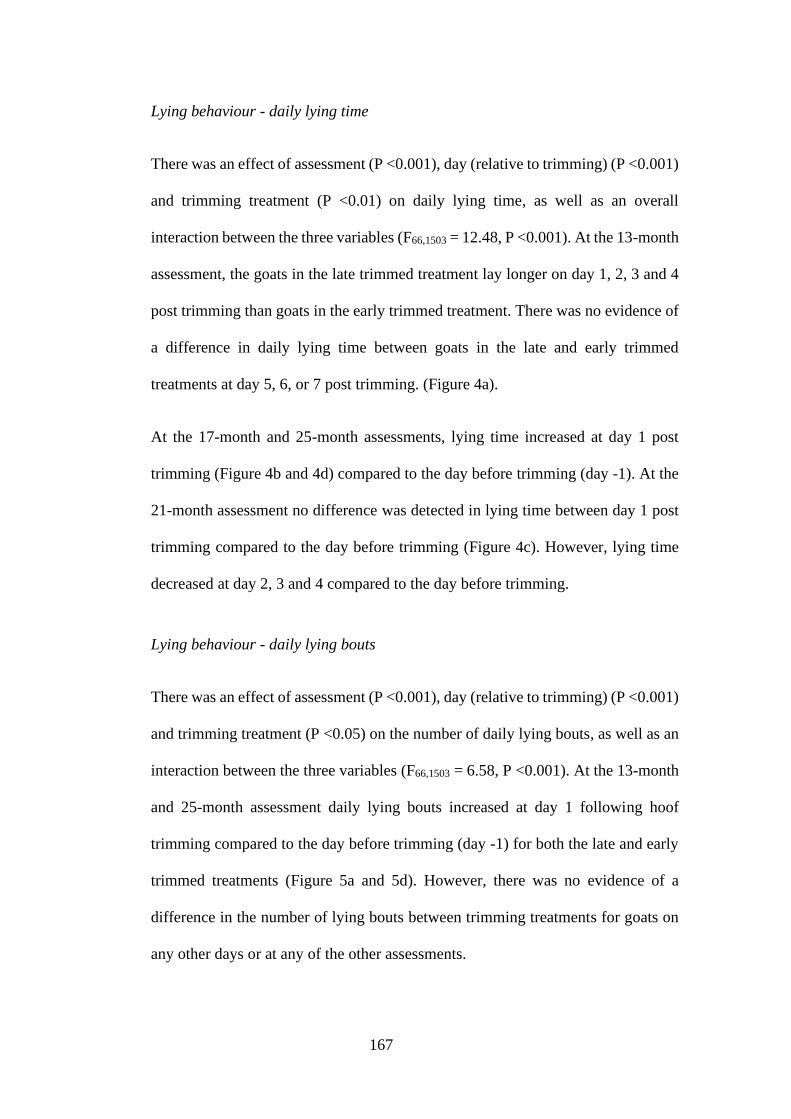
167
Lying behaviour - daily lying time
There was an effect of assessment (P <0.001), day (relative to trimming) (P <0.001)
and trimming treatment (P <0.01) on daily lying time, as well as an overall
interaction between the three variables (F66,1503 = 12.48, P <0.001). At the 13-month
assessment, the goats in the late trimmed treatment lay longer on day 1, 2, 3 and 4
post trimming than goats in the early trimmed treatment. There was no evidence of
a difference in daily lying time between goats in the late and early trimmed
treatments at day 5, 6, or 7 post trimming. (Figure 4a).
At the 17-month and 25-month assessments, lying time increased at day 1 post
trimming (Figure 4b and 4d) compared to the day before trimming (day -1). At the
21-month assessment no difference was detected in lying time between day 1 post
trimming compared to the day before trimming (Figure 4c). However, lying time
decreased at day 2, 3 and 4 compared to the day before trimming.
Lying behaviour - daily lying bouts
There was an effect of assessment (P <0.001), day (relative to trimming) (P <0.001)
and trimming treatment (P <0.05) on the number of daily lying bouts, as well as an
interaction between the three variables (F66,1503 = 6.58, P <0.001). At the 13-month
and 25-month assessment daily lying bouts increased at day 1 following hoof
trimming compared to the day before trimming (day -1) for both the late and early
trimmed treatments (Figure 5a and 5d). However, there was no evidence of a
difference in the number of lying bouts between trimming treatments for goats on
any other days or at any of the other assessments.

168
Figure 4. Mean ± SEM daily lying time (h/day) 3 days pre-trimming and 7 days post
trimming at four assessments (a) 13 months, (b) 17 months, (c) 21 months, (d) 25 months.
Day 0 removed as it was the day of trimming. The light grey dashed line signifies a
trimming event (n = 67 goats).
10
11
12
13
14
15
16
17
-3 -2 -1 1 2 3 4 5 6 7
Lyin
g ti
me
(h/d
ay)
Early Trim
Late Trim
10
11
12
13
14
15
16
17
-3 -2 -1 1 2 3 4 5 6 7
Lyin
g ti
me
(h/d
ay)
Early Trim
Late Trim
10
11
12
13
14
15
16
17
-3 -2 -1 1 2 3 4 5 6 7
Lyin
g ti
me
(h/d
ay)
Early Trim
Late Trim
Day relative to trimming
(a)
(b)
(c)
(d)
10
11
12
13
14
15
16
17
-3 -2 -1 1 2 3 4 5 6 7
Lyin
g ti
me
(h/d
ay)
Early Trim
Late Trim
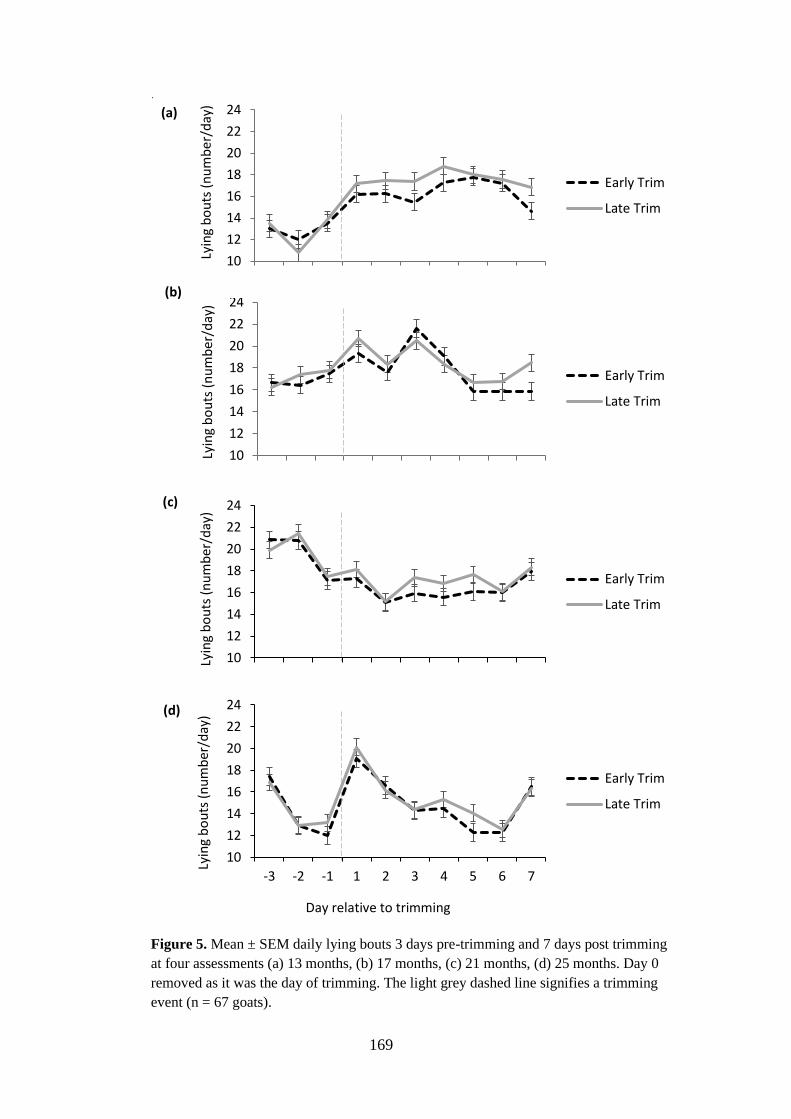
169
l
Figure 5. Mean ± SEM daily lying bouts 3 days pre-trimming and 7 days post trimming
at four assessments (a) 13 months, (b) 17 months, (c) 21 months, (d) 25 months. Day 0
removed as it was the day of trimming. The light grey dashed line signifies a trimming
event (n = 67 goats).
10
12
14
16
18
20
22
24
-3 -2 -1 1 2 3 4 5 6 7
Lyin
g b
ou
ts (
nu
mb
er/d
ay)
Early Trim
Late Trim
10
12
14
16
18
20
22
24
-3 -2 -1 1 2 3 4 5 6 7
Lyin
g b
ou
ts (
nu
mb
er/d
ay)
Early Trim
Late Trim
Day relative to trimming
(b)
10
12
14
16
18
20
22
24
-3 -2 -1 1 2 3 4 5 6 7
Lyin
g b
ou
ts (
nu
mb
er/d
ay)
Early Trim
Late Trim
(c)
(d)
10
12
14
16
18
20
22
24
-3 -2 -1 1 2 3 4 5 6 7
Lyin
g b
ou
ts (
nu
mb
er/d
ay)
Early Trim
Late Trim
(a)
170
Objective 2: To evaluate the long-term effects of early life hoof trimming
treatment on hoof conformation and joint positions
Hoof conformation
There was no evidence of a treatment effect on toe length ratio or claw splay
distance on the front or hind hooves at either pre or post trimming for the 13-month
or 25-month assessment. However, at the 13-month assessment, one goat in the late
trimmed treatment had an undue influence on the post trimming statistical model
for the front hooves. Though not considered an outlier by the criterion applied,
when this animal was removed, claw splay distance of the early trimmed treatment
was 4.9 ± 0.25cm, while the late trimmed treatment was 4.1 ± 0.27cm (F1,43 = 4.53,
P <0.05). This is in agreement with the binary claw splay score at the same
assessment, where a higher proportion of goats in the early trimmed treatment (80%,
n = 20 goats) had splayed claws on the front hooves after trimming compared with
the late trimmed treatment (48%, n = 12 goats) (Chi-squared P <0.05). No further
effects of trimming were detected for binary claw splay scores.
At the 13-month assessment a higher proportion of goats tended to have misshaped
hind hooves in the late trimmed treatment (24%, n = 8 goats) post trimming
compared with the early trimmed treatment (10% n = 3 goats) (Chi-squared, P =
0.08).
No other trimming treatment effects were detected for any of the other subjectively
scored hoof conformation variables either pre or post trimming for the 13-month or
25-month assessment.

171
Radiograph measurements
At the 13-month assessment no evidence of a treatment effect was detected on PIPJ,
DIPJ or JH for the front or hind hooves. Post-trimming, heel angle of the hind
hooves of the early trimmed treatment was 6.8o ± 2.39 (mean ± SED) greater than
that of the late trimmed treatment (early trimmed: 54.9 ± 1.61 vs late trimmed: 48.2
± 1.72) (mean ± SEM) (F1, 29 = 8.01, P <0.01).
At the 25-month assessment, the pre-trimming PIPJ joint angle of the front hooves
of the early trimmed treatment was 7.0o ± 2.86 (mean ± SED) less than that of the
late trimmed treatment (early trimmed: 30.98 ± 1.90 vs late trimmed: 37.95 ± 2.09
(mean ± SEM) (F1, 30 = 5.96, P <0.01). No other treatment effects were detected for
any of the radiograph measurements either pre- or post-trimming for the 25-month
assessment.
Objective 3: To investigate the pattern of lameness prevalence and hoof growth
across the first two years of life and to determine if there was an effect of trimming.
Gait scores - description of all gait scores
Few goats were clinically lame (gait score ≥ 3) at each of the assessments, the
majority were either not lame or showed an uneven gait (Table 6).
Gait scores -analysis of binary outcome data
There was no evidence of a treatment effect; trimming in early life did not affect
the odds of goats having an impaired gait, however the odds changed over
assessments (F4, 248 = 6.97, P <0.001). The highest proportions of goats classified as
having an impaired gait were observed at the 13-month (37.3%) and 25-month
172
assessment (47.5%) (proportions of goats with an impaired gait were 24.1%, 13.6%
and 25.4% for the 9, 17- and 21-month assessments respectively). The odds of a
goat having an impaired gait were greater by a factor of 2.15 (95% CI: 1.02 – 4.54,
P < 0.05) at the 13-month assessment and 3.79 (95% CI: 1.90 – 7.57, P < 0.001) at
the 25-month assessment compared to the 9-month assessment.
Table 6. Number of goats (%) that were scored as being not lame, having an
uneven gait or a lame gait using a 5-point gait scoring system at six assessments.
Gait score n
Assessment Age
(months)
1 (not lame) 2 (uneven
gait)*
3 + (lame
gait)*
1† 5 - - - -
2 9 60 (76.9) 17 (22.8) 1 (1.3) 78
3 13 42 (62.7) 19 (28.4) 6 (8.9) 67
4 17 57 (86.4) 8 (12.1) 1 (1.5) 66
5 21 47 (74.6) 16 (25.4) 0 (0.0) 63
6 25 32 (52.5) 26 (42.6) 3 (4.9) 61
* For analysis, goats with an uneven gait and lame gait were grouped, to create a binary
variable comparing non-lame to impaired gait. † Assessment 1 was excluded from analysis as accurate gait scores could not be assigned
due to goats moving faster than a walk
Hoof growth
There was no evidence of a trimming treatment effect on front hoof growth (P =
0.14). Hoof growth increased between 13 and 19 months of age, decreased from 19
to 22 months of age and increased again between 22 and 25 months of age (F5, 376
= 13.43, P < 0.001) (Figure 6a). Hind hoof growth was affected by trimming
treatment (P < 0.05) and assessment (P < 0.001). There was an interaction between
these two variables (F5, 369 = 3.09, P < 0.01); hoof growth increased between 13 and

173
16 months of age in the late trimmed treatment, but no increase was detected during
this time for the early trimmed treatment. At all other assessments, there was no
treatment difference in hind hoof growth. Hoof growth decreased between 19 and
22 months of age in both the early and late trimmed treatment (F5, 376 = 22.08, P <
0.001 (Figure 6b).

174
Figure 6. Mean ± SEM of growth rate of the (a) front hooves showing an assessment
effect and (b) hind hooves showing an assessment by trimming treatment interaction at
6 hoof growth assessments across the goats’ first two years of life, starting from 9 months
of age (n = 78 goats). The light grey dashed lines signify a trimming event.
Discussion
The aims of this study were to determine the immediate impacts of hoof trimming
and the long-term effects of starting hoof trimming at an earlier age on hoof
2
2.5
3
3.5
4
4.5
5
5.5
9 13 16 19 22 25
Ho
of
gro
wth
(m
m/m
on
th)
Age (months)
2
2.5
3
3.5
4
4.5
5
5.5
9 13 16 19 22 25
Ho
of
gro
wth
(m
m/m
on
th)
Age (months)
Early Trim
Late Trim
(b)
(a)

175
conformation, joint positions, lying behaviour, gait scores and hoof growth in dairy
goats. Overall, hoof trimming had beneficial effects on hoof conformation in the
short term. Unexpectedly, starting hoof trimming earlier in life had only minor and
inconsistent effects on hoof conformation and joint positions. On this farm, clinical
lameness prevalence was found to be low over the 2-year study period, though
prevalence of an impaired gait (uneven gait and lame gait) peaked after both kidding
events. Each of the objectives will now be explained in more detail.
Immediate effects of hoof trimming
The purpose of hoof trimming is to improve conformation by the removal of hoof
overgrowth (Phillips et al., 2000). In the present study, high proportions of the front
and hind hooves were subjectively scored as overgrown prior to hoof trimming at
all assessments. Additionally, toe length ratios were over 0.5 (toe length greater
than half the length of the rest of the hoof) in the front and hind hooves before
trimming at each assessment. Hoof trimming every four months was therefore not
frequent enough to prevent hoof overgrowth.
Before trimming, the toe length ratio differed between assessments, however, after
trimming, toe length ratio was consistently below 0.5. This indicates that regardless
of how much growth was present pre-trimming, the process of trimming restored
the toe to a consistent length. The commonly used ‘Dutch method’ (Van Der Tol et
al., 2004; Frankena et al., 2009) of hoof trimming in cows recommends that the
claw length should be trimmed to 75mm (Toussaint Raven, 1985). However, this
does not account for individual cow difference in the shape and size of claws and
may lead to over trimming of some cows (Archer et al., 2015). Therefore, using a
ratio that accounts for individual claw shape may reduce the risk of over trimming.

176
The authors acknowledge that the objective toe length ratio measurement would not
be practical for use on farm, however the subjective score for toe length may be
appropriate if validated for use on live animals (rather than from photographs).
As hooves become overgrown heel depth is reduced (cows: Glicken and Kendrick,
1977; Gitau et al., 1997) and fetlocks may become hyperextended (cows: Shearer
et al., 2012). In the present study this was particularly evident in the hind hooves
with over 80% of heels being dipped before trimming at each of the four
assessments. While the proportions of dipped heels reduced following trimming in
the hind hooves, over 40% of goats’ heels at each assessment had not recovered to
an upright position.
The impacts of dipped heels in dairy goats is unknown. However, in horses lower
heel angles are reported to significantly increase stress and deformation of the hoof
capsule (Hinterhofer et al., 2000), leading to increased tension on the suspensory
apparatus (Riemersma et al., 1996), and an increased risk of hyperextension
(dipping) of the fetlock (Gibson and Steel, 2002). Despite high proportions of
dipped heels, few dipped fetlocks were observed in the present study. However, it
is possible that dipped fetlocks become more apparent with age following
prolonged stress on the hoof and lower leg.
There are reported differences between the front and hind hooves in dairy cows,
with the hind hooves suggested to have a lower heel angle than the front hooves
(Shearer et al., 2005). My data indicate that the hind hooves may also have a lower
heel angle in dairy goats, which may explain why some of the dipped heels were
not recovered following trimming. In horses, it has been shown that recovery from
dipped heels requires a long-term, animal specific hoof care management (Hunt,

177
2012); while this is not practical in goats, I suggest that a better approach would be
to determine a more appropriate hoof trimming frequency that promotes heels to
maintain an appropriate upright position.
Hoof overgrowth creates a cascade of follow-on effects; in dairy cows claw shape
becomes abnormal (Manske et al., 2002b) and claws become splayed (van Amstel
and Shearer, 2006). In the present study, I identified that the shape of the hind
hooves improved following trimming, with a tendency for the front hooves to
improve. As hoof overgrowth is reported to be one of the main causes of hoof
deformation in dairy goats (Ajuda et al., 2014), the removal of overgrowth through
the trimming process has beneficial effects for overall claw conformation.
Furthermore, there were decreases in claw splay distance following hoof trimming.
In the present study a distance less than 4cm between the axial edge of the distal tip
of both claws would be considered non splayed. However, on average the claw
splay distances were still over 4 cm for all of the front hoof assessments post
trimming and for half of the hind hoof assessments post trimming. Consequently,
high proportions of goats were subjectively scored as having splayed claws
following hoof trimming. Claw splay may be largely determined by the
environment rather than hoof trimming; hooves that are responding to softer
substrates are more splayed (Zuba, 2012). Therefore, the high proportion of splayed
claws even following hoof trimming may be due to the goats’ hooves becoming
accustomed to their bedding (e.g., soft wood shavings). The claw splay of goats’
hooves in a more natural environment would need to be assessed to determine a
“normal” distance of claw splay.
This study highlights the immediate beneficial effects hoof trimming had on joint
positions within the distal limb and the value of objectively assessing these effects.

178
Hoof overgrowth impacts joint positions and angles (horses: Moleman et al., 2006),
and is reported to be the main cause of displacement of the distal phalanx (cows:
Meimandi-Parizi and Shakeri, 2007). All the radiograph measurements were
immediately altered by hoof trimming, suggesting that hoof overgrowth had
resulted in deviations of the joints. Restoring the displacement of the DIPJ joint
angle and heel angle are of particular importance due to their reported association
to structures within the hoof. For instance, an increased DIPJ angle is caused by
displacement of the distal phalanx resulting in the caudal edge of the bone becoming
a more prominent weight bearing surface, which can increase the risk of sole ulcers
(cows: Blowey, 1992; Lischer et al., 2002) and also results in increased loading of
the deep digital flexor tendon (horses: Moleman et al., 2006). In horses, just an 8-
week interval between two trimming sessions resulted in an increase in DIPJ angle
(Moleman et al., 2006) and lower heel angles (van Heel et al., 2006). This highlights
the importance of frequent hoof trimming to prevent hoof overgrowth and to
maintain anatomically correct conformation and joint positions.
As well as influencing anatomical features of the hoof and distal limb, trimming
also influenced the goats’ behaviour. In the present study daily lying time increased
at day 1 post trimming compared to the day prior to trimming at the 13 and 17- 25-
month assessments. An increase in lying time following hoof trimming has been
reported in cows, with trimmed cows lying more than sham cows (Chapinal et al.,
2010b). However, as lame cows were included in the trimmed group, but not in the
sham group it is difficult to draw conclusions about the reasons for the difference
in lying behaviour in that study.
An increase in lying time immediately following hoof trimming may be interpreted
as a pain response as lame animals lie more (Ito et al., 2010). However, it is difficult
179
to make conclusions about pain using behaviour as it is such a complex and
individualistic experience (Viñuela-Fernández et al., 2007). Nevertheless, an
increase in gait score has been reported following hoof trimming, which further
supports a pain response (Van Hertem et al., 2014). Furthermore, goats in the late
trimmed treatment lay more in the four days following hoof trimming at the 13-
month assessment compared with the goats that were in the early trimmed treatment.
As this was the first time the goats in the late treatment had been trimmed it suggests
that lack of experience of the trimming process may be impacting lying behaviour,
with a possible increased pain response compared to the early trimmed goats that
had been trimmed twice before.
As gait scores were not assessed following hoof trimming, it is not possible for me
to conclude whether the difference in lying time is due to a pain response. Another
explanation for an overall increase in lying time at day 1 following hoof trimming
may be that it is compensatory response due to the goats spending approximately 4
hours out of their pens the previous day. Further work is needed in a more controlled
setting to determine the immediate effects of hoof trimming on dairy goat behaviour.
Although a statistical effect of time was detected, there was high variability in both
lying time and lying bouts even in the 3 days prior to hoof trimming and across
assessments. This was evident at the 21-month assessment, with high lying bouts
and lying time observed in the days before trimming compared to the other
assessments. As the goats were in kid and therefore dry at this assessment, they
would not have been leaving the barn for milking, which may explain the increased
lying behaviour before trimming compared to the other assessments. However, the
much more erratic daily lying time pattern following hoof trimming at 21-months,
cannot be explained. Farm management factors that I could not control for may

180
have been impacting lying behaviour on a given day, for instance groups of goats
could have been mixed which may increase agonistic interactions and thus reduce
lying behaviour (Miranda-de La Lama and Mattiello, 2010). Conversely, fresh
bedding may have been added which could promote greater lying behaviour.
Longer term effects of early life trimming
Starting hoof trimming of goats at five months of age appeared to confer little
consistent advantage over beginning trimming following first kidding (13 month of
age) in terms of hoof conformation and joint positions. Unexpectedly, there were
more goats with splayed claws of the front hooves after trimming in the early
trimmed treatment compared to the late trimmed treatment at the 13-month
assessment. However, it should be noted this effect was not observed at the 25-
month, likely due to high proportions of splayed claws in both trimming treatments.
Differences were observed in the hind hooves, with goats in the late trimmed
treatment having lower HA compared to the early trimmed treatment at the 13-
month assessment. At the 25-month assessment PIPJ angle was smaller in the early
trimmed treatment compared to the late trimmed treatment.
The power analysis conducted for this study was based on horse data due to the lack
of data in either dairy cows or goats. I acknowledge that the sample size may have
been suitable to detect immediate effects of hoof trimming (primary objective),
however longer-term effects may have been masked due to too few animals, with
the potential for Type II errors being introduced. Indeed, a retrospective power
analysis highlighted that 40 goats per treatment were inadequate to find a long-term
effect on the objective measures of hoof conformation. A larger scale study would
181
be required to determine the longer-term impacts of trimming prior to first kidding
in dairy goats.
Nevertheless, as high proportions of overgrown hooves, dipped heels, misshaped
claws and splayed claws were observed across both treatments, it suggests neither
trimming treatment was successful at preventing poor hoof conformation. The
subsequent frequency of hoof trimming of every 4 months was included in the
present study as this is commonly implemented in the industry (Chapter 4).
However, my results suggest more frequent trimming is required; indeed, it is
suggested that as often as every 6-8 weeks is necessary depending on the housing
environment (Pugh and Baird, 2012).
Interestingly, caution should be taken to not over trim; trimming can have negative
effects. For instance, over-trimming causing bleeding of the hoof is associated with
increased lameness in sheep (Winter et al., 2015). Along with a potential pain
response following trimming (Van Hertem et al., 2014), hoof trimming, and the
necessary handling, causes stress reactions in dairy cows (Rizk et al., 2012);
increased faecal cortisol for up to 24 hours following hoof trimming, and reduced
milk production on the day of, and the day following, hoof trimming have been
reported (Pesenhofer et al., 2006). We therefore suggest that controlled research in
dairy goats is required to first determine the potential detrimental effects of hoof
trimming in general, and second to determine ideal trimming frequency. It is likely
that adequate trimming regimes need to include consideration of when trimming
begins, the frequency of subsequent trimming, but also the provision of
opportunities for goats to naturally wear their hooves.
182
An environment that promotes natural hoof wear will encourage self-maintenance
of the hooves (Florence and McDonnell, 2006), as hard substrates that promote hoof
wear result in shorter toe lengths and more upright hooves (horses: Hampson et al.,
2013). For example, dairy cows’ exposure to an abrasive concrete surface resulted
in 35% more hoof wear than cows exposed to a dirt surface (Hahn et al., 1986).
While in cows prolonged standing on concrete promotes lameness (Somers et al.,
2003), goats in their natural environment populate hilly and rugged environments
and often rest directly on rocks in steep terrain (Zobel et al., 2019). In an alpine
environment milking goats are reported to travel upward of 3km in a 24 hour period
(Zobel et al., 2018) and despite not being hoof trimmed for 5 months it was reported
their hooves were not overgrown (Zobel et al., 2019). Therefore, providing
substrates to promote hoof wear may reduce the need for such frequent hoof
trimming of dairy goats.
Hoof growth and lameness prevalence
Early trimming did not impact hoof growth in the front hooves and did not have a
consistent effect on growth in the hind hooves. However, hoof growth did slow in
the front and hind hooves at the 22-month assessment when the goats were in late
gestation. Similar results have been reported in dairy cows with hoof growth
decreasing during the second trimester of pregnancy (Dietz and Prietz, 1981).
Nevertheless, the hoof growth measurements were taken every 12 weeks and
therefore were not consistently spaced around trimming events. As hoof growth is
reported to significantly increase following trimming (cows: Manson and Leaver,
1988) this may have had an impact on the hoof growth measurements recorded.
Furthermore, we caution that only hoof trimming was controlled for, all other farm

183
management continued as per normal farm practice. Management aspects such as
provision of clean bedding, cleaning of the concrete skirt, and dietary changes, were
not controlled for; the authors acknowledge these factors may have impacted hoof
growth.
Most of the goats across the assessments were either not lame (gait score = 1,
assessment range: 52 – 77%) or showed an uneven gait (gait score = 2, assessment
range: 12 - 43%), thus clinical lameness (gait score ≥ 3) prevalence was low over
the study period. The prevalence of clinical lameness was less than 9% of goats at
all assessments over 2 years. Although limited, there are data that reports an
association between poor conformation and increased gait score in dairy goats
(Ajuda et al., 2014; Ajuda et al., 2019), therefore, I expected lameness prevalence
to be higher in the present study due to the high proportions of poor conformation
observed. It may be possible that the goats are able to adapt to some deviation of
conformation from an anatomically correct shape without gait being impacted.
However, I suggest that lameness may become more apparent with age, following
chronic, prolonged periods of poor conformation. Indeed, Ajuda et al (2019) report
an association between hoof overgrowth, poor conformation and lameness in dairy
goats aged 2-5 years of age. Further work is required to evaluate if there is an
association between poor conformation and lameness in New Zealand dairy goats.
Many goats walked faster than a walk at the 5-month assessment because of their
young age. Difficulty in assigning accurate gait scores due to the speed the goat
moves at has previously reported (Chapter 3), and therefore it was decided to
exclude the 5-month assessment from the analysis. At the 9-month assessment and
subsequent assessments, the goats moved at a steady walking pace.

184
Gait scores did not differ between the early trimmed goats and the late trimmed
goats. However, I caution that as discussed above the power of the study to find
such an association was low. There was a time effect, with goats having greater
odds of an impaired gait at the 13-month and 25-month assessments compared to
the 9-month assessment. There is evidence that lameness risk significantly increases
following calving in dairy cows (Offer et al., 2000; Tarlton et al., 2002). Metabolic
and hormonal changes associated with calving weaken the connective tissue of the
hoof suspensory apparatus, leading to an increased risk of lameness due to sole
ulcers and white line disease (Tarlton et al., 2002). At the 13 and 25-month
assessments in my study, the goats had recently kidded, suggesting parturition may
be impacting gait. However, I caution it was not within the scope of the present
study to investigate the exact cause of the observed lameness. Future work should
focus on the effect of age and stage of lactation on lameness and whether further
intervention is needed around kidding, a potentially critical time point.
Conclusion
In conclusion, there were immediate beneficial effects of hoof trimming, with hoof
conformation and joints restored to more anatomically correct shapes and positions.
There were no meaningful long-term effects of starting trimming prior to kidding
in terms of hoof conformation, joint positions or gait scores; however, I caution that
my study may not have had enough power to assess this. Goats had greater odds of
having an impaired gait following kidding, suggesting a parturition effect.
Additionally, hoof growth slowed when the goats were in kid, suggesting an effect
of stage of life and gestation. Changes in lying behaviour following hoof trimming
were observed suggesting a possible pain response, however as other management
factors may have been having an impact, conclusions about the behaviour changes
185
cannot not be made. The results provide evidence that trimming every 4 months (3
trims per year) is not frequent enough to prevent hoof overgrowth, poor
conformation and changes in joint positions. Therefore, trimming protocols may
need to be revised to include when trimming should start and how often it needs to
happen in order to produce long-term improvements to the hooves. Further work is
needed to be carried out for definitive conclusions about early life trimming regimes
to be drawn and to determine if hoof trimming does negatively impact dairy goat
behaviour. Additionally, work should investigate if the provision of an environment
that allows for natural hoof wear, thus promoting anatomically correct hoof
conformation and joint positions, reduces the need for such frequent hoof trimming.
References
Ajuda, I.G., Battini, M., Stilwell, G.T., 2019. The role of claw deformation and
claw size on goat lameness. Veterinary and Animal Science 8, 100080.
Ajuda, I. G., Vieira, A., Stilwell, G.T., 2014. Are there differences in dairy goats
claws' temperature, before and after trimming?, 2014 IEEE International
Symposium on Medical Measurements and Applications (MeMeA),
Lisbon, Portugal pp. 1-5.
Altman, D.G., 1990. Practical statistics for medical research. CRC press.
Andersson, L., Lundström, K., 1981. The influence of breed, age, body weight
and season on digital diseases and hoof size in dairy cows. Transboundary
and Emerging Diseases 28, 141-151.
Anzuino, K., Bell, N.J., Bazeley, K.J., Nicol, C.J., 2010. Assessment of welfare
on 24 commercial UK dairy goat farms based on direct observations.
Veterinary Record 167, 774-780.
Archer, S.C., Newsome, R., Dibble, H., Sturrock, C., Chagunda, M., Mason, C.,
Huxley, J., 2015. Claw length recommendations for dairy cow foot
trimming. The Veterinary Record 177, 222.
Baggott, D., 1982. Hoof lameness in dairy cattle. In practice 4, 133-141.
Bell, N., Bell, M., Knowles, T., Whay, H., Main, D., Webster, A., 2009. The
development, implementation and testing of a lameness control
programme based on HACCP principles and designed for heifers on dairy
farms. The Veterinary Journal 180, 178-188.

186
Blowey, R., 1992. Diseases of the bovine digit: Part 2 Hoof care and factors
influencing the incidence of lameness. In Practice 14, 118-124.
Bokko, B., Adamu, S., Mohammed, A., 2003. Limb conditions that predispose
sheep to lameness in the arid zone of Nigeria. Small Ruminant Research
47, 165-169.
Bryan, M., Tacoma, H., Hoekstra, F., 2012. The effect of hindclaw height
differential and subsequent trimming on lameness in large dairy cattle
herds in Canterbury, New Zealand. New Zealand Veterinary Journal 60,
349-355.
Chapinal, N., De Passille, A., Rushen, J., 2010a. Correlated changes in behavioral
indicators of lameness in dairy cows following hoof trimming. Journal of
Dairy Science 93, 5758-5763.
Chapinal, N., De Passillé, A., Rushen, J., Wagner, S., 2010b. Effect of analgesia
during hoof trimming on gait, weight distribution, and activity of dairy
cattle. Journal of Dairy Science 93, 3039-3046.
Colles, C.M., 1983. Interpreting radiographs 1: The foot. Equine Veterinary
Journal 15, 297-303.
Cook, N., 2016. A lesion oriented, life cycle approach to preventing lameness in
dairy herds., World Buiatric Congress., Dublin, Ireland, pp. 51-51.
de Sevilla, X.F., Fàbrega, E., Tibau, J., Casellas, J., 2008. Effect of leg
conformation on survivability of Duroc, Landrace, and Large White sows.
Journal of Animal Science 86, 2392-2400.
Dekker, A., Moonen, P., Pol, J., 2005. Linear hoof defects in sheep infected with
foot-and-mouth disease. Veterinary Record 156, 572-575.
Desrochers, A., Anderson, D.E., 2001. Anatomy of the Distal Limb. Veterinary
Clinics: Food Animal Practice 17, 25-38.
Dietz, O., Prietz, G., 1981. Quality and status of cattle hoof horn. Monatshefte fur
Veterinarmedizin 36, 419-422.
Dohoo, I.R., Martin, W., Stryhn, H., 2003. Veterinary epidemiologic research.
AVC Incorporated Charlottetown, PEI, Canada.
Drumond, B., Ginelli, A.M.G., Faleiros, R.R., de Magalhaes, J.F., Coelhos, C.S.,
2016. Hoof capsule distortion and radiographic measurements of the front
feet in Mangalarga Marchador horses subjected to athletic training.
Pferdeheilkunde 32, 110-118.
Florence, L., McDonnell, S., 2006. Hoof growth and wear of semi‐feral ponies
during an annual summer ‘self‐trimming’period. Equine veterinary journal
38, 642-645.

187
Frankena, K., Somers, J., Schouten, W.G.P., Van Stek, J.V., Metz, J.H.M.,
Stassen, E.N., Graat, E.A.M., 2009. The effect of digital lesions and floor
type on locomotion score in Dutch dairy cows. Preventive Veterinary
Medicine 88, 150-157.
Gibson, K.T., Steel, C.M., 2002. Conditions of the suspensory ligament causing
lameness in horses. Equine Veterinary Education, 14, 39-50.
Gitau, T., Mbiuki, S., McDermott, J., 1997. Assessment of bovine hoof
conformation and its association with lameness, animal factors and
management practices on small-scale dairy farms in Kiambu district,
Kenya. The Onderstepoort Journal of Veterinary Research 64, 135-140.
Glicken, A., Kendrick, J., 1977. Hoof overgrowth in Holstein--Friesian dairy
cattle. The Journal of Heredity 68, 386-390.
Gomez, A., Cook, N., Gaska, J., Dopfer, D., 2013. Should we trim heifers before
calving? American Association of Bovine Pracitioners Conference
Proceedings, Milwaukee, United States, pp226.
Hahn, M.V., McDaniel, B.T., Wilk, J.C., 1986. Rates of hoof growth and wear in
holstein cattle. Journal of Dairy Science 69, 2148-2156.
Hampson, B., De Laat, M., Mills, P., Pollitt, C., 2013. The feral horse foot. Part
A: observational study of the effect of environment on the morphometrics
of the feet of 100 A ustralian feral horses. Australian Veterinary Journal
91, 14-22.
Hill, N.P., Murphy, P.E., Nelson, A.J., Mouttotou, L.E., Green, L.E., Morgan,
K.L., 1997. Lameness and foot lesions in adult British dairy goats.
Veterinary Record 141, 412-416.
Hinterhofer, C., Stanek, C., Haider, H., 2000. The effect of flat horseshoes, raised
heels and lowered heels on the biomechanics of the equine hoof assessed
by finite element analysis (FEA). Journal of Veterinary Medicine Series A
47, 73-82.
Hirst, W.M., Murray, R.D., Ward, W.R., French, N.P., 2002. A mixed-effects
time-to-event analysis of the relationship between first-lactation lameness
and subsequent lameness in dairy cows in the UK. Preventive Veterinary
Medicine 54, 191-201.
Hunt, R.J., 2012. Farriery for the hoof with low or underrun heels. Veterinary
Clinics: Equine Practice 28, 351-364.
Ito, K., Von Keyserlingk, M., LeBlanc, S., Weary, D., 2010. Lying behavior as an
indicator of lameness in dairy cows. Journal of Dairy Science 93, 3553-
3560.
Kaler, J., Medley, G., Grogono-Thomas, R., Wellington, E., Calvo-Bado, L.,
Wassink, G., King, E., Moore, L., Russell, C., Green, L., 2010. Factors

188
associated with changes of state of foot conformation and lameness in a
flock of sheep. Preventive Veterinary Medicine 97, 237-244.
Kroekenstoel, A., Heel, M.v., Weeren, P.v., Back, W., 2006. Developmental
aspects of distal limb conformation in the horse: the potential
consequences of uneven feet in foals. Equine Veterinary Journal 38, 652-
656.
Kummer, M., Geyer, H., Imboden, I., Auer, J., Lischer, C., 2006. The effect of
hoof trimming on radiographic measurements of the front feet of normal
Warmblood horses. The Veterinary Journal 172, 58-66.
Lischer, C.J., Ossent, P., Räber, M., Geyer, H., 2002. Suspensory structures and
supporting tissues of the third phalanx of cows and their relevance to the
development of typical sole ulcers (Rusterholz ulcers). Veterinary Record
151, 694-698.
Mahendran, S., Huxley, J., Chang, Y.-M., Burnell, M., Barrett, D., Whay, H.,
Blackmore, T., Mason, C., Bell, N., 2017. Randomised controlled trial to
evaluate the effect of foot trimming before and after first calving on
subsequent lameness episodes and productivity in dairy heifers. The
Veterinary Journal 220, 105-110.
Manske, T., Hultgren, J., Bergsten, C., 2002a. The effect of claw trimming on the
hoof health of Swedish dairy cattle. Preventive Veterinary Medicine 54,
113-129.
Manske, T., Hultgren, J., Bergsten, C., 2002b. Prevalence and interrelationships of
hoof lesions and lameness in Swedish dairy cows. Preventive Veterinary
Medicine 54, 247-263.
Manson, F.J., Leaver, J.D., 1988. The influence of dietary protein intake and of
hoof trimming on lameness in dairy cattle. Animal Science 47, 191-199.
Meimandi-Parizi, A., Shakeri, M.A., 2007. Abattoir study of radiographic changes
of bones and joints of digital region in cattle with abnormal claws.
Veterinarski Arhiv 77, 187-194.
Miranda-de La Lama, G.C., Mattiello, S., 2010. The importance of social
behaviour for goat welfare in livestock farming. Small Ruminant Research
90, 1-10.
Moleman, M., Heel, M., Weeren, P., Back, W., 2006. Hoof growth between two
shoeing sessions leads to a substantial increase of the moment about the
distal, but not the proximal, interphalangeal joint. Equine Veterinary
Journal 38, 170-174.
Offer, J., McNulty, D., Logue, D., 2000. Observations of lameness, hoof
conformation and development of lesions in dairy cattle over four
lactations. The Veterinary Record 147, 105-109.
189
Pesenhofer, G., Palme, R., Pesenhofer, R., Kofler, J., 2006. Comparison of two
methods of fixation during functional claw trimming-walk-in crush versus
tilt table-in dairy cows using faecal cortisol metabolite concentrations and
daily milk yield as parameters. Veterinary Medicine Austria 288-294.
Phillips, C.J.C., Chiy, P.C., Bucktrout, M.J., Collins, S.M., Gasson, C.J., Jenkins,
A.C., Paranhos da Costa, M.J.R., 2000. Frictional properties of cattle
hooves and their conformation after trimming. Veterinary Record 146,
607-609.
Pugh, D.G., Baird, N.N., 2012. Sheep & Goat Medicine-E-Book. Elsevier Health
Sciences, Philadelphia, PA.
Randall, L., Green, M., Chagunda, M., Mason, C., Archer, S., Green, L., Huxley,
J., 2015. Low body condition predisposes cattle to lameness: An 8-year
study of one dairy herd. Journal of Dairy Science 98, 3766-3777.
Riemersma, D., Van den Bogert, A., Jansen, M.O., Schamhardt, H., 1996.
Influence of shoeing on ground reaction forces and tendon strains in the
forelimbs of ponies. Equine Veterinary Journal 28, 126-132.
Rizk, A., Herdtweck, S., Meyer, H., Offinger, J., Zaghloul, A., Rehage, J., 2012.
Effects of xylazine hydrochloride on hormonal, metabolic, and
cardiorespiratory stress responses to lateral recumbency and claw
trimming in dairy cows. Journal of the American Veterinary Medical
Association 240, 1223-1230.
Shearer, J.K., van Amstel, S.R., 2001. Functional and corrective claw trimming.
Veterinary Clinics of North America: Food Animal Practice 17, 53-72.
Shearer, J.K., van Amstel, S.R., Brodersen, B.W., 2012. Clinical Diagnosis of
Foot and Leg Lameness in Cattle. Veterinary Clinics: Food Animal
Practice 28, 535-556.
Shearer, J.K., van Amstel, S.R., Gonzalez, A., 2005. Manual of foot care in cattle.
Hoard's Dairyman Books, Fort Atkinson, Wisconsin.
Solis-Ramirez, J., Lopez-Villalobos, N., Blair, H., 2011. Dairy goat production
systems in Waikato, New Zealand, Proceedings of the New Zealand
Society of Animal Production, Invercargil, New Zealand, pp. 86-91.
Somers, J.G.C.J., Frankena, K., Noordhuizen-Stassen, E.N., Metz, J.H.M., 2003.
Prevalence of Claw Disorders in Dutch Dairy Cows Exposed to Several
Floor Systems. Journal of Dairy Science 86, 2082-2093.
Somers, J.G.C.J., Schouten, W.G.P., Frankena, K., Noordhuizen-Stassen, E.N.,
Metz, J.H.M., 2005. Development of claw traits and claw lesions in dairy
cows kept on different floor systems. Journal of Dairy Science 88, 110-
120.

190
Tarlton, J., Holah, D., Evans, K., Jones, S., Pearson, G., Webster, A., 2002.
Biomechanical and histopathological changes in the support structures of
bovine hooves around the time of first calving. The Veterinary Journal
163, 196-204.
Toussaint Raven, E., Halstra, R.T., Peterse, D.J., 1985. Cattle footcare and claw
trimming. Farming Press Ltd, Ipswich, UK
Tranter, W.P., Morris, R.S., 1991. A case study of lameness in three dairy herds.
New Zealand Veterinary Journal 39, 88-96.
Tranter, W.P., Morris, R.S., 1992. Hoof growth and wear in pasture-fed dairy
cattle. New Zealand Veterinary Journal 40, 89-96.
Van Amstel, S.R., Shearer, J.K., 2006. Manual for treatment and control of
lameness in cattle. Wiley Online Library.
Van Der Tol, P.P.J., Van Der Beek, S.S., Metz, J.H.M., Noordhuizen-Stassen,
E.N., Back, W., Braam, C.R., Weijs, W.A., 2004. The effect of preventive
trimming on weight bearing and force balance on the claws of dairy cattle.
Journal of Dairy Science 87, 1732-1738.
Van Heel, M.C.V., van Weeren, P.R., Back, W., 2006. Compensation for changes
in hoof conformation between shoeing sessions through the adaptation of
angular kinematics of the distal segments of the limbs of horses. American
Journal of Veterinary Research 67, 1199-1203.
Van Hertem, T., Parmet, Y., Steensels, M., Maltz, E., Antler, A., Schlageter-Tello,
A.A., Lokhorst, C., Romanini, C.E.B., Viazzi, S., Bahr, C., Berckmans,
D., Halachmi, I., 2014. The effect of routine hoof trimming on locomotion
score, ruminating time, activity, and milk yield of dairy cows. Journal of
Dairy Science 97, 4852-4863.
Vermunt, J., 2004. Herd Lameness - A Review, Major Causal Factors, and
Guidelines for Prevention and Control, Proceedings of 13th International
Symposium and Fifth Conference on Lameness in Ruminants Maribor,
Slovenija, pp. 3-18.
Vermunt, J.J., Greenough, P.R., 1995. Structural characteristics of the bovine
claw: Horn growth and wear, horn hardness and claw conformation.
British Veterinary Journal 151, 157-180.
Viñuela-Fernández, I., Jones, E., Welsh, E.M. and Fleetwood-Walker, S.M., 2007.
Pain mechanisms and their implication for the management of pain in farm
and companion animals. The Veterinary Journal, 174, 227-239.
Webster, A., 2002. Effects of housing practices on the development of foot lesions
in dairy heifers in early lactation. Veterinary Record 151, 9-12.
Wiesner, H., 1985. Problems in the management of chamois in captivity. Croom
Helm London.

191
Winter, J.R., Kaler, J., Ferguson, E., KilBride, A.L., Green, L.E., 2015. Changes
in prevalence of, and risk factors for, lameness in random samples of
English sheep flocks: 2004–2013. Preventive Veterinary Medicine 122,
121-128.
Zobel, G., Freeman, H., Schneider, D., Henderson, H., Johnstone, P., 2018.
Behaviour of dairy goats managed in a natural alpine environment,
Proceedings if the 52nd Congress of the International Society for Applied
Ethology, Prince Edward Island, Canada.
Zobel, G., Neave, H.W., Webster, J., 2019. Understanding natural behavior to
improve dairy goat (Capra hircus) management systems. Translational
Animal Science 3, 212-224.
Zobel, G., Weary, D., Leslie, K., Chapinal, N., Von Keyserlingk, M., 2015.
Validation of data loggers for recording lying behavior in dairy goats.
Journal of Dairy Science 98, 1082-1089.
Zuba, J.R., 2012. Hoof disorders in nondomestic artiodactylids, Fowler's Zoo and
Wild Animal Medicine, Elsevier Saunders, St. Louis, Missouri.

192

193
Chapter Six
General Discussion

194
The overall focus of this thesis was to examine the hoof conformation and gait of
dairy goats and to evaluate how these factors are impacted by hoof trimming. The
aims were to firstly develop and validate a hoof conformation assessment for use in
dairy goats, and secondly to develop a reliable gait scoring system to allow
detection of an uneven gait and varying degrees of lameness. Following on from
the development of these methods, I then aimed to use the hoof conformation
assessment and gait scoring system to aid in evaluating the impact of hoof trimming
regimes on the structure and functioning of dairy goats’ hooves. The hoof
conformation assessment was used in an observational study across 16 farms to
explore the relationship between timing and frequency of hoof trimming and hoof
conformation. Finally, in an experimental study on one farm, both the hoof
conformation assessment and gait scoring system were used in conjunction with
other measures to evaluate the immediate impacts of hoof trimming on anatomical
(i.e. hoof conformation, joint positions) and behavioural variables (i.e. lying
behaviour). Additionally, the longer-term effects of trimming prior to first kidding
on anatomical variables and gait were evaluated.
The lack of data on aspects of dairy goat hoof health became apparent during my
literature review in Chapter 1. Notably, there were few published data investigating
hoof conformation, lameness, and hoof trimming in goats, thus most of the literature
discussed in my review was based on dairy cow research. Furthermore, it should be
noted that the published literature on the benefits of preventative hoof trimming in
dairy cows is limited. The literature available largely reflects opinions based on
clinical experience rather than the findings of primary research, and therefore I
acknowledge a number of the references used within this thesis are not from
195
evidence-based literature. However, I have endeavored to reference primary
research where possible.
In this final chapter, I will discuss the findings of each of the chapters by
considering the literature gaps they aimed to address, and the wider implications of
the results. I will also discuss limitations of the work and highlight possible areas
of future research.
6.1. Main findings and implications
6.1.1. Prevalence of clinical lameness and uneven gait
There are currently no published peer reviewed data reporting lameness prevalence
in New Zealand dairy goats. In an industry survey from the 2013-2014 season (n =
30 farms), dairy goat farmers reported a lameness prevalence of 2% or less (Ganche
et al., 2015). However, farmers commonly underestimate lameness within their
herds (cows: Whay et al., 2002; Espejo et al., 2006). As lameness can be more
difficult to detect in dairy goats due to their quick movement (Chapter 3), I suggest
that there may be greater potential for underestimation of lameness by dairy goat
farmers. Additionally, this industry survey did not provide a standardised definition
of lameness, and therefore it is unknown what levels/degrees of lameness are
represented.
A systematic survey of lameness prevalence on New Zealand dairy goat farms is
needed. However, reliable methods of identifying and grading lameness and its
precursors are required to accurately estimate prevalence. More specifically this
requires gait scoring systems that facilitate the detection of the full range of gait
abnormalities. The previous gait scoring systems that have been used in dairy goats
196
focus on the presence of a distinct limp and do not allow for the detection of an
uneven gait, a potential precursor to lameness. Lameness often develops over time,
for instance, there is a delay of weeks between the time corium damage occurs and
the time a sole ulcer becomes apparent in dairy cows (Bradley et al., 1989).
Therefore early detection of subtle signs of lameness promotes early treatment,
which increases the chance of a full recovery (cows: Groenevelt et al., 2014) and
may reduce suffering by preventing the cause of the lameness from worsening
(cows: Leach et al., 2012).
The purpose of chapter 3 was to develop a reliable gait scoring system that also
detected an uneven gait, a potential precursor to lameness.The developed 5-point
gait scoring system was compared to the 4-point system previously used in dairy
goats (Anzuino et al., 2010) and was determined to be more sensitive. For instance,
in the 1st training session using the 4-point system 81% of the goats were assigned
score 1 (normal gait), while using the developed 5-point system only 36% of the
goats were assigned score 1 (normal gait), with 50% assigned score 2 (uneven gait).
Thus, the 5-point system provides a method to allow identification of animals that
may be predisposed to developing clinical lameness.
6.1.1.1.Preliminary information on the prevalence of clinical lameness
Clinical lameness refers to an animal with an obviously lame gait and a definite
limp (gait score ≥ 3) (Espejo et al., 2006). In the study completed at the AgResearch
goat facilities (Chapter 3), I report a prevalence of clinical lameness of 14% at the
week 1 training session when using the 5-point score. When the subsequent 5
assessments are considered, a similar prevalence of clinical lameness was observed
(range: 10-17% across 5 consecutive weekly assessments). This is similar to levels

197
reported from UK studies where between 9.1% (Hill et al., 1997) and 19.2 % of
goats had a definite limp (Anzuino et al., 2010). In contrast, the prevalence of
animals with a lame gait (score ≥ 3) on one commercial farm (Chapter 5) was lower
than I expected (range: 0 – 9%, across 5 assessments, during first two years of life).
The data presented in my thesis regarding clinical lameness was from one
AgResearch research herd and from one commercial farm. I suggest it is not
representative of the New Zealand dairy goat industry. However, a lameness
prevalence of 5% or more should prompt an investigation of the cause and
implementation of a control programme (sheep: Winter, 2004). Indeed, the Farm
Animal Welfare Council proposed that the prevalence of lameness in sheep should
fall from 10% to 5% by 2016, and to 2% by 2021 (FAWC, 2011). Therefore, further
investigation into the prevalence of lameness on New Zealand dairy goat farms is
required.
6.1.1.2.Preliminary information on the prevalence of an uneven gait
Using the developed 5-point gait scoring system I have provided some preliminary
information on the prevalence of an uneven gait in New Zealand dairy goat herds.
There were high proportions of uneven gait reported in the research herd (Chapter
3) at training session 1, and this persisted over the 7-week study period (range: 52-
75% across 5 assessments, n = 48 goats).The goats enrolled in that study were 2
and 3-year-old lactating does from a local farm where they had been permanently
housed on wood shavings. During the study period they were housed on rubber
matting and shavings. Therefore, the high proportions of uneven gait observed may
be due to the hooves being sensitive while they acclimated to the different flooring
198
substrates. The goats’ hooves acclimatising may have also accounted for some of
the clinical lameness observed in the research herd.
However, a similar prevalence of score 2s were observed at the 25-month
assessment (Assessment 6) on one commercial farm, where goats were permanently
housed on shavings, with 43% of 2-year-old goats assigned an uneven gait (Chapter
5). In contrast, prevalence of an uneven gait ranged from 8 – 26% at the previous
assessments completed across the first two years of life on this farm. At the 25-
month assessment the goats were a similar age to the goats for whom results are
reported in Chapter 3. This highlights that many dairy goats do not walk in a sound
manner and an uneven gait may become more prevalent as the goats get older.
It should be noted that an uneven gait is not necessarily linked to lameness. For
example, this movement pattern may be caused by udder fill causing abduction or
adduction of the hind legs in the swing phase of the stride (cows: Greenough et al.,
1997; Flower et al., 2006). However, all gait scoring in Chapter 3 and 5 was
completed following milking to try to minimise these effects. Additionally, hoof
overgrowth is associated with altered biomechanics (cows: van Amstel and Shearer,
2001) and may cause an altered gait, such as paddling of the limbs (sheep: Bokko
et al., 2003). As gait assessments in Chapter 5 were completed prior to trimming,
hoof overgrowth may be responsible for the high prevalence of uneven gait.
Nevertheless, the cause of the gait unevenness should be investigated, and treatment
provided if deemed necessary.
6.1.1.3. Possible parturition effect impacting lameness prevalence
199
An interesting pattern in the prevalence of lameness was observed on one
commercial farm (Chapter 5). There was a possible parturition effect, with the odds
of goats having an impaired gait (uneven or lame gait) increasing following kidding.
A parturition effect causing an increase in lameness has been reported in dairy cows
(Offer et al., 2000; Tarlton et al., 2002) and there is limited evidence previously
reported in dairy goats (Groenevelt et al., 2015).
High proportions of overgrowth and poor conformation were observed at all four
assessments before trimming. I suggest this may have a greater impact at kidding
than at the other assessments which were completed during lactation. For instance,
the long-toe dipped heel conformation caused by hoof overgrowth results in rotation
of the distal phalanx, thus increasing the risk of sole ulcers in dairy cows (Blowey,
1992). Dairy cows may lose body condition during gestation (Markusfeld et al.,
1997), which in turn can reduce the thickness of the digital cushion (Bicalho et al.,
2009). A thinner digital cushion has less shock absorbing capacity which may
further increase the risk of sole ulcers and other lesions (Bicalho et al., 2009). To
my knowledge, there are no data investigating the role of the digital cushion in the
hooves of dairy goats. However, a thinner digital cushion around parturition may
explain the higher prevalence of uneven and lame gait following kidding and
suggests that more attention to hoof management is required around this time.
Other factors may contribute to the higher observed prevalence of impaired gait
after kidding. Prior to parturition a nonlactating period (dry period) is believed
necessary to allow mammary tissue time to recover and repair (Capuco et al., 1997).
The dry off period for dairy goats is commonly 50-60 days long (Pugh and Baird,
2002; Caja et al., 2006). During this time their exercise regime is altered as they are
not visiting the parlour twice a day for milking, resulting in many goats spending

200
24 hours of the day in their shaving bedded barns. After kidding there may be an
acclimation period during which the hooves must adapt to walking on concrete
again once the goat joins the milking herd.
Furthermore, there are a number of other factors during the period when an animal
transitions from dry to the milking herd that can lead to lameness (cows: Bell, 2015).
During this transition period in dairy cows, the hormonal changes that impact the
suspensory apparatus within the hoof are a major contributory factor to the
development of sole lesions (Tarlton et al., 2002). Additionally, negative energy
balance (Collard et al., 2000) and needing to compete in a different social hierarchy
and environment can increase the likelihood of lameness around parturition in dairy
cows (Mahendran and Bell, 2015). As there are currently no data investigating hoof
health during the transition period in dairy goats, I suggest this is an area that
warrants further investigation.
6.1.2. Hoof conformation
In dairy goats, hoof deformation resulting from hoof overgrowth is a key cause of
lameness (Ajuda et al., 2014; Ajuda et al., 2019). Therefore, it is important that
animals with poor conformation can be identified. Prior to my research there were
no validated goat specific methods of assessing hoof conformation.
As reported in Chapter 2, I developed a reliable hoof conformation assessment for
use in dairy goats. Both the objective measures and subjective scores used to assess
aspects of hoof conformation could be accurately applied to photographs of hooves.
Additionally, two subjectively scored aspects of conformation were validated
against the objective measurements. These findings indicated that the subjective

201
scores may be appropriate to use rather than the more time-consuming objective
measures. Furthermore, the subjective scores would be more applicable to an on-
farm setting, as the objective scores require photographs and technical equipment.
6.1.2.1. Preliminary information on the prevalence of poor conformation
Previous studies in the UK have reported high prevalence of hoof overgrowth in
dairy goats (84-100%: Hill et al., 1997; Anzuino et al., 2010; Ajuda et al., 2019)
and the results of the studies reported in this thesis have found similar prevalence
levels. Prior to trimming the prevalence of overgrown hooves on one commercial
farm (Chapter 5) ranged from 55-97% at four assessments over the first two years
of life. Additionally, high prevalence of poor hoof conformation was observed prior
to trimming on this farm, particularly in the hind hooves. For instance, the
prevalence of dipped heels ranged from 85-98%, and misshaped claws ranged from
38-67%. The proportions of dipped heels and misshaped claws decreased following
hoof trimming, (range: 42-68%, and 17-33% respectively) suggesting an
association between hoof overgrowth and poor conformation.
Hoof overgrowth in dairy goats is not unique to New Zealand, but is a common
issue in all commercially indoor housed goats (UK: Anzuino et al., 2010; Italy:
Battini et al., 2016; Portugal: Ajuda et al., 2019). Overgrown hooves are caused by
lack of opportunity to naturally wear hooves and inadequate trimming practices
(AWIN, 2015). As reported in Chapter 5, dairy goats’ hooves grow at
approximately 4mm a month. If only trimmed every 4 months as is common
practice, (Chapter 5) this can amount to a considerable amount of growth. Without
opportunities for goats to wear their hooves, more frequent hoof trimming would
be required to prevent hoof overgrowth.

202
6.1.3. Hoof trimming
Through the validation of both scoring methods in the first two experimental
chapters, I was able to apply these methods to improve my understanding of the
anatomical and behavioural effects of hoof trimming. This included the immediate
effects of hoof trimming, and the impacts of early life trimming and subsequent
trimming frequency.
In this thesis, the term ‘early life trimming’ is used to describe whether goats were
trimmed before first kidding; when cow literature is discussed, it refers to trimming
heifers prior to first calving.
6.1.3.1. Immediate effects of hoof trimming
The aim of hoof trimming is to improve conformation by removing hoof
overgrowth (Bryan et al., 2012). In an experimental study on one farm (Chapter 5),
trimming was completed by a trained veterinarian and was successful in reducing
overgrowth. Furthermore, trimming consistently resulted in a toe length ratio of
<0.5 in the front and hind hooves, which indicates that trimming was done
appropriately. Interestingly, a similar toe length has been observed in goats kept in
an alpine environment that had not been trimmed for a number of months (Zobel et
al., 2019). In that study, the goats travelled upward of 3km in a 24 hour period and
had therefore naturally worn their hooves (Zobel et al., 2018), reducing the need for
frequent trimming.
Hoof trimming immediately improved other aspects of hoof conformation, notably
the prevalence of dipped heels and misshaped claws were reduced in the hind
hooves following trimming (Chapter 5). Additionally, hoof trimming reduced the
203
deviation of the joint positions in the distal limb. The deviation of the DIPJ signifies
rotation of the distal phalanx, and therefore restoring this to an anatomically correct
position is beneficial to reduce the risk of sole ulcers (cows: Blowey, 1992).
While there were immediate benefits of hoof trimming (Chapter 5), the process of
trimming may be both stressful and painful and the impacts of this on the animal
should be considered (cows: Pesenhofer et al., 2006). An increase in lying time and
gait score indicative of lameness has been reported in dairy cows following hoof
trimming and may be interpreted as a pain response (Chapinal et al., 2010; Van
Hertem et al., 2014). The increased time spent lying (increased lying time range: 2-
4 hours) observed on the day following trimming (at 3 of the 4 assessments; Chapter
5) suggests trimming impacts this behaviour. However, due to high variability in
lying behaviour even prior to trimming the data should be interpreted with caution.
Completing gait scores post trimming would provide information about the
lameness status of the animal and thus provide some evidence as to whether the
goats are indeed in pain following trimming.
6.1.3.2. Effects of early life trimming and subsequent trim frequency
While hoof trimming is known to be important for dairy animals, my work is the
first to evaluate the effects of early life trimming on aspects of hoof health in dairy
goats.
In the observational study across 16 dairy goat farms (Chapter 4), goats that had not
been trimmed prior to first mating (8.0 ± 0.70 months) had greater odds of poor
hind hoof conformation (overgrown hooves, dipped heels and misshaped claws) at
that time than compared with goats on farms that had already trimmed. In the longer

204
term, goats on farms that had not trimmed before first kidding (14.8 ± 0.86 months)
had greater odds of having dipped heels on the hind hooves at the end of second
lactation (34.1 ± 0.90 months).
In contrast in the experimental study on one commercial farm, there were only
minor long-term effects of trimming before first kidding (trimmed at 5 and 9 months)
on hoof conformation and joint positions and these were not consistent at
assessments at the end of the first (13 months) and second (25 months) lactations.
However, neither treatment (either trimmed twice in early life or not trimmed until
after first kidding) prevented hoof overgrowth and poor conformation, suggesting
that time of first trimming as well as the frequency of subsequent trimming may be
important
In terms of subsequent trimming frequency, the results from the observational and
experimental study indicate that the trimming frequencies included in these studies
were not appropriate to prevent poor hoof conformation. On one commercial farm
(Chapter 5) following the initial early life trimming all goats were trimmed every 4
months. As high prevalence of poor conformation was observed in both the early
and late trimmed treatments it suggests that the subsequent hoof trimming was not
frequent enough to prevent overgrowth. Across 16 farms, two of the regimes both
trimmed before first kidding, with one trimming ≥ 4 times per year thereafter, and
the other trimming 2-3 times per year thereafter. There were no differences in the
risk of hoof overgrowth and poor conformation between those two trimming
frequencies (Chapter 4), high proportions of poor conformation were observed in
both. However, the time since last trim was not taken into consideration. Therefore,
this will have impacted the amount of overgrowth and consequently the hoof

205
conformation observed, given the observed effects immediately after trimming on
hoof overgrowth, conformation and joint positions (Chapter 5).
In dairy heifers it is suggested that early life hoof management is important to
reduce the future risk of poor conformation and lameness (Offer et al., 2000; Bell
et al., 2009). Early life trimming is particularly important for heifers managed
indoors because they have little opportunity to wear their hooves, and may be
required as early as six months of age (Amstutz, 1985). As dairy goat kids are
typically reared indoors on soft bedding materials such as straw or shavings, early
life trimming is likely to be equally important. In the observational study across 16
farms there were high proportions of poor conformation observed (Chapter 4) at the
assessment at first mating. This suggests that trimming at an even younger age than
first mating may be required to prevent these poor conformation traits.
At the end of the second lactation the mean proportions across 16 farms were above
50% for dipped heels, misshaped claws, and splayed claws in the hind hooves.
Interestingly, at the end of the second lactation (Chapter 4) the proportion of hoof
overgrowth (range: 11-30%) was lower than the other aspects of poor conformation.
This suggests that the hoof trimming regimes were successful in reducing
overgrowth but not successful at correcting other aspects of conformation in the
longer term.
It was not within the scope of the study reported in Chapter 4 to investigate whether
the high levels of poor conformation increased the risk of lameness. High
proportions of poor conformation (overgrown toes, dipped heels, misshaped claws
and splayed claws) were observed before trimming at each of the four assessments
on one commercial farm (Chapter 5). However, although many goats were assessed

206
as having an uneven gait (range: 12.1-42.6%, across 5 assessments) few goats were
reported as clinically lame (0-9%, across 5 assessments) during the study period.
Dipped heel conformation and misshaped claws are associated with claw lesions
and lameness in dairy goats (Hill et al., 1997; Ajuda et al., 2014), therefore, it would
be valuable to further investigate the associations between an uneven gait, a lame
gait, and poor conformation. This will be discussed further below.
6.1.4. Other reasons for poor conformation
Factors other than the start and frequency of trimming may impact hoof
conformation. For example, hoof shape in dairy cows is in part dependent on the
trimming technique used (Vermunt and Greenough, 1995), therefore poor trimming
technique may cause poor conformation (Clarkson et al., 1993). It is possible that
this may be responsible for some of the poor conformation observed across the 16
farms (Chapter 4). For instance, over 50% of the hind hooves of goats were
misshaped at the assessment at the end of the second lactation.
However, there are also several environmental factors that impact upon hoof
conformation, such as flooring substrate (cows: Telezhenko et al., 2009). In Chapter
4, over 70% of the front and hind hooves of the goats were splayed, while in the
experimental study on one farm (Chapter 5), over 60% of the front hooves of the
goats were splayed at the end of the second lactation. All trimming in the
experimental study was completed by the same trained veterinarian using the
trimming approach used by Pugh and Baird (2002) and yet high proportions of
splayed claws were observed. This suggests there is a commonality among the
farms included in Chapters 4 and 5 that may be resulting in splayed claws. For
instance, dairy goats in New Zealand are typically bedded on wood shavings.

207
Indeed, it is suggested that claw splay is due to hooves adapting to softer flooring
substrates (Zuba, 2012). Therefore, the environment may be having a greater impact
on claw splay than hoof trimming.
Further, there may be a genetic component to the poor conformation observed
(cows: Bergsten, 2001). It is suggested that dairy heifers be closely examined for
conformational hoof traits prior to mating (Anderson and Rogers, 2001). If an
animal has poor conformation it should be not be considered as a viable replacement
(Anderson and Rogers, 2001) or included in breeding programmes (Baggott, 1982).
In dairy cattle, an improvement in foot and leg conformation traits is possible by
considering the claw measurements of future bulls (Boelling et al., 2001). No
information to evaluate a genetic component to poor conformation was gathered in
my studies, but I suggest that this is an area that may need considering in dairy goats.
However, methods of evaluating hoof conformation need to be standardised in
order to assess genetic associations and heritability. To be useful for this purpose,
the subjective aspects of the hoof conformation assessment developed (Chapter 2)
need testing in an on-farm setting. If reliable they could be used to determine those
goats with poor conformation and therefore indicate animals that may not be
suitable to breed from.
6.2. Management and animal welfare implications
Good hoof trimming protocols should include consideration for when trimming
begins and the frequency of subsequent trimming. Additionally, other factors need
to be considered when deciding on appropriate hoof care, such as, the provision of
opportunities for goats to naturally wear their hooves. This may aid in reducing
hoof overgrowth and the associated risk of poor conformation, thus decreasing the

208
need for frequent hoof trimming. I propose that hoof management in dairy goats
needs to be reviewed and protocols updated, with timing of first trimming, trimming
frequency and housing environments examined.
Hoof and leg disorders become more prevalent with more confined management
systems, as environmental conditions such as flooring substrate and poor hygiene
can influence hoof conformation (Bergsten, 2001). The results reported on one
commercial farm (Chapter 5) highlight that trimming more frequently than every 4
months is required to prevent hoof overgrowth and poor conformation when goats
are housed in an environment that does not promote hoof wear. In their natural
environment, goats populate hilly rugged environments (Zobel et al., 2019) and
indeed, when dairy goats are given the choice they prefer to be on harder flooring
substrates rather than shavings (Sutherland et al., 2017). Therefore, including hard
surfaces in the environment of commercially housed goats may be advantageous
for better meeting their preferences as well as promoting hoof wear, thus reducing
the need for such frequent trimming.
Similarly, to dairy goats, overgrown hooves are also an issue in captive zoo
ungulates due to decreased activity levels and reduced opportunity for hoof wear
compared to their wild counterparts (Huffman, 2013). Indeed, the Association of
Zoos and Aquariums (AZA) recommends providing abrasive flooring substrates
such as textured cement or crushed gravels in walkways and high traffic areas to
promote hoof wear (zebra: Fischer and Shurter, 2001, giraffe: Jolly, 2003). I suggest
that modifications to dairy goat housing to include abrasive surfaces may help with
hoof health issues, such as overgrowth and lameness. For instance, an outdoor
environment promotes more activity in dairy goats (Freeman et al., 2018). If the
outdoor environment is equipped with abrasive flooring substrates and/or climbing
209
opportunities this may encourage hoof wear and promote hoof health. Additionally,
enriched environments promote more activity in dairy goats and decrease abnormal
behaviours (Gomes et al., 2018), by encouraging more species specific behaviour
(van de Weerd and Day, 2009). This may improve animal welfare by promoting
positive affective states, promoting the performance of natural behaviours and
improving biological functioning.
The higher prevalence of lameness observed following kidding on one farm
(Chapter 5) may be a result of several factors. However, reducing extreme changes
in management around this time is likely to reduce lameness risk. For instance,
farmers could move the goats through the milking parlour during the dry period to
increase activity levels and to ensure the goats’ hooves are exposed to concrete
during this time. Exposure to the milking parlour and the concrete walkways may
be particularly important for primiparous goats as they will have had minimal prior
contact with concrete. Furthermore, keeping groups of goats as stable as possible
during the dry period and transition period may reduce the stress on the goats (Patt
et al., 2012), thus reducing the risk of antagonistic interactions and reducing
lameness risk (cows: Mahendran and Bell, 2015).
6.3. Limitations
A key limitation of the work completed for this thesis is that the developed hoof
conformation assessment and 5-point gait scoring system have not been tested in an
on-farm setting. In addition, the hoof conformation assessment required
considerable training prior to starting scoring of the photos, while some aspects
required intermittent training throughout the course of the study to ensure ongoing
reliability. The subjective scores would be most applicable to an on-farm setting.

210
Therefore, as the toe length and heel scores were reliably scored throughout, I
propose that these could be more readily trialled on farm.
The gait scoring system was developed using live observations of goats; however
this was in a controlled setting at the AgResearch Goat Research Facility, with the
goats released one at a time from the milking parlour. This would not be feasible if
trying to score a whole herd on farm. The 5-point system was used reliably in
Chapter 5; however, the scoring was completed from videos, allowing the observers
to watch and re-watch the video before allocating a score. Further testing is required
to determine if an uneven gait can be identified in an on-farm setting. If this is not
feasible, other methods of detecting an uneven gait will need to be explored (e.g.,
pressure plates); this will be discussed in more detail below.
Several other factors apart from the timing of first hoof trimming and the frequency
of subsequent trimming may influence hoof conformation. For example, farm
management factors will have a large impact (cows: Mahendran et al., 2017). In the
16-farm observational study (Chapter 4), farm management factors (e.g. stocking
density, distance walked to parlour, diet) were not considered, making it difficult to
make definitive conclusions about the effects of the observed hoof trimming
regimes. In addition, time since last trimming needs to be taken into consideration
as the amount of overgrowth will influence the other aspects of hoof conformation.
Nonetheless the study provides preliminary evidence that first trimming prior to
first mating is beneficial to hoof conformation. It also highlights the high
proportions of poor hoof conformation in New Zealand dairy goats, suggesting
further work is needed in this area.

211
A key limitation to the experimental study (Chapter 5) was the sample size. A power
analysis was conducted for one of the main variables of interest (hoof growth
between trimming intervals), however this was conducted using data from a study
of horses due to the lack of data for either dairy cows or dairy goats in this area.
The small sample size is likely to have introduced type II errors, whereby failure to
reject a null hypothesis which is actually false occurs (i.e. true effects are not
detected). Indeed, retrospective power analysis suggested over 400 animals per
treatment group would have been required to observe a difference in gait scores
between trimming treatments.
Another limitation of the experimental study (Chapter 5) was the lying behaviour
data. There was high variability in daily lying time even prior to hoof trimming.
Nevertheless, an increase in lying time the day following hoof trimming was
determined at 3 of the 4 assessments. The results provide evidence that there is a
behavioural response to hoof trimming, however due to the variability the data
should be interpreted with caution. It is possible that unknown farm management
factors were having a greater impact on lying than the trimming process itself. The
reason for the increase in lying time following hoof trimming needs investigating
in a more controlled environment.
Hoof growth was measured in 80 goats on one farm (Chapter 5), however it would
also have been advantageous to measure hoof wear, as it would have provided more
information about changes in hoof length. Hoof wear could be measured using a
similar method to hoof growth in dairy cows (Tranter and Morris, 1992). Therefore,
the same mark that was made below the periople for hoof growth could have been
utilised to determine hoof wear, by measuring the distance from the mark down to
the weight bearing surface of the claw (Tranter and Morris, 1992). It may be

212
possible that once the hoof gets to a certain length it reaches a homeostasis where
hoof growth equals hoof wear. For instance, a longer toe may promote greater wear,
therefore hooves may be growing at similar rates, but wearing at different rates
depending on how overgrown they are.
6.4. Future work
The research outlined in this thesis provides a fundamental starting point and offers
a platform for much needed future work into the area of hoof health in dairy goats.
The key area that warrants further work is to firstly determine lameness prevalence
on New Zealand dairy goat farms. Secondly, causes of lameness in New Zealand
dairy goats need to be determined. Thirdly, more research is needed to investigate
the role of hoof trimming and alternative ways to promote good hoof health. Finally,
I believe there is a common goal among researchers and farmers to minimise
lameness. However, I suggest there needs to be awareness raised among farmers
around the impacts of lameness, poor conformation and the importance of early
detection.
6.4.1. Methods to estimate lameness prevalence
The 5-point scoring system presented in Chapter 3 may allow for trained observers
to determine a more accurate lameness prevalence in New Zealand dairy goats. As
seen in the results presented in the experimental study, lameness prevalence can
change depending on the stage of lactation/gestation. Therefore, a snapshot
prevalence would not accurately represent the lameness status of the industry, nor
provide information regarding potential causes of lameness or allow identification
of high-risk periods. I suggest that at least two gait scores on each farm would be

213
required, one following kidding (at the start of lactation) and one towards the end
of lactation.
Large herd sizes mean that gait scoring all animals may not be feasible. To reduce
the time costs, sampling strategies for monitoring lameness prevalence in dairy
cows have been investigated. For example, Main et al. (2010) developed a sampling
strategy based on the order that cows exited the milking parlour, allowing for a
calculated sample size of cows to provide an estimate of lameness prevalence within
5% of the true prevalence. The herd size of dairy goat farms in New Zealand range
from 210 to 1800 goats (average 650 goats) (Stafford and Prosser, 2016), therefore,
sampling strategies may need to be considered rather than gait scoring every animal.
However, dairy goats are known to be difficult to gait score in an on-farm setting.
The first step in determining an industry wide lameness prevalence should be to
establish whether an uneven gait can be identified on farm. If standardised protocols
cannot be developed to identify an uneven gait and thus use the 5-point system,
other methods to detect potential precursors of clinical lameness on farm should be
investigated.
Pressure plates have been used to monitor ground reaction forces exerted on each
claw at the claw-floor interface at standing and in walk in dairy cows (Van der Tol
et al., 2002). As a lame animal will try to reduce the weight on the affected limb,
this is a successful automated method of lameness detection, with minimal human
intervention (cows: Maertens et al., 2011). Gait analysis has also been completed
in sheep using pressure plates (Agostinho et al., 2012), and in goats trained to walk
over a pressure-sensing walkway (Rifkin et al., 2019), therefore demonstrating that
this method can be used in smaller ruminants. However, it is essential the animal
walks at a steady pace for accurate assessments of the weight bearing on each limb

214
(Maertens et al., 2011). Due to dairy goats often moving faster than a walk, I suggest
that using pressure plates while standing may be more appropriate, with the
potential for this to be completed while they stand in the milking parlour.
Monitoring behaviour by attaching wearable sensors to the animal is becoming
increasingly used in farm management of dairy cows (Berckmans, 2006). However,
there are few data investigating the use of sensors in dairy goat management.
Accelerometers are non-invasive devices that are commonly attached to the
animal’s leg in order to monitor lying behaviour (Blackie et al., 2011). As lame
animals lie longer than non-lame animals (Ito et al., 2010), accelerometers can be
used to detect lameness. Leg mounted acccelerometers have been validated for use
in dairy goats (Zobel et al., 2015), however, there are currently no data from them
evaluating if lying beahviour is associated with lameness. Accelerometers attached
to the leg require restraint of the animal and can result in an adjustment period of
two days in dairy cows (MacKay et al., 2012). I therefore suggest alternative
wearable devices should be investigated in dairy goats. Ear tags have been
successfully used to detect lameness in sheep (Barwick et al., 2018) and pigs
(Scheel et al., 2017), while a neck collar sensor has been used in cows (Van Hertem
et al., 2013), this could therefore be an area of future research in dairy goats.
Infrared thermography (IRT) is a non-invasive, remote method of measuring an
animal’s surface temperature (Cook and Schaefer, 2013) and IRT has been used to
detect lameness in dairy cows (Alsaaod et al., 2015) and sheep (Byrne et al., 2018).
The body surface temperature is a function of blood flow and metabolism rate of
the underlying tissues (Turner, 1991). Injured or diseased tissue have an altered
circulation, therefore, measuring changes in surface temperature of the hoof can
detect increased heat which may relate to inflammation and lameness (horses: Eddy

215
et al., 2001), as claw lesions cause an increase in inflammation and therefore an
increase in temperature of the affected limb (cows: Alsaaod and Büscher, 2012).
The use of IRT to detect lameness in dairy goats should be investigated, however I
question its on-farm applicability due to a controlled environment being required
(Alsaaod et al., 2014).
6.4.2. Causes of lameness
Lameness is condition indicative of pain (Anil et al., 2002; Whay et al., 1997), with
hoof lesions associated with approximately 90% of lameness in cattle (Murray et
al., 1996). However, it is important to note that lesions do not always cause
lameness (Logue et al., 1994). Indeed, Manske et al., (2002) found no association
between the most prevalent hoof lesions (e.g. heel erosion, sole haemorrhage and
dermatitis) and lameness on 101 Swedish dairy cows farms. However, the authors
highlight that the environment in which gait was assessed was often suboptimal and
the estimate of lameness prevalence may have been underestimated. Furthermore,
pain is a complex and individualistic experience (Viñuela-Fernández et al., 2007)
and therefore not all animals will react in the same way. There is research from the
UK suggesting that bacterial claw lesions are a major risk factor of lameness in
dairy goats (Groenevelt et al., 2015; Groenevelt, 2017), However, the aetiology of
these lesions was not clear and the authors suggested lesions may have first
developed as a white line lesion or sole ulcer, with the treponeme infections being
secondary (Groenevelt et al., 2015). The major causes of lameness in New Zealand
dairy goats need investigating. Future work should focus on the categorisation and
aetiology of claw lesions in dairy goats, and the impact this has on the gait of the
animal.

216
Poor conformation traits such as overgrown hooves and dipped heels increase the
risk of claw lesions and lameness in dairy cows (Blowey, 1992) and goats (Ajuda
et al., 2014, Ajuda et al., 2019). However, it should be noted that primary research
to support this claim is lacking. The work in this thesis was based around the
assumption that poor conformation would cause lameness in New Zealand dairy
goats. However, in the experimental study (Chapter 5) high proportions of poor
hoof conformation were reported, but low levels of clinical lameness (gait score ≥
3) were observed. It is possible that the goats were able to adapt to some deviation
from anatomically correct conformation without gait being acutely impacted.
However, I caution that these data were collected on one commercial farm and are
therefore not representative of the wider population of New Zealand dairy goat
farms. Furthermore, although clinical lameness was lower than expected there were
many goats scored as having an uneven gait (Chapters 3 and 5). Some of the
possible reasons for this have been discussed previously in this chapter (e.g. hoof
overgrowth, udder fill, early development of a claw lesion). Further work needs to
be completed to determine the cause for the uneven gait and whether it develops
into clinical lameness. Additionally, I suggest that the goats in the experimental
study (Chapter 5) needed following past their second lactation to determine if
chronic, long term poor conformation results in lameness as the goats get older.
Indeed, Ajuda et al (2019) report an association between hoof overgrowth, poor
conformation and lameness in dairy goats aged 2-5 years of age. Determining if
lameness risk increases with age and prolonged poor conformation may help to
establish trimming management and treatment protocols. The increase of lameness
around kidding should also be considered, to determine if there are management
practices that could be put in place during this potentially critical period.

217
6.4.3. Hoof trimming
Given the failure of common trimming practices to prevent poor hoof conformation
in my studies, an investigation into how the provision of alternative flooring
substrates promotes hoof wear in dairy goats is required. Less frequent trimming
would reduce the potential negative impacts on the goat, and also reduce the
economic costs to the farmers in terms of paying contractors and mitigating any
drop in milk yield following trimming (cows: Pesenhofer et al., 2006).
To my knowledge there are no data investigating hoof trimming techniques in dairy
goats. The main source of trimming information regarding hoof trimming in goats
is from veterinary text books (e.g. Sheep and Goat Medicine: Pugh and Baird, 2002).
However, it is unlikely that contractors and farm workers/managers will be exposed
to this information. Indeed, in a recent survey of dairy cattle in the US, there was a
lot of variation in the training contract trimmers were exposed to, with most (65%)
stating they learnt from an apprenticeship, and 30% stating they learnt primarily
through experience (Kleinhenz et al., 2014).
I suggest that standardisation of information is important in the hoof trimming of
dairy goats. However, the appropriate standard can only be recommended once the
efficacy of trimming techniques in dairy goats has been evaluated. This needs to
include establishing an appropriate trimming frequency and determining the
effectiveness of techniques used in terms of promoting good conformation and
reducing lameness. In the experimental study completed on one farm (Chapter 5)
trimming every 4 months was not frequent enough to prevent hoof overgrowth and
poor conformation. Dairy goats hooves may need trimming as often as every 6-8
weeks depending on the housing environment (Pugh and Baird, 2002). I think it is

218
also important to note that as bacterial lesions are prevalent in the UK, trimmers in
New Zealand need to ensure equipment is disinfected between animals as a
precaution of spreading bacterial disease (Sullivan et al., 2014).
6.4.4. Raising awareness
Finally, I believe a complimentary approach to reducing lameness in the dairy goat
industry will be through increasing awareness among farmers. Farmers commonly
underestimate lameness (cows: Whay et al., 2002; Espejo et al., 2006). While this
may be due to difficulties in detecting subtle signs of lameness (Mill and Ward,
1994), it may also be due to a lack of understanding of the impact of lameness and
the importance of identifying lameness as early as possible (Whay et al., 2002).
One way of increasing awareness among farmers is through workshops. Following
a farmer workshop in Ontario Canada, 73% (n=19) of participants stated that the
information provided had altered their views on lameness (Deeming et al., 2016).
Whether this translates into altered practice remains to be evaluated.
Another way of promoting behaviour change among farmers is through
benchmarking. This process measures aspects of farm performance, thus allowing
producers to evaluate their current performance relative to others (von Keyserlingk
et al., 2012) and can encourage farmers to make changes to management in an effort
to improve performance (Atkinson et al., 2017; Sumner et al., 2018). Benchmarking
could provide an opportunity to increase awareness and motivate change (if
required) on New Zealand dairy goat farms.

219
6.5. Final conclusions
As lameness is one of the major welfare issues in the dairy industry, efforts need to
be made to minimise its occurrence and to understand the factors contributing to it.
The studies presented in this thesis have provided insights into the hoof
conformation and gait of dairy goats and how these factors are impacted by hoof
trimming. Hoof trimming was shown to have some short-term beneficial impacts
on hoof conformation and joint positions. However, the trimming practices
evaluated in these studies did not appear adequate to avoid poor conformation.
Overall, the results of my thesis suggest that a multifaceted approach is required
when considering hoof conformation and lameness in dairy goats. Hoof
management strategies should consider the timing of first hoof trimming and
subsequent trimming frequency, the trimming techniques used, as well as providing
an environment that promotes hoof wear, good conformation and hoof health. The
results of my research provide an essential starting point; however, there is still
significant work required in the area of hoof conformation and lameness in dairy
goats.
6.6. References
Agostinho, F.S., Rahal, S.C., Araújo, F.A.P., Conceição, R.T., Hussni, C.A., El-
Warrak, A.O., Monteiro, F.O.B., 2012. Gait analysis in clinically healthy
sheep from three different age groups using a pressure-sensitive walkway.
BMC Veterinary Research 8, 87.
Ajuda, I.G., Battini, M., Stilwell, G.T., 2019. The role of claw deformation and
claw size on goat lameness. Veterinary and Animal Science 8, 100080.
Ajuda, I.G., Vieira, A., Stilwell, G.T., 2014. Are there differences in dairy goats
claws' temperature, before and after trimming?, 2014 IEEE International
Symposium on Medical Measurements and Applications (MeMeA),
Lisbon, Portugal pp. 1-5.
Alsaaod, M., Büscher, W., 2012. Detection of hoof lesions using digital infrared
thermography in dairy cows. Journal of Dairy Science 95, 735-742.
220
Alsaaod, M., Schaefer, A.L., Büscher, W., Steiner, A., 2015. The role of infrared
thermography as a non-invasive tool for the detection of lameness in
cattle. Sensors 15, 14513-14525.
Alsaaod, M., Syring, C., Dietrich, J., Doherr, M.G., Gujan, T., Steiner, A., 2014.
A field trial of infrared thermography as a non-invasive diagnostic tool for
early detection of digital dermatitis in dairy cows. The Veterinary Journal
199, 281-285.
Amstutz, H.E., 1985. Prevention and Control of Lameness in Dairy Cattle.
Veterinary Clinics of North America: Food Animal Practice 1, 25-38.
Anderson, D.E., Rogers, G.M., 2001. Prevention of Lameness in Cow-Calf
Operations. Veterinary Clinics: Food Animal Practice 17, 209-223.
Anil, S.S., Anil, L., Deen, J., 2002. Challenges of pain assessment in domestic
animals. Journal of the American Veterinary Medical Association, 220,
313-319.
Anzuino, K., Bell, N.J., Bazeley, K.J., Nicol, C.J., 2010. Assessment of welfare
on 24 commercial UK dairy goat farms based on direct observations.
Veterinary Record 167, 774-780.
Atkinson, D.J., von Keyserlingk, M.A.G., Weary, D.M., 2017. Benchmarking
passive transfer of immunity and growth in dairy calves. Journal of Dairy
Science 100, 3773-3782.
AWIN, 2015. Animal Welfare Indicators (AWIN) welfare assessment protocol for
goats. https:// doi .org/ 10 .13130/ AWIN _goats _2015
Baggott, D., 1982. Hoof lameness in dairy cattle. In Practice 4, 133-141.
Barwick, J., Lamb, D., Dobos, R., Schneider, D., Welch, M., Trotter, M., 2018.
Predicting lameness in sheep activity using tri-axial acceleration signals.
Animals 8, 12.
Battini, M., Barbieri, S., Vieira, A., Stilwell, G., Mattiello, S., 2016. Results of
testing the prototype of the AWIN welfare assessment protocol for dairy
goats in 30 intensive farms in Northern Italy. Italian Journal of Animal
Science 15, 283-293.
Bell, N., 2015. The farm audit: foot health, lameness and footcare. Bovine
Medicine, 406.
Bell, N., Bell, M., Knowles, T., Whay, H., Main, D., Webster, A., 2009. The
development, implementation and testing of a lameness control
programme based on HACCP principles and designed for heifers on dairy
farms. The Veterinary Journal 180, 178-188.
Berckmans, D., 2006. Automatic on-line monitoring of animals by precision
livestock farming. Livestock Production and Society 287.
Bergsten, C., 2001. Effects of conformation and management system on hoof and
leg diseases and lameness in dairy cows. Veterinary Clinics of North
America: Food Animal Practice 17, 1-23.
Bicalho, R.C., Machado, V.S., Caixeta, L.S., 2009. Lameness in dairy cattle: A
debilitating disease or a disease of debilitated cattle? A cross-sectional

221
study of lameness prevalence and thickness of the digital cushion. Journal
of Dairy Science 92, 3175-3184.
Blackie, N., Amory, J., Bleach, E., Scaife, J., 2011. The effect of lameness on
lying behaviour of zero grazed Holstein dairy cattle. Applied Animal
Behaviour Science 134, 85-91.
Blowey, R., 1992. Diseases of the bovine digit: Part 2 Hoof care and factors
influencing the incidence of lameness. In Practice 14, 118-124.
Boelling, D., Madsen, P., Jensen, J., 2001. Genetic Parameters of Foot and Leg
Traits in Future AI Bulls: II. Correlation to Body Conformation Traits in
Daughters. Acta Agriculturae Scandinavica, Section A — Animal Science
51, 122-128.
Bokko, B., Adamu, S., Mohammed, A., 2003. Limb conditions that predispose
sheep to lameness in the arid zone of Nigeria. Small Ruminant Research
47, 165-169.
Bradley, H.K., Shannon, D., Neilson, D.R., 1989. Subclinical laminitis in dairy
heifers. The Veterinary Record 125, 177-179.
Bryan, M., Tacoma, H., Hoekstra, F., 2012. The effect of hindclaw height
differential and subsequent trimming on lameness in large dairy cattle
herds in Canterbury, New Zealand. New Zealand Veterinary Journal 60,
349-355.
Byrne, D.T., Berry, D.P., Esmonde, H., McGovern, F., Creighton, P., McHugh,
N., 2018. Infrared thermography as a tool to detect hoof lesions in sheep.
Translational Animal Science 3, 577-588.
Caja, G., Salama, A.A.K., Such, X., 2006. Omitting the Dry-Off Period
Negatively Affects Colostrum and Milk Yield in Dairy Goats. Journal of
Dairy Science 89, 4220-4228.
Capuco, A.V., Akers, R.M., Smith, J.J., 1997. Mammary growth in Holstein cows
during the dry period: Quantification of nucleic acids and histology.
Journal of Dairy Science 80, 477-487.
Chapinal, N., De Passille, A., Rushen, J., 2010. Correlated changes in behavioral
indicators of lameness in dairy cows following hoof trimming. Journal of
Dairy Science 93, 5758-5763.
Clarkson, M.J., Downham, D.Y., Faull, W.B., Hughes, J.W., Manson, F.J., Merrit,
J.D., Murray, R.D., Russell, W.B., Sutherst, J.E., Ward, W.R., 1993. An
epidemiological study to determine the risk factors of lameness in dairy
cows. University of Liverpool. Ministry of Agriculture, Fisheries and Food
(CSA 1379).
Collard, B.L., Boettcher, P.J., Dekkers, J.C.M., Petitclerc, D., Schaeffer, L.R.,
2000. Relationships between energy balance and health traits of dairy
cattle in early lactation. Journal of Dairy Science 83, 2683-2690.
Cook, N.J., Schaefer, A.L., 2013. Infrared thermography and disease surveillance.
Thermography: Current Status and Advances in Livestock Animals and in
Veterinary Medicine, 79-92.

222
Deeming, L., Beausoleil, N., Stafford, K., Webster, J., Zobel, G., 2016. Can a
workshop alter dairy goat farmers’ views on lameness? ISAE Regional
Meeting, Auckland, New Zealand
Eddy, A.L., Van Hoogmoed, L.M., Snyder, J.R., 2001. The Role of
Thermography in the Management of Equine Lameness. The Veterinary
Journal 162, 172-181.
Espejo, L.A., Endres, M.I., Salfer, J.A., 2006. Prevalence of lameness in high-
producing Holstein cows housed in freestall barns in Minnesota. Journal of
Dairy Science 89, 3052-3058.
FAWC (2011) Farm Animal Welfare Council - opinion on lameness in sheep.
Farm. Animal Welfare Council Reports
Fischer, M., Shurter, S., 2001. Husbandry standards for keeping wild equids in
captivity. Assocaition of Zoos and Aquariums.
Flower, F.C., Sanderson, D.J., Weary, D.M., 2006. Effects of milking on dairy
cow gait. Journal of Dairy Science 89, 2084-2089.
Freeman, H.B.R., Webster, J., Charlton, G.L., Lehnert, K., Zobel, G., 2018. The
effect of outdoor space provision on lying behaviour in lactating dairy
goats. Proceedings of the 52nd Congress of the International Society for
Applied Ethology, Prince Edward Island, Canada, p. 226.
Ganche, E., Hutchinson, K., Burggraaf, V., Johnson, M., King, W., 2015. Dairy
goat farm management practices. An industry survey. Report for Dairy
Goat Co-operative. AgResearch Publication No 398.
Gomes, K.A.R., Valentim, J.K., Lemke, S.S.R., Dallago, G.M., Vargas, R.C.,
Paiva, A.L.d.C., 2018. Behavior of Saanen dairy goats in an enriched
environment. Acta Scientiarum. Animal Sciences 40.
Greenough, P.R., MacCallum, F.J., Weaver, A.D., 1997. Lameness in cattle. 3rd
edition ed. W.B. Saunders, London, UK.
Groenevelt, M., 2017. Foot lameness in goats: like sheep, like cattle or completely
different? Livestock 22, 98-101.
Groenevelt, M., Anzuino, K., Smith, S., Lee, M.R., Grogono-Thomas, R., 2015. A
case report of lameness in two dairy goat herds; a suspected combination
of nutritional factors concurrent with treponeme infection. BMC Research
Notes 8, 791.
Groenevelt, M., Main, D.C.J., Tisdall, D., Knowles, T.G., Bell, N.J., 2014.
Measuring the response to therapeutic foot trimming in dairy cows with
fortnightly lameness scoring. The Veterinary Journal 201, 283-288.
Hill, N.P., Murphy, P.E., Nelson, A.J., Mouttotou, L.E., Green, L.E., Morgan,
K.L., 1997. Lameness and foot lesions in adult British dairy goats.
Veterinary Record 141, 412-416.
Huffman, B.A., 2013. Husbandry and Care of Hoofstock. University of Chicago
Press, Chicago, US.
Ito, K., Von Keyserlingk, M., LeBlanc, S., Weary, D., 2010. Lying behavior as an
indicator of lameness in dairy cows. Journal of Dairy Science 93, 3553-
3560.
223
Jolly, L., 2003. Giraffe Husbandry Manual. Association of Zoos and Aquariums.
Kleinhenz, K., Plummer, P.J., Danielson, J., Burzette, R.G., Gorden, P.J.,
Coetzee, J., Schleining, J.A., Cooper, V., Leuschen, B., Krull, A., 2014.
Survey of veterinarians and hoof trimmers on methods applied to treat
claw lesions in dairy cattle. Bovine Practitioner 48, 47-52.
Leach, K., Tisdall, D., Bell, N., Main, D., Green, L., 2012. The effects of early
treatment for hindlimb lameness in dairy cows on four commercial UK
farms. The Veterinary Journal 193, 626-632.
Logue, D.N., Offer, J.E. and Hyslop, J.J., 1994. Relationship of diet, hoof type
and locomotion score with lesions of the sole and white line in dairy cattle.
Animal Science 59, 173-181.
MacKay, J.R.D., Deag, J.M., Haskell, M.J., 2012. Establishing the extent of
behavioural reactions in dairy cattle to a leg mounted activity monitor.
Applied Animal Behaviour Science 139, 35-41.
Maertens, W., Vangeyte, J., Baert, J., Jantuan, A., Mertens, K.C., De Campeneere,
S., Pluk, A., Opsomer, G., Van Weyenberg, S., Van Nuffel, A., 2011.
Development of a real time cow gait tracking and analysing tool to assess
lameness using a pressure sensitive walkway: The GAITWISE system.
Biosystems Engineering 110, 29-39.
Mahendran, S., Bell, N., 2015. Lameness in cattle 2. Managing claw health
through appropriate trimming techniques. In Practice 37, 231-242.
Mahendran, S., Huxley, J., Chang, Y.-M., Burnell, M., Barrett, D., Whay, H.,
Blackmore, T., Mason, C., Bell, N., 2017. Randomised controlled trial to
evaluate the effect of foot trimming before and after first calving on
subsequent lameness episodes and productivity in dairy heifers. The
Veterinary Journal 220, 105-110.
Main, D.C.J., Barker, Z.E., Leach, K.A., Bell, N.J., Whay, H.R., Browne, W.J.,
2010. Sampling strategies for monitoring lameness in dairy cattle. Journal
of Dairy Science 93, 1970-1978.
Manning, A., Mahendran, S., Bell, N.J., 2016. Evidence base behind foot
trimming in UK dairy cattle. Livestock 21, 6-14.
Manske, T., Hultgren, J., Bergsten, C., 2002. Prevalence and interrelationships of
hoof lesions and lameness in Swedish dairy cows. Preventive Veterinary
Medicine 54, 247-263.
Markusfeld, O., Galon, N., Ezra, E., 1997. Body condition score, health, yield and
fertility in dairy cows. Veterinary Record 141, 67-72.
Mill, J.M., Ward, W.R., 1994. Lameness in dairy cows and farmers' knowledge,
training and awareness. The Veterinary Record 134, 162-164.
Murray, R., Downham, D., Clarkson, M., Faull, W., Hughes, J., Manson, F.,
Merritt, J., Russell, W., Sutherst, J., Ward, W., 1996. Epidemiology of
lameness in dairy cattle: description and analysis of foot lesions. The
Veterinary Record 138, 586-591.
224
Offer, J., McNulty, D., Logue, D., 2000. Observations of lameness, hoof
conformation and development of lesions in dairy cattle over four
lactations. The Veterinary Record 147, 105-109.
Patt, A., Gygax, L., Wechsler, B., Hillmann, E., Palme, R., Keil, N.M., 2012. The
introduction of individual goats into small established groups has serious
negative effects on the introduced goat but not on resident goats. Applied
Animal Behaviour Science 138, 47-59.
Pesenhofer, G., Palme, R., Pesenhofer, R., Kofler, J., 2006. Comparison of two
methods of fixation during functional claw trimming-walk-in crush versus
tilt table-in dairy cows using faecal cortisol metabolite concentrations and
daily milk yield as parameters. Veterinary Medicine Austria 288-294.
Pugh, D.G., Baird, N.N., 2002. Sheep & Goat Medicine. 1st Edition ed. W. B.
Saunders Company, Philadelphia, US.
Rifkin, R.E., Grzeskowiak, R.M., Mulon, P.-Y., Adair, H.S., Biris, A.S., Dhar,
M., Anderson, D.E., 2019. Use of a pressure-sensing walkway system for
biometric assessment of gait characteristics in goats. PloS one 14.
Scheel, C., Traulsen, I., Auer, W., Müller, K., Stamer, E., Krieter, J., 2017.
Detecting lameness in sows from ear tag-sampled acceleration data using
wavelets. Animal 11, 2076-2083.
Stafford, K., Prosser, C., 2016. Livestock Production in New Zealand. Massey
University Press, New Zealand
Sullivan, L.E., Blowey, R.W., Carter, S.D., Duncan, J.S., Grove-White, D.H.,
Page, P., Iveson, T., Angell, J.W., Evans, N.J., 2014. Presence of digital
dermatitis treponemes on cattle and sheep hoof trimming equipment.
Veterinary Record, 201-205.
Sumner, C.L., von Keyserlingk, M.A.G., Weary, D.M., 2018. How benchmarking
motivates farmers to improve dairy calf management. Journal of Dairy
Science 101, 3323-3333.
Sutherland, M.A., Lowe, G.L., Watson, T.J., Ross, C.M., Rapp, D., Zobel, G.A.,
2017. Dairy goats prefer to use different flooring types to perform
different behaviours. Applied Animal Behaviour Science 197, 24-31.
Tarlton, J., Holah, D., Evans, K., Jones, S., Pearson, G., Webster, A., 2002.
Biomechanical and histopathological changes in the support structures of
bovine hooves around the time of first calving. The Veterinary Journal
163, 196-204.
Telezhenko, E., Bergsten, C., Magnusson, M., Nilsson, C., 2009. Effect of
different flooring systems on claw conformation of dairy cows. Journal of
Dairy Science 92, 2625-2633.
Tranter, W., Morris, R., 1992. Hoof growth and wear in pasture-fed dairy cattle.
New Zealand Veterinary Journal 40, 89-96.
Turner, T.A., 1991. Thermography as an aid to the clinical lameness evaluation.
Veterinary Clinics of North America: Equine Practice 7, 311-338.
van Amstel, S.R., Shearer, J.K., 2001. Abnormalities of Hoof Growth and
Development. Veterinary Clinics: Food Animal Practice 17, 73-91.

225
van de Weerd, H.A., Day, J.E.L., 2009. A review of environmental enrichment for
pigs housed in intensive housing systems. Applied Animal Behaviour
Science 116, 1-20.
Van der Tol, P.P.J., Metz, J.H.M., Noordhuizen-Stassen, E.N., Back, W., Braam,
C.R., Weijs, W.A., 2002. The Pressure Distribution Under the Bovine
Claw During Square Standing on a Flat Substrate. Journal of Dairy
Science 85, 1476-1481.
Van Hertem, T., Maltz, E., Antler, A., Romanini, C.E.B., Viazzi, S., Bahr, C.,
Schlageter-Tello, A., Lokhorst, C., Berckmans, D., Halachmi, I., 2013.
Lameness detection based on multivariate continuous sensing of milk
yield, rumination, and neck activity. Journal of Dairy Science 96, 4286-
4298.
Van Hertem, T., Parmet, Y., Steensels, M., Maltz, E., Antler, A., Schlageter-Tello,
A.A., Lokhorst, C., Romanini, C.E.B., Viazzi, S., Bahr, C., Berckmans,
D., Halachmi, I., 2014. The effect of routine hoof trimming on locomotion
score, ruminating time, activity, and milk yield of dairy cows. Journal of
Dairy Science 97, 4852-4863.
Vermunt, J.J., Greenough, P.R., 1995. Structural characteristics of the bovine
claw: Horn growth and wear, horn hardness and claw conformation.
British Veterinary Journal 151, 157-180.
Viñuela-Fernández, I., Jones, E., Welsh, E.M., Fleetwood-Walker, S.M., 2007.
Pain mechanisms and their implication for the management of pain in farm
and companion animals. The Veterinary Journal 174, 227-239.
von Keyserlingk, M.A.G., Barrientos, A., Ito, K., Galo, E., Weary, D.M., 2012.
Benchmarking cow comfort on North American freestall dairies:
Lameness, leg injuries, lying time, facility design, and management for
high-producing Holstein dairy cows. Journal of Dairy Science 95, 7399-
7408.
Whay, H.R., Main, D.C.J., Green, L.E., Webster, A.J.F., 2002. Farmer perception
of lameness prevalence, Proceedings. 12th International Symposium of
Lameness in Ruminants Orlando, Florida, pp. 355–358.
Whay, H.R., Waterman, A.E., Webster, A.J.F., 1997. Associations between
locomotion, claw lesions and nociceptive threshold in dairy heifers during
the peri-partum period. Veterinary Journal 154, 155-161.
Winter, A., 2004. Lameness in sheep 1. Diagnosis. In Practice 26, 58-63.
Zobel, G., Freeman, H., Schneider, D., Henderson, H., Johnstone, P., 2018.
Behaviour of dairy goats managed in a natural alpine environment,
Proceedings of the 52nd Congress of the International Society for Applied
Ethology, Prince Edward Island, Canada, p. 229.
Zobel, G., Neave, H.W., Webster, J., 2019. Understanding natural behavior to
improve dairy goat (Capra hircus) management systems. Translational
Animal Science 3, 212-224.
Zobel, G., Weary, D., Leslie, K., Chapinal, N., Von Keyserlingk, M., 2015.
Validation of data loggers for recording lying behavior in dairy goats.
Journal of Dairy Science 98, 1082-1089.
226
Zuba, J.R., 2012. Hoof disorders in nondomestic artiodactylids, Fowler's Zoo and
Wild Animal Medicine, Elsevier Saunders, St. Louis, Missouri.
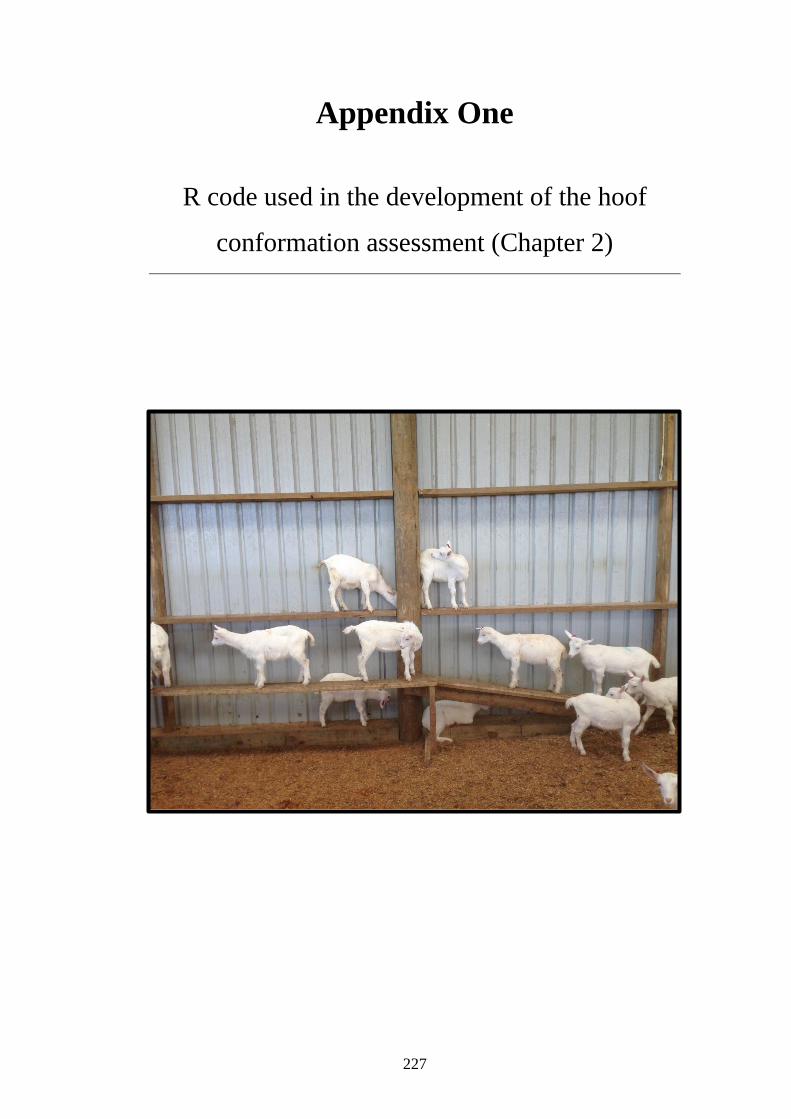
227
Appendix One
R code used in the development of the hoof
conformation assessment (Chapter 2)

228
229
230

231
232

233

234
235
Appendix Two
Conference abstracts
236
The effect of earlier and more frequent hoof trimming on hoof conformation
of dairy goats
Deeming LE, Beausoleil NJ, Stafford KJ, Webster JR, Zobel G
Presented at Universities Federation of Animal Welfare. Hong Kong. 25th-26th
October 2018.
Regular hoof trimming is important for hoof health and conformation in dairy
ruminants. Hoof growth due to a lack of trimming may adversely impact hoof
conformation. Nonetheless, it is common farm practice on New Zealand dairy goat
farms to start hoof trimming after first kidding (12-13 months of age) which may
be too late to prevent detrimental changes to hoof conformation. Therefore, the aims
of this trial were to determine: 1) if earlier and more frequent trimming impacts
hoof conformation 2) if hoof conformation is altered by the trimming process.
Sixteen Saanen X goat kids were enrolled after weaning (5-6 months of age) on a
commercial farm. They were randomly assigned to one of two hoof trimming
regimes: A) first trimming at 5 months of age, then trimmed at 9 and 13 months, B)
first trimming at 13 months of age. Each of the goats had radiographs taken
immediately before and one day after trimming at 13 months of age. Radiographs
were taken of the left front and left hind distal limb in a lateromedial direction and
analysed using eFilm 3.3.0 software. The following parameters were determined:
1) the angle of deviation of the third phalanx (P3) from a vertical 180o reference
point, 2) the height (cm) of P2/P3 joint (JH3). There was no difference between the
two trimming regimes in P3 angle or JH3 height evaluated at 13 months of age,
however these parameters were altered by the process of trimming. In both groups
the angle of P3 decreased after trimming for the front (F1,14 = 87.88, P < 0.001) and
hind hooves (F1,14 = 63.92, P < 0.001). Similarly, the height of JH3 decreased after
trimming for the front (F1,14 = 6.50, P < 0.05) and hind hooves (F1,14 = 24.02, P<
0.001). No effects of the earlier, more frequent trimming regime were found
compared to common farm practice. The effects of trimming on hoof conformation
found in this study, highlight the importance of hoof trimming. The removal of
overgrown horn decreased the deviation of P3 and the height of JH3, which may
decrease the risk of injury and lameness. The data presented are a subset of goats

237
from an ongoing trial, this study will continue in order to determine the longer-term
impacts of delayed trimming in dairy goats.

238
Can a workshop alter dairy goat farmers’ views on lameness?
Laura Deeming, Ngaio Beausoleil, Kevin Stafford, Jim Webster, Gosia Zobel
Presented at International Society for Applied Ethology Regional Conference.
Auckland. October 27th 2016.
Lameness, a painful condition that impedes normal walking, is one of the most
serious welfare issues faced by dairy animals. In dairy goats, knowledge about risk
factors and identification of lameness is particularly limited, and therefore farmers
may underestimate lameness prevalence on their farms. The aim of this study was
to determine if farmer views towards lameness in dairy goats changed following a
workshop. The workshop involved participants (n=26, Ontario, Canada dairy goat
farmers) completing a questionnaire prior to a presentation and facilitated
discussion about the impacts of lameness on welfare and production. Questions
included whether they perceived lameness to be an issue on their farm, their hoof
trimming regime and their opinion on the main cause of lameness. Following the
facilitated discussion participants were asked to share ideas and allocate them to
one of four themes: 1) not an issue (do nothing), 2) not an issue (educate the public),
3) issue (educate farmers), or 4) issue (do more research). Finally, farmers were
asked to reflect upon how their opinion regarding lameness had changed. Prior to
the workshop, 50% of the farmers (n=13) indicated that lameness was not an issue
on their farm, while 46% (n=12) responded that there were mild or occasional
lameness issues. The primary cause of lameness was thought to be infrequent hoof
trimming. Following the workshop 73% (n=19) of participants stated that the
information provided had altered their views on lameness, 15% (n=4) stated that
their opinion had not changed, the remaining 12% (n=3) did not respond. Most
farmers thought more research was needed regarding trimming regimes and hoof
care, and more farmer education is required. These results suggest that workshops
can be successful in educating farmers about the impacts of lameness and in turn
can alter farmer views on this serious welfare issue.
239
Appendix Three
Survival of replacement kids from birth to
mating on commercial dairy goat farms in New
Zealand
Authors note: Appendix three is a publication completed in parallel
with the research work in this thesis. It is presented in the style of the
Journal of Dairy Science where it has been published.
Todd CG, Bruce B, Deeming LE, Zobel, G. 2019. Short
communication: Survival of replacement kids from birth to mating on
commercial dairy goat farms in New Zealand. Journal of Dairy Science
10, 9382-9388.

240
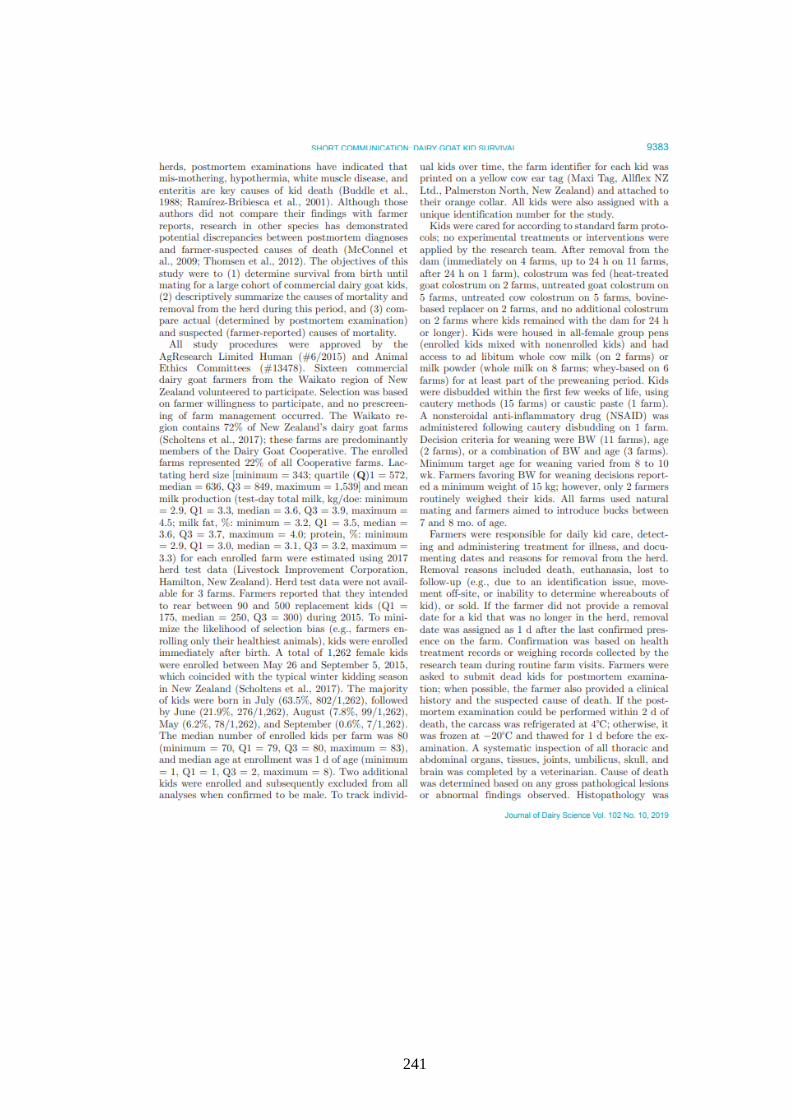
241
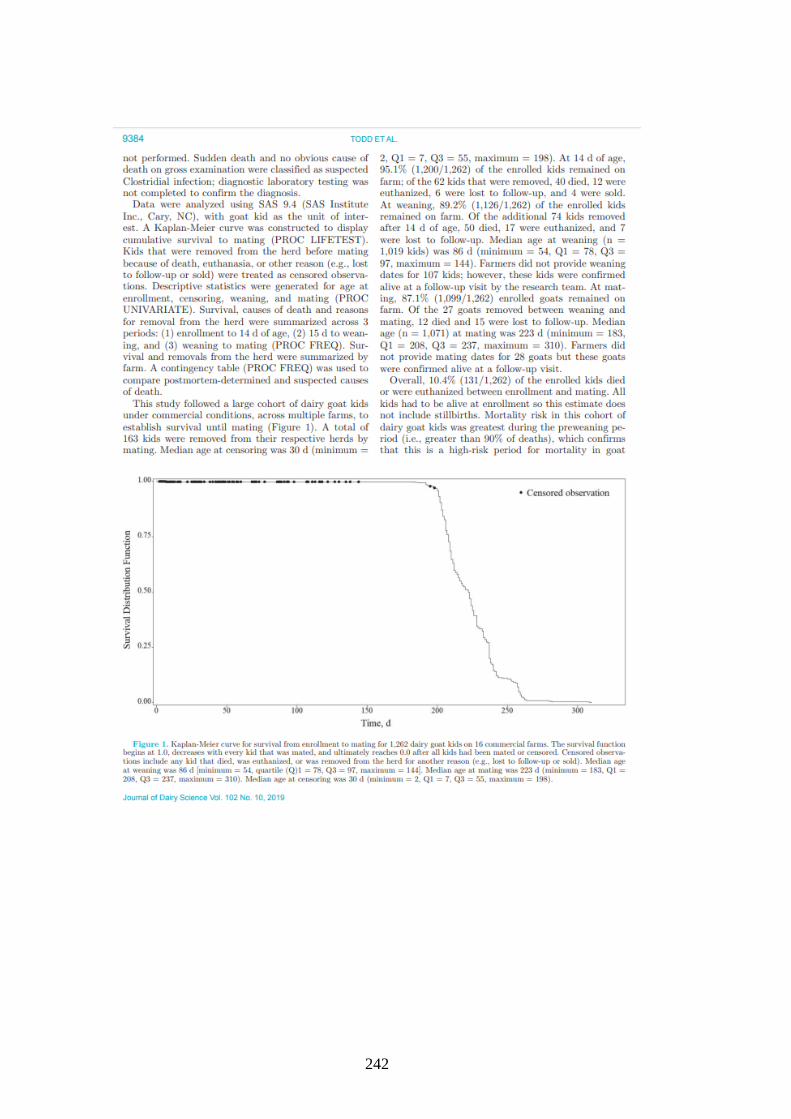
242

243

244

245

246
247
Appendix Four
Conference proceedings
Authors note: Appendix four consists of two peer reviewed
conference proceedings that were completed in parallel with the
research work in this thesis.

253
Appendix Five
Statements of contribution
Authors note: A statement of contribution has been completed for
each published chapter (Chapter 2 and 3).

254
Chapter 2: Deeming, LE., Beausoleil, NJ., Stafford, KJ., Webster, JR., Zobel, G.
2019. The development of a hoof conformation assessment for use in dairy goats.
Animals, 9, 973.
255
Chapter 3: Deeming, LE., Beausoleil, NJ., Stafford, KJ., Webster, JR., Zobel, G.
2018. Technical note: The development of a reliable 5-point gait scoring system
for use in dairy goats. Journal of Dairy Science 101, 4491-4497.