determination of aspect ratio limitations, accuracy … of aspect ratio limitations, accuracy and...
TRANSCRIPT
Boeckmans, B. et al.
Paper:
Determination of Aspect Ratio Limitations, Accuracy andRepeatability of a Laser Line Scanning CMM Probe
Bart Boeckmans∗, Min Zhang∗,∗∗, Frank Welkenhuyzen∗, and Jean-Pierre Kruth∗
∗Department Mechanical Engineering, Division Production Engineering, Machine Design and Automation, KU LeuvenCelestijnenlaan 300, B-3001 Leuven, Belgium
E-mail: [email protected]∗∗Beijing Engineering Research Center of Precision Measurement Technology and Instruments,
Beijing University of Technology (BJUT)Beijing 100124, China
[Received March 31, 2015; accepted May 31, 2015]
Coordinate measurement machine (CMM) probingtechniques can involve direct mechanical contact (e.g.,tactile probing) or diverse non-contact principles (e.g.,laser line scan probing). For some applications, con-tact methods are not capable of measuring fast enoughto ensure 100% quality controlled parts. A laserline scanning probe uses a laser triangulation-basedmethod to acquire 3D measurement points on a work-piece relative to a sensor. Mounting the sensor in a3D coordinate frame, e.g., in a CMM provides enoughinformation to fully examine the workpiece. Thesetechniques are most commonly exploited in medicalindustry and industries involving plate materials. Ahigh data density and measurement speed are sig-nificant advantages when measuring free-form sur-faces by laser line scanning, making the process muchmore time-efficient. However, high-precision geomet-rical features (such as cylinders, spheres, etc.) mustbe measured for locating and aligning the free-formshapes. The accuracy of the equipment therefore hasto be assessed. Probe Maximum Permissible Error(MPEP) values below 10 μμμm have been reported forcutting-edge laser line scanners. This paper comparesthe major influences on measurements on cylindricalfeatures. First, the aspect-ratio limitations are con-sidered by comparing two inherently different tech-niques. The stable inspection of reference features isimportant, while trying to maximize the spatial extentof the measured features. Second, the measurementmethod is analyzed in two ways: by using a limitedsample of the features to increase stability and elimi-nate interference from neighboring features; by vary-ing the number of scan tracks, which greatly affectsthe measurement time.
Keywords: dimensional metrology, CMM, laser linescanning, accuracy, repeatability
1. Introduction
This study focuses on coordinate measurement ma-chine (CMM) techniques where quality control (calibra-tion, verification, and traceability) is paramount [1–6].Tactile probe measurements are usually taken as the refer-ence in industry, because they are reliable and well under-stood. Tactile probes are used in CMMs but also for on-machine product measurements and machine error verifi-cation [7, 8]. The measurement speed is usually a limit-ing factor. Moreover, laser line scanning, a triangulation-based optical measurement method, has also been de-scribed in the literature [9]. The data acquisition speed ofa laser line scanner is much greater (up to 75,000 pointsper second in comparison to up to 2 points per second fortouch-trigger probing). In this technique, the sensor canbe implemented in either arm-based [10] or coordinate-based (CMM) [9] measurement frame. The use of thesedifferent probes in the same application can combine theiradvantages [11–15]. The main benefits of laser line scan-ning are its high acquisition speed, its high data density,and its independence of the form to be measured. Thelatter signifies that multiple features can be scanned si-multaneously, and that even free-form surfaces can be as-sessed quickly and compared to a CAD model. However,one drawback of this approach is its sensitivity to reflec-tive surface properties and the large number of operatorsettings. Surface properties (e.g., texture and reflectivity)strongly influence both the measurement offset with re-spect to a tactile reference value [16, 17] and the qualityof measurement [12, 18].
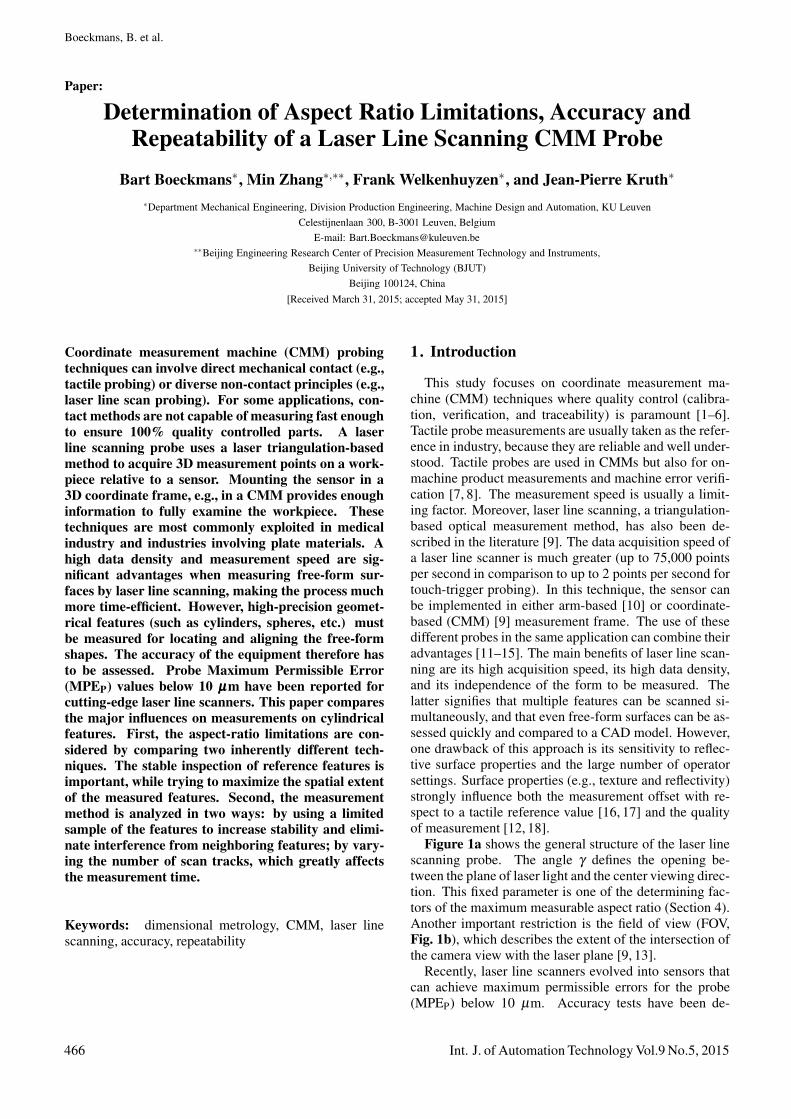
Figure 1a shows the general structure of the laser linescanning probe. The angle γ defines the opening be-tween the plane of laser light and the center viewing direc-tion. This fixed parameter is one of the determining fac-tors of the maximum measurable aspect ratio (Section 4).Another important restriction is the field of view (FOV,Fig. 1b), which describes the extent of the intersection ofthe camera view with the laser plane [9, 13].
Recently, laser line scanners evolved into sensors thatcan achieve maximum permissible errors for the probe(MPEP) below 10 μm. Accuracy tests have been de-
466 Int. J. of Automation Technology Vol.9 No.5, 2015
Determination of Aspect Ratio Limitations, Accuracy and Repeatabilityof a Laser Line Scanning CMM Probe
Fig. 1. Laser line scanning probe: (a) the sensor structureand (b) the field of view (FOV) limitation [9].
veloped [9, 19–21] and the operation of optical CMMprobes [22–24] has become more standardized. A stan-dard has been introduced to verify the MPESystem for aCMM equipped with an optical probe [25].
This paper presents an overview of the equipmentand then discusses the measurement procedures. Subse-quently it investigates the factors that affect the achievablemeasurement depth for cylindrical holes. Lastly, it con-siders an industrial case study to test the findings and toappraise the accuracy and the repeatability of two CMMprobes.
2. Equipment and Materials
2.1. Measuring EquipmentThe measurements presented in this paper were taken
with two CMMs: an LK Altera and a Coord3 MC16CMM. The corresponding MPECMM specifications aregiven, respectively, as:
MPELK = 1.8+L
400. . . . . . . . . . (1)
MPECoord3 = 5+L
200. . . . . . . . . . (2)
with the measured length L expressed in millimeters andMPE in micrometers. One touch-trigger probe (RenishawTP200) and one optical probe (Nikon Metrology LC60Dxlaser line scanner) are used. The specified MPEP valuefor the latter is 9 μm (in accordance with ISO 10360-1 [26] and ISO 10360-8 [25]). The probes are linked tothe CMM through a Renishaw PH10M rotary head.
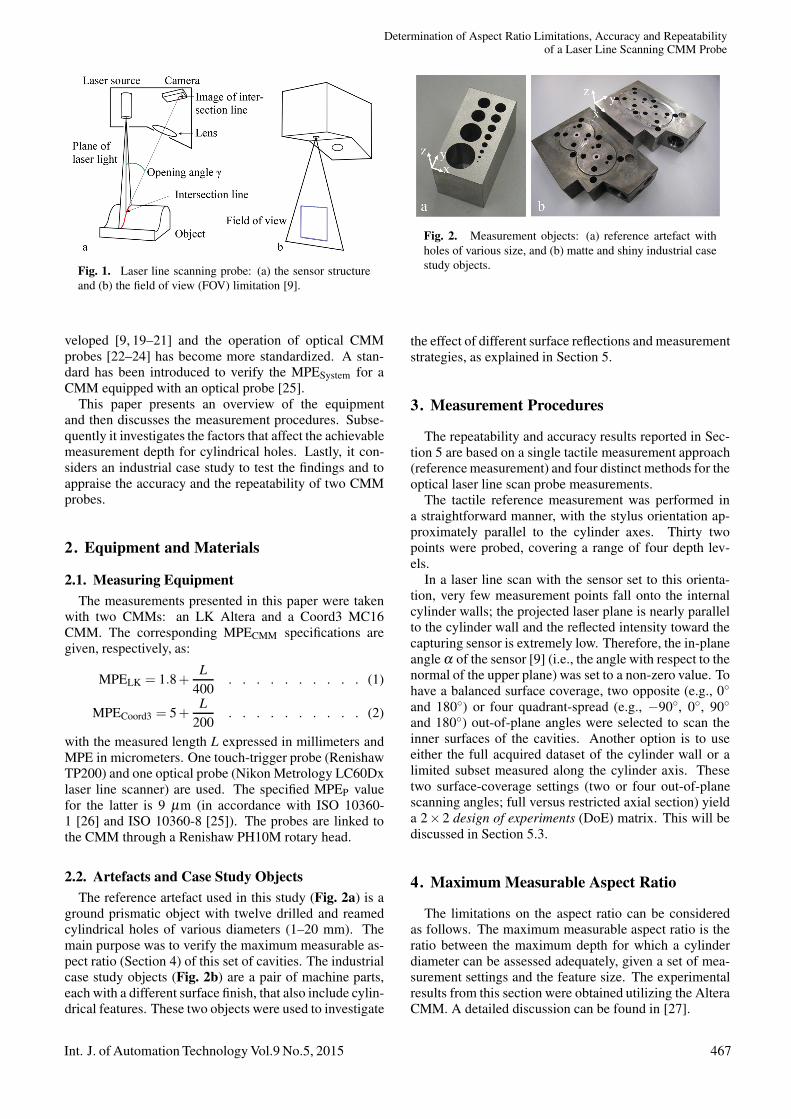
2.2. Artefacts and Case Study ObjectsThe reference artefact used in this study (Fig. 2a) is a
ground prismatic object with twelve drilled and reamedcylindrical holes of various diameters (1–20 mm). Themain purpose was to verify the maximum measurable as-pect ratio (Section 4) of this set of cavities. The industrialcase study objects (Fig. 2b) are a pair of machine parts,each with a different surface finish, that also include cylin-drical features. These two objects were used to investigate
Fig. 2. Measurement objects: (a) reference artefact withholes of various size, and (b) matte and shiny industrial casestudy objects.
the effect of different surface reflections and measurementstrategies, as explained in Section 5.
3. Measurement Procedures
The repeatability and accuracy results reported in Sec-tion 5 are based on a single tactile measurement approach(reference measurement) and four distinct methods for theoptical laser line scan probe measurements.
The tactile reference measurement was performed ina straightforward manner, with the stylus orientation ap-proximately parallel to the cylinder axes. Thirty twopoints were probed, covering a range of four depth lev-els.
In a laser line scan with the sensor set to this orienta-tion, very few measurement points fall onto the internalcylinder walls; the projected laser plane is nearly parallelto the cylinder wall and the reflected intensity toward thecapturing sensor is extremely low. Therefore, the in-planeangle α of the sensor [9] (i.e., the angle with respect to thenormal of the upper plane) was set to a non-zero value. Tohave a balanced surface coverage, two opposite (e.g., 0◦and 180◦) or four quadrant-spread (e.g., −90◦, 0◦, 90◦and 180◦) out-of-plane angles were selected to scan theinner surfaces of the cavities. Another option is to useeither the full acquired dataset of the cylinder wall or alimited subset measured along the cylinder axis. Thesetwo surface-coverage settings (two or four out-of-planescanning angles; full versus restricted axial section) yielda 2× 2 design of experiments (DoE) matrix. This will bediscussed in Section 5.3.
4. Maximum Measurable Aspect Ratio
The limitations on the aspect ratio can be consideredas follows. The maximum measurable aspect ratio is theratio between the maximum depth for which a cylinderdiameter can be assessed adequately, given a set of mea-surement settings and the feature size. The experimentalresults from this section were obtained utilizing the AlteraCMM. A detailed discussion can be found in [27].
Int. J. of Automation Technology Vol.9 No.5, 2015 467

Boeckmans, B. et al.
Fig. 3. Measurement scenarios with (a) maximum laserdepth t1,max, (b) maximum viewing depth t2,max, (c) optimalcombination t1,opt = t2,opt. (d) Top view of the scenario in(c), showing the optimal chord length (copt).
4.1. Theoretical Analysis
The maximum measurable aspect ratio can be derivedas an optimal condition (see Fig. 3c). In Figs. 3a–d, theextreme and optimal situations are depicted, using a fullyshaded red plane for the projected laser plane and a greenstriped plane for the incident camera viewing mid plane.The angle between the two planes is the opening angleγ in the worst-case scenario. Fig. 3a shows the situationwhere the laser plane coincides with the maximum chordlength on the circular top section, i.e., spanning the fulldiameter d. The depth down to which the laser plane pen-etrates into the cylinder is denoted as t1,max and can becalculated with Eq. (3), using the tangent of the in-planeangle setting α as a conversion factor. However, this isdeeper than the camera view can access, being limited toa chord length c2.
c = t · tanα . . . . . . . . . . . . . . (3)
The set of conditions illustrated in Fig. 3b show a verysimilar situation, although the viewing depth is maximalhere while the laser light penetration depth is suboptimal.Both of these scenarios occur at different times. However,a globally optimal intermediate scenario exists, whereinboth the laser light plane and the camera view are individ-
Fig. 4. Theoretical and experimental measurement depths,plotted as functions of the hole diameter.
ually suboptimal but overlap maximally.This optimal situation is illustrated in Fig. 3c from a
3D perspective and in Fig. 3d from a top-view perspec-tive. The same chord length copt is subtended in the top-view circular section for both the projected light and thecaptured light. This chord length can be determined fromEq. (4) in terms of the diameter and the inscribed angle β ,which itself depends on the angle between the projectedlaser plane and the viewing direction. In the worst case,this angle equals the opening angle γ .
c = d · sin(
β2
)= d · sin
(180− γ
2
). . . . (4)
By combining Eqs. (3) and (4), the theoretical maximummeasurable depth can be determined. Using this depthand the diameter of the cavity, the theoretical maximummeasurable aspect ratio can also be calculated.
4.2. Results and DiscussionFigure 4 compares plots of the experimental and the-
oretical results for the maximum measurable depth ofcylindrical features. The results are shown for an in-planeincident angle α of 30◦ (sensor orientation with respectto the normal of the top plane). The experimental resultswere acquired by scanning the entire object and doing fit-tings on the resulting point cloud. The search distance forthe fitted points was limited to a 4-mm-deep section. Thedepth into the cavity was gradually increased until sta-bility was no longer guaranteed. A good correlation canbe found for the middle section of the graph (diameters3–10 mm). For smaller diameter values, the experimen-tal results deviate from the theoretical values because theamount of data is too limited to perform a correct fitting.For holes larger than the FOV of the laser line scanner(diameters > 15 mm), the data points at the bottom of thehole are incorrect because the physical aspect ratio of thecylindrical cavities is too low. Direct and multiple reflec-tions from the bottom surface can produce scatter pointsthat compromise the correctness of the measurement atthe bottom of the cylindrical feature.
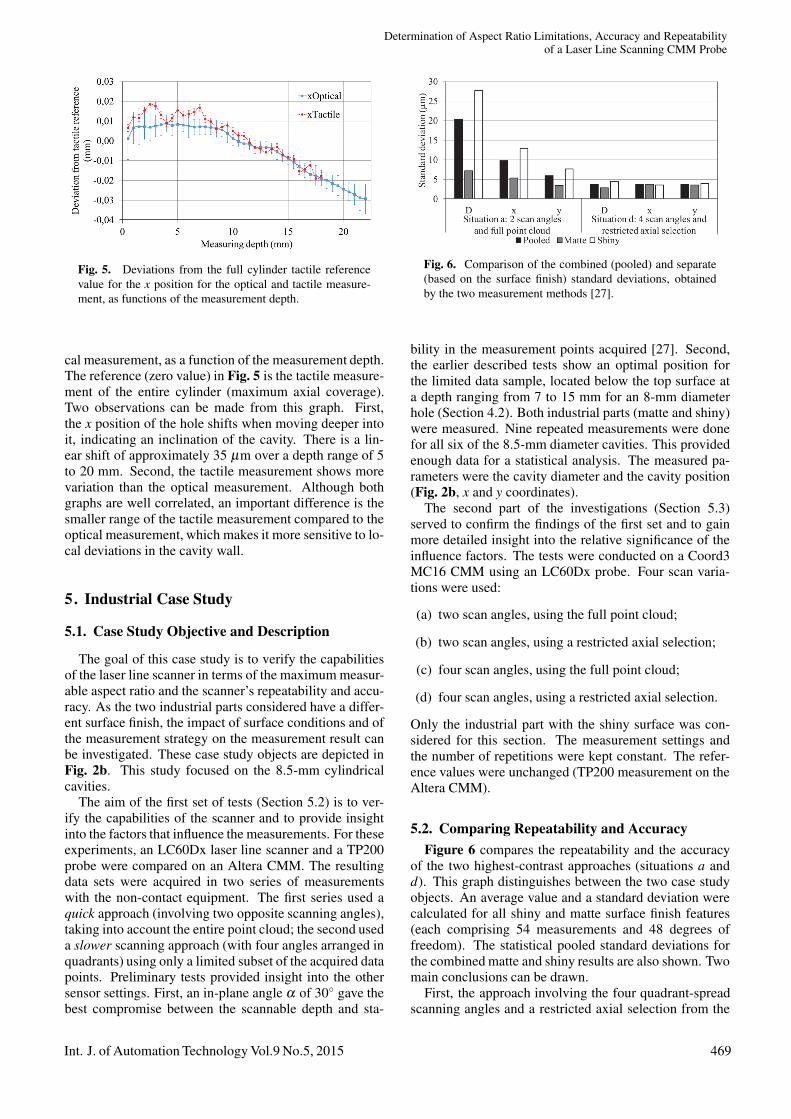
Figure 5 plots one of the cylinder parameters (the xposition – see Fig. 2a) derived from a tactile and an opti-
468 Int. J. of Automation Technology Vol.9 No.5, 2015
Determination of Aspect Ratio Limitations, Accuracy and Repeatabilityof a Laser Line Scanning CMM Probe
Fig. 5. Deviations from the full cylinder tactile referencevalue for the x position for the optical and tactile measure-ment, as functions of the measurement depth.
cal measurement, as a function of the measurement depth.The reference (zero value) in Fig. 5 is the tactile measure-ment of the entire cylinder (maximum axial coverage).Two observations can be made from this graph. First,the x position of the hole shifts when moving deeper intoit, indicating an inclination of the cavity. There is a lin-ear shift of approximately 35 μm over a depth range of 5to 20 mm. Second, the tactile measurement shows morevariation than the optical measurement. Although bothgraphs are well correlated, an important difference is thesmaller range of the tactile measurement compared to theoptical measurement, which makes it more sensitive to lo-cal deviations in the cavity wall.
5. Industrial Case Study
5.1. Case Study Objective and Description
The goal of this case study is to verify the capabilitiesof the laser line scanner in terms of the maximum measur-able aspect ratio and the scanner’s repeatability and accu-racy. As the two industrial parts considered have a differ-ent surface finish, the impact of surface conditions and ofthe measurement strategy on the measurement result canbe investigated. These case study objects are depicted inFig. 2b. This study focused on the 8.5-mm cylindricalcavities.
The aim of the first set of tests (Section 5.2) is to ver-ify the capabilities of the scanner and to provide insightinto the factors that influence the measurements. For theseexperiments, an LC60Dx laser line scanner and a TP200probe were compared on an Altera CMM. The resultingdata sets were acquired in two series of measurementswith the non-contact equipment. The first series used aquick approach (involving two opposite scanning angles),taking into account the entire point cloud; the second useda slower scanning approach (with four angles arranged inquadrants) using only a limited subset of the acquired datapoints. Preliminary tests provided insight into the othersensor settings. First, an in-plane angle α of 30◦ gave thebest compromise between the scannable depth and sta-
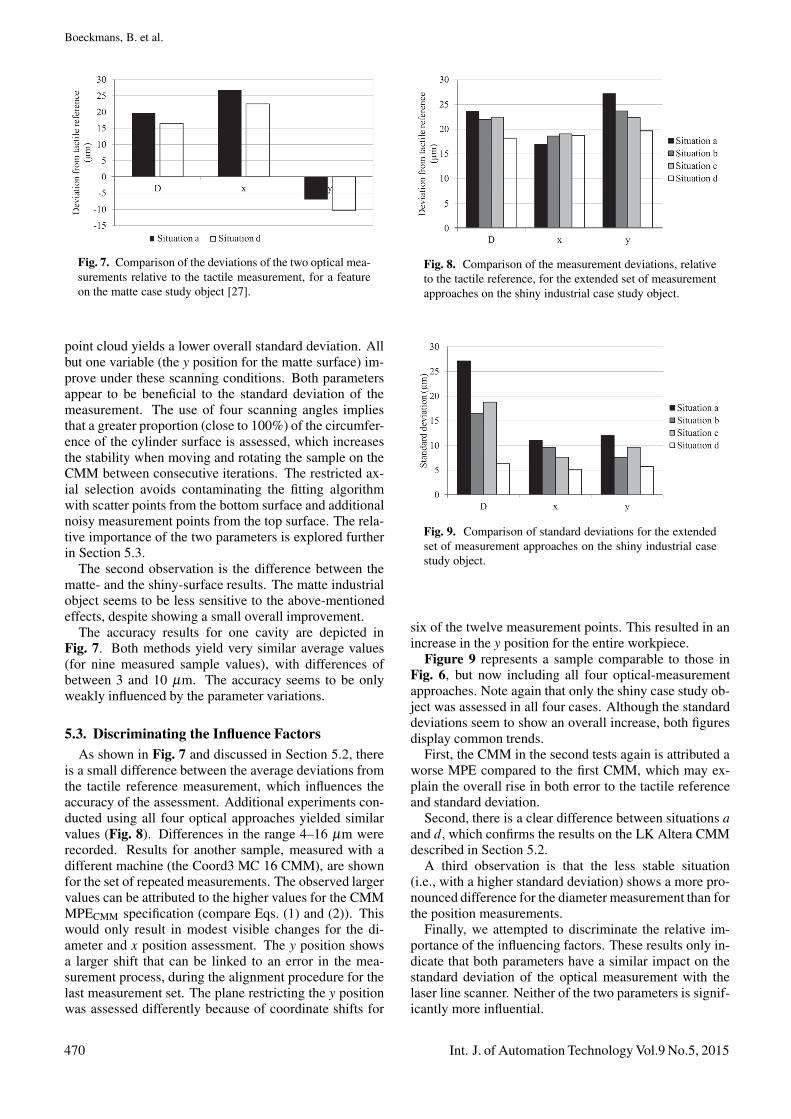
Fig. 6. Comparison of the combined (pooled) and separate(based on the surface finish) standard deviations, obtainedby the two measurement methods [27].
bility in the measurement points acquired [27]. Second,the earlier described tests show an optimal position forthe limited data sample, located below the top surface ata depth ranging from 7 to 15 mm for an 8-mm diameterhole (Section 4.2). Both industrial parts (matte and shiny)were measured. Nine repeated measurements were donefor all six of the 8.5-mm diameter cavities. This providedenough data for a statistical analysis. The measured pa-rameters were the cavity diameter and the cavity position(Fig. 2b, x and y coordinates).
The second part of the investigations (Section 5.3)served to confirm the findings of the first set and to gainmore detailed insight into the relative significance of theinfluence factors. The tests were conducted on a Coord3MC16 CMM using an LC60Dx probe. Four scan varia-tions were used:
(a) two scan angles, using the full point cloud;
(b) two scan angles, using a restricted axial selection;
(c) four scan angles, using the full point cloud;
(d) four scan angles, using a restricted axial selection.
Only the industrial part with the shiny surface was con-sidered for this section. The measurement settings andthe number of repetitions were kept constant. The refer-ence values were unchanged (TP200 measurement on theAltera CMM).
5.2. Comparing Repeatability and AccuracyFigure 6 compares the repeatability and the accuracy
of the two highest-contrast approaches (situations a andd). This graph distinguishes between the two case studyobjects. An average value and a standard deviation werecalculated for all shiny and matte surface finish features(each comprising 54 measurements and 48 degrees offreedom). The statistical pooled standard deviations forthe combined matte and shiny results are also shown. Twomain conclusions can be drawn.
First, the approach involving the four quadrant-spreadscanning angles and a restricted axial selection from the
Int. J. of Automation Technology Vol.9 No.5, 2015 469
Boeckmans, B. et al.
Fig. 7. Comparison of the deviations of the two optical mea-surements relative to the tactile measurement, for a featureon the matte case study object [27].
point cloud yields a lower overall standard deviation. Allbut one variable (the y position for the matte surface) im-prove under these scanning conditions. Both parametersappear to be beneficial to the standard deviation of themeasurement. The use of four scanning angles impliesthat a greater proportion (close to 100%) of the circumfer-ence of the cylinder surface is assessed, which increasesthe stability when moving and rotating the sample on theCMM between consecutive iterations. The restricted ax-ial selection avoids contaminating the fitting algorithmwith scatter points from the bottom surface and additionalnoisy measurement points from the top surface. The rela-tive importance of the two parameters is explored furtherin Section 5.3.
The second observation is the difference between thematte- and the shiny-surface results. The matte industrialobject seems to be less sensitive to the above-mentionedeffects, despite showing a small overall improvement.
The accuracy results for one cavity are depicted inFig. 7. Both methods yield very similar average values(for nine measured sample values), with differences ofbetween 3 and 10 μm. The accuracy seems to be onlyweakly influenced by the parameter variations.
5.3. Discriminating the Influence FactorsAs shown in Fig. 7 and discussed in Section 5.2, there
is a small difference between the average deviations fromthe tactile reference measurement, which influences theaccuracy of the assessment. Additional experiments con-ducted using all four optical approaches yielded similarvalues (Fig. 8). Differences in the range 4–16 μm wererecorded. Results for another sample, measured with adifferent machine (the Coord3 MC 16 CMM), are shownfor the set of repeated measurements. The observed largervalues can be attributed to the higher values for the CMMMPECMM specification (compare Eqs. (1) and (2)). Thiswould only result in modest visible changes for the di-ameter and x position assessment. The y position showsa larger shift that can be linked to an error in the mea-surement process, during the alignment procedure for thelast measurement set. The plane restricting the y positionwas assessed differently because of coordinate shifts for
Fig. 8. Comparison of the measurement deviations, relativeto the tactile reference, for the extended set of measurementapproaches on the shiny industrial case study object.
Fig. 9. Comparison of standard deviations for the extendedset of measurement approaches on the shiny industrial casestudy object.
six of the twelve measurement points. This resulted in anincrease in the y position for the entire workpiece.
Figure 9 represents a sample comparable to those inFig. 6, but now including all four optical-measurementapproaches. Note again that only the shiny case study ob-ject was assessed in all four cases. Although the standarddeviations seem to show an overall increase, both figuresdisplay common trends.
First, the CMM in the second tests again is attributed aworse MPE compared to the first CMM, which may ex-plain the overall rise in both error to the tactile referenceand standard deviation.
Second, there is a clear difference between situations aand d, which confirms the results on the LK Altera CMMdescribed in Section 5.2.
A third observation is that the less stable situation(i.e., with a higher standard deviation) shows a more pro-nounced difference for the diameter measurement than forthe position measurements.
Finally, we attempted to discriminate the relative im-portance of the influencing factors. These results only in-dicate that both parameters have a similar impact on thestandard deviation of the optical measurement with thelaser line scanner. Neither of the two parameters is signif-icantly more influential.
470 Int. J. of Automation Technology Vol.9 No.5, 2015
Determination of Aspect Ratio Limitations, Accuracy and Repeatabilityof a Laser Line Scanning CMM Probe
6. Conclusion
This study sought to contribute to a better understand-ing of the laser line scanner, used as a CMM probe. Sev-eral influence factors were considered. First, we dis-cussed the maximum measurable aspect ratio. Theoret-ical predictions and experimental results were correlated,and their discrepancies explained. Second, we investi-gated the impact of surface conditions. Shiny surfacesare more prone to instability when the fitting algorithmcovers a wider search field and when using fewer scan-ning angles. Thirdly, we tried to discriminate the relativeimpact of using a limited cylinder section and scanningwith fewer sensor orientations. We found a consistent in-crease in the measurement standard deviation when usingfewer scanning angles and when using a full cylinder fit-ting, rather than when using more scanning angles and alimited cylinder section fitting. Both parameters seem tocontribute with similar orders of magnitude.
AcknowledgementsThis study was funded by the agentschap voor Innovatie doorWetenschap en Technology (IWT) through the Tetra project Multi-sensor coordinaten meettechniek voor snel en accuraat opmetenvan complexe producten (MuSeS – 120167).
References:[1] S. Osawa, T. Takatsuji, T. Kurosawa, R. Furutani, and M. Shibata,
“Traceability system of coordinate measuring machines through in-ternet,” J. of the Japan Society for Precision Engineering, Vol.70,No.4, pp. 528-532, 2004.
[2] K. Umetsu, R. Furutani, S. Osawa, T. Takatsuji, and T. Kurosawa,“Optimization of measurement strategy for calibration of coordinatemeasuring machine,” J. of the Japan Society for Precision Engineer-ing, Vol.70, No.9, pp. 1174-1179, 2004.
[3] Y. Asano, R. Furutani, and M. Ozaki, “Verification of interim checkmethod of CMM,” Int. J. of Automation Technology, Vol.5, No.2,pp. 115-119, 2011.
[4] J. Matsuda, “Uncertainty analysis of three-dimensional coordinatemeasuring machines,” J. of Robotics and Mechatronics, Vol.9,No.2, pp. 140-145, 1997.
[5] Y. Takaya, “In-process and on-machine measurement of machiningaccuracy for process and product quality management: a review,”Int. J. of Automation Technology, Vol.8, No.1, pp. 4-19, 2014.
[6] O. Jusko, M. Neugebauer, H. Reimann, and R. Berhardt, “Recentprogress in CMM-based form measurement,” Int. J. of AutomationTechnology, Vol.9, No.2, pp. 170-175, 2015.
[7] S. Ibaraki and Y. Ota, “Error calibration for five-axis machine toolsby on-the-machine measurement using a touch-trigger probe,” Int.J. of Automation Technology, Vol.8, No.1, pp. 20-27, 2014.
[8] Y. Ihara and T. Nagasawa, “Fundamental study of the on-machinemeasurement in the machining center with a touch trigger probe,”Int. J. of Automation Technology, Vol.7, No.5, pp. 523-536, 2013.
[9] N. Van Gestel, S. Cuypers, P. Bleys, and J.-P. Kruth, “A perfor-mance evaluation test for laser line scanners on CMMs,” Optics andLasers in Engineering, Vol.47, pp. 336-342, 2009.
[10] H. Hamana, M. Tominaga, M. Ozaki, and R. Furutani, “Calibra-tion of articulated arm coordinate measuring machine consideringmeasuring posture,” Int. J. of Automation Technology, Vol.5, No.2,pp. 109-114, 2011.
[11] A. Weckenmann, X. Jiang, K.-D. Sommer, U. Neuschaefer-Rube,J. Seewig, L. Shaw, and T. Estler, “Multisensor data fusion in di-mensional metrology,” CIRP Annals – Manufacturing TechnologyVol.58, No.2, pp. 701-721, 2009.
[12] H. Zhao, J.-P. Kruth, B. Boeckmans, N. Van Gestel, and P. Bleys,“Automated dimensional inspection planning using the combina-tion of laser scanner and tactile probe,” Measurement, Vol.55, No.5,pp. 1057-1066, 2012.
[13] A. Contri, P. Bourdet, and C. Lartigue, “Quality of 3D digitizedpoints obtained with non-contact optical sensors,” CIRP Annals –Manufacturing Technology, Vol.51, No.1, pp. 443-446, 2002.
[14] C. Lartigue, A. Contri, and P. Bourdet, “Digitised point quality inrelation with point exploitation,” Measurement, Vol.6, pp. 193-203,2002.
[15] H. Feng, Y. Liu, and F. Xi, “Analysis of digitizing errors of alaser scanning system,” Precision Engineering, Vol.25, pp. 185-191,2001.
[16] Y. Tan, “Scanning and post-processing parameter optimization forCT dimensional metrology,” Ph.D. Thesis, Katholieke UniversiteitLeuven, Department of Mechanical Engineering, 2015 (in press).
[17] B. Boeckmans, Y. Tan, F. Welkenhuyzen, Y. S. Guo, W. Dewulf,and J.-P. Kruth, “Roughness offset differences between contact andnon-contact measurements,” Proc. of Euspen 15th Int. Conf., 2015,in press.
[18] B. Igor, N. Van Gestel, J.-P. Kruth, P. Bleys, and J. Hodolic, “Ac-curacy improvement of laser line scanning for feature measure-ments on CMM,” Optics and Lasers in Engineering, Vol.45, No.11,pp. 1274-1211, 2011.
[19] A. Bernard and M. Veron, “Analysis and Validation of 3D LaserSensor Scanning Process,” CIRP Annals – Manufacturing Technol-ogy, Vol.48, No.1, pp. 111-114, 1999.
[20] B. Boeckmans, F. Welkenhuyzen, and J.-P. Kruth, “Accuracy verifi-cation of a laser line scanner probe,” Laser Metrology and MachinePerformance X, pp. 279-288, 2013.
[21] B. Boeckmans, M. Zhang, F. Welkenhuyzen, W. Dewulf, and J.-P.Kruth, “CMM sensor evaluation method with machine error exclu-sion,” Laser Metrology and Machine Performance XI, 2015.
[22] ISO 14253-1:1998. GPS – Inspection by measurement of work-pieces and measuring equipment – Part 1: Decision rules for prov-ing conformance or non-conformance with specifications.
[23] ISO 14253-2:2011, GPS – Inspection by measurement of work-pieces and measuring equipment – Part 2: Guide to the estimation ofuncertainty in GPS measurement, in calibration of measuring equip-ment and in product verification.
[24] ISO, GUM, JCGM 100:2008: Evaluation of measurement data –Guide to the expression of uncertainty in measurement.
[25] ISO 10360-8:2013. Geometrical Product Specifications (GPS) –Acceptance and reverification test for coordinate measuring ma-chines (CMM) – Part 8: CMMs with optical distance sensors.
[26] ISO 10360-1:2000, Geometrical Product Specifications (GPS) –Acceptance and reverification tests for coordinate measuring ma-chines (CMM) – Part 1: Vocabulary.
[27] B. Boeckmans, M. Zhang, F. Welkenhuyzen, W. Dewulf, and J.-P.Kruth, “Comparison of aspect ratio, accuracy and repeatability ofa laser line scanning probe and a tactile probe,” Proc. of the 11th
IMEKO Symposium (LMPMI2014), A14, 2014.
Name:Bart Boeckmans
Affiliation:Ph.D. Researcher, Department Mechanical Engi-neering, Division Production Engineering, Ma-chine Design and Automation, KU Leuven
Address:Celestijnenlaan 300, 3001 Leuven, BelgiumBrief Biographical History:2010-2012 Scientific Coworker at KU Leuven2012- Ph.D. Researcher, Department Mechanical Engineering, DivisionProduction Engineering, Machine Design and Automation, KU LeuvenMain Works:• “Visual Inspection of powder deposition in Selective Laser Melting,”Machine Vision and Applications, Springer International, 2011.• “Accuracy verification of a laser line scanner probe,” Laser Metrologyand Machine Performance X, pp. 279-288, 2013.• “Comparison of Aspect Ratio, Accuracy and Repeatability of a LaserLine Scanning Probe and a Tactile Probe,” 10th IMEKO Symposium:Laser Metrology for Precision Measurement and Inspection in Industry(LMPMI), A14, 2014.
Int. J. of Automation Technology Vol.9 No.5, 2015 471
Boeckmans, B. et al.
Name:Min Zhang
Affiliation:Research Associate, Catholic University of Leu-ven (KU Leuven)Lecturer and Supervisor, Beijing University ofTechnology
Address:Celestijnenlaan 300, 3001 Leuven, BelgiumBrief Biographical History:2008-2011 Ph.D. in Applied Sciences - Mechanical Engineering, EcoleNormale Superieure de Cachan2012- Lecturer, Beijing University of Technology2014-2015 Research Associate, Catholic University of Leuven (KULeuven)Main Works:• Over 10 publications in journals and proceedings
Name:Frank Welkenhuyzen
Affiliation:Ph.D. Researcher, Department Mechanical Engi-neering, Division Production Engineering, Ma-chine Design and Automation, KU Leuven
Address:Celestijnenlaan 300, 3001 Leuven, BelgiumBrief Biographical History:2007- Scientific Coworker, KU Leuven2012- Ph.D. Researcher, Department Mechanical Engineering, DivisionProduction Engineering, Machine Design and Automation, KU LeuvenMain Works:• “Industrial computer tomography for dimensional metrology: Overviewof influence factors and improvement strategies,” Proc. of the 4th Int.Conf. on optical measurement techniques for structures and systems, 2009.• “Accuracy study of a 450 kv ct system with a calibrated test object,”Proc. of the 11th Int. Symposium on Measurement and Quality Control(ISMQC-2010), 2013.• “Investigation of the kinematic system of a 450 kv ct scanner and itsinfluence on dimensional ct metrology applications,” Proc. of the Int.Conf. on Industrial Computed Tomography, 2014.• “Simulation of x-ray projection images for dimensional ct metrology,”Proc. of the 5th Int. Conf. on optical measurement techniques forstructures and systems, 2012.• “Accuracy enhancement of the measuring probe for a camera basedmobile CMM,” LAMDAMAP 2009, Teddington, UK, June 30 to July 2,2009.
Name:Jean-Pierre Kruth
Affiliation:Full Professor and Research Team Leader, De-partment Mechanical Engineering, Division Pro-duction Engineering, Machine Design and Au-tomation (PMA), KU Leuven
Address:Celestijnenlaan 300, 3001 Leuven, BelgiumBrief Biographical History:1979 Received Ph.D. in Applied Sciences - Mechanical Engineering fromKU Leuven1979-1982 Lecturer, Institut Technologi Bandung, Indonesia1983-1987 Senior Research Engineer, WTCM-CRIF (Research Centre ofBelgian Metalworking Industry)1987- Professor, Catholic University of Leuven (KU Leuven)Main Works:• Over 500 publications in journals and proceedings• Industrial and Academic Career Award in Virtual and Rapid Prototyping(Portugal, 2009)• International (Senior) Freeform and Additive Manufacturing ExcellenceAward (FAME, Austin, USA, 2012)• SME Albert M. Sargent Progress Award (USA, 2014)• Laureate of the Franklin Institute (Bower Science Award, 2015)Membership in Academic Societies:• International Academy for Production Engineering (CIRP), Fellow• Society of Manufacturing Engineers (SME), Fellow• International Measurement Confederation (IMEKO), Member
472 Int. J. of Automation Technology Vol.9 No.5, 2015