accuracy requirements and benchmark experiments for cfd ... · accuracy and limitations of the...
TRANSCRIPT

NASA Technical Memorandum 1 Ow/
Accuracy Requirements and Benchmark Experiments for CFD Validation Joseph G. Marvin
(NASA-TLI- 100087) BCCUBACY R E Q U I R E H E N T S A N U N88-21423 BENCHMARK EXPERIHENTS F08 CPD Y A L I D A T I O N (NASA) 18 p C S C L 200
Unclas G3/34 0140259
National Aeronautics and space Administration
https://ntrs.nasa.gov/search.jsp?R=19880012039 2020-05-13T00:45:14+00:00Z

NASA Technical Memorandum 100087
Accuracy Requirements and Benchmark Experiments for CFD Validation
~~ ~ ~~~
Joseph G. Marvin, Ames Research Center, Moffett Field, California
National Aeronautics and Space Administration
Ames Research Center Moffett Field, California 94035

2- 1
ACCURACY REQUIREMENTS AND BENCHMARK EXPERIMENTS FOR CFD VALIDATION
Joseph G. Marvin Chief. Experimental Fluid Dynamics Branch
NASA Ames Research Center Moffett Field. CA 94035
SUFMARY
The role of experiment in the development of Computational Fluid Dynamics (CFD) for aerodynamic flow prediction is discussed. between computational and experimental disciplines. and their potential for design more feasible, it no longer suffices to use experimental data from surface or integral measurements alone to provide the required verification. Flow physics and modeling, flow field. and boundary condition measurements are emerging as critical data. Four types of experiments are introduced and examples given that meet the challenge of validation: (1) flow physics experiments; (2) flow modeling experiments; (3) calibration experiments; and (4) verification experiments. Measurement and accuracy requirements for each of these differ and are discussed. A comprehensive program of valida- tion is described, some examples given, and it is concluded that the future prospects are encouraging.
1. INTRODUCTION
CFD verification is a concept that depends on closely coordinated planning Because code applications are becoming more complex
Mathematical approximations. limited computer capacity, and lack of understanding of physical model- ing lead to uncertainties in the application of Computational Fluid Dynamics (CFD). pace of introduction and the extent of reliance on CFD in the design process depends on validation'; and experiments that verify CFD have become an essential element of its evolutionary development.2
Experimental validation is required for a number of different aerodynamic flows that occur over the full range of flight speeds. good planning and cooperation between various aerospace disciplines. Because of this situation the topic of validation has been intensely debated within NASA during the past year. An outgrowth of that debate resulted in the concepts of CFD validation and calibration and categories of experiments recommended by a NASA ad hoc Cornittee on Validation introduced by B r a d l e ~ . ~ And the first NASA CFD Validation Workshop made further reccinmendatlons: (1) provide closer cooperation between CFD developers and experimentalists; (2) provide detailed measurements of the flow field and boundary conditions in addition to model surface and integral quantities; (3) provide new or improved nonintrusive measurement capabilities, especially for hypersonic or reacting flow conditions; (4) provide redundancy in both measurements and experiments when- ever practical so as to clarify accuracy and credibility; (5) provide dedicated large facilities for vali- dation research activities; and (6) provide standardized test cases with accessible data bases.
introduce a synergistfc approach for timely accomplishment of validation. accuracy requirements will be discussed using the concepts of validation, calibration, and categories of experimentation as defined in Ref. 3.
CFD code validation: Detailed surface- and flow-field comparisons with experimental data to verify the code's ability to accurately model the critical physics of the flow. Validation can occur only when the accuracy and limltations of the experimental data are known and thoroughly understood and when the accuracy and limitations of the code's numerical algorithms, grid-density effects, and physical basis are equally known and understood over a range of specified parameters.
CFD code calibration: The comparison of CFD code results with experimental data for realistic geome- tries that are similar to the ones of design interest, made in order to provide a measure of the code's ability to predict specific parameters that are of importance to the design objectives without necessarily verifying that all the features of the flow are correctly modeled.
designed ta develop physical models; (3) experiments designed to calibrate CFD; (4) experiments designed to validate CFD.
the work of the author and his colleagues at the Ames Research Center. preparation of this material is greatly appreciated. Following that, accuracy, instrumentation and facil- ity requirements, and future prospects for validation experiments will be discussed.
2. EXPERIMENTAL REQUIREMENTS
Consequently, the
Any effective, timely program to provide the necessary data will require
The intent of the present paper i s to provide a perspective on validation using these ideas and to Detai 1s on experimental and
Categories of experimentation: (1) Experiments designed to understand flow physics; (2) experiments
The categories of experiments will be explained first with the aid of some examples that represent Their cooperation in the use and
2.1 Role of Experiments
A framework for describing the connection between experiment and computation was presented in Ref. 4. That framework can be depicted with the aid of Fig. 1, taken from Ref. 4. and extended to reflect new developments and the various categories of experiments defined in Ref. 3. The stages of code develop- ment are shown in ascending order of maturity and each is linked to a type(s) of experiment.

2-2
Research codes re fe r t o those developed by in tegra t ing new enabling technology such as supercompu- ters , algorithms, g r i d methodology. and new understanding o f physical modeling t o solve spec i f i c prob- lems. One o r two researchers are involved i n developing the code, and l i m i t e d documentation i s ava i la - ble. requi red t o understand f low physics, t o guide flow modeling processes. and t o va l ida te the computations f o r a p a r t i c u l a r problem. Two types of experiments make up the bu i ld ing blocks leading t o the development o f the research code. They are flow physics and f low modeling experiments. An addi t ional new development a t t h i s 1 ve l i s the use o f f u l l and large-eddy numerical simulat ions5 (FS and LES) and computational chemistry t o develop data bases fo r understanding phenomena such as a t rans i t ion , turbulence, and reac- t i o n r a t e chemistry.
P i l o t codes r e f e r t o a more mature stage of development. Documentation i s more complete, the code i s operated by others besides those involved i n the research code development. and the envelope o f appl ica- t i o n i s expanded i n recogn i t ion o f the po ten t ia l advances afforded by the research code. Benchmark exper- iments are the key t o t h i s stage of development. They provide the parametric in format ion leading t o the i d e n t i f i c a t i o n o f the range o f a p p l i c a b i l i t y o f the code. Ca l ib ra t ion and v e r i f i c a t i o n are the object ives o f these experiments.
Subsequently the code would advance t o i t s u l t imate development stage when i t could be used alone or i n combination w i t h codes from other d i s c i p l i n e s such as s t ructures o r propuls ion and applied conf ident ly i n the design process. needed f o r v e r i f i c a t i o n a t t h i s stage.
The de l ineat ion o f the various stages o f development ou t l ined above i s ideal ized, and not always evident i n pract ice, because of the dynamic nature o f CFD and i t s wide-ranging p o s s i b i l i t i e s f o r so lv ing such a v a r i e t y and complexity o f problems; but the framework depic ts how experiment and computation, work- i ng together. could accelerate the pace of development. Without question the success o f such a framework depends on close coord inat ion between experimental and computational f l u i d dynamicists and instrumentation developers. development.
Experiments u t i l i z e d a t t h i s stage are refer red t o as bu i ld ing blocks. These provide the data
Configurational, performance and system i n t e g r a t i o n experimental data would be
For t h i s paper, the emphasis w i l l be on the requirements f o r the f i r s t two stages o f
2.2 Flow Physics Experiments
The lack of understanding o f fundamental physical phenomena i s l i m i t i n g the pace o f CFD develop- ment. gas physics r e l a t e d t o hypersonic flows. Flow physics experiments are defined as those experiments t h a t prov ide fundamental understanding o f such phenomena so t h a t they can be accurately modeled i n the codes. As mentioned previously, computation i t s e l f i s beginning t o supplement data from f low physics experiments through numerical s imulat ions t h a t do not requ i re any modeling o f the physics. show how f u l l simulat ions o f the Navier-Stokes equations are being ccnnbined w i t h experiment t o prov ide a more fundamental understanding o f tu rbu len t boundary layers. These examples w i l l s u f f i c e t o i l l u s t r a t e what i s meant by f l o w physics experiments.
h i g h l i g h t s several imp r t a n t aspects o f the s t ruc tu re o f turbulence i n a simulated f l a t - p l a t e boundary
kind. The complete, time-dependent Navier-Stokes equations were solved using spect ra l methods a t each o f the 9.4 m i l l i o n g r i d p o i n t s i n the computational domain. The Reynolds number based on momentum thickness i s approxiniately 670. t ices. Shaded regions show where s ign i f i can t con t r ibu t ions t o the Reynolds shear stress, -E, are occur- r ing. Regions o f low-speed f l u i d e jected outwards. and high-speed f l u i d swept wallward are labeled. These, and other r e a l i z a t i o n s show t h a t la rge hook-shaped v o r t i c a l s t ruc tu res are c l e a r l y present i n the numerical tu rbu len t boundary layer, and the loact ions o f s i g n i f i c a n t Reynolds s t ress cont r ibu t ion are seen t o occur adjacent t o these v o r t i c a l structures. This l e v e l o f understanding o f the fundamental processes involved i n the Reynolds s t ress generation i s eventual ly expected t o a i d the development o f improved sta- t i s t i c a l models t h a t accurately r e f l e c t the underlying phys ica l behavior o f turbulence.
To gain s i m i l a r physi a1 ins ight , experimental techniques must general ly employ m u l t i p o i n t measure- ment schemes. An example ' o f such an approach i n a f l o w t h a t i s beyond the current c a p a b i l i t y o f f u l l s imulat ion i s shown i n Fig. 3(a). tu rbu len t boundary layer was invest igated by mounting a f l x e d hot-wire a t the wa l l i n conjunction w i th another, t ravers ing hot-wire mounted d i r e c t l y above the f i r s t . acter and extent o f the coherent eddies i n a Mach 3 axisymmetric boundary layer, and t o compare the r e s u l t s w i t h low Reynolds number, incompressible f low experiments and simulations.
ious pos i t ions o f the outer sensor are shown i n Fig. 3(b). between the two wires occurs up t o a separation distance of a t leas t h a l f the boundary-layer thickness. These data suggest the presence of coherent outer- layer s t ructures t h a t extend we l l i n t o the near-wall region. which may prov ide an energy t ransfer pa th between t h e free-stream f low and the near-wall, turbulence-producing region. using an eddy convection ve loc i ty , and I s shown i n Fig. 3(c) t o vary from 5" near the wal l t o 30" i n the outer layer.
Important expamples are t r a n s i t i o n from laminar t o tu rbu len t flow, turbulence, and h igh temperature
The fo l low ing examples
The phys ica l i n s i g h t obtainable from d i r e c t Navier-Stokes simulat ion7 i s shown i n Fig. 2. The f i g u r e
layer. The s imulat ion 8 was developed by P. R. Spalar t o f Allles, and employs no turbulence models o f any
I n the f igure. elongated whi te surfaces i d e n t i f y the low-pressure cores o f vor-
Here, the large-eddy s t ruc tu re o f a h igh Reynolds number, compressible
The object ive was t o map the spat ia l char-
The long-time-averaged, space-time-cross-correlation functions between the near-wall sensor and var- These curves show t h a t measurable c o r r e l a t i o n
The slope of these s t ructures can be deduced from the c o r r e l a t i o n curves by

2-3
The nature o f these large disturbances can be studied i n more d e t a i l by computing ensemble-averaged, mass-f low h i s t o r i e s around strong, rap id accelerat ions and decelerat ions. The resu l t s f o r accelerat ions, shown i n Fig. 3(d). c losely resemble those of S imi la r invest igat ions performed i n low-speed f lows and i n numerical simulat ions. turbulent boundary layers i s not fundamentally changed by compressibi l i ty , a t leas t f o r moderate Mach numbers.
This suggests Confirmation of Morkovin's hypothesis tha t the basic s t ruc tu re o f
2.3 Physical Modeling Experiments
lence.'' Physical modeling experiments are defined as experiments tha t provide guidance f o r and v e r i f i c a - t i o n o f the modeling process.
An example o f a physical modeling experiment" used t o improve turbulence modeling f o r transonic f lows w i th strong shock-wave/boundary-layer i n te rac t i on i s shown i n Fig. 4. The t e s t model consisted o f a c y l i n d r i c a l body f i t t e d w i th a c i r c u l a r arc sect ion s im i la r t o t h a t o f an a i r f o i l . t i ons of varying strengths were studied by varying free-stream Mach number. The choice of an axisymmetric geometry was made t o e l im ina te three-dimensional effects. Mean-flow ve loc i t y and turbulence p ro f i l es , obtained w i th a Laser Doppler Anemometer System (LOA), and surface quan t i t i es such as pressure and o i l - streak data were documented.
the turbulence modeling. wave loca t i on was predicted i nco r rec t l y and consequently the Pressure recovery was ser ious ly overpre- dicted. The mean- and turbulence-prof i le data were used t o exp la in the di f ferences and t o guide modeling improvement. The primary cause of the pressure recovery overpredict ion was the f a i l u r e o f the eddy v is - cos i t y model t o adequately r e f l e c t the lag o f turbulence adjustment through the shock wave. Using new modeling concepts i n conjunct ion w i t h the turbulence data resu l ted i n a s i g n i f i c a n t model improvement." I n pa r t i cu la r , the "h i s to ry e f fec ts " o f the turbulence changes through the shock wave were accounted f o r by prescr ib ing and solv ing an ordinary d i f f e r e n t i a l equation fo r the maximum shear stress development. The improved model r e s u l t s are shown.
2.4 Ca l ib ra t ion Experiments
data, i n most instances, are l i m i t e d w i th respect t o t h e i r a b i l i t y t o determine the completeness o f the f low modeling. Code c a l i b r a t i o n i s prevalent and important t o developing codes f o r rea l gas hypersonic appl icat ions because i n t h i s f l i g h t regime I t I s extremely d i f f i c u l t t o provide ground t e s t data f o r exact f l i g h t condi t ions and t h e i r attendant chemical and length scales. For example. f a c i l i t i e s may dupl icate f l i g h t energy leve ls bUL not match the a i r chemlstry. o r they may dupl icate f l i g h t Mach number but no t match the energy leve l .
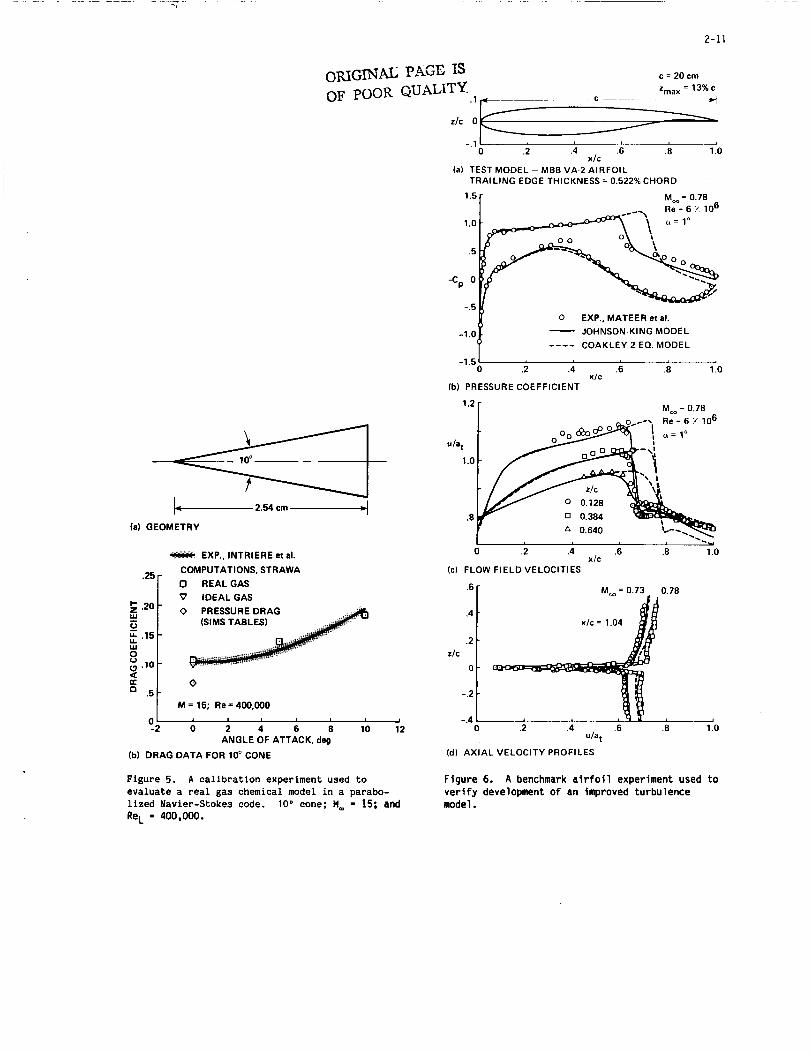
model used i n a parabolized Navier-Stokes codef5 i s shown i n Fig. Drag data from 10" sharp cones f i r e d down a B a l l i s t i c Range are shown as a funct ion o f angle of attack.P4 The angle o f at tack range represents the va r ia t i on (uncertainty) i n launch and f l i g h t p a t h angle of the cones from various f i r i n g s done nomi- n a l l y a t zero angle o f attack. t i o n i s small; and the temperature I n the viscous layer 4s s u f f i c i e n t l y high t o cause d issoc ia t ion o f the a i r . Drag owing t o f r i c t i o n and pressure i s about the same magnitude, so comparisons o f the data w i th integrated pressures and sk in f r i c t i o n from the computations provide a sens i t i ve measure o f how we l l the code p red ic t s sk in f r i c t i o n i n a high-speed boundary layer. The favorable comparison w i th the computa- t i ons performed by A. W. Strawa serves t o i l l u s t r a t e t h a t the code can p red ic t drag i n t h i s chemical ly reac t ing f low f i e l d .
Pr c t i c a l CFD appl icat ions invo lv ing complex tu rbu len t flows r e l y on s t a t i s t i c a l modeling o f turbu-
Shock-wave in te rac-
Computations o f the f low f i e l d from a Reynolds-averaged, Navier-Stokes code revealed de f ic ienc ies i n By using a model developed p r imar i l y fo r attached boundary layers, the shock
Ca l ib ra t ion experiments are intended t o reveal a code's a b i l i t y t o p red ic t spec i f i c parameters. The
An example o f a c a l i b r a t i o n experiment i n nded t o determine the a p p l i c a b i l i t y o f the a i r chemistry
For these t e s t condi t ions the flow i s laminar: v iscous- inviscid in te rac-
More discussion on t h i s experiment and i t s r e s u l t s are presented i n Ref. 15.
2.5 V e r i f i c a t i o n Experiments
V e r l f i c a t l o n experiments provide the f i n a l va l i da t i on o f the codes. As such they requ i re f l o w - f i e l d and surface measurements over a range o f condi t ions and i n s u f f i c l e n t d e t a i l t o ensure t h a t the f low phys- i c s i s proper ly represented.
Stokes code and compared w i th data from an a i r f o i l section. The a i r f o i l was mounted i n a spec ia l l y designed t e s t sect ion w i th s o l i d walls. Boundary-layer suct ion was appl ied upstream o f the a i r f o i l on the s idewal ls t o minimize interference. To fu r the r minimize wa l l Interference, the upper and lower wa l ls were contoured t o streamline shapes t h a t were predetermin d by computation t o account fo r the presence o f t h model, which fu r the r minimized interference. Tests'& were performed a t chord Reynolds number o f 6 10 and angle o f at tack and Mach number were var ied over a range s u f f i c i e n t t o produce transonic f low covering weak and strong shock-wave/boundary-layer i n te rac t i on and attendant displacement e f fec ts . The boundary layer was t r ipped on the upper and lower model surface t o ensure tu rbu len t f l o w beyond 7% chord. Model pressures, wall-boundary shapes and pressures, t o t a l drag, l i f t , and f l ow- f i e ld and wake v e l o c i t i e s from an LDA system were documented. A data base o f t h i s type w i t h minimal interference from a tunnel w i th s o l i d wa l ls provides an i dea l basis fo r evaluat ing the development o f codes fo r the t ransonic speed range because the codes can include wall-boundary condi t ions more prec ise ly than In te r fe rence correct ions can be made t o the data sets.
The fol lowing example i l l u s t r a t e s t h l s category of experiment.
The improved turbulence model shown previously has recent ly been introduced i n t o a transonic Navier-
8

2-4
An example o f some o f the comparisons i s shown i n Fig. 6. A t present the code does not include the s o l i d wall-boundary condit ions, but a pre l iminary assessment using these benchmark data ind icates t h a t the code provides very good simul developed by Johnson and KinJi i s employed. Results o f the comparisons f o r one strong i n t e r a c t i o n case (where separation occurred a t the t r a i l i n g edge) are shown. The a i r f o i l pressures, f low f i e l d v e l o c i t i e s a t constant heights above the model, and a wake p r o f i l e a t the t r a i l i n g edge are compared w i t h computa- t ions using two d i f f e r e n t turbulence models, a two-equation model.17 and the Johnson-King model. comparison shows t h a t the computations using the improved turbulence model simulate the measuremenLs very wel l . data set composed o f t o t a l drag, l i f t , boundary condit ions and f l o w - f i e l d surveys. f u r t h e r discussion.)
i o n f o r the strong i n t e r a c t i o n cases when the improved turbulence model
The
I t i s important t o emphasize t h a t t h i s conclusion could not have been drawn without the complete (See Ref. 16 f o r
3. MEASUREMENT REQUIREMENTS
3.1 Completeness
Each of the types o f experiment discussed prev ious ly requires s p e c i f i c information tha t w i l l enable a c r i t i c a l assessment o f the code's c a p a b i l i t i e s a t each stage o f i t s development. measurements and the t e s t condi t ions where they are needed are l i s t e d i n Fig. 7 taken from Ref. 4. these examples the measurements are representat ive and are germane t o the development o f Reynolds-averaged Navier-Stokes codes f o r f u l l y developed tu rbu len t flow.
Some examples o f these I n
Bu i ld ing block experiments must provide the data requi red f o r phenomenological understanding and/or modeling guidance and enable a c r i t i c a l t e s t o f the research code's a b i l i t y t o simulate important aerody- namic flows (e.g.. shock-induced Separation). Surface var iab les and f l o w - f i e l d variables, inc lud ing t u r - bulence data, are essent ia l measurements. and f u l l numerical s imulat ion o f the Navier-Stokes equations car r ied out f o r simple f lows a t incompressi- b l e and compressible condi t ions can be very he lp fu l i n prov id ing fundamental understanding and guidance o f s t a t i s t i c a l modeling. But the f l o w modeling data must be obtained a t representat ive f l i g h t Mach and Reynolds numbers where the codes are t o be applied t o ensure t h a t the physics i s modeled adequately.
For the turbulence modeling problem, f low physics experiments
Benchmark experiments must provide the parametric measurements necessary t o c a l i b r a t e o r v e r i f y p i l o t code development. Surface and f l o w - f i e l d data a t c r i t i c a l locat ions are the essent ia l in format ion since the ob jec t ive of v e r i f i c a t i o n i s t o ensure t h a t the code represents the correct physics o r f o r c a l i b r a t i o n t o ensure t h a t the code adequately p red ic ts some p a r t i c u l a r f low quant i t ies . I n order t o c l e a r l y i d e n t i f y the appl icable range o f the code, parametric t e s t i n g over as wide a range o f f l i g h t Mach and Reynolds numbers i s necessary. Experiments a t extremes i n such condi t ions are now o f t e n l i m i t e d by instrumentation and f a c i l i t y development, as i n hypersonic o r high Reynolds number regimes.
mance evaluat ion and the experiments should be car r ied out as close t o f l i g h t condi t ions as prac t ica l . CFD i s expected t o expedite the executlon of these by e l im ina t ing the need fo r f i n e increments i n paramet- r i c var ia t ions, by he lp ing t o resolve a n m a l w s data sets, and by ext rapolat ing the design performance data t o f l i g h t condi t ions when f a c i l i t i e s are unable t o achieve them.
may in f luence the f low f i e l d around t e s t models. Moreover, they may be needed t o i n i t i a t e computations. Free-stream o r i n i t i a l condit ions, Wall-boundary phys ica l loca t ion ard necessary measurement variables, and prec ise model l i n e s are examples of these measurement requirements.
3.2 Accuracy
there i s no quant i ta t i ve means f o r determining the l i m i t s and ranges o f a p p l i c a b i l i t y f o r the codes. Uncertainty analys is i s a well-establ ished method f o r determining experimental data accuracy and should be a p rerequ is i te f o r a l l l e v e l s o f experiment used t o develop CFD. developmental phases of experiments, fo r evaluat ing data obtained w i t h d i f f e r e n t instruments, and f o r comparing data from d i f f e r e n t experiments.
f l o w - f i e l d measured variables, and instrumentation should a1 1 be speci f ied and the method used documented s u f f i c i e n t l y t o a1 low independent assessment.
Reliance on s ing le experiments o r measurement procedures f o r code v a l i d a t i o n purposes should be viewed w i t h caut ion because o f the current l i m i t a t i o n s o f f a c i l i t i e s and instrumentation needed t o accom- p l i s h va l idat ion. (These l i m i t a t i o n s are especia l ly present i n hypersonic experiments.) Therefore, redundant measurement techniques and s l m i l a r experiments performed i n more than one f a c i l i t y may be required. c ruc ia l .
4. WIND TUNNEL REQUIREMENTS
Design experiments a t the f i n a l stage provide the optimal con f igura t ion data necessary f o r per for -
For each category of experiment Careful measurements o f boundary condi t ions are requi red because they
Accuracy assessments f o r both computational procedures and experiments are essential. Otherwise
It i s usefu l during the planning and
(See Ref. 18 f o r more discussion on accuracy.)
Error estimates f o r t e s t geometry dimensions. t e s t operating and free-stream condit ions, model and
I n every case. care fu l substant ia t ion and spec i f i ca t ion of experimental accuracy l i m i t s i s
The requirements f o r t e s t f a c i l i t i e s used t o va l ida te CFD were discussed i n Ref. 4. The most impor- t a n t o f these requirements are: (1) v e r s a t i l i t y , along w i t h well-defined t e s t and boundary conditions;

2-5
( 2 ) appropriate scale and speed range; (3) access ib i l i t y of nonintrusive instrumentation; (4) p rov is ion f o r high-speed data systems; and (5) dedicat ion o f Use t o ver i f icat ion-exper imentat ion.
5. FUTURE PROSPECTS
During the past year NASA has embarked on a comprehensive CFD va l i da t i on program. Coordinated exper- imental and computational studies have been i n i t i a t e d a t each o f the NASA OAST Research Centers by teams comprised o f computational and experimental research sc ien t is ts .
employing the Reynolds-averaged Navier-Stokes equations. ments are expected t o be published i n the pub l ic domain and made ava i lab le t o other computational f l u i d dynamicists car ry ing out CFD va l ida t ion . scope o f the program fol low.
ment of a 3-D incompressible Navier-Stokes code (INS-30) ,19 inc luding i t s turbulence model. t i o n o f the code i s t o study the axisymnetric f low i n the Space Shut t le Main Engine turn-around-duct. geometry consists o f a constant area aspect-rat io 10 duct which turns an a i r flow, a t high Reynolds num- ber, through a 180" bend. The bend radius i s equal t o the duct height and some separation o f the f low occurs on the inner corner wa l l near the end o f the turn. A planer ra ther than axisymmetric geometry was chosen t o permit access f o r nonintrusive laser instrumentation. Surface pressures, sk in f r i c t i o n , veloc- i t y p ro f i l es , and Reynolds-averaged normal- and shear-stress p r o f i l e s are being documented f o r a range o f Reynolds numbers. Companion computations f o r t h i s geometry are planned t o v e r i f y the range o f app l i cab i l - i t y of the code and various turbulence modeling approximations.
now under w a y t o guide the development of a transonic Navier-Stokes code (TNS)." The approach t o the experiments i s unique i n t h a t they are de l ibera te ly performed i n so l id -wa l l wind tunnel f a c i l i t i e s . This t e s t technique was chosen because the code can use the tunnel wa l ls as boundary condi t ions and el iminate uncertain correct ions t o the data f o r wa l l interference. Once the code has been val idated, i t can con f i - dent ly be used f o r f ree -a i r computations by appropr iately changing the boundary condit ions.
The f i r s t phase o f the experimental a c t i v i t y was conducted several years ago.21 A low-aspect r a t i o wing w i t h a NACA 0012 p r o f i l e sect ion i n the stream d i rec t i on was mounted on the sldewall o f a high Reynolds number f a c i l i t y and tested over a range o f Mach numbers from 0.5 t o 0.84. Reynolds numbers from 2 a lo6 t o 8 x lo6, and angle o f at tack from 0" t o 2'. cor rec t f o r "tunnel empty" boundary-layer growth and instrumented w i th pressure taps were employed. Inv isc id , no-s l ip boundary condi t ions along a l l wa l l s were assumed f o r the computations, but t h a t may not be e n t i r e l y adequate as discussed la te r . Model pressures, wall-boundary pressures, surface o i 1 flows, and l i m i t e d ve loc i t y p r o f i l e s obtained w i t h an LOA were documented. Thus fa r , the data have been used by computational groups a t the NASA Ames and Langley research centers.
The Ames group used comparisons w i t h the data a t the lower Mach numbers and angles o f at tack t o es tab l i sh confidence i n the zonal techniques employed I n the TNS code. angles $5 attack they used comparisons w i t h the data t o so r t out g r i d refinement and turbulence modeling Issues. Results o f the comparisons w i th the high Mach number data were sa t i s fac to ry only i n the sense tha t they reproduced many of the complex f low features, but it could not be determined whether the turbu- lence model was so le l y responsible fo r the dif ferences w i t h the data. Recently the Langley group showed the importance of inc lud ing the viscous. no-s l lp cond i t ion along the mounting wal l . Their resu l ts , taken from Ref. 23, are shown i n Fig. 9. A perspective view of the surface streamlines shows the inf luence o f the viscous sidewall . The streamline patterns, espec ia l l y i n the side-wall region, are remarkably s im i la r t o the experimental o i l flows. The comparison o f computed and measured pressures on the tunnel wa l ls and the wing shows good agreement except on the wing a t the span loca t i on where a strong shock forms. These dif ferences r e f l e c t the inadequacy o f the turbulence model. E f f o r t s are under way t o improve the model i ng . ment el iminates some of the shortcomings of the one previously described: the model and the t e s t f a c i l i t y are larger; the Reynolds number range can be extended; a more r e a l i s t i c , low-aspect. h igh- taper - ra t io wing gemet ry i s being used; and the sidewall boundary layer w i l l be measured. Moreover, p rov is ion i s made t o t e s t a wing-body combination. A photograph o f the wing-body model mounted i n the tunnel i s shown i n Fig. 10. The measurements t o be made are also l i s t e d . The half-model body i s mounted on the sidewall . The TNS computations w i l l employ no-s l ip boundary condi t ions along the mounting wa l l and s l i p condi t ions on the other walls. Prel iminary wing-alone and wa l l pressure data have been obtained recent ly.
3-0 Supersonic Shock In te rac t i on Experiments--Several experiments are under way t o study the interac- t i o n of shock waves w i th tu rbu len t boundary layers. Reference 24 presented data f o r a ser ies o f asymnet- r i c separated f lows on an ogive-cyl inder- f lare model. Shock unsteadiness was a major issue i n the experi- ments and the reader i s re fe r red t o Ref. 24 f o r f u r the r discussion.
Another ser ies o f experiments on a swept-wedge p l a t e are being con c ted by Sett les. Figure 11 shows the geometry, t e s t condi t ions and some recent ly publ ished measurements.'! The surface sk in f r i c t i o n on the p la te has been measured and compared w i th a computation solv ing the Reynolds-averaged Navier-Stokes
A t the Ames Research Center, the major th rus t o f the a c t i v i t y 1s supporting the development of codes Data from in-house and university-funded exper i -
Some examples o f the benchmark experiments tha t i l l u s t r a t e the
Turn-around-duct experiment: The experiment shown i n Fig. 8 i s under way t o help guide the develop- The appl ica-
The
Transonic Wing and Wing-Body Experiments: Transonic experiments have been erformed and others are
Solid, s t ra igh t , wind tunnel walls. sloped t o
A t the higher Mach numbers and
A fol low-on experiment conducted i n a s o l i d w a l l t ransonic t e s t sect ion i s under way. This experi-
2-6
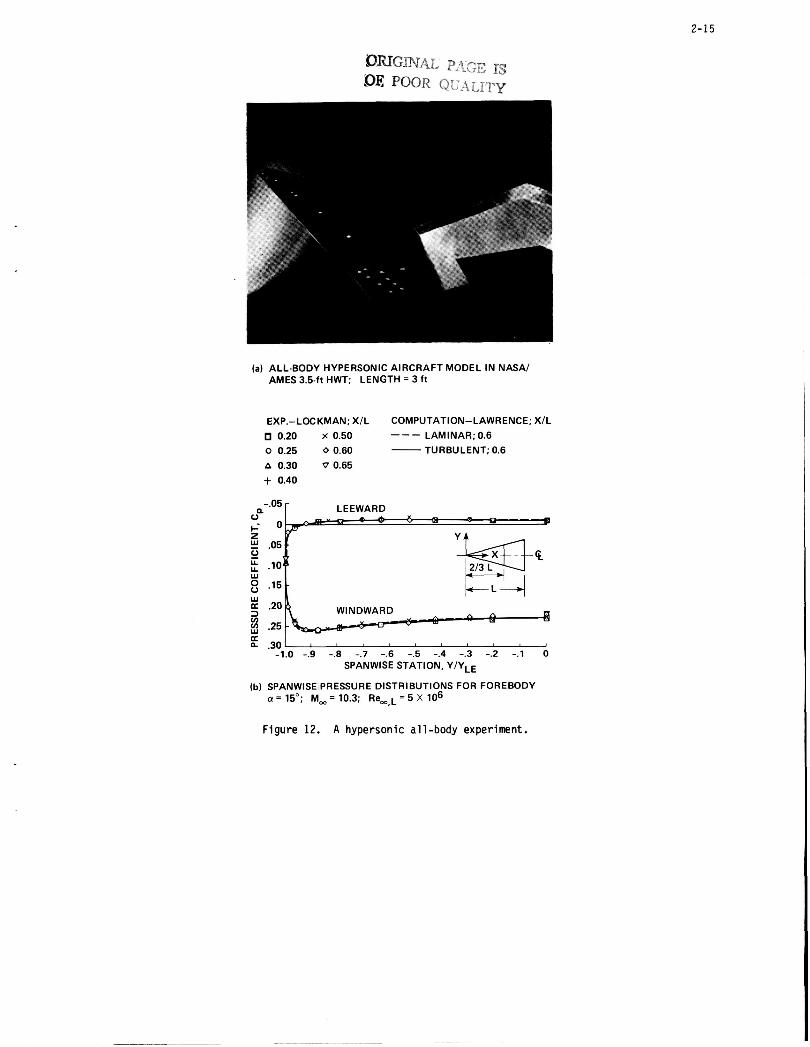
equations. A two-equation turbulence m d e l w i t h wa l l functions was employed and the r e s u l t s compare w e l l w i t h the data. b ra ic turbulence models show t h a t turbulence modeling i s not c r i t i c a l t o reso lv ing the s t ructure physics o f these flows, probably because they are dominated by I n v i s c i d ef fects . i t y are essent ia l t o reproducing the structures, and Euler codes probably cannot represent these f lows adequate 1 y . development o f a 3-0 Parabol ized Navier-Stokes c o d J 6 t h a t uses up-wind d i f fe renc ing t o ob ta in sharp shocks. A t the two- th i rds body length s tat ion, an expansion surface forms the upper p a r t on the model. Some recent experimental r e s u l t s taken from Ref. 27 are a lso shown i n Fig. 11. and M = 10.3 over the forebody reg ion ahead o f the expansion are shown compared w i t h the computations f o r a s ing le streamwise s tat ion, assuming e i t h e r laminar o r tu rbu len t f low from the leading edge. agreement i s good w i t h e i t h e r assumption because v iscous- inv isc ld i n t e r a c t i o n has a small in f luence on the pressure d i s t r i b u t i o n a t t h i s Reynolds number. p r o f i l e s are completed. o ther v a l i d a t i o n issues such as aerodynamic heating w i l l be addressed.
6. CONCLUDING REMARKS
I n Ref. 25. comparisons w i t h data f o r o ther wedge angles using both two-equation and alge-
However, the ef fects of viscos-
Hypersonic All-Body Experiment: The experimen depicted i n Fig. 12 i s being performed t o guide the
The geometry I s a 70" swept d e l t a w i t h an e l l i p t l c a l cross section.
Spanwise pressure d i s t r i b u t i o n s f o r 15" angle o f a t tack
The
When the remaining measurements o f heating and v e l o c i t y
Experiments p lay a c r i t i c a l r o l e i n the development o f CFD. They provide phenomenological data t o help understand the physics o f complex flows; they provide guidance i n the modeling process where the physics I s unknown o r so complex t h a t computational procedures are not p rac t ica l ; and u l t i m a t e l y they pro- vide the v e r i f i c a t i o n necessary t o es tab l i sh the l i m i t s o f a p p l i c a b i l i t y t o various aerodynamic flows.
(1) f low physics experi- ments, (2) f l o w modeling experiments, (3) c a l i b r a t i o n experiments, and (4) v a l i d a t i o n experiments. The f i r s t two types were broadly categorized as bu i ld ing block experiments. They provide the phenomenological and modeling data requi red f o r research code development. An add i t iona l new technological advance con- t r i b u t i n g t o the b u i l d i n g block data base i s f u l l - and large-eddy simulat ions and computational chemis- try. The bu i ld ing block data base i s more de ta i led and o f t e n requi res sophis t icated instrumentation and t e s t techniques. The second two types were broadly categorized as benchmark experiments. These experl- ments prov ide the data needed t o i d e n t i f y the accuracy and l i m i t a t i o n s on the code's a b i l i t y t o compute complex aerodynamic flows. The data requirements d i f f e r from the bu i ld lng block experiments i n the sense t h a t phenomenological and modeling issues are not invest lgated i n d e t a i l .
Four types o f experiments support ing the development o f CFD were described:
The categories o f experiments and corresponding measurements lead t o s p e c i f i c requirements f o r f a c i l - V e r s a t l l i t y , appropriate scale and speed range, a c c e s s i b i l i t y f o r nonint rus ive i t i e s used f o r va l idat ion.
instrumentation, computerized data systems, and dedicated use f o r v e r i f i c a t i o n are the important requirements.
vide v a l i d a t i o n experiments t h a t can guide the development o f advanced computational procedures f o r appl i - ca t ion t o complex flows. dynamic problems whose so lut ions are paced by the lack o f adequate understanding o f the f low physics and modeling and by the lack o f adequate v a l i d a t i o n data t o v e r i f y code development. success o f the program depends on t ime ly accomplishment o f the experiments, development and implementation o f new instrumentation. and development o f appropriate h igh Reynolds number and high Mach number, high- enthalpy f a c i l i t i e s .
REFERENCES
A synerg is t ic , comprehensive approach t o v a l i d a t i o n was introduced. A program i s under way t o pro-
Both cmputa t iona l and experimental f l u i d dynamicists are focusing on key aero-
The major challenge f o r
1.
2.
3 .
4.
5 .
6.
Bradley, R. G., Bhateley. I . C.. and Howell, 6. A.. "Computational F l u i d Dynamics - Trans i t ion t o Design Applications," Supercomputing i n Aerospace, NASA Conference. Pub l ica t ion 2454, pp. 69-767, Mar. 1987.
Current Capab i l i t ies and Future D i rec t ions I n Computational F l u i d Dynamics, National Research Coun- c i l , National Academy Press, Washington, D.C., 1986.
Bradley. R. G.. "CFD Va l ida t ion Philosophy." Paper No. 1. AGARO Symposium on Va l ida t ion o f Computa- t i o n a l F l u i d Dynamics, May 1988. Lisbon, Portugal.
Marvin, J. G., "Wind Tunnel Requirements f o r Computational F l u i d Dynamics Code Ver i f icat ion." Paper 34, AGARO Symposlum on Aerodynamlc Data Accuracy and Qua l i t y , Requirements and Capab i l i t ies i n Wind Tunnel Testing, Naples. I t a l y , Sep. 28-Oct. 1, 1987.
Moin, P. and Kim, J., "The Structure o f the V o r t l c i t y F i e l d i n Turbulent Channel Flow, Part I - Anal- y s i s o f Instantaneous F le lds and S t a t i s t i c a l Correlations." J. F l u l d Mechanics, Vol. 155, p. 441. 1985.
Cooper. 0. M., Jaffe. R. L.. and Arnold, J. 0.. "Computational Chemistry and Aeroassisted Orb i ta l Transfer Vehicles," Journal o f Spacecraft and Rockets, Vol. 22. No. 1, p. 60. Jan.-Feb. 1985.
2-7
7. Kl ine, S. J.. and Robinson, 5 . K., 06Turbulence-Producing Coherent Structures i n the Turbulent Bound- ary Layer: Progress of a Cooperative Evaluation." t o be presented a t the Zar ic Memorial Interna- t i o n a l Seminar on Wall Turbulence, Dubrovnik. Yugoslavia. May 1988.
Spalart, P. R., "D i rect Simulat ion o f a Turbulent Boundary Layer up t o Rtheta = 1410," NASA TM 89407, 1986.
Robinson, S. K. , "Space-Time Corre la t ion Measurements i n a Compressible Turbulent Boundary Layer," A I A A Paper 86-1130, Atlanta, GA, May 1986.
8.
9.
10. Marvin, J. G., "Turbulence Modeling f o r Computational Aerodynamics," AIAA Journal, Vol. 21. No. 7 , pp. 941-955. Jul. 1983.
11. Bachalo. W. D.. and Johnson. 0. A.. "An Invest igat ion of Transonic Turbulent Boundary Layer Separa- t i o n Generated on an Axisymmetric Flow Model," AIM Paper 79-1479, Williamsburg, VA. 1979.
12. Johnson, D. A., and King, L. S.. "Transonic Separated Flow Predict ions Based on a Mathematically Simple, Nonequil ibrium Turbulence Closure Model." IUTAM Symp. on Turbulent Shear Layer/Shock Wave In teract ion, Paris, France, Sep. 1985. NASA TM 86826, Oct. 1985.
Prabhu. D. K.. Tannehil l. J. C.. and Marvin, J. G.. "A New PNS Code f o r Three-Dimensional Chemically Reacting Flows." (U). A I A A 87-1472. Honolulu, HI. Jun. 1987.
I n t i e r e , P. F.. Kirk, 8. K.. Chapman. G. T., and Terry. J. E., " B a l l i s t i c Range Tests o f Ablat ing and Nonablating Slender Cones," (U), AIM J w r n a l , Vol. 8, No. 3, pp. 558-564. Mar. 1970.
15. Deiwert. G. S.. Strawa, A. W.. Sharma. S. P., and Park, C.. "Experimental Program f o r Real Gas Flow Codes a t NASA Ames Research Center," Paper No. 21. AGAR0 Symposium on Val idat ion o f Computational F l u i d Dynamics. Lisbon, Portugal, May 1988.
16. Mateer, G. G., Seegmiller, H. L., Coakley, T. J.. and Hand, L. A., "An Experimental Invest igat ion of a Superc r i t i ca l A i r f o i l a t Transonic Speeds.'' A I A A Paper 87-1241, Honolulu. HI, Jun. 1987.
13.
14.
17. Coakley. T. J., "Numerical Simulation o f Viscous Transonic A i r f o i l Flows." AIAA Paper 87-0416, Jan. 1987.
18. Mof fa t t . R. J.. "Contr ibut ions t o the Theory o f Uncertainty Analysis f o r Single-Sample Experiments," 1980-81 AFOSR/HTTM-Stanford Conference on Complex Turbulent Flows, Vol. 1 Objectives, Evaluat ion o f Data, Spec i f i ca t i on o f Tests Cases, Discussion, and Posi t ion Papers, ed i ted by 5. J . Kline, B. J. Cantwell, and 6. M. L i l l e y .
19. Chang, J. L. C.. and Kwak. D., "A Three-Dimensional Incompressible Flow Simulat ion Method and I t s Appl icat ion t o the Space Shut t le Maine Engine, Part 11--Turbulent Flow," A I A A Paper 85-1670, Reno, NV. Jan. 1984.
20. Holst . T. L., Kaynak. U., Gundy, K. L.. Thomas, S. D., Flores, J.. and Chaderjian, N. M.. "Numerical Solut ion o f Transonic Wing Flows Using an Euler Navier-Stokes Zonal Approach," A I A A Paper 85-1640, Cincinnat i , Ju l . 1985.
Lockman. W. K., and Seegmiller. H. L.. "An Experimental Invest igat ion o f the Subc r i t i ca l and Super- c r i t i c a l Flow About a Swept Semispan Wing," NASA TM-84367, Jun. 1983.
Kaynak, U.. Flores, J.. "Advances i n the Computation of Transonic Separated Flows over F i n i t e Wings." A I A A Paper 87-1195, Honolulu, HI , Jun. 1987.
Vasta. V. N., and Wedan. B. W., "Navier-Stokes Solut ions f o r Transonic Flow Over a Wing Mounted I n a Tunnel," AIAA Paper 88-0102, Reno NV. Jan. 1988.
21.
22.
23.
24. Brown. J. D., Brown, J. L., KUSSOY, M. I . , Holt , M.. and Horstman, C. C.. "Two-Component LDV Inves t i - gat ion o f 3-Dimensional Shock/Turbulent Boundary Layer Interact ions," A I A A Paper 87-0553. Reno, NV. Jan. 1987.
25. K i m . K. S.. and Sett les, G. S., "Skin F r i c t i o n Measurements by Laser Interferometry i n Swept Shock Wave/Turbulent Boundary-Layer Interact ions."
Lawrence, 5 . L., Chaussee, D. S., and Tannehil l, J. C. "Appl icat ion o f an Upwind Algor i thm t o the PNS Equations," (U), AIM Paper 87-1112, Honolulu, H I , Jun. 1987.
Lockman, W. K., Cleary, J. W., and Lawrence, S. L., "Flow V isua l i za t i on and Pressure D is t r i bu t i ons f o r an All-Body Hypersonic Ai rcraf t , " (U), Paper No. 53. Fourth Nat ional Aero Space Plane Technology Symposium, Honterey, CA, Feb. 1988.
26.
27.

2-8
PRODUCTION CODES
EXPERIMENTS
CON FlGU RATION PERFORMANCE
INTEGRATION
RESEARCH CODES
VAL1 DATION
EXPERIMENTS
TYPES: FLOW PHYSICS AND SIMULATIONS FLOW MODELING
Figure 1. The role o f experiment in developing CFD.
Figure 2. Re, = 670.
Turbulent flow-physics obtained from a full simulation of the Navier-Stokes equations. M, = 0,

2-9
Me = 2.97 Ue = 594 m/sec Re = 1.5 X lo7/,
I 7-
.0 1.2 1.6 2.0 0 .4 x i 6
IC) MEAN ANGLES OF DISTURBANCE FRONT
I
FIXED y+ = 29
__ TRAVERSED 7
la) HOT.WIRE PROBE INSTALLATION
T /o.o*
.5 R11
0
I I I
-2 0 2 4 4 TIME SHIFT, rUe/6
Ib) CROSS-CORRELATIONS BETWEEN TWO HOT-WIRES
VITA DETECTION AT yt = 29
/ I - -- 182 I 132
91
71
65
I 1 I 4 -2 0 2 4
tUe/6
(d) ENSEMBLE.AVERAGED VOLTAGES FOR LARGE POSITIVE EVENTS
Figure 3. Turbulent low-physics obtained from the experiment o f Ref. 9 employing mul t ip le hot-wires. M, = 3; Re = 1.5 x 10 5 /m.

2- 10
61.00 cm 23.65 cm 28.73 cm
MODEL SUPPORT
0 EXP., BACHELLO.JOHNSON - COMPUTATION, JOHNSON-KING MODEL COMPUTATION, CEBECI-SMITH MODEL
.75
5 0
ya .25
0
-.25
- 5 0 ' I I I I 1 I .4 .6 .8 1.0 1.2 1.4 1.6
x I C
(b) PRESSURE COEFFICIENT
x lc (c) VELOCITY, x/c = 1.0
" .4 .6 .8 1.0 1.2 1.4 1.6
xlc (d) MAXIMUM TURBULENT SHEAR STRESS
Figure 4. A flow-modeling experiment used to develop an improved turbulence model.
2-11
.25
I- '20 P 0
.15
x :: .10 U
ORIGINAL PAGE c = 2 0 c m zmax = 13% c
tl .1 ------ - c OF POOR QUALITY.
- 0 REALGAS V IDEALGAS
- 0 PRESSURE DRAG
- (SIMS TABLES)
-
b- 2.54 cm -4 (a) GEOMETRY
0 . 5c
M = 15; Re = 400,000
ANGLE OF ATTACK, deg (bl DRAG DATA FOR 10" CONE
Figure 5. A calibration experiment used to evaluate a real gas chemical model in a parabo- lized Navier-Stokes code. ReL = 400,000.
loo cone; M, = 15; and
zlc
-.l 0 .2 .4 .6 .E 1.0
x l c (a) TEST MODEL - MBB VA-2 AIRFOIL
TRAILING EDGE THICKNESS = 0.522% CHORD 1.5
1 .o
.5
-cp 0
-.5 0 EXP., MATEER e
-1.0
-1.5 0 .2 .4 .6 .8 1 .o
xlc (b) PRESSURE COEFFICIENT
1.2 r M, = 0.78
u/at
1 .o
.8
0 .2 .4 .6 .E 1 .o X I C
(c) FLOW FIELD VELOCITIES
M,= 0.73 0.78 I 1
.4
.2 zlc
0
-.2
-.4 0 .2 .4 6 1 0
u/at
(d) AXIAL VELOCITY PROFILES
Figure 6. verify development of an improved turbulence model.
A benchmark airfoil experiment used to

2-12
EXPERIMENT
BUILDING BLOCK (PHENOMENOLOGICAL)
BENCHMARK (PARAMETRICAL)
~
DESIGN (CONFIGURATIONAL)
MEASUREMENTS (REPRESENTATIVE FOR
TURBULENCE MODELING)
SURFACE QUANTITIES
FLOW FIELD QUANTITIES
TURBULENCE INDIVIDUAL STRESSES CORRELATION LENGTHS STRUCTURE
FREE STREAM TUNNEL WALLS MODEL SHAPE
INCLUDE TRANSITION PTS.
BOUNDARY CONDITIONS
SURFACE QUANTITIES
FLOW FIELD QUANTITIES (SELECTED LOCATIONS)
BOUNDARY CONDITIONS
INCLUDE TRANSITION PTS.
(SEE ABOVE)
DRAG, LIFT, MOMENTS, HEAT LOADS, SHEAR LOADS
BOUNDARY CONDITIONS (SEE ABOVE)
TEST CONDlTl,ONS
REPRESENTATIVE FLIGHT M, Re,
VARY M,. Re, a OVER FLIGHT RANGES
AS CLOSE TO FLIGHT M,. Re, (Y AS PRACTICAL
Figure 7. Experimental requirements.
(a) FLOW FIELD AND GEOMETRY
SURFACE: p,, ~ f , OIL FLOW
REH = 0.1 - 3.0 X lo6, M = 0.1 - 0.3 FLOW FIELD: U, V, 2, 7,
(b) MEASUREMENTS AND TEST CONDITIONS
ORIGINAL PAGE IS OF POOR QUALITY
(c) VIEW SHOWING LASER SKIN-FRICTION INTERFEROMETER
Figure 8. 2-0 turn-around-duct experiment.

2-13 P
0 0 EXP. - LOCKMAN COMPUTATION - VATSA
(a1 PERSPECTIVE VIEW OF COMPUTED STREAMLINES ON WING AND WALL
- COMPUTATION - VATSA EXP. - LOCKMAN Z/C h 2.000 0 0.750 A 1.500 0 0.375
P~/P, = 0.975
'2 UPPER WALL 0 1.125
0 CP
0
0
-.2
LOWER WALL
-2 -1 0 1 2 3 x/c
(b) TUNNEL WALL PRESSURE COMPARISONS
(SPAN) J = 0.25
.8 t 1.2 I 1
J = 0.50 4 1.2 I I I I
-1.2,-
. I , , , , , C = 0.78
1.2 0 .2 .4 .6 .E 1 .o
x/c (c) WING PRESSURE COMPARISONS
Figure 9. Comparison of Reynolds-averaged Navier-Stokes computations and data from a v e r i f i c a t i o n experi- ment. M, = 0.826, Re = 8 x lo6, a = 2". A/R = 3.

2-14
GEOMETRY
0 OGIVE-CYLINDER HALF-BODY
0 WING
NACA 64A008 STREAMWISE SECTION ASPECT RATIO = 3.2 TAPER RATIO = 0.25
L.E. SWEEP ANGLE = 36.9"
TEST CONDITIONS
0 M, = 0.5 TO 0.8
0 Re,+= 1 X IO6 TO 10 x lo6 a=O"T015"
MEASUREMENTS
0 FLOW VISUALIZATION
SURFACE (OIL FLOW)
FLOW FIELD (VAPOR SCREEN)
0 SURFACE PRESSURES (WING, TUNNEL WALLS)
MEAN VELOCITY - FLOW FIELD (LDV AND PROBES)
(a) GEOMETRY, TEST CONDITIONS AND MEASUREMENTS
(b) PHOTO OF MODEL MOUNTED IN TUNNEL
Figure 10. A low-aspect-ratio wing-body experiment.
SHARP FIN
INVISCID PLANAR \ SHOCKWAVE Y h
' FLAT PLATE OR WIND TUNNEL WALL
INITIAL 2D TURBULENT BOUNDARY LAYER
PENN STATE EXPERIMENT: M, J 2.4 - 4. a= 4 - 22", Rex 10 X106
MEASUREMENTS
SURFACE: OILFLOW, pw, cf FLOW FIELD: VAPOR SCREEN, p YAW ANGLE
'2' (a) FLOW GEOMETRY
LISF WITH ERROR BARS --- COMPUTATION, HO RSTMAN
,004 -
.003 - c f
,002 -
.001 - a = 16"
"15 20 25 30 35 40 45 50 55 P. deg
(b) SKIN FRICTION ON THE PLATE, x = 3.5 in.
Figure 11. interaction experiment.
A 3-D shock-wave boundary layer
ORIGINAL PAGE 7s OE POOR QUALITY
2-15
(a) ALL-BODY HYPERSONIC AIRCRAFT MODEL IN NASA/ AMES 3.5-h HWT: LENGTH = 3 ft
EXP.-LOCKMAN; X/L COMPUTATION-LAWRENCE; X/L LAMINAR: 0.6 --- 0.20 x 0.50
0 0.25 0 0.60 - TURBULENT; 0.6 A 0.30 V 0.65 + 0.40
LEEWARD -.05 r n
0 0
.05
.10
WINDWARD A A Ln h4
.30L I
-1.0 -.9 -.8 -.7 -.6 -.5 -.4 -.3 -.2 -.l 0 SPANWISE STATION, Y/YLE
SPANWISE PRESSURE DISTRIBUTIONS FOR FOREBODY a = 15"; M, = 10.3; Re,,L = 5 X lo6
Figure 12. A hypersonic all-body experiment.
Report Documentation Page 1. Report No. 2. Government Accession No.
NASA TM- 100087 4. Title and Subtitle
L Security Classif. (of this report)
Jn c las s if i ed
Accuracy Requirements and Benchmark Experiments for CFD Validation
20. Security Classif. (of this page) 21. No. of pages 22. Price
Unclassified 16 A02
7. AuthorM
Joseph G. Marvin
9. Performing Organization Name and Address
Ames Research Center Moffett Field, CA 94035
2. Sponsoring Agency Name and Address
National Aeronautics and Space Administration Washington, DC 20546-0001
5. Supplementary Notes
3. Recipient's Catalog No.
5. Report Date
May 1988 6. Performing Organization Code
8. Performing Organization Report No.
A-88 123 10. Work Unit No.
505-60- 1 1 11. Contract or Grant No.
13. Type of Report and Period Covered
Technical Memorandum 14. Sponsoring Agency Code
Point of Contact: Joseph G. Marvin, Ames Research Center, MS 229-1 Moffett Field, CA 94035 (415) 694-5390 or FTS 464-5390
6. Abstract
The role of experiment in the development of Computational Fluid Dynamics (CFD t'or aerodynamic flow prediction is discussed. jepends on closely coordinated planning between computational and experimental jisciplines. Because code applications are becoming more complex and their poten- tial for design more feasible, it no longer suffices to use experimental data from surface or integral measurements alone to provide the required verification. Flow physics and modeling, flow field, and boundary condition measurements are emerging 3s critical data. neet the challenge of validation: ( 1 ) flow physics experiments; (2) flow modeling Ixperiments; ( 3 ) calibration experiments; and ( 4 ) verification experiments. Mea- surement and accuracy requirements for each of these differ and are discussed. A Zomprehensive program of validation is described, some examples given, and it is :oncluded that the future prospects are encouraging.
CFD verification is a concept that
Four types of experiments are introduced and examples given that
7. Key Words (Suggested by Authork)) 1 18. Distribution Statement
Zomputer code validation 3xper imen ts rurbulent flows
Unclassified-Unlimited
Subject Category - 34
I I I NASA '626 OCT For sale by the National Technical Information Service, Springfield, Virginia 22161