design ground motion library: an interactive tool for
TRANSCRIPT

EARTHQUAKE ENGINEERING PRACTICE
Design Ground Motion Library:An Interactive Tool for SelectingEarthquake Ground Motions
Gang Wang,a) M.EERI, Robert Youngs,b) M.EERI, Maurice Power,b) M.EERI,and Zhihua Li,b) M.EERI
The Design Ground Motion Library (DGML) is an interactive tool for select-ing earthquake ground motion time histories based on contemporary knowledgeand engineering practice. It was created from a ground motion database thatconsists of 3,182 records from shallow crustal earthquakes in active tectonicregions rotated to fault-normal and fault-parallel directions. The DGML enablesusers to construct design response spectra based on Next-Generation Attenuation(NGA) relationships, including conditional mean spectra, code spectra, and user-specified spectra. It has the broad capability of searching for time history recordsets in the database on the basis of the similarity of a record’s response spectralshape to a design response spectrum over a user-defined period range. Selectioncriteria considering other ground motion characteristics and user needs are alsoprovided. The DGML has been adapted for online application by the PacificEarthquake Engineering Research Center (PEER) and incorporated as a beta ver-sion on the PEER database website. [DOI: 10.1193/090612EQS283M]
INTRODUCTION
In performance-based seismic design of civil structures, it is critical to develop systematicmethods and useful tools to search, select, and modify suitable ground motion time historiesfor engineering applications. In a project sponsored jointly by the California GeologicalSurvey-Strong Motion Instrumentation Program (CGS-SMIP) and the Pacific EarthquakeEngineering Research Center-Lifelines Program (PEER-LL), a multidisciplinary team ofgeotechnical engineers, seismologists, and structural engineers developed the Design GroundMotion Library (DGML; AMEC Geomatrix 2009).
Because only a limited number of ground motion records are available for rare design-level events, amplitude scaling of ground acceleration is commonly performed in earthquakeengineering design practice. However, ground motion scaling has been a subject of intensedebate over the years given that inappropriate record scaling can bias estimates of structuralresponse (e.g., Luco and Bazzurro 2007). Significant concerns have been raised regarding thevalidity of the scaling process in several studies (e.g., Grigoriu 2011). On the other hand, it
Earthquake Spectra, Volume 31, No. 2, pages 617–635, May 2015; © 2015, Earthquake Engineering Research Institute
a) Hong Kong University of Science and Technology, Kowloon, Hong Kongb) AMEC Environment & Infrastructure, Inc., Oakland, CA
617
has been reported that the degree of bias induced by record scaling systematically decreasesas more constraints are applied on the process of ground motion selection and scaling(Hancock et al. 2008). In terms of geotechnical applications, Watson-Lamprey andAbrahamson (2006) demonstrated that, if ground motion selection and scaling are basedon multiple well-selected parameters, ground motions can be scaled by large factors andstill lead to unbiased estimates of earthquake-induced sliding displacements for slopes.
In terms of structural response, a number of studies have found that the elastic responsespectrum over a period range of significance closely correlates with inelastic structuralresponse (e.g., Shome et al. 1998, Baker and Cornell 2005, 2006). The period range of signif-icance may include periods shorter than the fundamental structure period because of higher-mode effects and include periods longer than the fundamental structure period because ofstructure softening during inelastic response. Benchmark tests were recently conducted bythe PEER Ground Motion Selection and Modification (GMSM) Working Group to quantifythe accuracy of various GMSM schemes in predicting the median interstory drift response ofbuildings (Haselton 2009). The results demonstrated the importance of scaling records toaccount for the realistic spectral shape of ground motions at the design level. Especially,the conditional mean spectrum (CMS) describes the expected distribution of spectral accel-erations at different periods for a scenario earthquake (Baker and Cornell 2006, Baker 2011).Ground motion records scaled to match the CMS have a realistic spectral shape at multipleperiods, so they can better estimate the median interstory drift of buildings (Haselton 2009).
To explicitly account for the inelastic behavior of structures, ground motion–scalingmethods are also developed using inelastic deformation spectra or the response of thefirst-mode inelastic single-DOF system (e.g., Luco and Cornell 2007, Kalkan and Chopra2010, Reyes and Chopra 2012). In these procedures, important structure-specific properties,such as modal participation factors and structural strength, can be explicitly considered.
In summary, realistic estimates of inelastic response for different structure types requirethat ground motion selection and scaling be properly conducted by taking into account thestructural characteristics and single or multiple ground motion parameters that significantlycorrelate with structural response. These considerations, as well as considerations of a rangeof preferences by designers and analysts (e.g., the size of the time history sets), indicated thata “dynamic” ground motion library was needed—that is, one that would permit the selectionof time history records to be tailored to specific project needs and designer preferences. Oneof the objectives of developing the DGML was to create an efficient tool for time historyselection that is consistent with contemporary knowledge and engineering practice. TheDGML enables rapid searching and selection of time histories from a large ground motiondatabase based on appropriate criteria and user needs. Moreover, it has the broad capability ofsearching for time history record sets in the database on the basis of (1) the characteristics ofthe recordings in terms of earthquake magnitude, type of faulting, distance, and site char-acteristics; (2) the response spectral shape of the records in comparison with design or targetresponse spectra; and (3) other record characteristics, including duration and the presence ofvelocity pulses in near-fault time histories. Other criteria and limits can be specified by theuser to constrain searches. Also, supplemental searches can be conducted for individualrecords or records from selected earthquakes or stations, and these records can be evaluatedand incorporated in data sets of search results.
618 WANG ET AL.

Initially developed on a DVD-ROM, the DGML has been adapted for online applicationby PEER and incorporated as a beta version on the PEER database web site (PEER 2012b).This paper summarizes the development of the DGML and its application in the selection andscaling of earthquake ground motions for seismic design of civil structures.
EARTHQUAKE GROUND MOTION DATABASE
DGML STRONG MOTION DATABASE
The source for the DGML is the PEER Next-Generation Attenuation (PEER-NGA)project database of ground motion recordings and supporting information (PEER2012a), which was created as the principal resource for the development of updated groundmotion prediction equations (GMPEs) in the NGA research project coordinated by thePEER Lifelines Program (PEER-LL) in partnership with the U.S. Geological Survey(USGS) and the Southern California Earthquake Center (SCEC) (Chiou et al. 2008,Power et al. 2008). The PEER-NGA database represents a comprehensive update andexpansion of the preexisting PEER database. The ground motion records originate fromthe strong motion networks and databases of CGS-SMIP and USGS and other reliable inter-national sources.
The PEER-NGA database includes 3,551 three-component recordings from 173 earth-quakes and 1,456 recording stations. The DGML database consists of 3,182 records from thePEER-NGA database. Not incorporated were 369 records, including the following:
• Records considered to be from tectonic environments other than shallow crustalearthquakes in active tectonic regions, such as those from subduction zones.
• Records of earthquakes with poor-quality metadata.• Records obtained in recording stations not considered sufficiently close to free-field
ground surface conditions, such as those obtained in basements of buildings or onthe ground floors of tall buildings.
• Records lacking information on soil/geologic conditions at recording stations.• Records having only one horizontal component.• Records not rotated to fault-normal (FN) and fault-parallel (FP) directions because
of the absence of information on sensor orientations or fault strike.• Records of questionable quality.• Records that are proprietary.
Figure 1 shows the moment magnitude and rupture distance distribution of the records inthe DGML database.
Acceleration time histories in the DGML are horizontal components that have beenrotated to the FN and FP directions. However, this does not imply that these time historiesare for use in analyses in the FN and FP directions only; rather, they can be used in timehistory sets in the same manner as are time histories in the as-recorded orientations in otherdatabases. Nevertheless, FN and FP rotation does provide additional information with respectto the seismological conditions under which the recordings were obtained, and, as Somervilleet al. (1997) found, records in the FN direction often contain strong velocity pulses that maybe associated with rupture directivity effects.
DGML: AN INTERACTIVE TOOL FOR SELECTING EARTHQUAKE GROUNDMOTIONS 619

Ground motion parameters quantified for time histories in the DGML database areresponse spectra, peak ground acceleration (PGA), peak ground velocity (PGV), peak grounddisplacement (PGD), significant duration, assessments of the lowest usable frequency (longestusable period) for response spectra, and presence and periods of strong velocity pulses. Therecommended lowest usable frequency is related to the filtering of a record by the record-processing organization to remove low-frequency (long-period) noise. High-pass filteringresults in suppression of ground motion amplitudes and energy at frequencies lower thanthe lowest usable frequency such that themotion is not representative of the real groundmotionat those frequencies. The DGML user can choose to select or reject a record on the basis of thelowest usable frequency. It is recommended that selected records have lowest usable frequen-cies equal to or lower than the lowest frequency of interest.
A major effort was made in the PEER-NGA project to systematically evaluate and quan-tify supporting information (metadata) about the ground motion records. Metadata in thePEER-NGA database include the following:
• Earthquake source information, such as moment magnitude, type of faulting(mechanism), depth to the top of the fault rupture, and rupture directivityparameters.
• Source-to-recording station travel path information, such as different measures ofsource-to-site distance and recording station location on the hanging wall or foot-wall of the reverse or normal fault.
• Local site conditions at recording stations, such as average shear wave velocity inthe upper 30 meters of sediments (VS30) and depth to basement rock.
DGML metadata include earthquake magnitude and type of faulting, measures of closestdistance from the earthquake source to the recording station (closest distance to the fault
0.1 1 10 1004
5
6
7
8
Rupture distance (km)
Mag
nitu
de
CaliforniaTaiwanOther regions
Figure 1. Moment magnitude and rupture distance distribution for PEER NGA records in theDGML database.
620 WANG ET AL.

rupture surface and the Joyner-Boore distance), and site VS30. The DGML also providesaccess to vertical ground motion time histories and their response spectra if available.
RECORDS WITH VELOCITY PULSES
A number of studies have shown that strong velocity pulses in ground motion time his-tory records, such as often occur in near-source ground motions as a result of near-sourcefault rupture directivity effects, can impose severe demands on structures (Bertero et al. 1978,Hall et al. 1995, Alavi and Krawinkler 2001, Makris and Black 2003, Mavroeidis et al. 2004,Akkar et al. 2005, Luco and Cornell 2007). The presence of velocity pulses can be a criterionin searches for DGML records.
In the PEER-NGA database, certain ground motion records have been identified as hav-ing strong velocity pulses that may be associated with fault rupture directivity effects. Thefollowing general criteria define such records (Baker 2007): (1) the pulse is large relative tothe residual features of the ground motion after the pulse is extracted; (2) the pulse arrivesearly in the time history, as would be expected for pulses associated with rupture directivityeffects; and (3) the absolute velocity amplitudes are large (the PGV of the pulse record shouldbe equal to or greater than 30 cm∕s). Although Somerville et al. (1997) showed that thestrongest pulses are generally more closely aligned with the FN direction than with theFP direction, the criteria just listed apply to both FN and FP ground motion componentsin the NGA database. More detailed results and documentation of analyses can be found inBaker (2014). It is interesting that, even though velocity pulses may not seem apparentin some records in the FN or the FP direction, they may be present in other directions(Reyes and Kalkan 2012). However, the pulse records identified in the DGML are onlyfor FN and FP components.
Besides the pulse records indentified by Baker (2007), several records having strong FNpulses are included in the DGML if they have been identified as pulse records in at least twostudies by other researchers (Somerville 2003, Mavroeidis and Papageorgiou 2003, Bray andRodriguez-Marek 2004, Fu and Menun 2004) and if their PGV is equal to or greater than30 cm∕s (Baker’s criterion). In total, pulse records are identified in the DGML database asfollows: 63 have pulses in FN components only; 23 have pulses in FP components only; and30 have pulses in both FN and FP components. With the DGML user interface, records hav-ing FN pulses, FP pulses, or both FN and FP pulses can be searched. As with all DGMLrecords, a user can specify other criteria and limits, as described in the next section.
There can be no assurance that the velocity pulses of DGML records are all due to direc-tivity effects without detailed seismological study of individual records. It is likely that otherseismological factors may have caused or contributed to some of them. However, althoughthe causative mechanisms are uncertain, it is believed that the pulses are similar to thosecaused by directivity and are therefore suitable for use in modeling the effects of directivitypulses on structures. In addition to the commonly used ground motion parameters describedpreviously, the DGML provides estimates of pulse periods, primarily based on Baker (2007).For a more detailed understanding of pulses in time history records considered for analysis, itis suggested that the velocity time histories of candidate time histories be displayed andexamined. This can be readily done through the DGML graphic interface.
DGML: AN INTERACTIVE TOOL FOR SELECTING EARTHQUAKE GROUNDMOTIONS 621

GROUND MOTION SELECTION CRITERIA AND PROCEDURES
The selection of ground motions by the DGML is based on response spectral shape andother criteria in a three-step process: (1) specification of the design or target responsespectrum; (2) specification of criteria and limits for time history record searches; and(3) search of the database and selection and evaluation of records. A flow chart of theDGML is shown in Figure 2.
DEVELOPING THE TARGET SPECTRUM
The DGML Target Spectrum window is shown in Figure 3. It contains the followingmain parts: (1) Select Spectrum Model; (2) PEER-NGA Spectrum; (3) User DefinedSpectrum; (4) Code Specification; (5) Control (plot control panel); (6) Spectrum plot;(7) Notations; (8) Save Target Spectrum button; and (9) Next button (to go to the next stepin the search).
Three options are provided in the DGML for developing the target spectrum:
• Option 1: code spectrum. For this option, the target spectrum is the design earth-quake or maximum considered earthquake (MCE) spectrum as formulated in theNEHRP provisions (Building Seismic Safety Council 2009, 2012), ASCE standardsASCE 7-05 (ASCE 2006) and ASCE 7-10 (ASCE 2010), and the InternationalBuilding Code (ICC 2006). The code design spectrum is completely specifiedby three parameters, which are obtained using design ground motion maps andother provisions in the code document: site-class-adjusted 0.2-s spectral accelera-tion, SDS; site-class-adjusted 1.0-s spectral acceleration, SD1; and transition period,TL, from constant spectral velocity (for which spectral accelerations are proportionalto 1∕T) to constant spectral displacement (for which spectral accelerations are pro-portional to 1∕T2). The user enters the values for these three parameters and theDGML constructs and plots the response spectrum.
Optimally scaled record set that best matches the target spectrum
Strong Motion Database
Search criteria and limits
Selection bin of records
Target spectrum
Linearly scale the record spectrum to best match the target spectrum
Record inspection, evaluation and output
• Code spectrum • User defined spectrum • Scenario spectrum • Conditional mean
spectrum
Figure 2. Flow chart of the DGML.
622 WANG ET AL.
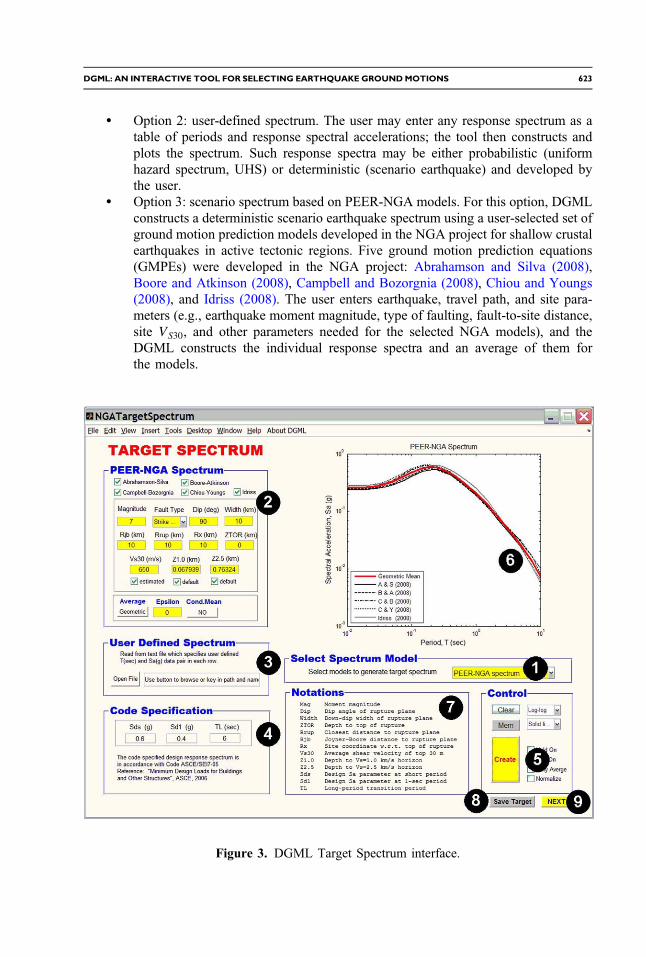
• Option 2: user-defined spectrum. The user may enter any response spectrum as atable of periods and response spectral accelerations; the tool then constructs andplots the spectrum. Such response spectra may be either probabilistic (uniformhazard spectrum, UHS) or deterministic (scenario earthquake) and developed bythe user.
• Option 3: scenario spectrum based on PEER-NGA models. For this option, DGMLconstructs a deterministic scenario earthquake spectrum using a user-selected set ofground motion prediction models developed in the NGA project for shallow crustalearthquakes in active tectonic regions. Five ground motion prediction equations(GMPEs) were developed in the NGA project: Abrahamson and Silva (2008),Boore and Atkinson (2008), Campbell and Bozorgnia (2008), Chiou and Youngs(2008), and Idriss (2008). The user enters earthquake, travel path, and site para-meters (e.g., earthquake moment magnitude, type of faulting, fault-to-site distance,site VS30, and other parameters needed for the selected NGA models), and theDGML constructs the individual response spectra and an average of them forthe models.
Figure 3. DGML Target Spectrum interface.
DGML: AN INTERACTIVE TOOL FOR SELECTING EARTHQUAKE GROUNDMOTIONS 623

The DGML also has the capability to construct the conditional mean spectrum (CMS) fora scenario earthquake. Although in practice sets of time histories are often formed to providean aggregate match to a probabilistic response spectrum (UHS), for design purposes theremay be conservatisms involved in doing so. As summarized by Cornell (2006) and Baker(2011), the UHS is different from the response spectrum expected for a single ground motionfrom a scenario earthquake. The spectral ordinates of a UHS at different periods may bedriven by two or more different scenario earthquake sources, and therefore the UHS maybe overly broad and thus conservative for a single earthquake. On the other hand, conditionalmean spectra can provide realistic spectral shapes for scenario earthquakes.
To construct conditional mean spectra, hazard deaggregation should be carried out first toidentify the dominant deterministic earthquake scenarios that contribute to a UHS, includingmagnitudes (M) and rupture distances (R). The “epsilon,” εðT0Þ, measures the number ofstandard deviations between the median spectrum of a scenario earthquake (based on Mand R) and a given target spectral acceleration value at period T0 as follows:
EQ-TARGET;temp:intralink-;e1;41;463εðT0Þ ¼ln SatargetðT0Þ � ln SaðM;R; T0Þ
σln SaðT0Þ(1)
where ln SatargetðT0Þ is the specified target value of the logarithmic spectral acceleration atT0, and ln SaðM;R; T0Þ and σln Sa ðT0Þ are the predicted mean and standard deviation, respec-tively, of the logarithmic spectral acceleration at period T0 provided by the NGAmodels. TheDGML allows the user to specify the εðT0Þ value directly to construct the conditional meanspectrum from the following equation (Baker and Cornell 2006, Baker 2011):
EQ-TARGET;temp:intralink-;e2;41;353 ln Sa�ðTÞ ¼ ln SaðM;R; TÞ þ ρðT ;T0Þ � σln SaðTÞ � εðT0Þ (2)
where ln Sa�ðTÞ is the conditional mean spectrum at period T , conditioned on a given targetspectral acceleration value at period T0, and ρðT ;T0Þ is the correlation coefficient between(logarithmic) spectral accelerations at T and T0 (e.g., Baker and Jayaram 2008).
Figure 4a shows the construction of a conditional mean spectrum by the DGML. For thisexample, the median and median þ1.5 standard deviation spectra are constructed using theNGA models based on a deterministic scenario (Mw ¼ 7, Rrup ¼ 10 km, strike-slip faulting,and rock site). The conditional mean spectra are conditional on the spectral acceleration at thelevel of 1.5 epsilon at the periods of 0.5 and 1 s, respectively, as specified by the DGML inthis example. Multiple conditional mean spectra can be constructed for different conditioningperiods. Figure 4b illustrates conceptually the construction of conditional mean responsespectra for different periods for two scenario earthquakes to more closely match, in aggre-gate, a UHS design spectrum. As shown, for scenario earthquakes A and B a single con-ditional mean spectrum for each event could fall substantially below the UHS at periodsdistant from the period at which the conditional mean spectrum is at the target epsilon. There-fore, again as shown, two (or more) conditional mean spectra might be required for eachscenario earthquake to satisfy code requirements for an aggregate match to the design UHS.
624 WANG ET AL.

SPECIFYING CRITERIA AND LIMITS FOR SEARCHES
A basic criterion used by the DGML to select a representative acceleration time history isthat the spectrum of the time history provide a “good match” to the user’s target spectrumover the user-defined spectral period range of interest. The quantitative measure used to eval-uate how well a time history conforms to the target spectrum is the mean squared error (MSE)of the difference between the spectral accelerations of the record and the target spectrum,computed using the logarithms of spectral period and spectral acceleration. The DGMLtool searches the database for records that satisfy the user’s general acceptance criteria
0 0.5 1 1.5
(a)
(b)
2 2.5 30
0.5
1
1.5
Period, T (s)
Spe
ctra
l acc
eler
atio
n, S
a (g
)
Median spectrumMedian + 1.5 ε spectrumCMS | T
0 = 1 s, ε = 1.5
CMS | T0 = 0.5 s, ε = 1.5
Target spectral value
0.1 1.00.01
0.1
1
Period, T (s)
Spe
ctra
l acc
eler
atio
n, S
a (g
)
UHS design spectrum (target) Median spectrum, scenario EQ A Median spectrum, scenario EQ B CMS | scenario EQ A at target levels CMS | scenario EQ B at target levels Target spectral values
εε
Figure 4. Construction of conditional mean spectrum by DGML: (a) conditioned on a scenarioearthquake at periods of 0.5 s and 1 s at ε ¼ 1.5 level; (b) conditioned on multiple scenario earth-quakes based on Cornell (2006).
DGML: AN INTERACTIVE TOOL FOR SELECTING EARTHQUAKE GROUNDMOTIONS 625

and then ranks them in order of increasing MSE, with the best matches having the lowestMSE. It is worth pointing out that the target spectrum developed using the three options listedpreviously and the response spectrum of individual records in the database are both linearlyinterpolated in the log-log scale using a set of periods equally spaced from 0.01 to 10 s in logscale (100 points/log cycle; therefore, 301 periods from 0.01 to 10 s with end pointsincluded). The MSE is computed using the interpolated data via Equation 3:
EQ-TARGET;temp:intralink-;e3;41;566MSE ¼P
iwðTiÞfln½SatargetðTiÞ� � ln½ f � SarecordðTiÞ�g2Pi wðTiÞ
(3)
where f is a linear scale factor applied to the entire response spectrum of the recording andwðTiÞ is a weight function that allows the user to assign relative weights to different parts ofthe period range of interest, providing greater flexibility in the selection of records. The sim-plest case is to assign an equal weight to all periods (i.e., wðTiÞ ¼ 1), but the user may wish toemphasize the match over a narrow period range of interest while maintaining a reasonablematch over a broad period range.
The DGML allows the user to select individual FN/FP component recordings that matchthe target spectrum; alternatively, the user can select recordings for which the geometricmean of the two horizontal FN/FP components matches the target spectrum. In the lattercase, the MSE is computed over the two components using Equation 3 with the samevalue of f applied to both. This process maintains the relative amplitude of the two horizontalcomponents.
Amplitude scaling of “as-recorded” strong ground motion acceleration time histories isused in the DGML, which does not alter the frequency content of the recordings. The user hasthree options for scaling. One option is to apply a scale factor that minimizes the MSE overthe period range of interest, which produces scaled recordings that provide the best match tothe spectral shape of the target spectrum over the user-specified period range of interest.Minimization of the MSE as defined in Equation 3 is achieved by a scale factor givenby the mean weighted residual in natural logarithm space between the target and the recordspectra:
EQ-TARGET;temp:intralink-;e4;41;264 ln f ¼P
iwðTiÞ ln½SatargetðTiÞ∕SarecordðTiÞ�Pi wðTiÞ
(4)
The second option is to scale the records so that the spectral acceleration at a single periodmatches the target spectral acceleration at that period. This can be used to scale a set ofrecords to have the same spectrum ordinate as the target conditional mean spectrum atthe conditioning period, T0. In this case, the scale factor is determined by
EQ-TARGET;temp:intralink-;e5;41;172f ¼ SatargetðT0ÞSarecordðT0Þ
(5)
The third option is not to apply any scaling.
For all three scaling options, the MSE is computed using Equation 3. Also, all optionsrequire the user to specify the weight function because it is used to calculate the MSE and
626 WANG ET AL.

order the results with respect to the degree of match between the target spectrum and thespectra of recordings over the user-specified period range of significance. In the DGML,the weight function is also discretized at each Ti. It represents only relative weights assignedto various discrete periods and is normalized in the program such that its summation overdiscrete period points equals unity. For this reason, the absolute value of the weight functionis immaterial.
The user specifies the ranges of parameters over which searches are to be conducted andother limits and restrictions. These may include earthquake magnitude range; type of faulting;distance range; VS30 range; significant duration range; whether records are to exclude,include, or be limited to pulse records; limits on the scale factor, f ; and restrictions on direc-tional components (i.e., arbitrary FN or FP components, no restriction; FN components only;FP components only; FN and FP components in pair).
Other criteria to be specified by the user are total number of records to be displayed andtotal number of records for which the average spectrum will be calculated. Figure 5 shows theDGML Search Engine graphical interface used to specify the primary search criteria and list
Figure 5. DGML Search Engine interface.
DGML: AN INTERACTIVE TOOL FOR SELECTING EARTHQUAKE GROUNDMOTIONS 627

and plot results, including time histories and individual and average response spectra ofscaled records sets compared with a specified design or target spectrum. The eight mainfunction modules are (1) Search Engine (specifies record acceptance criteria and performsthe search); (2) Weight Function (specifies the weight function to be used for scalingrecords); (3) spectra-plotting window; (4) weight function–plotting window; (5) Plot Accel-eration (or Velocity/Displacement) Time History for a selected record (one-, two-, or three-component time histories of a record can also be viewed at an expanded time scale to examinedetails, using a feature called Zoom in Time); (6) ground motion record information outputlist; (7) graphic control panel for line styles and display of ground motion components; and(8) buttons to accept or reject individual records and to save the results and selected accel-eration time history files. Figure 6 shows individual spectra and the average spectrum ofselected records compared with the target spectrum. Figure 7 shows the spectra of three com-ponents of an individual record (FN, FP, and vertical) and its acceleration, velocity, anddisplacement time histories.
SELECTION AND EVALUATION OF GROUND MOTION RECORDS
The software tool scans the database, selects all records meeting the user-specified cri-teria as summarized previously, scales the chosen records to match the target spectrum, andranks them in order of increasing MSE. The DGML also has a supplementary search functionto search for specific records according to specified NGA record sequence numbers or earth-quake or recording station name. Selected records from a supplementary search are scaledand ranked by MSE and can be incorporated into data sets as desired by the user. This searchcapability was added so that users can examine any record or group of records and furtherfine-tune the search results based on their preferences.
For a selected record set, a search report can be automatically generated and exported.It includes the following:
10−2
10−1
100
101
10−3
10−2
10−1
100
101
Period, T (s)
Spe
ctra
l acc
eler
atio
n, S
a (g
)
Target spectrumRecord geometric mean
Distribution of 30 output records
Average spectrum of 7 selected records
Period range of weight function
Figure 6. Example of an average spectrum of selected records.
628 WANG ET AL.

10−2
10−1
100
101
10−3
10−2
10−1
100
101
Period, T (s)
(a)
(b)
Spe
ctra
l acc
eler
atio
n, S
a (g
)
Target spectrum
Fault-normal
Fault-parallel
Vertical
0 5 10 15 20 25−0.2
0
0.2
Time (s)
Acc
eler
atio
n (g
)
0 5 10 15 20 25−20
0
20
Time (s)
Vel
ocity
(cm
/s)
0 5 10 15 20 25−10
0
10
Time (s)Dis
plac
emen
t (cm
)
Figure 7. Highlight of the response spectrum and time history of an individual record: (a) FN,FP, and vertical response spectrum; (b) FN and FP acceleration, velocity, and displacement timehistories.
DGML: AN INTERACTIVE TOOL FOR SELECTING EARTHQUAKE GROUNDMOTIONS 629
• Summaries of the search criteria and earthquake, distance, and station/siteinformation.
• Record-scaling factors and MSEs.• Scaled record characteristics, including PGA, PGV, PGD, response spectral accel-
erations, presence of pulses and pulse periods, significant durations, and recom-mended lowest usable frequencies.
• Scaled average spectral accelerations for the selected record set along with the targetor design spectral accelerations.
Although the search results are based on horizontal records, the response spectra for thecorresponding vertical records, scaled by the same factors as for the horizontal records, canbe saved in the search report, which can be output in an Excel spreadsheet. Spectra and timehistory plots can be saved as figure files. The horizontal and/or vertical components of theselected acceleration time histories can be saved as well; these are the unscaled original datafrom the PEER-NGA database.
The user can further modify the time histories for other purposes (e.g., fine-tune record-scaling factors to meet building code requirements, rotate time histories, or adjust the matchof record spectra to a design spectrum by altering the frequency content). For example, ASCE7-05 and ASCE 7-10 specify that for two-dimensional analysis the average value of the5%-damped response spectra for the set of time histories used shall be not less than the designresponse spectrum for periods ranging from 0.2T1 to 1.5T1, where T1 is the natural period ofthe structure in the fundamental mode for the direction of the response being analyzed (ASCE2006, 2010). This criterion can be easily checked using the average of the spectra for thescaled time histories provided by the DGML search report and then applying a minor adjust-ment factor to the set of records to meet the criterion.
For three-dimensional analysis of structures, ASCE 7-10 specifies that, in the periodrange Ti from 0.2T1 to 1.5T1, the average of the square root of the sum of squares
(SRSS) spectra (ffiffiffiffiffiffiffiffiffiffiffiffiffiffiffiffiffiffiffiffiffiffiffiffiffiffiffiffiffiffiffiffiffiffiffiffiffiffiffiffiffiSa2FNðTiÞ þ Sa2FPðTiÞ
p) from all time history pairs shall not fall below
the corresponding ordinate of the response spectrum used in the design. Again, with a littleeffort the criterion can be checked using the DGML output in Excel format. The user firstcomputes the SRSS spectrum for each pair of time histories and then compares the average ofthe SRSS spectra with the design spectrum, as shown in Figure 8. The DGML scales theselected time histories by comparing the geometric mean for each pair of records to the targetspectrum. The average of the geometric mean spectra selected by the DGML provides a goodmatch to the target design spectrum. The corresponding average of the SRSS spectra has ashape similar to that of the average of the geometric mean spectra but is higher, as expected.Comparison of the average SRSS spectrum with the design spectrum in the period range ofinterest provides a scale factor (0.76 in this case) that can be applied to the suite of selectedrecords to meet the criterion.
For the special case of three-dimensional analysis of sites located within 3 mi (5 km) ofthe active fault that controls the hazard, ASCE 7-10 requires that each pair of components berotated to the fault-normal and fault-parallel directions of the causative fault and scaled sothat the average of the FN components is not less than the risk-targeted MCE (MCER)response spectrum. The DGML facilitates meeting this criterion by first defining a targetspectrum as the MCER spectrum and searching for FN components only, and then adjusting
630 WANG ET AL.

the scaling of the FN components to meet the criterion in the same way as for the two-dimensional analysis case. The pairing of FP components is scaled by the same factors.
SUMMARY AND DISCUSSION
The successful development of the DGML is the outcome of a multidisciplinary teameffort. The DGML is a state-of-the-art software package that enables interactive selection andmodification of time histories for dynamic analysis of structures based on appropriate selec-tion criteria and user needs. It facilitates the construction of design response spectra usingrecently developed NGA relationships, including conditional mean spectra, and the construc-tion of code and any other user-specified spectra. The DGML has the broad capability ofsearching for time history record sets in the library database on the basis of response spectralshape, characteristics of the recordings in terms of earthquake magnitude and type of faulting,distance, site characteristics, duration, and presence of velocity pulses in near-fault timehistories.
The DGML features a Graphic User Interface (GUI) to facilitate data input, visualization,and processing. Results in each step can be visualized, and those for different sets of inputparameters can be easily compared. Users can inspect the response spectra and acceleration/velocity/displacement time histories for each record for each component. The DGML alsoprovides easy ways to output search results, plots, and tables. Files containing accelerationtime histories of selected records can be saved for each project. The DGML algorithm isrobust and efficient. The search engine can scan and sort the database within a few seconds.
It is worth pointing out that the ground motions selected by the DGML mainly aim atestimating the median response of structures based on an elastic target spectrum. Sometimesit is important to obtain the actual dispersion of structural behaviors in performance-basedearthquake design. For this purpose, ground motion selection algorithms for matching thetarget response spectrum mean and variance were recently developed (Wang 2011, Jayaramet al. 2011). These new developments will be readily implementable in the DGML in thefuture.
0 1 2 3 4 5 6
0.5
1
1.5
2
Period, T (s)
Spe
ctra
l acc
eler
atio
n, S
a (g
)
Period range of interest
Target design spectrumAverage of geometric mean spectraAverage of SRSS spectraRescaled average of SRSS spectra
Figure 8. Adjustment of the selected ground motion records to the ASCE 7-10 code designspectrum for three-dimensional analysis.
DGML: AN INTERACTIVE TOOL FOR SELECTING EARTHQUAKE GROUNDMOTIONS 631

The DGML prototype was developed using the Matlab (version 7.2) GUI, and it can beexecuted or modified in the Matlab environment. The DGML’s Matlab codes have beencompiled into a stand-alone executable using the Matlab Compiler, so the Matlab environ-ment is not required for end users. In 2009, the compiled DGML package (version 2) wasreleased in DVD-ROM format and distributed to a small group of experts for testing, evalua-tion, and review. It has since been adapted for online application by PEER and incorporatedas a beta version on the PEER database website (PEER 2012b). The online applicationenables broad access to the ground motion selection tool.
The DGML is currently limited to recorded time histories from shallow crustal earth-quakes in active tectonic regimes. With the completion of the PEER NGA-West2 program,a greatly expanded ground motion database (Ancheta et al. 2013) and updated attenuationrelationships have been developed and can be incorporated in a future update of the DGML.Time histories from subduction zone earthquakes are not as yet part of the DGML, but futuredevelopments will have the capability to add records from subduction zone earthquakesoccurring in coastal regions of northwestern California, Oregon, Washington, and Alaska;they may also supplement the library of recorded time histories with time histories simulatedby ground motion modeling. The DGML can be easily upgraded to accommodate thesefuture developments.
ACKNOWLEDGMENTS
The DGML was jointly sponsored by the California Geological Survey Strong MotionInstrumentation Program (CGS-SMIP) and the Pacific Earthquake Engineering ResearchCenter Lifelines Program (PEER-LL). In addition to the authors, project team membersinclude Faiz Makdisi, Chih-Cheng Chin, Allin Cornell, Jack Baker, Stephen Mahin, RonaldHamburger, Ronald Mayes, Roupen Donikian, Yusof Ghanaat, Walter Silva, PaulSomerville, and Ignatius Po Lam. We thank representatives of the project sponsors fortheir active participation, including Moh-Jiann Huang, Anthony Shakal, Yousef Bozorgnia,Brian Chiou, Thomas Shantz, and Norman Abrahamson. We also thank Tony Yang for hishelp with compiling the DGML software package. Gang Wang is supported by the HongKong Research Grants Council (RGC) grant 620311 and Direct Allocation GrantsDAG12EG07-3 and FSGRF13EG09 (HKUST/RGC). Any opinions, findings, and conclu-sions or recommendations expressed in this paper are those of the authors and do not neces-sarily reflect the view of the sponsors and other individuals.
REFERENCES
Abrahamson, N. A., and Silva, W. J., 2008. Summary of the Abrahamson & Silva NGA ground-motion relations, Earthquake Spectra 24, 67–97.
Akkar, S., Yazgan, U., and Gulkan, P., 2005. Drift estimates in frame buildings subjected to near-fault ground motions, Journal of Structural Engineering 131, 1014–1024.
Alavi, B., and Krawinkler, H., 2001. Effects of Near-Fault Ground Motions on Frame Structures,Blume Center Report #138, Stanford University, Stanford, CA.
AMEC Geomatrix, 2009. Design Ground Motion Library, Report and Software Package,Oakland, CA.
632 WANG ET AL.
American Society of Civil Engineers (ASCE), 2006. Minimum Design Loads for Buildings andOther Structures, ASCE 7-05, Reston, Virginia.
American Society of Civil Engineers (ASCE), 2010. Minimum Design Loads for Buildings andOther Structures, ASCE 7-10, Reston, Virginia.
Ancheta, T. D., Darragh, R. B., Stewar, J. P., Seyhan, E., Silva, W. J., Chiou, B. S.-J., Wooddell,K. E., Graves, R. W., Kottke, A. R., Boore, D. M., Kishida, T., and Donahue, J. L., 2013.PEER NGA-West2 Database, PEER Report 2013/03, Pacific Earthquake EngineeringResearch Center, University of California, Berkeley.
Baker, J. W., 2007. Quantitative classification of near-fault ground motions using wavelet ana-lysis, Bulletin of the Seismological Society of America 97, 1486–1501.
Baker, J. W., 2011. Conditional mean spectrum: Tool for ground motion selection, Journal ofStructural Engineering 137, 322–331.
Baker, J. W., 2014. Website of the Baker Research Group, available at http://web.stanford.edu/~bakerjw/pulse-classification.html (last accessed 30 January 2015).
Baker, J. W., and Cornell, C. A., 2005. A vector-valued ground motion intensity measure con-sisting of spectral acceleration and epsilon, Earthquake Engineering and Structural Dynamics34, 1193–1217.
Baker, J. W., and Cornell, C. A., 2006. Spectral shape, epsilon and record selection, EarthquakeEngineering and Structural Dynamics 35, 1077–1095.
Baker, J. W., and Jayaram, N., 2008. Correlation of spectral acceleration values from NGAground motion models, Earthquake Spectra 24, 299–317.
Bertero, V., Mahin, S., and Herrera, R., 1978. Aseismic design implications of near-faultSan Fernando earthquake records, Earthquake Engineering and Structural Dynamics 6,31–42.
Boore, D. M., and Atkinson, G. M., 2008. Ground-motion prediction equations for the averagehorizontal component of PGA, PGV, and 5% damped PSA at spectral periods between 0.01sand 10.0s, Earthquake Spectra 24, 99–138.
Bray, J. D., and Rodriguez-Marek, A., 2004. Characterization of forward-directivityground motions in the near-fault region, Soil Dynamics and Earthquake Engineering 24,815–828.
Building Seismic Safety Council of the National Institute of Building Sciences, 2009. NEHRPRecommended Seismic Provisions for New Buildings and Other Structures, FEMA ReportP-750, Federal Emergency Management Agency, Washington, D.C.
Building Seismic Safety Council of the National Institute of Building Sciences, 2012. NEHERPRecommended Seismic Provisions: Design Examples, FEMA Report P-751, FederalEmergency Management Agency, Washington, D.C.
Campbell, K. W., and Bozorgnia, Y., 2008. NGA ground motion model for the geometric meanhorizontal component of PGA, PGV, PGD, and 5% damped linear elastic response spectra forperiods ranging from 0.01s to 10.0s, Earthquake Spectra 24, 139–171.
Chiou, B., Darragh, R., Gregor, N., and Silva, W., 2008. NGA project strong-motion database,Earthquake Spectra 24, 23–44.
Chiou, B. S. J., and Youngs, R. R., 2008. Chiou-Youngs NGA ground motion relations for thegeometric mean horizontal component of peak and spectral ground motion parameters,Earthquake Spectra 24, 173–215.
Cornell, C. A., 2006. Should uniform hazard spectra be used for design? How should designresponse spectra be determined considering uniform hazard spectra from design maps and
DGML: AN INTERACTIVE TOOL FOR SELECTING EARTHQUAKE GROUNDMOTIONS 633
hazard deaggregation data? presentation to the Third ATC-35/USGS National EarthquakeGround Motion Mapping Workshop, 7–8 December 2006, San Mateo, CA.
Fu, Q., and Menun, C., 2004. Seismic-environment-based simulation of near-fault groundmotions, in Proceedings, 13th World Conference on Earthquake Engineering, Paper No. 332,1–6 August 2004, Vancouver, Canada.
Grigoriu, M., 2011. To scale or not to scale seismic ground-acceleration records, Journal of Engi-neering Mechanics 137, 284–293.
Hall, J. F., Heaton, T. H., Halling, M. W., and Wald, D. J., 1995. Near-source ground motion andits effects on flexible buildings, Earthquake Spectra 11, 569–605.
Hancock, J., Bommer, J. J., and Stafford, P. J., 2008. Numbers of scaled and matched acceler-ograms required for inelastic dynamic analyses, Earthquake Engineering and StructuralDynamics 37, 1585–1607.
Haselton, C. B. (ed.), 2009. Evaluation of Ground Motion Selection and Modification Methods:Predicting Median Interstory Drift Response of Buildings, PEER Report 2009/01, GroundMotion Selection and Modification Working Group, Pacific Earthquake Engineering ResearchCenter, University of California, Berkeley.
Idriss, I. M., 2008. An NGA empirical model for estimating the horizontal spectral values gen-erated by shallow crustal earthquakes, Earthquake Spectra 24, 217–242.
International Code Council (ICC), 2006. International Building Code, Washington, D.C.
Jayaram, N., Lin, T., and Baker, J. W., 2011. A computationally efficient ground-motionselection algorithm for matching a target response spectrum mean and variance, EarthquakeSpectra 27, 797–815.
Kalkan, E., and Chopra, A. K., 2011. Modal-pushover-based ground-motion scaling procedure,Journal of Structural Engineering 137, 298–310.
Luco, N., and Bazzurro, P., 2007. Does amplitude scaling of ground motion records result inbiased nonlinear structural drift responses? Earthquake Engineering and Structural Dynamics36, 1813–1835.
Luco, N., and Cornell, C. A., 2007. Structure-specific scalar intensity measures for near-sourceand ordinary earthquake ground motions, Earthquake Spectra 23, 357–392.
Makris, N., and Black, C., 2003. Dimensional analysis of inelastic structures subjected to nearfault ground motions, EERC 2003-05, Earthquake Engineering Research Center, Berkeley,California.
Mavroeidis, G. P., Dong, G., and Papageorgiou, A. S., 2004. Near-fault ground motions, and theresponse of elastic and inelastic single-degree-of-freedom (SDOF) systems, Earthquake Engi-neering and Structural Dynamics 33, 1023–1049.
Mavroeidis, G. P., and Papageorgiou, A. S., 2003. A mathematical representation of near-faultground motions, Bulletin of the Seismological Society of America 93, 1099–1131.
Pacific Earthquake Engineering Research Center (PEER), 2012a. NGA Database, available athttp://peer.berkeley.edu/nga/ (last accessed 30 January 2015).
Pacific Earthquake Engineering Research Center (PEER), 2012b. Strong Ground MotionDatabase, available at http://peer.berkeley.edu/products/strong_ground_motion_db.html(last accessed 30 January 2015).
Power, M., Chiou, B., Abrahamson, N., Bozorgnia, Y., Schantz, T., and Roblee, C., 2008. Anoverview of the NGA project, Earthquake Spectra 24, 3–21.
634 WANG ET AL.
Reyes, J. C., and Chopra, A. K., 2012. Modal pushover-based scaling of two componentsof ground motion records for nonlinear RHA of structures, Earthquake Spectra 28,1243–1267.
Reyes, J. C., and Kalkan, E., 2012. Should Ground-motion Records Be Rotated to Fault-Normal/Parallel or Maximum Direction for Response History Analysis of Buildings? Open-FileReport 2012–1261, USGS, Menlo Park, CA.
Shome, N., Cornell, C. A., Bazzurro, P., and Carballo, J. E., 1998. Earthquake records andnonlinear response, Earthquake Spectra 14, 469–500.
Somerville, P. G., 2003. Magnitude scaling of the near fault rupture directivity pulse, Physics ofthe Earth and Planetary Interiors 137, 12.
Somerville, P. G., Smith, N. F., Graves, R. W., and Abrahamson, N. A., 1997. Modification ofempirical strong ground motion attenuation relations to include the amplitude and durationeffects of rupture directivity, Seismological Research Letters 68, 199–222.
Wang, G., 2011. A ground motion selection and modification method capturing response spec-trum characteristics and variability of scenario earthquakes, Soil Dynamics and EarthquakeEngineering 31, 611–625.
Watson-Lamprey, J., and Abrahamson, N., 2006. Selection of ground motion time series andlimits on scaling, Soil Dynamics and Earthquake Engineering 26, 477–482.
(Received 6 September 2012; accepted 3 October 2013)
DGML: AN INTERACTIVE TOOL FOR SELECTING EARTHQUAKE GROUNDMOTIONS 635