design ground motion library (dgml): an interactive...
TRANSCRIPT

1
Design Ground Motion Library (DGML): An Interactive Tool for Selecting Earthquake Ground Motions Gang Wang,a) M.EERI, Robert Youngs,b) M.EERI, Maurice Power,b) M.EERI, and Zhihua Li, b) M.EERI
Design Ground Motion Library (DGML) is an interactive tool for selecting
earthquake ground motion time histories based on contemporary knowledge and
engineering practice. The ground motion database used consists of 3182 records
from shallow crustal earthquakes in active tectonic regions rotated to fault-normal
and fault-parallel directions. The DGML enables users to construct design
response spectra based on the Next Generation Attenuation relationships,
including conditional mean spectra, code spectra and user-specified spectra. The
DGML has the broad capability of searching for time history record sets in the
database on the basis of similarity of response spectral shape of a record to a
design response spectrum over a user-defined period range. Selection criteria
considering other ground motion characteristics and user’s need are also provided.
The DGML has been adapted for web-based application by Pacific Earthquake
Engineering Research Center (PEER) and incorporated as a Beta Version on the
PEER database website (http://peer.berkeley.edu/peer_ground_motion_database/).
INTRODUCTION
In performance-based seismic design of civil structures, it is critical to develop systematic
methods and useful tools to search, select and modify suitable ground motion time histories
for engineering applications. In a project sponsored jointly by the California Geological
Survey-Strong Motion Instrumentation Program (CGS-SMIP) and the Pacific Earthquake
Engineering Research Center-Lifelines Program (PEER-LL), a multidisciplinary team
including geotechnical engineers, seismologists, and structural engineers developed a Design
Ground Motion Library (DGML) (AMEC Geomatrix, Inc. 2009).
a) Hong Kong University of Science and Technology, Clear Water Bay, Kowloon, Hong Kong b) AMEC Environment & Infrastructure, 2101 Webster Street, 12th Floor, Oakland, CA 94612, USA

2
Since only a limited number of ground motion records are available for rare design-level
events, amplitude scaling of ground acceleration is commonly performed in earthquake
engineering design practice. However, ground motion scaling has been a subject of intensive
debate over years, as inappropriate record scaling can bias estimated structural response (e.g.,
Luco and Bazzurro 2007). Significant concerns have been raised regarding the validity of the
scaling process in several studies (e.g., Grigoriu 2011). On the other hand, it has been
reported that the degree of bias induced by record scaling can systematically decrease as
more constraints are applied on the ground motion selection and scaling process (Hancock et
al. 2008). In terms of geotechnical application, Watson-Lamprey and Abrahamson (2006)
demonstrated that ground motions can be scaled by large factors and still lead to unbiased
estimate of earthquake-induced sliding displacements for slopes, if ground selection and
scaling are based on multiple well-selected parameters. In terms of structural response, the
elastic response spectrum over a period range of significance has been found to be closely
correlated to inelastic structural response in a number of studies (e.g. Shome et al. 1998;
Baker and Cornell 2005, 2006). The period range of significance may include periods shorter
than the fundamental structure period because of higher-mode effects and periods longer than
the fundamental structure period because of structure softening during inelastic response.
Recently, benchmark tests were conducted by the PEER Ground Motion Selection and
Modification (GMSM) Working Group to quantify the accuracy of various GMSM schemes
in predicting median inter-story drift response of buildings (Haselton 2009). The results
demonstrated the importance of scaling records to account for the realistic spectral shape of
ground motions at the design level. Especially, the conditional mean spectrum (CMS)
describes the expected distribution of spectral accelerations at different periods for a scenario
earthquake (Baker and Cornell, 2006; Baker 2011). Ground motion records scaled to match
the CMS have realistic spectral shape at multiple periods, so they can better estimate the
median inter-story drift of buildings in that study (Haselton 2009). To explicitly account for
the inelastic behaviors of structures, ground motion scaling methods are also developed by
using inelastic deformation spectrum or the response of the first-mode inelastic single-DOF
system (e.g., Luco and Cornell 2007, Kalkan and Chopra 2010, Reyes and Chopra 2012). In
these procedures, important structure-specific properties such as the modal participation
factors and the structural strength other than the fundamental structure period alone can be
explicitly considered.

3
In summary, realistic estimates of inelastic response for different types of structures
requires ground motion selection and scaling to be properly conducted, by taking into
account the structural characteristics and single or multiple ground motion parameters that
are significantly correlated to the structural response. These considerations, as well as
considerations of a range of preferences by designers and analysts (such as the size of the
time history sets) indicated that a “dynamic” ground motion library was needed, i.e. a library
permitting the tailoring of the selection of time history records to specific project needs and
designer preferences. One of the objectives of developing the DGML was to create an
efficient tool for time history selection that is consistent with contemporary knowledge and
engineering practice. The DGML enables the rapid searching and selection of the time
histories from a large ground motion database based on appropriate criteria and user needs.
The DGML has the broad capability of searching for time history record sets in the library
database on the basis of (1) the characteristics of the recordings in terms of earthquake
magnitude, type of faulting, distance, and site characteristics, (2) the response spectral shape
of the records in comparison to design or target response spectra, and (3) other record
characteristics including duration and the presence of velocity pulses in near-fault time
histories. Other criteria and limits can be specified by the user to constrain searches for time
histories. Also, supplemental searches can be conducted for individual records or records
from selected earthquakes or stations and these records can be evaluated and incorporated in
data sets of search results. Initially developed on a DVD-ROM, the DGML has been adapted
for internet web-based application by PEER and incorporated as a Beta Version on the PEER
database web site (http://peer.berkeley.edu/peer_ground_motion_database/). This paper
summarizes the development of the DGML and its application in selecting and scaling
earthquake ground motions for seismic design of civil structures.
EARTHQUAKE GROUND MOTION DATABASE
(1) DGML Strong Motion Database
The source of the database for the DGML is the PEER Next-Generation Attenuation
(PEER-NGA) project database of ground motion recordings and supporting information
(http://peer.berkeley.edu/nga/). This database was developed as the principal resource for the
development of updated ground motion prediction equations (GMPEs) in the NGA research
project coordinated by PEER-Lifelines Program (PEER-LL), in partnership with the U.S.
Geological Survey (USGS) and the Southern California Earthquake Center (SCEC) (Chiou et

4
al. 2008; Power et al. 2008). The database represents a comprehensive update and expansion
of the pre-existing PEER database. The ground motion records are originally from strong
motion networks and databases of CGS-SMIP and U.S. Geological Survey (USGS) and other
reliable international sources. The PEER NGA database includes 3551 three-component
recordings from 173 earthquakes and 1456 recording stations. The DGML database consists
of 3182 records from the PEER-NGA database; 369 records were not included in the DGML
database for various reasons including one or more of the following: (a) records considered to
be from tectonic environments other than shallow crustal earthquakes in active tectonic
regions, e.g. records from subduction zones; (b) earthquakes with poor quality metadata; (c)
records obtained in recording stations not considered to be sufficiently close to free-field
ground surface conditions, e.g. records obtained in basements of buildings or on the ground
floors of tall buildings; (d) absence of information on soil/geologic conditions at recording
stations; (e) records having only one horizontal component; (f) records not rotated to fault-
normal (FN) and fault-parallel (FP) directions because of absence of information on sensor
orientations or fault strike; (g) records of questionable quality; (h) proprietary data etc. Figure
1 shows the magnitude and distance distribution of the included records in the DGML
database.
0.1 1 10 1004
5
6
7
8
Rupture Distance (km)
Mag
nitu
de
CaliforniaTaiwanOther Regions
Figure 1. Magnitude and rupture distance distribution for PEER NGA records in DGML database.
Acceleration time histories in the DGML are horizontal components that have been
rotated to FN and FP directions. The use of rotated time histories in the DGML does not
imply that they are for use in time history analyses in FN and FP directions only, and they
5
can be used in time history sets in the same manner as time histories in the as-recorded
orientations in other databases. The rotation to FN and FP directions does, however, provide
additional information with respect to the seismological conditions under which the
recordings were obtained, and, as studied previously, records in the FN direction have been
found to often contain strong velocity pulses that may be associated with rupture directivity
effects (Somerville et al. 1997).
Ground motion parameters quantified for time histories in the DGML database are
response spectra, peak ground acceleration (PGA), peak ground velocity (PGV), peak ground
displacement (PGD), significant duration, assessments of the lowest usable frequency
(longest usable period) for response spectra, and presence and periods of strong velocity
pulses. The recommended lowest usable frequency is related to filtering of a record by the
record processing organization to remove low-frequency (long-period) noise. High-pass
filtering results in suppression of ground motion amplitudes and energy at frequencies lower
than the lowest usable frequency such that the motion is not representative of the real ground
motion at those frequencies. It is a user’s choice in DGML on whether to select or reject a
record on the basis of the lowest usable frequency. Because of the suppression of ground
motion at frequencies lower than the lowest usable frequency, it is recommended that
selected records have lowest usable frequencies equal to or lower than the lowest frequency
of interest.
A major effort was made in the PEER-NGA project to systematically evaluate and
quantify supporting information (metadata) about the ground motion records. Metadata in the
PEER-NGA database include: earthquake source information (e.g. moment magnitude; type
of faulting (mechanism); depth to the top of fault rupture; rupture directivity parameters);
source-to-recording station-site travel path information (e.g. different measures of source-to-
site distance; recording station location on hanging wall or footwall of reverse or normal
fault); local site conditions at recording stations (e.g. average shear wave velocity in upper 30
meters of sediments, VS30; depth to basement rock). Metadata that have been included for
records in the DGML database are: earthquake magnitude and type of faulting; measures of
closest distance from earthquake source to recording station site (closest distance to fault
rupture surface and Joyner-Boore distance); and site VS30. The DGML also provides access to
the vertical ground motion time histories and their response spectra if available.

6
(2) Records with Velocity Pulses
A number of studies have shown that strong velocity pulses in ground motion time
history records, such as often occur in near-source ground motions due to near-source fault
rupture directivity effects, can impose severe demands on structures (Bertero et al. 1978; Hall
et al. 1995; Alavi and Krawinkler 2001; Makris and Black 2003; Mavroeidis et al. 2004;
Akkar et al. 2005; Luco and Cornell 2007). The presence of velocity pulses in records can be
a criterion in searches for records in the DGML.
Within the PEER-NGA database, certain ground motion records have been identified as
having strong velocity pulses that may be associated with fault rupture directivity effects. The
following general criteria were adopted in this project to define records with velocity pulses
(Baker 2007): (1) the pulse is large relative to the residual features of the ground motion after
the pulse is extracted; (2) the pulse arrives early in the time history, as would be expected for
pulses associated with rupture directivity effects; and (3) the absolute velocity amplitudes are
large (PGV of the pulse record should be equal to or greater than 30 cm/sec). Although prior
research (Somerville et al. 1997) has indicated that the strongest pulses are generally more
closely aligned with the FN direction than the FP direction, the above criteria were applied to
both FN and FP components of ground motions in the NGA database. More detailed results
and documentation of analyses are contained on the website http://www.stanford.edu/
~bakerjw/pulse-classification.html. It is also interesting to point out that even though some
records may not have apparent velocity pulses in the FN or FP direction, velocity pulses may
be presented in other directions (Reyes and Kalkan 2012). However, the pulse records
identified in the DGML are only for the FN and FP components.
Besides the pulse records indentified by Baker (2007), several additional records having
strong FN pulses were also included in the DGML if the records had been identified as pulse
records in at least two studies by other researchers (Somerville 2003; Mavroeidis and
Papageorgiou 2003; Bray and Rodriguez-Marek 2004; Fu and Menon 2004), and the PGV of
these records was equal to or greater than 30 cm/sec (same as Baker’s criterion). In total,
pulse records have been identified in the DGML database as follows: 63 records having
pulses in the FN components only; 23 records having pulses in the FP components only; and
30 records having pulses in both FN and FP components. The DGML user interface enables
searching for these pulse records; searches can be made for records having FN pulses, FP

7
pulses, or both FN and FP pulses. Similar to other records in the DGML, a user can also
specify criteria and limits described in the following section in searches for pulse records.
Note that there can be no assurance that velocity pulses of records in the DGML database
are all due to directivity effects without more detailed seismological study of individual
records. It is likely that other seismological factors may have caused or contributed to the
velocity pulses of some records. However, while the causative mechanisms for the pulses are
uncertain, it is expected that the pulses are similar to those caused by directivity and therefore
suitable for use in modeling effects of directivity pulses on structures. Besides the commonly
used ground motion parameters as described in the previous section, the DGML also provides
estimates of pulse periods for all identified pulse records, which are primarily based on Baker
(2007) except for these few records added. In order to obtain a more detailed understanding
of the nature of pulses in time history records considered for analysis, it is suggested that the
velocity time histories of candidate time histories be displayed and examined. This can be
readily done through the DGML graphic interface.
GROUND MOTION SELECTION CRITERIA AND PROCEDURES
The selection of ground motions by the DGML is based on response spectral shape and
other criteria in a three-step process: (1) specification of the design or target response
spectrum; (2) specification of criteria and limits for conducting searches for time history
records; and (3) search of database and selection and evaluation of records. The flow chart of
the DGML is illustrated in Figure 2.
Figure 2. Flow chart of the DGML.
Optimally scaled record set that best matches the target spectrum
Strong Motion Database
Search criteria and limits
Selection bin of records
Target spectrum
Linearly scale the record spectrum to best match the target spectrum
Record inspection, evaluation and output
• Code spectrum • User defined spectrum • Scenario spectrum • Conditional mean
spectrum

8
(1) Developing the Target Spectrum
The DGML “Target Spectrum” window is shown in Figure 3. The window contains the
following main parts: (1) Select spectrum model; (2) PEER-NGA spectrum; (3) User defined
spectrum; (4) Code spectrum; (5) Plot control panel; (6) Spectrum plot; (7) Explanation of
notations; (8) “Save Target Spectrum” button; (9) Go to “Next” step to perform DGML
search.
Figure 3. The DGML “Target Spectrum” interface.
Three options are provided within the DGML for developing the target spectrum:
Option 1: Code Spectrum. For this option, the target spectrum is the design earthquake
spectrum or the maximum considered earthquake (MCE) spectrum as formulated in the
NEHRP Provisions (FEMA 2009), ASCE Standard ASCE 7-05 (ASCE 2006), ASCE 7-10
(ASCE 2010) and the International Building Code (ICC 2006). The Code design spectrum is
completely specified by three parameters which are obtained using the design ground motion
2
3
47
6
1
5
8 9

9
maps and other provisions in the Code document: site-class-adjusted 0.2 second spectral
acceleration, SDS; site-class-adjusted 1.0-second spectral acceleration, SD1; and the transition
period, TL, from constant spectral velocity (for which spectral accelerations are proportional
to 1/T) to constant spectral displacement (for which spectral accelerations are proportional to
1/T2). The user enters the values for these three parameters and the DGML constructs and
plots the response spectrum.
Option 2: User-Defined Spectrum. The user may enter any response spectrum as a table
of periods and response spectral accelerations and the tool constructs and plots the spectrum.
Such response spectra may be either probabilistic (uniform hazard spectrum, UHS) or
deterministic (scenario earthquake) response spectra developed by the user.
Option 3: Scenario spectrum based on the PEER-NGA models. For this option, DGML
constructs a deterministic scenario earthquake spectrum using a user-selected set of ground
motion prediction models developed in the NGA project for shallow crustal earthquakes in
active tectonic regions. Five ground-motion prediction equations (GMPEs) were developed
in the NGA project: Abrahamson and Silva (2008), Boore and Atkinson (2008), Campbell
and Bozorgnia (2008), Chiou and Youngs (2008), and Idriss (2008). The user enters the
earthquake parameters, travel path parameters, and site parameters (e.g., earthquake moment
magnitude, type of faulting, fault-to-site distance, site shear wave velocity in the upper 30
meters (VS30), and other parameters needed for the selected NGA models), and the DGML
constructs the individual response spectra and an average of the spectra for the models.
The DGML also has the capability to construct the conditional mean spectrum (CMS) for
a scenario earthquake. Although sets of time histories are often formed in practice to provide
an aggregate match to a probabilistic response spectrum (uniform hazard spectrum, UHS) for
design purposes, there may be conservatisms involved in doing so. As summarized by
Cornell (2006) and Baker (2011), the UHS is different from the response spectrum expected
for a single ground motion from a scenario earthquake. The spectral ordinates of a UHS at
different periods may be driven by two or more different scenario earthquake sources and
therefore the UHS may be overly broad and thus conservative for a single earthquake. On the
other hand, conditional mean spectra can provide realistic spectral shapes for scenario
earthquakes.
To construct conditional mean spectra, hazard deaggregation should be carried out first to
identify the dominant deterministic earthquake scenarios, including their magnitudes (M) and

10
0.1 1.00.01
0.1
1
Period, T (sec)
Spe
ctra
l Acc
eler
atio
n, S
a (g
)
rupture distances (R), contributing to a UHS. The “epsilon”, ε(T0), measures the number of
standard deviations between the median spectrum of a scenario earthquake (based on M, R)
and a given target spectral acceleration value at period T0 as follows:
target
ln ( )
ln ( ) ln ( , , )( ) 0
0 00
Sa T
Sa T Sa M R TTεσ−= (1)
where targetln ( )0Sa T is the specified target value of the logarithmic spectral acceleration at T0,
and ln ( , , )0Sa M R T and ln ( )0Sa Tσ are the predicted mean and standard deviation, respectively,
of the logarithmic spectral acceleration at period T0 provided by the NGA models. The DGML
allows the user to specify the ε(T0) value directly to construct the conditional mean spectrum
from the following equation (Baker and Cornell 2006; Baker 2011):
* ln (T)ln ( ) ln ( ) ( ) ( )0 Sa 0Sa T Sa M,R,T T,T Tρ σ ε= + × × (2)
where *ln ( )Sa T is the conditional mean spectrum at period T, conditioned on a given target
spectral acceleration value at period T0; and ρ(T,T0) is the correlation coefficient between
(logarithmic) spectral accelerations at T and T0 (e.g. Baker and Jayaram 2008).
0 0.5 1 1.5 2 2.5 30
0.5
1
1.5
Period, T (sec)
Spe
ctra
l Acc
eler
atio
n, S
a (g
)
Median spectrumMedian + 1.5 ε spectrumCMS | T
0 = 1 s, ε = 1.5
CMS | T0 = 0.5 s, ε = 1.5
Target spectral value
Figure 4. Illustration of construction of conditional mean spectrum by DGML (a) CMS conditioned on a scenario earthquake at periods of 0.5 sec and 1 sec at ε = 1.5 level; (b) CMS conditioned on multiple scenario earthquakes, based on Cornell (2006).
Figure 4(a) illustrates construction of a conditional mean spectrum by the DGML. For
this example, the median and median + 1.5 standard deviation spectra are constructed using
the NGA models based on a deterministic scenario (Mw = 7, Rrup = 10 km, strike-slip
faulting, and rock site). The conditional mean spectra are conditional on the spectral
UHS design spectrum (target) Median spectrum, scenario EQ A Median spectrum, scenario EQ B CMS | scenario EQ A at target ε levels CMS | scenario EQ B at target ε levels Target spectral values
(a) (b)

11
acceleration at the level of 1.5 epsilon at the periods of 0.5 sec and 1 sec, respectively, as is
specified by the DGML in this example. Multiple conditional mean spectra can be
constructed for different conditioning periods. Figure 4(b) illustrates conceptually the
construction of conditional mean response spectra for different periods for two scenario
earthquakes in order to more closely match, in aggregate, a UHS design spectrum. As shown
in Figure 4(b) for scenario earthquakes A and B, a single conditional mean spectrum for each
earthquake could fall substantially below the UHS at periods distant from the period at which
the conditional mean spectrum is at the target epsilon. Therefore, as shown in the figure, two
(or more) conditional mean spectra could be required for each scenario earthquake to satisfy
code requirements for an aggregate match to the design UHS.
(2) Specifying Criteria and Limits for Searches
A basic criterion used by the DGML to select a representative acceleration time history is
that the spectrum of the time history provides a “good match” to the user’s target spectrum
over the spectral period range of interest defined by the user. The quantitative measure used
to evaluate how well a time history conforms to the target spectrum is the mean squared error
(MSE) of the difference between the spectral accelerations of the record and the target
spectrum, computed using the logarithms of spectral period and spectral acceleration. The
DGML tool searches the database for records that satisfy general acceptance criteria provided
by the user and then ranks the records in order of increasing MSE, with the best-matching
records having the lowest MSE. It is worth pointing out that the target spectrum developed
using options 1 to 3 in the previous section and the response spectrum of individual records
in the database are all linearly interpolated in the log-log scale using a set of periods equally-
spaced from 0.01 seconds to 10 seconds in log scale (100 points/log cycle, therefore 301
periods from 0.01 to 10 seconds with end points included). The MSE is computed using the
interpolated data via Equation (3):
{ }2target record( ) ln ( ) ln ( )MSE
( )
i i ii
ii
w T Sa T f Sa T
w T
⎡ ⎤ ⎡ ⎤− ×⎣ ⎦ ⎣ ⎦=∑
∑ (3)
where parameter f is a linear scale factor applied to the entire response spectrum of the
recording. Parameter w(Ti) is a weight function that allows the user to assign relative weights
to different parts of the period range of interest, providing greater flexibility in the selection
of records. The simplest case is to assign equal weight to all periods (i.e. w(Ti) = 1), but the

12
user may wish to emphasize the match over a narrow period range of interest while
maintaining a reasonable match over a broad period range.
The DGML allows the user to select individual FN/FP component recordings that provide
a good match to the target or, alternatively, select recordings for which the geometric mean
of the two horizontal FN and FP components provides a good match to the target spectrum.
In this latter case the MSE is computed over both components using Equation (3) with the
same value of f applied to both components. This process maintains the relative amplitude of
the two horizontal components.
Amplitude scaling of “as recorded” strong ground motion acceleration time histories is
used in the DGML, which does not alter the frequency content of the recordings. The user
has three options for scaling. One option is to apply a scale factor that minimizes the MSE
over the period range of interest. This approach produces scaled recordings that provide the
best match to the spectral shape of the target spectrum over the user-specified period range of
interest. Minimization of the MSE as defined in Equation (3) is achieved by a scale factor
given by the mean weighted residual in natural logarithm space between the target and the
record spectra:
target
record( )( )ln ( )
ln( )
ii
ii
ii
Sa Tw T Sa Tf
w T
⎛ ⎞⎜ ⎟⎝ ⎠=
∑∑
(4)
The second option is to scale the records so that the spectral acceleration at a single
period matches the target spectral acceleration at that period. This option can be used to scale
a set of records to have the same spectrum ordinate as the target conditional mean spectrum
at the conditioning period T0. In this case the scale factor is determined by:
target
0record
0
( )( )
Sa TfSa T
= (5)
A third option of applying no scaling is also available. For all three scaling options, the
MSE is computed using Equation (3). Note that for all options, it is necessary for the user to
specify the weight function because it is used to calculate the MSE and order the results with
respect to the degree of match between target spectrum and spectra of recordings over the
user-specified period range of significance. In DGML, the weight function is also discretized
at each Ti. The weight function only represents relative weights assigned to various discrete

13
periods and are normalized in the program such that the summation of the weight function
over discrete period points equals unity. Therefore, the absolute value of the weight function
is immaterial.
The user specifies the ranges of parameters over which searches are to be conducted and
other limits and restrictions on the searches. These may include: earthquake magnitude
range; type of faulting; distance range; VS30 range; significant duration range; whether
records are to exclude, include, or be limited to pulse records; limits on the scale factor f; and
restrictions on directional component (i.e., arbitrary FN or FP components [no restriction];
FN components only; FP component only; or FN and FP components in pair).
Other criteria to be specified by the user are (1) total number of records for the search that
will be displayed; and (2) total number of records for which the average spectrum will be
calculated. Figure 5 illustrates the DGML “Search Engine” graphic interface used to specify
primary search criteria and list and plot search results including time histories and individual
and average response spectra of scaled records sets compared to a specified design or target
spectrum. Eight main function modules are: (1) “Search Engine” to specify the record
acceptance criteria and perform search over the database; (2) Specification of weight function
used for scaling records; (3) Spectra plotting window; (4) Weight function plot window; (5)
Acceleration/velocity/displacement time history plotting of a selected record (one-, two-, or
three-component time histories of a record can also be viewed at an expanded time scale, if
desired to examine details of the time histories, using a feature called “Zoom in Time”); (6)
Ground motion record information output list; (7) Graphic control panel for line styles and
display of ground motion components; and (8) Buttons to accept or reject individual records
and to save the search results and selected acceleration time history files. Figure 6 illustrates
an example of individual spectra and the average spectrum of selected records compared with
the target spectrum. Figure 7 highlights the spectra of three-components (FN, FP and vertical)
of an individual record, as well as the acceleration, velocity and displacement time histories
of the record.
(3) Selection and Evaluation of Ground Motion Records
The software tool scans the database, selects all records meeting user-specified criteria as
summarized above, scales records to match the target spectrum, and ranks records in order of
increasing MSE. The software tool also has a “Supplementary Search” function to search for
specific records according to specified NGA record sequence number or by earthquake name

14
or recording station name. Selected records from a “Supplementary Search” are scaled and
ranked by MSE and can be incorporated into final data sets as desired by the user. This
search capability was added so that users can examine any record or group of records and
further fine-tune the search results based on user preferences.
Figure 5. The DGML “Search Engine” interface.
For a selected record set, a “Search Report” can be automatically generated and exported
by DGML, including: summary of search criteria; summary of earthquake, distance, and
station/site information; record scaling factors and MSEs; scaled record characteristics
including PGA, PGV, PGD, response spectral accelerations, presence of pulses and pulse
periods, significant durations, and recommended lowest usable frequencies; and scaled
average spectral accelerations for the selected record set along with the target or design
spectral accelerations. The Search Report can be saved as an Excel spread-sheet file.
Although the search results are based on horizontal records, the response spectra for
corresponding vertical records, scaled by the same factors as for the horizontal records, can
3
1
2
4 5
7
6
8

15
also be saved together with their horizontal counterparts in the search report. Spectra and
time history plots can be saved as figure files. The horizontal and/or vertical components of
the selected acceleration time histories can also be saved; the saved time histories are the
unscaled original data from the PEER-NGA database.
10−2
10−1
100
101
10−3
10−2
10−1
100
101
Period, T (sec)
Spe
ctra
l Acc
eler
atio
n, S
a (g
)
Target SpectrumRecord Geom. Mean
Figure 6. Example of average spectrum of selected records.
10−2
10−1
100
101
10−3
10−2
10−1
100
101
Period, T (sec)
Spe
ctra
l Acc
eler
atio
n, S
a (g
)
Target Spectrum
Fault Normal
Fault Parallel
Vertical
0 5 10 15 20 25−0.2
0
0.2
Time (sec)
Acc
(g
)
0 5 10 15 20 25−20
0
20
Time (sec)
Ve
loci
ty (
cm/s
)
0 5 10 15 20 25−10
0
10
Time (sec)
Dis
pl.
(cm
)
Figure 7. Highlight of the response spectrum and time history of an individual record. (a) FN, FP and vertical response spectrum (b) FN, FP acceleration, velocity and displacement time histories.
The user can further modify the time histories if required or desired for other purposes (e.g., fine-tune record scaling factors to meet building code requirements; rotate time histories; or adjust the match of record spectra to a design spectrum through frequency content altering methods etc.). For example, ASCE 7-05 and 7-10 specify that for two-dimensional analysis the average value of the 5 percent-damped response spectra for the set of time histories used shall be not less than the design response spectrum for periods ranging 0.2T1 to 1.5T1 where T1 is the natural period of the structure in the fundamental mode for the
Distribution of 30 output records
Average spectrum of 7 selected records
The period range of the weight function
(a) (b)
16
direction of response being analyzed (ASCE 2006, 2010). This criterion can be easily checked using the average of the spectra for the scaled time histories provided by the DGML Search Report output in Excel format and then applying any minor adjustment factor to the set of records to meet the criterion.
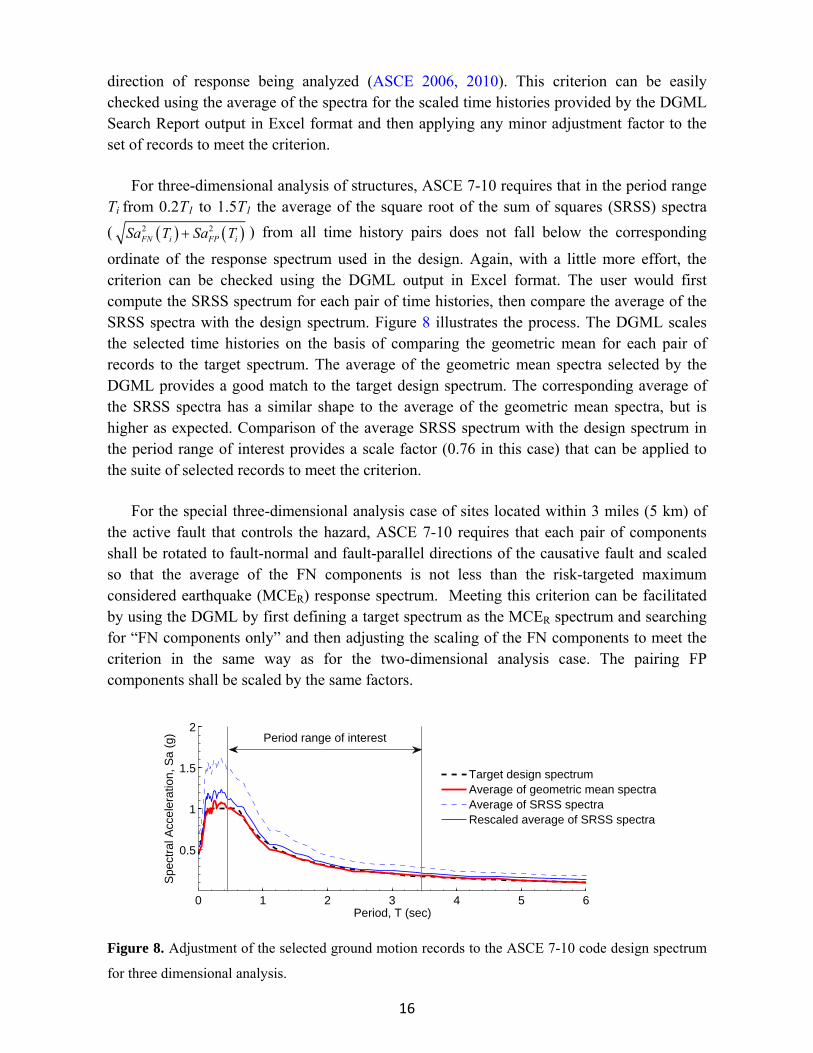
For three-dimensional analysis of structures, ASCE 7-10 requires that in the period range Ti from 0.2T1 to 1.5T1 the average of the square root of the sum of squares (SRSS) spectra ( ( ) ( )2 2
FN i FP iSa T Sa T+ ) from all time history pairs does not fall below the corresponding
ordinate of the response spectrum used in the design. Again, with a little more effort, the criterion can be checked using the DGML output in Excel format. The user would first compute the SRSS spectrum for each pair of time histories, then compare the average of the SRSS spectra with the design spectrum. Figure 8 illustrates the process. The DGML scales the selected time histories on the basis of comparing the geometric mean for each pair of records to the target spectrum. The average of the geometric mean spectra selected by the DGML provides a good match to the target design spectrum. The corresponding average of the SRSS spectra has a similar shape to the average of the geometric mean spectra, but is higher as expected. Comparison of the average SRSS spectrum with the design spectrum in the period range of interest provides a scale factor (0.76 in this case) that can be applied to the suite of selected records to meet the criterion.
For the special three-dimensional analysis case of sites located within 3 miles (5 km) of the active fault that controls the hazard, ASCE 7-10 requires that each pair of components shall be rotated to fault-normal and fault-parallel directions of the causative fault and scaled so that the average of the FN components is not less than the risk-targeted maximum considered earthquake (MCER) response spectrum. Meeting this criterion can be facilitated by using the DGML by first defining a target spectrum as the MCER spectrum and searching for “FN components only” and then adjusting the scaling of the FN components to meet the criterion in the same way as for the two-dimensional analysis case. The pairing FP components shall be scaled by the same factors.
0 1 2 3 4 5 6
0.5
1
1.5
2
Period, T (sec)
Spe
ctra
l Acc
eler
atio
n, S
a (g
)
Period range of interest
Target design spectrumAverage of geometric mean spectraAverage of SRSS spectraRescaled average of SRSS spectra
Figure 8. Adjustment of the selected ground motion records to the ASCE 7-10 code design spectrum
for three dimensional analysis.

17
SUMMARY AND DISCUSSION
The successful development of the DGML is the outcome of a multidisciplinary team
effort. It represents a state-of-the-art software package that enables interactive selection and
modification of time histories for dynamic analysis of structures based on appropriate
selection criteria and user needs. The DGML facilitates the construction of design response
spectra using recently-developed NGA relationships, including “conditional mean spectra”,
as well as to construct code spectra and any other user-specified spectra. The DGML has the
broad capability of searching for time history record sets in the library database on the basis
of the response spectral shape, the characteristics of the recordings in terms of earthquake
magnitude and type of faulting, distance, site characteristics, duration and the presence of
velocity pulses in near-fault time histories.
DGML features a friendly graphic user interface (GUI) to facilitate data input,
visualization and processing. Results in each step can be visualized, and results for different
sets of input parameters can be easily compared. Users can inspect the response spectra and
acceleration/velocity/displacement time-histories for each individual record for each
component. The DGML also provides easy ways to output search results, plots and tables.
Files containing acceleration time histories of selected records can be saved for each project.
The algorithm of the DGML package is robust and efficient. The search engine can scan and
sort the database within a few seconds.
It is also worth pointing out that ground motions selected by the DGML mainly aim at
estimating the median response of structures based on an elastic target spectrum. Sometimes,
it is important to obtain the actual dispersion of the structural behaviors in the performance-
based earthquake design. For this purpose, ground motion selection algorithms for matching
the target response spectrum mean and variance have been recently developed (Wang 2011,
Jayaram et al. 2011). These new development can be readily implemented in the DGML in
the future.
The prototype of DGML was developed using Matlab ® (version 7.2) Graphic User
Interface (GUI) and it can be executed or modified in the Matlab environment. The DGML
Matlab codes were subsequently compiled into a standalone executable using Matlab
Compiler® so that the Matlab environment is not required for end users. The compiled
DGML package (Version 2) was released on a DVD-ROM format and distributed to a small

18
group of experts for testing, evaluation and review in 2009. DGML has been adapted for
internet web-based application by PEER and incorporated as a Beta Version on the PEER
database website (http://peer.berkeley.edu/peer_ ground_motion_database/). The web-based
application enables broad access of the ground motion selection tool.
The DGML is currently limited to recorded time histories from shallow crustal
earthquakes in active tectonic regimes. With the completion of the PEER NGA-West 2
program, a greatly expanded ground motion database (Ancheta et al. 2013) and updated
attenuation relationships have been developed and can be incorporated to enhance the
capability of the DGML. Time histories from subduction zone earthquakes are not part of the
DGLM during this project. However, future developments of the DGML could add records
from subduction zone earthquakes (appropriate for these types of earthquakes occurring in
coastal regions of northwest California, Oregon, Washington, and Alaska) and could also
supplement the library of recorded time histories with time histories simulated by ground
motion modeling methods. The DGML can be easily upgraded to accommodate these future
developments.
ACKNOWLEDGEMENTS
The DGML was jointly sponsored by the California Geological Survey-Strong Motion
Instrumentation Program (CGS-SMIP) and the Pacific Earthquake Engineering Research
Center-Lifelines Program (PEER-LL). In addition to the authors, project team members
include Faiz Makdisi, Chih-Cheng Chin, Allin Cornell, Jack Baker, Stephen Mahin, Ronald
Hamburger, Ronald Mayes, Roupen Donikian, Yusof Ghanaat, Walter Silva, Paul Somerville,
and Ignatius Po Lam. We thank representatives of the project sponsors for their active
participation, including Moh-Jiann Huang, Anthony Shakal, Yousef Bozorgnia, Brian Chiou,
Thomas Shantz, and Norman Abrahamson. We thank Tony Yang for his help compiling the
DGML software package. Gang Wang is also supported by Hong Kong Research Grants
Council (RGC) grant 620311 and Direct Allocation Grants DAG12EG07-3, FSGRF13EG09
(HKUST/RGC). Any opinions, findings, and conclusions or recommendations expressed in
this publication are those of the authors and do not necessarily reflect the view of the
sponsors and other individuals.

19
REFERENCES
Abrahamson, N.A., and Silva, W.J., 2008. Summary of the Abrahamson & Silva NGA ground-motion relations, Earthquake Spectra 24, 67–97.
Akkar, S., Yazgan, U., and Gulkan, P., 2005. Drift estimates in frame buildings subjected to near-fault ground motions, Journal of Structural Engineering 131, 1014–1024.
Alavi, B., and Krawinkler, H., 2001. Effects of near-fault ground motions on frame structures, Blume Center Report #138, Stanford, California, 301 pp.
AMEC Geomatrix, Inc., 2009. Design Ground Motion Library, report and software package prepared for California Geological Survey-Strong Motion Instrumentation Program (CGS-SMIP) and Pacific Earthquake Engineering Research Center (PEER).
Ancheta, T.D. et al., 2013. PEER NGA-West2 Database. Pacific Earthquake Engineering Research Center PEER Report 2013/03, University of California, Berkeley.
ASCE, 2006, Minimum Design Loads for Buildings and Other Structures, ASCE 7-05, American Society of Civil Engineers, Reston, Virginia.
ASCE, 2010, Minimum Design Loads for Buildings and Other Structures, ASCE 7-10, American Society of Civil Engineers, Reston, Virginia.
Baker, J.W., 2007. Quantitative classification of near-fault ground motions using wavelet analysis, Bulletin of the Seismological Society of America 97, 1486–1501.
Baker, J. W., 2011. Conditional Mean Spectrum: Tool for ground motion selection. Journal of Structural Engineering 137, 322–331.
Baker, J.W., and Cornell C.A., 2005. A vector-valued ground motion intensity measure consisting of spectral acceleration and epsilon, Earthquake Engineering and Structural Dynamics 34, 1193–1217.
Baker, J.W., and Cornell, C.A., 2006. Spectral shape, epsilon and record selection, Earthquake Engineering and Structural Dynamics 35, 1077–1095.
Baker, J.W., and Jayaram, N., 2008. Correlation of spectral acceleration values from NGA ground motion models, Earthquake Spectra 24, 299–317.
Bertero, V., Mahin S., and Herrera R., 1978. Aseismic design implications of near-fault San Fernando earthquake records, Earthquake Engineering and Structural Dynamics 6, 31–42.
Boore, D.M., and Atkinson, G.M., 2008. Ground-motion prediction equations for the average horizontal component of PGA, PGV, and 5% damped PSA at spectral periods between 0.01s and 10.0s, Earthquake Spectra 24, 99–138.
Bray, J.D., and Rodriguez-Marek, A., 2004. Characterization of forward-directivity ground motions in the near-fault region, Soil Dynamics and Earthquake Engineering 24, 815–828.
Campbell, K.W., and Bozorgnia, Y., 2008. NGA ground motion Model for the geometric mean horizontal component of PGA, PGV, PGD, and 5% damped linear elastic response spectra for periods ranging from 0.01s to 10.0s, Earthquake Spectra 24, 139–171.
Chiou, B.S.J. and Youngs, R.R., 2008. Chiou-Youngs NGA ground motion relations for the geometric mean horizontal component of peak and spectral ground motion parameters, Earthquake Spectra 24, 173–215.
Chiou, B., Darragh, R., Gregor, N., and Silva, W., 2008. NGA project strong-motion database, Earthquake Spectra 24, 23–44.

20
Cornell, C.A., 2006. Should uniform hazard spectra be used for design? How should design response spectra be determined considering uniform hazard spectra from design maps and hazard deaggregation data? Abstract and PowerPoint presentation in Preprints, Third ATC-35/USGS National Earthquake Ground Motion Mapping Workshop, San Mateo, California, December.
FEMA, 2009. NEHRP Recommended Seismic Provisions for New Buildings and Other Structures, FEMA Report P-750, prepared by Building Seismic Safety Council of the National Institute of Building Sciences for Federal Emergency Management Agency, Washington, D.C.
FEMA, 2012. 2009 NEHERP Recommended Seismic Provisions: Design Examples, FEMA Report P-751, prepared by Building Seismic Safety Council of the National Institute of Building Sciences for Federal Emergency Management Agency, Washington, D.C.
Fu, Q., and Menun, C., 2004. Seismic-environment-based simulation of near-fault ground motions, Proceedings of the 13th World Conference on Earthquake Engineering, Vancouver, Canada.
Grigoriu, M., 2011. To scale or not to scale seismic ground-acceleration records. Journal of Engineering Mechanics 137, No. 4, 284–293.
Hall, J.F., Heaton, T.H., Halling, M.W., and Wald, D.J., 1995. Near-source ground motion and its effects on flexible buildings, Earthquake Spectra 11, 569–605.
Hancock, J., Bommer, J.J., and Stafford, P.J., 2008. Numbers of scaled and matched accelerograms required for inelastic dynamic analyses, Earthquake Engineering and Structural Dynamics 37, 1585–1607.
Haselton, C.B. (Editor), 2009, Evaluation of ground motion selection and modification methods: predicting median interstory drift response of buildings, Ground Motion Selection and Modification Working Group, Pacific Earthquake Engineering Research Center PEER Report 2009/01, University of California, Berkeley.
Idriss, I.M., 2008. An NGA empirical model for estimating the horizontal spectral values generated by shallow crustal earthquakes, Earthquake Spectra 24, 217–242.
ICC, 2006. International Building Code, International Code Council, Washington D.C. Jayaram, N., Lin, T., and Baker, J.W., 2011. A computationally efficient ground-motion
selection algorithm for matching a target response spectrum mean and variance, Earthquake Spectra 27, 797–815.
Kalkan, E., and Chopra, A.K., 2011. Modal-pushover-based ground-motion scaling procedure. Journal of Structural Engineering 137, 298–310.
Luco, N., and Cornell, C.A., 2007. Structure-specific scalar intensity measures for near-source and ordinary earthquake ground motions, Earthquake Spectra 23, 357–392.
Luco, N., and Bazzurro, P., 2007. Does amplitude scaling of ground motion records result in biased nonlinear structural drift responses? Earthquake Engineering and Structural Dynamics 36, 1813–1835.
Makris, N., and Black, C., 2003. Dimensional analysis of inelastic structures subjected to near fault ground motions, Earthquake Engineering Research Center, EERC 2003-05, Berkeley, California, 96 pp.
Mavroeidis, G.P., Dong, G., and Papageorgiou, A.S., 2004. Near-fault ground motions, and the response of elastic and inelastic single-degree-of-freedom (SDOF) systems, Earthquake Engineering and Structural Dynamics 33, 1023–1049.
21
Mavroeidis, G.P., and Papageorgiou, A.S., 2003. A mathematical representation of near-fault ground motions, Bulletin of the Seismological Society of America 93, 1099–1131.
Power, M., Chiou, B., Abrahamson, N., Bozorgnia, Y., Schantz, T., and Roblee, C., 2008. An overview of the NGA project, Earthquake Spectra 24, 3–21.
Reyes, J. C., and Chopra, A.K., 2012. Modal pushover-based scaling of two components of ground motion records for nonlinear RHA of structures. Earthquake Spectra 28, 1243–1267.
Reyes, J.C. and Kalkan, E., 2012, Should Ground-motion Records be Rotated to Fault-Normal/Parallel or Maximum Direction for Response History Analysis of Buildings? U.S. Geological Survey Open-File Report 2012–1261, 89 pp.
Shome, N., Cornell, C.A., Bazzurro, P., and Carballo, J.E., 1998. Earthquake records and nonlinear response, Earthquake Spectra 14, 469–500.
Somerville, P.G., 2003. Magnitude scaling of the near fault rupture directivity pulse, Physics of the Earth and Planetary Interiors 137, p. 12.
Somerville, P.G., Smith, N.F., Graves, R.W., and Abrahamson, N.A., 1997. Modification of empirical strong ground motion attenuation relations to include the amplitude and duration effects of rupture directivity, Seismological Research Letters 68, 199–222.
Wang, G., 2011. A ground motion selection and modification method capturing response spectrum characteristics and variability of scenario earthquakes, Soil Dynamics and Earthquake Engineering 31, 611–625.
Watson-Lamprey, J., and Abrahamson, N., 2006. Selection of ground motion time series and limits on scaling, Soil Dynamics and Earthquake Engineering 26, 477–482.