design and initial testing of imager for simultaneous bilateral optical mammography
DESCRIPTION
Design and Initial Testing of Imager for Simultaneous Bilateral Optical Mammography. OSA Biomedical Optics Topical Meeting April 13-17 th , 2004 Miami, Florida Randall L. Barbour, Ph.D. SUNY Downstate Med. Ct., Brooklyn, NY. CONFLICT. NIRx Medical Technologies, LLC. - PowerPoint PPT PresentationTRANSCRIPT

Design and Initial Testing of Imager for Simultaneous Bilateral Optical Mammography
OSA Biomedical Optics Topical Meeting
April 13-17th, 2004
Miami, Florida
Randall L. Barbour, Ph.D.
SUNY Downstate Med. Ct.,
Brooklyn, NY

CONFLICT
• NIRx Medical Technologies, LLC

Motivation for Time-Series Imaging
• Basic Physiology: Tissue-Vascular Coupling
– Oxygen delivery to tissue• Blood Volume • Blood Oxygenation
– Regulation of vascular response• Neural, hormonal, metabolic• Vascular rhythms
• Clinical Applications: Functional changes precede structural changes

Motivation for Time Series Breast Imaging
Figure 1. Corrosion Cast of Tumor Vasculature. ‘tp’, = tumor periphery, ‘st’ = surrounding tissue. From Ref. , p. 16.
Corrosion Cast of Tumor Vasculature

Technology Development

Approach to System Design
• Goal: Systems that have turn-key functionality that are suitable for a range of applications.
• Problem Areas– Data Collection.– Data Integrity.– Image Recovery.– Time-Series Image Analysis.– Image Display.

System Design Approach
• Large dynamic range (109)• Variable framing rate (2 - 90 Hz)• Multiwavelength (2-4 color)• Automated set-up and control• Real-time visualization• System-data integrity checks• Custom configured measuring heads• Comprehensive software:
– System control, image recovery, signal analysis, image display.
• Integrated vital sign monitoring.

Time Series Optical Tomography
1
2
3
Frame
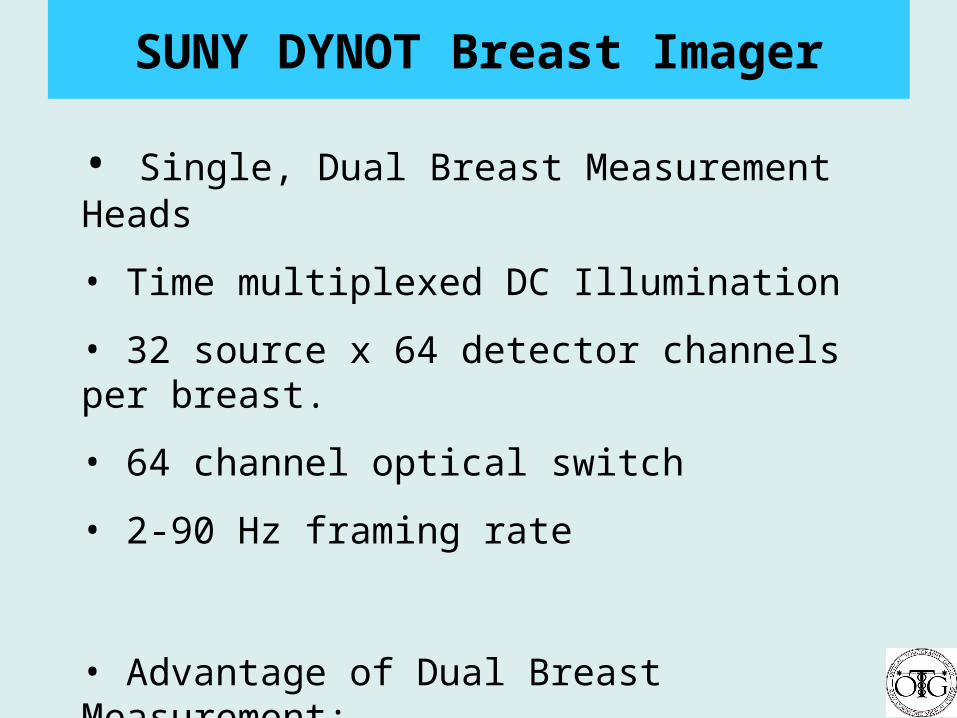
SUNY DYNOT Breast Imager
• Single, Dual Breast Measurement Heads
• Time multiplexed DC Illumination
• 32 source x 64 detector channels per breast.
• 64 channel optical switch
• 2-90 Hz framing rate
• Advantage of Dual Breast Measurement:
- Provides for differential measurement!

Breast Measurement Heads
Single Breast - Medieval Style Dual Breast - Madonna Style
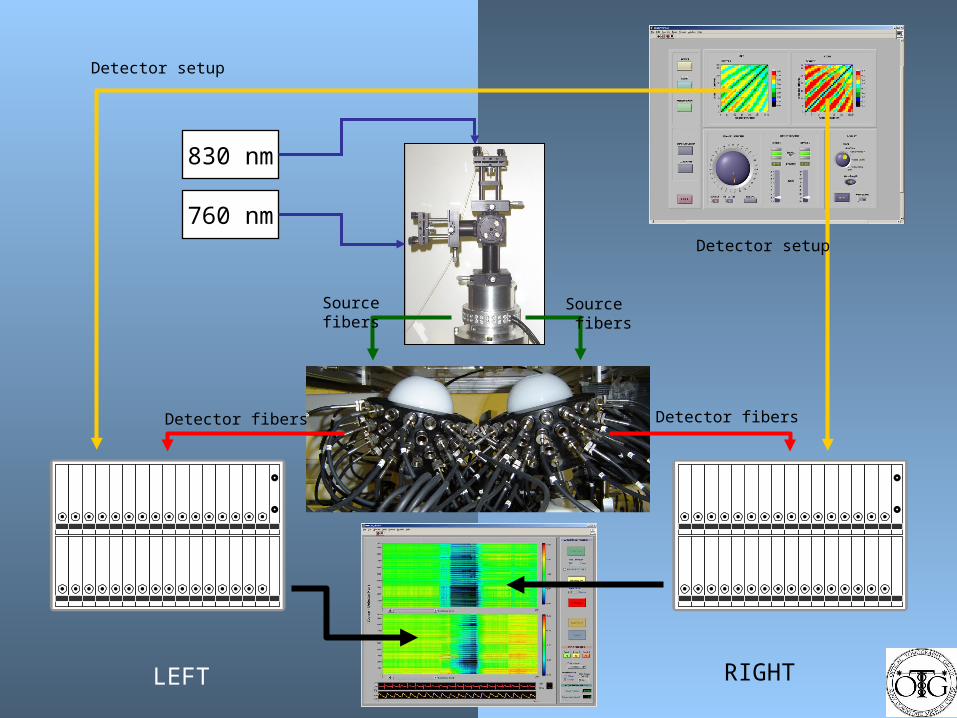
Detector fibers Detector fibers
760 nm
830 nm
Detector setup
Detector setup
Source fibers
Source fibers
LEFT RIGHT

Dual Breast Set-up Screen
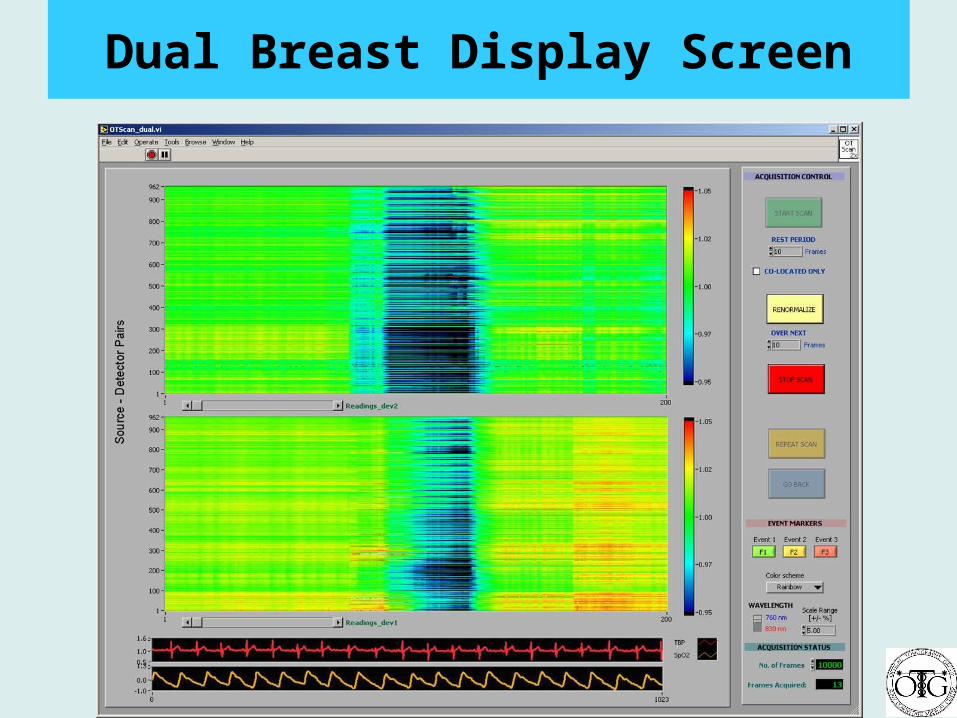
Dual Breast Display Screen

CASE STUDIES
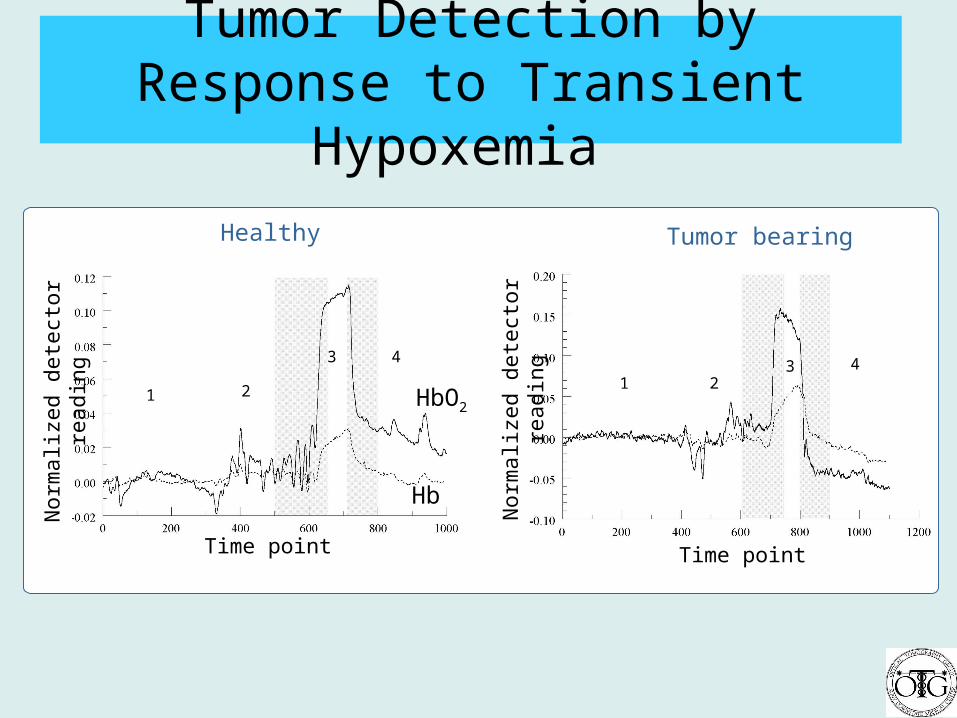
Tumor Detection by Response to Transient Hypoxemia
1 2
3 4
1 23 4
Time point Time point
Nor
mal
ized
det
ecto
r re
adin
g
Nor
mal
ized
det
ecto
r re
adin
g
Healthy Tumor bearing
HbO2
Hb

Image of Transient Hypoxemia
1.00
0.75
0.50
0.25
Relative Contrast
Figure 5. Right, 3D DYNOT image of tumor identifying imbalance in tissue oxygen supply/demand. Image was produced without need of contrast agents or compression. Left, sonogram image of same breast showing location of tumor. Note close agreement in size and location.
Tumor

Valsalva Maneuver

Vascular Response to Valsalva Maneuver
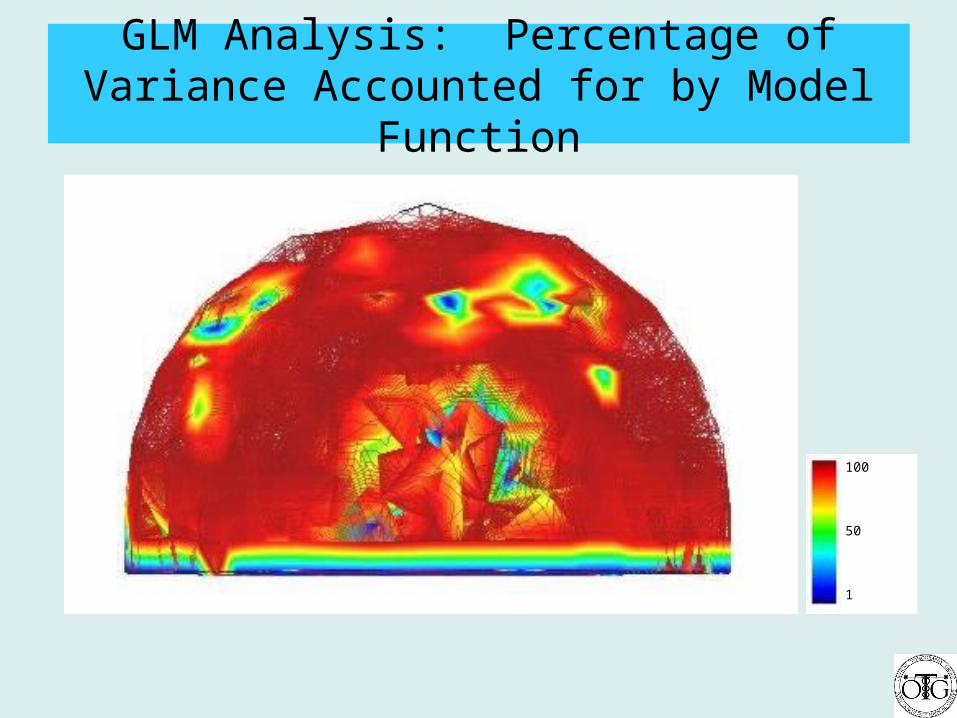
100
50
1
GLM Analysis: Percentage of Variance Accounted for by Model Function

1.5e-8
0
-9.3e-9
2.1e-8
0
-1.2e-8
P1: Left Breast
P1: Right Breast
1 2 3 4 5 6 7
1
2
3
4
56 7
1st derivative of the deoxyhemoglobin image time series at indicated time points indicated along the Valsalva maneuver (1)
(tumor-bearing patient: P1)
Ductal Carcinoma

1.1 e-8
0
-1.46e-8
4.7 e-8
0
-1.1e-8
N1: Left Breast
N1: Right Breast
1 2 3 4 5 6 7
1
2
3
4
56 7
1st derivative of the deoxyhemoglobin image time series at indicated time points indicated along the Valsalva maneuver (2)
(Healthy Volunteer)

Simultaneous Bilateral Measurements
Look for differential responses in baseline and in response to provocation!

Spatially averaged, low-pass filtered (0-0.38 Hz) total Hb (i.e., blood volume) baseline signals
(left breast, right breast)
0 100 200 300 400 500 600 700 800-5
0
5x 10
-5
Time(Sec)
Detector R
eadin
g
0 0.05 0.1 0.15 0.2 0.25 0.30
0.5
1
1.5
2x 10
-11
Frequency(Hz)
Am
plitude of C
SD
0 100 200 300 400 500 600 700 800-5
0
5x 10
-5
Time(Sec)
Detector R
eadin
g
0 0.05 0.1 0.15 0.2 0.25 0.3
-150
-100
-50
0
50
100
150
Frequency(Hz)
Phase of C
SD
0 100 200 300 400 500 600 700 800-5
0
5x 10
-5
Time(Sec)
Detector R
eadin
g
0 0.05 0.1 0.15 0.2 0.25 0.30
0.5
1
1.5
2
2.5
x 10-13
Frequency(Hz)
Am
plitude of C
SD
Baseline Comparisons
Amplitude CSD
Phase CSD

Patient with active breast cancer: Baseline
0 100 200 300 400 500 600 700 800-4
-2
0
2
4x 10
-5
Time(Sec)
Dete
cto
r R
eadin
g
0 0.05 0.1 0.15 0.2 0.25 0.3 0.35 0.4 0.450
0.5
1
1.5
2x 10
-6
Frequency(Hz)
Am
plitu
de
0 100 200 300 400 500 600 700 800-4
-2
0
2
4x 10
-5
Time(Sec)
Dete
cto
r R
eadin
g
0 0.05 0.1 0.15 0.2 0.25 0.3 0.35 0.4 0.450
0.2
0.4
0.6
0.8
1x 10
-6
Frequency(Hz)
Am
plitu
de
Spatially averaged, bandpass filtered (0.005-0.43 Hz) total Hb baseline signals
0 100 200 300 400 500 600 700 800-1
-0.5
0
0.5
1x 10
-5
Time(Sec)
Det
ecto
r R
eadi
ng
0 0.05 0.1 0.15 0.2 0.25 0.3 0.35 0.4 0.450
0.5
1
1.5
2
2.5x 10
-7
Frequency(Hz)
Am
plitu
de
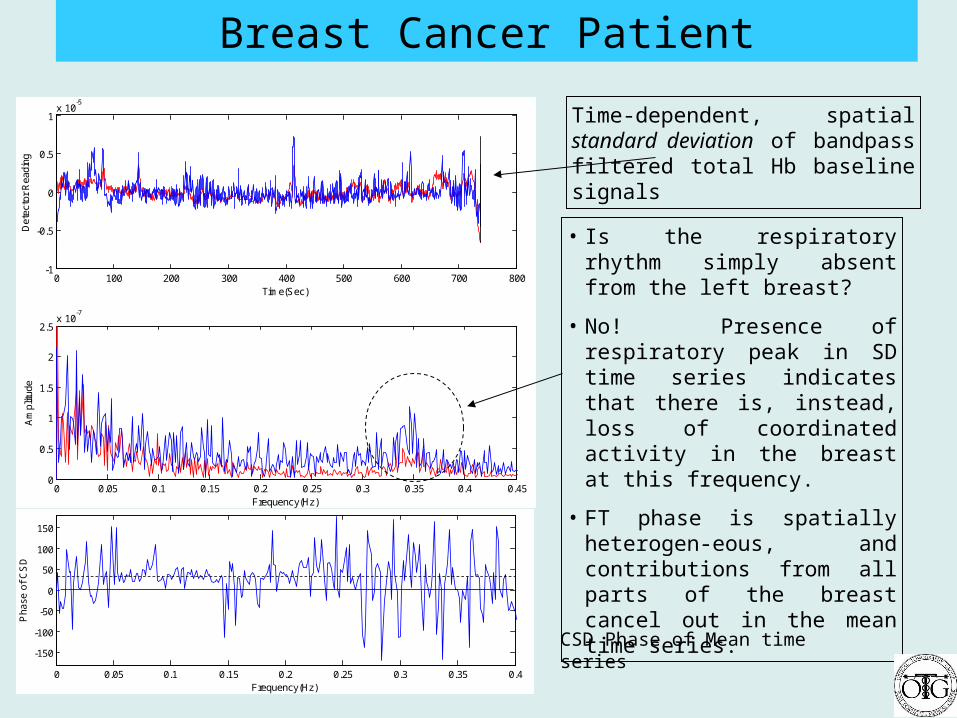
Breast Cancer Patient
Time-dependent, spatial standard deviation of bandpass filtered total Hb baseline signals
• Is the respiratory rhythm simply absent from the left breast?
• No! Presence of respiratory peak in SD time series indicates that there is, instead, loss of coordinated activity in the breast at this frequency.
• FT phase is spatially heterogen-eous, and contributions from all parts of the breast cancel out in the mean time series.
0 100 200 300 400 500 600 700 800-4
-2
0
2
4
6x 10
-5
Time(Sec)
Det
ecto
r R
eadi
ng
0 0.05 0.1 0.15 0.2 0.25 0.3 0.35 0.4
-150
-100
-50
0
50
100
150
Frequency(Hz)
Pha
se o
f C
SD
CSD Phase of Mean time series
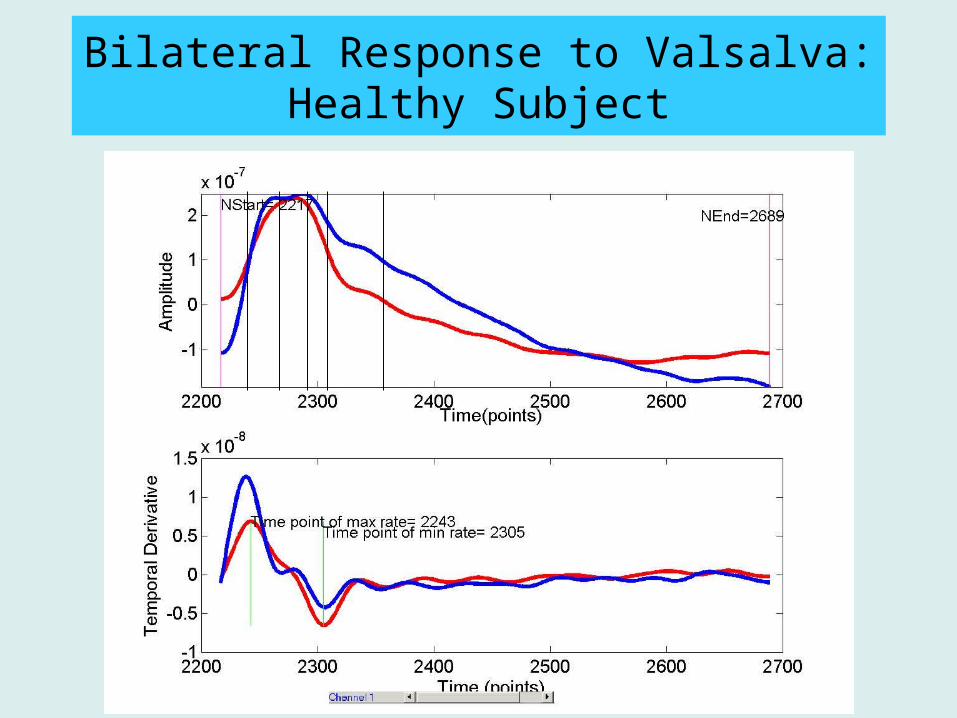
Bilateral Response to Valsalva: Healthy Subject

2232 2243 2277 2292 2305 2362
1st Derivative Images for Deoxy Hb: Healthy Subject
Time Points

Bilateral Response to Valsalva: Cancer Patient
Time Point
2610 2634 2677 2700 2750 2818
Left
Right
3050
Time Point
2500 2600 2700 2800 2900 3000 3100 3200
(d
eoxy
-Hb
Con
cent
ratio
n) [
a.u.
]
-3.50E-8
-1.50E-8
5.00E-9
2.50E-8
4.50E-8
6.50E-8
8.50E-8
1.05E-7
LeftRight
2610
2634
2677
2700
2750
2818
3050
Tumor

Summary
• Developed a integrated measuring system capable of simultaneous bilateral time-series breast imaging.
• Preliminary studies have shown evidence of characteristic changes to both baseline and response to
provocation.
• The form of these changes include disturbances in basal rhythms, and localized rates of change following a respiratory maneuver.

SUNY-NIRx Development Team
• Key Personnel Degree Expertise Responsibility
Randall Barbour Ph.D. Biochem, Lab. Med., Biomedical Optics PIHarry Graber Ph.D. Biophysics, Theory, Signal analysis Senior Appl. Specialist
Yaling Pei Ph.D. Engineering, Numerical Methods, Algorithm Dev. Dir. Software Eng.Christoph Schmitz Ph.D. Physics, System design and integration Dir. EngineeringDavid Klemer M.D., Ph.D. Int. Med., Elec. Eng., Application Development Medical DirectorMikhail Levin Ph.D. Physics, Physical Optics Optical System DesignMargarita Levin Ph.D. Physics, Physical Optics Sys. Testing, ValidationYong Xu Ph.D. Physics, Numerical Methods Algorithm DevelopmentRaphael Aronson Ph.D. Physics, Theory Adv. Theory Studies
Nelson Franco M.D. Surgical Resident Breast StudiesRosemarie Hardin M.D. Surgical Resident Breast StudiesMichael Katz M.D. Surgical Resident Limb StudiesAlessandro Smeraldi M.D. Vascular Fellow (Staten Island U. Hosp) Limb Studies

Acknowledgements
• NYS Department of Health
• Army Research Office• NIH: NIBIB, NIHLB, NINDS, NCI, NIDDK

I look to THE DIFFUSION OF LIGHT and education as the resource to be relied on for ameliorating the condition, promoting the virtue, and advancing the happiness of man.
— Thomas Jefferson (1822)