desert power: getting connected
TRANSCRIPT

Starting the debate for the grid infrastructure
for a sustainable power supply in EUMENA
DESERT POWER:
GETTING CONNECTED

3
DESERT POWER:
GETTING CONNECTED Starting the debate for the grid infrastructure for a sustainable
power supply in EUMENA
Dii has shown - with its 2012 and 2013
reports Desert Power 2050 and Desert
Power: Getting Started - that all coun-
tries in the EUMENA region would
benefit from the synergies of an inte-
grated power system largely based on
Renewables.
Desert Power: Getting Connected
DP:GC o ple e ts Dii’s pre ious work on the promotion of an integrat-
ed EUMENA power system. It provides
a clearer understanding of the re-
quirements of a transmission grid in-
frastructure that would enable the
efficient exchange of large amounts of
electricity across the European and
MENA power markets.
DP:GC must not be seen as the solution
for the transmission infrastructure
throughout EUMENA or only between
MENA and Europe. While analyses
were carried out in close cooperation
ith Dii’s shareholders
ABB, Red Eléctrica de España, Terna
S.p.A. and RWE, many uncertainties
regarding the future power systems
and technologies remain and simplifi-
cations inherent in modeling exercises
were made. Hence, the report does not
claim to offer yet the accuracy that
would be needed for detailed long
term grid planning.
Instead, DP: GC is intended as a contri-
bution to the emerging debates on a
pan EUMENA overlay grid i a high le el s he ati a . “u h o erla grid will not only increase the level of mar-
ket integration in the entire EUMENA
area. It will also allow for a secure and
cost-efficient implementation of long
term climate and Renewables targets,
e.g. the EU Roadmap for moving to a
competitive low carbon economy in
2050 or emerging MENA efforts in this
regard.
4 Desert Power: Getting Connected
CONTENTS
CONTENTS ........................................................................................................................................................ 4
FIGURES ............................................................................................................................................................ 5
TABLES .............................................................................................................................................................. 5
EXECUTIVE SUMMARY ..................................................................................................................................... 6
1 INTRODUCTION ...................................................................................................................................... 9
1.1 Report objectives and approach ................................................................................................ 10
1.2 Report outline ............................................................................................................................. 11
2 METHODOLOGY AND ASSUMPTIONS.................................................................................................. 12
2.1 DP:GS Connected Scenario in brief ............................................................................................ 12
2.2 Grid Model applied ..................................................................................................................... 15
3 RESULTS 2030 ....................................................................................................................................... 21
3.1 Western corridor ........................................................................................................................ 21
3.2 Central corridor........................................................................................................................... 24
3.3 Eastern corridor .......................................................................................................................... 27
4 RESULTS 2050 ....................................................................................................................................... 30
4.1 Technical results ......................................................................................................................... 30
4.2 Economic results ......................................................................................................................... 32
5 CONCLUSION AND RECOMMENDATIONS ........................................................................................... 34
It is time to act now .................................................................................................................................. 37
6 ABBREVIATIONS .................................................................................................................................... 38
5
FIGURES
Figure 1 The transition to a sustainable integrated EUMENA power system ............................................. 12
Figure 2 Generation mix and grid infrastructure in the DP:GS Connected scenario by 2030 .................... 13
Figure 3 Generation mix and grid infrastructure in the DP:GS Connected scenario by 2050 .................... 14
Figure 4 General description of the models used ........................................................................................ 15
Figure 5 The reference power system used for the 2050 grid analysis....................................................... 18
Figure 6 HVDC lines and converters capacities in the Western corridor by 2030 ...................................... 21
Figure 7 Electricity exchanges between regional nodes in the Western corridor by 2030........................ 22
Figure 8 Grid reinforcement Central corridor Option I ................................................................................ 25
Figure 9 Grid reinforcement Central corridor Option II ............................................................................... 25
Figure 10 Grid reinforcement Central corridor Option III ............................................................................ 25
Figure 11 Critical sections for AC grid in Algeria, Tunisia and Libya ............................................................ 26
Figure 12 HVDC overlay grid in the Eastern corridor by 2030 ..................................................................... 27
Figure 13 AC reinforcements in the Eastern corridor by 2030 .................................................................... 28
Figure 14 Line capacities of the EUMENA overlay grid by 2050 .................................................................. 30
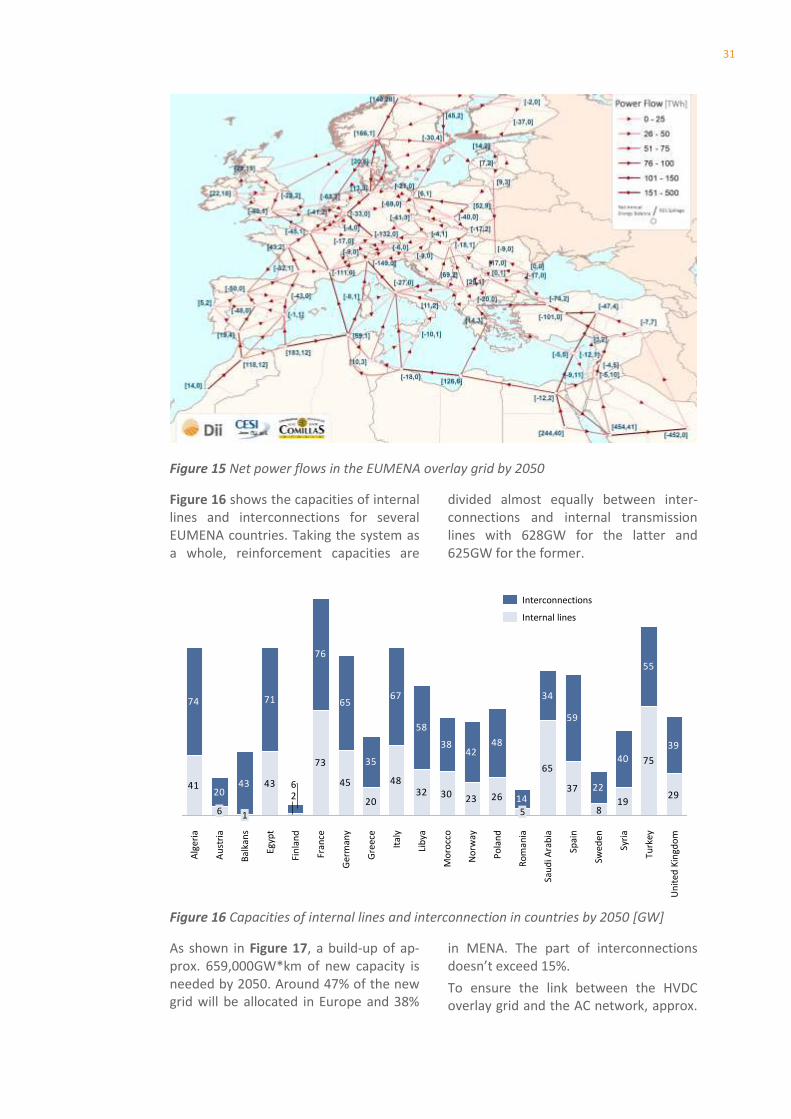
Figure 15 Net power flows in the EUMENA overlay grid by 2050 ............................................................... 31
Figure 16 Capacities of internal lines and interconnection in countries by 2050 [GW] ............................. 31
Figure 17 Capacities of the HVDC overlay grid by 2050 ............................................................................... 32
Figure 18 Grid investment costs by country up to the year 2050 ............................................................... 33
TABLES
Table 1 Investment and operation costs for HVDC facilities ........................................................................ 19
Table 2 AC transmission lines costs ............................................................................................................... 19
Table 3 Su statio ‘s exte sio osts ............................................................................................................. 20
Table 4 Technical and economic input parameters for the 2050 scenario ................................................. 20
Table 5 Total costs of the HVDC overlay grid in the Western corridor by 2030 (converters in brackets). 23
Table 6 Options investigated for the interconnections North Africa – Italy (Central corridor) ................. 24
Table 7 220/400 kV AC reinforcements [km] – Central corridor ................................................................. 25
Table 8 Investment costs for HVDC lines and DC converter stations in the Central corridor as well as AC
rei for e e ts i ra kets [M€] ................................................................................................................ 26
Table 9 HVDC and AC capacities in the Eastern corridor ............................................................................. 29
Table 10 I vest e t osts for HVDC a d AC i frastru ture i the Easter orridor [M€] ........................ 29
Table 11 Total investment costs in grid infrastructures ............................................................................... 32

2030: First HVDC highways and AC reinforcements
Building on current grid expansion planning in Europe and MENA, Dii’s analyses illustrate the step-
wise buildup of an overlay grid for a sustainable EUMENA power system in the coming decades.
Fo the ea load-lo ased g id odels ith se -
eral hundred nodes and lines per country were applied.
Fo egio al a d i te aio al g id e te sio s oth AC a d DC te h ologies e e o side ed; i te a io ith the e -
isi g high oltage g id as e pli itl i luded i the g id models. The build-up of a EUMENA overlay grid is expect-
ed to afe t, i the id-te , ai l the ou t ies at the borders between Europe and MENA; therefore the 2030
grid analysis is focused on three trans-Mediterranean
corridors, i.e. the Western corridor from Morocco and Algeria
Figure 1 AC and DC reinforcements in EUMENA between 2022 and 2030 [GWNTC]
across the Iberian Peninsula up to France, the Central corri-
dor from Algeria, Tunisia and Libya across Italy to its North-
ern neighbors and the Eastern corridor from Egypt and the
Middle East across Turkey to the South-Eastern countries of
the EU.
Figure 1 summarizes the results for the year 2030 and shows
a i st set of possi le outes a d the espe i e apa iies of new HVDC lines, as well as areas with strong reinforcements
of the AC grid.
EUMENA GRID EXPANSION
BY 2030 AND 2050
Desert Power: Getting Connected
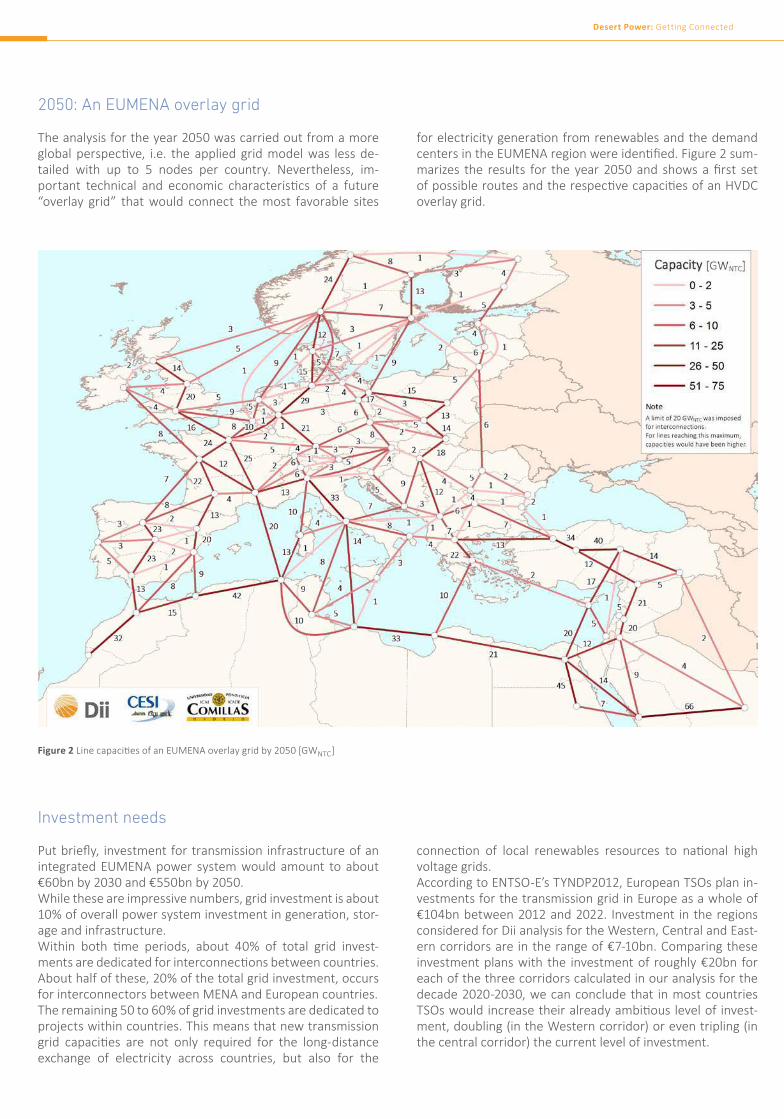
Figure 2 Li e apa iies of a EUMENA o e la g id [GWNTC]
2050: An EUMENA overlay grid
Investment needs
The analysis for the year 2050 was carried out from a more
glo al pe spe i e, i.e. the applied g id odel as less de-
tailed with up to 5 nodes per country. Nevertheless, im-
po ta t te h i al a d e o o i ha a te isi s of a futu e “overlay grid” that would connect the most favorable sites
fo ele t i it ge e aio f o e e a les a d the de a d e te s i the EUMENA egio e e ide iied. Figu e su -
a izes the esults fo the ea a d sho s a i st set of possi le outes a d the espe i e apa iies of a HVDC overlay grid.
Put iel , i est e t fo t a s issio i f ast u tu e of a integrated EUMENA power system would amount to about
€60bn by 2030 and €550bn by 2050.
While these are impressive numbers, grid investment is about
% of o e all po e s ste i est e t i ge e aio , sto -
age and infrastructure.
Withi oth i e pe iods, a out % of total g id i est-e ts a e dedi ated fo i te o e io s et ee ou t ies.
About half of these, 20% of the total grid investment, occurs
for interconnectors between MENA and European countries.
The remaining 50 to 60% of grid investments are dedicated to
projects within countries. This means that new transmission
g id apa iies a e ot o l e ui ed fo the lo g-dista e exchange of electricity across countries, but also for the
o e io of lo al e e a les esou es to aio al high voltage grids.
According to ENTSO-E’s TYNDP2012, European TSOs plan in-
vestments for the transmission grid in Europe as a whole of
€ et ee a d . I est e t i the egio s considered for Dii analysis for the Western, Central and East-
ern corridors are in the range of €7-10bn. Comparing these
investment plans with the investment of roughly €20bn for
each of the three corridors calculated in our analysis for the
decade 2020-2030, we can conclude that in most countries
TSOs ould i ease thei al ead a iious le el of i est-e t, dou li g i the Weste o ido o e e t ipli g i
the e t al o ido the u e t le el of i est e t.
Desert Power: Getting Connected

Short-term until 2020
Mid-term 2020 - 2030
By 2020, it is desirable that projects in-
cluded in the TYNDP and the MENA re-
gion master plans are fully implement-
ed without undue delays. In order to
demonstrate the techno-economic
feasibility of HVDC links between
North Africa and Europe, the imple-
e taio of the t o p oje ts f o Italy to Algeria and Tunisia, as included
in the TYNDP 2012, would be of great
e eit.Efe i e olla o aio a o g TSOs in MENA and European countries will
make the required exchange of infor-
aio a out the pla i g a d ope a-
io of the ele t i it s ste s possi le.The e Eu opea Regulaio o guidelines for trans-European energy
infrastructure already provides some
improvements in this respect for EU
member states. The quick develop-
e t of i st oss-Medite a ea interconnectors would greatly ben-
eit f o e pa di g the s ope of this egulaio to a ds p oje ts ith thi d
countries.
In the mid-term, a strong infrastruc-
tu e a p-up a d i te aio al poli convergence between MENA and Eu-
ropean countries is assumed.
The e ha ge of sig ii a t a ou ts of energy on long distances will re-
quire the use of common rules not
o l fo the ope aio of the po e system, but also for the whole elec-
tricity market.
This i ludes, i stl , o o et o k codes on security issues as well as on
apa it allo aio a d o gesio a age e t p a i es to e su e the
s ooth ope aio of the et o k.Se o dl , i te aio al poli ies fo the development of new transmission in-
f ast u tu e a e e ui ed. A sta i g poi t i this di e io o the Eu ope-
a side is the Regulaio o guideli es for trans-European energy infrastruc-
tu e p o idi g fa o a le egulaio
a d i a i g to P oje ts of Co o I te est. This egulaio should e e -
panded to all infrastructure projects
between MENA and Europe.
I addiio , o o egio al guide-
lines for transmission planning and
i est e t ost allo aio should e adopted. The European Union has
made considerable progress in this
respect over the last years. It is rec-
ommended that the countries in the
MENA region also start to establish
procedures for regional planning and
ost allo aio .Finally, it is important that planning
also starts to take place at an EUMENA-
ide le el. A i st step ould e fo ENTSO-E to take into account grid
developments and renewables poten-
ials i the eigh o i g Medite a ea countries.
Long-term 2030 - 2050
In order to achieve a fully integrated
power system, common EUMENA
transmission policies are required for
infrastructure development and oper-
aio .This should entail the gradual establish-
ment of a regional governance model
for an EUMENA-wide transmission
grid, including binding region-wide
investment plans and network codes.
I addiio , a egio al egulato ould oversee the planning process, the
e fo e e t of ost-allo aio p o e-
dures, and network codes.
HOW TO GET THERE?
Of course, the results of
this modeling analysis
only show one option for
strongly reinforcing and
interconnecting the power
grids across Europe and
the MENA region through
a high voltage overlay
grid. While reality as
implemented by the TSOs
will certainly look diferent,
the analysis provides a better
understanding of the extent
of the challenge and of the
main countries and regions
afected. It is, on the one
hand, intended to serve as
a basis to further detail the
concrete necessity, technical
feasibility and economic
viability of the variety of
potential projects; on the
other hand, it underlines
the need for substantial
progress and international
coordination in planning,
constructing, inancing, and
operating a future power
grid. From Dii’s perspective,
this would entail the
following short-, medium-
and long-term measures.
Desert Power: Getting Connected
9
1 INTRODUCTION Dii’s issio is to support an accelerated
deployment of Renewables in MENA as
well as their integration in the growing
electricity markets in the region and,
ultimately, across EUMENA and beyond.
With its 2012 and 2013 reports, Desert
Power 20501 (DP2050) and Desert Power:
Getting Started2 (DP:GS), Dii showed that
all countries in the EUMENA region would
benefit from the synergies of an integrat-
ed power system largely based on Re-
newables. I tegrati g desert po er from MENA will be one of the most effec-
tive options not only for contributing to
security of supply and cost control of
electricity, but also for reducing CO2
emissions.
In order to facilitate the development of
a power system that extends from Saudi
Arabia to Finland in the East and from
Ireland and the UK to Morocco in the
West, Dii has already carried out several
publicly available studies focusing on
renewable potentials, regulatory and
financing issues, economic and employ-
ment effects as well as required political
and institutional frameworks for renewa-
bles.
Desert Power: Getting Connected (DP:GC)
complements the previous work on the
promotion of an integrated EUMENA
power system and provides a clearer
understanding of the requirements of a
transmission grid infrastructure that
would enable the efficient exchange of
large amounts of electricity across the
European and MENA power markets.
For sure, a EUMENA overlay grid will
evolve gradually and, as for any grid de-
velopment, a profound planning process
is required. Some projects for the exten-
sion of interconnector capacities be-
tween Southern Europe and North Africa
are already envisaged within ENTSO-E’s
1 Dii. (2013). Desert Power 2050: Perspectives on a
Sustainable Power System for EUMENA 2 Dii. (2013). Desert Power: Getting Started. The manual
for renewable electricity in
MENA
Ten-Year Network Development Plan3
(TYNDP) for the coming decade, even if
reality shows, that a timely implementa-
tion of these trans-continental submarine
links cannot be taken for granted. DP:GC
provides an outlook beyond these plans,
on the potential development of the
transmission grid up to the years 2030
and 2050, which would facilitate an inte-
grated EUMENA power system.
It is worth mentioning that the motiva-
tion for DP:GC as ’t to o pete at the same level with sophisticated grid plan-
ning processes, which are the sole re-
sponsibility of transmission system oper-
ators (TSO) and ENTSO-E.
Nevertheless, DP:GC should rather be
understood as a contribution to the
emerging debates on an pan EUMENA
o erla grid i a high le el s he ati way. Such overlay grid will not only in-
crease the level of market integration in
the entire EUMENA area. It will also allow
for a secure and cost-efficient implemen-
tation of long term climate and Renewa-
bles targets, e.g. the EU Roadmap for
moving to a competitive low carbon
economy in 2050 or emerging MENA ef-
forts in this regard.
Since DP:GC aims only at initiating the
debate among relevant stakeholders on
the most appropriate grid infrastructure
for the future, any (cost) figures and grid
images should be seen within the context
of most reasonable assumptions from a
present perspective. Hence, the report
does not claim to offer yet the accuracy
that would be needed for detailed long
term grid planning.
In this context the report at hand com-
plements recent analysis carried out on
behalf of Medgrid, which evaluated the
effects on the European grid infrastruc-
ture, if electricity exchange between the
two regions was intensified by the year
2025. Hence, in an upcoming report
3
ENTSO-E. (2012). Ten-Year Network Development Plan
2012
10 Desert Power: Getting Connected
Medgrid concludes that a set of several
GW of interconnections from MENA can
be efficiently and, without major internal
reinforcements, easily connected to the
European transmission grid.
Additionally, Friends of the Supergrid
(FOSG) delivered with the regularly up-
dated Roadmap of the Supergrid Tech-
nologies a mid- and long-term outlook on
high voltage direct current (HVDC) tech-
nology developments and proved that
technology will likely not be the show
stopper for a European and EUMENA
overlay grid, respectively.
The present report is based on the results
of the e te si e stud Pre-feasibility
analysis on power highways for the Eu-
rope-MENA region integration in the year
a d arried out a o sor-
tium of the Italian consultant CESI S.p.A.
and the Spanish Institute for Research in
Technology at Universidad Pontificia
Comillas. Dii would like to acknowledge
the work of the consortium and would
also like to highlight the valuable contri-
bution of its Shareholders ABB, Red Eléc-
trica de España, Terna S.p.A. and RWE as
members of the grid study advisory
group.
1.1 Report objectives and approachThe analysis of a cost effective EUMENA
power system that was carried out for
DP:GS is based on an optimization model
for the power sector (i.e. no interde-
pendencies between the power and e.g.
the gas sector were considered) that rep-
resents each country with one node and
HVDC interconnections between these
country nodes. Even if such an approach
has been applied in a number of similar
system studies4 most studies have fo-
cused on Europe and not on the MENA or
even the EUMENA region. Hence, only
some preliminary indications regarding
the features of an overlay grid in the
whole EUMENA region was provided so
far.
Consequently, a specific and more de-
tailed analysis of the power grid can help
in identifying the technical and economic
feasibility of these new interconnections.
DP:GC steps in this vacuum and increases
the level of detail for the grid infrastruc-
ture that would be needed to allow for
the large power exchanges modeled in
DP:GS for the mid- (2030) and long-run
(2050).
“tarti g fro toda ’s tra s issio grid and the already planned grid extensions
for the year 2022 as announced in the
4
e.g. McKinsey & Company (2010): Transformation of
Europe’s po er s ste u til ; Europea Cli ate Foundation (2010): Roadmap 2050
TYNDP 2012 and by MENA countries,
DP:GC pursues a twofold approach for
the years 2030 and 2050.
For 2030, load-flow based grid models
with several hundred nodes and lines per
country were applied. For regional and
international grid extensions, both AC
and DC technologies were considered and
the interaction with the existing high
voltage grid was explicitly included in the
grid models. The analysis delivers a de-
tailed picture of the main transmission
corridors and related cost figures be-
tween EUMENA as well as the required
grid reinforcements within the respective
European and MENA countries. Since the
build-up of an EUMENA overlay grid will
in the mid-term mainly affect the coun-
tries at the borders between Europe and
MENA, the 2030 grid analysis is focused
on three trans-Mediterranean corridors,
i.e.
» from Morocco and Algeria to Spain,
Portugal and further to France
(Western corridor)
» from Algeria, Tunisia and Libya to
Italy and further to Central Europe
(Central corridor) and
» from Middle East to Turkey and fur-
ther to South-eastern Europe (East-
ern corridor).
Compared to the sophisticated grid mod-
eling for the year 2030, the analysis for
11
2050 was undertaken from a more global
perspective i.e. the applied grid model
was less detailed with up to 5 nodes per
country. Nevertheless, important tech-
nical and economic characteristics of a
future overlay grid that would connect
the most favorable sites for electricity
generation from renewables and the
demand centers in the EUMENA region
were identified.
Again, it is important to mention that
DP:GC does not only cover the (subma-
rine) interconnections between the two
regions but also includes the high voltage
grid reinforcements in the considered
countries to materialize the transfor-
atio of toda ’s ai l fossil a d u le-
ar based power systems to a system with
a share of more than 90 % renewables in
electricity production.
1.2 Report outline A high degree of accordance with the
power system configuration calculated
for Dii’s Desert Power: Getting Started
was an important boundary condition
both for the above-mentioned grid study
carried out by CESI and Comillas, and the
present report. For this reason, Chapter
2: Methodology and assumptions sum-
marizes the key findings and most im-
portant results of DP:GS. Further, Chapter
2 gives a short description of the applied
grid models as well as additionally re-
quired input parameters for the technical
and economic analysis of the identified
grid reinforcement needs.
Chapter 3: Results 2030 and Chapter 4:
Results 2050 outline and discuss the re-
sults of the underlying grid study for the
mid- and long-term horizon, respectively.
DP:GC concludes with Chapter 5: Conclu-
sions and recommendations, where the
technical and economic key findings of
the analysis are placed in context with
regulatory issues that can be derived
fro the stud ’s results.

12 Desert Power: Getting Connected
2 METHODOLOGY AND ASSUMPTIONSThis chapter provides a glimpse of the DP:GS Connected Scenario, the source of the
main boundary conditions of DP:GC as well as the models used, including their technical
and economic input parameters.
2.1 DP:GS Connected Scenario in briefIn order to understand how the grid of a
sustainable and cost effective EUMENA
power system may look like in the mid
(2030) and long term (2050), DP:GC has
considered as input the results of the
ai s e ario used i Dii’s, Desert Power:
Getting Started (DP:GS), i.e. the Connect-
ed Scenario.
This scenario identifies the milestones, in
terms of generation and transmission
infrastructure build-up, leading to a sus-
tainable and cost effective fully integrat-
ed EUMENA approach by 2050.
The scenario assumes a strongly inter-
connected Europe and MENA power sys-
tem with a generation mix made up of
93% renewables and 7% natural gas by
2050. National Renewable Energy Action
Plans (NREAPs) in the EU member states
have been considered for solar installa-
tions and a 70% rate of self-supply was
imposed (for more detail, see 2.1.2).
As reference, the existing grid plus the
planned grid reinforcements according to
the ENTSO-E’s Ten Year Network Devel-
opment Plan TYNDP2012 (ENTSO-E, 2012)
was used. Adopting a o e-node-per-
ou tr approa h, the DP:G“ Co e ted Scenario has examined through a techno-
economic optimization the generation
mix and interconnection capacities re-
quired to ensure the match between
demand and supply in EUMENA in every
hour of a whole year, in each of the four
time steps (2020, 2030, 2040, 2050) and
accordingly determines the power flows
between countries considered. The geo-
graphic scope of this analysis covers 42
countries, and extends from Saudi Arabia
to Finland in the East and from Ireland
and the UK to Morocco in the West.
Figure 1 shows the resulting evolution of
the EUMENA power system.
Figure 1 The transition to a sustainable integrated EUMENA power system
Short term
Until 2020
Long term
Post-2030
Mid term
2020-2030
TWhEUMENA8,489
9%
2050
51%
16%
10%
2040
7,291
11%
41%
13%
8%
17%
2030
6,185
18%
6%
13%
23%
6%
20%
2020
4,956
33%
20%6%
13%11%
38%
55%
80%
93%
3%
2%
1%
2%
10%
5%
5%
1%
3%
4%
2%
3%
4%
6%
3%
Biomass
Ex. Nuclear
Ex. Hydro carbons
Other RE
New gas
Hydro
Wind on-shorePV
CSPDemand
Wind off-shore
13
In the next paragraphs, the results issued
from DP:GS for the two timeframes con-
sidered in DP:GC, 2030 and 2050 are
highlighted. Further details about this
scenario can be found in the full report of
Desert Power: Getting Started pp. 49-119
(accessed free of charge under
http://www.dii-
eumena.com/publications/getting-
started.html).
2.1.1 EUMENA power system by 2030
The power system calculated for 2030
was optimized for minimum system cost
under a EUMENA carbon emission cap of
946Mtonnes p.a. while satisfying a de-
mand of approx. 6,200TWh split to ap-
prox. 4,800TWh in Europe and approx.
1,400TWh in MENA.
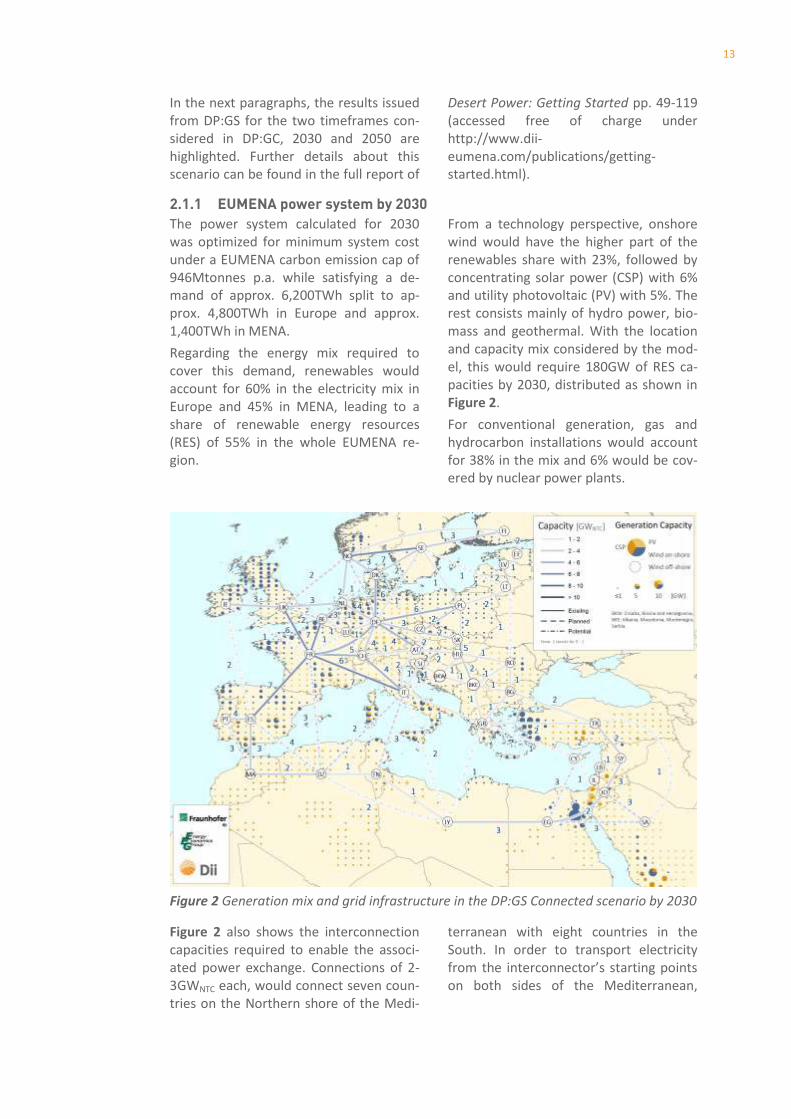
Regarding the energy mix required to
cover this demand, renewables would
account for 60% in the electricity mix in
Europe and 45% in MENA, leading to a
share of renewable energy resources
(RES) of 55% in the whole EUMENA re-
gion.
From a technology perspective, onshore
wind would have the higher part of the
renewables share with 23%, followed by
concentrating solar power (CSP) with 6%
and utility photovoltaic (PV) with 5%. The
rest consists mainly of hydro power, bio-
mass and geothermal. With the location
and capacity mix considered by the mod-
el, this would require 180GW of RES ca-
pacities by 2030, distributed as shown in
Figure 2.
For conventional generation, gas and
hydrocarbon installations would account
for 38% in the mix and 6% would be cov-
ered by nuclear power plants.
Figure 2 Generation mix and grid infrastructure in the DP:GS Connected scenario by 2030
Figure 2 also shows the interconnection
capacities required to enable the associ-
ated power exchange. Connections of 2-
3GWNTC each, would connect seven coun-
tries on the Northern shore of the Medi-
terranean with eight countries in the
South. In order to transport electricity
fro the i ter o e tor’s starti g poi ts on both sides of the Mediterranean,
14 Desert Power: Getting Connected
intra-European and intra-MENA grids are
essential.
This infrastructure would ensure gross
power flows between countries of ap-
prox. 600TWh, which represents approx.
10% of the overall energy produced. Total
electricity exchange between MENA and
Europe would reach 120TWh with a focus
on the South to North direction where
power flows represent 70% of the total
exchange.
2.1.2 EUMENA power system by 2050
By 2050, the underlying DP:GS Connected
Scenario looks at an optimal EUMENA
system able to achieve an almost com-
plete decarbonization with a maximum
carbon emission cap of 194Mtonnes p.a.
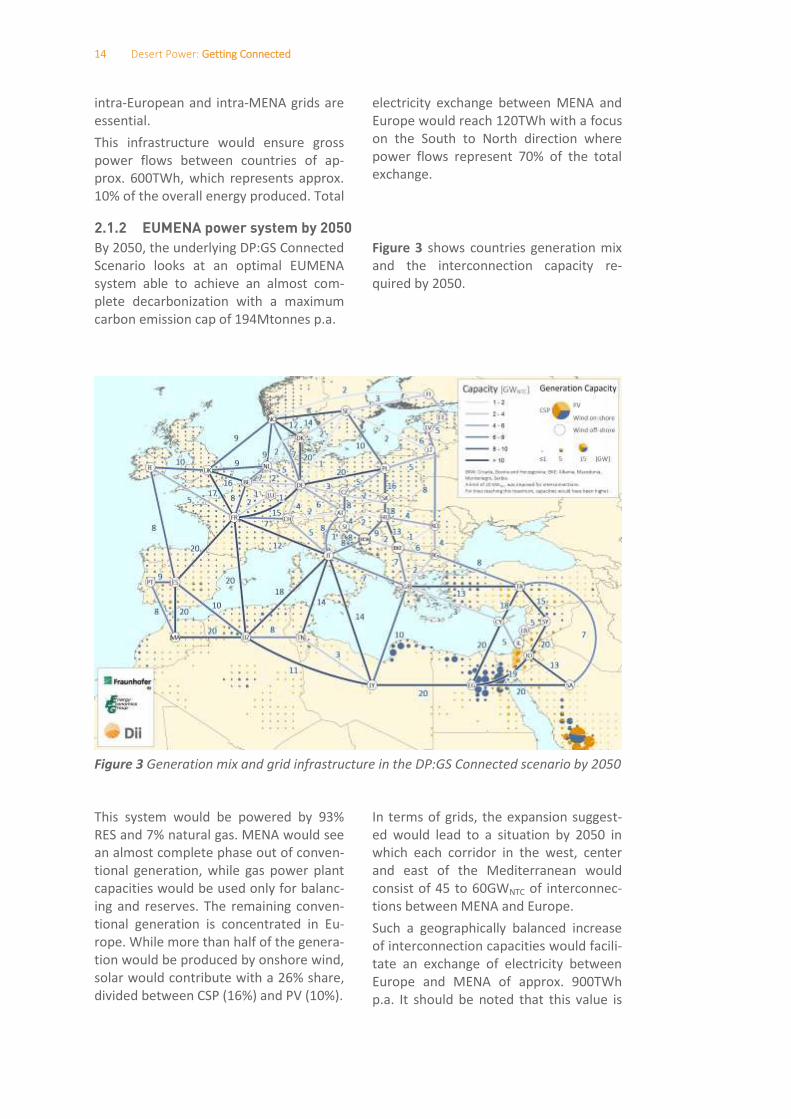
Figure 3 shows countries generation mix
and the interconnection capacity re-
quired by 2050.
Figure 3 Generation mix and grid infrastructure in the DP:GS Connected scenario by 2050
This system would be powered by 93%
RES and 7% natural gas. MENA would see
an almost complete phase out of conven-
tional generation, while gas power plant
capacities would be used only for balanc-
ing and reserves. The remaining conven-
tional generation is concentrated in Eu-
rope. While more than half of the genera-
tion would be produced by onshore wind,
solar would contribute with a 26% share,
divided between CSP (16%) and PV (10%).
In terms of grids, the expansion suggest-
ed would lead to a situation by 2050 in
which each corridor in the west, center
and east of the Mediterranean would
consist of 45 to 60GWNTC of interconnec-
tions between MENA and Europe.
Such a geographically balanced increase
of interconnection capacities would facili-
tate an exchange of electricity between
Europe and MENA of approx. 900TWh
p.a. It should be noted that this value is
15
limited by the upper limit of 20GWNTC
applied to the interconnections between
each two countries.
Overall electricity exchange could in-
crease six-fold from 2030 to 2050, from
600TWh to more than 3,650TWh where
net European imports would reach
570TWh, just below 10% of projected
European demand.
2.2 Grid Model applied
2.2.1 General description of models used
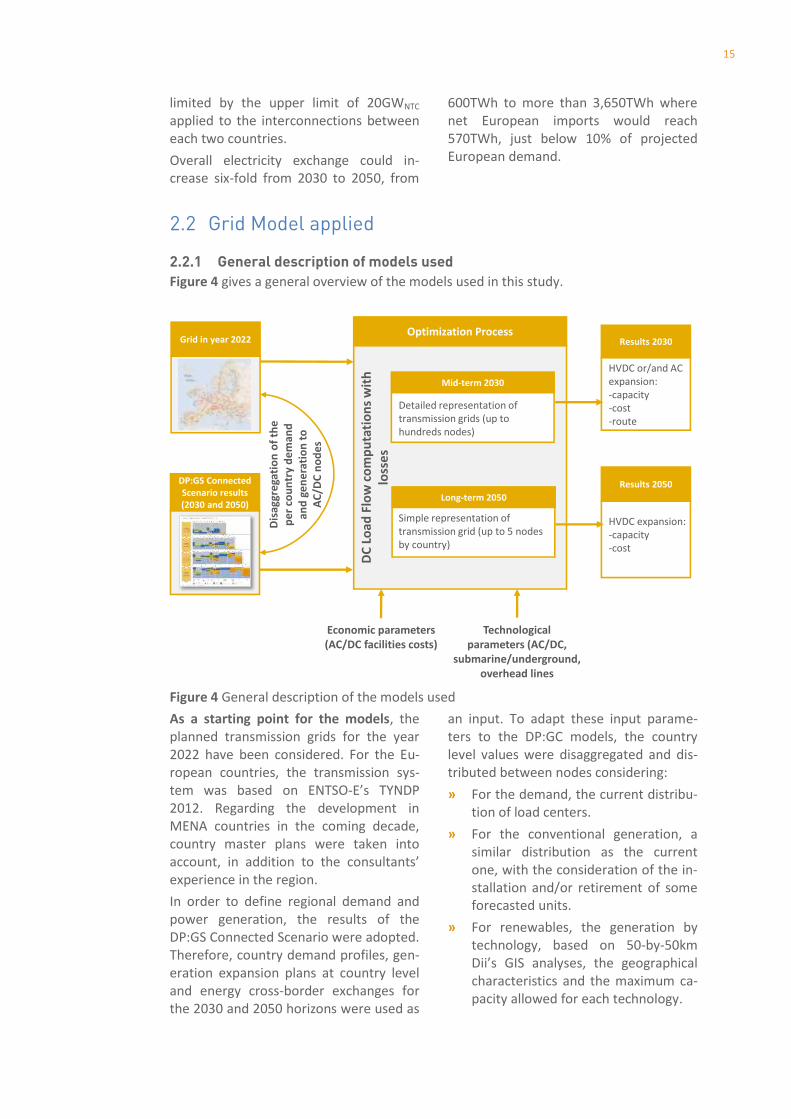
Figure 4 gives a general overview of the models used in this study.
Figure 4 General description of the models used
As a starting point for the models, the
planned transmission grids for the year
2022 have been considered. For the Eu-
ropean countries, the transmission sys-
tem was based on ENTSO-E’s TYNDP 2012. Regarding the development in
MENA countries in the coming decade,
country master plans were taken into
a ou t, i additio to the o sulta ts’ experience in the region.
In order to define regional demand and
power generation, the results of the
DP:GS Connected Scenario were adopted.
Therefore, country demand profiles, gen-
eration expansion plans at country level
and energy cross-border exchanges for
the 2030 and 2050 horizons were used as
an input. To adapt these input parame-
ters to the DP:GC models, the country
level values were disaggregated and dis-
tributed between nodes considering:
» For the demand, the current distribu-
tion of load centers.
» For the conventional generation, a
similar distribution as the current
one, with the consideration of the in-
stallation and/or retirement of some
forecasted units.
» For renewables, the generation by
technology, based on 50-by-50km
Dii’s GI“ a al ses, the geographi al characteristics and the maximum ca-
pacity allowed for each technology.
Optimization ProcessResults 2030
DP:GS Connected
Scenario results
(2030 and 2050)
DC
Lo
ad
Flo
w c
om
pu
tati
on
s w
ith
loss
es
Grid in year 2022
Results 2050
Economic parameters
(AC/DC facilities costs)
Technological
parameters (AC/DC,
submarine/underground,
overhead lines
Long-term 2050
Simple representation of
transmission grid (up to 5 nodes
by country)
Dis
ag
gre
gati
on
of
the
pe
r co
un
try
de
ma
nd
an
d g
en
era
tio
n t
o
AC
/DC
no
de
s
Mid-term 2030
Detailed representation of
transmission grids (up to
hundreds nodes)
HVDC expansion:
-capacity
-cost
HVDC or/and AC
expansion:
-capacity
-cost
-route
16 Desert Power: Getting Connected
In a second step, an optimization pro-
cess was carried out based on a set of DC
load flows. Taking into consideration the
different time scopes of the study, i.e. the
years 2030 and 2050, two different mod-
eling approaches were used. The main
difference between the two models con-
sists in the level of detail used to repre-
sent the transmission grids.
For the year 2030, a sophisticated ap-
proach was adopted. Given that the time
scope is only 15 years far away, impera-
tive regions were described by their high
voltage AC grid, represented by hundreds
of nodes.
For the year 2050, countries were dis-
aggregated in up to 5 macro-areas, linked
with HVDC interconnectors.
Finally, optimal reinforcements were
selected and their related capacities,
technologies and routes were given.
Generally, HDVC technology was favored
for the new connections in order to ease
calculations using Net Transfer Capacity
(NTC) values. This choice is deemed to be
in harmony with the pre-feasibility stage
of the study and would not harm the
quality of the results. In more detailed
planning studies, AC-technology could be
the technology of choice in certain cases.
Still, to guarantee consistency of results,
the reinforcements identified in the mid-
term horizon up to 2030 have been con-
sidered in the 2050 analyses.
2.2.2 Modeling approach for the year 2030
For the mid-term (2030), the analyses
shed light on the 3 electricity corridors
ensuring the electricity exchanges be-
tween both sides of the Mediterranean:
the Western, the Central and the Eastern
corridors.
» For the Western corridor, Portugal,
Spain and France are the main focus
of the analyses. In addition, in order
to take into account power-
exchanges, Morocco, Algeria and the
neighboring countries in Europe have
also been considered.
» For the Central corridor, Italy is the
focus of the analysis. However, in or-
der to consider the power flows up to
Central Europe, Austria and Switzer-
land were also considered, as well as
interconnections to the South of
Germany. Moreover, Algeria, Tunisia
and Libya potential reinforcements
were qualitatively assessed.
» For the Eastern corridor, Turkey is the
focus of the investigations. Again, in
order to consider the power flows up
to Central Europe, the Balkan region
and Eastern Europe up to South Ger-
many have also been inserted in the
model. Furthermore, MENA countries
in this region have been considered
with more details. A quantitative as-
sessment for them is reported.
The grid characteristics in these 3 regions
present some relevant differences.
In the Western corridor, several potential
interconnectors could link North Africa to
Europe (see Figure 2). Consequently,
potential links including Morocco-
Portugal, Algeria-Spain, Algeria-France
were examined considering the power
system’s operation in all hours of the
year.
This characteristic is not present to the
same extent in the Central and Eastern
corridors. In a first stage, Italy is the only
European country to be connected to
North Africa and, in the latter, the Middle
East area represents a narrow corridor
for transmitting power from MENA to
Eastern Europe.
Therefore and based on Spanish and Ital-
ian TSOs feedback (REE and TERNA), two
modeling approaches were adopted.
While for the Central and Eastern corri-
dors, both AC and DC reinforcements
were analyzed, in the Western corridor all
grid reinforcements after 2022 were as-
sumed to be implemented with HVDC
technology. It is worth mentioning that
these different approaches may be con-
17
sidered as case studies aiming at identify-
ing two different options for a cost-
effective grid infrastructure by 2030.
In the next paragraphs, the two ap-
proaches will be explained further.
Western corridor
The transmission expansion for the
Western corridor has been deemed to
consist of a set of HVDC links making a
meshed network that overlaps with the
existing AC grid. This HVDC grid will be
built connecting several selected nodes
already existing in the AC grid. These up
to 11 super-nodes (in the case of Spain)
per country are well connected with the
existing AC network and are therefore
well suited to be crossed by important
power flows.
In order to carry out the optimization
process, the Spanish Institute for Re-
search in Technology at Universidad Pon-
tificia Comillas (IIT Comillas) adapted and
updated its model TEPES5, which has
been used in several EU projects in the
past. This model minimizes total network
investment and operational costs subject
to a set of constraints including mainly
node energy balances, energy exchanges
among countries and regions and line
flow capacity limits.
Computations of DC load flows with loss-
es were applied to a set of 70 snapshots,
which cover all major demand, genera-
tion and power flow configurations that
may occur in the system over the whole
target year6.
In order to compute an optimal HVDC
grid, a large set of possible candidates
(both AC/DC converters and lines) to be
built are provided as an input to the
TEPES model. The model selects those
that should be built to minimize total
costs while complying with boundary
constraints and ensure that no overloads
would occur. It should be mentioned that
neither the N-1 criterion nor dynamic
5
http://www.iit.upcomillas.es/aramos/TEPES.htm 6 The choice of the snapshots was carried out via a clus-
tering analysis based on the K-means algorithm
analyses were considered, as these as-
pects are beyond the scope of this pre-
feasibility study.
Central and Eastern corridors
In the Central and Eastern corridors, the
transmission system was represented
ith a so alled us- ar odel. This model includes thousands of nodes inter-
connected by high and extra-high voltage
AC and DC lines.
Starting from the reference network, a
load flow analysis has been carried out
using the PSS/E® tool in order to deter-
mine the power flows and the possible
bottlenecks with respect to the transfer
capacity. These grid assessments were
perfor ed adopti g the DC load flo algorithm; dynamic has not been mod-
eled.
The generation dispatch has been based
on the merit order of the generating units
in relationship with the primary resources
and the assumed technologies. Whenever
a bottleneck is detected in the reference
grid, the transfer capacity is increased
choosing the optimal mix of reinforce-
ments between AC and DC technologies
in order to relieve the detected overloads
and minimize the investment costs. For
that aim, three snapshots representing
the most binding situations for the net-
work were simulated sequentially:
» Maximum transit from MENA: identi-
fication of the network reinforce-
ments necessary to deal with high
level of imports from South to North.
» Peak load conditions: in presence of
the reinforcements identified in Step
1, the additional infrastructures nec-
essary to deal with the maximum
load conditions are identified.
» Maximum transit to Central Europe:
in presence of the reinforcements
identified in the two previous steps,
the additional infrastructures neces-
sary to manage high level of power
flows towards Central Europe are
identified.
18 Desert Power: Getting Connected
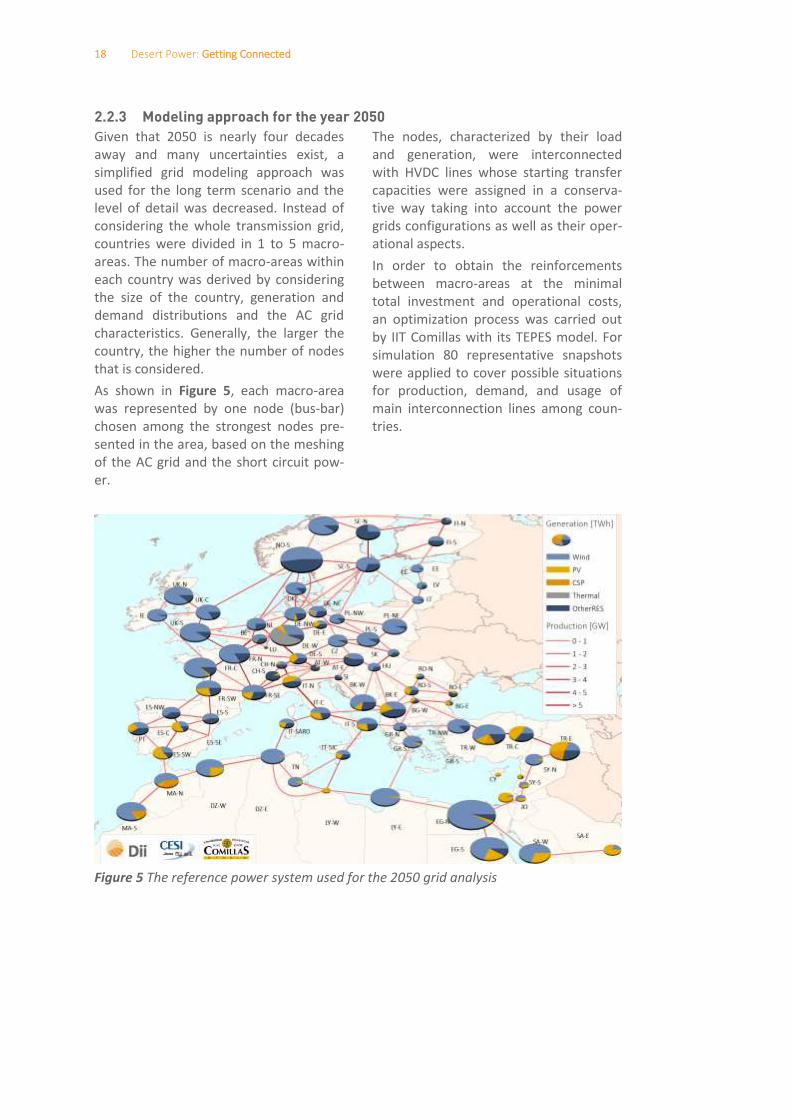
2.2.3 Modeling approach for the year 2050
Given that 2050 is nearly four decades
away and many uncertainties exist, a
simplified grid modeling approach was
used for the long term scenario and the
level of detail was decreased. Instead of
considering the whole transmission grid,
countries were divided in 1 to 5 macro-
areas. The number of macro-areas within
each country was derived by considering
the size of the country, generation and
demand distributions and the AC grid
characteristics. Generally, the larger the
country, the higher the number of nodes
that is considered.
As shown in Figure 5, each macro-area
was represented by one node (bus-bar)
chosen among the strongest nodes pre-
sented in the area, based on the meshing
of the AC grid and the short circuit pow-
er.
The nodes, characterized by their load
and generation, were interconnected
with HVDC lines whose starting transfer
capacities were assigned in a conserva-
tive way taking into account the power
grids configurations as well as their oper-
ational aspects.
In order to obtain the reinforcements
between macro-areas at the minimal
total investment and operational costs,
an optimization process was carried out
by IIT Comillas with its TEPES model. For
simulation 80 representative snapshots
were applied to cover possible situations
for production, demand, and usage of
main interconnection lines among coun-
tries.
Figure 5 The reference power system used for the 2050 grid analysis

19
2.2.4 Input parameters of DP:GC
Input parameters for the 2030 analyses
For the HVDC reinforcements, the VSC
technology with a bipolar configuration
of +/-500kV was adopted for the optimi-
zatio . For all li es’ t pe o sidered, i.e. overhead, underground and submarine,
investments have been assumed of a
discrete size, ranging from 1 to 3GW in
steps of 1GW. O&M costs were expressed
in percentage of the investment costs for
each year of the component life.
Table 1 presents the DC investment and
operation costs, as well as losses at rated
power. We note that these costs were
suggested by the consultants based on
their experience and could be subject to
certain uncertainties due to the large
time scope of the study. Furthermore,
the costs considered in DP:GC refer to the
value of money in 2012. A reserve margin
of 20% has been assumed for HVDC lines
and considered as an increase of a similar
percentage in NTC costs.
Transmission component
(HVDC 500 kV (+-)
Investment
costs
O&M costs (p.a. in %
of investment costs)
Losses (% of rated
power)
Overhead line 0.6 M€/km 1% 6.6%/1000km
Submarine cable 3GW 3.4 M€/km 0.1% 3.6%/1000km
On-land cable 3GW 3.7 M€/km 0.1% 3.6%/1000km
AC/DC converter 3GW
(one terminal) 225 M€ 1% 0.7%
Table 1 Investment and operation costs for HVDC facilities
For the AC reinforcements, overhead
220kV and 400kV double circuits were
considered with capacities of approx.
1,300MVA and 3,400MVA respectively.
Table 2 shows the associated costs, vary-
ing in accordance to the land mix consid-
ered based on topological estimates.
Cost of a double cir-
uit i k€/km
220kV 400kV
Italy 330 840
Austria 390 990
Switzerland 420 1,060
South
Germany 330 810
MENA
countries 260 650
Turkey 300 750
Eastern
Europe 280 700
Table 2 AC transmission lines costs
In addition to the AC lines costs, it is nec-
essary to consider the costs related to the
extension of the already existing substa-
tions. The values considered in the anal-
yses are those reported in Table 3.
Similar to DC overhead lines, 1% of the
annual investment was considered for
O&M costs. For losses, a distinction was
made between Europe and MENA given
the different characteristics of their net-
works in terms of meshing and line
length. Subsequently, 1.5% of the total
energy was estimated for Europe and
1.8% for MENA. Furthermore, for AC lines
crossing long distances, a value of 14% of
total flowing energy per 1000km was
considered. The cost of losses was calcu-
lated for each country referring to the
electricity costs in DP:GS Connected Sce-
nario and averages €/MWh. For the reserve margins, a security coeffi-
cient of 33% has been adopted for both
lines and transformers.
Finally, for both AC and DC components,
investment costs were annualized con-
20 Desert Power: Getting Connected
sidering an economic technical lifetime of
40 years and a discount rate of 7.5%.
Component Investment
ost [k€] Converter and Line (400
kV) bay 1,750
Line (220 kV) bay 1,300
Transformer Bay 1,420
450 MVA transformer 4,750
Auxiliary 2,050
SCADA - control system 3,100
Connections 300
Table 3 Su statio ‘s exte sio osts
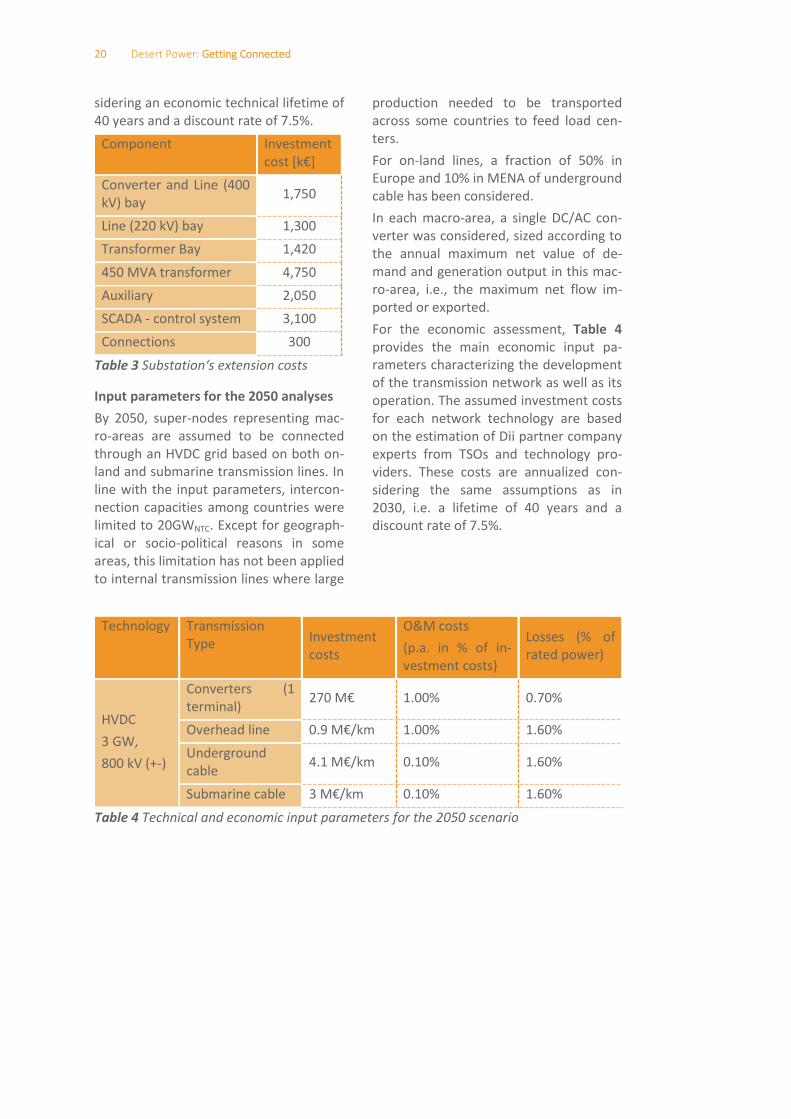
Input parameters for the 2050 analyses
By 2050, super-nodes representing mac-
ro-areas are assumed to be connected
through an HVDC grid based on both on-
land and submarine transmission lines. In
line with the input parameters, intercon-
nection capacities among countries were
limited to 20GWNTC. Except for geograph-
ical or socio-political reasons in some
areas, this limitation has not been applied
to internal transmission lines where large
production needed to be transported
across some countries to feed load cen-
ters.
For on-land lines, a fraction of 50% in
Europe and 10% in MENA of underground
cable has been considered.
In each macro-area, a single DC/AC con-
verter was considered, sized according to
the annual maximum net value of de-
mand and generation output in this mac-
ro-area, i.e., the maximum net flow im-
ported or exported.
For the economic assessment, Table 4
provides the main economic input pa-
rameters characterizing the development
of the transmission network as well as its
operation. The assumed investment costs
for each network technology are based
on the estimation of Dii partner company
experts from TSOs and technology pro-
viders. These costs are annualized con-
sidering the same assumptions as in
2030, i.e. a lifetime of 40 years and a
discount rate of 7.5%.
Technology Transmission
Type Investment
costs
O&M costs
(p.a. in % of in-
vestment costs)
Losses (% of
rated power)
HVDC
3 GW,
800 kV (+-)
Converters (1
terminal) M€ 1.00% 0.70%
Overhead line . M€/km 1.00% 1.60%
Underground
cable . M€/km 0.10% 1.60%
Submarine cable M€/km 0.10% 1.60%
Table 4 Technical and economic input parameters for the 2050 scenario
21
3 RESULTS 2030 This chapter summarizes the technical and economic results of the analysis in the medi-
um term (2030) for each of the 3 corridors analyzed: the Western, the Central and the
Eastern Corridors.
3.1 Western corridorThe analysis conducted for the Western
corridor is focused on the power systems
of Portugal, Spain and France. Further-
more, flow exchanges with neighboring
countries have been included, covering
Morocco and Algeria in MENA and the
UK, Ireland, Belgium, Luxemburg, Switzer-
land, Italy and Germany in Europe.
Starting from the network as planned for
the year 2022, the network expansion
planning tool TEPES has determined the
HVDC and AC/DC converters reinforce-
ments leading to the lowest possible
costs for the 2030 horizon.
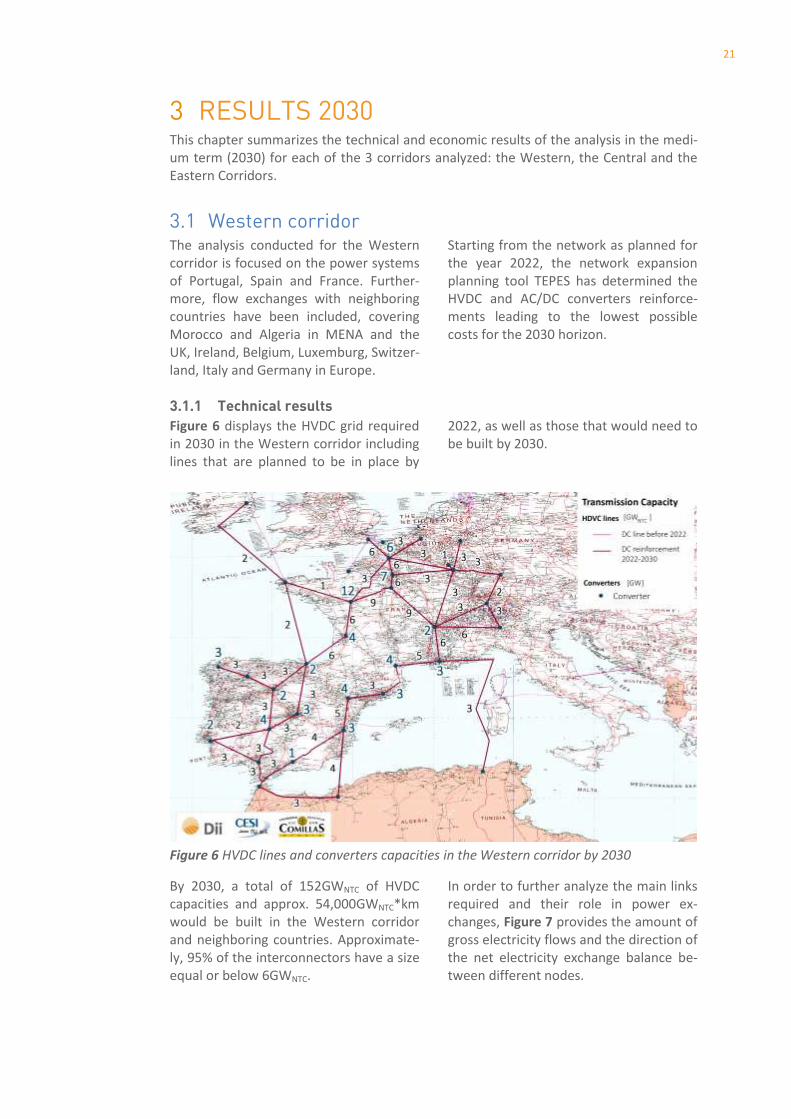
3.1.1 Technical results
Figure 6 displays the HVDC grid required
in 2030 in the Western corridor including
lines that are planned to be in place by
2022, as well as those that would need to
be built by 2030.
Figure 6 HVDC lines and converters capacities in the Western corridor by 2030
By 2030, a total of 152GWNTC of HVDC
capacities and approx. 54,000GWNTC*km
would be built in the Western corridor
and neighboring countries. Approximate-
ly, 95% of the interconnectors have a size
equal or below 6GWNTC.
In order to further analyze the main links
required and their role in power ex-
changes, Figure 7 provides the amount of
gross electricity flows and the direction of
the net electricity exchange balance be-
tween different nodes.

22 Desert Power: Getting Connected
Figure 7 Electricity exchanges between regional nodes in the Western corridor by 2030
The backbone of the grid will be consti-
tuted by important links, on one hand
between countries and on the other hand
among internal power systems nodes:
Among North Africa and Europe, four 3-
4GWNTC HVDC interconnections would be
built in order to exchange electricity be-
tween both shores of the Mediterranean.
While the 2 lines connecting Morocco
with the Iberian Peninsula would serve
mainly to export power northwards, the 2
remaining ones would be used to ex-
change power between Spain and France
on one side and Algeria on the other side.
The loop is closed with a 3GWNTC inter-
connection inside North Africa linking
Morocco to Algeria.
Between North Western and Central
Europe, 2 new submarine connections
would be necessary to import power
from the North characterized by good
wind conditions. A first 2GWNTC link
would connect Ireland to Spain through
France and serve to feed load in the
North of Spain and partially France. A
second 6GWNTC interconnection would
link the UK to France and supply directly
the Paris area.
Between Spain and France, electricity
would be exchanged via a new 6GWNTC
interconnection that would reinforce the
4GWNTC planned for the year 2022.
With Central European countries, France
would be linked directly or indirectly to
its eastern neighboring countries in order
to exchange electricity through several
connectors with capacities up to 6GWNTC.
Inside the Iberian peninsula, 3 highways
with capacities between 3 and 5GWNTC
transit the excess power coming mainly
from the Western and Southern areas
and feed the main internal load centers,
located especially in the North eastern
part of Spain. In total, approx.
8,200GWNTC*km of lines and 27GW of
converters would be built by 2030 in both
Spain and Portugal.
Within France, 2 large highways with
capacities reaching 9GWNTC would be
built in western and eastern sides of the
country participating in feeding large
loads mainly in the North through a
meshed network around Paris. Moreover,
the eastern interconnector is used to
transit electricity eastwards to Germany
via Switzerland. As a result, approx.

23
13,800GWNTC*km of HVDC lines and
41GW of converters would be needed.
For all country-to-country interconnec-
tions, capacities in the period 2022-2030
would need to be increased by 50% refer-
ring to those that would exist in 2022
passing from approx. 37GWNTC to
60GWNTC.
The lines built in the Western corridor
would be used with a rate slightly higher
than the current average utilization factor
of the Spanish grid, which is about 20-
25%. Higher utilization factors occur in
the interconnectors among countries,
including the interconnector between
Spain and France on the eastern side of
the border (64%) and the link between
France and the UK (46%).
3.1.2 Economic results
The costs of the HVDC grid expansion in
the Western corridor were calculated
based on the economic input parameters
presented in section 2.2.4.
Country/
interconnection
HVDC invest-
ments [M€]
Portugal 0 (150)
Spain 1,909 (1,875)
France 3,289 (3,075)
Portugal - Spain 438
Spain-France 1,314
Spain-Morocco 414
Spain-Algeria 1,134
Spain – Ireland 2,458
France – Algeria 4,230
France – Italy 910
France-Switzerland 303
France-Germany 364
France-Luxemburg 32
France-Belgium 127
France-UK 582
France-Ireland 878
Morocco-Algeria 308
Germany-
Switzerland
176
Italy-Switzerland 218
TOTAL HVDC 19,084 (5,100)
Table 5 Total costs of the HVDC overlay
grid in the Western corridor by 2030
(converters in brackets)
The results within different countries as
well as between interconnections are
shown in Table 5. It is worth mentioning
that for Portugal, only reinforcements in
interconnections are needed and hence
no internal line capacities are required.
Costs presented are in 2012 values.
Regarding the interconnectors among
countries, the most expensive are those
covering long submarine paths in order to
avoid high-depth waters in the Mediter-
ranean Sea. This applies to the intercon-
nectors France-Algeria, Spain-Ireland and
Spain-Algeria. Evidently, the challenging
submarine link Algeria-France could be
substituted by a connection across Spain,
but would increase the burden on build-
ing lines in Spain even more. The inter-
connector between France and Spain
requires high investments as well, due to
its capacity and to the need to be built as
a cable (submarine and underground).
The total investment costs of converters
in Portugal, Spain and France represent
20% of total investment costs and
a ou t to appro . €5.1bn.
In total, approx. €24.2bn of grid invest-
ments would be required in the period
2022-2030, representing approximately
the double of what was deemed to be
necessary in the decade before 2022
appro . € 1.3bn).
24 Desert Power: Getting Connected
3.2 Central corridorThe analysis of the Central corridor is
focused on its geographical backbone, i.e.
the Italian peninsula and the submarine
interconnections between Italy and North
Africa (Algeria, Tunisia and Libya). Fur-
thermore, required grid reinforcements
in the neighboring regions of Switzerland,
Austria, Southeast France and Southern
Germany as well as the above-mentioned
North African countries are identified.
Three alternatives of submarine inter-
connections between Italy and North
African countries were analyzed in detail.
The starting and ending points of the
interconnectors were identified in a way
that the HVDC overlay grid can interact
with the AC grid in the most efficient way,
i.e. they are located at already existing
strong AC nodes with high demand and
conventional generation capacities. How-
ever, different rationales for the three
options were applied to test the effects
of, e.g., a minimization of submarine or
land connections on the results.
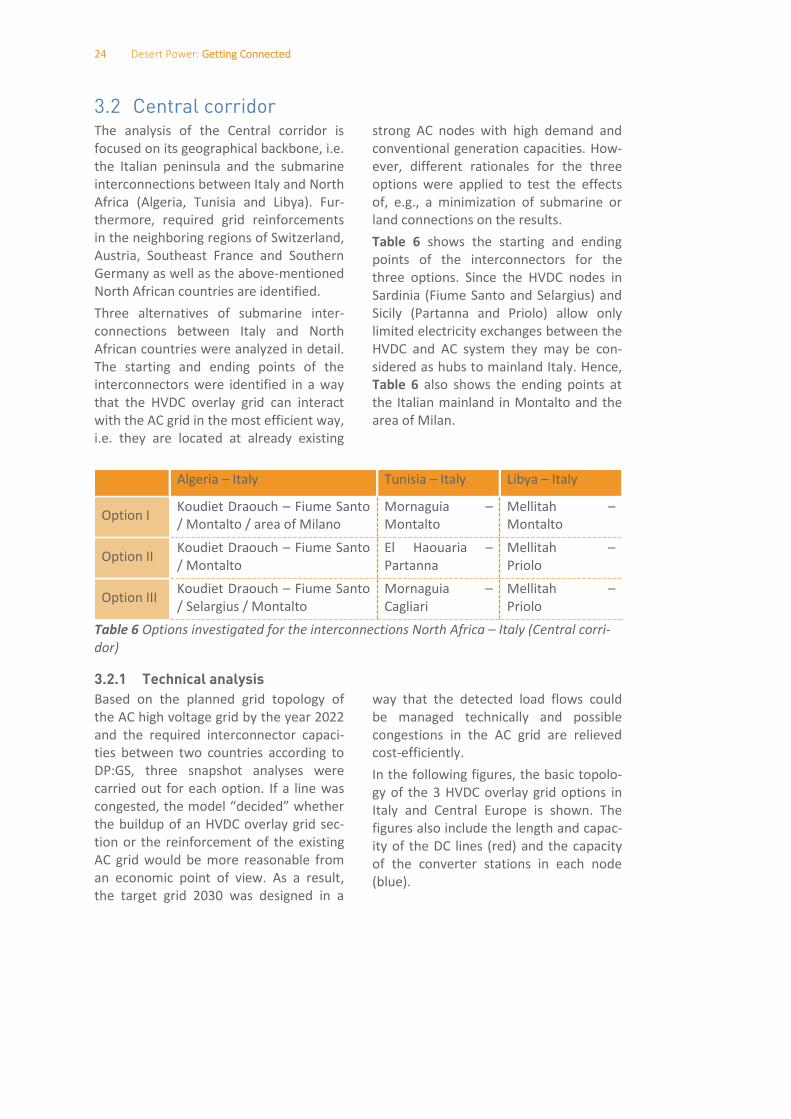
Table 6 shows the starting and ending
points of the interconnectors for the
three options. Since the HVDC nodes in
Sardinia (Fiume Santo and Selargius) and
Sicily (Partanna and Priolo) allow only
limited electricity exchanges between the
HVDC and AC system they may be con-
sidered as hubs to mainland Italy. Hence,
Table 6 also shows the ending points at
the Italian mainland in Montalto and the
area of Milan.
Algeria – Italy Tunisia – Italy Libya – Italy
Option I Koudiet Draouch – Fiume Santo
/ Montalto / area of Milano
Mornaguia –
Montalto
Mellitah –
Montalto
Option II Koudiet Draouch – Fiume Santo
/ Montalto
El Haouaria –
Partanna
Mellitah –
Priolo
Option III Koudiet Draouch – Fiume Santo
/ Selargius / Montalto
Mornaguia –
Cagliari
Mellitah –
Priolo
Table 6 Options investigated for the interconnections North Africa – Italy (Central corri-
dor)
3.2.1 Technical analysis
Based on the planned grid topology of
the AC high voltage grid by the year 2022
and the required interconnector capaci-
ties between two countries according to
DP:GS, three snapshot analyses were
carried out for each option. If a line was
congested, the odel de ided hether the buildup of an HVDC overlay grid sec-
tion or the reinforcement of the existing
AC grid would be more reasonable from
an economic point of view. As a result,
the target grid 2030 was designed in a
way that the detected load flows could
be managed technically and possible
congestions in the AC grid are relieved
cost-efficiently.
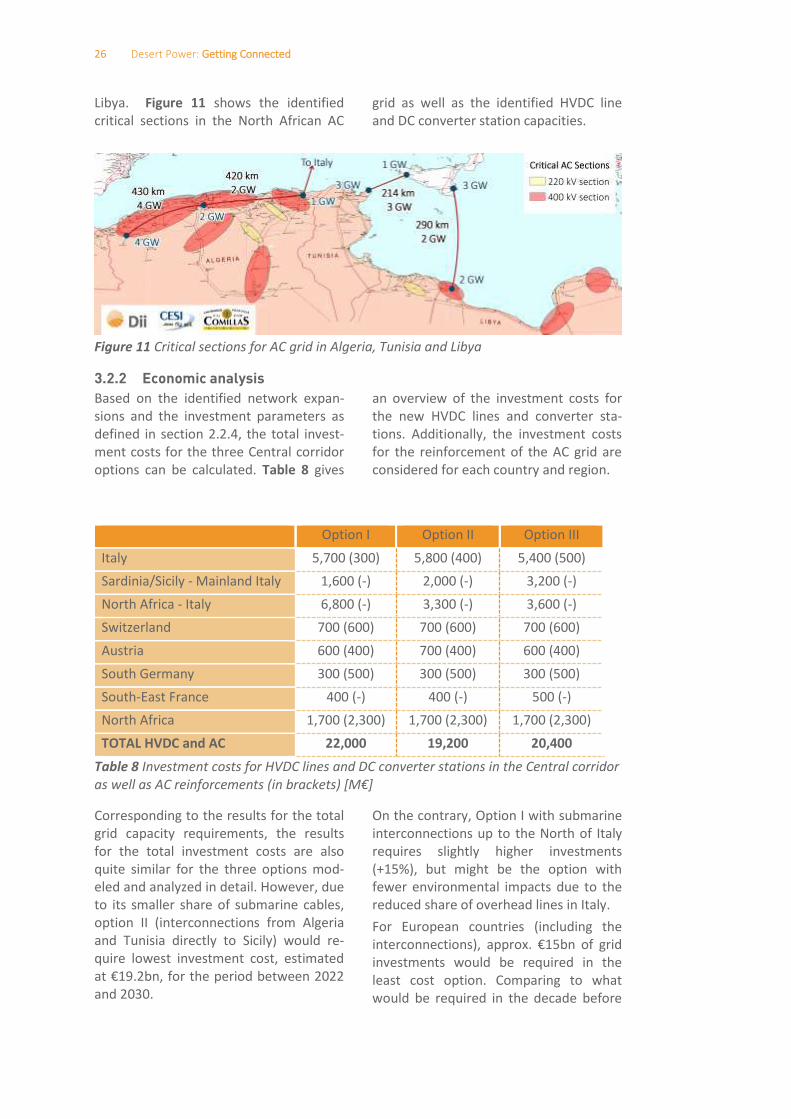
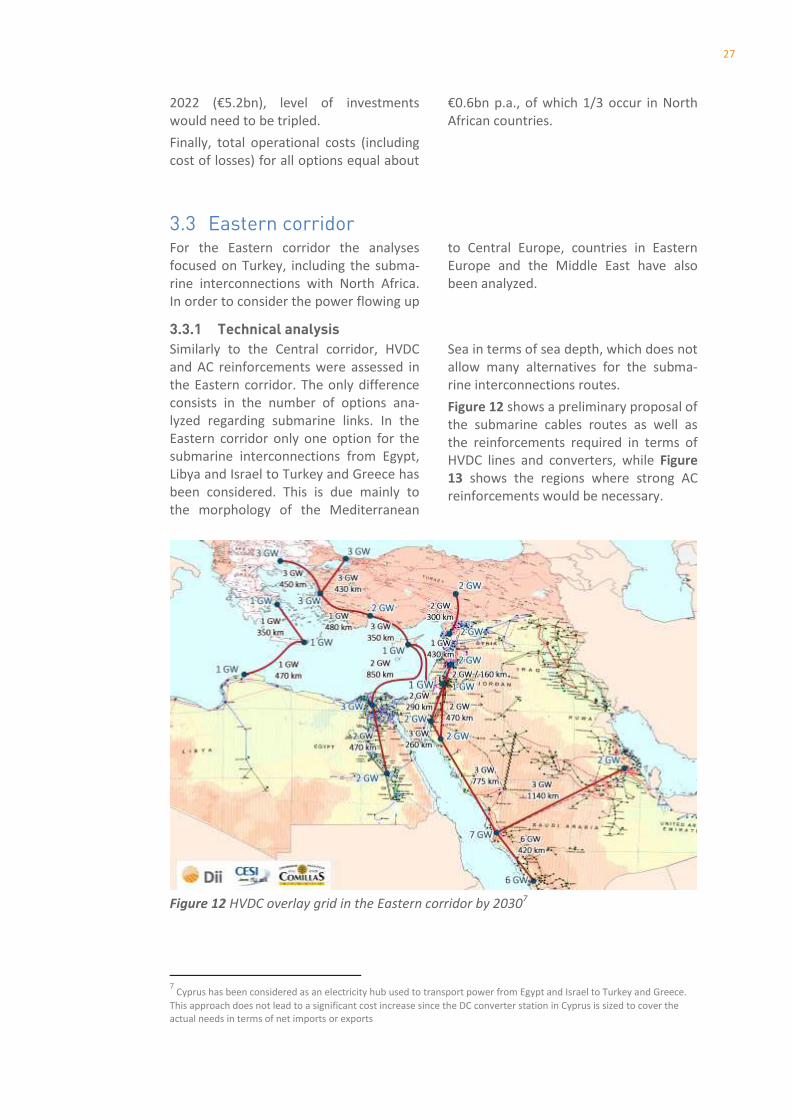
In the following figures, the basic topolo-
gy of the 3 HVDC overlay grid options in
Italy and Central Europe is shown. The
figures also include the length and capac-
ity of the DC lines (red) and the capacity
of the converter stations in each node
(blue).
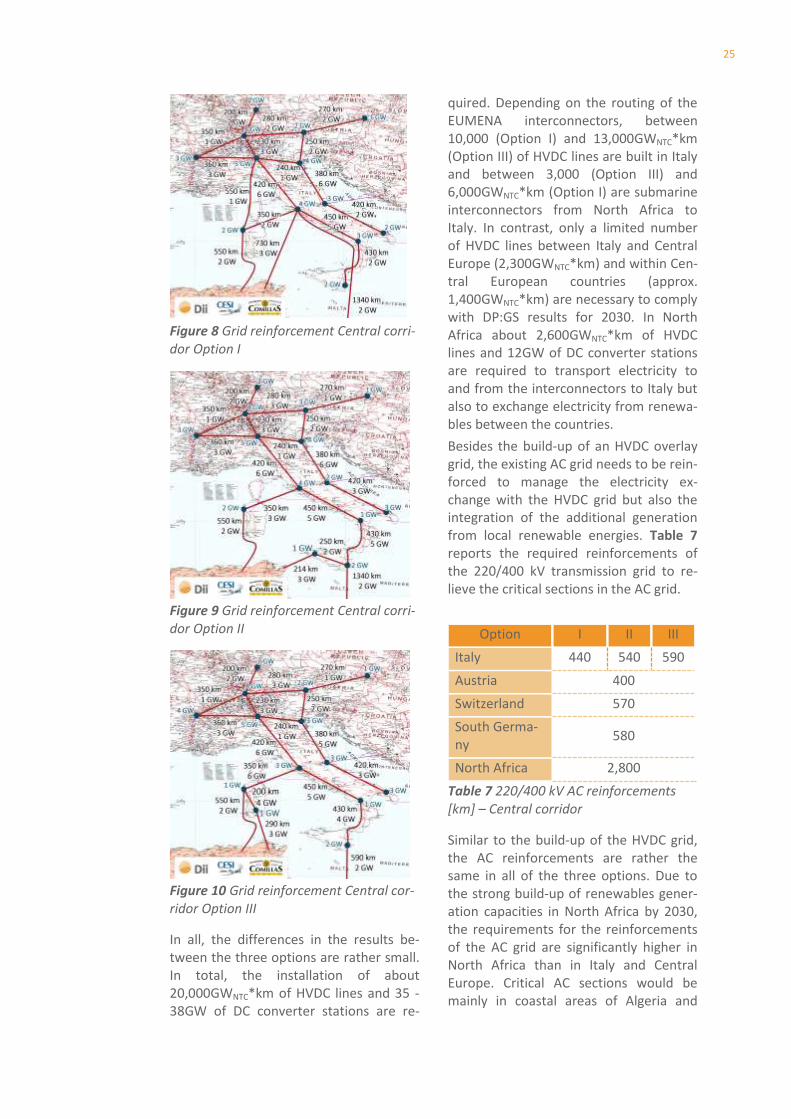
25
Figure 8 Grid reinforcement Central corri-
dor Option I
Figure 9 Grid reinforcement Central corri-
dor Option II
Figure 10 Grid reinforcement Central cor-
ridor Option III
In all, the differences in the results be-
tween the three options are rather small.
In total, the installation of about
20,000GWNTC*km of HVDC lines and 35 -
38GW of DC converter stations are re-
quired. Depending on the routing of the
EUMENA interconnectors, between
10,000 (Option I) and 13,000GWNTC*km
(Option III) of HVDC lines are built in Italy
and between 3,000 (Option III) and
6,000GWNTC*km (Option I) are submarine
interconnectors from North Africa to
Italy. In contrast, only a limited number
of HVDC lines between Italy and Central
Europe (2,300GWNTC*km) and within Cen-
tral European countries (approx.
1,400GWNTC*km) are necessary to comply
with DP:GS results for 2030. In North
Africa about 2,600GWNTC*km of HVDC
lines and 12GW of DC converter stations
are required to transport electricity to
and from the interconnectors to Italy but
also to exchange electricity from renewa-
bles between the countries.
Besides the build-up of an HVDC overlay
grid, the existing AC grid needs to be rein-
forced to manage the electricity ex-
change with the HVDC grid but also the
integration of the additional generation
from local renewable energies. Table 7
reports the required reinforcements of
the 220/400 kV transmission grid to re-
lieve the critical sections in the AC grid.
Option I II III
Italy 440 540 590
Austria 400
Switzerland 570
South Germa-
ny 580
North Africa 2,800
Table 7 220/400 kV AC reinforcements
[km] – Central corridor
Similar to the build-up of the HVDC grid,
the AC reinforcements are rather the
same in all of the three options. Due to
the strong build-up of renewables gener-
ation capacities in North Africa by 2030,
the requirements for the reinforcements
of the AC grid are significantly higher in
North Africa than in Italy and Central
Europe. Critical AC sections would be
mainly in coastal areas of Algeria and
26 Desert Power: Getting Connected
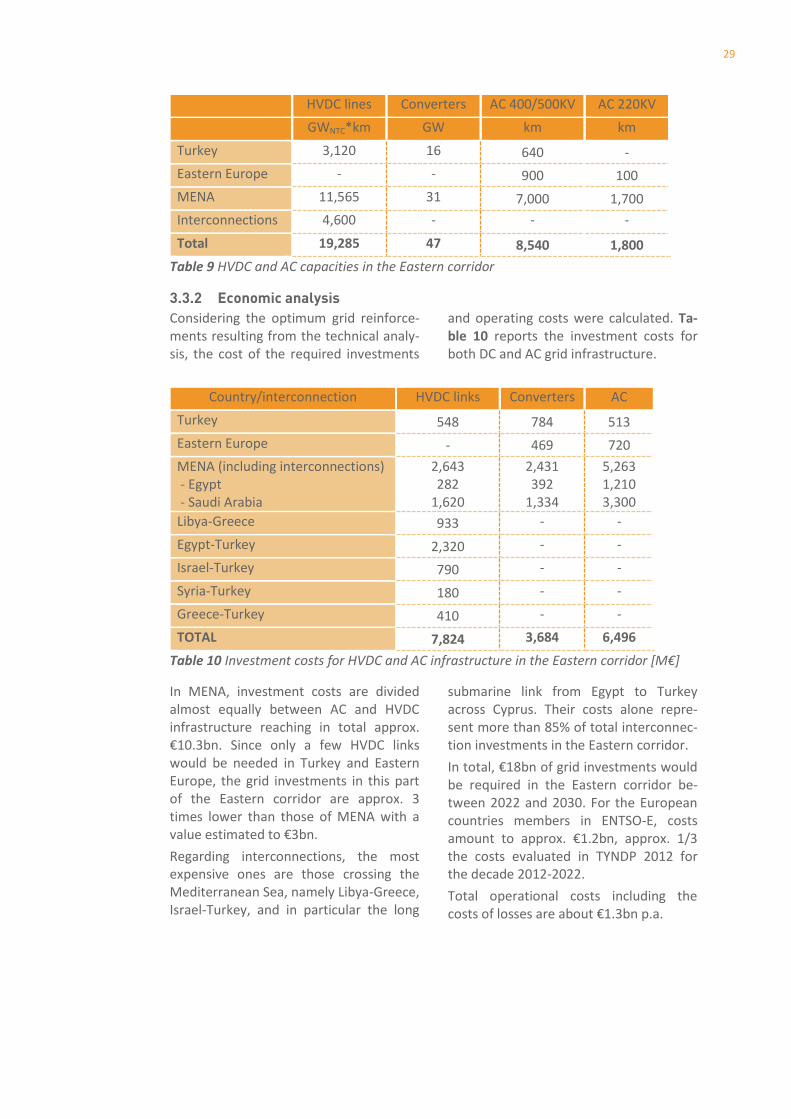
Libya. Figure 11 shows the identified
critical sections in the North African AC
grid as well as the identified HVDC line
and DC converter station capacities.
Figure 11 Critical sections for AC grid in Algeria, Tunisia and Libya
3.2.2 Economic analysis
Based on the identified network expan-
sions and the investment parameters as
defined in section 2.2.4, the total invest-
ment costs for the three Central corridor
options can be calculated. Table 8 gives
an overview of the investment costs for
the new HVDC lines and converter sta-
tions. Additionally, the investment costs
for the reinforcement of the AC grid are
considered for each country and region.
Option I Option II Option III
Italy 5,700 (300) 5,800 (400) 5,400 (500)
Sardinia/Sicily - Mainland Italy 1,600 (-) 2,000 (-) 3,200 (-)
North Africa - Italy 6,800 (-) 3,300 (-) 3,600 (-)
Switzerland 700 (600) 700 (600) 700 (600)
Austria 600 (400) 700 (400) 600 (400)
South Germany 300 (500) 300 (500) 300 (500)
South-East France 400 (-) 400 (-) 500 (-)
North Africa 1,700 (2,300) 1,700 (2,300) 1,700 (2,300)
TOTAL HVDC and AC 22,000 19,200 20,400
Table 8 Investment costs for HVDC lines and DC converter stations in the Central corridor
as well as AC rei for e e ts i ra kets [M€]
Corresponding to the results for the total
grid capacity requirements, the results
for the total investment costs are also
quite similar for the three options mod-
eled and analyzed in detail. However, due
to its smaller share of submarine cables,
option II (interconnections from Algeria
and Tunisia directly to Sicily) would re-
quire lowest investment cost, estimated
at € . , for the period et ee and 2030.
On the contrary, Option I with submarine
interconnections up to the North of Italy
requires slightly higher investments
(+15%), but might be the option with
fewer environmental impacts due to the
reduced share of overhead lines in Italy.
For European countries (including the
interconnections), appro . € of grid investments would be required in the
least cost option. Comparing to what
would be required in the decade before
27
€ . , le el of i est e ts would need to be tripled.
Finally, total operational costs (including
cost of losses) for all options equal about
€ . p.a., of hi h / occur in North
African countries.
3.3 Eastern corridor For the Eastern corridor the analyses
focused on Turkey, including the subma-
rine interconnections with North Africa.
In order to consider the power flowing up
to Central Europe, countries in Eastern
Europe and the Middle East have also
been analyzed.
3.3.1 Technical analysis
Similarly to the Central corridor, HVDC
and AC reinforcements were assessed in
the Eastern corridor. The only difference
consists in the number of options ana-
lyzed regarding submarine links. In the
Eastern corridor only one option for the
submarine interconnections from Egypt,
Libya and Israel to Turkey and Greece has
been considered. This is due mainly to
the morphology of the Mediterranean
Sea in terms of sea depth, which does not
allow many alternatives for the subma-
rine interconnections routes.
Figure 12 shows a preliminary proposal of
the submarine cables routes as well as
the reinforcements required in terms of
HVDC lines and converters, while Figure
13 shows the regions where strong AC
reinforcements would be necessary.
Figure 12 HVDC overlay grid in the Eastern corridor by 20307
7 Cyprus has been considered as an electricity hub used to transport power from Egypt and Israel to Turkey and Greece.
This approach does not lead to a significant cost increase since the DC converter station in Cyprus is sized to cover the
actual needs in terms of net imports or exports

28 Desert Power: Getting Connected
Figure 13 AC reinforcements in the Eastern corridor by 2030
In terms of MENA-Europe interconnec-
tions, 1 to 3GWNTC HVDC lines would link
the North and South shores of the Medi-
terranean on routes from Libya to
Greece, Egypt to Western Turkey and
Saudi/Egypt across Jordan and Syria to
Central Turkey.
For the submarine links, 4,000GWNTC*km
cables would be built with the aim of
minimizing sea depths to be crossed.
Nevertheless, the assumed submarine
link between Libya (Benghazi) and Greece
across Crete would reach sea depths of
up to 2,600m, while the maximum sea
depth of the line from Egypt to Turkey
through Cyprus is approximately 2,100m.
The capacity of on-land lines amounts to
600GWNTC*km linking Syria with Turkey.
Inside MENA countries, where electricity
needs to be transported over long dis-
tances to load centers, high transmission
capacities would be required, especially
in Egypt and Saudi Arabia. Reinforce-
ments would be necessary in both AC and
DC technologies. For the HVDC intercon-
nectors, a total amount of
11,500GWNTC*km line capacities and
31GW of converters would be needed.
Concerning AC reinforcements, 7000km
of 400/500kV lines and 1700km of 220kV
lines would be necessary. Most critical AC
sections would be in Egypt (Cairo urban
area and area of Nag Hammadi) and Sau-
di Arabia. Here, main load centers are in
the East of the countries, while most at-
tractive solar and wind resources are in
the South West along the Red Sea. Con-
sequently, HVDC lines are built to con-
nect the two parts of the country, as well
as to transmit power northbound along
the Red Sea coast, while extensive AC
reinforcements are needed in the areas
of main generation as well as load cen-
ters (areas of Shuqayq and Shedgum).
Inside Europe, capacities needed are less
important compared to the MENA region.
In fact, for the HVDC grid, approx.
3,100GWNTC*km of HVDC lines associated
with 16GW converter capacities would be
built. AC bottlenecks would occur in Tur-
key (Area of Alibeykoy) and across East-
ern European Countries. The critical AC
sections would be covered mostly by
approx. 1,500 Km of 400kV lines.
Table 9 summarizes the technical findings
for the Eastern corridor.
29
HVDC lines Converters AC 400/500KV AC 220KV
GWNTC*km GW km km
Turkey 3,120 16 640 -
Eastern Europe - - 900 100
MENA 11,565 31 7,000 1,700
Interconnections 4,600 - - -
Total 19,285 47 8,540 1,800
Table 9 HVDC and AC capacities in the Eastern corridor
3.3.2 Economic analysis
Considering the optimum grid reinforce-
ments resulting from the technical analy-
sis, the cost of the required investments
and operating costs were calculated. Ta-
ble 10 reports the investment costs for
both DC and AC grid infrastructure.
Country/interconnection HVDC links Converters AC
Turkey 548 784 513
Eastern Europe - 469 720
MENA (including interconnections)
- Egypt
- Saudi Arabia
2,643
282
1,620
2,431
392
1,334
5,263
1,210
3,300
Libya-Greece 933 - -
Egypt-Turkey 2,320 - -
Israel-Turkey 790 - -
Syria-Turkey 180 - -
Greece-Turkey 410 - -
TOTAL 7,824 3,684 6,496
Table 10 Investment costs for HVDC and AC infrastructure in the Eastern orridor [M€]
In MENA, investment costs are divided
almost equally between AC and HVDC
infrastructure reaching in total approx.
€ .3bn. Since only a few HVDC links
would be needed in Turkey and Eastern
Europe, the grid investments in this part
of the Eastern corridor are approx. 3
times lower than those of MENA with a
alue esti ated to € . Regarding interconnections, the most
expensive ones are those crossing the
Mediterranean Sea, namely Libya-Greece,
Israel-Turkey, and in particular the long
submarine link from Egypt to Turkey
across Cyprus. Their costs alone repre-
sent more than 85% of total interconnec-
tion investments in the Eastern corridor.
I total, € of grid i est e ts ould be required in the Eastern corridor be-
tween 2022 and 2030. For the European
countries members in ENTSO-E, costs
a ou t to appro . € . , approx. 1/3
the costs evaluated in TYNDP 2012 for
the decade 2012-2022.
Total operational costs including the
osts of losses are a out € . p.a.

30 Desert Power: Getting Connected
4 RESULTS 2050This chapter provides the results of the EUMENA HVDC grid development in the 2050
time horizon in terms of network reinforcements and required expenditures.
4.1 Technical resultsFigure 14 and Figure 15 show the capaci-
ties and the power flows of the EUMENA
overlay grid by 2050.
Large cross-border power interfaces
connect countries on the South shore of
the Mediterranean to their counterpar-
ties on the North side in order to route
power to demand areas in Central Eu-
rope. Besides that, South to South high-
ways connect Morocco to Algeria, Libya
to Egypt, and Jordan to Syria. Regarding
the transfers of power from Northern
Europe to Central and Eastern Europe,
main links are those connecting Norway
and Denmark with Germany, and Poland
with Germany.
Within countries, large corridors would
be built, either to import, export and
transit electricity, or to transport energy
from generation sites to load centers in
the countries. The latter is for example
the case of the line linking the West and
East of Saudi Arabia (approx. 66GW), in
order to transport renewable energies
(RE) produced in the West to consump-
tion areas in the East. The corridor be-
tween South Egypt and North Egypt (ap-
prox. 45GW) is used to transport RE pro-
duced in the South to the North, from
where power flows into Italy, South-
Eastern Europe, and the Middle East.
Similarly, large lines would link East and
West Libya, central and North Italy, South
and North France, and North and West
Germany.
Figure 14 Line capacities of the EUMENA overlay grid by 2050
31
Figure 15 Net power flows in the EUMENA overlay grid by 2050
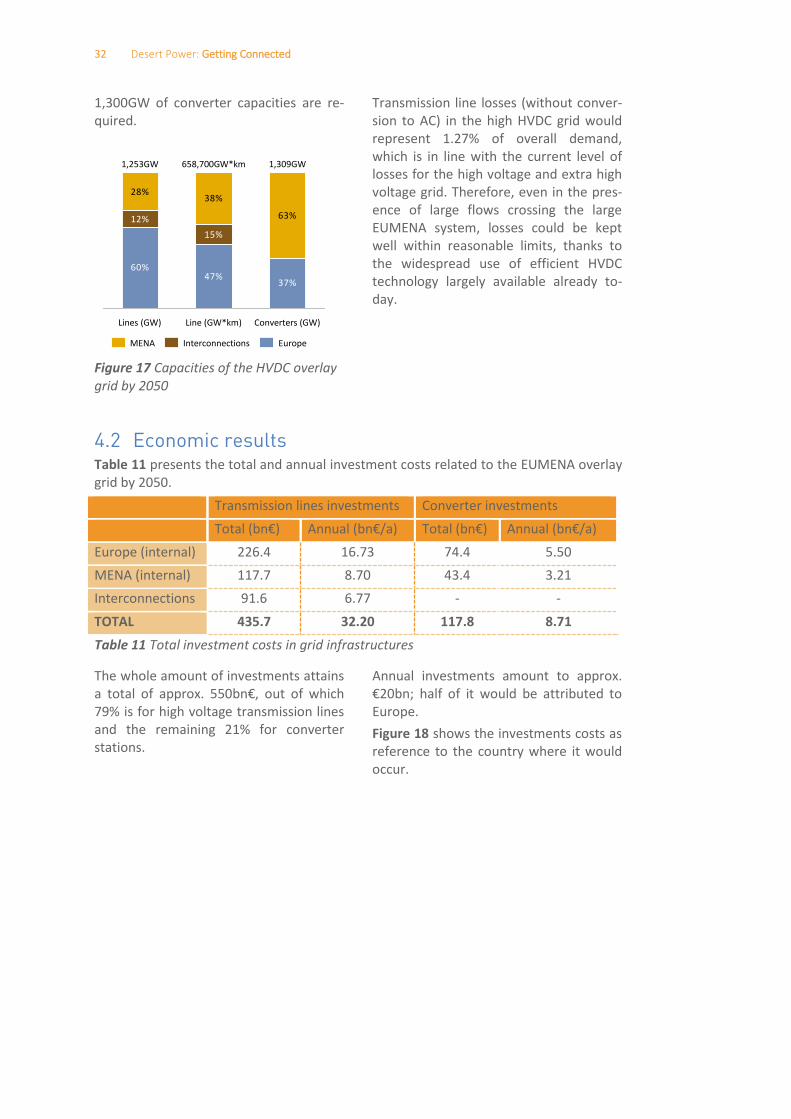
Figure 16 shows the capacities of internal
lines and interconnections for several
EUMENA countries. Taking the system as
a whole, reinforcement capacities are
divided almost equally between inter-
connections and internal transmission
lines with 628GW for the latter and
625GW for the former.
Figure 16 Capacities of internal lines and interconnection in countries by 2050 [GW]
As shown in Figure 17, a build-up of ap-
prox. 659,000GW*km of new capacity is
needed by 2050. Around 47% of the new
grid will be allocated in Europe and 38%
in MENA. The part of interconnections
does ’t e eed %. To ensure the link between the HVDC
overlay grid and the AC network, approx.
41 43
73
45
20
4832 30
23 26
65
37
19
75
29
74
2043
71
76
65
35
67
58
3842
48
14
34
59
22
40
55
39
8
26
Un
ite
d K
ing
do
m
Tu
rke
y
Syri
a
Sw
ed
en
Sp
ain
Sa
ud
i A
rab
ia
Ro
ma
nia
5
Po
lan
d
No
rwa
y
Gre
ece
Ge
rma
ny
Fra
nce
Fin
lan
d
Mo
rocc
o
Lib
ya
Ita
ly
Eg
yp
t
Ba
lka
ns
1
Au
stri
a
6
Alg
eri
a
Internal lines
Interconnections
32 Desert Power: Getting Connected
1,300GW of converter capacities are re-
quired.
Figure 17 Capacities of the HVDC overlay
grid by 2050
Transmission line losses (without conver-
sion to AC) in the high HVDC grid would
represent 1.27% of overall demand,
which is in line with the current level of
losses for the high voltage and extra high
voltage grid. Therefore, even in the pres-
ence of large flows crossing the large
EUMENA system, losses could be kept
well within reasonable limits, thanks to
the widespread use of efficient HVDC
technology largely available already to-
day.
4.2 Economic resultsTable 11 presents the total and annual investment costs related to the EUMENA overlay
grid by 2050.
Transmission lines investments Converter investments
Total € A ual €/a Total € A ual €/a
Europe (internal) 226.4 16.73 74.4 5.50
MENA (internal) 117.7 8.70 43.4 3.21
Interconnections 91.6 6.77 - -
TOTAL 435.7 32.20 117.8 8.71
Table 11 Total investment costs in grid infrastructures
The whole amount of investments attains
a total of approx. 550 €, out of hi h 79% is for high voltage transmission lines
and the remaining 21% for converter
stations.
Annual investments amount to approx.
€ ; half of it would be attributed to
Europe.
Figure 18 shows the investments costs as
reference to the country where it would
occur.
60%47%
37%
12%
15%
28%38%
63%
Lines (GW)
1,253GW 658,700GW*km
Line (GW*km) Converters (GW)
1,309GW
Interconnections EuropeMENA

33
Figure 18 Grid investment costs by country up to the year 2050
For transmission lines, large investment
costs would occur in those systems where
corridors need to be built to host a signif-
icant increase with respect to current
levels. This could occur in countries
where it is necessary to transfer power
internally over long distances either to
feed main load centers (e.g. Saudi Ara-
bia), or to export/transit electricity (e.g.
Italy Algeria and Norway).
Regarding converters, larger investment
costs take place mainly in countries fea-
turing large consumption or generation
centers. If both large consumption and
generation centers exist within a country,
investments are larger when power pro-
duction and consumption do not take
place in the same area. This is the case of
countries like Germany, France, the UK,
Egypt, Saudi Arabia, and Turkey. The re-
sults clearly show that investment needs
are far from being evenly distributed
among countries. In particular for the
case of transit countries, investments will
only take place, when a fair distribution
of costs among countries according to the
benefits associated with new lines will
take place. This will be one element of
regulatory reform, which we address in
the concluding chapter.

34 Desert Power: Getting Connected
5 CONCLUSION AND RECOMMENDATIONSWith Desert Power: Getting Connected,
Dii provides a detailed view of the trans-
mission infrastructure that could facilitate
the development of an integrated EU-
MENA power market. Based on sophisti-
cated grid models, not only technical and
economical parameters were calculated
but also a first set of possible routes were
identified. Thus, the results of this report
can be considered as a pre-feasibility
stage in the process of the required anal-
ysis of electricity highways between the
MENA region and Europe. Generally, this
eed for a tio does not only address
technical and financing aspects but also
social issues since the acceptance by the
local population and governments is cru-
cial for the success of any transmission
infrastructure project.
Put briefly, investment needs for trans-
mission infrastructure of an integrated
EUMENA power system – a out € a d € – might be con-
sidered to be notably high. However,
these costs are put into perspective if one
takes into account that they represent
only about 10 % of the total required
investment needs in the power sector.
Within both time periods, about 40% of
total grid investments are dedicated for
interconnections between countries.
About half of these, 20 % of the total grid
investment, occurs for interconnectors
between MENA and European countries.
The remaining 50 to 60% of grid invest-
ments are dedicated to projects within
countries. This means that new transmis-
sion grid capacities are not only required
for the long-distance exchange of elec-
tricity across countries, but also for the
connection of local renewables resources
to national high voltage grids. Especially
in large MENA countries, where the most
promising sites for wind and solar are
remote from load centers (e.g. Saudi Ara-
bia, Algeria and Egypt), significant in-
vestments in the local transmission grid
would be required to tap this renewable
sites.
According to ENTSO-E’s TYNDP2012, Eu-
ropean TSOs plan investments for the
transmission grid in Europe as a whole of
€ et ee a d . Invest-
ment in the regions considered for Dii
analysis for the Western, Central and
Easter orridors are i the ra ge of € -
10bn. Comparing these investment plans
with the investment of roughl € for each of the three corridors calculated in
our analysis for the decade 2020-2030,
we can conclude that in most countries
TSOs would increase their already ambi-
tious level of investment, doubling (in the
Western corridor) or even tripling (in the
central corridor) the current level of in-
vestment.
Of course, the results of this modeling
analysis only show one option for strong-
ly reinforcing and interconnecting the
power grids across Europe and the MENA
region through a high voltage overlay
grid. While reality as implemented by the
TSOs will certainly look different, the
analysis provides a better understanding
of the extent of the challenge and of the
main countries and regions affected. It is,
on the one hand, intended to serve as a
basis to further detail the concrete ne-
cessity, technical feasibility and economic
viability of the variety of potential pro-
jects; on the other hand, it underlines the
need for substantial progress and inter-
national coordination in planning, con-
structing, financing, and operating a fu-
ture po er grid. Fro Dii’s perspe ti e, this would entail the following short-,
medium- and long-term measures.
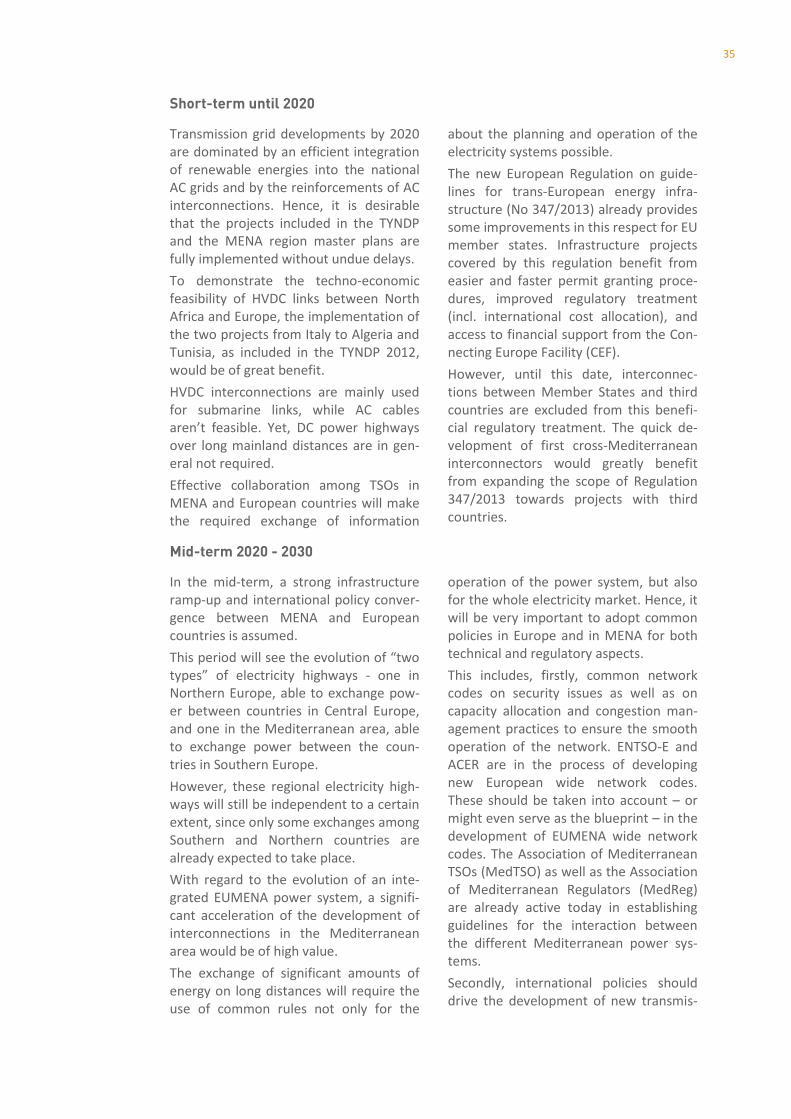
35
Short-term until 2020
Transmission grid developments by 2020
are dominated by an efficient integration
of renewable energies into the national
AC grids and by the reinforcements of AC
interconnections. Hence, it is desirable
that the projects included in the TYNDP
and the MENA region master plans are
fully implemented without undue delays.
To demonstrate the techno-economic
feasibility of HVDC links between North
Africa and Europe, the implementation of
the two projects from Italy to Algeria and
Tunisia, as included in the TYNDP 2012,
would be of great benefit.
HVDC interconnections are mainly used
for submarine links, while AC cables
are ’t feasi le. Yet, DC power highways
over long mainland distances are in gen-
eral not required.
Effective collaboration among TSOs in
MENA and European countries will make
the required exchange of information
about the planning and operation of the
electricity systems possible.
The new European Regulation on guide-
lines for trans-European energy infra-
structure (No 347/2013) already provides
some improvements in this respect for EU
member states. Infrastructure projects
covered by this regulation benefit from
easier and faster permit granting proce-
dures, improved regulatory treatment
(incl. international cost allocation), and
access to financial support from the Con-
necting Europe Facility (CEF).
However, until this date, interconnec-
tions between Member States and third
countries are excluded from this benefi-
cial regulatory treatment. The quick de-
velopment of first cross-Mediterranean
interconnectors would greatly benefit
from expanding the scope of Regulation
347/2013 towards projects with third
countries.
Mid-term 2020 - 2030
In the mid-term, a strong infrastructure
ramp-up and international policy conver-
gence between MENA and European
countries is assumed.
This period will see the evolution of t o t pes of electricity highways - one in
Northern Europe, able to exchange pow-
er between countries in Central Europe,
and one in the Mediterranean area, able
to exchange power between the coun-
tries in Southern Europe.
However, these regional electricity high-
ways will still be independent to a certain
extent, since only some exchanges among
Southern and Northern countries are
already expected to take place.
With regard to the evolution of an inte-
grated EUMENA power system, a signifi-
cant acceleration of the development of
interconnections in the Mediterranean
area would be of high value.
The exchange of significant amounts of
energy on long distances will require the
use of common rules not only for the
operation of the power system, but also
for the whole electricity market. Hence, it
will be very important to adopt common
policies in Europe and in MENA for both
technical and regulatory aspects.
This includes, firstly, common network
codes on security issues as well as on
capacity allocation and congestion man-
agement practices to ensure the smooth
operation of the network. ENTSO-E and
ACER are in the process of developing
new European wide network codes.
These should be taken into account – or
might even serve as the blueprint – in the
development of EUMENA wide network
codes. The Association of Mediterranean
TSOs (MedTSO) as well as the Association
of Mediterranean Regulators (MedReg)
are already active today in establishing
guidelines for the interaction between
the different Mediterranean power sys-
tems.
Secondly, international policies should
drive the development of new transmis-
36 Desert Power: Getting Connected
sion infrastructure. A first starting point
in this direction on the European side is
the Regulation on guidelines for trans-
European energy infrastructure providing
favorable regulation and financing to
Projects of Common Interest. This regula-
tion should be expanded to all infrastruc-
ture projects between MENA and Europe.
In addition, common regional guidelines
for transmission planning and investment
cost allocation should be adopted. The
European Union has made considerable
progress in this respect over the last
years. Since 2009, ENTSO-E is in charge of
conducting the bi-annual 10 year network
development plan for all EU Member
States. Regulation 347/2013, in addition,
foresees cost-benefit assessment for all
Projects of Common Interest, which could
serve as the basis for EU-wide cost- allo-
cation schemes.
It is recommended that the countries in
the MENA region also start to establish
procedures for regional planning and cost
allocation. This could be pursued by
providing a corresponding mandate to
MedTSO or another competent authority.
In a first step, national regulators and
ministries should ensure that their na-
tional transmission plans are in line with
this regional transmission plan. In a sec-
ond step, this regional plan, e.g., for the
Southern Mediterranean, could be made
binding. A regional institution with strong
powers and region-wide authority would
support this. In addition, the interaction
between ENTSO-E’s TYNDP a d a poten-
tial Mediterranean investment plan
would need to be clarified.
Finally, it is important that planning also
takes place at an EUMENA-wide level in
order to promote the development of
cross-Mediterranean interconnections. A
first step would be for ENTSO-E to take
into account grid developments and RE
potentials in the neighboring Mediterra-
nean countries when setting up its
TYNDP. To this end, a separate regional
group within ENTSO-E could be estab-
lished and tasked with network planning
and capacity building in the Southern
Mediterranean. This would also force
European TSOs to account for RE poten-
tials and grid developments in the South-
ern Mediterranean and can lead the way
to a more institutionalized and rules-
based approach towards international
transmission projects. This does not imply
that a European institution should con-
duct network planning in the MENA re-
gion, but rather that European TSOs
should account for developments in
MENA in their own transmission plans. In
order to make regional planning an effec-
tive tool, not only a regional body in
charge of planning, but also a regional
body with competencies for regulatory
oversight is needed.
Long-term 2030 - 2050
By 2050 electricity systems in Europe and
MENA would – to a large extent – be fully
integrated. Strong HVDC electricity high-
ways will serve as an overlay grid to the
AC grids to exchange significant quanti-
ties of electricity between the countries
and regions.
The build-up of a strong backbone for the
EUMENA markets will be the objective of
the evolution of the transmission grid in
the long-run.
In order to achieve a fully integrated
power system, common EUMENA trans-
mission policies are required with respect
to the development of operation of the
infrastructure.
This should entail the gradual establish-
ment of regional institutions governing
the development and operation of an
EUMENA-wide transmission grid. These
institutions would need to set up binding
region-wide investment plans and net-
work codes. In addition, regional regula-
tors would oversee the planning process,
the enforcement of cost-allocation pro-
cedures, and network codes.

37
It is time to act now
When we look decades ahead in the fu-
ture of the energy sector of a region as
large, diverse, dynamic and contradicting
as Europe, the Middle East and North
Africa, many uncertainties regarding eco-
nomic, political, technical and societal
development prevail. How will population
growth, economic activities and power
demand develop? Will political commit-
ments for international climate policies
happen? Will power markets be coher-
ently regulated to allow for fair competi-
tion among market participants and a
level playing field among generation
technologies? What will be the role of
decentralized generation facilities? Will
societies be ready to cooperate and ac-
cept the construction of transmission
infrastructure as a means to do so? What
interactions will take place across the
energy sector, e.g. between the power
and gas sector?
What remains unquestioned, however,
are the evidently great benefits of con-
necting power systems across large geo-
graphical regions with different solar and
wind regimes, time zones and demand
patterns. Engaging in a serious debate on
how an interconnected transmission grid
for Europe and the MENA region could
look like and develop is therefore more
than worthwhile in any case. Dii looks
forward to continue contributing to this
discussion with policy makers, regulators,
transmission system operators and all
interested stakeholders.
38 Desert Power: Getting Connected
6 ABBREVIATIONS
€ Euro
€ Billion Euro
€M Million Euro
AC Alternating Current
CSP Concentrating Solar Power
Dii Dii GmbH
DP:GC Desert Power : Getting
Connected
DP:GS Desert Power : Getting
Started
DP2050 Desert Power 2050
ENTSO-E
European Network of
Transmission System Op-
erators for Electricity
EU European Union
EUMENA European Union, Middle
East – North Africa region
FOSG Friends of the Supergrid
GW Gigawatt
HVDC High Voltage Direct Cur-
rent
IIT Comillas
Institute for Research in
Technology at Universidad
Pontificia Comillas
MENA Middle East – North Africa
NTC Net Transfer Capacity
PCI Projects of Common Inter-
est
PV Photovoltaic
RES Renewable Energy Source
TSO Transmission System Op-
erator
TWh Terawatt hour
TYNDP Ten-Year Network Devel-
opment Plan
VSC Voltage Source Converter

39
Acknowledgements (in alphabetical order)
Authors Philipp Godron, Jürgen Neubarth, Maher Soyah
Scientific co-authors Vincenzo Asceri, Gabriele Callegari, Bruno Cova (CESI S.p.A)
Fernando Bañez, Luis Olmos, Andrés Ramos, Michel Rivier
(IIT Comillas)
Contributors Katrin Muhme, Dominik Ruderer, Ahmad Yousef
Dii Management, Shareholders and Associated Partners
(ABB, Red Eléctrica de España, RWE AG, Terna S.p.A)
Corresponding authors Authors can be contacted at [email protected]
Legal Advice Published by Dii GmbH
Kaiserstr. 14
80801 Munich, Germany
Phone: +49. 89. 340 77 05-00
Fax: +49. 89. 340 77 05-11
E-Mail: [email protected]
www.dii-eumena.com
Credits Maps from ENTSO-E and AUE are used as basemaps
First Edition June 2014
Disclaimer: Dii GmbH is a limited liability company (GmbH) under German law, registered at the
local court of Munich, Germany under number HRB 183595. This publication does not
necessarily cover every aspect of the topics with which it deals. It is not designed to pro-
vide any advice and is for general information only.
© Dii GmbH 2014

Dii Network
ItalgenItalcementi Group