demand analysis and optimization of renewable energy
TRANSCRIPT

Demand Analysis and Optimization of Renewable Energy
Sustainable Rural Electrification of Mbanayili, Ghana
By:
Peter N. Bailey
Oracha Chotimongkol
Shinji Isono
A project submitted in partial fulfillment of requirements
for the degree of Master of Science
(Natural Resources and Environment)
April 17, 2007
Faculty Advisors:
Associate Professor Gregory Keoleian
Associate Professor Michael Moore


i
Abstract: Nearly ninety percent of people in rural northern Ghana are without electricity. Many off-grid projects undertaken by the Ghanaian Government to provide electricity to this region have been largely unsuccessful due to the fiscal burdens that prevent the coverage of operational and maintenance costs. This case study project proposes a sustainable electrification system and implementation plan for Mbanayili, a village in northern Ghana. The term "sustainable" is used in reference to two factors: 1) the fiscal sustainability of the villagers to maintain and pay for electrification, accomplished by using a manageable and affordable power generation system and 2) environmental sustainability, through the use of renewable energy. In order to minimize costs, partial electrification was proposed: electrifying a multifunctional community center as opposed to each individual residence. An on-site needs assessment was conducted in the summer of 2006 and questionnaire responses from 133 villagers was used to determine preferences for electric appliances and related activities (e.g., education and entertainment) as well as villagers’ willingness-to-pay for electricity. After the data were analyzed, a power consumption load curve for the community center was derived. The National Renewable Energy Laboratory’s Hybrid Optimization Model for Electric Renewables (HOMER) software was then used to design the optimal power generation system. A hybrid energy system, consisting of both photovoltaic (PV) arrays and a generator, was determined as the optimal configuration (benchmark model) to meet villagers’ ideal load curve. The feasibility of supplementing a fraction of fuel usage with a locally produced biofuel (Jatropha) was also investigated. Using demand side management (DSM), an alternative system was designed to meet financial sustainability requirements. This system consists of only PV arrays. Lastly, a multi-stage implementation plan was proposed (using DSM and a revenue generation scheme) to expand electricity generation capacity over time.

ii
Acknowledgments:
Without the support of many individuals, this project could not have come to fruition. First and
foremost, we extend our deepest gratitude to all of the residents of Mbanayili, Ghana. Many of
them volunteered a significant portion of their time to participate in the needs assessment.
Amadu Alhassan and Yussif Abdul Razak were instrumental in facilitating the field research in
Mbanayili. Without Amadu Alhassan’s connections to the village, hospitality, and familiarity
with the customs in Ghana, the field research would not have been possible. Our advisors,
Gregory Keoleian and Michael Moore, offered their time, expertise, and guidance in support of
this endeavor. Katsuya Kuge and Yukinari Tanaka, from the Japan International Cooperation
Agency, were extremely influential in instilling in us the importance of financial sustainability as
a fundamental aspect of successful rural development, which became central to our analysis.
Martin Mechtenberg and Donald Buaku conceived of the multifunctional community center and
offered numerous architectural renderings of it, a concept that has served as an integral aspect of
our research. Our dear friend and colleague Abigail Mechtenberg has provided much inspiration
for this project and has enriched our understanding of the importance of hybridization of
renewable energy systems and the value of human development. Editing this document without
the assistance and countless hours offered by Charlotte Maxwell-Jones would have proven far
more laborious that it was in actuality. Jacob Songsore, Ziblim Abukari, Daigo Koga, Theodora
Mame Nyaneba Jonah, and Jia-Yin Chao eased logistical planning of the field research and
provided many critical contacts. David Kline, Tom Lambert, and Peter Lilienthal, from the
National Renewable Energy Laboratory, assisted with questions concerning the HOMER
software, and their knowledge of renewable electrification in developing countries was
invaluable. We also appreciate all the students that participated in the winter 2006 independent
study class, dedicated to examining the feasibility of expanding Ghana’s renewable energy
portfolio, namely: Abigail Mechtenberg, Martin Mechtenberg, Donald Buaku, Matthew Garratt,
Michael Baratoff, Frederica Yawson, Sarah Powers, and Simeon Anderson. Professor James
Chaffers provided valuable insight and recommendations for this class. The University of
Michigan’s Rackham Graduate School was instrumental in funding the field research. To all of
the aforementioned, we are eternally grateful.

iii

iv
TABLE OF CONTENTS
Executive Summary ........................................................................................................................ 1
Chapter 1 Introduction: The Need for Rural Electrification in Ghana ......................................... 15
1.1 Geographic Information and Main Socioeconomic Issues of Ghana ........................................... 15 1.2 Impacts of Rural Electrification on Poverty................................................................................. 18 1.3 Research Objectives and Methods ............................................................................................... 18
Chapter 2: Background and Policy Analysis ................................................................................ 20
2.1 Preface.......................................................................................................................................... 20 2.2 Introduction .................................................................................................................................. 20 2.3 Pre-Reform History ...................................................................................................................... 20 2.4 Current Situation .......................................................................................................................... 21
2.4.1 Generation Sector.................................................................................................................. 21
2.4.2 Transmission Sector.............................................................................................................. 23
2.4.3 Distribution Sector ................................................................................................................ 24
2.5 Electrification Programs: On-Grid and Off-Grid ......................................................................... 25 2.6 Regulatory and Pricing Structure ................................................................................................. 28 2.7 Policy Analysis............................................................................................................................. 28
2.7.1 On-Grid Market: Problems ................................................................................................... 29 2.7.2 On-Grid Market: Solutions ................................................................................................... 31 2.7.3 Off-Grid Market: Problems................................................................................................... 32 2.7.4 Off-Grid Market: Solutions................................................................................................... 32 2.7.5 Reform Suggestions .............................................................................................................. 33
Chapter 3: The Purpose and Scope of the Research .................................................................... 34
3.1 Overview ...................................................................................................................................... 34 3.2 Project Approach.......................................................................................................................... 35
3.2.1 Partial Electrification ............................................................................................................ 35 3.2.2 Demand Side Analysis .......................................................................................................... 37 3.2.3 Supply Side Analysis ............................................................................................................ 37 3.2.4 A Case Study ........................................................................................................................ 38

v
Chapter 4: Field Research Overview..................................................................................................... 39
4.1 Overview of the Village and Its Energy Sources ......................................................................... 39 4.2 Interests and Problems of Mbanayili............................................................................................ 41 4.3 Introduction of the Field Research ............................................................................................... 41 4.4 The Steps of the Case Analysis .................................................................................................... 42
Chapter 5: Potential Demand Analysis ......................................................................................... 43
5.1 Overview of Potential Demand Analysis .....................................................................................43 5.2 Knowledge of Electrical Appliances ............................................................................................ 43 5.3 Preference Analysis...................................................................................................................... 45
5.3.1 Research Method .................................................................................................................. 45
5.3.2 Research Results ................................................................................................................... 47
5.3.3 Category Preference – by Attributes..................................................................................... 50
5.3.4 Activity Preference Survey – Overview of the Results ........................................................ 54
5.4 Load Curve Generation ................................................................................................................ 59 5.4.1 Overview of producing the Load Curve from the Field Research Data................................ 59
5.4.2 Activity Scheduling .............................................................................................................. 60
5.4.3 Electrical Appliance Selection .............................................................................................. 71
5.4.4 Load Curve Generation......................................................................................................... 74
Chapter 6: Biofuel Potential from Jatropha Curcas Linn.............................................................. 79
6.1 Multifunctional Platform.............................................................................................................. 79 6.2 Origins & Nomenclature .............................................................................................................. 80 6.3 Botanical Description ................................................................................................................... 80 6.4 Seed Properties ............................................................................................................................. 81 6.5 Toxicity ........................................................................................................................................ 82 6.6 Ecology......................................................................................................................................... 82 6.7 Agricultural Propagation Methods ............................................................................................... 84 6.8 Uses .............................................................................................................................................. 85
6.8.1 Living Fence ......................................................................................................................... 85 6.8.2 Mitigating Desertification & Crop Stabilization................................................................... 85 6.8.3 Food Source and Medicinal Properties ................................................................................. 86 6.8.4 Pesticide ................................................................................................................................ 86

vi
6.8.5 Fertilizer................................................................................................................................ 87 6.8.6 Soap Production .................................................................................................................... 88 6.8.7 Jatropha Oil........................................................................................................................... 88 6.8.8 Lighting and Cooking Fuel ................................................................................................... 88 6.8.9 Biofuel .................................................................................................................................. 89
6.9 Oil Expellers................................................................................................................................. 90 6.10 Oil Yields ................................................................................................................................... 91 6.11 Fuel Characteristics: Jatropha Biodiesel vs. Conventional Diesel ............................................. 92 6.12 Emissions: Jatropha Biodiesel vs. Conventional Diesel............................................................. 93 6.13 Engine Performance: Jatropha vs. Diesel ................................................................................... 95 6.14 Cost: Jatropha vs. Diesel ............................................................................................................ 96 6.15 Economic Viability & Conclusions............................................................................................ 96
Chapter 7 Supply Side Analysis: Optimal Generation System Modeling .................................... 98
7.1 Energy System Design Overview................................................................................................. 98 7.2 Benchmark HOMER Design Schematic ...................................................................................... 98 7.3 Benchmark Simulation ................................................................................................................. 99 7.4 Solar Irradiance .......................................................................................................................... 100 7.5 Photovoltaic................................................................................................................................ 102 7.6 DC Generator ............................................................................................................................. 103
7.6.1 Generator O&M Cost Calculation ...................................................................................... 104 7.7 Diesel Fuel Characteristics ......................................................................................................... 104 7.8 Load Characteristics ................................................................................................................... 105
7.8.1 DC Load Profile.................................................................................................................. 106 7.8.2 AC Load Profile.................................................................................................................. 106
7.9 Converters .................................................................................................................................. 107 7.10 Batteries.................................................................................................................................... 108 7.11 Battery Costs and Specifications .............................................................................................. 108 7.12 Economic Inputs....................................................................................................................... 109 7.13 Other Constraints...................................................................................................................... 110 7.14 Benchmark Simulation Optimization Results ..........................................................................111 7.15 Benchmark Simulation Sensitivity Analysis ............................................................................115
7.15.1 Cost Factor Sensitivity Analysis ....................................................................................... 119 7.16 Alternative Models ................................................................................................................... 121

vii
7.16.1 AC Only Load Profile Simulation .................................................................................... 121 7.16.2 Fixed System O&M Analysis ........................................................................................... 122
7.17 Conclusions and Model Limitations......................................................................................... 122 7.17.1 Generator Costs................................................................................................................. 122 7.17.2 Applying Standard Deviation (Noise) to AC and DC Load Profiles ................................ 123 7.17.3 Fuel Curve Assumptions (Jatropha and Diesel)................................................................ 123
Chapter 8: Financially Sustainable System Modeling - Simulation ........................................... 125
8.1 Background for Sustainable System Modeling .......................................................................... 125 8.2 Sustainability Rule ..................................................................................................................... 125 8.3 Willingness-to-Pay (WTP) Analysis .......................................................................................... 126
8.3.1 Data Screening .................................................................................................................... 126 8.3.2 Willingness-to-Pay Estimation for Mbanayili .................................................................... 127
8.4 Sustainability Check................................................................................................................... 129 8.5 Demand Side Analysis ............................................................................................................... 130
8.5.1 Necessity of Cost Reduction from Demand Side................................................................ 130 8.5.2 Introduction of Demand Side Management ........................................................................ 130 8.5.3 Demand Side Analysis - Simulation Method...................................................................... 131 8.5.4 Simulation Steps ................................................................................................................. 132
8.6 Simulation I (O&M ≤ WTP) ..................................................................................................... 134
8.6.1 Simulation Patterns ............................................................................................................. 134 8.6.2 Analysis of Simulation I (a) ................................................................................................ 135 8.6.3 Analysis of Simulation I (b)................................................................................................ 136 8.6.4 Cost-Benefit Analysis ......................................................................................................... 136 8.6.5 Analysis of Simulation I (c) ................................................................................................ 138
8.7 Simulation II (O&M + Replacement Cost ≤ WTP).................................................................... 139
8.7.1 Background of Simulation II .............................................................................................. 139 8.7.2 Simulation Patterns ............................................................................................................. 140 8.7.3 Results of Simulation II ...................................................................................................... 143 8.7.4 Evaluation of the Patterns ................................................................................................... 144 8.7.5 Evaluation Results – Round 1............................................................................................. 145 8.7.6 Evaluation Results – Round 2............................................................................................. 149 8.7.7 Evaluation Results – Round 3 (Final) ................................................................................. 152

viii
8.8 Revenue Generation Potential .................................................................................................... 154 8.8.1 Providing Job Opportunity for Women through Jatropha................................................... 155 8.8.2. Revenue Generation Scenario............................................................................................156 8.8.3 Impact Analysis .................................................................................................................. 158 8.8.4 Revenue Potentials.............................................................................................................. 159
8.9 Conclusion and Discussion ........................................................................................................ 160
Chapter 9 Recommendations for Project Implementation.......................................................... 162
9.1 Summary of the Project.............................................................................................................. 162 9.2 Suggested Further Research ....................................................................................................... 162 9.3 Recommendations for Implementation ...................................................................................... 164
9.3.1 Necessity of Electricity Consumption Management........................................................... 164 9.3.2 Operational and Maintenance Skill Acquisition ................................................................. 164 9.3.3 Payment Collection Scheme ............................................................................................... 165 9.3.4 Financial Supports .............................................................................................................. 167
9.4 Conclusion.................................................................................................................................. 168
Appendices.................................................................................................................................. 170
Appendix 1: Field Research Overview (Chapter 4) .........................................................................170 Appendix 2: Potential Demand Analysis (Chapter 5) ...................................................................... 174 Appendix 3: Biofuel Potential from Jatropha Curcas Linn. (Chapter 6).......................................... 199 Appendix 4: Financial Sustainable System Modeling (Chapter 8) .................................................. 201 Appendix 5: Recommendations and Future Plans (Chapter 9) ........................................................ 226
Bibliography ............................................................................................................................... 227
ix
LIST OF FIGURES
Figure E.1: Research Methodology Overview................................................................................ 2
Figure E.2: Schematic of Community Center................................................................................. 4
Figure E.3: Benchmark Optimization Cost Results........................................................................ 9
Figure 1. 1: Map of Republic of Ghana ........................................................................................ 15
Figure 1. 2: Map Showing Regions and Cities in Ghana.............................................................. 16
Figure 3. 1: Project Approach – Framework ................................................................................ 35
Figure 3. 2: Schematic Drawing of the Community Center ......................................................... 36
Figure 4. 1: Electrification Rate of Ghana in 2005....................................................................... 39
Figure 4. 2: Purpose of Energy Consumption by Energy Source ................................................. 40
Figure 4. 3: Share of Each Energy Cost in Income....................................................................... 40
Figure 4. 4: Basic Information of the Respondents ...................................................................... 42
Figure 5. 1: Respondents’ Exposure and Experience for the Appliances..................................... 44
Figure 5. 2: Average Monthly Income of People with and without TV Experience .................... 45
Figure 5. 3: Average Monthly Income of People with and without PC Exposure ....................... 45
Figure 5. 4: First Step: Three-Point Allocation – the Share of the Allocated Points.................... 48
Figure 5. 5: Second Step: Two-Point Allocation – the Share of the Allocated Points ................. 49
Figure 5. 6: Third Step: Five-Point Allocation – the Share of the Allocated Points .................... 49
Figure 5. 7: Category Preference Across Three Steps .................................................................. 50
Figure 5. 8: Category Preference by Gender ................................................................................ 51
Figure 5. 9: Category Preference by Age...................................................................................... 52
Figure 5. 10: Category Preference by Monthly Income ............................................................... 53
Figure 5. 11: Experience of Watching TV by Monthly Income ................................................... 53
Figure 5. 12: Category Preference by Distance to the Community Center .................................. 54
Figure 5. 13: Knowledge about PC by Distance to the Community Center ................................. 54
Figure 5. 14: Activity Preference between Pairs of Activities (1/2)............................................. 55
Figure 5. 15: Activity Preference between Pairs of Activities (2/2)............................................. 55
Figure 5. 16: Comparison between Party and Personal Computer by Age .................................. 56
Figure 5. 17: Exposure of Personal Computer by Age ................................................................. 56
Figure 5. 18: Comparison between Party and Personal Computer by Monthly Income .............. 57

x
Figure 5. 19: Comparison between Party and Personal Computer by Age .................................. 58
Figure 5. 20: Comparison between Television and Personal Computer by Monthly Income...... 58
Figure 5. 21: Comparison between Television and Personal Computer by Gender..................... 58
Figure 5. 22: Comparison between Television and Party by Gender ........................................... 59
Figure 5. 23: Process for Generating Potential Load Curve ........................................................ 60
Figure 5. 24: Activity Time Preference Type 1: Whole Day Activities ....................................... 65
Figure 5. 25: Activity Time Preference Type 2: Daytime Activity .............................................. 66
Figure 5. 26: Time Preference for Markets by Gender................................................................. 66
Figure 5. 27: Activity Time Preference Type 3: Night Time Activities....................................... 67
Figure 5. 28: Time Preference Data.............................................................................................. 68
Figure 5. 29:Activity Schedule – Example ................................................................................... 70
Figure 5. 30: Appliance Preference Selection Criterion and Result ............................................. 72
Figure 5. 31: Load Curve of April 2007 ....................................................................................... 75
Figure 5. 32: Distribution of the Electricity Consumption for the After Lunch Time Period ..... 77
Figure 5. 33: DC Load Curve ....................................................................................................... 77
Figure 5. 34: Share of Electricity Consumption by Time Slot ..................................................... 78
Figure 6. 1: Botanical Illustration of Jartropha Curcas L. ............................................................ 81
Figure 6. 2: African Regions Hospitable for Growing Jatropha................................................... 83
Figure 6. 3: Biodiesel vs. Conventional Diesel............................................................................. 94
Figure 6. 4: Engine Performance of Pure Jatropha, a 50% Blend of Jatropha and Diesel and
Straight Diesel............................................................................................................................... 95
Figure 7. 1: Benchmark HOMER Schematic ............................................................................... 99
Figure 7. 2: HOMER Solar Irradiation Potential of Ghana ........................................................ 101
Figure 7. 3: NREL Solar Irradiation Potential of Ghana ............................................................ 101
Figure 7. 4: DC Load Profile ...................................................................................................... 106
Figure 7. 5 AC Load Profile ....................................................................................................... 107
Figure 7. 6: Benchmark Optimization Results............................................................................ 111
Figure 7. 7: Benchmark Optimization Cost Results ................................................................... 113
Figure 7. 8: Photovoltaic Output at Hour of Day vs. Day of Year ............................................. 114
Figure 7. 9: Generator Output at Hour of Day vs. Day of Year ................................................. 115
Figure 7. 10: Sensitivity Results: Interest Rates vs. AC Load.................................................... 117

xi
Figure 7. 11: Sensitivity Results: Exogenous Constraints .......................................................... 118
Figure 7. 12: Optimization Results: Interest Rate Variance ....................................................... 119
Figure 7. 13: Optimization Results: Cost Factor ........................................................................ 120
Figure 7. 14: Sensitivity Results: Cost Factor ............................................................................ 121
Figure 7. 15: AC/DC vs. AC Only Load Configuration ............................................................. 122
Figure 7. 16: Diesel Fuel Efficiency Curve ................................................................................ 124
Figure 7. 17: Generator Efficiency Impacts on Optimal System Configuration ........................ 124
Figure 8. 1: Income Distribution of the Sampled People............................................................ 127
Figure 8. 2: Percentage of Willingness-to-Pay for Electricity in Income by Income Group...... 128
Figure 8. 3: Costs of the Benchmark Model ............................................................................... 130
Figure 8. 4: The Characteristics of Annual Costs ....................................................................... 132
Figure 8. 5: Two Directions of Simulation I............................................................................... 134
Figure 8. 6: Simulation I (a) – Simulation Results .................................................................... 135
Figure 8. 7: Simulation I (b) – Simulation Results ..................................................................... 136
Figure 8. 8: The Result of the Cost-Benefit Analysis by Activity.............................................. 137
Figure 8. 9: Simulation Results – Simulation I (c) ..................................................................... 138
Figure 8. 10: Optimal Generation System in Simulation I ......................................................... 139
Figure 8. 11: Costs of the Optimal Generation System in Simulation I ..................................... 139
Figure 8. 12: Simulation Results – Sensitivity of the Adoption Criterion for Electrical Appliances
..................................................................................................................................................... 140
Figure 8. 13: Simulation Types in Simulation II ........................................................................ 142
Figure 8. 14: Evaluation Orders.................................................................................................. 145
Figure 8. 15: Percentage of Supporters for Audio Devise Use in Newborn Celebration Party by
Gender......................................................................................................................................... 146
Figure 8. 16: Percentage of Supporters for Television Use in Party Activity by Income .......... 147
Figure 8. 17: Preferences of Elderly People and Affluent People for Entertainment Category and
Activities in the Category ........................................................................................................... 149
Figure 8. 18: Percentages of People Who Chose the Culture Category at First and Second Steps
..................................................................................................................................................... 151
Figure 8. 19: Preference for Television in Party Activity........................................................... 151

xii
Figure 8. 20: Women’s Preference for Two Activities (TV and Party) and for Television in the
Party Activity .............................................................................................................................. 152
Figure 8. 21: Optimal Generation System in Simulation II ........................................................ 153
Figure 8. 22: Costs of the Optimal Generation System in Simulation II.................................... 154
Figure 8. 23: Summary of the Evaluations ................................................................................. 154
Figure 8. 24: Revenue Generation Implementation Scenario..................................................... 156
Figure 8. 25: Revenues from Jatropha for Mbanayili ................................................................. 160
Figure A.1. 1: Mbanayili............................................................................................................. 170
Figure A.3. 1: Wind Power Potential in Ghana .......................................................................... 200
Figure A.5. 1: Implementation Plan............................................................................................ 226
xiii
LIST OF TABLES
Table E. 1: Implementation Plan Overview.................................................................................. 13
Table 1. 1: Facts about Ghana ...................................................................................................... 16
Table 5. 1: Category - Activity List .............................................................................................. 46
Table 5. 2: Questions for Activity Preference Survey .................................................................. 47
Table 5. 3: Allocation Pattern – Sample ....................................................................................... 47
Table 5. 4: Time Allocation across Activity Categories............................................................... 61
Table 5. 5: Available Time by Each Activity in the Community Center ..................................... 64
Table 5. 6: Time Periods and Corresponding Time Intervals....................................................... 64
Table 5. 7: Time Periods of Cultural Activities............................................................................ 68
Table 5. 8: Activity Time Selection Result................................................................................... 69
Table 5. 9: Electrical Appliances Used in Each of the Activities................................................. 73
Table 5. 10: Summary of Electricity Consumption in the Year 2007 .......................................... 75
Table 5. 11: Electricity Consumption Share of Activities in After Lunch Period of April 2007 . 76
Table 5. 12: Activities in After Lunch Period in April 2007........................................................ 76
Table 5. 13: Aggregate Electricity Consumption by Appliance of April 2007 ........................... 78
Table 6. 1: Jatropha Seed and Kernel Composition...................................................................... 82
Table 6. 2: Climatic Data of Seed Provenances............................................................................ 84
Table 6. 3: Jatropha Seed Yields................................................................................................... 85
Table 6. 4: Effective Jatropha Pesticide Preparations................................................................... 87
Table 6. 5: Jatropha Oil Yields ..................................................................................................... 91
Table 6. 6: Jatropha Biodiesel vs. Conventional Diesel ............................................................... 92
Table 7. 1: Solar Irradiation Potential of Ghana ......................................................................... 100
Table 7. 2: Photovoltaic Array Constraints................................................................................. 102
Table 7. 3: Generator Cost Constraints....................................................................................... 103
Table 7. 4: HOMER Generator Fuel Constraints........................................................................ 104
Table 7. 5: DC Load Characteristics........................................................................................... 106
Table 7. 6: AC Load Characteristics........................................................................................... 107
Table 7. 7: Converter Constraints ............................................................................................... 107
Table 7. 8: Battery Constraints ................................................................................................... 108

xiv
Table 7. 9: Economic Inputs ....................................................................................................... 109
Table 7. 10: Other HOMER Constraints..................................................................................... 110
Table 7. 11: Costs of Options for Rural Electrification of Mamprusi District East (Ghana) ..... 112
Table 7. 12: Sensitivity Values ................................................................................................... 115
Table 8. 1: Calculation of Average Willingness-to-Pay per Person ........................................... 128
Table 8. 2: Accepted Electricity Appliances (Adoption Criteria 50% and 80%) ....................... 135
Table 8. 3: Adopted Electrical Appliances (Adoption Criterion: 50% and 80%) without Cooking
Activity ....................................................................................................................................... 141
Table 8. 4: Simulation Patterns of Type (a), (b) and (c) (Percent of the Adoption Criterion for
Electrical Appliances)................................................................................................................. 142
Table 8. 5: Simulation Patterns of Type (d)................................................................................ 143
Table 8. 6: Simulation Results – Simulation II........................................................................... 143
Table 8. 7: Round 1-(1): Permitted Electrical Appliances.......................................................... 146
Table 8. 8: Round 1-(2): Permitted Electrical Appliances.......................................................... 146
Table 8. 9: Round 1-(3): Permitted Electrical Appliances.......................................................... 147
Table 8. 10: Percentages of Preferences for Audio Use for Markets and Newborn Celebration
Parties by Age, Income, and Gender .......................................................................................... 148
Table 8. 11: Round 2: Permitted Electrical Appliances.............................................................. 150
Table 8. 12: Round 3: Permitted Electrical Appliances.............................................................. 152
Table 8. 13 : Land Area Requirement in Each Stage of the Revenue Generation Scheme ........ 158
Table 9. 1 : Payment Levels under the Monthly Fixed Fee Scheme .......................................... 166
Table 9. 2 : Annual Payment under the Group Payment System................................................ 167
Table 9. 3: Implementation Plan Overview ................................................................................ 169
Table A.1. 1: Questionnaires ...................................................................................................... 171
Table A.2. 1: Models and Sources for Electrical Appliances Data for Activity Preference Survey
..................................................................................................................................................... 174
Table A.2. 2: Electrical Appliance List ...................................................................................... 174
Table A.2. 3: Activity Schedule of Year 2007............................................................................ 175
Table A.4. 1: Activity Schedule for An Optimal Financially Sustainable System in Simulation II
..................................................................................................................................................... 201
Table A.4. 2: Work Rate of KAKUTE Project........................................................................... 225

xv
Table A.4. 3: Detailed Calculation on Revenue Generation Scheme ......................................... 225

xvi
Abbreviations:
AC Alternating Current
Ah Amp hour
ANOVA Analysis of Variance
ASTM American Society of Testing and Materials
BD Biodiesel
CBI Cost Benefit Index
CDM Clean Development Mechanism
CFL Compact Fluorescent Lamp
CIA Central Intelligence Agency
COE Cost of Electricity
DANIDA Danish National International Development Assistance
DC Direct Current
DSM Demand Side Management
EC Energy Commission
ECG Electricity Corporation of Ghana
EPA Environmental Protection Agency
GDP Gross Domestic Product
GEF Global Environmental Facility
GLSS4 The Fourth Ghana Living Standard Survey
GOG Government of Ghana
ha Hectare
HOMER Hybrid Optimization Model for Electric Renewables
IEA International Energy Agency
IMF International Monetary Fund
IPP Independent Power Producer
Jatropha Jatropha Curcas Linn.
JICA Japan International Cooperation Agency
K Diesel
KAKUTE Kampuni ya Kusambaza Teknolojia

xvii
KNUST Kwame Nkrumah University of Science and Technology
kW Kilowatt
kWh Kilowatt-hour
L Liter
LPG Liquidified Petroluem Gas
m/s Meters per Second
NASA National Aeronautics and Space Administration
NED Northern Electricity Department
NES National Electrification Scheme
NGO Non Governmental Organization
NPC Net Present Cost
NREL National Renewable Energy Laboratory
O&M Operations and Maintenance
OEM Original Equipment Manufacture
PC Personal Computer
PPA Power Purchase Agreement
PPP Purchasing Power Parity
psi Pounds per Square Inch
PSRC Power Sector Reform Committee
PURC Public Utilities Regulatory Commission
PV Photovoltaic
RE Renewable Energy
RESPRO Renewable Energy Service Project
RPM Revolutions per Minute
SEC State Enterprise Commission
SHEP Self-Help Electrification Program
SHS Solar Home System
sq km Square Kilometers
SWERA Solar Wind Energy Resource Assessment
TPA Third Party Access
TSO Transmission system operator

xviii
TV Television
UNDP United Nations Development Programme
UN Energy United Nations Energy
US Census Bureau United States Census Bureau
USD United States Dollar
VAP Value Added Performance
VRA Volta River Authority
WAGP West African Gas Pipeline
Wh Watt-hour
WHO World Health Organization
WTP Willingness to Pay

1
Executive Summary
Project Summary
This project, by conducting a case study, proposes a sustainable electrification system
and implementation plan for Mbanayili, a village in northern Ghana that is currently
unelectrified. To achieve this, both demand side and supply side analyses were
evaluated. The term "sustainable" is used in reference to two factors: 1) the fiscal
sustainability of the villagers to maintain and pay for electrification, accomplished by
using a manageable and affordable power generation system and 2) environmental
sustainability, through the use of renewable energy. The Government of Ghana (GOG)
created an electrification initiative, the National Electrification Scheme (NES), which
intended to provide electricity to all villages with more than five hundred inhabitants
by the year 2020. Due to insufficient funding and inefficient electrification
strategies, this goal may not be feasible; some rural electrification projects that exist
under the auspices of the NES are failing and other attempts by the government to provide
electricity in the sparsely populated regions of northern Ghana have been largely
unsuccessful.
To engender a successful rural electricity project and mitigate the financial burdens of the
GOG, development and implementation of cost-effective measures that conform to a
community’s ability to pay are essential. In a collaborative effort between the authors and
students from various disciplines, a multifunctional community center was conceived of and
designed in an attempt to maximize the benefits for villagers, while maintaining costs within the
village's ability to pay. The optimal suite of electrical amenities and system configurations was
determined with the following procedures and illustrated in Figure E.1. First, an on-site needs
assessment was conducted in the summer of 2006, accomplished with questionnaire responses
from 133 villagers, to establish their ability to pay and their desired electricity needs. After this
data was analyzed, a power consumption load curve was derived for the village and modeled
using the National Renewable Energy Laboratory’s (NREL) Hybrid Optimization Model for
Electric Renewables (HOMER) software. HOMER was then used to design the power
generation system. Due to the government's expressed interest in expanding domestic biofuel
production and spurring economic development from a promising local plant, Jatropha Curcas

2
L., research was undertaken to incorporate this into the analysis. After the costs were obtained
for the benchmark power generation system, economic analysis was conducted to determine the
optimal system configuration, ensuring that the operations and maintenance costs do not exceed
villager’s ability to pay; this was facilitated by the use of demand side management (DSM).
Figure E.1: Research Methodology Overview
After completing this research, we propose a sustainable electricity generation system
and implementation strategy to increase the quality of life for village residents, hoping also to
advance the understanding of the inherent challenges of rural electrification in the developing
world.
Background: Power Sector Reform and Electrification Strategies (Chapter 2)
Ghana’s power sector is a vertically integrated, state monopoly governed by the Ministry
of Energy, which is responsible for policy development and coordination of the power sector
(Edjekumhene, 2001). The several institutions involved are: 1) the Volta River Authority
(VRA), which is responsible for generation, transmission, and construction of the transmission
system. The VRA dominates generation as well as controls transmission and distribution
activities; 2) the Electricity Corporation of Ghana (ECG), which is responsible for the
distribution of electricity in Southern Ghana, where 80% of the country's electricity consumption
exists; 3) the Northern Electricity Department (NED), which is responsible for distribution of
electricity in the sparsely populated regions of Northern Ghana, and 4) the State Enterprise
Commission (SEC), which acts as a regulatory body.
WTP
PartialElectrification
• Demand Side Management
• Developing a fiscally sustainable system
Electrify the village’s community center
• Estimating people’s needs for electricity
• Modeling load curve
Demand Side
NoFiscal
Constraint
FiscalConstraint
Supply Side
Renewable energy potential (Jatropha)-Environmental sustainability
Generation system configuration(minimum cost system)
Chapter 5 Chapter 6
Chapter 7Chapter 8

3
In 1989, the NES was initiated to facilitate the expansion of the electricity supply to
predominately rural inhabitants. Under the NES master plan, 4,221 communities with
populations exceeding 500 were chosen as ideal candidates for electrification (JICA, 2006). At
its inception, the NES created a mandate called the “life line” subsidy, which required the NED
to provide electricity to customers who pay flat uneconomic rates. Despite this mandate, there
were only minor improvements in network expansion and rural electrification, due to both
financial difficulties from operational inefficiencies, and a lack of funds for increasing reliability
and overall performance (ECA, 2003). The GOG continues to keep tariff prices artificially low,
in part due to the political ramifications of passing on the actual costs of generation to the public.
This places political pressure on representatives seeking election to provide the public with
electricity, even if it is not economically viable. Both the ECG and the NED have incurred
massive financial losses over the past decade, placing considerable economic strain on the
government (ECA, 2003).
The Self Help Electrification Program (SHEP), initiated in 1990, was created with the
expressed intent of fostering the NES' master plan. The SHEP functions by providing low
voltage grid connection and in-house wiring for a small fee, provided that the community
purchases the utility distribution poles and is situated no farther than 20km from the nearest grid
connection. Although the NES was generally heralded as a success, because from the period of
1989 to 2000, national household electrification in Ghana increased from 15% to 43%, it is not
without criticism. Payment default, especially by rural inhabitants, places considerable burden
on the project’s fiscal stability, which prohibits investment in future network expansion (JICA,
2006); and a lack of cohesive planning causes inefficient allocation of the distribution network.
Due to Ghana's dependence on hydropower, as high as 99% before 1992, the multiple
prolonged droughts of the 80's and 90's, coupled with increased electricity demand, caused
widespread power shortages (Edjekumhene, 2001). In 1993, in response to the increased
demand for generation, transmission, and distribution infrastructure, as well as for the
improvement of existing facilities and services, the GOG developed a plan to construct a thermal
combined cycle power plant. In response to their request for funding from the World Bank, the
GOG was met with an announcement that the World Bank would provide funding only if the
GOG reformed its power sector (Edjekumhene, 2001). Privatization is the primary tool in power

4
sector reform, and the GOG both recognized this trend and assented to give their full effort to
reforming their power sector and attracting the needed private investors.
The Renewable Energy Service Project (RESPRO) was initiated in 1999, with financial
backing from the Global Environmental Facility (GEF), the GOG, and NREL. From its
inception to the present, the RESPRO has had budget shortfalls, despite implementing a fee-for-
service approach. The financial instability of the program is caused by the high transaction costs
of collecting payment, maintenance, and the installation of PV systems in the sparsely populated
northern regions of Ghana. Insufficient operational funds available for maintenance, coupled
with a reactionary maintenance regime, culminated in many installed systems becoming defunct.
This further contributes to the lackluster perception that Ghanaians have of off-grid energy
systems, which they often believe to be inferior to on-grid electricity. In 2002, GEF funding for
the project ceased, and now it is being restructured as an NGO (JICA, 2006).
The difficulties exhibited by the projects above further underscore the necessity for
comprehensive field research and long-term contingency strategizing.
Community Center (Chapter 3)
To circumvent the financial difficulties of electrifying widely dispersed homes in
Northern Ghana, something many projects have attempted in the past, a collaborative effort was
undertaken, the culmination of which is a multi-functional community center, shown in Figure
E.2 (Mechtenberg and Buaku, 2006). Comprised of one versatile open area, one private room
used for health services, one storage room to house energy production components, and a
centralized cistern to capture rainwater, the community center is capable of accommodating one
hundred people at a time.
Figure E.2: Schematic of Community Center (Mechtenberg and Buaku, 2006)

5
Mbanayili: An Overview (Chapter 4)
Mbanayili, a village of approximately 1,000 households and 4,050 residents, lies 15km
northwest of Tamale, the largest city in Northern Ghana, and 7km from the nearest electricity
grid connection. While Ghana's national language is English, the inhabitants of Mbanayili only
speak Dagbani, which necessitated the use of a translator during field research. The average
monthly income of Mbanayili men is 147,661 Ghanaian cedis (16.40 USD), and of women is
57,453 cedis (6.40 USD), which is considerably lower than the national average of 24.20 USD.
The current primary energy sources of the village are firewood, charcoal, and kerosene,
which are predominantly used for cooking and light. These items consume 85% of their total
income.
The main problems of the village, as determined by the local leaders, are a lack of both
healthcare and educational facilities. The villagers believe that electrification will help to solve
these problems and facilitate economic welfare and a higher standard of living (Alhassan, 2006).
Field Research (Chapter 4)
Using a questionnaire, interviews (many inhabitants are illiterate) were conducted to
comprehend the villagers' electricity needs and priorities. Data were acquired on basic
demographic information as well as the villagers' preferences for electrical appliances, activities
requiring them, and the times of day that they desired to use them. These interviews were given
to 133 people, determined by a random sampling of the village's residents, though because many
women were otherwise engaged during the time of the field research, more men were
interviewed than women: 94 men and 39 women.
Demand Analysis (Chapter 5)
To ascertain the prioritization of villagers' preferences for various activity categories (i.e.,
education, entertainment, etc.), they were allocated a limited number of points to allot to their
preferred categories (chosen from a list of six), beginning with three points and progressing to
ten. With this method, three point allocation data reflects their priorities under the most
constrained circumstances, while the ten point allocation data illustrates their priorities under
more generous circumstances.

6
To elucidate the respondents' prioritization of specific activities within these categories
(i.e., cooking, television, etc.), a set of eight questions was posed to each respondent. Each
question asked for the preference of one of two activities and showed the amount of time that
each activity could be maintained using the same amount of energy (i.e., television: 60 min vs.
computer use: 20 min).
Data were also collected regarding the villagers' preferences for time allocation for
categories and then specific activities, data that were then pooled with the results of the above
analysis to create an activity schedule. Specific appliances were chosen to correspond with each
activity. Electricity requirements of these appliances were combined with this activity schedule
to create the power load curve, which is comprised of power consumption for all 8,760 hours in a
year.
Biofuel Production and Economic Development (Chapter 6)
In 2004, biodiesel derived from Jatropha Curcas L. fruits was proclaimed to be a mature,
commercially viable technology that could provide Ghana with "immense benefits" (Akuffo,
2004). The most notable benefits from establishing biofuel markets in Ghana would be: the
displacement of oil imports, which are a major contributor to the country’s astounding debt (oil
imports comprise 28% of the total energy supply and 10% of GDP); the emergence of new
markets to supplement existing agricultural industries; increases in the country’s Gross National
Product; and employment opportunities, especially in the rural northern regions (Akuffo, 2004;
UN Energy, 2006).
Jatropha is particularly well adapted to grow in Ghana, as it requires arid or semi-arid,
low altitude environments and can flourish on marginal soils that lack substantial nutrient
content. Oil products derived from Jatropha seeds and kernels have recently prompted
significant interest in determining whether or not these products can foster rural economic
development. Jatropha oil can be utilized in an array of products that do not require
prohibitively intensive capital investments, such as biofuel production and soap manufacturing;
this is promising for the creation of adaptive, small-scale industries. However, the revenue
generation potential for Jatropha products, namely unesterified Jatropha oil, biodiesel, and soap,
is entirely predicated on local market demand. Unless Jatropha biodiesel production costs
remain competitive with retail diesel prices, its suitability as a fossil fuel substitute will not be

7
possible, although its potential for localized revenue generation remains (Akuffo, 2004; Henning,
2004; Henning, unknown).
In the opinion of the authors, Jatropha production seems promising for use as a biofuel
and for spurring economic development, but warrants further research to determine if it is viable
for this particular village. Further investigations should answer the following simple, yet
fundamental questions:
Technical
• What is the oil content of plant varieties available in Ghana?
• Does the village have a land surplus to be dedicated to Jatropha cultivation?1
• Will growing Jatropha negatively impact existing crops?
• What are the anticipated seed and oil yields for Mbanayili?
• What is the probable oil recovery from technologically feasible extraction methods?
• How much technological education will the village residents require for cultivating and
processing Jatropha?
Economic
• Do current markets exist for Jatropha in or around the vicinity of Mbanayili?
• If so, what is the current and projected market price?
• What is the potential profitability of cultivating and selling Jatropha products in local
markets?
• For what purpose/products is Jatropha currently cultivated?
• What is the most advantageous use of Jatropha for Mbanayili?
• What funding avenues are available to facilitate project deployment?
Supply Side Analysis: Optimal Generation System Modeling (Chapter 7)
Optimal off-grid energy system configurations for powering the community center were
evaluated with the load curve data derived from the needs assessment questionnaires. Results
from the needs assessment were converted into text files, representing hourly energy 1 Using a conversion factor yielding approximately 2,000 L of Jatropha “feedstock” oil per hectare, the lower limit land area requirement for the village to supply ample fuel to power the generator with blended or pure biodiesel would be approximately half a hectare (Fulton et al, 2006). The upper limit land area requirement (2.225 ha/yr) was calculated using seed oil yields of 5kg/L (Henning, 2004) and land seed yields of 2,000kg/ha (Heller, 1996).

8
consumption for both the AC and DC sector loads for an entire year (8,760 hrs). The HOMER
software was the primary tool used to determine the best option, in terms of net-present-cost
(NPC), for supplying electricity to the community center in Mbanayili.
The hybrid energy system that the HOMER software determined to be optimal
incorporates the use of renewables and consists of three primary functions: power production,
energy consumption, and storage. Power production relies on a PV array and a diesel generator.2
Capital and replacement cost assumptions were taken from JICA’s report (2006 citing the
RESPRO), and while O&M costs are difficult to assess, they are minimal with routinely
maintained energy systems (JICA, 2006). For this reason, “system fixed O&M costs” were
designed to provide sufficient funds for a full-time employee to manage, maintain, and provide
security for the community center; the wages would be $1/day, which is nearly twice the average
pay for villagers.
Using NPC, the hybrid optimal system configuration for this scenario consists of: a 0.5
kW PV array; a 1.5 kW diesel generator; five 200 Ah batteries; and a 1.5 kW converter. As
shown in Figure E.3, the initial capital costs are fairly evenly distributed amongst the PV array,
the diesel generator, and the battery bank. Annual O&M costs are primarily attributed to
operating the generator and maintenance wages. With the benchmark parameters, the software
calculates a yearly diesel fuel usage of 890 liters at a cost of $579 per year.3
2 These power generation sources were selected for a number of reasons: a diesel generator allows for either straight diesel or biodiesel fuel blends of any ratio to be evaluated (at least in theory), which conforms to the GOG's expressed interest in expanding the usage of Jatropha Curcas L. (see Chapter 6). Furthermore, PVs and diesel generators have been used extensively in similar applications in Northern Ghana. Other resources such as mini-hydro and wind were also investigated, but eventually determined to be either unrealistic or less effective for this particular application. (see Appendix 3) 3 A 1996 Global Environmental Facility report, which suggests rural electrification options for Ghana's Mamprusi East District, estimated the cost of a PV/Diesel hybrid electrification system would be $1.30/kWh for 834 houses. In this HOMER simulation, the cost of hybrid electricity is $1.088/kWh for the community center.

9
Figure E.3: Benchmark Optimization Cost Results
Financially Sustainable System Modeling (Chapter 8)
In order to create the optimal system of appliances and activities for the community
center, research was conducted using the HOMER software and villager’s desired electricity
needs, from data that were collected from the questionnaires. It is necessary that this system
comply with the sustainability rule, which states that the annual expenses of several aspects of
the generation system must be equal to or below the villagers' willingness-to-pay (WTP), and
DSM was employed to fulfill this goal. The annual costs for the generation system usually entail
replacement costs, operational and maintenance costs, and fuel costs. For this analysis, the fuel
costs were omitted overall and one simulation was conducted using only operation and
maintenance costs. A second simulation took into account both operation and maintenance costs
as well as replacement costs. The omission of fuel costs was done because there is reason to
believe that these costs can either be covered by Jatropha production, the extra income that the
villagers will have when they do not have to spend it on current fuel expenditures, or a
combination of the two. The WTP of the village as a whole is 720 USD/year. This was set as
the financial limit during the analysis.
Multiple simulations were conducted. The first simulation used ten point allocation data
and conducted sustainability analysis that required the village to cover only operation and

10
maintenance costs. It analyzed a schedule that allowed every appliance that at least 50% of the
villagers wanted. This went far beyond the village's WTP, and it was determined that a system
would have to include only the appliances that at least 80% of the villagers wanted if the system
is to meet the sustainability rule, and this would often allow the use of only lights for many of
these activities. It was therefore decided that a cost-benefit-index (CBI) must be used to curb
some of the more expensive appliances and allow for more variation in appliance usage. The
CBI analyzes the cost of the activity vs. the benefit of the activity (this benefit is derived from
the allocation preference data). Using the CBI, it was determined that the cooking stove, an
appliance that at least 80% of the villagers wanted, had the highest CBI and was therefore
removed from the appliance options. Once removed, an activity schedule was created that
adhered to the sustainability rule.
The second simulation was conducted using a sustainability criterion that required the
villagers to cover operation and maintenance costs as well as replacement costs. This simulation,
taking DSM into consideration, also omitted the cooking stove, which reduced the peak
electricity load. This simulation used several methods to increase the variation and availability
of appliances, and lower total system costs. Using allocation data for activity categories, the
percentage of the adoption criteria for popular categories was lowered, while for the less popular
categories it was raised, thus leading to the omission of the least popular categories. Simulation
II also conducted these percentage shifts within specific activity categories. Using different
combinations of these adoption criteria, twelve different patterns were created. This total
number of patterns includes Simulation I's 80% adoption criterion pattern, which includes the
cooking stove. Out of these twelve patterns, only six met the sustainability check used in
Simulation II (this sustainability check included replacement costs, which were not included in
the sustainability check for the first simulation).
Comparative analysis was then conducted on these six patterns, using the prioritization of
three demographic groups to determine the optimal system: elderly men, women, and the
wealthy. This comparative analysis found two optimal patterns. One pattern coincides well with
the priorities of elderly men and the wealthy, while the other coincides more with the priorities
of women. While it has been shown that empowering women, something that can be done by
giving them access to their desired priorities, is beneficial to communities at large, the pattern
that coincided with elderly men and the wealthy (those currently holding the power in the

11
village) allowed more varied use of the community center, and appealed to two as opposed to
one demographic group, and was thus tentatively determined to be the optimal activity schedule
for Mbanayili. However, more research is needed to ensure that this is the best choice.
Implementation Plan (Chapter 9)
Management of a multifunctional community center, where many individuals are free to
use the facilities at their digression, poses many challenges. The potential for opportunistic
behavior is high, as patrons will pay flat rates for service and deterrents to limit usage are absent.
Maintaining energy consumption within the constraints of the community center’s power
generation system is critical for long-term project success. Mbanayili is governed by local
community leaders who have indicated that they wield authority sufficient for regulating patron
usage effectively, as well as for deterring opportunism.
Having a trained technician to conduct operation and maintenance is integral to the
project's success. However, trained professionals in Ghana have a tendency to depart rural
communities for urban areas where their skills return higher wages. To compensate for this, a
sufficient wage will be offered to an individual with strong community ties, that is, someone who
will value contributing to the community's prosperity while receiving this wage. This person will
be required to complete a technical training program, which is available in the urban centers of
Ghana. Once trained, the responsibilities of this individual will include routine daily maintenance
of the energy system, security, management of patron usage, and dispute resolution.
In order to counter the difficulties in payment that have led to the demise of many other
rural electrification projects, this project suggests the implementation of monthly fixed prices
that correspond to the income levels of the villagers. The villagers are divided into three groups,
based on their income level and WTP, and prices are tiered accordingly. To allow flexibility to
the patrons and to guarantee the continuation of the community center's amenities, a group
payment plan, similar to a micro-finance scheme, may be applied. These informal payment
groups have proved successful in many rural areas of developing countries (Nagarajan and
Meyer, 2006).
While the optimal electricity generation system for Mbanayili, that is, one that can
accommodate all of their appliance priorities, uses PV arrays, batteries, and a diesel generator,
this system does not meet the sustainability check. It is not below the villagers' WTP. The system

12
that best accommodates their needs while remaining within their financial abilities uses only PV
arrays and batteries. A graduated implementation strategy is needed to successfully reach the
villagers' ideal electricity system (see Table E.1). This has been planned as a four-stage effort,
which employs Jatropha cultivation as a means of revenue generation, a plan that has been
successfully implemented by another project (Henning, 2004).

13
Table E.1: Implementation Plan Overview
The first stage of this plan focuses on harvesting Jatropha seeds and selling them in an
unprocessed form for revenue generation. The second stage expands these activities to include

14
oil extraction, which is then sold for increased revenue. At this point, the power generation
system is comprised of only a PV array. In the third stage, using the revenue from selling
Jatropha seeds and oil, as well as soap made from Jatropha, the village should be capable of
financially supporting a hybrid electricity generation system consisting of PV arrays and a
generator.4 From this stage onward, a fraction of the fuel costs for the generator will be offset by
the use of Jatropha fuel oil. The fourth stage will occur when Jatropha production and usage
leads to the villagers' electricity goals being fully met. If achieved, this strategy will culminate in
the villagers' attainment of their desired energy consumption, without surpassing their WTP at
any phase of the project’s implementation. Furthermore, this plan would spur economic
development and improve the villagers' overall quality of life by eventually providing annual
revenue of 1,832 USD and twenty-two job opportunities.
4 Significant evidence exists that supports the use of Jatropha biodiesel as a proxy for diesel. However, initial attempts to model unesterified Jatropha oil in a Lister-style engine were not successful because of the difficulty in determining an appropriate fuel efficiency curve for this obscure biofuel and engine. For this reason, and due to the fact that diesel can be procured more easily in Mbanayili, initial benchmark modeling parameters assume that the generator is fueled by diesel. (see Chapter 6 and 7 for details)

15
Chapter 1 Introduction: The Need for Rural Electrification in Ghana
1.1 Geographic Information and Main Socioeconomic Issues of Ghana
Republic of Ghana is located on the West African Coast with Cote d’Ivoire on the west,
Burkina Faso on the north, Togo on the east, and Gulf of Ghana (Atlantic Ocean) on the south5
as shown in Figure 1.1.
Figure 1. 1: Map of Republic of Ghana (CIA the World Factbook, 2007)
Ghana encompasses an area of 92,100 sq miles (239,460 sq km) (CIA the World
Factbook, 2007). The population in 2006 was 22,409,572 (CIA the World Factbook, 2007). The
country is divided into ten administrative regions – Ashanti, Greater Accra, Eastern, Northern,
Western, Brong Ahafo, Volta, Central, Upper East, and Upper West. The capital city of Ghana is
Accra, which is located in the Greater Accra region, and has an approximate population of
2,000,000 inhabitants.6 Each region has its own capital city, which can be seen in Figure 1.2.
Other information is shown in Table 1.1.
5 Data from http://www.info-ghana.com/general_info.htm. 6 Data from http://www.info-ghana.com/general_info.htm.

16
Figure 1. 2: Map Showing Regions and Cities in Ghana (Ghanaweb.biz, 2007)
Table 1.1: Facts about Ghana (CIA the World Factbook, 2007)
During the past 30 years, Ghana has encountered high inflation rates, high interest rates,
and a lack of economic development (IMF, 2003) However, its development is quite significant
during the past five years. The inflation rate has decreased from around 40% to 10%. The interest
rate has been lower from 30% to 15%. The annual economic growth increases from 4% during
the past twenty years to 6.2% in 2006 (World Bank, 2007). Ghana’s GDP per capita in 2006 is
2,600 USD, which is approximately one fourth of the world’s average GDP.7 31.4% of the
population has income below the poverty line.8 When considering only rural areas, 50% of the
population in rural Ghana is below the poverty line. The problem is more acute in three northern
regions: Upper East, Upper West, and Northern regions, with fractions of the population below
the poverty line in 1999 of 88%, 84%, and 69%, respectively (IMF, 2003).
7 World’s GDP as of 2006 is $10,000. 8 Poverty line is the minimum level of income required for achieving adequate standard of living.

17
As a consequence of being poor, several health problems are prevalent in Ghana. For
example, malnutrition among Ghanaian children is high, 26% nationally and 35% - 40% in the
northern area of the country (IMF, 2003). The infant mortality rate in 2006 was 5.52%.
Inadequate medical service is also one of the problems (CIA the World Factbook, 2007). In
1998, a quarter of baby deliveries were neither supervised by technical practitioners or
Traditional Birth Attendants. The figure for rural northern regions is approximately 30% (IMF,
2003). The reasons for not using medical services are due to high transportation costs. 20% of
people in urban areas and 61% of people in rural areas are more than thirty minutes away from
the nearest health facility (IMF, 2003).
Education problems also relate to poverty. In 2003, only 74.8% of Ghanaians who are 15
years of age or older can read and write (CIA the World Factbook, 2007). According to the
fourth Ghana Living Standard Survey (GLSS4) conducted in 1998, 32% of Ghanaians did not
attend school, and only 10% have completed secondary school or attained higher education. The
main reasons for not attending school are that 1) the schools are too far from their residence; 2)
they have insufficient funds to pay for the tuition; 3) they have to work at home instead; 4) they
have a perception that schools cannot provide them with skills they need (IMF, 2003).
In addition, pervasive poverty contributes to lack of access to developed energy sources.
Electricity accessibility is 60% nationwide, 60% - 77%9 in urban area, and 17% in rural area
(Ackom, 2003; JICA, 2006). Situations in the three northern regions are more problematic. On
average, 20% of the population in these regions has access to electricity. Furthermore, rural areas
in these regions experience a higher incidence of these problems. The electricity access is as low
as 10%. Due to lack of access to electricity, major sources of energy consumed are traditional
biomass (97%).10 The remaining 3% is from other energy sources, which include crop residue,
kerosene, liquidified petroleum gas (LPG), and electricity. The use of traditional fuel, such as
fuel wood and charcoal, also produces in-door air pollution, which leads to health problems,
namely, acute respiratory diseases (World Bank, 2000).
9 According to Ackom, 77% of population in urban area has access to electricity, while JICA’s data shows 60%. 10 Traditional biomass includes firewood (84%) and charcoal (13%).

18
1.2 Impacts of Rural Electrification on Poverty
Electrification has been identified of as a measure to improve standards of living and the
eradication of poverty (World Bank, 2000). According to the World Bank (2000), providing
electricity to rural communities can positively impact the region in numerous ways;
• Living standard:
o Electric lighting allows studying in late evening and at night.
o Electric lighting increases safety.
o Electrical appliances can facilitate routine works.
• Health:
o Electricity can replace traditional energy sources, which reduces adverse health effects
such as asthma.
• Local economy
o Electric lighting allows working in late evening and at night.
o Employment can be increased on both supply side and demand side.
Supply side: electricity generation system provides job opportunities to rural villages.
Demand side: it can create new local businesses by enabling the village to adopt
industries requiring electricity.
1.3 Research Objectives and Methods
As discussed above, modern energy services are vital to solve Ghana’s poverty issues,
particularly in rural areas. Electrification can improve living standards, facilitate education,
relieve health problems, and promote the development of local economies. Therefore, energy
modernization is recognized by the government as having a central role in the alleviation of
poverty. Realizing the benefits of electrification, the Government of Ghana has established a
plan for nationwide electrification. However, despite the governmental emphasis on
electrification, large portion of Ghanaians, mainly in rural areas, are still without electricity.
Thus, this project began by studying the problems of the stagnated electrification plan. The
causes of the problems were then analyzed. From the analysis, the project concluded that the
electrification policy of the Government of Ghana should be modified to promote and accelerate
electrification.

19
Therefore, to support rural electrification in Ghana, this project has attempted to develop
new concepts and approaches that are feasible and effective for promoting rural electrification.
To meet the project’s goal, field research conducted in summer 2006, interviews with
professionals in rural electrification, lessons learned from other rural electrification projects in
Ghana, and academic journal research have been utilized. Chapters 3 through 9 will explain the
logic, the processes, the findings, and the recommendations for rural electrification in Ghana.

20
Chapter 2: Background and Policy Analysis
2.1 Preface
In the spring of 2006, the authors conducted preliminary research on power sector reform
in Ghana to become familiar with the institutional players, the challenges facing the power
industry and the current reform initiatives. The following is that report in its entirety:
2.2 Introduction
Despite Ghana’s endemic electricity supply shortages and low quality service, no
significant infrastructure redevelopment has been initiated. Because it is a state-owned
monopoly, the sector has neither substantial incentive nor sufficient funding to improve
operations. Consequently, power sector reform has been proposed as a means of increasing
competition, improving the sector’s operational efficiency and effectiveness, and acquiring
investment from the private sector. (Edjekumhene, 2001)
The purpose of this chapter is to review the history and current status of Ghana’s power
sector and its reform initiatives as per the Government of Ghana’s (GOG) 1997 reform plan. The
study will then analyze how Ghana’s economic and political landscape will affect the success of
the proposed initiatives. This study will critique the relative merits and weaknesses of the reform
plan and its ability to satisfy its objectives. Finally, recommendations for effectively initiating
energy sector reforms will be proposed.
2.3 Pre-Reform History
Ghana’s power sector is a vertically integrated state monopoly governed by the Ministry
of Energy, which is responsible for policy development and coordination of the power sector
(Edjekumhene, 2001). The institutions involved are 1) Volta River Authority (VRA), which is
responsible for generation, transmission, and construction of the transmission system. The VRA
dominates generation as well as controls transmission and distribution activities; 2) Electricity
Corporation of Ghana (ECG), which is responsible for distribution of electricity in southern
Ghana; 3) Northern Electricity Department (NED), which is responsible for distribution of
electricity in northern Ghana; and 4) State Enterprise Commission (SEC), which acts as a
regulatory body. The SEC inspects state-owned corporations and companies. Also, to measure
the management performance of those organizations, the SEC sets benchmarks for every
organization's annual performance contracts.

21
Due to the heavy dependence on hydropower for Ghana’s electricity energy supply (99%
before 1992) (Edjekumhene, 2001), the prolonged droughts in 1983-84 and 1993-94, coupled
with growing demand, caused severe power shortages. Consequently, more generation,
transmission, and distribution infrastructure was required, as well as improvement of the existing
facilities to meet the increasing electricity demand and to upgrade the service quality. Therefore,
in 1993, the GOG planned to construct a 330 MW thermal combined cycle power plant and
sought funding from the World Bank. That same year, the World Bank, which had been a major
source of funding for Ghana’s power sector, announced they would not provide any further
funding unless recipient countries committed to reforming their power sectors. To achieve this,
the GOG is in dire need of private sector investment to maintain and improve the current
infrastructure. With few alternatives, the GOG agreed to satisfy the World Bank’s conditions to
create an economic environment that attracts private investors. The GOG demonstrated its
commitment for reform by establishing the Power Sector Reform Committee (PSRC) in 1994.
2.4 Current Situation
2.4.1 Generation Sector
Ghana’s installed capacity as of 2003 is approximately 1,652 MW. Although three
thermal plants have been installed, 65% of generating capacity (1,072 MW) remains from hydro-
electricity (hereafter hydro) (Ministry of Energy, Government of Ghana, 2003). Hydro
generation has posed significant problems as a reliable source of electricity due to periodic
drought and unsustainable water consumption practices. The primary turbines at Akosombo
produce 52% of the country’s total generating capacity. In 2000 this facility had a shortfall of
380 GWh, which was offset by imports from neighbouring Cote D’Ivoire. This facility is
currently under renovation to increase water reserves, a project that was slated for completion in
late 2006. The added generating capacity anticipated after the renovations are completed will be
108 MW. However, generation shortfalls are likely to continue as demand (5% growth per
annum) is expected to outpace the availability of water and/or newly installed capacity
(Edjekumhene, 2001). Due to anticipated sustained energy shortfalls, the GOG is attempting to
transition their fuel mix from one that is heavily reliant on hydro to one that is primarily thermal
based, reliant on natural gas. This transition will be facilitated by the construction of the West

22
African Gas Pipeline (WAGP), which will transport natural gas from the plentiful reserves in
Nigeria to Ghana.
The VRA is effectively a state run monopoly and solely owns all the generating capacity,
except for a joint thermal plant venture between the VRA and the privately owned firm CMS
(CMS Energy Co.). As a government run and vertically integrated organization in a non-
competitive market, it has little incentive to improve efficiency. The 1997 reform plans call for
the GOG to divest from the VRA, and for all other generating operations to open up the market
to independent power producers (IPP). The current market is not attractive to investors for
myriad reasons. The VRA is the main generation, transmission, and distribution company—
previous market entrants faced opportunistic behavior perpetrated by the VRA, such as restricted
access to transmission lines, high transmission prices, and restricted customer access, which
causes new entrants to be wary and reluctant to invest. One of the previously cancelled projects
is a power plant in Ashanti Goldfields. The VRA served as a significant barrier to the project's
completion because it restricted access to transmission lines and did not allow the new plant to
sell electricity to the VRA’s existing customers (ECA, 2003). Thus, the reform plan calls for the
unbundling of the VRA’s activities and divestment from thermal generation in the short-term,
with a long-term goal of having the GOG completely divested from all power sector operations.
The immediate unbundling of the VRA’s upstream activities will prevent the opportunistic
behaviours that are a major impediment to private sector investment. The unbundling and
divestiture of the VRA from the upstream operations would also make cost and tariff structuring
activities transparent.
To make the markets competitive, the VRA is looking to divest from all thermal
generating plants, while remaining the country’s sole hydro producer. New entrants are reluctant
to come forth, knowing their costly thermal generation will be competing with the government’s
inexpensive hydro operations. This will continue to be a significant barrier to the formation of a
competitive market until it is resolved. Also, current generating tariffs are revised infrequently
and do not reflect long run marginal costs, which has caused the VRA to place significant
financial burdens on the GOG in order to sustain operations (ECA, 2003). Furthermore,
persistently high levels of inflation continue to erode the real value of the tariffs. The GOG keeps
tariff prices artificially low, in part due to the political ramifications of passing the actual costs of
generation on to the public. A common mantra voiced by the public is “no electricity, no vote”

23
(Ahiataku-Togobo, 2003). This places political pressure on representatives seeking election to
provide the public with electricity, even if it is not economically viable.
Another aspiration of the reform plan is to initiate competition for long-term bilateral
contracts in the wholesale market. This will give more opportunity for new private generators to
enter the market. However, there are not a sufficient number of power producers and large
volume consumers to create a competitive market for these contracts. Potential IPPs would be
discouraged by the lack of available contracts, because all the large consumers have already
locked in to long-term agreements.
This problem is further exacerbated by the fact that even if credible investors were
identified for participation in existing generating facilities, there would only be five generating
plants in operation. However, in the short-term the GOG is only looking to privatize two thermal
plants. This is hardly fertile ground for a competitive market. With so few generating facilities,
there is a strong likelihood that a dominant firm would surface and potentially monopolize the
market, or collusive practices would transpire amongst the few existing firms. Despite growing
electricity demand in Ghana, it might take a number of years before enough demand and
installed capacity exist to allow for a competitive market.
2.4.2 Transmission Sector
Currently, the VRA is vertically integrated into the transmission network, which serves as
a major obstacle to the formation of a competitive market. Third party access (TPA) to
transmission must be assured to entice private sector investment in the wholesale market. Strict
regulations will be required to ensure both the transparency of the VRA’s operations and the
absence of the discriminatory and collusive practices that have transpired in the past. Stringent
accounting rules could be devised to achieve this, but currently no strong regulatory body has the
jurisdiction to oversee compliance (ECA, 2003). An even better option is to have the VRA
divest from its transmission assets altogether, assuring that it has no vested interest in these
operations. Though an independent transmission systems operator (TSO) would be best, a non-
discriminatory TPA agreement would be ideal in the short term, because of the substantial
amount of time and coordination it would take to successfully create a TSO. In the short-term,
clearly delineating regulatory roles amongst current government institutions and, as well as the

24
government's unconditional support for TPA rights, is critical if progress towards a competitive
market is to be achieved.
Previously, transmission charges were set at 0.09 USD/kWh, which was prohibitively
high to attract IPPs. There has been difficulty in accessing the true cost of transmission, but
recently the PURC has cut these charges by 50% (0.045 USD/kWh) to try to encourage interest
in market investment. However, the PURC will continue to have difficulty in assessing the
actual cost of transmission as long as the VRA is vertically integrated and maintains its lax
accounting rules.
2.4.3 Distribution Sector
Currently, there are two main electricity distributors in Ghana: the ECG and the NED.
The ECG distributes energy to the densely populated southern region of Ghana, where 80% of
electricity consumption exists, while the NED is responsible for supplying energy to the sparsely
populated north. The ECG and the NED are entirely owned by the GOG, despite attempts to
make these companies available to private investment. In 1997, the ECG was transformed into a
limited liability corporation, but due to poor financial health the GOG was unable to attract
investors and remains the sole shareholder. Both of these distribution companies have incurred
massive financial losses over the past decade, placing considerable economic strain on the
government (ECA, 2003).
The ECG customer base has increased steadily over the past five years at approximately
8%-10% per annum (ECA, 2003). The company’s financial losses have been growing over the
same period, with annual losses of approximately 27% during the period from 1999 to 2001
(Ministry of Energy, Government of Ghana, 2003). This can be attributed to a number of factors
(as per ECA 2003):
an archaic and inefficient transmission network
inaccurate billing and meter reading services (collection service is only 80% efficient)
(Ministry of Energy, Government of Ghana, 2003)
unlawful connections and unmetered customers, who account for 3.5% of the total
customer base, and
inaccurate and outdated metering system
25
Similar to the ECG, the NED has exhibited major operation losses over the past five years,
ranging from 25% to 30% annually. Its customer base has been growing by more than 14% per
annum (Ministry of Energy, Government of Ghana, 2003), in large part due to the mandate of a
government program, the National Electrification Scheme (NES). This program contributes to
the NED’s financial instability because of various mandates, in particular the “life line” subsidy,
which requires the NED to provide electricity to customers who pay flat uneconomic rates that
are inadequate to recapture generation and transmission costs. This government electrification
scheme was not intended to be economically viable, but rather devised as a tool to garner
political favour by improving the standard of living.
Despite the NES, there is still a low quality of distribution services—technical and non-
technical losses, and low access to electricity, particularly in rural areas. After it was
implemented, there were only minor improvements in network expansion and rural
electrification, due to both financial difficulties from operational inefficiencies, and a lack of
funds for increasing reliability and overall performance. Thus, for higher operational
performance and the acquisition of additional funding for capital improvements, private sector
participation has been proposed. The reform plan aims to attract private sector investment in five
individual distribution business units, with exclusive market territories, by separating the ECG
into four distribution areas and making the NED the other business unit under an ECG holding
company. The long-term goal is to have the business units fully privatized by investors (ECA,
2003).
However, dividing distribution service into five companies may result in market
territories insufficient for each business unit to remain solvent. This would undermine the
distribution companies’ credibility as off takers of electricity with emerging IPPs.
2.5 Electrification Programs: On-Grid and Off-Grid
In 1995 the GOG conceived of a strategy that “will have achieved a balanced economy
and a middle-income country status and standard of living” by 2020. If successfully
implemented, the Ghana: Vision 2020 plan (also known as Ghana 2020) will increase access to
healthcare, employment, shelter, and leisure. The distribution of benefits derived from this
progress will be allocated in an equitable manner with the intent of eliminating “gross
deprivation and hard-core poverty”. In broad terms, this will be achieved by “deriving

26
maximum productivity from the use of [Ghana’s] human and natural resources”, while
simultaneously observing “due regard [for] the protection of the environment” (Ministry of
Finance, Government of Ghana, 2000).
In advance of the Ghana 2020 initiative, the government was cognizant that promoting
electrification would be a priority if progress is to be achieved. In 1989, the NES was instated to
facilitate the expansion of the electricity supply to predominately rural inhabitants with the intent
to satisfy the achievements envisioned by 2020. Under the NES master plan, 4,221 communities
with populations exceeding 500 were determined to be ideal candidates for future electrification,
to be administered at some point over the project’s duration. The Self Help Electrification
Program (SHEP), initiated in 1990, was created with the expressed intent of fostering the aims of
the NES master plan. The SHEP functions by providing low voltage grid connection and in-
house wiring for 5,000 cedi per household if the community purchases the utility distribution
poles, and is situated no farther that 20km from the nearest grid connection. This initiative was
generally heralded as a success, because from the period from 1989 to 2000, national household
electrification in Ghana increased from 15% to 43%. Accolades aside, this program is not
without criticism: Payment default, especially by rural inhabitants, places considerable burden
on the project’s fiscal stability, which impedes investment in future network expansion (JICA,
2006). A lack of cohesive planning causes inefficient allocation of the distribution network. The
government obligation to provide grid connections to whomever purchases distribution poles
permits haphazard network connectivity, which in turn increases the overall cost of electrifying
particular communities (JICA member, Pers. Comm., 2006).
Where on-grid electrification solutions under the SHEP program are uneconomical or
technologically infeasible, distributed off-grid rural electrification schemes are also being
implemented in remote communities. Over the past decade, many of these projects have been
fraught with substantial technical and financial hardships, in part due to a lack of long-term
strategic planning. In the mid 1990’s the World Bank financially backed a program to assist in
the installation of battery recharge stations powered by photovoltaic arrays. Approximately
2,000 Solar Home Systems were installed, but unfortunately, at present a non-negligible fraction
of these systems have been rendered obsolete because many of these communities have since
received grid electricity (JICA member, Pers. Comm., 2006).

27
The Renewable Energy Service Project (RESPRO) was initiated in 1999, with financial
backing from the Global Environmental Facility (GEF), the Ghanaian Government, and the US
Department of Energy’s National Renewable Energy Laboratory. From its inception to the
present, the RESPRO has been accumulating budget shortfalls, despite implementing a fee-for-
service approach. The financial instability of the program is attributable to a number of factors,
namely, the high transaction costs associated with collecting payment, and the maintenance and
installation of PV systems in the sparsely populated northern regions of Ghana. The RESPRO
was initiated without adequate financial and strategic planning from the government, and without
the cooperation of existing utility companies. Insufficient operational funds available for
maintenance, coupled with a reactionary maintenance regime, culminated in many installed
systems becoming defunct. This further contributes to the lackluster perception Ghanaians have
of off-grid energy systems, which are often believed to be inferior to grid electricity. In 2002,
GEF funding for the project ceased, and now it is currently being restructured as an NGO
corporation (JICA, 2006).
In 1999, the Danish National International Development Agency initiated a program to
construct 14 battery charge stations, operational from 2000 to 2002. The EC conducted
operations beginning in 2003 and promptly transferred operational responsibilities to regional
assemblies in 2004. Regional assemblies were required to provide the EC with annual
statements outlining financial activities. These local agencies were expected to collect the
payments owed to the rural banks which subsidized operations, because excessive transaction
costs prohibited the banks from directly overseeing repayment schedules themselves. Recipients
of these loans (local agencies) provided creditors with deposits and made almost entirely no
effort to repay the principal. This culminated in the demise of the project, which is largely
attributable to the following factors: mismanagement and opportunistic behavior by local
agencies caused the funding apparatus to disintegrate, in part because the sum of the loans
overwhelmed local farmers with financial burdens they could not realistically repay; apparent
dissatisfaction in the quality of service enabled service recipients to harbor grievances against
collection authorities and justify defaulting on payments; rural communities in Ghana are
dictated by blood relationships, further compounding the ability of these agencies to recapture
payment from individuals (JICA, 2006).

28
The difficulties exhibited by the projects above further underscore the necessity for
comprehensive field research and long-term contingency strategizing for successful project
deployment. The Japan International Cooperation Agency (2006) has provided in-depth analysis
on these issues.
2.6 Regulatory and Pricing Structure
The GOG established two regulatory bodies in 1997: the PURC and the EC. This has
been the only progress made to date regarding the recommendations posited by the 1997 reform
plan (ECA, 2003):
The PURC regulates tariffs for all public utilities and the monitoring of performance
standards, enforces customer service obligations, and promotes competition.
The EC grants licenses to qualified operators in the energy sector and sets standards of
performance.
The assignment of the roles of the two regulatory bodies could be considered deficient. No
regulators have been assigned to oversee the development of the market and competition. There
is also overlapping and inconsistency in their respective roles; separating licensing and setting
standards of performance for tariff regulation lowers the electricity companies' ability to improve
efficiency. Although the PURC is responsible for the tariff regulation, it lacks the power to
impose the regulation, because it cannot adjust licenses. Moreover, the PURC can only monitor
standards, which are set by the EC, and recommend that the EC suspend or cancel licenses to
enforce standards. Finally, it is not clear who is responsible for setting the performance standards
for service quality.
2.7 Policy Analysis
As outlined above, the problems in the energy sector are myriad and interrelated. The
government has tried to solve them, but their solutions have not had significant impact. To
understand the lackluster results, the attributes of Ghana's energy market must be detailed. The
current electricity market in Ghana is bifurcated into two distinct sectors: on-grid and off-grid.
This study analyzes the two markets separately because they differ in the scale of investment and
the numbers of players involved. Similarly, to develop and enact effective policies, the GOG
should not treat these as a single market, but rather analyze and strategize for them independently.
Thailand has a similarly bifurcated market and provides a potential paradigm of policy and

29
action. The Thai government has established two organizations for managing the electricity
market and industry; one is for the urban electricity market and the other is for the rural market.
As a result, responsibilities are more clearly assigned to each organization, thereby allowing
them to achieve their goals effectively (Ministry of Energy, Government of Ghana, 2003).
2.7.1 On-Grid Market: Problems
To cope with on-grid market problems, the GOG has instated a plan that focuses on
creating market competition by attracting private investors through organizational reforms, such
as the divestiture of the VRA and the dividing of distribution system responsibilities amongst
five independent companies. However, even if competition emerges, these problems will persist,
because the tariff structure (price) does not reflect the actual costs of generation, distribution, and
transmission. Consequently, emerging businesses cannot acquire sufficient funds for improving
the management or infrastructure necessary for a thriving and stable on-grid market. This is
because electricity price is determined not by market mechanisms but rather by government
regulation. Therefore, the reform plan would not lead to any significant improvements, which
conforms to the World Bank's criticism that an artificially low price is the primary obstacle for
the on-grid market to overcome (ECA, 2003).
The current energy price set by the PURC is less than the competitive market price.
Therefore, the producer’s surplus has been decreased by the price control, which deteriorates the
performance of the power companies. The price control at the lower level transfers the surplus
from the producers to the consumers. If the consumers do not have enough disposable income for
purchasing electricity, this policy is useful. However, judging from the increase of electricity
consumption in the on-grid area, one can presume that some consumers do in fact have the
ability to purchase electricity at the higher price. One can discern this by noting that if the current
price were too high for consumers, there would not be an increase in consumption. Therefore, the
surplus may be currently disproportionately distributed to the consumers. That is, the current
price might be lower than the price that consumers have the willingness-to-pay.
To set the price appropriately, Economic Consulting Associates (Ministry of Energy,
Government of Ghana, 2003) insists that the market should be competitive. For the successful
implementation of a competitive market, the following criteria must be met:

30
Infrastructure must be well established: trying to introduce a competitive market in advance
of revamping the existing archaic power sector infrastructure is likely to prevent the
emergence of new entrants. The long-term investment and uncertainty required by private
investors to improve the infrastructure will likely present excessive risk to entice such
entities. Thus, a competitive market does not necessarily improve the current infrastructure.
Government supported improvement to the infrastructure is vital prior to the promotion of a
competitive market.
Each company must have the capabilities and resources to compete with competitors: if this
is not the case, a competitive market may bankrupt some companies, especially the smaller
ones, culminating in a monopoly or oligopoly.
Political acceptance: increasing the number of suppliers may exacerbate the utility
company’s ability to achieve profitable margins. Since available generation capacities
would be dispersed amongst many suppliers, their fixed cost would increase, because of the
reduced generation capacity remaining for each supplier, thereby diminishing achievable
scales of economy. Consequently, electricity prices would soar in the short-term to cover
the increased electricity generation costs. Despite the potential long-term benefits of a
competitive market (i.e., inducing more effective management), policies that increase
consumer prices in the short-term would garner little favor amongst politicians because of
the consequent unfavorable public perception.
If Ghana can effectively introduce a competitive market by meeting these criteria, the
overall health and stability of the energy sector institutions will improve. As of yet, these criteria
have not been satisfied. For instance, the current infrastructure, especially the transmission
network, remains substandard and a competitive market may discourage the power companies
from making the large-scale investments required for improvement. The existing power
companies are not in a situation conducive to instigating a competitive market, due to their large
debt that restricts necessary efficiency improvements. It is also not known if the price will rise
adequately after market deregulation to cover the actual cost of generation. If consumer price
concessions continue in consort with capital improvements, the performance of these companies
will worsen.

31
Altogether, considering the current market conditions, a competitive market would not
provide enough benefits: As discussed above, the government needs to take actions to solve
these issues before a competitive market is introduced.
2.7.2 On-Grid Market: Solutions
The low performance of the power companies is the chief problem of the energy market.
The companies’ large debts prevent improvement of electricity transmission quality and network
expansion. In economic terms, the producer surplus should be increased so that they have enough
financial resources to improve their own performance. There are two main methods to increase
producer surplus. One method is resetting the electricity price based on current supply and
demand, which would lead to a price increase. The other method is providing government
subsidies to energy producers in order to alleviate their production cost. Unfortunately,
government subsidies are unfeasible given their current financial condition. Alternatively,
resetting the electricity price is feasible and effective, because the enhanced price gives a portion
of the customer surplus to the producers without government expenditure. In addition, changing
the price based on current demand and supply levels leads to the maximization of social surplus.
Through increased producer surplus, power companies can improve their performance and the
infrastructure. However, this method should receive attention in terms of the price stability.
Electricity production in Ghana is unstable, owing to its dependence on hydropower, which is
greatly contingent on weather conditions. Thus, in cases of severe drought, electricity shortages
make prices soar. In this particular case, if the price is determined only by the demand and
supply, the consumers’ surplus could decrease dramatically, causing serious political concerns,
because of widespread electricity outages. Therefore, even if the price is determined by the
demand and supply, a price cap mechanism is still needed to control the price.
The government may feel that this policy is unfeasible, because a strong citizen
opposition to a higher price is expected. Thus, the government must convincingly explain the
current conditions to the public. High quality electricity and expanded transmission systems are
vital for improving the economy. To achieve countrywide economic development, the power
companies must be healthy. However, the current low prices are deteriorating the companies’
performance. As long as the citizens insist on low prices, the economy will not improve.

32
2.7.3 Off-Grid Market: Problems
Rural areas have the potential to be a future market, because the energy consumption in
rural areas has increased 14% per year in recent years (JICA, 2005). After the implementation of
the NES' mandates, there is an expected electricity market of 12,530 GWh (JICA, 2005). Despite
this, partly due to future uncertainties and the lack of government support, potential companies
are hesitant to enter the market. Their main concerns are the long-term economic potential of the
rural market, the uncertainty of future governmental policy/support (tax, subsidy, etc), and the
ability of customers to pay the actual cost of electricity production (ECA, 2003). To complicate
the situation, the government focuses solely on on-grid solutions for rural electrification. Though
the on-grid expansion is a powerful solution for electrification, because it can maximize
economy of scale, this is not feasible, due to the large investments required and the current
inefficacy of the myriad of small, fragmented markets. In particular, focusing solely on on-grid
solutions is not a cost-effective solution to achieve electrification in low-density areas. Due to
this, the current government policy creates market barriers for potential producers and limits the
expansion of the off-grid market.
2.7.4 Off-Grid Market: Solutions
To promote rural electrification, the government should change their policy from an on-
grid centered solution to an off-grid system. The small amount of initial investment necessary for
the off-grid system would remove market barriers for potential producers; the cost of satisfying
the electricity needs of rural inhabitants with off-grid systems is less than utilizing on-grid
generation systems (Geller, 2002). If the government makes clear policies, such as giving
subsidies to off-grid energy producers, this would foster market expansion.
Specifically, the government should remove two major uncertainties in the rural
electricity market, namely, the future market scale and profitability of off-grid business, because
these are the two most influential factors for new producers considering entering the market
(World Bank, 2006). First, in order to remove the uncertainty with regard to future market scale,
the government should show commitment to rural electrification. Even though the government
has established the NES, which promotes rural electrification, the achievement of the plan is
somewhat doubtful. If the government commits to its goal, the market barriers will diminish,
because potential producers can develop business plans based on an anticipated future market

33
scale, thereby reducing risk, but if the achievement of these goals in not realistic, risk and
uncertainty will remain. The government should also find a mechanism for guaranteeing the
minimum profitability of emerging businesses. There are two major risks regarding profitability:
the risk of future solvency for rural villages, and the uncertainty of future policies regarding cost-
covering subsidies. First, the solvency of villages has to be assured. Since both the local
governments and the consumers do not have enough financial capacity and purchasing power,
potential producers may face the risk of irrecoverable debt. Thus, a scheme to minimize the risk
needs to be developed. Second, the GOG should demonstrate long-term commitment regarding
subsidies for electricity generation. The effectiveness of subsidies for electrification has been
proven (JICA, 2002). If the subsidies were ensured in the long term, the market would attract
new entrants.
2.7.5 Reform Suggestions
To implement the policy measures stated above, the government has to prioritize them,
due to its limited resources. Firstly, on-grid market problems—companies' huge debts,
deadweight loss, and uneven distribution of the social surplus—should be addressed as soon as
possible. This is because price measures based on demand and supply do not require any further
government expenditure. In addition, this measure would have a large impact in comparison to
other measures, because the size of the existing on-grid market is far larger than that of the off-
grid. Thus, an on-grid market reform would bring a large surplus to both the government and the
companies. A surplus increased by this measure would contribute not only to the improvement
of the companies’ profits, but also to the government’s revenues, due to increased tax earnings.
Using financial resources from this tax, the government could remove the market barriers to the
off-grid market through the measures stated above. Using these means, the current power
companies could improve their performance, and potential producers would be encouraged to
enter the market.

34
Chapter 3: The Purpose and Scope of the Research
3.1 Overview
As mentioned in the previous chapter, electricity scarcity is more evident in rural areas of
Ghana, especially in the north. In addition, achieving the goal of the government’s electrification
plan (National Electrification Scheme (NES)) is doubtful because of an ineffective electrification
strategy, which focuses mainly on on-grid electrification. This can be costly in sparsely
populated areas, which is a common characteristic of rural Ghana. Successful implementation of
the NES is further compounded by insufficient governmental funds and the reliance on donor
assistance (JICA, 2006).
Renewable resources are considered to be a cost-effective alternative for providing
energy to remote and rural areas in developing countries, according to IEA (International Energy
Agency) (Ackom, 2005). Moreover, utilizing local and distributed renewable energy, as opposed
to hydropower which is insufficient for the entire Ghana’s electricity demand, strengthens energy
security of Ghana. Additionally, utilizing renewable energy minimizes adverse impact on the
environment. However, some past renewable off-grid electrification projects were not successful
because of their inability to cover electricity generation costs.
Therefore, to promote the NES, the government’s electrification strategy needs to be
altered. This project proposes a new approach for rural electrification, that is, sustainable rural
electrification strategy. The term "sustainable" is used in reference to two factors: 1) financial
sustainability, which maintains electrification costs within the local communities’ ability to
afford it, and 2) environmental sustainability, which aims to minimize environmental
degradation through the use of renewable energies. For the long-term success of rural
electrification, attainment of these two aspects of sustainability is paramount. In the study, the
new approach is introduced and analyzed using a case study.
Field research was conducted in a rural village in northern Ghana for three reasons: to
thoroughly understand the needs for electricity in rural areas, to collect specific data for precise
analyses, and to posit pragmatic solutions. Through the case study, financially and
environmentally sustainable electrification solutions were developed. In addition, the lesson
could be adapted for rural electrification projects in other localities to suit their energy sources
availability and social characteristics.

35
3.2 Project Approach
As discussed above, lessons from past projects show that the main cause of previous
projects’ failures is lack of financial sustainability. Taking into account insufficient government
fund for rural electrification projects and villagers’ inability to cover all requite costs, it is
evident that cost minimization is integral to successful project deployment. Given this
realization, the study focuses on cost minimizing measures from both a demand and supply
perspectives. For example, in some situations, benefit lost from reducing end-use consumption
would be lower than the cost to generate additional electricity to meet the need. Thus, by
understanding sensitivities of both demand and supply, an optimum generation system can be
designed (Redford (1994) supports this idea). The overview of the project approach is shown in
Figure 3.1.
Figure 3.1: Project Approach – Framework
3.2.1 Partial Electrification
First, the study focuses on the roles and functions of a community center in rural areas.
The center plays an important role in rural villages, by providing a community space for cultural
activities. Electrifying the community center would be able to provide many benefits to villagers.
In addition, considering insufficient financial resources of the Ghanaian Government and local
individuals, the electrification of all households is not feasible. Thus, to provide electricity access
to many villagers under current financial constraints, this project proposes a partial electrification
strategy, which initially only electrifies the community center. The partial electrification can
significantly decrease electrification costs. Also, providing electricity contributes to improve
WTP
PartialElectrification
• Demand Side Management
• Developing a fiscally sustainable system
Electrify the village’s community center
• Estimating people’s needs for electricity
• Modeling load curve
Demand Side
NoFiscal
Constraint
FiscalConstraint
Supply Side
Renewable energy potential (Jatropha)-Environmental sustainability
Generation system configuration(minimum cost system)
Chapter 5 Chapter 6
Chapter 7Chapter 8

36
people’s standard of living and develop the local economy (Reiche et al., 2000). Through this
strategy, there is potential for increasing villagers’ income, affluence and quality of life. After
improving income levels, if villages aim at electrifying all households, they can do so with their
own funds. In general, electrification is expected to increase people’s income levels. This is the
primary reasons that the government of Ghana promotes electrification. However, successful
implementation often requires a certain level of the villagers’ own income. A paradox exists
because the funds necessary for electrification are not available in advance of the economic
development it intends to spur. To solve this issue, the study suggests electrification should take
two steps; 1) partial electrification, to provide minimum access to electricity at present, and 2)
the electrification of all households in the future once the community is capable of covering
these costs (see Figure A.5.1 in the Appendix.).
Working with graduate students from the University of Michigan’s School of Arts and
Architecture (Mechtenberg, Buaku, 2006) (see Figure 3.2), the community center was designed,
consisting of four zones: multifunctional open area, a health clinic, a storage room for ancillary
equipment, and a rainwater cistern. The open area is capable of accommodating 100 people. All
activities except health-related ones will be in the open area. The storage room is for storing an
electricity generator, batteries, and other equipments and supplies. The enclosed room would be
utilized as the health clinic, which has equipment necessary for minor treatments and
vaccination. The water tank is for storing and purifying rainwater, which can be used by villagers
for drinking, washing clothes and cooking. The health clinic and the open area are the zones that
will be electrified to power various appliances. Consequently, the project focuses on people’s
needs and an electricity generation system only for these two facets of the community center.
Figure 3.2: Schematic Drawing of the Community Center
Health clinic Water tank Activity SpaceStorage

37
This project focuses on electrifying the health clinic and the open space of the community
center to find measures for cost-effective rural electrification measures.
3.2.2 Demand Side Analysis (Chapters 5 and 8)
The demand side analysis takes two steps. First, the study focuses on people’s potential
needs for electricity and estimation of electricity consumption to satisfy these needs. According
to our field research, the needs expected from electrification are health service development,
education facilities improvement, cultural enhancement, greater entertainment options, and
increased job opportunities and revenue generation. In the research, people’s needs for electricity
are quantified based on data elicited from interviews. This helps in estimating potential needs for
electricity. Next, for each of the activities that consume electricity, their time preference and
electric appliances needs are analyzed. After that, a demand model is developed and people’s
potential demand for electricity is calculated using this preference data. From the developed
demand model, their consumption patterns are analyzed and the points to control the demand are
identified.
Second, people’s electricity consumption is controlled by demand side management for
an electricity generation system that is affordable for villagers. To maximize villagers’ benefits
from electricity use under the financial constraint, their benefits are analyzed using people’s
preference data for electricity use. Then, the study proposes a financially sustainable system for
the village.
3.2.3 Supply Side Analysis (Chapters 6 and 7)
The supply side analysis aims at designing renewable electricity generation systems that
provide electricity to fulfill demand derived from the demand side analysis with minimum cost.
To lower investment for electrification, the project proposes an electrified community center for
the village. The community center is designed such that it provides space, basic electrical
amenities, and electricity in order to satisfy the villagers’ basic needs.
To fulfill the villagers’ basic needs, the community center described above would be a
lower cost alternative for electrification, compared to having every household electrified and
equipped with fundamental amenities. Firstly, the former option can avoid the cost of a power
distribution system. Secondly, total requirement for electrical appliances of the community
center is less than that of the latter option because people can share them thus reduce purchasing

38
cost. Thirdly, as all villagers use the community center as a common space, they can share costs
such as electricity generation cost and repair cost, resulting in less cost per person. Likewise,
electricity generating capacity and electrical appliances are utilized more effectively. Therefore,
in a poor rural area, electrifying the community center would be more financially feasible than
electrifying all households in a village. Another rationale for electrifying the community center is
a shorter completion time than electrifying the entire village. Since improving people’s standard
of living by electrification is an imminent issue to be solved, this benefit is not negligible. Lastly,
potential electricity demand of the community center can be easier to estimate than that of every
household because the research scope is limited, reducing the research cost and uncertainties.
3.2.4 A Case Study
Detailed data on rural Ghanaians’ demand for electricity is crucial for our project because
it contributes to better realization of people’s needs, thus more realistic solution. However,
there is currently no such data available. Consequently, the field research is vital to collect the
needed data. A rural village in northern Ghana is selected as the case study for the project. A
case study enables us to conduct field research to collect detailed and specific data on the village,
which is essential for a thorough understanding of people’s potential electricity demand and
consumption pattern. Moreover, we can specifically select renewable resources based on their
abundance in the area. As a result, we can customize the system such that it best satisfies the
villagers’ need for electricity and, thus increase benefits of electricity. In addition, detailed data
allows us to perform precise analysis. Consequently, the project can deliver a more informed
recommendation for the case study. Eventually, the project as a whole could serve as a model for
Ghana’s rural electrification plan.
From the next chapter, our new approach, shown in Figure 3.1, is discussed and analyzed.

39
Chapter 4: Field Research Overview
4.1 Overview of the Village and Its Energy Sources
Understanding the potential demand for electricity, electricity consumption patterns and
the size of investment needed for electrification are critical elements to develop an electrification
plan for rural Ghana. Available data regarding electricity consumption for rural Ghana, however,
is very limited (Constantine et al., 1999; Al-Alawi et al., 2002). To explore the potential demand
for rural Ghana and to make our models more realistic, field research was conducted in June and
July of 2006. A village, Mbanayili (Figure A.1.1 in the Appendix), which is not yet electrified,
was chosen from the northern part of Ghana because the electrification rate of the northern area
is quite low compared to other regions (JICA, 2004) (Figure 4.1). In addition, electrification of
this region has been determined as a site of critical importance by the Ghana government (JICA,
2005).
Figure 4. 1: Electrification Rate of Ghana in 2005
Mbanayili is located about 15km northwest from Tamale, the largest city in the northern
Ghana, and approximately 7 km from the nearest electricity grid. The local language is Dagbani.
Despite Ghana’s national language being English, only a few villagers spoke it. According to one
of the village leaders, Mbanayili has 1,000 households and 4,050 residents. Annual birth rate is
approximately 1.5%, which is lower than the Ghana’s average: 3%11. There are two seasons: the
rainy season, from May to September, and the dry season, from October to April. The average
11 Data from Geographic.org: http://www.theodora.com/wfbcurrent/ghana/ghana_people.html.
SouthUrban
Ruralarea
NorthRural
60%
20% 10%
40%
80% 90%
with
Ele
ctric
ity
% population
SouthUrban
Ruralarea
NorthRural
60%
20% 10%
40%
80% 90%
with
Ele
ctric
ity
% population

40
monthly income is 147,661 cedis (16.4 USD12) for men and 57,453 cedis (6.4 USD) for women,
according to the field research (national monthly average income: 24.2 USD (2002)13).
The energy sources in the village were fuelwood, charcoal and kerosene, which are used
mainly for lighting or cooking (see Figure 4.2). These energy sources consume 85% of the
income of people living in Mbanayili (Figure 4.3). The remaining 15% of people’s income is
allocated to other purposes, such as clothing. Note that since many workers are farmers, they do
not need to pay for food.
Figure 4. 2: Purpose of Energy Consumption by Energy Source
Figure 4. 3: Share of Each Energy Cost in Income
Mbanayili villagers may pay for energy more than the people in neighboring villages,
because they do not need to pay rental fee to land owners owing to the policy of Mbanayili’s
chief (Alhassan, Pers. Comm., 2006).
12 The exchange rate is 9,000 cedis / USD (July, 2007). This exchange rate is used through all chapters. 13 Data from Ghana Homepage: http://www.ghanaweb.com/GhanaHomePage/economy/statistics.php
0% 20% 40% 60% 80% 100%
Kerosene
Charcoal
Fuelwoods 94%Lighting
82%Cooking
98%Cooking
Share of each purpose
Other purposes 6%
18%
2%
0% 20% 40% 60% 80% 100%
Kerosene
Charcoal
Fuelwoods 94%Lighting 94%Lighting
82%Cooking 82%Cooking
98%Cooking 98%Cooking
Share of each purpose
Other purposes 6%
18%
2%
Charcoal24%
Kerosene23%
Others15%
Fuelwood38%
Charcoal24%
Kerosene23%
Others15%
Fuelwood38%

41
4.2 Interests and Problems of Mbanayili
Through the interviews and observations, two salient problems were observed. According
to one of the leaders of Mbanayili, a prominent problem for the village is a lack of staffed
healthcare and educational facilities. He said, “Although they have one building for a hospital,
neither a nurse nor a doctor is there on any regular basis.” A nurse comes by the village mainly
for pediatric care only a few times a month. In addition, he said, “there are not enough
classrooms for students.” When the research was conducted, the students of a class had studied
outside. There was a general lack of educational infrastructure.
Villagers’ desire for electricity was great because they anticipate that it will solve many
of their problems. For example, a resident said, “if we have electricity and lighting, we can have
another class at night in the school.” They think electrification will improve their standard of
living and facilitate job creation (Alhassan, Pers. Comm., 2006).
4.3 Introduction of the Field Research
To understand the potential needs for electricity, a questionnaire was designed to elicit
information from the villagers in a consistent manner. It is comprised of two parts: 1) basic
information, such as gender, occupation and income, and 2) preference for electricity use,
including a) activity preference – which activities, such as watching television, having a party
and cooking, are preferred, b) time preference – what time these activities are desired to occur,
and c) electrical appliance preference – what kind of electrical appliances are preferred for these
activities (Table A.1.1 in the Appendix). In order to elicit the much needed information,
interviewing was determined to be the ideal method because most people could not read and
write English. The questions were asked in the local language through interpreters. By random
sampling, 133 residents (men: 94, women 39), who all were above 15 years old, were selected
and interviewed. (Note: At the time the interview was conducted, a funeral required the help of
many women. Thus, the number of female interviewees is substantially less than the number of
male interviewees. As seen in Chapter 5, since women’s preferences for electricity are different
from men, the results might be somewhat skewed).
The share of the people who were interviewed, out of all people of 15 years old or above,
is 5.4%. Basic data of the respondents is as follows.

42
Figure 4. 4: Basic Information of the Respondents
4.4 The Steps of the Case Analysis
In Chapters 5 to 8, this case is analyzed to explore the efficient electrification method. To
begin with, the preferences of electricity consumption and potential demand for electricity in
Mbanayili are analyzed and determined using the interview data. Then, the consumption patterns
are modeled based on the preferences and the resulting demand patterns (Chapter 5). Using the
model, an optimum generation system is designed to provide both cost effective and reliable
electricity production utilizing HOMER, software developed by National Renewable Energy
Laboratory (NREL, USA) (Chapters 6 and 7). After that, the potential for Mbanayili residents to
purchase electricity is measured by their willingness-to-pay. Through comparing the required
cost for the optimum generation system with the residents’ willingness-to-pay, disparities
between their ideal electricity demand and the ability for them to pay for it, are identified. Lastly,
measures to control electricity consumption to meet Mbanayili’s financial constraint are
developed with the intent to maximize the people’s benefit of electricity usage (Chapter 8).
Carpentor
Construction
Marketing
Mechanics
Student
Other
Micro Enterprise
Trading
Processing of crops
Agriculture
2(2%)
2(2%)
2(2%)
2(2%)
2(2%)
5(4%)
8(6%)
9(7%)
18(14%)
83(62%)
0 20 40 60 80 100
No of persons
By occupation
less than 10,000
less than 50,000
less than 100,000
less than 150,000
more than 150,000
By income(cedi)
5(4%)
25(19%)
48(36%)
26(20%)
29(22%)
0 10 20 30 40 50 60No of persons
Men, 9471%
Women, 3929%
Total 133 residents
By gender By age
0
10
20
30
40
50
60
70
11
58
40
16
61 1
<20 <30 <40 <50 <60 <70 <80
No of interviewees
Carpentor
Construction
Marketing
Mechanics
Student
Other
Micro Enterprise
Trading
Processing of crops
Agriculture
2(2%)
2(2%)
2(2%)
2(2%)
2(2%)
5(4%)
8(6%)
9(7%)
18(14%)
83(62%)
0 20 40 60 80 100
No of persons
By occupation
less than 10,000
less than 50,000
less than 100,000
less than 150,000
more than 150,000
By income(cedi)
5(4%)
25(19%)
48(36%)
26(20%)
29(22%)
0 10 20 30 40 50 60No of persons
Men, 9471%
Women, 3929%
Total 133 residents
By gender By age
0
10
20
30
40
50
60
70
11
58
40
16
61 1
0
10
20
30
40
50
60
70
11
58
40
16
61 1
<20 <30 <40 <50 <60 <70 <80
No of interviewees

43
Chapter 5: Potential Demand Analysis
5.1 Overview of Potential Demand Analysis
In general, electrification plans mainly focus on the supply side, including generation
technology, capacity and investment. This is because: 1) cost is the main concern for the
institutions, and 2) the outcome is usually measured by electrification rate in a village/region
(e.g., National Electrification Scheme of Ghana). The electrification plans are designed with an
emphasis on cost-effectiveness due to limited financial resources. Therefore, the governments’
primary concerns are price and durability of the generation system, including generators,
batteries and solar panels. In addition, governments place importance only on providing
electricity, because increasing the electrification rate is their primary goal.
The supply-side-centered electrification plan, however, has problems. For example, past
rural electrification projects in Ghana (e.g., World Bank’s project (SHS)) could not contribute
well to the rural development. One of the reasons would be that the project did little to consider
people’s affordability to pay for electricity and their technical capability of maintaining the
generation system, thus the households’ use of electricity were very limited or electricity
provider cannot cover all costs (a member of JICA, Pers. Comm., 2006). As a result, the
electrification cost was not recovered and the generation systems were deserted. If the people’s
needs, affordability and capability were well realized, the appropriate size generation system
could be designed for them.
Thus, to provide an optimal generation system to Mbanayili, this study focused on the
demand side before designing an optimal generation system. In this chapter, to begin with,
villagers’ potential need for electricity is estimated. Then, based on the results of potential
demand analysis, electricity consumption patterns and load curves are modeled. Using the load
curve models, in the next chapter, an optimum generation system for the village will be
configured.
5.2 Knowledge of Electrical Appliances
Before electricity demand in Mbanayili is explored, the study analyzed people’s exposure
of electrical appliances. Since Mbanayili is only 15 km from Tamale, the largest city in northern
Ghana, many people in the village had seen many electrical appliances (Figure 5.1-A). However,

44
Mbanayili people had rarely ever used them (Figure 5.1-B), partly because most electrical
appliances did not exist in Mbanayili with the exception of radios powered by battery.
Figure 5. 1: A) Respondents’ Exposure (left) and B) Experience (right) for the Appliances
As shown in Figure 5.1, more than 90 percent of the people had seen all electrical
appliances except for computers. Most of the people probably had seen these appliances in
Tamale. Since these appliances were displayed outside of the stores in the city, pedestrians had
opportunities to see them. This result suggests that the interviewees can realize benefits from
using these appliances. In contrast, only less than 20 percent of the people in Mbanayili had used
the appliances other than radios. Interestingly, though several radios were found in the village,
17 percent of the residents, mainly women, had no experience using them.
Furthermore, two correlations were observed. One is a correlation between income and
experience using the appliances and the other between income and the exposure to the
appliances. As seen in Figures 5.2 and 5.3, average incomes of people who have seen computer
or have used television are higher than those of the people who have never seen or used them.
The income difference by computer exposure is statistically significant (Television experience:
p=0.287, Computer exposure: p=0.01914). The probable reason is that the people with higher
income visit Tamale more often where they can see and use a variety of electrical appliances.
14 The means of two groups were compared by t-test.
99%
97%
98%
94%
96%
78%
96%
0% 20% 40% 60% 80% 100%
Radio
ElectricLamp
Fan
Fridge
TV
PC
Cell phone
83%
4%
7%
2%
19%
2%
3%
0% 20% 40% 60% 80% 100%
Radio
ElectricLamp
Fan
Fridge
TV
PC
Cell phone
99%
97%
98%
94%
96%
78%
96%
0% 20% 40% 60% 80% 100%
Radio
ElectricLamp
Fan
Fridge
TV
PC
Cell phone
83%
4%
7%
2%
19%
2%
3%
0% 20% 40% 60% 80% 100%
Radio
ElectricLamp
Fan
Fridge
TV
PC
Cell phone

45
136
115
0
20
40
60
80
100
120
140
160
Y N
Figure 5. 2: Average Monthly Income of People with (Y) and without (N) TV Experience (unit: 1,000 cedis)
129
82
0
20
40
60
80
100
120
140
Y N
Figure 5. 3: Average Monthly Income of People with (Y) and without (N) PC Exposure (unit: 1,000 cedis)
5.3 Preference Analysis
5.3.1 Research Method
In general, government planners focus mainly on consumption behavior with electrical
appliances to estimate potential electricity consumption (e.g., Al-Alawi et al., 2002). To explore
potential demand more precisely, this study, however, focuses primarily on people’s preference
for activities that consume electricity in the community center. Since people in Mbanayili have
not used many kinds of electrical appliances (Figure 5.1-B), their preferences for appliances may
not well represent their potential demand for electricity. In other words, people may not be able
to judge their own preferences for each appliance correctly. Surveying people’s preferences for
activities, however, would help them to know their potential electricity demand. For example, if
people are asked how long they want to use a stereo, they may not accurately estimate their own
needs for it. However, if they are asked these two questions: 1) how long would you like to have
a party, 2) which electrical appliances do you want, such as refrigerator, stereo and fan for the
party, they can answer their preference more precisely. This is because people already know

46
what a party is like, thus can easily imagine how much a stereo makes the party more fun.
Therefore, in this chapter, people’s activity preferences are analyzed first.
Activities in the community center were listed through a discussion with a local volunteer
before interviews (Table 5.1). As seen in the figure, the listed activities were categorized into six
areas: entertainment, culture, education, healthcare, business and communication and others.
Using this list, two types of surveys: 1) category preference survey and 2) activity preference
survey, clarified people’s preferences for electricity use. Table 5. 1: Category - Activity List
1) Category Preference Survey
First, preference for each category was asked. People in Mbanayili allocated ten points to
preferred categories to show their category preferences. To know their priority and importance of
these categories, this question was addressed in three steps. At the first step, people were asked
to allocate three points to preferred categories to show their highest priority. Second, they
allocated another two points to the next prioritized categories. Finally, the remaining five points
could be allocated to any preferred categories. People were allowed to allocate more than one
point to a category at each step. Based on this rule, for example, five people gave two points for
the entertainment category at the first step. The allocated points of each respondent were scored
at each step.
This category preference survey consisting of three steps could reveal the transition of
people’s preferences. For example, the result of the first step showed the most important
categories for electricity use. In other words, these categories need to be prioritized for people’s
electricity use. In contrast, categories that people chose at the third step represent the preferred
categories in case that they have plenty of electricity. As discussed below, people chose different
categories at each step, showing the transition of the preferences.

47
2) Activity Preference Survey
Second, eight questions were used to understand people’s preference for each activity
(see Table 5.2). For example, respondents answered which activity, watching television or
having a party, is preferred in the entertainment category (Question1). To accurately measure the
activity preference, two pieces of information were provided: 1) pictures of activities to aid their
identification and 2) the amount of time that each activity can be maintained using the same
amount of electricity (See Table A.5.1 in the appendix). For example, people were asked to
choose 60 minutes of attending a party or 100 minutes of using a computer (Question 7 in Table
5.2). Thus, both interests for the activities and the activities’ durations influenced the people’s
choice. Table 5. 2: Questions for Activity Preference Survey
5.3.2 Research Results
5.3.2.1 Category Preference Survey – Overview of the Results
Through the three steps of the category preference survey, 126 allocation patterns were
found from 133 respondents. In other words, only seven persons’ allocation patterns were the
same as others (five villagers’ allocation patterns were exactly same). Table 5.3 shows the
allocation pattern of the five respondents. At the first step, they allocated points to healthcare,
culture and education categories. Then, another two points were allocated to business &
communication and others categories at the second step. Finally, all categories except
entertainment category received one point each at the third step. Table 5. 3: Allocation Pattern – Sample

48
The fact that many allocation patterns were found represents a variety of people’s
category preferences. Category preference analysis, however, could find people’s tendencies
among the diversified preferences. In this part, after interpreting these results, category
preference was analyzed by attributes, such as gender and age.
5.3.2.2 Category Preference Survey – First Step
Figure 5.4 shows the results of the first step’s point allocation. As seen in the figure,
healthcare and education categories were the highest prioritized categories. 42% of the
interviewees chose both categories at this step. According to a local volunteer, local radio
programs might be influencing people’s preference for these categories, because the radio
programs had often emphasized the importance of improving healthcare and education
(Alhassan, Pers. Comm., 2006).
Figure 5. 4: First Step: Three-Point Allocation – the Share of the Allocated Points (%)
5.3.2.3 Category Preference Survey – Second Step
As seen in Figure 5.5, culture and others categories received more than 20% of the points
as second priorities. Interestingly, 80% of the people selected at least one category from these
three, namely, culture, business and others. In addition, 32% of them chose two from those
categories. This finding suggests that the people’s second priorities were different from the first
ones. In other words, they prefer to use electricity for more variety of activities, if more
electricity is provided.
Entertainment
14.5%
Healthcare22.3%
Culture9.3%
Education26.1%
Business &Communication
17.8%
Others10.0% Entertainment
14.5%
Healthcare22.3%
Culture9.3%
Education26.1%
Business &Communication
17.8%
Others10.0%

49
Figure 5. 5: Second Step: Two-Point Allocation – the Share of the Allocated Points (%)
5.3.2.4 Category Preference Survey – Third Step
The third step’s result revealed the category preferences given the least constraint in
electricity availability. As observed in Figure 5.6, people allocated the points more equally to
each category than the first and second steps. This result suggests that people’s preferences are
more diversified as more points are given to the interviewees.
Figure 5. 6: Third Step: Five-Point Allocation – the Share of the Allocated Points (%)
Figure 5.7 shows the allocation of accumulated points across three steps. The tendency
between three steps and diversity of people’s preference is clearly observed in this figure. For
example, points were disproportionately allocated to each category at the first step. Education,
the most popular category, received approximately three times more points than culture, the least
preferred category (Education: 26%, Culture: 9.3%). This difference between the most and the
least popular categories becomes smaller at the second step (Education: 21.2%, Entertainment:
13.3%) and more at the third step (Healthcare: 19.1%, Entertainment: 13.9%).
Entertainment
11.3%
Healthcare15.0%
Culture22.2%Education
13.9%
Business &Communication
16.5%
Others21.1%
Entertainment
11.3%
Healthcare15.0%
Culture22.2%Education
13.9%
Business &Communication
16.5%
Others21.1%
Entertainment14.5%
Healthcare18.8%
Culture16.6%
Education16.3%
Business &Communication
18.5%
Others15.3%
Entertainment14.5%
Healthcare18.8%
Culture16.6%
Education16.3%
Business &Communication
18.5%
Others15.3%

50
Figure 5. 7: Category Preference Across Three Steps
In addition, Figure 5.7 revealed other two interesting results. First, across the three steps,
the health and education categories were always either the first or the second important
categories. Second, business was the third most popular category at every step. Two comments
from the volunteer help to understand the finding: “People expect electrification not only to
improve people’s standard of living but also to create new jobs”. “Currently, Mbanayili has only
one small shop with limited variety of products. Thus, people’s needs are not well satisfied in the
village.” From these comments, the people might expect that the economic development by
electrification will provide a larger store for the people to meet their needs.
5.3.3 Category Preference – by Attributes
To better understand the category preference for electricity, the preference data were
analyzed according to four attributes: 1) gender, 2) age, 3) income, and 4) distance. Tendencies
of the people’s preferences were found from this analysis. Category preference data from the
first step was used for this analysis as clearly representing people’s preferences. The results from
this analysis are inputs for the financial sustainable system modeling (Chapter 8). This section
discusses the tendencies of the people’s preferences by attributes.
14.6% 13.3% 13.9%
22.2%19.4% 19.1%
9.3%
14.4% 15.5%
26.0%
21.2%18.8%
17.9% 17.4% 17.9%
9.8%
14.2% 14.8%
0%
5%
10%
15%
20%
25%
30%
First Step(3 points)
First + Second(5 points)
First + Second +Third(10 points)
Entertainment Healthcare Culture Education Business & Communication Others
14.6% 13.3% 13.9%
22.2%19.4% 19.1%
9.3%
14.4% 15.5%
26.0%
21.2%18.8%
17.9% 17.4% 17.9%
9.8%
14.2% 14.8%
0%
5%
10%
15%
20%
25%
30%
First Step(3 points)
First + Second(5 points)
First + Second +Third(10 points)
Entertainment Healthcare Culture Education Business & Communication Others

51
1) Gender
As seen in Figure 5.8, women have relatively stronger preferences for the education
category than men do, though it was not the significant difference (p=0.78915). Given their role
in taking care of children, women might perceive the importance of education for their children’s
future. In contrast, men were more likely to allocate their points to healthcare category than
women (p=0.19716). As a possible reason, farmers -88% of men’s occupation- often require
treatment for injuries resulting from their work.
Figure 5. 8: Category Preference by Gender
2) Age
Four correlations between age and category preferences were found (Figure 5.9). First,
younger people were more interested in the education category than older people (p=0.23417).
The percentage of the points allocated to the education category increases from 19% to 33% as
people’s age decreases. Second, younger people are more likely to choose the business category
(p=0.19618); they appear more interested in economic activities.
15 The means of two groups (“male” and “female”) were compared by t-test. 16 The means of two groups (“male” and “female”) were compared by t-test. 17 The means of four groups by age were compared by one-way ANOVA. 18 The means of four groups by age were compared by one-way ANOVA.
16%
14%
18%
24%
5%
11%
29%
24%
19%
17%
13%
9%
0% 20% 40% 60% 80% 100%
Female
Male

52
Figure 5. 9: Category Preference by Age
Third, older people were more attracted by the culture category (p=0.31719). It is
probable that they thought cultural ceremonies are important for their society. Lastly, though the
entertainment category was not popular for the people of three generations, only the people who
were forty years old or above were interested in using electricity for entertainment activities
(p=0.02220).
These analyses of the category preference by age showed contrasting results. Older
people placed the importance on entertaining and their current life, while younger people focused
on improving future life. As seen in Figure 5.9, the entertainment category was the most popular
for the generation of 40’s and more (22%), while the education category was the most popular
for teenagers (33%). These results reflect the people’s life expectancy. In other words, older
people are likely to demand short-term benefits, while the younger have long-term point of view.
3) Income
Figure 5.10 reveals three tendencies. First, lower-income people were more likely to
focus on the education category. People with an annual income of 50,000 cedis or less allocated
30% of their points to this category, while people with the income of more than 150,000 cedis
allocated only 22% of their points. In contrast, higher-income people were more likely to prefer
the culture and entertainment categories. The results suggest that the people realized the
importance of education for the improvement of their economic status and incomes. Thus, people
with lower income preferred this category to want to improve their living standards. In contrast, 19 The means of four groups by age were compared by one-way ANOVA. 20 The means of two groups (“10’s – 30’s” and “40’s and more”) were compared by t-test.
Entertainment OthersBusiness &
CommunicationEducationCulture
Healthcare
15%
12%
13%
22%
27%
19%
26%
21%
3%
9%
10%
13%
33%
27%
26%
19%
21%
21%
17%
11%
0%
13%
8%
10%
0% 20% 40% 60% 80% 100%
15%
12%
13%
22%
27%
19%
26%
21%
3%
9%
10%
13%
33%
27%
26%
19%
21%
21%
17%
11%
0%
13%
8%
10%
0% 20% 40% 60% 80% 100%
10's
20's
30's
40's & more

53
high-income people preferred using electricity for entertaining. Therefore, the entertainment and
culture categories were more important for people with higher income. In addition, people’s
knowledge of electrical appliances might influence their preferences. In other words, high-
income people could more perceive the benefit provided by entertaining activities. As seen in
Figure 5.11, since higher-income people have more experience of using television, they could
realize the benefit from the entertainment activity.
Figure 5. 10: Category Preference by Monthly Income
10.0%12.5%
19.2%
37.9%
0%
10%
20%
30%
40%
less than 50000 less than 100000 less than 150000 more than150000(cedi)
Figure 5. 11: Experience of Watching TV by Monthly Income
4) Distance from the Community Center
Distance between people’s houses and the community center influenced their
preferences. For example, as shown in Figure 5.12, people who live far from the community
center preferred the education category (p=0.20121). Since their houses were also far from the
21 The means of four groups by distance were compared by one-way ANOVA.
(cedi)
13%
12%
17%
18%
17%
25%
24%
21%
4%
10%
9%
13%
30%
27%
23%
22%
18%
16%
19%
20%
18%
8%
8%
7%
0% 20% 40% 60% 80% 100%
less than 50000
less than 100000
less than 150000
more than 150000
Entertainment OthersBusinessEducationCultureHealth

54
school of Mbanayili, they expected electricity to improve the current educational environment.
On the other hand, people living close to the center preferred using electricity for entertainment
(p=0.11022). They have more opportunities to get information regarding electrical appliances
such as television and TV programs through only one main road connecting Mbanayili to Tamale
and other villages. Such information, brought to the center of the village, could potentially
generate the interest for television in people living near the center. As illustrated in Figure 5.13,
people who live near the community center have more knowledge about computer than those
who live far from the center (p=0.08823).
Figure 5. 12: Category Preference by Distance to the Community Center
87.9% 87.5%76.7%
66.7%
0%
20%
40%
60%
80%
100%
<20m <50m <200m >200m
Figure 5. 13: Knowledge about PC by Distance to the Community Center
5.3.4 Activity Preference Survey – Overview of the Results
To measure people’s activity preference, respondents were asked to choose one preferred
activity from each pair of activities (Table 5.2). First, as Figure 5.14 shows, in five questions, 22 The means of four groups by distance were compared by one-way ANOVA. 23 The means of four groups by distance were compared by one-way ANOVA.
20%
17%
10%
12%
22%
19%
23%
22%
10%
13%
8%
8%
21%
24%
29%
28%
18%
19%
21%
14%
8%
8%
9%
12%
0% 20% 40% 60% 80% 100%
<20m
<50m
<200m
>200m
Entertainment OthersBusinessEducationCultureHealth

55
more than 80% of the people chose one activity. These preferred activities, namely cooking,
markets and studying (class) activities are related to people’s fundamental needs such as eating,
buying/selling (economic activity) and studying, while less popular activities are related to
entertaining or making their lives more comfortable. The results indicate that people preferred
using electricity primarily for the fundamental needs. This finding is consistent with the result of
the first step’s point allocation in the category preference survey. Specifically, people primarily
chose the categories of healthcare, education and business as satisfying their fundamental needs.
Figure 5. 14: Activity Preference between Pairs of Activities (1/2)
On the other hand, when comparing two activities for entertaining people’s life, the study
indicated the divergence of people’s opinion. For example, as shown in Figure 5.15, about 40%
of people preferred using personal computer, while 60% chose the party activity. This result
suggests that people do not always have same preferences in the village, when activities with
similar characteristics are compared.
Figure 5. 15: Activity Preference between Pairs of Activities (2/2)
In the following section, the study further explores these divergences to better understand
people’s preferences.
96.2%
88.0%
91.0%
89.5%
18.8%
3.8%
12.0%
9.0%
10.5%
81.2%
Markets
Studying(Class)
Markets
Cooking
PC
Cell phonecharging
Free Space
Free Space
Free Space
Studying(Class)
0% 20% 40% 60% 80% 100%% of supporters
96.2%
88.0%
91.0%
89.5%
18.8%
3.8%
12.0%
9.0%
10.5%
81.2%
Markets
Studying(Class)
Markets
Cooking
PC
Cell phonecharging
Free Space
Free Space
Free Space
Studying(Class)
0% 20% 40% 60% 80% 100%% of supporters
TV
TV
Parties
0% 20% 40% 60% 80% 100%
63.9%
69.9%
60.2%
36.1%
30.1%
39.8%
% of supporters
Parties
PC
PC
TV
TV
Parties
0% 20% 40% 60% 80% 100%
63.9%
69.9%
60.2%
36.1%
30.1%
39.8%
% of supporters
Parties
PC
PC

56
(a) Party (60.2%) vs. Personal Computer (39.8%)
The preferences by age show an interesting finding. As seen in Figure 5.16, only
teenagers strongly preferred using a computer to having a party (though it was not proved
statistically because of the sample number of teenagers is very small (p=0.56124)), since they
were probably more interested in new technology and up-to-date electrical appliances. Figure
5.17 explains teenagers’ strong interest about using computer. More than 90% of the teenagers,
which is the highest among all generations, already have seen computer.
Figure 5. 16: Comparison between Party and Personal Computer by Age
90.9%81.0% 80.0%
60.9%
0%
20%
40%
60%
80%
100%
10's 20's 30's 40's and older
Figure 5. 17: Exposure of Personal Computer by Age
24 The means of two groups (“10’s” and “30’s-40’s and more”) were compared by t-test.

57
In addition, income is another factor that influences people’s choice. The higher-income
people were more likely to choose the computer activity (Figure 5.18, p=0.06425), since they
could somewhat afford to use computer or internet service. (For example, the internet services in
internet cafés of Tamale cost between 6,000 cedis (0.66 USD) and 8,000 cedis (0.89 USD) per
hour.)
49%
68%
51%
32%
0% 20% 40% 60% 80% 100%
>= 150,000cedis
< 150,000 cedis
PartyPC
Figure 5. 18: Comparison between Party and Personal Computer by Monthly Income
These results suggest that only teenagers or high-income people were attracted by the
computer activity.
(b) Television (69.9%) vs. Personal Computer (30.1%)
The comparison between the television and computer activities provides the same
tendency as the comparison between having a party and using a computer (a). Teenagers and
high-income people more preferred using a computer to watching television (Figure 5.19:
p=0.14226, Figure 5.20: p<0.00127). In addition to them, Figure 5.21 revealed that women did not
choose using personal computer like men (p<0.00128). This result was different from the
comparison between the party and computer activities (a). In this comparison (a), women’s
25 The means of two groups (“income < 150,000 cedis/month” and “income >= 150,000 cedis/month”) were compared by t-test. 26 The means of two groups (“10’s” and “30’s-40’s and more”) were compared by t-test. 27 The means of two groups (“income < 150,000 cedis/month” and “income >= 150,000 cedis/month”) were compared by t-test. 28 The means of two groups (“male” and “female”) were compared by t-test.

58
preferences for a computer use were the same as men’s preferences (women: 38%, men: 40%).
Thus, this result suggests that the television activity influenced women’s choice.
Figure 5. 19: Comparison between Party and Personal Computer by Age
49%
85%
51%
15%
0% 20% 40% 60% 80% 100%
>= 150,000cedis
< 150,000 cedis
TVPC
Figure 5. 20: Comparison between Television and Personal Computer by Monthly Income
Figure 5. 21: Comparison between Television and Personal Computer by Gender
92%
61%
8%
39%
0% 20% 40% 60% 80% 100%
Female
Male
TVPC
92%
61%
8%
39%
0% 20% 40% 60% 80% 100%
Female
Male
TVPC

59
(c) Television (63.9%) vs. Party (36.1%)
As seen in Figure 5.22, women strongly preferred watching television to having a party,
while men had no preference between the two (p<0.00129). This result is consistent with those in
the previous two comparisons: (a) party vs. computer, and (b) television vs. computer. That is,
while men had no preference among three activities (television, party and computer), women
showed strong preference for the television activity. In this regard, people’s knowledge for
computer and television had not influenced their preferences (the exposure to computer: Male:
78.5%, Female: 76.9%, exposure to television: Male: 96.8%, Female 94.9%). Therefore, it can
be concluded that this gender’s difference of the preferences resulted from women’s strong
interest for watching television.
Figure 5. 22: Comparison between Television and Party by Gender
Based on the category preference survey and activity preference survey, people’s
potential electricity demand is estimated in the next section.
5.4 Load Curve Generation
5.4.1 Overview of producing the Load Curve from the Field Research Data
An electricity load curve for the community center has been generated based on the
villagers’ preference for activities. The steps can be described as 1) an activity schedule for the
center was created; 2) electrical appliances were selected for each activity and electricity
consumption for each activity was calculated; 3) the activity schedule and the corresponding
29 The means of two groups (“male” and “female”) were compared by t-test.
82%
56%
18%
44%
0% 20% 40% 60% 80% 100%
TVparty
Female
Male

60
electricity consumption of each appliance were combined to produce the load curve. The
procedure for generating load curve is described below in Figure 5.23.
Figure 5. 23: Process for Generating Potential Load Curve
5.4.2 Activity Scheduling
To aid the calculation, activity scheduling was conducted on a monthly basis. Prior to
scheduling activities, the length of time demanded for each activity was to be determined based
on people’s preference. The time was allocated across activity categories using category
preference data first and then distributed to activities within the same category using activity
preference data. Additionally, timeslots of day – before breakfast, after breakfast, after lunch,
after dinner, and bedtime - for each activity were also selected using time preference data. After
that, activities were arranged into a monthly schedule subject to time constraints and space
limitations of the community center.
5.4.2.1 Time Allocation
a) Time Allocation among Activity Categories
First, the study decided how long people can enjoy each activity category a month based
on the preference data. To accommodate the majority of villagers’ electricity needs, interviewees
were given 10 points in total, which represents having adequate electricity for all activities. Here
we assumed that points given to each category represented the relative length of time the
Appliance list for each activity
Appliance preference
Electricity consumption of each appliance
Demanded hoursof each activity Activity time of day
Space constraints Time constraints
Activity category preference &
Activity preference
Activity timeslot of day preference
1) Activity scheduling 2) Electricity consumption calculation by activity
3) Load curve generation
Load curve
Activity Schedule
Electricity consumption of
each activity

61
interviewees would expect for the activity.30 Using this assumption, we proportionately allocated
time to each activity category based on the points the category received.31
The allocation result across categories is shown in Table 5.4. Table 5. 4: Time Allocation across Activity Categories
b) Time Allocation for Activities within the Same Category
Time allocation for activities within a category was based on the results from the activity
preference survey, where the interviewees were given two activities within the same category,
and asked to select the preferred one. Within an activity pair, the time in hours was allocated in
proportion with the activity preference data. However, for activities in the culture category, the
lengths of time were distributed according to the village’s population data.
The number of newborn celebrations is determined from the number of births. Forecasted
from the village’s birth records in 2000 to May 2006, births in 2007 will be 54. However, there
are no such records for marriage and funerals. Therefore, the number of marriages and funerals
are estimated using Ghana’s past population data.
Data from the International Database of US Census Bureau (2006) for the year 2005 were
used for estimating the number of weddings. Ghanaians usually get married around 20 years old
(Alhassan, Pers. Comm., 2006). The corresponding age range to this information is 15 – 19 and
30 Time available for each month was calculated from multiplying number of days in a month by daily available time. Hours typically spent sleeping, which are approximately 5.5 hours per day, from 11pm to 4.30am (Alhassan, Pers. Comm., 2006), were excluded from daily available time. Therefore, the time that the community center will have activities per day is 24 hours deducted by 5.5 hours, which is 18.5 hours. As a result, available time for each month is 18.5 hrs*(days per month). 31 As health activities occur in a separated space from other activities, these activities can occur simultaneously with others; points given to health category were omitted from calculating the time available for other activities. Nonetheless, to compute hours demanded for health activities, the points given to this activity were included when allocating time to the health category.

62
20 - 24 years old. According to the data, 10.6% of males32 and 10.4% of females33 are between
15 and 24 years old. Using this national population distribution and the fact that the population in
Mbayanili at the time of field research was 4,050, there are an estimate 429 men and 421 women
between 15-24 years old in the village. In Ghanaian society, individuals with no children are
strongly disliked and disrespected (Ampofo, 2001). Therefore, this study assumes that all
villagers get married. This study also assumed equal frequency of weddings over time as the
villagers do not have seasonal preference for this ceremony. Therefore, there are an estimate 43
men and 42 women get married each year.34 According to the local volunteer (Alhassan, Pers.
Comm., 2007), rural Ghanaian women are responsible for getting water for their villages. If the
water supplies are far away from the villages, they have to travel far from their villages, and thus
might meet men outside and eventually get married with them. However, Mbanayili has pipe
born water. Therefore, Mbanayili women usually do not go outside the village. So it is unlikely
for them to get married with men from other villages. In addition, a study on marriages in
northern Ghana shows that approximately 30% of the villagers get married with people from
other villages (Goody, 1966). Therefore, this study assumes 70% - 100% of them get married
with people in the village. Using 70%, in each year, there will be 30 marriages among
Mbanayili’s villagers,35 13 men marrying to outside women,36 and 12 women marrying outside
men37. Among these 12 + 13 = 25 marriages with outside people, as Mbanayili is Muslim
community, where men are dominant, the weddings might usually be held in husbands’ villages.
Consequently, 13 out of 25 weddings are expected to be held in Mbanayili. As a result, possible
weddings held in Mbanayili are 30 + 13 = 43 weddings per year. And if 100% internal marriage
is assumed, there are still 43 possible weddings per year. Therefore, the possible number of
weddings per year is 43.
32 Percentage of men between 15 and 24 = (1,274 + 1,057) thousand/22,026 thousand = 10.6%. 33 Percentage of women between 15 and 24 = (1,255 + 1,033) thousand/22,026 thousand = 10.4% 34 As the age range is 10 years, one tenth of the 429 men and 421 women will get married each year. 35 To simplify the calculation for weddings between people in the village, the number of such weddings was based on number of men. That is, 70% of the 429 men, which are 300 men, get married to 300 women out of the 421 women. Therefore, the number of such marriages is 300 within 10 years, thus 300/10 = 30 marriages per year. 36 The number of Mbanayili men marrying women from other villages per year = (429 men * 30%)/10 years = 13 marriages/year. 37 The number of Mbanayili women marrying men from other villages per year = (421 women – 300 women)/10years = 12 marriages/year.

63
To estimate the number of funerals in 2007, 2006 Ghana’s mortality rate38 was used.
Assuming equal mortality rates in 2006 and 2007, estimated deaths in the village are 40 per year.
However, if all of these cultural events were held in the community center, assuming
equal frequency across the year, 13 hours39 x 54 = 702 hours would be newborn celebrations, 24
hours40 x 43 = 1,032 hours would be weddings, and 24 hours41 x 40 = 960 hours would be
funerals. That is 2,694 hours per year or 224.5 hours per month would have to be allocated for
cultural activities in each month, which is greater than the results of time allocation for culture
category. Therefore, the available time that the category received was allocated to each category
based on each activity’s demand (newborn celebrations: 26%, weddings: 38%, funerals: 36%).
The result of hours distributed to each of the activities is as shown in Table 5.5.
38 Data from http://www.theodora.com/wfbcurrent/ghana/ghana_people.html 39 Duration of a newborn celebration is 13 hours. This will be discussed in 5.4.2.2 Time of Day Selection, section b-2. 40 Duration of a wedding is 24 hours. See 5.4.2.2 section b-2. 41 Duration of a funeral is 24 hours. See 5.4.2.2 section b-2.

64
Table 5. 5: Available Time by Each Activity in the Community Center
5.4.2.2 Time of Day Selection
Timeslots for each activity were assigned based on the interviewees’ time preference data
and local practices. Since the lifestyle of the villagers does not require strict punctuality, they
typically identify time of day by their daily routines – getting up, having breakfast, having lunch,
having dinner, and going to bed. Normal daily schedule of a villager is as follows (Alhassan,
Pers. Comm., 2006)
4.30 am get up 7.00 am have breakfast 1.00 pm have lunch 8.00 pm have dinner 11.00 pm go to bed
Using these routine events and standard times, timeslots of day, which this study
identifies, were created. Time periods listed above represent time intervals as shown in Table
5.6. Table 5. 6: Time Periods and Corresponding Time Intervals

65
The questionnaire asked the interviewees to select the time periods in accordance with
this routine.42
a) Time Preference Analysis
Interviewees were asked in which time slots they would like to have each activity.43
Among nine activities included in the survey, three patterns of time preference were identified.
a-1) Type 1: Whole day activities
Figure 5. 24: Activity Time Preference Type 1: Whole Day Activities
As can be seen from Figure 5.24, all activities in this type are cultural activities. The
villagers’ desire to use electricity is always significantly high from before breakfast to after
dinner. This is because, according to their culture, the villagers would like the cultural activities
to last at least an entire day.
42 Bedtime was not included in the questionnaire as the villagers are sleeping thus not having any activities at the community center. However, there is an exception for having cultural activities during bedtime, which is described in the time selection assumptions. 43 They could select more than one timeslot.
0%
20%
40%
60%
80%
100%
Beforebreakfast
Afterbreakfast
After lunch After dinner
Wedding ceremoniesFuneralsNewborn celebration parties
0%
20%
40%
60%
80%
100%
Beforebreakfast
Afterbreakfast
After lunch After dinner
Wedding ceremoniesFuneralsNewborn celebration parties
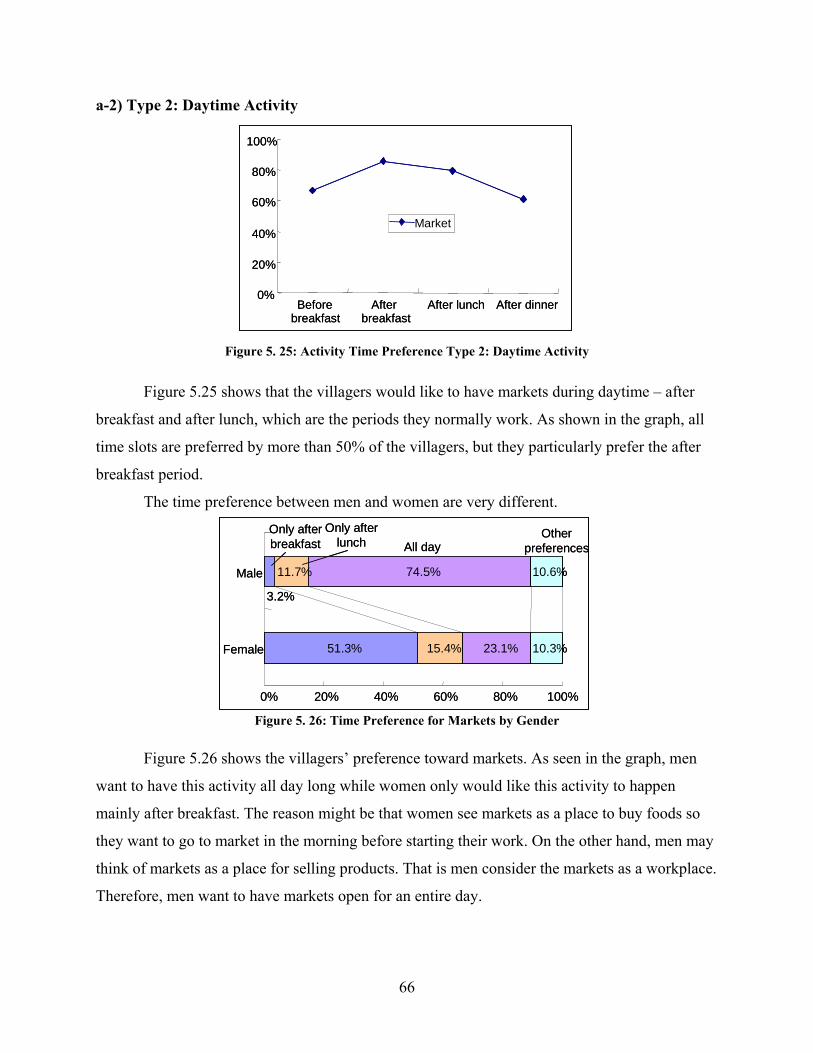
66
a-2) Type 2: Daytime Activity
Figure 5. 25: Activity Time Preference Type 2: Daytime Activity
Figure 5.25 shows that the villagers would like to have markets during daytime – after
breakfast and after lunch, which are the periods they normally work. As shown in the graph, all
time slots are preferred by more than 50% of the villagers, but they particularly prefer the after
breakfast period.
The time preference between men and women are very different.
Figure 5. 26: Time Preference for Markets by Gender
Figure 5.26 shows the villagers’ preference toward markets. As seen in the graph, men
want to have this activity all day long while women only would like this activity to happen
mainly after breakfast. The reason might be that women see markets as a place to buy foods so
they want to go to market in the morning before starting their work. On the other hand, men may
think of markets as a place for selling products. That is men consider the markets as a workplace.
Therefore, men want to have markets open for an entire day.
Beforebreakfast
Afterbreakfast
After lunch After dinner0%
20%
40%
60%
80%
100%
Market
Beforebreakfast
Afterbreakfast
After lunch After dinner0%
20%
40%
60%
80%
100%
Market
51.3%
3.2%
15.4%
11.7%
23.1%
74.5%
10.3%
10.6%
0% 20% 40% 60% 80% 100%
Female
Male
Only afterlunch All day
Otherpreferences
Only afterbreakfast
51.3%
3.2%
15.4%
11.7%
23.1%
74.5%
10.3%
10.6%
0% 20% 40% 60% 80% 100%
Female
Male
Only afterlunch All day
Otherpreferences
Only afterbreakfast

67
a-3) Type 3: Night Time Activities
Entertainment, education, and other activities, which include watching television, parties,
classes, using personal computer, cellular phone charging, and free space, are preferred during
the after dinner period (Figure 5.27). It shows that the villagers would like to use electricity after
dinner mainly for education and entertainment.
Figure 5. 27: Activity Time Preference Type 3: Night Time Activities
b) Time Selection Assumptions and Rules
b-1) Time Selection Rules
For each of the activities, time periods are classified into two groups based on the time
preference data from the survey. Therefore, rules are set accordingly as follows.
1) If 80 or higher percent of the respondents wish to have the activity at a specific time
period, the activity must be at that period.
2) If less than 80% of the respondents prefer to have the activity at a time period, the
activity can either occur or not occur at the time slot.
b-2) Time Selection Assumptions
All activities except cultural activities can be completed within one time slot. For
example, a class starting after lunchtime can finish before dinner time, which is when
the next time slot starts.
Assumptions for cultural activities
Time periods of the cultural activities were arranged in accordance with local practices.
Cultural activities in the village include wedding ceremonies, funerals, newborn celebrations and
Islamic New Year parties. As stated by a local volunteer (Alhassan, Pers. Comm., 2006), a
0%
20%
40%
60%
80%
100%
Beforebreakfast
Afterbreakfast
After lunch Afterdinner
TVClassComputerCellphonechargeFree Space

68
wedding and a funeral begin after breakfast and last for 24 hours. A newborn celebration starts
after breakfast and ends before dinner time of the same day. That is, a newborn celebration lasts
for 13 hours.
In addition to those ceremonies, the village has two Islamic New Year parties each year.
The first one is on the day of the Islamic New Year, which changes every year according to
tradition; and the second is two months later. This study assumes Islamic New Year parties are
between breakfast and dinner of the same day. This data is arranged into time periods and
illustrated in Table 5.7. Table 5. 7: Time Periods of Cultural Activities
Day 2Before
Breakfast After Breakfast After Lunch After Dinner BedtimeBefore
BreakfastWedding ceremony
FuneralNewborn celebration
Islamic New Year party
Day 1
Assumption for health activities
Time period selection for health activities was based on the regular hours that the nurse
from another town visits the village, which is in the after lunch time slot.
From the rule and assumptions described above, the result of the time preference data is
shown in Figure 5.28.
Time Preference Data
0%
80%
BeforeBreakfast
AfterBreakfast
AfterLunch
AfterDinner
WatchingtelevisionParties
Classes
ComputerUseMarket
Cell Phone
Free Space
Cooking
Figure 5. 28: Time Preference Data
Table 5.8 shows the result of time period classification using the criteria described.
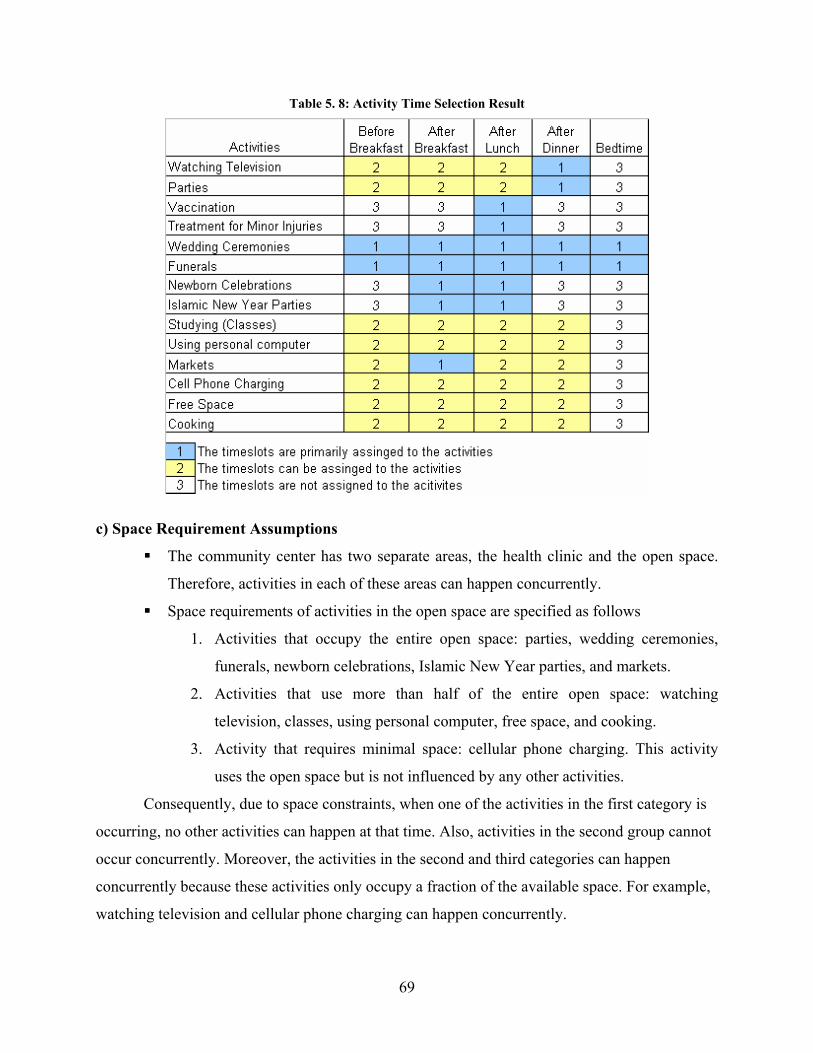
69
Table 5. 8: Activity Time Selection Result
c) Space Requirement Assumptions
The community center has two separate areas, the health clinic and the open space.
Therefore, activities in each of these areas can happen concurrently.
Space requirements of activities in the open space are specified as follows
1. Activities that occupy the entire open space: parties, wedding ceremonies,
funerals, newborn celebrations, Islamic New Year parties, and markets.
2. Activities that use more than half of the entire open space: watching
television, classes, using personal computer, free space, and cooking.
3. Activity that requires minimal space: cellular phone charging. This activity
uses the open space but is not influenced by any other activities.
Consequently, due to space constraints, when one of the activities in the first category is
occurring, no other activities can happen at that time. Also, activities in the second group cannot
occur concurrently. Moreover, the activities in the second and third categories can happen
concurrently because these activities only occupy a fraction of the available space. For example,
watching television and cellular phone charging can happen concurrently.

70
5.4.2.3 Activity Scheduling
After the activities’ hours per month and preferred time of day are identified, all activities
can be arranged into a monthly schedule. Limiting factors are time availability for each timeslot
of day, and space restrictions. Therefore, when arranging activities into the schedule, we had to
ensure that not only hours demanded are fulfilled but also the community center’s space are
utilized such that the space requirements described above is satisfied.
We have set two assumptions.
a) The villagers have no preference on which day they wish to have the activities.
b) They want each of the activities to occur equally frequent throughout a given month.
To begin with, for each month, the activity with the highest time period preference was
scheduled with uniform frequency across the month regardless of the date. Then activities with
lesser preferences were scheduled. When hours per month required by the villagers for an
activity could not be fulfilled by its most preferred time period due to either time conflicts or
insufficient space availability, the activity was arranged into the next preferred period(s). These
processes were continued until hours required by all activities were fulfilled.
However, there is a specific requirement for Islamic New Year parties. The Islamic New
Year has to be on a specific date according to the Islamic Calendar. In 2007, the Islamic New
Year parties are held on January 20th. 44 Therefore, the second party of the Islamic New Year is
on March 20th. We have assumed that the villagers prefer to have the New Year parties at the
same time period as newborn celebrations. Consequently, after breakfast and after lunch periods
on January 20th and March 20th, of 2007 are for Islamic New Year parties.
By the procedure described above, the monthly schedule for the community center was
produced. Example of the activity schedule is as shown in Figure 5.29.
Figure 5. 29:Activity Schedule – Example
44 Data from http://islam.about.com/cs/calendar/a/hijrah_calendar_3.htm.

71
Note that since the same procedure was used with every month, we streamlined the
process by using the same schedule for months with identical number of days in the months, and
adjusting a few activities in months with different numbers of days. Consequently, the schedules
of all months are similar. Months with 30 days have the exact same schedule. Months with 31
days have the exact same schedule except January and March, which have Islamic New Year
parties. The activity schedule for the year 2007 can be seen in Table A.5.3 in the appendix.
5.4.3 Electrical Appliance Selection
a) Appliance Selection Criteria
First, principal appliances were identified for each activity. This includes a television for
watching television, a computer for computer use, a cooking stove for cooking, cellular phone
chargers for cellular phone charging, and a vaccine refrigerator for health activities. Second,
supporting appliances were selected for an activity only if 50% of the interviewees wanted to use
it for the activity (Figure 5.30).

72
Figure 5. 30: Appliance Preference Selection Criterion and Result
b) Assumptions for Appliance Uses
In addition to appliance acceptance rule, there are assumptions for some appliances.
b-1) CFL
CFL use is different between daytime and nighttime because of sunlight availability.
Normal sunrise and sunset in Tamale, a city near Mbanayili, are at 6am and 6pm, respectively45
45 The sunrise and sunset times vary within 30 minutes.
84%56%
86%70%
63%72%
63%68%
95%56%
51%53%
1%95%
70%55%
63%2%3%
50%1%
21%24%
61%2%
65%32%
39%33%
59%26%
0% 50% 100%
CFL
Fan
CFL
Fan
Refrigerator
Television
Speaker
Radio-cassette
CFL
Fan
Speaker
Radio-cassette
Refrigerator
CFL
Fan
Speaker
Audio
Refrigerator
Television
Fan
Radio-cassette
CFL
Fan
Radio-cassette
Fan
CFL
Radio-cassette
Fan
Refrigerator
Television
Speaker
WatchingTelevision
Weddingceremonies
Funerals
Newborncelebrations
Studying(Classes)
Usingpersonalcomputer
Markets
Free space
Adoption Criterion: 50%
SelectedNot selected

73
across a year.46 For most of the activities, no CFLs are used during the daytime. However, for
activities that demand enhanced visibility, which are having classes and using computer, we have
assumed that 5 and 1 CFLs are used during the day, respectively.
b-2) Fan
Weather conditions affect fan usage. In the dry season, which starts from November to
March, the weather is relatively hot compared to the rainy season, which is April to October.
Though fans are obviously used in the dry season for cooling, its primary utility in the rainy
season is for deterring mosquitoes. However, from the villager’s responses, less than half (45%)
of the respondents would like to use fans in the rainy season. In accordance with their
prioritization, we have assumed that the villagers use fans only in the dry season.
b-3) Cooking stove
In the after lunch time slot, which is 7 hours long, the villagers would not cook for 7
hours before dinner. Therefore, if cooking occurs during the after lunch period, the hours that the
stove is being used would be reduced to 3.5 hours prior to dinner time.
Table 5.9 shows electrical appliances used in each of the activities. Table 5. 9: Electrical Appliances Used in Each of the Activities
46 Data from www.gaisma.com.

74
Greater than 50% of villagers want lighting for all activities except for computer. This is
because most of the interviewees have little knowledge about using computer and therefore do
not know that it requires enhanced visibility. So we have set 1 CFL for this activity.
Cultural activities usually incur playing music at high volume. Therefore, the villagers
desire to have speakers and radio-cassette for these activities. In addition, they prefer to have a
television and a refrigerator for weddings and parties in addition to those two appliances.
Appliance information, specifically power consumption and sizes, was drawn mainly
from the JICA technical report (JICA, 2007) and from various other sources. For instance, the
report selected ceiling fans with 55 Watts power consumption. Appliances not listed in the JICA
report were selected based on availability in Ghana, the size of the activities, and their prices to
minimize the cost. For example, the television chosen for this project is Sony BZ-21M50, which
is a 21” screen television, because Sony is available in Ghana and the price of a 21” television is
relatively low compared to larger televisions. Quantities of the appliances were identified based
on the size of the community center. For example, eleven light bulbs are required to provide
sufficient light for the open space during the night. (See the details in the appendix, Table A.2.2)
5.4.4 Load Curve Generation
Before a load curve was produced, the activity schedule was converted into an hourly
schedule based on the time periods described in section 5.4.2.2. And the load curves for the
entire year 2007 were constructed. There are two versions of load curves generated, the averaged
monthly load curve and 8,760 hours47 load curve. Utilizing both approaches allows us to
compare how HOMER, the optimization software for designing the electricity generation
system, would respond. To calculate electricity consumption for the averaged monthly load
curve, we assumed that electricity consumption of each period of a day is the same for every day
in a month. Therefore, for each time slot, the consumptions of every day in the month were
averaged and used as consumption for the time slot. For example, the consumption during 9am
to 10am of everyday in January was derived from averaging electricity consumptions from 9am
to 10am of January 1 to 31. The alternative hourly model was derived using hourly consumption
patterns for an entire year, 8,760 hours.
47 24 hours/day x 365 days/year = 8,760 hours/year.

75
Using the method above, the bedtime period ends (that is, the before breakfast period
starts) at 4.30am. Therefore, for the 8,760 hours load curve, electricity consumption between
4.00am to 5.00am is derived from averaging power consumption of both periods. Lastly, since
there are both AC and DC appliances selected for the community center, separate load curves for
AC appliances and DC appliances are generated (further detail is provided in Chapter 7).
Table 5.10 provides a summary of the load curve generated. Table 5. 10: Summary of Electricity Consumption in the Year 2007
Unit AC DC TotalTotal kWh 2,112 395 2,507Consumption kWh/day 5.79 1.08 6.87Peak Load kW 2.60 0.12 2.65
The load curves are similar across months with slightly higher consumption during the
dry season, when fans are used. This is because the schedules of each of the months are similar.
Shown below is the load curve generated for April 2007.
Figure 5. 31: Load Curve of April 2007
In the load curve above, the red line is the highest daily consumption of the month. In
contrast, the green line is the lowest consumption of the month. The blue line is the average
consumption, which is the load curve in the average scenario. As can be seen from the load curve
above, there are two peaks, one before breakfast and one after lunch. The main activity
responsible for the peaks is cooking, which uses cooking stove. In addition to cooking, activities
contributing to the after dinner peak are as shown in Table 5.11.
0
500
1,000
1,500
2,000
2,500
1 2 3 4 5 6 7 8 9 10 11 12 13 14 15 16 17 18 19 20 21 22 23 24
Average
Max
Min
day
(W) BeforeBreakfast
AfterLunch
AfterBreakfast
AfterDinner
BedTime
0
500
1,000
1,500
2,000
2,500
1 2 3 4 5 6 7 8 9 10 11 12 13 14 15 16 17 18 19 20 21 22 23 24
Average
Max
Min
day
(W) BeforeBreakfast
AfterLunch
AfterBreakfast
AfterDinner
BedTime

76
Table 5. 11: Electricity Consumption Share of Activities in After Lunch Period48 of April49 2007
Another observation from the load curve (Figure 5.31) is that the electricity consumption
fluctuates. To study the variation in detail, the activities are grouped by their power consumption
as listed in Table 5.12. Table 5. 12: Activities in After Lunch Period in April 2007
Electricity consumption (Wh)
Activities
1) Under 100 Healthcare2) 100 – under 200 Healthcare3) 200 – under 500 Markets, free space4) 500 – under 1000 Funerals, wedding ceremonies, newborn
celebrations, Islamic New Year parties5) 1000 – under 3000 Parties, using personal computer6) 3000 and above Cooking
As can be seen from Figure 5.32, activities using power between 200 and 500 Wh occur
most frequently within a month as well as activities consuming electricity over 9,000 Wh. The
bar chart also shows high variation in electricity consumption regardless of cooking activity. For
example, there are three days that the consumption is between 1,000 and 3,000 Wh while the
consumption is less than 200 Wh on another three days. The difference is more than 10 times. In
short, their consumption greatly fluctuates, and such fluctuation might impact electricity
generation cost.
48 Sunset is in after lunch period. Numbers of CFLs used are different before and after sunset. 49 April is in rainy season. Therefore, fans are not used in this month.

77
Figure 5. 32: Distribution of the Electricity Consumption for the After Lunch Time Period (1pm – 8pm)
Despite being the most popular activity period, dinner time slot does not have the highest
electricity consumption. This is because high energy consuming activities, such as cooking, are
not scheduled in this time slot.
However, if we consider only DC appliances, which are the refrigerator and the CFLs,
the peak occurs at a different time slot- after dinner. This is shown in Figure 5.33.
Figure 5. 33: DC Load Curve
Considering total monthly electricity consumption in each of the time slots, we will see
that 60% of electricity is consumed during the after lunch period (Figure 5.34). The second most
energy consuming period is before breakfast. This is largely due to the fact that cooking occurs
in these two time slots.
1 2 3 4 5 6 7 8 9 10 11 12 13 14 15 16 17 18 19 20 21 22 23 240
20
40
60
80
100
120
140
MinAverage
Max
day
(W) BeforeBreakfast
AfterLunch
AfterBreakfast
AfterDinner
BedTime
0
2
4
6
8
10
<100 <200 <500 <1000 <3000 >9000
No of days
Electricity consumption (W)
0
2
4
6
8
10
<100 <200 <500 <1000 <3000 >9000
No of days
Electricity consumption (W)
~~

78
Figure 5. 34: Share of Electricity Consumption by Time Slot (kWh, %)
Regarding total monthly consumption by appliance as shown in Table 5.13, the cooking
stove consumes the greatest amount of energy. The reason is that it requires the highest power.
CFLs are the next because they are turned on in all activities at night and also during daytime in
activities requiring enhanced visibility – classes and using personal computer. Cellular phone
chargers use the least electricity because they require minimal power. Also, cellular phone
charging occurs only approximately once a week.
Table 5. 13: Aggregate Electricity Consumption by Appliance of April 2007
In this chapter, the survey results of villagers’ preference toward activities and potential
demand for electricity have been analyzed and translated into numerical data for generating the
load curve. The load curve was then used by the supply analysis to determine the optimized
electrification system for the community center.
8(5%)
40(23%)
9(5%)
107(60%)
13(7%)
0% 20% 40% 60% 80% 100%
BedtimeBefore
Breakfast After Breakfast After Lunch After Dinner
8(5%)
40(23%)
9(5%)
107(60%)
13(7%)
0% 20% 40% 60% 80% 100%
BedtimeBefore
Breakfast After Breakfast After Lunch After Dinner

79
Chapter 6: Biofuel Potential from Jatropha Curcas Linn. 50
6.1 Multifunctional Platform51
The Ghanaian government has identified localized biofuel production, particularly from
Jatropha Curcas L. (hereafter Jatropha), as a potential method for alleviating poverty. The plant
can be utilized not only as a fuel source, but also for a number of highly adaptive revenue
generating schemes. Unlike fossil fuels that the GOG primarily procures through foreign
imports, added value derived from Jatropha production can remain within the country. Instead of
importing petroleum and exporting funds in return, biofuels have the potential for spurring
economic development by creating local markets for production, refining, and distribution of
Jatropha products and byproducts. Professor Fred Akuffo from the Kwame Nkrumah
University of Science and Technology (KNUST) made a 2004 keynote address to the GOG's
Energy Commission highlighting the benefits of Jatropha based biodiesel. In this address Prof.
Akuffo asserted that biodiesel is a mature, commercially viable technology that can provide the
country with "immense benefits" (Akuffo, 2004). The most notable benefits from establishing
biofuel markets would be: the displacement of oil imports that are a major contributor to the
county’s astounding debt (oil imports comprise 28% of the total energy supply and 10% of GDP)
(UN Energy, 2006); the emergence of new markets to supplement existing agricultural
industries; increases in the country’s Gross National Product and employment opportunities,
especially in the rural northern regions (Akuffo, 2004). Furthermore, it is apparent the GOG is
pursuing modernity, and this approach may help minimize energy scarcity and price volatility.
There is also mounting evidence suggesting that biofuels derived from Jatropha can be cost
competitive with fossil fuels, once greater experience is attained with cultivation, refining, and
distribution practices.
50 The following text was instrumental in this research and was heavily cited in many other works on the subject: Heller, Joachim. (1996) “Physic Nut. Jatropha curcas L. Promoting the conservation and use of underutilized and neglected crops.” Institute of Plant Genetics and Crop Plant Research, Gatersleben/Internation Plant Genetic Resource Institute, Rome, Italy. 51 The biofuel potential of Jatropha was given special attention here, partly because of the Ghanaian Government's expressed interest in expanding local biofuel production for energy security and poverty alleviation, but also due to the authors' unfamiliarity with this obscure biofuel. Furthermore, Jatropha presented the opportunity to examine the feasibility of providing both renewable energy production and economic development simultaneously. The rationale for the suite of energy sources (PV and a generator) used for modeling purposes is outlined in Chapter 7. Other potential sources for renewable energy production that were examined, but not considered within the scope of analysis, can be found in Appendix 3.

80
6.2 Origins & Nomenclature
There is considerable controversy regarding the origins of Jatropha, but most research
indicates that the center of origin was likely in Mexico or other regions of Central America.
Although some sourced contend Jatropha is indigenous to Africa, there is a sufficient body of
evidence to discredit this. Jatropha was probably introduced to the continents of Africa and Asia
by Portuguese merchants prior to 1810 (Heller, 1996). Since Jatropha introduction into Ghana, it
has acquired many different names regionally and is rarely referred to as Jatropha: in the Akan
region, Jatropha is known as Nkaneadua, in Ewe it is referred to as Kpotikpoti, and inhabitants in
Ga/Adangme call it Kutugbletso (Akuffo, 2004). English speakers have also ascribed numerous
nomenclatures to Jatropha: it is alternatively referred to as the physic nut, purge nut, pig nut, and
fig nut.
6.3 Botanical Description (see Figure 6.1)
Jatropha belongs to the euphorbia family and has an average lifespan of 50 years. The plant is
described as a small tree or large shrub, having a maximum height of 5 to 6 m (Benge, 2006;
Heller, 1996). The root structure of the plant consists of five roots, one tap root and four
peripheral roots. However, tap root formation is absent with vegetative plant propagation
(cuttings), with the exception of occasional pseudo-tap roots that mature abnormally, not
attaining the full size of tap roots cultivated from seedlings (Heller, 1996; Kobilke, 1998; Benge,
2006). Jatropha’s unisexual flowers (inflorescences) are clustered in a dichasial cyme
configuration, which means flower clusters emerge and bloom first at the terminal end of a
branch. Newer flower clusters then emerge and bloom further down the branch, leaving the
earliest blooming flower cluster at the terminal ends. Beneath the flower clusters are 5 to 7
leaves that have significant variation in length and width, both of which can span 6 to 15 cm.
Jatropha is not a self-propagating plant and requires insects for pollination. Once pollination
occurs, ellipsoidal fruits emerge containing three seed cavities (trilocular). The outer husk
(exocarp) remains firm and plump until the seeds are mature. The seeds are black in color,
weighing approximately half a gram, and have an average length and width of 18mm and 10mm
(Heller, 1996; Henning, unknown).

81
Figure 6. 1: Botanical Illustration of Jartropha Curcas L. (Heller 1996)
6.4 Seed Properties
The composition of the Jatropha seed is provided in Table 6.1, acquired from Joachim
Heller’s seminal text on Jatropha, entitled "Physic nut: Jatropha curcas L" (1996). The data were
compiled from J.E. Mendes Ferrao’s previous studies on Jatropha seed composition samples in
Cape Verde (Santiago and Fogo), Sao Tome, and Principe, islands off the west coast of Africa.
Unfortunately, only the crude fat content of the seeds were evaluated; more detailed analysis was
conducted on the kernel. Analysis on seeds from these three locations indicate: relative shell and
kernel compositions and crude fat content of seeds, as well as the moisture, ash, crude protein,
crude fat, and crude fiber content of the kernels. (see Table 6.1) Results from this analysis show
potential for deriving significant quantities of crude fat from Jatropha seeds, concentrated in the
kernel. As fats are the primary constituent of oil, prospects for achieving high oil yields from this
plant seem promising.

82
Table 6. 1: Jatropha Seed and Kernel Composition
LocationShell Kernel Moisture Ash Crude Protein Crude Fat Crude Fiber
Fogo 35.5 64.5 4.7 4.5 20.3 52.8 0.9Santiago 44.9 55.1 3.8 3.8 23.5 59.8 1.9Sao Tome' 47.7 50 7.8 6.4 28.4 46.7 4.2Mean 42.7 56.5 5.4 4.9 24.1 53.1 2.4Source: Heller 1996 citing Ferao et al. 1981;1984;1982
Seed Composition (%) Kernel Constituent (%) Seed Constituents (%)
30.2
Crude Fat32.132.923.7
Heller (1996) compiled data on the fatty acid composition of Jatropha oil from numerous
localities and sources. Only four significant fatty acids were evaluated: palmitic, stearic, oleic,
and linoleic. These findings were determined using gas chromatography after the oil had
undergone the methylesterification process. Jatropha oil is characteristic of most vegetable oils
in that the unsaturated fatty acids, oleic and linoleic, are the primary constituent.
6.5 Toxicity
Jatropha leaves and nuts contain phorbol esters and curcin, a highly toxic protein that has
similar properties to ricin, which is found in the castor bean. The only known nontoxic varieties
are indigenous to Mexico and can be consumed after roasting; however, consumption in this
manner is not totally devoid of risk (Benge, 2006). Despite the toxic nature of most varieties,
risk of illness or death is minimal unless ingested. The plants found in Ghana are of the highly
toxic variety and are not consumed as food, though small quantities have been ingested as a
purgative (Benge, 2006). According to Duke (1983) “Two seeds are [a] strong purgative. Four to
five seeds are said to have caused death,” although which particular seed variety this refers to
remains unclear. Further analysis of Jatropha’s toxicity is warranted to determine the risk
associated with handling the leaves and nuts, though anecdotal evidence indicates harvesting and
oil extraction can be conducted safely (Heller, 1996).
6.6 Ecology
Jatropha is particularly well adapted to grow in arid or semi-arid, low altitude (0-500 m)
environments and can flourish on marginal soils lacking high nutrient content. It has grown with
particular success in drier tropic areas with annual precipitation between 300 and 1000 mm
(Heller, 1996). Reportedly, it has survived prolonged drought in Cape Verde where annual
rainfall is merely 250mm, but successful growth is largely attributable to the intense regional
humidity (Henning, unknown). The majority of Africa south of the Sahara Desert is suitable for

83
growing Jatropha, including the entirety of Ghana. These regions are depicted in green on
Figure 6.2.
Figure 6. 2: African Regions Hospitable for Growing Jatropha (Green)
(Source: Bio King 2007, http://www.bioking-deutschland.com/img/AF-Map.jpg)
Ideal meteorological conditions require between 600 and 1000mm of precipitation and
annual average temperatures between 20°C and 28°C (Heller, 1996; Benge, 2006). For
comparison, the mean temperature in Ghana ranges from 29oC on the southern coast, to 34oC in
the extreme north and average precipitation in the north is approximately 1,100 mm annually
(Ghana Web, 2007; Ghana Meteorological Service Department, 2006). Table 6.2 provides
further detail as to climatic conditions observed at locations of seed collection. Jatropha is not
particularly resilient to cold weather. Though it can survive light frosts, all of its leaves will be
shed, likely diminishing fruit and seed yields. Jatropha has some characteristics that are
indicative of invasive species. This makes it unsuitable for agroforestry management techniques,
because it competes heavily for resources; the easy disbursement of toxic seeds and the ability to
thrive in marginal soils allow for Jatropha to maintain a competitive advantage over many
species in close proximity, although there seems to be conflicting evidence from various sources
as to Jatropha's actual invasive tendencies (Heller, 1996; Benge, 2006). According to a
Washington State University (2002) report, once planted, Jatropha has a tendency “to grow
where is has been planted”, without encroaching on adjacent lands. However, Benge's (2006)
description of Jatropha’s invasiveness claims it “has a potential to be weedy”, potentially
creating “dense stands on uncultivated lands”. He continues on, enumerating countries where it
is considered a weed, although the distinction should be made that weeds are not necessarily

84
synonymous with invasive species. Ackom (2005 citing Gubitz et al., 1999) clearly states that
“the Jatropha plant is not an invasive species”. Table 6. 2: Climatic Data of Seed Provenances
Origins of Provenances Altitude (m)
Average Temp (°C)
Average Annual Precipitation (mm)
Cape Verde, Fogo 150-1600 19-25 200-1000Senegal, Santhie Ram 15 28 700Ghana, Nyankpala 183 28 1080Benin, Cotonou 7 25 1330Burkina Faso, Kongoussi 300 - 520Kenya, Kitui 1020 28 790Tanzania, Mombo 430 20 670Burma, Sink Gaing, Mandalay 80 27 825India, Kangra 580 - -India, Kangra 434 11-38 -India, Poona 556 25 672Costa Rica, Rio Crande 10 28 2000Mexico, Veracruz 16 25 1623Source: Heller 1996
6.7 Agricultural Propagation Methods
Jatropha can grow from either vegetative (cuttings) or generative (seeding) propagation
methods. However, plants propagated from cuttings tend to be less resilient against disease and
tolerant of drought conditions because tap root formation is either partial or nonexistent. The
lack of deep penetrating tap roots inhibits the plants' ability to uptake water and nutrients (Heller,
1996). Furthermore, crops propagated from cuttings tend to have less genetic diversity, thereby
rendering them more susceptible to disease and pest incursions (Benge, 2006). Seed yields from
vegetative propagation methods are contingent on a number of factors, the most influential being
the age of the donor plant and the portion from which the donor plant cuttings were taken. The
soil's nutrient content, drainage, precipitation, the season in which plantation occurred, and soil
aeration are other elements which influence the viability of plant establishment with either
method (Benge, 2006; Heller, 1996). Vegetative propagation is ideal if immediate seed yields or
mitigation of soil erosion is desired, otherwise generative propagation methods are preferable for
plant longevity and prolonged seed yields. Myriad factors contribute to actual seed yields of
Jatropha, including: genetic variation, propagation methods, hedge configuration, and ecological
conditions, which may account for contradicting reports on observed yields (Heller, 1996;
Henning, unknown; WSU, 2002). For example, Heller (1996) compiled nineteen sources
reporting data between the years 1934 and 1987 on the seed yields of Jatropha. These findings
indicate a massive disparity in seed yields, from 100 to 8000 kg per hectare (see Table 6.3).

85
From this, Heller concludes that “at least 2-3 t [presumably metric tons] of seeds/ha can be
achieved in semi-arid areas”. Heller does not adequately substantiate this conclusion; no
calculations are provided. But performing a simple mean (2,490 kg/ha) using the data below
indicates that his conclusions are correct, though it would be more appropriate to discount
anomalous data points. It appears, however, that the standard deviation is significant, and
ascertaining which data points are in fact anomalous would prove daunting. The authors have
yet to discover comprehensive or contemporary analysis on the prevailing factors influencing
anticipated seed yields; further research and analysis is warranted. Table 6. 3: Jatropha Seed Yields
Location Yields (kg/ha) Age (years) ReferenceCape Verde - - Avila (1949)India 1733 3 Bhag Mal (pers. comm.)Nicaragua 5000 - Foidl (pers. comm.)Mali 2640 - Henning (pers. Comm.)Thailand 2146 - Ishii and Takeuchi (1987)Mali 8000 - Larochas (1948)Madagascar - - Martin and Mayeux (1984) Paraguay 100 3 Matsuno et al. (1985)Paraguay 700 4 Matsuno et al. (1985)Paraguay 1000 5 Matsuno et al. (1985)Paraguay 2000 6 Matsuno et al. (1985)Paraguay 3000 7 Matsuno et al. (1985)Paraguay 4000 8 Matsuno et al. (1985)Paraguay 4000 9 Matsuno et al. (1985)Cape Verde 1750 - Naigeon (1987)Cape Verde 200-800 - Silveira (1934)Thailand 794 1 Stienswat et al. (1986)Thailand - 1 Sukarin et al. (1987)Bukina Faso - - Zan (1985)
Conclusion 2000-3000 - Heller (1996)Source Heller (1996)
6.8 Uses
6.8.1 Living Fence
Traditionally, thick Jatropha hedgerows are used as a living fence to protect crops or to
delineate property boundaries, because it is easily established with vegetative propagation and its
toxic seeds deter livestock grazing (WSU, 2002).
6.8.2 Mitigating Desertification & Crop Stabilization
The extensive root structure formations that occur from cuttings, in consort with
hedgerows functioning as windbreaks, can help combat desertification by stabilizing soils against
wind and water erosion (Heller, 1996; WSU, 2002). Furthermore, its ability to flourish in

86
marginal soils likely provides understory shade, enhanced surface water percolation, and
groundwater recharge. Jatropha has been utilized to promote the growth of other crops, namely
for climbing plants such as vanilla and pepper, that adhere to Jatropha stalks for stabilization
(Heller, 1996; Benge, 2006; Henning, unknown date). Jatropha’s potential invasiveness may
limit its cohabitation with other species, though conflicting reports make it difficult to ascertain
its actual invasive tendencies, as mentioned earlier.
6.8.3 Food Source and Medicinal Properties
Seeds from the Mexican variety have been boiled or roasted for consumption due to the
absence of phorbol esters. All other varieties are considered toxic and are not consumed as a
food source. Nonetheless, Jatropha has been utilized for a number of medicinal purposes.
Extraction of oils from seeds, stems, and leaves by pressing or boiling (decoction) are used in
traditional medicine, either to be ingested or applied as a topical solution: the oils are a strong
purgative and effectively induce diarrhea or vomiting and offer pain relief against rheumatism
and certain types of skin disease; decocted leaves have antiseptic properties and are a proven
cough suppressant; teas derived from leaves are used as a malaria treatment; and sap is
administered to wounds to promote healing (Heller, 1996; Benge, 2006; Henning, date
unknown). Also, recent analysis on the recumbent protein of curcin (found in Jatropha curcas
seeds) conducted at Sichuan University in Chengdu, China, suggests this cell-killing agent may
restrict the growth of tumor cells (Meng-Jun LUO et al., 2006). Their conclusions are
promising, prompting continued research to determine if curcin can be utilized as an anti-cancer
or anti-viral agent.
6.8.4 Pesticide
Various extracts from the Jatropha plant have been identified as an effective insecticide
and/or molluscicide. Myriad concoctions from seed oil and seed oil extracts, as well as the
phorbol ester derivatives from this oil, have minimized the successful establishment of pests
associated with cotton, potato, pulse, mungbean, corn, and sorghum crops (Heller, 1996).
Pressed seed oil is the most common preparation, although aqueous, acetone and phorbol ester
extracts from the oil have also been deemed effective (Heller, 1996). A detailed listing of pest
species, corresponding crops, and pesticide preparation methods are provided in Table 6.4.
Unfortunately, research on the use of Jatropha extracts as a pesticide is limited. Consequently,

87
the active properties of the oil that enable it to function as a pesticide have not been isolated.
Preliminary evidence suggests the presence of phorbol esters are likely responsible for the ability
of these extracts to function as a plant protectant (Heller, 1996). Table 6. 4: Effective Jatropha Pesticide Preparations
Pest Crop Preperation Reference
Helicoverpa armigera Cottonseed oil;acetone seed extracts; aqueous oil
extracts
Solsoloy et al. (1987); Solsoloy (1993) ibid
(1995)
Aphis gossypii Cotton seed oil; aqueous oil extracts
Solsoloy (1993) ibid (1995)
Pectinophora gossypiella Cotton aqueous seed oil extracts Solsoloy (1993)
Empoasca biguttula Cotton seed oil Solsoloy (1995)Phthorimaea opercullela Potato seed oil Shelke et al. (1985)
Callosobruchus maculatus Pulse seed oil Jadhav and Jadhav (1984)
Callosobruchus chinensis Mungbean seed oil Solsoloy (1995)Sitophilus zeamays Corn seed oil Solsoloy (1995)
Manduca sexta - phorbol esters Sauerwein et al. (1993)Sesamia calamistis Sorghum oil and phorbol esters Henning (1994)
Source: Heller 1996
6.8.5 Fertilizer
Residual press cake, otherwise known as seed cake, derived from the vegetable matter
after seeds have undergone pressing to expel the oils, can often be used as animal feed. The
toxicity of Jatropha press cake prohibits its use in this application, though this co-product to oil
expulsion is sought after in many markets as fertilizer, having similar nitrogen content to that of
chicken manure and castor bean press cake (WSU, 2002; Heller, 1996). Field trials in Mali
examined the effects of various fertilizers (5t/ha of manure, 5t/ha of Jatropha press cake and
150kg/ha of mineral fertilizer) on pearl millet yields. Substantially higher yields were realized
from Jatropha press cake (1366 kg) versus manure (815 kg) and mineral fertilizer (1135 kg).
Furthermore, Jatropha press cake was considerably less costly than the next best alternative,
mineral fertilizer (Heller, 1996 citing Henning et al., 1995). Because of Jatropha's phytotoxicity,
which appears to affect crop yields, there may be limitations regarding how much Jatropha seed
cake can be used as fertilizer without causing unintended adverse impacts (Heller 1996).
Instances of reduced seed germination have been observed in applications where Jatropha
fertilizer is used in excess of 5 tons per hectare.

88
6.8.6 Soap Production
Saponification from Jatropha oil can be achieved in two ways: unadulterated Jatropha oil
can be combined and boiled with a base solution to release glycerol, the primary ingredient in
soap manufacturing. Alternatively, once the oil has undergone transesterification (see section
6.8.9 for detail) the resultant glyceride byproducts of biodiesel production can be used for soap
production as well. The Tata Oil Mills Co., LTD in Mumbai, India has successfully produced
high quality soap combining hydrogenated Jatropha oil (75%) and refined, bleached Jatropha oil
(15%), with coconut oil (10%) (Heller, 1996).
6.8.7 Jatropha Oil
Jatropha seeds contain between 35 to 40% oil, while seed kernels have higher oil
concentrations, between 55 to 60% (WSU, 2002). Oil products derived from Jatropha seeds and
kernels have recently prompted significant interest to determine whether or not these products
can foster rural economic development. Jatropha oil can be utilized for an array of products that
do not require prohibitively intensive capital investments, predominately for biofuel production
(non-transesterified) and soap manufacturing; this is promising for the creation of highly
adaptive, small-scale industries. The majority of recent analysis on Jatropha has been
undertaken to elucidate its feasibility for instigating economic growth in developing countries
(Akuffo, 2004; Henning, 2004; Henning, unknown).
6.8.8 Lighting and Cooking Fuel
Interest in Jatropha oil as a fuel for lighting and cooking apparatuses has been instigated
because it reportedly has similar characteristics to that of kerosene. Unfortunately, Jatropha's
higher ignition temperature and viscosity present a challenge for its use in standard kerosene
lanterns and stoves. The high viscosity of Jatropha oil tends to make it congeal, occluding hoses
and apertures, and its significantly higher ignition temperature requires the use of kerosene or
other supplemental fuels to facilitate ignition. Alternatively designed equipment has attempted to
compensate for these complications: lanterns fabricated with short wicks that maintain the flame
in proximity to the fuel source, thus providing greater heat for ignition; and stoves specially
designed to allow the flow of higher viscosity fuels (WSU, 2002).
89
6.8.9 Biofuel
The use of vegetable and/or animal oils as a fuel source for internal combustions engines
is not a novel concept. In 1900, Rudolf Diesel unveiled an engine that combusted peanut oil at
the world exhibition in Paris. Recently, there has been considerable interest in determining
whether or not Jatropha biofuel is a suitable alternative to diesel fuel. A number of studies have
examined Jatropha’s potential for this application, because of its drought resistance and ability to
grow in arid climates on marginal soils. Furthermore, unlike palm oil, which is commonly used
in Ghana for cooking, the toxicity of Jatropha renders it unfit for human consumption, precluding
market competition with other oil used as fodder.
Jatropha oil can be combusted in two ways: either as unadulterated oil or as biodiesel
after the oil has undergone transesterification. Once extracted and filtered, unadulterated oil can
be combusted in direct injection combustion engines. The most commonly cited with regard to
the use of Jatropha oil are Lister-style engines; duplicates of the original British 1930’s design
are known as Listeroids, and are currently mass-produced in India and China. These engines
have proven ideal for the combustion of viscous oils that have not undergone transesterification.
However, the viscous nature of the oil necessitates higher operational temperatures because of its
propensity to solidify, “which causes inadequate atomization and incomplete combustion”
(Forson et al., 2003). The simplicity of Lister engines has prompted extensive promotion of this
technology in rural applications, as they require minimal technical expertise to service and
replacement parts are fairly easily procured, compared to other, more complex engines. Lister
engines tend to operate at relatively low speeds, typically between 500-700 RPM and have been
successfully used to drive small mills, water pumps and electric generators (WSU, 2002).
Alternatively, Jatropha oil can be transesterified and combusted in any indirect injection
diesel engine. There are various methods for converting oils into biodiesel. Most current
biodiesel production combines oils or fats with an alcohol, such as methanol or ethanol.
Transesterification occurs once this mixture is in the presence of a base catalyst, typically
potassium or sodium hydroxide, which is often premixed with the alcohol solution. Methyl/ethyl
esters or pure biodiesel (B100) are produced, along with the glyceride co-products that separate
out during the reaction. Base catalyzed transesterification is considered superior to alternative
biodiesel production methods for a number of reasons: no intermediary processes are required to
achieve methyl/ethyl ester conversions; the reaction occurs at low temperatures (150◦F) and

90
pressure (20 psi); and it is a comparatively stable and controllable process capable of attaining
98% conversion efficiency with minimal reaction time (National Biodiesel Board, 2007). In
Ghana there is great potential for conducting the transesterification process with ethanol derived
from locally grown sugar cane or corn crops, as opposed to methanol, which is a petroleum
based product and must be imported. The feasibility of producing ethanol from surpluses in
either corn or sugar cane production should be investigated. Without ample surpluses, ethanol
production may prove a risky proposition, especially if it directly competes with food
production.
In developed countries, requisite raw materials and the equipment needed to conduct the
transesterification process are fairly easy to procure; however, acquisition of these materials by
rural inhabitants in developing counties may be unrealistic, particularly with methanol.
Methanol is a highly flammable and toxic material that requires handling and storage by trained
individuals. Direct human exposure to methanol or methanol vapors, via inhalation, skin
absorption or oral ingestion can have detrimental health impacts. Consumption of as little as one
ounce of methanol has been known to cause irreversible damage to the nervous system,
blindness, or even death (Methanol Institute, 2007). Although flammable, the toxicity of ethanol
is minimal in comparison to methanol or gasoline. Nonetheless, the level of technical expertise,
specialized equipment, and the handling of hazardous chemicals needed for the
transesterification of Jatropha oil into biodiesel may exceed what is practical under real world
conditions in Northern Ghana.
6.9 Oil Expellers
The oil can be expelled manually with rudimental hand (ram) presses, engine powered
screw and spindle presses, or hydraulic presses. Chemical expulsion can also be achieved with
hexane solvents (Heller, 1996). Significant variants in the relative efficiency between these
extraction methods have been observed. This is of importance with regard to economic
development, as oils are far more valuable on the open market than the residual seed-cake that
remains after pressing. With inefficient expulsion methods, oil content of the residual seed-cake
may exceed 25% - 50% of the total extractable oil residing within the seed, which translates into
huge economic losses (Benge, 2006). Khaodhiar et al. (date unknown) suggest that oil extraction
using chemical solvents is the most effective means of attaining high extraction efficiencies,

91
recovering 2.5 times more oil than with a “mechanical crusher”. Unfortunately, this method may
not be viable in rural applications, because of its requirements: a higher level of technical
expertise than mechanical extraction methods; the use of potentially volatile solvents that may
not be easily procured by rural inhabitants; and capital intensive, large-scale production needed
to make it economical.
6.10 Oil Yields
It is evident that oil yields from Jatropha are contingent on many factors; therefore, the
reliability with which data can be extrapolated and generalized is very limited. The most salient
factors determining oil yields are: genetic variation; ecological conditions; and propagation,
cultivation, harvesting, and oil expulsion methods. Few sources have gone so far as to actually
assert oil yields, but the variability in available reports is large and the calculations may be
contingent on extremely optimistic seed yields and other unrealistic assumptions (Benge, 2006).
The complexity underlying actual oil yields, coupled with inconsistent research methodologies,
further compounds the issue. It is unclear if yields can be predicted with any certainty without in
situ field trials. At this juncture, determining potential oil yields for Mbanayili would be sheer
conjecture without further field research. However, a few seemingly reputable sources indicated
oil yields and are provided in Table 6.5. Table 6. 5: Jatropha Oil Yields
Reference (year) Yield Oil TypeFulton et al (2006) 2,000 L/ha "feedstock"Benge (2006 citing Gaydou 1982) 2,100-2,800 L/ha "fuel oil"Ackom (2005 citing Henning 1994) 0.17 L/m "seed oil"Henning (2004) 5kg/L "raw oil"
The Worldwatch Institute (citing Fulton et al., 2006) and Benge (2006) both posit yields
in liters per hectare ranging between 2,000 and 2,100-2,800 liters, respectively. Fulton et al.
report their findings in terms of a biofuel “feedstock” while Benge’s values are apparently “fuel
oil” yields. Presumably, “feedstock” implies that the oil has not undergone the
transesterification process and “fuel oil,” as reported by Benge, insinuates that yields are in
biodiesel equivalents. It is disconcerting that one report indicates that fuel grade oil yields are
substantially higher than feedstock yields (considering conversion losses—although minimal).
However, given the inherent variability in actual biofuel yields, which are contingent on the
many factors mentioned earlier, this may be justifiable. Ackom posits an oil yield of 0.17 liters

92
“per meter of hedge per year”, but he does not indicate if this is in square or linear meters.
Henning (2004) cites a project in Tanzania (KAKUTE) that required 5 kg of seeds to expel a liter
of “raw oil”.
6.11 Fuel Characteristics: Jatropha Biodiesel vs. Conventional Diesel
The viscosity and the abundance of glycerides in untransesterified Jatropha oil make it
unsuitable for combustion in standard diesel engines, although transesterified Jatropha oil has
similar characteristics to those of conventional diesel. According to Ackom (2005, citing
Schrimpff, 2002), Jatropha biodiesel has similar properties to conventional diesel with regard to
its energy content and specific weight, although notable dissimilarities between the fuels exist:
Jatropha biodiesel is superior to conventional diesel with respects to cetane value, flash point,
sulfur content, and overall emissions, although there are limitations and tradeoffs worth
mentioning. (see Table 6.6) Table 6. 6: Jatropha Biodiesel vs. Conventional Diesel
Cetane values indicate a fuel's propensity to ignite: it is the time delay between the fuel's
injection in the cylinder and the initiation of combustion. Typical cetane values for conventional
diesel range between 40 and 50 with higher values indicating premium grade fuels. This
improves engine performance, longevity, and starting ability in cooler ambient temperatures.
Jatropha achieves a cetane value of 51 without using the cetane enhancing additives required for
some conventional diesel fuels to meet original equipment manufacturers (OEM) specifications
(The Department of Environment and Heritage, 2004).
Jatropha’s flash point, or the temperature at which fuel vapor ignites when exposed to an
open flame, is significantly higher (110-240◦C) than conventional diesel (80◦C). Higher flash
points allow for safer transportation and storage of the fuel and have negligible effects on engine
performance (Exxon, 2007).

93
There are a few potential limitations to combusting Jatropha biofuel in some diesel cycle
engines. Biodiesel mixtures, especially with concentrations exceeding 5% (also known as B5,
comprised of 5% pure biodiesel and 95% conventional diesel), have a tendency to corrode
natural rubber gaskets and seals. Many current manufacturers state that biodiesel blends,
typically between B5 and B20 that adhere to the American Society of Testing and Materials
formulation standard (ASTM D 6751) do not void OEM warranties. Fewer manufactures
provide coverage as biodiesel concentrations exceed 20% (National Biodiesel Board, 2006).
Ensuring fuel compatibility within engine specifications and tolerances is critical to maximizing
engine performance and minimizing the likelihood of unintended engine degradation. Jatropha’s
high solidifying point may restrict usage to regions where ambient air temperature drops below
2◦C, contrasted against conventional diesel which has a much lower solidifying point (-14◦C),
enabling its use in cooler climates. Although this does not present a problem in Ghana, it may in
other localities.
6.12 Emissions: Jatropha Biodiesel vs. Conventional Diesel
Conflicting evidence exists regarding the emissions of Jatropha biodiesel: the WSU
report (2002) contends that Jatropha biodiesel “contains no sulfur and so emits none”, which
conflicts with Schrimpff’s analysis, suggesting the fuel contains a paltry 0.13% sulfur.
Regardless of these inconsistencies, it is evident that Jatropha biofuel may be superior to
conventional diesel in that contains negligible sulfur, if any at all. According to the EPA’s
"Comparative Analysis of Biodiesel Impacts on Exhaust Emissions" (2002), pure biodiesel
(B100), predominately from soybean feedstock used in the United States, decreases carbon
monoxide and particulate matter by approximately 50%, the emission of unburned hydrocarbons
by 67%, and eliminates sulfates entirely. (see Figure 6.3)

94
Figure 6. 3: Biodiesel vs. Conventional Diesel (Source: EPA 2002)
The only apparent consequence, according to the EPA, with regard to biodiesel
emissions, is a 10% increase in nitrous oxides that occurs due to higher oxygen concentrations
present in biodiesel, which increase combustion temperatures and, consequently, nitrous oxide
formation. Although there is general consensus that increased nitrous oxide formation occurs
during biofuel combustion, other analysis contends that particular emissions increase with
Jatropha oil combustion. According to Kumar et al. 2001, “hydrocarbon and carbon monoxide
emissions were slightly higher with both Jatropha oil and its methyl ester than with diesel [,]
whereas NO levels were lower than with diesel.” These inconsistencies can be attributed to many
factors, namely, differing experimentation methods, particular fuel constituents, and engine
specifications. Many of the sources that analyzed Jatropha emissions, did so with direct injection
Lister engines, which likely have different emissions controls (if any at all) from the standard
diesel engines tested in the EPA's analysis.
Nonetheless, unlike diesel, Jatropha is a renewable resource that can provide carbon
neutral energy production if managed in a sustainable manner. Sustainable cultivation practices
would ensure that all carbon dioxide released during the fuel’s combustion will be recaptured
and sequestered in future plant respiration and biomass. Amid increasing global climate change
concerns, some projects have attempted to receive the carbon sequestration payments made
available under the Kyoto Protocol’s Clean Development Mechanism (CDM). Benge (2006)
cites Henning’s rough calculation of the anticipated payments that a Jatropha project in Egypt is

95
slated to receive under this provision; payments are approximated at $150 US per hectare,
although no formal data has been released.
6.13 Engine Performance: Jatropha vs. Diesel
Figure 6.4 indicates the results of comparative analysis on the engine performance of
pure Jatropha (BD 100), a 50% blend of Jatropha and conventional diesel (BD 50), and pure
diesel (K 100). The similarity of these fuels’ reaction within the fuel pipe and pressurization in
the cylinder is striking. With regard to the parameters tested, it appears Jatropha biodiesel and
conventional diesel are functionally equivalent when combusted in standard diesel engines.52
Figure 6. 4: Engine Performance of Pure Jatropha (BD 100), a 50% Blend of Jatropha and Diesel (BD 50)
and Straight Diesel (K100). Source: Manurung
Other analysis on the thermal efficiency of various fuels derived from Jatropha oil, when
combusted in a Lister-style compression ignition engine, suggest straight Jatropha vegetable oil
is less efficient than its methyl ester or diesel. Kumar et al. (2001) claim that the brake thermal
efficiency of Jatropha vegetable oil was 25.6%, which was slightly less than the 27.8% achieved
by the methyl ester. In these test diesel exhibited the highest thermal efficiency of 29.4%.
52 This figure was attained from an online presentation presented by Dr. Ir Robert Manurung at the Bio-Technology Research Center Institut Teknologi Bandung, however, the date is unknown. Unfortunately, original documentation of this research detailing the methodologies and assumptions underling this experiment was never acquired, either because it remains unpublished or was overlooked by the authors.

96
6.14 Cost: Jatropha vs. Diesel
The average price of diesel fuel in Ghana in 2005 was US $0.65/L according to Ackom
(2005), which is artificially low and does not reflect actual costs, due to substantial government
subsidies for fossil fuels. Ackom (2005 citing Schrimpff 2002; Protzen, 1997) claims
“production cost” of “Jatropha oil”—although not explicitly stated, it is presumably
transesterifed—is between US $0.45 and $0.60 per liter. Heller (1996) references a project in
Nicaragua that expects to produce 1,600 tons of methyl esters annually, and the expected
production costs were US $0.74 per gallon. No other details are provided to substantiate these
facts. Consequently, it is unclear whether these production costs are also achievable for small
quantity production or require economies of scale, supporting infrastructure, and supply chains.
Although the evidence is inconclusive, if these production costs are accurate, the rationale for
promoting economically viable biofuel production in Ghana should intensify, especially if
volatility in the world oil markets continues.
6.15 Economic Viability & Conclusions
The Anuanom Biodiesel Project, a collaboration between Jatropha Hamburg, various
private partners, and support from the GOG, has been ongoing in Ghana since 2002. As of May
2002, a productive variety of Jatropha with a nut oil content exceeding 60% has been planted in
excess of 2,000 hectares in the Greater-Accra, Eastern, and Western Regions of Ghana. The
project intended to allocate a quarter of “idle farmland” in Ghana to Jatropha cultivation,
achieving a total planted area of 250,000 hectares by 2004 or 2005 (Henning, unknown date).
According to Henning, the project was to have reached a “critical stage” in 2003 when the first
major yields and payments were anticipated. Unfortunately, attempts to contact Reinhard
Henning and locate more recent information as to the status of the project were unsuccessful.
Revenue generation potential for Jatropha products, namely unesterified Jatropha oil,
biodiesel, and soap, is entirely predicated on local market demand. Unless Jatropha biodiesel
production costs remain competitive with retail diesel prices, its suitability as a fossil fuel
substitute will not be possible. Though production costs cited by Ackom (2005) suggest
Jatropha biodiesel can be priced competitively with diesel, a project in Tanzania (2002) reported
that pure Jatropha oil traded for US $2/L, nearly three times the price of diesel at the time. In
this scenario, it was not economically viable as a biodiesel feedstock because local soap

97
manufactures needed the oil as a raw material input for their lucrative enterprise and were
prepared to pay a premium (Henning, unknown). Despite demanding such a high price, the
prospects for revenue generation seem promising. With prices of Jatropha oil exceeding those of
diesel, individuals desiring fuel could sell the oil and receive a greater volume of diesel than
what would be achievable by converting the oil into biodiesel.
In the opinion of the authors, Jatropha production intended for use as a biofuel and for
spurring economic development seems promising, but warrants further research to determine if it
is viable for this particular village. To make a sound determination of the prospect for Jatropha
production in Mbanayili, further investigations should answer the following simple, yet
fundamental questions:
Technical
• What is the oil content of plant varieties available in Ghana?
• Does the village have a land surplus to be dedicated to Jatropha cultivation?53
• Will growing Jatropha negatively impact existing crops?
• What are the anticipated seed and oil yields for Mbanayili?
• What is the probable oil recovery from technologically feasible extraction methods?
• How much technological education will the village residents require for cultivating and
processing Jatropha?
Economic
• Do current markets exist for Jatropha in or around the vicinity of Mbanayili?
• If so, what is the current and projected market price?
• What is the potential profitability of cultivating and selling Jatropha products in local
markets?
• For what purpose/products is Jatropha currently cultivated?
• What is the most advantageous usage of Jatropha oil for Mbanayili?
• What funding avenues are available to facilitate project deployment?
53 Using a conversion factor yielding approximately 2,000 L of Jatropha “feedstock” oil per hectare, the lower limit land area requirement for the village to supply ample fuel to power the generator with blended or pure biodiesel would be approximately half a hectare (Fulton et al (2006). The upper limit land area requirement (2.225 ha/yr) was calculated using seed oil yields of 5kg/L (Henning, 2004) and land seed yields of 2,000kg/ha (Heller, 1996). Further detail is provided in section 7.14.

98
Chapter 7 Supply Side Analysis: Optimal Generation System Modeling
7.1 Energy System Design Overview
This section evaluates optimal off-grid energy system configurations that can power the
community center, utilizing the load curve data discussed in Chapter 5. Hybrid Optimization
Model for Electric Renewables (HOMER), analytical software engineered by the National
Renewable Energy Laboratory (NREL), is the tool used in this analysis. This software calculates
which system configurations provide the best option, in terms of cost, for supplying electricity to
the community center. HOMER ranks optimal system configurations according to their net
present cost (NPC). 54 Sensitivity analyses were also conducted to determine the impact of
variations in natural resources, economic, or load conditions on the system, such as unanticipated
attenuation of solar radiance or increased electricity consumption; this helps determine which
system configurations are robust and adaptable to unanticipated variances in model assumptions.
7.2 Benchmark HOMER Design Schematic
This hybrid energy system, which incorporates the use of renewables, consists of three
primary functions: power production, energy consumption, and storage. Power production relies
on a PV array and diesel generator.55 Energy consumption is dictated by a power versus time
load curve derived from Chapter 5. Energy storage is achieved with the use of a battery bank
and converter. Figure 7.1 illustrates the relationship between these components.
54 Net present cost calculates the total cost of purchasing and operating the system over the project’s lifetime, discounted back to provide this cost in present value terms. 55 These power generation sources were selected for a number of reasons: a diesel generator allows for either diesel or biodiesel fuel blends to be evaluated (at least in theory), which conforms to the Government of Ghana's expressed interest in expanding the usage of Jatropha Curcas L. (see Chapter 6). Furthermore, PVs and diesel generators have been used extensively in similar applications in Northern Ghana. Other resources such as mini-hydro and wind were also investigated, but eventually determined to be either unrealistic or less effective for this particular application. (see appendix 3)

99
Figure 7. 1: Benchmark HOMER Schematic Source: NREL, 2006
Utilizing HOMER 2.2 beta56, the benchmark simulation is comprised of two independent
loads, alternating current (AC) and direct current (DC). The PV array and the generator produce
DC power that can be fed directly into the DC load without AC conversion. Excess energy
produced by either the PV array or the generator that surpasses both load requirements is stored
in the battery bank. If the DC load requirements exceed the energy production of the PV array
and the generator, stored energy in the battery bank is directly fed into the DC load. Meeting AC
energy load requirement necessitates that this energy be converted from DC to AC. The
converter allows for energy transformation from DC to AC, or vice versa. Given that neither the
PV array nor the generator produce AC energy, the converter should transform just enough
energy to AC to meet this load requirement in order to minimize conversion losses; in short,
transformation of energy from AC to DC energy is not necessary with this system configuration.
7.3 Benchmark Simulation
The benchmark simulation attempts to faithfully represent reality, although the lack of
available site specific data often proves a challenge. In compensation, alternative simulations and
56 At the time this model was created, the added functionality available in 2.2 was deemed potentially useful. Thus, analogue models were created and run in HOMER 2.19 “alpha” to determine if altered computational algorithms or design errors in the beta version affected model results. This test verified that the optimization and sensitivity results were equivalent between both software versions. Though a few of the cost calculations differed slightly, this variance had negligible influence on optimization and sensitivity outcomes.

100
sensitivity analysis were conducted to elucidate shortcomings in the benchmark case. After an
explanation of the benchmark simulation, the results of the alternative models will be discussed,
lending a more nuanced comprehension of modeling assumptions and their impacts on optimal
system configurations. Overall, the results of these tests indicate model robustness, as many
attempts to identify highly sensitive parameters were unsuccessful.
7.4 Solar Irradiance
Solar irradiance observed in Ghana fluctuates throughout the year, corresponding to
seasonal and regional variation. Ground irradiation values tend to be higher in the northern
regions, averaging about 5.42 kWh/m2/day (see Table 7.1), compared to the national average of
5.1 kWh/m2/day. Table 7. 1: Solar Irradiation Potential of Ghana
Reference Jan Feb Mar Apr May Jun Jul Aug Sep Oct Nov Dec Average kWh/m2/dayEC/JICA (national - ground) 4.97 5.36 5.48 5.65 5.46 4.83 4.56 4.38 4.73 5.36 5.41 4.98 5.10EC/JICA (national - satellite) 5.56 6.09 5.86 5.62 5.36 4.87 4.66 4.51 4.73 5.42 5.65 5.41 5.31EC/JICA (northern region - ground) 5.31 5.59 5.70 5.87 5.86 5.47 5.02 4.80 5.05 5.59 5.63 5.17 5.42EC/JICA (northern region--satellite) 5.56 6.32 6.26 6.15 6.00 5.51 5.10 4.78 5.23 5.91 5.77 5.41 5.67NASA 2007 5.81 6.23 6.31 6.27 5.87 5.44 5.01 4.67 5.13 5.73 5.79 5.72 5.66NREL (flat tilted) 2005 - - - - - - - - - - - - 5.5-6.0
Seasonality also has a significant impact on the availability of solar insolation. It tends to
be the lowest during the rainy season (April through October) and highest in the dry season
(November through March) (Alhassan, Pers. Comm., 2006; JICA, 2006). Another climatic
phenomenon that can impact the availability of solar insolation for PV generation, unique to the
region, is called a harmattan. A harmattan is a low level, widely dispersed dust storm: during the
dry season, fine sand particles are transported by the prevailing seasonal winds from the Sahara
to equatorial regions of Africa. Ghana is a recipient of the subsequent dust fallout from the
Sahara. Factors such as this can diminish the amount of solar insolation reaching the ground,
causing a disparity between ground and satellite data (JICA, 2006). To accommodate for the
variance between the reported availability of solar radiance and the effects of meteorological
phenomena, sensitivity analysis was conducted on this parameter. Benchmark solar resource data
was imported directly from NASA (a function available in HOMER’s “solar resource inputs”
table) by specifying the latitude (9o 28’ North) and longitude (0o 55’ West) of Mbanayili (see
Figure 7.2).

101
0.0
0.2
0.4
0.6
0.8
1.0
Jan Feb Mar Apr May Jun Jul Aug Sep Oct Nov Dec0
1
2
3
4
5
6
7
Dai
ly R
adia
tion
(kW
h/m
2/d)
Solar Resource
Cle
arne
ss In
dex
Daily Radiation Clearness Index Figure 7. 2: HOMER (NASA) Solar Irradiation Potential of Ghana57
Source: NREL, 2006
The “scaled annual average”58 resource available at this particular site, according to
NASA, is approximately 5.6 kWh/m2/day. Concerned that the data from NASA—which is likely
derived from satellites as opposed to ground measurements—might be overly optimistic, a
comparison was drawn from other data sources: NREL’s Solar and Wind Energy Resource
Assessment maps (see Figure 7.3) and JICA’s data, provided by the GOG’s Energy Commission
(EC), presented in Table 7.1.
Figure 7. 3: NREL Solar Irradiation Potential of Ghana (kWh/m2/day)
Source: NREL
57 The “clearness index” indicates how much extraterrestrial radiation available at the specified location is attenuated by the atmosphere (Lambert, 2004). 58 The scaled annual average parameter defaults to the corresponding annual average resource (kWh/m2/day) available at the site, and was created to facilitate sensitivity analysis (Lambert, 2004).

102
Flat plate tilted solar irradiation values provided by NREL, constructed by combining
both direct normal and horizontal irradiation values, indicate a solar resource availability of 5.5-
6.0 kWh/m2/day in the northern region. The Energy Commission indicates a discrepancy
between ground and satellite irradiation values for this region as well; yearly averages are 4.42
and 5.67 kWh/m2/day, respectively (JICA, 2006). Due to the variation in the data reported, the
additional sensitivities evaluated on this parameter are 5.0 and 6.0 kWh/m2/day, demonstrating
the influence solar variation has on system configurations and costs.59
7.5 Photovoltaic
Capital and replacement cost assumptions (see Table 7.2) were taken from JICA’s report
(2006 citing the Renewable Energy Service Project (RESPRO)) and converted from Euros using
a $1.25 exchange rate (10/2006). Operation and maintenance costs60 are difficult to assess, but
are considered minimal with routinely maintained renewable energy systems (JICA, 2006). In
this model a nominal fee was ascribed to this constraint ($20/yr for 500w). Table 7. 2: Photovoltaic Array Constraints61
Size (kW) Capital ($)
Replacement ($)
O&M ($/yr)
Lifetime (yr)
Derating Factor (%)
Slope (degrees)
Azimuth Ground Reflectance (%)
0.05 268 268 20 25 88 9.47* 0* 20*0.1 502 502 25
Source: NREL, 2006
Thus, total O&M costs were represented by including maintenance wages and
miscellaneous costs into the software’s “system fixed O&M costs” parameter. This will be
discussed further in a following section (7.12), which details economic input assumptions. The
twenty-five year lifetime of the PV array is considered industry standard. The derating factor is
88% and accounts for the added losses in the conversion of solar irradiance to energy by the PV
array due to various factors (e.g. dust accumulation on the array and high ambient temperatures)
that would result in the PV module producing less than its rated output. A number of sample
59 See the section on sensitivity analysis (7.15) for details. 60To clarify, component O&M costs represent specific costs incurred for a particular component, but do not account for maintenance personnel wages; these are included in the “system fixed O&M cost” parameter. It is important to recognize that the software computes O&M cost independently from replacement, fuel and labor costs, which other resources appear to consider included in O&M costs. The distinction is not always clear as to how other resources define this term. 61 All default software parameters will be denoted with an asterisk in tables.

103
HOMER models were evaluated, the majority of which represented this parameter with values
ranging between 88%-92% (Lambert, 2003). Recognizing the potential negative impacts of
climatic phenomena, such as harmattans (dust storm) and the high ambient temperatures
exhibited in this region, a conservative value of 88% was decided upon. The slope (angle relative
to horizontal) and azimuth (cardinal direction the panels are tilted) at which the PV array is
articulated and mounted are calculated by the software. The slope default settings are 9.467◦,
corresponding approximately to the site’s latitude. The software’s default azimuth setting for all
locations in the northern hemisphere is 0◦, or due South.
7.6 DC Generator
Most standard AC diesel generators cost between $800 and $1,000 per kW (Jimenez and
Olsen, 1998). HOMER's optimal configuration requires no more than a 1.5 kW generator for all
cost effective system configurations. Table 7. 3: Generator Cost Constraints
Size (kW)
Capital ($)
Replacement ($) O&M ($/hr)
Lifetime (hrs)
Minimum Load Ratio (%)
1 1500 1500 0.12 25,000 30*1.5 2250 2250 0.15
Source: NREL, 2006
Unfortunately, few manufacturers offer diesel generators in this low power range
category and they appear to be fairly specialized equipment. Even though it would be less
expensive to use an oversized AC diesel engine, fuel efficiency drops considerably if engines are
run at low loads (Jimenez and Olsen, 1998). For this reason, a small DC diesel generator was
chosen. These tend to be considerably more expensive than their AC counterpart, but the
performance is far superior with respect to fuel efficiency and reliability (Polar Power, 2006).
Also, having a DC generator that can power the vaccine refrigerator and lights without the use of
a converter will ensure that this critical load is met. As with other component cost assumptions
that were substantiated from the RESPRO’s data (2006), generators were never installed over the
duration of the project, consequently, substantiating this assumption with the same method is not
possible. Polar Power Inc. offers small 1-3.5 kW diesel generators outfitted with high quality
proprietary DC alternators. According to their price list, Yanmar or Lombardini diesel engines
fitted with a 1.5kW DC alternator demand a 50%-300% price premium over AC counterparts on
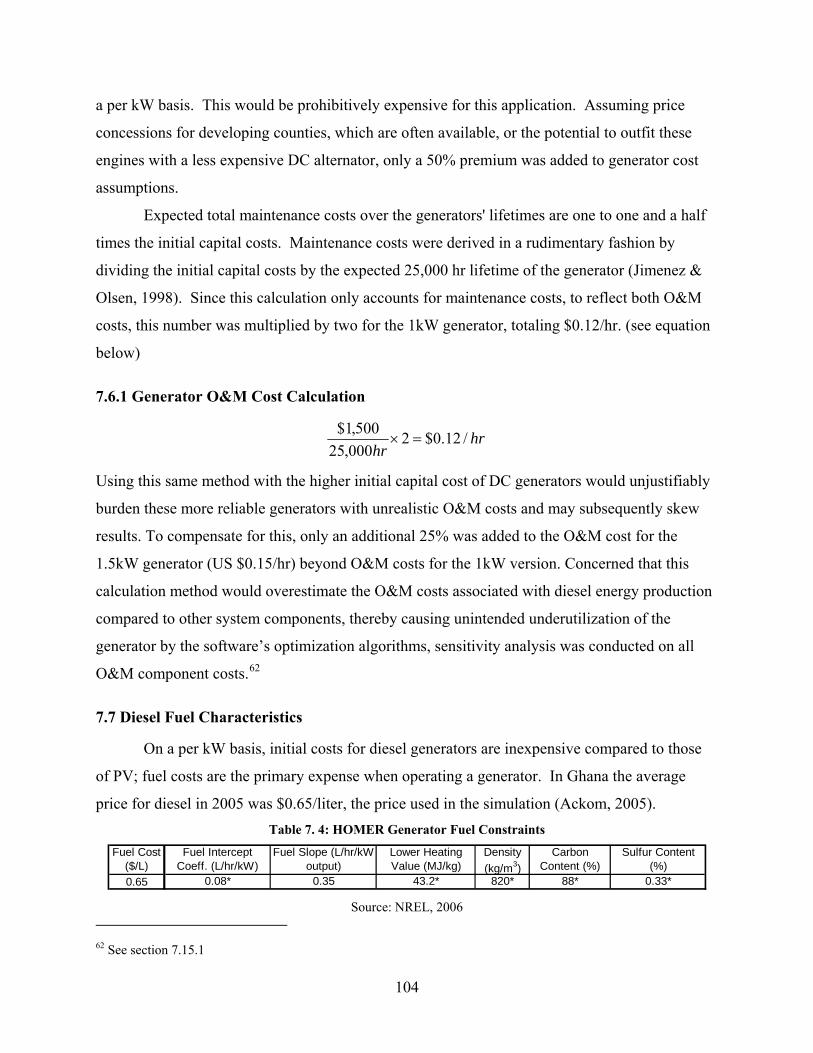
104
a per kW basis. This would be prohibitively expensive for this application. Assuming price
concessions for developing counties, which are often available, or the potential to outfit these
engines with a less expensive DC alternator, only a 50% premium was added to generator cost
assumptions.
Expected total maintenance costs over the generators' lifetimes are one to one and a half
times the initial capital costs. Maintenance costs were derived in a rudimentary fashion by
dividing the initial capital costs by the expected 25,000 hr lifetime of the generator (Jimenez &
Olsen, 1998). Since this calculation only accounts for maintenance costs, to reflect both O&M
costs, this number was multiplied by two for the 1kW generator, totaling $0.12/hr. (see equation
below)
7.6.1 Generator O&M Cost Calculation
hrhr
/12.0$2000,25500,1$
=×
Using this same method with the higher initial capital cost of DC generators would unjustifiably
burden these more reliable generators with unrealistic O&M costs and may subsequently skew
results. To compensate for this, only an additional 25% was added to the O&M cost for the
1.5kW generator (US $0.15/hr) beyond O&M costs for the 1kW version. Concerned that this
calculation method would overestimate the O&M costs associated with diesel energy production
compared to other system components, thereby causing unintended underutilization of the
generator by the software’s optimization algorithms, sensitivity analysis was conducted on all
O&M component costs.62
7.7 Diesel Fuel Characteristics
On a per kW basis, initial costs for diesel generators are inexpensive compared to those
of PV; fuel costs are the primary expense when operating a generator. In Ghana the average
price for diesel in 2005 was $0.65/liter, the price used in the simulation (Ackom, 2005). Table 7. 4: HOMER Generator Fuel Constraints
Fuel Cost ($/L)
Fuel Intercept Coeff. (L/hr/kW)
Fuel Slope (L/hr/kW output)
Lower Heating Value (MJ/kg)
Density (kg/m3)
Carbon Content (%)
Sulfur Content (%)
0.65 0.08* 0.35 43.2* 820* 88* 0.33* Source: NREL, 2006
62 See section 7.15.1

105
Although economies of scale have not been realized with Jatropha production, some
studies have suggested that production costs are between $0.45 and $0.60/liter (Ackom, 2005).
The previous study conducted on the feasibility of Jatropha as an alternative to diesel fuel
suggests their similar characteristics when combusted as fuel in diesel generators, justifying
utilizing Jatropha and diesel as proxies for one another—independent of emissions. Nonetheless,
to maintain model realism, generator benchmark conditions were designed to emulate diesel fuel
inputs63, because this fuel can be procured with certainty, unlike Jatropha fuel (either esterfied or
unesterfied), which requires supportive agribusiness and infrastructure that are currently
nonexistent in northern Ghana.
7.8 Load Characteristics
AC and DC electrical configurations were considered for system modeling. Ultimately,
the load was partitioned into two sectors, creating individual DC and AC loads. The DC sector
will accommodate the lights and vaccine refrigerator, while the remaining amenities (e.g. radios
and fans etc.) will remain on an independent AC sector. This will ensure reliable power to the
critical amenities, that is, the vaccine refrigerator and the lights. Most common appliances
require AC for operation, not DC. In realistic conditions, this will minimize the likelihood of
power losses in the event of ancillary equipment failure in items such as the converter or battery
bank. If ancillary equipment failure does occur, power from the generator or PV array can be fed
directly into the DC sector to ensure this critical load is met, without reliance on ancillary
equipment.
Load curve data derived from the needs assessment (discussed in Chapter 5) was
converted into text files, representing hourly energy consumption for both the AC and DC sector
loads for an entire year (8760 hrs). Once uploaded, HOMER creates an average load curve by
extrapolating from the text file data to simplify calculations. This aggregate data is provided
below in Figures 7.4 and 7.5, and Tables 7.5 and 7.6.
63 All fuel inputs were taken from the HOMER software’s default diesel settings with the exception of the “fuel slope”, which was increased from 0.25 to 0.35 to represent slightly less efficient generators common in the developing world. Sensitivity analysis was also conducted on this parameter, detailed in section 7.17.3.

106
7.8.1 DC Load Profile
Energy requirements for the DC load are fairly minimal, with a peak annual average of
1.08 kWh/day and an annual peak of 0.118 kW.
0 6 12 18 240.00
0.02
0.04
0.06
0.08
0.10
0.12D
eman
d (k
W)
Load Profile (from Load Curve_BeforeDSM_16_)
Hour Figure 7. 4: DC Load Profile
Table 7. 5: DC Load Characteristics
Annual Average Annual Peak Load Factor Daily Standard Deviation Hourly Standard Deviation1.08 kWh/day 0.118 kW 0.381 18.9% 50.2%
Source: NREL, 2006
The load factor, which is defined as the ratio of average load to peak load, is 0.381 for the
DC sector, indicating that peak load requirements are approximately three times greater than
average load requirements. Also, the daily and hourly standard deviations for this load are
18.8% and 50.2%, respectively.64
7.8.2 AC Load Profile
In contrast to the DC load profile, the AC load requires substantially more energy, having
an annual average of 5.7 kWh/day and an annual peak of 2.6 kW. Since this load exhibits far
more volatile fluctuations in average to peak load, the capacity factor is significantly smaller
than that of the DC load at 0.0927.
64 There are two different methods for calculating loads with HOMER. Modelers can either create an hourly load profile, as has been done in this analysis, or create average monthly and weekend load profiles. The authors chose the former method, as this is generally considered to be more representative of actual load conditions. When using the latter method, modelers are able to input their own added hourly and daily “noise”; with this method, some type of unknown stochastic noise pattern is always applied to the calculation. However, when uploading hourly load data, the added noise fields are calculated by HOMER and are not subject to editing. When checking the subsequent load profile, it does not appear as though randomness is added to calculations; rather, it appears to calculate standard deviation. As per a correspondence with Peter Lilienthal and Tom Lambert, HOMER software developers, they have verified that the noise parameter actually calculates standard deviation. The parameter is called noise to facilitate laypersons’ understanding. However, in this analysis, it will be referenced as “standard deviation”, not “noise”.

107
0 6 12 18 240.0
0.1
0.2
0.3
0.4
0.5
0.6
Dem
and
(kW
)
Load Profile (from Load Curve_BeforeDSM_16_)
Hour Figure 7. 5 AC Load Profile
Table 7. 6: AC Load Characteristics
Annual Average Annual Peak Load Factor Daily Standard Deviation Hourly Standard Deviation5.7 kWh/day 2.6 kW 0.0927 79.2% 412%
Source: NREL, 2006
This indicates the peak load is approximately 11 times greater than the average load
conditions. This is further exemplified by the noticeable increase in daily and hourly standard
deviations, which are 79.2% and 412%, respectively. Combined daily energy consumption for
both AC and DC loads is 6.78 kWh/day.
7.9 Converters
Converters (comprised of both an inverter and rectifier) allow for the system to transition
between alternating and direct currents. DC current from the PV array can be directly fed into
the batteries or the DC load. However, most appliances run off either sine wave or modified sine
wave alternating current. Table 7. 7: Converter Constraints
Size (kW)
Capital ($)
Replacement ($)
O&M ($/yr)
Inverter Lifetime (yr)
Inverter Efficiency (%)
Rectifier Capacity Relative to Inverter
Rectifier Efficiency (%)
0.225 237 237 10 15* 90* 80 85*0.45 261 261 15
Source: NREL, 2006
In this application an inverter will be needed to modify the current from the DC
generator, batteries, and the PV array to the AC load. Rectifiers function in the opposite way by
converting DC back to AC. Presumably, the rectifier constraint above is omitted from
calculations since this system lacks any AC energy production, rendering conversions from AC
to DC obsolete unless surplus energy is sent to the AC load. Once again, pricing parameters were
acquired from the RESPRO costs published by JICA (2006).

108
7.10 Batteries
Batteries have posed a significant problem to the long-term success of previous
renewable energy (RE) projects undertaken in Ghana (JICA, 2005). Due to insufficient funds
available for replacement batteries, substandard substitute batteries are sometimes utilized. This
subjects other system components to operating outside specified tolerances and specifications,
inadvertently causing the system to function inefficiently. With the expected lifetime of most
RE systems being twenty-five years, batteries would need to be replaced several times over this
duration. The lifetime of a battery is contingent on many factors, including brand specification,
ambient temperatures, and charging and dispatch regimes. Dependent on these factors, average
life expectancy can vary drastically, ranging between three and eight years (Jimenez & Olsen,
1998). The HOMER software projects the life expectancy of the batteries used in the benchmark
simulation to be 7.86 years. This requires batteries be replaced approximately three times over
the twenty-five years of the system's anticipated life.
7.11 Battery Costs and Specifications
Cost assumptions for batteries were taken from capital costs reported by the RESPRO.
This project utilized 216 Ah (amp hour), deep cycle DC batteries. The HOMER software
provides a number of preloaded batteries available for modeling purposes. Table 7. 8: Battery Constraints
Quantity Capital ($)
Replacement ($)
O&M ($/yr)
1 550 550 5 Nominal Voltage 200 Ah*Nominal Voltage 2V*Round Trip Efficiency 86%*Min. State of Charge 30%*Float Life 20 years*Max. Charge Rate 1 A/Ah*Max. Charge Current 40 A*Lifetime Throughput 680 kWh*Suggested Value 671 kWh*Max. Capacity 234 Ah*Capacity Ratio 0.374*Rate Constant 1.08 1/hr*
Hoppecke 4 OPzS 200 Vented lead-acid, tubular-plate, deep-cycle battery
Source: NREL, 2006
From these choices, a Hoppecke 4 OPzS vented lead-acid, tubular-plated, deep cycle
battery was decided upon as an appropriate surrogate for modeling. A detailed listing of this
battery’s specifications is provided above.

109
7.12 Economic Inputs
Ghana exhibits rather volatile economic conditions. Interest rates vary dramatically,
ranging from 19.5% to 45% over the last decade (Government of Ghana, 2005). These rates can
greatly influence optimal system configurations, because the HOMER software ranks each
system by its net present cost (NPC). Table 7. 9: Economic Inputs
Annual Real Interest Rate 8%Project Lifetime 25System Fixed Capital Costs -System Fixed O&M Costs $500/yrCapacity Shortage Penalty -
Economic Inputs
Source: NREL, 2006
Due to interest rate variability in Ghana, a wide range of rates was considered in the
sensitivity analysis. However, analyses conducted by JICA and other similar studies typically
represent interest rates at 8% as a baseline when performing financial calculations, independent
of actual rates experienced in the country, in order to facilitate comparative analysis between
results. All cost will be distributed over a twenty-five year project lifetime, which is considered
typical for modeling renewable energy projects (Lambert, 2003). As stated earlier, O&M and
replacement costs for renewable energy projects are notoriously difficult to assess, but are of
critical importance for successful project deployment. The RESPRO’s difficulty in recapturing
O&M costs was compounded by their reactionary and piecemeal maintenance regime; they often
conducted service only after a system had become defunct. However, according to JICA,
renewable energy components are relatively maintenance free as long as routine service is
conducted to ensure that the system is functioning optimally. For this reason, “system fixed
O&M costs” were designed to provide sufficient funds for a full-time employee to manage
maintain and provide security for the community center. This individual should be paid higher
than average wages for the Mbanayili residents; average monthly income is 16.4 USD for men
and 6.4 USD for women. (see Chapter 4) A dollar a day is nearly twice the average pay for
villagers and should be ample enough to entice an individual with strong ties to the community
to remain and perform these tasks. Thus, annual fixed system O&M costs for the benchmark
scenario will be 500 USD, allocating approximately 365 USD to wages and the remaining 135
USD to be earmarked for future O&M costs. Concerned that benchmark assumptions for this

110
parameter were overly optimistic, sensitivity analysis was conducted to determine how total
lifetime system costs would increase if substantially more funds were required for wages or
maintenance.
7.13 Other Constraints
The capacity shortage factor is a parameter in the HOMER software which allows the
modeler to specify the maximum percentage of time the load(s) can go unmet. As the capacity
shortage factor approaches zero the system becomes more reliable, but increasingly expensive
due to the extra investment in the capital equipment necessary to meet that requirement. Table 7. 10: Other HOMER Constraints
Maximum Annual Capacity Shortage 10% Hourly Load 10%*Minimum Renewable Fraction 0% Annual Peak Load 0%
Solar Power Output 25%*Wind Power Output 0%
Constraints Operating Reserve as a Percent of Load
Operating Reserve as a Percent of Renewable Output
Source: NREL, 2006
This system was designed to be considerably more reliable than the grid, which is prone
to energy shortfalls due to rapidly increasing demand as well as insufficient and archaic
infrastructure (Ackom, 2005). A 10% capacity shortage factor was used for the reference
model, but the HOMER software often optimizes designed systems that are far more reliable
than what is required by this constraint. The software allows for the modeler to specify a
minimum renewable fraction, which essentially forces the model to incorporate the use of
renewables independent of whether or not this is the most parsimonious approach for energy
production. Since our load profile is based on hourly data, not averages, the need to specify
significant added operating reserves that would compensate for unanticipated increases in load
demands or decreased energy production did not seem critical. Specifying substantially larger
operating reserves than are necessary to meet actual load conditions often requires additional
installed operating capacity, potentially increasing capital costs beyond what is reasonably
justifiable. Consequently, it was unnecessary to apply operating reserves larger than the
software’s default settings: solar operating reserves as a percent of renewable output are 25%
and operating reserves as a percent of hourly load are 10%.

111
7.14 Benchmark Simulation Optimization Results
Figure 7.6 ranks feasible system configurations for benchmark conditions from lowest
(27,429 USD) to highest (60,809 USD) net present cost (NPC). The software’s engineers
designed HOMER to rank feasible systems by NPC as opposed to the average cost of electricity
(COE).
Figure 7. 6: Benchmark Optimization Results Source: NREL, 2006
They argue that it is a much more reliable and less biased metric for making these
determinations, because it is a conventional mathematical formula does not require a number of
arbitrary assumptions, unlike the COE, which requires several. For example: “if the system
supplies less than 100% of the electric demand, should you calculate the cost per kWh of
demand, or per kWh of load actually supplied?” (Lambert, 2005). Considering NPC,
hybridization is the optimal system configuration for this scenario, consisting of: a 0.5 kW PV
array; a 1.5 kW diesel generator; five 200 Ah batteries; and a 1.5 kW converter. This is also the
optimal configuration when considering the COE as the determining criteria, which is US
$1.09/kWh. Though this is substantially higher than the cost of grid electricity in Ghana,
approximately 381 cedi/kWh (US $0.04/kWh at 2/07 exchange rate) under the lifeline tariff, if
the actual cost of grid electricity generation (at least US $0.08/kWh) and extension were
accounted for, this price would be more competitive (JICA, 2006). A 1996 Global
Environmental Facility (GEF) report estimating rural electrification options for Ghana’s
Mamprusi East District, which appears to be a pre-study for the RESPRO, concluded that the
cost of grid electrification would be US $1.3/kWh if each of the 1,661 households consume 0.03
kWh/day. (See Table 7.11) Furthermore, this analysis concluded that 834 households could also
be electrified with a PV/Diesel hybrid system for US $1.3/kWh. This is not to suggest that direct
comparisons can be drawn between this HOMER model and the GEF report, but rather that the
results of this simulation comport with other similar research.

112
Table 7. 11: Costs of Options for Rural Electrification of Mamprusi District East (Ghana)
Measure\ Option Grid Connection Diesel mini-grid PV/Diesel Hybrid PV Home Systems
Costs per
household1
US$2893 US$2966 US$2829 US$1706
Cost per kWh2 $1.3/kWh $1.4/kWh $1.3/kWh $0.8/kWh
Emissions per
household
2190 tonnes CO2 2190 tonnes CO2 547.5 tonnes CO2 0 tonnes CO2
Total Costs $4,805,733
(1661 hh’s)
$4,925,746
(1661 hh’s)
$2,359,469
(834 hh’s)
$1,410,642
(827 hh’s) 1 The total costs per household (hh) are calculated on the basis of a 20 year project horizon, discounted at 10%. 2 The costs per kWh assume that the household consumes 0.3 kWh per day under all options. This is likely the case for the PV options, but under the grid and mini-grid options, the consumption may rise above this level.
SOURCE: GLOBAL ENVIRONMENTAL FACILITY 1996
The software was specified to allow either a load following or cycle charging dispatch
strategy for the generator. The optimal system configuration utilizes a load following strategy
that only produces enough power to meet primary load requirements; secondary priorities, such
as recharging the batteries, will be satisfied by the PV array. On the other hand, a cycle charging
dispatch strategy operates the generator at full capacity if it is beneficial for ancillary purposes,
every time it is initiated to meet load conditions. With this strategy, surplus power exceeding
load requirements would be diverted to charging the batteries (Lambert, 2004). This dispatch
strategy is not utilized in the optimal system configuration, likely due to the static and periodic
nature of Mbanayili’s load profile.65 Adding standard deviation, a smaller capacity shortage
factor, or added operating reserve requirements might increase the use of cycle charging dispatch
in optimal simulation results.
The maximum capacity shortage of the model was intentionally restricted to 10%. As
stated earlier, this parameter is only an upper limit and the software’s optimal configuration
indicates a 7% capacity shortage occurred in this scenario. This means that load demands are met
93% of the time, compared to the Ghanaian grid, which is notoriously unreliable, experiencing
frequent energy shortfalls. Figure 7.7 details system costs from benchmark simulation results.
As shown, initial capital costs are fairly evenly distributed amongst the PV array, the diesel
generator, and the battery bank.
65 This “static and periodic” nature is detailed in section 7.17.2.

113
Figure 7. 7: Benchmark Optimization Cost Results
Source: NREL, 2006
Annualized replacement costs for batteries are noticeably higher (US $229/yr) compared
to other system components, accounting for the approximately ten replacement batteries that will
be needed over the project’s duration. With an anticipated life expectancy of 12.1 years,
annualized replacement costs for the generator will be allocated for the purchase of two more
generators. Unfortunately, with a 25,000 hour operating life66, which is considered a fairly
reasonable, if not an optimistic assumption, the last generator purchased will be operational for
less than a year. No replacement costs are associated with the PV array since the project
duration and the PV lifetime are both twenty-five years. Annual O&M costs are primarily
attributed to operating the generator and maintenance wages. With the benchmark parameters,
HOMER calculates a yearly diesel fuel usage of 890 liters at a cost of 579 USD per year.
66 Some argue the modeling of generators in developing countries should compensate for the effects of poverty on replacement schedules; there is greater incentive to continue repairing system components as opposed to incurring replacement costs. However, the absence of data would have rendered any attempts to model this arbitrary and was omitted from assumptions.

114
Utilizing a conversion factor yielding approximately 2,000 L of Jatropha “feedstock”67
oil per hectare, this lower limit land area requirement for the village to supply ample fuel to
power the generator with blended or pure biodiesel would be approximately half a hectare
(Fulton et al, 2006). (see equation below)
Jatropha Land Area Requirment Calculation:
yearhectareshectareliters
yrliters /445.0/000,2
/890=
yearhectareshectarekg
literkgyrliters /225.2/000,2
/5/890=
×
An upper limit land area requirement (2.225 ha/yr) was calculated using seed oil yields of
5kg/L (Henning, 2004) and land seed yields of 2,000kg/ha (Heller, 1996).
Figure 7.8 displays a typical daily power output (kW) of the PV array in the benchmark
scenario correlated to hours of the day over a 365 day period. As shown, power output begins
shortly after sunrise at 6am and ceases after sunset, around 6pm. Given that Ghana is
equatorially situated, the hours corresponding to sunrise and sunset remain relatively static
throughout the year. Power output during the day steadily increases in the morning and peaks
around noon every day.
Jan Feb Mar Apr May Jun Jul Aug Sep Oct Nov Dec0
6
12
18
24
Hou
r of
Day
PV Output
0.0000.0540.1080.1620.2160.2700.3240.3780.4320.4860.540
kW
Figure 7. 8: Photovoltaic Output (kW) at Hour of Day vs. Day of Year
Source: NREL, 2006
Due to seasonal variation, power production from the array begins diminishing during the
month of April and continually wanes until early August when more solar irradiation becomes
available as the rainy season concludes.
67 Though this conversion uses a “feedstock” as opposed to “fuel” oil figure, according to the National Biodiesel Board (2007) transesterification of vegetable oil to biodiesel can be achieved with 98% efficiency.

115
Figure 7.9 details the generator’s daily power output over a given year. With the load
following dispatch regime, power output from the generator will only be used to compensate for
production shortfalls from the PV array to meet prescribed power demands. Contrasting this
figure against the AC load profile (see Figure 7.5), where peak demand originates, there is a
clear correspondence between peak AC demand (around 6:00 and from 13:00-20:00) and diesel
generator output. Otherwise, generator usage appears to occur predominately in the early
morning and late evening during the absence of solar irradiance.
Jan Feb Mar Apr May Jun Jul Aug Sep Oct Nov Dec0
6
12
18
24
Hou
r of
Day
diesel Output
0.000.160.320.480.640.800.961.121.281.441.60
kW
Figure 7. 9: Generator Output (kW) at Hour of Day vs. Day of Year
Source: NREL, 2006
7.15 Benchmark Simulation Sensitivity Analysis
Over the course of this research, several iterations of the model were constructed and
certain parameters were observed to have significant impacts on optimal system configuration
and cost requirements. These were determined to be ideal parameters for conducting sensitivity
analysis. Table 7.12 provides both the original and the sensitivity parameters applied to the
benchmark HOMER model. Table 7. 12: Sensitivity Values
Parameter BenchmarkAC Load (kWh/d) 5.78 0 3 6
Global Solar (kWh/m2/d) 5.66 5 6 -Diesel Price ($/L) 0.65 0.45 0.85 -Interest Rate (%) 8 15 20 -
Max. Annual Capacity Shortage (%) 10 0 20 -
Sensitivities
Source: NREL, 2006
The DC load provides power to essential amenities, namely the vaccine refrigerator and
lighting fixtures. Therefore, sensitivity analysis on this parameter was omitted because it is
required for critical health services. The AC load, however, not only contributes to peak load

116
demands and substantially higher power requirements of the system as a whole; it is also
comprised of numerous nonessential amenities. Sensitivities were evaluated on this parameter to
determine how variances (ranging from 0 to 6 kWh/d) in this load would affect total system costs
and optimal system configurations. As mentioned earlier, there are significant disparities in the
reported availability of solar irradiance for the region. Available annual average solar irradiance
imported from NASA and applied to the benchmark model (5.66 kWh/m2/d) was likely
determined from satellites, not ground measurements. A value of 5.42 kWh/m2/d is provided by
the Ghanaian Energy Commission as the anticipated annual average solar irradiance available in
northern Ghana. To evaluate the impacts of anomalous reductions in available solar irradiation,
a range of 5.0 to 5.66 kWh/m2/d was analyzed. Baseline diesel fuel costs were taken from prices
observed in Ghana, which were approximately US $0.65/L in 2005 (Ackom, 2005). To
determine the significance of fuel price fluctuations from either diesel purchases or Jatropha
production, a range of US $0.45/L to $0.85/L was evaluated. Interest rates in Ghana are volatile
and significantly higher than the 8% figure used as a benchmark constraint. Since interest rates
are a major determining factor in NPC calculations and, subsequently, HOMER’s optimal system
ranking, interest rate sensitivities were run ranging from 8% to 20%. The intent was to construct
a power supply for the community center far more reliable than that of the Ghanaian grid. A
10% maximum capacity shortage factor was considered in the benchmark constraint. An
alternative factor of 20% was also appraised, given concern that this reliability may inflict
prohibitively expensive equipment costs.
Results from this analysis on the whole indicate that hybridization (red) is the optimal
system configuration, independent of plausible variation in initial model parameters. The vast
majority of sensitivities had marginal influence on system costs and hence optimal configuration
types. Only sensitivities that produced dramatic affects on either cost structures or configuration
types will be discussed in detail. In the simulation, depicted in figure 7.10, all parameters are
restricted to baseline conditions except interest rates (y-axis) and AC load demands (x-axis).
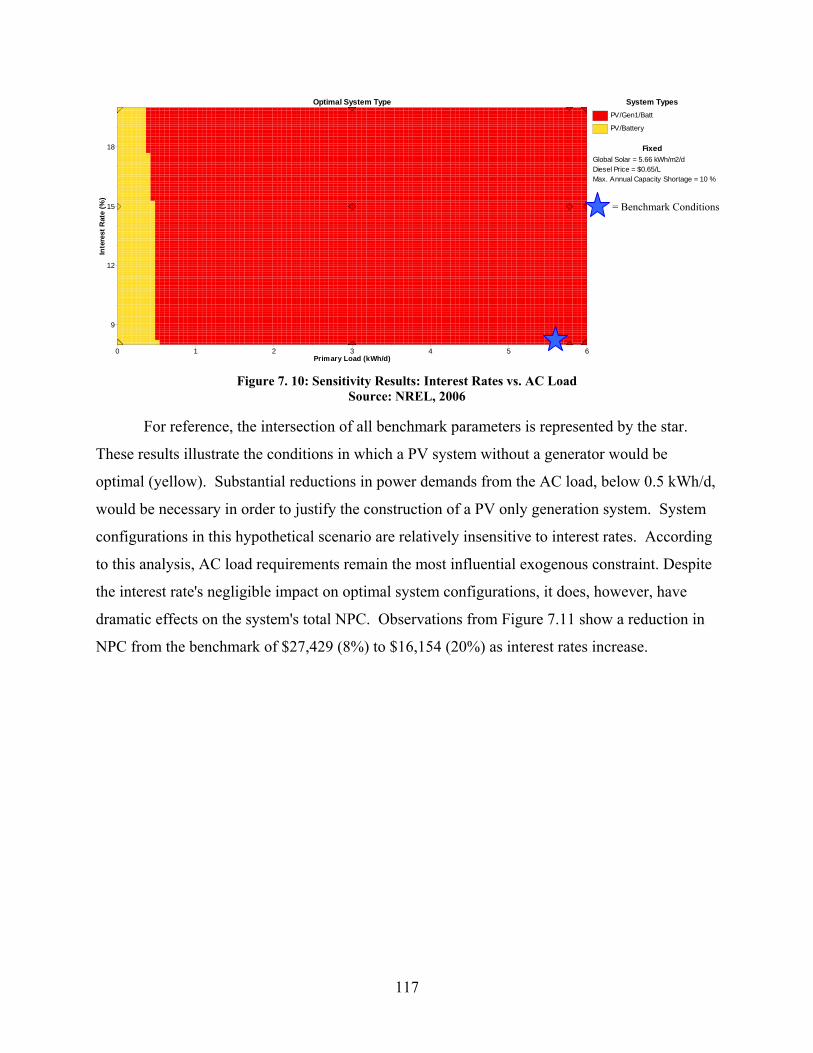
117
0 1 2 3 4 5 6
9
12
15
18
Inte
rest
Rat
e (%
)Optimal System Type
Primary Load (kWh/d)
System TypesPV/Gen1/Batt
PV/Battery
FixedGlobal Solar = 5.66 kWh/m2/dDiesel Price = $0.65/LMax. Annual Capacity Shortage = 10 %
Figure 7. 10: Sensitivity Results: Interest Rates vs. AC Load
Source: NREL, 2006
For reference, the intersection of all benchmark parameters is represented by the star.
These results illustrate the conditions in which a PV system without a generator would be
optimal (yellow). Substantial reductions in power demands from the AC load, below 0.5 kWh/d,
would be necessary in order to justify the construction of a PV only generation system. System
configurations in this hypothetical scenario are relatively insensitive to interest rates. According
to this analysis, AC load requirements remain the most influential exogenous constraint. Despite
the interest rate's negligible impact on optimal system configurations, it does, however, have
dramatic effects on the system's total NPC. Observations from Figure 7.11 show a reduction in
NPC from the benchmark of $27,429 (8%) to $16,154 (20%) as interest rates increase.
= Benchmark Conditions

118
0
5,000
10,000
15,000
20,000
25,000
30,000 $27,429
(5-6kWh/m2/d)Fuel Price
(0.45-0.85 $/L)Interest(8-20%)
All Impacts
$27,813
1% $25,4247%
$29,3297%
$16,154
41%
$14,814
$29,784
47%
9%
NPC($)
Benchmark
Solar Irradiance
Figure 7. 11: Sensitivity Results: Exogenous Constraints
Source: NREL, 2006
This is not surprising, as interest rates influence NPC calculations dramatically, dictating
how heavily a stream of payments are discounted from one period to the next (see equation
below); they remain the most critical exogenous factor, with respect to total system costs.
Net Present Cost Calculation:
nn
rC
rC
rC
rC
CNPC)1(
......)1()1(1 3
32
210 ++
++
++
+= = ∑= +
+t
nn
n
rCC
10 )1(
Whereby, NPC = net present cost
C = total annual costs in any period
r = interest rate
n = project lifetime
Interest rates do not influence optimal system configurations significantly, despite their
dramatic impact on NPC, because the effects are evenly distributed amongst capital,
replacement, and O&M costs equally, with one exception. In these simulations the PV array has
the exact anticipated lifetime as the system as a whole (twenty-five years), consequently, NPC
calculations do not include PV replacement costs; PV costs (besides O&M, which is minimal)
are entirely encapsulated in the initial capital costs that are unaffected by interest rates.
However, as interest rates increase, there is greater incentive to postpone purchases because the
future is discounted so heavily. This tends to handicap the PV array costs, which are almost
entirely accounted for as initial capital, more so than the total cost for a generator, which is
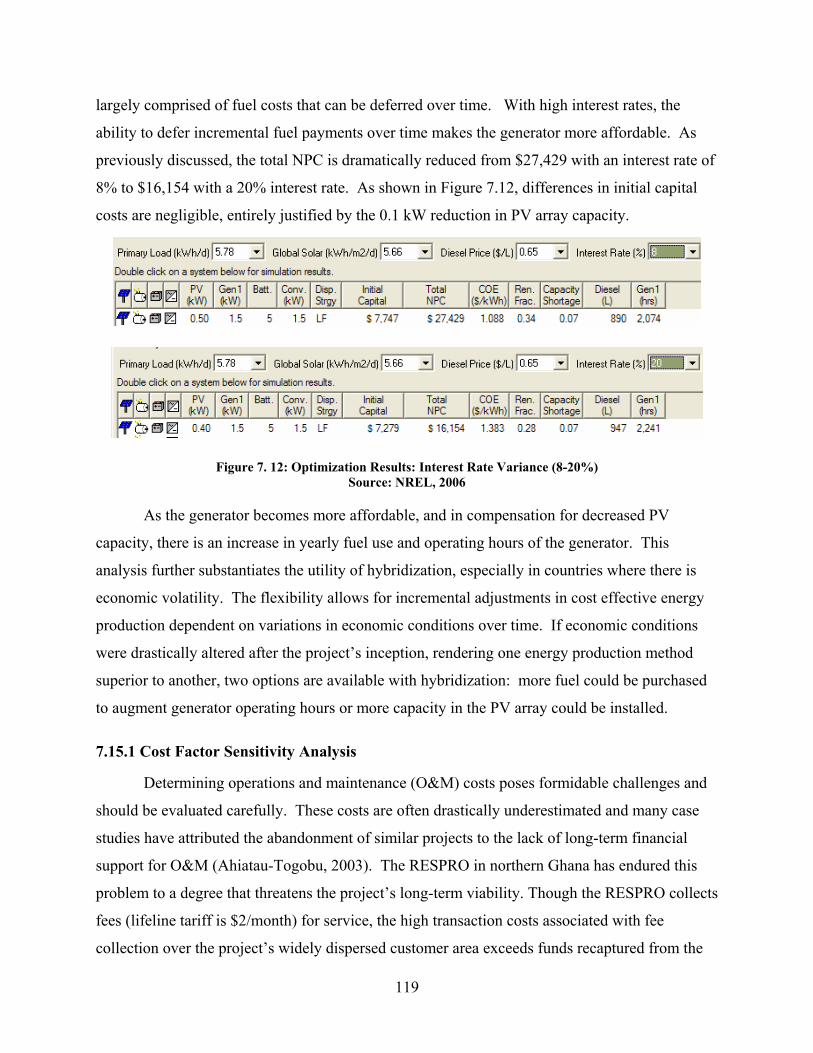
119
largely comprised of fuel costs that can be deferred over time. With high interest rates, the
ability to defer incremental fuel payments over time makes the generator more affordable. As
previously discussed, the total NPC is dramatically reduced from $27,429 with an interest rate of
8% to $16,154 with a 20% interest rate. As shown in Figure 7.12, differences in initial capital
costs are negligible, entirely justified by the 0.1 kW reduction in PV array capacity.
Figure 7. 12: Optimization Results: Interest Rate Variance (8-20%) Source: NREL, 2006
As the generator becomes more affordable, and in compensation for decreased PV
capacity, there is an increase in yearly fuel use and operating hours of the generator. This
analysis further substantiates the utility of hybridization, especially in countries where there is
economic volatility. The flexibility allows for incremental adjustments in cost effective energy
production dependent on variations in economic conditions over time. If economic conditions
were drastically altered after the project’s inception, rendering one energy production method
superior to another, two options are available with hybridization: more fuel could be purchased
to augment generator operating hours or more capacity in the PV array could be installed.
7.15.1 Cost Factor Sensitivity Analysis
Determining operations and maintenance (O&M) costs poses formidable challenges and
should be evaluated carefully. These costs are often drastically underestimated and many case
studies have attributed the abandonment of similar projects to the lack of long-term financial
support for O&M (Ahiatau-Togobu, 2003). The RESPRO in northern Ghana has endured this
problem to a degree that threatens the project’s long-term viability. Though the RESPRO collects
fees (lifeline tariff is $2/month) for service, the high transaction costs associated with fee
collection over the project’s widely dispersed customer area exceeds funds recaptured from the

120
tariff that are earmarked for O&M. Battery replacements account for the majority of the O&M
costs incurred by this project. The disparity between fees captured by the tariff and the actual
O&M costs is directly attributable to the project’s rapidly deteriorating fiscal health;
consequently, the project is in dire need of redevelopment and downsizing to remain solvent
(JICA, 2006). Personnel are also needed to maintain optimal performance of the system; PV
array surfaces need to be continually cleaned and tilt angles adjusted. To represent long-run
fiscal stability and project success, replacement, O&M, and fuel costs need to be evaluated.
Figure 7.13 displays the optimization results conducted on these integral financial aspects (with
the exception of fuel costs, which were evaluated in the previous section). Baseline assumptions
were contrasted against various cost factors that were applied to initial constraints. This feature
functions by multiplying the original baseline constraints by any factor of the modeler’s
choosing. The purpose of this is to examine the influence that variation in individual component
costs will have on total system NPC, and thus the optimal system configurations. Also, there is
concern that benchmark diesel generator initial capital, replacement, and O&M costs were
overestimated; the aim here is to determine under what cost constraints a stand-alone generator
would become economically viable, and hence optimal.
Figure 7. 13: Optimization Results: Cost Factor
Source: NREL, 2006
In HOMER the capital cost multipliers were correlated to replacement costs, because the
same figures were used for both, ensuring they will be altered simultaneously. In short, these
tests indicate that quadrupling PV O&M cost while halving all generator costs (capital,
replacement and O&M) influences optimal system configurations; in this scenario a standalone
generator becomes the primary source of energy production. However, if the same conditions
are applied, with the exception of reverting the capital and replacement costs for the generator
back to benchmark parameters, hybridization once again becomes the optimal system
configuration, because component O&M costs in the model account for a small fraction of the

121
total system cost. This is depicted in Figure 7.14, in which a standalone generation system is
only optimal in limited conditions.
1.0 1.5 2.0 2.5 3.0 3.5 4.00.5
1.0
1.5
2.0
Gen
1 C
apita
l Mul
tiplie
r
Optimal System Type
PV O&M Multiplier
System TypesPV/Gen1/Batt
Gen1/Battery
FixedGen1 O&M Multiplier = 0.5 Batt. Capital Multiplier = 1 Batt. O&M Multiplier = 1
Figure 7. 14: Sensitivity Results: Cost Factor
Source: NREL, 2006
For this to occur, three criteria must be met: (1) the PV O&M multiplier must exceed 3.8;
(2) the generator capital/replacement cost multiplier must be between 0.5 and 1; and (3) the
generator O&M multiplier must be set to 0.5. It appears that unless benchmark cost assumptions
are significantly underestimated for the PV array (by a factor of 4) and overestimated for the
generator (approaching a factor of 2), hybridization remains the optimal system configuration.
7.16 Alternative Models
7.16.1 AC Only Load Profile Simulation
The bifurcated load system configuration described in the benchmark simulation is
considered ideal, but is not always practical, depending on the availability of system
components. There is concern that specialized renewable DC vaccine refrigerators, lighting
fixtures, and bulbs might not be easily procured in northern Ghana. Therefore, an alternative
HOMER model was created to examine how optimization results would be impacted if DC
components were unavailable, requiring the use of only AC appliances. Another HOMER
simulation was conducted to determine how optimal system configurations would adjust if this
situation occurred. (see Figure 7.15)
= Benchmark
Conditions

122
Figure 7. 15: AC/DC (Top) vs. AC Only (Bottom) Load Configuration Source: NREL, 2006
An AC only text file was created and uploaded to HOMER by combining both the
benchmark AC and DC hourly load profiles. The results of this simulation indicate that in the
event DC components are unavailable, an AC only configuration will have negligible impact on
optimal system configurations—hybridization remains optimal—and total NPC. The only
apparent difference between the results is a slight increase in the generator operating hours from
2,074 in the benchmark simulation to 2,144 in the AC only version.
7.16.2 Fixed System O&M Analysis
Initial “fixed system O&M” costs used in benchmark model conditions ($500/yr), to
provide a wage for maintenance personnel and miscellaneous repair costs may be overly
optimistic. Since these costs are evenly distributed over total system costs and are not attributed
to any particular component, optimal system configurations remain unaffected by manipulating
this parameter. However, fixed O&M costs will contribute directly to total annualized costs and
NPC, independent of which optimal system configuration is analyzed.
7.17 Conclusions and Model Limitations
Overall the authors are pleased with the design of the various HOMER simulations used
throughout this analysis, especially considering the constrained time, geographic, and monetary
confines under which this analysis was conducted. Though painstaking efforts were taken to
construct the models in a pragmatic fashion, over the course of our analysis certain limitations
were identified and are enumerated below.
7.17.1 Generator Costs
Costs for all system components were taken from the RESPRO, and given their extensive
experience electrifying households in Northern Ghana using renewable energy systems, these
assumptions were deemed adequately substantiated. However, the RESPRO never utilized

123
generators in any of their rural electrification systems. Consequently, generator cost assumptions
were taken from a number of other sources that may not reflect the actual cost incurred if a
generator were to be procured in Ghana. This is also compounded by the fact that benchmark
simulations utilized a DC generator as opposed to the more common AC variety. To further
enhance the model’s realism, determining the actual capital, operation, and maintenance costs
associated with purchasing and operating a specific generator in Ghana would be valuable,
despite the fact that sensitivity analysis conducted on all of these assumptions indicated that their
influence on optimal system configurations was minimal.
7.17.2 Applying Standard Deviation (Noise) to AC and DC Load Profiles
As mentioned earlier, standard deviation (or stochastic variance) was not applied to our
load profiles. Profiles were derived by adding all appliance power consumption associated with
a particular activity for a given hour of the year, and then compiling this hourly data for all 8,760
hours in a year. This results in periodic and homogeneous peaks and troughs in the load profile,
which is not representative of the more nuanced consumption that would likely occur.
Incorporation of this randomness would be more indicative of reality. Consequently, peak load
demand and thus total system costs would be expected to increase slightly.
7.17.3 Fuel Curve Assumptions (Jatropha and Diesel)
HOMER’s default diesel fuel efficiency curve was used in this analysis with the
exception of the “fuel slope”, which was increased from 0.25 to 0.35 (max. efficiency of 32% to
24%, respectively) to represent the often antiquated and less efficient equipment that is common
in the developing world (see Figure 7.16). Furthermore, evidence suggests Lister engines run on
Jatropha vegetable oil have a “brake thermal efficiency [of] 25.6% (Kumar, 2001).

124
0 20 40 60 80 1000
5
10
15
20
25
Effi
cien
cy (%
)
Efficiency Curve
Output (%) Figure 7. 16: Diesel Fuel Efficiency Curve
Source: NREL, 2006
Nonetheless, modeling a particular generator with a specified fuel efficiency curve would
yield more accurate results. Future analysis should take this into account. Analysis with
HOMER’s default “fuel slope” parameter was found to have no significant impact on optimal
system configurations, although slightly less fuel was consumed on a yearly basis (from 890
liters to707 liters) than benchmark conditions. (see Figure 7.17)
Figure 7. 17: Generator Efficiency Impacts on Optimal System Configuration
Source: NREL, 2006
Significant evidence exists supporting the use of Jatropha biodiesel as a proxy for diesel.
However, initial attempts to model unesterifed Jatropha oil in a Lister-style engine were not
successful because of the difficulty in determining an appropriate fuel efficiency curve for this
obscure biofuel and engine. The ability to accurately model the combustion of Jatropha biofuel
(as opposed to biodiesel) in a Lister-style engine would help illuminate the technical and
financial feasibility of supplying rural electrification with these simple, inexpensive engines.

125
Chapter 8: Financially Sustainable System Modeling - Simulation
8.1 Background for Sustainable System Modeling
In the previous chapter, an optimum electricity generation system for Mbanayili was
constructed based on people’s preference for electricity. The annual cost and initial cost of the
system were 2,569 USD and 7,749 USD, respectively. To keep this generation system working,
villagers have to cover these costs by themselves or have to get financial support from the
government. In other words, the financial capability of the village is an important factor for the
electrification project to be a success.
In Chapter 8, this study analyzed the financial feasibility of sustaining the optimum
system first. The analysis showed that the current system was not sustainable in terms of the
village's limited financial resources. Consequently, as the next step, the study explored ways to
curtail the electricity consumption of the community center to reduce cost, and conducted a cost
simulation based on the more restricted consumption patterns. As a result, the simulation
suggested several sustainable generation systems. Then, in deciding the optimal system for
Mbanayili, the study analyzed the influence of reduced consumption on villagers for each system,
and proposed the optimal sustainable generation system for the village.
8.2 Sustainability Rule
The unsuccessful outcomes by the past electrification projects (see Chapter 2) suggest
that mechanisms to cover electricity generation costs have to be developed when a village is first
electrified. The failures of the projects were mainly due to the inability to cover electricity
generation costs for sustaining the generation systems. As discussed in Chapter 2, because the
financial resources of the government of Ghana are limited, the government cannot cover all
rural electrification costs. Thus, consumers need to share these costs if they intend to be
electrified. However, the villager's financial capability is also not enough to allocate a substantial
fraction of their meager income to electricity costs (Mbanayili’s monthly average income is
118,803 cedis (13.2 USD)). Therefore, under these constraints, for the success of an
electrification project, it must be designed in a manner that allows the villagers to cover all costs.
In this respect, a member in the Japan International Cooperation Agency (JICA) suggested (a
member of JICA, Pers. Comm., 2006), “Foreign investors or international development
organizations such as the JICA may be able to cover the initial (capital) costs. However, at least
126
the operation cost needs to be covered by local people for sustaining a generation system.” In his
opinion, the operation cost, which is generated periodically for a long time, cannot depend on
foreign organizations’ funds, because it is impossible for the organizations to indefinitely support
villages and generation systems.
In making a feasible plan and providing a financially sustainable generation system, this
study set a sustainability rule, based on the JICA’s comment, which states that the annual
expenses of a generation system must be covered by villagers. In this chapter, the study aims
to design a generation system whose cost can be covered by Mbanayili villagers and thus
satisfies this rule.
8.3 Willingness-to-Pay (WTP) Analysis
8.3.1 Data Screening
To design a sustainable generation system, villagers’ potential to pay electricity cost was
analyzed. First, interviewees were asked how much they are willing to pay for electricity use in
the community space. Their willingness-to-pay was quite high (3.06 USD (27,643 cedis) per
month per person, accounting for 23.2% of their income). One of the reasons is that villagers
have high expectation for electrification, as a way to improve their standard of living. Another
probable reason is that due to the low level of mathematical ability, villagers did not accurately
understand how much they can pay from their income for electricity. Actually, 8.3% of the
interviewees answered they are willing to pay for electricity more than their incomes.
To compensate for such errors, the actual affordability of electricity by villagers had to be
analyzed to correctly calculate their willingness-to-pay. To begin with, to get the conservative
value of the willingness-to-pay, women’s data were not used, because women’s life depends
heavily on men’s income (Doss, 2005). For example, current energy expenses of almost all
women interviewees (36 out of 39) could not be covered by their individual incomes. Thus,
women’s willingness-to-pay is also based on their family income from husbands and fathers. In
addition, according to the local volunteer for this project (Alhassan, Pers. Comm., 2006), women
have less power to decide what to buy in family. In this Islam dominant region, men usually have
the right to decide. Therefore, women’s answers might not accurately represent the willingness-
to-pay for electricity because men (husbands or fathers) may be opposed to pay. For these
reasons, this study assumed that only men pay for electricity.

127
In addition, the affordability of electricity for men was examined using collected data in
interviews. As equation (a) shows, at least villagers’ income needs to be equal to or lower than
the sum of pre-existing energy cost for kerosene, fuelwood and charcoal, and willingness-to-pay
in order for the people to be able to pay the amount of willingness-to-pay from their income. In
other words, the data that passes this affordability check can be considered credible. Only the
willingness-to-pay data of villagers that could satisfy the equation was used in this study.
Affordability Check:
(a): Income ≥ (Willingness-to-Pay for Electricity - Pre-Existing Energy Cost)
43% of men’s data passed this check. Next, using that data, the total willingness-to-pay
of Mbanayili was estimated.
8.3.2 Willingness-to-Pay Estimation for Mbanayili
The average of these forty men’s willingness-to-pay was 27,700 cedis per month (3.08
USD). This value, however, cannot be directly applied to all male villagers to estimate the total
willingness-to-pay of Mbanayili, because the distribution of the sampled population was skewed
through the affordability check. As seen in Figure 8.1, 60% of the sampled men belong to the
highest income group (more than 150,000 cedis per month).
Figure 8.1: Income Distribution of the Sampled People (Number of Persons, %)
To adequately reflect the income distribution of Mbanayili, the willingness-to-pay data
was averaged by income group. Figure 8.2 shows the percentage of willingness-to-pay in income
for each group. According to the figure, people with higher income are more willing to pay for
electricity.

128
9.9%
13.3% 13.5%
0%
2%
4%
6%
8%
10%
12%
14%
16%
less than 100000 less than 150000 more than 150000
Figure 8.2: Percentage of Willingness-to-Pay for Electricity in Income by Income Group
Table 8.1 shows the calculation of the average willingness-to-pay per person for
Mbanayili. First, the average willingness-to-pay by income group (C) was calculated using the
percentage of willingness-to-pay in income (A) and the average monthly income for each income
group (B).
(C) = (A)*(B)
Then, (C) was weighted by the income distribution of Mbanayili (D).
(E) = (C)*(D)
The total of the weighted willingness-to-pay for each income group is the average
willingness-to-pay per person in Mbanayili, which is 2.09 USD (18,776 cedis) per month. Table 8. 1: Calculation of Average Willingness-to-Pay per Person
The monthly willingness-to-pay of Mbanayili (2.09 USD) is greater than that of the
northern area’s average (1.5 USD (14,000 cedis)) (JICA, 2006), according to JICA’s research. In
this regard, the volunteer explained two possible reasons (Alhassan, Pers. Comm., 2006). First,
Mbanayili is somewhat wealthier than other villages. Since the village is close to markets in
Tamale, villagers have more chances to sell crops and products at a higher price directly in the
markets without paying shipping cost. Second, Mbanayili villagers have greater familiarity with

129
electricity and electrical appliances due to their close proximity to an electrified city, Tamale
(see Chapter 4). Compared to other northern villages, they could easily perceive the benefit from
electricity use.
Lastly, the willingness-to-pay value per man of Mbanayili was converted to the value for
the community center. Supposed there are 1,165 men in the village who are of working age68 and
can pay electricity cost, the village’s potential for paying the cost was 2,431 USD per month
(21,882,436 cedis, 2.09 USD/person multiplied by 1,165 persons). Since only 100 villagers can
use the center at the same time because of the center’s limited capacity (see Chapter 3), the
willingness-to-pay of Mbanayili for the community center is 60 USD per month or 720 USD per
annum (2,431 USD/month*(100 consumers/ 4,050 residents)).
8.4 Sustainability Check
Using the willingness-to-pay data, the sustainability of the optimum system, developed in
Chapter 7 (called “benchmark model” in this chapter), was examined.
The HOMER showed three kinds of annual costs - replacement cost, operation and
maintenance cost (O&M) and fuel cost - for the benchmark model (Figure 8.3). The sum of these
costs (1,844 USD) was more than twice the sustainable level (720 USD). The people’s
willingness-to-pay was insufficient to even cover O&M costs (939 USD). Thus, the benchmark
model does not satisfy the sustainability rule. To reduce the costs sufficiently enough to comport
with community actual ability to pay for electrical services, alternative measures need to be
taken.
68 Working age was defined as the age between 15 and 64 years old in this study. As the share of male workers in Ghana population, 28.8 percent (Theodora.com: http://www.theodora.com/wfbcurrent/ghana/ghana_people.html) was used for the calculation.

130
Figure 8.3: Costs of the Benchmark Model
8.5 Demand Side Analysis
8.5.1 Necessity of Cost Reduction from Demand Side
The development of cost reduction measures can be approached from both supply and
demand perspectives. The supply-side approach is to minimize the cost of generation system
based on the given amount of electricity use and electricity consumption pattern. In this study,
the HOMER has designed the least cost generation system based on the results of the potential
demand analysis (Chapters 5 and 7). This means that the benchmark model reflects the most cost
effective generation system under current assumptions regarding electricity needs. Thus, to get
additional cost reduction to satisfy the sustainability rule, the demand-side approach also needs
to be considered.
8.5.2 Introduction of Demand Side Management
Demand side management (DSM) has attracted much attention as a way to save
electricity cost in both developing and developed countries (Loughran et al., 2004; Finamore et
al. 2003 etc). The Natural Resource Defense Council (Finamore et al., 2003) defined DSM as a
mechanism to promote energy efficiency through educational and/or incentive programs.
According to Gellings et al. (1989), DSM measures that change the electricity consumption
curve can be classified into six categories: 1) peak clipping, 2) valley filling, 3) load shifting, 4)

131
strategic conservation, 5) strategic load growth, and 6) flexible load shape. From this, two main
strategies for cost reduction could be identified. The first strategy is to decrease electricity
consumption at certain time intervals, such as peak load time, or employment of a more
pervasive strategy curtailing energy usage throughout all time intervals. The size of required
generation capacity is based primarily on the amount of peak load consumption. Thus, reducing
peak load by DSM programs such as setting higher electricity prices corresponding to these
intervals can allow generation system downsizing, leading to a decrease in requisite capital and
maintenance costs. In addition, energy-efficient technologies can be used as measures for total
cost reduction. For example, promoting energy-efficient appliances such as compact fluorescent
lamps (CFLs) can significantly decrease electricity consumption through the year (for example,
the substitution of CFLs for incandescent lamps can reduce one third of the peak load in Bombay,
Weizsacker et.al., 1998). These aspects are considered as fundamental measures for the DSM.
The second strategy for cost reduction is to shift the time of electricity consumption from peak
periods to off-peak periods. Reducing peak load by time shifting can also contribute to cost
reductions. The advantage in this strategy is that consumers do not need to decrease total
electricity consumption in order to reduce costs, but merely redistribute their consumption to
create a more homogeneous load profile.
This study explored measures to decrease electricity cost from the first strategy, reducing
electricity consumption, but did not address the second strategy, time shifting, because of the
limited time availability of interviewees. To analyze the impact of the time sifting strategy, more
data are needed such as the sensitivity of people’s benefit regarding time shifting for each
activity, thus many more questions need to be asked. Since it was inappropriate to further burden
interviewees with increased time commitments, this study was unable to consider the second
strategy.
8.5.3 Demand Side Analysis - Simulation Method
The impacts of cost reduction by DSM measures were simulated. The study focused on
two parameters that significantly influence cost behaviors: 1) adoption criterion for electrical
appliances, i.e. which kind of electrical appliances the village can use for each activity, and 2)
the permission of electricity use for activities, i.e. whether the village is allowed to use

132
electricity for each activity. Simulation patterns were set by varying the values of these
parameters (these patterns are explained later in this chapter).
In addition, the study considered the impact of demand side management on villagers’
benefit as well. Curtailing electricity consumption to achieve cost reductions decreases villagers’
benefit derived from electricity use. Thus, the impacts of both cost reductions and forgone
benefits need to be considered simultaneously in order to choose the optimal usage pattern to
maximize benefits under realistic cost constraints.
Based on the results of cost simulation and impact analysis of benefit reductions, this
chapter concludes by suggesting the optimal system for the village.
8.5.4 Simulation Steps
The sustainability rule requires villagers to cover annual costs by their income. To satisfy
the rule, the annual costs need to be decreased by DSM. As stated above, however, this is very
difficult owing to the villagers’ limited financial resources. To cover all annual costs, their
electricity consumption will be highly restricted. Thus, in considering the feasibility of this
project, the scope of cost reduction should be discussed.
Before the discussion, the characteristics of the annual costs were clarified. As seen in
Figure 8.4, the costs were categorized by two dimensions; payment frequency and availability of
other cost-covering options.
Figure 8.4: The Characteristics of Annual Costs
To begin with, based on the payment frequency, the costs are categorized into two groups
(short or long). For example, O&M cost and fuel cost incur annually or monthly. Thus, every
year, villagers have to pay for them. In contrast, replacement cost does not necessarily incur
every year. For example, battery needs to be replaced periodically, but, once every 7-8 years. In
Nooption
Otheroptions
exist
Capital Costforeign organizations
can coverFuel Cost
O&M cost ReplacementCost
Short(ex. every month)
Long(ex. every two year)
Annual Cost
Payment frequency
Availabilityof other
cost-coveringoptions No
option
Otheroptions
exist
Capital Costforeign organizations
can coverFuel Cost
O&M cost ReplacementCost
Short(ex. every month)
Long(ex. every two year)
Annual Cost
Payment frequency
Availabilityof other
cost-coveringoptions

133
other words, annualized replacement cost does not need to be covered each year. To sustain a
generation system, thus, covering fuel cost and O&M cost by villagers’ income should be
prioritized.
Other aspect is whether villagers can have other financial resources to cover each cost
other than villagers’ current income. While O&M cost and replacement cost cannot be covered
by other financial resources, villagers can have other resources for fuel cost. This is because, as
discussed in Chapter 6, Jatropha system has potential to provide fuel and increase villagers’
revenue. For example, the village may be able to produce the fuel (Jatropha oil) by harvesting
from their lands (see Chapter 6 and discussed in Section 8.8). If the Jatropha oil production is
feasible in Mbanayili, the fuel cost can be covered partly by the oil production. In addition to this,
saved pre-existing energy costs for kerosene, fuelwood and charcoal by electrification can be
used for fuel to generate electricity in the community center. For example, using CFLs in the
community center somewhat reduces the consumption of kerosene for lights at homes, in turn
reducing kerosene costs for household use. Villagers can use this saved money for the fuel cost
in the community center. Furthermore, Jatropha oil production may be able to increase villagers’
income (for example, producing soaps made from Jatropha oil would be profitable. see Section
8.8). These options can decrease the fuel cost or increase people’s income, thus villagers do not
necessarily pay all of the fuel cost from their current income. In contrast, O&M cost and
replacement cost have no other cost-covering options. Therefore, these two costs need to be
covered only by villagers’ income.
The results of this analysis suggests that O&M cost has the highest priority to be covered
in terms both of payment frequency and the availability of other cost-covering options, while
replacement cost and fuel cost are the second. Thus, first, this study targets only O&M cost for
the cost reduction and explored a consumption pattern that can meet the sustainability rule
(Simulation I: O&M ≤WTP). To be sustainable, covering the largest item of the annual costs, i.e.
O&M cost (37% of annual costs), would be the minimal requirement. Second, the study
additionally considered replacement cost and simulated consumption patterns to determine
fiscally sustainable systems (Simulation II: O&M + replacement cost ≤ WTP). Since foreign
organizations can support only initial costs, replacement costs also need to be covered by
villagers to sustain a generation system in perpetuity. This study, however, did not analyze
Simulation III (O&M + replacement cost + fuel cost ≤ WTP). This is because, as stated above,

134
other cost-covering options can be taken. To conduct the simulation, the impact of these options
should be assessed because its impact significantly influences the results of the simulations.
Since currently many uncertainties for the impact exist (see Chapter 6), Simulation III was not
analyzed.
Apart from load curve data, the benchmark model’s standard values for other parameters
were set, such as interest rate (8%), maximum annual capacity shortage (10%) and fuel price
(0.65USD/L) (see Chapter 7). Then, the HOMER software configured the least cost generation
system based on each electricity consumption pattern controlled by the DSM.
8.6 Simulation I (O&M ≤ WTP)
8.6.1 Simulation Patterns
To reduce O&M costs, two directions were considered (Figure 8.5).
Figure 8.5: Two Directions of Simulation I
One is to change the adoption criterion for electrical appliances (Simulation I (a)). In the
benchmark model, electrical appliances for each activity were considered acceptable, if more
than 50% of the people would like to use them (see Chapter 5). Shifting this cut-off criterion
(called “adoption criterion for electrical appliances”) from 50% to 60% or more would curtail
electricity consumption and provide cost reductions. Another way is to use different type of
preference data to change the shape of electricity load curve (Simulation I (b)). The benchmark
model used ten-point allocation data that represents villagers’ preferences for electricity under
the least constrained usage (see Chapter 5). As analyzed before, however, considerable cost
reductions would be needed to satisfy the sustainability rule, requiring a more stringent
constraint. Thus, three-point preference allocation data that reveals people’s needs under limited
Ten-pointallocation data
Three-pointallocation data
Adoption criterionfor electrical appliances
BasicModel
SimulationⅠ(a)
50% >60%
(a)
(b) (b)
SimulationⅠ(b)
Ten-pointallocation data
Three-pointallocation data
Adoption criterionfor electrical appliances
BasicModel
SimulationⅠ(a)
50% >60%
(a)
(b) (b)
SimulationⅠ(b)

135
electricity provisions will facilitate cost reductions better than the previous ten-point allocation
method. Using the restricted preference data, this study conducted cost simulation and analyzed
cost reduction impacts69.
8.6.2 Analysis of Simulation I (a)
The impact of shifting the cut-off line of the adoption criterion for electrical appliances
was analyzed using ten-point allocation data. Figure 8.6 shows the results of Simulation I (a). As
illustrated, the O&M cost decreases as the adoption criterion for electrical appliances become
more restrictive. The 80% adoption criterion that rejects the use of many electrical appliances
(see Table 8.2) could reduce O&M costs from the benchmark model by 16.7%. The cost (782
USD), however, was still greater than the willingness-to-pay of Mbanayili.
Figure 8.6: Simulation I (a) – Simulation Results
Table 8. 2: Accepted Electricity Appliances (Adoption Criteria 50% and 80%)
To satisfy the sustainability rule, a further increase in the adoption criterion percentage
(beyond 80%) is required. Surpassing the 80% adoption criterion, however, constrains electrical 69 Using five-point allocation data is another option. Under current assumptions, however, this method could not decrease electricity cost. Thus, this study did not consider this option.
939
867
784
782
326
247
158
145
0 200 400 600 800 1,000 1,200
50%
60%
70%
80%
O&M Replacement
Ado
ptio
n C
riter
ia fo
r el
ectri
c ap
plia
nces
Cost (USD) per annum
WTP 720 USD

136
appliances usage only to lighting for many activities. Though lighting is the most critical, the
villagers’ desired benefits from electricity use would be severely restrained. Thus, this study
decided an 80% adoption criterion is the upper limit to entice enough interest in the project.
Consequently, the study concluded that Simulation I (a) cannot satisfy the sustainability
rule.
8.6.3 Analysis of Simulation I (b)
As observed in Figure 8.7, the use of three-point allocation data with 50% as the adoption
criterion reduced O&M costs by approximately 7% compared to the benchmark model. In
addition to this, the change of the adoption criterion from 50% to 80% provided an additional
10% cost reduction, which required less cost than the result of Simulation I (a). These patterns,
however, could not satisfy the sustainability rule yet (the O&M costs is still more than 720 USD).
Figure 8.7: Simulation I (b) – Simulation Results
The findings from Simulation I (a) and (b) suggested that only changing the parameters
of the adoption criterion for electrical appliances is insufficient to meet the sustainability rule.
Thus, to explore other cost reduction measures in Simulation I, cost-benefit analysis was
conducted to evaluate the cost-effectiveness of each activity.
8.6.4 Cost-Benefit Analysis
In analyzing cost-effectiveness for each activity, the study created a Cost Benefit Index
(CBI) and calculated the values of the CBI for all activities in the benchmark model. The CBI
was defined as follows;
Cost Benefit Index (USD/point)
= Cost (electricity cost by activity*1) / Benefit (allocated preference points by activity*2)
50%
50%
80%
O&M Replacement
939
877
779
326
260
148
0 200 400 600 800 1,000 1,200Cost (USD) per annum
WTP 720 USD
10 pts
AllocationPoints
3 pts
AdoptionCriterion
50%
50%
80%
O&M Replacement
939
877
779
326
260
148
0 200 400 600 800 1,000 1,200Cost (USD) per annum
WTP 720 USD
10 pts
AllocationPoints
3 pts
AdoptionCriterion

137
*1: Cost =
The annual electricity cost includes replacement cost, O&M cost and fuel cost
*2: Benefit = allocated points to each category at the third step (Figure 5.6)
* activity preference (%, Figures 5.14, 5.15)
This index can be stated as the cost requirements necessary to satisfy one preference
point for each category. For example, the lowest CBI value for a particular activity indicates that
the people’s needs for the activity can be met with less cost than any other activity. In other
words, this activity is the most cost-effective.
Figure 8.8 shows the values of the CBI by activity. As can be observed in the graph,
cooking was the most costly activity. Even compared to the second most costly activity,
attributable to weddings, the CBI value of cooking was more than twice as costly as this.
Figure 8.8: The Result of the Cost-Benefit Analysis by Activity
The reason for this is that electric cooking stove required for the activity is energy
intensive, consuming 2.6 kW. Consequently, electricity consumption for the activity accounted
for 65.6 % of the community center’s total consumption. In addition, the activity drastically
increased peak load consumptions across all months (from 399 W without the cooking activity to
2,648 W with the activity). Thus, this activity is a critical obstacle to overcome in order to satisfy
Annual electricity cost * Amount of total electricity consumption (Wh)
Amount of electricity consumption for each activity (Wh)Annual electricity cost *
Amount of total electricity consumption (Wh)
Amount of electricity consumption for each activity (Wh)
$/point
1.031.84
0.804.31
2.120.080.29
1.880.21
0.050.52
10.580.0 2.0 4.0 6.0 8.0 10.0
TVParties
HealthcareWedding ceremonies
FuneralsNewborn celebration
StudyingPC
MarketCellphone
Free SpaceCooking
$/point
1.031.84
0.804.31
2.120.080.29
1.880.21
0.050.52
10.580.0 2.0 4.0 6.0 8.0 10.0
TVParties
HealthcareWedding ceremonies
FuneralsNewborn celebration
StudyingPC
MarketCellphone
Free SpaceCooking

138
the sustainability rule. From these results, it was concluded that permitting this costly activity to
occur would inhibit the possibility of providing a financially sustainable generation system.
8.6.5 Analysis of Simulation I (c)
The study removed the cooking activity from the activity schedule. The allocated times
for the activity (about 80 hours/month) were proportionately reallocated to other activities based
on the category and activity preference data. After reassigning other activities, simulations were
conducted again by same ways as Simulation I (a) and (b) (called Simulation I (c)).
As seen in Figure 8.9, the sustainability rule could be satisfied. As the adoption criterion
for electrical appliances was set as 60%, the O&M costs, based on both ten-point data and three-
point data, were less than the willingness-to-pay (25% of the O&M cost reduction from the
benchmark model).
Figure 8. 9: Simulation Results – Simulation I (c)
Two patterns that meet the sustainability rule exist, namely (1) ten-point allocation data
with the adoption criterion of 60% and (2) three-point allocation data with the adoption criterion
of 60%. Since the three-point allocation data better reflects people’s preference, (2) would be
more desirable choice for Mbanayili residents. As stated in Chapter 5, the ten-point allocation
data and the three-point allocation data reflect the villagers’ preferences under different
conditions. The three-point allocation data represents people’s electricity needs with the
assumption that electricity consumption is highly restricted, while the ten-point allocation data
assumes that an abundant amount of electricity is provided to villagers. In simulation I, the
electricity consumption is restricted greatly by not permitting cooking activity and shifting the
802
710
776
706
137
133
129
146
0 200 400 600 800 1,000
50%
60%
50%
60%
Cost (USD) per annum
WTP 720 USDO&M Replacement
Ado
ptio
n C
riter
ia fo
r el
ectri
c ap
plia
nces
10points
3points

139
cut-off line of the adoption criterion for electrical appliances from 50% to 60%. Thus, the pattern
using the three-point data (2) was selected as the optimal system for Mbanayili in Simulation I.
Figures 8.10 and 8.11 show the details of the system. This is a hybrid system that is
comprised of PV solar generators and Jatropha generators.
Figure 8.10: Optimal Generation System in Simulation I
Figure 8. 11: Costs of the Optimal Generation System in Simulation I
8.7 Simulation II (O&M + Replacement Cost ≤ WTP)
8.7.1 Background of Simulation II
With a view to a strictly fiscally sustainable system, consumers have to cover not only the
O&M cost, but also the replacement cost in order to keep the generation system working.
Because replacement costs are incurred periodically and perpetually, foreign organizations such
as cooperative agencies and donors cannot cover them, due to the difficulty of indefinite support.
Thus, in Simulation II, the study explored ways of meeting the sustainability rule, which states
that both the O&M cost and the replacement cost must be covered by villagers.

140
Simulation II excluded the same cooking activity as Simulation I. In addition, only
three-point allocation data was used, because this simulation required greater electricity
conservation to satisfy the rule.
This simulation considered the replacement costs only for the cost of the expendable
goods that are involved in sustaining the generation system (see Chapter 7). In other words, the
replacement costs for electrical appliances such as CFLs were not included (the costs of
electrical appliances are shown in Table A.2.2 of the Appendix), because the lifetimes of
electrical appliances, which influence annual replacement cost, depend both on their use and
their maintenance. In particular, dust from the dirt floors may damage electrical appliances,
shortening their lifetimes. Since more data is needed to estimate a reasonable lifetime for each
appliance, the study did not consider the replacement costs.
8.7.2 Simulation Patterns
Initially, as conducted in Simulation I, the adoption criterion percentage for electrical
appliances was varied. As observed in Figure 8.12, when 80% is set as the criterion, the sum of
the O&M cost and the replacement cost is less than 720 USD, meaning that the system is
sustainable (this model is called “80% model” in this study).
Figure 8.12: Simulation Results – Sensitivity of the Adoption Criterion for Electrical Appliances
706
596
596
146
136
107
0 200 400 600 800
60%
70%
80%
O&M Replacement
Ado
ptio
n C
riter
ia fo
r el
ectri
c ap
plia
nces
WTP 720 USD
Cost (USD) per annum

141
Table 8. 3: Adopted Electrical Appliances (Adoption Criterion: 50% and 80%) without Cooking Activity Activity
Entertainment Cultture Education Business OtherAppliance Party TV Wedding Funeral Newborn New year Class Computer Market Cellphone Free space Cooking
TVStereoSpeakerComputerFanLight (CFL)Cooking stoveCell phonechargerFridge
Financially Sustainable System ($720) Benchmark Model ($1,844)
Healthcare
This system, however, is problematic. As discussed in Simulation I, and shown in Table
8.3, if 80% is set as the adoption criterion for electrical appliances, many activities are only
permitted the use of lights, not any other appliances the villagers may have wanted. In other
words, people’s demands for other appliances are highly suppressed. To maximize people’s
benefit from electricity use, the study explored other ways to permit more electrical appliances.
The percentage of the adoption criterion needs to be lowered from 80% to allow the use
of more electrical appliances. This, however, increases the electricity cost. To balance this
problem, the study set different percentages for the criterion based on the popularity of each
category or activity. Using this method, four types of simulations were created (see Figure 8.13).
a) The percentages of the adoption criterion for popular activity categories were
decreased, instead of incremental percentages for less popular categories.
b) The least popular categories were denied the use of electricity, in order to allow
more appliances in other categories.
c) The factors of both (a) and (b) were considered. That is, the least popular
categories were not allowed to use electricity at all and the more popular
categories were given lower percentages for the adoption criterion.
d) While (a), (b) and (c) applied different percentages of the adoption criterion by
category, the rule applied in (b) was applied to each activity.

142
Figure 8.13: Simulation Types in Simulation II
Using these simulation types, the study generated eleven simulation patterns (Patterns A
thru K, see Tables 8.4 and 8.5). Table 8. 4: Simulation Patterns of Type (a), (b) and (c)
(Percent of the Adoption Criterion for Electrical Appliances)
Ado
ptio
n C
riter
ion
for e
lect
ric a
pplia
nces
Category preferenceMore
popularLess
popular
80%
Category preferenceMore
popularLess
popular
80%
Activity preferenceMore
popularLess
popular
80%
Ado
ptio
n C
riter
ion
for e
lect
ric a
pplia
nces
Category preferenceMore
popularLess
popular
80%
(a) Different Criteria by category (b) Selection of popular categories
(c) Hybrid (a) & (b) (d) Selection of popular activities

143
Table 8. 5: Simulation Patterns of Type (d)
8.7.3 Results of Simulation II
Using adjusted electricity consumption data based on the simulation patterns, the
optimum generation system for each pattern was configured by HOMER. Table 8.6 shows a
summary of the simulation results. Table 8. 6: Simulation Results – Simulation II
As seen in this table, five patterns, B, C, E, J and K, could satisfy the sustainability rule.
That is, these patterns are affordable for Mbanayili villagers.
Interestingly, the HOMER only selected solar generation for the optimum systems of
these patterns. The hybrid system that consists of both solar generation and Jatropha generators
was not chosen, although it was used in the benchmark model and chosen as the optimal system
in Simulation I. This is partly because generation capacity could be downsized to minimize
initial costs owing to the greatly reduced electricity consumption.

144
8.7.4 Evaluation of the Patterns
The study identified six patterns of generation systems that satisfy the sustainability rule
(80% model and Patterns B, C, E, J and K). Discussion among Mbanayili's villagers might
enable them to select the generation system that maximizes their own benefits. However, it
would be difficult to reach a consensus, because the village has a variety of preferences that
differ according to gender, income, and age, as discussed in Chapter 5. To support their decision,
this study analyzed each pattern’s benefits and evaluated the patterns using the results of the
preference analysis (Chapter 5). Then, the optimal pattern for the village was proposed.
To identify the best out of six patterns, this study evaluated the benefit impacts of each
pattern on villagers. Since the precise measurement of all potential benefits is difficult to assess
(no research relating to this evaluation was found), the study employed a comparative approach
that focused on the differences in benefits among the patterns. For example, a difference between
Pattern J and others is that only Pattern J bans electricity use for party activity. In this fashion,
the study only analyzed the benefit impacts of the difference, and evaluated the patterns based on
the result of the impact analysis.
In addition, to adequately comprehend the impacts of each pattern, this study focused
mainly on three important demographics: 1) elderly men (specifically, more than 40 years old),
2) people of the upper income level, and 3) women. This is because the influences of these
portions of the population are critical for the success of an electrification project, in terms of both
sustaining a generation system and improving their standard of living. First, elderly men have
important decision-making power in Mbanayili. Important village matters are decided at
meetings where Mbanayili’s leaders, many of whom are forty years old or above, are in
attendance (Alhassan, Pers. Comm., 2006). Therefore, these men’s opinions cannot be ignored so
that a generation system is accepted. In other words, the benefit impact of elders needs to receive
enough attention. Second, financial resources to keep the generation system working are limited
in Mbanayili. Thus, the more affluent people’s financial support is vital for the success of the
electrification project. To receive support, their needs have to be satisfied to as great an extent as
possible. Lastly, the study also considered women’s benefits. As much research shows (World
Bank, 2000a; World Bank, 2000b etc), women’s empowerment is very important for rural
development, and their access to electricity is a significant means of improving their living

145
standard. Therefore, impacts on women were analyzed along with the impacts on elderly men
and the affluent class.
Simultaneously comparing every difference of the benefits from the six patterns would be
highly complicated because each pattern provides a variety of benefits to different segments of
villagers. To simplify the evaluation, this study initially formed three pairs and compared each
one. Then, whichever pattern had higher benefits within the pair was compared to another pattern
that was more advantageous in another pair. By following this format, six patterns were
compared and evaluated (Figure 8.14). Round 1 paired two patterns that permit similar electrical
appliances.
Figure 8. 14: Evaluation Orders
8.7.5 Evaluation Results – Round 1
This round compared three pairs (1), (2) and (3) (see Figure 8.14). Then, the differences
of the benefits between two patterns in each pair were analyzed.
Round 1-(1): 80% Adoption Criterion vs. Pattern B
By applying 80% adoption criterion for electrical appliances to all activities (80% model),
the generation system could be sustainable. This system, however, did not permit many electrical
appliances (see Table 8.3). In contrast, Pattern B used different percentages by category for the
adoption criterion (see Table 8.4). Owing to changes of percentages, one more electrical
appliance was permitted in Pattern B than in the 80% model.
80%Adoption Criterion
Pattern B
Pattern C
Pattern E
Pattern J
Pattern K
Round 1 Round 2 Round 3
Round 1Winner
Round 2Winner
Round 1Winner
Round 1Winner
Best Systemfor Mbanayili
(1)
(2)
(3)
80%Adoption Criterion
Pattern B
Pattern C
Pattern E
Pattern J
Pattern K
Round 1 Round 2 Round 3
Round 1Winner
Round 2Winner
Round 1Winner
Round 1Winner
Best Systemfor Mbanayili
80%Adoption Criterion
Pattern B
Pattern C
Pattern E
Pattern J
Pattern K
Round 1 Round 2Round 2 Round 3Round 3
Round 1Winner
Round 2Winner
Round 1Winner
Round 1Winner
Best Systemfor Mbanayili
(1)
(2)
(3)

146
Table 8. 7: Round 1-(1): Permitted Electrical Appliances
As Table 8.7 illustrates, Pattern B permits audio for newborn celebration parties, which
was the only difference between the two patterns. Figure 8.15 represents the supporters of this
appliance use for newborn celebration parties broken down by gender. As shown, 80% of
females voted for the audio use. Since giving more benefits to women as well as more
opportunities for electricity use to villagers, Pattern B is more desirable for Mbanayili.
Figure 8.15: Percentage of Supporters for Audio Devise Use in Newborn Celebration Party by Gender
Round 1-(2): Pattern C vs. Pattern E
Both Patterns C and E do not permit electricity use for the least two popular categories,
that is, “culture” and “others”. In exchange for this electricity consumption reduction, Pattern C
lowers the percentage of the adoption criterion for all electrical appliances from 80% to 70%. On
the other hand, Pattern E sets several different percentages for other categories based on category
popularity (see Table 8.4). The only difference between the two patterns is that Pattern C allows
television use for party activity (Table 8.8) because of its lower percentage of the adoption
criterion for entertainment category as compared to Pattern E (Pattern C: 70%, Pattern E: 80%,
see Table 8.4).
Regarding Pattern C's greater allowance of electrical appliances, it is undoubtedly
preferable to Pattern E. In particular, this pattern would attract high-income people, as more than
95% of this group demanded television use in the party activity (see Figure 8.16). Table 8. 8: Round 1-(2): Permitted Electrical Appliances
82.1%
55.3%
0% 20% 40% 60% 80% 100%
Female
Male
82.1%
55.3%
0% 20% 40% 60% 80% 100%
Female
Male

147
Figure 8.16: Percentage of Supporters for Television Use in Party Activity by Income
Round 1-(3): Pattern J vs. Pattern K
Pattern K and Pattern J set different percentages for the adoption, i.e., 70% and 60%
respectively. In addition, another difference is that Pattern J dropped the party activity from the
activity schedule in order to be sustainable (Table 8.5).
The comparison between these two patterns is more complicated than the previous two,
because each pattern attracts different segments of villagers. As Table 8.9 represents, Pattern J
permits fan and audio use for one or two activities, while Pattern K allows electricity use for the
party activity. Table 8. 9: Round 1-(3): Permitted Electrical Appliances
To compare the benefits of the patterns, the study began by analyzing potential supporters
of Pattern J, specifically, for audio use during the New Year party and market activity (the
benefit impact of the fan was not considered because the appliance is used only during the dry
season (Chapter 5), thus its impact is considerably limited.).
66.7%
61.7%
76.0%
95.2%
0% 20% 40% 60% 80% 100%
Less than50,000 cedis
Less than100,000 cedis
Less than150,000 cedis
More than150,000 cedis
66.7%
61.7%
76.0%
95.2%
0% 20% 40% 60% 80% 100%
Less than50,000 cedis
Less than100,000 cedis
Less than150,000 cedis
More than150,000 cedis
Less than50,000 cedis
Less than100,000 cedis
Less than150,000 cedis
More than150,000 cedis
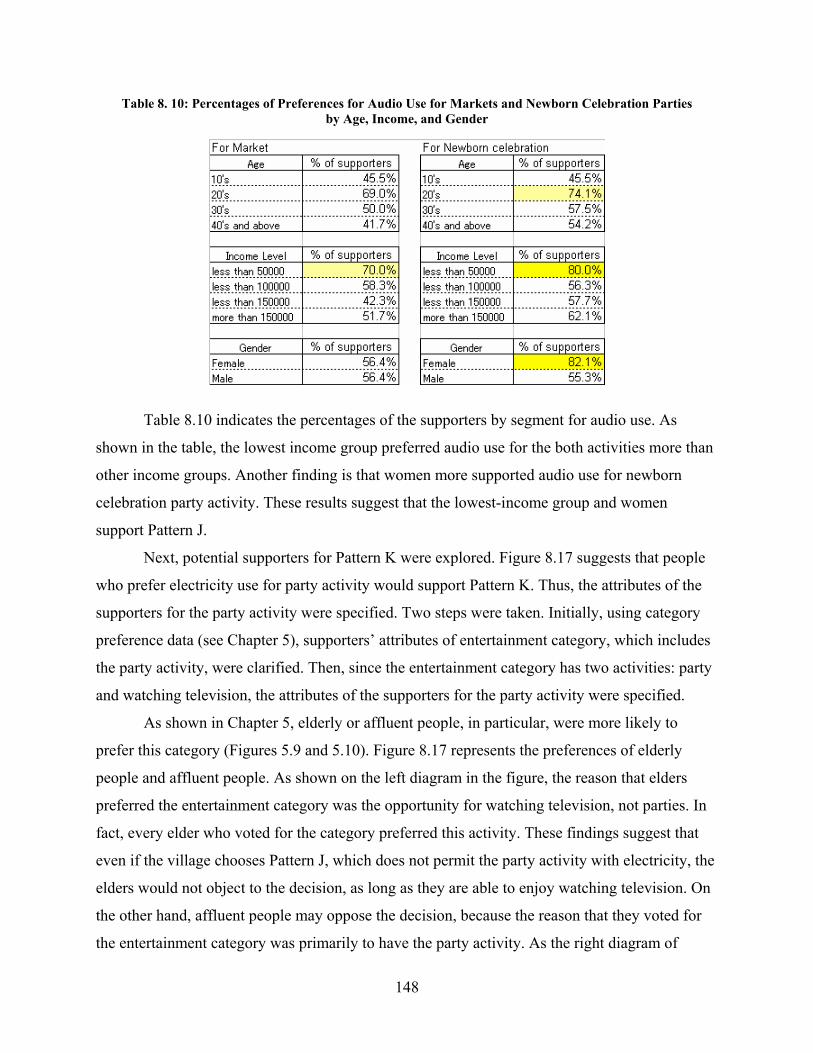
148
Table 8. 10: Percentages of Preferences for Audio Use for Markets and Newborn Celebration Parties by Age, Income, and Gender
Table 8.10 indicates the percentages of the supporters by segment for audio use. As
shown in the table, the lowest income group preferred audio use for the both activities more than
other income groups. Another finding is that women more supported audio use for newborn
celebration party activity. These results suggest that the lowest-income group and women
support Pattern J.
Next, potential supporters for Pattern K were explored. Figure 8.17 suggests that people
who prefer electricity use for party activity would support Pattern K. Thus, the attributes of the
supporters for the party activity were specified. Two steps were taken. Initially, using category
preference data (see Chapter 5), supporters’ attributes of entertainment category, which includes
the party activity, were clarified. Then, since the entertainment category has two activities: party
and watching television, the attributes of the supporters for the party activity were specified.
As shown in Chapter 5, elderly or affluent people, in particular, were more likely to
prefer this category (Figures 5.9 and 5.10). Figure 8.17 represents the preferences of elderly
people and affluent people. As shown on the left diagram in the figure, the reason that elders
preferred the entertainment category was the opportunity for watching television, not parties. In
fact, every elder who voted for the category preferred this activity. These findings suggest that
even if the village chooses Pattern J, which does not permit the party activity with electricity, the
elders would not object to the decision, as long as they are able to enjoy watching television. On
the other hand, affluent people may oppose the decision, because the reason that they voted for
the entertainment category was primarily to have the party activity. As the right diagram of

149
Figure 8.17 shows, among the high-income supporters for the entertainment category (52% of
affluent people voted for the category), the party activity was preferred more than watching
television (Television: 17%, Party: 31%). Therefore, some affluent people may not support
Pattern J. Since the percentage is less than one-third, however, the impact of the objection would
be limited.
Figure 8. 17: Preferences of Elderly People (40 years old or above) and Affluent People (more than 150,000
cedis of monthly income) for Entertainment Category and Activities in the Category
From these results, the study concluded that Pattern J is preferable for Mbanayili. This is
because the majority of women would support Pattern J. Since they have less economic and
social power in the village, increasing the benefits of these segments by Pattern J would
contribute to the success of the electrification project (collaterally, this pattern provides benefits
to low-income people too. This pattern would support the improvement of their standard of
living).
Furthermore, the findings suggest that the influential groups for this selection -affluent
people and elderly people- would not oppose the decision, and if they did, the impact of the
objection would be limited.
8.7.6 Evaluation Results – Round 2
In Round 1, the study identified Patterns B, C, and J as the optimal choices in each pair
for Mbanayili. Then, Patterns B and C were compared in Round 2, and the better option was
selected.
100%
Vote:52%
No vote:48%TV: 45%
Party: 7%
TV: 17%
Party: 31%100%
Vote:57%
No vote:43%
TV :57%
TV:17%
Party: 26%n=23 n=29
Income: > 150,000 cedisAge: 40’s and above
Entertainmentcategory
Entertainmentcategory
Activitypreference
Activitypreference

150
Round 2: Pattern B vs. Pattern C
Table 8.11 shows the permitted electrical appliances for both Patterns B and C. The main
differences between them are that Pattern B allows the use of lights (CFLs) for some activities
such as weddings and funerals, while Pattern C permits watching television during party activity.
As observed in Figure 8.16, Pattern C would attract affluent people. In contrast, Pattern
B’s cultural activities, such as weddings and funerals, would be preferred by male, elderly, or
affluent people (Figures 5.8, 5.9 and 5.10). Since affluent people are attracted by the both
patterns, it is unclear about which pattern they chose. Thus, based on the impacts only on elderly
people and women, the optimal pattern was selected. Table 8. 11: Round 2: Permitted Electrical Appliances
TV Party Wedding Funeral Newborn New Year Study Computer Market Free Space Cellphone HealthCFL TV CFL TV CFL CFL CFL Audio CFL CFL CFL PC CFL CFL Charger CFL Fan Refrigerator
Pattern B O O O - O O O O O O O O O O O O O OPattern C O O O O - - - - - O O O O - O O O O
As stated in Chapter 5, elders prefer the cultural activities more than the younger people,
which include weddings, funerals, newborn celebration parties and New Year parties. Figure
8.18 provides more detailed data. As seen, the oldest people (40’s and above) more supported the
culture category than other age groups. For example, in the category preference survey (second
step, five-point allocation), about 80% of elders allocated at least one point to this category. In
addition, fewer elderly people supported television use during party activity. As Figure 8.19
shows, their preference for the appliance was lower than that of other age groups. From these
results, the study concluded that Pattern B would more accurately reflect elderly people’s
preferences, thus would garner their support.

151
Figure 8. 18: Percentages of People Who Chose the Culture Category at First (three-point allocation) and
Second (five-point allocation) Steps
87.5%
77.2%
71.4%
52.2%
0% 20% 40% 60% 80% 100%
10's
20's
30's
40's and above
Figure 8.19: Preference for Television in Party Activity
On the other hand, women’s preferences were different from elders’. As discussed in
Chapter 5, women preferred watching television more than men. However, their preference for
television use during party activity was almost the same as men’s (men: 71%, women: 72%).
Therefore, even if Pattern C is not selected, the benefit impact on women would not be different
from the impact on men. However, the demand of 72% of women for television is not negligible.
To evaluate the impact of the demand, the study provided a diagram (Figure 8.20) using activity
preference data for women (see Figure 5.22). As this figure illustrates, women preferred the
television activity to the party activity (television: 82%, party: 18%), and only 15% of women
preferred the party activity and desired television use in this activity. In other words, 56 % out of
72 % of women preferred the watching television activity to the party activity. This finding
suggests that more than half of the women’s needs for television use can be satisfied in the
television activity, not in the party activity. Therefore, even if television use is not permitted in
the party activity, that is, if Pattern B is selected, the benefit reduction on women would be
limited.
First step (3pts)
9%
26%
30%
39%
73%
59%
68%
78%
0% 20% 40% 60% 80%
10's
20's
30's
40's and above
Second step (5pts)
First step (3pts)First step (3pts)
9%
26%
30%
39%
73%
59%
68%
78%
0% 20% 40% 60% 80%
10's
20's
30's
40's and above
Second step (5pts)

152
Figure 8.20: Women’s Preference for Two Activities (TV and Party)
and for Television in the Party Activity
In short, Pattern B would attract elderly people because it allows electricity use for
cultural activities. In addition, fewer elders preferred Pattern C’s benefit, which is television use
during party activity. Furthermore, Pattern B’s adverse impact on women is limited because their
needs of watching television are not restricted in Pattern C. From these results, the study
concluded that Pattern B is preferable for Mbanayili.
8.7.7 Evaluation Results – Round 3 (Final)
Finally, the study compared Pattern B with Pattern J and suggested an optimal
consumption pattern and generation system for Mbanayili.
Round 3: Pattern B vs. Pattern J
As observed in Table 8.12, the electricity consumption patterns of Pattern B and J are
significantly different. Pattern B allows electricity use for many activities; however, only lighting
can be used for four activities. On the other hand, Pattern J permits fan and/or audio for two
activities to compensate for lack of electricity use during six activities such as weddings.
Table 8. 12: Round 3: Permitted Electrical Appliances
As previously discussed, electricity use for cultural activities in Pattern B would attract
both elderly people and affluent people (Chapter 5), while Pattern J would gain support for audio
use from women (Table 8.10).
This study could not decide the optimal pattern using these results, because both patterns
yield benefits to different population groups, and such benefits are equally important in terms of
Allwomen
TV
Party
Yes
No
82%
18%
Which activityis preferred?
Do you want TVfor party?
No
3%
15%56%
26%
Allwomen
TV
Party
Yes
No
82%
18%
Which activityis preferred?
Do you want TVfor party?
No
3%
15%56%
26%

153
both the success of the electrification project and rural development. To find the optimal system
for the village, additional data is needed to analyze the extent to which each pattern provides
benefits to villagers.
However, the optimal pattern may be decided from other standpoints: 1) increasing the
number of people who experience electricity use and 2) maximizing the utilized capacity of the
community center. Since Pattern B provides many parties and ceremonies with electricity to
villagers throughout the year, more people can have experience of using electricity (currently,
fewer villagers have used electricity, see Figure 5.1). In addition, the community center can be
effectively used, if Pattern B is selected. More timeslots of the community center are scheduled
by activities in Pattern B than in Pattern J (see Tables 8.4 and 8.5).
If these two benefits are important factors for the success of the electrification project,
Pattern B can be regarded as the optimal system for Mbanayili. Figures 8.21 and 8.22 show the
details of Pattern B’s system. It was comprised of only solar generation (the activity schedule of
Pattern B is shown in Table A.4.1 of the appendix).
Figure 8. 21: Optimal Generation System in Simulation II

154
Figure 8.22: Costs of the Optimal Generation System in Simulation II
Figure 8.23 summarizes the evaluation results in Simulation II.
Figure 8. 23: Summary of the Evaluations
8.8 Revenue Generation Potential
As discussed before, the potential of Jatropha oil production exists (see Chapter 6). This
production can contribute to Mbanayili’s income growth and provide a cost-covering option for
80%Adoption Criterion
Pattern B
Pattern C
Pattern E
Pattern J
Pattern K
Round 1 Round 2 Round 3
Pattern C
Pattern B
Pattern B
Pattern J
80%Adoption Criterion
Pattern B
Pattern C
Pattern E
Pattern J
Pattern K
Round 1 Round 2Round 2 Round 3Round 3
Pattern C
Pattern B
Pattern B
Pattern J

155
the fuel cost of a generation system (see Section 8.5.4). In this section, the study estimates the
potential of the revenue generation by the Jatropha oil production.
8.8.1 Providing Job Opportunity for Women through Jatropha
According to interview results, some women do not have jobs, or if they do, their
incomes are very low compared to men’s (see Chapter 5). Currently 20.5% women work in
micro enterprise, which produces Shea butter. This proposed revenue generation scheme is
providing job opportunities for women in addition to their current jobs, and thus improving their
financial status. In general, providing job opportunities to women has more impact on income
growth and improvement of living standard than providing jobs to men (Forsythe et. al., 2000).
Also, increasing women’s income can contribute significantly to women empowerment and
poverty reduction (Forsythe et. al., 2000). This study analyzed the potential of job opportunity
provided from Jatropha for unemployed women. From interview data, 5% of the women do not
have job. The age range of women assumed to be working is 15-69. Based on Ghana’s
population data in 2005 (US Census Bureau, 2006), 28.7% of the population are women between
15 and 69 years old. So there are 4,050*28.7% = 1,163 working-age women in Mbanayili.
Therefore, there are 1,163*5% = 58 women without employment.
KAKUTE (Kampuni ya Kusambaza Teknolojia), a successful project in Tanzania, sheds
light on revenue generation through harvesting and processing Jatropha. According to the
economic analysis of the project by Henning in 2004, the KAKUTE project consists of three
revenue generating activities: 1) collection of seeds, 2) oil extraction and 3) soap making. Values
added for one person of each of the activities are 0.29 USD/hour, 0.73 USD/hour and
2.49USD/hour, respectively. To adequately reflect Ghana’s price level, values added of
KAKUTE project were converted using purchasing power parity (PPP) (WHO, 2000).70
Therefore, values added per person for Ghana would be 1) collection of seeds: 0.11 USD/hour,
2) oil extraction: 0.27 USD/hour, and 3) soap production: 0.91 USD/hour, and hence could be
thought of as the target performance for revenue generation.
70 PPP of Ghana and United Republic of Tanzania in the year 2000 is 1,124.83 and 357.967, respectively.

156
8.8.2. Revenue Generation Scenario
To analyze potential impacts of revenue generation in Mbanayili, this study has assumed
that through training and experience, the village can achieve the same performance as KAKUTE
project. The figure below illustrates a proposed scenario for creating job opportunities for
Mbanayili women.
Figure 8. 24: Revenue Generation Implementation Scenario
Optimum power generation system under the current income level uses just solar power
(see Section 8.7.7). Thus, this project assumes that in the first and second stages, this solar power
generation system is installed and operated in Mbanayili. Then, from the third stage, the village
aims to have a hybrid system, which utilizes both solar and Jatropha (benchmark model,
configured in Chapter 7) to satisfy demand under the minimum control for their electricity
consumption by revenue generation. In the first and second stages, this revenue generation
project will increase villagers’ income. In addition to this, as stated above, providing access to
electricity promotes income improvement to all villagers. Thus, the income increase can help
make the hybrid system affordable.

157
Implementing this program would involve allowing lead-time for education, training and
equipment installation. Thus, the scenario consists of four stages; and the scope of the project
gradually expands during the first three stages. At the first stage, the program only focuses on
seed collection, which consists of harvesting the crops and selling the seeds. At the second stage,
the scope is expanded to oil extraction. And starting from the third step, Jatropha oil is used for
the hybrid electricity generation system as well as for soap production.
For the time being, all crops can be sold on market since they are not used as fuel for
electricity generation. In the first stage, villagers gain experience from Jatropha seed collection.
After being trained for oil extraction, they begin selling Jatropha oil in the second stage, and thus
earn more revenue. From the third stage, with the villagers’ 100% performance in oil production,
the village will be capable of supplying the oil for the benchmark hybrid electricity generation
system. As indicated in Chapter 7, the amount of oil necessary for the hybrid system (the
benchmark generation model) is 890 L/year. The eventual goal of this scheme is not only to self-
supply Jatropha oil for generating electricity but also to earn revenue. Therefore, we set the
additional amount of the oil for revenue generation at 20% and 50% of the amount required for
generating electricity in the third and future periods, respectively. This is illustrated in Figure 9.1.
So Jatropha seeds required for such amount of oil is 890 L/year * 120% * 5 kg/L 71 = 5,340 kg of
seeds per year, and 890 L/year * 150% * 5kg/L = 6,675 kg/year. 890 liters of the oil extracted
will be used for electricity generation first, and the remaining oil will be supplied to soap
production.
In addition, the study incorporates value added performance (VAP)72 into the analysis to
take into account the learning period before the villagers are capable of achieving the same
performance as the successful KAKUTE project. Here the study assumes a gradual increase in
performance within two to three years after the training. The VAPs of four activities in four
different stages are shown in Figure 8.24. The assumption is that in each activity, after just being
trained, people can work at 80% of the KAKUTE project’s performance.73 Then, in the next
71 5 kg of seeds are required for 1 liter of oil (Henning, 2004) 72 Value added performance is defined as the relative value added level of the villagers to that of the KAKUTE project 73 This paper assumes 80% learning curve, which is a general pattern for labor. (Ebert, 1976)

158
stage, the same performance of this benchmark project is achieved owing to learning effect. In
addition, the figure shows seed production in the four stages based on the VAPs.74
8.8.3 Impact Analysis
This section assesses possibility and impacts of the proposed revenue generation scheme.
Land requirements for Jatropha production, job opportunity for Mbanayili women, and revenue
generated are identified.
8.8.3.1 Land Area Requirement
From the seed production, land area required in each stage can be calculated using the
formula below and the seed yield of 2,000 – 3,000 kg/ha (Heller, 1996). The results are shown in
Table 8.13.
Land area hakg
LkgyrLtrequiremen/
/*/=
Table 8. 13 : Land Area Requirement in Each Stage of the Revenue Generation Scheme
Stage 1 2 3 Future
Land requirement (ha/yr) 1.19 - 1.78 1.48 - 2.23 1.78 - 2.67 2.23 - 3.34
This land requirement would be one of the constraints to implement the revenue
generation scheme. Though the study could not verify the land availability for Jatropha
production, the required land size appears to be reasonable for Mbanayili.
8.8.3.2 Job Opportunities for Women
Using the benchmark data from KAKUTE on workforce requirements (see Table A.4.2 in
the Appendix), numbers of workers needed for the first, second, third, and future stage in
Mbanayili are 6, 13, 16, and 22, respectively (see Table A.4.3). As calculated in Section 8.8.1,
eventually this revenue generation scheme will reduce unemployment rate in women by 37.9%
(=22/58).
74 The seed production in the future stage is the seed production in the third stage multiplied by 150% and by VAP of 100%. So the production is 4,450 kg/year * 150% * 100% = 6,675 kg/year.

159
8.8.4 Revenue Potentials
With this scheme, the revenues generated at each of the stages are as displayed in Figure
8.25. Aggregate annual revenue in the first, second, third, and future stages are 157 USD, 437
USD, 1,180 USD, and 1,833 USD, respectively. This means, in the future stage, this scheme
increases Mbanayili’s gross income by 0.6%.
Note that the saved energy costs are not revenue generated but rather avoided fuel cost of
supplying electricity. In the third stage, with the VAP of electricity generation at 80%, the
operator is still incapable of efficiently running the generator. Consequently, 890 liters of oil
input will yield 80% of electricity demanded. As a result, additional 20% of 890 liters of the fuel
needs to be purchased to fulfill electricity demand, thus decreasing the energy cost saving.
However, in the future, when the generator operator accumulates sufficient skills, the village will
achieve full saving on fuel cost (i.e., VAP is 100%). That is, all of 890 liters fuel cost is saved.
However, one concern is the benchmark model uses the diesel generator. To be compatible with
the diesel generator, Jatropha oil has to be transesterified. Consequently, an additional system is
needed to transesterify Jatropha oil.75 Therefore, the saved energy costs will be lower.76 In
addition to avoiding diesel fuel costs, the villagers will earn greater revenue from selling more
seeds, oil, and soap.
75 The additional system consists of tanks, ethanol, and potassium hydroxide supplies 76 There is currently no data available on how much the additional equipment and supplies would cost. Therefore, the cost of this system could not be accurately estimated.

160
Figure 8. 25: Revenues from Jatropha for Mbanayili
As can be seen in Figure 8.25, revenue in the third stage increases drastically from the
second stage (37% increase). Also, making soap which provides more value added will
contribute significantly to income growth (28.7% of income increase). Furthermore, cost saving
for fuel cost also shares 32% of revenue generation impact.
8.9 Conclusion and Discussion
In this chapter, after establishing the sustainability rule (annual costs must be covered by
villagers), the study conducted two types of simulations (Simulation I and II) and discussed the
results. The optimal sustainable generation systems for Mbanayili were then proposed. The
results suggested that sustainable systems can be achieved through demand side management.
These simulations, however, required significant restrictions to the villagers’ electricity
consumption, resulting in inability to meet some of their needs for electricity. To maximize
people’s benefit from electricity use, other options of decreasing electricity cost need to be
explored, thus further research is needed. For example, time shifting may be another effective
way to reduce the cost with minimum benefit loss.
161
Simulation II explored the feasibility of six sustainable generation systems in terms of
their impact on controlling electricity consumptions within particular population groups,
specifically elderly people, affluent people and women. The results suggested that the different
interests of these groups would influence the selection of an optimal generation system for the
village.
These simulation results suggested that Mbanayili villagers’ income is insufficient to
satisfy many of the villagers’ demands. As long as a sustainable generation system is configured
based on the current affordability, their electricity consumption would be highly restricted. Thus,
actions should be taken not only to minimize electricity cost, but also to increase people’s
income.
Thus, this study showed the potential of revenue generation from Jatropha oil production.
Jatropha may be able to contribute to the economic development in rural Ghana by providing
extra revenue and biofuel for the generation system.
Though further research is needed to address uncertainties that were not covered in this
study, this case study could present a paradigm for finding an optimal financially sustainable
electricity generation system in rural villages. As of now, few rural electrification studies, which
design generation systems based on people’s needs, demand, and affordability for electricity,
have been conducted (UNDP/ World Bank, 2003). Thus, the results of this study can hopefully
guide future research as well as policy decision-makings regarding the promotion of rural
electrification.

162
Chapter 9 Recommendations for Project Implementation
9.1 Summary of the Project
Ghana’s electrification plan has stagnated because of the lack of a long-term strategy and
financial resources (Chapter 2). To promote Ghana’s rural electrification, this project has
proposed an environmentally and financially sustainable generation system. First, to achieve
cost-effective electrification, the idea of partial electrification was suggested. The study focused
on the role and function of the community center as a public area for serving the villagers’ needs
using electricity. Electrifying only the community center will significantly reduce electrification
cost while still being capable of providing access for electricity to all villagers (Chapter 3).
Second, in Chapters 5 to 8, a sustainable electricity generation system was explored using a case
study, Mbanayili, a rural village in northern Ghana (Chapter 4). This project first focused on the
demand side, i.e. potential demand for electricity in the village. The villagers’ preferences for
electricity were identified by interviews. In addition, electricity consumption of the village was
estimated using these preferences (Chapter 5). The study then focused on the supply side. An
optimal electricity generation system was configured based on the potential electricity demand
(Chapter 7). Furthermore, the potential of renewable energies was evaluated. The study
identified the potential of Jatropha oil production in Mbanayili (Chapter 6). Last, financial
sustainability to keep a generation system working was explored. Using the result of willingness-
to-pay analysis, the study identified a financially sustainable generation system that maximizes
people’s benefits while meeting their affordability requirements. Also, a revenue generation
opportunity through Jatropha production was examined (Chapter 8). Through these chapters, this
study showed the feasibility of sustainable rural electrification, promoting rural electrification
plan of the NES and contributing to the improvement of people’s standard of living.
This chapter presents specific guidance for implementation of the rural electrification
plan for Mbanayili and other villages in northern Ghana.
9.2 Suggested Further Research
The data availability was a critical problem in this study. In particular, no data regarding
people’s demand was found in other research. Though the field research clarified people’s needs,
owing to the time constraint of the research, the number of interviewed villagers is not large
enough to be statistically valid for representing the entire village residents. To clearly understand

163
people’s needs, a larger sample may be needed. In addition, Mbanayili is very close to a city,
Tamale, thus this village may have different characteristics from other northern villages. For
example, while many Mbanayili villagers have seen electric appliances, people in other rural
villages may not have much knowledge about electricity (see Chapter 5). That is, this village’s
data may not represent all characteristics of other northern villages. Conducting this research in
other villages would contribute to removing Mbanayili’s bias and generalize people’s potential
demand for electricity. With more extensive data collection, the study could be refined and thus
applicable to projects in other communities. In addition, people’s preferences are changing over
time as can be observed from the preference difference between age groups described in Chapter
5, thus the load curve needs to be revised based on periodical preference analysis.
Furthermore, some model assumptions established in this project might be difficult to
substantiate with certainty. For example, batteries or other equipment for electricity generation
cannot be procured at assumed price levels in rural Ghana because transportation and immature
markets may become barriers for northern villages to receive required equipment. In addition,
assumed price structures may not accurately represent what is feasible under realistic or future
conditions. For example, Ghana’s interest rate over the last ten years is very volatile, ranging
from 19.5% to 45% (Ministry of Finance, Government of Ghana, 2005). Although many of the
model assumptions were based on data from the literature and similar projects, certain parameter
specifications were not available or were difficult to quantify. Consequently, these specifications
were based on the best estimates by the team.
Photovoltaics can play an important role in electrifying Ghana given solar irradiance
available; photovoltaics have been extensively used in various electrification projects in Ghana
in the past (JICA, 2006). Renewable energy derived from hydropower or wind resources was
not considered a feasible option for power generation at Mbanayili because endowments of these
resources are scarce in Northern Ghana. To some degree, recognition of this limited availability
of alternative sources for energy production in the region has influenced the Government of
Ghana’s decisions to examine the feasibility of Jatropha biofuel production. The government’s
decisions, in part, are to offset the growing national trend of expanding thermal generation
capacity, which is entirely reliant on fossil fuel imports (UN Energy, 2006). As stated earlier in
Chapter 7, the prospects are promising for utilizing Jatropha cultivation as a means to spur
economic development and for use as a locally produced biofuel. Although, to make any

164
conclusive determination as to the viability and net benefits from Jatropha production for
Mbanayili residents, fundamental questions must be answered (see Section 6.15) In particular,
the potential market for Jatropha and the productivity of Jatropha oil in northern Ghana’s climate
should be firstly studied.
9.3 Recommendations for Implementation
In addition to having the carefully designed electricity consumption model and
generation system, adhering to such consumption limit greatly contributes to the project’s
success. Also, developing and maintaining adequate skills to operate the project is needed.
Furthermore, as learned from past rural electrification projects, collecting payments is essential
for the project’s sustainability. Taking into account these concerns, this section suggests a
consumption management scheme, measures to sustain engineering skills in the village, and a
payment collection scheme.
9.3.1 Necessity of Electricity Consumption Management
To be successful, controlling villagers’ electricity consumption would be important. If the
village cannot appropriately manage electricity consumption based on an activity schedule, the
proposed project idea will not result in sustained rural electrification. Ensuring that the villagers
have activities in the community center, and use only the allowed set of appliances as directed in
Chapters 6 and 8, is the key to maintain electricity consumption at a financially sustainable level
of electricity generation. According to the interview with one of Mbanayili’s leaders, the leader
can take responsibility for ensuring that the villagers follow such rules. However, monitoring
electricity consumption all the time is very difficult. Thus, a consumption management scheme
needs to be developed. For example, a villager may be assigned to manage the appliances. When
an activity finishes, he will keep the appliances in the closed room and lock the door to prevent
unnecessary electricity use. In addition, building energy conservation awareness for villagers
would be a key. This could be done through education and emphasis by the community leaders.
9.3.2 Operational and Maintenance Skill Acquisition
For the generation system to be self-sustained, technical education and training for local
operators are vital (World Bank, 2006). However, in Ghana, trained personnel are likely to leave
their villages for working in cities with higher wages (a member of JICA, Pers. Comm., 2006).

165
Thus, it is very difficult to keep required knowledge and skills in villages. A suggested approach
to attract the trained personnel to work for the village’s community center is
• Select a villager, and not an individual from outside, to be the operator. The villagers
have stronger ties to the community and thus are less likely to leave the village.
• Moreover, to attract the operator to work for the village’s community center, not only
setting the salary to be competitive to jobs in cities but also bestowing honor on the work
position are necessary. This will offer the operator financial benefit and an honorable
social status. This also explains why a villager is preferred to an outside individual. A
villager will be more honored to receive this title than an outsider.
9.3.3 Payment Collection Scheme
Covering initial investment and operation costs is vital for rural electrification but very
difficult due to limited financial resources and poverty. RESPRO77 and DANIDA78, other rural
electrification projects in Ghana, which used different payment methods, show the difficulties in
collecting payment. One of the reasons is that collecting payments incurs high transaction costs.
For example, since a bank system does not exist in Mbanayili, periodically a person has to visit
each home to collect payments. In addition, monitoring costs to prevent villagers’ default are
needed. Consequently, these projects could not sustain themselves financially. Therefore,
effective ways to collect payments need to be studied and identified for the success of rural
electrification.
Another concern is how to identify the payers when an activity has more than one
participant, which is the nature of most of the activities offered in the community center. If only
recipients of the benefits from electricity use pay electricity cost, the village has to identify who
uses electricity for every activity. But it is difficult to do so. Moreover, as most villagers’
incomes are low and fluctuate across a year, they may not be able to follow a strict payment
schedule. Therefore, a flexible payment system that allows the villagers to accumulate funds or
defer payment would be preferred. In addition, the pricing and payment schemes have to be
77 RESPRO operated under the fee-for-service model. The electricity price was defined according to the existing on-grid electricity price regardless of whether the price would cover O&M cost and recover initial investment (JICA, 2006). Therefore, the project could not generate sufficient income to be sustainably self-funding. 78 Danish Agency for Development Assistance (DANIDA) promoted the Solar Home System (SHS). The project had the local communities loaned the money from local banks to purchase the SHSs, and eventually transferred all SHSs to the communities. However, the owners of the SHSs failed to pay for the loans (JICA, 2006).

166
simple so the villagers can operate without depending on outside sources by themselves. All in
all, an alternative payment scheme capable of fulfilling the criteria below will be required.
• Ensure that payments are made.
• Offer flexible payment options.
• Establish service fees that are simple for the villagers.
• Provide easy payment monitoring and collection.
To guarantee revenue to the community center and allow flexibility to the payers, a group
payment system may be applicable. For example, the village could create several payment
groups. Each group consists of twelve people who make payments. In each month of a year, each
person takes turn to pay for the service. That is, each of the group members pays once a year on
different months. Such informal payment groups are proved to be successful in many remote
rural areas in developing countries, including African countries (Nagarajan and Meyer, 2006). In
addition, the social pressure to pay electricity bills will motivate the people paying.
For simplicity in making payment, the study suggests monthly fixed prices for villagers.
The reason is that many villagers have weak math skills. The fixed fees can avoid calculation,
thus prevent payment error. In addition, to cover the costs without putting much burden on the
low-income people, three levels of price are determined according to the willingness-to-pay by
income group (see Table 9.1). Percentage of income that the villagers79 are willing to pay and
their average income from section 8.3.3 are used for calculating such service fees. Total
population of Mbanayili is 4,050. The community space can accommodate 100 persons at a time.
Therefore, each villager pays a fraction of 100/4,050 of his/her willingness to pay. The fixed fees
calculated are shown in Table 9.1. For example, the most affluent people with more than 150,000
cedis should pay 991 cedis per month for electricity use in the community center.
Table 9. 1 : Payment Levels under the Monthly Fixed Fee Scheme
Income Group(A)
% of WTP inincome
(B)Average monthly
income (cedi)
(C)Average WTP
(cedi)
(E)*Allocated monthly costfor each person (cedi)
(F)Allocated monthly costfor each person (USD)
less than 100000 9.9% 61,565 6,095 150 0.02less than 150000 13.3% 116,597 15,507 383 0.04m ore than 150000 13.5% 297,380 40,146 991 0.11*:(E)=(C )*(100 consum ers in the com m unity space/4,050 persons of all villagers)
79 According to section 8.3.1 of Chapter 8, only male villagers able to afford pre-existing energy cost and willingness to pay for electricity are used for estimating the village’s willingness to pay for electricity.

167
Combining the group payment system and the fixed fee scheme together, the group
payment scheme for Mbanayili requires each person to pay for the entire year electricity
consumption based on his assigned fee in Table 9.1. For example, if his monthly income is less
than 100,000 cedis, he has to pay 150 cedis * 12 months = 1,800 cedis, which equals 0.2 USD.
Annual payment for villagers is shown in Table 9.2.
Table 9. 2 : Annual Payment under the Group Payment System
This approach allows the villagers to accumulate their money across a year to pay for the
service. As many of them are farmers, their income fluctuates across a year. They might receive
income only in the harvesting season. So, in the period that their income is low, they may not be
able to make for monthly payments. On the other hand, annual payment allows the villagers to
save over a year.
Also, with this scheme, members of each group are responsible for all payments of their
group. Thus, if a person cannot pay in his assigned month, other group member(s) have to pay
for him. To prevent this situation, the group leader and members periodically check each others’
ability to pay and assist or advise them as needed. If nobody in a group can pay for a few
consecutive months, they would no longer be allowed to use electricity in the community center.
Using this scheme, which is similar to a microfinance scheme, the payment would be
well managed and help sustain a generation system. At monthly community leader meeting, the
leaders check the amount of money collected. If the amount is less than the actual cost, next
month’s activity schedule may be changed to save electricity consumption and recover the
previous month’s loss.
9.3.4 Financial Supports
Since this project assumes that the initial cost will be covered by donors, financial
support is necessary to start the project. However, the Government of Ghana may not be a
promising source of funding due to its low governmental fund. Therefore, financial support from
other sources is needed. Possible sources of financial support are the World Bank, foreign
governments’ organizations, and NGOs. Alternative to donating money to the village, the

168
organization might lend money to the village at a low interest rate and long payback period. As
this project can satisfy the financial sustainability rule described in Chapter 8, this project, either
on its own or promoted through the Government of Ghana, is likely to attract foreign investors
because it assures success. Currently, the World Bank is financing the Volta River Authority to
implement the Energy Development and Access Project with $160 million. One of the four
project’s goals is to expand electricity access utilizing both grid expansion and off-grid
technologies. This project could be a potential financier to this proposed community center and
together significantly accelerate rural electrification in Ghana.
9.4 Conclusion
To implement this project approach, some problems have to be solved as discussed in this
chapter. In particular, the scheme to control people’s electricity consumption in accordance with
activity schedule, retaining skills to operate and maintain a generation system and the payment
collection scheme are important to the success of the project. From the experiences of other
projects, ensuring payment collection should be in place before the village is electrified. To solve
this issue, this study suggested the group payment system similar to the microfinance scheme.
This will not only ensure sufficient revenue for the operating the system but also allow flexibility
in payment in the poor rural village. Lastly, the study proposes an implementation plan, a portion
of which consists of three electrification stages (see Figure A.5.1). The first stage is when the
financially sustainable system is installed (2007 or 2008). After that, in the second stage, the
village upgrades to the hybrid system by 2012 through the revenue generation scheme (see
Chapter 8). In this stage, people's income is increased by the partial electrification as well.
Lastly, by 2020, income increase accumulated during the first and second stages enable the
village to afford the electrification of all households. This would contribute to Ghana’s National
Electrification Scheme (NES). The details of the first two steps are shown in Table 9.3 showing
all results in Chapters 5 through 8.

169
Table 9. 3: Implementation Plan Overview

170
Appendix
Appendix 1: Field Research Overview (Chapter 4)
Figure A.1. 1: Mbanayili

171
Table A.1. 1: Questionnaires

172

173

174
Appendix 2: Potential Demand Analysis (Chapter 5)
Table A.2. 1: Models and Sources for Electrical Appliances Data for Activity Preference Survey
Table A.2. 2: Electrical Appliance List

175
Table A.2. 3: Activity Schedule of Year 2007

176

177

178

179

180

181
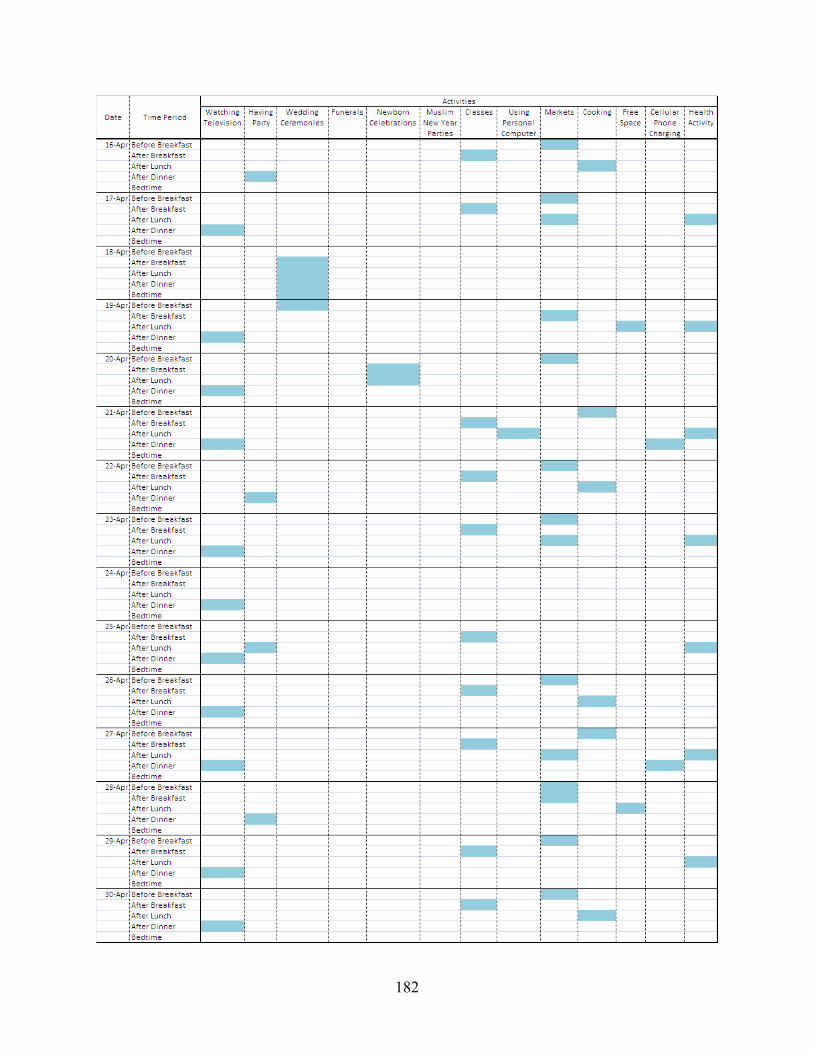
182

183

184

185

186
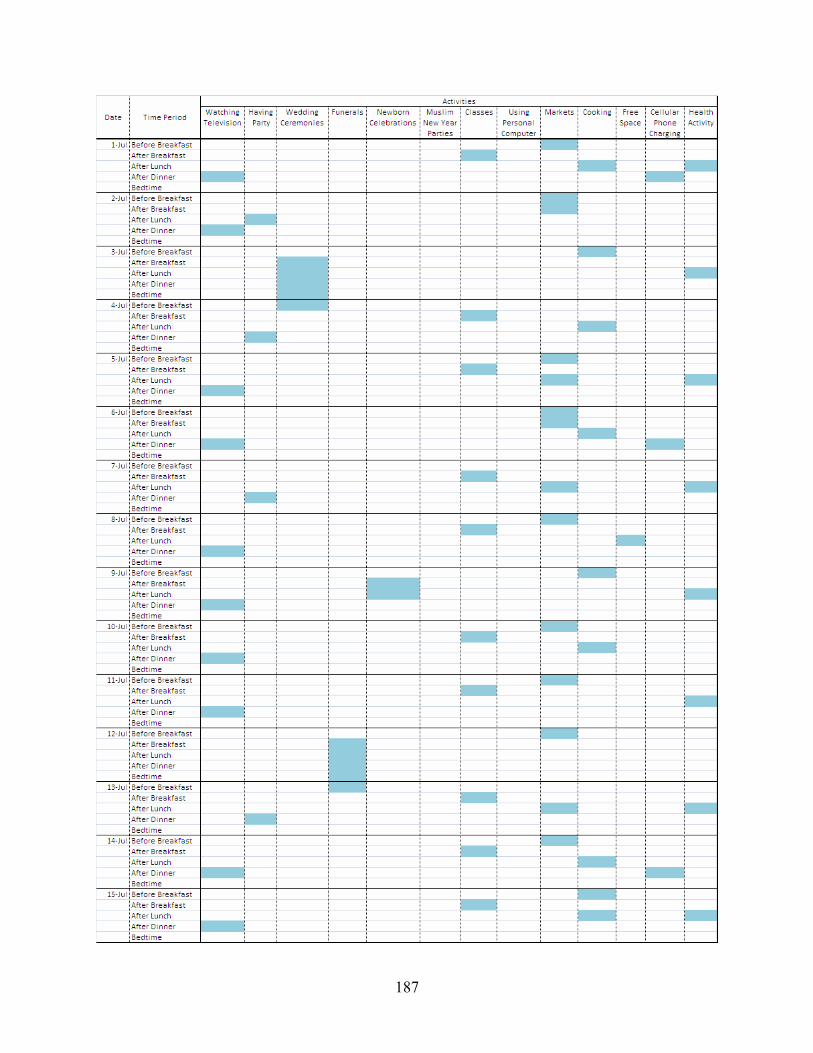
187

188

189

190

191

192

193

194

195

196

197

198

199
Appendix 3: Biofuel Potential from Jatropha Curcas Linn. (Chapter 6)
A.3 Other Energy Sources Considered (not modeled)
A.3.1 Mini Hydropower
The Ghanaian Government has considerable interest in expanding the installed capacity
of mini hydropower, specifically in the southern regions of the country. Twenty-one sites have
been identified as suitable for the installation of mini hydorpower, however, all of these sites are
located in the south (JICA, 2006); no such sites have been identified near Mbanayili.
Furthermore, the topography around Mbanayili is quite flat and is not considered conducive for
this application (Alhassan, Pers. Comm., 2006).
A.3.2 Wind Resources
Ghana is not endowed with significant wind resources, except for in isolated patches
typically located in the mountainous regions, the southern coast, or the Volta River Basin
(NREL, 2004). The average national wind speed is less than 3m/s at an elevation of 10 meters;
however, wind velocities are higher at elevations beyond 50m above the ground (164 ft). This
may be unrealistic for many rural applications, because inexpensive turbine towers do not reach
these heights, and towers that do are prohibitively expensive, unless substantial wind resources
are available to justify higher capital investment. Few turbines begin to produce power below 5
m/s and many do not provide peak power until wind speeds approach 8-10 m/s. According to the
Energy Commission, Tamale, located ca.14 km from the site of this case study, exhibits an
average monthly wind velocity of 3.9 m/s (JICA, 2006). Therefore, wind power is not considered
a viable option for the micropower systems in Mbanayili.

200
Figure A.3. 1: Wind Power Potential in Ghana (Source: NREL)
As previously mentioned, there is evidence to suggest wind farms might be economically
viable in mountainous regions and in offshore installations on the southern cost. A recent study
by Riso Laboratory (Denmark) and the Energy Commission (Ghana) indicates strong potential
for installing an offshore wind farm. Preliminary estimates claim sustained wind speeds of 5m/s,
which is generally considered the minimal requirement for large scale wind projects to be
economically viable (Ackom, 2005). Despite the strong desire to incorporate wind into the
model—because of its cost competitiveness with grid electricity—there is no evidence to suggest
that a wind turbine would be a viable solution for energy production at this site and was thus
omitted from this model.
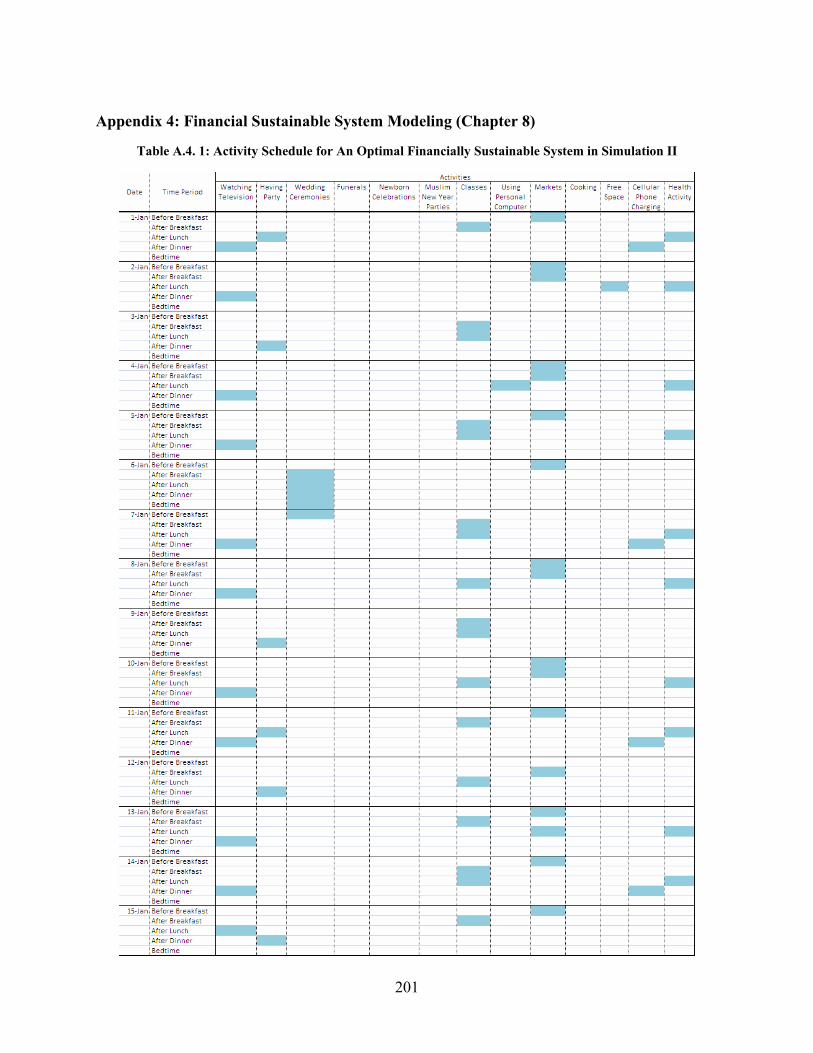
201
Appendix 4: Financial Sustainable System Modeling (Chapter 8)
Table A.4. 1: Activity Schedule for An Optimal Financially Sustainable System in Simulation II

202

203

204

205

206

207

208

209

210

211

212

213

214

215

216
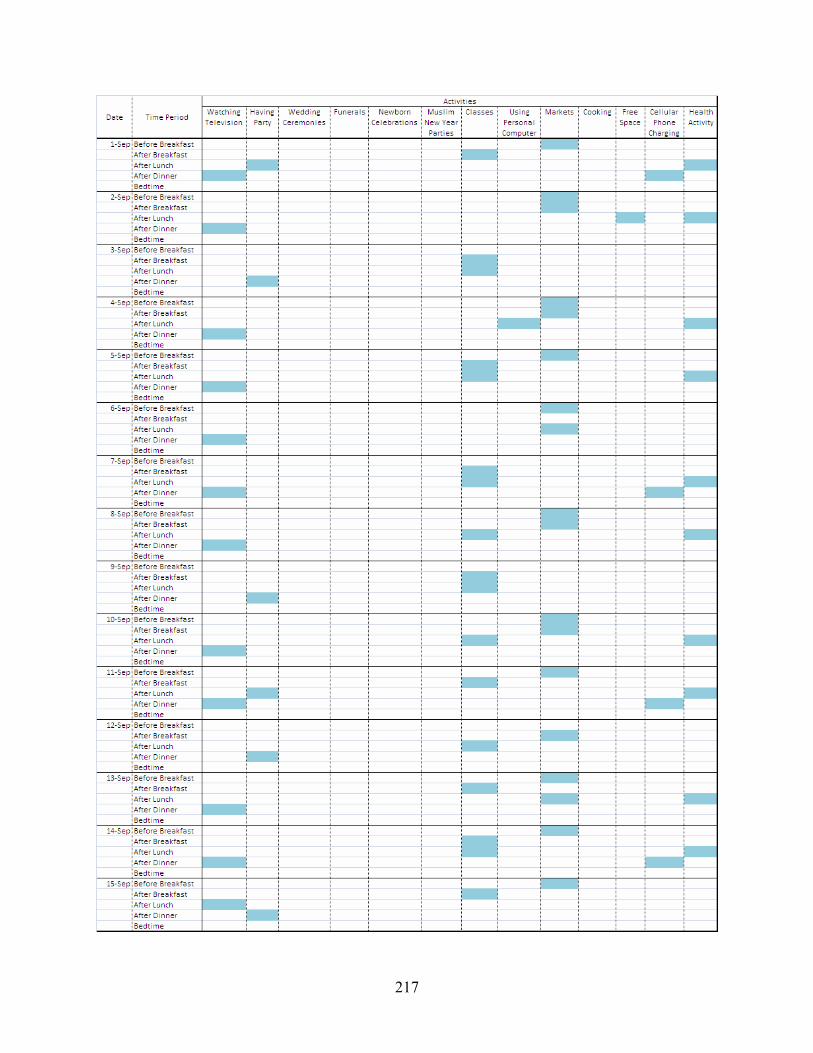
217

218

219

220

221

222

223
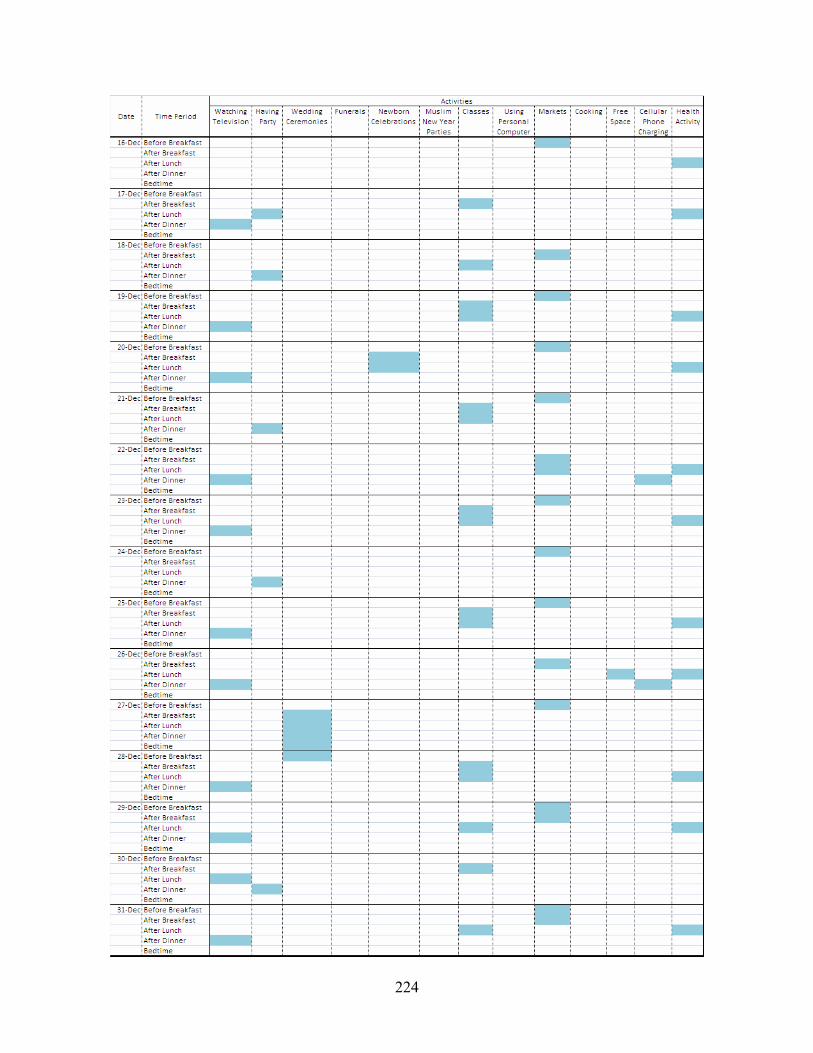
224

225
Table A.4. 2: Work Rate of KAKUTE Project
Table A.4. 3: Detailed Calculation on Revenue Generation Scheme

226
Appendix 5: Recommendations and Future Plans (Chapter 9)
Figure A.5. 1: Implementation Plan
20202007 2012
Partial Electrification
Electrifyall households
in Mbanayili
FinanciallySustainable System
Benchmark Model(Hybrid System)
Improvement ofLiving Standard
RevenueGeneration
Economic Development(Income Increase)
WTP(Current Income)
Electrification(Community Center)
Income Up Electrification(Households)
WTP(Current Income)
Electrification(Community Center)
Income Up Electrification(Households)
Upgrade

227
Bibliography:
Ackom, Emmanuel K. “Technological and Economic Viability Analysis of Renewable Energy Technologies in Ghana.” PhD diss., Brandenburg University of Technology, 2005.
Adanu, Komla Godfrey. “Photovoltaic Electricity in Ghana – Current Use and Potential for
the Future.” Renewable Energy, Vol.1, No. 5/6 (2001): 823-826, 1991. African Energy. Accessed: 1/8/2006 through 4/5/2006,
http://www.africanenergy.net/en/home/index. Ahiataku-Togobo, Wisdom. "Challenges of Solar PV for Remote Electrification in Ghana."
Accra, Ghana: Renewable Energy Unit, Ministry of Energy, 2003. Accessed: 8/20/06, www.zef.de/fileadmin/webfiles/renewables/praesentations/Ahiataku-Togobo_solar%20PV%20Ghana.pdf.
Akella A.K., M.P. Sharma, R.P. Saini. “Optimum Utilization of Renewable Energy Sources
in a Remote Area.” Renewable and Sustainable Energy Reviews, xx (2005): 1-15. Akuffo, Fred. “Professor Fred Akuffo on Biodiesel Extraction in Ghana.” Keynote address,
Biodiesel Investor’s Forum, April 27, 2004. Alhassan, Amadu, Personal Communication, June 23 and 25 2006. Al-Alawi, Ali, and Syed Islam. “Estimation of Electricity Demand for Remote Area Power
Supply Systems including Water Desalination and Demand Side Management Models.”, 2002.
Ampofo, Akosua Adomako. “When Men Speak, Women Listen”: Gender Socialization and
Young Adolescents’ Attitude to Sexual and Reproductive Issues.” African Journal of Reproductive Health 5, no. 3 (2001): 196-212.
Ashenayit, K. et al. “IRES – A Program to Design Integrated Renewable Energy Systems.”
Energy, Vol.15, No.12 (1990): 1143-1152. Australian Department of the Environment and Heritage. “National Fuel Quality Standards:
Measuring Cetane Number: Options for Diesel and Alternative Diesel Fuels.” Australian Government, 2004. Accessed: 2/28/2006, http://www.deh.gov.au/atmosphere/fuelquality/publications/pubs/cetane.pdf
Author unknown, “Islamic Year 1428H. (2007-2008).” Accessed: 3/12/2006.
http://islam.about.com/cs/calendar/a/hijrah_calendar_3.htm. Author unknown, “Tamale, Ghana – Sunrise, Sunset, Dawn, and Dusk Times.” Accessed:
5/7/2006. http://www.gaisma.com/en/location/tamale.html.

228
Baring-Gould et al. “Field Performance of Hybrid Power Systems.” A National Renewable Energy Laboratory paper presented at the WindPower 2001 Conference of the American Wind Energy Association, Washington, D.C., June 4-7, 2001.
Baron, Scott K, “Developing Power Business Plan: Empowering the Bottom of the
Pyramid.” The Electricity Journal, April 2004. Benge, Mike. “Assessment of the Potential of Jatropha curcas, (biodiesel tree,) for Energy
Production and Other Uses in Developing Countries.” Accessed: 11/13/06, http://www.echotech.org/mambo/index.php?option=com_docman&task=doc_view&gid=179&Itemid=68.
Bergey, Paul K. et al. “A Decision Support System for the Electrical Power Districting
Problem.” Decision Support Systems, 36 (2003): 1-17, July 2002. Bioking Deutschland. Image: Suitable Growing Regions of Jatropha in Africa. Accessed:
4/23/2006, http://www.bioking-deutschland.com. Buaku, Donald and Martin Mechtenberg. Community Center Architectural Rendering.
Unpublished text, 2006. Cecelski, Elizabeth. “Enabling Equitable Access to Rural Electrification: Current Thinking
and Major Activities in Energy, Poverty and Gender.” January 2003. Central Intelligence Agency. “The World Factbook.” Accessed: 3/16/2007.
https://www.cia.gov/cia/publications/factbook/geos/gh.html. Chamberlin et al. “Mitigating Rate Impacts of DSM Programs”. The Electricity Journal,
November 1993. Constantine et al. “Ghana Residential Energy Use and Appliance Ownership Survey: Final
Report on the Potential Impact of Appliance Performance Standards in Ghana.” Energy Analysis Department, Environmental Energy Technologies Division, Lawrence Berkeley National Laboratory, University of California Berkeley, March 30, 1999.
D’Sa, Antonette. “Integrated Resource Planning (IRP) and Power Sector Reform in
Developing Countries.” Energy Policy, 2004. Davriu A, F. Massot, M. Ribière, and P. Valentin. “Demand Side Management and Rural
Network Extension.” CIRED (1997) Conference Publication No. 438, IEE, 1997. Deng Limited. Accessed: 2/5/2006, http://www.deng-ghana.com/. Doss, Cheryl, “The Effects of Intrahousehold Property Ownership on Expenditure Patterns in
Ghana.” Journal of American Economies, Volume 15, Number 01, 149-180, October 2005. Earth Tools. Accessed: 1/1/2006 through 4/5/2006, http://www.earthtools.org/.

229
Ebert, Ronald J..”Aggregate Planning with Learning Curve Productivity.” Management
Science 23, no. 2 (1976): 171 – 182. Economic Consulting Associates. “Ghana Power Sector Review of Reform Programme Final
Report.” Mar 2003. Edjekumhene, Amadu, and Brew-Hammond. “Preserving and Enhancing Public Benefits
under Power Sector Reform: the Case of Ghana.” Energy for Sustainable Development Volume V No. 2 Jun 1, 2001.
Ertel, Jürgen et al. “Technical & Economic Viability Analysis of Renewable Energy
Technologies in Ghana.” July 2005. Essandoh-Yeddu, Joseph. “Current Solar Energy Utilization in Ghana.” Renewable Energy,
Vol. 10, No.2/3, 433-436, 1997. Exxon Mobile Corporation. “Diesel FAQ.” Accessed: 3/3/2007,
http://www.exxon.com/USA-English/GFM/Products_Services/Fuels/Diesel_Fuels_FAQ.asp
Ferguson, Rich. “Electric Industry Restructuring and Environmental Stewardship.” The
Electricity Journal, July 1999. Finamore et al. “Demand-Side Management in China, Benefits, Barriers and Policy
Recommendations.” October 2003. Fishbein, Robert E. “Survey of Productive Uses of Electricity in Rural Areas.” April 2003. Flowers et al. “Renewables for Sustainable Village Power.” A National Renewable Energy
Laboratory paper presented at the WindPower 2000 Conference of the American Wind Energy Association, Palm Springs, CA, April 30-May 4, 2000.
Forson, F. K. el at. “Performance of Jatropha Oil Blends in a Diesel Engine.” Renewable
Energy 29 (2004): 1135-1145. Forsythe, Nancy, Roberto Patricio Korzeniewicz, and Valerie Durrant. “Gender Inequalities
and Economic Growth: A Longitudinal Evaluation.” Economic Development and Cultural Change 48, no 3 (2000): 573-617. Accessed 5/1/2007. http://www.jstor.org/view/00130079/sp050005/05x0019s/0.
Fraser, Hamish. “The Importance of an Active Demand Side in the Electricity Industry.” The
Electricity Journal, 2001. Gehring, Kay L. “Can Yesterday’s Demand-Side Management Lessons Become Tomorrow’s
Market Solutions?.” The Electricity Journal, June 2002.

230
Geller, Howard S. “Energy Revolution: Policies for a Sustainable Future.” Washington DC:
Island Press, 2002. Gellings, Clark W., and William M. Smith. “Integrating Demand-Side Management into
Utility Planning.” June 1989. Ghana Home Page. Accessed: 4/13/2006 through 2/5/2007, http://www.ghanaweb.com Ghana Investment Promotion Center. Accessed: 1/4/2006 through 4/5/2006,
http://www.gipc.org.gh/IPA_Information.asp?hdnGroupID=2&hdnLevelID=2. Ghana Meteorological Service Department. Accessed: 1/12/2006 through 4/5/2006,
http://www.meteo.gov.gh/climatology.html. Global Environmental Facility (GEF). “Renewable energy-based Electricity for Rural Social
and Economic Devel¬opment in Ghana.” GEF Project Proposal, 1997. Accessed: 2/22/2007, www.gefweb.org/wprogram/1096/ghana.doc.
Goody, Jack. “ ‘Normative’, ‘Recollected’, and ‘Actual’ Marriage Payments among the
Lowiili of Northern Ghana, 1951 - 1966.” Journal of the International African Institute 39, no. 1 (1969): 54-61.
Heller, Joachim. Physic Nut: Jatropha curcas L. Promoting the Conservation and Use of
Underutilized and Neglected Crops. Rome, Italy: International Plant Genetic Resource Institute/Institute of Plant Genetics and Crop Plant Research, 1996.
Henning, Reinhard K. “Jatropha curcas L. in Africa: Assessment of the Impacts of the
Dissemination of ‘the Jatropha System’ on the Ecology of the Rural Area and the Social and Economic Situation of the Rural Population (target group) in Selected Countries in Africa.” Weissensberg, Germany: Bagani, date unknown.
Henning, Reinhard K. “The Jatropha System—Economy & Dissemination Strategy:
Integrated Rural Development by Utilization of Jatropha curcas L.” Paper presented at Renewables 2004, Bonn, Germany, June 1-4, 2004.
Hernandez, Antonio San Segundo, and Carlos Rodrígues Monroy. “Developing Sustainable
Electricity Supplies in Rural Areas of Developing Countries.” The Electricity Journal 18, no. 5 (2005): 68-73.
Hirst, Eric. “Balancing the Scales: Toward Parity in Electric Supply and Demand Data.” The
Electricity Journal, May 1990. International Monetary Fund (IMF). “Ghana: Poverty Reduction Strategy Paper.” Country
Report No. 03/56. Washington, D.C.: IMF Publication Services (2003): 1-289.
231
Japan International Cooperation Agency (JICA). “The Master Plan Study on Rural Electrification Using Renewable Energy Resources in the Northern Part of the Republic of Ghana.” Japan International Cooperation Agency, Economic Development Department (2006).
Japan International Cooperation Agency (JICA). “Basic Design Study Report on the Project
for Rural Electrification in the Republic of Ghana.” Japan International Cooperation Agency, August 2002.
Japan International Cooperation Agency (JICA). “Ghana-koku Hokubu Saisei Kanou Energy
Riyou Chihou Denaka Master Plan Chosa.” Japan International Cooperation Agency, December 2004.
Japan International Cooperation Agency (JICA). “Master Plan and Feasibility Pre-study for
Rural Electrification by Renewable Energy Resources.” Japan International Cooperation Agency, December 2005.
Jimenez, Antonio, and Ken Olson. “Renewable Energy for Rural Health Clinics.” National
Renewable Energy Laboratory (1998). Kahn, Alfred E. “The Adequacy of Prospective Returns on Generation Investments under
Price Control Mechanisms.” The Electricity Journal, 2002. Karekezi, Stephen, and Waeni Kithyoma. “Renewable Energy Strategies for Rural Africa: Is
a PV-led Renewable Energy Strategy the Right Approach for Providing Modern Energy to the Rural Poor of Sub-Saharan Africa?.” Energy Policy 30 (2002): 1071-1086.
Khoadhiar et al. “Jatropha Curcas Linn. As a Renewable Energy Source.” Chulalongkorn
University, Thailand, date unknown. Accessed: 2/8/2006, http://unit.aist.go.jp/internat/biomassws/02workshop/reports/20051213PP03-14a.pdf.
Kihm, Steven G. “Why Utility Stockholders Don’t Need Financial Incentives to Support
Demand-Side Management.” The Electricity Journal, 1991. Kuge, Katsuya (A member of Japan International Organization Agency). Personal
Communication, June 19 2006. Kumar et al. “Investigations on the Ase of Jatropha Ail and its Methyl Ester as a Fuel in a
Compression Ignition Engine.” Institute of Energy 74 (2001): 24-28. Lambert et al. “Micropower Systems Modeling With Homer.” Integration of Alternative
sources of Energy. John Wiley & Sons, Inc (2006): 379-418. Accessed: 1/20/06. www.mistaya.ca/homer/MicropowerSystemModelingWithHOMER.pdf.
Lambert, Tom, and Peter Lilienthal. Personal Communication, 2007.

232
Lambert, Tom. “HOMER Sample Files.” Mistaya Engineering Inc. National Renewable Energy Laboratory, 2003. Accessed: 2/2/2006, http://www.nrel.gov/homer/default.asp.
Loughran, D. and Kulick, J.. “Demand side management and energy efficiency in the United
States.” The Energy Journal 24, (1),(2004): 19-43. Luo, Meng-Jun et al. “Expression, Purification and Anit-tumor Activity of Curcin.” Acta
Biochimica et Biophysics Sinica 38(9)(2006): 633-668. Manurung, R. “Jatropha, A Promissing Plant.” Bandung, Indonesia: Bio-Technology
Research Center Institut Teknologi (date unknown) Accessed: 2/12/06, http://www.jarakpagar.com/pdf/jatropha_oil.pdf.
Marsh et al. “The Village Well, Using Wind to Provide Clean Water for People in
Developing Countries.” 2005. Martinot et al. “The GEF Solar PV Portfolio: Emerging Experience and Lessons.” August
2000. Mastny, Lisa, ed. “Biofuels for Transportation: Global Potential and Implications for
Sustainable Agriculture and Energy in the 21st Century.” Washinton, DC: Worldwatch Institute. Eschborn, Germany: Deutsche Gesellshaft fur Technische Zusammenardbeit, 2006.
McPherson, E. Gregory. “Evaluating the Cost Effectiveness of Shade Trees for Demand-Side
Management.” The Electricity Journal, November 1993. Methanol Institute. “Frequently Asked Questions about the Safe Handling and Use of
Methanol.” Accessed: 2/17/2006, http://www.biodiesel.org/resources/reportsdatabase/reports/gen/20060401_GEN-370.pdf.
Meyer, Richard L., and Geetha Nagarajan. “Rural Finance Today: Advances and
Challenges.” ADB Finance for the Poor 7, no3 (2006): 1-7. Ministry of Energy. “Electricity Sector Overview.” Government of Ghana (2003). Ministry of Finance. “Interim Poverty Reduction Strategy Paper 2000-2002.” Government of
Ghana (2000): 1-39. Morrison Jay. “Why We Need Standby Rates for On-Site Generation.” The Electricity
Journal, 2003. National Biodiesel Board. “Biodiesel Production.” Accessed: 1/27/2006
http://www.biodiesel.org/pdf_files/fuelfactsheets/Production.PDF.

233
National Biodiesel Board. “OEM Warrenty Statement and Use of Biodiesel Blends over 5% (B5).” Accessed: 2/27/2006, http://www.biodiesel.org/pdf_files/B5_warranty_statement_32206.pdf.
National Renewable Energy Laboratory. “Getting Started Guide for HOMER Version 2.1.”
Midwest Research Institute (2005). Accessed: 6/8/2006. http://www.nrel.gov/homer/includes/downloads/HOMERGettingStarted210.pdf.
Northern Wind & Arizona Sun. Accessed: 1/1/2006 through 4/5/2006, http://store.solar-
electric.com/suprdecyba.html. Osei, William Yaw. “Rural Energy Technology: Issues and Options for Sustainable
Development in Ghana.” Geoforum, Vol. 27, No. 1, 63-74, 1996. Pant K. S. et al. “Seed Oil Content Variation in Jatropha curcas Linn. In Different Altitudinal
Ranges and Site Conditions in H.P. India.” Lyonia: A Journal of Ecology and Application 11(2) (2006): 23-26.
Pohekar et al. “Dissemination of Cooking Energy Alternatives in India – a Review-.”
Renewable and Sustainable Energy Reviews, 9 (2005) 379-393, 2004. Polar Power Inc. Accessed: 1/18/2006 through 4/5/2006,
http://www.polarpowerinc.com/products/generators/index.htm. Pritchett, Terry et al. “Why Industry Demand-Side Management Programs Should Be Self-
Directed.” The Electricity Journal, 1993. Quansah et al. “Ghana LPG Rural Energy Challenge.” Kumasi Institute of Technology and
Environment, August 2003. Redford, Simon J.. “Rationale for DSM.” Power Engineering Journal (1994) :211-217. Schillings et al. “Solar and Wind Resource Assessment: High Resolution Solar Radiation
Assessment for Ghana.” Stuttgart, Germany: Deutsches Zentrum fur Luft- und Raumfarht (2004).
Solar Light Company LTD. Accessed: 1/1/2006 through 4/5/2006, http://www.solar-
light.com/. Source Guides. Accessed: 1/1/2006 through 4/5/2006,
http://energy.sourceguides.com/businesses/byGeo/byC/Ghana/Ghana.shtml. Sustainable Village. Accessed: 1/1/2006 through 4/5/2006,
http://www.sustainablevillage.com/.

234
Switzer, Sheldon. “On-Site Generation and Pricing Policies for a Local Distribution Company: A Utility Line Is “Used and Useful” Even if It’s Not in Use.” The Electricity Journal, July 2004.
Tatie'tse' et al. “Contribution to the Analysis of Urban Residential Electrical Energy Demand
in Developing Countries.” Energy, 27 (2002) 591-606. Team Lister Green. Columbia University School of Engineering. Accessed: 2/21/2007,
http://www.me.columbia.edu/me3410/spring06/group01/index.html. Thom, Cecile. “Use of Grid Electricity by Rural Households in South Africa.” Energy for
Sustainable Development, Volume IV No.4, December 2000. Tickell, Josh. “Solutions to NOx Emmissions.” Biodiesel America. Accessed: 3/8/2007,
http://www.biodieselamerica.org/node/1058. Tse, Mawuli. “Commercialization of Renewable Energy Technologies in Ghana: Barriers
and Opportunities.” 2000. UN Energy, “Assessing Policy Options for Increasing the Use of Renewable Energy for
Sustainable Development: Modelling [sic] Energy Scenarios for Ghana.” Paper presented at CSD-14 at the UN Headquarters, New York, NY, May 1-12, 2006.
UNDP, and World Bank Sector Management Assistance Programme (ESMAP). "Monitoring
and Evaluation in Rural Electrification Projects: A Demand-Oriented Approach." (2003). United Nations Development Programme in Ghana. “Environment and Energy, Liquefied
Petroleum Gas (LPG) Substitution for Wood Fuel in Ghana – Opportunities and Challenges.” November 2004.
United States Environmental Protection Agency. “A Comparative Analysis of Biodiesel
Impacts on Exhaust Emissions.” Ann Arbor: Assessment and Standards Division Office of Transport and Air Quality U.S. EPA, 2002.
US Census Bureau. “International Data Base Summary Demographic Data for Ghana.”
Accessed: 2/7/2007. http://www.census.gov/cgi-bin/ipc/idbsum.pl?cty=GH. Washington State University. “An Industry and Market Study on Six Plant Products in
Southern Aftica: Jatropha or Physic Nut.” US Agency for International Development (2002).
Weisbrod, Glen, et al. “Learning From India: Defining Profitable Demand-Side Management
and Energy Service Company Programs for a Utility.” The Electricity Journal, April 1999. Weisser, Daniel. “On the Economics of Electricity Consumption in Small Island Developing
States: A Role for Renewable Energy Technologies?” Energy Policy, 32 (2004) 127-140.

235
Weizsacker, E., A. von Lovins, and H. Lovins. Factor Four: Doubling Wealth!Ahalving
Resource Use. London: Earthscan, 1997. World Bank (a). “Enabling Equitable Access to Rural Electrification, Current Thinking and
Major Activities in Energy, Poverty and Gender.” 2000. World Bank (b). “The World Development Report 2000.” 2000. World Bank. “Expanding Electricity Access to Remote Areas: Off-Grid Rural Electrification
in Developing Countries” 2006. World Bank. “Ghana’s Growth, Falling Poverty Rates, Could Raise Income Status in a
Decade.” Accessed: 3/16/2007. http://web.worldbank.org/WBSITE/EXTERNAL/NEWS/0,,contentMDK:21241709~pagePK:64257043~piPK:437376~theSitePK:4607,00.html
World Health Organization. “Purchasing Power Parity 2000.” Accessed: 5/3/2007.
http://www.who.int/choice/costs/ppp/en/index.html. World Health Organization. Accessed: 2/5/2006,
http://www.who.int/mediacentre/factsheets/en/.