automated demand response and optimization in action
DESCRIPTION
Automated Demand Response and Optimization in Action. Agenda. Identifying demand reduction potential How to implement and what tools exist Utility programs and rebates Case studies - PowerPoint PPT PresentationTRANSCRIPT


AUTOMATED DEMAND RESPONSE AND
OPTIMIZATION IN ACTION

Agenda• Identifying demand reduction potential• How to implement and what tools exist • Utility programs and rebates• Case studies
Learning objective: how to start paying attention to your building’s demand reduction potential and your options

Identifying Demand Reduction PotentialHow to analyze your data

Utility and Metered Data• What resolution is your utility/metered data?

Monthly Data• Monthly data shows seasonal peaks

Weekly Data• Weekly profiles shows day of week peaks

Interval Data• Interval data will show time of day peaks

Weather Influence• Electric reheat load influenced by temp
Higher AM demand peaks caused by colder temp
Afternoon load less affected by temp
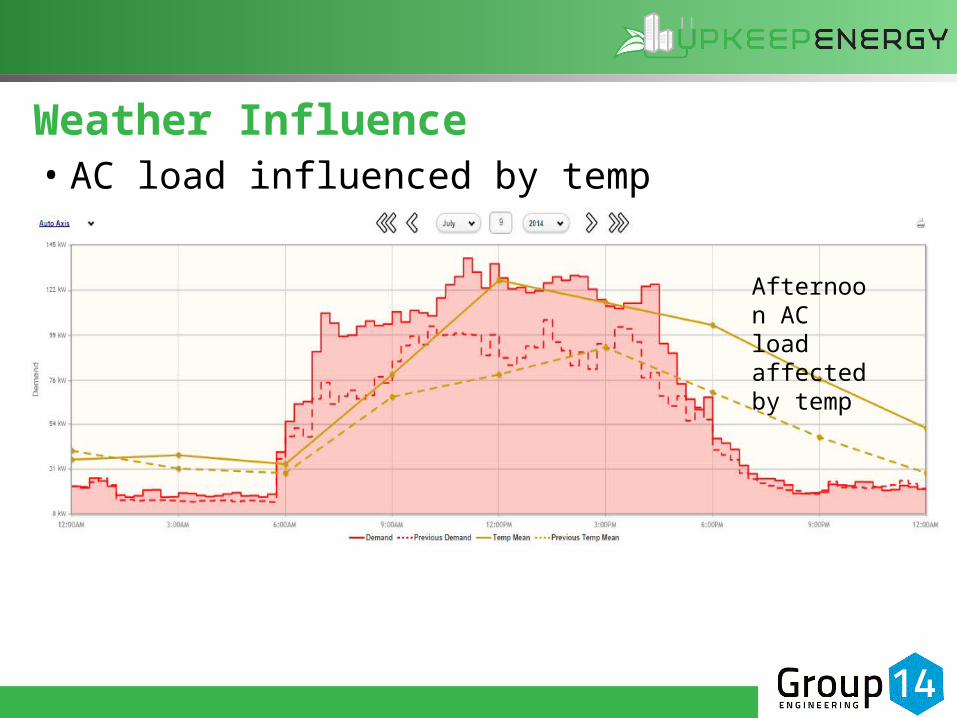
Weather Influence• AC load influenced by temp
Afternoon AC load affected by temp

Building Load Factor• Base load vs peak loads

Building Energy Disaggregation• Understand the associated load with major end uses
Graph courtesy of Brad Queen, Cube Resources

Building Energy Disaggregation• Monitor load of major equipment
Graph courtesy of Brad Queen, Cube Resources

How “Spikey” is the Data?• Are demand peaks getting set by a couple occurrences?

How “Spikey” is the Data?
Graph courtesy of Brad Queen, Cube Resources
How Much Can I Save?
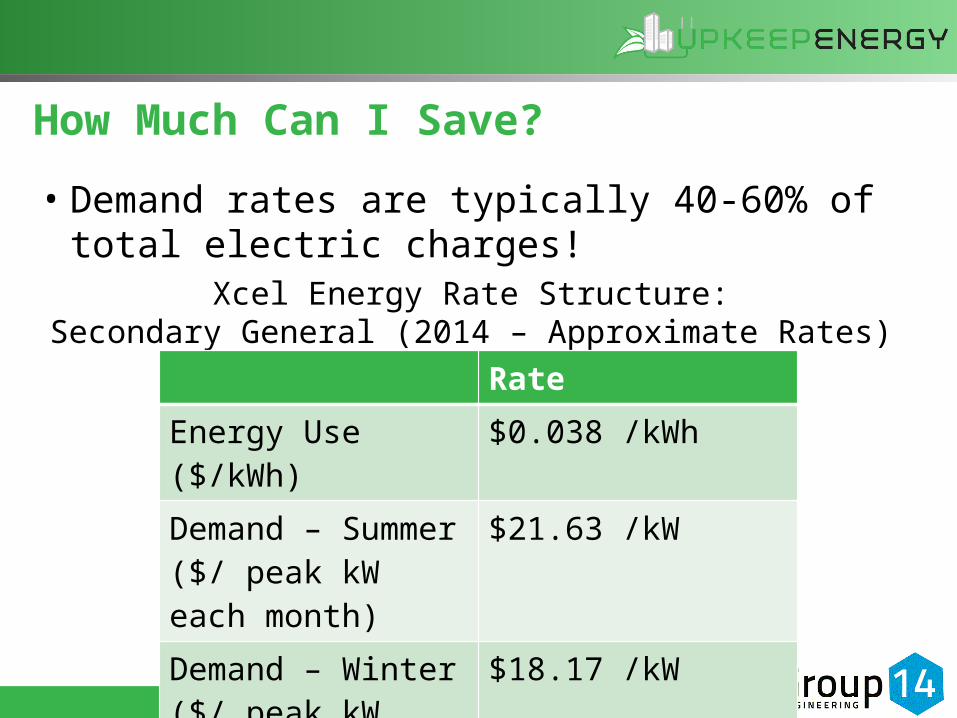
• Demand rates are typically 40-60% of total electric charges!
Xcel Energy Rate Structure:Secondary General (2014 – Approximate Rates)
RateEnergy Use ($/kWh) $0.038 /kWhDemand – Summer ($/ peak kW each month)
$21.63 /kW
Demand – Winter ($/ peak kW each month)
$18.17 /kW

How Much Can I Save?• What is the typical daily peak

How Much Can I Save?
Graph courtesy of Brad Queen, Cube Resources

Demand Reduction & Tools
How to reduce demand and the tools to help

Why Demand Reduction
• Demand costs can amount to 40-60% of your utility bill• USGBC LEED Credits for AutoDR implementation (pilot)• Growth in renewable generation driving need for fast
acting DR to balance markets• AutoDR technologies are being utilized to also manage
dynamic price response

Types of Demand Reduction
Demand Optimization: Make equipment or operational change that reduces peak at all times
Demand Response (DR):- Manual – Manually turn off lights and
equipment for DR event- Semi-Manual – Turn on pre-programmed
BAS control strategy for DR event- Automatic - External price, reliability, or
event signal automatically triggers a BAS control sequence; no human intervention needed

Efficiency versus Demand Reduction• Reducing demand for short period has minimal impact
on energy use• Energy Use Intensity (EUI) and Energy Star are based on
energy use (kBtu/SF), not affected by peak• Many efficiency measures impact non-peak times

Reducing Demand
• Reset space temp set points• Reset discharge air temp set points• Reset chilled water supply temp set points• Limit motor (fan, pump) speeds• Limit equipment operation/staging• 2nd stage of compressor• Electric reheat stages• Demand limiting features on chillers• #s of motors or chillers on

Reducing Demand
• Dim lights or lighting sweeps• Shut equipment off (don’t operate industrial
equipment during demand window)• Pre-cool the building• Thermal energy (ice) storage

Demand Reduction Challenges
• Comfort compromise is a myth
– Duration of demand event changes impact; 4 hour event may only drop 10% of the kW that ½ to 1 hour event can drop due to thermal lag
• Education critical to understand rates/benefits and how to drop load
• Uncertain results – measure what would have been?• Financial incentives worth the risk and hassle?

Tools - Demand Notification (Dashboards)• Alert if threshold has been exceeded
Northwrite
Enernoc
Lucid

Tools – Fault Detection Diagnostics (FDD)/ SkySpark
• A database of building operating data - ANY data!•View/Analyze data•“Rules” identify data behavior across all data•Makes use of the data we used to throw away

Tools – FDD/ SkySpark• Data visualization – meter and equipment detail• Identify & quantify opportunities – get to the
source of operational improvements• Automate detection through “rules”

Tools – FDD/ SkySpark
• x Identifies “Sparks” when kW exceeds
target (220 kW)

Tools - Building IQ• Cloud-based software communicates with your
building management system (BMS) • Results in lower energy use as well as reduced demand
during demand response events• Predictive Energy Optimization™ uses advanced
algorithms to automatically fine tune and control HVAC systems

Tools - Building IQ• Software automatically learns and models the building’s
thermal characteristics and usage patterns• Then system uses predictive thermal modeling to maintain
occupant comfort by optimizing set points and schedules based on weather forecasts, unique building characteristics, energy prices, and demand response signals.

Tools – LOBOS (Load Based Optimization
System)• Tool that combines energy reduction control strategies, automated demand response, and fault detection and diagnostics
• Built on Niagara platform• Connects to BAS through JACE• Adaptive learning to optimize
controls (load based control)• Automatic demand control

Utility Demand Programs

Utility Demand Programs• Turning off demand has essentially the same effect as
turning on additional generation• Triggers: changes in the price of electricity or utility is
reaching peak capacity • Many different demand response program types• Direct load control• Interruptible load• Spinning/non-spinning
reserves• Critical peak pricing and
other pricing programs
www.DemandResponseDirectory.com

Nevada Energy Demand Pilot ProgrammPoweredTM Energy Optimization for Commercial Buildings• The program is designed to help building owners lower
energy costs and allow NV Energy to initiate demand response events during times of peak load – all without impacting occupant comfort.
• The mPowered program offers participating facilities advanced software technology provided by Building IQ that communicates with the BAS.
• Program Value: 15% annual energy savings, up to $20k in equipment or meter upgrades, free software subscription

Nevada Energy Demand Pilot Program• Control shifts usage outside peak times. • Building IQ’s software predicts how much energy is required to
maintain comfort during the scheduled demand event. Then automatically pre-cools the building to maintain occupant comfort thresholds.

Xcel EnergyInterruptible Service Option Credit (ISOC)• Tariff for large industrial customers – larger than 300 kW• Two options: 1 hour notice and less than 10 minute
notice• 1 hour notice: Xcel contacts client, they are
responsible for load drop (however that happens)• Less 10 min: Xcel puts hardware in the field and the
hardware automatically drops load. Typically this is put on pumps, motors, and industrial loads
• Substantial rate decrease but penalties if don’t drop to the previously agreed upon load

Xcel EnergyPeak Savings Business Program• Medium to large commercial/industrial program• Run by EnerNOC• They have a 40 MW capacity agreement• EnerNOC does customer recruitment, incentive
determination based on agreed load drop• Xcel calls EnerNOC they call their clients (~200 clients)• Drop is accomplished through hardware controls, BAS
control language, and manual control (with coaching/advisement)

Xcel EnergySaver Switch• 175,000 switches in CO• CO is just residential, MN also has light commercial
• Automatic switch control to limit compressor operation• $40 rebateSmart Thermostat (Residential Pilot)• Wifi enabled thermostat• Performance incentives during DR events• Xcel provides incentives to buy Tstat

Fort Collins UtilityHot Shot / AC Load Control• Remote devices installed on electric water heaters or air
conditioners• Devices turn off heaters for short periods during
demand events• Residential program• Annual rebate• Program only for existing enrollmentAdvanced Smart Meters• Program to be developed

Case Studies

Examples - Banking/Office Building• Monthly peak 240 kW• Peak daily demand was typically around 170-180 kW
except for that one day
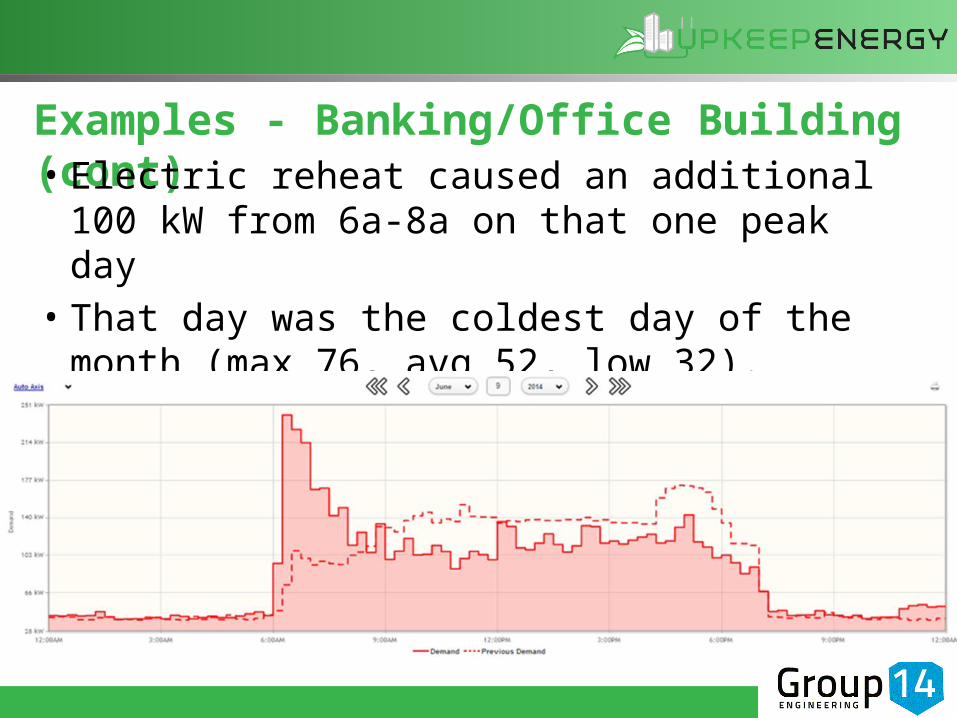
Examples - Banking/Office Building (cont)• Electric reheat caused an additional 100 kW from 6a-
8a on that one peak day • That day was the coldest day of the month (max 76,
avg 52, low 32).
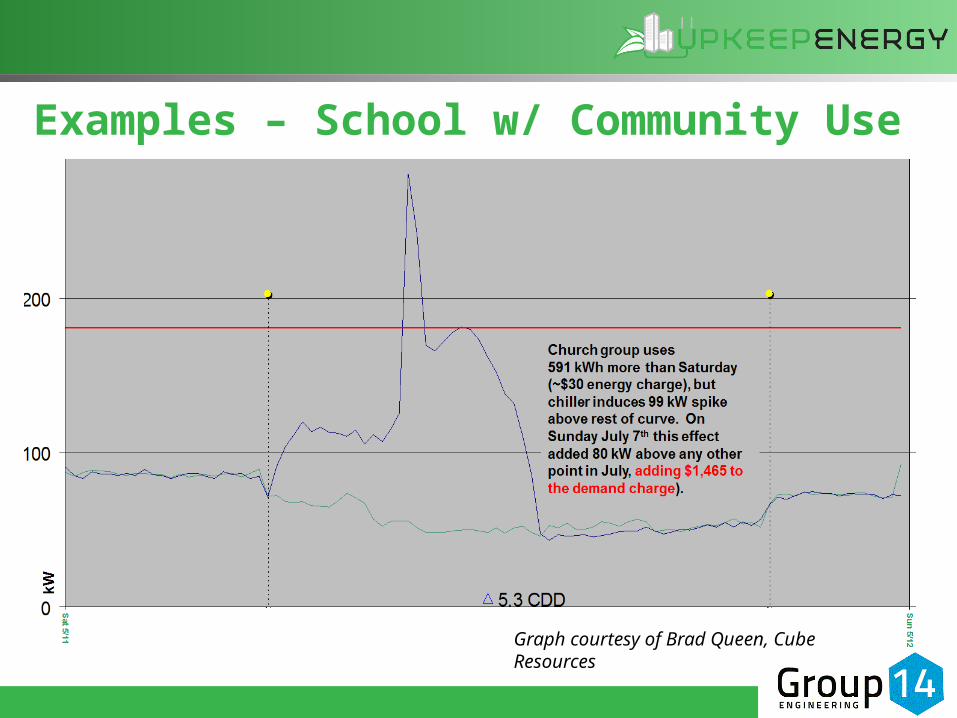
Examples – School w/ Community Use
Graph courtesy of Brad Queen, Cube Resources

Case Study – Denver Office• 437,000 SF, 17 story office building located in Denver• Two large built-up variable air volume (VAV) air
handling units • VAVs with electric reheat

Denver Office – Demand Profile• Highest demand costs in winter

Denver Office – Demand Profile• SkySpark graph – winter demand (high peak) vs. summer

Denver Office – Demand Profile• Peak demand occurs during morning warm up during winter months
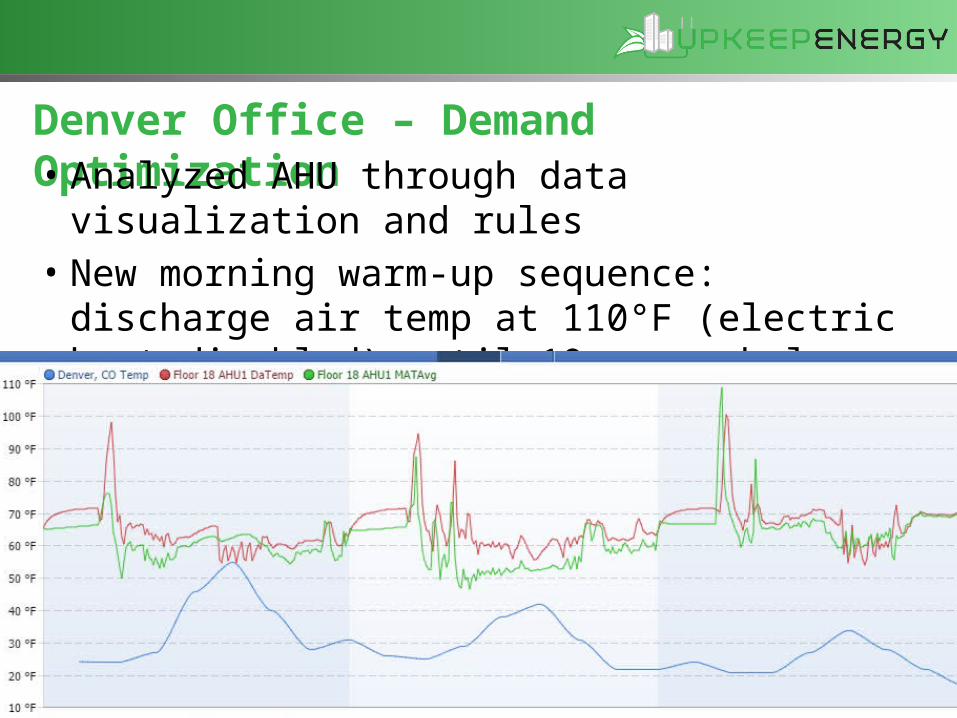
Denver Office – Demand Optimization• Analyzed AHU through data visualization and rules• New morning warm-up sequence: discharge air temp
at 110°F (electric heat disabled) until 10 zones below setpoint, then step DAT down 5°F every 10 min

Denver Office – Results• Significant savings of almost $58,000/yr through
demand reduction alone
Previous year (1,300 kW morning peak) vs. this year (500 kW peak)

HERE TO ANSWER YOUR QUESTIONS
Jessica Lorentz, PE, CEM, LEED AP [email protected](303) 946-0732www.upkeepenergy.com
Facility Optimization
Measurement and Verification
Training
Energy Services
Energy Savings that Last
Celeste Cizik, PE, CEM, LEED AP [email protected] (720) 382-1705www.group14eng.com
