regional market demand for renewable energy
TRANSCRIPT

REGIONAL MARKET DEMAND
FOR RENEWABLE ENERGY
New Mexico Revenue Stabilization & Tax Policy Committee
September 27, 2021
Rikki Seguin
Executive Director
Interwest Energy Alliance
1

INTERWEST
ENERGY ALLIANCE
Regional non-profit trade
association representing
nation’s leading developers and
manufacturers of wind, solar,
geothermal, and storage
technologies, working with
environmental NGOs
Mission is to make the
Intermountain West a leader in
deployment of reliable, cost-
effective, and diverse
renewable energy resources.
New Mexico, Colorado, Wyoming, Utah, Nevada, Arizona2

3

IN-STATE POLICY DRIVERS
Energy Transition Act in 2019
100% carbon-free by 2045
50% RPS by 2040
Goal of 80% renewable by 2040
4
Source: Peak load data: PNM 2020-2040 Integrated Resource Plan presentation Aug. 25, 2020; Wind data: AWEA; Solar data: SEIA Source: WECC
New Mexico Load is Small
NM electricity demand makes up just 3.5% of
total WECC demand
Total renewables online in NM: 3,582 MW
Wind 2,351 MW
Solar 1,231 MW

5
Source: WECC

REGIONAL POLICY DRIVERS
Over 80% of
customers in the
West are aligned on
decarbonization
requirements
6
Source: American Clean Power Association
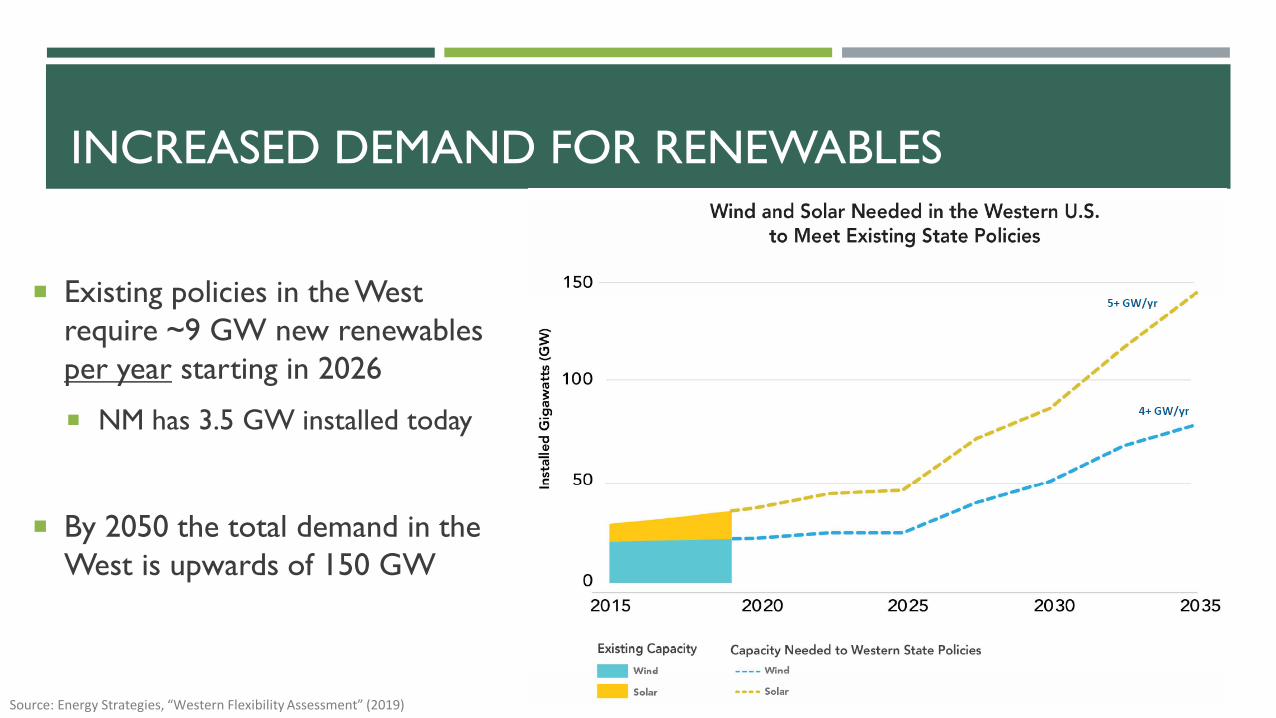
INCREASED DEMAND FOR RENEWABLES
Existing policies in the West
require ~9 GW new renewables
per year starting in 2026
NM has 3.5 GW installed today
By 2050 the total demand in the
West is upwards of 150 GW
7
Source: Energy Strategies, “Western Flexibility Assessment” (2019)

8
REGIONAL DRIVERS
2016 Net Interchange by Balancing Area
Red = Export
Blue = Import
New Mexico projects can serve customers around the region, but projects must win competitive solicitations.
Standard steps:
Utility identifies need
Utility issues RFP (request for proposals) for resource
Companies bid in proposed projects from around the region
Utility selects the best project (considering cost, resource type, etc.)
If bid is not selected, project does not get built.
Source: WECC “State of the Interconnection Digest” (Summer 2018)

RFP RESULTS: PSCO 2018 RFP FOR 454 MW
9
Source: CoPUC Proceeding No. 16A-0396E

10
Source: NREL: Global Horizonal Solar Irradiance 1998-2016 Source: NREL: US 80m Wind Resource
+RESOURCE

+RESOURCE DIVERSITY
11
Source: Pattern Energy
Regional Electricity markets
benefit from geographic diversity
“Duck Curve” challenges are
affecting many markets with high
renewable penetration
Regional coordination enables
least cost, highly efficient pairing of
wind and solar resources

+COST
12
Source: Univ. of Wyoming, “Estimating the Impact of State Taxation Policies on the Cost of Wind Development in the West” (March 2019)

13
RFP RESULTS: NVE AND BHE
Source: Moss Adams LLP

RFP RESULTS: NVE AND BHE
Price difference is a matter of cents
NV Energy 2018 RFP Shortlist
Approx. difference between highest and lowest bid = $0.50/MWh
Black Hills Energy 2019 RFP Shortlist
Approx. difference between highest and lowest bid = $0.87/MWh
14
Source: Calculations based on PWRR values published in each utility’s RFP response filing with outliers removed.

NM WILL BENEFIT FROM GROWTH SCENARIO
Need to stay competitive in order to win bids
Projects generally will not be built if they cannot win RFPs
Additional development means additional revenue for the state
Bulk of state tax collection comes during construction phase
Transmission expansion/grid modernization
More transmission is needed to move electrons
15

QUESTIONS?
Rikki Seguin
Executive Director
400 Gold Ave. SW Suite 700
Albuquerque, NM 87102
16