deliver insights - iasa session papers... · deliver insights ... planning/essbase applications six...
TRANSCRIPT


IASA 86TH ANNUAL EDUCATIONAL CONFERENCE & BUSINESS SHOW
Transforming FP&A: Combining Process Redesign & Technology to Deliver Insights
Session 602
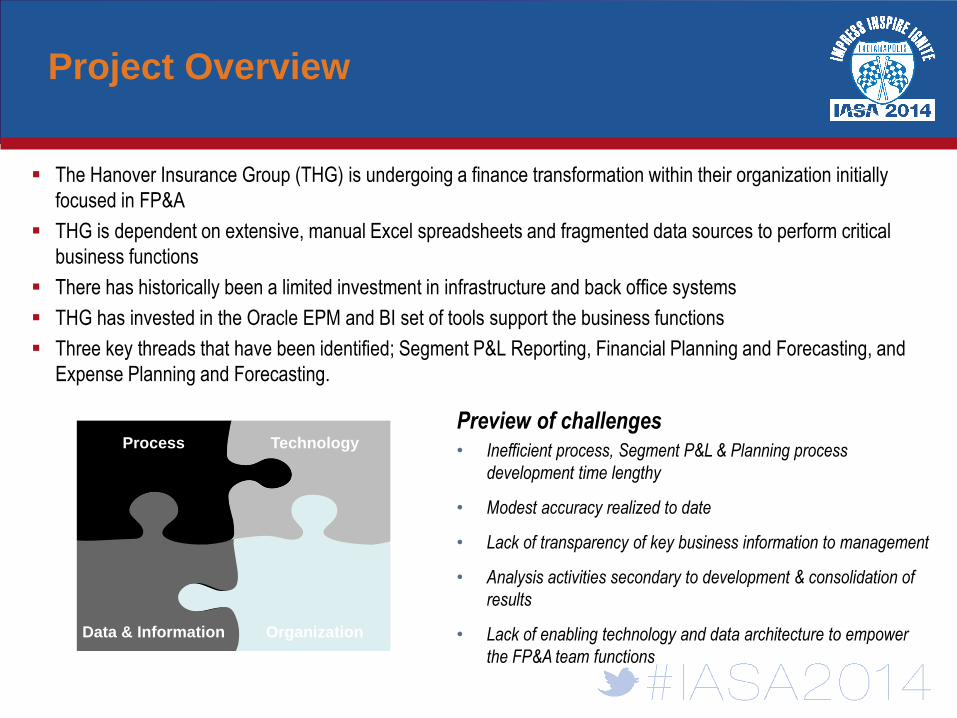
The Hanover Insurance Group (THG) is undergoing a finance transformation within their organization initially
focused in FP&A
THG is dependent on extensive, manual Excel spreadsheets and fragmented data sources to perform critical
business functions
There has historically been a limited investment in infrastructure and back office systems
THG has invested in the Oracle EPM and BI set of tools support the business functions
Three key threads that have been identified; Segment P&L Reporting, Financial Planning and Forecasting, and
Expense Planning and Forecasting.
Preview of challenges • Inefficient process, Segment P&L & Planning process
development time lengthy
• Modest accuracy realized to date
• Lack of transparency of key business information to management
• Analysis activities secondary to development & consolidation of
results
• Lack of enabling technology and data architecture to empower
the FP&A team functions
Process Technology
Organization Data & Information
Project Overview
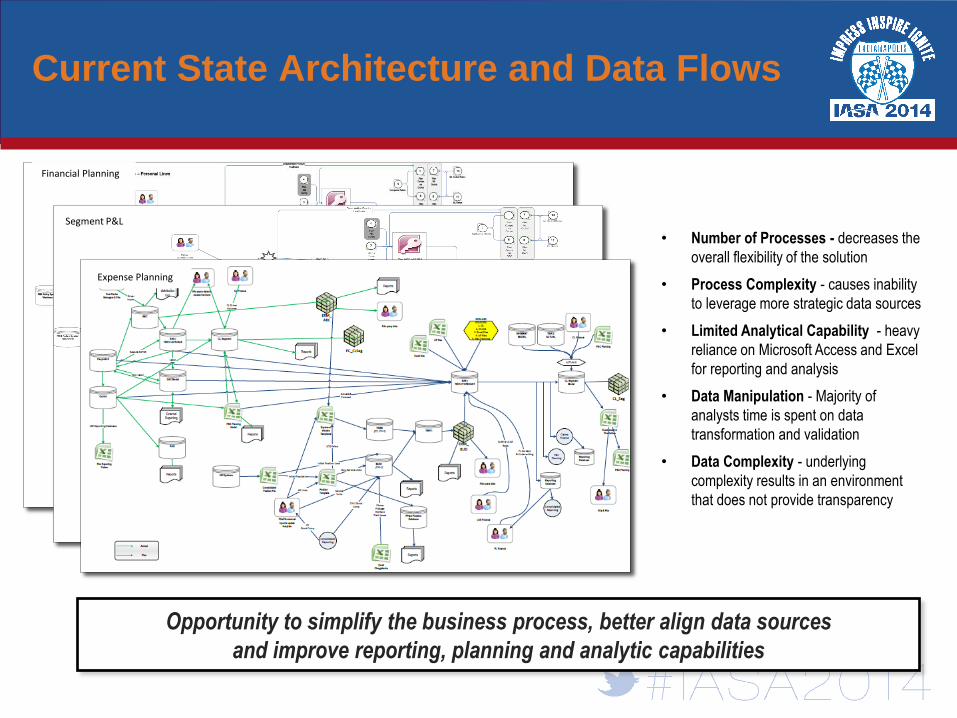
Current State Architecture and Data Flows
• Number of Processes - decreases the
overall flexibility of the solution
• Process Complexity - causes inability
to leverage more strategic data sources
• Limited Analytical Capability - heavy
reliance on Microsoft Access and Excel
for reporting and analysis
• Data Manipulation - Majority of
analysts time is spent on data
transformation and validation
• Data Complexity - underlying
complexity results in an environment
that does not provide transparency
Opportunity to simplify the business process, better align data sources
and improve reporting, planning and analytic capabilities
Expense Planning
Segment P&L
Financial Planning
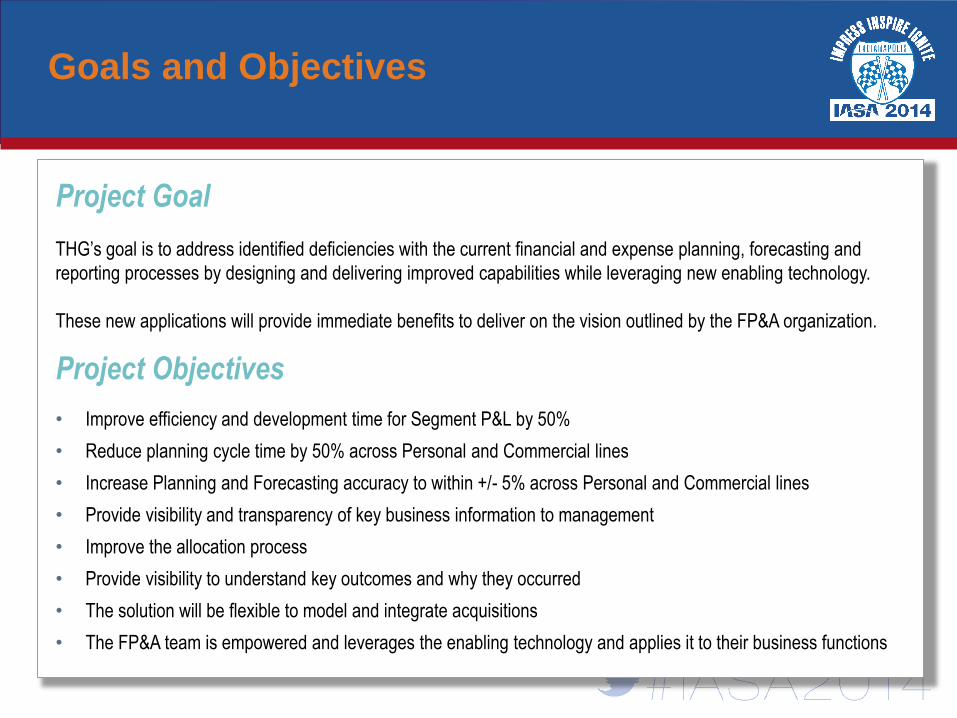
Project Goal
THG’s goal is to address identified deficiencies with the current financial and expense planning, forecasting and
reporting processes by designing and delivering improved capabilities while leveraging new enabling technology.
These new applications will provide immediate benefits to deliver on the vision outlined by the FP&A organization.
Project Objectives
• Improve efficiency and development time for Segment P&L by 50%
• Reduce planning cycle time by 50% across Personal and Commercial lines
• Increase Planning and Forecasting accuracy to within +/- 5% across Personal and Commercial lines
• Provide visibility and transparency of key business information to management
• Improve the allocation process
• Provide visibility to understand key outcomes and why they occurred
• The solution will be flexible to model and integrate acquisitions
• The FP&A team is empowered and leverages the enabling technology and applies it to their business functions
Goals and Objectives
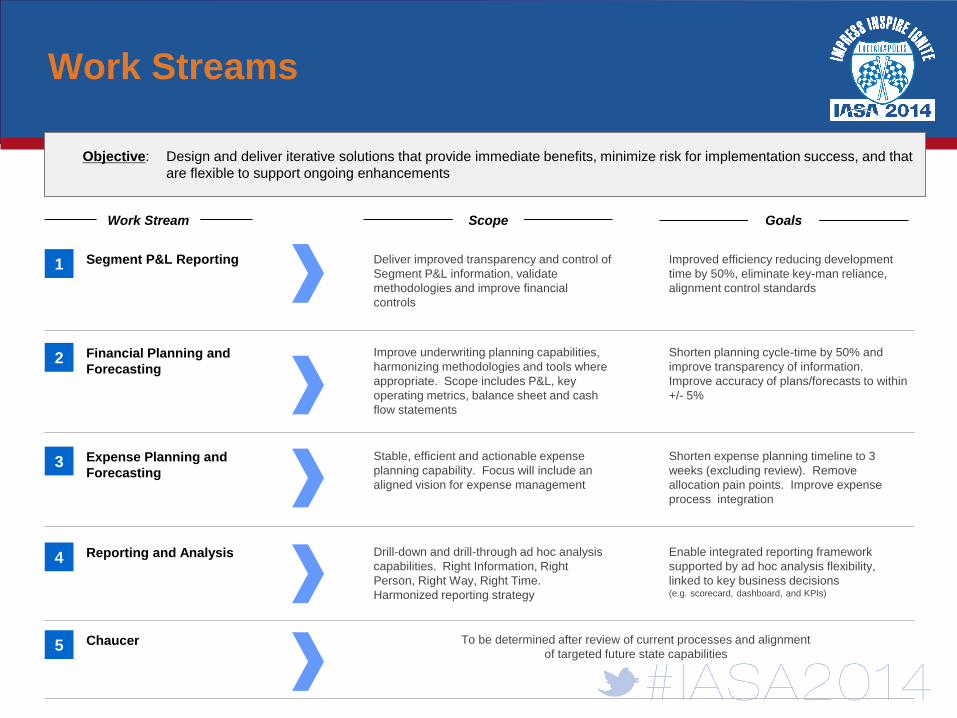
Objective: Design and deliver iterative solutions that provide immediate benefits, minimize risk for implementation success, and that
are flexible to support ongoing enhancements
1 Segment P&L Reporting
2 Financial Planning and
Forecasting
3 Expense Planning and
Forecasting
4 Reporting and Analysis
5 Chaucer
Deliver improved transparency and control of
Segment P&L information, validate
methodologies and improve financial
controls
Goals
Improved efficiency reducing development
time by 50%, eliminate key-man reliance,
alignment control standards
Scope
Improve underwriting planning capabilities,
harmonizing methodologies and tools where
appropriate. Scope includes P&L, key
operating metrics, balance sheet and cash
flow statements
Shorten planning cycle-time by 50% and
improve transparency of information.
Improve accuracy of plans/forecasts to within
+/- 5%
Stable, efficient and actionable expense
planning capability. Focus will include an
aligned vision for expense management
Shorten expense planning timeline to 3
weeks (excluding review). Remove
allocation pain points. Improve expense
process integration
Work Stream
Drill-down and drill-through ad hoc analysis
capabilities. Right Information, Right
Person, Right Way, Right Time.
Harmonized reporting strategy
Enable integrated reporting framework
supported by ad hoc analysis flexibility,
linked to key business decisions (e.g. scorecard, dashboard, and KPIs)
To be determined after review of current processes and alignment
of targeted future state capabilities
Work Streams
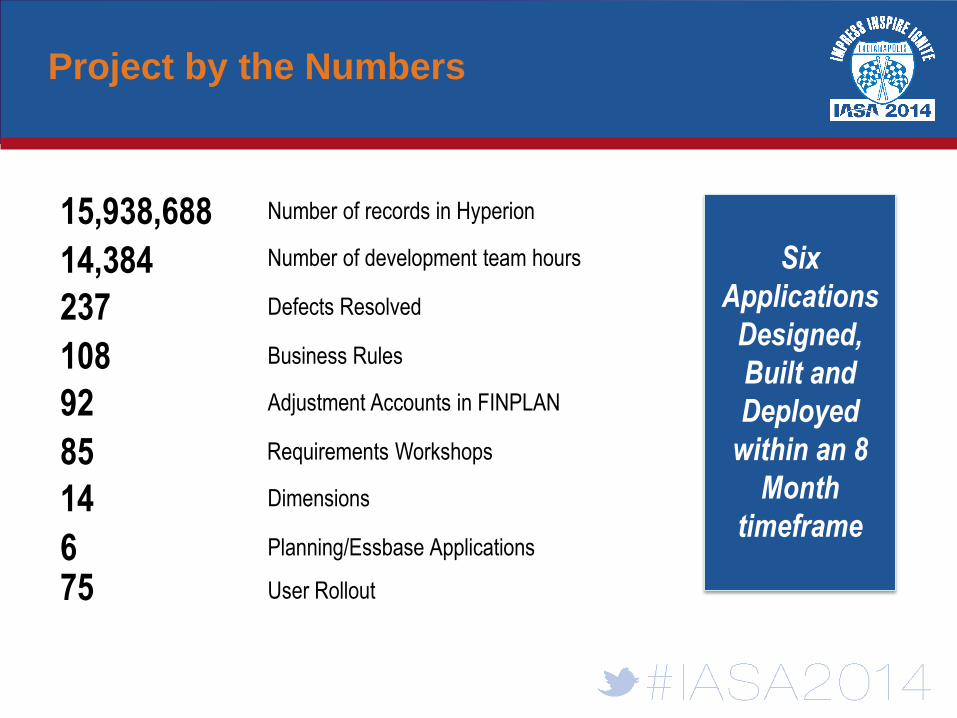
15,938,688
14,384
237
108
92
85
14
6
Number of records in Hyperion
Number of development team hours
Defects Resolved
Business Rules
Adjustment Accounts in FINPLAN
Requirements Workshops
Dimensions
Planning/Essbase Applications
Six
Applications
Designed,
Built and
Deployed
within an 8
Month
timeframe
User Rollout 75
Project by the Numbers
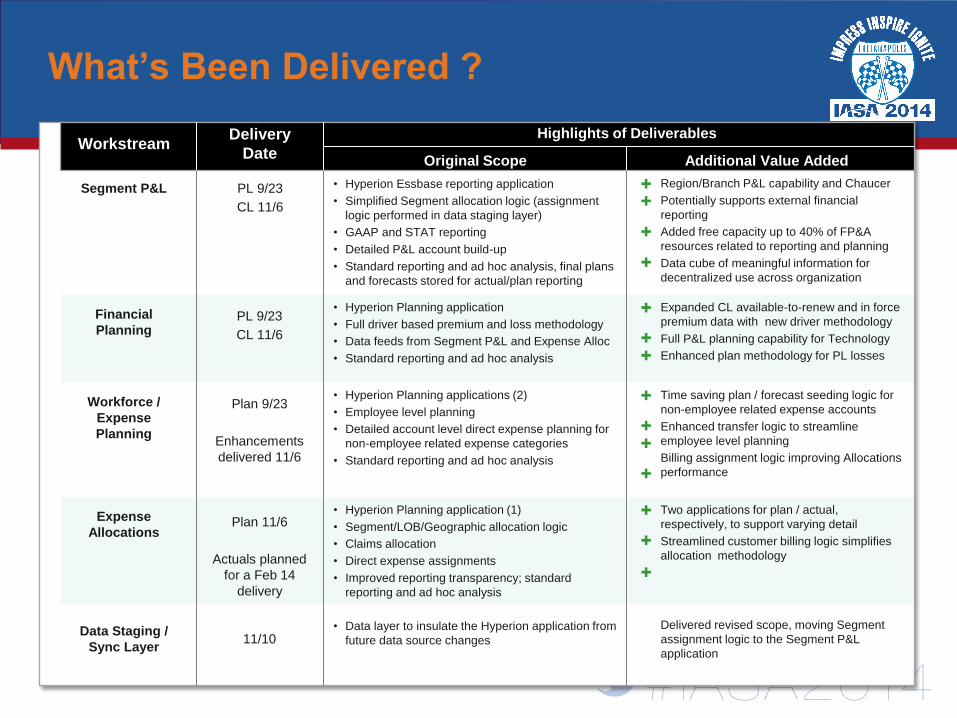
Workstream Delivery
Date
Highlights of Deliverables
Original Scope Additional Value Added
Segment P&L • Hyperion Essbase reporting application
• Simplified Segment allocation logic (assignment
logic performed in data staging layer)
• GAAP and STAT reporting
• Detailed P&L account build-up
• Standard reporting and ad hoc analysis, final plans
and forecasts stored for actual/plan reporting
Region/Branch P&L capability and Chaucer
Potentially supports external financial
reporting
Added free capacity up to 40% of FP&A
resources related to reporting and planning
Data cube of meaningful information for
decentralized use across organization
Expanded CL available-to-renew and in force
premium data with new driver methodology
Full P&L planning capability for Technology
Enhanced plan methodology for PL losses
Financial
Planning
Workforce /
Expense
Planning
Expense
Allocations
PL 9/23
CL 11/6
PL 9/23
CL 11/6
Plan 9/23
Enhancements
delivered 11/6
Plan 11/6
Actuals planned
for a Feb 14
delivery
Data Staging /
Sync Layer
• Hyperion Planning application
• Full driver based premium and loss methodology
• Data feeds from Segment P&L and Expense Alloc
• Standard reporting and ad hoc analysis
• Hyperion Planning applications (2)
• Employee level planning
• Detailed account level direct expense planning for
non-employee related expense categories
• Standard reporting and ad hoc analysis
Time saving plan / forecast seeding logic for
non-employee related expense accounts
Enhanced transfer logic to streamline
employee level planning
Billing assignment logic improving Allocations
performance
• Hyperion Planning application (1)
• Segment/LOB/Geographic allocation logic
• Claims allocation
• Direct expense assignments
• Improved reporting transparency; standard
reporting and ad hoc analysis
Two applications for plan / actual,
respectively, to support varying detail
Streamlined customer billing logic simplifies
allocation methodology
• Data layer to insulate the Hyperion application from
future data source changes
Delivered revised scope, moving Segment
assignment logic to the Segment P&L
application
11/10
What’s Been Delivered ?
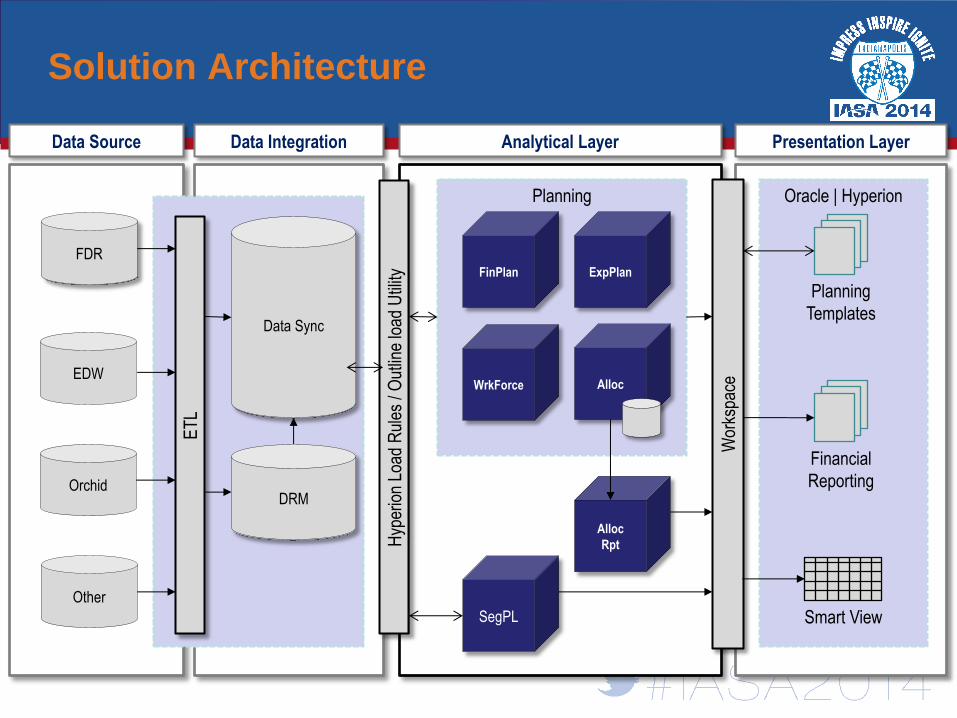
Planning
Data Source Data Integration Analytical Layer Presentation Layer
FinPlan ExpPlan
FDR
Other
Data Sync
ET
L Oracle | Hyperion
Financial
Reporting
Smart View
Orchid
Hyp
erio
n Lo
ad R
ules
/ O
utlin
e lo
ad U
tility
Planning
Templates
Wor
kspa
ce
WrkForce Alloc EDW
SegPL
DRM
Alloc
Rpt
Solution Architecture
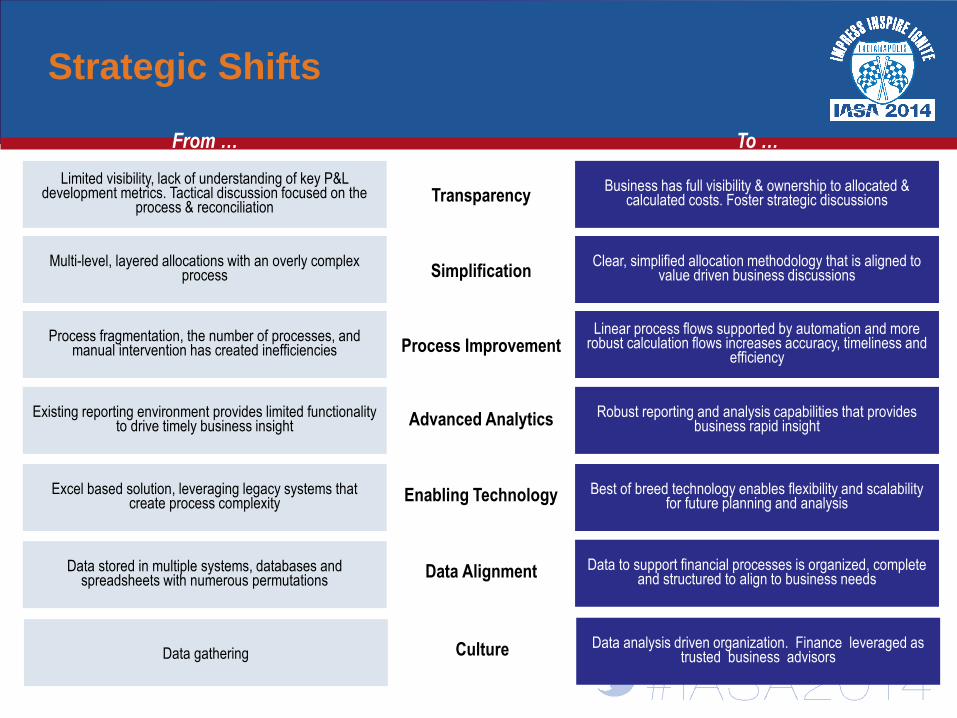
Strategic Shifts
Transparency
Simplification
Process Improvement
Data Alignment
Advanced Analytics
Enabling Technology
From … To …
Limited visibility, lack of understanding of key P&L development metrics. Tactical discussion focused on the
process & reconciliation
Business has full visibility & ownership to allocated & calculated costs. Foster strategic discussions
Multi-level, layered allocations with an overly complex process
Clear, simplified allocation methodology that is aligned to value driven business discussions
Data stored in multiple systems, databases and spreadsheets with numerous permutations
Data to support financial processes is organized, complete and structured to align to business needs
Excel based solution, leveraging legacy systems that create process complexity
Best of breed technology enables flexibility and scalability for future planning and analysis
Process fragmentation, the number of processes, and manual intervention has created inefficiencies
Linear process flows supported by automation and more robust calculation flows increases accuracy, timeliness and
efficiency
Existing reporting environment provides limited functionality to drive timely business insight
Robust reporting and analysis capabilities that provides business rapid insight
Culture Data gathering Data analysis driven organization. Finance leveraged as
trusted business advisors

Realized Solution Benefits
Process
Efficiencies
and
Automation
Planning
Accuracy
Planning and
Analysis
Level of Detail
Allocation
Methodology
Transparency
Budget
Accountability
Application
Flexibility
• Significantly reduced the number of steps in
the planning process
• Automated highly leveraged processes while
providing “checks” within the overall process
• Solution leverages metadata management
tools, automated application builds, and
dynamic calculations, forms, and reports
• Lower level of detail than what
was available in the prior
solution
• Segment level available for
management reporting
• Accuracy of allocations
• Streamlined the allocation
methodology
• Aligned actual and plan
allocation methodology
• Reduced the number of
allocation steps
• Transformed the planning
process across the company
• Process is repeatable and
produces consistent results
• Highly leverages a driver-
based planning model
• Budget owners were heavily
leveraged during the design,
build, and test of the
application
• Increased visibility to data and
processes
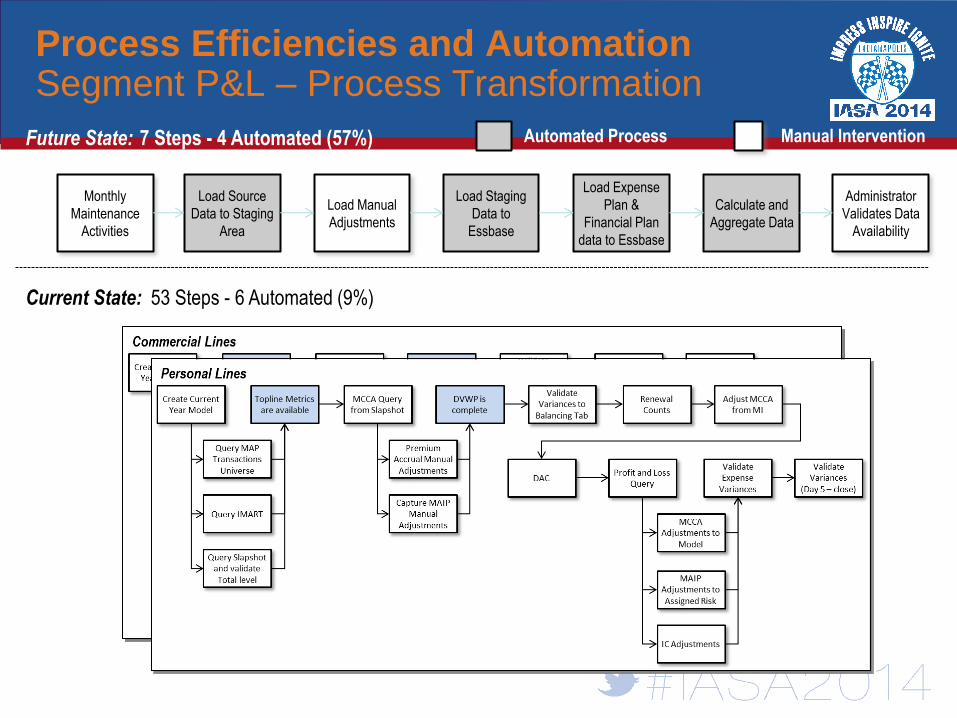
Process Efficiencies and Automation Segment P&L – Process Transformation
Future State: 7 Steps - 4 Automated (57%)
Monthly
Maintenance
Activities
Load Manual
Adjustments
Load Staging
Data to
Essbase
Load Source
Data to Staging
Area
Load Expense
Plan &
Financial Plan
data to Essbase
Calculate and
Aggregate Data
Administrator
Validates Data
Availability
Automated Process Manual Intervention
Current State: 53 Steps - 6 Automated (9%)
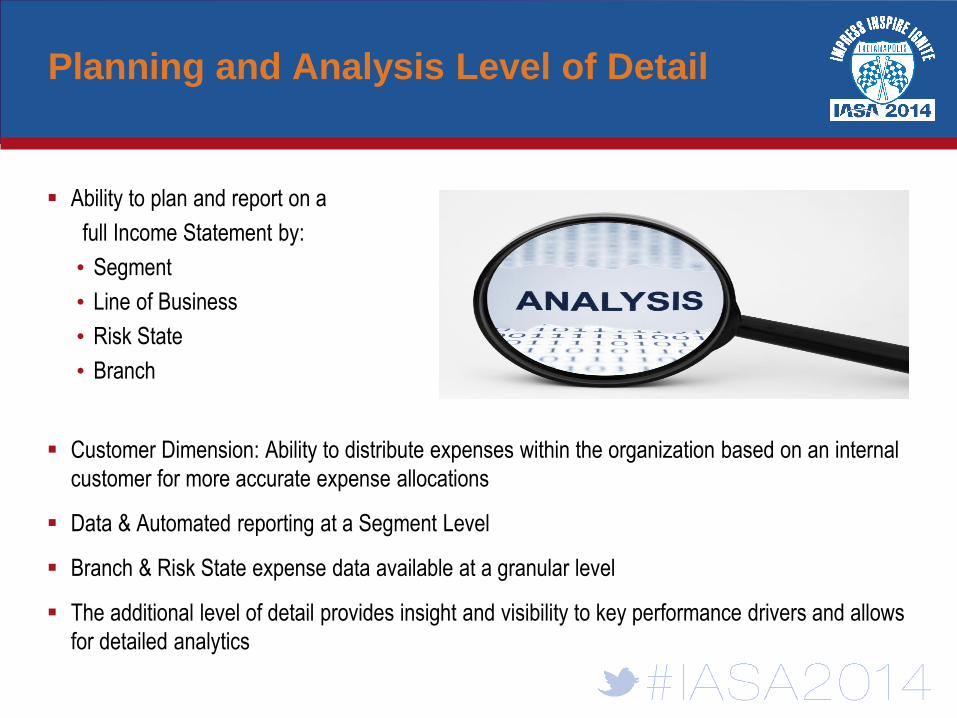
Planning and Analysis Level of Detail
Ability to plan and report on a
full Income Statement by:
• Segment
• Line of Business
• Risk State
• Branch
Customer Dimension: Ability to distribute expenses within the organization based on an internal
customer for more accurate expense allocations
Data & Automated reporting at a Segment Level
Branch & Risk State expense data available at a granular level
The additional level of detail provides insight and visibility to key performance drivers and allows
for detailed analytics
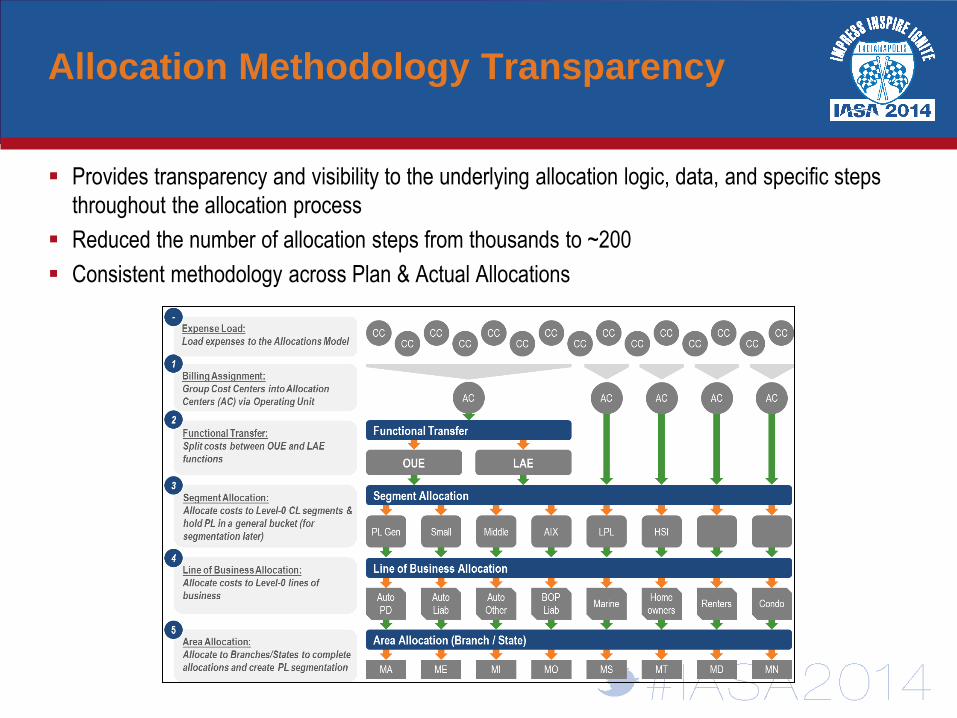
Allocation Methodology Transparency
Provides transparency and visibility to the underlying allocation logic, data, and specific steps
throughout the allocation process
Reduced the number of allocation steps from thousands to ~200
Consistent methodology across Plan & Actual Allocations
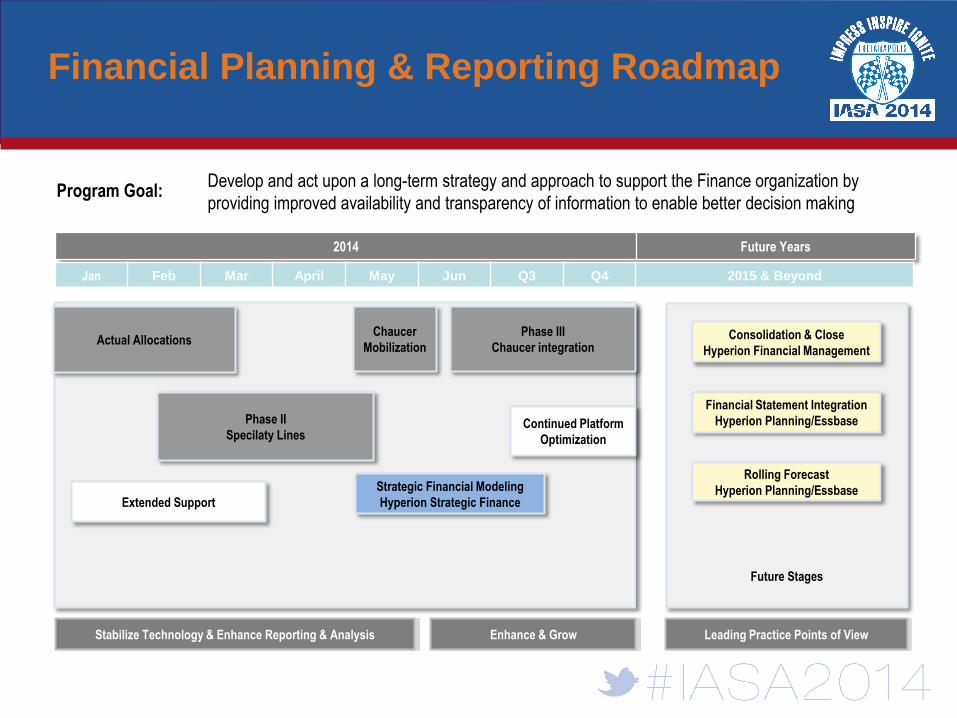
2014 Future Years
Phase II
Specilaty Lines
Chaucer
Mobilization
Stabilize Technology & Enhance Reporting & Analysis Leading Practice Points of View
Program Goal:
Future Stages
Strategic Financial Modeling
Hyperion Strategic Finance
Rolling Forecast
Hyperion Planning/Essbase
Jan Feb Mar April May Jun Q3 Q4 2015 & Beyond
Consolidation & Close
Hyperion Financial Management
Enhance & Grow
Develop and act upon a long-term strategy and approach to support the Finance organization by
providing improved availability and transparency of information to enable better decision making
Actual Allocations
Financial Statement Integration
Hyperion Planning/Essbase
Extended Support
Phase III
Chaucer integration
Continued Platform
Optimization
Financial Planning & Reporting Roadmap
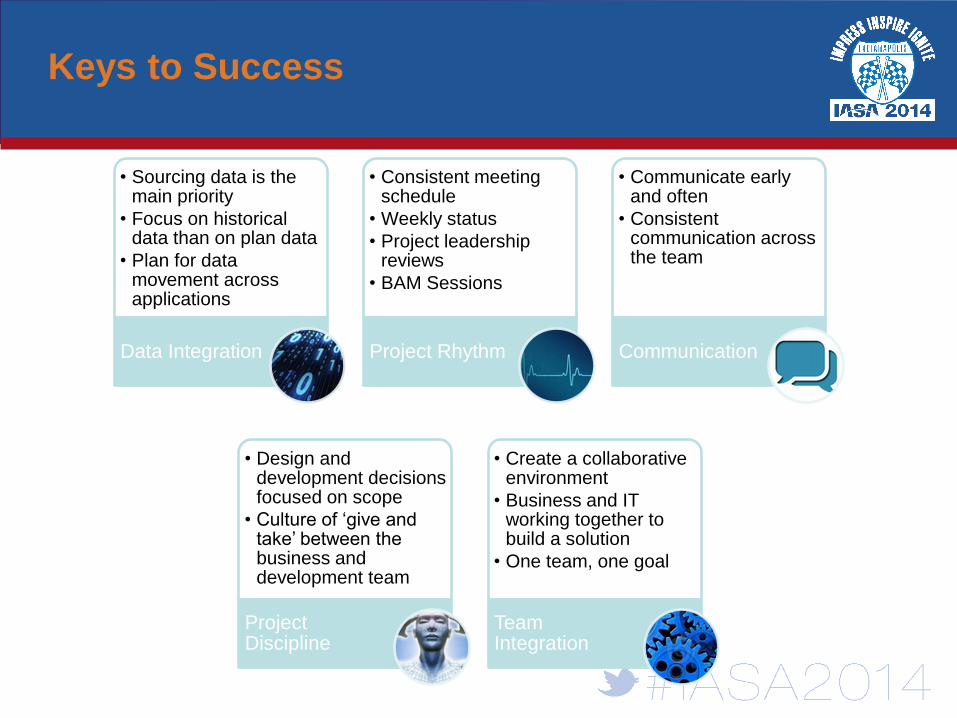
Keys to Success
• Sourcing data is the main priority
• Focus on historical data than on plan data
• Plan for data movement across applications
Data Integration
• Consistent meeting schedule
• Weekly status
• Project leadership reviews
• BAM Sessions
Project Rhythm
• Communicate early and often
• Consistent communication across the team
Communication
• Design and development decisions focused on scope
• Culture of ‘give and take’ between the business and development team
Project Discipline
• Create a collaborative environment
• Business and IT working together to build a solution
• One team, one goal
Team Integration

IASA 86TH ANNUAL EDUCATIONAL CONFERENCE & BUSINESS SHOW
Please Complete the Session Evaluation Form on the Conference App and Include Your Conference Registration ID# to be Included in a Drawing for a Free Conference Registration for the 2014 Annual Conference!
NOTE: Your Conference Registration ID# is Located at the
Bottom Left Hand Corner of Your Badge.