applications, examples & insights
TRANSCRIPT

APPLICATIONS, EXAMPLES & INSIGHTS
2/04/2015 1EyeSee

Table of contents
1.Examples of TV Commercial research2.Examples of packaging/shelving research3.Examples of website research4.Examples of advert research5.Examples of newsletter research6.Examples of cover research7.Examples of folder research
2/04/2015 EyeSee 2
Examples and insights of TV commercial research:
2/04/2015 EyeSee 3
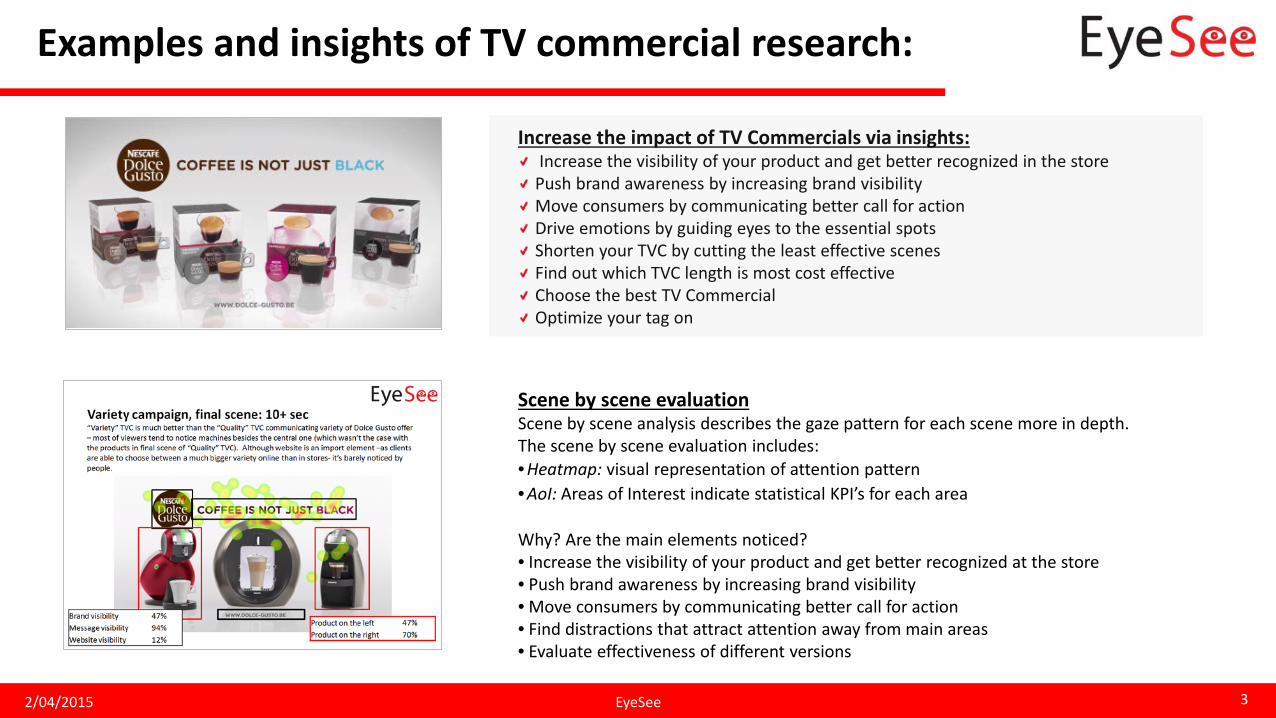
Scene by scene evaluationScene by scene analysis describes the gaze pattern for each scene more in depth. The scene by scene evaluation includes:•Heatmap: visual representation of attention pattern•AoI: Areas of Interest indicate statistical KPI’s for each area
Why? Are the main elements noticed?• Increase the visibility of your product and get better recognized at the store• Push brand awareness by increasing brand visibility• Move consumers by communicating better call for action • Find distractions that attract attention away from main areas• Evaluate effectiveness of different versions
Increase the impact of TV Commercials via insights:Increase the visibility of your product and get better recognized in the store
Push brand awareness by increasing brand visibilityMove consumers by communicating better call for action Drive emotions by guiding eyes to the essential spotsShorten your TVC by cutting the least effective scenesFind out which TVC length is most cost effectiveChoose the best TV CommercialOptimize your tag on

Examples and insights of TV commercial research:
2/04/2015 EyeSee 4
Choosing the most cost effective TVC length You received 3 TVC variations: 15s, 25s, 35s TVC, which one is most cost effective to boost i.e. your brand awareness?EyeSee facilitates your decision and improves impact based on real exposure time of your most important elements:• % of viewers who noticed (y-axis) • avg. time looking at product/ brand (red arrows)
The 35s TVC is much more (cost) effective than 25s. On average panel looked 1.28s to product in 35s TVC and 0.66s in 25s TVC. This is a difference of almost 50%. Which is much more than the additional costs.
Optimizing TV commercial lengthYou want to add a tag on or save Euros, and need to cut some seconds in the TVC, which seconds will you cut?
EyeSee provides a clear overview of potential cuts based on:• Visibility of key areas: Cut seconds when people are not looking at key areas• Processed information: Cut seconds when people processed all important data• Clearness of scene: Cut scenes which increases confusion or decreases attention level

Examples and insights of packaging research:
2/04/2015 EyeSee 5
Will people notice your package? How fast?Consumers are asked to click on the product they would buy and you receive 3 critical parameters:• % Seen: How many people noticed your product? The more people that notice your product the more you likely you will sell (more). • Time to See product: How fast are consumers noticing your product? The faster your product is noticed, the less chance they will buy the competitor’s product before yours is seen.• Time spend: How long did consumers look at your product? There is a strong correlation between time spend and buying behavior.
Increase the impact of packaging via insights:Most purchase decisions are made in a split second & subconsciously. Non surprisingly attention is the #1 driver of sales:
Get more noticed in the store: what you don’t see, you don’t buy Get faster noticed in the shelve, each second longer is a bigger threat that the
competitor’s product will be boughtIncrease time spend looking at product. There is a clear correlation between time spend
and sales!Attract more attention with POS materialIncrease the visibility of your USP or call for action

Examples and insights of packaging research:
2/04/2015 EyeSee 6
What’s the impact of POS? What‘s the best shelf lay out?Consumers are asked to click on the product they would buy. 2 different shelves are tested (e.g. with POS material 1 and 2). and you receive 3 critical parameters:• Time spend: How long did consumers look at your adapted areas (and other)? There is a strong correlation between time spend and buying behavior.• % Seen: How many people noticed the adapted area? • Time to See product: How fast are consumers noticing the adapted areas?
Will clients notice your brand and USP on your package?Shoppers browse through different packages and are asked at the end which one they would buy.• % Seen area (e.g. USP): Which percentage of clients noticed your USP? .• Time to see area: how fast are they noticing the key area?• Time spend: How long did they look at your product?
Why? The more people that notice your USP, call for action, and brand the more you will sell.
Examples and insights of website research:
2/04/2015 EyeSee 7
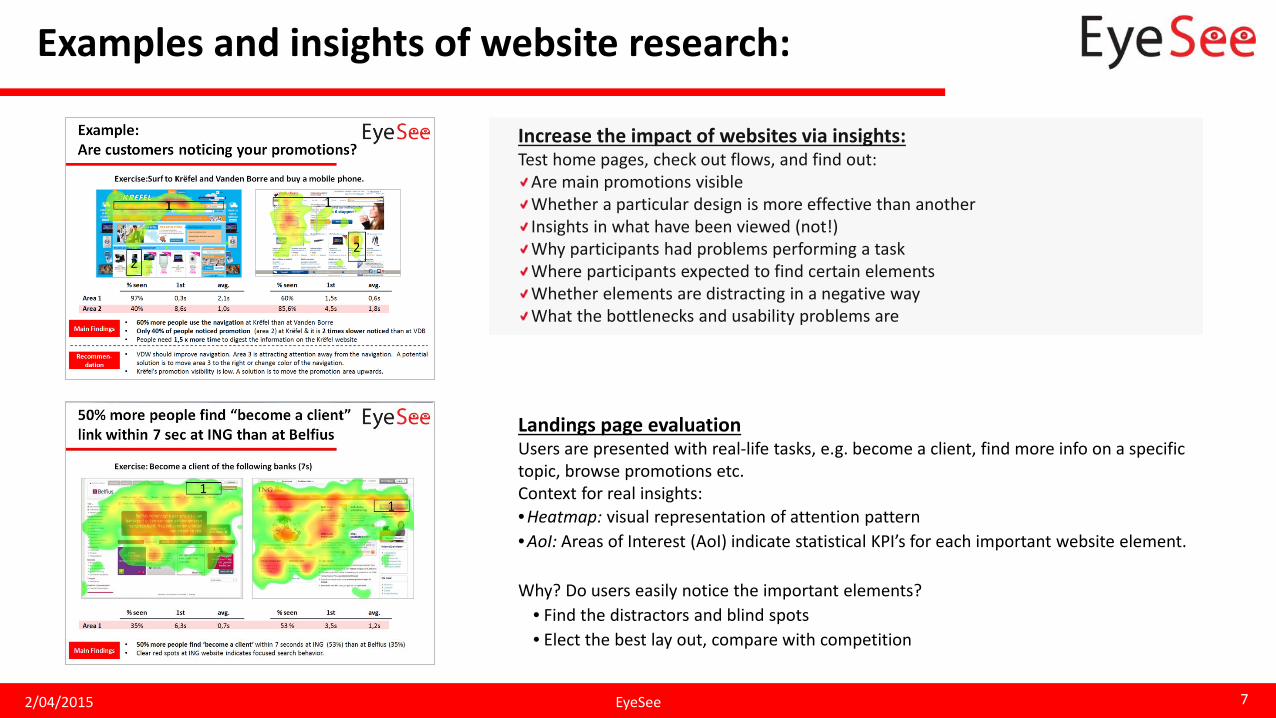
Landings page evaluationUsers are presented with real-life tasks, e.g. become a client, find more info on a specific topic, browse promotions etc. Context for real insights:•Heatmap: visual representation of attention pattern•AoI: Areas of Interest (AoI) indicate statistical KPI’s for each important website element.
Why? Do users easily notice the important elements?• Find the distractors and blind spots• Elect the best lay out, compare with competition
Increase the impact of websites via insights:Test home pages, check out flows, and find out:
Are main promotions visibleWhether a particular design is more effective than anotherInsights in what have been viewed (not!)Why participants had problems performing a taskWhere participants expected to find certain elements Whether elements are distracting in a negative wayWhat the bottlenecks and usability problems are

Examples and insights of advert research:
2/04/2015 EyeSee 8
Does the advert possess enough stopping power?Print/online/outdoor advert is placed in environment –e.g. journal- and people browse through the journal while eyes are tracked. Key metrics to evaluate stopping power are:• Visibility: How many people notice the advert• Engagement: How long did respondents look at advert• Attraction: How fast did they notice the advert
Why? Calculate the impact of advert & select the best ad:• Left ad: 43% looked at your ad: 430.000 viewers*• Right ad: 70% looked at your ad: 700.000 viewers*• This is a difference of 62% or 270.000 more viewers*!* If 1.000.000 people read the journal
Increase the ROI of you adverts via insights:Attract a higher percentage of clients to your adHold longer the attention and communicate more/betterDetermine the most cost effective format for publishingIncrease the visibility of your key message and call for actionIncrease brand awareness by increase attention to brandMake sure none of the elements are distracting in a negative wayFilter out sub-optimal creative agency solutions

Examples and insights of advert research:
2/04/2015 EyeSee 9
Is your ad communicating in line with objectives?Determine the way consumers interact with your ads. Ad is shown in standalone in order to identify:• Which elements are seen first • Which are not seen (“blind” elements)• Which ones evoke most interest• Determine the browsing pattern
Why? Maximize your impact by attracting eyes to the most important areas. Ad 1 (cf. example) will boost brand awareness significantly more.
Which format is the most cost effective?Print/online ad is placed in environment –e.g. journal- and people browse through the journal while eyes are tracked.Key metrics to evaluate stopping power are:• Visibility: How many people notice the advert• Engagement: How long did respondents look at advert
Why? Calculate the impact of advert & select the best ad:• Left ad: 43% looked at your ad: 430.000 viewers*• Right ad: x% looked at your ad: x viewers*• This is a difference of y% or y more viewers*!* If 1.000.000 people read the journal

Examples and insights of newsletter research:
2/04/2015 EyeSee 10
Will they evoke consumer interest?•Heatmap: visual representation of attention pattern•AoI: Areas of Interest (AoI) indicate statistical KPI’s for each important element•Why? Do consumers notice the elements that motivate them to browse further
• Are consumers noticing the main promotion(s), messages and call for action?• Do they personally find the most visible elements relevant? (SURVEY)• What are the blind spots?
More than half of all ad spending in the US is channeled towards direct marketing. But, bulk of DM material remains unseen by any humans! Newsletters that do get opened are typically just glanced at and therefore It is crucial that they communicate perfectly from the start.
Increase the impact of newsletters via insights:Filter out ineffective lay-outsMake main benefit most visibleDetermine visibility of call for actionOptimize length of paragraphs
Folder research: impact on results
2/04/2015 EyeSee 11
Folders have a big impact on sales and traffic!• 80% of people read weekly folders• 70% use folder to create shopping lists• 47% of people surf to websites thanks to folders
However, is your folder effective given that?• People only read 2 folders out of the 20 they receive!• They read at an average speed of <6 seconds per page
Test with EyeSee:• Cover: Does your cover possess enough stopping power to open?• Full cover and spreads: Are people looking at your promotions and price deals?
Impact on results:• Increased visibility and engagement results in higher message delivery• Increased marketing effectiveness, increases sales• Spot blind areas and optimize results in more efficient use of folder• In depth knowledge of location visibility increases negotiation power with suppliers
Examples and insights of cover research:
2/04/2015 EyeSee 12
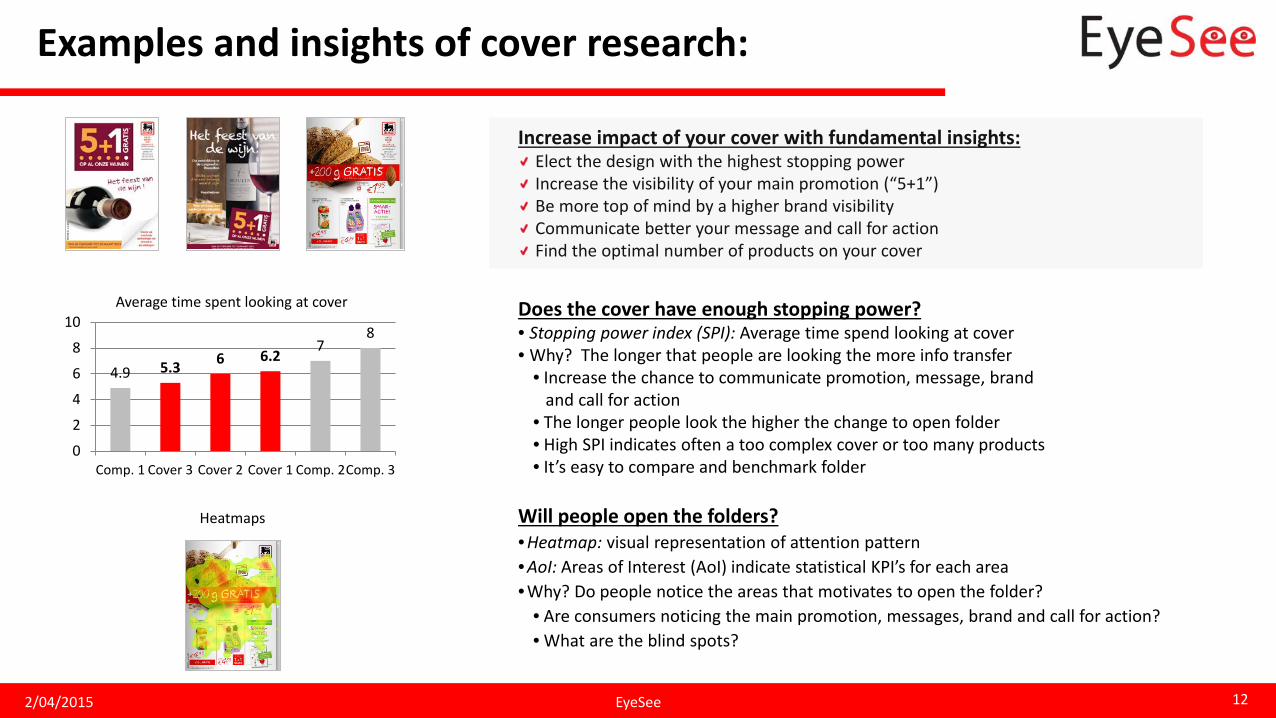
Will people open the folders?•Heatmap: visual representation of attention pattern•AoI: Areas of Interest (AoI) indicate statistical KPI’s for each area•Why? Do people notice the areas that motivates to open the folder?
• Are consumers noticing the main promotion, messages, brand and call for action?• What are the blind spots?
Increase impact of your cover with fundamental insights:Elect the design with the highest stopping powerIncrease the visibility of your main promotion (“5+1”) Be more top of mind by a higher brand visibilityCommunicate better your message and call for actionFind the optimal number of products on your cover
4.9 5.3 6 6.27
8
0
2
4
6
8
10
Comp. 1 Cover 3 Cover 2 Cover 1 Comp. 2Comp. 3
Average time spent looking at cover Does the cover have enough stopping power? • Stopping power index (SPI): Average time spend looking at cover• Why? The longer that people are looking the more info transfer
• Increase the chance to communicate promotion, message, brand and call for action
• The longer people look the higher the change to open folder• High SPI indicates often a too complex cover or too many products• It’s easy to compare and benchmark folder
Heatmaps

Examples and insights of folder research:
2/04/2015 EyeSee 13
70
80
90
100
1 6 11 16 21 26 31
Attention value
Page Number
Heatmaps
AoI
Increase the impact of your full folder via insights:Attract most attention to your high margin productsIncrease visibility of your call for actionLocate the blind spots and find the best lay outUnderstand the impact of the number of products/pageDecrease costs by publishing the optimal lengthConvince suppliers of superb location
Which pages hold attention?• Attention value: indicator based on % of people that are looking
longer than 5 seconds to the page• Why? The longer that people are looking the more info transfer
• Compare and choose the best lay out• Optimize folder length• Determine page value (to supplier/category managers)
Are clients noticing the most important elements?•Heatmap: visual representation of attention pattern•AoI: Areas of Interest (AoI) indicate statistical KPI’s for each area•Why? Do people notice the main areas?
• Increase the visibility of your main promotions and call for action• Find the blind spots• Elect the best lay out

Maximize marketing impact with EyeSeeIt’s fast, affordable and easy!
2/04/2015 14EyeSee
Olivier Tilleuil+32 477 41 52 90