december 2014 torrance real estate market trends update
TRANSCRIPT


Table of
Contents
Key Statistics for December
Sales 2014 Residential Sales Stats Year-to-Year Total Sales by Map Area Median 2014 Median Sales Stats Year-to-Year Median Sales by Map Area Listings 2014 Active Listings by Map Area 2014 Total Active Listings vs. Total Sales Year-to-Year Active Listings by Map Area Inventory 2014 Months of Inventory by Map Area Year-to-Year Months of Inventory
Outlook for January
About Hady Chahine Contact Information
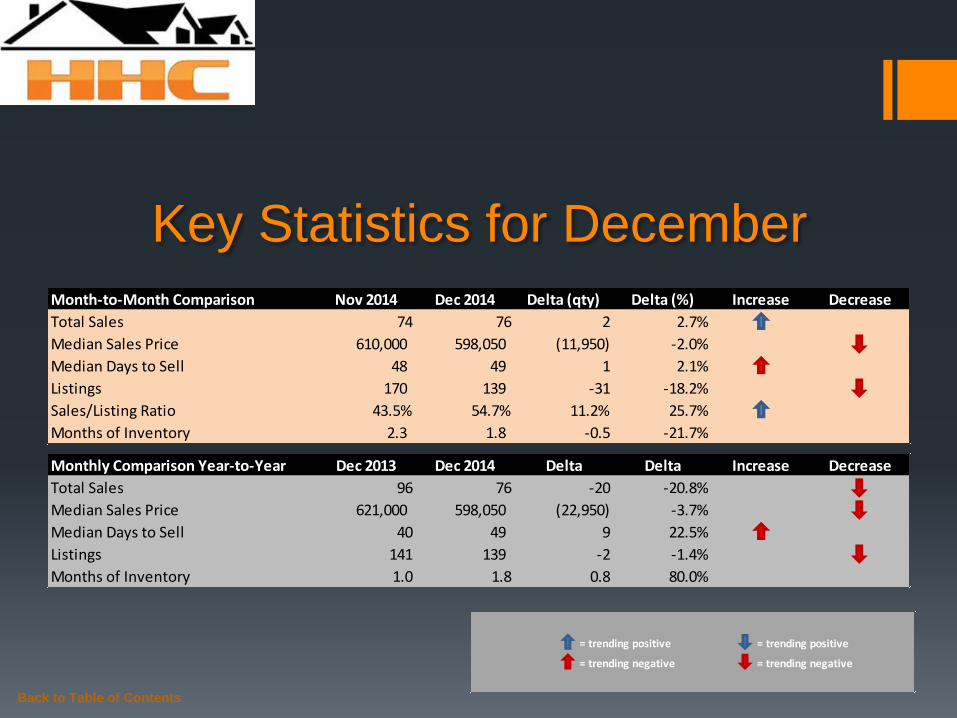
Key Statistics for December
Back to Table of Contents
= trending positive = trending positive
= trending negative = trending negative
Month-to-Month Comparison Nov 2014 Dec 2014 Delta (qty) Delta (%) Increase Decrease
Total Sales 74 76 2 2.7%
Median Sales Price 610,000 598,050 (11,950) -2.0%
Median Days to Sell 48 49 1 2.1%
Listings 170 139 -31 -18.2%
Sales/Listing Ratio 43.5% 54.7% 11.2% 25.7%
Months of Inventory 2.3 1.8 -0.5 -21.7%
Monthly Comparison Year-to-Year Dec 2013 Dec 2014 Delta Delta Increase Decrease
Total Sales 96 76 -20 -20.8%
Median Sales Price 621,000 598,050 (22,950) -3.7%
Median Days to Sell 40 49 9 22.5%
Listings 141 139 -2 -1.4%
Months of Inventory 1.0 1.8 0.8 80.0%

Back to Table of Contents
Total Sales Month-to-Month by Map Area Oct Nov Dec
Central Torrance 18 13 11
South East Torrance - West 5 7 9
Hollywood Riviera 15 9 11
South Torrance 8 2 3
Southwood 5 3 5
West Torrance 5 8 4
N Torrance - West 11 10 12
N Torrance - East 8 6 7
Old Torrance 9 8 8
South East Torrance - East 7 8 6
Total Sales 91 74 76
0
10
20
30
40
50
60
70
80
90
100
Oct Nov Dec
2014 Total Sales Month-to-Month by Map Area
Central Torrance
South East Torrance - West
Hollywood Riviera
South Torrance
Southwood
West Torrance
N Torrance - West
N Torrance - East
Old Torrance
South East Torrance - East
Total Sales

Back to Table of Contents
Total Sales Year-to-Year by Map Area 2012 2013 2014
Central Torrance 12 15 11
South East Torrance - West 6 10 9
Hollywood Riviera 7 15 11
South Torrance 5 7 3
Southwood 2 6 5
West Torrance 8 6 4
N Torrance - West 15 9 12
N Torrance - East 7 7 7
Old Torrance 8 14 8
South East Torrance - East 9 7 6
Total Sales 79 96 76
0
10
20
30
40
50
60
70
80
90
100
2012 2013 2014
Total Sales Year-to-Year by Map Area: December
Central Torrance
South East Torrance - West
Hollywood Riviera
South Torrance
Southwood
West Torrance
N Torrance - West
N Torrance - East
Old Torrance
South East Torrance - East
Total Sales

Back to Table of Contents
Median Sales Price Month-to-Month by Map Area Oct Nov Dec
Central Torrance 519,000 651,000 610,000
South East Torrance - West 780,000 475,000 765,000
Hollywood Riviera 999,000 1,080,000 1,109,999
South Torrance 748,750 1,132,500 808,000
Southwood 725,000 765,000 700,000
West Torrance 705,100 694,250 639,950
N Torrance - West 590,000 573,500 566,000
N Torrance - East 569,500 534,375 559,000
Old Torrance 510,000 575,250 488,500
South East Torrance - East 695,000 609,500 667,000
Market Median Sales Price 628,000 610,000 598,050
-
200,000
400,000
600,000
800,000
1,000,000
1,200,000
Oct Nov Dec
2014 Median Sales Price Month-to-Month by Map Area
Central Torrance
South East Torrance - West
Hollywood Riviera
South Torrance
Southwood
West Torrance
N Torrance - West
N Torrance - East
Old Torrance
South East Torrance - East
Market Median Sales Price

Back to Table of Contents
Median Sales Price Year-to-Year by Map Area 2012 2013 2014
Central Torrance 602,500 520,000 610,000
South East Torrance - West 432,500 487,375 765,000
Hollywood Riviera 785,700 919,000 1,109,999
South Torrance 700,000 809,000 808,000
Southwood 611,500 751,500 700,000
West Torrance 605,000 663,500 639,950
N Torrance - West 435,000 524,000 566,000
N Torrance - East 405,000 575,000 559,000
Old Torrance 474,500 507,500 488,500
South East Torrance - East 595,000 670,000 667,000
Market Median Sales Price 535,000 621,000 598,050
-
200,000
400,000
600,000
800,000
1,000,000
1,200,000
2012 2013 2014
Median Sales Price Year-to-Year by Map Area: December
Central Torrance
South East Torrance - West
Hollywood Riviera
South Torrance
Southwood
West Torrance
N Torrance - West
N Torrance - East
Old Torrance
South East Torrance - East
Market Median Sales Price

Back to Table of Contents
Active Listings vs. Total Sales by Map Area Jan Feb Mar Apr May Jun Jul Aug Sep Oct Nov Dec
Central Torrance 17 18 25 26 32 36 37 30 29 26 25 20
South East Torrance - West 9 9 8 6 15 17 20 13 18 21 22 18
Hollywood Riviera 14 13 18 17 23 23 31 24 23 22 13 13
South Torrance 8 13 17 17 14 18 18 17 15 14 16 12
Southwood 4 4 4 7 12 12 7 6 3 7 8 3
West Torrance 10 10 11 15 16 13 14 15 14 13 11 9
N Torrance - West 20 19 23 26 18 23 22 26 34 27 23 19
N Torrance - East 7 8 10 6 7 12 14 9 14 15 9 8
Old Torrance 18 16 19 25 38 39 41 42 36 37 28 26
South East Torrance - East 12 13 15 21 25 26 16 22 16 17 15 11
Total Active Listings 119 123 150 166 200 219 220 204 202 199 170 139
-
5
10
15
20
25
30
35
40
45
Jan Feb Mar Apr May Jun Jul Aug Sep Oct Nov Dec
2014 Active Listings by Map Area
Central Torrance
South East Torrance - West
Hollywood Riviera
South Torrance
Southwood
West Torrance
N Torrance - West
N Torrance - East
Old Torrance
South East Torrance - East

Back to Table of Contents
Active Listings vs. Total Sales by Map Area Jan Feb Mar Apr May Jun Jul Aug Sep Oct Nov Dec
Central Torrance 17 18 25 26 32 36 37 30 29 26 25 20
South East Torrance - West 9 9 8 6 15 17 20 13 18 21 22 18
Hollywood Riviera 14 13 18 17 23 23 31 24 23 22 13 13
South Torrance 8 13 17 17 14 18 18 17 15 14 16 12
Southwood 4 4 4 7 12 12 7 6 3 7 8 3
West Torrance 10 10 11 15 16 13 14 15 14 13 11 9
N Torrance - West 20 19 23 26 18 23 22 26 34 27 23 19
N Torrance - East 7 8 10 6 7 12 14 9 14 15 9 8
Old Torrance 18 16 19 25 38 39 41 42 36 37 28 26
South East Torrance - East 12 13 15 21 25 26 16 22 16 17 15 11
Total Active Listings 119 123 150 166 200 219 220 204 202 199 170 139
Total Sales 60 63 77 74 94 73 106 98 75 91 74 76
Sales/Listings Ratio 50.4% 51.2% 51.3% 44.6% 47.0% 33.3% 48.2% 48.0% 37.1% 45.7% 43.5% 54.7%
-
50
100
150
200
250
Jan Feb Mar Apr May Jun Jul Aug Sep Oct Nov Dec
2014 Total Active Listings vs. Total Sales
Total Active Listings Total Sales

Back to Table of Contents
Active Listings Year-to-Year by Map Area 2012 2013 2014
Central Torrance 24 18 20
South East Torrance - West 12 5 18
Hollywood Riviera 16 15 13
South Torrance 7 16 12
Southwood 3 5 3
West Torrance 20 12 9
N Torrance - West 14 25 19
N Torrance - East 5 8 8
Old Torrance 21 26 26
South East Torrance - East 17 11 11
Total Active Listings 139 141 139
0
20
40
60
80
100
120
140
160
2012 2013 2014
Active Listings Year-to-Year by Map Area: December
Central Torrance
South East Torrance - West
Hollywood Riviera
South Torrance
Southwood
West Torrance
N Torrance - West
N Torrance - East
Old Torrance
South East Torrance - East
Total Active Listings

Back to Table of Contents
Months of Inventory by Map Area Jan Feb Mar Apr May Jun Jul Aug Sep Oct Nov Dec
Central Torrance 2.1 2.6 2.5 2.6 1.5 3.6 1.6 1.8 1.7 1.4 1.9 1.8
South East Torrance - West 1.3 3.0 1.3 2.0 7.5 3.4 10.0 1.3 6.0 4.2 3.1 2.0
Hollywood Riviera 2.3 1.3 3.0 1.7 3.3 2.6 2.2 1.3 3.8 1.5 1.4 1.2
South Torrance 2.0 2.6 2.4 1.9 2.0 3.0 1.6 3.4 2.1 1.8 8.0 4.0
Southwood 1.0 1.3 1.0 2.3 4.0 3.0 0.9 1.2 0.6 1.4 2.7 0.6
West Torrance 1.1 2.0 1.6 3.8 1.2 1.4 1.6 3.0 2.3 2.6 1.4 2.3
N Torrance - West 1.8 1.7 1.9 1.9 1.2 2.6 1.2 2.4 4.9 2.5 2.3 2.0
N Torrance - East 7.0 4.0 1.4 0.8 0.7 3.0 2.8 1.1 4.7 1.9 1.5 1.8
Old Torrance 2.0 1.2 2.7 3.1 4.8 3.9 5.1 3.5 2.6 4.1 3.5 8.3
South East Torrance - East 12.0 3.3 1.4 4.2 3.6 3.7 2.0 3.1 2.3 2.4 1.9 1.8
-
2.0
4.0
6.0
8.0
10.0
12.0
Jan Feb Mar Apr May Jun Jul Aug Sep Oct Nov Dec
2014 Months of Inventory by Map Area
Central Torrance
South East Torrance - West
Hollywood Riviera
South Torrance
Southwood
West Torrance
N Torrance - West
N Torrance - East
Old Torrance
South East Torrance - East
Back to Table of Contents
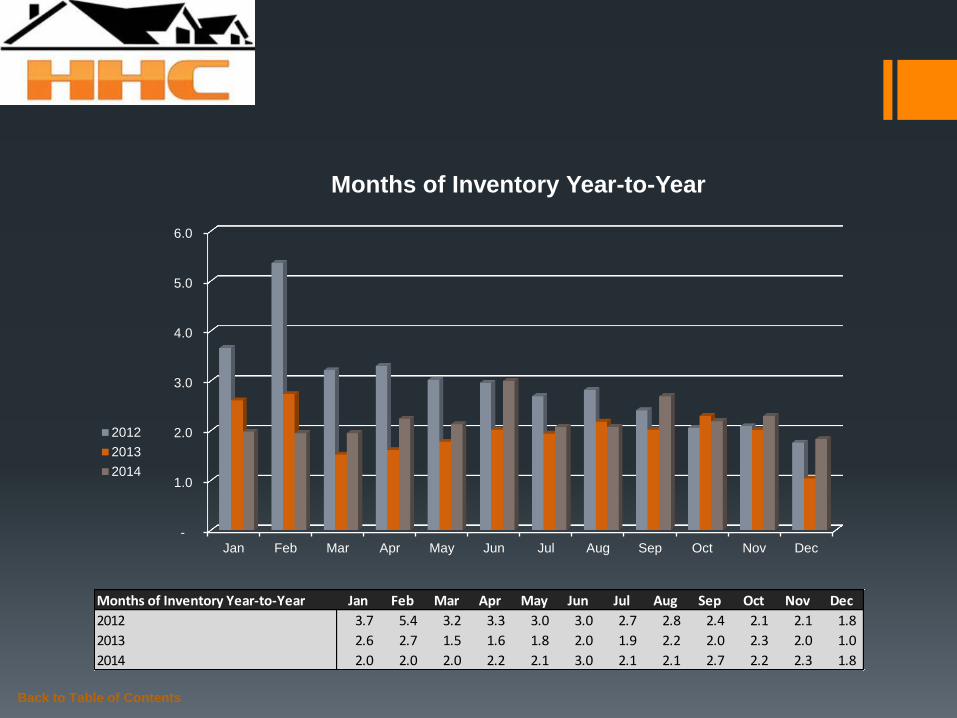
Months of Inventory Year-to-Year Jan Feb Mar Apr May Jun Jul Aug Sep Oct Nov Dec
2012 3.7 5.4 3.2 3.3 3.0 3.0 2.7 2.8 2.4 2.1 2.1 1.8
2013 2.6 2.7 1.5 1.6 1.8 2.0 1.9 2.2 2.0 2.3 2.0 1.0
2014 2.0 2.0 2.0 2.2 2.1 3.0 2.1 2.1 2.7 2.2 2.3 1.8
-
1.0
2.0
3.0
4.0
5.0
6.0
Jan Feb Mar Apr May Jun Jul Aug Sep Oct Nov Dec
Months of Inventory Year-to-Year
2012
2013
2014

Outlook for January
As projected would likely occur the Torrance real estate market slowed a bit in December with respect
to summer and fall activity. Of course, this was assumed and is partially explained due to the holiday
season. Interestingly, however, is the market median sales price remained fairly stable year-over-
year, with $621,000 reported in December 2013 as compared to $598,050 posted for December 2014.
In summary, one word to describe real estate activity for the Torrance market ending 2014 is positive.
“What should you expect in 2015?” you ask. Given the Fed’s recent posturing to increase interest
rates in the first half of the year, along with other micro- and macro-economic factors, such as GDP
production, employment rates and the volatility of energy prices, it is probable to see a shift in trending
behavior towards a buyer’s market. Though, the level and consistency of housing inventory will play a
critical role in this supply/demand relationship. My advice, if you are interested in selling or buying
now is the time to act. For questions, I would be happy to schedule a free consultation to discuss how
I can be of service to you.
Your recap…
Back to Table of Contents
Month-to-Month Comparison Nov 2014 Dec 2014 Delta (qty) Delta (%) Increase Decrease
Total Sales 74 76 2 2.7%
Median Sales Price 610,000 598,050 (11,950) -2.0%
Median Days to Sell 48 49 1 2.1%
Listings 170 139 -31 -18.2%
Sales/Listing Ratio 43.5% 54.7% 11.2% 25.7%
Months of Inventory 2.3 1.8 -0.5 -21.7%

Back to Table of Contents
Serving South Bay Home Buyers and Sellers Since 2001
RE/MAX Top 4 Team in California – 2012
RE/MAX 100% Club - 2011
Shorewood Realtors Top 5% in Overall Sales 2001-2006, 2008-2010
About
Hady Chahine…

The information being provided by CARETS (CLAW, CRISNet MLS, DAMLS, CRMLS, i-Tech MLS, and/or VCRDS) is for the visitor’s personal, non-commercial use and may not be used for
any purpose other than to identify prospective properties visitor may be interested in purchasing. Any information relating to a property referenced on this web site comes from the Internet
Data Exchange (IDX) program of CARETS. This web site may reference real estate listing(s) held by a brokerage firm other than the broker and/or agent who owns this web site. The accuracy
of all information, regardless of source, including but not limited to square footages and lot sizes, is deemed reliable but not guaranteed and should be personally verified through personal
inspection by and/or with the appropriate professionals.
Back to Table of Contents
Listings MLS BLOG Website