dealmakers - pitcher · dealmakers face in the forthcoming year as geopolitics and disruption add...
TRANSCRIPT
Dealmakers: Mid-market M&A in Australia 2019

ContentsExecutive summary 4
Trends and survey highlights 5
M&A in Australia: Onward and upward 6
Mid-market deal drivers and challenges 10
Cross-border deal flows 14
Spotlight on sectors 18Energy, mining and utilities 20
Leisure 22
Consumer 24
Methodology 26

3
Welcome to the fifth issue of Dealmakers: Mid-market M&A in Australia 2019, produced in collaboration with Mergermarket, an Acuris company. Pitcher Partners has commissioned Mergermarket to again canvass the opinions of 60 M&A dealmakers in Australia for their first-hand insights and expectations regarding activity in the Australian mid-market in 2019 and beyond.
This report compares survey respondents’ collective sentiments for the deal market in the year ahead, making comparisons to opinions from last year to present an informative picture of the current market and developments likely to occur in the months ahead. These sentiments, matched with in-depth analyses of M&A data trends, offer a holistic view of the challenges and opportunities on offer in Australia’s mid-market.
About the survey

4
Australian M&A is primed and ready for take-off for another stellar year, and the mid-market will continue to be the engine driving this ascent in 2019.
Dealmakers were certainly busy last year, rounding out 2018 with strong deal flows that saw M&A volumes increase 5% year on year. This was the fourth year of growth for acquisitions and takeovers, which show no signs of stopping as private and strategic bidders take bigger and bolder swings into the market.
The mid-market once again assumed its leading role in this activity, with 70% of all deals falling in the mid-market territory (deals valued between AU$10m and AU$250m). While reported mid-market totals decreased 5% from 2017, dealmakers are confident of an uptick, with 77% of survey respondents saying M&A in 2019 will again concentrate on the middle deal segment and 100% expecting mid-market M&A to either increase (67% of respondents) or at least remain unchanged (33%) from levels in 2018. The increase in large-cap deals from 11% to 16% of activity also points to the strength of the market and appetite for deal-making at all levels.
Activity in 2018 was driven by several trends. A favourable environment of low interest rates and strong corporate balance sheets has prompted local strategic bidders and cashed-up private equity (PE) firms to complete M&A transactions as they search for growth and stable returns. Foreign investors, particularly those from North America, are throttling up investments as Australia continues to be a beacon of stability in a region rife with volatility and geopolitical unrest. At the same time, Asia-based bidders appear to be on the way out.
Looking at industries, respondents widely expect deals to increase across most sectors, with standouts once again in technology, media and telecommunications (TMT), consumer and financial services. Respondents mention that dealmaking in these segments will be particularly aggressive as established companies use acquisitions to snap up the latest and greatest tech-savvy mid-market firms to enhance their digital offerings and tap into new customer markets. In this way, mid-market M&A will enable these companies to remain leaders instead of becoming laggards, with those dealmakers surveyed widely agreeing that innovation and agility are the mid-market’s greatest value adds.
As in past years, this report looks at these trends to spot current opportunities and those likely to arise in the Australian mid-market. We also assess the challenges dealmakers face in the forthcoming year as geopolitics and disruption add to the complexities that lie ahead. The interviews this year provide a bounty of useful insights, and research and trend analysis in conjunction with Mergermarket provides a window through which dealmakers can see ahead as they plan out their next investment. Pitcher Partners hopes you find this an informative read and welcome you to join the conversation by reaching out to one of the firm’s dealmaking specialists across Australia.
Executive summary
Small cap
Current deal drivers
Expected inbound M&A from:
Federal elections
M&A deal size breakdown (percentage of total volume)
Deal �ow
Top sectors by deal volume in 2018
Top opportunity sectors in 2019
14%
70%
16%
Dea
l vol
ume
2016 2017 2018
0
20
40
60
80
100
120
Q4Q3Q2Q1Q4Q3Q2Q1Q4Q3Q2Q10
1,000
2,000
3,000
4,000
5,000
6,000
7,000
Q4Q3Q2Q1Q4Q3Q2Q1Q4Q3Q2Q1
say the upcoming election will have either no impact or a positive impact on mid-market M&A.
Capital deployed by PE �rms
Valuation alignment between buyers and sellers
2018
Mid-market
Large cap
Mid-market M&A in Australia
67% expect an increase in the level of mid-market dealmaking in the next 12 months.
33% expect mid-market deal activity to remain the same as current levels.
Foreign dealmakers in the mid-market
Consumer
Consumer
Financial services
TMTEMU
Leisure
90%
92%
expect an increase in foreign inbound deals
expect an increase in private equity deals
48% expect an increase in Australian outbound deals
say a change of government could
negatively impact M&A.30%
North America 98%
North Asia77%
Japan/UK 42%
95%
Deal value (AU
$m)

5
SubheadEvelitiam nobit volorio molut alicium quuntio. Uga. Ut qui comnihi liquia derataeperum vel maximo doluptae. Cullan-ditaes repratque moloriat ipienihitati reniend emporestissi blam aspid ut et lab is acea ea nonsectas eaquam volorrunte audi as verum hicatem harumet am, es nihit, nonseratur anis qui occae escidelecto in cuptae et faccum commosse endempo rporatur sanda dolorerumque et acepelia ima quassitia vollist minulla cerunt repere pa se nusaped itaepro qui sit fuga. Itate pa voluptus rescid qui cor solorporate liam hillent oreseque dellaborem. Namet mod qui sandem eatem eum sequis pro quam dolorem doluptatque perrovid mod magnam aut ad eost velectur, sit hil idellam, aut facepudisqui dolorempe cus et aut et elesequiant et doluptatia volore sit la quiam quia doluptae con con con nosapit ipsaect aquiaep er-oribus nis asimod molupta nobitae raecull uptatempore, sam re dusdae veligentia doluptas atquam is sequiat inctem sin rest laborem nust ommolupis ut volupta tectur a conseque incipsapis magnimposam eum doluptatur, cusam suntur,
Evelitiam nobit volorio molut alicium quuntio. Uga. Ut qui comnihi liquia derataeperum vel maximo doluptae. Cullan-ditaes repratque moloriat ipienihitati reniend emporestissi blam aspid ut et lab is acea ea nonsectas eaquam volorrunte audi as verum hicatem harumet am, es nihit, nonseratur anis qui occae escidelecto in cuptae et faccum commosse endempo rporatur sanda dolorerumque et acepelia ima quassitia vollist minulla cerunt repere pa se nusaped itaepro qui sit fuga. Itate pa voluptus rescid qui cor solorporate liam hillent oreseque dellaborem. Namet mod qui sandem eatem eum sequis pro quam dolorem doluptatque perrovid mod magnam aut ad eost velectur, sit hil idellam, aut facepudisqui dolorempe cus et aut et elesequiant et doluptatia volore sit la quiam quia doluptae con con con nosapit ipsaect aquiaep eroribus nis asimod molupta nobitae raecull lupta tectur a conseque incipsapis magnimposam eum doluptatur, cusam suntur,
Graph title
Graph title
Key for above two charts:
Key
Key
20%
17%
11%10%
9%
7%
6%
6%
5%
4%3% 2%
20%
17%
11%10%
9%
7%
6%
6%
5%
4%3% 2%
Trends and survey highlights
Small cap
Current deal drivers
Expected inbound M&A from:
Federal elections
M&A deal size breakdown (percentage of total volume)
Deal �ow
Top sectors by deal volume in 2018
Top opportunity sectors in 2019
14%
70%
16%
Dea
l vol
ume
2016 2017 2018
0
20
40
60
80
100
120
Q4Q3Q2Q1Q4Q3Q2Q1Q4Q3Q2Q10
1,000
2,000
3,000
4,000
5,000
6,000
7,000
Q4Q3Q2Q1Q4Q3Q2Q1Q4Q3Q2Q1
say the upcoming election will have either no impact or a positive impact on mid-market M&A.
Capital deployed by PE �rms
Valuation alignment between buyers and sellers
2018
Mid-market
Large cap
Mid-market M&A in Australia
67% expect an increase in the level of mid-market dealmaking in the next 12 months.
33% expect mid-market deal activity to remain the same as current levels.
Foreign dealmakers in the mid-market
Consumer
Consumer
Financial services
TMTEMU
Leisure
90%
92%
expect an increase in foreign inbound deals
expect an increase in private equity deals
48% expect an increase in Australian outbound deals
say a change of government could
negatively impact M&A.30%
North America 98%
North Asia77%
Japan/UK 42%
95%
Deal value (AU
$m)
Deal volume Deal value
6
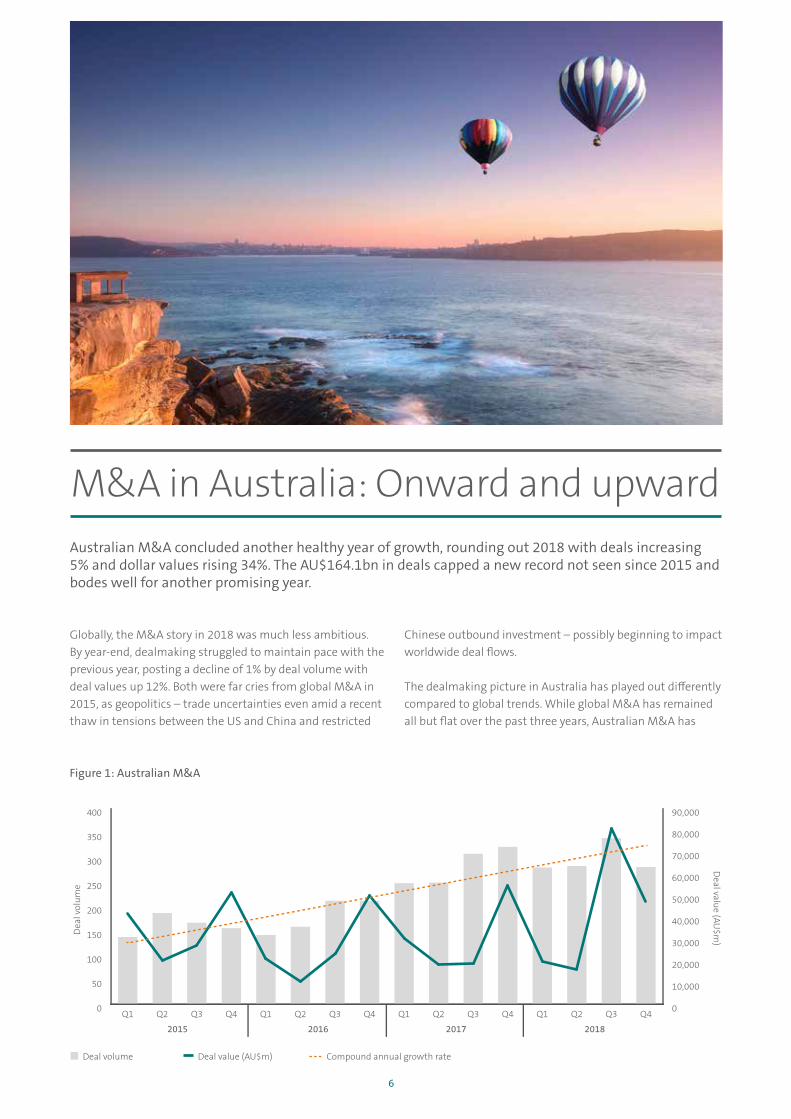
Australian M&A concluded another healthy year of growth, rounding out 2018 with deals increasing 5% and dollar values rising 34%. The AU$164.1bn in deals capped a new record not seen since 2015 and bodes well for another promising year.
M&A in Australia: Onward and upward
Globally, the M&A story in 2018 was much less ambitious. By year-end, dealmaking struggled to maintain pace with the previous year, posting a decline of 1% by deal volume with deal values up 12%. Both were far cries from global M&A in 2015, as geopolitics – trade uncertainties even amid a recent thaw in tensions between the US and China and restricted
Chinese outbound investment – possibly beginning to impact worldwide deal flows.
The dealmaking picture in Australia has played out differently compared to global trends. While global M&A has remained all but flat over the past three years, Australian M&A has
Dea
l vol
ume
Deal value (AU
$m)
0
50
100
150
200
250
300
350
400
Q4Q3Q2Q1Q4Q3Q2Q1Q4Q3Q2Q1Q4Q3Q2Q1 0
10,000
20,000
30,000
40,000
50,000
60,000
70,000
80,000
90,000
2015 2016 2017 2018
Figure 1: Australian M&A
Deal volume Deal value (AU$m) Compound annual growth rate

7
Global Australia Australia'smid-market
down 1% up 5% down 12%1,127 deals
AU$122.6bnyear-on-year
increase in volume1,184 deals
AU$164.1bn
2018 M&A volumes at a glance M&A in Australia
2017 5% 2018
been on an aggressive and persistent uptrend over the past two years. Comparatively, 2018 saw deal volumes grow 63% in volume terms and 56% by value from 2016. And all indications show this trend has no sign of stopping as Australian companies continue to make balance sheet improvements (cutting costs and reducing debt) while turning to M&A to expand and diversify their businesses.
Likewise, sentiment remains strong among international strategic and private investors toward Australia’s ability to deliver valuable deal opportunities, positive economics, and political stability. These are all significant positives that investors these days cannot take for granted, especially in an environment marked by various market complexities – such as the constant disruption from digital competitors and regulatory changes in key economies – and the new normal of geopolitical volatility. For these reasons, Australia is poised to maintain its safe-haven status for international investors looking for stable shores and reliable returns.
Mega deals and the mid-marketIf 2018 is remembered for one thing, it will be the prevalence of mega deals. Large-cap transactions valued above AU$250m accounted for 16% of all deals and included several high-profile infrastructure-related transactions and privatizations, such as the AU$22bn deal for APA Group and an AU$13bn deal involving a majority stake acquisition in the Sydney Motorway Corporation. Additional transactions in the large-cap category are being driven by the combination of rising confidence and balance sheet firepower, leading many companies to turn their attention to growth via M&A.
Yet, while mega deals may have stolen the show, the mid-market (deals valued between AU$10m and AU$250m) was – and will likely continue to be – the main act. Deals in this segment accounted for 70% of overall M&A in 2018, on track with previous years where roughly three in four transactions have been completed in the mid-market.
This lines up with expectations for 2019, where respondents considered 77% of dealmaking would fall within mid-market territory, only 5% would be in the bulge bracket, with the remaining 18% of deals being small-cap transactions.
The middle prizeFrom a price perspective, the mid-market is the obvious choice for companies and investors looking to business maturity and revenue generation beyond the unpredictability of small-cap ventures. Integration, while not necessarily seamless, can be easier – and less time and resource intensive – than transactions completed in the bulge bracket, where operations and financial systems may not be taken apart and reassembled with quite the same ease.
Beyond the financials, however, is where the true value of the mid-market is found. As survey respondents point out, the Australian mid-market prize is one for both local buyers looking to expand domestically and international firms searching for sound investments and an easy entry point into a key market in Asia-Pacific.
From the overall commentary and interviews with these respondents, most highlight three key areas where mid-market firms excel – making them prime candidates for
Mid-market companies are generally very close to their customer base and are quick to adapt to changing needs of those customers. This helps them maintain consistent growth.
Survey respondent

8
14%
12%
22%
66%
77%
12%
11%
70%
16%
2018
2017
2016
business rivals, many who struggle to utilize new technologies and are largely reactive to change as opposed to drivers of it.
• CUSTOMER CENTRICITY: The combination of agility and innovation allows mid-market firms to maintain a high degree of customer centricity, an invaluable factor that engenders customer loyalty and “keeps their primary customer base coming back for more while helping the business to grow into new customer segments. This reputation [toward the customer] is the key aspect that is a major driving factor for investors,” says another respondent.
acquisitions – compared with their small-cap and bulge bracket counterparts:
• AGILITY: As one respondent notes, the “ability of mid-market companies to meet the changing demands of their core consumers by launching new products and services sets them apart,” especially from smaller upstarts that may lack the financials and operations. Another respondent says that agility among mid-market businesses has allowed them to sustain growth over the years despite tumultuous market conditions. Perhaps more importantly, respondents agree that this agility has allowed mid-market firms to pivot and adapt as needed to meet the challenge of an increasingly disruptive market from digital and non-traditional competitors.
• DISRUPTION: More than just responding to change, many mid-market firms are actively leading the charge. Experimenting with new technologies and processes and applying these to existing operations is common in the mid-market and these companies “actively disrupt the markets they operate in… giving them an edge over competitors.” Several other respondents recognize this leadership in this area over their larger, more-established
[Mid-market companies] actively disrupt the markets they operate in… giving them an edge over competitors.
Survey respondent
Figure 3: Australian M&A deal size breakdown (Percentage of total volume)
Small cap <AU$10m
Mid-market AU$10m-AU$250m
Large cap >AU$250m

9
Federal elections: A positive for M&A? Just as respondents point to the mid-market’s positives as a choice deal segment for investment, they are also taking stock of the situation likely to develop later in 2019 following the federal election expected in May. Political stability has traditionally been one of Australia’s more reliable strengths and while the election is unlikely to see any major upheavals, historically elections have resulted in dealmakers side-lining their efforts until it becomes clearer who the Government will be and what policies they will pursue. This said, Pitcher Partners are expecting solid deal activity in Q1 with any pre-election slow down likely to be limited to Q2.
Providing a bit of ease to these tensions, the perceived impact on M&A, particularly in the mid-market, will be largely positive, with 7% saying it will be very positive. Only 5% say there will be a negative effect to deal flow while 45% are of the opinion it will result in no change at all. In short, the M&A train will roll on.
As one respondent says, the “change to the M&A market will be mostly positive for mid-market dealmakers. While policy changes are expected, these will create stability across sectors.” Another says that there is growing confidence that the elections will result in a resurgence of the Australian economy and that further support for SMEs will help mid-market firms grow.
Compared to their domestic counterparts, foreign-based respondents held the highest hopes that mid-market M&A would improve following the elections, according to 58% of international businesses and investors. None felt that the elections would in any way negatively impact the market or make it less attractive.
The segment of those in opposition point out that if there is a change in government, new legislators could create policies that will break the current dealmaking momentum. For this reason, 30% expect a change in government to have a negative impact on Australian mid-market M&A, while 42% say it will have no impact at all.
“Elections can distract dealmakers and policy announcements can spook bidders momentarily until there is a clearer path forward. The M&A market response to the 2019 election is unlikely to be any different and we expect dealmaking to be softer in Q2 in the lead up to the election, before bouncing back in the second half of the year.
Pitcher Partners
Figure 4: What impact do you think the federal election will have on mid-market dealmaking in 2019?
Figure 5: Should there be a change of government at the federal election what impact do you think this will have on mid-market dealmaking in 2019?
0 10 20 30 40 50
Largely negative
Negative
Neutral/No impact
Positive
Largely positive 7%
43%
45%
5%
0%
0 10 20 30 40 50
Largely negative
Negative
Neutral/No impact
Positive
Largely positive 2%
27%
42%
28%
2%
0

10
Private equity (PE) investment will drive mid-market dealmaking as funds armed with amply dry powder search for value as they put their money to work. Of the 73% of respondents agreeing on this, many say that PE firms will target the mid-market as inflated valuations among larger targets prove prohibitive. Respondents also say that the Australian market in general provides a low-risk market compared to others across Asia-Pacific. Shedding additional light on this trend, one respondent says, “as the concentration of PE investors has risen globally and with focus shifting away from Europe, the next logical and viable destination for this capital is Australia.”
Supporting these sentiments, an even larger percentage of respondents (92%) believe PE deals will increase in the year ahead. The remaining 8% think it will remain on par with 2018. This mirrors sentiments from last year’s research when 85% expected PE investment to increase across the year. In dollar amounts, these sentiments have translated into deals with AU$2.5bn (25 deals) completed in mid-market investments in 2018 compared to AU$1.5bn (24 deals) in 2017. Total PE investment in 2018 totalled AU$21.6bn, a year-on-year increase of 51%, although significantly less than the AU$35.1bn in fund deployments in 2016.
Private equity and foreign investment will be primary drivers in Australia’s mid-market in 2019. One common thread among domestic and international dealmakers will be the search for growth acceleration via acquisition, opportunities of which many agree are abundant in the mid-market.
While the majority of PE investments are run by Australia-based funds, international firms with hefty assets under management have also been active, helping to bolster totals in recent years. These foreign private capital investments feed into sentiment that foreign dealmakers will play a greater role in mid-market M&A, according to 68% of respondents. A further 90% see foreign inbound M&A, from both private and strategic investors, increasing in 2019.
This sentiment reflects a noticeable increase from the 72% in 2018 who held similar beliefs, driven mostly by geopolitical events and various market uncertainties, specifically in Europe and the UK. As one respondent says, “Australia may not be as popular as the US or UK, but with unstable conditions in Europe and the ongoing Brexit situation, we expect investors to turn to Australia.”
Favourable valuations, the result of expectations between buyers and sellers becoming more aligned, will likewise provide impetus to mid-market M&A, according to 68% of respondents. This has been particularly evident for US inbound buyers, with one respondent saying that “valuations have been favourable to investors as the US dollar gains strength, providing US buyers more firepower for dealmaking.”
Mid-market deal drivers and challenges
11
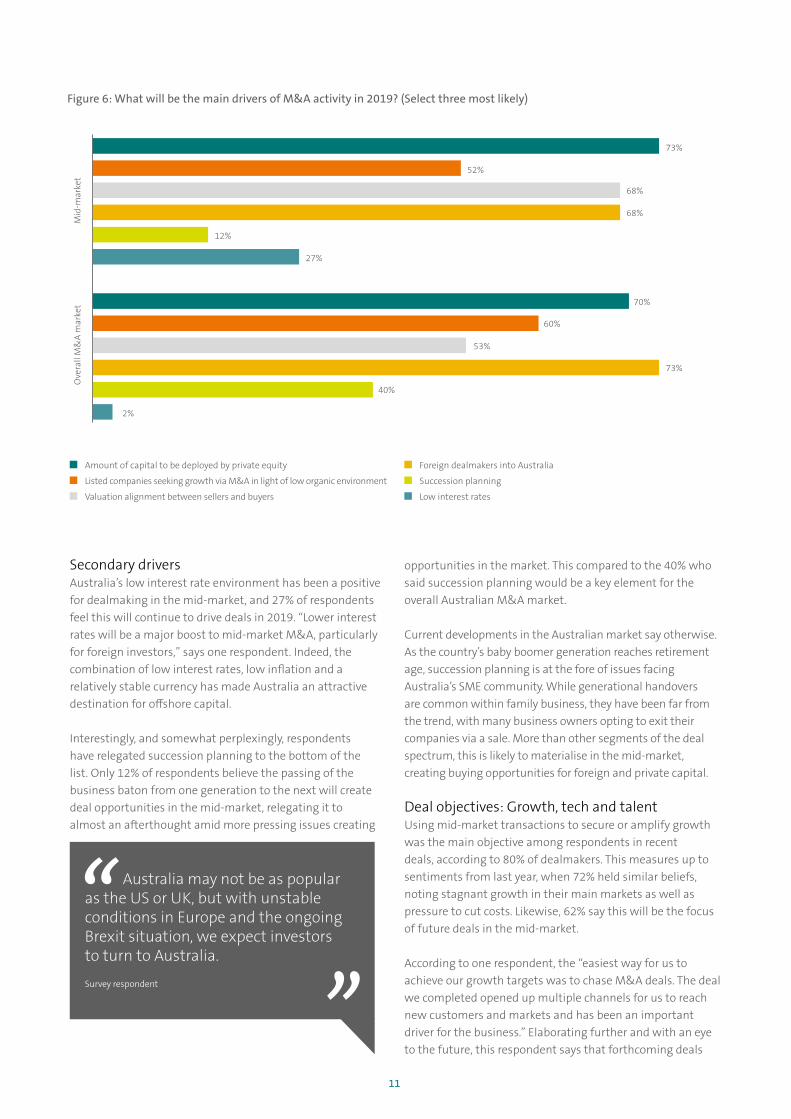
Secondary drivers Australia’s low interest rate environment has been a positive for dealmaking in the mid-market, and 27% of respondents feel this will continue to drive deals in 2019. “Lower interest rates will be a major boost to mid-market M&A, particularly for foreign investors,” says one respondent. Indeed, the combination of low interest rates, low inflation and a relatively stable currency has made Australia an attractive destination for offshore capital.
Interestingly, and somewhat perplexingly, respondents have relegated succession planning to the bottom of the list. Only 12% of respondents believe the passing of the business baton from one generation to the next will create deal opportunities in the mid-market, relegating it to almost an afterthought amid more pressing issues creating
opportunities in the market. This compared to the 40% who said succession planning would be a key element for the overall Australian M&A market.
Current developments in the Australian market say otherwise. As the country’s baby boomer generation reaches retirement age, succession planning is at the fore of issues facing Australia’s SME community. While generational handovers are common within family business, they have been far from the trend, with many business owners opting to exit their companies via a sale. More than other segments of the deal spectrum, this is likely to materialise in the mid-market, creating buying opportunities for foreign and private capital.
Deal objectives: Growth, tech and talent Using mid-market transactions to secure or amplify growth was the main objective among respondents in recent deals, according to 80% of dealmakers. This measures up to sentiments from last year, when 72% held similar beliefs, noting stagnant growth in their main markets as well as pressure to cut costs. Likewise, 62% say this will be the focus of future deals in the mid-market.
According to one respondent, the “easiest way for us to achieve our growth targets was to chase M&A deals. The deal we completed opened up multiple channels for us to reach new customers and markets and has been an important driver for the business.” Elaborating further and with an eye to the future, this respondent says that forthcoming deals
Figure 6: What will be the main drivers of M&A activity in 2019? (Select three most likely)
Amount of capital to be deployed by private equity
Listed companies seeking growth via M&A in light of low organic environment
Valuation alignment between sellers and buyers
Foreign dealmakers into Australia
Succession planning
Low interest rates
73%
52%
Mid
-mar
ket
Ove
rall
M&
A m
arke
t
68%
68%
12%
27%
70%
60%
53%
73%
40%
2%
Australia may not be as popular as the US or UK, but with unstable conditions in Europe and the ongoing Brexit situation, we expect investors to turn to Australia.
Survey respondent

12
will “concentrate on upgrading our technology and also looking at a niche labour force that is fluent in the latest tech and can operate efficiently.”
These comments reflect the broader trend in our research: that acquiring new technology and IP may not be a current priority (with only 47% saying such) but will rise the ranks of importance in future (according to 67%).
Speaking further on this point, another respondent says, “Our most recent acquisition was strategic in that we’re starting to think about how data-analytics will play into the future business. It’s a fast-growing business function… and the investment has put us in a good position to access smarter and more effective technologies and support our current expansion.”
Likewise, accessing skilled or niche talent will see a jump from 23% at present to 37% who see it as a future priority.
Industry consolidation is another objective of dealmakers with 58% of respondents saying it was a current objective rising to 73% of respondents when future objectives were taken into account. As in past years, the overall view is that several fragmented industries with limited capacity could benefit from M&A to enhance economies of scale and expand their reach.
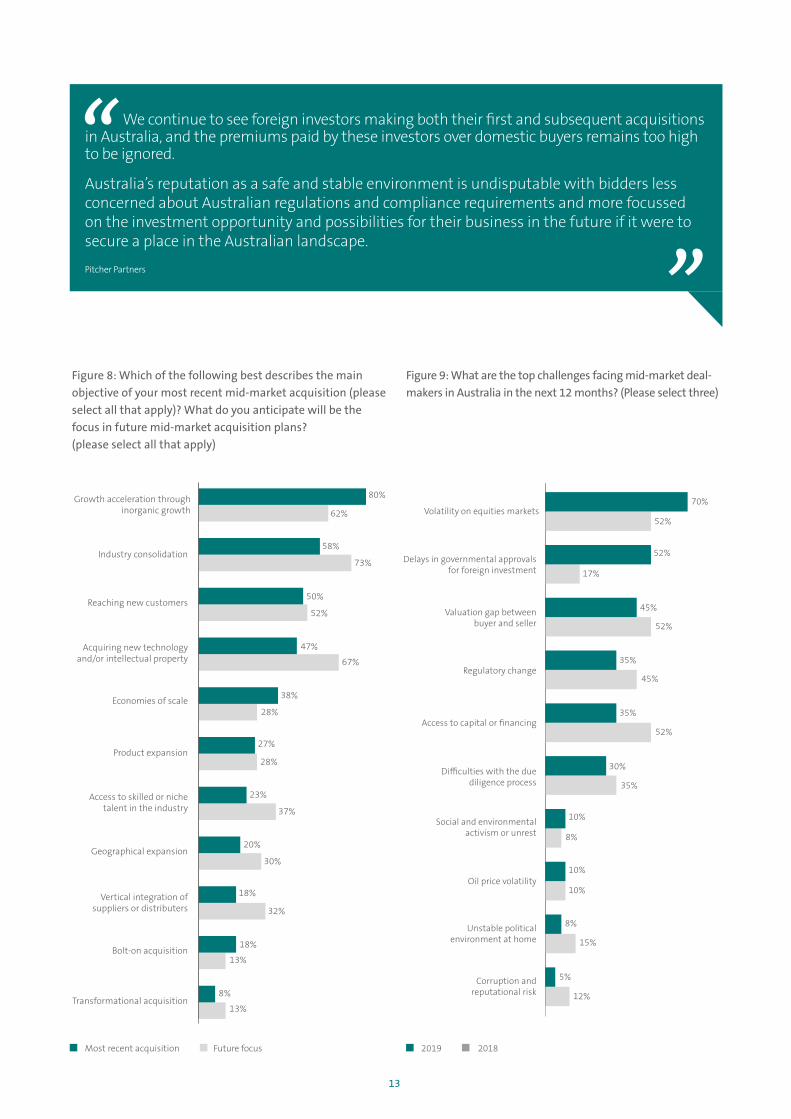
Challenges: Government getting in the way? Similar to last year, volatility on equities markets will be a top challenge for mid-market dealmakers in 2019, although perhaps more pressing as 70% feel this is the top issue they will face compared to only 52% in 2018. Adding colour to this sentiment, one respondent says this volatility, alongside various industry-specific conditions across sectors, has caused confidence to waver.
The more pressing issue, at least for foreign investors, may be roadblocks regarding regulatory approval. Indeed, more than half of respondents (52%) feel delays in government approvals for foreign investment could compromise dealmaking, compared to only 17% last year. According to one respondent, “there’s been a noticeable increase in delays by the government to approve foreign deals. A major reason for this has been the inconsistency in the political landscape, which has given rise to a more fluid policymaking environment.”
Interestingly, regulatory change as a challenge was viewed to have eased, dropping from almost half of respondents (45%) to only 35% this year. Equally, political instability decreased in line with sentiments that say the upcoming elections could be, on balance, a positive for the M&A market.
Another positive may be the ease of securing deal financing. While one of three top concerns last year, sentiment has shifted, with only 25% saying access to capital or financing would be problematic as 2019 unfolds.
Figure 7: What do you expect will happen to the level of mid-market deal activity for the following deals or investor groups over the next 12 months?
2019 2018
Private equity deals
Outbound
Foreign inbound
Domestic
Overall mid-market
92%
85%
48%
82%
90%
72%
95%
78%
67%
78%
Our most recent [mid-market] acquisition was strategic in that we’re starting to think about how data-analytics will play into the future business… The investment has put us in a good position to access smarter and more effective technologies and support our current expansion.
Survey respondent
13
Figure 8: Which of the following best describes the main objective of your most recent mid-market acquisition (please select all that apply)? What do you anticipate will be the focus in future mid-market acquisition plans? (please select all that apply)
Most recent acquisition Future focus
Figure 9: What are the top challenges facing mid-market deal-makers in Australia in the next 12 months? (Please select three)
70%Volatility on equities markets
Delays in governmental approvals for foreign investment
Valuation gap between buyer and seller
Regulatory change
Access to capital or �nancing
Difficulties with the due diligence process
Social and environmental activism or unrest
Oil price volatility
Unstable political environment at home
Corruption and reputational risk
52%
52%
17%
45%
52%
35%
45%
35%
52%
30%
35%
10%
8%
10%
10%
8%
15%
5%
12%
2019 2018
80%Growth acceleration through inorganic growth
Industry consolidation
Reaching new customers
Acquiring new technology and/or intellectual property
Economies of scale
Product expansion
Access to skilled or niche talent in the industry
Geographical expansion
Vertical integration of suppliers or distributers
Bolt-on acquisition
Transformational acquisition
62%
58%
73%
50%
52%
47%
67%
38%
28%
27%
28%
23%
37%
20%
30%
18%
32%
18%
13%
8%
13%
We continue to see foreign investors making both their first and subsequent acquisitions in Australia, and the premiums paid by these investors over domestic buyers remains too high to be ignored.
Australia’s reputation as a safe and stable environment is undisputable with bidders less concerned about Australian regulations and compliance requirements and more focussed on the investment opportunity and possibilities for their business in the future if it were to secure a place in the Australian landscape.
Pitcher Partners

14
Cross-border deal flows
Foreign inbound M&A into the mid-market is expected to increase in 2019, according to 90% of respondents, with high expectations that North American dealmakers will lead the way. The outbound story is playing out differently, with less than half (48%) expecting Australian companies to buy abroad.
Australia remains a favoured destination for international dealmakers looking for opportunities in Asia-Pacific, both in terms of respondent sentiment and the deals that have been signed over the past year. While overall inbound M&A declined slightly year on year, totalling 132 deals worth AU$9bn compared to 139 deals worth AU$8bn in 2017, Australia’s status as a mature economy with a sound legal system are stand-out features in a region of high-growth, yet high-risk emerging markets.
Inbound deals accounted for 38% of totals in the mid-market and 45% of deal values in 2018.
Inbound M&A: North America sets its sights North American dealmakers, led by the United States, will drive inbound deal flows into the Australian mid-market, according to 98% of respondents. This surpassed sentiment last year, where 83% thought North American buyers would be active at the deal table.
US bidders completed 22 deals worth AU$1.8bn in 2018, declining 24% by volume but increasing 4% by value. Deal flow is expected to improve in 2019 as the US-China trade war creates difficulties for American companies operating in China, forcing many to look for alternative investment destinations.
Trade disputes and uncertainties aside, US investors generally view Australia as a safe haven for longer-term investments. “These investors are searching the globe for deal opportunities and the right fit in terms of investments and the mid-market in Australia will provide these opportunities and access to Australia’s sustainable economic growth over the long term,” says one respondent.
Another respondent says, “cultural and operational similarities and an open and transparent market make it easy for North American investors to do business in Australia. They are confident in the market, the deal parties and the well-balanced nature of the mid-market.”
Dea
l vol
ume
Deal value (AU
$m)
0
5
10
15
20
25
30
35
40
45
Q4Q3Q2Q1Q4Q3Q2Q1Q4Q3Q2Q1 0
500
1,000
1,500
2,000
2,500
3,000
2016 2017 2018
0
500
1,000
1,500
2,000
2,500
3,000
0
5
10
15
20
25
30
35
40
45
Q4Q3Q2Q1Q4Q3Q2Q1Q4Q3Q2Q1
Figure 10: Australian inbound mid-market M&A
Deal volume Deal value (AU$m)
15
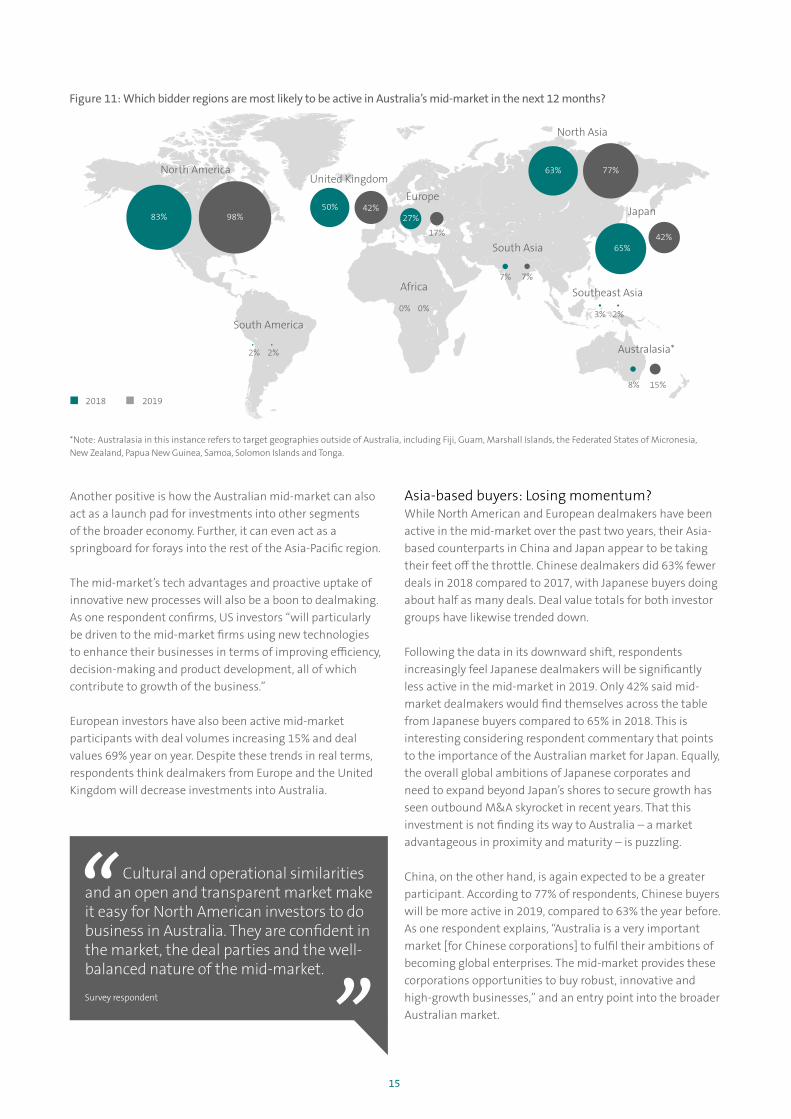
Another positive is how the Australian mid-market can also act as a launch pad for investments into other segments of the broader economy. Further, it can even act as a springboard for forays into the rest of the Asia-Pacific region.
The mid-market’s tech advantages and proactive uptake of innovative new processes will also be a boon to dealmaking. As one respondent confirms, US investors “will particularly be driven to the mid-market firms using new technologies to enhance their businesses in terms of improving efficiency, decision-making and product development, all of which contribute to growth of the business.”
European investors have also been active mid-market participants with deal volumes increasing 15% and deal values 69% year on year. Despite these trends in real terms, respondents think dealmakers from Europe and the United Kingdom will decrease investments into Australia.
Asia-based buyers: Losing momentum? While North American and European dealmakers have been active in the mid-market over the past two years, their Asia-based counterparts in China and Japan appear to be taking their feet off the throttle. Chinese dealmakers did 63% fewer deals in 2018 compared to 2017, with Japanese buyers doing about half as many deals. Deal value totals for both investor groups have likewise trended down.
Following the data in its downward shift, respondents increasingly feel Japanese dealmakers will be significantly less active in the mid-market in 2019. Only 42% said mid-market dealmakers would find themselves across the table from Japanese buyers compared to 65% in 2018. This is interesting considering respondent commentary that points to the importance of the Australian market for Japan. Equally, the overall global ambitions of Japanese corporates and need to expand beyond Japan’s shores to secure growth has seen outbound M&A skyrocket in recent years. That this investment is not finding its way to Australia – a market advantageous in proximity and maturity – is puzzling.
China, on the other hand, is again expected to be a greater participant. According to 77% of respondents, Chinese buyers will be more active in 2019, compared to 63% the year before. As one respondent explains, “Australia is a very important market [for Chinese corporations] to fulfil their ambitions of becoming global enterprises. The mid-market provides these corporations opportunities to buy robust, innovative and high-growth businesses,” and an entry point into the broader Australian market.
Figure 11: Which bidder regions are most likely to be active in Australia’s mid-market in the next 12 months?
2018 2019
North America
JapanEurope
South Asia
Southeast Asia
South America
Africa
83% 98%
0% 0%
42%65%
North Asia
77%63%United Kingdom
42%50%
17%
27%
7%
3% 2%
2% 2%
7%
Australasia*
15%8%
Cultural and operational similarities and an open and transparent market make it easy for North American investors to do business in Australia. They are confident in the market, the deal parties and the well-balanced nature of the mid-market.
Survey respondent
*Note: Australasia in this instance refers to target geographies outside of Australia, including Fiji, Guam, Marshall Islands, the Federated States of Micronesia,New Zealand, Papua New Guinea, Samoa, Solomon Islands and Tonga.

16
The fact that deals have declined compared to market sentiments is unsurprising. Stricter capital controls on outbound forays have limited China’s push into global markets. An emphasis on investment into economies along China’s Belt and Road Initiative, which spans Eurasia with limited impact on Australia, could also explain the downward directional flow of capital. In the years ahead, however, this trend could reverse as Chinese investment in Australia shows renewed interest in the mining space alongside deals involving commercial real estate and the healthcare sector.
Australia could see an uptick in investment depending on the outcome of the US-China trade war. As CFIUS makes it more difficult for Chinese investors to enter the US market, many could turn their attention to Australian shores.
Outbound M&A: Interest beyond the obstacles Only 48% of respondents expect an increase in outbound deal flow in 2019 – and 13% expect it to decline. This surprising turn on sentiment goes strongly against the 82% last year – the second highest among deal flow expectations – that Australian outbound dealmaking would increase. Likewise, deal actuals have declined in line with these expectations, sinking to 33 deals in 2018 compared to 62 the year before. So, what has changed?
Several respondents point to volatility in offshore markets and the complex and unpredictable geopolitical climate at present. Regulatory uncertainty and opaque legal regimes, particularly in emerging markets (83%), have proved challenging in the past, as has the due diligence process of investigating targets and attaining reliable information (72%) when operating in high-growth, high-risk markets globally.
These issues aside, respondents said cultural differences (98%) between buyer and seller were the main culprit causing cross-border deal distress.
Whatever the reasons, respondents note that opting out of international expansion and promising growth prospects is not always the answer. Many respondents agree that when it comes to cross-border M&A, confidence is key, and a simple solution exists to providing this boost. Says one respondent, “I think Australian companies may just lack confidence when making an outbound buy, but this doesn’t have to be the case. Hiring an experienced advisor to guide them through the process will help produce better results and reduce risks.”
This lack of confidence and growing concern for unnecessary risk often found in emerging markets could explain the shift in sentiment toward target markets. Respondents widely agree that North America will be the main target for Australian outbound M&A, according to 73% this year.
High-growth markets will also maintain favour, with 70% saying North Asia and 60% saying South Asia will see Australian investment. While sentiment toward Europe increased marginally, respondents agree that the UK will see less outbound deals. Surprisingly, Southeast Asia, long seen as a market of opportunities given its positive demographics, economic growth and proximity to Australia, saw sentiment decline precipitously from 63% last year to only 28% this year.
Figure 12: Australian outbound mid-market M&A
Dea
l vol
ume
Deal value (AU
$m)
0
5
10
15
20
25
30
35
40
45
Q4Q3Q2Q1Q4Q3Q2Q1Q4Q3Q2Q12016 2017 2018
Q4Q3Q2Q1Q4Q3Q2Q1Q4Q3Q2Q10
5
10
15
20
25
30
35
40
45
12
3
4
18
3
4
14
9
11
15
6
12
16
7
10
10
7
10
7
5
6
15
8
9
11
8
10
14
6
7
12
8
8
21
6
14
Mid-market Non mid-market Undisclosed deal value

17
While there have been a number of well documented failings when Australian businesses have sought to expand offshore, the growth potential in larger foreign markets can’t be ignored. Those considering expansion offshore should ensure they do their homework over a long period of time. Consideration should also be given as to how the local market knowledge and expertise can be retained in the business post transaction. While straight out acquisitions can be favourable to capture all the earnings potential, a buyout over time does ensure the existing team are incentivised to work with their new Australian owners to the medium term success of the foreign subsidiary. Likewise it may also be beneficial to consider the long terms benefits of engaging with a local partner who understands the nuances of their market.
Pitcher Partners
Figure 13: Which markets are most likely to be the targets for Australian businesses looking for cross-border deal opportunities in the next 12 months?
2018 2019
6 63%
0 6 12 18 24 30
Southeast Asia
South Asia
North Asia
North America
South America
Europe
Africa
United Kingdom
Australasia
Japan
28%
53%
60%
45%
70%
43%
73%
35%
15%
20%
28%
13%
0%
8%
0%
3%
0%
15%
7%
Figure 14: Generally, what are the main challenges Australian buyers face when completing cross-border acquisitions?
IP risks
Other, please specify
Closing the valuation gap
Market volatility
Tax challenges
Corruption issues
Obtaining sufficient information about the target
Regulatory hurdles/insufficient understanding of legal
regimes in target market
Cultural differences 98%
83%
72%
68%
67%
65%
52%
30%
0%

18
We see both positive and negative influences driving deal activity across consumer and financial services in 2019 as strong demand for consumer product brands drives activity at the same time as struggling retailers are also forced to transact. Likewise, the Royal Commission into the banking sector and resultant recommendations are likely to create deal opportunities within the finance sector.
Pitcher Partners
Spotlight on sectors
Technology, media and telecommunications (TMT), consumer goods and financial services are once again tapped to lead mid-market dealmaking as the Australian economy continues its transformation to a services-based model. In real terms, however, energy, mining and utilities (EMU) remains firmly in the front seat as the sector leader for mid-market totals.
While respondents generally agree that almost every industry will experience an uptick in mid-market M&A in 2019, respondent feedback points to the TMT space having the healthiest pipeline of upcoming transactions. For the second year in a row, respondents unanimously agree (100%) that an increase in this sector is likely as companies turn to TMT to inject technological capital into their businesses. From the commentary, respondents again point to cross-sector convergence as the primary driver in what is essentially a land-grab for tech start-ups and anything that could potentially provide digital advantages.
One respondent sums up this frenzy accurately, noting that “mid-market opportunities are fuelled basically by a quest for technology or market expansion.” In best-case scenarios, that quest captures both factors, which mid-market firms can often help their larger buyers accomplish, a move that the respondent goes on to describe as “looking to jump to new horizons by enhancing existing operations, process and products with newly acquired technologies.”
The sector watchlist also includes consumer goods and financials, with 98% of respondents for each in agreement that dealmaking will prove robust in 2019. Respondents highlight both industries’ contribution to economic growth and the national transition from resource-reliant to services-based. While consumer goods deals could continue to be led by PE investments, multinational corporations from North America and Asia will also likely help drive deals. In the financial services sector, dealmaking could be the result of divestitures and non-core sales, with sellers in the sector likely to divest assets and create asset-buying opportunities in the mid-market.
Despite these expectations, M&A trend actuals show that EMU continues to dominate mid-market dealmaking. Consumer and leisure sector dealmaking have both been contributors to the trends shaping 2018.
Figure 15: Which sectors will see the most increases in mid-market M&A in the next 12 months?
2018 2019
83%Technology, media and
telecommunications
Consumer
Financial services
Pharma, medical and biotech
Industrials and chemicals
Leisure
Business services
Agriculture
Energy, mining and utilities
Construction
Real estate
Transportation
Government
Defence
100%100%
98%98%
92%98%
80%97%
95%67%
93%68%
85%62%
80%67%
68%70%
65%32%
60%27%
58%22%
57%48%
52%47%

19
Figure 16: Mid-market M&A volumes in Australia by sectors
2017
% of mid-market
18%Deal volume
71
2018
% of mid-market
22%Deal volume
75
Energy, mining and utilities
2017
% of mid-market
7%Deal volume
29
2018
% of mid-market
10%Deal volume
34
Real estate
2017
% of mid-market
14%Deal volume
55
2018
% of mid-market
12%Deal volume
41
Leisure
6%
2017
% of mid-market
7%Deal volume
27
2018
% of mid-market
10%Deal volume
35
Pharma, medical and biotech
30% 17%
2017
% of mid-market
6%Deal volume
25
2018
% of mid-market
5%Deal volume
18
Industrials and chemicals
-28%
2017
% of mid-market
3%Deal volume
11
2018
% of mid-market
2%Deal volume
7
Agriculture
-36%
2017
% of mid-market
2%Deal volume
9
2018
% of mid-market
1%Deal volume
3
Transportation
-67%
%% Year-over-year decrease in volume Year-over-year increase in volume
Business services
2017
% of mid-market
16%Deal volume
62
2018
% of mid-market
8%Deal volume
29
-53%
-25%
2017
% of mid-market
14%Deal volume
54
2018
% of mid-market
11%Deal volume
38
Consumer
-30%
2017
% of mid-market
5%Deal volume
21
2018
% of mid-market
9%Deal volume
31
Financial services
48%
2017
% of mid-market
5%Deal volume
18
2018
% of mid-market
7%Deal volume
24
Technology, media and telecommunications
33%
2017
% of mid-market
2%Deal volume
9
2018
% of mid-market
4%Deal volume
13
Construction
44%

20
Energy, mining and utilities
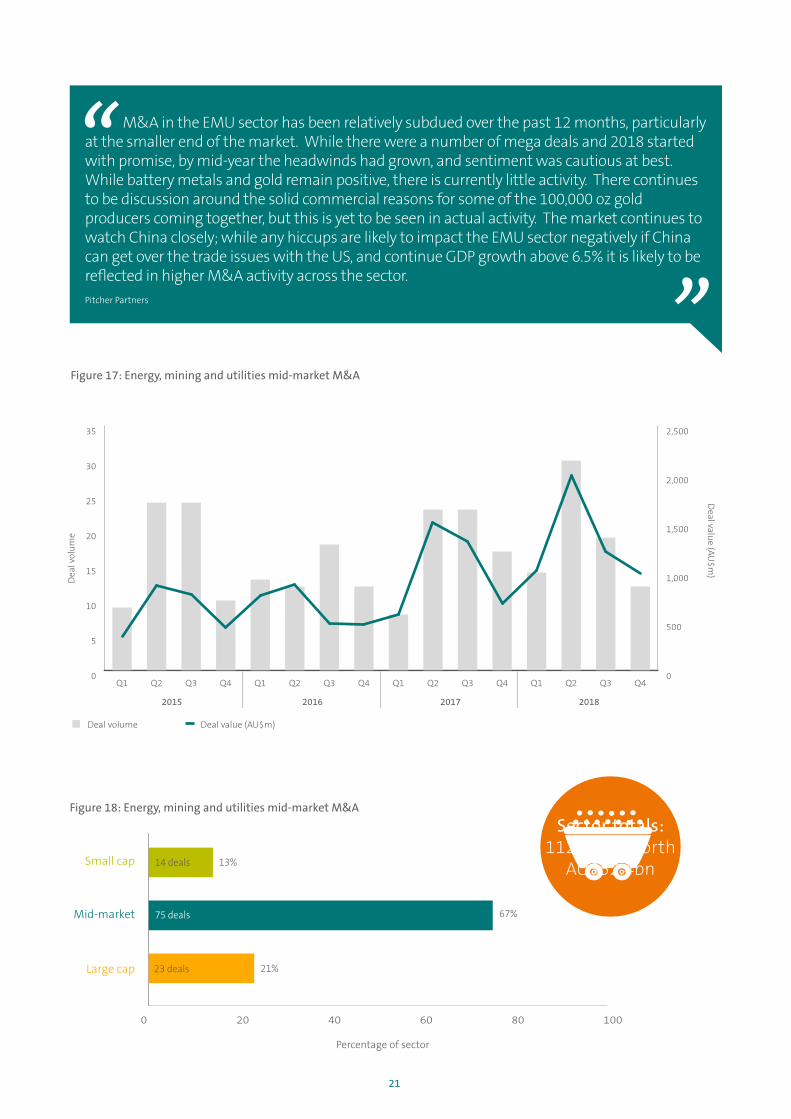
After several slow years in the sector, EMU dealmaking is back from the brink in both volume and value terms. There were 75 deals in the sector in 2018, an increase of 6% as once struggling miners and energy companies begin to turn around their businesses. By mid-market values, 2018 was the largest since 2015, at AU$5.2bn.
Overall, the mid-market accounted for 68% of disclosed deal totals, although only 10% of deal values. The capital-intensive nature of these deals often means many transactions fall into mega-deal terrain, with five of the industry’s 18 large cap deals valued above AU$1bn (with the APA Group transaction capping values at AU$22.4bn).
Despite the actual trends, only 68% of respondents say EMU dealmaking will increase in the year ahead, still high although ranking well below many of Australia’s services-based industries. As one respondent says, “environmental concerns have been mounting in Australia and will become a factor driving deals,” going on to explain how policy changes regarding the transition to renewable energy could put a dent in traditional energy sources, such as coal, albeit a trend likely to develop across the next decade, not the next few quarters.
22% of Australian mid-market in 2018.
68% of respondents expect an increase in activity in 2019.
Indeed, the renewables drive could be a significant theme for EMU M&A in the years ahead. While still at a preliminary stage of development, the clean energy space has seen deal numbers grow rapidly recently, especially as offshore investors and contractors take notice of the sector and build up dealmaking as they buy, build and sell assets.
On the mining front, key drivers likely to unfold across 2019 include mergers and various tie-ups among mining services providers as the sub-sector enters a new phase of consolidation where companies seek deals for scale and to snare new business verticals, according to Mergermarket intelligence. Growth, rather than simply survival, will lead the agenda, and larger mining groups will look to the mid-market to make strategic deals to add value, grow larger and stronger, and be more diverse.
Environmental concerns have been mounting in Australia and will become a factor driving deals.
Survey respondent
21
Dea
l vol
ume
Deal value (AU
$m)
0
5
10
15
20
25
30
35
Q4Q3Q2Q1Q4Q3Q2Q1Q4Q3Q2Q1Q4Q3Q2Q10
500
1,000
1,500
2,000
2,500
2015 2016 2017 2018
Figure 17: Energy, mining and utilities mid-market M&A
Deal volume Deal value (AU$m)
Figure 18: Energy, mining and utilities mid-market M&A
0 10 20 30 40 50 60 70 80 90 100
Large cap
Mid-market
Small cap 13%
67%
21%
75 deals
23 deals
Percentage of sector
14 deals
75 deals
23 deals
Sector totals: 112 deals worth
AU$52.4bn
M&A in the EMU sector has been relatively subdued over the past 12 months, particularly at the smaller end of the market. While there were a number of mega deals and 2018 started with promise, by mid-year the headwinds had grown, and sentiment was cautious at best. While battery metals and gold remain positive, there is currently little activity. There continues to be discussion around the solid commercial reasons for some of the 100,000 oz gold producers coming together, but this is yet to be seen in actual activity. The market continues to watch China closely; while any hiccups are likely to impact the EMU sector negatively if China can get over the trade issues with the US, and continue GDP growth above 6.5% it is likely to be reflected in higher M&A activity across the sector.Pitcher Partners

22
Leisure
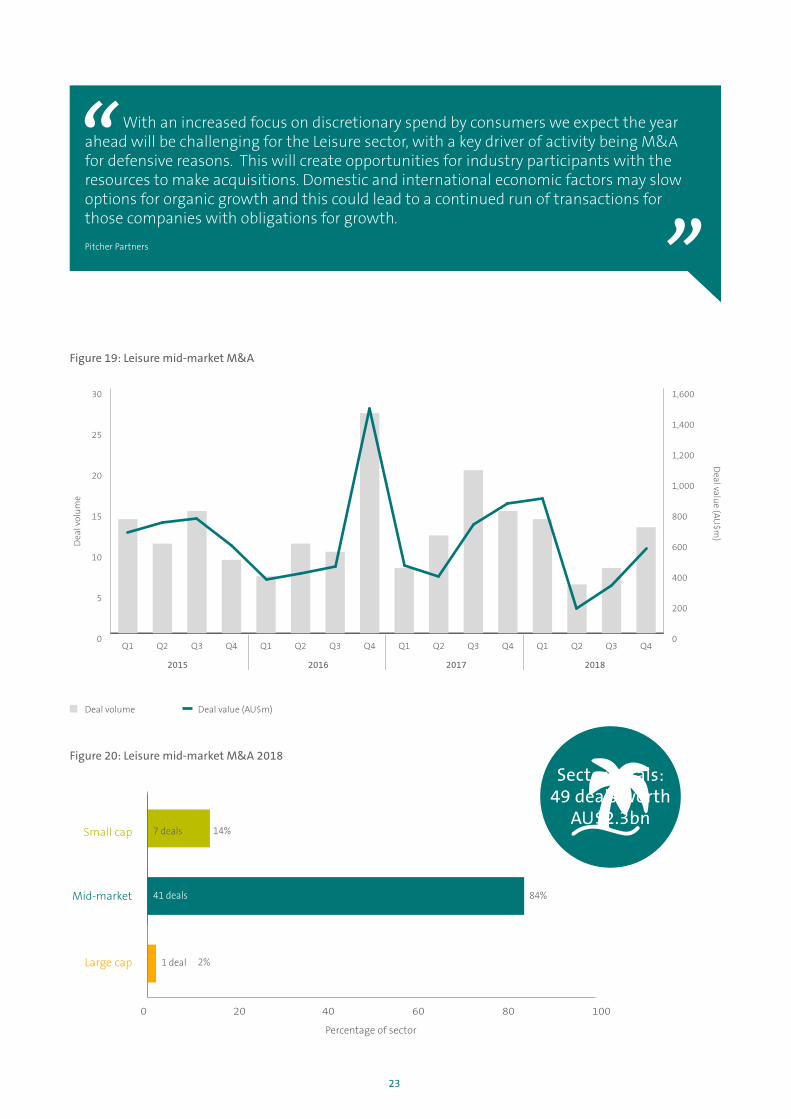
Australia’s leisure sector had 41 mid-market deals valued at AU$1.9bn in 2018, a 25% drop in volume and 19% by value from 2017. Inbound dealmaking has likewise slipped from highs of 18 deals valued at AU$1.2bn in 2015 to 14 deals worth AU$929m in 2018. As a percent of mid-market M&A, foreign buys remained stable at 37% over that same timeframe.
Despite these sharp declines, leisure was an active sector for mid-market M&A and remains a high-growth segment of the economy with expectations for future M&A activity. Indeed, the sector accounted for 11% of total mid-market deals in 2018 and 93% of respondents anticipate healthy deal flow and a growing pipeline of opportunities coming to market in 2019.
As in past years, an upsurge in inbound travellers from emerging markets, specifically China, continues to be the biggest bonus for Australia’s tourism boom. Almost 1.3 million Chinese tourists (of 8.3 million international visitors) visited Australia in the 12 months to June 2018, spending AU$11.3bn, a record number according to Tourism Research Australia. These figures could increase as relations improve between China and Australia following a diplomatic “freeze” between the two nations, and estimates hold that by 2026, more than 3.3 million Chinese tourists are forecast to be visiting Australia annually.
Another theme sweeping not only the Australian leisure space but the global tourism market is the rise and re-invention of healthy hospitality. Body-and-mind-conscious travellers, in addition to a relaxing retreat, are also searching
out venues that provide cutting-edge wellness experiences. While this often takes the form of venues offering unique spa treatments and alternative medicine, also trending is the rise of such wellness programs including meditation retreats and various immersive experiences and detox programs as tourism providers continue to carve out alternative tourism niche to attract a new breed of travellers. As one respondent explains, “Australia is developing various new facilities and rethinking old but popular ones to help the market maintain its attractiveness as a tourism market.”
Another elaborates that “these businesses are coming up with unique and innovative ideas and have rolled out the facilities necessary to take tourism and experiential services to the next level. Consumers are ready to spend big for these accommodations and experiences – and larger companies will also open their wallets to buy these companies as a way to expand their products and services and strengthen their customer base in Australia.”
12% of Australian mid-market in 2018.
93% of respondents expect an increase in activity in 2019.
These businesses are coming up with unique and innovative ideas and have rolled out facilities necessary to take leisure, tourism and experiential services to the next level. Consumers are ready to spend big for these accommodations and experiences – and larger companies will also open their wallets to buy these companies as a way to expand their products and services and strengthen their customer base in Australia.
Survey respondent
23
Sector totals: 49 deals worth
AU$2.3bn
With an increased focus on discretionary spend by consumers we expect the year ahead will be challenging for the Leisure sector, with a key driver of activity being M&A for defensive reasons. This will create opportunities for industry participants with the resources to make acquisitions. Domestic and international economic factors may slow options for organic growth and this could lead to a continued run of transactions for those companies with obligations for growth.
Pitcher Partners
Figure 20: Leisure mid-market M&A 2018
10 20 30 40 50 60 70 80 90 100
Large cap
Mid-market
Small cap
0 20 40 60 80 100
Percentage of sector
14%
84%
2%
7 deals
41 deals
1 deal
Dea
l vol
ume
Deal value (AU
$m)
0
5
10
15
20
25
30
Q4Q3Q2Q1Q4Q3Q2Q1Q4Q3Q2Q1Q4Q3Q2Q10
200
400
600
800
1,000
1,200
1,400
1,600
2015 2016 2017 2018
Figure 19: Leisure mid-market M&A
Deal volume Deal value (AU$m)
24
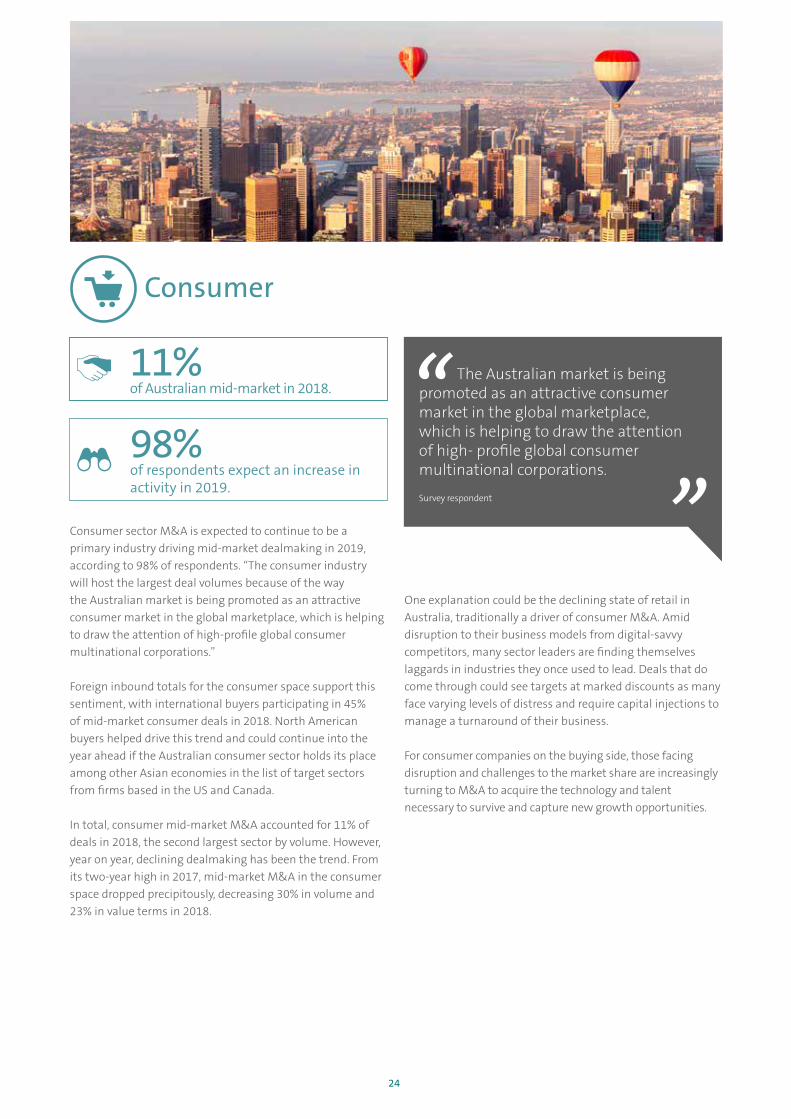
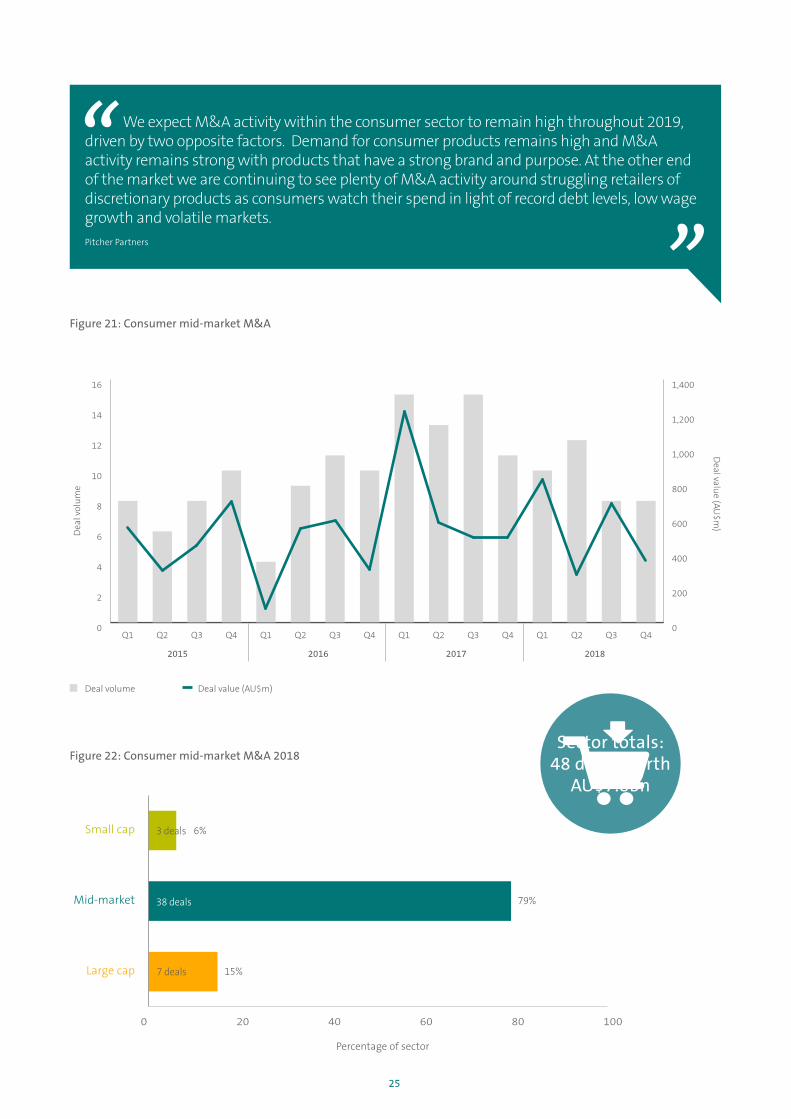
Consumer sector M&A is expected to continue to be a primary industry driving mid-market dealmaking in 2019, according to 98% of respondents. “The consumer industry will host the largest deal volumes because of the way the Australian market is being promoted as an attractive consumer market in the global marketplace, which is helping to draw the attention of high-profile global consumer multinational corporations.”
Foreign inbound totals for the consumer space support this sentiment, with international buyers participating in 45% of mid-market consumer deals in 2018. North American buyers helped drive this trend and could continue into the year ahead if the Australian consumer sector holds its place among other Asian economies in the list of target sectors from firms based in the US and Canada.
In total, consumer mid-market M&A accounted for 11% of deals in 2018, the second largest sector by volume. However, year on year, declining dealmaking has been the trend. From its two-year high in 2017, mid-market M&A in the consumer space dropped precipitously, decreasing 30% in volume and 23% in value terms in 2018.
One explanation could be the declining state of retail in Australia, traditionally a driver of consumer M&A. Amid disruption to their business models from digital-savvy competitors, many sector leaders are finding themselves laggards in industries they once used to lead. Deals that do come through could see targets at marked discounts as many face varying levels of distress and require capital injections to manage a turnaround of their business.
For consumer companies on the buying side, those facing disruption and challenges to the market share are increasingly turning to M&A to acquire the technology and talent necessary to survive and capture new growth opportunities.
Consumer
11% of Australian mid-market in 2018.
98% of respondents expect an increase in activity in 2019.
The Australian market is being promoted as an attractive consumer market in the global marketplace, which is helping to draw the attention of high- profile global consumer multinational corporations.
Survey respondent
25
Dea
l vol
ume
Deal value (AU
$m)
0
2
4
6
8
10
12
14
16
Q4Q3Q2Q1Q4Q3Q2Q1Q4Q3Q2Q1Q4Q3Q2Q10
200
400
600
800
1,000
1,200
1,400
2015 2016 2017 2018
Sector totals: 48 deals worth
AU$7.8bn
0 20 40 60 80 100
Large cap
Mid-market
Small cap
Percentage of sector
3 deals 6%
79%
15%
38 deals
7 deals
Figure 22: Consumer mid-market M&A 2018
Figure 21: Consumer mid-market M&A
Deal volume Deal value (AU$m)
We expect M&A activity within the consumer sector to remain high throughout 2019, driven by two opposite factors. Demand for consumer products remains high and M&A activity remains strong with products that have a strong brand and purpose. At the other end of the market we are continuing to see plenty of M&A activity around struggling retailers of discretionary products as consumers watch their spend in light of record debt levels, low wage growth and volatile markets.Pitcher Partners

26
Methodology
For this publication, Pitcher Partners commissioned Mergermarket to canvass the opinions of 60 M&A dealmakers in Australia. 60% of the respondents were from Australian corporations, 30% were from foreign corporations with operations in Australia, 5% were from Australian private equity firms, and 5% were from foreign private equity firms.
All dollar figures, unless otherwise stated, are in Australian dollars (AUD). Data used in this report was compiled on 1 January 2019 from the Mergermarket intelligence database, the S&P Capital IQ database, and additional sources noted within this report. Percentages may not sum to 100% due to rounding. M&A figures may include deals that fall outside Mergermarket’s official inclusion criteria. Unless otherwise stated, all date references refer to calendar year and not financial year.
Figure 23: How many mid-market domestic and cross- border acquisitions did you make in the last 12 months?
Domestic M&A Cross-border M&A
Figure 24: How would you categorise your company? Figure 25: Please describe your company
Figure 26: What was your company’s most recent annual revenue (AU$)?
1.7%
0 6 12 18 24 30
More than �ve
Three to �ve
One to two
None
Europe
South Asia
South East Asia
South America
Africa
1.7%
30.0%
22.0%
68.3%
59.3%
0.0%
16.9%
27%
17%
7%
7%
3%
2%
2%
2%
0%
0%
Public company
Private company
80%
6% 6%9%
60%
5%
30%
5% Australian corporation
Australian private equity firm
Foreign corporation with operations in Australia
Foreign private equity firm
80%
6% 6%9%
9.3%
90.7%
0 6 12 18 24 30
Less than AU$10m (Small cap)
AU$10 - AU$49m (Mid-market)
AU$50m - AU$150m (Mid-market)
AU$151m - AU$250m (Mid-market)
More than AU$250m (Large cap)
0.0%
0.0%
14.8%
7.4%
77.8%

27
Figure 27: In which sector(s) is your company most active? Please select all that apply
Government
Industrials and chemicals
Financial services
Energy, mining and utilities
Defence
Technology and media
Other, please specify
Transportation
Real estate
Pharma, medical and biotech
Leisure
Consumer
Construction
Business services
Agriculture 3.3%
20.0%
6.7%
11.7%
1.7%
18.3%
11.7%
11.7%
11.7%
0.0%
3.3%
10.0%
21.7%
8.3%
6.7%
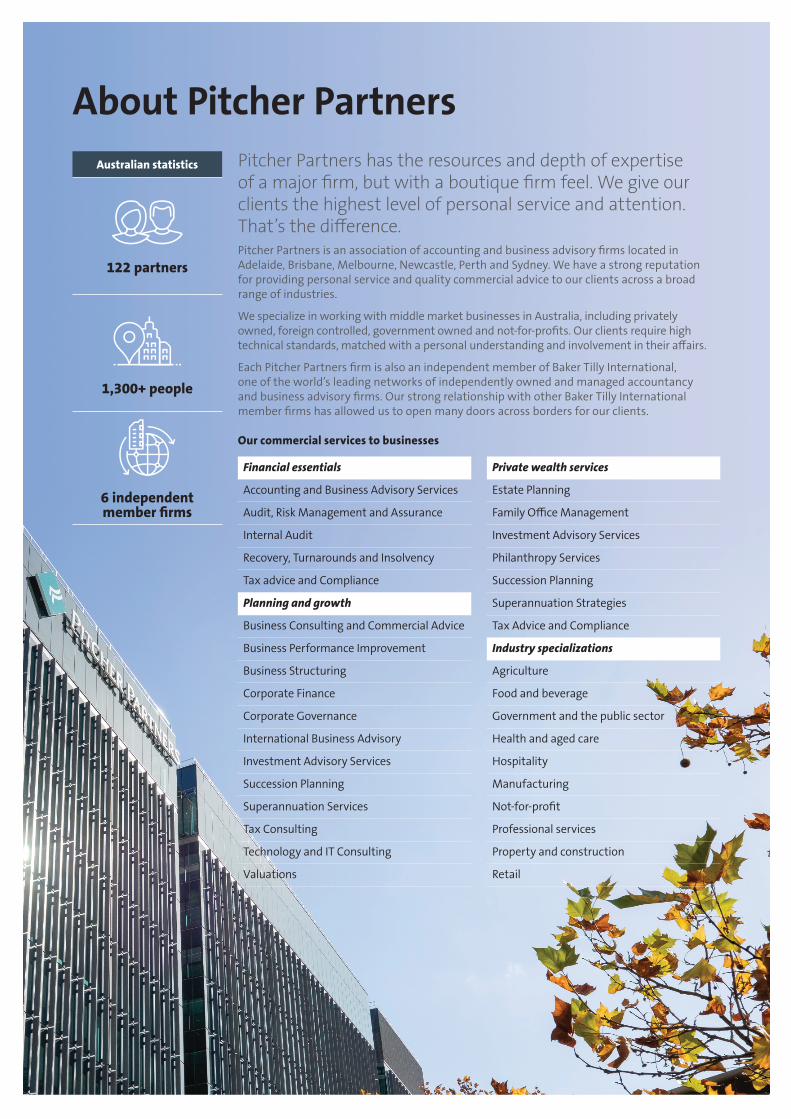
About Pitcher PartnersPitcher Partners has the resources and depth of expertise of a major firm, but with a boutique firm feel. We give our clients the highest level of personal service and attention. That’s the difference.Pitcher Partners is an association of accounting and business advisory firms located in Adelaide, Brisbane, Melbourne, Newcastle, Perth and Sydney. We have a strong reputation for providing personal service and quality commercial advice to our clients across a broad range of industries.
We specialize in working with middle market businesses in Australia, including privately owned, foreign controlled, government owned and not-for-profits. Our clients require high technical standards, matched with a personal understanding and involvement in their affairs.
Each Pitcher Partners firm is also an independent member of Baker Tilly International, one of the world’s leading networks of independently owned and managed accountancy and business advisory firms. Our strong relationship with other Baker Tilly International member firms has allowed us to open many doors across borders for our clients.
Our commercial services to businesses
Australian statistics
122 partners
1,300+ people
6 independent member firms
Financial essentials
Accounting and Business Advisory Services
Audit, Risk Management and Assurance
Internal Audit
Recovery, Turnarounds and Insolvency
Tax advice and Compliance
Planning and growth
Business Consulting and Commercial Advice
Business Performance Improvement
Business Structuring
Corporate Finance
Corporate Governance
International Business Advisory
Investment Advisory Services
Succession Planning
Superannuation Services
Tax Consulting
Technology and IT Consulting
Valuations
Private wealth services
Estate Planning
Family Office Management
Investment Advisory Services
Philanthropy Services
Succession Planning
Superannuation Strategies
Tax Advice and Compliance
Industry specializations
Agriculture
Food and beverage
Government and the public sector
Health and aged care
Hospitality
Manufacturing
Not-for-profit
Professional services
Property and construction
Retail
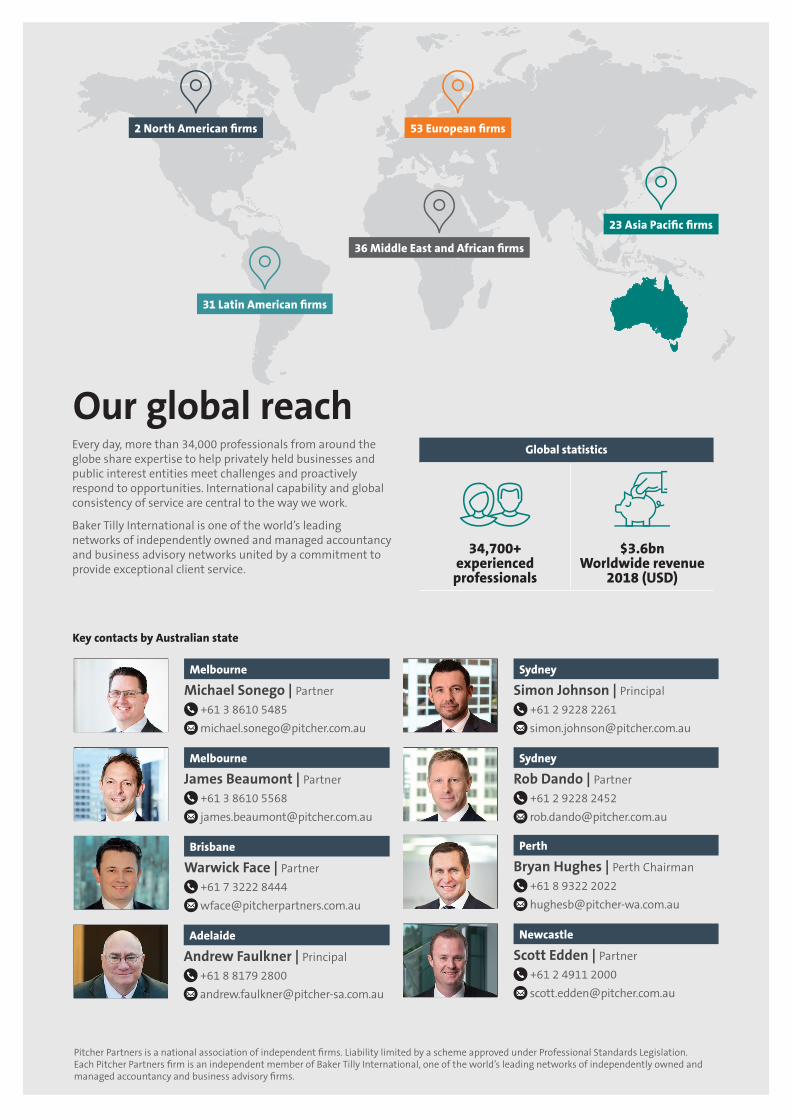
Our global reachGlobal statistics
34,700+ experienced professionals
$3.6bn Worldwide revenue
2018 (USD)
23 Asia Pacific firms
53 European firms
36 Middle East and African firms
2 North American firms
31 Latin American firms
Key contacts by Australian state
Michael Sonego | Partner
+61 3 8610 5485
Melbourne
James Beaumont | Partner
+61 3 8610 5568
Melbourne
Warwick Face | Partner
+61 7 3222 8444
Brisbane
Bryan Hughes | Perth Chairman
+61 8 9322 2022
Perth
Scott Edden | Partner
+61 2 4911 2000
Newcastle
Andrew Faulkner | Principal
+61 8 8179 2800
Adelaide
Simon Johnson | Principal
+61 2 9228 2261
Sydney
Rob Dando | Partner
+61 2 9228 2452
Sydney
Every day, more than 34,000 professionals from around the globe share expertise to help privately held businesses and public interest entities meet challenges and proactively respond to opportunities. International capability and global consistency of service are central to the way we work.
Baker Tilly International is one of the world’s leading networks of independently owned and managed accountancy and business advisory networks united by a commitment to provide exceptional client service.
Pitcher Partners is a national association of independent firms. Liability limited by a scheme approved under Professional Standards Legislation. Each Pitcher Partners firm is an independent member of Baker Tilly International, one of the world’s leading networks of independently owned and managed accountancy and business advisory firms.

About Mergermarket
Acuris Studios, the events and publications arm of Acuris, offers a range of publishing, research and events services that enable clients to enhance their brand profile, and to develop new business opportunities with their target audience.
To find out more, please visit www.acuris.com
Please contact: Pearlie Sham Business Development Manager, Acuris Studios Tel: +852 2158 9788
Mergermarket is an unparalleled, independent mergers & acquisitions (M&A) proprietary intelligence tool. Unlike any other service of its kind, Mergermarket provides a complete overview of the M&A market by offering both a forward-looking intelligence database and a historical deals database, achieving real revenues for Mergermarket clients.
DisclaimerThis publication contains general information and is not intended to be comprehensive nor to provide financial, investment, legal, tax or other professional advice or services. This publication is not a substitute for such professional advice or services, and it should not be acted on or relied upon or used as a basis for any investment or other decision or action that may affect you or your business. Before taking any such decision, you should consult a suitably qualified professional adviser. Whilst reasonable effort has been made to ensure the accuracy of the information contained in this publication, this cannot be guaranteed and neither Mergermarket nor any of its subsidiaries or any affiliate thereof or other related entity shall have any liability to any person or entity which relies on the information contained in this publication, including incidental or consequential damages arising from errors or omissions. Any such reliance is solely at the user’s risk.
www.mergermarket.com
1501 Broadway, 8th FloorNew York NY 10036USA
t: +1 212 686 5606f: +1 212 686 2664
10 Queen Street Place LondonEC4R 1BEUnited Kingdom
t: +44 (0)20 7059 6100f: +44 (0)20 7059 6101
16/FGrand Millennium Plaza181 Queen’s Road, CentralHong Kong
t: +852 2158 9700f: +852 2158 9701
MELBOURNE
ADELAIDE
SYDNEY
BRISBANE
PERTH
NEWCASTLE
PITCHER.COM.AU
+61 3 8610 [email protected]
+61 8 8179 [email protected]
+61 2 9221 [email protected]
+61 7 3222 [email protected]
+61 8 9322 [email protected]
© Pitcher Partners+61 2 4911 [email protected]
Pitcher Partners is an association of independent firms. Liability limited by a scheme approved under Professional Standards Legislation.
Disclaimer Each Pitcher Partners firm is an independent member of Baker Tilly International. Baker Tilly International Limited is an English company. Baker Tilly International provides no professional services to clients. Each member firm is a separate and independent legal entity, and each describes itself as such. Pitcher Partners is not Baker Tilly International’s agent and does not have the authority to bind Baker Tilly International or act on Baker Tilly International’s behalf. None of Baker Tilly International, Pitcher Partners, nor any of the other member firms of Baker Tilly International has any liability for each other’s acts or omissions. The name Baker Tilly and its associated logo is used under licence from Baker Tilly International.