dealing with a triple crisis
TRANSCRIPT

WORLD BANK GROUP
PAPUA NEW GUINEA ECONOMIC UPDATE JANUARY 2021
Dealing with a Triple Crisis
Pub
lic D
iscl
osur
e A
utho
rized
Pub
lic D
iscl
osur
e A
utho
rized
Pub
lic D
iscl
osur
e A
utho
rized
Pub
lic D
iscl
osur
e A
utho
rized


PAPUA NEW GUINEA ECONOMIC UPDATE Dealing with a Triple Crisis
January 2021
Preface and Acknowledgments
This publication is the sixth in the current series of Papua New Guinea Economic Updates (PNG EU). It has two principal aims. First, it analyzes the key recent developments in Papua New Guinea’s economy and places these in a longer-term and global context. Based on these developments and recent policy changes, the PNG EU updates the outlook for the country’s economy and the welfare of its citizens. Second, the PNG EU provides an in-depth examination of a selected development issue and evaluates the implications of recent trends and policy reforms in terms of the government’s stated development objectives. It is intended for a broad audience, including policy makers, business leaders, and the community of analysts and professionals engaged in Papua New Guinea’s evolving economy.
The PNG EU was compiled by the Macroeconomics, Trade and Investment Global Practice, under the guidance of Lars Moller (Practice Manager) and Stefano Mocci (Country Manager). The core economic team comprises Ilyas Sarsenov, John Grinyer, and Rashad Hasanov. The special focus section on institutional capital was prepared by Virginia Horscroft, David Craig, Doug Porter, George Bopi, Nao Badu, Kerenssa Kay, Donna Andrews, Andrew Ragatz, Ryoko Tomita, Kenglin Lai, Aneesa Arur, Rochelle Eng, Alan Cairns, Matthew Dornan, Eric Blackburn, Noroarisoa Rabefaniraka, Satoshi Ogita, Hedwig Kembek, Allan Tobalbal Oliver, Viet Anh Nguyen, Vishesh Agarwal, and Boer Xia. The team would like to acknowledge contributions provided by Ekaterine Vashakmadze, Maham Faisal Khan, Katia D'Hulster, and Wilfred Lus. Michelle Lee and Rachel Leka provided administrative support. Bronwen Brown edited the text. Dissemination is organized by Tom Perry, Hamish Wyatt, Ruth Moiam, and Helen Wagambie.
The team is grateful to the Bank of Papua New Guinea, the Department of Treasury, the Internal Revenue Commission, the Village Courts and Land Mediation Secretariat of the Department of Justice and Attorney General, the Department of Education, the National Department of Health, and the Department of Works and Implementation for their collaboration in the development of this report. The team would like to express appreciation for feedback from Paul Vallely, Fily Sissoko, David Gould, Shilpa Pradhan, Jane Sprouster, Ekaterine Vashakmadze, Ergys Islamaj, Duong Le, Deborah Isser, and Vera Kehayova.
This report is a product of the staff of the International Bank for Reconstruction and Development/The World Bank. The findings, interpretations, and conclusions expressed in this report do not necessarily reflect the views of the Executive Directors of the World Bank or the governments they represent. The World Bank does not guarantee the accuracy of the data included in this work. The boundaries, colors, denominations, and other information shown on any map in this work do not imply any judgment on the part of the World Bank concerning the legal status of any territory or the endorsement or acceptance of such boundaries.
Cover design is by Félix Genêt Laframboise. Cover photographs are by Rachel Gunn, Jeremy Mark, and Elodie Van Lierde. Chapter photographs are by Parrotfish Journey, EMTV Online, The Road Provides, Ian Geraint Jones, David Craig. All rights reserved.
To be included on an email distribution list for this Economic Update series and related publications, please contact Ruth Moiam: [email protected]. For questions and comments relating to this publication, please contact Ilyas Sarsenov: [email protected]. For information about the World Bank and its activities in Papua New Guinea, please visit www.worldbank.org/png.

Abbreviations and Acronyms
LNG Liquefied natural gas
LMIC Lower-middle-income country
MP Member of parliament
MMBtu Million Metric British thermal units
NDoH National Department of Health
NRA National Roads Authority
NEC National Executive Council
PHA Provincial Health Authority
PIP Public Investment Program
PNG Papua New Guinea
PNG EU Papua New Guinea Economic Update
PNG LNG Papua New Guinea Liquefied Natural Gas Project
PIT Personal income tax
PSIP Provincial Services Improvement Program
SOE State-owned enterprise
TFF Tuition Fee Free
WGI Worldwide Governance Indicators
ADB Asian Development Bank
BPNG Bank of Papua New Guinea
CIT Corporate income tax
CPIA Country Policy and Institutional Assessment
CHW Community health worker
DDA District Development Authority
DoTI Department of Transport and Infrastructure
DoW Department of Works and Implementation
DSIP District services improvement program
EAP East Asia and Pacific region
GDP Gross domestic product
GST Goods and services tax
GTFS Government Tuition Fee Subsidy
IMF International Monetary Fund
IRC Internal Revenue Commission
ITC Infrastructure tax credit
LLG Local level governments

IV
Table of Contents
EXECUTIVE SUMMARY .......................................................................................................... VII
A. ECONOMIC UPDATE: DEALING WITH A TRIPLE CRISIS .............................................. 1
1. Recent economic developments .......................................................................................... 3
1.1. Economic growth ................................................................................................................................ 3
1.2. Fiscal developments ............................................................................................................................ 7
1.3. Monetary policy and price developments ...................................................................................... 12
1.4. External sector ................................................................................................................................... 16
2. Outlook and risks .............................................................................................................. 20
2.1. Global economic outlook and risks ................................................................................................ 20
2.2. Papua New Guinea’s economic outlook and risks ....................................................................... 21
B. SPECIAL FOCUS: INSTITUTIONAL CAPITAL FOR PUBLIC SERVICE DELIVERY ... 25
1. What is institutional capital and why does it matter in Papua New Guinea? ................... 27
1.1. Institutions and everyday life in Papua New Guinea ................................................................... 27
1.2. Understanding institutions: rules, roles, and resources ................................................................ 28
1.3. Understanding public institutional capital: grasp and reach ........................................................ 29
1.4. Focus of this report ........................................................................................................................... 29
2. Institutional capital: stocktaking, constraints, and opportunities ..................................... 31
2.1. Institutional capital for basic order and justice ............................................................................. 33
2.2. Institutional capital for basic education ......................................................................................... 37
2.3. Institutional capital for basic health ................................................................................................ 44
2.4. Institutional capital for roads ........................................................................................................... 49
2.5. Institutional capital for public revenue ........................................................................................... 55
3. Recommendations and priorities for strengthening institutional capital ......................... 61
ANNEXES..................................................................................................................................... 69
REFERENCES ............................................................................................................................. 73

V
LIST OF FIGURES
Figure 1. PNG’s Real GDP Growth, 2017–20 .............................................................................................................. 4 Figure 2. Trading Partners’ GDP Growth, 2019–20 .................................................................................................... 4 Figure 3. Human Mobility During the Pandemic .......................................................................................................... 5 Figure 4. EAP Downgrades in 2020 Growth ................................................................................................................. 5 Figure 5. Average Severity of Pandemic Restrictions ................................................................................................... 5 Figure 6. Government Revenue in 2014–20 .................................................................................................................. 8 Figure 7. Government Debt in 2014–22 ......................................................................................................................... 9 Figure 8. Interest Payments in 2012–20 .......................................................................................................................... 9 Figure 9. Output Gap and Primary Balance, 2012–21 ................................................................................................ 10 Figure 10. Budget Deficit Forecasts............................................................................................................................... 10 Figure 11. Consumer Price Inflation ............................................................................................................................. 13 Figure 12. Contribution to Total CPI in June 2020 .................................................................................................... 13 Figure 13. Commercial Bank Lending ........................................................................................................................... 14 Figure 14. Advances Classified by Interest Rate .......................................................................................................... 14 Figure 15. Current Account Balance Composition ..................................................................................................... 17 Figure 16. Major Commodity Export Items................................................................................................................. 17 Figure 17. Composition of Financing by Instrument in 2021 ................................................................................... 18 Figure 18. Currency Depreciation Rates in 2019 and 2020 ........................................................................................ 18 Figure 19. Imports Dynamics and Availability of International Reserves ............................................................... 18 Figure 20. Real GDP Levels in 2018–23 ....................................................................................................................... 22 Figure 21. The New Fiscal Consolidation Path ........................................................................................................... 22 Figure 22. Institutions and Institutional Capital .......................................................................................................... 29 Figure 23. Tiers of Government in PNG ..................................................................................................................... 32 Figure 24. CPIA and Public Sector Management Cluster .......................................................................................... 32 Figure 25. WGI and Government Effectiveness Indicator ....................................................................................... 32 Figure 26. WGI Voice and Accountability, and Control of Corruption Indicators ............................................... 33 Figure 27. Who are those involved in solving problems or community issues? (Gulf Province) ........................ 33 Figure 28. Expansion in Schools, Students, and Teachers, 2000–18 ....................................................................... 38 Figure 29. Trends in Basic Proficiency and Mean Scores, PNG ............................................................................... 39 Figure 30. Learning-adjusted School Years, LMICs.................................................................................................... 39 Figure 31. Provincial Variation in Minimum Proficiency Levels for Literacy in Year 6 (2015 PILNA) ............ 42 Figure 32. Key Health Indicators ................................................................................................................................... 45 Figure 33. Key Health Entities ....................................................................................................................................... 45 Figure 34. Provincial Health Performance.................................................................................................................... 47 Figure 35. Provincial Health Staff Deployment ........................................................................................................... 47 Figure 36. Agricultural Livelihoods in PNG vs LMICs .............................................................................................. 50 Figure 37. Road Density in PNG vs LMICs ................................................................................................................ 50 Figure 38. PNG’s Road Network ................................................................................................................................... 51 Figure 39. Estimated Road Maintenance Spending Required Versus Actual Spending ........................................ 53 Figure 40. Revenue and Tax Revenue Collection ........................................................................................................ 57 Figure 41. PNG Tax Comparisons ................................................................................................................................ 57 Figure 42. PNG Revenue Collection by Tax Type ...................................................................................................... 58 Figure 43. PNG Tax Mix Comparisons, 2018 ............................................................................................................. 58 Figure 44. IRC Staffing .................................................................................................................................................... 59 Figure 45. PNG Customs Service Staffing ................................................................................................................... 59

VI
LIST OF TABLES
Table 1. Key Macro-Fiscal Indicators, 2017–24 ..........................................................................................................IX Table 2. Other Indicators of Economic Activity ........................................................................................................... 5 Table 3. Government Revenues, January–June 2020 .................................................................................................... 8 Table 4. Key Government Budget Parameters, 2020 and 2021 .................................................................................. 9 Table 5. Real GDP Growth, 2017–22 ........................................................................................................................... 21 Table 6. Real GDP Growth: Baseline and Low-Case Scenarios in 2021–24 .......................................................... 23 Table 7. Summary of Recommendations ...................................................................................................................... 67
LIST OF BOXES
Box 1. Implications of Porgera mine’s closure .............................................................................................................. 6 Box 2. The functional allocation of the government budget ..................................................................................... 11 Box 3. Changes to the Central Banking Act ................................................................................................................. 15 Box 4. What are village courts? ....................................................................................................................................... 34 Box 5. How do school governance arrangements work? ........................................................................................... 41

Executive summary
EXECUTIVE SUMMARY
Economic Update and Special Focus


IX
A. Economic Update: Dealing with a Triple Crisis
In 2020, Papua New Guinea faced three crises: the COVID-19 health emergency, an economic
contraction, and political turmoil. Although the country largely avoided the health emergency experienced
elsewhere, as of end-January 2021, Papua New Guinea had recorded more than 860 confirmed cases of
COVID-19 and 9 deaths.1 As a result of pandemic-related restrictions and weaker demand, it is estimated that
real GDP contracted by 3.8 percent in 2020 (compared to a pre-crisis projection of 2.9 percent growth), and
the fiscal deficit widened to 8.1 percent of GDP (3 percentage points larger than the pre-crisis projection).
Consequently, the debt-to-GDP ratio surged to 49 percent (9 percentage points higher than the pre-crisis
projection). At the same time, unemployment increased, affecting the most vulnerable households, including
women and youth. On top of these new challenges, the government faced a political crisis, with a threatened
no-confidence vote and delays in approving the 2021 National Budget.
Table 1. Key Macro-Fiscal Indicators, 2017–24 2017 2018 2019 2020 2021 2022 2023 2024
Est. Est. Projections*
GDP growth (percent) 3.5 -0.3 5.9 -3.8 3.5 4.2 2.4 2.6 Resource sector 4.5 -3.7 9.3 -5.8 4.3 5.6 1.4 1.8 Non-resource economy 1.5 2.7 2.4 -0.2 1.1 2.0 2.5 2.6 Overall fiscal deficit (percent of GDP) -2.5 -2.6 -5.0 -8.1 -7.3 -5.3 -3.2 -2.1 Public debt, net (percent of GDP) 35.9 36.6 39.5 49.0 52.2 53.3 54.3 54.0 Current account balance (percent of GDP) 23.8 23.5 22.2 23.8 14.5 9.3 3.8 4.0
Sources: PNG National Statistical Office; World Bank staff estimates and projections. Note: *A sizable rebound in 2021–22 will be driven by the resource sector, which is expected to grow slower in 2023–24.
Despite a rapid launch of the emergency health and economic support program, legal and funding
issues slowed its implementation. In April 2020, the government announced an anti-crisis program of
PGK 1.8 billion (about US$500 million, or 2.2 percent of GDP), comprising budget and off-budget funding.
By the end of October 2020, only 74 percent of the fiscal stimulus program has been warranted. The lack of
formal safety net programs constrained government support to poor households. Cash constraints—due to
reduced domestic revenue (as discussed in Part B) and backloaded external support from development
partners2—slowed the implementation of health and economic relief measures initially. The government
focused on securing foreign grants and loan support and amended the Central Banking Act to tap into
domestically available funding at the Bank of Papua New Guinea (BPNG). Budget support provided by the
Government of Australia and the Asian Development Bank (ADB) led to an increase in international reserves
at the end of 2020, affecting the pace of exchange rate adjustment.
Considering that the economy entered the COVID-19 crisis with a poor record of resilience to external
shocks, strengthening macroeconomic management and accelerating structural reforms will be vital.
Economic growth is expected to rebound to about 3.5 percent in 2021–22, but the economy will be 9 percent
smaller in 2023 compared to our pre-pandemic forecast. Risks to the outlook are firmly weighted to the
downside. The main risks include the possibility that the COVID-19 pandemic lingers and has an enduring
economic impact. For more inclusive and sustainable development over the medium term, the authorities will
need to ensure that frontline health services continue to deliver during the crisis, introduce safety nets for the
poor and vulnerable, support firms and employment in the informal sector, and strengthen the macroeconomic
policy framework, including a renewed focus on fiscal consolidation. Strengthening and investing in key
institutions that deliver basic public services, especially during crises, will be vital, as discussed in a special focus
section of this report.
1 Data from the National Department of Health (https://covid19.info.gov.pg/). 2 Except for the International Monetary Fund (IMF), which disbursed a Rapid Credit Facility loan in June 2020.

X
B. Special Focus: Institutional Capital for Public Service Delivery
The delivery of basic services in Papua New Guinea is extraordinarily challenging. The population is
highly dispersed and fragmented, as a result of the mountainous and archipelagic geography, low urbanization
rate, high ethno-linguistic diversity, and social identities that are primarily small-scale. Papua New Guinea shares
the political economy characteristics of resource-rich states. These combine with Papua New Guinea’s political
structures and small-scale social identities to yield a political system and state that is increasingly dominated by
patron-client relationships. In this context, it is very challenging for the state to be able to provide its population
with basic services such as order and justice, education, health and roads. To understand how it does so, and
why it is more successful in some areas than in others, requires an understanding of the capabilities of the
institutions involved.
This special focus section uses an institutional capital framework to examine how Papua New
Guinea’s institutions actually work and their existing capabilities. The approach recognizes that the
capabilities that institutions have are a product not only of factors internal to institutions, but also of factors in
the broader social, economic, geographic, and political context. The section focuses on institutions that provide
basic services—village courts, education, health, and roads—and institutions that collect public revenues to
fund these basic services. It provides a stocktaking of institutional capital in these sectors and analyzes key
resilience factors and opportunities, and key vulnerabilities and constraints, in each sector.
The analysis shows that the capability to deliver basic services depends on how effectively different
state and non-state institutions come together to jointly provide the services. No single scale or type of
institution—state or non-state—has the requisite capabilities alone. Only through joint efforts can the
capabilities required for service delivery in this extraordinarily challenging context be mobilized. The analysis
shows that institutional capital is weakest where these partnerships are weak or absent. This tends to be more
the case where: the service requires significant amounts of capital spending, or significant amounts of non-
salary recurrent spending controlled centrally by a single institution; the political value of the service can be
gained even if the service is provided only to a narrow set of beneficiaries; the service is complex; local-level
partnerships are vulnerable to the intrusion of patron-client relationships from higher tiers of government; or
there is a large divergence between the rules coming from the different institutions jointly providing the service.
Key recommendations for policy makers, development partners, and other stakeholders include:
• In revenue, donors should continue to support Papua New Guinea to access to the global expertise
needed to negotiate and implement agreements that secure a proper share of natural resource proceeds
for consolidated revenue, even though political economy dynamics work against such outcomes.
• In basic order and justice, government should make the modest investments required to increase the
village court system’s coverage in urban settlements and to increase the representation of women
magistrates. These changes are partly implemented, but the funds to complete them are outstanding.
• In basic education, the priority should be to protect and raise the importance and authority of local
school boards, to further strengthen local ownership and accountability for basic education.
• In basic health, government needs to reduce the sector’s vulnerability to fiscal volatility, especially for
church health providers, which has been starkly illustrated during the COVID-19 health emergency
covered in Part A. Provincial Health Authorities should be supported to establish and maintain
effective partnerships with institutions across the health sector, to address institutional fragmentation.
• In roads, at the national level, donors should take measures to safeguard funding for maintenance
work in roads investments. At the subnational level, there is the opportunity to build on function grants
for road maintenance, and substantially increase the incentives for maintenance, by providing results-
based grants to provinces that successfully maintain provincial and local roads.

A. Economic Update: Dealing with a Triple Crisis
Part A
ECONOMIC UPDATE
Dealing with a Triple Crisis


P a p u a N e w G u i n e a E c o n o m i c U p d a t e J a n u a r y 2 0 2 1
3
Papua New Guinea practices COVID-19 prevention. Photo: Parrotfish Journey/Shutterstock.com.
1. Recent economic developments
1.1. Economic growth
1. The COVID-19 pandemic has spurred a global recession surpassed only by the two World
Wars and the Great Depression. The global economy has started growing again since the last quarter of 2020,
led by Asia (mainly China and Vietnam), but the pandemic is expected to keep economic activity and incomes
below their pre-pandemic levels for a prolonged period. The easing of lockdowns after the first wave supported
a recovery in economic activity. However, a second wave—corresponding with the northern hemisphere’s
winter and the emergence of more contagious strains in Europe, Brazil, and South Africa—has caused a
resurgence of cases and the reimposition of restrictions in many economies. The World Bank estimates that
global economic growth contracted by 4.3 percent in 2020, compared to a pre-pandemic forecast of 2.5 percent
growth, while global investment is estimated to have fallen by about 5 percent (World Bank 2021).
2. Papua New Guinea’s economy has been hit by weaker external demand and less favorable
terms of trade due to the global pandemic. The World Bank estimates that real GDP contracted by
3.8 percent in 2020, driven mainly by a sharp decline in the resource sectors (Figure 1). With Papua New Guinea
not being dependent on inflows from tourism or remittances, international trade has been the most significant
external transmission channel for the pandemic. Papua New Guinea’s main trading partners—Australia, China,
and Japan—saw a slowdown in their GDP growth prospects (Figure 2), with negative implications for PNG’s

P a p u a N e w G u i n e a E c o n o m i c U p d a t e J a n u a r y 2 0 2 1
4
overwhelmingly commodity-based export basket. Although prices for gold, copper, palm oil, timber, and coffee
have all risen over the past 12 months, large falls in prices for liquefied natural gas (LNG) and crude oil have
pushed down PNG’s overall export prices. Together, these negative volume and price effects have led to a
substantial fall in export revenue, with negative implications for aggregate demand.
3. On the supply side, both pandemic and non-pandemic issues constrained output. Weaker
external demand and disruptions due to the March–April lockdown contributed to falls in the production of
palm oil (-5.8 percent year on year), hard logs (-13 percent), marine products (-8 percent), and coffee (-30
percent). The closure of many businesses during the country’s 6-week lockdown negatively impacted the service
sector. Meanwhile, the Porgera gold mine in Enga province has been closed and is under maintenance—halting
production—since April 25, 2020, as discussions on its future take place (Box 1). The mine produced just 5.7
tons of gold in 2020 (before the closure), a 70-percent decline from the 18.6 tons produced in 2019. The
shutdown is estimated to have reduced GDP by 1.5 percentage points in 2020. Combined with the temporary
closure of the Ok Tedi mine (as a COVID-19 prevention measure), gold export volumes fell by 24 percent year
on year in the first half of 2020. While gold prices hit record highs, Papua New Guinea did not benefit from
production increases or higher government revenues due to these issues.
Figure 1. PNG’s Real GDP Growth, 2017–20 (Annual percent change)
Figure 2. Trading Partners’ GDP Growth, 2019–20 (Annual percent change)
Sources: PNG National Statistical Office; World Bank staff estimates. Sources: World Bank Global Economic Prospects; IMF World Economic Outlook.
4. Available data suggest a significant downturn in the non-resource economy in 2020. Data for
the first half of 2020 show a decline in most indicators, including employment, goods and services tax (GST)
collections, and non-mineral exports (Table 2). The financial, business, and other services sectors experienced
the largest falls in employment, declining by 14 percent; manufacturing employment rose by 5 percent (not
enough to offset the overall fall in employment). Collections of GST fell by 5.9 percent year on year in the first
half of 2020, and non-resource exports were down 5.6 percent, reflecting declines in both prices and volumes.
Mobility data provided by Facebook (using cell phone GPS information) show a 16 percent reduction in
people’s movements during the March 24–May 4 lockdown period (Figure 3). While this reflects lower
economic activity, the fall in movement is considerably less than that seen in other countries in the region
during this period. Overall, non-resource GDP is estimated to have declined by 0.2 percent in 2020 (3.3
percentage points lower than the pre-pandemic forecast), the first and significant contraction since 2015.
-10
-8
-6
-4
-2
0
2
4
6
8China Japan
Taiwan,China Australia Philippines Thailand
Series1
Series2
2019
2020 pre-pandemic
2020 post-pandemic

P a p u a N e w G u i n e a E c o n o m i c U p d a t e J a n u a r y 2 0 2 1
5
Table 2. Other Indicators of Economic Activity (Annual percent change)
Figure 3. Human Mobility During the Pandemic (Percent change compared to before pandemic)
H1 2020
Growth compared to H1 2019 Non-mineral exports -5.6
Formal sector employment -4.0
GST Collections -5.9
Credit to non-extractive businesses and households
+2.7
Growth compared to Q1–Q3 2019
Imports from China (US$ value) +13.3
Imports from Australia (US$ value) -19.0
Sources: Bank of Papua New Guinea; China Customs; PNG Treasury. Source: Facebook Movement Range Maps (https://dataforgood.fb.com/tools/movement-range-maps/).
5. The pandemic is causing volatility in commodity prices, with gold prices rising and LNG
prices falling. Gold prices surged 27 percent year on year in 2020 to record-high levels. Meanwhile, as detailed
in the previous PNG Economic Update (World Bank 2020d, Box 2), falling oil prices have finally caught up
with PNG’s flagship liquified natural gas project, with LNG prices received falling to US$4.20 per million
metric British thermal units (MMBtu) in the third quarter of 2020, down from US$9.40 a year earlier. Although
this will impact on the profitability of the PNG LNG project, the decline in LNG prices is unlikely to have any
large fiscal impact on Papua New Guinea, as production will remain at full capacity and its contribution to
government revenues is relatively small (0.9 percent of GDP in 2017). As such, any decline in LNG prices is
not expected to have a significant impact on government finances.
6. Relatively, the impact of the pandemic on Papua New Guinea was not as bad, compared to
many other regional economies. Like some other relatively isolated economies in the Pacific region, Papua
New Guinea is likely to see a smaller growth impact than its more-open neighbors (Figure 4). Tourism-based
economies (such as Fiji and Palau) have been hit worst, while economies with the strictest lockdowns also
suffered. So far, Papua New Guinea’s economy has proven to be relatively resilient to the pandemic—tourism
is small, demand for gold is high, and LNG production has been largely unaffected. Meanwhile, although
PNG’s lockdown was not as severe as elsewhere (Figure 5), it had a significant impact on the non-resource
economy, as described above.
Figure 4. EAP Downgrades in 2020 Growth (Percentage point difference in forecast real GDP growth)
Figure 5. Average Severity of Pandemic Restrictions (Average stringency index, January 1–September 30)
EAP = East Asia and Pacific Source: IMF World Economic Outlook database.
Source: Oxford Covid-19 Government Response Tracker (https://covidtracker.bsg.ox.ac.uk/).
-70
-60
-50
-40
-30
-20
-10
0
10
20
Mar Apr May Jun Jul Aug Sep Oct Nov
Papua New Guinea
Australia
New Zealand
Indonesia
Country Average
-30
-25
-20
-15
-10
-5
0
0
10
20
30
40
50
60

P a p u a N e w G u i n e a E c o n o m i c U p d a t e J a n u a r y 2 0 2 1
6
Box 1. Implications of Porgera mine’s closure
The estimated impact on government revenue
The Government of Papua New Guinea entered negotiations with Canada’s Barrick Gold and China’s state-owned Zijin Mining in April 2020 on renewing the mining lease for the Porgera gold mine. In 2019, Porgera was the second most productive gold mine in the country, producing 18.6 tons and generating US$326 million in profits (earnings before interest, taxes, depreciation, and amortization). In 2017, the Extractive Industries Transparency Initiative, which publishes the most detailed information on PNG’s mining sector, estimated the ‘take’ from Porgera (the proportion of the profits that goes to the state) at around 11 percent in 2016, higher than for the Lihir mine (9 percent) but lower than the state-owned Ok Tedi mine (17.5 percent). These numbers—which are only approximations and date from 2017 when gold prices were 27 percent lower than in 2020—give a sense of the calculations underpinning the ongoing negotiations. Production at Porgera has been suspended since April 2020, costing the government roughly US$3 million per month in lost revenue (roughly 1 percent of total revenue). In a joint statement from the government and Barrick in late 2020, the parties announced their agreement in principle to reopen Porgera, ending a period of uncertainty. Although the exact date of reopening is not clear yet, if Porgera reopened in early 2021, the government would have foregone around US$24-36 million in revenue. The benefits of this loss are a higher take into the future. Assuming that the new take equals that of Ok Tedi (17.5 percent), then revenues will rise to around $4.8 million per month based on forecast gold prices and Barrick’s production cost estimates. In this scenario, the government would break even by April 2022. Of course, there are other costs involved—for example, retrenched mine workers’ lost incomes and the cost of any future equity investment in Porgera by the government to ensure a higher take. Moreover, many service providers have been impacted negatively by the Porgera closure as well. Nevertheless, while these calculations are simplistic approximations, they shed light on the revenue arithmetic behind renegotiating mining contracts.
Comparison of Assessable Income and State Revenue Received by Project, 2017 (US$, millions)
Porgera’s Estimated Government Revenues Under Different Scenarios (US$, millions)
Source: Extractive Industries Transparency Initiative. Source: World Bank staff calculations.
0 1,000 2,000 3,000 4,000
Porgera
Ok Tedi
Lihir
Total Government Revenue
Assessable Income
0
500
1,000
1,500
2,000
2,500
3,000
3,500
4,000
May
Au
gN
ov
Feb
May
Au
gN
ov
Feb
May
Au
gN
ov
Feb
May
Au
gN
ov
Feb
May
Au
gN
ov
Feb
May
Au
gN
ov
2020 2021 2022 2023 2024 2025
Business as usual Renegotiation
Breakeven in April 2022
Revenue gained
Revenue lost
P a p u a N e w G u i n e a E c o n o m i c U p d a t e J a n u a r y 2 0 2 1
7
The COVID-19 crisis has led to a sharp reduction in government revenue. Photo: EMTV Online.
1.2. Fiscal developments
7. The government forecast that the COVID-19 crisis will lead to a record-high fiscal deficit in
2020. The overall deficit was 5.0 percent of GDP in the first six months of 2020 (up from 3.9 percent in the
year-earlier period). This annualized figure compares to a pre-pandemic planned deficit of 5.1 percent.
Following a Supplementary budget in September 2020, the latest government projections are for the 2020
deficit to reach 8.1 percent of GDP, a record high for the country. Because spending is typically higher in the
second half of the year as capital spending accelerates, the deficit may reach this level, but this will depend on
whether capital investment accelerated as planned (the government executed less than one-quarter of its 2020
investment budget in the first half of the year).
8. Domestic revenues are estimated to have fallen for the year. Revenues fell by just 3.3 percent year
on year in the first half of 2020, with tax revenue down 0.2 percent—a smaller decline than in neighboring
countries (Table 3). Most of the drop was due to lower GST collections, unsurprising given the lockdown
during the period. Income taxes were broadly flat; customs duties increased slightly. No grants from
development partners were recorded in the first half of 2020, leaving a large hole in revenues. The authorities
reported that this was due to the delays caused by the repackaging of donor support as COVID-19 relief
funding. The authorities expected to receive PGK 932 million (1 percent of GDP) in grants in the second half
of the year. Looking at the bigger picture, revenues have been declining steadily since 2014. Non-resource taxes
have driven this decline, falling from over 16 percent of GDP in 2014 to an estimated 11.5 percent of GDP in
2020 (Figure 6).

P a p u a N e w G u i n e a E c o n o m i c U p d a t e J a n u a r y 2 0 2 1
8
Table 3. Government Revenues, January–June 2020 (Annual percentage change)
Figure 6. Government Revenue in 2014–20 (Percent of GDP)
Change from
H1 2019
Papua New Guinea
Tax revenue -0.2
Total domestic revenue -3.3
Australia
Tax revenue -3.6
Total domestic revenue -5.9
New Zealand
Tax revenue -3.3
Indonesia
Total domestic revenue -15.4
Sources: PNG Treasury; Australian Treasury; Statistics New Zealand; Ministry of Finance Indonesia.
Sources: PNG Treasury; World Bank staff estimates.
9. The government spending picture was mixed in 2020. Recurrent expenditure was up 5.4 percent
year on year in the first half of 2020, while capital spending was down 39 percent. The increase in recurrent
spending was almost entirely at the provincial level. In 2019 spending in the provinces was 36 percent (PGK
779 million) lower than budgeted, and higher spending in 2020 may reflect the payment of outstanding invoices
from 2019. Spending on personnel emoluments was up 10 percent compared with 2019, reflecting in part a 3-
percent pay increase. On capital spending, major expenditure items in the first half of 2020 were on the Service
Improvement Program (representing capital transfers to districts and provinces), the Waigani Court House,
and investments in commercial agriculture through the State Equity Fund.
10. Personnel emoluments continued to overspend. The Supplementary budget estimated that the
government required an additional PGK 90 million to cover public sector wages and salaries in 2020. The
National Department of Health (NDoH), Hospital Management Services, and the provisional health authorities
had all spent over 50 percent of their budget allocations by midyear, reflecting additional COVID-19–related
spending. The National Department of Education and several provincial administrations also spent above 50
percent of their budgets in the first half of the year, suggesting that local administrations continue to struggle
to keep within their budget ceilings.
11. COVID-19–related emergency fiscal spending totaled PGK 444 million (0.5 percent of GDP)
at the end of October.3 PNG’s COVID-19 emergency response funding comprised two programs: health and
security containment (PGK 280 million) and economic support programs (PGK 320 million). The largest
spending areas were (i) through the District Development Agency Containment Fund in the provinces, and
(ii) additional allocations to the NDoH. Tracking and adequately accounting for emergency spending programs
is critical (see paragraph 15 in the previous PNG Economic Update). The authorities are working on publishing
details of contracts awarded on the National Procurement Centre’s website.4 As part of the IMF Rapid Credit
Facility loan, authorities have also committed to delivering a consolidated report to the National Executive
Council within three months of the end of the State of Emergency and to conduct an independent audit within
a year of all the emergency spending.
3 This is much lower than fiscal stimulus programs initiated in the other EAP economies (World Bank 2020f) due to a very limited fiscal space available in Papua New Guinea. 4 See http://www.procurement.gov.pg/covid-19-procurement/.
0
5
10
15
20
25
2014 2015 2016 2017 2018 2019 2020
Non-resource revenue Total revenue and grants

P a p u a N e w G u i n e a E c o n o m i c U p d a t e J a n u a r y 2 0 2 1
9
12. Public debt is estimated to have reached 49 percent of GDP at end-2020 and is expected to
continue climbing. The most recent IMF–World Bank debt sustainability assessment raised Papua New
Guinea’s risk of debt distress from moderate to high. COVID-19 has deepened Papua New Guinea’s
challenges, but its increasing debt levels reflect previous years of overspending and further increase the urgency
of key revenue reform. A recent due-diligence exercise conducted by the current government has also revealed
substantial amounts of expenditure arrears accumulated by the previous administration, adding to the current
level of public debt. The government amended the Fiscal Responsibility Act (in 2018, 2019 and 2020) to adjust
the debt ceiling and accommodate expenditure arrears (Figure 7). Meanwhile, debt interest payments increased,
doubling from less than 5 percent of spending in 2012–13 to over 11 percent in 2017–20 (Figure 8).
Figure 7. Government Debt in 2014–22 (Percent of GDP)
Figure 8. Interest Payments in 2012–20 (Percent of spending)
Sources: PNG Treasury; World Bank staff estimates. Source: PNG Treasury.
13. The 2021 budget plans for a large overall fiscal deficit. If this deficit materializes, 2020 and 2021
would be record years for deficit spending, with an equivalent increase in government debt. The 2021 budget
projects a partial revenue recovery from the COVID-19 shock, while recurrent expenditure will increase, and
capital spending remains at 2020 levels. Interest payments will reach 2.5 percent of GDP; hence the primary
deficit will be 4.8 percent of GDP. We estimate that the non-resource economy will operate at 3.1 percent
below its potential level in 2021. As a result, the cyclically-adjusted primary deficit will reach 4.7 percent of
GDP, which is significantly larger than previously seen and reflects the government’s desire to support the
economy with additional spending (Figure 9). However, the fiscal stance for the 2021 budget is negative,
indicating that, on paper, the 2021 budget provides a smaller stimulus than the highly expansionary
Supplementary budget for 2020 (Table 4).
Table 4. Key Government Budget Parameters, 2020 and 2021 (Percent of GDP)
Revenue
and grants Expenditure Deficit
Cyclically adjusted deficit
Fiscal stance*
Original budget 2020 15.4 18.8 -3.4 -3.4 -1.6
Supplementary budget 2020 14.9 23.0 -8.1 -7.7 +2.7
Original budget 2021 14.4 21.7 -7.3 -6.9 -0.7 Sources: PNG Treasury; World Bank staff estimates. Note: * a positive fiscal stance indicates an expansionary budget; negative indicates contractionary.
-5
5
15
25
35
45
55
65
2014 2015 2016 2017 2018 2019e 2020e 2021f 2022f
Domestic debt
External debt
Fiscal Responsibility Actdebt ceiling
0
2
4
6
8
10
12
14
2012 2013 2014 2015 2016 2017 2018 2019 2020

P a p u a N e w G u i n e a E c o n o m i c U p d a t e J a n u a r y 2 0 2 1
10
14. An analysis of the 2021 Public Investment Program shows a large decrease in planned
investment in the health sector. The government maintains a Public Investment Program (PIP), which is
published as Volume 3 of the annual budget. The 2021 PIP plans spending of PGK 6 billion in 2021, with the
largest projects being in road construction and maintenance.5 In the health sector, the 2020 PIP planned for
PGK 4.9 billion in spending over the next 5 years, but this has been cut to PGK 1.7 billion in the 2021 PIP,
despite the establishment of 17 provincial health authorities.
15. Papua New Guinea’s budget forecasts tend to be optimistic, but that may not be the case this
time. Government deficits are typically larger than initial projections (Figure 10). This “optimism bias”—
whereby governments systematically overforecast revenues and underforecast spending—is common to many
economies. However, the forecasts in the 2021 budget show sizeable deficits for 2020 and 2021. Given the
relatively benign fiscal outturn in the first half of 2020, it may be that Papua New Guinea’s budget deficit will
be smaller than forecast for the first time.
Figure 9. Output Gap and Primary Balance, 2012–21 (Percent of GDP)
Figure 10. Budget Deficit Forecasts (PGK, millions)
Source: PNG Treasury; World Bank staff estimates. Source: Volume 1 of the Annual Budget, various years.
5 These projects include the Keltiga Junction to Kagamuga Airport road widening, the Highlands Highway Rehabilitation Programme, the Highlands Region Roads Improvement Program, and the Rural Bridge Program, which together account for 4 percent of PIP spending.

P a p u a N e w G u i n e a E c o n o m i c U p d a t e J a n u a r y 2 0 2 1
11
Box 2. The functional allocation of the government budget
Where does the money go?
The 2021 budget was presented against a fraught political backdrop in November 2020. The annual budget provides a useful pointer to a government’s spending priorities – whilst a budget speech may highlight the great work the government plans to do in green energy and child health, the numbers may paint a different picture—which areas see an increase in spending, and which a decline? The government has been making progress in presenting spending along functional lines—health, education, transport etc.—with the 2016 budget being the first to classify spending in this manner (see Volume 1 Table 12 in the annual budget). The categories match those in the second Medium-Term Development Plan which are different from the international COFOG standard6 but are good enough to see where the money is going. As figure below shows, the largest area of increase in the 2021 budget is ‘miscellaneous’ which includes a PGK 600 million allocation for the COVID-19 relief (shaded yellow), but also includes payments to settle various liabilities, including payment arrears (PGK 700 million), severance payments to civil servants who are still working but are over the age of 65 (PGK 430 million), payments to superannuation funds (PGK 309 million) and various other payments. In total, the ‘miscellaneous’ category amounts to PGK 3,136 million or 16 percent of total planned spending. Transport sees the second largest increase, this is largely capital spending on flagship road projects, including the Highlands Highway and the rural bridge program. Law and Justice (which includes the police) and Education see a shrinking allocation, with both seeing declines in their operational budgets (salaries, and goods and services)—this is partly down to an attempt to constrain spending, but with the number of school age children increasing by 1.1 percent a year, these cuts may not prove possible. The functional allocation of PNG’s spending deserves more attention, it is not just how much to spend and how much debt incurs that is important, where the money goes should also be scrutinized. Changes in sectoral spending between 2020 and 2021 budgets (PGK, millions)
Source: Volume 1 of the Annual Budget, various years.
6 Classification of the Functions of Government (https://unstats.un.org/unsd/classifications/Family/Detail/4).
P a p u a N e w G u i n e a E c o n o m i c U p d a t e J a n u a r y 2 0 2 1
12
A group of men selling and consuming betel nuts (areca nuts) at a street stall outside Port Moresby.
Photo: The Road Provides/Shutterstock.com.
1.3. Monetary policy and price developments
16. Annual headline inflation jumped from 3.5 percent in March to 6 percent in June 2020 (Figure
11), primarily driven by a sharp increase in betel nut prices. The latter recorded quarterly inflation of 16.5
percent, adding 3 percentage points to overall inflation (Figure 12). Despite pandemic-related disruptions to
supply chains and reduced agricultural production, food prices rose only modestly (2.7 percent in the second
quarter of 2020).7 Fruit and vegetable inflation increased by 3.7 percent in the second quarter of 2020. During
the reference period, the health category also recorded a large price increase (6.1 percent), reflecting surging
demand for pandemic-related health products such as face masks and other personal protective equipment.
Transport prices also rose (8 percent), reflecting increased transport fares, particularly for public transportation
and taxi services. In contrast, categories affected by lockdown measures and overall sluggish domestic economic
conditions (housing, clothing and footwear, education, household equipment) declined in the second quarter
of 2020. Despite the uptick in headline inflation, annual growth in underlying inflation that excludes seasonal
and price-controlled items stood at 2.9 percent.
7 This might reflect an important effect on households. For instance, loss of households’ incomes due to rising unemployment have led to food insecurity in countries globally, including in advanced economies.

P a p u a N e w G u i n e a E c o n o m i c U p d a t e J a n u a r y 2 0 2 1
13
Figure 11. Consumer Price Inflation (Percentage change)
Figure 12. Contribution to Total CPI in June 2020 (Quarterly CPI Index points, June)
Source: PNG National Statistics Office. Source: PNG National Statistics Office.
17. The broad money supply increased by 7.2 percent in the year to June 2020. The upswing in
money supply is due to an increase in private sector credit and net claims on the central government as the
Bank of Papua New Guinea (BPNG, the central bank) continued monetizing the fiscal deficit through the
purchase of COVID-19 bonds and other domestic debt instruments. With amendments to the Fiscal
Responsibility Act and the Central Banking Act, government debt financing is forecast to continue in the short
term. On the other hand, the increase in private sector credit reflects the use of overdraft facilities by firms to
maintain their operations during the economic downturn.
18. Business access to finance is a major impediment to private sector growth. Although credit from
commercial banks to businesses contracted by 2 percent in the second quarter of 2020, the year-on-year decline
was negligible (Figure 13). Advances to manufacturing, transport, and hotels and restaurants recorded major
contractions. On the other hand, lending to businesses in the construction and agriculture sectors increased
substantially compared to a year earlier. A recent PNG Business Pulse Survey—sanctioned by the Governor of
the BPNG to assess the impact of lockdown measures on micro, small, and medium-size enterprises—found
that 35 percent of respondents were aware of government stimulus measures. Just 5 percent of respondents
had applied for government support and credit assistance from financial institutions. Many business owners
also claimed that they did not benefit from the loan repayment holiday.
19. Addressing structural challenges in the financial sector is crucial for the country to recover
from the pandemic and build resilience to withstand future economic shocks. Many factors—high
informality, limited competition, poor financial literacy8—limit businesses’ access to finance and make
borrowing expensive. Papua New Guinea’s interest rate spreads are high: the average interest rate on loans
stood at 7.8 percent in June, while the deposit rate was just 0.9 percent. Greater competition in the banking
sector would help to lower these interest rate spreads.
8 These issues are widely discussed in the January 2019 edition of this publication.

P a p u a N e w G u i n e a E c o n o m i c U p d a t e J a n u a r y 2 0 2 1
14
Figure 13. Commercial Bank Lending (Percent)
Figure 14. Advances Classified by Interest Rate (Percent)
Source: Bank of Papua New Guinea. Source: Bank of Papua New Guinea.
20. The BPNG announced a series of policy measures to ensure adequate liquidity in the financial
system and to support the flow of financial resources to the real sector. These measures included a
reduction in the key policy rate—the Kina Facility Rate—lowering reserve requirements, and repurchasing of
government securities in the secondary market (a quantitative easing program). Reducing the cash reserve
requirement and implementing the quantitative easing program injected additional liquidity of around
PGK 1.4 billion (US$400 million) into the banking system. In response to the financial institutions’ agreement
to provide a temporary loan repayment holiday, the BPNG suspended loan-loss provisioning for the affected
loans. According to the latest figures from the BPNG, an estimated PGK 1.8 billion in loans have benefitted
from the repayment moratorium.
21. The government amended the Superannuation Act and the Central Banking Act in September
2020. The Superannuation Act was amended to allow employees to access their savings during the economic
downturn. Members directly affected by COVID-19 were entitled to a one-off payment of 20 percent of their
own contribution, up to a maximum of PGK 10,000. The Central Banking Act was amended to raise the limit
for the Temporary Advance Facility (TAF; Box 3). The government views the amendment to the Central
Banking Act as a necessary step to ensure sufficient cashflow, noting that the temporary advance must be repaid
at the end of the year, as required by the IMF’s Staff-Monitored Program.
22. The announced policy measures are commendable steps in ensuring financial and monetary
stability in Papua New Guinea, but their monitoring will be as important as their introduction. Before
the pandemic, the banking sector was stable and profitable with ample liquidity. The sector remains well
capitalized with an overall Tier 1 capital ratio of 30.1 percent and a nonperforming loan ratio of 5 percent.9 The
Bank of the South Pacific, one of the country’s major banks with important cross border operations in the
region, remained profitable and well-capitalized in 2020 with a Tier 1 ratio of 16 percent as at 30 June 2020,
down from 19.5 percent at the end of 2019. Policy makers should continue monitoring the financial sector’s
resilience and keep a close watch on banks’ and non-banks lender asset quality and loan remediation processes.
Once the temporary borrower support arrangements come to an end and government financial assistance
measures phase out, it is likely that nonperforming loans will increase further. Despite injecting additional
liquidity into the banking system, business lending has dropped while credit to households remained flat in the
9 Latest data available from the IMF Financial Soundness Indictors database. More background and comments on financial sector resilience are available in the WB Policy Brief “Financial Stability Impact of Covid-19 on Pacific Island Countries” to be published soon.
P a p u a N e w G u i n e a E c o n o m i c U p d a t e J a n u a r y 2 0 2 1
15
second quarter. The PNG Business Pulse Survey concluded that loan applications’ stringent requirements kept
firms from accessing credit to fund business activities during the lockdown period.
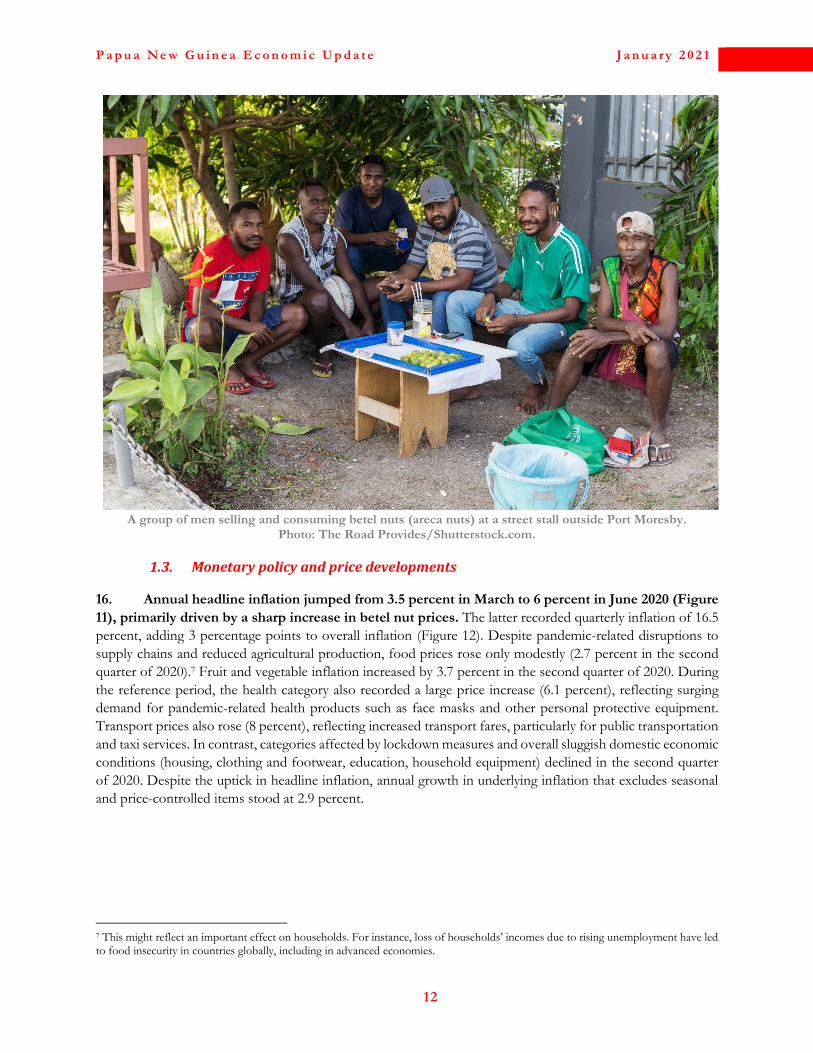
Box 3. Changes to the Central Banking Act Considerations for cashflow management
In line with international practice, the Government of Papua New Guinea has a Temporary Advance Facility (TAF) from
its central bank, BPNG. The TAF allows for temporary advances to the government to cover cash flow deficiencies
resulting from revenue–expenditure mismatches. Restrictions on lending to the government are important for monetary
policy stability and to preserve central bank independence. In practice, these restrictions may take different forms,
including blanket prohibitions or quantity limits and may limit the lending activity to a specific purpose and financing
maturity.
Papua New Guinea’s parliament adopted changes to the Central Banking Act in September 2020. The amendments
resulted in the following changes:
• The TAF’s upper ceiling was changed from PGK 300 million to 12 percent of the annual average total revenue
and grants receipts over the previous 3 years to the year in which advances are sought (an equivalent of about
PGK 1,500 million currently). After adjusting for inflation and applying the actual revenue figures to calculate
the new limit, the new BPNG lending limit is five times greater than the previous one.
• The maturity of lending was extended from 6 months before the amendment to 12 months from the date of
the advance. The IMF’s Staff-Monitored Programs requires TAF to be fully covered by the end of 2020.
• The BPNG can fund the government’s fiscal deficit, which was prohibited previously.
The government justifies these changes with cash flow timing in the 2021 budget, arguing that PNG’s TAF level is low
compared to its peer economies. An IMF analysis of limits on central bank lending to government in 150 economies
suggests that a common practice for TAF not to exceed 8 percent of total revenue. The PNG case goes above the general
practice.
While similar amendments help to ensure better management of cashflow, increasing the lending limit to the government
carries the risk of increasing potential exposure of the BPNG to future political pressure to monetize the deficit, leading
to fiscal dominance. Careful vigilance will be required. The academic literature on the macroeconomic and institutional
implications of central bank lending to government concludes that similar amendments may lead to reduced political and
operational autonomy of central banks. The review of the related literature also suggests that relaxing restrictions on
lending to government may disrupt a central bank’s objective of preserving price stability (Matamoros-Indorf, et al.,
2012).
Limits on Central Bank Lending to Government New and Previous Limits on Central Bank Lending
(Percent of revenues) (PGK, millions)
Source: Matomoros-Indorf, et al. 2012. Source: Bank of Papua New Guinea.
-
500
1,000
1,500
2,000
2015 2016 2017 2018 2019
New limit
Previous limit (adjusted for inflation)
0
10
20
30
40
50
60
Up to 10% 10%-20% 20%-30% > 30%

P a p u a N e w G u i n e a E c o n o m i c U p d a t e J a n u a r y 2 0 2 1
16
Weak external demand and domestic supply issues in the resource sector have reduced Papua New Guinea’s
export volumes. Photo: Ian Geraint Jones/Shutterstock.com.
1.4. External sector
23. The pandemic impacted Papua New Guinea’s external sector via falling export earnings, but
import compression and surging gold prices contained the damage. The current account surplus widened
in the first half of 2020, increasing by 14 percent year on year, supported by a strong merchandise trade
performance (Figure 15). Although prices for major exports recorded substantial declines, earnings from the
mining sector—notably, gold exports—sustained a sizeable trade surplus. Furthermore, continued import
compression contributed to the overall current account surplus. Lower export earnings were more than offset
by a 24 percent year-on-year decline in import spending in the first half of 2020. The services trade balance was
negative during the period, influenced by negative balances on transport, education, and other business services.
However, compared to the same period of 2019, the deficits in services and income narrowed. Together with
a small increase in transfers, these developments propelled the current account further into positive territory.
24. Export earnings fell 14.3 percent amid a slump in global demand and disruption to supply
chains. Prices of major exports have recorded a substantial drop since the start of the pandemic. Notably,
export receipts from mineral resources, including LNG (down 15 percent year on year), crude oil (down 22
percent), and copper (down 18 percent), recorded large declines (Figure 16). The increase in the price of gold
amid uncertainty surrounding the pandemic outweighed the negative impact of lower production due to the
Porgera mine closure. As a result, total export earnings from gold rose by 9 percent year on year in June 2020.

P a p u a N e w G u i n e a E c o n o m i c U p d a t e J a n u a r y 2 0 2 1
17
Agricultural commodity exports declined by 9.2 percent year on year, driven by lower export values for cocoa,
coffee, and logs, and only partially offset by higher receipts from palm oil exports.
Figure 15. Current Account Balance Composition (PGK, millions)
Figure 16. Major Commodity Export Items (Annual percent growth, June 2020)
Source: Bank of Papua New Guinea. Source: Bank of Papua New Guinea.
25. Import spending fell by 25 percent year on year in January–June 2020. Significant variations in
the various import categories’ growth rates reflect the pandemic’s impact on different sectors of the economy.
For example, imports of chemicals tripled relative to the first half of 2019 to meet the demand for COVID-19
essential supplies, including disinfectants. In contrast, food, beverage, and machinery imports recorded large
declines, reflecting slowing domestic economic activity. Import spending’s downward trajectory reflects import
compression, which tends to move in the same direction as gross international reserves in Papua New Guinea.
Decoupling of the two series occurred in the second quarter of 2020, mainly due to external financing inflows
under the IMF’s US$363 million Rapid Credit Facility.
26. The balance of payments recorded a small surplus in the first half of 2020, but the BPNG
projects a full-year deficit of PGK 1.3 billion. Outflows on the capital and financial account largely offset
the current account surplus in the first half. The capital account recorded a deficit of nearly PGK 9 billion in
January–June driven by continued financing commitments of key projects in the mineral sector and offshore
dividend payments. This will remain a feature of PNG’s external sector until the initial loan financing is paid
off. Ongoing tensions with foreign investors coupled with implications of the pandemic on financial inflows
may lead to deteriorating capital and financial account balance in the coming years.
27. Reduced domestic economic activity combined with export losses drove an increase in the
external financing requirement. External financing, particularly assistance from development partners, has
been instrumental in addressing budgetary and external financing gaps. Disbursement of US$363 million under
the Rapid Credit Facility from the IMF, and external budget support from the ADB, the World Bank, and
bilateral partners were major sources of external financing in 2020. The Supplementary budget increased the
overall financing requirement in 2020 to PGK 6.6 billion, of which PGK 4.3 billion was expected to be financed
from external sources. Similarly, the 2021 Budget implies a heavy reliance on external financing to close the
fiscal gap (PGK 2.3 billion, including repayments). Potential sources of financing include budget support from
the international agencies, the multilateral and bilateral partners (Figure 17). With a large interest rate differential
on domestic and external financing (weighted average interest paid on external borrowing is 3.2 percent as
opposed to 8.7 percent on domestic borrowing), the government is considering switching from domestic
borrowing to reduce the interest payments.

P a p u a N e w G u i n e a E c o n o m i c U p d a t e J a n u a r y 2 0 2 1
18
Figure 17. Composition of Financing by Instrument in 2021
(US$, millions)
Sources: PNG Treasury; World Bank staff estimates.
28. Sourcing this external financing will provide the much-needed injection into foreign exchange
reserves to ease the foreign exchange imbalance. With limited domestic and external borrowing
opportunities, both the fiscal and balance-of-payment financing gaps will likely need to be closed by a
drawdown of reserves, which are already under pressure. The combination of reduced mineral sector inflows
and higher demand for foreign currency to import medical supplies resulted in a reduction of foreign exchange
reserves (from US$2.3 billion at the end of 2019 to under US$2 billion in May 2020). Reserves increased briefly
following improved resources sector earnings and the inflow associated with the IMF’s Rapid Credit Facility.
However, a subsequent deterioration in the terms of trade and a drawdown of reserves brought the level of
official reserves to just over US$2 billion at the end of October 2020, providing 5.5 months of import cover.
Figure 18. Currency Depreciation Rates in 2019 and 2020 (Percent change in average US$/PGK exchange rate)
Figure 19. Imports Dynamics and Availability of International Reserves (US$ millions)
Source: Bank of Papua New Guinea. Source: Bank of Papua New Guinea.
29. The government’s attempt to secure better deal for the country from mining projects continue
to impact investor confidence and delay major mining projects. The closure of the Porgera gold mine
-0.60
-0.50
-0.40
-0.30
-0.20
-0.10
0.00
Jan
Mar
May Ju
l
Sep
No
v
Jan
Mar
May Ju
l
Sep
2019 2020
-
500
1,000
1,500
2,000
2,500
2015 2016 2017 2018 2019 2020
Imports Reserves

P a p u a N e w G u i n e a E c o n o m i c U p d a t e J a n u a r y 2 0 2 1
19
since April 2020 due to non-renewal of the Special Mining Lease reduced PNG’s gold production just as gold
prices hit a record high. The mine produced 284,000 ounces of gold in 2019 at an all-in sustaining cost of
US$1,003 per ounce. The operator estimated a 10.8 percent drop in its overall gold production in the third
quarter of 2020 was due to the closure of the Porgera mine. In addition, delays related to other resource projects,
including P’nyang and Wafu-Gopu are likely to shake investor confidence further, with knock-on effect on
economic growth, employment, and loss of tax revenue and foreign reserves.
30. There are some encouraging developments in the mining sector. In October 2020, the
government and Barrick agreed in principle to reopen the Porgera gold mine, ending a period of uncertainty.
And, in November 2020, parliament passed six pieces of legislation that will pave the way for the Papua LNG
project. The project, led by Total in partnership with Exxon and Oil Search, has received the green light from
the government. The Wafi-Golpu Joint Venture is also set to receive an environmental permit that will allow
the government to begin negotiations with the developer. Speedy resolution of these tensions related to mining
projects will ensure higher inflows of foreign currency and taxation revenue, supporting a stronger economic
recovery.
31. The Kina continued depreciating against major trading partner currencies. Currency
depreciation partially reflects deteriorating terms of trade and high import demand. However, cross-currency
movements have also contributed to a weakening of the domestic currency. Notably, the Australian dollar,
backed by strong mineral exports, started appreciating against the U.S. dollar in the second half of 2020. While
the Kina remained relatively stable at the beginning of the year, the global economic slowdown amid the
pandemic and perceived safe-haven status of the U.S. dollar put downward pressure on the Kina exchange rate
starting from March. The average monthly deprecation of the Kina against the U.S. dollar was 0.3 percent,
leading to a 2.5 percent depreciation from the start of the year to October 2020. Deprecation against the
Australian dollar was much faster (0.7 percent monthly on average since April 2020), resulting in a 6.8 percent
depreciation in the same period. These factors’ combined effects led to a 4.9 decline in the exchange rate’s
Trade Weighted Index.
32. The Kina remains overvalued against fundamentals despite an eighth consecutive annual
depreciation in 2020. The IMF suggests a further 10–11 percent real depreciation is required to eliminate the
overvaluation. Allowing for faster exchange rate depreciation could help to boost non-resource exports and
address the foreign exchange shortage. However, authorities are concerned about higher imported inflation
driven by a cheaper currency. Figure 18 shows the average monthly depreciation of the Kina against the U.S.
dollar. The pace of deprecation has been 0.35 percent every month from April to September 2020, pointing at
careful management of the exchange rate by the BPNG.
P a p u a N e w G u i n e a E c o n o m i c U p d a t e J a n u a r y 2 0 2 1
20
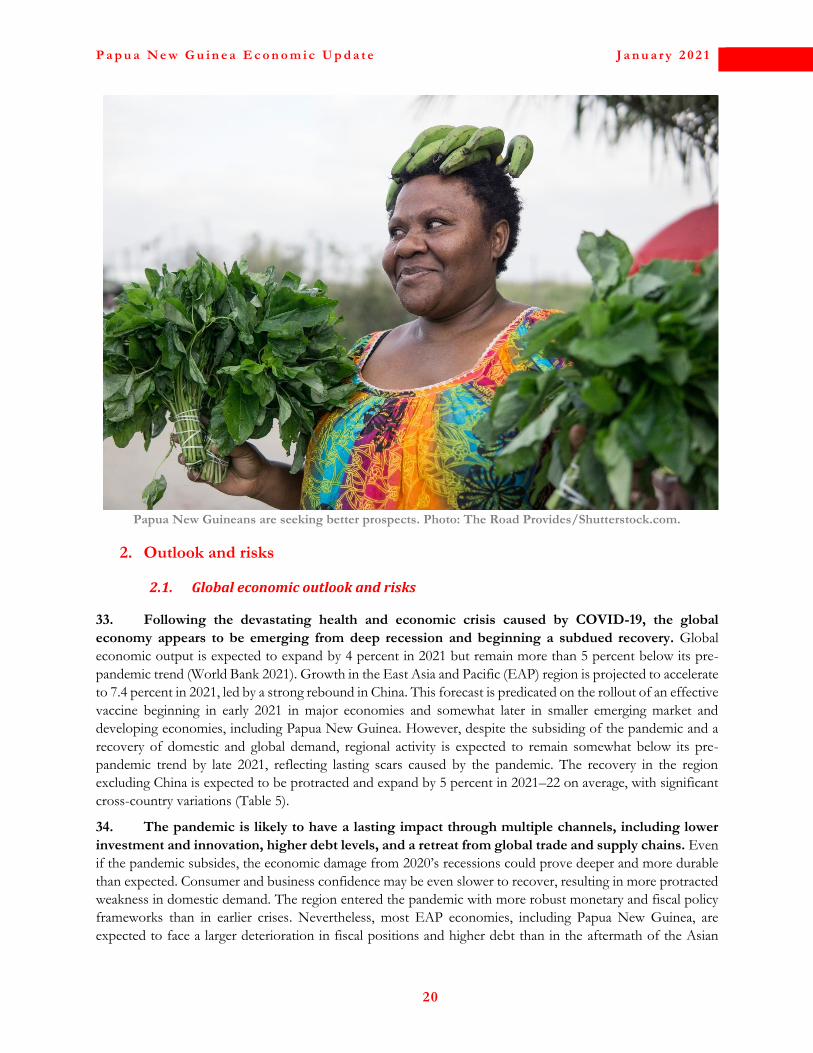
Papua New Guineans are seeking better prospects. Photo: The Road Provides/Shutterstock.com.
2. Outlook and risks
2.1. Global economic outlook and risks
33. Following the devastating health and economic crisis caused by COVID-19, the global
economy appears to be emerging from deep recession and beginning a subdued recovery. Global
economic output is expected to expand by 4 percent in 2021 but remain more than 5 percent below its pre-
pandemic trend (World Bank 2021). Growth in the East Asia and Pacific (EAP) region is projected to accelerate
to 7.4 percent in 2021, led by a strong rebound in China. This forecast is predicated on the rollout of an effective
vaccine beginning in early 2021 in major economies and somewhat later in smaller emerging market and
developing economies, including Papua New Guinea. However, despite the subsiding of the pandemic and a
recovery of domestic and global demand, regional activity is expected to remain somewhat below its pre-
pandemic trend by late 2021, reflecting lasting scars caused by the pandemic. The recovery in the region
excluding China is expected to be protracted and expand by 5 percent in 2021–22 on average, with significant
cross-country variations (Table 5).
34. The pandemic is likely to have a lasting impact through multiple channels, including lower
investment and innovation, higher debt levels, and a retreat from global trade and supply chains. Even
if the pandemic subsides, the economic damage from 2020’s recessions could prove deeper and more durable
than expected. Consumer and business confidence may be even slower to recover, resulting in more protracted
weakness in domestic demand. The region entered the pandemic with more robust monetary and fiscal policy
frameworks than in earlier crises. Nevertheless, most EAP economies, including Papua New Guinea, are
expected to face a larger deterioration in fiscal positions and higher debt than in the aftermath of the Asian

P a p u a N e w G u i n e a E c o n o m i c U p d a t e J a n u a r y 2 0 2 1
21
Financial Crisis and the global financial crisis. Weak global growth and remaining travel restrictions have
worsened the prospects for a trade-led recovery in the region. More contentious relations in international affairs
could result in rising costs for businesses, fragmentation in global economic links, and lower productivity.
Table 5. Real GDP Growth, 2017–22 (Percent)
Percentage point differences from
pre-pandemic projections
2017 2018 2019 2020 2021 as of 2022 2021 2022
Est. Jan-20 Jan-21 Jan-21 ∆ change
World 3.3 3.0 2.4 -4.3 2.6 4.0 3.8 1.4 1.1 East Asia and Pacific region 5.4 6.3 5.8 0.9 5.6 7.4 5.2 1.8 -0.4 Cambodia 7.0 7.5 7.1 -2.0 6.8 4.0 5.2 -2.8 -1.6 China 6.8 6.6 6.1 2.0 5.8 7.9 5.2 2.1 -0.5 Fiji 5.4 3.8 -0.4 -19.0 2.9 2.6 8.2 -0.3 5.2 Indonesia 5.1 5.2 5.0 -2.2 5.2 4.4 4.8 -0.8 -0.4 Lao PDR 6.9 6.3 4.7 -0.6 5.7 4.9 4.8 -0.8 -0.8 Malaysia 5.7 4.7 4.3 -5.8 4.5 6.7 4.8 2.2 0.3 Mongolia 5.3 7.0 5.0 -5.2 5.2 4.3 5.4 -0.9 -0.1 Myanmar 6.2 6.4 6.8 1.7 6.8 2.0 8.0 -4.8 1.2 Papua New Guinea 3.5 -0.3 5.9 -3.8 2.9 3.5 4.2 0.6 1.2 Philippines 6.9 6.3 6.0 -8.1 6.2 5.9 6.0 -0.3 -0.2 Solomon Islands 3.7 3.9 1.2 -4.8 2.8 3.2 3.5 0.4 0.8 Thailand 4.1 4.1 2.4 -6.5 2.8 4.0 4.7 1.2 1.8 Timor-Leste -3.8 -0.8 3.4 -6.8 2.9 3.1 4.2 0.2 -0.8 Vietnam 6.8 7.1 7.0 2.8 6.5 6.7 6.5 0.2 0.1
Source: World Bank staff estimates and projections.
35. On the upside, the rapid deployment of highly effective vaccines could trigger a faster- and
stronger-than-expected rebound in major economies and global demand. The early arrival of an effective
and widely available vaccine remains a possibility and could potentially trigger a sharp rise in consumer
confidence and a wave of pent-up demand. Private spending would strengthen steadily as employment recovers
and pandemic induced uncertainties dissipate. The benefits would quickly be felt in the hardest-hit service
sectors such as tourism and travel. New business models, including widespread teleworking introduced during
the pandemic, may support durable increases in productivity, boost productive investment, and mitigate the
pandemic’s long-term damage. Nevertheless, teleworking is not possible to a diverse number of workers, who
rely on face-to-face interaction. Developing economies, including Papua New Guinea, also suffer from a digital
divide, which further complicates teleworking and work-from-home opportunities.
2.2. Papua New Guinea’s economic outlook and risks
36. Like in the rest of the world, the pandemic’s shock is expected to lead to a long period of
below-trend economic growth in Papua New Guinea. The economy will likely experience steady growth
from 2021, but we estimate that the economy will be 9 percent smaller in 2023 compared to our pre-pandemic
forecast. This outlook reflects both delays to forthcoming resource projects and some level of “scarring” caused
by pandemic-related disruptions, whereby the consequences of higher unemployment, falling incomes, and
reduced economic activity impact future consumer spending and business investment. The outlook is expected
to follow a shallow “U-shaped” recovery instead of a more rapid “V-shaped” bounce back (Figure 20). These
forecasts are subject to a high level of uncertainty. They will depend on the speed of both domestic and
international vaccine rollouts,10 future levels of demand for Papua New Guinea’s exports, and government
efforts to improve economic and fiscal resilience to external shocks.
10 A recently adopted PNG’s vaccine strategy envisages a rollout of vaccination staring from April 2021. The early phase of the vaccine rollout will target frontline healthcare workers, older people, and people with chronic health conditions.

P a p u a N e w G u i n e a E c o n o m i c U p d a t e J a n u a r y 2 0 2 1
22
37. The government is committed to resuming much-needed fiscal consolidation in the post-crisis
period, once the COVID-19 crisis eventually subsides. The COVID-19 crisis has resulted in a record-high
fiscal deficit, contributing to a higher debt-to-GDP ratio of 49 percent in 2020. Under our baseline scenario,
this ratio will rise further in 2021, to 52 percent. Nevertheless, these levels are considered relatively moderate
and stay within the debt limit of 60 percent of GDP set in PNG’s recently revised Fiscal Responsibility Act. To
contain public debt from rising further, the government has committed to resuming fiscal consolidation efforts
in the post-COVID-19 period, by focusing on mobilizing domestic revenue and improving public expenditure
efficiency. The 2021 Budget Strategy Paper defines an updated fiscal vision, with the fiscal consolidation agenda
to be resumed in 2022 (Figure 21).
Figure 20. Real GDP Levels in 2018–23 (Index, 2018 = 100)
Figure 21. The New Fiscal Consolidation Path (Percent of GDP)
Sources: National Statistics Office; World Bank staff estimates. Sources: PNG Treasury; World Bank staff estimates.
38. Inflation is likely to remain in check, although risks are weighted to the upside. On the one
hand, the BPNG’s accommodative monetary policy stance is expected to continue through end-2021, placing
upward pressure on prices. Supply chain disruptions resulting from the prolonged pandemic and associated
containment measures also carry the risk of a spike in food prices, similar to the first pandemic wave. Increased
government spending to provide much-needed stimulus to the economy will add to upside risks. On the other
hand, subdued domestic and global economic conditions are likely to contain inflation via depressed domestic
demand and lower imported inflation.
39. Developments in the external sector will be dictated by the health and economic implications
of the COVID-19 pandemic. Export receipts from commodities will determine the external financing
requirement, level of international reserves, and exchange rate developments. Sluggish global economic
conditions owing to the second wave of the pandemic and associated lockdown measures are likely to keep
commodity prices down, leading to large losses of export earnings for Papua New Guinea. On a positive note,
commodity prices for Papua New Guinea’s exports recovered in the third quarter of 2020 in response to an
acceleration of industrial activity globally, particularly in China. However, energy prices were one-third lower
in 2020 than in 2019. Metal prices fell slightly overall, although gold prices rose by a record 27 percent year on
year. Agricultural prices also recorded a modest decline.
40. Despite falling commodity prices and an exceptionally uncertain global economic outlook, the
current account balance is estimated to have recorded a surplus in 2020. However, the size of the surplus
will be significantly smaller than in 2019. As in previous years, the current account surplus will be offset by a
large deficit on the capital and financial account. In a pessimistic scenario, the second wave of the pandemic
may lead to a more prolonged global recession with implications for Papua New Guinea’s export revenue. In
-9
-8
-7
-6
-5
-4
-3
-2
-1
0
2018 2019 2020e 2021f 2022f 2023f 2024f
Overall fiscal balance Non-resource primary balance

P a p u a N e w G u i n e a E c o n o m i c U p d a t e J a n u a r y 2 0 2 1
23
addition, failure to resolve tensions surrounding mining projects may further depress export revenue and shake
investor confidence in Papua New Guinea. These factors may lead to a balance of payments deficit, creating a
requirement for additional external financing or a drawdown of reserves. Although currently above the level
recommended by the IMF, foreign exchange reserves are under pressure. Against this backdrop, the Kina is
expected to continue its depreciating trend. However, noting authorities’ careful management of the exchange
rate, the deprecation is likely to be modest.
41. PNG’s medium-term macroeconomic outcomes remain subject to high downside risks.
Although domestic GDP growth will resume in 2021, the growth rate may be volatile owing to external and
domestic factors. Externally, suppose economic growth in Australia, China, and Japan—PNG’s main trading
partners—is below expectations. In that case, demand for Papua New Guinea’s key commodity exports may
be affected, placing downward pressure on the local currency and eroding external buffers. Commodity-price
and natural-disaster shocks may continue to impact extractive sector performance, with negative implications
for the rest of the economy. These developments would negatively impact resource revenue flows to Papua
New Guinea’s external and fiscal accounts. Domestically, this volatility is subject to an uncertain performance
by the country’s major (existing and new) resource projects. Potential delays in the implementation of new
resource projects may also impact macroeconomic outcomes, affecting the underlying assumptions of the
baseline scenario.
42. The low-case scenario for 2021–24 suggests a slower-than-anticipated recovery in 2021; fiscal
and debt targets may also be missed (Table 6). The extractive sector could take the greatest hit if external
demand softens and commodity prices decline further, except for gold prices (which may offset the impact). A
reintroduction of movement restrictions and limited access to face-to-face services may affect the non-resource
economy, leading to a relatively sluggish recovery. Fiscal and debt sustainability may be undermined by weaker
revenue performance and slow progress on wage bill reform, leading to higher fiscal deficits and rising public
debt than envisaged in the baseline scenario. In the case of weaker revenue performance and poor results from
wage bill reform, the overall fiscal deficit may remain above 5 percent of GDP in the medium term, contributing
to a further escalation of the debt-to-GDP ratio. In these circumstances, the stock of public and publicly
guaranteed debt may quickly approach the recently increased debt-to-GDP threshold of 60 percent of GDP.
Table 6. Real GDP Growth: Baseline and Low-Case Scenarios in 2021–24 (In percent, unless otherwise indicated)
2020 2021 2022 2023 2024 Est. Projections
Baseline scenario Real GDP growth -3.8 3.5 4.2 2.4 2.6
Resource sector -5.8 4.3 5.6 1.4 1.8 Non-resource economy -0.2 1.1 2.0 2.5 2.6
Overall fiscal deficit (percent of GDP) -8.1 -7.3 -5.3 -3.2 -2.1 Public and publicly guaranteed debt (percent of GDP) 49.0 52.2 53.3 54.3 54.0
Low-case scenario Real GDP growth -3.8 1.1 3.5 2.5 2.7
Resource sector -5.8 -0.1 4.4 1.2 1.6 Non-resource economy -0.2 0.7 1.8 2.7 2.9
Overall fiscal deficit (percent of GDP) -8.1 -7.4 -5.5 -5.4 -5.5 Public and publicly guaranteed debt (percent of GDP) 49.0 53.0 54.4 56.6 59.0
Source: World Bank staff estimates and projections.
43. Political risks to the outlook are high, exacerbated by recent political turmoil. Successful
motions of no-confidence are relatively frequent, and governing coalitions do not tend to be based on clear
programmatic policy platforms, so the policy environment can be quite unpredictable. Although the most
recent motion of no-confidence against the current government failed to succeed, the political situation remains

P a p u a N e w G u i n e a E c o n o m i c U p d a t e J a n u a r y 2 0 2 1
24
fluid. The current Prime Minister has managed to secure a majority in parliament at the end of 2020, following
a series of negotiations with several members in the opposition camp. This helped to pass the 2021 National
Budget in time. Another attempt of initiating a vote-of-no-confidence is likely when parliament resumes its
business in April 2021. This political uncertainty will remain until next elections to be held in June 2022, with
certain risks to the negotiation process with current and potential investors and the overall business sentiment
in the country. Despite political agendas of different parties in the coalition, the government should pursue
structural reforms of the economy and continue strengthening institutions in the country, especially the ones
that are providing basic public services to the population. The latter is covered in a special focus section of this
report (Part B).

B. Special Focus: Institutional Capital for Public Service Delivery
Part B
SPECIAL FOCUS
Institutional Capital for Public Service Delivery
What underpins the capabilities of the
key institutions for basic service delivery in PNG, and how can these be strengthened?


P a p u a N e w G u i n e a E c o n o m i c U p d a t e J a n u a r y 2 0 2 1
27
Village courts play an important role in supporting social order and justice at the local level. Photo: David Craig.
1. What is institutional capital and why does it matter in Papua New Guinea?
1.1. Institutions and everyday life in Papua New Guinea
44. The delivery of basic services in PNG is extraordinarily challenging. The population is highly
dispersed and fragmented, as a result of the mountainous and archipelagic geography, low urbanization rate (13
percent), high ethnolinguistic diversity (840 distinct language groups), and social identities that are primarily
small-scale. PNG shares the political economy characteristics of resource-rich states.11 These combine with
PNG’s political structures and its small-scale social identities to yield political economy dynamics that support
patron-client relationships to dominate the political system and state. In this context, it is very challenging for
the state to be able to provide its population with basic services such as order and justice, education, health and
roads. To understand how it does so, and why it is more successful in some areas than in others, requires an
understanding of the capabilities of the institutions involved.
45. Many different institutions matter for the delivery of the basic services that affect Papua New
Guineans’ daily lives. These include state and non-state institutions (for example, institutions of kinship, land
and resource ownership, customary authority and religious authority). They include institutions at multiple
levels of scale (local, district, province, national and international—for example, donor institutions). They
include institutions in different sectors, both on the spending side of the state and on the revenue side. They
include political institutions and administrative institutions, including oversight and accountability institutions.
Whether or not these institutions work well is critical to the well-being and livelihoods of people throughout
PNG. The crucial nature of these institutional capabilities is clear in ordinary times, and starkly apparent during
times of crisis. For example, the current COVID-19 emergency is testing the capabilities of health institutions;
the current economic contraction is testing the capabilities of institutions that support agricultural livelihoods.
11 These characteristics are described in Barma and others (2012).

P a p u a N e w G u i n e a E c o n o m i c U p d a t e J a n u a r y 2 0 2 1
28
It is essential to understand which institutions work well, why they work, and how institutional capabilities can
be built on and strengthened.
46. This special focus section uses an institutional capital framework to understand the
capabilities of the institutions that provide basic services in PNG. It examines why some institutions can
do this with some degree of regularity and reliability—though not always equitably—and why others cannot.
This approach focuses on the ways institutions in PNG actually work and their existing capabilities, rather than
starting with a good practice model and identifying PNG’s deficits against that. The approach recognizes that
the capabilities that institutions have are a product not only of factors internal to institutions, but also of external
factors in the broader social, economic, geographic, and political context. Its approach to recommendations,
therefore, is to ensure that they are informed by the wider contextual reality within which they must be able to
work. This approach can be valuable to policy makers by identifying how existing capabilities can be built on
and supported to become more reliable and more equitable. It can also be valuable in recognizing how to avoid
undermining existing capabilities.
1.2. Understanding institutions: rules, roles, and resources
47. To introduce this institutional capital framework, we first need to understand what institutions
are. Institutions are constituted by regular patterns or bundles of rules, roles, and resources (March and Olsen 2008,
3). These combine to yield specific capabilities in particular contexts—for instance, the capability to deliver
health services or maintain social order in a particular area of the country. An institution may be manifest in a
series of individual organizations (for instance, a particular village court is a manifestation of the wider
institution of village courts). This report focuses not on a specific organization (it does not ask, for example,
how a specific school performs) but on the wider institutions. By definition, institutions are reasonably
durable—otherwise, they would not be regular patterns that influence people’s actions and expectations in fairly
predictable ways over time. Part of that durability comes from the effects they have on their surrounding
contexts and how these effects feed back to the institutions in ways that sustain them. Institutions do, of course,
change in response to changes in factors both internal and external to them. Sometimes they change through
slow evolution; other times they change very rapidly (in the face of a crisis, for instance).
48. What are rules, roles, and resources? Institutional rules are the way things are done (North 1991).
They can be written or unwritten, but either way, they influence what is and what is not done in a particular
context (the procedures for operating a health clinic or the ways people pass on land to the next generation,
for example). Institutional roles are the parts that people perform in a particular context (the part played by a
teacher in a school or the part played by a magistrate in a village court hearing). Institutional resources are the
funds with which the institution operates in a particular context (these resources may be in the form of staff,
equipment, and so on). An institution’s rules, roles, and resources affect and are affected by its surrounding
context. In particular, an institution’s fit within and implications for the distribution of power and resources in
its surrounding context is critical to the institution’s resilience and vulnerability.
49. The ways institutions combine their rules, roles, and resources yield their capabilities—things
the institution can do on a fairly reliable basis in a particular context. The set of those capabilities is what
we refer to as institutional capital (Sen 1985; Nussbaum 2011). PNG possesses institutional capital in customary
and imported institutions, and typically in combinations of the two. But which aspects of institutional capital
matter most for institutions to work in particular contexts in PNG? In what sectors is PNG’s institutional
capital strong? How and in what contexts could it be strengthened? This special focus section examines these
questions. Institutional capital is not limited to a particular sphere (public, private or civil society) or scale
(international, national, provincial, district or local). However, given the section’s focus on public service
delivery, it is worth enriching this framework with a specific focus on public institutional capital.

P a p u a N e w G u i n e a E c o n o m i c U p d a t e J a n u a r y 2 0 2 1
29
1.3. Understanding public institutional capital: grasp and reach
50. The approach we take to public institutional capital focuses on two crucial and closely-related
capabilities: grasp and reach.12 The first core capability of a state is the ability to pull or grasp together the
rules, roles, and resources needed to organize and regulate people and other resources in the public sector, in a
coherent way. Grasping is about getting political and administrative officeholders in the state to play specific
roles, according to particular rules, with resources organized to support this. Grasp is a capability required by
state institutions at all levels, from national to local institutions. Enabling this kind of capability for collective
action can be extremely challenging where rules, roles, and resources are fragmented across institutions. For
example, Provincial Health Authorities (PHAs) in PNG pull or grasp together—under a single Board—
legislated powers and established procedures (rules), an array of management roles in planning, budgeting, and
monitoring and evaluation, and fiscal resources that are clear and reasonably reliable. However, their grasp is
limited when it comes to the fiscal resources for health infrastructure that Members of Parliament (MPs) have—
PHAs do not yet have the capability to plan, budget, or monitor these resources. Where rules, roles, and
resources are fragmented across levels of government, grasp capability at one level will be interdependent with
capabilities at other levels.
51. The second core capability of a state—reach—is closely related to the first, like the two sides
of a coin. With grasp established in state institutions, those institutions need to be able to project their
capabilities across the territory of their jurisdiction. The state needs to be able to reach down to local
communities to provide public goods and services—security and social order, health and education, goods and
services that enable people’s livelihoods, and so on—whether directly or through the reach of lower levels of
government. Essentially, reach is about the effective projection of the state’s authority and capability with respect
to the people and resources within its territory. Grasp and reach capabilities interact not only within levels of
government but between them. For example, central government reach to reliably distribute vaccines to health
clinics is critical to the grasp capabilities of clinics at local level. Figure 22 illustrates this understanding of
institutional capital.
Figure 22. Institutions and Institutional Capital
1.4. Focus of this study and a look ahead at its findings
52. To explore institutional capital in PNG, this study focuses on sectors that are important to the
daily lives of most Papua New Guineans. The overwhelming majority of the population lives in rural
settings, and a significant share of urban dwellers live in informal settlements. The study focuses on the
institutions that deliver basic services including order and justice (particularly village courts), education, health,
and roads. It also focuses on the institutions through which public revenues are collected to fund these basic
12 This approach draws on global and PNG literature on state-building, political order, and state-society relations. See Fukuyama (2008); Fukuyama (2014); Mann (1984); Khan (2010); Laws (2012).
P a p u a N e w G u i n e a E c o n o m i c U p d a t e J a n u a r y 2 0 2 1
30
services. The next section provides a stocktaking of institutional capital in these sectors. It analyzes key
resilience factors and opportunities. It also analyzes key vulnerabilities and constraints, including those arising
from the fiscal volatility associated with PNG’s resource-dependent economy—as examined in Part A. In a
report of this length, the coverage of institutional capital in the selected sectors is necessarily very brief, rather
than being comprehensive. The focus in each sector is to illuminate important aspects of its institutional capital
in order to identify where it may be feasible to protect and strengthen that institutional capital. The final section
sets out the key findings and policy recommendations identified through the sectoral analysis.
53. To foreshadow these key findings, the study shows that the capability to deliver basic services
in PNG depends on how effectively different state and non-state institutions come together to jointly
provide the services. No single scale or type of institution—state or non-state—has the requisite grasp and
reach capabilities alone. Instead, both grasp and reach capabilities depend on the ability to mobilize
contributions to rules, roles and resources from the multiple scales and types of institutions that hold them.
Only through such joint efforts can the rules, roles, and resources required for service delivery in PNG’s
extraordinarily challenging context be mobilized. Service delivery tends to occur reliably when there are
sustained partnerships between institutions which allow the rules, roles, and resources of each to be drawn on
to enable greater capabilities—in effect, to jointly provide the service.
54. The study finds that institutional capital is weakest where these partnerships are weak or
absent. In such circumstances, the requisite rules, roles, or resources cannot be mobilized and coordinated to
a shared purpose. This tends to be more the case, the more the following considerations are at play:
• The service requires significant amounts of capital spending, or significant amounts of non-salary
recurrent spending controlled centrally by a single institution. These types of spending tend to be both
volatile and vulnerable to patronage.
• The political value of the service can be gained even if the service is provided only narrowly (by social
group or geographic area), it does not depend on equitable provision.
• The service is complex, requiring coordination and stable commitments of rules, roles, and resource
contributions across a large number of institutions to enable collective action.
• Patron-client relationships at higher tiers of government penetrate those at the local level, undermining
local contributions of rules, roles, or resources to the service.
• There is a large divergence between the rules coming from the different institutions that are needed to
jointly provide the service.
55. Based on these findings, the recommendations focus on ways to build on and strengthen
institutional arrangements that enable the joint provision of services. In weaker areas, the
recommendations offer suggestions of ways to contest or help to shift political incentives that currently
undermine the development of institutional capital. The recommendations are framed in a medium-term time
horizon. The current crises PNG is experiencing – examined in Part A – make clear some of the key resilience
factors and vulnerabilities of its institutional capital, the recommendations in Part B look beyond the immediate
crises to medium-term prospects for strengthening institutional capital.
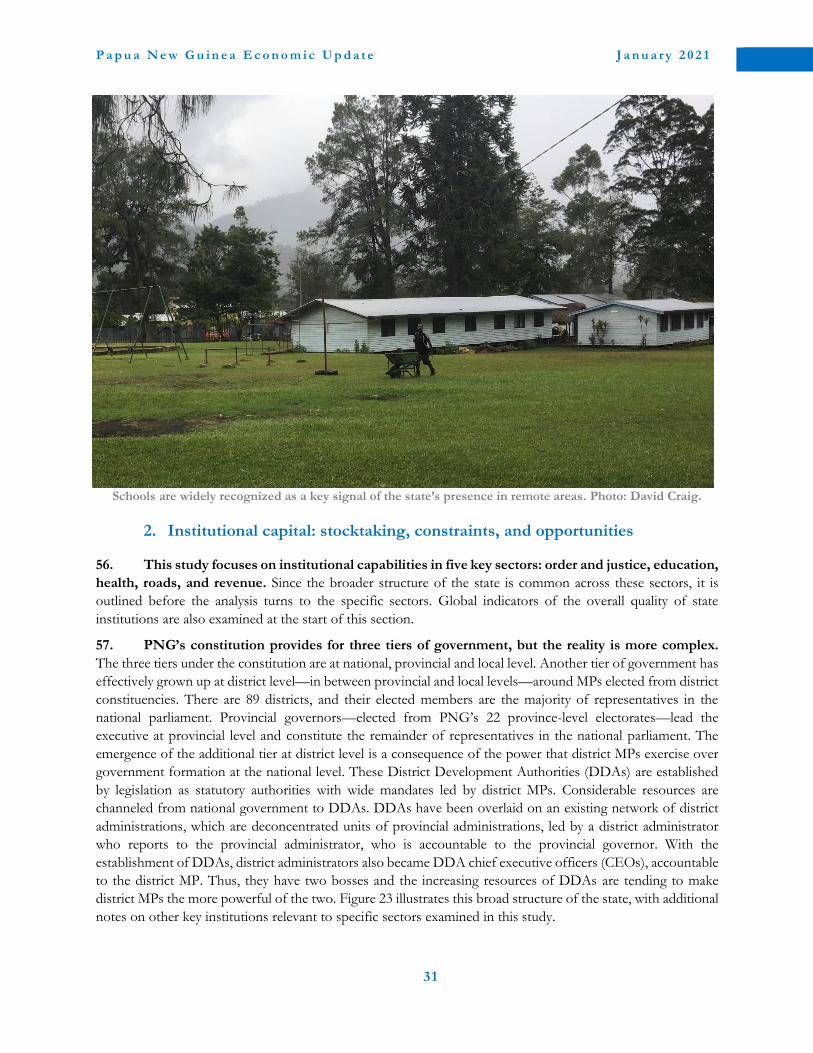
P a p u a N e w G u i n e a E c o n o m i c U p d a t e J a n u a r y 2 0 2 1
31
Schools are widely recognized as a key signal of the state’s presence in remote areas. Photo: David Craig.
2. Institutional capital: stocktaking, constraints, and opportunities
56. This study focuses on institutional capabilities in five key sectors: order and justice, education,
health, roads, and revenue. Since the broader structure of the state is common across these sectors, it is
outlined before the analysis turns to the specific sectors. Global indicators of the overall quality of state
institutions are also examined at the start of this section.
57. PNG’s constitution provides for three tiers of government, but the reality is more complex.
The three tiers under the constitution are at national, provincial and local level. Another tier of government has
effectively grown up at district level—in between provincial and local levels—around MPs elected from district
constituencies. There are 89 districts, and their elected members are the majority of representatives in the
national parliament. Provincial governors—elected from PNG’s 22 province-level electorates—lead the
executive at provincial level and constitute the remainder of representatives in the national parliament. The
emergence of the additional tier at district level is a consequence of the power that district MPs exercise over
government formation at the national level. These District Development Authorities (DDAs) are established
by legislation as statutory authorities with wide mandates led by district MPs. Considerable resources are
channeled from national government to DDAs. DDAs have been overlaid on an existing network of district
administrations, which are deconcentrated units of provincial administrations, led by a district administrator
who reports to the provincial administrator, who is accountable to the provincial governor. With the
establishment of DDAs, district administrators also became DDA chief executive officers (CEOs), accountable
to the district MP. Thus, they have two bosses and the increasing resources of DDAs are tending to make
district MPs the more powerful of the two. Figure 23 illustrates this broad structure of the state, with additional
notes on other key institutions relevant to specific sectors examined in this study.
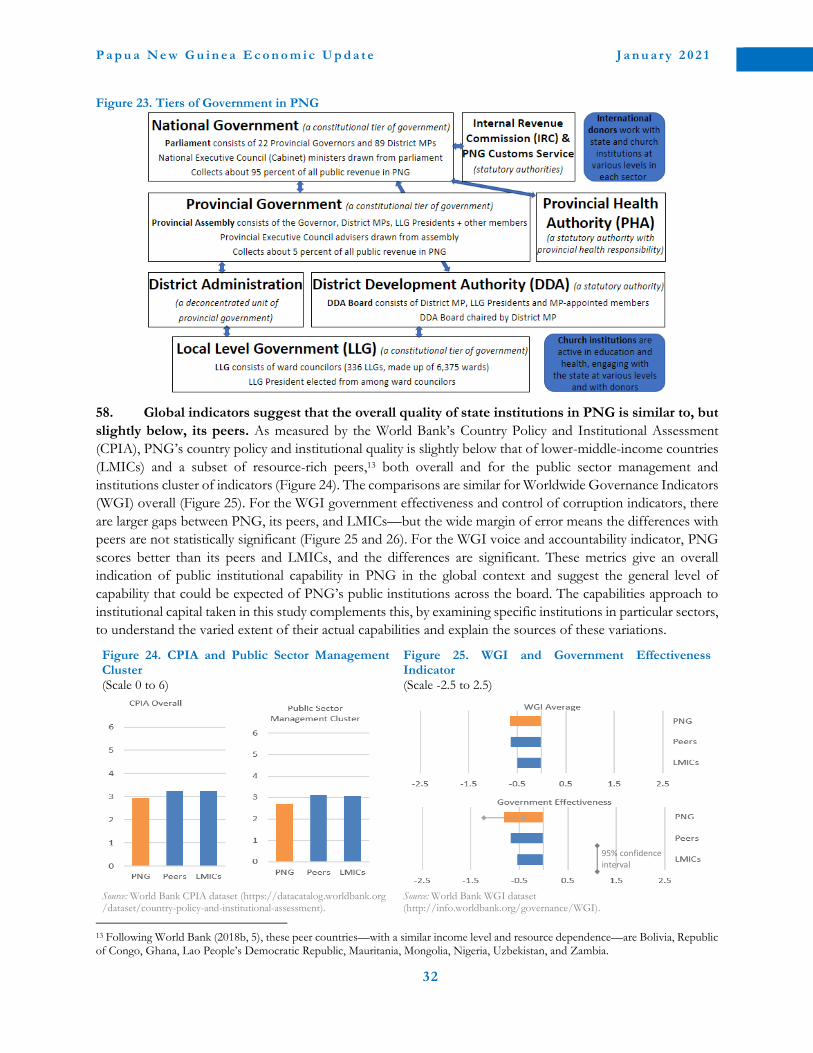
P a p u a N e w G u i n e a E c o n o m i c U p d a t e J a n u a r y 2 0 2 1
32
Figure 23. Tiers of Government in PNG
58. Global indicators suggest that the overall quality of state institutions in PNG is similar to, but
slightly below, its peers. As measured by the World Bank’s Country Policy and Institutional Assessment
(CPIA), PNG’s country policy and institutional quality is slightly below that of lower-middle-income countries
(LMICs) and a subset of resource-rich peers,13 both overall and for the public sector management and
institutions cluster of indicators (Figure 24). The comparisons are similar for Worldwide Governance Indicators
(WGI) overall (Figure 25). For the WGI government effectiveness and control of corruption indicators, there
are larger gaps between PNG, its peers, and LMICs—but the wide margin of error means the differences with
peers are not statistically significant (Figure 25 and 26). For the WGI voice and accountability indicator, PNG
scores better than its peers and LMICs, and the differences are significant. These metrics give an overall
indication of public institutional capability in PNG in the global context and suggest the general level of
capability that could be expected of PNG’s public institutions across the board. The capabilities approach to
institutional capital taken in this study complements this, by examining specific institutions in particular sectors,
to understand the varied extent of their actual capabilities and explain the sources of these variations.
Figure 24. CPIA and Public Sector Management Cluster (Scale 0 to 6)
Figure 25. WGI and Government Effectiveness Indicator (Scale -2.5 to 2.5)
Source: World Bank CPIA dataset (https://datacatalog.worldbank.org /dataset/country-policy-and-institutional-assessment).
Source: World Bank WGI dataset (http://info.worldbank.org/governance/WGI).
13 Following World Bank (2018b, 5), these peer countries—with a similar income level and resource dependence—are Bolivia, Republic of Congo, Ghana, Lao People’s Democratic Republic, Mauritania, Mongolia, Nigeria, Uzbekistan, and Zambia.
95% confidence interval
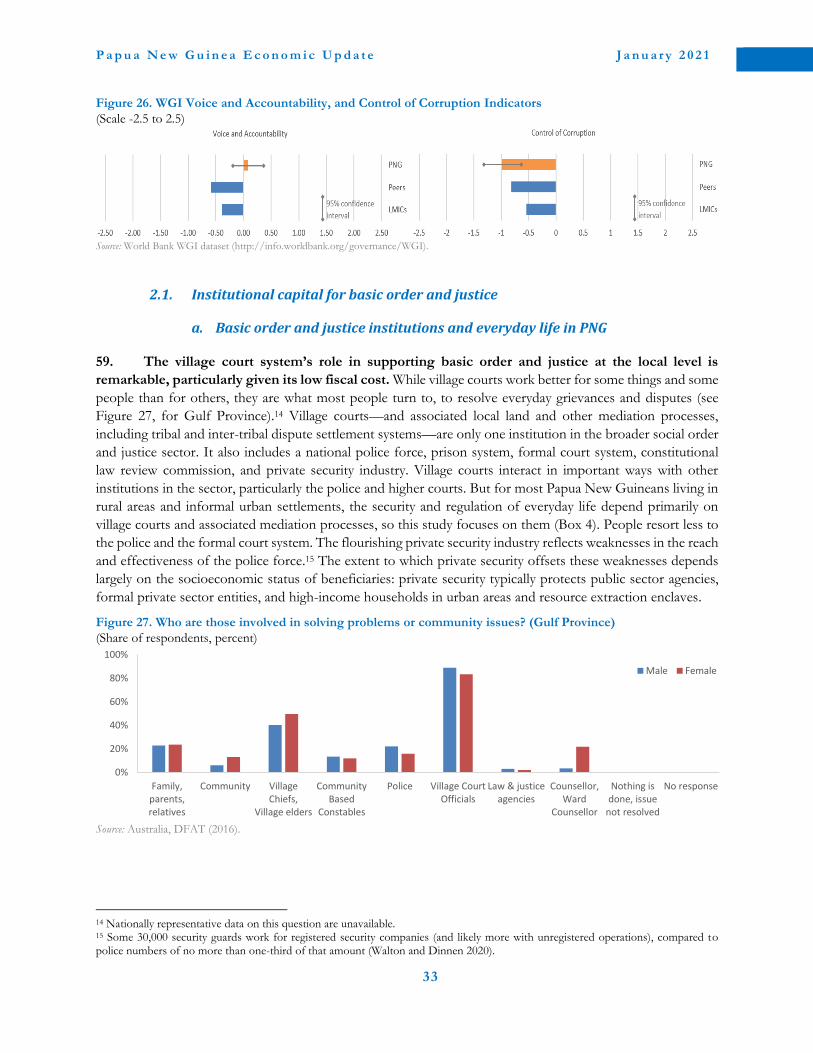
P a p u a N e w G u i n e a E c o n o m i c U p d a t e J a n u a r y 2 0 2 1
33
Figure 26. WGI Voice and Accountability, and Control of Corruption Indicators
(Scale -2.5 to 2.5)
Source: World Bank WGI dataset (http://info.worldbank.org/governance/WGI).
2.1. Institutional capital for basic order and justice
a. Basic order and justice institutions and everyday life in PNG
59. The village court system’s role in supporting basic order and justice at the local level is
remarkable, particularly given its low fiscal cost. While village courts work better for some things and some
people than for others, they are what most people turn to, to resolve everyday grievances and disputes (see
Figure 27, for Gulf Province).14 Village courts—and associated local land and other mediation processes,
including tribal and inter-tribal dispute settlement systems—are only one institution in the broader social order
and justice sector. It also includes a national police force, prison system, formal court system, constitutional
law review commission, and private security industry. Village courts interact in important ways with other
institutions in the sector, particularly the police and higher courts. But for most Papua New Guineans living in
rural areas and informal urban settlements, the security and regulation of everyday life depend primarily on
village courts and associated mediation processes, so this study focuses on them (Box 4). People resort less to
the police and the formal court system. The flourishing private security industry reflects weaknesses in the reach
and effectiveness of the police force.15 The extent to which private security offsets these weaknesses depends
largely on the socioeconomic status of beneficiaries: private security typically protects public sector agencies,
formal private sector entities, and high-income households in urban areas and resource extraction enclaves.
Figure 27. Who are those involved in solving problems or community issues? (Gulf Province)
(Share of respondents, percent)
Source: Australia, DFAT (2016).
14 Nationally representative data on this question are unavailable. 15 Some 30,000 security guards work for registered security companies (and likely more with unregistered operations), compared to police numbers of no more than one-third of that amount (Walton and Dinnen 2020).
0%
20%
40%
60%
80%
100%
Family,parents,relatives
Community VillageChiefs,
Village elders
CommunityBased
Constables
Police Village CourtOfficials
Law & justiceagencies
Counsellor,Ward
Counsellor
Nothing isdone, issue
not resolved
No response
Male Female

P a p u a N e w G u i n e a E c o n o m i c U p d a t e J a n u a r y 2 0 2 1
34
b. The institutional capital of the village court system
60. To understand the institutional capital of the village court system, we first have to understand
how village courts work. Village court hearings typically involve not only individual disputants but also family
and clan representatives from all sides. Settlements or compensation are agreed upon through a mix of
arbitration and mediation involving the wider groups, emphasizing win-win outcomes and restorative justice.
Cases are typically heard quickly, locally, and in ‘tokples’ (the local language). Village courts meet regularly, but
their magistrates can and do convene immediately at almost any time to prevent escalation of conflict and take
initial ‘belkol’ (cooling the belly—temperament or situation) steps so grievances are heard and justice processes
are underway. Of course, village courts are not successful in resolving every matter brought to them and
facilitating agreement on outcomes. Survey data from two areas of PNG suggest that people are less likely to
be satisfied with village courts where cases were not resolved or the compensation the village court decided on
was not paid (Australia, DFAT 2016).
Box 4. What are village courts?
The village court system supports basic order and justice at the local level throughout PNG
As summarized by Goddard (2009, 2), “the fundamental work of the village courts is to deal with disputes.”
These disputes commonly involve land and agriculture, family and marital relationships, lending, and fights between
clan members. Sometimes they involve matters including sorcery, sexual and family violence, serious assaults, interclan
fighting, and murder. The latter types of matters are, in fact, beyond the legal scope of village courts and should involve
police and be referred to district courts. The hearing of some of these types of cases in village courts is a vulnerability
that we return to below. Alongside village courts, there are systems of land mediation operated by publicly-appointed
local land mediators. In those informal urban settlements where village courts have not yet been established, mediation
systems akin to village court processes often operate at the local level without any public funding.
Village courts operate at the intersection of the formal state and local, non-state forms of public authority.
They are sanctioned by the state but staffed locally. PNG now has roughly 1,680 village courts, made up of 18,480
officials, of whom perhaps 6 percent are women.a Each village court is staffed by five to seven magistrates, a court
clerk, and one to two peace officers (or bailiffs). These officials are formally gazetted and paid a monthly stipend by the
national government—or at least they are meant to be. Budget documents suggest that 44 percent of appointed officials
are not currently gazetted or paid. Officials are recruited via local processes under the supervision of the national
government’s Village Courts and Land Mediation Secretariat. These processes vary from place to place: in some areas,
magistrates are elected; in others, magistrates are nominated based on consultations between provincial village court
officers, sitting magistrates and local community members. These processes tend to be taken seriously, and usually—
but not always —see the appointment of well-respected and competent officials. People’s recognition of the importance
of village courts for security and justice in their daily lives means they generally attempt to choose well-respected and
competent people for the roles. This supports village court authority and effectiveness, creating a virtuous circle.
Village court magistrates must not have formal legal training. Rather, they “employ customary methods of
mediation and conflict resolution which are basic concepts of restorative justice.”b The Village Courts and Land
Mediation Secretariat is responsible for training materials and training. In practice, training is largely delegated to
provincial governments and varies with their capability and commitment. In some cases, it covers the Village Courts Act,
village court processes, village court officials’ roles, communication and mediation, and ethics, corruption, gender and
sexual violence. The Village Courts and Land Mediation Secretariat is also responsible for monitoring the effectiveness
of village courts, but in practice this oversight function is delegated to provincial governments and its performance
varies by province. Provincial governments receive function grants for the support functions they provide for the village
court system. Village courts require no special buildings or paraphernalia (other than the village court record book).
a. The estimate for the number of women is based on 2015 data (around 900 women of 15,000 officials). For more information,
see http://www.justice.gov.pg/index.php/2015-04-26-07-32-15/village-courts-and-land-mediation-secretariat.
b. See http://www.justice.gov.pg/index.php/2015-04-26-07-32-15/village-courts-and-land-mediation-secretariat.

P a p u a N e w G u i n e a E c o n o m i c U p d a t e J a n u a r y 2 0 2 1
35
61. A key part of the institutional capital of village courts is their capability to grasp together
different forms and sources of authority. Part of the authority of village court officials comes from their
ability to speak, elicit others to speak, maintain trust, and deliver respected outcomes in often intensely disputed
situations. Another part of their authority typically comes from their standing in church, previous public service
roles, or other domains. That is, it is gathered (horizontally) from other local settings or forms of authority.
Village court officials also gather authority (vertically) from the state, which delegates judicial authority to them.
Their appointment process and formal gazetting is important in this regard. Village courts tend to gain
credibility from their ability to include different parties and perspectives. This has been critical to the
institution’s ability to translate from rural village to urban settlement contexts. In urban settlements, village
courts have proven able to draw authority from the different ‘kastom’ (underlying culture) of different regions
of PNG, and from their ability to bring these together.
62. Another key part of the institutional capital of village courts is their capability to extend the
reach of basic order and justice out to the very edges of the state, into local society and its authority
structures. Through village courts, the state works in partnership with local, non-state forms of public authority
to jointly provide basic order and justice. Their reach is due not only to the rules, roles, and resources they have
from the state, but also those they gain from communities and their authority structures. This includes the
social order, conflict resolution, and justice capabilities of different social groupings in PNG established
historically—capabilities that did not depend on the reach of a central state in precolonial years. Part of the
reach capability of village courts is this adaptability to the norms and authority structures of local populations.
As Goddard (2009, 3) observes:
“Each of the…village courts reflects, in its workings and decisions, the sociality of the particular community it serves… Village courts, staffed by local community members and knowledgeable of local issues and the social context of minor disputes, yet representing the country’s ‘law’ in a manner that is relatively easy for villagers to comprehend, have become enormously popular. Their accountability on the one hand to Western legal principles…(the Village Courts Act), and on the other to local notions of just outcomes, has resulted in an enormous variety of ‘styles’ of practice among them.”
In some rural contexts, it is evident that the adaptability of the village court system includes the ability to be
scaled-up. For example, in Enga, Operation ‘Mekim Savi’ (‘Make Them Understand’) has been initiated by the
provincial government. Under it, a higher tier of courts has been established for inter-tribal conflict resolution,
combining leading magistrates from ordinary village courts that have demonstrated their intra-tribal authority
(Pupu and Wiessner 2018).
63. The adaptability of the village court system is also evident in mediation processes. In urban
contexts, informal settlement development has often outpaced the establishment of village courts. In Lae, for
example, local leaders have appropriated village court norms and procedures in the practice of peace and good
order ‘komitis’ (committees), which depend on local human, social and financial capital. They operate informal
‘courts’ using mediation processes, providing some access to justice in settlements. These ‘courts’ seek
representation from each ethnic group present locally, producing ‘village’ law and justice structures and
leadership that effectively integrate those of the constituent communities. These can underpin authority and
trust even in diverse contexts. While in some settlements formally gazetted village court officials work with
other recognized local justice leaders, and provide an umbrella of apprenticeship for emerging leaders, in others
mediators compete with village court magistrates, with mixed results (Craig, Porter, and Hukula 2016). Village
court magistrates can themselves act as mediators—outside village courts—and can establish city or
provincewide reputations.16
16 By acting as mediators, outside village courts, they can settle disputes without the restricted compensation limits imposed on village court settlements. Since village court officials are paid a monthly stipend, they are not supposed to charge fees. When they work as

P a p u a N e w G u i n e a E c o n o m i c U p d a t e J a n u a r y 2 0 2 1
36
c. Resilience and opportunities of the village court system
64. The way that basic order and justice is provided jointly by state and non-state actors in village
courts is crucial to the resilience of the village court system. Local communities and their authority
structures make substantial contributions to the rules, roles, and resources that village courts need to be
effective. These contributions are made because village courts have a strong fit in local contexts and are
recognized as very important. They also offer opportunities to emerging leaders to perform well in an arena
that really matters locally, facilitating their contributions. These factors contribute to the grasp capabilities of
village courts-—pulling rules, roles, and resources together from both state and non-state sources. The extent
of local contributions of rules, roles, and resources to village court authority and operations is an important
part of why the capabilities of the village court system can be achieved at such a limited fiscal cost.17
65. The resilience of the village court system is also a product of the nature and extent of the
contributions it requires from the state. The rules and roles that the state contributes have been stable over
time. In contrast to some of the other institutions examined in this study, the resources have also been fairly
stable. The nature and extent of these public resources are crucial. The bulk—over 85 percent—of the fiscal
resources required is for village court officials’ stipends. The payroll is one of the government’s highest
expenditure priorities. Although it may at times be delayed amid severe cash flow constraints, it is almost always
paid. The dominance of payroll spending in the fiscal resources required by the village court system makes
these resources reasonably secure. The non-salary recurrent costs of the village court system are relatively
limited. It is also well placed for those, because the funds come through function grants to provinces. These
are intergovernmental grants based on needs (accounting for the cost of service provision and the availability
of own source revenue). They are constitutionally guaranteed—while often paid late, they are always paid. They
are also relatively hard to divert to other purposes, due to the specific financial controls that apply to them. The
village court system requires minimal capital funds.18 Thus, even in the midst of the fiscal constraints triggered
by the COVID-19-crisis, the regular flows of fiscal resources for village courts have continued.
66. PNG has the opportunity to build on the existing capabilities of the village court system,
through modest additional funding. Many appointed village court officials are currently not gazetted or
being paid (see Box 4).19 This reflects a lengthy interruption to an expansion of the village court system begun
in the mid-2010s. Under it, new village courts were created—particularly in urban settlements—to catch up
with changes in where people live. Additional officials were also appointed, significantly increasing the number
of women magistrates. While payroll is relatively secure in the face of fiscal constraints, this expansion was
vulnerable because the fiscal situation tightened when it was incomplete and most new appointees had not yet
been added to the payroll. Completing this expansion would still leave village court expenditure below 1 percent
of total public spending. To complement this, PNG could also utilize the skills and expertise of its most
experienced urban and rural mediators, to train and build the capacity of new village court magistrates. This
would be particularly important for women magistrates, who have typically had fewer opportunities for
apprenticeship under serving village court magistrates.20
mediators, however (where compensation levels are higher and a great deal of engagement may be required to ensure agreements are reached and accepted), fees may be collected as a share of the compensation. Fees are often, but certainly not always, token. 17 According to PNG Treasury data, this cost is 4.7 percent of law and order sector expenditure and 0.4 percent of total public spending. 18 Capital funding for village courts is not delineated separately in the budget, but capital spending for village, district, national, and supreme courts combined is equivalent to about 0.4 percent of total law and order sector spending, according to PNG Treasury data. 19 In some cases where stipends are delayed (or, for more recently-appointed officials who are not gazetted and paid, but who are working anyway, not paid at all), village courts can continue to operate, with officials either withholding the fines levied instead of remitting them to provincial governments or charging fees. 20 Magistrates can be observed to recruit what are called ‘little boys’ (often men in their forties, but with little experience), to serve and learn from them via informal processes of patronage and apprenticeship. Woman magistrates play the same role for younger women, but the few women magistrates mean fewer such apprenticeship opportunities for emerging women leaders.
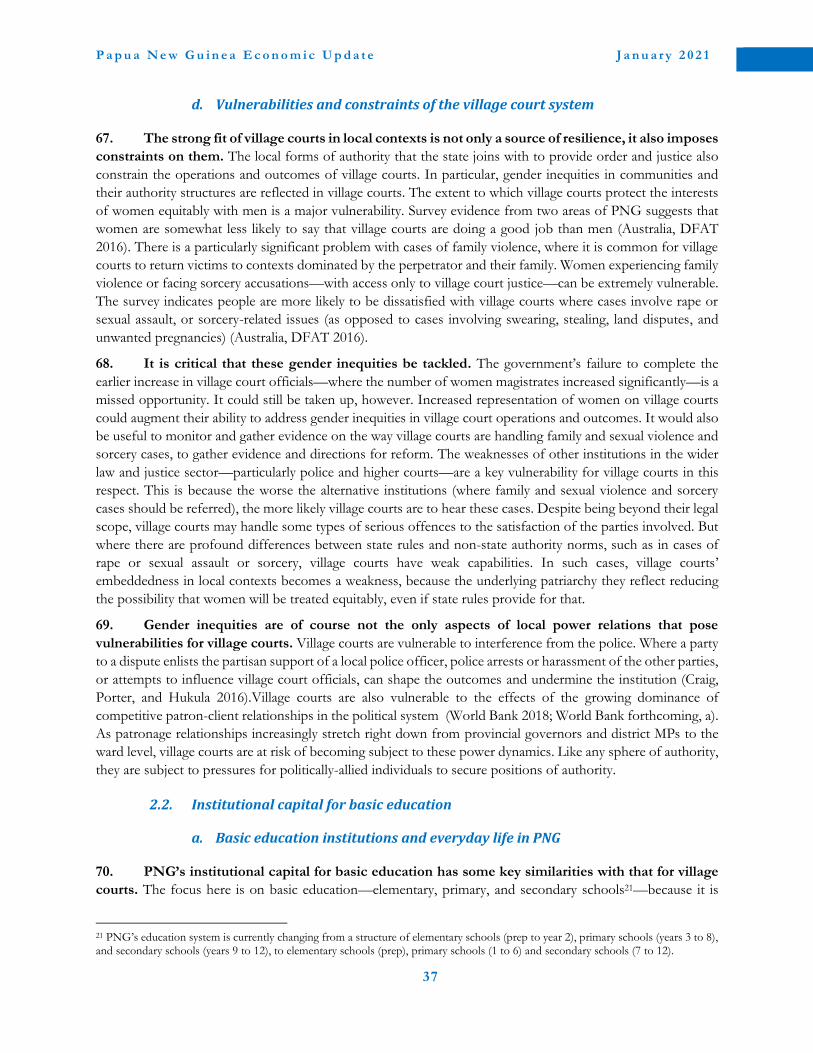
P a p u a N e w G u i n e a E c o n o m i c U p d a t e J a n u a r y 2 0 2 1
37
d. Vulnerabilities and constraints of the village court system
67. The strong fit of village courts in local contexts is not only a source of resilience, it also imposes
constraints on them. The local forms of authority that the state joins with to provide order and justice also
constrain the operations and outcomes of village courts. In particular, gender inequities in communities and
their authority structures are reflected in village courts. The extent to which village courts protect the interests
of women equitably with men is a major vulnerability. Survey evidence from two areas of PNG suggests that
women are somewhat less likely to say that village courts are doing a good job than men (Australia, DFAT
2016). There is a particularly significant problem with cases of family violence, where it is common for village
courts to return victims to contexts dominated by the perpetrator and their family. Women experiencing family
violence or facing sorcery accusations—with access only to village court justice—can be extremely vulnerable.
The survey indicates people are more likely to be dissatisfied with village courts where cases involve rape or
sexual assault, or sorcery-related issues (as opposed to cases involving swearing, stealing, land disputes, and
unwanted pregnancies) (Australia, DFAT 2016).
68. It is critical that these gender inequities be tackled. The government’s failure to complete the
earlier increase in village court officials—where the number of women magistrates increased significantly—is a
missed opportunity. It could still be taken up, however. Increased representation of women on village courts
could augment their ability to address gender inequities in village court operations and outcomes. It would also
be useful to monitor and gather evidence on the way village courts are handling family and sexual violence and
sorcery cases, to gather evidence and directions for reform. The weaknesses of other institutions in the wider
law and justice sector—particularly police and higher courts—are a key vulnerability for village courts in this
respect. This is because the worse the alternative institutions (where family and sexual violence and sorcery
cases should be referred), the more likely village courts are to hear these cases. Despite being beyond their legal
scope, village courts may handle some types of serious offences to the satisfaction of the parties involved. But
where there are profound differences between state rules and non-state authority norms, such as in cases of
rape or sexual assault or sorcery, village courts have weak capabilities. In such cases, village courts’
embeddedness in local contexts becomes a weakness, because the underlying patriarchy they reflect reducing
the possibility that women will be treated equitably, even if state rules provide for that.
69. Gender inequities are of course not the only aspects of local power relations that pose
vulnerabilities for village courts. Village courts are vulnerable to interference from the police. Where a party
to a dispute enlists the partisan support of a local police officer, police arrests or harassment of the other parties,
or attempts to influence village court officials, can shape the outcomes and undermine the institution (Craig,
Porter, and Hukula 2016).Village courts are also vulnerable to the effects of the growing dominance of
competitive patron-client relationships in the political system (World Bank 2018; World Bank forthcoming, a).
As patronage relationships increasingly stretch right down from provincial governors and district MPs to the
ward level, village courts are at risk of becoming subject to these power dynamics. Like any sphere of authority,
they are subject to pressures for politically-allied individuals to secure positions of authority.
2.2. Institutional capital for basic education
a. Basic education institutions and everyday life in PNG
70. PNG’s institutional capital for basic education has some key similarities with that for village
courts. The focus here is on basic education—elementary, primary, and secondary schools21—because it is
21 PNG’s education system is currently changing from a structure of elementary schools (prep to year 2), primary schools (years 3 to 8), and secondary schools (years 9 to 12), to elementary schools (prep), primary schools (1 to 6) and secondary schools (7 to 12).
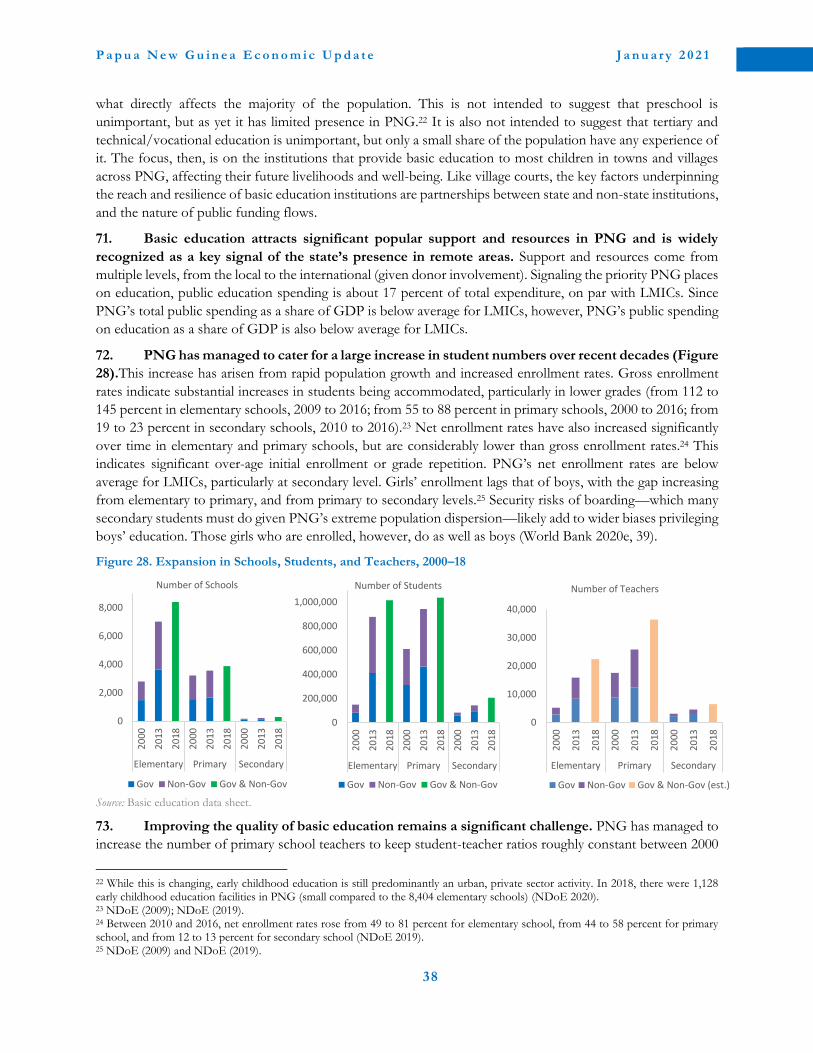
P a p u a N e w G u i n e a E c o n o m i c U p d a t e J a n u a r y 2 0 2 1
38
what directly affects the majority of the population. This is not intended to suggest that preschool is
unimportant, but as yet it has limited presence in PNG.22 It is also not intended to suggest that tertiary and
technical/vocational education is unimportant, but only a small share of the population have any experience of
it. The focus, then, is on the institutions that provide basic education to most children in towns and villages
across PNG, affecting their future livelihoods and well-being. Like village courts, the key factors underpinning
the reach and resilience of basic education institutions are partnerships between state and non-state institutions,
and the nature of public funding flows.
71. Basic education attracts significant popular support and resources in PNG and is widely
recognized as a key signal of the state’s presence in remote areas. Support and resources come from
multiple levels, from the local to the international (given donor involvement). Signaling the priority PNG places
on education, public education spending is about 17 percent of total expenditure, on par with LMICs. Since
PNG’s total public spending as a share of GDP is below average for LMICs, however, PNG’s public spending
on education as a share of GDP is also below average for LMICs.
72. PNG has managed to cater for a large increase in student numbers over recent decades (Figure
28).This increase has arisen from rapid population growth and increased enrollment rates. Gross enrollment
rates indicate substantial increases in students being accommodated, particularly in lower grades (from 112 to
145 percent in elementary schools, 2009 to 2016; from 55 to 88 percent in primary schools, 2000 to 2016; from
19 to 23 percent in secondary schools, 2010 to 2016).23 Net enrollment rates have also increased significantly
over time in elementary and primary schools, but are considerably lower than gross enrollment rates.24 This
indicates significant over-age initial enrollment or grade repetition. PNG’s net enrollment rates are below
average for LMICs, particularly at secondary level. Girls’ enrollment lags that of boys, with the gap increasing
from elementary to primary, and from primary to secondary levels.25 Security risks of boarding—which many
secondary students must do given PNG’s extreme population dispersion—likely add to wider biases privileging
boys’ education. Those girls who are enrolled, however, do as well as boys (World Bank 2020e, 39).
Figure 28. Expansion in Schools, Students, and Teachers, 2000–18
Source: Basic education data sheet.
73. Improving the quality of basic education remains a significant challenge. PNG has managed to
increase the number of primary school teachers to keep student-teacher ratios roughly constant between 2000
22 While this is changing, early childhood education is still predominantly an urban, private sector activity. In 2018, there were 1,128 early childhood education facilities in PNG (small compared to the 8,404 elementary schools) (NDoE 2020). 23 NDoE (2009); NDoE (2019). 24 Between 2010 and 2016, net enrollment rates rose from 49 to 81 percent for elementary school, from 44 to 58 percent for primary school, and from 12 to 13 percent for secondary school (NDoE 2019). 25 NDoE (2009) and NDoE (2019).
0
2,000
4,000
6,000
8,000
20
00
20
13
20
18
20
00
20
13
20
18
20
00
20
13
20
18
Elementary Primary Secondary
Number of Schools
Gov Non-Gov Gov & Non-Gov
0
200,000
400,000
600,000
800,000
1,000,000
20
00
20
13
20
18
20
00
20
13
20
18
20
00
20
13
20
18
Elementary Primary Secondary
Number of Students
Gov Non-Gov Gov & Non-Gov
0
10,000
20,000
30,000
40,000
20
00
20
13
20
18
20
00
20
13
20
18
20
00
20
13
20
18
Elementary Primary Secondary
Number of Teachers
Gov Non-Gov Gov & Non-Gov (est.)

P a p u a N e w G u i n e a E c o n o m i c U p d a t e J a n u a r y 2 0 2 1
39
and 2016, but the same has not been true at elementary or secondary level, where student-teacher ratios have
increased considerably.26 Overall, the number of teachers graduating each year is insufficient to offset attrition
and increase the teaching workforce to match growth in student numbers. Insofar as the quality of education
outcomes is indicated by standardized test scores, there have been both positive and negative trends in recent
years. The proportion of students achieving minimum proficiency levels in literacy and numeracy appears to
have increased between 2015 and 2018, but most mean scores have decreased (Figure 29). On minimum
proficiency and mean scores in literacy and numeracy, PNG’s results are below regional averages for the Pacific
(World Bank 2020e, 30). In global terms, PNG’s learning-adjusted years of schooling are well below average
for its income level (Figure 30).
Figure 29. Trends in Basic Proficiency and Mean Scores, PNG Figure 30. Learning-adjusted School Years,
LMICs
Source: Basic education data sheet (year 4 minimum proficiency shares in 2015 are not available); World Bank HCI.
b. The institutional capital of the basic education system
74. The institutional capital of the basic education system depends on partnerships that enable
different institutions to jointly provide education. These partnerships involve institutions at local,
subnational, national, and international level, among both state and non-state institutions. Church institutions
are particularly important in these partnerships: they operate about half of PNG’s elementary and primary
schools, and over a third of its secondary schools. While each of these partnerships matters to the capability of
schools, it is the partnerships between state and non-state institutions at the school level that appear to have
overarching importance. After outlining the wider array of state and non-state institutions that contribute to
basic education capability, this section focuses on the school level.
75. Multiple state institutions have responsibilities and resources for basic education. Legislation,
policy, curriculum, exams and teacher standards come from the national government. So also do the resources
for the teaching payroll (covering teachers in both state and church schools) and textbooks. The national
government provides funds for school infrastructure development and maintenance to provincial governments
and to MPs via Service Improvement Program (SIP) grants. The national government provides funds for school
operating costs to schools (state and church). Provincial governments have responsibility for all schools (state
and church) operating in their provinces. They exercise these responsibilities through Provincial Education
26 World Bank staff estimates using NDoE data; NDoE (2019).

P a p u a N e w G u i n e a E c o n o m i c U p d a t e J a n u a r y 2 0 2 1
40
Boards (PEBs), which church education authorities are part of. PEBs appoint teachers to established positions,
recommend tenure and promotions to the national Teaching Services Commission, and oversee the
administration of the teaching payroll. Provincial governments manage school infrastructure development and
maintenance, variously through provincial works departments, grants to schools, and grants to church
education authorities. They receive specific function grants for these educational responsibilities, and in some
cases contribute own-source revenue to the sector too. MPs (both provincial governors and district MPs) have
discretion over their SIP funds, a portion of which is intended for school infrastructure.
76. Communities, clans, villages and churches make critical contributions to the provision of
education at the local level. They contribute through formal school governance arrangements, informal
oversight and accountability, school or project fees, labor and materials, and land for school facilities. Church
education authorities also play key roles at multiple levels, overseeing individual church schools, working with
PEBs, working with the national department,27 and partnering with donors. Donor partnerships also exist with
multiple tiers of government.28
77. The capability of the basic education system comes together at the local level in schools
throughout PNG, and these schools have a reasonable degree of autonomy. Schools are arguably the
most extensive element of the state’s reach in PNG, with greater local presence in remote areas than village
courts, health facilities, and roads. They are the sites where the rules, roles, and resources contributed by the
different institutions come together, to jointly produce education. Critically, schools have a reasonable degree
of autonomy. Although it has undergone changes over time, PNG has operated a facility-based funding model
for schools in recent decades. All schools have School Learning and Improvement Plans (SLIPs). These detail
enrolments, operations, infrastructure requirements and budgets, providing a basis for the management of
school activities for the year. SLIPs are a precondition for the release of operating grants to schools. The staff
and operating grants that the state provides come together in schools with the resources individual schools
secure from communities, clans, wider church institutions, MPs, and so on. The staff and operating grants from
the state enable schools to provide the bare bones of basic education; their ability to secure additional resources
from these other sources enables them to augment that.
78. Much of the accountability that exists in PNG for basic education comes from school-level
governance arrangements. Alongside rules and roles from the state, schools also draw rules and roles from
communities, clans, and wider church institutions. Thereby, the institutional capital of state and non-state
institutions contributes to the capability of schools to provide education. Schools boards serve as the lynchpin
of these partnerships. They oversee school management and performance. In so doing, they can bring values
of trust, integrity and respect from non-state institutions to schools, affecting school management, teaching,
finances, and the treatment of school assets. They source funds and other resources for infrastructure
development and maintenance from communities, clans, wider church institutions, provincial governments,
MPs, donors and so forth. In PNG’s highly fragmented and dispersed context, where the possibilities for
centralized oversight are so limited, school boards can provide local oversight. This matters not only at the
school level, but for school communities to help hold higher tiers of government to account for the
responsibilities they are meant to carry out and the resources they are meant to provide. Where the church
denomination that schools are part of contains high levels of institutional capital, this benefits its schools (Box
5). Some facility-level surveys find that parents at church schools are more likely than parents at state schools
to report that teachers are often or always teaching, teachers are at school on time each day, and that school
27 Agreements with church providers are negotiated nationally, covering staffing, salaries, infrastructure and equipment. 28 Donor spending that is captured in the government’s expenditure management system varies considerably (in the five years to 2018, it ranged from 0.1 percent to 9.6 percent of total education expenditure). These proportions likely underestimate total donor spending, because much of it occurs off-system.

P a p u a N e w G u i n e a E c o n o m i c U p d a t e J a n u a r y 2 0 2 1
41
boards are effective (Howes and others 2014, 162). Whether church schools produce better learning outcomes
would require more detailed data than are available for this report.29
Box 5. How do school governance arrangements work?
State and church school arrangements differ, but both are integrated into the same state structures
State and church schools are governed by the same legislation, receive the same public resources, and are
integrated within a single overall governance framework at provincial level, but there are some important
differences in their school governance arrangements. The National Education Act 1983 provides overall guidance
for appointing school boards, to facilitate community participation in school governance and community ownership of
schools. The daily engagement and interest of families with the schools their children attend provides a strong
foundation for this governance model.a State school boards are appointed by the PEB on the recommendation of
parent/community meetings (processes ward councilors often take a lead role in organizing). Church agencies are
allowed to determine their own criteria for selecting members of school boards. In the Catholic system, school boards
are constituted by parish members, vetted by the parish priest and rotated every three years. Parish priests or their
nominees are a mandatory member of all school boards, and can arbitrate on issues of contention among board
members and between school boards and school administrations.
School boards have oversight of school performance, with responsibility to make recommendations on
principals and teachers, including on disciplinary matters. For state schools, these recommendations go from
school boards and school inspectors to the PEB. In the Catholic system, recommendations on principals and teachers
go from school boards to the Diocesan Catholic Education Board (DCEB). If endorsed, the DCEB recommends these
to the PEB and works to ensure the PEB implements them. Disciplinary matters go from school boards to both the
DCEB and PEB. The PEB holds school boards (for governance issues) and principals (for administrative issues,
including public financial management) to account, including through the reporting of school inspectors. In the Catholic
system, additional accountability is provided by the DCEB, which school boards and principals report to. The DCEB
also provides specific training on financial management and reporting, and specific monitoring of public financial
management in its schools. The DCEB has a dedicated projects office to source and coordinate funding for Catholic
schools, and to manage the infrastructure projects that funds are secured for. Support for the infrastructure work in
state schools is arranged at the school level, working with provincial works departments and other stakeholders
providing resources.
Land and governance are intertwined in important ways in schools. Church schools are constructed on church
land, and as such are recognized as church property. State elementary and primary schools are usually constructed on
land under customary ownership, through agreements between landowners and state. Typically, the clan served by the
school and whose land the school is on dominates the school board and influences the use of school resources through
the principal. At secondary level, where schools usually serve multiple clans and are on state land, it can be challenging
to build effective school boards from representatives of the different clans.
a. See Asian Development Bank (2019: 42) on the contrasts in these local relationships between education and health facilities.
Source: Bopi (forthcoming).
79. The capabilities of schools are affected by how well higher tiers of government carry out their
responsibilities and how efficiently they channel resources to schools. The significant educational
responsibilities of provincial governments mean they play a critical role, with the varied quality of their
contributions explaining some part of the significant geographic variation in educational outcomes in PNG
(Figure 31). The more capable PEBs support the effectiveness of principals and teachers through efficient
teacher recruitment and placement, efficient payroll administration, and strong oversight of staffing. They
support the effective use of public resource through strong oversight of SLIPs and through allocating resources
29 The data from regional standardized tests for 2018 suggests superior performance of state school students over non-state school students on literacy, and the reverse for numeracy (World Bank 2020e, 30).

P a p u a N e w G u i n e a E c o n o m i c U p d a t e J a n u a r y 2 0 2 1
42
according to SLIPs. The most capable provincial governments use efficiency savings from function grants or
provide own-source revenues for teacher housing, transport, and even salary supplements to address the critical
challenge of attracting and retaining qualified teachers in remote locations. They also enable robust school
inspection regimes. (The national government places school inspectors in the provinces, but the extent to which
they can do their job largely depends on whether provincial governments provide them with transport and
other support.) Regular school inspection supports teaching quality and teacher opportunities, because the
inspections feed into PEB recommendations for tenure and promotions). A number of provinces are now
responsible for administering and disbursing school operational grants, in place of the national government.30
In these provinces, provincial capability to administer these grants well and disburse them on time is vital to
school operations, and to public perceptions of provincial performance in the critical sphere of basic education.
Figure 31. Provincial Variation in Minimum Proficiency Levels for Literacy in Year 6 (2015 PILNA)
Source: NDoE (2019).
80. The political importance of basic education in PNG also affects school capabilities. The
provision of new classrooms typically draws large local crowds, yielding incentives for MPs to invest their SIP
funds in these, to strengthen their status as a patron who delivers tangible and highly-valued benefits (Ketan
2007; Allan and Hasnain 2010). Some governors with significant influence at the national level use this to secure
national government or donor projects for teacher training or vocational education colleges in their provinces.
Unusually among policy issues in PNG, education policy has been a leading part of political platforms over the
last decade. Political parties in PNG tend to revolve around personalized patronage relationships between party
leaders and members; policy positions have fairly limited relevance within parties or for the formation of
governing coalitions (World Bank 2018, 97-105; World Bank forthcoming, a). The Tuition Fee Free (TFF)
policy of the People’s National Congress party under former Prime Minister O’Neill, is a rare instance of politics
in PNG moving beyond what is known as ‘elite patronage’ to ‘mass patronage’.31 The TFF policy was an
important campaign promise, implemented by the O’Neill-Dion government. It was replaced under the
Marape-Steven government by an alternative Government Tuition Fee Subsidy (GTFS) policy, involving the
reinstatement of a portion of school fees. School fees are important in political debates, including whether
campaign promises are met, TFF/GTFS funds reach schools on time, and whether fees are needed to underpin
local ownership and accountability for schools.
c. Resilience and opportunities of the basic education system
81. The resilience of the basic education system is crucially dependent on partnerships between
state and non-state institutions to jointly provide education. School capabilities depend on rules, roles,
30 These now include Enga, Eastern Highlands, East Sepik, Morobe, Oro, Milne Bay, East New Britain and New Ireland. 31 Elite patronage (or clientelism) refers to provisioning pacts between national politicians; mass patronage refers to populist policy commitments under which governing coalitions need to deliver on policies that directly affect voters (as opposed to provisioning political elites who in turn independently provision their support bases) (Van der Walle 2007).
0%
10%
20%
30%
40%
50%
Hel
a
AR
oB
Jiw
aka
Enga
East
Hig
hla
nd
sN
ewIr
elan
d
Oro
Gu
lf
San
dau
n
Mo
rob
e
Wes
tern
Pro
vin
ceW
est
New
Bri
tain
East
Sep
ik
Cen
tral
Sou
ther
nH
igh
lan
ds
East
New
Bri
tain
Wes
tern
Hig
hla
nd
sK
iun
gaLake…
Mad
ang
NC
D
Man
us
Miln
e B
ay
Sim
bu

P a p u a N e w G u i n e a E c o n o m i c U p d a t e J a n u a r y 2 0 2 1
43
and resources contributed by both state and non-state entities—particularly local communities and church
institutions. At the local level, school boards and church education authorities are a critical source of oversight
and accountability for school management and performance. They also play a critical role in holding higher
tiers of government accountable for the way they perform their roles to support schools. For example, the
timely disbursement of TFF/GTFS funds to schools is vital for school operations. The national department
provides information to stakeholders on the amount of funds each school is to receive. But how is this
transparency translated into accountability? Because institutions like school boards and church education
authorities exist with a strong interest in using that information to hold the national or provincial government
to account for getting it to their school on time.
82. The nature of the public funds required is also crucial to the resilience of the basic education
system. The bulk of the public funds required are for payroll (typically 90 percent of recurrent education
spending and 80 percent of total education spending). Total education spending is not immune to the wider
fiscal volatility associated with PNG’s resource dependence, as examined in Part A. But the high priority the
government places on the payroll makes it fairly secure. Since principals and teachers in church schools are on
the public payroll like their counterparts in state schools, the bulk of funds required by the sector are fairly
secure. The reliability of non-salary recurrent funds is supported by the constitutional guarantee of provincial
function grants (often delayed, but nearly always paid).32 It is also supported by the political importance of
facility-based TFF/GTFS funds, and the interests of school boards and church institutions in holding
government to account for these (delays and less-than-full payment attract considerable media attention).33 In
contrast to the payroll and other recurrent funds flows, the extent to schools benefit from infrastructure funds
executed by provinces and MPs is highly variable. Capital inputs are of course not unimportant, but the basic
education system has considerable resilience nonetheless, due to the reliable receipt by schools of the bulk of
the fiscal resources they require for basic education.
83. PNG’s basic education system has been successful in accommodating significantly more
students in recent decades, but it needs to be able to do more to improve the quality of learning. There
are opportunities to do this, by building on its existing institutional capital. This includes learning from and
supporting the kinds of school governance arrangements in state and church schools that school results suggest
best support teaching and learning quality. Similarly, learning from the stronger education capabilities of some
provincial governments, to support improvements in others. The national government could facilitate this
learning between state and church school authorities and between provinces. This would build on the strengths
of PNG’s decentralized basic education system, where school facilities have considerable autonomy and
successful innovations can emanate from the local and provincial levels. PNG could also build on the strengths
of its facility-based funding approach, by applying it more to capital resources. Such a move would likely be
resisted by MPs who are interested in retaining discretionary control over capital funds for education. But small
advances may be possible, and could have an important impact. Small increases in the responsibilities and
resources of school boards for key aspects of school infrastructure could not only improve the provision and
maintenance of that infrastructure, but also strengthen the authority of school boards. That could in turn
support wider accountability in the sector.
d. Vulnerabilities and constraints of the basic education system
84. While the nature of the public funds required for basic education is a key source of resilience,
the extent of the funds required poses a vulnerability. PNG’s rapidly growing population means that
32 Education function grants represent a further 5 percent of total education spending, with actual payments matching budget appropriations very closely (PNG, NEFC 2020). 33 This is not a complete guarantee that these funds will be prioritized, however. For example, as fiscal constraints increased, TFF resources were only about 85 percent disbursed in 2017 and 2018 (as against full disbursement in 2016).

P a p u a N e w G u i n e a E c o n o m i c U p d a t e J a n u a r y 2 0 2 1
44
significantly more payroll resources will be required to maintain student-teacher ratios in primary schools and
regain manageable student-teacher ratios in elementary and secondary schools. Given PNG’s fiscal situation,
this poses a problem: education is already a reasonable share of total spending; it is the total spending envelope
that is low, constrained by inadequate revenues. In addition, some aspects of basic education depend heavily
on adequate capital funding—for example, science and technology subjects, access to education for girls (toilet
and hygiene facilities, and security of boarding arrangements), and remote learning capabilities (as required for
education to continue during the COVID-19 lockdowns in 2020). Given the underlying fiscal constraints
examined in Part A, securing additional capital resources for education is unlikely in the medium term. This
makes the effective use of existing capital resources critical. If school fees are retained to underpin local
ownership and accountability for schools,34 additional resources will need to reach either vulnerable families or
school facilities to offset the adverse equity implications of fees.35 Girls are particularly vulnerable to exclusion.
Securing such additional non-salary recurrent resources for education will be a challenge in the medium term.
85. There are severe constraints on the capability of PNG’s institutions to ensure the good use of
capital funds. Capital funds are fragmented between provincial governments, provincial governors and district
MPs, among others. Except in the case of provincial governments, recurrent and capital budgets are fragmented.
Education infrastructure is meant to account for 20 percent of the SIP funds of provincial governors and
district MPs, but they do not have recurrent responsibilities and have little incentive to coordinate their capital
spending with those who do. Given the discretionary nature of SIPs and the political importance of basic
education, provincial governors and district MPs face strong incentives to direct their funds to classroom
construction in the often narrow areas of their electoral base (Wiltshire 2016a). Weak procurement controls
limit the likelihood of value-for-money in contracting such work.36 (Still, those that are built have reasonable
prospects of being used, given the fairly straightforward technical specifications of basic classrooms.)
86. There are also constraints on the capability of PNG’s institutions to ensure the good use of
some aspects of non-salary recurrent funds. Where these are retained in aggregate by government—rather
than disbursed to facilities—they offer patronage opportunities to those controlling them. Funds for textbooks,
for example, have long been retained at the national level, offering a large pool of funds for execution through
a small number of high-value contracts. From 2016, TFF funds for infrastructure that were previously disbursed
to facilities were redirected to provinces.37 Resisting the carving off of more elements of facility-based funds
for execution by government is important for spending quality and to protect the existing degree of school
autonomy that is vital to the overall capability of the education system.
2.3. Institutional capital for basic health
a. Basic health institutions and everyday life in PNG
87. PNG’s institutional capital for basic health shares similarities with that for basic education,
but also has some key differences. This study’s focus is on basic health services—the preventative and
primary care that most Papua New Guineans depend on, on a day-to-day basis, for services and for referrals to
higher-level facilities for more complex clinical care. This is not intended to suggest that higher-level facilities
are unimportant—on the contrary, the efficacy of care at both levels depends on that at the other. But the focus
34 Without clear evidence either way (see Walton 2018), there are anecdotal claims that the removal of school fees under the TFF led to local disengagement with schools and damaged accountability relationships between schools and parents. This was a key justification for TFF’s replacement by GTFS by the Marape-Stevens government. 35 School fee debts at the household level are common (UNDP 2020, 33). 36 There are anecdotal indications that church schools may be less vulnerable to patronage-based volatility in infrastructure funding than state schools. Church education authorities can be sufficiently powerful that they can negotiate with MPs to provide the funds to the church education authority to execute, rather than the MP executing the funds directly. 37 See Walton and others (2017); Nunn and Nelson (2019). This TFF component was abolished, with the transition to the GTFS.

P a p u a N e w G u i n e a E c o n o m i c U p d a t e J a n u a r y 2 0 2 1
45
is on the basic health institutions that dominate the health care of most people, most of the time, affecting their
health and well-being, children’s learning, and adults’ livelihoods. PNG’s institutional capital for basic health
depends on partnerships between the many institutions, both state and non-state, that jointly provide health
services. The challenges of getting these partnerships to work are more pronounced in health than in education.
And whereas the nature of the public resources required for education is largely a source of resilience, it poses
a key vulnerability for health—a vulnerability starkly illustrated during the COVID-19 crisis in 2020.
88. In recent decades, PNG’s basic health institutions
have contributed to improved health outcomes for its rapidly
growing population. Key health indicators have generally
improved, but not always—as with immunization (Figure 32),
which have fluctuated but declined overall. Health performance
in PNG has often improved at a slower rate than the average for
LMICs (the gap with LMICs on PNG’s historically lower
maternal mortality outcomes is closing, and that for its historically
lower child mortality outcomes has nearly closed). The same is
true for the comparison between PNG and resource-rich peer
countries. In addition, while PNG’a immunization rates have
fluctuated and then declined, immunization rates in LMICs and
resource-rich peers have tended to improve. (Outreach patrols for
vaccinations require considerable grasp and reach capabilities. For
vaccines, fridges, vehicles or boats, fuel, cash for daily allowances,
food and accommodation in villages, to come together in one
place at the same time requires coordination across multiple
institutions at different levels of government (Wiltshire 2016b).)
b. The institutional capital of the basic
health system
89. The institutional capital of the basic health system
depends heavily on partnerships that enable different
institutions to jointly provide health services. The capability
that comes together in frontline health facilities draws on rules,
roles, and resources from entities at local, subnational, national
and international level, both state and non-state. They include
local communities and churches who oversee, operate or
otherwise contribute to local facilities. They include multiple
levels of subnational government, with various
health-related responsibilities and resources. At the
national level, the National Department of Health
(NDoH) provides for policy and standards, sector
planning, coordination and monitoring, and the
procurement and distribution of medical supplies
and equipment. NDoH coordinates with church
health authorities at the national level. It also
coordinates with the range of development partners
that provide technical assistance and resources to
Figure 33. Key Health Entities
Figure 32. Key Health Indicators
Source: World Bank World Development Indicators.
P a p u a N e w G u i n e a E c o n o m i c U p d a t e J a n u a r y 2 0 2 1
46
the health sector. Donors also work directly with subnational government entities and with church health
authorities.
90. Given PNG’s highly dispersed and fragmented population, the capability of reach is critical to
institutional capital for basic health. Like with village court and basic education, institutional capital for
health depends on partnerships and joint provision. Partnerships with church health providers are crucial. The
backbone of the basic health system is the network of facilities at the district level and below (including district
hospital and health centers, but not including aid posts). Half of these facilities are run by church health
providers. This includes facilities in very remote geographic areas, serving hard-to-reach population groups.
Previous studies have found church-run facilities to somewhat outperform state-run facilities on particular
aspects of patient satisfaction and services. For example, a study concluding in 2012 found higher levels (‘very
good’) of patient satisfaction reported at church-run facilities, but the results evened out when ‘very good’ and
‘adequate’ results were added together (Howes and others 2014). A 2017 study found church-run facilities to
outperform state-run facilities on the four indices compiled (general services availability, laboratory services
availability, readiness, and drugs availability), though the differences were modest except on the laboratory
services availability index (Khan and others 2017). In contrast, a 2018 analysis by the World Bank, which created
a composite index of performance indicators, found that four of the five higher performing provinces had
more state-run facilities than church-run facilities.
91. Institutional fragmentation appears to be more pronounced in the health sector than the
education sector, making grasp capability harder to achieve. This is partly due to the greater importance
and complexity of non-salary recurrent inputs and capital inputs for basic health services. Vaccines, medicines,
other medical supplies, infrastructure, and equipment are all vital to basic health service provision. Supply chains
must be coordinated from the international or national level down to the local level. The challenges go even
further, however, because supplying health clinics and aid posts is insufficient to reach a significant portion of
the population. That requires outreach from these clinics (staff travelling out over one or more days to remote
communities). For state-run facilities to do this, they have to coordinate with higher tiers of government for
complementary inputs like vehicles, fuel and cash for expenses, since PNG does not operate a facility-based
funding model in health. Like education, capital funds are fragmented between institutions, and recurrent and
capital budgets are also fragmented. The greater importance and complexity of capital inputs for basic health
makes this fragmentation a more significant vulnerability in health. Where SIP funds are directed to health
infrastructure, without coordination with health authorities, there are higher risks that the infrastructure will
not be useable than in the case of school classrooms. Moreover, for maximum impact on health access and
outcomes, health investments need to be coordinated with other sectoral investments (in roads, water and
sanitation, for example).
92. To tackle the institutional fragmentation in the health sector, PNG has established PHAs in
all provinces to oversee the delivery of health services. PHAs are statutory authorities with administrative
and financial responsibility for hospitals as well as primary health services. They are responsible for coordinating
state and non-state health service providers. The establishment of PHAs does not of course eliminate
institutional fragmentation. Instead, PHAs offer a device to improve coordination between the entities
involved. Their success in doing this will be highly dependent on PHAs’ effectiveness in building and sustaining
partnerships with all the entities that health services in their provinces depend on (local, subnational, national
and international entities, both state and non-state). Given the importance of church-run facilities for frontline
services, the success of PHAs’ partnerships with church health authorities will be critical. PHA Boards and
CEOs have a vital role to play in leading and overseeing such partnerships.
93. PHAs in provinces where health outcomes are weaker face even greater challenges. Many
factors other than the capabilities of health institutions affect health outcomes, including socioeconomic status,
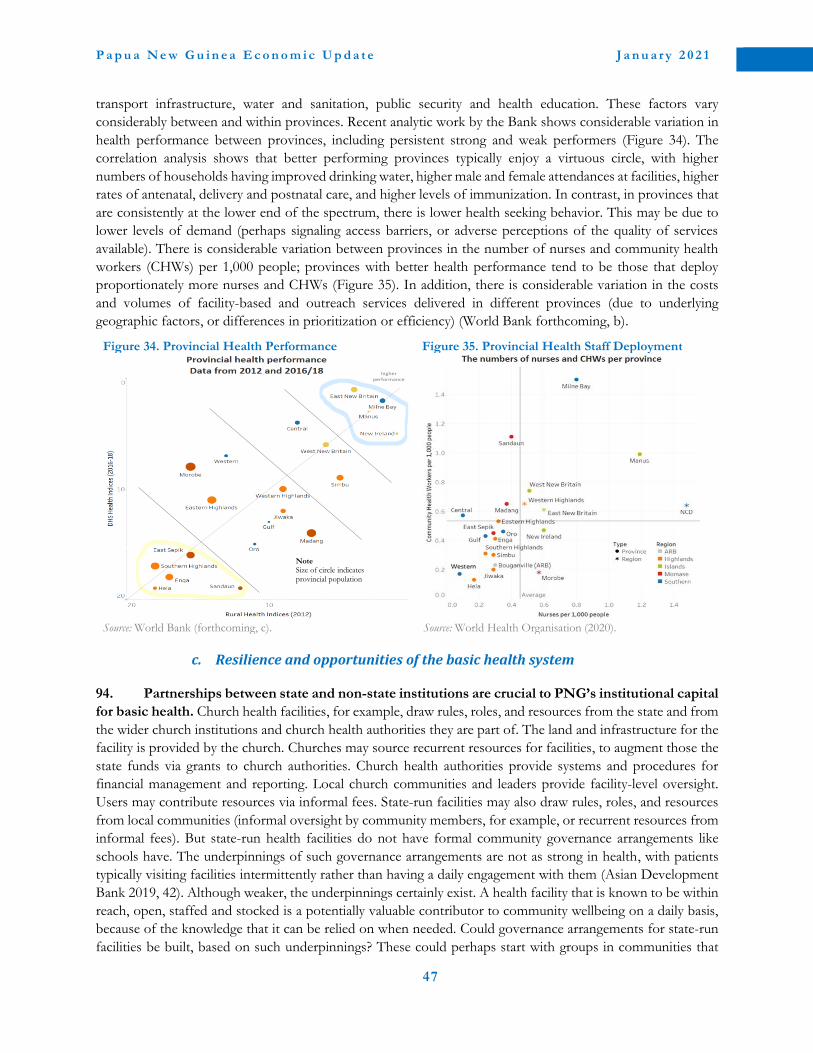
P a p u a N e w G u i n e a E c o n o m i c U p d a t e J a n u a r y 2 0 2 1
47
transport infrastructure, water and sanitation, public security and health education. These factors vary
considerably between and within provinces. Recent analytic work by the Bank shows considerable variation in
health performance between provinces, including persistent strong and weak performers (Figure 34). The
correlation analysis shows that better performing provinces typically enjoy a virtuous circle, with higher
numbers of households having improved drinking water, higher male and female attendances at facilities, higher
rates of antenatal, delivery and postnatal care, and higher levels of immunization. In contrast, in provinces that
are consistently at the lower end of the spectrum, there is lower health seeking behavior. This may be due to
lower levels of demand (perhaps signaling access barriers, or adverse perceptions of the quality of services
available). There is considerable variation between provinces in the number of nurses and community health
workers (CHWs) per 1,000 people; provinces with better health performance tend to be those that deploy
proportionately more nurses and CHWs (Figure 35). In addition, there is considerable variation in the costs
and volumes of facility-based and outreach services delivered in different provinces (due to underlying
geographic factors, or differences in prioritization or efficiency) (World Bank forthcoming, b).
Figure 34. Provincial Health Performance Figure 35. Provincial Health Staff Deployment
Source: World Bank (forthcoming, c). Source: World Health Organisation (2020).
c. Resilience and opportunities of the basic health system
94. Partnerships between state and non-state institutions are crucial to PNG’s institutional capital
for basic health. Church health facilities, for example, draw rules, roles, and resources from the state and from
the wider church institutions and church health authorities they are part of. The land and infrastructure for the
facility is provided by the church. Churches may source recurrent resources for facilities, to augment those the
state funds via grants to church authorities. Church health authorities provide systems and procedures for
financial management and reporting. Local church communities and leaders provide facility-level oversight.
Users may contribute resources via informal fees. State-run facilities may also draw rules, roles, and resources
from local communities (informal oversight by community members, for example, or recurrent resources from
informal fees). But state-run health facilities do not have formal community governance arrangements like
schools have. The underpinnings of such governance arrangements are not as strong in health, with patients
typically visiting facilities intermittently rather than having a daily engagement with them (Asian Development
Bank 2019, 42). Although weaker, the underpinnings certainly exist. A health facility that is known to be within
reach, open, staffed and stocked is a potentially valuable contributor to community wellbeing on a daily basis,
because of the knowledge that it can be relied on when needed. Could governance arrangements for state-run
facilities be built, based on such underpinnings? These could perhaps start with groups in communities that
higher performance
Note Size of circle indicates provincial population

P a p u a N e w G u i n e a E c o n o m i c U p d a t e J a n u a r y 2 0 2 1
48
have more regular engagement with health facilities —pregnant women and women with young children, for
example.
95. The establishment of PHAs offers a new opportunity to support the capabilities of frontline
facilities by tackling the fragmentation among the institutions that frontline facilities depend on. PHAs
have the mandate to forge agreements with church health providers, provincial governments, and DDAs in
order to coordinate health sector planning, budgeting, resource contributions, responsibilities, operations and
reporting across the province.38 To do this successfully, PHAs need to prioritize building and sustaining these
partnerships. This includes participating in provincial planning and budgeting processes that affect basic health.
For example, the extent to which provincial governments direct their own-source revenues to the construction
and maintenance of staff housing is vital to the ability of PHAs to attract and retain skilled health staff at remote
facilities. More broadly, provincial roads, water and sanitation programs are critical to health access and
outcomes. PHAs also need to try to build partnerships with DDAs, to coordinate their capital spending on
health from SIP funds with sector priorities and recurrent funds, and to influence district roads, water and
sanitation programs.
96. Forging such partnerships will be an ongoing challenge, given PNG’s political context. To
secure and coordinate the resources that the health sector needs, PHA Boards and CEOs need to be able to
work effectively with provincial governments (governors and administrators) and DDAs (MPs and
administrators), even where these institutions struggle to work together directly. PHA Boards are appointed by
the minister of health, having consulted with the provincial governor. Like all board appointments in PNG,
there is an ever-present risk that appointments will be patronage rather than capability-based. PHAs have some
features that may help limit the incursion of patronage. The patronage value of control over them is reasonably
limited, because their resources are primarily recurrent and dominated by tightly-restricted function grants, and
each PHA Board only controls the resources for one province (rather than there being a national body with
aggregate resources to control). In addition, there are a large number of senior medical professionals engaged
in them, making misappropriation of funds more likely to encounter whistleblowers.
97. Rich data are now available, which could be used to underpin performance monitoring and
learning in the health sector. Disaggregated data on financing, inputs, outputs and outcomes now allows
performance monitoring of facilities across districts and authorities (state, and different church denominations).
Analysis of these data could yield insights into the factors that support stronger capabilities in different contexts,
which could be applied to strengthen capabilities. The key question is, who will use this information to monitor
performance and hold different institutions to account? NDoH has this responsibility, and could play an
important role in facilitating learning between provinces and between state and church health providers. This
would accelerate the uptake of successful approaches developed in specific places or institutions. Beyond
NDoH’s role, is there a role for communities in performance monitoring, via facility-level governance? Could
the institutional capital of church health authorities be used to help translate greater transparency into stronger
accountability in the wider health sector?
d. Vulnerabilities and constraints of the basic health system
98. The extent of the public funds required poses a key vulnerability for institutional capital in the
health sector. Even though important gains have been made over the last decade, significantly more payroll
resources will be required to further improve the ratio of health professionals to population.39 Given PNG’s
38 At the same time as they coordinate horizontally, within the province, they are the focal point for coordination vertically with national authorities (as part of procurement and supply chains, for instance). 39 The number of health professionals increased from 0.55 per 1,000 people in 2009 to 1.03 per 1,000 people in 2018, but this is well short of the World Health Organization’s benchmark of 4.45 per 1,000 people to achieve universal health coverage (WHO, 2020).
P a p u a N e w G u i n e a E c o n o m i c U p d a t e J a n u a r y 2 0 2 1
49
fiscal situation, this poses a problem. Like in education, the constraint is due to inadequate revenues and thus
the relatively low overall spending envelope. Thus, PNG’s spending on health is both significantly above the
average for LMICs as a share of total public spending, and significantly below the average for LMICs as a share
of GDP.
99. The nature of the public funds required also poses some key vulnerabilities for institutional
capital in the health sector. Payroll is an important component of health spending, but this does not provide
the same degree of resilience for health as it does education. This is partly because payroll resources are not as
large a share of health resources as they are of education resources. In health, significant non-salary recurrent
spending is also vital (for example, medical supplies and transport for outreach services). Capital spending is
very important too (for example, medical equipment). Thus, the reliability of the public payroll is far from
sufficient for basic health services, if non-salary recurrent spending and capital spending is volatile or unreliable.
Some parts of non-salary recurrent spending in health are reasonably reliable, such as function grants for
PHAs.40 Others are less reliable, either because they are subject to delays or non-payment when the fiscal
situation is tight, or because they are vulnerable to misuse. For example, large pools of recurrent funds held at
national level are executed through a small number of high-value contracts for drug procurement, posing a risk
due to the potential patronage value of such procurements. Given the importance of capital inputs to health
service provision, the fragmentation of capital funds among different entities, the disconnect between capital
and recurrent budgets, and the discretionary control MPs have over SIP funds impose important constraints
on basic health capabilities.
100. A further reason why the reliability of the public payroll does not yield the same resilience in
health as it does in education is because the staff in the church health sector are not on the public
payroll. Their payroll costs are funded via grants from the national government to church health authorities.
Like other non-salary recurrent allocations, they are vulnerable to delays when public cash flows are tight,
exposing them to the fiscal volatility associated with PNG’s resource dependence. In 2020, as fiscal constraints
in PNG intensified with the impact of the COVID-19 pandemic, delays in the disbursement of grants to church
health authorities extended over several months, leaving church health workers unpaid and funds for operating
costs unavailable. This undermined frontline facilities at the height of the health crisis. In 2021, grants to church
health authorities have been cut significantly. Overall, the health sector is vulnerable to fiscal volatility because
of the importance of non-salary recurrent and capital inputs to health services. The impact of fiscal volatility is
amplified in the church health sector, because its payroll depends on grants, so are more like non-salary
recurrent funds for volatility. Given the significance of church-run facilities for overall frontline services in
PNG, this represents a key vulnerability for the institutional capital of the basic health system as a whole.
2.4. Institutional capital for roads
a. Roads institutions and everyday life in PNG
101. In debates about infrastructure and livelihoods in PNG, “Give us the roads and then forget
about us!” is a frequent refrain. It reflects a sense that if the government would only ensure that people have
passable roads to get to markets, they would be able to do the rest without further need of the government.
Roads are, of course, not the only component of transport infrastructure that matters for people’s livelihoods
40 A further source of volatility in some provinces arises from how the formula for function grants interacts with the new institutional setup of PHAs. Function grants are determined by fiscal need, based in part on the own-source revenues of provinces. In some provinces, own-source revenues are sufficiently large that function grants are zero. But the own-source revenues belong to provincial governments (which health function grants used to be paid to, before PHAs were established), not PHAs. In such contexts, PHAs depend on negotiations with provincial governments to benefit from their own-source revenues, in order to secure the equivalent of a function grant.

P a p u a N e w G u i n e a E c o n o m i c U p d a t e J a n u a r y 2 0 2 1
50
or their access to basic services: wharves/jetties and airports are important too, especially in remote inland and
outer island locations. But the overwhelming importance of roads is undeniable, something that can be best
understood when the significance of agriculture to livelihoods in PNG is taken into account (Figure 36). Roads
are the most important part of transport infrastructure for agriculture in PNG. Both because of their
significance to agricultural livelihoods, and because they exist at the furthest reaches of the transport network—
including connecting people to wharves/jetties and airports—roads serve as a particularly important symbol of
state capability and reach in PNG. This section focuses on institutional capital for the construction,
rehabilitation, and maintenance of roads. The political importance of roads, as well as the nature of the spending
involved, significantly affect this institutional capital.
102. PNG presents an enormously challenging context for road infrastructure, even without
accounting for the institutional factors that are the focus of this study. These challenges arise from the
extreme dispersion and low level of urbanization of the population; the mountainous, riverine and swampland
geography of the mainland; the archipelagic geography of the remainder of PNG; and the climatic and
geological conditions that generate frequent extreme weather and geological events. As an indication of this
challenging context, only one of the 15 mainland provincial capitals (Kerema, in Gulf Province) is connected
to Port Moresby by road (Figure 38).41 PNG’s road density is very low compared to other LMICs (Figure 37).
Only about 15 percent of the roughly 29,700 km total road network is sealed.42 Although PNG’s per km
rehabilitation and maintenance costs may be high in the global context, data suggest that rehabilitation costs
are comparable with those in Solomon Islands and below those in Fiji (World Bank 2020e, 36).
Figure 36. Agricultural Livelihoods in PNG vs LMICs
Figure 37. Road Density in PNG vs LMICs
Source: World Development Indicators database. Sources: CIA World Factbook; World Development Indicators database.
a. The institutional capital for roads
103. PNG’s institutions for road construction, rehabilitation and maintenance are highly
fragmented. The allocation of mandates for different types or areas of roads to different levels of government
occurs in many countries. But in PNG, roads institutions are characterized by unclear and duplicated mandates,
41 This tally excludes Central Province and the National Capital District, which Port Moresby serves as the capital for. 42 Sealed roads account for 40 percent of the 8,738km of national roads and 10 percent of the 8,070km of provincial and local roads accounted for in the national road asset management database. The remaining provincial and local roads are not accounted for in that database. See World Bank (2020e, 36).
0
10
20
30
40
50
60
70
0 1000 2000 3000 4000
Agr
icu
ltu
re s
har
e o
f em
plo
ymen
t
GNI per capita, current US$
PNG
BhutanMorocco
Lao PDR
0
10
20
30
40
50
60
70
80
90
100
0 1000 2000 3000 4000
Ro
ad d
ensi
ty (
km p
er 1
00
sq
uar
e km
)
GNI per capita, current US$
PNGSuriname
Bolivia
MauritaniaRep. of Congo
Solomon Is
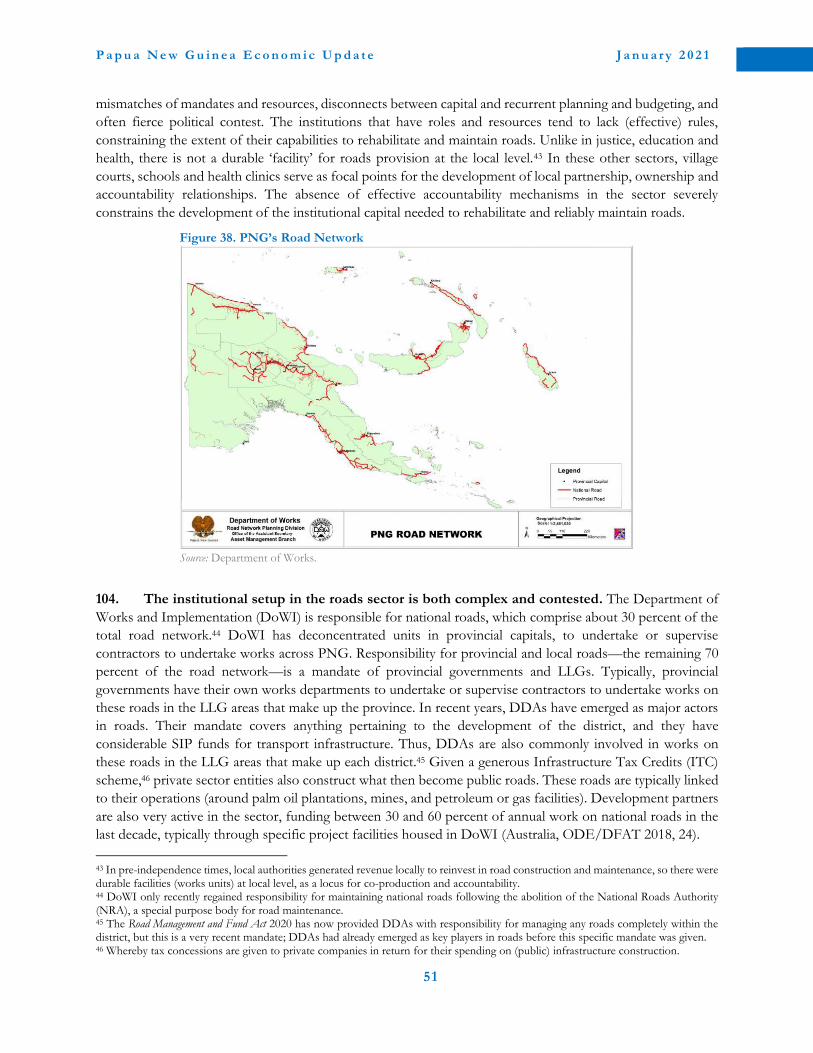
P a p u a N e w G u i n e a E c o n o m i c U p d a t e J a n u a r y 2 0 2 1
51
mismatches of mandates and resources, disconnects between capital and recurrent planning and budgeting, and
often fierce political contest. The institutions that have roles and resources tend to lack (effective) rules,
constraining the extent of their capabilities to rehabilitate and maintain roads. Unlike in justice, education and
health, there is not a durable ‘facility’ for roads provision at the local level.43 In these other sectors, village
courts, schools and health clinics serve as focal points for the development of local partnership, ownership and
accountability relationships. The absence of effective accountability mechanisms in the sector severely
constrains the development of the institutional capital needed to rehabilitate and reliably maintain roads.
Figure 38. PNG’s Road Network
Source: Department of Works.
104. The institutional setup in the roads sector is both complex and contested. The Department of
Works and Implementation (DoWI) is responsible for national roads, which comprise about 30 percent of the
total road network.44 DoWI has deconcentrated units in provincial capitals, to undertake or supervise
contractors to undertake works across PNG. Responsibility for provincial and local roads—the remaining 70
percent of the road network—is a mandate of provincial governments and LLGs. Typically, provincial
governments have their own works departments to undertake or supervise contractors to undertake works on
these roads in the LLG areas that make up the province. In recent years, DDAs have emerged as major actors
in roads. Their mandate covers anything pertaining to the development of the district, and they have
considerable SIP funds for transport infrastructure. Thus, DDAs are also commonly involved in works on
these roads in the LLG areas that make up each district.45 Given a generous Infrastructure Tax Credits (ITC)
scheme,46 private sector entities also construct what then become public roads. These roads are typically linked
to their operations (around palm oil plantations, mines, and petroleum or gas facilities). Development partners
are also very active in the sector, funding between 30 and 60 percent of annual work on national roads in the
last decade, typically through specific project facilities housed in DoWI (Australia, ODE/DFAT 2018, 24).
43 In pre-independence times, local authorities generated revenue locally to reinvest in road construction and maintenance, so there were durable facilities (works units) at local level, as a locus for co-production and accountability. 44 DoWI only recently regained responsibility for maintaining national roads following the abolition of the National Roads Authority (NRA), a special purpose body for road maintenance. 45 The Road Management and Fund Act 2020 has now provided DDAs with responsibility for managing any roads completely within the district, but this is a very recent mandate; DDAs had already emerged as key players in roads before this specific mandate was given. 46 Whereby tax concessions are given to private companies in return for their spending on (public) infrastructure construction.

P a p u a N e w G u i n e a E c o n o m i c U p d a t e J a n u a r y 2 0 2 1
52
105. The nature of roads spending affects the institutional capital that has developed in the sector.
In PNG, roads spending is highly vulnerable to political capture. This is due both to what the funds are spent
on, and how they are spent. The roads that funds are spent on have considerable political value, in themselves.
Since passable roads are both critical and scarce, someone who is able to deliver them generates considerable
patronage among those who benefit from those roads. Controlling where—and therefore also to whom—roads
are delivered is important to the electoral strategies of political representatives. In PNG, road construction and
rehabilitation seem to offer more patronage value with supporters than routine repair and maintenance—
probably through their greater visibility, including the groundbreaking ceremonies associated with them.
106. How funds are spent also has considerable patronage value, with greater patronage available
from construction and rehabilitation than from maintenance. In contrast to some of the other sectors
examined in this study, road works require significant amounts of non-salary recurrent and capital inputs, and
relatively small payroll inputs. This is the case for construction, rehabilitation, and maintenance, though the
importance of non-salary recurrent and capital inputs is even higher for construction and rehabilitation than it
is for maintenance. Public employment of course has potential patronage value, but in PNG the patronage
value available from the procurement of non-salary recurrent and capital inputs appears to be higher, perhaps
because it can be more readily translated into flows of money.47 This makes fiscal resources for roads particularly
vulnerable to capture. If the higher-level political actors who make decisions between road construction or
rehabilitation and road maintenance, and between in-house and procured works, are better placed to secure
patronage from spending on construction or rehabilitation than from maintenance, and from spending on
procured than in-house works, spending is likely to be skewed toward road construction or rehabilitation by
private contractors. Since road construction or rehabilitation can involve the procurement and implementation
of a few, high-value contracts controlled at senior levels in higher tiers of government, this is likely to be the
case. It is liable to result in contracts in which political leaders or senior officials in higher tiers of government
have a beneficial interest. Road maintenance, on the other hand, tends more to many, small-value contracts or
to in-house work, controlled at more junior levels in higher tiers of government or in lower tiers of government.
The greater potential patronage value of contracted works over in-house works—where payroll and
administrative overheads reduce the discretionary funds available—may explain why earlier reforms hollowing
out in-house capacity in favor of contracting private firms were embraced so readily in PNG.
107. Contests for control over roads spending have contributed to the institutional fragmentation
in the roads sector. At the national level, these contests are over the national roads spending in the PIP
(including the donor projects it contains), and the ways funds are spent. At the provincial level, these contests
are over the works that are prioritized and the ways funds are spent under the governor’s roads program (from
provincial SIP funds for transport infrastructure, totaling PGK 66 million annually). They are also over the
activities of the provincial works departments (from function grants for the maintenance of transport
infrastructure—totaling about PGK 150 million annually—and from provincial own-source revenue). At the
district level, the contests are over the works that are prioritized and the ways funds are spent under the DDA’s
roads program (from district SIP funds for transport infrastructure, totaling PGK 267 million annually).
Indirectly, through forgone revenue, the public sector also funds the roads that private companies construct
with ITCs, involving contests at the national level over which roads at what valuation can be offset against tax
obligations.
108. Institutional fragmentation contributes to the lack of development of institutional capital in
the sector, particularly road maintenance capability. The functional mandate of DDAs for roads has never
been clarified. If it is for provincial and local road construction or rehabilitation—as it is commonly interpreted
in practice—then there is a clear disconnect between planning and budgeting for capital works (in DDAs) and
47 See PNG, Auditor-General’s Office of PNG (2014, 13).

P a p u a N e w G u i n e a E c o n o m i c U p d a t e J a n u a r y 2 0 2 1
53
planning and budgeting for recurrent maintenance (in provincial governments). Provincial governments have a
mandate for construction, rehabilitation, and maintenance, but the only transfer they receive—the function
grant—is for maintenance. Provinces with own-source revenues have funds they can use for construction,
rehabilitation or maintenance, so have the potential to coordinate construction/rehabilitation and maintenance
work. Although it may not be consistent with the political strategies of many governors, it is at least plausible
for governors’ SIP-funded capital works to be coordinated with the maintenance plans of provincial
governments. That is not really plausible for DDAs’ SIP-funded capital works. DDA structures are dominated
by district MPs, with both the institutional setup of DDAs and the funding arrangements for SIPs offering
considerable discretion to MPs over what they spend on and how they spend those funds. s, Coordination with
other parts of government (such as with the maintenance plans of provincial works departments), would curtail
the patronage opportunities of district MPs. Such coordination thus tends to be elusive.
109. Underspending on maintenance reinforces a vicious build-neglect-rebuild cycle that reduces
the quality of the road network that can be achieved with a given level of resources. This is because the
less maintenance that is done, the higher the consequent road rehabilitation costs, the scarcer the funds available
for maintenance. Rehabilitating roads in PNG is estimated to cost multiples of what it would cost to maintain
them (Dornan 2014; DoWI 2018, 3). PNG appears to be caught in this vicious cycle of needing to spend more
resources and to spend them more frequently on road rehabilitation, at the cost of maintenance. A physical
assessment of the condition of national priority roads—4,300km of priority roads within the larger network of
national roads—in 2014/15 found 13 percent to be in good condition, 7 percent in fair condition, 21 percent
in poor condition and 59 percent in very poor condition.48 The government’s estimate of the condition of roads
designated as provincial and local roads is that 64 percent are in poor or failed condition (DoWI 2018, vii).
More than 75 percent of national, provincial, and local roads become impassable during the year, and about 80
percent of bridges are structurally deficient (World Bank 2020e, 38). Estimates of the funds required to maintain
PNG’s existing road network far exceed actual maintenance spending (Figure 39). These estimates also raise
the question of whether maintaining PNG’s roads (leaving aside the costs of rehabilitation) is an impossible
task given the public resource envelope: the mid-point of the government’s cost estimates for the required road
maintenance (2.4 percent of GDP annually), may exceed the total amount the government spends on road
construction, rehabilitation and maintenance.49 The overall scarcity of resources relative to the task likely
intensifies competition for resources among different political actors and the roads institutions they control.
Figure 39. Estimated Road Maintenance Spending Required Versus Actual Spending
Source: DoWI (2018: 2).
48 This physical assessment was carried out for the Australian Government’s Office of Development Effectiveness. Its results contrasted with those in PNG’s road condition database (which in 2011 showed approximately 47 percent of roads to be in good condition and 48 percent to be in fair condition, with a steady improvement since 2005). Given the contrast with the results of the physical assessment, the Office of Development Effectiveness concluded that PNG’s database was inaccurate. See Australia, ODE/DFAT (2018). 49 Maintenance cost estimates are from DoWI (2018b: 2); actual spending on road construction and maintenance is from PNG Treasury data, and underestimates spending to the extent that it does not capture SIP funds spent on roads.
0
500
1000
1500
2000
2500
2008 2009 2010 2011 2012 2013 2014 2015 2016
Kin
a (m
illio
n)
Recommended maintenance spending (range) Actual road/bridge maintenance spending

P a p u a N e w G u i n e a E c o n o m i c U p d a t e J a n u a r y 2 0 2 1
54
b. Resilience and opportunities of the roads system
110. Identifying sources of resilience and plausible opportunities to strengthen institutional capital
for roads is challenging. As a result of the nature of the resources required for roads, the fragmented
institutional structure of the sector, and the wider political economy context, political actors have very strong
incentives to retain the status quo of build-neglect-rebuild.
111. For national roads, there is in theory the possibility that DoWI could coordinate planning and
budgeting of capital and recurrent work and could rebalance spending towards maintenance. But
strong political economy dynamics and weak accountability mechanisms continue to see maintenance
deprioritized, even where the mandates for road construction, rehabilitation and maintenance are held by a
single institution. Moves by some donor partners to fund only the rehabilitation of the existing network may
help to avoid worsening the problem by extending the network to be maintained. Adhering to this position will
be an ongoing challenge for donors, however, given that they are also subject to pressure to align their programs
with PNG’s domestic political economy imperatives. Moves to employ life-cycle contracting for project-
financed rehabilitation, to include the costs of maintenance in the initial contract, are also promising. Such
contracts give incentives for rehabilitation work to be done in a way that minimizes maintenance requirements,
and also ensure that the costs of that maintenance are covered. To be effective, the government would have to
enforce the contract over the life-cycle of the asset—both while donor oversight continues (during the life of
the project), and after it ceases (since donor project-cycles are shorter than asset life-cycles).
112. For provincial and local roads, donor funds could plausibly be used to provide stronger
incentives for maintenance. The function grant for transport infrastructure maintenance is one source of
resilience in the sector, providing a constitutionally-guaranteed flow of funds, linked by formula to the local
cost of providing a minimal level of maintenance services. The province of Simbu demonstrates what can be
achieved through the effective use of this function grant to keep the road network open to four-wheel drive
vehicles year-round. In Simbu, this is achieved by keeping the function grant under very tight administrative
control. But function grants are small in the wider scheme of infrastructure funds: district MPs collectively have
more than double the value of function grants for transport infrastructure. Matching grants paid to provinces
that successfully maintain provincial and local roads could potentially offer very significant incentives, at least
to provinces that lack own-source revenue and are dependent on function grants. Could the promise of the
reliable provision of passable roads year-round offer a viable political strategy for a governor? The education
TFF showed that a clear promise on an item of universal value could garner votes on a policy basis. Roads have
similar universal value. If such a political strategy were viable, provision of significant additional resources for
road maintenance might both enable a governor to build a functioning works department and provide the
incentive for the governor to ensure that it maintains the road network, in order to continue to secure electoral
support. Development partners could complement the matching grants with technical assistance to help the
provincial works department achieve the technical capability required for reliable road maintenance.
c. Vulnerabilities and constraints of the roads system
113. The nature of the resources required for roads, the fragmented institutional structure of the
sector, and the wider political economy context, severely constrain institutional capital for roads in
PNG. Previous attempts to address these constraints have only served to illustrate their severity. The prime
example is the creation and subsequent abolition of the National Roads Authority (NRA). With some strong
donor support, the NRA was established to maintain national roads, using the proceeds of a special purpose
fund resourced by a fuel levy. The independence of the institutional setup, and funding source that could not
be diverted to road construction, were expected to insulate the NRA from the wider political economy context.
The resources generated by the fuel levy were inadequate, however. By 2016, the revenue of the road fund was

P a p u a N e w G u i n e a E c o n o m i c U p d a t e J a n u a r y 2 0 2 1
55
less than 1.5 percent of total government spending on roads (Dornan 2016, 452). The NRA’s insulation from
the wider political economy context appeared to be its undoing: political leaders simply channeled the resources
under their control to institutions more useful to them. In 2020, the NRA was disestablished and its roles were
returned temporarily to DoWI.50
2.5. Institutional capital for public revenue
a. Public revenue institutions and everyday life in PNG
114. This final section of the analysis focuses on institutional capital on the revenue side of the
state. This is important because PNG faces considerable challenges raising public revenue, with critical
implications for the fiscal resources the state can provide to public institutions in any sector. It also has
implications for the state’s ability to build up fiscal buffers, to help manage the external shocks PNG is highly
vulnerable to. Grasp and reach capabilities matter to institutions on the revenue side, just as they do on the
expenditure side of the state. As on the expenditure side, these capabilities are influenced in critical ways by the
wider context in which the institutions operate, as well as by factors internal to the institutions.
115. The capabilities that revenue-collecting institutions will need in order to collect revenues
depend on decisions about who and what the state will collect revenue from. For example, collecting
GST on goods and services transactions across the country requires very different institutional capabilities than
collecting duties on imported goods at a handful of designated ports of entry. Decisions about institutional
setups for collecting different types of revenue can also have implications for how those revenues will be used.
For example, the Internal Revenue Commission (IRC) is empowered to collect personal income tax and must
remit it to consolidated revenue, where its use is controlled by parliamentary appropriation. In contrast, the
National Fisheries Authority is empowered to collect fisheries access fees and retain them for use in accordance
with the priorities set by its board. To take another example, if urban LLGs and city authorities are responsible
for collecting property taxes to fund urban roads and other amenities, local property owners who use those
roads and amenities may scrutinize urban authority spending very carefully. They may be less likely to do this
if urban authorities are funded by grants from the central government.
116. The wider political economy context affects decisions about who and what the state will collect
revenue from and the institutional arrangements for collection. State theory on political settlements offers
an understanding of how that wider political economy context affects such decisions.51 ‘Political settlements’
refer to the ways political and economic powerholders come together for the purposes of collective action. This
underpins the state and the ways in which it draws in various social and economic actors—with their resources.
Different kinds of political settlements are more and less conducive to private actors agreeing to bear a tax or
charge on their private resources. Some political settlements—especially in older democracies—are based on
long-established political parties representing different sections of the population (for instance, conservatives/
business versus social democrats/labor). Other political settlements focus on maintaining the unity of a country,
50 More recently, the Road Management and Fund Act 2020 has made road management the responsibility of ‘Roads Authorities’, which can be national departments such as DoWI, levels of subnational government such as provinces, and statutory authorities such as DDAs. The PNG Roads Trust Fund will be responsible for allocating funds to such Roads Authorities. Its subsidiary, the PNG Road Maintenance Trust Fund, is to receive funding from a range of sources—including fuel levies and road user charges, as well as drivers licenses and motor vehicle registration (both of which have been important areas of own source revenue for provinces, up until now)—to allocate for road maintenance. 51 See, in particular, Slater (2010) and Khan (2010).
P a p u a N e w G u i n e a E c o n o m i c U p d a t e J a n u a r y 2 0 2 1
56
or the dominance of a particular party or leader, against a perceived threat. These demand that political and
economic powerholders sacrifice local, personal and party interests to protect this common good.52
117. Some political settlements, including PNG’s, depend on the ability of a leading party or
individual to draw together a range of very diverse interests, parties and politicians.53 Especially after
elections and during confidence votes in national parliaments, these countries draw together diverse interests
by ‘provisioning’ MPs with resources available at the central level. This enables these MPs to act as patrons in
their local areas. This kind of provisioning is not primarily achieved via extending the state’s reach to the local
level public institutions that delivering services. Instead, it is primarily achieved through the transfer of resources
from central to local level under the discretionary control of MPs. In such contexts, there tends to be intense
political competition at central level, where the main resources accrue, and a high level of fragmentation of the
state all the way down to the local level (Watts 2018). This type of political settlement tends to have profound
implications for public revenue. Typically, instead of taxing economic elites significantly and directing these
resources to the public administration, political leaders draw resources from them through other channels where
these can more readily be used to provision governing coalitions. In return, economic elites can be given
preferential treatment in government spending, procurement, and—completing the circle—taxation.
b. Institutional capital for public revenue
118. Institutional arrangements for revenue collection in PNG are highly fragmented, both across
and within different levels of government. At the national level, taxes are collected by the IRC and the PNG
Customs Service, which are statutory authorities. Fees, fines, charges, and other revenues are collected by a
large number of other departments, statutory authorities, parastatal commissions, and state-owned enterprises
(SOEs). These revenues include PNG’s valuable resource revenues from fisheries, forests, petroleum, and
minerals. Dividends are received from SOEs and private companies in which the state holds equity.54 At the
subnational level, provincial governments and LLGs have mandates to collect a range of taxes and other
revenues. The dominance of central government is clearly indicated by the fact that provincial revenues are
typically equivalent to about 5–6 percent of central government revenues.55 It is common for provincial
governments to establish provincial corporations, and these raise revenues as part of the businesses they
conduct.56 DDAs do not have a mandate to collect taxes, but they do have mandates to charge fees for their
services and “do anything incidental to any of its powers.”57 It is also common for DDAs to establish
corporations. Some DDAs have been active in seeking to have resource royalties and other public revenues
paid to them, rather than to provincial governments, and expressed interest in reviving local head or poll taxes.58
119. The extent of revenues raised by PNG’s revenue-collecting institutions indicate that their
capabilities are fairly weak, overall. Total revenue to GDP (excluding grants) and tax revenue to GDP in
PNG are well below the averages for LMICs. PNG’s total revenue to GDP (excluding grants) is also well below
the average for a set of resource-rich comparators, but its tax revenue to GDP is only slightly below them
52 These are known as ‘protection pacts’ and exist in some of PNG’s South-East Asian neighbors. They extract revenues from elites in order to maintain the dominant coalition. The conditions required for them do not tend to be found in recently independent, resource-rich states like PNG, however. In these, political elites are able to use other revenues—such as resource revenues—to get the support needed to form a government. See Watts (2018). 53 For a fuller description of the political settlement in PNG, see World Bank (2018, 97-105) and World Bank (forthcoming, a). 54 These include a holdings company for the state’s equity interests in oil and gas projects, established under specific legislation and registered under the Companies Act, over which the authority of the Public Accounts Committee (PAC) is contested. The National Executive Council (Cabinet) decided in July 2020 that PAC authority does not apply to it. See Pokiton (2019); Sukbat (2020). 55 This figure is estimated using data from the PNG National Economic and Fiscal Commission (2020) and PNG Treasury. 56 The revenues of provincial corporations do not necessarily exceed their costs, however. 57 See the Government of Papua New Guinea, District Development Authority Act 2014, page 3. 58 See, for example, Post Courier (2019).

P a p u a N e w G u i n e a E c o n o m i c U p d a t e J a n u a r y 2 0 2 1
57
(Figure 41).59 Concerningly, tax revenue as a share of GDP has been on a generally declining trend over the last
two decades, settling at about 13 percent of GDP in the last five years (Figure 40). Internationally, tax revenue
below 15 percent of GDP is typically seen as a signal of a state that is having trouble grasping together the
resources needed to govern and deliver services. PNG’s non-tax revenue has not grown to offset the decline
in tax revenue and is well below the average for LMICs and resource-rich comparators.
Figure 40. Revenue and Tax Revenue Collection (Percent of GDP)
Figure 41. PNG Tax Comparisons (Percent of GDP)
Source: World Bank staff analysis. Source: World Bank staff analysis.
120. The types of revenues raised by PNG’s revenue-collecting institutions indicate that personal
income is relatively heavily taxed, while corporate income and goods and services transactions are
relatively lightly taxed. Corporate income tax (CIT) requires sophisticated capability in revenue institutions
if corporate tax evasion is to be avoided. PNG’s CIT revenue, although volatile, appears to have declined overall
over the last two decades (Figure 42). At 2.4 percent of GDP, it is significantly below LMICs (3.8 percent), but
only just below resource-rich comparators (2.8 percent) (Figure 43).60 Personal income tax (PIT) makes quite
modest demands on institutional capabilities, if the tax-free threshold is set at a level that means the tax
effectively only applies to formal sector workers, as in PNG. PNG’s PIT revenue rose sharply in 2011–15
during the construction boom for a major resource project, before declining. Even so, PNG accrues
significantly more revenue from PIT (3.9 percent of GDP) than LMICs (2.6 percent) and resource-rich
comparators (1.9 percent). Collecting GST requires revenue institutions to have significant reach across the
country in order to ensure the tax is implemented in the multitude of sites where goods and services transactions
take place. PNG’s revenue from GST has been quite volatile, but on a generally increasing trend. At 2.6 percent
of GDP, it is far below that in LMICs (5.7 percent) and resource-rich comparators (4.5 percent).61 The
significant declines in CIT and PIT revenue as shares of GDP have been the key drivers of the overall decline
in tax to GDP over the last decade.
121. PNG’s resource revenues appear to be very low, at least for on-budget revenues. Examining
resource revenues for insights into institutional capabilities in this area of revenue is challenging in PNG. This
is because non-trivial amounts of resource revenues are raised and retained off-budget by statutory authorities,
parastatal commissions, and SOEs. It is also because resource revenues accrue in special purpose companies
holding state equity in private resource projects. The available data suggest that mining and petroleum tax
59 The resource rich comparators are Algeria, Cameroon, Colombia, Côte d’Ivoire, Ecuador, El Salvador, Ghana, Honduras, Kenya, Nigeria, Tanzania, and Uganda. 60 PNG’s CIT efficiency ratio is also below the average for resource-rich LMICs (World Bank forthcoming, d). 61 PNG’s GST productivity is very similar to resource-rich LMICs in Africa, but below that of resource-rich LMICs in Latin America (World Bank forthcoming, d).
0
10
20
30
20
04
20
05
20
06
20
07
20
08
20
09
20
10
20
11
20
12
20
13
20
14
20
15
20
16
20
17
20
18
20
19
20
20p
Total revenue and grantsTax revenueGrantsOther revenue
0
5
10
15
20
25
LMICs PNG Resource-rich
Tax Revenue
Non-Tax Revenue
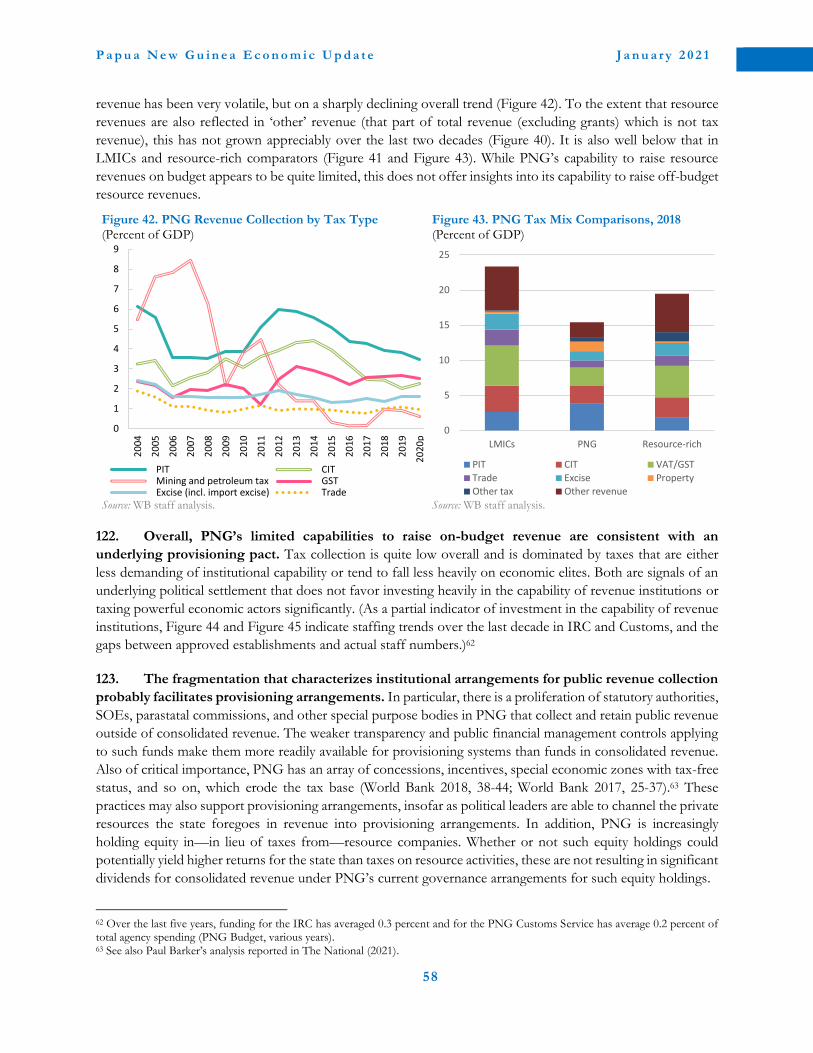
P a p u a N e w G u i n e a E c o n o m i c U p d a t e J a n u a r y 2 0 2 1
58
revenue has been very volatile, but on a sharply declining overall trend (Figure 42). To the extent that resource
revenues are also reflected in ‘other’ revenue (that part of total revenue (excluding grants) which is not tax
revenue), this has not grown appreciably over the last two decades (Figure 40). It is also well below that in
LMICs and resource-rich comparators (Figure 41 and Figure 43). While PNG’s capability to raise resource
revenues on budget appears to be quite limited, this does not offer insights into its capability to raise off-budget
resource revenues.
Figure 42. PNG Revenue Collection by Tax Type (Percent of GDP)
Figure 43. PNG Tax Mix Comparisons, 2018 (Percent of GDP)
Source: WB staff analysis. Source: WB staff analysis.
122. Overall, PNG’s limited capabilities to raise on-budget revenue are consistent with an
underlying provisioning pact. Tax collection is quite low overall and is dominated by taxes that are either
less demanding of institutional capability or tend to fall less heavily on economic elites. Both are signals of an
underlying political settlement that does not favor investing heavily in the capability of revenue institutions or
taxing powerful economic actors significantly. (As a partial indicator of investment in the capability of revenue
institutions, Figure 44 and Figure 45 indicate staffing trends over the last decade in IRC and Customs, and the
gaps between approved establishments and actual staff numbers.)62
123. The fragmentation that characterizes institutional arrangements for public revenue collection
probably facilitates provisioning arrangements. In particular, there is a proliferation of statutory authorities,
SOEs, parastatal commissions, and other special purpose bodies in PNG that collect and retain public revenue
outside of consolidated revenue. The weaker transparency and public financial management controls applying
to such funds make them more readily available for provisioning systems than funds in consolidated revenue.
Also of critical importance, PNG has an array of concessions, incentives, special economic zones with tax-free
status, and so on, which erode the tax base (World Bank 2018, 38-44; World Bank 2017, 25-37).63 These
practices may also support provisioning arrangements, insofar as political leaders are able to channel the private
resources the state foregoes in revenue into provisioning arrangements. In addition, PNG is increasingly
holding equity in—in lieu of taxes from—resource companies. Whether or not such equity holdings could
potentially yield higher returns for the state than taxes on resource activities, these are not resulting in significant
dividends for consolidated revenue under PNG’s current governance arrangements for such equity holdings.
62 Over the last five years, funding for the IRC has averaged 0.3 percent and for the PNG Customs Service has average 0.2 percent of total agency spending (PNG Budget, various years). 63 See also Paul Barker’s analysis reported in The National (2021).
0
1
2
3
4
5
6
7
8
9
20
04
20
05
20
06
20
07
20
08
20
09
20
10
20
11
20
12
20
13
20
14
20
15
20
16
20
17
20
18
20
19
20
20p
PIT CIT Mining and petroleum tax GST Excise (incl. import excise) Trade
0
5
10
15
20
25
LMICs PNG Resource-rich
PIT CIT VAT/GST
Trade Excise Property
Other tax Other revenue

P a p u a N e w G u i n e a E c o n o m i c U p d a t e J a n u a r y 2 0 2 1
59
Figure 44. IRC Staffing Figure 45. PNG Customs Service Staffing
Source: PNG Budget, various years. Note: 2016 data unavailable. Source: PNG Budget, various years. Note: 2016 data unavailable.
c. Resilience and opportunities of revenue institutions
124. Institutional capital for public revenue is likely to remain highly constrained without a change
in PNG’s underlying political economy dynamics. However, it does have some sources of resilience. There
are strong cohorts of public officials—including some strong and progressive leaders—in the IRC and some
central agencies, who are identifying and attempting to address some of the weaknesses described above. The
Public Money Management Regularization Act (2017) sought to oblige all statutory authorities to pay the non-
tax revenue they collect into consolidated revenue, and to finance the costs of these statutory authorities from
budget appropriations. Following a court ruling in 2020 that this legislation was unconstitutional, the 2021
Budget indicated government plans to introduce a Non-Tax Revenue Administration Bill to achieve the same
thing.64 In recent years, the IRC has started to estimate the value of revenue forgone through a range of tax
concession and incentive schemes, publish this information in the budget each year, and formulate legislative
and regulatory amendments to reduce these losses. While quantification and transparency will not themselves
result in actions to reduce these losses, it is hard to envisage the impetus for change developing in the absence
of the dissemination of this information. And some actions are taken (even as new concessions and incentives
are opened up). Development partner support can help to augment the capabilities of these cohorts of officials.
125. The public revenue being forgone from the resources sector is so significant that efforts to
address the situation should continue, even though the political economy context is unfavorable to
such change. Leaving aside the political economy context, asymmetries of expertise between PNG’s
negotiators and multinational resource corporations are such that PNG would be unlikely to be able to negotiate
arrangements in its interests. Development partners can provide PNG’s officials with access to the technical
expertise needed devise equitable agreements. Given the stakes, such offers should continue to be made, even
though the prospects of political leaders using such capabilities to improve outcomes are very limited.
Development partners can also support global initiatives that strengthen the corporate social responsibilities of
resource corporations, and support local civil society actors seeking to improve the accountability of state and
corporate actors in the resources sector. Such measures would help to contest current resource sector
arrangements in PNG. To provide effective assistance, development partners would have to address the
conflicts of interest they may have internally, due to the domicile of the resource corporations engaged in PNG.
126. A further opportunity exists in IRC’s initiative to build partnerships with provincial
governments in order to strengthen revenue capabilities. IRC and provincial governments have a shared
interest in GST compliance. The GST is a national tax administered by IRC, but provincial governments receive
60 percent of the GST revenue that IRC derives from their provinces. PNG’s GST revenue is low against
64 See Volume 1 of the 2021 Budget, page 132.
0
200
400
600
800
1000
1200
1400
2011 2012 2013 2014 2015 2016 2017 2018 2019 2020 2021
Establishment sizeActual staffFunded vacancies
0
200
400
600
800
1000
1200
2011 2012 2013 2014 2015 2016 2017 2018 2019 2020 2021
Establishment sizeActual staffFunded vacancies
P a p u a N e w G u i n e a E c o n o m i c U p d a t e J a n u a r y 2 0 2 1
60
comparators. One constraint IRC faces is its limited reach outside the country’s main urban centers. IRC is
attempting to address this by increasing its presence and capabilities in smaller urban centers and forging
partnerships with provincial governments. Provincial governments have greater local knowledge and reach than
IRC, including through their district administrations and their relationships with LLGs. In some cases,
provincial governments are contributing provincial staff, non-salary inputs and capital inputs to jointly provide
tax administration capability with IRC in their provinces.65 In addition to increasing GST revenue, improved
GST compliance outside the main urban areas could yield valuable information for IRC to gauge economic
activity levels and indicate whether other taxes (like CIT) are being evaded in these hard to monitor geographic
areas. Partnerships between the IRC and provincial governments offer plausible opportunities to strengthen
institutional capital for public revenue. However, they are not a solution to the more fundamental challenge
PNG faces with low overall revenues, which is driven by forgone revenue from resource sector agreements and
from the country’s array of concessions and incentives that affect CIT revenue more broadly.
d. Vulnerabilities and constraints of revenue institutions
127. There are considerable risks to the existing institutional capital PNG has for public revenue.
These include the risk of further expansions of concessions, incentives, special economic zones, and deals with
resource companies that do not yield a proper return to public revenue. They include the risk of further
institutional fragmentation, through the creation of new institutions with control over particular revenue
streams outside consolidated revenue or the provision of new revenue powers to institutions that do not
currently have them. In particular, there is the risk that DDAs will capture revenue streams of other public
institutions or create their own taxes. The current draft of a revised Organic Law on Provincial Governments
and Local-Level Governments—which would reform the structure and functions of subnational government—
includes district-level governments with revenue powers.66 Given the little effective oversight of DDAs, MPs’
dominance of them (often serving fairly narrow client bases defined by clan), and the rural nature of most
constituencies, tax literature would suggest the risk that enforcing district-level taxes in rural contexts could
demand a level of coercion (Moore and others 2018). In strongly contested contexts, such coercion may well
proceed along political lines.
128. If revenue institutions and the revenue regime are further fragmented, on-budget revenue is
likely to continue to decline as a share of GDP—a prospect that should raise very serious concern.
PNG’s rapid population growth and the significant service delivery challenges it already faces in key sectors
underscore the critical importance of raising—not further lowering—public revenue as a share of GDP. The
importance of reversing PNG’s declining revenue to GDP trajectory is well recognized, but there is a risk that
development assistance to tackle this challenge may inadvertently increase the inequity of PNG’s tax regime.
Given the political economy context, it is likely that development assistance will not be effective in getting the
state to tackle the fundamental problem with public revenue: the inadequate revenue being earned from the
resource sector. As a result, development partners may focus more on areas that can be addressed—making
regimes for GST, PIT, trade taxes, and so forth more effective. If this support is successful and PNG increases
its revenue from these sources, while the under-taxation of the resources sector and economic elites more
broadly continues or worsens, the overall equity of the revenue regime may decrease. Development assistance
in any area of revenue needs to keep this bigger picture in view.
65 See, for example, IRC (2020). 66 See Post Courier (2020).
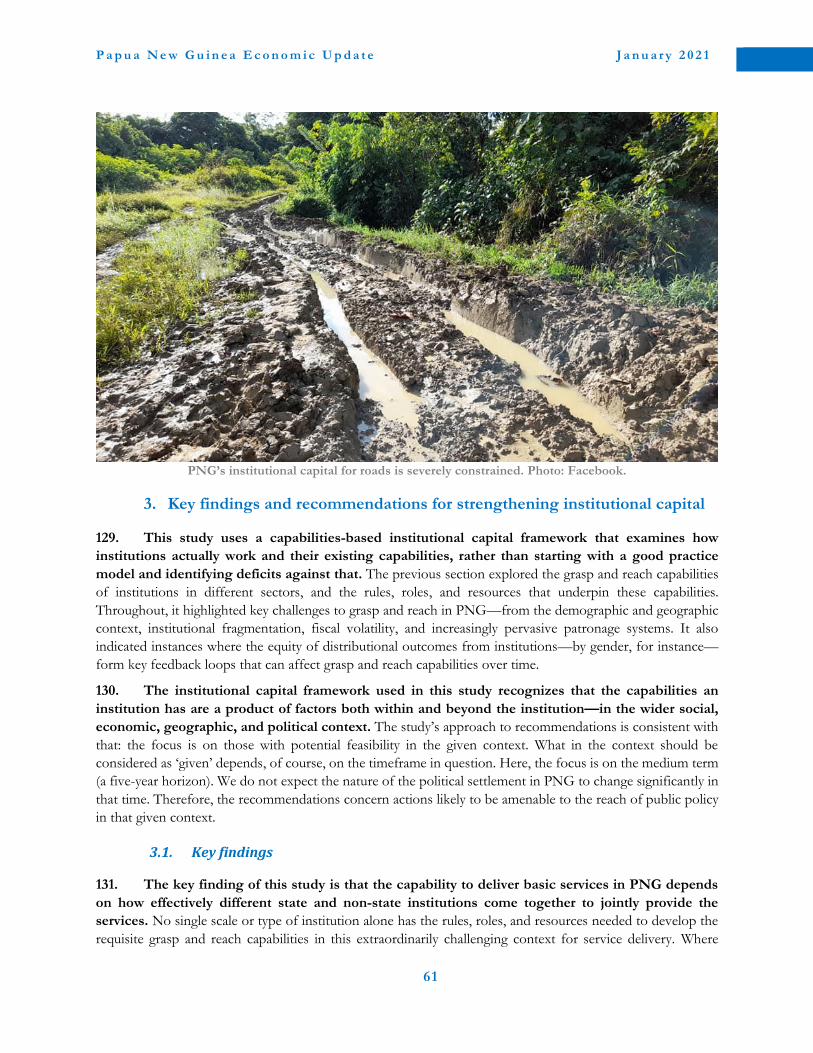
P a p u a N e w G u i n e a E c o n o m i c U p d a t e J a n u a r y 2 0 2 1
61
PNG’s institutional capital for roads is severely constrained. Photo: Facebook.
3. Key findings and recommendations for strengthening institutional capital
129. This study uses a capabilities-based institutional capital framework that examines how
institutions actually work and their existing capabilities, rather than starting with a good practice
model and identifying deficits against that. The previous section explored the grasp and reach capabilities
of institutions in different sectors, and the rules, roles, and resources that underpin these capabilities.
Throughout, it highlighted key challenges to grasp and reach in PNG—from the demographic and geographic
context, institutional fragmentation, fiscal volatility, and increasingly pervasive patronage systems. It also
indicated instances where the equity of distributional outcomes from institutions—by gender, for instance—
form key feedback loops that can affect grasp and reach capabilities over time.
130. The institutional capital framework used in this study recognizes that the capabilities an
institution has are a product of factors both within and beyond the institution—in the wider social,
economic, geographic, and political context. The study’s approach to recommendations is consistent with
that: the focus is on those with potential feasibility in the given context. What in the context should be
considered as ‘given’ depends, of course, on the timeframe in question. Here, the focus is on the medium term
(a five-year horizon). We do not expect the nature of the political settlement in PNG to change significantly in
that time. Therefore, the recommendations concern actions likely to be amenable to the reach of public policy
in that given context.
3.1. Key findings
131. The key finding of this study is that the capability to deliver basic services in PNG depends
on how effectively different state and non-state institutions come together to jointly provide the
services. No single scale or type of institution alone has the rules, roles, and resources needed to develop the
requisite grasp and reach capabilities in this extraordinarily challenging context for service delivery. Where

P a p u a N e w G u i n e a E c o n o m i c U p d a t e J a n u a r y 2 0 2 1
62
institutional capital for service delivery is greatest, we invariably find sustained partnerships between institutions
which allow the rules, roles, and resources of each to join together to enable greater capabilities. This occurs
between different tiers of government, and between state and non-state institutions.
132. Frequently in these joint service provision arrangements, non-state institutions make critical
contributions to accountability mechanisms. These contributions can come from norms and values,
financial management processes and oversight, local authority and ownership—including that associated with
providing the land for the service facility. This is perhaps not surprising, given that the dominance of patronage
relationships in PNG’s political system makes the political system unlikely to hold state institutions accountable
for service delivery. It is in the nature of patronage relationships that loyalty, rather than capability, is the primary
basis for appointments, action, and accountability. For there to be effective accountability for performance and
outcomes in service delivery to the public—as opposed to clients or supporters—it may increasingly need to
come from non-state institutions.
133. The contrasts between the sectors examined in this study demonstrate that institutional
capital tends to be weaker where the service requires significant amounts of capital spending. Similarly,
vulnerabilities arise where significant amounts of non-salary recurrent spending are executed by a single
institution (for example, central drug procurement versus funds for school operating costs that are disbursed
to facilities for execution). Resources for capital and non-salary recurrent spending tend to be more volatile and
more vulnerable to capture than payroll resources. Services that depend on these types of resources are
hampered by not reliably receiving the resources required for the intended purpose (as in roads, for example).
In contrast, where the fiscal resources that the service depends on are primarily payroll resources, they do tend
to be reliably received (as in village courts and schools, but only partially in health because church health workers
are not on the public payroll).
134. The contrasts between the sectors examined in this study suggest several other common
sources of vulnerability for institutional capital.
• The political importance of the service appears to be a double-edged sword for resource flows. If its
political value can be realized through universal delivery, greater political importance can facilitate the
reliability of resource flows (as with TFF/GTFS policies in education). If instead its political value can
be realized through narrow delivery, greater political importance can intensify the volatility of resource
flows (as with roads). Services of lesser political importance may be less vulnerable to political
interference, but also less able to secure additional resources in tight fiscal situations (as with the stalled
village court expansion).
• The more complex the service, the harder it seems to be to develop institutional capital (for example,
a set of capital and non-salary recurrent inputs of particular technical specifications need to come
together with the requisite skilled staff for health services to be delivered). This is because coordination
and stable commitments of rules, roles, and resources are required from a large number of institutions,
which is challenging to achieve in PNG. In contrast, village courts require a much simpler set of inputs,
placing lower demands on coordination and commitments.
• Where there are significant divergences in the rules contributed by the different partner institutions,
institutional capital is vulnerable. For example, village courts work reasonably well for cases where state
rules have a reasonably good fit with the norms of local, non-state authority. They work less well when
state rules and non-state authority norms are not mutually reinforcing—as in cases of sexual violence
and sorcery, for example.
• Local-level partnerships are increasingly vulnerable to the intrusion of patron-client relationships from
higher tiers of government. For example, a village court’s authority depends on the extent to which
disputants believe its magistrates to be competent and impartial. A school board’s effectiveness

P a p u a N e w G u i n e a E c o n o m i c U p d a t e J a n u a r y 2 0 2 1
63
depends on its coherence and its ability to work with school principals and provincial education
authorities. Patron-client relationships are increasingly reaching down from higher tiers of government
into local institutions. Where the allies of higher-level political patrons are elected to village courts or
school boards, their authority and coherence can be comprised, weakening their ability to secure local
contributions of rules, roles, and resources, and impeding ability to work with tiers of government
dominated by rival political patrons.
3.2. Key recommendations
135. The recommendations build on these findings, suggesting plausible ways to reinforce the
strengths and address the weaknesses of institutional capital in the different sectors, given the political
economy context. The recommendations are suggestive, not prescriptive. They indicate the areas that may be
most worthy of attention, and provide illustrative examples of measures in these priority areas. Selecting specific
measures would require further consideration and dialogue among the local actors who are best placed to advise
on and carry through change. Table 7 summarizes the key recommendations discussed below, together with
the other recommendations raised in the previous section’s analysis of opportunities and vulnerabilities of
institutional capital in each sector.
136. We begin with institutional capital for public revenue because it affects the resources the state
can deploy in all other sectors. The analysis suggests that political leaders in PNG have a strong interest in
securing resources for political provisioning, which is the basis of the political system. These interests may be
served more readily by channeling public revenue streams into an array of different public bodies, than by
maximizing consolidated revenue. They may also be served more readily by forgoing public revenue in return
for private contributions to provisioning arrangements, than by maximizing consolidated revenue. As a
consequence, the state is not getting an appropriate share of the proceeds from the resource sector, nor from
the wider economic activities of economic and political elites. But the bulk of PNG’s revenue potential lies in
resource revenues and CIT. Until it can realize that potential, the state’s service delivery capability will be
severely curtailed across the board.
137. Since the stakes are so high, donors should continue to support PNG to access the expertise
needed to negotiate and implement equitable resource agreements. Similarly, donors should support
PNG to access the expertise needed for effective corporate taxation. This expertise is available globally, and
without it the asymmetries of technical expertise between a fragile LMIC like PNG and the corporate actors it
deals with will remain formidable. While cohorts of officials in key central agencies and revenue institutions
may be supported to develop or access such expertise, the nature of PNG’s political settlement makes it unlikely
that political leaders will make use of this expertise. This recommendation is something of an exception to the
approach of focusing on areas where change is plausible in the given political economy context. It is made,
however, because there is virtually no possibility of better outcomes without access to such expertise, and
because getting more resource and corporate tax revenues into consolidated revenue is foundational for PNG’s
development. Development partners should complement it with support for corporate social responsibility
initiatives, local civil society actors and other measures that would help to contest current resource sector
arrangements.
138. Turning to the spending side of the state, in the area of basic order and justice, PNG’s village
court system has substantial grasp and reach capabilities and is worth investing in further. A strong
indication of the relevance and capability of village courts is that most people turn to them to deal with everyday
disputes and grievances. Their considerable institutional capital is worth building on and improving. The
relatively low fiscal cost of the village court system means that even modest investments could yield significant
improvements in its capabilities. Funding village courts in each ward in urban LLGs—especially in areas with

P a p u a N e w G u i n e a E c o n o m i c U p d a t e J a n u a r y 2 0 2 1
64
many informal settlements—would increase the system’s coverage to reflect where people live. It may also help
it to resist the intrusion of patron-client relationships linked to higher tiers of government. This is because the
more widespread village courts are at the local level, the more directly accessible and observable they are to the
people who need to use them. In contrast, the greater the importance of vertical hierarchy—as with village
courts that cover wide areas, potentially facilitating the development of a sub-ordinate tier of actors that control
access to more distant village courts—the greater the opportunities for patronage relationships.
139. Modest investments to raise the number of magistrates on each village court could increase
the representation of women magistrates. Augmenting the weight of women in positions of authority in the
village court system, could augment their ability to find workable ways to address challenges of gender inequity
in the operations and outcomes of village courts. In part, these inequities reflect the patriarchy within non-state
authorities that village courts draw on for their institutional capital. Augmenting the weight of women’s
authority within village courts could expand the space to mitigate the extent of influence of this patriarchy, in
the specific arena of village courts. Both of these investments—in new village courts in unserved areas and in
increased numbers of village court officials, particularly women—were begun within the last decade. New
village courts were established and new officials were selected. The government’s failure to provide the modest
resources to complete and sustain these investments is a missed opportunity. The political economy context
does not seem to be antagonistic to these developments, but the funding does appear to be an easy source of
savings each year. As a result, successive budgets refer to the appointments as temporarily unfunded. The
government should address why it continues to not provide these very modest resources to this vital institution.
140. With respect to institutional capital for basic education, the highest priority should be placed
on protecting and strengthening the local partnerships between state and non-state actors that
underpin school governance and accountability. First, it is important to avoid undermining what is already
there, which the progressive carving off of elements of facility-based funding for execution by other tiers of
government threatens to do. Instead, maintaining and increasing facility-based funding is essential.
141. Beyond that, the focus should be on identifying and trialling measures to increase the
importance and authority of local governance arrangements for schools. Examining the factors that
underpin stronger ownership and accountability of schools in some geographic areas or school systems, may
provide insights into measures that could strengthen it in areas where it is weaker.67 Opportunities might also
be identified from global education experience with facility-level governance models like school boards.
Providing school boards with specific responsibilities that are both important and within their capability, and
with the requisite resources to carry them out, tends to strengthen their authority. Could staff housing offer
this opportunity in PNG? It is very important and could be within the capability of school boards to manage.
It would also benefit from community partnership, because of the inputs communities may need to provide to
it and because of the value of increased community ownership of teaching. In addition, it could help to
strengthen wider accountability relationships in the sector, since provincial government performance of its
roles—for example, disbursing funding and providing basic designs—would be critical to school board success.
One risk to be considered is that augmented funding—even if modest—might intensify incentives for higher-
level political actors to reach down into school boards through local political allies.
142. While the importance of payroll resources gives the basic education system considerable
resilience, reliable access to non-salary recurrent and capital inputs is also needed to support improved
learning outcomes and increased access for girls. Facility-based funding and education function grants
67 If local ownership is strongest in schools in more homogenous contexts (drawing authority from a single clan or church institution, for instance), it may also be worth considering whether there is anything to learn from village courts in heterogenous urban settlement contexts. Perhaps out of necessity, at least some of these have found ways to draw strength from the different ‘kastom’ of the different communities present in the areas they operate in.

P a p u a N e w G u i n e a E c o n o m i c U p d a t e J a n u a r y 2 0 2 1
65
provide reasonably secure non-salary recurrent funds, given their design their transparency, and the established
institutions that have an interest in holding higher tiers of government accountable for their provision. In what
other ways could counterweights against the volatility or misuse of non-salary recurrent and capital inputs for
basic education be strengthened? While the incentives applying to the central procurement of textbooks and to
SIP funds for education infrastructure are generally unfavourable, greater transparency has some potential to
be utilized for accountability, because of the existence and interests of institutions like school boards and church
education authorities. Strengthening the Auditor-General’s Office (AGO)—including via advocacy to make its
funding independent of the executive—could increase the information that stakeholders have to raise pressure
against the misuse of resources. Incremental improvements in the transparency of SIP spending—through
publishing the information on SIP expenditure captured in the Integrated Financial Management System
(IFMS) or collected by central government agencies from the acquittals that some MPs submit—could likewise
help school boards and other stakeholders to raise pressure for their better use. These measures could
potentially help to shift political incentives over time.
143. In basic health, it is pivotal for PHAs to build and maintain the partnerships with other
institutions that are required to address the fragmentation in the sector. PHAs were established to
address this institutional fragmentation, but they will not do so automatically. Instead, they have to operate as
a device to improve coordination and commitments across the fragments. This will require them to have Boards
and CEOs who can forge and maintain effective partnerships with all the institutions involved—particularly
church health authorities, provincial governments, provincial governors, DDAs and NDoH. The very rich data
now available in the sector could support learning about the approaches that enable better service delivery
performance. But who will use the available information to hold PHAs accountable for their performance?
Formally, PHA Boards are accountable to the Minister for Health, so NDoH should play a key role in this
respect. Considering both the similarities and contrasts with schools, are there opportunities to support greater
local authority and ownership of health facilities, that could strengthen demand and accountability for
performance from the local level? Could the monitoring and accountability frameworks used by church health
authorities be of value to the wider sector?
144. A second key priority is to address the volatility of resources for health, which poses an
ongoing threat to the delivery of frontline services. The health sector is vulnerable to resource volatility,
because of its requirements for significant non-salary recurrent and capital inputs. This vulnerability is amplified
for church health providers, since their funding—including for payroll for church health workers—comes from
central government in the form of grants. This was clearly illustrated in the first half of 2020, when central
government grants to church health authorities were delayed by so many months that their health facilities were
starting to shut down. It could be evident again in 2021, given the significant reduction in the appropriation for
church health grants this year. The merging of church health workers on the public payroll would reduce this
vulnerability, but would this benefit outweigh the costs (for example, to church health authorities’ autonomy
of management of their workforces)? Are there ways to shift political incentives to better align with prioritizing
critical resource flows to the health sector, including grants to church health authorities and funds for the timely
procurement of medical supplies? Until resource volatility is addressed, the capabilities of health institutions
will continue to be undermined.
145. Of the sectors examined in this study, constraints on the development of institutional capital
are most severe for roads institutions. These constraints arise from the nature of the resources required for
roads, the fragmented institutional structure of the sector, and the wider political economy context. There is
little reason to expect these factors to change much over the medium term. Given these constraints, the most
plausible source of improvement at the national level is from how donors structure their investments. This is
the area of sector where decision-making is most insulated from domestic political economy imperatives.
Examples include donors restricting their resources to the rehabilitation and maintenance of the existing
P a p u a N e w G u i n e a E c o n o m i c U p d a t e J a n u a r y 2 0 2 1
66
network of national roads—not its extension—and moving to life-cycle contracts to decrease maintenance
requirements and ensure maintenance costs are funded.
146. At subnational level, the potential weight of donor resources offers the possibility of seeking
to shift political incentives towards maintenance—if resources are directed to provincial governments
that maintain their road networks. At present, DDAs hold the major share of resources for provincial and
local roads. In their current form, DDAs are unlikely to have an interest in or develop the capability to reliably
maintain roads across the whole district. Political dynamics are similar at the provincial level: rarely will a
governor’s political strategy favor road maintenance across the whole province, over road construction and
rehabilitation in the particular areas of their electoral base. But at the provincial level, there is some possibility
of a critical mass of administration to somewhat counterbalance the governor’s power. There is also a prospect
of building and sustaining in-house capacity for road maintenance, building on the function grant. Given the
relatively small size of the function grant, it may be within the capability of donor partners to offer resources
of considerable value to provincial governments that maintain their roads. The relative size of these resources
could shift political incentives, potentially making viable a political strategy based on the reliable provision of
passable roads year-round. Matching grants based on maintenance outcomes would require accurate,
independent verification of road conditions in often remote contexts. Still, technologies to support this are now
readily available at relatively low cost, opening opportunities that have not previously existed to influence this
very challenging sectoral context.
147. These recommendations focus on the areas that may be most worthy of attention to protect,
build on, and strengthen key aspects of PNG’s institutional capital. They provide examples of specific
measures in these areas that are plausible in the wider political economy context. They also suggest approaches
that have some potential to shift or contest the prevailing political incentives over time. There may well be
other approaches not considered here that could equally serve the same purposes. It is hoped that the examples
suggested will prompt consideration of these and other such possibilities, and garner support for measures with
the best potential to strengthen institutional capital in these sectors that are so critical to the wellbeing and
livelihoods of people throughout PNG.

P a p u a N e w G u i n e a E c o n o m i c U p d a t e J a n u a r y 2 0 2 1
67
Table 7. Summary of Recommendations
Recommendation Rationale
Public revenue institutions Development partners should continue
to offer PNG access to global expertise
for resource agreement negotiations
and implementation, to augment what
key cohorts of officials in central
agencies and revenue institutions can
contribute, even if those institutions are
likely to be set aside at critical junctures.
Access to such expertise is necessary for reasonable outcomes to result. It is
not sufficient, with political economy dynamics likely to continue to see
political leaders setting aside contributions by competent institutions in the
negotiation and implementation of resource agreements (and more widely,
in decisions on the concessions and incentives that erode the tax base). The
stakes are so high that it should be offered anyway; reasonable outcomes
will not result without it, and it would be unrealistic to expect that PNG
could build and sustain the expertise itself, even if leaders wanted it to.
Development partners should support
global initiatives to strengthen the
corporate social responsibilities of
resource corporations, and local civil
society actors seeking to improve
accountability in the resources sector.
The political economy dynamics that work against the state getting a proper
share of the proceeds of resource activities into consolidated revenue are
not likely to change much over the medium term. These measures are
simply aimed at increasing the weight of institutions contesting these
arrangements, to challenge them as far as possible.
IRC, provincial governments and city
authorities should invest in partnerships
enabling joint revenue capabilities,
particularly for the GST; donors can
support such investments.
Particularly given the incentives built into the allocation of GST revenues,
these partnerships offer the best prospect for developing the grasp and
reach capabilities needed for the GST regime to be effective. Efforts in this
area need to occur conscious that the bulk of PNG’s revenue potential lies
in resource revenues and CIT; increases in other revenues can have only a
limited impact on the core problem of low overall revenues.
Efforts should be made to resist the
further fragmentation of the revenue
regime, via creating new institutions
with control over particular revenue
streams, or via providing revenue/tax
powers to district-level governments.
For as long as district-level governments are heavily dominated by MPs—as
is the case with DDAs—the allocation of revenue/tax powers to this level
of government would be very risky. In predominantly rural and highly
contested constituencies, revenue/tax enforcement could demand a level of
coercion and this coercion could well proceed along political lines.
Basic order and justice institutions
The national government needs to fund
the additional courts and magistrates
that have already been established and
appointed, to complete the earlier
expansion of the village court system.
The additional courts are required in as yet unserved areas of urban
settlements. Ensuring that all areas have a village court that local people can
access and observe directly is likely to support the ability of the institution
to resist incursion of politically-linked patronage to some extent. Additional
magistrates are required to augment the weight of women’s authority within
village courts, to increase their ability to address the challenges of gender
inequity in ways that may be workable in specific local contexts.
Development partners could support
this expansion by providing resources
for training and capacity building,
particularly to enable the expertise and
experience of PNG’s most experienced
urban and rural mediators to be
brought together and shared more
widely.
While village court officials typically already have considerable mediation
experience and skills, this suggestion reflects an opportunity to better utilize
the extraordinary capability of PNG’s leading mediators. This promises to
be particularly important for new women magistrates, given the fewer
opportunities emerging women leaders have typically had for apprenticeship
under serving village court magistrates, relative to emerging male leaders.
Basic education institutions
National and provincial education
authorities should prioritize measures
to protect and strengthen the local
School boards (reinforced in church schools by church education
authorities) appear to be critical not only to accountability at the school
level, but also to the extent to which national and provincial governments

P a p u a N e w G u i n e a E c o n o m i c U p d a t e J a n u a r y 2 0 2 1
68
partnerships that underpin school
governance and accountability.
are held accountable for their roles in basic education. Strengthening their
importance and authority is thus critical at a systemic level.
Development partners should continue
assistance geared to strengthening the
AGO’s capabilities and independence,
and also continue to advocate and assist
with increased transparency of SIP
spending.
There are established institutions with an interest in education resources
being available reliably and well used. Measures to increase the ability of
these institutions to contest the volatility and misuse of resources have the
potential to help shift political incentives over time. This context provides
the basis for transparency to be translated into accountability, making
transparency measures a priority for support.
Basic health institutions
PHAs need to prioritize building and
maintaining partnerships with the key
institutions involved in resourcing and
providing frontline health services.
Agreements with church providers are vital, to clarify roles and resources
and to recognize church providers as partners in basic service provision.
For recurrent and capital resources to be coordinated across the sector,
PHAs also have to find ways to work effectively with provinces and DDAs.
Consider avenues that could increase
local authority and ownership of health
facilities, to strengthen local demand
and accountability for performance.
Given that PNG’s political system mutes incentives for central government
to hold actors in any sector accountable for their performance, identifying
and supporting institutions with the potential to generate alternative sources
of accountability is critical. Church health authorities could offer lessons, as
might school boards (though any local governance arrangements in health
would need to fit the community level context of health engagement).
NDoH and church health authorities
should consider measures to address
the volatility of resources available to
the sector.
Resource volatility has an amplified impact on church health providers,
because their staff are not on the public payroll, so the whole of their
funding depends on central government discretion over paying their grants.
Would merging church health workers onto the public payroll be beneficial?
Beyond measures under the sector’s control, are there ways to shift political
incentives to better align with prioritizing resource flows to health, perhaps
by supporting institutions with interests in contesting non-provision?
Roads institutions
Development partners should adhere to
their joint commitment to fund the
rehabilitation and maintenance of the
existing national road network, not its
extension; and should take further
measures to safeguard maintenance
work in their investments.
The constraints on institutional capital in roads are so severe that it is
unlikely that the capabilities required to reliably maintain roads will be
developed using public resources in the medium term. The most feasible
prospects for the development of these capabilities appear to be in donor-
financed investments, which are more—but by no means fully—insulated
from domestic political economy imperatives. These political economy
imperatives will still affect the enforcement of contracts after donor
projects conclude, however, so unless further mitigation measures can be
developed (or project life-cycles extended to match asset life-cycles),
expectations should remain modest.
Development partners should consider
establishing matching grant
arrangements and verification
mechanisms, to significantly increase
the resources of provincial
governments that maintain their roads.
This measure would build on existing function grants and the potential of
provincial administrations to develop in-house road maintenance capability,
by providing resources sufficient to make viable a political strategy at
provincial level based on a platform of ensuring the road network is
passable year-round. For example, this might require several multiples of
the function grant for road maintenance—at least in the early years when a
greater rehabilitation backlog has to be addressed to make maintenance
feasible.
Annexes
ANNEXES
[No subheading]


71
Annex 1. Selected Economic and Social Indicators
2016 2017 2018 2019 2020 2021 2022 2023
Est. Projections
National income and prices (In percent, unless otherwise indicated)
Nominal GDP (US$ billions) 20.8 22.7 24.1 24.8 23.6 25.4 27.3 28.1
Real GDP growth 5.5 3.5 -0.3 5.9 -3.8 3.5 4.2 2.4
Resource sector 10.8 4.5 -3.7 9.3 -5.8 4.3 5.6 1.4 Non-resource economy 2.3 1.5 2.7 2.4 -0.2 1.1 2.0 2.5
Consumer price inflation, period average 6.7 5.4 4.6 3.7 5.3 5.0 5.0 5.0 GDP deflator 2.5 7.7 9.8 0.0 0.9 6.9 5.6 3.1 Real exchange rate change, US$/PGK* -6.9 1.4 -1.1 -1.0 1.7 0.7 0.4 0.4
Fiscal accounts (In percent of GDP, unless otherwise indicated)
Revenue and grants 16.1 15.9 17.7 16.3 14.9 15.2 16.0 17.0 Non-resource tax revenue 12.8 12.4 12.2 12.1 11.6 12.0 12.2 13.3 Resource revenue 0.6 0.9 1.8 1.4 0.6 0.9 1.0 1.0 Grants and other revenue 2.7 2.5 3.7 2.8 2.7 2.4 2.8 2.7
Expenditure and net lending 20.9 18.4 20.3 21.2 23.0 22.6 21.3 20.1 Primary expenditure 18.9 16.1 17.9 18.7 20.5 20.1 19.1 17.7 Interest payments 1.9 2.3 2.4 2.6 2.6 2.5 2.2 2.4
Overall fiscal balance -4.7 -2.5 -2.6 -5.0 -8.1 -7.3 -5.3 -3.2 Non-resource primary balance (% non-extractive GDP) -4.5 -1.6 -2.7 -5.2 -8.0 -7.6 -5.5 -2.3 Net public debt 34.6 35.9 36.6 39.5 49.0 52.2 53.3 54.3
Gross government debt and guarantees 34.6 35.9 38.2 40.0 49.0 52.2 53.3 54.3 Gross government savings 0.0 0.0 1.5 0.5 0.0 0.0 0.0 0.0
External accounts (In millions of U.S. dollars, unless otherwise indicated)
Exports, f.o.b., of which: 8,202 9,958 10,504 11,402 9,825 10,358 10,885 11,139 Extractive sector 6,730 8,335 8,862 9,965 8,481 8,936 9,404 9,627
Imports, c.i.f. 2,077 3,066 3,519 4,012 3,008 3,672 4,015 4,743 Current account 5,286 5,402 5,676 5,520 5,608 3,683 2,526 1,053
(in percent of GDP) 25.5 23.8 23.5 22.2 23.8 14.5 9.3 3.8 Overall balance of payments -184 36 517 101 366 264 85 165 Gross official reserves 1,681 1,717 2,235 2,335 2,701 2,965 3,051 3,216 (in months of goods and services imports) 4.3 4.0 4.8 6.6 4.9 4.3 3.8 3.8 (in months of non-extractive imports) 12.0 8.6 9.5 15.5 14.2 14.7 14.3 11.4
Money and credit (In percent, unless otherwise indicated)
Broad money growth 10.9 -0.9 -3.8 9.6 0.6 8.0 9.2 9.2 Domestic credit growth 24.6 -0.1 -7.9 12.7 6.3 6.2 6.9 6.9 Growth of credit to the private sector 7.2 -3.8 7.4 10.5 2.9 3.2 6.0 8.4 Interest rate of 182-day T-bills, period average 7.4 7.1 7.0 6.5 4.8 4.5 5.7 6.1
Social indicators
Population, total (millions) 8.3 8.4 8.6 8.8 8.9 9.1 9.3 9.5 Population growth (percent) 2.0 2.0 2.0 2.0 2.0 1.9 1.9 1.9 Life expectancy at birth (years) 63.7 64.0 64.3 64.4 .. .. .. ..
Sources: Official historical data; World Bank staff estimates and projections. Note: * An increase represents appreciation and a decrease is depreciation.


References
REFERENCES
[No subheading]


75
References/Bibliography
Allen, M., and Z. Hasnain. 2010. “Power, Pork and Patronage: Decentralisation and the Politicisation of the
Development Budget in Papua New Guinea.” Commonwealth Journal of Local Governance, Issue 6: July. Australia, DFAT (Department of Foreign Affairs and Trade). 2016. Evaluation of Village Court Officials’ Training:
Vol 1: Summary of Findings. https://www.dfat.gov.au/sites/default/files/png-evaluation-village-court-officials-training-march-2016.pdf.
Australia, ODE (Office of Development Effectiveness) and DFAT (Department of Foreign Affairs and Trade). 2018. Road management in Papua New Guinea: An evaluation of a decade of Australian support 2007–2017. Canberra: DFAT.
Barma, Naazneen H., Kai Kaiser, Tuan Minh Le, and Lorena Vinuela. 2012. Rents to Riches? The Political Economy of Natural Resource-led Development. World Bank.
Business Advantage PNG. 2020. “Forex squeeze: is Papua New Guinea’s stable kina a liability?” Business Advantage PNG online edition, April 1. https://www.businessadvantagepng.com/forex-squeeze-is-papua-new-guineas-stable-kina-a-liability/.
Business Advantage PNG. 2020. “Explainer: Papua New Guinea’s stimulus package relying on overstretched IMF.” Business Advantage PNG online edition, April 6. https://www.businessadvantagepng.com/explainer-papua-new-guineas-stimulus-package-relying-on-overstretched-imf/.
Business Advantage PNG. 2020. “Exclusive: Central Bank Governor on forex, COVID-19 and the future of the kina.” Business Advantage PNG online edition, April 21. https://www.businessadvantagepng.com/exclusive-central-bank-governor-on-forex-covid-19-and-the-future-of-the-kina/.
Business Advantage PNG. 2020. “Thinking about PNG’s COVID-19 economic response [opinion].” Business Advantage PNG online edition, May 4. https://www.businessadvantagepng.com/thinking-about-pngs-covid-19-economic-response-opinion/.
Craig, David, Doug Porter, and Fiona Hukula. 2016. “’Come and see the system in place’: Mediation Capabilities in Papua New Guinea’s Urban Settlements.” World Bank, Washington, DC.
DFAT, PNG-Australia Law and Justice Partnership – Transition Program. 2016. Evaluation of Village Court Officials’ Training: Vol 1: Summary of Findings. Port Moresby. Available at https://www.dfat.gov.au/sites/default/files/png-evaluation-village-court-officials-training-march-2016.pdf
Dornan. M. 2014. “Road management in Papua New Guinea (part 1): the maintenance challenge.” DevPolicy (blog) Available at https://devpolicy.org/road-management-in-papua-new-guinea-part-1-the-maintenance-challenge-20140903/
Dornan. M. 2016. “The Political Economy of Road Management Reform: Papua New Guinea’s National Road Fund.” Asia and the Pacific Policy Studies 3 (3): 443–57.
Edmonds C., M. Wiegand, E. Koomen, M. Pradhan, and B.P.J. Andrée. 2018. “Assessing the Impact of Road Development on Household Welfare in Rural Papua New Guinea. Financing Infrastructure in Asia and the Pacific Capturing Impacts and New Sources.” ADB Institute. https://www.adb.org/publications/financing-infrastructure-asia-capturing-impacts-and-new-sources.
Extractive Industries Transparency Initiative (EITI). 2019. Papua New Guinea EITI report 2018. http://www.pngeiti.org.pg/wp-content/uploads/2020/01/2018-PNG-EITI-REPORT.pdf.
Financial Times. 2020. “Papua New Guinea threatens to seize Barrick’s Porgera gold mine.” Financial Times online edition, April 28. https://www.ft.com/content/77ced490-1349-4ebb-afb9-984a12da748e.
Fukuyama, Francis. 2008. “Governance Reform in Papua New Guinea.” Mimeo. Fukuyama, Francis. 2014. Political Order and Political Decay. London: Profile. Goddard, M. 2009. Substantial Justice: An Anthropology of Village Courts in Papua New Guinea. New York:
Berghahn Books. Howes, S., A. A. Mako, A. Swan, G. Walton, T. Webster, and C. Wiltshire. 2014. “A Lost Decade? Service
Delivery and Reforms in Papua New Guinea 2002–2012.” National Research Institute and the

76
Development Policy Centre, Australian National University. http://devpolicy.org/publications/reports/PEPE/PEPE_A_lost_decade_FULL_REPORT.pdf.
IMF (International Monetary Fund). 2020a. Papua New Guinea—Staff Report for the 2019 Article IV Consultation, and a Request for a Staff-Monitored Program—Main Report, Informational Annex, and Debt Sustainability Analysis. IMF Country Report No. 20/95. Washington, DC: IMF.
IMF (International Monetary Fund). 2020b. Papua New Guinea—Request for Disbursement Under the Rapid Credit Facility—Staff Report and Debt Sustainability Analysis. IMF Country Report No. 20/211. Washington, DC: IMF.
IRC. East Sepik Provincial Government Signs MOU with IRC. Media Release. Available at https://irc.gov.pg/wp-content/uploads/2020/02/ESP-and-IRC-signs-MOU-converted.pdf
Ketan, J. 2007. “The Use and Abuse of Electoral Development Funds and their Impact on Electoral Politics and Governance in Papua New Guinea.” ANU/CDI Papers on Political Governance (2007/2), Canberra.
Khan, Mushtaq. 2010. Political Settlements and the Governance of Growth-Enhancing Institutions (unpublished). https://eprints.soas.ac.uk/9968/1/Political_Settlements_internet.pdf.
Khan, M. M., Pulford, J., Saweri, O. N., Demir, I., Haider, R., and Ahmed, S. (2017) Service Delivery by Health Facilities in Papua New Guinea: Report based on a countrywide health facility survey. Port Moresby: World Bank.
Lawrence, Craig. 2015. “Infrastructure Challenges for Papua New Guinea’s Future.” Lowry Institute.
https://interactives.lowyinstitute.org/archive/png-in-2017/downloads/Lawrence_Infrastructure.pdf.
Laws, M. 2012. Political Settlements, Elite Pacts and Governments of National Unity: a Conceptual Study. Development
Leadership Program Background Paper 10.
March, J.G. and J. P. Olsen. 2008. “Elaborating the ‘New Institutionalism.’” in S. A. Binder, R. A. W. Rhodes, and B. Rockman (eds.) The Oxford Handbook of Political Institutions. Oxford: Oxford University Press.
Mann, M. 1984. “The Autonomous Power of the State. Its Origins, Mechanisms and Results.” European Journal of Sociology 25 (2): 185–213.
Matamoros-Indorf, M., Sharma, M., Townsend, S., and Jácom, L., 2012. “Central Bank Credit to the Government" in Central Bank Credit to the Government: What Can We Learn From International Practices? USA: International Monetary Fund. doi: https://doi.org/10.5089/9781463931216.001
Moore, Mick, Wilson Prichard, and Odd-Helge Fjeldstad. 2018. Taxing Africa: Coercion, Reform and Development. London: Zed Books.
North, D. 1991. “Institutions.” The Journal of Economic Perspectives 5 (1): 97–112.
Nunn, Rachel Mason, and Genevieve Nelson. 2019. “PNG: Has education policy reform worked?” The
Interpreter, October 1. https://www.lowyinstitute.org/the-interpreter/png-has-education-policy-reform-
worked.
Nussbaum, Martha. 2011. Creating Capabilities: The Human Development Approach. Harvard University Press. Oil Search. 2021. Fourth Quarter Report for the Period Ending 31 December 2020.
https://www.oilsearch.com/__data/assets/pdf_file/0016/54214/2168283.pdf. Oxford Business Group. 2019. The Report: Papua New Guinea 2019. https://oxfordbusinessgroup.com/papua-
new-guinea-2019. Oxford Business Group. 2020. Can gold ease Papua New Guinea's foreign exchange pressures as Covid-19 disrupts
inflows? April 24. https://oxfordbusinessgroup.com/news/can-gold-ease-papua-new-guineas-foreign-exchange-pressures-covid-19-disrupts-inflows.
PNG, Auditor-General’s Office of Papua New Guinea. 2014. District Services Improvement Program: A Report on the Key Findings Resulting from the 2012/2013 District Audits of Expenditure Relating to the District Services Improvement Program (DSIP). Port Moresby.
PNG, Government of Papua New Guinea. 2009. Papua New Guinea Vision 2050. https://actnowpng.org/sites/default/files/png%20version%202050.pdf.
PNG, Government of Papua New Guinea. 2014. District Development Authority Act 2014. http://www.parliament.gov.pg/uploads/acts/14A-40.pdf.
PNG, Government of Papua New Guinea. 2020. The 2021 Budget Strategy Paper. https://www.treasury.gov.pg/html/national_budget/files/2013/budget_documents/BSP%202021.pdf.

77
PNG, Central Bank (Bank of Papua New Guinea). 2020. Papua New Guinea 2020 Monetary Policy Statement. September 30.
PNG, Central Bank (Bank of Papua New Guinea). 2021. Papua New Guinea Quarterly Economic Bulletin: September Quarter 2020. January 15.
PNG, DoTI (Department of Transport and Infrastructure). 2013. National Transport Strategy. PNG, DoTI (Department of Transport and Infrastructure). 2018. Medium Term Transport Plan II 2019-2022. PNG, DoTI (Department of Transport and Infrastructure). 2019. Transport Sector Funding in Papua New Guinea. PNG, DoWI (Department of Works and Implementation). 2017. Road Asset Management Branch Statistics Report. PNG, DoWI (Department of Works and Implementation). 2018a. Review of Institutional Arrangements for
Managing the Road Network in Papua New Guinea. PNG, DoW (Department of Works and Implementation). 2018b. 2018–37 National Road Network Strategy.
https://www.works.gov.pg/files/DoW_NRNS.pdf. PNG, DNPM (Department of National Planning and Monitoring). 2010. Development Strategic Plan 2010-2030. PNG, DNPM (Department of National Planning and Monitoring). 2017a. Papua New Guinea Medium Term
Development Plan III 2018 - 2022. PNG, IRC (Internal Revenue Commission). 2020. IRC COVID-19 Responses: Tax Administrative Relief Measures.
April 2. PNG, NDoE (National Department of Education). 2020. COVID-19 Education Emergency Response and Recovery
Plan. National Department of Education: Port Moresby. http://planipolis.iiep.unesco.org/sites/planipolis/files/ressources/papua_new_guinea_covid-19-education-response-and-recovery-plan-final-draft-04-05-2020.pdf.
PNG, NDoE (National Department of Education). 2019. Boosting Education Standards Together in PNG (Best PNG Program). National Department of Education: Port Moresby. https://www.globalpartnership.org/sites/default/files/2019-04-gpe-png-program-document.pdf.
PNG, NDoE (National Department of Education). 2009. Universal Basic Education Plan 2010–19: Achieving Universal Education for a Better Future. National Department of Education: Port Moresby. https://www.education.gov.pg/quicklinks/documents/ube-plan-2010-2019.pdf.
PNG, NEFC (National Economic and Fiscal Commission). 2020. 2019 Budget Fiscal Report. National Economic and Fiscal Commission: Port Moresby.
PNG, NSO (National Statistical Office). 2020. Papua New Guinea National Accounts 2011 to 2018: Gross Domestic Product at Current and Constant Price. November 11.
PNG, NSO (National Statistical Office). 2020. Papua New Guinea Consumer Price Index: June Quarter 2020. October 1.
PNG, Treasury. 2020a. Ministerial Statement on Economic Stimulus Package: Responding to COVID-19. April 2. PNG, Treasury. 2020b. Papua New Guinea Final Budget Outcome 2019. Port Moresby: Department of Treasury. PNG, Treasury. 2020c. Papua New Guinea 2021 Budget Strategy Paper. Port Moresby: Department of Treasury. PNG, Treasury. 20120d. Papua New Guinea 2021 National Budget, Volume 1: Economic and Development Policies. Port
Moresby: Department of Treasury. Pokiton, S. 2019. Functions of Public Accounts Committee questioned in court. Loop. Available at
https://www.looppng.com/png-news/functions-public-accounts-committee-questioned-court-87838 October 24.
Post-Courier. 2019. Bulolo to Introduce Head Tax at Ward Level – Basil. Available at https://postcourier.com.pg/bulolo-to-introduce-head-tax-at-ward-level-basil/ November 7.
Post-Courier. 2020. Organic Law on Provincial and Local Level Governments to be Repealed. Available at https://postcourier.com.pg/organic-law-on-provincial-and-local-level-governments-to-be-repealed/ July 15.
Pupu, Nitze, and Polly Wiessner. 2018. “The Challenges of Village Courts and Operation Mekim Save among the Enga of Papua New Guinea Today: A View from the Inside.” Discussion Paper 2018/1, Department of Pacific Affairs, Australian National University. https://openresearch-repository.anu.edu.au/handle/1885/144696.

78
Reuters. 2019. “PNG to Seek More from Exxon on P’nyang Deal Than Total’s Papua LNG.” Reuters online edition, September 26. https://www.reuters.com/article/us-japan-lng-conference-papua/png-to-seek-more-from-exxon-on-pnyang-deal-than-totals-papua-lng-idUSKBN1WB09W.
Sen, A. 1985. Commodities and Capabilities. Amsterdam: North-Holland. Slater, D. 2010. Ordering Power: Contentious Politics and Authoritarian Leviathans in Southeast Asia. Cambridge. Sukbat, J. 2020. NEC frees KPHL from answering to PAC. Loop. Available at https://www.looppng.com/png-news/nec-frees-kphl-answering-pac-93693 July 26. Sum, D.J. 2020. “The PNG kina during COVID-19: standing out from the crowd.” DevPolicy (blog). Sum, D.J., M. Laveil, M., and S. Howes. 2020. “Thinking about PNG’s COVID-19 economic response: part
1.” DevPolicy (blog), April 29. https://devpolicy.org/thinking-about-pngs-covid-19-economic-response-part-1-20200429-2/.
Sum, D.J., M. Laveil, M., and S. Howes. 2020. “Thinking about PNG’s COVID-19 economic response: part 2.” DevPolicy (blog), April 30. https://devpolicy.org/thinking-about-pngs-covid-19-economic-response-part-2-20200430-1/.
UNDP (United Nations Development Programme). 2020. Socio-Economic Impact Assessment of COVID-19 on Papua New Guinea. Port Moresby: UNDP. https://www.undp.org/content/dam/undp/library/covid19/UN_PNG_SEIA%20Report%20-%20Advance%20Edition_2020-08-26.pdf.
Van der Walle, N. 2007. “The Path from Neopatrimonialism: Democracy and Clientelism in Africa Today.” Working Paper 3-07, Mario Einaudi Center for International Studies, Cornell University. https://ecommons.cornell.edu/bitstream/handle/1813/55028/2007_WP3_vandeWalle.pdf?sequence=1.
Walton, G., Davda T., and Kanaparo, P. 2017. The challenges of providing free education in Papua New Guinea. Development Policy Centre Discussion Paper #61, Crawford School of Public Policy, The Australian National University, Canberra.
Walton, Grant W. 2018. “Fee-Free Education, Decentralisation and the Politics of Scale in Papua New Guinea.” Journal of Education Policy 34 (1): 1–21.
Walton, G, and S. Dinnen. 2020. “Regulating the growth of Private Security in PNG.” DevPolicy (blog), January 16. https://devpolicy.org/regulating-the-growth-of-private-security-in-png-20200116/.
Watts, M. J. 2018. “Frontiers: Authority, Precarity, and Insurgency at the Edge of the State.” World Development 101: 477–88.
Wiltshire, C. 2016a. “Political economy drivers of decentralisation in Papua New Guinea.” Presentation at 2016 PNG Update, Port Moresby.
Wiltshire, C. 2016b. Service Delivery in Papua New Guinea: Tracking Budgets to Health Clinics. PhD thesis, October 2016, Australian National University.
World Bank. 2017. Papua New Guinea Economic Update, December 2017: Reinforcing Resilience. Washington, DC: World Bank.
World Bank. 2018. The Independent State of Papua New Guinea: Systematic Country Diagnostic. Washington, DC: World Bank. https://openknowledge.worldbank.org/handle/10986/30976.
World Bank. 2019a. The Independent State of Papua New Guinea: Country Partnership Framework for the period FY19–FY23. Washington, DC: World Bank. http://pubdocs.worldbank.org/en/855611558494047116/CPF-PNG-FY19-23.pdf.
World Bank. 2019b. Doing Business 2020 Economy Profile Papua New Guinea. Washington, DC: World Bank. https://www.doingbusiness.org/content/dam/doingBusiness/country/p/papua-new-guinea/PNG.pdf
World Bank. 2020a. World Development Indicators (WDI) database. Washington, DC: World Bank. World Bank. 2020b. Global Economic Prospects, January 2020. Washington, DC: World Bank. World Bank. 2020c. Papua New Guinea Economic Update, January 2020: Facing Economic Headwinds. Washington,
DC: World Bank. http://documents.worldbank.org/curated/en/584121580926099153/pdf/Papua-New-Guinea-Economic-Update-Facing-Economic-Headwinds.pdf.
World Bank. 2020d. Papua New Guinea Economic Update, July 2020: In the Time of COVID-19: From Relief to Recovery. Washington, DC: World Bank.

79
http://documents1.worldbank.org/curated/en/964591594230524376/pdf/Papua-New-Guinea-Economic-Update-In-the-Time-of-COVID-19-From-Relief-to-Recovery.pdf.
World Bank. 2020e. Commodity Markets Outlook, October 2020. Washington, DC: World Bank. https://www.worldbank.org/en/research/commodity-markets.
World Bank. 2020f. East Asia and Pacific Economic Update, October 2020: From Containment to Recovery. Washington, DC: World Bank. http://www.worldbank.org/en/region/eap/publication/east-asia-pacific-economic-update.
World Bank. 2021. Global Economic Prospects, January 2021. Washington, DC: World Bank. http://www.worldbank.org/en/publication/global-economic-prospects.World Bank. Forthcoming, a. Political Economy and Institutional Context of Subnational Public Financial Management and Service Delivery in PNG.
World Bank. Forthcoming, b. Delivering Value for Money in the Health Sector – Exploring Performance, Productivity and
Utilisation. World Bank. Forthcoming, c. Delivering health services to all Papua New Guineans – Exploring the Drivers of Health
Equity. World Bank. Forthcoming, d.

80