david etkin estimating oil spill risk - vancouver
TRANSCRIPT

WRITTEN EVIDENCE OF THE CITY OF VANCOUVER APPENDIX 22Written Evidence of David Etkin
{00224463v1}

National Energy Board Hearing into Trans Mountain
Expansion Project
Written Direct Evidence of
David Etkin
8 May 2015

Table of Contents
1. Introduction and summary of witness qualifications 1
2. Summary of Conclusions 2
3. Summary of Analysis 3
Appendix A: Report of David Etkin dated April 21, 2015
Appendix B: Review of Trans Mountain Response to City of Vancouver IR No.2
Appendix C: Certificate of Experts Duty

1 INTRODUCTION AND SUMMARY OF QUALIFICATIONS
3
4 Q.l Please state your name, occupation and business address
5
6 A.l My name is David Etkin. I am an Associate Professor of Disaster and Emergency
7 Management at York University and have held this position since 2005. My primary areas of research
8 are risk analysis, risk perception, natural hazards, disaster risk reduction, disaster ethics and climate
9 change.
10
11
12 Prior to York University, I worked for Environment Canada from 1977 through to 2005. I worked
13 on applied research in the Arctic and Industrial Climatology Divisions of the Canadian Climate Centre
14 and, in 1993, I joined the Adaptation and Impacts Research Group of the Meteorological Service of
15 Canada, specializing in the interdisciplinary study of natural hazards and disasters. From 1996-2005 I
16 also worked at the University of Toronto with the Institute for Environmental Studies doing research
17 on natural hazards and disasters. I have contributed research to several national and international
||j natural hazard projects including the 2nd U.S. National Assessment of Research on Natural Hazards1
20 and the Intergovernmental Panel on Climate Change2. I was the Principal Investigator of the
21 Canadian National Assessment of Natural Hazards and I am the Past President of the Canadian Risk
22 and Hazards Network.
23
24 Q.2 What is your academic background?
25
26 A.2 B.A Physics and Mathematics, York University 1972; B.Ed., University of Toronto, 1974; MSc
27 Physics, York University, 1991.
28
29 Q.3 Please outline your principal areas of research
30
31 A.3 My primary areas of research are risk analysis, risk perception, natural hazards, disaster risk
32 reduction, disaster ethics and climate change3.
1 htioi/'www.colorado.edu/hazards/Dublications/disastershvdesign.htinl2 http://www.ipcc.ch/3 For example:
• Etkin, D. (2015). Disaster Theory: An Interdisciplinary Approach to Concepts and Causes. Butterworth-
Heineman. Etkin, D., Ivanova, J., MacGregor, S. and Spektor, A. (20 14). Risk Perception and Belief in Guardian
Spirits. SAGE Open, 4(3), 2158244014549741 .
• Etkin, D. and Timmerman, P. (2013). Emergency Management and Ethics. International Journal ofEmergency
Management, 9(4), 277-297.
• Nirupama, N., & Etkin, D. (2012). Institutional perception and support in emergency management in Ontario,
Canada. Disaster Prevention and Management, Vol. 21 Iss:5

1
2 Q.4 What is the purpose of your evidence in this proceeding?
3
4 A.4 Trans Mountain Pipeline ULC ('Trans Mountain") has applied to the National Energy Board
5 (the "NEB") pursuant to section 52 of the National Energy Board Act for a certificate of public
6 convenience and necessity in respect of the proposed Trans Mountain Expansion Project (the "TMEP").
7 The proposed expansion would increase capacity of the current pipeline from 300,000 barrels per day
8 (bbl/day) to 890,000 bbl/day, expand the tank farm and Marine Terminal facilities, and increase tanker
9 traffic to and from the Westridge Maine Terminal from 5 tankers per month to 34 tankers per month.
10
11
12 4.2 The City of Vancouver is an Intervener in the hearing of the TMEP application and has retained
13 me to evaluate the risk assessment methodology used by Det Norske Veritas (DNV) in the report filed
14 by Trans Mountain in support of its application and to provide my opinion on whether the exclusion of
15 Segment 2 and Segment 3 from the risk assessment was reasonable. A copy of my report dated April
16 21, 201 5 is attached at Appendix A.
17
18
19 4.3 The City of Vancouver subsequently requested that I review Trans Mountain's Response to City
20 of Vancouver IR No. 2, 2. 08.01.a through 2.08.01.d. and a copy of my report is attached as Appendix
21 B.
22
23 SUMMARY OF CONCLUSIONS
24
25 Q.5 Please summarize your conclusions
26
27 A.5 My conclusions are summarized in the following paragraphs:28
29 • The most commonly used definition of risk in disaster studies presents risk as a function of
30 hazard (including probability & severity) and consequences (a result of exposure &
31 vulnerability). It is usually framed as Risk = Hazard x Consequences.
32 • Any risk assessment must incorporate consequence, no matter how risk is specifically defined.
34 • The Trans Mountain/DNV risk assessment excludes a large range of high magnitude spills and
35 potential spills in Segments 2, 3 &4 based upon probability alone. Risk can only be evaluated
36 using both (1) hazard (probability & severity) and (2) consequence (exposure & vulnerability).
37 • The Trans Mountain/DNV risk assessment incorrectly uses hazard probability in lieu of risk and
38 this has resulted in an improper exclusion of a large range of low probability, high consequence
39 (LPHC) events from the risk assessment.

1
2 • There are both quantitative and qualitative aspects to risk; it is not only a function of objective
3 and measurable quantities, but is also culturally framed. This is important because values play a
4 large role in determining costs and benefits, and acceptable levels of risk.
5 • The Trans Mountain/DNY risk analysis does not include perceived risks of populations, and
6 therefore does not meet TERMPOL standards as setout out in section 3.15 of the TERMPOL
7 report. This error is particularly evident in the exclusion of Segment 2 adjacent to the City of
8 Vancouver.
9 • There are other reasons to support the inclusion of a spill in Segments 2 and 3 in the risk
10 assessment. One is based upon observational evidence, which is that rare, very large spills have
11 happened historically and represent a significant proportion of total spill amounts. The other
12 reason is theoretical, and relates to the nature of the probability distribution that describes
13 tanker spill frequencies. Oil spill impacts, as well as frequencies,_ follow a power law
14 distribution, which means that LPHC events account for a significant amount of total impacts,
15 and must be included in a risk analysis.
16 • The problem with relying exclusively upon historical data for risk analyses (particularly data
17 that are only a few decades in length) is that it excludes events that just haven't happened yet.
18 For example, a tsunami risk analysis based upon data extending over a few decades, if done
19 prior to 2004, would not have captured the Indonesian catastrophe of December 2004 or the
20 Japan one of 2011.
21 • The DNV credible worst case scenario is based upon a 16% spill of an Aframax tanker, which
22 holds about 637,500 barrels (85% of capacity). Historical data do show much greater losses, of
23 between 74% and 100% of cargo, than the DNV 16% scenario, though none that large have
24 occurred since 1997.
25 • The effects of an aging fleet are not incorporated into the DNV risk analysis. Empirical data
26 shows increasing failures as fleets age.
27 • The risk assessment by DNV/TMPEP only addresses the individual impact of spills, not
28 cumulative impacts. This is not best practice within the risk assessment community and
29 represents a serious omission.
3031
32 SUMMARY OF ANALYSIS CONDUCTED
33
34 Q.6 Please provide a summary of the analysis that you conducted in addressing the above
35 questions above.
3

12
3
4
5
6
7
8
9
10
11
12
13
14
15
16
17
18
19
2021
22
23
24
Definition of Risk
A.6 The most commonly used definition of risk in disaster studies presents risk as a fimction of
hazard (including probability & severity) and consequences (a result of exposure & vulnerability). It is
usually framed as Risk = Hazard x Consequences. An example of a matrix that is typically used by
emergency management professionals to illustrate how risk is a function of these two variables is shown
in Table 1. It can be seen from this table that even low to very low probability events can be associated
with high to very high risk, if consequences are major or extreme. It should be kept in mind that this
table represents averages over long periods of time. An individual event that is very low probability
can be catastrophic when it actually happens.
Table 1: Example ofa RiskMatrix based upon Risk = Hazard x Consequence
Consequence to People, Communities
and the Environment
Low Minor Moderate Major Extreme
Hazard
Probability
Very high High High Very High Lxtrcmc Lxtrcmc
High Moderate High wmVery
High Lxtrcmc
Medium Low Moderate wmVery
High Very High
Low Low Low Very H iuh
Very Low Very Low Low Moderate High High
Risk can only be evaluated using both (1) hazard (probability & severity) and (2) consequence
(exposure & vulnerability). This is illustrated in Table 1 where the level of risk is assessed by the
vertical variable "Hazard Frequency" combined with the horizontal variable "Consequence".
Observational Evidence
Figure 1 shows tanker spill data from the International Tanker Owners Pollution Federation Limited
(ITOPC)4for ships of all capacities. In this graph spills are ranked from largest (rank 1) to smallest
4 The International Tanker Owners Pollution Federation Limited, http://www.itopf.com/

1
2
3
4
5
6
7
8
9
10
11
12
1314
15
(rank 131), with the Y axis showing spill size (as yet I have no data for ranks 107 to 130 and have
therefore interpolated values). Note the relative importance of the largest spills; the top 4 spills account
for 20% of the total amount spilt from the 131 events. For context, the theoretical worst case spill (A)
and DMV credible worst-case spill (B) are shown by red arrows at the bottom left of the graph. The
DNV credible worst case scenario is based upon a 16% spill of an Aframax tanker, which holds about
637,500 barrels (85% of capacity). Historical data do show much greater losses, of between 74% and
100% of cargo, than the DNV 16% scenario, though none that large have occurred since 1997.
Figure I: Global tanker spills from tankers ofall capacities, rank ordered. Note the relative importance oflow
probability high consequence events in terms of total amount ofoil spilt, shown by ranks 1-8 on the left side of
the curve. High frequency events have much smaller spill sizes, but are so common that a risk analysis should
consider the cumulative impact of these spills. Data Source: International Tanker Owners Pollution
Federation Limited (ITOPF)5
Tanker Oil Spills, 1967-2014
300,000
250,000
cO 200,000
a"in— 150,000
"E.(A
100,000
A"~*
50,000
B —>
A: Worst-case spill,
85% of Aframax tanker capacity
B: DNV Credible worst-case spill,
16% of Aframax tanker capacity
Area of catastrophic spills from low
frequency, high consequence events
Area of cumulative impacts from high
frequency, low consequence events
r Region of interpolation
for missing data
— — ? ?
20 40 100
Rank (l=largest)
140
' The International Tanker Owners Pollution Federation Limited, http://www.itopf.com/

1 There are obvious problems with using this data to infer probabilities, the most important of which is
2 that over the past few decades there have been significant decreases in spill frequencies due to the use
3 of double hulled ships and improved technology. This trend may also partly result from the use of
4 newer tankers. As fleets age, empirical data shows increasing failures6, so the documented trend
5 towards fewer spills may shift in the future (I note that the effects of an aging fleet are not incorporated
6 into the DNV risk analysis). Figure 1 alone should not discount the premise of DNV that a 14,000 ton
7 (equivalent to a spill of 16% of tanker capacity) spill represents a credible worst case scenario, though it
8 does make it more challenging to accept. The intent of Figure 1 is to demonstrate that spills conform to
9 a power law distribution7, discussed below.
10
11
12 Theoretical Considerations - The Power Law and Hazard13
14 A. Probability Distribution ofthe Hazard
16 The nature of the hazard probability distribution plays an important role in whether or not exclusions of
17 Segments 2, 3 & 4 and exclusion of LPHC spills larger than 16% of tanker capacity are reasonable. For
18 example, a normal or Gaussian distribution (the well-known 'bell curve') behaves very differently from
19 one represented by a power law (Figure 3). The issue of LPHC events is less important for hazards
20 represented by normal distributions, and more important if they are represented by power laws. The
21 reason is that rare events are a greater proportion of overall risk in the latter. "Compared to many
22 statistical distributions, power laws drop offmore gradually, i.e. they have "fat tails "... This problem is
23 intuitive. Power laws havefat tails so high casualty events arefairly common. "82425262728293031323334
353637
6 Eliopoulou, E., Papanikolaou, A., Diamantis, P., & Hamann, R. (2012). Analysis of tanker casualties after the OilPollution Act (USA, 1990). Proceedings ofthe Institution ofMechanical Engineers, Part M:Journal ofEngineering
for the Maritime Environment, 226(4), 301-312.
7 Eckle, P., Burgherr, P., & Michaux, E. (2012). Risk of large oil spills: a statistical analysis in the aftermath ofdeepwater horizon. Environmental science & technology, 46(23), 13002-13008.
8 Becerra, 6., Johnson, N., Meier, P., Restrepo, J., & Spagat, M. (2012). Natural disasters, casualties and power laws: Acomparative analysis with armed conflict. In Proceedings of the Annual Meeting of the American Political Science
Association.

1
2
3
4
56789
101112131415161718192021222324252627
2829
30
31
32
3334353637
38
39
40
41
42
43
444546
47
48
4950
515253
Figure S: Comparison ofNormal and Power Law Distributions. Note that in normal distribution
(left), variables spend "most " oftheir time near some average or mean magnitude. Where
distributions are power laws (right), the notion ofaverage is not useful. There are a huge number
ofsmall magnitude events with afew medium ones, and rarer extreme ones.
Normal Distribution Power Law Distribution
>
1 A ^ifflong tall
-? * -i -J ¦ i -H * t ^
Magnitude Magnitude
The probability distribution of disaster data are generally best represented by a power law.
Mathematically a power law is represented by the equation f(x) = axk. The tendency of people to think
in terms of averages is not helpful for variables that follow power laws (Box 1).
Box 1 : "One consequence is that events with power laws are scale-free; there is
no characteristic size that is typical of the system. What power laws challenge us
to do then is give up the view of the world as consisting of typical events with
infrequent random variations. Instead, we must accept that there is no "average"
event. There are simply many small ones, a few larger ones, and occasionally
extremely large ones. "9
Using data for the worst 131 tanker spills obtained from International Tanker Owners Pollution
Federation Limited (ITOPC), a statistical analysis using SPSS resulted in the following relationship:
P(x) = 47xl09x"17
9 Farber, D. A. (2003). ProbabilitiesBehavingBadly: Complexity Theory andEnvironmental Uncertainty. UC Davis L.Rev., 37, 145. Retrieved from http://scholarship.law.berkelev.edU/facpubs/6 14

1
2
3
4
5
6
7
89
10
11
12
13
Where P = probability and x = size of tanker oil spill. Figure 6 shows the fitted power law curve to the
data. Note that the R2 value (a measure of goodness of fit where 1.0 is a perfect fit) for this curve is
0.98, which is very high. The X axis is bins of spill size using ranges of 30,000 tons (e.g., the first bin is
<30,000 tons, the second bin is 30,000-60,000 tons, and so on). The Y axis is the number of spills
within that bin. The blue diamonds are the observed TTOPC data and the red line is the power law
curve. The spill data clearly shows a power law distribution, meaning that the low probability events are
significant and should be included in the risk analysis.
Figure 6: Frequency distribution oftanker oil spills using
ITOPCdata.
Tanker Oil Spill
90
F 80
r 70
e 60
q50
40
u30
e20
n10
c 0
y
Regiession
\\I
\i ? -
Observed Frequency
SPSS Prediction
50,000 100,000 150,000 200,000 250,000 300,000 350,000
Spill Size (tons)

1
2
3
4
5
67
8
9
10
11
12
13
14
15
16
17
18
If tanker spills conformed to a normal distribution it might be reasonable to exclude some LPHC
events, but given that they follow a power law, the weight of evidence means that they should be
included. If it can be shown that consequences or impacts also follow power laws, then the
conclusion that the full range of LPHC events must be included is not in question.
B. Probability Distribution ofthe Consequences or Impacts ofthe Hazard
Disaster impacts generally follow power laws, no matter what the source. For example, Figures 6a
and 6b show deaths from earthquakes and the cost of weather disasters in the United States.
Earthquakes represent a useful comparison to tanker accidents, since deaths happen when the
buildings people live and work in collapse on them; in this sense they are more of a technological
disaster than a natural one. Additional examples for mining, explosions, industrial disasters,
maritime disasters, stampedes & panics, structural collapses and structural fires are included in
Appendix B to my report, and show similar patterns.
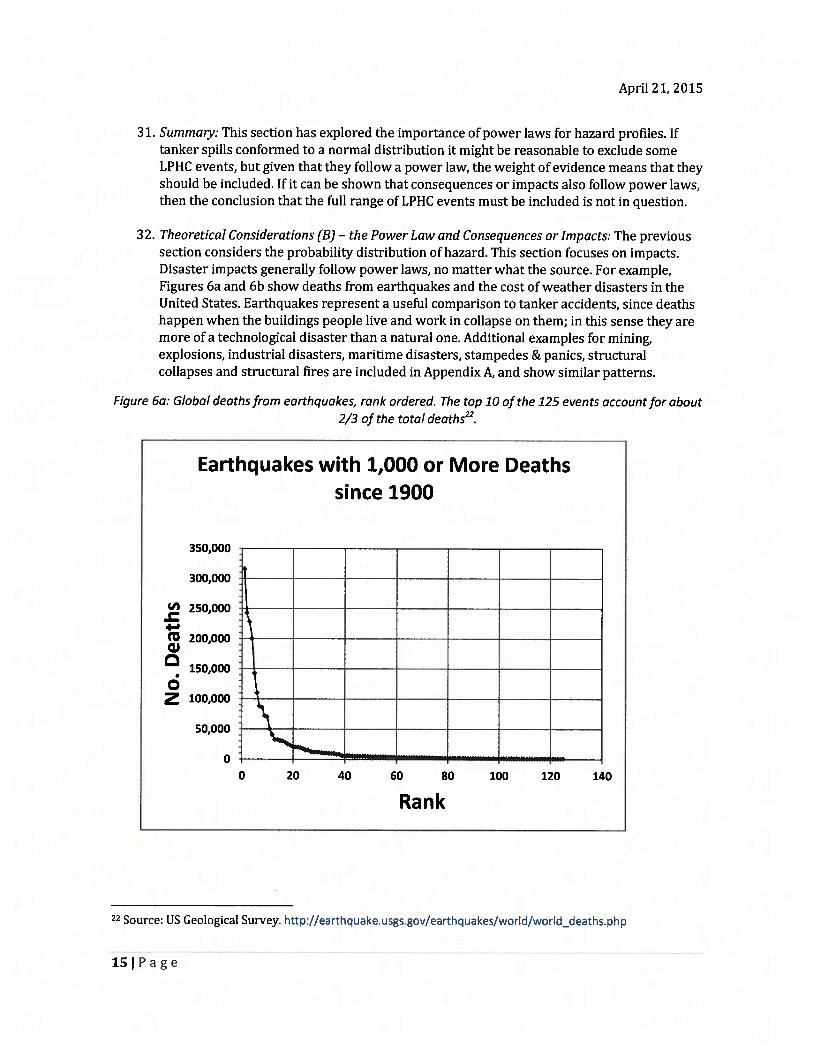
Figure 6a: Global deathsfrom earthquakes, rank ordered. The top 10 ofthe 125 events account
for about 2/3 ofthe total deaths'0.
Earthquakes with 1,000 or More Deaths
since 1900
350,000
300,000
J|2 250,000
W 200,000
150,000
100,000
50,000
60 80 100 120 140
Rank
10Source: US Geological Survey. http://earthquake.usgs.gov/earthquakes/worl(i/world_deaths.php

1
2
345
Figure 6b: Relative costs ofweather related disasters in the US exceeding $1 billion, CPI
adjusted to 2013. The top 6 ofthe 134 events accountfor 43% ofthe total cumulative damage in
the list.
US Billion Dollar Weather Disasters (2013$)
160
140
vv120(/>
2 100o(A
o 80
COS. 60
(0
5 40
20
0
1 1¦^Hurricane Katrina
,19880irought/Heat Wave
^Superstorm Sandy
?—HurrIcane Andre:w
vX
20 40 60 80
Rank
100 120 140 160
10

1 Both examples in Figures 6a&b and the examples in Appendix A to my report provide
2 strong empirical evidence that support the importance of including LPHC events as part
3 of a risk analysis. The mathematics of risk calculations also support this conclusion.
4 There are compelling reasons to believe that oil spill impacts, as well as frequencies,
5 follow power law distributions, which means that LPHC events account for a significant
6 amount of total impacts, and must be included in a risk analysis.
7
8
9 Q.7 Do you submit the contents of this document and the Appendices as your
10 written evidence?
11
12 A.7 Yes, this is my written evidence.
11

APPENDIX A TO THE WRITTEN EVIDENCE OF DAVID ETKIN
Report of David Etkin dated April 21, 2015Low Probability High Consequence Events and
The Risk of Oil Spills:An Evaluation of the Trans Mountain - Det Norske Veritas
Risk Analysis

April 21, 2015
LOW PROBABILITY HIGH CONSEQUENCE
EVENTS AND THE RISK OF OIL SPILLS:
AN EVALUATION OF THE TRANS
MOUNTAIN-DET NORSKE VERITAS RISK
ANALYSIS
8 Y
DAVID ETKIN
Associate Professor, Disaster and Emergency Management
Faculty of Liberal Arts and Professional Studies, York University
4700 Keele St., Toronto, Ontario, Canada, M3J 1P3
l|Page

April 21, 2015
1. EXECUTIVE SUMMARY:—i—— ... L1 1 —ma ¦¦ ¦¦ i j. j ...j. i.. .... ¦ —eaeeea .
1. This report is an evaluation of the methodology used in the Trans Mountain-Det Norske
Veritas (TM/DNV) risk analysis of oil spills from tankers in support of the Trans Mountain
Pipeline ULC application to the National Energy Board in respect of the TM Expansion
Project (TMEP); specifically, (a) the methodology for risk assessment involving low
probability/high consequence events, and (b) whether or not the exclusion of either or both
of Segment 2 and Segment 3 from the spill modeling and impacts assessment is consistent
with that risk assessment methodology.
2. In order to answer this question I considered both observational evidence of historical spills
and theoretical issues related to the probability distributions of tanker oil spills.
3. My conclusion is that the methodology used by TM/DNV Risk Assessment is flawed and
significantly underestimates the real risk of an oil spill. I reach this conclusion because of
the following reasons:
a. A flaw of logic: by using only hazard probability, instead of risk (which includes both
hazard and consequences), to exclude Segments 2, 3 &4 and to exclude scenarios
greater than 16% of cargo loss, the TM/DNV methodology failed to properly use
their own definition of risk in their risk assessment.
b. Observational evidence shows that the full range of Low Probability / High
Consequence should be included in the oil spill risk analysis.
c. Theoretical considerations show that the full range of Low Probability High
Consequence should be included in the oil spill risk analysis.
4. There is no doubt that the full range of Low Probability / High Consequence events form a
significant component of overall impacts, and should be explicitly included beyond the low
threshold used in the TM/DNV risk analysis.
5. I also note that the TM/DNV risk analysis does not meet TERMPOL standards to include
consequences, especially the risk perception of local communities.
6. Additionally, the cumulative impact of lesser spills is of potential significance, and should
also form a part of the risk analysis. This is considered "best practice" within the risk
assessment community.
7. I certify that I, David Etkin, am solely responsible for the production of this report and have
no conflict of interest regarding the TM/DNV risk assessment.
2 | P a g e

April 21, 2015
CONTENTS
1. Executive Summary: 2
2. Scope of Work: 4
3. The Importance of Defining Risk 5
4. Hazard Probability Profile 7
5. LPHC events & the Titanic Mentality 17
6. Cumulative Effect Assessment 18
7. General Conclusions 18
Appendix A: Examples of Disasters & Power Laws 19
Appendix B: Abbreviated CV 21
3 | P a g e

April 21, 2015
2. SCOPE OF WORK:
8. I have been retained by the City ofVancouver to evaluate the risk assessment methodology
used by Det Norske Veritas (DNV) in their report to Trans Mountain Pipeline ULC (TM), in
support ofTM's application to the National Energy Board for a certificate ofpublic
convenience and necessity in respect of the TMEP. Specifically, (a) the methodology for risk
assessment involving low probability/high consequence events; and (b) whether or not the
exclusion of either or both of Segment 2 and Segment 3 from the spill modeling and impacts
assessment is consistent with that risk assessment methodology.
9. The methodological issue underlying both 8(a) and (b) above relates to the incorporation of
low probability, high consequence (LPHC) events into a risk assessment. Specifically, the
risk assessment of oil spills from tankers associated with the Trans Mountain Pipeline
Expansion Project (TMPEP) is being considered.
10. Summary ofthe Issue: The inclusion of LPHC events in risk analyses is an interesting and
important issue. It is obvious that excluding any range of events from a risk
assessment will bias it towards a low estimation of risk; the important question to be
asked is whether or not the exclusion is significant and the remaining hazard ranges
being considered can provide a reasonable estimate of overall risk.
a. The answer is not obvious and will vary depending upon the hazard being
considered and the vulnerability of exposed elements. It is common in the physical
sciences to make simplifying assumptions in order to clarify complex systems and
make their analysis more tractable. Examples include the flat earth assumption for
aerodynamics and Newton's Law for forces. Such simplifications are justified by
sensitivity analyses showing insignificant errors within defined ranges, but fail
when extrapolated beyond certain bounds.
11. Excluded Segments: TM has stated in its application that there is no need for the inclusion of
specific areas1 in their risk assessment on the basis that the rarity of spills excludes the
need for consideration. Thus, oil spill scenarios were not considered for study segments 3
(English Bay) and 4 (Roberts Bank). I also note the exclusion of study segment 2
(Vancouver Harbour Area) from their analysis, though in Appendix 2 of the Navigational
HAZID Workshop it was stated in section 4 (HAZID Conclusion) that the route hazard and
navigation complexity is "Above average due to draft and tidal restriction obstructionsfrom
thefirst and second narrows and the high density oftraffic within the harbour area." Segment
2 is adjacent to the highly populated area of the City of Vancouver and other communities,
and is of particular interest because of their exposure to oil spills.
12. Excluded Scenarios: As well as excluding study segments 2, 3 &4, a range of large oil spill
scenarios were excluded from the TM/DNV risk analysis, specifically large spills exceeding
16% of tanker capacity. Again, the reason given is that they are very low probability events.
1 Study Segments 3 and 4 "Not considered as viable spill location due to relatively lowfrequencyfor anaccidental oil cargo spill." Source: TERMPOL 3.25 General Risk Analysis and Intended Methods of Reducing
Risks, Ch. 10.1 Table 31.
4 | P a g e

April 21, 2015
13. Report Topics: In this report I examine (a) the TM/DNV risk assessment methodology as it
relates to the above excluded areas and spill ranges, (b] the degree to which the TM/DNV
risk assessment methodology is reasonable, and (c) consider if the methodology meets
industry best practices and TERMPOL requirements. Ultimately, it is reasonable if a risk
assessment excluding rare events is not substantially biased relative to a more complete
estimation. My assessment will consider observational evidence, theoretical considerations,
and published literature describing best practice risk assessments.
14. Short Biography: David Etkin is an Associate Professor of Disaster and Emergency
Management at York University. His primary areas of expertise are: risk analysis, risk
perception, natural hazards, disaster risk reduction, disaster ethics and climate change.
Prior to being at York he worked for Environment Canada (1977-2005). During his career,
he has done applied research in the Arctic and Industrial Climatology Divisions of the
Canadian Climate Centre. In 1993 he joined the Adaptation and Impacts Research Group of
the Meteorological Service of Canada, specializing in the interdisciplinary study of natural
hazards and disasters. From 1996-2005 he worked at the University of Toronto with the
Institute for Environmental Studies doing research on natural hazards and disasters. He
has contributed to several national and international natural hazard projects including the
2nd U.S. national assessment, the Intergovernmental Panel on Climate Change, was
Principal Investigator of the Canadian National Assessment of Natural Hazards and is Past
President of the Canadian Risk and Hazards Network. He has 80 publications to his credit.
3. THE IMPORTANCE OF DEFINING RISK
15. In this section I will explain why the definition of risk is critical to evaluating the TM/DNV
risk assessment. In their risk assessment the incorrect use of hazard probability in lieu of
risk has resulted in an improper exclusion of a large range of LPHC events from the risk
analysis. This is called an "unwarranted assumption fallacy"2. 1 also note that DNV has not
sufficiently included consequence in their risk estimations. 3
16. Definition ofRisk: There are various definitions of risk within the academic and professional
communities. The one most commonly used in disaster studies presents risk as a function of
hazard (including probability & severity) and consequences (a result of exposure &
vulnerability). It is usually framed as Risk = Hazard x Consequences4. An example of a
matrix that is typically used by emergency management professionals5 to illustrate how risk
is a function of these two variables is shown in Table 1. It can be seen from this table that
even low to very low probability events can be associated with high to very high risk, if
2 It is often true that low probability events are not important to consider, but this is not generalizable to allevents. The logical error made was that DNV applied this "rule" to a situation and context for which it is notapplicable.
3Any risk assessment must incorporate consequence, no matter how risk is specifically defined by a user.
4 Blaikie, P., Cannon, T., Davis, 1., & Wisner, B. (2004). At risk: natural hazards, people's vulnerability and
disasters. Routledge.
5 For example. Emergency Management BC uses it as part of their Hazard, Risk and Vulnerability Analysis
Tool Kit, http://www.embc.gov.bc.ca/em/hrva/toolkithtml
5 | P a g e

April 21, 2015
consequences are major or extreme. It should be kept in mind that this table represents
averages over long periods of time. An individual event that is very low probability can be
catastrophic when it actually happens.
Table 1: Example of a Risk Matrix based upon Risk = Hazard x Consequence
Consequence to People, Communities
and the Environment
Low Minor Moderate Major Extreme
Hazard
Probability
Very high High
High Moderate
Medium Low
Low
Very Low
Low
Very Low
High Very High Extreme Extreme
High
Moderate
Low
Very
High Very High
| Very High
Low Moderate High High
17. Cultural Framing: There are both quantitative and qualitative aspects to risk; it is not only a
function of objective and measurable quantities, but is also culturally framed. This is
important because values play a large role in determining costs and benefits, and acceptable
levels of risk. For example, a developer would estimate the relative value of an old growth
forest as compared to a retail development very differently than an environmentalist would.
When consequences are being considered, one must address the issue of who is affected,
and the voices and values of potentially affected people and communities must be part of
the assessment. This is why in section 3.15 of the TERMPOL report6 where they discuss riskanalysis, the following statement is made: "Analysis should not be limited to a mathematical
index (probability ofan incident) but should also include perceived risks to:
• populations within coastal zones along the intended route;
• the terminal berth and surrounding area; and
• the marine environment, fish and wildlife habitat."
The TM/DIMV risk analysis does not include perceived risks of populations, and therefore does
not meet TERMPOL standards. This is particularly evident in their exclusion of Segment 2
adjacent to the City of Vancouver.
6 Transport Canada (2001). TERMPOL Review Process 2001, Marine Safety, Transport Canada TP742E.
6 | P a g e

April 21, 2015
18. Logical Flaw in the TM/DNV Methodology: There is a serious logical flaw in the DNV/TM risk
assessment methodology7. The error is that their analysis excludes a large range of high
magnitude spills and potential spills in Segments 2, 3 &4 based upon probability alone8. But
it is risk, not probability, which is of primary interest, and risk can only be evaluated using
both (1) hazard [probability & severity) and [2] consequence (exposure & vulnerability).
This is illustrated in Table 1 where the level of risk is assessed by the vertical variable
"Hazard Frequency" combined with the horizontal variable "Consequence".
19. Summary: Excluding LPHC events on the basis of probability alone is a logical fallacy. This
represents a serious error in the DNV/TM risk assessment methodology. The potential
consequences of a LPHC spill on the City of Vancouver and other communities should be
calculated and be an explicit component of the risk analysis.
4. HAZARD PROBABILITY PROFILE
20. Three Types ofEvidence [Definitional, Observational & Theoretical): The previous section
identified a logical error in the TM/DNV risk assessment methodology, which related to the
actual definition of risk and their exclusion from their risk assessment of (a) segments 2, 3
and 4 and (b) a range of high magnitude spills beyond 16% of tanker capacity. There are
other reasons to support the inclusion of the missing segments and high magnitude spills.
One is based upon observational evidence, which is that rare, very large spills have
happened historically and represent a significant proportion of total spill amounts. The
other reason is theoretical, and relates to the nature of the probability distribution that
describes tanker spill frequencies.
21. Observational Evidence: Figure 1 shows tanker spill data from the International Tanker
Owners Pollution Federation Limited (ITOPC)9 for ships of all capacities. In this graph spills
are ranked from largest (rank 1) to smallest (rank 131), with the Y axis showing spill size
(as yet I have no data for ranks 107 to 130 and have therefore interpolated values). Note the
relative importance of the largest spills: the top 4 spills account for 20% of the total amount
spilt from the 131 events. For context, the theoretical worst case spill (A) and DMV credible
worst-case spill (B) are shown by red arrows at the bottom left of the graph. The DNV
credible worst case scenario is based upon a 16% spill of an Aframax tanker, which holds
about 637,500 barrels (85% of capacity). Historical data do show much greater losses, of
between 74% and 100% of cargo10, than the DNV 16% scenario, though none that large
have occurred since 1997.
Figure 1: Global tanker spills from tankers ofall capacities, rank ordered. Note the relative importance of
low probability high consequence events in terms of total amount ofoil spilt, shown by ranks 1-8 on the
left side of the curve. High frequency events have much smaller spill sizes, but are so common that a risk
7 Det Norske Veritas (U.S.A.), Inc. (2013). TERMPOL 3.15 - GENERAL RISK ANALYSIS AND INTENDEDMETHODS OF REDUCING RISKS, Trans Mountain Expansion Project DNV Doc. No./Report No.: 167ITKV-
9/PP061115
8 TERMPOL 3.25 General Risk Analysis and Intended Methods of Reducing Risks, Ch. 10.1 Table 31.
9 The International Tanker Owners Pollution Federation Limited, http://www.itopf.com/
10 Etkin, D. S. (2001, March). Analysis ofoil spill trends in the United States and worldwide. In International Oil
Spill Conference (Vol. 2001, No. 2, pp. 1291-1300). American Petroleum Institute.
7 1 P a g e

April 21, 2015
analysis should consider the cumulative impact of these spills. Data Source: International Tanker Owners
Pollution Federation Limited (ITOPC)11
Tanker Oil Spills, 1967-2014
300,000
50,000
250,000
O 200,000
150,000
100,000
A; Worst-case spill,
85% of Aframax tanker capacity
B; DNV Credible worst-case spill,
16% of Aframax tanker capacity
Area of catastrophic spills from low
frequency, high consequence events
Area of cumulative impacts from high
frequency, low consequence events
r Region of interpolation
for missing data
— — —? ?
20
Rank (l=largest)
22. The following quote from ITOPF supports the importance of these rare events - "... it should
be noted that a few very large spills are responsible for a high percentage ofoil spilt." 12
International Tanker Owners Pollution Federation Limited.
23. Limitations to Figure 1: There are obvious problems with using this data to infer
probabilities, the most important of which is that over the past few decades there have been
significant decreases in spill frequencies due to the use of double hulled ships and improved
technology (Figure 213]. This trend may also partly result from the use of newer tankers. As
11 The International Tanker Owners Pollution Federation Limited, http://www.itopf.com/
12 ITOPF: Oil Tanker Spill Statistics 2013. The International Tanker Owners Pollution Federation Limited.
13 At first glance the curves of Figure 5 appear to be different from the following Figures 3 and 4, but this is
only because the x-axis and y-axis are logarithmic scales. If they were linear scales the curves would look the
same since they are all power laws.
8 | P a g e

April 21, 2015
fleets age, empirical data shows increasing failures14, so the documented trend towards
fewer spills may shift in the future (I note that the effects of an aging fleet are not
incorporated into the DNV risk analysis). Figure 1 alone should not discount the premise of
DNV that a 14,000 ton (equivalent to a spill of 16% of tanker capacity) spill represents a
credible worst case scenario, though it does make it more challenging to accept. The intent
of Figure 1 is to demonstrate that spills conform to a power law distribution.
Figure 2: Tends in Oil Spill Frequencies. Note the trend towards fewer spills. The distribution ofspills
however, follows a power law distribution (discussed below).15 Both axes are logarithmic, unlike thefollowing graphs. This is why the curves appear different; on linear graph paper they would appear
similar.
104 10* 10*Spill quantity exceeded [tons]
Figure 5. Empirical frequency consequence curves (l-ECDF) Xfrequency constructed from global historical ship spills exceeding 200
tons. The data set was split into four time intervals as the frequency ofspills is found to decrease over time.
24. Theoretical Considerations (A) - The Power Law and Hazard: The nature of the hazard
probability distribution plays an important role in whether or not exclusions of Segments 2,
3 & 4 and exclusion of LPHC spills larger than 16% of tanker capacity is reasonable. For
example, a normal or Gaussian16 distribution (the well-known 'bell curve') behaves very
differently from one represented by a power law (Figure 3). The issue of LPHC events is less
important for hazards represented by normal distributions, and more important if they are
represented by power laws. The reason is that rare events are a greater proportion of
overall risk in the latter. "Compared to many statistical distributions, power laws drop off
14 Eliopoulou, E., Papanikolaou, A., Diamantis, P., & Hamann, R. (2012). Analysis of tanker casualties after the
Oil Pollution Act (USA, 1990). Proceedings of the Institution ofMechanical Engineers, PartM:Journal ofEngineering for the Maritime Environment, 226(4), 301-312.
15 Eckle, P., Burgherr, P., & Michaux, E. (2012). Risk of large oil spills: a statistical analysis in the aftermath ofdeepwater horizon. Environmental science & technology, 46(23), 13002-13008.
16 The Gaussian distribution is represented by the equation F(x) = a exp(-(x-b)2)/2c2) +d
9 | P a g e

April 21, 2015
more gradually, i.e. they have "fat tails"... This problem is intuitive. Power laws havefat tails
so high casualty events arefairly common."1''
Figure 3: Comparison ofNormal and Power Law Distributions. Note that In normal distribution (left),
variables spend "most" of their time near some average or mean magnitude. Where distributions are
power laws (right), the notion of average is not useful. There are a huge number ofsmall magnitude
events with a few medium ones, and rarer extreme ones.
Normal Distribution Power Law Distribution
>>
r01T
/>. 01
i" | Iu.
Long tail
-i -t o i z a 4^^Magnitude Magnitude
25. Normal Distributions: To illustrate by example, Figures 4a & b shows July mean maximum
temperatures (approximately normally distributed) at Vancouver Airport for the period
1950-2012.
Figure 4a: Histogram ofJuly average maximum temperatures at Vancouver Airport. This is an example of
a probability distribution that is approximately normal. Rare events are important, but not necessarily
overwhelmingly so compared to the rest of the distribution. Data from NOAA,
http://www.ncdc.noaa.gov/data-access/land-based-station-data.
17 Becerra, 6., Johnson, N., Meier, P., Restrepo, J., & Spagat, M. (2012). Natural disasters, casualties and powerlaws: A comparative analysis with armed conflict. In Proceedings of the Annual Meeting of the AmericanPolitical Science Association.
10 | P a g e

April 21, 2015
19 20 21 22 23 24 25 26
Temperature Range (C)
Figure 4b: Data from Figure 4a was rank plotted, and is approximately linear, as is the case for normal
distributions. Rank 1 is the warmest month, and is at the extreme left of the x-axis.
Vancouver Airport Mean July T(max)
26. Note that in Figure 4b, where the data are rank ordered, the relationship is linear except for
two years [1958 and 1985), which at ranks 1 & 2 are somewhat higher than a linear fit
would suggest. This may be because of an unusual weather pattern, instrument error, or a
change in the physical environment at the weather station [such as nearby construction).
Statistical averages and variances are useful for normal distributions, since they indicate a
region where variables exist most of the time.
27. Disaster Data Fit a Power Law, Not a Normal Distribution: The probability distribution of
disaster data are very different from Figures 4 and are generally best represented by a
11 1 Page

April 21, 2015
power law. Mathematically a power law is represented by the equation f(x) = axk. An
example of this is earthquake frequencies (Figure 5a). The tendency of people to think in
terms of averages is not helpful for variables that follow power laws (Box 1). Recall that
earthquake magnitude (MM) is logarithmic, such that a MM=8 is one-tenth as strong as a
MM=9. Figure 5b shows the 100 largest recorded earthquakes, rank ordered; note the non
linear curve.
28. Box 1: "One consequence is that events with power laws
are scale-free; there is no characteristic size that is typical
ofthe system. What power laws challenge us to do then is
give up the view ofthe world as consisting oftypical events
with infrequent random variations. Instead, we must
accept that there is no "average" event There are simply
many small ones, a few larger ones, and occasionally
extremely large ones. "18
18 Farber, D. A. (2003). Probabilities Behaving Badly: Complexity Theory and Environmental Uncertainty. UC
Davis L. Rev., 37, 145. Retrieved from http://scholarship.law.berkeley.edu/facpubs/614
12 | P a g e

April 21, 2015
Figure 5a: Frequency ofearthquakes by magnitude19. Note the rarity of high magnitude events comparedto small ones. This curve is best represented by a power law. The X-axis of this curve has low magnitude
events to the right and high magnitude events to the left, which is the opposite of Figure 3. This is why
the curve is a mirror image of the right side of Figure 3.
Frequency of Earthquakes per year
1400000
1200000
1000000
800000
600000
400000
200000
0
8+
-i—•—i * ^ i «
7-7.9 6-6.9 5-5,9 4-4.9 3-3.9 2-2.9
Magnitude Range
Figure 5b: Example ofa power law. 100 largest recorded earthquakes, rank ordered (rank 1 = largest
recorded quake). Note how the curve grows exponentially upward to the left, as events become rarer
and of higher magnitude20. The Y-axis (MM) has a logarithmic definition, such that a 9.0 earthquake is
ten times as strong as an 8.0.
100 Largest Earthquakes
s100
19 Source: Teaching Quantitative Skills in the Geosciences. Carleton University.
http://serc.carleton.edu/quantskills/methods/quantlit/loganthms.html20 Data Source: US Geological Survey, http://earthquake.usgs.gov/earthquakes/world/world_deaths.php
13 1 P a g e

April 21, 2015
29. When are LPHC Events Important to a Risk AnaIysis?:The importance of including LPHC
events in the TM/DNV risk assessment will depend upon what kind of probability
distribution best fit tanker spills. If spills fit a power law distribution, then, in my opinion,
they should be included.
30. Do Tanker Oil Spills Follow Power Laws? Using data for the worst 131 tanker spills obtained
from International Tanker Owners Pollution Federation Limited (ITOPCp1, a statistical
analysis using SPSS resulted in the following relationship:
P(x] = 4.7xl09x17
Where P = probability and x = size of tanker oil spill. Figure 6 shows the fitted power law
curve to the data. Note that the R2 value [a measure of goodness of fit where 1.0 is a perfect
fit) for this curve is 0.98, which is very high. The X axis is bins of spill size using ranges of
30,000 tons (e.g., the first bin is <30,000 tons, the second bin is 30,000-60,000 tons, and so
on). The Y axis is the number of spills within that bin. The blue diamonds are the observed
1TOPC data and the red line is the power law curve. The spill data clearly shows a power law
distribution, meaning that the low probability events are significant and should be included
in the risk analysis.
Figure 6: Frequency distribution of tanker oil spills using ITOPC data.
90
F 80
r 70
e 60
q 5040
u30
e20
" 10C n
Tanker Oil Spill Regression
? Observed Frequency
•Jl ¦ 1 ViV4l\»LIUI 1
0 50,000 100,000 150,000 200,000 250,000 300,000 350,000
y Spill Size (tons)
21 The International Tanker Owners Pollution Federation Limited, http://www.itopf.com/
14 | P a g e
April 21, 2015
31. Summary: This section has explored the importance ofpower laws for hazard profiles. If
tanker spills conformed to a normal distribution it might be reasonable to exclude some
LPHC events, but given that they follow a power law, the weight of evidence means that they
should be included. If it can be shown that consequences or impacts also follow power laws,
then the conclusion that the full range of LPHC events must be included is not in question.
32. Theoretical Considerations (B) - the Power Law and Consequences or Impacts: The previous
section considers the probability distribution of hazard. This section focuses on impacts.
Disaster impacts generally follow power laws, no matter what the source. For example,
Figures 6a and 6b show deaths from earthquakes and the cost of weather disasters in the
United States. Earthquakes represent a useful comparison to tanker accidents, since deaths
happen when the buildings people live and work in collapse on them; in this sense they are
more of a technological disaster than a natural one. Additional examples for mining,
explosions, industrial disasters, maritime disasters, stampedes & panics, structural
collapses and structural fires are included in Appendix A, and show similar patterns.
Figure 6a: Global deaths from earthquakes, rank ordered. The top 10 of the 125 events account for about
2/3 of the total deaths22.
Earthquakes with 1,000 or More Deaths
since 1900
¦srn nnn
300,000 ;
J2 250,000 ;
4-»
ro 200,000 :(U
^ 150,000 :6Z 100,000
50,000 ;
0
( to
\
) 20 40 60 8
Rank
0 K)o i:SO li
22 Source: US Geological Survey, http://earthquake.usgs gov/earthquakes/world/world_deaths.php
15 | Page

April 21, 2015
Figure 6b: Relative costs of weather related disasters in the US exceeding $1 billion, CP! adjusted to 2013.
The top 6 of the 134 events account for 43% of the total cumulative damage in the list23.
US Billion Dollar Weather Disasters (2013$)160
140
vv120«/J
2 100(/>
co
CO
80
60*-•
reoU 40
20
1 1
'^Hurricane Katrina
1988 D rought/He;at Wave
\/Superstorm Sandy1 ' '
i—Hurricane Andreiw
vN.
20 40 60 80
Rank
100 120 140 160
33. Will Oil Spill Impacts Follow Power Laws?: Both examples in Figures 6a&b and the examples
in Appendix B provide strong empirical evidence that support the importance of including
LPHC events as part of a risk analysis. The mathematics of risk calculations also support this
conclusion. There are compelling reasons to believe that oil spill impacts, as well as
frequencies, follow power law distributions, which means that LPHC events account for a
significant amount of total impacts, and must be included in a risk analysis.
34. Conclusion: Evidence indicates that oil spill impacts follow power law distributions. LPHC
events should, therefore, be included in a risk analysis.
23 Data Source; National Oceanic and Atmospheric Administration, http;//www.ncdc,noaa.gov/billions/events
16 | P a g e

April 21, 2015
5. LPHC EVENTS & THE TITANIC MENTALITY
35. Titanic Mentality: Unfortunately, there is a long history of catastrophes that were
considered to be so implausible that they were not properly planned for. Examples include
the Titanic, nuclear power plant failures at Three Mile Island, Chernobyl and Fukishima, and
others. The mentality is that failure is not possible because the system/ship/etc. has been
designed so well. There is even a phrase for it in popular culture, called the "Titanic
Mentality".
36. Box 3: The Titanic Mentality mindset is noted in various
papers and After Action Reports, for example:
a. The Executive Summary of the Final Report-
Investigation Committee on the Accident at
Fukushima Nuclear Power Stations of Tokyo Electric
Power Company noted: "...a lack of... imagination
toward a major tsunami".2*
The 9/11 Commission Report found: "...afailure of
imagination and a mindset that dismissed possibilities'
as a key underlyingfactor"25.
"Prior to the Three Mile Island-2 accident, a "Titanic
mentality"... existed in many minds about nuclear
reactor plant robustness"26
b.
c.
37. DNV/TM and the Titanic Mentality: DNV notes that "Based upon thefact that there has not
been any total loss ofcontainment scenarios involving a double hull tanker, ever, to date a
credible worst case scenario does not include total loss oftanker with complete loss of
cargo."21 This is a mindset that is fundamentally flawed. The problem with relying
exclusively upon historical data for risk analyses (particularly data that are only a few
decades in length) is that it excludes events that just haven't happened yet. For example, a
tsunami risk analysis based upon data extending over a few decades, if done prior to 2004,
would not have captured the Indonesian catastrophe of December 2004 or the Japan one of
2011. Using such data as a basis for a credible worst case scenario can easily lead to a
deeply flawed risk estimation. If risk assessments are to be robust, they must go beyond a
historical lessons learned approach and include scenarios of possibilities. To do otherwise is
to be caught in a cognitive trap where risk estimations are bounded too narrowly.
24 Investigation Committee on the Accident at Fukushima Nuclear Power Stations of Tokyo Electric PowerCompany (2012). Executive Summary of the Final Report
http://www.cas.go.jp/jp/seisaku/icanps/eng/finalgaiyou.pdf
25 The 9/11 Commission Report (2004). http://www.9-llcommission.gov/report/911Report.pdf26 Rempe, J., Farmer, M., Corradini, M., Ott, L., Gauntt, R., & Powers, D. (2012). Revisiting Insights from Three
Mile Island Unit 2 Postaccident Examinations and Evaluations in View of the Fukushima Daiichi Accident.Nuclear Science and Engineering, 172(3), 223-248.
27 TERMPOL 3.15 - General Risk Analysis and Intended Methods of Reducing Risks: Trans Mountain
Expansion Project, Section 9.1.5, Det Norske Veritas (U.S.A.), Inc., DNV Doc. No./Report No.: 167ITKV-
9/PP061115
17| Page

April 21, 2015
6. CUMULATIVE EFFECT ASSESSMENT
38. There is a large literature on the importance of assessing the cumulative effects or impacts
of projects, and cumulative assessments are often required by legislation and/or policy,
such as the Canadian Environmental Assessment Act. It is beyond the scope of this report to
discuss this issue, but 1 feel compelled to observe that the risk assessment by DNV/TMPEP
only addresses the individual impact of spills, not cumulative impacts. This is not best
practice within the risk assessment community and represents a serious omission.
7. GENERAL CONCLUSIONS
39. Methodological Error: The DNV/TM risk analysis has a serious methodological flaw related
to their exclusion of a range of LPHC events. Though they define risk properly in their risk
analysis (Risk = Hazard x Consequences], they only use probability of hazard to eliminateSegments 2, 3 &4, and LPHC scenarios larger than 16% of tanker capacity. They should be
included. This error, in my opinion, leads to a serious underestimation of risk.
a. The DNV/TM risk analysis excludes specific Segments (2, 3 & 4] on the basis of their
low probability. This exclusion, in my opinion, leads to a serious underestimation of
risk. The potential consequences of a LPHC spill on the City ofVancouver and other
communities should be calculated and be an explicit component of the risk analysis.
b. The DNV/TM risk analysis excludes tanker spills in excess of 16% of tanker capacity
on the basis of their low probability. This exclusion, in my opinion, leads to a serious
underestimation of risk.
40. Cumulative Impacts: Doing a risk assessment of a hazard such as tanker oil spills, which is
represented by a power law distribution, requires an evaluation of both (a] specific impacts
from LFHC disastrous events, and also (b) the cumulative impact from high probability /
low consequence (HPLC) events. The latter has not been done and may represent a serious
omission.
41. Cultural Framing ofRisk: Additionally, because risk is culturally framed, input from
potentially affected communities plays an important role in determining acceptable level of
risk. Such input is not included in the DNV risk assessment, and should be added. This is
particularly true for Segment 2 near the City of Vancouver.
18 | P a g e

April 21, 2015
APPENDIX A: EXAMPLES OF DISASTERS & POWER LAWS
Mining Deaths
7,000
6.000
^ 5,000
¦| 4,000% 3,000
2,000
1,000
0
C
Deaths from Eplosions
30
,
I) s0 100 1!
Rank
>0 2(
4,
4,
3,
-£ 3'
J i'1.
,500
,000
500
000
500
000
,500
.000
500
0
Industrial Deaths
—
b .SO 100 150
Rank
3,000
2,500
2 2,000
§ 1,500
z 1,000
500
0
Maritime Deaths
E100 150
Rank
19 | P a g e

April 21, 2015
Deaths From Stampedes & Panics
7,000
6,000
5,000
* 4,000
| MOO2,000
1,000
0
20 40
Rank
60 80
Deaths From Strucural Fires
2,500
2,000
| 1,500Oo
6 1,000
500
0
20 40 60
Rank
80 100 120
Deaths From Structural Collapse
1,200
1,000
J 800
J 600
* 400
200
0
20 40
Rank
60 80
1,800 .
1,600
1,400
1,200
S 1,000
° 800Z 600
400
200
Rail Deaths
>
X)
0
C) 20 40 6
Rank
0 80 1(
42. Data: Mining Disasters (USA): 1839-2019. Explosions (not including bombings, aviation
incidents or mining disasters): 1597-2013. Industrial Disasters: 1860-2013. Maritime
Disasters (peacetime only): 1622-2012. Stampedes & Panics; 1809-2010. Structural
Collapses: 1907-2013 (with one event in 1627). Structural Fires: 1863-2012. Rail Disasters
(more than 90 Deaths); 1876-2010. Sources: Centre for Disease Control for mining
disasters28 and Wikipedia29 for other disasters. Wikipedia data do not include deaths by
natural disasters, war or violent acts.
43. Chart Descriptions: Each chart is rank ordered along the x-axis with the largest event as rank
1. Number of deaths is along the y-axis; where a range of values were given the lesser value
was used in order to provide conservative estimates. These graphs, like Figures 6, illustrate
the pattern typical of disasters following power laws - that a few extreme events account for
a relatively large proportion of the total losses.
28 Centre for Disease Control, http://www.cdc.gov/niosh/mining/statistics/content/allminingdisasters.html
29 Wikipedia. Missing data is likely due to the unreviewed nature of the data sources, but does not affect the
shape of the curve.
http://en.m.wikipedia,org/wiki/List„of_accidents^ and.disasters _by death_toll#RaiLaccidents..and_disasters
20 | P a g e

April 21, 2015
APPENDIX B: ABBREVIATED CV
A. PERSONAL
1. NAME: David A. Etkin, Associate Professor, York University;
Associate Faculty, Royal Roads University.
2. DEGREES:
B.Sc., York University, Faculty of Science (1972)
B.Ed., University of Toronto, Faculty of Education (1974)
M.Sc., York University, Faculty of Science (1991)
3, EMPLOYMENT HISTORY:
Employer Time Period Position
York University 2005-present;
Faculty of Liberal and
Professional Studies
CLA 2005-2008
Assistant Professor 2008-2011
Associate Professor 2011-present
Environment
Canada
1976-94 Weather Forecaster & Instructor,
Research Meteorologist
1994-2005:
Institute for Environmental
Studies, U. ofT.
Natural Hazards and Risk Analyst,
Associate Member of the School of
Graduate Studies
Etobicoke Board of
Education
1974-76 Teacher of math and science
4. HONOURS AND AWARDS:
Environment Canada Award for Excellence (2003)
York University Merit Award (2011 & 2012)
B, SCHOLARLY AND PROFESSIONAL CONTRIBUTIONS:
1. SUMMARY OF PUBLICATIONS AND PROFESSIONAL CONTRIBUTIONS
• 1 textbook on disaster theory and 6 edited volumes
• 11 book chapters
• 37 refereed publications:
• 23 publications in peer reviewed journals. Two of these publications have over
100 citations.
• 2 publications in peer reviewed conference proceedings
• 12 other refereed publications
21 1 P a g e

April 21, 2015
Co-editor of 1 online textbook
29 non-refereed articles
2 works in progress
PI or Contributor to several national and international projects, including the
IPCC (co-recipient of the 2007 Nobel Peace Prize)
Frequent reviewer of manuscripts submitted to peer review journals
Summary of Citation indices from Google Scholar, as of December 6, 2014
All Since 2009
Citations 856 438
h-index 14 11
ilO-index 19 13
h-index is the largest number h such that h publications have at least h citations. The second column has the
"recent" version of this metric which is the largest number h such that h publications have at least h new
citations in the last 5 years.
ilO-index is the largest number h such that h publications have at least h citations. The second column has the
"recent" version of this metric which is the largest number h such that h publications have at least h new
citations in the last 5 years.
2. SELECTED PUBLICATIONS:
1. Etkin, D. (2015). Disaster Theory: An Interdisciplinary Approach to Concepts and Causes.
Butterworth- Heineman.
2. Etkin, D., Ivanova, J., MacGregor, S., & Serota, T. (2014). Risk Perception and Belief in
Guardian Spirits. SAGE Open, 4(3), 2158244014549741.
3. Etkin, D. (2014). What is Your Dangerous Idea? Newsletter of the Canadian Risk & Hazards
Network, Vol. 6(1) Fall, 2014, pp. 37-38.
4. Etkin, D., Buchanan, A., Cheung, G., Lee-Bun, C., Macdonald, K., Marcon, H., Musten, M. and
Ristic, M. (2013). A Dangerous Idea. World Conference on Disaster Management: The Power
ofGlobal Networking, http://www.wcdm.org/blog/york-university-presents-a-dangerous-
idea.html
5. Etkin, D. (2013). Reflections on Modeling Disaster. Encyclopedia of Natural Hazards,
Springer, Netherlands, pp. 827-835.
6. Etkin, D. and Timmerman, P. (2013). Emergency Management and Ethics. International
Journal ofEmergency Management, 9(4), 277-297.
7. Haque, C.E. and Etkin. D. (Editors) (2012). Disaster Risk and Vulnerability: Mitigation
Through Mobilizing Communities and Partnerships. McGill-Queens University Press, 300
Pgs.
8. Haque, C.E. and Etkin, D. (2012). Dealing with Disaster Risk and Vulnerability; People,
Community and Resilience Perspectives. In 'Haque, C.E. and Etkin. D. (Editors) (2012).
22 | P a g e

April 21, 2015
Disaster Risk and Vulnerability: Mitigation through Mobilizing Communities and
Partnerships. McGill-Queens University Press, pp. 3-23.
9. Nirupama, N., & Etkin, D. (2012). Institutional perception and support in emergency
management in Ontario, Canada. Disaster Prevention and Management, Vol. 21 Iss:5
10. Etkin, D., Higuchi, K. and Medayle, J. (2012). Climate Change and Natural Disasters: An
Exploration ofthe Issues. Journal of Climate Change, June 2012, Volume 112, Issue 3-4, pp.
585-599.
11. Editor and Author: Textbook on "Disaster & Emergency Management: The Canadian Context'.
A Canadian Risk and Hazards Network Project (www.crhnet.ca). In Progress, at
http://www.yorku.ca/etkin/dem_book/
23 | Page

APPENDIX B TO THE WRITTEN EVIDENCE OF DAVID ETKIN
Review of Trans Mountain Response toCity of Vancouver IR No. 2

Review of Trans Mountain (TM) Response to
City of Vancouver IR No. 2By
Professor David Etkin1, York University
1. TM has responded to the following City of Vancouver Information Requests (ID A4H819, PDF
page 174):
a. Trans Mountain Response to City of Vancouver IR No. 2, 2.08.01.a
b. Trans Mountain Response to City of Vancouver IR No. 2, 2.08.01.b
c. Trans Mountain Response to City of Vancouver IR No. 2, 2.08.01.C
d. Trans Mountain Response to City of Vancouver IR No. 2, 2.08.01. d
The purpose of this note is to comment on the relevance and validity of their responses.
2. City of Vancouver IR2.08.01a: Please confirm that DNV did not take into consideration low
probability, high consequence events when performing its risk analysis for the Trans Mountain
Expansion Pipeline.
3. TM Response: DNV undertook a quantitative marine risk assessment for the Trans Mountain
Expansion Project. Guidelines from Transport Canada on the TERMPOL Review Process, 2001
were followed. TERMPOL requires the proponent to assess risk, in terms of "the probabilities of
credible incidents which result in the breaching of the ship's cargo containment system". A
credible worst case oil spill from a project tanker (as calculated in the updated risk assessment)
is 16,500 m3 of oil cargo and occurs once every 2,840 years. Please refer to Table A-8 in Trans
Mountain's Response to NEB IR regarding TERMPOL report and Outstanding Filings (Filing ID
A4G3U5). DNV considers such an event a low probability, high consequence event. Figure 34
and Figure 35 in the report show all modelled oil spill volumes and probabilities, this is again
paired with incident frequencies in Figure 41 to show the total risk picture. Trans Mountain is
confident that the evaluation of potential environmental effects applying this methodology
fulfills NEB requirements (Filing ID A3V6I2) and describes the range of environmental effects
that could result from an oil spill along the marine shipping route.
4. Comments by Etkin:
a. In the DNV risk analysis they accounted for some, but by no means all. Low Probability
High Consequence (LPHC) events. This is the crux of the problem with their analysis.
They should have included all the possible events. This applies both to spills larger than
16% of tanker capacity, and segments 2, 3 & 4 that are excluded from their risk analysis.
b. DNV indicates that they accept the need for the evaluation of LPHC events, but this
statement must be placed in context, particularly with respect to their assumptions.
Their methodology limits these worst case events to those that are considered 'credible'
(as per to the TERMPOL Review Process 2001), and so to a large degree the issue
revolves around the meaning of that word. Their judgement is that tanker spills can be
analyzed using a cutoff of 16% of tanker capacity (this is very different from an absolute
1 Associate Professor, Disaster and Emergency Mangement, York University, 4700 Keele St., Toronto, Ontario,
Canada, M3J 1P3, 416-736-2100 x44016, [email protected]
worst case scenario, which is over 6 times that volume) and that some segments need
not be included, simply because of low probability. Excluding scenarios on the basis of
probability alone, without including consequence, is an error in logic. But also the
question must be asked - What is the meaning of 'credible', in this context?
c. The meaning of the word credible is "capable of being believed", "plausible" or "worthy
of belief". My first response to the notion that the tanker shipping system could operate
for almost 3 thousand years (according to their calculations) without a spill of greater
than 16% of tanker capacity is one of incredulity. However it is beyond my mandate to
review in detail the mathematics of how probabilities were calculated. I note though,
that the level of safety assumed is based upon the use of double hulled tankers, which
replaced the more vulnerable single hulled ones. A factor not considered is the age of
the fleet. The new double hulled fleet replaced an older one, and research shows that
older ships are more likely to have spills2. As the current fleet ages, gains in safety that
have been observed over the past few decades may not be maintained. No analysis of
this aging tanker issue exists in the DNV report. It is also worth commenting on
uncertainties associated with extrapolating a few decades of data to return periods of
thousands of years. Doing this should generate large error bars, an analysis that is
missing from their report, but which is essential to understanding the probability
analysis.
d. There is another important issue that DNV avoids. In section 3.15 of the TERMPOL
report3 where they discuss the risk analysis, the following statement is made; "Analysisshould not be limited to a mathematical index (probability of an incident) but should also
include perceived risks to:
i. populations within coastal zones along the intended route;
ii. the terminal berth and surrounding area; and
iii. the marine environment, fish and wildlife habitat."
This clearly indicates that the TERMPOL notion of risk includes both hazard probability and
the impact of a spill on exposed social and ecosystems. The DNV report uses only hazard
probability as delimiter of risk, and therefore fails to meet the TERMPOL standards, as well
as best practice within the risk assessment industry, which would include a comprehensive
assessment of impacts.
e. Since tanker oil spills follow a power law distribution, the inclusion of all LPHC events
(that is, those existing within the 'fat tail' of the probability distribution), not just a small
subset of them, is important, especially when the exponent in the defining equation is
small. Power laws (or as they are also know, Pareto distributions) are represented by
the equation
2 Eliopoulou, E., Papanikolaou, A., Diamantis, P., & Hamann, R. (2012). Analysis of tanker casualties after theOil Pollution Act (USA, 1990). Proceedings ofthe Institution ofMechanical Engineers, Part M: Journal ofEngineering for the Maritime Environment, 226(4), 301-312.
3 Transport Canada (2001). TERMPOL Review Process 2001, Marine Safety, Transport Canada TP742E.

P{x) = kx*
where P is probability, x is some variable, k is a constant, and a is the exponent or scaling
parameter. The smaller the scaling parameter a, the fatter the tail and the more important are
rare events. Using data for the worst 131 tanker spills obtained from International Tanker
Owners Pollution Federation Limited (ITOPF)4, a statistical analysis using SPSS resulted in the
following relationship:
P(x) = 4.7x10V1 7
Where x = size of tanker oil spill in tons. Figure 1 shows the fit of the curve to the data. Note that
the R2 value for this curve is 0.98, which is very high. The X axis is bins of spill size using ranges of
30,000 tons (e.g., the first bin is <30,000 tons, the second bin is 30,000-60,000 tons, and so on).
The Y axis is the number of spills within that bin. The blue diamonds are the observed ITOPF
data and the red line is the power law curve.
F 90
r 8070
6 6050
U 40
e 3020
n 10C n
Tanker Oil Spill Regression
. ? Observed
Frequency
i
ti Prediction
i
y 0 100,000 200,000 300,000
Spill Size (tons)
Where a is small, the LPHC events become relatively more important. For comparison
purposes fatality datasets for the following disaster types were similarly analyzed with
the following results fora: U.S. mining disasters (a=-3.8), structural fires (a=-2.4), U.S.
tornadoes (a=-1.5), earthquakes (a=-2.7), explosions (a=-2.6), structural collapses (a=-
2.8), railway (a=-2.1); and U.S. billion dollar weather disasters (a=-2.5). The scaling
parameter for tanker oil spills of a=-1.7, with the exception of tornadoes, is smaller than
4 The International Tanker Owners Pollution Federation Limited, http://www.itopf.com/

the other disaster types analyzed, suggesting that it is even more important to include
all rare events.
g. It is axiomatic that excluding a range of scenarios from a risk analysis will bias risk
estimation to a lower value. In science, simplifying assumptions are often made in order
to make problems tractable. Examples include Newton's Law and the Flat Earth
Assumption. The issue is, to what extent are the assumptions valid. If errors generated
are small or do not matter to a particular application, then they are justifiable. Is this the
case for tanker oil spills?
h. Because disasters have power law distributions, the exclusion of rare events is, in
general, difficult to justify. There is a large body of literature demonstrating the
importance of including events in a risk analysis when they lie within the fat tail of a
power law (for example Jo and Ko, 20145). Consider, for example, the Haiti earthquake
of 2011, the Indonesian tsunami of 2004, Hurricane Katrina of 2004 or the earthquake
disaster at Fukushima in 2011. Each of these events was rare, but the exclusion of them
in a risk assessment would result in one that was deeply flawed and much too
optimistic. Given the relatively small value of the exponent of a=-1.7, one should
conclude that a risk analysis should include all events.
5. City of Vancouver IR2.08.01b: Does DNV agree with the statement in Reference i that "it is time
for us to focus our attention, technical skill and research and development on the low
probability, high consequence, events"? If not, explain why.
6. TM Response: DNV does agree with this statement. Therefore, DNV together with Trans
Mountain focused on identifying current and extraordinary risk-reducing measures so that the
frequency of a credible worst case oil spill event remains low. Please refer to the risk-reducing
measures in Section 13 of Volume 8C TERMPOL 3.15 (Filing ID A3S5F6).
7. Comments by Etkin: I cannot comment on the accuracy of this answer since I am not an expert
in oil spill risk reduction methods. I note, though, that their answer addresses risk-reducing
measures only, and not the risk analysis, in which a large range of LPHC events were excluded.
8. City of Vancouver IR2.08.01c: Does DNV agree with the statement in Reference ii that
"Understanding the risk of a major oil leak or a blowout gives half the oil spill risk picture. The
probability of impacting personnel and the environment and the potential consequences of this
must also be included in the overall risk picture"? If not, explain why.
9. TM Response: Risk is widely considered as a combination of probability and consequence. The
probability of impacts on personnel and the environment and the potential consequences are
components of the overall consequences of major failures. DNV is very aware of this; therefore,
DNV together with Trans Mountain focused on identifying current and extraordinary risk-
reducing measures so that the frequency of a credible worst case oil spill event remains low.
Please refer to the risk-reducing measures in Section 13 of Volume 8C TERMPOL 3.15 (Filing ID
5 Jo, H. H., & Ko, Y. L. (2014). Large Variance and Fat Tail of Damage by Natural Disaster. arXiv preprintarXiv: 1407. 6209.

A3S5F6). DNV GL's risk assessment has been the basis for the oil drift modelling, which in turn
has been the basis for assessment of environmental impact risk. Trans Mountain believes that
sufficient information has been provided to address the National Energy Board's (NEB) List of
Issues (Filing ID A3V6I2).
10. Comments by Etkin: It is unfortunate that the recognition of risk as being a function of
probability and consequence, as acknowledged here by DNV, was not incorporated into their
risk assessment. DNV did not answer the question asked regarding the actual risk assessment
they did, but rather pivoted to answer a question not asked, regarding risk reduction measures.
They did this for the simple reason that they, in fact, did not include consequence in their risk
assessment.
11. City of Vancouver IR2.08.01d: Does a risk assessment which fails to take into consideration low
probability, high consequence events meet DNV's standard for best practices? If yes, explain
DNV's standard for risk assessment best practices and how it is met by an assessment that fails
to take into consideration low probability, high consequence events.
12. TM Response: DNV GL is confident that this study meets the objectives of a state of the art risk
assessment.
13. Comments by Etkin: DNV indicates that they are following best practice, but this is not an
accurate statement. There are serious flaws in their risk assessment, as discussed above in my
report dated April 21, 2015. The second part of the question was not answered.

APPENDIX C TO THE WRITTEN EVIDENCE OF DAVID ETKIN
Certificate of Expert's Duty

Appendix "C": Certificate of Expert's Duty
I, David Etkin, of Vancouver, British Columbia have been engaged on behalf of the City
of Vancouver to provide evidence in relation to Trans Mountain Pipeline ULC's Trans
Mountain Expansion Project application currently before the National Energy Board.
In providing evidence in relation to the above-noted proceeding, I acknowledge that it is
my duty to provide evidence as follows:
1 . to provide evidence that is fair, objective, and non-partisan;
2. to provide evidence that is related only to matters within my area of expertise; and
3. to provide such additional assistance as the tribunal may reasonably require to
determine a matter in issue.
I acknowledge that my duty is to assist the tribunal, not act as an advocate for any
particular party. This duty to the tribunal prevails over any obligation I may owe any
other party, including the party on whose behalf I am engaged.
Date: May 8, 2015 Signature: