cybercom group annual report 2004 · 2014-09-19 · management and a project that involves system...
TRANSCRIPT

Cybercom Group Annual Report 2004

Forthcoming reports
Dates when fi nancial reports are published:• January–March, published on: Thursday, 21 April 2005
• January–June, published on: Wednesday, 17 August 2005
• January–September, published on: Thursday, 20 October 2005
• Year-end 2005, published on Tuesday, 7 February 2006
Annual general meeting (AGM)The AGM of Cybercom Group Europe AB will be held on Friday, 22 April 2005 at 3 p.m. at the company’s new head-quarters on Fleminggatan 20 in Stockholm. Participant regis-tration starts at 2 p.m.
Shareholders who wish to participate in the AGM must:
• Be registered in the VPC AB share database by Tuesday, 12 April 2005.
• Have sent notifi cation (and the number of participants) to the company’s headquarters by Friday, 15 April 2005 by 5 p.m. at the latest. Shareholders, whose shares are regis- tered through banks or other managers, must temporarily register the shares in their own names if they want to participate in the AGM. This type of registration must be fi led with VPC AB in suffi cient time before 12 April.
Notifi cationNotifi cation of attendance must be submitted in writing to Cybercom Group Europe AB, Box 7574, SE-103 93 Stockholm, Sweden (write AGM notifi cation on the envelope). Notifi cation of attendance can also be made by phone: +46 8 578 646 00, fax: +46 8 578 646 10, or e-mail: [email protected].
Specify all names, addresses, phone numbers, Swedish civil registration numbers (or corporate IDs), and number of shares.
Welcome!
Alfred Berg StockholmKarl Berglund+46 8-723 58 00
Cazenove & CoLondonGorm Thomassen+44 20 7588 2828
Cheuvreux NordicLondonMartin Persson +44 20 7621 5176
Danske Bank CopenhagenPeter Trigarszky+45 33 44 04 49
D.Carnegie & CoStockholmCharlotte WidmarkTomas Öqvist+46 8-676 88 00
Analysts who regularly monitor Cybercom and its industry
Enskilda SecuritiesStockholm Lars Sveder +46 8-522 29 500
Handelsbanken Capital MarketsStockholm Stefan Wård+46 8-701 10 00
Kaupthing Bank StockholmDaniel Djurberg+46 8-791 48 00
Redeye StockholmJonas Elofsson+46 8-545 013 30
United BrokersStockholm David Lindström+46 8-506 520 20
Contents
2004 in brief. . . . . . . . . . . . . . . . . . . . . . . . . . . . . . . . . . 1
Business concept, goals, and strategies . . . . . . . . . . . . . 2
Cybercom’s offerings . . . . . . . . . . . . . . . . . . . . . . . . . . . 2
Directors’ report . . . . . . . . . . . . . . . . . . . . . . . . . . . . . . . 3– The operation . . . . . . . . . . . . . . . . . . . . . . . . . . . . . . . 3– Sales and income . . . . . . . . . . . . . . . . . . . . . . . . . . . . . 3– Important events in 2004. . . . . . . . . . . . . . . . . . . . . . . 4– Personnel . . . . . . . . . . . . . . . . . . . . . . . . . . . . . . . . . . . 5– Market trends . . . . . . . . . . . . . . . . . . . . . . . . . . . . . . . 6– Business areas . . . . . . . . . . . . . . . . . . . . . . . . . . . . . . . 8– Internal resources. . . . . . . . . . . . . . . . . . . . . . . . . . . . . 9– The Cybercom share . . . . . . . . . . . . . . . . . . . . . . . . . 10– Investments . . . . . . . . . . . . . . . . . . . . . . . . . . . . . . . . 12– Liquidity and cash fl ow. . . . . . . . . . . . . . . . . . . . . . . . 12– Financial position . . . . . . . . . . . . . . . . . . . . . . . . . . . . 12– Parent company . . . . . . . . . . . . . . . . . . . . . . . . . . . . . 12– Incentive program . . . . . . . . . . . . . . . . . . . . . . . . . . . 12– Corporate governance . . . . . . . . . . . . . . . . . . . . . . . . 12– Transition to IFRS . . . . . . . . . . . . . . . . . . . . . . . . . . . . 14– Risk and sensitivity analyses . . . . . . . . . . . . . . . . . . . . 15– Outlook . . . . . . . . . . . . . . . . . . . . . . . . . . . . . . . . . . . 15– Proposed treatment of accumulated loss . . . . . . . . . . 15– Financial performance summary . . . . . . . . . . . . . . . . . 16– Defi nitions . . . . . . . . . . . . . . . . . . . . . . . . . . . . . . . . . 16– Profi t and loss statement: Group and parent company 18– Cash fl ow analysis . . . . . . . . . . . . . . . . . . . . . . . . . . . 19– Balance sheet: Group and parent company . . . . . . . . 20– Changes in shareholder equity . . . . . . . . . . . . . . . . . . 22– Notes . . . . . . . . . . . . . . . . . . . . . . . . . . . . . . . . . . . . . 23
Auditors’ report . . . . . . . . . . . . . . . . . . . . . . . . . . . . . . 33
Board and executives . . . . . . . . . . . . . . . . . . . . . . . . . . 34
Addresses . . . . . . . . . . . . . . . . . . . . . . . . . . . . . . . . . . . 36

1
Jan.–Dec. Jan.–Dec. Q4 Q4 Q3 Q2 Q1 2004 2003 2004 2003 2004 2004 2004
Sales, SEK million (MSEK) 405.3 309.7 113.8 84.0 89.7 98.6 103.2
Operating profi t/loss EBITA, MSEK 15.1 –2.2 6.4 –7.8 2.6 2.5 3.6
Margin, % 3.7 –0.7 5.7 –9.3 2.9 2.6 3.5
Operating profi t/loss EBIT, MSEK 8.0 –111.9 4.2 –8.4 0.8 1.1 1.9
Operating margin, % 2.0 –36.1 3.7 –10.0 0.9 1.0 1.8
Return on equity, % 2.7 Neg
Return on capital employed, % 7.1 Neg
Profi t/loss per share, SEK 0.41 –11.7
Cash fl ow per share, SEK 1.04 0.55
Equity/assets ratio, % 65.2 54.1
No. of employees at period’s end 375 375 375 375 371 366 359
2004 in brief• Strong growth and increased profi tability.
• The Swedish operation is organised into one business area (BA) that targets telecom and selected technologies. The Group’s international subsidiaries are already organised under the International BA.
• Growth in telecom is strong and demand for Cybercom’s services increased sharply, especially in the Öresund region (southern Sweden), where Cybercom has established a strong position.
• Integration with Consafe Infotech is succeeding as planned and is leading to new business. For example, Cybercom wins strategically important assignments within device management and a project that involves system tests and verifi cations of mobile phone platforms for Ericsson Mobile Platforms.
• Cybercom is increasing its commitments with all key customers; it is signing new frame agreements with Ericsson, Teracom, TeliaSonera, and SEB – to name a few.
• Sales of CyberMate are starting.
• JCE Group AB, Magellan B.V, and J Christer Ericsson personally become Cybercom’s largest shareholders in December 2004.
2 Business ConceptCybercom creates business success by using leading-edge technologies.
VisionTo be the preferred partner for delivery of mission-critical solutions in telecom and leading-edge technologies.
Goals and objectivesCybercom will be an established, international solution provi-der within telecom.
Its fi nancial objective is to generate SEK 750 million in sales during 2006; 25% will come from outside Sweden. The company will have an 8% operating margin, and 40–60% of its revenue will come from total project assignments.
Business concept, goals, and strategies2004 objectives and their fulfi lmentIn 2004, Cybercom continued to develop the operation with a focus on telecom. The company reported profi table 31% growth; Q4 2004 growth in its telecom operation increased 48% compared with Q4 2003. Investments in the fi nance sector did not have the desired breakthrough, so it was liquidated and integrated with other operations with focus on telecom and key customers in other segments. Solution-based assignments represent about 40% of sales in 2004, which gives Cybercom a stable revenue stream. Consafe Infotech, which was acquired in 2003, was successfully integrated; this led to increased capacity and new projects.
StrategyCybercom will realise its objectives by focusing on telecom, technology, and growth. Its growth objective of SEK 750 mil-lion in sales by year-end 2006 will be reached by:
1. Focusing operations on three key areas; portals and mobile solutions, e-commerce and billing, and embedded solu-tions.
2. Broadening the customer base and increasing internation-alisation towards Nordic telecom operations.
3. Organic growth combined with acquired growth.
4. Develop spin-off businesses outside telecom, in areas where Cybercom has unique technological expertise.
Cybercom is a specialised IT consulting company that focuses on mobile solutions. Its services primarily target the telecom sector and key customers in other sectors. Cybercom’s of-ferings fall into three areas: embedded systems, portals and mobile solutions, and e-commerce and billing.
Embedded systemsCybercom develops and builds applications and communica-tion software for mobile phones, network simulators, and communication equipment.
Portals and mobile solutionsCybercom designs, develops, and operates portals, and it builds services and offerings that are linked to the portals.
Cybercom’s offeringsE-commerce and billingCybercom delivers solutions for all business processes in the entire e-commerce value chain for B2B, B2E, and B2C. Besides billing solutions linked to e-commerce, Cybercom develops specifi c billing modules for telecom operators.
Application management and projectsIn addition to development and solution sales, Cybercom offers application management (AM) services, which involve system maintenance and further development.
TechnologyCybercom’s consultants are specialists in solutions that use these technologies: Java, .Net, WebSphere, Oracle, J2EE, and Akamai. Mastering the underlying technology is the founda-tion for being able to select, implement, and build the best solutions.
3
Directors’ reportThe board and president of Cybercom Group Europe AB (publ.), corporate ID 556544-6522, hereby submit their annual report for the 1 January 2004–31 December 2004 period.
This report covers the: • Board’s report.
• Consolidated and parent company profi t and loss statement.
• Consolidated and parent company balance sheet.
• Cash fl ow analysis.
• Notes.
All amounts are reported in SEK thousands unless otherwise specifi ed. Numbers enclosed in parentheses ( ) refer to the previous year.
THE OPERATION
The Cybercom Group is a high-tech consulting company that offers business-critical IT solutions mainly in telecom and selec-ted technologies. Cybercom was founded in Sweden in 1995 and has been listed on the Stockholm stock exchange (Stock-holmsbörsen) since 1999. The Group has customers worldwide and offi ces in Denmark, Norway, Sweden, and the UK. It has 375 employees; its consultants have an average of 13 years of industry experience.
Cybercom’s customers are important international players that operate with leading-edge technologies and seek speciali-sed partners. Consequently, Cybercom’s unsurpassed position, with operations know-how and technological expertise won their trust. The company’s largest customers are Ericsson, Sony Ericsson, TeliaSonera, Nokia, Reuters, AFA, ASSA ABLOY, and SEB. In 2004, Cybercom increased its commitments with all of them.
Cybercom develops, integrates, tests, verifi es, and runs app-lication management projects within these areas:
• Portals and mobile solutions.
• E-commerce and billing.
• Embedded systems.
In 2004, Cybercom was commissioned for several new pro-jects such as:
• Upgrading Suntel’s CRM and billing system (an operator in Sri Lanka).
• Delivering a billing solution for TeliaSonera; the solution is used for invoicing electronic refi ll cards that are distributed via retailers.
• Managing a system testing and verifi cation centre for Ericsson Mobile Platforms.
• Managing applications and developing Sony Ericsson’s consumer portal worldwide.
• Developing and integrating ASSA ABLOY’s internal purcha-sing portal for use worldwide.
• Implementing an Akamai solution for the SKF portal.
• Several IBM WebSphere e-commerce projects.
• Solutions for device management of embedded systems.
• Customer life-cycle management-related solution for Telia Mobile Denmark.
• Improvement of a wireless platform for Real Time in Den-mark.
• Wireless communication system for credit card transactions at Clear Channel in Norway.
Cybercom also signed new, larger frame agreements with Ericsson, the Government Offi ces of Sweden (Regeringskans-liet), SEB, TeliaSonera, and Teracom.
SALES AND INCOME
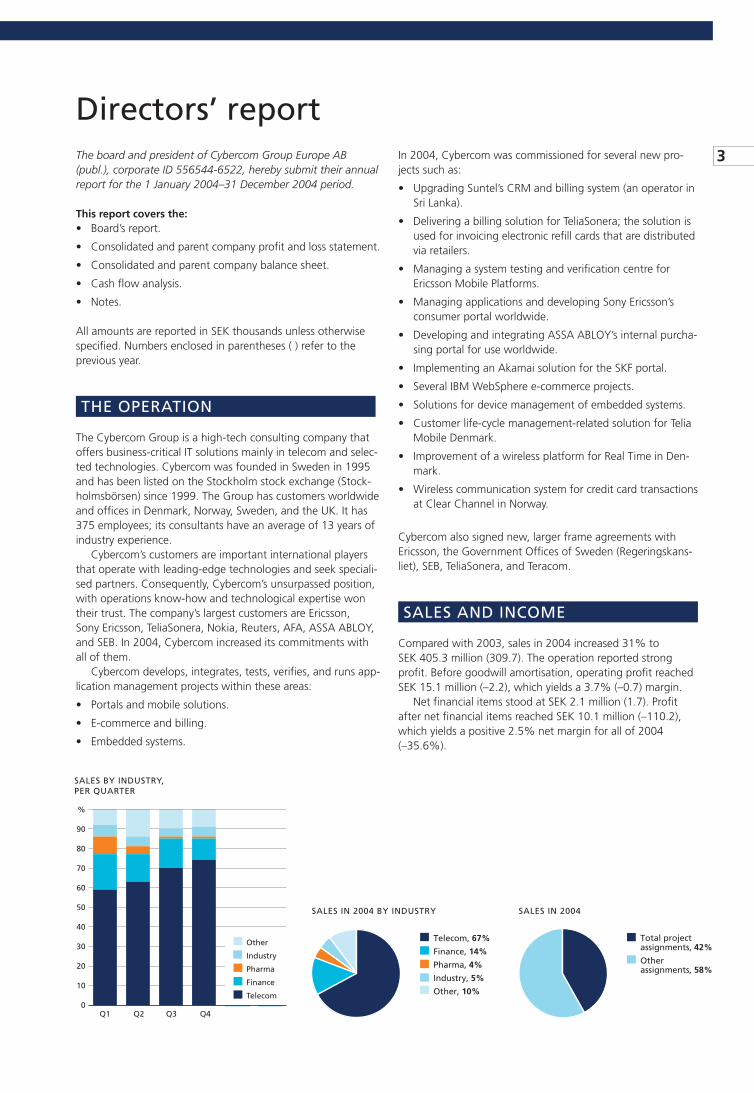
Compared with 2003, sales in 2004 increased 31% to SEK 405.3 million (309.7). The operation reported strong profi t. Before goodwill amortisation, operating profi t reached SEK 15.1 million (–2.2), which yields a 3.7% (–0.7) margin.
Net fi nancial items stood at SEK 2.1 million (1.7). Profi t after net fi nancial items reached SEK 10.1 million (–110.2), which yields a positive 2.5% net margin for all of 2004 (–35.6%).
SALES IN 2004 BY INDUSTRY
Telecom, 67%
Finance, 14%
Pharma, 4%
Industry, 5%
Other, 10%
SALES BY INDUSTRY, PER QUARTER
Q1 Q2 Q3 Q4
%
90
80
70
60
50
40
30
20
10
0
Other
Industry
Pharma
Finance
Telecom
SALES IN 2004
Total project assignments, 42%
Other assignments, 58%

4
DIRECTORS’ REPORT
IMPORTANT EVENTS IN 2004
Focus on telecom from December 2004Cybercom strengthened its position within telecom. Sales to this market increased from about 60% in Q1 to 74% in Q4. Cybercom’s capabilities were particularly in demand for em-bedded systems and systems that support them (e.g., device management). The company also worked with the entire e-commerce supply chain; here, Cybercom has unrivalled experience and expertise in billing and in portals with mobile solutions.
In December, Cybercom’s executives decided to further focus the operation in Sweden on telecom and on selected technologies that give Cybercom a unique position that enables successful business deals. The decision is aligned with Cybercom’s growth strategy – to better meet demand for its services and to continue assertive growth.
In 2004, Cybercom’s Financial Services BA carried out ini-tiatives that targeted banking, fi nance, and insurance. Desired results were not achieved, so the BA successively refocused toward selected key customers and selected technology areas that it has in common with the Telecom & Services BA. The Swedish operation is now organised into one BA that targets telecom and technologies that are Cybercom’s strongest suit.
Cybercom’s CyberMate PreHospital product is offered to county councils and other enterprises that offer emergency care in Europe. Several licenses were sold in 2004. The market for med-tech equipment has a long sales cycle. Because of the focus that Cybercom now makes on telecom and selected technologies, a decision was taken regarding the sale of CyberMate and its operation. By selling CyberMate, the product’s long-term development is assured.
Starting 1 January 2005, Cybercom’s operation is reported as two divisions:
• Sweden – operations in Sweden that mainly specialise in telecom and selected technologies.
• International – operations in the Group’s companies in Denmark, Norway, and the UK.
Before and during 2004, Cybercom reported its operations in three BAs:
• Telecom and Services – operations in Sweden that mostly specialise in telecom.
• Financial Services – operations in Sweden that mostly specialise in banking, fi nance, and insurance.
• International – operations in the Group’s companies in Denmark, Norway, and the UK.
Successful integration of Consafe InfotechConsafe Infotech was acquired in 2003 and fully integrated in 2004, which led to substantial business synergy effects. From the start, the main focus of the integration was placed on customers, and the merger resulted in business that neither of the companies would have won on their own. Several projects were staffed with consultants from both operations.
In October 2004, a supplementary purchase price of SEK 18 million was set for the acquired Consafe Infotech; this increased Group goodwill by the same amount. The 8 Decem-ber 2004 extraordinary meeting decided on a new share issue of 523,887 shares directed to the previous majority owners of Consafe Infotech. Minority owners were paid in cash.
During 2004, the acquired operation accounted for 30% of sales in the Telecom & Services BA and 20% of sales in the International BA.
New issue and new ownerIn December, Cybercom decided that a special issue of new shares would fi nance the fi xed supplementary purchase price of the Consafe Infotech acquisition. With this new issue, JCE Group AB, Magellan BV, and J. Christer Ericsson became the largest shareholders in Cybercom Group Europe, with total holdings of 14.3%. This new issue increased the company’s share capital by SEK 10,672,468 to 11,196,355. A total of 523,887 shares were issued with a nominal value of SEK 1 per share, at an issue price per share equal to the latest price paid on 8 December 2004, which was SEK 30.10.
In December, Cybercom’s founders and JCE Group AB reached an agreement regarding share transfer. Through the agreement, JCE Group acquires all the founders’ shares, and on 15 March 2005, JCE Group AB owns 37.8% of all shares in Cybercom.

5
DIRECTORS’ REPORT
PERSONNEL
For all of 2004, the average number of employees in the Gro-up was 325 (263). At year-end, the number of employees in the Group was 375 (375), of which 25% (24) were women. Cybercom has offi ces in Denmark, Norway, Sweden, and the UK. The company has operations in six other countries, including Sri Lanka and Switzerland. Most employees work in Sweden (81%).
Of all Cybercom’s consultants, 91% (87) have a university education. The company’s IT consultants have an average of 13 (13) years of industry experience. Total personnel turnover in the Group was 19.7%; restructuring of Financial Services accounts for most of the turnover. Of the 74 employees who left, 44 were in Financial Services. Remaining turnover was 9%, which is normal for the industry. Absence due to illness was 2.6% (2.1), of which 1.1% (1.1)1 was long-term illnesses.
During 2004, Cybercom hired 74 employees, mainly for telecom; 50 are working in this operation.
1 These fi gures cover the 1 July–31 December 2003 period only.
YEARS OF EMPLOYMENT
< 3 years, 48%
3–5 years, 32%
5–10 years, 20%
INDUSTRY EXPERIENCE
< 5 years, 21%
5–10 years, 29%
10–15 years, 19%
15–20 years, 19%
> 20 years, 12%
EDUCATION
University-trained engineer, 37%
Systems analysts, 16%
Other academic education in technology, 23%
Other academic education, 15%
Other post-secondary studies, 9%
EMPLOYEES’ AGES
ages 21–25, 2%
ages 26–30, 18%
ages 31–35, 27%
ages 36–40, 24%
ages 41–45, 16%
ages > 45, 13%

6
DIRECTORS’ REPORT
MARKET
A Nordic company with an international perspectiveCybercom mainly operates in northern Europe, with establis-hed operations in Denmark, Norway, Sweden, and the UK. In 2004, 90% of sales came from the Swedish operation. Cybercom will mainly expand in the Nordics.
Continued investment upsurges in 2004The IT market gained momentum in 2004, which led to increased activity. In 2002 and 2003, customers put a hold on investments; nearly all investments they made involved cost-cutting measures. This hard-line approach began to loosen up during H2 2003, and it continued into 2004.
Continued strict cost controlThe market for IT services has matured, which has resulted in stricter cost-control requirements from customers. Despite increased investments in 2004, customers’ cost controls continue to be stringent, and cost-saving investments are still the most common. But business development investments for increasing business volume increased. Telecom companies, which are now in an intensive development phase, were espe-cially inclined to make new investments. For these companies, 2004 was the time to grab additional market shares. Swedish exports increased substantially in 2004, mainly because of the very active telecom sector.
New technology drives investmentsNew technology and shifts in technology mainly drive these assertive market investments. This tremendous rate of innova-tion has decreased since the 1990s, and a more long-term balance between technological development and its com-mercial applications was seen in 2004. Many technologies within mobile services have now reached a commercial phase, and development is more and more commercially driven. So it’s important for consultants to complement their specialised technical expertise with expertise in the application area.
Outsourcing of IT system development and administrationCustomers’ tendencies to outsource some services continue to be strong drivers on the IT services market. These services include IT system development and management and testing
operations. Often, customers retain overall control of their systems and only purchase subsystems or solutions for specifi c application areas – and that’s where specialised consultancies like Cybercom enter the picture. Large consultancies, such as IBM, CapGemini, and Accenture often take on larger, far-reaching assignments.
Increased mobility for IT consultantsThe improved IT consultancy market, primarily within telecom, resulted in increased mobility for consultants in 2004. After several years of downsizing and staff reductions, many consultancies need new people. The market for consultants presents a fragmented picture, where the degree of speciali-sation, expertise, and experience determines demand.
Consolidation results in specialisationConsultancy sector consolidation, which has been occurring since 2000, has continued; this indicates that the industry has been split into various segments.
One segment consists of large global companies with very broad capabilities focused on large, complex orders.
Another segment consists of specialised consultancies that are also relatively large. These consultancies offer develop-ment and solutions within special niches, often with highly technical content. Cybercom belongs to this segment.
A third segment consists of pure resource consultants that sell their services by the hour, along with a certain amount of functions; here, the degree of specialisation is low, and pricing is very competitive. Companies in this segment often work as subcontractors for companies in the fi rst two seg-ments.
Consolidation continues, which provides good opportuni-ties for acquisition of mostly smaller consultancies that realise they can’t move into the second segment on their own.
Cybercom has different competitors in different areas. The company has won and lost contracts in competition with IBM, Accenture, TietoEnator, Teleca, CapGemini, Sigma, and HiQ.
Telecom leads investmentsPositive market signals are mostly noted within the telecom sector; operators have begun to invest in development of new business areas and services. Revenue from voice traffi c and short message services still dominates, but this revenue
IT COMPANIES’ POSITIONS IN THE VALUE CHAIN
CybercomTeleca, HiQ, Enea,
Sigma
Resource consultants
Cybercom positions itself in the middle of the value chain, so it delivers concepts and specialized solutions in close co-operation with customers.Source: Cybercom
Customers have concepts, buy solutions and system co-ordination
Customers develop in-house, buy blanket-order resources
Customers outsource IT, buy total functionality
IBM, WM-data,Accenture, TietoEnator,
Cap Gemini Ernst & Young
VOLUME
IMPORTANT PARTNERSHIPS

7
DIRECTORS’ REPORT
is decreasing. Interest in investing in new, more sophisticated services has increased. The commercial breakthrough for mobile telephony’s third generation (3G) defi nitely occurred in 2004. Expansion of the 3G network spurred investments, because 3G provides new business opportunities through advanced mobile data services. Gradually, larger portions of a telecom operator’s revenue will come from other types of content services or digital media.
Telecom operators and other companies in telecom offer these services, but content is developed and supplied by the music industry, terminal manufacturers, news agencies, and others. The increased infl uence that content providers have on telecom operators’ service offerings creates a need for new business models and payment functions. Consumers must be able to easily pay for these services, and content providers and telecom operators must be able to collect pay-ments. That’s why new billing solutions and pricing strategies for revenue streams between telecom operators and content providers must be developed.
IP telephony, which links data communication to telepho-ny, has also started to be used on a large scale. Conditions are good for telephony over the Internet to gain momentum. New IP telephony solutions will be implemented, and IT sys-tems will have to be adapted and developed.
Larger customers and fewer vendorsA few large companies dominate the telecom market. Custo-mers of consulting companies have become larger, and the
paring down of purchases has resulted in a transition from dealing with more than 100 different vendors to signing mas-ter contracts with 20–30 selected vendors. These contracts lead to long-term relationships with highly qualifi ed vendors. Size, specialisation, and international presence are critical suc-cess factors for consultancies.
Similar developments in all the Nordic countriesMarket trends in Norway and Denmark signal increased activity, although market players are somewhat more cautious than in Sweden. The Öresund region in southern Sweden enjoyed the strongest upturn. The Danish market differs from the Swedish in that it’s more fragmented and dominated by mid-sized customers, so vendor size isn’t as important. In Norway, the telecom market mostly consists of telecom ope-rators and service providers; here, equipment manufacturers have pretty much disappeared. Finland’s market is similar to Sweden’s, with a few large customers within telecom. Prices in the Nordic countries are stable.
Continued investment-rate escalation Increased investment activities that prevailed in telecom during 2004 are expected to continue in 2005. The upswing in telecom at the end of 2004 is expected to continue for several quarters but at a slower pace. The Öresund region is expected to continue to be the driving force.
Affärsvärlden’s ranking of IT consultancies Sales No. profi table Market value/ Ranking Ranking 2004, Growth years Margin employee Sales/ P/E future stability (MSEK) 5 years, % 2000–2004 20041 (KSEK) employee (2005)3 outlook (fi ve year)2
Tieto Enator 13,725 36 5 12 1,542 1,075 15 4 5
HIQ 513 27 4 10 2,226 959 19 4 4
Semcon 1,289 28 4 4 416 876 11 4 4
Cybercom 405 13 3 2 995 1,080 16 4 4
Teleca 2,728 10 3 –0.2 817 871 18 4 3
Knowit 384 –23 2 3 879 1,110 12 3 3
Sigma 853 –15 2 0.7 834 985 19 4 3
WM-Data 8,160 –38 4 4 982 1,071 18 4 2
ENEA 657 –23 2 0 3,659 1,357 37 3 2
ADDNODE 300 –43 2 5 1,271 1,145 7 3 2
Prevas 178 –25 2 8 1,065 1,053 7 3 2
Acando Frontec 600 –41 2 3 822 1,183 13 3 2
Framfab 326 –78 1 3 1,829 997 29 3 1
LB Icon 568 –67 0 –8 1,146 840 33 2 1
1 Profi t/loss after net fi nancial items & sales. 2 Sales trend, personnel development, dividend. 3 Redeye’s assessment (without WM-data, Enea, Addnode, Prevas, Framfab, and Icon).Source: Affärsvärlden No. 7, 16 February 2005
TOTAL CELL PHONE SALES WORLDWIDE(2002–2008; f=forecast)
2002
GrowthNumber
03 04fSource: Alpha Research-Nordea Markets
05f 06f 07f 08f
billion
1,000
800
600
400
200
0
%
25
20
15
10
5
0
MOBILE INFRASTRUCTURE MARKET(2001–2010 f=forecast)
2001
GrowthMarket value
0302 04f 05f 06f 07f 08f 09f 10f
EUR m
60,000
50,000
40,000
30,000
20,000
10,000
0
%
20
10
0
–10
–20
–30
–40
Source: Alpha Research-Nordea Markets
8
DIRECTORS’ REPORT
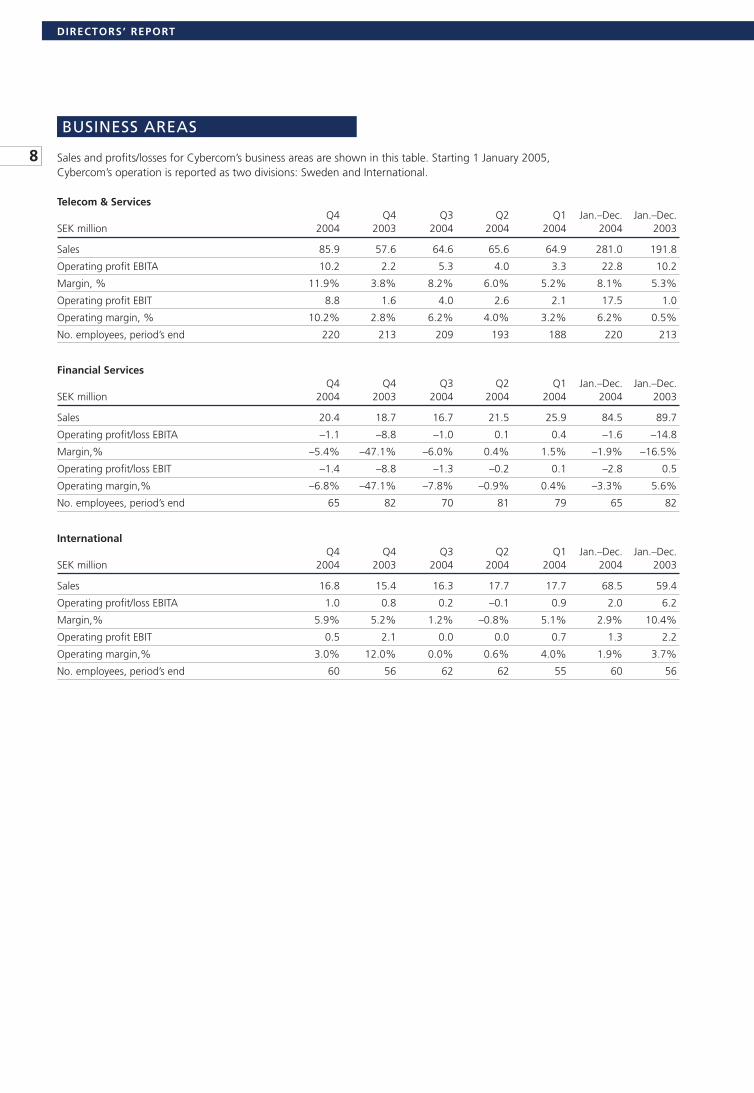
BUSINESS AREAS
Sales and profi ts/losses for Cybercom’s business areas are shown in this table. Starting 1 January 2005, Cybercom’s operation is reported as two divisions: Sweden and International.
Telecom & Services Q4 Q4 Q3 Q2 Q1 Jan.–Dec. Jan.–Dec.SEK million 2004 2003 2004 2004 2004 2004 2003
Sales 85.9 57.6 64.6 65.6 64.9 281.0 191.8
Operating profi t EBITA 10.2 2.2 5.3 4.0 3.3 22.8 10.2
Margin, % 11.9% 3.8% 8.2% 6.0% 5.2% 8.1% 5.3%
Operating profi t EBIT 8.8 1.6 4.0 2.6 2.1 17.5 1.0
Operating margin, % 10.2% 2.8% 6.2% 4.0% 3.2% 6.2% 0.5%
No. employees, period’s end 220 213 209 193 188 220 213
Financial Services Q4 Q4 Q3 Q2 Q1 Jan.–Dec. Jan.–Dec.SEK million 2004 2003 2004 2004 2004 2004 2003
Sales 20.4 18.7 16.7 21.5 25.9 84.5 89.7
Operating profi t/loss EBITA –1.1 –8.8 –1.0 0.1 0.4 –1.6 –14.8
Margin,% –5.4% –47.1% –6.0% 0.4% 1.5% –1.9% –16.5%
Operating profi t/loss EBIT –1.4 –8.8 –1.3 –0.2 0.1 –2.8 0.5
Operating margin,% –6.8% –47.1% –7.8% –0.9% 0.4% –3.3% 5.6%
No. employees, period’s end 65 82 70 81 79 65 82
International Q4 Q4 Q3 Q2 Q1 Jan.–Dec. Jan.–Dec.SEK million 2004 2003 2004 2004 2004 2004 2003
Sales 16.8 15.4 16.3 17.7 17.7 68.5 59.4
Operating profi t/loss EBITA 1.0 0.8 0.2 –0.1 0.9 2.0 6.2
Margin,% 5.9% 5.2% 1.2% –0.8% 5.1% 2.9% 10.4%
Operating profi t EBIT 0.5 2.1 0.0 0.0 0.7 1.3 2.2
Operating margin,% 3.0% 12.0% 0.0% 0.6% 4.0% 1.9% 3.7%
No. employees, period’s end 60 56 62 62 55 60 56

9
DIRECTORS’ REPORT
INTERNAL RESOURCES
Quality process – ISO 9000Cybercom always strives to reach its goals and offers value beyond its contracted requirements. To live up to our own standards, and our customers’ standards, Cybercom works according to the quality management principles that are the cornerstone of the ISO 9000 standard. Our employees use several well-documented processes that compose a system that’s constantly being reviewed. Cybercom follows guidelines from the Swedish Institute for Quality, the European Founda-tion for Quality Management, and Six Sigma.
Testing systems for best possible quality assuranceToday, product development has more technical content and a shorter life cycle, while stringent demands are put on pro-ductivity, security, and quality. Cybercom uses modern tools and methods for system development, project management, and testing – to assure that all requirements are met. This includes established commercial tools and custom-developed tools. We have lots of experience with recognised methods such as Agile, Extreme Programming, RUP, PPS, and PROPS. Cybercom’s consultants are certifi ed in these methods.
The company has developed project and testing meth-ods for information systems called X-pert and X-act – for implementing and securing successful projects and testing in a structured, effi cient, and consistent manner. X-pert divides the project into three phases: preparation, production, and close-down (wind-up). Each phase defi nes which activities are included, which decision points (milestones) arise, and which documents are required. X-pert supports daily project work by providing concepts, procedures, templates, and checklists. The same goes for X-act. Cybercom’s high standards in its test management projects have led to independent projects in which Cybercom performs system tests and verifi cations of mobile telephone platforms.
Application management – maintenance and development of operational systemsDeveloping and running IT projects takes a lot of time and money. To stay within a budget, it’s important to have control over costs. Cybercom offers a service called applica-tion management (AM), which guarantees high quality and service levels at a fi xed price. With AM, Cybercom takes on maintenance and development of IT systems that are in operation. This service can include customised and third-party applications. The concept clarifi es responsibilities, activities, and costs related to support, development, and operation of a system or an application. Cybercom’s AM concept focuses
on all key business processes that demand maximum use of applications – from business development and management to technical support. It’s a structured way of working that enables contracted service levels and facilitates accurate cost forecasting. Each AM service is driven by one or more service level agreements. Cybercom’s management, together with customer and supplier representatives, regularly follow up on the AM services.
Information security policyInformation and data are the most important resources we have, and they are invaluable. Operational procedures are well documented in the information security policy and the business support system. Cybercom works actively, systemati-cally, and continuously to protect information and information systems from assessed threats and to ensure that current laws and regulations are followed.
Environment policyCybercom works actively to improve its operation from an ecological perspective by prioritising environment-related issues in its operations. The company ensures that hardware suppliers comply with TCO 95 and TCO 99 (environmental regulations) and that material is marked to enable effective recycling. Cybercom also strives to select the best products from energy-effi ciency and environmentally friendly perspec-tives. The company is not subject to reporting obligations established by the Swedish Environmental Protection Agency.
Professional developmentCybercom has a strategy for professional development in which management decides which business areas, services, and products should be prioritised. Based on these priorities, annual reviews are done where decisions on comprehensive, company-wide professional development areas are made. An-nual performance appraisals are signifi cant, because employ-ees and managers together design individual development plans. The plans are based on Cybercom’s strategy and each individual’s development needs. Professional development at Cybercom occurs in customer projects, expert groups, and through external training. Costs for external training in 2004 amounted to about SEK 718,500. Besides pure professional development, Cybercom also runs a series of seminars that emphasise the business culture and technical interests within the Group.
Research and developmentThe company does not run an R&D operation.

10
DIRECTORS’ REPORT
THE CYBERCOM SHARE
Share capitalOn 31 December 2004, Cybercom’s share capital stood at SEK 11,196,355, which was divided among an equal number of shares. The share’s nominal value is SEK 1. All shareholders have an equal right to a share in the company’s assets and profi ts.
Price trend and turnoverOn 1 December 1999, Cybercom B shares were listed on the Stockholm Stock Exchange’s O list.
In August 2000, Cybercom’s A shares (not issued) and B shares were reclassifi ed as shares without classifi cation. Since then, Cybercom has just one type of share. One round lot consists of 500 shares. During 2004, Cybercom’s share price was unchanged. The SX-IT index, which includes Cybercom’s share, rose 47%, and the SX All-Share index rose 16%.
At year-end, the share price was SEK 30.40, which yields a stock market value of SEK 323 million. The price has fl uctuated between SEK 22.10 (12 August) and SEK 38.80 (9 February). On average, 33,031 shares were traded daily during 2004; this is comparable to SEK 0.9 million per stock-exchange day.
ShareholdersAt year-end, there were 5,301 shareholders (5,720), of which 73% (75) of these shareholders owned 500 shares or fewer. Large institutional shareholders owned 24.0% (25.2); the company’s board members (including the company’s foun-ders) owned 24.5% (28.5); company executives owned 0.7% (0.3); and other shareholders owned 37.4% (46.0). Foreign shareholders owned 12.0% (15.6).
Dividend policyThe board set a goal of securing Cybercom’s continued growth. Regard must always be made to the Group’s invest-
ment needs and fi nancial position before dividend-related decisions are made. The board proposes to the annual general meeting that no dividend be given for the 2004 fi nancial year.
WarrantsDuring the year, the 500,000 warrants in warrant program 6 expired; at that time, the share’s market value was lower than the subscription rate, so warrants weren’t exercised. During January and February 2005, the 162,483 warrants in warrant program 8 will expire at a subscription rate of SEK 33.50. The 200,000 warrants in warrant program 9, with the 16 August 2006–16 January 2007 subscription period and a subscription price of SEK 32.92, were in Cybercom’s possession as of 31 December 2004.
Acquisitions and new issuesAt an extraordinary meeting of Cybercom Group Europe on 8 December, it was decided to fi nance the fi xed supplemen-tary purchase price of the acquired Consafe Infotech through a directed share issue according to the board’s proposal. This new issue increased the company’s share capital of SEK 10,672,468 by SEK 523,887 to SEK 11,196,355. A total of 523,887 shares were issued with a nominal value of SEK 1 per share at an issue price per share that is equal to the latest price paid on 8 December 2004, which was SEK 30.10.
Those entitled to subscribe for the newly issued shares are the JCE Group, Magellan B.V, J Christer Ericsson, and Per Edlund, which deviates from other shareholders’ preferential rights. Because Per Edlund is on Cybercom’s board, it’s requi-red that the emission be approved by a decision in which at least nine-tenths of the votes cast and those shares represen-ted at the meeting approve the issue, according to statute 1987:646 on directed issues in stock market companies. The meeting’s decision was unanimous.
Source: Ecovision
THE CYBERCOM SHARE
0
500
1,000
1,500
2,000
2,500
3,000
No. (000s)
0
50
100
150
200
250
SEK
2000 2001 2002 2003 2004
Cybercom SX-All-Share SX-IT Traded shares in 000s

11
DIRECTORS’ REPORT
Share capital trends Nominal Future no. Total Share capital- Total shareYear Transaction amount, SEK of shares Price, SEK shares increase, SEK capital, SEK
1997 Company construction 100 1,000 – 1,000 100,000 100,000
1998 Split 5000:1 0.02 4,999,000 – 5,000,000 – 100,000
1998 New issue directed to Intertech Ltd, Torsten Jungner, & Melina AB 0.02 515,000 13.60 5,515,000 10,300 110,300
1998 New issue directed to Peter Törnquist and Lars Ahlman 0.02 110,300 16.32 5,625,300 2,206 112,506
1998 New issue directed to Peter Törnquist and Peter Karaszi 0.02 57,575 16.32 5,682,875 1,152 113,658
1999 Bonus (share dividend) issue 1 – – 5,682,875 5,569,218 5,682,875
1999 New issue directed to Pir New World Media AB 1 300,000 35.00 5,982,875 300,000 5,982,875
1999 New issue directed to Lingfi eld AB 1 100,000 40.00 6,082,875 100,000 6,082,875
1999 New issue directed to the 6th AP fund 1 100,000 45.00 6,182,875 100,000 6,182,875
1999 New issue 1 1,700,000 62.00 7,882,875 1,700,000 7,882,875
2000 New issue directed to shareholders of Intra-X Data AB 1 111,428 210.00 7,994,303 111,428 7,994,303
2000 New issue after exercise of warrants – warrant programme (WP 1) 1 350,000 23.50 8,344,303 350,000 8,344,303
2000 New issue after exercise of warrants (WP 2) 1 95,500 41.50 8,439,803 95,500 8,439,803
2001 New issue after exercise of warrants (WP 2) 1 53,000 41.50 8,492,803 53,000 8,492,803
2001 New issue directed to shareholders of StreamIT AB 1 101,521 98.50 8,594,324 101,521 8,594,324
2001 New issue directed to shareholders of Intra-X Data AB 1 145,455 87.00 8,739,779 145,455 8,739,779
2001 New issue after exercise of warrants (WP 3) 1 17,500 51.50 8,757,279 17,500 8,757,279
2002 New issue directed to shareholders of Intra-X Data AB 1 227,274 32.90 8,984,553 227,274 8,984,553
2002 New issue directed to shareholders of Stratum PM Ltd 1 267,224 34.61 9,251,777 267,224 9,251,777
2003 New issue directed to shareholders of Mobility Partner Europe AB 1 200,000 16.55 9,451,777 200,000 9,451,777
2004 New issue directed to shareholders of Consafe Infotech 1 1,220,691 26.50 10,672,468 1,220,691 10,672,468
2004 New issue directed to the JCE Group with Christer Ericsson as largest owner 1 523,887 30.10 11,196,355 523,887 11,196,355
2005 Fully subscribed warrants (WP 8) 1 162,483 33.50 11,358,838 162,483 11,358,838
2007 Fully subscribed warrants (WP 9) 1 200,000 32.92 11,558,838 200,000 11,558,838
Subscription of the new shares was done on a special sub-scription list by 15 December 2004. With this new issue, the JCE Group, Magellan B.V, and J Christer Ericsson became the largest shareholders in Cybercom Group Europe, with total holdings of 14.3%.
In December 2004, an agreement was also reached regar-ding a share transfer between the JCE Group and Cybercom’s founder who has also been the principal owner of the company until now. Through this share transfer agreement, the JCE Group acquired 2,628,050 shares from two compa-nies that were controlled by Per Bergström and Pekka Seitola, Cybercom’s previous principal owners. The price per share was SEK 33. The shares will be issued in two instalments: 50% on 17 January 2005 and 50% on 15 March 2005.
The new issue increases the collective holdings of the JCE Group, Magellan B.V and J Christer Ericsson to a total of 1,602,429 shares in Cybercom, which corresponds to 14.3% of the total number of shares and votes.
Through an agreement with both of the principal owners regarding acquisition of shares, the JCE Group is further increasing its holdings to 4,230,479 shares. So after 15 March 2005, the JCE Group, Magellan B.V, and J Christer Ericsson, all else being equal, together own shares in Cybercom equiva-lent to 37.8% of the total number of shares.
The number of shares – at full dilution of 362,483 warrants and including the new issue of 523,887 shares – amounted to 11,558,838 at year-end.
Ownership structure as of 31 December 2004 No. of shares Share ofName and capital votes in, %
Per Bergström via company 1,314,025 11.74
Pekka Seitola via company 1,314,025 11.74
MAGELLAN BV* 949,501 8.48
JCE GROUP* 622,894 5.56
AMF PENSION FUND – SMALL COMPANY 459,700 4.11
SIS Segaintersettle AG 354,350 3.16
Carlson Small Company Fund 191,000 1.71
Östersjöstiftelsen 142,700 1.27
MORGAN STANLEY & CO INTL LTD, W8IMY 140,000 1.25
NORDEA BANK S A 119,850 1.07
Total for the 10 largest owners 5,608,045 50.1
Other 5,588,310 49.9
Total** 11,196,355 100.0
* Company controlled by J Christer Ericsson, total 14%.** 523,887 newly issued shares were registered with PRV on 29 December but were registered in the owners’ names in January 2005.
Holdings as of 31 December 2004 SHARES OWNERS
Size Quantity % Quantity %
1 – 100 120,773 1.1% 1,995 37.6%
101 – 500 565,693 5.1% 1,852 34.9%
501 – 1,000 630,250 5.6% 697 13.1%
1,001 – 5,000 1,480,208 13.2% 609 11.5%
5,001 – 10,000 464,857 4.2% 64 1.2%
10,001 – 50,000 1,272,395 11.4% 62 1.2%
50,001 – 100,000 739,634 6.6% 9 0.2%
100,001 – 5,922,545 52.9% 13 0.2%
11,196,355 100% 5,301 100%

12
DIRECTORS’ REPORT
INVESTMENTS
In 2004, tangible, fi xed-asset investments reached SEK 5.6 million (3.6). Total intangible-asset investments reached SEK 26.6 million (63.0), of which goodwill accounts for SEK 20.8 million (57.3). Besides goodwill related to Consafe Infotech, executives in Cyber Com Consulting A/S exercised their warrants to purchase an additional 3.3% of the shares in the Danish subsidiary. During Q2 2004, the Group bought back these shares for SEK 2.4 million, which led to a SEK 2.2 million goodwill item.
LIQUIDITY AND CASH FLOW
On 31 December 2004, the Group’s liquid assets were worth SEK 47.7 million (74.1 million on 31 December 2003).
Cash fl ow from the operation was SEK 11.1 million for all of 2004 (5.3). During 2004, SEK –26.5 million affected the in-vestment operation’s results because of earlier acquisitions: (1) SEK –18 million for redemption of loan notes from Stratum, Cybercom’s UK company, and (2) SEK –8.5 million, which was paid after year-end 2004 for Consafe Infotech.
FINANCIAL POSITION
As of 31 December 2004, shareholders’ equity stood at SEK 173.2 million (149.5), which yields a 65.2% (54.1%) equity/assets ratio. Shareholders’ equity per share reached SEK 15.47 (14.01).
THE PARENT COMPANY
Parent company operations primarily support Group functions (e.g., fi nance, communications, marketing, administration, HR, and internal systems). Sales in 2004 reached SEK 29.0 million (27.1). Operating loss was SEK 6.2 million (–4.9). Loss after fi nancial items was SEK 5.4 million (–145.1). On 31 De-cember 2004, the parent company’s cash fl ow stood at SEK 17.8 million (68.4). Investments worth SEK 0.5 million (0.3), in computers and other equipment, were made during 2004. At year-end, the parent company employed 25 (24) persons, of which 5 were on leave of absence. The average number of employees during the year stood at 18 (17).
INCENTIVE PROGRAM
During 2004, 500,00 options (warrant programme 6) expired. There are now 362,483 options outstanding, all directed to employees in the UK operation: 162,483 expire during January–February 2005 and 200,000 during August 2006–January 2007. See note 23.
CORPORATE GOVERNANCE
Cybercom’s board has briefl y evaluated the new Swedish code for corporate governance that the Stockholm stock exchange is expected to add to its regulations. This evaluation led to the conclusion that Cybercom’s governance meets the require-ments of the code and that no changes will be made for the time being. The board intends to comply with the code as soon as it’s adopted by a larger regulatory entity, such as the Stockholm Stock Exchange.
Shareholder and board representationCybercom’s board and executive team work diligently with corporate governance issues. Three of the largest sharehol-ders are represented on the board. The company’s nomination committee requires that board members have the appropriate expertise. A remuneration committee strives to create the best possible conditions for reasonable compensation and bonus levels. The audit committee consists of all board members who work closely with the company’s auditors. Individual sha-reholders may submit proposals to the committees, via regular mail, to Cybercom’s headquarters in Stockholm.
Annual general meeting (AGM)The AGM is the decision-making body in which all sharehol-ders can participate. At the AGM, developments in the com-pany are presented and decisions are made on several central items, such as dividends, remuneration for the board and auditors, changes to the articles of association, the appoint-ment of auditors, discharge from liability for board members, and election of the board for the coming 12 months.
Nomination committeeAt the AGM, a nomination committee is elected and charged with submitting proposals regarding possible board mem-bers, choice of auditors, remuneration, and associated issues before the next AGM. The nomination committee makes up a profi le of requirements and ensures that the company’s board members have expertise relevant to Cybercom’s operation. Committee members before the 2005 AGM are Gert Schybor-ger (chairman), John Örtengren, representative for minority shareholders (via the Swedish Shareholders’ Association), and Per Bergström, representative for the company’s larger share-holders in 2004. Per Edlund was a co-opted member for the meetings that were held after the contract went into effect regarding share transfer from the previous main owners. The nomination committee works closely with the shareholders and meets three times a year.
The boardThe board is responsible for the Group’s organisation and management according the Swedish Companies Act. A fi xed programme regulates the distribution of responsibilities bet-ween the board and Cybercom’s CEO. According to this pro-gramme, the board takes decisions on the CEO appointment, the main organisation, long-term fi nancial planning, opera-tion plans, the budget, and annual reports. The programme

13
DIRECTORS’ REPORT
is considered and fi xed annually. The board formulates CEO and reporting instructions, and Cybercom’s CEO is responsible for planning and implementing initiatives according to board decisions and the company’s ongoing administration.
The board consists of eight members who represent a broad range of expertise in IT, telecom, business development, and other areas. Three of the largest owners are represented on the board; they represent a total of 37.2% of the votes in Cybercom. During 2004, the board met nine times. According to the corporate bylaws, Cybercom’s board can select three deputies. The nomination committee and the board decided to exercise that right for another year, because it’s a good way to phase-in future board members. The nomination commit-tee reviews and evaluates the board’s work and contributions of individual members.
Remuneration committeeCybercom’s remuneration committee sets salaries for the CEO, vice president, and other executives. The remuneration committee strives to create the best possible conditions so that benefi t issues are treated comprehensively and carefully. The remuneration committee met three times during 2004; its members are:1. Gert Schyborger, Cybercom’s board chairman.
2. Kerstin Ryer, board member and CEO of HumanPartner AB. She was the HR director of If Skadeförsäkring AB. She has extensive experience in developing remuneration prin-ciples for salary setting and other terms of employment.
3. Pekka Seitola, one of Cybercom’s founders, board mem-ber, and representative for larger shareholders.
Audit committeeThe audit committee consists of all board members and is charged with proposing auditors and approving their fees. Ulf Pettersson, Öhrlings PricewaterhouseCoopers, was elected as auditor through 2008. During the year, the board receives presentations from the company’s auditor, who ensures that the company’s internal and external reports fulfi l the require-ments of a company listed on the stock exchange.
AuditorsAuditors are appointed at the AGM every fourth year; the last appointment was done at the AGM held in 2004. The auditor’s job is to audit the company’s annual report, its accounting records, and the asset management activities of the board and the CEO on behalf of the shareholders. The auditors report continuously to the board.
Group managementThe CEO supervises the Group’s managing directors and orga-nises and develops the business in such a way that the goals established by the board regarding profi tability and direction are reached. Written instructions determine the work distribu-tion between the board and the CEO. The CEO submits a
monthly report to the board. The work distribution rules also regulate the CEO’s fi nancial framework.
During 2004, Cybercom has strengthened Group mana-gement to better refl ect the company’s focus on telecom and its international growth strategy. The management group increased from four to ten persons during the year. In the an-nual budget process, the board and Group management set the framework for the operation and lay the groundwork for a strong decentralisation of the Group’s operation. Common policy documents set the framework for management and follow-up.
Finance policyThe fi nance policy regulates the division of fi nancial responsi-bilities and authority between the board, the CEO, the CFO, and the subsidiary managers. The fi nance policy includes cur-rency and cash handling, and fi nances.
Management of business areasThe Cybercom Group’s managing directors report to their respective business area managers. At the end of 2004, there were two business areas whose managers report to the CEO, who in turn reports to the board. Each month, the subsidia-ries submit reports that contain:
• New and existing customer business.
• Customers or jobs lost.
• New sales.
• Workload.
• Threats and opportunities.
Internal controlManagement and internal control follow the Group’s com-mon reporting structure, fi nance policy, and other policies established by the parent company’s board. Internal reporting procedures are audited during the annual audit. The audi-tors also draw up an annual risk analysis for the Group. The auditors’ review of internal controls and risks is presented in a report that is submitted to the board.
CommunicationCybercom’s intends to increase interest in Cybercom shares with existing and potential investors. This will be done by actively and quickly furnishing the market with relevant and current information. Openness and a high level of service are also part of Cybercom’s ambition to develop trust in the com-pany on the stock exchange. During the year, Cybercom met regularly with investors and capital market companies. On the company’s website (www.cybercomgroup.se), you will fi nd all published information on the Group’s development, stock exchange information, and other important information. All external contact with the market is made by the board chair-man, the CEO or the communications manager.

14
DIRECTORS’ REPORT
TRANSITION TO INTERNATIONAL FINANCIAL REPORTING STANDARDS (IFRS)
From 1 January 2005, the company will issue fi nancial reports according to the IFRS. The interim report for Q1 2005 will be the company’s fi rst IFRS report. Through 2004, the company used the Swedish Financial Accounting Standards Council’s recommendations. Provided that the transition date is 1 January 2004, the transition to IFRS is reported according to IFRS 1: First-time Adoption of International Financial Reporting Standards. IFRS 1 stipulates that the 2004 compa-rison year must also be reported according to IFRS. Financial information referring to fi nancial years before 2004 are not recalculated. The principal rule states that all applicable IFRS and IAS standards that take effect and are approved by the EU as of 31 December 2005 must be applied retroactively. But IFRS 1 contains some exceptions to the principal rule that the company can choose to follow.
The changes in accounting principles that this transi-tion entails and the transition effects on the Group’s profi t and loss statements and balance sheets are presented here. The exceptions to complete retroactive application that the company chose to apply are also explained. These effects are preliminary and may change because the revision of certain IAS/IFRS standards are still in progress and further information from the IFRIC can be expected during 2005. It’s possible that new standards with an application date of 1 January 2006 might have to be implemented in advance.
Here are the most important changes that affect Cybercom in connection with the transition to IFRS:
• IFRS 3: company acquisitions. IFRS 3 (Business Combina-tions) requires that goodwill and other intangible assets with an undetermined useful life should no longer be written off, but should be tested for depreciation when transitioning to IFRS on 1 January 2004, and annually or more often – if there are indications of a decrease in value. Such an asset is depreciated if the reported value exceeds the recoverability value. The company performed deprecia-tion tests as of 1 January 2004 and 30 September 2004. According to these tests, there is no need for depreciation requirements. According to Swedish accounting principles, all intangible assets, including goodwill, are written off during the assessed useful life. This change doesn’t affect shareholders’ equity at the time of transition because goodwill amortisation before 1 January 2004 will not be cancelled. As a consequence of the transition to IFRS, goodwill amortisation for 2004 that was reported ac-cording to Swedish accounting principles (SEK 7.1 million) was cancelled.
Another effect of the transition to IFRS 3 is a change in rules regarding distribution of purchase prices for company acquisitions, where it’s required that the purchase price, to a greater extent than what Swedish accounting principles stipulate, is allocated to intangible assets in the acquired company before the residual can be classifi ed as goodwill. The transition rules in IFRS 1 require that allocation of purchase prices according to IFRS 3 be done for all com-
pany acquisitions made after 1 January 2004. Acquisitions before 1 January 2004 need not be recalculated according to IFRS 1. Cybercom did not acquire companies during 2004, so recalculation need not be done.
• IFRS 5: sale of assets. Fixed assets or sold groups that fulfi l criteria for being classifi ed as holdings to be sold must be assessed at the lowest reported value and the actual value minus selling costs. These assets must not be written off during the period when the asset is classifi ed as a holding to be sold until it’s disposed of. According to the transition rules, companies should apply this recommendation begin-ning 1 January 2005. During Q4 2004, Cybercom decided to sell CyberMate PreHospital, which is an intangible asset. There are no effects resulting from the transition to IFRS 5, because the reported value falls below the actual value minus the selling costs.
• IAS 32 and 39: fi nancial instruments. Reporting and valuation were applied starting 1 January 2005. With the support of IFRS 1, the company chose to not recalculate corresponding fi gures for 2004, which relate to fi nancial instruments, according to IAS 39 principles. A reclas-sifi cation and revaluation of the assets and liabilities to be reported according to IAS 39 were implemented on 1 January 2005. So fi nancial instruments are reported in corresponding fi gures for 2004 according to previously applied principles. The difference between reported values, according to IAS 39, and previously applied principles will be reported in the 1 January 2005 balance sheet directly against equity capital according to IFRS 1 transition rules. Effect from the transition to IAS 39 is expected to be SEK –0.6 million, which will be reported directly against shareholders’ equity for 2005. A revaluation of short-term investments in bonds and currency futures will be done.
The transition’s fi nancial effectsThe table illustrates the way in which recalculating the 2004 corresponding fi gures preliminarily affect the Group’s income and balance sheet.
SEK million Equity Profi t/loss
Opening balance, 1 January 2004 149.5
Opening balance à la IFRS 149.5
Income statement
Profi t after tax, 2004 4.3 4.3
Equity, net change, 2004 19.4
IFRS 3 acquisition 7.1
Deferred tax –0.3
Adjusted profi t for the year 6.8 6.8
Closing balance according to IFRS 180.0
Closing balance à la Swedish accounting, 31 Dec. 2004 173.2
All information above is preliminary and may change because the new recommendations are still being implemented.

15
DIRECTORS’ REPORT
RISK AND SENSITIVITY ANALYSES
Business risks
Market changesA few large companies dominate the telecom sector. This trend has meant that customers of consulting companies have gone from working with more than 100 vendors to signing master contracts with 20–30 select vendors. These contracts lead to long-term relationships with highly qualifi ed vendors. Size, specialisation, and an international presence have become increasingly important for consultancies. Cybercom currently has master contracts with about 11 companies that together represent 71% of Cybercom’s sales.
Business-cycle sensitivityThe market and customers are basing their businesses and IT investments on the business cycle. That’s why Cybercom positioned itself so that cycle swings will have minimal effect on business and revenue. Cybercom offers total solutions and works closely with customers.
AcquisitionsPart of Cybercom’s growth strategy involves acquisition of other operations. Cybercom has developed a method for suc-cessfully integrating these operations as quickly and effecti-vely as possible.
CustomersCybercom’s 10 largest customers account for 73% of its sales. Cybercom has long-term relationships with many customers.
CompetitorsA turbulent market means that players, offerings, and pricing models constantly change. It’s becoming increasingly impor-tant for companies to create niches and position themselves in relation to their market players to create their own custo-mer space. Cybercom has clear offerings for its niches.
Recruitment and skillsQualifi ed consultants are a requirement for enabling the com-pany to implement successful projects and to satisfy custo-mers. During recruitment, Cybercom puts stringent demands on experience and expertise. The company continuously strives to ensure that it has the right skills mix.
Financial risks
Credits, interest, and liquid assetsCybercom has no external credits. Liquid assets are placed in risk-free interest-bearing funds.
Credit institutes’ ratingsThe Cybercom Group’s parent company has an AA rating with D&B (previously called Duhn & Bradstreet), a credit institute.
Currency effectSubsidiaries in Denmark, Norway, and the UK generate sales equal to 16% of the Group’s total sales. The subsidiaries’ net assets are exposed to translation risk. For larger exposures in foreign currency, the Group uses derivative instruments to secure the exposure.
TaxPrepaid tax can be used against future tax on profi ts for the operations in Denmark, Norway, and Sweden and can thus lower future tax. The company isn’t involved in a tax dispute.
Personnel expensePersonnel expense is the company’s largest fi nancial item, which is about 64% of total expenses, excluding goodwill.
Table:These items show effects from a 1% change in operating profi t, calculated on the outcome for 2004
+/– 1% MSEK
Price paid by customer 3.1
Amount/degree of invoicing 2.2
No. of consultants 0.5
HR expenses 2.6
These effects are independent of each other and are depen-dent on other factors not changing.
To lower sensitivity to the above factors, Cybercom restruc-tured its operation to accommodate solution-based assign-ments. So its capabilities and effi ciency in delivering solutions affect profi tability more than hourly rates, invoicing rates, and the number of consultants.
OUTLOOK
The outlook for Cybercom’s services in telecom and selected technologies is positive. Cybercom intends to grow organically and through acquisition and to strengthen its international presence.
The company’s fi nancial goal before year-end 2006 is to generate sales worth SEK 750 million, of which 25% come from outside Sweden. It still targets an 8% operating margin.
PROPOSAL FOR TREATMENT OF ACCUMULATED LOSS
The board proposes that the accumulated loss of SEK 103,694,180 be covered by offsetting it against the share premium reserve.
According to the consolidated balance sheet, the Group’s accumulated loss is SEK 99,787,313. Appropriation of restric-ted reserves has not been proposed.

16 Profi t and loss statement, SEK million 2004 2003 2002 2001 2000 1999
Sales 405.3 309.7 344.8 396.2 357.6 191.9Operating expense* –382.0 –401.0 –338.6 –368.9 –320.6 –178.6Scheduled depreciation –8.2 –7.0 –5.8 –6.2 –6.2 –3.8Items affecting comparability – – – – –4.1 –Operating profi t/loss before goodwill 15.1 –98.3 0.4 21.1 26.7 9.5
Goodwill amortisation –7.1 –13.6 –12.9 –8.9 –6.4 –0.7Operating profi t/loss 8.0 –111.9 –12.5 12.2 20.3 8.8
Financial income 4.2 2.6 5.4 4.8 3.3 6.2Financial expenses –2.1 –0.9 –1.1 –5.2 –0.2 –0.5Profi t/loss after fi nancial items 10.1 –110.2 –8.2 11.8 23.4 14.5
Tax –5.8 –0.5 –1.2 –6.9 –8.5 0.0
Profi t/loss for the year 4.3 –110.7 –9.4 4.9 14.9 14.5
Shareholder equity/share, SEK 15.47 14.01 25.02 25.52 23.15 17.43
Balance sheet, SEK million 2004 2003 2002 2001 2000 1999
Assets Intangible fi xed assets 86.7 69.7 121.0 83.3 75.9 9.3Tangible fi xed assets 10.7 10.8 9.9 11.3 11.3 10.3Financial fi xed assets 11.8 14.4 3.7 2.9 5.6 1.8Total other current assets 108.7 107.3 70.7 91.2 89.9 50.0Liquid assets 47.7 74.1 111.5 120.8 111.9 107.3
Total assets 265.6 276.3 316.8 309.5 294.6 178.7
Shareholders’ equity and liabilities Shareholders’ equity 173.2 149.5 231.5 223.5 195.4 137.4Provisions 4.5 14.8 4.3 6.1 20.1 0.9Interest-bearing liabilities 0.4 0.3 11.2 0.0 0.0 0.0Non-interest-bearing liabilities 87.5 111.7 69.8 79.9 79.1 40.4
Total shareholders’ equity and liabilities 265.6 276.3 316.8 309.5 294.6 178.7
Cash fl ow, SEK million 2004 2003 2002 2001 2000 1999
Cash fl ow from current activities 11.1 5.2 7.0 31.4 28.7 7Cash fl ow from investment activities –41.3 –24.4 –17.1 –23.4 –44.1 –13.2Cash fl ow from fi nancing activities 4.0 –16.0 1.4 0.9 20.0 107.6Change in liquid assets –26.2 –35.2 –8.7 8.9 4.6 101.4
Liquid assets at year’s start 74.1 111.5 120.8 111.9 107.3 5.9Translation difference –0.2 –2.2 –0.6 – – –
Liquid assets at year’s end 47.7 74.1 111.5 120.8 111.9 107.3
* Including goodwill write-off.
Group fi nancial performance summary
Acid-test ratioCurrent assets excluding stock divided by current liabilities.
Asset turnover rateNet sales divided by average balance sheet total.
Ave. no. of consultantsAverage number of employed consultants based on monthly fi gures and adjusted for part-time employment.
Ave. no. of employeesAverage number of employees based on monthly fi gures and adjusted for part-time employment.
Average number of sharesCalculated as a weighted average for each year according to the Swedish Society of Financial Analysts’ recommendations.
Capital employedBalance sheet total minus non-interest-bearing liabilities.
Defi nitions
EBITEarnings before interest and taxes.
EBITAEarnings before interest, taxes, and amortisation.
Employee turnoverNumber of employees that terminated employ-ment divided by the average number of em-ployees for the period.
Equity/assets ratioShareholders’ equity as a percentage of the balance sheet total.
Interest coverage ratioProfi t/loss after fi nancial items plus fi nancial expenses divided by fi nancial expenses.
Net debt/equity ratioNet interest-bearing liabilities divided by share-holders’ equity.
Cash fl ow per shareCurrent cash fl ow divided by average number of shares after full dilution.
Capital turnover rateNet sales divided by an average balance sheet total.
Debt/equity ratioInterest-bearing liabilities divided by shareholders’ equity.
Earnings per shareProfi t after fi nancial items minus tax divided by average number of shares.
Earnings per share after full dilutionEarnings per share is calculated as though war-rants had already been exercised. Net profi t/loss is credited on an estimated 4% return on subscrip-tion liquidity minus 28% tax after which the adjusted profi t/loss is divided by the average number of shares after warrants are exercised.

17
GROUP FINANCIAL PERFORMANCE SUMMARY
Key fi gures 2004 2003 2002 2001 2000 1999
Total capital, SEK million 265.6 276.3 314.5 309.5 294.6 178.7Capital employed, SEK million 178.1 164.6 247.0 229.3 215.5 138.3Shareholders’ equity, SEK million 173.2 149.5 231.5 223.5 195.4 137.4
Return on total capital, % 4.5% Neg Neg 5.6% 10.0% 13.6%Return on employed capital, % 7.1% Neg Neg 7.6% 13.4% 19.5%Return on shareholders’ equity, % 2.7% Neg Neg 2.3% 9.0% 19.3%
Operating margin before goodwill and items affecting comparability, % 3.7% Neg 0.1% 5.3% 7.5% 5.0%Operating margin, % 2.0% Neg Neg 3.1% 5.7% 4.6%Net margin, % 2.5% Neg Neg 3.0% 6.6% 7.6%
Acid test ratio 1.8 1.6 2.7 2.6 2.6 3.9Equity/assets ratio, % 65.2% 54.1% 73.6% 72.2% 66.3% 76.9%Debt/equity ratio 0.0 0.0 0.0 0.0 0.0 0.0Net debt/equity ratio Neg Neg Neg Neg Neg NegShare of risk-bearing capital, % 66.9% 55.9% 75.0% 74.2% 73.2% 77.4%Interest coverage ratio 6.3 Neg Neg 3.3 82.9 30.3Working capital in relation to net sales, % 5.2% Neg 0.3% 2.8% 3.0% 5.0%Capital turnover rate, multiple 1.5 1.2 1.1 1.3 1.5 1.7Investments, SEK million 32.2 71.3 54.0 24.5 42.2 19.3
Ave. no. of employees 325 263 289 312 310 185No. of employees at year’s end 375 375 280 300 285 270Ave. no. of consultants 265 215 236 252 263 157Net sales per employee, SEK thousand 1,247 1,177 1,193 1,270 1,153 1,037Net sales per consultant, SEK thousand 1,529 1,440 1,461 1,572 1,360 1,222Value added per employee, SEK thousand 811 3921) 715 742 722 756Salaries and remunerations excluding social security costs, SEK million 189.2 154.1 167.0 162.4 150.7 97.0
Share data 2004 2003 2002 2001 2000 1999
No. of shares at year-end 11,196,355 10,672,4682) 9,251,777 8,757,279 8,439,803 7,882,875No. of shares at year-end, full dilution 11,196,355 10,672,4682) 9,251,777 9,384,553 9,417,032 8,532,875Shareholders’ equity per share, SEK 15.47 14.01 25.02 25.52 23.15 17.43Shareholders’ equity per share after full dilution, SEK 15.47 14.01 25.02 23.82 20.75 16.10Ave. no. of shares 10,716,125 9,470,197 9,169,361 8,696,703 8,212,315 5,991,208Ave. no. of shares after full dilution 10,716,125 9,470,197 9,169,361 8,757,279 9,198,839 6,553,708Profi t/loss per share, SEK 0.41 –11.7 –1.03 0.56 1.82 2.42Profi t/loss per share after full dilution, SEK 0.41 –11.7 –1.03 0.65 1.73 2.21Cash fl ow per share after full dilution, SEK 1.04 0.55 0.76 3.34 3.13 1.07Dividend per share, SEK 0.00 0.00 0.00 0.00 0.00 0.001) Includes one-time goodwill write-down of SEK 96.1 million, see note 15.2) Includes new issue for the Consafe Infotech acquisition.
Dilution effects are only considered in instances when profi t per share or shareholders’ equity per share declines.
Net interest-bearing liabilitiesInterest-bearing liabilities minus interest-bearing assets.
Net marginProfi t/loss after fi nancial items as a percentage of net sales.
Net sales per employee/consultantNet sales for the period divided by the average number of employees or consultants.
Number of employees at period’s endNumber of persons with an employment contract on the last day of the period.
Operating expensesOperating expenses including goodwill amortisa-tion.
Operating marginOperating profi t/loss as a percentage of net sales.
Return on capital employedProfi t/loss after fi nancial items plus fi nancial ex-penses as a percentage of the average capital employed.
Return on shareholders’ equityProfi t/loss after fi nancial items minus tax as a percentage of average shareholders’ equity.
Return on total capitalProfi t/loss after fi nancial items plus fi nancial ex-penses as a percentage of the average balance sheet total.
Share of risk-bearing capitalShareholders’ equity plus deferred tax (including minority) as a percentage of the balance sheet total.
Shareholders’ equityShareholders’ equity includes 72% of the un-taxed reserves.
Shareholders’ equity per shareShareholders’ equity divided by the number of shares at the period’s end.
Total project assignmentsOutsourcing, application management (AM) assignments or projects in which Cybercom has management and staffi ng responsibilities.
Value added per employeeOperating profi t/loss plus labour costs divided by the average number of employees. Labour costs are salary expenses plus a standard 35% for social security costs.
Working capitalCurrent assets minus liquid assets and current liabilities.

18
Profi t and loss statement GROUP PARENT COMPANY
SEK in thousands NOTE 2004 2003 2004 2003
Operating income
Sales 34, 3 405,131 309,059 28,984 26,658
Other operating income 155 596 822 491
Total operating income 405,286 309,655 29,806 27,149
Operating expense
Other external expenses 34, 5, 7 –123,631 –89,218 –18,793 –16,805
Personnel expenses 4, 26, 34 –258,092 –215,163 –16,637 –14,201
Depreciation and write-downs of tangible and intangible assets 15, 16 –15,287 –116,699 –613 –777
Other operating expenses 6 –242 –487 –7 –465
Total operating expense –397,252 –421,567 –36,050 –32,248
Operating profi t/loss 8,034 –111,912 –6,244 –5,099
Profi t/loss from fi nancial investments
Loss from shares in Group company 8 –163 – –1,048 –142,296
Profi t/loss from other securities and receivables 9 – –182 – –
Interest income and similar income items 10 4,261 2 542 3,792 2,764
Interest expenses and similar items 11 –1,938 –682 –1,891 –444
Total profi t/loss from fi nancial items 2,160 1,678 853 –139,976
Profi t/loss after fi nancial items 10,194 –110,234 –5,391 –145,075
Tax on the year’s income 12 –5,845 –540 470 963
PROFIT/LOSS FOR THE YEAR 4,349 –110,774 –4,921 –144,112
Share information GROUP
Amount in SEK 2004 2003
Before dilution
Profi t/loss per share, SEK 0.41 –11.70
Shareholders’ equity/share, SEK 15.47 14.01
No. of shares at period’s end 11,196,355 10,672,468
Ave. no. of shares 10,716,125 9,470,197
After dilution
Profi t/loss per share, SEK 0.41 –11.70
Shareholders’ equity/share, SEK 15.47 14.01
No. of shares at period’s end 11,196,355 10,672,468
Ave. no. of shares 10,716,125 9,470,197
Dilution effects are only considered in instances when profi t per share or shareholders’ equity per share declines.
19
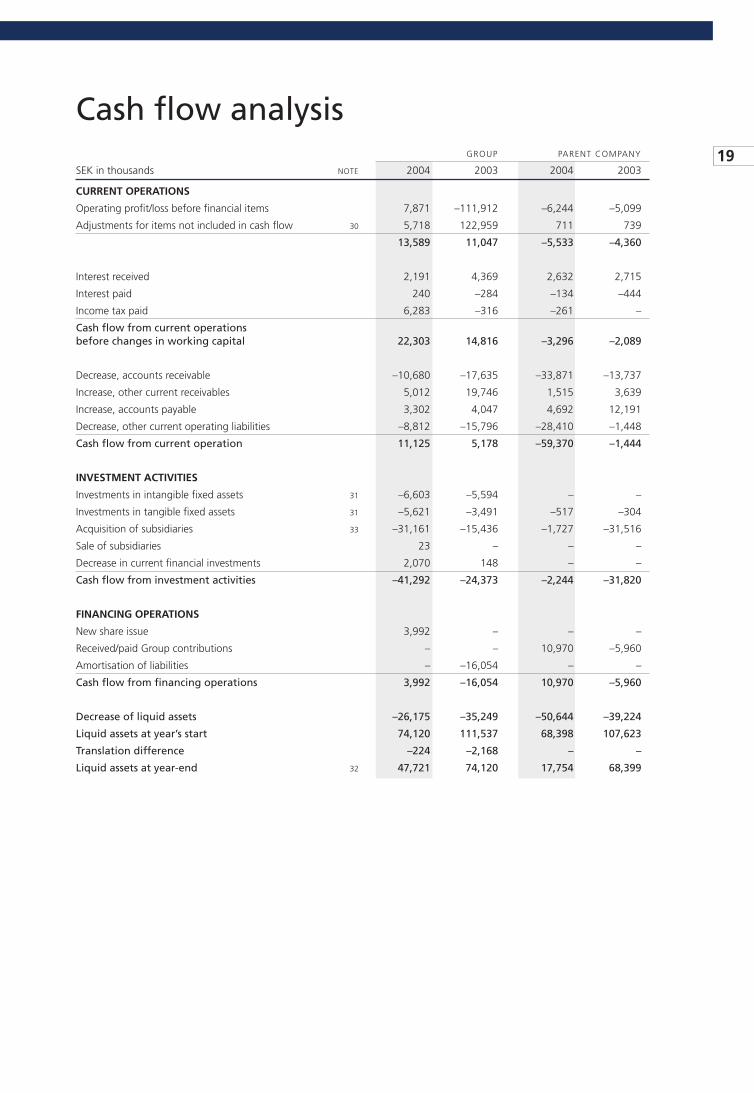
Cash fl ow analysis GROUP PARENT COMPANY
SEK in thousands NOTE 2004 2003 2004 2003
CURRENT OPERATIONS
Operating profi t/loss before fi nancial items 7,871 –111,912 –6,244 –5,099
Adjustments for items not included in cash fl ow 30 5,718 122,959 711 739
13,589 11,047 –5,533 –4,360
Interest received 2,191 4,369 2,632 2,715
Interest paid 240 –284 –134 –444
Income tax paid 6,283 –316 –261 –
Cash fl ow from current operationsbefore changes in working capital 22,303 14,816 –3,296 –2,089
Decrease, accounts receivable –10,680 –17,635 –33,871 –13,737
Increase, other current receivables 5,012 19,746 1,515 3,639
Increase, accounts payable 3,302 4,047 4,692 12,191
Decrease, other current operating liabilities –8,812 –15,796 –28,410 –1,448
Cash fl ow from current operation 11,125 5,178 –59,370 –1,444
INVESTMENT ACTIVITIES
Investments in intangible fi xed assets 31 –6,603 –5,594 – –
Investments in tangible fi xed assets 31 –5,621 –3,491 –517 –304
Acquisition of subsidiaries 33 –31,161 –15,436 –1,727 –31,516
Sale of subsidiaries 23 – – –
Decrease in current fi nancial investments 2,070 148 – –
Cash fl ow from investment activities –41,292 –24,373 –2,244 –31,820
FINANCING OPERATIONS
New share issue 3,992 – – –
Received/paid Group contributions – – 10,970 –5,960
Amortisation of liabilities – –16,054 – –
Cash fl ow from fi nancing operations 3,992 –16,054 10,970 –5,960
Decrease of liquid assets –26,175 –35,249 –50,644 –39,224
Liquid assets at year’s start 74,120 111,537 68,398 107,623
Translation difference –224 –2,168 – –
Liquid assets at year-end 32 47,721 74,120 17,754 68,399
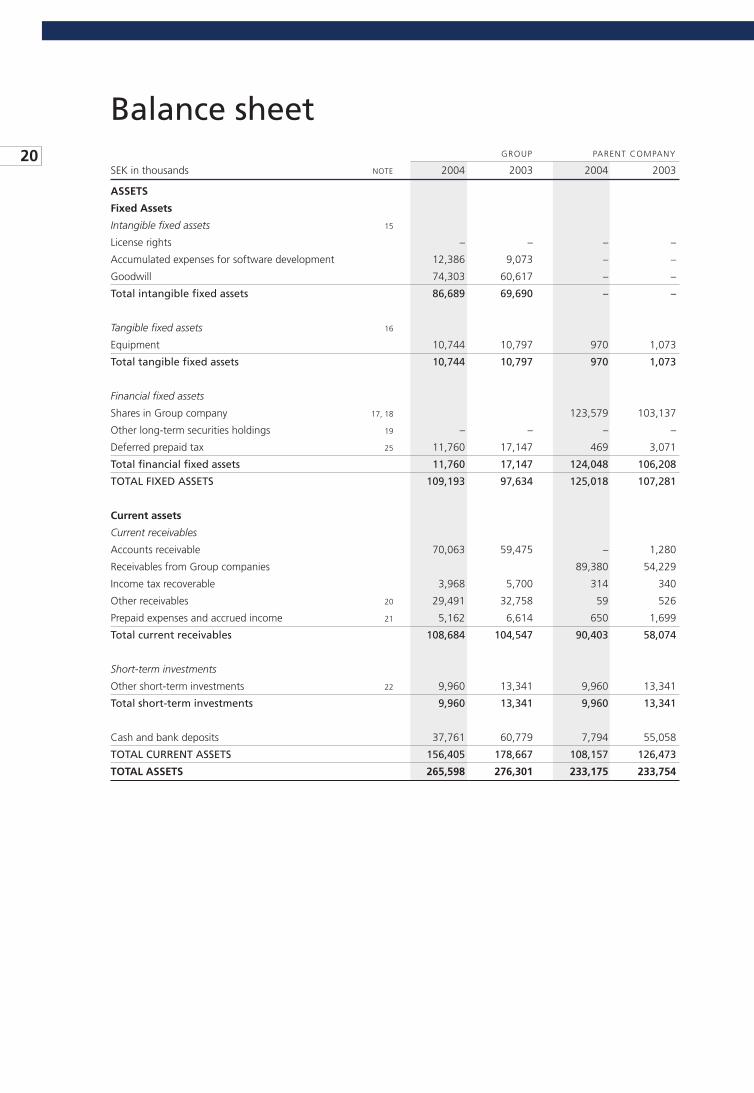
20
Balance sheet GROUP PARENT COMPANY
SEK in thousands NOTE 2004 2003 2004 2003
ASSETS
Fixed Assets
Intangible fi xed assets 15
License rights – – – –
Accumulated expenses for software development 12,386 9,073 – –
Goodwill 74,303 60,617 – –
Total intangible fi xed assets 86,689 69,690 – –
Tangible fi xed assets 16
Equipment 10,744 10,797 970 1,073
Total tangible fi xed assets 10,744 10,797 970 1,073
Financial fi xed assets
Shares in Group company 17, 18 123,579 103,137
Other long-term securities holdings 19 – – – –
Deferred prepaid tax 25 11,760 17,147 469 3,071
Total fi nancial fi xed assets 11,760 17,147 124,048 106,208
TOTAL FIXED ASSETS 109,193 97,634 125,018 107,281
Current assets
Current receivables
Accounts receivable 70,063 59,475 – 1,280
Receivables from Group companies 89,380 54,229
Income tax recoverable 3,968 5,700 314 340
Other receivables 20 29,491 32,758 59 526
Prepaid expenses and accrued income 21 5,162 6,614 650 1,699
Total current receivables 108,684 104,547 90,403 58,074
Short-term investments
Other short-term investments 22 9,960 13,341 9,960 13,341
Total short-term investments 9,960 13,341 9,960 13,341
Cash and bank deposits 37,761 60,779 7,794 55,058
TOTAL CURRENT ASSETS 156,405 178,667 108,157 126,473
TOTAL ASSETS 265,598 276,301 233,175 233,754
21
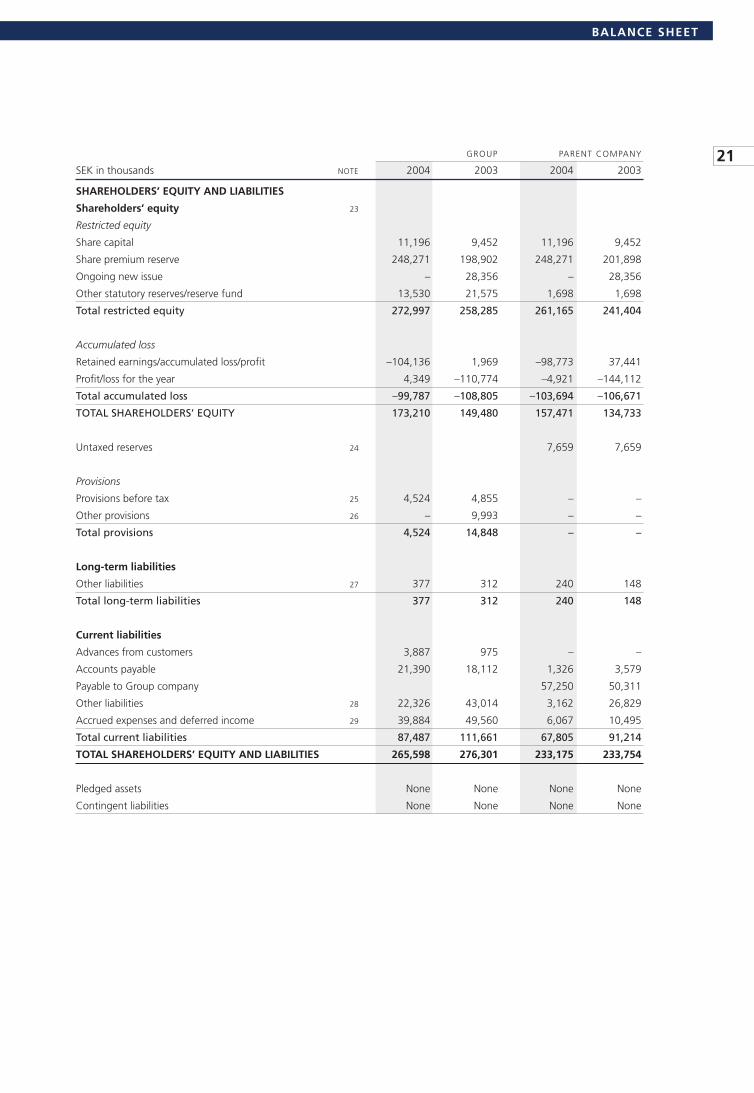
BALANCE SHEET
GROUP PARENT COMPANY
SEK in thousands NOTE 2004 2003 2004 2003
SHAREHOLDERS’ EQUITY AND LIABILITIES
Shareholders’ equity 23
Restricted equity
Share capital 11,196 9,452 11,196 9,452
Share premium reserve 248,271 198,902 248,271 201,898
Ongoing new issue – 28,356 – 28,356
Other statutory reserves/reserve fund 13,530 21,575 1,698 1,698
Total restricted equity 272,997 258,285 261,165 241,404
Accumulated loss
Retained earnings/accumulated loss/profi t –104,136 1,969 –98,773 37,441
Profi t/loss for the year 4,349 –110,774 –4,921 –144,112
Total accumulated loss –99,787 –108,805 –103,694 –106,671
TOTAL SHAREHOLDERS’ EQUITY 173,210 149,480 157,471 134,733
Untaxed reserves 24 7,659 7,659
Provisions
Provisions before tax 25 4,524 4,855 – –
Other provisions 26 – 9,993 – –
Total provisions 4,524 14,848 – –
Long-term liabilities
Other liabilities 27 377 312 240 148
Total long-term liabilities 377 312 240 148
Current liabilities
Advances from customers 3,887 975 – –
Accounts payable 21,390 18,112 1,326 3,579
Payable to Group company 57,250 50,311
Other liabilities 28 22,326 43,014 3,162 26,829
Accrued expenses and deferred income 29 39,884 49,560 6,067 10,495
Total current liabilities 87,487 111,661 67,805 91,214
TOTAL SHAREHOLDERS’ EQUITY AND LIABILITIES 265,598 276,301 233,175 233,754
Pledged assets None None None None
Contingent liabilities None None None None

22
Changes in shareholder equitySEK in thousands
Share Non- Share premium Ongoing Restricted restricted Group 2003 capital reserve new issue reserves equity Total
Opening shareholders’ equity according to established balance sheet 9,252 195,808 – 13,497 12,931 231,488
New issues 200 3,110 28,356 – – 31,666
Issue costs – –16 – – – –16
Change in translation difference – – – 24 –2,908 –2,884
Adjustment of free and bound capital – – – 8,054 –8,054 –
Loss for the year – – – – –110,774 –110,774
Amount at year-end 9,452 198,902 28,356 21,575 –108,805 149,480
Group 2004
Opening shareholders’ equity according to established balance sheet 9,452 198,902 28,356 21,575 –108,805 149,480
New issues 1,744 49,369 –28,356 –2,996 – 19,761
Issue costs – – – – – –
Change in translation difference – – – 21 –401 –380
Adjustment of free and bound capital – – – –5,070 5,070 –
Profi t for the year – – – – 4,349 4,349
Amount at year-end 11,196 248,271 – 13,530 –99,787 173,210
Parent company 2003
The year’s opening amount 9,252 198,804 – 1,698 41,732 251,486
New issues 200 3,110 28,356 – – 31,666
Issue costs – –16 – – – –16
Received/paid Group contribution – – – – –5,960 –5,960
Tax consequences, received/paid Group contribution – – – – 1,669 1,669
Loss for the year – – – – –144,112 –144,112
Amount at year-end 9,452 201,898 28,356 1,698 –106,671 134,733
Parent company 2004
The year’s opening amount 9,452 201,898 28,356 1,698 –106,671 134,733
New issues 1,744 46,373 –28,356 – – 19,761
Issue costs – – – – – –
Received/paid Group contribution – – – – 10,970 10,970
Tax consequences, received/paid Group contribution – – – – –3,072 –3,072
Loss for the year – – – – –4,921 –4,921
Amount at year-end 11,196 248,271 – 1,698 –103,694 157,471

23
Cybercom annual report notes NOTE 1 ACCOUNTING AND VALUATION PRINCIPLES
The annual report was prepared according to the Annual Accounts Act and the Swedish Financial Accounting Standards Council’s recom-mendations and statements. From 1 January 2004, the company ap-plies RR29 (compensation for employees). The new recommendation does not involve changes to the applied accounting standards. The company has only premium-based pensions for its employees and therefore is not affected by the Act on Safeguarding Pension Obliga-tions or regulations from the Swedish Financial Supervisory. The company’s accounting standards are otherwise unchanged.
Consolidated accountsThe consolidated accounts include those companies in which the par-ent company directly or indirectly holds 50% or more of the shares and companies in which ownership is less than 50% but where deci-sive infl uence exists.
The acquisition accounting method was used to prepare the conso-lidated accounts, so acquisition cost of shares in subsidiaries was eli-minated against acquired shareholders’ equity. Any difference be-tween acquisition value of the subsidiary’s shares and its shareholders’ equity, at the time of acquisition, is booked as goodwill.
When a subsidiary is acquired during the year, the subsidiary’s in-come and expenses are only included in the consolidated profi t and loss statement for the time after the acquisition.
When a subsidiary is sold during the year, profi t/loss is included for the period of ownership, and its income and expenses are reported in the consolidated profi t and loss statement.
Capital gains and losses are calculated within the Group as the difference between the selling price and the consolidated value of the subsidiary’s net assets.
Receivables and liabilities within the Group and associated unreal-ised profi ts and losses and transactions between companies within the Group, are eliminated in their entirety in the consolidated statements.
When converting profi t and loss statements and balance sheets of foreign subsidiaries, all subsidiaries’ assets and liabilities are converted using the closing day rate, while profi t and loss statements are conver-ted using the average exchange rate. Shareholders’ equity was con-verted at the historical rate. Conversion differences have had no im-pact on profi t or loss but are booked directly to shareholders’ equity.
Revenue recognitionThe Group’s revenue primarily comes from consulting services, which account for 97% of sales. Software sales make up 1%, and other revenue makes up 2% of the Group’s sales.
Service assignments on running accountsRunning-account assignments are recognised as profi t/loss at the rate that the assignments are performed, that is, revenues and expenses are reported for the period in which they were earned or incurred. Non-invoiced revenue earned on the balance sheet date is reported as accrued income under the heading for other receivables.
Fixed-price servicesIf a fi xed-price, service-assignment outcome can be reliably estimated, then the assignment’s revenue and expenses are reported as revenue and expenses, respectively, regarding the assignment’s degree of com-pletion on the balance sheet date (the percentage of completion method). The number of spent hours on the balance sheet date, in relation to the assignment’s estimated total, mainly determines the percentage of completion.
If estimation diffi culties occur (e.g., a project is in an early phase) and if the customer will cover accrued expenses, then income is repor-ted on the balance sheet date at an amount that corresponds to the assignment’s accrued expenses. So no profi t is reported.
If an assignment’s profi t and loss cannot be reliably estimated, then only anticipated customer-defrayed expenses are reported as income. If the customer probably will not pay the accrued expenses, then no income is reported. Suspected loss is booked immediately as an ex-pense, in as much as it can be estimated.
Assignments performed on a fi xed-price basis currently represent 42% (22%) of the Group’s sales. Fees on fi xed-price assignment in-voices, for services not yet performed, are reported as advances from customers.
Segment reportingBusiness segments contain products or services that are subject to risks and returns that differ from other business segments. Geographic markets offer products or services within a specifi c economic environ-ment that are subject to risks and returns that differ from the risks and returns that apply to units that operate in other economic environ-ments. In the Group and parent company, business segments are def-ined as primary segments; geographic areas are defi ned as secondary segments.
Loan expensesLoan expenses affect profi t/loss for the period to which they refer.
Appropriations and untaxed reserves The consolidated accounts do not include appropriations for untaxed reserves.
Deferred tax on untaxed reserves is estimated without discounting, based on the actual tax expense for the next year. For 2004, 28% of the untaxed reserves relate to deferred tax and 72% to shareholder’s equity.
Intangible fi xed assetsIntangible fi xed assets are valued at acquisition value with deductions for estimated residual value (normally 0) and for scheduled, accumula-ted depreciation. Scheduled depreciation is based on the acquisition value of the fi xed assets. Depreciation is based on the economic life-span of the assets; these write-off/amortisation rates were applied:
License rights 4 yearsAccumulated software development expenses 3 yearsGoodwill 5–10 years
Ordinarily, expenses for software development and maintenance are booked immediately. But expenses directly related to identifi able, unique software products that the Group controls and that probably provide fi nancial benefi t that exceeds cost after one year, are capital-ised as intangible assets. Direct costs include staff expenses for pro-gram development personnel and a reasonable share of relevant in-direct costs. Expenses that increase performance or extend the software’s lifespan beyond its original level are booked as improve-ment expenses, which increase the original acquisition value. Develop-ment has been fi nanced with the Group’s own assets, so there was no interest rate. There were no expenses for development, and research does not occur within the Group.
Goodwill represents the amount with which the acquisition value exceeds actual value of the Group’s share of the acquired subsidiary’s net assets upon acquisition. Goodwill is linearly amortised over the asset’s calculated economic lifespan, which is estimated individually for each acquisition. Goodwill arising from larger strategic acquisitions is amortised over a maximum of 10 years. Strategic acquisitions are those that the Group made to expand its product line in closely rela-ted areas, broaden its customer base or strengthen its expertise in existing or closely related technologies. Goodwill arising from the purchase of the net assets of a business is normally amortised over fi ve years, but can be amortised over 10 years if it is the result of stra-tegic acquisitions.

24
NOTES
Tangible fi xed assetsInventory is valued at acquisition value, with scheduled deductions for accumulated depreciation. Scheduled depreciation is based on fi xed assets’ acquisition value and the assets’ economic life spans. This depreciation/write-off rate applies to:
Computers and other inventory 3–5 years
Income taxReported income tax comprises tax that should be paid or received for the current year, adjustments to the previous year’s actual tax, and changes in deferred tax. A valuation of all tax liabilities/prepaid tax is calculated at a nominal amount according to tax regulations and es-tablished tax rates or proposed tax rates that will probably be adopted.
The balance sheet method was used to calculate deferred tax on all temporary differences that arose between the reported and fi scal val-ues of assets and liabilities. The temporary differences primarily arose through changes in untaxed reserves and fi scal defi cits.
Deferred tax claims regarding tax defi cits or other fi scal deductions are reported to the extent that it is probable that the deduction can be applied against future tax surpluses. Please see the supplementary information in note 25.
The parent company reports deferred tax on untaxed reserves as part of the untaxed reserves because of the connection between ac-counting and taxation.
AllocationsObligations are reported as allocations if they are attributable to this fi nancial year or earlier fi nancial years, and if on the balance sheet date, they are certain or likely to occur but are uncertain in terms of amount or when they will be fulfi lled.
Write-downsWhen there is an indication that the value of an asset has diminished, an evaluation of the asset’s booked value occurs. In those cases when an asset’s booked value exceeds its calculated recovery value, the asset is immediately depreciated to its recovery value.
An evaluation of cash-generating units was done according to RR17 (write-downs). Upon calculation of the remaining life span for goodwill or shares in the subsidiary, the discounting rate of 20% was applied.
ReceivablesReceivables are valued individually and requisite allowances are made.
Receivables and liabilities in foreign currenciesCurrent receivables and liabilities were converted using the closing day rate. Exchange rate differences for receivables and liabilities are repor-ted in the profi t and loss statement under fi nancial items, while other exchange rate differences are under operating profi t/loss. For a de-scription of currency risk management, please see note 2 on fi nancial risk management.
Current investmentsOn the balance sheet date, current investments that mainly consist of interest-bearing securities are reported at either the acquisition value or market value, whichever is the lower of the two.
Leasing agreementsThe lessor and/or the lessee make the decision for the classifi cation of leasing agreements based on the scope of the economic risks and benefi ts that are associated with the ownership of the leased object. To guarantee this, individual examinations of all agreements are done during the year. In 2004, there were only the usual operational leasing agreements, such as for renting premises and copy machines. No im-portant leasing agreements were entered into during the year.
Group contributionsCybercom follows the Swedish Financial Accounting Standards Council’s statement on reporting of Group contributions. So reporting of Group contributions is based on the contributions’ fi nancial impli-cations and consequences. Group contributions paid and received, to minimise the Group’s tax, are reported as a decrease or an increase in unrestricted equity.
Cash fl ow analysisThe indirect method is used to develop the cash fl ow analysis. Repor-ted cash fl ow covers only transactions that lead to incoming or out-going payments.
Besides cash and bank balances, liquid assets include short-term fi nancial investments that (1) are exposed to only an insignifi cant risk of value fl uctuations, and (2) are traded in an open market in which amounts are known, or (3) have a term shorter than three months from the time of acquisition.
NOTE 2 FINANCIAL RISK MANAGEMENT
Financial risksThrough its operation, the Group has been exposed to various fi nan-cial risks, including the effects of changes in exchange rates and inter-est rates. The board establishes written principles for overall manage-ment of risks and for specifi c areas, such as currency risks, interest risks, credit risks, and the use of derivative instruments and the place-ment of extra liquidity. The policy should be revised frequently, at least once a year.
AccountsThe actual worth of fi nancial assets and liabilities coincides with book value, with the exception of current investments (see note 22 for the market value of these). Financial liabilities concern only operating lia-bilities or promissory notes that should be paid in Swedish or foreign currencies. Liabilities in foreign currencies are valued according to the same standards as receivables in foreign currencies.
Currency risksThe parent company has holdings in foreign subsidiaries whose net assets are exposed to currency conversion risks, directly in Danish crowns and British pounds, and indirectly in Norwegian crowns. Liabil-ities and liquid funds can be partially in Swedish currency and partially in foreign. Foreign currency is valued at the closing day’s rate accor-ding to the applied accounting standards. Liabilities are valued indivi-dually and requisite allowances are made. For managing larger expo-sures to the risk of fl uctuations in foreign currency exchange rates, derivative instruments are used.
Interest risksThe Group’s income and cash fl ow from operations are essentially independent of changes in the market’s interest rates. The Group has interest-bearing assets in the form of bank securities and interest funds.
Credit riskThe Group was not indebted to credit institutions the day the fi nal accounts were closed.
Liquidity riskCaution is the starting point for liquidity risk management, which involves maintaining suffi cient liquid assets and saleable securities.

25
NOTES
NOTE 3 SEGMENT REPORTING
Primary segment – business areas Financial Telecom &Financial year 2004 Services Services International Other Elimination* Group
Revenue
External sales 73,690 277,326 49,051 5,219 – 405,286
Internal sales 10,845 3,681 19,460 28,387 –62,373 0
Total revenue 84,535 281,007 68,511 33,606 –62,373 405,286 Profi t/loss
Operating profi t/loss –2,761 17,501 1,308 –8,819 805 8,034
Interest expense 240
Interest income 2,191
Proportion of loss –271
Annual tax expense –5,845
Annual net profi t 4,349 Other information
Assets 34,271 163,365 48,599 251,250 –231,889 265,596
Non-allocated assets
Total assets 34,271 163,365 48,599 251,250 –231,887 265,598
Liabilities 29,500 132,931 16,601 87,086 –173,730 92,388
Non-allocated liabilities
Total liabilities 29,500 132,931 16,601 87,086 –173,730 92,388
Investments 379 20,977 4,529 6,350 – 32,235
Write-offs –1,590 –7,943 –2,027 –3,727 –15,287
Payments that do not correspond to expenses 5,452 3,157 – 961 – 9,570
Financial Telecom &Financial year 2003 Services Services International Other Elimination* Group
Revenue
External sales 84,547 175,606 48,505 997 309,655
Internal sales 5,188 16,215 10,930 26,151 –58,484 0
Total revenue 89,735 191,821 59,435 27,148 –58,484 309,655 Profi t/loss
Operating profi t/loss –15,203 –58,794 –34,068 –4,850 1,003 –111,912
Interest expense –682
Interest income 2,542
Proportion of loss –182 –182
Annual tax expense –540
Annual net loss –110,774
Other information
Assets 22,983 180,859 47,794 62,492 –120,617 193,511
Non-allocated assets 82,790 82,790
Total assets 22,983 180,859 47,794 62,492 –37,827 276,301
Liabilities 22,937 114,501 23,164 88,838 –153,985 95,455
Non-allocated liabilities 31,366 31,366
Total liabilities 22,937 114,501 23,164 88,838 –122,619 126,821
Investments 13,408 53,107 1,926 2,826 71,267
Write-offs –3,215 –11,486 –5,152 –777 –18 –20,648
Amortisation –59,766 –36,285 –182 –96,233
Expenses, exceeding write-offs that do not correspond to payments –6,060 –200 –6,260
* In 2004, elimination was on a higher level because of a system change; 2003 cannot be reconstructed.
During 2004, the Group was organised into these main business areas (BAs): Telecom & Services focuses on telecommunications and selected technologies for billing, portals, and mobile solutions – plus embedded systems. Financial Services, primarily serves customers within banking, fi nance, and insurance; it offers business-deve-loping IT solutions for Internet-based service development, fi nancial information services, and product development. In 2004, Financial Services refocused more toward telecommunications and selected technologies for solutions that are in high demand. The International BA consists of subsidiaries in Denmark, Norway, and the UK. The Other column refers mainly to the parent company’s activities. Starting 1 January 2005, the Cybercom Group is reviewing its operation in two BAs: Sweden and International. Non-allocated assets represent shared costs. BA assets mainly consist of intangible and tangible fi xed assets and receivables. BA liabilities consist of operating liabilities, excluding tax liabilities.Investments consist of tangible and intangible assets, including increases that are the result of acquisitions.Non-allocated assets and liabilities consist of deferred tax, liquidity in the parent company, and liabilities associated with acquisitions.Internal deliveries affected BA revenue, expenses, and profi t/loss. Internal rates are market-based.
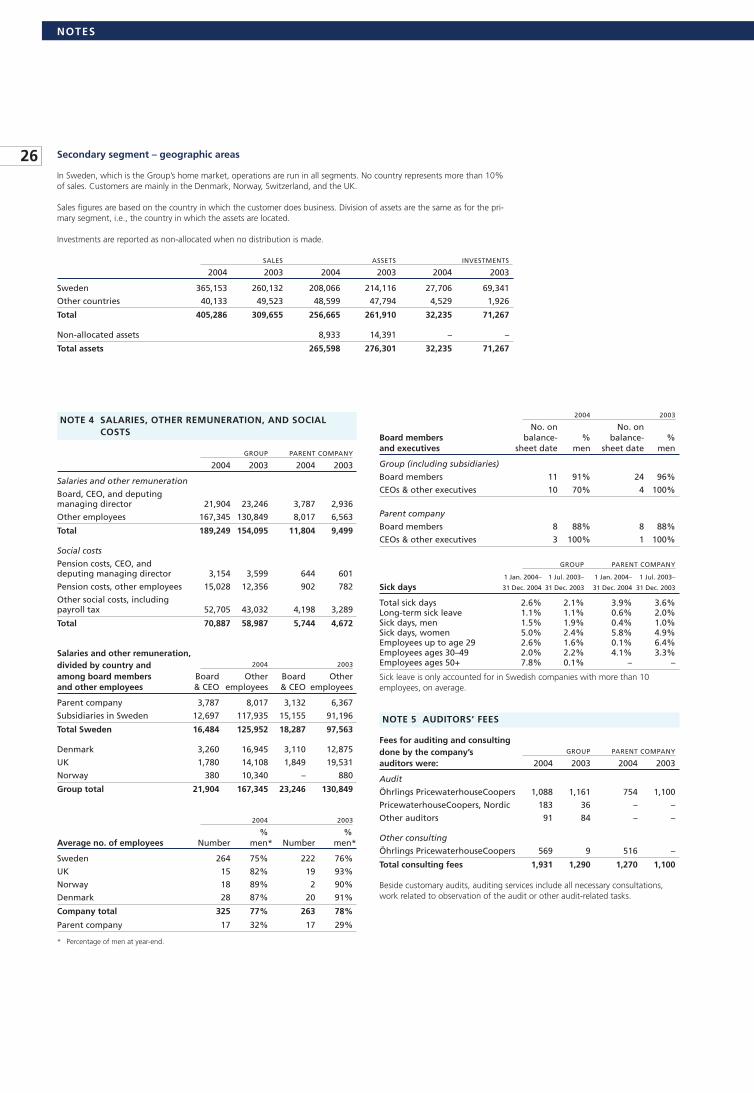
26
NOTES
Secondary segment – geographic areas
In Sweden, which is the Group’s home market, operations are run in all segments. No country represents more than 10% of sales. Customers are mainly in the Denmark, Norway, Switzerland, and the UK.
Sales fi gures are based on the country in which the customer does business. Division of assets are the same as for the pri-mary segment, i.e., the country in which the assets are located.
Investments are reported as non-allocated when no distribution is made. SALES ASSETS INVESTMENTS
2004 2003 2004 2003 2004 2003
Sweden 365,153 260,132 208,066 214,116 27,706 69,341
Other countries 40,133 49,523 48,599 47,794 4,529 1,926
Total 405,286 309,655 256,665 261,910 32,235 71,267 Non-allocated assets 8,933 14,391 – –
Total assets 265,598 276,301 32,235 71,267
NOTE 4 SALARIES, OTHER REMUNERATION, AND SOCIAL COSTS
GROUP PARENT COMPANY
2004 2003 2004 2003
Salaries and other remuneration
Board, CEO, and deputing managing director 21,904 23,246 3,787 2,936
Other employees 167,345 130,849 8,017 6,563
Total 189,249 154,095 11,804 9,499
Social costs
Pension costs, CEO, and deputing managing director 3,154 3,599 644 601
Pension costs, other employees 15,028 12,356 902 782
Other social costs, including payroll tax 52,705 43,032 4,198 3,289
Total 70,887 58,987 5,744 4,672
Salaries and other remuneration, divided by country and 2004 2003
among board members Board Other Board Otherand other employees & CEO employees & CEO employees
Parent company 3,787 8,017 3,132 6,367
Subsidiaries in Sweden 12,697 117,935 15,155 91,196
Total Sweden 16,484 125,952 18,287 97,563
Denmark 3,260 16,945 3,110 12,875
UK 1,780 14,108 1,849 19,531
Norway 380 10,340 – 880
Group total 21,904 167,345 23,246 130,849
2004 2003
% % Average no. of employees Number men* Number men*
Sweden 264 75% 222 76%
UK 15 82% 19 93%
Norway 18 89% 2 90%
Denmark 28 87% 20 91%
Company total 325 77% 263 78%
Parent company 17 32% 17 29%
* Percentage of men at year-end.
2004 2003
No. on No. onBoard members balance- % balance- %and executives sheet date men sheet date men
Group (including subsidiaries)
Board members 11 91% 24 96%
CEOs & other executives 10 70% 4 100%
Parent company
Board members 8 88% 8 88%
CEOs & other executives 3 100% 1 100%
GROUP PARENT COMPANY
1 Jan. 2004– 1 Jul. 2003– 1 Jan. 2004– 1 Jul. 2003–
Sick days 31 Dec. 2004 31 Dec. 2003 31 Dec. 2004 31 Dec. 2003
Total sick days 2.6% 2.1% 3.9% 3.6%Long-term sick leave 1.1% 1.1% 0.6% 2.0%Sick days, men 1.5% 1.9% 0.4% 1.0%Sick days, women 5.0% 2.4% 5.8% 4.9%Employees up to age 29 2.6% 1.6% 0.1% 6.4%Employees ages 30–49 2.0% 2.2% 4.1% 3.3%Employees ages 50+ 7.8% 0.1% – –
Sick leave is only accounted for in Swedish companies with more than 10 employees, on average.
NOTE 5 AUDITORS’ FEES
Fees for auditing and consultingdone by the company’s GROUP PARENT COMPANY
auditors were: 2004 2003 2004 2003
Audit
Öhrlings PricewaterhouseCoopers 1,088 1,161 754 1,100
PricewaterhouseCoopers, Nordic 183 36 – –
Other auditors 91 84 – –
Other consulting
Öhrlings PricewaterhouseCoopers 569 9 516 –
Total consulting fees 1,931 1,290 1,270 1,100
Beside customary audits, auditing services include all necessary consultations, work related to observation of the audit or other audit-related tasks.

27
NOTES
NOTE 6 EXCHANGE RATE DIFFERENCES
Exchange rate differences are included in operating profi t/loss for business recei-vables and liabilities, as follows: GROUP PARENT COMPANY
2004 2003 2004 2003
Other operating costs –242 –487 –7 –465
Total –242 –487 –7 –465
NOTE 7 OPERATIONAL LEASING
The nominal worth of future minimum leasing fees related to non-cancellable leasing agreements are distributed according to:
GROUP PARENT COMPANY
2004 2003 2004 2003
Payable within 1 year 11,309 10,137 7,803 3,097
Payable within 1–5 years 30,079 1,951 27,025 584
Payable after 5 years – – – –
Leasing costs and revenue related to operational leasing agreements during the year amount to:
Leasing costs 11,451 10,409 4,020 3,836
Leasing revenue for subleased items 249 430 19 –
Rental contracts that expire during the period were estimated under simi-lar conditions.
NOTE 8 PROFIT/LOSS FROM SHARES IN GROUP COMPANIES
GROUP PARENT COMPANY
2004 2003 2004 2003
Capital loss from sale of subsidiaries –163 – – –
Write-downs – – –1,048 –142,296
Total –163 – –1,048 –142,296
See note 18.
NOTE 9 PROFIT/LOSS FROM OTHER SECURITIES AND RECEIVABLES THAT ARE FIXED ASSETS
GROUP PARENT COMPANY
2004 2003 2004 2003
Loss from other securities – –182 – –
Total – –182 – –
NOTE 10 INTEREST INCOME AND SIMILAR ITEMS
GROUP PARENT COMPANY
2004 2003 2004 2003
Interest 2,191 2,542 2,632 2,715
Exchange rate differences 2,070 – 1,160 49
Total 4,261 2,542 3,792 2,764
NOTE 11 INTEREST EXPENSES AND SIMILAR ITEMS
GROUP PARENT COMPANY
2004 2003 2004 2003
Interest 240 –284 –134 –444
Exchange rate differences –2,178 –398 –1,757 –
Total –1,938 –682 –1,891 –444
NOTE 12 TAXES
GROUP PARENT COMPANY
2004 2003 2004 2003
Year’s taxes –1,282 –1,202 3,072 –1,669
Taxes attributable to previous years 401 –621 – –189
Deferred taxes –4,964 1,283 –2,602 2,821
Total –5,845 –540 470 963
GROUP PARENT COMPANY
2004 2003 2004 2003
The year’s deferred tax expense or recoverable tax
Deferred tax expense regarding temporary differences –5,294 –7 –2,602 76
Deferred recoverable tax regarding temporary differences 330 1,290 – 2,745
Previously non-reported prepaid-tax for unused tax deduction – – – –
Deferred taxes in the profi t and loss statement –4,964 1,283 –2,602 2,821
GroupDeferred tax expenses refer to changes in opening temporary differences, mainly for deductions regarding untaxed reserves. Deferred recoverable tax refers primar-ily to capital insurance provisions. See temporary differences in note 25.
Parent companyDeferred recoverable tax refers primarily to capital insurance provisions.
GROUP PARENT COMPANY
2004 2003 2004 2003
Taxes regarding items booked directly against shareholders’ equity
Tax effect from Group contributions – – 3,072 –1,669
Total – – 3,072 –1,669
GROUP PARENT COMPANY
2004 2003 2004 2003
Difference between the Group’s tax expense and tax expense based on current rate
Reported profi t/loss before tax 10,194 –110,234 –5,391 –145,076
Tax according to current tax rate –2,854 30,866 1,509 40,621
Adjustments attributed to shareholder contribution – – –293 –418
Goodwill amortisation –1,757 –3,829 – –
Taxes attributable to previous years 401 –621 –459 –189
Tax effect from amortisation orwrite-downs of goodwill/shares in subsidiaries –1,056 –26,894 – –39,007
Tax effect from non-deductible costs –218 –306 –38 –48
Tax effect from other non-deductible costs –592 –192 –277 –29
Tax effect from other revenue not subject to tax liability 35 116 1 16
Tax effect from non-reported deductible costs 252 196 27 17
Used earlier non-reported prepaid tax for loss deduction – 207 – –
Effect from foreign tax rates –56 –82 – –
Tax on the year’s profi t/loss according to the profi t and loss statement –5,845 –540 470 963
MinorityMinority share amounts to SEK 0 (0) thousand in the Group.
Tax rateThe Group and parent company’s tax rate was 28%. The Group’s effective tax rate was 57% (–0.5%). The parent company’s effective tax rate was –8.7% (–0.7%).

28
NOTES
NOTE 13 DIVIDENDS PER SHARE
According to Cybercom’s dividend policy, the board proposes that no dividends will be distributed for the 2004 fi nancial year. No dividends were distributed for the 2003 fi nancial year.
NOTE 14 PROFIT/LOSS PER SHARE
Share information amount in SEK GROUP
Before and after dilution 2004 2003
Profi t/loss per share, SEK 0.41 –11.70
Shareholder equity/share, SEK 15.47 14.01
No. of shares at period’s end 11,196,355 10,672,468
Ave. no. of shares 10,716,125 9,470,197
Dilution is considered only in cases when it has a negative impact on profi t per share or shareholders’ equity per share.
NOTE 15 INTANGIBLE FIXED ASSETS
GROUP
License rights 2004 2003
Opening acquisition value 1,600 1,600
Closing accumulated acquisition value 1,600 1,600
Opening write-offs –1,600 –1,433
The year’s write-offs – –167
Closing accumulated write-offs –1,600 –1,600
Closing scheduled residual value – –
Accumulated software GROUP
development expenses 2004 2003
Opening acquisition value 10,622 3,028
The year’s capitalised expenses, internal development 5,809 7,594
The year’s capitalised expenses, purchases – –
Closing accumulated acquisition value 16,431 10,622
Opening write-offs –1,549 –
The year’s write-offs –2,496 –1,549
Closing accumulated write-offs –4,045 –1,549
Closing scheduled residual value 12,386 9,073
NOTE 15 INTANGIBLE FIXED ASSETS (CONT.)
GROUP
Goodwill 2004 2003
Opening acquisition value 197,353 144,827
The year’s acquisitions 20,805 57,335
Purchase price reduction 0 –4,809
Disposals –96,051 –
Closing accumulated acquisition value 122,107 197,353
Opening write-offs –40,685 –27,010
Disposals – –
The year’s write-offs –7,119 –13,675
Closing accumulated write-offs –47,804 –40,685
Opening amortisation –96,051 –
The year’s amortisation – –96,051
Disposals 96,051 –
Closing accumulated amortisation 0 –96,051
Closing scheduled residual value 74,303 60,617
REMAINING AMORTISATION PERIOD IN NUMBER OF YEARSScheduled, booked residual value consists of: 31 DEC. 2004
Cyber Com Consulting AEBS AB 4,026 8
Cyber Com Consulting A/S 1,151 3
Cyber Com Consulting A/S 1,891 4
Cyber Com Intra-X AB 3,772 5
Mobility Partner Europe AB 5,121 8
Consafe Infotech AB 58,342 9
Total 74,303
Along with the goodwill-amortisation test, estimates of future cash fl ow, which the assets could generate, are made. Value of future cash fl ow depends signifi -cantly on the applied interest rate. Assumptions and assessments that were done with the amortisation test in 2004 are described below.
When the operations’ cash fl ows are forecasted without accounting for fi nancial items, the applied interest rate for discounting cash fl ows refl ects the weighted capital cost for shareholders’ equity with loan fi nancing after tax, i.e., the weight-ed average cost of capital (WACC). To determine the WACC, these factors must be estimated:
• Debt/equity ratio (fi nancing mix)
• Return on investment demands on shareholders’ equity
• Cost of long-term loan fi nancing
The company decided to always fi nance with shareholders’ equity. The company acquired tangible fi xed assets and 100% fi nancing with shareholders’ equity, which is supported by comparison with other companies.
The return-demand level on shareholders’ equity is normally based on the capital asset pricing model (CAPM); consequently, return demand is based on risk-free interest, with the addition of a risk premium.
The risk-free interest rate is equal to 10-year government bonds, about 5%.
The risk premium comprises:
• General compensation for share-investment risks. This market risk premium was estimated to be about 5%.
• A weighting up or down for the current investment risk, relative to the market average. This factor was estimated to be about 1.5.
• A supplement regarding the company’s size and a specifi c, risk-condition supplement. In the company’s case (besides size-related supplement), this means, e.g., an insuffi cient track record that supports positive future fi nancial trends and especially dependent relationships (primarily customers and key people). Together, these supplements were estimated to be from 6.5% to about 8.5%.
The total projected interest rate (median value in the above interval) after tax was based on the above factors and estimated to be:
5% + 1.5 x 5% + 7.5% = 20%.
The interest rate is unchanged from the previous year.

29
NOTES
NOTE 16 TANGIBLE FIXED ASSETS
GROUP PARENT COMPANY
Inventory and equipment 2004 2003 2004 2003
Opening acquisition value 29,501 23,738 5,046 4,742
Purchases 5,621 3,528 517 304
Sales and disposals –1,042 –608 –17 –
Through acquisition of subsidiaries – 2,916
Conversion differences –58 –73
Closing accumulated acquisition value 34,022 29,501 5,546 5,046
Opening write-offs –18,704 –13,875 –3,973 –3,196
Sales and disposals 791 417 10 –
Through acquisition of subsidiaries – –106 – –
The year’s write-offs –5,674 –5,151 –613 –777
Conversion differences 309 11
Closing accumulated write-offs –23,278 –18,704 –4,576 –3,973
Closing scheduled residual value 10,744 10,797 970 1,073
NOTE 17 PARTICIPATION IN SUBSIDIARIES
PARENT COMPANY
Shares in Group company 2004 2003
Opening acquisition value 266,714 199,873
Acquisition of subsidiaries 20,442 70,190
Shareholder contributions 1,047 1,493
Purchase price reduction – –4,842
Closing accumulated acquisition value 288,203 266,714
Opening write-downs –163,577 –21,281
The year’s write-downs –1,047 –142,296
Closing accumulated write-downs –164,624 –163,577
Closing scheduled residual value 123,579 103,137
NOTE 18 PARTICIPATION IN SUBSIDIARIES
Share of capital No. of Book & votes shares value
Cyber Com Consulting Stockholm AB 100.0% 1,001 120
Cyber Com Consulting Innovation Stockholm AB 100.0% 1,000 120
Cyber Com Consulting 603 AB 100.0% 1,000 120
Cyber Com Consulting Uppsala AB 100.0% 1,000 120
Cyber Com Consulting Business Uniware AB 100.0% 1,000 120
Cyber Com Consulting Business Solutions AB 100.0% 1,000 120
Cybercom Group Stockholm AB 100.0% 1,000 120
Cyber Com Consulting EC AB 100.0% 1,000 120
Cyber Com Consulting ER AB 100.0% 1,000 120
Cyber Com Consulting Concentit AB 100.0% 1,000 120
Cyber Com Consulting Communications i Stockholm AB 100.0% 1,000 120
Cyber Com Consulting CoreTech Stockholm AB 100.0% 1,000 120
Global Communication Solutions Nordic AB 100.0% 1,000 120
Cyber Com Net Business Consulting AB 100.0% 1,000 120
Cyber Com Pir New World Media AB 100.0% 1,000 120
Cyber Com Consulting PM AB 100.0% 1,000 120
Cybercom Mobility Stockholm AB 100.0% 1,000 120
Cyber Com Consulting ProvideIT AB 100.0% 1,000 120
Cyber Com Consulting ConnectIT Sverige AB 100.0% 1,000 120
Cyber Com Mobile Communication Scandinavia AB 100.0% 1,000 120
Cyber Com Consulting Electronic Business AB 100.0% 1,000 120
Cyber Com Consulting AE BS AB 100.0% 1,000 120
Cyber Com Consulting I-Net Solutions AB 100.0% 1,000 120
Cyber Com Consulting Syd AB 100.0% 1,000 100
Cyber Com Intra-X AB 100.0% 1,000 4,591
Cyber Com StreamIT AB 100.0% 108,003 133
Cyber Com Consulting A/S 100.0% 5,000 3,133
Cybercom Group UK Ltd 100.0% 100 24,608
Cyber Com I.T Consulting Ltd 90.0% 0
Mobility Partner Europe AB 100.0% 1,372,000 19,618
Mobility Partner Invest AB 100.0% 1,000
Cybercom CGSIT AB 100.0% 1,114,350 68,636
Cybercom Öst AB 100.0% 10,000
Cybercom Syd AB 100.0% 10,000
Cybercom Syd Product AB 100.0% 1,000
Cybercom Norge AS 100.0% 1,001
Total 123,579

30
NOTES
NOTE 18 PARTICIPATION IN SUBSIDIARIES (CONT.)
Subsidiaries’ corporate IDs and sites: ID Sites
Cyber Com Consulting Stockholm AB 556497-0787 Stockholm
Cyber Com Consulting Innovation Stockholm AB 556535-3389 Stockholm
Cyber Com Consulting 603 AB 556538-0432 Stockholm
Cyber Com Consulting Uppsala AB 556544-6225 Stockholm
Cyber Com Consulting Business Uniware AB 556542-2127 Stockholm
Cyber Com Consulting Business Solutions AB 556544-6332 Stockholm
Cybercom Group Stockholm AB 556551-4493 Stockholm
Cyber Com Consulting EC AB 556554-3161 Stockholm
Cyber Com Consulting ER AB 556554-8673 Stockholm
Cyber Com Consulting ConcentIT AB 556563-8359 Stockholm
Cyber Com Consulting Communications i Stockholm AB 556566-1575 Stockholm
Cyber Com Consulting CoreTech Stockholm AB 556566-0452 Stockholm
Global Communication Solutions Nordic AB 556566-0445 Stockholm
Cyber Com Net Business Consulting AB 556567-9445 Stockholm
Cyber Com Pir New World Media AB 556571-9845 Stockholm
Cyber Com Consulting PM AB 556575-7589 Stockholm
CyberCom Mobility Stockholm AB 556578-2694 Stockholm
Cyber Com Consulting ProvideIT AB 556575-9783 Stockholm
Cyber Com Consulting ConnectIT Sverige AB 556579-4608 Stockholm
Cyber Com Mobile Communication Scandinavia AB 556577-1606 Stockholm
Cyber Com Consulting Electronic Business AB 556579-4582 Stockholm
Cyber Com Consulting AE BS AB 556576-8347 Stockholm
Cyber Com Consulting I-Net Solutions AB 556577-4717 Stockholm
Cyber Com Consulting Syd AB 556581-6674 Stockholm
Cyber Com Intra-X AB 556498-6825 Stockholm
Cyber Com StreamIT AB 556551-4568 Stockholm
Cyber Com Consulting A/S 25795938 Copenhagen
Cybercom Group UK Ltd 3064392 London
Cyber Com I.T Consulting Ltd London
Mobility Partner Europe AB 556582-4421 Stockholm
Mobility Partner Invest AB 556599-8514 Stockholm
Cybercom CGSIT AB 556518-3455 Stockholm
Cybercom Öst AB 556591-6524 Stockholm
Cybercom Syd AB 556591-8421 Stockholm
Cybercom Syd Product AB 556525-5873 Stockholm
Cybercom Norge AS 980 981 215 Asker, Norway
Three executives in Cyber Com Consulting A/S, the Danish subsidiary, acquired warrants that entitle them to buy a total of 9.9% of the shares in the subsidiary at a nominal price per share, for a total about SEK 67,000. The executives have the right to acquire 3.3% of the shares during each of these periods: 20–30 March 2004, 20–30 March 2005, and 1–10 December 2005. In addition, there is a call option that gives Cybercom the right to buy subscribed shares, based on the company’s profi t (after write-offs), which is burdened by a 30% tax. For 2004, an accumulated profi t report was made for the period up to and including 2003. During Q1 2004, the executives exercised their warrants, which thus re-sulted in a Group capital loss of SEK 163,000. The Group bought back these shares during Q2 2004 for SEK 2,378,000, which resulted in SEK 2,192,000 in goodwill.
For March 2005, a report will be made for the 2004 fi nancial year. For No-vember 2005, a 1 January 2005–31 October 2005 period-closing report and a profi t/loss forecast for up to 31 March 2006 will be made.
In case the executives exercise their warrants, to acquire 3.3% of the shares, then in March, a Group capital loss of SEK 233,000 will be reported. This loss is based on the subsidiary’s equity as of 31 December 2004.
NOTE 19 OTHER LONG-TERM SECURITIES
GROUP
2004 2003
Opening acquisition value 182 190
Conversion differences – –8
Closing accumulated acquisition value 182 182
Opening write-offs –182
The year’s write-offs – –182
Closing accumulated write-offs –182 –182
Closing scheduled residual value – –
The actual worth is based on reduced cash fl ow, through use of a discounted interest rate that is based on the rate available for a lender on the closing date.
NOTE 20 OTHER RECEIVABLES
GROUP PARENT COMPANY
2004 2003 2004 2003
Non-invoiced revenue for service assignments 25,522 25,945 – –
Other items 3,969 6,813 59 526
Total 29,491 32,758 59 526
NOTE 21 PREPAID EXPENSES AND ACCRUED INCOME
GROUP PARENT COMPANY
2004 2003 2004 2003
Prepaid rent 1,999 3,217 17 1,080
Prepaid leasing fees 73 209 5 –
Prepaid insurance premiums 1,533 1,142 343 244
Prepaid services and fees 254 450 31 –
Prepaid licensing fees 378 350 210 190
Prepaid data communication 60 – 29 –
Other items 865 1,246 15 185
Total 5,162 6,614 650 1,699
NOTE 22 OTHER SHORT-TERM INVESTMENTS
GROUP PARENT COMPANY
Current assets 2004 2003 2004 2003
Interest funds – 13,341 – 13,341
3-month certifi cates 9,960 – 9,960 –
Actual value 9,964 14,186 9,964 14,186
NOTE 23 SHAREHOLDERS’ EQUITY
Share capital consists of 11,196,355 shares at a nominal value of SEK 1.
Coversion differences GROUP
in shareholder equity 2004 2003
Opening balance –2,884 –606
Change in conversion of existing subsidiaries for the year –380 –2,278
Closing balance –3,264 –2,884
As of 31 December 2004, two outstanding warrants programmes remain.
Warrants programme 8 was part of Cybercom’s earlier acquisition of Stratum in 2002, with these conditions:
No. of subscription rights issued 162,483
Subscription period 1 January–28 February 2005
Subscription rate SEK 33.50
Warrants programme 8 intended for employees in the UK.

31
NOTES
NOTE 23 SHAREHOLDERS’ EQUITY (CONT.)
Warrants programme 9 was implemented in November 2003 with these conditions:
No. of subscription rights issued 200,000
Subscription period 16 August 2006–16 January 2007
Subscription rate SEK 32.92
Warrants programme 9 is intended for employees in the UK. As of 31 December 2004, all warrants are custodial
During the year, warrants programme 6 (500,000 warrants) expired. At that time, the Cybercom share’s market value was lower than the subscription rate, so the warrants were not exercised.
No. of outstanding warrants at year’s start 862,483
New issue warrants
Exercised warrants
Non-exercised warrants –500,000
Less custodial warrants (pertaining to warrants programme 9) –200,000
Total outstanding warrants at year’s end 162,483
NOTE 24 UNTAXED RESERVES
PARENT COMPANY
2004 2003
Tax allocation reserve, tax assessment 2001 332 332
Tax allocation reserve, tax assessment 7,327 7,327
Total 7,659 7,659
NOTE 25 DEFERRED TAX
GROUP PARENT COMPANY
2004 2003 2004 2003
Deferred prepaid tax
Restructuring reserves allocation – 747 – –
Non-deductible write-offs on inventory 862 948 120 109
Allocation for special employer’s contribution on capital insurance 785 749 345 213
Write-down of accounts receivable 11 71 4 4
Loss deduction 10,102 14,632 – 2,745
Total deferred prepaid tax 11,760 17,147 469 3,071
Deferred tax liability
Accumulated excess write-offs –27 –12 – –
Tax allocation reserve –4,497 –4,843 – –
Total deferred tax liability –4,524 –4,855 – –
Deferred tax liability, net 7,236 12,292 469 3,071
Deferred prepaid taxes and tax liabilities are offset when there is a legal offset right for current prepaid taxes and tax liabilities and when deferred taxes are processed by the same tax authority. After offsetting, these amounts were de-rived and reported in the balance sheet.
There are no temporary differences related to investments in subsidiaries.
Amounts on the balance sheet include:
GROUP PARENT COMPANY
2004 2003 2004 2003
Deferred prepaid taxes used after more than 12 months 7,200 12,815 435 –
Deferred tax liabilities payable after more than 12 months –4,518 –4,812 – –
The Group believes that 40% of the defi cit reduction can be used during 2005. The rest can be used during 2006. So the deferred tax is taken at its full value.
NOTE 25 DEFERRED TAX (CONT.)
GROUP PARENT COMPANY
2004 2003 2004 2003
Change in deferred prepaid taxes
Claims at period’s start 17,147 3,490 3,071 250
Acquired tax claims –93 11,827 – –
Period change –5,294 1,830 –2,602 2,821
Closing scheduled residual value 11,760 17,147 469 3,071
GROUP PARENT COMPANY
2004 2003 2004 2003
Allocation for deferred taxes
Allocation at period’s start 4,855 4,308
Period allocation –331 547
Closing scheduled residual value 4,524 4,855
NOTE 26 ALLOCATION FOR RESTRUCTURING
GROUP
2004 2003
Allocation at period’s start 9,993 3,760
Use –9,570 –3,760
Period allocation – 9,993
Reversal of allocations –423 –
Closing scheduled residual value 0 9,993
NOTE 27 OTHER LONG-TERM LIABILITIES
GROUP PARENT COMPANY
2004 2003 2004 2003
Special income tax on capital insurance 377 312 240 148
Total 377 312 240 148
NOTE 28 OTHER SHORT-TERM LIABILITIES
GROUP PARENT COMPANY
2004 2003 2004 2003
Tax-related liabilities 21,125 10,340 2,844 278
Liability to minority in Consafe Infotech – 8,500 – 8,500
Liability to Cybercom Group UK Limited’s previous shareholders – 18,011 – 18,011
Other short-term liabilities 1,201 6,163 318 40
Total 22,326 43,014 3,162 26,829
NOTE 29 ACCRUED EXPENSE AND PREPAID INCOME
GROUP PARENT COMPANY
2004 2003 2004 2003
Accrued salaries 8,976 11,674 2,055 812
Accrued holiday pay 11,943 6,409 658 423
Accrued social security fees 10,431 13,118 1,312 919
Accrued external services 5,733 5,202 962 1,745
Accrued acquisition costs – 4,908 – 4,908
Other items 2,801 8,249 1,080 1,688
Total 39,884 49,560 6,067 10,495

32
NOTES
NOTE 30 ADJUSTMENTS FOR ITEMS NOT INCLUDED IN CASH FLOW
GROUP PARENT COMPANY
2004 2003 2004 2003
Write-offs 15,288 20,648 613 777
Write-downs – 96,051 – –
Allocations –9,570 – – –
Other – 6,260 98 –38
Total 5,718 122,959 711 739
NOTE 31 ACQUISITION OF TANGIBLE AND INTANGIBLE FIXED ASSETS
The year’s total investments in tangible and intangible fi xed assets are:
GROUP PARENT COMPANY
2004 2003 2004 2003
Intangible fi xed assets
The year’s investments –26,623 –62,960 – –
Group value of fi xed assets in new subsidiaries – 57,366 – –
Coming Group value of fi xed assetswith increasing ownership inexisting subsidiaries 20,020 – – –
Effect on liquid assets from the year’s investments –6,603 –5,594 – –
Effect on liquid assets in investment operations –6,603 –5,594 – –
GROUP PARENT COMPANY
2004 2003 2004 2003
Tangible fi xed assets
The year’s investments –5,621 –6,407 –517 –304
Group value of fi xed assets in new subsidiaries – 2,916 – –
Effect on liquid assets from the year’s investments –5,621 –3,491 –517 –304
Effect on liquid assets in investment operations –5,621 –3,491 –418 –304
NOTE 32 LIQUID ASSETS
GROUP PARENT COMPANY
2004 2003 2004 2003
Current investments 9,960 13,341 9,960 13,341
Cash and bank deposits 37,761 60,779 7,794 55,058
Liquid assets 47,721 74,120 17,754 68,399
NOTE 33 SUBSIDIARY ACQUISITIONS
During Q1, executives at Cybercom Consulting A/S exercised their rights to buy 3.3% of the shares in the Danish subsidiary. During Q2, the Group bought back these shares for SEK 2.4 million, which led to goodwill of SEK 2.2 million.
A supplementary purchase price of SEK 18 million for the acquired Consafe Infotech was set in October, which increased the Group’s goodwill by the same amount. At an 8 December extraordinary meeting, it was decided that a new issue of 523,887 shares would be given to Consafe Infotech’s previous main owners; minority owners were paid in cash. The issue rate was SEK 30.10. Total worth of the acquired assets and liabilities, purchase prices, and effect on the Group’s liquid assets was the following:
GROUP
2004 2003
Intangible fi xed assets 20,419 57,366
Tangible fi xed assets 2,810
Other current assets 54,411
Allocations 5,541
Long-term liabilities –16,054
Short-term liabilities –33,114
Total purchase price 20,419 70,960
NOTE 33 SUBSIDIARY ACQUISITIONS (CONT.)
GROUP
2004 2003
Unpaid part of purchase price –8,500
Payment with issue of own shares –15,769 –31,666
Liquid assets in the acquired companies –16,723
Effect on liquid assets from the year’s acquisitions 4,650 14,071
Amortisation of liabilities regarding acquisitions in previous years 26,511 1,365
Total cash fl ow referring to investments in subsidiaries 31,161 15,436
NOTE 34 TRANSACTIONS AMONG GROUP COMPANIES
The parent company’s purchases and sales with Group companiesIn 2004, the parent company sold internal services worth SEK 28.9 million to Group companies (administration, management, and rental of premises with applicable services); the fi gure for 2003 was SEK 30 million. The parent company bought services from Group companies for SEK 0.5 million. These purchases covered system support for administration systems within the Group; the pur-chase fi gure for 2003 was for SEK 0.8 million.
Purchases and sales with affi liated companiesIn 2004, services were sold to an affi liated company for SEK 1.6 million. The company is part of a group that is controlled by Christer Ericsson, Cybercom’s new main owner. Pricing principles were the same as those used for transactions with external companies.
Executive management remunerationIn 2004, salary and other remuneration paid to the CEO of the parent company was SEK 2,888,000; variable compensation accounts for SEK 203,000 of this amount and SEK 528,000 was guaranteed.
Salary and remuneration to the other executives was SEK 13,224,000; variable compensation accounts for 1,317,000 of this amount. This affected 9 persons; three worked part of the year.
Executives’ salaries and compensation consist of two parts: fi xed and variable. The fi xed part is comparable to the person’s base salary; the variable part is based on achieved objectives during the year. Two of the executives have no variable compensation.
Executives receive premium-based provisions. A premium-based pension pro-vision of 30% of gross salary is made for the current president and CEO. A provi-sion of 25% of gross salary is made for one of the executives. And an additional four persons receive pension provisions according to the Group’s age- and salary-based premium plan. One executive is covered by pension insurance schemes equivalent to the ITP plan.
Besides benefi ts described above for executives, there are no specifi c pension benefi ts.
Other agreements with executive managementIf the company cancels the CEO’s contract, then besides a salary during the six-month notifi cation period, the CEO is entitled to severance pay equal to six months’ salary. If the company cancels other executives’ contracts, then a 4–24 month notifi cation applies, and no severance pay is granted.
Board remunerationThe board receives SEK 695,000; of this amount, SEK 135,000 goes to the board chairman.
The remaining SEK 560,000 is divided among the other board members. Payment is made during 2005.
There are 30,000 outstanding warrants for executives; in March 2004, Cybercom’s last warrants programme for Swedish employees expired. The market value was lower at that time than the subscription rate, so the warrants were not exercised.
Decision on remuneration and benefi ts for executives Each year, the shareholders’ meeting sets the board’s compensation. The board sets (1) the CEO’s annual salary and benefi ts (for which the board chair is ultima-tely responsible) and (2) other executives’ salaries and benefi ts.
Other transactionsIn separate notes, there is information on:– Salaries and compensation for the CEO and board.– Transactions with Group companies.
In accordance with RR23, no other transactions with affi liates occurred during 2004.
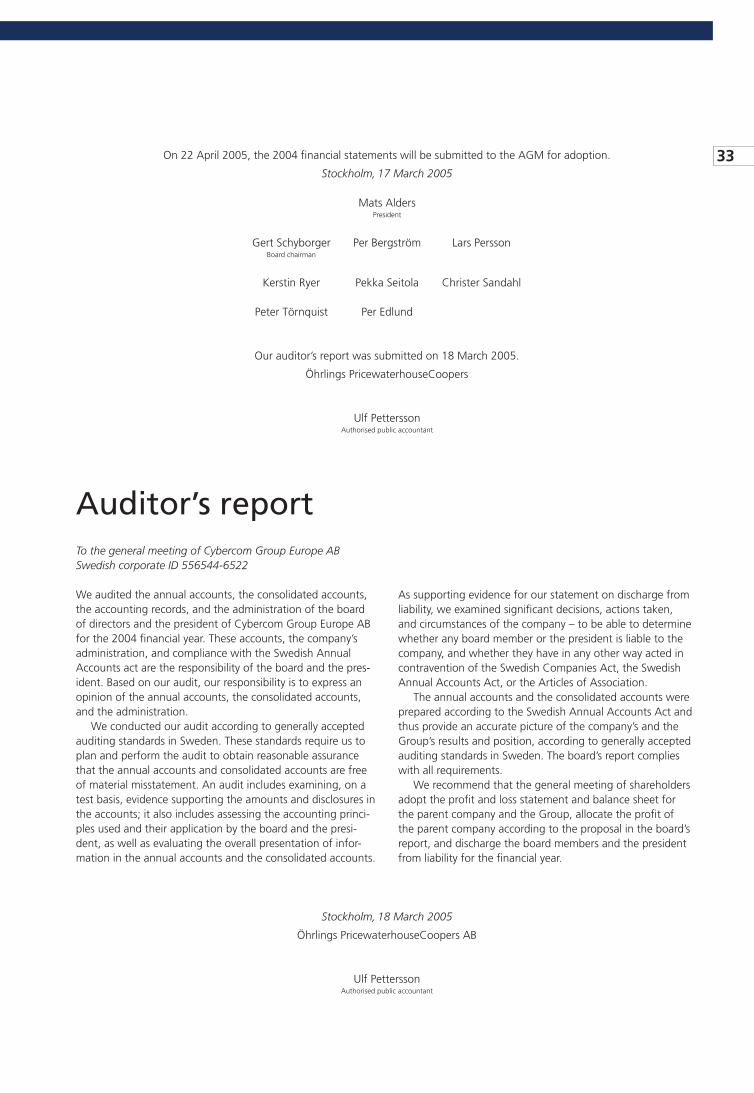
33
To the general meeting of Cybercom Group Europe ABSwedish corporate ID 556544-6522
We audited the annual accounts, the consolidated accounts, the accounting records, and the administration of the board of directors and the president of Cybercom Group Europe AB for the 2004 fi nancial year. These accounts, the company’s administration, and compliance with the Swedish Annual Accounts act are the responsibility of the board and the pres-ident. Based on our audit, our responsibility is to express an opinion of the annual accounts, the consolidated accounts, and the administration.
We conducted our audit according to generally accepted auditing standards in Sweden. These standards require us to plan and perform the audit to obtain reasonable assurance that the annual accounts and consolidated accounts are free of material misstatement. An audit includes examining, on a test basis, evidence supporting the amounts and disclosures in the accounts; it also includes assessing the accounting princi-ples used and their application by the board and the presi-dent, as well as evaluating the overall presentation of infor-mation in the annual accounts and the consolidated accounts.
Auditor’s report
As supporting evidence for our statement on discharge from liability, we examined signifi cant decisions, actions taken, and circumstances of the company – to be able to determine whether any board member or the president is liable to the company, and whether they have in any other way acted in contravention of the Swedish Companies Act, the Swedish Annual Accounts Act, or the Articles of Association.
The annual accounts and the consolidated accounts were prepared according to the Swedish Annual Accounts Act and thus provide an accurate picture of the company’s and the Group’s results and position, according to generally accepted auditing standards in Sweden. The board’s report complies with all requirements.
We recommend that the general meeting of shareholders adopt the profi t and loss statement and balance sheet for the parent company and the Group, allocate the profi t of the parent company according to the proposal in the board’s report, and discharge the board members and the president from liability for the fi nancial year.
Stockholm, 18 March 2005
Öhrlings PricewaterhouseCoopers AB
Ulf PetterssonAuthorised public accountant
On 22 April 2005, the 2004 fi nancial statements will be submitted to the AGM for adoption.
Stockholm, 17 March 2005
Mats Alders President
Gert Schyborger Per Bergström Lars Persson Board chairman
Kerstin Ryer Pekka Seitola Christer Sandahl
Peter Törnquist Per Edlund
Our auditor’s report was submitted on 18 March 2005.
Öhrlings PricewaterhouseCoopers
Ulf Pettersson Authorised public accountant

34
Board and executivesBoard
Gert Schyborger born 1940Member and chair since 2000.Vice president SAAB AB.
Other board positionsBoard chair of MSC AB, IST AB, and Novator AB.Member of Technology Nexus AB, Dotcom Solutions AB, and Enlight AB.
Cybercom holdings5,000 shares.
ExpertiseTechnology and international business.
Per Bergström born 1958Member and vice chair since 1997.Founder. President and CEO from 1997–2000.
Other board positionsBoard chair of TIMECUT AB, Cyber Venture Capital AB, and Tele5.
Cybercom holdings1,314,025 shares, which were sold after year-end, according to a transfer contract with JCE Group AB.
ExpertiseIT industry.
Per Edlund born 1958Member since 2003. CEO of Consafe IT AB and JCE Gruppen Fastighets AB.
Other board positionsBoard chair of Docteq AB, member of MA-system AB, Smarteq AB, Consafe Logistic AB.
Cybercom holdings41,998 issue shares. The JCE Group AB, an associated company, acquired 4,230,479 shares through the contracted, 15 March 2005 share transfer from Cybercom’s two founders.
ExpertiseBusiness acquisitions and development.
Lars Persson born 1956Member since 1998. CEO of Marratech AB.
Other board positionsMarratech Inc., Repeatit AB, The PhonePages AB, and Turn to Törn AB.
Cybercom holdings0 shares.
ExpertiseTelecom industry.
Kerstin Ryer born 1948Member since 2000.CEO HumanPartner AB.
Cybercom holdings0 shares.
ExpertiseHuman resources.
Christer Sandahl born 1944Member since 2000. CEO of Christer Sandahl Consulting AB.
Other board positionsBoard chair of Rival AB, member of Proffi ce AB and others.
Cybercom holdings0 shares.
ExpertiseMarketing communications.
Pekka Seitola born 1958Founder. Board member since 1997.
Other board positionsTIMECUT AB, Eye Control Technology AB, Trebis AB, Nordiska Kakelcenter AB, Pero Fastigheter AB, Urfjället AB.
Cybercom holdings1,316,025 shares, which were sold after year-end, according to a transfer contract with JCE Group AB.
ExpertiseIT industry.
Peter Törnquist born 1953Member since 1998; chair from 1998–2000. Managing director of CVC Capital Partners.
Other board positionsBoard chair for Technology Nexus AB, Danske Traelast A/S, and Starbreeze Studios AB.
Cybercom holdings62,725 shares.
ExpertiseInternational business, business development, acquisitions, and fi nancing.
Holdings per December 31, 2004.
Auditor
Ulf Pettersson born 1959Authorised auditor.Öhrlings PricewaterhouseCoopers AB.Auditor since 1999.

35
BOARD AND EXECUTIVES
Executives
Mats AldersPresident and CEO. Born 1958. CFO from 1998–2000 and vice president 1999–2000. Employed since 1998. B.S. in economics and market economy. Previous employment: CelsiusTech, Tele2, and TietoEnator.
Cybercom holdings: 25,400 shares.
Thomas BargeCEO of Cybercom Syd AB. Born 1962. M. Sc. Lund Institute of Tech-nology. Employed since 2003. Previous employment: Consafe Infotech Syd AB, Consafe Infotech AB, Exallon Systems AB.
Cybercom holdings: 15,030 shares.
Henrik Gavelli CEO of Cybercom Mobility Stockholm AB (as of March 2005). Born 1960. M.Sc. Royal Institute of Techno-logy, Stockholm. Employed since 1999. Previ-ous employment: Ericsson AB, Devenator AB and his own operation.
Cybercom holdings: 0 shares.
Johan GlimskogCEO of Global Communication Solutions Nordic AB. Born 1966. ADB graduate, Stockholm University. Employed since 1996. Previous employment: SJ Data and Assisstor.
Cybercom holdings: 18,400 shares.
Terry HunterCEO of Cybercom Group UK. Born 1962. Attended East Herts College. Employed since 2003. Previous employment: CBI International and Reuters Group Plc.
Cybercom holdings: 30,000 warrants.
John KolsvikCEO of Cybercom Norge AS. Born 1954. Technical engineer, Oslo Institute of Technology. Employed since 2004. Previous employment: HiQ AS, Convexo Ltd, El Tele AS, GlobalOne Communications AS, France Telecom AS, Kvaerner Process System AS, Computervision AS.
Cybercom holdings: 4,000 shares.
Peter Keller-Andreasen CEO of Cyber Com Consulting A/S. Born 1956. Electronic engineer, Danish Technical University. Employed since 2001. Previous employment: TietoEnator A/S and Digital A/S.
Cybercom holdings: 1,000 shares.
Bengt LevinManager of Sweden and International BAs. Born 1955. M.Sc. in engineering. Employed since 2000. Previous employment: Tieto-Enator AB and his own operation.
Cybercom holdings: 5,000 shares.
Anneli LindblomCFO. Born 1967. Economics, Frans Schartau Stockholm. Employed since 1999. Previous employment: Celsius Tech, Bofors Systems, Företagarnas Revisionsbyrå.
Cybercom holdings: 6,400 shares.
Kristina SvenssonManager Corporate Communications. Born 1968. M.A. Uppsala University. Employed since 1999. Previous employment: Linköping University Hospital.
Cybercom holdings: 3,400 shares.
Holdings per December 31, 2004.
36 Cybercom Group
Stockholm, SwedenBox 7574
SE-103 93 Stockholm
Tel +46 8 578 646 00
Fax +46 8 578 646 10
Visitors address:
Fleminggatan 20
London, United Kingdom128 Cheapside
London EC2V 6BT
Tel +44 20 7796 4700
Fax +44 20 7796 4701
Copenhagen, DenmarkVesterbrogade 149
DK-1620 Copenhagen
Tel +45 70 42 42 70
Fax +45 70 42 42 72
Oslo, NorwayDrammensveien 167
NO-0277 Oslo
Tel +47 982 99 600
Fax +47 983 99 600
Gothenburg, SwedenDrottninggatan 31
SE-411 14 Gothenburg
Tel +46 31 711 22 10
Fax +46 31 711 22 29
Linköping, SwedenTeknikringen 1F
SE-583 30 Linköping
Tel +46 13 210 650
Fax +46 13 21 35 78
Malmö, SwedenAdelgatan 9
SE-211 22 Malmö
Tel +46 40 691 96 00
Fax +46 40 691 96 96
Sundsvall, SwedenStorgatan 29
SE-852 30 Sundsvall
Tel +46 60 17 40 50
Fax +46 60 17 40 57
Addresses

Production: AB Taurus Kommunikation/Cybercom Group Europe AB.
Translation: American Writing & Editing AB.
Graphic design: Wille Wilhelmsson.
Photo: Håkan Flank.
Print: NRS Tryckeri AB, 2005.
This annual report has been produced in two versions, one in Swedish and one in English. In the event of any discrepancies or inconsistencies between the two versions, the Swedish version shall prevail.

www.cybercomgroup.se