customer needs assessment survey -philippi east planning area- prepared by : roots research sa for :...
TRANSCRIPT

Customer Needs Assessment Survey-Philippi East Planning Area-
Prepared by : Roots Research SAFor : City of Cape Town
August 2002

Background and Objectives
To ensure meaningful public input in the Phillip East planning process it was proposed that a community survey be conducted to obtain community input around service delivery and development priorities.
The objective of the survey were to:
• Establish a demographic and socio-economic profile of the community in terms of household size and composition, education, income and work status
• Identify the priorities and preferences of the community by measuring perceptions of the importance of various services as well as levels of customer satisfaction for current service provision
• Gauge the ability or willingness to pay for various levels of services

Methodology
• The face-to-face methodology with a random selection of households in the area was used. A map was provided of the area and a set number of interviews were conducted within each sampling point identified. This method ensured that the whole area was covered.
• All interviews were conducted in the home language of the respondents by interviewers who are both ethnically and linguistically matched to the respondents

MaleFemale
Gender
40 60
020406080
100
Demographic profile of respondents
Age
1
14
25
26
14
13
7
0 20 40 60 80 100
<18yrs
18 - 24 yrs
25-29yrs
30-34yrs
35-39yrs
40-49yrs
50+yrs
Education
51
165
23
5Some primary
Primary
Some HS
HS completed
Post matric
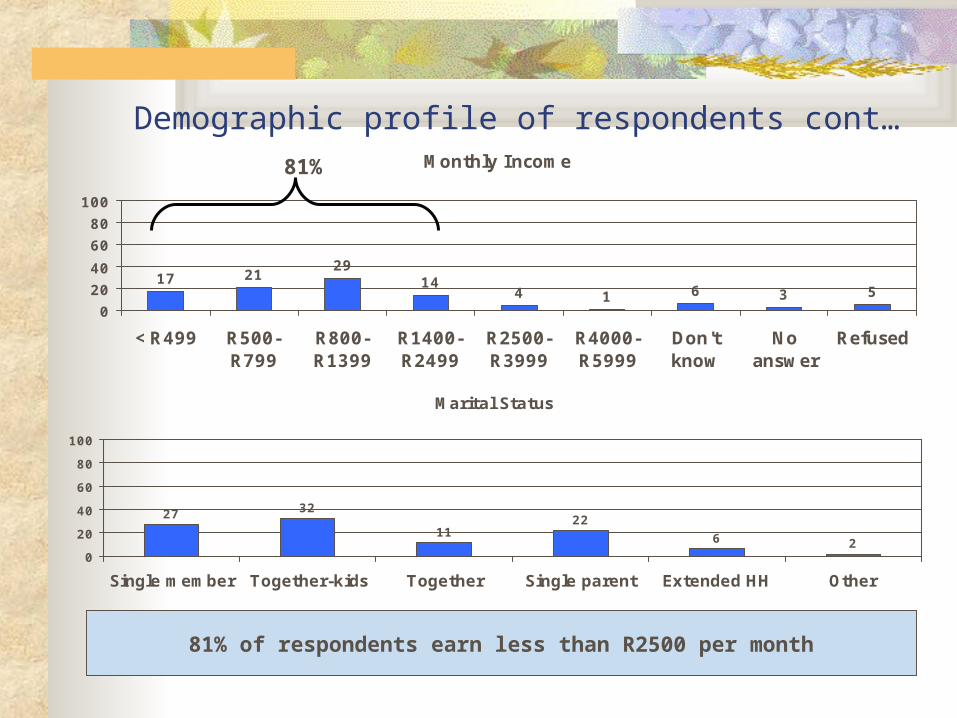
Demographic profile of respondents cont…
Marital Status
27 32
1122
6 20
20
40
60
80
100
Single member Together-kids Together Single parent Extended HH Other
Monthly Income
17 2129
144 1 6 3 5
0
20
40
60
80
100
<R499 R500-R799
R800-R1399
R1400-R2499
R2500-R3999
R4000-R5999
Don'tknow
Noanswer
Refused
81% of respondents earn less than R2500 per month
81%
Employment Status
21
15
9
33
2
8
1
11
0 20 40 60 80 100
Full-time
Part-time
Part-time (home)
Unemployed(looking)
Retired
Student
Unemployed(notlooking
Housewife
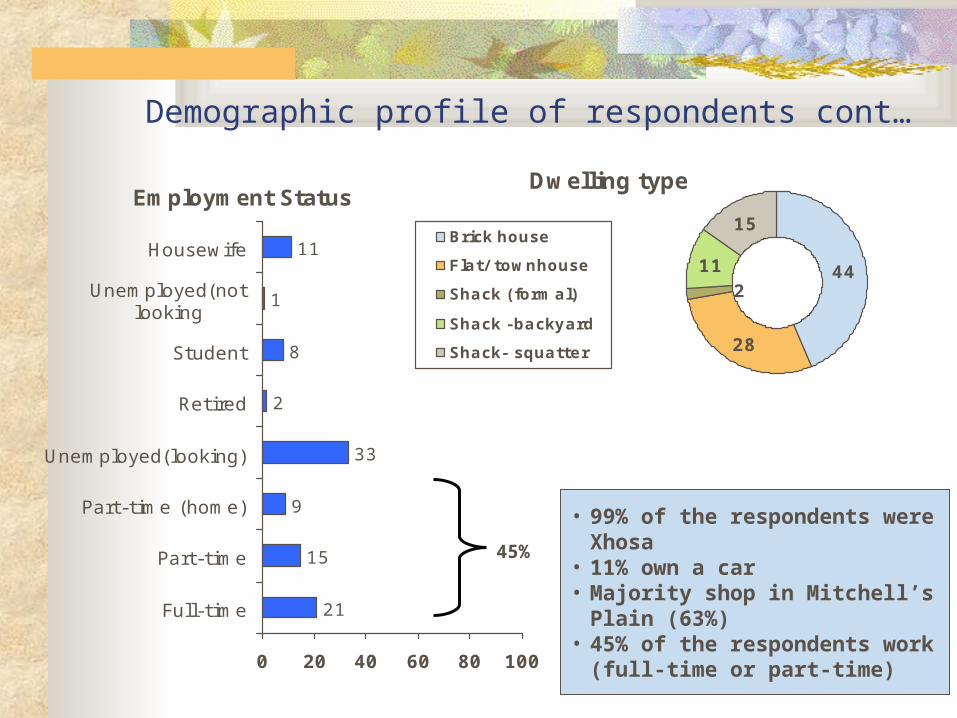
• 99% of the respondents were Xhosa
• 11% own a car• Majority shop in Mitchell’s
Plain (63%)• 45% of the respondents
work (full-time or part-time)
Dwelling type
44
28
11
15
2
Brick house
Flat/ townhouse
Shack (formal)
Shack -backyard
Shack- squatter
Demographic profile of respondents cont…
45%

Attitudinal segments
• Respondents were exposed to a list of statements and asked to indicate their level of agreement on the various statements.
• This exercise enabled us to segment the sample into three distinct groups, namely, Willing Payers, Neutrals and Begrudging Payers

Segment descriptions
Willing Payers
%
Neutral
%
Begrudging Payers
%
Size of segment 60 27 13
Female 59 50 64
Male 41 50 36
18-29yrs 36 50 36
30-39yrs 36 33 47
40+yrs 28 17 17
Employed(P/T or F/T)
42 36 53
Unemployed (seeking)
38 35 17

Segment descriptions
Willing Payers
%
Neutral
%
Begrudging Payers
%
Primary education
27 35 51
High School 65 57 49
Post Matric 8 5 -
Formal Dwelling 83 70 50
Informal dwelling 17 30 50
<R800 44 21 56
R800-R2499 37 58 36
R2599+ 6 1 3
Refused 13 20 5

Defining statements for attitudinal segments- Willing Payers
• Non-payment of services will affect the quality of services rendered in my area
• Paying for a service is like paying any other account• Without payment of services there will be no services in our area• I’m so used to the services in my area I will feel its absence if no
longer there
These statements were strongly agreed to by Willing Payers and less so by other segments
The Willing Payers are the largest of the three segments comprising mainly females. An equal spread of ages in this segment, with most living in formal dwellings. By comparison, the highest percentage of post matric qualifications present in this group. They have a positive
attitude towards payment of services and understand that without payment there is likely to be deterioration of services or at worst no
services in the area at all

Defining statements for attitudinal segments- Neutrals
• It is necessary to pay for services as the income generated helps to change and improve things in my area
• Payment for a service is no different to paying any other account• Its not important to pay for services because it is not catering for my
needs• It is necessary to pay but I feel resentful about paying
These statements were strongly agreed to by Neutrals and less so by other segments
The Neutrals were the second largest segment and have an equal gender split. They were mainly younger in the age group 18 – 29 years and had some high school education. They understand the
need to pay for services given that the income generated could help to improve or change things in the area where they live. However, they claimed that the services rendered were not catering for their
needs

Defining statements for attitudinal segments- Begrudging Payers
• I only pay because I am forced to do so• It’s government’s responsibility to provide services free of charge• The quality of services rendered do not warrant a full fee• Most people are not paying for their services why should I
These statements were strongly agreed to by Begrudging Payers and less so by other segments
The Begrudging Payers segment was the smallest of the three segments and comprised mainly females in the age group 30 – 39 years. These are resident in both formal and informal dwellings and have primary school qualifications. The respondents in this
segment were self centred and have an air of entitlement.

Average I mportance
Ranking
Satisfaction index
Provides clean water on tap 2.1 89.2
Provides a dependable electricity supply
2.6 77.2
Maintains sewerage and storm water drainage systems
3.3 63.6
Regularly collects household rubbish/ refuse
3.4 81.3
Provides and maintains adequate street lighting
3.6 72.8
Importance and satisfaction with specific services - basic services - ranked in order of importance [where 1 = very important] of where money should be spent first and the level of satisfaction with each
Satisfaction levels are relatively high. Even higher were provision of clean water 89% and collection of refuse 81%. The provision of clean water and electricity were the two most important services

Basic Services
Looking at the three groups and their satisfaction levels with basic services:
• The Willing Payers group are the most receptive and positive towards services provided. The Begrudging Payers are the least positive.

TOTAL
%
Willing Payers
%
Neutral
%
Begrudging Payers
% Provides clean water on tap
Average importance ranking
2.1 2 2.1 2.4
Satisfaction index 89.2 94.1 80.4 73.6
Maintains sewerage and storm water drainage systems Average importance ranking
3.3 3 3.7 3.2
Satisfaction index 63.6 67.5 48.7 34
Importance and satisfaction with specific services - basic services
- ranked in order of importance [where 1 = very important] of where money should be spent first and the level of satisfaction with each

TOTAL
%
Willing Payers
%
Neutral
%
Begrudging Payers
% Provides a dependable electricity supply
Average importance ranking
2.6 2.8 2.2 2.8
Satisfaction index 77.2 79.5 69.6 55.6
Regularly collects household rubbish/ refuse Average importance ranking
3.4 3.5 3.6 3.4
Satisfaction index 81.3 88.6 68.6 58.3
Importance and satisfaction with specific services cont..

TOTAL
%
Willing Payers
%
Neutral
%
Begrudging Payers
% Provides and maintains adequate street lighting
Average importance ranking
3.6 3.7 3.4 3.2
Satisfaction index 72.8 77.8 60.9 52.8
Importance and satisfaction with specific services cont..

Average I mportance
Ranking
Satisfaction index
Provides council clinics for basic health care 3 47.2
Assists with provision of affordable housing 4.5 56.5
Keeps streets in your area in a good state of repair/ condition
4.8 57.7
Provides and maintains public libraries 5.2 50.4
Provides community halls and sports centres
5.2 57.3
Supports the economic development of Phillippi East
5.3 59.3
Provides and maintains play-parks 5.5 43.1
Keeps public places clean and in good condition
5.5 51.7
Provides sports and recreation facilities 6.1 43.9
Importance and satisfaction with specific services - community services - ranked in order of importance [where 1 = very important] of where money should be spent first and the level of satisfaction with each

Community services
• As with basic services, community services have higher satisfaction scores among the Willing Payers. However on comparing the Begrudging against the Neutral Payers, the former seem to be more satisfied than the latter
• Most of the community services rank low in terms of importance
• Provision of clinics was ranked highest in this batch

TOTAL
%
Willing Payers
%
Neutral
%
Begrudging Payers
% Provides council clinics for basic health care
Average importance ranking
3 3.3 2.8 3
Satisfaction index 47.2. 44.6 26.6 32.6
Importance and satisfaction with specific services -community services

TOTAL
%
Willing Payers
%
Neutral
%
Begrudging Payers
% Keeps streets in your area in a good state of repair/ condition
Average importance ranking
4.8 4.6 5.4 4.4
Satisfaction index 57.7 61.5 37.5 38.9
Provides community halls and sports centres
Average importance ranking
5.2 4.6 5.5 6.1
Satisfaction index 57.3 62.1 40.3 42.4
Importance and satisfaction with specific services cont..

TOTAL
%
Willing Payers
%
Neutral
%
Begrudging Payers
% Provides and maintains public libraries
Average importance ranking
5.2 4.7 4.7 5.6
Satisfaction index 50.4 50.7 37.7 44.3
Provides and maintains play-parks for children Average importance ranking
5.5 5 5.4 6.4
Satisfaction index 43.1 45.3 24.7 25
Importance and satisfaction with specific services cont..

TOTAL
%
Willing Payers
%
Neutral
%
Begrudging Payers
% Provides sport and recreation facilities
Average importance ranking
6.1 5.9 6.4 4.9
Satisfaction index 43.9 43.4 26 38.2
Assists with provision of affordable housing Average importance ranking
4.5 4.9 3.9 4.5
Satisfaction index 56.5 60.1 36 31.9
Importance and satisfaction with specific services cont..

TOTAL
%
Willing Payers
%
Neutral
%
Begrudging Payers
% Keeps public places clean and in good condition
Average importance ranking
5.5 6 5.8 5.1
Satisfaction index 51.7 50.3 32.5 36.8
Supports the economic development of Phillippi East Average importance ranking
5.3 6.1 5 5.2
Satisfaction index 59.3 60.8 39.1 43.8
Importance and satisfaction with specific services cont..

Average Importance
Ranking
Satisfaction index
Provides fire protection 2.3 46.2
Prevents illegal dumping 2.5 46.3
Enforces health regulations 2.6 44.2
Enforces traffic control 2.6 48.9
Importance and satisfaction with specific services - regulated services - ranked in order of importance [where 1 = very important] of where money should be spent first and the level of satisfaction with each
All regulated services are ranked important but have the lowest satisfaction scores overall.

TOTAL
%
Willing Payers
%
Neutral
%
Begrudging Payers
% Provides fire protection
Average importance ranking
2.3 2.3 2.2 2.1
Satisfaction index 46.2 47.8 27.2 17.4
Enforces traffic control Average importance ranking
2.6 2.6 2.6 2.3
Satisfaction index 48.9 52 25.9 21.5
Importance and satisfaction with specific services -regulated services

TOTAL
%
Willing Payers
%
Neutral
%
Begrudging Payers
% Prevents illegal dumping
Average importance ranking
2.5 2.7 2.3 2.7
Satisfaction index 46.3 50.3 24.1 14.6
Enforces health regulations Average importance ranking
2.6 2.4 2.8 2.9
Satisfaction index 44.2 44.8 22.2 16.7
Importance and satisfaction with specific services cont..

Serious problems facing the household / community – Top 5 mentioned
Household• Unemployment 39%• Housing -structural 17%• Poverty/hunger 16%• Crime 13%• Illness 13%
Community• Crime 70%• Lack of service 10%• Unemployment 8%• Poverty 7%• Illness 5%
Problems are fragmented, varying from unemployment to leaking roofs etc. Crime is the biggest problem facing the
community

103
28 30
57 60
5 7
0
50
100
Formal Informal
Got better The same Got worse Unsure
Regardless of dwelling the popular view was that crime in the past year had worsened
During the past year - what has happened to the crime situation?

Victims of violent crimes - (yes answers shown)
412
30
3
35
0
50
100
Rape Assault Robbery Hijacking Other
Yes
Have you been a victim of any of the following violent crimes in the past year?

Victims of property crimes - (yes answers shown)
8
33
1 1 1 5
38
0
50
100
Burglary Theft Car Theft Theft outof car
Stocktheft
Fraud Other
Yes
Have you been a victim of any of the following property crimes in the past year?

34 37 3441
66 63 6659
0
50
100
Male Female Formal Informal
Safe Unsafe
Overall 60% generally feel unsafe during the day
How safe do you feel walking in the area where you live during the day?

61 1
10
9499 99
90
0
50
100
Male Female Formal Informal
Safe Unsafe
How safe do you feel walking in the area where you live after dark?
Over 90% of people feeling unsafe after dark

Where do you feel unsafe?
26
2419
14
107
GarageStationSpecific streetsShopping centreShebeensShack areas
Specific streets mentioned were Mandela, Holomisa and Ruth First

Agreement with….re last dealings you had with council
I was treated in a professional and courteous manner
TOTAL
%
Willing Payers
%
Neutral
%
Begrudging Payers
%
Strongly agree 15 21 10 3
Agree 35 39 21 6
Disagree 16 6 29 8
Strongly disagree 3 1 6 11
Cannot remember 32 33 34 72
Willing Payers believe more strongly that they are treated professionally and courteously by council – are ‘good’ payers
treated differently to perceived ‘bad’ payers?

Agreement with….re last dealings you had with council
I was immediately directed to the person who could best see to my needs
TOTAL
%
Willing Payers
%
Neutral
%
Begrudging Payers
%
Strongly agree 14 18 9 -
Agree 29 29 21 8
Disagree 17 12 25 6
Strongly disagree 13 17 10 19
Cannot remember 27 24 35 67
The most agreeable to the statement were the Willing Payers

Statement best describing your knowledge of the Council
TOTAL
%
Willing Payers
%
Neutral
%
Begrudging Payers
% I know a great deal about the Council 4 7 1 -
I know quite a lot about the Council 13 18 13 3
I know very little about the Council 56 53 49 33
I know nothing about the Council 26 21 36 58
No answer 1 1 1 6
Overall respondents claim to know little or nothing about the council with 58% of the Begrudging Payers claiming to know
nothing about council

Satisfaction with the overall performance of the council in providing services to residents
TOTAL
%
Willing Payers
%
Neutral
%
Begrudging Payers
%
Very satisfied 22 23 8 3
Somewhat satisfied 33 41 23 11
Dissatisfied 13 8 28 14
Very dissatisfied 18 10 29 53
Not sure 13 17 11 17
No answer 1 1 1 2
55% of the sample indicated some satisfaction with the overall performance of the council
The bulk of those positive were the Willing Payers

Over the last 4-5 years would you say that the council has improved its service delivery in your area? TOTAL
%
Willing Payers
%
Neutral
%
Begrudging Payers
%
Yes - a great deal 24 17 10 6
Yes - somewhat 35 51 20 17
Stayed the same 19 17 33 25
No - have deteriorated a bit 9 6 18 11
No - have become a great deal worse 7 4 10 22
Unsure 6 3 10 19
Overall 59% of the sample claimed that improvements in service delivery was
evident whilst 16% said that it had deteriorated. The bulk of those seeing the improvements were in the Willing Payers segment. A third of the Begrudging Payers were negatively disposed towards service delivery

Which of the following do you pay for regularly? TOTAL
%
Willing Payers
%
Neutral
%
Begrudging Payers
% Electricity 85 92 75 53
Water 52 76 31 11
School fees 50 50 60 50
Clothing accounts 50 53 48 44
Rates 48 76 33 11
Furniture accounts 45 50 50 47
TV Licence 22 32 14 19
Services paid for regularly (50%+) were electricity, water, school fees, and clothing accounts. Looking at the different segments, the Willing Payers pay all services regularly except the television licence (32%).

Total
%
Formal dwelling
%
Informal dwelling
% Electricity 85 99 46
Water 52 67 10
School fees 50 57 31
Clothing accounts 50 54 38
Rates 48 63 8
Furniture accounts 45 52 27
TV Licence 22 25 14
None 6 - 22
People in formal dwellings pay their accounts more regularly than those in informal dwellings
Which of the following do you pay for regularly?

TOTAL
%
Willing Payers
%
Neutral
%
Begrudging Payers
%
Groceries/ Food 66 67 90 97
Lighting and heating 60 66 76 61
Accounts 46 48 54 70
Water 22 39 8 3
School fees 17 11 33 31
Transport 16 9 36 28
Rates 15 28 3 3
Major expenses in household – open ended spontaneous mentions
Groceries, lighting and accounts are the major expenses facing the households. Interestingly enough among the Willing Payers, the expenses were more evenly spread when compared to the neutrals and Begrudging Payers

TOTAL
%
Formal dwelling
%
Informal dwelling
% Groceries/ Food
66 70 53
Lighting and heating 60 69 34
Accounts 46 48 37
Water 22 29 3
School fees 17 21 8
Transport 16 19 7
Rates 15 20 -
Major expenses in household – open ended spontaneous mentions

Detailed household spending patterns
TOTAL
%
Willing Payers
%
Neutral
%
Begrudging Payers
% Food and non-alcoholic drinks 88 89 89 89 Average Rands R261 R264 R296 R211 Electricity
79
85
73
47
Average Rands R77 R76 R88 R79 Transport
75
71
76
75
Average Rands R82 R80 R84 R100 Housing
44
66
21
11
Average Rands R62.5 R47.5 R74.8 R24

TOTAL
%
Willing Payers
%
Neutral
%
Begrudging Payers
% Education 38 33 56 42
Average Rands R112 R128 R92 R75
Gambling
36
25
54
55
Average Rands R23 R18 R23 R21
Savings
28
25
21
31
Average Rands R140 R170 R80 R44 Tobacco
19
22
15
31
Average Rands R46 R42 R33 R65
Detailed household spending patterns

TOTAL
%
Willing Payers
%
Neutral
%
Begrudging Payers
% Leisure/ recreation
18
20
14
-
Average Rands R51 R43 R48 R0 Alcoholic drinks
18
18
40
33 Average Rands R69 R75 R60 R44 Telephone
6
8
8
3
Average Rands R72 R52 R121 R80
Detailed household spending patterns

Total
%
Formal dwelling
%
Informal dwelling
% Food and non-alcoholic drinks
88
89
87
Average Rands R261 R276 R219 Electricity
79
92
42
Average Rands R77 R80 R64
Transport
75
75
74
Average Rands R82 R91 R59
Housing
44
58
1
Average Rands R62.5 R62 R125
Detailed household spending patterns

Total
%
Formal dwelling
%
Informal dwelling
% Education 38 41 31
Average Rands R112 R124 R68 Gambling
36
36
37
Average Rands R23 R25 R18
Savings
28
28
27
Average Rands R140 R151 R111
Tobacco
19
18
23
Average Rands R46 R48 R42
Detailed household spending patterns

Total
%
Formal dwelling
%
Informal dwelling
% Leisure/ recreation
18
21
11
Average Rands R51 R51 R50 Alcoholic drinks
18
19
18
Average Rands R64 R70 R45
Telephone
6
8
1
Average Rands R72 R76 R30
Detailed household spending patterns