philippi market study - pedipedi.org.za/.../2016/02/demacon_philippi-market-study_-jan-2014.pdf ·...
TRANSCRIPT
1
© 2009 Demacon Market Studies © 2013 Demacon Market Studies
1
Contact Person: Milinda Brink © 2014 Demacon Market Studies +27 83 324 7363 (c) [email protected] www.demacon.co.za
PHILIPPI MARKET STUDY
January 2014
2
© 2013 Demacon Market Studies
PRESENTATION OUTLINE
• Project Brief & Process • Location Analysis & Findings • Economy & Demographics • Demand Analysis & Findings
• Industrial • Retail • Residential • Office • Other
• Economic Impact Assessment • Way Forward
3
© 2013 Demacon Market Studies
ü Demacon Market Studies were commissioned by Philippi Economic Development Initiative (PEDI) to perform in-depth market research
ü It is our understanding that an in-depth market research is required to inform strategic planning regarding current and future development potential, optimum mix of activities and market penetration rates, etc.
ü This study is focused towards the Philippi (especially in terms of the Philippi East area) area. A specialist market study is compiled, outlining current market potential (2013 as base year) as well as up to a 20-year growth forecast..
ü Study outcome: • Unlock the latent potential of Philippi Industrial
• Provide direct access to the Industrial hub; • Promote integration of Philippi to surrounding area; • Allow for the integration of Philippi Industrial to Airport
Industrial.
PROJECT BRIEF
4
© 2013 Demacon Market Studies
4
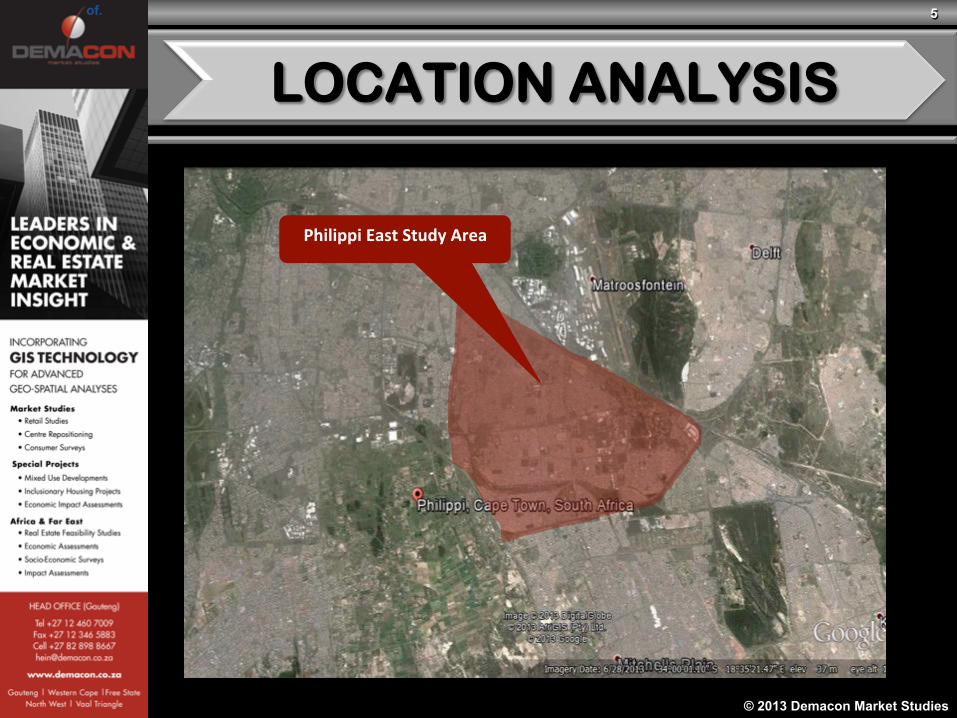
ü The Philippi area encompasses a unique and distinctive landscape, as well as the last remaining agricultural area in the Cape Town City Metropolitan area.
ü Philippi also forms part of District G (Cape Flats District) and District F (Mitchells Plain/Khayelitsha District) within the City of Cape Town context.
ü Philippi is an enormous area, bounded by Lansdowne Rd in the north, and
the railway line in the South. It is a large, diverse area with various housing types, businesses and population groups (mostly Xhosa).
ü Philippi is strategically positioned - located next to the airport, close
proximity to horticultural land and the City – all of which have made the land valuable.
ü Philippi East is identified as a sub metropolitan node (2nd highest hierarchy
of nodes).
LOCATION ANALYSIS
5
© 2013 Demacon Market Studies
of.
Philippi East Study Area
LOCATION ANALYSIS
6
© 2013 Demacon Market Studies
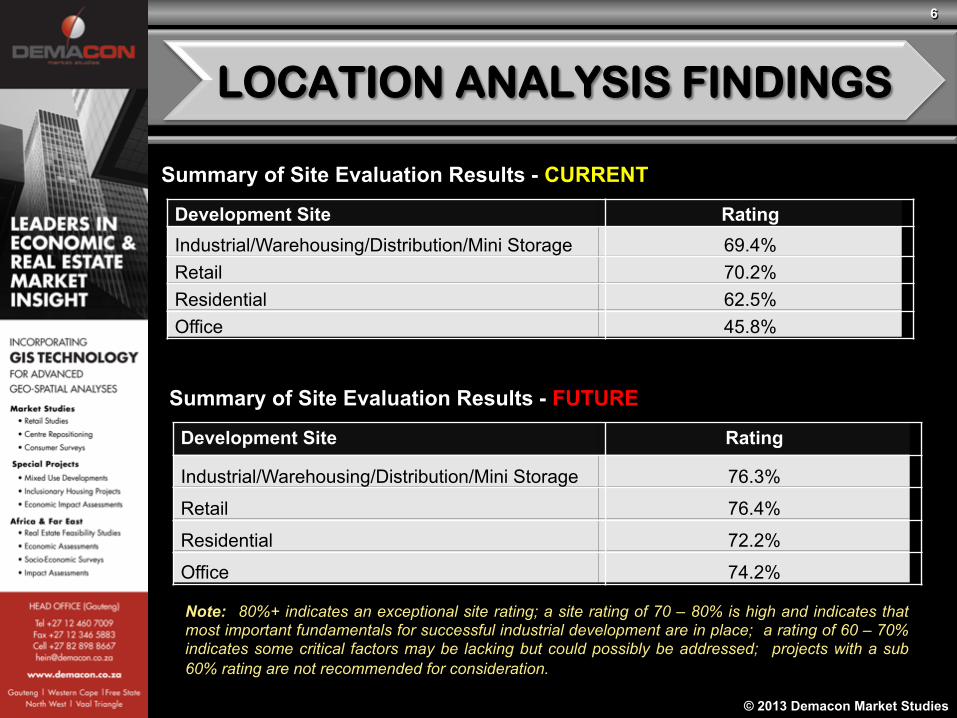
Summary of Site Evaluation Results - CURRENT
Development Site Rating
Industrial/Warehousing/Distribution/Mini Storage 69.4% Retail 70.2% Residential 62.5% Office 45.8%
Summary of Site Evaluation Results - FUTURE
Development Site Rating
Industrial/Warehousing/Distribution/Mini Storage 76.3%
Retail 76.4%
Residential 72.2%
Office 74.2%
Note: 80%+ indicates an exceptional site rating; a site rating of 70 – 80% is high and indicates that most important fundamentals for successful industrial development are in place; a rating of 60 – 70% indicates some critical factors may be lacking but could possibly be addressed; projects with a sub 60% rating are not recommended for consideration.
LOCATION ANALYSIS FINDINGS
7
© 2013 Demacon Market Studies
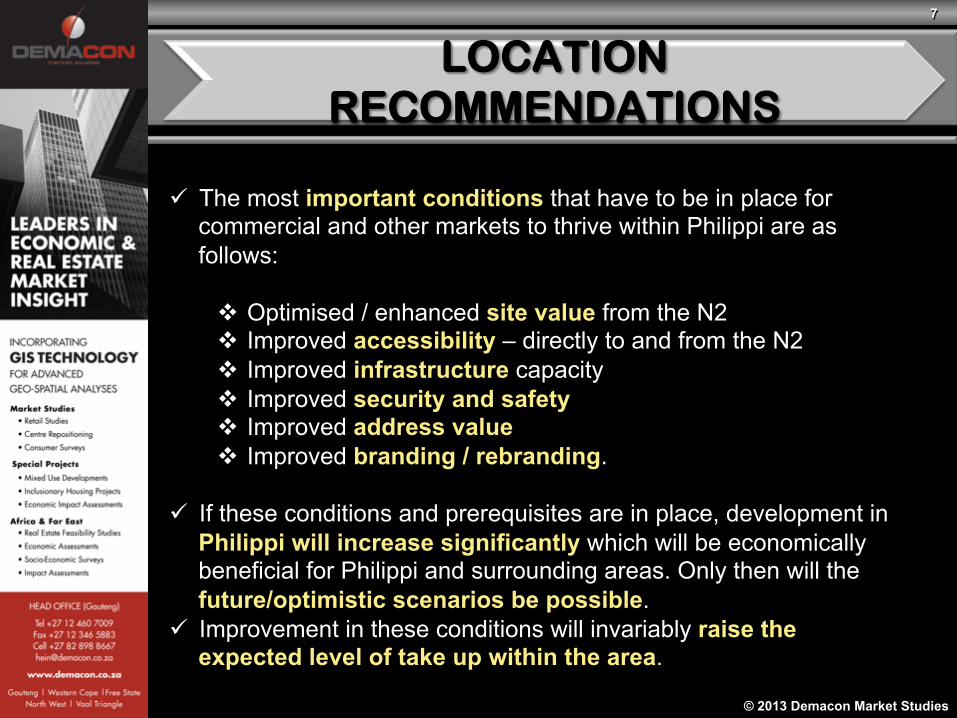
ü The most important conditions that have to be in place for commercial and other markets to thrive within Philippi are as follows:
v Optimised / enhanced site value from the N2 v Improved accessibility – directly to and from the N2 v Improved infrastructure capacity v Improved security and safety v Improved address value v Improved branding / rebranding.
ü If these conditions and prerequisites are in place, development in Philippi will increase significantly which will be economically beneficial for Philippi and surrounding areas. Only then will the future/optimistic scenarios be possible.
ü Improvement in these conditions will invariably raise the expected level of take up within the area.
LOCATION RECOMMENDATIONS

8
© 2013 Demacon Market Studies
ECONOMIC PROFILE

9
© 2013 Demacon Market Studies
VARIABLE MARKET CHARACTERISTICS
Size of the Sub-Regional Economy (2011) ü City of Cape Town Metropolitan municipal economy contributes
73.5% to the Western Cape Provincial economy.
Dominant Economic Contributions (2011)
ü CoCT Economic Profile: 1. Finance, insurance, real estate and business services
-36.1% 2. Manufacturing – 15.9% 3. Wholesale and retail trade, catering and accommodation –
15.2% 4. Transport, storage and communication – 10.9% 5. General government – 9.8%
Economic Growth Performance – Time Period 1996 - 2011
ü The City of Cape Town Metropolitan municipal economy recorded an average growth rate of approximately 3.7% over the long-term period (1995 – 2011). The short to medium term (2006 – 2011) recorded an average growth rate of approximately 3.1%.
ü Western Cape Province recorded an average growth rate of approximately 3.7% over the long-term period (1995 – 2011). The short to medium term (2006 – 2011) recorded an average growth rate of approximately 3.2%.
Manufacturing Sector Performance & Growth Time Period 2007 - 2011
ü The Petroleum products, chemicals, rubber and plastic sector is the largest sector within the Manufacturing sector with a contribution of 23.7% in 2011, followed by the Food, beverages and tobacco sector with a 17.3% contribution.
ü The manufacturing sector produced a negative growth rate of -7.7% during 2009 to 2010 followed by a growth rate of 4.2% between 2010 and 2011.
ECONOMIC PROFILE SUMMARY
10
© 2013 Demacon Market Studies
DEMOGRAPHIC PROFILE
11
© 2013 Demacon Market Studies
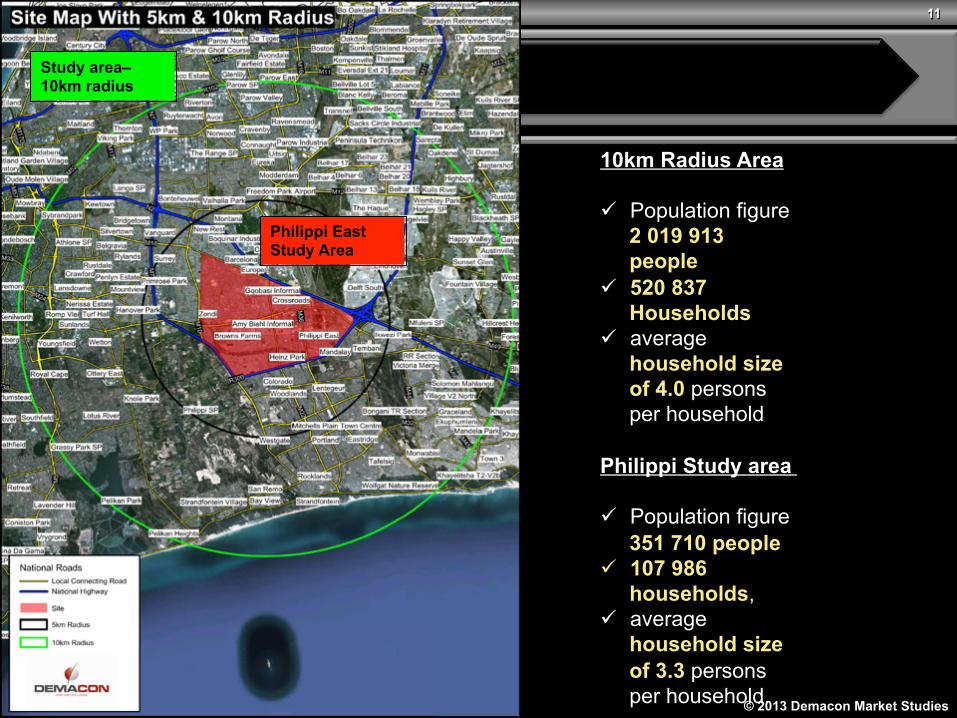
Study area– 10km radius
10km Radius Area ü Population figure
2 019 913 people
ü 520 837 Households
ü average household size of 4.0 persons per household
Philippi Study area
ü Population figure 351 710 people
ü 107 986 households,
ü average household size of 3.3 persons per household.
Philippi East Study Area

12
© 2013 Demacon Market Studies
Population Size
ü In terms of population size, the numbers are high within the Philippi study area
13
© 2013 Demacon Market Studies
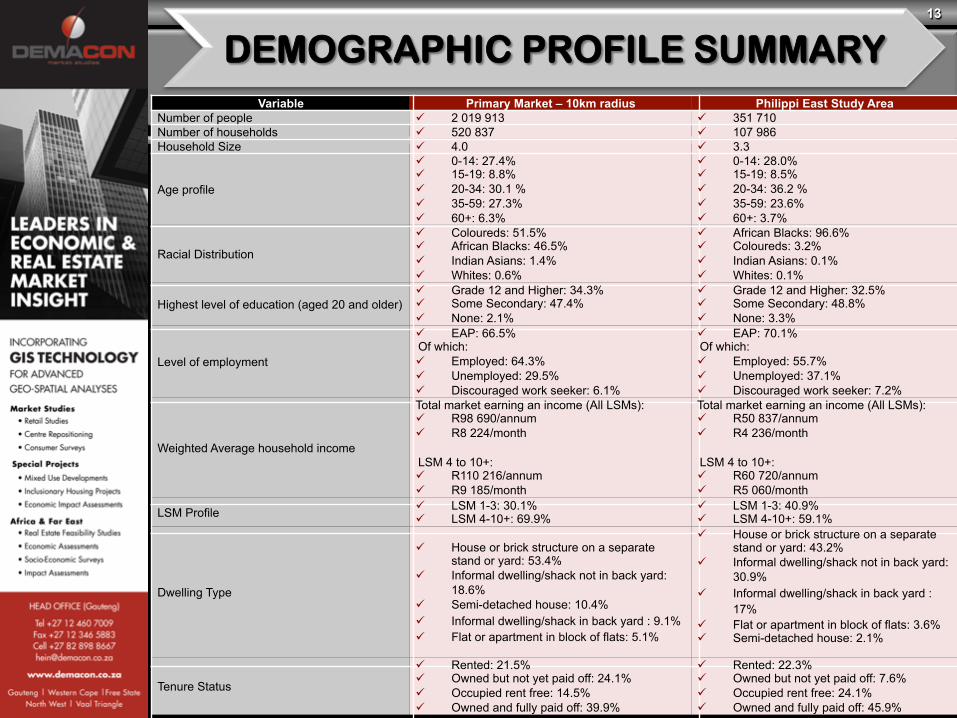
Variable Primary Market – 10km radius Philippi East Study Area Number of people ü 2 019 913 ü 351 710 Number of households ü 520 837 ü 107 986 Household Size ü 4.0 ü 3.3
Age profile
ü 0-14: 27.4% ü 15-19: 8.8% ü 20-34: 30.1 % ü 35-59: 27.3% ü 60+: 6.3%
ü 0-14: 28.0% ü 15-19: 8.5% ü 20-34: 36.2 % ü 35-59: 23.6% ü 60+: 3.7%
Racial Distribution
ü Coloureds: 51.5% ü African Blacks: 46.5% ü Indian Asians: 1.4% ü Whites: 0.6%
ü African Blacks: 96.6% ü Coloureds: 3.2% ü Indian Asians: 0.1% ü Whites: 0.1%
Highest level of education (aged 20 and older) ü Grade 12 and Higher: 34.3% ü Some Secondary: 47.4% ü None: 2.1%
ü Grade 12 and Higher: 32.5% ü Some Secondary: 48.8% ü None: 3.3%
Level of employment
ü EAP: 66.5% Of which: ü Employed: 64.3% ü Unemployed: 29.5% ü Discouraged work seeker: 6.1%
ü EAP: 70.1% Of which: ü Employed: 55.7% ü Unemployed: 37.1% ü Discouraged work seeker: 7.2%
Weighted Average household income
Total market earning an income (All LSMs): ü R98 690/annum ü R8 224/month LSM 4 to 10+: ü R110 216/annum ü R9 185/month
Total market earning an income (All LSMs): ü R50 837/annum ü R4 236/month LSM 4 to 10+: ü R60 720/annum ü R5 060/month
LSM Profile ü LSM 1-3: 30.1% ü LSM 4-10+: 69.9%
ü LSM 1-3: 40.9% ü LSM 4-10+: 59.1%
Dwelling Type
ü House or brick structure on a separate stand or yard: 53.4%
ü Informal dwelling/shack not in back yard: 18.6%
ü Semi-detached house: 10.4% ü Informal dwelling/shack in back yard : 9.1% ü Flat or apartment in block of flats: 5.1%
ü House or brick structure on a separate stand or yard: 43.2%
ü Informal dwelling/shack not in back yard: 30.9%
ü Informal dwelling/shack in back yard : 17%
ü Flat or apartment in block of flats: 3.6% ü Semi-detached house: 2.1%
Tenure Status
ü Rented: 21.5% ü Owned but not yet paid off: 24.1% ü Occupied rent free: 14.5% ü Owned and fully paid off: 39.9%
ü Rented: 22.3% ü Owned but not yet paid off: 7.6% ü Occupied rent free: 24.1% ü Owned and fully paid off: 45.9%
DEMOGRAPHIC PROFILE SUMMARY
14
© 2013 Demacon Market Studies
INDUSTRIAL MARKET FINDINGS
15
© 2013 Demacon Market Studies
INDUSTRIAL ACTIVITY
16
© 2013 Demacon Market Studies
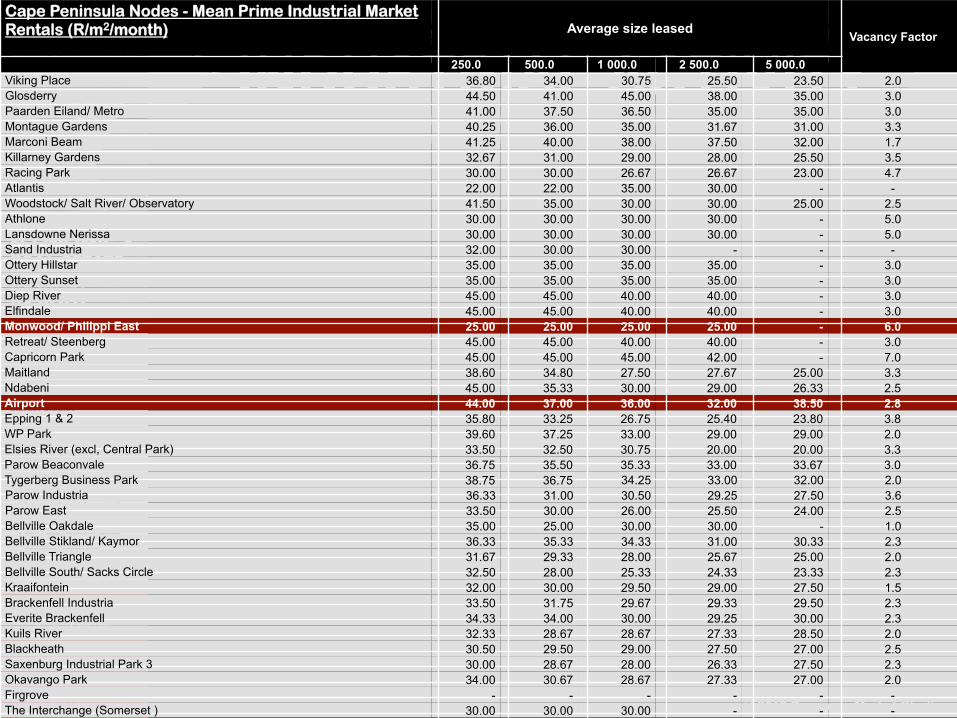
INDUSTRIAL ACTIVITY Cape Peninsula Nodes - Mean Prime Industrial Market Rentals (R/m2/month)
Average size leased Vacancy Factor
250.0 500.0 1 000.0 2 500.0 5 000.0 Viking Place 36.80 34.00 30.75 25.50 23.50 2.0 Glosderry 44.50 41.00 45.00 38.00 35.00 3.0 Paarden Eiland/ Metro 41.00 37.50 36.50 35.00 35.00 3.0 Montague Gardens 40.25 36.00 35.00 31.67 31.00 3.3 Marconi Beam 41.25 40.00 38.00 37.50 32.00 1.7 Killarney Gardens 32.67 31.00 29.00 28.00 25.50 3.5 Racing Park 30.00 30.00 26.67 26.67 23.00 4.7 Atlantis 22.00 22.00 35.00 30.00 - - Woodstock/ Salt River/ Observatory 41.50 35.00 30.00 30.00 25.00 2.5 Athlone 30.00 30.00 30.00 30.00 - 5.0 Lansdowne Nerissa 30.00 30.00 30.00 30.00 - 5.0 Sand Industria 32.00 30.00 30.00 - - - Ottery Hillstar 35.00 35.00 35.00 35.00 - 3.0 Ottery Sunset 35.00 35.00 35.00 35.00 - 3.0 Diep River 45.00 45.00 40.00 40.00 - 3.0 Elfindale 45.00 45.00 40.00 40.00 - 3.0 Monwood/ Philippi East 25.00 25.00 25.00 25.00 - 6.0 Retreat/ Steenberg 45.00 45.00 40.00 40.00 - 3.0 Capricorn Park 45.00 45.00 45.00 42.00 - 7.0 Maitland 38.60 34.80 27.50 27.67 25.00 3.3 Ndabeni 45.00 35.33 30.00 29.00 26.33 2.5 Airport 44.00 37.00 36.00 32.00 38.50 2.8 Epping 1 & 2 35.80 33.25 26.75 25.40 23.80 3.8 WP Park 39.60 37.25 33.00 29.00 29.00 2.0 Elsies River (excl, Central Park) 33.50 32.50 30.75 20.00 20.00 3.3 Parow Beaconvale 36.75 35.50 35.33 33.00 33.67 3.0 Tygerberg Business Park 38.75 36.75 34.25 33.00 32.00 2.0 Parow Industria 36.33 31.00 30.50 29.25 27.50 3.6 Parow East 33.50 30.00 26.00 25.50 24.00 2.5 Bellville Oakdale 35.00 25.00 30.00 30.00 - 1.0 Bellville Stikland/ Kaymor 36.33 35.33 34.33 31.00 30.33 2.3 Bellville Triangle 31.67 29.33 28.00 25.67 25.00 2.0 Bellville South/ Sacks Circle 32.50 28.00 25.33 24.33 23.33 2.3 Kraaifontein 32.00 30.00 29.50 29.00 27.50 1.5 Brackenfell Industria 33.50 31.75 29.67 29.33 29.50 2.3 Everite Brackenfell 34.33 34.00 30.00 29.25 30.00 2.3 Kuils River 32.33 28.67 28.67 27.33 28.50 2.0 Blackheath 30.50 29.50 29.00 27.50 27.00 2.5 Saxenburg Industrial Park 3 30.00 28.67 28.00 26.33 27.50 2.3 Okavango Park 34.00 30.67 28.67 27.33 27.00 2.0 Firgrove - - - - - - The Interchange (Somerset ) 30.00 30.00 30.00 - - -
17
© 2013 Demacon Market Studies
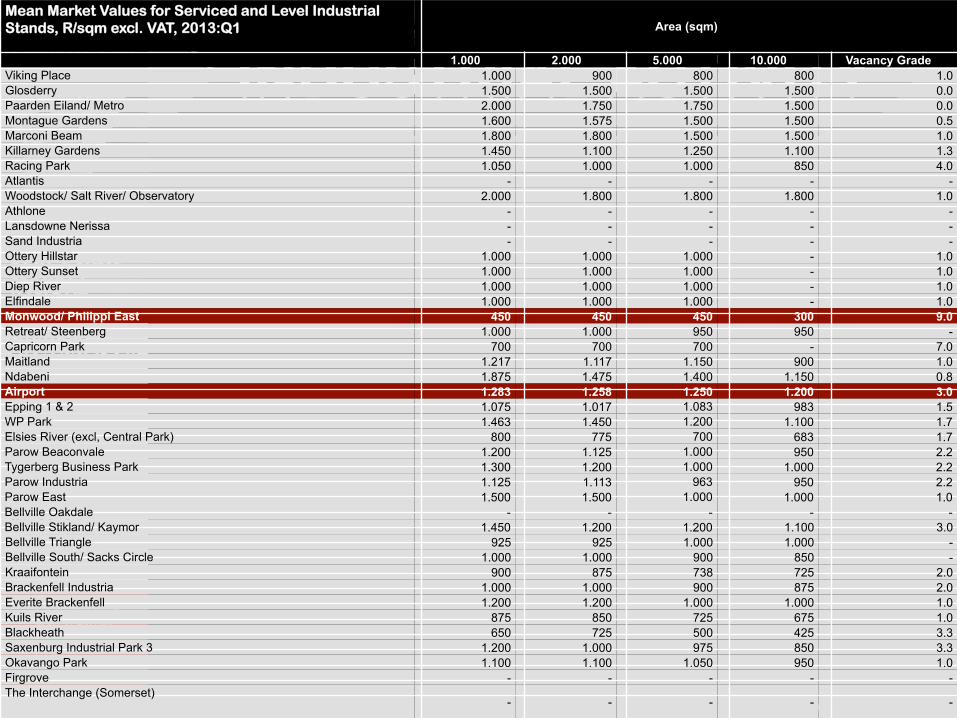
INDUSTRIAL ACTIVITY Mean Market Values for Serviced and Level Industrial Stands, R/sqm excl. VAT, 2013:Q1
Area (sqm)
1.000 2.000 5.000 10.000 Vacancy Grade Viking Place 1.000 900 800 800 1.0 Glosderry 1.500 1.500 1.500 1.500 0.0 Paarden Eiland/ Metro 2.000 1.750 1.750 1.500 0.0 Montague Gardens 1.600 1.575 1.500 1.500 0.5 Marconi Beam 1.800 1.800 1.500 1.500 1.0 Killarney Gardens 1.450 1.100 1.250 1.100 1.3 Racing Park 1.050 1.000 1.000 850 4.0 Atlantis - - - - - Woodstock/ Salt River/ Observatory 2.000 1.800 1.800 1.800 1.0 Athlone - - - - - Lansdowne Nerissa - - - - - Sand Industria - - - - - Ottery Hillstar 1.000 1.000 1.000 - 1.0 Ottery Sunset 1.000 1.000 1.000 - 1.0 Diep River 1.000 1.000 1.000 - 1.0 Elfindale 1.000 1.000 1.000 - 1.0 Monwood/ Philippi East 450 450 450 300 9.0 Retreat/ Steenberg 1.000 1.000 950 950 - Capricorn Park 700 700 700 - 7.0 Maitland 1.217 1.117 1.150 900 1.0 Ndabeni 1.875 1.475 1.400 1.150 0.8 Airport 1.283 1.258 1.250 1.200 3.0 Epping 1 & 2 1.075 1.017 1.083 983 1.5 WP Park 1.463 1.450 1.200 1.100 1.7 Elsies River (excl, Central Park) 800 775 700 683 1.7 Parow Beaconvale 1.200 1.125 1.000 950 2.2 Tygerberg Business Park 1.300 1.200 1.000 1.000 2.2 Parow Industria 1.125 1.113 963 950 2.2 Parow East 1.500 1.500 1.000 1.000 1.0 Bellville Oakdale - - - - - Bellville Stikland/ Kaymor 1.450 1.200 1.200 1.100 3.0 Bellville Triangle 925 925 1.000 1.000 - Bellville South/ Sacks Circle 1.000 1.000 900 850 - Kraaifontein 900 875 738 725 2.0 Brackenfell Industria 1.000 1.000 900 875 2.0 Everite Brackenfell 1.200 1.200 1.000 1.000 1.0 Kuils River 875 850 725 675 1.0 Blackheath 650 725 500 425 3.3 Saxenburg Industrial Park 3 1.200 1.000 975 850 3.3 Okavango Park 1.100 1.100 1.050 950 1.0 Firgrove - - - - - The Interchange (Somerset)
- - - - -
18
© 2013 Demacon Market Studies
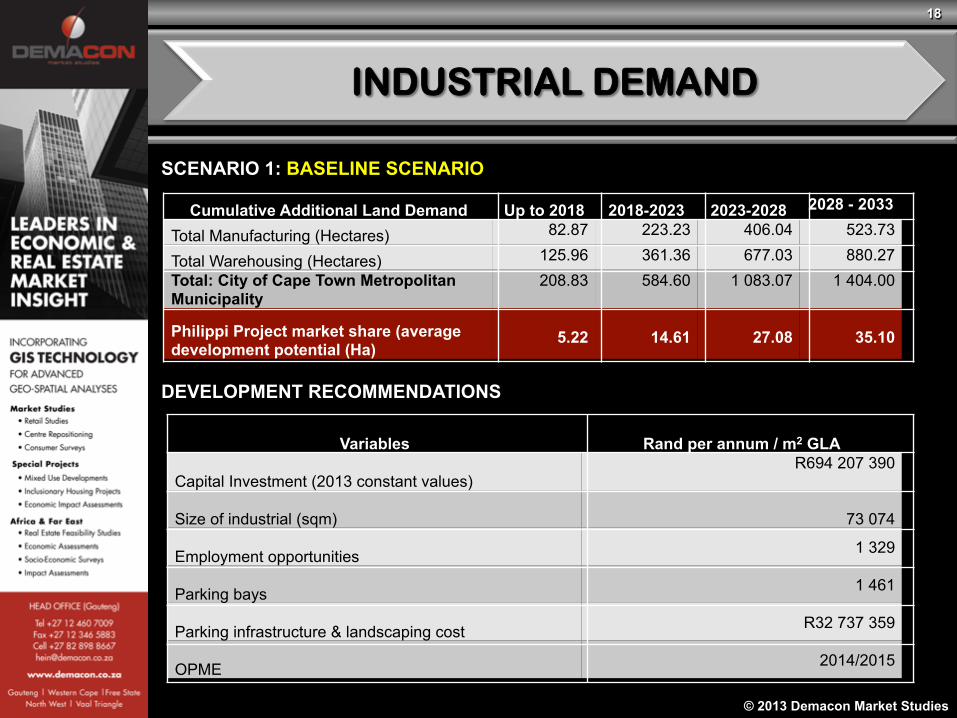
SCENARIO 1: BASELINE SCENARIO
Cumulative Additional Land Demand Up to 2018 2018-2023 2023-2028 2028 - 2033
Total Manufacturing (Hectares) 82.87 223.23 406.04 523.73
Total Warehousing (Hectares) 125.96 361.36 677.03 880.27 Total: City of Cape Town Metropolitan Municipality
208.83 584.60 1 083.07 1 404.00
Philippi Project market share (average development potential (Ha)
5.22
14.61
27.08
35.10
Variables Rand per annum / m2 GLA
Capital Investment (2013 constant values) R694 207 390
Size of industrial (sqm) 73 074
Employment opportunities 1 329
Parking bays 1 461
Parking infrastructure & landscaping cost R32 737 359
OPME 2014/2015
DEVELOPMENT RECOMMENDATIONS
INDUSTRIAL DEMAND
19
© 2013 Demacon Market Studies
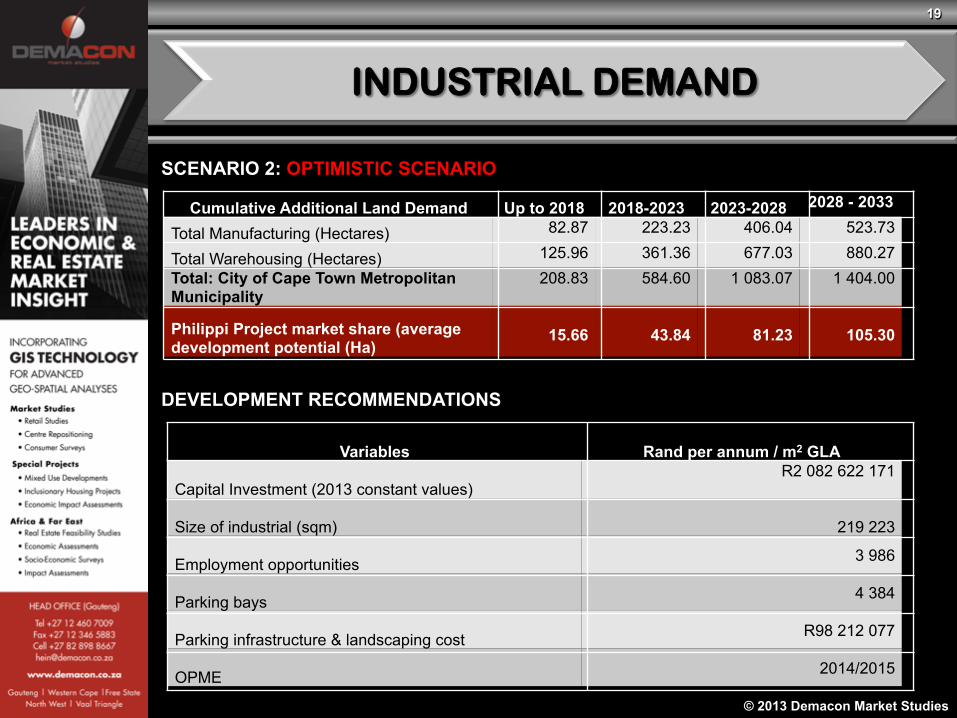
SCENARIO 2: OPTIMISTIC SCENARIO
Cumulative Additional Land Demand Up to 2018 2018-2023 2023-2028 2028 - 2033
Total Manufacturing (Hectares) 82.87 223.23 406.04 523.73
Total Warehousing (Hectares) 125.96 361.36 677.03 880.27 Total: City of Cape Town Metropolitan Municipality
208.83 584.60 1 083.07 1 404.00
Philippi Project market share (average development potential (Ha)
15.66
43.84
81.23
105.30
Variables Rand per annum / m2 GLA
Capital Investment (2013 constant values) R2 082 622 171
Size of industrial (sqm) 219 223
Employment opportunities 3 986
Parking bays 4 384
Parking infrastructure & landscaping cost R98 212 077
OPME 2014/2015
DEVELOPMENT RECOMMENDATIONS
INDUSTRIAL DEMAND
20
© 2013 Demacon Market Studies
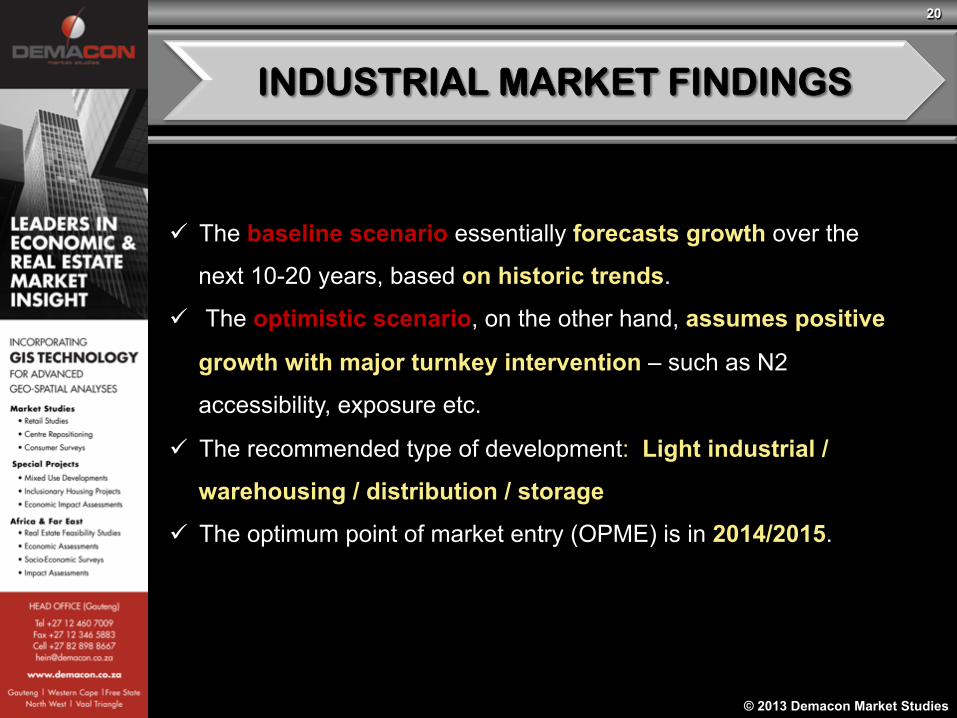
ü The baseline scenario essentially forecasts growth over the
next 10-20 years, based on historic trends.
ü The optimistic scenario, on the other hand, assumes positive
growth with major turnkey intervention – such as N2
accessibility, exposure etc.
ü The recommended type of development: Light industrial /
warehousing / distribution / storage
ü The optimum point of market entry (OPME) is in 2014/2015.
INDUSTRIAL MARKET FINDINGS

21
© 2013 Demacon Market Studies
RETAIL MARKET FINDINGS

22
© 2013 Demacon Market Studies
RETAIL SUPPLY
ü There is scope to do the first super-regional sized township mall in SA.
ü The single largest is currently 72 000sqm.
23
© 2013 Demacon Market Studies
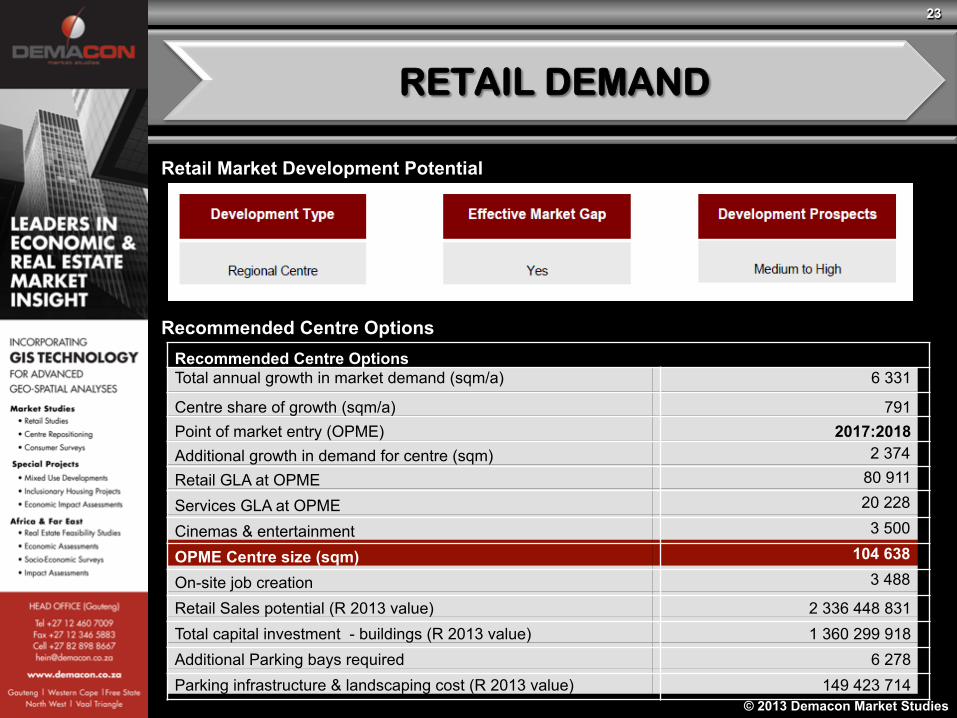
Retail Market Development Potential
Recommended Centre Options Recommended Centre Options Total annual growth in market demand (sqm/a) 6 331
Centre share of growth (sqm/a) 791 Point of market entry (OPME) 2017:2018 Additional growth in demand for centre (sqm) 2 374
Retail GLA at OPME 80 911
Services GLA at OPME 20 228
Cinemas & entertainment 3 500
OPME Centre size (sqm) 104 638
On-site job creation 3 488
Retail Sales potential (R 2013 value) 2 336 448 831 Total capital investment - buildings (R 2013 value) 1 360 299 918 Additional Parking bays required 6 278 Parking infrastructure & landscaping cost (R 2013 value) 149 423 714
RETAIL DEMAND
24
© 2013 Demacon Market Studies
RESIDENTIAL MARKET FINDINGS
25
© 2013 Demacon Market Studies
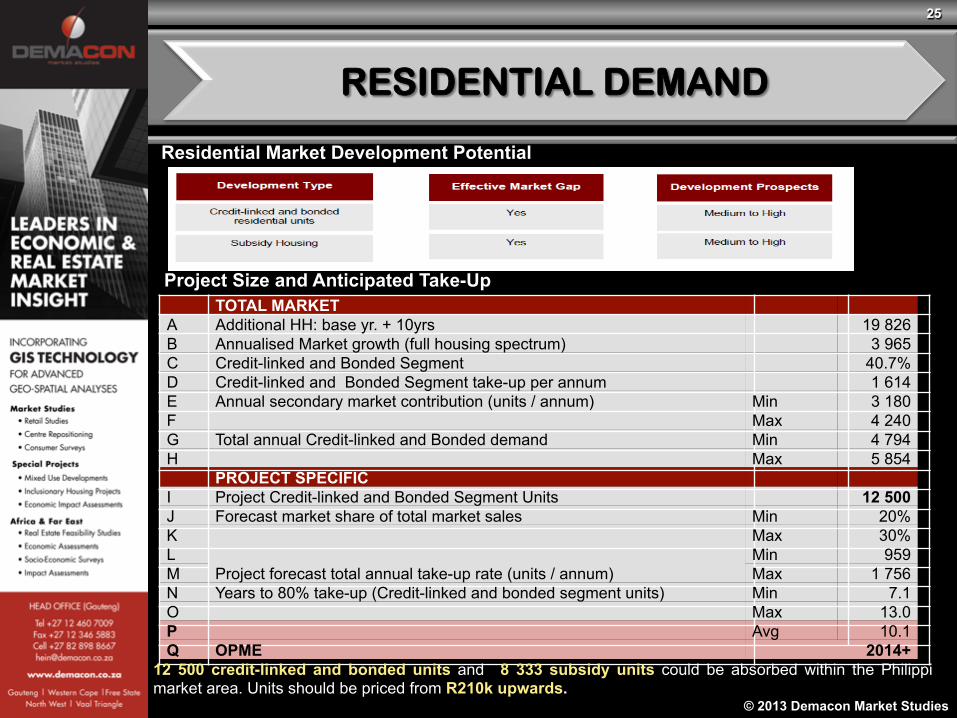
Residential Market Development Potential
Project Size and Anticipated Take-Up TOTAL MARKET A Additional HH: base yr. + 10yrs 19 826 B Annualised Market growth (full housing spectrum) 3 965 C Credit-linked and Bonded Segment 40.7% D Credit-linked and Bonded Segment take-up per annum 1 614 E Annual secondary market contribution (units / annum) Min 3 180 F Max 4 240 G Total annual Credit-linked and Bonded demand Min 4 794 H Max 5 854 PROJECT SPECIFIC I Project Credit-linked and Bonded Segment Units 12 500 J Forecast market share of total market sales Min 20% K Max 30% L
Project forecast total annual take-up rate (units / annum) Min 959
M Max 1 756 N Years to 80% take-up (Credit-linked and bonded segment units) Min 7.1 O Max 13.0 P Avg 10.1 Q OPME 2014+
12 500 credit-linked and bonded units and 8 333 subsidy units could be absorbed within the Philippi market area. Units should be priced from R210k upwards.
RESIDENTIAL DEMAND
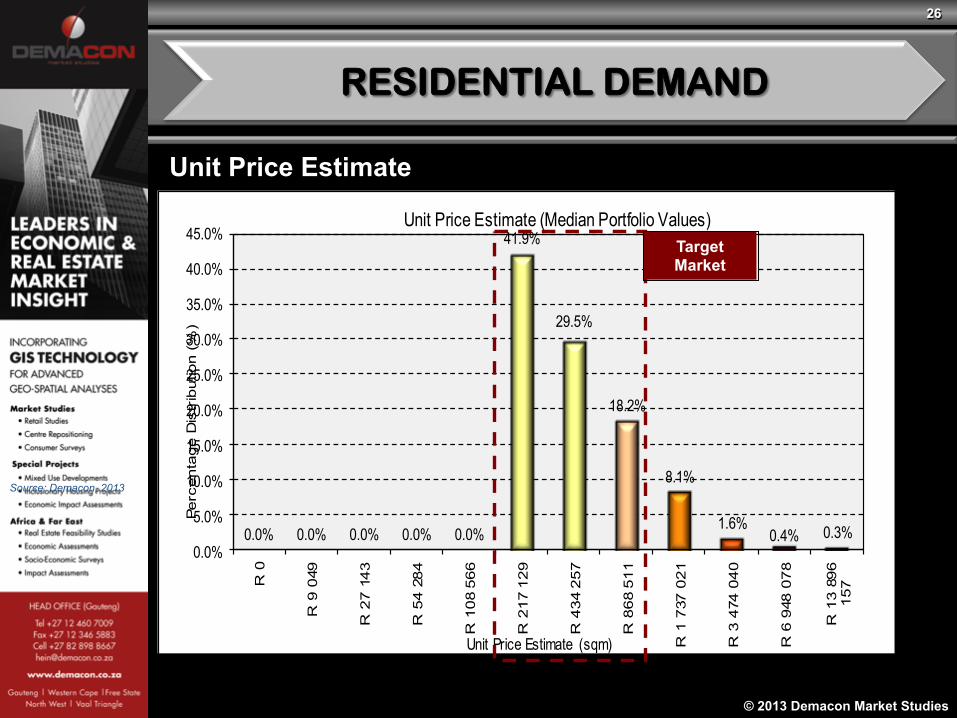
26
© 2013 Demacon Market Studies
0.0% 0.0% 0.0% 0.0% 0.0%
41.9%
29.5%
18.2%
8.1%
1.6%0.4% 0.3%
0.0%
5.0%
10.0%
15.0%
20.0%
25.0%
30.0%
35.0%
40.0%
45.0%R
0
R 9
049
R 2
7 1
43
R 5
4 2
84
R 1
08
566
R 2
17
129
R 4
34
257
R 8
68
511
R 1
737
021
R 3
474
040
R 6
948
078
R 1
3 8
96
157
Perc
enta
ge D
istr
ibutio
n (
%)
Unit Price Estimate (sqm)
Unit Price Estimate (Median Portfolio Values)Target Market
Unit Price Estimate
Source: Demacon, 2013
RESIDENTIAL DEMAND
27
© 2013 Demacon Market Studies
NOTE: ü To ensure alignment of sustainable human settlement development and urban public
finance sustainability an appropriate mix of subsidies and affordable residential products needs to be created.
ü In terms of its location, the area could potentially cater to the bonded and credit linked demand base, priced from R210k upwards, however, arguably the greatest threats to sustainability of this development is the disproportionally large segment of households that qualify for subsidised (i.e. non-rateable) housing. Disproportionally large subsidy component as part of the mixed typologies affects the projects image and branding.
ü Industry best practice indicates that an absolute maximum of 30% - 40% of units in an integrated mixed typology type development should comprise subsidy and social housing. Ratios exceeding this number negatively affect project branding and take-up of bonded units. Further to the above, fully integrated approach was to be followed (i.e. subsidy and bonded in one precinct) the subsidy ratio should not exceed 20% to 25%.
ü The 60:40 ratio provides for the creation of a rateable housing component which, in turn, would be required to facilitate sustainable cross-subsidisation of non-rateable subsidy housing.
ü This approach facilitates much needed net additional growth of the local municipal fiscus.
RESIDENTIAL MARKET FINDINGS
28
© 2013 Demacon Market Studies
ü Given the current housing backlog in the City of Cape Town of 300 000 units, this project could account for as much as ±40% of the backlog. Although the project will meet important social needs, it will simultaneously create a disproportional infrastructural burden with costs exceeding further income yields. Efforts clearly need to be made to stimulate economic growth and increase the demand for rateable bonded housing in the area. The following illustrates two interlinked strategies to facilitate growth and rateable bonded units:
1. Increasing residential density around nodes to bolster demand thresholds 2. Increased demand, will in turn, increase the potential viability of commercial
real estate such as shopping centres – which, in turn, typically forms powerful nodal catalysts.
ü Housing schemes in Gauteng have a 60% and higher subsidy component. In these
projects take-up of bonded units (i.e. rateable assets) has been notably slower compared with projects where the subsidy component has not exceeded 30% to 40%.
ü The market is brand conscious and to be financially feasible the biggest
proportion should consist out of rateable assets. The biggest challenge facing the country is not the housing challenge per se, but it is one of economic and financial sustainability.
RESIDENTIAL MARKET FINDINGS

29
© 2013 Demacon Market Studies
OFFICE MARKET FINDINGS
30
© 2013 Demacon Market Studies
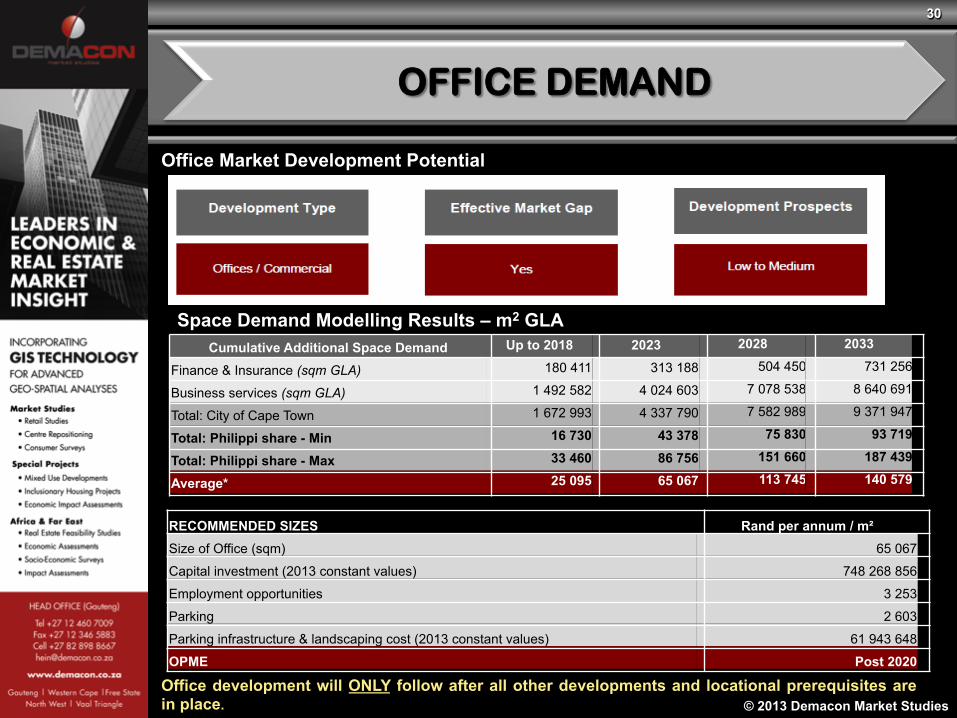
Office Market Development Potential
Space Demand Modelling Results – m2 GLA Cumulative Additional Space Demand Up to 2018 2023 2028 2033
Finance & Insurance (sqm GLA) 180 411 313 188 504 450 731 256
Business services (sqm GLA) 1 492 582 4 024 603 7 078 538 8 640 691
Total: City of Cape Town 1 672 993 4 337 790 7 582 989 9 371 947
Total: Philippi share - Min 16 730 43 378 75 830 93 719
Total: Philippi share - Max 33 460 86 756 151 660 187 439
Average* 25 095 65 067 113 745 140 579
RECOMMENDED SIZES Rand per annum / m² Size of Office (sqm) 65 067
Capital investment (2013 constant values) 748 268 856
Employment opportunities 3 253
Parking 2 603
Parking infrastructure & landscaping cost (2013 constant values) 61 943 648
OPME Post 2020
Office development will ONLY follow after all other developments and locational prerequisites are in place.
OFFICE DEMAND
31
© 2013 Demacon Market Studies
AGRI-PROCESING MARKET FINDINGS
32
© 2013 Demacon Market Studies
ü It is evident that the agriculture sector in Philippi relies on the production of primary products such as vegetables
ü No significant value is being added to these products currently. ü Value adding to primary products could expand the market and create
economic opportunities for both the investor (monetary return on exports of beneficiated goods) as well as the job market for those who are unemployed within the local area.
ü Opportunities exist within the wider agribusiness framework for the Philippi area to take advantage of its latent strengths and comparative advantages. This can help with the development of a support base for emerging farmers.
ü In terms of the quantity of the labour force in the agricultural sector, the Philippi area does not have a shortage in labourers. But in terms of the quality of the labour force, the labourers in the agricultural sector are in need of education, skills and training.
ü It was established within the Economic Profile that the agricultural sector within Philippi is a “leading” sector where local growth exceeded metropolitan growth.
AGRI-PROCESSING MARKET
33
© 2013 Demacon Market Studies
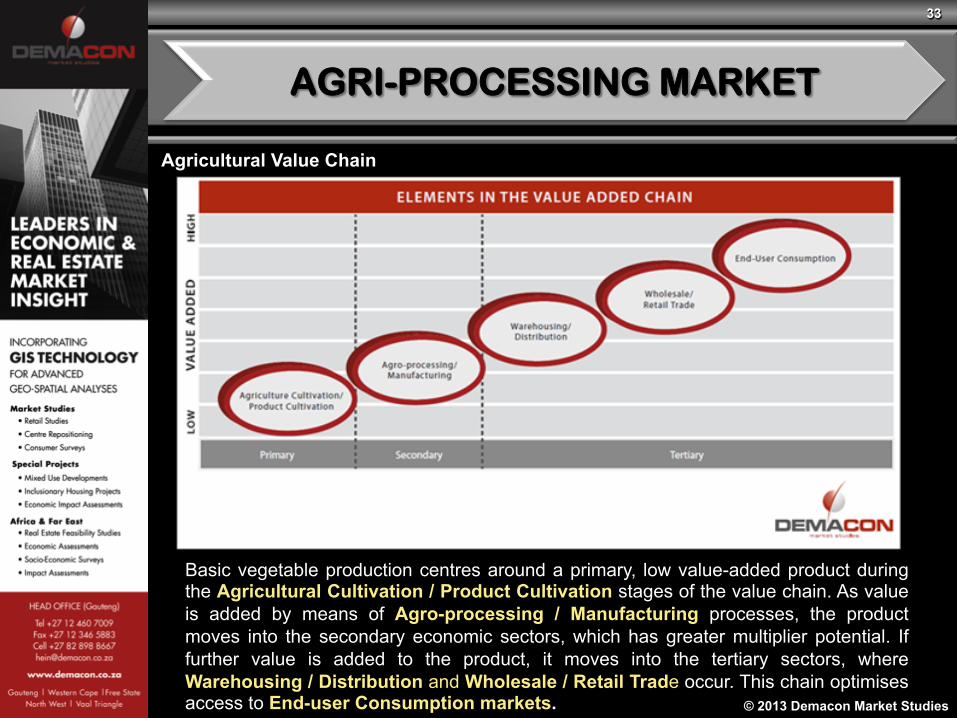
Agricultural Value Chain
Basic vegetable production centres around a primary, low value-added product during the Agricultural Cultivation / Product Cultivation stages of the value chain. As value is added by means of Agro-processing / Manufacturing processes, the product moves into the secondary economic sectors, which has greater multiplier potential. If further value is added to the product, it moves into the tertiary sectors, where Warehousing / Distribution and Wholesale / Retail Trade occur. This chain optimises access to End-user Consumption markets.
AGRI-PROCESSING MARKET
34
© 2013 Demacon Market Studies
In terms of the manufacturing sector and the downstream possibilities; the manufacturing sub-sectors which was identified as the leading sectors within Philippi which could possibly be further developed in terms of Agri-processing/Manufacturing possibilities are as follows:
v Textiles, clothing and leather goods v Wood, paper, publishing and printing v Other non-metal mineral products v Metals, metal products, machinery and equipment v Electrical machinery and apparatus v Radio, TV, instruments, watches and clocks v Transport equipment v Furniture and other manufacturing
AGRI-PROCESSING MARKET
35
© 2013 Demacon Market Studies
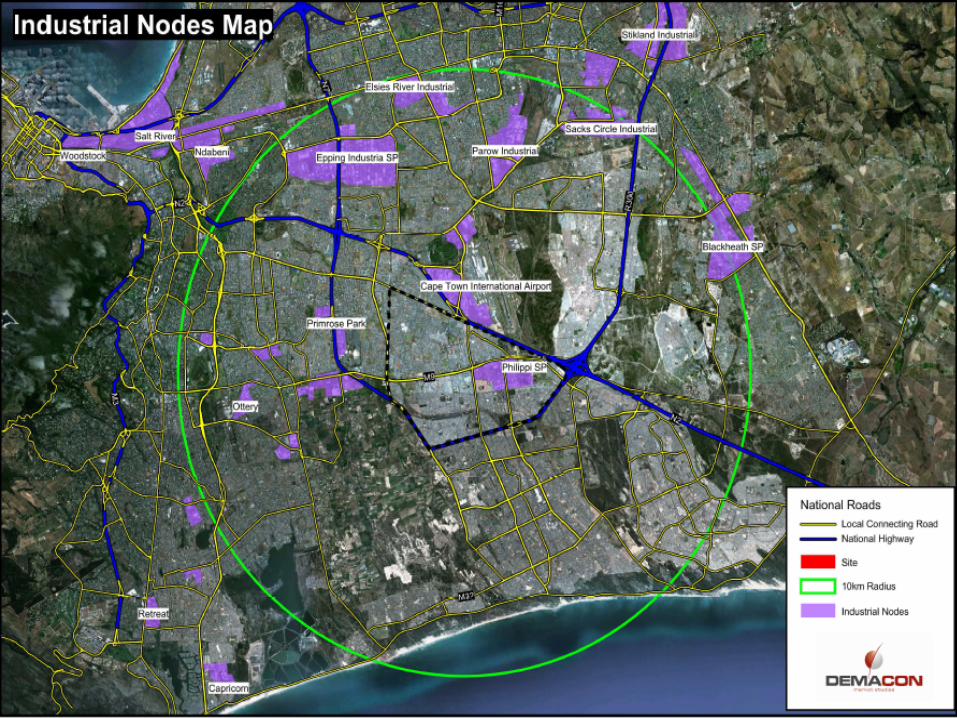
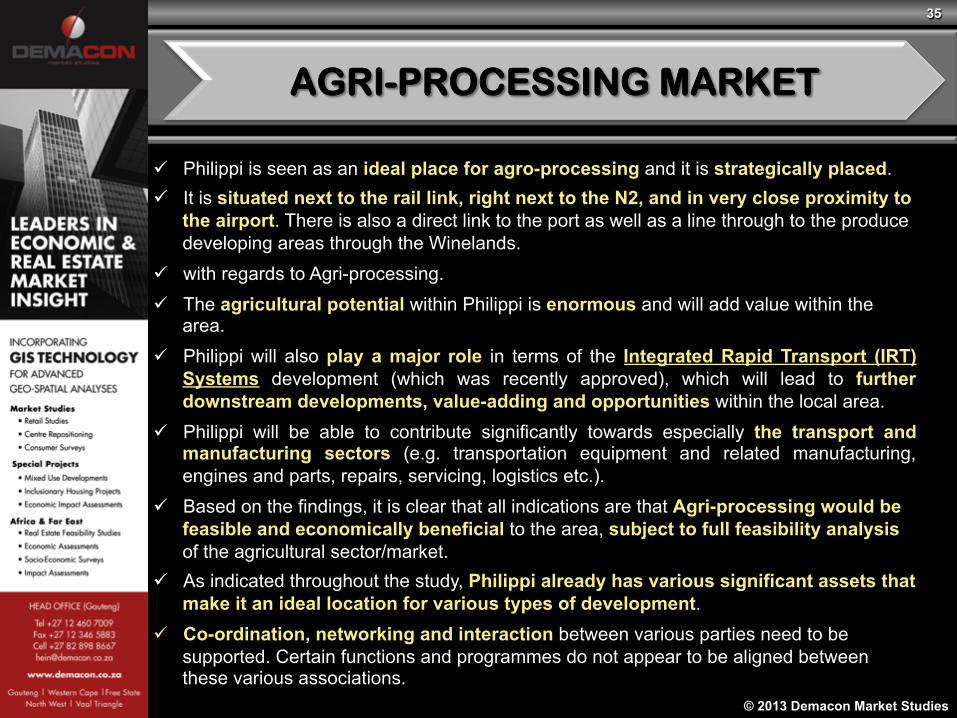
ü Philippi is seen as an ideal place for agro-processing and it is strategically placed. ü It is situated next to the rail link, right next to the N2, and in very close proximity to
the airport. There is also a direct link to the port as well as a line through to the produce developing areas through the Winelands.
ü with regards to Agri-processing. ü The agricultural potential within Philippi is enormous and will add value within the
area. ü Philippi will also play a major role in terms of the Integrated Rapid Transport (IRT)
Systems development (which was recently approved), which will lead to further downstream developments, value-adding and opportunities within the local area.
ü Philippi will be able to contribute significantly towards especially the transport and manufacturing sectors (e.g. transportation equipment and related manufacturing, engines and parts, repairs, servicing, logistics etc.).
ü Based on the findings, it is clear that all indications are that Agri-processing would be feasible and economically beneficial to the area, subject to full feasibility analysis of the agricultural sector/market.
ü As indicated throughout the study, Philippi already has various significant assets that make it an ideal location for various types of development.
ü Co-ordination, networking and interaction between various parties need to be supported. Certain functions and programmes do not appear to be aligned between these various associations.
AGRI-PROCESSING MARKET
36
© 2013 Demacon Market Studies
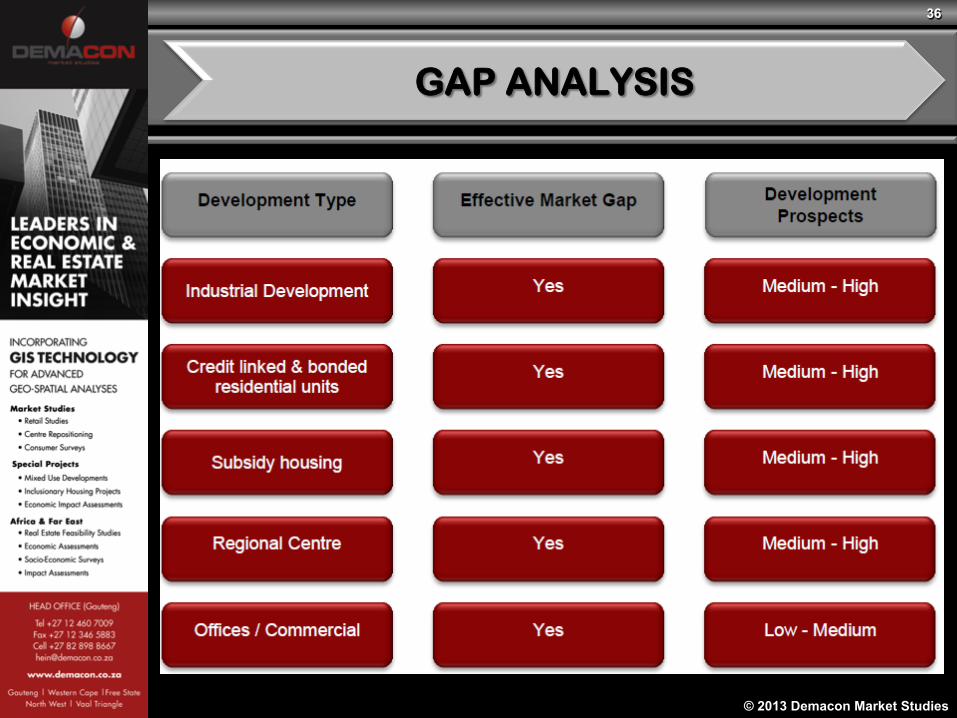
GAP ANALYSIS
37
© 2013 Demacon Market Studies
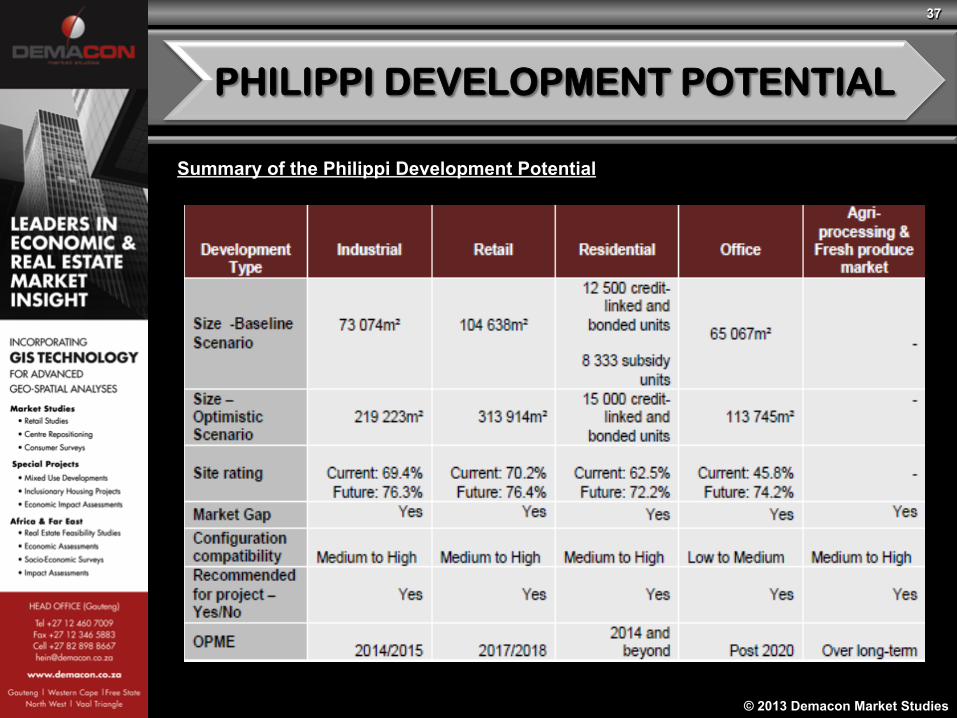
Summary of the Philippi Development Potential
PHILIPPI DEVELOPMENT POTENTIAL
38
© 2013 Demacon Market Studies
ü It is evident that the proposed development is in line with current and future spatial development guidelines set out in the Regional Spatial Development Framework and the District Plans.
ü The proposed development will provide a supportive / complimentary function, especially in terms of industrial, towards the broader node as well as Airport Industria and the Cape Town International Airport, and in such a manner expand the industrial hierarchy of the area.
ü The proposed development will also act on the future potential generated by the N2.
ü The development will contribute to the expansion and development of the Philippi local economy as well as the local rates and tax base of the City.
PHILIPPI DEVELOPMENT POTENTIAL
39
© 2013 Demacon Market Studies
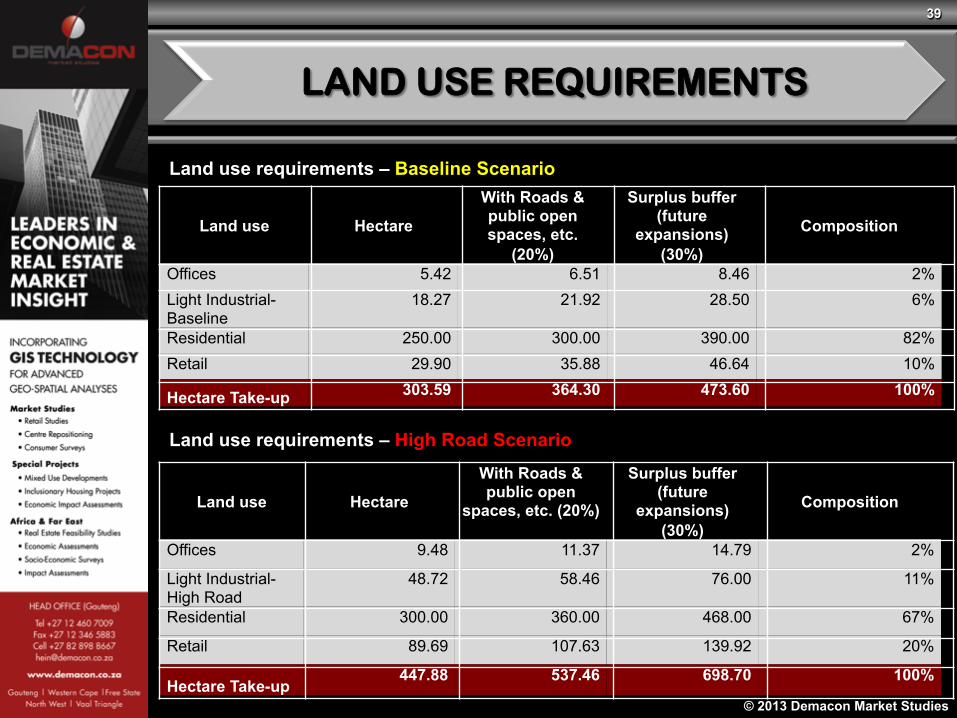
Land use requirements – Baseline Scenario
Land use requirements – High Road Scenario
Land use Hectare
With Roads & public open spaces, etc.
(20%)
Surplus buffer (future
expansions) (30%)
Composition
Offices 5.42 6.51 8.46 2% Light Industrial- Baseline
18.27 21.92 28.50 6%
Residential 250.00 300.00 390.00 82% Retail 29.90 35.88 46.64 10%
Hectare Take-up 303.59 364.30 473.60 100%
Land use Hectare
With Roads & public open
spaces, etc. (20%)
Surplus buffer (future
expansions) (30%)
Composition
Offices 9.48 11.37 14.79 2%
Light Industrial- High Road
48.72 58.46 76.00 11%
Residential 300.00 360.00 468.00 67%
Retail 89.69 107.63 139.92 20%
Hectare Take-up 447.88 537.46 698.70 100%
LAND USE REQUIREMENTS
40
© 2013 Demacon Market Studies
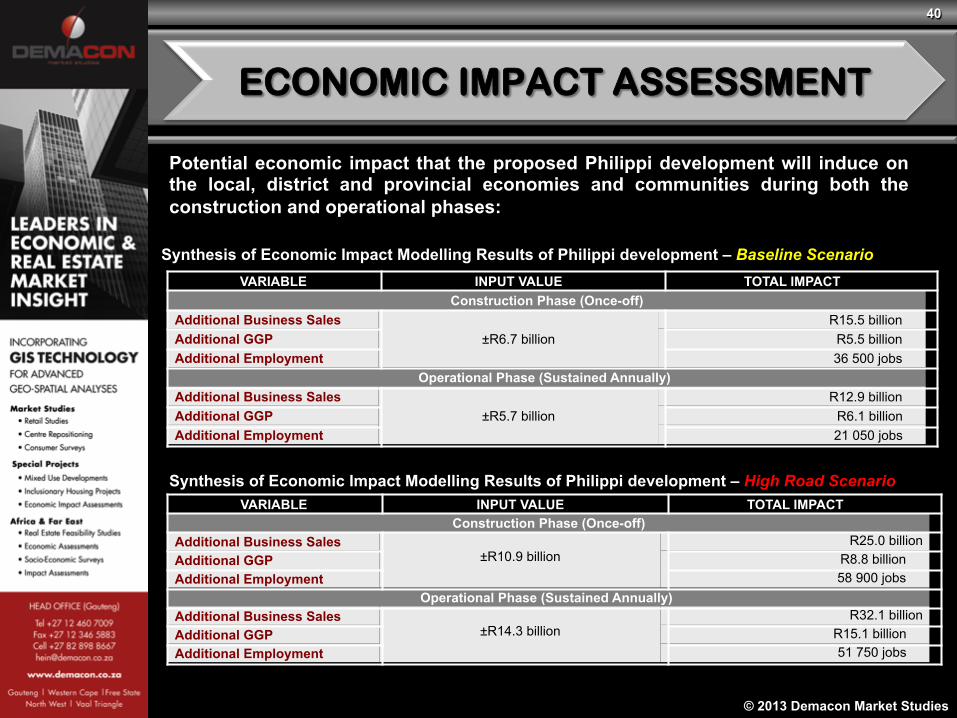
Synthesis of Economic Impact Modelling Results of Philippi development – Baseline Scenario VARIABLE INPUT VALUE TOTAL IMPACT
Construction Phase (Once-off) Additional Business Sales
±R6.7 billion R15.5 billion
Additional GGP R5.5 billion Additional Employment 36 500 jobs
Operational Phase (Sustained Annually) Additional Business Sales
±R5.7 billion R12.9 billion
Additional GGP R6.1 billion Additional Employment 21 050 jobs
Synthesis of Economic Impact Modelling Results of Philippi development – High Road Scenario VARIABLE INPUT VALUE TOTAL IMPACT
Construction Phase (Once-off) Additional Business Sales
±R10.9 billion
R25.0 billion Additional GGP R8.8 billion Additional Employment 58 900 jobs
Operational Phase (Sustained Annually) Additional Business Sales
±R14.3 billion
R32.1 billion Additional GGP R15.1 billion Additional Employment 51 750 jobs
Potential economic impact that the proposed Philippi development will induce on the local, district and provincial economies and communities during both the construction and operational phases:
ECONOMIC IMPACT ASSESSMENT
41
© 2013 Demacon Market Studies
ECONOMIC IMPACT ASSESSMENT
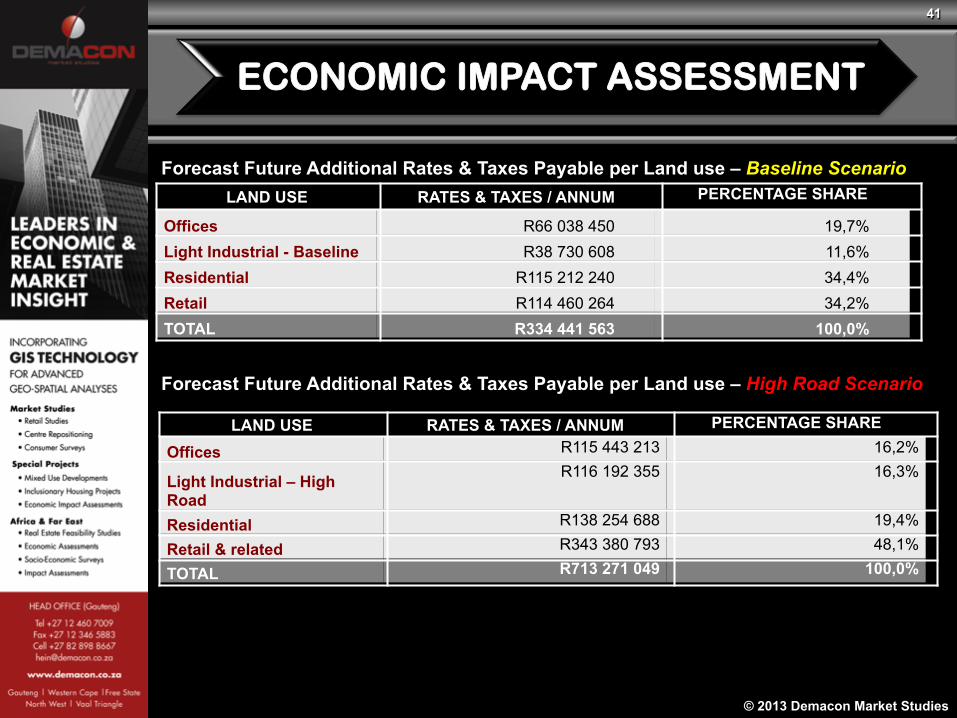
Forecast Future Additional Rates & Taxes Payable per Land use – Baseline Scenario LAND USE RATES & TAXES / ANNUM PERCENTAGE SHARE
Offices R66 038 450 19,7% Light Industrial - Baseline R38 730 608 11,6% Residential R115 212 240 34,4% Retail R114 460 264 34,2% TOTAL R334 441 563 100,0%
Forecast Future Additional Rates & Taxes Payable per Land use – High Road Scenario
LAND USE RATES & TAXES / ANNUM PERCENTAGE SHARE
Offices R115 443 213 16,2%
Light Industrial – High Road
R116 192 355 16,3%
Residential R138 254 688 19,4%
Retail & related R343 380 793 48,1%
TOTAL R713 271 049 100,0%
42
© 2013 Demacon Market Studies
ECONOMIC IMPACT ASSESSMENT
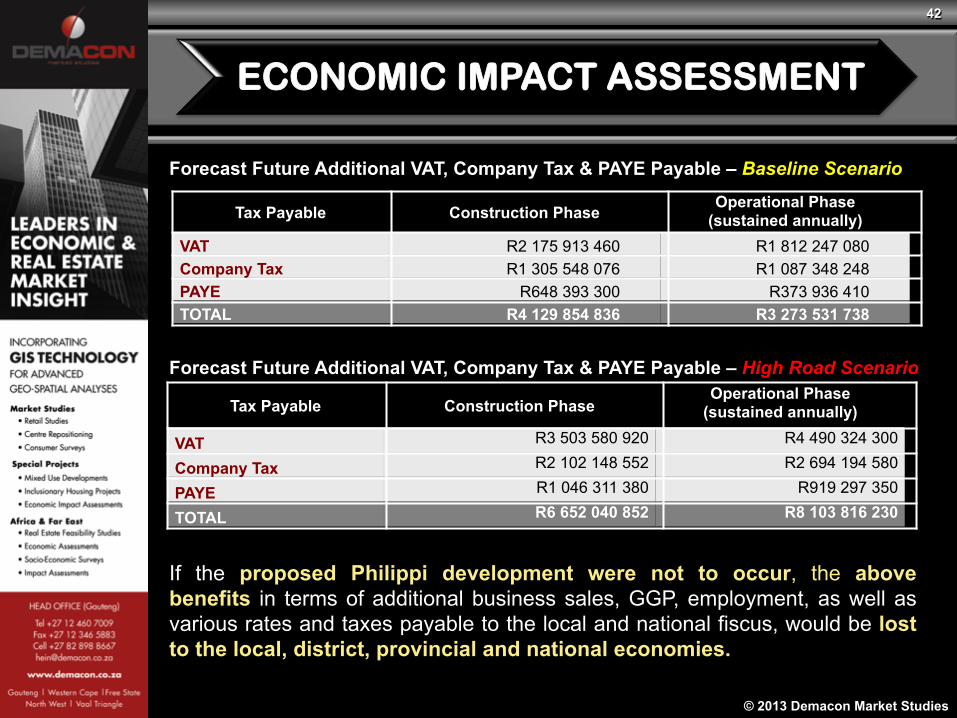
Forecast Future Additional VAT, Company Tax & PAYE Payable – Baseline Scenario
Tax Payable Construction Phase Operational Phase
(sustained annually) VAT R2 175 913 460 R1 812 247 080 Company Tax R1 305 548 076 R1 087 348 248 PAYE R648 393 300 R373 936 410 TOTAL R4 129 854 836 R3 273 531 738
Forecast Future Additional VAT, Company Tax & PAYE Payable – High Road Scenario
Tax Payable Construction Phase Operational Phase
(sustained annually)
VAT R3 503 580 920 R4 490 324 300
Company Tax R2 102 148 552 R2 694 194 580
PAYE R1 046 311 380 R919 297 350
TOTAL R6 652 040 852 R8 103 816 230
If the proposed Philippi development were not to occur, the above benefits in terms of additional business sales, GGP, employment, as well as various rates and taxes payable to the local and national fiscus, would be lost to the local, district, provincial and national economies.
43
© 2013 Demacon Market Studies
ü Land Availability
ü Business Plans
ü Feasibility Studies
ü Detailed Economic Assessments
ü Economic and Fiscal Impact Assessments
ü Surveys
ü EIAs
WAY FORWARD