philippi horticultural area - elsenburg.com · 1 . building the city of cape town ’s resilience...
TRANSCRIPT
1
Building the City of Cape Town’s Resilience
and Adding to Regional Competitiveness
Philippi Horticultural Area: Socio-Economic Agricultural Plan
23rd April 2018 Prepared by
In association with UMVOTO Pty (Ltd), SetPlan and Dr Willem Hoffman
2
This report has been independently prepared by Indego Consulting for the Western Cape Department of Agriculture. An extensive stakeholder engagement process was undertaken in preparation of the report. Three base-line reports were compiled that informed the key recommendations of this study. These reports focused on natural resource management (prepared by Kornelius Riemann and David Mc Gibbon from UMVOTO), spatial planning (prepared by Neville van der Westhuizen and Anthony Meuleman) and the performance of the agricultural sector within the PHA (prepared by Dr Willem Hoffman). Emma Vink and Silindile Mncube were the field researchers that undertook the agricultural survey. Karen Harrison was the socio-economic specialist on the team and led and facilitated the stakeholder engagement process. Karen was the overall project manager.
Indego Consulting Karen Harrison, Sole Proprietor
PO Box 1385
Somerset West 7129
Cell: 082 4144 750 Email: [email protected]
3
Contents Acronyms ................................................................................................................................................ 6
Executive Summary ................................................................................................................................. 8
Introduction .......................................................................................................................................... 13
Purpose of the Plan ............................................................................................................................... 13
Methodology ......................................................................................................................................... 14
PHA Study Area ..................................................................................................................................... 17
Extent of the PHA .............................................................................................................................. 17
PHA Informal Settlements ................................................................................................................ 19
Problem Statement ............................................................................................................................... 21
PHA Stakeholders .................................................................................................................................. 22
Broader PHA Context ............................................................................................................................ 23
Climate Change ................................................................................................................................. 23
Urban Agriculture as a Component of Sustainable Urban Development ......................................... 24
Impact of Horticultural Production on Food Prices .......................................................................... 27
Agrarian Reform ................................................................................................................................ 30
Legislative and Policy Mandates ........................................................................................................... 31
National and Provincial Legislation and Policy ................................................................................. 31
City-Level Land-Use and Planning Policy .......................................................................................... 35
Significance of the PHA ......................................................................................................................... 38
Environmental Significance ............................................................................................................... 38
Climate .......................................................................................................................................... 38
Ground Water: Cape Flats Aquifer ................................................................................................ 39
Geology and Soil............................................................................................................................ 44
Socio-Economic Significance ............................................................................................................. 47
PHA Socio-Economic Context ........................................................................................................ 47
History and Heritage ..................................................................................................................... 50
PHA Production ............................................................................................................................. 53
Summary of Agricultural Findings ................................................................................................. 67
Risks Associated with the Loss of the PHA ............................................................................................ 68
Implications for the Protection of the PHA ........................................................................................... 69
Alignment of the Protection of the PHA with CCT and WCG Spatial Development Plans .................... 69
City of Cape Town ............................................................................................................................. 69
Aerotropolis ...................................................................................................................................... 72
Human Settlement Plans .................................................................................................................. 75
Emerging PHA Scenarios ....................................................................................................................... 78
4
Preferred Scenario: Save the PHA ..................................................................................................... 80
The PHA Socio Economic Agricultural Plan ........................................................................................... 80
Vision ................................................................................................................................................. 80
Objectives ......................................................................................................................................... 82
Project Phases ................................................................................................................................... 82
Phase 1: Stabilisation (Year One) .................................................................................................. 82
Phase 2: Consolidation (Year Two to Six) ...................................................................................... 89
Phase 3: Growth (Year Seven and onwards) ................................................................................. 92
“Whole of Society” Approach ........................................................................................................... 92
PHA Work Plan ...................................................................................................................................... 93
Implementation Approach .................................................................................................................... 99
Inter-Governmental Co-ordination and Implementation Protocol .................................................. 99
Inter-Sectoral Co-ordination and Social Compact .......................................................................... 100
Implementation Risks ......................................................................................................................... 101
Conclusion ........................................................................................................................................... 102
List of Annexures ................................................................................................................................. 102
Annexure A: Survey of Natural Resources ...................................................................................... 102
Annexure B: Spatial Planning Context ............................................................................................ 102
Annexure C: Vegetable Production in South Africa and the Western Cape ................................... 102
Annexure D: List of stakeholders Consulted ................................................................................... 102
Bibliography ........................................................................................................................................ 103
List of Tables
Table 1 Informal Settlements within the PHA and its Buffers .............................................................. 19 Table 2 Relevant National and Provincial Legislation and Policy for the PHA ..................................... 32 Table 3 Powers and Functions of the Three Spheres of Government in relation to the PHA ............. 34 Table 4 Mean Age of PHA Farmers by Farmer Category ...................................................................... 54 Table 5 Production Land Sizes and Ranges per Farmer Grouping ........................................................ 57 Table 6 Number of Unskilled Workers Employed by Farmer Categories in the PHA ........................... 61 Table 7 Example of Multipliers as Indicated by the SAM Modelling .................................................... 63 Table 8 Interpretation of Loss on Selected Farmer Income and Profit in the 2016/17 financial year . 66 Table 9 Scenario Planning for the PHA ................................................................................................. 79 Table 10 Precinct Management Structure Options ............................................................................. 89 Table 11 PHA Plan Work Plan ............................................................................................................... 94 Table 12 Risks to the Implementation of the PHA Plan ..................................................................... 101
5
List of Figures
Figure 1 Location of the PHA within the broader City of Cape Town Source: CCT Tourism ................. 13 Figure 2 Map of the PHA Study Area .................................................................................................... 17 Figure 3 PHA Land Use (per reclassified Land Cover Data, 2014) ........................................................ 17 Figure 4 Existing Land Use in the Greater PHA ..................................................................................... 19 Figure 5 Reduction of the PHA Core owing to a Sequence of Planning Decisions ............................... 21 Figure 6 PHA Stakeholders .................................................................................................................... 22 Figure 7 Value of Output of the Main Agricultural Sub-Sectors in South Africa 2000 - 2015 .............. 27 Figure 8 Price Trends for Selected Vegetables in the Main Fresh Produce Markets in South Africa ... 28 Figure 9 Producer price indices for agricultural products .................................................................... 28 Figure 10 Producer Price Indices for Horticultural Products ................................................................ 29 Figure 11 Indices of producer prices of important vegetables sold on the major fresh produce markets nationally ................................................................................................................................ 29 Figure 12 CCT’s MSDF, 2017 ................................................................................................................. 37 Figure 13 PHA Comparative Average Monthly Temperature 2017 ...................................................... 38 Figure 14 PHA Comparative Monthly Maximum Temperature 2017 .................................................. 39 Figure 15 PHA Comparative Monthly Minimum Temperature 2017 ................................................... 39 Figure 16 CFA boundary and simplified slope map and dune morphologies ...................................... 40 Figure 17 Detailed hydrological map of the PHA ................................................................................. 41 Figure 18 Bedrock geomorphology of the Cape Flats Area .................................................................. 41 Figure 19 Seasonal variations in recorded water levels at Mitchells Plan hospital between 2005 and 2015. ..................................................................................................................................................... 42 Figure 20 Hydrochemical samples from the DWS WMS Database (2009) .......................................... 43 Figure 21 Geology of the PHA ............................................................................................................... 44 Figure 22 Building Sand Mines in the PHA Source: Council for GeoScience ......................................... 45 Figure 23 Aerial photograph of the symbiotic relationship between building sand mining and agricultural expansion in the PHA ......................................................................................................... 46 Figure 24 Distribution of Witsands and Springfontyn Formations within the PHA .............................. 46 Figure 25 Cape Flats District Map ......................................................................................................... 48 Figure 26 Early German PHA Settlers ................................................................................................... 52 Figure 27 District 6 Forced Removals ................................................................................................... 53 Figure 28 PHA Farmer Race According to Farmer Categories .............................................................. 54 Figure 29 PHA Farmer Formal Education Levels .................................................................................. 55 Figure 30 Mean Years of Farmer Management Experience per Farmer Category in the PHA ............. 55 Figure 31 Farm Size, Cultivated Area and Available Irrigation for each Farmer Grouping in the PHA . 56 Figure 32 PHA Farmer Irrigation Infrastructure .................................................................................... 57 Figure 33 Percentage of PHA Farmers Growing Vegetable Types ....................................................... 58 Figure 34 Percentage of Farmers owning a Packaging Plant in the PHA ............................................. 59 Figure 35 Percentage of PHA Farmers Selling to each Market Type .................................................... 59 Figure 36 PHA Value Chain .................................................................................................................... 62 Figure 37 Top 20 employment multipliers (jobs per million Rand output) with agricultural sub-sectors in red ......................................................................................................................................... 64 Figure 38 Relative Share of Factors resulting in Income Losses ........................................................... 65 Figure 39 The CCT's Spatial Targeting Strategy Source: CCT 2018 BEPP ............................................. 71 Figure 40 CCT's Spatial Targeting and Investment Strategy Source: CCT’s 2018 BEPP ...................... 71 Figure 41 Blue Downs Corridor Developments .................................................................................... 72
6
Figure 42 Aerotropolis Value Proposition ............................................................................................ 73 Figure 43 ACSA's Planned Symphony Way Development .................................................................... 74 Figure 44 The new realigned Runway and Swartklip Site .................................................................... 74 Figure 45 Southern Corridor Human Settlement Projects .................................................................... 76 Figure 46 MSDF 2017 Snapshot of WCG and CCT human settlements plans in relation to the PHA ... 77 Figure 47 PHA Vision ............................................................................................................................ 81 Figure 48 Proposed Spatial Components for the PHA ......................................................................... 84
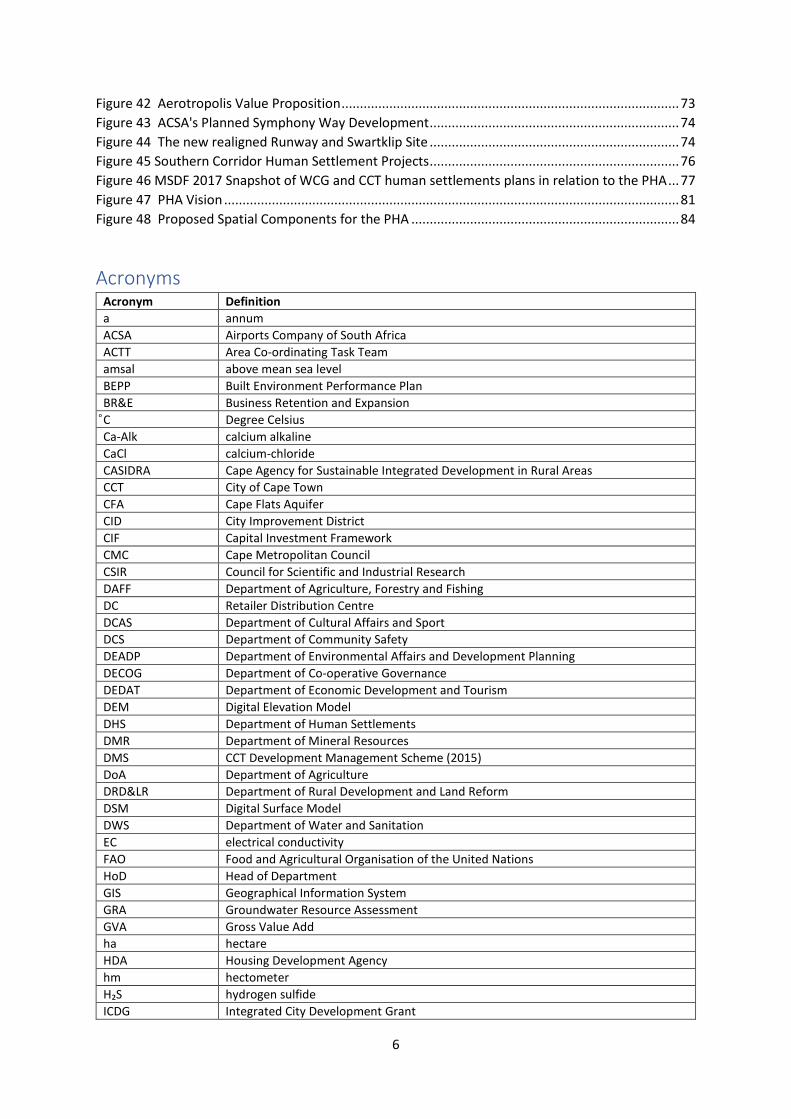
Acronyms Acronym Definition a annum ACSA Airports Company of South Africa ACTT Area Co-ordinating Task Team amsal above mean sea level BEPP Built Environment Performance Plan BR&E Business Retention and Expansion ͦC Degree Celsius Ca-Alk calcium alkaline CaCl calcium-chloride CASIDRA Cape Agency for Sustainable Integrated Development in Rural Areas CCT City of Cape Town CFA Cape Flats Aquifer CID City Improvement District CIF Capital Investment Framework CMC Cape Metropolitan Council CSIR Council for Scientific and Industrial Research DAFF Department of Agriculture, Forestry and Fishing DC Retailer Distribution Centre DCAS Department of Cultural Affairs and Sport DCS Department of Community Safety DEADP Department of Environmental Affairs and Development Planning DECOG Department of Co-operative Governance DEDAT Department of Economic Development and Tourism DEM Digital Elevation Model DHS Department of Human Settlements DMR Department of Mineral Resources DMS CCT Development Management Scheme (2015) DoA Department of Agriculture DRD&LR Department of Rural Development and Land Reform DSM Digital Surface Model DWS Department of Water and Sanitation EC electrical conductivity FAO Food and Agricultural Organisation of the United Nations HoD Head of Department GIS Geographical Information System GRA Groundwater Resource Assessment GVA Gross Value Add ha hectare HDA Housing Development Agency hm hectometer H₂S hydrogen sulfide ICDG Integrated City Development Grant
7
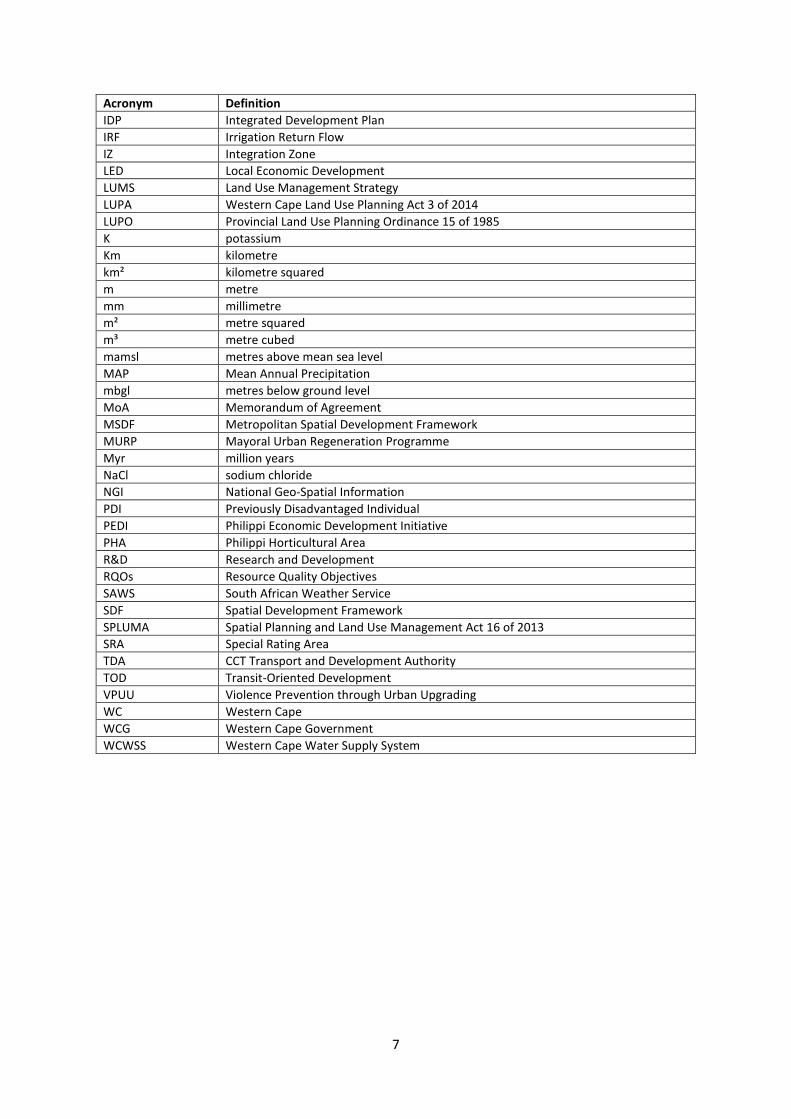
Acronym Definition IDP Integrated Development Plan IRF Irrigation Return Flow IZ Integration Zone LED Local Economic Development LUMS Land Use Management Strategy LUPA Western Cape Land Use Planning Act 3 of 2014 LUPO Provincial Land Use Planning Ordinance 15 of 1985 K potassium Km kilometre km² kilometre squared m metre mm millimetre m² metre squared m³ metre cubed mamsl metres above mean sea level MAP Mean Annual Precipitation mbgl metres below ground level MoA Memorandum of Agreement MSDF Metropolitan Spatial Development Framework MURP Mayoral Urban Regeneration Programme Myr million years NaCl sodium chloride NGI National Geo-Spatial Information PDI Previously Disadvantaged Individual PEDI Philippi Economic Development Initiative PHA Philippi Horticultural Area R&D Research and Development RQOs Resource Quality Objectives SAWS South African Weather Service SDF Spatial Development Framework SPLUMA Spatial Planning and Land Use Management Act 16 of 2013 SRA Special Rating Area TDA CCT Transport and Development Authority TOD Transit-Oriented Development VPUU Violence Prevention through Urban Upgrading WC Western Cape WCG Western Cape Government WCWSS Western Cape Water Supply System
8
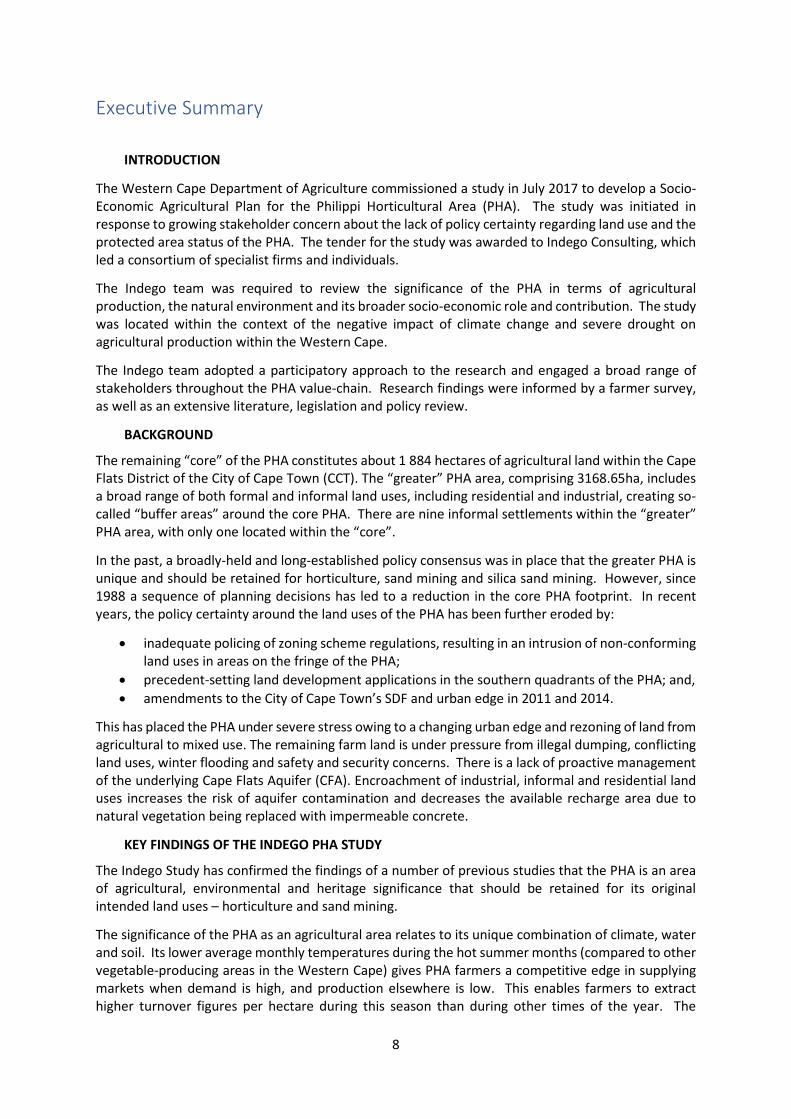
Executive Summary
INTRODUCTION
The Western Cape Department of Agriculture commissioned a study in July 2017 to develop a Socio-Economic Agricultural Plan for the Philippi Horticultural Area (PHA). The study was initiated in response to growing stakeholder concern about the lack of policy certainty regarding land use and the protected area status of the PHA. The tender for the study was awarded to Indego Consulting, which led a consortium of specialist firms and individuals.
The Indego team was required to review the significance of the PHA in terms of agricultural production, the natural environment and its broader socio-economic role and contribution. The study was located within the context of the negative impact of climate change and severe drought on agricultural production within the Western Cape.
The Indego team adopted a participatory approach to the research and engaged a broad range of stakeholders throughout the PHA value-chain. Research findings were informed by a farmer survey, as well as an extensive literature, legislation and policy review.
BACKGROUND
The remaining “core” of the PHA constitutes about 1 884 hectares of agricultural land within the Cape Flats District of the City of Cape Town (CCT). The “greater” PHA area, comprising 3168.65ha, includes a broad range of both formal and informal land uses, including residential and industrial, creating so-called “buffer areas” around the core PHA. There are nine informal settlements within the “greater” PHA area, with only one located within the “core”.
In the past, a broadly-held and long-established policy consensus was in place that the greater PHA is unique and should be retained for horticulture, sand mining and silica sand mining. However, since 1988 a sequence of planning decisions has led to a reduction in the core PHA footprint. In recent years, the policy certainty around the land uses of the PHA has been further eroded by:
• inadequate policing of zoning scheme regulations, resulting in an intrusion of non-conforming land uses in areas on the fringe of the PHA;
• precedent-setting land development applications in the southern quadrants of the PHA; and, • amendments to the City of Cape Town’s SDF and urban edge in 2011 and 2014.
This has placed the PHA under severe stress owing to a changing urban edge and rezoning of land from agricultural to mixed use. The remaining farm land is under pressure from illegal dumping, conflicting land uses, winter flooding and safety and security concerns. There is a lack of proactive management of the underlying Cape Flats Aquifer (CFA). Encroachment of industrial, informal and residential land uses increases the risk of aquifer contamination and decreases the available recharge area due to natural vegetation being replaced with impermeable concrete.
KEY FINDINGS OF THE INDEGO PHA STUDY
The Indego Study has confirmed the findings of a number of previous studies that the PHA is an area of agricultural, environmental and heritage significance that should be retained for its original intended land uses – horticulture and sand mining.
The significance of the PHA as an agricultural area relates to its unique combination of climate, water and soil. Its lower average monthly temperatures during the hot summer months (compared to other vegetable-producing areas in the Western Cape) gives PHA farmers a competitive edge in supplying markets when demand is high, and production elsewhere is low. This enables farmers to extract higher turnover figures per hectare during this season than during other times of the year. The
9
underground water available throughout the PHA enables at least 3 to 4 crop cycles per annum. A key study finding is that there is sufficient ground water of the required quality for expanded agricultural activity.
The Witsands geological formation has been mined for construction sand for generations and a symbiotic relationship exists with the PHA farmers. Even today, as the sand is mined, horticultural activity immediately follows. The PHA soil is valued more as a growing medium than a source of nutrients.
The PHA growing conditions are not replicable within a 120-kilometre radius of Cape Town and have made the PHA more drought-resilient than other areas, according to both market and producer feedback.
The environmental significance of the PHA is attributable to its location over the portion of the CFA with the greatest groundwater potential and some of the best water quality. This results in a network of vleis and dams across the production area and means that much of the PHA is unsuitable for low-cost housing owing to the low water table. Sand mining companies have been granted permission to mine to 1 metre above the water table and the ground level is dependent on whether the mining was undertaken in winter or summer months. The PHA remains a natural recharge area for the CFA. The protection of the CFA will increase the climate change resilience and food security of the City.
The PHA’s heritage is evident in the: discovery of the prehistoric Cape Flats Skull; findings of SAN and Khoi artefacts; the designation of the land for production by the Colonial government; the transformation of the PHA into the “vegetable pantry” of Cape Town by German settlers; and the establishment of a number of Cape Flats settlements through the passing of the Group Areas Act and the District 6 forced removals.
All the above factors support the designation of the PHA as a “unique Growing area” that requires formal protection, management and regulation.
The PHA is currently actively farmed, with at least 64% of the “core” land under production. Thirty horticultural products are being produced with carrots, lettuce, cabbage, spinach and cauliflower being the top five crops. There are about 30 active farmers in the PHA, of whom five are classified as large commercial. The PHA producers are firmly embedded in the Western Cape agricultural value chain through the sourcing of inputs, logistics, services and markets. For every R 1 million spent in the vegetable industry, 4.65 direct jobs and 46.5 indirect jobs are created, translating into the PHA contributing about 3000 direct jobs and 30 000 indirect jobs to the regional economy. The PHA further contributes about R484 million direct and R938 million indirect turnover into the regional economy. This could grow further through more land being made available for farming, the adoption of new technologies, and compatible economic activity. The farmers supply both formal and informal vegetable markets. Some of the large commercial farmers dominate the retail market, whilst smaller commercial and small-holders focus more on supplying the Cape Town Market, the bakkie traders, middle-men and direct sales. The spread of markets supplied by the PHA makes the area critical for food security across all income groups. The proximity of PHA farmers to the markets lowers transport input costs, which translate into a moderating food price effect nationally.
The agricultural activity within the PHA has broader socio-economic significance as a contributor to:
• the CCT and Western Cape’s climate change resilience; • sustainable and inclusive urban development; • CCT, regional and national food security and positive food price regulation; and • regional economic competitiveness.
10
In addition, all the elements are in place for a successful agrarian reform model – the availability of land, water, climate, skills, different producer types, market access and knowledge. There is enormous potential for a broad multi-stakeholder partnership model, which can integrate small - medium enterprise development and commercial opportunities throughout the agricultural value-chain – to drive future social and economic development within the PHA that is linked to broader regional opportunities.
There is substantial stakeholder consensus that the PHA needs to be retained for horticultural purposes. This is translated into provincial and CCT spatial plans and development frameworks. The latest draft of the Metro SDF identifies the PHA as a “Critical Natural Area” owing to its agricultural and heritage significance and broader contribution to metropolitan food security that must be protected. City and provincial human settlements and public transport spatial and investment plans are within the so-called Metro South East and Blue Downs Corridor that lie to the north and east of the PHA. ACSA’s plans, supported by the CCT and province, to utilize the Cape Town International Airport as a catalyst for an aerotropolis, recognizes the importance of a production area in proximity that can fill excess cargo capacity and support linked agro-processing activity.
Whilst Indego’s research has reconfirmed the significance of the PHA and has shown that substantial agricultural production continues to take place, the PHA faces significant risks linked to: the failure to manage and regulate the PHA; farmer and community safety and security; land invasions; illegal land-use and dumping; and low levels of social trust. The environmental, agricultural and socio-economic value of the PHA demands protection in terms of legislative and policy mandates to all spheres of government.
PROPOSED PHA SOCIO-ECONOMIC AGRICULTURAL PLAN
The vision is for a PHA that is protected, productive, sustainable, inclusive, safe and secure for all who work, live, invest and visit there. This would be achieved by farmers, farm workers, suppliers, markets, adjacent communities and the public sector actively collaborating to protect the PHA for horticulture and driving agrarian reform and compatible economic activity. Sustainable economic growth will be supported through expanded market linkages, technology, support to informal vegetable traders and agro-tourism related activity such as urban farm tours, good eating and vegetable growing courses, food stalls and markets, hiking and cycling. The human settlement needs of farm workers and informal settlement dwellers must be addressed and ethical business practices and sound labour relations encouraged. Greater productivity and linkages to the envisaged aerotropolis and its services, logistics and markets must be facilitated to increase the contribution of the PHA to regional economic competitiveness. The PHA will be an agricultural investment area of value and choice.
To achieve this vision, the key objectives are stated below in order of priority:
1. To stabilise the PHA through: a. Providing policy and planning certainty regarding the future of the core PHA and its
buffers through using available legal and policy instruments; b. Addressing the safety and security concerns of the farmers, farm workers and
informal settlement dwellers of the PHA; c. Strengthening the land-use and environmental regulation of the PHA; d. Securing the CFA underlying the PHA through the establishment and management
of CFA protection zones around the PHA; and e. Setting up a dedicated PHA precinct management structure.
2. To consolidate the PHA through: a. Implementing a comprehensive agrarian reform programme in the PHA, that
includes proactive land acquisition, a comprehensive farmer support programme, and the adoption of sustainable farming practices;
b. Ensuring the proper management of the CFA;
11
c. Prioritising and addressing the needs of informal settlement dwellers within the PHA and its buffers;
d. Formalising human settlements within the PHA buffers and encouraging complementary urban agriculture design principles;
e. Encouraging complementary economic activity within the PHA and its buffers, such as addressing the needs of informal vegetable traders, stimulating agro-tourism and processing and promoting public works opportunities; and
f. Facilitating strategic linkages to broader initiatives within the Metro Central Partnership, such as to the aerotropolis, the WCG Air Access project and broader agro-processing initiatives.
3. To grow the PHA through: a. Destination and product branding; and b. Further product and technological development, market access and expansion.
A “Whole of Society” approach will be adopted that is driven through the co-ordination of multi-stakeholder and “inter-governmental” commitments. Core public sector partners are the:
• CCT (represented by a range of departments responsible for spatial planning and land use management; water and sanitation; urban development (human settlements and public transport); economic development; community safety and area-based management;
• WCG (especially the Office of the Premier, Department of Agriculture (DoA), Community Safety (DCS), Environmental Affairs and Planning (DEADP), Human Settlements (DHS) and Economic Development and Tourism (DEDAT));
• National government (especially departments responsible for water and sanitation, land reform, agriculture, disaster management and minerals);
• National and provincial parastatals such as SAPS, ACSA, Heritage Western Cape, SANRAL and WESGRO; and
• Private sector and civil society in terms of: supplier development programmes; BBBEE; knowledge and skills sharing; job creation; technology transfer; promotion of sustainable agricultural practices; branding and marketing; regulation; corporate social investment; protection of the PHA for its intended land use; and research and innovation.
IMPLEMENTATION APPROACH
Within the public sector, the PHA Plan will be implemented through a partnership between the CCT and the WCG. Political and administrative champions will be identified to drive the implementation of the Plan. The CCT and the WC DoA will be the lead partners and each partner will identify political and administrative champions for the PHA Plan. The lead partners will need to set up a dedicated PHA Unit with project management and process facilitation capacity. The Premier’s Office, together with the Provincial Treasury and the Department of Local Government, will oversee the provincial inter-departmental planning and budgeting process to give effect to the PHA Plan.
The WC DoA and CCT will jointly approach the relevant national departments, such as the DWS, DRD&LR, DAFF, DECOG and the DMR, to secure relevant commitments to the PHA Plan. In addition, the WC DoA and CCT will approach the relevant parastatals – SANRAL, ACSA, SAPS, Heritage Western Cape and WESGRO – in partnership with relevant provincial departments. The public-sector commitments within the PHA Plan will be formalised through the signing of an Implementation Protocol in terms of Section 35 of the Inter-Governmental Relations Framework Act, No. 13 of 2005.
The CCT and WC DoA will be required to champion the PHA Plan with the private and civil society sectors. To lock in the commitments of the private and civil society sectors to the implementation of the PHA Plan, it is proposed that a Social Compact is entered.
12
The main implementation risks identified are: failure of government to provide policy clarity regarding the protection of the PHA; failure of the public sector to implement the plan; farmer and community safety and security; land invasions; illegal land-use and dumping; and low levels of social trust.
CONCLUSION
The implementation of this PHA Plan must happen. The PHA is an urban asset that contributes to the City’s water resilience, inclusivity, food security and sustainability. It is an asset that has value for all City citizens and especially the agricultural sector and those that live, work, visit and invest in the PHA. The failure to implement the Plan will result in the further deterioration and loss of the PHA. The public sector has a legislative and policy mandate to protect, manage and regulate this land owing to its environmental, agricultural and socio-economic significance. However, the public sector cannot do this alone. The socio-economic and environmental context of the PHA requires the participation of the private sector, organised civil society and communities to protect and defend the PHA and support sustainable and appropriate economic activity. This requires a social compact that will focus on the improved management, regulation, safety, social and appropriate economic development of the PHA. It requires stakeholders to move forward together based on policy and planning certainty that the PHA is to be retained for horticultural and compatible sand mining purposes.
13
Introduction The Western Cape Department of Agriculture commissioned a study in July 2017 to develop a Socio-Economic Agricultural Plan for the Philippi Horticultural Area (PHA) that was focused on unlocking sustainable agricultural activities through a value-chain and multi stakeholder approach. The study was initiated in response to growing government and broader stakeholder concern about the lack of policy certainty regarding the protected status of the PHA. This was resulting in increased contestation over land use and weak management and regulation of the area. The tender for the study was awarded to Indego Consulting, which led a consortium of specialist firms and individuals.
The Indego team was required to review the significance of the PHA in terms of agricultural production, the natural environment and its broader socio-economic role and contribution. The study was located within the context of the negative impact of climate change and severe drought on agricultural production within the Western Cape.
The Indego team adopted a highly participatory approach to the research and engaged a broad range of stakeholders throughout the PHA value-chain. Research findings were informed by a farmer survey and key informant interviews as well as an extensive literature, legislation and policy review.
Purpose of the Plan This Philippi Horticultural Area: Socio-Economic Agricultural Plan (“PHA Plan”) is focused on protecting and managing the PHA for its originally intended land uses – horticulture and sand mining – to leverage sustainable economic, social and environmental benefits from the area.
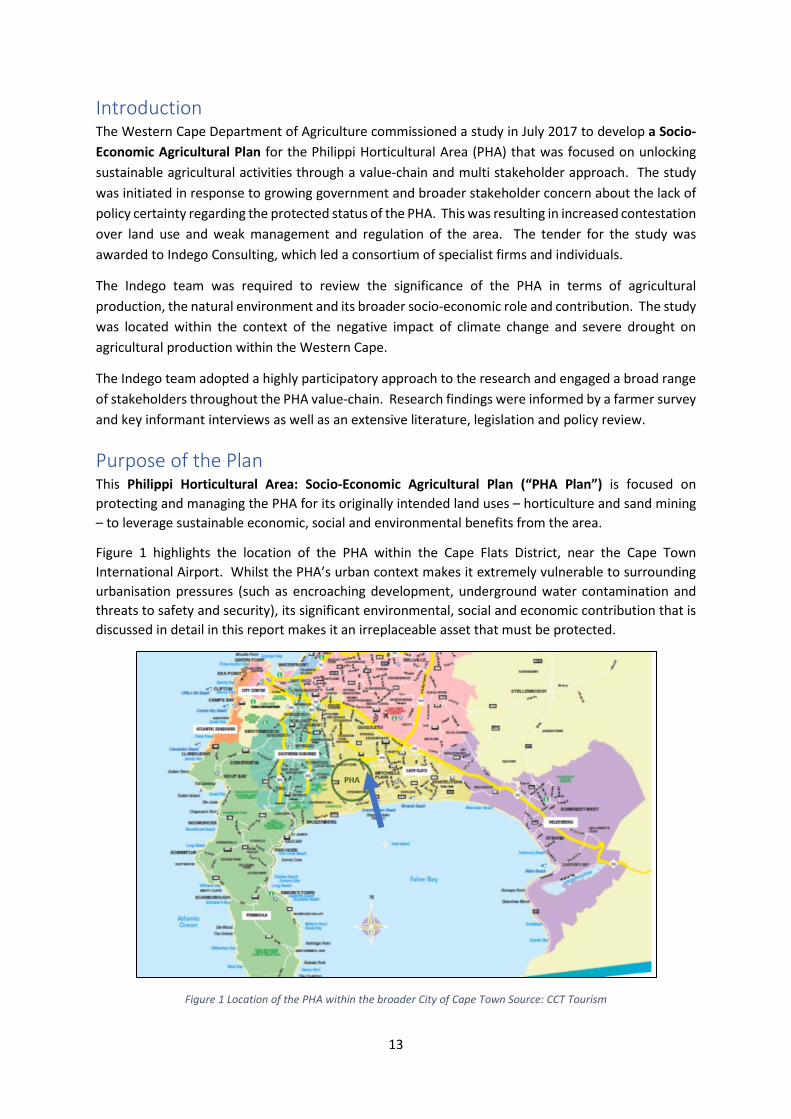
Figure 1 highlights the location of the PHA within the Cape Flats District, near the Cape Town International Airport. Whilst the PHA’s urban context makes it extremely vulnerable to surrounding urbanisation pressures (such as encroaching development, underground water contamination and threats to safety and security), its significant environmental, social and economic contribution that is discussed in detail in this report makes it an irreplaceable asset that must be protected.
Figure 1 Location of the PHA within the broader City of Cape Town Source: CCT Tourism
14
The significance of the PHA lies in:
• The combination of a moderate climate, water availability and soil that make the PHA a “unique farming area” that is considered “irreplaceable” in a 120-kilometre radius to the City centre. The PHA consists of “unique Agricultural Land” in terms of the definition contained in the National Policy on the Protection of High Potential and Unique Agricultural Land (2006).1
• The Cape Flats Driftsands topography; and • The broader regional, and even national, significance of the PHA in terms of its contribution
to climate change resilience, Cape Flats Aquifer recharge, food security, containment of national food prices, job creation and regional competitiveness.
The PHA Plan provides policy certainty that the PHA is recognised by all three spheres of government as an area of agricultural, environmental and socio-economic significance that must be protected for its intended land uses. This policy certainty is reflected in the City of Cape Town’s (CCT) designation of the PHA as a “Critical Natural Area” within its Municipal Spatial Development Framework, 2017.
The Plan recognises the current failure of the public sector to adequately plan, regulate and manage the PHA and the fact that the PHA is at a “tipping point” whereby if the status quo continues it will no longer be economically viable nor desirable to farm in the PHA and the underground water resource will suffer increasing contamination.
The successful implementation of the Plan is intended to result in the effective protection and management of the PHA that enables increased production and compatible economic activity. This in turn will strengthen the resilience, sustainability and competitiveness of the greater City of Cape Town region.
The PHA Plan adopts a “Whole of Society Approach” that mobilises the participation of all three spheres of government and relevant State-Owned Enterprises (SOEs), the private sector, farm workers, communities and organised civil society. The CCT and the Western Cape Department of Agriculture (DoA) will lead in the implementation of the Plan and the intention is to establish a PHA precinct management structure that will include other relevant stakeholders.
Methodology Indego’s approach to the assignment was to: first, to understand the policy and legislative mandates of all three spheres of government and State-Owned Enterprises (SOEs) in relation to the PHA; secondly, establish the environmental agricultural and broader socio-economic significance of the PHA; thirdly, to consult and engage a broad range of stakeholders; and fourthly, based on the findings of the research to make recommendations to the client. The Indego team was organised in four concurrent work-streams, namely:
1 The PHA is defined as “unique Agricultural Land” in terms of the National Policy on the Protection of High Potential and Unique Agricultural Land (2006), that is: land that is or can be used for producing specific high value crops. It is not usually high potential but important to agriculture due to a specific combination of location, climate or soil properties that make it highly suited for a specific crop when managed with specific farming or conservation methods. This includes land of high local importance where it is useful and environmentally sound to encourage continued agricultural production, even if some or most of the land is of mediocre quality for agriculture and is not used for particularly high value crops.
15
1. Spatial planning and land-use management; 2. Natural resources management 3. Agriculture sector performance; and 4. Broader socio-economic research and stakeholder engagement.
The work teams were led by Setplan, UMVOTO Africa Pty (Ltd), Dr Willem Hoffman and Indego respectively. The agricultural field survey was conducted by Emma Vink and Silindile Mncube. The respective work team reports are included as annexures to this report. The four workstreams adopted the following methodologies: The approach of the spatial planning and land use management team involved: • Defining a functional and sustainable PHA Core Area to serve as the minimum footprint for
horticultural and allied activities; • Identifying hard edges or other elements of the built environment to best define the outer limits
of the PHA Core Area; and • Determining a way to secure legally the long-term integrity of the PHA Core Area. A desk-top review of relevant documentation and an initial land-use assessment, based on March 2017 high-resolution aerial photography allied with the latest available (2014) Land Cover Datasets, was undertaken. The initial land-use assessment was tested through: in-field verification over the period July to September 2017; assembling of land ownership data from the latest available datasets; and obtaining primary data via a series of structured interviews with officials representing the CCT and the Western Cape Department of Environmental Affairs and Development Planning (DEADP). The natural resource management team undertook a detailed literature and desktop data review and analysis. A summary of available PHA data and information was produced reflecting: topography; drainage patterns and inter-catchment transfers; rainfall; geology; hydrogeology; trends in land-use patterns; and, the importance of PHA ecosystems and services to urban sustainability within the CCT. The team made recommendations regarding the: management of current groundwater usage; evaluation of unused groundwater potential and development; and the development of an integrated, holistic plan for sustainable natural resource management that includes flood mitigation, waste generation and management, and resource monitoring.
A survey was conducted through face-to-face interviews with 30 farmers. The survey questionnaire was drafted in consultation with the client. The results of the survey were captured and analysed and presented to the farmers in January 2018 for their review and input. A secondary data analysis of the performance of the South African vegetable industry provided necessary context. Interviews were conducted with key stakeholders in the agricultural value chain, such as: packagers, retailers, agro-processors, informal vegetable traders, the Cape Town Market, informal settlement leaders and suppliers.
The broader socio-economic context for the PHA was reviewed through secondary document analysis (including a comprehensive review of relevant national and provincial legislation and policy) as well as broader value-chain interviews with business, civil society and research institution representatives. In addition to the agricultural value chain, interviews with sand miners and a consultant in the industry were conducted.
16
The complex stakeholder environment and many competing stakeholder interests demanded a highly participatory process. Indego organised mid-project stakeholder engagement sessions in October 2017 to test the credibility of emerging study findings from the different work streams. The findings of the agricultural survey were tested with the survey participants in January 2018. A broad and final stakeholder feedback session on the PHA Plan was held in Philippi on the 24th April 2018.
A clear message from private and civil society stakeholders was that unless the Study resulted in policy certainty regarding the future of the PHA, it would have been meaningless and the situation in the PHA would continue to deteriorate leading to the loss of the PHA to agriculture. This message was conveyed by Indego to the client, who embarked on an extensive public sector engagement process regarding the findings and recommendations of the research.
In February 2018, the Indego PHA study findings and recommendations were presented to a Provincial Top Management Meeting where the project findings and recommendations received the support of the Director-General (DG) and Heads of Departments (HoDs), and it was agreed that a presentation be made to Provincial Cabinet. Prior to the Extended Cabinet presentation on the 7th March 2018, bilaterals were held by Indego and the DoA with senior officials in lead provincial departments – such as DEADP, Human Settlements, Community Safety and Economic Development and Tourism - at the request of their respective HoDs to formalise commitments of the departments to the proposed PHA Plan if policy certainty was provided. The Extended Cabinet Meeting was positive towards the findings and recommendations of the Study and requested that concerns raised by the Minister responsible for Human Settlements be addressed through a Ministerial Sub-Committee meeting. This meeting took place on the 11th April 2018 where consensus was reached regarding the support of the sub-committee for the PHA Plan. The Extended Cabinet Meeting took a decision that the PHA Plan be presented at the planned Inter-Governmental Committee on the 9th April 2018. In preparation for this meeting, Indego held bilaterals with CCT Councillors Brett Herron, responsible for Transport and Planning, and JP Smith, responsible for Safety, Security and Social Services. The IGC confirmed the alignment of the CCT’s spatial development plans with Indego’s recommendations for the PHA. The IGC requested that a composite map be produced highlighting the PHA in relation to both provincial and CCT human settlements plans. This map has been produced by the CCT and is included in this Report as Figure 46. The Study findings have subsequently been presented to and supported by the CCT’s Economy and Environmental Cluster Committee on the 12th April 2018 and the Western Cape Parliamentary Standing Committee on Economic Opportunities, Tourism and Agriculture on the 18th April 2018. At both these presentations, Indego received support from all political parties for both the research findings and recommendations. The Minister for Economic Opportunities, Alan Winde, provided feedback to farmer representatives on Tuesday the 17th April 2018 on government’s positive response to the Indego study findings and recommendations and held a press briefing thereafter. The next steps are for the CCT to formally adopt the MSDF and Cabinet the PHA Study recommendations. This will deliver the necessary policy certainty that the PHA is to be protected for agriculture.
Indego would like to thank the WCG and the CCT for giving the team the space to undertake the technical work independently and professionally. The high-level political and administrative support for the findings of Indego’s research has been a critical enabler in the subsequent planning and public-sector stakeholder engagement process. The commitment demonstrated by all three spheres of government to implementing the recommendations of this report should go far in building the necessary trust with broader stakeholders that there strong and justified concerns will be addressed.
17
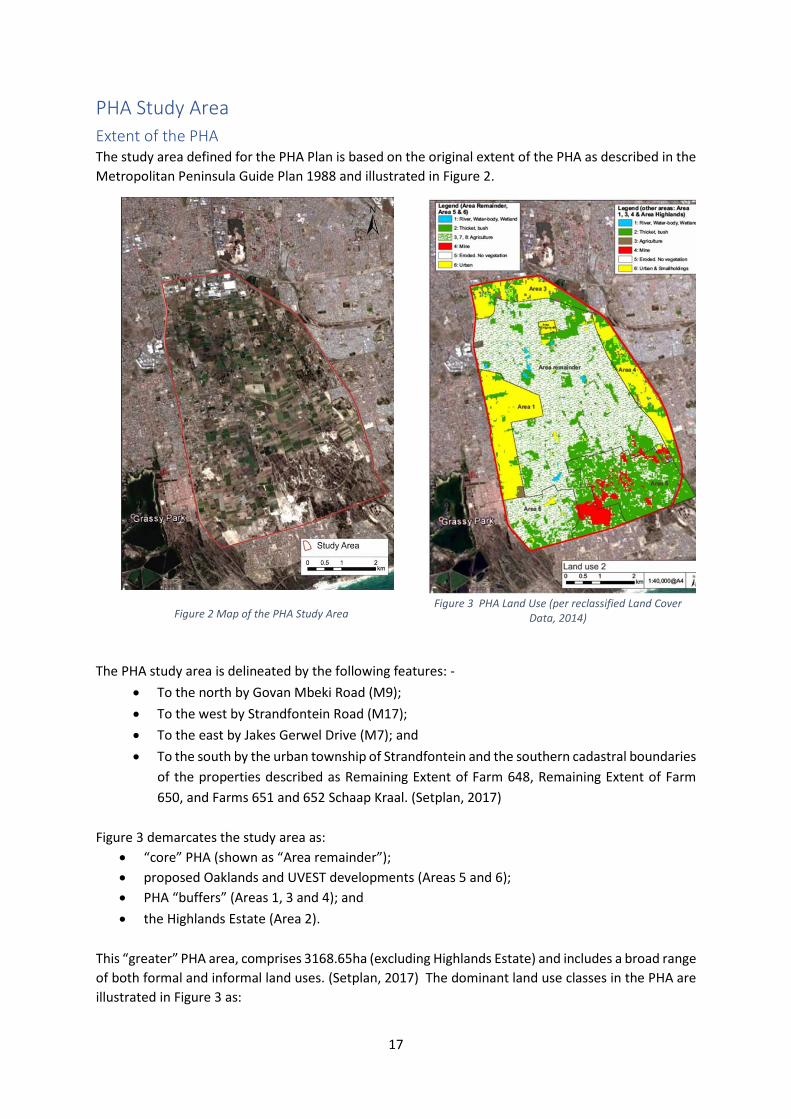
PHA Study Area Extent of the PHA The study area defined for the PHA Plan is based on the original extent of the PHA as described in the Metropolitan Peninsula Guide Plan 1988 and illustrated in Figure 2.
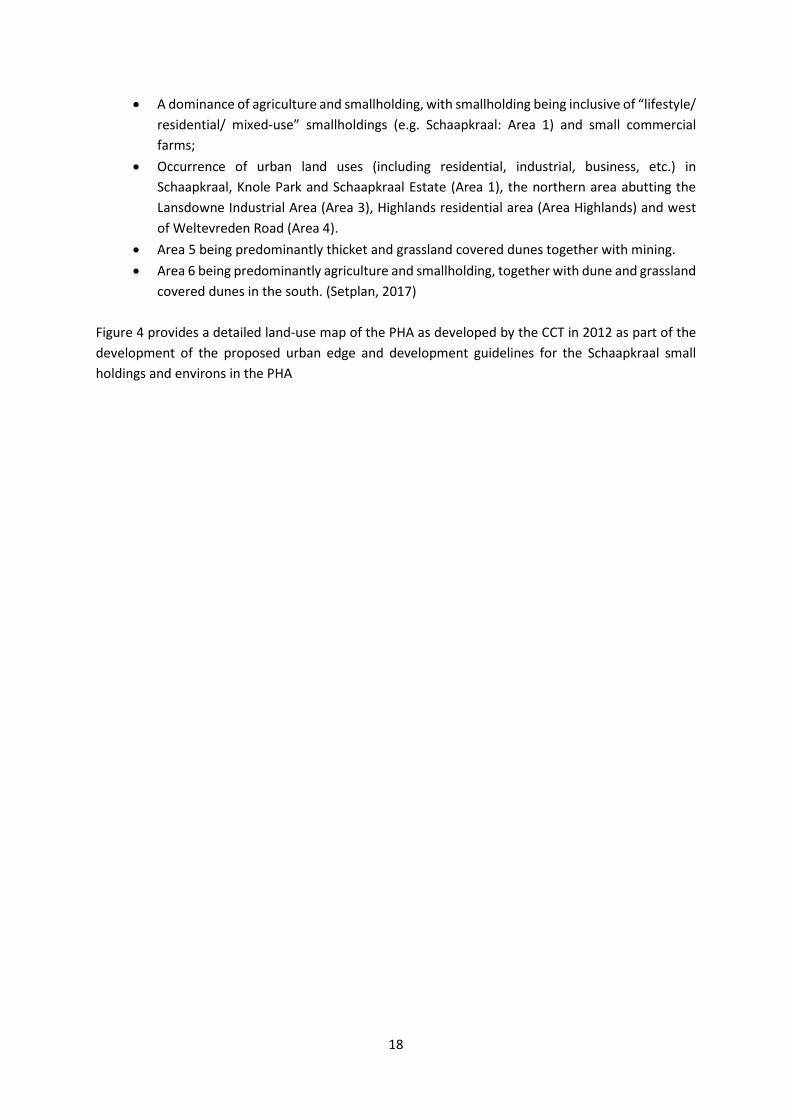
Figure 3 PHA Land Use (per reclassified Land Cover
Data, 2014)
The PHA study area is delineated by the following features: - • To the north by Govan Mbeki Road (M9); • To the west by Strandfontein Road (M17); • To the east by Jakes Gerwel Drive (M7); and • To the south by the urban township of Strandfontein and the southern cadastral boundaries
of the properties described as Remaining Extent of Farm 648, Remaining Extent of Farm 650, and Farms 651 and 652 Schaap Kraal. (Setplan, 2017)
Figure 3 demarcates the study area as:
• “core” PHA (shown as “Area remainder”); • proposed Oaklands and UVEST developments (Areas 5 and 6); • PHA “buffers” (Areas 1, 3 and 4); and • the Highlands Estate (Area 2).
This “greater” PHA area, comprises 3168.65ha (excluding Highlands Estate) and includes a broad range of both formal and informal land uses. (Setplan, 2017) The dominant land use classes in the PHA are illustrated in Figure 3 as:
Figure 2 Map of the PHA Study Area
18
• A dominance of agriculture and smallholding, with smallholding being inclusive of “lifestyle/ residential/ mixed-use” smallholdings (e.g. Schaapkraal: Area 1) and small commercial farms;
• Occurrence of urban land uses (including residential, industrial, business, etc.) in Schaapkraal, Knole Park and Schaapkraal Estate (Area 1), the northern area abutting the Lansdowne Industrial Area (Area 3), Highlands residential area (Area Highlands) and west of Weltevreden Road (Area 4).
• Area 5 being predominantly thicket and grassland covered dunes together with mining. • Area 6 being predominantly agriculture and smallholding, together with dune and grassland
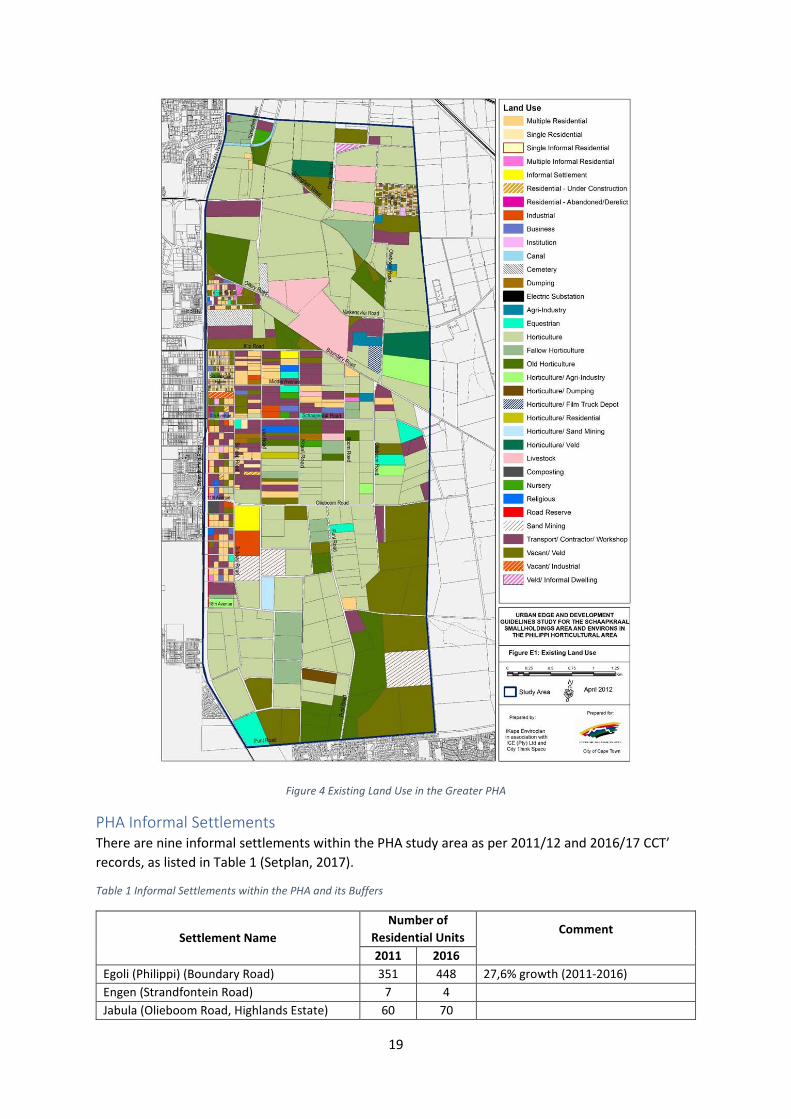
covered dunes in the south. (Setplan, 2017) Figure 4 provides a detailed land-use map of the PHA as developed by the CCT in 2012 as part of the development of the proposed urban edge and development guidelines for the Schaapkraal small holdings and environs in the PHA
19
Figure 4 Existing Land Use in the Greater PHA
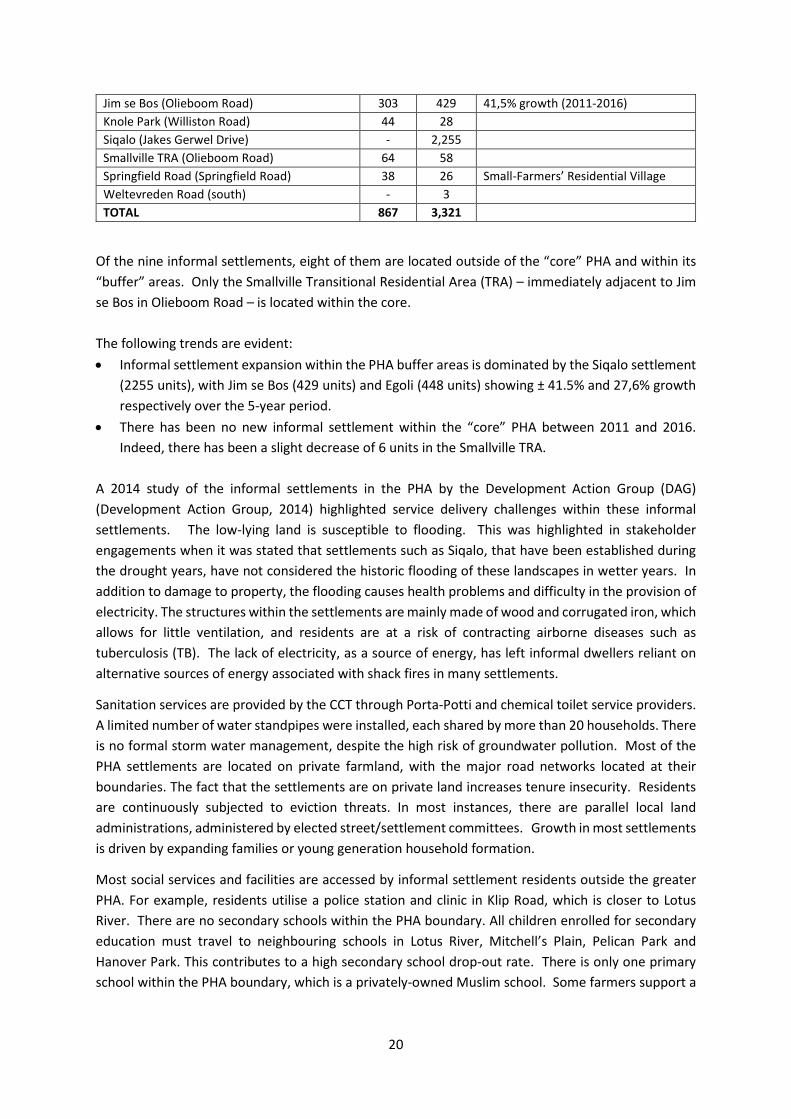
PHA Informal Settlements There are nine informal settlements within the PHA study area as per 2011/12 and 2016/17 CCT’ records, as listed in Table 1 (Setplan, 2017).
Table 1 Informal Settlements within the PHA and its Buffers
Settlement Name Number of
Residential Units Comment
2011 2016 Egoli (Philippi) (Boundary Road) 351 448 27,6% growth (2011-2016) Engen (Strandfontein Road) 7 4 Jabula (Olieboom Road, Highlands Estate) 60 70
20
Jim se Bos (Olieboom Road) 303 429 41,5% growth (2011-2016) Knole Park (Williston Road) 44 28 Siqalo (Jakes Gerwel Drive) - 2,255 Smallville TRA (Olieboom Road) 64 58 Springfield Road (Springfield Road) 38 26 Small-Farmers’ Residential Village Weltevreden Road (south) - 3 TOTAL 867 3,321
Of the nine informal settlements, eight of them are located outside of the “core” PHA and within its “buffer” areas. Only the Smallville Transitional Residential Area (TRA) – immediately adjacent to Jim se Bos in Olieboom Road – is located within the core. The following trends are evident: • Informal settlement expansion within the PHA buffer areas is dominated by the Siqalo settlement
(2255 units), with Jim se Bos (429 units) and Egoli (448 units) showing ± 41.5% and 27,6% growth respectively over the 5-year period.
• There has been no new informal settlement within the “core” PHA between 2011 and 2016. Indeed, there has been a slight decrease of 6 units in the Smallville TRA.
A 2014 study of the informal settlements in the PHA by the Development Action Group (DAG) (Development Action Group, 2014) highlighted service delivery challenges within these informal settlements. The low-lying land is susceptible to flooding. This was highlighted in stakeholder engagements when it was stated that settlements such as Siqalo, that have been established during the drought years, have not considered the historic flooding of these landscapes in wetter years. In addition to damage to property, the flooding causes health problems and difficulty in the provision of electricity. The structures within the settlements are mainly made of wood and corrugated iron, which allows for little ventilation, and residents are at a risk of contracting airborne diseases such as tuberculosis (TB). The lack of electricity, as a source of energy, has left informal dwellers reliant on alternative sources of energy associated with shack fires in many settlements.
Sanitation services are provided by the CCT through Porta-Potti and chemical toilet service providers. A limited number of water standpipes were installed, each shared by more than 20 households. There is no formal storm water management, despite the high risk of groundwater pollution. Most of the PHA settlements are located on private farmland, with the major road networks located at their boundaries. The fact that the settlements are on private land increases tenure insecurity. Residents are continuously subjected to eviction threats. In most instances, there are parallel local land administrations, administered by elected street/settlement committees. Growth in most settlements is driven by expanding families or young generation household formation.
Most social services and facilities are accessed by informal settlement residents outside the greater PHA. For example, residents utilise a police station and clinic in Klip Road, which is closer to Lotus River. There are no secondary schools within the PHA boundary. All children enrolled for secondary education must travel to neighbouring schools in Lotus River, Mitchell’s Plain, Pelican Park and Hanover Park. This contributes to a high secondary school drop-out rate. There is only one primary school within the PHA boundary, which is a privately-owned Muslim school. Some farmers support a
21
large ECD facility in the Weltevreden Wedge. There is a need for further ECD facilities servicing other informal settlements.
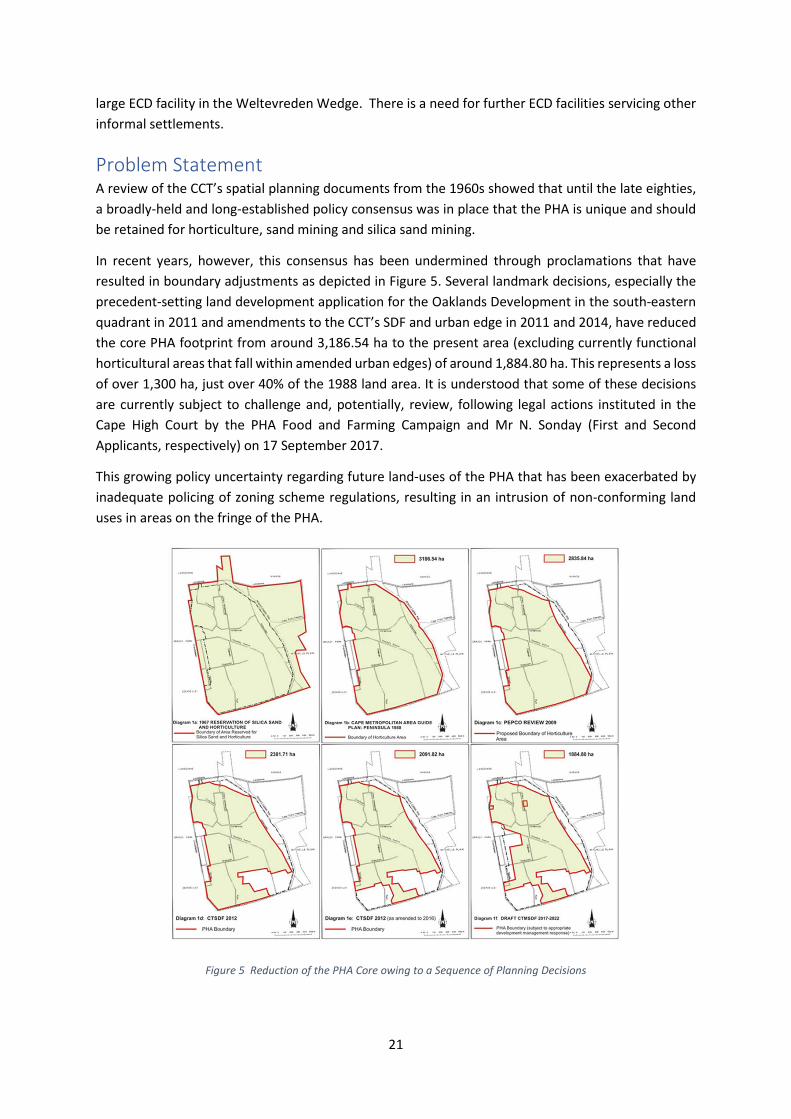
Problem Statement A review of the CCT’s spatial planning documents from the 1960s showed that until the late eighties, a broadly-held and long-established policy consensus was in place that the PHA is unique and should be retained for horticulture, sand mining and silica sand mining.
In recent years, however, this consensus has been undermined through proclamations that have resulted in boundary adjustments as depicted in Figure 5. Several landmark decisions, especially the precedent-setting land development application for the Oaklands Development in the south-eastern quadrant in 2011 and amendments to the CCT’s SDF and urban edge in 2011 and 2014, have reduced the core PHA footprint from around 3,186.54 ha to the present area (excluding currently functional horticultural areas that fall within amended urban edges) of around 1,884.80 ha. This represents a loss of over 1,300 ha, just over 40% of the 1988 land area. It is understood that some of these decisions are currently subject to challenge and, potentially, review, following legal actions instituted in the Cape High Court by the PHA Food and Farming Campaign and Mr N. Sonday (First and Second Applicants, respectively) on 17 September 2017.
This growing policy uncertainty regarding future land-uses of the PHA that has been exacerbated by inadequate policing of zoning scheme regulations, resulting in an intrusion of non-conforming land uses in areas on the fringe of the PHA.
Figure 5 Reduction of the PHA Core owing to a Sequence of Planning Decisions
22
As a result, the PHA and the underlying part of the Cape Flats Aquifer (CFA) have been placed under severe threat. The future of the PHA has been framed in terms of a contestation over horticultural versus human settlements land-use for the area, with calls to respectively “SAVE” or “PAVE”.
This context has led to: • high levels of social division and mistrust; • uncertainty of land owners and farmers regarding the future development path of the PHA; • an increase in the land price differential between agri- and urban-development leading to
increased land speculation; • threats to the integrity of the PHA land area and productive activities; • safety and security threats; • an increase in the costs of doing business to manage risks; and • uncertainty on the part of informal settlements located on the fringes of the PHA regarding
long-term tenure security and socio-economic prospects.
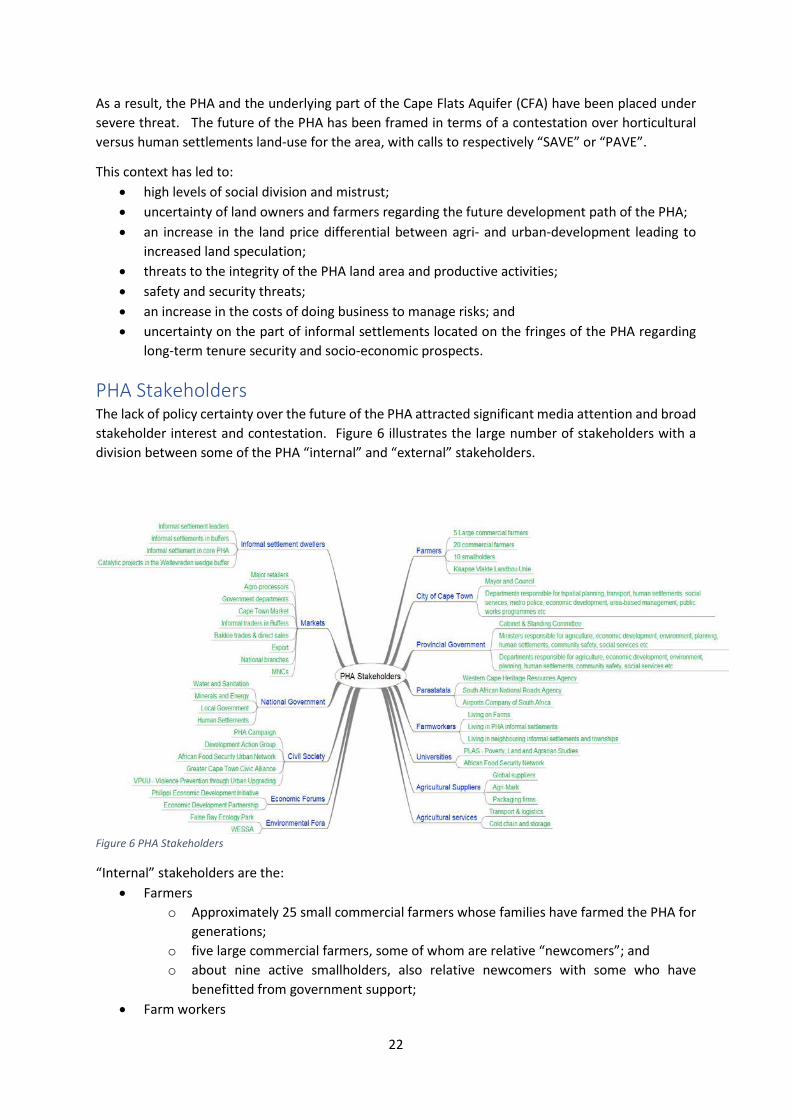
PHA Stakeholders The lack of policy certainty over the future of the PHA attracted significant media attention and broad stakeholder interest and contestation. Figure 6 illustrates the large number of stakeholders with a division between some of the PHA “internal” and “external” stakeholders.
Figure 6 PHA Stakeholders
“Internal” stakeholders are the: • Farmers
o Approximately 25 small commercial farmers whose families have farmed the PHA for generations;
o five large commercial farmers, some of whom are relative “newcomers”; and o about nine active smallholders, also relative newcomers with some who have
benefitted from government support; • Farm workers
23
o inter-generational; and o relative newcomers;
• Informal settlement dwellers o established settlements o relatively new settlements
“Newcomers” include farmers and informal settlement dwellers who could have established in the PHA as many as ten or more years ago.
“External” stakeholders are generally regarded as the: markets; suppliers; service providers; broader civil society groupings; universities; and government.
Many of the white commercial farmers are members of the Kaapse Vlakte Landbou Unie (KVLU) - the oldest farmers’ association in South Africa. Their years of connection has resulted in strong bonds, often through inter-marriage, but also divisions because of family disputes, competitive market and business practices, and disagreement over the future of farming in the PHA. The commercial farmers are ageing, with few family members interested in pursuing the family farming businesses owing to the tough socio-economic climate in which farmers operate. Some seek a profitable exit strategy. Relationships between farmers and farm workers are generally poor, although there are some notable exceptions. Land-hungry small-holders see the opportunity to benefit from the PHA to the extent that the commercial farmers have done yet are subjected to the same socio-economic pressures. They tend to be younger, some with multiple livelihood strategies.
Producer markets value the PHA in terms of its all-year-round production for certain crops, and proximity to distribution networks. There are a broad range of market actors, including retailers, agro-processors, the Cape Town Market and informal vegetable traders. Some of the large commercial farmers are valued as “core” or “strategic” suppliers by retailers. The relationship between the farmers and markets is mixed, with some markets regarded as easier to operate in than others.
Informal settlement dweller leaders have indicated their desire for better living conditions and municipal and social services. They state that many work on the farms and support the retention and protection of the PHA for horticultural purposes. (Igshaan Adams, 2017) Civil society and university institutes highlight the significance of the PHA to the broader food security and climate change resilience of the greater City of Cape Town region and demand a stake in the decisions regarding the future of the PHA. (PHA Summit, 2017) The PHA Campaign has been particularly vocal in support of “saving the PHA” claiming to represent both internal and external stakeholder interests. The lack of policy certainty has escalated stakeholder tensions and laid bare competing interests.
Broader PHA Context Climate Change The South African Country Study on Climate Change, carried out in the late 1990s, identified the Northern and Western Cape provinces as being at most risk from projected climate-change induced warming and rainfall change. (Planning W. C., 2005) The Western Cape Government (WCG) predicts the following climate changes for the province: higher average annual temperature; higher maximum temperatures; more hot days and more heat waves; higher minimum temperatures; fewer cold days and frost days; reduced average rainfall, particularly in the western parts; and an increase in the frequency and intensity of extreme weather events, including floods, droughts and storm surges. (Planning, 2018) The province’s water resources (rivers, wetlands, estuaries), coastal areas, biodiversity and, livelihoods are considered most vulnerable. (Planning W. C., 2005)
24
The broader Southern Africa region has been adversely affected since early 2015 by a shift in weather patterns due to El Niño, resulting in the worst regional drought in 35 years (Western Cape Government, 2016). Resulting crop losses and loss of raw materials have implications for the entire agro-processing value chain and broader economy. This has led to the drought in the country being declared a national disaster in March 2018. The economic impact of the drought on vegetable production in the province is estimated as a 20.2% production drop and a decrease of R79 million in GVA between 2016/17 and 2017/18. The employment losses in the industry are estimated at 2 716. (Agriculture, 2018) According to interviews with retailers, food processing companies and the Cape Town Market, the PHA has been the least affected vegetable production area within the Western Cape owing to its groundwater availability and conducive climate. (Murray, 2017) (Lortan, 2017) (Villiers, 2017)
Water has been identified as the biggest limiting factor to agricultural production within the Western Cape. Over time, a greater share of water is being allocated to urban use which results in less being made available for agriculture. This amplifies the negative impact that climate-induced water shocks could have on the agro-processing value chain, and ultimately the broader economy. Shocks may lead to a reduction of local food security, increased food prices for retailers and consumers, and job losses throughout the value chain. Severe and sustained shocks could increase the dependency on imports and result in a loss of export earnings, and even impede the development of particularly rural communities through its impact on health, nutrition, education and the development of human capital (World Bank, 2016). The WCG has developed a climate change response plan in partnership with the University of Cape Town’s African Climate and Development Initiative. This roadmap, SmartAgri, guides a move towards a more productive and sustainable future and is based on addressing the interdependence between economic growth, social protection and natural ecosystems. SmartAgri’s priority projects include climate-proofing the growth of agro-processing and encouraging a shift towards the adoption of green technologies and practices throughout the agricultural value chain (GreenCape, 2016). Any decision regarding the future of the PHA must be considered within the context of climate change and the massive challenges facing the agricultural sector – especially in terms of water and land availability – and its proven climate change resilience and contribution to food security.
Urban Agriculture as a Component of Sustainable Urban Development The location of the PHA within an urban context has heightened debates as to whether it is an urban asset (as a natural and growing area) or a liability (offering threats of land invasions and urban decay). These debates are not specific to the PHA, as reflected in a growing body of international and national literature in the field of urban agriculture.
With more than half of the world’s population living in cities – a figure that the United Nations expects to increase to 67% by 2050 – there is significant focus on making cities more resilient, habitable, and adaptable to change. (Witman, 2018) Indeed, with an increase in urban poverty, food insecurity and malnutrition, renewed interest has arisen globally in alternative strategies for improving urban livelihoods.
25
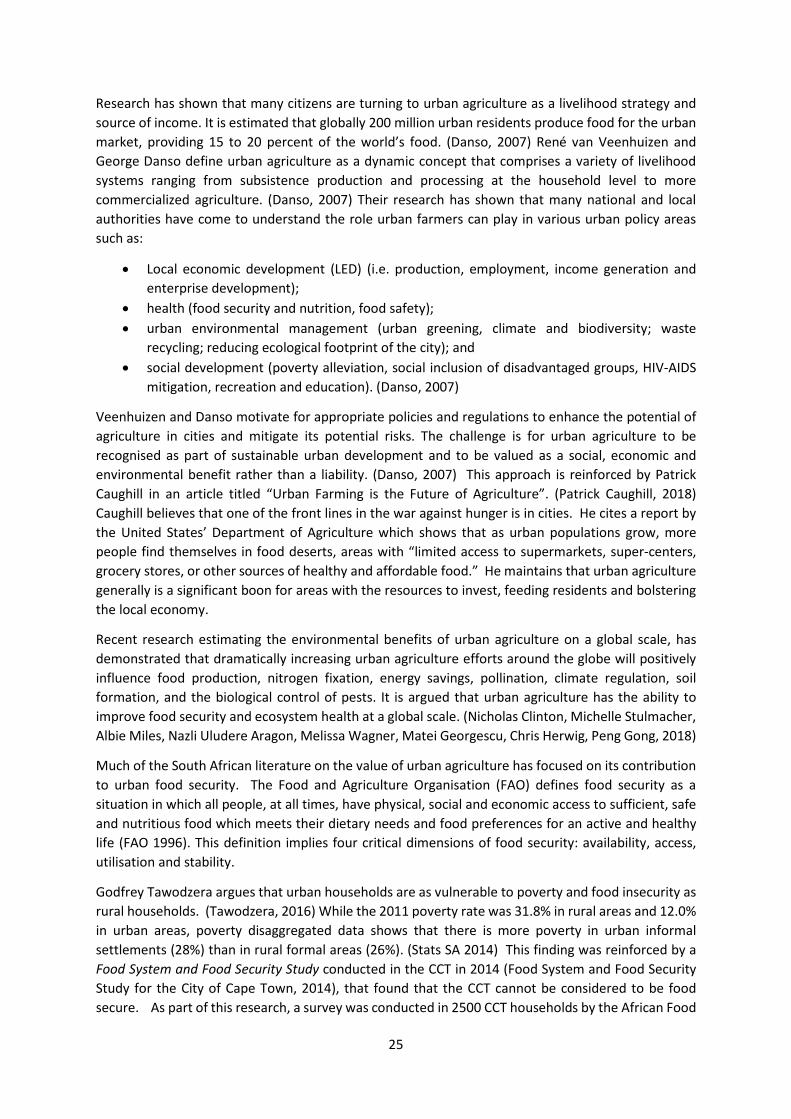
Research has shown that many citizens are turning to urban agriculture as a livelihood strategy and source of income. It is estimated that globally 200 million urban residents produce food for the urban market, providing 15 to 20 percent of the world’s food. (Danso, 2007) René van Veenhuizen and George Danso define urban agriculture as a dynamic concept that comprises a variety of livelihood systems ranging from subsistence production and processing at the household level to more commercialized agriculture. (Danso, 2007) Their research has shown that many national and local authorities have come to understand the role urban farmers can play in various urban policy areas such as:
• Local economic development (LED) (i.e. production, employment, income generation and enterprise development);
• health (food security and nutrition, food safety); • urban environmental management (urban greening, climate and biodiversity; waste
recycling; reducing ecological footprint of the city); and • social development (poverty alleviation, social inclusion of disadvantaged groups, HIV-AIDS
mitigation, recreation and education). (Danso, 2007)
Veenhuizen and Danso motivate for appropriate policies and regulations to enhance the potential of agriculture in cities and mitigate its potential risks. The challenge is for urban agriculture to be recognised as part of sustainable urban development and to be valued as a social, economic and environmental benefit rather than a liability. (Danso, 2007) This approach is reinforced by Patrick Caughill in an article titled “Urban Farming is the Future of Agriculture”. (Patrick Caughill, 2018) Caughill believes that one of the front lines in the war against hunger is in cities. He cites a report by the United States’ Department of Agriculture which shows that as urban populations grow, more people find themselves in food deserts, areas with “limited access to supermarkets, super-centers, grocery stores, or other sources of healthy and affordable food.” He maintains that urban agriculture generally is a significant boon for areas with the resources to invest, feeding residents and bolstering the local economy.
Recent research estimating the environmental benefits of urban agriculture on a global scale, has demonstrated that dramatically increasing urban agriculture efforts around the globe will positively influence food production, nitrogen fixation, energy savings, pollination, climate regulation, soil formation, and the biological control of pests. It is argued that urban agriculture has the ability to improve food security and ecosystem health at a global scale. (Nicholas Clinton, Michelle Stulmacher, Albie Miles, Nazli Uludere Aragon, Melissa Wagner, Matei Georgescu, Chris Herwig, Peng Gong, 2018)
Much of the South African literature on the value of urban agriculture has focused on its contribution to urban food security. The Food and Agriculture Organisation (FAO) defines food security as a situation in which all people, at all times, have physical, social and economic access to sufficient, safe and nutritious food which meets their dietary needs and food preferences for an active and healthy life (FAO 1996). This definition implies four critical dimensions of food security: availability, access, utilisation and stability.
Godfrey Tawodzera argues that urban households are as vulnerable to poverty and food insecurity as rural households. (Tawodzera, 2016) While the 2011 poverty rate was 31.8% in rural areas and 12.0% in urban areas, poverty disaggregated data shows that there is more poverty in urban informal settlements (28%) than in rural formal areas (26%). (Stats SA 2014) This finding was reinforced by a Food System and Food Security Study conducted in the CCT in 2014 (Food System and Food Security Study for the City of Cape Town, 2014), that found that the CCT cannot be considered to be food secure. As part of this research, a survey was conducted in 2500 CCT households by the African Food
26
Security Network (AFSUN). The average food insecurity level was 58%, with significantly higher levels of 72% in low-income areas. Food security at the household scale is impacted by conditions in the wider food system.
Understanding the changing food system within South Africa and the CCT is important to understanding the role and value of the PHA in supplying the markets. The food system in South Africa in undergoing a rapid transition in terms of production, import/export balance and retailing, and is increasingly consolidated. The ten largest packaged food companies in South Africa account for 52%of total packaged food sales. Supermarkets have become an increasingly important component of the food retail sector. Having accounted for 50-60% of all food retail sales in 2003, the supermarket sector accounted for 68% of all food retail by 2010. It is currently estimated to account for 75% of all grocery sales, with the remainder largely accounted for by the informal sector. (Jane Battersby, 2017)
Low-income households depend on sourcing food from formal and informal retailers, both of which have benefits and weaknesses regarding access to healthy, safe and affordable food. Formal retailers offer lower prices per unit and have well-regulated safety standards, but they retail in unit sizes unaffordable to the poorest, have limited opening hours and do not grant credit. Informal retailers are often more expensive per unit and lack adequate safety standards, but sell in affordable unit sizes, are open longer hours and often offer credit. (Jane Battersby, 2017) These findings were supported by research undertaken by the Institute for Poverty, Land and Agrarian Studies (PLAS) in 2016 in Cape Town on the informal sector’s role in food security (Haysom, 2016). The research identified a pattern of lower-income urban residents buying bulk staples from supermarkets and relying on the informal food economy for other foodstuffs. Whilst most urban residents use the formal sector, lower income terciles use the formal sector less frequently.
The PLAS paper has shown that the informal economy is a vital means by which the poor in South Africa attain a measure of food security. PLAS argues that if policy approaches do not formally recognise the importance of the informal sector, the negative consequences will not only be shrinking employment and greater reliance on a resource-poor state, but growing food insecurity , placing extra burdens on the state and society. (Haysom, 2016)
Tawodzera points out that it is in South Africa’s power to prioritise food security through various instruments as laid out in the country’s food security strategy. Whether that goal is achievable depends on political commitment and the will to address the country’s huge inequalities (Tawodzera, 2016). Encouragingly, the WCG has recognised the importance of adopting a food system’s approach to food security and has recently developed the Western Cape Food Security Strategic Framework with 6 pillars, namely: food access; food awareness and food safety; food sensitive planning that includes the protection of agricultural land; sustainable natural resource use; inclusive food economy; and, food governance.
Jane Battersby maintains that local government has a profound role to play in reshaping the food system through non-food related planning and policy decisions designed to achieve urban development objectives. This may entail the inclusion and adaptation of the principles of food sensitive planning and design into City zoning scheme by-laws. Battersby stresses that new opportunities for more inclusive urban food systems planning are being afforded by UN-Habitat’s New Urban Agenda and Sustainable Development Goals. The New Urban Agenda (UN-Habitat, 2016) explicitly calls for food systems planning to be part of future urban planning and urban governance (Jane Battersbry, 2017). It is understood that the CCT is reviewing its current approach to food security
27
and urban agriculture, and that specialised capacity is being recruited to enable an expanded and more catalytic agricultural and agro-processing sector focus by the CCT (Greyling, 2017).
Impact of Horticultural Production on Food Prices Market price increases erode household purchasing power because wages do not increase at similar rates. According to Tawodzera, food prices are probably the single most important cause of vulnerability among the urban poor, since they are reliant on purchasing their food. (Tawodzera, 2016). Significantly, urban vegetable production in South Africa is shown to have an important food price moderating effect. The proximity of urban agricultural areas to the markets gives an advantage of lower transport costs that can be transferred to the end consumer. This contributes more broadly to food system robustness (Food System and Food Security Study for the City of Cape Town, 2014).
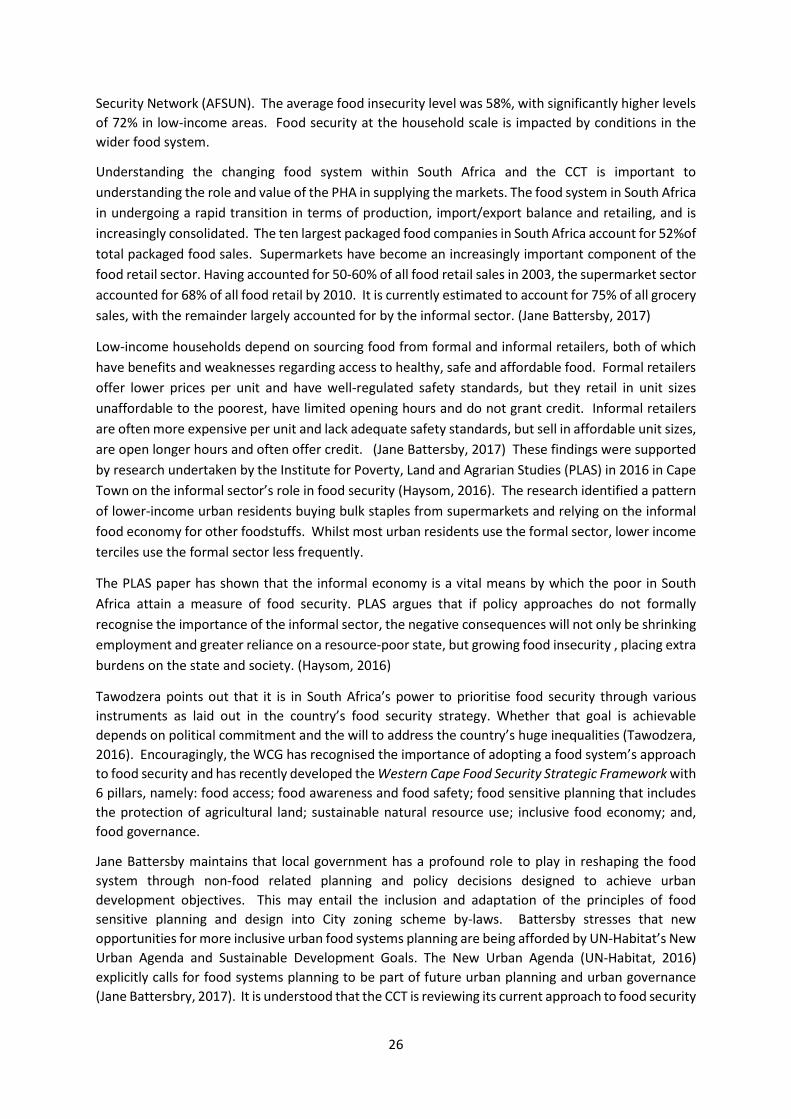
The impact of horticultural production, especially vegetables, on food prices nationally is discussed below. Figure 7 shows that the value of horticulture output, like the field crops and animal production, is increasing in South Africa. It is noticeable that, over time, the total horticultural output is less volatile than field crops. The value of animal production has increased at a greater rate, which is a normal trend where people move into higher income groups.
Figure 7 Value of Output of the Main Agricultural Sub-Sectors in South Africa 2000 - 2015
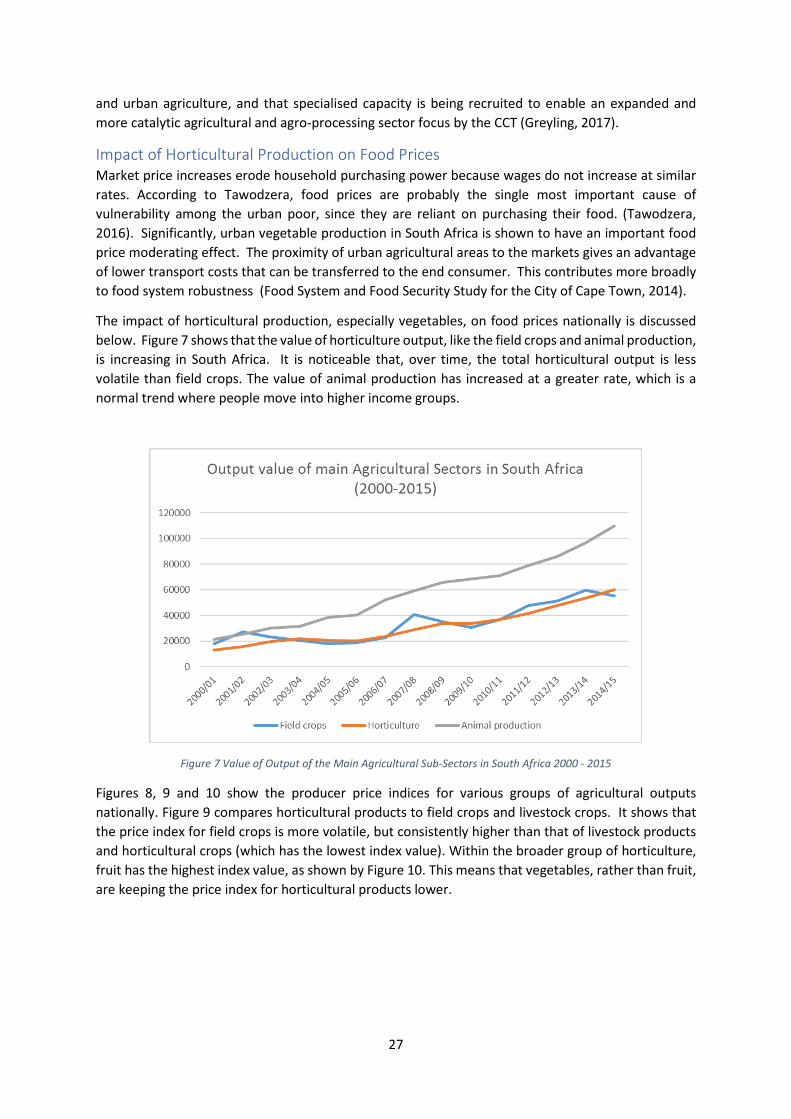
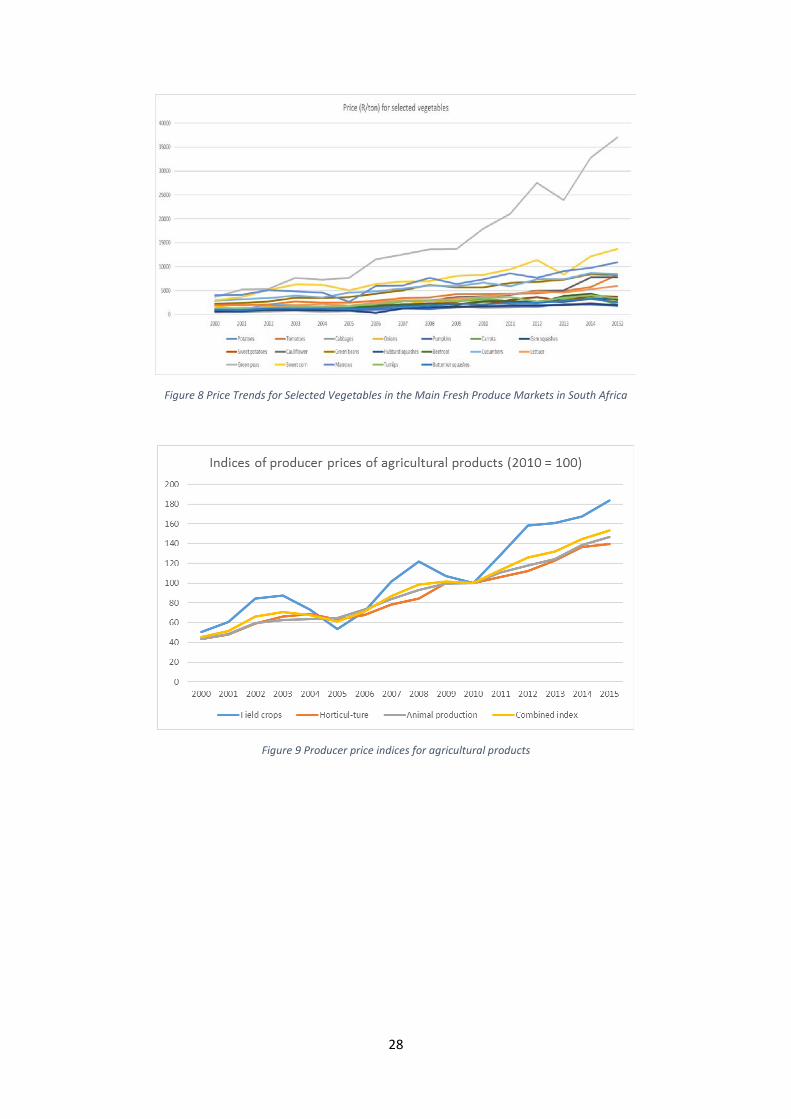
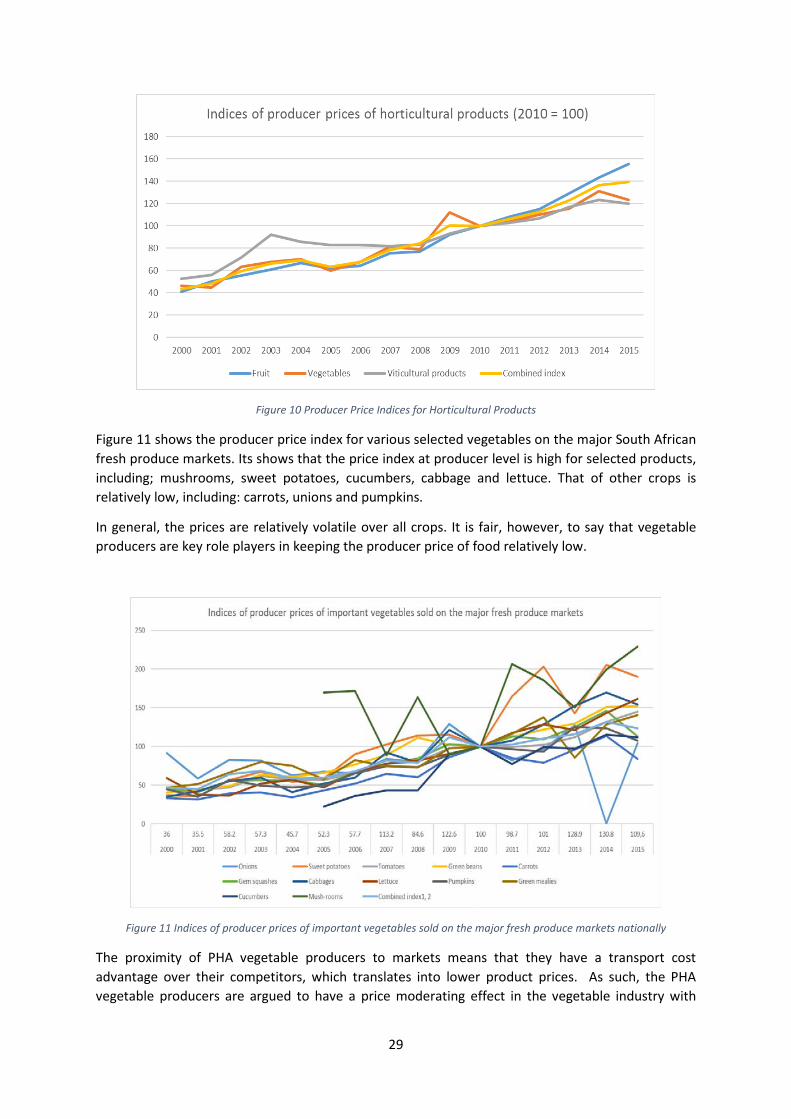
Figures 8, 9 and 10 show the producer price indices for various groups of agricultural outputs nationally. Figure 9 compares horticultural products to field crops and livestock crops. It shows that the price index for field crops is more volatile, but consistently higher than that of livestock products and horticultural crops (which has the lowest index value). Within the broader group of horticulture, fruit has the highest index value, as shown by Figure 10. This means that vegetables, rather than fruit, are keeping the price index for horticultural products lower.
28
Figure 8 Price Trends for Selected Vegetables in the Main Fresh Produce Markets in South Africa
Figure 9 Producer price indices for agricultural products
29
Figure 10 Producer Price Indices for Horticultural Products
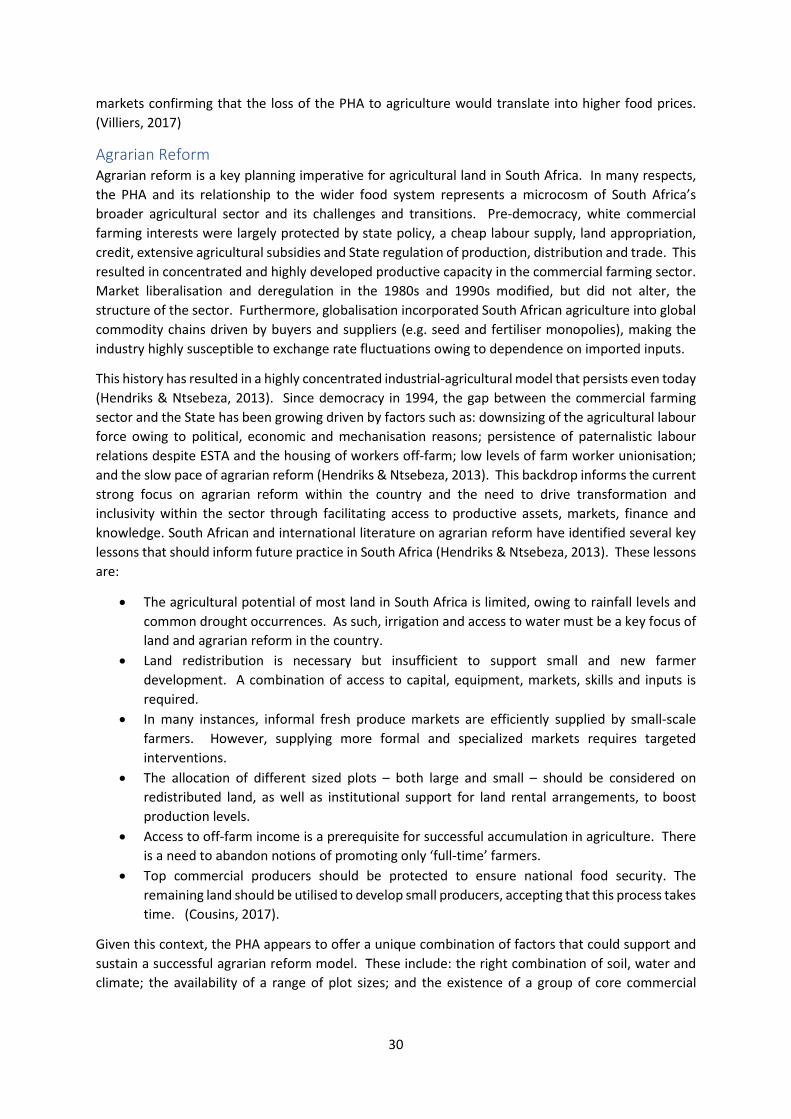
Figure 11 shows the producer price index for various selected vegetables on the major South African fresh produce markets. Its shows that the price index at producer level is high for selected products, including; mushrooms, sweet potatoes, cucumbers, cabbage and lettuce. That of other crops is relatively low, including: carrots, unions and pumpkins.
In general, the prices are relatively volatile over all crops. It is fair, however, to say that vegetable producers are key role players in keeping the producer price of food relatively low.
Figure 11 Indices of producer prices of important vegetables sold on the major fresh produce markets nationally
The proximity of PHA vegetable producers to markets means that they have a transport cost advantage over their competitors, which translates into lower product prices. As such, the PHA vegetable producers are argued to have a price moderating effect in the vegetable industry with
30
markets confirming that the loss of the PHA to agriculture would translate into higher food prices. (Villiers, 2017)
Agrarian Reform Agrarian reform is a key planning imperative for agricultural land in South Africa. In many respects, the PHA and its relationship to the wider food system represents a microcosm of South Africa’s broader agricultural sector and its challenges and transitions. Pre-democracy, white commercial farming interests were largely protected by state policy, a cheap labour supply, land appropriation, credit, extensive agricultural subsidies and State regulation of production, distribution and trade. This resulted in concentrated and highly developed productive capacity in the commercial farming sector. Market liberalisation and deregulation in the 1980s and 1990s modified, but did not alter, the structure of the sector. Furthermore, globalisation incorporated South African agriculture into global commodity chains driven by buyers and suppliers (e.g. seed and fertiliser monopolies), making the industry highly susceptible to exchange rate fluctuations owing to dependence on imported inputs.
This history has resulted in a highly concentrated industrial-agricultural model that persists even today (Hendriks & Ntsebeza, 2013). Since democracy in 1994, the gap between the commercial farming sector and the State has been growing driven by factors such as: downsizing of the agricultural labour force owing to political, economic and mechanisation reasons; persistence of paternalistic labour relations despite ESTA and the housing of workers off-farm; low levels of farm worker unionisation; and the slow pace of agrarian reform (Hendriks & Ntsebeza, 2013). This backdrop informs the current strong focus on agrarian reform within the country and the need to drive transformation and inclusivity within the sector through facilitating access to productive assets, markets, finance and knowledge. South African and international literature on agrarian reform have identified several key lessons that should inform future practice in South Africa (Hendriks & Ntsebeza, 2013). These lessons are:
• The agricultural potential of most land in South Africa is limited, owing to rainfall levels and common drought occurrences. As such, irrigation and access to water must be a key focus of land and agrarian reform in the country.
• Land redistribution is necessary but insufficient to support small and new farmer development. A combination of access to capital, equipment, markets, skills and inputs is required.
• In many instances, informal fresh produce markets are efficiently supplied by small-scale farmers. However, supplying more formal and specialized markets requires targeted interventions.
• The allocation of different sized plots – both large and small – should be considered on redistributed land, as well as institutional support for land rental arrangements, to boost production levels.
• Access to off-farm income is a prerequisite for successful accumulation in agriculture. There is a need to abandon notions of promoting only ‘full-time’ farmers.
• Top commercial producers should be protected to ensure national food security. The remaining land should be utilised to develop small producers, accepting that this process takes time. (Cousins, 2017).
Given this context, the PHA appears to offer a unique combination of factors that could support and sustain a successful agrarian reform model. These include: the right combination of soil, water and climate; the availability of a range of plot sizes; and the existence of a group of core commercial
31
farmers with established and strategic linkages into the formal markets. The latter could be approached to participate in agrarian reform in a manner that enables all PHA farmers to benefit.
Legislative and Policy Mandates National and Provincial Legislation and Policy There is a wide range of national and provincial legislation and policy that must inform the response of the public sector (i.e. all three spheres of government and SOEs) to the PHA. This relates to: environmental protection and sustainable natural resource management; food security; climate change resilience; protection of heritage resources; land reform and restitution; conservation of agricultural land; agrarian reform; Agri-BEE; spatial transformation; integrated human settlements planning and development; and, sustainable urban development and land-use management (see Table 2). These obligations should be reflected within the strategic frameworks and plans and in the performance of the powers and functions of all three spheres of government and SOEs.
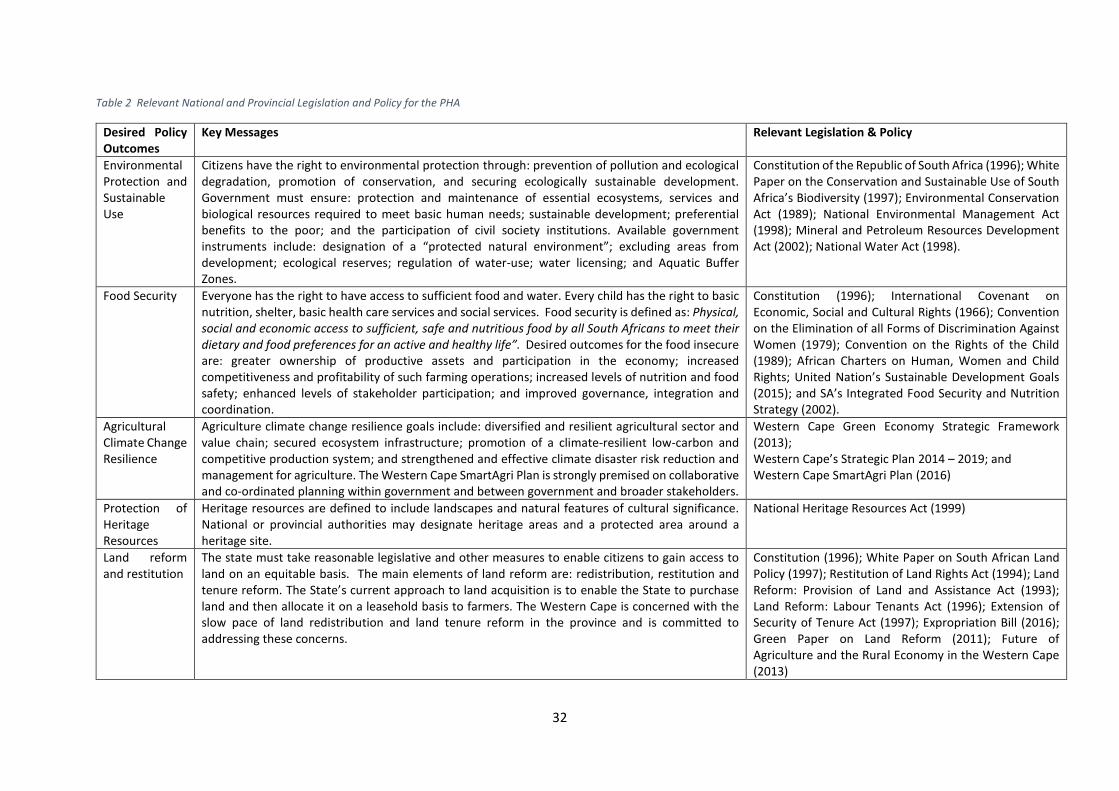
32
Table 2 Relevant National and Provincial Legislation and Policy for the PHA
Desired Policy Outcomes
Key Messages Relevant Legislation & Policy
Environmental Protection and Sustainable Use
Citizens have the right to environmental protection through: prevention of pollution and ecological degradation, promotion of conservation, and securing ecologically sustainable development. Government must ensure: protection and maintenance of essential ecosystems, services and biological resources required to meet basic human needs; sustainable development; preferential benefits to the poor; and the participation of civil society institutions. Available government instruments include: designation of a “protected natural environment”; excluding areas from development; ecological reserves; regulation of water-use; water licensing; and Aquatic Buffer Zones.
Constitution of the Republic of South Africa (1996); White Paper on the Conservation and Sustainable Use of South Africa’s Biodiversity (1997); Environmental Conservation Act (1989); National Environmental Management Act (1998); Mineral and Petroleum Resources Development Act (2002); National Water Act (1998).
Food Security Everyone has the right to have access to sufficient food and water. Every child has the right to basic nutrition, shelter, basic health care services and social services. Food security is defined as: Physical, social and economic access to sufficient, safe and nutritious food by all South Africans to meet their dietary and food preferences for an active and healthy life”. Desired outcomes for the food insecure are: greater ownership of productive assets and participation in the economy; increased competitiveness and profitability of such farming operations; increased levels of nutrition and food safety; enhanced levels of stakeholder participation; and improved governance, integration and coordination.
Constitution (1996); International Covenant on Economic, Social and Cultural Rights (1966); Convention on the Elimination of all Forms of Discrimination Against Women (1979); Convention on the Rights of the Child (1989); African Charters on Human, Women and Child Rights; United Nation’s Sustainable Development Goals (2015); and SA’s Integrated Food Security and Nutrition Strategy (2002).
Agricultural Climate Change Resilience
Agriculture climate change resilience goals include: diversified and resilient agricultural sector and value chain; secured ecosystem infrastructure; promotion of a climate-resilient low-carbon and competitive production system; and strengthened and effective climate disaster risk reduction and management for agriculture. The Western Cape SmartAgri Plan is strongly premised on collaborative and co-ordinated planning within government and between government and broader stakeholders.
Western Cape Green Economy Strategic Framework (2013); Western Cape’s Strategic Plan 2014 – 2019; and Western Cape SmartAgri Plan (2016)
Protection of Heritage Resources
Heritage resources are defined to include landscapes and natural features of cultural significance. National or provincial authorities may designate heritage areas and a protected area around a heritage site.
National Heritage Resources Act (1999)
Land reform and restitution
The state must take reasonable legislative and other measures to enable citizens to gain access to land on an equitable basis. The main elements of land reform are: redistribution, restitution and tenure reform. The State’s current approach to land acquisition is to enable the State to purchase land and then allocate it on a leasehold basis to farmers. The Western Cape is concerned with the slow pace of land redistribution and land tenure reform in the province and is committed to addressing these concerns.
Constitution (1996); White Paper on South African Land Policy (1997); Restitution of Land Rights Act (1994); Land Reform: Provision of Land and Assistance Act (1993); Land Reform: Labour Tenants Act (1996); Extension of Security of Tenure Act (1997); Expropriation Bill (2016); Green Paper on Land Reform (2011); Future of Agriculture and the Rural Economy in the Western Cape (2013)
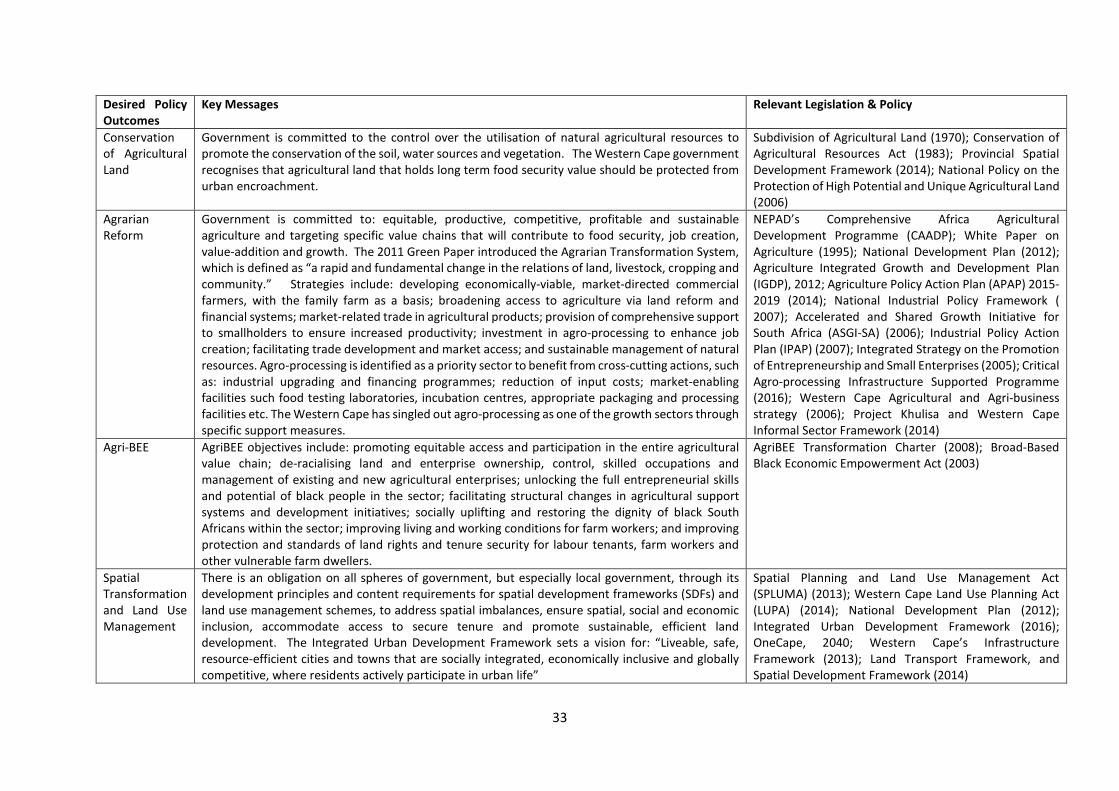
33
Desired Policy Outcomes
Key Messages Relevant Legislation & Policy
Conservation of Agricultural Land
Government is committed to the control over the utilisation of natural agricultural resources to promote the conservation of the soil, water sources and vegetation. The Western Cape government recognises that agricultural land that holds long term food security value should be protected from urban encroachment.
Subdivision of Agricultural Land (1970); Conservation of Agricultural Resources Act (1983); Provincial Spatial Development Framework (2014); National Policy on the Protection of High Potential and Unique Agricultural Land (2006)
Agrarian Reform
Government is committed to: equitable, productive, competitive, profitable and sustainable agriculture and targeting specific value chains that will contribute to food security, job creation, value-addition and growth. The 2011 Green Paper introduced the Agrarian Transformation System, which is defined as “a rapid and fundamental change in the relations of land, livestock, cropping and community.” Strategies include: developing economically-viable, market-directed commercial farmers, with the family farm as a basis; broadening access to agriculture via land reform and financial systems; market-related trade in agricultural products; provision of comprehensive support to smallholders to ensure increased productivity; investment in agro-processing to enhance job creation; facilitating trade development and market access; and sustainable management of natural resources. Agro-processing is identified as a priority sector to benefit from cross-cutting actions, such as: industrial upgrading and financing programmes; reduction of input costs; market-enabling facilities such food testing laboratories, incubation centres, appropriate packaging and processing facilities etc. The Western Cape has singled out agro-processing as one of the growth sectors through specific support measures.
NEPAD’s Comprehensive Africa Agricultural Development Programme (CAADP); White Paper on Agriculture (1995); National Development Plan (2012); Agriculture Integrated Growth and Development Plan (IGDP), 2012; Agriculture Policy Action Plan (APAP) 2015-2019 (2014); National Industrial Policy Framework ( 2007); Accelerated and Shared Growth Initiative for South Africa (ASGI-SA) (2006); Industrial Policy Action Plan (IPAP) (2007); Integrated Strategy on the Promotion of Entrepreneurship and Small Enterprises (2005); Critical Agro-processing Infrastructure Supported Programme (2016); Western Cape Agricultural and Agri-business strategy (2006); Project Khulisa and Western Cape Informal Sector Framework (2014)
Agri-BEE AgriBEE objectives include: promoting equitable access and participation in the entire agricultural value chain; de-racialising land and enterprise ownership, control, skilled occupations and management of existing and new agricultural enterprises; unlocking the full entrepreneurial skills and potential of black people in the sector; facilitating structural changes in agricultural support systems and development initiatives; socially uplifting and restoring the dignity of black South Africans within the sector; improving living and working conditions for farm workers; and improving protection and standards of land rights and tenure security for labour tenants, farm workers and other vulnerable farm dwellers.
AgriBEE Transformation Charter (2008); Broad-Based Black Economic Empowerment Act (2003)
Spatial Transformation and Land Use Management
There is an obligation on all spheres of government, but especially local government, through its development principles and content requirements for spatial development frameworks (SDFs) and land use management schemes, to address spatial imbalances, ensure spatial, social and economic inclusion, accommodate access to secure tenure and promote sustainable, efficient land development. The Integrated Urban Development Framework sets a vision for: “Liveable, safe, resource-efficient cities and towns that are socially integrated, economically inclusive and globally competitive, where residents actively participate in urban life”
Spatial Planning and Land Use Management Act (SPLUMA) (2013); Western Cape Land Use Planning Act (LUPA) (2014); National Development Plan (2012); Integrated Urban Development Framework (2016); OneCape, 2040; Western Cape’s Infrastructure Framework (2013); Land Transport Framework, and Spatial Development Framework (2014)
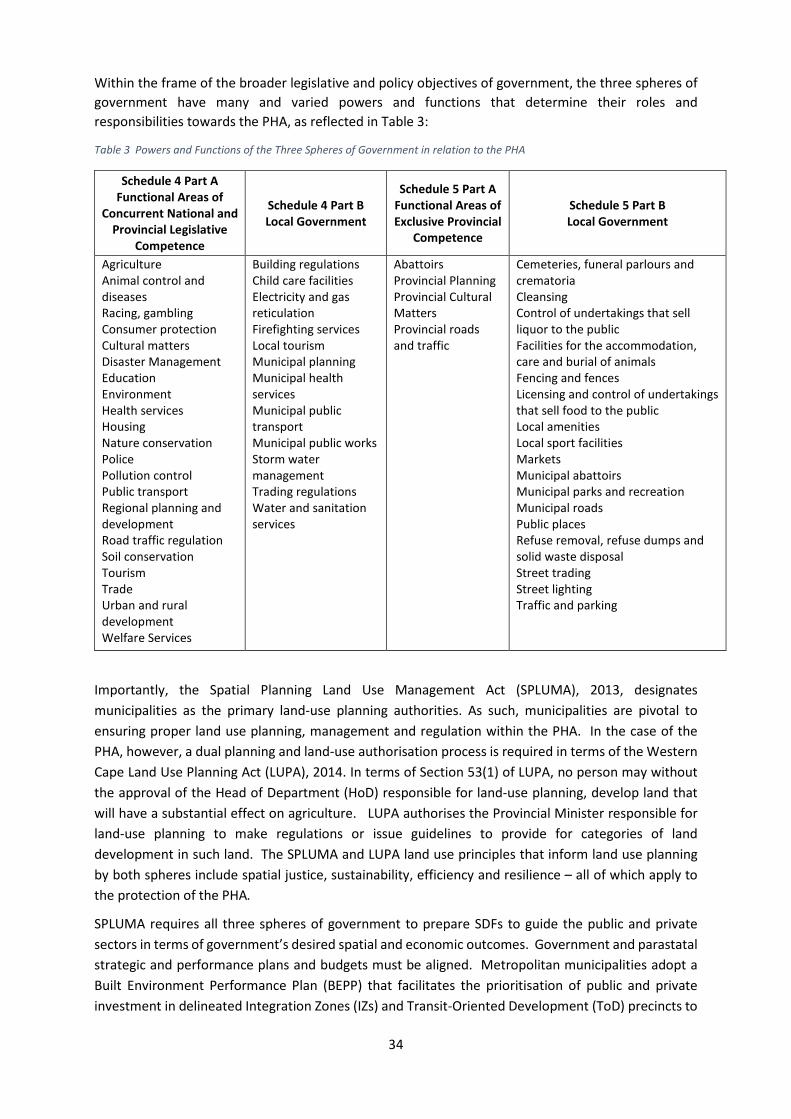
34
Within the frame of the broader legislative and policy objectives of government, the three spheres of government have many and varied powers and functions that determine their roles and responsibilities towards the PHA, as reflected in Table 3:
Table 3 Powers and Functions of the Three Spheres of Government in relation to the PHA
Schedule 4 Part A Functional Areas of
Concurrent National and Provincial Legislative
Competence
Schedule 4 Part B Local Government
Schedule 5 Part A Functional Areas of Exclusive Provincial
Competence
Schedule 5 Part B Local Government
Agriculture Animal control and diseases Racing, gambling Consumer protection Cultural matters Disaster Management Education Environment Health services Housing Nature conservation Police Pollution control Public transport Regional planning and development Road traffic regulation Soil conservation Tourism Trade Urban and rural development Welfare Services
Building regulations Child care facilities Electricity and gas reticulation Firefighting services Local tourism Municipal planning Municipal health services Municipal public transport Municipal public works Storm water management Trading regulations Water and sanitation services
Abattoirs Provincial Planning Provincial Cultural Matters Provincial roads and traffic
Cemeteries, funeral parlours and crematoria Cleansing Control of undertakings that sell liquor to the public Facilities for the accommodation, care and burial of animals Fencing and fences Licensing and control of undertakings that sell food to the public Local amenities Local sport facilities Markets Municipal abattoirs Municipal parks and recreation Municipal roads Public places Refuse removal, refuse dumps and solid waste disposal Street trading Street lighting Traffic and parking
Importantly, the Spatial Planning Land Use Management Act (SPLUMA), 2013, designates municipalities as the primary land-use planning authorities. As such, municipalities are pivotal to ensuring proper land use planning, management and regulation within the PHA. In the case of the PHA, however, a dual planning and land-use authorisation process is required in terms of the Western Cape Land Use Planning Act (LUPA), 2014. In terms of Section 53(1) of LUPA, no person may without the approval of the Head of Department (HoD) responsible for land-use planning, develop land that will have a substantial effect on agriculture. LUPA authorises the Provincial Minister responsible for land-use planning to make regulations or issue guidelines to provide for categories of land development in such land. The SPLUMA and LUPA land use principles that inform land use planning by both spheres include spatial justice, sustainability, efficiency and resilience – all of which apply to the protection of the PHA.
SPLUMA requires all three spheres of government to prepare SDFs to guide the public and private sectors in terms of government’s desired spatial and economic outcomes. Government and parastatal strategic and performance plans and budgets must be aligned. Metropolitan municipalities adopt a Built Environment Performance Plan (BEPP) that facilitates the prioritisation of public and private investment in delineated Integration Zones (IZs) and Transit-Oriented Development (ToD) precincts to
35
drive spatial transformation and improved urban management. The SDF and BEPP planning instruments of the CCT, therefore, are the decisive policy instruments in the protection of the PHA.
City-Level Land-Use and Planning Policy Over the years, substantial land-use and planning policy has been developed for the PHA as summarised in this section of the report. This summary is based on a more detailed “Spatial Planning and Land Development Management” input (Setplan, 2017) attached as Annexure A.
The PHA was designated for horticultural use, mining and beneficiation of silica in terms of the Physical Planning Act (Act 88 of 1967) and boundary amendments as per the Cape Metropolitan Area Guide Plan, Volume 1: Peninsula (1988). Subsequently the area has been subject to a range of pressures for land use transformation, particularly in its outer fringe areas, and has been the subject of many studies.
Applicable laws and policies regarding the reservation/proclamation of the Philippi horticultural and silica deposit area include: Government Gazette of 4 October 1968 (Notice 1760): Protection of certain land uses in the Philippi Horticultural and Silica Area in terms of Article 4 (1) of the Physical Planning Act (Act 88 of 1967); Government Proclamation of 1989; Physical Planning Act (Act 125 of 1991); Western Cape Land Use Planning Act (Act 3 of 2014); Western Cape Land Use Planning Regulations, 2015; and Province of the Western Cape; Policy for the Establishment of Agricultural Holdings in the Urban Fringe (2000).
These laws and policies reflect a broad legislative and policy consensus that the PHA should be retained for horticulture and sand mining. The need for hard and clearly defined urban edges, and to restrict settlement rights on agricultural holdings in line with those applicable to agricultural land in rural areas, was recognised. Applications for land use change were only to be considered in highly exceptional circumstances. Removal of building sand was only permitted where such removal would contribute to the development of cultivable land (i.e. levelling of dunes to 1,0m above the winter water table). The following statutory prescriptions, regulations and guidelines inform land use development and management within the PHA, especially in relation to the extent of such area, sub-division policy and permissions for non-agricultural activities, as well as the fixing of a development edge:
• Cape Metropolitan Guide Plan: Volume 1: Peninsula (1988); • Lansdowne Road – Philippi Local Structure Plan; • Metro South-East Plan: Future of the Philippi Horticultural Area, 1997 (adopted by the Cape
Metropolitan Council in 1997); • Philippi Horticultural Area Management Plan, 2000 (prepared for the CCT); • An assessment of three potential growth areas for future housing and city development,
2002 (prepared for the CCT Spatial Planning Department); • Cape Town Development Edges Policy: Urban and Coastal Edge, 2009 (draft) and Western
Cape PSDF: Urban Edge Guideline Policy (2005); • City of Cape Town Agricultural Land Study, 2006 (prepared for the CCT); • City of Cape Town Agricultural Land Review, 2008 (prepared for the CCT); • Philippi Horticultural Area – PEPCO Review, 2009 (prepared for the CCT); • Cape Town Spatial Development Framework; Statutory Report (2012 – as amended until end
2016); • Urban Edge and Development Guidelines Study for the Schaapkraal Smallholdings Area and
Environs in the Philippi Horticultural Area (2012); and • Draft Cape Town Municipal Spatial Development Framework (2017).
36
The CCT’s Agricultural Land Study in 2006, the City’s Agricultural Land Review in 2008 (Town, Agricultural Land Review, 2008) and PEPCO Review in 2009 (PEPCO Review, 2009) declared the PHA a “unique production area” of national significance given its ability to produce an average of 2,5 to 5 crop cycles per annum, its agro-climatic resources and conditions, its market proximity and soil characteristics. The PEPCO Review argued that there was no equivalent horticultural area within 120kms of Cape Town and that the area is “irreplaceable”. The City’s 2012 Council Report on the PHA argued that the high-water table within the PHA made it a significant risk to urban development, especially affordable housing given the associated infrastructure investment that would be required. These studies maintain that the danger of the PHA being urbanized in a piece-meal fashion would fail to create a satisfactory urban environment and would effectively destroy the long-term agricultural viability of the area. (Town, The Role of Philippi Horticultural Area in Securing the Future of the City, 2012) A Study for the CCT by Jane Battersby-Lennard and Gareth Haysom in 2012 found that the PHA is an area of high cultural, social and ecological significance. The importance of the Cape Flats Aquifer and the relationship between this, the land, the city and climate change were found to be of critical importance - particularly in the context of the links between food production, food security, food prices and climate related resilience. When a longer time scale is considered, the PHA offers even greater value, particularly in the context of future challenges such as food system threats, exponentially increasing oil and fuel costs, climate change and climate variability. (Dr Jane Battersby-Lennard and Gareth Haysom, 2012)
The CCT’s MSDF, 2017 has recognised the value of the PHA and has identified it as a Critical Natural Area with overlays of agricultural and heritage significance as shown in Figure 12. This designation recognises the broader metropolitan food security and climate change resilience contribution of the PHA. This designation provides the policy certainty that is necessary to protect the PHA and needs to be translated into district and precinct level plans, and be supported through the use of other legal and policy protection instruments, which are detailed in the section of the Plan dealing with implementation.
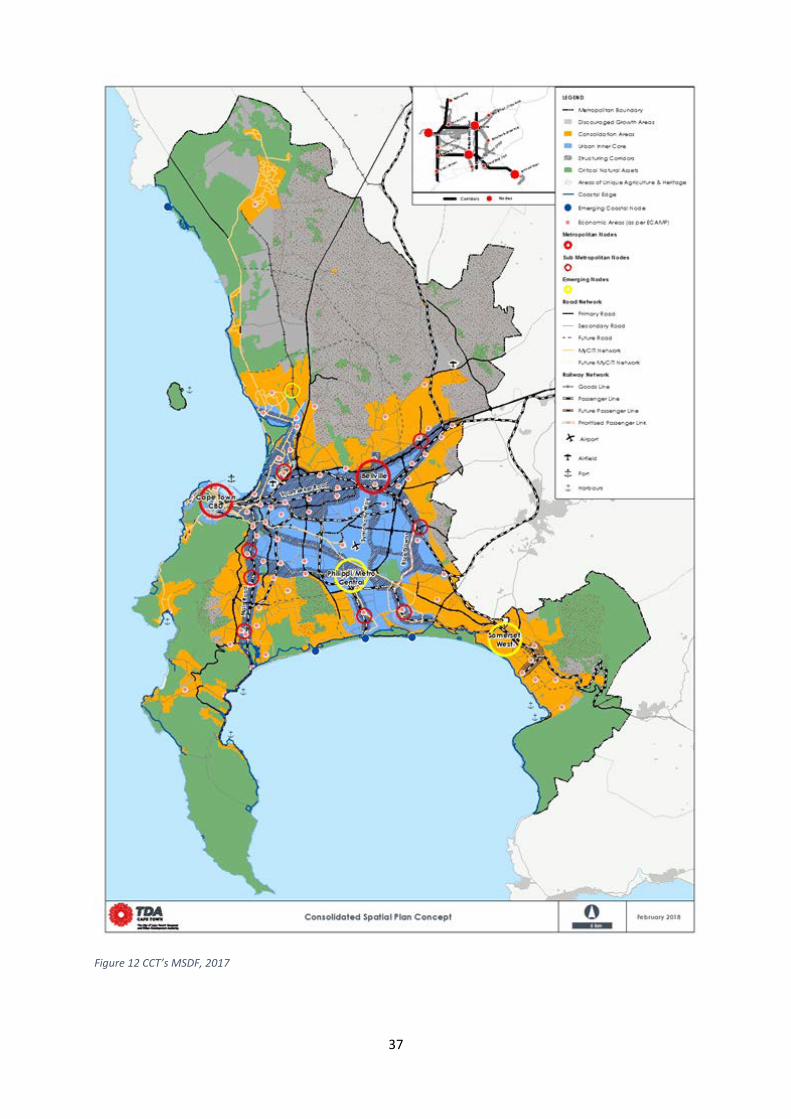
37
Figure 12 CCT’s MSDF, 2017
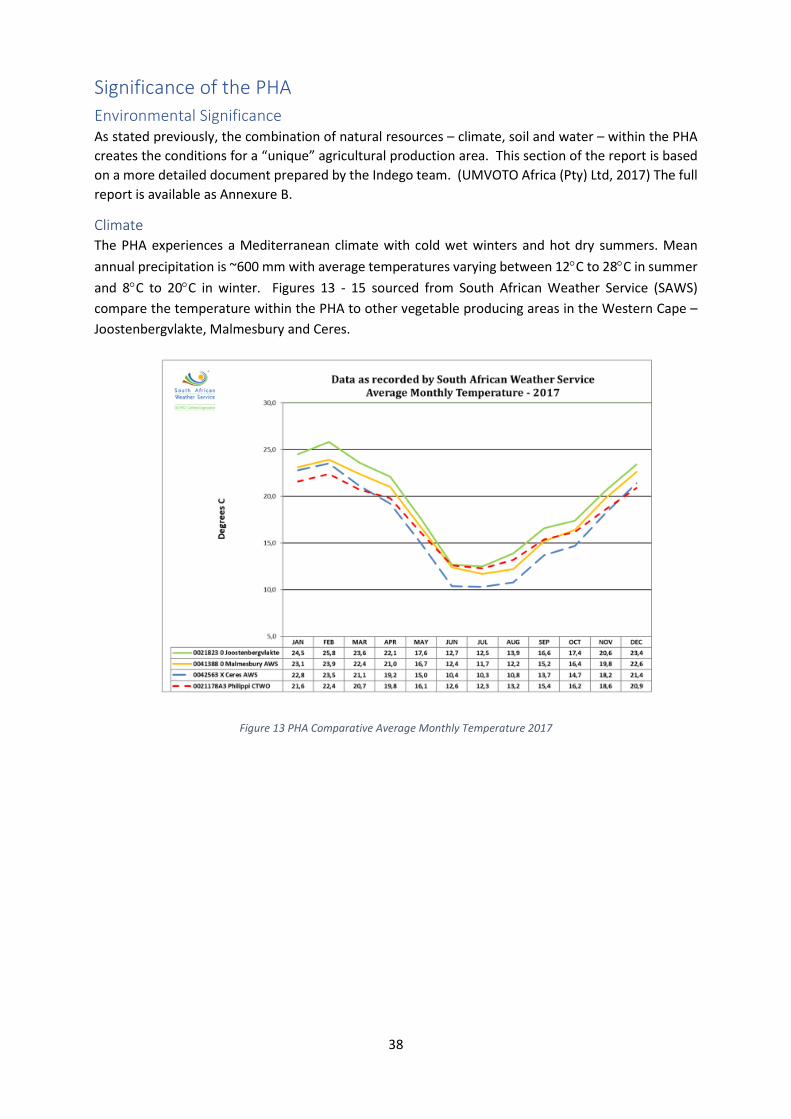
38
Significance of the PHA Environmental Significance As stated previously, the combination of natural resources – climate, soil and water – within the PHA creates the conditions for a “unique” agricultural production area. This section of the report is based on a more detailed document prepared by the Indego team. (UMVOTO Africa (Pty) Ltd, 2017) The full report is available as Annexure B.
Climate The PHA experiences a Mediterranean climate with cold wet winters and hot dry summers. Mean annual precipitation is ~600 mm with average temperatures varying between 12°C to 28°C in summer and 8°C to 20°C in winter. Figures 13 - 15 sourced from South African Weather Service (SAWS) compare the temperature within the PHA to other vegetable producing areas in the Western Cape – Joostenbergvlakte, Malmesbury and Ceres.
Figure 13 PHA Comparative Average Monthly Temperature 2017
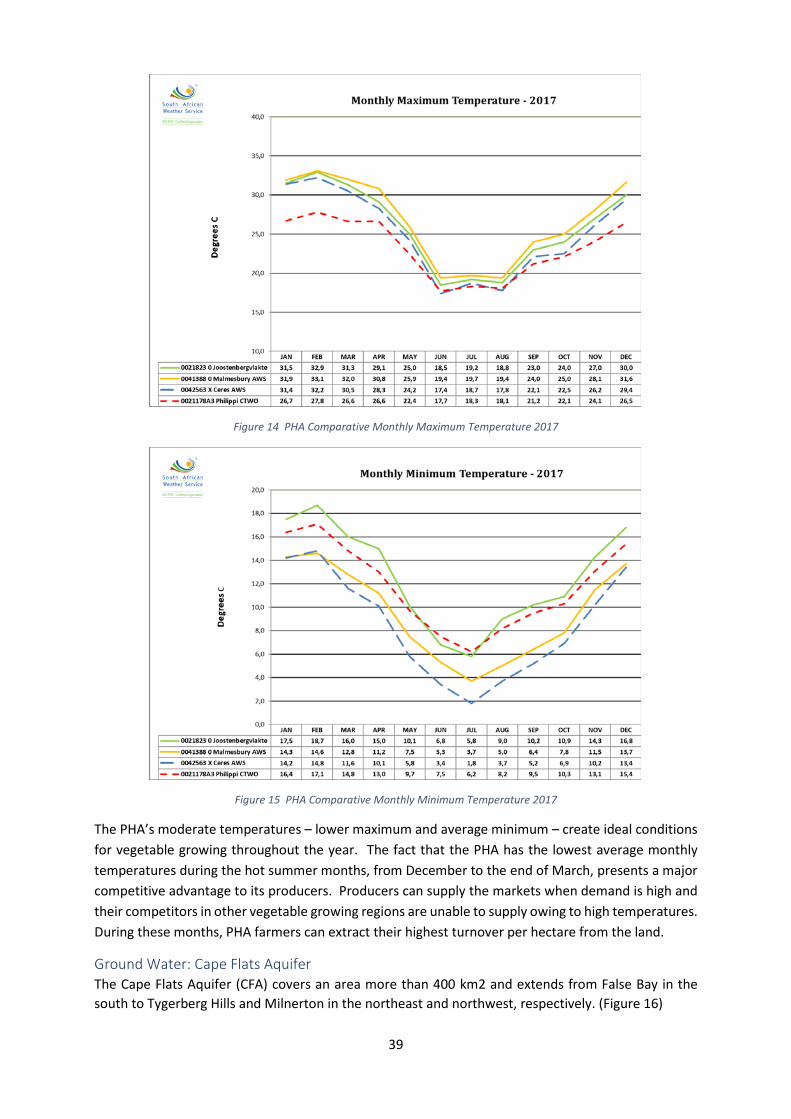
39
Figure 14 PHA Comparative Monthly Maximum Temperature 2017
Figure 15 PHA Comparative Monthly Minimum Temperature 2017
The PHA’s moderate temperatures – lower maximum and average minimum – create ideal conditions for vegetable growing throughout the year. The fact that the PHA has the lowest average monthly temperatures during the hot summer months, from December to the end of March, presents a major competitive advantage to its producers. Producers can supply the markets when demand is high and their competitors in other vegetable growing regions are unable to supply owing to high temperatures. During these months, PHA farmers can extract their highest turnover per hectare from the land.
Ground Water: Cape Flats Aquifer The Cape Flats Aquifer (CFA) covers an area more than 400 km2 and extends from False Bay in the south to Tygerberg Hills and Milnerton in the northeast and northwest, respectively. (Figure 16)
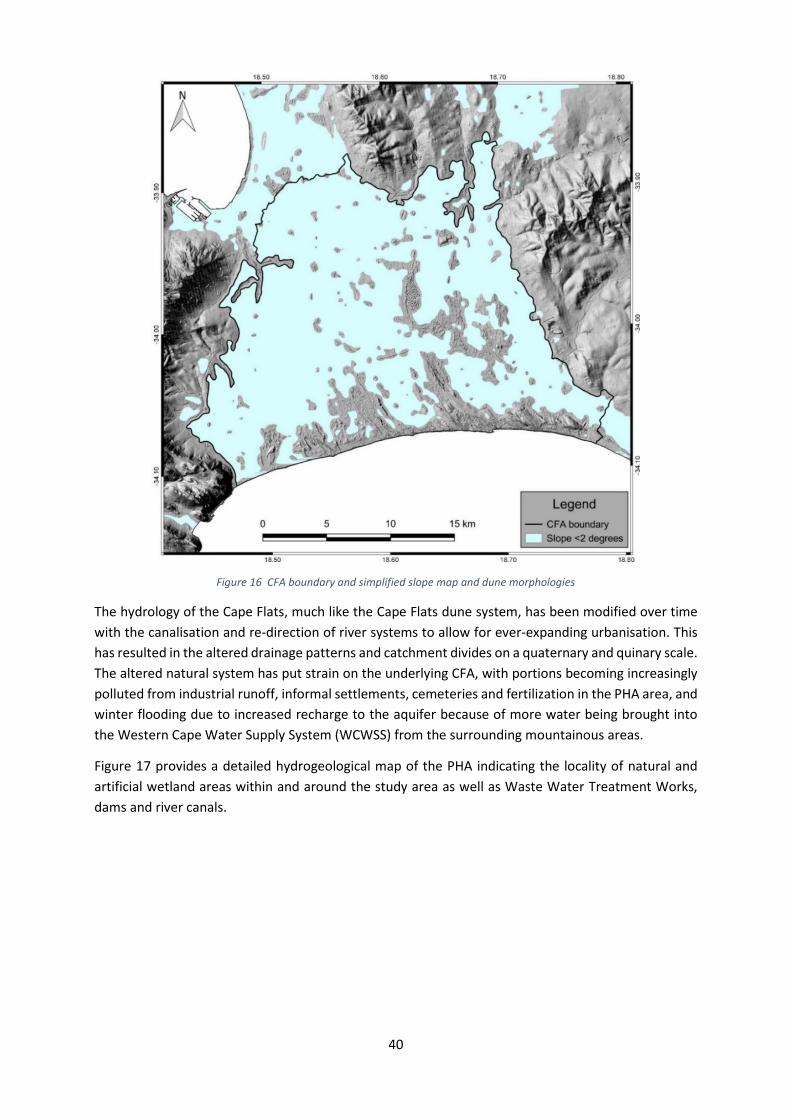
40
Figure 16 CFA boundary and simplified slope map and dune morphologies
The hydrology of the Cape Flats, much like the Cape Flats dune system, has been modified over time with the canalisation and re-direction of river systems to allow for ever-expanding urbanisation. This has resulted in the altered drainage patterns and catchment divides on a quaternary and quinary scale. The altered natural system has put strain on the underlying CFA, with portions becoming increasingly polluted from industrial runoff, informal settlements, cemeteries and fertilization in the PHA area, and winter flooding due to increased recharge to the aquifer because of more water being brought into the Western Cape Water Supply System (WCWSS) from the surrounding mountainous areas.
Figure 17 provides a detailed hydrogeological map of the PHA indicating the locality of natural and artificial wetland areas within and around the study area as well as Waste Water Treatment Works, dams and river canals.
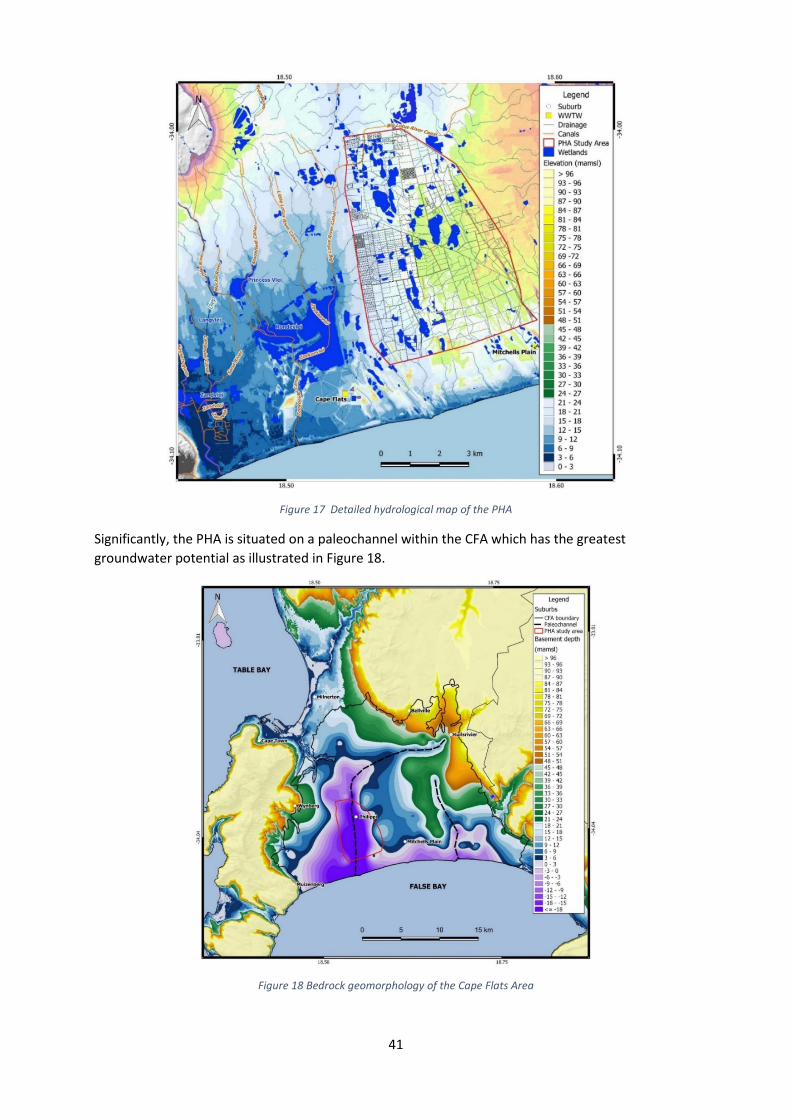
41
Figure 17 Detailed hydrological map of the PHA
Significantly, the PHA is situated on a paleochannel within the CFA which has the greatest groundwater potential as illustrated in Figure 18.
Figure 18 Bedrock geomorphology of the Cape Flats Area
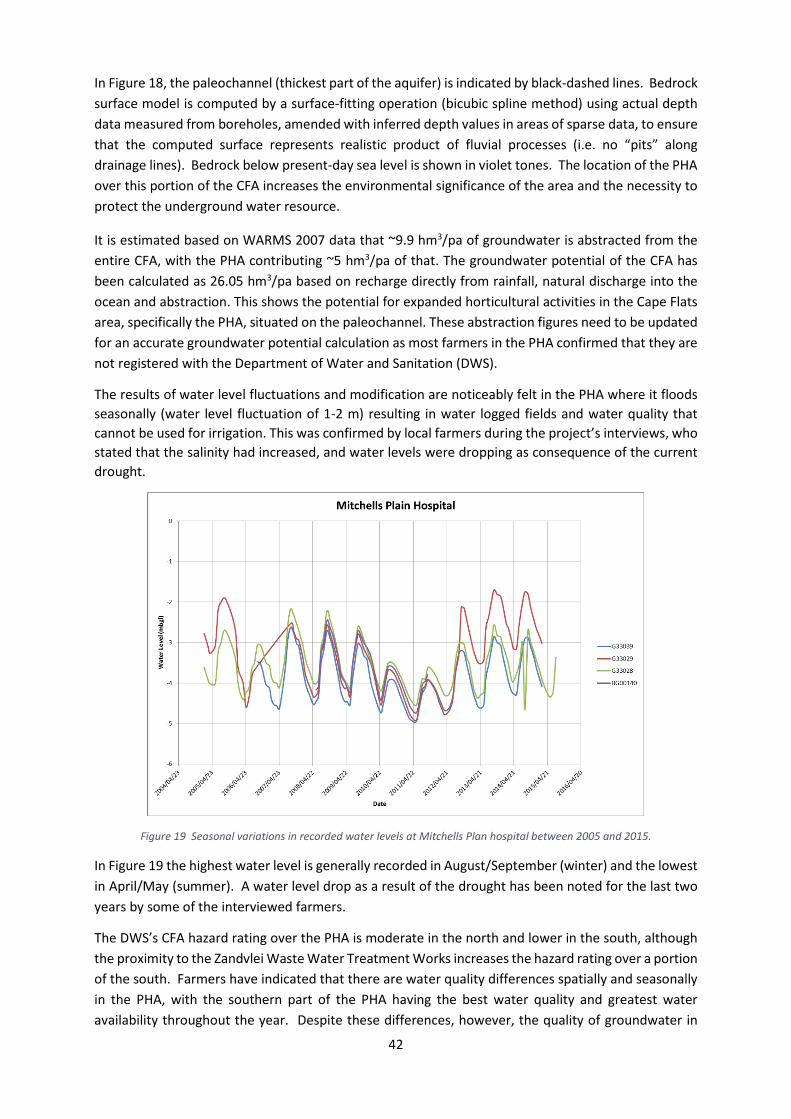
42
In Figure 18, the paleochannel (thickest part of the aquifer) is indicated by black-dashed lines. Bedrock surface model is computed by a surface-fitting operation (bicubic spline method) using actual depth data measured from boreholes, amended with inferred depth values in areas of sparse data, to ensure that the computed surface represents realistic product of fluvial processes (i.e. no “pits” along drainage lines). Bedrock below present-day sea level is shown in violet tones. The location of the PHA over this portion of the CFA increases the environmental significance of the area and the necessity to protect the underground water resource.
It is estimated based on WARMS 2007 data that ~9.9 hm3/pa of groundwater is abstracted from the entire CFA, with the PHA contributing ~5 hm3/pa of that. The groundwater potential of the CFA has been calculated as 26.05 hm3/pa based on recharge directly from rainfall, natural discharge into the ocean and abstraction. This shows the potential for expanded horticultural activities in the Cape Flats area, specifically the PHA, situated on the paleochannel. These abstraction figures need to be updated for an accurate groundwater potential calculation as most farmers in the PHA confirmed that they are not registered with the Department of Water and Sanitation (DWS).
The results of water level fluctuations and modification are noticeably felt in the PHA where it floods seasonally (water level fluctuation of 1-2 m) resulting in water logged fields and water quality that cannot be used for irrigation. This was confirmed by local farmers during the project’s interviews, who stated that the salinity had increased, and water levels were dropping as consequence of the current drought.
Figure 19 Seasonal variations in recorded water levels at Mitchells Plan hospital between 2005 and 2015.
In Figure 19 the highest water level is generally recorded in August/September (winter) and the lowest in April/May (summer). A water level drop as a result of the drought has been noted for the last two years by some of the interviewed farmers.
The DWS’s CFA hazard rating over the PHA is moderate in the north and lower in the south, although the proximity to the Zandvlei Waste Water Treatment Works increases the hazard rating over a portion of the south. Farmers have indicated that there are water quality differences spatially and seasonally in the PHA, with the southern part of the PHA having the best water quality and greatest water availability throughout the year. Despite these differences, however, the quality of groundwater in
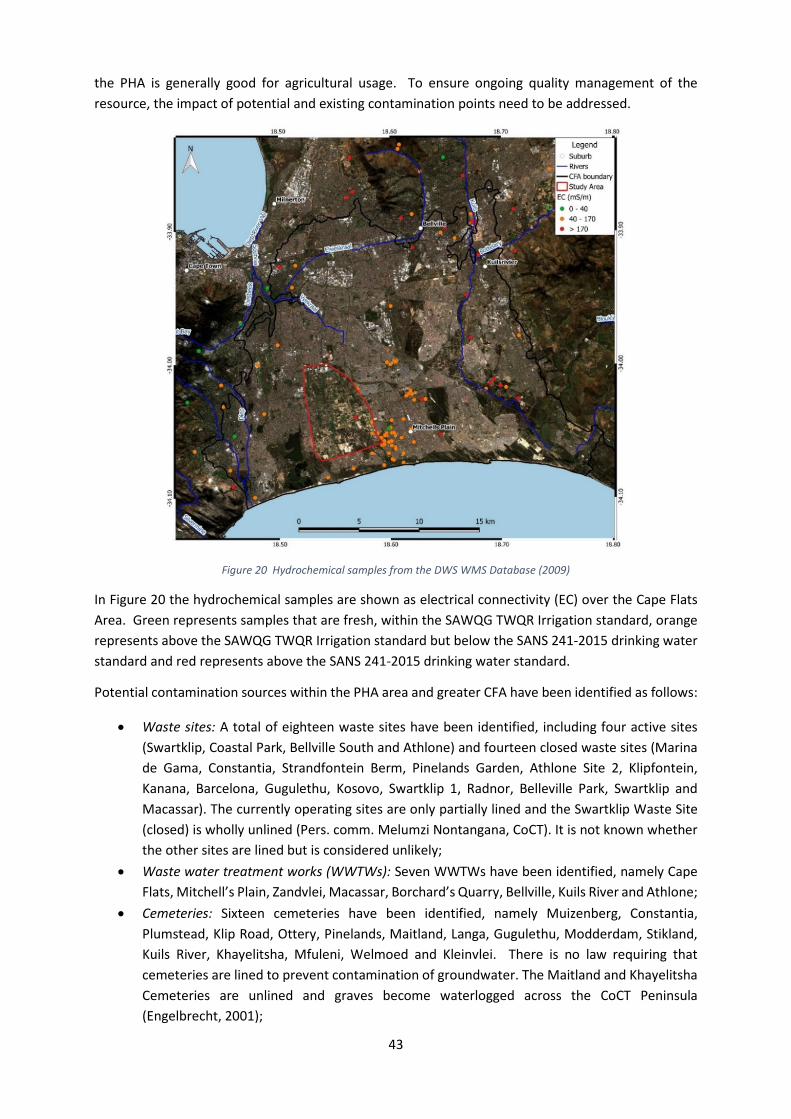
43
the PHA is generally good for agricultural usage. To ensure ongoing quality management of the resource, the impact of potential and existing contamination points need to be addressed.
Figure 20 Hydrochemical samples from the DWS WMS Database (2009)
In Figure 20 the hydrochemical samples are shown as electrical connectivity (EC) over the Cape Flats Area. Green represents samples that are fresh, within the SAWQG TWQR Irrigation standard, orange represents above the SAWQG TWQR Irrigation standard but below the SANS 241-2015 drinking water standard and red represents above the SANS 241-2015 drinking water standard.
Potential contamination sources within the PHA area and greater CFA have been identified as follows:
• Waste sites: A total of eighteen waste sites have been identified, including four active sites (Swartklip, Coastal Park, Bellville South and Athlone) and fourteen closed waste sites (Marina de Gama, Constantia, Strandfontein Berm, Pinelands Garden, Athlone Site 2, Klipfontein, Kanana, Barcelona, Gugulethu, Kosovo, Swartklip 1, Radnor, Belleville Park, Swartklip and Macassar). The currently operating sites are only partially lined and the Swartklip Waste Site (closed) is wholly unlined (Pers. comm. Melumzi Nontangana, CoCT). It is not known whether the other sites are lined but is considered unlikely;
• Waste water treatment works (WWTWs): Seven WWTWs have been identified, namely Cape Flats, Mitchell’s Plain, Zandvlei, Macassar, Borchard’s Quarry, Bellville, Kuils River and Athlone;
• Cemeteries: Sixteen cemeteries have been identified, namely Muizenberg, Constantia, Plumstead, Klip Road, Ottery, Pinelands, Maitland, Langa, Gugulethu, Modderdam, Stikland, Kuils River, Khayelitsha, Mfuleni, Welmoed and Kleinvlei. There is no law requiring that cemeteries are lined to prevent contamination of groundwater. The Maitland and Khayelitsha Cemeteries are unlined and graves become waterlogged across the CoCT Peninsula (Engelbrecht, 2001);
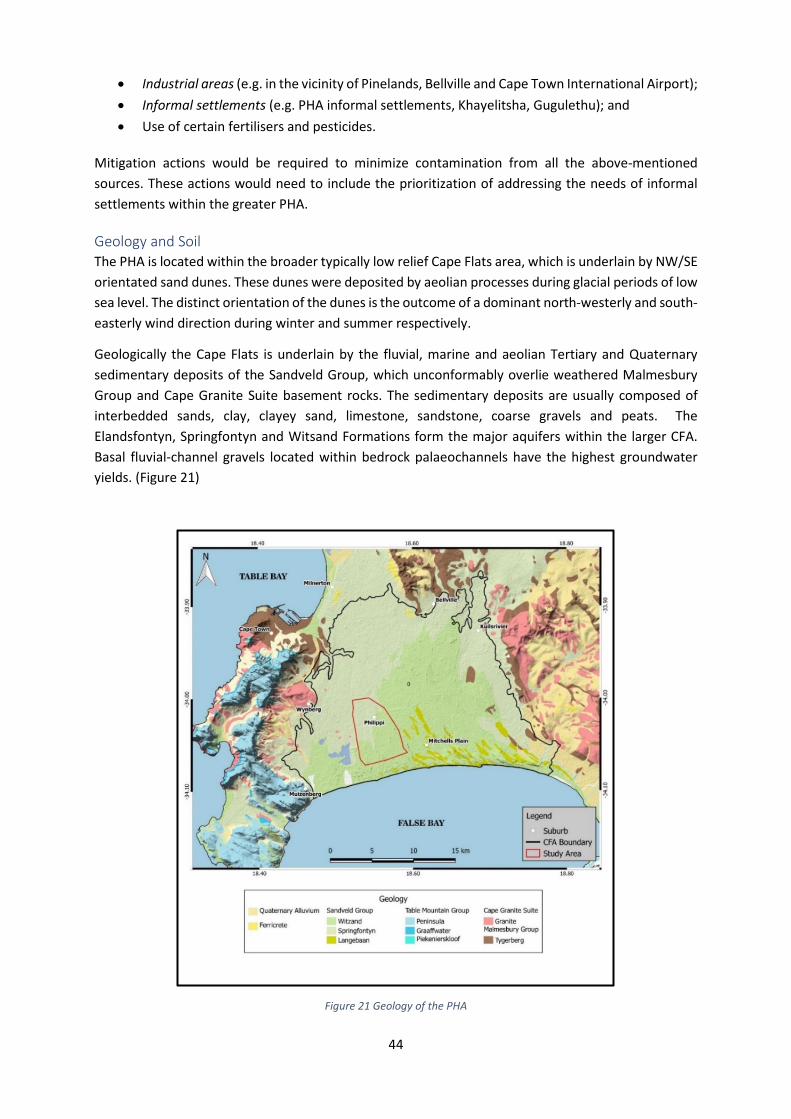
44
• Industrial areas (e.g. in the vicinity of Pinelands, Bellville and Cape Town International Airport); • Informal settlements (e.g. PHA informal settlements, Khayelitsha, Gugulethu); and • Use of certain fertilisers and pesticides.
Mitigation actions would be required to minimize contamination from all the above-mentioned sources. These actions would need to include the prioritization of addressing the needs of informal settlements within the greater PHA.
Geology and Soil The PHA is located within the broader typically low relief Cape Flats area, which is underlain by NW/SE orientated sand dunes. These dunes were deposited by aeolian processes during glacial periods of low sea level. The distinct orientation of the dunes is the outcome of a dominant north-westerly and south-easterly wind direction during winter and summer respectively.
Geologically the Cape Flats is underlain by the fluvial, marine and aeolian Tertiary and Quaternary sedimentary deposits of the Sandveld Group, which unconformably overlie weathered Malmesbury Group and Cape Granite Suite basement rocks. The sedimentary deposits are usually composed of interbedded sands, clay, clayey sand, limestone, sandstone, coarse gravels and peats. The Elandsfontyn, Springfontyn and Witsand Formations form the major aquifers within the larger CFA. Basal fluvial-channel gravels located within bedrock palaeochannels have the highest groundwater yields. (Figure 21)
Figure 21 Geology of the PHA
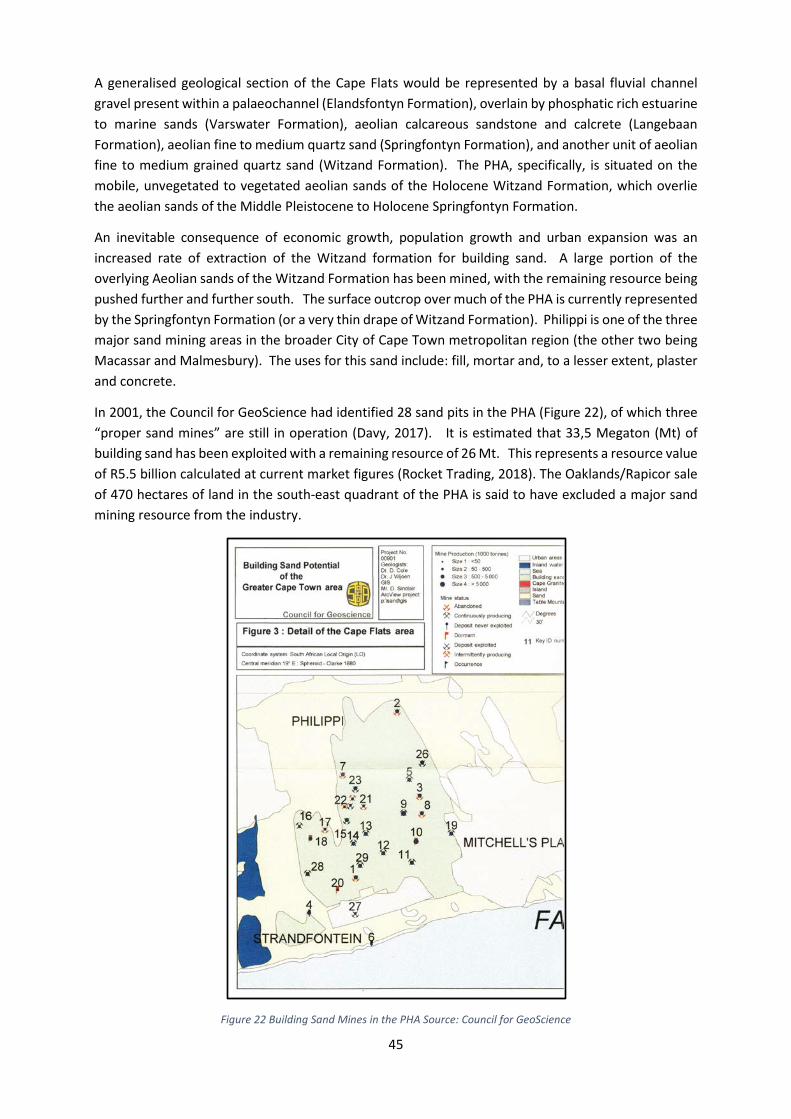
45
A generalised geological section of the Cape Flats would be represented by a basal fluvial channel gravel present within a palaeochannel (Elandsfontyn Formation), overlain by phosphatic rich estuarine to marine sands (Varswater Formation), aeolian calcareous sandstone and calcrete (Langebaan Formation), aeolian fine to medium quartz sand (Springfontyn Formation), and another unit of aeolian fine to medium grained quartz sand (Witzand Formation). The PHA, specifically, is situated on the mobile, unvegetated to vegetated aeolian sands of the Holocene Witzand Formation, which overlie the aeolian sands of the Middle Pleistocene to Holocene Springfontyn Formation.
An inevitable consequence of economic growth, population growth and urban expansion was an increased rate of extraction of the Witzand formation for building sand. A large portion of the overlying Aeolian sands of the Witzand Formation has been mined, with the remaining resource being pushed further and further south. The surface outcrop over much of the PHA is currently represented by the Springfontyn Formation (or a very thin drape of Witzand Formation). Philippi is one of the three major sand mining areas in the broader City of Cape Town metropolitan region (the other two being Macassar and Malmesbury). The uses for this sand include: fill, mortar and, to a lesser extent, plaster and concrete.
In 2001, the Council for GeoScience had identified 28 sand pits in the PHA (Figure 22), of which three “proper sand mines” are still in operation (Davy, 2017). It is estimated that 33,5 Megaton (Mt) of building sand has been exploited with a remaining resource of 26 Mt. This represents a resource value of R5.5 billion calculated at current market figures (Rocket Trading, 2018). The Oaklands/Rapicor sale of 470 hectares of land in the south-east quadrant of the PHA is said to have excluded a major sand mining resource from the industry.
Figure 22 Building Sand Mines in the PHA Source: Council for GeoScience
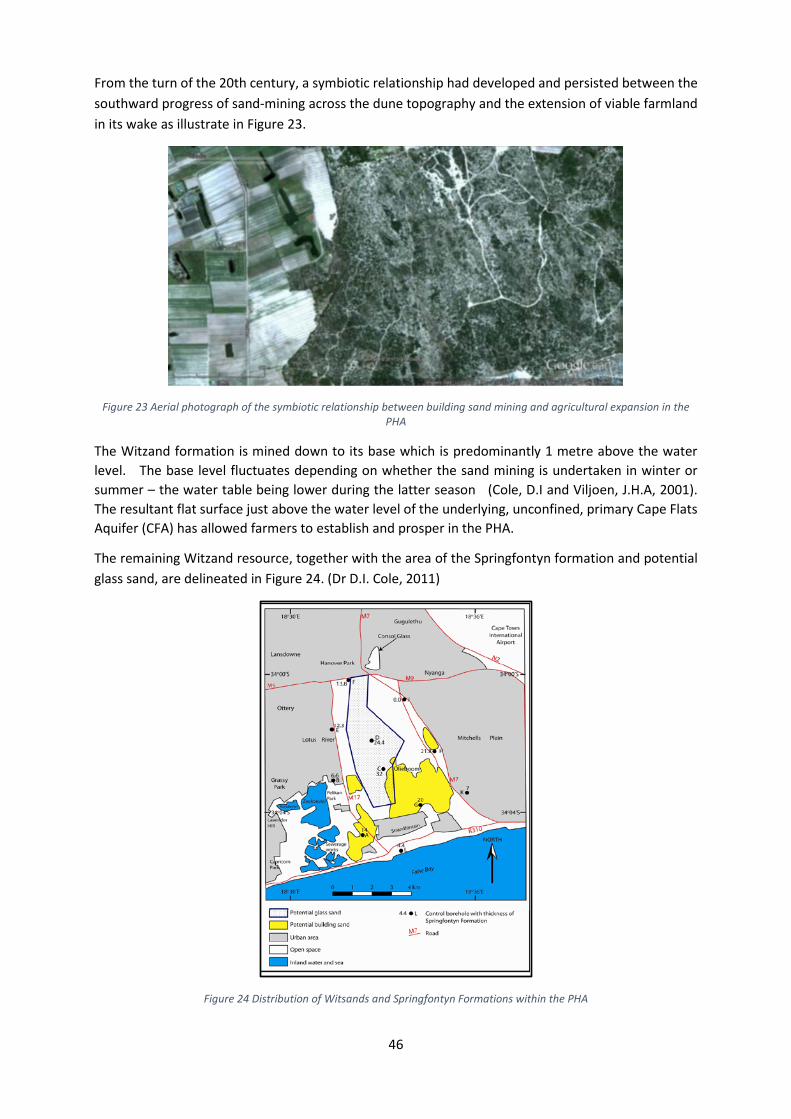
46
From the turn of the 20th century, a symbiotic relationship had developed and persisted between the southward progress of sand-mining across the dune topography and the extension of viable farmland in its wake as illustrate in Figure 23.
Figure 23 Aerial photograph of the symbiotic relationship between building sand mining and agricultural expansion in the PHA
The Witzand formation is mined down to its base which is predominantly 1 metre above the water level. The base level fluctuates depending on whether the sand mining is undertaken in winter or summer – the water table being lower during the latter season (Cole, D.I and Viljoen, J.H.A, 2001). The resultant flat surface just above the water level of the underlying, unconfined, primary Cape Flats Aquifer (CFA) has allowed farmers to establish and prosper in the PHA.
The remaining Witzand resource, together with the area of the Springfontyn formation and potential glass sand, are delineated in Figure 24. (Dr D.I. Cole, 2011)
Figure 24 Distribution of Witsands and Springfontyn Formations within the PHA
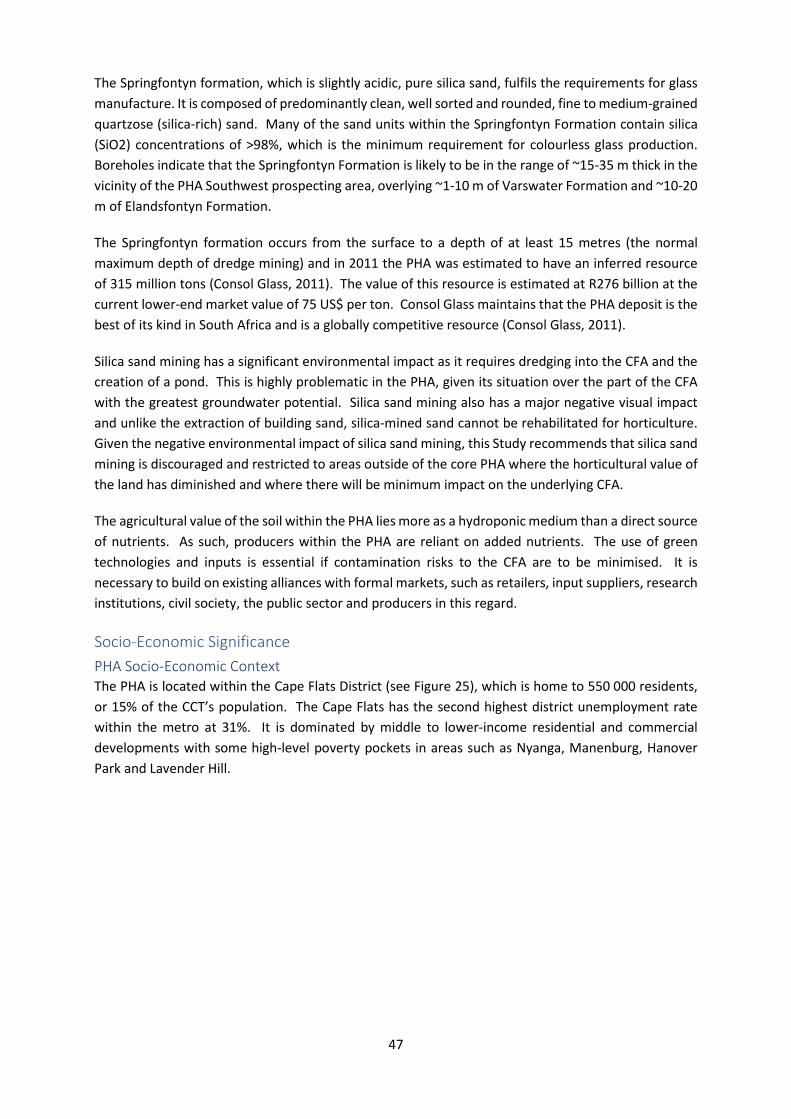
47
The Springfontyn formation, which is slightly acidic, pure silica sand, fulfils the requirements for glass manufacture. It is composed of predominantly clean, well sorted and rounded, fine to medium-grained quartzose (silica-rich) sand. Many of the sand units within the Springfontyn Formation contain silica (SiO2) concentrations of >98%, which is the minimum requirement for colourless glass production. Boreholes indicate that the Springfontyn Formation is likely to be in the range of ~15-35 m thick in the vicinity of the PHA Southwest prospecting area, overlying ~1-10 m of Varswater Formation and ~10-20 m of Elandsfontyn Formation.
The Springfontyn formation occurs from the surface to a depth of at least 15 metres (the normal maximum depth of dredge mining) and in 2011 the PHA was estimated to have an inferred resource of 315 million tons (Consol Glass, 2011). The value of this resource is estimated at R276 billion at the current lower-end market value of 75 US$ per ton. Consol Glass maintains that the PHA deposit is the best of its kind in South Africa and is a globally competitive resource (Consol Glass, 2011).
Silica sand mining has a significant environmental impact as it requires dredging into the CFA and the creation of a pond. This is highly problematic in the PHA, given its situation over the part of the CFA with the greatest groundwater potential. Silica sand mining also has a major negative visual impact and unlike the extraction of building sand, silica-mined sand cannot be rehabilitated for horticulture. Given the negative environmental impact of silica sand mining, this Study recommends that silica sand mining is discouraged and restricted to areas outside of the core PHA where the horticultural value of the land has diminished and where there will be minimum impact on the underlying CFA.
The agricultural value of the soil within the PHA lies more as a hydroponic medium than a direct source of nutrients. As such, producers within the PHA are reliant on added nutrients. The use of green technologies and inputs is essential if contamination risks to the CFA are to be minimised. It is necessary to build on existing alliances with formal markets, such as retailers, input suppliers, research institutions, civil society, the public sector and producers in this regard.
Socio-Economic Significance PHA Socio-Economic Context The PHA is located within the Cape Flats District (see Figure 25), which is home to 550 000 residents, or 15% of the CCT’s population. The Cape Flats has the second highest district unemployment rate within the metro at 31%. It is dominated by middle to lower-income residential and commercial developments with some high-level poverty pockets in areas such as Nyanga, Manenburg, Hanover Park and Lavender Hill.
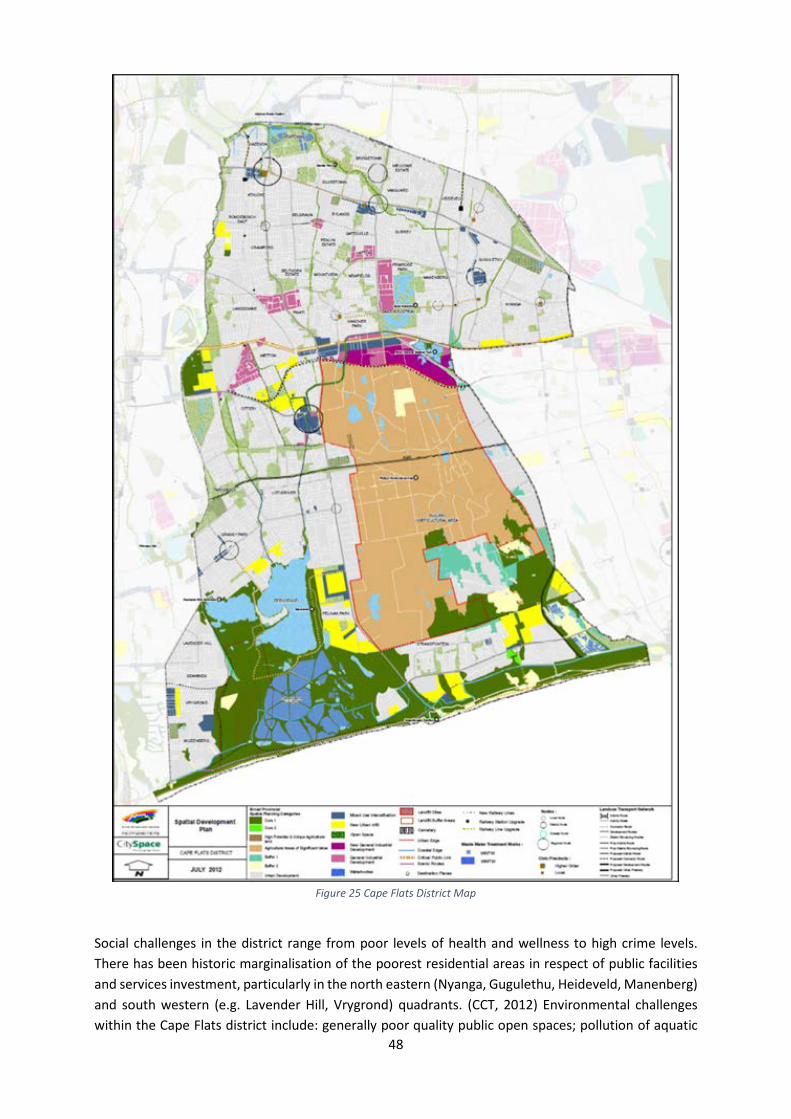
48
Figure 25 Cape Flats District Map
Social challenges in the district range from poor levels of health and wellness to high crime levels. There has been historic marginalisation of the poorest residential areas in respect of public facilities and services investment, particularly in the north eastern (Nyanga, Gugulethu, Heideveld, Manenberg) and south western (e.g. Lavender Hill, Vrygrond) quadrants. (CCT, 2012) Environmental challenges within the Cape Flats district include: generally poor quality public open spaces; pollution of aquatic
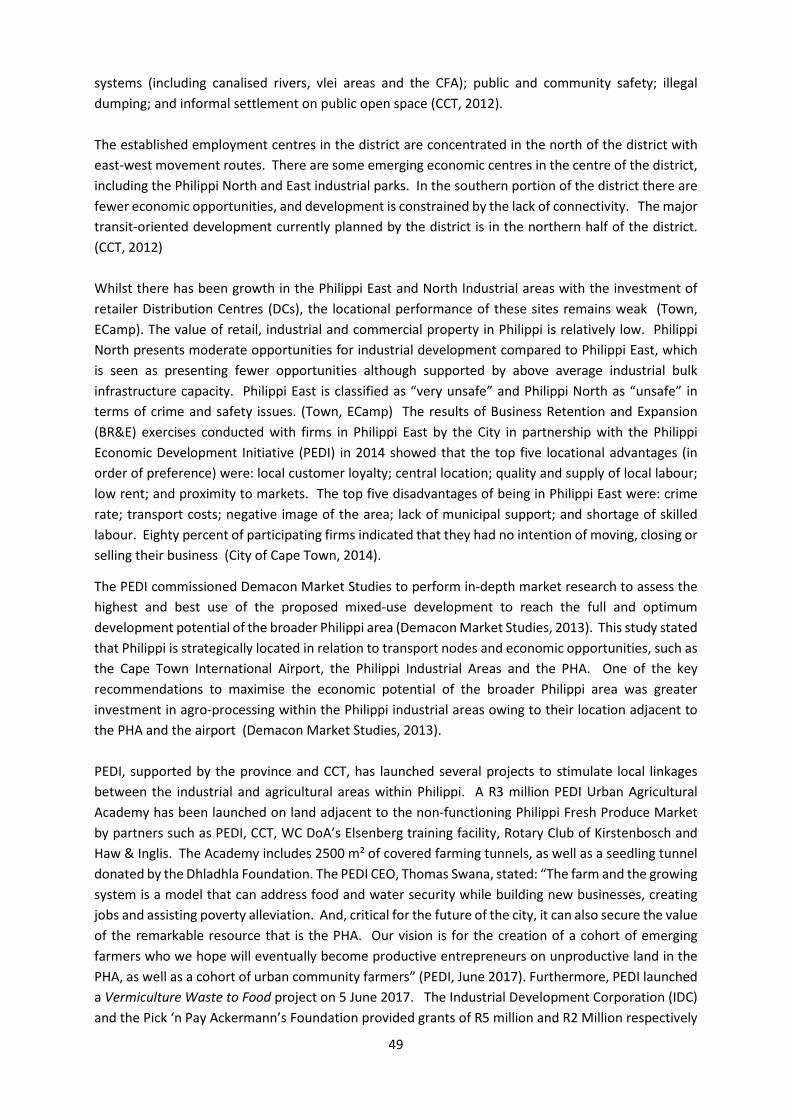
49
systems (including canalised rivers, vlei areas and the CFA); public and community safety; illegal dumping; and informal settlement on public open space (CCT, 2012). The established employment centres in the district are concentrated in the north of the district with east-west movement routes. There are some emerging economic centres in the centre of the district, including the Philippi North and East industrial parks. In the southern portion of the district there are fewer economic opportunities, and development is constrained by the lack of connectivity. The major transit-oriented development currently planned by the district is in the northern half of the district. (CCT, 2012) Whilst there has been growth in the Philippi East and North Industrial areas with the investment of retailer Distribution Centres (DCs), the locational performance of these sites remains weak (Town, ECamp). The value of retail, industrial and commercial property in Philippi is relatively low. Philippi North presents moderate opportunities for industrial development compared to Philippi East, which is seen as presenting fewer opportunities although supported by above average industrial bulk infrastructure capacity. Philippi East is classified as “very unsafe” and Philippi North as “unsafe” in terms of crime and safety issues. (Town, ECamp) The results of Business Retention and Expansion (BR&E) exercises conducted with firms in Philippi East by the City in partnership with the Philippi Economic Development Initiative (PEDI) in 2014 showed that the top five locational advantages (in order of preference) were: local customer loyalty; central location; quality and supply of local labour; low rent; and proximity to markets. The top five disadvantages of being in Philippi East were: crime rate; transport costs; negative image of the area; lack of municipal support; and shortage of skilled labour. Eighty percent of participating firms indicated that they had no intention of moving, closing or selling their business (City of Cape Town, 2014).
The PEDI commissioned Demacon Market Studies to perform in-depth market research to assess the highest and best use of the proposed mixed-use development to reach the full and optimum development potential of the broader Philippi area (Demacon Market Studies, 2013). This study stated that Philippi is strategically located in relation to transport nodes and economic opportunities, such as the Cape Town International Airport, the Philippi Industrial Areas and the PHA. One of the key recommendations to maximise the economic potential of the broader Philippi area was greater investment in agro-processing within the Philippi industrial areas owing to their location adjacent to the PHA and the airport (Demacon Market Studies, 2013). PEDI, supported by the province and CCT, has launched several projects to stimulate local linkages between the industrial and agricultural areas within Philippi. A R3 million PEDI Urban Agricultural Academy has been launched on land adjacent to the non-functioning Philippi Fresh Produce Market by partners such as PEDI, CCT, WC DoA’s Elsenberg training facility, Rotary Club of Kirstenbosch and Haw & Inglis. The Academy includes 2500 m² of covered farming tunnels, as well as a seedling tunnel donated by the Dhladhla Foundation. The PEDI CEO, Thomas Swana, stated: “The farm and the growing system is a model that can address food and water security while building new businesses, creating jobs and assisting poverty alleviation. And, critical for the future of the city, it can also secure the value of the remarkable resource that is the PHA. Our vision is for the creation of a cohort of emerging farmers who we hope will eventually become productive entrepreneurs on unproductive land in the PHA, as well as a cohort of urban community farmers” (PEDI, June 2017). Furthermore, PEDI launched a Vermiculture Waste to Food project on 5 June 2017. The Industrial Development Corporation (IDC) and the Pick ‘n Pay Ackermann’s Foundation provided grants of R5 million and R2 Million respectively
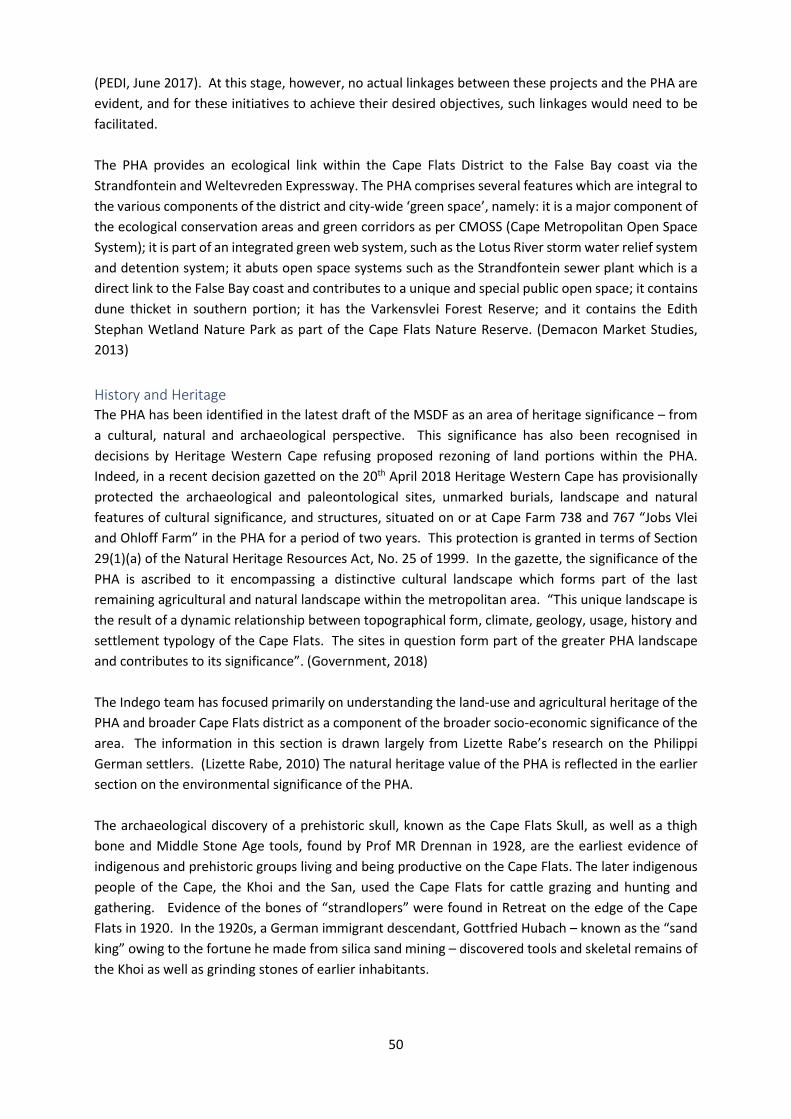
50
(PEDI, June 2017). At this stage, however, no actual linkages between these projects and the PHA are evident, and for these initiatives to achieve their desired objectives, such linkages would need to be facilitated. The PHA provides an ecological link within the Cape Flats District to the False Bay coast via the Strandfontein and Weltevreden Expressway. The PHA comprises several features which are integral to the various components of the district and city-wide ‘green space’, namely: it is a major component of the ecological conservation areas and green corridors as per CMOSS (Cape Metropolitan Open Space System); it is part of an integrated green web system, such as the Lotus River storm water relief system and detention system; it abuts open space systems such as the Strandfontein sewer plant which is a direct link to the False Bay coast and contributes to a unique and special public open space; it contains dune thicket in southern portion; it has the Varkensvlei Forest Reserve; and it contains the Edith Stephan Wetland Nature Park as part of the Cape Flats Nature Reserve. (Demacon Market Studies, 2013)
History and Heritage The PHA has been identified in the latest draft of the MSDF as an area of heritage significance – from a cultural, natural and archaeological perspective. This significance has also been recognised in decisions by Heritage Western Cape refusing proposed rezoning of land portions within the PHA. Indeed, in a recent decision gazetted on the 20th April 2018 Heritage Western Cape has provisionally protected the archaeological and paleontological sites, unmarked burials, landscape and natural features of cultural significance, and structures, situated on or at Cape Farm 738 and 767 “Jobs Vlei and Ohloff Farm” in the PHA for a period of two years. This protection is granted in terms of Section 29(1)(a) of the Natural Heritage Resources Act, No. 25 of 1999. In the gazette, the significance of the PHA is ascribed to it encompassing a distinctive cultural landscape which forms part of the last remaining agricultural and natural landscape within the metropolitan area. “This unique landscape is the result of a dynamic relationship between topographical form, climate, geology, usage, history and settlement typology of the Cape Flats. The sites in question form part of the greater PHA landscape and contributes to its significance”. (Government, 2018) The Indego team has focused primarily on understanding the land-use and agricultural heritage of the PHA and broader Cape Flats district as a component of the broader socio-economic significance of the area. The information in this section is drawn largely from Lizette Rabe’s research on the Philippi German settlers. (Lizette Rabe, 2010) The natural heritage value of the PHA is reflected in the earlier section on the environmental significance of the PHA. The archaeological discovery of a prehistoric skull, known as the Cape Flats Skull, as well as a thigh bone and Middle Stone Age tools, found by Prof MR Drennan in 1928, are the earliest evidence of indigenous and prehistoric groups living and being productive on the Cape Flats. The later indigenous people of the Cape, the Khoi and the San, used the Cape Flats for cattle grazing and hunting and gathering. Evidence of the bones of “strandlopers” were found in Retreat on the edge of the Cape Flats in 1920. In the 1920s, a German immigrant descendant, Gottfried Hubach – known as the “sand king” owing to the fortune he made from silica sand mining – discovered tools and skeletal remains of the Khoi as well as grinding stones of earlier inhabitants.
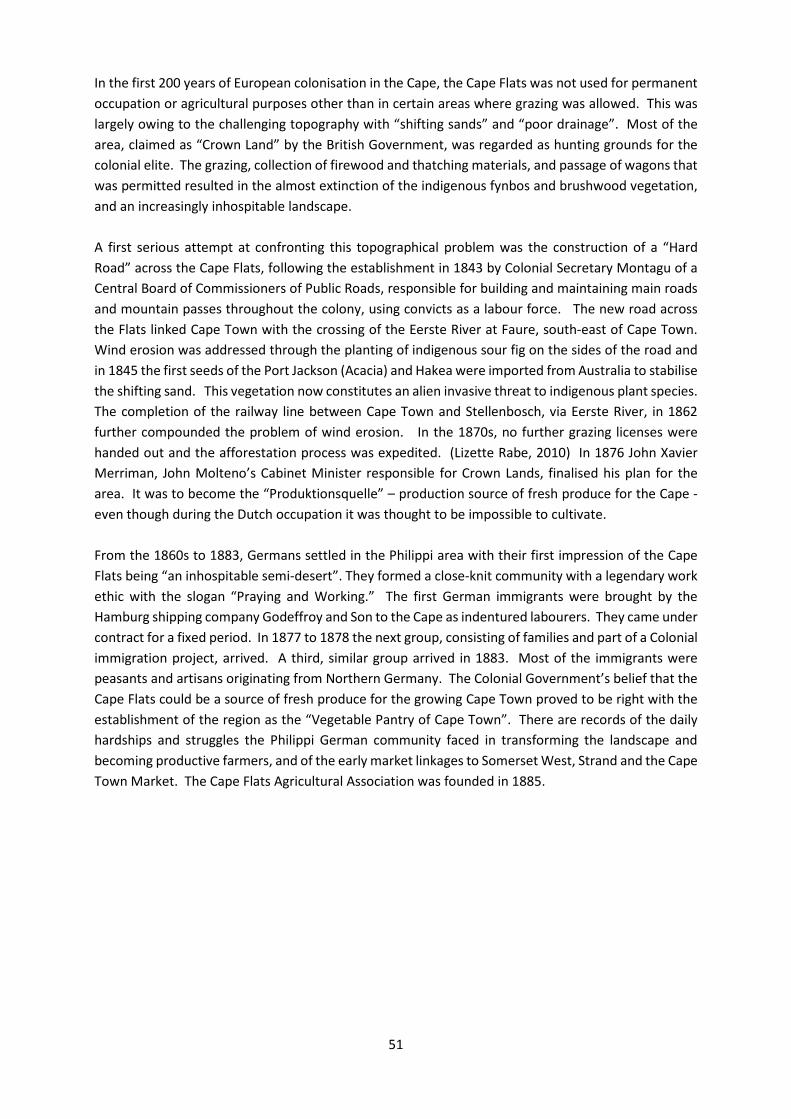
51
In the first 200 years of European colonisation in the Cape, the Cape Flats was not used for permanent occupation or agricultural purposes other than in certain areas where grazing was allowed. This was largely owing to the challenging topography with “shifting sands” and “poor drainage”. Most of the area, claimed as “Crown Land” by the British Government, was regarded as hunting grounds for the colonial elite. The grazing, collection of firewood and thatching materials, and passage of wagons that was permitted resulted in the almost extinction of the indigenous fynbos and brushwood vegetation, and an increasingly inhospitable landscape. A first serious attempt at confronting this topographical problem was the construction of a “Hard Road” across the Cape Flats, following the establishment in 1843 by Colonial Secretary Montagu of a Central Board of Commissioners of Public Roads, responsible for building and maintaining main roads and mountain passes throughout the colony, using convicts as a labour force. The new road across the Flats linked Cape Town with the crossing of the Eerste River at Faure, south-east of Cape Town. Wind erosion was addressed through the planting of indigenous sour fig on the sides of the road and in 1845 the first seeds of the Port Jackson (Acacia) and Hakea were imported from Australia to stabilise the shifting sand. This vegetation now constitutes an alien invasive threat to indigenous plant species. The completion of the railway line between Cape Town and Stellenbosch, via Eerste River, in 1862 further compounded the problem of wind erosion. In the 1870s, no further grazing licenses were handed out and the afforestation process was expedited. (Lizette Rabe, 2010) In 1876 John Xavier Merriman, John Molteno’s Cabinet Minister responsible for Crown Lands, finalised his plan for the area. It was to become the “Produktionsquelle” – production source of fresh produce for the Cape - even though during the Dutch occupation it was thought to be impossible to cultivate. From the 1860s to 1883, Germans settled in the Philippi area with their first impression of the Cape Flats being “an inhospitable semi-desert”. They formed a close-knit community with a legendary work ethic with the slogan “Praying and Working.” The first German immigrants were brought by the Hamburg shipping company Godeffroy and Son to the Cape as indentured labourers. They came under contract for a fixed period. In 1877 to 1878 the next group, consisting of families and part of a Colonial immigration project, arrived. A third, similar group arrived in 1883. Most of the immigrants were peasants and artisans originating from Northern Germany. The Colonial Government’s belief that the Cape Flats could be a source of fresh produce for the growing Cape Town proved to be right with the establishment of the region as the “Vegetable Pantry of Cape Town”. There are records of the daily hardships and struggles the Philippi German community faced in transforming the landscape and becoming productive farmers, and of the early market linkages to Somerset West, Strand and the Cape Town Market. The Cape Flats Agricultural Association was founded in 1885.
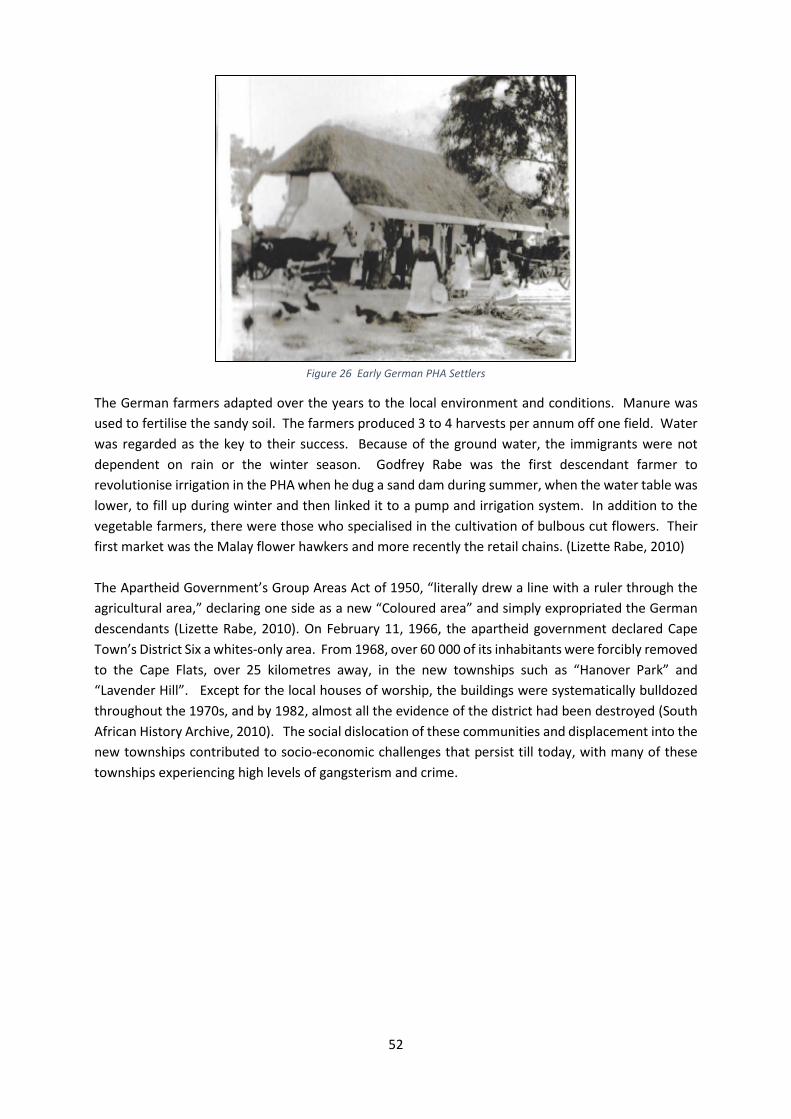
52
Figure 26 Early German PHA Settlers
The German farmers adapted over the years to the local environment and conditions. Manure was used to fertilise the sandy soil. The farmers produced 3 to 4 harvests per annum off one field. Water was regarded as the key to their success. Because of the ground water, the immigrants were not dependent on rain or the winter season. Godfrey Rabe was the first descendant farmer to revolutionise irrigation in the PHA when he dug a sand dam during summer, when the water table was lower, to fill up during winter and then linked it to a pump and irrigation system. In addition to the vegetable farmers, there were those who specialised in the cultivation of bulbous cut flowers. Their first market was the Malay flower hawkers and more recently the retail chains. (Lizette Rabe, 2010) The Apartheid Government’s Group Areas Act of 1950, “literally drew a line with a ruler through the agricultural area,” declaring one side as a new “Coloured area” and simply expropriated the German descendants (Lizette Rabe, 2010). On February 11, 1966, the apartheid government declared Cape Town’s District Six a whites-only area. From 1968, over 60 000 of its inhabitants were forcibly removed to the Cape Flats, over 25 kilometres away, in the new townships such as “Hanover Park” and “Lavender Hill”. Except for the local houses of worship, the buildings were systematically bulldozed throughout the 1970s, and by 1982, almost all the evidence of the district had been destroyed (South African History Archive, 2010). The social dislocation of these communities and displacement into the new townships contributed to socio-economic challenges that persist till today, with many of these townships experiencing high levels of gangsterism and crime.
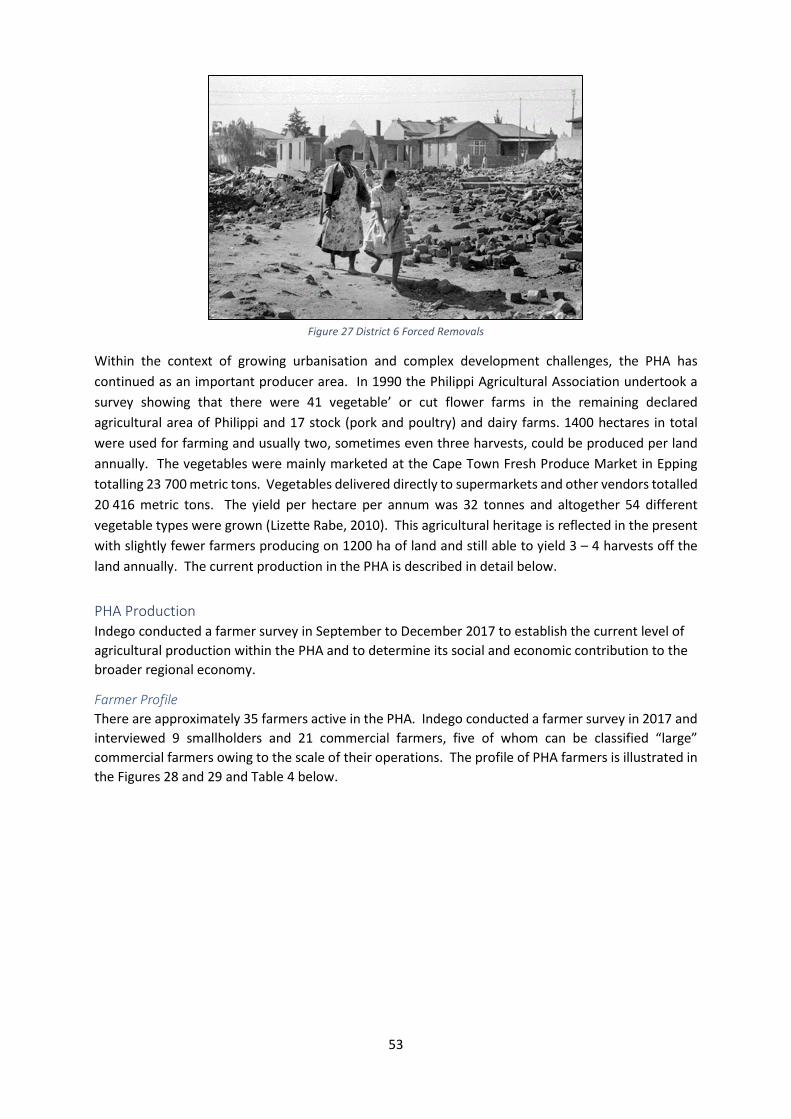
53
Figure 27 District 6 Forced Removals
Within the context of growing urbanisation and complex development challenges, the PHA has continued as an important producer area. In 1990 the Philippi Agricultural Association undertook a survey showing that there were 41 vegetable’ or cut flower farms in the remaining declared agricultural area of Philippi and 17 stock (pork and poultry) and dairy farms. 1400 hectares in total were used for farming and usually two, sometimes even three harvests, could be produced per land annually. The vegetables were mainly marketed at the Cape Town Fresh Produce Market in Epping totalling 23 700 metric tons. Vegetables delivered directly to supermarkets and other vendors totalled 20 416 metric tons. The yield per hectare per annum was 32 tonnes and altogether 54 different vegetable types were grown (Lizette Rabe, 2010). This agricultural heritage is reflected in the present with slightly fewer farmers producing on 1200 ha of land and still able to yield 3 – 4 harvests off the land annually. The current production in the PHA is described in detail below.
PHA Production Indego conducted a farmer survey in September to December 2017 to establish the current level of agricultural production within the PHA and to determine its social and economic contribution to the broader regional economy.
Farmer Profile There are approximately 35 farmers active in the PHA. Indego conducted a farmer survey in 2017 and interviewed 9 smallholders and 21 commercial farmers, five of whom can be classified “large” commercial farmers owing to the scale of their operations. The profile of PHA farmers is illustrated in the Figures 28 and 29 and Table 4 below.
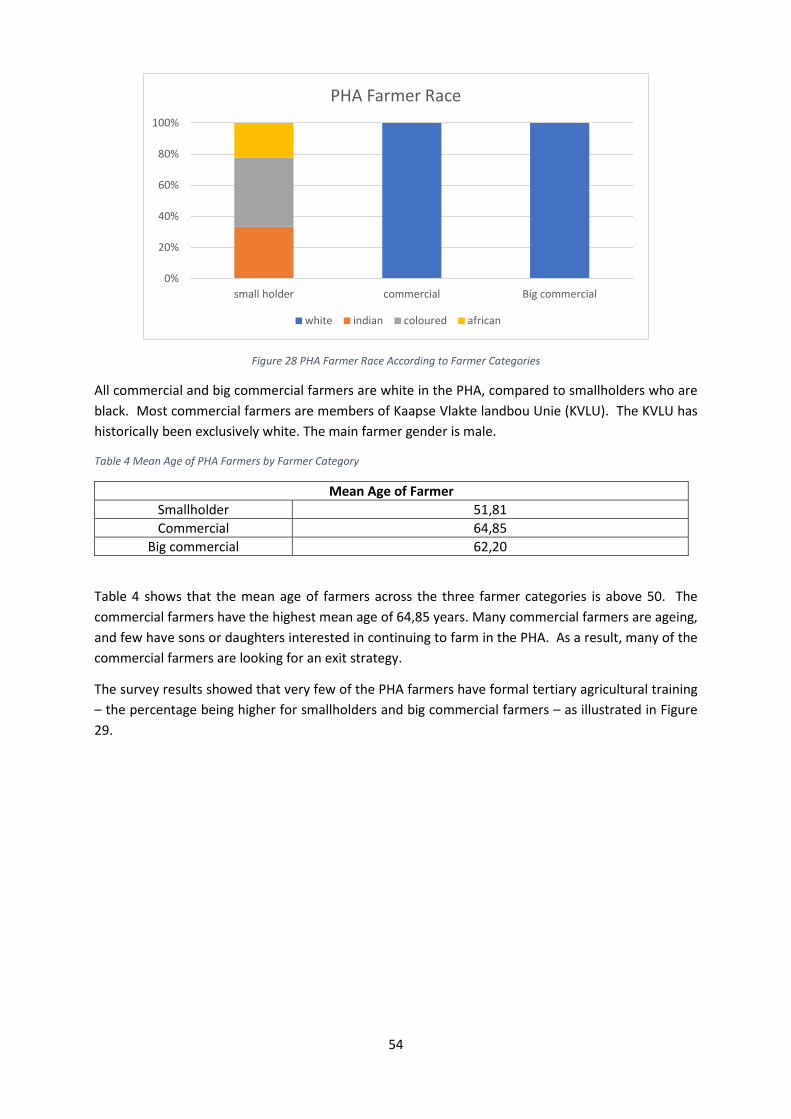
54
Figure 28 PHA Farmer Race According to Farmer Categories
All commercial and big commercial farmers are white in the PHA, compared to smallholders who are black. Most commercial farmers are members of Kaapse Vlakte landbou Unie (KVLU). The KVLU has historically been exclusively white. The main farmer gender is male.
Table 4 Mean Age of PHA Farmers by Farmer Category
Mean Age of Farmer Smallholder 51,81 Commercial 64,85
Big commercial 62,20
Table 4 shows that the mean age of farmers across the three farmer categories is above 50. The commercial farmers have the highest mean age of 64,85 years. Many commercial farmers are ageing, and few have sons or daughters interested in continuing to farm in the PHA. As a result, many of the commercial farmers are looking for an exit strategy.
The survey results showed that very few of the PHA farmers have formal tertiary agricultural training – the percentage being higher for smallholders and big commercial farmers – as illustrated in Figure 29.
0%
20%
40%
60%
80%
100%
small holder commercial Big commercial
PHA Farmer Race
white indian coloured african
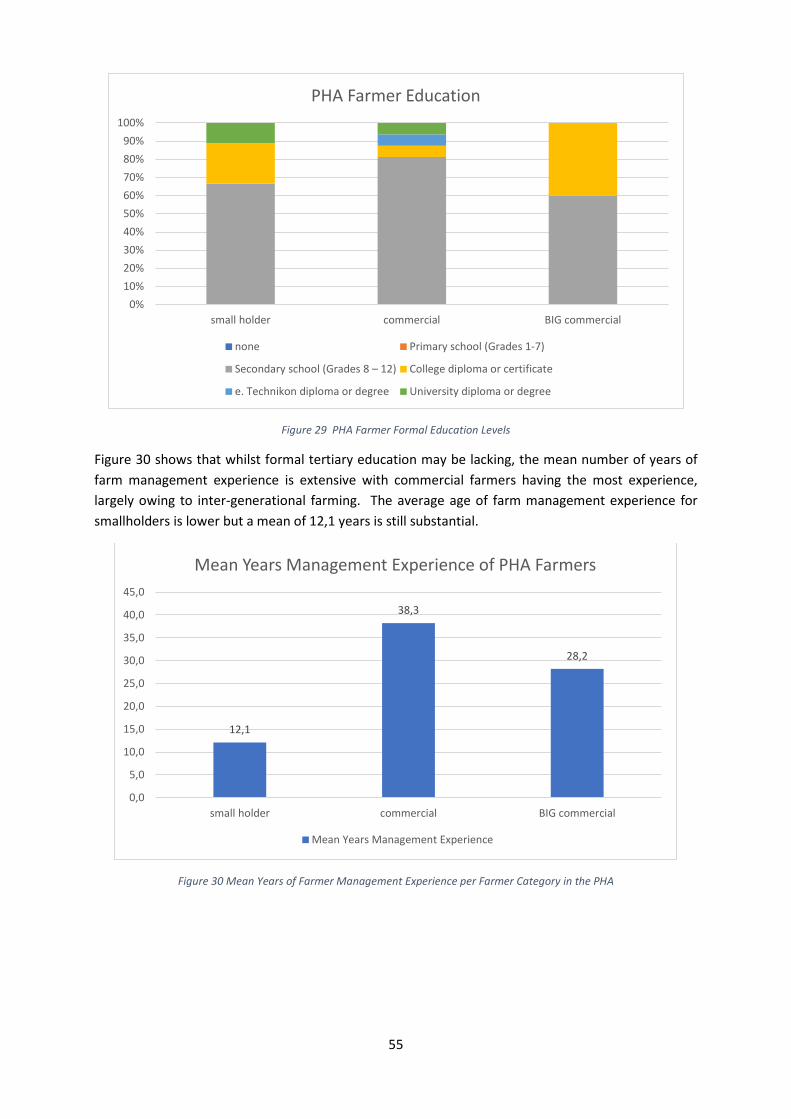
55
Figure 29 PHA Farmer Formal Education Levels
Figure 30 shows that whilst formal tertiary education may be lacking, the mean number of years of farm management experience is extensive with commercial farmers having the most experience, largely owing to inter-generational farming. The average age of farm management experience for smallholders is lower but a mean of 12,1 years is still substantial.
Figure 30 Mean Years of Farmer Management Experience per Farmer Category in the PHA
0%10%20%30%40%50%60%70%80%90%
100%
small holder commercial BIG commercial
PHA Farmer Education
none Primary school (Grades 1-7)
Secondary school (Grades 8 – 12) College diploma or certificate
e. Technikon diploma or degree University diploma or degree
12,1
38,3
28,2
0,0
5,0
10,0
15,0
20,0
25,0
30,0
35,0
40,0
45,0
small holder commercial BIG commercial
Mean Years Management Experience of PHA Farmers
Mean Years Management Experience
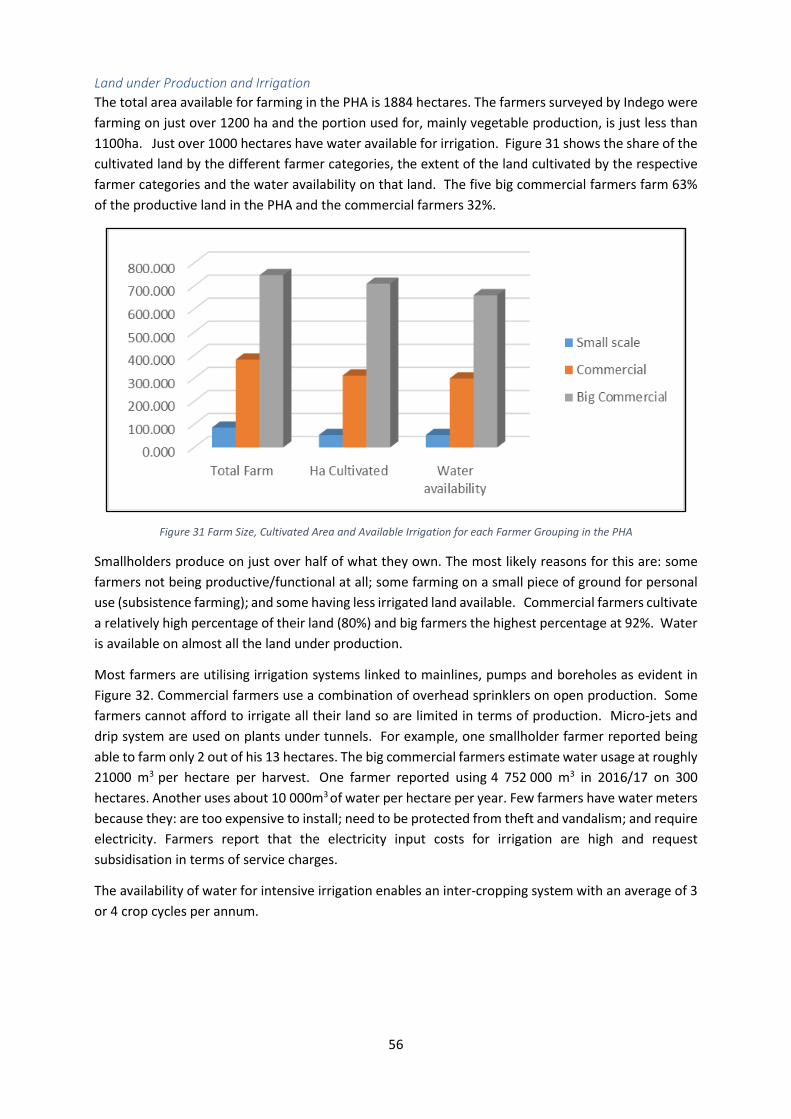
56
Land under Production and Irrigation The total area available for farming in the PHA is 1884 hectares. The farmers surveyed by Indego were farming on just over 1200 ha and the portion used for, mainly vegetable production, is just less than 1100ha. Just over 1000 hectares have water available for irrigation. Figure 31 shows the share of the cultivated land by the different farmer categories, the extent of the land cultivated by the respective farmer categories and the water availability on that land. The five big commercial farmers farm 63% of the productive land in the PHA and the commercial farmers 32%.
Figure 31 Farm Size, Cultivated Area and Available Irrigation for each Farmer Grouping in the PHA
Smallholders produce on just over half of what they own. The most likely reasons for this are: some farmers not being productive/functional at all; some farming on a small piece of ground for personal use (subsistence farming); and some having less irrigated land available. Commercial farmers cultivate a relatively high percentage of their land (80%) and big farmers the highest percentage at 92%. Water is available on almost all the land under production.
Most farmers are utilising irrigation systems linked to mainlines, pumps and boreholes as evident in Figure 32. Commercial farmers use a combination of overhead sprinklers on open production. Some farmers cannot afford to irrigate all their land so are limited in terms of production. Micro-jets and drip system are used on plants under tunnels. For example, one smallholder farmer reported being able to farm only 2 out of his 13 hectares. The big commercial farmers estimate water usage at roughly 21000 m3 per hectare per harvest. One farmer reported using 4 752 000 m3 in 2016/17 on 300 hectares. Another uses about 10 000m3 of water per hectare per year. Few farmers have water meters because they: are too expensive to install; need to be protected from theft and vandalism; and require electricity. Farmers report that the electricity input costs for irrigation are high and request subsidisation in terms of service charges.
The availability of water for intensive irrigation enables an inter-cropping system with an average of 3 or 4 crop cycles per annum.
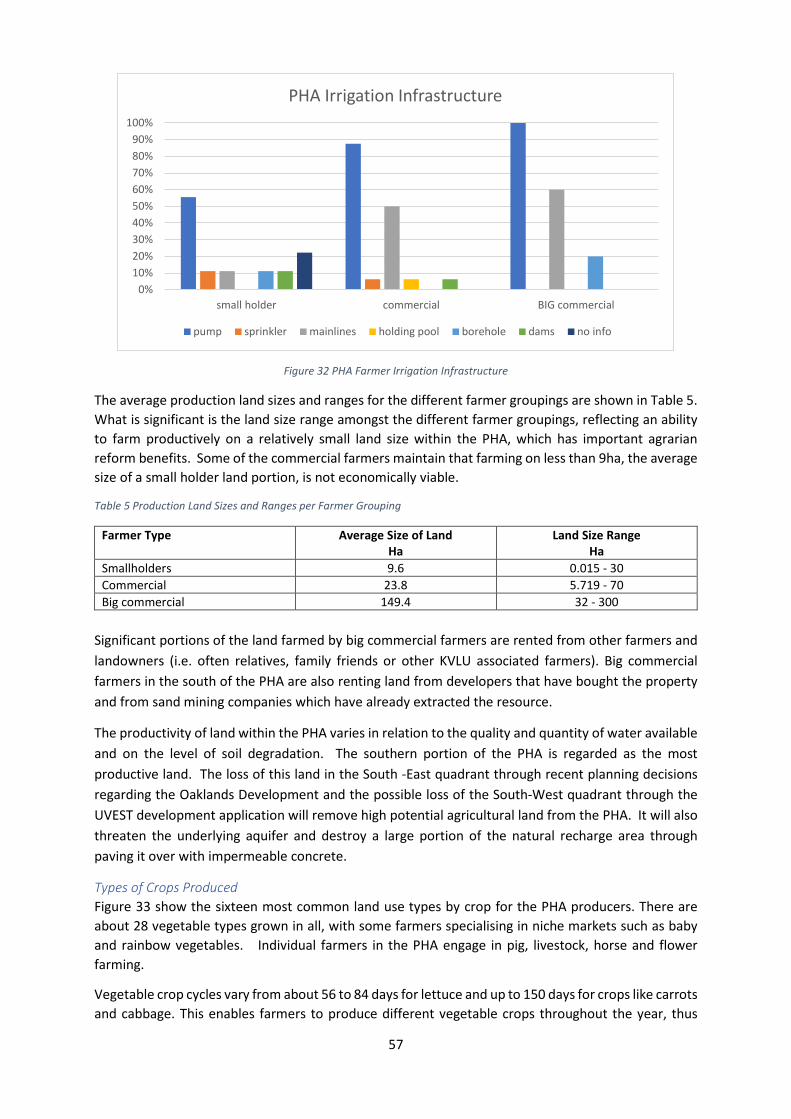
57
Figure 32 PHA Farmer Irrigation Infrastructure
The average production land sizes and ranges for the different farmer groupings are shown in Table 5. What is significant is the land size range amongst the different farmer groupings, reflecting an ability to farm productively on a relatively small land size within the PHA, which has important agrarian reform benefits. Some of the commercial farmers maintain that farming on less than 9ha, the average size of a small holder land portion, is not economically viable.
Table 5 Production Land Sizes and Ranges per Farmer Grouping
Farmer Type Average Size of Land Ha
Land Size Range Ha
Smallholders 9.6 0.015 - 30 Commercial 23.8 5.719 - 70 Big commercial 149.4 32 - 300
Significant portions of the land farmed by big commercial farmers are rented from other farmers and landowners (i.e. often relatives, family friends or other KVLU associated farmers). Big commercial farmers in the south of the PHA are also renting land from developers that have bought the property and from sand mining companies which have already extracted the resource.
The productivity of land within the PHA varies in relation to the quality and quantity of water available and on the level of soil degradation. The southern portion of the PHA is regarded as the most productive land. The loss of this land in the South -East quadrant through recent planning decisions regarding the Oaklands Development and the possible loss of the South-West quadrant through the UVEST development application will remove high potential agricultural land from the PHA. It will also threaten the underlying aquifer and destroy a large portion of the natural recharge area through paving it over with impermeable concrete.
Types of Crops Produced Figure 33 show the sixteen most common land use types by crop for the PHA producers. There are about 28 vegetable types grown in all, with some farmers specialising in niche markets such as baby and rainbow vegetables. Individual farmers in the PHA engage in pig, livestock, horse and flower farming.
Vegetable crop cycles vary from about 56 to 84 days for lettuce and up to 150 days for crops like carrots and cabbage. This enables farmers to produce different vegetable crops throughout the year, thus
0%10%20%30%40%50%60%70%80%90%
100%
small holder commercial BIG commercial
PHA Irrigation Infrastructure
pump sprinkler mainlines holding pool borehole dams no info
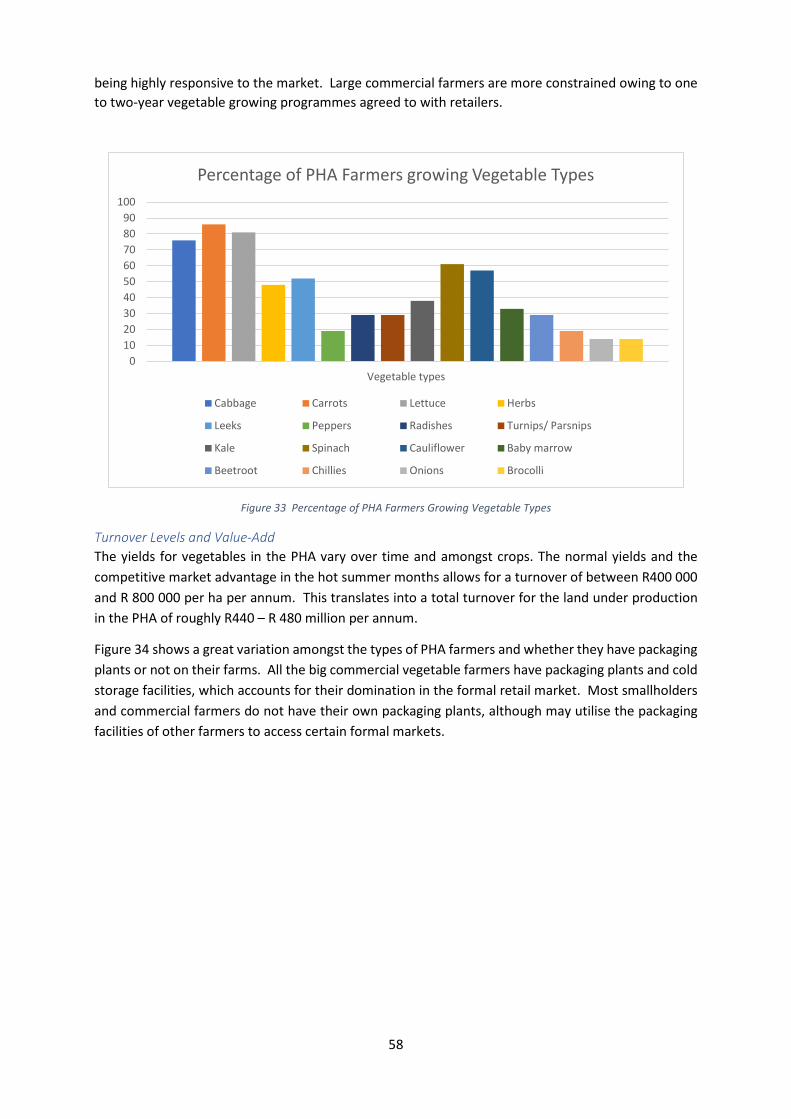
58
being highly responsive to the market. Large commercial farmers are more constrained owing to one to two-year vegetable growing programmes agreed to with retailers.
Figure 33 Percentage of PHA Farmers Growing Vegetable Types
Turnover Levels and Value-Add The yields for vegetables in the PHA vary over time and amongst crops. The normal yields and the competitive market advantage in the hot summer months allows for a turnover of between R400 000 and R 800 000 per ha per annum. This translates into a total turnover for the land under production in the PHA of roughly R440 – R 480 million per annum.
Figure 34 shows a great variation amongst the types of PHA farmers and whether they have packaging plants or not on their farms. All the big commercial vegetable farmers have packaging plants and cold storage facilities, which accounts for their domination in the formal retail market. Most smallholders and commercial farmers do not have their own packaging plants, although may utilise the packaging facilities of other farmers to access certain formal markets.
0102030405060708090
100
Vegetable types
Percentage of PHA Farmers growing Vegetable Types
Cabbage Carrots Lettuce Herbs
Leeks Peppers Radishes Turnips/ Parsnips
Kale Spinach Cauliflower Baby marrow
Beetroot Chillies Onions Brocolli
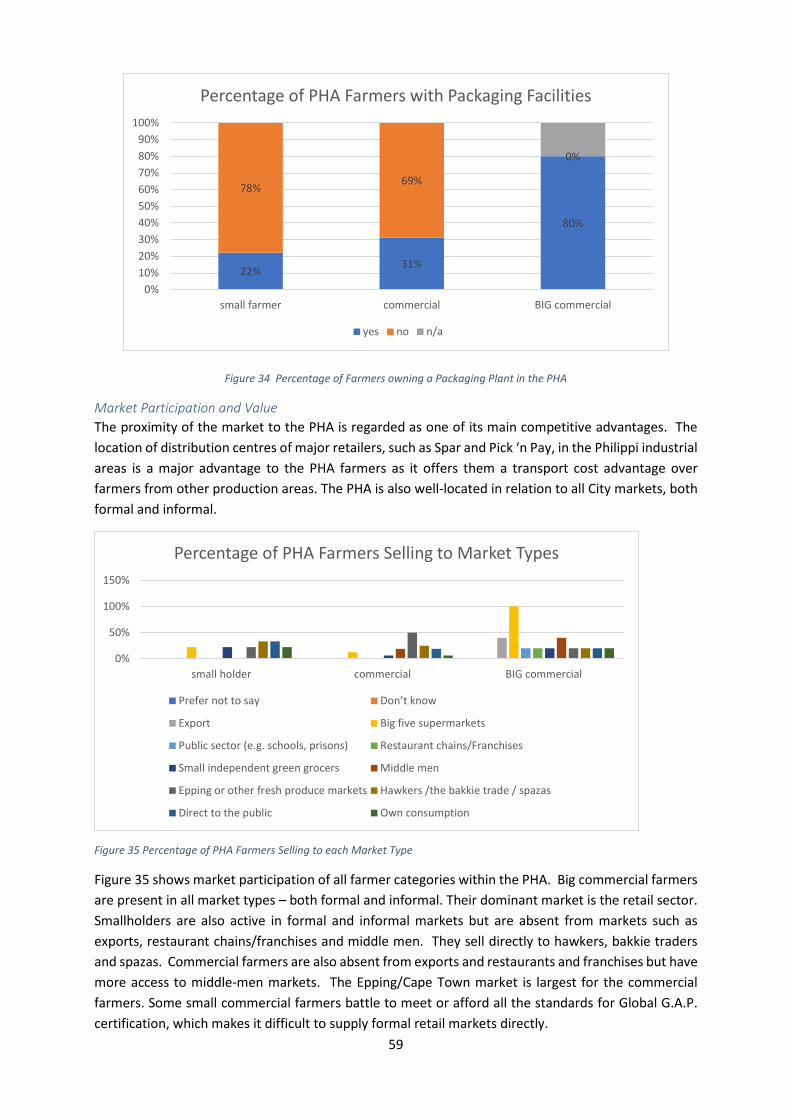
59
Figure 34 Percentage of Farmers owning a Packaging Plant in the PHA
Market Participation and Value The proximity of the market to the PHA is regarded as one of its main competitive advantages. The location of distribution centres of major retailers, such as Spar and Pick ‘n Pay, in the Philippi industrial areas is a major advantage to the PHA farmers as it offers them a transport cost advantage over farmers from other production areas. The PHA is also well-located in relation to all City markets, both formal and informal.
Figure 35 Percentage of PHA Farmers Selling to each Market Type
Figure 35 shows market participation of all farmer categories within the PHA. Big commercial farmers are present in all market types – both formal and informal. Their dominant market is the retail sector. Smallholders are also active in formal and informal markets but are absent from markets such as exports, restaurant chains/franchises and middle men. They sell directly to hawkers, bakkie traders and spazas. Commercial farmers are also absent from exports and restaurants and franchises but have more access to middle-men markets. The Epping/Cape Town market is largest for the commercial farmers. Some small commercial farmers battle to meet or afford all the standards for Global G.A.P. certification, which makes it difficult to supply formal retail markets directly.
22% 31%
80%
78% 69%
0%
0%10%20%30%40%50%60%70%80%90%
100%
small farmer commercial BIG commercial
Percentage of PHA Farmers with Packaging Facilities
yes no n/a
0%
50%
100%
150%
small holder commercial BIG commercial
Percentage of PHA Farmers Selling to Market Types
Prefer not to say Don’t know
Export Big five supermarkets
Public sector (e.g. schools, prisons) Restaurant chains/Franchises
Small independent green grocers Middle men
Epping or other fresh produce markets Hawkers /the bakkie trade / spazas
Direct to the public Own consumption
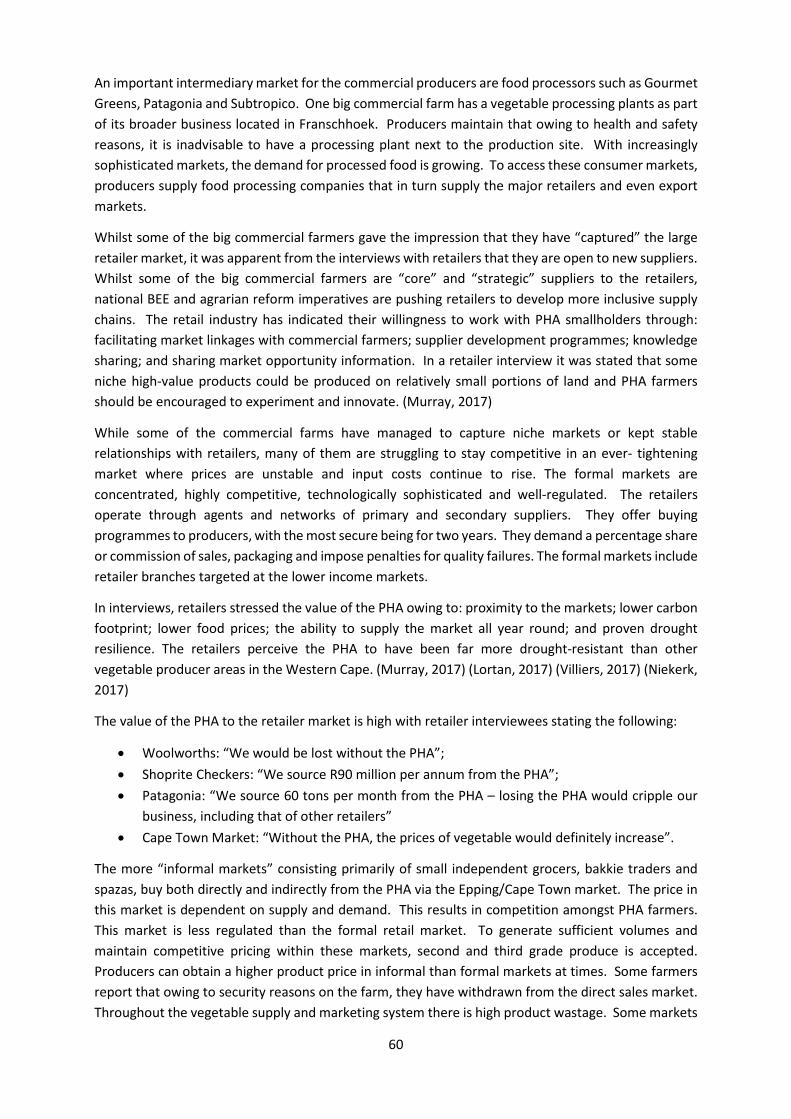
60
An important intermediary market for the commercial producers are food processors such as Gourmet Greens, Patagonia and Subtropico. One big commercial farm has a vegetable processing plants as part of its broader business located in Franschhoek. Producers maintain that owing to health and safety reasons, it is inadvisable to have a processing plant next to the production site. With increasingly sophisticated markets, the demand for processed food is growing. To access these consumer markets, producers supply food processing companies that in turn supply the major retailers and even export markets.
Whilst some of the big commercial farmers gave the impression that they have “captured” the large retailer market, it was apparent from the interviews with retailers that they are open to new suppliers. Whilst some of the big commercial farmers are “core” and “strategic” suppliers to the retailers, national BEE and agrarian reform imperatives are pushing retailers to develop more inclusive supply chains. The retail industry has indicated their willingness to work with PHA smallholders through: facilitating market linkages with commercial farmers; supplier development programmes; knowledge sharing; and sharing market opportunity information. In a retailer interview it was stated that some niche high-value products could be produced on relatively small portions of land and PHA farmers should be encouraged to experiment and innovate. (Murray, 2017)
While some of the commercial farms have managed to capture niche markets or kept stable relationships with retailers, many of them are struggling to stay competitive in an ever- tightening market where prices are unstable and input costs continue to rise. The formal markets are concentrated, highly competitive, technologically sophisticated and well-regulated. The retailers operate through agents and networks of primary and secondary suppliers. They offer buying programmes to producers, with the most secure being for two years. They demand a percentage share or commission of sales, packaging and impose penalties for quality failures. The formal markets include retailer branches targeted at the lower income markets.
In interviews, retailers stressed the value of the PHA owing to: proximity to the markets; lower carbon footprint; lower food prices; the ability to supply the market all year round; and proven drought resilience. The retailers perceive the PHA to have been far more drought-resistant than other vegetable producer areas in the Western Cape. (Murray, 2017) (Lortan, 2017) (Villiers, 2017) (Niekerk, 2017)
The value of the PHA to the retailer market is high with retailer interviewees stating the following:
• Woolworths: “We would be lost without the PHA”; • Shoprite Checkers: “We source R90 million per annum from the PHA”; • Patagonia: “We source 60 tons per month from the PHA – losing the PHA would cripple our
business, including that of other retailers” • Cape Town Market: “Without the PHA, the prices of vegetable would definitely increase”.
The more “informal markets” consisting primarily of small independent grocers, bakkie traders and spazas, buy both directly and indirectly from the PHA via the Epping/Cape Town market. The price in this market is dependent on supply and demand. This results in competition amongst PHA farmers. This market is less regulated than the formal retail market. To generate sufficient volumes and maintain competitive pricing within these markets, second and third grade produce is accepted. Producers can obtain a higher product price in informal than formal markets at times. Some farmers report that owing to security reasons on the farm, they have withdrawn from the direct sales market. Throughout the vegetable supply and marketing system there is high product wastage. Some markets
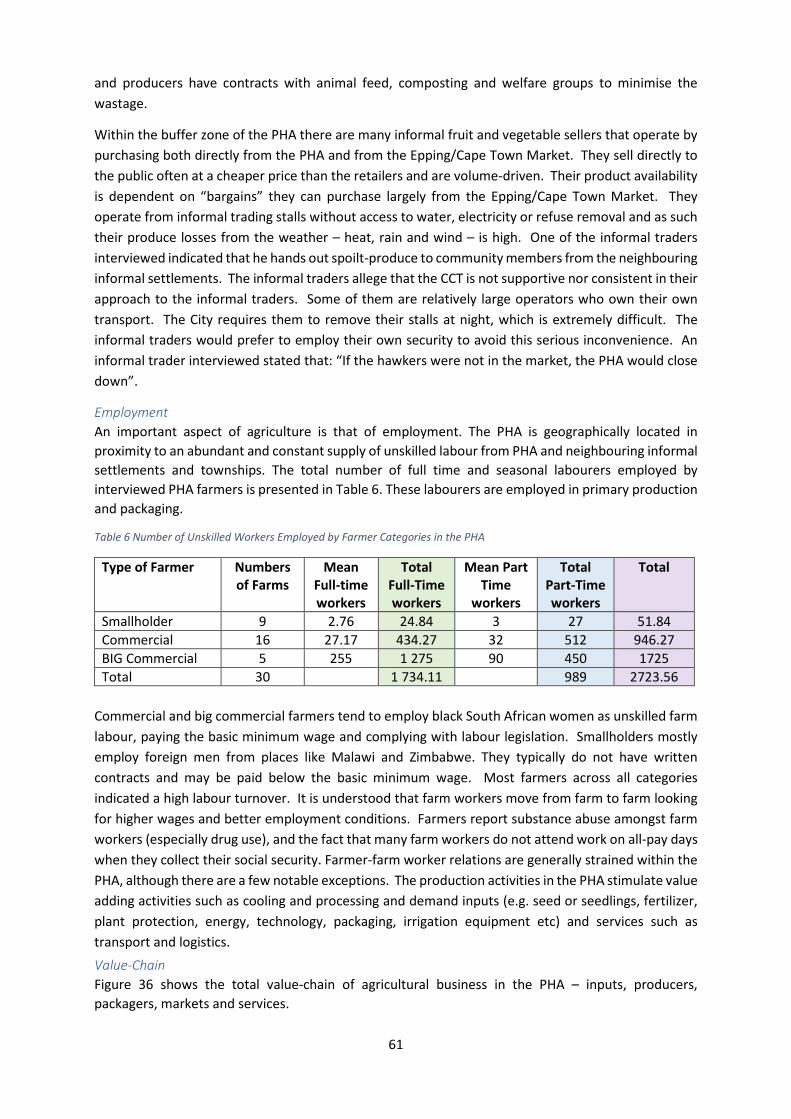
61
and producers have contracts with animal feed, composting and welfare groups to minimise the wastage.
Within the buffer zone of the PHA there are many informal fruit and vegetable sellers that operate by purchasing both directly from the PHA and from the Epping/Cape Town Market. They sell directly to the public often at a cheaper price than the retailers and are volume-driven. Their product availability is dependent on “bargains” they can purchase largely from the Epping/Cape Town Market. They operate from informal trading stalls without access to water, electricity or refuse removal and as such their produce losses from the weather – heat, rain and wind – is high. One of the informal traders interviewed indicated that he hands out spoilt-produce to community members from the neighbouring informal settlements. The informal traders allege that the CCT is not supportive nor consistent in their approach to the informal traders. Some of them are relatively large operators who own their own transport. The City requires them to remove their stalls at night, which is extremely difficult. The informal traders would prefer to employ their own security to avoid this serious inconvenience. An informal trader interviewed stated that: “If the hawkers were not in the market, the PHA would close down”.
Employment An important aspect of agriculture is that of employment. The PHA is geographically located in proximity to an abundant and constant supply of unskilled labour from PHA and neighbouring informal settlements and townships. The total number of full time and seasonal labourers employed by interviewed PHA farmers is presented in Table 6. These labourers are employed in primary production and packaging.
Table 6 Number of Unskilled Workers Employed by Farmer Categories in the PHA
Type of Farmer Numbers of Farms
Mean Full-time workers
Total Full-Time workers
Mean Part Time
workers
Total Part-Time workers
Total
Smallholder 9 2.76 24.84 3 27 51.84 Commercial 16 27.17 434.27 32 512 946.27 BIG Commercial 5 255 1 275 90 450 1725 Total 30 1 734.11 989 2723.56
Commercial and big commercial farmers tend to employ black South African women as unskilled farm labour, paying the basic minimum wage and complying with labour legislation. Smallholders mostly employ foreign men from places like Malawi and Zimbabwe. They typically do not have written contracts and may be paid below the basic minimum wage. Most farmers across all categories indicated a high labour turnover. It is understood that farm workers move from farm to farm looking for higher wages and better employment conditions. Farmers report substance abuse amongst farm workers (especially drug use), and the fact that many farm workers do not attend work on all-pay days when they collect their social security. Farmer-farm worker relations are generally strained within the PHA, although there are a few notable exceptions. The production activities in the PHA stimulate value adding activities such as cooling and processing and demand inputs (e.g. seed or seedlings, fertilizer, plant protection, energy, technology, packaging, irrigation equipment etc) and services such as transport and logistics. Value-Chain Figure 36 shows the total value-chain of agricultural business in the PHA – inputs, producers, packagers, markets and services.
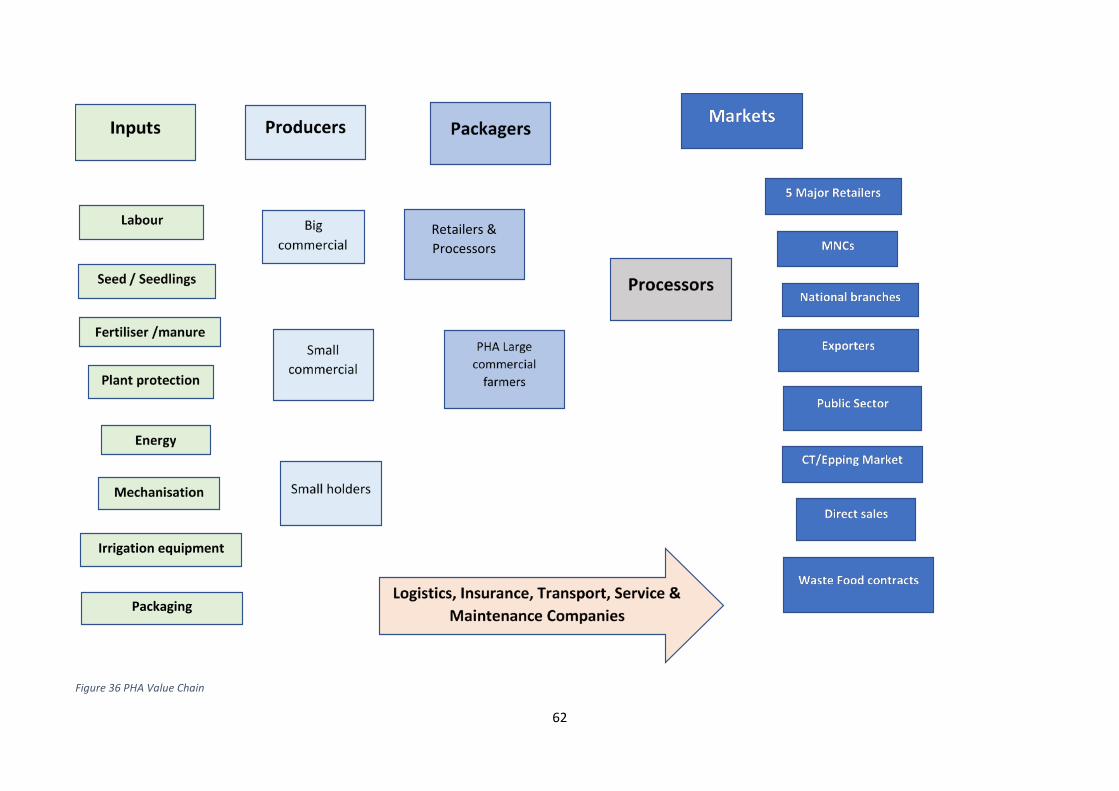
62
Figure 36 PHA Value Chain
Retailers & Processors
Irrigation equipment
Packaging
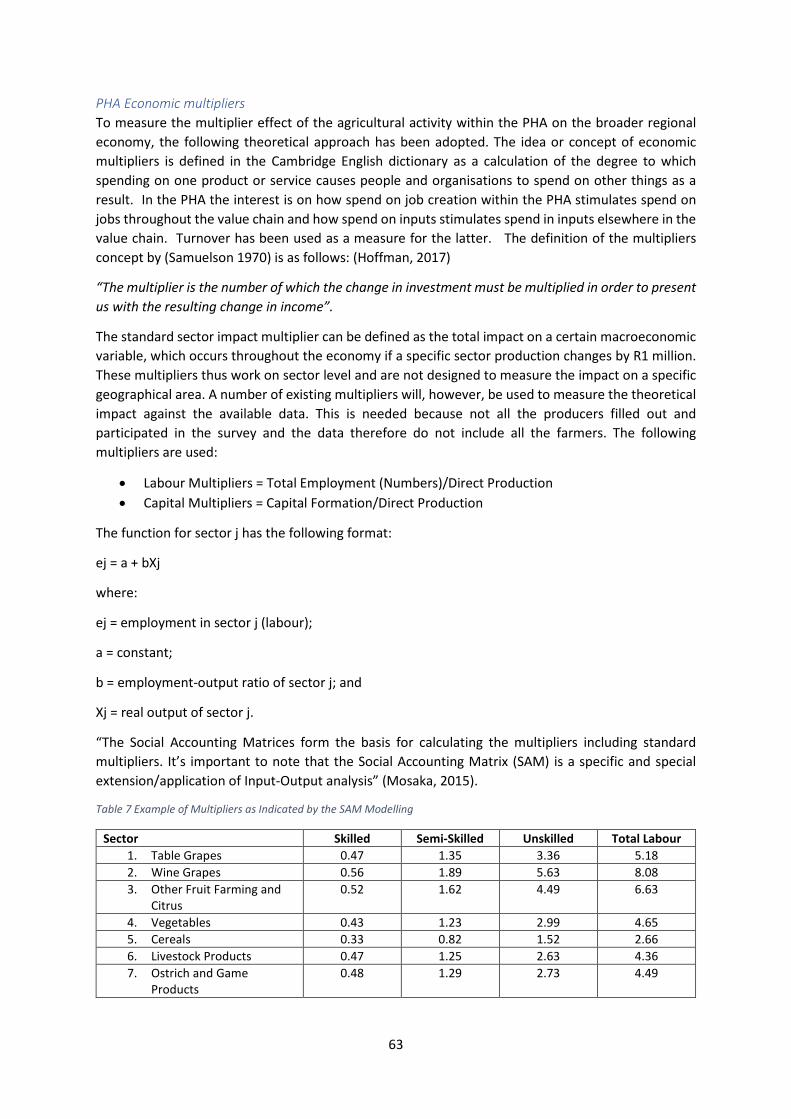
63
PHA Economic multipliers To measure the multiplier effect of the agricultural activity within the PHA on the broader regional economy, the following theoretical approach has been adopted. The idea or concept of economic multipliers is defined in the Cambridge English dictionary as a calculation of the degree to which spending on one product or service causes people and organisations to spend on other things as a result. In the PHA the interest is on how spend on job creation within the PHA stimulates spend on jobs throughout the value chain and how spend on inputs stimulates spend in inputs elsewhere in the value chain. Turnover has been used as a measure for the latter. The definition of the multipliers concept by (Samuelson 1970) is as follows: (Hoffman, 2017)
“The multiplier is the number of which the change in investment must be multiplied in order to present us with the resulting change in income”.
The standard sector impact multiplier can be defined as the total impact on a certain macroeconomic variable, which occurs throughout the economy if a specific sector production changes by R1 million. These multipliers thus work on sector level and are not designed to measure the impact on a specific geographical area. A number of existing multipliers will, however, be used to measure the theoretical impact against the available data. This is needed because not all the producers filled out and participated in the survey and the data therefore do not include all the farmers. The following multipliers are used:
• Labour Multipliers = Total Employment (Numbers)/Direct Production • Capital Multipliers = Capital Formation/Direct Production
The function for sector j has the following format:
ej = a + bXj
where:
ej = employment in sector j (labour);
a = constant;
b = employment-output ratio of sector j; and
Xj = real output of sector j.
“The Social Accounting Matrices form the basis for calculating the multipliers including standard multipliers. It’s important to note that the Social Accounting Matrix (SAM) is a specific and special extension/application of Input-Output analysis” (Mosaka, 2015).
Table 7 Example of Multipliers as Indicated by the SAM Modelling
Sector Skilled Semi-Skilled Unskilled Total Labour 1. Table Grapes 0.47 1.35 3.36 5.18 2. Wine Grapes 0.56 1.89 5.63 8.08 3. Other Fruit Farming and
Citrus 0.52 1.62 4.49 6.63
4. Vegetables 0.43 1.23 2.99 4.65 5. Cereals 0.33 0.82 1.52 2.66 6. Livestock Products 0.47 1.25 2.63 4.36 7. Ostrich and Game
Products 0.48 1.29 2.73 4.49
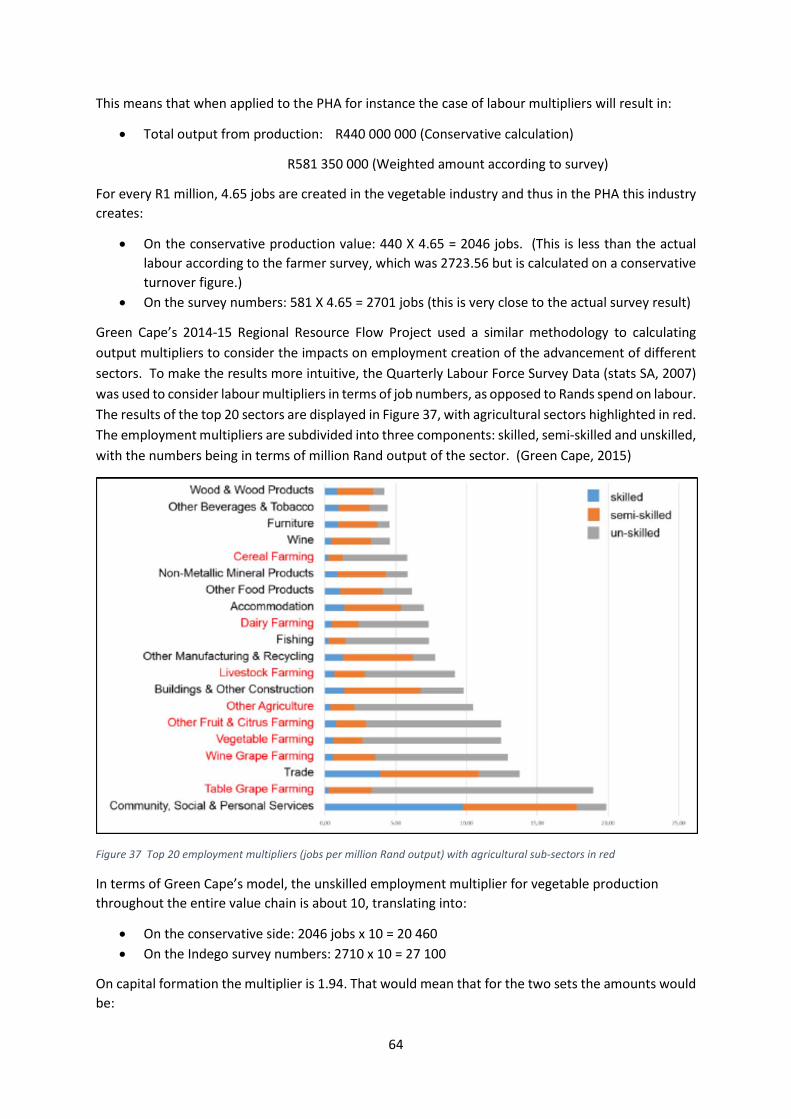
64
This means that when applied to the PHA for instance the case of labour multipliers will result in:
• Total output from production: R440 000 000 (Conservative calculation)
R581 350 000 (Weighted amount according to survey)
For every R1 million, 4.65 jobs are created in the vegetable industry and thus in the PHA this industry creates:
• On the conservative production value: 440 X 4.65 = 2046 jobs. (This is less than the actual labour according to the farmer survey, which was 2723.56 but is calculated on a conservative turnover figure.)
• On the survey numbers: 581 X 4.65 = 2701 jobs (this is very close to the actual survey result)
Green Cape’s 2014-15 Regional Resource Flow Project used a similar methodology to calculating output multipliers to consider the impacts on employment creation of the advancement of different sectors. To make the results more intuitive, the Quarterly Labour Force Survey Data (stats SA, 2007) was used to consider labour multipliers in terms of job numbers, as opposed to Rands spend on labour. The results of the top 20 sectors are displayed in Figure 37, with agricultural sectors highlighted in red. The employment multipliers are subdivided into three components: skilled, semi-skilled and unskilled, with the numbers being in terms of million Rand output of the sector. (Green Cape, 2015)
Figure 37 Top 20 employment multipliers (jobs per million Rand output) with agricultural sub-sectors in red
In terms of Green Cape’s model, the unskilled employment multiplier for vegetable production throughout the entire value chain is about 10, translating into:
• On the conservative side: 2046 jobs x 10 = 20 460 • On the Indego survey numbers: 2710 x 10 = 27 100
On capital formation the multiplier is 1.94. That would mean that for the two sets the amounts would be:
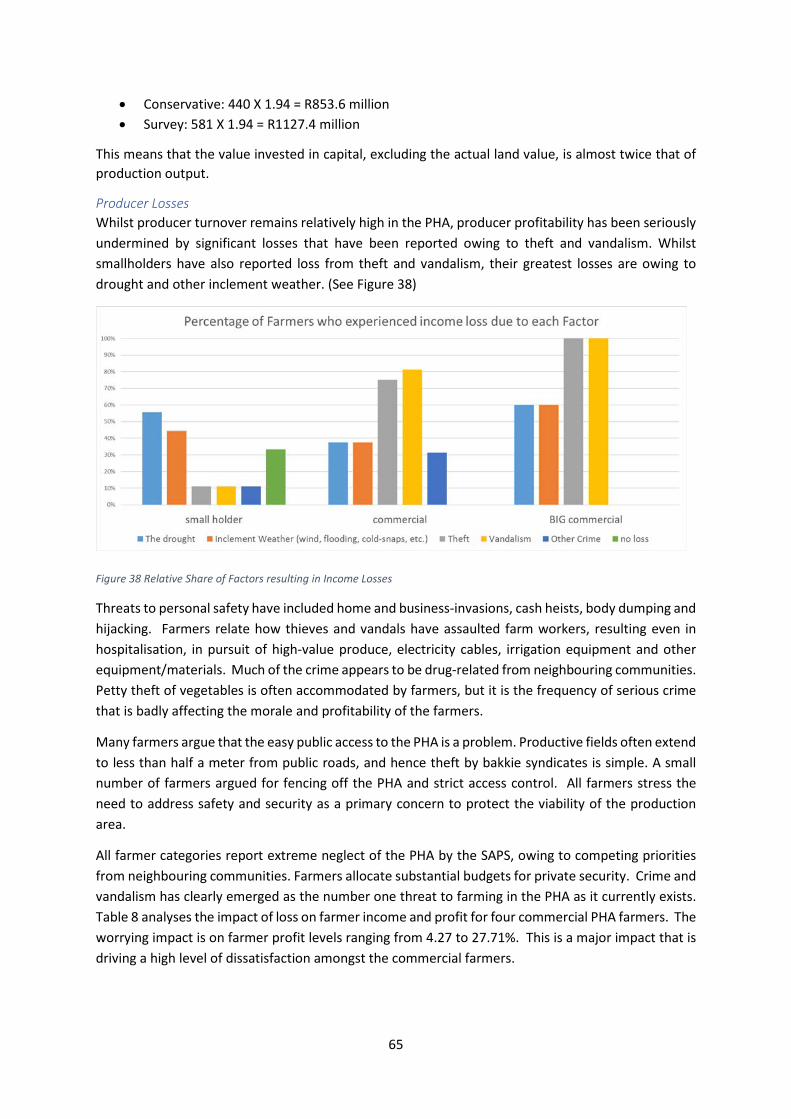
65
• Conservative: 440 X 1.94 = R853.6 million • Survey: 581 X 1.94 = R1127.4 million
This means that the value invested in capital, excluding the actual land value, is almost twice that of production output.
Producer Losses Whilst producer turnover remains relatively high in the PHA, producer profitability has been seriously undermined by significant losses that have been reported owing to theft and vandalism. Whilst smallholders have also reported loss from theft and vandalism, their greatest losses are owing to drought and other inclement weather. (See Figure 38)
Figure 38 Relative Share of Factors resulting in Income Losses
Threats to personal safety have included home and business-invasions, cash heists, body dumping and hijacking. Farmers relate how thieves and vandals have assaulted farm workers, resulting even in hospitalisation, in pursuit of high-value produce, electricity cables, irrigation equipment and other equipment/materials. Much of the crime appears to be drug-related from neighbouring communities. Petty theft of vegetables is often accommodated by farmers, but it is the frequency of serious crime that is badly affecting the morale and profitability of the farmers.
Many farmers argue that the easy public access to the PHA is a problem. Productive fields often extend to less than half a meter from public roads, and hence theft by bakkie syndicates is simple. A small number of farmers argued for fencing off the PHA and strict access control. All farmers stress the need to address safety and security as a primary concern to protect the viability of the production area.
All farmer categories report extreme neglect of the PHA by the SAPS, owing to competing priorities from neighbouring communities. Farmers allocate substantial budgets for private security. Crime and vandalism has clearly emerged as the number one threat to farming in the PHA as it currently exists. Table 8 analyses the impact of loss on farmer income and profit for four commercial PHA farmers. The worrying impact is on farmer profit levels ranging from 4.27 to 27.71%. This is a major impact that is driving a high level of dissatisfaction amongst the commercial farmers.
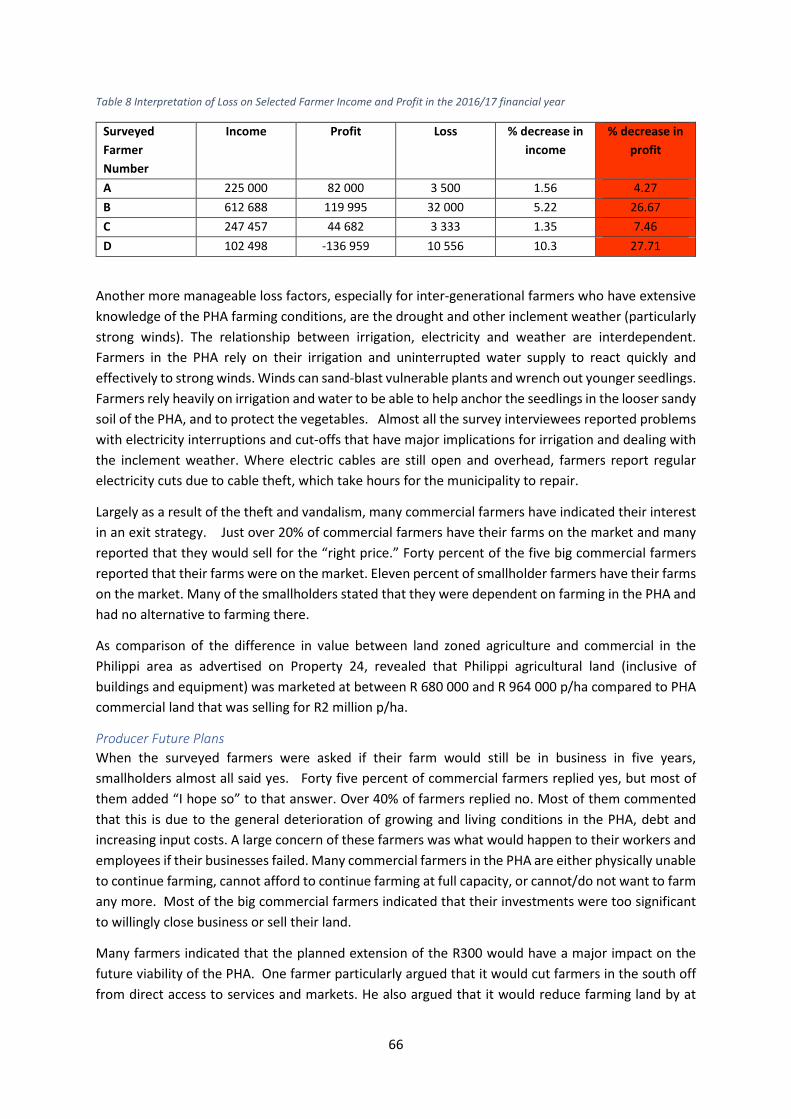
66
Table 8 Interpretation of Loss on Selected Farmer Income and Profit in the 2016/17 financial year
Surveyed Farmer Number
Income Profit Loss % decrease in income
% decrease in profit
A 225 000 82 000 3 500 1.56 4.27 B 612 688 119 995 32 000 5.22 26.67 C 247 457 44 682 3 333 1.35 7.46 D 102 498 -136 959 10 556 10.3 27.71
Another more manageable loss factors, especially for inter-generational farmers who have extensive knowledge of the PHA farming conditions, are the drought and other inclement weather (particularly strong winds). The relationship between irrigation, electricity and weather are interdependent. Farmers in the PHA rely on their irrigation and uninterrupted water supply to react quickly and effectively to strong winds. Winds can sand-blast vulnerable plants and wrench out younger seedlings. Farmers rely heavily on irrigation and water to be able to help anchor the seedlings in the looser sandy soil of the PHA, and to protect the vegetables. Almost all the survey interviewees reported problems with electricity interruptions and cut-offs that have major implications for irrigation and dealing with the inclement weather. Where electric cables are still open and overhead, farmers report regular electricity cuts due to cable theft, which take hours for the municipality to repair.
Largely as a result of the theft and vandalism, many commercial farmers have indicated their interest in an exit strategy. Just over 20% of commercial farmers have their farms on the market and many reported that they would sell for the “right price.” Forty percent of the five big commercial farmers reported that their farms were on the market. Eleven percent of smallholder farmers have their farms on the market. Many of the smallholders stated that they were dependent on farming in the PHA and had no alternative to farming there.
As comparison of the difference in value between land zoned agriculture and commercial in the Philippi area as advertised on Property 24, revealed that Philippi agricultural land (inclusive of buildings and equipment) was marketed at between R 680 000 and R 964 000 p/ha compared to PHA commercial land that was selling for R2 million p/ha.
Producer Future Plans When the surveyed farmers were asked if their farm would still be in business in five years, smallholders almost all said yes. Forty five percent of commercial farmers replied yes, but most of them added “I hope so” to that answer. Over 40% of farmers replied no. Most of them commented that this is due to the general deterioration of growing and living conditions in the PHA, debt and increasing input costs. A large concern of these farmers was what would happen to their workers and employees if their businesses failed. Many commercial farmers in the PHA are either physically unable to continue farming, cannot afford to continue farming at full capacity, or cannot/do not want to farm any more. Most of the big commercial farmers indicated that their investments were too significant to willingly close business or sell their land.
Many farmers indicated that the planned extension of the R300 would have a major impact on the future viability of the PHA. One farmer particularly argued that it would cut farmers in the south off from direct access to services and markets. He also argued that it would reduce farming land by at
67
least one kilometre on each side of the new R300 for buffer zones. Farmers would be unwilling to risk production on these strips until the controversy is resolved. In discussions with the provincial Department of Transport it was confirmed that neither SANRAL or the department have any plans to pursue the R300 extension.
Summary of Agricultural Findings The main agricultural sector findings are:
• The Philippi Horticultural Area (PHA) is a unique geographical production area on the Cape Flats that has been actively farmed for generations. The specific combination of a moderate climate, soil and extensive water availability make it a unique agricultural area.
• The PHA if highly productive with most of the land being farmed generating a minimum of 3 – 4 crop cycles per annum resulting in a high turnover per hectare.
• The PHA creates about 2700 direct jobs for unskilled workers at the vegetable industry standard of 4.65 for every R 1 million spent and has a multiplier effect of 10 for job creation throughout the value chain.
• The PHA’s turnover multiplier is estimated at 1.9 generating value throughout the value chain. • The PHA is highly valued by the markets and is performing an important agricultural price-
moderating role at a regional and national level. • There are possibilities expanded agricultural production through increased access to land and
employment of new technologies. • The southern portion of the PHA has the highest agricultural potential and its loss to non-
agricultural- related development is of serious concern and is not supported by the findings of this Study.
• There are possibilities for compatible economic activity to be stimulated both within the core PHA – such as agro-tourism, public works programmes and community markets – and within its buffer areas – such as small and large-scale agro-processors and informal vegetable traders.
• The PHA should be regarded as an asset to the CCT and the broader City region through its contribution to:
o Climate change resilience through food production and groundwater protection; o Sustainable and inclusive urban development through job creation (especially
unskilled); natural resource protection; and integrated human settlements; o City, regional and national food security through supplying both formal and informal
markets and moderating national food prices; and o Regional competitiveness through its embeddedness in the broader agricultural value
chain, forward linkages to agro-processing and possible further linkages to the planned aerotropolis development.
• All elements are in place within the PHA for a successful agrarian reform model – land, water, climate, different types of producers, knowledge, markets, logistics etc – that could be showcased throughout South Africa. There is an opportunity to work with willing commercial farmers to expand commercial production and to increase their support smallholders in terms of market access, knowledge and value chain participation and improved labour relations. There are opportunities for retailers to co-operate in this regard.
• Given the intensity of water-use and inputs into the soil, there is a need for PHA farmers to investigate alternative sustainable agricultural practices, such as irrigation and inputs such as fertiliser and pesticide options.
68
• It is necessary for the WC DoA to roll out a farmer support programme in co-operation with input suppliers, retailers and other market representatives, the PHA farmers, Green Cape, ACSA, Elsenberg College, research institutions and relevant civil society groupings to:
o Encourage sustainable and ethical farming practices o Build co-operative farmer relationships o Facilitate land availability o Investigate farmer incentives o Drive innovation and technology o Facilitate market access o Provide training and a Centre of Excellence.
• Exit strategies for willing and ageing farmers could be facilitated through Proactive Land Acquisition.
The Subdivision of Agricultural Land Act (Act 70 of 1970) should be utilised for the further protection of the PHA for agricultural land-use together with any subsequent legislation dealing with the protection of agricultural land. It is strongly recommended that any decisions regarding the development of the south west quadrant for non-agricultural purposes are reversed and that it is reintegrated into the core PHA. It is understood that matters pertaining to the south-east quadrant are subject to a Court application.
Risks Associated with the Loss of the PHA The risks associated with the loss of the PHA agricultural footprint to-date as well as on-going erosion of the remaining 1884.80 ha through unchecked land use transformation (i.e. to urban uses) and formal conversion to non-agri land use (e.g. residential) include the following: • Potential loss of irreplaceable areas of significant/ unique agricultural land, including the
southern portion, which is a highly productive, all-year round soft-leaf vegetable growing area because of its favourable micro-climate and adequate groundwater resource quality and quantity.
• Threat to the Cape Town metropolitan region’s food security through loss of agricultural land not replaceable elsewhere. Such land loss also contributing to Cape Town food insecurity, especially in the Khayelitsha-Cape Flats District, diminishing the PHA capability to provide affordable locally produced vegetables and the opportunity for community-based gardens to supplement household food baskets.
• Loss of a viable and sustainable platform for agrarian reform opportunities (subsistence and commercial growers) within all agri-commodity sectors (cultivation, agro-processing, transport, marketing, agri-business, etc.) given working farms and opportunities suited to current agrarian reform models and programmes (e.g. ownership, pro-active land acquisition, mentorship, research and development, agri-tourism).
• Jeopardizing of existing and emerging city, provincial and national “game changers” founded on agro-processing and export of agri-product to Africa and overseas markets (e.g. Project Khulisa) through the loss of an integral production component (i.e. the PHA) critical to such programmes (e.g. Philippi East/ Aerotropolis, Airport Industria, Joostebergvlakte Agro-processing Platform).
• Loss of one of the last agri-working landscapes (i.e. cultural landscapes), with a heritage loss and impact on potential agri-tourism focussing on agrarian reform, food security and sustainability, and healthy living.
• Loss of opportunity for agri-/food production R&D, education in food security and nutrition, and organic food production within the City boundaries, highly accessible to all residents.
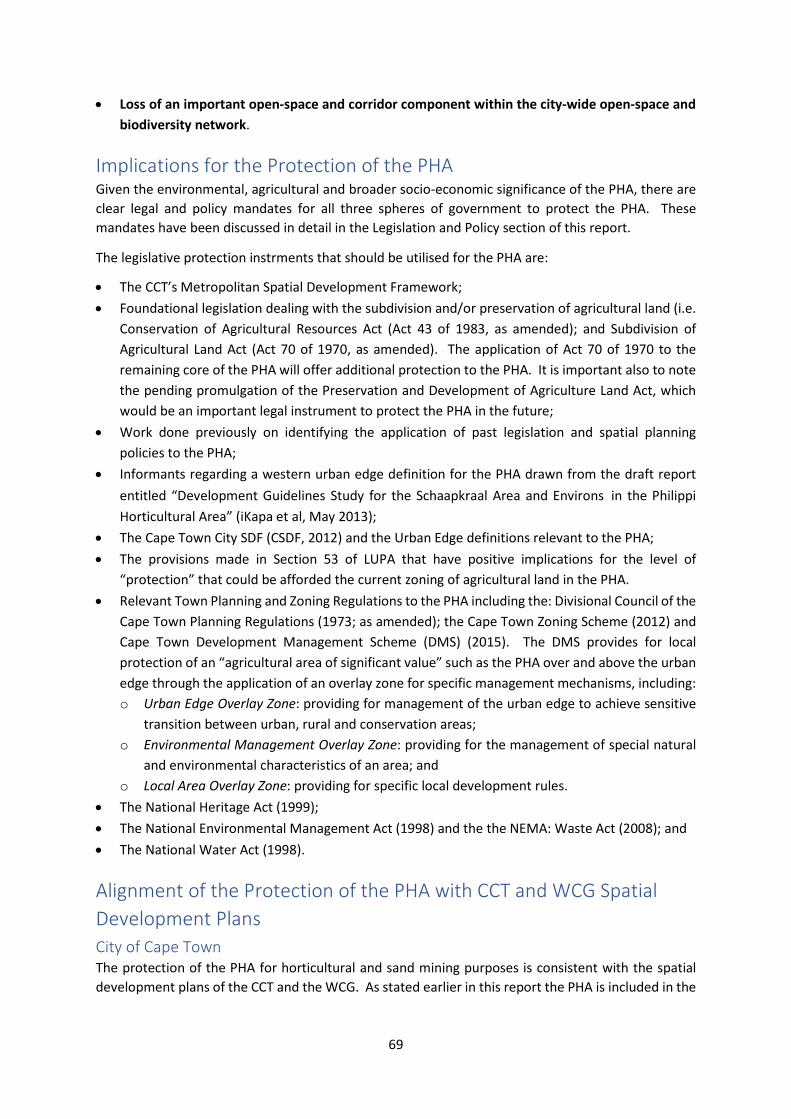
69
• Loss of an important open-space and corridor component within the city-wide open-space and biodiversity network.
Implications for the Protection of the PHA Given the environmental, agricultural and broader socio-economic significance of the PHA, there are clear legal and policy mandates for all three spheres of government to protect the PHA. These mandates have been discussed in detail in the Legislation and Policy section of this report.
The legislative protection instrments that should be utilised for the PHA are:
• The CCT’s Metropolitan Spatial Development Framework; • Foundational legislation dealing with the subdivision and/or preservation of agricultural land (i.e.
Conservation of Agricultural Resources Act (Act 43 of 1983, as amended); and Subdivision of Agricultural Land Act (Act 70 of 1970, as amended). The application of Act 70 of 1970 to the remaining core of the PHA will offer additional protection to the PHA. It is important also to note the pending promulgation of the Preservation and Development of Agriculture Land Act, which would be an important legal instrument to protect the PHA in the future;
• Work done previously on identifying the application of past legislation and spatial planning policies to the PHA;
• Informants regarding a western urban edge definition for the PHA drawn from the draft report entitled “Development Guidelines Study for the Schaapkraal Area and Environsin the Philippi Horticultural Area” (iKapa et al, May 2013);
• The Cape Town City SDF (CSDF, 2012) and the Urban Edge definitions relevant to the PHA; • The provisions made in Section 53 of LUPA that have positive implications for the level of
“protection” that could be afforded the current zoning of agricultural land in the PHA. • Relevant Town Planning and Zoning Regulations to the PHA including the: Divisional Council of the
Cape Town Planning Regulations (1973; as amended); the Cape Town Zoning Scheme (2012) and Cape Town Development Management Scheme (DMS) (2015). The DMS provides for local protection of an “agricultural area of significant value” such as the PHA over and above the urban edge through the application of an overlay zone for specific management mechanisms, including: o Urban Edge Overlay Zone: providing for management of the urban edge to achieve sensitive
transition between urban, rural and conservation areas; o Environmental Management Overlay Zone: providing for the management of special natural
and environmental characteristics of an area; and o Local Area Overlay Zone: providing for specific local development rules.
• The National Heritage Act (1999); • The National Environmental Management Act (1998) and the the NEMA: Waste Act (2008); and • The National Water Act (1998).
Alignment of the Protection of the PHA with CCT and WCG Spatial Development Plans City of Cape Town The protection of the PHA for horticultural and sand mining purposes is consistent with the spatial development plans of the CCT and the WCG. As stated earlier in this report the PHA is included in the
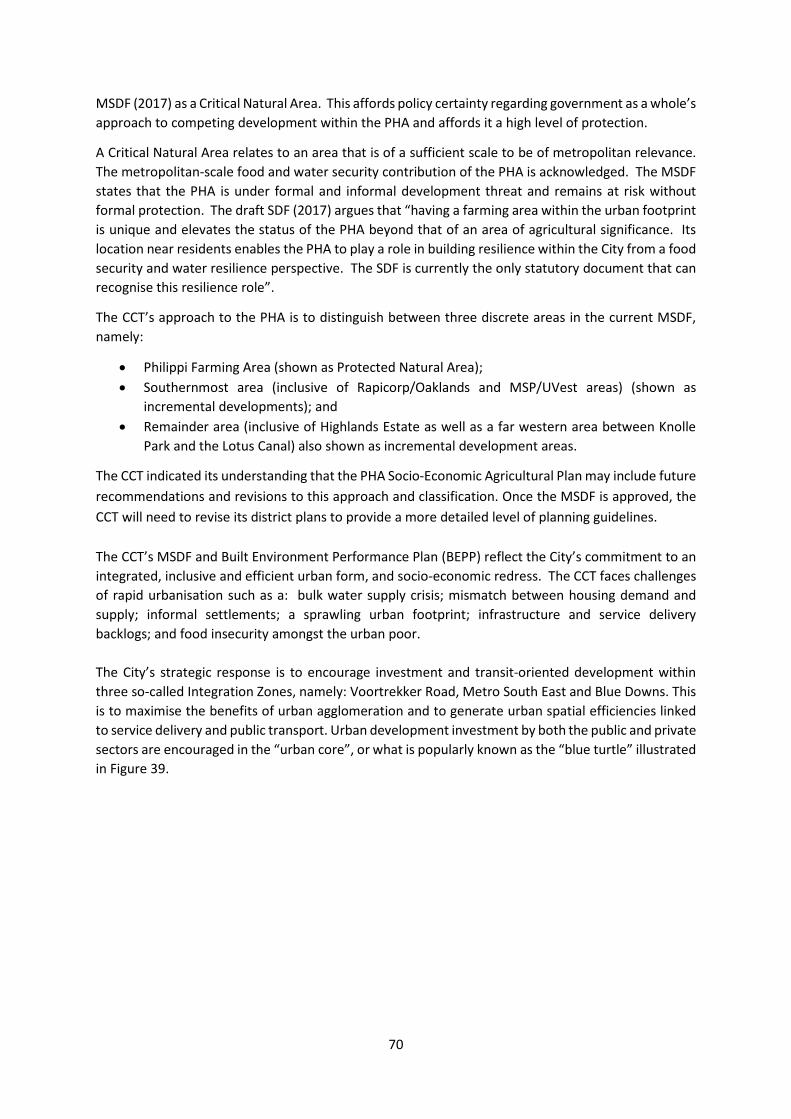
70
MSDF (2017) as a Critical Natural Area. This affords policy certainty regarding government as a whole’s approach to competing development within the PHA and affords it a high level of protection.
A Critical Natural Area relates to an area that is of a sufficient scale to be of metropolitan relevance. The metropolitan-scale food and water security contribution of the PHA is acknowledged. The MSDF states that the PHA is under formal and informal development threat and remains at risk without formal protection. The draft SDF (2017) argues that “having a farming area within the urban footprint is unique and elevates the status of the PHA beyond that of an area of agricultural significance. Its location near residents enables the PHA to play a role in building resilience within the City from a food security and water resilience perspective. The SDF is currently the only statutory document that can recognise this resilience role”.
The CCT’s approach to the PHA is to distinguish between three discrete areas in the current MSDF, namely:
• Philippi Farming Area (shown as Protected Natural Area); • Southernmost area (inclusive of Rapicorp/Oaklands and MSP/UVest areas) (shown as
incremental developments); and • Remainder area (inclusive of Highlands Estate as well as a far western area between Knolle
Park and the Lotus Canal) also shown as incremental development areas.
The CCT indicated its understanding that the PHA Socio-Economic Agricultural Plan may include future recommendations and revisions to this approach and classification. Once the MSDF is approved, the CCT will need to revise its district plans to provide a more detailed level of planning guidelines. The CCT’s MSDF and Built Environment Performance Plan (BEPP) reflect the City’s commitment to an integrated, inclusive and efficient urban form, and socio-economic redress. The CCT faces challenges of rapid urbanisation such as a: bulk water supply crisis; mismatch between housing demand and supply; informal settlements; a sprawling urban footprint; infrastructure and service delivery backlogs; and food insecurity amongst the urban poor. The City’s strategic response is to encourage investment and transit-oriented development within three so-called Integration Zones, namely: Voortrekker Road, Metro South East and Blue Downs. This is to maximise the benefits of urban agglomeration and to generate urban spatial efficiencies linked to service delivery and public transport. Urban development investment by both the public and private sectors are encouraged in the “urban core”, or what is popularly known as the “blue turtle” illustrated in Figure 39.
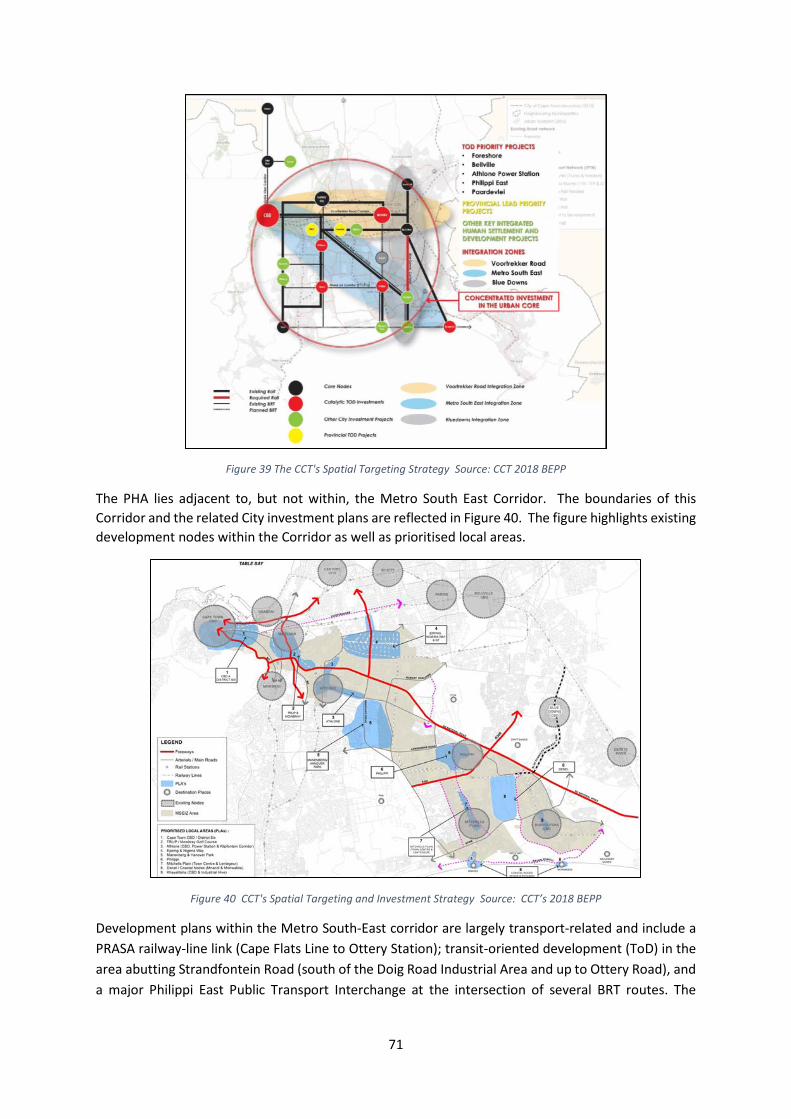
71
Figure 39 The CCT's Spatial Targeting Strategy Source: CCT 2018 BEPP
The PHA lies adjacent to, but not within, the Metro South East Corridor. The boundaries of this Corridor and the related City investment plans are reflected in Figure 40. The figure highlights existing development nodes within the Corridor as well as prioritised local areas.
Figure 40 CCT's Spatial Targeting and Investment Strategy Source: CCT’s 2018 BEPP
Development plans within the Metro South-East corridor are largely transport-related and include a PRASA railway-line link (Cape Flats Line to Ottery Station); transit-oriented development (ToD) in the area abutting Strandfontein Road (south of the Doig Road Industrial Area and up to Ottery Road), and a major Philippi East Public Transport Interchange at the intersection of several BRT routes. The
72
corridor accommodates five industrial zones – Airport Industria, Athlone Industrial, Epping Industrial, Philippi East and Philippi North industrial. (City of Cape Town, 2016) Figure 41 details the Blue Downs Corridor that will be managed as the Metro Central Partnership, with the Economic Development Partnership (EDP) playing a facilitative role. The boundaries of the Metro Central Partnership currently exclude the PHA but include Philippi East. The boundary delineation of the partnership is still under discussion. The Swartklip site (Number 28 in Figure 41) is the linkage between the Metro South East and the Blue Downs Corridor. The Blue Downs Corridor is driven largely through public transport interchange projects, with the Nolungile station and the aerotropolis developments being the major ones. Given its significance for the PHA, the latter will be discussed in detail below.
Figure 41 Blue Downs Corridor Developments
Aerotropolis Together with the City and province, the Airports Company of South Africa (ACSA) is driving a major initiative to set up an aerotropolis linked to the expansion of the Cape Town International Airport as part of the Metro Central Partnership. (AECOM, 2016)
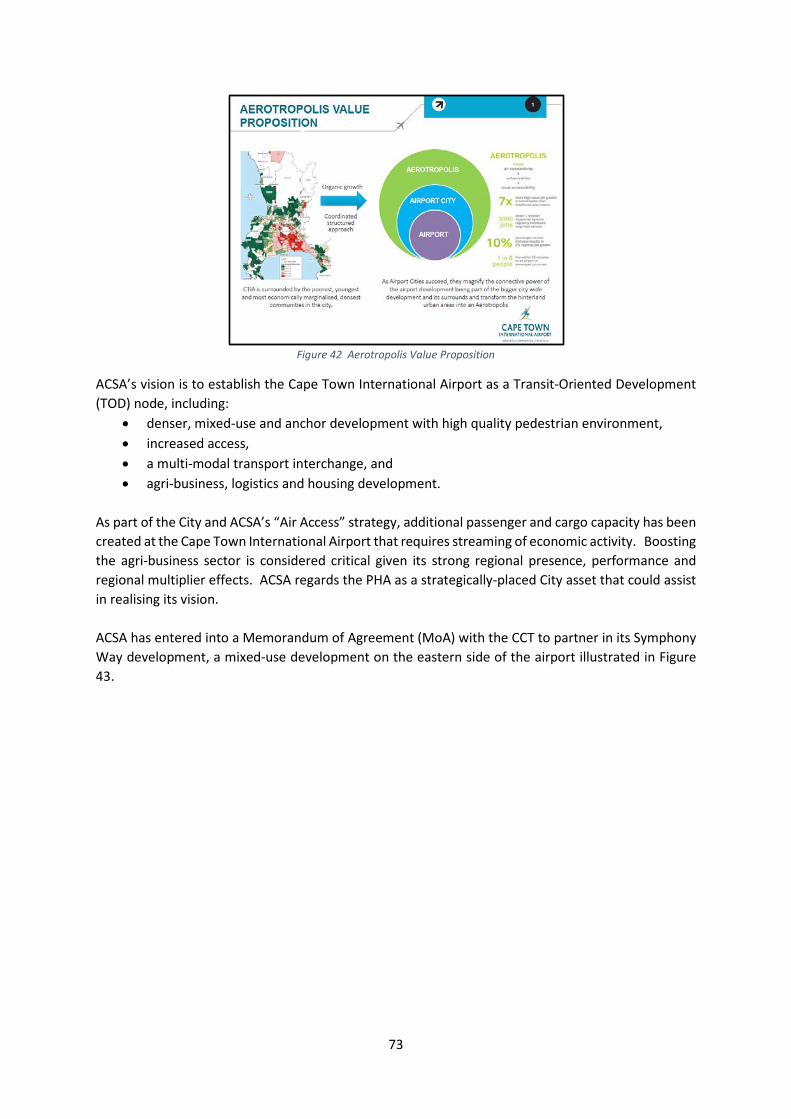
73
Figure 42 Aerotropolis Value Proposition
ACSA’s vision is to establish the Cape Town International Airport as a Transit-Oriented Development (TOD) node, including:
• denser, mixed-use and anchor development with high quality pedestrian environment, • increased access, • a multi-modal transport interchange, and • agri-business, logistics and housing development.
As part of the City and ACSA’s “Air Access” strategy, additional passenger and cargo capacity has been created at the Cape Town International Airport that requires streaming of economic activity. Boosting the agri-business sector is considered critical given its strong regional presence, performance and regional multiplier effects. ACSA regards the PHA as a strategically-placed City asset that could assist in realising its vision. ACSA has entered into a Memorandum of Agreement (MoA) with the CCT to partner in its Symphony Way development, a mixed-use development on the eastern side of the airport illustrated in Figure 43.
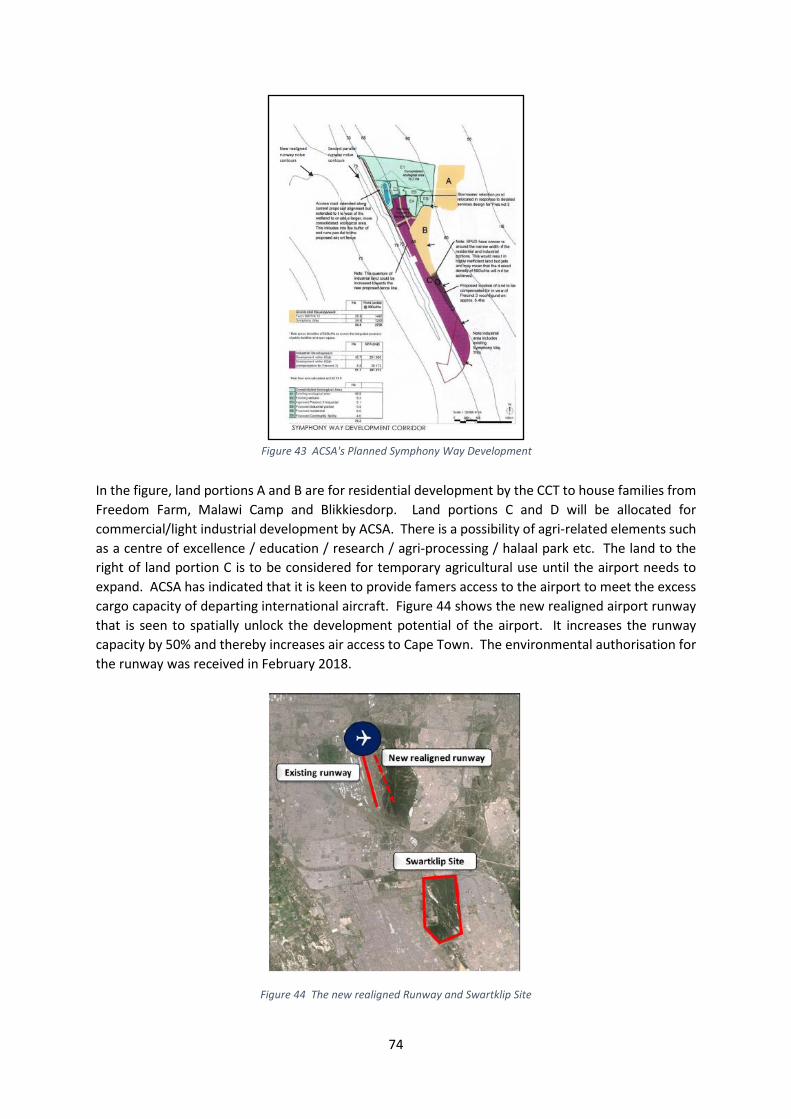
74
In the figure, land portions A and B are for residential development by the CCT to house families from Freedom Farm, Malawi Camp and Blikkiesdorp. Land portions C and D will be allocated for commercial/light industrial development by ACSA. There is a possibility of agri-related elements such as a centre of excellence / education / research / agri-processing / halaal park etc. The land to the right of land portion C is to be considered for temporary agricultural use until the airport needs to expand. ACSA has indicated that it is keen to provide famers access to the airport to meet the excess cargo capacity of departing international aircraft. Figure 44 shows the new realigned airport runway that is seen to spatially unlock the development potential of the airport. It increases the runway capacity by 50% and thereby increases air access to Cape Town. The environmental authorisation for the runway was received in February 2018.
Figure 44 The new realigned Runway and Swartklip Site
Figure 43 ACSA's Planned Symphony Way Development
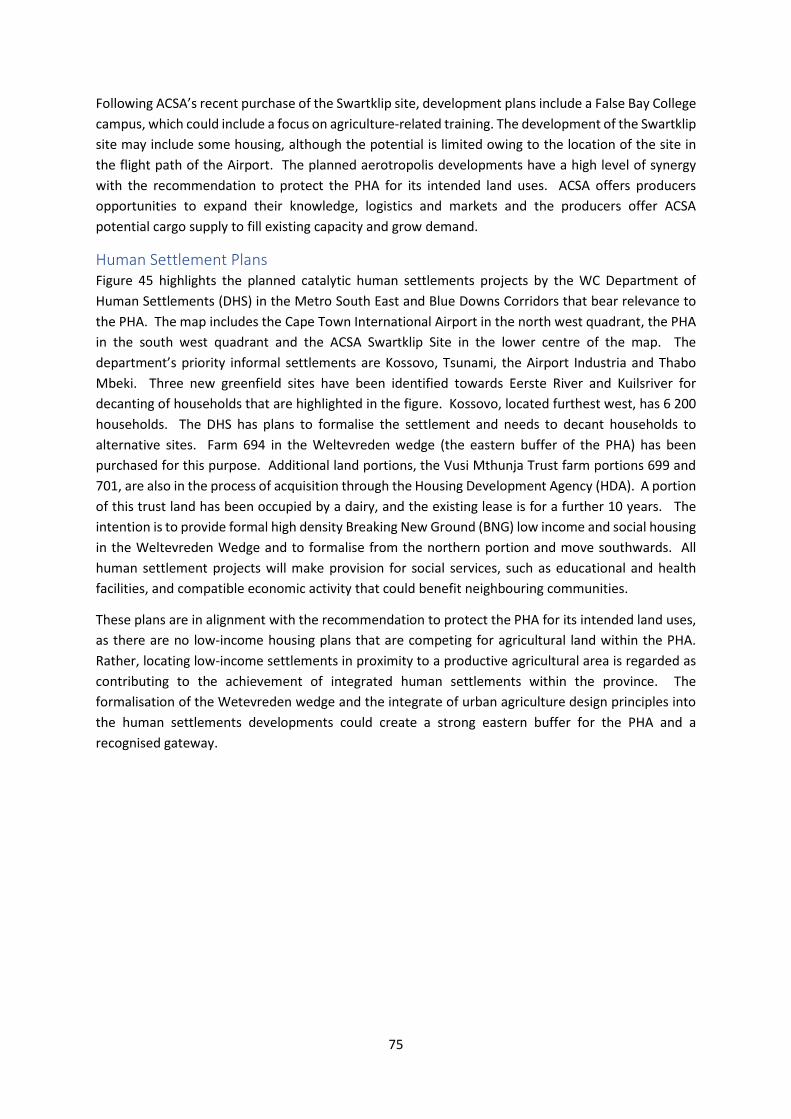
75
Following ACSA’s recent purchase of the Swartklip site, development plans include a False Bay College campus, which could include a focus on agriculture-related training. The development of the Swartklip site may include some housing, although the potential is limited owing to the location of the site in the flight path of the Airport. The planned aerotropolis developments have a high level of synergy with the recommendation to protect the PHA for its intended land uses. ACSA offers producers opportunities to expand their knowledge, logistics and markets and the producers offer ACSA potential cargo supply to fill existing capacity and grow demand.
Human Settlement Plans Figure 45 highlights the planned catalytic human settlements projects by the WC Department of Human Settlements (DHS) in the Metro South East and Blue Downs Corridors that bear relevance to the PHA. The map includes the Cape Town International Airport in the north west quadrant, the PHA in the south west quadrant and the ACSA Swartklip Site in the lower centre of the map. The department’s priority informal settlements are Kossovo, Tsunami, the Airport Industria and Thabo Mbeki. Three new greenfield sites have been identified towards Eerste River and Kuilsriver for decanting of households that are highlighted in the figure. Kossovo, located furthest west, has 6 200 households. The DHS has plans to formalise the settlement and needs to decant households to alternative sites. Farm 694 in the Weltevreden wedge (the eastern buffer of the PHA) has been purchased for this purpose. Additional land portions, the Vusi Mthunja Trust farm portions 699 and 701, are also in the process of acquisition through the Housing Development Agency (HDA). A portion of this trust land has been occupied by a dairy, and the existing lease is for a further 10 years. The intention is to provide formal high density Breaking New Ground (BNG) low income and social housing in the Weltevreden Wedge and to formalise from the northern portion and move southwards. All human settlement projects will make provision for social services, such as educational and health facilities, and compatible economic activity that could benefit neighbouring communities.
These plans are in alignment with the recommendation to protect the PHA for its intended land uses, as there are no low-income housing plans that are competing for agricultural land within the PHA. Rather, locating low-income settlements in proximity to a productive agricultural area is regarded as contributing to the achievement of integrated human settlements within the province. The formalisation of the Wetevreden wedge and the integrate of urban agriculture design principles into the human settlements developments could create a strong eastern buffer for the PHA and a recognised gateway.
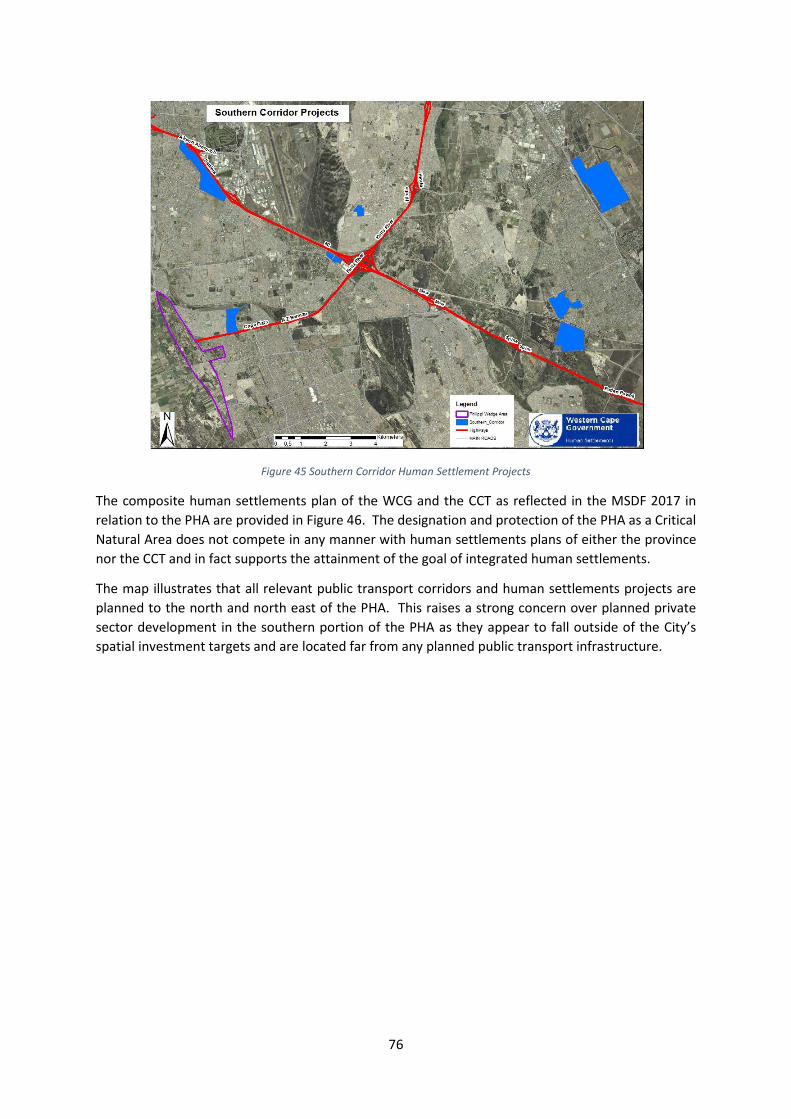
76
Figure 45 Southern Corridor Human Settlement Projects
The composite human settlements plan of the WCG and the CCT as reflected in the MSDF 2017 in relation to the PHA are provided in Figure 46. The designation and protection of the PHA as a Critical Natural Area does not compete in any manner with human settlements plans of either the province nor the CCT and in fact supports the attainment of the goal of integrated human settlements.
The map illustrates that all relevant public transport corridors and human settlements projects are planned to the north and north east of the PHA. This raises a strong concern over planned private sector development in the southern portion of the PHA as they appear to fall outside of the City’s spatial investment targets and are located far from any planned public transport infrastructure.
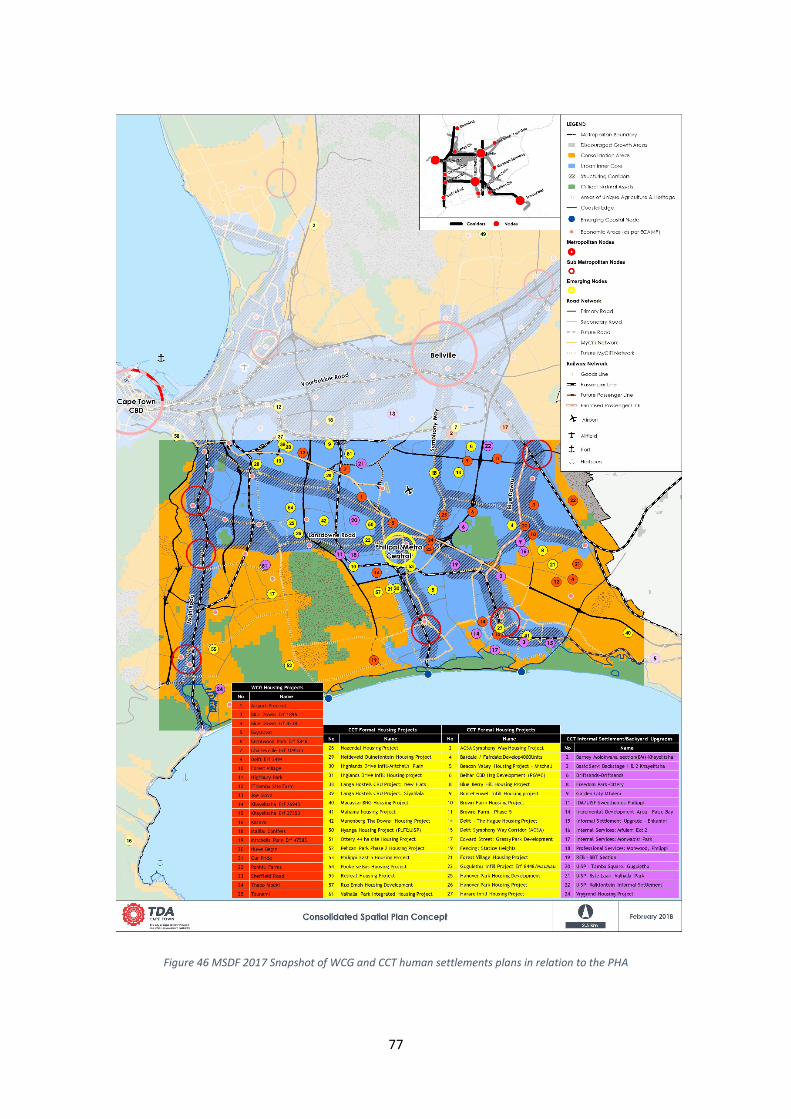
77
Figure 46 MSDF 2017 Snapshot of WCG and CCT human settlements plans in relation to the PHA
78
Emerging PHA Scenarios Despite these risks it was apparent during the research that four scenarios were emerging, namely:
1. Grave the PHA: allow the status quo to continue 2. Pave the PHA: PHA not protected and urban encroachment continues 3. Save the PHA: Protect the PHA and reincorporate the South West Quadrant into the Core
PHA 4. Stave the PHA: Protect the PHA but lose the southern portion of the PHA to non-agricultural
development
The pave and save the PHA scenarios will be a result of deliberate decisions and actions, whereas the other two through the failure to make decisions and inaction. These scenarios are briefly described in Table 9. Each scenario is tested against the following key variables:
• Policy certainty • Protection of the Cape Flats Aquifer • Addressing the needs of informal settlement dwellers in the PHA and its buffers • Social cohesion and community safety • Food security • Climate change resilience
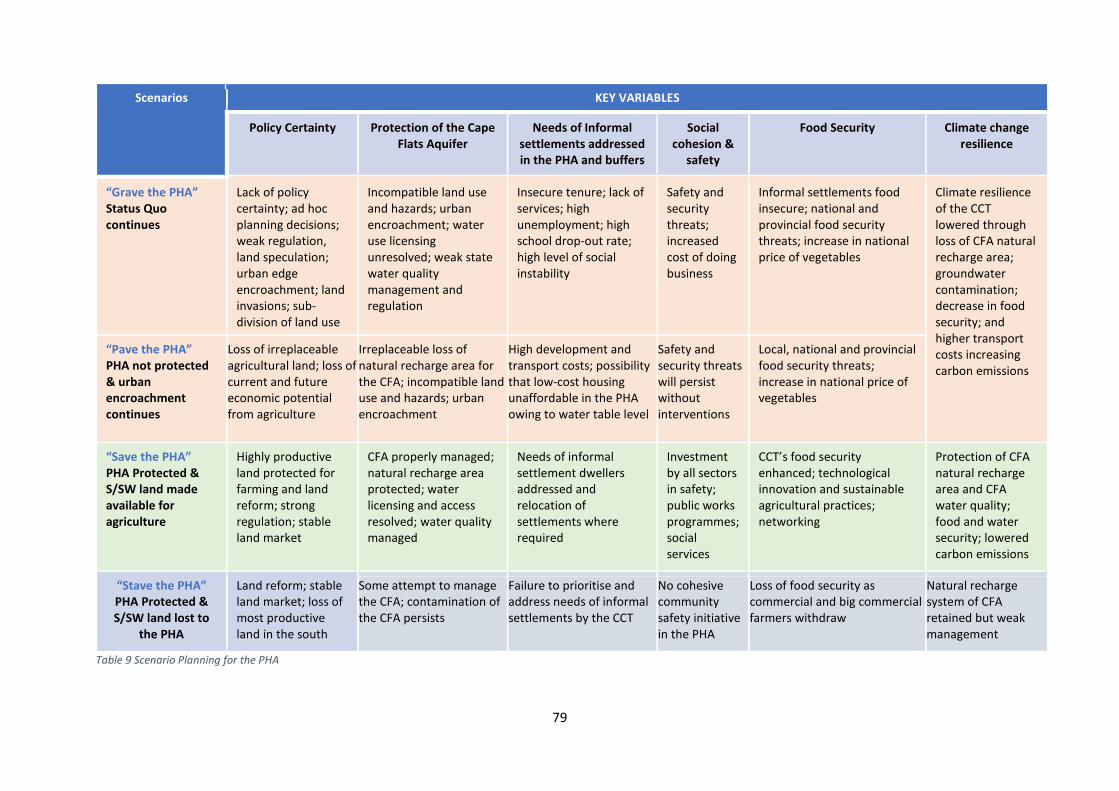
79
Table 9 Scenario Planning for the PHA
Scenarios KEY VARIABLES
Policy Certainty Protection of the Cape Flats Aquifer
Needs of Informal settlements addressed in the PHA and buffers
Social cohesion &
safety
Food Security Climate change resilience
“Grave the PHA” Status Quo continues
Lack of policy certainty; ad hoc planning decisions; weak regulation, land speculation; urban edge encroachment; land invasions; sub-division of land use
Incompatible land use and hazards; urban encroachment; water use licensing unresolved; weak state water quality management and regulation
Insecure tenure; lack of services; high unemployment; high school drop-out rate; high level of social instability
Safety and security threats; increased cost of doing business
Informal settlements food insecure; national and provincial food security threats; increase in national price of vegetables
Climate resilience of the CCT lowered through loss of CFA natural recharge area; groundwater contamination; decrease in food security; and higher transport costs increasing carbon emissions
“Pave the PHA” PHA not protected & urban encroachment continues
Loss of irreplaceable agricultural land; loss of current and future economic potential from agriculture
Irreplaceable loss of natural recharge area for the CFA; incompatible land use and hazards; urban encroachment
High development and transport costs; possibility that low-cost housing unaffordable in the PHA owing to water table level
Safety and security threats will persist without interventions
Local, national and provincial food security threats; increase in national price of vegetables
“Save the PHA” PHA Protected & S/SW land made available for agriculture
Highly productive land protected for farming and land reform; strong regulation; stable land market
CFA properly managed; natural recharge area protected; water licensing and access resolved; water quality managed
Needs of informal settlement dwellers addressed and relocation of settlements where required
Investment by all sectors in safety; public works programmes; social services
CCT’s food security enhanced; technological innovation and sustainable agricultural practices; networking
Protection of CFA natural recharge area and CFA water quality; food and water security; lowered carbon emissions
“Stave the PHA” PHA Protected & S/SW land lost to
the PHA
Land reform; stable land market; loss of most productive land in the south
Some attempt to manage the CFA; contamination of the CFA persists
Failure to prioritise and address needs of informal settlements by the CCT
No cohesive community safety initiative in the PHA
Loss of food security as commercial and big commercial farmers withdraw
Natural recharge system of CFA retained but weak management
80
Preferred Scenario: Save the PHA Based on the research conducted by the Indego team, it is unequivocally recommended that the “Save the PHA” scenario is pursued. This scenario is driven by both an acknowledgement of the indisputable value of the PHA to the City of Cape Town, the province and South Africa; and a vision for the further potential of this land. This vision is captured in Figure 47.
The PHA Socio Economic Agricultural Plan Vision The vision is for a PHA that is protected, productive, sustainable, inclusive, safe and secure for all who work, live, invest and visit there. This would be achieved by farmers, farm workers, suppliers, markets, adjacent communities and the public sector actively collaborating to protect the PHA for horticulture and driving agrarian reform and compatible economic activity. Sustainable economic growth will be supported through expanded market linkages, technology, support to informal vegetable traders and agro-tourism related activity such as urban farm tours, good eating and vegetable growing courses, food stalls and markets, hiking and cycling. The human settlement needs of farm workers and informal settlement dwellers must be addressed and incorporate urban farming design. Ethical business practices and sound labour relations must be encouraged. Greater productivity and linkages to the envisaged aerotropolis and its services, logistics and markets must be facilitated to increase the contribution of the PHA to regional economic competitiveness. The agricultural land value will increase as it will be a production area of choice. The value of the PHA and the need for its protection will be understood and appreciated by everyone.
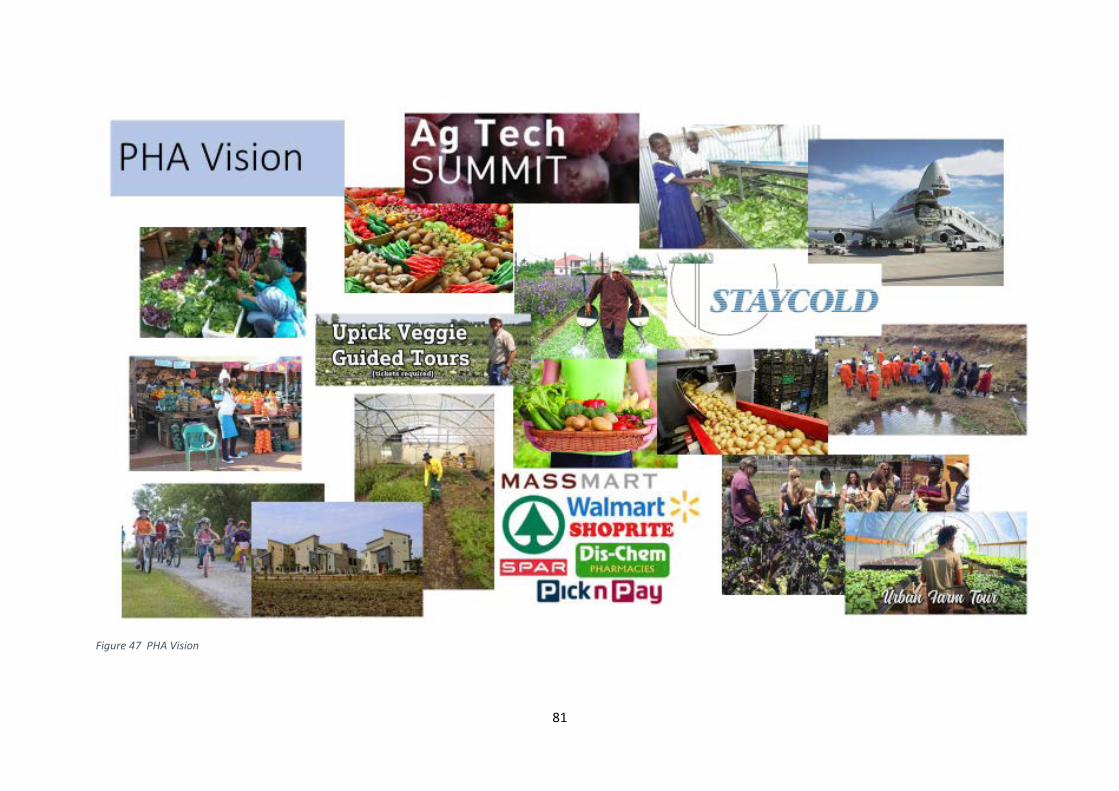
81
Figure 47 PHA Vision
82
Objectives To achieve this vision, the key objectives are stated below in order of priority:
1. To stabilise the PHA through: a. Providing policy and planning certainty regarding the future of the core PHA and its
buffers through using available legal and policy instruments; b. Addressing the safety and security concerns of the farmers, farm workers and
informal settlement dwellers of the PHA; c. Strengthening the land-use and environmental regulation of the PHA; d. Securing the CFA underlying the PHA through the establishment and management of
CFA protection zones around the PHA; and e. Setting up a PHA precinct management structure
2. To consolidate the PHA through: a. Implementing a comprehensive agrarian reform programme in the PHA, that
includes proactive land acquisition, a comprehensive farmer support programme, and the adoption of sustainable farming practices;
b. Ensure the proper management of the CFA; c. Prioritising and addressing the needs of informal settlement dwellers within the PHA
and its buffers; d. Formalising human settlements within the PHA buffers and encouraging
complementary urban agriculture design principles; e. Encouraging complementary economic activity within the PHA and its buffers, such
as addressing the needs of informal vegetable traders, stimulating agro-tourism and processing and promoting public works opportunities; and
f. Facilitate strategic linkages to broader initiatives within the Metro Central Partnership, such as to the aerotropolis, the WCG Air Access project and broader agro-processing initiatives.
3. To grow the PHA through: a. Destination and product branding; b. Further product and technological development, market access and expansion.
Whilst the objectives imply a phased approach to the achievement of the vision for the PHA, it must be understood that the stabilisation actions continue through the consolidation and growth phase and the consolidation actions continue into the growth phase. The phases will be discussed in detail as follows:
• Phase 1: Stabilisation • Phase 2: Consolidation • Phase 3: Growth
Project Phases Phase 1: Stabilisation (Year One) Phase 1 should be implemented over a period of one year and will consist of 6 priority actions, namely:
1. Provide policy certainty regarding land uses and the protection of the PHA and its underground water resource through the adoption of the MSDF by the CCT Council and a Cabinet decision that is jointly communicated to stakeholders.
83
2. Provide planning certainty for the PHA through the clear designation of the core horticultural land and the buffer zones and affording clarity regarding the R300 extension.
3. Develop and implement a PHA community safety plan in consultation with all relevant stakeholders.
4. Undertake proactive land and environmental management and regulation within the PHA. 5. Implement the CFA Management Strategy and establish and manage CFA protection zones
around the PHA; and 6. Set up a PHA precinct management Structure.
The provision of policy and planning certainty and the protection of the PHA and its underground water resource are of the highest priority to secure the PHA. The main objective is to secure endorsement and recognition of a minimum core functional horticultural area that must be subject to statutory protection against further non-agricultural land use intrusions or excisions. The mechanisms through which this will be achieved are the identification of:
1. Proposed Spatial Components of the PHA; and
2. Key Spatial Elements, the development and/or preservation of which are essential to the future sustainable and efficient functioning of the PHA as an Agricultural Area of Significance.
Spatial Components The following proposed Spatial Components of the PHA are based on a consideration of (i) current land uses in the study area as well as identified land use trends and issues; and (ii) legal and policy informants. They are mapped in Figure 48:
1. A Core Functional Horticultural Area comprising a total area of some 2,174.69 ha in extent where the prescribed preferred land use outcomes will be reinforced as sand mining and horticulture, being made up of:
a. The current remaining “Central” Horticultural Area (Area 1) plus
b. The proposed reintegration of the area identified as the South-Western Quadrant (Area 2 on the map below) plus
c. Planning confirmation that the proposed R300 extension is no longer under consideration.
2. Buffer/Support Land Use Areas where hard edges (predominantly roads) define the limits of these areas, where a mix of land uses is envisaged. These Buffers Areas are identified as being:
a. The Schaapkraal Urban and Smallholding Area Buffer (Area 3), located to the west of the Core PHA;
b. The Lansdowne Industrial-Lotus River Canal Buffer Area (Area 4), located to the north of the proposed Sheffield Road alignment;
c. The Weltevreden Road “Wedge” Buffer Area (Area 5), located to the east of the Core PHA, between Weltevreden Road and Jakes Gerwel Drive; and
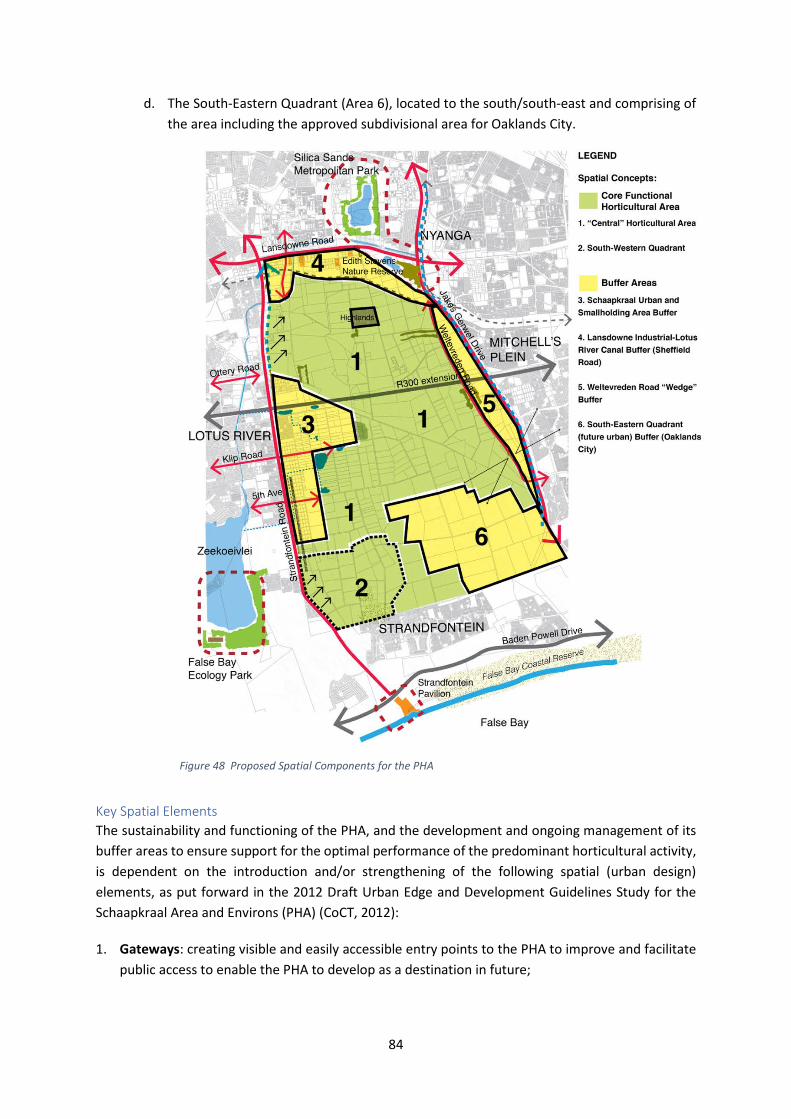
84
Figure 48 Proposed Spatial Components for the PHA
d. The South-Eastern Quadrant (Area 6), located to the south/south-east and comprising of the area including the approved subdivisional area for Oaklands City.
Key Spatial Elements The sustainability and functioning of the PHA, and the development and ongoing management of its buffer areas to ensure support for the optimal performance of the predominant horticultural activity, is dependent on the introduction and/or strengthening of the following spatial (urban design) elements, as put forward in the 2012 Draft Urban Edge and Development Guidelines Study for the Schaapkraal Area and Environs (PHA) (CoCT, 2012):
1. Gateways: creating visible and easily accessible entry points to the PHA to improve and facilitate public access to enable the PHA to develop as a destination in future;
85
2. Movement Linkages: focusing on developing appropriate links to reintegrate the PHA with its surrounding Buffer Areas and to redefine and reinforce the respective functional roles of these areas in relation to each other;
3. Developing or Improving Complementary Facility and Resource Linkages: developing pathways to link higher order metropolitan environmental and recreation facilities/resources, several of which are currently underutilized, through the PHA and Schaapkraal could reinforce the study area as a metro-scale eco-environmental and recreational destination;
4. District and Metro-scale Agri-Sector Linkages: strengthening existing, and developing new linkages to regional and metro-wide agri-production, processing, packaging, marketing and distribution destinations, hubs and platforms; and
5. Urban Horticulture Edges: to effectively limit urban transformation and non-agricultural land uses within the horticultural area and optimise the role of the Buffer Areas in securing the horticultural area, clear transitions and edges between the urban areas and horticultural activities are required. To be effective, such edges must not only clearly define the boundary, but reflect a strong defensible space/element, including a major roadway, canal, non-motorised transport route, or dominant land use (e.g. school, sporting facility or protected natural area such as a Critical Biodiversity Area [CBA]) etc.
Land Use within the Spatial Components The effective and sustainable implementation of the PHA Plan requires the support and maintenance of a range of land uses to ensure economic diversity within the Core Horticultural Area and the effective functioning of the Buffer Support Areas.
Accordingly, the following is proposed:
1. The Core Functional Horticultural Area be retained under the CoCT Development Management Scheme’s (DMS MPB-L:2015) Agricultural Zoning which “promotes and protects agriculture on farms as an important economic, environmental and cultural resource. Limited provision is made for non-agricultural uses to provide owners with an opportunity to increase the economic potential of their properties, without causing a significant negative impact on the primary agricultural resource”. In addition, Overlay Zonings should be made applicable to give effect to the PHA’s status as an Agricultural Area of Significance and a Heritage Resource area. The Subdivision of Agricultural Land Act, No 70 of 1970 and the Preservation and Development of Agricultural Land Bill are also relevant.
2. The Buffer Areas being zoned to permit uses that are identified as being supportive of the Core Functional Horticultural Area, including business, residential, community facilities (e.g. guesthouses, B&B’s, farm-stays, agri-and enviro-education facilities), home industry (e.g. vegetable preserving, pickling and processing), and non-noxious light and general industry (e.g. vegetable packaging, processing and agri-requisite suppliers).
Application and Enforcement of Other Relevant Legislation In addition to the above, the sustainable use of agricultural and natural resources within both the Core Functional Horticultural Area and its Buffer Areas requires the strict application of:
86
• the Regulations made in terms of the National Environmental Management Act (NEMA, Act 107 of 1998, as amended) when listed activities are triggered requiring environmental authorisation (i.e. for existing and proposed activities);
• the NEMA Waste Act (Act 59 of 2008) with regard to preventing the contamination or potential contamination of land, control of emergency incidents leading to pollution and remediation of contaminated land (e.g. building rubble sites); and
• the National Water Act (Act 36 of 1998) regarding verification of water rights, requirement for Water Use Licences, and the control and management of waste water quality and discharge, etc.
In the above regard, it is crucial that the rigorous application of the NEMA Regulations and the CCT DMS are in line with the applicable zoning of land parcels, and the policing of permitted land uses and development rules pertaining to such zoning categories, be carried out on a sustained basis by the CCT and/or any other agency so authorized in terms of assigned functional competencies and responsibilities for environmental and/or land use and land development management.
Natural Resource Management Due to the large abstraction volume from the CFA in the PHA area it is recommended that:
• A protection zone is established around the PHA to restrict urban edge encroachment and protect ecosystem functioning of the aquifer (recharge, reduced contamination). Resource Quality Objectives (RQO’s) should provide guidelines as to what activities can be practised in the protection/buffer zones to reduce threats of pollution. This is vitally important as the CFA is a critical water source for the City of Cape Town.
• All water-related activities and decisions in the PHA should be aligned to the Cape Flats Aquifer Management Strategy (DWS, 2015).
Community Safety Plan Given the significant impact of theft and vandalism on the economic performance of the PHA, the financial viability and profitability of farmers, and the health and safety of the PHA community – farmers, farm workers and informal settlement dwellers – there is a need to urgently develop and implement a Community Safety Plan. This requires contributions from and co-ordination amongst the community, farmers, CCT, DCS and SAPS. The plan should include a range of elements such as:
• The strengthening of Neighbourhood Watch structures; • The training of auxiliary volunteers; • Introduction of surveillance technologies, such as CCTV cameras and drones; • Youth safety development programme (e.g. through the DCS and Chrysalis Academy) • A rent-a-cop programme; and • Effective community policing.
The intention would be to build partnerships with the farmers to more effectively utilise available private spend on security within the PHA and to mobilise further private spend through collaboration with other value chain participants.
87
Setting up a PHA Precinct Management Structure The unique nature of the PHA requires effective urban precinct management by the CCT. The CCT uses several mechanisms to promote improved precinct (i.e. a localised area designated for a specific use) management within priority areas (Built Environment Performance Plan 2017 18 Final, 2017):
• Special Rating Areas (SRAs) incorporating City Improvement Districts (CIDs) have been implemented in many metropolitan and sub-metropolitan nodes and industrial areas, such as: Airport, Athlone, Blackheath, Muizenberg, Parow Industria, and Zeekoeivlei Peninsula. The purposes of CIDs are to (Town, City Improvement District By-Law, 2003):
o Enhance and supplement the municipal services provided by the City of Cape Town; o Facilitate investment; o Facilitate a co-operative approach between the City and the private sector in the
provision of municipal services; o Halt the degeneration and facilitate the upliftment of distressed business and mixed-
use areas; and o Promote economic growth and sustainable development and in this way assist the
Council in the fulfilment of its objects and developmental duties as set out in sections 152 and 153 of the Constitution.
The establishment of a CID requires written confirmation from owners of rateable properties within the boundaries of the proposed CID who together own not fewer than 25% in number of such properties and not less than 25% of the rates base value of such properties. A CID plan will be developed to be implemented by the CID management body. Owners of rateable property and tenants within the boundaries of the CID are entitled to be members of the management body. Where a CID has been established, the Council will levy in accordance with the provisions of relevant legislation, a property rate in addition to the rates that it already charges on the owners of rateable property in the CID for the purposes of the CID.
• In the City’s metropolitan nodes (Cape Town and Bellville CBDs) the SRAs/CID initiatives have been complemented by the City entering into partnerships with the private sector to promote investment and investment retention in these nodes, namely the Greater Tygerberg Partnership and the Cape Town Partnership.
• The Mayoral Urban Regeneration Programme (MURP) has identified some declining CBD’s, town centres and community nodes where Area Coordinating Task Teams (ACTTs) have been established. MURP areas include: Athlone CBD; Bellville Transport Interchange and Voortrekker Road Corridor; Bishop Lavis; Macassar; Manenberg; Hanover Park and Mitchells Plain town centre. Under the leadership of the relevant sub-councils, the ACTTs include all relevant Council line departments as well as other stakeholders and local community representatives. They employ short term urban management solutions and oversee the development of a more comprehensive community action planning process that draws from the best practices developed under the Violence Prevention through Urban Upgrading (VPUU) Programme. The above is premised on a strong social crime prevention approach. Work is progressing towards the realisation of a community policing programme and integrated neighbourhood safety programme based on the work piloted by MURP in areas presently suffering from gang activity. In addition to resources available via the MURP playing a catalytic
88
or “unblocking” role around minor urban management issues that struggle to receive attention, Integrated City Development Grant (ICDG) allocations have invested in supportive urban management infrastructure such as CCTV installations and improvement in public spaces.
The City has recently piloted a conceptual framework for business precinct management in Wynberg, Philippi and Mitchells Plain. All three pilots were in public transport nodes, but the key success factors identified are applicable to any precinct management structure. These include:
• A dedicated entity or function that has overall Business Precinct Management responsibility is required;
• An adequate budget allocation for the provision of specified services should be available; • The ability to generate private sector participation or partnerships should be in place; • Overall there should be meaningful local participation from all levels of the business spectrum; • The management and co-ordination of multi-stakeholder participation would be a
prerequisite; • The management responsibilities and functions should be exercised on the basis of a detailed
specification of Business Precinct Management responsibilities in respect of basic services delivery and any add-on support services. This may imply distinguishing between infrastructure provision responsibilities and management services;
• There is a need for clarity on the Business Precinct Management concept within the City environment requiring consensus between all relevant City role players and Departments, coupled with a strong communication function;
• Sufficient capacity within the entity or function to support and manage specified precinct activities must be established;
• Overall a solid understanding of local market and property development considerations must be applied;
• Ability to work within all statutory requirements, particularly including land use regulation must be in place; and
• Overall ability of Business Precinct Management model to be financially sustainable within a specified ratepayers’ base and complemented by any other additional funding as may be secured in terms of budgeted expenditure requirements.
This report highlights a business precinct development continuum concept that reflects levels of maturity and the needs of the nodes. The continuum is from basic to hybrid to full precinct development. In terms of this continuum, the PHA would probably be located at the hybrid stage that is characterised by:
• A growing rates base enabling contributions for targeted improvements; and • Reasonable business cohesion (organised groupings).
The PHA will require a dedicated precinct management structure to oversee the implementation of the PHA Plan. The broad nature of the PHA Plan and the complex stakeholder context may require a more representative precinct management structure than a SRA/CID that is inclusive of broader internal and external stakeholders. This could take the form of a registered non-profit organisation. This would be established in terms of the Non-Profit Organisations Act, No. 71 of 1997.
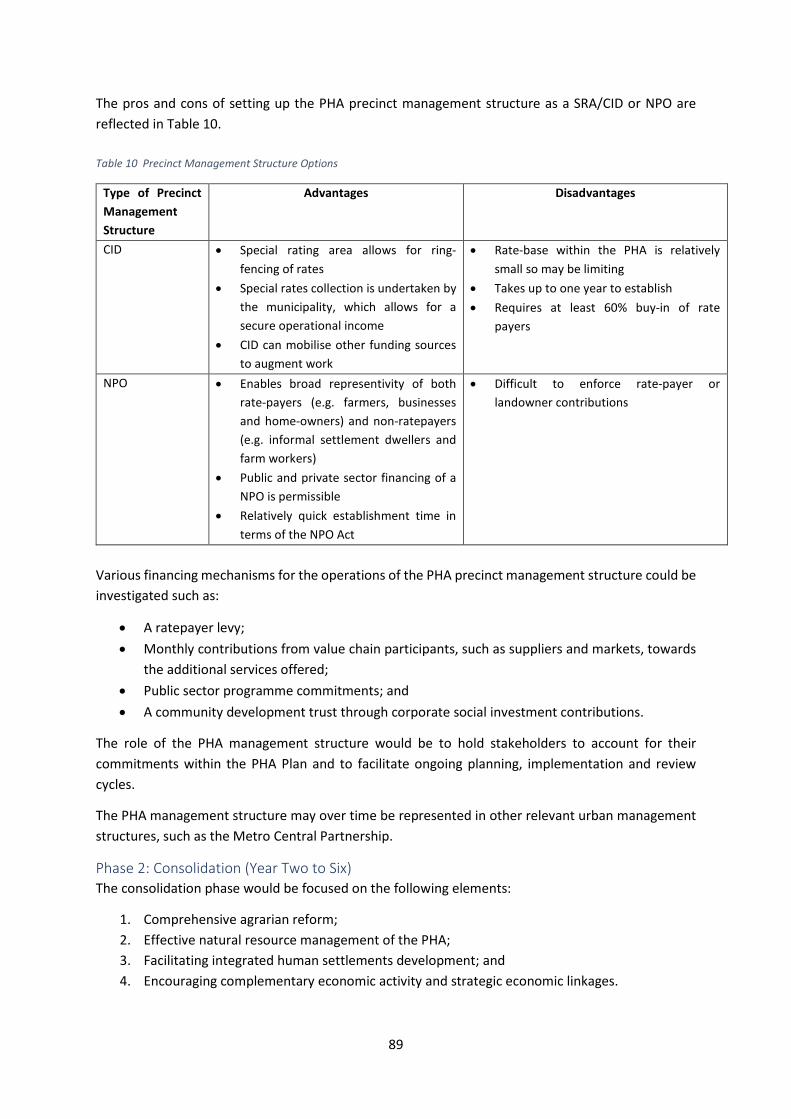
89
The pros and cons of setting up the PHA precinct management structure as a SRA/CID or NPO are reflected in Table 10. Table 10 Precinct Management Structure Options
Type of Precinct Management Structure
Advantages Disadvantages
CID • Special rating area allows for ring-fencing of rates
• Special rates collection is undertaken by the municipality, which allows for a secure operational income
• CID can mobilise other funding sources to augment work
• Rate-base within the PHA is relatively small so may be limiting
• Takes up to one year to establish • Requires at least 60% buy-in of rate
payers
NPO • Enables broad representivity of both rate-payers (e.g. farmers, businesses and home-owners) and non-ratepayers (e.g. informal settlement dwellers and farm workers)
• Public and private sector financing of a NPO is permissible
• Relatively quick establishment time in terms of the NPO Act
• Difficult to enforce rate-payer or landowner contributions
Various financing mechanisms for the operations of the PHA precinct management structure could be investigated such as:
• A ratepayer levy; • Monthly contributions from value chain participants, such as suppliers and markets, towards
the additional services offered; • Public sector programme commitments; and • A community development trust through corporate social investment contributions.
The role of the PHA management structure would be to hold stakeholders to account for their commitments within the PHA Plan and to facilitate ongoing planning, implementation and review cycles.
The PHA management structure may over time be represented in other relevant urban management structures, such as the Metro Central Partnership.
Phase 2: Consolidation (Year Two to Six) The consolidation phase would be focused on the following elements:
1. Comprehensive agrarian reform; 2. Effective natural resource management of the PHA; 3. Facilitating integrated human settlements development; and 4. Encouraging complementary economic activity and strategic economic linkages.
90
Agrarian Reform Agrarian reform will be expedited through a range of different strategies that include:
• Proactive land acquisition by the DRD&LR. • The WC DoA will roll out a farmer support programme in co-operation with input suppliers,
retailers & other market agents, farmers, Green Cape, ACSA, Elsenberg College, research institutions & relevant civil society groupings to:
o Encourage sustainable and ethical business practices throughout the PHA value-chain; o Build co-operative farmer relationships – the intention would be to work with
interested and willing commercial and shall holder farmers in encouraging co-operation regarding: market access, purchasing of inputs, human resource management, adoption of sustainable technologies and land access;
o Facilitate land availability for commercial and small holder farmers through co-operation with the DRD&LR and empowerment models;
o Investigate farmer incentives, such as reduced electricity prices and BBEEE; o Drive innovation and technology, in partnership with retailers, input suppliers,
initiatives such as Green Cape and tertiary institutions; o Facilitate market access, especially to public sector contracts through engagements
with relevant national and provincial departments, such as Social Services, Correctional Services, Education etc.;
o Provide training and an Agri-Centre of Excellence through partnerships with ACSA, tertiary institutions; the Elsenburg Agricultural Training Institute; and the PEDI Agricultural College.
Effective Natural Resource Management of the CFA The following actions are necessary:
• Groundwater usage figures should be updated by a detailed hydro-census of the PHA, so that the current situation is known and the groundwater potential of the PHA can be accurately calculated. The Berg-Olifants Proto-CMA is currently conducting a validation and verification (V&V) survey of the PHA to determine lawful existing users.
• Groundwater usage above what was determined as existing usage in 1998 should be licensed with the DWS. This requires a B-BBEE rating or a business model that shows upliftment and benefits to historically disadvantaged individuals.
• The current groundwater usage in the PHA should be managed wholistically, where farmers are advised on the best irrigation practices for crops and sustainable use of the aquifer.
• Enhanced aquifer recharge should be attained through capturing storm-water discharge and return flows within the PHA to improve the quality and quantity of the water resource. This should follow the Cape Flats Aquifer Management Strategy that highlights the importance of enhanced aquifer recharge and managed aquifer storage in the CFA (DWS, 2015).
• Once the groundwater potential of the CFA as a whole is known, it can then be developed sustainably using aquifer management strategies which try to maximise aquifer storage by balancing abstraction and recharge. Abstraction can be maximised in summer, creating more available storage for the winter rains and reducing the risk of flooding. Artificial recharge needs to be incorporated as a management tool where storm-water runoff and treated
91
effluent is artificially recharge into the aquifer, therefore increasing the groundwater potential of the aquifer.
• Detailed hydrochemical analysis of the surface water (including storm-water canals and discharged effluent from WWTW’s) and groundwater in the PHA and greater Cape Flats area is required to identify hotspots and implement methods of rehabilitating the water quality. Bioremediation, such as artificial wetlands, can be used to improve the quality of any surface water before it infiltrates into the underlying aquifer, therefore improving the quality of the natural system as a whole in the long run. Wetlands are used effectively for this purpose in the Atlantis Wellfield. Wetlands could be incorporated into the PHA area as a case study to improve the quality of water stored in their dams before it is used for irrigation.
• The alignment of sand mining policy, planning and licensing with the PHA Plan should be facilitated.
Facilitating Integrated Human Settlements development During the Consolidation Phase, the WC DHS will continue securing land within the Weltevreden wedge for a range of low-income formal housing typologies. The human settlements’ plans for the Weltevreden Wedge accommodate social services (such as schools and health facilities) and economic services that can benefit the informal settlement dwellers and farm workers in the PHA. There is the potential for the human settlements projects within this wedge to be included in a joint pilot between the WC DHS and DEDAT regarding innovative urban human settlement design. There is a strong possibility of incorporating urban food gardens into the design and improving the Weltevreden “gateway” into the PHA.
There will be a focus on addressing the needs of informal settlement dwellers in the nine informal settlements located within the broader PHA area. The CCT will need to assess the needs of the different settlements and whether some need to be relocated to alternative suitable land within the PHA buffer areas. The aim will be to ensure basic municipal and social service provision to communities within the PHA.
There is further potential to work with households in the Schaapkraal Small holdings and the Highlands Estate to regulate incompatible economic activity and promote compatible economic activity and urban design that will enhance their status as PHA buffer areas and integrate them into the broader vision for the PHA.
Encouraging complementary economic activity and strategic economic linkages. Actions will include:
• A partnership with ACSA that involves: o Setting up a Trade/ Agri Zone as part of the Symphony Way Corridor development; o Facilitating direct airside access for PHA producers for international markets; o A digital solution for efficient and direct export market access to benefit all types of
farmers; o Facilitating temporary and permanent land access for agricultural production; o Provision of farmer services and logistical support; o Establishment of an Agri Centre of Excellence that offers farming advice, skills
training, research and the facilitation of linkages to relevant educational institutions. • Support from DEDAT and WESGRO that includes:
92
o Collaboration regarding the aerotropolis regarding the proposed Agri Zone and the facilitation of PHA export links (e.g. vegetables, processed goods, flowers);
o Strengthening links for target markets via the Air Access project; and o Supporting complementary economic activity within the PHA buffer development
(e.g. informal vegetable traders). The specific needs of informal vegetable traders need to be met such as: permanent stalls, waste management, electricity supply, refrigeration and parking.
Phase 3: Growth (Year Seven and onwards) The growth phase will see the ongoing implementation and management of initiatives introduced within the Consolidation Phase. In this Phase there will be a strong focus on:
• PHA destination and product branding and marketing; • Further small business development linked to the PHA horticultural activity focused on the
promotion of: o urban farm tours, o vegetable picking, o food production & healthy eating courses, o showcasing sustainable agricultural practices, o farmer markets, o PHA events;
• The development of a tourism activity cluster that links the PHA to Cape Flats tourism attractions in townships (e.g. Langa’s Gugu S’Thebe Centre and Quarter Cultural Precinct and the Gugulethu 7 Memorial) and natural areas (e.g. Swartklip site, False Bay coast, Varkensvlei Forest Reserve, and the Edith Stephan Wetland Nature Park as part of the Cape Flats Nature Reserve).
• Further agricultural product and technological development, market access and expansion.
“Whole of Society” Approach A “Whole of Society” approach is necessary to achieve the vision and objectives, which means mobilising commitments and resources from the:
o City of Cape Town; o Relevant Provincial Government departments including the: Premier’s Office, DoA, DEADP,
Transport, DCS, Treasury, Local Government, DCAS, DHS, social sector departments and DEDAT;
o National departments including the: DWS, DRD&LR, DAFF, DECOG (including the National Disaster Management Centre) and DMR.
o The Private Sector and Civil Society. The contributions of these sectors will be through: o Supplier development programmes; o Promotion of BBBEE; o Job Creation; o Knowledge Sharing; o Technology transfer; o Promotion of sustainable agricultural practices; o Branding and marketing; o Regulation (e.g. food, soil and water quality); o Corporate Social Investment; and
93
o Research and innovation.
The commitments of all stakeholders will be reflected in a detailed Work Plan that will be implemented through the proposed PHA Precinct Management Structure. Proposed public sector commitments are reflected in the work-plan included in the PHA Plan thus far. The intention would be to expand the commitments contained in the Work-Plan through follow-up stakeholder engagements.
PHA Work Plan Table 11 provides a detailed implementation plan with short, medium and long-term actions that will be undertaken by specific public-sector role-players to ensure that the PHA is protected for its intended land uses, namely agriculture and sand-mining.
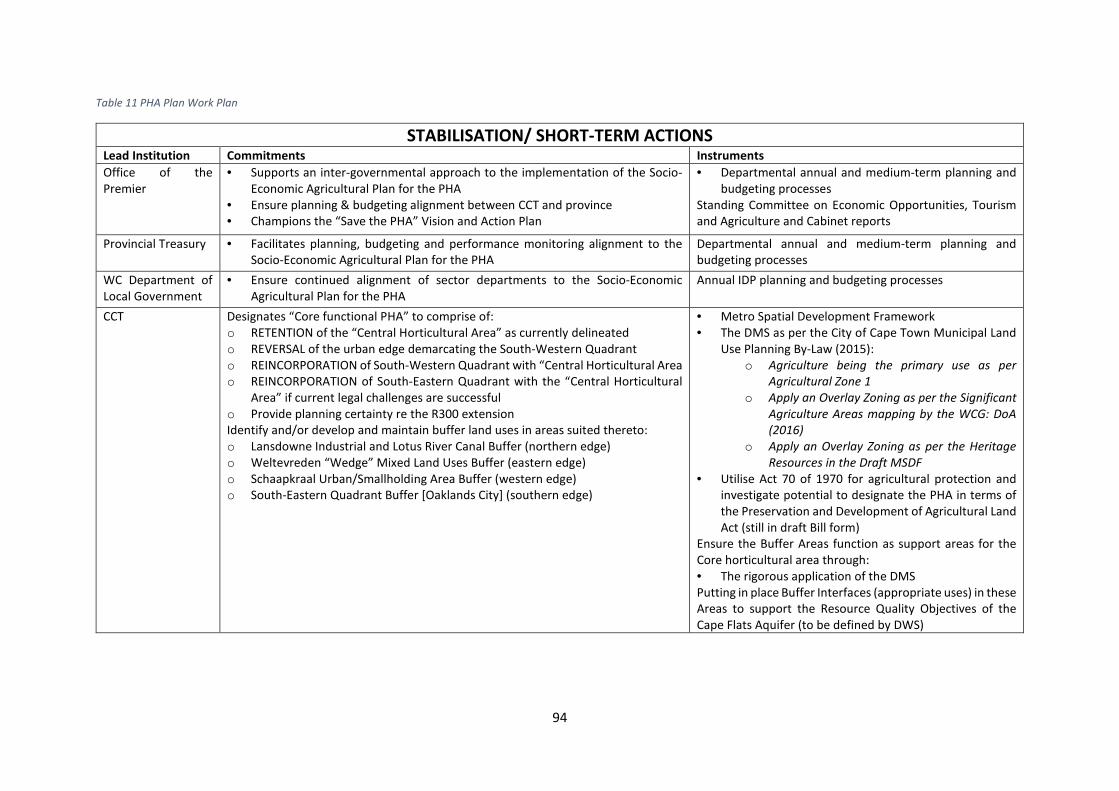
94
Table 11 PHA Plan Work Plan
STABILISATION/ SHORT-TERM ACTIONS Lead Institution Commitments Instruments Office of the Premier
• Supports an inter-governmental approach to the implementation of the Socio-Economic Agricultural Plan for the PHA
• Ensure planning & budgeting alignment between CCT and province • Champions the “Save the PHA” Vision and Action Plan
• Departmental annual and medium-term planning and budgeting processes
Standing Committee on Economic Opportunities, Tourism and Agriculture and Cabinet reports
Provincial Treasury • Facilitates planning, budgeting and performance monitoring alignment to the Socio-Economic Agricultural Plan for the PHA
Departmental annual and medium-term planning and budgeting processes
WC Department of Local Government
• Ensure continued alignment of sector departments to the Socio-Economic Agricultural Plan for the PHA
Annual IDP planning and budgeting processes
CCT Designates “Core functional PHA” to comprise of: o RETENTION of the “Central Horticultural Area” as currently delineated o REVERSAL of the urban edge demarcating the South-Western Quadrant o REINCORPORATION of South-Western Quadrant with “Central Horticultural Area o REINCORPORATION of South-Eastern Quadrant with the “Central Horticultural
Area” if current legal challenges are successful o Provide planning certainty re the R300 extension Identify and/or develop and maintain buffer land uses in areas suited thereto: o Lansdowne Industrial and Lotus River Canal Buffer (northern edge) o Weltevreden “Wedge” Mixed Land Uses Buffer (eastern edge) o Schaapkraal Urban/Smallholding Area Buffer (western edge) o South-Eastern Quadrant Buffer [Oaklands City] (southern edge)
• Metro Spatial Development Framework • The DMS as per the City of Cape Town Municipal Land
Use Planning By-Law (2015): o Agriculture being the primary use as per
Agricultural Zone 1 o Apply an Overlay Zoning as per the Significant
Agriculture Areas mapping by the WCG: DoA (2016)
o Apply an Overlay Zoning as per the Heritage Resources in the Draft MSDF
• Utilise Act 70 of 1970 for agricultural protection and investigate potential to designate the PHA in terms of the Preservation and Development of Agricultural Land Act (still in draft Bill form)
Ensure the Buffer Areas function as support areas for the Core horticultural area through: • The rigorous application of the DMS Putting in place Buffer Interfaces (appropriate uses) in these Areas to support the Resource Quality Objectives of the Cape Flats Aquifer (to be defined by DWS)
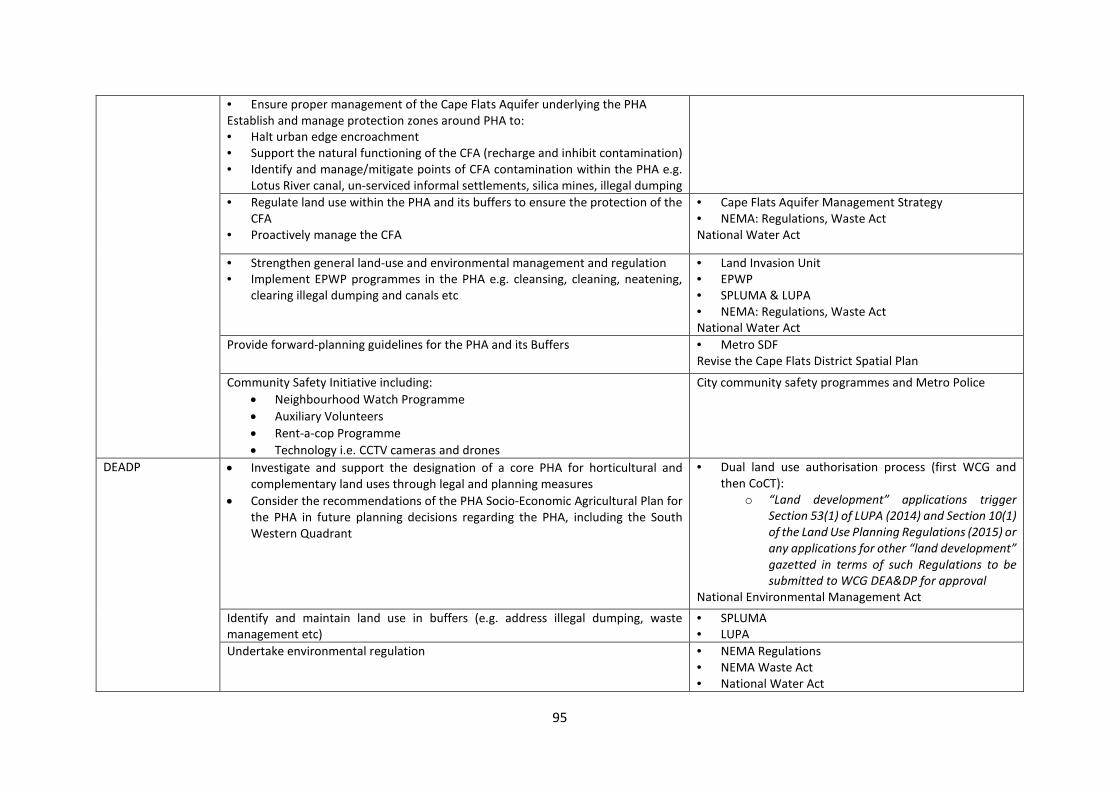
95
• Ensure proper management of the Cape Flats Aquifer underlying the PHA Establish and manage protection zones around PHA to: • Halt urban edge encroachment • Support the natural functioning of the CFA (recharge and inhibit contamination) • Identify and manage/mitigate points of CFA contamination within the PHA e.g.
Lotus River canal, un-serviced informal settlements, silica mines, illegal dumping
• Regulate land use within the PHA and its buffers to ensure the protection of the CFA
• Proactively manage the CFA
• Cape Flats Aquifer Management Strategy • NEMA: Regulations, Waste Act National Water Act
• Strengthen general land-use and environmental management and regulation • Implement EPWP programmes in the PHA e.g. cleansing, cleaning, neatening,
clearing illegal dumping and canals etc
• Land Invasion Unit • EPWP • SPLUMA & LUPA • NEMA: Regulations, Waste Act National Water Act
Provide forward-planning guidelines for the PHA and its Buffers • Metro SDF Revise the Cape Flats District Spatial Plan
Community Safety Initiative including: • Neighbourhood Watch Programme • Auxiliary Volunteers • Rent-a-cop Programme • Technology i.e. CCTV cameras and drones
City community safety programmes and Metro Police
DEADP • Investigate and support the designation of a core PHA for horticultural and complementary land uses through legal and planning measures
• Consider the recommendations of the PHA Socio-Economic Agricultural Plan for the PHA in future planning decisions regarding the PHA, including the South Western Quadrant
• Dual land use authorisation process (first WCG and then CoCT):
o “Land development” applications trigger Section 53(1) of LUPA (2014) and Section 10(1) of the Land Use Planning Regulations (2015) or any applications for other “land development” gazetted in terms of such Regulations to be submitted to WCG DEA&DP for approval
National Environmental Management Act
Identify and maintain land use in buffers (e.g. address illegal dumping, waste management etc)
• SPLUMA • LUPA
Undertake environmental regulation • NEMA Regulations • NEMA Waste Act • National Water Act
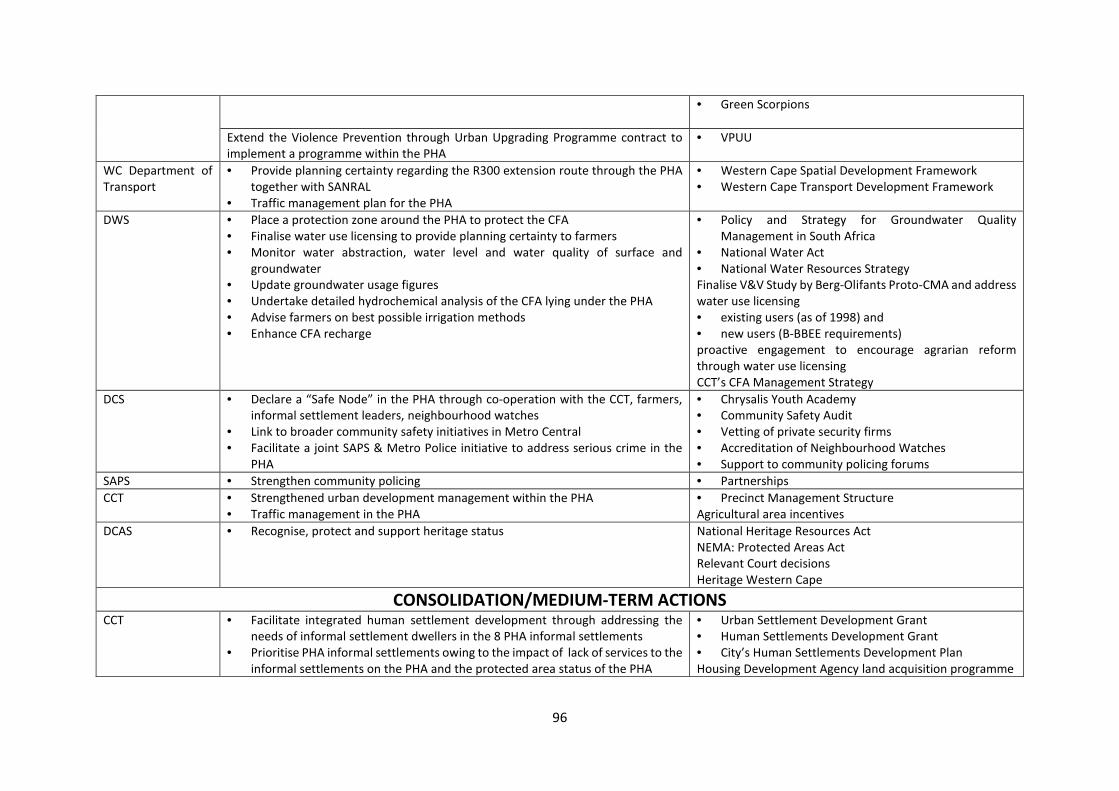
96
• Green Scorpions
Extend the Violence Prevention through Urban Upgrading Programme contract to implement a programme within the PHA
• VPUU
WC Department of Transport
• Provide planning certainty regarding the R300 extension route through the PHA together with SANRAL
• Traffic management plan for the PHA
• Western Cape Spatial Development Framework • Western Cape Transport Development Framework
DWS • Place a protection zone around the PHA to protect the CFA • Finalise water use licensing to provide planning certainty to farmers • Monitor water abstraction, water level and water quality of surface and
groundwater • Update groundwater usage figures • Undertake detailed hydrochemical analysis of the CFA lying under the PHA • Advise farmers on best possible irrigation methods • Enhance CFA recharge
• Policy and Strategy for Groundwater Quality Management in South Africa
• National Water Act • National Water Resources Strategy Finalise V&V Study by Berg-Olifants Proto-CMA and address water use licensing • existing users (as of 1998) and • new users (B-BBEE requirements) proactive engagement to encourage agrarian reform through water use licensing CCT’s CFA Management Strategy
DCS • Declare a “Safe Node” in the PHA through co-operation with the CCT, farmers, informal settlement leaders, neighbourhood watches
• Link to broader community safety initiatives in Metro Central • Facilitate a joint SAPS & Metro Police initiative to address serious crime in the
PHA
• Chrysalis Youth Academy • Community Safety Audit • Vetting of private security firms • Accreditation of Neighbourhood Watches • Support to community policing forums
SAPS • Strengthen community policing • Partnerships CCT • Strengthened urban development management within the PHA
• Traffic management in the PHA • Precinct Management Structure Agricultural area incentives
DCAS • Recognise, protect and support heritage status National Heritage Resources Act NEMA: Protected Areas Act Relevant Court decisions Heritage Western Cape
CONSOLIDATION/MEDIUM-TERM ACTIONS CCT • Facilitate integrated human settlement development through addressing the
needs of informal settlement dwellers in the 8 PHA informal settlements • Prioritise PHA informal settlements owing to the impact of lack of services to the
informal settlements on the PHA and the protected area status of the PHA
• Urban Settlement Development Grant • Human Settlements Development Grant • City’s Human Settlements Development Plan Housing Development Agency land acquisition programme
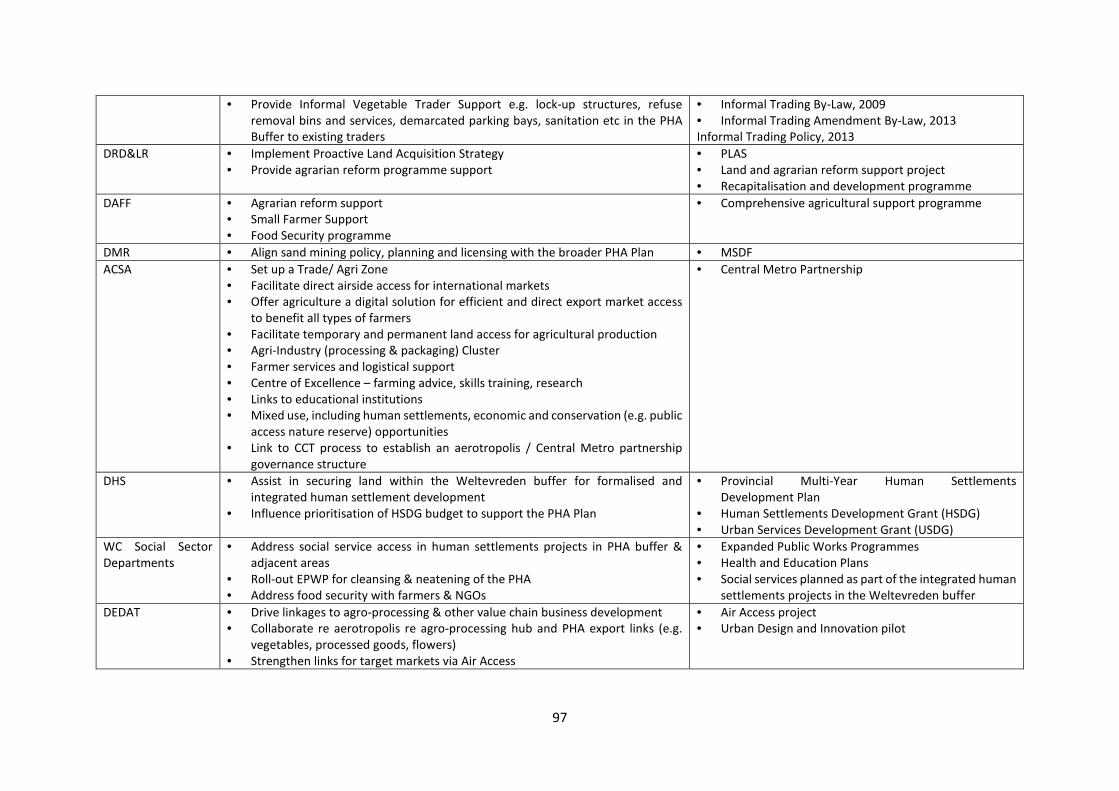
97
• Provide Informal Vegetable Trader Support e.g. lock-up structures, refuse removal bins and services, demarcated parking bays, sanitation etc in the PHA Buffer to existing traders
• Informal Trading By-Law, 2009 • Informal Trading Amendment By-Law, 2013 Informal Trading Policy, 2013
DRD&LR • Implement Proactive Land Acquisition Strategy • Provide agrarian reform programme support
• PLAS • Land and agrarian reform support project • Recapitalisation and development programme
DAFF • Agrarian reform support • Small Farmer Support • Food Security programme
• Comprehensive agricultural support programme
DMR • Align sand mining policy, planning and licensing with the broader PHA Plan • MSDF ACSA • Set up a Trade/ Agri Zone
• Facilitate direct airside access for international markets • Offer agriculture a digital solution for efficient and direct export market access
to benefit all types of farmers • Facilitate temporary and permanent land access for agricultural production • Agri-Industry (processing & packaging) Cluster • Farmer services and logistical support • Centre of Excellence – farming advice, skills training, research • Links to educational institutions • Mixed use, including human settlements, economic and conservation (e.g. public
access nature reserve) opportunities • Link to CCT process to establish an aerotropolis / Central Metro partnership
governance structure
• Central Metro Partnership
DHS • Assist in securing land within the Weltevreden buffer for formalised and integrated human settlement development
• Influence prioritisation of HSDG budget to support the PHA Plan
• Provincial Multi-Year Human Settlements Development Plan
• Human Settlements Development Grant (HSDG) • Urban Services Development Grant (USDG)
WC Social Sector Departments
• Address social service access in human settlements projects in PHA buffer & adjacent areas
• Roll-out EPWP for cleansing & neatening of the PHA • Address food security with farmers & NGOs
• Expanded Public Works Programmes • Health and Education Plans • Social services planned as part of the integrated human
settlements projects in the Weltevreden buffer DEDAT • Drive linkages to agro-processing & other value chain business development
• Collaborate re aerotropolis re agro-processing hub and PHA export links (e.g. vegetables, processed goods, flowers)
• Strengthen links for target markets via Air Access
• Air Access project • Urban Design and Innovation pilot
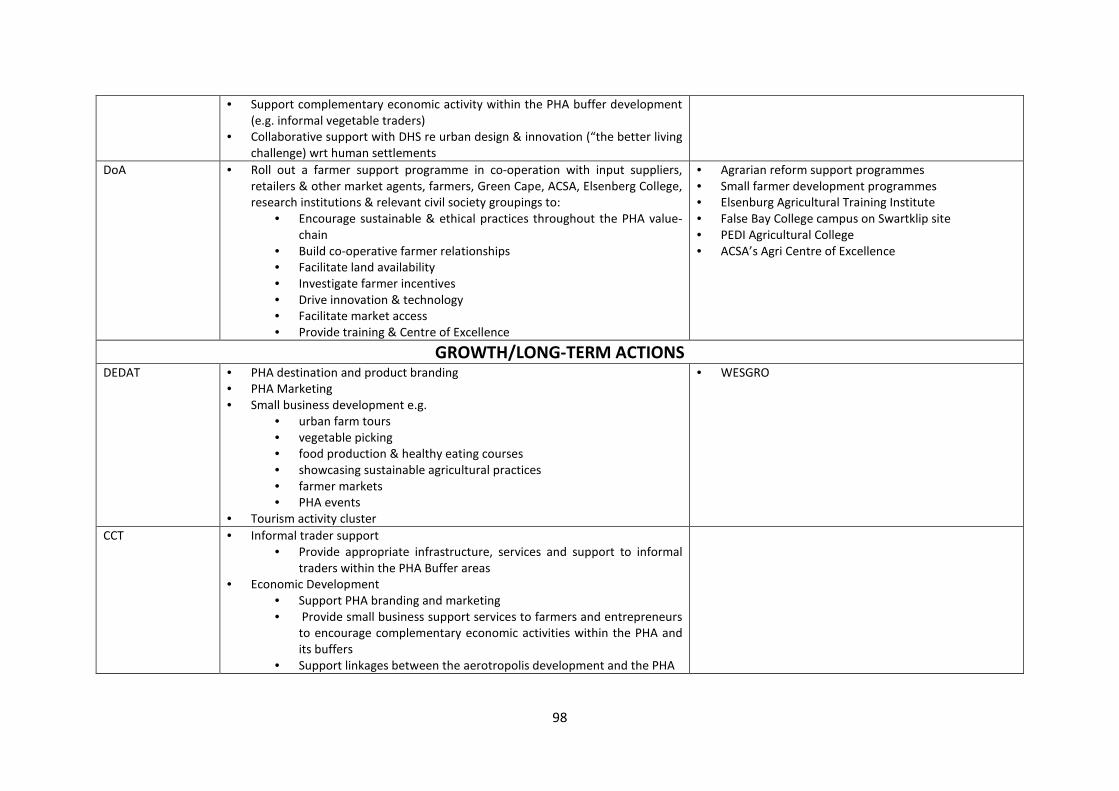
98
• Support complementary economic activity within the PHA buffer development (e.g. informal vegetable traders)
• Collaborative support with DHS re urban design & innovation (“the better living challenge) wrt human settlements
DoA • Roll out a farmer support programme in co-operation with input suppliers, retailers & other market agents, farmers, Green Cape, ACSA, Elsenberg College, research institutions & relevant civil society groupings to:
• Encourage sustainable & ethical practices throughout the PHA value-chain
• Build co-operative farmer relationships • Facilitate land availability • Investigate farmer incentives • Drive innovation & technology • Facilitate market access • Provide training & Centre of Excellence
• Agrarian reform support programmes • Small farmer development programmes • Elsenburg Agricultural Training Institute • False Bay College campus on Swartklip site • PEDI Agricultural College • ACSA’s Agri Centre of Excellence
GROWTH/LONG-TERM ACTIONS DEDAT • PHA destination and product branding
• PHA Marketing • Small business development e.g.
• urban farm tours • vegetable picking • food production & healthy eating courses • showcasing sustainable agricultural practices • farmer markets • PHA events
• Tourism activity cluster
• WESGRO
CCT • Informal trader support • Provide appropriate infrastructure, services and support to informal
traders within the PHA Buffer areas • Economic Development
• Support PHA branding and marketing • Provide small business support services to farmers and entrepreneurs
to encourage complementary economic activities within the PHA and its buffers
• Support linkages between the aerotropolis development and the PHA
99
Implementation Approach Inter-Governmental Co-ordination and Implementation Protocol The PHA Plan will be implemented through a partnership between the CCT and the WCG. Political and administrative champions will be identified to drive the implementation of the Plan. The CCT and the WC DoA will be the lead partners and each partner will identify political and administrative champions for the PHA Plan. The lead partners will need to set up a dedicated PHA Unit with project management and process facilitation capacity. The Premier’s Office, together with the Provincial Treasury and the Department of Local Government, will oversee the provincial inter-departmental planning and budgeting process to give effect to the PHA Plan. Relevant provincial departments will be required to incorporate their commitments within the PHA Plan into their Annual and Multi-Year Performance Plans and Budgets and Senior Management Service Performance Management Agreements. This will require the translation of these commitments into performance outputs, activities and standards and the setting of target delivery dates in terms of the set templates. This will link the implementation of the PHA Plan into the formal planning, budgeting and performance management system of the province. The political and administrative champions identified in the CCT will oversee the planning and budgeting alignment process across relevant departments responsible for: planning and land-use management; water and sanitation; urban development, integrated human settlements and public transport; economic development; area-based management; social development; and community safety and security. CCT responsibilities within the PHA Plan will need to be incorporated into the City’s IDP, MSDF, LUMS, district plans, sector plans and economic development plans and budgets, and performance management system. The WC DoA and CCT will jointly approach the relevant national departments, such as the DWS, DRD&LR, DAFF, DECOG and the DMR, to secure relevant commitments to the PHA Plan. These commitments would be reflected in national department annual and medium-term plans, budgets and performance agreements. In addition, the WC DoA and CCT will approach the relevant parastatals – SANRAL, ACSA, SAPS, Heritage Western Cape and WESGRO – in partnership with relevant provincial departments. The intention would be to secure relevant commitments from the parastatals to the PHA Plan through inclusion in their annual budgets and three-year corporate plans, as required by the Public Finance Management Act. The public-sector commitments within the PHA Plan will be formalised through the signing of an Implementation Protocol in terms of Section 35 of the Inter-Governmental Relations Framework Act, No. 13 of 2005. In terms of this Section, where the implementation of a policy, the exercise of a statutory power, the performance of a statutory function or the provision of a service depends on the participation of organs of state in different governments, those organs of state must co-ordinate their actions in such a manner as may be appropriate or required in the circumstance, and may do so by entering into an implementation protocol. An Implementation Protocol must-
a) Identify any challenges facing the implementation of the policy and state how these challenges will be addressed;
b) Describe the roles and responsibilities of each organ of state in implementing the policy; c) Give an outline of the priorities, aims and desired outcomes;
100
d) Determine indicators to measure the effective implementation of the protocol; e) Provide for oversight mechanisms and procedures for monitoring the effective
implementation of the protocol; f) Determine the required and available resources to implement the protocol and the resources
to be contributed by each organ of state with respect to the roles and responsibilities allocated to is;
g) Provide for dispute-settlement procedures and mechanisms should disputes arise in the implementation of the protocol;
h) Determine the duration of the protocol; and i) Include any other matters on which the parties may agree.
The implementation protocol may be co-ordinated by an appropriate intergovernmental forum in terms of the Act. The lead partners will constitute a public-sector Project Management Team (PMT) that is representative of the major national and provincial lead departments that will oversee the implementation of the public-sector commitments within the PHA Plan. The PMT will report on implementation progress through the PHA Plan lead partners, that is the CCT and WC DoA. The responsibilities of the Project Management Team will be to:
o Oversee the implementation of the PHA Plan by all public-sector role-players in terms of the signed Implementation Protocol;
o Identify and facilitate the setting up of any necessary transversal CCT and IGR structures to facilitate the implementation of the PHA Plan;
o Establish any necessary PMT project teams for the implementation of the PHA Plan and ensure the accountability of such teams to the PMT;
o Report on implementation progress; o Address any obstacles to implementation; o Facilitate annual planning and budgeting review process for the PHA amongst public sector
partners; o Develop recommendations regarding future public-sector plans and budgets for the PHA; and o Facilitate the establishment of, and oversee the functioning of, a precinct management
structure for the PHA.
Inter-Sectoral Co-ordination and Social Compact The CCT and WC DoA will be required to champion the PHA Plan with the private and civil society sectors. This will require a series of bilateral meetings with strategic partners such as:
o The PHA big commercial farmers; o Interested and willing PHA commercial and small-holder farmers; o Informal settlement leaders within the PHA; o The big five retailers – Shoprite Group, Massmart, Pick ‘n Pay, Woolworths Food and Spar; o Agro-processing companies such as DewCrisp, Gourmet Greens, Patagonia, Natural Value
Foods and In2Food; o Major input (e.g. seed, fertilisers, pesticide, irrigation equipment, packaging) suppliers; o University institutes such as PLAS and AFSUN; o Civil society groupings such as the PHA Campaign, DAG and the VPUU; and o Economic development structures such as the Economic Development Partnership and PEDI.
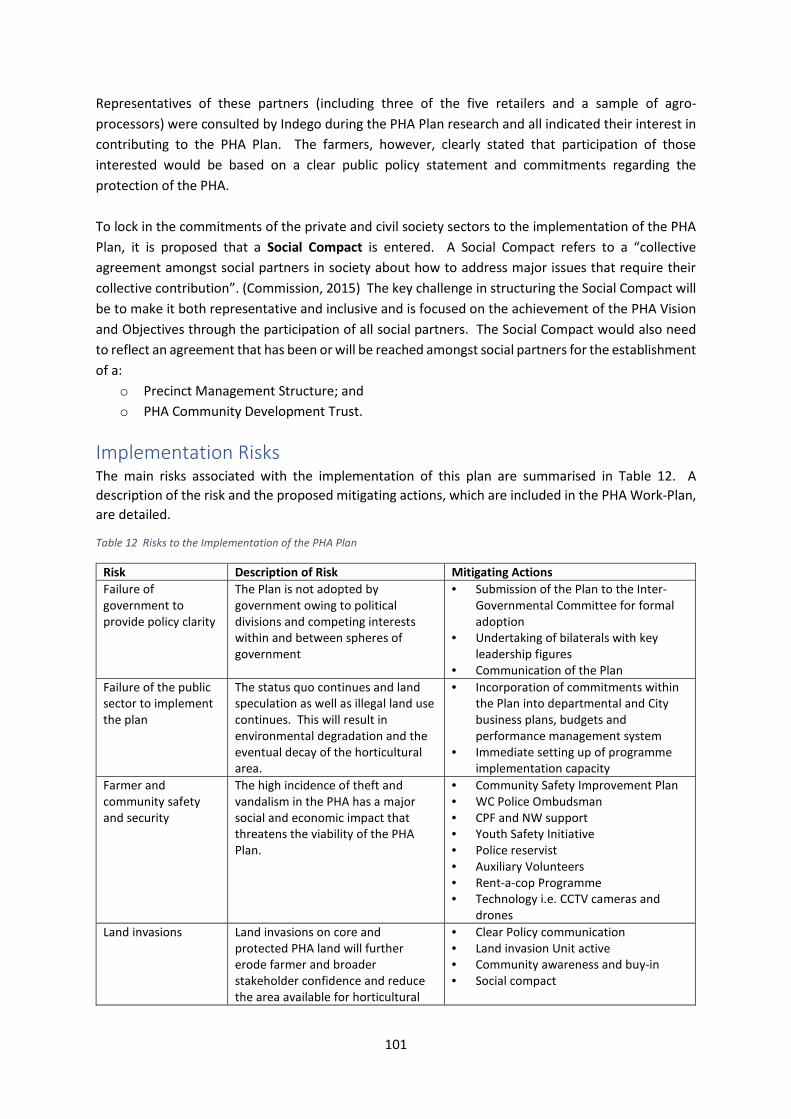
101
Representatives of these partners (including three of the five retailers and a sample of agro-processors) were consulted by Indego during the PHA Plan research and all indicated their interest in contributing to the PHA Plan. The farmers, however, clearly stated that participation of those interested would be based on a clear public policy statement and commitments regarding the protection of the PHA. To lock in the commitments of the private and civil society sectors to the implementation of the PHA Plan, it is proposed that a Social Compact is entered. A Social Compact refers to a “collective agreement amongst social partners in society about how to address major issues that require their collective contribution”. (Commission, 2015) The key challenge in structuring the Social Compact will be to make it both representative and inclusive and is focused on the achievement of the PHA Vision and Objectives through the participation of all social partners. The Social Compact would also need to reflect an agreement that has been or will be reached amongst social partners for the establishment of a:
o Precinct Management Structure; and o PHA Community Development Trust.
Implementation Risks The main risks associated with the implementation of this plan are summarised in Table 12. A description of the risk and the proposed mitigating actions, which are included in the PHA Work-Plan, are detailed.
Table 12 Risks to the Implementation of the PHA Plan
Risk Description of Risk Mitigating Actions Failure of government to provide policy clarity
The Plan is not adopted by government owing to political divisions and competing interests within and between spheres of government
• Submission of the Plan to the Inter-Governmental Committee for formal adoption
• Undertaking of bilaterals with key leadership figures
• Communication of the Plan Failure of the public sector to implement the plan
The status quo continues and land speculation as well as illegal land use continues. This will result in environmental degradation and the eventual decay of the horticultural area.
• Incorporation of commitments within the Plan into departmental and City business plans, budgets and performance management system
• Immediate setting up of programme implementation capacity
Farmer and community safety and security
The high incidence of theft and vandalism in the PHA has a major social and economic impact that threatens the viability of the PHA Plan.
• Community Safety Improvement Plan • WC Police Ombudsman • CPF and NW support • Youth Safety Initiative • Police reservist • Auxiliary Volunteers • Rent-a-cop Programme • Technology i.e. CCTV cameras and
drones Land invasions
Land invasions on core and protected PHA land will further erode farmer and broader stakeholder confidence and reduce the area available for horticultural
• Clear Policy communication • Land invasion Unit active • Community awareness and buy-in • Social compact
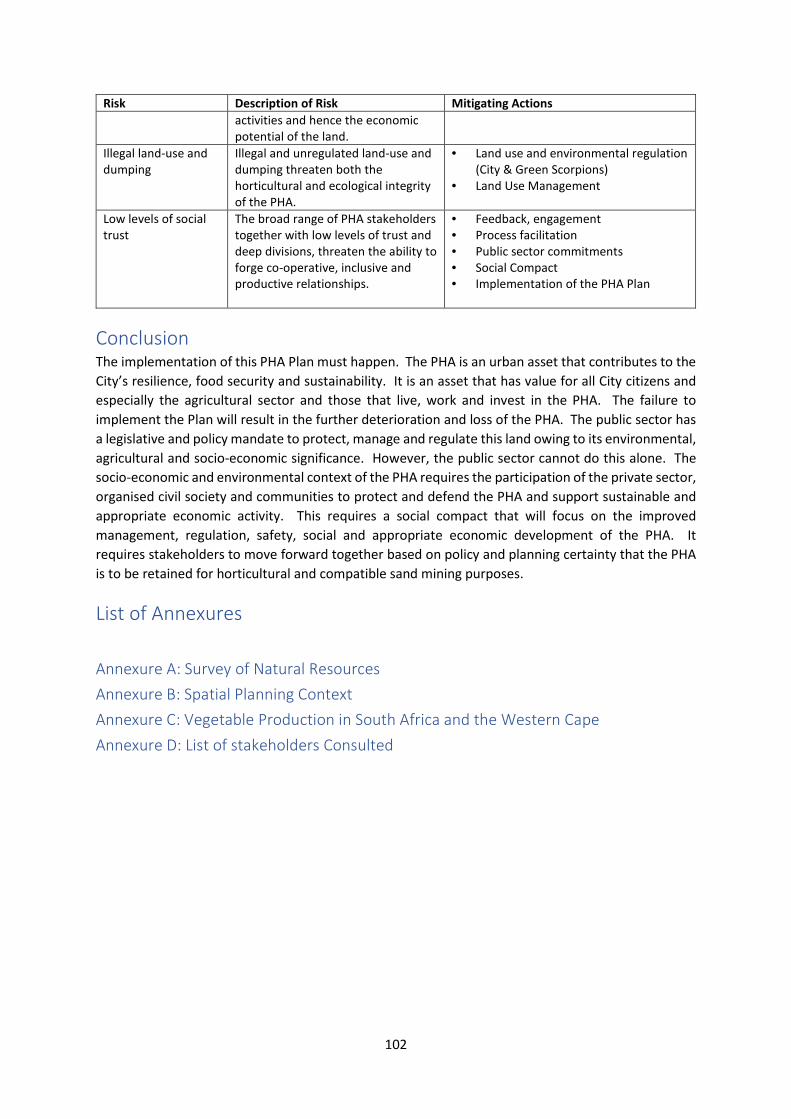
102
Risk Description of Risk Mitigating Actions activities and hence the economic potential of the land.
Illegal land-use and dumping
Illegal and unregulated land-use and dumping threaten both the horticultural and ecological integrity of the PHA.
• Land use and environmental regulation (City & Green Scorpions)
• Land Use Management
Low levels of social trust
The broad range of PHA stakeholders together with low levels of trust and deep divisions, threaten the ability to forge co-operative, inclusive and productive relationships.
• Feedback, engagement • Process facilitation • Public sector commitments • Social Compact • Implementation of the PHA Plan
Conclusion The implementation of this PHA Plan must happen. The PHA is an urban asset that contributes to the City’s resilience, food security and sustainability. It is an asset that has value for all City citizens and especially the agricultural sector and those that live, work and invest in the PHA. The failure to implement the Plan will result in the further deterioration and loss of the PHA. The public sector has a legislative and policy mandate to protect, manage and regulate this land owing to its environmental, agricultural and socio-economic significance. However, the public sector cannot do this alone. The socio-economic and environmental context of the PHA requires the participation of the private sector, organised civil society and communities to protect and defend the PHA and support sustainable and appropriate economic activity. This requires a social compact that will focus on the improved management, regulation, safety, social and appropriate economic development of the PHA. It requires stakeholders to move forward together based on policy and planning certainty that the PHA is to be retained for horticultural and compatible sand mining purposes.
List of Annexures
Annexure A: Survey of Natural Resources Annexure B: Spatial Planning Context Annexure C: Vegetable Production in South Africa and the Western Cape Annexure D: List of stakeholders Consulted
103
Bibliography City of AECOM. (2016). Study to Determine Feasibility of an Aerotropolis Strategy for Cape Town:
Final Project Report. Cape Town: ACSA.
AECOM. (2016). Study to Determine the Feasibility of Following an Aerotropoolis Strategy for Cape Town: Final Project Report. Cape Town: ACSA.
Agriculture, W. C. (2018, March 02). Drought Policy Brief and Assessment Feedback 2018. Cabinet Briefing Powerpoint Presentation. Cape Town, Western Cape, South Africa: Unpublished.
Amy Cuff. (2017). An exploration of the competing policy imperatives in the Philippi Horticultural Area. Cape Town: Department of Environmental and Geographical Science, University of Cape Town.
CCT. (2012). Cape Flats District Plan, Spatial Development Plan and Environmental Management Framework Technical Report. Cape Town: City of Cape Town.
City of Cape Town. (2014). Philippi East Business Retention and Expansion Results. Cape Town: City of Cape Town.
City of Cape Town. (2016). Industrial Survey: Economic Development Department. Cape Town: City of Cape Town.
City of Cape Town prepared by" iKapa Enviroplan, ICE (Pty) Ltd and City Think Space. (2012). Urban Edge and Development Guidelines Study for the Schaapkraal Smallholdings Area and Environs in the Philippi Horticultural Area Phase 2: Analysis and Feasibility. Cape Town: City of Cape Town.
Cole, D.I and Viljoen, J.H.A. (2001). Building Sand Potential of the Greater Cape Town Area. Pretoria: Council for Geoscience South Africa.
Commission, N. P. (2015). Towards a Social Compact for South Africa. Pretoria: National Planning Commission.
Consol Glass. (2011). Comment on the Final Draft Cape Flats SDP and EMF. Cape Town: Consol Glass.
Cousins, B. (2017, October 24). Professor. (K. Harrison, Interviewer)
Danso, R. v. (2007). Profitability and sustainability of urban and peri-urban agriculture. Agricultural Management, Marketing and Finance, Occasional Paper 19.
Davy, S. (2017, November 2). Consultant Geologist. (K. Harrison, Interviewer)
Demacon Market Studies. (2013). Philippi Highest and Best Market Study: Draft Report - Market Research Findings and Recommendations. Cape Town: Philippi Economic Development Initiative.
Development Action Group. (2014). Community Profile: Philippi Horticultural Area Informal Settlements. Cape Town: Development Action Group.
Dr D.I. Cole. (2011). Geological Report on the High-Grade Silica Sands of the PHA near Cape Town. Pretoria: Council for Geo Science.
104
Dr Jane Battersby-Lennard and Gareth Haysom. (2012). Philippi Horticultural Area: A city asset or potential development node. Cape Town: Rooftops Canada Foundation Inc. Foundation Abri International in partnership with the African Food Security Urban Network.
Drivdal, L. (2011). Report on Floddong on the Informal Settlement, 'Egoli', in Philippi / Schaapkraal, Cape Town 2010 and 2011. Cape Town: IDRC / DFID.
Government, W. C. (2018, April 20). Heritage Western Cape. Province of Western Cape Provincial Gazette 7916. Cape Town: Western Cape Government.
Green Cape. (2015). Regional Resource Flow Model Project 2014/15: Synthesis EReport. Cape Town: Western Cape Government, DEDAT.
Green Cape. (2015). Regional Resource Flow Model Social Accounting Matrix Analysis. Cape Town: Department of Economic Development and Tourism, Western Cape.
GreenCape. (2016). Agriculture 2016 Market Intelligence Report. City of Cape Town: Green Cape.
Greyling, L. (2017, March 1). CCT Director: Trade and Investment. (K. Harrison, Interviewer)
Haysom, C. S. (2016). The informal sector's role in food security: A missing link in policy debates? Institute for Poverty, Land and Agrarian Studies Working Paper 44, 1-25.
Hendriks, F., & Ntsebeza, L. a. (2013). The Promise of Land: Undoing a Century of Dispossession in South Africa. Johannesburg: Jacana Media.
Hoffman, W. a. (2017). Overview of the Vegetable Industry in the Western Cape. Cape Town: Unpublished.
Igshaan Adams, A. F. (2017, October 5). PHA informal settlement leaders interview. (K. Harrison, Interviewer)
Jane Battersbry. (2017). Food System transformation in the Absence of Food System Planning: The Case of Supermarket and Shopping Mall Retail Expansion in Cape Town, South Africa. Built Environment Volume 43 No 3, 330-343.
Jane Battersby. (2017). Food System transformation in the Absence of Food System Planning: The Case of Supermarket and Shopping Mall Retail Expansion in Cape Town, South Africa. Built Environment Volume 43 No 3, 330-343.
Jane Battersby Lennard. (2016). Conflicting ways of knowing in land use planning: Revising the urban edge in the Philippi Horticultural Area, Cape Town, South Africa. Cape Town: African Centre for Cities, University of Cape Town.
Jane Battersby, Gareth Haysom, Godfrey Tawodzera, Milla Mc Lachlan, Jonathan Crush, Tani Lombard, Irene Labuschange, Verena Bitzer, Nick Simpson, Jessica Rattle, Sarah Duncan, Maya Marshak, Jackie James and Florian Kroll. (2014). Food System and Food Security Study for the City of Cape Town. Cape Town.
Lizette Rabe. (2010). "Bete und Arbeite" The Philippi Germans and their Story. Cape Town: Mzansimedia.
Lortan, A. (2017, October 19). Patagonia representative. (K. Harrison, Interviewer)
Murray, T. (2017, September 14). Woolworths representative. (K. Harrison, Interviewer)
105
Nicholas Clinton, Michelle Stulmacher, Albie Miles, Nazli Uludere Aragon, Melissa Wagner, Matei Georgescu, Chris Herwig, Peng Gong. (2018, January). A Global Geospatial Ecosystem Services Estimate of Urban Agriculture. Retrieved from AGU100 Advancing Earth and Space Science: http://agupubs.onlinelibrary.wiley.com/doi/abs/10.1002/2017EF000536
Niekerk, L. v. (2017, November 20). Pick 'n Pay representative. (K. Harrison, Interviewer)
Patrick Caughill. (2018, January 16). Futurism. Retrieved from Future Society: https://futurism.com/urban-farming-future-agriculture/
PEDI. (June 2017). PEDI Newsletter. Cape Town: PEDI.
PEPCO Review. (2009). Philippi Horticultural Area Viability. Cape Town.
PHA Summit. (2017, September 12 - 14). Cape Town.
Planning, W. C. (2005). A Status Quo, Vulnerability and Adaptation Assessment of the Physical and Socio-Economic Effects of Climate Change in the Western Cape. Cape Town: Western Cape Government.
Planning, W. C. (2018). Climate Change Projections for the Western Cape. Retrieved from Western Cape Government Environmental Affairs and Planning: https://www.westerncape.gov.za/eadp/climate-change-municipal-support-forum/climate-change-projections-for-the-western-cape
Rocket Trading, C. T. (2018, March 27). Enquiry regarding Philippi building sand value. (K. Harrison, Interviewer)
Setplan. (2017). Socio-Economic Agricultural Plan for the PHA: Spatial Planning and Land Development Management Input. City of Cape Town: Unpublished.
South African History Archive. (2010, February 11). District Six: recalling the forced removals. Retrieved from SAHA Archive for Justice: http://www.saha.org.za/news/2010/February/district_six_recalling_the_forced_removals.htm
Studies in Poverty and Inequality Institute. (2015). The Right to Food in South Africa An analysis of the content, policy effort, resource allocation and enjoyment of the constitutional right to food. Johannesburg: Studies in Poverty and Inequality Institute.
Tawodzera, G. (2016). Local food geographies - the nature and extent of food insecurity in South Africa. Institute for Poverty, Land and Agrarian Studies Working Paper 37, 1-26.
ThinkSpace, C. o. (2012). Urban Edge and Development Guidelines Study for the Schaapkraal Smallholdings Area and Environs in the Philippi Holrticultural Area Phase 2: Analysis and Feasibility. Cape Town: City of Cape Town.
Town, C. o. (2003, February 21). City Improvement District By-Law. Final Draft City Improvement District By-Law. City of Cape Town, Western Cape, South Africa: City of Cape Town.
Town, C. o. (2008). Agricultural Land Review. City of Cape Town: City of Cape Town.
Town, C. o. (2008). Agricultural Land Review. Cape Town: City of Cape Town.
Town, C. o. (2012). Cape Flats District Plan. Cape Town: City of Cape Town.
106
Town, C. o. (2012). The Role of Philippi Horticultural Area in Securing the Future of the City. City of Cape Town: City of Cape Town.
Town, C. o. (2017). Built Environment Performance Plan 2017 18 Final. Cape Town: City of Cape Town.
Town, C. o. (n.d.). ECamp. City of Cape Town, Western Cape, South Africa.
UMVOTO Africa (Pty) Ltd. (2017). Socio-Economic Agricultural Plan for the Existing PHA: Survey of Natural Resources. Cape Town: Unpublished.
Villiers, A. D. (2017, November 14). Cape Town Market representative. (K. Harriosn, Interviewer)
WCG. (2016). Municipal Economic Review and Outlook. Cape Town: Western Cape Provincial Government.
Western Cape Economic Development Partnership. (2016). Partnering Solutions for Philippi. Cape Town: City of Cape Town Trade and Investment Unit.
Western Cape Government. (2016). Provincial Economic Review and Outlook. Cape Town: Western Cape Government.
Witman, S. (2018, March 2). Urban Agriculture Could Provide Billions in Ecosystem Services. Retrieved from Earth and Space Science News: http://eos.org/research-spotlights/urban-agriculture-could-provide-billions-in-ecosystem-services