current and future verification of operational wave models
TRANSCRIPT

ECMWF Workshop on Ocean Waves, 25-27 June 2012 159
Current and future verification of operational wave models
Andy Saulter
Met Office FitzRoy Road, Exeter, EX1 3PB
Observation and modelling of ocean waves have seen significant advances in the last 10-15 years. These include increases in near real-time availability of ground truth data and parameter types describing wave fields, and improvements in model skill. The changes offer an opportunity to enhance operational verification systems beyond standard assessments of forecast skill for significant wave height. This paper discusses some of the steps needed to review the verification systems, approaches that could be adopted in order to enhance verification analyses, and potential challenges in exploiting present observation resources. Review needs to be driven by clarifying the questions that can be answered robustly using statistics derived from data sampled over typical operational periods (monthly, quarterly, annual), and using stratification criteria that band error datasets into geographic, condition based or process based regimes. Upfront analyses based on known wave field climate are recommended in order to define robust stratification methods, particularly when aiming to verify parameters that describe the wave spectrum. Other key issues include ensuring independence in the sampling schemes used and understanding how operational verification can serve both scientific and downstream users in a practicable manner, inclusive of agreeing whether pursuing a universally consistent form of truth is desirable.
1. Introduction Verification data are a crucial accompaniment to wave forecast model outputs. Statistics generated from a good verification scheme should measure the performance of a model and enable provision of uncertainty information to accompany model guidance. Since in extreme cases neglecting to account for forecast errors can lead to failure of high cost marine operations, and even risk to life, uncertainty data should ideally influence or be an explicit component of an issued marine forecast.
Verifying operationally, in order to issue regular updates of uncertainty and performance information, based on monthly, seasonal or annual sampling periods, is important in that it enables assessment of modelling systems that change with time and monitors performance over timescales that are short enough to reflect forecast busts associated with particular events. Running an operational verification scheme leads to infrastructure maintenance and data continuity constraints that may preclude frequent system updates. Nevertheless, periodic review that takes into account developments in the observations, metrics and the information required from operational verification is important in order to ensure that the statistics generated are of the best possible quality and relevance to current practical uses and scientific development needs.
Significant increases in the data volumes and range of parameters regularly received in near real-time from observing networks globally have been made in the last 10-15 years. During the same period ongoing research has aimed to define and provide methods to explore numerous aspects of wave model performance, such as improvements to parameterizations of the source terms (WISE Group 2007; Tolman et al., 2011). This paper discusses how some of these changes and new insights might enable enhancement of existing operational verification schemes. Particular examples of such schemes are the long-running Joint WMO-IOC Technical Commission for Oceanography and Marine Meteorology intercomparison of operational ocean wave forecasting systems against buoy data (known for the remainder of this document as the ‘JCOMM buoy intercomparison’) run by the European Centre for Medium-Range Weather Forecasting (Bidlot et al., 2002; Bidlot and Holt, 2006),

SAULTER, A.: CURRENT AND FUTURE VERIFICATION OF OPERATIONAL WAVE MODELS
160 ECMWF Workshop on Ocean Waves, 25-27 June 2012
and a recently initiated pilot extension wave forecast verification system using satellite data spun-up within the European Space Agency GlobWave project ( www.globwave.org ).
2. Changes to data for use in wave verification Having identified the benefits of providing consistent verification of forecast wave models run by operational centres worldwide, the JCOMM buoy intercomparison was set up in 1995. By 1996 the project involved 5 founding participants and generated performance measures for wind speed and direction, significant wave height (Hs), and peak period from comparison between model data and in-situ measurements from 36 buoys, located in the North Pacific and North Atlantic (Bidlot et al., 2002). Contributing models were global, and resolved at between 0.5 and 2.5 degrees (50-250km). Since the project’s initiation, and through significant collaborative effort, the number of observation sites has risen to the point where almost 400 buoys or other in-situ measurement types are included (Figure 1). The number of participating centres has also risen to 17, with the models assessed comprising a mixture of global and regional configurations with resolutions varying between approximately 0.5 and 0.1 degrees (50-10km). One of the major strengths of the project is the ability to inter-compare data from a diverse range of participating systems which, in addition to being differently resolved, employ forcing data from a variety of atmospheric models, initiate the wave models with or without data assimilation, and use different approaches to the wave source terms.
Figure 1. Buoy locations in the JCOMM buoy intercomparison scheme, January 2012.
The period from the early 1990s to present has seen remote sensed measurements from polar orbiting satellites become a major part of the global wave and wind observation dataset. Radar altimeter wind speed and Hs measurement inversion algorithms can be considered mature and the data well calibrated against in-situ measurements (e.g. Carter et al., 1992; Queffeulou and Croize-Fillon 2009; and Quefeulou et al., 2011). Advanced Synthetic Aperture Radar measurements can be inverted to generate observations of (truncated) two-dimensional wave spectra, and a number of recent studies and applications have demonstrated the utility and robustness of these data (for a summary of examples see Haselmann et al., 2012). Satellite observations have been used within data assimilation schemes run by a number of forecasting centres since the mid to late 1990s and more recently, as for the in-situ data, the benefits of coordinated application of these data to verification have been

SAULTER, A: CURRENT AND FUTURE VERIFICATION OF OPERATIONAL WAVE MODELS
ECMWF Workshop on Ocean Waves, 25-27 June 2012 161
recognised through establishment of the GlobWave verification system. Figure 2 shows match-up data volumes from this system for a month of satellite altimeter soundings where three instruments were available. The data were sampled at 1Hz and then aggregated onto a 2x2 degree grid. Assuming individual passes to be independent and comprising approximately 20-25 soundings (based on an 8km along-track resolution per sounding), observations at offshore locations globally were generally made independently between 10 and 60 times.
Figure 2. ESA GlobWave project wave forecast verification scheme matchup sample numbers for 1Hz altimeter soundings from Jason-1, Jason-2 and Envisat missions during January 2012. The matchups are amalgamated onto a grid of 2x2 degree cells.
Further developments in wave observation have seen an increased deployment of buoys with measurements and communication systems suitable for return of parameters describing the wave spectrum (via methods briefly summarized in Jensen et al., 2011), application of X-band and HF radar technologies (Wyatt et al., 2003) and trialling of wave data generated via GPS signals from drifting buoys (Herbers et al, 2011). At present approximately 180 of the buoys in the JCOMM intercomparison return some form of spectral data, with approximately 100 of these in deep-intermediate open waters. Once data volumes of a particular type reach a critical mass, exploitation within an operational system becomes feasible and sustainable. In this respect the increasing access to observations with more detailed representation of the wave spectrum suggests a potential step improvement can be made in the detail to which wave models can be tested through operational verification. Looking further ahead, mircoseism data are a subject of current research and could provide further sources of comparison (e.g. Ardhuin et al., 2011a).
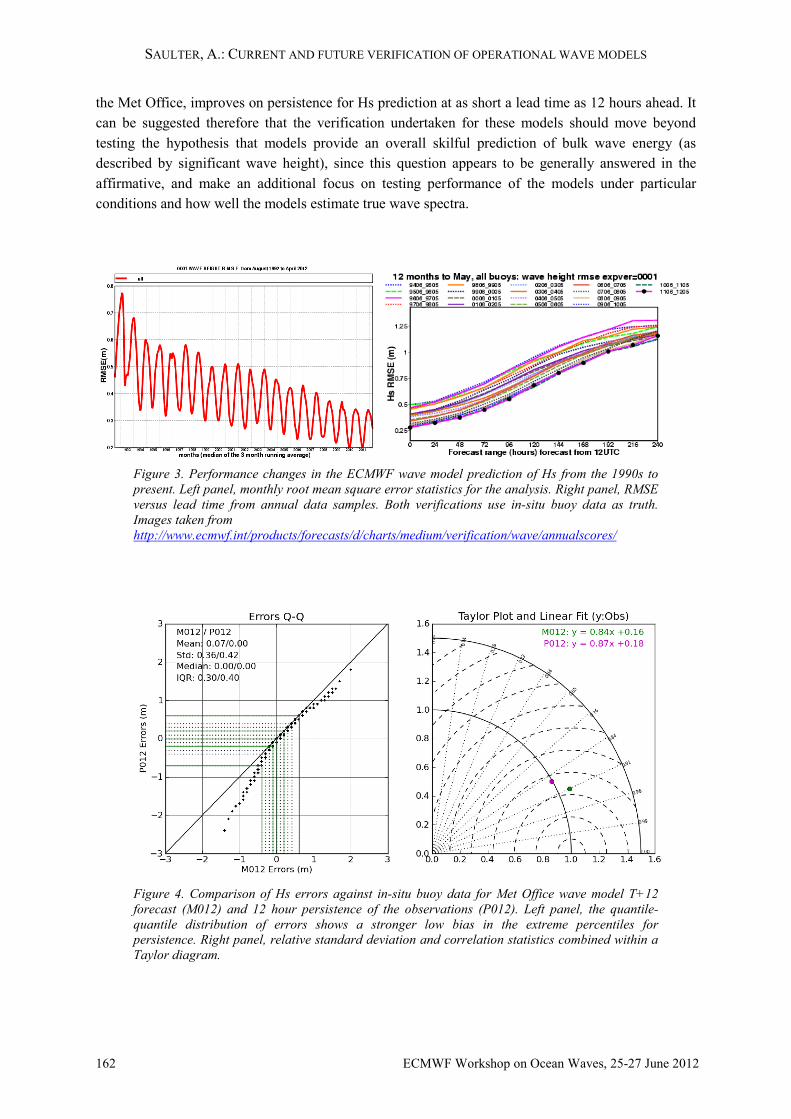
As the observed data landscape has changed, the models used to predict sea-state have also seen significant improvements in both resolution and skill. Figure 3a demonstrates how the Hs root mean square error (RMSE) between the ECMWF wave model analysis and in-situ observations has changed between 1993 and the present. Seasonal fluctuations are present (due to the northern hemisphere bias in observation locations), but do not mask the clear improvement in skill over the years. Looking at forecast times (Figure 3b), the 2012 system now has the same RMSE at 4 days ahead as it did on day 1 in 1994. Figure 4 demonstrates that even a model without data assimilation, such as run presently at
SAULTER, A.: CURRENT AND FUTURE VERIFICATION OF OPERATIONAL WAVE MODELS
162 ECMWF Workshop on Ocean Waves, 25-27 June 2012
the Met Office, improves on persistence for Hs prediction at as short a lead time as 12 hours ahead. It can be suggested therefore that the verification undertaken for these models should move beyond testing the hypothesis that models provide an overall skilful prediction of bulk wave energy (as described by significant wave height), since this question appears to be generally answered in the affirmative, and make an additional focus on testing performance of the models under particular conditions and how well the models estimate true wave spectra.
Figure 3. Performance changes in the ECMWF wave model prediction of Hs from the 1990s to present. Left panel, monthly root mean square error statistics for the analysis. Right panel, RMSE versus lead time from annual data samples. Both verifications use in-situ buoy data as truth. Images taken from http://www.ecmwf.int/products/forecasts/d/charts/medium/verification/wave/annualscores/
Figure 4. Comparison of Hs errors against in-situ buoy data for Met Office wave model T+12 forecast (M012) and 12 hour persistence of the observations (P012). Left panel, the quantile-quantile distribution of errors shows a stronger low bias in the extreme percentiles for persistence. Right panel, relative standard deviation and correlation statistics combined within a Taylor diagram.

SAULTER, A: CURRENT AND FUTURE VERIFICATION OF OPERATIONAL WAVE MODELS
ECMWF Workshop on Ocean Waves, 25-27 June 2012 163
3. Defining purposes for operational verification Verification metrics are at their most useful when clearly defined links exist between the statistics they generate and either a hypothesis to be tested or an application of the results. For example the metrics in Figure 4 can be used to answer the question ‘is the model generally more skilful at predicting Hs values 12 hours ahead than a persistence based forecast?’ In reviewing the statistics that are produced from an operational system it is important therefore to determine the key questions that the verification intends to analyse. Since a forecast model produces guidance that will be used downstream in public and commercial forecasts, it is an ideal that these questions should address the needs of downstream user communities as well as providing feedback to the scientists that develop the models.
In thinking about downstream issues it is suggested that a finite demarcation of downstream users into two types, ‘forecaster’ and ‘end-user’ can be made in order to avoid verification attempting to address a proliferation of bespoke user community requirements. Under these definitions a forecaster will have sufficient knowledge of the model to allow application of verification statistics either in post processing the guidance or communicating risk associated with a given forecast to marine decision makers. The end-user is more interested in verification describing how the model might perform for a specific application and how consistent the model might be with other decision making assets such as on-site observations. The brief discussion within this section examines how the different perspectives might influence verification questions, and will focus on scientific and forecaster requirements.
The questions posed to the verification should ideally comprise two components that describe: 1) the parameter(s) to be tested and (if necessary) the baseline for comparison, i.e. the hypothesis; 2) the range of conditions over which data will be tested, i.e. a rule for ‘stratification’ of the data. In verification answering questions relevant to scientific development of a model, examples of the major parameters and hypotheses to be tested are likely to include the following. Testing that model performance is improved by system changes. Quantifying the errors input to a wave model from the (vector wind) forcing data and other boundary conditions. Demonstrating that the overall energy balance in the wave field (e.g. as described by Hs) is predicted skilfully and determining any linkages to the input wind errors. Demonstrating that energy levels are skilfully assigned to spectral components of different frequencies and that direction and spread properties are also well predicted.
Tolman et al. (2011) present a summary of key scientific research questions needing to be addressed within continuing wave model development. These questions are well aligned with options for stratification and include determining variations in model behaviours for wind-sea and swell, wave growth under non-aligned winds, extreme conditions, in diminishing winds and shallow waters. Stratification against geographic area may also be useful where regions are subject to specific predominant sea types (e.g. short fetch local seas versus long range oceanic swells).
Whilst for a forecaster details of spectral evolution might be of interest, such data may have less practical value in terms of implementing corrections or delivering uncertainty information direct to the most common types of user. Hypotheses are more likely to be applied to parameters integrated from the spectrum (e.g. overall or component Hs) and be based on evaluating the distribution of errors, including relative to theoretical distributions that can then be applied to the raw forecast (e.g. Hodge and Milligan, 2011; Pinson et al., 2011). In such cases stratification enables a refinement of how error measures may be applied to the model guidance in post processing, the simplest example

SAULTER, A.: CURRENT AND FUTURE VERIFICATION OF OPERATIONAL WAVE MODELS
164 ECMWF Workshop on Ocean Waves, 25-27 June 2012
being use of geographically localised errors rather than errors derived from a global dataset. Another common choice might be evaluating the distribution of errors close to specific forecast thresholds and lead times (e.g. the alpha factors given in Det Norske Veritas Rules for Planning and Execution of Marine Operations, Part 1, Chapter 2).
4. Which questions can be met with operational verification? Defining idealised parameter, test and stratification requirements provides a background for making a pragmatic assessment of what can actually be achieved using the data resources available to operational verification systems. Within the following discussion verification of models against the current global observation resource is focused upon, and it is assumed that the key data sources available comprise: wind speed and direction, wave height and period data from buoys in the JCOMM buoy intercomparison; a subset of spectral wave buoys; wind speed and wave height data from satellite altimetry (with 1-3 platforms in operation at any given time); and spectral wave parameters derived from ASAR (1-2 platforms operational).
There are acknowledged omissions from the above list. For example, wind has a key role in wave prediction, and verification using scatterometer data would seem a valuable supplement to existing observations used to understand the effect of winds on the wave model forecast (e.g. Durrant and Greenslade, 2011). Since features of wave analysis fields are dominated by the underlying forced wave model rather than the observations, verification against analyses are believed to be more limited in their benefits. However, intercomparison of fields from different modelling systems might present an alternative spatially data rich source from which further information about the behaviour of various model parameterizations and numerical schemes may be determined.
Sections 2 and 3 have indicated the need to verify the forecast wave field in more detail and to focus not just on general model behaviour but also model response to specific conditions. Stratification requirements associated with these needs lead to issues in terms of obtaining statistically viable sample sizes, particularly since operational verification restricts data volumes through use of a finite sampling period. Estimation of observed data volumes makes it very clear that bulk wind speed and Hs data are by far the most common data available and can therefore be analysed in a less restricted fashion than other wave parameters. Further sampling complexities are introduced by the fact that the various parameters used to describe the wave field cannot be treated simply as independent entities.
4.1. Exploiting increased data volumes – improving stratification
Assuming that verification data can be sampled independently, large increases in observed data volumes should yield a clear opportunity to stratify data according to conditions (e.g. Figure 5 and Ardhuin et al., 2011) and/or geographic area (e.g. Figure 6 and Bidlot, 2007). More flexibility is offered by the high data volumes available for wind speed and Hs than for other parameters and, although these data lack spectral detail, suitable stratification may allow inference of some aspects of behaviour in model parameterizations. For example Figure 5 suggests a rather different bias pattern through the low to moderate wave height range in the Met Office WAVEWATCH III configuration using Tolman and Chalikov (1996) source terms when compared to the ECMWF WAM model (Bidlot et al., 2007), although low to moderate wind speed biases for the two systems appear broadly similar. The geographic distribution of bias in Figure 6 also hints at issues with the growth and

SAULTER, A: CURRENT AND FUTURE VERIFICATION OF OPERATIONAL WAVE MODELS
ECMWF Workshop on Ocean Waves, 25-27 June 2012 165
dissipation balance in the TC96 terms by showing west-east dipoles in bias over ocean basins in the northern hemisphere and a consistent high bias in the southern ocean. The latter bias seems too high to be fully attributable to lack of iceberg representation in the model as described by Ardhuin et al. (2011b). Since the present generation of forecast models offer a number of parameters describing amount of spectral energy in the wind-sea, wave age and so on, more complex stratification methods might be achieved reasonably robustly based on parameters available from the model itself.
Figure 5. T+48 forecast Met Office and ECMWF wind speed, Hs and Tp bias and error standard deviation statistics stratified based on incremental 5% subsamples of model data. The models are compared against buoy data and show differing trends through wind speed and wave energy ranges.
Figure 6. Hs bias data for 1 year Met Office hindcast compared against GlobWave L2P satellite data. Errors are aggregated onto a 200x200km grid and show strong geographic variations.
Stratification may also be made more robust through use of resampling techniques such as the ‘bootstrap’ (Efron and Gong, 1983). These techniques enable a test of the stability of given statistics by examining the effect of changes to the data sample from which the statistics are derived. Resampling has particular application where data sample sizes are considered marginal. Figure 7

SAULTER, A.: CURRENT AND FUTURE VERIFICATION OF OPERATIONAL WAVE MODELS
166 ECMWF Workshop on Ocean Waves, 25-27 June 2012
demonstrates the stability of Hs bias and error standard deviation statistics stratified by 5% groupings of forecast values when based on a full complement of the JCOMM buoys versus a significantly smaller regional subset. At the global level the statistics are extremely stable and changes through the forecast range are significant relative to the small error bounds shown. The regional level uses a factor of 30 less data, yielding much larger error bounds. Nevertheless changes in the errors are still likely to be significant for bias found between forecasts of low to moderate wave heights (less than 4m) and values at 5m plus, whilst standard deviation shows significant change for forecasts from 2m to 4m and then 4m to 6m regimes.
Figure 7. Use of 10000 member bootstrap samples to determine uncertainty in statistics based on sample size. The large sample size underpinning statistics in the left panel allows generation of stable values, whilst the smaller sample size used for analyses on the right leads to uncertainty in the data. Assessing ‘signal to noise’ in the plots enables determination of whether trends in the data are real.
4.2. Exploiting increased parameter sets
Incorporating parameters other than wind speed and Hs into operational verification appears feasible, but should be approached pragmatically in order to sensibly define data sampling periods and methodologies to verify parameters that may have significant dependencies. Stoffolen (1998) provides an example of how vector wind error distributions can take on more or less complex forms dependent on whether the data are viewed in an arbitrary orthogonal u, v or magnitude, direction frame of reference. Figure 8 shows a similar example in which orthogonal errors (u’,v’ defining across vector and along vector respectively) have been derived relative to the forecast wind vector. In this case the error distributions appear independent and the data are in sufficient volumes to allow a limited stratification of the data based on wind speed.

SAULTER, A: CURRENT AND FUTURE VERIFICATION OF OPERATIONAL WAVE MODELS
ECMWF Workshop on Ocean Waves, 25-27 June 2012 167
Figure 8. Along (v’) and across (u’) vector wind errors between Met Office analysis and in-situ buoy data, stratified by model wind speed less than 5m/s, 5-10m/s, 10-15m/s and greater than 15m/s. Colours in plots represent proportion of the data sample in 0.2m/s bins.
At the scales generally verified wave fields are more complicated than wind fields. An impact is that the detail that might be determined from multi-variate analyses of parameters derived from the entire spectrum will be offset if sufficient consideration has not been made of the nature of the sea-state being verified. For the established tests of Hs this is generally not an issue since the hypothesis tested is skilful prediction of the bulk energy response to wind forcing. However, a parameter such as peak period will be much more unstable in multi-component sea-states. Figure 9, which examines the percentage occurrence of a significant secondary wave component in the model spectrum for a range of JCOMM buoy locations, indicates that such seas make up a significant proportion of the overall data sample. Any verification of parameters describing the wave spectrum needs to account for this.
With this in mind, the long term solution to verifying the wave field would appear to be to verify the full two-dimensional spectrum. Methods such as the WAVEVAL toolbox (Jensen et al., 2011) or 1D spectral verification as shown in Bidlot et al. (2005) are available to achieve this. However a restriction that has particular impacts on operational systems is that, even in its one-dimensional form, the wave spectrum represents a very large parameter space needing to be populated with a statistically significant sample. At the same time, sub-ranges within the spectrum will be particularly sensitive to different conditions (for example high frequencies to growing and dissipating wind-seas, very low frequencies to extreme storms and long range propagation of energy), such that the results of spectral statistics may only have clear meaning when used in tandem with stratification. Combined, the implication is that full spectral verification on operational timescales may be limited by the ability to achieve robust conditional sample sizes and this question needs further investigation.

SAULTER, A.: CURRENT AND FUTURE VERIFICATION OF OPERATIONAL WAVE MODELS
168 ECMWF Workshop on Ocean Waves, 25-27 June 2012
Figure 9. Normalised frequency of (model) sea-states including a secondary wave system (defined using a topographic spectral partitioning scheme) with greater than 10% of the overall wave energy.
Hanson et al. (2009, for buoy data), and Delpey et al. (2010, for ASAR data), demonstrate verification that takes one step back from the full spectrum and uses topographically partitioned components. The advantage of this approach is that a significant reduction in parameter space relative to the full spectrum is achieved, whilst information on multi-modal seas is retained. Li and Holt (2009) and Jensen et al. (2011) have approached reduced spectral data comparisons through the more simple technique of using of various sub-range wave data. Ardhuin et al. (2011c) show comparisons between the model high frequency tail and altimeter mean square slope data. Feasible options for partitioned wave data verification exist therefore, with the main restrictions preventing effective implementation being selection of a common and robust method for partitioning wave data that will also allow stratification, and a need to reconcile the information that can be sensibly derived when 2D model wave spectra are compared to the types of directional data available from buoys (i.e. the ‘First 5’ components, Jensen et al., 2011).
5. Issues for future operational verification? Making the most of the resources available for operational verification requires definition of the problems that can be viably tested by schemes that sample data over a specified limited periods. Agreement of the most useful stratification methods and identifying requirements for extra parameters that may need to be provided by participating centres is needed. Understanding what serves as a sensible stratification policy is likely to require some apriori assessment of the wave climate in order to understand likely sample sizes at different times of the year. A significant number of long term datasets of observations (e.g. via the National Data Buoy Centre and GlobWave L2P dataset) and model data (e.g. Ardhuin et al., 2011c; Chawla et al., 2011; Cox et al., 2011, Dee et al., 2011; Reistad et al., 2011) are now available that could meet this requirement.

SAULTER, A: CURRENT AND FUTURE VERIFICATION OF OPERATIONAL WAVE MODELS
ECMWF Workshop on Ocean Waves, 25-27 June 2012 169
The extent to which operational verification should cater to the needs of downstream users is an open question. Particular considerations include update and release cycles for data or reports – the more regularly and rapidly these are required, the greater the need for engineering datafeed and automated observation quality control procedures, and managing a potential proliferation of ‘critical’ user thresholds against which to verify. In addition user focused verification raises the need to deal with the issue of representation errors produced by inconsistencies in observation versus model scales. Model focused verification, including the JCOMM buoy intercomparison, aim to mitigate representation errors by super-observing data onto a model equivalent scale (Bidlot and Holt, 2006). In contrast, operational forecasts will normally be judged directly against spot measurements or often a user’s short assessment of sea conditions. Arguably user focused verification should use the same type of method as its reference scale. Where the model data verified is sourced from a mixture of global, mesoscale or coastal scale configurations, comparing against a common observed baseline may also be a more sustainable and universal approach. Figure 10 indicates that, at least for certain parameters, this might not be a significant issue. In this case the error distributions for Hs using both a 4 hour super observation and raw data from the JCOMM buoy intercomparison show very similar characteristics until the most extreme percentiles.
Figure 10. Comparison of error data generated when verifying the Met Office Hs analysis against raw in-situ observations (20 minute sample) and the JCOMM scheme 4-hour ‘super-observation’.
The discussion has heavily featured the benefits that can be obtained via better exploitation of increased observation data volumes. The programmes delivering these data need support in order to sustain and grow, part of which includes demonstration of the utility of verification programmes – this emphasises the need to consider making results relevant and available to communities downstream from science. In dealing with increased amounts of data the methods used must also be mindful of a need to ensure independence in the errors sampled in order not to alias statistics. In some observation dense regions this issue may now need to be examined. For example Figure 11 suggests that the JCOMM buoy data are temporally correlated for Hs between successive 6 hour samples, such that the

SAULTER, A.: CURRENT AND FUTURE VERIFICATION OF OPERATIONAL WAVE MODELS
170 ECMWF Workshop on Ocean Waves, 25-27 June 2012
independent data sample from this scheme may only be in the region of approximately 50% of the observation count used. Figure 12 examines the Hs correlation between buoys at zero lag and indicates that several clusters of buoys are contained in the dataset for which the sampling regime is extremely similar. Within the global dataset there are probably sufficient buoys not to affect the overall statistics, but this may be an issue for regional data.
Figure 11. Temporal correlations of (x-axis) observed Hs and (y-axis) model-observation Hs errors for buoys in the JCOMM intercomparison. Data were processed over a 3 month sample.
In using verification of models against ‘the observation’ a final issue for consideration is the question of the scales and mixes of data for which the truth that can be considered to be consistent. Taking the global example, applying a consistent truth would imply that statistics regarding model performance derived in buoy rich regions should not be significantly at odds with similar tests made where only satellite data are available. In-situ buoy observations have traditionally been considered as the baseline truth. In keeping with this, substantial efforts have been made to calibrate satellite data consistently against wave buoy networks (Carter et al., 1992; Durrant et al., 2009; Queffeulou and Croize-Fillon 2009). Nonetheless, triple collocation studies of independent buoy, satellite and model data made at global scales (e.g. Janssen et al., 2006) have demonstrated that overall satellite errors may be lower and more consistent than errors from the amalgamation of various sets of buoy and platform data making up the global in-situ dataset. Specific instances of inconsistencies in in-situ data

SAULTER, A: CURRENT AND FUTURE VERIFICATION OF OPERATIONAL WAVE MODELS
ECMWF Workshop on Ocean Waves, 25-27 June 2012 171
are provided by Durrant et al. (2009). Since methods to determine errors in observation systems are established, further application to the observed dataset is warranted. For example, testing the global findings of Janssen et al. (2006) at finer scales and in a regional context. Such information should help understanding of the feasibility of consistently applying wave verification using differing mixes of in-situ and satellite data.
Figure 12. As for Figure 11, but for correlation at zero-lag between individual buoys
6. Summary Operational verification enables wave forecasting centres to provide regularly updated information on model performance and measures of forecast uncertainty that can potentially be applied to the model guidance downstream. Changes to available near real-time observation data and models over the last 10-15 years have led to significant improvements in the available ground truth, parameter sets for verification and model skill. These changes should enable operational verification to become focused on performance metrics over and above measuring skill in the wave model’s bulk energy response to forcing. In addition to the presently used verification assets, further use of scatterometer data and inter-comparison of full model fields could be considered as immediately available enhancements to the present baseline observation data.
Defining the form of a verification system requires consideration of metrics, but needs primarily to be concerned with clarifying those questions that can be answered robustly by statistics derived from data sampled over typical operational periods (monthly, quarterly, annual) and under stratification criteria that band error datasets into geographic, condition based or process based regimes. From a

SAULTER, A.: CURRENT AND FUTURE VERIFICATION OF OPERATIONAL WAVE MODELS
172 ECMWF Workshop on Ocean Waves, 25-27 June 2012
science perspective major questions to be analysed can be determined from open literature and in scientific forums, whilst downstream user requirements need engagement with forecaster and end user communities. Apriori assessment of approaches to stratification using wave climate data are recommended in order to ensure that operational data samples will achieve statistically viable data populations.
Other key issues identified for systems development are requirements to ensure independence in the sampling schemes used and to understand how operational verification can serve both scientific and downstream users in a practicable manner, inclusive of agreeing whether pursuing a universally consistent form of truth is desirable.
7. References Abdalla, S., Janssen, P.A.E.M. and Bidlot, J.R., 2011. Altimeter near real time wind and wave
products: random error estimation. Marine Geodesy, 34, 393-406, doi:/10.1080/01490419.2011.585113.
Ardhuin, F., Stutzmann, E., Schimmel, M. and Mangeney, A., 2011a. Ocean wave sources of seismic noise. J. Geophys. Res., 116, C09004,doi:/10.1029/2011JC006952.
Ardhuin, F., Tournadre, J., Queffeulou, P., Girard-Ardhuin, F., and Collard, F, 2011b. Observation and parameterization of small icebergs: drifting breakwaters in the southern ocean. Ocean Modelling, 39, 405-410, doi:10.1016/j.ocemod.2011.03.004.
Ardhuin, F., Hanafin, J., Quilfen, Y., Chapron, B., Queffeulou, P. and Orbreski, M., 2011c. Calibration of the ‘IOWAGA’ global wave hindcast (1991-2011) using ECMWF and CFSR winds. Proceedings of the 12th International Workshop on Wave Hindcasting and Forecasting. http://www.waveworkshop.org/12thWaves/index.htm
Bidlot, J.R., Holmes, D.J., Wittmann, P.A., Lalbeharry, R. and Chen, H.S., 2002. Intercomparison of the performance of operational ocean wave forecasting systems with buoy data. Weather and Forecasting, 17, 287-310.
Bidlot, J.R., Janssen, P.A.E.M. and Abdalla, S., 2005. On the importance of spectral wave observations in the continued development of global wave models. Proc. 5th International Symposium WAVES 2005.
Bidlot, J.R. and Holt, M., 2006. Verification of operational global and regional wave forecasting systems against measurements for moored buoys. JCOMM Technical Report No. 30. ftp://ftp.wmo.int/Documents/PublicWeb/amp/mmop/documents/JCOMM-TR/J-TR-30/J-TR-30.pdf
Bidlot, J.R., Li., J.-G., Wittmann, P., Fauchon, M., Chen, H., Lefevre, J.-M., Bruns, T., Greenslade, D., Ardhuin, F., Kohno, N., Park, S., and Gomez, M., 2007. Inter-comparison of operational wave forecasting systems. Proc. 10th International Workshop on Wave Hindcasting and Forecasting. http://www.waveworkshop.org/10thWaves/ProgramFrameset.htm

SAULTER, A: CURRENT AND FUTURE VERIFICATION OF OPERATIONAL WAVE MODELS
ECMWF Workshop on Ocean Waves, 25-27 June 2012 173
Bidlot, J., P. Janssen, S. Abdalla, 2007: A revised formulation of ocean wave dissipation and its model impact. ECMWF Tech. Memo. 509, 29 pp.
Carter, D., Challenor, P., Srokosz, M., 1992. An assesment of Geosat wave height and wind speed measurements. J. Geophys. Res. 97, 11383–11392.
Chawla, A., Spindler, D., Tolman, H., 2011. A thirty year wave hindcast using the latest NCEP climate forecast system reanalysis winds. Proc. 12th International Workshop on Wave Hindcasting and Forecasting. http://www.waveworkshop.org/12thWaves/index.htm
Cox, A., Cardone, V., Swail, V., 2011. On the use of the climate forecast system reanalysis wind forcing in ocean response modelling. Proc. 12th International Workshop on Wave Hindcasting and Forecasting. http://www.waveworkshop.org/12thWaves/index.htm
Dee, D. P. Uppala, S. M. Simmons, A. J. Berrisford, P. Poli, P. Kobayashi, S. Andrae, U. Balmaseda, M. A. Balsamo, G. Bauer, P. Bechtold, P. Beljaars, A. C. M. van de Berg, L. Bidlot, J. Bormann, N. Delsol, C. Dragani, R. Fuentes, M. Geer, A. J. Haimberger, L. Healy, S. B. Hersbach, H. Hólm, E. V. Isaksen, L. Kållberg, P. Köhler, M. Matricardi, M. McNally, A. P. Monge-Sanz, B. M. Morcrette, J.-J. Park, B.-K. Peubey, C. de Rosnay, P. Tavolato, C. Thépaut, J.-N. Vitart, F. 2011. The ERA-Interim reanalysis: configuration and performance of the data assimilation system. Q. J. R. Meteorol. Soc. 656, 553–597.
Delpey, M.T., Ardhuin, F., Collard, F. and Chapron, B., 2010. Space-time structure of long ocean swell fields. J. Geophys. Res., 115, C12037, doi:10.1029/2009JC005885.
Durrant, T.H., Greenslade, D.J.M. and Simmonds, I., 2009. Validation of Jason-1 and Envisat remotely sensed wave heights. J. Atmos. Oc. Tech., 26, 123-134, doi:10.1175/2008JTECHO598.1.
Durrant, T. and Greenslade, D., 2011. The application of learned wind corrections to wave forecasts. Proceedings of the 12th International Workshop on Wave Hindcasting and Forecasting. http://www.waveworkshop.org/12thWaves/index.htm
Det Norske Veritas, 1998. Rules for Planning and Execution of Marine Operations.
Efron, B. and Gong, G., 1983. A leisurely look at the bootstrap, the jackknife, and corss-validation. Am. Stat., 37, 36-48.
Hanson, J.L., Tracy, B.A., Tolman, H.L. and Scott, R.D., 2009. Pacific hindcast performance of three numerical models. J. Atmos. Oc. Tech., 26, 1614-1633, doi:10.1175/2009JTECHO650.1.
Hasselmann, K., B. Chapron, L. Aouf, F. Ardhuin, F. Collard, G. Engen, S. Hasselmann, P. Heimbach, P. Janssen, H. Johnsen, H. Krogstad, S. Lehner, J-G. Li, X-M. Li, W. Rosenthal, J. Schulz-Stellenfleth, 2012: The ERS SAR Wave Mode – a breakthrough in global ocean wave observations. ESA Publication (in press)
Herbers T.P., Jessen, P., Janssen, T., Colbert, D. and MacMahan, J., 2012. Observing ocean surface waves with GPS-tracked buoys. J. Atmos. Oc. Tech., doi:10.1175/JTECH-D-11-00128.1, in press.

SAULTER, A.: CURRENT AND FUTURE VERIFICATION OF OPERATIONAL WAVE MODELS
174 ECMWF Workshop on Ocean Waves, 25-27 June 2012
Hodge, B.M. and Milligan, M., 2011. Wind power forecasting error distributions over multiple timescales. Proc. Power and Energy Society General Meeting, NREL/CP-5500-50614
Janssen, P.A.E.M., Abdalla, S., Hersbach, H. and Bidlot, J.R., 2006. Error estimation of buoy, satellite, and model wave height data. J. Atmos. Oc. Tech., 24, 1665-1677, doi:10.1175/JTECH2069.1.
Jensen, R., Swail, V., Lee, B. and O’Reilly, W.A., 2011. Wave measurement evaluation and testing. Proceedings of the 12th International Workshop on Wave Hindcasting and Forecasting. http://www.waveworkshop.org/12thWaves/index.htm
Pinson, P., Reikard, G. and Bidlot, J.R., 2011. Probabilistic forecasting of wave energy flux. Submitted to Applied Energy.
Queffeulou P & Croizé-Fillon D June 2009. Global altimeter SWH data set. IFREMER ([email protected])
Reistad, M., Breivik, Ø., Haakenstad, H., Aarnes, O., Furevik, B., Bidlot, J.R., 2011. A high-resolution hindcast of wind and waves for the North Sea, the Norwegian Sea and the Barents sea. J. Geophys. Res. 116, C05019, doi:10.1029/2010JC006402
Saetra, O. and Bidlot, J.R., 2004. Potential benefits of using probabilistic forecasts for waves and marine winds based on the ECMWF ensemble prediction system. Weather and Forecasting, 19, 673-689.
Stoffelen, A., 1998. Error modelling and calibration; towards the true surface wind speed. J. Geophys. Res., 103 (C4), 7755-7766.
Tolman, H.L., Banner, M.L. and Kaihatu, J.M., 2011. The NOPP Operational Wave Model Improvement Project. Proc. 12th International Workshop on Wave Hindcasting and Forecasting. http://www.waveworkshop.org/12thWaves/index.htm
WISE Group, 2007: Wave modelling - the state of the art. Progress in Oceanography, 75, 603–674.
Wyatt, L.R., Green, J.J., Gurgel, K.-W., Nieto Borge, J.C., Reichart, K., Hessner, K., Gunther, H., Rosenthal, W., Saetra, O. and Resitad, M., 2003. Validation and intercomparisons of wave measurements and models during the EuroROSE experiments. Coastal Engineering, 48, 1-28, doi:10.1016/S0378-3839(02)00157-6.
Acknowledgements Man thanks to Jean Bidlot (ECMWF) for his invitation to present at this meeting, and Tamzin Palmer for review of the paper.