standardized wave and wind environments for nato operational areas
TRANSCRIPT

4m1 DAVID W. TAYLOR NAVAL SHIP,--I
RESEARCH AND DEVELOPMENT CENTERB-etheu, Maryl"d 20064
C.,,
I--
CSTANDARDIZED ,AVE AND WIND ENVIRONMENTS
FOR NATerO'PERATIONAL AREAS •
0' B -- ý-
W AH T.ALEE
JOYCE .M./,OELKER
APPROVED FOR PUBLIC RELEASE: DISTRIBUTION UNLIMITED
Laii
SHIP PERFORMANCE DEPARTMENT
OCT 14 1981
A
u .00 ~ /~DTNSRDC/SP-998
81 10 103 4-.

MAJOR DTNSRDC ORGANIZATIONAL COMPONENTS
DTNIRoCCOMMANDER
TECHNICAL DIRECTOR01
OFFICER-I N-CHARGE OFFICER-IN-CHARGE
CARDIEROCK 0 NAPOLIS 04
SYSTEMSDEVELOPMENTDEPARTMENT
11
AVIATION ANDSHIP PERFORMANCE SURFACE EFFECTS
DEPARTMENT IDEPARTMENT15 16
STRUCTURES 1COMPUTATION,DEPARTMENT MATHEMATICS ANDDEPARTMENT _ILOGISTICS DEPARTMENT
17 18
HI A C PROPULSION ANDSHIP ACOUSTICS AUXILIARY SYSTEMS
19ATMN DEPARTMENT 219 27
SHIP MATERIALS CENTRALENGINEERING INSTNUMENTATIONDEPARTMENT I DEPARTMENT
NOW-DThSt0JC 30/43b (R'. 3-71spao on v

SECURITY CLASSIFICATION OF THIS PAGE (When Date Entored)
REPORT DOCUMENTATION PAGE REOD R TE C'O '-
I. REPORT NUMBER ,.GOVTACCESSIONNo. 3. RECIPIENT'S C .TAO....
DTNSRDC/SPD-091 9-01 _________
4. TITLE (and Subtitle) S. TYPE OF REPOt & P!:P.1 COVERED
STANDARDIZED WAVE AND WIND ENVIRONMENTS FOR FinalNATO OPERATIONAL AREAS 6. PERFORMING ORG. REPORT NUMBER
7. AU"HOR(,) I. CONTRACT OR GRANT NUMBER(*.
Susan L. Bales, Wah T. Lee and Joyce M. Voelker
9. PERFORMING ORGANIZATION NAME AND ADDRESS 10. PROGRAM ELEMENT. PROJECT, TASK
AREA & WORK UNIT NUMBERS
Ship Performance DepartmentDavid W. Taylor Naval Ship R&D Center (See reverse side)Bethesda, Maryland 20084
11. CONTROLLING OFFICE NAME AND ADDRESS 12. REPORT DATE
Naval Sea Systems Command, Washington, D.C. 20362 July 1981Naval Material Cogxmand, Washington, D.C. 20360 13, NUMBER OF PAGES
336"•T. MONITORING AGENCY NAME & ADDRESS(Il different from Controlling Office) IS. SECURITY CLASS, (of tlhi report)
UNCLASS I FI ED1S3. DECL ASSI FICATION/DOWNGRADING
SCHEDULE
16. DISTRIBUTION STATEMENT (of this Report)
APPROVED FOR PUBLIC RELEASE: DISTRIBUTION UNLIMITED
17. DISTRIBUTION STATEMENT (of the abstract entered in Block 20, If dilfleent hem IRepor)
IS, SUPPLEMENTARY NOTES
IS. KEY WORDS (Contihnue on rovere, side if neceesary and Identify' block numbw)
Natural Environment Ship Performanc~eSpectral Ocean Wave Model (SOWM) Wave SpectraHindcast Wave StatisticsNATO Standard Agreement (STANAG)
20. ABSTRACT (Comlituae an revfees, side if neceeesay and identity by Mock numbw.)
This report is a source document for specifying wind and wave conditionsfor those regions considered appropriate for Joint operations of NATO navalforces. The areas considered are the North Atlantic Ocean northward from theTropic of Cancer, the Mediterranean Sea, and coastal or landlocked areas suchas the North, Baltic and Black Seas. The report provides seasonal and geo-graphic distributions of wind and wave parameters and specifies mathematical
(Continued on reverse side)
DD 1 A 473 EDtITION OF I NOV 9 IS OBSOLETE
5 'N 0CS0C-LFI0N6601 UNCLASSPIAFIEDSECURITY CLASSIF'ICATIO14 Of THIS P AGO[ (When Does Iftfoed)

•' i ' ' i iU i |ik I jil ll III II!lIIU I I IB ,•
_ _ _____ UTL.Se! Eh..."INAct IFiED 1SECURITY CLASSIFICATION OF THIS PACE (1Wn Dots MI•tored)
(Block 10) I
Program Element 62543N and 62759NProject ZF 43 421 001 and SF 59 557 695Work Unit Numbers 1568-323-A!, 1500-104-26, 1568-838-03, 1500-300-37
(Block 20 continued) Imodels by which wave spectra, required by any ship seakeeping performancemethodology, can be developed. Portions of the data contained herein arederived from the U.S. Navy's emerging Twenty Year Hindcast Wind and Wave IClimatology, and are considered to be far superior to data previously 'Vavailable for those operating areas.
I1k
J,L I
i]
I Ii
:Li UNCLASSIF I EDSECURITY CLASIFIC~IATION OF WTISPAGEIWl~m Du III eed]
*. . . 2•.,,;••

I. TABLE OF CONTENTSPage
ABSTRACT .. .. .... ......... . .. .. .. .. .. .. * . .. .. . .* . .
ADMINISTRATIVE INFORMIATION .. .. ....... . .... ..... . . .. .. . .. . . I
B ACKGROUNDcI.. .. .... .......... . .. .. ... . .. .. .... . . . . . . . 1
APPROACH. .. ..... . ................ . . . . . . . . . . . 2
OPEN OCEk! NORTH ATLANTIC. .. ......... . . . . . . . .. .. .. ... . . . . 2
WAVE AND WIND STATISTICS . .. .. .. .. .. .. .. . .. . . . . . . . 2jWAVE SPECTRAL FAMILY .. ....... . ............ .. .. ..... . . . . . . . 6
MEDITERRANEAN SEA . . . . . . . . . . . *.. .. .. . .*. . . . . .. . . . 8
jWAVE AND WIND STATISTICS . . . . . . ... . . . . . . . . . . . . . . . . 8
WAVE SPECTRAL FAMILY . .. .. .. ........ ............... ...... .. . ... . 8
COASTALANDLAANDLOC CDA EDA REA. . . . ... .. . ... .. .. . . . . ... 8WAVE AND WIND STATISTICS . . . . . . . . . . .. .. . .. . . . . . . . . 8
WAVE SPECTRAL FAMILY . .. .. .. . ..... .. .. .. .. . . . . . . . 9
*TOTAL MARINE ENVIRONMENT .. .. .. .. . .. . . . 1.* .. .. .. . ...
EXTREME SEAS . . . .. .. .. .. .. .. .. .. .. .. .. .. .. .. .. 11
ACKNOWLEDGMENTS. ........ . ... . .... . .... .. .. .. .. .. .. .. 12
REFERENCES .. .. .... ............... . ........ .. .. .. .. .. .. .. ... 13
I.APPENDIX A - SEASONAL CLIMATOLOGY OF THE NORTH ATLANTIC OCEAN. .. ...... ......A-i
12APPENDIX B - SEASONAL CLIMATOLOGY OF THE MEDITERRANEAN SEA . .. .. .. .. ......
APPENDIX C - SEASONAL CLIMATOLOGY OF THE NORTH SEA .. .. .... ........... . . . C-1
EAPPENDIX D - SEASONAL CLIMATOLOGY OF THE BALTIC SEA. .. .... ....... . . . . .D-1
APPENDIX E - SEASONAL CLIMATOLOGY OF THE BLACK SEA . . . . .. .. .. .. . .E-1
APPENDIX F - DATA FORMAT DESCRIPTION .. ....... .. ......... . ................F-i
rAPPENDIX G -RELATIVE WIND ENVELOPES FOR VTOL AIRCRAFT OPERATIONS . . . . . . G-1
APPENDIX H -FORTRAN SUBROUTINE TO CALCULATE BRETSCHNEIDER SPECTRA . . . . . . H-i
APPENDIX I -FORTRAN SUBROUTINE TO CALCULATE MODIFIED JONSWAP SPECTRA 1 -1
Page
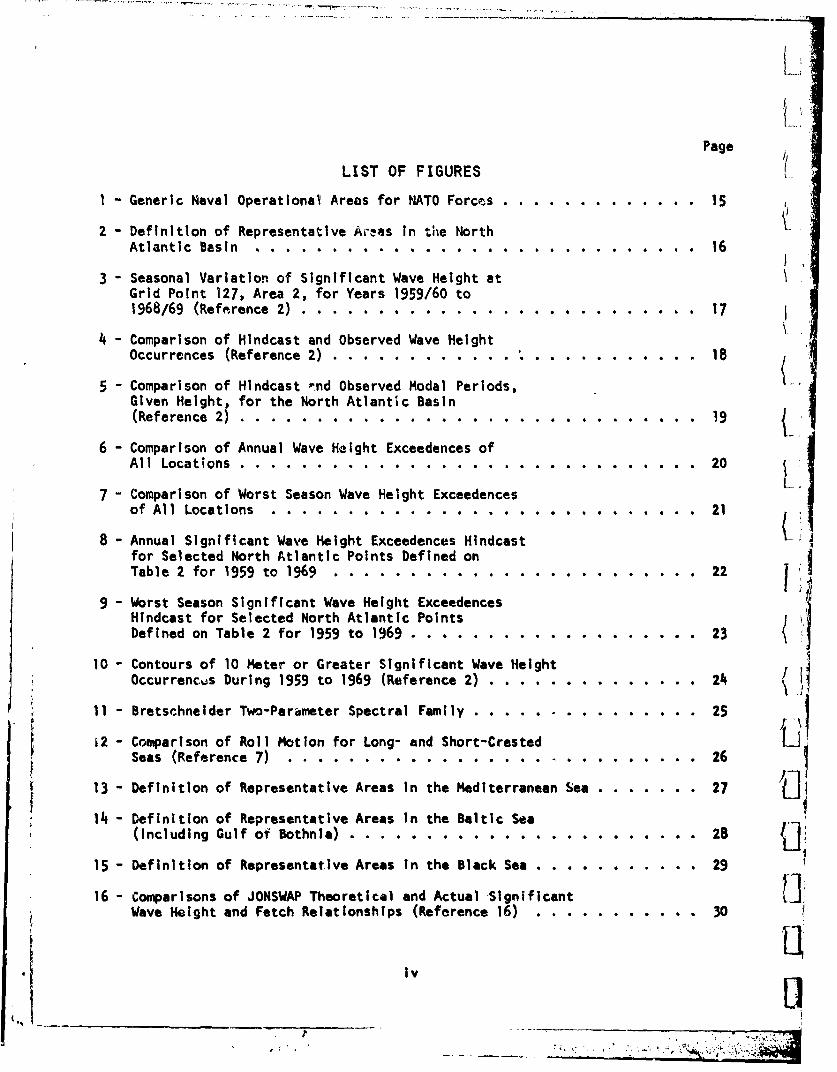
LIST OF FIGURES
1 - Generic Naval Operational Areas for NATO Forces . . . . ......... 15
2 - Definition of Representative Areas In the NorthAtlantic Basin . . . . . . . . . . . . . . . . . . . . . . . . . . ..... 16
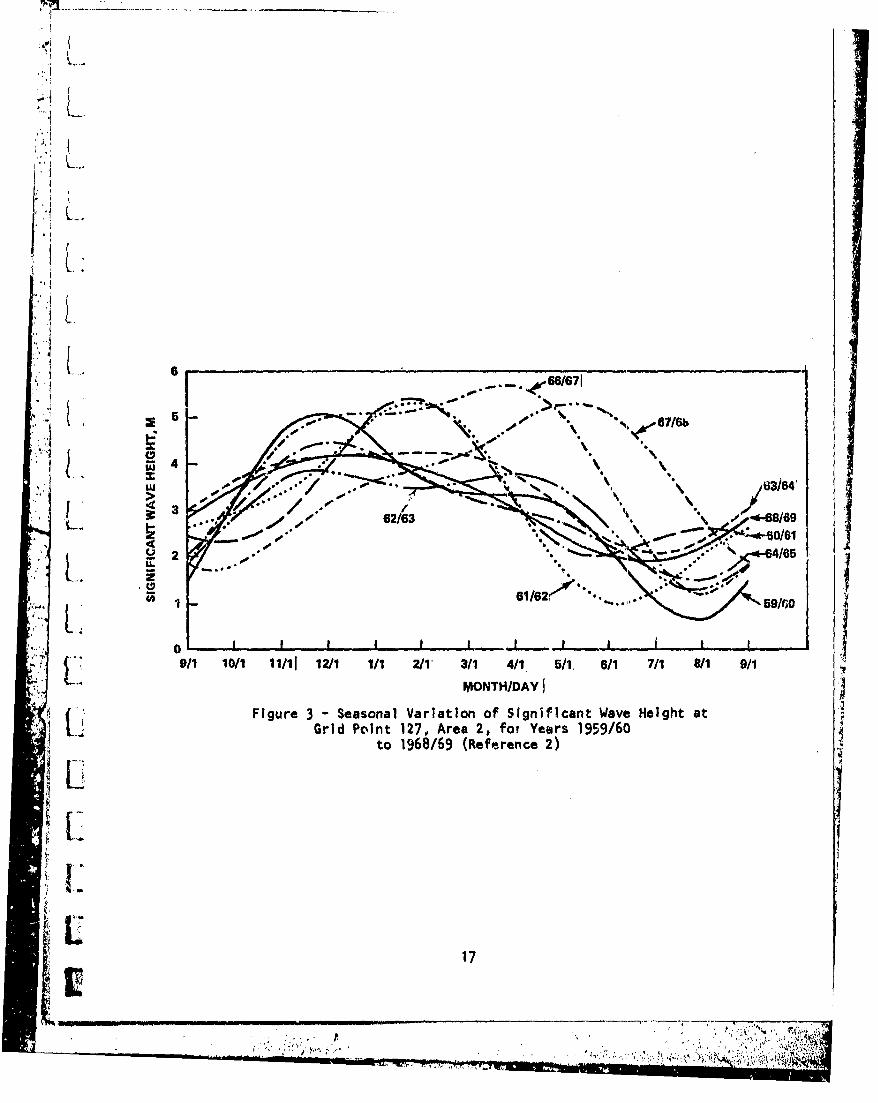
3 - Seasonal Variation of Significant Wave Height atGrid Point 127, Area 2, for Years 1959/60 to1968/69 (Reference 2) .. . . ... . .. ... .... . .. .. .. . . 17
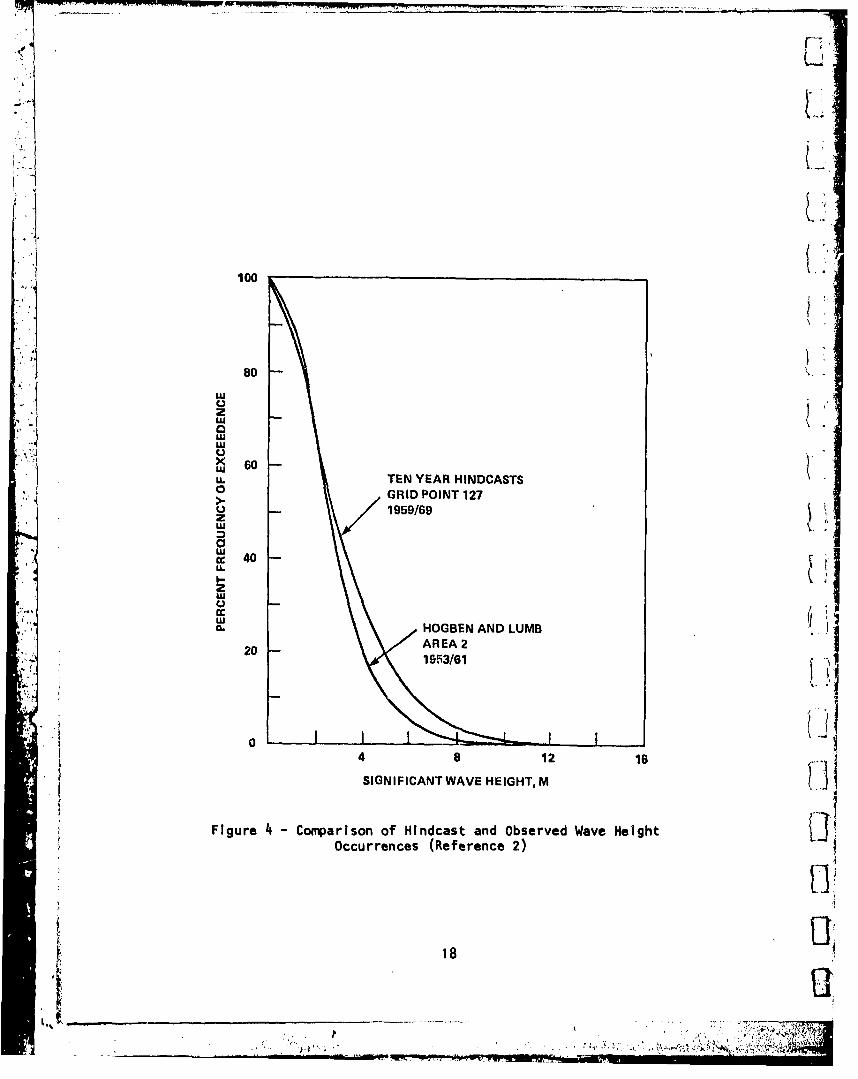
4 - Comparison of Hindcast and Observed Wave HeightOccurrences (Reference 2) ......... ............ ............. 18
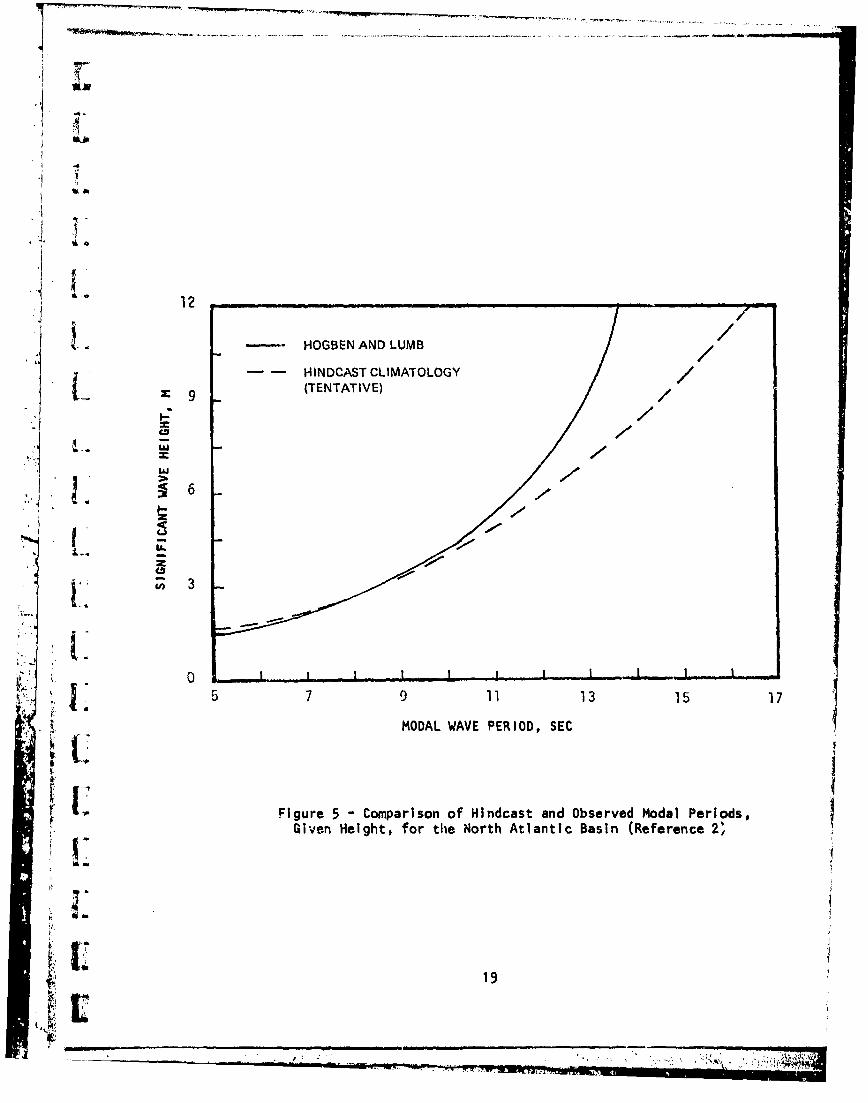
5 - Comparison of Hindcast wnd Observed Modal Periods,Given Height, for the North Atlantic Basin(Reference 2) ....................... ......... . 19
6 - Comparison of Annual Wave Height Exceedences ofAll Locations....... ..... ....... ..... ..... ....... ..... ..... . 20
7 - Comparison of Worst Season Wave Height Exceedencesof All Locations ...... ..... ............................ 21
8 - Annual Significant Wave Height Exceedences Hindcastfor Selected North Atlantic Points Defined onTable 2 for 1959 to 1969 .... .................... .. . . 22
9 - Worst Season Significant Wave Height Exceedences
Hindcast for Selected North Atlantic PointsDefined on Table 2 for 1959 to 1969 ...... ................... ... 23
10 - Contours of 10 Meter or Greater Significant Wave HeightOccurrences During 1959 to 1969 (Reference 2) .............. 24
11 - Bretschneider Two-Parameter Spectral Family .......... . . . . . 2512 - Comparison of Roll Motion for Long- and Short-Crested
Seas (Reference 7) ........ ..... .......................... ... 26
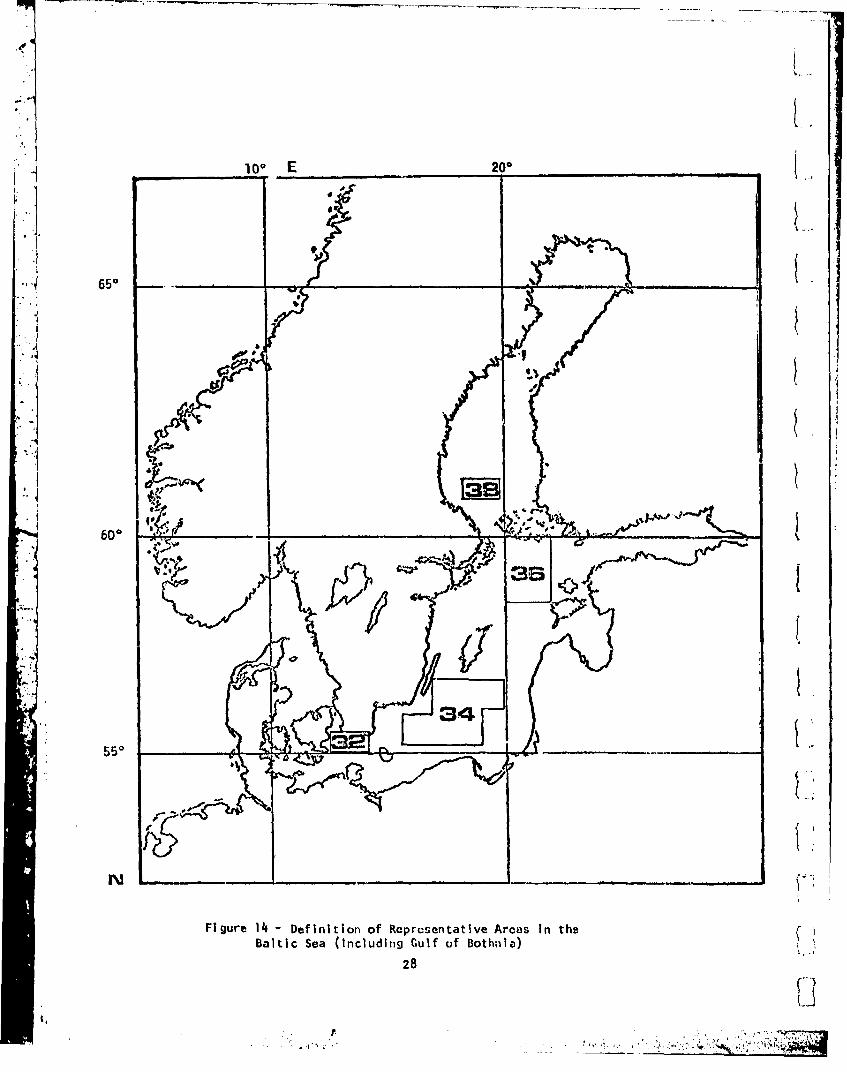
13 - Definition of Representative Areas In the Mediterranean Sea .... ....... 27 {j14 - Definition of Representative Areas In the Baltic Sea
(Including Gulf of Bothnia) ....... ... ...................... . 28
15 - Definition of Representative Areas in the Black Sea ............... . 29
16 - Comparisons of JONSWAP Theoretical and Actual Significant tiWave Height and Fetch Relationships (Reference 16) ...... ........... 30
IV
I.I
* *m * . , m

r'age
17 - Determination of 0 for Modified JONSWAP Spectrum(Reference 16) . . ............................ 31
18 - Determination of Sm&ll 0 for Modified JOt4SWAPSpectrum (Reference 16) . . . . . . . . . . . .......... . . . 32
19 - Typical Modified JONSWAP Spectra for Significant WaveHeights of 2 and 5 M (Reference 16) . . . . . . . . . . . . . . . . . . . 33
20 - Typical Modified JONSWAP Spectra for Significant WaveHeights of 3 and 7 M (Reference 16) . . . .............. . 3
21 - Modified JONSWAP Spectral Relationships Between ModalWave Period, Fetch, and Wind Speed (Reference 16) ...... ............ 35
22 - Modified JONSWAP Spectral Relationships Between Significant:1 Wave Hei,-ht, Fetch, and Wind Speed (Reference 16) . . . . . . . . . . . . 35
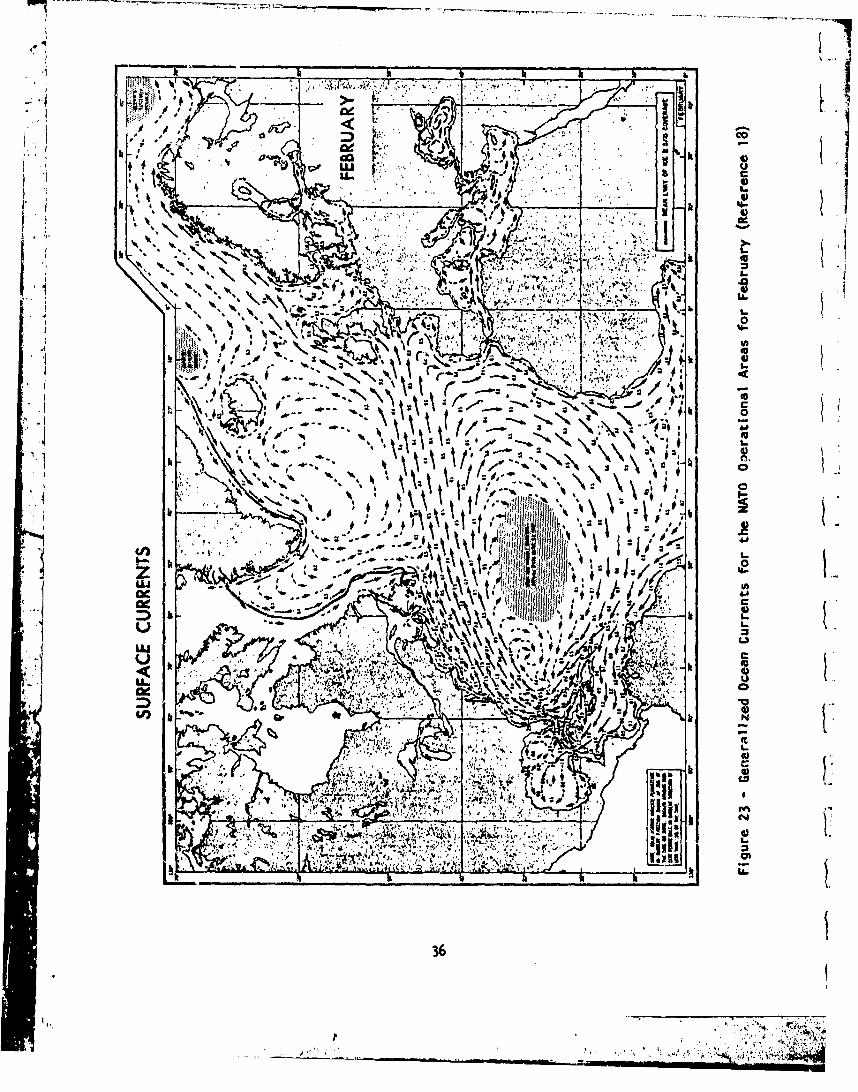
23 - Generalized Ocean Currents for the NATO Operational Areasfor February (Reference 18) . . . . . . . . . . . . . . 36
,t 24 - Generalized Ocean Currents for the NATO Operational Areasfor May (Reference 18) . . . . . . . . . . . . . . . . . 6 37
I !25 - Generalized Ocean Currents for the HATO Operational Areasfor August (Reference 18) . . . . ... . . . .. . . . . . . 38
L 26 -Generalized Ocean Currents for the NATO Operational Areasfor November (Reference 18)....... . . ..... . . . 39
L LIST OF TABLES
"I Typical Hindcast Directional Spectrum (Variances)S(Reference 2)................................. 40
2 - Locations Defining North Atlantia Ocean Areas InCurrent Study . . . . . . . . . . . . . . . . . . . . . .. . 41
3 - Modal Wave Period Values for Seakeeping Performance.Assessments . . . . . . . . . . . . . . . . . . . . . . . . . . . . . . . 42!
4- Sample Spreading Weights (a of 15 Degrees and v of j0 Degrees) (Reference 8) ..... ....................... . . 43
5 -Natural Environment Veruus Ship Function . . . . .. .. . .. . . . . . . 411, v

4!
ABSTRACTThis report Is a source document for specifying wind
and wave conditions for those regions consi•-r.d appropriatefor Joltit operations of NATO naval forces. The areas con-sidered are the North Atlantic Ocean nort;*.ard from theTropic of Cancer, the Mediterranean Sea, and coastal orlandlocked areas such as the North, Balti. and B1.ck Seas.The report provides seasonal and geographic distributionsof wind and wave parameters and specifies mathematical modelsby which wave spectra, requ~red by any ship seakeeping per-formance methodology, can be developed. Portionts of the dita--contained he re In n-a`Fi--d-eftVded tir6im theU .S'. S Avy rs emeerg In ..Twenty Year i'ndcast Wi,,d and Wave Climatology, and are coin-sidered to be far supjrior to data previously available forthose operatingj areas.
ADMINISTRATIVE I MFORMATI ONThis report was prepared under the sponsorship of the Naval Sea Systems Con,?and
(NAVSEA), Code 3213 Work Request Number WR91589, the Ship Performance and Hydro-
mechanics Prr)gram funded under Program Element 62543N and Slock Number ZF 43 421 0I1,,
and the Surface Wave Spectra for Ship Design Program under P!ograin Element 62759N and
Project Number SF 59 557 695. It Is Identified by Wo.rk Unit Numbers 1568-823-01,
1500-104-26, 1568-838-03, and 1500-300-37 at the David W. Taylor Naval Ship Research
and Development Center (DTNSRDC).
BACKGROUND
In 1978, NATO Information Exchange Group 6 (IEG/6), Sub-Group 5 *SG/5), whose
purpose Is to develop a Standard Agreement (STANAG) between NATO nations for assess-
ing destroyer and frigate seakeeping properties, Identified the need to also develop
a STANAG which provides the appropriate natural environment Inputs to the seakeeping
methudology and provides a standard for observing sea conditions during NATO ship• i / trals or operational evaluations. The U.S. delegate to the sub-group volunteered
to explore such an effort, and a tentative approach was proposed to the group at
the April 1979 meeting held at DTNSRDC in Bethesda, Maryland. The approach was
subsequently approved, and this report has been developed as the source document of
wave and wind ,tatistics required to develop the STANAG.
p '
•,• ~~. . .. . ... . ........-..... ...... ,. •.. ,..,...... •.

APPROACH"The procedure followed Is broken Into four succinct steps. They are
* 1. Define operational areas2. Develop wind and wave statistical data bases
3. Develop wave spectral families4i. Show sample methodology application
The definition of operational areas Is straightforward and dependent only upon
the proximity and geographic locations of the NATO rnations. Figure 1 Identifies the
((.,'.I three generic operational areas that are readtly Identlfable. They are
•tI. Open ocean North Atlantic from the Tropic of Clancer northward/
2. Mediterranean Sea
3. Coastal and landlocked waters (e.g., North, Baltic and Black Seas)
As the statistical data bases and the wave spectral families appropriate for (each area ma.. vary, subsequent sections of this report deai with each region sepa-
, Irately. The data for each region Is provided in Appendices A to E. Appendix F
provides a description of the data formats which have been amployed. Appendix 4
provides the relative wind envelopes for VTOL aircraft operations. Appendices H and
I providi computer FORTRAN subruutines for calculating the recommended wave spectra
for each oparetional area.
OPEN OCEAN NORTH ATLANTIC
WAVE AND WIND STATISTICSThe open ocean region identified on Figure 1 spans the North Atlantic from thc
latitudes of the Northeast Trade Winds (up to about 30* N) through those of the pre-
vaiiing Westerl:es (30 - 60' N) and Into the Polar Northeasterlies (above 60* N), so
that it Is not surprising that the cIlimatology of the operational area Is strongly a
function of northerly location or latitude. Additionally, the Influence of landmass, currents, continental shelf, and local storm tracks each cause a similar
climatology variation with longitude. Therefore, it is considered appropriate to
divide the open ocean area Into sub-areas which are Identified In Figure 2. Because
of the previous wide usage of the wave statistics provided by Hogben and Lumb, see pReference 1*, it was decided to adopt their definition of geographic zones where
*A complete listing of references is given on pages 13 and 14.
2
..

SI
"possible. Areas 1, 2, 3, 4, 6, 7, 8, 9, 10, and 11 are taken as defined by Hogben
-a and Lumb. Areas 15, 16, 17, and 18 are also taken as defined by Hogben and Lumb but
truncated at the Tropic of Cancer (23* N). Areas 00 and 0 are new areas which have
been added to span the more 'northerly operational regions.
S -While Reference 1 provided the previous standard for developing wave statistics
- lfor the Noeth Atlantic Basin, a new data base Is now emerging which will become a
' ( . primary source of environmental data for ship seakeeplng analyses. This new data.1A!
set has been under development by the U.S. Navy since 1976, and as it Is well
treated In Reference 2, will only be briefly described here.
/ In short, the Spectral Ocean Wave Model (SOWM), documented In Reference 3 and
f based on the work of Pierson and his associates, see Reference 4, Is being used tohirndcast wave conditions throughout the Northern Hemisphere. The model utilizes
archived and well-refined wind fields, see Reference 5, from which directional wave
spectra are hindcast at six-hour Intervals for a continuous period of 20 years.
The hindcasts reflect the propagation of wave energy from one location to another as
well as the growth and decay of the seaway with local winds.
"A Lypical hindcast directional spectrum Is given In Table 1. From the set of
-, such spectra, a series of parameters are derived which provide a simple summary of
the character (height, period, and direction) of the seaway and which can be used to
define families of representative wave spectra. As the wind speed and direction ts
carried along with the data set, joint distributions of wind and wave parameters are
f also constructed.
The darkened circles about the grid points within each area on Figure 2 indi-
cate the SOWM grid points included !n this work. Ultimately the data may be expandedI - to include Pt least the circled grid points. Table 2 provides a sunmvry of the
points currently included. The parameter sets that are developed are
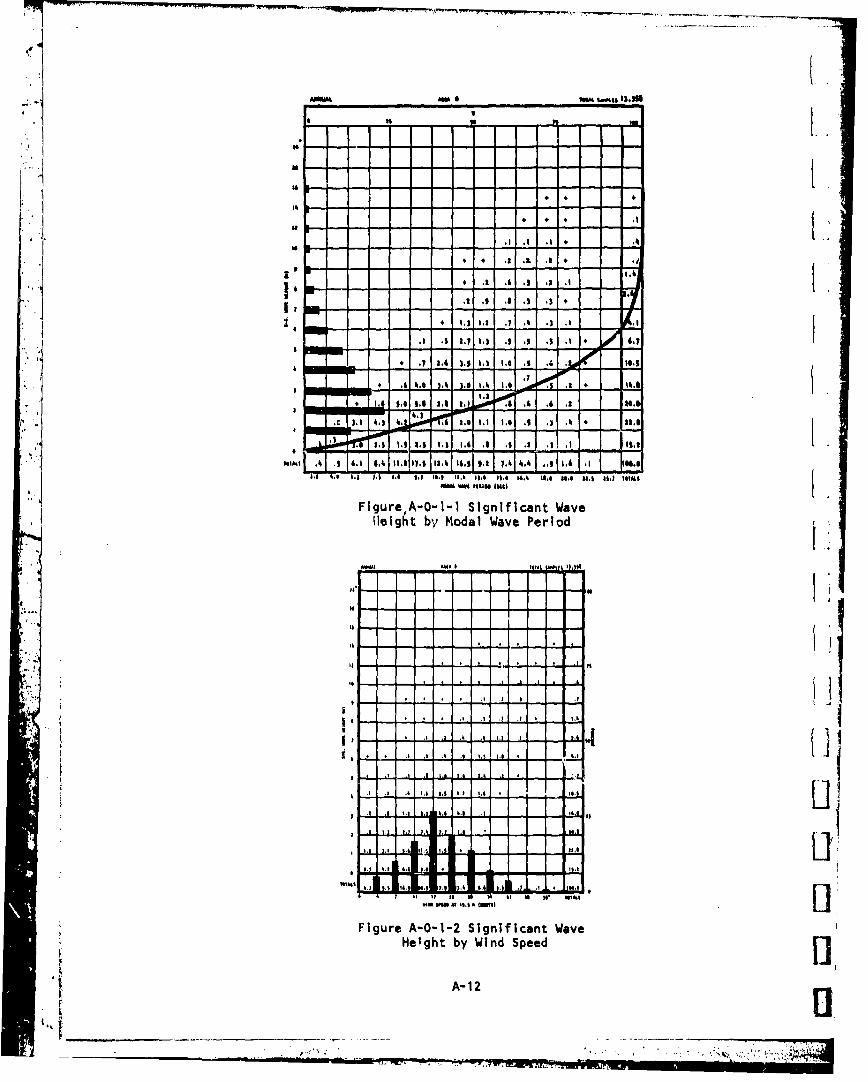
1. Significant wave height vs. nodal wave period
F 2. Significant wave height vs. wind speed
S3. Significant wave height vs. primary wave direction
4I. Wind speed vs. wind direction
5. Significant wave height vs. wind speed (using World Meteorological Organi-I: zation Standard Sea State definition)
* 6. Persistence of significant wave htight
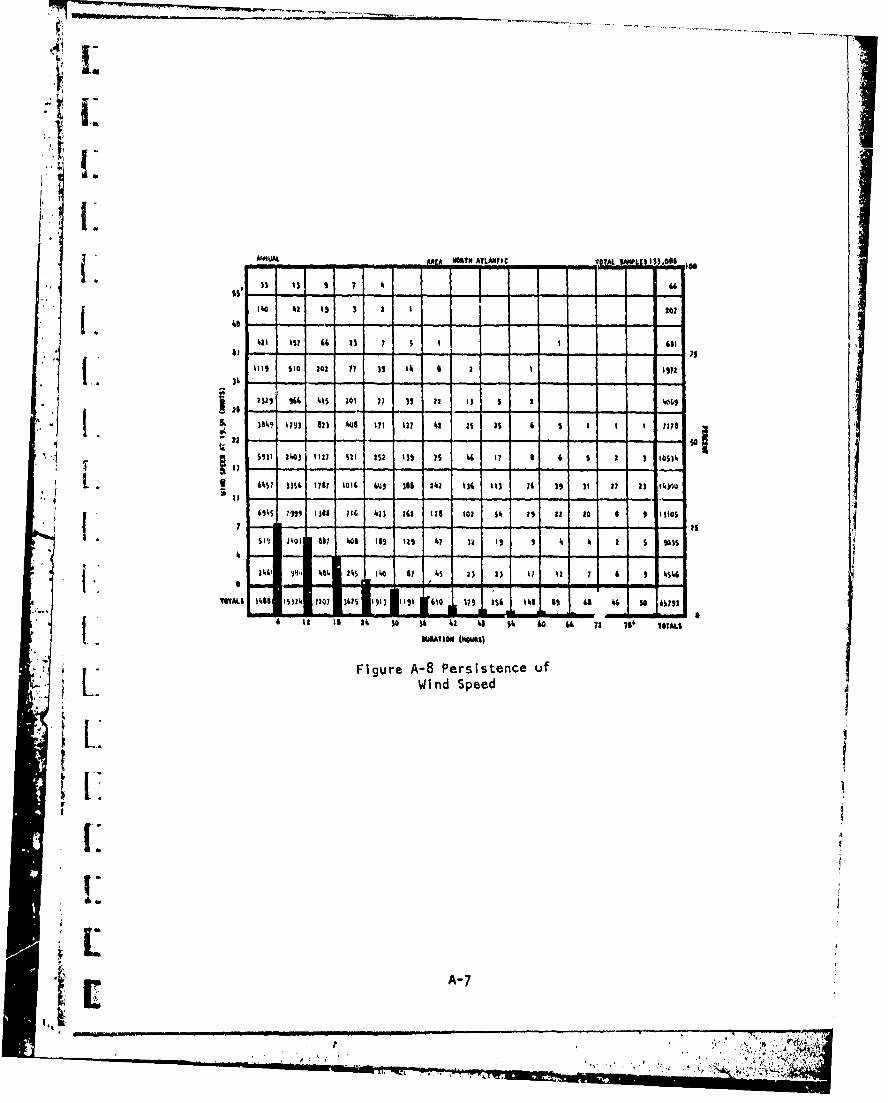
7. Persistence of significant wind spsed )
3
~,,£

.11.'.......-
Other parameter 'ntributicns (e.g., primary spectral width vs. primary wave di-
rection, primary wave direction vs. secondary wave direction, directional spread
about primary wave direction vf. directional spread about secondary direction) canbe added to this source doc.ument as computer resources permit. While these data
distributions are developed for the ten year period from September 1959 to August
1969, it Is noted that seasonal parameter distributions are also of interest and
4 should be utilized !n the seakeeping performance assessment methodology.
Appendix A provides the data base of open ocean wind and wave conditions de-
rived from the T-- ýeai "lindcast Wind and Wave Climatology. Tables are provided for
sreas Identiftiel the morth Atlantic open ocean region. Areas Included are pro-
"vIded In Tab'e l. Both . al and seasonal distributions are provided. In keeping
with Reft ' .: ....v seasot- eae defined by
1 . Vlt ite' - ;.!rember t,. February
'i 2. 3, , 9i rc!, to May
3. S- ,ner - un ,,- .v A ju',
4. FP13 - !4ptember to November ifHowever, a" ongoing evaluation of a dynamic season definition (for example, of vary-
Ina length for each year) may indicate the need to revise .hese definitions of
season at a later tim,. Figure 3, from Reference 2, Illustrates the seasonal van-
ation of mean significant wave height at the selected location In Area 2. Clenrly.
the duration of more severe-conditions can occur at varying times in different
yearly cycles. Therefore, cumulating data for a fixed calendar span (e.g., all
December to Februarys) wculd produce a somewhat different worst season than If a
sliding seasonal definition were used.
Figure 14, from Reference 2, provides a comparison of some of the newly developed
Area 2 (grid point 127) data with that provided previously by Reference I. This
latter data has been converted from observed to significant values by application of
the Nordenstr~m relationship* described in a draft "Sea Environment Manual for Ship L
"Design"** and developed In Reference 6. The wave height occurrences for grid point
* 127, if taken collectively over the ten year sample, are fairly typical for the (9 /
*The Nordenstrom relationshp is given by( / 1.68 ( )obs)0 7 5 meters
**Report DTNSRDC/SPD-0720-'I to be published in 1982,
* a4 I I II I! I

S71
entire region bounded by Area 2. The hindcast data set Is without fair weather and
observer skill biases which nmy be at least partially surmised from the figure. For
4 example, the hindcast data set provides a greater statistical occurrence of I1l
waves exceeding about 2 meters. The highest significant wave height in this ten
[ . year sample of hindcasts is 17.8 nf.ters and the correspondong mode of the uirectionalspectrum Is about 23 seconds. On the other hand, the highest observed wave In theI
"Hogben-Lumb sample it about 12.8 meters and Its observed mode is between 10 and 11
seconds. Clearly, the hindcast data set provides the naval architect with Importantnew wave statistics which will hopefully Improve the realism of seakeeping perform-
ance assessments. It is noted that the modal periods developed In this work are
"A ; f reflective of the peak of the primary direction of the (density) directional spectrum.
Very often this coincides with the peak of the primary direction as well as the
entire spectrum.
With regard to wave periods, the hindcasts generally indicate longer wave
i periods for given heights. This is not surprising as It Is difficult to observe
them at sea and even the codes used to record observed occurrences on board ship are
inadequate In this regard. Very often, the naval architect uses the most: probable
modal or peak wave period for several varying wave heights. In this work, the modal
periods, being longer, will cause larger responses to b, calculated for the longer
* - ships. Figure 5 •hows a comparison of the new (tentative) most probable period -
significant wave height relationship with tne previously used one recommended in the"Sea Environment Manual for Ship Design." Clearly, for waves In excess of about
6.5 meters, the hindcast periods are from 0.5 to 3 seconds longer.
Without doubt, the most severe wave conditions which NATO fleets will encounter
- are In the North Atlantic. Figure 6 presents an annual comparison of significant
wave height occurrences for the five generic operational areas. As might be expected,
the North Sea Is ranked second most severe with the Black Sea third, the Miediterranean
Sea fourth, and the Baltic Sea fifth. When only worst seasons are compared the
ranking Isthefor t nual oc, se Fure 7Figures 8 and 9 provide a more detailed Illustration Of annual and worst season
occurrences for the areas defined In Table 2 in the North Atlantic. These data are
Sbased on the occurrences provided In Appendix A. Gene ally, the severer conditions
prevail between 50 and 60* N with the western portions Indicating someivhat worsened
S ! conditions.
ii 5--. [ p- *s
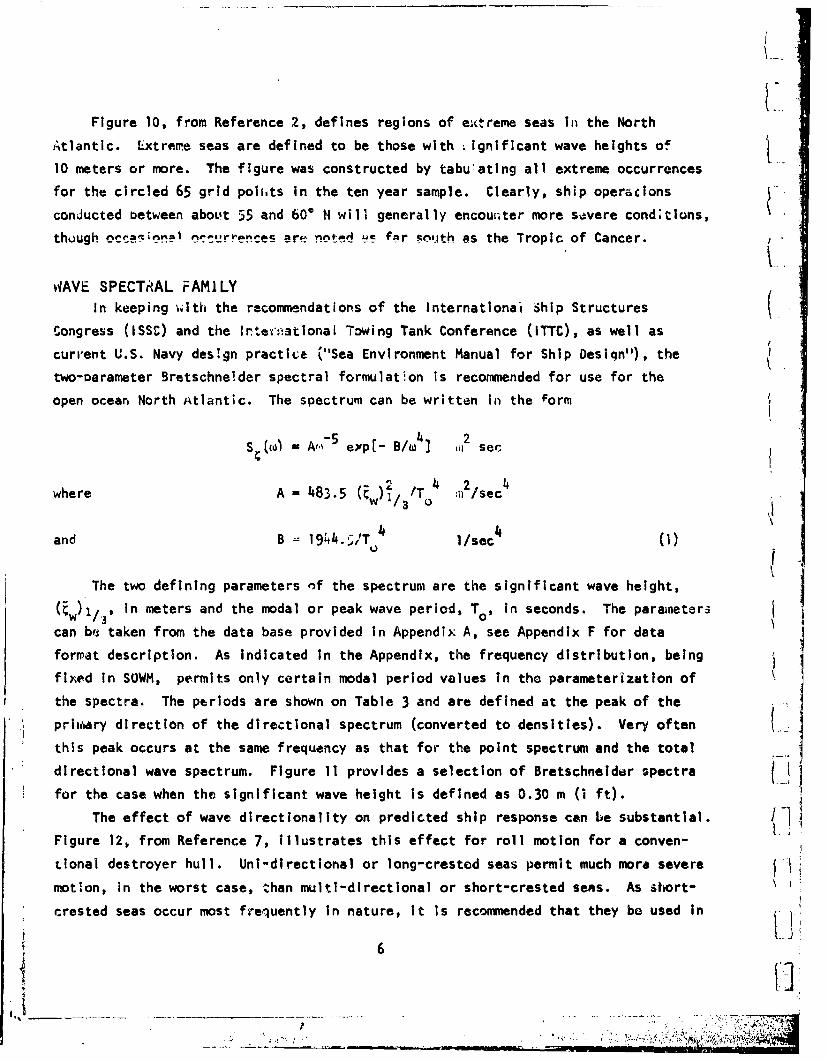
Figure 10, from Reference 2, defines regions of extreme seas in the North
A;tlantic. Lxtrerne seas are defined to be those with .ignificant wave heights of
10 meters or more. The figure was constructed by tabu'ating all extreme occurrences
for the circled 65 grid poiihts in the ten year sample. Clearly, ship operations
conJucted between about 55 and 60* N will generally encouriter more severe cond*tions,
though occesi- 1 n•,,'si''cs ere nnter ý4_s fr south as the Tropic of Cancer.
WAVE SPECTRAL FAMILYIn keeping ý,lth the reconmmendations of the Internationai Ship Structures k
Congress (ISSC) and the Zrternational Towing Tank Conference (ITTC), as well as
current U.S. Navy design practice '"Sea Environment Manual for Ship Desiqn"), the
two-oarameter Bretschne!der spectral formulation is recommended for use for the
open ocean North Atlantic. The spectrum can be written in the form
S() ( A'm5 exp[- B/]o] 4 l2 ser
where A = 483.5 (w /T C :12/sec
and B 1944.JT 4 1/sec4 ()
The two defining parameters of the spectrum are the significant wave height,
Qw~ In meters and the modal or peak wave period, To, in seconds. The paraineteri
can be taken from the data base provided In Appendix A, see Appendix F for data
format description. As Indicated In the Appendix, the frequency distribution, being
fixed in SOWM, permits only certain modal period values in the parameterization of
the spectra. The periods are shown on Table 3 and are defined at the peak of the
prit•ary direction of the directional spectrum (converted to densities). Very often
this peak occurs at the same frequency as that for the point spectrum and the total
directional wave spectrum. Figure 11 provides a selection of Bretschnelder spectra
for the case when the significant wave height is defined as 0.30 m (0 ft).
The effect of wave directionality on predicted ship response can be substantial. 1Figure 12, from Reference 7, Illustrates this effect for roll motion for a conven-
tional destroyer hull. Uni-directional or long-crested seas permit much more severe
motion, in the worst case, than multi-directional or short-crested sens. As Short-
crested seas occur most frequently in nature, it is recommended that they be used in
6
, ... -, - 1..:. . . i• M
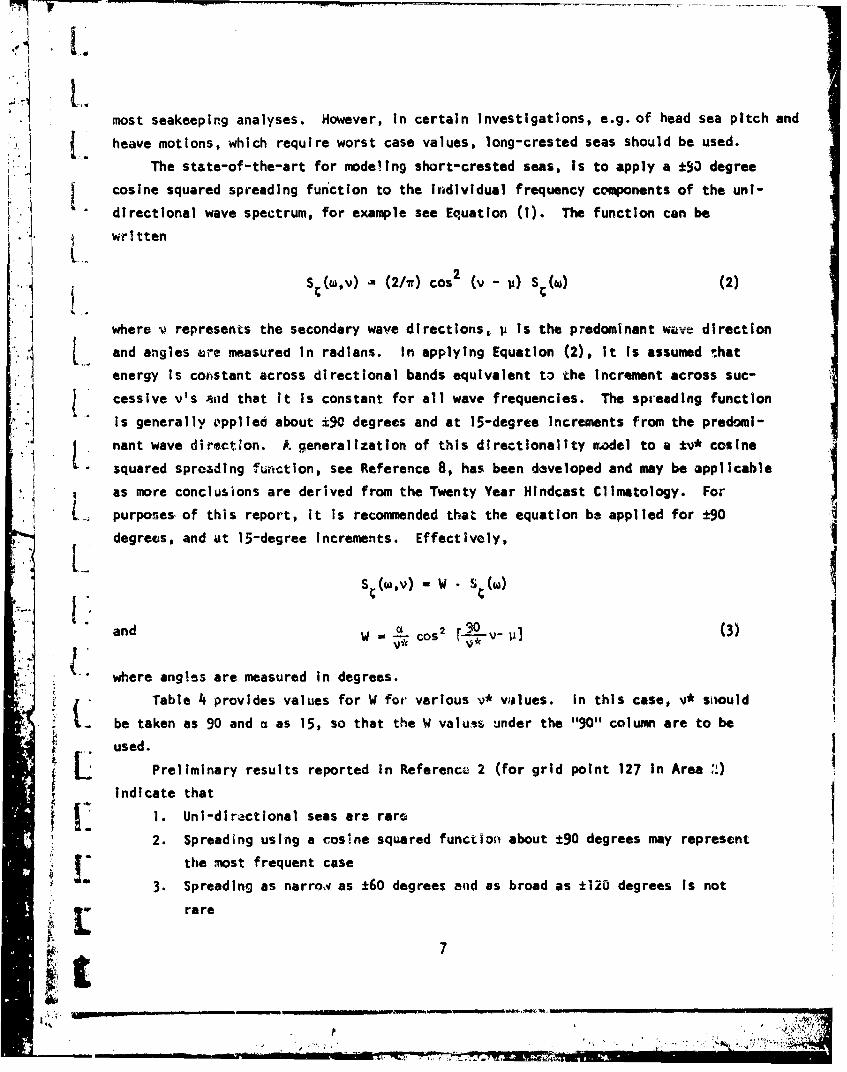
Lmost seakeeping analyses. However, In certain Investigations, e.g. of head sea pitch and
heave motions, which require worst case values, long-crested seas should be used.
The state-of-the-art for mode!ing short-crested seas, Is to apply a ±9a degree
cosine squared spreading function to the individual frequency components of the uni-
directional wave spectrum, for example see Equation (1). The function can be
wrItten
S C (s,v) - (2/w) cos2 (V - 11) S C(W (2)
where v represents the secondary wave directions, V is the predominant wave direction
. [ and angles are measured in radians. In applying Equation (2), it Is assumed that
energy Is constant across directional bands equivalent to the increment across suc-
] ; cessive v's And that It is constant for all wave frequencies. The spreading function
is generally opplled about ±9C degrees and at 15-degree increments from the predomi-
"* [ nant wave direction. A generalization of this directionality model to a ±v* cosine
squared spreading function, see Reference 8, has been developed and may be applicable(Ias more conclusions are derived from the Twenty Year Hindcast Climatology. For
, i t • pu rposes- of this report, it Is recommended that the equation be applied for ±90degrees, and dt 15-degree Increments. Effectively,
S (W,v) - W . s (W)
and W- os92 V- (3)
"where angles are measured in degrees.
Table 4 provides values for W foat various v* vi;lues. In this case, v* snould
be taken as 90 and a as 15, so that the W valu.,s under the "90"1 column are to be
used.
Preliminary results reported in Referencz 2 (for grid point 127 in Area L)
Indicate that
1. Uni-directional seas are rare
2. Spreading using a cosIne squared function about ±90 degrees may represent
pL the most frequent case
3. Spreading as narro~v as ±60 degrees and as broad as ±120 degrees is not
l rare
47____.._'_______ __.____S , n*
,. . .., . ' . , ; ,- • . . • ,,.s !•"p.

MEDITERRANEAN SEA
WAVE AND WIND STATISTICSWave and wind statistics for the Mediterranean Sea are provided in Appendix B
* I for both annual and seasonal time spans. Frequencies of occurrence, developed from
Reference 9, are provided for the three areas (29, 30, 31) Identified on Figure 13.Parameters Inc'•-Ud•d :
1. Significant wave height vs. modal wave per'od2. Significant wave height vs. wind speed
3. Significant wave height vs. primary wa'.e eirection
4. Wind speed vs. wind direction I
The seasons are defined as for the open ocean North Atlantic case.As indicated in Reference 2, the Twenty Year Hindcast Climatology will eventu-
J . ally be wxtended to include the Mediterranean Basirn us!ng an operational model, with
-4 • a grid spacing of about 40 miles, currently in use by the U.S. Navy, see Reference10. Hence, the data given In Appendix B will eventually be replaced with distribu-
tions similar to those of Appendix A. Additionally, the basl" will be divided Into
operational areas such as Is done in the North Atlantic.
WAVE SPECTRAL FAMILYAs the three Mediterranean areas noted on Figure 13 are In suffirciently deep
water and with sufficiently long fetches, the Bretschneider Spectral Family discussed
previously, should be used. In keeping with the range of values givien in Appendix B,
modal periods up to 13 seconds together with the appropriate significant heights,should be used to define the spectra. The same recommndations with regard to
directionality as made for the opan ocean are also applicable here.
COASTAL ANDLANDLOCKED AREAS* WAVE AND WIND STATISTICS
_ Wave and wind statistics for coastal and landlocked operating areas are pro-
vided in Appendices C, D, and E. 1-Appendix C, developed from the Twenty Year Hindcast Climstology, provides data
for the North Sea. Parameter distributions are similar to those provided for the
open ocean in Appendix A and are for grid pL. it 124 in Area 4 on Figure 2. A summary L_of some, wave occurrences In this area is provided in Figures 6 and 7. The same
.--. -----. uu----- -un-- --- '

parameter sets and seasonal definitions as for the open ocean North Atlantic are
also applicable here.*
Appendix D provides wave and wind statistics for thu Baltic Sea, Including the
Gulf of Bothnia, which are derived from References 9, 11, 12, and 13. The specific
operating areas Included are noted on Figure 14. The same parameter sets and
seasonal definitions as used for the Mediterranean are also applicable here.
-" Appendix E provides wave and wind statistics for the Black Sea derived from
Refsrence 14. Figure 15 defines the specific operating area included. The. eastern
part of the Black Sea was not treated as the prevailing conditions there are less
severe than the more western area shown In the figure. The parameter sets are the
( same as used for the Mediterranean while the seasons are defined as for the open
ocean North Atlantic case.
WAVE SPECTRAL FAMILYj As all of these operating regions are relatively shallow** and at least
partially surrounded by land, the Bretschneider spectral formulation is not recom-
mended for use here. Instead, the mean JONSWAP spectrum is recowmmended here. This
* formulation was developed by Hasseimann in order to model fetch-limited, shailow
water wave conditions, see Reference 15.
"The JONSWAP spectrum Is a generalization of the Plerson-Moskowitz form by
Inclusion of fetch as an additional parameter to wind speed. As it Is usually
written, the mean JONSWAP spectrum Is dependent on the two parameters wind speed and
fetch. However, for simplicity, as wall as consistency with the current state-of-
the-art In seakeeping performance assessment, a JONSWAP expression which Is dependent
only on the two parametirs, significant wave height and modal wave period, Is
desirable. Such an expression is derived In Reference 16 and given byt.TIOwT~ -4 epl - 1)232- 3.3exp 2a 2
S(W) 9 ep 5 0 33 2a m sec (5)
*It should be noted that this Appendix will eventually be replaced by oneconsisting of hindcast date, under development by the German Navy, for a fine gridspacing throughout the North Sea.
**The Black Sea is actually of greater depth than the North or Baltic Seas,but no data have been found with which to determine the most appropriate wavespectral family.; 9

- -,
L,.•
where
cr -0 .07 for <cjL (00o m 0.•.7 - T-Yor0
a -0.09 for AL>ij- (7)V
and where w is the circular wave frequency In radians per second. 8 Is a constant
dependent on the significant wave height, (Q)1/3, and the modal wave period, T0 .
B was developed to replace the a parameter given In the usual JONSWAP formulation
and to correct for the parameter's nonuniversality. The Inconsistency In the usualJONSWAP formulation arises for relatively high waves with long periods. Figure 16
provides an illustration of the difficulty for winds of 20 and 30 knots. The solid
line represents the theoretical relationship between significant wave height and
fetch for those wind speeds. The dashed line represents the values which are actu-ally computed from the spectral area when the given fetch and wind spead are speci-
fled in the usual JONS'.AP formulation. The difference between the solid and dashed
lines represents a rather noticeable Increase In significant wave height for fetches
above about 40 nautical miles.
Figures 17 and 18 from Reference 16 permit the determination of 0s for given
values of significant wave height and modal wave period. The wave parameter ranges
are deliberately broad in anticipation of extreme occurrences which may be hindcast
for the North Sea. The height and period ranges oere determined by examination of
Figures 19 and 20 provide sample modified JONSWAP spectra for significant wave
heights of 2, 3, 5, and 7 m and a range of modal wvave periods. As is the case with
the Bretschnelder formulation, Equation (5) can be applied without special regard tto fetch or wind speed. However, as those values could be of Interest in some sea-
keeping analyses, FIgures 21 and 22 are included to provide a comparison with
corresponding heightL and period ranges.As with the usual JONSWAP formulation, the modified expression given in
Equation (5) Is for, long-crested seas. While there is limited experimental veri-
fication, the cosine squared spreading function Is recommnended for use with the
JONSWAP spectral formulation at this time.
10
_P

I-~
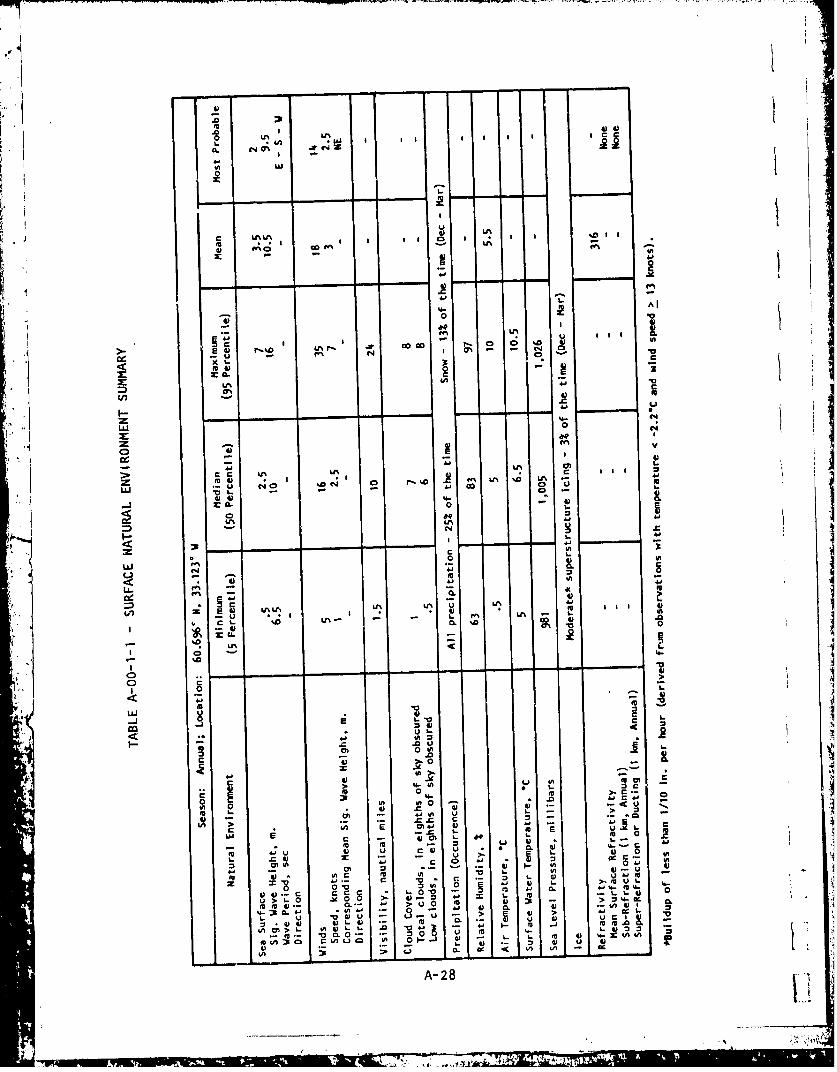
TOTAL MARINE ENVIRONMENT* I The overall mission effectiveness of a naval ship Is dependent on the total
natural environment that the ship encounters.* While the functional relationshipsbetween the ship (including all of Its combat and support systems) and the naturalenvironment are not completely understood, some consideration of these factors maybe appropriate. While tihis document emphasizes wave and wind phenomena, It isrecognized that other environmental occurrences may be equally Important to the
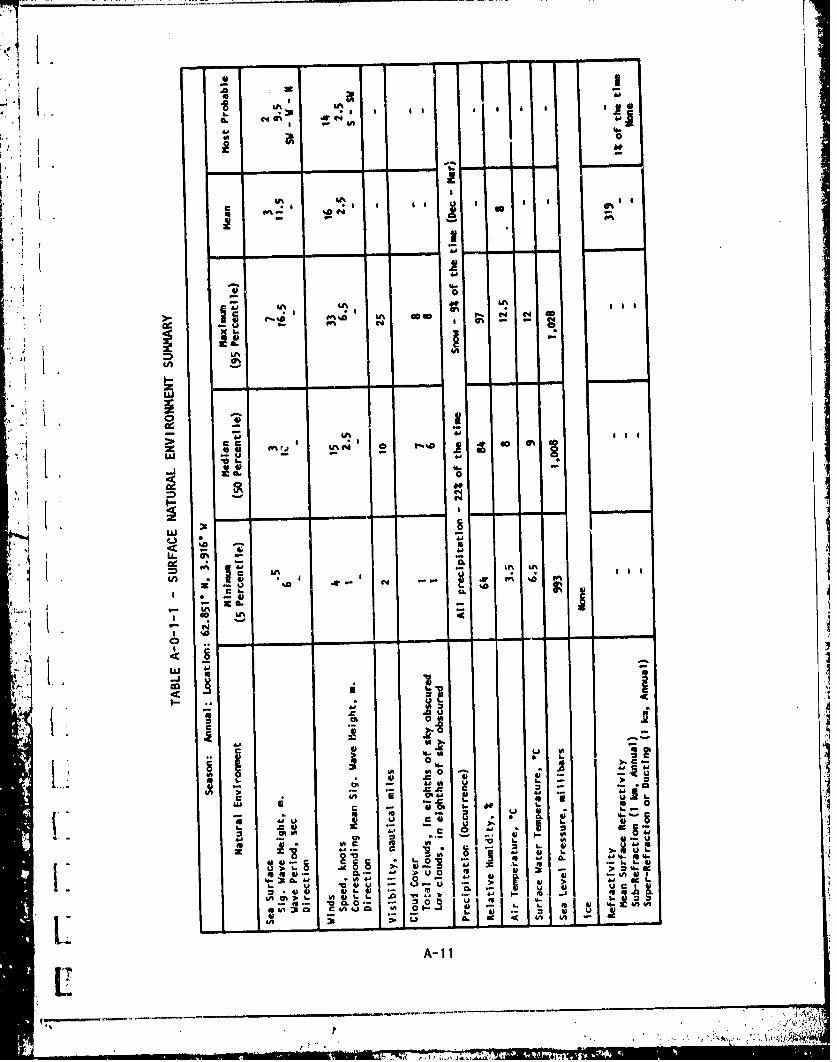
.2 ) ship's performance. Table 5, adopted from Reference 17, Identifies a number ofnatural en:Ilronment parameters that may impact performance of certain missions. In
S*• | recognition of this, a summary table providing data for many of these parameters IsI t given In Appendices A to E. The data, developed for annual occurrences, provides
* ranges of values expected for each parameter and is desciibed in detail In AppendixF.
Figures 23 to 2(, adopted from Reference 18, provide seasonal (February, May,
out the NATO operational areas. Limits of ice coverage are also Indicated for more
t northerly latitudes.
EXTREME SEASThe recommendations for the use of various wave spectral formulations generally
reflect moderate to heavy weather operations (e.g., up to Sea State 6). Host navalmissions to wh'ch this report Is directed will be conducted in no more severe con-ditions than these. However, the occasion may arise when extreme conditions should
-' be considered, particularly In the context of mobility mission requirements in theopen ocean North Atlantic. For this case It is not clear whether the availableBretschneider or the JONSWAP spectral formulations are more appropriate. WhileBretschneider spectra appear to be too broad (against frequency) and of Insufficientpeak definition, the JONSWAP formulation has not yet been well establis, 3d as a
L model for extreme seas, particularly in the open ocean. What is more certain Isthat the directionality model associated with extreme seas should represent multi-directional, confused seas, see Reference 19. Future Investigations will perhapsIdentify the more appropriate spectral formulation.
*Of course, it Is also dependent on the man-made threat environment wI•ich ispresent.
• 11
-- ,"L

. : I
ACKNOWLEDGMENTS
The Authors acknowledge the assistance of Mrs. Beverly Simon rf DTNSRDC and (j. , As. Dottle M,:Lear. of ORI, Inc. in developing the graphs presented ii the Appendices.
I
4
I
II
i--
I
;ii12!

REFERENCeS
1. Hogben, N. and F.E. Lumb, Ocean Wave Statistics, London, Her Majesty's
Stationery Office (1967).
2. Cummins, W.E. and S.L. Bales, "Extreme Value and Rare Occurrence Wave
Statistics for Northern Hemispheric Shipping Lanes," Proceedings of The Society of
Naval Architects and Marine Engineers Spring/STAR Meeting (June 1980).
S..3. Lazanoff, S.M. and N.M. Stevenson, "An Evaluation of i Hemispheric Oper-
ational Wave Spectral Model," FNWC Technical Note 75-3 (June 1975).
4. Pierson, W.J., L.J. Tick and L. Beer, "Computer Based Procedures for
I lPreparing Global Wave Forecasts and Wind Field Analyses Capable of Using Wave Data
Obtained by a Spacecraft," in Sixth Naval Hydrodynamics Symposium, Washington, D.C.,
- 1 Office of Naval Research (1966).
Si "5. Lazanoff, S.M. and N.M. Stevenson, "A Twenty Year Northern Hemisphere WaveSpectral Climatology," In Turbulent Fluxes Through the Sea Surface. Wave DynamlcsLand Prediction, edited by A. Favre and K. Hasselmann, New York and London, PlenumPress (1978).
6. Nordenstrom, N., "Methods for Predicting Long Term Distributions of Uave
Loads and Probability Failure for Ships, App II," Det Norske Veritas Research
Department Report No. 69-22-S (1969).
7. Cox, G.G. and A.R. Lloyd, "Hydrodynamic Design Basis for Navy Ship Roll
Motion Stabilization," Transactions of The Soctety of Naval Architects and Marine
Engineers, Vol. 85, pp. 51-93 (1977).
8. Bales, S.L., E.N. Comstock, R.T. Van Eseltine and E.W. Foley, "Ship Sea-
/ • keeping Operator Guidance Simulation," Proceedings of the Summer Simulation Confer-
o ence (July 1979).
9. "U.S. Navy Marine Climatic Atlas of the World, Vol. 1, North Atlantic
Ocean," Naval Weather Service Detachment Publication NAVAIR-50-1C-528 (1974).
10. Lezanoff, S.h. and N.M. Stevenson, "A Mediterranean See Wave Spectral
Model," FNWC Technical Note No. 73-1 (Apr 1973).
11. Wahl, G., "Wave Statistics from Swedish Coastal Waters, Lightship FinnGrundet, Visual Observations," The Swedish State Shipbuilding Experimental Tank,
Report No. 37 (Nov 1973).
,13'IL
,- " -- - " - I ~ il •" .' ' *
A U
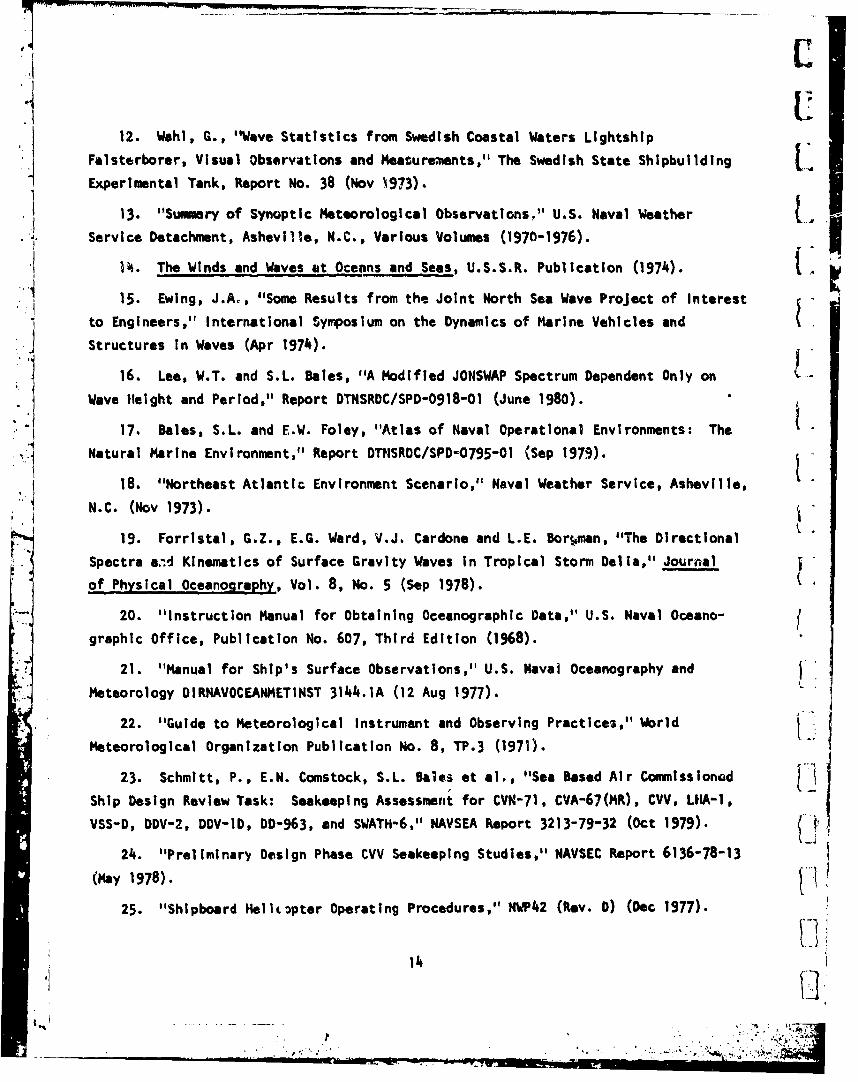
12. Wahl, G., "Wave Statistics from Swedish Coastal Waters Lightship
Falsterborer, Visual Observations and Meaturements," The Swedish State Shipbuilding
Experimental Tank, Report No. 38 (Nov 1973).
13. "Summary of Synoptic Meteorological Observations," U.S. Naval WeatherL
*.•. Service Detachment, Asheville, N.C., Various Volumes (1970-1976).
14. The Winds and Waves at Oceans and Seas, U.S.S.R. Publication (1974).
15. Ewing, J.A., "Some Results from the Joint North Sea Wave Project of Interest
to Engineers," International Synposium on the Dynamics of Marine Vehicles and
Structures In Waves (Apr 1974).
16. Lee, W.T. and S.L. Bales, "A Modified JONSWAP Spectrum Dependent Only on !Wave Height and Period," Report DTNSRDC/SPD-0918-OI (June 1980).
17. Bales, S.L. and E.W. Foley, "Atlas of Naval Operational Environments: The
"AI Natural Marine Environment," Report DTNSRDC/SPD-0795-01 (Sep 1979). s18. "Northeast Atlantic Environment Scenario," Naval Weather Service, Asheville,
,* N.C. (Nov 1973).
19. Forristal, G.Z., E.G. Ward, V.J. Cardone and L.E. Bortman, "The Directional
Spectra a,-d Kinematics of Surface Gravity Waves In Tropical Storm Delia," Journal
of Physical Oceanography, Vol. 8, No. 5 (Sep 1978).
20. "instruction Manual for Obtaining Oceanographic Data," U.S. Naval Oceano-
graphic Office, Publication No. 607, Third Edition (1968).
21. "Manual for Ship's Surface Observations," U.S. Naval Oceanography and
Meteorology DIRNAVOCEANMETINST 3144.lA (12 Aug 1977).
22. "Guide to Meteorological Instrument and Observing Practices," World
Meteorological Organization Publication No. 8, TP.3 (1971).
23. Schmitt, P., E.N. Comstock, 5.L. Bales et al., "Sea Based Air Commissioned
Ship Design Review Task: Seakeeping Assessment for CVN-71, CVA-67(MR), CVV, LIA-1,
VSS-D, DDV-2, DDV-ID, DD-963, and SWATH-6," NAVSEA Report 3213-79-32 (Oct 1979).
24. "Preliminary Design Phase CVV Seakeeping Studies," NAVSEC Report 6136-78-13
(May 1978).
25. "Shipboard Heilitpter Operating Procedures," ?4WP42 (Rev. D) (Dec 1977).
"14

. it
120 90 60 30 W 0 E 30
'." , .GREENLAND 70
CANADA 60
..3 50
U..A 4030
!I AFRICA 2010
1 0
F•gure I Generic Naval Operational
Areas for NATO Forces
14 15

K]rd
¼*44
q>1.
0 V 14 0
c(
16
0/6
L.S.
*Ole
Gri Pon 12,A3/2,64ers1596
117
LU-
..
100
80 G .. . ...'U]
LU
c40LLw
U TEN YEAR HINDCASTS0 GRID POINT 127
19V. /61U40
SIGNCHOGBEN AND LUMB M20 AREA 2
Figure 4 - Comparison of Hlndcast and Observed Wave HeightOccurrences (Reference 2)
18
* ., .., ,.. , ,, ., .:, ' : . ! :..' ,.•'•,,
S~~~~~~~~~~~~................... ... .-. .. - . -7"".. ..... r ___-
11
L -* HOGBEN AND LUMB/
-- HINDCAST CLIMATOLOGY/9 (TENTATIVE)
""U
w7>7
SI 0
U579 11 13 1I5 17
Figure 5 -Comparison of Hindcast and Observed Modal Periods,Given Height, for the North Atlantic Basin (Reference 2,
19
- ------.

•4 i
<1t
too I - + +
NORTH ATLANTIC
EODITERRANEAN
NORTH SEA (
°/• o
; h0 BALTIC SEA,
20
4. -~ BA L AC K SEA
Lih
o 4 8 12 16
SIGNIFICANT WAVE MIGHT, f"
Figure 6 - Comparison of Annual Wave Height ..Exceedences of All Locations
20
S........ . ..

KtooN NORTH ATLANTIC
-MEDCITERRANEAN
w NORTH SEA4" '
wUI
ti 40 ALICK SEA
*20
0
0 V2
IU
21
w LACKT SEA
t_.. 20
, . 108 42 16SIGN'VrICANT WAVE WEIG)1TT, t
figure 7 - Comparison of Worst Season Wave1.. Height Excee•'ences of All Locat~on•
U•!.-
|2
--,-- .
• .• .,~ t _ , ' ,

UkU
ALL
KK
c 0
us
"1 t+6
.I-
SINFCN WAVE HEGT M
22
w
0 4 a11
SIGNIFICANT WAVE HEIGHT. M
Figure 8 - Annual Significant Wave Height ExceedencesHindca~t for Selected Niorth Atlantic Points
Defined on Table 2 for 1959 to 1969 f7
22

'H LIw
.1. I"i I lo I I'
F 1 !
4 -'
I0
LU
w
S
NW
V xZ
-1 i - ~ ~~Figure 9 -Worst Season Significant veeihEcedne
S, Hindcast for Selected North Atlantic Points Defined
on Table 2 for 1959 to 1969
23
i•
• • '• • ,'U.• "+/
S•
.:.•,,. • . , • :. : : ,.,:,-..:,•.•:+'. •. ..:..' i::.•.• • ".,•:.• ''I,

X
90 w0 300 W 00E 300*
NOE NUMBERS AT GRID POINTS INDICATE NUMBER OF OCCURRENCES OF 10M OR GREATER
-200
5005 j70* .0>* 1p;1
2V
Sp~~L Is

.17
* ( SIGNIFICANT HEIGHT = 4 * (SPECTRAL AREA)1
1~ -0.3 Ki
13SEC
LL
ILj
WAVE FREQUENCY, RAD/SEC
1: Figure ii-Bretschneider Two-Parameter Spectral Family
25
auto,'
4 4 'p

'4 SIGNIFICAtIT WAVE HEIGHT - 3.6 M
MODAL WAVE PERIOD - 9.6 SEC
SHIP SPEED =20 KNOTS
6 "
LONG-CRESTEDWAVES
74• UNSTABILIZED
= 1
• .1
0
SHORT-CRESTED
Figure 12 - Comparison of Roll Mot' on for Long- andShort-Crested Seas (Reference 7) •
226
.-. . . . .. ..
i-If . j

I -4L
.4
01 0am z
C
In
L ElEl
1J. ElI C1 L
- ElS. �
L - -*2
0U 0
.� I. C.,'
LIL El4..
C0
a SI L1. 0.U I)
L U 0
4J
IIa
00 Ie�I ______ _______ I
[I
I; 271�
II4 .4
I.'r
- ,. -.-
10200
650 -_____
I 16* 60*
tWto
Figure 14. Definition of Representative Areas In theIBaltic Sea (including Giulf of Bothnia)
28

"* 0 0
i- .4-
, 0 4
': ( 0 ,. 0•.4.
• • I
:: ' tl)I
L - 4gI
ii a, . •'. :
S.... .... ' , •"• i ' ':,;o/•~~~~.- • •,. i.. , ". ,,• /•~.!•
Fmnm

A:
16
~12
1: 0
8)
o02040 60 80 100 200 400 600 800 1000
FETCH, NAUTICAL MILES
Figure 16 -comparisons of JONSWAP Theoretical and Actual
Significant
Wave Height and Fetch Relationships (Reference 16)
30

I I. II I.1A 1,
II
40)
4-
zipi's;
X1I
IN I I
I -T-
AL 0
IW I % A I 0 -1
31

* 10
Li- It
04)
LA V
to 4)
II
w
-#ft- I I Ik L
4-
910 LIUL
0 lilt 00
o0 0V60
UMU324
323
/ qtilT

M-T~~ - -I~i I I A
i-) %0 (Y' N0 c0 r1 .
C
- 'u
L .D
t* 41
CLIm4
IA. 4)I, cc - C1
LAJ 0
u0)
C4 N 0 co 0 -w C4 a
33S- W'Wn)Ji33dS 3AVA dVtASNoI' NV3W
33
mmi iý

-
LA
U.U
~ I)IV
-. IV,41O~t -
In- uILII
o gn
w C
*~i r--
--.
5 40%
ODLL
Go IN
33S-ZW 'wnfhi33dS 3AVIM avi~sNmo HN)W
34

- 1000
1400 _
4-
it..X.. .:q,
F. 100
&oo -.--- c~j .1
LL
20 2 4 6 8: _0 12 14 16 18--__._
MIGIFIANT WAVE PERIOD, NE
Figure4 22 Modifited JONSWAP Spectral Relationships Between SiNod a ntWave Heright, Fetch, and Wind Speed (Referen~ce 16)
1035
Boo
010
OIL)
zz 40
* , ~'L'~.r.' * *4'~~ .?v'. . -
* ~ k A~' . . ~ .~ 4~ &J
.42
4 ~NN N~\~rr -fta/s
qw k
36b

j~ .. .. ..
V :4 j I
2 ... 4 9:
-1 *1 4
N;'~~ ..- .... ..:& ~ : ' ...x...
1k.5
.... ....~ ... 2
2 , .... I.....LL/f AA
II.tl lit.,~

d-
.. r- *.o"* .L
_ _ __p
.4 .ll:'"' .l, in.
4-1h
I ~ ILk~ ~ -d~4 A
"IN m
-I (Y-',- 104- Hz I , U
384

Ito-,--.
~ IS.,; il1
~. iOILL0
j : z>
~ 4-4
44
122
-- ~ ~ i 14 - - .'I
S 10
U 4
X,,
91.0
39

LL. wcc )f~l~lD ) >is~d~c5 <
uJi
00
C14 z
w _
oU Rw C',
I-l
o~c >~~L
S.- C4 '-0CL) 0. ;
z L
NA13'- w
q W (1 CIO C
C6~

Li .* TABLE 2 - LOCATIONS DEFINING NORTH ATLANTIC OCEANTABEJ AREAS IN CURRENT STUDY
NATO Subprojection/GP Latitude (* N) Longitude ( W)1 Area
00 3/110 60.696 33.123
0 3/84 62,851 3.916
1 31169 52.755 33.765
2 3/127 58.292 12.297
14 3/124 55.870 4.391E
6 2/279 46.191 44.891
7 3/216 45.-199 21.648
10 2/228 34.-097 52.857
11 3/244 39.912 21.794
16 2/2211 29.7748 66.526
17 2/182 26.694 148.-502
4I1
:1+--41

4 L
TABLE 3 -MODAL WAVE PERIOD VALUES FOR SEAKEEPINGPERFORMANCE ASSESSMENTS
1 f (Sowm) TJ -Hertz Seconds
, . .039 25.6
..044 22.7
.050 20.0
• 1,56 17.8
.c61 16.4
S.067 14.9
.072 13.9
.081 12.3 V!
.092 10.9
.103, 9.7
.113 8.8 II .117 8.5 li
.158 6.3
.208 4.9 I
.308 3.2
[It,• . .. . .
42.. ' •, a~•

TABLE 4- SAMPLE SPREADING WEIGHTS (c, OF 15 DEGREES ANDv OF 0 DEGREES) (REFERENCE 8)
.W F 7 75 60 46 30 Is 0
-90 0.000 - - - -- -
.t , , -75 0.011 0.000 -...
460 0.042 0.019 0.000 - -- -!ill o o o ..-45 0.083 0.069 0.037 0.000 - -
-1 130 0.125 0.131 0.125 0.063 0.00 00
-15 0.158 0.181 0.213 0.250 0.250 0.000 0.001---z
4 0 (J) 0.167 0.200 0.250 0.333 0.6500 1.000 1.000
15 0.155 0.181 0.213 0.250 0.250 0.000 0.'L•)
I V 30 0.125 0.131 0.125 0.063 0.000 - -
45 0.083 0.069 0.037 0.000 - - -
60 0.042 0.019 0.000 - --
175 0.011 0.000 -- --
90 0.080 - - - --
SL4
ii.
I i 9 +, .'+ , ••
S. ... ..L, , . .. ,43 - _ ! -.

49 -
-. - x - - - - - - - - x
aj IACL x x
0.- u
tot0.
.
z
-x x
101
0m 0 1 >
zm _
4-1 41 1-
%I- .i -
In 41W' A
4-44

APPENDIX A
SEASONAL CLIMATOLOGY OF THE NORTH ATLANTIC OCEAN
1A-
V4,

J ~ The following data graphs are derived primarily
from the Ten Year Hilndcast L
developed from Reference 9.
JI
A-2

Io I I4
11'~ 0 __
CD in
L owA- 3
W.1r

RIF
" - 91 -94- 9J-• • •AIA^ "O ATLJ41tC MAL1 Sw.1s MAN011
, 1 . . . .. .
'I-
Figr A Si ,n fi a *Wav He
~~b Moa Wav PerJl iod+.I
.1 I ." - - - - "'- - -.---- ,"T
1.
. 1A Ili .a 3 * *
,. 4 . . ,1 .1 . 2
, * 3,0 .0 .7 .3 .. a
' . . .... ... . +
'I~~. WMs~ **S
Figure A--3 Significant Wave Hih
HeigModal W.i, Speio d
A-4I
NEA. ho Ll . lA. 99,8T AVL9II ,em ti ~ 9U •
991'1 --1
' i-(9 ,• •, • , 37+I~o l.• ,S ~ o .5 . -.
a ,l - - - - - - - - - -£ . 16 6 <' •
4 *b * Moa *av Peio .: . *
II S
,"4 .9 .9 .2,5. .9 4 ..
, .7.3 , .0 4 ,|3.
, 9 .9 . 7 t.4 2. .2,* *15"
.9 .1. .2 9 ,a 3. 9 5 9 6I.0
? .0 38 ,.7 4,3 .2 12,.5.
- - - '. _I
+ Figure A" 0Sig5.ian Wave00.
! ~Height by Win. Speed
S,,,.i-++• - +• -- 7" . ... . .' :' .+A 4.
-- '. ... . ... ... ' -- - II '• " . •:•',.,+.,+,'•'••t)S. . . . . . .. . . ; • . ... . . . . . . • .. • .. + . .. .

a . - - A
I. * " 1.2 4..2
II
14. 0 I' 4 .2 2 . 1 1. 4 61.3l 1.1 1. 1. ' , 11 1"
a, l • -4 .2 * * .2 .2 .2 ,I
1 . 2 . .6 .6 . , .. . 2..
". * .2 .2- * .2 .2.4 .*'*1|
2 .1 .. .. .. .2 1.9 .3 ,.3
S. 6 1.6 2 .7 1. 6 1.. I .3 2.2
4 .6 t .t .9l .l 2.9 2.9 a. . 2,0 .9
UA 02.3 16.1 3.6
IA w. 2.6 2.2AL ii39 1 1.
I I
Figure A- Significant WaveHeight by nave Direction
A5* 116 iaPt6, 33$,6l
ItN
I. 4 4 ,2 .2 .2 .2 .3 2 .It I
r - 1 i. 26 3.'. 92 39 . 6
1,r - II 1, ~ l II
• •'.• ~ ~.6 • . • . .S..2 2.2' 2. 3.2• ' 2.9 3.6 2.2' 2.9 6h6.e"
7 J 6 M S .I•IlL
S1 • d D regloni

.4
USAm^ RACA OMT AYWWMIC MOAL IWMPLRI 119,00
. . .. . .
1. 1.4 4 .0 I. $ 1 61 .. 1 W e
I t It , ,, 6 o .
6 I ISI lIt I,| tI .? 4? 1.5 lT |
wiwIN 61 AT is N toins)
Figure A-6 Significant Wave Height byWind Speed (WMO Sea State Chart)
SI .-------------------------- ,- - I
4.e~ I I . .,,
"ANA 601 041 OLAO I1f1 I1.! 1.1,I6
S'0 11 i IO I O
oI a. t lot
1F41 i tsr soft Sini c n 1?v 1eightVb1a - - -I
4 11 I I4 I - I0I.V 1,1 1 "1 16 a I) 14 6 i 1 I 6
- - V- -- - -66
?iV I! b
• 77,
a*90 ). * ! *V • 1 W * 4W4
SI.l4 ,a a .4l a. 14• 48 14 40 48 lo4
---- I I
Figure A-7 Persistence of
Significant Wave Height
A- 6
- - - - - • ' . -... , . - , ...... ,.• . .. .. , . . . .. . . ... _, ,. -.
AIPIeAI. AM, MOM? ATLANTIIC ~ OV~4AL u' Li 066o o
331 is? 4 3 7 1
)k m $-5-I-a- 22 1 s Il 6I1
1840 0 7 2 42 Is is S I 107ISO121 24)1 17 621 23 2 7 ll IS 46 17 S
sl I llS 50 202 77 09 194 7 U 2 1 1 4 4 %i
26 4 133 4', 4 AS 140 72 1 3 2 ) 3 ) 1 1 5 Its"4
(S . 484~1 3 82)? 12 Jos 191 till 420 79 25f 111 0 I I 7271
as---------------- P---1 o51 203 12 24 2 s2 13 6 7 44 17 6h is 7 2 101"s
DURATIONf l , (""I
43115F gur A- Per ist nc 71 2 4 16 12 5 3 22 2 10
7 ~ ~ ~ ~ ~ Wn Speed--- - -- - -- -
J~l 681 408 iS U, ~ 2 0A-74 2

-, -z--' ,- V ''09110NTAN Anwi MAL WOISNMtf
as~4, 4. 4'91- - - - -
1.. .*. I '
. ,1 .1 o. *
10
"".1 . , , s ",#As
-i i l~ra owll 1,14 (me) I .
A--8*s . 9 , , .3 .51 . I 4 4 ,
3'8 - 1- 1'4'-- -F-•~,O',•,•••"
4 5 .0 .56 .9 * ,
I , ,- ~ -. ,. , -,,. ,.-. ,. .,- ,.
.8• 7 o7 , 3., ,| 1' ,7 ,.A ,8 ,| ... ,, 4, 5,
9,. 7....5 8,
I ,
.,.).. ., , , •
I
T , , I I , I I * A I
I i i -0 $ $ f
1 I III , I I l(16
I,, ,,il ,l . . . . .. I , 1 ,, . .
Figure A-IO Significant Wave
Height by Wind Speed .Ii
A-8 [LI
, . . .. . . . . . . _ .. .. .--. ., . . . ,. . . ..-.. : • • • •

jw".. ATLUITICOL "• Met
Is-1S. . . . . 4 "r* I 4 * *k .2 4l .2
2 ..2 1. . .2 4 .1* 72
', ."il "11"0a I .• 10. 1". too.'
.4 *. 2 , . 2. 2 ' .$41, .31.1 )
It K -b out.,- -
--, 4 , 4 . 2 . 2 . 2 , 2 . 4 ., 3 2,o ',,
i .5' .3 ,' .9 s.' ,,1 2s .2, •,.5
. .1: , .6 .I, ,.3 1.4 2.2 2.4 •.z
2. |3 .7O .9 ,1. 1.7 2.6 ,2. 1.1 12,2
Figure A- 1 1 Si.gni 2i 2 .ant Wave
Height by Wave DirectionwIwan AMIANTIO ATIANTIC TOTAL. SWIL91
1,, 4. 4a4. ,c 4.,i4, ,
4 4 41 4 4 , .2 ,4 .3
15---------------------------
L..•.3 ,5 .4 .1 .7 .1 1.2 "- 1 .3
[ .7 .6 .3 1.1 2.3 1.1 2.0J 2.2 1.7•to ,I
- .6 .9 2.A 2.5 2.2 k. 4 1 .0 15.0
2.3 1, 1 ., 1.4 3.6 2.1 16.7
5 2., 2.6 . 0f2, ,.2 4.5 3.6 1.? ,1.4
S,.s I 6 . . 2 1 .7 14 .6
7. .9 -. - -. 25
2.l I$ . 2 1. 2. 6 2.23 . 6 .8 . .
Ct - SSo~~e/r.I ~ i le ii I.ACI o , .
o _AL 1 .2 . 5 2 .3 6. 3.6 6.5 2.6 2.$ 26.L " "66" "" """ " 1"
It iFigure A-12 Wind Speed by5 Wind Direction,A-9
7, A *,ký M 11
_____ ~ ... 1. ~y1*.- .,"+•Z.il

MAVA MOATN ATLAWTIC TOTAL UMPLIS35,.•"
1. .2 .1 .4 7
-6.0 -
a. 2.5 .0 5.5 9s.4 7. 29.2 5
2.5
".' . 6.0.0
,4.0 .. . mm. . ,..
OTA. ). s 23.8 17.4 15.. .2 ,
,6 .4 1 1. 21 1 5 P TTL
Figure A-13 Significant Wave Height byWind Speed (WMo Seaa State Chart)
A1
0£
FgrA-3Sgiia- t KaeHigtb
Li
46 4 re
IAj
I 1
414
IA I
C - - -
44.141 0
C~ CL
- - -0 -Z
In UO 0-"
A-1
-- . -- --
.IA
* 5 *0 4 .15.A 2 . 2 .7 .4 ,.,. -1 INA
• 4 -
4.1 6A 5 22.1 2,4 5, It.% iss it's it .Sk o to's 11 .1 Oil I
$1 11 I flat" 4140,
Figure A-0-1-1 Significant Wave* I height by Modal Wave Period
11
".4 " 2
1. .. .. .. .
2-14 A I .
S*i I | I.I .p .2 4 1, 5 l
,I . .2 a.4 *, .4.,2 I * ./ ,
.4 |.L 1,o l~o LL. .
J I| -
- ',A0 6-
. .1 .6| 0 ll ll ll • I i . tHI
14ItL AJlJl, * L II,L'•.• I, t, , 1, ,IA AS , .1 1 1106A ~
we" a24 4.114.2 tom)4
Figure A-O-I-2 Significant WaveHelght by Wind Speed I]
A-1 2
777. -. I",Is
ma

.4
t MAI lt. MAL oft ,s I)
L t.
,'---- -
1* 94
* 9 3-tt.---,, - 4- ~7
4. 1.9 8. 1 .3' 0ý.3 1A 13 A
. 4 23 . . 8 .4 .
*1~~ 1 1 -
1 -6 1 .,1 ,, * * .L ,0 hr t~ ,*
1.4 E l I ., 14. I. 1. 1 ,. 4 l)4.4 4 .e *J ,I [ L. 4, • ] l3 3
* . I ,t ,I~ t,93 i,!4&I ,o ,!
M191V •I *iMtT9li
Figure A-O-i-3 Significant WaveHeight by Wave Direction
4 4 4.
I* , , 4 4~ 4, 4, ,i ,I
* 1. " 1 - - - -. -, -. . -. - |
•.1 4,Ii t . 2 .1 .9 II4 1.9 6.
* .7 .9 * O .7 .i2¢ .5 2 .
Figur A-O-l4 3 i3. nd, Speed b .
t *• " '- - ' ' 21---- a - - - - -• -""- - --- - -
LI• ".1" 1 2'"2.' 13 ., ., 97

L
AI~tAM"L AR11A 0 TOTAL SAIIPLI 13.31.0L
m.1 -S 7 -7li.0 ~ 1i.
- - . 1.2 .3 . ,1 4.0 1.31 I,| .23,
4 .11I 4.: ,s . •. ,I, s
2.0 2.3
I , .I
ilkl
10.7 11.4 2y.4 5io 14. 1 2.3 .3 I00.0
0 5 • 1i2 IS II 7 17 55 6|4 TOTALS
IIl lot Ill AT is It I(NOT$N
IsI
Fignrf icantWaSgnifigan
--14'iIi -
111 It I $ )
a1 -- - - - - ----,, 0'to Ja I I 1-
1. ' . . . 11*t a+
Illt Il $ I ) II I a a I I $
a4l Ill It aa It tO 0 0 I I t I I S61
alA IIl Ift to )I IS I I I O 1 (, a III
a II
8)1 lIt l 117 4 tI$ I II at 4 I I 0 $ It+ SII
Ill 10 I I) ll t1 SI 07 +1 3)t Ii II S S a Is Olt +
It II I I 71 ?• 'Ik I 14 It 71 I I? I S I S ll a|
I.M IS. l tO 144 It l ]t II .01 4 I )P IS I 01 •+ t~ll/•
i Figure A-O-1-6 Persistence ofSSignificant Wave Height IAl
A-14

-,, • -.. .. . _ _._ •- ... .. . . .1 . . . . -. - . ..
I.L . -1ICC
AIIIJUAL AREA 0 TOTAL IA 4PLS 1 0
10 1Io2 I1;
41 so 1...
I01 65 23 IA 4 3 0 221
342 7 ?S 1 3 7 k a 2 l 4 g
45 2131 99 61 5 3 :
678 306 1A5 75 30 I1 A 3 3 2 1 2 1268
651i 1.06 182 113 55 19 Is t 7 7 3 IS454 10.7 1 6 5+72C 281 115 7) 29• t 6 7 2 2 1 2 1 1262
47 174 63 30 1o 7 2 2 762
222f 47 34 21. 6 A 1 I 359
0 - I- - - - - 7 - 0 -14749
D TOTALS 36 1 9 169 Il 1 .22 1712 A 6 , 7 1 91 3
1 II 2s14 30 36 42 4, ;4 60 66 72 78+ TOTALS
OURATION (HOURS)
Figure A-0-1-7 Persistence ofWind Speed
"IA1
- I.
•+ A- 15
(,.'. .:

?44L j iLOSS
Ifm
Figure A-O2 Siniicn Wav
U., *IrI I I lI
Figure A-0-2-2 Significant Wave
Hihetgbt boda Wavei sPeeld
A- 16
1.9.

- AAA TOTAlO PL$S 3,592
* I
20
. 2 . !.
.. 1 2.9 )1 .0 .3 * .5
1 J 2 ,1- - , -. ' + I
1.4 .2 . 1 .$ . 2.4
TTL .2 ,5 .0 2.. .1 2.0
2.) 2 2. 2.0 A * 0. m
Figur, A02-3 Si, ni, .i JWOav
2. 111 A IkA 2.0 2 T , 2I2 3.5
2.2 .2 ,I 2.2 2.3 0.. 2.0 .0 20.2
is X
,1 .I .6 1.7 2.0 2.h 2, I. A 1 7.2
I I , 1 10
.0.. ,| 0 2.0 .I. 2, 2.0 2.2 20.2
17 - -
1. ,1 . 2.2 2 2 0 2 . 42 232 0.4 2 .0 2 3 • 00
1. 4 .9 1 4 . 7 .7 . .
P02l,001 20201 0IftL¢! 2004
: !Figure A-0-2-3 Significant Wave
Height by Wave Direction
020102~t AMA 0 1OTA. SiPIl .,592
0 50 200
0 ,2 ,1 .2
.] 0' .2 .5 .2 .t .3 2.4
2.1~ .3 .2 2.5 2.1 2.2 ., J .5 7o.0
2.5 2.0 2.0 2.0 3 .0 ] . 1 2.3 22.0
22 0. .5 22 2. . 1. .2O.
7 ~~- - - - 2
2.40 .91 ,• 4 ,0 .? .7 ,6 1.2
00MI 0[ 02 0.2 m TOTA2.S
t • ~ F igure A-O-2-4 Wi nd Speed by
,t A- 17
ii
L4.. . "- + I

WINTRl AIA 0 TOTAL SAMIPLES 31
•1|
+ 1 . . 3 1
I. 1 25 2.Z 12.0 .1- -.• 14.0' .8 l. . .' I .
- 1.0 1 , .1 6.7 1,5 81.2
2.5 -3. 1.6 .- -.,-.-- I,.2I* •. I .2
1•0I 4 - 1) - ? -
S10.7 22. .20 17.9 22.0 .4 1 100.0
0 6 IQ 16 . 7, 7 S$ W5 ..3 TOTALSV "I V116 AT 10 h (KNOTS)
Figure A-0-1-5 Significant Wave Height byWind Speed (WMO Sea State Chmi't)
A-18 1
'M
.ii.
II
r~t1:
-- •+ A-18
i' [ +
p •, + + ;;

--, -, - -..---. -,| j,: N I • I '**•: J !*; -- ,, --- -
Palma. -A 0 TO,.L , . . - , , ,
.2 A .1
1.3.I-I,,I -,-,I,
,! ja ,_ ,_ _ .•~. Iv I. a , .7 • . I1
* a. _,_ __6 . 4 ; _
2. 88. 99 1. -s1. . .Figure A-0-3-1 Significant Wave
Height by Modal Wave Period
"Ii
.-. .| I' . 78 ~ .3 .- ., 87,
i :98 -- t
I.. Figure A-0-3-2 Significant Wave
.. , ~~Height byMoa WinvSePerid
,A-1
I 7 8 .. . , 9.
-- - - - --. 4 *
5' | ' "
I --
71• . a$ 8.1 79. 8 9. .8,
Figure A-O-3-2 Significant Wavei: r Height by Wind Speed
A- 1
0+ L3364 2M t1 ,I23
IWO AN ,1 MAL VA,3 618
SI f
}33 - - -
S • , 6 II . 3 .,1t ,
13
.,3 I , ).3 1.3 2. ).3 , 1 .1
2.3M- A
14 7.13
•.0 .2 .3 34I 3. 0 3,4 I .2 15.1
. -+ '. -.° ".-. , -" -'t'-f4. .3. 3.) 24 .0 .3 I. $ 2.
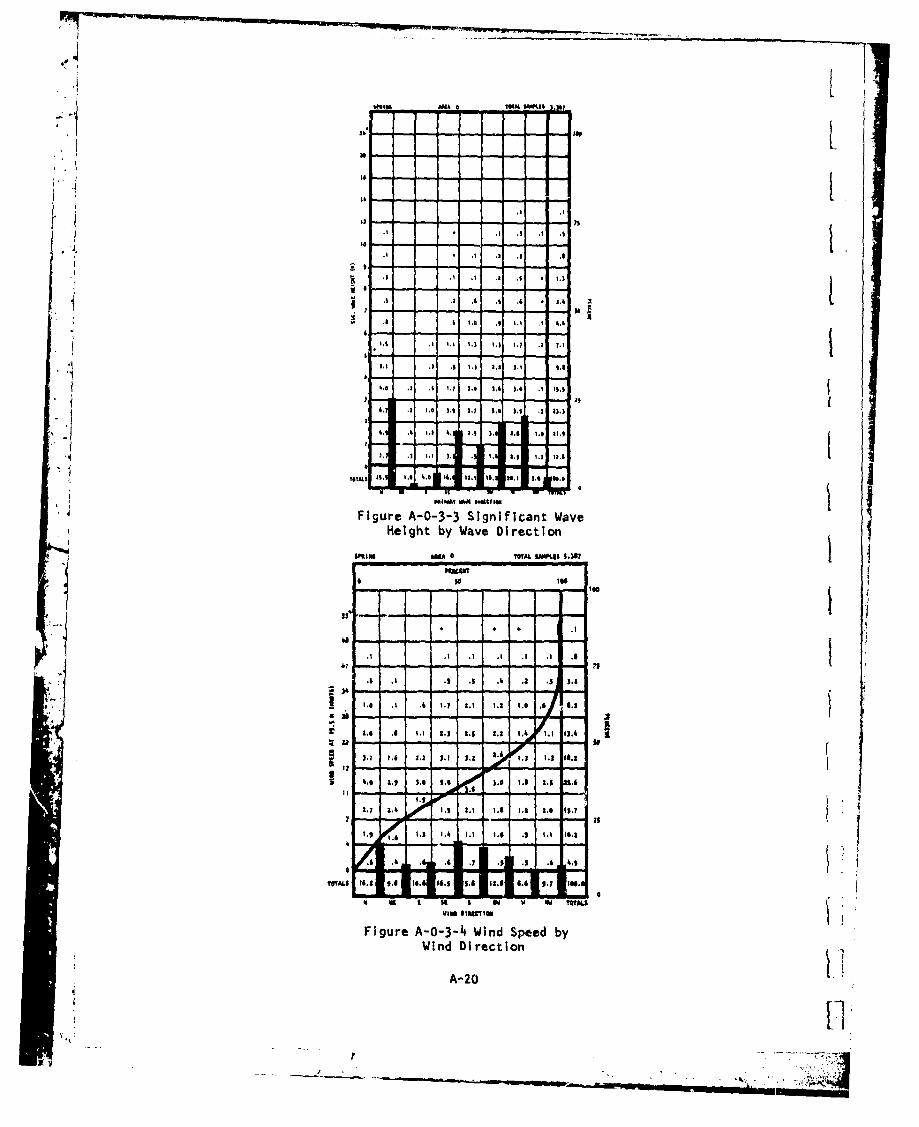
" J Figure A-O-3-3 Significant Wave
Height by Wave DirectionIt
80.0 .3 71T.9 IM I .38
* e . 1. 8 . 2.5 n.
4. 2. 00;0 15 . 1 . 4 1 . . 2 1
.I .3 .2 .I i. .2 .3
.6 4 .1 . S J . . 6 , .5 1.
2.1 6 2.2 1. 3 t.. .12.4 22 . 3 22.41"
1 0 Is • I I MI ,e 2.5 3.6 3.0 ), 8 2.8 2.3• .| |4
A.202.,7 2.3 2.3 2.2 2.8 2.3 1.0 25.7
j- 0f
80 " 3.1 3 .b W "
8280 OIIITIW4•IOl
i ~Figure A-O-3-4• Wind Speed by, •/~ind Direction !
SA-: 20'
4
- , -7r..-T ,::,2

A44A 0 TOTAL SAPLES E ,$ 7
I |1
.0 I 1. ,5 1 .5 8.1 7.2 14.4
- .1 1.s 4.j 6.3 5.0 +
S -- -'S3 .6 S .6 1 2 . 7 7 . 4 .3 9 .
3.7 S.3 S.0 + 14.1
+- - - - 2
11,- I 15.1 25.1 12.0 14. 14.0 .10
- I -
0 6 10 16 21 27 47 55 63* TOTALSWIND SPEED AT 10 M (KNOTS)
Figure A-0-3-5 Significant Wave Height byWind Speed (WMO Sea State Chart)
S'A I
" , A- 21
I.'
"12 *1 II

-40
tot
S0 .4.ie.
. . .. -:
•Ii---
- -- -
-' •--- -- - - -I
"". j, 4-
16. 114 9 . 1. 6 6 1 2 . 11 1. I l
*4 1
.-- I
I.I . | .
(I..
Fiur A-04- Sigifcat
Wav
S,
. . ,I ,.. 1iz
A--
* *II IA ~ 1111,
SI
s il0
1 K J*
II 9 11 I*l 4' .0 1
l
1]____________
A AUIA 0 TOTAL. S•MPLIS 3.155
-, -500
.4 1. 2. L
5 .- 0 3
a
TOA$ i.2 . 2. 10.2 . .i " o+.. . 2 , . .
. 20 .2 . • .3 .5
A1 .O 1 . . 2 15.50 5. 8 5.1 55 .2
|,.L 22.5 5.5 5 .2 2.2. a .5 5 4 7 . 50 .0
I2555 t50 2 2 .10 1 IJ
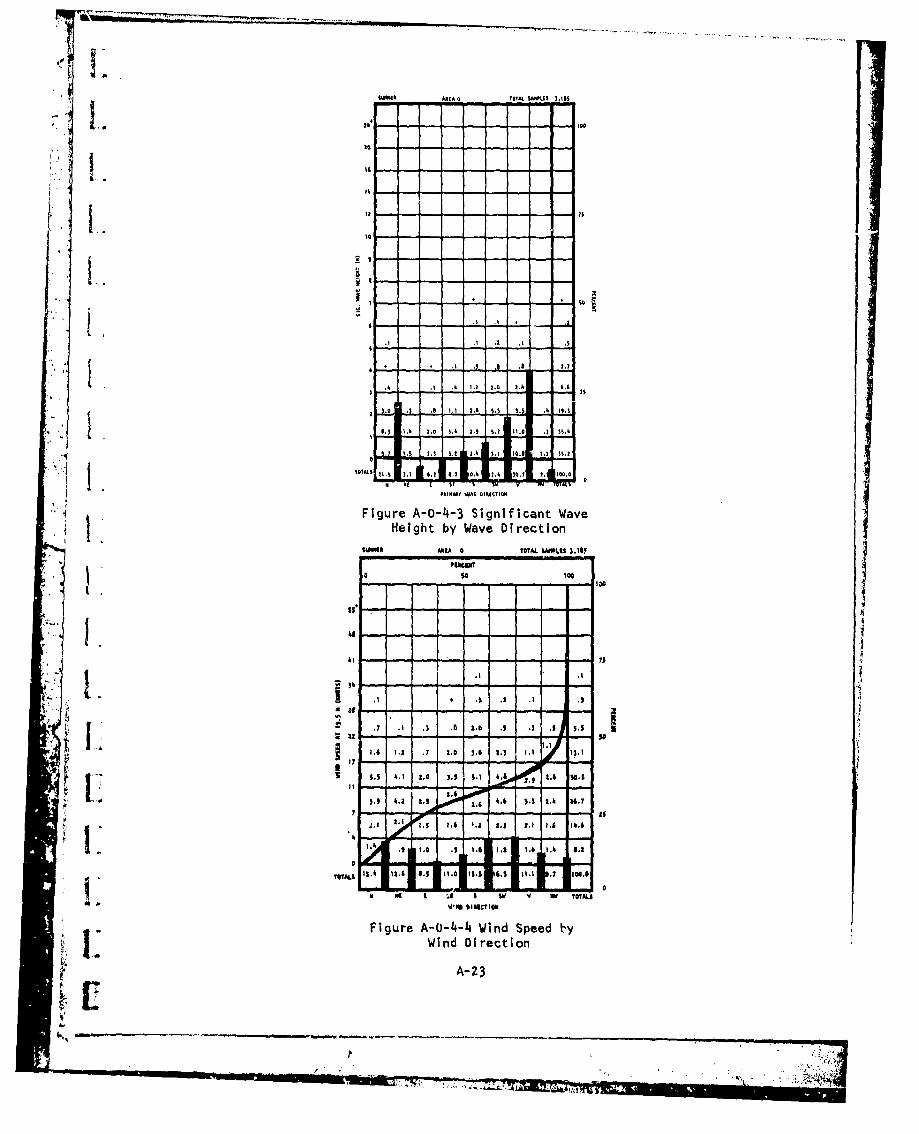
Figure A-O-4-3 Significant Wave
Height by Wave Direction1W994 826.5 5 TOTAL 1 $I .tA-2
O 3 500
J 4. - -l - - -
u 34
f 1.4 2.1 .7 2.0 3.0 3. 5., 5 1, ).5
1 j•jdl •h 1.2 1.4 0.
•A- 23
2--
I1.

SUMPI[a AREA O TOTAL 5rL.S 3,1S5l .-, I I..o
1.2 * .1 .I 7
4.0
S3,0 A. 17.1 9.1 .3 3&.7
,i S 12.5 13.6 .2 35.2
all 5..8 .4 10.7 2
S16.6 26.O 34-S I1.0 6.1 1.7 100.o
a 6 to it 2a 27 47 55 631 TOTAL$WIND SPIFO AT 10 X5 (KiNOTS)
Figure A-0-4-5 Significant Wave Height byWind Speed (WHO Sea State Chart)
IA
+.I
A-24
+tii__~
p ,-,- *.-- -
+* .., ,+

k 19qP
FA|L AA C71
I N .
.4 + 6_S
a. -- -2- - - - - -
!d iI
-
'46 . -- - -- A- 0.1.
.1 ,. 2. .3
4W
.S . I .I .3
..7 .7 2.3.1
1. . . 1.1
M 1 6, 1 .1 I U 144 . ..
FiueA-0-5-i Significant WaveHeight by Modal Wave Period
,3 .A , . 01
34.
2-2
, / ,• I
, I , , I . • , ,
!i
l~Il * .5 31.8 , .O I,.' 1. 0 . .7 .8. 1 . 0 ,.
|.| $ ,5 02, l bg II ,i 1* , 1 011.
1 . 01. 1 9112 l, bI 1 . 1 ,.1 ) , ,
1.lFigure A-O-5-2 Significant Wave
•, • ~ Height byMoa Wind Speeid
L.o
I 'i.

-
FALL 3AAC 0 TOTAL SMIPLOS 1$.114
20
lal 1.2 3.
2.6 .- - 6.
3 . M .1 13.3
"". 1 .2 .1 1 .1 S.A II. . * .2 I . 2 1 . 2 *. 2! 6
3.4 .1 . .. s . i 1,
i I
,.o .t . 1.4 .1 |.i 1.2 .1 2I.2 S
H b D
2.2 .2 .2 .3 2.5 5.5 2.3 .2 2,.2
F..ALL , .2 . 2. 2 . 5 .7 A.E .0 TOT 11 .-,,
Figure A-0-5-3 Significant Wave
Height by Wave Direction
P03~.2. ASIA 0 TOTAL IMPI1 3,21
2 . l0 2. 00 .,,, , 100 .
ASS
I I - , - - - 24. 4, .3 ,L I Li . 7
S2. 2.3 .5 2.2 .l 2.7 .a .i ,,t
- -, -. -. - , - o tO -?,4
22 20 .321 1 .0 .
Yo5
O i ij 9.7 I~p 11.. 15.0 2.2 1.4 11.0 142.
1.7 2. 3. 52.T-' . 8• . .7 3.0 .8 .• 2.3 2•.0 7.0
SFigure A-0-5-4 Wind Speed by-Wind Direction
SA-26
...- � . . 1
S44.
LSlA .1 40 TOA2ML 1 . S0 . •4 * .5 .2 A
.I I .2 .4 .7 4.1 1.7
5 10 1.3 5. . II. h 5. 5 2T .3 L
4.0 - - - - A
F .i .0 5.5 7. g a.0 21.4 W H
Win. S.0 4.7 , e 13.S )
8.5 1 3.8l 27.4 20.9 1i,1 |1 .2 17o.0
0 A o 10 I 21 27 4t 55 6)3 TOTALS
* IND SPE[D AT |0 gi (xNOTS)
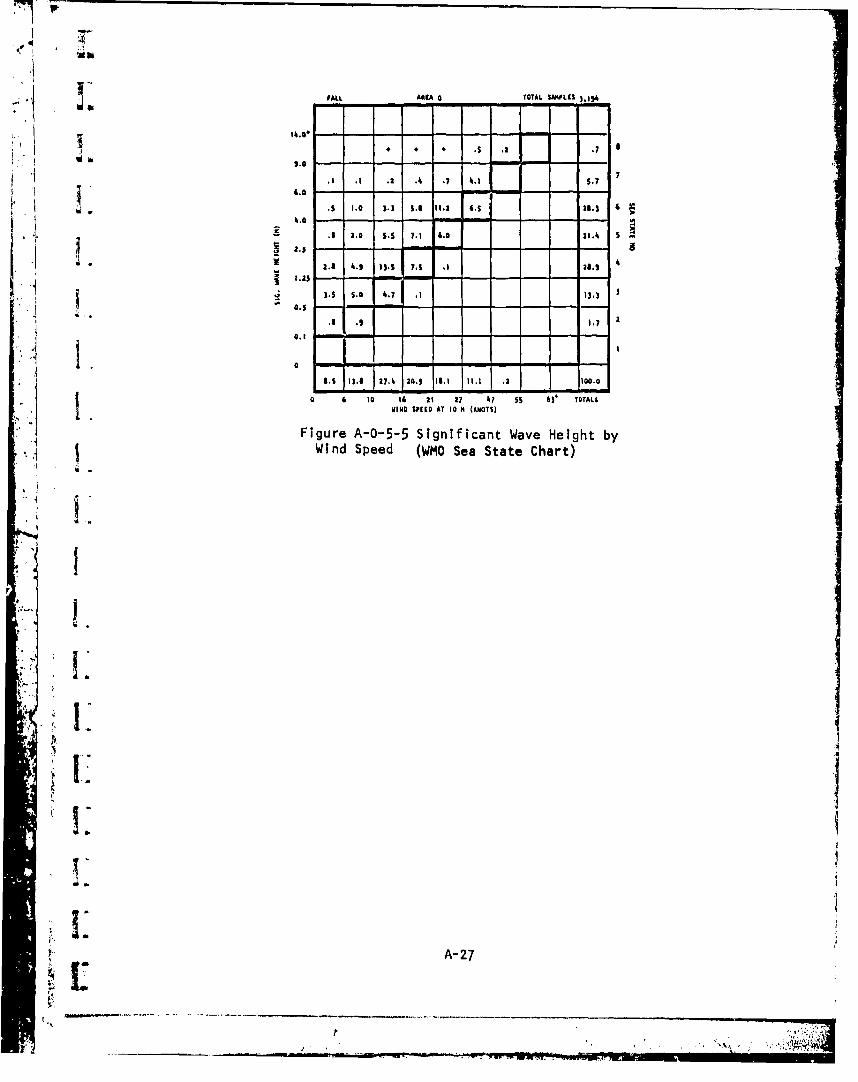
1 ~Figure A-0-5-5 Significant Wave Height byI, Wind Speed (WMO Sea State Chart)
Ii
I.
1..
I.
JA 27.
t !q ----
U%4)4
-J I)
4)4J
00
41)
NN
LU V4
4cm
0) )44.
L. u
ONN
- L. 4.vo 3
CL
vlu 00
> 4- *-i
4.' -
en u 4) 4-C4) c 0 4~cc .C4 Z IA)
al M 5 U uIA' vi 0
4) cce ULu >) 4. 0 e
~~- 0::4' 4) ~ -0
1, -1 10, m 4u,4)
UA US 2 . 04~
-9 1. J )
A- 28
F" "I1*iml

ANWAI.MO AFA MLOO 64ftc%.957
.4 a
.6 .2
. 0 .1 .73
1 .9 .2 . 4
. S. . .3 .9 .7 11.7..1~~~ 00 --
- -- .
.210.01
411_ L- .... L lj .2 11.7Tf 7 .3 * .i
/. . NOIM 4uM $
Figure A-00-1-1 Significant WaveHeight by Modal Wave Period
221 wSA 77VOAL M111%2 220
16.
I I •
* ..2 . 10 7 .0 .0 7.0 ,
II•.1 2 .. S.1 13 ..4 •
'•~ J. ,.1 ,1., | i 5
2 • 1. 1.. .6 . ..0 . .2 1 21".
.u . 0. ,. 2 S.0 2.0c2 nt2 Wa .e
•. . . I. $, 0. . ,l 1 7 . 0 .4.
70 00 2. ,0 70 , 0 0 9 2 01. 0• 0. 01 .0 .1 0 .2 1 0. i7tl*
2. 10 .70 01p 00 12' 7000t
Height by Wind Speed
A- 29
II•~~l'. .!|. . I 6 . | o S|o.4........... .......... .......... .......... .......... .0 l.k ................. -.-.01.S
/. p
A 2.•L AMA 00 TOTAL Swu'Lt I2,a?
' it'!
16
)2
.* I _ _
•* , t , .2 I , * .1.2
. . l 10 1.7 1,0 t.4l .6 I'S .1 7.1
11
.6 1.5 2 .3 I's 21 1.0 2.0 .2 11.11.2 2.4 ).0 1.9 SO I.1 ).2 .3 1 2.5
1.11 ). 5 2.3 .1 3.9 2 .2 .5 11.1
2.6 ),2 13.5 4.2 2.5 3,4 .7 3 2 I.2
TOIAL' 8.1 2 1. 22.1 20.) 7.1 213, 27.2 2.1- 2
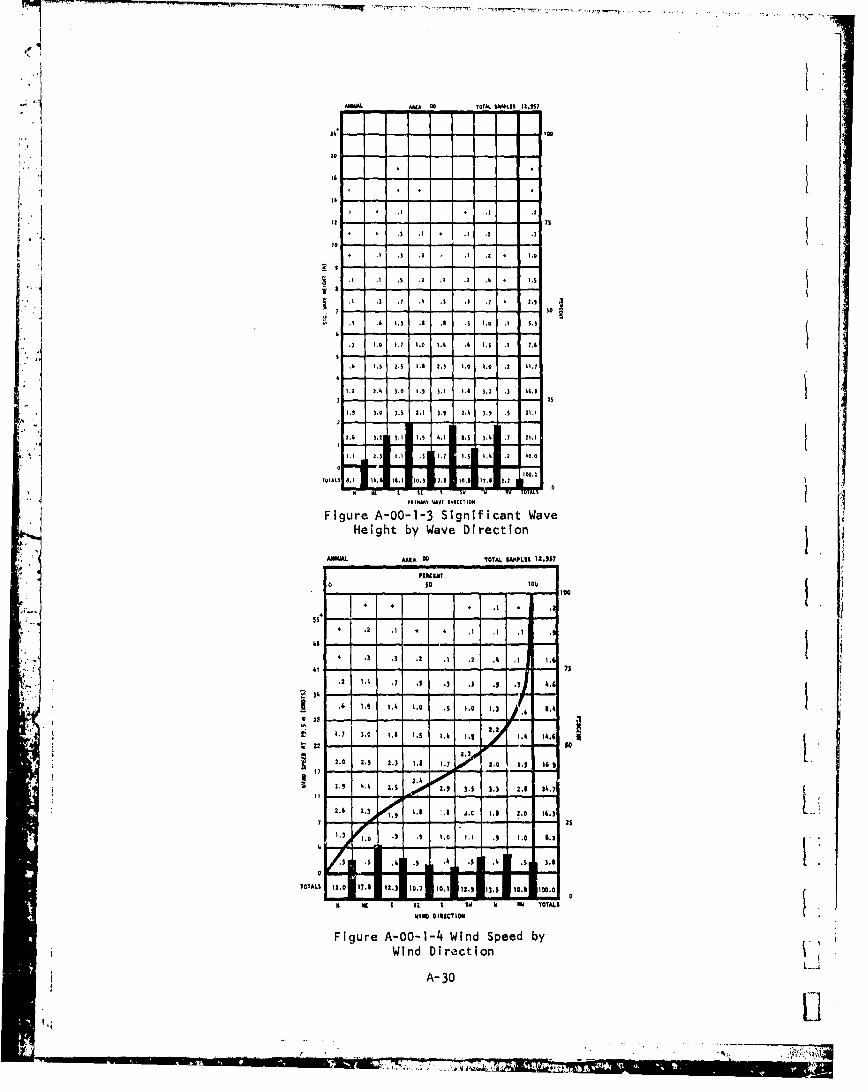
Figure A-00-1-3 Significant WaveHeight by Wave Direction
A8M6A. AREA 00 TOTAL SM2PL2S 32IS 7
FISICLIM720 $0ro {
., -- 00S I -, -
i, .• , * . . , .. .2
* 3. ,0 . 2 .3 . 2 . 4 .1 7. 1
22 - -:/- -~ -
.0 2. 2 . 1. 1 . ., .31 4.6
.9 4.) 2. 2.0 .5 2 .2 1*3 .0 24.4
2.6 t20 I A A i ' 2 .0 I..
- .7 30 s,. 2.5 2 2.4 . . 4 24.6
S12.0 2. 8 2 . ? 0. 1 12. 2.0 2.3 261
019. t 3.5 3. Will 24.7
2. , 25 .''" i . 6 , 6 3 S
WIND DIK|CT|ON
Figure A-00-1-4 Wind Speed by .,Wind Direction i
"A-30TOTLS 2.0 27. 233 2,7 0.2 33. 255 3.2 00.

ANUWAL ARIA 00 TOTAL SAMPLES 12.11W
6.D -
.6 12 - .9 8.7 79fT -+ 26.5 6
4.0*1.1 2.1 .3 6.0 5.2 .1 I19.11 5
A3.2 5.9 11.8 4.5 .3 + 27.7
1.25 1
2.8 .5 4.2 4, 11.5 3
0.5-
1.5 1.42.9 2
9.2 1 511 175 250 1 10 5.4 1I..4 1~ 2 4 1 00.0J
0 & to10 , 2 7 4 577 .
Figure A-00-1-5 Significant Wave Height byWindl Speed (WMO Sea State Chart)
AWJJARIA" 10¶1A& 16MOM 112.957
*o I,
10AO 1~? CeO I IA I.,- 0 C ,
A Is I ~ II IS I0 bb 0 0 *. 7 I tT
244 ~ ~ A 31 a 1 1
11r7 1 4 t 1 1 9It)'~~ 00 ~ W l it~ 11 44 lit )I to
So is to 4
AN~IMAL AREA 00 TOTAL SA4PLES Ica~7
$1 29 17 3 1 132
184 30 19 I- -S
I301 143 65 30 14 4 2 9
it554 23h 08 46 24 15 5 6 2 1 2 997
754 307 133 43 24 12 2 1 1281
75k 360 177 V1 48 29 17 12 1* 1 I 2 1 1 1 529
71C : 6 _o I7 1 2 6 3 11 is
h l 4s 59 19 J4 2 1 is
21 59 20 132 2_
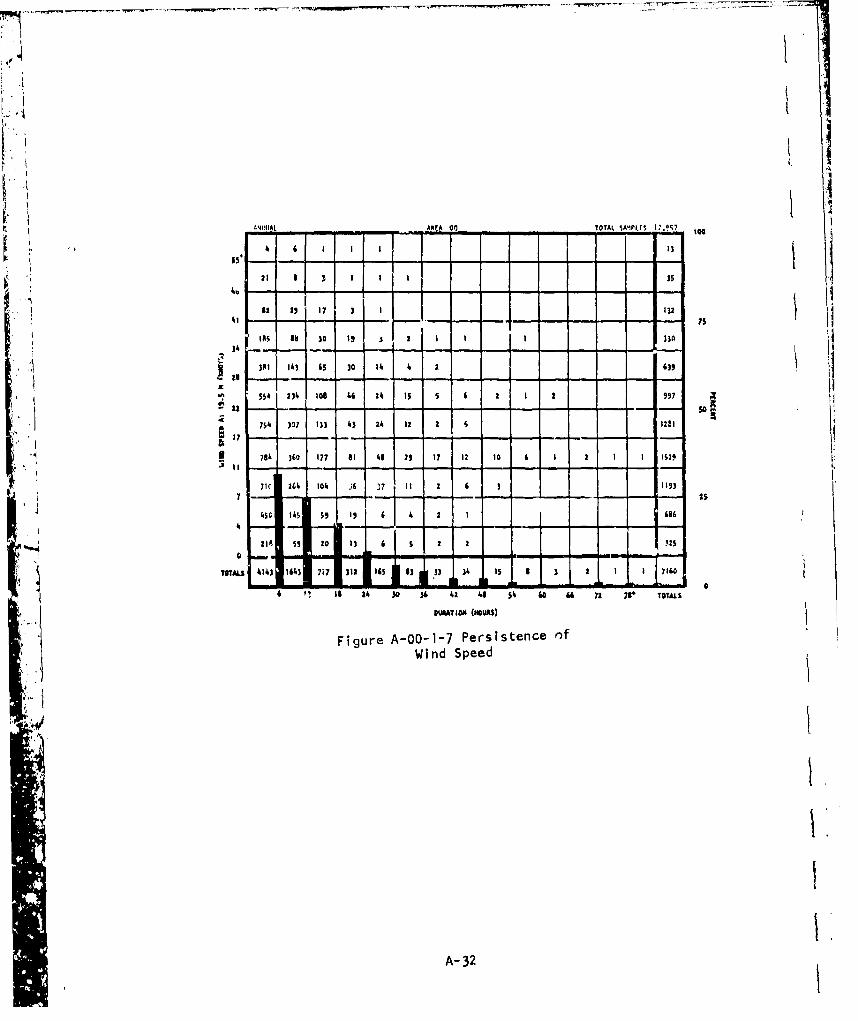
TOM.S 414) 1643 M1 III 16S 3) .33 34 IS 2 3 2 7160
6 P0 Is 24 30 36 42 48 54 60 66 72 726 TOTA4.
CUUTION (HOUA1)
Figure A-00-1-7 Persistence o~fWind Speed
A- 32

-S,. S 1 15
a - o
3.; :i. . 1 2 1 . o . $ 31.
. : ; :P *-
-. ' . 242,1. - •
5 , - - -+
•. , • ~~~ ~~.7 . ~ . 7I. .
S+ m• • 1 4 .6 Is's "A HA Wl 10.1ý
U-------------------
. -110" 1.6 IV," l .u.g.), n.
SII V
i . I. . . . .2 .+" .,s 181.
F•g .A-0.0-t. 12.2 S .i .7 . Wave
H.ei.h t.2 .. .1 .W .n Spiee
.- , . .9 .9 1, 1 .
O.1 h~ 0. 4 S. 1. 0 S. I ii . 0 ii ,5 45~ i 4,0 05. 5 0i 5 11.5 01.o ol.| iS
+ +-+Figure A-OO-2-1 Significant WaveHeight by Modal Wave Period
S,. * ,
Il I g o
---- --- ---- --- ---- --- ----- , - .0
0 $~ l 00) 0' i I i 1.i
.4. 0i II 0 0 , 00 * li.b
* I i .0 0.0, 0 0 l6.0
O is jo n0 t ' 6W
.0 0 0 II i'0 1 tk 4 l SS O~
0l l I II, l lt000 O '0 0 001
Figure A-0O-2-2 Significant Wave= i. Height b'/ Wind Speed
A- 33

AME 03 TO 00 IS
Jo ~ ~ ~ s 5-- --
.' -
3. 1. * .I
3l * .3 0 .3 .6
1. I I . 5 1. 2 +I *1 .4 1.9
3. . 3 . 5t 3, . 3 35 3I .6 33
-. 3 . 0 , 3 .0 1. .0 .3 ,.3 3. j,r.3 A 03 3.3niica.3 Wav
3.0 3 , 3.3i 3.0i I . 3 , .3 , 0 33. 1O0..31, 0. 3 3. 3 31. 0 0.3] .0 30.3
IG
0 .33 .7 . 37 lO 3.3 .1 00.0
S1.5 ~~ ~1.7 ~ ~ , 1. . , . i.
:. .1 I. 1.4 1 . 1 1.63
I 2 ..r 2b.l • 1,I l.2 1 .0 2l.4 1. 1 17l . 1
• + Figure A-00-2-3 Significant Wave+ Height by Wave Direction
I 30 .23 401I 00 TOT. 1.9 l.0 3. 50J
.0001
2.4 300 2.1 1.
V. .3 . .3 .
, .3 . . 1 , 2 3.3
.M f 3. 3.7 3.3 .2 .2 1 .3 . .11
99~~~ 11t 1.1 OTL
A.34
+ 3, . .4 3 341. . 37.
33 lt 34 i 0.3 3.3 0.3 0,l 1.3 IS.
3.7 3.7 I3.3 3.3 3,3 ,I 3 o 3 l.3 3.7 - I- 12
.5 .7 7j 7 . .. ,,. 3.i
,3 .2 ,4 ,3 . .3 ,3 .0l 0. *
0 a -TOTAL5 O , 30,4 33,0 33 l0,0 3. 30, 2 I 33,0 5.4 330.
0 00 [ 31 0 03 0 . I1 T6"4 .
Figure A-00-2-4 Wind Speed byWilnd Direct ion !
A- 34
[.I

WINTER - AREA 00 TOTAL WPLL[S 3.514
Sb I 1 .I .2
S* . 1 3 .0 1 . ) 4 . I 4 . 3
,.2 1 1.0 2.4 ,.5 14.2 .2 19.6 7
I"~.
1.) 2.0 S.6 6.9 11.0 10.1 0
4 1.2 2.3 1,0 5.2 137 .7 13.1 S
15_4..2 2 .•2, : , .3 .3 . • lG , | 4
1.1 1.I .7 41 1 .3
0.5 - ' -
2. *7 2, 100.0
6- t 04 0 I (l 21 27 47 $5 6 e TOTALS" WINDO SPEEO AT 10 m (uOTS)
"Figure A-00-2-5 Significant Wave Height byWind Speed (WMO Sea State Chart)
* , 1'
1
,.,,,,,,5
L u A- 35l!4

4. +
A. J~I iA0 il At5.S
4.8 -1 1. 1. '0.- - - - - -1 .2
1 .3 ..
.3 .2 .5
.M .3 .1 * .5,
3. k. 6. a 66 91 4. t 18 .10 1. 69 U4 3 4 S 14
-w o- K i.
.4 1 .4 A.
V -1
S 1.7 4.7 7.1 23.3 11. 2.0 9. 4 7., 1.3 3.0 . .IA
; • 41WI ~ 111410 1+
Figure A-O0-3-1 Significant WaveHeight by Modal Wave Period
A-3
II
.II44 .1
.1 1
' I 4 I , iA SW 04 4 i 1 1414
+AJ, • I Il1J At 4I.4 I iiul
Figr A-OO-32ll+ .ignfia t Wv"Hegh byWn-pe
"•I .6 . , l~ i . A- 36
o I : : t
77IPOIIW RA 005 T021 OTAL PLEI 3,35t
,0 .2 .1 A
•,.2 .2 .2 .2 , .5
S.. .2 . * * . 1
1 .5 1.3 4 .2 1 .0 2 , 7 1.0 I ,s , 14 .0
I~ .0 4 .1 .. 2 .5 10.
2. 432 .2 . 6 1. 0 . 6 21.2I t
1 , - - - - - - - - --,- --.S •, .i 9 55
2.2 2. 0.0 2 .23, 45. 2.1 2,0 ,A 2h
5 I 3 .2 .I .5I 2I I I CT.5
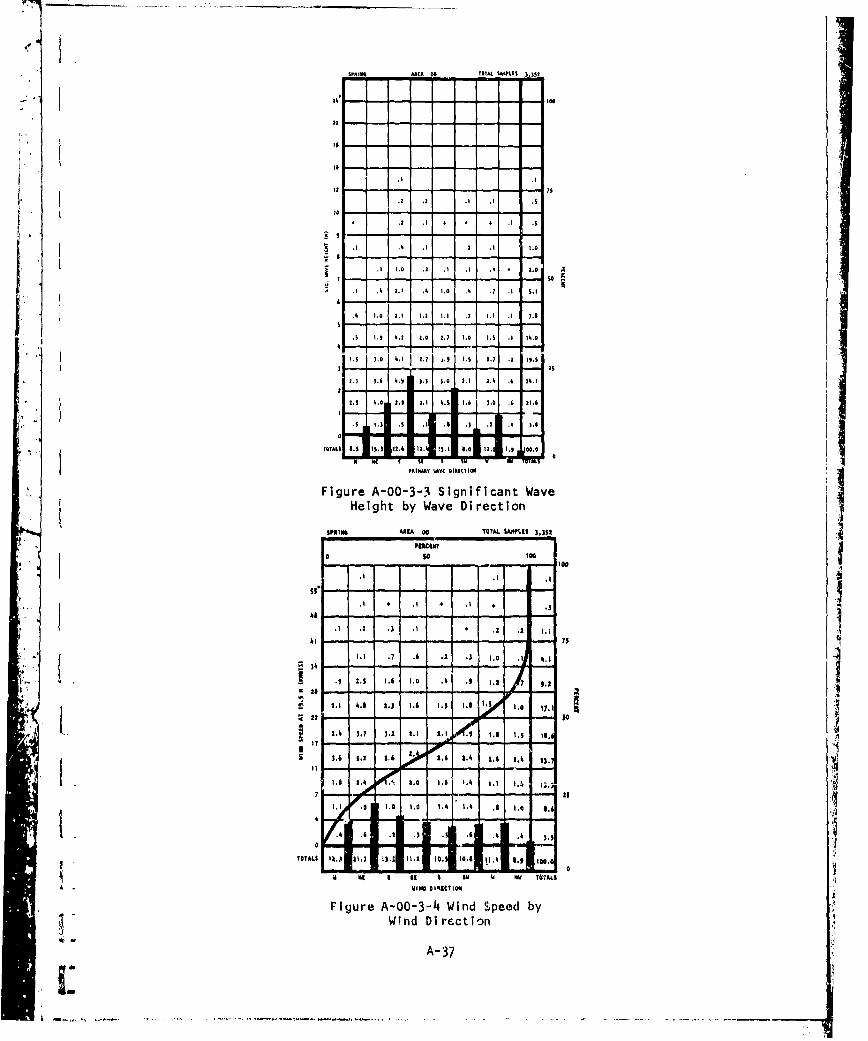
Figure A-00-3-3 Significant WaveHeight by Wave Direction
$PRIMO ALA 00o TOThAL U USiI5 3,35z
. 6 .. . .
• - -- - -- -.5 ,0 .2 0 .2 ,* I~{ 5 .05. 7 3.
221
2. 0.1 2.3 .6 1.5 13 2.5 . 5.5S21 4 , )7 2, t.6 I 1., h 100111 7,l
w llt dr w V IoL
27 2,4 3,7 3.1 2,2 1.2 hi . ,8 . 1 II
l.A 5,1 1. m 11.0I.11 ici , 2,
.0 . 3.A .0 00.35
AI 24 £ 50 5 50 A NA TOTrAL.|
Figure A-00-3-4 Wind Speed byWind Direction
A-37

7-7
SPRING ARIA DO TOTAL SAIPLES 3.352
.7 .3 .1 i.i 8
3 .0 " - - - - -
,| * .2 .A 1.t 6.2 .1 8.1 7
I. 1.0 3.0 5.0 10.) 3.8 29.6 6
116 1.9 6.3 7. 6.5 23.3 5 9
4.,4 7.1 11.9 s.1 .4 .. 7 5.
2.2 3.0 2.0 7,1
0.5.2 .2 .
-0. -- 0
9 3.1M 23.4 19.0 18.2 116.8 1. 100.0
o 4 10 16 21 27 47 55 63' TOTALS
WIND SPEED AT to M (KNOTS)
Figure A-00-3-5 Significant Wave Height by
Wind Speed (WMO Sea State Chart)
II 'I1I
4
l A- 38

Sw*g , IA 00 -- . ,124
IS
-
*+ iii...--...- .. !.- - I . %
S2 -6.. 1 2.6 1.4 2.3 100.0
Figure A-OO-471 S~i~gnificant Waveheight by Model Wave Period
-
"V I f'-
6 1.1 ..
I 'A 1.1 1.4 AI I 4
i. 1s •.1 4 I! . .
I .1 I . j, I .I 11
-"-(• i . . . .. - - -- --
3 1 1'-e' 4 6.7 .1I9" *."'4 _ .' I -S I., CC. I•.
Hi~ l ItI . MS -." -~ -~ -S ,- -
i WI ,S
Figure A-O0-4-2 Significant WaveHeight by Wiend Speed
a: A- 39
- .wlab4siA,# M!, tt*~IA &,JIPf1 I44SSnl',S~tyLWSS~

22 __ - ... ... ~... . . ... . _ ..
I 'I IS suiM~iJ•AREA 00 TOTAL ?,AKPOM( 2,834
r' 1
.2 . 3.Li : i 3
S , 2.1 4. I 3. . 81.9
4. 1 . 2.3 112,0 6,7 4.A 1.? 15,3
23. 4 22. 7'. 3 3. .2.1 3,2 5.,6
Elm 0
PRtIMARY Y40k01 0lULIl
Figure A-00-4-3 Significant WaveHeight by Wave Direction
UWI214 AREIA 00 MAL SOAPLIS I,Wh
31. 13. 30
I i ~~I.;••zsai•5}4•S. Y II Z II 1
'22
S.1 1.2 / .3 11.1
110.
5. Fig .r A-O0-0-00 Sini ic n 11a!1 ve J.
S .0 1.5 .7 .7 .7 3 .2 1.2 . 7.
~~ 32
•IHe~~ighnd Wv Direction
27 . - - -5.3 3.4) 3.S 7 3.7 3.2 2,9 3.3 it.2
3. o . 3 3, 4 3, 5 3..7 3.7 32,4
7• 3.0 ,, "I ,6 ,7 .5 |, 7,3
24 3t £ 22 $ iV 0 W~ 7•?•rAt,
Figure A-OO-14-14 Wind Speed by_aWind Direction
I~A -40
~~0
S.i

S PW Iq s,-,. O. TOTAL SAMPPLlU 1.4
- a -O+ '- -
1.0
'1 .2 .5 .5 2.1 2.s 7.0* 4~.0 -.. .. .- - -
.. 2.7 3.8 5.2 1 12.7 S
52.1 ). 12,6 . - 3-.-
4. 11,6 I.1 11.2t 30.0
S. 5.6' s . 3, 11.9I
0.1- -
14.1 24.4 31.9 17.3 S.6 2.9 100.0
0 10 16 21 27 47 55 4)3 TOTALSWIND SPEED AT to M (KNOTS)
Figure A-00-4-5 Significant Wave Height by"Wind Speed (WMO Sea State Chart)
A- 41
1
A-4
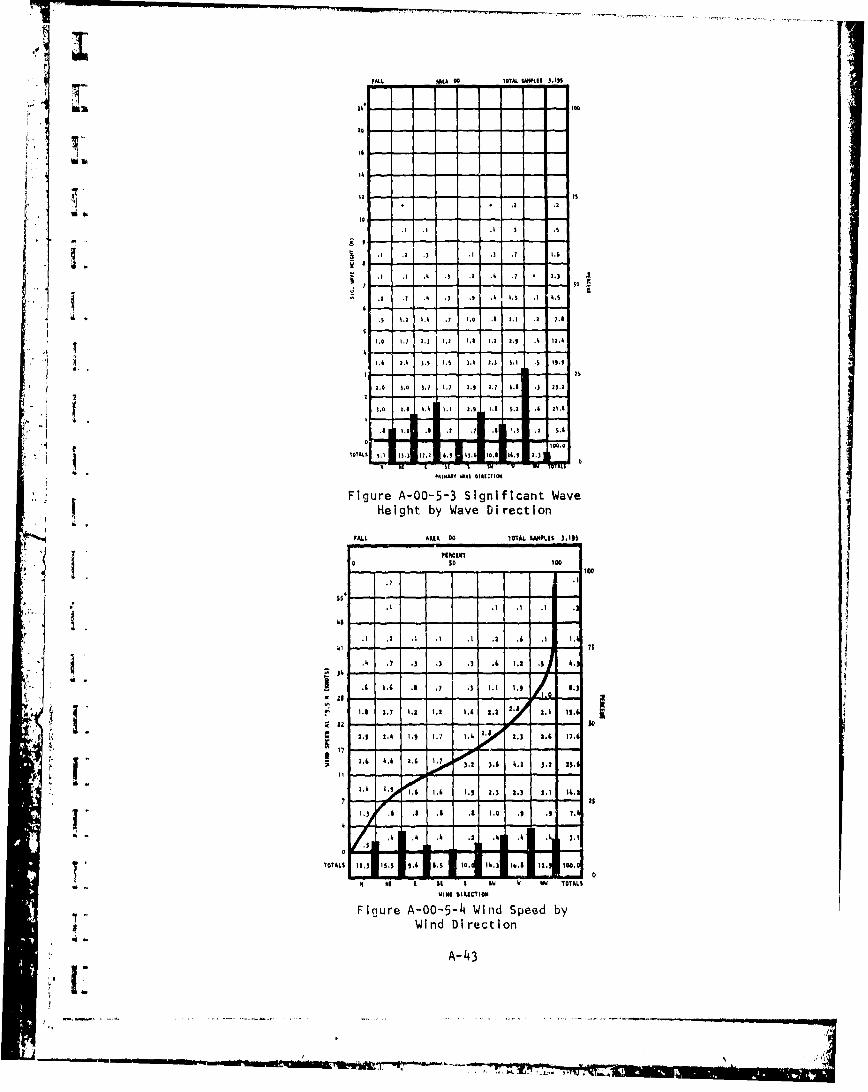
FALL 'u Do M&T seis 3.19S
4 .2
.4 . - 2-. .
68 19 .7
S÷ .4 .. I .2 .1
'* 77 2--
_.8 1.2 h. . 2 .
- --• 1010 1S+ ~ l 41 .• • , ' .8 •.o .) 1:
..2
WAS .3 5.; 238 23 llt12.:1 '.4 .8 I i . 1 .l ,oo
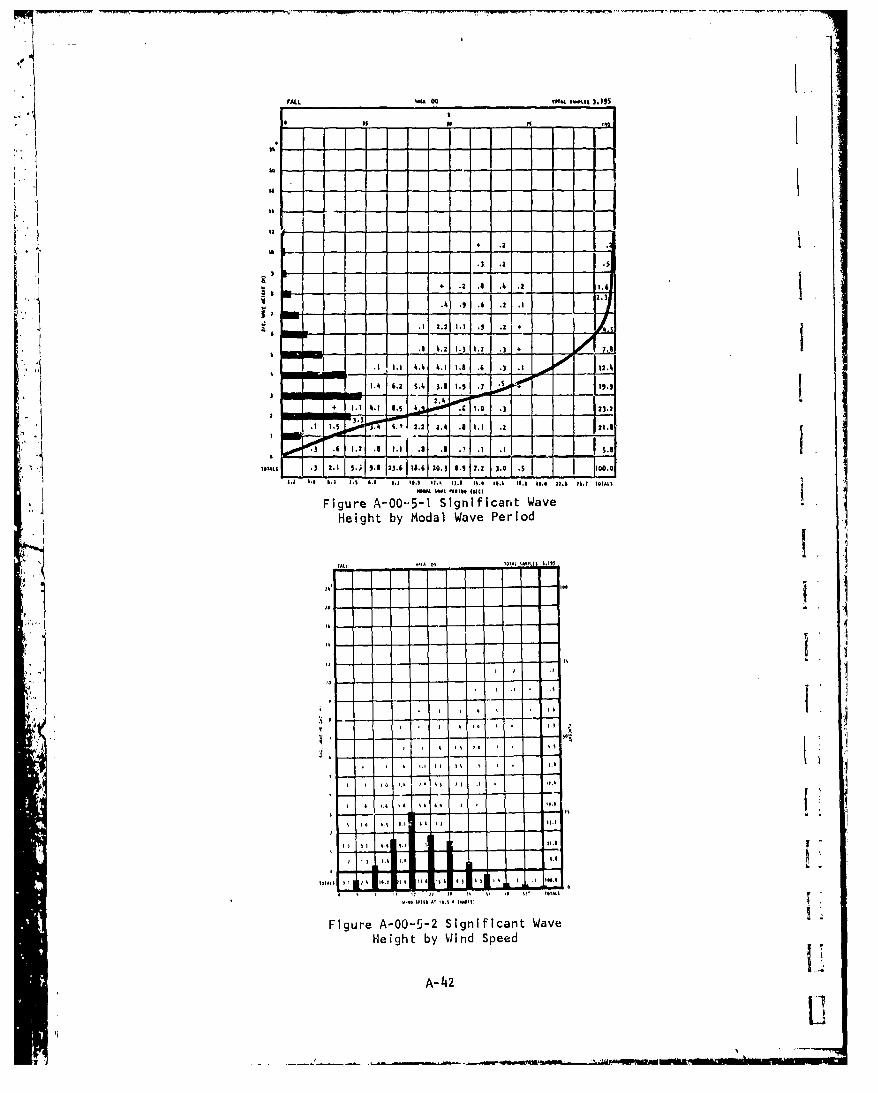
Figure A-00-5-1 Significant Wave
Height by Modal Wave Period
14'
k 4 . 4 14 1 4 4.A
.1'
9_ 1 1
1 VA 14 6 4 1 4. 4 19.
"" ,i k.. W 4
Figure A-00-5-2 Significant Wave "
Height by Wind Speed
A-42
1 7100
:FN-L 0010 00 TOT7N. IMOIP0.10 3.0)$
1 . .- .- .- 2 0 - .- -. -1. -. - 12. 0
0 ,2 - . 1..... ,5. 1 2.. 3.. 5.1....= . 9-9
0 .0 3.0 M 1. 29 27 46 2.
3. S1.2 ,21- -+ .0 ., , ., . . , 2 ,.,5
S.0 .2 .2 . 0 . 3 . 7 1. 0. 0 .
S. 0 t . 0 I . . 2 I .0 . 7 0~ 2.2 7.
T .O 1.7 .: 1.3 6 .1 .4 0. . .
FAL A.RI. A. 0 ,0 TOTA 2.0 E 1.2 7.
0 .0 0.o ,7 2 .0 0,2 1 0 , 7 0.2 , 2.2 .4 2,
0 - 0
0.0 2),0 3. 5 0.5i 2.0 2, .0 5.0 +.5 02.I
" "2.0 3. 2. 0.0 2., 2.7 0, ., 32.2
-. 1 *g0,..*I0Y 0000 00310010lm
:. j Figure A-00-5-3 Significant WaveI Height by Wave Direction
SFALL ARIIA 00 T0TAO. I&•eLCl5 3,0•I
050 1000
.0 .1
00 -
01 -- - - - - - 75
.0 .3 .3 .7 .3 1 ., 0. .5 4.00.1 .7 .5 .7 .5 3 . r , 0 6,) 4d
"" 1.6 2 .0.3 2.. 1.2 2.2 . I 1.4
tý 22 - - - -300
S 2.s5 2.4 0.1 1.7 0. 2.3 2.6 17.;
,-/
2., I , 0.0 •. 2,3 3.5 2.0 04.
0.3 .6 , .5 1 3 0,l1a .0 .9 7.V2S * . 0/ J ., .0 .21 .4 .4 .4 3.0
TOTALS 12,3 105,3 1 .0 0 .5 t0o 0, Ol , 041 N 2. 000,- I I I W w
Figure A-00-5-4 Wind Speed byWind Direction
A-43
- ~ 4 - ,, I

FALL lltA 00 TOTAL $0A!PLIS J.159
--- v,.+ .- - - - I'
.1 .30 .0
,5 1.3 3.3 £,0 5.7 5.0 * 2 A5 6 •
2.O H'' --- a': j":'. 2. .0 1. 5. -22,6
2-s~
' •3.8 7.2 12.5 57 .2 2 .
.0 3. 4.2
.47 1 4 . 6 2 4 . o 1 9 . 2 1 6 . 4 I 5 .5 .s .1I W O o
"""6 10 16 21 2 t7 47 $5 63* TOTALS
WIND SPEED AT 10 Mq (KNOTS)
Figure A-00-5-5 Significant Wave Height byWind Speed (WM0 Sea State Chart)
A-4MPPMP

0. C4CJ
-II00C-
'40.4
x 6 1- co 00 1 00 4 m 0N
I
0
In
I-41 4)
- Lo
- U) c-m
of
z. VU- L. ) A
00 0
C z)
0.
£L C. L.
t- 0)
01 *0 u
4) V C
M . 4)-R- >uL0> CiiI- u v : Lu4) V ) L 4 )u c I W01> m. 0..lo -
CL 0 0. 0 4) U. nVI 31 ca o u011L w v;:
a- 4- CC )~
A- 45

-- 1 77 - -----
.5 .3
.5 3.7 1. .2 .5 .3IJJ SA140 .4.2-1--.s ;R0 .7 .s .
11 -. 7 2. 4. .3 .*2 .5 .
Vol 2. 3 .3 .
b.4.$ c 2 .1 2. 8 a .- V .A Im .4 140 1.2 * s IS .? I
$a .7 d.01.1.01 .4 2.8.
I . 5. .1 .0 .3 . .1 I7.
If40 3 19.
Figur A--- SinfcatWvHe.0h by Wind S.peed 3 2
:1 ~23 25 .2 2.2 A-46 .. .
5.8 48 8. 1.4 8.8 .1 _

tto
.I ( • I 7 4.I , M7.4 3.72
_
P
4' •• . I . k . g , .7} .S,
7, 7
.|I.;. , . .Ii€I. ~
"".9 .4 1.6 1.4 1. 1.2 .7 11 . 1 17. "
1.4
.4or A-.2 - Si ni ic n .W.a.ve. 4
U-
1 .5 . 2 I .4 .4 $ .4 ,4 2 .4 9.2
"1.7 .3 76 7.r e. 2.2 -4.gn 4i a n 7. a ve.
Height by Wave Direction
too0 14 2 00
2 . ,I2*' .3 .t ,
.4 ..4 2.1 . 41
. 2.4 2.1.5 5 .4 %. 3
1. 1. .4 1.4 6.1
Ii
4.7 50 4. 40.3 21.5 .7 . 2. 140.0
I' " . 1 .s , 6 1 3.9
0 l . 7 S .O IA 1.4 6. 6 1
Figure A-1-1-4 Wind Speed byWind Direction
I .... A- 47
"mono"
S" " =

: " '°. .... .. t-.. °
- - - --
ANWIALARE~A I TVrAL.
I.o - -' . 1' L:iI. l . - .4 ,7 .5 '.. ' . ". 2}
S •.60 ' '
-F 1"2 3 ~ .6 5.7 11.9 G.S 27.9 6 A
VI2.5 -7.2. S 5.7 7.8 .. 3
"31• .11 ... * 95
6 Ia- 16 22 2.7 4 ,. 6. TOAL
0~ Val At to " - - -
S ". o.- -
Figure A-1-1-5 Significant Wave Height byWind Speed (WMic Sea State Chart)
&.I 0 I IIII I t I22.11l
DIP
111 1% it I5.7 it. | i.$ •1.1 , ) , 0.
"--" -- 0 IA Is it of of It- - -
• • Fiure Ai-I-SSignificant Wave Height b
A-4
54 " - - - - - - -I
NI.1
a. 2| 4 SI 51 II I I
- Ill a. 1 I I I i I t I I a
I -- ]22, 2I II 1 1 4 5 2, 42
599 2 I II? 14 16 11 , ?4 U 1 / 4 O 2 i II 2 II 2 llI 1
242F1igure22 A1- 1-2 6 Pesstec of4 4
ii• , I '"* - - ,.-'. -142~S 419 14 429 444 24I ,5 4 9'

AIMAU.L AREA I TOTAL SAMPLES 11 7ql )O
It2
- -,- *' 200
35S ) t 1 48
73 33 14 5 I I 1317S
203 Sk 33 to0 2 347
34 - - . .. . .
"" 3 382 132 4 35 1 7 4 1 1 438
4 S71 253 114 41 27 14 4 2 1- - . I I I4z
,.1 791 304 I4 71 34 19 it 3 2
""j f 735 394 118 104 56 44 25 10 4 A a I 1 2 1634
VI? ?57 120 39 14 It 3 2 2 I 1140, ,7 s5
US5 157 56 21 6 7 1 1 -58---i1 1
20) 94 44 5 2 347
0 1 -r-
tau 4181 1714 el 8 11 Ica 49I~ 21 165 II 3 a 73
6 i s IS 24 30 34 4h 48 s4 Go 44 72 7e TOTALS
ii Figure A-I-I-7 Persistence ofWind Speed
I.
I: j
•. A-49
1P1S. ,+ , .I., *.,- ,+ ,'

S ~ ~ ~ . 1._ .7 _ 2 !
.5 4.6 5- . 3
24 -. 2, 1 . 2 .0 2. 5 . 5 .
1. 1 .2 S 23 .
let. 1 .123 . 7 3.0 26.) 0 . 5 .1 '0 ±&t
Kmu __tt 1.750S4.212.2.E2.IL~j~.3 0.5 .2 J __10 2
.1 11L
*33145.1 11 3t 3033 "1 43 33In'
lb - . -- - - -.- t o-- Mal-.33* --.. w-
Fiur A-1-2--2 Sinfcn Wav
Height byWn pe
A-5

070NT3 APIA I TOTAL SAMPLIS 3,530
0 I1,is
to
7. I, 7.
I, 6 12 10 2.0 ,A 3,0 1,} 10.6.. . . .7 . 6 17.
..4 1. 2 .2 3.9 I.3 21.1
190 .2 .s 1 7.10 .
. .0 . .3 .7 .. |.2 2.2 i.)3
S i .3 .2 7.7 .3 1.7 .11 3, 10 7. 7 .
6.
TOAL" " "6.'
0 -
2.7mm %AY S, A 01.0 41N .3 30 ,
.Figure A-1-2-3 Sgnificant Wave
Si • Height by Wave Direction
Inn
,7 ,1 . . .0 t .3 .3 0 1.0
TOTA 700 3 , . 7 73. 0 1.7 30.7 0 . 1, .
2UIS 1.o l .t 3 6 s 7 . 5 17. 91iris
0 ! ItsS
-- -
Figure A-1-2-4 Signdifin Wved b
eitbyWave Direction4 5 70 '00
A-51
_ ". _,, . ,7
L 75
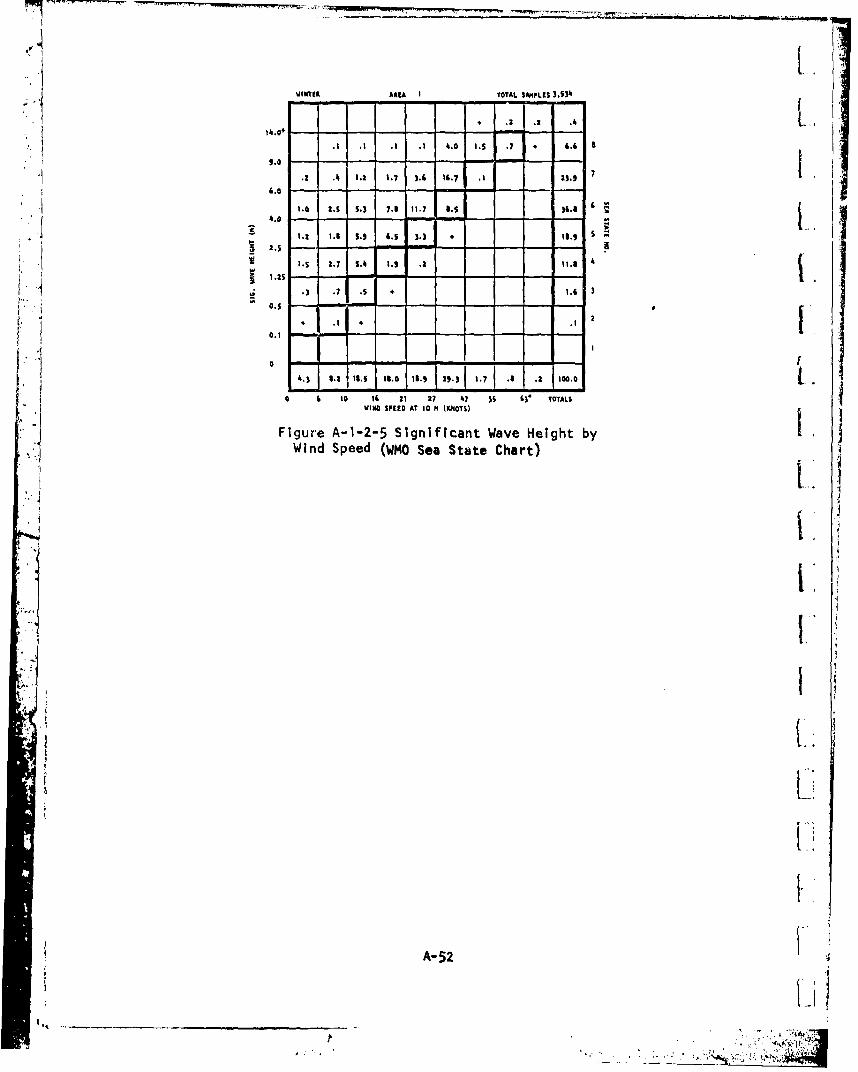
WINTER ARiA I TOTAL SAMPLES 3.5)3a - - -. 2 - -
. .2.0.2
•I . 1 . 1 ,I .0 I.S .7 *' 8.815.0 I
2l .4 1.2 1.7 3.6 16,7 .7 23. 7
1.0 24 5.3 7.5 11.7 1 .5 38.8 -
1 . 1 S .9 5 . $ 8 .5 3 1 1._ .. ,2I
1's 2.7 $.1 1.9 .1 11.8 4
1.25 •. 17 .. 3 .7 .5 4 1.8 3
'i0.5 - a -- 1-.
i I <, ,I0.1
:1 ]43 5.2 11.5 I1.0 :I.9 :9.: 1.7 .8 .2 100.0
a 6 10 It 21 27 47 35 63* TOTALS• •WIND SPEED AT 10 " (KN4OTS)
Figure A-1-2-5 Significant Wave Height by V ,Wind Speed (WMO Sea State Chart)
A-52
7 1
"IL. L
I.
A- 52
tii- -• I
Sl s i|°t

• b , . - -.. . . -r ,.= , .•... .• • • , .. •
( .
. , .7 A
.. - I .--*
* .2 .5 .2 .
, , -- 1- ?,3, t.
4. . . 7 .3 A. I
2.4 _.7 1.2 2
I !io,,- /,-, -- * 1. 3 1. 3 1.3 .I .I
"" 1 1 . 3 1. 0 .8 1 . 4 * 6 . * 121
a" " 01141 lug
7 . 3. 8 . 1 .5 .7 . 8 .3 1.8
Lir 1..*. I A& 6 3 i .0 5.7 I. ? .
a 1.357 ~ ~ J1.6
-~~~~. 1.1 3 .2 . 1.1 . . 7 3 . 11.
.3 ~ ~ I, At .5 .3 .3 INNIS 2 ) 3
4 , 1 ~ .3 , 12.l ,I8. 18. 12.4 I3.4 I1.1 11 II.E .1 ,I Ii JISo.) ~ A
• & 2t 44024 11411
Figure A-1-1-2 Significant, Wave
Height by Modal Wave Period
A..
42 -
.4 .I .2 .4 .4 ,I i
* , i , I .2 . 2 , I 4 ., 4
1' . .4 .4 ,$ ,$ .4 h.2i
, .i .2 . 2 .9 4. 4 I 4. 0 .} 2.2
l.1 . 2 .1 ., 4 2.2 2.2 .2 2.2* a
t .t 1 . 2 . 4 .4 4, 2 4.4 2. 2* I4 2 .
4 . .. 2- , .. .. * : ' J- :
4.2 ur A-4 , -1 . , Sl ni l2n.W1e,
Height- y Wind-Speed.4 44 . , .* - - - - --- -I
442 mll
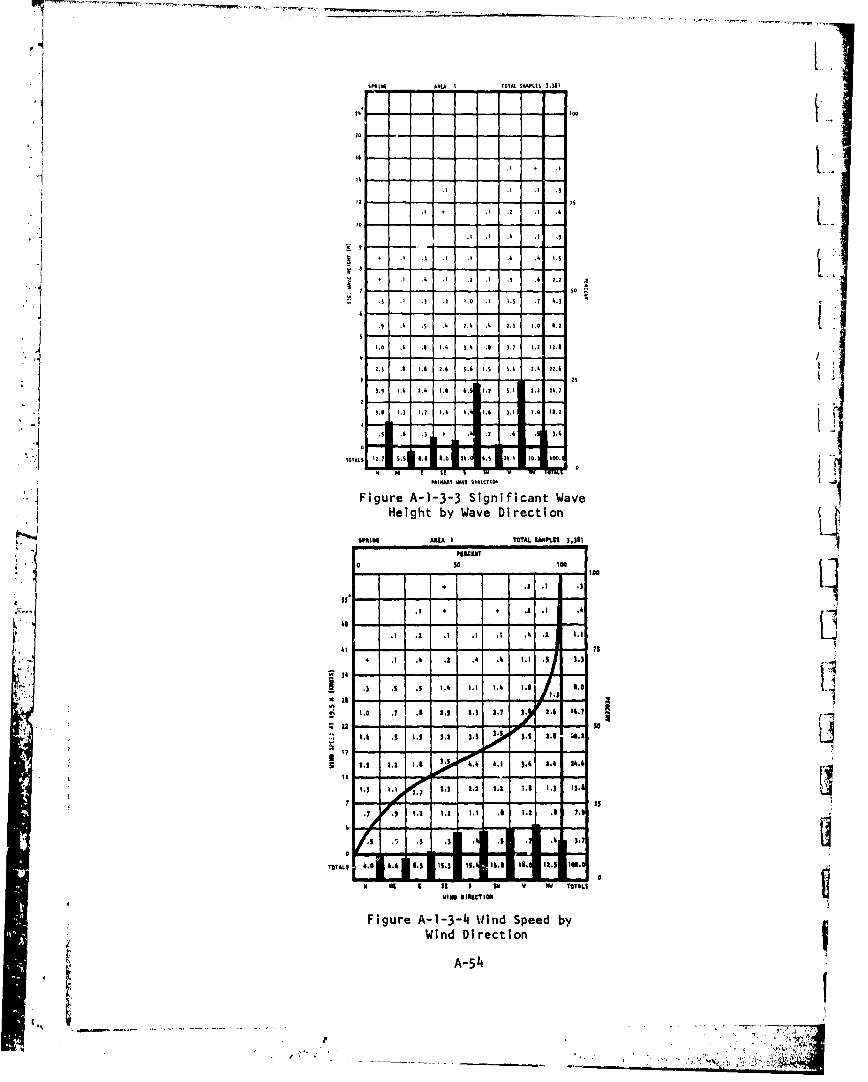
I[
SPR03 AltA I 30732. W3PLt% 3.381
..3..
"". L1 .2 ..
.. 1 .I 2 2 .
S* .2 .3 .2 .2 .3 .A 2.3 I
I • + .2 ,4 . .7 ,1 .3 .3 2.2
M. . 2 .3 , . 1.0 o . 1 2.3 .7 3.3
.1 1. .) .1 1 ,4 )3 .1 1. .20
2.0 .3 .3 IAl 3,3 .8 3.7 2.2 22.3l
k.3 .O 2.8 2.I 3.3 2.3 3.3 2.3 22.3
3.F i .g 2.e 1. - .3 S .2 3.2 2i . 2 a.7
3.8 1.3 2.7 I.3 3i.l 2.3 3.2 2. 28 I.2
733.3 2. 33 3 30 2 .3 .3 2 , 2 2 20
24 . +3 I *0
SI4 Figure A-1-3-3 Significant Wave
Height by Wave Direction
0SlRIl AM I TIOVTAL, SI&PLII 3,31 -PIIN
0 so too
A. .. .5 .3
.3 3 4 .1 . L
.0 .71 9 .9 . ' 1 .7 .1 1.6737 - - - - - - - - - 75
K.1 *444 .4 2 s
:417 -
1 2.3 3.2 1.6 1 4,4 3.3 3.4 1.4 14.6
it - - -t t. - . l
3.3 i's 1.2 .1 . 13.3 73.1L
*.7 .3 3.0 3. t .3 .. 3.3 .2 7.1
/. I , t .1 1 .5 .1 3.7°8 -
4ri~ .0 13.4 C.S I73.) I3I. 1 5.6 1 3 18 . 3 12.518
8 o I SI $ 11 0 w T rOTALS
Figure A-1-3-4 Wind Speed byWind Direction
A-54

S G AREA 1TOTAL SAMPLE$ 3.381
1B . .2 . 1 . .9 .2
,.m 34.0+
. 7 120 7-.
71 . 10 .dI 10 AT S ( T 7TT
•'~~4. "° .7 , 1. 7 S4.• ,3 1. . o ,
S1,4 1.7 1, .4 S..
Fiue -- 3.Sinfiat v eight by
2'
.,5 .3
.• 2 .
I.0,
0 0 16 21 27 k S 6+ TTL
WIND SPEEDO AT 10 M (KNUOTS)
"6 Figure A-1-3-5 Significant %-.!ave Height by
. . Wind Speed (WMO Sea State Chart)
A-55
L " .,,•.i''
__,. . .,•+.@

*-I--.-..-!- -- ,-.-I--~~.
" J-.'.-• *.-.-w --. . -. -S--- -
2 * S I -.
-
i
I-
-
V .
I
j
. 2 ....
- 1,
.3 1. 9 p. o .2 * .I
MI Il- TTA
I. O
40. 0
3. I
.A 1.1
.1 6. , ? .1.?.3 1. 1 .1 2 17.0
Figure A-1ib-4- Significant Wave
mA -56
NI+, 1 .MW tt:
,? .. 31
i i.J
Fiur A--i Signiicat Wave
.1 1
'
3 7351 W31
I -
ii7 77 7 t 33 33 55 57
s3 * 1155 '303j
Figure A 1-l -I-2 Significant Wave
Height by Wind Speed
A- 56
".
[p

1 71.
11 1.
"" .j -1.
-,'5
< I 70 . .-. l . .
.3 .2 .7 .7 . 3 2. .5 7.9
2. . 7 . 7 . 0 . 7.5 6. 10.I
I -- - 25 I
OT•. 9 7 .0 . ' 70.). 3 2 .36 0 .3 2. ,
Figure A-1-4-3 Significant Wave
Height by Wave Direction
I lI ARIA 5 TOTAL SI4WI5I 3,353
-I
.7 1 -9 -. 5. 5.7 -4 5 18.
. .. .I ,. .3
7 2S7 . 1 - .5 I. .2 .3 . 0 • .
. 3 .3 .. 1 .7 .. 7 1. 58.5
I I.5 .8 5 • i , 0 .7 t4 l~7 - - S-
S.8 . .7 . 7 .7 5.6 I,3 7.3 1.7
.' .5 .S . 5 .6 .7 5."
TOTALS 1 3 3 .9 5. 7. 37 5.9 555.0
a M I49 I $ 1 Ow V WIN TOTAlS755M OSROI III•TI
Figure A-1-4-4 Wind Speed byWind Direction
[ ° A-57
• , • / . •.,,. . , ' . . ., .., - : 7 ., • :

ARA I TOTAL ~LES
-. 2. 2
:.1:- - - - -- ;
0 .0 16.2 3 7 .2 0
2.1 ÷ 5 6.2 22 .2 l2 . • .5.•i+ -- - - - - - - +
_0 .m 1 6 2. 1 a.o 4. 7 . s TO.T
S• 2| 5. 2z~ - -I. -,
II.z 2
I -.
WIND0 SPED AT 10 Ml00KNOTS)
I: Figure A-1-4-5 Significant Wave Height by
Wind Speed (UMO Sea State Chart)
A- 58
+ 1.

.1 '1
+ .6 Cs S0 16 I.
o"'l 15 . 2 .2
. .3
S.,18.. ... 1.,
.6- 7 Il 11 .412 . ?1 . .1 .
I I
.1 C62 1 2.7 1. 1 5 .Igo 5
-0 it 4Am31 I8Figure A-1-5-i Soignificant Wave
J"I
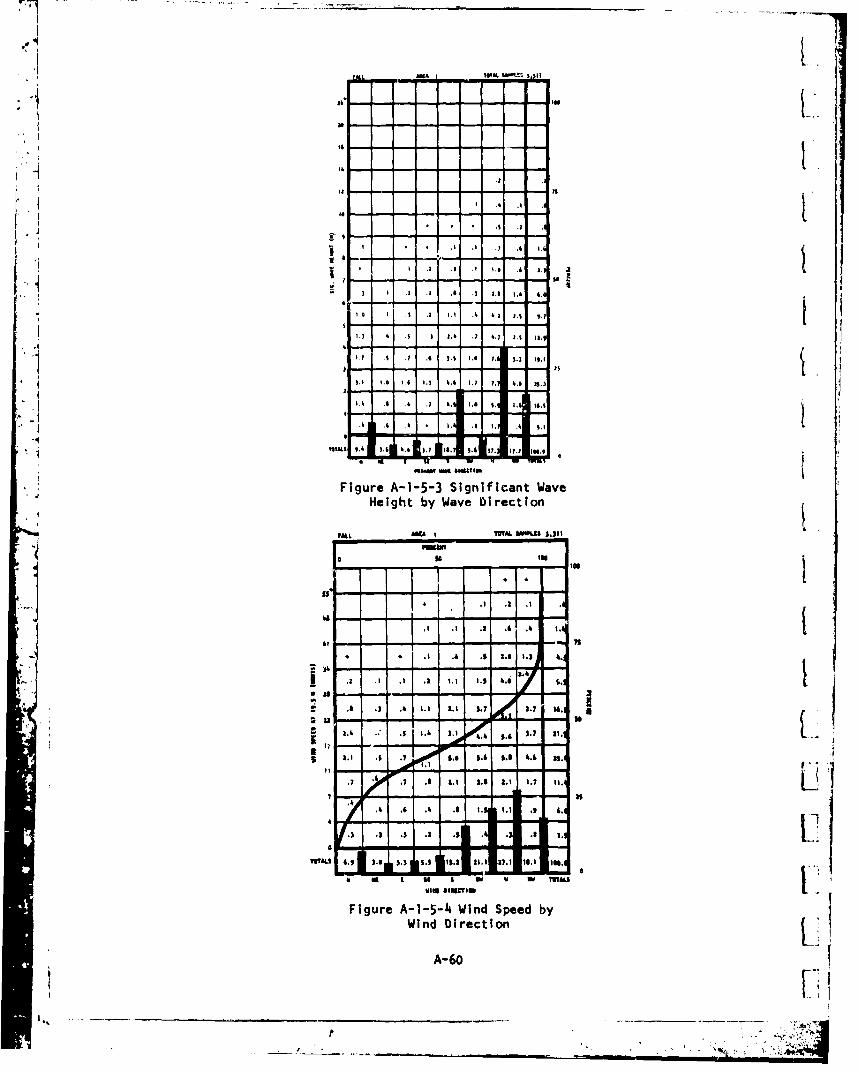
m. ! . . .. . . -_,. - , .. . . . .. _
1. 6
1 .1 A .1 .4 1 -11 .
0 -4 In
,1 . % 1 11 .
'a -
I I 1
s .. .1
"Wav .. ..~ "S* *1 .51� . l .4 3.
- I I 2 .3 . .2 3.S la a.O
T " 1.0 I , . 11.2 ,it 1 27.1 a . 1 a I*.
1.gu A-1 .- 54 Wind7 S, ee b
I? l . 8 " . .8 2.8 I.I 7.l 3.3 IlI*
a.' i~e 8 . ~ . . ae~4 -, -. 1- -, -. -. -, I1, 4
l .a .8 .' . .i a , * a .. a. i a *.a
-"11 " W i D ,i , ,
TIM , 1.a 3.8 , I,., r . , ,. ,,, ,6.., .
j Figure A-1-5-3 Significant WaveHeight by Wave Direction
a ¶IT. 8M '"t )*2
. ,I .2 .2 .II l*
* * .8 ., .5 , .$ , 8 . 4,I
* .. ..
t- 1.
3 . Si~ ..1 4,6 n.
."7 " .t7 .8 2.2 1.6 LIl 8.7 at. L--. 3+• .3 .3 .1 .5 t.4 .t ,3
r -r
I826 TI.UCi -
FiueA-1-5-ls Wind Speed by
Wind Direction •
__,__.. ...... .. +

FALL M9A I TOTAl, S4PlIs 3.311
S* 4 1.1 .k .1 1.5 6
61 - . I I *I .3 . .1 .2 1 11.3 7
a . .8 3.6 6.7 iz-0 8.4 32.3 6
i / .2 1,7 S66 9.0 S-3. 2 ,II.0 s
2-7 4.61 11.1 6.1 .2 -4,
2 5 I .1 2.7 7. 3
.I .1 I ..S
i ,4.i..L ... O (lOs .- -
423.5 U.s .1 10.6
* 5 1, l , 7 ss S i * TOTALS
Figure A-1-5-5 Significant Wave Height byWind Speed (WMO Sea State Chart)
A-61
.!11
'1
iI-
I .
S• A- 61
E.'. •lm!+"I' + 'q '~ ~ , + "•. . .. ++ '+ .:+

rýI U GO I [VI%
V u 0 6 L% 0% ) I
'I * 4o
LrL
CCW u
-; - 0
fA 4.0
c4 41 .. #0 Lo-
ala
3 1 - -0
00 V~s t. -0
4 fi 39 r0 0% t in
-A 62-

II
9 ,*• 9* . _ _,_~l*N
- I 3
1. .- I
94 - -
U ,€.2 4 , .1
:. . .3 .ft *t
s 1 4 . . 7 . 6 .3 . j E- -Ii .7 . , ? . 4 .1 .7 .7
$3.0 7.0 hi .4 '. 3 ,t l h ?7.
.3 1
9 -'
".3 1 4. -4.4 g.2 . .4 4 . 0 . ' .3 * 30,1
. ,2.03 1 .1 2. 1 2. 1 . 3 7.4 j. .2 .* , 3t
"" ) 7 .3i t0 , .1|7 t, l & ,• , * 73.,
1. Figure A-2-1-1 Significant Wave
Height by Modal Wave Period
It
I .I .99 .9 . | . 4 * L
1. ii - ~1-------
..9 1. .9
- . ? -.- 1 - - - -1.,
S.. .. .9 3 - * ha' a * . .9 . 9 .9 l .$ t . * ,
99I9 " " .. .. ...- 9
11 to of 1,, 4., %,A it to99 9 9 9 99 9 9' 999
Figure A-2-1-2 Significant WaveHeight by Wind Speed
A- 63
_______.....______ ____-_ ______ __'"_.. ...
__ _____ ,______ _"___
, . ...9,i , : ,
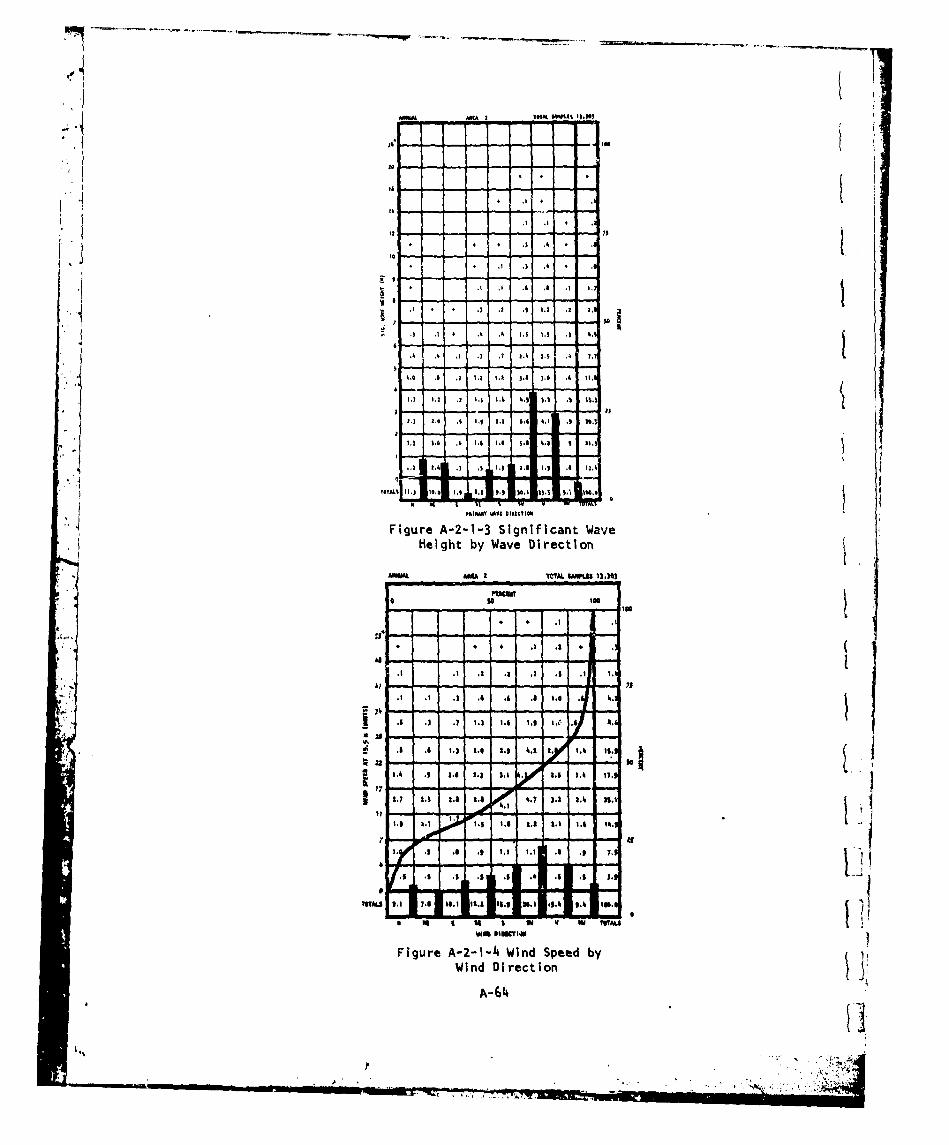
A AMM ! VIA V PLI$ 1).3 4)
. .2 's .2 -. . .. - . .- ,,.2 • , .3 * ,
3 2. -7.
.2• 2 .3 .3 .3 2.2 | I,
j .3 ,t 4 .6 f.4 $ .4 .3 4.!
,T i t .) .7 .7 1. 311. .5 7.I
Figure A-.3 i33 2.3 ) 3.3 30 .3 Wave
Hegh by Wav Direction
"''I2.7 3.0 .+ I.3 3t.4 ,) 3l.3 .3I 33.3+
- 31
.3 • 3.ft .3I ..3 i~ . 1. 1 , 1.1 , 3.II ft,
i 'Y
MAU 9.1 . . pl 4 .9 3 6.1 0III5CtIOI
Figure A-2-1-3 Significant WaveHeight by Wave Direction
* 3 . .. 3 .,
A-6-
* 1 , t .3 .| o .1
_ ., . 3. , ., .2 ., ,.o .3; 3.! I
.6 .6 3. , 33, II.
zai - - -. - ,1 .4 .6 3.6 3. 33 *+ 3.3 . Ii.•
27'".- -- -> -,3.7 3.6 3.6 3..37 3.3 3.4 ,16.
•' - ,- ----- 35
3 I .' . ., ., 3.1 ,6 , 7.t+.,S .6 .3 .6 .6 .3s , .5 6 .•
U 00 1 4 6 , I3 66 31 6 ITALS +
Figure A-2-1-£+ Wind Speed by 3Wind Direction
A-6•
i,'ri *lqp

S I A1 LlA TOTAL SWe.tS 13.303
.I I. *6.7 .1 ,
S.. ,4.3. 9.7 I1.$ 17.6 6
. 3 A,. : S. 6 s A . ., 17.7 S.. S. .4. 16.4
S. S.-1 .1 . .7 1357
O.e
*~ .1 32 &.S .7 0.527.
*1.
13 13.2 24. 61 4.9 .1 16.7 S .1 . I .Oa a - I
S.I t 1 27 4 SI 5 TOT&AL%WIND SPEt AT 0 K (LOOTS)
"Figure A-2-1-5 Significant Wave Height byWind Speed (WMO Sea State Chart)
SIt
lIlk
for - o 10- I
' I I
IISI
I I1 I I at
1z 14 0 G . l4o
pIp pt 115 72 4 Ii 24 I ) 5 |1 4 4) 1
StlI W * II t •1 ,I ' IF ¶ 4 I 2 ' ip
Figure A-2-1-6 Persistence of
II I * 4I III
Significant Wave Height
l |i• I~ •11 I| r• I I• i A -65|

,a tol -22 4 4 101o
SIt iL
:' ,751 )11 434 71 I I I I )1 41
', -(0
67 7 14* 67 91 p 3 2 4 to 0 5 2 4
itt 21) 158 I01 57 31 14 7 $ a I 5atol
Ii5$- . 5
"'~is 175 2 ) S 13 4 it 7D6 | )•)1 t
! w &79 )?" 0174 704 $1 1" lls I t It 7 ) 6VOl• t
J 20
A - , - -A
. F5J 6 7': 37 t a* 45 21 64 7 $2 t8i15
1J 37 -- - - -r
'43 158 220 57 z6 IS $ 7 9 ,79 6
'73AL 3!1 76• 67• 92 $2, 29 206• 20 7 7 3 1 4127.1 75 312 13 14 32 23 22 S 4 3 0 26 23226 25A•
' 7 2Figure A-2 -1-7 Persistence of
] ~Wind Speed
A I-6
41 7 5 2 6 021--
250 22'32 2 3 2 2 2S__ _272 06 33 26 .$ 2 1 2 2i70
* 5 Lm 3 6 61 2 6 6 6 2 7 -"~M, '* - • ,)v,
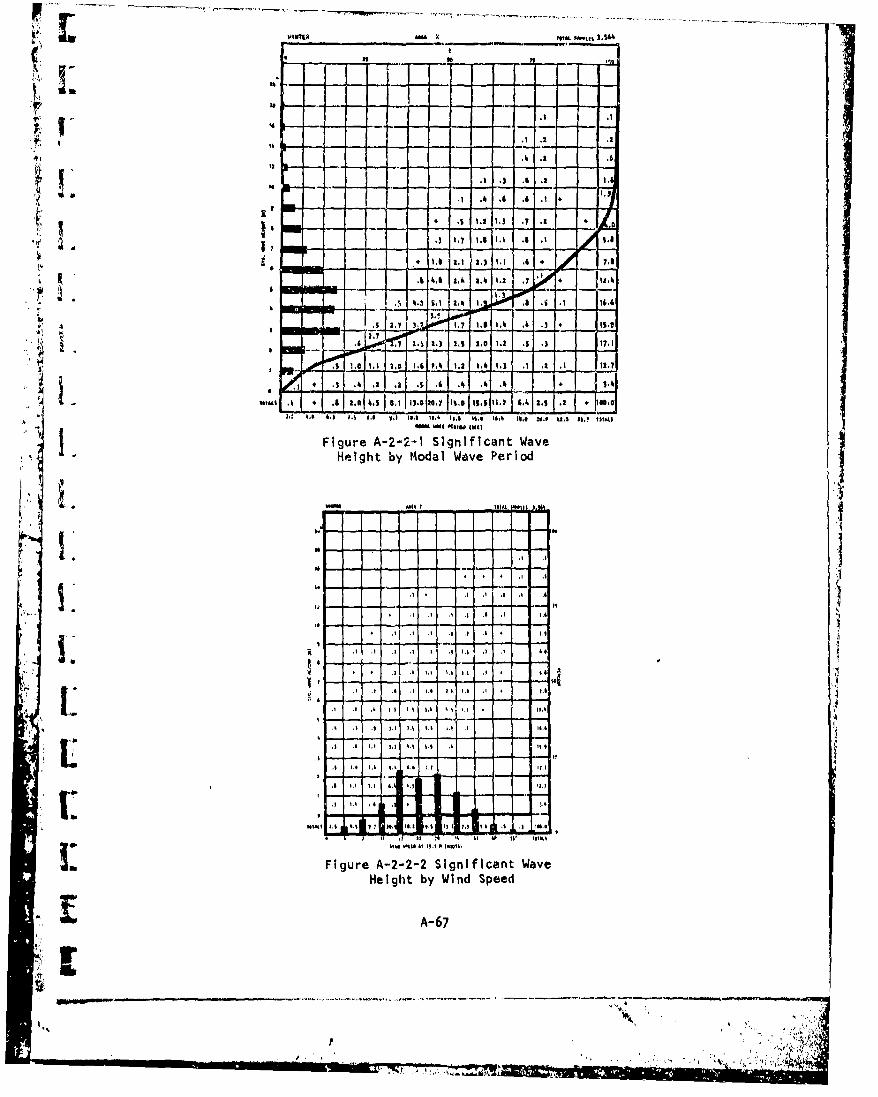
4~4WI4 888 ~ y ~ n 4............
!N
I P
.I , I .- sop-
5.1 1.1
4.6 .4 ,A .. 4 $.4
4 16A W. ... . . 5 ,11 . 1 , I
Fiur A-2-2-1- Sinfcn Wav
4'i i4* h? h73.i I.I. . .4.1 25.1•, .7 . . , 2 .3 , - . , I .
11.
.3.0 l1.4 1 .2 .. 4..3 2.71t. ! ...... -1-:-r-------- -.. - i
, ai 4 .8 2!o.0 4 .5 , .1 1 i3 .@ 2! = 25 i,0 i 1.5 .2 •• •
l, .. 4. s 4i.4 ?l . S ?8 , - IW, N. . 44. 4198A 2
I A, 'k48 k. is
Figure A-2-2-1 Significant Wave"Height by yodal Wave Period
.I. I. . . .-- ---- 1-.1 .-- - - 5 - -.- - - " . .i 4 I.8
.1 .1 . .I .I . 4h . 8 . 4 t.8
'I .8 U - - .- -. -hi - -I. .t '.
Su I . 4 . . 4 I . 4 .3 I . .i 3.h8
.i . 8 . 8 4. 4 4. 8. 8 I . 4
. 4 . 8 .i 4. 4. 8 4.t 4. 8 ,I 4i.8
S.8 .8 4.4 4.4 4.4 8.4 .8 48.4
l!I8 1 +: iI 4.4 i1+ o4.
!• ........ I, I I~m,
Figure A-2-2-2 Significant WaveS~Height by Wind Speed
r • A- 67
-.-. ,?
m., 4 .+,-,, ,,+.++. ..,

'V L03316* ~ ~ TTA w082173 ~fttI 3.9"3
23 -
k .3 1.
Ii ÷ I, I• -
A4 4.
TA ,4.2 4 4 0 .4
30 - -' -. - 1
I, ~ , , .7 .80 , 3 3,3,l~
F u .3 .... .Wav
Height by Wave Direction
.3L.I MAL 3.3 .2 3.8 0
.. 3.
IA 23 . 3.11 , 14 8 27 1 . 3.7
S . 4 . 1" I. 3.1 I',s ,3 , .2 o ,7
m -
-8 L 33.a 3 , 2, .8 322 2 .3 23 .7 2.3 ,1 00.0
N - 111 t 11 I
P838I.1. 8 38388 238* 8
Figure A--2-4 S Wind Speed byHgtbyWind Direction
A-68 .
, . 3 3.,,. ,,-•:

- w4INT0 AREA 2 TOTAL SIMPLIS 3.5"
•I ,, ,1 ,I ,3
i... . 4 ,• .1 .1 .2 2.7 .s .I 3.5
1.. .4 2A 1.2 2. 12.3 .a 17.6 71.0- - -
1.1 5.0 .. O 11.4 i lt 34.1 6
4.0 .
7 .9,. 1.4 3 .5 5 9. 1,4 .2 10, S
2.0 2. 1 S .1 1. 0 .1 1.12 4 AS1 .25 -, 1.- S, -
Figurei A2-2- S. ' 5.1fin WaeHigtb
0 i.5 Sp - S S Chart)
7 , 1 3. .. .2 . 00144il 21 7 47 55 ?* 1i .:' I Figure A-2-2-5 S.gniflcant Wave Height by
.. ~ i
' !. I
1 LI
ft
an 1f -6
Aft
~ A, • ,.

SPAiNQ IM N Tom 14. L(0 3.371
141
.1 . 2.S,, _-1,,
5t2171 7 I' I1. .1. . 2 . 2 a.33
. .C7 41 1 4 1 . 3 .4 17.7
1 , 1.7.)
.• ' .. .1 4.,3d
RIVAL WW o ,s 4"t)
"1.7 I.5 .5 .1 . .1 7.i1
4. 4; 1.0 . ...
,4.2 4.4 3.7 1 4.3 .� 20..
. 3. 7 2 . 1 . ., .7 .4 1 . 1o.5
S-4.3 1.1 1o'* oel, .3 .4 2.5 5.0 3;.2 13.4 15.3 23;.7 10.4 10.1 5.4 2.7 2.5 .3 4 l00.0
2. 2.0 4 .2 1 .1 0.4 0.1 20.| t o 22.4 I & . 1.0 22.4 W i.0 . 0.. ... ,l OOM,
-9.5 W 2041
i":1 Figure A-2-3-2 Significant WaveHeight by Modal Wave Period
A-7
2 .2 .2
.2 .2 .2 . .2 * 2.3I' --- - .
. .2 . , . 1 .2 2.,2
S . 2 .2 .2 2. 2.2 .22.2
... . 2 " .J 2.i 2.. 4 . , .2 2.. ..
| .• - - -..
"2.2" 2.2 2 22.2
S. .. . :..... "".• 2• ,; ;', ' ,:.;- p20222 2.2 0. 2 2 2'"2 . 12.

SPII2I AAMA 3 TOTAL SARPI|iO 3.371
A 2
7 .-
* .7 .7
1.2 1 2.3
.3 ..3 .7
- . , I 1 .7 ..) .i , 7.3j., I,) .$ , I i ___ 7 l~
2.9 1., .7 13 2. 9 *. 1 17,7
247•
"3.6 CC -.- 1. . - ooh
- 2 .21. 2 .3 1. 1.7 .5 11.2
.0 .3 .1 .. . 2. 7 3. 0 .7 7.1
N,.3 A. R 3 i TO.T 7.3 I 3.3 27 1" .
7.3 .3F2.2e2,-2-.3 . t o W1.
A Nl
• Height by Wave Direction
* .l[A 2 'OTAl. 0pL1.37 )371
A A
.. .2 0. .4 .0 .1 1 .3
. A ". 3 . .a .9 I .4 . 57 .
3.. 7
2.4I 2.5 k . 3- .9 2.
1~.!,K .0 1. 1. 7 0 .0 . 1.3 10.7 '
S9 1 .1 IA 7.1 .7 1.7 $.1t , - , .,4 .1 .3 .7 .,@i 7.$ .3 2.7 I.0 2.3 I 2. 1 7 .2 17.4
TTL . ,1 0. 1 424 3S. .6 3. 107.1
7.1) 3.0 7.0 .7 1. .0 7. 13 70.7
7.3 : • • 1) ,7 =. • 7.7 7 .7 .7 7.0 8.7
I0A .3 0. . 13.0 70. 75 4.3 70,0 74.0 I. 70.0
I 0 K 1 01 0 I 0 I¢R TOTALSWIN2 DIRICT7077
Figure A-2-3-4 Wind Speed byWind Direction
A-'71
SI. .•o i• " " ' " "" "' ' . ... "" •"" "i : ::" :'-•'• ;'A.
. .. , . . .. . ,,- ",

AREA 2 TOTAL SAMPLIS 3.3711.2.
14.0 -I
9.0 --
÷ .7 .. 1 7 *I 8.26.0 -- +
. 4.7 20.4 9.3 2B.7 6
4.64.0 --- t- 5 - ..• I .i 4.o s.s s.S .2 2£.z s •,
2., $.1 11.7 ..9 2S.5
i1.25 - .6 --
2.7 5.3 4.8 .2 22.9 3
0 .5 20 .S~~~~I.s I •6 . .
..1 2 ,. . 27.7 28.2. 16.4 .7 .2 200.0 Ii
0 6 20 26 21 27 47 S 6e3 TOTALSWl4I SPEED AT 10 N (KNOTS)
' Figure A-2-3-5 Significant Wave Height by
Wind Speed (WMO Sea State Chart) I
[.1
A-72
__ _ .. . . ,-7
....... ...... . .>.,-.. iIL, :++ •.+;,,++•-.J,,

$WWI MI ks-i
1001. 3--.-1.
II , -
I - - - - - - ,, .1 .. 1
.8 11 w .6 .6 .1 1 s.1:- j::-
S- .3 . .9 3 . m e w 7 . 3 .s f.
* "
"Figure A-2-4-1 Significant WaveHeight by Modal Wave Period
------
_I .3 .i .
ii'-f'.3 . .... 3
.3 ,. 3.3 '. .3 9.3l
S. , . , 3 .3 3 . 3 .3 . . . . 3. ,
I FiueA21- SgiiatWv
Height by Wind Speed
A-73
AL- p

- -
S " TO LE 1.1%
24 1
.171
ii -
.7- 1• .. a.
K 1 .1 1 1.
* . . i .4 2. i
L . . .1 .1 2. . .24..I .2 .4 ., ,4. 0.2 i0 ~
* - - -- - - -2.0 4. . .0 2• .0 7 .0 l 4.0 . 50
OT .I 0 .0 . 2 .0 .4,0 . 00.4 0 ,0 0 ,20.
Figure A-2-4-3 Significant Wave'~1 - Height by Wave Direction4
"AMA 2 MAL 181U8 3.1.
0 . 1. S * II 111 I, ,I I ,! *
-"-
."."10 .2I " " L' .2 .0° .7'
t o t o
.u A.3 .g ia .a
41 75
+ 8 1 .9 3 . I 9.1 .
• . 2 . .5 3. 3.3 . , .3 L i17
0.4 1 .6 0.0 2.3 0. 0.6 0.? 02.0
0 . 1 .7
"" 1*7 910.7 18.2 18.8 16., 1).1 00.8 1I. 12.1 MAI
6 49 i U I IM 0 U TMTALSwinIlUC IO 4iilI
Figure A-2-4-4 Wind Speed byWind Direction
A-74
a. . , 4 . Vk• ";.+ .

4) 1SUWKR AREU TOTAL SAMPLIS 3,180
6.6- - - - .' - -
-1.3 4.3 .1
4..1
• 3.61. 4. l .
S~~4.5 -
t. .5 3.0 6.3 1.2 * 15.1 5
:,4nl tll , , j,*C•v OS - n - -"-
0 15. |1 ,4 12. 4 14 I oo 1.0 2.7 I.100.00 6 0 16 il 217 4? ss 63* TOTALS
"WIND SPIED AT 10 M (KNOTS)
Figure A-2-4-5 Significant Wave Height byWind Speed (WMO Sea State Chart)I.
A-75
Lý

SI
FALL MI 2 unL eag 3,3tl.
e - -- -- -$53,
*. .6 .31
61 13% -.- - -- - .. - -. - .- - .- ,
8.0 16. 'A. 1). 16. L .411 41 1,1 ol 11
at,
FAL i4, , uA MO1 A
t I
1 . 7 3.3 .1 .I
)k1 1 U.5. Tiu
.1 S11 At 19.A 4,01
Hegh y Wind Speed
-A-76
,4 3. 3.3 3.7 .~ .5 . 3 ,. .
.' 3.3, .33.,. .. .3. .. 3 . _.
' ~Figure A-2-5-1 Significant Wove
'i, Height by Modal W/ave Period/
, !-
.3 /
.3 .3 ,' .3 ,o
S, • , i .3 3.3 .
. 3 .8 3. 7I 8 ,8 1,3 3 .3 13 * 8,3
.3 .1 3. , 8 1, 6 , 8.8 ).| , 51 I7
3.3 8I .8 2 .6 3 . ) h.8 .)l
-$ I| • I*I •1 , I, •
6 33 33 33 )4 4 II 38$3 8 11' e68s
: Figure A-2-5-2 Significant Wave, Height by Wind Speed [I
I:A- 76tj
". .....".~________ I II,*, . ;.]
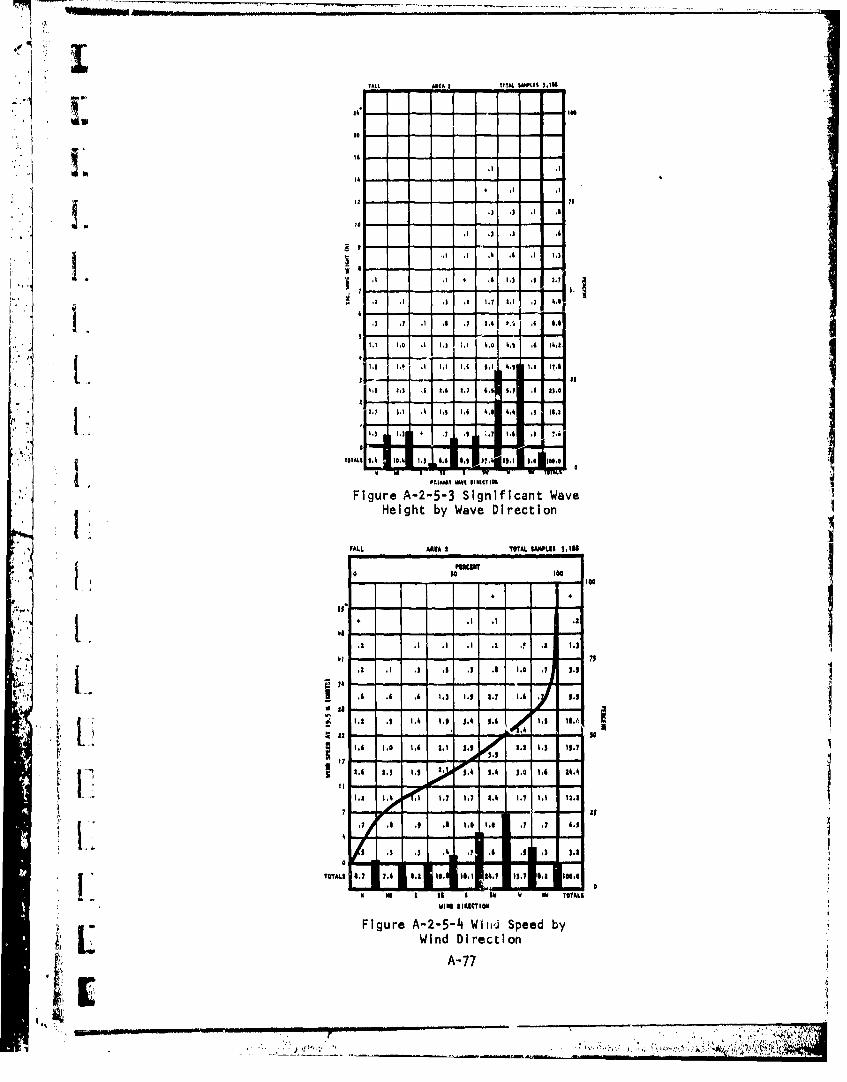
InTAl 4( 2'N.IPI032
VA6
.3 ,3
.1 . I. 3 ,I 4.
. 4 1.3 .3 .0
.0 1.2 .1 . .0 .I 1,4.
1 * . 8 2.7 .1 11.,
II.3 .7 i's 1.8 4.7 , 4.4 8.
Height by Wave Direction
FALL ARIA I YTOAL W~PM~ ),lIN
- - .-1. 20 t.O.) la l
10 0 4
1., .. 7 1..
"",6 2..6 h . 0 . 1 .1 283 h.,
72.61. 0:00,, 5.4i 3. 1. j 2j: .
- .0 8 .1 IHeigh nbdW Direction
A-77
-5 - - -++' II II Ii , .l-.l ,. . 3l .
84 -- - -0-
,,, 1 - 4 - II - - 4 - - - T. 7
.1 i . .5 .3IC .l 2.l.l3
A.-28 . 2 7 17 3. . 22 2.
-. - 3
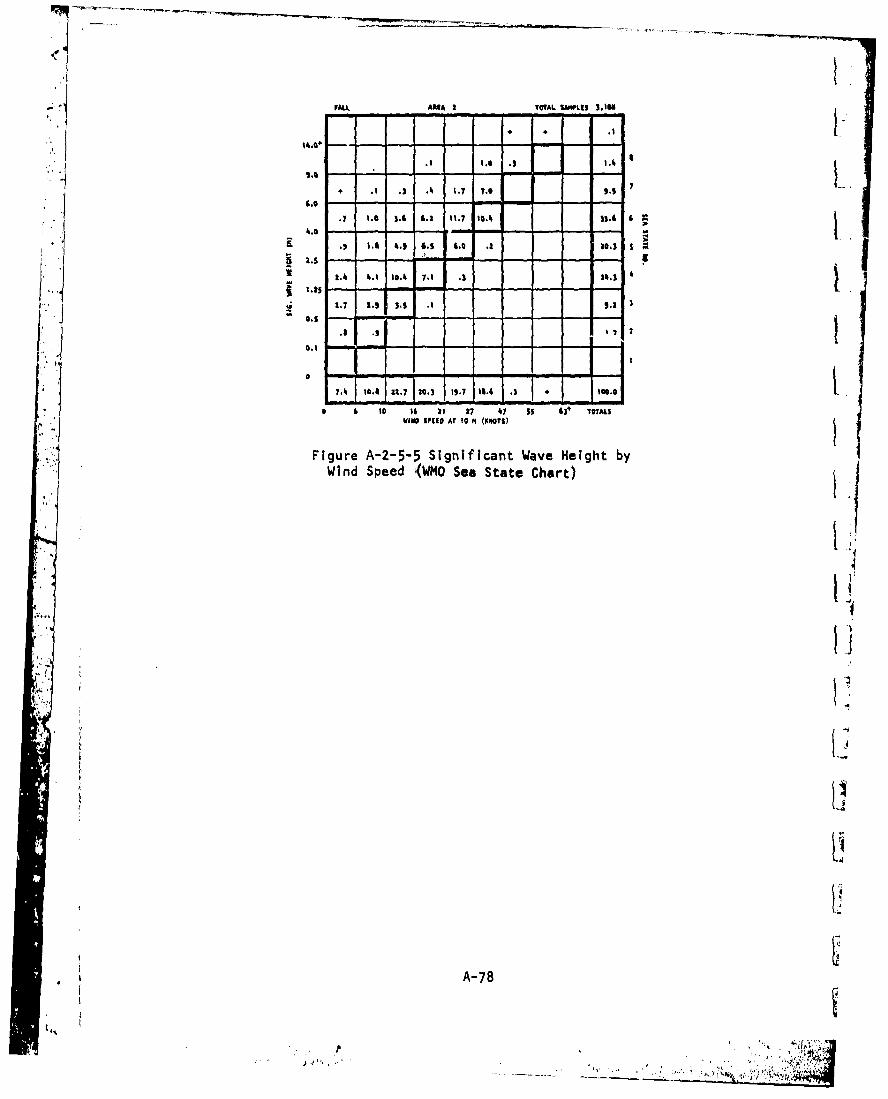
SFALL ARIA 2 TOTAL -SaLES 3.I0* ,- --
4, 4,.
.1 ".e 3 IA.4 C
F . 3 . % .4 -.7 7.0 1.-
,1. 3.4 CR It.? l. A
S, t.9 4 . 5 4, .0 .3 10.$ s
2.4 4.1 10.4 7.1 3
j* I , .t )S .IgLi.2.7 j 3.1 .1 9.2
G 1 1.
7A 1.4 L 2. 20.I 7. I .3 16.a at 17 47 ia &r TOTALS
WINDO SPEED AT 10 M~ (01M')
Figure An2-5-5 Significant Wave Height by
Wind Speed (WMO Sea State Chart)
AI-
i . A-78

'10
aA 4A
00
I-
acSA
I UN.:
0 aS
CIII vss 1.u VS N-4
'A C
1'~. u V to-0-W. 1. 2. ' .
-A-7
.t L Di
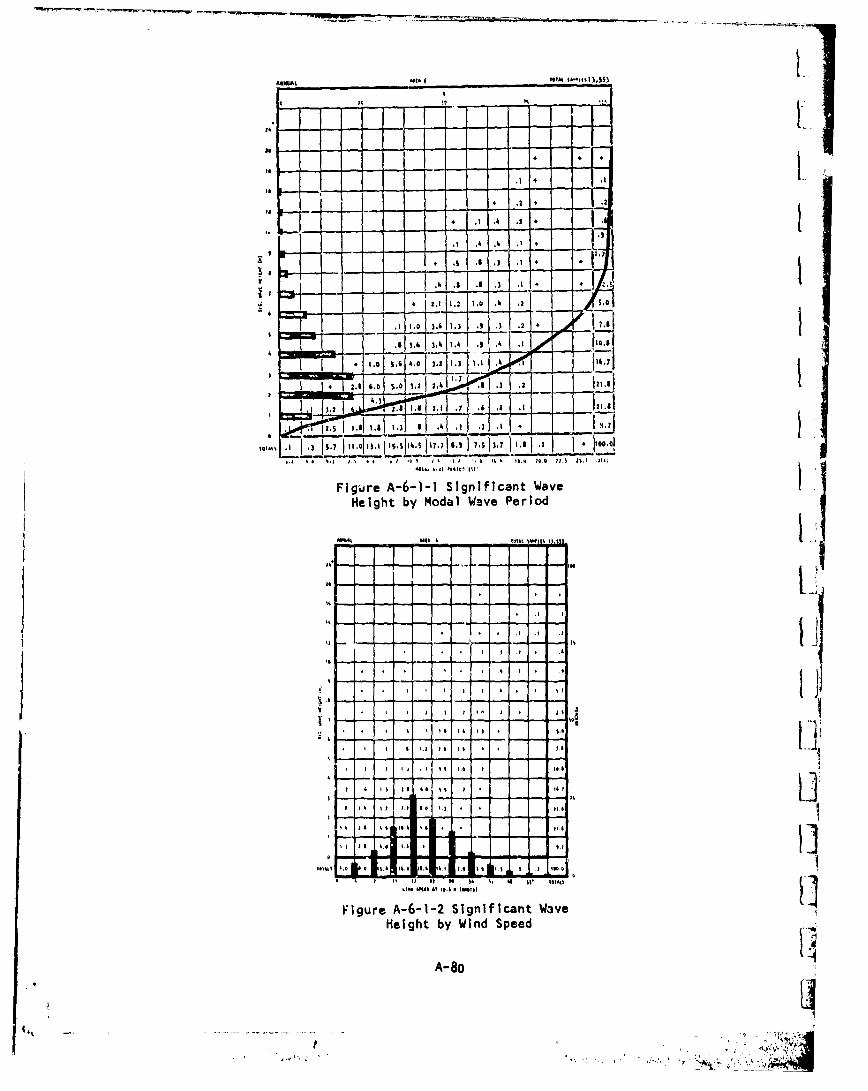
L M I I
'A I'U --4*- -- I-
4 .3. 1.l .
1. SA ..0 3.2 ..2 1. 1
LI - -- --- s
II
_ I
Figure A-6-1-1 Significant WaveHeight by Modal Wave Period
IsI
A I
II
1.41
I I tt A )A k..t-t
Figure A-6-1-2 Significant WaveHeight by Wind Speed
A- 8o
* --- • I '+ * , t..

4' t
AW1JAL 333 A 3 TOTAL ....PLI .
32
II
A 2.9 .. 2. .. I
335
I's .1.1
3 i 1
30.
2 - .1 .3 .3 t , , ,
•• .3, 1• .3 .1 .3 I .3 .,, .o 2.3,I
T A 1 .6 11 ,1 .0 1 2 3. I 2, 3Go
2.gu .e .- -13 Si. .n ,i 2.2 Wave
3. )0 ,6 3.3 1.2 2.3 2,2 3. , 3 33 1,T/
le
2 I,3 .3 3.2 3,0 4).3 $. . 2,1 3. ,
TOAL 3.' 3. 33 . 0 373 3 .213 3., 33, tI 1, 4 . 1 1 8 '
"Figure A-6-1-3 Sig.3ificant WaveHeight by Wave Direction
13 * ,1 3 ,
' 4 2 , 4 ,3 _3 .
* 2.
-,-3 ,I t~ ' ,s |,: 3.1 3IS3. 33
F ,ur A-6$ - Wind t Spee byI 2J4
Wind Di rection ,
A- 81
,, . .
m3 , , .. ,.i

A6MiJhL AitA ( OTAL SAiPLES13,553
1.2 . + 2.0
6.0. -z 5 .1. *
4.0 - -.2I 4,7 2 I 7 19.5 3
-.2 - -
Figur A- 6-- 21nl lc i 27v He gh 55 6yOTL
Wind SpIed (W7 O Sea State Chart)2
So 6MIA I 10TAL ippN sli lts%
16 •. ,
I I 2, 1
At J) a I t
41 it II I 1 27 6 5 64TTL
16 1 " 41 ) t 1, 10 1 IS"
819 ItIoEC ID 19 is as i1-
- - -
111 I ts
M ALI I I 1 £ U!
14• I1 I) l • 4k 1 •1 46 66 6 it ?A to I)- ! I~ - .......l l
Figure A-6--I-6 Persistence of
Significant Wave Height
A-82
I4 I

i ,
EAIltI_,A A 6 TOTAL SAMPLES Vt 100
k 2 1 2 14I
_8 -...-. . --..... O-
33 IS 3448
$ 1 35 9 5 1 3 1 1 14
221l 14 31 5 3 3 I 3652
355 147 55 27 12 4 5 I 252
Sol 53 17 l 17 1) 5 1 1 101l59
K ol27 340 SO 622 6 IS 7 5 3 i 1 14.37 Iis I
903 301 206 107 64 36 20 12 5 2 1 2 1 1660
71. . 221 go 11 23 7 I S I I 1 1110
" 7 - ... - - - - - - - - - - - .... .Sj
41u 1l0 43 Is 4 5 3 2 I659
2151 70 3 [ 14 _ 4 574
0!MOAL$ 447 1651 3 t l 9 2 165 1 2 1 475
6 It Is 24 A0 36 42 44 54 60 I6 72 7 TOTAL$
MJIATI IM (HOURS)
Figure A-6-1-7 Persistence ofWind Speed
•rA8I/i,
C
lil • •-•-T• " .. .. .. . - i-"" ''• . . .A -B 3 ... . " ., •
& }••

:4 ~WI MTTA!
1-4 .1 .9 .3 2 .
- -~ ~:+~ 13.0 2._
4kI.9 2.512.h1 .0 -1!0 L i1A. 1 2.5j 2.31 2.3 2.1 I1.6 .5 .4 1 i4 .
.1 . 71. 2 .a
11. .21 .2 1 ________1__.7_
I .I I$ I ______-1_1___._11 _____0____
Fi 76-- Sig i catWveigh byModal Wave Period
.1~. . -I
WI "U 41 I i
Figur A--- iniia tW v
H3gh by Win See
A-8403

WINTER AR-A 6 TOTAL SAMPLES 3,.52
29 .9 - -.
2 .2 .,
.'
* .I ). 3 . 3 .
. 2 .2 .2 1 2.4 .1 2.0
232
'4
S ---- -- - 50
,. .. . . 6 . 2 . 4 . 2.6 2.8 11.0
'" 1 -j- -- 2"3. 3, [ . 0 , 1 1 ., 1, .1,1 1. 1 1 ' . .. ..
) 10 1.7 . 1. ,1 1.t 1 .8 20.0
2.5 1.0 3.. .8 0.3 1.2 1,8 1.8 14.6
2.0 .6 . 2 32.53 . .
. 2 2 ., .2 .2 .7
TOTA"O 2. 1, 2.4 3. 6.3 6.9 29.5 23.3 20o.3
N 41PRIMARY WAVE DIRICTIO2
Figure A-6-2-3 Significant Wave'. • Height by Wave Direction
62wIN1R ARIA 6 TOTAL S0MLIS s.St9
O 50 30
,,,
1.4
. 2 . 2 .2 .5 .7 1.
S,.. 6 A ,I .2 .3 . 3 1 .3 1 . 3.
S41 •-75
lI0, .1 3. 6 , 1 •,
1 .4 .7 .6 .9 3.2 3.2 ,3. 14.4
6.0 .6 3 ,.1 j 4.0 4.0 37.0
2. . 2 . .0 1.2 3. 2 2.1. 7.4
2.3 35 1.
.6 .7 .5 . .7 .7 .7 5.
- 6*.
Ss~ •, to tsI ,l ,o1 7.4 t
.37,, .,, . 3 . 6 ., . 3 . 31 . 3 .7 •,
S° Ii•01AL1 . 6.5 43, 7.6 35.1 14.1 ,3.3 33.6 200.0
0 AM8 w WIN 62 62 TOTALS
Figure A-6-2-4 Wind Speed byWind Direction
A- 85
Ll 7
.
2'1

WINTER AREA 6 TOTAL SAMPI.03.592
.1 .. 3. ÷ .5 .2 E5
9..0
I';. 14.0" -77 + I( - I3.0 - - - -.1 .1. 1.5 3.1 4's 21.0
1.2 3.3 6.4 7.5 13.0 I1.0 42.6 .
2.0 2.6 5.1 5.4 .1 18.3 5
1 .5 2.4 4.1 2.3 .2 10.9
0 I I
.. 6 9,4 17.3 16.7 19.5 1 .28. 1 5 .4 .2 100 1
0 6 10 o 1( 21 27 A7 55 61* TOTAL0•,II0 SPEED AT 10 N lKMIOTS
Figure A-6-2-5 Significant Wavd Height by"Wind Speed (WHO Sea State Chart)
A.
iI
A- 86t[I"

tIi•.,_ , - i- .1 2 *• L ,.
.3
j,'.4 . 5 . ,
1, . .
. 4 .2 1.7 .9 .4 .) ,.1 -0
- .4
R 1 L .911 .2 -, 1.1: ., 1, .
1 .7 4.9110.1 117.8117.....4 3 78 35f
""._____________,_________ I742. 111I
ii . , i I. hi ~ . i.I.h. , I s. e a; ii., i',+
Figure A-6-3-I Significant Wave-. Height by Modal Wave Period
I - - 1 IA -L,,1.,3
VA5a . 1. , I , , , , . ,
- I S 5 IO IA IS - 58
L . I , I1 ; I I I I I
---- S S II I . . .. 5, S ISO ;
"1 .. ... ... ... .. '5 . .. i , . . .
S~Figure A-6-3-2 Significant Wave
, A- 87

:1690 ,
S.9 .9 .3
2 -7 72 701
* .9 .i * .0 .3 .0
.3 -l .2 . 2 .3 . 0 .6 , 3.4
.1 .0 .0 .0 9 S. 0 ). a 9.3 34.5
2.2 .4 7 3• .. 3 2.0 93.0
/!~~~. 4. 17l8 14 )| 14 |1 I| |.3. 0 9. 93 . 9 1.3 1516 . 0 0.0
- 2
*1I I IUC93
Figure A-6-3-3 Significant WaveHeight by Wave Direction
PRIM AMA IPAL 133 3.4,
%i -.I . .. I 3 .I3 l.8
1." 1 .9 .8 11.
1. I 4 ,.,3 , I . 3 .4
"TAU .1I . .t .6 11.3 1.3 i -" --'- - -t
Figur A-.3 36- 3.3- 4 Wid .pedb
3• .3 ,S .l 3.3 3.) i 4.3 4.6 33,6
3.3 3.6 1 .3. • 4.3 4.5 4l.3 , 1 4.83ll
I I . . • 3P .3 1.4 i 3 .2 3 .6 3 .3 2 I.0 133 . .
' -- • IS.2 . .6 .4 .4i I . 4 .3 1, 3.46
WIn
-• Figure A-6-3-'4 Wind Speed byWind Direction
A-88
S... . 1, . .. . ... .. . .. ..-, , , , : ,. [,jq q • ,,39
SI : I I

' .2
-4.o
IsPR 1.N 0 S R. A 6 TOTAL SI.LC$ 32,$0
", + I 1, ,5 ,-÷ ,
1.7 .7 6.2 , .6 5 .4 .1 23I.4 ;r 1,
4.,0 .... ,- ,-
3.A 5.7 I0.M 5.5 .1 + 25.5,i' i i~.25 .. . "
0.1
I_ 1 11.7 23.-7 210118.2 117.2 6 21 100.0
., - - - - -S
0 10 16 21 27 47 5s 61* TOTAL%
W11l) SPEED AT 10 M (KNIOTS)
Figure A-6-3-5 Significant Wave Height byWind Speed (WMO Sea State Ch&rt)
1.
1.
1.
lI
p 1~ A- 89
E, ,

bumkAllA IO311 twits323
0 tit0 0 ___
rr --- - -I
'4 - 1.
1 i) - _ .. . . . . . . . .
If* 0l I - I i
, , I
.3.
* K. I-...- - - - - - - ,- -
* - - .3 3-w ,
, .6 $, 6 L a CA , 1
1 It it Is, 1,t 41, .7 Is- W
hll• 131* FifthSI i3I33
Figure A-6-4-2 Significant WaveHeight by Modal Wave Period
31 - - A- 9D-
rb .S -
vl '~x ii,.1 1. l
• .$ 1, 4 t, l 3, 3 - *,4 1( *1Si 3 6.3 33.3 {I.e I 03.4
,0130. 3.1 i3. 1 1.bb b. . . .
Figure A-6-4-2 Significant Wave 1.'Height by Wind Speedii iI A- •OIi_______ .__________________________________
• . •, ' ' ' - - - ,.. " ,• ' ' p
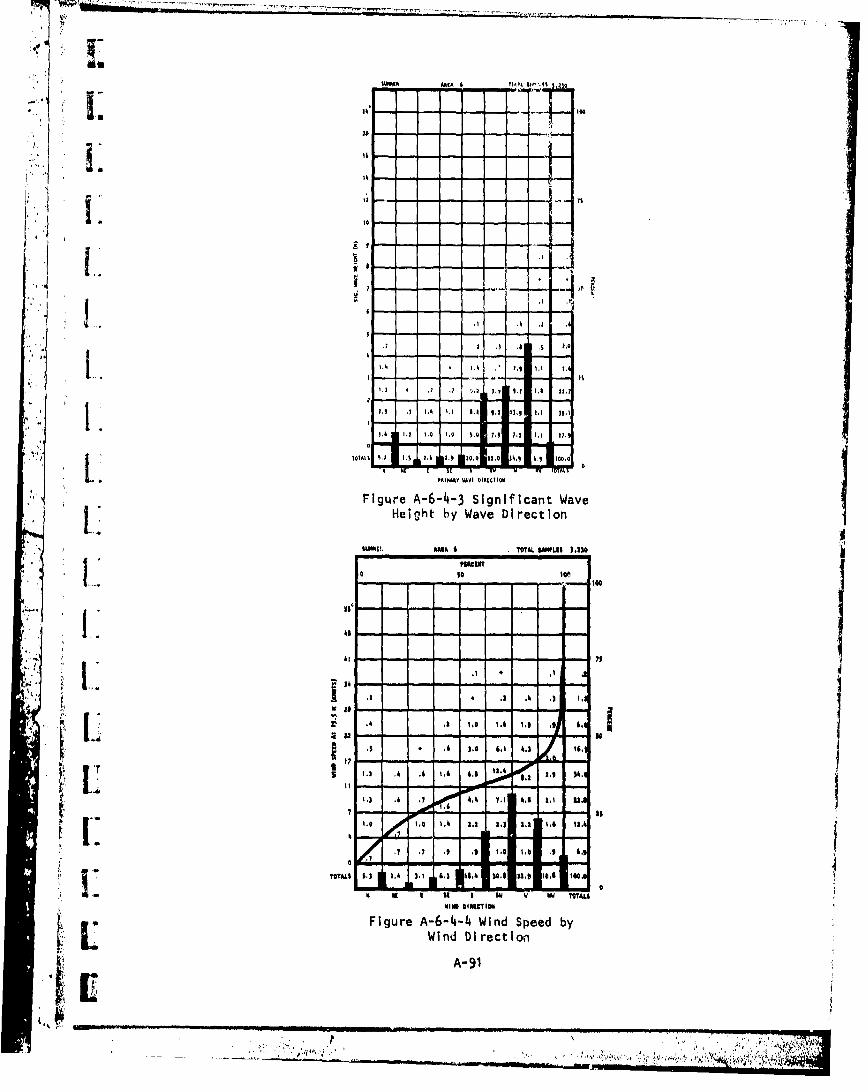
lOS"IR 0000 6 TIIAL At' O l
1 .4 1 1 . ...
Ia
1.9 - . 0. 9. -1. -. W
S6 -.
I 1.6 . 1 ..0 1. A , 9 . 7.1
F ' I g .u , e~ A-64- Signficat Wave•,
Ii
Figure A-6-14-3 Significant Wave
Height by Wave Direction
0 SO 004W1MI 0.0 .TTAL. SMPLKI 1,2%*
I.341ii," I I•6.1 4. it,
5 ~ ~ ~ . A. 0404* ..
,• .4 .7 4O 7.41. 6 .1 U
I .7 1.0 0. , 110 .0 6.4 lINI11• I t I Aw w IN "TArLI
1 • ¥ 1 10Im I II J" " IN OFigure A-6-4-4 Wind Speed by
Wind Direction
A-91

-AREA •OTA-• SM•ES 3,230
Ll
a w t•AREA 6 tQ~t•. 5A•PLtS 3,23•
li*1 .. 1 .-0•".I . . .. £
1 - .• - Is
7 . .7 2.1 5.7 .1 .. .2 "
14.5 9. 8 3. 9 19.5 %.1-
), 5t 21.0 12 27 . 1 * W 3ASI ".3, 3. .2i ,
WM/D S*PEED AT' |€O M 1007$~
•tFigure A-6-4-5 Significant Wave Height byoWind Speed (a 0 Sea State Chart)
I5.S 5.5 11 2,2loo,
FWeA-92 Wb
d o o m " " '',
•' ', "" ........ "'• * I,' •i
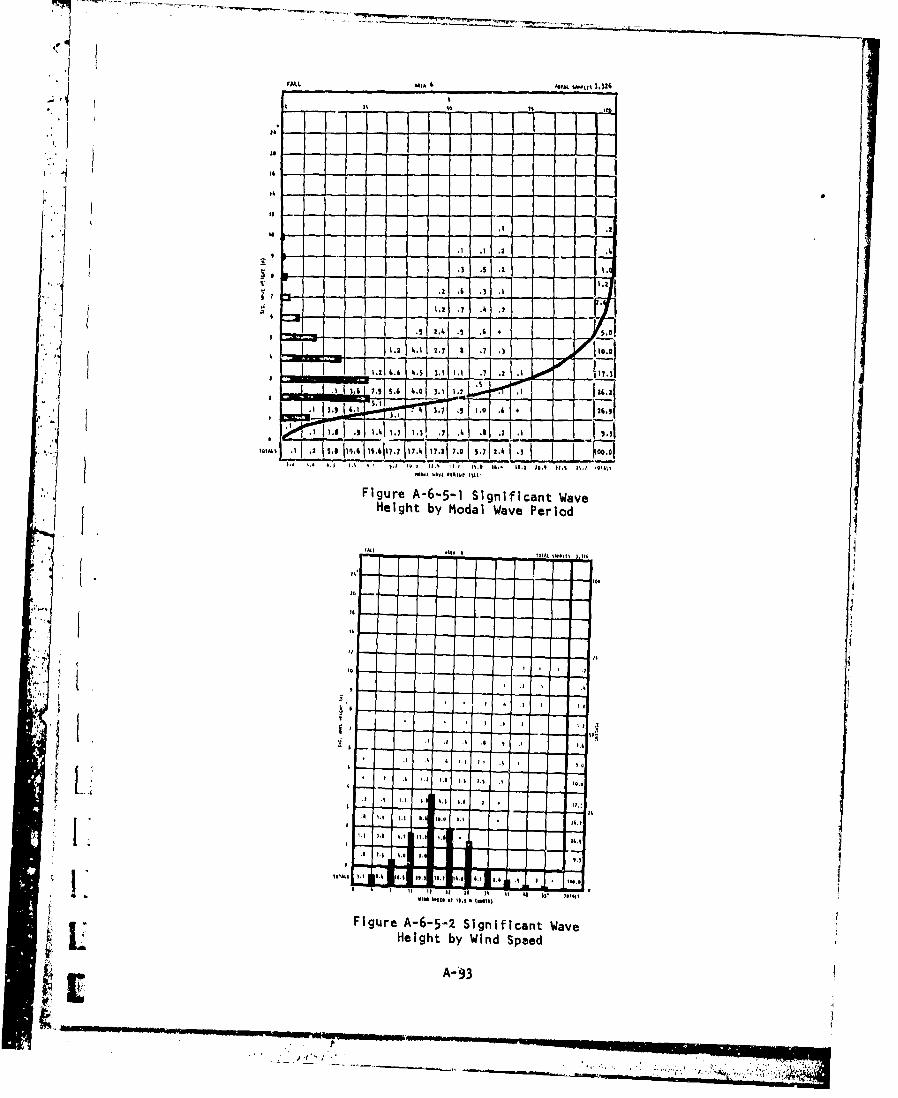
FALL u'l. , M1M IA. ,6
S.. . .2
.2 .- /. 37 ..,.1 ..6 45 ).1 . 1. 1 . 1
Fi gure A-6-5I-I Si gnificn 'wave
Heght by Modal Wave Pod
, 1` 1_ .4 " 1 :1 t 1 -%.0,16'.
•F i Fgure A-6-5-1 Significant WaveSHeight by Mo nda WaePerid
AAIA A OAt SM-LIA J.114
'4 AlA
'it
. 9 ..-
f. . ... !
$I I l l
VIIN lotgo AV s4 s It A
Figure A-6-5--2 Significant WaveHeight by Wind Speed

),,
-- --- ------
•+** .1 .IA 1. S.
4.1 1. 4. 2 .
IA
F g r A- - - Sin f c n Wave1.I . . ,I +
20. - .- -
S ...
4.. * . I $ , * .2 • •.5
i ;I.4 . 1 .0l all .l D6 m. .] I.
.. ' 1
7 as
**S, I'. 1 .2 4.5 J.5 L.2 i.5 .1
* TV L . 2 .4. ,1 .8 .4 1 ,4 1. 6 . 2
t +.' . 5 I . 2 I . 51 " .' 5,.I ,1 ,., , .,
11101111y •1 Mr.INII
",•Figure A-6-5-4 Winiind n Sped ve'•,'••. He~~ind y ae Direction.
A-9420
5. 52 .2 5. .5 ... ,2 2.
5 2. . . .5 .5 ,| 5 .5 ,.2
soss,4 , 5 5 .5 2 1.5 0 2 0 , 25.5 55.
i2 0 - . "
555I5 , 5 SI. CI
I~l lFigurel A-65- S)lign ifin Wave
Heighte by6- Wav irdSection
PAindAM Dietion~ IMP. ,
A-MW

•rALL AREA TOTAL SAMPLES 3.32C
4.1019 1. .3 .2 * .5 A
|I ./ 0 L.1 , , 7.114 -, =, f
I /II:
O' 2. d
'•. g 3.8 6'.L. 152,91 3|,))
.1,25 '.'So ,5 - , , ,! - -•
64 1. 1 , . .a a T a 29.1 20.8 15.2 11.1 .210.
' . 0 6 10 16 21 27 47 5 63" TOTALSgUII S~i'ED Al 10 A ILXlIOTI
Figure A-6-5-5 Significant Wave Height byWind Speed (WMO Sea State Chart)
L IA-
1;2
I!E
A- 95
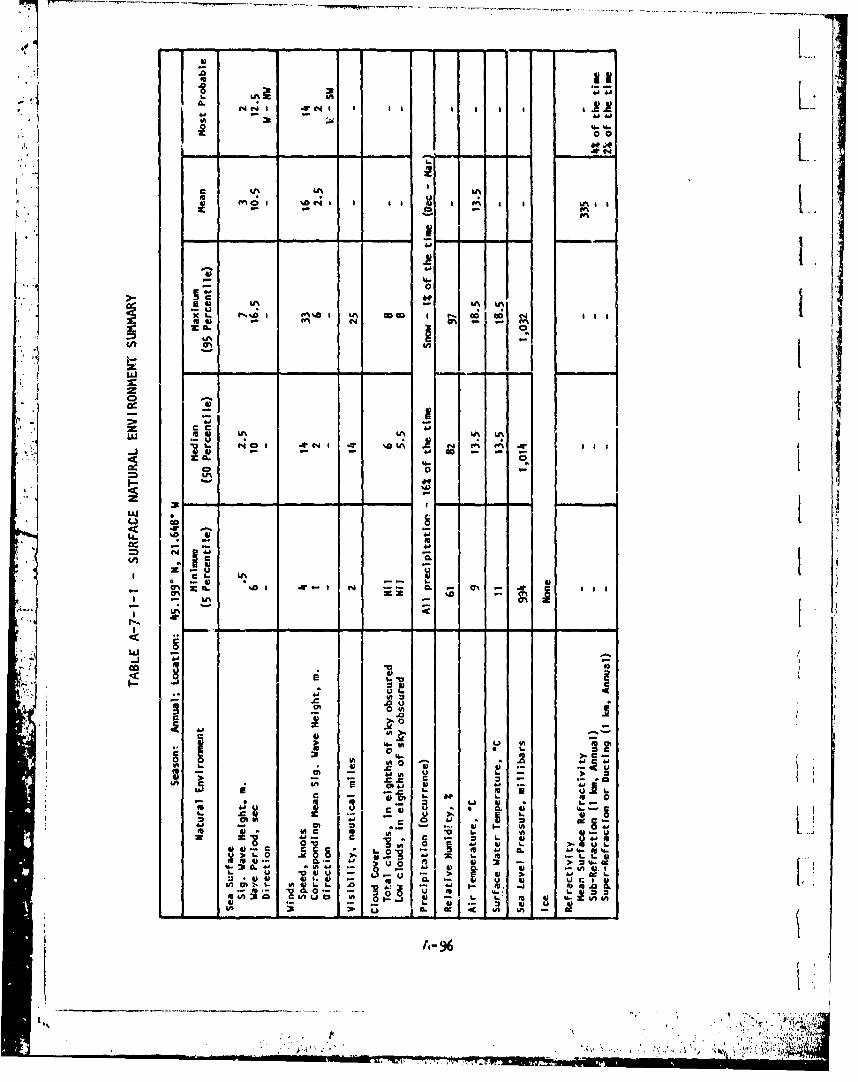
.00
U%- UN
C;a I % 1 a I 1 2 1 ' A m
0
I4)- %a I an A IIca. u
CM Cc aN 61% UN a U% a
- 4) 41
cmzz cm '- s a% an ON
I-. in fI
4) ,. p a-U 4
2; -
4nm 4. m - . 0
4))C c
v 1! 0c &--. I. a $A 24c). Lt
UN C; 0, . 0 K t 0 .0
.3 ..- '

ANNUAL lom 13. 19s
* 1O
.,
'1S .
• .0
2.71 1 1 .2 123,2 1° -.1 521n s:1 .
rigure A-7-1-i Significant WaveHeight by Modal Wave Period
000jl3 ARIA I00 I NRILI 13,33
' I' N
* ir II; I
1. 0
1i . I i 111 G~o 3.,) Si.llqi
Figure A-7-1-2 Significant WaveHeight by Wind Speed
A-9
A- ~ $Ii~l ~ 97 7,,
I.
*'.**!

AIWYJAL AREA I TOTAIL SAMPLES t11.95
F.2
.2 A 2 5 2 .2 .4 .2.8.
5 ., 5 .8 .5 3.5 2,5 ).5 . ..
.7 .9 .3 .9 .8 1.1 2.5 ,.3 I,
.. 4 . 4.5 ,.) 5 20,
25.1
1.5 1.2 I, .2 .3 2, 2 ) .6 4, 3 1, 0.
TO LS . , 3.9 2. 1 .2 - 1. 2.1 32. , 1 00.0
Figure A-7-I-3 Significant WaveHeight by Wave Direction
ANL AUA 7 TOTAl. AlPS 13,135
1 2 1 50 9 18 11 .02
282
22 - - - -
1. . $ 1 0 1l1 2.7'I 2 10 M O
4 2.22 .
Fi ur A -7-T4 6in Spee b 7
.3 . 1. 0 2.5 3.2 7.5 2. 7.0
TOAL $3 .0 .2 2.3 3 2.9 2 2. 2 231. 2 1 .
- 209 .9 .0 2. S.2 3. .0 TO7.L
Wind Direction
A-98
,,2 - - - ;- - , , • .. .i.... ...• , ..:•

.ISANNUAL AREA T OCTAL. SAMPLES I3,195- . - - - . !
I 2 .2.
3.0 -
S.6 • 1 +.7 . 6.1 5.2 .1 17.6 2
S i 3,2 5.6 13.5 7.7 .3 30,
1 .1 .2 4 22 4 1 j
6.0 - - I ____
0.1 2 . 2 21 ' 2
4. 16 2 7 L 5 6. TTL
AT I I I ;.6 1. I. I 5 2 I i
?. ~ ~W1110 SPEED A I0 m (:tl
Figure A-7-1-5 Significant Wave Height by
f• Wind Speed (WMO Sea State Chart)
0 16
4. .6 1 .as 1.
." I k 1 $4
3) 11 11 .I'l8 to4391 9 11 ~ j .
61 1 1 0 3 11 A 01
0 b 1O I % 21 27 60 3.5 I 63 ' T IALS
e i5f cant Wave Height b
- - I ,i99
3.I I II 7 I• ] 0)• k 1 • O 6 • 0 l
a l~$ 172 ,4 i 7 20 I. 4• 2 ' I 41: 1 , . ,
"S - , - - - -
- .- . ' "- -• -- -.-- - - -!;:
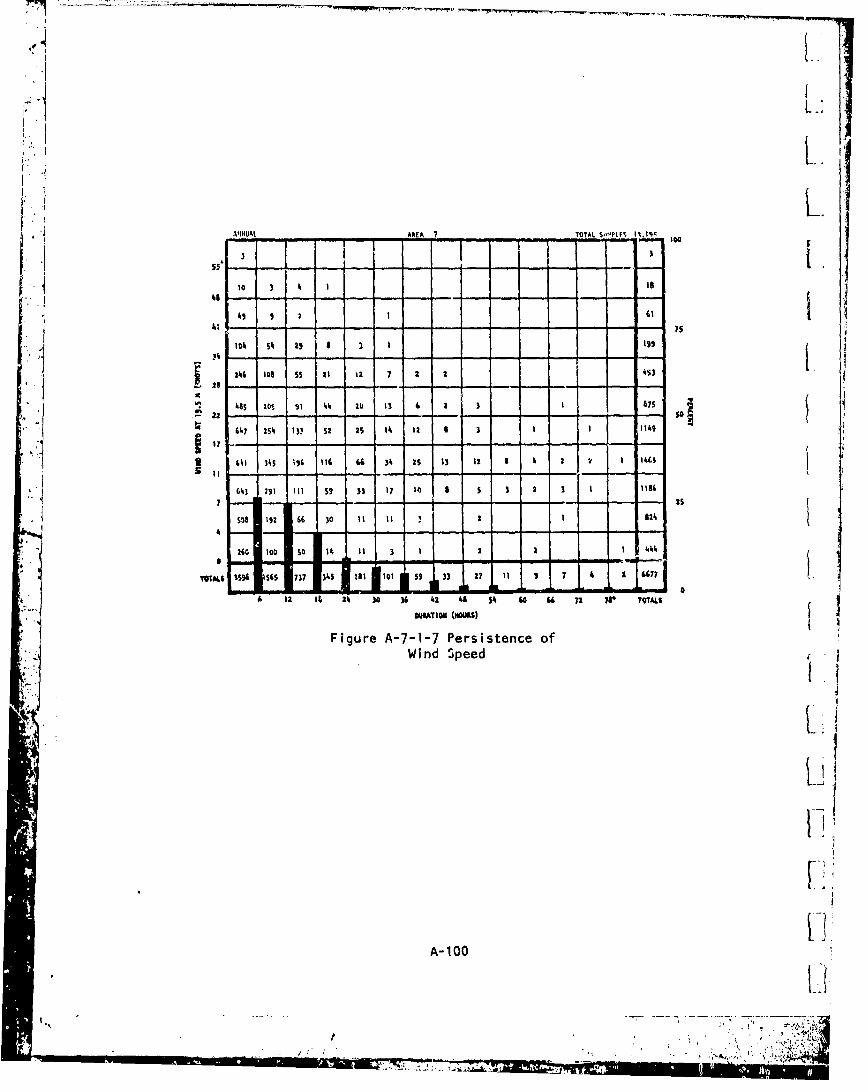
1'71
I K0
* . I K
10 3
1 7517-1 0 4 iA 5 AJ 6 1AP4 3 4 15,5 |11
A 34+ ,.t| .
*'•Io 20 512) i .
I-
m , 413 291 111 59 33 17 1) a 3 2 1156
m•- - - - --- 2-
s* 58 132 66 30 11 It I 3 2I £24
4
"
.. .,26 1010111 ~ 4
TOTA6L% 36 1 565 7 3 101 5 337 I 2 I 5 7 4 a "71
7 -5 19I ii am , .JL ..d..A 6 -..
4 12 16 24 30 36 42 48 54 60 ?a 72 7S TOTAL$
MIJUTO (IWA4S)
Figure A-7-1-7 Persistence ofWind Speed j
A-100
L J
2•G 00 5 I/; 1| 1 2•L I 4N1

itS| , , M 7 0 ,q I'tt ,5
2.. 12. 1. "1- 1 1. 100
3. 2. 211 .
:' !. 1 I l
.. I . ,1. .2 I.7' !. , I I.I I I .' .' ., 1., I ","' -,,,, /I-
, A. S . S1. 1 .. . . 5..
. .0 . 1.0 lk. 1 . 7 00..010 Il
*1 .t 1. Ot ... , $. I -. t.,
] . 1 I * •• ,I : I ., '. ,.,I,., I,., 2.6 ,'~.7 !"_
3013•. 0, 1 2: •, , l.0 1. ,I,2.,I 11. ,,I : .1 - ,".I" I .v_ .S I 1 . l. 0t2 _. . I,) 15 .
S,-, .• ,. ,-1,., '. . .0 . , , , . , ,,, .2 2+.7
Figur A721Significant WaveHeight by Nodal Wave Period
.4.
IsI
Fig.r. A-7- I gn ¶an t WavI I .' 1 '°
I [ . . . I
3 S, Ii . IIi
I ll l °l. "| i ... .... .. . I ... .. .. 1, . . ...00
1• + '3 3,3I II. k II *,1 itku
33l4 303111 .II It .40, 1(
Hielght by Wind Speed
"" 0

A f
u.3 . 1 .9
-7-2-3 Sig. nific. nt3. ave
.3" .1. . .3 3' .
. .. 1 , .
.0 .1 .3 30 1 , I. ,1 3
.8 3. 30 ,8 .6 3.1 .3 1.3 3 4. 0
30 .1 3.1 3.3 3.1 5.8 3. 0 M.I33
3. . 1 3.3 1.7 3. 1 4 .9 to 3 . )
/ 4 .- -- -
i •i
1i 1 ..
.1, , ., S 0, 3 8,•s I, ,
eig y Direction
A810
I.0. 14 . I . 3 .4. *. 4 . 7
+, , 3,: j[" I '~~~~ 3 " I"-" ,
I 4 . 3. 0. •. 45 3. 3
. !1
88 1 | 1 4 18 ,SI
,_____ 11| ~ l *| , 61
00, 3 ° ' " ' ,' "

WINTER AREA 7 IOTAL SAMPLES 1.511
,I _____ It4.0*
2 2.) I + .53.2
6,.0 tl-l
, 1.3 4,4 6.7 12.9 0.36.7
.I ?7 5.2 7.8 0 2.0.8
2.s
i, I 2.2 1,6 8.1 5.2 , 19,S,3,
L :: *7~1]2 .
8.9 1 1,13 120.5 20.8 124 . 8 1 *'s
*00 I t 16 21 27 07 5 A3 TOTAL0
WIND SP.LEO AT 10 M (KI011
Figure A-7-2-5 Significant Wave Height byWind Speed (WMO Sea State Chart)
.A-I10
ii
IT 1,
iI
I.
--i
.'. A- 103
-4.

II
'4
54I - --S--
_- ,2
I I
414414 ~14
Fi u e A 7 - -I S I ,g nt f1
,c W v
,I
o6
1. 1
,4
-
,,
1 , 4.
,1 o
4.%
1.,
1---.. . ....- - - - - .- - - .
,1 , ,, ,, ,,, , i,, , 34, 4,,I.) i,~ .23,,.'
WAR, S .011 0 At40 143'
S I
Figure A-7-3- 2 Significant
Wave
" I
~~Height: by o l W ind Spe
eld
A-104
a l3 I 8, .6,1 . 3 3, .1. .5
'
I $ 2, 1 4 o I. 311,6Li I.
1454,II )/,i. 2,
100
.! -. - -,. - j . I. 4
u. 4i , 1, .4
{ It
I
FIgure A-7-1- Si n f c n Wav
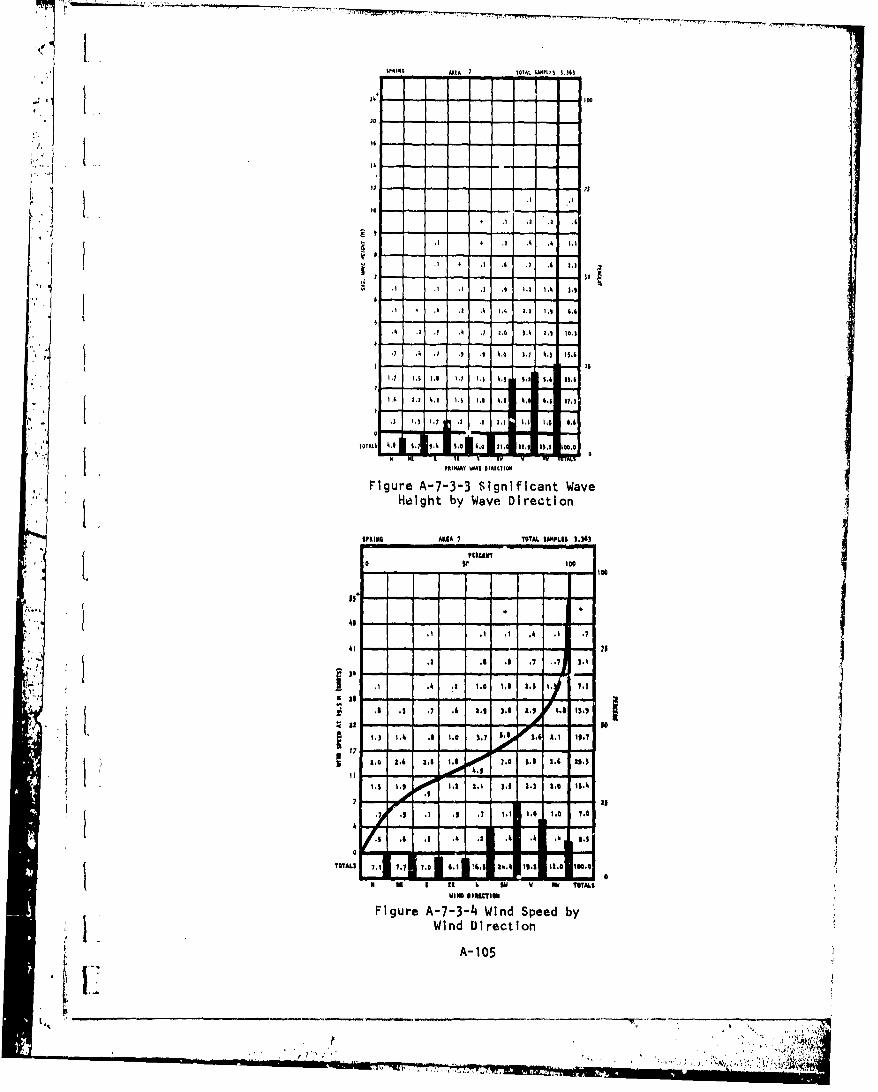
4P4940 ARTA 7 tOTAL SMU 3.341
13i 1 - 1 .1 1 .. 03
94 - ,4 ,- ,t - , - , ,
,4 I ** 4 .1 , 1.1 1,g Ol.t
1.7 I. - - - -i . -. -. ~l 1.
.7• , *, 1 ,| .4 ., 4 9, 9 7
- 0.0.3 9,3 .9h7 .3 .3 3.9 hi9 94S 5.4
5-RIIUY W0- DIAI-Y16!
Figure A-7-3-3 Significant WaveHeight by Wave Direction
AFlllNl ARIA I 'ITAL. SA1PLIS 11.36 )PIMINI0 59 300(.-- -- -- -- - 00
33 -
,9 .9 .3 ,t .3 .7
S.2 .l0 . .7 .7 3.3
-. 1 . .4 , .3 3.0 X, ; 3O t 37. 9
9.) 7.A .0 9.0 1.7 1, 34 19 3.
17 -00s. -. - 10.7
5 24 3.4 3.6 1.6 7.0 $.1 2.6 111.4
1 .9 4 . . 4 . 15.3
7 rl9 .
TO ,ALS 7,1 7.7 7.4 '.,5 MI 1 1.0 30.0
N 0 K I 0 It 4 s 0 54 T1W ALI
Figure A-7-3-4i Wind Speed byWind Direction
A-105
I:
- I*I, ,I , i ,/, ,,*

SPRING AREA 7 TOTAL SAMP.t0 . 3.36 3
4T1T
, .7 2.9 4.7 $.1 414 5. f
S1 . 2, . s IGO a
0 6 IQ 1 6 21 "7 47 5 6 TOTALSOWIRD SP10 AT 10 Al IXI)OO1S)
Figure A-7-3-5 Significant Wave Height byWind Speed (WHO Sea State Chart)
SA-106
'I
S "•••; • Jl

WOW.,. AMA 7 ?rm l2-2of16
2l* - { "' .. .. - -"
I.] 1 4
01.
3 .2 _. .2 300,, . .J4
7.0 70 6 I_ I 11 .
I I .. .2•
_ _37.21
WA 7 15.1122.) 1 19.1 h,1 .5 1 01 ,I17.0 2.1 1 .2 1 1 1100O.01
Figure A-7-4-I Stgnificant WaveHeight by Modal Wave Period
1. 20 : : - - - -
AAI I 10- M~t t
II
S.2 . ' . .
11.4
1; 2 . 1.1 A 1% 0 -." k
21... . . 1 1 .. ....
Figure A-7-4-2 Significant WaveHeight by Wind Spoed
A-107
E W 7
• 2 %;2

SUMER AREA 7 TOTAL $2MTLCý 1,10
.22
"I Ku ."
,.0 ,1 5 .4
!!ii ii
RE 222
A d 1 7.1
hi*~1. hi1 1.4 26.4 , l h$ ),
I
I I L III, O I O0 ,
"AFigure A-7-4-4 Wignd SAe ba
" He~~~inhdb Wv Direction
2.2 A A A,10.
IA 33 3, 22 2,!20. .. , .
A i,W I
ARI 7 ToT I M I 3,24.1
*4 . I , , ,0 .2k .3~
II ,,..4 .
1. 2, 2. I. . .2 34 1.25t
3 Il l 31 $ 35 I IW TOTLS•l~
Figure A-7-4-4 Wind Speed byWind Direction '
A- 108
I " - , " " ; " -- T;7,.. .. i ,•;+
*p ,: ,... 7,o/ .{ "5+••.

oUM. ~AREA 7TOTAL SAMpLES 3,160
.1 1 "°O ' . I I' -
•.4 .6 -.- 3.7 4
1. .7 2.2 3.2 3.5 .1 2.8
3. 2 6.7 1-9 9 .9 . 3-0,
10.2 12 , II.) I i 3.3 .
0.5J1-1 S .7 11,.
19.2 26.1 3.8 5.3 1.4 100.
I 10 16 it 27 47 ss 63* TOTALS1l110 SPEEO AT tO M IKNO', S'
Figure A-7-4-5 Significant Wave Height byWind Speed (WHO Sea State Chart)
A-0
Ell"
V1
.11.-
I,
A-109
* ,'**

*.' 7ALL AA 7 ) 3 ,161
St h ,,-- - . .- .. .
.2 .1 .2
I-.6 7 1 .6h. .3 . 5 .•5 .8 1 211-
I L1 _. _.7__.
2. ,.7 3.2 1.0 1.$ ,
6 1 | 1.51 I, Y7[7 -,
r- , .12 17.k i2, I 1 .1 .8 I - . Q1
Figure A-7-5-i Significant Wave'. Height by Modal Wave Period
I0L 9.0 1 P.1
NA 1. 1
0 sit. , 111 0
16Ii, NO W IA
, 1 .-w WI D o! 1. I W O.
Figure A-7-5-2 Significant WaveHelht by Wind Speed
A-110
-. I
,* ,

- LARItA 7 t7.TA3, SMPLES 3.161
, I2 -- - - , I C
7 3 . ,.3
II 1 ,I .1.5 - ~ - ~ - - - -S. 73~
72AI -42 w
~~~N w.I + b 4 .7
.AL AMA., •7 . M, .o 4.7 ',161
.2 .
22 -
3. .3. 4 1.7 .17
3.4 1. LEI .I . 2 , 7 .3 3. 4 ,1 .4, + .Z .7 .7 I.7 .~ 7.0 3, .6 I,,
.7 .igur A-7- .3 .igni, ica. t Wave,
"1 • ey7r
*~~ I -
So 3 A A 73 1 . 1 . 1 . 71 7.3 23.
.N it aw 11 VIALFigure A-7-5-4 Signidcn Waved by
.- 2 .7
7 ' , ! .3 ..7 7. . 3 .4. 5. 7.
t17 150=Oý
77 , - , - .- - , 4.S ,1 -. t-,
p,- - , ,t
Ii I2,4 7i)l. I.8 3.5T 3. 24 7.
•+ Figur A-7-5- Win Speed by
S• .,...,,;..;•m,,+3' •3 ' " ' IUCT,3.•
8 M S II S 8~3 3 Pd 07.I
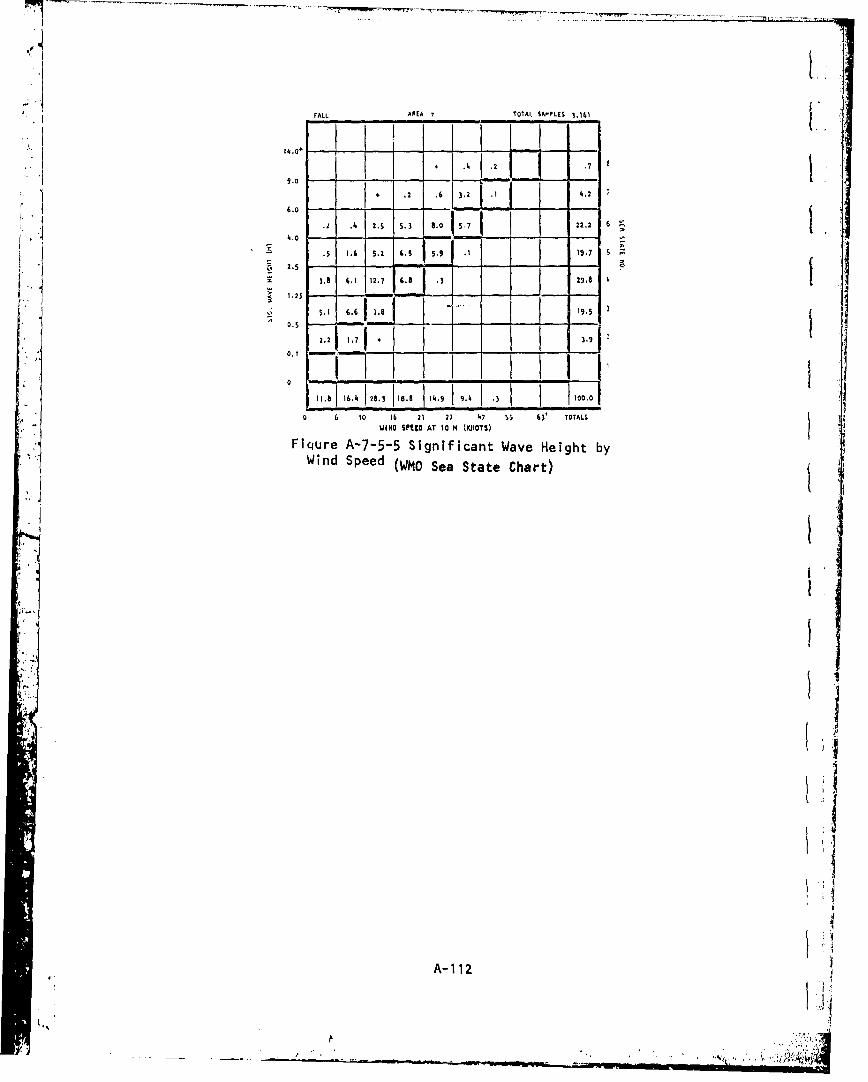
FALL AREA 7 TOTAl SAMPLES 3.161
I • --.14.0*'
4 .2 .6 32 .2 7
. .4 2.5 5.3 8.0 5 .7 22.2 6
.5 1.6 5.2 6 ,5 . ,9 19 .7 S
, 2.5 -
).8 6.1 12.7 8 .3 - 23. 4
,.1125 f'5. ,1 6.6 7,618
2.2 1.7
f 3.9
0, a. a, a
11.8 16.1. 28.3 18.8 1k l , , I0,
5. 3 i .8 14. a. .3.a
6 to 16 21 27 47 55 63' TOTALS
WINDO SPED AT 10 M (IVJOTS)
Fi ure A-7-5-5 Significant Wave Height byWind Speed (WHO Sea State Chart)
SA-112
* I ' ,•• , '

13 4
CA -f C44,
4-'0 00
eJ .C'A IN a, C I 4 N
0~0 N N'
L.
CA
01
Z ~ . LA LAL
00 Ho>
LA
.14 c- ~Q- 4 04)
'~ C-4/', i *'~~4* ~ ~ * bI
7 Lf\ 1
U4 - S)4 '. 4 - 4. I
w A-1 13

i.* . . . . . ..- '
f. I ANNUAL •lARIA 10T 1 ,.94 t Iwtf ,12.72
1- . 2 ...2.d
.2# A 7. 0 1.2024. .. u 72.32
2.7- 2. 1. ._7
.9 4.6 1. 3.117, 6.3
tel' 10. 12. U. 4 1. 1. . 3S 11 . 0
"- i
.L I .- - 1 1 1 1 1 1 .3
J. . .) ., 7. I.. 1.2 ... It. S IA S .;
m| 1.8 (U
[ . •. .2 ... .*JI
Fgre A-10-1-1 Significant -ave
* f .27 24 7I
7.1 ..36 4- ." -
___ ,__ _____ .,; .' .I
- .S 2.7 2,.0 2.- 2.2 2.2 3.4t 2.. 23* 234, 2. h•
Figure A-10-i-2 Significant WaveHeight byMoa Wav SePerid
2L 202•4 0 �.212A 2,221 . 14.7.-7, . --
• ' "T'• s .I , ÷ l2,2.o _ o • • • . . 4•. t•. *. 24 . . . .
•.4 . 1 . . 222.
4 2 .2 .6 . . ., $i l
VIM| 222* 2. , -]"
Figure A-10-!.-2 Significant WdveHeight by Wind bpeed
- • A'114
7,

*1(3 30 TlA4. '3. $ 1|.fl3
3'.
i "s
.,3 * ,I
S- . 5 W!
.. _ - -V T -
3.1 . M 30 1. ) 1.6 3.3 3.1
* 3,3 ,3 33 31 3 S 6 .6 3.3 21 .
TOAL .4- - S - 1
33.2. 37 333 3, 13. 3 1.6 33. 3 3,$ 6.
' m .1. 'YI, 1411icido ll" M TI
Figure A-1O-1-3 Significant WaveHeight by Wave Direction
-... , ,0- .,
. .3 .3
., w, 3 3 ,i .$ .3 3.1
. I .* . .3 . .3 3.3 " • . 3 3.•
. ., ., ., ,. ,. -. ' . ,,. Z7 S -
SI.I l.I .1 1 .l6 4 .6 a 4 t~
.3 . 7 . I 1. 4 3. 3.0 Li , 0 33.I". 1.9 1 i. 1 a 2. U
"IA • , 3.5 2. 3 . .. .
33.. . 5 .3" *'.•. • ',d
9 iU I VA w N MAL
Figure A-10-1-4 Wind Speed byWind Direction
A- 115

-,+
ANNUAL AREA 10 TCTAL SAMPLES 12,972,, °... I I I
4.0
.2 .4 i.3 2.1 4.1 .6.oI+.o jl -I+ '°
., 5.0 .1, 36 3.7 .1 12.1
2 1
7.0 10.7 11 .2 I .1 2 ,0
0.51 . a . -
.j 0,1
. 1. t0 1 21 j1 47 55 43" TOTAL$
WIND SPEED AT 20 A tK2OTSI
Figure A-1O-I-5 Significant Wave Height byWind Speed (WHO Sea State Chart)
AWL" AMA If look2 2i3ls$ 2311
it t
ils 4 so -11 94
3+3
""; 16 I t 62 It is I t i ? I I
i t It V
le 6 - I - l - 6 1- 1.11
A-1161
61 - - 3 t- 1
•- -
i4 23 34 1 II 34 32 24 24 411+'
*2. I 4133 4 ' 4 9 ' . 2 1 3 22 2)
I i I" ""+' i li i. ..' "=
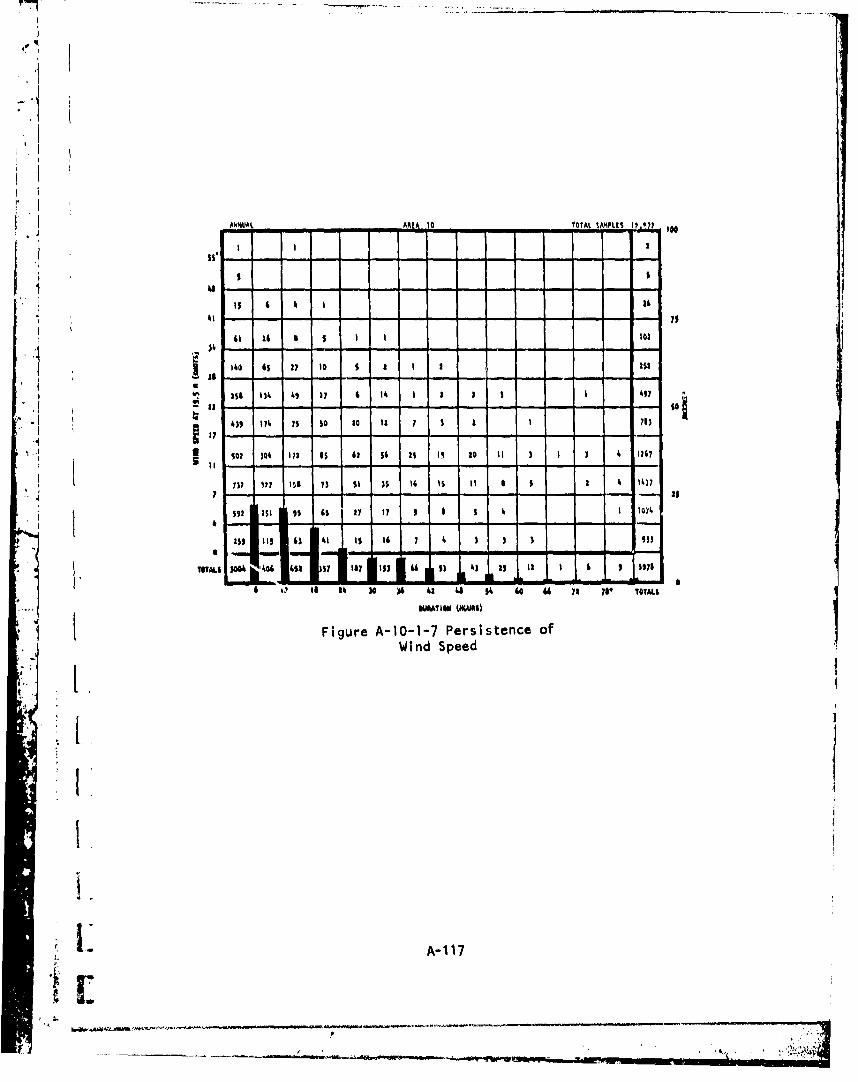
-11
11 11 IS 1 10 11T 1pM~I
I it
6IS a
IS-- 16
A 41 6 A 40 TL OT
Fgr A - Persistence 2of
* iS ,
7-117
552 21 •l *5 27 175 I IoV
259 115 *3 1 I IS 77 I 0 3 3 35)
* -
"",' I 20 3 0 * I * 727| OA S O
w.AL)0O• O *7 S 357 1*7 II) *4 53 0 | I * 5715
FiueA1-- Pritneo I7,I I
-" " -- ------ |--*

.11 10TMSWIS6
144
Figure A- 10-2- 1 Significanlt Wave
* J ~Height by Modal Wave Period
isiit
Itt
I l
s It. A 24.4 1 4 TI,
Figure A-10-2-2 Significant Wave
Height by Wind Speed
A-118
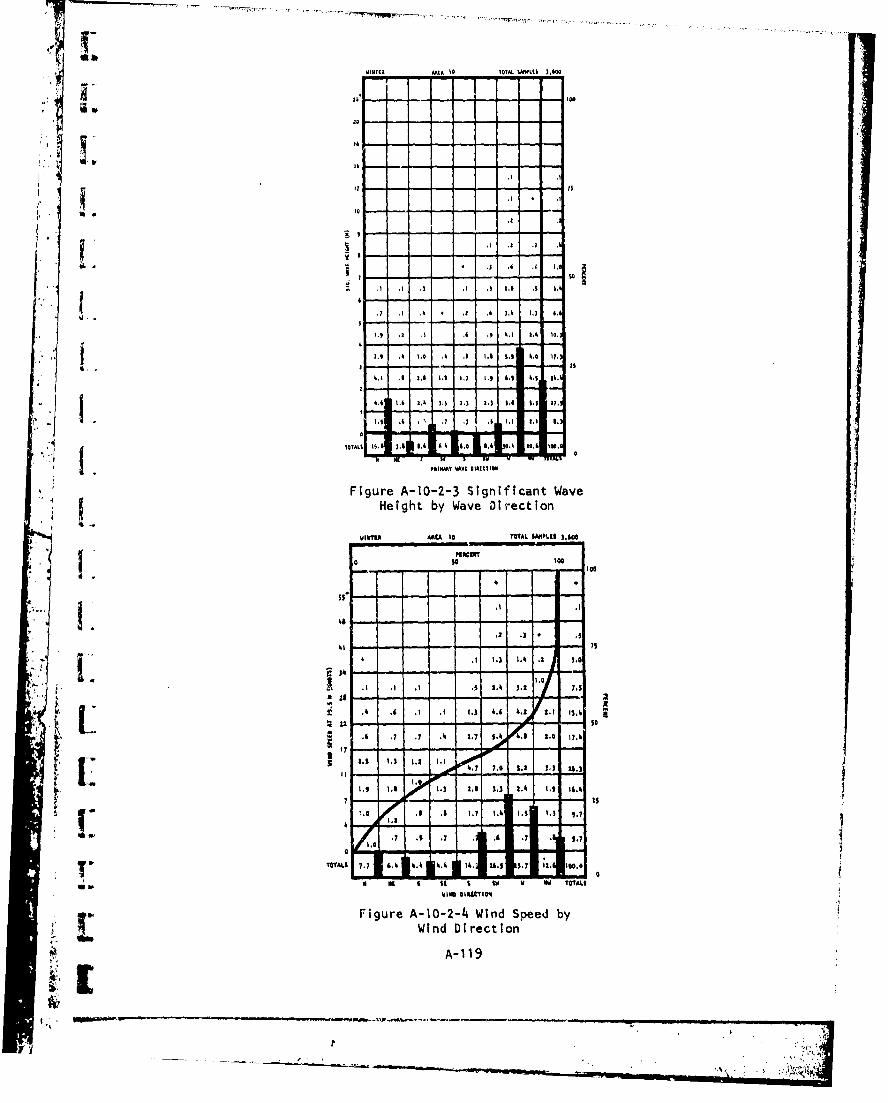
WINTUR ARIA 70 TOTA0O MA PLI$ 3,4W0
a..
.. 7 .7 4 + , 6 , ~ .
. 10, .
.0
kI ,I 3,| t ~ .i 7 I . 2 .2 ,S I~
"" '.g 1b.
1.5 .7
I0.zKA 4,1 014 1:1s"
4, 1 2.r A, I02 .3 S .ig n f 0. 0 27, vHegh by Wav Dieto
"W9022*2 *225 710 TA0P 1
z INll lf
.77-
.1 1. -. - - 70
.7 154 00 ý . 74
171 1.3 1.12,i 1.1 S .1 13 6.1
" . 4 .34 .,
orL
.2 .7 1.7 2 .2 1. 7 .0
1 7 .2 .,7 6.4 4.4 .121. 6.5 3.7 Ia 1.0 o
i it MR at t sw w NW TGtAUS1il e 2.2 ICTIo'
SFigure A-10-2-4I Wind Speed by
j' Wind Direction
A-1197 7...1 7 1.
Ii 7 . 7 . . .7 . ".7..,, . : .; i'++ ,+
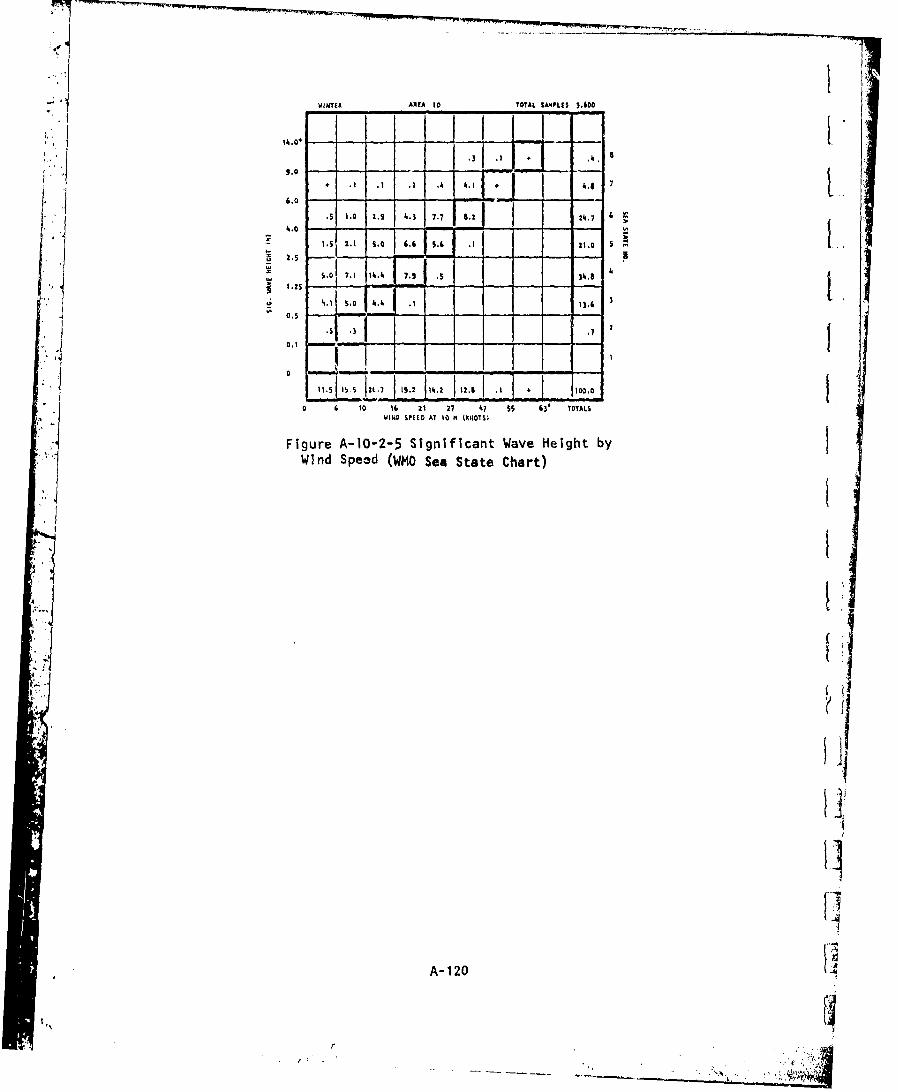
-WINTER AREA 10 TOTAL. SAMPLES 3.OO00
11..0 2. h,3 -7- - -4. -- 6
1. .. . .4 .1 5~
7 .1 .4 7 .9 14.8
50 4.11 13.
0 a 1o 16 V1 27 47 55 63* TOTALSWIkO SPED AT 10 M (XI40TS)
Figure A-10-2-5 Significant Wave Height byWind Speed (WMO Sea State Chart)
A-120r(

•1 - --•.. ... - -r.,- ..r , - * -- --- ,.•'
SPR.I1G A&4A 20 matM s5,2Lt 3,294In J. ,
- -,-- -.--- -- - -
Ii - ',.2
4 V 111 111 "
S2.0 .7 .3 .2I
3 2.6 2.2 1.2 .9 .3 .-1 4
I 130,
.. . _.,
.2 .2 2 2. 1.7 .1.1 ÷ .,.7 6 . .1.4 . . .• .3
1,2~ - .. . .) =. ., , ., .,
111. 1. , . , . 14,1 1.0 22. 11.1 C
Figure A-10-3-i Siqnificant WaveHeight by Modal Wave Period
I 5It
V.~
A-1,2
, . ,2 . 12
* I .. 1 . ,! ,
1 .II 12'l • O I)I~.
. -II 'illA..|,$* ,. li
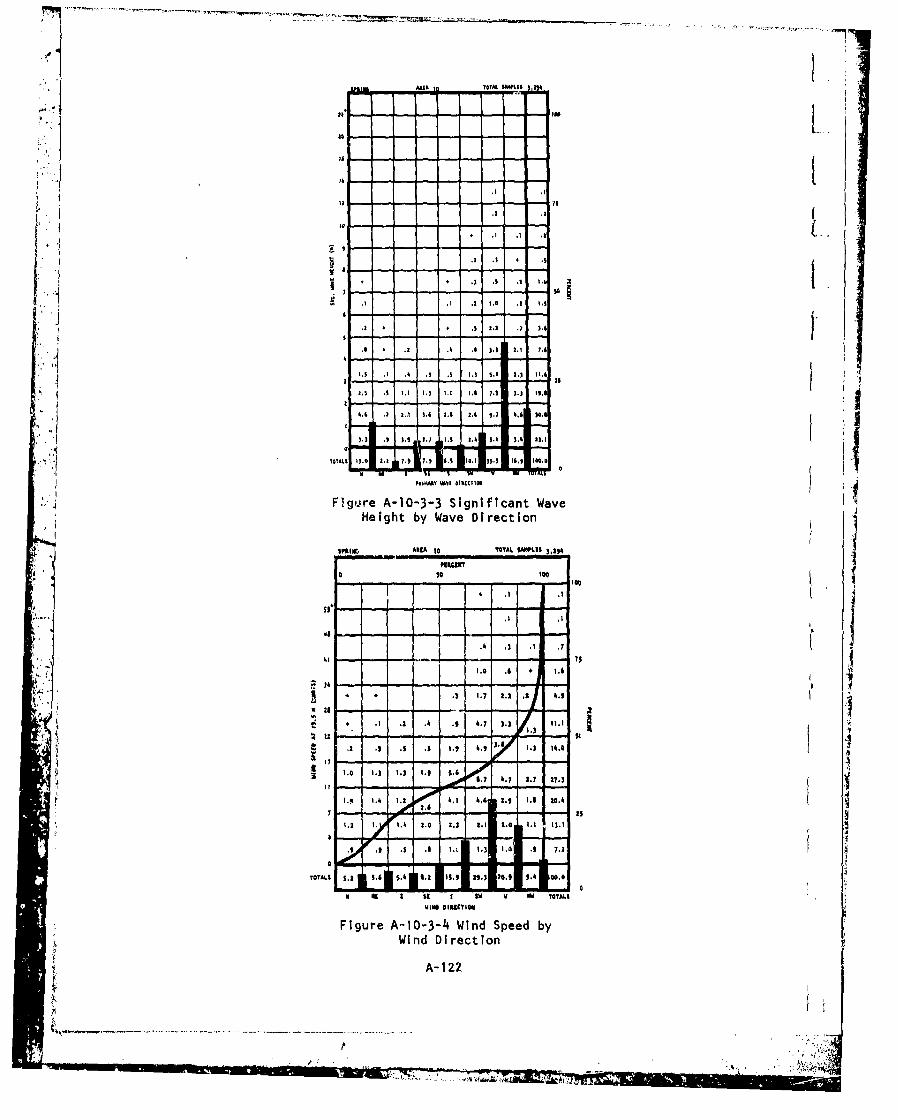
Ut, TOTAL &PPIK96
. . . ..S.3 ., L
II. 1.1 5.1 S.
t IO TA .I .. 1 .9
,! + * .3 .-3 .f Wav
to
3.$ .3 .2 .2 .3 3.3 3.2 2.3 753
-m I
I 1OTA 3 .3 a2ii 7.3 7.3 2.3 30.l 31.2 30,, 300,,
P 3 0 2 1 . 2.3C30 .11 4.51
'!Figu~re A-I0-3-3 Significant Wave, i Height by Wave Direction
It O~ go23 30. M32 ,)
.. .. 3, 3.
1 7 4~.39.
II.33 .3 .3 .71•
.. 0 .0 * 3.6
I • 3 1.7 1. 1 .
1 ,3 .4 .2 ., 2.7 3.3 a3.3
O. .--3 - 9 2
t .2 . .4 4.2 U. 3 . 1 . 0 3., 3.03. pt 0 3.3 3 .3 .) 3 .0 , ,
a sI 1 t sw wY m TOT&A|
: Figure A-10-3-4 Wind Speed by= Wind Direction
il A-122
I. . 17 1.
33 -
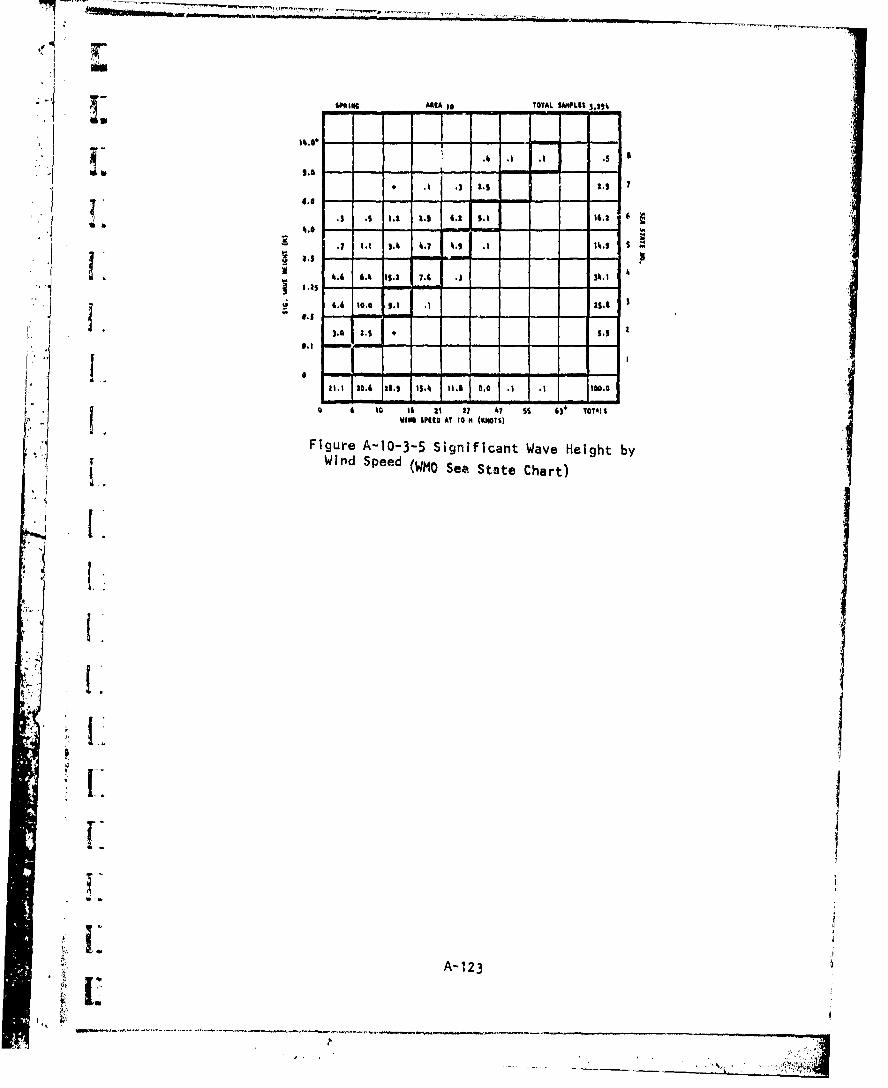
SINGlI ARIA 16 TOTAL SAPIPLIS ,g
2I 'IIL/
.h .1 1 43S- - at - - - 1
Figue A-10-3-5 Sinfcn Wav Hegh by.
."5 10.3 9.1..1,5.6 I
j
W S . S e S t a t C h a r
• • *.t - '3.0 3 .5 * I 5.5 3
A 1
,i.1 Figure A-I0-3-5 Significant Wave Height byi ~Wind Speed (WMO See Stste Chart) •
i "
I.!I
,t I: -12
i~, q
3°.

' ' St~q•[A
IA to ?Tofu U•ts 2,4s
4.
1.
-. . . .. .. 7 _9 -2
"".6
a --
i IIA S-- _
, j
s 54 1
A -
S' 1
1, ,
Figure A-10-4-2 Significant Wave
Height by Modal Wave Period
A-12
X J -4 ,,-
I.I
... .W SlUh At 49"' 4
°|I Figure A-I0-4-2 Significant Wave
Height by Wind Speed
I•
A-124
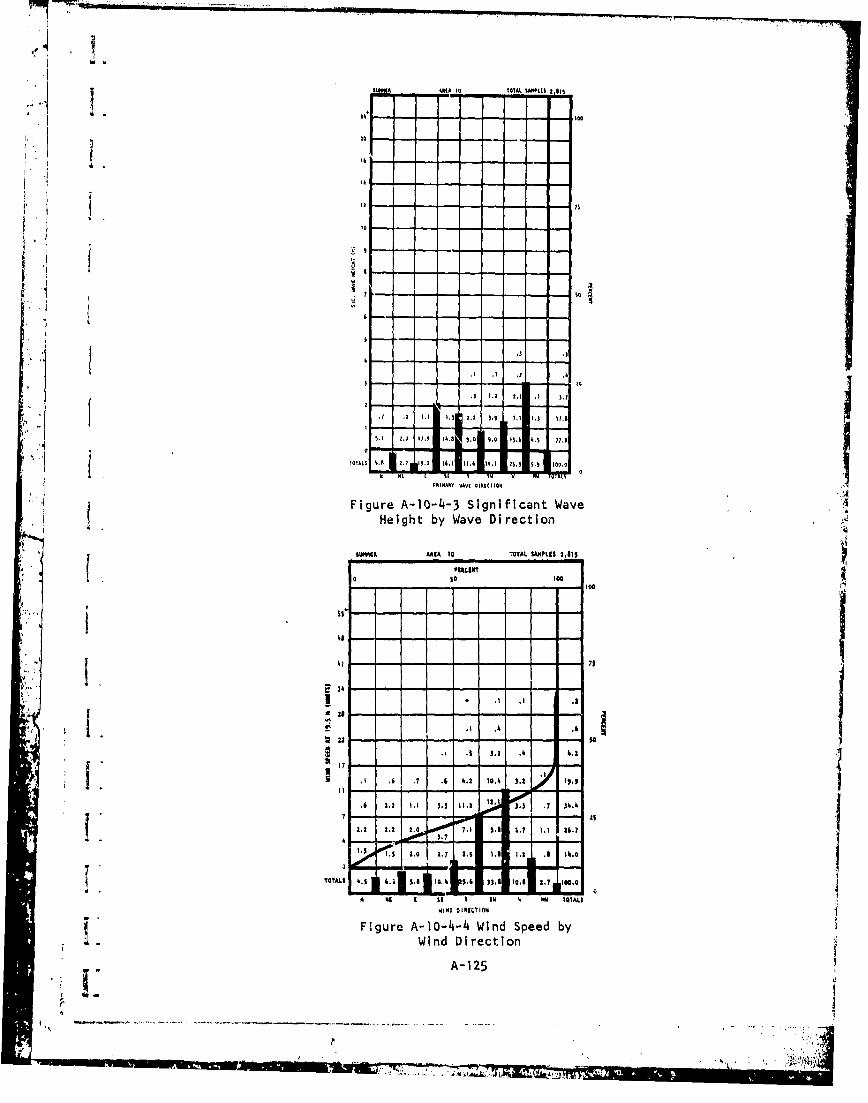
SSLKMA US 0TOTAL $AMPLIA$ IS
11
74 -
!56
1. .1 3.7
.23. . 1.1 .1 03
.7 .2 7 . 22 I 3 ,1 7 ,7 .3 7.
1 .7 S 12 .0 77 q 7)6 3 ,. 11, I ,A . 00,0IIS~~PRIM4ARY 'WAY[V UHi~tI[ION
Figure A-10-4-3 Significant WaveHeight by Wave Direction
SSUMI7, ARIA, |0 TOTAL 1AMiPLIS 2,875
*~s Icai0WSo 100. ... 19 0 970
I Itt , , ,
1.0 ,o 1 . 7 2 . , . , . . .0
. 3- 10.47 0.
3 o. . n ,i ,, ,-I ;, , .,o,! ,.,,I.
TOAL w -- 5-- 1 U
S•~lHO O IICIO•f1NFigure A-10-4-4 Wind Speed by
Wind Direction
4. A-125
'!.m7 - -• . - - -. .. , ,, . ' .- ,.•.••
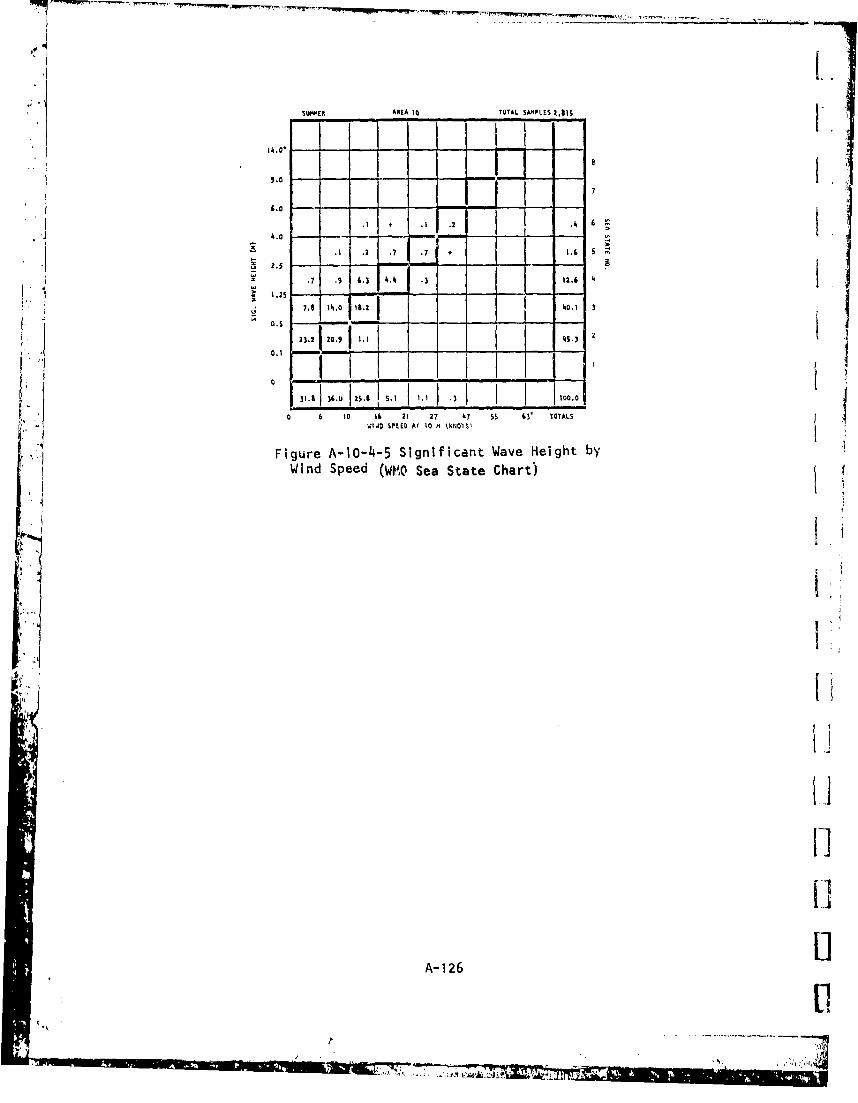
SUMMER AREA I0 TOTAL SAMPLtS 2,815
14,0*
I 7
3.0
S•.7 .9 4.) '4.4 .3 12.6 4
1.25 - ',.;7.8 Ih.O ill.2 40.1 3
0.5
23,2 20.9 1 114,3 2
CI jt31.8 36.U 2511 S.l 1.1 .3
a 6 10 16 21 27 47 55 63 " TOTALS
W St)PEED ArO 10 (KNOW1
Figure A-1O-4-5 Significant Wave Height by
Wind Speed (W,0 Sea State Chart)
ii
i~i
SA-126 -41

FALL 33A I 10 ~t3 .6
151
3. - - -3-5
15 7 1.,09 + 100.
.3.*
9 1. ,| SA .2 .4
12 t. ,6 is I .I
IM IU
$,1 .t +) #,• .•l l,• 3o 8 1| 4 t, $0 i s, IO|.I •.LS ••t 0/
Figure A-10-5-2 Significant WaveHeiqht by Modal Wave Period
A1.
I OLE. "MCI -A,
w on3.
3M3 . . .. .' . . . . .. .' ..... I4
.1 3,
V3 3 I.------------------------
Figre--1-5----------nt 3.-e
,.e3h .y 3ln Spe d
.3 ." .3A-12.
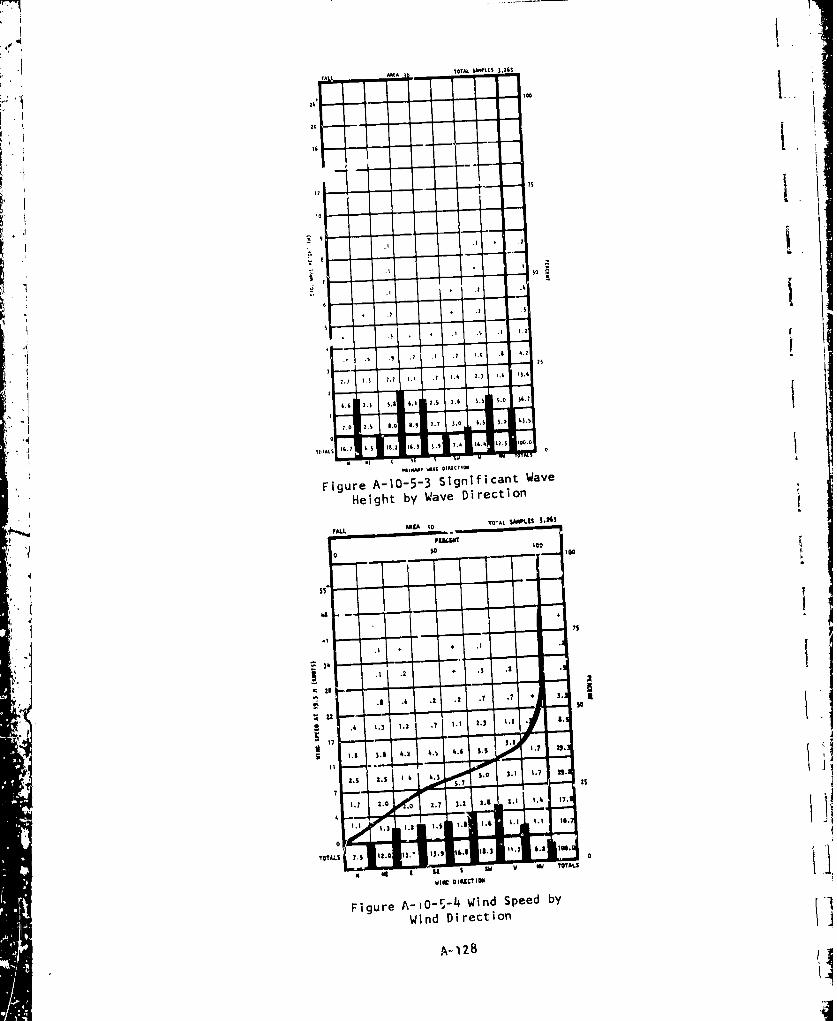
2.
I& °20
II
I
*
Figure A-0-5-3 Significant Wave
Height by Wave Direction
.2LIM IS .~
SWI
J
Figure A-10-5- Siniicnd Spveedb
HihbyWivd Direction
.l . iFALL ARP A 10 TO A SA.9
Ma ItosI
S.4 1.3 1.3 .7 1.1 2. .3
"-] ,1.6
3.8 4.1 4. .6 s.5 1. is
-1.1 1.7 0 . 0 17 )3 ,2 ~ 14 i
.I ".4 3 ". 9 ~ lit ls t
S~Figure A-iO-r-4 Wind Speed by
Wind Direction
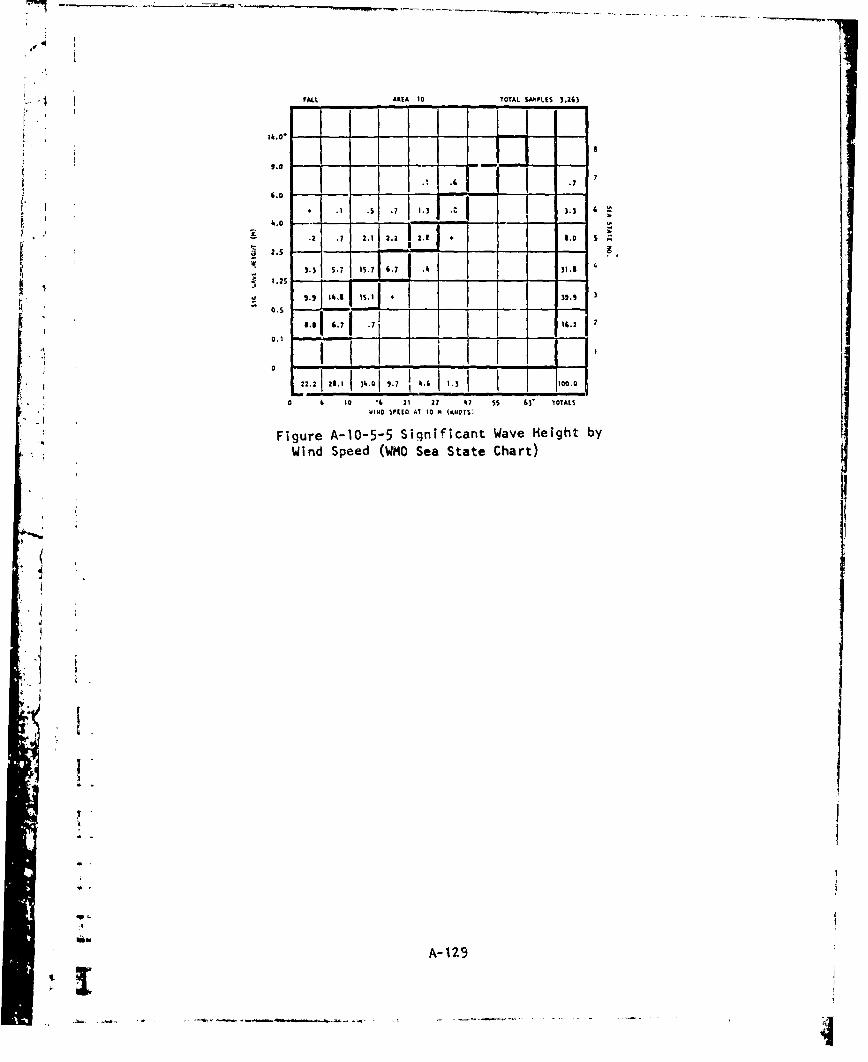
44
, .2
".4 !ALL AREA 10 TOTAL Sa.•PLI$ 3,2R3
9. 144. +01..L - -,
s3.3 .7 15.7 2
0.5 -, "'2J
22.2 I2.1 1 .01 9.7 .3 1 .0 00S I I I I
0 k 10 t 21 27 47 ,5 ,3 TOTALS4114O SPEED AT 10 M (,IKIWT1
Figure A-10-5-5 Significant Wave Height by
Wind Speed (WMO Sea State Chart)
A
.i.
.1.
1 .
m-
A- 129
"I

o 0
C4 C'4 1 ~ a a a a I1
00
mm
C. L
0) 4)
CL)
40
10C.
0
2Z.~U C j -
- r C r r
l V :l
*A- 30C

, .-.. g .| 4 V"3 ***' (*0 : , . 3.
A, •AL *-ml
A-
34 2.- •., ..
-. I , ....a•,.
F• I 'r A-11 1 in fca tW v
£. ., ,,• , ., .2 .3 ., .4,.
,., ,. , . 2 , . 3,. .,3 . ,3.•
0 Figure A-11-1-2 Significant Wave'- ~ ~Height by oa WinvSePerid
A-131
- ~~.....4.6 .6. .
., '.5
- - 3 ----- ---------.
-iiI.------------------ - -
3.' 3. 3." 2.5 2. I. .5 .5
".231131133II 2231..3 I2.
,• Figure A-i=I-i Significant Wave
eghtiby Moda Wave Speredj
, -- -. A-- 131
3II"3

AMAL 030A It TOTAL UON 3,53
3'.
IIIVA Wiw bl40
Figure A-1-- Siniicn Wave
Height7 byWv ieto
A3 2.133 . .3 2.7 3. .1
4 .0 23 0 2. .3 3.2 .0 . l . 0
1. - -.- - - . 27
2.6 3.3 .3 3 .3 .2 3 .) 1). s
doi - - i3302 .0 232 .3 3.9 . . 23 . 2 33 . 6 .
.1205 D33 3210322
Figure A-1I-1-4 Wlnicnd Wave bHe Whibnd v Direction
A.B303. A -1A 3 2 0A 33.37,,

ANAIUA. ARlA 22 TOTAL S"sJu$ I21.35
, w4. 4
4* 4 ,3 .2 .4 8
4 .2 .2 .3 .7 2.6 4. 7
2.0 + -
£ .3 2 .7 5.5 5 .6 3.6 16.5 6S~4.0
6 2 . 3 2,5 8.0 2--3.9 3
23.0.5• 4.5 4.0 9.1II
S0.2 .- - -
L 5.7 V.11 3.6 11430 10.1 2 .2 .i 1 1200.0
06 1 16 at 27 47 5S 63' TOTALSWINo SPEEo AT 10 M (KNOTS)
Figure A-1I-1-5 Significant Wave Height byWind Speed (WMO Sea State Chart)
IIt
M 0 t 1
2j,2
14 it $
\ I I
"k% It 14 Ito 246
4
N 2 4 2' 2 k 2 4 4S 42 $0 0 It 7 IS, l674.
SS +2 • IM S
Figure A.-'1-1-6 Persistence ofSignificant Wave Height
w. - A-133
121
21 1~ 1 1 I , I I 11 I|
] .... I • -I

i..
4I
SAt11I:AI. AREA II YQTTAI. 5tMPL!•$ '.
53. 25 119
4 I,3
2 i97
54 1. go 52 2$ 1 9 $"4
553 11 53 a7 11 43 27 53 1
"I. S;I ,iI ~~~11 6 i |2
689 317 16k a4 51 33 17 11 111 1 9
SO 220 15s l 2 3 1 2 a 0
269 126 3v, 23 9 1 1 3~ $'9
i 12
TOTALS UP3 1405 174 13 234 ihs *75 42 is sI 8@ 54S a- - '..
4 152 t 24 16 hl 44 3 40 44 76+ TOTALS
' "TIN (WAS)
Figure A-I1-1-7 Persistence ofWind Speed
A-I
i 8 !•) }• t~l o6 •) ) 1 IS 6 5 5 it~I
, ',.• ,. .. .• . . . . ...

mul-L Iom34
SlI+•'l•''+ :•" ••" "•'• , .. -... .--- ..,13,
• is
3 4- 3-5 3,0 Sl ,- .1
., 72. 1,1. 11 +
1A ' "1 "_9 " i.7 .S 1--.
5' - -,--
Ibl , * 2.1 41,1 6.7 11,1 111 1 16.6 11,I 15.1 I9.• 9.1 I. .1 I ' 10,|.1.. 1, 0.6Iil , i| I4 l)i I 1.6 , 66A I i l~l. •$ Is.* 1s Ow tol
' 1 Figure A-II-2-i Significant Wave• Height by Modal Wave Period
..0
+Ji ,,,l4 .1++ .1 .il1 o4,
4 Figure A-Il-2-2 Significant 'WaveHeight by Wand Speed
A,..,'

WINTER2 AREA 12 TOTAL UAPLLS3 ,4964
.7 2
.2 4A $3 1.
22 . 1 -. . .
1 . . . 2 .1 104
I0U
At* ,i VIA - - L. -
F ~ .1 .71. f .3 3.7
.2 1. . M~ 4.0 7 .1 . 54.0
5 7 1..
7.. 27 .1 2 17.1 4.2. S.1 4.2 22.2.
i .1 1, 1. A 1. 35 I' 1. 13.j
.7 01. .1 3 2.6 6.62 10 2
TOTALI124A 4.4 2(1). 12.1 96 I. 0.
Figu~re W-12- indsfrc Wave b,Wehid byW tAveDiecio
0242.12.A -136 '722 I2LI ,~

UlVQR ARIA II TOTAL SAFPLIS 3,498
I *I . , l.1
12. 26 .1 200 1 . 5 1 . 1 1 1.
.8 5.5
1. 2' I-. -- ,
1.I I.E A.5 1.0 Is + I 5? 5
2 .I 4l.l 13.0 6.5 .2 27.1
"0.- - -
.II I, 2
S+ II4 1 L'" a" j2'. 0,o0 17.1 I'"" ." , 0
|•- .+Q i 10 l6 21 77 ;+7 5, 03++ IOTALSI• lif'. .WIMD$PEED AT 10l l (IuC+Ts)
Figure A-1I-2-5 Significant Wave Height by3 3 W'nd Speed (WMO Sea State Chart)
A1
i, I.1
A-i ~7
~~TA
A-I..3 . . . . .~ .-.--.

S I MAL .. 3.1
',
V k -
A t - - - -
"4. .4l'• . .3 .I
IsINI*|1.3 . I.I 1.il .- 000 .
1 I
Is's. .3. .,Ii~ 'l. ~ 15 i . 1 9. 4 4. 6 . 2."1 • .1
Figure A-if-3-1 Significant WaveHeight by Modal Wave Period
PR 11 A,
19 14 4 6 i, MAI
Aj... . . . .. . . - -' 2
. . . . . . . . . . . I
S 2 n I. ., L A l ] I • }
I MP A, I9. . ~ 11
2• I 2.! I'l~ I ....
.2 2 Ii 2.2I II 142i40.2 OIL
Figure A-11-3-2 Significant Wave
Height by Wind Speed
," A-138
2. , . 12 . *h7. 2 . .22.

%POW ARI 11 TO'A SAPU 3. ' ,- - ..4
20
IN 0
Uh
,7 .7 2.1
1 11"1116 AM| It TOTAL S WUS[ }14
70 ..7
..
4 1 7
.. .. .1 .3
S.2 , .0 7.)
.0 1 7. .7 ,12.7
+ 2.7 0
well I1 . 7 1.2 1 1 1. .3 1 .
I .0 0 . 7 1 .7 0.. 0
T T L 111. 9. 8 1. 5 si, I Q it.) 1 9-1 14.1 toI
WIpND00 0 I03 1 TIC01
"Figure A-11-3-3 Significant WaveHe ight by Wave Directi on
"wA-13
OPO~lIK Ai•|A I1 TOTAL SNOPLI3 3,37,0
0 SO 700
-- - - - 00
* I
* ,1 .0 .0 , 7.A
,1 • . ,I 1 4 1,3 7.0 ,$ 0.•
• ' .1 ,., .0 ,1 7.o 1.7 O,6 L i ,!
, so
- 100 3 33 0 V 00 0 TOALS
07740 OI)IICTIOII
.- • •,,Figure A-11--3-4 Wind Speed byJ. Wind Direction
A-139
-.7

SAREA I TOTAL SASPLES3,344
i- I.O -r - -- -
1.3 .A .5 .2 . 4.390 6.0 w 1
.1 .) I.3 .4 3,5 6.2 1. -16. ' 1,
,. 0 4.7 7.1 4.9 6
A,4.1 7,1 It.) 7.0 .1 36.6
C. 4.7 7.6 6.f + 15.7 3
,.k 1.2 ,I 4.7 2
)iF -- 1'" iKI i12-1 19-1 31.9 17.9 11.5 6.9 .1 0.
t 0 6 to 16 21l 27 47 55 03" TOTAL$"WIND SPEED AT 10 M (KNOTS)
Figure A-1I-3-5 Significant Wave Height byWind Speed (WMO Sea State Chart)
J ,
A
/ ilI_.1
A--140O

.. , -.3 . ..
--
i -'
' ~,1
II
Figure A-11-4-1 Significant Yv
SHeight by Modal Wave Period
,14 4,,i ~ o .I
~I .. .. .. .1...
A •41
Fisure A-II-4 -1 Significant Wave
N,
Height byMoa Wind SPerid
_ _ _ _ _ -

.0 - ---
1:k-
t.I6g a
Hegh by Wav Die tio
.1 ,I .4 I.3 |,13,
.6AL :: ; .I • 4.3 I 1. . 7.I
":11. 4.0 330 , .0 3.7 l a I .I 3 14. 1 *1
4 C
3.0 3I 3. 6.3 30.3 7.5 . 0
• i Figure A-II-4I-3 Significant Wave". Height by Wave Direction
it A II TOTA l IL . 3,3I0
1.0 1.0 .0
"" i I
S.) 11. - .-. 6. - 5.- I
1.6 h| ' 1, sI .6 1.3 1. 1~. 1 1. 14.
S 5. ,., l,, .3 . 1 3. 3 0 . 0 4.0
37 - - A- - 142
.. .A .. ...... 5. S:
.3 4.3 3. • .0 .1 . , 0 6.7 -O.W
i, --•~~~ ~ -,, ,, . -0 ., a a. ,. . ,,,.1043 3.,3. . .3 40 3. M3 90 W " ".
"i"0 10 I 1U I U v U TOTLS'l000 I NII WlllTlFigure A-11-4-J~ Wind Speed by
• ~Wind Direction
A..lI2
S. i, .,

SWWIERqn ARCA II TOTAL SAMPLES 3.330
14.0*
II IO*
4.0
- I .7 IS II S 3 5' s
i ~~~~~2.5- - - - - - - -
2.7 .2 13.1 3.8 .1 24.I 4
[:4 1.25 -
"' +' 13.0 18.4 III.0 S.
0 .5 -" - -
S"13.5 1O.5 .3 244
. 2 . 10
0 10 I 16 21 27 47 55 613 TOTALSw1ow SPOlb AT I0 m (KNOTS)
Figure A-11-4-5 Significant Wave Height byWind Speed (WHO Sea State Chart)
4
IA1
1.
4.1tp