cribbs patchway new neighbourhood heat network feasibility ... · cribbs patchway new neighbourhood...
TRANSCRIPT

Sept 2015
CRIBBS PATCHWAY NEW
NEIGHBOURHOOD
HEAT NETWORK FEASIBILITY STUDY
South Gloucestershire Council
3514119A-BEE
FINAL


Cribbs Patchway New Neighbourhood
Heat Network Feasibility Study
3514119A-BEE
Prepared for South Gloucestershire Council
Prepared by WSP | Parsons Brinckerhoff
www.wspgroup.co.uk
www.pbworld.com


Report Title : Cribbs Patchway New Neighbourhood Heat
Network Feasibility Study Report Status : FINAL Job No : [3514199A-BEE] Date : Sept 2015
DOCUMENT HISTORY AND STATUS
Document control
Prepared by Cerri Friedman Checked by (technical)
Digby Morrison
Approved by Bruce Geldard Checked by (quality assurance)
Bruce Geldard
Revision details
Version Date Pages
affected Comments
1.0 April 2015
2.0 Sept 2015 Response to comments across report
2.1 Nov 2015 Final amendments
2.2 Jan 2016 Minor modifications
2.3 Mar 2016 Expanded section on delivery and benefits
FINAL May 2016 89 & 91 Final amendments on section 9

Cribbs Patchway New Neighbourhood
Heat Network Feasibility Study
3514199A-BEE CPNN DH Feasibility - FINAL - 10-05-16_v2 Prepared by WSP | Parsons Brinckerhoff Sept 2015 for South Gloucestershire Council - 1 -
CONTENTS Page
List of Abbreviations 3
Executive Summary 5
1 Introduction 9
1.1 Background 9
1.2 Scope of Report 10
2 Previous Study Outcomes 11
2.1 Potential for Renewable and Low Carbon Energy Supply in South Gloucestershire, 2010 11
2.2 Renewable and Low Carbon Energy in the West of England 11
2.3 South Gloucestershire District Energy Study, Cofely Energy, December 2012 11
2.4 Multi-Utilities Sustainable Infrastructure Strategy (MUSIS), 2014 11
3 Study Areas 12
4 Heat Demand Development and Phasing 13
4.1 Assumptions 13
4.2 Phased Heat Demands 14
4.3 Heat Density Analysis 21
5 Energy Cluster Analysis 26
5.1 Introduction 26
5.2 Assumptions and Methodology 26
5.3 Network Options 26
5.4 Linear Heat Density Analysis Results 33
5.5 Priority Sites Recommendation 34
6 Network Route Assessment and Design 39
6.1 Introduction 39
6.2 Energy Centre Locations 39
6.3 Proposed Network Designs 42
7 Energy Modelling 51
7.1 Introduction 51
7.2 Assumptions 51
7.3 Gas CHP Plant Modelling Results 52
7.4 Biomass Boiler Plant Modelling Results 59
8 Economic Modelling 65
8.1 Introduction 65
8.2 Capital Cost Plan 65
8.3 Cash Flow Analysis 70
8.4 Whole Life Cost Analysis 80
8.5 JT Baylis Site Connection 86
9 Delivery and Interconnection 89
9.1 Delivery 89

Cribbs Patchway New Neighbourhood
Heat Network Feasibility Study
3514199A-BEE CPNN DH Feasibility - FINAL - 10-05-16_v2 Prepared by WSP | Parsons Brinckerhoff Sept 2015 for South Gloucestershire Council - 2 -
9.2 Interconnection 91
9.3 Risks 91
9.4 Benefits 92
10 Conclusions and Recommendations 93
11 Appendix 95
11.1 Heat Mapping Assumptions 95
12 Private Wire Budget Cost Estimates 103
13 CAPEX Phasing Methodology 106
13.1 Introduction 106
13.2 Phasing Approach 106
13.3 Phased CAPEX through Time 107
13.4 REPEX Schedules 148
13.5 Phased OPEX through Time 153
13.6 NPV Results 163

Cribbs Patchway New Neighbourhood
Heat Network Feasibility Study
3514199A-BEE CPNN DH Feasibility - FINAL - 10-05-16_v2 Prepared by WSP | Parsons Brinckerhoff Sept 2015 for South Gloucestershire Council - 3 -
LIST OF ABBREVIATIONS
BAU Business as usual
CAPEX Capital expenditure
CCL Climate Change Levy
CHP Combined heat and power
CHPQA Combined Heat and Power Quality Assurance
CIBSE Chartered Institute of Building Services Engineers
CO2 Carbon dioxide
CPNN Cribbs Patchway New Neighbourhood
CRC Carbon Reduction Commitment
CT Current transformer
Cu Copper
DB Distribution board
DECC Department of Energy and Climate Change
DH District heating
EC Energy centre
ESCo Energy services company
ETS Emissions Trading Scheme
EU European Union
GIS Geographical Information System
HMRC Her Majesty's Revenue and Customs
HV High voltage
kg kilogram
kW Kilowatt
kWh Kilowatt hour
LV Low voltage
MW Megawatt
MWh Megawatt hour
NPV Net present value
p.a. per annum
PoC Point of connection
PW Private wire
QI Quality Index
REPEX Replacement expenditure
RHI Renewable Heat Incentive

Cribbs Patchway New Neighbourhood
Heat Network Feasibility Study
3514199A-BEE CPNN DH Feasibility - FINAL - 10-05-16_v2 Prepared by WSP | Parsons Brinckerhoff Sept 2015 for South Gloucestershire Council - 4 -
S/S Substation
SGC South Gloucestershire Council
sqm square metre
SWA Steel wire armour
Tx Transformer
VCB Vacuum circuit breaker
WPD Western Power Distribution
Subscripts
th Thermal
e Electrical
Cribbs Patchway New Neighbourhood
Heat Network Feasibility Study
3514199A-BEE CPNN DH Feasibility - FINAL - 10-05-16_v2 Prepared by WSP | Parsons Brinckerhoff Sept 2015 for South Gloucestershire Council - 5 -
EXECUTIVE SUMMARY
South Gloucestershire Council (SGC) commissioned WSP | Parsons Brinckerhoff to undertake an assessment of the feasibility of developing localised district heat networks as ‘nodal schemes’ within CPNN and to investigate the potential for interconnection of these as well as integration to a potential future area-wide strategic heat network. The study, part funded by the Department for Energy and Climate Change (DECC), has been undertaken to advise the Council how viable schemes may be taken forward, not only within CPNN but also within other major development sites in South Gloucestershire. This feasibility study examined the potential for the development of localised networks within the Sites of Opportunity defined as the Filton Airfield site which is to be developed by BAe Systems and the “Triangle Site” to be developed by Deely Freed. Energy mapping was conducted for the BAe Systems, Deely Freed and Persimmon Homes sites based on information provided within outline planning applications. Demands were also determined, although not mapped, for the Mall at Cribbs Causeway which is proposing an extension. The phasing of consumer demands through time was determined based on trigger years for the development of public buildings through Section 106 agreements and a draft housing phasing trajectory provided by SGC. Linear heat density analysis was used to provide an initial recommendation of the network options to be taken forward for techno-economic modelling. Based on initial screening of potential network options through this analysis, a network connecting high density BAe sites, a whole BAe site option and a Deely Freed network option were chosen as priority networks for further analysis. Although this initial screening provided a high-level assessment of the potential based on rough estimates of possible network routes, it was determined that of these options, the BAe High Density Site Network option had the highest heat demand density followed by the Deely Freed network. Although the option of a whole BAe site network had not been assessed at this stage it was considered, based on the results of the other networks assessed, to have sufficient potential for further modelling. A variant of these options was also modelled assessing the impact of a connection to serve the existing Mall at Cribbs Causeway and a proposed extension to it. Capacities of biomass boiler and gas CHP primary plant options were assessed through a technical modelling exercise. The build out of the energy centres was assumed to be phased in line with the phasing of energy demands within each of the network options.
Cribbs Patchway New Neighbourhood
Heat Network Feasibility Study
3514199A-BEE CPNN DH Feasibility - FINAL - 10-05-16_v2 Prepared by WSP | Parsons Brinckerhoff Sept 2015 for South Gloucestershire Council - 6 -
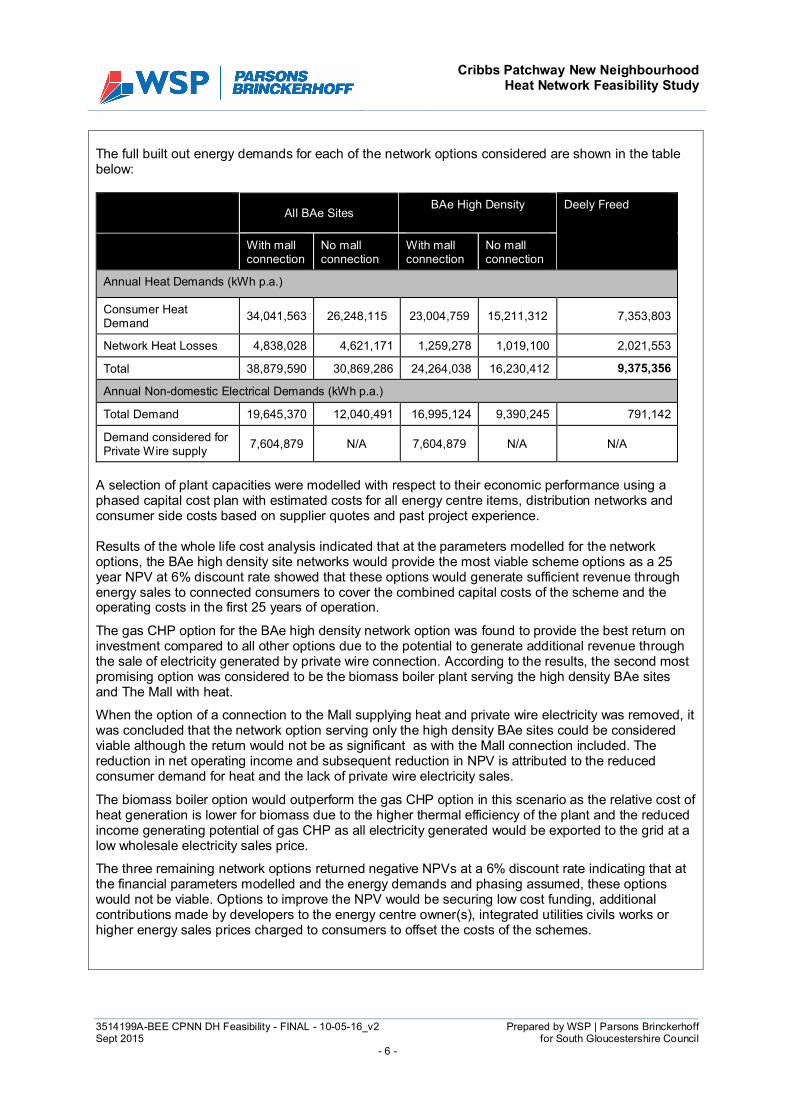
The full built out energy demands for each of the network options considered are shown in the table below:
All BAe Sites
BAe High Density
Deely Freed
With mall connection
No mall connection
With mall connection
No mall connection
Annual Heat Demands (kWh p.a.)
Consumer Heat Demand
34,041,563 26,248,115 23,004,759 15,211,312 7,353,803
Network Heat Losses 4,838,028 4,621,171 1,259,278 1,019,100 2,021,553
Total 38,879,590 30,869,286 24,264,038 16,230,412 9,375,356
Annual Non-domestic Electrical Demands (kWh p.a.)
Total Demand 19,645,370 12,040,491 16,995,124 9,390,245 791,142
Demand considered for Private Wire supply
7,604,879 N/A 7,604,879 N/A N/A
A selection of plant capacities were modelled with respect to their economic performance using a phased capital cost plan with estimated costs for all energy centre items, distribution networks and consumer side costs based on supplier quotes and past project experience. Results of the whole life cost analysis indicated that at the parameters modelled for the network options, the BAe high density site networks would provide the most viable scheme options as a 25 year NPV at 6% discount rate showed that these options would generate sufficient revenue through energy sales to connected consumers to cover the combined capital costs of the scheme and the operating costs in the first 25 years of operation.
The gas CHP option for the BAe high density network option was found to provide the best return on investment compared to all other options due to the potential to generate additional revenue through the sale of electricity generated by private wire connection. According to the results, the second most promising option was considered to be the biomass boiler plant serving the high density BAe sites and The Mall with heat.
When the option of a connection to the Mall supplying heat and private wire electricity was removed, it was concluded that the network option serving only the high density BAe sites could be considered viable although the return would not be as significant as with the Mall connection included. The reduction in net operating income and subsequent reduction in NPV is attributed to the reduced consumer demand for heat and the lack of private wire electricity sales.
The biomass boiler option would outperform the gas CHP option in this scenario as the relative cost of heat generation is lower for biomass due to the higher thermal efficiency of the plant and the reduced income generating potential of gas CHP as all electricity generated would be exported to the grid at a low wholesale electricity sales price.
The three remaining network options returned negative NPVs at a 6% discount rate indicating that at the financial parameters modelled and the energy demands and phasing assumed, these options would not be viable. Options to improve the NPV would be securing low cost funding, additional contributions made by developers to the energy centre owner(s), integrated utilities civils works or higher energy sales prices charged to consumers to offset the costs of the schemes.
Cribbs Patchway New Neighbourhood
Heat Network Feasibility Study
3514199A-BEE CPNN DH Feasibility - FINAL - 10-05-16_v2 Prepared by WSP | Parsons Brinckerhoff Sept 2015 for South Gloucestershire Council - 7 -
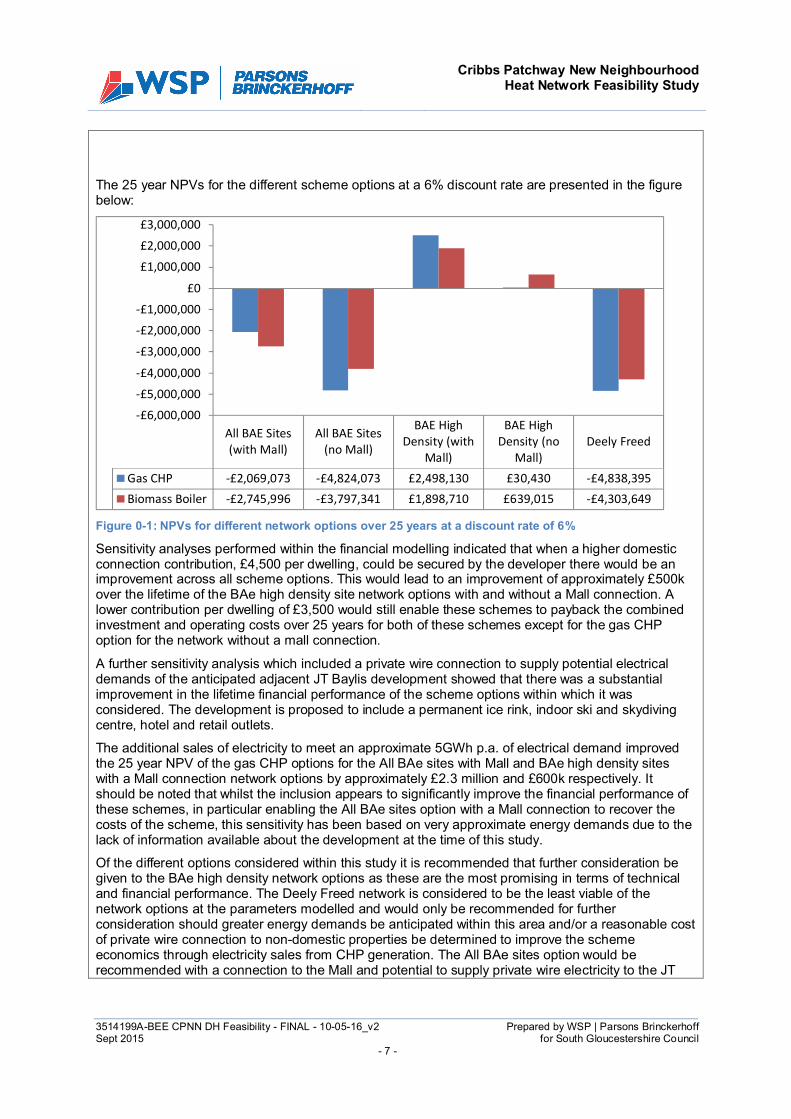
The 25 year NPVs for the different scheme options at a 6% discount rate are presented in the figure below:
Figure 0-1: NPVs for different network options over 25 years at a discount rate of 6%
Sensitivity analyses performed within the financial modelling indicated that when a higher domestic connection contribution, £4,500 per dwelling, could be secured by the developer there would be an improvement across all scheme options. This would lead to an improvement of approximately £500k over the lifetime of the BAe high density site network options with and without a Mall connection. A lower contribution per dwelling of £3,500 would still enable these schemes to payback the combined investment and operating costs over 25 years for both of these schemes except for the gas CHP option for the network without a mall connection.
A further sensitivity analysis which included a private wire connection to supply potential electrical demands of the anticipated adjacent JT Baylis development showed that there was a substantial improvement in the lifetime financial performance of the scheme options within which it was considered. The development is proposed to include a permanent ice rink, indoor ski and skydiving centre, hotel and retail outlets.
The additional sales of electricity to meet an approximate 5GWh p.a. of electrical demand improved the 25 year NPV of the gas CHP options for the All BAe sites with Mall and BAe high density sites with a Mall connection network options by approximately £2.3 million and £600k respectively. It should be noted that whilst the inclusion appears to significantly improve the financial performance of these schemes, in particular enabling the All BAe sites option with a Mall connection to recover the costs of the scheme, this sensitivity has been based on very approximate energy demands due to the lack of information available about the development at the time of this study.
Of the different options considered within this study it is recommended that further consideration be given to the BAe high density network options as these are the most promising in terms of technical and financial performance. The Deely Freed network is considered to be the least viable of the network options at the parameters modelled and would only be recommended for further consideration should greater energy demands be anticipated within this area and/or a reasonable cost of private wire connection to non-domestic properties be determined to improve the scheme economics through electricity sales from CHP generation. The All BAe sites option would be recommended with a connection to the Mall and potential to supply private wire electricity to the JT
All BAE Sites(with Mall)
All BAE Sites(no Mall)
BAE HighDensity (with
Mall)
BAE HighDensity (no
Mall)Deely Freed
Gas CHP -£2,069,073 -£4,824,073 £2,498,130 £30,430 -£4,838,395
Biomass Boiler -£2,745,996 -£3,797,341 £1,898,710 £639,015 -£4,303,649
-£6,000,000
-£5,000,000
-£4,000,000
-£3,000,000
-£2,000,000
-£1,000,000
£0
£1,000,000
£2,000,000
£3,000,000

Cribbs Patchway New Neighbourhood
Heat Network Feasibility Study
3514199A-BEE CPNN DH Feasibility - FINAL - 10-05-16_v2 Prepared by WSP | Parsons Brinckerhoff Sept 2015 for South Gloucestershire Council - 8 -
Baylis proposed development.
None of the network options modelled could cover the cost of initial investment where discount rates of 12% or 15% were applied, irrespective of the domestic consumer connection charge contribution modelled. At the parameters modelled, this indicates that the network options may not prove to be an attractive proposition to either a public-private partnership or a private sector ESCo but could more realistically be delivered by a local authority/public sector ESCo.

Cribbs Patchway New Neighbourhood
Heat Network Feasibility Study
3514199A-BEE CPNN DH Feasibility - FINAL - 10-05-16_v2 Prepared by WSP | Parsons Brinckerhoff Sept 2015 for South Gloucestershire Council - 9 -
1 INTRODUCTION
1.1 Background
Cribbs Patchway New Neighbourhood (CPNN) is located within the Bristol North Fringe and is an area of strong economic activity and employment provision. It is anticipated that by 2027, CPNN will provide 5,700 new homes and around 50 ha of employment land, together with a range of community services and facilities. South Gloucestershire Council (SGC) is committed to the development of heat networks in its growth areas to ensure that projected growth is sustainable and that additional carbon emissions are minimised. Local and regional planning guidance, particularly CS4 reinforced by CS25 and CS26 of the Core Strategy endorse the use of heat networks for new developments. SGC wishes to ensure that opportunities to construct heat networks in conjunction with new developments are maximised. CPNN Supplementary Planning Document (SPD) published in March 2014, states: “ensure an overview is provided of the whole site in terms of its suitability for district heating”. CS4 of the Core Strategy states that major development proposals (more than 100 dwellings that are wholly or in part greater than 50 dph or non-residential of more than 10,000sqm) should endeavour to install heat networks, where practical and viable.” Policy CS26 CPNN says that the redevelopment will provide a “coordinated approach to carbon reduction, and new renewable and low-carbon energy generation and distribution networks.” The reduction in carbon emissions resulting from lower fossil fuel use would help the council to meet its CO2 reduction and renewable energy targets in its Climate Change Strategy (2013):
To reduce emission by 35% by 2020 against a 1990 baseline; and, For 7.5% of total energy consumption to be generated from renewable sources.
Whilst SGC is keen to determine the potential of incorporating low carbon heat and CHP networks within the wider area, the following two “Sites of Opportunity” are of particular interest.
1. The “Triangle Site” at Cribbs Causeway 2. Former Filton Airfield
A previous study, “The South Gloucestershire District Energy Study”, delivered by Cofely Energy in December 2012, investigated the commercial viability and technical feasibility for district energy within three of SGC’s areas of major growth, one of which was Cribbs Causeway. Although some energy mapping was carried out, there was inadequate spatial planning data at the time to carry out detailed heat mapping. The Multi-Utilities Sustainable Infrastructure Strategy (MUSIS, 2014) stated: “The Cribbs development had the benefit of significant scale but due to its size and likely varied approach to phasing we believe that it is not economic to support a development wide CHP scheme. However we do recommend that a localised and modularised approach to accommodate the long-term and phased nature of the proposed development be considered.” Since the completion of these two studies, three planning applications have been submitted which relate to the study area. These are:

Cribbs Patchway New Neighbourhood
Heat Network Feasibility Study
3514199A-BEE CPNN DH Feasibility - FINAL - 10-05-16_v2 Prepared by WSP | Parsons Brinckerhoff Sept 2015 for South Gloucestershire Council - 10 -
Joint venture Partners application for land at Cribbs Causeway, Almondsbury, covering the “Triangle Site”.
BAe Systems plc planning application for land at Former Filton Airfield, Filton. Persimmon planning application for land at Fishpool Hill, Cribbs Causeway covering land
adjacent to the Sites of Opportunity.
1.2 Scope of Report
SGC commissioned WSP | Parsons Brinckerhoff to undertake an assessment of the feasibility of developing localised district heat networks as ‘nodal schemes’ within CPNN and to investigate the potential for interconnection of these as well as integration to a potential future area-wide strategic heat network. The study, partly funded by the Department for Energy and Climate Change (DECC), has been undertaken to advise the Council how viable schemes may be taken forward, not only within CPNN but also within other major development sites in South Gloucestershire. This feasibility study examines the potential for the development of localised networks within the Sites of Opportunity. The main objectives of the study are as follows:
Identify locations for heat and CHP networks within the Sites of Opportunity.
Development of business case for each network and determine viability for up to 4 nodal schemes within the Sites of Opportunity.
Production of development and delivery plans for viable networks in partnership with
developers to coincide with development timeframes whilst referring to relevant case studies around the UK.
Demonstrate the benefits of installing networks to developers.
Consider energy demand across the study area and assess the viability of connecting the
identified schemes; potential for future growth of the identified networks; and, viability for connection to a potential future strategic heat network.
Production of replicable models which can be applied to similar developments.
Generate energy mapping data to the wider study.

Cribbs Patchway New Neighbourhood
Heat Network Feasibility Study
3514199A-BEE CPNN DH Feasibility - FINAL - 10-05-16_v2 Prepared by WSP | Parsons Brinckerhoff Sept 2015 for South Gloucestershire Council - 11 -
2 PREVIOUS STUDY OUTCOMES
2.1 Potential for Renewable and Low Carbon Energy Supply in South Gloucestershire, 2010
Mainly identifies potential anchor loads and heat sources within the vicinity of the highlighted Sites of Opportunity, not extending to assessment of viability of heat networks serving these.
2.2 Renewable and Low Carbon Energy in the West of England
This report offers no new evidence or assessment of heat network viability simply reproducing the outcome of the Potential for Renewable and Low Carbon Energy Supply in South Gloucestershire report.
2.3 South Gloucestershire District Energy Study, Cofely Energy, December 2012
The nodal approach was originally proposed within the South Gloucestershire District Energy Study alongside proposing an overview of the potential options for heat networks serving the developments. Due to the lack of information regarding the proposed developments within the study area, the report was unable to provide detailed rationale for nodal heat networks to serve potential heat loads. The report concluded that: “… there is expected to be a range of property overall, but with substantial areas of low & medium density housing which will create a number of areas where DE would not be likely to be cost effective. However, a number of higher density mixed-use district and local centres and substantial commercial development is also proposed. In these areas DE could provide a cost effective solution for heating and hot water provision in the new dwellings and businesses providing a possible solution to meet current and future building regulations. The result, if widely adopted, would be to create a series of DE nodes across the new neighbourhoods, providing a consistent local approach.”
2.4 Multi-Utilities Sustainable Infrastructure Strategy (MUSIS), 2014
The MUSIS study proposes that a site wide heat network would not be considered viable and therefore local nodal heat networks should be considered. It provides no basis for this proposal, simply repeating it from the previous Cofely study.
The MUSIS report suggested that a heat network could only be viable if served from The Mall Cribbs Causeway. WSP | Parsons Brinckerhoff investigate this suggestion further within this study.

Cribbs Patchway New Neighbourhood
Heat Network Feasibility Study
3514199A-BEE CPNN DH Feasibility - FINAL - 10-05-16_v2 Prepared by WSP | Parsons Brinckerhoff Sept 2015 for South Gloucestershire Council - 12 -
3 STUDY AREAS
The feasibility study considers the potential for district heating and CHP within CPNN as a strategic growth area. The figure below shows the extent of the area identified in the specification for this study and highlights the two main Sites of Opportunity to be assessed with respect to the potential for developing heat networks.
© Crown copyright and database rights 2015 Ordnance Survey License Number 100023410
Figure 3-1: Extent of CPNN study, including Sites of Opportunity
A wider energy mapping and master planning exercise was carried out alongside this study, for the area shown in the following figure. It should be noted that detailed energy mapping is not conducted within this wider area however the energy mapping carried out for the Sites of Opportunity within CPNN is carried out in the context of a long term ambition to develop potential strategic heat networks to distribute heat from power generators at Avonmouth Severnside to South Gloucestershire’s urban fringes.
© Crown copyright and database rights 2015 Ordnance Survey License Number 100023410
Cribbs Patchway New Neighbourhood
Heat Network Feasibility Study
3514199A-BEE CPNN DH Feasibility - FINAL - 10-05-16_v2 Prepared by WSP | Parsons Brinckerhoff Sept 2015 for South Gloucestershire Council - 13 -
Figure 3-2: Extent of Avonmouth-Severnside Energy Mapping and Master planning study
4 HEAT DEMAND DEVELOPMENT AND PHASING
Heat demands within the study areas were identified through planning applications submitted by developers within the Sites of Opportunity and through a general energy mapping exercise. Table 11-1 and Table 11-2 in the Appendices present the documentation received from the Outline Planning Applications which have been used to gather relevant information for the heat mapping exercise. Benchmarking has been carried out according to CIBSE Guide F and TM46 benchmarks and discounted to account for fabric building improvements and implementation of energy efficiency measures where appropriate. The approach, assumptions and information on which the demands were based were shared with developers prior to heat mapping and no comments were received in response.
4.1 Assumptions
4.1.1 Residential Demands
Residential heat benchmarks were developed from SAP calculations for properties planned in 2012 by Taylor Wimpey and Persimmon homes and typical floor areas per property type. Property sizes were averaged based on whether detached, semi-detached, terraced or flats and the corresponding annual space heating and hot water demands were averaged from these. The estimated average space heating demand per unit area was determined for the different property types and was determined to be within +/- 10% of the space heating demands proposed for homes incorporating fabric efficiency improvements to comply with 2016 building regulations part L proposed at the time of the analysis (although these have subsequently been scrapped by the new government). Fabric Energy Efficiency Standards (FEES) defined by Zero Carbon Hub provided a reasonable indication of likely heat demands as it was probable (before being scrapped) that all dwellings would have to comply with this target from 2016. It is important to note that the actual energy demand may differ from these values depending on the fabric efficiency standards to which the buildings are designed. (in fact the demands may even be greater if future standards are less stringent on fabric energy efficiency). The following tables present the heat demand benchmark used for each property type and a comparison to the FEES values proposed at the time of the analysis for 2016. It should be noted that the hot water demands are strongly dependent on the number of occupants per property, as information on bedroom numbers was not provided within the outline planning applications for the CPNN area, an average hot water demand has been assumed based on an average occupancy per property type. Table 4-1: Residential property assumptions based on typical new build properties
Detached Semi-Detached Terraced Flat
Average footprint (sqm) 137 92 76 56
Average Bedrooms 4 3 3 2
Heat demands (kWh p.a.)
Space Heating 4,243 2,979 2,094 1,932
Hot Water 3,705 3,092 2,838 2,520
Total 7,948 6,071 4,932 4,452
4.1.2 Non-Residential Demands
Cribbs Patchway New Neighbourhood
Heat Network Feasibility Study
3514199A-BEE CPNN DH Feasibility - FINAL - 10-05-16_v2 Prepared by WSP | Parsons Brinckerhoff Sept 2015 for South Gloucestershire Council - 14 -
CIBSE TM 46 fossil fuel values were used to benchmark the heat demands of the non-residential properties assuming boiler efficiencies of 80%. The CIBSE values were discounted to account for compliance with changes to building regulations proposed at the time of the analysis, which stipulated that all non-domestic properties should be zero carbon by 2019. A 31% discount on stock average values has been applied for heating demands to account for fabric efficiency improvements, based on in-house calculations to establish the space heating demand reduction due to improved fabric measures required by progressive building regulations improvements. 4.1.3 Phasing Assumptions
The phasing of residential heat demands was based on the draft housing trajectory provided by SGC and an indication for when school construction would be triggered. Where more specific information was provided within the developer’s outline planning applications, this was incorporated into the phasing strategy.
4.2 Phased Heat Demands
Site specific energy demand assumptions for the BAe Filton and Deely Freed sites are provided within the Appendix in Section 11.1.
4.2.1 BAe Systems Filton Airfield
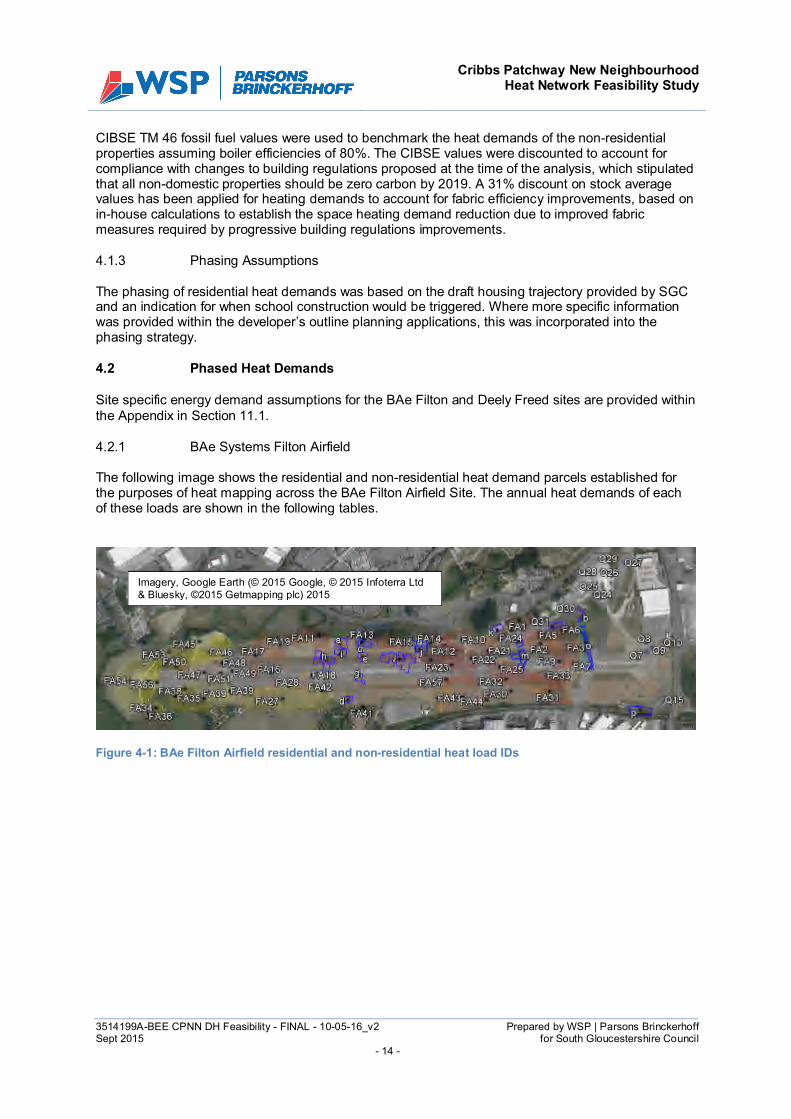
The following image shows the residential and non-residential heat demand parcels established for the purposes of heat mapping across the BAe Filton Airfield Site. The annual heat demands of each of these loads are shown in the following tables.
Figure 4-1: BAe Filton Airfield residential and non-residential heat load IDs
Imagery, Google Earth (© 2015 Google, © 2015 Infoterra Ltd & Bluesky, ©2015 Getmapping plc) 2015

Cribbs Patchway New Neighbourhood
Heat Network Feasibility Study
3514199A-BEE CPNN DH Feasibility - FINAL - 10-05-16_v2 Prepared by WSP | Parsons Brinckerhoff Sept 2015 for South Gloucestershire Council - 15 -
Table 4-2: Residential heat demands at full build out
Load ID Annual Heat Demand (kWh p.a.)
Load ID Annual Heat Demand (kWh p.a.)
FA1 105,560 FA30 342,470
FA2 273,698 FA31 460,230
FA3 514,504 FA32 255,378
FA4 108,117 FA33 300,548
FA5 143,215 FA34 101,986
FA6 113,705 FA35 843,683
FA7 82,621 FA36 22,970
FA8 83,764 FA37 33,222
FA9 116,362 FA38 31,961
FA10 320,105 FA39 44,077
FA11 322,811 FA40 387,345
FA12 152,109 FA41 179,540
FA13 102,797 FA42 82,233
FA14 192,794 FA43 144,648
FA15 333,049 FA44 183,514
FA16 161,085 FA45 89,884
FA17 244,851 FA46 651,502
FA18 342,470 FA47 27,370
FA19 600,163 FA48 1,508,102
FA20 43,172 FA49 17,708
FA21 161944 FA50 58,988
FA22 74,942 FA51 17,261
FA23 407,070 FA52 29,851
FA24 84,484 FA53 939,069
FA25 166,495 FA54 170,129
FA26 209,259 FA55 374,787
FA27 1,099,819 FA56 103,147
FA28 100,619 FA57 183,514
FA29 61,647
Residential heat demand phasing through time is shown in the graph below as a proportion of the full built out demand.

Cribbs Patchway New Neighbourhood
Heat Network Feasibility Study
3514199A-BEE CPNN DH Feasibility - FINAL - 10-05-16_v2 Prepared by WSP | Parsons Brinckerhoff Sept 2015 for South Gloucestershire Council - 16 -
Figure 4-2: Residential heat demand phasing through time
Table 4-3: Non-residential heat and electricity demands
Load ID Load Description Annual Heat Demand (kWh p.a.)
Annual Electricity Demand (kWh p.a.)
a retail supermarket 247,773 1,114,800
b retail/café/bar in employment hub building 64,716 211,500
c Mixed Use Centre 410,699 425,000
d Pub 158,785 104,000
e Library and community centre 236,847 120,000
f Secondary School 1,692,561 404,900
g Sports Hall (school and public use) 361,253 248,000
h West Primary School 99,046 466,053
i West Nursery School (72 places) 46,075 9,792
j Residential Extra Care Site 2,789,751 812,500
k Mixed use Shed 47,512 16,800
l East Nursery (72 places) 46,075 9,792
m East Primary School 310,702 66,031
n Hotel 674,802 399,000
o Live/work units 75,791 114,000
p Rail Halt site 284,217 427,500
Employment Area
q
Offices 4,573,605 6,879,310
Retail/Food/Drink 64,716 211,500
0%
10%
20%
30%
40%
50%
60%
70%
80%
90%
100%
Q1 Q3 Q1 Q3 Q1 Q3 Q1 Q3 Q1 Q3 Q1 Q3 Q1 Q3 Q1 Q3 Q1 Q3 Q1 Q3 Q1 Q3 Q1 Q3 Q1 Q3 Q1 Q3 Q1 Q3 Q1 Q3 Q1 Q3 Q1 Q3 Q1 Q3 Q1 Q3
2016 2017 2018 2019 2020 2021 2022 2023 2024 2025 2026 2027 2028 2029 2030 2031 2032 2033 2034 2035

Cribbs Patchway New Neighbourhood
Heat Network Feasibility Study
3514199A-BEE CPNN DH Feasibility - FINAL - 10-05-16_v2 Prepared by WSP | Parsons Brinckerhoff Sept 2015 for South Gloucestershire Council - 17 -
4.2.2 Deely Freed Site
The following image shows the residential and non-residential heat demand parcels within the Deely Freed site. The heat density of each of these loads is shown in the following tables.
Figure 4-3: Deely Freed residential and non-residential heat load IDs
Table 4-4: Residential heat demands at full build out
Load ID Annual Heat Demand (kWh p.a.)
Load ID Annual Heat Demand (kWh p.a.)
DF1 598,000 DF12 75,890
DF2 560,258 DF13 90,536
DF3 447,363 DF14 416,863
DF4 86,557 DF15 90,536
DF5 235,460 DF16 60,566
DF6 147,122 DF17 161,052
DF7 67,902 DF18 384,474
DF8 626,228 DF19 230,084
DF9 345,154 DF20 226,289
DF10 101,853 DF21 205,254
DF11 123,706
Residential heat demand phasing through time is shown in the graph below as a proportion of the full built out demand.
Imagery, Google Earth (© 2015 Google, © 2015 Infoterra Ltd & Bluesky, ©2015 Getmapping plc) 2015

Cribbs Patchway New Neighbourhood
Heat Network Feasibility Study
3514199A-BEE CPNN DH Feasibility - FINAL - 10-05-16_v2 Prepared by WSP | Parsons Brinckerhoff Sept 2015 for South Gloucestershire Council - 18 -
Figure 4-4: Residential heat demand phasing through time
Table 4-5: Non-residential heat and electricity demands
Load ID Load Description Annual Heat Demand (kWh p.a.)
Annual Electricity Demand (kWh p.a.)
r School/Nursery 361,978 76,928
s Local Convenience/ Retail 62,936 50,000
t1 GP/Dental Surgery
27,664 17,500
t2 27,664 17,500
u Food Store 116,189 200,000
v Community Centre 41,496 43,500
w Extra Care Home 1,434,729 385,714
Note: t1/t2 are a straight 50/50 split of the heat demands assessed for the site with dual use 4.2.3 Persimmon Homes Fishpool Hill
The following image shows the residential and non-residential heat demand parcels within the Persimmon Homes Fishpool Hill Site. The heat density of each of these loads is shown in the following tables.
0%
10%
20%
30%
40%
50%
60%
70%
80%
90%
100%
Q1 Q2 Q3 Q4 Q1 Q2 Q3 Q4 Q1 Q2 Q3 Q4 Q1 Q2 Q3 Q4 Q1 Q2 Q3 Q4 Q1 Q2 Q3 Q4 Q1 Q2 Q3 Q4 Q1 Q2 Q3 Q4
2016 2016 2017 2018 2019 2020 2021 2022 2023

Cribbs Patchway New Neighbourhood
Heat Network Feasibility Study
3514199A-BEE CPNN DH Feasibility - FINAL - 10-05-16_v2 Prepared by WSP | Parsons Brinckerhoff Sept 2015 for South Gloucestershire Council - 19 -
Figure 4-5: Persimmon Homes Fishpool Hill residential and non-residential heat load IDs
Table 4-6: Residential heat demands at full build out
Load ID Annual Heat Demand (kWh p.a.)
Load ID Annual Heat Demand (kWh p.a.)
P1 63,263 P15 275,357
P2 178,156 P16 82,758
P3 24,573 P17 233,872
P5 213,247 P18 164,550
P6 1,062,309 P19 256,500
P7 328,723 P20 200,441
P8 84,862 P21 161,140
P9 77,488 P22 629,159
P10 33,812 P23 629,613
P11 560,472 P24 158,930
P4 234,370 P25 63,978
P12 200,763 P26 38,151
P13 195,057 P27 84,190
P14 372,664 P28 80,861
Residential heat demand phasing through time is shown in the graph below as a proportion of the full built out demand.
Imagery, Google Earth (© 2015 Google, © 2015 Infoterra Ltd & Bluesky, ©2015 Getmapping plc) 2015

Cribbs Patchway New Neighbourhood
Heat Network Feasibility Study
3514199A-BEE CPNN DH Feasibility - FINAL - 10-05-16_v2 Prepared by WSP | Parsons Brinckerhoff Sept 2015 for South Gloucestershire Council - 20 -
Figure 4-6: Residential heat demand phasing through time
Table 4-7: Non-residential heat demands
Load ID Load Description Annual Heat Demand (kWh p.a.) Annual Electricity Demand (kWh p.a.)
x Primary School 302,796 64,351
4.2.4 The Mall
The heat demands of the proposed extension to The Mall were determined from the Energy Statement within the outline planning application documents. The current heat demands of the existing mall are based on the gas and electricity consumption data provided by The Mall and assume a gas boiler efficiency of 80%. The heat demands of The Mall are shown in the table below: Table 4-8: Heat and electricity demands for proposed extension and existing demands for The Mall
Load Type Class Annual Heat Demand (kWh p.a.)
Annual Electricity Demand (kWh p.a.)
Extension
Retail A1 3,133,829 2,467,500
Retail A2-A5 798,348 628,600
Leisure D1-D2 1,695,241 1,143,000
Hotel C1 834,623 493,500
Dwellings C3 1,461,779
Existing Demands
Existing Mall (2014-15) 663,604 2,872,279
Total 8,587,424 7,604,879
0%
10%
20%
30%
40%
50%
60%
70%
80%
90%
100%
Q1 Q2 Q3 Q4 Q1 Q2 Q3 Q4 Q1 Q2 Q3 Q4 Q1 Q2 Q3 Q4 Q1 Q2 Q3 Q4 Q1 Q2 Q3 Q4 Q1 Q2 Q3 Q4 Q1 Q2 Q3 Q4 Q1 Q2 Q3 Q4
2016 2016 2017 2018 2019 2020 2021 2022 2023 2024

Cribbs Patchway New Neighbourhood
Heat Network Feasibility Study
3514199A-BEE CPNN DH Feasibility - FINAL - 10-05-16_v2 Prepared by WSP | Parsons Brinckerhoff Sept 2015 for South Gloucestershire Council - 21 -
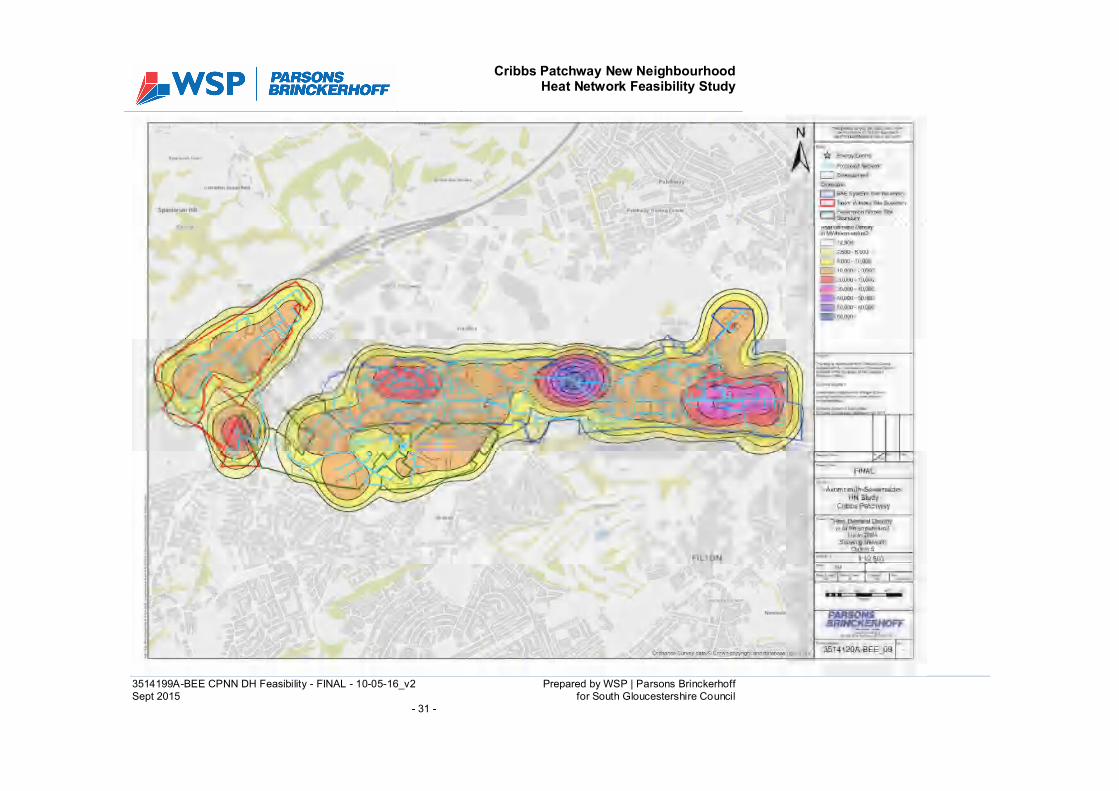
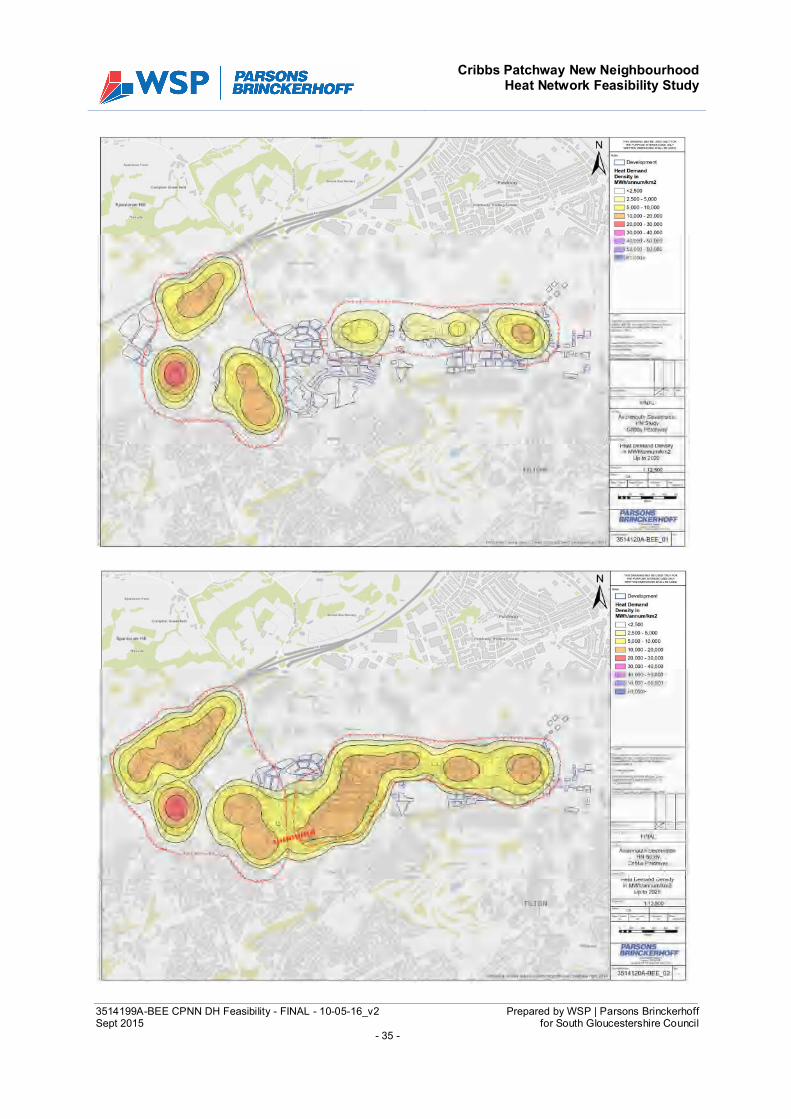
4.3 Heat Density Analysis
The heat densities for the different areas have been mapped for phasing in 5 year increments, the maps developed for each of the developments through time are shown in the following images. It should be noted that these figures do not include the heat demands represented by The Mall since data for this was received after the maps below were produced.

Cribbs Patchway New Neighbourhood
Heat Network Feasibility Study
3514199A-BEE CPNN DH Feasibility - FINAL - 10-05-16_v2 Prepared by WSP | Parsons Brinckerhoff Sept 2015 for South Gloucestershire Council - 22 -

Cribbs Patchway New Neighbourhood
Heat Network Feasibility Study
3514199A-BEE CPNN DH Feasibility - FINAL - 10-05-16_v2 Prepared by WSP | Parsons Brinckerhoff Sept 2015 for South Gloucestershire Council - 23 -

Cribbs Patchway New Neighbourhood
Heat Network Feasibility Study
3514199A-BEE CPNN DH Feasibility - FINAL - 10-05-16_v2 Prepared by WSP | Parsons Brinckerhoff Sept 2015 for South Gloucestershire Council - 24 -

Cribbs Patchway New Neighbourhood
Heat Network Feasibility Study
3514199A-BEE CPNN DH Feasibility - FINAL - 10-05-16_v2 Prepared by WSP | Parsons Brinckerhoff Sept 2015 for South Gloucestershire Council - 25 -

Cribbs Patchway New Neighbourhood
Heat Network Feasibility Study
3514199A-BEE CPNN DH Feasibility - FINAL - 10-05-16_v2 Prepared by WSP | Parsons Brinckerhoff Sept 2015 for South Gloucestershire Council - 26 -
5 ENERGY CLUSTER ANALYSIS
5.1 Introduction
The cluster analysis is intended to identify heat demand density clusters that may provide the opportunity for viable heat network developments, whilst also testing the previous assessment that nodal networks are the preferred approach for the Sites of Opportunity. This analysis uses the concept of linear heat density. Linear heat density is the total heat load divided by the total length of network required to connect up this load, or the length of pipe required per annual unit of heat demand served. This factor serves as a useful indicator of the likely viability of a heat network depending on the magnitude of heat loads connected. Selection of the scale and areas served by a network to be taken through to feasibility was informed by comparing the value for proposed networks, with that of networks that have been progressed and built.
WSP | Parsons Brinckerhoff has determined a reference value for linear heat density from previous experience of a similar scale, mixed use, housing and non-domestic development which has been built with district heat. The previous project undertaken by WSP | Parsons Brinckerhoff indicated a linear heat density for the first phase of 1,080 homes of 1.05 MWh pa/m. This phase of the scheme was almost exclusively housing with a small district centre comprising a primary school, community building and 4-5 retail units. It should be noted that this scheme received £3m grant funding via the Homes and Communities Agency for initial district heat infrastructure construction.
5.2 Assumptions and Methodology
WSP | Parsons Brinckerhoff has developed a GIS based tool which establishes the optimum initial outline network route to serve identified loads based on the road network layout. For CPNN, the road network was digitised from master plan maps provided as part of planning applications, overlaid on the existing road network. It should be noted whilst the tool provides a useful relative comparison, estimates of the network lengths tend to be conservative and slightly overestimated which can lead to underestimates of the linear heat density calculated.
To determine the linear heat density of a number of different network options, clusters of heat loads were tested, serving all loads within a heat density contour, for a range of contour values. Networks serving separate ‘hot spots’ identified in the heat mapping were tested in isolation and as part of larger networks serving plots and properties within lower heat density contours between the hotspots.
Identification of potential significant heat demands adjacent to the study boundary was within the scope of study for this project. Whilst data for The Mall Cribbs Causeway was available at the time of writing, insufficient data had been received as part of the data gathering exercise within the Avonmouth and Severnside study. As a result the study includes an assessment of the potential to serve the existing and future Mall’s developments’ heat and electricity demands but no consideration of other loads outside the boundary of the BAe, Deely Freed and Persimmon Homes development sites.
Energy demand data for The Mall has been included within the linear heat density analyses to indicate the benefit of establishing a connection to that site, but not shown on the heat mapping since the data was not available prior to the preparation of those maps.
5.3 Network Options
The different network options as optimised through the initial cluster analysis mapping are shown in light blue in the figures below, with the individual development site boundaries highlighted:

Cribbs Patchway New Neighbourhood
Heat Network Feasibility Study
3514199A-BEE CPNN DH Feasibility - FINAL - 10-05-16_v2 Prepared by WSP | Parsons Brinckerhoff Sept 2015 for South Gloucestershire Council - 27 -

Cribbs Patchway New Neighbourhood
Heat Network Feasibility Study
3514199A-BEE CPNN DH Feasibility - FINAL - 10-05-16_v2 Prepared by WSP | Parsons Brinckerhoff Sept 2015 for South Gloucestershire Council - 28 -

Cribbs Patchway New Neighbourhood
Heat Network Feasibility Study
3514199A-BEE CPNN DH Feasibility - FINAL - 10-05-16_v2 Prepared by WSP | Parsons Brinckerhoff Sept 2015 for South Gloucestershire Council - 29 -

Cribbs Patchway New Neighbourhood
Heat Network Feasibility Study
3514199A-BEE CPNN DH Feasibility - FINAL - 10-05-16_v2 Prepared by WSP | Parsons Brinckerhoff Sept 2015 for South Gloucestershire Council - 30 -
Cribbs Patchway New Neighbourhood
Heat Network Feasibility Study
3514199A-BEE CPNN DH Feasibility - FINAL - 10-05-16_v2 Prepared by WSP | Parsons Brinckerhoff Sept 2015 for South Gloucestershire Council - 31 -

Cribbs Patchway New Neighbourhood
Heat Network Feasibility Study
3514199A-BEE CPNN DH Feasibility - FINAL - 10-05-16_v2 Prepared by WSP | Parsons Brinckerhoff Sept 2015 for South Gloucestershire Council - 32 -

Cribbs Patchway New Neighbourhood
Heat Network Feasibility Study
3514199A-BEE CPNN DH Feasibility - FINAL - 10-05-16_v2 Prepared by WSP | Parsons Brinckerhoff Sept 2015 for South Gloucestershire Council - 33 -
5.4 Linear Heat Density Analysis Results
5.4.1 Network Options Linear Heat Density Analysis
An analysis was undertaken to determine the linear heat density at full build-out for the different network options shown in Section 5.3 above. Further network options were identified following this initial assessment.
The total lengths of network connecting to each block of residential properties and up to each non-domestic property was determined from the mapping. The total heat demand density of the connected loads within each of the network options at full build out in 2034 were used to determine the linear heat density on a MWh p.a./m basis.
Table 5-1: Linear heat densities, network lengths and heat densities at full build out for different network options
Network Option ID
Sites Included Linear Heat Density (MWh p.a./m)
Network Length (m)
Heat Demand at Full Build Out (kWh p.a.)
1 BAe High Density Cluster- West 7.37 722 5,320,497
2 BAe High Density Cluster- East 2.51 1,785 4,476,966
3 All BAe High Density & Fishpool Hill 1.55 21,940 34,084,195
4 All HD BAe Sites, Deely Freed and Fishpool Hill 1.51 26,883 40,681,275
5 All BAe Sites, Deely Freed and Fishpool Hill 1.46 30,097 43,966,770
6 All Deely Freed 1.56 4,655 7,238,197
From the table above, it is evident that all of the network options exceed the 1.05 MWh pa/m linear heat density reference value established from past project experience. Options 1,3,4&5 are all ‘supported’ by the significant concentration of heat loads within the area served by option 1.
Option 6 – the independent network for the entire Deely Freed site shows a higher linear heat density than all but Options 1&2.
5.4.2 Network Linear Heat Densities with Connections to The Mall
Existing heat loads for The Mall, Cribbs Causeway were supplied by the property management company and demands for the proposed extension taken from the outline energy strategy accompanying the application. These were located notionally on the map and network lengths to serve them estimated. These are not shown on the network maps above.
The linear heat densities of the networks, when The Mall heat demand is included, improve significantly for Network Option 1 and 2 and provide a modest improvement for Options 3, 4 and 5 as shown in the table below.
The linear heat density analysis and feasibility has not considered a connection to The Mall from an isolated Deely Freed network (Option 6) due to the significant distance between the centres of demands at these sites.

Cribbs Patchway New Neighbourhood
Heat Network Feasibility Study
3514199A-BEE CPNN DH Feasibility - FINAL - 10-05-16_v2 Prepared by WSP | Parsons Brinckerhoff Sept 2015 for South Gloucestershire Council - 34 -
Table 5-2: Linear heat densities, network lengths and heat densities at full build out for different network options INCLUDING a connection to The Mall
Network Option ID Linear Heat Density (MWh p.a./m)
Network Length (m) Heat Demand at Full Build Out (kWh p.a.)
1 13.22 1,052 13,907,921
2 3.89 3,390 13,181,587
3 1.92 22,270 42,788,815
4 1.81 27,213 49,385,895
5 1.73 30,427 52,671,390
The effect of adding a connection to The Mall in the case of the nodal schemes significantly improves the linear heat density of these networks since The Mall load is proportionately much more significant within these smaller networks. Whilst the addition also improves the linear heat density of the wider schemes, the increase in the overall heat demand is much smaller relatively. As a result a connection to The Mall would be highly recommended for the nodal schemes options 1 and 2 but also recommended for relatively modest improvements in heat demands to the others.
5.5 Priority Sites Recommendation
The linear heat density analysis shows that almost all the network options offer a linear heat density greater than the reference network which has been built, albeit that the reference network had significant grant funding.
It should also be noted that the network routes created for this analysis are indicative and generally overestimate the network length required, so the linear heat densities estimated for the CPNN network options are likely to be underestimates compared to the reference figure.
The phased build out of loads was referred back to, in the context of the clusters analysed under the linear heat density approach. This revealed two clearly separate areas of development and associated growth of load which made an obvious split for two separate networks to grow, eventually connecting as development expands across the sites.
Cribbs Patchway New Neighbourhood
Heat Network Feasibility Study
3514199A-BEE CPNN DH Feasibility - FINAL - 10-05-16_v2 Prepared by WSP | Parsons Brinckerhoff Sept 2015 for South Gloucestershire Council - 35 -

Cribbs Patchway New Neighbourhood
Heat Network Feasibility Study
3514199A-BEE CPNN DH Feasibility - FINAL - 10-05-16_v2 Prepared by WSP | Parsons Brinckerhoff Sept 2015 for South Gloucestershire Council - 36 -
A network which connects the option 1, and option 2 networks, and serves any load adjacent to the connecting pipe was also modelled as option 7 below:
A further network option, extending this approach to the third ‘hotspot’ within the BAe Filton site was also modelled as option 9:

Cribbs Patchway New Neighbourhood
Heat Network Feasibility Study
3514199A-BEE CPNN DH Feasibility - FINAL - 10-05-16_v2 Prepared by WSP | Parsons Brinckerhoff Sept 2015 for South Gloucestershire Council - 37 -
Finally, in order to comply with the brief, the Triangle site was modelled in isolation as option 8:

Cribbs Patchway New Neighbourhood
Heat Network Feasibility Study
3514199A-BEE CPNN DH Feasibility - FINAL - 10-05-16_v2 Prepared by WSP | Parsons Brinckerhoff Sept 2015 for South Gloucestershire Council - 38 -
Table 5-3: Linear heat density for all network options (no mall connections)
Network Option ID
Sites Included Linear Heat Density (MWh p.a./m)
Network Length (m)
Heat Demand at Full Build Out (kWh p.a.)
7 BAe High Density West and East 2.18 4,915 10,727,515
8 Deely Freed Triangle Site 4.84 442 2,139,950
9 BAe HD Three Cluster Option 2.00 7,959 15,930,867
Options considered for further analysis include the high density BAe site option (Network Option 7), with and without a connection to The Mall. This option has the highest linear heat density after the single high density cluster BAe options in the east and west of the development (Network Options 1 and 2).
The Deely Freed only network (Option 6) was recommended to be taken forward for further modelling. According to the results of the linear heat density analysis this has the next best linear heat density value after the BAe High Density network options. No networks which included the Fishpool Hill site were taken forward due to concerns over the lack of engagement of the developer.
Although this initial screening provided a high-level assessment of the potential based on rough estimates of possible network routes, it was determined that of these options, the BAe High Density Site Network options had the highest heat demand density followed by the Deely Freed network. Although the option of an “all density” BAe network was not assessed at this stage it can be inferred that the linear density would likely lie between these two options due to the relatively sparsely distributed heat demands within the Fishpool Hill site and the relative distance to the Deely Freed site included within the all site network option. Accordingly a network option which includes all BAe loads with and without a connection to The Mall was taken forward to the techno-economic modelling.

Cribbs Patchway New Neighbourhood
Heat Network Feasibility Study
3514199A-BEE CPNN DH Feasibility - FINAL - 10-05-16_v2 Prepared by WSP | Parsons Brinckerhoff Sept 2015 for South Gloucestershire Council - 39 -
6 NETWORK ROUTE ASSESSMENT AND DESIGN
6.1 Introduction
Following the identification of different potential schemes within the previous section, possible heat mains routes and energy centre locations are considered. Potential heat mains route options discussed within this section are considered in relation to constraints such as utilities, services and practical considerations whilst attempting to minimise pipe lengths to reduce capital costs associated with the network and reduce heat losses through the network. When considering network routes within the Sites for Opportunity it has been assumed that, as brownfield sites, these would be substantially cleared prior to development. Routes of proposed transport and/or utilities infrastructure provided within development master plans have been used to propose potential network routing options where district heating would be viable assuming that network infrastructure would be installed in advance of roads and pathways as part of the conventional utility infrastructure. Indicative heat mains routes have been used to determine the length and diameters of pipework required to serve priority cluster sites and develop an estimate of network installation costs. Pipe sizing has been carried out using in-house, specialist hydraulic analysis software which has been specifically developed for multi connection residential district heating network design. The software optimises pipe sizes to balance the capital cost of the pipe against the whole life operating cost. Whole life costs for each of the proposed routes are compared for the different route options to indicate the preferred route in terms of economic viability. It should be noted that as the information provided is currently at master plan level for outline application, WSP | Parsons Brinckerhoff has used detailed network designs which were prepared for other developments as a proxy for the residential development at CPNN. Estimated heat losses have been included within the energy modelling, the results of which are presented in Section 7. The capital cost estimate associated with the network and anticipated operating costs have been included within the economic modelling which is presented in Section 8.
6.2 Energy Centre Locations
Energy centre locations in urban extensions are influenced by three key considerations
Proximity to the centre of demand density. Proximity to potential anchor loads to the site. Location relative to non-residential uses (e.g. adjacent to education campus/within
employment uses).
Within proposed developments, the value of land used as intended in the master plan (although any ESCo would have to acquire or lease the site) and attitude of the developer are also key to determining a suitable energy centre location. WSP | Parsons Brinckerhoff has identified the following energy centre locations initially within a desktop study.
The benefits and drawbacks of each of the options are presented in this section which was shared with developers. Whilst not representing a commitment to these sites, the feedback received on these locations was that they were sensible and presented no major issues.

Cribbs Patchway New Neighbourhood
Heat Network Feasibility Study
3514199A-BEE CPNN DH Feasibility - FINAL - 10-05-16_v2 Prepared by WSP | Parsons Brinckerhoff Sept 2015 for South Gloucestershire Council - 40 -
Energy centre locations as identified to serve the loads included within the different network options are presented in the figure below. Table 6-1 Energy Centre Locations
Network Option Energy Centre Location Rationale
BAe High Density Option
EC1
within supermarket site (a)
Sited near Merlin Road for ease of vehicular access during installation phase and post completion access for fuel deliveries, for biomass fuelled plants, and maintenance activities.
Located in close proximity to potential consumers of electricity generated, in the case of CHP plant therefore reducing private wire capital costs.
All BAe Sites (low-high density)
Final built out network for all sites proposed to be served from the same energy centre location as that serving the high density BAe site for the reasons mentioned above.
Initial temporary energy centre is proposed to be sited at location 2 serving the Deely Freed site due to site phasing and anticipated demand build out.
Deely Freed Site EC2
North of care home (w).
Accessible from Cribbs Causeway and Wyke Beck Road. Ease of vehicular access during installation phase and post completion access for fuel deliveries, for biomass fuelled plants, and maintenance activities.
Sufficient space available to site a plant of sufficient capacity to serve the heat demands of the scheme.
Mall Connections EC3
South west of The Mall.
Sited adjacent to Merlin Road on the Cribbs Causeway Mall site at the South Western extreme of the car park.
Ease of vehicular access for site installation and post completion access for fuel deliveries, for biomass fuelled plants and maintenance activities.
Connection between existing and proposed mall extensions and the BAe site and Deely Freed site possibility to be facilitated through service ducts within the road bridge proposed within the outline planning application for the mall extension.
Location in close proximity to the most significant potential electricity customers within both the BAe High Density and All Sites networks. For the CHP options, this could reduce the capital costs associated with installation of private wire where suitable.

Cribbs Patchway New Neighbourhood
Heat Network Feasibility Study
3514199A-BEE CPNN DH Feasibility - FINAL - 10-05-16_v2 Prepared by WSP | Parsons Brinckerhoff Sept 2015 for South Gloucestershire Council - 41 -
Figure 6-1 proposed energy centre locations
Cribbs Patchway New Neighbourhood
Heat Network Feasibility Study
3514199A-BEE CPNN DH Feasibility - FINAL - 10-05-16_v2 Prepared by WSP | Parsons Brinckerhoff Sept 2015 for South Gloucestershire Council - 42 -
6.3 Proposed Network Designs
WSP | Parsons Brinckerhoff has undertaken analyses for the different priority network options and the pipe schedules and proposed layouts for the different networks are shown in the following sections. District heating mains routes proposed to serve the prioritised clusters selected within Section 5.5 from the energy centre locations proposed within Section 6.2 are presented below.
Pipe sizes have been calculated based on 85ºC flow/45ºC return temperature operation. The cost of individual dwelling connections has been assumed based on an average trench length per dwelling based on experience from previous projects. It is assumed that a reduction in the costs would apply for these pipe lengths as these would be primary “soft-dig” with associated lower civils costs. The capital costs of pre-insulated steel pipework are also included which would have a service life of 40+ years. The network cost estimates are based on benchmark prices from leading contractors and previous tenders.
It has been assumed that individual dwelling connection pipework is comprised of pipe sizes ranging from 25-50mm depending on the heat demand peak which is related to the size and number of properties connecting from a single branch. As the exact distribution of properties within the parcels within each development site is not yet known and the network design provides only a nominal indication, an equal distribution between the pipe sizes has been assumed for all development sites. The average heat loss per length of pipework connection has been weighted based on an equal distribution of the different sizes, as has the capital costs associated with these pipework lengths.

Cribbs Patchway New Neighbourhood
Heat Network Feasibility Study
3514199A-BEE CPNN DH Feasibility - FINAL - 10-05-16_v2 Prepared by WSP | Parsons Brinckerhoff Sept 2015 for South Gloucestershire Council - 43 -
6.3.1 Network Option 1
A proposed network route designed on the basis of the energy centre location, identified in the previous section, is shown in the following figure for the BAe High Density network including and excluding connection to The Mall Cribbs Causeway. The DH pipework schedule for the main spine network is presented in the table below. Indicative heat losses and full, installed capital costs associated with the network are also presented for this option (including pipe cost, installation and civil works to trench and backfill). The total length of pipework to connect individual dwellings has been estimated and is included in the table below. Table 6-2: District heating pipework schedule and cost1
Pipe Diameter Nominal
(mm)
Unit BAe High Density
No Mall Connection Mall Connection
Main Spine Network
25 m 73 73
32 m 240 206
40 m 274 336
50 m 387 462
65 m 656 764
80 m 400 398
100 m 464 890
125 m 121 335
150 m 283 417
200 m 1,061 973
250 m 124 356
Total Main Spine Length m 4,082 5,209
Main Spine CAPEX £1,839,129 £2,391,963
1 Pipe schedule based on supplying consumers peak requirements.

Cribbs Patchway New Neighbourhood
Heat Network Feasibility Study
3514199A-BEE CPNN DH Feasibility - FINAL - 10-05-16_v2 Prepared by WSP | Parsons Brinckerhoff Sept 2015 for South Gloucestershire Council - 44 -

Cribbs Patchway New Neighbourhood
Heat Network Feasibility Study
3514199A-BEE CPNN DH Feasibility - FINAL - 10-05-16_v2 Prepared by WSP | Parsons Brinckerhoff Sept 2015 for South Gloucestershire Council - 45 -

Cribbs Patchway New Neighbourhood
Heat Network Feasibility Study
3514199A-BEE CPNN DH Feasibility - FINAL - 10-05-16_v2 Prepared by WSP | Parsons Brinckerhoff Sept 2015 for South Gloucestershire Council - 46 -
6.3.2 Network Option 2
A proposed network route designed on the basis of the energy centre location, identified in the previous section, is shown in the following figure for the Deely Freed network. The DH pipework schedule for the main spine network is presented in the table below. Indicative heat losses and full installed capital costs associated with the network are also presented for this option (including pipe cost, installation and civil works to trench and backfill). The total length of pipework to connect individual dwellings has been estimated and is included in the table below. Table 6-3: District heating pipework schedule and cost2
Pipe Diameter Nominal
(mm)
Unit Deely Freed
25 m 100
32 m 20
40 m 221
50 m 318
65 m 505
80 m 175
100 m 1,055
125 m 302
150 m 4
200 m 11
Total Main Spine Length m 2,711
Main Spine CAPEX £1,104,486
2 Pipe schedule based on supplying consumers peak requirements.

Cribbs Patchway New Neighbourhood
Heat Network Feasibility Study
3514199A-BEE CPNN DH Feasibility - FINAL - 10-05-16_v2 Prepared by WSP | Parsons Brinckerhoff Sept 2015 for South Gloucestershire Council - 47 -

Cribbs Patchway New Neighbourhood
Heat Network Feasibility Study
3514199A-BEE CPNN DH Feasibility - FINAL - 10-05-16_v2 Prepared by WSP | Parsons Brinckerhoff Sept 2015 for South Gloucestershire Council - 48 -
6.3.3 Network Option 3
A proposed network route designed on the basis of the energy centre location, identified in the previous section, is shown in the following figure connecting all BAe sites within a combined network including and excluding connection to The Mall Cribbs Causeway. The DH pipework schedule for the main spine network is presented in the table below. Indicative heat losses and full installed capital costs associated with the network are also presented for this option(including pipe cost, installation and civil works to trench and backfill). The total length of pipework to connect individual dwellings has been estimated and is included in the table below. Table 6-4: District Heating Pipework Schedule and Cost3
Pipe Diameter Nominal
(mm)
Unit All BAe Sites
No mall connection With mall connection
25 m 268 277
32 m 462 462
40 m 711 711
50 m 853 853
65 m 1,286 1303
80 m 487 487
100 m 1,174 1251
125 m 429 962
150 m 613 618
200 m 1,239 1465
250 m 764 484
300 m 274
Total Main Spine Length m 8,295 9,147
Main Spine CAPEX £3,744,125 £4,180,612
3 Pipe schedule based on supplying consumers peak requirements.

Cribbs Patchway New Neighbourhood
Heat Network Feasibility Study
3514199A-BEE CPNN DH Feasibility - FINAL - 10-05-16_v2 Prepared by WSP | Parsons Brinckerhoff Sept 2015 for South Gloucestershire Council - 49 -
15

Cribbs Patchway New Neighbourhood
Heat Network Feasibility Study
3514199A-BEE CPNN DH Feasibility - FINAL - 10-05-16_v2 Prepared by WSP | Parsons Brinckerhoff Sept 2015 for South Gloucestershire Council - 50 -

Cribbs Patchway New Neighbourhood
Heat Network Feasibility Study
3514199A-BEE CPNN DH Feasibility - FINAL - 10-05-16_v2 Prepared by WSP | Parsons Brinckerhoff Sept 2015 for South Gloucestershire Council - 51 -
7 ENERGY MODELLING
7.1 Introduction
The potential to utilise geothermal resource has been reviewed in a separate report4 with the conclusion that there is no viable resource available. Gas CHP and biomass boiler options were modelled using in-house modelling software to assess the technical performance of a range of different boiler and CHP engine sizes against the full built out heat demands of each of the networks proposed within the previous sections. The total heat demands of the networks were presented in Section 4. The total residential and non-residential heat and electrical demands for each of the network options are presented in the table below including heat losses for the distribution pipework as determined by the pipe sizing modelling exercise discussed in the previous section. Table 7-1: Annual heat demands for different network options
Annual Heat Demand (kWhth p.a.)
All BAe Sites BAe High Density Deely Freed
No mall connection
With mall connection
No mall connection
With mall connection
Residential 14,166,499 14,834,301 4,972,730 5,640,532 5,281,148
Non-Residential 12,081,616 19,207,261 10,238,581 17,364,227 2,072,655
Sub-total 26,248,115 34,041,563 15,211,312 23,004,759 7,353,803
Network Heat Losses 4,621,171 4,838,028 1,019,100 1,259,278 2,021,553
Total 30,869,286 38,879,590 16,230,412 24,264,038 9,375,356
Table 7-2: Annual electrical demands for different network options
Annual Electrical Demand (kWhe p.a.)
All BAe Sites BAe High Density Deely Freed
No mall connection
With mall connection
No mall connection
With mall connection
Potential Private Wire Connection Demand
N/A 7,604,879 N/A 7,604,879 N/A
Total Non-Residential 12,040,491 19,645,370 9,390,245 16,995,124 791,142
The private wire connection demand includes a forecast of demand for the proposed Mall extension
7.2 Assumptions
Within the modelling, the gas CHP engines and biomass boilers have been considered to be the principal energy generation source and assessed with respect to their ability to meet the baseline energy demand of the network. As mentioned above, the initial plant modelling was carried out to determine the suitable total plant capacities to meet the built out demands of the different network options.
4 Cribbs Patchway Heat Network Feasibility Study – Geothermal Options Assessment – May 2015

Cribbs Patchway New Neighbourhood
Heat Network Feasibility Study
3514199A-BEE CPNN DH Feasibility - FINAL - 10-05-16_v2 Prepared by WSP | Parsons Brinckerhoff Sept 2015 for South Gloucestershire Council - 52 -
All options were modelled assuming that back-up and top-up heat capacity would be provided by gas boilers. Provision for thermal storage was included within the technical modelling to provide back-end protection for the biomass boilers and improve annual heat demand by allowing a greater proportion of low load and peak demand to be met by the principal heat generation plant. Thermal stores are charged by a surplus of thermal energy generation and discharge heat as required by the network. Assumptions used within the modelling for both technologies are presented in the table below- Table 7-3: Technical assumptions for CHP and biomass boiler technical modelling
CHP Biomass Boilers
Thermal Efficiency 35-40%* 85% *dependent on engine size
Electrical Efficiency 35-40%* n/a
Turndown 50% 30% [minimum part load operation]
Thermal Storage 100l/kWth 50l/kWth
Operating Hours 17h/day 24h/day
Annual Plant Availability 92.1%
7.3 Gas CHP Plant Modelling Results
7.3.1 Fully Built Out Network Demands
A range of gas CHP engines were modelled to serve the heat demand of the networks. Gas CHP technical modelling was conducted on the basis that the gas CHP unit operates when there is demand for heat and that the electricity produced is consumed by the private wire consumer and residual electricity is exported to the grid. The effect of this approach is that the unit will not run if there is not a demand for heat. Gas CHP engines would normally be operated to ensure that the power can be generated relatively consistently and reduce the frequency of engine start-ups therefore reducing stress on the engine. Gas CHP size selections are influenced by the relatively limited modulation capability. Typically gas CHP engines only modulate to 50% of the rated output capacity and therefore they operate within a relatively narrow output range. As a result, there tends to be a greater utilisation of top-up/back-up gas boilers within CHP plants compared to biomass boiler based systems. As indicated in the table of assumptions presented in the previous section, the performance of gas CHP engine operation for 17 hours/day was assessed (07:00-00:00). This period responds to daytime electricity prices where the value of electricity is higher, as well as corresponding with the period during which more significant electricity demands typically occur. Results for the technical modelling of the gas CHP options for each of the network options are shown in the following tables. It should be noted that for all gas CHP options modelled within initial plant sizing, dual identical gas CHP engines were assumed for all plants with a total low carbon plant capacity exceeding 1MW. This approach was taken to increase operation of the gas CHP engine plant by reducing the effect of the relatively limited modulation ability of CHP engines, particularly within the MW scale. This also provides the opportunity to introduce main plant in a phased approach as the demand increases (as development is completed).

Cribbs Patchway New Neighbourhood
Heat Network Feasibility Study
3514199A-BEE CPNN DH Feasibility - FINAL - 10-05-16_v2 Prepared by WSP | Parsons Brinckerhoff Sept 2015 for South Gloucestershire Council - 53 -
Table 7-4: All BAe Sites with Mall connection- gas CHP engine sizing
CHP Engine 1 Capacity MWth 2 2.5 3 3.5
MWe 2.05 2.5 3.1 3.6
CHP Engine 2 Capacity MWth 2 2.5 3 3.5
MWe 2.05 2.5 3.1 3.6
Modelling Summary
Operating Hours- CHP Engine 1 Hours 5,694 5,661 5,649 5,614
Operating Hours- CHP Engine 2 Hours 5,091 4,655 4,037 3,598
Network Heat Load met by Gas CHP
kWhth 21,250,312 25,038,041 28,120,621 30,515,633
% 55% 64% 72% 78%
Private Wire Electricity Demand met by Gas CHP
kWhe 6,267,552 6,254,384 6,246,040 6,227,890
% 82% 82% 82% 82%
Carbon Emissions kgCO2e tCO2e
BAU
Gas Heating 0.18366 8,600
Electricity Import 0.517 3,932
Gas CHP 1
0.18366
5,348 6,581 7,775 8,747
Gas CHP 2 4,656 5,206 5,463 5,619
Top-up Gas Boilers 3,898 3,060 2,378 1,849
Electricity Import 0.517 691 698 703 712
Electricity Export 0.529 - 8,214 - 10,276 - 11,796 - 13,262
Electricity Generated and Used on Site
0.012 - 75 - 75 - 75 - 75
Net CO2 emissions, gas CHP 6,304 5,194 4,448 3,590
% Reduction 50% 59% 65% 71%
Based on the energy modelling results summarised in the table above, the two 2.5MW gas CHP plant configuration was considered to be the optimal size to serve all of the BAe loads within a network including a connection to The Mall. This plant capacity could supply 82% of the electricity demands of The Mall should a private wire connection be judged viable and would meet 64% of the built out heat demand from the gas CHP plant. Whilst the dual 3MW and dual 3.5MW gas CHP options would generate heat sufficient to meet between 72 and 78% of network heat demand from the gas CHP plant, the annual operating hours of the second engines are considered to be unreasonably low at the full built out heat demand. Conversely whilst the combined 4MW plant would operate almost continuously throughout the annual availability of the plant, the reduction in the proportion of heat met by gas CHP compared to the 5MW plant would be unlikely to justify the lower capital costs associated with the smaller engines.

Cribbs Patchway New Neighbourhood
Heat Network Feasibility Study
3514199A-BEE CPNN DH Feasibility - FINAL - 10-05-16_v2 Prepared by WSP | Parsons Brinckerhoff Sept 2015 for South Gloucestershire Council - 54 -
At the parameters modelled, the 5MW gas CHP plant would be capable of meeting a significant proportion of the heat and electrical demands of network connected loads from gas CHP with the potential to deliver 59% of carbon emissions reduction compared to a BAU scenario in which it is assumed that all heat demands would be met by gas boilers and electricity demands met by importing from the grid. Option without the mall connection It was determined that the 4MW gas CHP plant comprising of two 2MW CHP engines would be most suitable to meet the demands of the scheme. A lower total energy centre capacity was found to be most suitable for this network option due to the reduction in revenue arising from the lower heat sales and lack of private wire electricity consumers. It was assumed that all electricity generated by CHP would be exported to grid, which commands a lower unit sales price compared to private wire electricity sale. A dual 2MW gas CHP energy centre would meet 66% of connected consumers’ heat demand from gas CHP and be capable of delivering 71% of carbon emissions reductions when compared to the BAU gas heating scenario. Table 7-5: BAe High Density Sites with Mall connection- gas CHP engine sizing
CHP Engine 1 Capacity MWth 1 1.5 2 2.5
MWe 1.02 1.54 2.05 2.56
CHP Engine 2 Capacity MWth 1 1.5 2 2.5
MWe 1.02 1.54 2.05 2.56
Modelling Summary
Operating Hours- CHP Engine 1 Hours 5,677 5,644 5,355 4,810
Operating Hours- CHP Engine 2 Hours 5,166 4,431 3,804 3,377
Network Heat Load met by Gas CHP
kWhth 10,723,471 14,581,217 17,395,576 19,370,553
% 44% 59% 71% 79%
Private Wire Electricity Demand met by Gas CHP
kWhe 6,067,670 6,228,194 6,093,652 5,714,862
% 80% 82% 80% 75%
Carbon Emissions kgCO2e tCO2e
BAU Gas Heating 0.18366 5,430
Electricity Import
0.517 3,932
Gas CHP 1
0.18366
2,665 3,874 4,797 5,418
Gas CHP 2 2,384 2,990 3,393 3,701
Top-up Gas Boilers 3,057 2,203 1,581 1,144
Electricity Import 0.517 795 712 781 977
Electricity Export 0.529 - 2,608 - 4,617 - 6,117 - 7,487
Electricity Generated and Used on Site
0.012 - 73 - 75 - 73 - 69
Net CO2 emissions, gas CHP 6,219 5,088 4,361 3,685

Cribbs Patchway New Neighbourhood
Heat Network Feasibility Study
3514199A-BEE CPNN DH Feasibility - FINAL - 10-05-16_v2 Prepared by WSP | Parsons Brinckerhoff Sept 2015 for South Gloucestershire Council - 55 -
% Reduction 34% 46% 53% 61%
The dual 1.5MW gas CHP engine configuration is considered most suitable to meet the heat demands of the network connecting the BAe high density sites with The Mall. This plant would be capable of meeting just under 60% of the total network heat demand and 82% of The Mall electrical demands should it be judged feasible to serve the electrical demands with private wire. There is potential for this scheme to nearly halve the carbon emissions associated with gas heating and grid imported electricity. Option without the mall connection A smaller capacity gas CHP plant would be recommended due to the reduced heat demand of the network when the relatively significant proportion of overall heat demand that The Mall represents is removed as a connection opportunity. Although the proportion of network heat demand which could be met by gas CHP would increase by approximately 10%, the annual operating hours of the 3MW plant would reduce by over 1,000 hours. In this case the dual 1MW gas CHP engine option is considered most suitable as it could meet nearly 62% of network heat demand from the gas CHP plant, operate for an average of 90% of total annual availability and provide carbon emissions savings of 80% compared to equivalent heating by gas boilers only and grid electricity import. Table 7-6: Deely Freed network option- gas CHP engine sizing
CHP Engine 1 Capacity MWth 0.5 0.75 1 1.25
MWe 0.51 0.77 1.03 1.28
Modelling Summary
Operating Hours- CHP Engine 1 Hours 5,712 5,712 5,651 5,253
Network Heat Load met by Gas CHP
kWhth 2,855,583 4,275,371 5,498,477 6,240,740
% 30% 46% 59% 67%
Carbon Emissions kgCO2e tCO2e
BAU-Gas Heating
0.18366
2,074
Gas CHP 1,344 2,013 2,589 2,938
Top-up Gas Boilers 1,442 1,128 857 693
Electricity Export 0.529 - 1,549 - 2,320 - 2,983 - 3,386
Net CO2 emissions, gas CHP 1,237 821 462 245
% Reduction 40% 60% 78% 88%
From the results of the energy modelling, the 1MW gas CHP plant is considered to be the most suitable to serve the Deely Freed network on the basis of the proportion of heat demand which could be met by low carbon plant, annual operating hours and the potential for carbon emissions reductions compared to a scenario of gas heating only. Although the larger gas CHP engine modelled would meet a higher proportion of heat demand from the low carbon plant and has higher associated potential carbon emissions reductions, as a single CHP unit has been modelled, it has to be considered that whilst the operating hours are reasonable for the fully built out scheme, this would not be the case throughout the operating lifetime of the plant as heat loads are phased in over time.

Cribbs Patchway New Neighbourhood
Heat Network Feasibility Study
3514199A-BEE CPNN DH Feasibility - FINAL - 10-05-16_v2 Prepared by WSP | Parsons Brinckerhoff Sept 2015 for South Gloucestershire Council - 56 -
The 1MW option is considered to provide reasonable operation from the year of incorporation into the energy centre. Further discussion on the phasing of primary plant items is provided within the financial modelling assumptions detailed in Section 13.2 within the Appendix. 7.3.2 Technical Performance against Demand Phasing
The technical performance of the different plant options selected in the previous section is shown relative to the phasing of heat demands within each of the networks. The following figures provide a summary of the performance of the selected gas CHP engine plant capacities for each network option through time with regards to the proportion of heat demand met by the biomass boiler plants, the potential carbon emissions savings potential compared to gas heating. The annual heat output from the gas CHP engines and back-up gas boilers is also provided. From the figures, the years in which the gas CHP engines are introduced within the energy centres for the different network options are evident. It was considered that it would be most suitable for the gas CHP engines to be brought on line where the total network heat demand reached a point at which they would be capable of operating for a reasonable number of annual operating hours.
Figure 7-1: All BAe Sites with Mall connection network option- two 2.5MW CHP engines
0%
10%
20%
30%
40%
50%
60%
70%
80%
90%
0
5,000,000
10,000,000
15,000,000
20,000,000
25,000,000
30,000,000
35,000,000
40,000,000
45,000,000
2016 2021 2026 2031 2036 2041 2046
He
at D
em
an
d (
kW
h p
.a.)
Year
CHP Engine 1 CHP Engine 2 Top-Up Gas Boilers % Carbon Emissions Reductions % Heat Demand met by CHP % Electricity Demand met by CHP

Cribbs Patchway New Neighbourhood
Heat Network Feasibility Study
3514199A-BEE CPNN DH Feasibility - FINAL - 10-05-16_v2 Prepared by WSP | Parsons Brinckerhoff Sept 2015 for South Gloucestershire Council - 57 -
Figure 7-2: All BAe Sites with Mall connection network option- two 2MW CHP engines
Figure 7-3: BAe High Density sites with Mall connection network option- two 1.5MW CHP engines
0%
10%
20%
30%
40%
50%
60%
70%
80%
90%
100%
0
5,000,000
10,000,000
15,000,000
20,000,000
25,000,000
30,000,000
35,000,000
2016 2021 2026 2031 2036 2041 2046
He
at D
eman
d (
kWh
p.a
.)
Year
CHP Engine 1 CHP Engine 2 Top-Up Gas Boilers % Carbon Emissions Reductions % Heat Demand met by CHP
0%
10%
20%
30%
40%
50%
60%
70%
80%
90%
0
5,000,000
10,000,000
15,000,000
20,000,000
25,000,000
30,000,000
2016 2021 2026 2031 2036 2041 2046
Hea
t D
em
and
(kW
h p
.a.)
Year
CHP Engine 1 CHP Engine 2 Top-Up Gas Boilers % Carbon Emissions Reductions % Heat Demand met by CHP % Electricity Demand met by CHP

Cribbs Patchway New Neighbourhood
Heat Network Feasibility Study
3514199A-BEE CPNN DH Feasibility - FINAL - 10-05-16_v2 Prepared by WSP | Parsons Brinckerhoff Sept 2015 for South Gloucestershire Council - 58 -
Figure 7-4: BAe High Density sites network option - two 1MW CHP engines
Figure 7-5: Deely Freed site network option- 1MW CHP engine
0%
10%
20%
30%
40%
50%
60%
70%
80%
90%
0
2,000,000
4,000,000
6,000,000
8,000,000
10,000,000
12,000,000
14,000,000
16,000,000
18,000,000
20,000,000
2016 2021 2026 2031 2036 2041 2046
Hea
t D
eman
d (
kWh
p.a
.)
Year
CHP Engine 1 CHP Engine 2 Top-Up Gas Boilers % Carbon Emissions Reductions % Heat Demand met by CHP
0%
10%
20%
30%
40%
50%
60%
70%
80%
90%
100%
0
1,000,000
2,000,000
3,000,000
4,000,000
5,000,000
6,000,000
7,000,000
8,000,000
9,000,000
10,000,000
2016 2021 2026 2031 2036 2041 2046
He
at D
em
and
(kW
h p
.a.)
YearCHP Engine 1 Top-Up Gas Boilers % Carbon Emissions Reductions % Heat Demand met by CHP

Cribbs Patchway New Neighbourhood
Heat Network Feasibility Study
3514199A-BEE CPNN DH Feasibility - FINAL - 10-05-16_v2 Prepared by WSP | Parsons Brinckerhoff Sept 2015 for South Gloucestershire Council - 59 -
7.4 Biomass Boiler Plant Modelling Results
7.4.1 Fully Built Out Network Demands
A range of biomass boilers sizes were modelled to serve the heat demand of the different network options selected for techno-economic modelling and feasibility assessment in Section 8. The following tables summarise the results of the technical modelling of biomass boiler options to size plant suitable for the different identified networks. Table 7-7: All BAe Sites with Mall connection- biomass boiler sizing
Biomass Boiler 1 MWth 2 2.5 3 3.5
Biomass Boiler 2 MWth 2 2.5 3 3.5
Modelling Summary
Operating Hours-Biomass Boiler 1 Hours 7,962 7,596 6,872 6,387
Operating Hours-Biomass Boiler 2 5,183 4,694 4,659 4,356
Network Load met by Biomass kWhth 24,587,599 27,881,599 30,234,798 31,773,002
% 63% 72% 78% 82%
Carbon Emissions kgCO2/kWh
BAU-Gas Heating 0.18366 8,600
Biomass Boiler 1 0.039
689 787 823 863
Biomass Boiler 2 439 492 565 595
Top-up Gas Boilers 0.18366 3,161 2,432 1,911 1,572
Total CO2 emissions, biomass 4,289 3,711 3,299 3,030
% Reduction 50% 57% 62% 65%
The results show that for the all BAe loads network option with a connection to the Mall Cribbs Causeway the most suitable biomass boiler plant capacity would be the 5MW plant comprised of two 2.5MW boilers and could meet 72% of the network heat demand from the biomass plant. Whilst the 6MW and 7MW biomass boiler plants would meet a greater proportion of heat demand than that achieved by the 5MW plant, this capacity would provide a significant proportion of low carbon heat while ensuring that the boiler could operate for a reasonable number of hours per year. At full built out heat demand, the plant could provide carbon emissions reductions of just under 60% compared to the BAU scenario of gas heating only to meet the network heat demands. In the network option where there is no connection to The Mall, the 5MW plant would operate for 500 hours fewer per annum however there would be an 8% increase in the proportion of heat demand represented by the network which could be met by biomass. Due to the reduction in annual operation of this plant as a result of the removal of heat loads associated with the Mall, it has been judged that a 4MW biomass plant comprising of two 2MW boilers would be more suited to meet the demands of the network. A 4MW plant could meet 74% of the built out network heat demand from biomass and has the potential to provide carbon emissions reductions of 59% compared to gas only heating.

Cribbs Patchway New Neighbourhood
Heat Network Feasibility Study
3514199A-BEE CPNN DH Feasibility - FINAL - 10-05-16_v2 Prepared by WSP | Parsons Brinckerhoff Sept 2015 for South Gloucestershire Council - 60 -
Table 7-8: BAe High Density with Mall connection- biomass boiler sizing
Biomass Boiler 1 MWth 1 1.5 2 2.5
Biomass Boiler 2 MWth 1 1.5 2 2.5
Modelling Summary
Operating Hours- Biomass Boiler 1 Hours 7,856 6,935 6,595 6,117
Operating Hours- Biomass Boiler 2 5,672 4,953 4,226 3,715
Network Heat Load met by Biomass
kWhth 12,670,170 16,116,257 18,553,340 19,934,529
% 52% 66% 76% 81%
Carbon Emissions
BAU-Gas Heating 0.18366 5,430
Biomass Boiler 1 0.009
343
429
513
561
Biomass Boiler 2
238
311
338
354
Top-up Gas Boilers 0.18366 2,627 1,864 1,325 1,020
Total CO2 emissions, biomass 3,208 2,604 2,176 1,935
% Reduction 41% 52% 60% 64%
According to the initial plant sizing for the BAe High Density network option with a connection to The Mall Cribbs Causeway the most suitable biomass plant capacity to meet the full built out heat demands of the network would be the 3MW plant. Although the 4MW and 5MW plants are capable of meeting a higher proportion of heat demand from biomass the operating hours for these options are relatively low. Whilst the 2MW plant would operate for a greater proportion of the annual available hours, the proportion of heat demand which could be met from the low carbon plant is less than 50%. A total biomass boiler capacity of 3MW would deliver 52% of carbon emissions savings at fully built out network demand compared to the gas heating scenario, provide a respectable proportion of heat demand from the biomass plant and operate for a suitable number of operating hours. For the network option where there is no connection to the Mall, it was judged that the 3MW biomass boiler option would not be suitable due to the significant reduction of heat demand attributed to The Mall. Although the 3MW boiler could meet approximately 66% of the network heat demand, the plant’s operation would reduce significantly, by 1,400 hours (17% of annual availability). A 2MW biomass boiler is considered to be more suited to this network. This biomass boiler capacity could meet 68% of the full built out heat demand of connected loads, operate for an average of just over 6,000 hours per year and result in potential carbon emissions savings of 54% compared to the gas heating scenario. Table 7-9: Deely Freed- biomass boiler sizing
0.5 MW 0.75MW 1MW 1.5MW
Modelling Summary
Operating Hours Hours 8,064 8,064 7,148 5,905
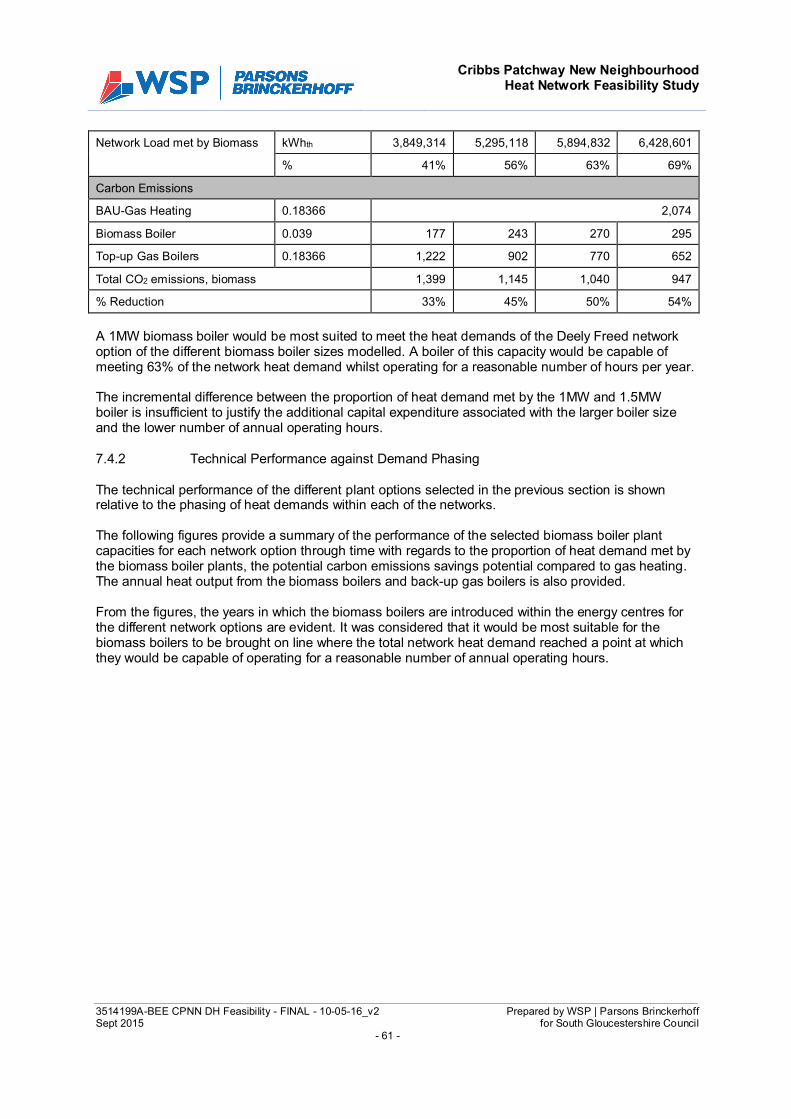
Cribbs Patchway New Neighbourhood
Heat Network Feasibility Study
3514199A-BEE CPNN DH Feasibility - FINAL - 10-05-16_v2 Prepared by WSP | Parsons Brinckerhoff Sept 2015 for South Gloucestershire Council - 61 -
Network Load met by Biomass kWhth 3,849,314 5,295,118 5,894,832 6,428,601
% 41% 56% 63% 69%
Carbon Emissions
BAU-Gas Heating 0.18366 2,074
Biomass Boiler 0.039 177 243 270 295
Top-up Gas Boilers 0.18366 1,222 902 770 652
Total CO2 emissions, biomass 1,399 1,145 1,040 947
% Reduction 33% 45% 50% 54%
A 1MW biomass boiler would be most suited to meet the heat demands of the Deely Freed network option of the different biomass boiler sizes modelled. A boiler of this capacity would be capable of meeting 63% of the network heat demand whilst operating for a reasonable number of hours per year. The incremental difference between the proportion of heat demand met by the 1MW and 1.5MW boiler is insufficient to justify the additional capital expenditure associated with the larger boiler size and the lower number of annual operating hours. 7.4.2 Technical Performance against Demand Phasing
The technical performance of the different plant options selected in the previous section is shown relative to the phasing of heat demands within each of the networks. The following figures provide a summary of the performance of the selected biomass boiler plant capacities for each network option through time with regards to the proportion of heat demand met by the biomass boiler plants, the potential carbon emissions savings potential compared to gas heating. The annual heat output from the biomass boilers and back-up gas boilers is also provided. From the figures, the years in which the biomass boilers are introduced within the energy centres for the different network options are evident. It was considered that it would be most suitable for the biomass boilers to be brought on line where the total network heat demand reached a point at which they would be capable of operating for a reasonable number of annual operating hours.

Cribbs Patchway New Neighbourhood
Heat Network Feasibility Study
3514199A-BEE CPNN DH Feasibility - FINAL - 10-05-16_v2 Prepared by WSP | Parsons Brinckerhoff Sept 2015 for South Gloucestershire Council - 62 -
Figure 7-6: All BAe Sites with Mall connection network option- two 2.5MW biomass boilers
Figure 7-7: All BAe Sites with Mall connection network option- two 2MW biomass boilers
0%
10%
20%
30%
40%
50%
60%
70%
80%
90%
0
5,000,000
10,000,000
15,000,000
20,000,000
25,000,000
30,000,000
35,000,000
40,000,000
2016 2021 2026 2031 2036 2041 2046
He
at D
em
and
(kW
h p
.a.)
Year
Biomass Boiler 1 Biomass Boiler 2 Top-Up Gas Boilers % Carbon Emissions Reductions % Heat Demand met by Biomass Boilers
0%
10%
20%
30%
40%
50%
60%
70%
80%
90%
0
5,000,000
10,000,000
15,000,000
20,000,000
25,000,000
30,000,000
2016 2021 2026 2031 2036 2041 2046
He
at D
em
and
(kW
h p
.a.)
Year
Biomass Boiler 1 Biomass Boiler 2 Top-Up Gas Boilers % Carbon Emissions Reductions % Heat Demand met by Biomass Boilers

Cribbs Patchway New Neighbourhood
Heat Network Feasibility Study
3514199A-BEE CPNN DH Feasibility - FINAL - 10-05-16_v2 Prepared by WSP | Parsons Brinckerhoff Sept 2015 for South Gloucestershire Council - 63 -
Figure 7-8: BAe High Density sites with Mall connection network option- two 1.5MW biomass boilers
Figure 7-9: BAe High Density sites with Mall connection network option- two 1.5MW biomass boilers
0%
10%
20%
30%
40%
50%
60%
70%
0
5,000,000
10,000,000
15,000,000
20,000,000
25,000,000
30,000,000
2016 2021 2026 2031 2036 2041 2046
Hea
t D
eman
d (
kWh
p.a
.)
Year
Biomass Boiler 1 Biomass Boiler 2 Top-Up Gas Boilers % Carbon Emissions Reductions % Heat Demand met by Biomass Boilers
0%
10%
20%
30%
40%
50%
60%
70%
0
2,000,000
4,000,000
6,000,000
8,000,000
10,000,000
12,000,000
14,000,000
16,000,000
18,000,000
2016 2021 2026 2031 2036 2041 2046
He
at D
em
and
(kW
h p
.a.)
Year
Biomass Boiler 1 Biomass Boiler 2 Top-Up Gas Boilers % Carbon Emissions Reductions % Heat Demand met by Biomass Boilers

Cribbs Patchway New Neighbourhood
Heat Network Feasibility Study
3514199A-BEE CPNN DH Feasibility - FINAL - 10-05-16_v2 Prepared by WSP | Parsons Brinckerhoff Sept 2015 for South Gloucestershire Council - 64 -
Figure 7-10: Deely Freed site network option- 1MW biomass boiler
0%
10%
20%
30%
40%
50%
60%
70%
80%
0
1,000,000
2,000,000
3,000,000
4,000,000
5,000,000
6,000,000
7,000,000
8,000,000
9,000,000
10,000,000
2016 2021 2026 2031 2036 2041 2046
He
at D
em
and
(kW
h p
.a.)
Year
Biomass Boiler 1 Top-Up Gas Boilers % Carbon Emissions Reductions % Heat Demand met by Biomass Boilers

Cribbs Patchway New Neighbourhood
Heat Network Feasibility Study
3514199A-BEE CPNN DH Feasibility - FINAL - 10-05-16_v2 Prepared by WSP | Parsons Brinckerhoff Sept 2015 for South Gloucestershire Council - 65 -
8 ECONOMIC MODELLING
8.1 Introduction
In this section the gas CHP engines and biomass boilers sized within the energy modelling section for the different network options are modelled for financial performance.
8.2 Capital Cost Plan
8.2.1 Energy Centre Costs
Indicative energy centre costs have been estimated based on the following plant items-
Prime Mover (Gas CHP/ Biomass Boiler)
Costs based on previous project experience and supplier quotes and account for inflation.
Fuel Store and Handling (Biomass Boiler option only)
Costs based on previous project experience and supplier quotes and account for inflation.
Top-Up/Back-Up Gas Boiler Plant
Total back-up boiler capacity has been based on the peak heat demands for the different network options and accounts for diversity of hot water supply for the domestic and non-domestic dwellings. Resiliency of boiler capacity supply has been included on an n+1 basis to ensure security of supply in the event of unexpected circumstances. Gas boiler costs have been based on an average of the all-in-rates for gas fired boilers within Spon’s 2012 values which are £65-£115/kW. These costs account for gas fired boilers including gas train, controls, flue, plant room pipework, valves and insulation, pumps and pressurisation equipment. A cost of £90/kW has been used and accounts for inflation.
Thermal Storage
Costs based on previous projects and supplier quotes and account for inflation. As mentioned within the energy modelling section, the capacity of thermal storage for each of the energy centre options is based on 50l/kW for the biomass boiler options and 100l/kW for the gas CHP options.
Utility Connections
A nominal cost for utility connections at the energy centre has been included for all network options; the magnitude of these costs is roughly correlated with the capacity of scheme.
Energy Centre Building
The building costs have been based on the space requirements of the technology recommended for each network option, the back-up gas boiler plant and an additional footprint allowance to accommodate plant connecting pipework and ancillary plant items which have not been separately itemised. It is assumed that the capital cost associated with the energy centre building would be spread over the first two years of scheme development, with 25% of the total CAPEX incurred in year 0 and the remainder due in year 1.

Cribbs Patchway New Neighbourhood
Heat Network Feasibility Study
3514199A-BEE CPNN DH Feasibility - FINAL - 10-05-16_v2 Prepared by WSP | Parsons Brinckerhoff Sept 2015 for South Gloucestershire Council - 66 -
It should be noted that for all network options, the energy centre building cost estimate is highly conservation both in terms of phasing and the total CAPEX due to the conservative sizing approach taken. The following table presents the estimated footprint of the energy centre buildings for each of the network options and total corresponding capital costs based on Spon’s building cost of £1650/sqm.
Table 8-1: Energy centre footprints and CAPEX for different network options
Gas CHP Biomass Boiler
Footprint (sqm) CAPEX (£) Footprint (sqm) CAPEX (£)
All BAe Sites with Mall 984 £1,623,904 1,275 £2,103,750
All BAe Sites 780 £1,286,479 1,055 £1,740,750
BAe High Density Sites with Mall
710 £1,171,804 960 £1,584,000
BAe High Density 588 £970,504 843 £1,390,125
Deely Freed 388 £639,939 515 £998,250
Private Wire Connection
A high level estimated of the capital cost associated with the installation of a private wire connection to the Mall has been determined based on a number of assumptions. It is stressed that the cost estimates are indicative only and subject to detailed cost analysis. At this stage, the following elements have been excluded-
o System commissioning and project management costs. o Contractor prelims. o Professional and project management costs. o DNO costs associated with new connection and modifications to existing connection. o Trench excavation and backfilling along the PW routes. o Site surveys such as CAT scan etc. o Back-up generation cost during any shutdown period. o CHP auxiliary power supply requirements shall be considered under CHP/ energy
centre estimates. o All cost estimates exclude VAT.
The total capital cost for this private wire connection to the Mall is £1,333,000. A full break down of the costs in line with the assumptions listed above is provided in Section 12 of the Appendix.

Cribbs Patchway New Neighbourhood
Heat Network Feasibility Study
3514199A-BEE CPNN DH Feasibility - FINAL - 10-05-16_v2 Prepared by WSP | Parsons Brinckerhoff Sept 2015 for South Gloucestershire Council - 67 -
8.2.2 Distribution Costs
Distribution pipework required to serve heat to the properties considered within each of the network options consists of two main elements: main spine pipework and developer plot level individual dwelling connections. The underground distribution pipework costs have been based on the total capital cost for the indicative pipe schedules provided in Section 6.3. As it is anticipated that properties will be phased throughout the development until 2039, the cost of distribution of the main spine network has been phased according to the build out of the respective network option. The costs of individual dwelling connections within each development plot have been based on a cost per dwelling from past experience of the costs incurred in district heating systems designed and installed for similar systems. An average cost per dwelling of £4,600 has been used assuming Series 2 insulation and a combination of Aluflex 25mm pipework for end connections and pre-insulated steel twin pipe (32-80mm nominal internal diameters) for plot level branch connections. 8.2.3 Consumer Side Costs
Heating interface unit and commercial consumer interface unit costs have been included within the capital costs of the different scheme options. Within the economic modelling it has been assumed that the capital cost expenditure would occur in the year proceeding property connection to applicable district heating schemes. Table 8-2: Domestic HIU and non-domestic CIU cost assumptions
Cost Note
HIU (domestics) £1,200/dwelling Based on an average HIU cost for an average 50kW unit.
CIU (non-domestics) Varies depending on the capacity of CIU required within the non-commercial properties.
It has been assumed that all non-domestic properties requiring heat interface units with capacities exceeding 200kW would be supplied with dual plate heat exchangers whilst those with lower capacities would be of single plate type.
8.2.4 CAPEX Phasing Approach
Charts and tables summarising the methodology and phasing of CAPEX throughout the build out of the different network options are shown in Section 13.3 in the Appendix. 8.2.5 Whole Lifetime CAPEX
The following tables summarise the total CAPEX throughout the development of the scheme at full build out. A phased approach has been taken throughout the techno-economic modelling, as such it should be noted that the following tables provide an indication of the total CAPEX in real terms and are not representative of the CAPEX modelled and whole life cost analysis results.

Cribbs Patchway New Neighbourhood
Heat Network Feasibility Study
3514199A-BEE CPNN DH Feasibility - FINAL - 10-05-16_v2 Prepared by WSP | Parsons Brinckerhoff Sept 2015 for South Gloucestershire Council - 68 -
Table 8-3: All BAe sites network options’ total CAPEX
All BAe Sites + Mall All BAe Sites Only
Gas CHP Biomass Gas CHP Biomass
Energy Centre
Low Carbon Plant £2,332,132 £1,585,372 £1,914,792 £1,277,722
Energy Centre Building £1,623,904 £2,103,750 £1,286,479 £1,740,750
Thermal Storage £311,162 £185,764 £263,552 £157,340
Biomass Fuel Store and Handling N/A £146,775 N/A £146,775
Back Up Gas Boilers £3,137,792 £3,137,792 £2,241,280 £2,241,280
Private Wire Connection £1,309,740
Utility Connections £100,000 £100,000 £100,000 £100,000
DH Distribution
Main Spine Network £4,180,612 £4,180,612 £3,744,125 £3,744,125
Individual Dwelling Connections £5,759,749 £5,759,749 £5,759,749 £5,759,749
Heat Interface Units
Residential HIUs £3,481,483 £3,481,483 £3,301,483 £3,301,483
CIUs £1,424,652 £1,424,652 £1,168,297 £1,168,297
Total CAPEX
Professional Fees £2,957,653 £2,763,244 £2,472,469 £2,454,690
Sub-Total £26,618,880 £24,869,192 £22,252,225 £22,092,210
Contingency (@20%) £5,323,776 £4,973,838 £4,450,445 £4,418,442
Total £31,942,656 £29,843,031 £26,702,670 £26,510,652
Table 8-4: BAe High Density network options’ total CAPEX
BAe High Density with Mall Connection
BAe High Density Only
Gas CHP Biomass Gas CHP Biomass
Energy Centre
Prime Mover £1,497,452 £882,972 £1,080,112 £400,000
Energy Centre Building £1,171,804 £1,584,000 £970,504 £1,390,125
Thermal Storage £212,759 £127,017 £212,759 £127,017
Biomass Fuel Store and Handling N/A £146,775 N/A £146,775
Back Up Gas Boilers £1,793,024 £1,793,024 £1,299,942 £1,299,942
Private Wire Connection £1,309,740
Utility Connections £50,000 £50,000 £50,000 £50,000
DH Distribution
Main Spine Network £2,332,164 £2,332,164 £1,839,129 £1,839,129

Cribbs Patchway New Neighbourhood
Heat Network Feasibility Study
3514199A-BEE CPNN DH Feasibility - FINAL - 10-05-16_v2 Prepared by WSP | Parsons Brinckerhoff Sept 2015 for South Gloucestershire Council - 69 -
Individual Dwelling Connections £361,351 £361,351 £361,351 £361,351
Heat Interface Units
Residential HIUs £1,510,197 £1,510,197 £1,330,197 £1,330,197
CIUs £1,084,851 £1,084,851 £828,495 £828,495
Total CAPEX
Professional Fees £1,415,418 £1,483,977 £1,024,577 £999,645
Sub-Total £13,614,424 £11,356,328 £8,997,066 £8,772,676
Contingency (@20%) £2,547,752 £2,671,159 £1,844,239 £1,799,361
Total £16,162,175 £14,027,486 £10,841,305 £10,572,037
Table 8-5: Deely Freed network options’ total CAPEX
Deely Freed
Gas CHP Biomass
Energy Centre
Prime Mover £540,056 £200,000
Energy Centre Building £639,939 £998,250
Thermal Storage £93,932 £56,077
Biomass Fuel Store and Handling N/A £50,000
Back Up Gas Boilers £896,512 £896,512
Utility Connections £50,000 £50,000
DH Distribution
Main Spine Network £1,104,486 £1,104,486
Individual Dwelling Connections £3,515,073 £3,515,073
Heat Interface Units
Residential HIUs £1,140,000 £1,140,000
CIUs £169,485 £169,485
Total CAPEX
Professional Fees £1,018,685 £1,022,485
Sub-Total £9,168,169 £9,202,369
Contingency (@20%) £1,833,634 £1,840,474
Total £11,001,803 £11,042,843

Cribbs Patchway New Neighbourhood
Heat Network Feasibility Study
3514199A-BEE CPNN DH Feasibility - FINAL - 10-05-16_v2 Prepared by WSP | Parsons Brinckerhoff Sept 2015 for South Gloucestershire Council - 70 -
8.3 Cash Flow Analysis
8.3.1 Operating Costs
Energy Costs
The cost of energy supplies to the different scheme options has a significant impact on the techno-economic feasibility of the different options. Gas and electricity base prices from the DECC Energy Price Projections were used to model the fuel costs associated with the different network options for gas CHP and biomass boiler based energy centres. Climate change levy5 (CCL) relief was applied where relevant to fuel inputs. According to CHPQA guidance, gas supplies to CHP systems classed as good quality are exempt from main rates of CCL. All CHP engines modelled within this study would meet the threshold criteria for good quality CHP as defined by CHPQA. The boundary for determining good quality CHP was extended to include the back-up gas boilers to determine any benefit in terms of main rate CCL relief. For all gas CHP network options it was determined that all gas supplies to the energy centre (CHP engine and back-up gas boilers) would be exempt from main rate CCL as in all cases, throughout scheme operation either the Quality Index (QI) threshold is met or the total energy centre threshold electrical efficiency exceeds 20%6. Prior to the introduction of gas CHP engines at the energy centres, the gas input to the gas boilers is considered liable for CCL and has been included as an additional cost within the operating cost modelling. Main rate CCL is also included for all back-up gas boiler fuel input within the biomass boiler options. The value of main rate CCL used modelled within the techno-economic analysis at the most recently published rate at the time of writing. This has been assumed to remain constant throughout the lifetime of the scheme in real terms and no indexation of this has been included. Table 8-6: Energy price projections- 2014 base prices
Base Price [p/kwh]
Data Used
Gas 3.067 DECC Central scenario services gas cost base price excluding CCL.
Main Rate CCL (gas) 0.1938 HMRC April 2015 rate
Electricity Import 11.29 Central scenario services electricity cost.
Electricity and gas prices have been indexed through time according to DECC Central Energy Price Projections 2014. The projected trend of prices through time varies depending on the nature of
5 During the final review of this report Government announced proposals to revamp CCL but no decision had been made 6 HMRC Excise Notice CCL1/2: combined heat and power schemes. 06/2015. https://www.gov.uk/government/publications/excise-notice-ccl12-combined-heat-and-power-schemes/excise-notice-ccl12-combined-heat-and-power-schemes 7 DECC Updated Energy & Emissions Projections - September 2014 https://www.gov.uk/government/publications/updated-energy-and-emissions-projections-2014 8 https://www.gov.uk/climate-change-levy-application-rates-and-exemptions#main-rates

Cribbs Patchway New Neighbourhood
Heat Network Feasibility Study
3514199A-BEE CPNN DH Feasibility - FINAL - 10-05-16_v2 Prepared by WSP | Parsons Brinckerhoff Sept 2015 for South Gloucestershire Council - 71 -
supply. The base prices and projections used within the economic modelling are shown in the table below- The utility price trends used for modelling in this report are illustrated in the figure below. The figure also includes the central trend for electricity wholesale prices as projected by DECC. This is discussed within the Operating Income section.
Figure 8-1: DECC utility central price projections
Parasitics
Electricity required by plant items, referred to as parasitic electricity, and has been included as an operating cost for all network options. Rule of thumb guidance has been used to provide an estimate of the electrical consumptions of the different energy centre options which recommends that this be approximated to equal 2% of the heat output of the generating plant.
This electricity has been accounted for as an energy cost by using electricity import prices indexed by DECC Central Scenario Energy Price Projections for electricity services.
Maintenance
Plant and system maintenance has been included within the operating costs of the network and has been based on the following approach and assumptions. Table 8-7: Energy centre and system maintenance
Plant Item Unit Note
Energy Centre Maintenance
Biomass Boiler £/annum Nominal sum of 3% of biomass boiler CAPEX.
Gas CHP p/kWhe Based on supplier quotes for a range of CHP engine capacities.
0.00
2.00
4.00
6.00
8.00
10.00
12.00
14.00
16.00
18.00
2014 2019 2024 2029 2034 2039 2044 2049
p/k
Wh
Gas (services) Electricity (services) Elec Wholesale

Cribbs Patchway New Neighbourhood
Heat Network Feasibility Study
3514199A-BEE CPNN DH Feasibility - FINAL - 10-05-16_v2 Prepared by WSP | Parsons Brinckerhoff Sept 2015 for South Gloucestershire Council - 72 -
M&E £/annum Nominal sum of 1% of back up boiler CAPEX.
Distribution Pipework
Main Spine £/annum 1%of capital cost following a 2 year warranty period.
Individual Dwelling Connections
£/annum
Replacement Costs (REPEX)
Energy centre plant items, distribution pipework and consumer interface unit replacement costs have been included within the financial modelling for the different network options. Anticipated operating lifetimes of various plant equipment and distribution equipment and the likely proportions of initial capital spend which would be required for the replacement are provided in the table below, where the proportion is shown as a % of the CAPEX for that item. Table 8-8: Replacement cost assumptions
Anticipated Lifetime (years)
Replacement Cost as % of CAPEX
Energy Centre
Biomass Boiler 25 70%
Gas CHP Unit 15 70%
Energy Centre Building 40 40%
Back Up Gas Boilers 30 50%
Heat Interface Units
Residential HIUs 15 75%
CIUs 25 75%
REPEX schedules through time for the different network options are provided in Section 13.4 within the Appendix. Consumer Unit Maintenance, Metering and Billing Costs Annual metering and billing costs are included on an annual basis for domestic and non-domestic properties. Average annual costs have been assumed for all domestic and non-domestic properties considered for each network option regardless of the demand of the individual property. The metering and billing costs to domestic and commercial consumers are phased in line with development phasing and are applied cumulatively as buildings would be anticipated to connect to the network. Table 8-9: Break down of consumer metering and billing costs
Item Cost per dwelling or property per annum
Domestic Consumers
Account Management £85
Heat Trust £5

Cribbs Patchway New Neighbourhood
Heat Network Feasibility Study
3514199A-BEE CPNN DH Feasibility - FINAL - 10-05-16_v2 Prepared by WSP | Parsons Brinckerhoff Sept 2015 for South Gloucestershire Council - 73 -
Bi-Annual HIU £25
Commercial Consumers
Account Management £400
Periodic Inspection £100
8.3.2 Operating Income
Connection Charges In lieu of developers covering the cost of domestic and non-domestic heating interface units, the approach taken within the financial modelling was that there would be a connection charge for all domestic and non-domestic properties as their connections are phased onto the different network options. For all the different network options modelled, the connection charges are introduced the year prior to connection. It should be noted that these costs are one-off charges to heat consumers as they prepare to connect to the network. The connection charges which have been applied throughout the financial modelling of the different network options are based on agreed values which have been applied to previous projects. Heat Sales Heat sales income represents one of the most significant income streams for each of the network options modelled. Different heat sales prices have been used depending on the heat consumer on the network. It has been assumed that existing buildings connecting to the scheme would receive a discount on the heat sales price compared to the new buildings connecting as an incentive to connect. The heat sales price for new non-domestic properties is assumed to be lower on a unit basis compared to that for domestic consumers due to the much greater proportion of heat consumed on an annual basis compared to individual dwellings. Electricity Sales The benefit of providing private wire electricity to the mall has been considered for two of the network options: All BAe Sites and BAe High Density Sites. These network options were considered to be the most practical to assess a mall connection due to the relative proximity of the existing and future mall loads. For these options, it is assumed that the total electrical demand of the existing and future mall would be met by the gas CHP scheme, whether this is generated by the CHP engines or imported from the grid at times of high demand and/or low CHP supply. The 2016 base price for private wire electricity sales is modelled at 10.5p/kWh. This price is indexed through time against the DECC energy price projections for electrical service prices. For the options where a mall connection is not considered, it is assumed that all electricity generated by the gas CHP option would be exported to the grid at the electricity wholesale price. The 2016 base price for grid exported electricity is modelled at 4.5p/kWh. This price is indexed through time against the DECC energy price projections for electrical wholesale prices.

Cribbs Patchway New Neighbourhood
Heat Network Feasibility Study
3514199A-BEE CPNN DH Feasibility - FINAL - 10-05-16_v2 Prepared by WSP | Parsons Brinckerhoff Sept 2015 for South Gloucestershire Council - 74 -
The biomass boiler options were modelled as purely heat only options and there has been no account made of electrical demands of the mall throughout the modelling of these options. It is assumed that in this case, the existing mall’s demands would continue to be met by the DNO as would all future demands.

Cribbs Patchway New Neighbourhood
Heat Network Feasibility Study
3514199A-BEE CPNN DH Feasibility - FINAL - 10-05-16_v2 Prepared by WSP | Parsons Brinckerhoff Sept 2015 for South Gloucestershire Council - 75 -
Other Income/ Avoided Cost Benefit No other income streams have been modelled within this study including the potential for avoided cost benefit compared to a BAU case. The current status of various schemes and rationale for their exclusion from consideration at this stage is summarised below- Carbon Reduction Commitment (CRC) Benefit
o Avoided carbon emissions which arise through the operation and consumption of energy
generated through a district heating/ cogeneration scheme are assigned a financial value which can be considered a benefit in terms of net operating income when compared to a business as usual scenario.
o CRC is only applicable to schemes which are not reportable for gas and electricity consumed within EU ETS installations, therefore to the scheme must have a thermal input lower than 20MW.
o Energy consumers and energy centre operators which consume in excess of 6,000 MWh p.a. of qualifying electricity through settled half hourly meters are liable for CRC and must purchase CRC allowances to cover the amount of carbon generated across the organisation.
o Biomass is zero rated as a carbon emitter under CRC and the government currently treats input fuels to CHP generation as used for electricity generation rather than for heating and is therefore not considered a supply under CRC.
o Domestic consumers are not liable for CRC as residential supplies of electricity and gas consumed are not supplies for CRC purposes and would therefore not realise any financial benefits in terms of avoided costs in this regard.
o Under current treatment, non-domestic consumers of heat (and private wire electricity) which qualify under the criteria of CRC receive benefits in terms of avoided carbon when reporting the organisation’s annual energy consumption and associated carbon emissions.
Due to the uncertain nature of the consumers that would connect to a given scheme and the operating model of the ESCo, it is very difficult to quantify the potential financial benefit to be gained with regards to CRC against a base case scenario.
EU Emissions Trading Scheme (EU-ETS) Benefit
o For all network options considered the threshold of 20MW thermal input, would not be
triggered until 2020 at the earliest. This would place the schemes within Phase 4 of EU-ETS which is set to begin in 2020.
o It is anticipated that the EU would create Market Stability Reserve (MSR) from 2021. This would reduce the availability of permits when these are in abundance and carbon prices are low to boost the price of carbon from anywhere from 17-35 EURO/tonne. It is possible that this approach might be brought forward by 3 years9.
As there is no specific guidance published at the current time for Phase 4, EU-ETS is not considered in the current feasibility study. It is recommended that the potential treatment of the different network option under EU ETS would be considered in future, more detailed analysis of any schemes considered for further development.
Renewable Heat Incentive There is significant uncertainty regarding the level of support for biomass boiler installations that will be available in the short to medium term future. Due to the phasing assumed for the
9 Energy World (04/2015)

Cribbs Patchway New Neighbourhood
Heat Network Feasibility Study
3514199A-BEE CPNN DH Feasibility - FINAL - 10-05-16_v2 Prepared by WSP | Parsons Brinckerhoff Sept 2015 for South Gloucestershire Council - 76 -
introduction of biomass boilers, the first of all biomass boilers to be installed within all of the network options would not come online until 2020 at which point it is difficult to predict the support which would be available for all. For one of the network options the second boiler would not be installed until 2031.
8.3.3 Undiscounted Cash Flows
Phased OPEX graphs for each technology and network option are provided within Section 13.5 in the Appendix. These graphs show the variation of itemised operating cost and incomes through time including capital and replacement cost expenditure on an annual basis.
To present a comparison of the net operating income of each technology option for the different network options, the operating net incomes are shown in the figures below. It should be noted that these figures are exclusive of the CAPEX and REPEX spend through time.
Figure 8-2: All BAe Sites with mall connection net operating income
Figure 8-3: All BAe Sites net operating income
£0
£500,000
£1,000,000
£1,500,000
£2,000,000
£2,500,000
£3,000,000
£3,500,000
2015 2020 2025 2030 2035 2040 2045 2050
Gas CHP (base connection charge) Biomass Boiler (base connection charge)
£0
£500,000
£1,000,000
£1,500,000
£2,000,000
£2,500,000
£3,000,000
2015 2020 2025 2030 2035 2040 2045 2050
Gas CHP (base connection charge) Biomass Boiler (base connection charge)

Cribbs Patchway New Neighbourhood
Heat Network Feasibility Study
3514199A-BEE CPNN DH Feasibility - FINAL - 10-05-16_v2 Prepared by WSP | Parsons Brinckerhoff Sept 2015 for South Gloucestershire Council - 77 -
For the all BAe site options, it can be observed that the network option with The Mall connection would result in a greater net operating income over time compared to the option without The Mall connection. For the All BAe sites with Mall connection option, the gas CHP energy centre outperforms the biomass boiler option for all years following connection of the future Mall developments anticipated in 2021. This is due to the additional revenue available from private wire electricity sales and a relatively small amount of sales from electricity exported to the grid. For the network option without the Mall connection, the biomass boiler performs better in terms of net operating income particularly following the installation and commencement of operation of the second CHP engine/ biomass boiler in 2031. This is due to the relatively higher net benefit associated with heat sales from the biomass boiler against the lower operating costs compared to those from the gas CHP engine due to the relatively low sales price available for electricity export. The peaks in net operating income observed in the undiscounted cash flow graphs above occur due to the phasing of consumers connecting to the networks as they develop, maintenance costs through time as different plant items are installed within the energy centres and the phasing of distribution network and consumer interface units.
Figure 8-4: BAe High Density Sites with mall connection net operating income
£0
£500,000
£1,000,000
£1,500,000
£2,000,000
2015 2020 2025 2030 2035 2040 2045 2050
Gas CHP (base connection charge) Biomass Boiler (base connection charge)

Cribbs Patchway New Neighbourhood
Heat Network Feasibility Study
3514199A-BEE CPNN DH Feasibility - FINAL - 10-05-16_v2 Prepared by WSP | Parsons Brinckerhoff Sept 2015 for South Gloucestershire Council - 78 -
Figure 8-5: BAe High Density Sites net operating income
Similarly to the All BAe Sites with and without a Mall connection, the two BAe high density development network options have significantly different net operating income performances and similar trends can be observed between the operations of the different primary plant technology options as they serve each network. The BAe High Density network option with a Mall connection has a superior performance compared to that of the network option with no Mall connection throughout the lifetime of the scheme as modelled. This is due to the additional income associated with the energy sales to existing and future mall customers which offsets the additional operating costs such as increases in maintenance associated with the phasing of CAPEX items within the energy centre, distribution network costs and heat interface units. The difference between the economic performances of the different technology options is particularly pronounced after 2025 at which point the first gas CHP engine/ biomass boiler commences operation. For the network option with the Mall connection, it can be observed that the gas CHP engine energy centre operation has a poorer performance in terms of net operating income compared to the biomass boiler option from 2021 until 2025 as electricity import is required to meet the total electricity demands of The Mall for these years which is passed on to consumers at a lower private wire electricity sales price resulting in a net loss in terms of electricity supply at the energy centre. After 2025, the net operating income for the gas CHP option improves surpassing that of the biomass boiler option due to the additional income gained from sales of electricity generated from the CHP engine to the private wire customers at The Mall and the value of heat sales to the connected properties. The biomass boiler outperforms the gas CHP option throughout the lifetime of the BAe High Density network option without the Mall connection. This is due to the relative expense of generating heat using gas CHP when all electricity generated is exported to the grid at wholesale electricity sales prices. The biomass boiler is able to modulate better to meet heat demands represented by connected energy consumers and generate heat at a relatively cheaper rate due to the higher thermal efficiency and potential for lower cost input fuel. For the Deely Freed network option, no private wire connection option has been included within the techno-economic modelling. As a result, the biomass boiler option outperforms the gas CHP option
£0
£200,000
£400,000
£600,000
£800,000
£1,000,000
£1,200,000
£1,400,000
2015 2020 2025 2030 2035 2040 2045 2050
Gas CHP (base connection charge) Biomass Boiler (base connection charge)

Cribbs Patchway New Neighbourhood
Heat Network Feasibility Study
3514199A-BEE CPNN DH Feasibility - FINAL - 10-05-16_v2 Prepared by WSP | Parsons Brinckerhoff Sept 2015 for South Gloucestershire Council - 79 -
throughout the lifetime of the scheme. This is particularly the case following full build out of the network and consumer heat demands in 2024 as the magnitude of export electricity sales income is not sufficient to offset the operating costs of the gas CHP energy centre.
Figure 8-6: Deely Freed net operating income
£0
£200,000
£400,000
£600,000
£800,000
£1,000,000
£1,200,000
£1,400,000
2015 2020 2025 2030 2035 2040 2045 2050
Gas CHP (base connection charge) Biomass Boiler (base connection charge)

Cribbs Patchway New Neighbourhood
Heat Network Feasibility Study
3514199A-BEE CPNN DH Feasibility - FINAL - 10-05-16_v2 Prepared by WSP | Parsons Brinckerhoff Sept 2015 for South Gloucestershire Council - 80 -
8.4 Whole Life Cost Analysis
8.4.1 Introduction
Net present values have been determined for each of the different network options at the following discount rates for a 25 and 40-year period. It should be noted that the 40-year NPVs assume a constant net operating income post-2050 and do not account for any plant or network replacement past this year. It should be noted that all NPV analysis assumes the phasing and magnitude of consumer energy demands as determined within the energy mapping exercise. If the phasing or demands of potential connecting consumers were to change as the developments are built out, this might result in a substantial impact on the NPV. As such the following NPV analyses should be treated as indicative estimates only and any schemes considered for further analysis should undergo detailed financial modelling. NPVs are presented at the following discount rates to represent those used within the associated network delivery model options-
6%: Local Authority ESCo
12%: Public-Private Partnership
15%: Private Sector ESCo
8.4.2 Net Present Value (NPV) Results
The following tables show the NPVs of the different network options at the varying discount rates including a sensitivity analysis on the domestic connection charge as discussed previously in Section. 8.3.2. Graphs comparing the 25-year NPVs for each of the different network options for the base connection charge scenario are also provided. All other NPV graphics are included in Section 13.5 of the Appendix. A table of the 40-year NPVs is also shown. However it should be noted that this is provided for a rough indication of the whole life cost for this duration. It was assumed that the net operating income would remain constant from 2050 to 2056. This provides an indicative NPV as replacement costs which may be incurred during this period are not reflected within these modelling results. The 25 year NPVs show that the only network options presenting a positive NPV at a 6% discount rate representing that applicable for a local authority ESCo are the BAe high density network options, with biomass OR gas CHP, for all domestic connection charge scenarios, as shown in the figure below.

Cribbs Patchway New Neighbourhood
Heat Network Feasibility Study
3514199A-BEE CPNN DH Feasibility - FINAL - 10-05-16_v2 Prepared by WSP | Parsons Brinckerhoff Sept 2015 for South Gloucestershire Council - 81 -
Figure 8-7: 25 year NPV for 6% discount rate and base domestic connection charge (£4k/dwelling)
The NPVs are greatest for both the gas CHP and biomass boiler energy supply options within the BAe High Density with Mall Connection option. This is due to the greater consumer demand and opportunity for energy sales including private wire electricity sales which are more than sufficient for the energy centre operator to recover the combined capital costs of the scheme and all operating costs throughout the 25 year period. Although the NPV is lower for the BAe High Density without a Mall connection, the scheme could pay back all of the operating costs and capital costs associated with this network option which reduces the impact of the risk to the scheme should the anticipated future Mall customers chose not to connect to the scheme. This is despite the lower primary and back-up plant capacity assumed to be installed at the energy centre serving this network option, lower pipework distribution costs and capital costs associated with the private wire connection required for the network option with a connection to the mall. For all network options, the gas CHP energy centre only outperforms the biomass boiler heat only supply options where the potential benefit of a connection to The Mall to supply heat and electricity is considered. For all other options, the biomass boiler has a superior performance due to the cheaper cost of heat generation from this technology option compared to that of gas CHP when all electricity is exported to the grid. The Deely Freed option has the worst NPV over a 25 year period for both the gas CHP and biomass boiler energy supply options. This is due to the lower heat density of this option which means that the capital, replacement and maintenance costs, associated with the proportionally larger distribution network required to connect consumers to the heat supply from the energy centre, are not recovered in the operating life of the scheme. As no private wire option has been explored within this study for the Deely Freed network option, any potential benefit that might be gained from supplying the non-commercial loads on this network with private wire electricity sales is purely speculative. It could be considered that a private wire connection from the energy centre to all non-domestic loads would be unjustifiably costly due to the relatively low electricity demands represented by these loads, sparse nature of non-domestic consumer locations and distance from the energy centre to the nearest non-domestic consumer considered to connect to the network.
All BAE Sites(with Mall)
All BAE Sites(no Mall)
BAE HighDensity (with
Mall)
BAE HighDensity (no
Mall)Deely Freed
Gas CHP -£2,069,073 -£4,824,073 £2,498,130 £30,430 -£4,838,395
Biomass Boiler -£2,745,996 -£3,797,341 £1,898,710 £639,015 -£4,303,649
-£6,000,000
-£5,000,000
-£4,000,000
-£3,000,000
-£2,000,000
-£1,000,000
£0
£1,000,000
£2,000,000
£3,000,000

Cribbs Patchway New Neighbourhood
Heat Network Feasibility Study
3514199A-BEE CPNN DH Feasibility - FINAL - 10-05-16_v2 Prepared by WSP | Parsons Brinckerhoff Sept 2015 for South Gloucestershire Council - 82 -
The All BAe sites options with and without connections to The Mall perform slightly better than the Deely Freed network option over 25 years of scheme operation although they still present negative NPVs at a 6% discount rate. This means that despite the greater consumer base assumed to connect to this network, the demand is too sparse for heat sales to pay back the combined capital costs of the scheme (which it has been assumed are incurred from 2016 to 2033) and associated maintenance and replacement costs. As is the case for the other network options, when a connection to The Mall is assumed, the All BAe sites network option performs better due to the potential for additional energy sales which more than make up for the additional capital costs of heat distribution network connection, private wire connection and additional energy centre costs due to the requirement for greater primary plant installed capacity and additional gas boilers. The 40 year NPVs at a 6% discount rate are shown in the following figure to show how the net operating income after an additional 15 years of operation can offset the combined capital costs. For the BAe high density network options, the final year of capital expenditure (excluding replacement costs) is incurred in 2033 therefore the 40 year NPV provides an assessment of the benefit of 23 years without any capital cost. There is an improvement of just under £2m for the gas CHP option and about £1.4m for the biomass boiler option when energy sales to The Mall are considered. There is a much more modest improvement when the energy demands of The Mall are disregarded, just over £500k for the gas CHP option and over £100k for the biomass option. It should be noted that the actual improvement in the gas CHP NPV when this is calculated for the additional 15 years would be lower as secondary replacement costs would be incurred for one of the gas CHP engines in 2055, whilst there would be no additional replacement of biomass boilers in the period from 2050 to 2056 as these first replacements occur prior to this.
Figure 8-8:40 year NPV for 6% discount rate and base domestic connection charge (£4k/dwelling)
The 40 year NPVs for the All BAe Site options also show improvements compared to those determined for the first 25 years of scheme operation although according to the parameters at which the techno-economic modelling was conducted, the additional net operating income available to the scheme post CAPEX spend would still be insufficient to repay the combined costs of the network.
All BAE Sites(with Mall)
All BAE Sites(no Mall)
BAE HighDensity
(with Mall)
BAE HighDensity (no
Mall)Deely Freed
Gas CHP -£766,272 -£4,002,594 £4,590,454 £589,644 -£4,689,003
Biomass Boiler -£1,558,477 -£2,209,671 £3,238,605 £773,852 -£3,922,032
-£6,000,000
-£4,000,000
-£2,000,000
£0
£2,000,000
£4,000,000
£6,000,000

Cribbs Patchway New Neighbourhood
Heat Network Feasibility Study
3514199A-BEE CPNN DH Feasibility - FINAL - 10-05-16_v2 Prepared by WSP | Parsons Brinckerhoff Sept 2015 for South Gloucestershire Council - 83 -
The Deely Freed network option still results in the poorest whole life economic performance when the 40 year NPV is determined. The relatively modest improvement compared to the improvement of the other network options is due to the earlier phasing of CAPEX for this option as it is assumed that the Deely Freed network is fully built out much earlier than the BAe network options. This means that for a significant proportion of the 25years for which the NPV was initially determined, there was no capital spend (excluding replacement costs). As mentioned in an earlier section, all of the NPV results are highly dependent on the magnitude and phasing of energy demands of consumers assumed to connect to the network. The results of NPV analysis for all discount rate scenarios and domestic connection charges are presented in the tables below and as figures in Section 13.5 in the Appendix.

Cribbs Patchway New Neighbourhood
Heat Network Feasibility Study
3514199A-BEE CPNN DH Feasibility - FINAL - 10-05-16_v2 Prepared by WSP | Parsons Brinckerhoff Sept 2015 for South Gloucestershire Council - 84 -
Discount Rate
6% 12% 15%
Domestic Connection Charge Scenario
Gas CHP Biomass Boiler Gas CHP Biomass Boiler Gas CHP Biomass Boiler
All BAe Sites with Mall
Base (Mid) -£2,069,073 -£2,745,996 -£4,196,541 -£4,399,322 -£4,501,999 -£4,585,667
Low -£2,978,047 -£3,654,971 -£4,822,024 -£5,024,805 -£5,035,931 -£5,119,599
High -£1,160,098 -£1,837,022 -£3,571,057 -£3,773,838 -£3,968,067 -£4,051,735
All BAe Sites
Base (Mid) -£4,824,073 -£3,797,341 -£4,383,700 -£4,315,040 -£4,121,637 -£4,258,468
Low -£5,673,640 -£4,646,908 -£4,961,519 -£4,892,859 -£4,612,688 -£4,749,519
High -£3,974,505 -£2,947,773 -£3,805,880 -£3,737,220 -£3,630,587 -£3,767,418
BAe High Density Sites with Mall
Base (Mid) £2,498,130 £1,898,710 -£339,297 -£495,221 -£954,231 -£1,045,429
Low £2,033,076 £1,433,657 -£703,131 -£859,055 -£1,281,360 -£1,372,558
High £2,963,184 £2,363,764 £24,537 -£131,387 -£627,103 -£1,372,558
BAe High Density Sites
Base (Mid) £30,430 £639,015 -£586,574 -£637,544 -£713,366 -£909,899
Low -£375,217 £233,368 -£902,744 -£953,714 -£997,613 -£1,194,146
High £436,076 £1,044,662 -£270,404 -£321,374 -£429,119 -£625,653
Deely Freed
Base (Mid) -£4,838,395 -£4,303,649 -£4,956,944 -£4,817,423 -£4,910,548 -£4,869,080
Low -£5,215,498 -£4,680,752 -£5,262,546 -£5,123,024 -£5,187,546 -£5,146,078
High -£4,461,292 -£3,926,546 -£4,651,343 -£4,511,822 -£4,633,550 -£4,592,082
Figure 8-9: 25-year NPVs: domestic connection charge scenarios (Base- £4k/dwelling, low-£3.5k/dwelling, high-£4.5k/dwelling)

Cribbs Patchway New Neighbourhood
Heat Network Feasibility Study
3514199A-BEE CPNN DH Feasibility - FINAL - 10-05-16_v2 Prepared by WSP | Parsons Brinckerhoff Sept 2015 for South Gloucestershire Council - 85 -
Discount Rate
6% 12% 15%
Domestic Connection Charge Scenario
Gas CHP Biomass Boiler Gas CHP Biomass Boiler Gas CHP Biomass Boiler
All BAe Sites with Mall
Base (Mid) -£766,272 -£1,558,477 -£3,906,706 -£4,141,933 -£4,362,284 -£4,462,544
Low -£1,675,246 -£2,467,452 -£4,532,189 -£4,767,416 -£4,896,216 -£4,996,476
High £142,703 -£649,503 -£3,281,222 -£3,516,449 -£3,828,352 -£3,928,612
All BAe Sites
Base (Mid) -£4,002,594 -£2,209,671 -£4,238,898 -£4,018,574 -£4,057,591 -£4,124,257
Low -£4,852,161 -£3,059,239 -£4,816,717 -£4,596,393 -£4,548,641 -£4,615,308
High -£3,153,026 -£1,360,104 -£3,661,078 -£3,440,754 -£3,566,541 -£3,633,207
BAe High Density Sites with Mall
Base (Mid) £4,590,454 £3,238,605 £26,677 -£196,336 -£792,705 -£802,338
Low £4,125,401 £2,799,875 -£337,156 -£521,188 -£1,119,834 -£1,086,797
High £5,055,508 £3,677,335 £390,511 £128,516 -£465,577 -£517,879
BAe High Density Sites
Base (Mid) £589,644 £773,852 -£484,639 -£1,292,661 -£667,548 -£1,664,343
Low £183,997 £348,539 -£800,809 -£1,628,498 -£951,794 -£1,968,256
High £995,290 £1,199,165 -£168,469 -£956,825 -£383,301 -£1,360,429
Deely Freed
Base (Mid) -£4,689,003 -£3,922,032 -£4,930,282 -£4,752,520 -£4,898,425 -£4,840,607
Low -£5,066,106 -£4,299,134 -£5,235,883 -£5,058,122 -£5,175,423 -£5,117,605
High -£4,311,900 -£3,544,929 -£4,624,681 -£4,446,919 -£4,621,427 -£4,563,609
Figure 8-10: 40-year NPVs: domestic connection charge scenarios (Base- £4k/dwelling, low-£3.5k/dwelling, high-£4.5k/dwelling)

Cribbs Patchway New Neighbourhood
Heat Network Feasibility Study
3514199A-BEE CPNN DH Feasibility - FINAL - 10-05-16_v2 Prepared by WSP | Parsons Brinckerhoff Sept 2015 for South Gloucestershire Council - 86 -
8.5 JT Baylis Site Connection
8.5.1 Introduction
As sensitivity to the techno-economic modelling, an additional development within the vicinity of CPNN is considered as a potential electricity customer for the gas CHP options where a private wire connection is considered to the Mall. Due to the pre-application stage of this particular site, at the time of writing there was only limited information available on the proposals for this development. The site area concerned is shown in relation to the anticipated mall loads in the image below-
Figure 8-11: Indicative site area of JT Baylis development area with nominal private wire connection
8.5.2 Estimated Electricity Demands
According to press releases about the site, plans have been unveiled which reveal intentions to build a permanent indoor ice rink, skydiving and ski centre at Cribbs Causeway. Other facilities planned within this development are a hotel, sports store, restaurant, coffee ‘drive-thru’ and a car showroom all to be developed on land adjacent to the venue hosting the sports facilities. High level estimates of electricity demands for these types of consumers have been determined and are shown in the table below with customer specific assumptions including an indicative gross internal area footprint.
Imagery, Google Earth (© 2015 Google, © 2015 Infoterra Ltd & Bluesky, ©2015 Getmapping plc) 2015

Cribbs Patchway New Neighbourhood
Heat Network Feasibility Study
3514199A-BEE CPNN DH Feasibility - FINAL - 10-05-16_v2 Prepared by WSP | Parsons Brinckerhoff Sept 2015 for South Gloucestershire Council - 87 -
Table 8-10: High-level electricity demand estimates for JT Baylis site facilities
Property Type Area (sqm)
Annual Electricity Demand
Notes
kWhe
Car Showroom 3,000 210,000
based on footprint
http://www.building.co.uk/cost-model-car-showrooms/3082521.article
Hotel 3,800 399,000 assumed same hotel demands as in BAe site
Sports Store 1,000 70,000 large nominal GIA for sports store
Restaurant 1,000 90,000 large nominal GIA for chain restaurant
Coffee Shop 200 18,000 nominal GIA for chain coffee shop with ‘drive-thru’
Ski Centre 1,846,000
based on energy statement for recent ski slope with a similar leisure development in Swindon. Total thermal cooling demand assumed to be 2.17GWh p.a and CoP of 2.8.
Ice Rink
956,250
Energy Efficiency Best Practice- Guide 78. Type 7: Ice Rink. Main hall with 56x26m ice pad and 500 seat limited spectator area, boothire, changing areas, occasional-use showers, a café, licensed bar and video game areas. Storage included for machines to tend the rink. Typical average floor area- 3750sqm.
Indoor Sky Diving 2,177,444
Assuming 1,600 horsepower wind tunnel as in Manchester and Basingstoke facilities. Assuming that tunnel is in operation for a total of 5 hours per day.
Total 5,766,694
8.5.3 Impact on Economic Performance
The effect of including potential private wire electricity sales to this development on the economic performance of the network options for which it has been considered is discussed below. It should be noted that this sensitivity only includes a rough incremental cost of private wire connection to one substation for this development and as the locations of consumers within the JT Baylis development site were unknown at the time of writing, the length of cabling required has been based on a nominal point location within the development site. As no heat supply has been modelled, no connection charges have been assumed for consumers within this site. The additional capital cost (excluding contingency) for the connection of the JT Baylis non-domestic properties is £67,220. This is assuming all exclusions and assumptions stated within Section 8.2 and 12. The figure below shows the impact of the additional energy income on the NPV for the applicable network options.

Cribbs Patchway New Neighbourhood
Heat Network Feasibility Study
3514199A-BEE CPNN DH Feasibility - FINAL - 10-05-16_v2 Prepared by WSP | Parsons Brinckerhoff Sept 2015 for South Gloucestershire Council - 88 -
Figure 8-12: 25 year NPV for gas CHP options including and excluding the JT Baylis at 6% discount rate
It can be observed that the inclusion of the estimated electricity demands at the JT Baylis site has the potential to significantly improve the economic performance of these schemes. Since the CHP engine sizes have been selected on the basis of heat load, they have been retained in this analysis. This explains the significant difference in impact of the JT Baylis private wire load on the two schemes. Since the BAe All Sites scheme has a larger CHP it would export a much greater volume of electricity than the High Density only scheme. The bulk of the electricity generated on the High Density scheme is already consumed on the private wire network, meaning that there is not enough generated electricity to meet the full JT Baylis site consumption. These results indicate that extending the High Density scheme could further improve the NPV with a private wire connection to the JT Bayliss site since this would provide heat demand to justify a larger CHP engine, thus serving more of the JT Baylis electricity demand. It is stressed that there is a very high level of error present within this analysis due to lack of information relating to the size, location and likely energy consumption of the proposed developments and the large number of assumptions made regarding the costs associated with private wire connection. More detailed financial and technical modelling would be required to decisively conclude any benefit arising from the connection of the developments at the JT Baylis site.
exclude JT Baylis include JT Baylis
All BAE Sites (with Mall) -£2,069,073 £297,302
BAE HD Sites (with Mall) £2,498,130 £3,092,959
-£3,000,000
-£2,000,000
-£1,000,000
£0
£1,000,000
£2,000,000
£3,000,000
£4,000,000

Cribbs Patchway New Neighbourhood
Heat Network Feasibility Study
3514199A-BEE CPNN DH Feasibility - FINAL - 10-05-16_v2 Prepared by WSP | Parsons Brinckerhoff Sept 2015 for South Gloucestershire Council - 89 -
9 DELIVERY AND INTERCONNECTION
9.1 Delivery
The priority sites identified as viable through this study comprise a network serving the BAe high density area, with a potential link to The Mall, and possible extension across the wider BAe Filton masterplan area, if The Mall connection and/or a connection to JT Baylis could be secured (since the modelling here indicates that a wider BAe site network would only be viable with one or both of those connections). These schemes would most likely be delivered by the private sector through a commercial arrangement between the BAe site developer and a private sector ESCo in the form of a concession agreement. This was the model attendees of the workshop confirmed would be most likely. Therefore ownership of the delivery programme would sit with that private sector ESCo. The programme for delivery is directly linked to the delivery of development sites, but the collective response to an indicative minimum 1 year duration to reach commercial agreement floated at the workshop was that this was felt to be too short and unlikely to be achieved. Given the outline planning permission already secured by these sites, that makes the need to start the process of securing a private sector ESCo an imminent requirement.
Figure 9-1 Delivery process and timescale slide from developer workshop
For clarity, the green process flow in the slide presented above follows on from the blue process flow – once procurement has completed. Delivery of the infrastructure would be in line with the construction programme for the development. Whilst there is no detailed programme for that, we have provided a commentary of the stages required and typical points in the development programme that these would link into:
Initial plot networks Temporary energy centres

Cribbs Patchway New Neighbourhood
Heat Network Feasibility Study
3514199A-BEE CPNN DH Feasibility - FINAL - 10-05-16_v2 Prepared by WSP | Parsons Brinckerhoff Sept 2015 for South Gloucestershire Council - 90 -
Main energy centre Main spine connections
Typically the network itself is installed alongside the road network which precedes construction of buildings, as enabling infrastructure. Once completed this road network is generally subject to ‘no-dig’ conditions for a typical period of 2-3yrs, imposed by the highway authority. This can result in main spine connections having to be installed earlier in the development programme than indicated above. Energy centre delivery programmes need to meet heat-on dates for the first completions, ready for occupation. Typically on residential developments, the first heat-on is required for show homes, well in advance of the first actual occupants so temporary arrangements are preferred. The techno-economic modelling in this study has assumed that the energy centre building is completed at the outset, but the use of temporary energy centres can enable this to be delayed until more significant demand is built out on the development. Often programme demands (developers wanting to get the first units completed and occupied) also result in heat-on needing to be provided prior to completion of the main energy centre. This is enabled by temporary energy centres installed at the point of connection of a plot network to the main spine (which would ultimately provide the link back to the main energy centre). The decision on which approach to take will be driven by the pace at which development is delivered and the location of the first completions. Either way, the first infrastructure installed is typically the plot network, and often some sections of the main spine, in line with the delivery of the road network. Where a temporary energy centre approach is adopted, these are the next infrastructure installed, in time to provide heat to the first completions on the plot networks they serve. Where the main energy centre is to be relied upon as the heat supply option from first completions, the construction programme for this needs to precede all other development. The figure below maps these activities for a standard approach of building the energy centre first, where the blue activities comprise a simplified typical developer construction programme and the green activities those for the heat network ESCo.
Figure 9-2 alignment of heat network and development construction programmes
site groundworks
infrastructure and civils
marketing suite and ph1
houses
further phases
communal facilities
retail and commercial
energy centre & main spine
network
distribution neworks up
to HIUs
future phase main spines
further phase distribution
neworks

Cribbs Patchway New Neighbourhood
Heat Network Feasibility Study
3514199A-BEE CPNN DH Feasibility - FINAL - 10-05-16_v2 Prepared by WSP | Parsons Brinckerhoff Sept 2015 for South Gloucestershire Council - 91 -
In terms of pre-construction activities, there are some vital points at which the heat network offer and the development stages need to align. The figure below attempts to outline these, where red activities are the local authority, blue the developer and green the district heating ESCo. Again this is a simplified approach since every development and the delivery of a heat network on it will follow a different programme. There is no fixed approach.
Figure 9-3 alignment of planning policy drivers with district heat ESCo pre-construction activities
The key interconnections here are that policy needs to be adopted prior to outline planning consent being granted, commercial ESCos need to be engaged with landowners preferably by outline planning stage, with agreements signed between developer and ESCo alongside reserved matters consent, and then delivery can happen alongside the developer’s construction programme.
9.2 Interconnection
Interconnection options for the priority sites identified as viable through this study, are limited to:
The Mall JT Baylis
Wider area network (subject of a separate, parallel study)
The proposed energy centre location (EC1 in Table 6-1 shown in wider scale in Figure 6-1) is at the intersection of the networks that would be required to connect these sites. As such, timing of connections to these sites is not inter-related and can simply be delivered in line with the development programme of these sites.
Similarly, the energy centre location proposed for an interconnected network serving BAe (whether high density or the wider site) has been selected for its proximity to the likely route of an incoming wider area network transmission main. This is likely to emanate from Severnside and run east towards Emmerson’s Green. Such a route is likely to come into the BAe Filton site in the area of The Mall, and as such the proposed energy centre location at The Mall would enable a connection.
Once a business case and programme for development of such a network has been developed, this should be fed into the design of the main energy centre serving a BAe network, in particular impacting on future low carbon plant capacities and making space allowance for transmission main interfaces.
9.3 Risks
A risk register has been provided alongside this report
evidence
base
adopt
policy
re-enforce policy championing delivery of district heat
Site Allocation Masterplanning
Outline Planning
Detailed Planning
Reserved Matters
0 Strategic Definition
1 Preparation
and Brief
2 Concept Design
3 Developed Design
4 Technical Design
5 Construction
6 Handover and Close
Out
negotiations with landowners / developers
design delivery

Cribbs Patchway New Neighbourhood
Heat Network Feasibility Study
3514199A-BEE CPNN DH Feasibility - FINAL - 10-05-16_v2 Prepared by WSP | Parsons Brinckerhoff Sept 2015 for South Gloucestershire Council - 92 -
9.4 Benefits
A summary of the benefits presented and discussed at the developer workshop is provided below:
A benefits register has been provided alongside this report.

Cribbs Patchway New Neighbourhood
Heat Network Feasibility Study
3514199A-BEE CPNN DH Feasibility - FINAL - 10-05-16_v2 Prepared by WSP | Parsons Brinckerhoff Sept 2015 for South Gloucestershire Council - 93 -
10 CONCLUSIONS AND RECOMMENDATIONS
Linear heat density analysis provided an initial recommendation of network options to be taken forward for techno-economic modelling. Based on the values of linear heat densities and consultation with SGC on their priorities and view of developer appetite, a high density BAe site option, an all density BAe site option and a Deely Freed network option were chosen as priority networks for further analysis. The following energy centre capacities were recommended to meet the heat demands of connected consumers whilst ensuring reasonable annual operation of the plant over time. Due to the phasing of heat demands as sites are proposed to be developed, the introduction of both primary and back-up plant energy generating capacity was phased over time.
All BAe Sites BAe High Density Deely Freed
With mall connection
No mall connection
With mall connection
No mall connection
Primary plant capacity (MWth) 5 4 3 2 1
% of heat demand met by primary plant
CHP 64% 66% 59% 62% 59%
Biomass Boiler 72% 74% 66% 68% 63%
% of electricity demand generated
CHP 82% N/A 82% N/A N/A
% potential carbon emissions reductions compared to base case
CHP 59% 88% 46% 82% 78%
Biomass Boiler 57% 59% 52% 54% 50%
Phasing of plant equipment and the distribution network to serve customers with heat generated within the energy centre also provides a benefit in terms of the economic performance of the scheme as the phasing of capital costs provides a number of benefits to the energy centre operator or owner. It was determined that the best performing scheme would connect the high density BAe sites with a private wire electricity and heat supply to existing and future consumers at The Mall. This result was expected in line with the initial linear heat density screening. At the parameters modelled, the inclusion of private wire electricity sales to The Mall results in the gas CHP option producing the best NPV of just under £2.5m for a period of 25 years at a discount rate of 6%. This is followed by the biomass boiler option serving the same network with an NPV of approximately £1.9m.

Cribbs Patchway New Neighbourhood
Heat Network Feasibility Study
3514199A-BEE CPNN DH Feasibility - FINAL - 10-05-16_v2 Prepared by WSP | Parsons Brinckerhoff Sept 2015 for South Gloucestershire Council - 94 -
Figure 10-1: NPVs for different network options over 25 years at a discount rate of 6%
Whilst the All BAe sites network option including a connection to The Mall does not fully cover the costs of combined capital investment and operating costs throughout the first 25 years of scheme operation, it provides the third best opportunity of the different network options considered. The economic performance of this scheme led by gas CHP would be significantly improved if a private wire connection to the proposed JT Baylis leisure development site were included and would generate a positive 25 year NPV when modelled with a local authority ESCo discount rate of 6%. It is recommended that the BAe high density network options be considered for further development as these have demonstrated potential to provide viable schemes in terms of economics and to provide a significant proportion of the developments’ energy demands from both the gas CHP and biomass boiler primary plant options. These options also have the potential to reduce carbon emissions by 46-82% depending on the technology and customer connections assessed. It is recommended that further, more detailed analysis accounting for the following, is performed to ensure an accurate representation of the network options’ techno-economic potential:
Accurate energy demand projections for consumers considered to connect to the different scheme options.
Detailed and up to date anticipated phasing of developments to ensure optimal phasing of technology installation and capital cost phasing through time.
Accurate private wire capital costs be determined upon receipt of information on the subject of current electricity supply arrangements to potential private wire electricity consumers to better reflect the costs and benefits associated with the opportunity for connection to non-domestic customers.
The potential treatment of the value of carbon affecting the financial performance of the
schemes be further explored as quantifiable information becomes available as the commencements of applicable scheme phases are approached.
All BAE Sites
(with Mall)
All BAE Sites
(no Mall)
BAE HighDensity (with
Mall)
BAE HighDensity (no
Mall)Deely Freed
Gas CHP -£2,069,073 -£4,824,073 £2,498,130 £30,430 -£4,838,395
Biomass Boiler -£2,745,996 -£3,797,341 £1,898,710 £639,015 -£4,303,649
-£6,000,000
-£5,000,000
-£4,000,000
-£3,000,000
-£2,000,000
-£1,000,000
£0
£1,000,000
£2,000,000
£3,000,000

Cribbs Patchway New Neighbourhood
Heat Network Feasibility Study
3514199A-BEE CPNN DH Feasibility - FINAL - 10-05-16_v2 Prepared by WSP | Parsons Brinckerhoff Sept 2015 for South Gloucestershire Council - 95 -
11 APPENDIX
11.1 Heat Mapping Assumptions
11.1.1 Assumptions for Heat Mapping – Deely Freed
This document provides a summary of the assumptions and information used to determine the heat demands and phasing over time within the Sites of Opportunity within the CPNN area. Benchmarks used to determine heat demands for residential and non-residential properties are explained and the rationale behind discounting these explained. Summarises information provided by SGC and Planning Application Documents used to determine potential heat loads and phasing of properties over time for the Deely Freed/Taylor Wimpey Land at Cribbs Causeway. Where information is considered ambiguous or incomplete, assumptions and estimates have been made to provide as significant a level of granularity as possible at the level of information currently available. The following table presents the documentation contained in the Outline Planning Application which has been used to gather relevant information required for heat mapping. Table 11-1: Summary of information used from outline planning applications for heat mapping and demand phasing for Deely Freed sites
master plan density Phasing
PT14_0565_O-ILLUSTRATIVE MASTERPLAN-4914169
PT14_0565_O-PARAMETER PLAN-DENSITY-4869976
PT14_0565_O-DESIGN AND ACCESS STATEMENT-4871051 (Section 9.9/pg. 137).
PT14_0565_O-DESIGN AND ACCESS STATEMENT-4871051 (Section 5.2-5.3/pp. 66-68).
SGC Proposed Phasing Plan (annotated drawing)
SGC Draft Housing Trajectory (Excel)
Non Residential Demands Table of non-residential areas and uses from design and access statement as shown below assumed-
As there is no indication of the split of these between the western site and the “Triangle Site”, apart from the extra care home which is located in the latter.” 7” which is defined as retail and mixed use including satellite GP and dental surgery, food store and local convenience is displayed within the illustrative master plan as being within both sites
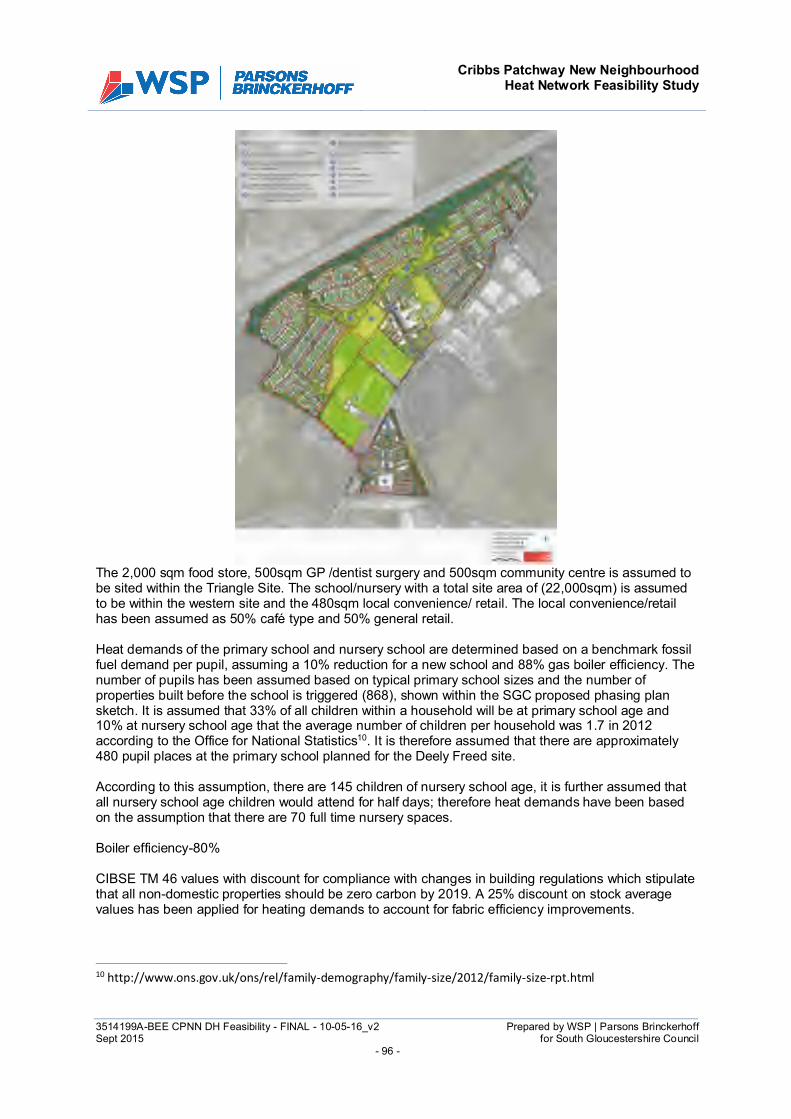
Cribbs Patchway New Neighbourhood
Heat Network Feasibility Study
3514199A-BEE CPNN DH Feasibility - FINAL - 10-05-16_v2 Prepared by WSP | Parsons Brinckerhoff Sept 2015 for South Gloucestershire Council - 96 -
The 2,000 sqm food store, 500sqm GP /dentist surgery and 500sqm community centre is assumed to be sited within the Triangle Site. The school/nursery with a total site area of (22,000sqm) is assumed to be within the western site and the 480sqm local convenience/ retail. The local convenience/retail has been assumed as 50% café type and 50% general retail. Heat demands of the primary school and nursery school are determined based on a benchmark fossil fuel demand per pupil, assuming a 10% reduction for a new school and 88% gas boiler efficiency. The number of pupils has been assumed based on typical primary school sizes and the number of properties built before the school is triggered (868), shown within the SGC proposed phasing plan sketch. It is assumed that 33% of all children within a household will be at primary school age and 10% at nursery school age that the average number of children per household was 1.7 in 2012 according to the Office for National Statistics10. It is therefore assumed that there are approximately 480 pupil places at the primary school planned for the Deely Freed site. According to this assumption, there are 145 children of nursery school age, it is further assumed that all nursery school age children would attend for half days; therefore heat demands have been based on the assumption that there are 70 full time nursery spaces. Boiler efficiency-80% CIBSE TM 46 values with discount for compliance with changes in building regulations which stipulate that all non-domestic properties should be zero carbon by 2019. A 25% discount on stock average values has been applied for heating demands to account for fabric efficiency improvements.
10 http://www.ons.gov.uk/ons/rel/family-demography/family-size/2012/family-size-rpt.html

Cribbs Patchway New Neighbourhood
Heat Network Feasibility Study
3514199A-BEE CPNN DH Feasibility - FINAL - 10-05-16_v2 Prepared by WSP | Parsons Brinckerhoff Sept 2015 for South Gloucestershire Council - 97 -
Residential Demands Residential heat demands determined for parcels R01-R20 as shown within the Parameter Plan: Density (below).
The heat demands within each of these parcels have been determined using the accommodation schedule (table below) and accommodation layout (figure below) within the design and access statement and scaled based on the total dwelling number, 950, within the draft housing trajectory. Total areas of all residential parcels determined through estimations using Google Earth.

Cribbs Patchway New Neighbourhood
Heat Network Feasibility Study
3514199A-BEE CPNN DH Feasibility - FINAL - 10-05-16_v2 Prepared by WSP | Parsons Brinckerhoff Sept 2015 for South Gloucestershire Council - 98 -
Phasing of heat loads is assumed across the site based on the draft housing trajectory, the phasing Diagram in the Design and Access Statement and the phasing plan sketch provided by SGC used to depict when primary school construction is required.

Cribbs Patchway New Neighbourhood
Heat Network Feasibility Study
3514199A-BEE CPNN DH Feasibility - FINAL - 10-05-16_v2 Prepared by WSP | Parsons Brinckerhoff Sept 2015 for South Gloucestershire Council - 99 -
Residential heat benchmarks developed from SAP calculations for properties planned in 2012 by Taylor Wimpey and Persimmon homes (on a separate development) and typical floor areas per property type. Property sizes averaged based on whether detached, semi-detached, and terraced or flats and corresponding annual space heating and hot water demands averaged. The estimated average space heating demand per unit area was determined for the different property types and was determined to be within +/- 10% of the space heating demands proposed for homes incorporating fabric efficiency improvements to comply with proposed 2016 building regulations part L (39-46kWh p.a./sqm11). 11.1.2 Assumptions for Heat Mapping - BAe Filton
This document provides a summary of the assumptions and information used to determine the heat demands and phasing over time within the Sites of Opportunity within the CPNN area. Benchmarks used to determine heat demands for residential and non-residential properties are explained and the rationale behind discounting these explained. Summarises information provided by SGC and Planning Application Documents used to determine potential heat loads and phasing of properties over time for BAe Filton Airfield. Where information is considered ambiguous or incomplete, assumptions and estimates have been made to provide as significant a level of granularity as possible at the level of information currently available. The following table presents the documentation contained in the outline Planning Application which has been used to gather relevant information required for heat mapping. Table 11-2: Summary of information used from outline planning applications for heat mapping and demand phasing of BAe Filton site
master plan density Phasing
PT14_3867_O-PARAMETER PLAN- LAND USE QUANTUM-4872695 PT_3867_O-DENSITY-
4872690
PT14_3867_O-PARAMETER_PLAN-PHASING-4875969
PT14_3867_O-MASTERPLAN-4872724
PT14_3867_O-PLANNING STATEMENT_FULL-48724191(pg.2.)
SGC Proposed Phasing Plan (annotated drawing)
SGC Draft Housing Trajectory (Excel)
11 http://www.zerocarbonhub.org/zero-carbon-policy/fabric-energy-efficiency-standard

Cribbs Patchway New Neighbourhood
Heat Network Feasibility Study
3514199A-BEE CPNN DH Feasibility - FINAL - 10-05-16_v2 Prepared by WSP | Parsons Brinckerhoff Sept 2015 for South Gloucestershire Council - 100 -
Non Residential Demands The site areas for each non-domestic property type are taken from the Land Use and Quantum master plan table for sites A-P shown below-
The Employment area is specified as 2.4 ha. According to measurements on Google Earth, this appears to correspond to the total site area rather than total building floor areas. It has been assumed that 20% of this total area is building footprint with a mix of 2-4 storey office blocks (average of 3 used). This is based on an out of town new office development with a car parking ratio of 1 space per 35sqm. The footprint of offices within this area has therefore been assumed to be 48,276 sqm with a total internal area of 144,828 sqm. This allows for 4,138 car parking spaces. Boiler efficiency-80% CIBSE TM 46 values with discount for compliance with changes in building regulations which stipulate that all non-domestic properties should be zero carbon by 2019. A 25% discount on stock average values has been applied for heating demands to account for fabric efficiency improvements.

Cribbs Patchway New Neighbourhood
Heat Network Feasibility Study
3514199A-BEE CPNN DH Feasibility - FINAL - 10-05-16_v2 Prepared by WSP | Parsons Brinckerhoff Sept 2015 for South Gloucestershire Council - 101 -
Residential Demands Heat demands mapped by density throughout the development. Density table with the number of dwellings per hectare and the areas of each density type used to determine property numbers within each density category (below). Assumed density categories have heat demands roughly in line with housing types as follows-
Lowest density- detached
Low density-semi-detached
Medium density- terraced
Medium density residential-flats
High density residential- flats
The number of properties within each of these densities is scaled according to the total number of properties, 950, within the draft housing trajectory provided by SGC (excel workbook). It is assumed that the different density areas are phased over time in line with the build rate of 50 units p.a. within each phase as shown within the master plan phasing plan (below) and according to overall development phasing rate within the draft trajectory phasing plan.
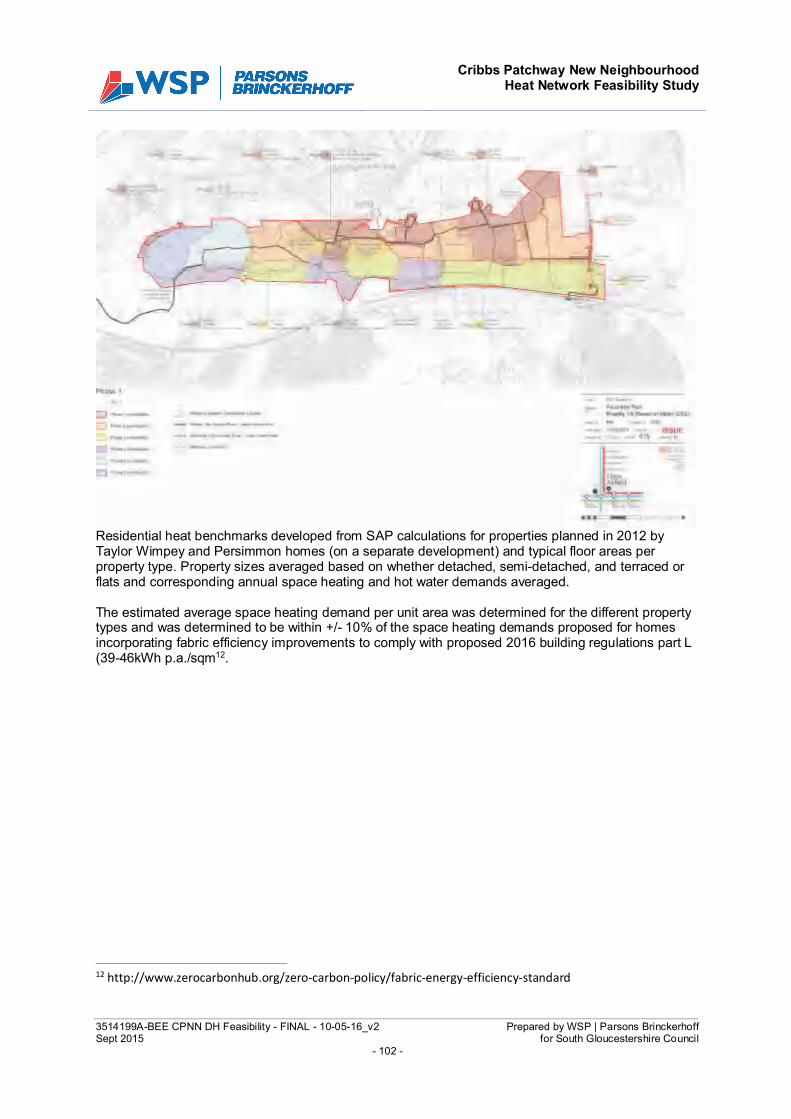
Cribbs Patchway New Neighbourhood
Heat Network Feasibility Study
3514199A-BEE CPNN DH Feasibility - FINAL - 10-05-16_v2 Prepared by WSP | Parsons Brinckerhoff Sept 2015 for South Gloucestershire Council - 102 -
Residential heat benchmarks developed from SAP calculations for properties planned in 2012 by Taylor Wimpey and Persimmon homes (on a separate development) and typical floor areas per property type. Property sizes averaged based on whether detached, semi-detached, and terraced or flats and corresponding annual space heating and hot water demands averaged. The estimated average space heating demand per unit area was determined for the different property types and was determined to be within +/- 10% of the space heating demands proposed for homes incorporating fabric efficiency improvements to comply with proposed 2016 building regulations part L (39-46kWh p.a./sqm12.
12 http://www.zerocarbonhub.org/zero-carbon-policy/fabric-energy-efficiency-standard

Cribbs Patchway New Neighbourhood
Heat Network Feasibility Study
3514199A-BEE CPNN DH Feasibility - FINAL - 10-05-16_v2 Prepared by WSP | Parsons Brinckerhoff Sept 2015 for South Gloucestershire Council - 103 -
12 PRIVATE WIRE BUDGET COST ESTIMATES
Table 12-1: Private wire cost estimates for mall connection- incoming supply
Incoming Supply Note
Main intake HV Switchgear ( located in WPD room ) three phase 11kV/630A HV switchgear, with two incomers, Section breaker and two outgoing vacuum circuit breakers rated 630A, equipped with overcurrent and earth fault protection relays/CTs for outgoings, energy meter, equipment.
Budget estimate from WPD would be required.
Metering for the incomers from WPD
11kV HV Cables from primary substation to WPD intake room (subject to PoC)
Tripping battery and charger and other ancillary plant equipment

Cribbs Patchway New Neighbourhood
Heat Network Feasibility Study
3514199A-BEE CPNN DH Feasibility - FINAL - 10-05-16_v2 Prepared by WSP | Parsons Brinckerhoff Sept 2015 for South Gloucestershire Council - 104 -
Table 12-2: Private wire cost estimates for mall connection- private wire costs
Private Wire Cost
Unit Material Unit cost
Qty Sub total Unit
Labour Unit cost
Duration / Qty Hrs
Sub total Total
Private wire cables 11kV MDPE/SWA,3C cables from WPD intake S/S to PW S/S
m 75 40 3,000 m 15 20 300 3,300
Schneider three phase HV Genie evo switchgear 11kV/630A, with two incomers, Section breaker and six outgoing vacuum circuit breakers rated 630A, equipped with overcurrent and earth fault protection relays/CTs for outgoings, energy meter, G59, etc
panels
30,000 10 300,000 hrs 105 240 25,200 325,200
Midel oil filled transformers and three phase 11kV, 630A, SF6 insulated RMU with VCB or SF6 200A circuit breaker tee-off, including overcurrent and earth fault relays / CTs for tee-off and cable boxes in customer substations
each
25,000 8 200,000 hrs 105 576 60,480 260,480
Single phase DB, lighting, small power and fire alarm system in PW substations
item 10,000 8 80,000 hrs 85 768 65,280 145,280
11kV MDPE/SWA,3C private wire cables including marker tapes, laid in trench / ducts
75 1,700 127,500 m 15 850 12,750 140,250
LV Switchboard in customer S/Ss excluded in PW cost estimates
Allowance for LSF CU LV cables from Tx to LV switchboards excluded in PW cost estimates
G59 Witnessing item 1 10,000 10,000 10,000
Total 884,510
Table 12-3: Private wire connection costs- energy centre auxiliary load
Energy Centre Aux Load Unit Material Unit cost
Qty Sub total Unit
Labour Unit cost
Duration / Qty Hrs
Sub total Total
1000kVA midel oil filled transformer and three phase 11/0.417kV each 20,000 2 40,000 hrs 105 112 11,760 51,760

Cribbs Patchway New Neighbourhood
Heat Network Feasibility Study
3514199A-BEE CPNN DH Feasibility - FINAL - 10-05-16_v2 Prepared by WSP | Parsons Brinckerhoff Sept 2015 for South Gloucestershire Council - 105 -
Schneider three phase LV Switchboard complete with protections and CTs, VTs etc
each 50,000 1 50,000 hrs 105 56 5,880 55,880
Allowance for LSF CU LV cables 4C 300sqmm meters
80 1,000 80,000 each 15 500 7,500 87,500
Lighting and fire alarm system each 60,000 1 60,000 hrs 85 1,200 102,000 162,000
LV Cable containment item 20,000
Lightning protection + earthing item 20,000
Power distrbution board (PDU) + DBs each 20,000 1 20,000 each 85 96 8,160 28,160
Small power each 5,000 1 5,000 each 85 96 8,160 13,160
Total 438,460

Cribbs Patchway New Neighbourhood
Heat Network Feasibility Study
3514199A-BEE CPNN DH Feasibility - FINAL - 10-05-16_v2 Prepared by WSP | Parsons Brinckerhoff Sept 2015 for South Gloucestershire Council - 106 -
13 CAPEX PHASING METHODOLOGY
13.1 Introduction
The capital costs associated with the different network options have been phased throughout the development of the scheme within the techno-economic modelling of all options. CAPEX phasing was introduced to reflect the phasing of the developments within each of the developer plots and corresponding energy demands. Phasing of CAPEX was judged to be a more suitable approach than introducing all scheme components in year 0 of the scheme. The approach taken would enable the energy centre operator to spread the costs of the scheme with the ability to provide energy to connected customers as and when they come on line. Cashflow requirements of the scheme would be eased and there would be ample opportunities for the energy centre owner to explore potential avenues for lower cost funding throughout the development of the scheme as an operating track record is developed.
13.2 Phasing Approach
13.2.1 Prime Mover (Gas CHP and Biomass Boilers)
As mentioned within the energy modelling section, gas CHP and biomass boilers are introduced to the scheme when there is sufficient heat demand to ensure that they operate for a reasonable number of operating hours. This approach has been taken to ensure that the primary plant is well utilised and not idle for significant periods throughout the duration of its operational lifetime and is not installed prematurely which would adversely affect the scheme cash flow until the consumer base is sufficient to generate revenue to offset the capital costs. It has been assumed that the thermal store would be installed in the same year as the first gas CHP engine/ biomass boiler. Thermal storage is not included prior to this as the gas boilers installed to meet initial heat demands of connected customers are able to fully modulate therefore there would be little benefit of thermal storage at this stage. It is assumed that the thermal store would be sited externally to the energy centre and therefore would not impact either the design or phasing of the energy centre building. For the biomass boiler options, the fuel storage and handling is also not included until the installation of the first biomass boiler. Similarly to the thermal store, it is also considered that this would not be impact the design of the energy centre as it would be located externally. 13.2.2 Back-Up Gas Boilers
Top-up/back up gas boilers are introduced within the energy centre as the peak demands of the network options require. The installation and capital costs associated with back up gas boilers has been assumed the year prior to their requirement in relation to the peak demands of the network. The total capacity of gas boilers within the energy centres for each of the network options at full build out has been based on the total residential peak heat demand accounting for diversity of hot water peak demands across all dwellings connected to the scheme and a the total diversified commercial peak load. Due to the relatively lower hot water requirements of commercial properties of the nature considered within CPNN, excepting proposed hotels and restaurants, the peak heat demand of commercial properties has only been diversified to 80%.

Cribbs Patchway New Neighbourhood
Heat Network Feasibility Study
3514199A-BEE CPNN DH Feasibility - FINAL - 10-05-16_v2 Prepared by WSP | Parsons Brinckerhoff Sept 2015 for South Gloucestershire Council - 107 -
Resiliency of back-up heat supply is ensured as the total gas boiler capacity includes an n+1 resiliency. The additional boiler for all network options is considered to provide additional back-up at the capacity of the mid-range boilers previously installed within the energy centres. For example if boilers of capacities in increments of 2.5, 5 and 10MW are installed in the energy centre, the final gas boiler plant would have an additional 5MW boiler to provide the additional resiliency. 13.2.3 Interface Units
As mentioned in Section 8.2.3, domestic HIU and non-domestic CIU installation and capital spend is assumed to occur the year prior to connection.
13.2.4 Heat Distribution Network
The main spine network is phased through time with respect to the phasing of residential and non-residential peak demand phasing over time. Where there is relatively low incremental peak phasing, it is assumed that development of the main spine network would occur at a steady rate to ensure that unreasonably rapid development and installation would not be required in the year proceeding a sharp increase in the total peak demand of a given network development. The phasing of CAPEX on the distribution network connecting the individual dwellings within the sites connected within the different network options is based on the phasing of houses within the site although an indication of the total number of dwellings (including flats) is provided within the following CAPEX phasing figures. It should be noted that as the numbers of blocks of flats and respective sizes were not known at the time of writing.
13.3 Phased CAPEX through Time
The following figures and tables show the capital cost phasing of the aforementioned items through time for each of the network options. It should be noted that all figures representing the phased CAPEX no contingency has been included. 20% contingency for all CAPEX is presented in the CAPEX summary tables and corresponding graphs for each network option.

Cribbs Patchway New Neighbourhood
Heat Network Feasibility Study
3514199A-BEE CPNN DH Feasibility - FINAL - 10-05-16_v2 Prepared by WSP | Parsons Brinckerhoff Sept 2015 for South Gloucestershire Council - 108 -
13.3.1 All BAe Sites with Mall Connection Network
Energy Centre CAPEX
Figure 13-1: Gas CHP energy centre CAPEX spend through time
Figure 13-2: Biomass boiler energy centre CAPEX spend through time
Top-Up/Back up Boiler Phasing
£0
£500,000
£1,000,000
£1,500,000
£2,000,000
£2,500,000
£3,000,000
£3,500,000
£4,000,000
£4,500,000
2016 2017 2018 2019 2020 2021 2022 2023 2024 2025 2026 2027 2028 2029 2030 2031 2032 2033
CHP Engines Energy Centre Building Thermal Store Back-Up Gas Boilers Private Wire Utilities Connections
£0
£500,000
£1,000,000
£1,500,000
£2,000,000
£2,500,000
£3,000,000
2016 2017 2018 2019 2020 2021 2022 2023 2024 2025
Biomass Boilers Energy Centre Building Fuel Handling and Storage Thermal Store Back-Up Gas Boilers Utilities Connections

Cribbs Patchway New Neighbourhood
Heat Network Feasibility Study
3514199A-BEE CPNN DH Feasibility - FINAL - 10-05-16_v2 Prepared by WSP | Parsons Brinckerhoff Sept 2015 for South Gloucestershire Council - 109 -
Gas boiler phasing for both the gas CHP and biomass boiler energy centre options is shown in the following figure.
Figure 13-3: Top-Up/ Back-Up gas boiler phasing through time
Distribution Network Phasing
Figure 13-4: Main spine DH network phasing
2016 2017 2018 2019 2020 2021 2022 2023 2024 2025 2026 2027 2028 2029 2030 2031 2032 2033
CAPEX £448,256 £0 £0 £0 £1,344,768 £0 £0 £0 £0 £448,256 £0 £0 £0 £0 £0 £0 £0 £0
Cumulative %Peak Demand
3% 4% 5% 6% 8% 41% 45% 46% 48% 49% 57% 58% 59% 65% 95% 97% 99% 100%
0%
10%
20%
30%
40%
50%
60%
70%
80%
90%
100%
£0
£200,000
£400,000
£600,000
£800,000
£1,000,000
£1,200,000
£1,400,000
£1,600,000
2016 2017 2018 2019 2020 2021 2022 2023 2024 2025 2026 2027 2028 2029 2030 2031 2032 2033
CAPEX £209,031 £209,031 £104,515 £522,577 £731,607 £104,515 £209,031 £104,515 £104,515 £209,031 £418,061 £418,061 £418,061 £209,031 £209,031 £0 £0 £0
Cumulative % network build out 8% 10% 13% 25% 43% 45% 50% 53% 55% 60% 70% 80% 90% 100% 100% 100% 100% 100%
Cumulative % total peak heat demand 3% 4% 5% 6% 8% 41% 45% 46% 48% 49% 57% 58% 59% 65% 95% 97% 99% 100%
0%
10%
20%
30%
40%
50%
60%
70%
80%
90%
100%
£0
£100,000
£200,000
£300,000
£400,000
£500,000
£600,000
£700,000
£800,000

Cribbs Patchway New Neighbourhood
Heat Network Feasibility Study
3514199A-BEE CPNN DH Feasibility - FINAL - 10-05-16_v2 Prepared by WSP | Parsons Brinckerhoff Sept 2015 for South Gloucestershire Council - 110 -
Individual Dwelling Connections
Figure 13-5: Individual dwelling connection network phasing
Interface Unit Phasing
Figure 13-6: Commercial consumer interface unit phased CAPEX
2016 2017 2018 2019 2020 2021 2022 2023 2024 2025 2026 2027 2028 2029 2030 2031 2032 2033
CAPEX £0 £64,404 £64,404 £64,404 £64,404 £120,291 £288,983 £274,396 £505,490 £507,403 £363,909 £477,254 £580,987 £680,550 £653,767 £609,560 £439,545 £0
No. House Connections (cumulative) 0 0 14 28 42 56 82 145 205 314 425 504 608 734 882 1024 1156 1252
Total Dwelling Connections (cumulative) 59 157 315 474 632 940 1,095 1,249 1,406 1,623 1,811 1,943 2,095 2,274 2,467 2,636 2,790 2,901
0
500
1000
1500
2000
2500
3000
3500
£0
£100,000
£200,000
£300,000
£400,000
£500,000
£600,000
£700,000
£800,000
Nu
mb
er
2016 2017 2018 2019 2020 2021 2022 2023 2024 2025 2026 2027 2028 2029 2030 2031 2032 2033
CAPEX £54,830 £0 £0 £23,574 £275,230 £103,934 £23,574 £0 £0 £117,274 £0 £0 £66,040 £736,623 £0 £0 £0 £23,574
Cumulative % Peak Commercial Demand 15% 15% 15% 15% 15% 47% 52% 54% 54% 54% 69% 69% 69% 75% 99% 99% 99% 99%
0%
10%
20%
30%
40%
50%
60%
70%
80%
90%
100%
£0
£100,000
£200,000
£300,000
£400,000
£500,000
£600,000
£700,000
£800,000

Cribbs Patchway New Neighbourhood
Heat Network Feasibility Study
3514199A-BEE CPNN DH Feasibility - FINAL - 10-05-16_v2 Prepared by WSP | Parsons Brinckerhoff Sept 2015 for South Gloucestershire Council - 111 -
Figure 13-7: Domestic heat interface unit phased CAPEX
2016 2017 2018 2019 2020 2021 2022 2023 2024 2025 2026 2027 2028 2029 2030 2031 2032 2033
CAPEX £70,425 £307,792 £190,167 £190,167 £370,167 £369,768 £365,430 £364,529 £368,520 £440,286 £406,321 £338,648 £361,351 £395,059 £412,143 £382,196 £365,555 £133,124
Cumulative No. Dwelling Connections 59 157 315 474 632 940 1,095 1,249 1,406 1,623 1,811 1,943 2,095 2,274 2,467 2,636 2,790 2,901
0
500
1,000
1,500
2,000
2,500
3,000
3,500
£0
£50,000
£100,000
£150,000
£200,000
£250,000
£300,000
£350,000
£400,000
£450,000
£500,000
Nu
mb
er

Cribbs Patchway New Neighbourhood
Heat Network Feasibility Study
3514199A-BEE CPNN DH Feasibility - FINAL - 10-05-16_v2 Prepared by WSP | Parsons Brinckerhoff Sept 2015 for South Gloucestershire Council - 112 -
All BAe Sites with Mall Connection Summary Phasing Table 13-1: Energy demand and connection summary
2016 2017 2018 2019 2020 2021 2022 2023 2024 2025 2026 2027 2028 2029 2030 2031 2032 2033
Annual Heat Demand inc. losses (MWh p.a.) 1,056 1,555 2,423 3,292 4,161 14,102 16,082 17,121 18,013 19,303 24,075 24,857 25,717 28,990 35,839 36,936 37,957 38,708
Total Dwelling Connections 59 157 315 474 782 940 1,095 1,249 1,406 1,623 1,811 1,943 2,095 2,274 2,467 2,636 2,790 2,901
Commercial Peak Heat Demand (MW) 2.494 2.494 2.494 2.494 2.494 8.148 8.976 9.211 9.211 9.211 11.780 11.780 11.780 12.920 17.005 17.060 17.060 17.060
Total Peak Heat Demand (MW) 0.620 0.879 1.330 1.782 2.233 13.245 14.477 15.011 15.475 16.145 18.199 18.605 19.052 21.068 31.114 31.847 32.542 33.053
Table 13-2: Gas CHP network option CAPEX phasing (£k)
2016 2017 2018 2019 2020 2021 2022 2023 2024 2025 2026 2027 2028 2029 2030 2031 2032 2033
CHP Engines £0 £0 £0 £0 £1,166 £0 £0 £0 £0 £1,166 £0 £0 £0 £0 £0 £0 £0 £0
Energy Centre Building £406 £1,218 £0 £0 £0 £0 £0 £0 £0 £0 £0 £0 £0 £0 £0 £0 £0 £0
Thermal Store £0 £0 £0 £0 £311 £0 £0 £0 £0 £0 £0 £0 £0 £0 £0 £0 £0 £0
Back-Up Gas Boilers £448 £0 £0 £0 £1,345 £0 £0 £0 £0 £448 £0 £0 £0 £0 £0 £0 £0 £0
Private Wire Connection £0 £0 £0 £0 £0 £1,310 £0 £0 £0 £0 £0 £0 £0 £0 £0 £0 £0 £0
Utilities Connections £100 £0 £0 £0 £0 £0 £0 £0 £0 £0 £0 £0 £0 £0 £0 £0 £0 £0
Main Spine £209 £209 £105 £523 £732 £105 £209 £105 £105 £209 £418 £418 £418 £209 £209 £0 £0 £0
Individual Dwelling Connections £0 £64 £64 £64 £64 £120 £289 £274 £505 £507 £364 £477 £581 £681 £654 £610 £440 £0
HIU £70 £308 £190 £190 £370 £185 £185 £189 £260 £226 £159 £181 £215 £232 £202 £186 £133 £0
CIU £55 £0 £0 £24 £275 £104 £24 £0 £0 £117 £0 £0 £66 £737 £0 £0 £0 £24
Professional Fees £161 £225 £45 £100 £697 £64 £88 £71 £109 £334 £118 £135 £272 £232 £133 £99 £72 £3
Contingency £290 £405 £81 £180 £1,254 £116 £159 £128 £196 £602 £212 £242 £490 £418 £240 £179 £129 £5
Total £1,739 £2,429 £485 £1,081 £7,523 £694 £953 £766 £1,175 £3,610 £1,270 £1,454 £2,042 £2,509 £1,438 £1,073 £773 £32

Cribbs Patchway New Neighbourhood
Heat Network Feasibility Study
3514199A-BEE CPNN DH Feasibility - FINAL - 10-05-16_v2 Prepared by WSP | Parsons Brinckerhoff Sept 2015 for South Gloucestershire Council - 113 -
Figure 13-8: Total CAPEX through time- gas CHP network option
£0
£1,000,000
£2,000,000
£3,000,000
£4,000,000
£5,000,000
£6,000,000
£7,000,000
£8,000,000
2016 2017 2018 2019 2020 2021 2022 2023 2024 2025 2026 2027 2028 2029 2030 2031 2032 2033
CHP Engines Energy Centre Building Thermal Store
Back-Up Gas Boilers Private Wire Utilities Connections
Main Spine Individual Dwelling Connections HIU

Cribbs Patchway New Neighbourhood
Heat Network Feasibility Study
3514199A-BEE CPNN DH Feasibility - FINAL - 10-05-16_v2 Prepared by WSP | Parsons Brinckerhoff Sept 2015 for South Gloucestershire Council - 114 -
Table 13-3: Biomass boiler network option CAPEX phasing (£k)
2016 2017 2018 2019 2020 2021 2022 2023 2024 2025 2026 2027 2028 2029 2030 2031 2032 2033
Biomass Boilers £0 £0 £0 £0 £793 £0 £0 £0 £0 £793 £0 £0 £0 £0 £0 £0 £0 £0
Energy Centre Building £0 £526 £1,578 £0 £0 £0 £0 £0 £0 £0 £0 £0 £0 £0 £0 £0 £0 £0
Thermal Store £0 £0 £0 £0 £0 £186 £0 £0 £0 £0 £0 £0 £0 £0 £0 £0 £0 £0
Fuel Handling and Storage £0 £0 £0 £0 £0 £147 £0 £0 £0 £0 £0 £0 £0 £0 £0 £0 £0 £0
Back-Up Gas Boilers £0 £448 £0 £0 £0 £1,345 £0 £0 £0 £0 £448 £0 £0 £0 £0 £0 £0 £0
Utilities Connections £0 £100 £0 £0 £0 £0 £0 £0 £0 £0 £0 £0 £0 £0 £0 £0 £0 £0
Main Spine £209 £209 £105 £523 £732 £105 £209 £105 £105 £209 £418 £418 £418 £209 £209 £0 £0 £0
Individual Dwelling Connections £0 £64 £64 £64 £64 £120 £289 £274 £505 £507 £364 £477 £581 £681 £654 £610 £440 £0
HIU £70 £308 £190 £190 £370 £185 £185 £189 £260 £226 £159 £181 £215 £232 £202 £186 £133 £0
CIU £55 £0 £0 £24 £275 £104 £24 £0 £0 £117 £0 £0 £66 £737 £0 £0 £0 £24
Professional Fees £176 £270 £45 £100 £489 £64 £88 £71 £109 £288 £118 £135 £272 £232 £133 £99 £72 £3
Contingency £317 £486 £81 £180 £880 £116 £159 £128 £196 £518 £212 £242 £490 £418 £240 £179 £129 £5
Total £1,901 £2,915 £485 £1,081 £5,133 £694 £953 £766 £1,175 £3,555 £1,270 £1,454 £2,042 £2,509 £1,438 £1,073 £773 £32

Cribbs Patchway New Neighbourhood
Heat Network Feasibility Study
3514199A-BEE CPNN DH Feasibility - FINAL - 10-05-16_v2 Prepared by WSP | Parsons Brinckerhoff Sept 2015 for South Gloucestershire Council - 115 -
Figure 13-9: Total CAPEX through time- biomass boiler network option
£0
£1,000,000
£2,000,000
£3,000,000
£4,000,000
£5,000,000
£6,000,000
2016 2017 2018 2019 2020 2021 2022 2023 2024 2025 2026 2027 2028 2029 2030 2031 2032 2033
Biomass Boilers Energy Centre Building Fuel Handling and Storage Thermal Store
Back-Up Gas Boilers Utilities Connections Main Spine Individual Dwelling Connections
HIU CIU Professional Fees Contingency

Cribbs Patchway New Neighbourhood
Heat Network Feasibility Study
3514199A-BEE CPNN DH Feasibility - FINAL - 10-05-16_v2 Prepared by WSP | Parsons Brinckerhoff Sept 2015 for South Gloucestershire Council - 116 -
13.3.2 All BAe Sites Network Option
Energy Centre CAPEX
Figure 13-10: Gas CHP energy centre CAPEX spend through time
Figure 13-11: Biomass boiler energy centre CAPEX spend through time
£0
£200,000
£400,000
£600,000
£800,000
£1,000,000
£1,200,000
£1,400,000
£1,600,000
£1,800,000
2016 2017 2018 2019 2020 2021 2022 2023 2024 2025 2026 2027 2028 2029 2030
CHP Engines Energy Centre Building Thermal Store Back-Up Gas Boilers Utilities Connections
£0
£200,000
£400,000
£600,000
£800,000
£1,000,000
£1,200,000
£1,400,000
£1,600,000
2016 2017 2018 2019 2020 2021 2022 2023 2024 2025 2026 2027 2028 2029
Biomass Boilers Energy Centre Building Fuel Handling and Storage Thermal Store Back-Up Gas Boilers Utilities Connections

Cribbs Patchway New Neighbourhood
Heat Network Feasibility Study
3514199A-BEE CPNN DH Feasibility - FINAL - 10-05-16_v2 Prepared by WSP | Parsons Brinckerhoff Sept 2015 for South Gloucestershire Council - 117 -
Top-Up/Back up Boiler Phasing Gas boiler phasing for both the gas CHP and biomass boiler energy centre options is shown in the following figure.
Figure 13-12: Top-Up/ Back-Up gas boiler phasing through time
2016 2017 2018 2019 2020 2021 2022 2023 2024 2025 2026 2027 2028 2029 2030 2031 2032 2033 2033
CAPEX £448,25 £0 £0 £0 £448,25 £0 £0 £0 £0 £448,25 £0 £0 £896,51 £0 £0 £0 £0 £0 £0
Cumulative % Peak Demand 1% 2% 3% 5% 7% 10% 17% 19% 21% 23% 33% 35% 36% 44% 95% 97% 99% 100% 100%
0%
10%
20%
30%
40%
50%
60%
70%
80%
90%
100%
£0
£100,000
£200,000
£300,000
£400,000
£500,000
£600,000
£700,000
£800,000
£900,000
£1,000,000

Cribbs Patchway New Neighbourhood
Heat Network Feasibility Study
3514199A-BEE CPNN DH Feasibility - FINAL - 10-05-16_v2 Prepared by WSP | Parsons Brinckerhoff Sept 2015 for South Gloucestershire Council - 118 -
Distribution Network Phasing
Figure 13-13: Main spine DH network phasing
Individual Dwelling Connections
Figure 13-14: Individual dwelling connection network phasing
2016 2017 2018 2019 2020 2021 2022 2023 2024 2025 2026 2027 2028 2029 2030 2031 2032 2033
CAPEX £187,206 £374,412 £187,206 £187,206 £187,206 £187,206 £187,206 £187,206 £187,206 £374,412 £187,206 £187,206 £374,412 £748,825 £0 £0 £0 £0
Cumulative % network build out 10% 15% 20% 25% 30% 35% 40% 45% 50% 60% 65% 70% 80% 100% 100% 100% 100% 100%
Cumulative % total peak heat demand 1% 2% 3% 5% 7% 10% 17% 19% 21% 23% 33% 35% 36% 44% 95% 97% 99% 100%
0%
10%
20%
30%
40%
50%
60%
70%
80%
90%
100%
£0
£100,000
£200,000
£300,000
£400,000
£500,000
£600,000
£700,000
£800,000
2016 2017 2018 2019 2020 2021 2022 2023 2024 2025 2026 2027 2028 2029 2030 2031 2032 2033
CAPEX £0 £64,404 £64,404 £64,404 £64,404 £120,291 £288,983 £274,396 £505,490 £507,403 £363,909 £477,254 £580,987 £680,550 £653,767 £609,560 £439,545 £0
No. House Connections (cumulative) 0 0 14 28 42 56 82 145 205 314 425 504 608 734 882 1024 1156 1252
No. Dwelling Connections (cumulative) 59 157 315 474 632 790 945 1,099 1,256 1,473 1,661 1,793 1,945 2,124 2,317 2,486 2,640 2,751
0
500
1000
1500
2000
2500
3000
£0
£100,000
£200,000
£300,000
£400,000
£500,000
£600,000
£700,000
£800,000
Nu
mb
er

Cribbs Patchway New Neighbourhood
Heat Network Feasibility Study
3514199A-BEE CPNN DH Feasibility - FINAL - 10-05-16_v2 Prepared by WSP | Parsons Brinckerhoff Sept 2015 for South Gloucestershire Council - 119 -
Interface Unit Phasing
Figure 13-15: Commercial consumer interface unit phased CAPEX
Figure 13-16: Domestic heat interface unit phased CAPEX
2016 2017 2018 2019 2020 2021 2022 2023 2024 2025 2026 2027 2028 2029 2030 2031 2032 2033
CAPEX £0 £0 £0 £23,574 £73,705 £103,934 £23,574 £0 £0 £117,274 £0 £0 £66,040 £736,623 £0 £0 £0 £23,574
Cumulative % Peak Commercial Demand 0% 0% 0% 0% 0% 7% 15% 18% 18% 18% 44% 44% 44% 56% 98% 99% 99% 99%
0%
10%
20%
30%
40%
50%
60%
70%
80%
90%
100%
£0
£100,000
£200,000
£300,000
£400,000
£500,000
£600,000
£700,000
£800,000
2016 2017 2018 2019 2020 2021 2022 2023 2024 2025 2026 2027 2028 2029 2030 2031 2032 2033
CAPEX £70,425 £307,792 £190,167 £190,167 £190,167 £189,768 £185,430 £184,529 £188,520 £260,286 £226,321 £158,648 £181,351 £215,059 £232,143 £202,196 £185,555 £133,124
Cumulative No. Dwelling Connections 59 157 315 474 632 790 945 1,099 1,256 1,473 1,661 1,793 1,945 2,124 2,317 2,486 2,640 2,751
0
500
1,000
1,500
2,000
2,500
3,000
£0
£50,000
£100,000
£150,000
£200,000
£250,000
£300,000
£350,000
Num
be
r

Cribbs Patchway New Neighbourhood
Heat Network Feasibility Study
3514199A-BEE CPNN DH Feasibility - FINAL - 10-05-16_v2 Prepared by WSP | Parsons Brinckerhoff Sept 2015 for South Gloucestershire Council - 120 -
All BAe Sites Summary Phasing
Table 13-4: Energy demand and connection summary
2016 2017 2018 2019 2020 2021 2022 2023 2024 2025 2026 2027 2028 2029 2030 2031 2032 2033
Annual Heat Demand inc. losses (MWh p.a.) 307 821 1,715 2,610 3,504 5,356 7,394 8,464 9,383 10,711 15,625 16,430 17,315 20,686 27,738 28,868 29,919 30,693
Total Dwelling Connections 59 157 315 474 632 790 945 1,099 1,256 1,473 1,661 1,793 1,945 2,124 2,317 2,486 2,640 2,751
Commercial Peak Heat Demand (MW) 0 0 0 0 0 0.674 1.501 1.736 1.736 1.736 4.306 4.306 4.306 5.445 9.531 9.585 9.585 9.585
Total Peak Heat Demand (MW) 0.149 0.399 0.833 1.268 1.702 2.445 3.834 4.320 4.766 5.411 7.309 7.700 8.130 9.892 21.571 22.079 22.566 22.924
Table 13-5: Gas CHP network option CAPEX phasing (£k)
2016 2017 2018 2019 2020 2021 2022 2023 2024 2025 2026 2027 2028 2029 2030 2031 2032 2033
CHP Engines £0 £0 £0 £0 £0 £0 £0 £0 £0 £957 £0 £0 £0 £957 £0 £0 £0 £0
Energy Centre Building £322 £965 £0 £0 £0 £0 £0 £0 £0 £0 £0 £0 £0 £0 £0 £0 £0 £0
Thermal Store £0 £0 £0 £0 £0 £0 £0 £0 £0 £264 £0 £0 £0 £0 £0 £0 £0 £0
Back-Up Gas Boilers £448 £0 £0 £0 £448 £0 £0 £0 £0 £448 £0 £0 £897 £0 £0 £0 £0 £0
Utilities Connections £100 £0 £0 £0 £0 £0 £0 £0 £0 £0 £0 £0 £0 £0 £0 £0 £0 £0
Main Spine £187 £374 £187 £187 £187 £187 £187 £187 £187 £374 £187 £187 £374 £749 £0 £0 £0 £0
Individual Dwelling Connections £0 £64 £64 £64 £64 £120 £289 £274 £505 £507 £364 £477 £581 £681 £654 £610 £440 £0
HIU £70 £308 £190 £190 £190 £185 £185 £189 £260 £226 £159 £181 £215 £232 £202 £186 £133 £0
CIU £0 £0 £0 £24 £74 £104 £24 £0 £0 £117 £0 £0 £66 £737 £0 £0 £0 £24
Professional Fees £141 £214 £55 £58 £120 £75 £86 £81 £119 £362 £89 £106 £267 £419 £107 £99 £72 £3
Contingency £254 £385 £99 £105 £217 £134 £154 £146 £214 £651 £160 £190 £480 £755 £193 £179 £129 £5
Total £1,522 £2,310 £596 £628 £1,301 £806 £924 £878 £1,287 £3,908 £958 £1,142 £2,880 £4,530 £1,156 £1,073 £773 £32

Cribbs Patchway New Neighbourhood
Heat Network Feasibility Study
3514199A-BEE CPNN DH Feasibility - FINAL - 10-05-16_v2 Prepared by WSP | Parsons Brinckerhoff Sept 2015 for South Gloucestershire Council - 121 -
Figure 13-17: Total CAPEX through time- gas CHP network option
£0
£500,000
£1,000,000
£1,500,000
£2,000,000
£2,500,000
£3,000,000
£3,500,000
£4,000,000
£4,500,000
£5,000,000
2016 2017 2018 2019 2020 2021 2022 2023 2024 2025 2026 2027 2028 2029 2030 2031 2032 2033
CHP Engines Energy Centre Building Thermal Store Back-Up Gas Boilers
Utilities Connections Main Spine Individual Dwelling Connections HIU
CIU Professional Fees Contingency

Cribbs Patchway New Neighbourhood
Heat Network Feasibility Study
3514199A-BEE CPNN DH Feasibility - FINAL - 10-05-16_v2 Prepared by WSP | Parsons Brinckerhoff Sept 2015 for South Gloucestershire Council - 122 -
Table 13-6: Biomass boiler network option CAPEX phasing (£k)
2016 2017 2018 2019 2020 2021 2022 2023 2024 2025 2026 2027 2028 2029 2030 2031 2032 2033
Biomass Boilers £0 £0 £0 £0 £0 £0 £0 £0 £0 £639 £0 £0 £0 £639 £0 £0 £0 £0
Energy Centre Building £435 £1,306 £0 £0 £0 £0 £0 £0 £0 £0 £0 £0 £0 £0 £0 £0 £0 £0
Thermal Store £0 £0 £0 £0 £0 £0 £0 £0 £0 £157 £0 £0 £0 £0 £0 £0 £0 £0
Fuel Handling and Storage £0 £0 £0 £0 £0 £0 £0 £0 £0 £147 £0 £0 £0 £0 £0 £0 £0 £0
Back-Up Gas Boilers £448 £0 £0 £0 £448 £0 £0 £0 £0 £448 £0 £0 £897 £0 £0 £0 £0 £0
Utilities Connections £100 £0 £0 £0 £0 £0 £0 £0 £0 £0 £0 £0 £0 £0 £0 £0 £0 £0
Main Spine £187 £374 £187 £187 £187 £187 £187 £187 £187 £374 £187 £187 £374 £749 £0 £0 £0 £0
Individual Dwelling Connections £0 £64 £64 £64 £64 £120 £289 £274 £505 £507 £364 £477 £581 £681 £654 £610 £440 £0
HIU £70 £308 £190 £190 £190 £185 £185 £189 £260 £226 £159 £181 £215 £232 £202 £186 £133 £0
CIU £0 £0 £0 £24 £74 £104 £24 £0 £0 £117 £0 £0 £66 £737 £0 £0 £0 £24
Professional Fees £155 £257 £55 £58 £120 £75 £86 £81 £119 £327 £89 £106 £267 £380 £107 £99 £72 £3
Contingency £279 £462 £99 £105 £217 £134 £154 £146 £214 £589 £160 £190 £480 £683 £193 £179 £129 £5
Total £1,675 £2,770 £596 £628 £1,301 £806 £924 £878 £1,287 £3,386 £958 £1,142 £3,776 £4,100 £1,156 £1,073 £773 £32

Cribbs Patchway New Neighbourhood
Heat Network Feasibility Study
3514199A-BEE CPNN DH Feasibility - FINAL - 10-05-16_v2 Prepared by WSP | Parsons Brinckerhoff Sept 2015 for South Gloucestershire Council - 123 -
Figure 13-18: Total CAPEX through time- biomass boiler network option
£0
£1,000,000
£2,000,000
£3,000,000
£4,000,000
£5,000,000
£6,000,000
2016 2017 2018 2019 2020 2021 2022 2023 2024 2025 2026 2027 2028 2029 2030 2031 2032 2033
Biomass Boilers Energy Centre Building Fuel Handling and Storage Thermal Store
Back-Up Gas Boilers Utilities Connections Main Spine Individual Dwelling Connections
HIU CIU Professional Fees Contingency

Cribbs Patchway New Neighbourhood
Heat Network Feasibility Study
3514199A-BEE CPNN DH Feasibility - FINAL - 10-05-16_v2 Prepared by WSP | Parsons Brinckerhoff Sept 2015 for South Gloucestershire Council - 124 -
13.3.3 BAe High Density with Mall Network Options
Energy Centre CAPEX
Figure 13-19: Gas CHP energy centre CAPEX spend through time
Figure 13-20: Biomass boiler energy centre CAPEX spend through time
£0
£200,000
£400,000
£600,000
£800,000
£1,000,000
£1,200,000
£1,400,000
£1,600,000
£1,800,000
£2,000,000
2015 2016 2017 2018 2019 2020 2021 2022 2023 2024 2025 2026 2027 2028 2029 2030 2031 2032
CHP Engines Energy Centre Building Thermal Store Back-Up Gas Boilers Utilities Connections Private Wire
£0
£200,000
£400,000
£600,000
£800,000
£1,000,000
£1,200,000
£1,400,000
£1,600,000
£1,800,000
2016 2017 2018 2019 2020 2021 2022 2023 2024 2025 2026 2027 2028 2029 2030
Biomass Boilers Energy Centre Building Fuel Handling and Storage Thermal Store Back-Up Gas Boilers Utilities Connections

Cribbs Patchway New Neighbourhood
Heat Network Feasibility Study
3514199A-BEE CPNN DH Feasibility - FINAL - 10-05-16_v2 Prepared by WSP | Parsons Brinckerhoff Sept 2015 for South Gloucestershire Council - 125 -
Top-Up/Back up Boiler Phasing Gas boiler phasing for both the gas CHP and biomass boiler energy centre options is shown in the following figure.
Figure 13-21: Top-Up/ Back-Up gas boiler phasing through time
2016 2017 2018 2019 2020 2021 2022 2023 2024 2025 2026 2027 2028 2029 2030 2031 2032 2033
CAPEX £448,256 £448,256 £0 £0 £0 £0 £0 £0 £448,256 £0 £0 £0 £448,256 £0 £0 £0 £0 £0
Cumulative %Peak Demand
5% 6% 7% 9% 10% 60% 65% 65% 66% 67% 76% 76% 76% 84% 100% 100% 100% 100%
0%
10%
20%
30%
40%
50%
60%
70%
80%
90%
100%
£0
£50,000
£100,000
£150,000
£200,000
£250,000
£300,000
£350,000
£400,000
£450,000
£500,000

Cribbs Patchway New Neighbourhood
Heat Network Feasibility Study
3514199A-BEE CPNN DH Feasibility - FINAL - 10-05-16_v2 Prepared by WSP | Parsons Brinckerhoff Sept 2015 for South Gloucestershire Council - 126 -
Distribution Network Phasing
Figure 13-22: Main spine DH network phasing
Individual Dwelling Connections
Figure 13-23: Individual dwelling connection network phasing
2016 2017 2018 2019 2020 2021 2022 2023 2024 2025 2026 2027 2028 2029 2030 2031 2032 2033
CAPEX £59,799 £119,598 £59,799 £298,995 £597,991 £119,598 £119,598 £59,799 £59,799 £59,799 £59,799 £239,196 £239,196 £239,196 £0 £0 £0 £0
Cumulative % network build out 8% 10% 13% 25% 50% 55% 60% 63% 65% 68% 70% 80% 90% 100% 100% 100% 100% 100%
Cumulative % total peak heat demand 5% 6% 7% 9% 10% 60% 65% 65% 66% 67% 76% 76% 76% 84% 100% 100% 100% 100%
0%
10%
20%
30%
40%
50%
60%
70%
80%
90%
100%
£0
£100,000
£200,000
£300,000
£400,000
£500,000
£600,000
£700,000
2016 2017 2018 2019 2020 2021 2022 2023 2024 2025 2026 2027 2028 2029 2030 2031 2032 2033
CAPEX £0 £0 £0 £0 £0 £0 £0 £0 £0 £55,937 £55,937 £55,937 £55,937 £55,937 £55,937 £25,731 £0 £0
No. House Connections (cumulative) 0 0 0 0 0 0 0 0 0 0 12 24 36 49 61 73 79 79
No. Dwelling Connections (cumulative) 59 157 274 392 510 776 863 909 970 1,034 1,083 1,115 1,146 1,181 1,213 1,235 1,250 1,258
0
200
400
600
800
1000
1200
1400
£0
£10,000
£20,000
£30,000
£40,000
£50,000
£60,000
Nu
mb
er

Cribbs Patchway New Neighbourhood
Heat Network Feasibility Study
3514199A-BEE CPNN DH Feasibility - FINAL - 10-05-16_v2 Prepared by WSP | Parsons Brinckerhoff Sept 2015 for South Gloucestershire Council - 127 -
Interface Unit Phasing
Figure 13-24: Commercial consumer interface unit phased CAPEX
Figure 13-25: Domestic heat interface unit phased CAPEX
2016 2017 2018 2019 2020 2021 2022 2023 2024 2025 2026 2027 2028 2029 2030 2031 2032 2033
CAPEX £54,830 £0 £0 £0 £275,230 £103,934 £23,574 £0 £0 £117,274 £0 £0 £66,040 £443,969 £0 £0 £0 £0
Cumulative % Peak Commercial Demand 16% 16% 16% 16% 16% 52% 57% 59% 59% 59% 75% 75% 75% 83% 100% 100% 100% 100%
0%
10%
20%
30%
40%
50%
60%
70%
80%
90%
100%
£0
£50,000
£100,000
£150,000
£200,000
£250,000
£300,000
£350,000
£400,000
£450,000
£500,000
2016 2017 2018 2019 2020 2021 2022 2023 2024 2025 2026 2027 2028 2029 2030 2031 2032 2033
CAPEX £70,425 £188,051 £141,225 £141,225 £321,225 £319,344 £284,944 £234,300 £254,040 £256,036 £238,656 £219,045 £217,170 £222,083 £218,655 £206,093 £198,214 £9,893
Cumulative No. Dwelling Connections 59 157 274 392 510 776 863 909 970 1,034 1,083 1,115 1,146 1,181 1,213 1,235 1,250 1,258
0
200
400
600
800
1,000
1,200
1,400
£0
£50,000
£100,000
£150,000
£200,000
£250,000
£300,000
£350,000
Nu
mbe
r

Cribbs Patchway New Neighbourhood
Heat Network Feasibility Study
3514199A-BEE CPNN DH Feasibility - FINAL - 10-05-16_v2 Prepared by WSP | Parsons Brinckerhoff Sept 2015 for South Gloucestershire Council - 128 -
BAe High Density Sites with Mall Connection Summary Phasing Table 13-7: Energy demand and connection summary
2016 2017 2018 2019 2020 2021 2022 2023 2024 2025 2026 2027 2028 2029 2030 2031 2032 2033
Annual Heat Demand inc. losses (MWh p.a.) 985 1,450 2,008 2,566 3,124 12,138 13,587 13,908 14,200 14,501 18,141 18,301 18,455 20,682 24,323 24,432 24,507 24,546
Total Dwelling Connections 59 157 274 392 510 776 863 909 970 1,034 1,083 1,115 1,146 1,181 1,213 1,235 1,250 1,258
Commercial Peak Heat Demand (MW) 2.494 2.494 2.494 2.494 2.494 8.148 8.976 9.211 9.211 9.211 11.780 11.780 11.780 12.920 15.581 15.636 15.636 15.636
Total Peak Heat Demand (MW) 0.467 0.691 0.961 1.231 1.500 10.863 11.720 11.862 12.004 12.149 13.457 13.535 13.609 14.931 17.642 17.681 17.718 17.736
Table 13-8: Gas CHP network option CAPEX phasing
2016 2017 2018 2019 2020 2021 2022 2023 2024 2025 2026 2027 2028 2029 2030 2031 2032 2033
CHP Engines £0 £0 £0 £0 £0 £0 £0 £0 £749 £0 £0 £0 £0 £0 £749 £0 £0 £0
Energy Centre Building £293 £879 £0 £0 £0 £0 £0 £0 £0 £0 £0 £0 £0 £0 £0 £0 £0 £0
Thermal Store £0 £0 £0 £0 £0 £0 £0 £0 £213 £0 £0 £0 £0 £0 £0 £0 £0 £0
Back-Up Gas Boilers £448 £448 £0 £0 £0 £0 £0 £0 £448 £0 £0 £0 £448 £0 £0 £0 £0 £0
Utilities Connections £50 £0 £0 £0 £0 £0 £0 £0 £0 £0 £0 £0 £0 £0 £0 £0 £0 £0
Private Wire Connection £0 £0 £0 £0 £0 £0 £0 £0 £434 £0 £0 £0 £0 £0 £0 £0 £0 £0
Main Spine £60 £120 £60 £299 £598 £120 £120 £60 £60 £60 £60 £239 £239 £239 £0 £0 £0 £0
Individual Dwelling Connections £0 £0 £0 £0 £0 £0 £0 £0 £0 £56 £56 £56 £56 £56 £56 £26 £0 £0
HIU £70 £259 £141 £141 £319 £105 £54 £74 £76 £59 £39 £37 £42 £39 £26 £18 £10 £0
CIU £55 £0 £0 £0 £275 £104 £24 £0 £0 £117 £0 £0 £66 £444 £0 £0 £0 £0
Professional Fees £122 £213 £25 £55 £149 £41 £25 £17 £357 £36 £19 £42 £106 £97 £104 £5 £1 £0
Contingency £220 £384 £45 £99 £268 £74 £44 £30 £642 £66 £35 £75 £192 £175 £187 £10 £2 £0
Total £1,318 £2,303 £271 £594 £1,610 £443 £267 £181 £2,979 £394 £209 £449 £1,150 £1,050 £1,122 £59 £13 £0

Cribbs Patchway New Neighbourhood
Heat Network Feasibility Study
3514199A-BEE CPNN DH Feasibility - FINAL - 10-05-16_v2 Prepared by WSP | Parsons Brinckerhoff Sept 2015 for South Gloucestershire Council - 129 -
Figure 13-26: Total CAPEX through time- gas CHP network option
£0
£500,000
£1,000,000
£1,500,000
£2,000,000
£2,500,000
£3,000,000
£3,500,000
2016 2017 2018 2019 2020 2021 2022 2023 2024 2025 2026 2027 2028 2029 2030 2031 2032 2033
CHP Engines Energy Centre Building Thermal Store
Back-Up Gas Boilers Private Wire Utilities Connections
Main Spine Individual Dwelling Connections HIU

Cribbs Patchway New Neighbourhood
Heat Network Feasibility Study
3514199A-BEE CPNN DH Feasibility - FINAL - 10-05-16_v2 Prepared by WSP | Parsons Brinckerhoff Sept 2015 for South Gloucestershire Council - 130 -
Table 13-9: Biomass boiler network option CAPEX phasing
2016 2017 2018 2019 2020 2021 2022 2023 2024 2025 2026 2027 2028 2029 2030 2031 2032 2033
Biomass Boilers £0 £0 £0 £0 £0 £0 £0 £0 £441 £0 £0 £0 £0 £0 £441 £0 £0 £0
Energy Centre Building £396 £1,188 £0 £0 £0 £0 £0 £0 £0 £0 £0 £0 £0 £0 £0 £0 £0 £0
Thermal Store £0 £0 £0 £0 £0 £0 £0 £0 £127 £0 £0 £0 £0 £0 £0 £0 £0 £0
Fuel Handling and Storage £0 £0 £0 £0 £0 £0 £0 £0 £147 £0 £0 £0 £0 £0 £0 £0 £0 £0
Back-Up Gas Boilers £448 £448 £0 £0 £0 £0 £0 £0 £448 £0 £0 £0 £448 £0 £0 £0 £0 £0
Utilities Connections £50 £0 £0 £0 £0 £0 £0 £0 £0 £0 £0 £0 £0 £0 £0 £0 £0 £0
Main Spine £60 £120 £60 £299 £598 £120 £120 £60 £60 £60 £60 £239 £239 £239 £0 £0 £0 £0
Individual Dwelling Connections £0 £0 £0 £0 £0 £0 £0 £0 £0 £56 £56 £56 £56 £56 £56 £26 £0 £0
HIU £70 £259 £141 £141 £319 £105 £54 £74 £76 £59 £39 £37 £42 £39 £26 £18 £10 £0
CIU £55 £0 £0 £0 £275 £104 £24 £0 £0 £117 £0 £0 £66 £444 £0 £0 £0 £0
Professional Fees £135 £252 £25 £55 £149 £41 £25 £17 £162 £36 £19 £42 £106 £97 £65 £5 £1 £0
Contingency £243 £453 £45 £99 £268 £74 £44 £30 £292 £66 £35 £75 £192 £175 £118 £10 £2 £0
Total £1,457 £2,720 £271 £594 £1,610 £443 £267 £181 £1,607 £394 £209 £449 £1,598 £1,050 £707 £59 £13 £0
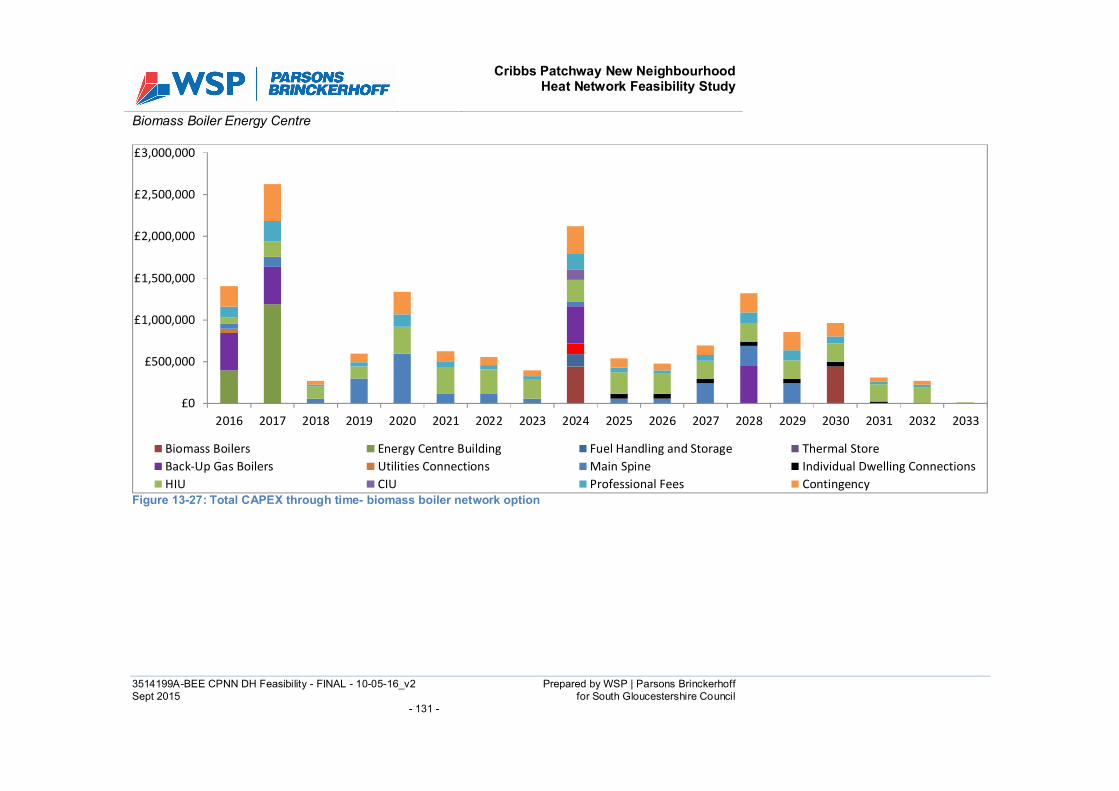
Cribbs Patchway New Neighbourhood
Heat Network Feasibility Study
3514199A-BEE CPNN DH Feasibility - FINAL - 10-05-16_v2 Prepared by WSP | Parsons Brinckerhoff Sept 2015 for South Gloucestershire Council - 131 -
Biomass Boiler Energy Centre
Figure 13-27: Total CAPEX through time- biomass boiler network option
£0
£500,000
£1,000,000
£1,500,000
£2,000,000
£2,500,000
£3,000,000
2016 2017 2018 2019 2020 2021 2022 2023 2024 2025 2026 2027 2028 2029 2030 2031 2032 2033
Biomass Boilers Energy Centre Building Fuel Handling and Storage Thermal Store
Back-Up Gas Boilers Utilities Connections Main Spine Individual Dwelling Connections
HIU CIU Professional Fees Contingency

Cribbs Patchway New Neighbourhood
Heat Network Feasibility Study
3514199A-BEE CPNN DH Feasibility - FINAL - 10-05-16_v2 Prepared by WSP | Parsons Brinckerhoff Sept 2015 for South Gloucestershire Council - 132 -
13.3.4 BAe High Density Network Option
Energy Centre CAPEX
Figure 13-28: Gas CHP energy centre CAPEX spend through time
Figure 13-29: Biomass boiler energy centre CAPEX spend through time
£0
£100,000
£200,000
£300,000
£400,000
£500,000
£600,000
£700,000
£800,000
£900,000
2016 2017 2018 2019 2020 2021 2022 2023 2024 2025 2026 2027 2028 2029 2030
CHP Engines Energy Centre Building Thermal Store Back-Up Gas Boilers Utilities Connections
£0
£200,000
£400,000
£600,000
£800,000
£1,000,000
£1,200,000
2016 2017 2018 2019 2020 2021 2022 2023 2024 2025 2026 2027 2028 2029 2030
Biomass Boilers Energy Centre Fuel Handling and Storage Thermal Store Back-Up Gas Boilers Utilities Connections

Cribbs Patchway New Neighbourhood
Heat Network Feasibility Study
3514199A-BEE CPNN DH Feasibility - FINAL - 10-05-16_v2 Prepared by WSP | Parsons Brinckerhoff Sept 2015 for South Gloucestershire Council - 133 -
Top-Up/Back up Boiler Phasing Gas boiler phasing for both the gas CHP and biomass boiler energy centre options is shown in the following figure.
Figure 13-30: Top-Up/ Back-Up gas boiler phasing through time
2016 2017 2018 2019 2020 2021 2022 2023 2024 2025 2026 2027 2028 2029 2030 2031 2032 2033
CAPEX £179,302 £0 £0 £0 £224,128 £0 £0 £0 £0 £0 £0 £0 £448,256 £448,256 £0 £0 £0 £0
Cumulative % Peak Demand 0% 1% 1% 2% 3% 6% 12% 14% 14% 15% 26% 27% 27% 36% 98% 99% 99% 100%
0%
10%
20%
30%
40%
50%
60%
70%
80%
90%
100%
£0
£50,000
£100,000
£150,000
£200,000
£250,000
£300,000
£350,000
£400,000
£450,000
£500,000

Cribbs Patchway New Neighbourhood
Heat Network Feasibility Study
3514199A-BEE CPNN DH Feasibility - FINAL - 10-05-16_v2 Prepared by WSP | Parsons Brinckerhoff Sept 2015 for South Gloucestershire Council - 134 -
Distribution Network Phasing
Figure 13-31: Main spine DH network phasing
Individual Dwelling Connections
Figure 13-32: Individual dwelling connection network phasing
2016 2017 2018 2019 2020 2021 2022 2023 2024 2025 2026 2027 2028 2029 2030 2031 2032 2033
CAPEX £0 £91,956 £45,978 £45,978 £45,978 £45,978 £91,956 £183,913 £183,913 £183,913 £183,913 £275,869 £275,869 £183,913 £0 £0 £0 £0
Cumulative % network build out 3% 5% 8% 10% 13% 15% 20% 30% 40% 50% 60% 75% 90% 100% 100% 100% 100% 100%
Cumulative % total peak heat demand 0% 1% 1% 2% 3% 6% 12% 14% 14% 15% 26% 27% 27% 36% 98% 99% 99% 100%
0%
10%
20%
30%
40%
50%
60%
70%
80%
90%
100%
£0
£50,000
£100,000
£150,000
£200,000
£250,000
£300,000
2016 2017 2018 2019 2020 2021 2022 2023 2024 2025 2026 2027 2028 2029 2030 2031 2032 2033
CAPEX £0 £0 £0 £0 £0 £0 £0 £0 £0 £55,937 £55,937 £55,937 £55,937 £55,937 £55,937 £25,731 £0 £0
No. House Connections (cumulative) 0 0 0 0 0 0 0 0 0 0 12 24 36 49 61 73 79 79
No. Dwelling Connections (cumulative) 59 157 274 392 510 626 713 759 820 884 933 965 996 1,031 1,063 1,085 1,100 1,108
0
200
400
600
800
1000
1200
£0
£10,000
£20,000
£30,000
£40,000
£50,000
£60,000
Nu
mb
er

Cribbs Patchway New Neighbourhood
Heat Network Feasibility Study
3514199A-BEE CPNN DH Feasibility - FINAL - 10-05-16_v2 Prepared by WSP | Parsons Brinckerhoff Sept 2015 for South Gloucestershire Council - 135 -
Interface Unit Phasing
Figure 13-33: Commercial consumer interface unit phased CAPEX
Figure 13-34: Domestic heat interface unit phased CAPEX
2016 2017 2018 2019 2020 2021 2022 2023 2024 2025 2026 2027 2028 2029 2030 2031 2032 2033
CAPEX £0 £0 £0 £0 £73,705 £103,934 £23,574 £0 £0 £117,274 £0 £0 £66,040 £443,969 £0 £0 £0 £0
Cumulative % Peak Commercial Demand 0% 0% 0% 0% 0% 8% 18% 21% 21% 21% 53% 53% 53% 67% 99% 100% 100% 100%
0%
10%
20%
30%
40%
50%
60%
70%
80%
90%
100%
£0
£50,000
£100,000
£150,000
£200,000
£250,000
£300,000
£350,000
£400,000
£450,000
£500,000
2016 2017 2018 2019 2020 2021 2022 2023 2024 2025 2026 2027 2028 2029 2030 2031 2032 2033
CAPEX £70,425 £188,051£141,225£141,225£141,225£139,344£104,944£54,300 £74,040 £76,036 £58,656 £39,045 £37,170 £42,083 £38,655 £26,093 £18,214 £9,893
Cumulative No. Dwelling Connections 59 157 274 392 510 626 713 759 820 884 933 965 996 1,031 1,063 1,085 1,100 1,108
0
200
400
600
800
1,000
1,200
£0
£20,000
£40,000
£60,000
£80,000
£100,000
£120,000
£140,000
£160,000
£180,000
£200,000
Nu
mb
er

Cribbs Patchway New Neighbourhood
Heat Network Feasibility Study
3514199A-BEE CPNN DH Feasibility - FINAL - 10-05-16_v2 Prepared by WSP | Parsons Brinckerhoff Sept 2015 for South Gloucestershire Council - 136 -
BAe High Density Sites with Mall Connection Summary Phasing Table 13-10: Energy demand and connection summary
2016 2017 2018 2019 2020 2021 2022 2023 2024 2025 2026 2027 2028 2029 2030 2031 2032 2033
Annual Heat Demand inc. losses (MWh p.a.) 278 743 1,301 1,859 2,417 3,836 5,284 5,604 5,897 6,197 9,837 9,997 10,150 12,377 16,017 16,126 16,201 16,240
Total Dwelling Connections 59 157 274 392 510 626 713 759 820 884 933 965 996 1,031 1,063 1,085 1,100 1,108
Commercial Peak Heat Demand (MW) 0.000 0.000 0.000 0.000 0.000 0.674 1.501 1.736 1.736 1.736 4.306 4.306 4.306 5.445 9.531 9.585 9.585 9.585
Total Peak Heat Demand (MW) 0.037 0.099 0.206 0.314 0.421 0.701 1.430 1.541 1.651 1.811 2.705 2.802 2.909 3.829 12.145 12.260 12.380 12.469
Table 13-11: Gas CHP network option CAPEX phasing
2016 2017 2018 2019 2020 2021 2022 2023 2024 2025 2026 2027 2028 2029 2030 2031 2032 2033
CHP Engines £0 £0 £0 £0 £0 £0 £0 £0 £0 £540 £0 £0 £0 £0 £540 £0 £0 £0
Energy Centre Building £243 £728 £0 £0 £0 £0 £0 £0 £0 £0 £0 £0 £0 £0 £0 £0 £0 £0
Thermal Store £0 £0 £0 £0 £0 £0 £0 £0 £0 £213 £0 £0 £0 £0 £0 £0 £0 £0
Back-Up Gas Boilers £179 £0 £0 £0 £224 £0 £0 £0 £0 £0 £0 £0 £448 £448 £0 £0 £0 £0
Utilities Connections £50 £0 £0 £0 £0 £0 £0 £0 £0 £0 £0 £0 £0 £0 £0 £0 £0 £0
Main Spine £0 £92 £46 £46 £46 £46 £92 £184 £184 £184 £184 £276 £276 £184 £0 £0 £0 £0
Individual Dwelling Connections £0 £0 £0 £0 £0 £0 £0 £0 £0 £56 £56 £56 £56 £56 £56 £26 £0 £0
HIU £70 £259 £141 £141 £139 £105 £54 £74 £76 £59 £39 £37 £42 £39 £26 £18 £10 £0
CIU £0 £0 £0 £0 £74 £104 £24 £0 £0 £117 £0 £0 £66 £444 £0 £0 £0 £0
Professional Fees £68 £135 £23 £23 £60 £32 £21 £60 £32 £52 £35 £46 £149 £90 £10 £62 £57 £68
Contingency £122 £243 £42 £42 £109 £57 £38 £108 £58 £94 £63 £83 £268 £163 £18 £111 £103 £122
Total £732 £1,456 £253 £253 £652 £344 £229 £427 £351 £1,314 £377 £498 £1,306 £1,424 £651 £216 £170 £189

Cribbs Patchway New Neighbourhood
Heat Network Feasibility Study
3514199A-BEE CPNN DH Feasibility - FINAL - 10-05-16_v2 Prepared by WSP | Parsons Brinckerhoff Sept 2015 for South Gloucestershire Council - 137 -
Figure 13-35: Total CAPEX through time- gas CHP network option
£0
£200,000
£400,000
£600,000
£800,000
£1,000,000
£1,200,000
£1,400,000
£1,600,000
2016 2017 2018 2019 2020 2021 2022 2023 2024 2025 2026 2027 2028 2029 2030 2031 2032 2033
CHP Engines Energy Centre Building Thermal Store Back-Up Gas Boilers
Utilities Connections Main Spine Individual Dwelling Connections HIU
CIU Professional Fees Contingency

Cribbs Patchway New Neighbourhood
Heat Network Feasibility Study
3514199A-BEE CPNN DH Feasibility - FINAL - 10-05-16_v2 Prepared by WSP | Parsons Brinckerhoff Sept 2015 for South Gloucestershire Council - 138 -
Table 13-12: Biomass boiler network option CAPEX phasing
2016 2017 2018 2019 2020 2021 2022 2023 2024 2025 2026 2027 2028 2029 2030 2031 2032 2033
Biomass Boilers £0 £0 £0 £0 £0 £0 £0 £0 £0 £200 £0 £0 £0 £0 £200 £0 £0 £0
Energy Centre Building £348 £1,043 £0 £0 £0 £0 £0 £0 £0 £0 £0 £0 £0 £0 £0 £0 £0 £0
Thermal Store £0 £0 £0 £0 £0 £0 £0 £0 £0 £127 £0 £0 £0 £0 £0 £0 £0 £0
Fuel Handling and Storage £0 £0 £0 £0 £0 £0 £0 £0 £0 £147 £0 £0 £0 £0 £0 £0 £0 £0
Back-Up Gas Boilers £179 £0 £0 £0 £224 £0 £0 £0 £0 £0 £0 £0 £448 £448 £0 £0 £0 £0
Utilities Connections £50 £0 £0 £0 £0 £0 £0 £0 £0 £0 £0 £0 £0 £0 £0 £0 £0 £0
Main Spine £0 £92 £46 £46 £46 £46 £92 £184 £184 £184 £184 £276 £276 £184 £0 £0 £0 £0
Individual Dwelling Connections £0 £0 £0 £0 £0 £0 £0 £0 £0 £56 £56 £56 £56 £56 £56 £26 £0 £0
HIU £70 £259 £141 £141 £139 £105 £54 £74 £76 £59 £39 £37 £42 £39 £26 £18 £10 £0
CIU £0 £0 £0 £0 £74 £104 £24 £0 £0 £117 £0 £0 £66 £444 £0 £0 £0 £0
Professional Fees £81 £174 £23 £23 £60 £32 £21 £60 £32 £52 £35 £46 £114 £90 £10 £62 £57 £25
Contingency £146 £314 £42 £42 £109 £57 £38 £108 £58 £94 £63 £83 £206 £163 £18 £111 £103 £45
Total £874 £1,881 £253 £253 £652 £344 £229 £427 £351 £888 £377 £498 £1,208 £1,872 £311 £216 £170 £70

Cribbs Patchway New Neighbourhood
Heat Network Feasibility Study
3514199A-BEE CPNN DH Feasibility - FINAL - 10-05-16_v2 Prepared by WSP | Parsons Brinckerhoff Sept 2015 for South Gloucestershire Council - 139 -
Figure 13-36: Total CAPEX through time- biomass boiler network option
£0
£200,000
£400,000
£600,000
£800,000
£1,000,000
£1,200,000
£1,400,000
£1,600,000
£1,800,000
£2,000,000
2016 2017 2018 2019 2020 2021 2022 2023 2024 2025 2026 2027 2028 2029 2030 2031 2032 2033
Biomass Boilers Energy Centre Fuel Handling and Storage Thermal Store
Back-Up Gas Boilers Utilities Connections Main Spine Individual Dwelling Connections
HIU CIU Professional Fees Contingency

Cribbs Patchway New Neighbourhood
Heat Network Feasibility Study
3514199A-BEE CPNN DH Feasibility - FINAL - 10-05-16_v2 Prepared by WSP | Parsons Brinckerhoff Sept 2015 for South Gloucestershire Council - 140 -
13.3.5 Deely Freed Network Option
Energy Centre CAPEX
Figure 13-37: Gas CHP energy centre CAPEX spend through time
Figure 13-38: Biomass boiler energy centre CAPEX spend through time
£0
£100,000
£200,000
£300,000
£400,000
£500,000
£600,000
£700,000
2016 2017 2018 2019
CHP Engines Energy Centre Building Thermal Store Back-Up Gas Boilers Utilities Connections
£0
£100,000
£200,000
£300,000
£400,000
£500,000
£600,000
£700,000
£800,000
2016 2017 2018 2019
Biomass Boilers Energy Centre Building Fuel Handling and Storage Thermal Store Back-Up Gas Boilers Utilities Connections
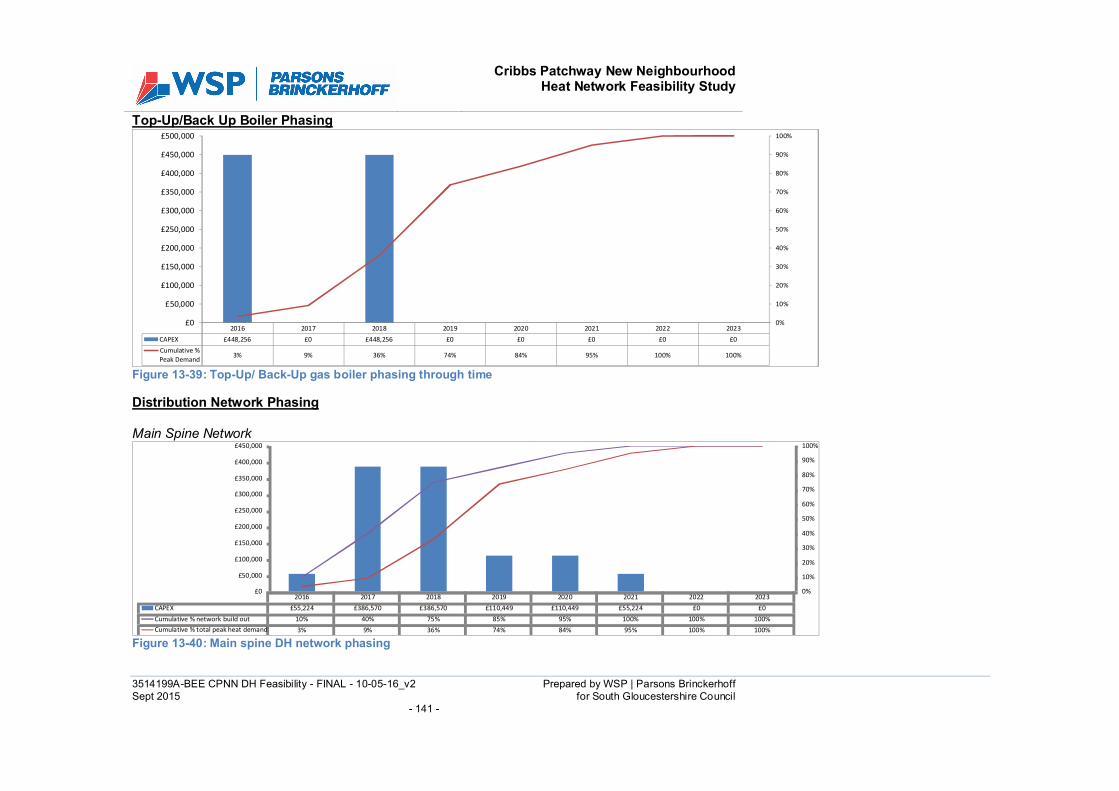
Cribbs Patchway New Neighbourhood
Heat Network Feasibility Study
3514199A-BEE CPNN DH Feasibility - FINAL - 10-05-16_v2 Prepared by WSP | Parsons Brinckerhoff Sept 2015 for South Gloucestershire Council - 141 -
Top-Up/Back Up Boiler Phasing
Figure 13-39: Top-Up/ Back-Up gas boiler phasing through time
Distribution Network Phasing Main Spine Network
Figure 13-40: Main spine DH network phasing
2016 2017 2018 2019 2020 2021 2022 2023
CAPEX £448,256 £0 £448,256 £0 £0 £0 £0 £0
Cumulative %
Peak Demand3% 9% 36% 74% 84% 95% 100% 100%
0%
10%
20%
30%
40%
50%
60%
70%
80%
90%
100%
£0
£50,000
£100,000
£150,000
£200,000
£250,000
£300,000
£350,000
£400,000
£450,000
£500,000
2016 2017 2018 2019 2020 2021 2022 2023
CAPEX £55,224 £386,570 £386,570 £110,449 £110,449 £55,224 £0 £0
Cumulative % network build out 10% 40% 75% 85% 95% 100% 100% 100%
Cumulative % total peak heat demand 3% 9% 36% 74% 84% 95% 100% 100%
0%
10%
20%
30%
40%
50%
60%
70%
80%
90%
100%
£0
£50,000
£100,000
£150,000
£200,000
£250,000
£300,000
£350,000
£400,000
£450,000

Cribbs Patchway New Neighbourhood
Heat Network Feasibility Study
3514199A-BEE CPNN DH Feasibility - FINAL - 10-05-16_v2 Prepared by WSP | Parsons Brinckerhoff Sept 2015 for South Gloucestershire Council - 142 -
Individual Dwelling Connections
Figure 13-41: Individual dwelling connection network phasing
Interface Unit Phasing
Figure 13-42: Commercial consumer interface unit phased CAPEX
2016 2017 2018 2019 2020 2021 2022 2023 2024
CAPEX £0 £674,681 £989,743 £478,399 £372,608 £690,014 £309,629 £0 £0
No. House Connections (cumulative) 0 40 147 362 466 547 697 764 764
No. Dwelling Connections (cumulative) 0 50 183 433 583 733 883 950 950
0
100
200
300
400
500
600
700
800
900
1000
£0
£200,000
£400,000
£600,000
£800,000
£1,000,000
£1,200,000
Nu
mb
er
2016 2017 2018 2019 2020 2021 2022 2023
CAPEX £0 £0 £81,879 £87,606 £0 £0 £0 £0
Cumulative % Peak Commercial Demand 0% 0% 12% 22% 100% 100% 100% 100%
0%
10%
20%
30%
40%
50%
60%
70%
80%
90%
100%
£0
£10,000
£20,000
£30,000
£40,000
£50,000
£60,000
£70,000
£80,000
£90,000
£100,000

Cribbs Patchway New Neighbourhood
Heat Network Feasibility Study
3514199A-BEE CPNN DH Feasibility - FINAL - 10-05-16_v2 Prepared by WSP | Parsons Brinckerhoff Sept 2015 for South Gloucestershire Council - 143 -
Figure 13-43: Domestic heat interface unit phased CAPEX
2016 2017 2018 2019 2020 2021 2022 2023
CAPEX £0 £220,001 £160,001 £299,536 £180,207 £179,530 £179,969 £0
Cumulative No. Dwelling Connections 0 50 183 433 583 733 883 950
0
100
200
300
400
500
600
700
800
900
1,000
£0
£50,000
£100,000
£150,000
£200,000
£250,000
£300,000
£350,000
Nu
mb
er

Cribbs Patchway New Neighbourhood
Heat Network Feasibility Study
3514199A-BEE CPNN DH Feasibility - FINAL - 10-05-16_v2 Prepared by WSP | Parsons Brinckerhoff Sept 2015 for South Gloucestershire Council - 144 -
Deely Freed Network Option Summary Phasing Table 13-13: Energy demand and connection summary (£k)
2016 2017 2018 2019 2020 2021 2022 2023
Annual Heat Demand inc. losses (MWh p.a.) 0 334 1,226 3,362 6,851 7,820 8,894 9,375
Total Dwelling Connections 0 50 183 433 583 733 883 950
Commercial Peak Heat Demand (MW) 0 0 0.227 0.398 1.844 1.844 1.844 1.844
Total Peak Heat Demand (MW) 0.232 0.618 2.352 4.839 5.150 5.895 6.229 6.229
Table 13-14: Gas CHP network option CAPEX phasing (£k)
2016 2017 2018 2019 2020 2021 2022
CHP Engines £0 £0 £0 £540 £0 £0 £0
Energy Centre Building £160 £480 £0 £0 £0 £0 £0
Thermal Store £0 £0 £0 £94 £0 £0 £0
Back-Up Gas Boilers £448 £0 £448 £0 £0 £0 £0
Utilities Connections £50 £0 £0 £0 £0 £0 £0
Main Spine £55 £387 £387 £110 £110 £55 £0
Individual Dwelling Connections £0 £675 £990 £478 £373 £690 £310
HIU £0 £220 £300 £180 £180 £180 £81
CIU £0 £0 £82 £88 £0 £0 £0
Professional Fees £89 £220 £276 £186 £83 £116 £49
Contingency £161 £396 £496 £335 £149 £208 £88
Total £963 £2,378 £2,978 £2,012 £894 £1,249 £527

Cribbs Patchway New Neighbourhood
Heat Network Feasibility Study
3514199A-BEE CPNN DH Feasibility - FINAL - 10-05-16_v2 Prepared by WSP | Parsons Brinckerhoff Sept 2015 for South Gloucestershire Council - 145 -
Figure 13-44: Total CAPEX through time- gas CHP network option
£0
£500,000
£1,000,000
£1,500,000
£2,000,000
£2,500,000
£3,000,000
2016 2017 2018 2019 2020 2021 2022
CHP Engines Energy Centre Building Thermal Store Back-Up Gas Boilers
Utilities Connections Main Spine Individual Dwelling Connections HIU
CIU Professional Fees Contingency

Cribbs Patchway New Neighbourhood
Heat Network Feasibility Study
3514199A-BEE CPNN DH Feasibility - FINAL - 10-05-16_v2 Prepared by WSP | Parsons Brinckerhoff Sept 2015 for South Gloucestershire Council - 146 -
Table 13-15: Biomass boiler network option CAPEX phasing
2016 2017 2018 2019 2020 2021 2022
Biomass Boilers £0 £0 £0 £200 £0 £0 £0
Energy Centre Building £250 £749 £0 £0 £0 £0 £0
Thermal Store £0 £0 £0 £56 £0 £0 £0
Fuel Handling and Storage £0 £0 £0 £147 £0 £0 £0
Back-Up Gas Boilers £448 £0 £448 £0 £0 £0 £0
Utilities Connections £50 £0 £0 £0 £0 £0 £0
Main Spine £55 £387 £387 £110 £110 £55 £0
Individual Dwelling Connections £0 £675 £990 £478 £373 £690 £310
HIU £0 £220 £300 £180 £180 £180 £81
CIU £0 £0 £82 £88 £0 £0 £0
Professional Fees £100 £254 £276 £145 £83 £116 £49
Contingency £181 £457 £496 £262 £149 £208 £88
Total £1,084 £2,740 £2,978 £1,520 £894 £1,249 £527
Biomass Boiler Energy Centre

Cribbs Patchway New Neighbourhood
Heat Network Feasibility Study
3514199A-BEE CPNN DH Feasibility - FINAL - 10-05-16_v2 Prepared by WSP | Parsons Brinckerhoff Sept 2015 for South Gloucestershire Council - 147 -
Figure 13-45: Total CAPEX through time- biomass boiler network option
£0
£500,000
£1,000,000
£1,500,000
£2,000,000
£2,500,000
£3,000,000
2016 2017 2018 2019 2020 2021 2022
Biomass Boilers Energy Centre Building Thermal Store Fuel Handling and Storage
Back-Up Gas Boilers Utilities Connections Main Spine Individual Dwelling Connections
HIU CIU Professional Fees Contingency

Cribbs Patchway New Neighbourhood
Heat Network Feasibility Study
3514199A-BEE CPNN DH Feasibility - FINAL - 10-05-16_v2 Prepared by WSP | Parsons Brinckerhoff Sept 2015 for South Gloucestershire Council - 148 -
13.4 REPEX Schedules
13.4.1 All BAe Sites with Mall Network Option
Figure 13-46: Gas CHP REPEX schedule
Figure 13-47: Biomass boiler REPEX schedule
2031 2032 2033 2034 2035 2036 2037 2038 2039 2040 2041 2042 2043 2044 2045 2046 2047 2048 2049 2050
CIU £0 £0 £0 £0 £0 £0 £0 £0 £0 £0 £0 £0 £0 £17,680 £206,423 £77,950 £17,680 £0 £0 £87,956
HIU £52,819 £230,844 £142,625 £142,625 £277,326 £139,073 £138,397 £141,390 £195,215 £169,741 £118,986 £136,014 £161,294 £174,108 £151,647 £191,985 £330,687 £142,625 £142,625 £277,326
Back Up Gas Boilers £0 £0 £0 £0 £0 £0 £0 £0 £0 £0 £0 £0 £0 £0 £0 £224,128 £0 £0 £0 £672,384
Gas CHP Engines £0 £0 £0 £0 £816,246 £0 £0 £0 £0 £816,246 £0 £0 £0 £0 £0 £0 £0 £0 £0 £816,246
£0
£200,000
£400,000
£600,000
£800,000
£1,000,000
£1,200,000
£1,400,000
£1,600,000
£1,800,000
£2,000,000
2031 2032 2033 2034 2035 2036 2037 2038 2039 2040 2041 2042 2043 2044 2045 2046 2047 2048 2049 2050
CIU £0 £0 £0 £0 £0 £0 £0 £0 £0 £0 £0 £0 £0 £17,680 £206,423 £77,950 £17,680 £0 £0 £87,956
HIU £52,819 £230,844 £142,625 £142,625 £277,326 £139,073 £138,397 £141,390 £195,215 £169,741 £118,986 £136,014 £161,294 £174,108 £151,647 £191,985 £330,687 £142,625 £142,625 £277,326
Back Up Gas Boilers £0 £0 £0 £0 £0 £0 £0 £0 £0 £0 £0 £0 £0 £0 £0 £224,128 £0 £0 £0 £672,384
Biomass Boilers £0 £0 £0 £0 £0 £0 £0 £0 £0 £0 £0 £0 £0 £0 £554,880 £0 £0 £0 £0 £554,880
£0
£200,000
£400,000
£600,000
£800,000
£1,000,000
£1,200,000
£1,400,000
£1,600,000
£1,800,000

Cribbs Patchway New Neighbourhood
Heat Network Feasibility Study
3514199A-BEE CPNN DH Feasibility - FINAL - 10-05-16_v2 Prepared by WSP | Parsons Brinckerhoff Sept 2015 for South Gloucestershire Council - 149 -
13.4.2 All BAe Sites Network Option
Figure 13-48: Gas CHP REPEX schedule
Figure 13-49: Biomass boiler REPEX schedule
2031 2032 2033 2034 2035 2036 2037 2038 2039 2040 2041 2042 2043 2044 2045 2046 2047 2048 2049 2050
CIU £0 £0 £0 £0 £0 £0 £0 £0 £0 £0 £0 £55,279 £77,950 £17,680 £17,680 £0 £87,956 £0 £0 £49,530
HIU £142,625 £142,326 £139,073 £138,397 £141,390 £195,215 £169,741 £118,986 £136,014 £161,294 £174,108 £151,647 £139,166 £99,843 £142,625 £142,625 £142,326 £139,073 £138,397 £141,390
Back Up Gas Boilers £0 £0 £0 £0 £0 £0 £0 £0 £0 £0 £0 £0 £0 £0 £0 £224,128 £0 £0 £0 £224,128
Gas CHP Engines £0 £0 £0 £0 £0 £0 £0 £0 £0 £670,177 £0 £0 £0 £670,177 £0 £0 £0 £0 £0 £0
£0
£100,000
£200,000
£300,000
£400,000
£500,000
£600,000
£700,000
£800,000
£900,000
2031 2032 2033 2034 2035 2036 2037 2038 2039 2040 2041 2042 2043 2044 2045 2046 2047 2048 2049 2050
CIU £0 £0 £0 £0 £0 £0 £0 £0 £0 £0 £0 £55,279 £77,950 £17,680 £0 £0 £87,956 £0 £0 £49,530
HIU £142,625 £142,326 £139,073 £138,397 £141,390 £195,215 £169,741 £118,986 £136,014 £161,294 £174,108 £151,647 £139,166 £99,843 £142,625 £0 £0 £0 £0 £0
Back Up Gas Boilers £0 £0 £0 £0 £0 £0 £0 £0 £0 £0 £0 £0 £0 £0 £0 £224,128 £0 £0 £0 £224,128
Biomass Boilers £0 £0 £0 £0 £0 £0 £0 £0 £0 £0 £0 £0 £0 £0 £0 £0 £0 £0 £0 £447,203
£0
£100,000
£200,000
£300,000
£400,000
£500,000
£600,000
£700,000
£800,000

Cribbs Patchway New Neighbourhood
Heat Network Feasibility Study
3514199A-BEE CPNN DH Feasibility - FINAL - 10-05-16_v2 Prepared by WSP | Parsons Brinckerhoff Sept 2015 for South Gloucestershire Council - 150 -
13.4.3 BAe High Density with Mall Connection Network Option
Figure 13-50: Gas CHP REPEX schedule
Figure 13-51: Biomass boiler REPEX schedule
2031 2032 2033 2034 2035 2036 2037 2038 2039 2040 2041 2042 2043 2044 2045 2046 2047 2048 2049 2050
CIU £0 £0 £0 £0 £0 £0 £0 £0 £0 £0 £0 £206,423 £77,950 £17,680 £0 £0 £87,956 £0 £0 £49,530
HIU £105,919 £239,508 £78,708 £40,725 £55,530 £57,027 £43,992 £29,283 £27,877 £31,562 £28,991 £19,570 £13,661 £7,420 £105,919 £105,919 £239,508 £78,708 £40,725 £55,530
Back Up Gas Boilers £0 £0 £0 £0 £0 £0 £0 £0 £0 £0 £0 £0 £0 £0 £0 £224,128 £224,128 £0 £0 £0
Gas CHP Engines £0 £0 £0 £0 £0 £0 £0 £0 £524,108 £0 £0 £0 £0 £0 £524,108 £0 £0 £0 £0 £0
£0
£100,000
£200,000
£300,000
£400,000
£500,000
£600,000
£700,000
2031 2032 2033 2034 2035 2036 2037 2038 2039 2040 2041 2042 2043 2044 2045 2046 2047 2048 2049 2050
CIU £0 £0 £0 £0 £0 £0 £0 £0 £0 £0 £0 £206,423 £77,950 £17,680 £0 £0 £87,956 £0 £0 £49,530
HIU £105,919 £239,508 £78,708 £40,725 £55,530 £57,027 £43,992 £29,283 £27,877 £31,562 £28,991 £19,570 £13,661 £7,420 £105,919 £105,919 £239,508 £78,708 £40,725 £55,530
Back Up Gas Boilers £0 £0 £0 £0 £0 £0 £0 £0 £0 £0 £0 £0 £0 £0 £0 £224,128 £224,128 £0 £0 £0
Biomass Boilers £0 £0 £0 £0 £0 £0 £0 £0 £0 £0 £0 £0 £0 £0 £0 £0 £0 £0 £309,040 £0
£0
£100,000
£200,000
£300,000
£400,000
£500,000
£600,000

Cribbs Patchway New Neighbourhood
Heat Network Feasibility Study
3514199A-BEE CPNN DH Feasibility - FINAL - 10-05-16_v2 Prepared by WSP | Parsons Brinckerhoff Sept 2015 for South Gloucestershire Council - 151 -
13.4.4 BAe High Density Network Option
Figure 13-52: Gas CHP REPEX schedule
Figure 13-53: Biomass boiler REPEX schedule
2031 2032 2033 2034 2035 2036 2037 2038 2039 2040 2041 2042 2043 2044 2045 2046 2047 2048 2049 2050
CIU £0 £0 £0 £0 £0 £0 £0 £0 £0 £0 £0 £55,279 £77,950 £17,680 £0 £0 £87,956 £0 £0 £49,530
HIU £105,919 £104,508 £78,708 £40,725 £55,530 £57,027 £43,992 £29,283 £27,877 £31,562 £28,991 £19,570 £13,661 £7,420 £105,919 £105,919 £104,508 £78,708 £40,725 £55,530
Back Up Gas Boilers £0 £0 £0 £0 £0 £0 £0 £0 £0 £0 £0 £0 £0 £0 £0 £89,651 £0 £0 £0 £112,064
Gas CHP Engines £0 £0 £0 £0 £0 £0 £0 £0 £0 £378,039 £0 £0 £0 £0 £378,039 £0 £0 £0 £0 £0
£0
£100,000
£200,000
£300,000
£400,000
£500,000
£600,000
2031 2032 2033 2034 2035 2036 2037 2038 2039 2040 2041 2042 2043 2044 2045 2046 2047 2048 2049 2050
CIU £0 £0 £0 £0 £0 £0 £0 £0 £0 £0 £0 £55,279 £77,950 £17,680 £0 £0 £87,956 £0 £0 £49,530
HIU £105,919 £104,508 £78,708 £40,725 £55,530 £57,027 £43,992 £29,283 £27,877 £31,562 £28,991 £19,570 £13,661 £7,420 £105,919 £105,919 £104,508 £78,708 £40,725 £55,530
Back Up Gas Boilers £0 £0 £0 £0 £0 £0 £0 £0 £0 £0 £0 £0 £0 £0 £0 £89,651 £0 £0 £0 £112,064
Biomass Boilers £0 £0 £0 £0 £0 £0 £0 £0 £0 £0 £0 £0 £0 £0 £0 £0 £0 £0 £0 £140,000
£0
£50,000
£100,000
£150,000
£200,000
£250,000
£300,000
£350,000
£400,000

Cribbs Patchway New Neighbourhood
Heat Network Feasibility Study
3514199A-BEE CPNN DH Feasibility - FINAL - 10-05-16_v2 Prepared by WSP | Parsons Brinckerhoff Sept 2015 for South Gloucestershire Council - 152 -
13.4.5 Deely Freed Network Option
Figure 13-54: Gas CHP REPEX schedule
Figure 13-55: Biomass boiler REPEX schedule
2031 2032 2033 2034 2035 2036 2037 2038 2039 2040 2041 2042 2043 2044 2045 2046 2047 2048 2049 2050
CIU £0 £0 £0 £0 £0 £0 £0 £0 £0 £0 £0 £0 £0 £0 £0 £0 £0 £0 £0 £0
HIU £135,155 £134,647 £134,977 £60,568 £0 £0 £0 £0 £0 £0 £0 £0 £0 £0 £0 £135,155 £134,647 £134,977 £60,568 £0
Back Up Gas Boilers £0 £0 £0 £0 £0 £0 £0 £0 £0 £0 £0 £0 £0 £0 £0 £224,128 £0 £224,128 £0 £0
Gas CHP Engines £0 £0 £0 £378,039 £0 £0 £0 £0 £0 £0 £0 £0 £0 £0 £0 £0 £0 £0 £378,039 £0
£0
£50,000
£100,000
£150,000
£200,000
£250,000
£300,000
£350,000
£400,000
£450,000
£500,000
2031 2032 2033 2034 2035 2036 2037 2038 2039 2040 2041 2042 2043 2044 2045 2046 2047 2048 2049 2050
CIU £0 £0 £0 £0 £0 £0 £0 £0 £0 £0 £0 £0 £0 £0 £0 £0 £0 £0 £0 £0
HIU £135,155 £134,647 £134,977 £60,568 £0 £0 £0 £0 £0 £0 £0 £0 £0 £0 £224,652 £135,155 £134,647 £134,977 £60,568 £0
Back Up Gas Boilers £0 £0 £0 £0 £0 £0 £0 £0 £0 £0 £0 £0 £0 £0 £0 £224,128 £0 £224,128 £0 £0
Biomass Boilers £0 £0 £0 £0 £0 £0 £0 £0 £0 £0 £0 £0 £0 £140,000 £0 £0 £0 £0 £0 £0
£0
£50,000
£100,000
£150,000
£200,000
£250,000
£300,000
£350,000
£400,000

Cribbs Patchway New Neighbourhood
Heat Network Feasibility Study
3514199A-BEE CPNN DH Feasibility - FINAL - 10-05-16_v2 Prepared by WSP | Parsons Brinckerhoff Sept 2015 for South Gloucestershire Council - 153 -
13.5 Phased OPEX through Time
13.5.1 All BAe Sites with Mall
Figure 13-56: Gas CHP scheme phased OPEX for all BAe sites with mall connection network option
£0
£1,000,000
£2,000,000
£3,000,000
£4,000,000
£5,000,000
£6,000,000
£7,000,000
£8,000,000
£9,000,000
2016 2017 2018 2019 2020 2021 2022 2023 2024 2025 2026 2027 2028 2029 2030 2031 2032 2033 2034 2035 2036 2037 2038 2039 2040 2041 2042 2043 2044 2045 2046 2047 2048 2049 2050
CAPEX REPEX Maintenance Import Electricity Energy Costs (low carbon plant) Energy costs (top-up gas) Main Rate CCL Metering and Billing Heat Sales Private Wire Electricity Sales Electricity Export Connection Charges (base)

Cribbs Patchway New Neighbourhood
Heat Network Feasibility Study
3514199A-BEE CPNN DH Feasibility - FINAL - 10-05-16_v2 Prepared by WSP | Parsons Brinckerhoff Sept 2015 for South Gloucestershire Council - 154 -
Figure 13-57: Biomass boiler scheme phased OPEX for all BAe sites with mall connection network option
£0
£1,000,000
£2,000,000
£3,000,000
£4,000,000
£5,000,000
£6,000,000
2016 2017 2018 2019 2020 2021 2022 2023 2024 2025 2026 2027 2028 2029 2030 2031 2032 2033 2034 2035 2036 2037 2038 2039 2040 2041 2042 2043 2044 2045 2046 2047 2048 2049 2050
CAPEX REPEX Maintenance Import Electricity Energy Costs (low carbon plant) Energy costs (top-up gas) Main Rate CCL Metering and Billing Heat Sales Connection Charges (base)

Cribbs Patchway New Neighbourhood
Heat Network Feasibility Study
3514199A-BEE CPNN DH Feasibility - FINAL - 10-05-16_v2 Prepared by WSP | Parsons Brinckerhoff Sept 2015 for South Gloucestershire Council - 155 -
13.5.2 All BAe Sites
Figure 13-58: Gas CHP scheme phased OPEX for all BAe sites network option
£0
£1,000,000
£2,000,000
£3,000,000
£4,000,000
£5,000,000
£6,000,000
£7,000,000
2016 2017 2018 2019 2020 2021 2022 2023 2024 2025 2026 2027 2028 2029 2030 2031 2032 2033 2034 2035 2036 2037 2038 2039 2040 2041 2042 2043 2044 2045 2046 2047 2048 2049 2050
CAPEX REPEX Maintenance Import Electricity Energy Costs (low carbon plant) Energy costs (top-up gas) Main Rate CCL Metering and Billing Heat Sales Electricity Export Connection Charges (base)

Cribbs Patchway New Neighbourhood
Heat Network Feasibility Study
3514199A-BEE CPNN DH Feasibility - FINAL - 10-05-16_v2 Prepared by WSP | Parsons Brinckerhoff Sept 2015 for South Gloucestershire Council - 156 -
Figure 13-59: Biomass boiler scheme phased OPEX for all BAe sites network option
£0
£1,000,000
£2,000,000
£3,000,000
£4,000,000
£5,000,000
£6,000,000
2016 2017 2018 2019 2020 2021 2022 2023 2024 2025 2026 2027 2028 2029 2030 2031 2032 2033 2034 2035 2036 2037 2038 2039 2040 2041 2042 2043 2044 2045 2046 2047 2048 2049 2050
CAPEX REPEX Maintenance Import Electricity Energy Costs (low carbon plant) Energy costs (top-up gas) Main Rate CCL Metering and Billing Heat Sales Connection Charges (base)

Cribbs Patchway New Neighbourhood
Heat Network Feasibility Study
3514199A-BEE CPNN DH Feasibility - FINAL - 10-05-16_v2 Prepared by WSP | Parsons Brinckerhoff Sept 2015 for South Gloucestershire Council - 157 -
13.5.3 BAe High Density Sites with Mall
Figure 13-60: Gas CHP scheme phased OPEX for BAe high density sites with mall connection network option
£0
£1,000,000
£2,000,000
£3,000,000
£4,000,000
£5,000,000
£6,000,000
2016 2017 2018 2019 2020 2021 2022 2023 2024 2025 2026 2027 2028 2029 2030 2031 2032 2033 2034 2035 2036 2037 2038 2039 2040 2041 2042 2043 2044 2045 2046 2047 2048 2049 2050
CAPEX REPEX Maintenance Import Electricity Energy Costs (low carbon plant) Energy costs (top-up gas) Main Rate CCL Metering and Billing Heat Sales Electricity Export Connection Charges (base)

Cribbs Patchway New Neighbourhood
Heat Network Feasibility Study
3514199A-BEE CPNN DH Feasibility - FINAL - 10-05-16_v2 Prepared by WSP | Parsons Brinckerhoff Sept 2015 for South Gloucestershire Council - 158 -
Figure 13-61: Biomass boiler scheme phased OPEX for BAe high density sites with mall connection network option
£0
£500,000
£1,000,000
£1,500,000
£2,000,000
£2,500,000
£3,000,000
2016 2017 2018 2019 2020 2021 2022 2023 2024 2025 2026 2027 2028 2029 2030 2031 2032 2033 2034 2035 2036 2037 2038 2039 2040 2041 2042 2043 2044 2045 2046 2047 2048 2049 2050
CAPEX REPEX Maintenance Import Electricity Energy Costs (low carbon plant) Energy costs (top-up gas) Main Rate CCL Metering and Billing Heat Sales Connection Charges (base)

Cribbs Patchway New Neighbourhood
Heat Network Feasibility Study
3514199A-BEE CPNN DH Feasibility - FINAL - 10-05-16_v2 Prepared by WSP | Parsons Brinckerhoff Sept 2015 for South Gloucestershire Council - 159 -
13.5.4 BAe High Density Sites
Figure 13-62: Gas CHP scheme phased OPEX for BAe high density sites network option
£0
£500,000
£1,000,000
£1,500,000
£2,000,000
£2,500,000
£3,000,000
2016 2017 2018 2019 2020 2021 2022 2023 2024 2025 2026 2027 2028 2029 2030 2031 2032 2033 2034 2035 2036 2037 2038 2039 2040 2041 2042 2043 2044 2045 2046 2047 2048 2049 2050
CAPEX REPEX Maintenance Import Electricity Energy Costs (low carbon plant) Energy costs (top-up gas) Main Rate CCL Metering and Billing Heat Sales Electricity Export Connection Charges (base)

Cribbs Patchway New Neighbourhood
Heat Network Feasibility Study
3514199A-BEE CPNN DH Feasibility - FINAL - 10-05-16_v2 Prepared by WSP | Parsons Brinckerhoff Sept 2015 for South Gloucestershire Council - 160 -
Figure 13-63: Biomass boiler scheme phased OPEX for BAe high density sites network option
£0
£500,000
£1,000,000
£1,500,000
£2,000,000
£2,500,000
2016 2017 2018 2019 2020 2021 2022 2023 2024 2025 2026 2027 2028 2029 2030 2031 2032 2033 2034 2035 2036 2037 2038 2039 2040 2041 2042 2043 2044 2045 2046 2047 2048 2049 2050
CAPEX REPEX Maintenance Import Electricity Energy Costs (low carbon plant) Energy costs (top-up gas) Main Rate CCL Metering and Billing Heat Sales Connection Charges (base)

Cribbs Patchway New Neighbourhood
Heat Network Feasibility Study
3514199A-BEE CPNN DH Feasibility - FINAL - 10-05-16_v2 Prepared by WSP | Parsons Brinckerhoff Sept 2015 for South Gloucestershire Council - 161 -
13.5.5 Deely Freed
Figure 13-64: Gas CHP scheme phased OPEX for Deely Freed network option
£0
£500,000
£1,000,000
£1,500,000
£2,000,000
£2,500,000
£3,000,000
£3,500,000
2016 2017 2018 2019 2020 2021 2022 2023 2024 2025 2026 2027 2028 2029 2030 2031 2032 2033 2034 2035 2036 2037 2038 2039 2040 2041 2042 2043 2044 2045 2046 2047 2048 2049 2050
CAPEX REPEX Maintenance Import Electricity Energy Costs (low carbon plant) Main Rate CCL Main Rate CCL Metering and Billing Heat Sales Electricity Export Connection Charges (base)
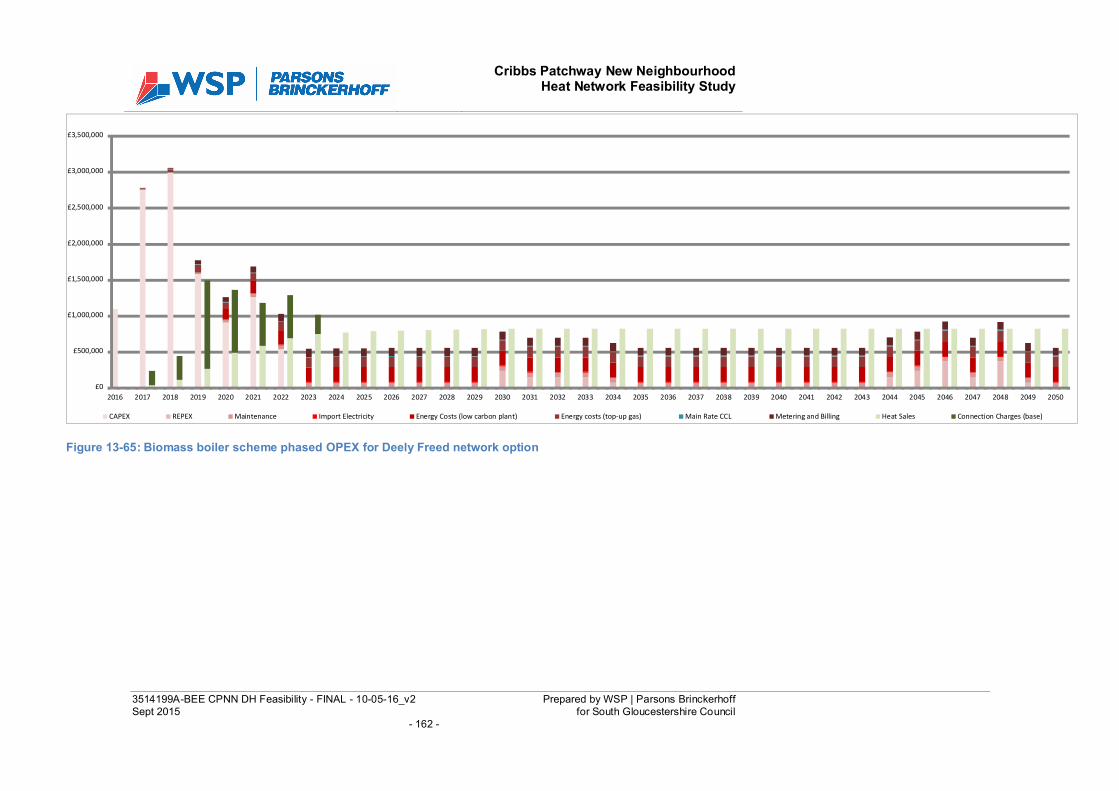
Cribbs Patchway New Neighbourhood
Heat Network Feasibility Study
3514199A-BEE CPNN DH Feasibility - FINAL - 10-05-16_v2 Prepared by WSP | Parsons Brinckerhoff Sept 2015 for South Gloucestershire Council - 162 -
Figure 13-65: Biomass boiler scheme phased OPEX for Deely Freed network option
£0
£500,000
£1,000,000
£1,500,000
£2,000,000
£2,500,000
£3,000,000
£3,500,000
2016 2017 2018 2019 2020 2021 2022 2023 2024 2025 2026 2027 2028 2029 2030 2031 2032 2033 2034 2035 2036 2037 2038 2039 2040 2041 2042 2043 2044 2045 2046 2047 2048 2049 2050
CAPEX REPEX Maintenance Import Electricity Energy Costs (low carbon plant) Energy costs (top-up gas) Main Rate CCL Metering and Billing Heat Sales Connection Charges (base)

Cribbs Patchway New Neighbourhood
Heat Network Feasibility Study
3514199A-BEE CPNN DH Feasibility - FINAL - 10-05-16_v2 Prepared by WSP | Parsons Brinckerhoff Sept 2015 for South Gloucestershire Council - 163 -
13.6 NPV Results
13.6.1 Local Authority Discount Rate (6%)
Residential Connection Charge: Base
Residential Connection Charge: Low
All BAE Sites
(with Mall)
All BAE Sites
(no Mall)
BAE HighDensity (with
Mall)
BAE HighDensity (no
Mall)Deely Freed
Gas CHP -£2,054,926 -£4,824,073 £2,509,725 £30,430 -£4,838,395
Biomass Boiler -£2,745,996 -£3,797,341 £1,898,710 £639,015 -£4,303,649
-£6,000,000
-£5,000,000
-£4,000,000
-£3,000,000
-£2,000,000
-£1,000,000
£0
£1,000,000
£2,000,000
£3,000,000
NPV 25 Years
All BAE Sites(with Mall)
All BAE Sites(no Mall)
BAE HighDensity
(with Mall)
BAE HighDensity (no
Mall)Deely Freed
Gas CHP -£752,125 -£4,002,594 £4,602,249 £589,644 -£4,689,003
Biomass Boiler -£1,558,477 -£2,209,671 £3,238,605 £773,852 -£3,922,032
-£6,000,000
-£4,000,000
-£2,000,000
£0
£2,000,000
£4,000,000
£6,000,000
NPV 40 Years
All BAE Sites(with Mall)
All BAE Sites(no Mall)
BAE HighDensity (with
Mall)
BAE HighDensity (no
Mall)Deely Freed
Gas CHP -£2,963,900 -£5,673,640 £2,044,671 -£375,217 -£5,215,498
Biomass Boiler -£3,654,971 -£4,646,908 £1,433,657 £233,368 -£4,680,752
-£7,000,000
-£6,000,000
-£5,000,000
-£4,000,000
-£3,000,000
-£2,000,000
-£1,000,000
£0
£1,000,000
£2,000,000
£3,000,000
NPV 25 Years
All BAE Sites(with Mall)
All BAE Sites(no Mall)
BAE HighDensity
(with Mall)
BAE HighDensity (no
Mall)Deely Freed
Gas CHP -£1,661,099 -£4,852,161 £4,137,196 £183,997 -£5,066,106
Biomass Boiler -£2,467,452 -£3,059,239 £2,799,875 £348,539 -£4,299,134
-£6,000,000
-£4,000,000
-£2,000,000
£0
£2,000,000
£4,000,000
£6,000,000
NPV 40 Years

Cribbs Patchway New Neighbourhood
Heat Network Feasibility Study
3514199A-BEE CPNN DH Feasibility - FINAL - 10-05-16_v2 Prepared by WSP | Parsons Brinckerhoff Sept 2015 for South Gloucestershire Council - 164 -
Residential Connection Charge: High
13.6.2 Public-Private Partnership Discount Rate (12%)
Residential Connection Charge: Base
Residential Connection Charge: Low
All BAE Sites(with Mall)
All BAE Sites(no Mall)
BAE HighDensity (with
Mall)
BAE HighDensity (no
Mall)Deely Freed
Gas CHP -£1,145,952 -£3,974,505 £2,974,778 £436,076 -£4,461,292
Biomass Boiler -£1,837,022 -£2,947,773 £2,363,764 £1,044,662 -£3,926,546
-£5,000,000
-£4,000,000
-£3,000,000
-£2,000,000
-£1,000,000
£0
£1,000,000
£2,000,000
£3,000,000
£4,000,000
NPV 25 Years
All BAE Sites(with Mall)
All BAE Sites(no Mall)
BAE HighDensity
(with Mall)
BAE HighDensity (no
Mall)Deely Freed
Gas CHP £156,850 -£3,153,026 £5,067,303 £995,290 -£4,311,900
Biomass Boiler -£649,503 -£1,360,104 £3,677,335 £1,199,165 -£3,544,929
-£6,000,000
-£4,000,000
-£2,000,000
£0
£2,000,000
£4,000,000
£6,000,000
NPV 40 Years
All BAE Sites(with Mall)
All BAE Sites(no Mall)
BAE HighDensity (with
Mall)
BAE HighDensity (no
Mall)Deely Freed
Gas CHP -£4,185,190 -£4,383,700 -£331,938 -£586,574 -£4,956,944
Biomass Boiler -£4,399,322 -£4,315,040 -£495,221 -£637,544 -£4,817,423
-£6,000,000
-£5,000,000
-£4,000,000
-£3,000,000
-£2,000,000
-£1,000,000
£0
NPV 25 Years
All BAE Sites(with Mall)
All BAE Sites(no Mall)
BAE HighDensity
(with Mall)
BAE HighDensity (no
Mall)
Deely Freed
Gas CHP -£3,895,355 -£4,238,898 £34,072 -£484,639 -£4,930,282
Biomass Boiler -£4,141,933 -£4,018,574 -£196,336 -£1,292,661 -£4,752,520
-£6,000,000
-£5,000,000
-£4,000,000
-£3,000,000
-£2,000,000
-£1,000,000
£0
£1,000,000
NPV 40 Years

Cribbs Patchway New Neighbourhood
Heat Network Feasibility Study
3514199A-BEE CPNN DH Feasibility - FINAL - 10-05-16_v2 Prepared by WSP | Parsons Brinckerhoff Sept 2015 for South Gloucestershire Council - 165 -
Residential Connection Charge: High
All BAE Sites(with Mall)
All BAE Sites(no Mall)
BAE HighDensity (with
Mall)
BAE HighDensity (no
Mall)
Deely Freed
Gas CHP -£4,810,674 -£4,961,519 -£695,772 -£902,744 -£5,262,546
Biomass Boiler -£5,024,805 -£4,892,859 -£859,055 -£953,714 -£5,123,024
-£6,000,000
-£5,000,000
-£4,000,000
-£3,000,000
-£2,000,000
-£1,000,000
£0
NPV 25 Years
All BAE Sites(with Mall)
All BAE Sites(no Mall)
BAE HighDensity
(with Mall)
BAE HighDensity (no
Mall)Deely Freed
Gas CHP -£4,520,838 -£4,816,717 -£329,762 -£800,809 -£5,235,883
Biomass Boiler -£4,767,416 -£4,596,393 -£521,188 -£1,628,498 -£5,058,122
-£6,000,000
-£5,000,000
-£4,000,000
-£3,000,000
-£2,000,000
-£1,000,000
£0
NPV 40 Years
All BAE Sites
(with Mall)
All BAE Sites
(no Mall)
BAE High
Density (withMall)
BAE High
Density (noMall)
Deely Freed
Gas CHP -£3,559,707 -£3,805,880 £31,896 -£270,404 -£4,651,343
Biomass Boiler -£3,773,838 -£3,737,220 -£131,387 -£321,374 -£4,511,822
-£5,000,000
-£4,000,000
-£3,000,000
-£2,000,000
-£1,000,000
£0
£1,000,000
NPV 25 Years
All BAE Sites(with Mall)
All BAE Sites(no Mall)
BAE HighDensity
(with Mall)
BAE HighDensity (no
Mall)Deely Freed
Gas CHP -£3,269,872 -£3,661,078 £397,906 -£168,469 -£4,624,681
Biomass Boiler -£3,516,449 -£3,440,754 £128,516 -£956,825 -£4,446,919
-£5,000,000
-£4,000,000
-£3,000,000
-£2,000,000
-£1,000,000
£0
£1,000,000NPV 40 Years

Cribbs Patchway New Neighbourhood
Heat Network Feasibility Study
3514199A-BEE CPNN DH Feasibility - FINAL - 10-05-16_v2 Prepared by WSP | Parsons Brinckerhoff Sept 2015 for South Gloucestershire Council - 166 -
13.6.3 Private Sector ESCo Partnership Discount Rate (15%)
Residential Connection Charge: Base
Residential Connection Charge: Low
All BAE Sites
(with Mall)
All BAE Sites
(no Mall)
BAE HighDensity (with
Mall)
BAE HighDensity (no
Mall)Deely Freed
Gas CHP -£4,491,787 -£4,121,637 -£948,301 -£713,366 -£4,910,548
Biomass Boiler -£4,585,667 -£4,258,468 -£1,045,429 -£909,899 -£4,869,080
-£6,000,000
-£5,000,000
-£4,000,000
-£3,000,000
-£2,000,000
-£1,000,000
£0NPV 25 Years
All BAE Sites(with Mall)
All BAE Sites(no Mall)
BAE HighDensity
(with Mall)
BAE HighDensity (no
Mall)Deely Freed
Gas CHP -£4,352,072 -£4,057,591 -£786,759 -£667,548 -£4,898,425
Biomass Boiler -£4,462,544 -£4,124,257 -£802,338 -£1,664,343 -£4,840,607
-£6,000,000
-£5,000,000
-£4,000,000
-£3,000,000
-£2,000,000
-£1,000,000
£0NPV 40 Years
All BAE Sites(with Mall)
All BAE Sites(no Mall)
BAE High
Density (withMall)
BAE High
Density (noMall)
Deely Freed
Gas CHP -£5,025,719 -£4,612,688 -£1,275,429 -£997,613 -£5,187,546
Biomass Boiler -£5,119,599 -£4,749,519 -£1,372,558 -£1,194,146 -£5,146,078
-£6,000,000
-£5,000,000
-£4,000,000
-£3,000,000
-£2,000,000
-£1,000,000
£0NPV 25 Years
All BAE Sites(with Mall)
All BAE Sites(no Mall)
BAE HighDensity
(with Mall)
BAE HighDensity (no
Mall)
Deely Freed
Gas CHP -£4,886,004 -£4,548,641 -£1,113,887 -£951,794 -£5,175,423
Biomass Boiler -£4,996,476 -£4,615,308 -£1,086,797 -£1,968,256 -£5,117,605
-£6,000,000
-£5,000,000
-£4,000,000
-£3,000,000
-£2,000,000
-£1,000,000
£0NPV 40 Years

Cribbs Patchway New Neighbourhood
Heat Network Feasibility Study
3514199A-BEE CPNN DH Feasibility - FINAL - 10-05-16_v2 Prepared by WSP | Parsons Brinckerhoff Sept 2015 for South Gloucestershire Council - 167 -
Residential Connection Charge: High
All BAE Sites(with Mall)
All BAE Sites(no Mall)
BAE HighDensity (with
Mall)
BAE HighDensity (no
Mall)
Deely Freed
Gas CHP -£3,957,855 -£3,630,587 -£621,172 -£429,119 -£4,633,550
Biomass Boiler -£4,051,735 -£3,767,418 -£1,372,558 -£625,653 -£4,592,082
-£5,000,000
-£4,500,000
-£4,000,000
-£3,500,000
-£3,000,000
-£2,500,000
-£2,000,000
-£1,500,000
-£1,000,000
-£500,000
£0NPV 25 Years
All BAE Sites
(with Mall)
All BAE Sites
(no Mall)
BAE HighDensity
(with Mall)
BAE HighDensity (no
Mall)Deely Freed
Gas CHP -£3,818,140 -£3,566,541 -£459,631 -£383,301 -£4,621,427
Biomass Boiler -£3,928,612 -£3,633,207 -£517,879 -£1,360,429 -£4,563,609
-£5,000,000
-£4,500,000
-£4,000,000
-£3,500,000
-£3,000,000
-£2,500,000
-£2,000,000
-£1,500,000
-£1,000,000
-£500,000
£0NPV 40 Years