copyright © 2015, 2012, and 2009 pearson education, inc. 1 chapter correlation and regression 9
TRANSCRIPT
Copyright © 2015, 2012, and 2009 Pearson Education, Inc. 1
ChapterCorrelation and Regression
9

Copyright © 2015, 2012, and 2009 Pearson Education, Inc. 2
Chapter Outline
• 9.1 Correlation
• 9.2 Linear Regression
• 9.3 Measures of Regression and Prediction Intervals
• 9.4 Multiple Regression
.
Copyright © 2015, 2012, and 2009 Pearson Education, Inc. 3
Section 9.1
Correlation
.

Copyright © 2015, 2012, and 2009 Pearson Education, Inc. 4
Section 9.1 Objectives
• An introduction to linear correlation, independent and dependent variables, and the types of correlation
• How to find a correlation coefficient
• How to test a population correlation coefficient ρ using a table
• How to perform a hypothesis test for a population correlation coefficient ρ
• How to distinguish between correlation and causation
.
Copyright © 2015, 2012, and 2009 Pearson Education, Inc. 5
Correlation
Correlation
• A relationship between two variables.
• The data can be represented by ordered pairs (x, y) x is the independent (or explanatory) variable y is the dependent (or response) variable
.
Copyright © 2015, 2012, and 2009 Pearson Education, Inc. 6
Correlation
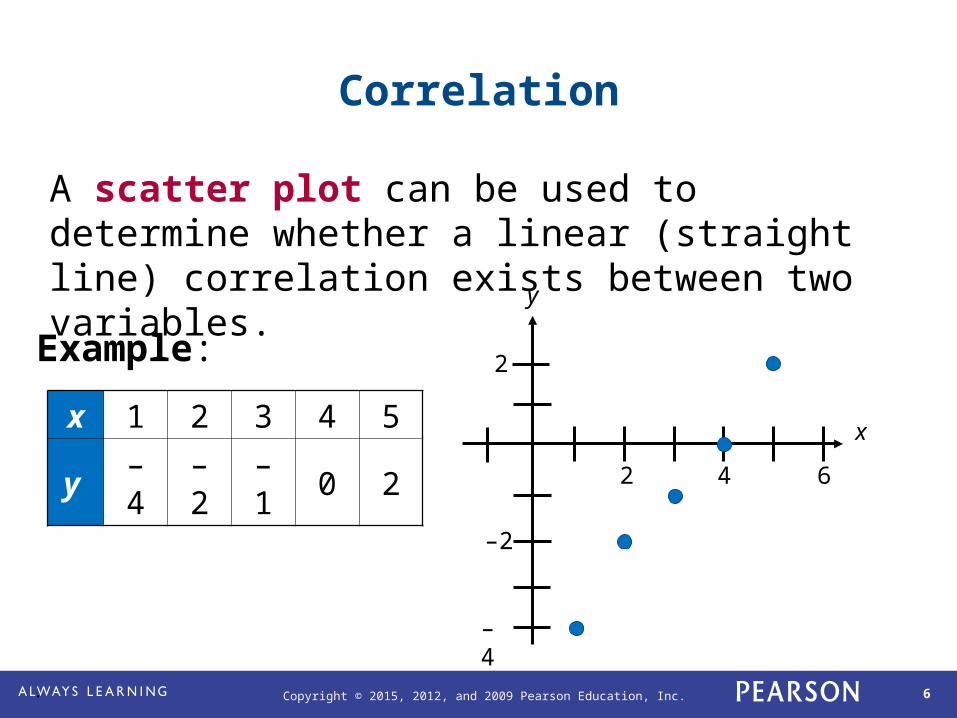
x 1 2 3 4 5
y – 4 – 2 – 1 0 2
A scatter plot can be used to determine whether a linear (straight line) correlation exists between two variables.
x
2 4
–2
– 4
y
2
6
Example:
.

Copyright © 2015, 2012, and 2009 Pearson Education, Inc. 7
Types of Correlation
x
y
Negative Linear Correlation
x
y
No Correlation
x
y
Positive Linear Correlation
x
y
Nonlinear Correlation
As x increases, y tends to decrease.
As x increases, y tends to increase.
.
Copyright © 2015, 2012, and 2009 Pearson Education, Inc. 8
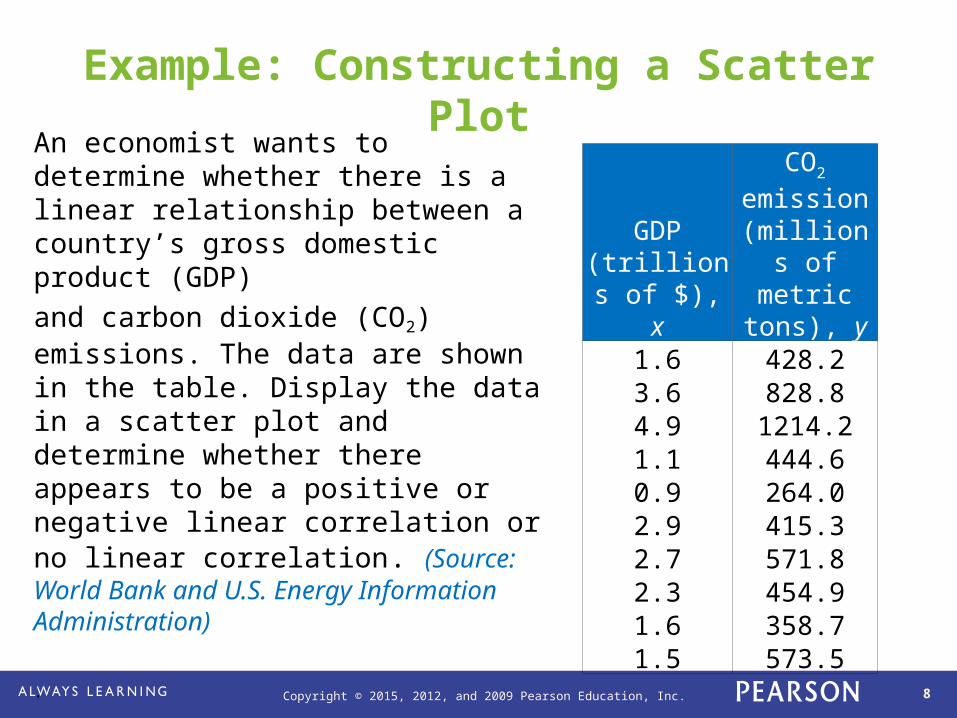
Example: Constructing a Scatter PlotAn economist wants to determine whether there is a linear relationship between a country’s gross domestic product (GDP)
and carbon dioxide (CO2) emissions. The data are shown in the table. Display the data in a scatter plot and determine whether there appears to be a positive or negative linear correlation or no linear correlation. (Source: World Bank and U.S. Energy Information Administration)
GDP(trillions of
$), x
CO2 emission
(millions of metric tons),
y1.6 428.23.6 828.84.9 1214.21.1 444.60.9 264.02.9 415.32.7 571.82.3 454.91.6 358.71.5 573.5
.
Copyright © 2015, 2012, and 2009 Pearson Education, Inc. 9
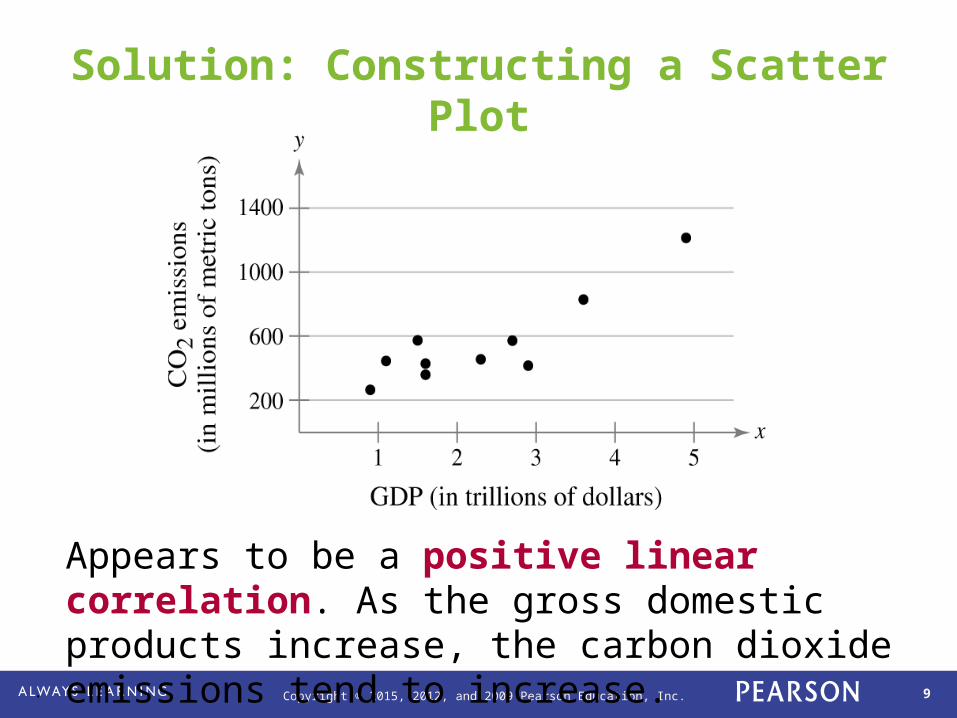
Solution: Constructing a Scatter Plot
Appears to be a positive linear correlation. As the gross domestic products increase, the carbon dioxide emissions tend to increase.
.

Copyright © 2015, 2012, and 2009 Pearson Education, Inc. 10
Example: Constructing a Scatter Plot Using Technology
Old Faithful, located in Yellowstone National Park, is the world’s most famous geyser. The duration (in minutes) of several of Old Faithful’s eruptions and the times (in minutes) until the next eruption are shown in the table. Using a TI-83/84, display the data in a scatter plot. Determine the type of correlation.
Durationx
Time,y
Durationx
Time,y
1.8 56 3.78 79
1.82 58 3.83 85
1.9 62 3.88 80
1.93 56 4.1 89
1.98 57 4.27 90
2.05 57 4.3 89
2.13 60 4.43 89
2.3 57 4.47 86
2.37 61 4.53 89
2.82 73 4.55 86
3.13 76 4.6 92
3.27 77 4.63 91
3.65 77
.
Copyright © 2015, 2012, and 2009 Pearson Education, Inc. 11
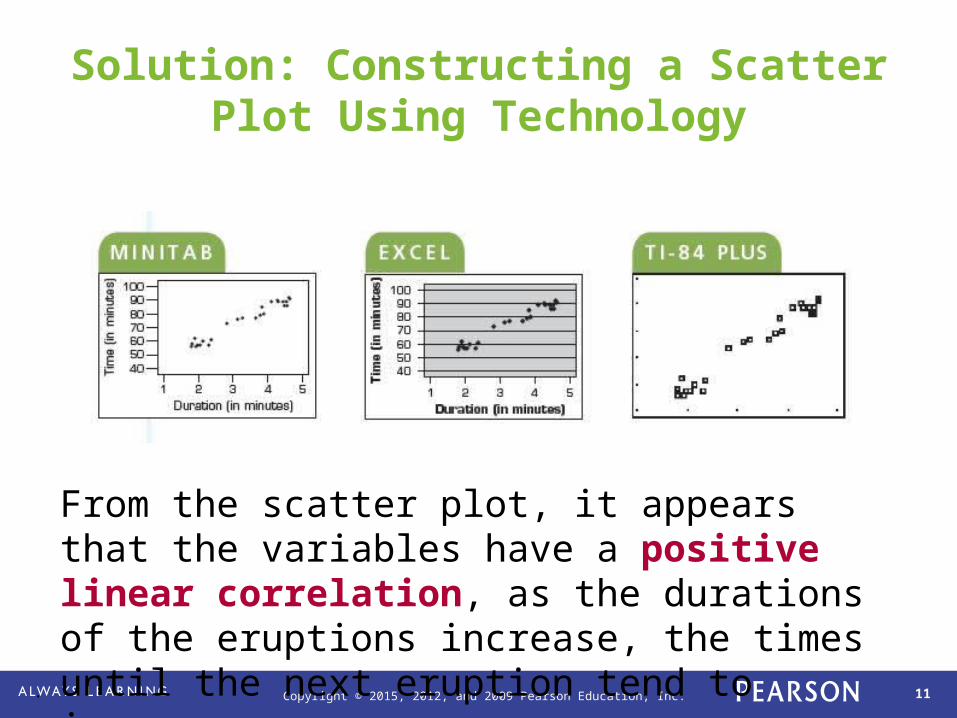
Solution: Constructing a Scatter Plot Using Technology
From the scatter plot, it appears that the variables have a positive linear correlation, as the durations of the eruptions increase, the times until the next eruption tend to increase.
.
Copyright © 2015, 2012, and 2009 Pearson Education, Inc. 12
Correlation Coefficient
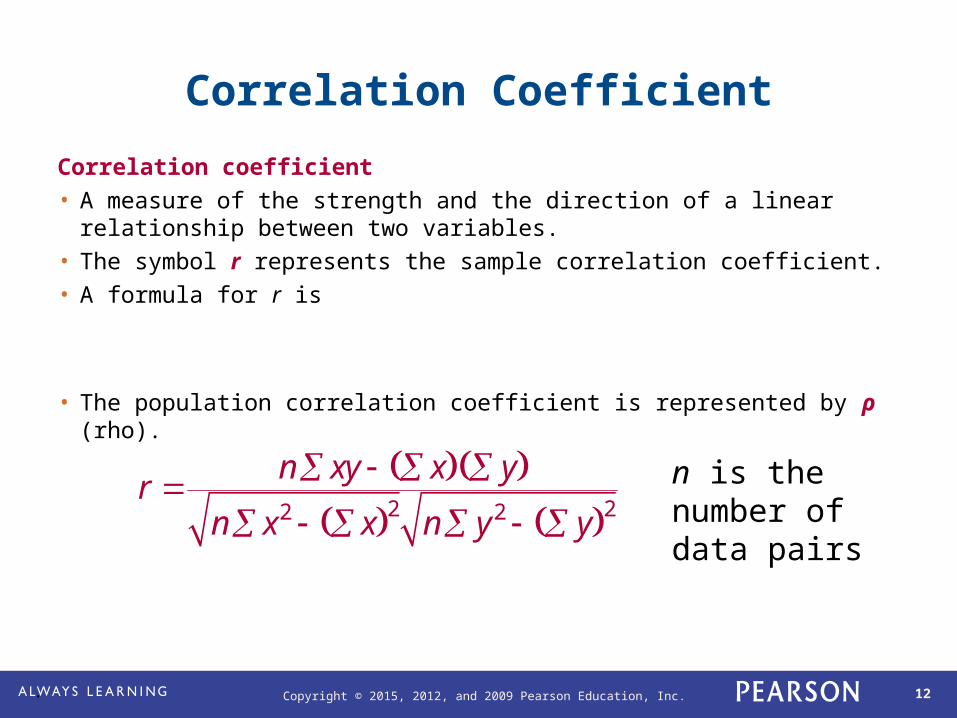
Correlation coefficient
• A measure of the strength and the direction of a linear relationship between two variables.
• The symbol r represents the sample correlation coefficient.
• A formula for r is
• The population correlation coefficient is represented by ρ (rho). 2 22 2
n xy x yr
n x x n y y
n is the number of data pairs
.

Copyright © 2015, 2012, and 2009 Pearson Education, Inc. 13
Correlation Coefficient
• The range of the correlation coefficient is -1 to 1.
-1 0 1
If r = -1 there is a perfect negative
correlation
If r = 1 there is a perfect positive
correlation
If r is close to 0 there is no linear
correlation
.

Copyright © 2015, 2012, and 2009 Pearson Education, Inc. 14
Linear Correlation
Strong negative correlation
Weak positive correlation
Strong positive correlation
No Correlation
x
y
x
y
x
y
x
y
r = 0.91 r = 0.88
r = 0.42 r = 0.07
.
Copyright © 2015, 2012, and 2009 Pearson Education, Inc. 15
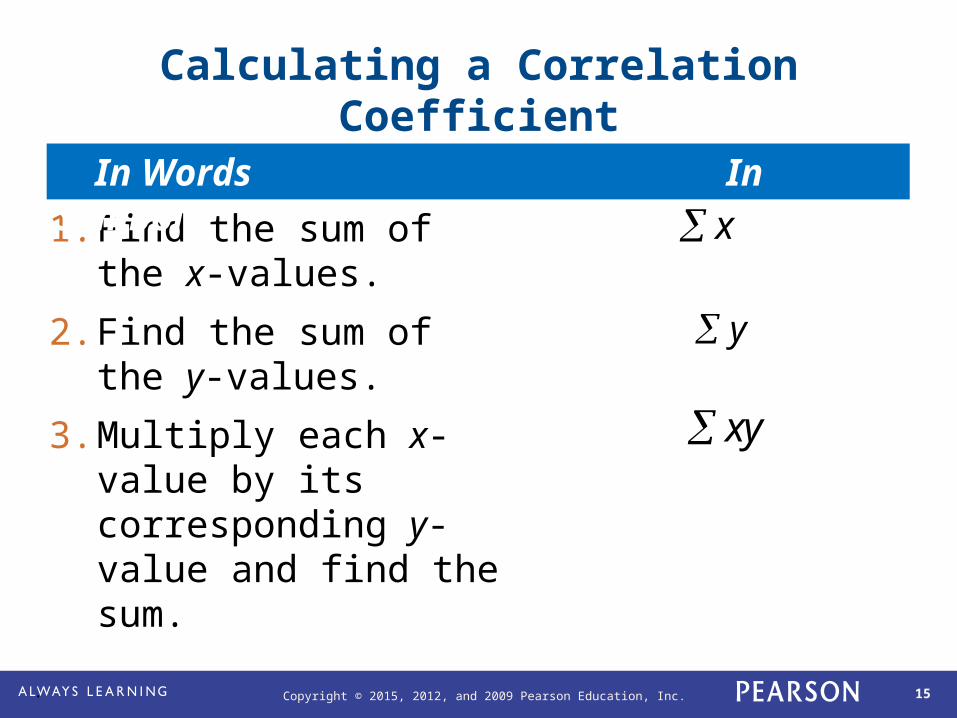
Calculating a Correlation Coefficient
1. Find the sum of the x-values.
2. Find the sum of the y-values.
3. Multiply each x-value by its corresponding y-value and find the sum.
x
y
xy
In Words In Symbols
.

Copyright © 2015, 2012, and 2009 Pearson Education, Inc. 16
Calculating a Correlation Coefficient
4. Square each x-value and find the sum.
5. Square each y-value and find the sum.
6. Use these five sums to calculate the correlation coefficient.
2x
2y
2 22 2
n xy x yr
n x x n y y
In Words In Symbols
.

Copyright © 2015, 2012, and 2009 Pearson Education, Inc. 17
Example: Calculating the Correlation Coefficient
Calculate the correlation coefficient for the gross domestic products and carbon dioxide emissions data. What can you conclude?
GDP(trillions of
$), x
CO2 emission (millions of
metric tons), y1.6 428.23.6 828.84.9 1214.21.1 444.60.9 264.02.9 415.32.7 571.82.3 454.91.6 358.71.5 573.5
.

Copyright © 2015, 2012, and 2009 Pearson Education, Inc. 18
Solution: Calculating the Correlation Coefficient
x y xy x2 y2
1.6 428.2 685.12 2.56 183,355.243.6 828.8 2983.68 12.96 686,909.444.9 1214.2 5949.58 24.01 1,474,281.641.1 444.6 489.06 1.21 197,669.160.9 264.0 237.6 0.81 69,6962.9 415.3 1204.37 8.41 172,474.092.7 571.8 1543.86 7.29 326,955.242.3 454.9 1046.27 5.29 206,934.011.6 358.7 573.92 2.56 128,665.691.5 573.5 860.25 2.25 328,902.25
Σx = 23.1 Σy = 5554 Σxy = 15,573.71 Σx2 = 67.35 Σy2 = 3,775,842.76.

Copyright © 2015, 2012, and 2009 Pearson Education, Inc. 19
Solution: Calculating the Correlation Coefficient
2 22 2
n xy x yr
n x x n y y
2 2
10(15,573.71) 23.1 5554
10(67.35) 23.1 10(3,775,842.76) 5554
27,439.7 0.882139.89 6,911,511.6
Σx = 23.1 Σy = 5554 Σxy = 15,573.71 Σx2 = 32.44
Σy2 = 3,775,842.76
r ≈ 0.882 suggests a strong positive linear correlation. As the gross domestic product increases, the carbon dioxide emissions also increase.
.

Copyright © 2015, 2012, and 2009 Pearson Education, Inc. 20
Example: Using Technology to Find a Correlation Coefficient
Use a technology tool to calculate the correlation coefficient for the Old Faithful data. What can you conclude?
Durationx
Time,y
Durationx
Time,y
1.8 56 3.78 79
1.82 58 3.83 85
1.9 62 3.88 80
1.93 56 4.1 89
1.98 57 4.27 90
2.05 57 4.3 89
2.13 60 4.43 89
2.3 57 4.47 86
2.37 61 4.53 89
2.82 73 4.55 86
3.13 76 4.6 92
3.27 77 4.63 91
3.65 77
.

Copyright © 2015, 2012, and 2009 Pearson Education, Inc. 21
Solution: Using Technology to Find a Correlation Coefficient
STAT > CalcTo calculate r, you must first enter the DiagnosticOn command found in the Catalog menu
r ≈ 0.979 suggests a strong positive correlation.
.
Copyright © 2015, 2012, and 2009 Pearson Education, Inc. 22
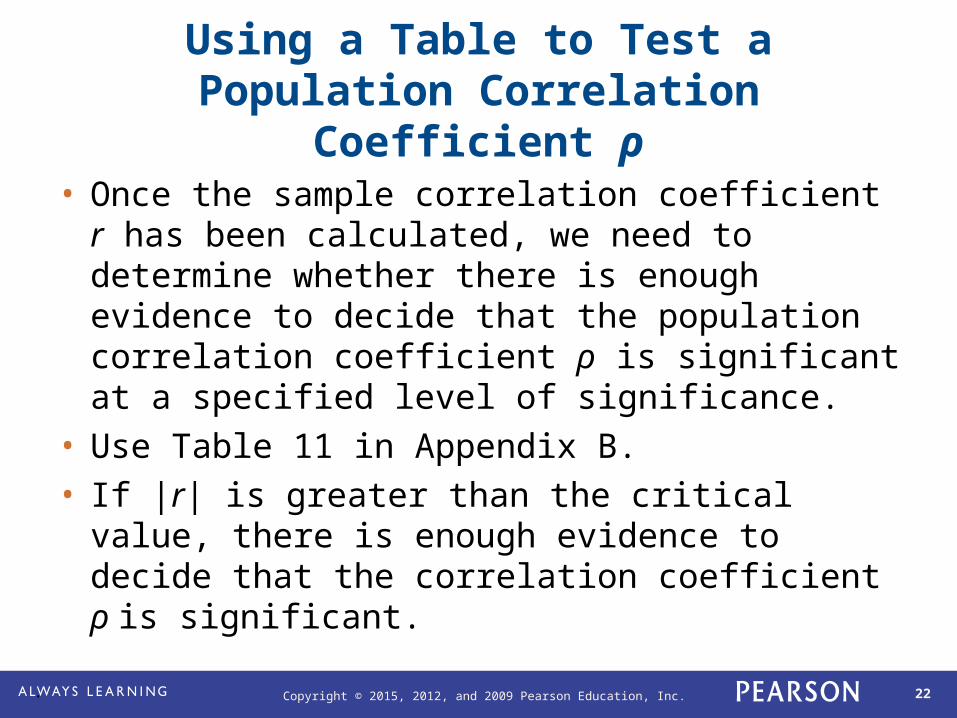
Using a Table to Test a Population Correlation Coefficient ρ
• Once the sample correlation coefficient r has been calculated, we need to determine whether there is enough evidence to decide that the population correlation coefficient ρ is significant at a specified level of significance.
• Use Table 11 in Appendix B.
• If |r| is greater than the critical value, there is enough evidence to decide that the correlation coefficient ρ is significant.
.
Copyright © 2015, 2012, and 2009 Pearson Education, Inc. 23
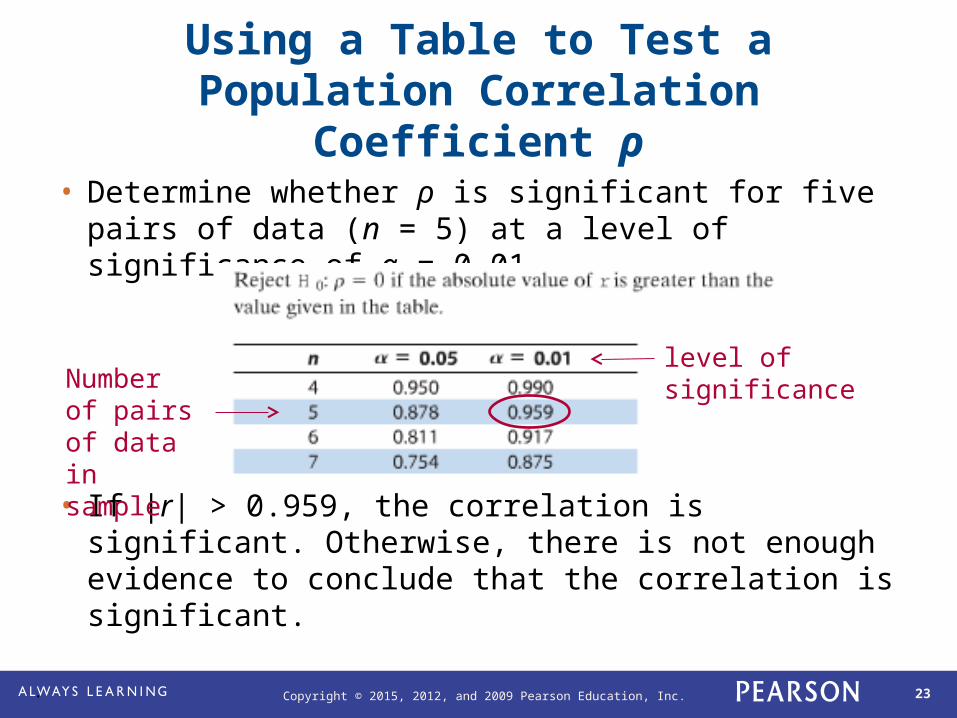
Using a Table to Test a Population Correlation Coefficient ρ
• Determine whether ρ is significant for five pairs of data (n = 5) at a level of significance of α = 0.01.
• If |r| > 0.959, the correlation is significant. Otherwise, there is not enough evidence to conclude that the correlation is significant.
Number of pairs of data in sample
level of significance
.

Copyright © 2015, 2012, and 2009 Pearson Education, Inc. 24
Using a Table to Test a Population Correlation Coefficient ρ
1. Determine the number of pairs of data in the sample.
2. Specify the level of significance.
3. Find the critical value.
Determine n.
Identify .
Use Table 11 in Appendix B.
In Words In Symbols
.

Copyright © 2015, 2012, and 2009 Pearson Education, Inc. 25
Using a Table to Test a Population Correlation Coefficient ρ
In Words In Symbols
4. Decide if the correlation is significant.
5. Interpret the decision in the context of the original claim.
If |r| > critical value, the correlation is significant. Otherwise, there is not enough evidence to support that the correlation is significant.
.
Copyright © 2015, 2012, and 2009 Pearson Education, Inc. 26
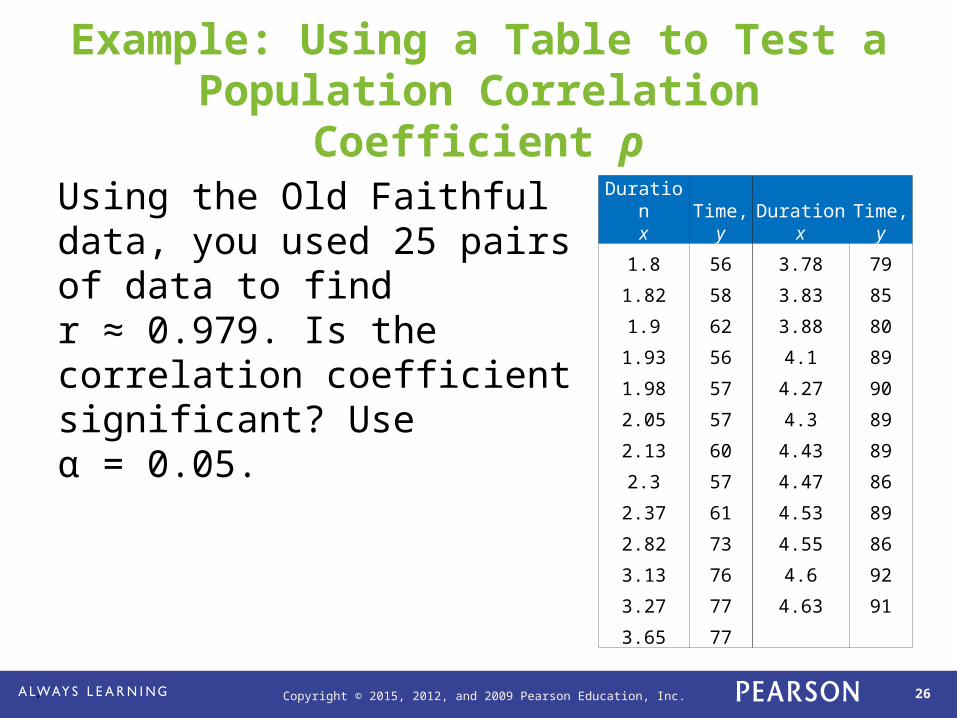
Example: Using a Table to Test a Population Correlation Coefficient ρ
Using the Old Faithful data, you used 25 pairs of data to find r ≈ 0.979. Is the correlation coefficient significant? Use α = 0.05.
Durationx
Time,y
Durationx
Time,y
1.8 56 3.78 79
1.82 58 3.83 85
1.9 62 3.88 80
1.93 56 4.1 89
1.98 57 4.27 90
2.05 57 4.3 89
2.13 60 4.43 89
2.3 57 4.47 86
2.37 61 4.53 89
2.82 73 4.55 86
3.13 76 4.6 92
3.27 77 4.63 91
3.65 77
.
Copyright © 2015, 2012, and 2009 Pearson Education, Inc. 27
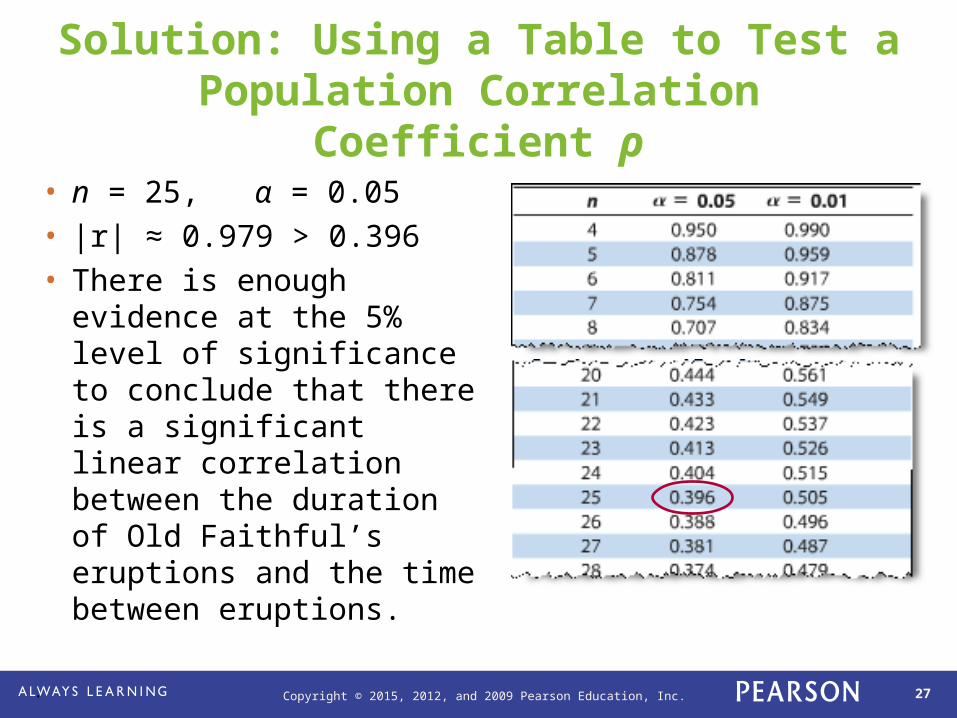
Solution: Using a Table to Test a Population Correlation Coefficient ρ
• n = 25, α = 0.05
• |r| ≈ 0.979 > 0.396
• There is enough evidence at the 5% level of significance to conclude that there is a significant linear correlation between the duration of Old Faithful’s eruptions and the time between eruptions.
.
Copyright © 2015, 2012, and 2009 Pearson Education, Inc. 28
Hypothesis Testing for a Population Correlation Coefficient ρ
• A hypothesis test can also be used to determine whether the sample correlation coefficient r provides enough evidence to conclude that the population correlation coefficient ρ is significant at a specified level of significance.
• A hypothesis test can be one-tailed or two-tailed.
.
Copyright © 2015, 2012, and 2009 Pearson Education, Inc. 29
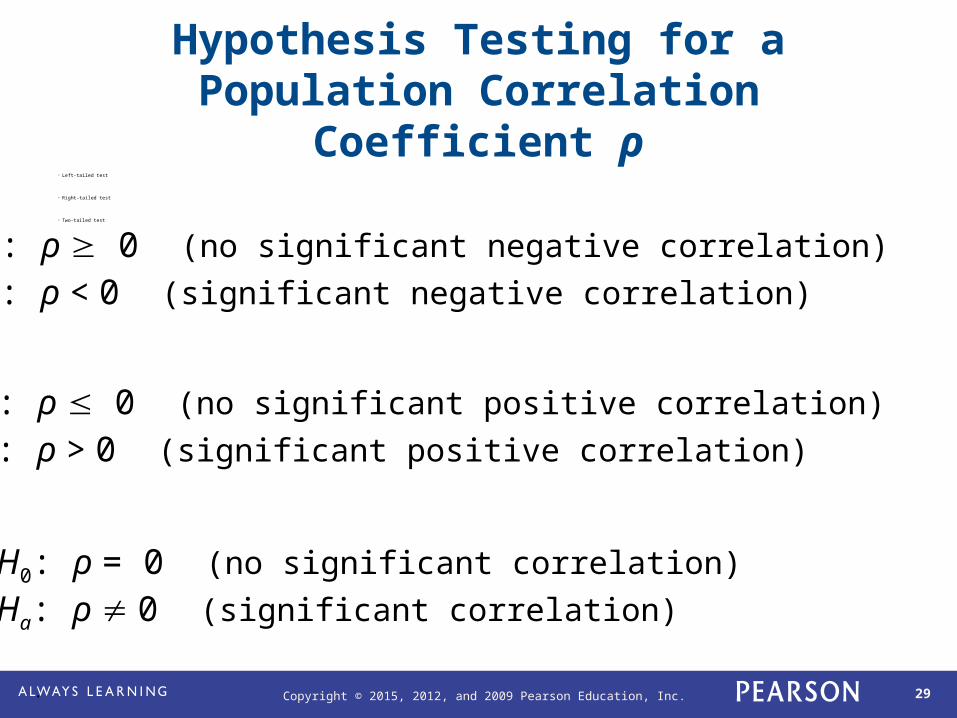
Hypothesis Testing for a Population Correlation Coefficient ρ
• Left-tailed test
• Right-tailed test
• Two-tailed test
H0: ρ 0 (no significant negative correlation)
Ha: ρ < 0 (significant negative correlation)
H0: ρ 0 (no significant positive correlation)
Ha: ρ > 0 (significant positive correlation)
H0: ρ = 0 (no significant correlation)
Ha: ρ 0 (significant correlation)
.

Copyright © 2015, 2012, and 2009 Pearson Education, Inc. 30
The t-Test for the Correlation Coefficient
• Can be used to test whether the correlation between two variables is significant.
• The test statistic is r
• The standardized test statistic
follows a t-distribution with d.f. = n – 2.
• In this text, only two-tailed hypothesis tests for ρ are considered.
212
r
r rtr
n
.

Copyright © 2015, 2012, and 2009 Pearson Education, Inc. 31
Using the t-Test for ρ
1. State the null and alternative hypothesis.
2. Specify the level of significance.
3. Identify the degrees of freedom.
4. Determine the critical value(s) and rejection region(s).
State H0 and Ha.
Identify .
d.f. = n – 2.
Use Table 5 in Appendix B.
In Words In Symbols
.

Copyright © 2015, 2012, and 2009 Pearson Education, Inc. 32
Using the t-Test for ρ
5. Find the standardized test statistic.
6. Make a decision to reject or fail to reject the null hypothesis.
7. Interpret the decision in the context of the original claim.
In Words In Symbols
If t is in the rejection region, reject H0. Otherwise fail to reject H0.
212
rtr
n
.
Copyright © 2015, 2012, and 2009 Pearson Education, Inc. 33
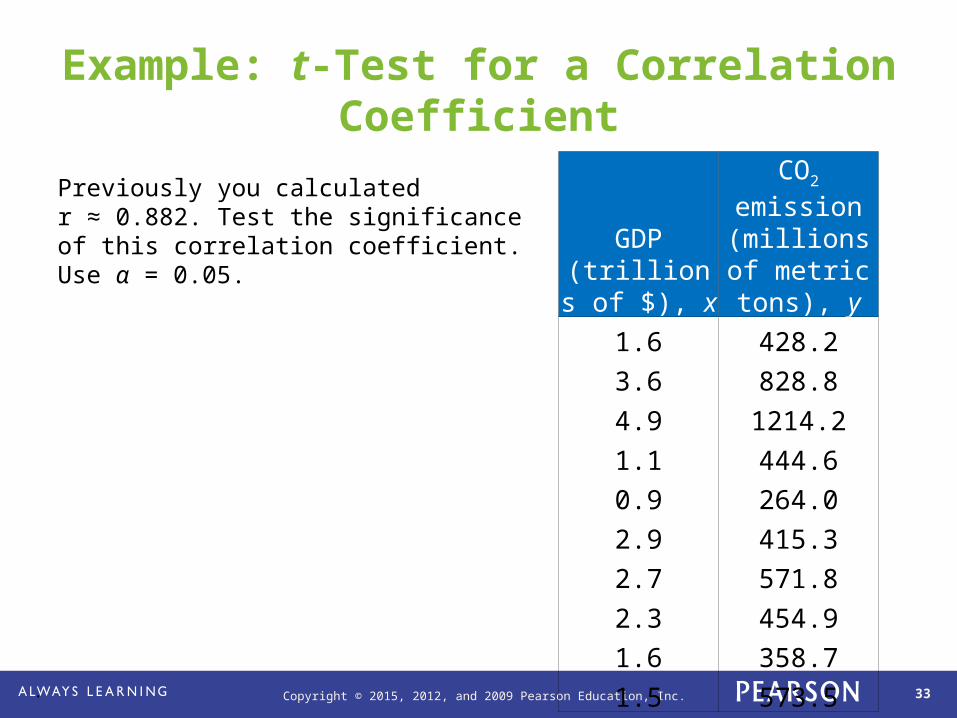
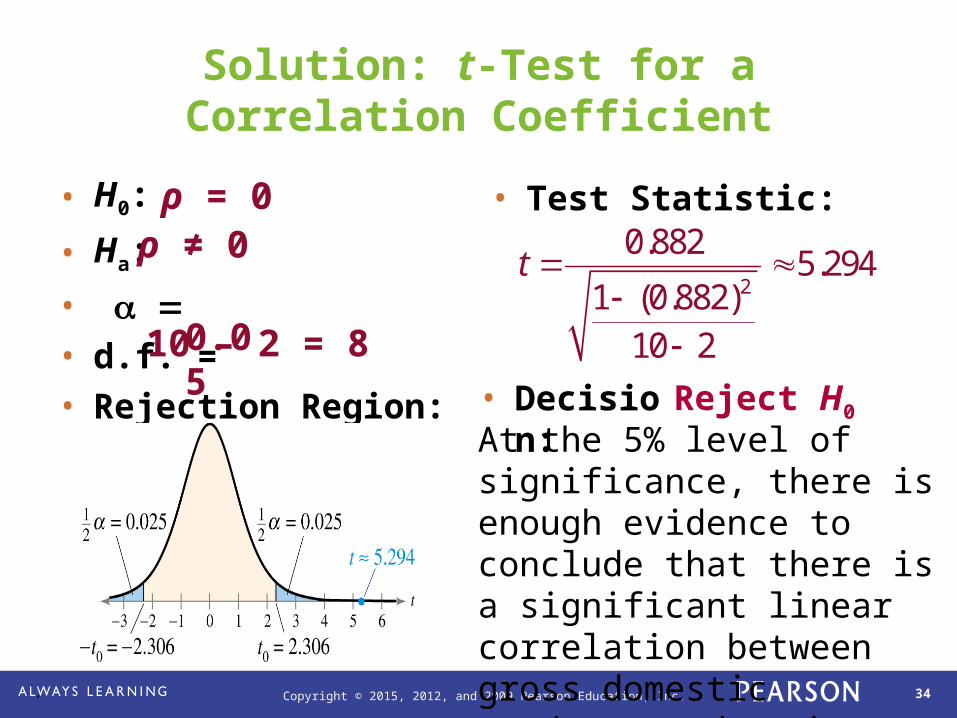
Example: t-Test for a Correlation Coefficient
Previously you calculated r ≈ 0.882. Test the significance of this correlation coefficient. Use α = 0.05.
GDP(trillions of $),
x
CO2 emission (millions of
metric tons), y
1.6 428.2
3.6 828.8
4.9 1214.2
1.1 444.6
0.9 264.0
2.9 415.3
2.7 571.8
2.3 454.9
1.6 358.7
1.5 573.5
.
Copyright © 2015, 2012, and 2009 Pearson Education, Inc. 34
Solution: t-Test for a Correlation Coefficient
• H0:
• Ha:
•
• d.f. =
• Rejection Region:
• Test Statistic:
0.0510 – 2 = 8
2
0.8825.294
1 (0.882)10 2
t
ρ = 0ρ ≠ 0
• Decision:At the 5% level of significance, there is enough evidence to conclude that there is a significant linear correlation between gross domestic products and carbon dioxide emissions.
Reject H0
.

Copyright © 2015, 2012, and 2009 Pearson Education, Inc. 35
Correlation and Causation
• The fact that two variables are strongly correlated does not in itself imply a cause-and-effect relationship between the variables.
• If there is a significant correlation between two variables, you should consider the following possibilities.1. Is there a direct cause-and-effect relationship
between the variables?• Does x cause y?
.

Copyright © 2015, 2012, and 2009 Pearson Education, Inc. 36
Correlation and Causation
2. Is there a reverse cause-and-effect relationship between the variables?• Does y cause x?
3. Is it possible that the relationship between the variables can be caused by a third variable or by a combination of several other variables?
4. Is it possible that the relationship between two variables may be a coincidence?
.

Copyright © 2015, 2012, and 2009 Pearson Education, Inc. 37
Section 9.1 Summary
• Introduced to linear correlation, independent and dependent variables and the types of correlation
• Found a correlation coefficient
• Tested a population correlation coefficient ρ using a table
• Performed a hypothesis test for a population correlation coefficient ρ
• Distinguished between correlation and causation
.