correlation and regression dr. ghada abo-zaid correlation and regression
TRANSCRIPT

CORRELATION AND REGRESSION
DR. GHADA ABO-ZAID
Correlation and regression

Outline
Once you have finished studying this chapter, you will be able to:
Draw a scatter diagram, and explain the relationship between two variables from the plot.
Understand the definition of covariance. Calculate the covariance, and interpret the
results. Calculate the coefficient of correlation and
interpret the results. Clarify the difference between the covariance
and correlation.

Identify the assumptions and limitations of correlation coefficient.
Test the hypothesis of coefficient of correlation. Understand the definition of Spearman's rank
correlation coefficient. Calculate Spearman's rank correlation
coefficient and interpret the results. Identify the difference between the correlation
coefficient and Spearman's rank correlation coefficient.
Test the hypothesis of Spearman's rank correlation coefficient.
Outline

Scatter Plot
Exploring the dataset before starting any statistical analysis is considered currently as one of the most important steps in the statistical analysis, especially in social science research.
A scatter plot or scatter diagram might be used for examining initially whether there is an association between two variables, and shows the direction of this association.

Possible scatter plots association between X and Y variables.

Negative association

No association and non-linear association

Covariance
Basically, covariance is used for detecting the direction of an association between two random variables.
If the two variables are moved at the same direction, it is named as a positive covariance.
If the two variables are moved at the reverse directions, it is named as a negative covariance.

Covariance
In other words, A covariance is a positive or a negative single number that help in detecting the association between two variables by its sign. For example if the single number is minus, this refers to an indirect association between two variables and vice versa.
Covariance is denoted as Cov (X,Y).

Sampling Covariance
The sample covariance between X and Y is defined by two formulas:
Second: Short calculation formula
where and are the sampling means for X and Y respectively.

Example
In the stock market, the interest of the analyst is to select stocks that:
a) reduce the risk taken for the same amount of return.
b) select the stocks that are working well together.
Table 4.1 shows the daily returns for two stocks using the closing prices, say NSGB bank, , and Sidi krier petroleum, , in 2014, for a sequence of 10 days.

Table 4.1: Gives the daily returns for two stocks using the closing prices.
Calculate the covariance between X and Y by using
a) Long calculation formulab) Short calculation formula

Short calculation formula

Short calculation formula

Short calculation formula
Interpretation: The result indicates to a positive relationship between the two variables (return of the two stocks) X and Y.

Correlation
Though a covariance measure gives the direct association between two variables, it is still not capable of measuring the size or strength of an association.
A correlation is a statistical measure that determines the strength of an association between two variables and detect their direction.
It is also named as Pearson's correlation coefficient in honour of Karl Person (1857 -1936)

Short calculation formula

Note that the coefficient of correlation lies between +1 and -1.
if r = +1 this indicates a perfect positive correlation between X and Y.
if r = -1 , this indicates a perfect negative association between X and Y.
If r = 0 , this is an indicator of no correlation between X and Y.

Assumptions of Person's Correlation
The variables X and Y must be continuous random variables.
The data for X and Y variables must tend to a normal distribution ( bell shape).

Example
A sample of 8 students was selected randomly to examine the association between the number of hours a student spent studying for an exam (X) and the score that a student obtained on that exam (Y). The data are given below

Example
Find the linear correlation coefficient between the number of hours a student spent in studying and the score a student obtained in the exam, and interpret the result.

Solution by using short calculation formula

Solution by using short calculation formula

Solution by using short calculation formula

Solution by using short calculation formula
Interpretation: This indicates there is a very strong positive association between the number of hours a student spent in studying and the number of the score on the exam.
Interpretation: This means that the more hours a student spent in studying, the better score he or she will obtain.

Hypothesis Test for a Linear Correlation Coefficient
Hypothesis test for a linear correlation coefficient is basically used to detect whether the sample correlation coefficient r is the estimator of population correlation coefficient r (rho) or not by using the Student t distribution.
The student t statistic formula is given below:
which is distributed as with degree of freedom

listed the steps of the hypothesis t- test for a linear correlation coefficient

the steps of the hypothesis t- test for a linear correlation coefficient

Example
A sample of 7 observations was taken randomly to examine the association between the income per thousand pounds, X, and the number of breads con
consumed for person per day, Y

Example
Find the linear correlation coefficient between X and Y and interpret the result
Test the significant of the linear correlation coefficient at significant level, , equals 5%

Solution
Find the linear correlation coefficient between X and Y and interpret the result

Solution

Interpretation: This indicates there is a very strong negative association between the income and the number of bread consumed for person. This means that the more income a person earns the less money spent on bread.

Test the significant of the linear correlation coefficient at significant level, , equals 5% Step 1: Let
Step 2 :

Test the significant of the linear correlation coefficient at significant level, , equals 5%

Test the significant of the linear correlation coefficient at significant level, , equals 5%
We conclude that there is a sufficient evidence to support that there is a linear correlation coefficient between the two variables.

Rank Correlation
Coefficient of correlation is used to measure the association between two variables, but this is under certain conditions.
One of these conditions is that X and Y random variables should be continuous.
In addition, the data of X and Y variables are underlying the normal distribution.
What happen if one of those conditions is not achieved?

Rank Correlation
this basically lead to think of another measure of correlation called rank correlation coefficient
It is also named as Spearman's rank correlation coefficient.
Spearman's rank correlation coefficient, is a non-parametric statistics measure that is equivalent to Pearson's correlation coefficient, r.

It is also undertaken to measure the association between two variables, even if these variables do not underlying normal distribution or they are not continuous variables.
Spearman's Rank correlation coefficient is undertaken if the data are in orders or can be ranked in orders.
Rank Correlation
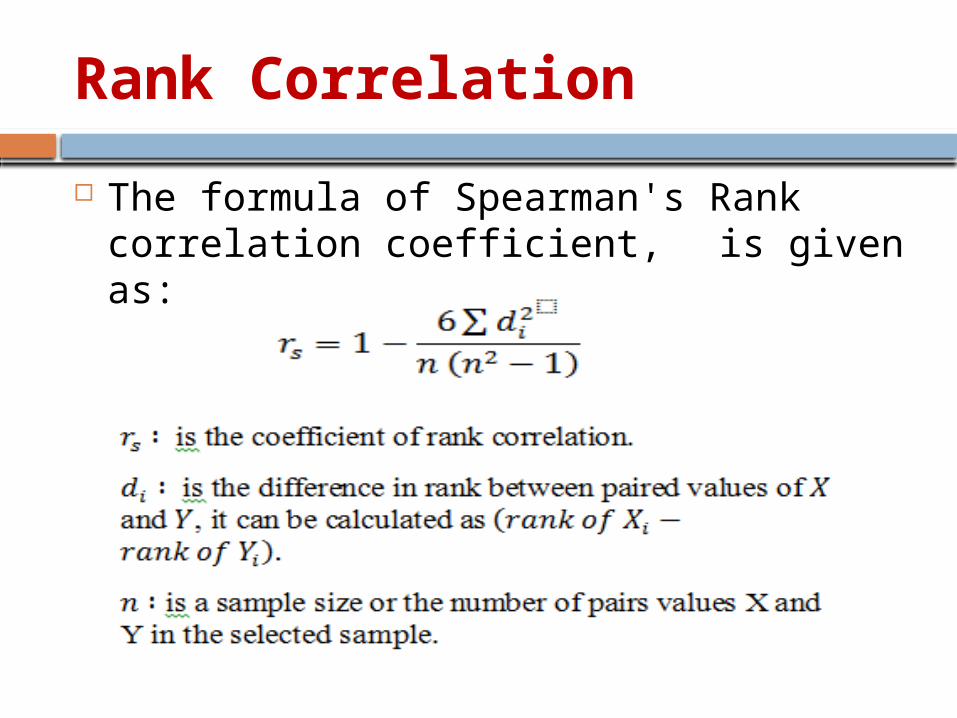
The formula of Spearman's Rank correlation coefficient, is given as:

Steps for calculating Spearman's Rank Correlation Coefficient

Steps for calculating Spearman's Rank Correlation Coefficient

Example
The following table gives the grades of 8 students in linear algebra course , X, and probability course, Y
where : E , V.G, G, and P are excellent, very good, good, and pass respectively. Find the correlation between X and Y.

Solution

Solution
Interpretation: This indicates that there is a moderate positive association between the evaluation grades of linear algebra and probability course.

Hypothesis Significant test of Spearman's Rank Correlation Coefficient Hypothesis test is also undertaken for a
Spearman's Rank Correlation Coefficient to detect whether the sample rank correlation coefficient is an estimator of population correlation coefficient r (rho) or not by using the Student t distribution.

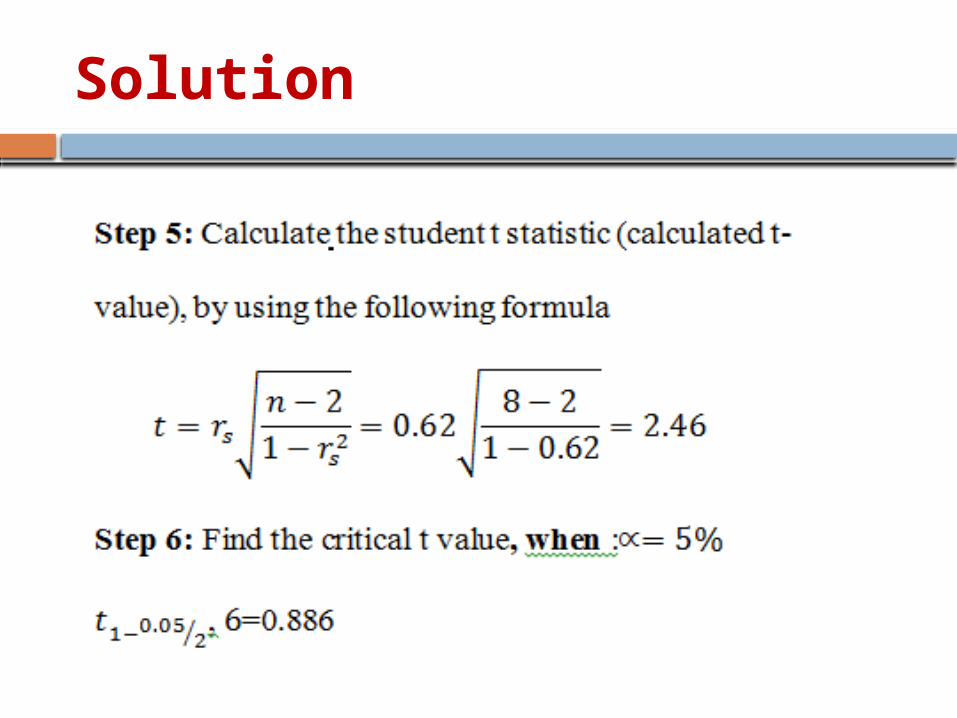
the steps of the hypothesis t- test for Spearman's Rank Correlation Coefficient

the steps of the hypothesis t- test for Spearman's Rank Correlation Coefficient

Example
In the previous Example test the significance of Spearman's Rank Correlation Coefficient

Solution
Solution

Solution

SIMPLE REGRESSION ANALYSIS

Outlines
Goals of chapter five simple linear regression analysis
Once you have finished studying this chapter, you will be able to:
Identify the difference between the dependent and independent variable.
Fit simple linear egression model and interpret the results.
Understand the assumption of simple linear regression model.
know the BLUE method and the advantage of this method for estimating the unknown parameters of simple linear regression model.

Outlines
Assessing the best fitted simple linear regression model.
Construct ANOVA table and calculate F-value.
Understand hypothesis tests of individual regression coefficients.
Calculate the coefficient of determination and interpret the result.

Simple Regression Analysis The Correlation coefficient is a statistics
measure that examines an association between two variables and determine the direction and the strength of there relation.
However, it does not indicate causation. For instance, if two variables, say X and Y show high positive correlation, this does not mean that if Y increase by a certain value, X will increase by the same amount or more.
In addition, it does not give any information about one of the variables predict one another.
Simple Regression Analysis Simple linear regression model is a
simple statistical model that indicates causality by determining the dependent variable, Y and an independent variable, X .
Least square estimation method is used for fitting a model and estimate the effect size of the independent variable, X that influence on the dependent variable, Y.

Simple Regression Analysis In social sciences, it is difficult to
estimate the exact relationship between two variables. It is often assumed that there is an acceptable measurement of error.
In statistical analysis, the error term is included in the model as a random factor called the error term or disturbance term.

Simple Regression Analysis The simple linear regression model is
written mathematically as:

Estimation of and

The sum of square error

Example
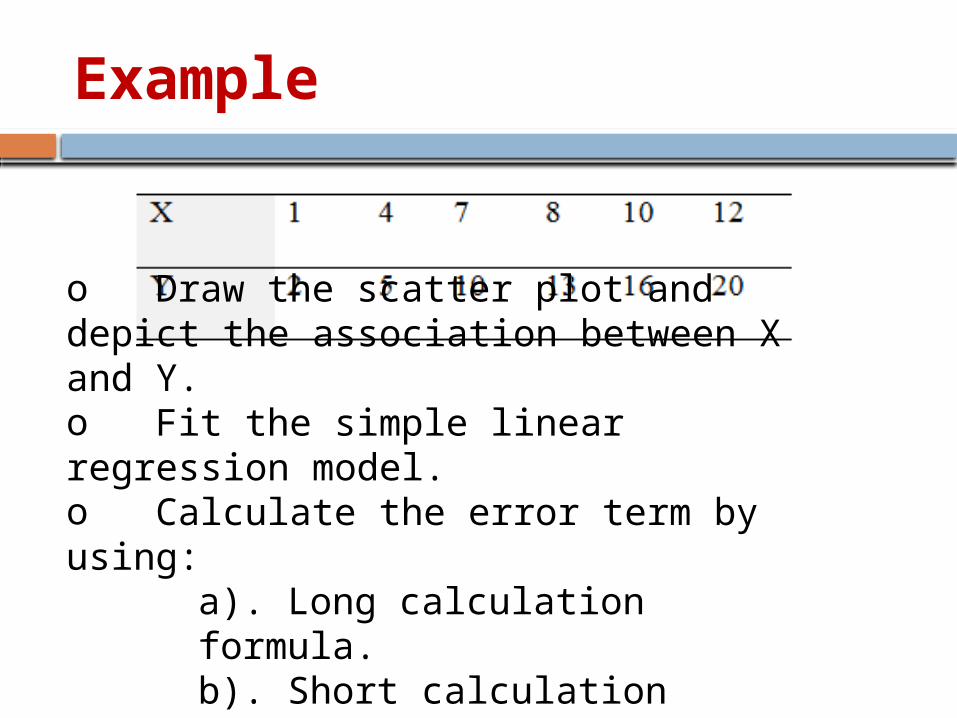
A chain of stores sells treadmills; the manager of the stores wants to know whether advertising of the product increase the sales. The manger decided to examine the association between an advertising expenditures and sales for 6 months. Note that advertising expenditures is the independent variable, X and is measured by thousand Egyptian pounds per month, and Y is the number of treadmills sold per month. The data are given in the following table.
Example
o Draw the scatter plot and depict the association between X and Y.o Fit the simple linear regression model.o Calculate the error term by using:
a). Long calculation formula. b). Short calculation formula.

Solution
Draw the scatter plot

Depict of Scatter plot
The scatter plot shows a direct association between the advertising expenditures, X and the number of sold treadmill, Y.
This indicates that the more amount of money spending on advertising, the more expected number of treadmills are sold.

2. Fitting the simple linear regression model.

Estimate b0 and b1

Estimate b0 and b1

Calculate the error term
First: Long calculation formula

Calculate the error term

Assessing the Best Fitted Simple Linear Regression ModelTesting the significance of the linear regression
model can be undertaken through three methods. The first method is Analysis of variance (ANOVA)
table, that aimed to test the full model by calculating F-value.
The second method is used hypotheses test to test whether a regression parameter are significant or not.
The last one is the coefficient of determination, In the following sections, the three assessing methods are explained in details.

First method: Analysis of Variance (ANOVA table)
To construct ANOVA table, three types of variation should be defined , which are given in the following equation:
SST is named as total sum of squares variation, and it calculated by using the following formula

SSE is named as sum of square error which is the error that not explained by regression.
It can be calculated as follows

SSR is named as sum of square regression. It is variation that explained by regression.
it can be written mathematically as follows:

Construct an ANOVA table
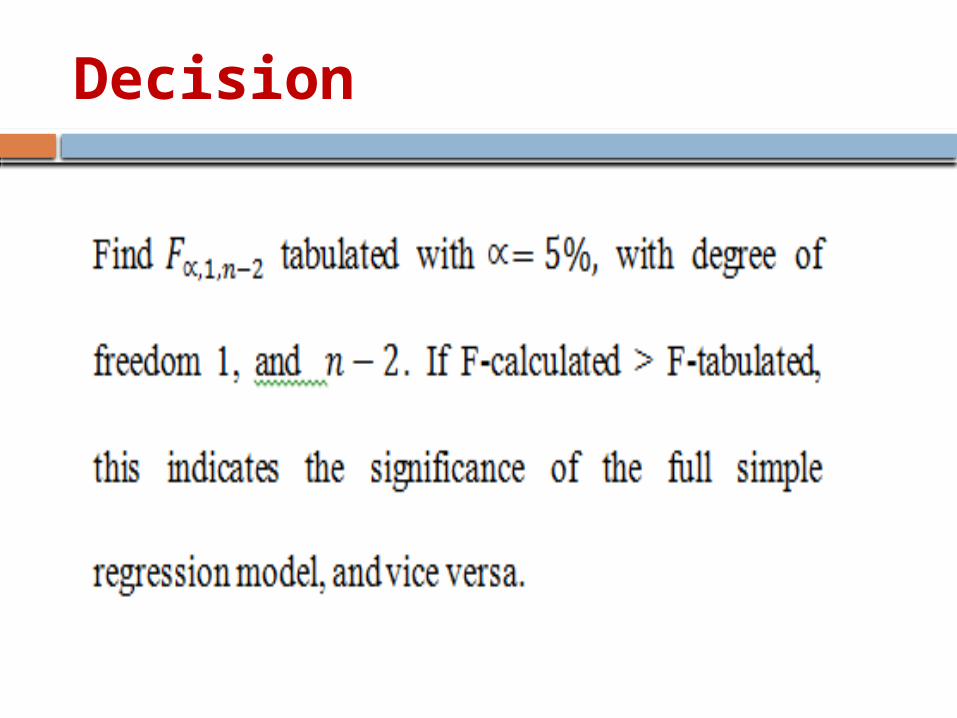
Decision

Hypothesis Tests of Individual Regression Coefficients
Test the significance of slope

Test the significance of slope b1

test the significance of b0

test the significance of b0

Third Method: The Coefficient of Determination,
The coefficient of determination is one of the statistical tool that assess linear regression model.
This indicates how well data fit the line. The coefficient of determination lies between zero and one.
If the coefficient of determination, equals one, this indicates the perfect linear relationship between X and Y.
While, if =0 this indicates that there is no linear relationship between X and Y.
In general, if the value of is close to one, this indicates that the model is a good fit and vice versa

The formula of coefficient of determination is given below
In other words, the coefficient of determination is the square of the Person's correlation coefficient between X and Y, and it is written mathematically as follows:

Example
In previous example , the estimate simple linear regression model were as follows:

Example
From the dataset at previous example find the following:
Test the full estimate simple regression model by constructing ANOVA table , find F-value and interpret the results.
Test the significance of and individually, at 5% significant level.
Calculate the coefficient of determination, and interpret the results.

Solution
Test the full estimate simple regression model by constructing ANOVA table , find F-value and interpret the results.

Solution
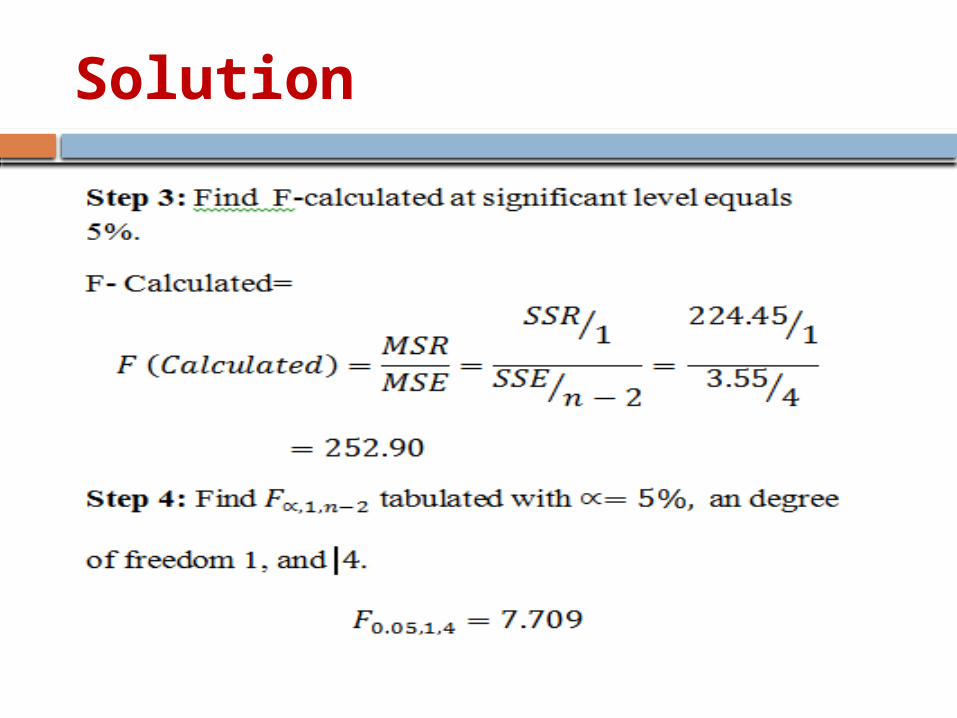
Solution

Solution
Step 5: Decision Since F-calculated> F-tabulated, then,
this indicates the significance of the full simple regression model.

Solution

Solution

Solution

Second : test the significance of b0

Second : test the significance of b0

3) Calculate the coefficient of determination, and interpret the results.