copy (2) of chapter-04
DESCRIPTION
vTRANSCRIPT

Phase Behaviour of Hydrocarbon Systems
CONTENTS
1 DEFINITIONS
2 PHASEBEHAVIOUROFPURESUBSTANCES 2.1 ThePhaseDiagram
3 TWOCOMPONENTSYSTEMS 3.1 Pressure-TemperatureDiagrams 3.2 PressureVolumeDiagram
4 MULTI-COMPONENTHYDROCARBON 4.1 PressureVolumeDiagram 4.2 PressureTemperatureDiagram 4.3 CriticalPoint 4.4 RetrogradeCondensation5 MULTI-COMPONENTHYDROCARBON 5.1 OilSystems(BlackOilsandVolatileOils) 5.2 RetrogradeCondensateGas 5.3 WetGas 5.4 DryGas
6 COMPARISONOFTHEPHASEDIAGRAMSOFRESERVOIRFLUIDS
7 RESERVOIRSWITHAGASCAP
8 CRITICALPOINTDRYING

�
LEARNING OBJECTIVES
Having worked through this chapter the Student will be able to:
General• Define;system,components,phases,equilibrium,intensiveandextensive
properties.
PureComponents• Sketchapressure-temperature(PT)diagramforapurecomponentandillustrate
onit;thevapour-pressureline,criticalpoint,triplepoint,sublimation-pressureline,themeltingpointline,theliquid,gasandsolidphasezones.
• Definethecriticalpressureandcriticaltemperatureforapurecomponent.• DescribebrieflywiththeaidofaPTdiagramthebehaviorofapurecomponent
systembelow(left|)andabove(right)ofthecriticalpoint.• Sketchthepressure-volume(PV)diagramforapurecomponentillustratingthe
behaviorabovethebubblepoint,betweenthebubbleanddewpointandbelowthedewpoint.
• SketchaseriesofPVlinesforapurecomponentwithatemperaturebelow,atandabovethecriticaltemperature.
• Sketchthethreedimensionalphasediagramforpurecomponentsystems.TwoComponents• PlotaPVdiagramfora2componentsystemandidentifykeyparameters.• PlotaPVdiagramfora2componentsystemandidentifykeyparametersand
therelationshiptothevapourpressurelinesforthetwopurecomponents.• Sketchthecriticalpointlociforaseriesofbinarymixturesincludingmethane
andindicatehowamixtureamixtureofmethaneandanothercomponentcanexistas2phasesatpressuresmuchgreaterthanthe2phaselimitforthetwocontributingcomponents.
• DrawaPTdiagramforatwocomponentsystem,toillustratethecricondentherm,cricondenbarandtheregionofretrogradecondensation.
• Definethetermscricondenthermandcricindenbar.• Explainbrieflywhatretrogradecondensationis.MulticomponentSystems• SketchaPTandPVdiagramstoillustratethebehaviouratconstanttemperature
forafluidinaPVTcell.Identifykeyfeatures.• DrawaPTdiagram foraheavyoil,volatileoil, retrogradecondensategas,
wetgasanddrygas.Illustrateandexplainthebehaviourofdepletionfromtheundersaturatedconditiontotheconditionwithinthephasediagram.
• Describebrieflywiththeaidofasketch,thereasonsforandtheprocessofgascycling,forretrogradegascondensatereservoirs.
• PlotaPTdiagramforareservoirwithagascaptoillustratethegasatdewpointandoilatbubblepoint.
Miscellaneous• Withtheaidofsketchexplaintheprocessofcriticalpointdrying.

Phase Behaviour of Hydrocarbon Systems
Institute of Petroleum Engineering, Heriot-Watt University �
Oilandgasreservoirfluidsaremixturesofalargenumberofcomponentswhichwhensubjectedtodifferentpressureandtemperaturesenvironmentsmayexistindifferentforms,whichwecallphases.Phasebehaviourisakeyaspectinunderstandingthenatureandbehaviourofthesefluidsbothinrelationtotheirstateinthereservoirandthechangeswhichtheyexperienceduringvariousaspectsoftheproductionprocess.Inthischapterwewillreviewthequalitativeaspectsofthebehaviourofreservoirfluidswhensubjectedtochangesinpressureandtemperature.
1 DEFINITIONS
Beforeweconsidertheeffectoftemperatureandpressureonhydrocarbonsystemswewilldefinesometerms:
• System-amountofsubstanceswithingivenboundariesunderspecificconditionscomposedofanumberofcomponents.Everythingwithintheseboundariesarepartofthesystemandthatexistingoutsideoftheboundariesarenotpartofthesystem.Ifanythingmovesacrosstheseboundariesthenthesystemwillhavechanged.
• Components - those pure substances which produce the system under allconditions.
Forexample,inthecontextofreservoirengineering,methane,ethane,carbondioxideandwaterareexamplesofpurecomponents.
• Phases-Thistermdescribesseparate,physicallyhomogenouspartswhichareseparatedbydefiniteboundaries.1Examplesinthecontextofwaterarethethreephases,ice,liquidwaterandwatervapour.
• Equilibrium-Whenasystemisinequilibriumthennochangestakeplacewithrespecttotimeinthemeasurablephysicalpropertiesoftheseparatephases.
• Intensive and extensive properties - physical properties are termed eitherintensiveorextensive. Intensive propertiesareindependentof thequantityofmaterialpresent.Forexampledensity,specificvolumeandcompressibilityfactorareintensivepropertieswhereaspropertiessuchasvolumeandmassaretermedextensive properties;theirvaluesbeingdeterminedbythetotalquantityofmatterpresent.
Thephysicalbehaviourofhydrocarbonswhenpressureand temperaturechangescanbeexplainedinrelationtothebehaviouroftheindividualmoleculesmakingupthesystem.Temperature,pressureandintermolecularforcesareimportantaspectsofphysicalbehaviour.
The temperatureisanindicationofthekineticenergyofthemolecules.Itisaphysicalmeasureoftheaveragekineticenergyofthemolecules.Thekineticenergyincreasesasheatisadded.Thisincreaseinkineticenergycausesanincreaseinthemotionofthemoleculeswhichalsoresultsinthemoleculesmovingfurtherapart.

�
Thepressurereflectsthefrequencyofthecollisionofthemoleculesonthewallsofitscontainer.Asmoremoleculesareforcedclosertogetherthepressureincreases.
Intramolecularforcesaretheattractiveandrepulsiveforcesbetweenmolecules.Theyareaffectedbythedistancebetweenthemolecules.Theattractiveforcesincreasesasthedistancebetweenthemoleculesdecreasesuntilhowevertheelectronicfieldofthemoleculesoverlapandthenfurtherdecreaseindistancecausesarepulsiveforce,whichincreasesasthemoleculesareforcedclosertogether.
Themoleculesingasesarewidelyspacedandattractiveforcesexistbetweenthemoleculeswhereasforliquidswherethemoleculesareclosertogetherthereisarepellingforcewhichcausestheliquidtoresistfurthercompression.
Thehydrocarbonfluidsofinterestinreservoirsystemsarecomposedofmanycompo-nents howeverinunderstandingthephasebehaviourofthesesystemsitisconvenienttoreflectonthebehaviourofsingleandtwocomponentsystems.
2 PHASE BEHAVIOUR OF PURE SUBSTANCES
2.1 The Phase DiagramItisbeneficialtostudythebehaviourofapurehydrocarbonundervaryingpressureandtemperaturetogainaninsightintothebehaviourofmorecomplexhydrocarbonsystems.
Phasediagramsareusefulwaysofpresentingthebehaviourofsystems.Theyaregenerallyplotsofpressureversustemperatureandshowthephasesthatexistunderthesevaryingconditions.
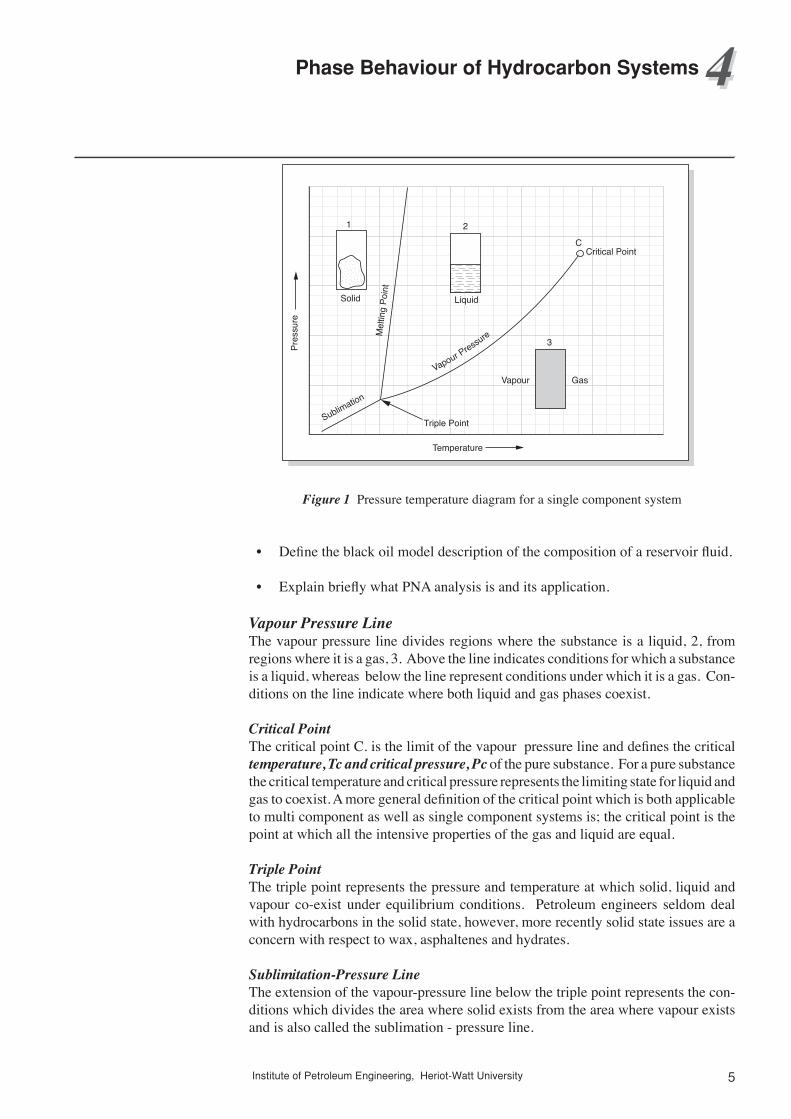
Figure1givesapressure-temperaturephasediagramforasingle-componentsystemonapressuretemperaturediagramandthefollowingpointsaretobenoted.
Phase Behaviour of Hydrocarbon Systems
Institute of Petroleum Engineering, Heriot-Watt University �
Pres
sure
Temperature
Mel
ting
Poin
t
Sublimation
Vapour Pressure
Triple Point
Critical PointC
1 2
3
Vapour
LiquidSolid
Gas
Figure 1 Pressuretemperaturediagramforasinglecomponentsystem
• Definetheblackoilmodeldescriptionofthecompositionofareservoirfluid.
• ExplainbrieflywhatPNAanalysisisanditsapplication.
Vapour Pressure LineThevapourpressurelinedividesregionswherethesubstanceisaliquid,2,fromregionswhereitisagas,3.Abovethelineindicatesconditionsforwhichasubstanceisaliquid,whereasbelowthelinerepresentconditionsunderwhichitisagas.Con-ditionsonthelineindicatewherebothliquidandgasphasescoexist.
Critical PointThecriticalpointC.isthelimitofthevapourpressurelineanddefinesthecriticaltemperature, Tc and critical pressure, Pcofthepuresubstance.Forapuresubstancethecriticaltemperatureandcriticalpressurerepresentsthelimitingstateforliquidandgastocoexist.Amoregeneraldefinitionofthecriticalpointwhichisbothapplicabletomulticomponentaswellassinglecomponentsystemsis;thecriticalpointisthepointatwhichalltheintensivepropertiesofthegasandliquidareequal.
Triple PointThetriplepointrepresentsthepressureandtemperatureatwhichsolid,liquidandvapour co-exist under equilibrium conditions. Petroleum engineers seldomdealwithhydrocarbonsinthesolidstate,however,morerecentlysolidstateissuesareaconcernwithrespecttowax,asphaltenesandhydrates.
Sublimitation-Pressure LineTheextensionofthevapour-pressurelinebelowthetriplepointrepresentsthecon-ditionswhichdividestheareawheresolidexistsfromtheareawherevapourexistsandisalsocalledthesublimation-pressureline.

�
Melting Point LineThemeltinglinedividessolidfromliquid.Forpurehydrocarbonsthemeltingpointgenerallyincreaseswithpressuresotheslopeofthelineispositive.(Waterisex-ceptionalinthatitsmeltingpointdecreaseswithpressure).
3 USE OF PHASE DIAGRAMS
3.1 Pressure -Temperature Diagrams (PT)Considerthebehaviourofacellchargedwithapuresubstanceandthevolumevariedbythefrictionlessdisplacementofapistonasshowninfigure2,below.
P1 Pb P Pd P2
Liquid
Gas
Figure 2 PhaseChangesWithPressureatConstantTemperature
Forexample,followingthepath1-2infigure3onthepressure-temperaturediagram,ieholdingtemperatureconstantandvaryingpressurebyexpansionofthecylinder.

Phase Behaviour of Hydrocarbon Systems
Institute of Petroleum Engineering, Heriot-Watt University �
cPc
Tc
Pres
sure
Temperature
Solid Liquid
Mel
ting
- Poi
nt L
ine
Vapour - pressure line
T
Gas
E
A B G
F
1
2
3
4
Figure 3 Pressure-TemperatureDiagramforaSingle-ComponentSystem
Asthepressureisreduced,thepressurefallsrapidlyuntilapressureisreachedlyingonthevapourpressureline.Agasphasewillbegintoformandmoleculesleavetheliquid.Atfurtherattemptstoreducethepressurethevolumeofgasphaseincreases,whileliquidphasevolumedecreasesbutthepressureremainsconstant.Oncetheliquidphasedisappearsfurtherattemptstoreducepressurewillbesuccessfulasthegasexpands.
Abovethecriticaltemperature,followingthepath3-4,adecreaseinpressurewillcauseasteadychangeinthephysicalproperties,forexampleadecreaseindensitybuttherewillnotbeanabruptdensitychangeasthevapourpressurelineisnotcrossed.Nophasechangetakesplace.
Considerthebehaviourofthesystemaroundthecriticalpoint.IfwegofrompointAtopointB,byincreasingthetemperature,wegothoughadistinctivephasechangeonthevapourpressurelinewheretwophases,liquidandgasco-exist.IfwenowgoadifferentroutetoB,startingwiththeliquidstateat‘A’increasethepressureiso-thermally(constanttemperature)toavaluegreaterthanPcatE.ThenkeepingthepressureconstantincreasethetemperaturetoavaluegreaterthanTcatpointF.NowdecreasethepressuretoitsoriginalvalueatG.Finally,decreasethetemperaturekeepingthepressureconstantuntilBisreached.Thesystemisnowinthevapourstateandthisstatehasbeenachieved withoutanabruptphasechange.Thevapourstatesareonlymeaningfulinthetwophaseregions.Inareasfarremovedfromthetwophaseregionparticularlywherepressureandtemperatureareabovethecriticalvalues,definitionoftheliquidorgaseousstateisimpossibleandthesystemisbestdescribedasinthefluidstate.
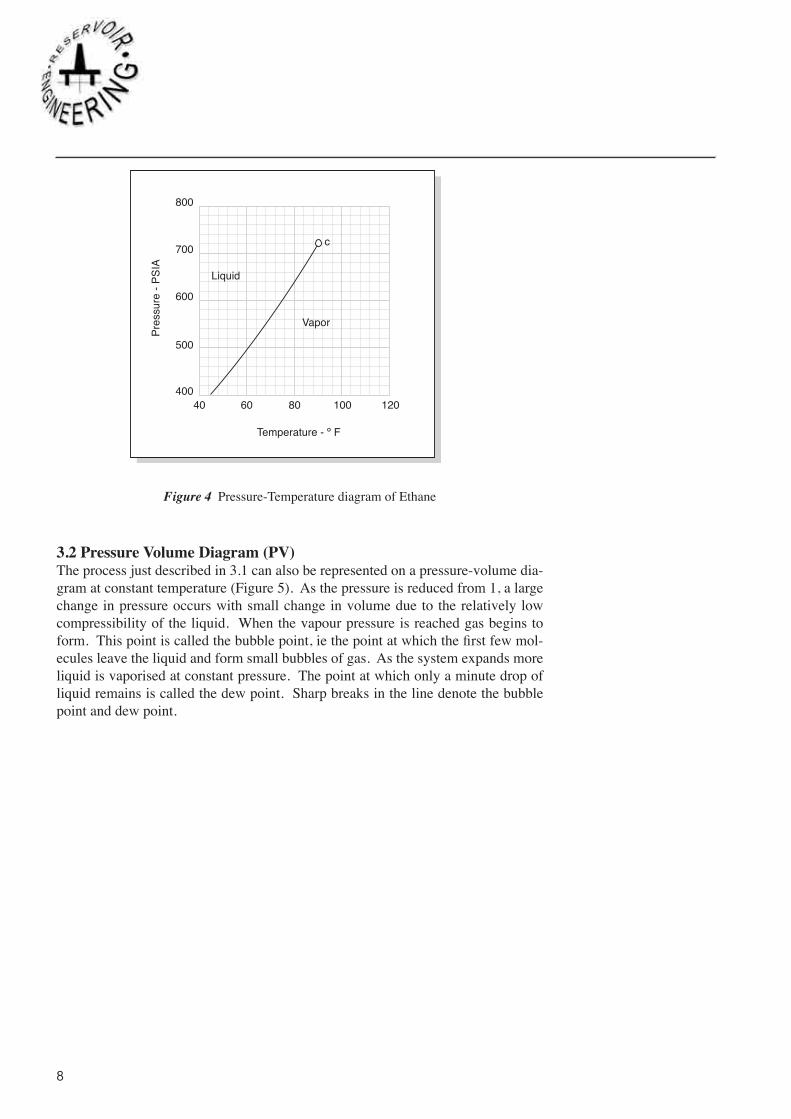
Thepressure-temperaturediagramforethaneisgiveninFigure4.
�
400
500
600
700
800
40 60 80 100 120
Liquid
Vapor
c
Temperature - º F
Pres
sure
- PS
IA
Figure 4 Pressure-TemperaturediagramofEthane
3.2 Pressure Volume Diagram (PV)Theprocessjustdescribedin3.1canalsoberepresentedonapressure-volumedia-gramatconstanttemperature(Figure5).Asthepressureisreducedfrom1,alargechangeinpressureoccurswithsmallchangeinvolumedueto therelativelylowcompressibilityoftheliquid.Whenthevapourpressureisreachedgasbeginstoform.Thispointiscalledthebubblepoint,iethepointatwhichthefirstfewmol-eculesleavetheliquidandformsmallbubblesofgas.Asthesystemexpandsmoreliquidisvaporisedatconstantpressure.Thepointatwhichonlyaminutedropofliquidremainsiscalledthedewpoint.Sharpbreaksinthelinedenotethebubblepointanddewpoint.

Phase Behaviour of Hydrocarbon Systems
Institute of Petroleum Engineering, Heriot-Watt University �
4
PVT CELL PV DIAGRAM
All Liquid
All Gas
First Gas Bubble
Last Drop of Liquid
1
2
Liquid state-rapid change of pressure with small volume change
Pressure remains constant while both gas and liquid are present
Dew Point
GasBubble Point
VolumePr
essu
re
TWO PHASE REGION
SINGLE PHASE T > Tc
T < Tc
T2 > Tc
Figure 5 Pressure-VolumediagramforaSingle-ComponentSystem
Forapuresubstancevapourpressuresatbubblepointanddewpointareequaltothevapourpressureofthesubstanceatthattemperature.Abovethecriticalpoint,ie3-4,thePVbehaviourlineshowsnoabruptchangeandsimplyshowsanexpansionofthesubstanceandnophasechange.Thisfluidiscalledasupercriticalfluid.
A series of expansions canbeperformedat various constant temperatures and apressurevolumediagrambuiltupandthelocusofthebubblepointanddewpointvaluesgivesthebubblepointanddewpointlineswhichmeetatthecriticalpoint.Conditions under the bubble point and dew point lines represent the conditionswheretwophasescoexistwhereasthoseabovethesecurvesrepresenttheconditionswhereonlyonephaseexists.AtthecriticaltemperaturetheP,Tcurvegoesthroughthecriticalpoint.Figure6

10
Bubb
le P
oint
Cur
ve Dew Point Curve
4
3Liquid state rapidchange of temperaturewith small volume change
Critical Point
1
2
Volume
Pres
sure
TWO PHASE REGION
SINGLE PHASE
T = Tc
T < Tc
T > Tc
Pressure remains constant whileboth gas and liquid are present
Figure 6 SeriesofPVlinesforapurecomponent
Thepressurevolumecurveforpurecomponentethaneisgiveninfigure7
Thelocusofthebubblepointsanddewpointsformathree-dimensionaldiagramwhenprojectedintoaP-Tdiagramgivethevapourpressureline(Figure8).
400
500
600
700
800
900
0 0.05 0.10 0.15 0.20 0.25
Liquid Vapor
C
D BA
Specific Volume - Cu. Ft. per lb.
Pres
sure
- PS
IA
Two Phase Region
110 º F90 º F
60 º F
Figure 7 Pressure-VolumeDiagramofEthane

Phase Behaviour of Hydrocarbon Systems
Institute of Petroleum Engineering, Heriot-Watt University 11
Volume
Temperature
Temperature
Liquid
Gas
LiquidGas
and
Liqu
id
Gas
Critical Point
Critical Point
Vapor Pressure Curve
Dew Point Line
Bubble Point Line
Pres
sure
Pres
sure
Figure 8 ThreeDimensionalPhaseDiagramforaPureComponentSystem
4 TWO COMPONENT SYSTEMSReservoirfluidscontainmanycomponentsbutwewillfirstconsiderasystemcon-tainingtwocomponents,suchasystemiscalledabinary.
4.1 Pressure Volume DiagramThebehaviourofamixtureoftwocomponentsisnotassimpleasforapuresub-stance.Figure9showstheP-Vdiagramofatwo-componentmixtureforaconstanttemperaturesystem.
Pres
sure
Volume
Liquid
Gas
Liquid and GasBubble Point
Dew Point
Figure 9 Pressure-VolumeLineforaTwo-ComponentSystematConstantTemperature

1�
Theisothermisverysimilartothepurecomponentbutthepressureincreasesasthesystempassesfromthedewpointtothebubblepoint.Thisisbecausethecomposi-tionoftheliquidandvapourchangesasitpassesthroughthetwo-phaseregion.Atthebubble pointthecompositionoftheliquidisessentiallyequaltothecomposi-tionofthemixturebuttheinfinitesimalamountofgasisricherinthemorevolatilecomponent.Atthedew pointthecompositionofvapourisessentiallythemixturecompositionwhereastheinfinitesimalamountofliquidisricherinthelessvolatilecomponent.Breaksinthelinearenotassharpasforpuresubstances.
Thepressure-volumediagramforaspecificn-pentaneandn-heptanemixtureisgiveninFigure10.Clearlyadifferentcompositionofthetwocomponentswouldresultinadifferentshapeofthediagram.
100
200
300
400
500
600
0 0.1 0.2 0.3 0.4 0.5
Critical point
Specific Volume - Cu. Ft. per lb.
Pres
sure
- PS
IA
454 º F450 º
425 º
400 º
350 º
300 º
Dew Point Line
Bubb
le P
oint
Lin
e
Figure 10 Pressure-VolumeDiagramforN-PentaneandN-Heptane(52.4mole%Heptane)ref.4
4.2 Pressure Temperature DiagramComparedtothesinglelinerepresentingthevapourpressurecurveforpuresubstancesthereisabroadregioninwhichthetwophasesco-exist.Thetwo-phaseregionofthediagramisboundedbythebubble point lineandthedew point line,andthetwolinesmeetatthe criticalpoint. Pointswithinalooprepresenttwo-phasesystems(Figure11).
Considertheconstanttemperatureexpansionofaparticularmixturecomposition.At1thesubstanceisliquidandaspressureisreducedliquidexpandsuntilthebubblepointisreached.Thepressureatwhichthefirstbubblesofgasappearistermedthebubblepointpressure.Aspressureisdecreasedliquidandgasco-existuntilaminuteamountofliquidremainsatthedewpointpressure.Furtherreductionofpressurecausesexpansionofthegas.

Phase Behaviour of Hydrocarbon Systems
Institute of Petroleum Engineering, Heriot-Watt University 1�
Bycarryingoutaseriesofconstanttemperatureexpansionsthephaseenvelopeisdefinedandwithintheenvelopecontoursofliquidtogasratiosobtained.Thesearecalledqualitylinesanddescribethepressureandtemperatureconditionsforequalvolumesofliquid.Thequalitylinesconvergeatthecriticalpoint.
4.3 Critical PointInthesamewayaspurecomponents,whenmorethanonecomponentispresentliquidandgasescannotcoexist,atpressuresandtemperatureshigherthanthecriti-calpoint.Thecriticalpointforamorethanonecomponentmixtureisdefinedasapointatwhichthebubblepointlineanddewpointlinejoin,ie.itisalsothepointatwhichalltheintensivepropertiesoftheliquidareidentical.Thisaspectisaveryseveretestforphysicalpropertypredictionmethods.
IfthevapourpressurelinesforthepurecomponentsaredrawnontheP-Tdiagramthenthetwo-phaseregionforthemixtureliesbetweenthevapourpressurelines.Inthefigure11thecriticaltemperatureofthemixtureTcABliesbetweenTcAandTcBwhereasthecriticalpressurePcABliesabovePcAandPcB.ItisimportanttonotethatthePcABandTcABofthemixturedoesnotnecessarilyliebetweenthePc&Tcofthetwopurecomponents.
CA
CB
PCAB
TCA
Pres
sure
Temperature
Liquid
Gas
1
2
TCAB TCB
PCA
PCB
Bubble - Point Line
Dew Point
% Liq.
100
75
50
25
0
Critical Point
Figure 11 Pressure-TemperatureDiagramforaTwoComponentSystem
Aspecificmixturecompositionwillgiveaspecificphaseenvelopelyingbetweenthevapourpressurelines.Amixturewithdifferentproportionsofthesamecomponentswillgiveadifferentphasediagram.Thelocusofthecriticalpointofdifferentmix-turecompositionsisshowninFigure12fortheethaneandn-heptanesystem,andinFigure13foraseriesofbinaryhydrocarbonmixtures.Figure13demonstratesthatforbinarymixturee.g.Methaneandn-decanetwophasescancoexistatconditionsofpressureconsiderablygreaterthanthetwophaselimit,criticalconditionsfortheseparatepurecomponents.Methaneisasignificantcomponentofreservoirfluids.

1�
0 100 200 300 400
1400
1200
1000
800
600
400
200
0500 600
Temperature º F
C2
C1
A1
A2
A3B1
B2B3
B
A
C C3
C7
Dew Point li
ne
N-Heptane
Etha
ne
Bubble Point Line
CompositionNo Wt % EthaneC 100.00C1 90.22C2 50.25C3 9.78C7 N-Heptane
Pres
sure
, lbs
./Sq.
In. A
BS
Figure 12 Pressure-TemperatureDiagramfortheEthane-HeptaneSystem2

Phase Behaviour of Hydrocarbon Systems
Institute of Petroleum Engineering, Heriot-Watt University 1�
0
1000
2000
3000
4000
5000
6000
0 -100 0 100 200 300 400 500 600 700
Temperature º F
Pres
sure
Lbs
. (ps
ia)
M
ethan
e
Ethane
Propane N-Butane
N- Pentane
N-Hexane N-Heptane
N-Decane
Two Phases
Single Phase
Figure 13 CriticalPointLociforaSeriesofBinaryHydrocarbonMixtures2
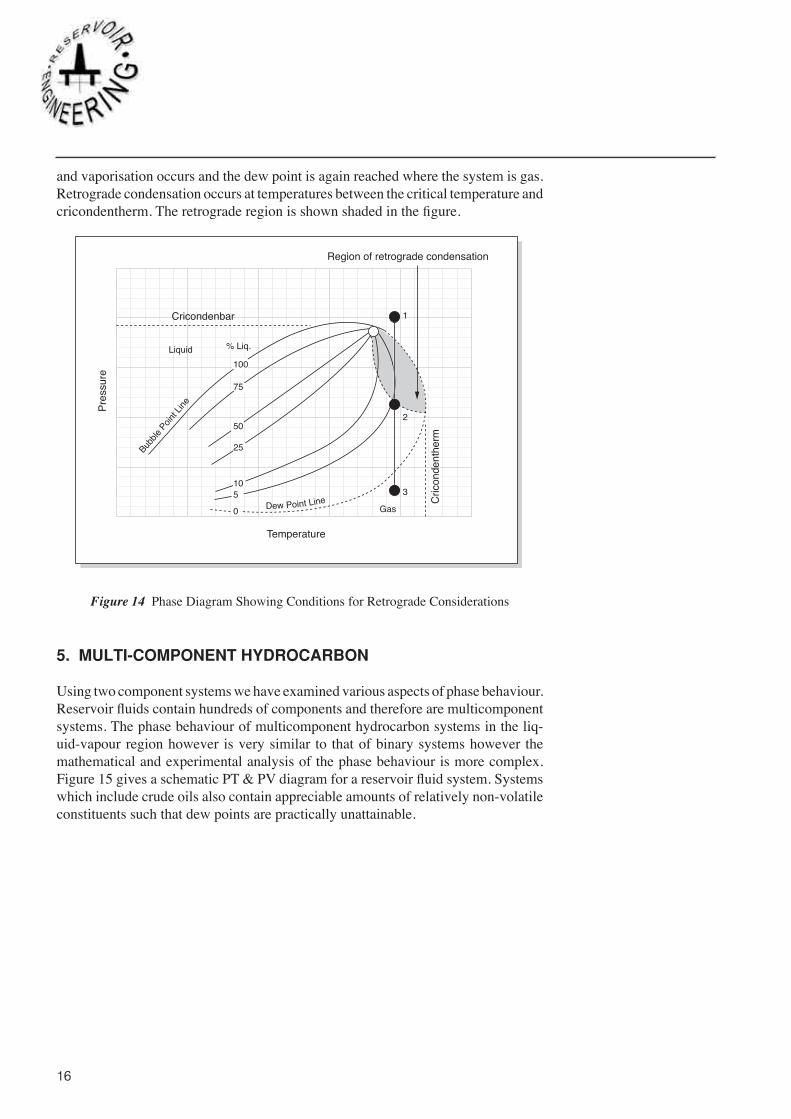
4.4 Retrograde CondensationWithinthetwophaseregionourtwocomponentsystemtherecanbetemperaturesandpressureshigherthanthecriticaltemperaturewheretwophasesexistandsimilarlypressures.Theselimitingtemperaturesandpressuresarethecricondenthermandcricondenbar .Thecricondenthermcanbedefinedasthetemperatureabovewhichliquidcannotbeformedregardlessofpressure,orexpresseddifferently,asthemaxi-mumtemperatureatwhichtwophasescanexistinequilibrium.Thecricondenbarcanbedefinedasthepressureabovewhichnogascanbeformedregardlessoftem-peratureorasthemaximumpressureatwhichtwophasescanexistinequilibrium.(Figure14).
Theselimitsareofparticularsignificanceinrelationtotheshapeofthediagraminfigure14.
ConsiderasingleisothermonFigure14.Forapuresubstanceadecreaseinpressurecausesachangeofphasefromliquidtogas.Foratwo-componentsystembelowTcadecreaseinpressurecausesachangefromliquidtogas.Wenowconsidertheconstanttemperaturedecreaseinpressure,1-2-3,infigure14atatemperaturebetweenthecriticaltemperatureandthecricondentherm.Aspressureisdecreasedfrom1thedewpointisreachedandliquidforms,i.e.,at2thesystemissuchthat5%liquidand95%vapourexists,i.e.adecreaseinpressurehascausedachangefromgastoliquid,oppositetothebehaviouronewouldexpect.Thephenom-enaistermed Retrograde Condensation.From2-3,theamountofliquiddecreases
1�
andvaporisationoccursandthedewpointisagainreachedwherethesystemisgas.Retrogradecondensationoccursattemperaturesbetweenthecriticaltemperatureandcricondentherm.Theretrograderegionisshownshadedinthefigure.
Bubble
Point L
ine
Dew Point Line
% Liq.
100
75
50
25
510
0
Pres
sure
Temperature
Liquid
Gas
1
2
3
Cricondenbar
Cric
onde
nthe
rm
Region of retrograde condensation
Figure 14 PhaseDiagramShowingConditionsforRetrogradeConsiderations5. MULTI-COMPONENT HYDROCARBON
Usingtwocomponentsystemswehaveexaminedvariousaspectsofphasebehaviour.Reservoirfluidscontainhundredsofcomponentsandthereforearemulticomponentsystems.Thephasebehaviourofmulticomponenthydrocarbonsystemsintheliq-uid-vapourregionhowever isverysimilar to thatofbinarysystemshowever themathematicalandexperimentalanalysisofthephasebehaviourismorecomplex.Figure15givesaschematicPT&PVdiagramforareservoirfluidsystem.Systemswhichincludecrudeoilsalsocontainappreciableamountsofrelativelynon-volatileconstituentssuchthatdewpointsarepracticallyunattainable.

Phase Behaviour of Hydrocarbon Systems
Institute of Petroleum Engineering, Heriot-Watt University 1�
PVT CELL PHASE DIAGRAM
All Liquid
Gas / 40% Liquid
All Gas
First Gas Bubble
Last Drop of Liquid
"a"Critical Point
Dew Point
Bubble PointBubble Point
Temperature
Pres
sure
Pres
sure
Volume
Liquid
Bubb
le Po
int Li
ne
Dew Point Line
80%
Liqu
id
60%
40%
20%
Dew Point
Figure 15 PhaseDiagramsforMulticomponentSystems
Wewillconsiderthebehaviourofseveralexamplesoftypicalcrudeoilsandnaturalgases:
Low-shrinkageoil(heavyoil-blackoil) High-shrinkageoil(volatileoil) Retrogradecondensategas Wetgas DryGas
Figure16isausefuldiagramtoillustratethebehaviouroftherespectivefluidtypesabove.Howeveritshouldbeemphasisedthatforeachfluidtypetherewillbedifferentscales.Theverticallineshelptodistinguishthedifferentreservoirfluidtypes.
Isothermalbehaviourbelowthecriticalpointdesignatesthebehaviourofoilsystemsandthefluidisliquidinthereservoir,whereasbehaviourtotherightofthecriticalpointillustratesthebehaviourofsystemswhicharegasinthereservoir.

1�
X5
Pres
sure
Temperature
% Liquid
Gas
(Gas)Black
Oil Volatile
Oil Gas
Condensate Gas
TM2
75
100
50
25201510
50 Single Phase Region
Single Phase Region(Liquid)Single Phase Region
Two Phase Region
CP
Where:
Pb = Bubble point pressure at indicated temperature
Pm = Maximum pressure at which two phases can coexist
Tm = Maximum temperature at which two phases can coexist
C = Critical conditions
X5 = Cricondentherm
Bubble Point Line
Dew Point Line
PmPb
Figure 16 Phasediagramforreservoirfluids
5.1 Oil Systems ( Black Oils and Volatile Oils) Figures17&18 illustratethePTphasediagramsforblackandvolatileoils.
Thetwo-phaseregioncoversawiderangeofpressureandtemperature.Tcishigherthanthereservoirtemperature.Infigure17theline1-2-3representstheconstantreservoirtemperaturepressurereductionthatoccursinthereservoirascrudeoilisproducedforablack oil.Theseoilsareacommonoiltype.Thedottedlineshowstheconditionsencounteredasthefluidleavesthereservoirandflowsthroughthetubingtotheseparator.
If theinitialreservoirpressureandtemperatureareat2, theoil isat itsreservoirbubble pointandissaidtobesaturated,thatis,theoilcontainsasmuchdissolvedgasasitcanandafurtherreductioninpressurewillcauseformationofgas.Iftheinitialreservoirpressureandtemperatureareat1,theoilissaidtobeundersaturated,i.e.ThepressureinthereservoircanbereducedtoPbbeforegasisreleasedintotheformation.Foranoilsystemthesaturation pressure is the bubble point pressure.

Phase Behaviour of Hydrocarbon Systems
Institute of Petroleum Engineering, Heriot-Watt University 1�
Sep.
Pres
sure
Temperature
Liquid
Gas
1 Undersaturated
2 Saturated
3
100
75
50
25
0
Critical Point
Dew
Point
line
Bubb
le Po
int Li
ne
Mole % Liq.
Pb
Figure 17 PhaseDiagramforaBlackOil
Asthepressureisdroppedfromtheinitialconditionasaresultofproductionofflu-ids,thefluidsremaininsinglephaseinthereservoiruntilthebubblepointpressurecorrespondingtothereservoirtemperatureisreached.Atthispointthefirstbubblesofgasarereleasedandtheircompositionwillbedifferentfromtheoilbeingmoreconcentratedinthelighter(morevolatile)components.Whenthefluidsarebroughttothesurfacetheycomeintotheseparatorandasshownonthediagram,thesepara-torconditionsliewellwithinthetwophaseregionandthereforethefluidpresentsitselfasbothliquidandgas.Thepressureandtemperatureconditionsexistingintheseparatorindicatethataround85%liquidisproduced,thatisahighpercentageandasaresultthevolumeofliquidatthesurfacehasnotreducedagreatamountcomparedtoitsvolumeatreservoirconditions.Hencethetermlow-shrinkageoil.
Asthepressureisfurtherreducedasoilisremovedfromthereservoir,point3willbereachedand75%liquidand25%gaswillbeexistinginthereservoir.Strictlyspeakingoncethereservoirpressurehasdroppedtothebubblepoint,beyondthatthephasediagramdoesnottrulyrepresentthebehaviourofthereservoirfluid.Aswewillseeinthechapterondrivemechanisms,belowthebubblepointgasproducedflowsmorereadilythantheassociatedoilandthereforethecompositionofthereservoirfluiddoesnotremainconstant.Thesystemiscontinuallychanginginthereservoirandthereforetherelatedphasediagramchanges.Thesummarycharacteristicsforablackoilsometimestermedaheavyoilorlowshrinkageoilareasfollows.
Broad-phaseenvelope Highpercentageofliquid Highproportionofheavierhydrocarbons GOR<500SCF/STB

�0
Oilgravity30˚APIorheavier Liquid-blackordeepcolour
Volatile oilcontainsamuchhigherproportionoflighterandintermediatehydocar-bonsthanheavierblackoilandthereforetheyliberaterelativelylargevolumesofgasleavingsmalleramountsofliquidcomparedtoblackoils.Forthisreasontheyusedtobecalledhighshrinkageoils.Thediagraminfigure18showssimilarbehaviourtotheblackoilexceptthatthelinesofconstantliquidtogasaremorecloselyspaced.
Points1and2havethesamemeaningasfortheblackoil.Asthepressureisreducedbelow2alargeamountofgasisproducedsuchthatat3thereservoircontains40%liquidand60%gas.
Atseparatorconditions65%ofthefluidisliquid,i.e.lessthanpreviousmixture.Thesummarycharacteristicsforavolatilesometimestermedaheavyoilorhighshrinkageoilwhencomparedtoblackoilsareasfollows.
Notsobroadphaseenvelopeasblackoil Fewerheavierhydrocarbons Deepcoloured API<50˚ GOR<8000SCF/STB
Pres
sure
Temperature
Liquid
Gas
1
2
3
100
75
50
250
Critical PointMole % Liq.
Sep.
Bubb
le po
int lin
e
Dew po
int lin
e
40
Figure 18 PhaseDiagramforaVolatileOil
Clearly,forthesefluids,itisthecompositionofthefluidthatdeterminesthenatureofthephasebehaviourandtherelativepositionofthesaturationlines,(bubblepointanddewpointlines),thelinesofconstantproportionofgas/liquidandthecriticalpoint.

Phase Behaviour of Hydrocarbon Systems
Institute of Petroleum Engineering, Heriot-Watt University �1
Forbothofthesefluidstypesonecanpreventthereservoirfluidgoingtwophasebymaintainingthereservoirpressureaboveitssaturationpressurebyinjectingflu-idsintothereservoir.Themostcommonpractiseistheuseofwaterasapressuremaintenancefluid.5.2 Retrograde Condensate GasIfthereservoirtemperatureliesbetweenthecriticalpointandthecricondenthermaretrograde gas condensatefieldexistsandFigure19givesthePTdiagramforsuchafluid.Abovethephaseenvelopeasinglephasefluidexists.Asthepressurede-clinesto2adewpointoccursandliquidbeginstoforminthereservoir.Theliquidisricherinheaviercomponentsthantheassociatedgas.Asthepressurereducesto3theamountofliquidincreases.Furtherpressurereductioncausesthereductionofliquidinthereservoirbyre-vaporisation.Itisimportanttorecognisethatthephasediagrambelowforaretrogradecondensatefluidrepresentsthediagramforaconstantcompositionsystem.
Beforeproductionthefluidinthereservoirexistsasasinglephaseandisgenerallycalledagas.Itisprobablymoreaccuratetocallitadense phase fluid.Ifthereservoirdropsbelowthesaturationpressurethedewpoint,thenretrogradecondensationoc-curswithintheformation.Thenatureofthiscondensingfluidisonlyinrecentyearsbeingunderstood.Itwaspreviouslyconsideredthatthecondensingfluidwouldbeimmobilesinceitsmaximumproportionwasbelowthevalueforittohavemobil-ity.Itwasconsideredthereforethatsuchvaluablecondensedfluidswouldbelosttoproductionandtheviabilityoftheprojectwouldbethatfromthe‘wet’gas.
Bubble
Point Line
Dew Point Line
Pres
sure
Temperature
Liquid
Gas
1
2
3
100
75
5025
1050
Critical Point
Mole % Liq.
Sep.
Figure 19 PhaseDiagramforaRetrogradeCondensateGas
Oneofthedevelopmentoptionsforsuchafieldthereforeistosetinplaceapressuremaintenance procedure whereby the reservoir pressure does not fall below thesaturationpressure.Watercouldbeusedasforoilsbutgasmightbetrappedbehindthewateras thewateradvances through the reservoir. Gas injection,calledgas

��
cycling (Figure20),isthepreferredyetveryexpensiveoption.Inthisprocesstheproducedfluidsareseparatedatthesurfaceandtheliquidcondensates,highvalueproductrelativetoheavyoil,aresentforexport,inanoffshoresituationprobablybytanker.The‘dry’gasisthencompressedandreinjectedintothereservoirtomaintainthepressureabovethedewpoint.Clearlywiththisprocessthepressurewillstilldeclinebecausethevolumeoccupiedbythegasvolumeoftheexportedliquidisnotbeing replaced. Full pressuremaintenance isobtainedby importingdrygasequivalenttothisexportedvolumefromanearbysource.Eventuallytheinjecteddrygasdisplacesthe‘wet’gasandthenthefieldcanbeblowndownasaconventionaldrygasreservoir,ifasuitableexportrouteforthegasistheninplace.Theprocessdescribedisverycostlyandcarrieswithitanumberofrisksnotleastthepossibilityofearlydrygasbreakthrough.
Imported Gas
Gas
Surface Separation
Gas Water Contact
Dry Gas Reinjection
Injection Well
Production Well
Condensate Sales
Figure 20 Gascyclingprocess
Recentresearchhasshownthatthenatureofoilforminginporousmediabythisret-rogradeprocessmaynotbeasfirstconsidered.Theisolationofcondensingliquidsinporousrockisdependantontherelativestrengthoftheinterfacialtensionandviscousforcesworkingintherock.Iftherelativemagnitudeoftheseishighthenthefluidwillbetrappedhoweveriftheyarelowasaresultoflowinterfacialtension,whichisthecasenearerthecriticalpoint,thenthecondensingliquidsmaybemobileandmoveasaresultofviscousandgravityforces.Condensateliquidshavebeenabletoflowatsaturationswellbelowthepreviouslyconsideredirreduciblesaturationproportion.Establishedrelativepermeabilitythinkingishavingtobereconsideredinthecontextofgascondensates.Thephenomenajustdescribedmaygiveexplanationtotheobservationsometimesmadeofanoilrimbelowagascondensatefield.
LookingatthePTphasediagramonemightconsiderthat"blowingthereservoirdown"

Phase Behaviour of Hydrocarbon Systems
Institute of Petroleum Engineering, Heriot-Watt University ��
quicklymightbeanoptionandasaresultvaporisethecondensedliquidsinthefor-mation.Thisisnotaseriousoptionsinceoncethereservoirpressurefallsbelowthedewpointtheimpactoftheincreasingliquidproportionremaininginthereservoircausesthephasediagramtomovetotherightrelativetoreservoirconditions,andanyvaporisingwillbeofthelightestcomponentswhicharelikelytobeingoodsupplyandthereforenotofsignificantvalue.Thesummarycharacteristicsforaretrogradegascondensatefluidareasfollows.
ContainsmorelighterHC’sandfewerheavierHC’sthanhigh-shrinkageoil APIupto60˚API GORupto70,000SCF/STB Stocktankoiliswater-whiteorslightlycoloured5.3 Wet GasThephasediagram for amixture containing smaller hydrocarbonmolecules lieswellbelowthereservoirtemperature.Figure21.Thereservoirconditionsalwaysremainoutsidethetwo-phaseenvelopegoingfrom1to2andthereforethefluidex-istsasagasthroughoutthereductioninreservoirpressure.Forawetgassystem,theseparatorconditionsliewithinthetwo-phaseregion,thereforeatsurfaceheavycomponentspresentinthereservoirfluidcondenseunderseparatorconditionsandthisliquidisnormallycalledcondensate.Theseliquidcondensateshaveahighpropor-tionoflightendsandsellatapremium.Theproportionofcondensatesdependonthecompositionalmixofthereservoirfluidasrepresentedbytheiso-volumelinesonthePTdiagram.
Pres
sure
Temperature
Liquid
Gas
1
2 100
75502550
Critical Point
Mole % Liq.
Sep.
Figure 21 PhaseDiagramforaWetGas
Thereferencewetgas,clearlydoesnotrefertothesystembeingwetduetothepres-enceofwaterbutduetotheproductioncondensateliquids.

��
Insomelocationswheretherearenaturalpetroleumleakagesatthesurface,whencondensatesareproducedtheyaresometimescalledwhiteoil.Thesummarycharacteristicsforwetgasareasfollows. GOR<100,000SCF/STB Condensateliquid>50˚API
5.5 Dry GasThephaseenvelopeofthedrygas,whichcontainsasmallerfractionoftheC2-C6components,issimilartothewetgassystembutwiththedistinctionthattheseparatoralsoliesoutsidetheenvelopeinthegasregion(Figure22).Thetermdryindicatestherefore that thefluiddoesnotcontainenoughheavierHC’s to forma liquidatsurfaceconditions.
Thesummarycharacteristicsforadrygasareasfollows.
GOR>100,000SCF/STB
Pres
sure
Temperature
Liquid
Gas
1
2 755025
Critical Point
Sep.
Figure 22 PhaseDiagramforaDryGas
6 COMPARISON OF THE PHASE DIAGRAMS OF RESERVOIR FLU-IDS
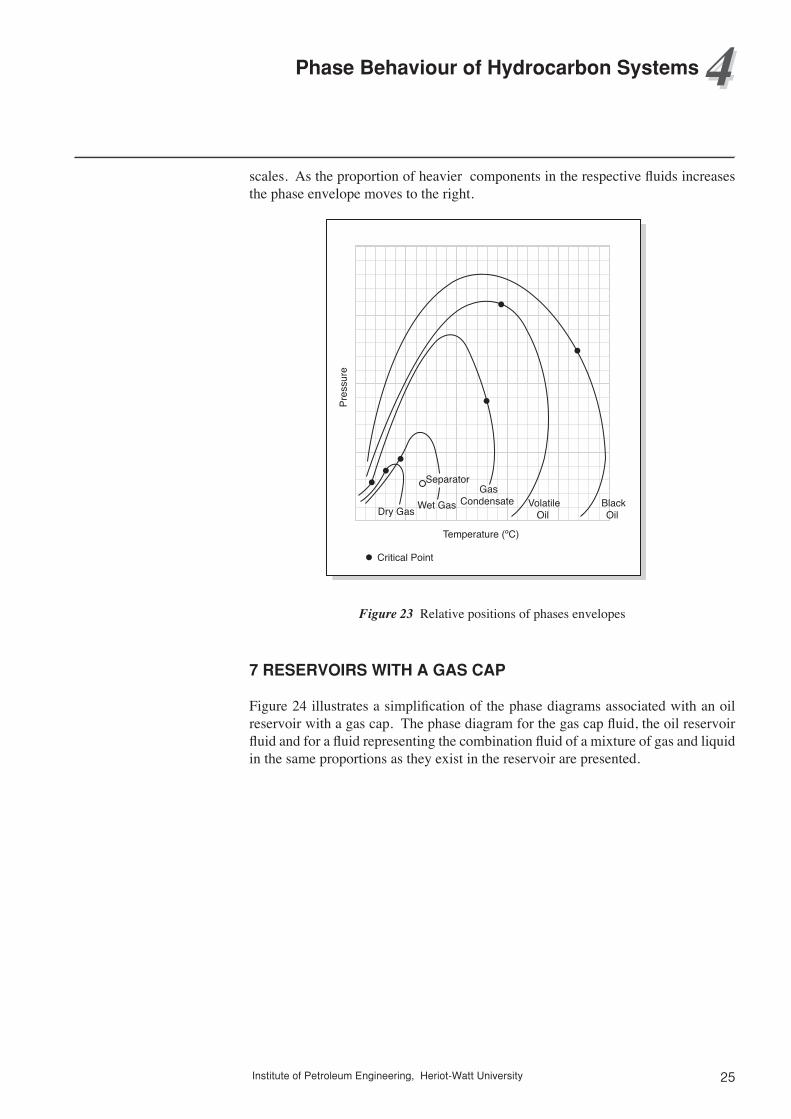
Figure16gavearathersimplisticrepresentationofthevarioustypesoffluidswithrespect to therelativepositionofreservoir temperaturewithrespect to thephasediagram.Inrealityitisthephasediagramwhichchangesaccordingtocompositionandtherelativepositionofthereservoirtemperatureandseparatorconditions,andthesedeterminethecharacterofthefluidbehaviour.Figure23givesabetterindica-tionofthevariousreservoirtypeswithrespecttoaspecificpressureandtemperature
Phase Behaviour of Hydrocarbon Systems
Institute of Petroleum Engineering, Heriot-Watt University ��
scales.Astheproportionofheaviercomponentsintherespectivefluidsincreasesthephaseenvelopemovestotheright.
Dry Gas Wet Gas Gas
Condensate
Separator
Critical Point
VolatileOil
BlackOil
Temperature (ºC)
Pres
sure
Figure 23 Relativepositionsofphasesenvelopes
7 RESERVOIRS WITH A GAS CAP
Figure24illustratesasimplificationofthephasediagramsassociatedwithanoilreservoirwithagascap.Thephasediagramforthegascapfluid,theoilreservoirfluidandforafluidrepresentingthecombinationfluidofamixtureofgasandliquidinthesameproportionsastheyexistinthereservoirarepresented.

��
Pres
sure
Temperature
CG
CL
Reservoir Liquid
Total Reservoir Fluid
Reservoir TemperatureReservoir Gas
C
Separator
Initial Reservoir Pressure
Pd=Pb
Figure 24 PhaseDiagramforanOilReservoirwithaGasCap
Thediagramillustratesthatatthegas-oilcontactthegasisatitsdewpressure,theoilisatitsbubblepointpressureandthecombinationfluidliesontheconstantpropor-tionqualitylinerepresentingtheratioofthegasandoilastheyexistinthereservoirsystem.Thegascapmaybedry,wetorcondensatedependingonthecompositionandphasediagramofthegas.
8 CRITICAL POINT DRYING
Althoughnotpartofthetopicofphasebehaviourinthecontextofreservoirfluidsitisusefultoillustratetheapplicationinaverypracticalapplicationinthecontextoftheevaluationofrockproperties.Criticalpointdryinghasbeenusedbyanumberofsciencestopreparespecimensofdelicatematerialsforsubsequentmicrovisualanalysis where conventional preparation techniques will destroy delicate fabric.Criticalpointdryingtakesadvantageofthebehaviouroffluidsaroundthecriticalpointwhereonecangofromonephasetype,likeliquidtogaswithoutavisuallyobservedphasechange.Inthe1980’sitwasobservedinaUKoffshorefieldthattheinterpretedpermeabilityforawellsandinthezonewherewaterinjectionwasproposedwasdifferentfromwellinjectivitytestswhencomparedtothecoreanalysisvaluewherethevaluewasmanytimesmore.Theextentofthisdifferencewassuchthatpermeabilitiesfromthewelltestgavevalueswhichwouldpreventinjectiontotakeplacewhereasthosefromthecoretestswouldresultinpracticalinjectivities.Clearlythedifferencewasimportant.

Phase Behaviour of Hydrocarbon Systems
Institute of Petroleum Engineering, Heriot-Watt University ��
Thecompanyconcernedembarkedonamoresophisticatedcorerecoveryandanaly-sisprocesssuspiciousthatperhapsthefabricoftherockwasbeingaffectedbycorepreparationmethods.Theyresortedtocritical point drying.
Thecorerecoveredfromthewaterzoneofthereservoirfromasubsequentnewwellwasimmersedandtransferredtothetestlaboratorysubmergedin‘formationwater’.Atthelaboratoryacoreplugsamplewasextracted,cuttosizeandloadedintoacoreholderstillsubmergedinthewater.Thecorewasthenmountedinaflowrig(figure25)andanalcoholwhichismisciblewithwaterdisplacedthewaterinthecore.Carbondioxideatapressureandtemperaturewhereitisintheliquidstatewasthenintroducedwhichmiscibledisplacedthealcohol.ThetemperatureandpressurewasthenadjustedtakingthemaroundthecriticalpointratherthanacrossthevapourpressurelineofthePTphasediagram(figure26)endingupwithatemperatureandpressurebelowthevapourpressurelinewiththefluidnowinagaseousstate.Afterthisprocessthepermeabilitywasmeasuredtobeofthesameorderasthatinterpretedfromthewellinjectivitytest.
Thereasonforthisdifferencewassubsequentlydemonstratedtobeaveryfragileclaywhichduringconventionalcorerecoveryandcleaningwasdamagedtoanextentthatitsporeblockingstructurewasdestroyed.
PT
Core In Holder
Figure 25 Criticalpointdryingsystem
Temperature
Pres
sure
Vapour Pressure Line
GAS
LIQUID
Critical Point
Critical Point Drying Route
Figure 26 Criticalpointdrying

��
REFERENCES
1.Fig1Daniels,FFarrington:“OutlinesofPhysicalChemistry,”JohnWiley&Sons,IncNewYork,1948
2.Fig 2 Brown,GG et al. “ Natural Gasoline and Volatile Hydrocarbons,”NaturalGasolineAssociationofAmerica,Tulsa,Okl.,1948.
Fig10Sage,S.G.,Lacy,W.N.VolumetricandPhaseBehaviourofHydrocarbons,GulfPublishingCo.Houston1949