contract report cr-11-027-env biostimulation and
TRANSCRIPT
ENGINEERING SERVICE CENTER Port Hueneme, California 93043-4370
Approved for public release; distribution is unlimited.
CONTRACT REPORT
CR-11-027-ENV
TITLE: GUIDANCE PROTOCOL: APPLICATION OF NUCLEIC ACID-BASED TOOLS FOR MONITORING MONITORED NATURAL ATTENUATION (MNA), BIOSTIMULATION AND BIOAUGMENTATION AT CHLORINATED SOLVENT SITES
ESTCP Project ER0518 NAVFAC ESC
By
Carmen A. Lebrón (NAVFAC ESC)
Dr. Erik Petrovskis (Geosyntec Consultants)
Dr. Frank Löffler (University of Tennessee)
Keith Henn (Tetra Tech, Inc.)
February 2011

Report Documentation Page Form ApprovedOMB No. 0704-0188
Public reporting burden for the collection of information is estimated to average 1 hour per response, including the time for reviewing instructions, searching existing data sources, gathering andmaintaining the data needed, and completing and reviewing the collection of information. Send comments regarding this burden estimate or any other aspect of this collection of information,including suggestions for reducing this burden, to Washington Headquarters Services, Directorate for Information Operations and Reports, 1215 Jefferson Davis Highway, Suite 1204, ArlingtonVA 22202-4302. Respondents should be aware that notwithstanding any other provision of law, no person shall be subject to a penalty for failing to comply with a collection of information if itdoes not display a currently valid OMB control number.
1. REPORT DATE FEB 2011 2. REPORT TYPE
3. DATES COVERED 00-00-2011 to 00-00-2011
4. TITLE AND SUBTITLE Guidance Protocol: Application of Nucleic Acid-Based Tools forMonitoring Monitored Natural Attenuation (MNA), Biostimulation, andBioaugmentation at Chlorinated Solvent Sites
5a. CONTRACT NUMBER
5b. GRANT NUMBER
5c. PROGRAM ELEMENT NUMBER
6. AUTHOR(S) 5d. PROJECT NUMBER
5e. TASK NUMBER
5f. WORK UNIT NUMBER
7. PERFORMING ORGANIZATION NAME(S) AND ADDRESS(ES) Naval Facilities Engineering Command,Engineering Service Center,110023rd Street,Port Hueneme,CA,93043-4370
8. PERFORMING ORGANIZATIONREPORT NUMBER
9. SPONSORING/MONITORING AGENCY NAME(S) AND ADDRESS(ES) 10. SPONSOR/MONITOR’S ACRONYM(S)
11. SPONSOR/MONITOR’S REPORT NUMBER(S)
12. DISTRIBUTION/AVAILABILITY STATEMENT Approved for public release; distribution unlimited
13. SUPPLEMENTARY NOTES
14. ABSTRACT
15. SUBJECT TERMS
16. SECURITY CLASSIFICATION OF: 17. LIMITATION OF ABSTRACT Same as
Report (SAR)
18. NUMBEROF PAGES
35
19a. NAME OFRESPONSIBLE PERSON
a. REPORT unclassified
b. ABSTRACT unclassified
c. THIS PAGE unclassified
Standard Form 298 (Rev. 8-98) Prescribed by ANSI Std Z39-18
GUIDANCE PROTOCOL
Environmental Restoration Project ER-0518
Application of Nucleic Acid-Based Tools for Monitoring Monitored Natural Attenuation (MNA), Biostimulation,
and Bioaugmentation at Chlorinated Solvent Sites
January 2011

ESTCP ER-0518 Guidance Protocol 1
TABLE OF CONTENTS
LIST OF FIGURES ....................................................................................................................... 1
LIST OF TABLES ........................................................................................................................ 1
EXECUTIVE SUMMARY ........................................................................................................... 2
1. PURPOSE ................................................................................................................... 6
2. INTRODUCTION ...................................................................................................... 6
3. BACKGROUND ........................................................................................................ 7
4. MOLECULAR BIOLOGICAL TOOLS .................................................................. 11
4.1 qPCR ANALYSIS FOR DECHLORINATING Dhc BACTERIA .......................... 12 5. APPLICATION OF qPCR IN BIOREMEDIATION EVALUATION .................... 14
5.1 qPCR USE IN SUPPORTING MONITORED NATURAL ATTENUATION ....... 15 5.2 qPCR USE IN SUPPORTING BIOSTIMULATION .............................................. 18 AND BIOAUGMENTATION .............................................................................................. 18
6. FIELD SAMPLING METHODS ............................................................................. 21
6.1 COLLECTION OF SAMPLE VOLUME AND SAMPLE FILTRATION ............. 23 6.2 SAMPLING LOCATIONS AND FREQUENCY .................................................... 28
7. REFERENCES ......................................................................................................... 29
LIST OF FIGURES
Figure 1: Populations Involved in Reductive Dechlorination of PCE to Ethene ......................... 9
Figure 2: MBT Analysis to Support MNA for Chlorinated Ethenes ........................................ 17
Figure 3: MBT Analysis to Support Biostimulation/Bioaugmentation at Chlorinated Ethene
Contaminated Sites .................................................................................................. 20
Figure 4: Groundwater Sampling Protocol ............................................................................... 27
LIST OF TABLES
Table 1: Summary of Molecular Biological Tools and Applications
Table 2: MBT Sampling Locations and Frequency

ESTCP ER-0518 Guidance Protocol 2
EXECUTIVE SUMMARY Reductive dechlorination is a promising process for biodegradation of chlorinated solvents. The
successful field evaluation and implementation of the reductive dechlorination process is
dependent on a comprehensive understanding of contaminant, geochemical, and microbial data.
Nucleic acid-based tools are commercially available to identify relevant Dehalococcoides (Dhc)
bacteria. These tools detect and quantify Dhc 16S rRNA genes and three Dhc reductive
dehalogenase (RDase) genes involved in the reductive dechlorination of chlorinated ethenes.
These tools were demonstrated and validated in ESTCP Project ER-0518 (Application of Nucleic
Acid-Based Tools for Monitoring Monitored Natural Attenuation (MNA), Biostimulation, and
Bioaugmentation at Chlorinated Solvent Sites). The application of nucleic acid-based molecular
biological tools (MBTs) can result in significant cost reductions and reduced project time-lines,
as users can use MBT site data to assess:
• Where long-term Monitored Natural Attenuation (MNA) will be effective; • Where biostimulation will achieve complete dechlorination without DCE/VC “stall”;
and/or • Where bioaugmentation will be required.
For MNA sites, MBT analysis should be considered after the primary line of evidence is
obtained (e.g., the groundwater plume appears to be stable or decreasing in concentrations over
time) and adequate reducing conditions have been observed. It has been demonstrated that Dhc
cell titers of 104/L – 105/L support MNA at chlorinated ethene sites.
For sites where enhanced anaerobic bioremediation (e.g., biostimulation with or without
bioaugmentation) has been proposed, MBT analysis should be conducted as a part of a pre-
design remedial investigation to assess the site’s geochemical conditions, determine if
implementation of the microbial reductive dechlorination process is a viable remedial alternative,
and evaluate the possible need for bioaugmentation. Dhc titers below 104/L or a need to reduce
remediation time frames indicate bioaugmentation may be needed.
There are several sampling methodologies available to field practitioners. The selection of
groundwater sampling methods can significantly influence the quantification of Dhc biomarker
genes (SERDP and ESTCP, 2005; Ritalahti et al., 2010). Sampling options should consider site-
specific data quality objectives (DQOs) to determine the most appropriate method for a given
ESTCP ER-0518 Guidance Protocol 3
site. Ongoing SERDP-funded research will help to identify improved management practices
with respect to laboratory methods for MBT analysis and will evaluate procedures to optimize
collection of representative solid and groundwater samples from an aquifer.
The sampling and handling procedures described herein have been validated for Dhc assessment
at chlorinated solvent sites. These techniques can also be applied to sites impacted with other
contaminants, such as petroleum hydrocarbons or metals, for collecting microbial biomass to
extract biomarkers for MBT analysis.
For the purpose of this protocol, groundwater sampling should be conducted using low-flow
purging methods. To correct for sampling biases, the number of Dhc gene copies can also be
normalized to the total number of bacterial 16S rRNA genes quantified in the same sample and
reported as %Dhc. The %Dhc values can range from low fractions of percentages in samples
that have low numbers of Dhc and high numbers of other bacteria to greater than 50% in
enriched dechlorinating consortia (SiREM, 2005). Normalization of Dhc cell counts is most
useful when evaluating temporal variation of the Dhc population during bioremediation
performance monitoring.
Based upon field trials conducted in ER-0518 (Ritalahti et al., 2010) and guidance of commercial
vendors, on-site (i.e., in the field) groundwater filtration is recommended. Field filtration
increases the likelihood of collecting suspended particles, decreases shipping costs, reduces time-
consuming and costly laboratory biomass collection procedures, and avoids cost for disposal of
contaminated groundwater. A protocol providing a step-by-step approach to groundwater
sampling during bioremediation monitoring (Ritalahti et al. 2009; Petrovskis et al. 2011) is
provided and summarized in Figure 4. Methods may vary according to site-specific conditions;
however, a crucial consideration is that the sampling protocol for a given well (or site) is defined
and maintained for the duration of the monitoring efforts.
A Dhc cell titer exceeding 106 cells per liter is a good predictor of ethene production and
complete detoxification (Ritalahti et. al, 2010; Lu et al. 2006). Due to variability in laboratory
analyses, this protocol establishes a Dhc cell titer of 106 to 107 per liter as a target threshold for
ethene production. The following guidance is provided for groundwater samples:
ESTCP ER-0518 Guidance Protocol 4
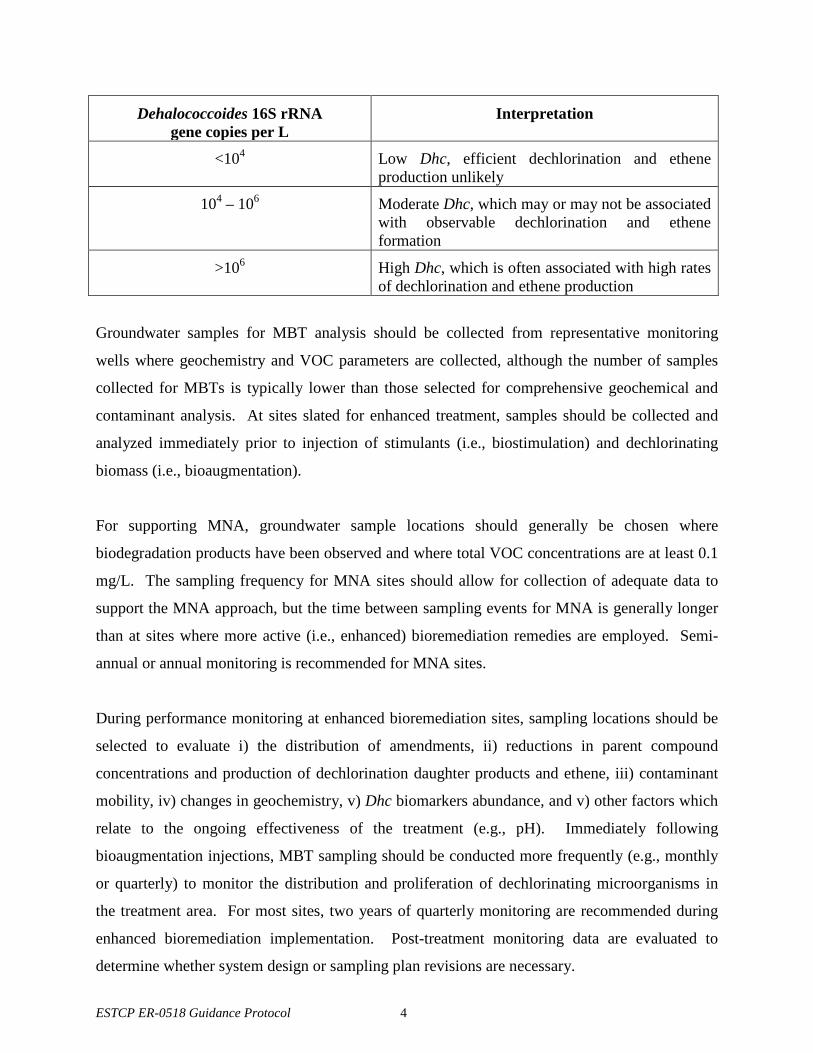
Dehalococcoides 16S rRNA gene copies per L
Interpretation
<104 Low Dhc, efficient dechlorination and ethene production unlikely
104 – 106 Moderate Dhc, which may or may not be associated with observable dechlorination and ethene formation
>106 High Dhc, which is often associated with high rates of dechlorination and ethene production
Groundwater samples for MBT analysis should be collected from representative monitoring
wells where geochemistry and VOC parameters are collected, although the number of samples
collected for MBTs is typically lower than those selected for comprehensive geochemical and
contaminant analysis. At sites slated for enhanced treatment, samples should be collected and
analyzed immediately prior to injection of stimulants (i.e., biostimulation) and dechlorinating
biomass (i.e., bioaugmentation).
For supporting MNA, groundwater sample locations should generally be chosen where
biodegradation products have been observed and where total VOC concentrations are at least 0.1
mg/L. The sampling frequency for MNA sites should allow for collection of adequate data to
support the MNA approach, but the time between sampling events for MNA is generally longer
than at sites where more active (i.e., enhanced) bioremediation remedies are employed. Semi-
annual or annual monitoring is recommended for MNA sites.
During performance monitoring at enhanced bioremediation sites, sampling locations should be
selected to evaluate i) the distribution of amendments, ii) reductions in parent compound
concentrations and production of dechlorination daughter products and ethene, iii) contaminant
mobility, iv) changes in geochemistry, v) Dhc biomarkers abundance, and v) other factors which
relate to the ongoing effectiveness of the treatment (e.g., pH). Immediately following
bioaugmentation injections, MBT sampling should be conducted more frequently (e.g., monthly
or quarterly) to monitor the distribution and proliferation of dechlorinating microorganisms in
the treatment area. For most sites, two years of quarterly monitoring are recommended during
enhanced bioremediation implementation. Post-treatment monitoring data are evaluated to
determine whether system design or sampling plan revisions are necessary.
ESTCP ER-0518 Guidance Protocol 5
By clearly understanding how site geochemistry and Dhc abundance affect contaminant
transformation and detoxification, MNA, biostimulation, and bioaugmentation, remedies can be
designed and modified to optimize the efficiency of bioremediation treatments.
ESTCP ER-0518 Guidance Protocol 6
1. PURPOSE
The purpose of this document is to provide guidance to Remedial Project Managers (RPMs) and
field practitioners on the application of Molecular Biological Tools (MBTs), specifically nucleic-
acid based tools, for evaluating monitored natural attenuation (MNA), biostimulation and
bioaugmentation at chlorinated solvent sites. This protocol summarizes the current state of the
practice of these tools and is intended to provide a technically sound and practical approach to
MBT use. This guidance document will be updated, based on the findings from SERDP project
ER-1561 (Standardized Procedures For Use Of Nucleic Acid-Based Tools). This guidance
document provides recommendations regarding sampling approaches and criteria in evaluation
of data for use in bioremediation decision-making.
2. INTRODUCTION
Microbial degradation plays a primary role in the fate and transport, and ultimately the
remediation of chlorinated solvents. Knowledge of the responsible microbial processes is
crucial to understanding the impact of biodegradation on cleanup times at a given site.
Understanding these microbial processes can assist site owners in making informed decisions to
better assess contaminated sites and manage bioremediation efforts.
MBTs measure target biomarkers (e.g., specific nucleic acid or ribonucleic acid sequences,
contaminant-specific isotopes, peptides, proteins or lipids) that are indicators of potential
biological degradation of target contaminants. Research and development needs regarding the
use of MBTs for environmental remediation were addressed in a SERDP and ESTCP Expert
Panel Workshop (2005). This workshop presented a comprehensive summary of the MBT
techniques, applications, issues, questions, and associated research needs. Among all MBTs,
application of nucleic acid-based tools is the most advanced for application to environmental
samples, and assays to detect the presence and enumerate the abundance of key dechlorinators
(e.g., Dehalococcoides (Dhc) bacteria) have been designed and are commercially available.
Current research efforts aim at identifying a wider range of biomarker genes to describe the
dechlorinating bacterial community with greater accuracy. Recent laboratory studies suggested
that peptide, protein and lipid biomarkers are also useful for monitoring target dechlorinators;

ESTCP ER-0518 Guidance Protocol 7
however, these tools have to mature before they can complement nucleic acid-based tools for site
assessment and bioremediation monitoring. Hence, the current focus is on nucleic acid-based
tools.
The integrated application and analysis of MBT, geochemical, and contaminant data is useful to
determine if a biological remedy is suitable for a particular site or if a physical-chemical
treatment option should be considered. Further, the application of nucleic acid-based tools allows
site owners and managers to decide and focus on the most effective bioremediation strategy (i.e.,
monitored natural attenuation, biostimulation and/or bioaugmentation). Following technology
implementation, MBTs monitor the bioremediation process and yield information to allow site
management decisions for achieving cleanup goals in the most cost-effective manner and desired
time frames.
3. BACKGROUND
The chlorinated solvents tetrachloroethene (PCE), trichloroethene (TCE), and their
transformation products cis-1,2-dichloroethene (cis-DCE), trans-DCE, 1,1-DCE and vinyl
chloride (VC) are common groundwater pollutants. PCE and TCE are resistant to degradation
under aerobic conditions but can be reductively dechlorinated to less chlorinated ethenes and
ethene under anaerobic conditions. While phylogenetically diverse bacteria dechlorinate PCE
and TCE to cis-DCE, only members of the Dhc group have been demonstrated to carry out the
final dechlorination steps from DCE to ethene. However, the complete dechlorination of PCE to
ethene is a multi-step process and is most effectively carried out by more than one population.
These specialized bacteria use the chlorinated ethenes as electron acceptors and gain energy for
growth from the reductive dechlorination reactions. This process has been called
(de)chlororespiration but the term organohalide respiration should be used. Figure 1 summarizes
the current knowledge of microbial populations involved in the reductive dechlorination of PCE
to ethene. An electron donor is required to support organohalide respiration because each
reductive dechlorination step requires 2 electron and 2 protons. The chlorine substituent is
released as HCl, which dissociates and forms chloride and a proton. These are relevant
observations because the availability of suitable electron donors often limits the activity of
dechlorinators including Dhc, in-situ and the formation of HCl can decrease the groundwater pH

ESTCP ER-0518 Guidance Protocol 8
and limit dechlorination activity. Dhc are active at circumneutral pH and reductive
dechlorination rates decrease at lower pH with no activity below pH 5.5.
Under methanogenic conditions, ethene is sometimes reduced to ethane. VC, ethene and ethane
can be mineralized to carbon dioxide under both micro-aerophilic and aerobic conditions.
Generally, the anaerobic reductive pathway is the most important degradation pathway for
chlorinated ethenes in field applications, and hence, is the focus of this protocol.
ESTCP ER-0518 Guidance Protocol 9
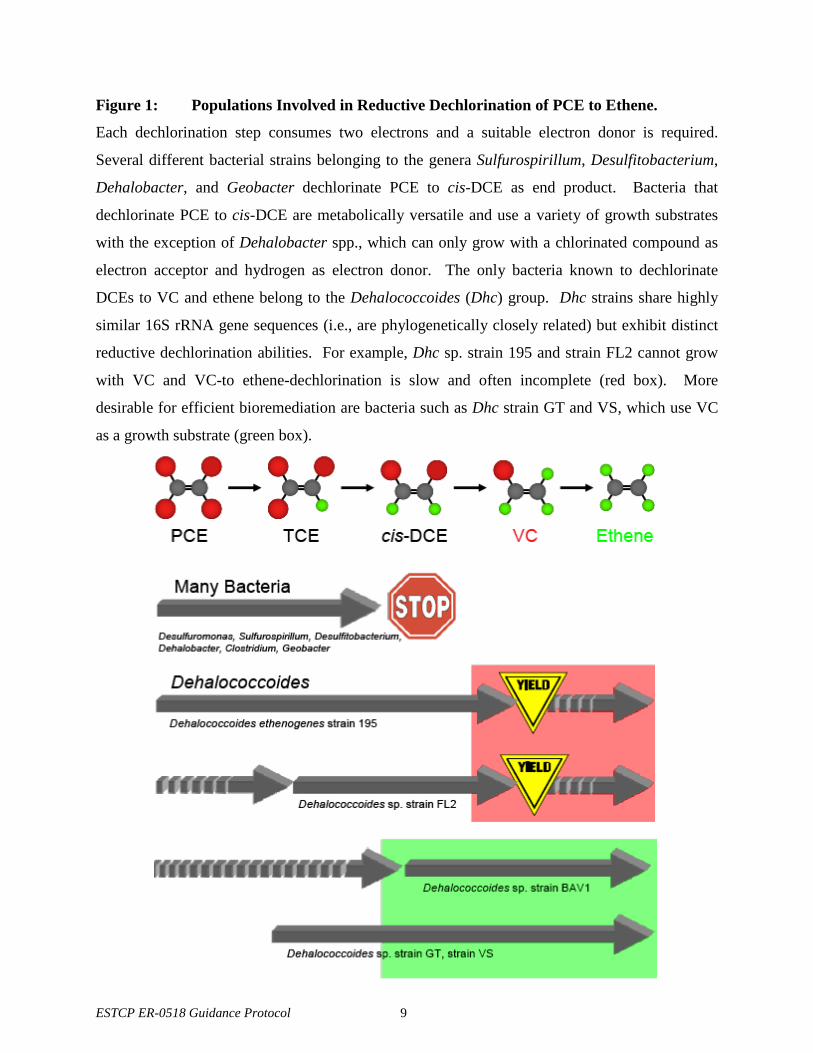
Figure 1: Populations Involved in Reductive Dechlorination of PCE to Ethene.
Each dechlorination step consumes two electrons and a suitable electron donor is required.
Several different bacterial strains belonging to the genera Sulfurospirillum, Desulfitobacterium,
Dehalobacter, and Geobacter dechlorinate PCE to cis-DCE as end product. Bacteria that
dechlorinate PCE to cis-DCE are metabolically versatile and use a variety of growth substrates
with the exception of Dehalobacter spp., which can only grow with a chlorinated compound as
electron acceptor and hydrogen as electron donor. The only bacteria known to dechlorinate
DCEs to VC and ethene belong to the Dehalococcoides (Dhc) group. Dhc strains share highly
similar 16S rRNA gene sequences (i.e., are phylogenetically closely related) but exhibit distinct
reductive dechlorination abilities. For example, Dhc sp. strain 195 and strain FL2 cannot grow
with VC and VC-to ethene-dechlorination is slow and often incomplete (red box). More
desirable for efficient bioremediation are bacteria such as Dhc strain GT and VS, which use VC
as a growth substrate (green box).
ESTCP ER-0518 Guidance Protocol 10
A few members of the genus Desulfitobacterium dechlorinate PCE to TCE only; however,
reductive dechlorination of PCE to cis-DCE is more commonly observed. Bacteria that grow via
PCE to cis-DCE reductive dechlorination belong to the genera Desulfuromonas, Dehalobacter,
Sulfurospirillum, and Geobacter. PCE-to-cis-DCE-dechlorinating bacteria are not rare in
subsurface environments and aquifers and cis-DCE plumes likely reflect the activity of such
microorganisms.
Dehalococcoides ethenogenes strain 195 was the first isolate shown to carry out the complete
reductive dechlorination sequence leading to ethene formation (Maymó-Gatell et. al. 1997);
however, the final dechlorination step, the reduction of VC to ethene, is cometabolic and slow,
and does not support growth of strain 195. Another isolate, Dhc sp. strain FL2, also produced
ethene from PCE though the PCE-to-TCE and VC-to-ethene steps were cometabolic (He et al.
2005). The first Dhc isolate capable of growth with VC as electron acceptor was isolated from
the chloroethene-contaminated Bachman aquifer (He et al. 2003). This Bachman isolate was
designated Dhc sp. strain BAV1 and grew with all DCE isomers and VC as electron acceptors,
thus efficiently detoxifying these compounds to ethene. Strain BAV1 also dechlorinated PCE
and TCE but only in the presence of a DCE isomer or VC. Unlike BAV1, isolate Dhc sp. strain
GT and strain VS are capable of capturing energy for growth from TCE dechlorination to ethene
(Müller et al. 2004; Sung et al. 2006).
To date, no other bacteria that reductively dechlorinate DCEs and VC to environmentally benign
ethene have been identified. Of course, it is possible that other bacteria involved in chlorinated
solvent biodegradation and detoxification will be identified; however, with the information
currently available, a primary focus on the Dhc group for the majority of chlorinated ethene
bioremediation sites is justified (Löffler and Edwards 2006, AFCEE, et al. 2004). Dhc bacteria
play relevant roles in the attenuation of chloroorganic contaminants and details about Dhc
biology and application for chlorinated solvent bioremediation are available in Volume 4 of the
SERDP and ESTCP Remediation Technology Monograph Series (Petrovskis, et al. 2011).
The attenuation of chlorinated ethenes is dependent on several site characteristics, including
hydrogeologic, geochemical, and microbiological parameters. Collecting this information and

ESTCP ER-0518 Guidance Protocol 11
evaluating it in a weight of evidence approach is essential in determining the applicability and
performance of MNA, biostimulation, and bioaugmentation. The following references provide
site assessment criteria or guidelines for evaluating site characteristics favorable for the
microbial reductive dechlorination process and the detoxification of chlorinated ethenes in
anoxic subsurface environments.
• Implementation of MNA (Wiedemeier 1998),
• Application of a suite of electron donors (RABITT protocol by Morse et al. 1998),
• The use of soluble carbohydrates to enhance reductive dechlorination (Suthersan et al.
2002),
• The use of emulsified vegetable oils to enhance reductive dechlorination (AFCEE, 2004),
and
• Enhanced anaerobic bioremediation (AFCEE, 2004).
This guidance protocol addresses the use of MBTs to quantitatively assess the Dhc population at
chlorinated ethene sites and aims at providing guidance to evaluate MBT data. The focus will be
on Dhc-targeted nucleic acid-based tools that have been validated and are offered commercially.
The MBT of choice for specific detection and quantification of a target DNA sequence in
environmental matrices is the quantitative real-time polymerase chain reaction or short qPCR.
The qPCR tool provides quantitative information about Dhc cells in groundwater and can
identify Dhc cells that efficiently dechlorinate VC to ethene (Figure 1).
4. MOLECULAR BIOLOGICAL TOOLS
Used in conjunction with contaminant and geochemical data, nucleic acid-based MBTs can be
utilized to develop an understanding of the potential for biotransformation and detoxification at
chlorinated ethene sites. These tools assist in identifying the potential for anaerobic
biotransformation at a given site, establish cause-and-effect relationships after technology
implementation, and inform RPMs of the most efficient site management decisions following
technology implementation. Several MBTs have been developed and evaluated under the
auspices of SERDP and ESTCP. qPCR assays have been most widely used to detect and
quantify genes of key bacteria. Target genes include the Dhc 16S rRNA gene and the functional
genes encoding for reductive dehalogenases responsible for individual reductive dechlorination

ESTCP ER-0518 Guidance Protocol 12
reactions. Other techniques [e.g., fluorescent in-situ hybridization (FISH), denaturing gradient
gel electrophoresis (DGGE), terminal restriction fragment length polymorphism (T-RFLP), and
others], and microarray approaches have been developed (Table 1). These MBTs can address
specific questions about target organisms and the microbial community but qPCR is the method
of choice for detecting and enumerating target genes in environmental samples. The presence
and abundance of target genes does not directly inform of the cells metabolic status (i.e., inactive
Dhc cells also harbor the target genes but do not contribute to dechlorination). The quantitative
assessment of RDase gene expression was suggested as a means of measuring Dhc activity. The
rationale is that mRNA (a measure of gene activity) is only produced in cells that are actively
dechlorinating. Unfortunately, mRNA quantity is a poor measure of Dhc dechlorination activity
because non-dechlorinating Dhc cells maintain RDase gene transcripts (i.e., the presence and
abundance of RDase mRNA are not linked with dechlorination activity) (Amos et al. 2008,
Fletcher et al. 2010). Although DNA-based tools cannot provide direct evidence for activity,
temporal measurements of Dhc target gene abundance can serve as an indirect activity measure
because Dhc can only increase in numbers when performing reductive dechlorination reactions.
4.1 qPCR ANALYSIS FOR DECHLORINATING Dhc BACTERIA To identify bacteria associated with the detoxification pathway of interest, deoxyribonucleic acid
(DNA) can be extracted from site aquifer material or groundwater, and target (biomarker) genes
can be specifically detected and quantified using qPCR assays.
This analysis assists in determining the potential for reductive dechlorination and predict the end
product(s) of the process. PCR analyses are commercially available for approximately $300 per
sample. Further advances in multiplex, high-throughput PCR analysis should reduce the cost.
PCR-based approaches for detecting several PCE-to-cis-DCE-dechlorinating bacteria (e.g.,
Desulfitobacterium, Dehalobacter, Sulfurospirillum, and Desulfuromonas) are also commercially
available (Löffler et. al., 2000; Hendrickson 2002; Ritalahti and Löffler 2004; Sung et al., 2006;
Ritalahti et al. 2006).
A correlation exists between complete reductive dechlorination to ethene and the presence of
Dhc bacteria (Löffler and Ritalahti, 2001; Ritalahti et al., 2002; Hendrickson et al., 2002).
Unfortunately, one cannot rely solely on the detection of Dhc bacteria, because members of this

ESTCP ER-0518 Guidance Protocol 13
group have different RDase genes and therefore dechlorinating activities despite sharing highly
similar or identical 16S rRNA gene sequences (He et al., 2003, Duhamel et al. 2004, Sung et al.
2006). Therefore, Dhc 16S rRNA gene-targeted qPCR quantifies the total Dhc population but
cannot distinguish between Dhc strains with different dechlorination activities (i.e., Dhc strains
that efficiently reduce VC versus Dhc strain that cannot grow with VC as electron acceptor). To
overcome the limitations of the 16S rRNA gene approach, functional genes coding for reductive
dehalogenases (RDases) involved in specific dechlorination step(s) must be identified for
accurately monitoring the process of interest. Four RDase genes involved in chloroethene
dechlorination have been identified in Dhc bacteria: pceA encoding a PCE-to-TCE RDase and
tceA coding for a TCE RDase, both present in strain 195 (Magnusson et al. 2000); tceA in strain
FL2 (He et al., 2005), vcrA coding for a VC RDase present in strain VS (Müller et al., 2004) and
strain GT (Sung et al., 2006), and bvcA coding for another VC RDase in strain BAV1
(Krajmalnik-Brown et al., 2004). Analysis of these functional genes provides more direct
information about the key dechlorinators; however, additional RDase genes involved in
chloroethene dechlorination exist, and efforts are underway to identify additional Dhc RDase
genes to more comprehensively assess and monitor reductive dechlorination processes.
qPCR allows for sensitive detection and quantitative analyses of biomarker gene copies of
dechlorinating bacteria of interest (i.e., Dhc). As this tool is now commercially available and has
been applied for bioremediation monitoring for years, correlations have been developed for
threshold numbers of Dhc biomarker gene copies and dechlorinating activity. Note that other
qPCR assays can be adopted to quantify messenger RNA (mRNA) as a measure of gene
expression, and therefore activity. The measurement of mRNA of Dhc RDase genes would
inform of RDase gene expression and hence, only measure active Dhc cells, and, at least
theoretically, the mRNA abundance should correlate with dechlorination activity (i.e., rates).
Although promising, recent findings suggest that RDase mRNA abundance in Dhc cells
correlates poorly with dechlorination activity.
This protocol will focus on the currently available Dhc biomarker genes (i.e., DNA) and qPCR.
More useful biomarker genes to monitor reductive dechlorination processes await discovery and
multiple research groups address this research need. Nevertheless, the qPCR analysis of the Dhc
16S rRNA gene and the tceA, vcrA and tceA gene provide useful information of the Dhc

ESTCP ER-0518 Guidance Protocol 14
population responsible for the reductive dechlorination of chlorinated ethenes, and the existing
qPCR protocols can easily be expanded to include the analysis of additional biomarker genes.
5. APPLICATION OF qPCR IN BIOREMEDIATION EVALUATION
The following two sections provide a general protocol for the use of qPCR for evaluation of
MNA and biostimulation/bioaugmentation.
Guidance for interpreting Dhc test results has been provided by commercial vendors. qPCR
analysis of the Dhc 16S rRNA gene is generally interpreted as the number of cells present in the
sample. This is justified because all known Dhc cells possess a single 16S rRNA gene, and the
number of Dhc 16S rRNA genes quantified equals the number of Dhc cells. Similarly, the
known biomarker RDase genes occur as single copy gene on the known Dhc genomes. The
following guidance is provided for groundwater samples:
Dehalococcoides 16S rRNA gene copies per L
Interpretation
<104 Low Dhc, efficient dechlorination and ethene production unlikely
104 – 106 Moderate Dhc, which may or may not be associated with observable dechlorination and ethene formation
>106 High Dhc, which is often associated with high rates of dechlorination and ethene production
Through ESTCP project ER-0518 (Ritalahti et al. 2010) and other research (Lu et al. 2006), Dhc
16S rRNA or vcrA gene copies of 106 to 107 per liter of groundwater have been found to strongly
correlate with complete detoxification and ethene production.
It should be noted that complete detoxification (i.e., removal of all chlorinated ethenes) can be
observed without the production of ethene. For one thing, ethene is less tractable with the
contemporary analytical procedures than the chlorinated ethenes, and the focus is on contaminant
removal rather than ethene production. Further, alternative processes, such as anaerobic VC or
ethene oxidation (Bradley and Chapelle, 2000), or aerobic oxidation at low oxygen thresholds

ESTCP ER-0518 Guidance Protocol 15
(Gossett, 2010), can contribute to VC and ethene removal. Therefore, field data will rarely
generate closed mass balances.
The quantification of Dhc is highly dependent on the sampling method (SERDP and ESTCP,
2005). For the purpose of this protocol, groundwater sampling should be conducted using low-
flow purging methods (Ritalahti, 2009). To correct for sampling biases, the number of Dhc gene
copies can also be normalized to the total number of bacterial 16S rRNA genes and reported as
%Dhc (Ritalahti et al. 2006). The %Dhc values can range from low fractions of percentages in
samples with low Dhc to greater than 10% in groundwater form field sites undergoing
bioremediation. Normalization of Dhc cell counts is most useful at a site when evaluating
temporal variation of Dhc during bioremediation performance monitoring.
5.1 qPCR USE IN SUPPORTING MONITORED NATURAL ATTENUATION Monitored natural attenuation (MNA) is a technically feasible and cost-effective remedial action
for many chlorinated solvent groundwater plumes. It is recommended that at least the following
three lines of evidence (Wiedemeier et al. 1998) are used to support MNA:
• Primary: stable or decreasing groundwater VOC plume concentrations;
• Secondary: favorable geochemical conditions (i.e., iron reducing, sulfate reducing, and/or
methanogenic conditions); and,
• Tertiary: microbiological evidence supporting biodegradation.
qPCR provides the most rapid method for providing evidence that microbes capable of reductive
dechlorination of chlorinated ethenes are present. As the use and limitations of qPCR become
better understood, the importance of this data will increase, potentially replacing surrogate
geochemical measures of activity. Figure 2 provides guidance to site owners/managers on
whether to apply/not apply qPCR as part of their remediation strategy. The protocol assumes
that primary lines of evidence (a stable plume and favorable biogeochemical conditions) suggest
that the reductive dechlorination process is feasible at the site.
For supporting MNA, groundwater sample locations should be chosen where biodegradation
products have been observed and where total VOC concentrations are at least 100 µg/L. Higher
ESTCP ER-0518 Guidance Protocol 16
concentrations are typically observed near the source area, with lower concentrations in the
associated plume. At lower VOC concentrations (less than 100 µg/L), such as in the
downgradient plume areas, organohalide-respiring bacteria may not be present in high numbers
due to low electron acceptor (chlorinated ethenes) concentrations, electron donor limitations, or
unfavorable geochemical (e.g., oxic) conditions. The flow chart presented in Figure 2 presents a
general framework to help RPMs to decide on the value of MBT application at MNA sites. Of
course, MBT application may provide useful information even if the flow chart recommends
“MBTs not needed” in cases where alternative microbial remedies (e.g., biostimulation) are
being considered. Under such scenarios, MBT analysis may be very useful to decide on the most
promising enhanced biological remedy.

ESTCP ER-0518 Guidance Protocol 17
Figure 2: MBT Analysis in Support of MNA at Chlorinated Ethene Sites
VOC plume stable or
decreasing?
Geochemical conditions favorable?
VOC concentrations
> 100 µg/L?
Biodegradation products?
Sample for MBTs
Primary Evidence
Secondary Evidence
Tertiary Evidence
No
Yes
No
Yes
No
Yes
No
MNA supported
Yes
Yes
No
Will MBT analysis support MNA?
MBTs not needed
MBTs not needed
MBTs not needed
MBTs not needed
Dhc > 104/L - 106/L
in groundwater?
MNA not supported
ESTCP ER-0518 Guidance Protocol 18
5.2 qPCR USE IN SUPPORTING BIOSTIMULATION AND BIOAUGMENTATION
Enhanced anaerobic bioremediation has been implemented with varying degrees of success
(AFCEE, 2004). In some cases, an accumulation of intermediate daughter products, such as cis-
DCE and VC, may occur due to insufficient amount of electron donor, inappropriate
geochemical conditions (e.g., aerobic, low pH), and/or the lack of sufficient Dhc bacteria
responsible for complete reductive dechlorination to ethene. Biostimulation coupled with
bioaugmentation has been implemented to address incomplete transformation and accumulation
of toxic intermediates (i.e., daughter products).
qPCR assays to quantify Dhc cells during bioremediation are mature, commercially available,
and their value for decision-making has been repeatedly demonstrated. For example, soil and
groundwater samples were collected from different locations inside a pilot test plot at the
Bachman Road chlorinated ethene site in Oscoda, Michigan. The data indicated that Dhc
bacteria were present in high numbers at locations where complete dechlorination to ethene
occurred. On the other hand, Dhc bacteria were present in low numbers, or were not detectable,
in locations where groundwater measurements indicated activity cis-DCE/VC stall. qPCR
application showed that the Dhc population size increased following biostimulation,
demonstrating engineered Dhc growth under field conditions (Lendvay et al. 2003).
MBTs can also be used during feasibility studies to evaluate remediation technologies and design
pilot tests. For example, at a TCE-contaminated site, qPCR analysis and microcosm studies
indicated that bioaugmentation would be required for successful remediation. This was
confirmed during lactate injection in the field pilot test, where cis-DCE accumulation was
observed until the site was bioaugmented. Following bioaugmentation, TCE and cis-DCE were
dechlorinated to VC, which was removed to non-detectable concentrations with negligible ethene
production. qPCR data demonstrated that the injected Dhc strains increased in situ following
bioaugmentation and Dhc cell titers correlated with reductive dechlorination activity (Seguiti et
al. 2006).

ESTCP ER-0518 Guidance Protocol 19
Figure 3 presents a flowchart for using qPCR in design of enhanced bioremediation systems. If
geochemical conditions are favorable (i.e., iron reducing, sulfate reducing, and/or
methanogenic), VOC concentrations are greater than 100 μg/L, and dechlorination products are
observed, then qPCR analysis can be used to assist in determining the necessity of including
biostimulation with or without bioaugmentation for effective site bioremediation. The decision
to bioaugment depends on several factors, such as desired remediation time frames, the ability to
inject cell suspensions into the subsurface, and the hydraulic characteristics of the contaminated
subsurface (AFCEE, 2004).

ESTCP ER-0518 Guidance Protocol 20
Figure 3. MBT Analysis in Support of Biostimulation/Bioaugmentation at Chlorinated Ethene-
Contaminated Sites
Will MBT analysis support
Implementation of blo!)timulotion or
bloaugmentation?
Sample for MBTs
Blostimulation
MBTs not needed
Bioaugmentallon
ESTCP ER-0518 Guidance Protocol 21
6. FIELD SAMPLING METHODS
DNA may be extracted from soil/aquifer material or groundwater samples for the quantification
of relevant dechlorinating (i.e., organohalide-respiring) bacteria (i.e., Dhc). Due to the spatial
variability of microbes in aquifers and inadequate sampling approaches to address this
variability, false negative results are possible, and a sufficient number of samples must be
analyzed to build confidence in the analytical results. The selected groundwater sampling
method significantly influences the quantification of Dhc (SERDP and ESTCP, 2005). The
following factors can influence microbial quantification in groundwater samples:
• Laboratory QA/QC procedures and standardization
• Well age and materials of construction
• Sampling technique and procedures
• Sampling frequency
• Groundwater and atmospheric temperature effects
• Sample turbidity
• Geochemical environment
• Chlorinated ethene concentrations in groundwater
• Sample processing and shipping
The sampling and handling procedures described herein have been validated for Dhc assessment
at chlorinated solvent sites. These techniques can also be applied to sites impacted by petroleum
hydrocarbons or metals for collecting microbial biomass for MBT application.
It is currently unclear whether the majority of Dhc cells and other dechlorinating bacteria are
bound to soil particles or freely suspended in groundwater. Preliminary work in column studies
indicates that Dhc can be identified primarily as planktonic cells (un-attached to surfaces) in the
aqueous phase, although a fraction of the Dhc population occurs associated with solids (Cápiro et
al. 2010). The quantification of Dhc may be influenced by many factors; however,
normalization between samples is possible by determining total bacterial 16S rRNA genes with
qPCR and expressing the Dhc 16S rRNA genes (i.e., Dhc cells) as a proportion of total bacterial
16S rRNA genes in the sample. The methods described below should be considered and selected
based on site-specific objectives and the same methods should be used for samples bound for
ESTCP ER-0518 Guidance Protocol 22
contaminant and geochemical analyses. Selection of the most appropriate sampling method is
outside the scope of this protocol. It is recommended that the appropriate Federal, state, and/or
local guidance be reviewed and adhered to before selecting and implementing the most
appropriate method for a given site. The same method should be used throughout the evaluation
of a given site because changes in the groundwater sampling protocols over the course of the
monitoring effort will render comparative data analysis difficult or impossible. Therefore, MBT
data should only be compared when the same sampling methods were applied. Below is a list of
possible groundwater sample collection procedures and some advantages and disadvantages of
each.
High-flow Purge
Historically, the most common method of collecting groundwater samples involves using bailers
or high-speed pumps to purge three to five casing volumes prior to sample collection. Although
this method agitates the water column and can mobilize sediment, the sample stream is often
cleared up by the time the purge is complete (Stroo et al. 2006). Therefore, this method may
decrease the turbidity of the sample, which may result in lower concentrations of Dhc bacteria in
the sample.
Low-flow Purge
Low-flow purging (100-500 mL/min) is generally recommended to collect a representative
sample prior to contaminant or geochemical analysis (Puls and Barcelona, 1996). These low
turbidity samples may underestimate Dhc cell titers in the subsurface because the methods are
derived to collect low turbidity samples. This is of particular concern if VOC and geochemical
data suggest that biotransformation to ethene is occurring and Dhc cell titers are falsely
underestimated or not detected (i.e., false negative). Some commercial vendors recommend
surging the well after parameter stabilization to increase the turbidity prior to collection of a
groundwater sample for microbial analysis (SiREM 2005). The suspension of sediment after
surging is likely derived from the well sump, which may not be representative of the flow zone
of interest across the well screen.

ESTCP ER-0518 Guidance Protocol 23
Passive Sample Collection
Passive sample collection involves insertion of a retrievable device into a monitoring well for
collection of a groundwater sample or for development of a microbial biofilm on the medium for
subsequent laboratory analysis. This method may or may not represent the actual Dhc titer in the
aquifer. One limitation of this approach is that the quantification of Dhc should be normalized to
total bacterial biomass, limiting the interpretation of the result. Dhc cell titers may be affected
(i.e., increased or decreased) by the matrix, which is colonized by bacteria (native sediment vs.
artificial support media). Retrievable groundwater sampling devices and sophisticated biotraps
are commercially available.
Sump Sediment Collection
Collection of sediment from the groundwater monitoring well sump is intended to gather fine-
grained particulates that originated from the aquifer matrix. This procedure presupposes that
Dhc exist predominantly surface-associated (i.e., attached to aquifer solids), and collection of the
sump sediment resembles the colonized surface of aquifer solids. The sample procedure
involves placing the intake of the sample tubing at the bottom of the well and field filtering the
slurry that is pumped to land surface. This procedure overcomes some of the limitations
associated with low flow sampling and multi-casing well purges that may result in lower
turbidity and therefore potentially increase detection of Dhc cells. The Dhc cell numbers should
be normalized to total bacteria rather than a volume of water filtered. Potential drawbacks
associated with this procedure include the contaminant flow zone of interest may not intersect
with the bottom of the well and/or the influence of diffusion of stagnant water in the monitoring
well riser into the well sump that does not reflect the geochemical conditions in the aquifer.
These two conditions may affect the MBT analysis and the results may not reflect the Dhc
abundance in the aquifer.
6.1 COLLECTION OF SAMPLE VOLUME AND SAMPLE FILTRATION As noted earlier, one limitation of groundwater sampling for bacteria is the inability to determine
whether the planktonic cells in a groundwater sample are representative of the true abundance in
the aquifer formation. In addition to the sampling methods for groundwater described above, the
approach for biomass collection must also be considered. There are two commonly recognized
methods for biomass collection from groundwater: 1) A relatively large volume (e.g., more than

ESTCP ER-0518 Guidance Protocol 24
1 liter) of groundwater is collected and shipped to the analytical laboratory for biomass
collection and, 2) the Groundwater is filtered in the field (i.e., on-site). Each of these options has
advantages and disadvantages. For example, collection of large volumes of water requires
shipment of large volumes, which is costly, requires laboratory handling of large volumes of
contaminated water and proper disposal. Based upon field trials conducted in ER-0518 (Ritalahti
et al., 2010) and guidance from commercial vendors, field filtration is recommended. Field
filtration decreases shipping costs, reduces costly laboratory extraction procedures, and avoids
off-site disposal of contaminated water. Details of the on-site groundwater filtration procedure
are provided in Ritalahti et al. 2009, Ritalahti et al. 2010, and Petrovskis et al. 2011.
The following protocol provides a step-by-step approach to groundwater sampling (Ritalahti et
al. 2009; Petrovskis et al. 2011). The protocol is summarized in Figure 4. Methods may vary
according to site-specific conditions; however, a crucial consideration is that the sampling
protocol for a given well (or site) is defined and maintained for the duration of the monitoring
efforts. Changes to the protocol during monitoring will complicate data interpretation and
should be avoided.
Connect a flow-through cell and hand held multiparameter instrument to a low-flow pump
(e.g., peristaltic pump) and begin purging. Record the start time and field measurements for
pH, oxidation-reaction potential (ORP), specific conductance, temperature, dissolved
oxygen, and turbidity.
Disconnect the flow-through cell after parameter stabilization.
Optional if low cell titers are expected: Lower a disposable polyethylene bailer into the well
to the midpoint of the screen and move the bailer up and down within the water column to
surge the well. It is important to agitate at the midpoint of the well screen to avoid stirring up
sediment in the sump and/or the bottom of the well. While continuing to surge the well with
the bailer, re-connect the flow-through cell and record the field measurements for pH, ORP,
specific conductance, temperature, dissolved oxygen, and turbidity until stabilization of
geochemical parameters is achieved. Disconnect the flow-through cell but continue to surge
the well with the bailer through the sample collection process.
In order to sample groundwater for off-site biomass collection, fill the appropriate sample
containers (e.g., clean, sterile 1-liter amber glass or plastic bottles with Teflon-lined caps, no
preservatives added) directly from the effluent end of the pump. The bottles should be filled

ESTCP ER-0518 Guidance Protocol 25
with groundwater from tubing that has already been used to withdraw one to two well
volumes of groundwater to ensure that a representative sample of aquifer water, rather than
well water, is collected. The bottles should be filled to capacity (i.e., minimal headspace) to
minimize air exposure. Apply the Teflon-lined caps and ensure a tight seal.
For on-site biomass collection (recommended), use sterile 0.22 µm membrane filter
cartridges. Attach 1/4 to 5/16-inch polyethylene tubing to the inlet of the sterile filter
cartridge and secure with a clamp. Place the cartridge over a graduated cylinder that can
accurately measure the volume of water filtered. Ideally, 0.5 to 2 liters of water are
collected; however, depending on groundwater characteristics, up to 10 liters are filtered, and
as little as 10 mL may be sufficient for subsequent biomarker analysis. Using a 10-mL
syringe filled with air, push any remaining liquid out of the sterile filter cartridge. Close the
inlet and the outlet of the filter cartridge with male and female leak-proof plugs, respectively.
If needed, replicate samples should be collected consecutively without flow interruption.
Record the volume of filtered groundwater on the chain-of-custody form and on the filter
cartridge barrel with a black permanent marker, and transfer each capped filter cartridge to a
separate, new 50-mL conical plastic tube.
Immediately after sampling, transfer samples to coolers with ice packs and/or blue ice (in
plastic freezer bags) to ensure refrigeration at 4 ˚C until arrival at the analytical laboratory.
Falcon tubes (50 mL) or equivalent containers are used for protecting the filter cartridges
during shipping and storage. Use additional packing material, as appropriate, to prevent
movement and breakage during shipping, and place each sample in separate plastic freezer
bags. The coolers with samples should be shipped for next day delivery to the analytical
laboratory. It is important to notify analytical laboratories when samples are shipped to
avoid delays in handling and processing that could affect biomarker integrity.
Immediately following sample collection, record the sampling well location, the well ID,
notes on individual samples (e.g., the volume of water that passed through each filter
cartridge), date and time of sampling, and the type of analyses requested. Standard chain-of-
custody forms must accompany each sample shipment.
SERDP-funded research is ongoing to standardize laboratory procedures and to evaluate field
sampling methods to ensure collection of representative samples from an aquifer. Sampling

ESTCP ER-0518 Guidance Protocol 26
options should be considered with site-specific data quality objectives (DQOs) in mind to
determine the most appropriate method for a given site.

ESTCP ER-0518 Guidance Protocol 27
Figure 4. Groundwater Sampling Protocol
Low-flow purge
Well surging
Re-connect flow-through cell
▪ Collect 1 L groundwater for laboratory filtrationOR
▪ Filter 1 L groundwater using Sterivex filters
Ship samples overnight at 4°C
Field documentation
Continue surging
Geochemical parameters stable?
Geochemical parameters stable?

ESTCP ER-0518 Guidance Protocol 28
6.2 SAMPLING LOCATIONS AND FREQUENCY For MNA sites, MBT analysis should be considered as a tertiary line of evidence after the
primary line of evidence is obtained (e.g., the groundwater plume appears to be stable or
decreasing in concentrations over time) and adequate reducing conditions have been observed.
This will allow selection of sample locations most relevant for evaluating the microbiology
contributing to chlorinated ethene detoxification within the plume area. The sampling frequency
for MNA sites should allow for collection of adequate data to show that the lines of evidence
(Figure 2) continue to support a MNA approach, but the time between sampling events for MNA
is generally less than sites where more active (i.e., enhanced) bioremediation remedies are
employed. Semi-annual or annual monitoring is recommended.
For sites where enhanced anaerobic bioremediation has been proposed, MBT analysis should be
conducted as a part of a pre-design remedial investigation to assess the site microbiology
contributing to the transformation and detoxification of chlorinated ethenes within the plume
area and evaluate the potential need for bioaugmentation. During remediation performance
monitoring, MBTs should be used to evaluate the effectiveness of the treatment and the need for
revising system design or monitoring strategy. Immediately following bioaugmentation
injections, MBT sampling should be conducted more frequently (e.g., monthly or quarterly) to
monitor the distribution and proliferation of dechlorinating bacteria (i.e., Dhc) in the treatment
area. Two years of quarterly monitoring are recommended during bioremediation
implementation. Post-treatment monitoring data is evaluated to determine whether system
design or sampling plan revisions are necessary.
Factors to consider for determining the appropriate number of samples, sampling locations and
frequency are considered in Table 2. As always, site-specific project objectives should be taken
into consideration when selecting the number, location, and sampling frequency. Generally,
samples for MBT analysis should be collected from monitoring wells where the geochemistry
and VOC parameters are collected, although typically not all samples are subjected to MBT
analysis.

om egroups t communit ys
o
Table 1Summary of Molecular Biological Tools and Applications
Tools Comments Summary/UseDirect/Nested PCR Easy to perform but has fa
negativeslse Replaced by qPCR
qPCR (16SrRNA gene) (quantitative rtime Polymerase chain reaction)
eal Determines presence/abseabundance
nce/ Commercially available - widespread use
qPCR mRNA (ribosomal ribonucleic acid) Gene expression, but unstable More R&D needed; perhaps the future of MBTs
qPCR (target genes) Determines presence/abseabundance
nce/ Commercially available - widespread use
DGGE (denaturating gradient gel electrophoresis)
Community screening, quabut maybe inconclusive
nitative, Specialized use, replaced by qPCR
PLFA (phospholipid fatty acid analysis) Community screening (viabi ass and g neral bactgroups); but maybe inconclusive); bu maybe inconc
ble erial
Used to determine biomass, screening of high level community analysislusive y anal is
CSIA (compound specific isotope analysis)
Distinguish biological v. nobiological degradation, gopotential
n-d deal of
Not yet commercially available, very powerful tool.
Notes:(1) SERDP and ESTCP Expert Panel. 2005. Workshop on Research and Development Needs for the Environmental Remediation Application of Molecular Biological Tools. http://docs.serdp-estcp.org/index.cfm

Table 2. MBT Sampling Locations and Frequency
Components of Sampling Plan Factors to Consider Explanation Guidance
Number of Samples Vertical and aerial extent of plume. Border of compliance. What are the goals: source zone remediation, establishment of a biobarrier, or treatment of the entire plume?
The number of MBT samples is partial dependent on the volume/size of the plume and the remedial goals (e.g., the clean up target area).
The goal of the MBT analysis must be clearly defined. The number of samples should be suffice to clearly establish cause-and-effect relationships, guide site management decisions, and to be accepted by regulatory agencies as a line of evidence for attenuation.
Variability of data used to characterize and delineate plume.
The variability of the VOC data across the plume may be an indicator of the expected variability of the MBT sample results.
The number of MBT samples should be sufficient to document expected variability in MBT results.
Sample Locations Plume shape and expansion in relation to source area.
Does the plume have a simple elliptical shape emanating from a single source area or does it have an irregular shape with one or more source areas?
MBT samples should be collected from locations so that the results are representative of the area targeted for remediation.
Distribution of contamination within stratified/heterogeneous aquifers.
Is the plume contained in one homogenous aquifer or is it contained in multiple stratified aquifers separated by low permeability units.
MBT samples should be collected from each aquifer/unit containing the plume.
Distribution of indicator parameters throughout the target area (i.e. biodegradation products, DO, ORP).
Does the distribution of indicator parameters, such as biodegradation products, oxygen, and ORP, indicate that there are distinct biodegradation zones in the plume?
MBT results must be performed in an integrated manner and include site geochemical parametersthere are distinct biodegradation zones in the plume? site geochemical parameters collected simultaneously. At least one sample should be collected from each distinct biodegradation zone.
Sample Frequency Seasonal variability of groundwater data (i.e. VOCs, oxygen, ORP).
Is there seasonal variability of the existing groundwater data, such as VOC concentration, oxygen, and ORP, that indicate the potential for seasonal variability of the MBT data?
The sample frequency should be sufficient to document expected seasonal variability of MBT results.
For active remediation systems, frequency of electron donor injection, observed biodegradation rates, location of monitoring wells relative to injection points and groundwater flow velocity, and remediation goals
For enhanced bioremediation performance monitoring, a baseline should be established prior to any treatment. Donor injection will rapidly affect the richness and eveness of the microbial community.
Sampling should be conducted more frequently (monthly or quarterly) following bioaugmentation to monitor the distribution of dechlorinators and the establishment of dechlorinating activity in the target area
ESTCP ER-0518 Guidance Protocol 29
7. REFERENCES AFCEE (Air Force Center for Environmental Excellence), ESTCP (Environmental Security
Technology Certification Program), Naval Facilities Engineering Service Center (NAVFAC ESC). 2004. Principles and practices of enhanced anaerobic bioremediation of chlorinated solvents. Prepared by Parsons Infrastructure and Technology Group, Inc.
Amos, B. K., Suchomel, E. J., Pennell, K. D., and Löffler, F. E. 2008. Correlating microbial activity and distribution with enhanced contaminant dissolution from a NAPL source zone. Water Res., 42, 2963-2974.
Amos, B.K., Suchomel, E.J., Pennell, K.D., and Löffler, F.E. 2009. Spatial and Temporal Distributions of Geobacter lovleyi and Dehalococcoides spp. during bioenhanced PCE-DNAPL dissolution. Environ Sci Technol 43: 1977-1985.
Bradley, P. M., F.H. Chapelle. 2000. Acetogenic microbial degradation of vinyl chloride. Environ. Sci. Technol. 34, 2761-2763
Cápiro, N.L., J.K. Hatt, K.D. Pennell, F.E. Löffler. 2010. Distribution of Dehalococcoides Bacteria Between Aqueous and Solid Phases. 8th Annual Conference on Remediation of Chlorinated and Recalcitrant Compounds, Monterey, CA.
Duhamel, M., K. Mo and E. Edwards. 2004. Characterization of a highly enriched Dehalococcoides-containing culture that grows on vinyl chloride and trichloroethene. Appl. Environ. Microbiol. 70: 5538-5545.
ESTCP. 2005. Bioaugmentation for remediation of chlorinated solvents: technology development, status and research needs. http://www.estcp.org/Technology/upload/BioaugChlorinatedSol.pdf
EPA. 2008. A Guide for Assessing Biodegradation and Source Identification of Organic Ground
Water Contaminants using Compound Specific Isotope Analysis, EPA/600/R-08/148. Fletcher, K. E., C. Cruz-Garcia, N. S. Ramaswamy, J. Costanza, K. D. Pennell, and F. E. Löffler.
2010. Effects of elevated temperatures on Dehalococcoides dechlorination performance and biomarker gene and transcript quantification. Environ. Sci. Technol. In Press.
Gossett, J. M. 2010. Sustained aerobic oxidation of vinyl chloride at low oxygen concentrations.
Environ. Sci. Technol. 44: 1405-1411. He, J., K. M. Ritalahti, K.-L. Yang, S. S. Koenigsberg, and F. E. Löffler. 2003. Detoxification of
vinyl chloride to ethene coupled to growth of an anaerobic bacterium. Nature 424:62-65. Hendrickson, E. R., J. A. Payne, R. M. Young, M. G. Starr, M. P. Perry, S. Fahnestock, D. E. Ellis,
and R. C. Ebersole. 2002. Molecular analysis of Dehalococcoides 16S ribosomal DNA from chloroethene-contaminated sites throughout North America and Europe. Appl. Environ. Microbiol. 68:486-495.
Lendvay, J.M., F.E. Löffler, M. Dollhopf, M.R. Aiello, G. Daniels, B.Z. Fathepure, M. Gebhard,
R. Heine, R. Helton, J. Shi, R. Krajmalnik-Brown, C.L. Major, M.J. Barcelona, E. Petrovskis,

ESTCP ER-0518 Guidance Protocol 30
J.M. Tiedje, and P. Adriaens. 2003. Bioreactive barriers: a comparison of bioaugmentation and biostimulation for chlorinated solvent remediation. Environ. Sci. Technol. 37:1422-1431.
Löffler, F., Q. Sun, J. Li, and J. Tiedje. 2000. 16S rRNA gene-based detection of
tetrachloroethene-dechlorinating Desulfuromonas and Dehalococcoides species. Appl. Environ. Microbiol., 66(4):1369-1374.
Löffler, F. E. and K. M. Ritalahti. 2001. 16S rDNA-based tools identify Dehalococcoides species
in many reductively-dechlorinating enrichment cultures, p. 53-68. In M. A. Kornmüller (ed.), Anaerobic dehalogenation. SFB 193 Biological Waste Water Remediation, Technical University Berlin, Germany.
Lu X, J.T. Wilson, D.H. Kampbell. 2006. Relationship between Dehalococcoides DNA in
ground water and rates of reductive dechlorination at field scale. Water Res 40: 3131-3140.
Magnuson J. K., M. F. Romine, D. R. Burris, and M. T. Kingsley. 2000. Trichloroethene reductive dehalogenase from Dehalococcoides ethenogenes: Sequence of tceA and substrate range characterization. Appl. Environ. Microbiol. 66:5141-5147.
Maymó-Gatell, X., Y.-T., Chien, J. M. Gossett, and S. H. Zinder. 1997. Isolation of a bacterium
that reductively dechlorinates tetrachloroethene to ethene. Science 276:1568-1571. Morse J.J., B.C. Alleman, J.M. Gossett, S.H. Zinder, D.E. Fennell, G.W. Sewell, and C.M.
Vogel. 1998. Draft technical protocol: A treatability test for evaluating the potential applicability of the reductive anaerobic biological in situ treatment technology (RABITT) to remediate chloroethenes. ESTCP, February 23, 1998.
Müller, J. A., B. M. Rosner, G. von Abendroth, G. Meshluham-Simon, P. McCarty, and A. M.
Spormann. 2004. Molecular identification of the catabolic vinyl chloride reductase from Dehalococcoides sp. strain VS and its environmental distribution. Appl. Environ. Microbiol. 70:4880-4888.
Petrovskis E.A., W. Amber, C. Walker. 2011. Microbial monitoring during bioaugmentation
with Dehalococcoides. SERDP and ESTCP Remediation Technology Monograph Series. Volume 4: Bioaugmentation for Groundwater Remediation. In Press.
Puls, R.W. and M..J. Barcelona. 1996. Low-flow (minimal drawdown) ground-water sampling
procedures. EPA/540/S-95/504. Ritalahti, K. M., R. Krajmalnik-Brown, J. He, Y. Sung, and F. E. Löffler. 2002. Microbial
communities contributing to the degradation of cis-1,2-dichloroethene (cis-DCE), vinyl chloride (VC) and 1,2-dichloropropane (1,2-D). 6th International Symposium on Environmental Biotechnology, June 9-12, Veracruz, México.
Ritalahti, K. M., and F. E. Löffler. 2004. Populations implicated in the anaerobic reductive
dechlorination of 1,2-dichloropropane in highly enriched bacterial communities. Appl. Environ. Microbiol. 70:4088-4095.
ESTCP ER-0518 Guidance Protocol 31
Ritalahti, K. M.; J. K. Hatt; E. Petrovskis, F. E. Löffler, 2009. Groundwater sampling for nucleic acid biomarker analysis. In Handbook of Hydrocarbon and Lipid Microbiology, Timmis, K. N., Ed. Springer: Berlin, pp. 3407-3418.
Ritalahti, K. M.; J. K. Hatt; V. Lugmayr, K. Henn, E. A. Petrovskis, D. M. Ogles, G. A. Davis, C.
M. Yeager, C. A. Lebrón, F. E. Löffler, 2010. Comparing on-site to off-site collection for Dehalococcoides biomarker gene quantification to predict in situ chlorinated ethene detoxification potential. Environ, Sci. Technol. 44:5127-5133.
Seguiti, F.A., C.D. Drummond, E.A. Petrovskis, F.E. Loeffler, and K. Ritalahti. 2006.
Management/Site Closure for a TCE-Impacted Aquifer Following Bioaugmentation. 6th Annual Conference on Remediation of Chlorinated and Recalcitrant Compounds, Monterey, CA.
SERDP and ESTCP Expert Panel. 2005. Workshop on Research and Development Needs for the
Environmental Remediation Application of Molecular Biological Tools. http://docs.serdp-estcp.org/index.cfm
SiREM, 2006, Gene Trac Testing Protocol. Stroo, H.F., A. Leeson, A. Shepard, S. Koenigsberg, and C. Casey. 2006. Monitored Natural
Attenuation Forum: Environmental Remediation Applications of Molecular Biological Tools. Remediation. Spring
Sung, Y., K. M. Ritalahti, F. E. Löffler. 2005. Complete Detoxification of Trichloroethene (TCE)
to Ethene by a New Dehalococcoides Species Designated Strain GT, abstr. Q-038. In Abstracts of the 104th General Meeting of the American Society for Microbiology, Atlanta, GA.
Suthersan, S. et al., 2002. Technical Protocol for Using Soluble Carbohydrates to Enhance
Reductive Dechlorination of Chlorinated Aliphatic Hydrocarbons. ESTCP, December 19, 2002.
He X., Y. Deng, J. D. Van Nostrand, Q. Tu, M. Xu, C. L. Hemme, X. Li, L. Wu, T. J. Gentry, Y.
Yin, J. Liebich, T. C. Hazen and J. Zhou. 2010. GeoChip 3.0 as a high-throughput tool for analyzing microbial community composition, structure and functional activity. ISME J 29 April 2010.
Wiedemeier, T.H., et al. 1998. Technical protocol for evaluating natural attenuation of chlorinated
solvents in groundwater. EPA/600/R-98/128.