consumer - ambitreports.ambitcapital.com/reports/ambit_b2cdistributorssurvey... · and gsk consumer...
TRANSCRIPT

CONSUMER
Rakshit Ranjan, [email protected]: +91 22 3043 3021
October 2015Co
nsum
er
Com
pani
es
Input Costs
Tailwind Till3QFY16
Analysts:
B2C Distributors’ Survey
Channel LiquidityIssues
DelayedDiwali
RuralWoes
Bhargav [email protected]: +91 22 30433252
Abhishek Ranganathan, [email protected]: +91 22 3043 3085
Nitin [email protected]: +91 22 3043 3241

B2C Distributors Survey
October 05, 2015 Ambit Capital Pvt. Ltd. Page 2
CONTENTS
Topline growth to slide further………….........................................................3
Survey summary ……………………………………………………………………..4
Investment implications ……………………………………………………………10
FMCG and staples ………………………………………………………………….13
Paints… ……………………………………………………………………………...16
Kitchenware………………………………………………………………………….. 18
Jewellery……………………………………………………………………………… 20
Light Electricals………………………………………………………………………. 22
Air conditioners……………………………………………………………………… 25

Ambit Capital and / or its affiliates do and seek to do business including investment banking with companies covered in its research reports. As a result, investors should be aware that Ambit Capital may have a conflict of interest that could affect the objectivity of this report. Investors should not consider this report as the only factor in making their investment decision.
Topline growth to slide further
The YoY revenue growth of consumer companies in 2QFY16 is likely to be weaker than that in 1QFY16, owing to: (a) rise in liquidity issues at distributors (arising from weak consumer demand); (b) lower price realisation growth due to price cuts in FMCG & paints (softening input costs were passed on to customers); and (c) a delayed festive season, which affected demand for categories like FMCG, paints and jewellery (shift of sales from Sep to Oct vs last year). With modest demand growth during the Onam festival, urban demand is unlikely to turn around meaningfully in 3QFY16 (the Diwali quarter). For the FMCG sector, we expect average volume growth of 4.7% YoY in 2QFY16 vs 5.0%/5.6% for 1QFY16/2QFY15 across our coverage universe. Margin benefits from softening input costs will support earnings growth for FMCG/paints companies until 3QFY16. Our tops BUYs are ITC, Page, Titan, TTK Prestige and V-Guard. Summary of our findings from the Distributors survey
Category Volume Growth
Price Growth
Promotional Intensity
Most at Risk
Most Secure
Air conditioners Flat Voltas, LG Daikin
FMCG & staples Increased Nestle, Colgate Britannia
Paints Increased Akzo, Kansai Berger, Asian
Kitchenware Increased Hawkins TTK Prestige
Jewellery Increased Regional/ unorg Titan
Light electricals Flat Bajaj V-Guard, Crompton
Source: Ambit Capital research; Note: ‘’ indicates acceleration of YoY growth vs 4QFY15; ‘’ indicates unchanged YoY growth rates vs 4QFY15; and ‘ ‘ indicates deceleration in YoY growth vs 4QFY15.
Market share shifts: Key market share changes in FMCG in 2QFY16: (a) Dabur and GSK Consumer gained share from Colgate and HUL in modern trade in oral care; (b) ITC gained share from Nestle in noodles; and (c) P&G gained share in shampoos from HUL. Berger and Asian Paints have both gained share from Akzo and Kansai. TTK Prestige has gained share particularly in north India from Hawkins. Regional players such as V-Guard (water heater, fans and wires) and Finolex Cables (cables and wires) have gained share in non-south markets.
Key recommendations: 2QFY16 results are likely to act as a negative catalyst for firms like Nestle and Colgate and for paint stocks where consensus earnings estimates underestimate the drag from weak volume growth and weak realisation gains. Although tailwinds from lower input costs will lead to ~170bps EBITDA margin expansion YoY in 2QFY16 for FMCG, these gains will end in 4QFY16 (base effect). Our top BUYs are ITC, Page, Titan, TTK Prestige and V-Guard.
Summary of our volume and value growth expectations for 2QFY16
Ticker 2Q volume 2Q value 2Q =
Ticker 2Q volume 2Q value 2Q =
growth growth Catalyst? growth growth Catalyst? GSKCH 2% 8% Neutral APNT 10% 9% Negative NEST -26% -21% Negative BRGR 9% 8% Negative CLGT 3% 6% Negative BATA 4% 8% Neutral HUVR 5% 5% Neutral JUBI 10% 28% Neutral DABUR 6% 7% Neutral BJE 2% 2% Negative MRCO 6% 7% Neutral PAG 9% 15% Neutral GCPL 7% 11% Neutral PIDI 10% 11% Neutral BRIT NA 12% Neutral HAVL 3% 2% Neutral ITC -15% 5% Neutral VGUARD 9% 7% Neutral TTKPT 3% 6% Neutral TTAN -20% -25% Positive
Source: Ambit Capital research; Note: Volume growth is YoY and pertains to the domestic business based on our channel checks; Value growth pertains to consolidated growth based on Ambit estimates
THEMATIC October 05, 2015
B2C Distributors SurveyNEGATIVE
Analyst Details
Consumer Rakshit Ranjan, CFA +91 22 3043 3021 [email protected]
Ritesh Vaidya, CFA +91 22 3043 3246 [email protected]
Aditya Bagul +91 22 3043 3264 [email protected]
Light Electricals Bhargav Buddhadev +91 22 30433252 [email protected]
Deepesh Agarwal +91 22 30433275 [email protected]
Jewellery Abhishek Ranganathan, CFA +91 22 3043 3085 [email protected] Air Conditioner Nitin Bhasin +91 22 3043 3241 [email protected]
Utsav Mehta, CFA +91 22 3043 3209 [email protected]
Consumer

B2C Distributors Survey
October 05, 2015 Ambit Capital Pvt. Ltd. Page 4
Survey summary During the second half of September 2015, we conducted a survey of more than 100 large distributors and unlisted companies spread across India and across most of the key consumption segments. This survey focused on identifying the YoY growth trends in consumer demand over July-September 2015 across categories as well as individual brands. Here are the key takeaways from our survey:
1 Weakness in consumer demand from higher liquidity issues at distributors: Consumer demand has remained weak due to a combination of: (a) poor wealth effect from softening prices of land/real estate/gold; and (b) no major increase in the investment cycle and hence no improvement in wage rates/ new job creation/ business growth prospects. This has resulted in distributors, especially in north and west India complaining about liquidity issues due to ballooning receivables from retailers. Thus, distributors’ ROIs have reduced and hence liquidity has tightened, making it difficult to fund incremental sales growth. This factor is likely to result in weak volume growth across all consumption categories during 2QFY16.
2 Weak pricing component of revenue growth in FMCG and paints: In categories with high competitive intensity and favourable input cost trends, companies have been forced to pass on input cost deflationary benefits to the trade channel and consumers amidst high price elasticity of demand; for example: (a) price cuts of 2-10% in soaps, detergents and paints; (b) price cuts of 20-30% in shampoos and UHT milk; and (c) aggressive promotions on most other products. With such pricing action being taken to avoid market share loss to competitors, we do not expect incremental volume growth following this pricing action. Thus, overall revenue growth of firms such as HUL, Asian Paints and Berger Paints is likely to be weaker than their volume growth rates.
3 Impact on kitchenware, fruit juice and paints from a delayed festive season: These segments receive festive demand nearly 4-6 weeks before Diwali each year. Thus, since Diwali in 2015 has been delayed by ~20 days as compared to last year, the corresponding festive demand will see a shift from Sept 2015 to Oct 2015.
A modest start to the festive season; weak hopes of urban demand revival in 3QFY16: Channel partners in event-oriented segments of consumption, like paints, kitchenware, and jewellery, are hoping that the festive season (more so due to a delayed Diwali and hence a longer festive period) will be a positive catalyst for urban demand in these categories. However, the festivities so far have NOT led to a meaningful increase in demand; for example: (a) the Ganapati festival in Maharashtra (September) appears to have seen no meaningful growth in demand YoY; and (b) Onam in Kerala and Tamil Nadu has seen only modest YoY growth in demand for most of the relevant product categories.
Rural India’s woes continue: The rural sector, we believe, is NOT likely to see a revival in consumption demand before 1QFY17 due to a combination of the following factors:
Job creation in the construction sector following the expected execution of public sector infrastructure projects will lag by at least six months after the initiation of plans for such execution by the corporate offices of the respective companies.
Asset value creation in smaller cities and rural India will take place only once the connectivity of smaller cities increases, following the execution of infrastructure projects.
The monsoon season so far has been below normal and hence we do NOT expect the agriculture crop harvest in 2HFY16 to bring cheer to rural disposable household income.
2Q demand has been affected by liquidity issues, lack of price hikes and delayed festive season
Onam in South India has seen only a modest demand growth – a pre-cursor to the 3Q festive demand
Rural demand moderated incrementally; urban demand remained as weak as it was in 1Q

B2C Distributors Survey
October 05, 2015 Ambit Capital Pvt. Ltd. Page 5
Summary of our sector-specific channel checks FMCG/Staples: Volume growth fails to increase despite QoQ price deflation
Consumer demand for 2QFY16 has failed to increase despite price deflation and heightened promotional intensity in several categories. Our channel checks suggest that urban demand remained weak during the quarter whilst rural demand deteriorated incrementally QoQ due to deficient rainfall. Also, revenue growth during the quarter will be impacted by a delayed Diwali (in 3Q this year vs 2Q last year).
Personal care faced the highest competitive intensity, as P&G cut shampoo prices by 25-30% and gained market share from HUL and L’Oreal.
In oral care, Colgate continued to lose market share in urban areas.
In cigarettes, ITC is likely to end 2Q with a volume decline of 15% YoY.
As a result, for 2QFY16, we expect average volume growth of 4.7% YoY vs 5.0%/5.6% for 1QFY16/2QFY15 across our coverage.
We reiterate that any uptick in consumer demand will be gradual and is likely to happen, at the earliest, from 1QFY17 onwards.
Paints: Another weak quarter for revenue; margin expansion to continue until 3QFY16
Revenue growth in 2QFY16 for the paints sector is likely to have been affected by a combination of: (a) delayed Diwali (resulting in a shift in demand from 2QFY16 to 3QFY16); (b) weak overall demand for the home improvement segment and especially mid and premium paint products; and (c) YoY declines in price realisations given no price hikes and one price cut (of 2%) over the past 12 months.
Asian Paints continues to further improve its speed of delivery of products to dealers. Based on our previous discussions with the management of Asian Paints, speedy delivery is likely to be through automation of input/output warehousing in the supply chain, and better use of data analytics to forecast demand more accurately.
Berger also continues to gain share from peers like Kansai and Akzo.
We expect revenue growth of 9%/8% YoY for Asian Paints/ Berger Paints. Soft input costs, partially offset by the recent depreciation in INR against USD, will lead to gross margin expansion of 200-400bps in both 2QFY16 as well as 3QFY16, which is likely to be unsustainable from 4QFY16 onwards.
Kitchenware: Weak September after modest growth in Jul-Aug for TTK; Hawkins likely to report flat-to-declining revenues YoY
Whilst sales growth for the kitchenware segment improved in July and August, September has been exceptionally weak mainly due to a delayed Diwali. Liquidity constraints at the distributor level have increased significantly in north and south India (less so in the east and west regions). Demand during the festive season of Onam in south India was moderately positive. Most brands launched new products over the past 3-4 months, albeit with varying degrees of success.
TTK Prestige has seen strong demand for new launches like “Cute pressure cookers” in north India, “Multi-Kadhai” in south India, and “Clip-on cookers” in Karnataka.
Hawkins, on the other hand, has NOT seen any meaningful success with its ceramic-coated cookers, due to high product prices and increased complaints from several customers (around the coating coming off).
We expect TTK Prestige to report revenue growth of 6% in 2QFY16 driven by market share gains, new product launches and strong performance of franchisee stores. Hawkins, on the other hand, is likely to report flat YoY revenue growth at best.
FMCG - We expect average volume growth of 4.7% YoY vs 5.0%/5.6% for 1QFY16/2QFY15
Paints – delayed Diwali, weak home improvement sector demand, and price cuts YoY
Kitchenware – weak macro demand; several new product launches from TTK Prestige and Hawkins

B2C Distributors Survey
October 05, 2015 Ambit Capital Pvt. Ltd. Page 6
Jewellery: 2Q an aberration; underlying changes favour Titan
Our discussions with various stores (including Tanishq), unlisted jewellers and trade participants indicate: (1) marginal increase in demand, (2) fall in footfalls and revenues due to discontinuation of the monthly gold deposit scheme. Out of these, the impact of the discontinuation of the gold deposit scheme would be the highest, as the scheme accounted for nearly 50% of Titan’s 2QFY15 jewellery revenues. The LTL growth for Tanishq will not be comparable for 2QFY15 due to early redemption of gold deposit scheme wherein deposits maturing in 2HFY15 were redeemed during that quarter. Therefore, whilst the 2QFY16 results will optically reflect a 25% fall in revenues and profits, the same are not comparable. However, the absence of the scheme has been partially offset by promotions. Also, we gather that there has been system-level reduction in inventory by most players due to working capital constraints. Consequently, their ability to retain market share through range and lower pricing will be severely constrained. We are BUYers of Titan, as it is best placed to gain market share from these organised players and as it continues asset-light expansion of stores.
Light Electricals: Another sluggish quarter; festival season to be a washout in FY16
Our discussions with channel partners suggest that demand continues to be timid, given sluggish construction-led demand and weak consumer sentiment. Diwali most likely will be weak, as Onam was bad and enquiries from corporates were weak.
Within product categories, whilst switchgear, lighting and water heater are likely to report a volume decline of 3-5% YoY, construction wires, small appliances and fans are likely to report a volume growth of 2-5% YoY.
Stabilisers and inverters are likely to grow at a faster pace of ~8% (vs 8% volume growth in 1Q) due to higher sales of air conditioners in 2Q on account of the warm weather (weak monsoon) and increase in power outages (weak offtake by SEBs).
However, companies are likely to continue reporting gross margin expansion owing to pricing discipline despite weak copper and crude prices. New entrants may be marginalised given weak product quality and lacklustre after-sales service.
We reiterate our BUY stance on V-Guard and Finolex Cables, as these regional franchises are gaining market share in the non-south markets and are fast emerging as pan-India players.
Air conditioners: Sluggish off-season quarter; premium brands are going strong
Our dealer checks indicated that demand continues to be weak across the country with volume declines of 15-20% YoY in the typically seasonally weak 2Q. Volume growth has not worsened materially from 1QFY16 when volumes declined by 13% YoY (according to Voltas’ management). Amongst companies, dealers spoke positively on Daikin and Mitsubishi’s market share whilst LG and Voltas have ceded ground. This may be due to weakness in the mid-market segment of air-conditioners that typically would impact brands such as Voltas and LG. Premium segment offtake has been relatively resilient. Pricing has been relatively stable across brands as inventory at the dealer level continues to remain high. However, few dealers did highlight a potential hike in prices driven by the USD depreciation.
B2C Distributors Survey
October 05, 2015 Ambit Capital Pvt. Ltd. Page 7
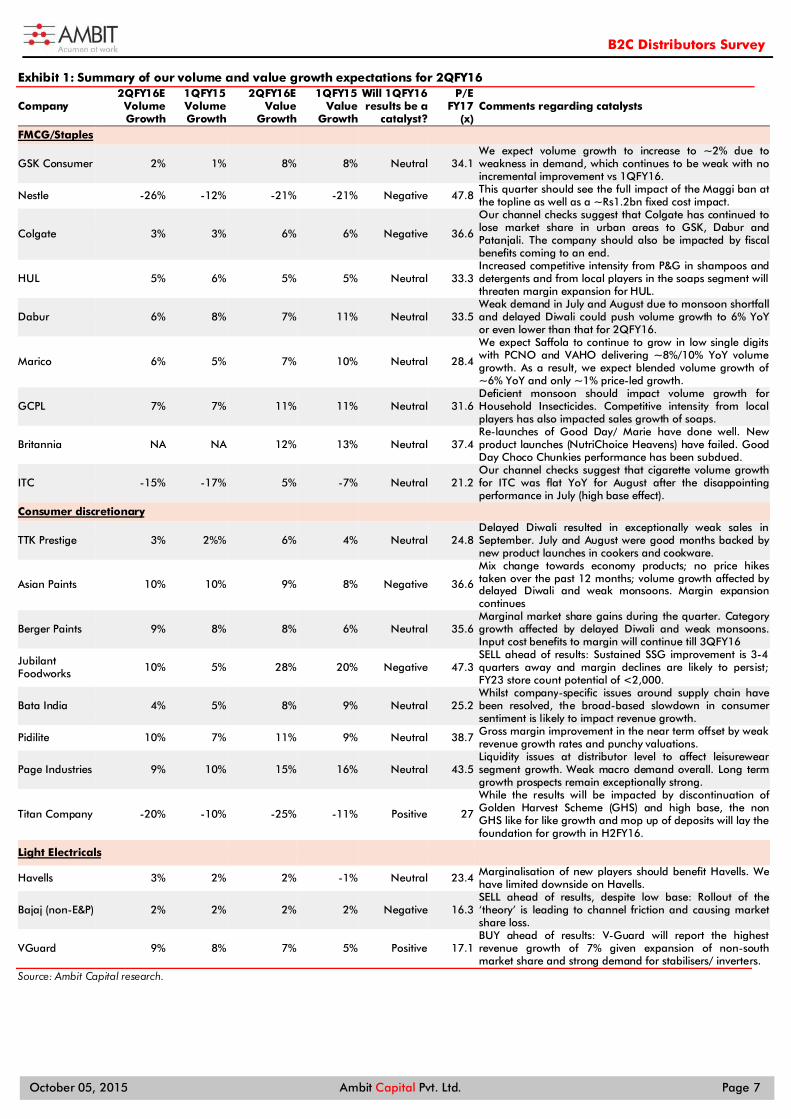
Summary of our volume and value growth expectations for 2QFY16 Exhibit 1:
Company 2QFY16E Volume Growth
1QFY15 Volume Growth
2QFY16E Value
Growth
1QFY15 Value
Growth
Will 1QFY16 results be a
catalyst?
P/E FY17
(x) Comments regarding catalysts
FMCG/Staples
GSK Consumer 2% 1% 8% 8% Neutral 34.1 We expect volume growth to increase to ~2% due to weakness in demand, which continues to be weak with no incremental improvement vs 1QFY16.
Nestle -26% -12% -21% -21% Negative 47.8 This quarter should see the full impact of the Maggi ban at the topline as well as a ~Rs1.2bn fixed cost impact.
Colgate 3% 3% 6% 6% Negative 36.6
Our channel checks suggest that Colgate has continued to lose market share in urban areas to GSK, Dabur and Patanjali. The company should also be impacted by fiscal benefits coming to an end.
HUL 5% 6% 5% 5% Neutral 33.3 Increased competitive intensity from P&G in shampoos and detergents and from local players in the soaps segment will threaten margin expansion for HUL.
Dabur 6% 8% 7% 11% Neutral 33.5 Weak demand in July and August due to monsoon shortfall and delayed Diwali could push volume growth to 6% YoY or even lower than that for 2QFY16.
Marico 6% 5% 7% 10% Neutral 28.4
We expect Saffola to continue to grow in low single digits with PCNO and VAHO delivering ~8%/10% YoY volume growth. As a result, we expect blended volume growth of ~6% YoY and only ~1% price-led growth.
GCPL 7% 7% 11% 11% Neutral 31.6 Deficient monsoon should impact volume growth for Household Insecticides. Competitive intensity from local players has also impacted sales growth of soaps.
Britannia NA NA 12% 13% Neutral 37.4 Re-launches of Good Day/ Marie have done well. New product launches (NutriChoice Heavens) have failed. Good Day Choco Chunkies performance has been subdued.
ITC -15% -17% 5% -7% Neutral 21.2 Our channel checks suggest that cigarette volume growth for ITC was flat YoY for August after the disappointing performance in July (high base effect).
Consumer discretionary
TTK Prestige 3% 2%% 6% 4% Neutral 24.8 Delayed Diwali resulted in exceptionally weak sales in September. July and August were good months backed by new product launches in cookers and cookware.
Asian Paints 10% 10% 9% 8% Negative 36.6
Mix change towards economy products; no price hikes taken over the past 12 months; volume growth affected by delayed Diwali and weak monsoons. Margin expansion continues
Berger Paints 9% 8% 8% 6% Neutral 35.6 Marginal market share gains during the quarter. Category growth affected by delayed Diwali and weak monsoons. Input cost benefits to margin will continue till 3QFY16
Jubilant Foodworks 10% 5% 28% 20% Negative 47.3
SELL ahead of results: Sustained SSG improvement is 3-4 quarters away and margin declines are likely to persist; FY23 store count potential of <2,000.
Bata India 4% 5% 8% 9% Neutral 25.2 Whilst company-specific issues around supply chain have been resolved, the broad-based slowdown in consumer sentiment is likely to impact revenue growth.
Pidilite 10% 7% 11% 9% Neutral 38.7 Gross margin improvement in the near term offset by weak revenue growth rates and punchy valuations.
Page Industries 9% 10% 15% 16% Neutral 43.5 Liquidity issues at distributor level to affect leisurewear segment growth. Weak macro demand overall. Long term growth prospects remain exceptionally strong.
Titan Company -20% -10% -25% -11% Positive 27
While the results will be impacted by discontinuation of Golden Harvest Scheme (GHS) and high base, the non GHS like for like growth and mop up of deposits will lay the foundation for growth in H2FY16.
Light Electricals
Havells 3% 2% 2% -1% Neutral 23.4 Marginalisation of new players should benefit Havells. We have limited downside on Havells.
Bajaj (non-E&P) 2% 2% 2% 2% Negative 16.3 SELL ahead of results, despite low base: Rollout of the ‘theory’ is leading to channel friction and causing market share loss.
VGuard 9% 8% 7% 5% Positive 17.1 BUY ahead of results: V-Guard will report the highest revenue growth of 7% given expansion of non-south market share and strong demand for stabilisers/ inverters.
Source: Ambit Capital research.

B2C Distributors Survey
October 05, 2015 Ambit Capital Pvt. Ltd. Page 8
Margin expansion to continue in 2QFY16 Gross margins to expand due to lower raw material prices, partially offset by INR depreciation
During the quarter, crude oil prices were down ~25% YoY. Prices of key raw materials such as Palm Fatty Acid Distillate (PFAD, down ~25% YoY) used in soap manufacturing, Linear Alkyl Benzene (LAB, down ~10% YoY) used in synthetic detergents, High Density Polyethylene (HDPE, down ~15% YoY) used in plastic packaging material and Light Liquid Paraffin (LLP, down ~30% YoY) also corrected during the quarter. Companies reaped the benefits of lower input prices over the last 9 months and would continue to benefit from lower input costs during this quarter as well.
Firms such as Asian Paints, Berger and Pidilite import 30-40% of their overall raw materials. As a result, ~10% depreciation in the Rupee over the past 3-4 months will partially offset the gross margin gains due to incremental softening in crude prices over the past 3-4 months. We expect gross margins for FMCG and Paints sector to be ~290bps higher YoY in 2QFY16.
Higher gross margin to be partially offset by higher A&P spends in 1QFY16: Due to increased competitive intensity in categories like soaps, detergents and shampoos, we believe companies have partially invested gains at the gross margin level into higher A&P spends. Thus, we expect A&P spends to increase by 67bps YoY, partially offsetting the gains at the gross margin level.
EBITDA margins are likely to increase by ~170bps YoY, as gains at the gross margin level are likely to be partially invested into higher A&P spends. Due to the significant EBITDA margin expansion, we expect average PAT growth of ~18% YoY, ahead of sales growth of ~8% YoY for 1QFY16. This will result in the FMCG sector report earnings growth of 18% YoY despite only 4.7% volume growth and 8% YoY revenue growth during 2QFY16.
Gains at the gross margin level to be partially invested into higher A&P spends Exhibit 2:
Company Revenue growth (%) YoY Change in
A&P spends as % of sales
bps
YoY Change in Gross Margin
bps
YoY Change in EBITDA Margin
bps 2QFY16E 1QFY16 2QFY15
Britannia 12.0% 13.0% 12.5% 50 355 385
Colgate 5.5% 5.6% 11.1% 41 78 7
Dabur 7.0% 10.7% 10.3% 57 280 160
GCPL 10.9% 11.1% 5.0% 12 372 198
GSK Consumer 8.4% 8.2% 9.8% 86 450 173
HUL 5.0% 5.3% 10.6% 139 312 173
Marico 7.0% 9.9% 28.0% 80 173 73
Nestle -21.3% -20.1% 8.9% NA 300 (507)
ITC 5.0% -7.1% 14.8% NA 80 (92)
Average (ex-ITC, Nestle) 8.0% 9.1% 12.5% 67 289 167
Source: Company, Ambit Capital research
Input cost tailwind will last only until 3QFY16 As highlighted in the exhibit below, gross margin expansion due to fall in commodity prices started partially in 3QFY15 and had its full impact from 4QFY15. Given limited incremental softening in input costs over the past 9 months, we expect the tailwind to earnings growth from gross margin expansion to get over by 4QFY16. As a result, without an overall demand revival (currently we expect from 1QFY17 onwards), current earnings growth momentum will moderate substantially from 4QFY16 onwards.
Gross margin expansion likely due to softening of raw material prices YoY
Heightened competitive intensity has led to partial investment of gross margin into A&P spends
Consequently, we expect EBITDA margin expansion of ~170bps YoY for FMCG

B2C Distributors Survey
October 05, 2015 Ambit Capital Pvt. Ltd. Page 9
Margins have expanded whilst volume growth has remained soft for the Exhibit 3:FMCG sector
Source: Company, Ambit Capital research Note: We have considered Colgate, Dabur, Britannia, HUL, GCPL, GSK CH and Marico for the above chart
Gross margin gains due to softer input costs Exhibit 4:
Source: Ambit Capital research, Company
4.0%
5.0%
6.0%
7.0%
8.0%
9.0%
(200)
(100)
-
100
200
300
400
3QFY
14
4QFY
14
1QFY
15
2QFY
15
3QFY
15
4QFY
15
1QFY
16
2QFY
16E
GM ch YoY (bps) EBITDA ch YoY (bps) Volume growth (YoY %), RHS
(200)
(100)
-
100
200
300
(200)
(100)
-
100
200
300
Sep'14 Dec'14 Mar'15 Jun'15 Sep'15e
APNT GM expansion YoY (bps) BRGR GM expansion YoY (bps)
APNT EBITDA expansion YoY (bps) BRGR EBITDA expansion YoY (bps)

B2C Distributors Survey
October 05, 2015 Ambit Capital Pvt. Ltd. Page 10
Investment implications Amongst large-caps, we reiterate our BUY on ITC due to its longer-term earnings growth potential and limited downside from current valuations. Amongst mid-caps and small-caps, we reiterate our BUYs on Page Industries and TTK Prestige, as 3QFY16 is likely to be a significant positive catalyst for both the stocks due to: (a) resolution of channel constraints by Page during Sep-Oct, which will result in resumption of strong revenue growth momentum despite weak macro demand; (b) new product launches by both Page (kids innerwear) and TTK Prestige (pan-India roll out of ‘multi-kadhai’, ‘Cute cookers’, Clip-on, etc) during 3QFY16; and (c) market share gains given sustained competitive advantages. We highlight Page Industries as our ‘top BUY’ idea. 1 ITC (BUY, TP Rs405, 27% upside): India’s total cigarette volume
consumption has remained unchanged in FY12-14; however, a 15% excise hike CAGR over FY13-16 and poor implementation of anti-cigarette regulations have resulted in a consumption shift from legal to illegal cigarettes, bidis and chewing tobacco. Thus, the tax collected by the Government from the tobacco sector has reduced. Over 1993-2000, the UK faced a similar situation of rising proliferation of illegal cigarettes due to high taxation, which eventually led to moderation of excise duty on cigarettes. We expect a similar sequence of events to unfold in the Indian market to result in a revival in ITC’s cigarette volume CAGR to 1% over FY15-25. ITC’s non-cigarette FMCG portfolio is likely to benefit from high-quality middle and senior management teams focusing on product innovation and leveraging on ITC’s scale and distribution channel dominance. Hence, we forecast 21%/12% revenue CAGR in packaged foods/personal care over FY15-25 and 4x improvement in EBITDA margin from 2.4% in FY15 to 11.3% in FY25. Overall, we expect the non-cigarette FMCG business to deliver sales/EBIT CAGR of 19%/64% over FY15-25. At CMP of Rs315/share, our reverse DCF suggests that the share price already factors in: (a) Cigarette volume decline of 6% over FY15-25 and (b) Excise duty hike of ~15% CAGR over FY15-25. Hence, we see limited downside from current levels. (Click here for our detailed 04 June 2015 note on ITC).
2 TTK Prestige (BUY, TP Rs4,437, 17% upside): TTK Prestige’s revenue growth is likely to revive to 6%/18%/20% YoY in 2QFY16E/2HFY16E/FY17E (from 7% YoY in FY15), as the external headwinds that affected its revenue growth over FY14 and FY15 have now dissipated. Whilst TTK is likely to be impacted by a seasonal shift of festive demand from 2QFY16 to 3QFY16, the company is also likely to benefit from a series of new product launches. This includes a successful test-launch in certain markets for products like Multi-Kadhai (south India), Cute pressure cookers (north India), and Clip-ons (Karnataka). Moreover, its recent tie-ups with e-commerce aggregators and establishment of fulfilling centres in Hosur and Maharashtra will ensure expansion of TTK’s presence in this channel without inventory de-stocking in the brick-and-mortar channel. Also, the Prestige Smart Kitchen (PSK) franchisee network has been growing strongly thanks to the efficient handling of new launches and large value SKUs. Improved capacity utilisation (20% increase targeted in FY16) will support EBITDA margin expansion and help deliver 39% EPS CAGR in FY15-18E. Our DCF model generates a TP of Rs4,437 (17% upside, 29x implied FY17E P/E). We reiterate BUY. (Click here for our detailed 03 July 2015 note on TTK.)
3 Page Industries (BUY, TP Rs16,650, 17% upside): Our channel checks and management discussions indicate that Page’s sales growth in 2QFY16 has been similar to that in 1QFY16 (vs more than 25% until 4QFY15) mainly due to liquidity constraints at the distributor level. However, the company is changing its distribution structure to overcome this issue from 3QFY16 onwards. Fall in cotton prices is likely to result in EBITDA margin benefit of 75-100bps in the rest of FY16. Page continues to build on its competitive strengths around manufacturing, distribution and brand recall through: (a)

B2C Distributors Survey
October 05, 2015 Ambit Capital Pvt. Ltd. Page 11
rapid expansion of the exclusive brand outlet (EBO) network; (b) launch of its e-commerce portal; (c) upcoming launch of kidswear; and (d) ongoing IT investments into streamlining distribution. Hence, the recent weakness in revenue growth (vs 30%/35% revenue/EPS CAGR over FY15-20E) offers attractive entry points for investors. Revival of revenue growth, launch of kidswear collection and implementation of new software for supply chain management are likely to be the key positive catalysts in 2HFY16. We reiterate BUY. (Click here for our detailed 22 June 2015 note on Page.)
4 V-Guard (BUY, TP Rs1,241/share, 35% upside)
Fast emerging as a pan-India player: V-Guard is strengthening its non-south franchise by beefing up its distribution network and recruiting marketing employees from leading competitors. Consequently, the company is gaining market share in all the five product categories in non-south.
Expansion of scale in non-south is margin-accelerative: Non-south’s EBITDA margins have starting improving with expanding scale (improved from -1.3% in FY12 to 1.5% in FY15 and ~4% in 1QFY16). There is tremendous scope for further improvement, as non-south EBITDA margin is 980bps lower than south margin.
Product diversification: V-Guard is successfully reducing its dependence on stabilisers by launching new products. The revenue share of stabilisers has declined from 37% in FY08 to 19% in FY15 led by strong growth in newer products such as inverters, fans, induction cooktop and switchgears
V-Guard is trading at 19.4x FY17 P/E, a 26% discount to Havells standalone despite higher FY15-17E EPS CAGR of 41% (vs Havells’ 14%) and 660bps higher FY17E RoE of 27.6% (vs Havells’ 21.0%). We believe a ‘growth company’ like V-Guard deserves to trade closer to the price multiple of a ‘market leader’ like Havells given similar return ratios and higher earnings growth. We value V-Guard at Rs1,241, implying FY17E P/E of 26.4x (in line with Havells). (Click here for our detailed dated 06 January 2015 (Fading glory note on V-Guard.)
5 Titan (BUY, TP Rs404, 24% upside) New GHS to contribute materially from FY17E: The new GHS will begin contributing materially from FY17E, wherein it will form 12% of revenues. Moreover, the discounts offered by this scheme are 80bps lower than the erstwhile scheme, hence resulting in better like-for-like margins.
Competition is in a tight spot: Low making charges (8-10%), high debt:equity (1.5x) and restrictions on customer deposits will affect sustainability and expansion of competition. Thus, Tanishq will gain market share from not only unorganised players but also organised players at a higher pace than ever (260bps over FY16-20E vs 150bps over FY10-15).
Whilst the withdrawal of the erstwhile deposit scheme will lead to flat revenue/PAT in FY16E, PAT/revenue CAGR will be strong at 28%/25% FY16-18E given the scheme’s return, maturing retail space (37% less than 3 years old) and rising share of studded jewellery (32% in FY15 vs 26% in FY12). Our DCF-based fair value of `404 (34x FY17E EPS) reflects the strengthening competitive position and market share gains. As adornment jewellery (28% of the market; lower ticket size and gold content) grows with changing demographics, designs and repeat buying will override the impact of gold prices, thus warranting higher multiples than the historical average of 32x. (Click here for our detailed 28 Sept 2015 note on Titan.)
6 Voltas (SELL, TP: Rs157, 42% downside) Voltas’s EBIT margin recovery in the Middle East (ME) EMP segment remains elusive and could be at best 2% in FY16; higher infrastructure component in the CY13-18 order pipeline (vs CY08-13) remains the key risk. Our primary data checks and peer management commentary suggest that commercial real estate demand continues to be weak in the top-six cities excluding Bangalore.
B2C Distributors Survey
October 05, 2015 Ambit Capital Pvt. Ltd. Page 12
Hence, the Indian EMP business is unlikely to show a material margin improvement. However, Voltas’s room AC business performance remains robust and it appears that the company can sustain this momentum (growth in line/marginally ahead of the industry) and margins, given its strong reach, a good entry-level brand and strong bargaining power with vendors and channel partners; however, our long standing fear of market share losses with time (as better product companies build reach) are coming true albeit slowly (near stagnation for last 12 months and now a decline in market share in 1QFY16). Weak market could increase competitive intensity and impact margins. In that context, current valuations of 19x FY17 P/E are punchy.
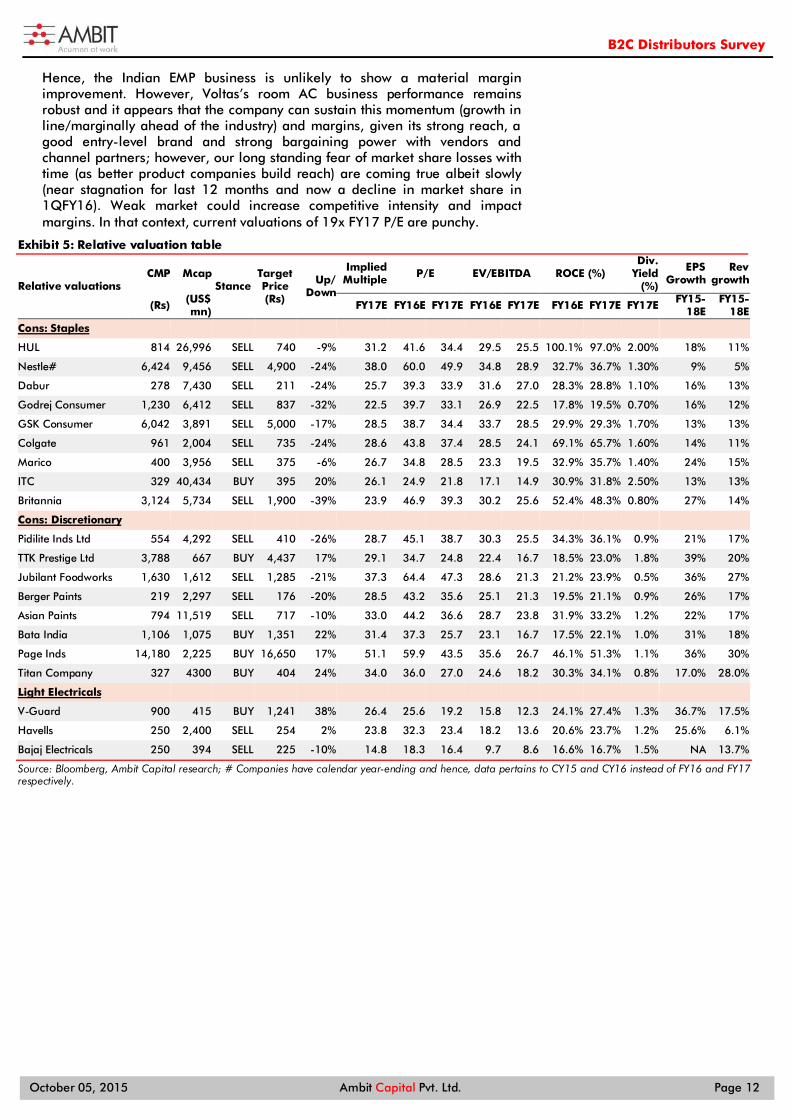
Relative valuation table Exhibit 5:
Relative valuations CMP Mcap
Stance Target Price (Rs)
Up/ Down
Implied Multiple P/E EV/EBITDA ROCE (%)
Div. Yield
(%)
EPS Growth
Rev growth
(Rs) (US$ mn) FY17E FY16E FY17E FY16E FY17E FY16E FY17E FY17E FY15-
18E FY15-
18E
Cons: Staples HUL 814 26,996 SELL 740 -9% 31.2 41.6 34.4 29.5 25.5 100.1% 97.0% 2.00% 18% 11%
Nestle# 6,424 9,456 SELL 4,900 -24% 38.0 60.0 49.9 34.8 28.9 32.7% 36.7% 1.30% 9% 5%
Dabur 278 7,430 SELL 211 -24% 25.7 39.3 33.9 31.6 27.0 28.3% 28.8% 1.10% 16% 13%
Godrej Consumer 1,230 6,412 SELL 837 -32% 22.5 39.7 33.1 26.9 22.5 17.8% 19.5% 0.70% 16% 12%
GSK Consumer 6,042 3,891 SELL 5,000 -17% 28.5 38.7 34.4 33.7 28.5 29.9% 29.3% 1.70% 13% 13%
Colgate 961 2,004 SELL 735 -24% 28.6 43.8 37.4 28.5 24.1 69.1% 65.7% 1.60% 14% 11%
Marico 400 3,956 SELL 375 -6% 26.7 34.8 28.5 23.3 19.5 32.9% 35.7% 1.40% 24% 15%
ITC 329 40,434 BUY 395 20% 26.1 24.9 21.8 17.1 14.9 30.9% 31.8% 2.50% 13% 13%
Britannia 3,124 5,734 SELL 1,900 -39% 23.9 46.9 39.3 30.2 25.6 52.4% 48.3% 0.80% 27% 14%
Cons: Discretionary Pidilite Inds Ltd 554 4,292 SELL 410 -26% 28.7 45.1 38.7 30.3 25.5 34.3% 36.1% 0.9% 21% 17%
TTK Prestige Ltd 3,788 667 BUY 4,437 17% 29.1 34.7 24.8 22.4 16.7 18.5% 23.0% 1.8% 39% 20%
Jubilant Foodworks 1,630 1,612 SELL 1,285 -21% 37.3 64.4 47.3 28.6 21.3 21.2% 23.9% 0.5% 36% 27%
Berger Paints 219 2,297 SELL 176 -20% 28.5 43.2 35.6 25.1 21.3 19.5% 21.1% 0.9% 26% 17%
Asian Paints 794 11,519 SELL 717 -10% 33.0 44.2 36.6 28.7 23.8 31.9% 33.2% 1.2% 22% 17%
Bata India 1,106 1,075 BUY 1,351 22% 31.4 37.3 25.7 23.1 16.7 17.5% 22.1% 1.0% 31% 18%
Page Inds 14,180 2,225 BUY 16,650 17% 51.1 59.9 43.5 35.6 26.7 46.1% 51.3% 1.1% 36% 30%
Titan Company 327 4300 BUY 404 24% 34.0 36.0 27.0 24.6 18.2 30.3% 34.1% 0.8% 17.0% 28.0%
Light Electricals V-Guard 900 415 BUY 1,241 38% 26.4 25.6 19.2 15.8 12.3 24.1% 27.4% 1.3% 36.7% 17.5%
Havells 250 2,400 SELL 254 2% 23.8 32.3 23.4 18.2 13.6 20.6% 23.7% 1.2% 25.6% 6.1%
Bajaj Electricals 250 394 SELL 225 -10% 14.8 18.3 16.4 9.7 8.6 16.6% 16.7% 1.5% NA 13.7%
Source: Bloomberg, Ambit Capital research; # Companies have calendar year-ending and hence, data pertains to CY15 and CY16 instead of FY16 and FY17 respectively.

B2C Distributors Survey
October 05, 2015 Ambit Capital Pvt. Ltd. Page 13
FMCG and staples Consumer demand for 2QFY16 has failed to gain momentum despite price deflation and heightened promotional intensity in several categories. Our channel checks suggest that urban demand has remained weak during the quarter whilst rural demand has deteriorated incrementally QoQ due to deficient rainfall. Also, revenue growth during the quarter will be impacted by a delayed Diwali (in 3Q this year vs 2Q last year). Personal care saw the highest competitive intensity, as P&G cut shampoo prices and gained market share from HUL and L’Oreal. In oral care, Colgate continued to lose market share in urban areas. In cigarettes, ITC is likely to end 2Q with a volume decline of 15% YoY. As a result, for 2QFY16, we expect average volume growth of 4.7% YoY vs 5.0%/5.6% for 1QFY16/2QFY15 across our coverage. We reiterate that any uptick in consumer demand will be gradual and is likely to happen, at the earliest, from 1QFY17 onwards.
Category-wise trends Shampoo – P&G initiates price war in the category
As highlighted in our 19 August 2015 report, ‘The beginning of a price war’ P&G took a ~30% price cut on its Shampoo portfolio, forcing HUL and L’Oreal also to take similar price cuts. This was accompanied by increased advertising intensity by P&G for its shampoo portfolio. Our channel checks suggest that P&G’s Pantene has been able to win back some of its lost market share from HUL. Stock impact: Negative for HUL
Soaps and Detergents: Product re-launches and further price cuts
HUL re-launched Surf Excelmatic during the quarter whilst P&G re-launched both Tide and Ariel during the quarter. Post the re-launch, P&G has matched HUL’s price points for Rin and Surf using Tide Plus and Ariel respectively through consumer promotions. P&G has also significantly stepped up the advertising intensity for detergents. Along with ~10% price cuts on some SKUs in Lux and promotional packs in Dove, the company continues to incentivise distributors to drive sales of mass-market brands such as Breeze in north India. Stock impact: Negative for HUL.
Oral care – GSK and Dabur gaining share; threat even from Patanjali
During the previous quarters, Colgate countered its moderating volume growth by launching the Rs10 SKU of Colgate Dental Cream. However, faced with moderation in rural volume growth and market share loss in urban areas to GSK, Dabur and Patanjali, Colgate has increased promotional intensity in urban areas particularly in modern trade. Colgate has been offering Buy One, Get One (BOGO) promotional packs of Colgate Sensitive Pro-Relief and ~30% discounts on multi-packs of Colgate Total. Colgate’s Active Salt with Neem has had moderate success since its launch late last quarter. Our channel checks indicate that Pepsodent has failed to show signs of recovery during the quarter. Stock impact: Negative for Colgate and HUL; Positive for GSK and Dabur.
Cigarettes – Expecting volume decline of ~15% YoY vs 17% decline in 2QFY16
July 2014 saw strong sales growth, as it was the month of union budget announcement. As a result, July 2015 was a very weak month due to the high base. Our channel checks indicate that volume growth in August was almost flat YoY due to the weak base. We expect volume growth in September also to have been flat YoY and hence we expect a volume decline of 15% YoY in 2QFY16 for ITC (an improvement over the ~17% volume decline in 1QFY16). The 64mm segment has been growing for ITC whilst the RSFT (69mm) segment has been the weakest segment, with volumes declining by ~30% YoY. Stock impact: Positive for ITC.
“Pantene has been gaining market share following their price cut.” – An HUL distributor based out
of Uttar Pradesh
“Colgate has continued to lose market share in modern trade to GSK and Dabur.” – A Colgate distributor based out of a metro

B2C Distributors Survey
October 05, 2015 Ambit Capital Pvt. Ltd. Page 14
Biscuits – Britannia continues to lead the category
Our channel checks suggest that Britannia could deliver volume growth of 7-8% YoY for the quarter led by the successful re-launch of Good Day and Marie during the quarter. However, the company’s new product launch, Nutri Choice Heavens, has been a failure whilst Good Day Choco Chunkies have also seen only modest repeat demand. The premium health cookies segment dominated by Heavens from Britannia, Simply Good from Parle and Farmlite from ITC has been a failure. Parle Magix has been doing very well for Parle, with the company re-gaining its lost market share. ITC’s ‘Mom’s Magic’ has been growing in double digits whilst Dark Fantasy has seen stagnant sales over the last quarter.
Penetration in Hindi belt to take time for Britannia: Britannia has always been a strong player in south and east India. However, north has been weak particularly the Hindi belt of Uttar Pradesh, Bihar and Rajasthan. This region is dominated by Parle which has a strong presence in north and west India. Our channel checks suggest that increasing penetration in these areas is difficult for Britannia due to low media penetration and weak brand equity of Britannia in this region. Stock impact: Neutral for Britannia.
Packaged food and beverages – ITC gaining share in instant noodles; Nestle aggressive in milk category
The recent Maggi noodle controversy had led to a cut back in consumer demand for the entire instant noodles category. However, following the new advertising campaign from ITC, our channel checks indicate that consumers have again increased consumption of instant noodles with ‘Yippee!’ being the biggest beneficiary.
In the milk and milk products category, our channel checks suggest that milk procurement costs from farmers have reduced to Rs18/litre vs Rs24/litre a year ago. Nestle has taken ~20% price cuts on its carton milk and curd product portfolio and has reduced its price differential vs competition.
In the MFD category, sales of the Horlicks base variant and the highest-selling variant have continued to slow down, as consumers are not readily increasing consumption. GSK has been driving volume growth by increasing penetration of GSK’s value-added variants. Stock impact: Negative for Nestle; negative for GSK.
Hair oil and edible oil – Marico facing competition from local players in coconut oil; Saffola continues to be weak
Due to the lower-than-expected correction in copra prices, Marico has not been able to unwind the price hikes on its PCNO (Parachute Coconut Oil) portfolio. As a result, the company continues to face competition from local coconut players. In order to grow its Value Added Hair Oil (VAHO) portfolio, the company is prototyping ‘Parachute Aloe Vera’, ‘Parachute Aromatherapy’ and ‘Nihar Naturals Shanti Sarson Kesh Tel’.
In the edible oils category, Marico’s Saffola has initiated an advertising campaign highlighting the benefit of Saffola vs edible oils with other ingredients. However, our channel checks indicate that volume growth has been soft for Saffola. Stock impact: Negative for Marico.
Volume growth in 2Q likely to be flat QoQ Exhibit 6:Company 2QFY16E 1QFY16 2QFY15 Colgate 3.0% 3.0% 7.0% Dabur 5.5% 8.1% 8.7% GCPL 6.9% 6.6% 2.8% GSK Consumer 2.0% 1.0% 2.0% HUL 5.0% 6.0% 5.0% Marico 6.0% 5.0% 8.0% Nestle -26.0% -12.0% 1.0% ITC -15.0% -18.0% -4.0% Average (ex-ITC, Nestle) 4.7% 5.0% 5.6%
Source: Company, Ambit Capital research
“The Good Day re-launch has been a success…premium nutrition biscuit launches have completely failed in the sector.” – A Parle distributor based out of Maharashtra
“Sales of Yippee have picked up in the last month following their new advertising campaign.”
– An ITC distributor in the northern region

B2C Distributors Survey
October 05, 2015 Ambit Capital Pvt. Ltd. Page 15
Margin expansion to continue in 2QFY16 Gross margins to expand due to lower raw material prices, partially offset by INR depreciation
During the quarter, crude oil prices were down ~25% YoY. Prices of key raw materials such as Palm Fatty Acid Distillate (PFAD, down ~25% YoY) used in soap manufacturing, Linear Alkyl Benzene (LAB, down ~10% YoY) used in synthetic detergents, High Density Polyethylene (HDPE, down ~15% YoY) used in plastic packaging material and Light Liquid Paraffin (LLP, down ~30% YoY) also corrected during the quarter. Companies reaped the benefits of lower input prices over the last 9 months and would continue to benefit from lower input costs during this quarter as well. We expect gross margins to be ~290bps higher YoY in 2QFY16.
EBITDA margins are likely to increase by ~170bps YoY, as gains at the gross margin level are likely to be partially invested into higher A&P spends. Due to the significant EBITDA margin expansion, we expect average PAT growth of ~18% YoY, ahead of sales growth of ~8% YoY for 1QFY16. This will result in the FMCG sector report earnings growth of 18% YoY despite only 4.7% volume growth and 8% YoY revenue growth during 2QFY16.
Gains at the gross margin level to be partially invested into higher A&P spends Exhibit 7:
Company Revenue growth (%) YoY Change in
A&P spends as % of sales
bps
YoY Change in Gross Margin
bps
YoY Change in EBITDA Margin
bps 2QFY16E 1QFY16 2QFY15
Britannia 12.0% 13.0% 12.5% 50 355 385
Colgate 5.5% 5.6% 11.1% 41 78 7
Dabur 7.0% 10.7% 10.3% 57 280 160
GCPL 10.9% 11.1% 5.0% 12 372 198
GSK Consumer 8.4% 8.2% 9.8% 86 450 173
HUL 5.0% 5.3% 10.6% 139 312 173
Marico 7.0% 9.9% 28.0% 80 173 73
Nestle -21.3% -20.1% 8.9% NA 300 (507)
ITC 5.0% -7.1% 14.8% NA 80 (92)
Average (ex-ITC, Nestle) 8.0% 9.1% 12.5% 67 289 167
Source: Company, Ambit Capital research
Gross margin expansion likely due to softening of raw material prices YoY
Heightened competitive intensity has led to partial investment of gross margin into A&P spends
Consequently, we expect EBITDA margin expansion of ~170bps YoY for FMCG

B2C Distributors Survey
October 05, 2015 Ambit Capital Pvt. Ltd. Page 16
Paints Revenue growth for paints companies in 2QFY16 was affected by: (i) a delayed Diwali (leading to a shift in demand from 2QFY16 to 3QFY16); (ii) weak overall demand for the home improvement segment, especially mid and premium paint products; and (iii) YoY declines in price realisations given no price hikes and one price cut (of 2%) over the past 12 months. Asian Paints continues to further improve its speed of delivery of products to the dealers through automation of input/output warehousing in the supply chain and better use of data analytics to forecast demand more accurately. Berger also continues to gain share from peers like Kansai and Akzo through an aggressive approach towards distribution expansion. We expect revenue growth of 9%/8% YoY for Asian Paints/Berger Paints in 2QFY16. Soft input costs, partially offset by the recent depreciation in INR against USD will result in gross margin expansion of 200-400bps in both 2QFY16 as well as 3QFY16, which is likely to be unsustainable from 4QFY16 onwards.
Macro demand: Until 1QFY16, revenue growth for mid- and premium-priced products was moderating due to: (a) black money being sucked out of the economy, thereby affecting the demand for re-painting of individual home buyers (who are mainly business families) and/or (b) weakness in consumer sentiment, leading to elongation of repainting cycles. 2QFY16 has seen incremental weakness in revenue growth due to additional factors such as: (a) a delayed Diwali (festive season); (b) a YoY decline in price realisations due to no price hikes and one price cut (2-3% in February 2015) during the past 12 months. Similar to 1QFY16, volume growth will be driven mainly by economy products (like putty).
Asian and Berger continue to build on their competitive advantages: As the velocity of the supply chain (i.e. time taken to deliver products once the dealer has placed an order) is the most important metric for a competitive advantage, Asian Paints continues to build on its strengths around this metric. Ongoing projects include automation of input/output warehousing in the supply chain and better use of data analytics to more accurately forecast demand. Berger Paints, thanks to its aggressive approach towards distribution expansion, is likely to have further increased its footprint with dealers across the country during the quarter, thereby gaining share from Akzo Nobel and Kansai Nerolac.
Waterproofing segment: The waterproofing segment includes strong brands from Pidilite like Dr Fixit, M-Seal, and ‘Raincoat’ exterior paints. The segment has more than 100 products. Asian Paints (8 products currently) entered into the waterproofing segment meaningfully 18 months ago and it has been aggressively pushing its waterproofing range with paint dealers and cement dealers as well. Asian Paints has been offering quality products at a ~35% discount to Pidilite’s waterproofing range. Asian Paints has communicated a revenue target of ~Rs15bn by FY17 to its dealers (vs no meaningful contribution to revenues currently).
Expectations of a demand revival: Most channel partners expect only a seasonal revival in the paints sector’s volume growth in 3QFY16 due to the longer festive season. This is because Diwali in mid-November in 2015 vs late-October in 2014 will give an extra 2-3 weeks of festivities-related paint demand during the quarter on a YoY basis. Besides this, there is no near-term evidence available of a likely revival in demand in 3QFY16.

B2C Distributors Survey
October 05, 2015 Ambit Capital Pvt. Ltd. Page 17
Revenue growth profile of Asian Paints and Berger Paints Exhibit 8:
Source: Company, Ambit Capital research
Margin expansion to last until 3QFY16: With no price hikes since 1QFY15 and the 2-3% price cut in February 2015, revenue growth for the paints sector will not see a material contribution from an increase in realisation rates. This trend, we believe, will partially offset gross margin gains for the paint companies, as they continue to pass on the benefits of softening input costs to customers and the trade channel. We expect gross margin expansion of ~336bps/163bps YoY and EBITDA margin expansion of ~300bps/100bps YoY for Asian/Berger in 2QFY16.
These margin expansion trends will continue until 3QFY16, after which: (a) higher margin will be a part of the base year in YoY comparisons; and (b) paint companies will avoid price hikes to gradually move towards more sustainable EBITDA margin levels that are 300-400bps lower than the current levels, given the high competitive intensity.
Sector/Investment thesis
We expect Berger Paints to report volume/revenue growth of ~9%/8% driven by market share gains from Akzo Nobel and Kansai Nerolac during the quarter. Asian Paints, we believe, will report unchanged market share and hence expand volumes/revenue at ~10%/9% YoY during the quarter. However, over the longer term, we expect Berger to lag behind Asian Paints in premiumisation of its product mix over the next few years primarily due to better scale economies around marketing and best-in-class supply chain. This justifies a premium rating for Asian Paints over Berger on P/E multiples. We, however, view both stocks as richly valued currently and reiterate our SELL stance on Asian Paints (10% downside from CMP) and Berger (20% downside from CMP).
13%
17%19%
7%
12%
18%
13%
21%18%
17%
6% 7% 8% 9%
16%
13%
17%
8%
13%
19%
12%
19%17%
14%
8% 6%6%
8%
0%
5%
10%
15%
20%
25%
Jun'12 Sep'12 Dec'12 Mar'13 Jun'13 Sep'13 Dec'13 Mar'14 Jun'14 Sep'14 Dec'14 Mar'15 Jun'15 Sep'15
Asian Paints Berger
B2C Distributors Survey
October 05, 2015 Ambit Capital Pvt. Ltd. Page 18
Kitchenware Whilst July and August reported strong sales growth, September has been exceptionally weak, mainly due to a delayed Diwali. Liquidity constraints at the distributor level have increased significantly in north and south India (less so in east and west). Demand during the festive season of Onam in south India was moderately positive. Most brands launched new products over the past 3-4 months, albeit with varying degrees of success. TTK Prestige has seen strong demand for new launches like “Cute pressure cookers” in north India, “Multi-Kadhai” in south India, and “Clip-on cookers” in Karnataka. Hawkins, on the other hand, has NOT seen any meaningful success with its ceramic-coated cookers. We expect TTK Prestige to report revenue growth of 6% in 2QFY16 driven by market share gains, new product launches and strong performance of PSKs (its franchisee stores). Hawkins, on the other hand, is likely to report flat YoY revenue growth at best.
Demand growth: July and August were good; September has been weak
Retail footfalls (YoY) at kitchenware stores during July and August were marginally better than those during 1QFY16. However, this trend has reversed significantly during September, with exceptionally weak demand growth YoY during the month mainly due to a delayed Diwali in 2015 and hence a likely shift of festive demand from Sep-Oct last year to Oct-Nov this year. Also, sustained sluggishness in the overall macro environment for more than 12 months now has led to rising liquidity issues at distributors (due to growing receivables from retailers). Such liquidity problems are bigger in north and south India (less so in west and east India).
New product launches: Successful for TTK Prestige; not so successful for Hawkins
During 2QFY16, TTK Prestige has launched a wide range of products in selective zones before a nation-wide rollout in 3QFY16. Key successful new launches amongst these include: (a) ‘Multi-Kadhai’ launched in south India, which has attracted significant demand in the region; (b) ‘Hard Anodized 3-piece Kadhai set’ launched in North India, which seen a good response from customers; and (c) ‘Cute pressure cooker (inner-lid)’ launched in north India, which has seen a strong positive response from customers.
On the other hand, our channel checks suggest that Hawkins’ new launch of ceramic-coated inner-lid pressure cookers have received several complaints from customers around: (a) ceramic coating coming off with use; (b) ~20% higher price point of the product vs similar products by TTK Prestige; and (c) lack of enough customer preference for two out of the three colours launched in this range (Mustard Yellow and Apple Green).
Overall, we expect TTK Prestige to have further gained market share against Hawkins in non-south regions, well supported by the success of its new product launches. A pan-India rollout of these newly launched products is likely to further improve TTK’s market share against peers.
Hopes from the festive season in 3QFY16
Whilst demand related to the Onam festival in south India has not been a disappointment, this has not positively surprised the distributors and companies either. Given a weak base of sales during November 2014, distributors believe that a delayed Diwali will result in a strong revival in revenue growth during 3QFY16. However, the sustainability of such a strengthening in revenue growth beyond 3QFY16 is NOT certain at present.
B2C Distributors Survey
October 05, 2015 Ambit Capital Pvt. Ltd. Page 19
Investment thesis
TTK Prestige’s revenue growth is likely to revive to 6%/18%/20% YoY in 2QFY16E/2HFY16E/FY17E (from 7% YoY in FY15), as the external headwinds that affected its revenue growth over FY14 and FY15 have now dissipated.
Whilst the firm is likely to see the impact of a seasonal shift of festive demand from 2QFY16 to 3QFY16, TTK is also likely to benefit from a series of new product launches. Its recent tie-ups with e-commerce aggregators and establishment of fulfilling centres in Hosur and Maharashtra will ensure expansion of TTK’s presence in this channel without inventory de-stocking in the brick-and-mortar channel. Also, the Prestige Smart Kitchen (PSK) franchisee network has been growing strongly thanks to the efficient handling of new launches and large value SKUs.
Improved capacity utilisation (20% increase targeted in FY16) will support EBITDA margin expansion and help deliver 39% EPS CAGR in FY15-18E. Our DCF model generates a TP of Rs4,437 (17% upside, 29x implied FY17E P/E). We reiterate BUY.

B2C Distributors Survey
October 05, 2015 Ambit Capital Pvt. Ltd. Page 20
Jewellery Our discussions with various stores (including Tanishq), unlisted jewellers and trade participants indicate: (1) marginal increase in demand, (2) fall in footfalls and revenues due to discontinuation of the monthly gold deposit scheme. Out of these, the impact of the discontinuation of the gold deposit scheme would be the highest, as the scheme accounted for nearly 50% of Titan’s 2QFY15 jewellery revenues. The LTL growth for Tanishq will not be comparable for 2QFY15 due to early redemption of the gold deposit scheme wherein deposits maturing in 2HFY15 were redeemed during that quarter. Therefore, whilst the 2QFY16 results will optically reflect a 25% fall in revenues and profits, the same are not comparable. However, the absence of the scheme has been partially offset by promotions. Also, we gather that there has been system-level reduction in inventory by most players due to working capital constraints. Consequently, their ability to retain market share through range and lower pricing will be severely constrained. We are BUYers of Titan, as it is best placed to gain market share from these organised players and as it continues asset-light expansion of stores.
Trends Drop in gold price spurred demand in July
Consumer sentiment did not change significantly in the quarter though a fall in gold prices led to spurt in gold jewellery demand in July and August.
Fall in gold price in mid-2QFY16 led to higher jewellery demand Exhibit 9:
Source: Bloomberg, Ambit Capital research
Impact of discontinuance of Gold Deposit Scheme
The provisions of the new Companies Act came into effect in FY15, and jewellers were forced to withdraw the scheme and refund/book early redemptions on the monies collected. Leading jewellery chains such as Tanishq stopped accepting fresh deposits under Golden Harvest Scheme (GHS) from early 1QFY15 (deposits typically are redeemed for jewellery at the end of 12 months, resulting in booking revenue). Therefore, the outlets of these chains have seen a drop in revenues of 25% due to discontinuation of these schemes. However, in case of Tanishq non GHS like to like comparison showed an improvement.
Investment demand (coins and bars) continues to be subdued
Demand for coins and bars continues to be subdued, as investment demand continues to be slack on the back of: (a) lack of price appreciation and b) expectation of eventual reduction in customs duty (currently 10%, which was 2% until 4QFY13) especially given decision to implement the domestic gold monetisation scheme.
20,000
22,500
25,000
27,500
30,000
32,500
35,000
1QFY
12
2QFY
12
3QFY
12
4QFY
12
1QFY
13
2QFY
13
3QFY
13
4QFY
13
1QFY
14
2QFY
14
3QFY
14
4QFY
14
1QFY
15
2QFY
15
3QFY
15
4QFY
15
1QFY
16
2QFY
16
Gold Price in INR for 10 gm Gold (24 karat)
“Tanishq stores experienced a healthy growth in walk-ins, conversions, numbers of buyers as well as total sales on a non GHS base.” – Titan’s 2QFY16 operational update

B2C Distributors Survey
October 05, 2015 Ambit Capital Pvt. Ltd. Page 21
Demand for bars and coins has been declining… Exhibit 10:
Source: World Gold Council, Ambit Capital research
Large organised players have been reducing inventory
Our checks indicate that some of the large organised jewellers have been reducing store-level inventory due to working capital constraints which have multiplied after restrictions on customer advances (now limited to 25% of net worth). Consequently, the range offered by regional jewellers is likely to recede in the absence of rise in gold prices, which has been the main margin contributor for them.
Investment implications
Titan’s jewellery business is likely to witness a steep fall (yoy 25%) in 2QFY16 jewellery revenues due to the high base (one-off). In order to comply with the new Companies Act, Titan advanced the redemption of sales from customer advances (even the ones due in 2HFY15 - 25% of 2Q sales) to 2QFY15. Since most jewellers collected customer deposits exceeding 100% of net worth, working capital debt increased after the change in regulation. As a result, low making charges offered by most jewellers will not suffice to cover interest costs. Therefore, apart from their ability to compete on making charges, sustainability as well as scalability of most organised jewellers is suspect. Titan with a net cash balance sheet (never used customer deposits for working capital financing) is in a stronger position to gain market share from not only unorganised players but also organised players at a higher pace than ever (260bps over FY16-20E vs 150bps over FY10-15)
We remain BUYers of Titan which as superior business model – asset light, state of the art supply chain and net cash balance sheet and trades at 27x FY17E EPS discount to the historical average (one-year forward) of 32x.
0
20
40
60
80
100
120
140
Q1
FY11
Q2
FY11
Q3
FY11
Q4
FY11
1QFY
12
2QFY
12
3QFY
12
4QFY
12
1QFY
13
2QFY
13
3QFY
13
4QFY
13
1QFY
14
2QFY
14
3QFY
14
4QFY
14
1QFY
15
2QFY
15
3QFY
15
4QFY
15
1QFY
16
Bars and Coin Demand (tonnes)

B2C Distributors Survey
October 05, 2015 Ambit Capital Pvt. Ltd. Page 22
Light Electricals Our discussions with channel partners suggest that demand continues to be timid, given sluggish construction-led demand and weak consumer sentiment. Diwali most likely will be weak, as Onam was bad and enquiries from corporates were weak. Within product categories, whilst switchgear, lighting and water heater are likely to report a volume decline of 3-5% YoY, construction wires, small appliances and fans are likely to report a volume growth of 2-5% YoY. Stabilisers and inverters are likely to grow at a faster pace of ~8% due to higher sales of air conditioners in 2Q on account of the warm weather (weak monsoon) and increase in power outages (weak offtake by SEBs). However, companies are likely to continue reporting gross margin expansion owing to pricing discipline despite weak copper and crude prices. New entrants may be marginalised given weak product quality and lacklustre after-sales service. We reiterate our BUY stance on V-Guard and Finolex Cables, as these regional franchises are gaining market share in the non-south markets and are fast emerging as pan-India players.
Continued weakness in demand environment: Our discussions with the channel partners suggest that the demand environment remains sluggish across product categories given the prevailing real estate slowdown and weak consumer sentiment. Whilst fans, small appliances and housing wires have seen a YoY volume growth of 2%, 3% and 5%, lighting, switchgear and water heaters have seen a YoY volume decline of 3%, 3% and 5% respectively in 2QFY16. However, volume growth for stabilisers and inverters remained strong at 8% YoY due to warm weather (weak monsoon) and increase in power outages (weak offtake by SEBs).
Snapshot of growth across light electrical products Exhibit 11:
Product categories Volume growth YoY (%) Value growth YoY (%) Market share in 2QFY16
2QFY16E 1QFY16 FY15 2QFY16E 1QFY16 FY15 Gainer Loser
Cyclical products Construction wires 5.0% 5.0% 13.0% 0.0% 11.0% 5.0% V-Guard, Finolex Havells
Switchgears -3.0% -3.4% 4.9% -3.0% -3.4% 14.0% No major change
Lighting -3.0% -2.0% 3.0% -3.0% -2.0% 3.0% Syska Bajaj, Havells
Consumer products Small appliances 3.0% 5.0% 10.0% 3.0% 5.0% 17.0% Crompton Bajaj
Water heaters -5.0% 10.0% 15.0% -5.0% 10.0% 17.0% V-Guard AO Smith
Fans 2.0% 5.0% 12.0% 2.0% 5.0% 15.0% Crompton, Orient Bajaj, Havells
Stabiliser 8.0% 6.0% 19.0% 10.0% 8.0% 22.0% No major change
Source: Ambit Capital research; Note: We have estimated industry growth rate across the products for 2QFY16, 1QFY16 and FY15 based anecdotal data
FY16 to be a washout year: The channel partners do not expect a material improvement in demand in the remaining quarters of FY16. The channel partners expect FY16 to be a washout year for festival demand as well, led by poor enquiries from the corporate sector; typically corporates start floating enquires for small appliances in August and September for gifting during Diwali but this time around enquiries have been negligible. Onam (a big festival in Kerala) which sets the trend for the festive season (started since 28th August) saw weak demand except for air conditioners and television.
Price war unlikely in the Light Electricals sector; margin expansion likely: The FMCG industry is facing a price war, unlike the light electrical sector. According to the channel partners, pricing is stable across product categories, except cables and wires (where prices are down ~12% YoY led by weak copper prices) despite the recent fall in copper prices (down 19% YoY) and crude price (key raw material for PVC; down 48% YoY). Consequently, we believe the light electrical companies should continue reporting YoY improvement in gross margin. We factor in gross margin improvement of 90-350bps in FY16 for our coverage universe (Havells, V-Guard, Bajaj Electricals and Finolex Cables)
“Increase in power outages due to weak hydro generation has meant a strong demand for stabilisers.”
- A Kochi-based large distributor
“Liquidity constraints coupled with weak consumer sentiments continues to impact the overall demand environment.”
- A Delhi-based large distributor
“The festival season is likely to be ‘Non-Event’ as enquiries for corporate gifting have yet not been floated in the market.”
- A Mumbai-based large distributor

B2C Distributors Survey
October 05, 2015 Ambit Capital Pvt. Ltd. Page 23
vs reported gross margin improvement of 190-300bps YoY in 1QFY16. However given the weak volumes, we expect flattish EBITDA margin in FY16. Whilst we model EBITDA margin decline of 120bps for Havells standalone, we model 120bps and 40bps improvement for V-Guard and Finolex respectively in FY16.
Weak prices for copper and crude, which Exhibit 12:are key raw material inputs…
Source: Company, Ambit Capital research
…are helping LE companies report improvement Exhibit 13:in gross margin, as pricing discipline continues
Gross margin (%)
Quarterly Annual
1QFY15 1QFY16 YoY FY15 FY16E YoY
V-Guard 26% 28% 190bps 26% 27% 90bps
Havells standalone 39% 42% 230bps 39% 40% 30bps
Finolex Cables 25% 28% 300bps 34% 38% 350bps
Source: Company, Ambit Capital research
However, we may have to cut our FY16 revenue growth estimate for all Exhibit 14:the companies under our coverage, as a recovery in 2HFY16 seems unlikely
Revenue growth YoY (%) 1QFY16 FY16E 9MFY16E
V-Guard 5% 15% 18%
Havells standalone -1% 11% 14%
Finolex Cables 3% 16% 18%
Source: Company, Ambit Capital research
Weak promotional activities; new schemes likely to be announced: Despite the weak demand environment, light electrical companies are not engaging in any promotional activities. Except for Bajaj and Surya (which are giving free LED bulbs with electric water heaters), no other company is running any promotional schemes. However, the channel partners expect promotional activities to kick-start closer to Diwali (the main festive season), as this seems to be the only way to revive demand. Competitive intensity to decline as new players struggle: New entrants like Polycab, Luminous, Surya Roshni, RR Kabel and Orient, which have recently ventured into new product categories (such as small consumer durables) are facing difficulties in promoting their products, given poor product quality and weak after-sales servicing. According to the channel partners, these companies neither have in-house manufacturing (except for Polycab in fans) nor credible sourcing partners. Alongside, they do not have sufficient product-serving staff and relevant technical know-how which amplifies their problems. Increase in attrition for these players suggests that many of them are about to back-out of the new product categories soon. Attrition is especially severe in companies like Polycab and RR Kabel where a large proportion of employees in the new product divisions are looking for new jobs (as highlighted by distributors).
Several players in the last two years have introduced new product Exhibit 15:categories…
Company Flagship product New products added
RR Kabel Electrical Wires Fans
Polycab Electrical Wires Fans, lighting, switches, switchgears
Orient Fans Small appliances
Luminous Invertors Fans, switches, CFLs, switchgears
Anchor Switches Electrical cables, lighting, switchgears
Surya Roshni Lighting Fans, small appliances, water heaters
Source: Industry, Ambit Capital research
2,000
3,000
4,000
5,000
6,000
7,000
300
350
400
450
500
550
Jan-
14
Mar
-14
May
-14
Jul-
14
Sep-
14
Nov
-14
Jan-
15
Mar
-15
May
-15
Jul-
15
Sep-
15
MCX copper (Rs/kg)MCX crude (Rs/bbl) on RHS

B2C Distributors Survey
October 05, 2015 Ambit Capital Pvt. Ltd. Page 24
Investment implications: We prefer regional companies with strong management teams and aggressive pan-India roll-out plans over pan-India players. We believe revenue growth for the Light Electricals sector would likely decline to the low teens in FY15-24E after a stellar 18% growth in FY06-15. The bulk of this lower growth is likely to come from tier-III and tier-IV cities (where per square feet spending is at least 30% lower than tier-1 and tier-II cities). Also, rising premiumisation would lead to lower growth in the replacement market (as the average life of switchgears, lightings, appliances and fans increased by 20% in the last decade). Thus, we are BUYers of regional players like V-Guard and Finolex Cables which are expanding into pan-India franchises with higher PAT growth.
In Havells, we see limited downgrades to our TP of Rs254/share, as marginalisation of new players should benefit Havells.
We are SELLers in Bajaj Electricals, given its weakening franchise and significant volatility in E&P margins.
We prefer regional players such as V-Guard over pan-India players such as Bajaj Electricals

B2C Distributors Survey
October 05, 2015 Ambit Capital Pvt. Ltd. Page 25
Air conditioners Summary of findings Exhibit 16:
Particulars 2QFY16
Volume decline (YoY) 15%
Market share changes Gain: Daikin, Mitsubishi; Hitachi Loss: Voltas, LG
Promotions and incentives No major promotions and incentives started yet; Further, pricing remains largely stable with some dealers highlighting a potential hike in prices
Conclusions
Inventory build-up at dealer level may prevent material price hikes despite depreciation in USD Demand weak in the mid-market segment that continues to impact LG and Voltas; Premium segment players gained share driven by resilient demand in that category and gradual decline in pricing by brands such as Daikin
Source: Ambit Capital research
Volume growth for the industry remained weak in 2QFY16 (15-20% decline vs 13% in 1QFY16), though this is typically a seasonally weak quarter. Dealers cited weak consumer sentiment. Amongst the brands, premium brands such as Daikin and Mitsubishi gained market share from LG and Voltas. This may be because demand in the premium segment is resilient as compared to the mid-market segment that impacts Voltas and LG. There has been no surge in promotions, incentives and discounting despite a build-up of inventory at the dealer level, indicating that pricing discipline has been maintained. Our checks even indicated that companies may hike prices on the back of USD depreciation. However, preparations for the festive season are yet to begin and we suspect that companies may find it difficult to pass-on any price increases. Hence, any margin benefits from the Yuan depreciation may be offset by the USD depreciation.
Volume declines continue into 2QFY16: Volumes in the seasonally strong 1QFY16 declined by 13% YoY (according to Voltas’ management) driven by a stunted summer. The weakness in demand has continued into 2QFY16 with dealers indicating a 15-20% decline in sales volumes. Volume was relatively better in July and has deteriorated in the final two months of the quarter. Amongst the companies, our checks indicated that Voltas and LG have lost some market share as demand in the mid-market segment has been weak.
Pricing stable; too soon to ascertain strategy for festive season: Our checks indicated that there have no major discounts announced either in anticipation of the festive season demand or driven by the build-up of inventory in the system. Pricing has been relatively stable or has been marginally increased by select players. Dealers anticipate further price increases to be undertaken in the coming months. However, we are skeptical; high competitive intensity should result in pricing pressure.
Voltas: Voltas is the market leader with a revenue market share of ~19% (Ambit estimate). The company’s positioning is extremely strong in North India. For instance, our checks indicate a market share in excess of 40% in Delhi. It has a significant reach advantage over peers – 9,000 touch-points vs 3,500 for Blue Star and 4,000 for Hitachi. Further, it is a significant market leader in the window AC segment (~50% market share). With faster growth in the energy-saving segments such as inverter and quality perception advantage enjoyed by Japanese players, the company is likely to face near term challenges to maintain its market share. Our recent checks also suggest a few problems in after sales services, especially in Central India, with increasing number of days required for servicing as compared to peers.
Blue Star: Blue Star has made significant market share gains in the last two years from ~7% to 9.5% in FY15. This was driven by increasing its reach – the company now has 3,500 touch-points vs ~3,000 in the previous year with a special focus on tier II and III towns. It is especially strong in the southern markets such as Chennai. The company is looking to increase its pan-India

B2C Distributors Survey
October 05, 2015 Ambit Capital Pvt. Ltd. Page 26
presence. A significant portion of the company’s sales comes from its sole-selling agents (~40%).
Hitachi: Hitachi, like Blue Star, has focused on increasing its reach across the country with a focus on tier II and tier III towns – it has 4,000 sales points now vs 2,000 in FY12. The company has been gaining market share with a volume growth of 53% in FY15 and is likely to be on-par or better than Samsung and Panasonic in terms of market share. Our primary checks on Hitachi’s products were a mixed bag - some dealers indicated that the recently introduced product portfolio was good and was priced well; some indicated that break-downs were frequent. It enjoys quality perception premium due to its Japanese heritage.
Industry volume decline witnessed in 1QFY16 to sustain Exhibit 17:
Source: Company, Industry, Ambit Capital research
-40%-20%
0%20%40%60%80%
100%
FY09
FY10
FY11
FY12
FY13
FY14
FY15
1QFY
16Sector room AC volume YoY growth Voltas Volume growth
Price increase led by energy lable change and INR depreciation, delay in onset of summer
Energy label change, power supply issue, increase in prices
Weak summer leads to volume declines
Price increase led by energy lable change and INR depreciation, delay in onset of summer
Energy label change, power supply issue, increase in prices
Weak summer leads to volume declines
B2C Distributors Survey
October 05, 2015 Ambit Capital Pvt. Ltd. Page 27
Institutional Equities Team Saurabh Mukherjea, CFA CEO, Institutional Equities (022) 30433174 [email protected]
Research
Analysts Industry Sectors Desk-Phone E-mail
Nitin Bhasin - Head of Research E&C / Infra / Cement / Industrials (022) 30433241 [email protected]
Aadesh Mehta, CFA Banking / Financial Services (022) 30433239 [email protected]
Abhishek Ranganathan, CFA Retail / Mid-caps (022) 30433085 [email protected]
Achint Bhagat, CFA Cement / Roads / Home Building (022) 30433178 [email protected]
Aditya Bagul Consumer (022) 30433264 [email protected]
Aditya Khemka Healthcare (022) 30433272 [email protected]
Ashvin Shetty, CFA Automobile (022) 30433285 [email protected]
Bhargav Buddhadev Power Utilities / Capital Goods (022) 30433252 [email protected]
Deepesh Agarwal Power Utilities / Capital Goods (022) 30433275 [email protected] Gaurav Mehta, CFA Strategy / Derivatives Research (022) 30433255 [email protected]
Girisha Saraf Mid-caps / Small-caps (022) 30433211 [email protected]
Karan Khanna Strategy (022) 30433251 [email protected]
Kushank Poddar Technology (022) 30433203 [email protected] Pankaj Agarwal, CFA Banking / Financial Services (022) 30433206 [email protected]
Paresh Dave, CFA Healthcare (022) 30433212 [email protected]
Parita Ashar, CFA Metals & Mining (022) 30433223 [email protected]
Prashant Mittal, CFA Derivatives (022) 30433218 [email protected]
Rakshit Ranjan, CFA Consumer (022) 30433201 [email protected]
Ravi Singh Banking / Financial Services (022) 30433181 [email protected]
Ritesh Gupta, CFA Oil & Gas / Chemicals (022) 30433242 [email protected]
Ritesh Vaidya, CFA Consumer (022) 30433246 [email protected] Ritika Mankar Mukherjee, CFA Economy / Strategy (022) 30433175 [email protected]
Ritu Modi Automobile (022) 30433292 [email protected]
Sagar Rastogi Technology (022) 30433291 [email protected]
Sumit Shekhar Economy / Strategy (022) 30433229 [email protected]
Utsav Mehta, CFA E&C / Industrials (022) 30433209 [email protected]
Sales
Name Regions Desk-Phone E-mail
Sarojini Ramachandran - Head of Sales UK +44 (0) 20 7614 8374 [email protected]
Dharmen Shah India / Asia (022) 30433289 [email protected]
Dipti Mehta India / USA (022) 30433053 [email protected]
Hitakshi Mehra India (022) 30433204 [email protected]
Krishnan V India / Asia (022) 30433295 [email protected]
Nityam Shah, CFA USA / Europe (022) 30433259 [email protected]
Parees Purohit, CFA UK / USA (022) 30433169 [email protected]
Praveena Pattabiraman India / Asia (022) 30433268 [email protected]
Shaleen Silori India (022) 30433256 [email protected]
Singapore
Pramod Gubbi, CFA – Director Singapore +65 8606 6476 [email protected]
Shashank Abhisheik Singapore +65 6536 1935 [email protected]
USA / Canada
Ravilochan Pola - CEO Americas +1(646) 361 3107 [email protected]
Production
Sajid Merchant Production (022) 30433247 [email protected]
Sharoz G Hussain Production (022) 30433183 [email protected]
Joel Pereira Editor (022) 30433284 [email protected]
Nikhil Pillai Database (022) 30433265 [email protected]
E&C = Engineering & Construction

B2C Distributors Survey
October 05, 2015 Ambit Capital Pvt. Ltd. Page 28
Hindustan Unilever Ltd (HUVR IN, SELL)
Source: Bloomberg, Ambit Capital research
Asian Paints Ltd (APNT IN, SELL)
Source: Bloomberg, Ambit Capital research
Nestle India Ltd (NEST IN, SELL)
Source: Bloomberg, Ambit Capital research
Dabur India Ltd (DABUR IN, SELL)
Source: Bloomberg, Ambit Capital research
Godrej Consumer Products Ltd (GCPL IN, SELL)
Source: Bloomberg, Ambit Capital research
Colgate Palmolive (India) (CLGT IN, SELL)
Source: Bloomberg, Ambit Capital research
0
200
400
600
800
1,000
1,200
Sep-
12
Dec
-12
Mar
-13
Jun-
13
Sep-
13
Dec
-13
Mar
-14
Jun-
14
Sep-
14
Dec
-14
Mar
-15
Jun-
15HINDUSTAN UNILEVER LTD
0
200
400
600
800
1,000
Sep-
12
Dec
-12
Mar
-13
Jun-
13
Sep-
13
Dec
-13
Mar
-14
Jun-
14
Sep-
14
Dec
-14
Mar
-15
Jun-
15
ASIAN PAINTS LTD
01,0002,0003,0004,0005,0006,0007,0008,000
Sep-
12
Dec
-12
Mar
-13
Jun-
13
Sep-
13
Dec
-13
Mar
-14
Jun-
14
Sep-
14
Dec
-14
Mar
-15
Jun-
15
NESTLE INDIA LTD
050
100150200250300350
Sep-
12
Dec
-12
Mar
-13
Jun-
13
Sep-
13
Dec
-13
Mar
-14
Jun-
14
Sep-
14
Dec
-14
Mar
-15
Jun-
15
DABUR INDIA LTD
0200400600800
1,0001,2001,4001,600
Sep-
12
Dec
-12
Mar
-13
Jun-
13
Sep-
13
Dec
-13
Mar
-14
Jun-
14
Sep-
14
Dec
-14
Mar
-15
Jun-
15
GODREJ CONSUMER PRODUCTS LTD
0
500
1,000
1,500
2,000
2,500
Sep-
12
Dec
-12
Mar
-13
Jun-
13
Sep-
13
Dec
-13
Mar
-14
Jun-
14
Sep-
14
Dec
-14
Mar
-15
Jun-
15
COLGATE PALMOLIVE (INDIA)
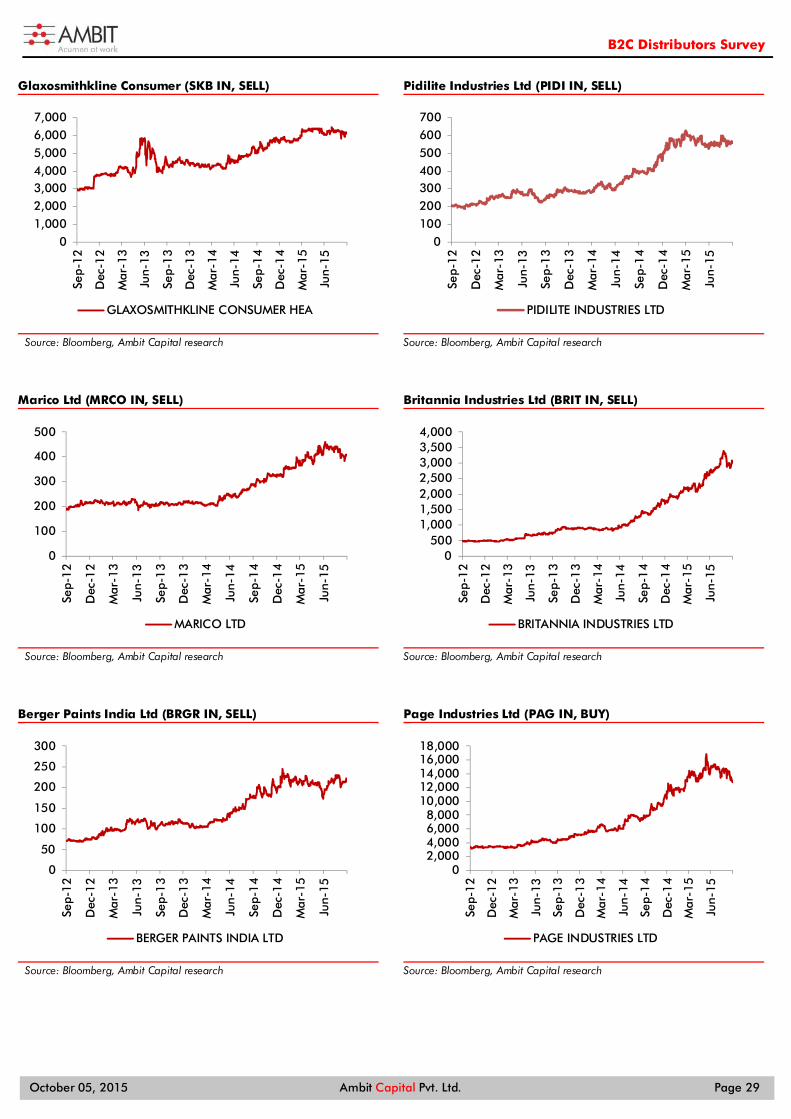
B2C Distributors Survey
October 05, 2015 Ambit Capital Pvt. Ltd. Page 29
Glaxosmithkline Consumer (SKB IN, SELL)
Source: Bloomberg, Ambit Capital research
Pidilite Industries Ltd (PIDI IN, SELL)
Source: Bloomberg, Ambit Capital research
Marico Ltd (MRCO IN, SELL)
Source: Bloomberg, Ambit Capital research
Britannia Industries Ltd (BRIT IN, SELL)
Source: Bloomberg, Ambit Capital research
Berger Paints India Ltd (BRGR IN, SELL)
Source: Bloomberg, Ambit Capital research
Page Industries Ltd (PAG IN, BUY)
Source: Bloomberg, Ambit Capital research
01,0002,0003,0004,0005,0006,0007,000
Sep-
12
Dec
-12
Mar
-13
Jun-
13
Sep-
13
Dec
-13
Mar
-14
Jun-
14
Sep-
14
Dec
-14
Mar
-15
Jun-
15GLAXOSMITHKLINE CONSUMER HEA
0100200300400500600700
Sep-
12
Dec
-12
Mar
-13
Jun-
13
Sep-
13
Dec
-13
Mar
-14
Jun-
14
Sep-
14
Dec
-14
Mar
-15
Jun-
15
PIDILITE INDUSTRIES LTD
0
100
200
300
400
500
Sep-
12
Dec
-12
Mar
-13
Jun-
13
Sep-
13
Dec
-13
Mar
-14
Jun-
14
Sep-
14
Dec
-14
Mar
-15
Jun-
15
MARICO LTD
0500
1,0001,5002,0002,5003,0003,5004,000
Sep-
12
Dec
-12
Mar
-13
Jun-
13
Sep-
13
Dec
-13
Mar
-14
Jun-
14
Sep-
14
Dec
-14
Mar
-15
Jun-
15
BRITANNIA INDUSTRIES LTD
0
50
100
150
200
250
300
Sep-
12
Dec
-12
Mar
-13
Jun-
13
Sep-
13
Dec
-13
Mar
-14
Jun-
14
Sep-
14
Dec
-14
Mar
-15
Jun-
15
BERGER PAINTS INDIA LTD
02,0004,0006,0008,000
10,00012,00014,00016,00018,000
Sep-
12
Dec
-12
Mar
-13
Jun-
13
Sep-
13
Dec
-13
Mar
-14
Jun-
14
Sep-
14
Dec
-14
Mar
-15
Jun-
15
PAGE INDUSTRIES LTD

B2C Distributors Survey
October 05, 2015 Ambit Capital Pvt. Ltd. Page 30
Jubilant Foodworks Ltd (JUBI IN, SELL)
Source: Bloomberg, Ambit Capital research
Bata India Ltd (BATA IN, BUY)
Source: Bloomberg, Ambit Capital research
TTK Prestige Ltd (TTKPT IN, BUY)
Source: Bloomberg, Ambit Capital research
ITC LTD (ITC IN, BUY)
Source: Bloomberg, Ambit Capital research
Voltas Ltd (VOLT IN, SELL)
Source: Bloomberg, Ambit Capital research
Bajaj Electricals Ltd (BJE IN, SELL)
Source: Bloomberg, Ambit Capital research
0
500
1,000
1,500
2,000
2,500
Sep-
12
Dec
-12
Mar
-13
Jun-
13
Sep-
13
Dec
-13
Mar
-14
Jun-
14
Sep-
14
Dec
-14
Mar
-15
Jun-
15JUBILANT FOODWORKS LTD
0200400600800
1,0001,2001,4001,600
Sep-
12
Dec
-12
Mar
-13
Jun-
13
Sep-
13
Dec
-13
Mar
-14
Jun-
14
Sep-
14
Dec
-14
Mar
-15
Jun-
15
BATA INDIA LTD
0
1,000
2,000
3,000
4,000
5,000
Sep-
12
Dec
-12
Mar
-13
Jun-
13
Sep-
13
Dec
-13
Mar
-14
Jun-
14
Sep-
14
Dec
-14
Mar
-15
Jun-
15
TTK PRESTIGE LTD
200
250
300
350
400
450
Sep-
12
Dec
-12
Mar
-13
Jun-
13
Sep-
13
Dec
-13
Mar
-14
Jun-
14
Sep-
14
Dec
-14
Mar
-15
Jun-
15
ITC LTD
050
100150200250300350400
Aug
-12
Nov
-12
Feb-
13
May
-13
Aug
-13
Nov
-13
Feb-
14
May
-14
Aug
-14
Nov
-14
Feb-
15
May
-15
Aug
-15
VOLTAS LTD
050
100150200250300350400
Aug
-12
Nov
-12
Feb-
13
May
-13
Aug
-13
Nov
-13
Feb-
14
May
-14
Aug
-14
Nov
-14
Feb-
15
May
-15
Aug
-15
BAJAJ ELECTRICALS LTD

B2C Distributors Survey
October 05, 2015 Ambit Capital Pvt. Ltd. Page 31
Havells India Ltd (HAVL IN, SELL)
Source: Bloomberg, Ambit Capital research
V-Guard Industries Ltd (VGRD IN, BUY)
Source: Bloomberg, Ambit Capital research
Titan Co Ltd (TTAN IN, BUY)
Source: Bloomberg, Ambit Capital research
050
100150200250300350
Sep-
12
Dec
-12
Mar
-13
Jun-
13
Sep-
13
Dec
-13
Mar
-14
Jun-
14
Sep-
14
Dec
-14
Mar
-15
Jun-
15HAVELLS INDIA LTD
0200400600800
1,0001,2001,400
Aug
-12
Nov
-12
Feb-
13
May
-13
Aug
-13
Nov
-13
Feb-
14
May
-14
Aug
-14
Nov
-14
Feb-
15
May
-15
Aug
-15
V-GUARD INDUSTRIES LTD
0
100
200
300
400
500
Sep-
12
Dec
-12
Mar
-13
Jun-
13
Sep-
13
Dec
-13
Mar
-14
Jun-
14
Sep-
14
Dec
-14
Mar
-15
Jun-
15
TITAN CO LTD

B2C Distributors Survey
October 05, 2015 Ambit Capital Pvt. Ltd. Page 32
Explanation of Investment Rating
Investment Rating Expected return (over 12-month)
BUY >10%
SELL <10%
NO STANCE We have forward looking estimates for the stock but we refrain from assigning valuation and recommendation
UNDER REVIEW We will revisit our recommendation, valuation and estimates on the stock following recent events
NOT RATED We do not have any forward looking estimates, valuation or recommendation for the stock Disclaimer
This report or any portion hereof may not be reprinted, sold or redistributed without the written consent of Ambit Capital. AMBIT Capital Research is disseminated and available primarily electronically, and, in some cases, in printed form.
Additional information on recommended securities is available on request.
Disclaimer
1. AMBIT Capital Private Limited (“AMBIT Capital”) and its affiliates are a full service, integrated investment banking, investment advisory and brokerage group. AMBIT Capital is a Stock Broker, Portfolio Manager and Depository Participant registered with Securities and Exchange Board of India Limited (SEBI) and is regulated by SEBI
2. AMBIT Capital makes best endeavours to ensure that the research analyst(s) use current, reliable, comprehensive information and obtain such information from sources which the analyst(s) believes to be reliable. However, such information has not been independently verified by AMBIT Capital and/or the analyst(s) and no representation or warranty, express or implied, is made as to the accuracy or completeness of any information obtained from third parties. The information, opinions, views expressed in this Research Report are those of the research analyst as at the date of this Research Report which are subject to change and do not represent to be an authority on the subject. AMBIT Capital may or may not subscribe to any and/ or all the views expressed herein.
3. This Research Report should be read and relied upon at the sole discretion and risk of the recipient. If you are dissatisfied with the contents of this complimentary Research Report or with the terms of this Disclaimer, your sole and exclusive remedy is to stop using this Research Report and AMBIT Capital or its affiliates shall not be responsible and/ or liable for any direct/consequential loss howsoever directly or indirectly, from any use of this Research Report.
4. If this Research Report is received by any client of AMBIT Capital or its affiliate, the relationship of AMBIT Capital/its affiliate with such client will continue to be governed by the terms and conditions in place between AMBIT Capital/ such affiliate and the client.
5. This Research Report is issued for information only and the 'Buy', 'Sell', or ‘Other Recommendation’ made in this Research Report such should not be construed as an investment advice to any recipient to acquire, subscribe, purchase, sell, dispose of, retain any securities and should not be intended or treated as a substitute for necessary review or validation or any professional advice. Recipients should consider this Research Report as only a single factor in making any investment decisions. This Research Report is not an offer to sell or the solicitation of an offer to purchase or subscribe for any investment or as an official endorsement of any investment.
6. This Research Report is being supplied to you solely for your information and may not be reproduced, redistributed or passed on, directly or indirectly, to any other person or published, copied in whole or in part, for any purpose. Neither this Research Report nor any copy of it may be taken or transmitted or distributed, directly or indirectly within India or into any other country including United States (to US Persons), Canada or Japan or to any resident thereof. The distribution of this Research Report in other jurisdictions may be strictly restricted and/ or prohibited by law or contract, and persons into whose possession this Research Report comes should inform themselves about such restriction and/ or prohibition, and observe any such restrictions and/ or prohibition.
7. Ambit Capital Private Limited is registered as a Research Entity under the SEBI (Research Analysts) Regulations, 2014.
Conflict of Interests
8. In the normal course of AMBIT Capital’s business circumstances may arise that could result in the interests of AMBIT Capital conflicting with the interests of clients or one client’s interests conflicting with the interest of another client. AMBIT Capital makes best efforts to ensure that conflicts are identified and managed and that clients’ interests are protected. AMBIT Capital has policies and procedures in place to control the flow and use of non-public, price sensitive information and employees’ personal account trading. Where appropriate and reasonably achievable, AMBIT Capital segregates the activities of staff working in areas where conflicts of interest may arise. However, clients/potential clients of AMBIT Capital should be aware of these possible conflicts of interests and should make informed decisions in relation to AMBIT Capital’s services.
9. AMBIT Capital and/or its affiliates may from time to time have or solicit investment banking, investment advisory and other business relationships with companies covered in this Research Report and may receive compensation for the same.
Additional Disclaimer for U.S. Persons
10. The research report is solely a product of AMBIT Capital 11. AMBIT Capital is the employer of the research analyst(s) who has prepared the research report 12. Any subsequent transactions in securities discussed in the research reports should be effected through Enclave Capital LLC. (“Enclave”). 13. Enclave does not accept or receive any compensation of any kind for the dissemination of the AMBIT Capital research reports. 14. The research analyst(s) preparing the email / Research Report/ attachment is resident outside the United States and is/are not associated persons of any U.S. regulated broker-dealer and that therefore
the analyst(s) is/are not subject to supervision by a U.S. broker-dealer, and is/are not required to satisfy the regulatory licensing requirements of FINRA or required to otherwise comply with U.S. rules or regulations regarding, among other things, communications with a subject company, public appearances and trading securities held by a research analyst account.
15. This report is prepared, approved, published and distributed by the Ambit Capital located outside of the United States (a non-US Group Company”). This report is distributed in the U.S.by Enclave Capital LLC, a U.S. registered broker dealer, on behalf of Ambit Capital only to major U.S. institutional investors (as defined in Rule 15a-6 under the U.S. Securities Exchange Act of 1934 (the “Exchange Act”)) pursuant to the exemption in Rule 15a-6 and any transaction effected by a U.S. customer in the securities described in this report must be effected through Enclave Capital LLC (19 West 44th Street, suite 1700, New York, NY 10036).
16. As of the publication of this report Enclave Capital LLC, does not make a market in the subject securities. 17. This document does not constitute an offer of, or an invitation by or on behalf of Ambit Capital or its affiliates or any other company to any person, to buy or sell any security. The information contained
herein has been obtained from published information and other sources, which Ambit Capital or its Affiliates consider to be reliable. None of Ambit Capital accepts any liability or responsibility whatsoever for the accuracy or completeness of any such information. All estimates, expressions of opinion and other subjective judgments contained herein are made as of the date of this document. Emerging securities markets may be subject to risks significantly higher than more established markets. In particular, the political and economic environment, company practices and market prices and volumes may be subject to significant variations. The ability to assess such risks may also be limited due to significantly lower information quantity and quality. By accepting this document, you agree to be bound by all the foregoing provisions.
Additional Disclaimer for Canadian Persons
18. AMBIT Capital is not registered in the Province of Ontario and /or Province of Québec to trade in securities and/or to provide advice with respect to securities. 19. AMBIT Capital's head office or principal place of business is located in India. 20. All or substantially all of AMBIT Capital's assets may be situated outside of Canada. 21. It may be difficult for enforcing legal rights against AMBIT Capital because of the above. 22. Name and address of AMBIT Capital's agent for service of process in the Province of Ontario is: Torys LLP, 79 Wellington St. W., 30th Floor, Box 270, TD South Tower, Toronto, Ontario M5K 1N2
Canada. 23. Name and address of AMBIT Capital's agent for service of process in the Province of Montréal is Torys Law Firm LLP, 1 Place Ville Marie, Suite 1919 Montréal, Québec H3B 2C3 Canada.
Additional Disclaimer for Singapore Persons 24. This Report is prepared and distributed by Ambit Capital Private Limited and distributed as per the approved arrangement under Paragraph 9 of Third Schedule of Securities and Futures Act (CAP 289)
and Paragraph 11 of the First Schedule to the Financial Advisors Act (CAP 110) provided to Ambit Singapore Pte. Limited by Monetary Authority of Singapore. 25. This Report is only available to persons in Singapore who are institutional investors (as defined in section 4A of the Securities and Futures Act (Cap. 289) of Singapore (the “SFA”).” Accordingly, if a
Singapore Person is not or ceases to be such an institutional investor, such Singapore Person must immediately discontinue any use of this Report and inform Ambit Singapore Pte. Limited.
Disclosure 26. Ambit and/or its associates have financial interest in HUL, ITC and Asian Paints.
Analyst Certification Each of the analysts identified in this report certifies, with respect to the companies or securities that the individual analyses, that (1) the views expressed in this report reflect his or her personal views about all of the subject companies and securities and (2) no part of his or her compensation was, is or will be directly or indirectly dependent on the specific recommendations or views expressed in this report. © Copyright 2015 AMBIT Capital Private Limited. All rights reserved.
Ambit Capital Pvt. Ltd. Ambit House, 3rd Floor. 449, Senapati Bapat Marg, Lower Parel, Mumbai 400 013, India. Phone: +91-22-3043 3000 | Fax: +91-22-3043 3100 CIN: U74140MH1997PTC107598 www.ambitcapital.com