consolidated financial results for the six months ended .... forecast of business results for the...
TRANSCRIPT
Consolidated Financial Results
October 12, 2017
for the Six Months ended August 31, 2017 Seven & i Holdings Co., Ltd. (URL http://www.7andi.com/en)
Securities Code No. 3382 President : Ryuichi Isaka The Company’s shares are listed on the First Section of the Tokyo Stock Exchange. Submission date of quarterly securities report scheduled: October 13, 2017 Starting date of paying dividend: November 15, 2017 Preparation of brief summary materials for quarterly financial results: Yes Holding of quarterly financial results presentation: Yes
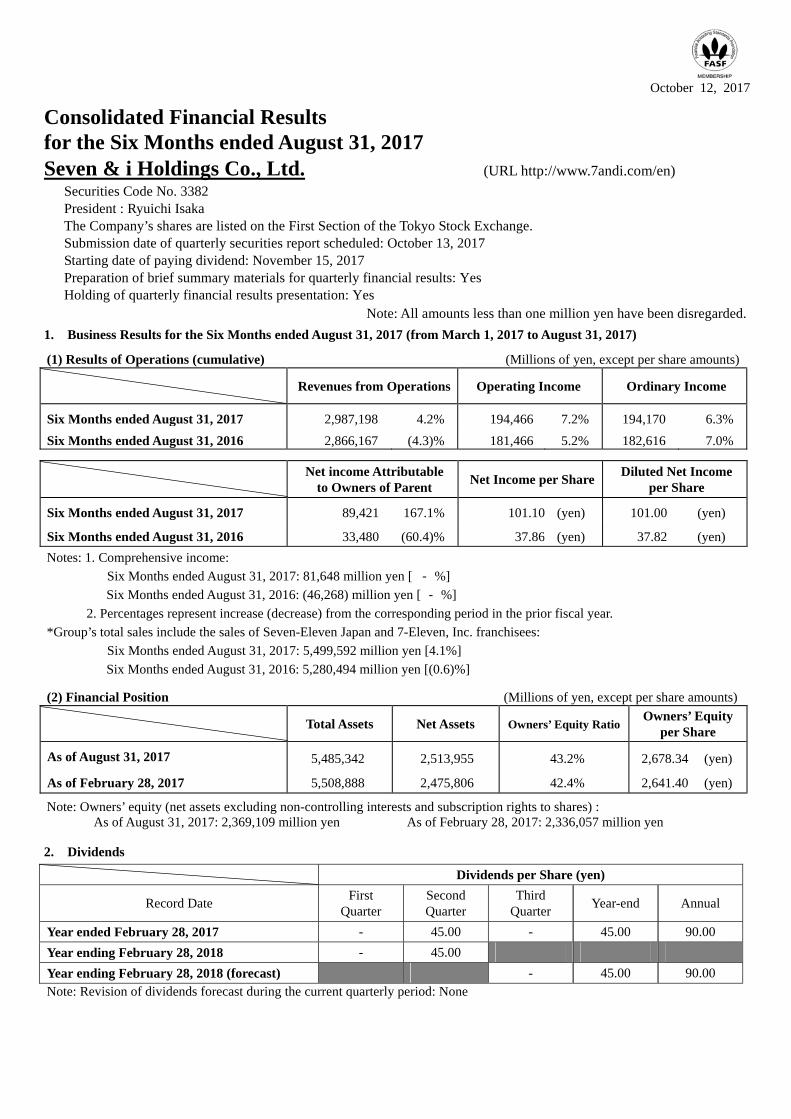
Note: All amounts less than one million yen have been disregarded. 1. Business Results for the Six Months ended August 31, 2017 (from March 1, 2017 to August 31, 2017)
(1) Results of Operations (cumulative) (Millions of yen, except per share amounts)
Revenues from Operations Operating Income Ordinary Income
Six Months ended August 31, 2017 2,987,198 4.2% 194,466 7.2% 194,170 6.3%Six Months ended August 31, 2016 2,866,167 (4.3)% 181,466 5.2% 182,616 7.0%
Net income Attributable to Owners of Parent Net Income per Share Diluted Net Income
per Share
Six Months ended August 31, 2017 89,421 167.1% 101.10 (yen) 101.00 (yen)
Six Months ended August 31, 2016 33,480 (60.4)% 37.86 (yen) 37.82 (yen) Notes: 1. Comprehensive income: Six Months ended August 31, 2017: 81,648 million yen [ ‐ %]
Six Months ended August 31, 2016: (46,268) million yen [ ‐ %] 2. Percentages represent increase (decrease) from the corresponding period in the prior fiscal year.
*Group’s total sales include the sales of Seven-Eleven Japan and 7-Eleven, Inc. franchisees: Six Months ended August 31, 2017: 5,499,592 million yen [4.1%]
Six Months ended August 31, 2016: 5,280,494 million yen [(0.6)%] (2) Financial Position (Millions of yen, except per share amounts)
Total Assets Net Assets Owners’ Equity Ratio Owners’ Equity
per Share
As of August 31, 2017 5,485,342 2,513,955 43.2% 2,678.34 (yen)
As of February 28, 2017 5,508,888 2,475,806 42.4% 2,641.40 (yen) Note: Owners’ equity (net assets excluding non-controlling interests and subscription rights to shares) : As of August 31, 2017: 2,369,109 million yen As of February 28, 2017: 2,336,057 million yen 2. Dividends
Dividends per Share (yen)
Record Date First Quarter
Second Quarter
Third Quarter Year-end Annual
Year ended February 28, 2017 - 45.00 - 45.00 90.00 Year ending February 28, 2018 - 45.00 Year ending February 28, 2018 (forecast) - 45.00 90.00 Note: Revision of dividends forecast during the current quarterly period: None Notes:

3. Forecast of Business Results for the Fiscal Year ending February 28, 2018 (from March 1, 2017 to February 28, 2018) (Millions of yen, except per share amounts)
Revenues from Operations
Operating Income Ordinary Income
Net income Attributable to Owners of
Parent
Net Income per Share
Entire Year 6,100,000 4.5% 386,500 6.0% 385,000 5.7% 177,000 82.9% 200.11 (yen)
Notes: 1. Percentages represent increase (decrease) from the corresponding period in the prior fiscal year. 2. Revision of business results forecast during the current quarterly period: None
* The forecast of Group’s total sales include the sales of Seven-Eleven Japan and 7-Eleven, Inc. franchisees: Entire Year: 11,150,000 million yen [5.0%]
4. Others
(1) Changes in significant subsidiaries during the period: (changes in specific subsidiaries accompanying change in scope of consolidation): None Added: none Excluded: none
(2) Application of specific accounting for preparing the quarterly consolidated financial statements: None (3) Changes in accounting policies, accounting estimates or restatements
1. Changes due to amendment of accounting standards: None
2. Changes due to other reasons: None 3. Changes in accounting estimates: None 4. Restatements: None
(4) Number of shares outstanding (common stock) 1. Number of shares outstanding at the end of period (including treasury stock) As of August 31, 2017: 886,441,983 shares As of February 28, 2017: 886,441,983 shares 2. Number of treasury stock at the end of period As of August 31, 2017: 1,897,824 shares As of February 28, 2017: 2,039,799 shares 3. Average number of shares during the period (cumulative quarterly consolidated period) As of August 31, 2017: 884,517,966 shares As of August 31, 2016: 884,227,468 shares
(5) Supplementary information (Application of implementation on recoverability of deferred tax assets) The Company has applied the “Implementation Guidance on Recoverability of Deferred Tax Assets” (ASBJ Guidance No.26 dated March 28,2016)from the first quarter of the consolidated fiscal year under review. There is no impact on the consolidated financial statements from the application of the implementation guidance.
NOTICE REGARDING QUARTERLY REVIEW PROCEDURES FOR THE QUARTERLY FINANCIAL RESULTS This quarterly financial results statement is exempt from the quarterly review procedures based upon the Financial Instruments and Exchange Act. At the time of disclosure of this quarterly financial results statement, the quarterly review procedure based upon the Financial Instruments and Exchange Act has not been completed.
FORWARD LOOKING STATEMENTS
1. The forecast for the year ending February 28, 2018 is based on Seven & i Holdings’ hypotheses, plans and estimates at the date of publication. It is possible that some uncertain factors will cause the Company’s future performance to differ significantly from the contents of the forecast.
2. Brief summary for the second quarter of FY2018 will be posted on the Company’s website (http://www.7andi.com/en/ir/library/kh/201802.html). The presentation materials related to management policy and financial results which will be used on financial results presentation planned to be held on October 13, 2017, will be posted as soon as possible after the presentation.

Attached Materials
Contents
Consolidated Quarterly Financial Statements
(1) Consolidated Quarterly Balance Sheets ・・・・・・・・・・・・・・・・・・・・・・・・・・・・・・・・・・・・・・・・・・・・・・ 2
(2) Consolidated Quarterly Statements of Income and Consolidated Quarterly Statements of Comprehensive Income ・・・・・・・・・・・・・・・・・・・・・・・・ 4
(3) Consolidated Quarterly Statements of Cash Flows ・・・・・・・・・・・・・・・・・・・・・・・・・・・・・・・・・・・・・・ 6
(4) Doubts on the Premise of Going Concern ・・・・・・・・・・・・・・・・・・・・・・・・・・・・・・・・・・・・・・・・・・・・・ 8
(5) Notes to Consolidated Quarterly Statements of Income ・・・・・・・・・・・・・・・・・・・・・・・・・・・・・・・・・・ 8
(6) Segment Information ・・・・・・・・・・・・・・・・・・・・・・・・・・・・・・・・・・・・・・・・・・・・・・・・・・・・・・・・・・・・・ 8 (7) Notes on Significant Changes in the Amount of Shareholders' Equity ・・・・・・・・・・・・・・・・・・・・・・ 10
-1-

(1) Consolidated Quarterly Balance Sheets
(Millions of yen)
ASSETS
Current assets 2,274,403 2,305,830
Cash and bank deposits 1,222,101 1,273,850
Notes and accounts receivable - trade 347,838 356,124
Trade accounts receivable - financial services 91,052 93,693
Merchandise and finished goods 189,193 175,714
Work in process 31 23
Raw materials and supplies 3,238 3,470
Prepaid expenses 49,113 51,404
ATM-related temporary payments 98,710 83,322
Deferred income taxes 30,239 28,935
Other 247,866 244,709
Allowance for doubtful accounts (4,983) (5,419)
Non-current assets 3,234,485 3,179,511
Property and equipment 2,007,829 1,977,575
Buildings and structures, net 865,439 856,688
Furniture, fixtures and equipment, net 311,762 311,391
Land 768,926 749,135
Lease assets, net 12,735 8,799
Construction in progress 48,677 48,361
Other, net 288 3,199
Intangible assets 495,935 478,853
Goodwill 270,055 253,892
Software 72,416 75,116
Other 153,463 149,844
Investments and other assets 730,720 723,082
Investments in securities 188,162 184,409
Long-term loans receivable 15,315 15,070
Long-term leasehold deposits 396,707 389,533
Advances for store construction 389 253
Net defined benefit asset 44,628 47,163
Deferred income taxes 25,261 29,395
Other 64,064 60,856
Allowance for doubtful accounts (3,808) (3,600)
TOTAL ASSETS 5,508,888 5,485,342
5. Consolidated Quarterly Financial Statements
February 28, 2017 August 31, 2017
Amount Amount
-2-

(Millions of yen)
LIABILITIESCurrent liabilities 1,947,618 1,982,538 Notes and accounts payable, trade 415,349 462,937 Short-term loans 150,376 153,745 Current portion of bonds 50,000 74,998 Current portion of long-term loans 64,301 61,256 Income taxes payable 34,462 38,759 Accrued expenses 131,871 119,570 Deposits received 188,798 158,570 ATM-related temporary advances 46,072 37,869 Allowance for sales promotion expenses 21,409 22,677 Allowance for bonuses to employees 14,159 16,113
Audit & Supervisory Board Members
gift certificates Provision for sales returns 77 67 Deposits received in banking business 538,815 547,289 Call money 20,000 20,000 Other 269,804 266,900Non-current liabilities 1,085,463 988,848 Bonds 349,996 275,000 Long-term loans 433,814 419,615 Deferred income taxes 49,080 51,720 Allowance for retirement benefits to Directors
and Audit & Supervisory Board Members Net defined benefit liability 9,163 8,595 Deposits received from tenants and
Asset retirement obligations 77,640 79,303 Other 109,502 99,052TOTAL LIABILITIES 3,033,082 2,971,387NET ASSETSShareholders' equity 2,247,056 2,297,077 Common stock 50,000 50,000 Capital surplus 409,095 409,144 Retained earnings 1,793,035 1,842,658 Treasury stock, at cost (5,074) (4,725)Total accumulated other comprehensive income 89,000 72,031 Unrealized gains (losses) on available-for-sale securities, net of taxes Unrealized gains (losses) on hedging derivatives, net of taxes Foreign currency translation adjustments 56,391 37,515 Remeasurements of defined benefit plan 4,117 5,673Subscription rights to shares 2,594 2,637Non-controlling interests 137,154 142,207TOTAL NET ASSETS 2,475,806 2,513,955TOTAL LIABILITIES AND NET ASSETS 5,508,888 5,485,342
February 28, 2017 August 31, 2017
Amount Amount
Allowance for bonuses to Directors and165
Allowance for loss on future collection of
franchised stores
311
1,807
939
55,327
28,467
23
1,616
938
54,622
28,896
(53)
-3-
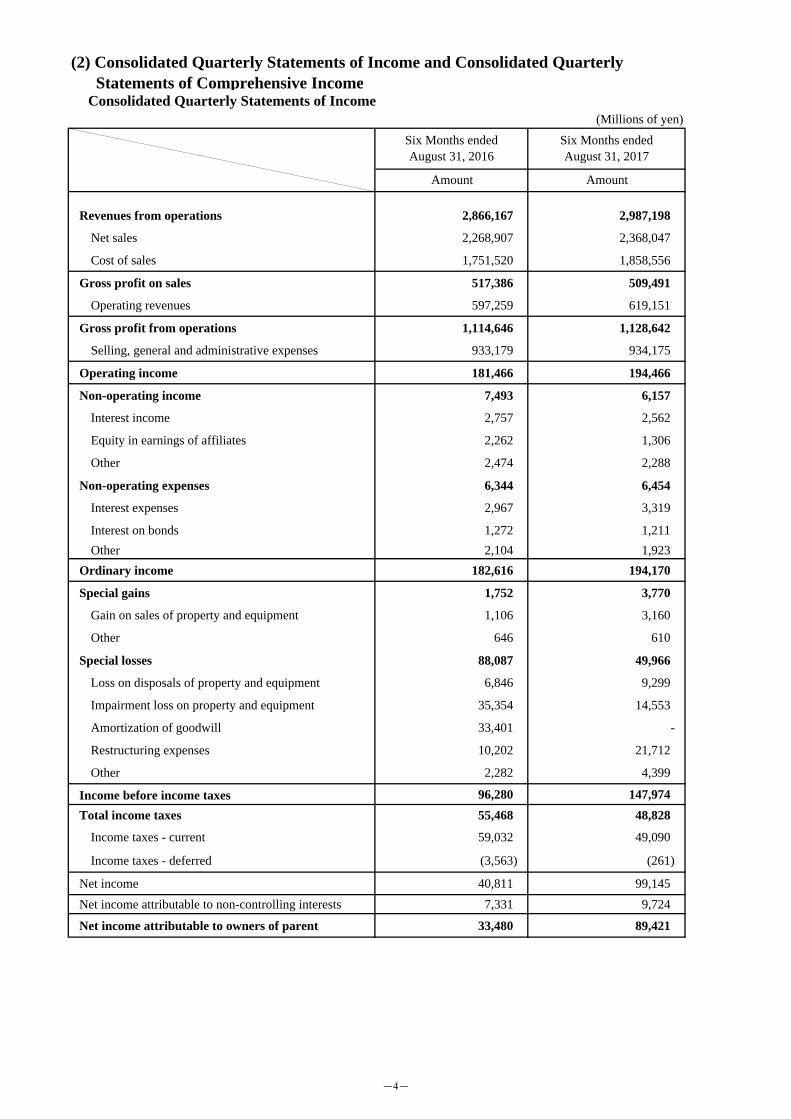
(2) Consolidated Quarterly Statements of Income and Consolidated Quarterly Statements of Comprehensive Income Consolidated Quarterly Statements of Income
(Millions of yen)
Revenues from operations 2,866,167 2,987,198
Net sales 2,268,907 2,368,047
Cost of sales 1,751,520 1,858,556
Gross profit on sales 517,386 509,491
Operating revenues 597,259 619,151
Gross profit from operations 1,114,646 1,128,642
Selling, general and administrative expenses 933,179 934,175
Operating income 181,466 194,466
Non-operating income 7,493 6,157
Interest income 2,757 2,562
Equity in earnings of affiliates 2,262 1,306
Other 2,474 2,288
Non-operating expenses 6,344 6,454
Interest expenses 2,967 3,319
Interest on bonds 1,272 1,211Other 2,104 1,923
Ordinary income 182,616 194,170
Special gains 1,752 3,770
Gain on sales of property and equipment 1,106 3,160
Other 646 610
Special losses 88,087 49,966
Loss on disposals of property and equipment 6,846 9,299
Impairment loss on property and equipment 35,354 14,553
Amortization of goodwill 33,401 -
Restructuring expenses 10,202 21,712
Other 2,282 4,399
Income before income taxes 96,280 147,974Total income taxes 55,468 48,828
Income taxes - current 59,032 49,090
Income taxes - deferred (3,563) (261)
Net income 40,811 99,145Net income attributable to non-controlling interests 7,331 9,724
Net income attributable to owners of parent 33,480 89,421
Six Months endedAugust 31, 2016
Six Months endedAugust 31, 2017
Amount Amount
-4-

Consolidated Quarterly Statements of Comprehensive Income(Millions of yen)
Net income 40,811 99,145Other comprehensive income
Unrealized gains (losses) on available-for-sale securities, net of taxesUnrealized gains (losses) on hedging derivatives, net of taxesForeign currency translation adjustments (86,581) (19,387)Remeasurements of defined benefit plan 2,240 1,570Share of other comprehensive income of entities accounted for using equity method
Total other comprehensive income (87,080) (17,497)Comprehensive income (46,268) 81,648Comprehensive income attributable to owners of parentComprehensive income attributable to non-controlling interests
(69)
(55)
72,453
9,195
(1,176)
(142)
(51,266)
4,997
Six Months endedAugust 31, 2016
Six Months endedAugust 31, 2017
Amount Amount
(1,421) 445
-5-

(3) Consolidated Quarterly Statements of Cash Flows(Millions of yen)
Cash flows from operating activities:
Income before income taxes 96,280 147,974Depreciation and amortization 102,992 105,927Impairment loss on property and equipment 40,888 31,966Amortization of goodwill 41,653 8,404Interest income (2,757) (2,562)Interest expenses and interest on bonds 4,240 4,531Equity in losses (earnings) of affiliates (2,262) (1,306)Gain on sales of property and equipment (1,106) (3,160)Loss on disposals of property and equipment 6,897 9,373Decrease (increase) in notes and accounts receivable, trade 775 (9,890)Decrease (increase) in trade accounts receivable, financial services (3,404) (2,640)Decrease (increase) in inventories 917 10,358Increase (decrease) in notes and accounts payable, trade 54,308 50,641Increase (decrease) in deposits received (2) (29,950)Net increase (decrease) in loans in banking business (1,000) -Net increase (decrease) in bonds in banking business - (30,000)Net increase (decrease) in deposits received in banking business 6,471 8,473Net decrease (increase) in call loans in banking business (5,000) -Net change in ATM-related temporary accounts (3,184) 7,183Other (7,524) (26,517)
Sub-total 329,184 278,806Interest and dividends received 2,231 2,146Interest paid (4,525) (4,562)Income taxes paid (55,520) (41,869)Income taxes refund - 16,936
Net cash provided by operating activities 271,369 251,457
Cash flows from investing activities:
Acquisition of property and equipment (135,655) (123,370)Proceeds from sales of property and equipment 12,605 14,151Acquisition of intangible assets (12,406) (15,507)Payment for purchase of investments in securities (30,985) (8,940)Proceeds from sales of investments in securities 18,697 15,613Proceeds from sales of investments in subsidiaries resulting in
change in scope of consolidationPayment for long-term leasehold deposits (19,519) (7,430)Refund of long-term leasehold deposits 15,066 18,274Proceeds from deposits from tenants 1,951 1,757Refund of deposits from tenants (1,723) (3,123)Payment for acquisition of business (2,303) (2,482)Payment for time deposits (4,880) (3,523)Proceeds from withdrawal of time deposits 23,052 6,471Other (6,272) (5,577)
Net cash used in investing activities (142,372) (113,578)
108
Six Months endedAugust 31, 2016
Six Months endedAugust 31, 2017
Amount Amount
-
-6-
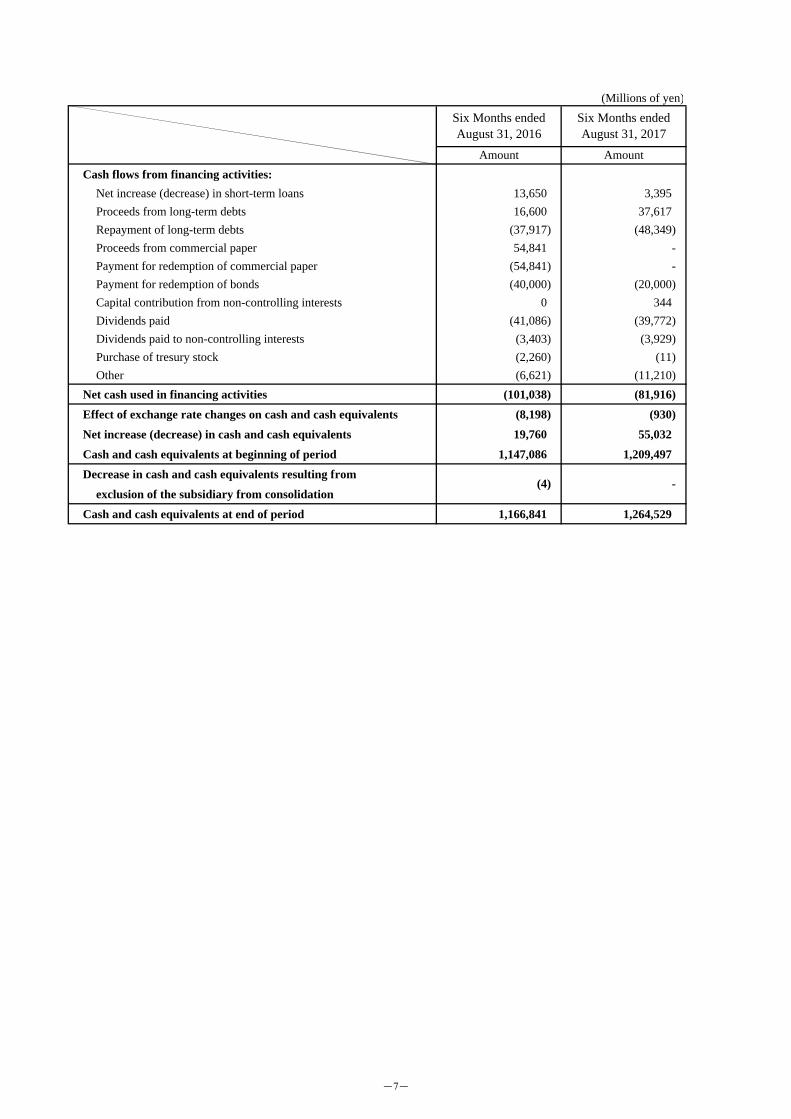
(Millions of yen)
Cash flows from financing activities:Net increase (decrease) in short-term loans 13,650 3,395Proceeds from long-term debts 16,600 37,617Repayment of long-term debts (37,917) (48,349)Proceeds from commercial paper 54,841 -Payment for redemption of commercial paper (54,841) -Payment for redemption of bonds (40,000) (20,000)Capital contribution from non-controlling interests 0 344Dividends paid (41,086) (39,772)Dividends paid to non-controlling interests (3,403) (3,929)Purchase of tresury stock (2,260) (11)Other (6,621) (11,210)
Net cash used in financing activities (101,038) (81,916)
Effect of exchange rate changes on cash and cash equivalents (8,198) (930)
Net increase (decrease) in cash and cash equivalents 19,760 55,032
Cash and cash equivalents at beginning of period 1,147,086 1,209,497 Decrease in cash and cash equivalents resulting from
exclusion of the subsidiary from consolidation
Cash and cash equivalents at end of period 1,166,841 1,264,529
(4) -
Six Months endedAugust 31, 2016
Six Months endedAugust 31, 2017
Amount Amount
-7-

(4) Doubts on the Premise of Going Concern None
(5) Notes to Consolidated Quarterly Statements of Income 1. The Company recorded the loss on valuation of stocks of subsidiaries and affiliates on Sogo & Seibu's share on its financial statement
of the second quarter of the consolidated fiscal year ended February 28, 2017, it is determined that there has been a decrease in it's substantial value. In consequence, the Company recorded amortization of goodwill of 33,401 million yen.
2. A breakdown of Restructuring expenses listed below.
Impairment loss
Loss on sales of property and equipment
Store closing losses
Early retirement benefit
Loss on disposals of property and equipment
Others
Total
(6) Segment Information
I. Six Months ended August 31, 2016 (From March 1, 2016 to August 31, 2016)
1. Information on Revenues from Operations and Income (Loss) by Reportable Segment (Millions of yen)
Revenues from operationsRevenues1. Customers 454,805 796,314 971,024 350,506 80,153 209,708 3,653 2,866,167 - 2,866,1672. Intersegment 747 95 5,783 4,840 18,461 1,558 8,151 39,637 (39,637) -
Total 455,552 796,410 976,808 355,346 98,615 211,266 11,805 2,905,804 (39,637) 2,866,167
Segment income (loss) 126,616 32,677 6,568 (1,359) 25,789 (4,371) 1,752 187,672 (6,205) 181,466
Notes: 1. The adjustments on segment income (loss) of (6,205) million yen are eliminations of intersegment transactions and certain expense items that are not allocated to reportable segments. 2. Segment income (loss) is reconciled with the operating income in the Consolidated Quarterly Statements of Income.
2. Impairment of Fixed Assets and Goodwill by Reportable Segment(Application of Accounting Standard for Business Combinations and other accounting standards)Effective from the first quarter of the consolidated fiscal year ended February 28, 2017, differences caused by change in the Company’s equity in the subsidiaries and affiliates remaining under the control of the Company are adjusted in capital surplus, and acquisition-related costs are reported as expenses incurred during the consolidated financial year in which acquisitions take place.As a result of the application and in comparison with the previous method, segment income in the second quarter of the consolidated fiscal year increasedby 1,601 million yen in “Overseas convenience store operations” segment, by 7 million yen in “Superstore operations” segment, by 142 million yen in “Financial services” segment, respectively. Furthermore, segment loss decreased by 676 million yen in “Department store operations” segment, by 14 million yen in“Specialty store operations” segment, respectively.
(Significant Asset Impairment Loss)In the second quarter of the consolidated fiscal year ended February 28, 2017, impairment loss of 16,504 million yen in “Superstore operations” and 16,004 millionyen in “Department store operations” was recorded.The figures mentioned above include “Restructuring expenses” in Consolidated Quarterly Statements of Income for the six months ended August 31, 2016.
(Significant Change in the Amount of Goodwill)As a result of the application of Accounting Standard for Business Combinations, Accounting Standard for Consolidated Financial Statements, and of AccountingStandard for Business Divestiture, etc., effective from the first quarter of the consolidated fiscal year ended February 28, 2017, the amount in Goodwill has beenreduced. In accordance with the application, the amount of goodwill, as at the beginning of the second quarter of the consolidated fiscal year ended February 28, 2017, was reduced by 33,368 million yen in the “Overseas convenience store operations” segment, by 226 million yen in “Superstore operations” segment, by 14,044million yen in “Department store operations” segment, by 3,271 million yen in “Financial services” segment, and by 413 million yen in “Specialty store operations”segment respectively.By recording amortization of goodwill in “Department store operations” in the second quarter of the consolidated fiscal year ended February 28, 2017, there hasbeen a significant change in the amount of goodwill. In accordance with the application, the amount of goodwill was reduced by 33,401 million yen in “Department store operations”.
(Millions of yen)
Six Months ended Six Months ended
August 31, 2016 August 31, 2017
5,534 17,413
1,188 1,001
3,241 272
- 2,504
51 73
187 448
10,202 21,712
Domesticconvenience
storeoperations operations
Superstore operations
Overseasconvenience
store
Departmentstore
operations
Financialservices
Specialtystore
operations
Consolidatedtotal
(Note 2)
Reportable segments
OthersTotal Adjustments
(Note 1)
-8-

II. Six Months ended August 31, 2017 (From March 1, 2017 to August 31, 2017)
1. Information on Revenues from Operations and Income (Loss) by Reportable Segment (Millions of yen)
Revenues from operationsRevenues1. Customers 471,966 957,832 937,635 325,801 82,803 207,336 3,822 2,987,198 - 2,987,1982. Intersegment 730 116 5,195 4,389 18,537 1,286 7,734 37,988 (37,988) -
Total 472,696 957,948 942,830 330,190 101,341 208,622 11,557 3,025,187 (37,988) 2,987,198
Segment income (loss) 131,087 33,437 6,666 875 25,821 834 2,119 200,841 (6,375) 194,466
Notes: 1. The adjustments on segment income (loss) of (6,375) million yen are eliminations of intersegment transactions and certain expense items that are not allocated to reportable segments. 2. Segment income (loss) is reconciled with the operating income in the Consolidated Quarterly Statements of Income.
2. Impairment of Fixed Assets and Goodwill by Reportable SegmentNo significant items to be reported.
3. Matters concerning the change of Reportable Segment, etc.(Change in Reportable Segment Classifications)The Company changed the Group's segment classification from the first quarter of this consolidated fiscal year as follows:
a. Domestic convenience store operations This is the operating segment of convenience store operations led by Seven-Eleven Japan Co., Ltd. (hereinafter“SEJ”), and includes SEJ, its subsidiaries and affiliate and the overseas businesses (China, Hawaii) that SEJ provides sales support, and business promotion and management.b. Overseas convenience store operations This is the operating segment of convenience store operations led by 7-Eleven, Inc. (hereinafter “SEI”), and includes SEI, its subsidiaries and affiliates, and the business operating companies that SEI provides sales support, and business promotion and management.c. Superstore operations This is the operating segment of retail operations that comprehensively provide the necessary items for daily life such as popular consumer choices in foods and daily goods, and includes Ito-Yokado Co., Ltd., York-Benimaru Co., Ltd., York Mart Co., Ltd., SHELL GARDEN CO., LTD., and the subsidiaries and affiliates of these companies. Akachan Honpo Co., Ltd., etc. that provide high specialty products have been reorganized into specialty store operations.d. Department store operations This is the operating segment of retail operations that provide diverse luxury goods and high specialty products operated in large scale stores, and includes Sogo & Seibu Co., Ltd. and its subsidiaries and affiliates. THE LOFT CO., LTD., which provides high specialty products, has been reorganized into specialty store operations.e. Financial services This is the operating segment of the operations that provide services related to the banking, credit cards and leases businesses, and includes Seven Bank, Ltd. and its subsidiaries and affiliates, Seven Financial Service Co., Ltd., Seven Card Service Co., Ltd. and Seven CS Card Service Co., Ltd. SEVEN & i Financial Center Co., Ltd. has been reorganized into the corporate operations not included in any reportable segment.f. Specialty store operations This is the operating segment of retail operations that provide high specialty or characteristic products and services, and includes business operating companies such as Akachan Honpo Co., Ltd., THE LOFT CO.,LTD., Seven & i Food Systems Co., Ltd., Barneys Japan Co., Ltd. and Nissen Co., Ltd.g. Others This includes the operating segments that do not belong to the other six segments above, and includes Seven & i Create Link Co., Ltd. and Seven & i Asset Management Co., Ltd. dealing with the real estate businesses, SEVEN & i Publishing Co., Ltd. dealing with the publishing business, Seven Culture Network Co., Ltd. providing cultural education services and Yatsugatake Kogen Lodge Co., Ltd running the hotel-operation, villa management, etc. business.
Note: The Company and SEVEN & i Financial Center Co., Ltd. are not included in any of the above segments, as they are classified as corporate operations.
The segment information for the second quarter of the consolidated fiscal year ended February 28, 2017 is prepared based on the classification of reportablesegments after the change.
Domestic Overseasconvenience
storeoperations
Superstore operations
conveniencestore
operations
Departmentstore
operations
Financialservices
operations
Specialtystore
Consolidatedtotal
(Note 2)
Reportable segments
OthersTotal Adjustments
(Note 1)
-9-

(Reference)Revenues from operations and operating income by geographic area segments are as described below.
Six Months ended August 31, 2016 (From March 1, 2016 to August 31, 2016) (Millions of yen)
Revenues from operations
Revenues 1. Customers 1,996,115 812,211 57,839 2,866,167 - 2,866,167 2. Intersegment 351 95 242 689 (689) -
Total 1,996,467 812,306 58,082 2,866,857 (689) 2,866,167
Operating income (loss) 149,697 31,863 (100) 181,460 5 181,466
Six Months ended August 31, 2017 (From March 1, 2017 to August 31, 2017) (Millions of yen)
Revenues from operations
Revenues 1. Customers 1,956,408 975,540 55,249 2,987,198 - 2,987,198 2. Intersegment 351 116 14 482 (482) -
Total 1,956,760 975,657 55,263 2,987,681 (482) 2,987,198
Operating income (loss) 161,718 32,129 613 194,461 4 194,466
Notes: 1. The classification of geographic area segments is determined according to geographical distances. 2. "Others" consists of the business results in the People's Republic of China, etc.
(7) Notes on Significant Changes in the Amount of Shareholders' Equity None
Japan
JapanNorth
America
Others
Others
NorthAmerica
Total beforeeliminations
Total beforeeliminations
Eliminations Consolidated total
Consolidated total
Eliminations
-10-