consolidated and separate financial statements for … · consolidated and separate financial...
TRANSCRIPT

Consolidated and Separate Financial Statements
for the year ended 30 June 2017
Digital Bros S.p.A.
Via Tortona, 37 – 20144 Milan, Italy
VAT No. and tax code 09554160151
Share capital: Euro 6,024,334.80 of which Euro 5,704,334.80 subscribed
Milan Companies Register No. 290680 - Vol. 7394 Chamber of Commerce No.
1302132
This report is available in the Investors section of the Company’s website at www.digitalbros.com

Digital Bros Group: Annual Report 2016-17
2
(this page intentionally left blank)

Digital Bros Group: Annual Report 2016-17
3
Contents
Board of directors and supervisory bodies 5
Directors' report 7
1. Group structure 7
2. The video games market 11
3. Market seasonality 14
4. Significant events during the year 15
5. Analysis of results for the year ended 30 June 2017 18
6. Analysis of the statement of financial position at 30 June 2017 22
7. Results of operating segments 24
8. Intercompany and related party transactions and atypical/unusual transactions 43
9. Treasury shares 45
10. Research and development 45
11. Risk management 46
12. Reconciliation of result for the year and equity of parent company to those of Group 51
13. Contingent assets and liabilities 53
14. Subsequent events 53
15. Business outlook 54
16. Other information 55
17. Report on corporate governance and ownership structure 56
18. Remuneration report 56
Consolidated financial statements for the year ended 30 June 2017 57
Consolidated statement of financial position at 30 June 2017 59
Consolidated statement of profit or loss for the year ended 30 June 2017 60
Consolidated statement of comprehensive income for the year ended 30 June 2017 61
Consolidated statement of cash flows for the year ended 30 June 2017 62
Consolidated statement of changes in equity 64
Statements compliant with Consob Resolution 15519 65
Notes to the consolidated financial statements for the year ended 30 June 2017 69
1. Form, content and other general information 70
2. Accounting policies 73
3. Use of estimates 88
4. Basis of consolidation 91
5. Equity investments in associates and other companies 93
6. Analysis of the statement of financial position 94
7. Analysis of the statement of profit or loss 116
8. Financial instruments and financial risk management (IFRS 7) 123
9 Non-recurring income and expenses 132
10. Information concerning operating segments 133
11. Related party transactions 140
12. Atypical or unusual transactions 141
13. Information on assets subject to revaluation in accordance with special laws 141
14. Loans granted to members of administrative, managerial and supervisory bodies 141
15. External audit fees 142
Statement pursuant to Art. 154- Bis (5) of the Consolidated Finance Act 144

Digital Bros Group: Annual Report 2016-17
4
Separate financial statements
146
Directors' report 147
1. The video games market 147
2. Market seasonality 150
3. Significant events during the year 151
4. Analysis of results for the year ended 30 June 2017 154
5. Analysis of the statement of financial position at 30 June 2017 156
6 Intercompany and related party transactions and atypical/unusual transactions 158
7 Treasury shares 158
8. Research and development 159
9. Management of operational risk, financial risk and financial instruments 159
10. Contingent assets and liabilities 162
11. Subsequent events 162
12 Business outlook 162
13. Other information 163
14. Allocation of result for the year 163
Statement of financial position at 30 June 2017 165
Separate statement of profit or loss for the year ended 30 June 2017 166
Separate statement of comprehensive income for the year ended 30 June 2017 167
Statement of cash flows for the year ended 30 June 2017 168
Statement of changes in equity 170
Statements compliant with Consob Resolution 15519 171
Notes to the separate financial statements for the year ended 30 June 2017 175
1. Form, content and other general information 176
2. Accounting policies 179
3. Use of estimates 193
4. Analysis of the statement of financial position 195
5. Analysis of the statement of profit or loss 214
6. Financial instruments and financial risk management (IFRS 7) 220
7. Non-recurring income and expenses 230
8. Contingent assets and liabilities 230
9. Related party transactions 230
10. Atypical or unusual transactions 234
11. Other information 234
12. Information on share ownership structure (pursuant to Art. 123-bis of the Consolidated Finance Act) 235
13. Information on assets subject to revaluation in accordance with special laws 236
14. Loans granted to members of administrative, managerial and supervisory bodies 236
15. External audit fees 236
Statement pursuant to Art. 154- Bis (5) of the Consolidated Finance Act 237
Digital Bros Group: Annual Report 2016-17
5
BOARD OF DIRECTORS AND SUPERVISORY BODIES
Board of Directors
Lidia Florean Director (2)
Abramo Galante Chairman and managing director (1)
Davide Galante Director (2)
Raffaele Galante Managing director (1)
Guido Guetta Director (3)
Elena Morini Director (3)
Stefano Salbe Director (1) (4)
Bruno Soresina Director (3)
Dario Treves Director (1)
(1) Executive directors
(2) Non-executive directors
(3) Independent directors
(4) Financial reporting manager pursuant to Art. 154 bis of Legislative Decree 58/98
Internal control and risk committee Remuneration committee
Guido Guetta (Chairman) Guido Guetta (Chairman)
Elena Morini Elena Morini
Bruno Soresina Bruno Soresina
Board of statutory auditors
Emanuela Maria Conti Acting auditor
Simone Luigi Dalledonne Acting auditor
Paolo Villa Chairman
Vincenzo Miceli Alternate auditor
Patrizia Riva Alternate auditor
The shareholders’ meeting of 28 October 2014 appointed the members of the Board of Directors and Board
of Statutory Auditors. The terms of office of the directors and statutory auditors will end with the
shareholders’ meeting held to approve the financial statements for the year ended 30 June 2017.
On 28 October 2016, the shareholders in general meeting approved the appointment of Paolo Villa as
Chairman of the Board of Statutory Auditors and the appointment of Emanuela Maria Conti and Simone
Luigi Dalledonne as acting auditors up to the end of the Board of Statutory Auditors' mandate. At the same
time, the shareholders appointed Vincenzo Miceli and Patrizia Riva as alternate auditors and they shall
remain in office up to the end of the Board of Statutory Auditors' mandate.
On 7 August 2007, the Board of Directors appointed the board member Stefano Salbe to the position of
financial reporting manager pursuant to Art. 154 bis of Legislative Decree 58/98 and granted him adequate
powers.
Digital Bros Group: Annual Report 2016-17
6
External auditors
Deloitte & Touche S.p.A.
On 26 October 2012, the shareholders in general meeting appointed Deloitte & Touche S.p.A, Via Tortona
25, Milan, as external auditors up to the approval of the financial statements for the year ending 30 June
2021.
Other information
Publication of the consolidated financial statements of Digital Bros S.p.A. Group for the year ended 30 June
2017 was authorised by resolution of the Board of Directors on 12 September 2017. Digital Bros S.p.A. is
a company limited by shares incorporated and domiciled in Italy. It is listed on the STAR segment of the
MTA market managed by Borsa Italiana S.p.A.

Digital Bros Group: Annual Report 2016-17
7
DIRECTORS' REPORT
1. GROUP STRUCTURE
Digital Bros Group develops, publishes, distributes and markets video games on an international scale.
During the course of the previous financial year, the Group's organisational structure and operating
segments were revised. The previous organisation was structured based on distribution channels, namely
International Publishing and Mobile, whereas it has been decided to focus on games categories, namely
Premium Games and Free to Play. The structure of the Development, Italian Distribution, Other Activities
and Holding operating segments has remained unchanged.
Accordingly, the Group is organised into five operating segments:
Development: the Development operating segment designs and develops video games and software
applications. Its operations are conducted through a dedicated organisational structure. The operating
segment undertakes development projects on behalf of Group companies and external customers. This work
is performed by the subsidiary Pipeworks Inc.
Premium Games: its operations consist of the acquisition of video game content exploitation rights from
developers and the subsequent distribution of the games through a traditional international sales network
and via digital marketplaces such as Steam, Sony PlayStation Network and Microsoft Xbox Live.
The video games are normally acquired under an exclusive licence and with international exploitation rights
valid for several years. The Group operates globally under the 505 Games brand.
Premium Games' operations were conducted during the year by the subsidiary 505 Games S.p.A., which
coordinates the operating segment, together with 505 Games France S.a.s., 505 Games Ltd., 505 Games
(US) Inc., 505 Games Spain Slu and 505 Games GmbH, which operate in the French, UK, U.S., Spanish
and German markets, respectively. 505 Games Interactive (US) Inc. provides consulting services on behalf
of 505 Games S.p.A. The liquidation of the Swedish company, 505 Games Nordic AB, was completed in
the year.
On 15 March 2017, the acquisition was completed of the Italian company, Kunos Simulazioni S.r.l., the
developer and publisher of the Assetto Corsa video game.
Free to Play: its operations consist of the development and publishing of video games available free of
charge on digital marketplaces, but which allow the gamer to make purchases during the various stages of
the game. With respect to Premium video games, Free to Play games are generally simpler and have greater
longevity, since the video game is continuously developed and improved subsequent to its launch, in order
to gain the public's loyalty and to extend the lifespan of the game.
The operating segment is coordinated by the subsidiary 505 Mobile S.r.l. and by the U.S. company 505
Mobile (US) Inc., which provides consulting services to the Group, by the UK company DR Studios Ltd.,

Digital Bros Group: Annual Report 2016-17
8
which is a developer of Free to Play games and by the newly formed company Hawken Entertainment Inc.,
which is the developer of the Hawken video game.
The Group operates globally in this segment under the 505 Games Mobile brand.
Italian Distribution: this deals with the distribution in Italy of video games purchased from international
publishers.
Its operations are conducted by the parent, Digital Bros S.p.A., under the Halifax brand, and by the
subsidiary Game Entertainment S.r.l., which handles distribution via the newsstand distribution channel.
The Group also distributes the Yu-Gi-Oh! trading card game in Italy.
Other Activities: this operating segment handles all of the Group's less significant activities, which are thus
grouped within a separate operating segment for a logical presentation of the results. It includes the
operations of the subsidiary Game Network S.r.l., which manages paid games under concession from
AAMS (Italian State Monopoly Administration) and the operations of the subsidiary Digital Bros Game
Academy S.r.l., which organises specialisation courses and training on video games.
Holding: this includes all the coordinating functions carried out by Digital Bros S.p.A. on behalf of the
various operating segments. The Holding operating segment also handles administration, management
control and business development. The parent company has also availed itself of the contribution made by
Digital Bros China Ltd., which operated in the year as a business developer for Asian markets and by 133
W. Broadway Inc., the owner of property located in Eugene, Oregon, USA that has been leased to Group
companies, whereas Digital Bros Holdings Ltd. was dormant in the year.
Details are provided below of the Group structure at 30 June 2017. All the investee companies shown are
100% held.

Digital Bros Group: Annual Report 2016-17
9
GROUP STRUCTURE AT 30 JUNE 2017

Digital Bros Group: Annual Report 2016-17
10
The Group operated from the following locations during the year:
Company Address Function
Digital Bros S.p.A. Via Tortona 37, Milan Offices
Digital Bros S.p.A. Via Boccaccio 95, Trezzano sul Naviglio (MI) Logistics
133 W. Broadway, Inc. 133 W. Broadway, Suite 200, Eugene, Oregon, USA. Offices
Digital Bros China (Shenzhen) Ltd. Tao Yuan Road, Nanshan district, Shenzhen 518062, China Offices
Digital Bros Game Academy S.r.l. Via Labus, 15 Milan Offices
Digital Bros Holdings Ltd. (3) 402 Silbury Court, Silbury Boulevard, Milton Keynes, UK Offices
DR Studios Ltd. 4 Linford Forum, Rockingham Drive, Milton Keynes, UK Offices
Game Entertainment S.r.l. Via Tortona 37, Milan Offices
505 Games S.p.A. Via Tortona 37, Milan Offices
505 Games France S.a.s. 2, Chemin de la Chauderaie, Francheville, France Offices
505 Games Spain Slu Calle Cabo Rufino Lazaro 15, Las Rozas de Madrid, Spain Offices
505 Games Ltd. 402 Silbury Court, Silbury Boulevard, Milton Keynes, UK Offices
505 Games (US) Inc. 5145 Douglas Fir Road, Calabasas, California, USA. Offices
505 Games GmbH Brunnfeld 2-6, Burglengenfeld, Germany Offices
505 Games Interactive (US) Inc. 5145 Douglas Fir Road, Calabasas, California, USA. Offices
Game Network S.r.l. Via Tortona 37, Milan Offices
Game Service S.r.l. Via Tortona 37, Milan Offices
Hawken Entertainment Inc. (1) 1526 Brookhollow Drive, Santa Ana, California, USA. Offices
Kunos Simulazioni S.r.l. (2) Via degli Olmetti 39, Formello (Rome) Offices
Pipeworks Inc. 133 W. Broadway, Suite 200, Eugene, Oregon, USA. Offices
505 Mobile S.r.l. Via Tortona 37, Milan Offices
505 Mobile (US) Inc. 5145 Douglas Fir Road, Calabasas, California, USA. Offices
(1) Hawken Entertainment Inc., which is based in the United States and which was set up on 28 September 2016,
commenced operations in the second quarter of the financial year.
(2) Kunos Simulazioni S.r.l. has been consolidated as of its acquisition date of 15 March 2017.
(3) Digital Bros Holdings Ltd. was dormant in the year.
Details are provided below of the Group's equity investments in associates at 30 June 2017 together with
their respective carrying amounts (in Euro thousands):
Name Location Holding
Carrying
amount
Delta DNA Ltd. Edinburgh, UK 1.04% 60
Ebooks&Kids S.r.l. Milan 16% 52
Cityglance S.r.l. in liquidation Milan 42.5% 2
Ovosonico S.r.l. Varese 49% 720
Seekhana Ltd. Milton Keynes, UK 33.61% 511
Total equity investments in associates 1,345

Digital Bros Group: Annual Report 2016-17
11
2. THE VIDEO GAMES MARKET
The video games market is part of the broader entertainment industry. Films, publishing, video games and
toys are sectors that share the same characters, brands, distinctive features and intellectual property. The
market is in constant flux and its growth rate is driven by non-stop technological advances. Gaming is no
longer limited to traditional consoles, such as the various iterations of Sony PlayStation and Microsoft
Xbox, but has expanded to mobile phones and tablets. Widespread connectivity at increasingly lower costs
and the availability of fibre optic networks and high speed mobile phones enable video games to become
increasingly diversified, sophisticated and interactive. The widespread use of smartphones by the
population, of all ages and walks of life, has led to creativity being expressed in a completely innovative
manner that is suitable for adults and females.
As is the case for almost all technological markets, the video games market for the Sony PlayStation and
Microsoft Xbox is cyclical as it is linked to the stage of development of the consoles for which the video
games are developed. With the rollout of a given console, prices of the hardware and the video games
designed therefor are high and relatively small quantities are sold. During their lifespan, hardware and game
prices gradually go down, as they progress from new releases to maturity and the quantities sold increase
along with a simultaneous increase in the quality of the video games.
High quality video games with high sales potential, in addition to being marketed on the digital marketplace,
are also produced physically and distributed through traditional sales networks. In this case, the value chain
is as follows:
Developers are those who create and program a game, which is usually based on an original idea, a
successful brand, a film or sports simulations, etc. The developers retain the intellectual property rights, but
they transfer the exploitation rights for a limited amount of time, as agreed by contract, to international
video game publishers, which are therefore a key element in the value chain when it comes to completing
the game, enhancing its reputation and distributing it internationally thanks to their direct and indirect
international sales networks.
Publishers usually finance the development phases of a video game. The publisher decides on a game’s
release schedule, its global pricing and sales policy and studies its product positioning and package design,
while taking on all of the risks and, jointly with the developer, benefiting from all the opportunities that the
video game may generate if it is a success.
The console manufacturer is the company that designs, engineers, produces and markets the hardware or
platform on which consumers play the game. Sony is the Sony PlayStation 4 console manufacturer,
Microsoft is the Microsoft Xbox One console manufacturer and Nintendo is the Nintendo Switch console
Developers PublishersConsole
manufacturersDistributors Retailers End consumers

Digital Bros Group: Annual Report 2016-17
12
manufacturer. The console manufacturer stamps the game on behalf of publishers in facilities dedicated to
the reproduction of software on the various physical storage devices used. The console manufacturer and
the video game publisher are often one and the same.
The role of the distributor varies from country to country. The more a market is fragmented, such as the
Italian market, the more the distributor’s role is integrated with that of the publisher, with the
implementation of communication policies for the local market and the undertaking of public relations. In
certain markets, such as the UK and the U.S., due to a high concentration of retailers, publishers usually
have a direct presence. Due to the increasing digitalisation of the market, more recently incorporated video
game publishers do not have their own traditional international retail sales structures as they make use of
distribution structures pertaining to other publishers present in various markets.
The retailer is the outlet where the end consumer purchases a game. Retailers may be international chains
specialised in the sale of video games, mass retail stores, specialised independent shops, or even online
shopping web sites that sell directly to the public.
Consumers are moving more towards purchases of games on digital platforms and, accordingly, console
manufacturers have developed marketplaces whereby video games can be sold directly to the end consumer
without the need for a distributor or retailer.
The value chain is less complex for games distributed in digital format on the marketplaces and for those
designed for smartphones and tablets, as indicated below:
The main marketplaces through which video games for consoles are sold to end consumers are: Sony's
PlayStation Store, Microsoft's Xbox Live and Nintendo's eShop. Steam marketplace is the global leader in
the digital distribution of games for personal computers.
The gradual growth in online gaming has driven Microsoft, with its Microsoft Xbox Live Pass, and Sony,
with its Sony PlayStation Now, to create digital platforms on which the gamer, instead of purchasing a
single game, may make use of all the games available on the marketplace by paying a subscription valid
for a set time period. Revenue recognition by the publisher is tied to the use of its games by end consumers.
Free to Play video games are offered to the public solely in a digital format. The marketplaces used are the
App Store for iPhone and iPad video games, the Play Store for Android video games in Western markets
and various marketplaces for Eastern markets. Free to Play video games are also available on Sony's and
Microsoft's marketplaces for consoles and on Steam for personal computers.
Developers Publishers Marketplace End consumers

Digital Bros Group: Annual Report 2016-17
13
Digital distribution has made it possible to significantly extend the lifespan of each video game. In fact, a
product's availability is not strictly limited to the launch period, as is the case with the retail market, but it
remains available on individual marketplaces thereafter, thus, ensuring a continuous flow of sales that may
be significantly affected by temporary promotional and communication policies.
The extension of the lifespan of a product is also affected by the fact that a publisher may implement product
policies that envisage the publication of additional game episodes and/or content available for a fee or free
of charge on digital marketplaces (so-called DLC, or downloadable content).
Digital Bros Group: Annual Report 2016-17
14
3. MARKET SEASONALITY
Seasonality is influenced by the launch of successful products. Quarter-on-quarter results can be volatile
depending on whether or not a popular new game is released. In fact, the launch of these products leads to
a concentration of sales in the first few days following their release.
The seasonal pattern is even more pronounced for a video game publisher, which usually releases a limited
number of games over a 12-month period, whereas a distributor can count on a steady stream of new
products, as its business is to sell different publishers' games in a given geographical market.
The publication and distribution of video games on the digital marketplace mitigates the volatility of a
publisher's results from one quarter to the next. In fact, in the event of digital distribution, revenue is
recognised when the end consumer purchases a game from the marketplace. This process occurs more
gradually over time and not prevalently in the days immediately after the launch, unlike traditional
distribution, for which revenue is recognised at the time of shipment of the finished product to the
distributor/dealer, regardless of whether it has been purchased by the end consumer. The fact that it is
possible to offer product promotions on the main marketplaces in a fairly rapid and effective manner tends
to concentrate revenue during such periods. It is evident that publishers try to plan their promotional
campaigns for the more favourable phases of the market, such as the Christmas season for European markets
or Black Friday for the American market.
The trend in Free to Play video games revenue is less influenced by seasonality factors than Premium video
games, given that, up till now, successful Free to Play video games have achieved revenue growth over
time without any particular peaks over the launch period, with certain rare exceptions relating to Free to
Play video games that had been highly anticipated and with well known brands. The impact of promotions
on revenue trends is significant, but, unlike the Premium video games market, promotions are more
frequently repeated after short intervals and thus do not create distortive effects on the revenue trend for
each video game.
The financial position is also closely linked to the revenue trend. The physical distribution of a product in
a quarter entails the concentration of net working capital investment, which is temporarily reflected by the
level of net cash/debt until such time as the related sales revenue is collected. This factor is accentuated by
the launch of Premium products, which also require net working capital investment for the physical
production of a game.

Digital Bros Group: Annual Report 2016-17
15
4. SIGNIFICANT EVENTS DURING THE YEAR
The main events that occurred during the year are as follows:
on 1 July 2016, Digital Bros S.p.A. sold 2,841,321 Starbreeze A shares for a consideration of Euro
6,059 thousand, resulting in a gain of Euro 3,136 thousand and, at the same time, purchased
2,841,321 Starbreeze B ordinary shares for a consideration of the same amount;
on 26 August 2016, 505 Games S.p.A. sold 2,000,000 Starbreeze B ordinary shares for a
consideration of Euro 4,805 thousand, resulting in a gross gain of Euro 602 thousand and granted
a right to the purchaser to purchase the same quantity of shares at the same price to be exercised
by 30 June 2017;
on 23 September 2016, 505 Games S.p.A. sold 8,500,000 Starbreeze B ordinary shares for a
consideration of Euro 20,846 thousand, resulting in a gross gain of Euro 2,988 thousand;
on 27 September 2016, the Group announced that, via its subsidiary 505 Games S.p.A., it had
entered into an agreement with Starbreeze AB for the exclusive global distribution of retail console
versions of the RAID: World War II video game with an investment by the Group of 4 million
U.S. dollars;
on 5 October 2016, Digital Bros Group, via its subsidiary 505 Games S.p.A., entered into an
agreement with ArtPLay Inc. for the exclusive publication of all formats of the Bloodstained video
game with the exclusion of the mobile versions thereof. The guaranteed minimum payable by the
Group to the developer amounts to 4.4 million U.S. dollars. The planned release date is Spring
2018;
in October 2016, Digital Bros S.p.A. sold its entire holding of 130,247 treasury shares for a
consideration of Euro 1,230 thousand;
on 28 October 2016, an extraordinary general meeting of the shareholders of 505 Games S.p.A.
approved a bonus capital increase of Euro 9 million from Euro 1 million to Euro 10 million, by
means of the issue of 9,000,000 shares with a par value of Euro 1.00 each, via the partial use of
retained earnings and also approved the distribution of a dividend to Digital Bros S.p.A. of Euro
6 million;
on 11 January 2017, the shareholders in general meeting approved the “2016-2026 Stock Option
Plan” aimed at a limited number of directors and managers of the Company and of the Group that
had been identified by the Board of Directors. The Plan will terminate on 30 June 2026 and it
envisages the allotment of a maximum number of 800,000 options as follows:
240,000 options on 1 July 2019;
240,000 options on 1 July 2022;
320,000 options on 1 July 2025.
Digital Bros Group: Annual Report 2016-17
16
The exercise price of the options shall equate to the average reference price of Digital Bros shares
recorded on the STAR segment of the MTA market in the half-year prior to the grant date.
The options have been fully assigned, whereby 744,000 were assigned on 29 January 2017 at Euro
10.61 per share and 56,000 were assigned on 12 May 2017 at Euro 12.95 per share.
Further information on the “2016-2026 Stock Option Plan” and on the capital increase to service
the Plan is provided in the notes to the separate financial statements of the Company for the year
ended 30 June 2017 and in the information document which may be found in the Investor Relations
section of the website at www.digitalbros.com, as well as in the Remuneration Report;
on 20 January 2017, the Board of Directors of Digital Bros S.p.A. approved the execution of an
agreement for the acquisition of a 100% equity interest in Kunos Simulazioni S.r.l., the Italian
developer of the Assetto Corsa video game. Kunos Simulazioni S.r.l. is an Italian company based
in Formello (RM) with many years of experience in the construction of simulators for Italy's
leading car manufacturers. Taking advantage of this experience, in 2014 it developed and launched
the Assetto Corsa video game. The transaction has given rise to the acquisition by Digital Bros
S.p.A. of 100% of the quotas of Kunos Simulazioni S.r.l., which is held equally by the two
founding owners Stefano Casillo and Marco Massarutto, for a total nominal consideration of Euro
4,341,500 payable as follows:
Euro 1,375,000 entirely in cash on the closing date;
Euro 1,375,000 entirely in cash within one year from the closing date;
Euro 1,591,500 via the issue of 150,000 new Digital Bros ordinary shares, with a par value
of Euro 0.40 each, at a price of Euro 10.61 each, equating to the average reference price of
Digital Bros shares in the previous six months. The issue was approved by the shareholders
in general meeting on 13 March 2017.
on 3 February 2017, the Group announced that, via its subsidiary 505 Games S.p.A., it had entered
into an agreement with Starbreeze AB for the global distribution of retail console versions of the
Dead by Daylight video game, with the exclusion of the Scandinavian and Asian markets. The
agreement provides for the payment of a guaranteed minimum of 2.5 million U.S. dollars;
on 4 April 2017, the Group entered into a worldwide console and mobile publishing agreement with
Re-Logic for the Terraria: Otherworld video game, with the exclusion of the PC Steam version. The
Group, via 505 Games, will act as publisher for Terraria: Otherworld by promoting and distributing
the console and mobile version worldwide, and will also act as developer, via the subsidiary Pipeworks
Inc., which will complete the development of the game with an initial estimated development budget
of 4.8 million U.S. dollars. The worldwide console and mobile publishing rights are for a minimum
period of 5 years. The agreement provides for the payment of a royalty of 60% for digital version sales
and of 30% for retail version sales. Pipeworks will benefit from a 5% royalty on global Terraria:
Otherworld sales, including the PC version, which will be published directly by Re-Logic;

Digital Bros Group: Annual Report 2016-17
17
on 6 April 2017, the Group assigned exclusive rights for the Chinese market to Guangzhou Duoyi
Network Co. Ltd. for the launch of PC and mobile versions of the Group's fully owned intellectual
property, Portal Knights, with the exclusion of the PC Steam version. The Group will benefit from a
50% royalty, from a licensing fee and a guaranteed minimum. The agreement also provides for the
development by Duoyi of a new version of the video game that the Chinese company and 505 Games
will distribute in the Chinese market and in the rest of the world, respectively. Duoyi Co. Ltd. will
localise and adapt Portal Knights for the Chinese market;
on 3 May 2017, the Group entered into an agreement with Remedy Entertainment Ltd. for the
worldwide production of a new video game, digital and retail versions of which will be launched for
PlayStation 4, Xbox One and PC, including the Steam platform. The investment will amount to Euro
7.75 million and the Group will contribute to the development, marketing, production and distribution
of all versions of the game worldwide. The agreement provides for a royalty payment equating to 45%
of net sales;
effective 1 July 2017, 505 Games S.p.a. and Psyonix have mutually agreed to terminate their Rocket
League retail distribution contract. Psyonix will officially take over the management of the Rocket
League retail distribution channel and will assume all responsibilities relating thereto. 505 Games
S.p.A. will be entitled to revenue on sales recognised up to 30 June 2017, as well as a significant
reduction of the contractually due royalty. Psyonix will be liable for any potential future liabilities
linked to price reductions, markdowns and product-related trade marketing.

Digital Bros Group: Annual Report 2016-17
18
5. ANALYSIS OF RESULTS FOR THE YEAR ENDED 30 JUNE 2017
Euro thousands
Year ended
30 June 2017
Year ended
30 June 2016 Change
1 Gross revenue 142,400 105.2% 110,192 102.8% 32,208 29.2%
2 Revenue adjustments (7,017) -5.2% (2,977) -2.8% (4,040) n.m.
3 Net revenue 135,383 100.0% 107,215 100.0% 28,168 26.3%
4 Purchase of products for resale (31,206) -23.1% (21,193) -19.8% (10,013) 47.2%
5 Purchase of services for resale (9,533) -7.0% (5,580) -5.2% (3,953) 70.8%
6 Royalties (37,102) -27.4% (23,851) -22.2% (13,251) 55.6%
7
Changes in inventories of finished
products 882 0.7% (948) -0.9% 1,830 n.m.
8 Total cost of sales (76,959) -56.8% (51,572) -48.1% (25,387) 49.2%
9 Gross profit (3+8) 58,424 43.2% 55,643 51.9% 2,781 5.0%
10 Other income 1,959 1.4% 5,714 5.3% (3,755) -65.7%
11 Cost of services (13,142) -9.7% (13,425) -12.5% 283 -2.1%
12 Lease and rental charges (1,476) -1.1% (1,555) -1.5% 79 -5.0%
13 Labour costs (22,469) -16.6% (19,861) -18.5% (2,608) 13.1%
14 Other operating costs (1,998) -1.5% (1,421) -1.3% (577) 40.6%
15 Total operating costs (39,085) -28.9% (36,262) -33.8% (2,823) 7.8%
16
Gross operating margin (EBITDA)
(9+10+15) 21,298 15.7% 25,095 23.4% (3,797) -15.1%
17 Depreciation and amortisation (7,714) -5.7% (3,788) -3.5% (3,926) n.m.
18 Allocations to provisions (854) -0.6% 0 0.0% (854) n.m.
19 Impairment losses recognised on assets (1,653) -1.2% (1,080) -1.0% (573) 53.1%
20
Reversal of impairment losses and non-
monetary income 0 0.0% 588 0.5% (588) n.m.
21
Total non-monetary income and
operating costs (10,221) -7.5% (4,280) -4.0% (5,941) n.m.
22 Operating margin (EBIT) (16+21) 11,077 8.2% 20,815 19.4% (9,738) -46.8%
23 Interest and finance income 8,772 6.5% 3,093 2.9% 5,679 n.m.
24 Interest expense and finance costs (3,137) -2.3% (5,570) -5.2% 2,433 -43.7%
25 Net finance income (costs) 5,635 4.2% (2,477) -2.3% 8,112 n.m.
26 Profit before tax (22+25) 16,712 12.3% 18,338 17.1% (1,626) -8.9%
27 Current tax (5,140) -3.8% (6,644) -6.2% 1,504 -22.6%
28 Deferred tax (276) -0.2% 845 0.8% (1,121) n.m.
29 Total income tax expense (5,415) -4.0% (5,799) -5.4% 384 -6.6%
30 Profit for the year (26+29) 11,297 8.3% 12,539 11.7% (1,242) -9.9%
Earnings per share:
33 Basic earnings per share (in euros) 0.80 0.90 (0.10) -11.0%
34 Diluted earnings per share (in euros) 0.80 0.90 (0.10) -11.0% Note: “n.m.” in this and the tables which follow stands for not meaningful

Digital Bros Group: Annual Report 2016-17
19
Gross consolidated revenue for the year amounted to Euro 142,400 thousand, representing an increase of
29.2% with respect to the prior year figure of Euro 110,192 thousand. Prior year revenue had benefited
from an amount of Euro 26,832 thousand arising from the sale of PAYDAY2 rights to the Swedish
developer Starbreeze. The contributory factors to the positive performance in the year include the launch
of the console versions of the Assetto Corsa video game, the continuous revenue stream generated by the
Rocket League video game, which was launched at the prior financial year end, and video game contract
revenue generated by the Development operating segment. In addition to the positive trend in revenue
reported by the Premium Games operating segment that increased by Euro 22,414 thousand, revenue for
the year also benefited from revenue growth reported by the Free to Play and Development operating
segments of Euro 2,461 thousand and Euro 7,983 thousand, respectively. There was a downward trend in
the Italian Distribution operating segment's revenue, which fell in the year by Euro 767 thousand.
A breakdown is provided below of revenue by operating segment for the years ended 30 June 2017 and
2016:
Euro thousands Gross revenue Net revenue
2017 2016 Change 2017 2016 Change
Premium Games 105,618 83,204 22,414 26.9% 100,892 81,556 19,336 23.7%
Italian Distribution 18,464 19,231 (767) -4.0% 16,613 17,958 (1,345) -7.5%
Development 9,719 1,736 7,983 n.m. 9,719 1,736 7,983 n.m.
Free to Play 7,736 5,275 2,461 46.7% 7,736 5,275 2,461 46.7%
Other Activities 863 746 117 15.7% 423 690 (267) -38.7%
Total gross
revenue 142,400 110,192
32,208
29.2% 135,383 107,215
28,168
26.3%
Revenue reported by the Premium Games operating segment amounted to Euro 105,618 thousand and was
the major contributor to consolidated revenue, as had also been the case in prior years. Details are provided
below of revenue by video game:
Amounts in Euro thousands
Year ended
30 June 2017
Year ended
30 June 2016 Change
Rocket League 37,348 5,833 31,515
Terraria 12,828 19,113 (6,285)
Assetto Corsa 12,584 0 12,584
PAYDAY 2 12,372 15,741 (3,369)
Portal Knights 6,777 1,264 5,513
Abzu 5,425 0 5,425
Sniper Elite V3 5,859 8,260 (2,401)
How to Survive 2,485 1,583 902
Brothers 1,203 2,312 (1,109)
Other products 8,737 2,266 6,471
Sale of PAYDAY 2 rights 0 26,832 (26,832)
Total Premium Games gross revenue 105,618 83,204 22,414
The product that generated the highest volumes in the year was Rocket League (retail versions for the Sony
PlayStation 4 and Microsoft Xbox One platforms), which produced revenue of Euro 37,348 thousand,
inclusive of income arising from the early termination of the retail distribution contract. The video game,

Digital Bros Group: Annual Report 2016-17
20
which was launched in June 2016, has remained in the international video games sales charts throughout
the year.
The operating segment's revenue was substantially boosted by sales of products launched in the year,
namely Assetto Corsa (Euro 12,584 thousand) and Abzu (Euro 5,425 thousand). Portal Knights (final PC
version, together with brand new console versions) was launched in the fourth quarter, generating revenue
of Euro 6,777 thousand. Solely an Early Access PC version of the game, which was conceived and created
internally, and the intellectual property of which is fully held by the Group, had previously been available
on the Steam marketplace.
The video games that have contributed the most to Group revenue in recent years, namely, PAYDAY 2 and
Terraria, continued to generate significant revenue in the year of Euro 12,372 thousand and Euro 12,828
thousand, respectively, despite the fact that they were launched years ago, providing proof of the extremely
long lifespan that products may now count on following the digitalisation of the market.
The revenue trend reported by the Italian Distribution operating segment was attributable to a fall in revenue
generated by the retail distribution of video games in Italy. In the prior year, the operating segment had in
fact benefited from the simultaneous launch of PES 2016 and Metal Gear Solid. Trading cards revenue,
however, grew by 21.1%.
Worthy of note is the percentage growth in revenue reported by the Free to Play operating segment that
increased by 46.7% from the prior year figure of Euro 5,275 thousand to Euro 7,736 thousand in the year
just ended. This operating segment also benefited from the launch of new products, such as Hawken and
Prominence Poker, even though the video game that generated the largest portion of revenue was Gems of
War, which, despite having been launched in November 2014, generated revenue in the year of Euro 3,516
thousand.
Significant contract wins by the U.S. subsidiary, Pipeworks, from non-Group customers enabled the
Development operating segment to significantly increase its revenue that went from the prior year figure
of Euro 1,736 thousand to Euro 9,719 thousand for the year ended 30 June 2017.
The Other Activities operating segment's revenue amounted to Euro 863 thousand and related to sales
generated by the Daily Fantasy Sport Fantasfida and revenue generated by specialisation courses organised
by Digital Bros Game Academy S.r.l.
Cost of sales for the year amounted to Euro 76,959 thousand.
Other income went from Euro 5,714 thousand to Euro 1,959 thousand in the year just ended and consists
of the capitalisation of internal development costs of video games undergoing development by the
subsidiaries DR Studios Ltd. and Pipeworks Inc. The significant decrease is in line with the reduction in
intercompany development contracts pertaining to the subsidiary Pipeworks Inc.
Operating costs increased by 7.8% (Euro 2,823 thousand), which was significantly lower than the turnover
trend. In addition to the normal effect of operating leverage triggered by revenue growth, there was a

Digital Bros Group: Annual Report 2016-17
21
decrease in advertising expenditure on the Daily Fantasy Sport Fantasfida that had characterised the prior
year and that amounted to Euro 2,291 thousand.
The gross operating margin for the year amounted to Euro 21,298 thousand, compared to the margin
reported for the year ended 30 June 2016 of Euro 25,095 thousand.
Non-monetary operating costs, net of non-monetary income, increased by Euro 5,941 thousand primarily
due to an increase in amortisation of intellectual property, in line with capital expenditure made by the
Group. Other minor increases were attributable to the recognition of asset impairment and an allocation to
a risk provision in connection with a tax audit of 505 Games S.p.A.
The operating margin (EBIT) thus decreased by Euro 9,738 thousand to Euro 11,077 thousand for the year
just ended from the prior year figure of Euro 20,815 thousand, which, however, had benefited from the sale
of PAYDAY2 rights.
Net finance income amounted to Euro 5,635 thousand compared to prior year net finance costs of Euro
2,477 thousand. Interest and finance income increased by Euro 5,679 thousand in the year. This mainly
consisted of gains recognised in the year on the sale and purchase of Starbreeze shares of Euro 6,891
thousand and exchange gains of Euro 1,752 thousand. Interest expense and finance costs amounted to Euro
3,137 thousand, representing a decrease in the year of Euro 2,433 thousand, attributable to a reduction in
losses recognised in the year on the measurement of Starbreeze shares of Euro 2,770 thousand.
Profit before tax for the year ended 30 June 2017 came to Euro 16,712 thousand, down by Euro 1,626
thousand compared to the amount reported for the year ended 30 June 2016 of Euro 18,338 thousand. Profit
for the year amounted to Euro 11,297 thousand, having decreased by Euro 1,242 thousand compared to the
profit for the year ended 30 June 2016 of Euro 12,539 thousand.
Basic and diluted earnings per share came to Euro 0.80, compared to prior year earnings per share of
Euro 0.90.

Digital Bros Group: Annual Report 2016-17
22
6. ANALYSIS OF THE STATEMENT OF FINANCIAL POSITION AT 30 JUNE
2017
Euro thousands 30 June 2017 30 June 2016 Change
Non-current assets
1 Property, plant and equipment 6,619 7,032 (413) -5.9%
2 Investment property 0 0 0 0.0%
3 Intangible assets 18,867 10,458 8,409 80.4%
4 Equity investments 1,345 898 447 49.7%
5 Non-current receivables and other assets 1,052 1,056 (4) -0.4%
6 Deferred tax assets 2,807 2,619 188 7.2%
Total non-current assets 30,690 22,063 8,627 39.1%
Non-current liabilities
7 Employee benefits (545) (529) (16) 2.9%
8 Non-current provisions (79) (36) (43) n.m.
9 Other non-current payables and liabilities 0 (252) 252 n.m.
Total non-current liabilities (624) (817) 193 -23.5%
Net working capital
10 Inventories 12,815 11,933 882 7.4%
11 Trade receivables 36,763 34,840 1,923 5.5%
12 Current tax assets 2,064 2,019 45 2.3%
13 Other current assets 3,263 5,034 (1,771) -35.2%
14 Trade payables (27,680) (21,712) (5,968) 27.5%
15 Current tax liabilities (5,736) (6,211) 475 -7.6%
16 Current provisions (854) 0 (854) n.m.
17 Other current liabilities (3,954) (2,312) (1,642) 71.0%
Total net working capital 16,681 23,591 (6,910) -29.3%
Capital and reserves
18 Share capital (5,704) (5,644) (60) 1.1%
19 Reserves (19,805) (20,804) 999 -4.8%
20 Treasury shares 0 390 (390) n.m.
21 (Retained earnings) accumulated losses (33,265) (22,290) (10,975) 49.2%
Total equity (58,774) (48,348) (10,426) 21.6%
Total net assets (12,027) (3,511) (8,516) n.m.
22 Cash and cash equivalents 12,136 2,785 9,351 n.m.
23 Current bank debt (1,942) (25,929) 23,987 -92.5%
24 Other current financial assets and liabilities 950 28,913 (27,963) -96.7%
Current net cash 11,144 5,769 5,375 93.2%
25 Non-current financial assets 1,306 1,195 111 9.3%
26 Non-current bank debt (383) (1,558) 1,175 -75.4%
27 Other non-current financial liabilities (40) (1,895) 1,855 -97.9%
Non-current net cash/debt 883 (2,258) 3,141 n.m.
Total net cash 12,027 3,511 8,516 n.m.

Digital Bros Group: Annual Report 2016-17
23
Non-current assets increased by Euro 8,627 thousand with respect to the balance at 30 June 2016 mainly
due to net expenditure on intangible assets of Euro 8,409 thousand relating to the acquisition and internal
production of intellectual property. Equity investments increased by Euro 447 thousand due to further
capital subscriptions in Seekhana Ltd. and Ovosonico S.r.l. of Euro 339 thousand and Euro 300 thousand,
respectively, net of a write-down of investments in Cityglance S.r.l. and Ebook&Kids S.r.l. of Euro 44
thousand and Euro 148 thousand, respectively.
Non-current liabilities decreased by Euro 193 thousand due to the classification as current payables of the
variable remuneration linked to the medium/long-term incentive scheme for directors and key managers
that will be paid in September 2017.
Net working capital decreased in the year by Euro 6,910 thousand. An analysis of net working capital
together with comparative figures at 30 June 2016 is provided below:
Euro thousands 30 June 2017 30 June 2016 Change
Inventories 12,815 11,933 882 7.4%
Trade receivables 36,763 34,840 1,923 5.5%
Current tax assets 2,064 2,019 45 2.3%
Other current assets 3,263 5,034 (1,771) -35.2%
Trade payables (28,534) (21,712) (6,822) 31.4%
Current tax liabilities (5,736) (6,211) 475 -7.6%
Current provisions 0 0 0 n.m.
Other current liabilities (3,954) (2,312) (1,642) 71.0%
Total net working capital 16,681 23,591 (6,910) -29.3%
Net cash amounted to Euro 12,027 thousand, representing an improvement of Euro 8,516 thousand
compared to the balance at 30 June 2016 of Euro 3,511 thousand.
An analysis of net cash/debt together with comparative figures at 30 June 2016 is provided below:
Euro thousands 30 June 2017 30 June 2016 Change
Cash and cash equivalents 12,136 2,785 9,351 n.m.
Current bank debt (1,942) (25,929) 23,987 -92.5%
Other current financial assets and
liabilities 950 28,913 (27,963) -96.7%
Current net cash 11,144 5,769 5,375 93.2%
Non-current financial assets 1,306 1,195 111 9.3%
Non-current bank debt (383) (1,558) 1,175 -75.4%
Other non-current financial liabilities (40) (1,895) 1,855 -97.9%
Non-current net cash/debt 883 (2,258) 3,141 n.m.
Total net cash 12,027 3,511 8,516 n.m.

Digital Bros Group: Annual Report 2016-17
24
7. RESULTS OF OPERATING SEGMENTS
Development
Financial highlights (reclassified)
Consolidated amounts in Euro
thousands Development
Year ended
30 June 2017
Year ended
30 June 2016 Change
1 Gross revenue 9,719 100.0% 1,736 100.0% 7,983 n.m.
2 Revenue adjustments 0 0.0% 0 0.0% 0 0.0%
3 Net revenue 9,719 100.0% 1,736 100.0% 7,983 n.m.
4 Purchase of products for resale 0 0.0% 0 0.0% 0 0.0%
5 Purchase of services for resale (2,526) -26.0% (468) -27.0%
(2,058
) n.m.
6 Royalties 0 0.0% 0 0.0% 0 0.0%
7 Changes in inventories of finished products 0 0.0% 0 0.0% 0 0.0%
8 Total cost of sales (2,526) -26.0% (468) -27.0%
(2,058
) n.m.
9 Gross profit (3+8) 7,193 74.0% 1,268 73.1% 5,925 n.m.
10 Other income 894 9.2% 4,374 252.0%
(3,480
) -79.6%
11 Cost of services (425) -4.4% (342) -19.7% (83) 24.2%
12 Lease and rental charges 0 0.0% (95) -5.5% 95 n.m.
13 Labour costs (4,935) -50.8%
(5,333
) -307.3% 398 -7.5%
14 Other operating costs (142) -1.5% (122) -7.1% (20) 15.7%
15 Total operating costs (5,502) -56.6%
(5,892
) -339.5% 390 -6.6%
16
Gross operating margin (EBITDA)
(9+10+15) 2,585 26.6% (250) -14.4% 2,835 n.m.
17 Depreciation and amortisation (594) -6.1% (601) -34.6% 7 -1.1%
18 Allocations to provisions 0 0.0% 0 0.0% 0 0.0%
19 Impairment losses recognised on assets 0 0.0% (16) -0.9% 16 n.m.
20
Reversal of impairment losses and non-
monetary income 0 0.0% 0 0.0% 0 0.0%
21
Total non-monetary income and
operating costs (594) -6.1% (617) -35.5% 23 -3.7%
22 Operating margin (EBIT) (16+21) 1,991 20.5% (867) -49.9% 2,857 n.m.
This operating segment comprises the business operations of the U.S. subsidiary Pipeworks Inc.
The Development operating segment’s revenue relates to development contracts that the subsidiary has
entered into with non-Group customers, whereas revenue consisting of the capitalisation of internal

Digital Bros Group: Annual Report 2016-17
25
development costs for video games on behalf of the Group is classified as other income, net of realised
intercompany margins.
The focus of the U.S. subsidiary Pipeworks' operations almost entirely on job orders for non-Group
customers enabled the Development operating segment to significantly increase its revenue from the prior
year figure of Euro 1,736 thousand to Euro 9,719 thousand for the year ended 30 June 2017. During the
year, Pipeworks Inc. performed services for the Group consisting of quality assurance, live support for the
Prominence Poker video game and development of the Terraria 1.3 video game.
The increase in purchase of services for resale is attributable to a greater use of specialised external
professional resources driven by increased activity in the year.
The decrease in other income of Euro 3,480 thousand is attributable to a significant decrease in
intercompany contracts.
Labour costs were the most significant component of operating costs and amounted to Euro 4,935 thousand,
representing a decrease of 7.5% compared to the figure reported for the year ended 30 June 2016 of Euro
5,333 thousand.
Depreciation and amortisation expense consists of the amortisation of intangible assets of Euro 156
thousand and the amortisation of development contracts arising from the allocation of the excess value
recognised upon acquisition of the subsidiary of Euro 438 thousand.
The operating segment has reported a positive operating margin of Euro 1,991 thousand versus the prior
year negative margin of Euro 867 thousand.
A summary statement of financial position is provided below:
Euro thousands
30 June
2017 %
30 June
2016 % Change
Total non-current assets 1,651 17.0% 6,007 346.0% (4,356) -72.5%
Total non-current liabilities 0 0.0% 0 0.0% 0 0.0%
Net working capital
10 Inventories 0 0 0 n.m.
11 Trade receivables 2,286 207 2,079 n.m.
12 Current tax assets 0 0 0 n.m.
13 Other current assets 63 49 13 26.7%
14 Trade payables (1,094) (58) (1,036) n.m.
15 Current tax liabilities (1,105) 0 (1,105) n.m.
17 Other current liabilities (640) (630) (10) n.m.
Total net working capital (490) -5.0% (432) -24.9% (58) n.m.
Gross revenue - Development 9,719 1,736 7,983 n.m.
Non-current assets mainly consist of internal orders developed by Pipeworks Inc. on behalf of Group
companies, net of transfers out.

Digital Bros Group: Annual Report 2016-17
26
Details of non-current assets are provided below:
Euro thousands 30 June 2017 30 June 2016 Change
Internal job orders 1,139 4,839 (3,700)
Open contracts 73 511 (438)
Software 18 31 (13)
Property, plant and equipment 201 264 (63)
Deferred tax assets 220 362 (142)
Total non-current assets 1,651 6,007 (4,356)
Details of internal job orders by project are provided below:
Euro thousands 30 June 2017 30 June 2016 Change
Terraria 1.3 1,076 0 1,076
Prominence Poker 0 3,141 (3,141)
Galapagos 0 596 (596)
Superfight 0 769 (769)
Other 63 333 (270)
Total internal job orders 1,139 4,839 (3,700)
The Group has recognised as an intangible asset the difference between the purchase price of the investment
and the underlying equity at the acquisition date that was allocated to the carrying amount of open contracts
with third party customers and which is being amortised over three years, with the charge for the year
having amounted to Euro 73 thousand.

Digital Bros Group: Annual Report 2016-17
27
Premium Games
Financial highlights (reclassified)
Consolidated amounts in Euro
thousands Premium Games
Year ended
30 June 2017
Year ended
30 June 2016 Change
1 Gross revenue 105,618 104.7% 83,204 102.0% 22,414 26.9%
2 Revenue adjustments (4,726) -4.7% (1,648) -2.0% (3,078) n.m.
3 Net revenue 100,892 100.0% 81,556 100.0% 19,336 23.7%
4 Purchase of products for resale (18,687) -18.5% (8,135) -10.0% (10,552) n.m.
5 Purchase of services for resale (3,337) -3.3% (3,610) -4.4% 273 -7.6%
6 Royalties (36,648) -36.3% (20,975) -25.7% (15,673) 74.7%
7
Changes in inventories of finished
products 367 0.4% (721) -0.9% 1,088 n.m.
8 Total cost of sales (58,305) -57.8% (33,441) -41.0% (24,864) 74.4%
9 Gross profit (3+8) 42,587 42.2% 48,115 59.0% (5,528) -11.5%
10 Other income 200 0.2% 186 0.2% 14 7.5%
11 Cost of services (7,528) -7.5% (6,191) -7.6% (1,337) 21.6%
12 Lease and rental charges (606) -0.6% (596) -0.7% (10) 1.7%
13 Labour costs (7,650) -7.6% (6,591) -8.1% (1,059) 16.1%
14 Other operating costs (591) -0.6% (445) -0.5% (146) 32.9%
15 Total operating costs (16,375) -16.2% (13,823) -16.9% (2,552) 18.5%
16
Gross operating margin (EBITDA)
(9+10+15) 26,412 26.2% 34,478 42.3% (8,066) -23.4%
17 Depreciation and amortisation (3,667) -3.6% (1,216) -1.5% (2,451) n.m.
18 Allocations to provisions (854) -0.8% 0 0.0% (854) 0.0%
19 Impairment losses recognised on assets (882) -0.9% 0 0.0% (882) 0.0%
20
Reversal of impairment losses and non-
monetary income 0 0.0% 0 0.0% 0 0.0%
21
Total non-monetary income and
operating costs (5,403) -5.4% (1,216) -1.5% (4,187) n.m.
22 Operating margin (EBIT) (16+21) 21,009 20.8% 33,262 40.8% (12,253) -36.8%
Revenue reported by the Premium Games operating segment amounted to Euro 105,618 thousand, having
increased by 26.9%, that is, by Euro 22,414 thousand with respect to the amount reported for the year ended
30 June 2016 of Euro 83,204 thousand. Revenue for the year ended 30 June 2016 had benefited from income
from the sale of PAYDAY 2 rights of Euro 26,832 thousand, whereas revenue for the year ended 30 June
2017 has benefited from the retrocession of Rocket League distribution rights.
Digital Bros Group: Annual Report 2016-17
28
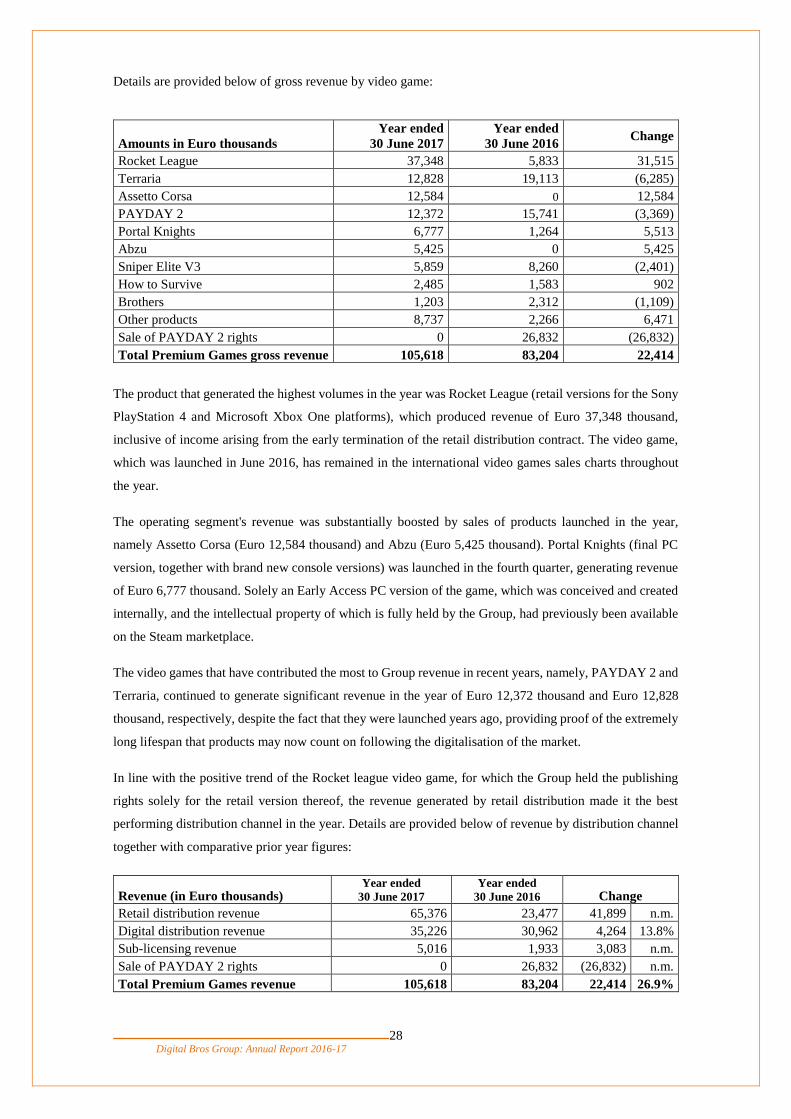
Details are provided below of gross revenue by video game:
Amounts in Euro thousands
Year ended
30 June 2017
Year ended
30 June 2016 Change
Rocket League 37,348 5,833 31,515
Terraria 12,828 19,113 (6,285)
Assetto Corsa 12,584 0 12,584
PAYDAY 2 12,372 15,741 (3,369)
Portal Knights 6,777 1,264 5,513
Abzu 5,425 0 5,425
Sniper Elite V3 5,859 8,260 (2,401)
How to Survive 2,485 1,583 902
Brothers 1,203 2,312 (1,109)
Other products 8,737 2,266 6,471
Sale of PAYDAY 2 rights 0 26,832 (26,832)
Total Premium Games gross revenue 105,618 83,204 22,414
The product that generated the highest volumes in the year was Rocket League (retail versions for the Sony
PlayStation 4 and Microsoft Xbox One platforms), which produced revenue of Euro 37,348 thousand,
inclusive of income arising from the early termination of the retail distribution contract. The video game,
which was launched in June 2016, has remained in the international video games sales charts throughout
the year.
The operating segment's revenue was substantially boosted by sales of products launched in the year,
namely Assetto Corsa (Euro 12,584 thousand) and Abzu (Euro 5,425 thousand). Portal Knights (final PC
version, together with brand new console versions) was launched in the fourth quarter, generating revenue
of Euro 6,777 thousand. Solely an Early Access PC version of the game, which was conceived and created
internally, and the intellectual property of which is fully held by the Group, had previously been available
on the Steam marketplace.
The video games that have contributed the most to Group revenue in recent years, namely, PAYDAY 2 and
Terraria, continued to generate significant revenue in the year of Euro 12,372 thousand and Euro 12,828
thousand, respectively, despite the fact that they were launched years ago, providing proof of the extremely
long lifespan that products may now count on following the digitalisation of the market.
In line with the positive trend of the Rocket league video game, for which the Group held the publishing
rights solely for the retail version thereof, the revenue generated by retail distribution made it the best
performing distribution channel in the year. Details are provided below of revenue by distribution channel
together with comparative prior year figures:
Revenue (in Euro thousands) Year ended
30 June 2017
Year ended
30 June 2016 Change
Retail distribution revenue 65,376 23,477 41,899 n.m.
Digital distribution revenue 35,226 30,962 4,264 13.8%
Sub-licensing revenue 5,016 1,933 3,083 n.m.
Sale of PAYDAY 2 rights 0 26,832 (26,832) n.m.
Total Premium Games revenue 105,618 83,204 22,414 26.9%

Digital Bros Group: Annual Report 2016-17
29
Details are provided below of digital distribution revenue by digital marketplace for the year ended 30 June
2017:
Revenue (in Euro thousands) Year ended
30 June 2017
Year ended
30 June 2017 Change
Sony PlayStation Network 13,783 7,993 5,790 72.4%
Microsoft Xbox Live 9,629 8,193 1,436 17.5%
Steam 7,478 8,947 (1,469) -16.4%
iTunes 1,746 2,739 (993) -36.3%
Google 927 1,193 (266) -22.3%
Other marketplaces 1,663 1,897 (234) -12.3%
Total digital distribution revenue 35,226 30,962 4,264 13.8%
Sub-licensing revenue rose significantly by Euro 3,083 thousand due to the sale of exploitation rights in
China pertaining to the Terraria video game and from the recent sale of various video game rights for the
Microsoft Game Pass platform, inclusive of Terraria and PAYDAY 2.
Revenue adjustments have gone from Euro 1,648 thousand to Euro 4,726 thousand for the year ended
30 June 2017. This line item includes an estimate of credit notes for unsold products that the Group expects
to issue to customers in the near future. Expressed as a percentage of retail distribution revenue, the figure
for the period of 4.7% is in line with market trends, especially following the launch of new products. The
operating segment's net revenue grew by 23.7%.
The significant increase in royalty costs of Euro 15,673 thousand, being an increase in the year of 74.7%,
is attributable to an increased weighting of revenue from products, which, due to the nature of the contracts
entered into and the lower risks that the Group assumes with the publishing of retail products, have higher
than average royalty percentages applied thereto. Cost of sales increased by Euro 24,864 thousand, thus
giving rise to gross profit reported by the operating segment of Euro 42,587 thousand versus Euro 48,115
thousand for the year ended 30 June 2016.
Operating costs increased by Euro 2,552 thousand, mainly due to an increase in cost of services of Euro
1,337 thousand, which was attributable to higher advertising expenditure following the launch of new
products, as well as an increase in labour costs of Euro 1,337 thousand.
The gross operating margin amounted to Euro 26,412 thousand, compared to the amount reported for the
year ended 30 June 2016 of Euro 34,478 thousand.
Non-monetary operating costs rose by Euro 4,187 thousand due to an increase in amortisation of intellectual
property acquired by the Group, to an allocation to a risk provision triggered by a tax audit of 505 Games
S.p.A. and to the recognition of asset impairment, bringing the operating margin to Euro 21,009 thousand,
equating to 20.8% of net revenue.
Digital Bros Group: Annual Report 2016-17
30
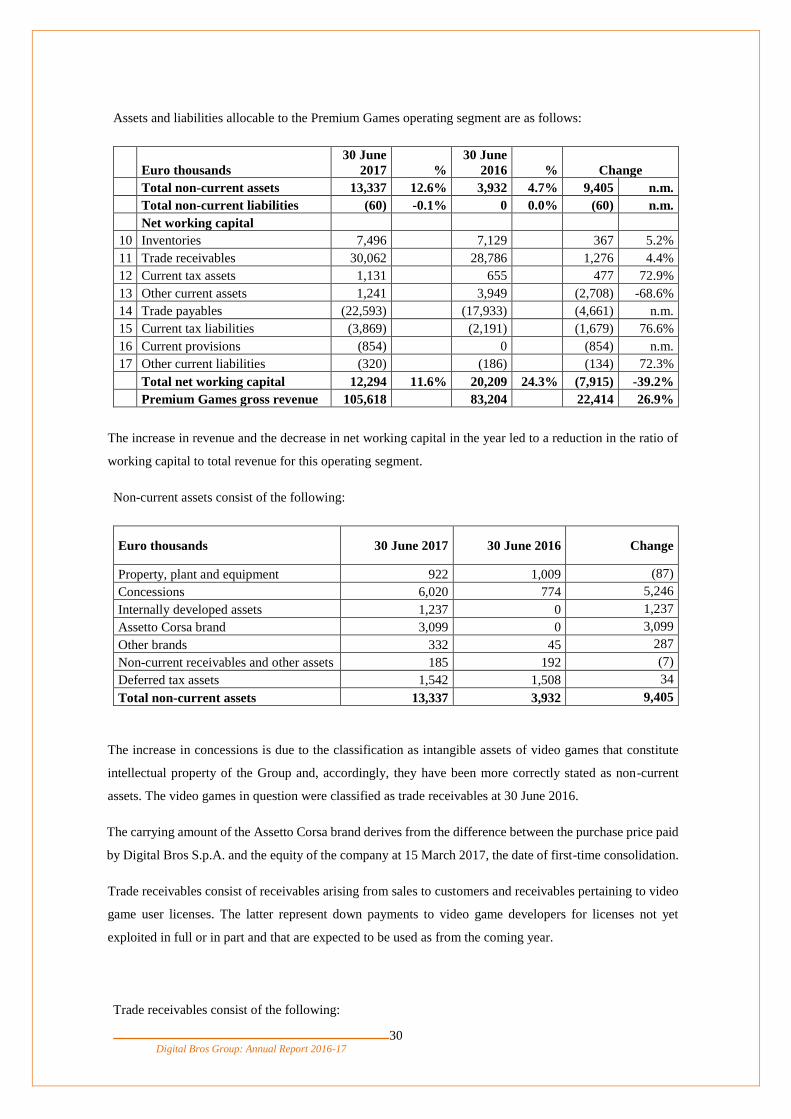
Assets and liabilities allocable to the Premium Games operating segment are as follows:
Euro thousands
30 June
2017 %
30 June
2016 % Change
Total non-current assets 13,337 12.6% 3,932 4.7% 9,405 n.m.
Total non-current liabilities (60) -0.1% 0 0.0% (60) n.m.
Net working capital
10 Inventories 7,496 7,129 367 5.2%
11 Trade receivables 30,062 28,786 1,276 4.4%
12 Current tax assets 1,131 655 477 72.9%
13 Other current assets 1,241 3,949 (2,708) -68.6%
14 Trade payables (22,593) (17,933) (4,661) n.m.
15 Current tax liabilities (3,869) (2,191) (1,679) 76.6%
16 Current provisions (854) 0 (854) n.m.
17 Other current liabilities (320) (186) (134) 72.3%
Total net working capital 12,294 11.6% 20,209 24.3% (7,915) -39.2%
Premium Games gross revenue 105,618 83,204 22,414 26.9%
The increase in revenue and the decrease in net working capital in the year led to a reduction in the ratio of
working capital to total revenue for this operating segment.
Non-current assets consist of the following:
Euro thousands 30 June 2017 30 June 2016 Change
Property, plant and equipment 922 1,009 (87)
Concessions 6,020 774 5,246
Internally developed assets 1,237 0 1,237
Assetto Corsa brand 3,099 0 3,099
Other brands 332 45 287
Non-current receivables and other assets 185 192 (7)
Deferred tax assets 1,542 1,508 34
Total non-current assets 13,337 3,932 9,405
The increase in concessions is due to the classification as intangible assets of video games that constitute
intellectual property of the Group and, accordingly, they have been more correctly stated as non-current
assets. The video games in question were classified as trade receivables at 30 June 2016.
The carrying amount of the Assetto Corsa brand derives from the difference between the purchase price paid
by Digital Bros S.p.A. and the equity of the company at 15 March 2017, the date of first-time consolidation.
Trade receivables consist of receivables arising from sales to customers and receivables pertaining to video
game user licenses. The latter represent down payments to video game developers for licenses not yet
exploited in full or in part and that are expected to be used as from the coming year.
Trade receivables consist of the following:

Digital Bros Group: Annual Report 2016-17
31
Category 30 June 2017 30 June 2016 Change
Receivables due from customers 11,872 10,307 1,565
Receivables pertaining to video game user licenses 18,190 18,479 (289)
Total trade receivables 30,062 28,786 1,276
The increase in trade payables is attributable to a rise in royalties due to video game developers as a result
of higher sales.
Other current assets consist mainly of advances paid to suppliers of localisation, programming, rating and
quality assurance services, which are recognised in profit or loss when a video game is released. The
decrease in advances is mainly due to a reduction in advances for PAYDAY 2 and Family Guy video game
programming of Euro 1,206 thousand and Euro 986 thousand, respectively.
The increase in current tax liabilities is mainly attributable to the subsidiaries Games US Inc. and 505
Games Ltd. due to higher taxable income pertaining thereto.
Current provisions solely include a risk provision in connection with a tax audit of 505 Games S.p.A.
Digital Bros Group: Annual Report 2016-17
32
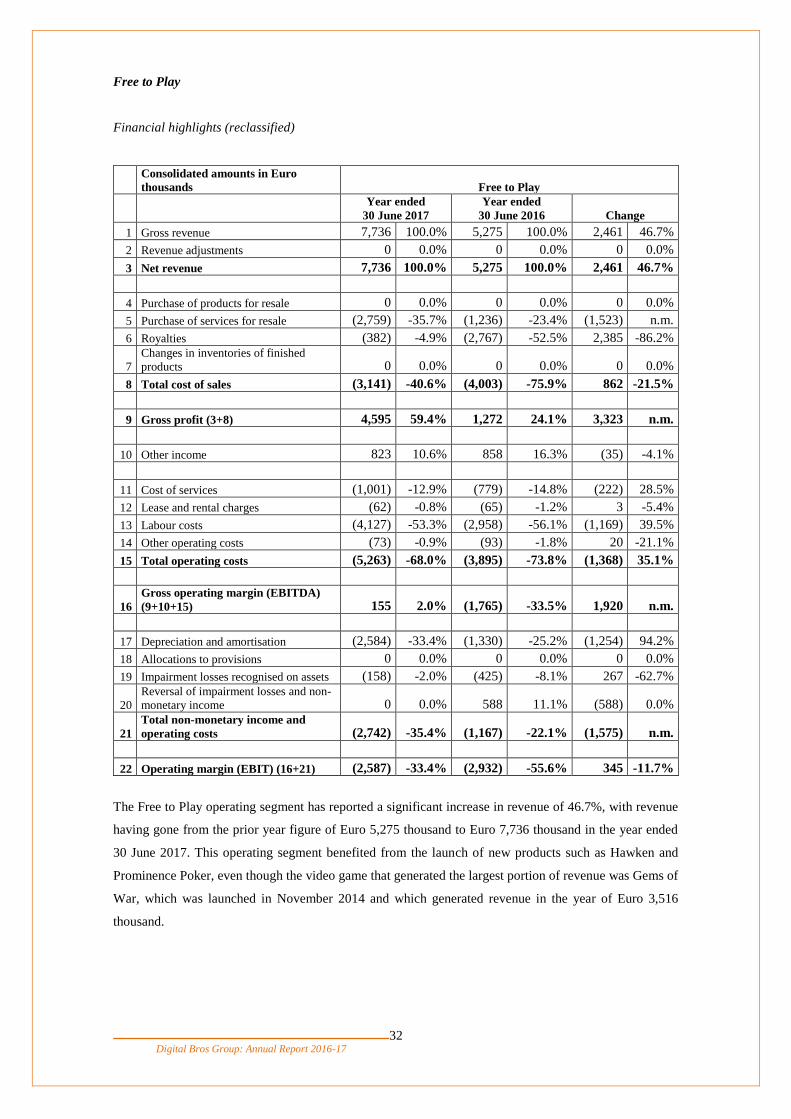
Free to Play
Financial highlights (reclassified)
Consolidated amounts in Euro
thousands Free to Play
Year ended
30 June 2017
Year ended
30 June 2016 Change
1 Gross revenue 7,736 100.0% 5,275 100.0% 2,461 46.7%
2 Revenue adjustments 0 0.0% 0 0.0% 0 0.0%
3 Net revenue 7,736 100.0% 5,275 100.0% 2,461 46.7%
4 Purchase of products for resale 0 0.0% 0 0.0% 0 0.0%
5 Purchase of services for resale (2,759) -35.7% (1,236) -23.4% (1,523) n.m.
6 Royalties (382) -4.9% (2,767) -52.5% 2,385 -86.2%
7
Changes in inventories of finished
products 0 0.0% 0 0.0% 0 0.0%
8 Total cost of sales (3,141) -40.6% (4,003) -75.9% 862 -21.5%
9 Gross profit (3+8) 4,595 59.4% 1,272 24.1% 3,323 n.m.
10 Other income 823 10.6% 858 16.3% (35) -4.1%
11 Cost of services (1,001) -12.9% (779) -14.8% (222) 28.5%
12 Lease and rental charges (62) -0.8% (65) -1.2% 3 -5.4%
13 Labour costs (4,127) -53.3% (2,958) -56.1% (1,169) 39.5%
14 Other operating costs (73) -0.9% (93) -1.8% 20 -21.1%
15 Total operating costs (5,263) -68.0% (3,895) -73.8% (1,368) 35.1%
16
Gross operating margin (EBITDA)
(9+10+15) 155 2.0% (1,765) -33.5% 1,920 n.m.
17 Depreciation and amortisation (2,584) -33.4% (1,330) -25.2% (1,254) 94.2%
18 Allocations to provisions 0 0.0% 0 0.0% 0 0.0%
19 Impairment losses recognised on assets (158) -2.0% (425) -8.1% 267 -62.7%
20
Reversal of impairment losses and non-
monetary income 0 0.0% 588 11.1% (588) 0.0%
21
Total non-monetary income and
operating costs (2,742) -35.4% (1,167) -22.1% (1,575) n.m.
22 Operating margin (EBIT) (16+21) (2,587) -33.4% (2,932) -55.6% 345 -11.7%
The Free to Play operating segment has reported a significant increase in revenue of 46.7%, with revenue
having gone from the prior year figure of Euro 5,275 thousand to Euro 7,736 thousand in the year ended
30 June 2017. This operating segment benefited from the launch of new products such as Hawken and
Prominence Poker, even though the video game that generated the largest portion of revenue was Gems of
War, which was launched in November 2014 and which generated revenue in the year of Euro 3,516
thousand.

Digital Bros Group: Annual Report 2016-17
33
Details are provided below of revenue for the year together with comparative prior year figures:
Revenue (in Euro thousands)
Year ended
30 June 2017
Year ended
30 June 2016
Change
Gems of War 3,516 1,622 1,894
Battle Islands 1,103 2,478 (1,375)
Prominence Poker 1,060 0 1,060
Battle Ages 1,032 572 460
Hawken 625 0 625
Other products 400 603 (203)
Total Free to Play revenue 7,736 5,275 2,461
The Battle Ages and Battle Islands video games, which were developed by the subsidiary DR Studios Ltd.,
contributed revenue in the year of Euro 1,032 thousand and Euro 1,103 thousand, respectively.
The impact on revenue for the year generated by the two games launched in the year, Prominence Poker
and Hawken, was Euro 1,060 thousand and Euro 625 thousand, respectively. With specific reference to the
second of the two, in view of the potential that the video game is deemed to have, a new organisational
unit, Hawken Entertainment Inc., has been set up, through which exploitation rights for Hawken intellectual
property have been purchased. The subsidiary has provided live support for the game and has handled the
preliminary stages of development of the new version of the game.
Cost of sales solely consists of purchases of services and royalties. The former, which amounted to Euro
2,759 thousand in the year, consist of localisation, ratings and quality assurance costs, as well as costs
incurred for live support services. Details are provided below of cost of services by category:
Amounts in Euro thousands
Year ended
30 June 2017
Year ended
30 June 2016 Change
Live support 1,399 608 791
Quality assurance 183 348 (165)
Hosting 892 238 654
Other 285 43 242
Total 2,759 1,237 1,522
The increase in live support costs was attributable to Gems of War and Hawken.
The significant increase in hosting costs is due to the fact that the two recently launched games have a
greater need for game server capacity made available to gamers.
The capitalisation of internal development costs incurred in the year for the game has been recognised as
other income.
Operating costs mainly consist of advertising costs incurred to acquire new gamers, as well as labour costs.
The former increased in the year by Euro 222 thousand, whereas the latter increased by Euro 1,169 thousand
(39.5%) compared to comparative prior year figures, in line with the increase in the number of the operating
segment's employees, partially impacted by professional staff hired by the newly formed Hawken
Entertainment Inc.
Digital Bros Group: Annual Report 2016-17
34
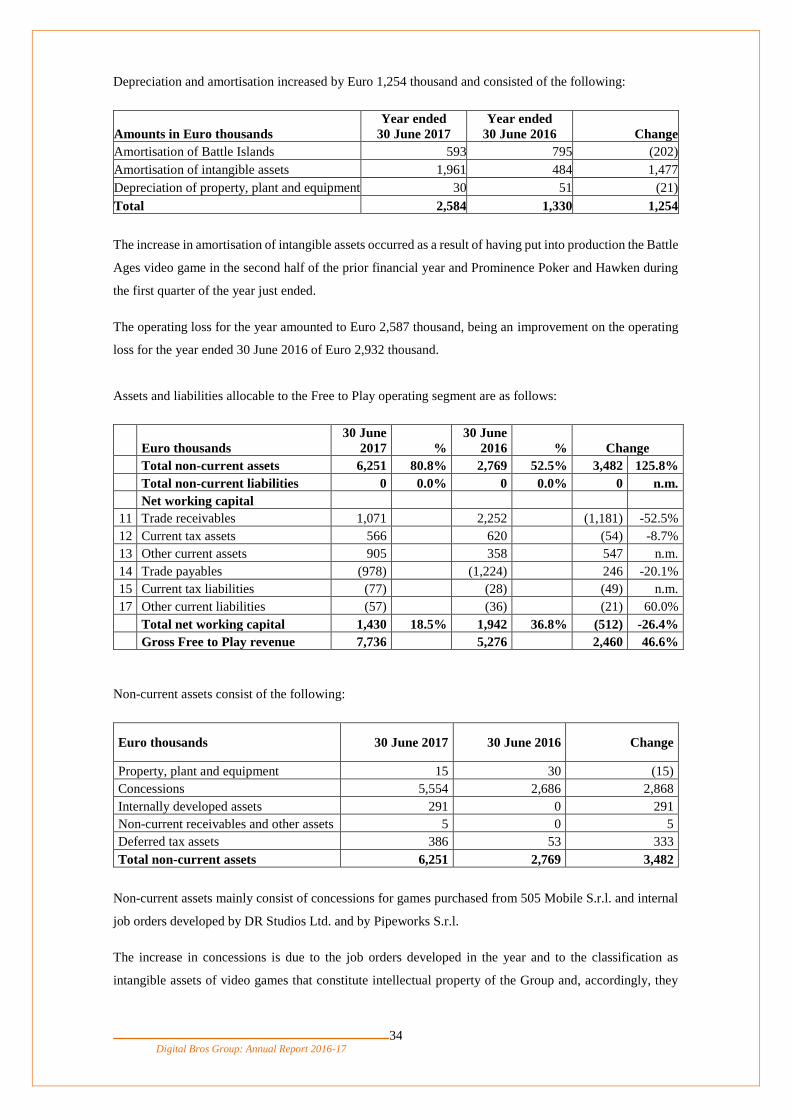
Depreciation and amortisation increased by Euro 1,254 thousand and consisted of the following:
Amounts in Euro thousands
Year ended
30 June 2017
Year ended
30 June 2016 Change
Amortisation of Battle Islands 593 795 (202)
Amortisation of intangible assets 1,961 484 1,477
Depreciation of property, plant and equipment 30 51 (21)
Total 2,584 1,330 1,254
The increase in amortisation of intangible assets occurred as a result of having put into production the Battle
Ages video game in the second half of the prior financial year and Prominence Poker and Hawken during
the first quarter of the year just ended.
The operating loss for the year amounted to Euro 2,587 thousand, being an improvement on the operating
loss for the year ended 30 June 2016 of Euro 2,932 thousand.
Assets and liabilities allocable to the Free to Play operating segment are as follows:
Euro thousands
30 June
2017 %
30 June
2016 % Change
Total non-current assets 6,251 80.8% 2,769 52.5% 3,482 125.8%
Total non-current liabilities 0 0.0% 0 0.0% 0 n.m.
Net working capital
11 Trade receivables 1,071 2,252 (1,181) -52.5%
12 Current tax assets 566 620 (54) -8.7%
13 Other current assets 905 358 547 n.m.
14 Trade payables (978) (1,224) 246 -20.1%
15 Current tax liabilities (77) (28) (49) n.m.
17 Other current liabilities (57) (36) (21) 60.0%
Total net working capital 1,430 18.5% 1,942 36.8% (512) -26.4%
Gross Free to Play revenue 7,736 5,276 2,460 46.6%
Non-current assets consist of the following:
Euro thousands 30 June 2017 30 June 2016 Change
Property, plant and equipment 15 30 (15)
Concessions 5,554 2,686 2,868
Internally developed assets 291 0 291
Non-current receivables and other assets 5 0 5
Deferred tax assets 386 53 333
Total non-current assets 6,251 2,769 3,482
Non-current assets mainly consist of concessions for games purchased from 505 Mobile S.r.l. and internal
job orders developed by DR Studios Ltd. and by Pipeworks S.r.l.
The increase in concessions is due to the job orders developed in the year and to the classification as
intangible assets of video games that constitute intellectual property of the Group and, accordingly, they

Digital Bros Group: Annual Report 2016-17
35
have been more correctly stated as non-current assets. The video games in question were classified as trade
receivables at 30 June 2016.
Trade receivables mainly relate to receivables for video game user licences and receivables due from the
main marketplaces. Trade payables mainly consist of payables due to video game developers.
Trade receivables are a significant component of total net working capital and are made up as follows:
Category 30 June 2017 30 June 2016 Change
Receivables due from customers 955 966 (11)
Receivables pertaining to video game user licenses 116 1,286 (1,170)
Total trade receivables 1,071 2,252 (1,181)

Digital Bros Group: Annual Report 2016-17
36
Italian Distribution
Financial highlights (reclassified)
Consolidated amounts in Euro
thousands Italian Distribution
Year ended
30 June 2017
Year ended
30 June 2016 Change
1 Gross revenue 18,464 111.1% 19,231 107.1% (767) -4.0%
2 Revenue adjustments (1,851) -11.1% (1,273) -7.1% (578) 45.4%
3 Net revenue 16,613 100.0% 17,958 100.0% (1,345) -7.5%
4 Purchase of products for resale (12,519) -75.4% (13,058) -72.7% 539 -4.1%
5 Purchase of services for resale (734) -4.4% (131) -0.7% (603) n.m.
6 Royalties 0 0.0% 0 0.0% 0 0.0%
7
Changes in inventories of finished
products 515 3.1% (227) -1.3% 742 n.m.
8 Total cost of sales (12,738) -76.7% (13,416) -74.7% 678 -5.1%
9 Gross profit (3+8) 3,875 23.3% 4,542 25.3% (667) -14.7%
1
0 Other income 42 0.3% 68 0.4% (26) -38.2%
1
1 Cost of services (1,554) -9.4% (1,981) -11.0% 427 -21.6% 1
2 Lease and rental charges (44) -0.3% (58) -0.3% 14 -24.7% 1
3 Labour costs (1,549) -9.3% (1,646) -9.2% 97 -5.9% 1
4 Other operating costs (205) -1.2% (220) -1.2% 15 -7.0%
1
5 Total operating costs (3,352) -20.2% (3,905) -21.7% 553 -14.1%
1
6
Gross operating margin (EBITDA)
(9+10+15) 565 3.4% 705 3.9% (140) n.m.
1
7 Depreciation and amortisation (261) -1.6% (179) -1.0% (82) 45.7% 1
8 Allocations to provisions 0 0.0% 0 0.0% 0 0.0% 1
9 Impairment losses recognised on assets (420) -2.5% (639) -3.6% 219 -34.2% 2
0
Reversal of impairment losses and non-
monetary income 0 0.0% 0 0.0% 0 0.0%
2
1
Total non-monetary income and
operating costs (681) -4.1% (818) -4.6% 137 n.m.
2
2 Operating margin (EBIT) (16+21) (116) -0.7% (113) -0.6% (3) n.m.
The decrease in revenue reported by the Italian Distribution operating segment was attributable to a fall in
revenue generated by the distribution of video games. In the prior year, the operating segment had in fact
benefited from the simultaneous launch of PES 2016 and Metal Gear Solid. Trading cards revenue,
however, grew by 21.1%.

Digital Bros Group: Annual Report 2016-17
37
Details are provided below of gross revenue by type of video game distributed:
Euro thousands Year ended
30 June 2017
Year ended
30 June 2016 Change
Distribution of video games for consoles 10,562 12,522 (1,960) -15.7%
Distribution of video games for PC 667 477 190 39.9%
Distribution of trading cards 6,760 5,581 1,179 21.1%
Distribution of other products and services 499 690 (191) -27.7%
Cash discounts (24) (39) 15 -38.2%
Total gross Italian Distribution revenue 18,464 19,231 (767) -4.0%
The trend in gross revenue from the distribution of video games for consoles is as follows:
Revenue (in Euro thousands)
Year ended
30 June 2017
Year ended
30 June 2016 Change
Units Revenue Units Revenue Units Revenue
Sony PlayStation 4 240,138 7,488 188,969 6,873 27.1% 9.0%
Sony PlayStation 3 43,315 998 136,761 2,810 -68.3% -64.5%
Microsoft Xbox One 41,797 1,336 36,974 1,238 13.0% 7.9%
Microsoft Xbox 360 28,884 456 69,231 1,244 -58.3% -63.4%
Other consoles 33,667 284 40,521 357 -16.9% -20.4%
Total console revenue 387,801 10,562 472,456 12,522 -17.9% -15.7%
In line with the lifespan of consoles, total revenue fell by Euro 1,960 thousand, although revenue from the
new Sony PlayStation 4 and Microsoft Xbox One platforms has increased by 9.0% and 7.9%, respectively,
whereas there has been a rather substantial fall in revenue from consoles that have reached an advanced
stage of maturity of 64.5% for the Sony PlayStation 3 console and 63.4% for the Microsoft Xbox 360.
Sales of Yu-Gi-Oh! trading cards increased by Euro 1,179 thousand.
Net revenue amounted to Euro 16,613 thousand, down by 7.5% on the prior year figure.
Cost of sales decreased by 5.1%, giving rise to gross profit reported by the operating segment of Euro 3,875
thousand versus the prior year figure of Euro 4,542 thousand.
Operating costs fell by 14.1% to Euro 553 thousand. The decrease was mainly due to a reduction in cost of
services of Euro 427 thousand and in labour costs of Euro 97 thousand.
Non-monetary operating costs rose by Euro 137 thousand mainly due to the impact of an allocation to the
provision for doubtful debts, to take account of the potential loss arising from difficulties encountered in
collecting certain accounts receivable due from customers.
The operating loss reported by the operating segment is essentially in line with the prior year loss, having
gone from Euro 113 thousand for the year ended 30 June 2016 to Euro 116 thousand for the year just ended.
Assets and liabilities allocable to the Italian Distribution operating segment are:

Digital Bros Group: Annual Report 2016-17
38
Euro thousands
30 June
2017 %
30 June
2016 % Change
Total non-current assets 3,422 18.5% 3,409 17.7% 13 0.4%
Total non-current liabilities (496) 2.7% (531) 2.8% 36 -6.7%
Net working capital
10 Inventories 5,319 4,804 515 10.7%
11 Trade receivables 3,339 3,595 (255) -7.1%
12 Current tax assets 353 741 (388) -52.3%
13 Other current assets 539 312 227 72.8%
14 Trade payables (1,981) (1,669) (312) 18.7%
15 Current tax liabilities (167) (155) (11) 7.3%
17 Other current liabilities (896) (797) (99) 12.4%
Total net working capital 6,506 35.2% 6,831 35.5% (325) -4.8%
Gross Italian Distribution
revenue 18,464 19,231 (767) -4.0%
Net working capital has decreased in line with the revenue trend, while the slight rise in inventories is due
to an increase in Yu-Gi-Oh! trading cards inventory with a view to the distribution thereof to newsstands
that the Group started in the year just ended.
Non-current assets consist of the carrying amount of the Trezzano sul Naviglio warehouse, of deferred tax
assets allocable to the operating segment and of other minor amounts of property, plant and equipment and
intangible assets.
Other Activities

Digital Bros Group: Annual Report 2016-17
39
Financial highlights (reclassified)
Consolidated amounts in Euro thousands Other Activities
Year ended
30 June 2017
Year ended
30 June 2016 Change
1 Gross revenue 863 204.1% 746 108.2% 117 15.7%
2 Revenue adjustments (440) -104.1% (56) -8.2% (384) n.m.
3 Net revenue 423 100.0% 690 100.0% (267) -38.7%
4 Purchase of products for resale 0 0.1% 0 0.1% 0 0.0%
5 Purchase of services for resale (177) -42.0% (135) -19.6% (42) 31.0%
6 Royalties (72) -16.9% (109) -15.8% 37 -34.2%
7 Changes in inventories of finished products 0 -0.1% 0 0.0% 0 0.0%
8 Total cost of sales (249) -58.9% (244) -35.4% (5) 2.1%
9 Gross profit (3+8) 174 41.1% 446 64.6% (272) -61.0%
10 Other income 0 0.0% 228 33.0% (228) n.m.
11 Cost of services (1,020) -241.2% (2,849) -412.9% 1,829 -64.2%
12 Lease and rental charges (18) -4.2% (20) -2.9% 2 -10.7%
13 Labour costs (883) -208.9% (647) -93.8% (236) 36.5%
14 Other operating costs (49) -11.6% (73) -10.5% 24 -32.5%
15 Total operating costs (1,970) -465.8% (3,589) -520.2% 1,619 -45.1%
16 Gross operating margin (EBITDA) (9+10+15) (1,796) -424.7% (2,915) -422.6% 1,119 -38.4%
17 Depreciation and amortisation (379) -89.7% (275) -39.8% (104) 38.2%
18 Allocations to provisions 0 0.0% 0 0.0% 0 0.0%
19 Impairment losses recognised on assets 0 0.0% 0 0.0% 0 0.0%
20 Reversal of impairment losses and non-monetary income 0 0.0% 0 0.0% 0 0.0%
21 Total non-monetary income and operating costs (379) -89.7% (275) -39.8% (104) 38.2%
22 Operating margin (EBIT) (16+21) (2,175) -514.1% (3,190) -462.4% 1,015 -31.8%
The Other Activities operating segment's revenue amounted to Euro 863 thousand and related to sales
generated by the Daily Fantasy Sport Fantasfida and revenue generated by specialisation courses organised
by Digital Bros Game Academy S.r.l.
Revenue adjustments consist of taxes paid on revenue generated by the portals www.gameplaza.it and
www.fantasfida.it and on amounts awarded as bonuses to Fantasfida players.
Operating costs decreased by Euro 1,619 thousand from Euro 3,589 thousand to Euro 1,970 thousand due
to lower costs incurred for the Italian launch of Fantasfida that in the prior year had amounted to Euro 2,291
thousand.
The negative gross operating margin amounted to Euro 1,796 thousand compared to the negative gross
operating margin of Euro 2,915 thousand reported for the year ended 30 June 2016, representing an
improvement of Euro 1,119 thousand.
A summary statement of financial position is provided below:

Digital Bros Group: Annual Report 2016-17
40
Euro thousands
30 June
2017 %
30 June
2016 % Change
Total non-current assets 1,016 117.7% 1,281 171.7% (264) -20.7%
Total non-current liabilities (68) 7.8% (34) 4.5% (34) n.m.
Net working capital
10 Inventories 0 0 0 0.0%
11 Trade receivables 5 0 5 n.m.
12 Current tax assets 14 3 11 n.m.
13 Other current assets 164 128 35 27.5%
14 Trade payables (184) (383) 200 n.m.
15 Current tax liabilities (45) (21) (24) n.m.
17 Other current liabilities (651) (660) 9 n.m.
Total net working capital (697) -80.7% (933) -125.1% 236 -25.3%
Gross revenue - Other Activities 863 746 117 15.7%
Non-current assets consist of Euro 493 thousand of expenditure incurred by Game Network S.r.l. for the
launch of Fantasfida and which is being amortised over three years and of Euro 220 thousand of cautionary
deposits relating to operations governed by AAMS, while the remainder consists of deferred tax assets and
plant and machinery.
Other current liabilities include amounts due to Game Network S.r.l.'s employees for accruals of additional
monthly salaries, holiday pay and leave of absence and the portion of registration fees for training courses
already received by Digital Bros Game Academy S.r.l., but which is attributable to the coming year.
Holding
Financial highlights (reclassified)

Digital Bros Group: Annual Report 2016-17
41
Consolidated amounts in Euro thousands Holding
Year ended
30 June 2017
Year ended
30 June 2016 Change
1 Gross revenue 0 0.0% 0 0.0% 0 0.0%
2 Revenue adjustments 0 0.0% 0 0.0% 0 0.0%
3 Net revenue 0
0.0
% 0
0.0
% 0 0.0%
4 Purchase of products for resale 0 0.0% 0 0.0% 0 0.0%
5 Purchase of services for resale 0 0.0% 0 0.0% 0 0.0%
6 Royalties 0 0.0% 0 0.0% 0 0.0%
7 Changes in inventories of finished products 0 0.0% 0 0.0% 0 0.0%
8 Total cost of sales 0
0.0
% 0
0.0
% 0 0.0%
9 Gross profit (3+8) 0
0.0
% (0)
0.0
% 0 0.0%
1
0 Other income 0 0.0% 0 0.0% 0 0.0%
1
1 Cost of services
(1,614
) 0.0%
(1,283
) 0.0% (331) 25.7% 1
2 Lease and rental charges (746) 0.0% (721) 0.0% (25) 3.5%
1
3 Labour costs
(3,325
) 0.0%
(2,686
) 0.0% (639) 23.8% 1
4 Other operating costs (938) 0.0% (468) 0.0% (470) n.m.
1
5 Total operating costs
(6,623
)
0.0
%
(5,158
)
0.0
%
(1,465
)
28.4
%
1
6 Gross operating margin (EBITDA) (9+10+15)
(6,623
)
0.0
%
(5,158
)
0.0
%
(1,465
)
28.4
%
1
7 Depreciation and amortisation (229) 0.0% (187) 0.0% (42) 22.6% 1
8 Allocations to provisions 0 0.0% 0 0.0% 0 0.0% 1
9 Impairment losses recognised on assets (193) 0.0% 0 0.0% (193) n.m. 2
0
Reversal of impairment losses and non-monetary
income 0 0.0% 0 0.0% 0 0.0%
2
1 Total non-monetary income and operating costs (422)
0.0
% (187)
0.0
% (235) n.m.
2
2 Operating margin (EBIT) (16+21)
(7,045
)
0.0
%
(5,345
)
0.0
%
(1,700
)
31.8
%
Operating costs amounted to Euro 6,623 thousand, representing an increase in the year of Euro 1,465
thousand. The increase is mainly due to a rise in labour costs of Euro 371 thousand linked to the stock
option plan approved in the year, to fees of Euro 516 thousand incurred by 505 Games S.p.A. in connection
with the sale and purchase of Starbreeze shares during the course of the year and to professional advisory
costs of Euro 134 thousand incurred for the preparation of the share incentive plan and for the acquisition
of Kunos Simulazioni S.r.l.

Digital Bros Group: Annual Report 2016-17
42
Depreciation and amortisation increased by Euro 42 thousand due to the depreciation of the Eugene
property, which is used by the subsidiary Pipeworks Inc., and the amortisation of capital expenditure
incurred by the Group on ERP systems in the second half of the prior financial year. Impairment losses
were recognised on investments in the associates Cityglance S.r.l. and Ebook&Kids S.r.l. of Euro 44
thousand and Euro 149 thousand, respectively.
Assets and liabilities allocable to the operating segment are as follows:
Euro thousands 30 June 2017 30 June 2016 Change
Non-current assets
1 Property, plant and equipment 2,593 2,721 (128) -4.7%
3 Intangible assets 367 399 (32) -8.0%
4 Equity investments 1,345 898 447 49.8%
5 Non-current receivables and other assets 639 635 4 0.7%
6 Deferred tax assets 69 12 57 n.m.
Total non-current assets 5,013 4,665 348 7.4%
Non-current liabilities 0 (252) 252 n.m.
Net working capital (2,362) (4,025) 1,663 -41.3%
The decrease in property relates to the depreciation by the subsidiary 133 West Broadway of the property
located in Eugene, Oregon.
The decrease in non-current liabilities is a consequence of the classification as current payables of the
variable remuneration linked to the medium/long-term incentive scheme for directors and key managers
that will be paid in September 2017.

Digital Bros Group: Annual Report 2016-17
43
8. INTERCOMPANY AND RELATED PARTY TRANSACTIONS AND
ATYPICAL/UNUSUAL TRANSACTIONS
All intercompany and related party transactions entered into by Group companies are conducted at arm’s
length.
Intercompany transactions
The main intercompany transactions are the sale of video games by 505 Games S.p.A. to local distributors.
The U.S. subsidiary 505 Games (US) Inc. is charged royalties by 505 Games S.p.A. for products distributed
locally in the American market.
505 Games Ltd. and 505 Games (US) Inc. bill 505 Games S.p.A. for labour costs and overheads pertaining
to employees involved in production and international marketing for the Premium Games operating
segment.
505 Games Interactive Inc. bills 505 Games S.p.A. for labour costs and overheads pertaining to employees
involved in product management for the Premium Games operating segment.
505 Games Mobile (US) Inc. bills 505 Mobile S.r.l. for labour costs and overheads pertaining to employees
involved in production and marketing for the Free to Play operating segment.
At the time of acquisition, DR Studios Ltd. was party to development and live support contracts for various
video games entered into with the subsidiaries 505 Games S.p.A. and 505 Mobile S.r.l., which have
remained unchanged. The new development contracts subsequent to integration were governed by a
framework agreement based on direct project costs incurred plus a percentage mark-up.
At the time of acquisition, Kunos Simulazioni S.r.l. was party to a development contract for the Assetto
Corsa video game entered into with the subsidiary 505 Games S.p.A., which has remained unchanged.
Hawken Entertainment Inc. has provided live support services for the Hawken video game to 505 Games
S.p.A.
Pipeworks Inc. is party to a number of open video game development contracts with 505 Games S.p.A. and
505 Mobile S.r.l. based on direct project costs incurred plus a percentage mark-up.
Digital Bros S.p.A., 505 Games Ltd., Digital Bros S.p.A., 505 Games Ltd., 505 Games France, 505 Games
Spain Slu and 505 Games GmbH bill 505 Games S.p.A. an amount equating to 15% of digital revenue
achieved in the respective countries as recognition of the indirect marketing and public relations services
performed by the local companies that are not directly attributable to individual products.
Digital Bros S.p.A. bills 505 Games S.p.A. the direct costs directly incurred on its behalf, and, based on a
percentage of the holding company's total costs, indirect costs for the coordination of the acquisition of
games and for administrative, financial, legal, logistics and IT services.

Digital Bros Group: Annual Report 2016-17
44
Digital Bros S.p.A. charges Digital Bros Game Academy S.r.l. for the cost of administrative, financial,
legal and IT services incurred on its behalf and for the cost of the lease of the property located in Via Labus,
Milan, the subsidiary’s operational headquarters.
505 Games S.p.A. charges the U.S. company 505 Games US for the cost of coordinating the acquisition of
games and the cost of administrative, financial, legal and IT services incurred on its behalf.
133 W. Broadway charges rent to Pipeworks Inc. for the use of the property located in Eugene, where the
company is based.
Other minor transactions consisted of administrative, financial, legal and general services that are usually
performed by Digital Bros S.p.A. on behalf of other Group companies. The parent company also provides
a centralised cash management service, using intercompany current accounts to which positive and negative
balances between Group companies are transferred, including through the transfer of receivables. These
accounts do not bear interest.
Italian Group companies also transfer tax receivables and payables to the parent company Digital Bros
S.p.A. in accordance with domestic tax group arrangements.
On preparing the consolidated financial statements for the year ended 30 June 2017, the impact of
intercompany transactions on the results and financial position has been eliminated.
Related party transactions
Related party transactions consist of:
legal counsel provided by the director Dario Treves;
lease of property by Matov Imm. S.r.l. to the parent company and the subsidiary 505 Games France
S.a.s.;
lease of property by Matov LLC to the subsidiary 505 Games (US) Inc.
Both Matov Imm. S.r.l. and Matov LLC are owned by Abramo and Raffaele Galante.
The impact of related party transactions is disclosed in paragraph 12 of the explanatory notes.
Atypical transactions
There were no atypical or unusual transactions in the year just ended or in the prior year, as defined by
Consob Communication DEM 6064293 of 28 July 2006.

Digital Bros Group: Annual Report 2016-17
45
9. TREASURY SHARES
Pursuant to Art. 2428 paragraph 2 of the Italian Civil Code, it is hereby disclosed that at 30 June 2017
Digital Bros S.p.A. did not hold any treasury shares, given that the 130,247 treasury shares held at 30 June
2016 were sold during the year just ended.
10. RESEARCH AND DEVELOPMENT
The Group incurred research costs in the year of Euro 383 thousand and development costs of Euro 4,726
thousand. The amounts incurred in the year ended 30 June 2016 were Euro 66 thousand and Euro 5,051
thousand, respectively.
The research relates to the preliminary stages of the conception of new video games and is performed by
the subsidiaries Pipeworks Inc., DR Studios Ltd. and Kunos Simulazioni S.r.l., which also carry out any
development subsequent to the research phase.
Digital Bros Group: Annual Report 2016-17
46
11. MANAGEMENT OF OPERATIONAL RISK, FINANCIAL RISK AND
FINANCIAL INSTRUMENTS
The Group has implemented a risk identification process that involves the Board of Directors together with
top-level organisational structures in coordination meetings that are held periodically throughout the year.
Their work is summarised in a risk matrix that is prepared and regularly reviewed by the director in charge
of control, who attends the coordination meetings. Records are maintained for each risk that provide a
description of the risk in question, a gross risk rating based on a probability/impact matrix, any mitigating
factors and/or safeguards put in place to reduce and monitor the risk and the allocation of a net risk rating.
The executive director is assisted in this task by the Control and Risks Committee.
The individual risk records also show the impact that a failure to meet the control objectives would have in
terms of operations and financial reporting.
The thoroughness of the risk map and the ratings of net risk are assessed jointly by the two managing
directors and by the director in charge of control and are updated by the Board of Directors at least once a
year.
Risks fall into one of two types: operational risks and financial risks.
Operational risks
The most significant operational risks are:
ability to publish popular games;
disintermediation of the publisher and the failure to control intellectual property;
product obsolescence;
dependence on key employees.
Ability to publish popular games
The video games market, like the entire entertainment industry, is exposed to a number of risks outside the
Group’s control. These include the popularity of celebrities and sports, the platforms players favour,
changes in the demography of consumption and the rise of other forms of entertainment. If the Group were
unable to please consumers and keep up with the speed of change, its revenues and margins could be deeply
affected and its targets could be difficult to meet. This risk is mitigated by experienced management and
by the procedure implemented by the Group for the acquisition of licensing and development contracts,
which involves close examination of a product’s economic potential using market analysis that is performed
on an ongoing basis, inclusive of during the development phases of a video game.

Digital Bros Group: Annual Report 2016-17
47
Disintermediation of the publisher and the failure to control intellectual property
The continuous digitalisation of revenue has led to a shortening of the value chain. The possibility of a
further shortening of the value chain occurring in the near future could cast doubts on the role of the
publisher, should the latter no longer own intellectual property and/or control it contractually. To mitigate
this risk, the Group has pursued a strategy of acquiring controlling interests (Pipeworks, DR Studios and
Kunos Simulazioni) and/or non-controlling interests (Ovosonico) in order to increase the level of control
over intellectual property. In addition to this, the Group has set up a number of organisational units designed
to identify new intellectual property, such as Portal Knights. The risk, however, is deemed to be high and,
accordingly, the Group has implemented all necessary measures to ensure the risk is mitigated by
contractual arrangements whereby exploitation rights are acquired.
Product obsolescence
Video games can quickly become obsolete. A game that is sold at a certain price is then repositioned at
gradually lower prices over time. The launch price of a game is usually high during the launch of a console
and then decreases throughout the lifespan of the hardware.
The decision to invest in a certain game is often made years before its actual release. Management must
therefore estimate the retail price a game will sell for in subsequent periods. A sudden acceleration in the
obsolescence of a game or its supporting hardware could push retail prices below those originally foreseen,
to the detriment of actual revenues and margins compared to those that were planned.
The risk of obsolescence is mitigated by the fact that it is possible to reduce production, marketing and
royalty costs payable to developers, thereby minimising the impact on margins, as well as by knowledge
gained of the lifespans of earlier consoles and advance information procured on new gaming platforms.
Dependence on key employees
The Group’s success depends on the performance of certain key individuals who have made a solid
contribution to its development and have acquired valuable experience in the industry.
The Group has an executive team (chairman, managing director and CFO) with many years’ experience in
the sector and a decisive role in the management of its business. The loss of the services of these individuals
without suitable replacements could have a negative impact on the Group’s results and financial position
and, in particular, could affect the process for the identification, assessment and monitoring of risks. In any
case, management feels that the Group has an operational and executive structure that can ensure continuity
in the handling of business affairs.
Financial instruments and financial risk management
The main financial instruments used by the Group are as follows:
Bank overdrafts
Sight and short-term bank deposits

Digital Bros Group: Annual Report 2016-17
48
Import financing
Export financing
Commercial credit lines (factoring)
Finance leases
Derivative contracts
Financial instruments held for trading.
The purpose of these instruments is to finance the Group’s operating activities. The policy for the use of
financial instruments, including derivative contracts and financial instruments held for trading, are
described in the explanatory notes.
Credit facilities granted to the Group and drawn down at 30 June 2017 are as follows:
Euro thousands Facilities granted
Drawn
down Available
Bank overdrafts 2,650 0 2,650
Import financing 21,000 0 21,000
Advances on invoices and cash orders subject to collection 18,567 0 18,567
Factoring 15,280 218 15,062
Endorsement credits 1,000 0 1,000
Total 58,497 218 58,279
The parent company Digital Bros S.p.A. manages all financial risks on behalf of itself and its subsidiaries,
with the exception of other financial instruments not listed above, namely trade payables and receivables
arising from operating activities for which the financial risk is the responsibility of the individual company.
The Group tries to maintain a balance between short-term and medium/long-term financial instruments.
The Group’s core business, the marketing of video games, entails investments primarily in net working
capital which are funded through short-term credit lines. Long-term investments are normally financed
through medium/long-term lines of credit often dedicated to the individual investment, including in the
form of finance leases.
Given the above, medium- and long-term financial payables have a well-distributed range of maturities.
The main risks generated by the Group’s financial instruments are:
interest rate risk
liquidity risk
exchange rate risk
credit risk
Interest rate risk

Digital Bros Group: Annual Report 2016-17
49
The Group’s exposure to interest rate fluctuations is marginal with respect to its medium- and long-term
financial instruments, which were originally designated as fixed-rate instruments or have been converted
into fixed rates using appropriate derivative agreements.
For short-term financial instruments, the possibility of rising interest rates is an effective risk, because the
Group cannot immediately transfer the higher rates to its prices. These risks are reduced by:
the availability of an interconnected series of short-term credit lines, allowing it to borrow under
the most favourable conditions;
the level of short-term borrowings, which varies substantially on the basis of seasonal trends in
the video games market and that has shown a constantly falling trend;
the implementation of a short-term cash flow procedure that constantly monitors the trend in short-
term debt and allows preventive action to be taken when interest rates are expected to rise.
Liquidity risk
Liquidity risk arises if it becomes difficult or impossible to obtain, under sustainable conditions, the
financial resources needed to operate the business.
The factors that influence the Group’s financial needs are the resources generated or absorbed by operating
and investing activities, the maturity and renewal terms of debt and the liquidity of investments and current
conditions and available funds in the credit market.
The Group has reduced this risk by setting up the centralised management of treasury procedures and credit
lines, by obtaining adequate credit that allows the creation of a sustainable liability structure through the
use of irrevocable credit lines and continuous monitoring of prospective liquidity conditions.
It is believed that the results of short- and medium/long-term planning and currently available funds, along
with those to be generated by operating activities, should allow the Group to satisfy its requirements as far
as investment, working capital management and debt repayment at natural maturity are concerned and in
any case to determine its financing needs sufficiently ahead of time.
Exchange rate risk
The Group’s exposure in US dollars arising from the operations of its U.S. subsidiaries is mitigated by the
fact that the Group is party to a considerable number of game development contracts denominated in that
currency and, thus, any negative changes in the EUR/USD exchange rate would cause licence costs to go
up but would also lead to a rise in margins earned by the subsidiaries (the reverse also holds true).
To monitor the risk level of the EUR/USD and EUR/GBP exchange rate, the Group closely monitors
exchange rate forecasts from independent analysts and other sources and may use derivative instruments to
hedge this risk as appropriate (no such instruments are used at present).
In the preparation of its forecasts, the Group runs models that take account of various currencies used by
the companies and forward exchange rates based on reports issued by independent analysts.

Digital Bros Group: Annual Report 2016-17
50
Credit risk
As far as Italian customers are concerned, the Group sells exclusively to known buyers. If necessary
information on customers is not available, merchandise is sold with advance payment and/or cash on
delivery to limit credit risk.
The finance department reviews credit facilities and customer balances before any shipments are made.
Despite these precautions, the Group has taken out insurance covering a significant percentage of its
customers.
All foreign subsidiaries have taken out an appropriate credit insurance policy. The credit policy is never to
exceed the limits of coverage for each individual customer, thereby limiting the chance that any difficulties
faced by customers will affect the Group’s performance.
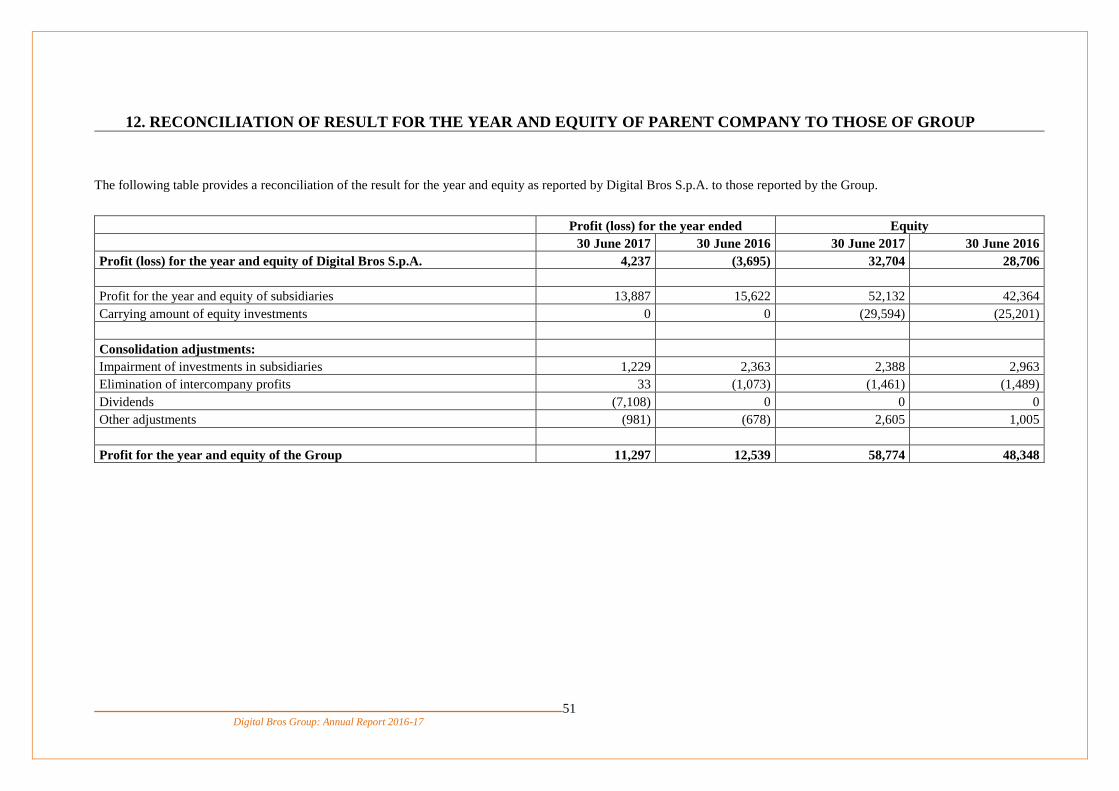
Digital Bros Group: Annual Report 2016-17
51
12. RECONCILIATION OF RESULT FOR THE YEAR AND EQUITY OF PARENT COMPANY TO THOSE OF GROUP
The following table provides a reconciliation of the result for the year and equity as reported by Digital Bros S.p.A. to those reported by the Group.
Profit (loss) for the year ended Equity
30 June 2017 30 June 2016 30 June 2017 30 June 2016
Profit (loss) for the year and equity of Digital Bros S.p.A. 4,237 (3,695) 32,704 28,706
Profit for the year and equity of subsidiaries 13,887 15,622 52,132 42,364
Carrying amount of equity investments 0 0 (29,594) (25,201)
Consolidation adjustments:
Impairment of investments in subsidiaries 1,229 2,363 2,388 2,963
Elimination of intercompany profits 33 (1,073) (1,461) (1,489)
Dividends (7,108) 0 0 0
Other adjustments (981) (678) 2,605 1,005
Profit for the year and equity of the Group 11,297 12,539 58,774 48,348

Digital Bros Group: Annual Report 2016-17
52
Details are provided below of consolidation adjustments at 30 June 2017 and 2016 and for the years then ended:
Profit (loss) for the year ended Equity
30 June 2017 30 June 2016 30 June 2017 30 June 2016
Impairment of Digital Bros S.p.A.'s investment in Game Network S.r.l. 1,459 1,991 1,156 1,301
Impairment of Digital Bros S.p.A.'s investment in Digital Bros Game Academy S.r.l. 119 372 90 171
Impairment (reversal of impairment) of Digital Bros S.p.A.'s investment in Pipeworks Inc. (1,491) 0 0 1,491
Impairment of 505 Games S.p.A.'s investment in 505 Mobile S.r.l. 1,142 0 1,142 0
Total impairment of investments in subsidiaries 1,229 2,363 2,388 2,963
Profits in inventory (156) (80) (364) (208)
DR Studios Ltd. and Pipeworks Inc. margin on intercompany sales 189 (993) (1,097) (1,281)
Total elimination of intercompany profits 33 (1,073) (1,461) (1,489)
Dividends from 505 Games Ltd. (1,108) 0 0 0
Dividends from 505 Games S.p.A. (6,000) 0 0 0
Total dividends (7,108) 0 0 0
Amortisation/depreciation/allocation of purchase price of DR Studios Ltd., net of the related tax
effect (315) (359) 86 401
Amortisation/depreciation/allocation of purchase price of Pipeworks Inc., net of the related tax
effect (318) (319) 50 370
Amortisation/depreciation/allocation of purchase price of Kunos S.r.l., net of the related tax effect (249) 0 2,235 0
Other (99) 0 234 234
Total consolidation adjustments (981) (678) 2,605 1,005

Digital Bros Group: Annual Report 2016-17
53
13. CONTINGENT ASSETS AND LIABILITIES
One of the key financial terms of the sale of rights to Starbreeze by the Group in May 2016 provided the
Group with the chance to earn up to a maximum of 40 million U.S. dollars to be computed as 33% of net
revenue that Starbreeze shall recognise on sales of PAYDAY3. On 16 February 2017, upon the approval
of Starbreeze's financial statements, its CEO officially announced that the game had entered into its
production phase, without specifying the timing of its release.
As at the reporting date, the Group has deemed the foregoing to be a contingent asset, as was also the case
at the prior financial year end.
14. SUBSEQUENT EVENTS
Details of subsequent events are as follows:
With the issue of its findings on 25 July 2017, the Milan unit of the Italian Tax Police completed
a tax audit of the subsidiary 505 Games S.p.A. that had commenced on 19 October 2016 and which
had focused on corporate income tax (IRES and IRAP) for the tax years 2011, 2012, 2013 and
2014 and on withholding tax for the tax years 2012, 2013, 2014 and 2015. The tax audit report
addresses issues concerning transfer pricing and the incorrect application of withholding tax that
come to a significant total amount. The risks involved have been assessed by the directors and an
amount of Euro 854 thousand has been provided at 30 June 2017 in relation thereto.
On the same date, the Milan unit of the Italian Tax Police completed a tax audit of Digital Bros
S.p.A. that had commenced on 10 February 2016 and which had focused on corporate income tax
(IRES and IRAP) for the tax years 2011, 2012, 2013 and 2014 and on withholding tax for the tax
years 2012, 2013, 2014 and 2015. No irregularities arose from the audit;
Digital Bros S.p.A. sold all the Starbreeze B ordinary shares held at 30 June 2017 at an average
price of 15.24 Swedish Krona resulting in a gain of Euro 88 thousand Euro.

Digital Bros Group: Annual Report 2016-17
54
15. BUSINESS OUTLOOK
Over the coming twelve months, the Group will launch Premium products of interest, such as Bloodstained
and Mars, although this will also be a preparatory period for the release of major video game productions
that have already started, such as Overkill’s the Walking Dead and a Remedy product, the code name of
which is P7, both of which are expected to be launched in the year ending 30 June 2019. Strong sales are
expected to continue of products that have been around for some time, such as Terraria and PAYDAY2, as
well as of new games released in the year just ended, such as Portal Knights and Assetto Corsa. The
operating segment's business operations will be characterised by the release of a number of newly published
retail products, such as Raid, along with continuing sales of previously published products, such as Dead
by Daylight, although sales are not expected to repeat the prior year performance that was boosted by the
extraordinary success of Rocket League. Due to the impact of the foregoing, it is expected that there will
be a temporary downturn in revenue generated by the Premium Games operating segment over the coming
year, but there will then be a return to fairly significant growth in the following financial year.
For all the other operating segments, the outlook is for growth even without the launch of new products by
the Free to Play operating segment, which will benefit from a strong performance by Gems of War and
which will prepare for the launch of the second version of the Hawken video game, the release of which is
planned for the following financial year. This growth, however, will not offset at consolidated level the
temporary loss of revenue by the Premium Games operating segment.
As far as earnings are concerned, the outlook is identical. The Premium Games sector will experience a
downturn in earnings attributable to the expected temporary fall in revenue, even if it is expected to remain
the major contributor to EBIT, while the other operating segments are expected to contribute to the
reduction of the impact of the foregoing due to a reduction in the losses expected to be reported by the Free
to play and Other Activities operating segments, as well as by an expected decrease in costs incurred by the
Holding operating segment.
Net cash is expected to remain fairly stable over the course of the financial year, with a decrease in the first
half and a subsequent realignment to the current level in the second half, despite significant expenditure on
the new productions Overkill’s the Walking Dead and P7.

Digital Bros Group: Annual Report 2016-17
55
16. OTHER INFORMATION
EMPLOYEES
Below are details of the workforce at 30 June 2017 with comparative figures at 30 June 2016:
Category 30 June 2017 30 June 2016 Change
Managers 10 10 0
Office workers 252 225 27
Blue-collar workers and apprentices 4 4 0
Total employees 266 239 27
Below are details of employees of foreign companies at 30 June 2017 with comparative figures at 30 June
2016:
Category 30 June 2017 30 June 2016 Change
Managers 5 5 0
Office workers 181 169 12
Total employees abroad 186 174 12
The average headcount for the year, calculated as the average number of employees in service at the end of
every month, is shown below with prior year comparative figures:
Category 2017 average 2016 average Change
Managers 10 10 0
Office workers 237 208 29
Blue-collar workers and apprentices 4 4 0
Total employees 251 222 29
The average headcount at foreign companies is as follows:
Category 2017 average 2016 average Change
Managers 5 5 0
Office workers 175 154 21
Total employees abroad 180 159 21
The increase in the number of employees abroad is due to growth in the international structure of the
Premium Games and Free to Play operating segments and to having set up Hawken Entertainment Inc.,
whereas the increase in the number of employees of the Italian companies is due to the acquisition of Kunos
Simulazioni S.r.l.
The Group’s Italian companies apply the current Confcommercio national collective employment contract
for the commercial, distribution and services sector.
ENVIRONMENT
At 30 June 2017, there were no issues of an environmental nature and as the Group’s environment-related
activities consist chiefly of packing and shipping video games and affixing labels to packaging, there is no
reason any such problems should arise in the future.
Digital Bros Group: Annual Report 2016-17
56
17. REPORT ON CORPORATE GOVERNANCE AND OWNERSHIP
STRUCTURE
The report on corporate governance and ownership structure, which describes how Digital Bros Group
complies with the Corporate Governance Code for Listed Companies endorsed by Borsa Italiana S.p.A.
and which provides the additional information required by Art. 123-bis of the Consolidated Finance Act, is
published in Italian and English in the investors section of the website at www.digitalbros.com.
18. REMUNERATION REPORT
The remuneration report, containing the information required by Art. 123-ter of the Consolidated Finance
Act, is published in Italian and English in the investors section of the website at www.digitalbros.com.

Digital Bros Group: Annual Report 2016-17
57
Consolidated financial statements
for the year ended 30 June 2017

Digital Bros Group: Annual Report 2016-17
58
(this page intentionally left blank)

Digital Bros Group: Annual Report 2016-17
59
FINANCIAL STATEMENTS Digital Bros Group
Consolidated statement of financial position at 30 June 2017
Euro thousands 30 June 2017 30 June 2016 Change
Non-current assets
1 Property, plant and equipment 6,619 7,032 (413) -5.9%
2 Investment property 0 0 0 0.0%
3 Intangible assets 18,867 10,458 8,409 80.4%
4 Equity investments 1,345 898 447 49.7%
5 Non-current receivables and other assets 1,052 1,056 (4) -0.4%
6 Deferred tax assets 2,807 2,619 188 7.2%
Total non-current assets 30,690 22,063 8,627 39.1%
Non-current liabilities
7 Employee benefits (545) (529) (16) 2.9%
8 Non-current provisions (79) (36) (43) n.m.
9 Other non-current payables and liabilities 0 (252) 252 n.m.
Total non-current liabilities (624) (817) 193 -23.5%
Net working capital
10 Inventories 12,815 11,933 882 7.4%
11 Trade receivables 36,763 34,840 1,923 5.5%
12 Current tax assets 2,064 2,019 45 2.3%
13 Other current assets 3,263 5,034 (1,771) -35.2%
14 Trade payables (27,680) (21,712) (5,968) 27.5%
15 Current tax liabilities (5,736) (6,211) 475 -7.6%
16 Current provisions (854) 0 (854) n.m.
17 Other current liabilities (3,954) (2,312) (1,642) 71.0%
Total net working capital 16,681 23,591 (6,910) -29.3%
Capital and reserves
18 Share capital (5,704) (5,644) (60) 1.1%
19 Reserves (19,805) (20,804) 999 -4.8%
20 Treasury shares 0 390 (390) n.m.
21 (Retained earnings) accumulated losses (33,265) (22,290) (10,975) 49.2%
Total equity (58,774) (48,348) (10,426) 21.6%
Total net assets (12,027) (3,511) (8,516) n.m.
22 Cash and cash equivalents 12,136 2,785 9,351 n.m.
23 Current bank debt (1,942) (25,929) 23,987 -92.5%
24 Other current financial assets and liabilities 950 28,913 (27,963) -96.7%
Current net cash/debt 11,144 5,769 5,375 93.2%
25 Non-current financial assets 1,306 1,195 111 9.3%
26 Non-current bank debt (383) (1,558) 1,175 -75.4%
27 Other non-current financial liabilities (40) (1,895) 1,855 -97.9%
Non-current net cash/debt 883 (2,258) 3,141 n.m.
Total net cash 12,027 3,511 8,516 n.m.

Digital Bros Group: Annual Report 2016-17
60
Digital Bros Group
Consolidated statement of profit or loss for the year ended 30 June 2017
Euro thousands
Year ended
30 June 2017
Year ended
30 June 2016 Change
1 Gross revenue 142,400 105.2% 110,192 102.8% 32,208 29.2%
2 Revenue adjustments (7,017) -5.2% (2,977) -2.8% (4,040) n.m.
3 Net revenue 135,383 100.0% 107,215 100.0% 28,168 26.3%
4 Purchase of products for resale (31,206) -23.1% (21,193) -19.8% (10,013) 47.2%
5 Purchase of services for resale (9,533) -7.0% (5,580) -5.2% (3,953) 70.8%
6 Royalties (37,102) -27.4% (23,851) -22.2% (13,251) 55.6%
7
Changes in inventories of finished
products 882 0.7% (948) -0.9% 1,830 n.m.
8 Total cost of sales (76,959) -56.8% (51,572) -48.1% (25,387) 49.2%
9 Gross profit (3+8) 58,424 43.2% 55,643 51.9% 2,781 5.0%
10 Other income 1,959 1.4% 5,714 5.3% (3,755) -65.7%
11 Cost of services (13,142) -9.7% (13,425) -12.5% 283 -2.1%
12 Lease and rental charges (1,476) -1.1% (1,555) -1.5% 79 -5.0%
13 Labour costs (22,469) -16.6% (19,861) -18.5% (2,608) 13.1%
14 Other operating costs (1,998) -1.5% (1,421) -1.3% (577) 40.6%
15 Total operating costs (39,085) -28.9% (36,262) -33.8% (2,823) 7.8%
16
Gross operating margin (EBITDA)
(9+10+15) 21,298 15.7% 25,095 23.4% (3,797) -15.1%
17 Depreciation and amortisation (7,714) -5.7% (3,788) -3.5% (3,926) n.m.
18 Allocations to provisions (854) -0.6% 0 0.0% (854) n.m.
19 Impairment losses recognised on assets (1,653) -1.2% (1,080) -1.0% (573) 53.1%
20
Reversal of impairment losses and non-
monetary income 0 0.0% 588 0.5% (588) n.m.
21
Total non-monetary income and
operating costs (10,221) -7.5% (4,280) -4.0% (5,941) n.m.
22 Operating margin (EBIT) (16+21) 11,077 8.2% 20,815 19.4% (9,738) -46.8%
23 Interest and finance income 8,772 6.5% 3,093 2.9% 5,679 n.m.
24 Interest expense and finance costs (3,137) -2.3% (5,570) -5.2% 2,433 -43.7%
25 Net finance income (costs) 5,635 4.2% (2,477) -2.3% 8,112 n.m.
26 Profit before tax (22+25) 16,712 12.3% 18,338 17.1% (1,626) -8.9%
27 Current tax (5,140) -3.8% (6,644) -6.2% 1,504 -22.6%
28 Deferred tax (276) -0.2% 845 0.8% (1,121) n.m.
29 Total income tax expense (5,415) -4.0% (5,799) -5.4% 384 -6.6%
30 Profit for the year (26+29) 11,297 8.3% 12,539 11.7% (1,242) -9.9%
Earnings per share:
33 Basic earnings per share (in euros) 0.80 0.90 (0.10) -11.0%
34 Diluted earnings per share (in euros) 0.80 0.90 (0.10) -11.0%

Digital Bros Group: Annual Report 2016-17
61
Digital Bros Group
Consolidated statement of comprehensive income for the year ended 30 June 2017
Euro thousands
Year ended
30 June 2017
Year ended
30 June 2016 Change
Profit (loss) for the year (A) 11,297 12,539 (1,242)
Items that will not be reclassified subsequently
to profit or loss (B) 0 0 0
Actuarial gain (loss) 25 (45) 70
Income tax relating to the actuarial gain (loss) (7) 11 (18)
Exchange differences on translation of foreign
operations (634) (569) (65)
Income tax relating to exchange differences on
translation of foreign operations 0 0 0
Fair value measurement of shares designated as
available for sale (3,075) 2,746 (5,821)
Income tax relating to the fair value
measurement of shares designated as available
for sale 845 (756) 1,601
Items that may be reclassified subsequently
to profit or loss (C) (2,846) 1,387 (4,233)
Total other comprehensive income D =
(B)+(C) (2,846) 1,387 (4,233)
Total comprehensive income (loss) (A)+(D) 8,451 13,926 (5,475)
Attributable to:
Owners of the Company 8,451 13,926 (5,475)
Non-controlling interests 0 0 0

Digital Bros Group: Annual Report 2016-17
62
Digital Bros Group
Consolidated statement of cash flows for the year ended 30 June 2017
Euro thousands
Year ended
30 June 2017
Year ended
30 June 2016
A. Opening net cash/debt 3,511 (8,333)
B. Cash flows from operating activities
Profit (loss) for the year attributable to the Group 11,297 12,539
Depreciation, amortisation and non-monetary costs:
Provisions and impairment losses 1,653 0
Amortisation of intangible assets 6,937 3,117
Depreciation of property, plant and equipment 777 671
Net change in other provisions 43 (134)
Net change in employee benefit provisions 16 43
Net change in other non-current liabilities (252) (470)
SUBTOTAL B. 20,471 15,766
C. Change in net working capital
Inventories (882) 948
Trade receivables (2,343) 1,510
Current tax assets (72) 447
Other current assets 1,771 1,114
Trade payables 5,968 (5,217)
Current tax liabilities (475) 3,182
Current provisions 854 0
Other current liabilities 1,642 586
SUBTOTAL C. 6,463 2,570
D. Cash flows from investing activities
Net payments for intangible assets (16,360) (5,629)
Net payments for property, plant and equipment (364) (2,862)
Net payments for non-current financial assets (823) (1)
SUBTOTAL D. (17,547) (8,492)
E. Cash flows from financing activities
Proceeds from capital increases 60 0
Proceeds from share premium 1,532 0
SUBTOTAL E. 1,592 0
F. Changes in consolidated equity
Dividends distributed (1,834) (1,818)
Changes in treasury shares held 390 809
Increases (decreases) in other equity components (1,018) 3,009
SUBTOTAL F. (2,462) 2,000
G. Cash flow for the year (B+C+D+E+F) 8,516 11,844
H. Closing net cash (A+G) 12,027 3,511

Digital Bros Group: Annual Report 2016-17
63
Notes to the statement of cash flows
Details of cash flow by maturity:
Euro thousands Year ended 30 June 2017 Year ended 30 June 2016
Increase (decrease) in securities and cash and cash equivalents 9,351 (1,554)
Decrease (increase) in current bank debt 23,987 (13,191)
Decrease (increase) in other current financial assets and liabilities (27,963) 27,228
Cash flow for the year pertaining to current net cash/debt 5,375 12,483
Cash flow for the year pertaining to non-current net cash/debt 3,141 (639)
Cash flow for the year 8,516 11,844

Digital Bros Group: Annual Report 2016-17
64
Digital Bros Group
Consolidated statement of changes in equity
Euro thousands
Share
capital
(A)
Share
premium
Legal
reserve
IAS
transition
reserve
Currency
translation
reserve
Other
reserves
Total
reserves
(B)
Treasury
shares
(C)
Retained
earnings
(accumulated
losses)
Profit
(loss)
for the
year
Total
retained
earnings
(D)
Consolidated
equity
attributable
to Group
(A+B+C+D)
As at 1 July 2015 5,644 16,954 1,129 1,367 (244) 211 19,417 (1,199) (3,006) 12,953 9,947 33,809
Allocation of profit for the year 0 9,105 (9,105) 0 0
Payment of dividends (1,818) (1,818) (1,818)
Other changes 0 809 1,622 1,622 2,431
Comprehensive income (loss) (569) 1,956 1,387 12,539 12,539 13,926
As at 30 June 2016 5,644 16,954 1,129 1,367 (813) 2,167 20,804 (390) 5,903 16,387 22,290 48,348
As at 1 July 2016 5,644 16,954 1,129 1,367 (813) 2,167 20,804 (390) 5,903 16,387 22,290 48,348
Capital increase 60 1,532 1,532 0 1,592
Allocation of profit for the year 0 16,387 (16,387) 0 0
Payment of dividends 0 (1,834) (1,834) (1,834)
Other changes 315 315 390 1,512 1,512 2,217
Comprehensive income (loss) (634) (2,212) (2,846) 11,297 11,297 8,451
As at 30 June 2017 5,704 18,486 1,129 1,367 (1,447) 270 19,805 0 21,968 11,297 33,265 58,774
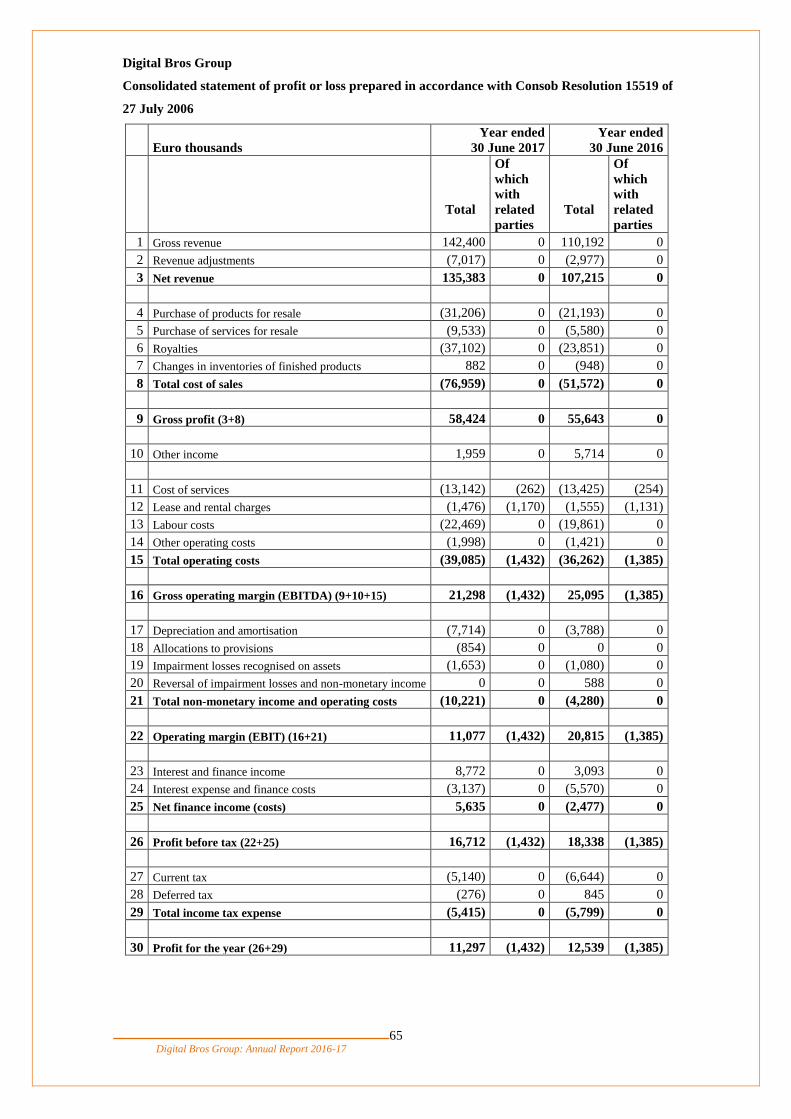
Digital Bros Group: Annual Report 2016-17
65
Digital Bros Group
Consolidated statement of profit or loss prepared in accordance with Consob Resolution 15519 of
27 July 2006
Euro thousands
Year ended
30 June 2017
Year ended
30 June 2016
Total
Of
which
with
related
parties
Total
Of
which
with
related
parties
1 Gross revenue 142,400 0 110,192 0
2 Revenue adjustments (7,017) 0 (2,977) 0
3 Net revenue 135,383 0 107,215 0
4 Purchase of products for resale (31,206) 0 (21,193) 0
5 Purchase of services for resale (9,533) 0 (5,580) 0
6 Royalties (37,102) 0 (23,851) 0
7 Changes in inventories of finished products 882 0 (948) 0
8 Total cost of sales (76,959) 0 (51,572) 0
9 Gross profit (3+8) 58,424 0 55,643 0
10 Other income 1,959 0 5,714 0
11 Cost of services (13,142) (262) (13,425) (254)
12 Lease and rental charges (1,476) (1,170) (1,555) (1,131)
13 Labour costs (22,469) 0 (19,861) 0
14 Other operating costs (1,998) 0 (1,421) 0
15 Total operating costs (39,085) (1,432) (36,262) (1,385)
16 Gross operating margin (EBITDA) (9+10+15) 21,298 (1,432) 25,095 (1,385)
17 Depreciation and amortisation (7,714) 0 (3,788) 0
18 Allocations to provisions (854) 0 0 0
19 Impairment losses recognised on assets (1,653) 0 (1,080) 0
20 Reversal of impairment losses and non-monetary income 0 0 588 0
21 Total non-monetary income and operating costs (10,221) 0 (4,280) 0
22 Operating margin (EBIT) (16+21) 11,077 (1,432) 20,815 (1,385)
23 Interest and finance income 8,772 0 3,093 0
24 Interest expense and finance costs (3,137) 0 (5,570) 0
25 Net finance income (costs) 5,635 0 (2,477) 0
26 Profit before tax (22+25) 16,712 (1,432) 18,338 (1,385)
27 Current tax (5,140) 0 (6,644) 0
28 Deferred tax (276) 0 845 0
29 Total income tax expense (5,415) 0 (5,799) 0
30 Profit for the year (26+29) 11,297 (1,432) 12,539 (1,385)

Digital Bros Group: Annual Report 2016-17
66
Digital Bros Group
Statement of financial position prepared in accordance with Consob Resolution 15519 of 27 July 2006
Euro thousands 30 June 2017 30 June 2016
Non-current assets
Total
Of which
with
related
parties
Total
Of which
with
related
parties
1 Property, plant and equipment 6,619 0 7,032 0
2 Investment property 0 0 0 0
3 Intangible assets 18,867 0 10,458 0
4 Equity investments 1,345 0 898 0
5 Non-current receivables and other assets 1,052 765 1,056 768
6 Deferred tax assets 2,807 0 2,619 0
Total non-current assets 30,690 765 22,063 768
Non-current liabilities
7 Employee benefits (545) 0 (529) 0
8 Non-current provisions (79) 0 (36) 0
9 Other non-current payables and liabilities 0 0 (252) 0
Total non-current liabilities (624) 0 (817) 0
Net working capital
10 Inventories 12,815 0 11,933 0
11 Trade receivables 36,763 0 34,840 0
12 Current tax assets 2,064 0 2,019 0
13 Other current assets 3,263 0 5,034 0
14 Trade payables (27,680) (22) (21,712) (25)
15 Current tax liabilities (5,736) 0 (6,211) 0
16 Current provisions (854) 0 0 0
17 Other current liabilities (3,954) 0 (2,312) 0
Total net working capital 16,681 (22) 23,591 (25)
Capital and reserves
18 Share capital (5,704) 0 (5,644) 0
19 Reserves (19,805) 0 (20,804) 0
20 Treasury shares 0 0 390 0
21 (Retained earnings) accumulated losses (33,265) 0 (22,290) 0
Total equity (58,774) 0 (48,348) 0
Total net assets (12,027) 743 (3,511) 743
22 Cash and cash equivalents 12,136 0 2,785 0
23 Current bank debt (1,942) 0 (25,929) 0
24 Other current financial assets and liabilities 950 0 28,913 0
Current net cash 11,144 0 5,769 0
25 Non-current financial assets 1,306 0 1,195 0
26 Non-current bank debt (383) 0 (1,558) 0
27 Other non-current financial liabilities (40) 0 (1,895) 0
Non-current net cash/debt 883 0 (2,258) 0
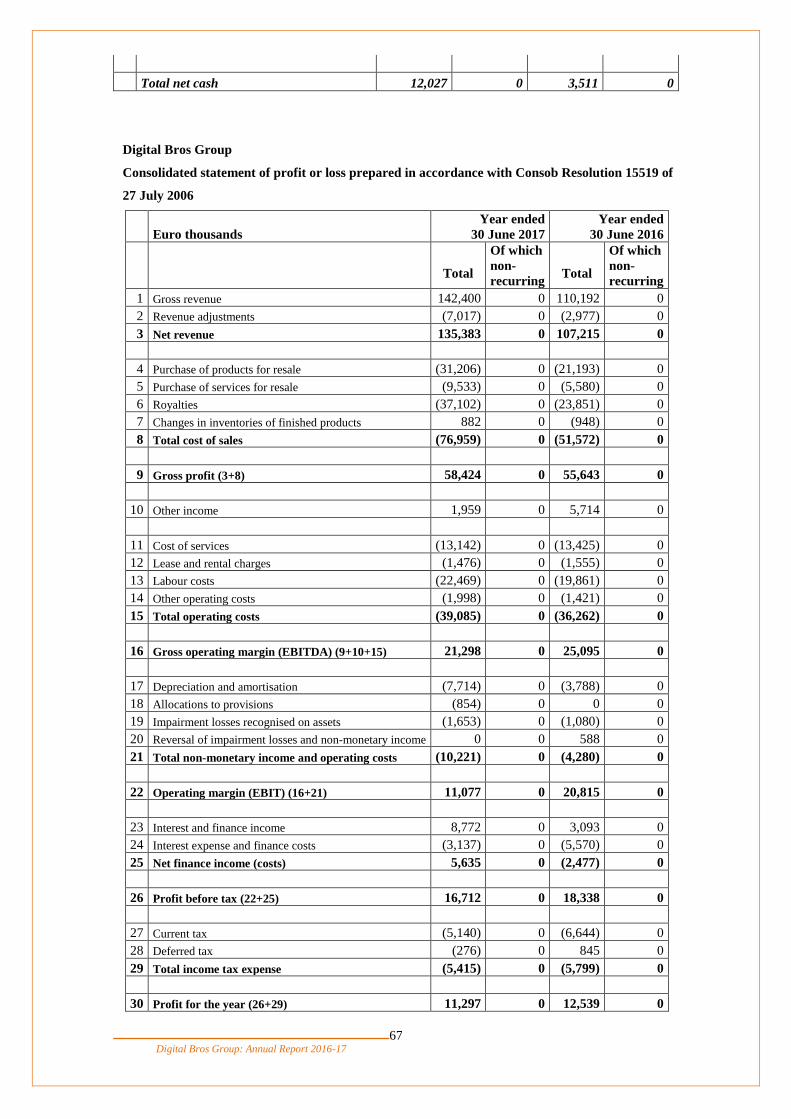
Digital Bros Group: Annual Report 2016-17
67
Total net cash 12,027 0 3,511 0
Digital Bros Group
Consolidated statement of profit or loss prepared in accordance with Consob Resolution 15519 of
27 July 2006
Euro thousands
Year ended
30 June 2017
Year ended
30 June 2016
Total
Of which
non-
recurring
Total
Of which
non-
recurring
1 Gross revenue 142,400 0 110,192 0
2 Revenue adjustments (7,017) 0 (2,977) 0
3 Net revenue 135,383 0 107,215 0
4 Purchase of products for resale (31,206) 0 (21,193) 0
5 Purchase of services for resale (9,533) 0 (5,580) 0
6 Royalties (37,102) 0 (23,851) 0
7 Changes in inventories of finished products 882 0 (948) 0
8 Total cost of sales (76,959) 0 (51,572) 0
9 Gross profit (3+8) 58,424 0 55,643 0
10 Other income 1,959 0 5,714 0
11 Cost of services (13,142) 0 (13,425) 0
12 Lease and rental charges (1,476) 0 (1,555) 0
13 Labour costs (22,469) 0 (19,861) 0
14 Other operating costs (1,998) 0 (1,421) 0
15 Total operating costs (39,085) 0 (36,262) 0
16 Gross operating margin (EBITDA) (9+10+15) 21,298 0 25,095 0
17 Depreciation and amortisation (7,714) 0 (3,788) 0
18 Allocations to provisions (854) 0 0 0
19 Impairment losses recognised on assets (1,653) 0 (1,080) 0
20 Reversal of impairment losses and non-monetary income 0 0 588 0
21 Total non-monetary income and operating costs (10,221) 0 (4,280) 0
22 Operating margin (EBIT) (16+21) 11,077 0 20,815 0
23 Interest and finance income 8,772 0 3,093 0
24 Interest expense and finance costs (3,137) 0 (5,570) 0
25 Net finance income (costs) 5,635 0 (2,477) 0
26 Profit before tax (22+25) 16,712 0 18,338 0
27 Current tax (5,140) 0 (6,644) 0
28 Deferred tax (276) 0 845 0
29 Total income tax expense (5,415) 0 (5,799) 0
30 Profit for the year (26+29) 11,297 0 12,539 0
Digital Bros Group: Annual Report 2016-17
68
(this page intentionally left blank)

Digital Bros Group: Annual Report 2016-17
69
Notes to the consolidated financial statements
for the year ended 30 June 2017

Digital Bros Group: Annual Report 2016-17
70
1. INTRODUCTORY NOTE
The main operations inclusive of those of subsidiaries are described in the directors’ report.
The consolidated financial statements for the year ended 30 June 2017 have been prepared on a going
concern basis. The Group has deemed that the uncertainties and risks to which it is exposed, as described
in the directors’ report, do not cast doubt on its ability to operate as a going concern.
Accounting standards adopted and declaration of compliance with IAS/IFRS
The consolidated financial statements of Digital Bros Group. for the year ended 30 June 2017 have been
prepared in accordance with Art. 154-ter of Legislative Decree 58 of 24 February 1998 and subsequent
amendments thereto. They comply with International Financial Reporting Standards (IFRS) issued by the
International Accounting Standards Board (IASB), on the basis of the text published in the Official Journal
of the European Union. The term “IFRS” encompasses International Accounting Standards (IAS) still in
effect, as well as all interpretations published by the International Financial Reporting Interpretations
Committee (IFRIC). All amounts included in the consolidated financial statements for the year ended 30
June 2017 are stated in thousands of euros, unless otherwise specified.
Reporting formats
The consolidated financial statements for the year ended 30 June 2017 comply with International Financial
Reporting Standards and with the interpretations thereof (SIC/IFRIC) endorsed by the European
Commission as of the reporting date.
The financial statements and the notes thereto also include the disclosures required by Consob Resolution
15519 of 27 July 2006 and Consob Communication 6064293 of 28 July 2006.
No changes have been made to the reporting format with respect to previous years and all schedules are
consistent with those used for the consolidated financial statements for the year ended 30 June 2016.
The financial statements comprise:
consolidated statement of financial position at 30 June 2017 with comparative figures at 30 June
2016 (the annual reporting date for the previous consolidated financial statements);
consolidated statement of profit or loss for the period from 1 July 2016 to 30 June 2017 together
with comparative figures for the period from 1 July 2015 to 30 June 2016;
consolidated statement of comprehensive income for the period from 1 July 2016 to 30 June 2017
together with comparative figures for the period from 1 July 2015 to 30 June 2016;
consolidated statement of cash flows from 1 July 2016 to 30 June 2017 with comparative figures
for the period from 1 July 2015 to 30 June 2016;
consolidated statement of changes in equity from 1 July 2016 to 30 June 2017 and from 1 July
2015 to 30 June 2016.
The following have been provided to supplement the information presented in the financial statements:

Digital Bros Group: Annual Report 2016-17
71
details of cash flows for the year by maturity together with comparative figures for the previous
year;
additional information on the consolidated statement of cash flows together with comparative
figures for the previous year.
The first column of the statement of financial position indicates the number of the relevant note.
The components of the statement of financial position have been allocated to the following five categories:
non-current assets;
non-current liabilities;
net working capital;
equity;
net cash/debt.
Non-current assets consist of assets that are long-term in nature, such as property, plant and equipment to
be used for more than one period, equity investments in associated companies and receivables that fall due
in subsequent periods. They also include deferred tax assets regardless of when they might be realised.
Non-current liabilities comprise provisions not expected to be used within 12 months as well as post-
employment benefits, particularly the provision for employee termination indemnities pertaining to the
parent company and its Italian subsidiaries, and, in general, payables that fall due beyond 30 June 2018.
Net working capital comprises current assets and liabilities. Due to the commercial nature of the Group’s
operations, net working capital is particularly significant, as it represents the amount the Group invests in
operating activities to boost its turnover. Net working capital is significantly influenced by the trend in
turnover and seasonality that is a feature of the market.
Equity consists of share capital, reserves, retained earnings (profit for the year plus prior year profits not
allocated to specific reserves by the shareholders in general meeting) as adjusted for treasury shares.
Total net assets are the sum of non-current assets plus net working capital, less non-current liabilities and
equity.
Net cash/debt is split into current and non-current cash/debt and corresponds to total net assets.
The first column of the consolidated statement of profit or loss and of the statement of profit or loss
presented for segment reporting purposes indicates the number of the relevant note.
The statement of profit or loss has been presented in a multi-step format, with expenses analysed by nature
and shows four intermediate levels of profit:
gross profit, the difference between net revenue and total cost of sales;
gross operating margin (EBITDA), the difference between gross profit and total operating costs;

Digital Bros Group: Annual Report 2016-17
72
operating margin (EBIT), the difference between gross operating margin and non-monetary
operating costs;
profit before tax, the difference between the operating margin and net finance income (costs).
Profit for the year, which is the difference between profit before tax and total income tax income (expense)
is followed by earnings per share.
The statement of cash flows has been prepared using the indirect method, whereby profit is adjusted for the
effects of transactions of a non-cash nature, changes in net working capital, cash flows from financing and
investing activities and changes in consolidated equity.
The overall change for the period is given by the sum of the following:
cash flows from operating activities;
changes in net working capital;
cash flows from investing activities;
cash flows from financing activities;
changes in consolidated equity.
The statement of changes in equity has been prepared in accordance with International Financial Reporting
Standards and shows changes between 1 July 2015 and 30 June 2017.
There are no non-controlling interests, which are therefore not reported.

Digital Bros Group: Annual Report 2016-17
73
2. ACCOUNTING POLICIES
The consolidated financial statements for the year ended 30 June 2017 have been prepared in accordance
with International Financial Reporting Standards and their interpretations in force at that date.
The consolidated financial statements were prepared on the basis of financial statements prepared by the
Group companies falling within the scope of consolidation for the year ended 30 June 2017, adjusted, where
necessary, to bring them into line with Group accounting policies and IAS/IFRS. All prior period
comparative figures have been adjusted, as necessary, in order to render them compliant with IAS/IFRS.
The measurement criteria used to prepare the consolidated financial statements for the year ended 30 June
2017 are consistent with those used to prepare the consolidated financial statements for the year ended 30
June 2016. Changes in the standards and interpretations endorsed by the European Union have had no
significant effect on the preparation of the consolidated financial statements for the year ended 30 June
2017.
Property, plant and equipment
Property, plant and equipment are recognised at purchase or production cost and are shown net of
depreciation and impairment. No assets have been revalued in prior years. No borrowing costs have been
capitalised.
Leasehold improvements and costs incurred subsequent to purchase are capitalised only if they increase the
future economic benefits associated with the asset. All other costs are recognised in profit or loss when
incurred.
Depreciation is computed on a straight-line basis over the assets' estimated useful lives, as follows:
Buildings 2.56%-3%
Plant and machinery 12%-25%
Industrial and commercial equipment 20%
Other assets 20%-25%
Leasehold improvements 17%
Assets held under finance leases, whereby all of the risks and benefits of ownership are transferred to the
Group, are recognised at their fair value at the inception of the lease or, if lower, at the present value of the
minimum lease payments payable over the entire lease term. The corresponding lease obligation is
recognised under financial liabilities. Depreciation is charged on a straight-line basis over the estimated
useful life of each asset category.
Leasing arrangements, whereby the lessor retains substantially all the risks and rewards incidental to
ownership of an asset, are accounted for as operating leases. Operating lease costs are recognised in profit
or loss over the lease term as lease and rental charges.
Land is not depreciated, although impairment losses are recognised if the fair value thereof falls below cost.

Digital Bros Group: Annual Report 2016-17
74
Intangible assets
Intangible assets acquired separately or internally-generated are capitalised in accordance with IAS 38 -
Intangible assets, when it is likely that their use will generate future economic benefits and when their cost
can be reliably determined.
They are recognised at purchase or production cost and those with a finite useful life are amortised on a
straight-line basis over their estimated useful lives.
The amortisation rates applied are as follows:
Brands and similar rights: 33.3% (including intellectual property, usage rights and long-term
licenses)
Microsoft Dynamics Navision licenses: 20%
Long-term licences / usage rights: 20%.
Intangible assets with finite useful lives are amortised systematically over their estimated useful lives and
amortisation begins when the assets are available for use; their carrying amount is tested for recoverability
in accordance with IAS 36, as explained under “impairment of assets” below.
The Group applies amortisation on a straight-line basis over the contract term and, in any event, over a
period not exceeding five years.
The related amortisation is included in depreciation and amortisation expense in the statement of profit
or loss.
Business combinations
Acquisitions of businesses are accounted for using the acquisition method. The cost of an acquisition is
measured as the fair value of the consideration transferred as of the acquisition date plus the amount of any
non-controlling interest held in the acquiree. For each business combination, the Group decides whether to
measure any non-controlling interest in the acquiree at fair value or in proportion to the non-controlling
interest's attributable portion of the acquiree’s net identifiable assets. Acquisition-related costs are generally
recognised in profit or loss as incurred as administrative costs.
When the Group acquires a business, it classifies or designates the financial assets acquired and the
liabilities assumed in accordance with the relevant contractual terms and the economic and other conditions
existing at the acquisition date.
If a business combination is achieved in stages, the Group’s previously held equity interest in the acquiree
measured using the equity method is remeasured to its acquisition-date fair value and the resulting gain or
loss, if any, is recognised in profit or loss.
Any contingent consideration is recognised at its acquisition-date fair value. In accordance with IAS 39, a
change in the fair value of contingent consideration classified as an asset or liability is recognised in profit

Digital Bros Group: Annual Report 2016-17
75
or loss or in other comprehensive income. If the contingent consideration is classified as equity, it need not
be remeasured until settlement of the contingency is reflected within equity. The subsequent transaction
will be accounted for in equity. If contingent consideration does not fall within the scope of IAS 39, it is
measured in accordance with the appropriate IFRS.
Goodwill is initially stated at cost, measured as the excess of the sum of the consideration transferred and
the amount of any non-controlling interest in the acquiree, over the net of the acquisition-date amounts of
the identifiable assets acquired and the liabilities assumed by the Group. If the consideration paid is less
than the fair value of the net assets acquired, the difference is recognised in profit or loss.
In the event that it is only possible to make a preliminary determination of the fair value of the assets,
liabilities and contingent liabilities, the business combination is recognised using these preliminary
amounts. Any adjustments arising from the final determination of the foregoing are recognised within
twelve months of the acquisition and the comparatives are restated.
After its initial recognition, goodwill is carried at cost less accumulated impairment losses. For the purpose
of impairment testing, goodwill acquired in a business combination is, from the acquisition date, allocated
to each of the Group’s cash-generating units expected to benefit from the synergies of the combination,
regardless of whether other assets or liabilities of the acquiree are assigned to those units.
If goodwill has been allocated to a cash-generating unit and the entity disposes of an operation within that
unit, the goodwill associated with the operation disposed of is included in the carrying amount of the
operation when determining the gain or loss on disposal. The goodwill associated with the operation
disposed of is measured on the basis of the relative values of the disposed operation and the portion of the
cash-generating unit retained.
Acquisitions of businesses are accounted for using the acquisition method in accordance with IFRS 3. At
the effective acquisition date, the assets and liabilities that form part of the transaction are recognised at
their fair value, except for deferred tax assets or liabilities, and assets or liabilities related to employee
benefit arrangements that are recognised in accordance with the relevant accounting standards. Acquisition-
related costs are generally recognised in profit or loss as incurred.
At the acquisition date, the identifiable assets acquired and the liabilities assumed are recognised at their
fair value; the following, which are recognised and measured in accordance with the relevant accounting
standards, are an exception:
deferred tax assets and liabilities;
assets or liabilities related to employee benefit arrangements;
liabilities or equity instruments related to share-based payment arrangements of the acquiree or
share-based payment arrangements of the Group entered into to replace share-based payment
arrangements of the acquiree;
assets that are classified as held for sale;
discontinued operations.
Equity investments

Digital Bros Group: Annual Report 2016-17
76
Equity investments in associates are recognised at cost less any impairment.
The positive difference arising at the time of acquisition from third parties between the purchase cost and
the Group's share of the fair value of equity is included in the carrying amount of the investment.
Once a year, or more frequently if necessary, equity investments in associates undergo impairment testing
in accordance with IAS 36. If there is evidence that these investments have suffered an impairment loss,
this is duly recognised in profit or loss. If the Group's share of an investee’s losses exceeds the carrying
amount of the equity investment and if the Group is obliged to cover this loss, the carrying amount of the
investment is reduced to zero and the Group's share of the additional losses is recognised as a provision in
the statement of financial position. If there is any subsequent indication that an impairment loss may no
longer exist or may have decreased, the reversal thereof is recognised in profit or loss up to the amount of
the cost of the asset.
Other available-for-sale financial assets
In accordance with IAS 39, investments in companies other than subsidiaries and associates, constituting
non-current financial assets which are not held for trading, are classified as available-for-sale financial
assets and are measured at fair value, except in situations where the fair value may not be reliably
determined: in such cases, the cost method is adopted.
Gains and losses resulting from fair value adjustments are recognised in a specific other comprehensive
income reserve until an asset is sold or impaired; when an asset is sold, gains or losses previously recognised
in other comprehensive income are reclassified to profit or loss for the period. When an asset is impaired,
the accumulated loss is recognised in profit or loss as interest expense and finance costs.
For further information on the accounting policy for financial assets, reference should be made to the
relevant note (“Financial Assets") included in the paragraph relating to net cash/debt.
Impairment of assets
IAS 36 requires intangible assets and property, plant and equipment to be tested for impairment by
discounting future cash flows.
Accordingly, at least once a year, the Group tests the recoverability of the above assets’ carrying amounts.
If there is any indication that those assets have suffered an impairment loss, the recoverable amount of the
asset is estimated in order to determine the extent of the impairment loss. When it is not possible to estimate
the recoverable amount of an individual asset, the Group estimates the recoverable amount of the cash-
generating unit to which the asset belongs.
The recoverable amount of an asset is the higher of fair value less costs of disposal and value in use. An
asset’s value in use is estimated by discounting estimated future cash flows after taxes to their present
value at a discount rate that reflects the time value of money and the risks specific to the asset.
An impairment loss is recognised if the recoverable amount is less than its carrying amount. If impairment
is subsequently reduced or reversed, the carrying amount of the asset or cash-generating unit is increased
to the revised estimate of its recoverable amount, but so that the increased carrying amount does not exceed

Digital Bros Group: Annual Report 2016-17
77
the carrying amount that would have been determined had no impairment loss been recognised, with the
exception of goodwill, for which the reversal of an impairment loss is prohibited. A reversal of an
impairment loss is recognised immediately in profit or loss.
Inventories
Finished product inventories are recognised at the lower of cost including ancillary expenses and realisable
value, as estimated from market trends. Specific cost is the measurement used to define cost.
When the realisable value of inventories is less than their purchase cost, impairment is charged directly to
the unit value of the article in question.
Receivables and payables
Receivables are measured at amortised cost, which coincides with their estimated realisable value. The
face value of receivables is adjusted to their estimated realisable value by means of a provision for doubtful
accounts, which takes account of debtors’ individual situations.
Receivables due from customers undergoing insolvency procedures are written off in full, or written down
to the extent that ongoing legal action indicates they are partially collectible.
Payables are stated at face value.
Factoring of trade receivables
The Group has factored its trade receivables without recourse to various factoring companies. In
accordance with IAS 39, factored assets may be derecognised only when the associated risks and benefits
have been substantially transferred. Accordingly, receivables factored without recourse that include
provisions limiting the transfer of these risks and benefits at the time of the transaction, such as deferred
payments or deductibles by the transferor, or that imply continued significant exposure to the trend in
inflows deriving from the receivables, remain in the consolidated financial statements even though said
receivables have been transferred. An amount equal to the sums advanced for factored receivables not yet
collected is therefore recognised in the consolidated financial statements under other current financial
liabilities.
Employee benefits
Employee termination indemnities (trattamento di fine rapporto or TFR), which are mandatory for Italian
companies pursuant to Art. 2120 of the Civil Code, qualify as deferred compensation and depend on the
employee’s duration of employment and amount of compensation received while in the Company’s service.
Effective 1 January 2007, significant changes were made to Italian law governing the TFR, including the
employee’s choice as to where his or her benefits are to be held (in supplementary pension schemes or in
the “Treasury Fund” managed by the Social Security agency INPS). Thus, the obligation to INPS and the
payments to supplementary pension schemes qualify as defined contribution plans, while the amounts
remaining in TFR, in accordance with IAS 19, retain their status as defined benefit plans.
Actuarial gains and losses in accordance with the amendment to IAS 19 are recognised in equity under

Digital Bros Group: Annual Report 2016-17
78
other reserves.
Current and non-current provisions
The Group makes provisions against legal or constructive obligations to third parties whose exact amount
and/or timing are unknown and/or it is likely that the Group's resources will have to be employed to fulfil
the obligation and the amount can be reliably estimated. The provisions are adjusted periodically to reflect
any changes in the estimated amount of the liability.
Changes in estimates are recognised in the profit or loss for the period in which the change occurs.
Financial assets and liabilities
Current financial assets, non-current financial assets and current and non-current financial liabilities are
recognised in accordance with IAS 39 – Financial Instruments: Recognition and Measurement.
Cash and cash equivalents include cash on hand, bank deposits, mutual fund units, other highly negotiable
securities and other financial assets recognised as available-for-sale.
Current financial assets and securities are booked on the basis of their trading date and upon initial
recognition they are measured at purchase cost including transaction expenses. Subsequent to initial
recognition, available-for-sale financial instruments and securities held for sale are measured at fair value.
If no market price is available, the fair value of available-for-sale financial instruments is measured with
the most appropriate valuation techniques, such as the discounted cash flow method, using the market
information available at the close of the year.
Financial liabilities comprise financial payables and other financial liabilities, including those arising from
the recognition of derivative instruments at market value.
Financial assets measured at fair value through profit or loss
In accordance with IAS 39 this category includes the following cases:
financial assets that are specifically held for trading;
any financial asset that is designated on initial recognition as one to be measured at fair value.
On initial recognition, financial assets held for trading are measured at fair value, without adding directly
attributable transaction costs or income that are recognised in profit or loss.
All assets within this category are classified as current if they are held for trading or if they are expected to
be sold within 12 months from the reporting date.
Designation of a financial instrument to this category is final (IAS 39 only envisages some exceptional
circumstances in which said financial assets may be classified in another category) and can only be done
on initial recognition.
Gains or losses on financial assets measured at fair value through profit or loss are immediately recognised
in profit or loss.

Digital Bros Group: Annual Report 2016-17
79
Fair value is the amount for which an asset could be exchanged, or to be paid to transfer the liability (“exit
price”) in an arm’s length transaction between knowledgeable and independent parties. In the case of
securities traded on regulated markets, the fair value is determined with reference to bid prices at the end
of trading on the reporting date.
Purchases or sales regulated at “market prices” are recognised on the trade date, which is the date on which
the Group commits to purchase or sell the asset. In cases where fair value cannot be reliably determined,
the financial asset is measured at cost, with disclosure in the notes of its type and related reasons.
Investments in financial assets may be derecognised only upon expiry of the contractual rights to receive
cash flows from investments (e.g. final redemption of bonds subscribed) or when the Company transfers
the financial asset and all related risks and benefits.
Derivative financial instruments
Derivatives are normally used to hedge the risk of fluctuation in exchange rates and interest rates. In
accordance with IAS 39, derivative financial instruments may be recognised on a hedge accounting basis
only if, at the inception of the hedge, the relationship is formally designated and documented, the hedge is
expected to be highly effective, its effectiveness can be reliably measured and the hedge is assessed as
being highly effective throughout the financial reporting periods for which it was designated.
All derivative financial instruments are measured at fair value, as established by IAS 39.
When derivative financial instruments meet the conditions for hedge accounting, they are accounted for as
follows:
Fair value hedge - If a derivative financial instrument is designated as a hedge against changes in
the fair value of a recognised asset or liability attributable to a particular risk that may affect profit
or loss, the gain or loss arising from subsequent fair value measurement of the hedge is recognised
in profit or loss. The gain or loss on the hedged item attributable to the hedged risk adjusts the
carrying amount of that item and is recognised in profit or loss.
Cash flow hedge - If a financial instrument is designated as a hedge against exposure to variations
in the cash flows of a recognised asset or liability or a forecast transaction that is highly probable
and could affect profit or loss, the effective portion of the gain or loss on the financial instrument
is recognised directly in equity. The cumulative gain or loss is transferred from equity to profit or
loss in the same period in which the hedged transaction is recognised. The ineffective portion of
the gain or loss on the hedging instrument is recognised immediately in profit or loss. If a hedge
or a hedging relationship is closed, but the hedged transaction has not yet taken place, the gains
or losses recognised up to that time in equity are reclassified to profit or loss as soon as the
transaction occurs. If the hedged transaction is no longer deemed probable, the profits or losses
not yet realised that have been accounted for in equity are immediately recognised in profit or
loss.
If hedge accounting cannot be used, the gains or losses arising from the fair value measurement of the
derivative financial instrument are recognised immediately in profit or loss as interest income/expense or
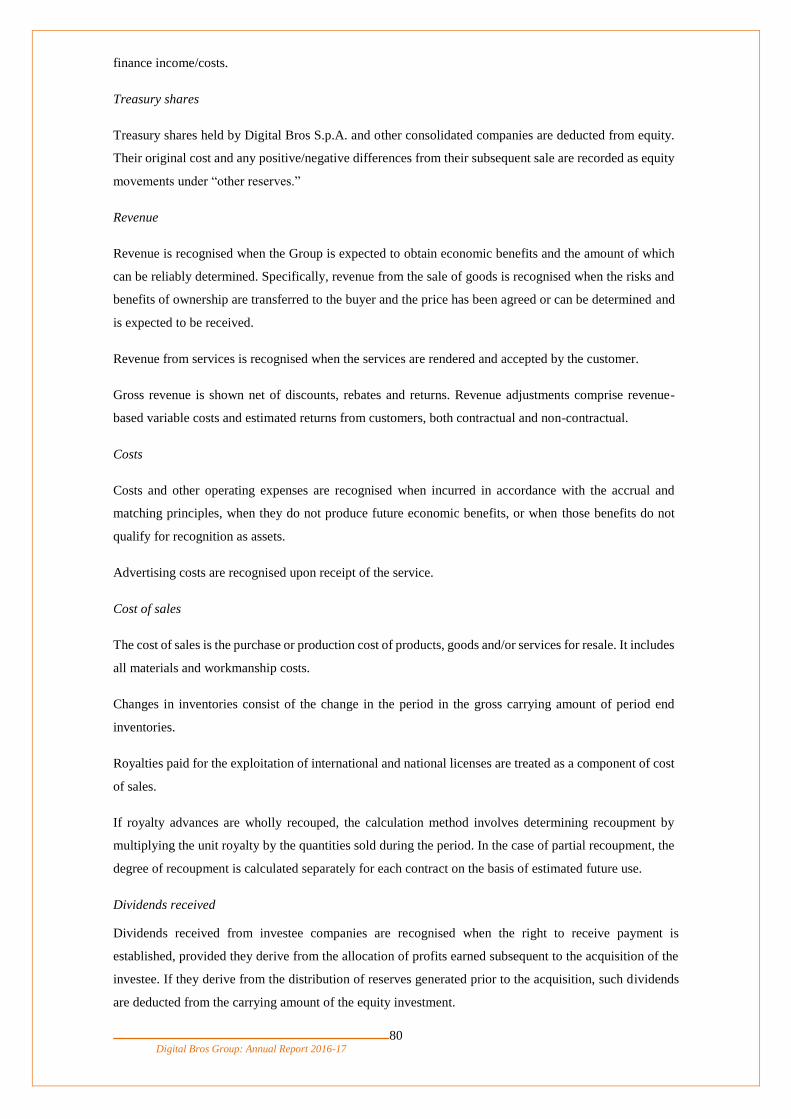
Digital Bros Group: Annual Report 2016-17
80
finance income/costs.
Treasury shares
Treasury shares held by Digital Bros S.p.A. and other consolidated companies are deducted from equity.
Their original cost and any positive/negative differences from their subsequent sale are recorded as equity
movements under “other reserves.”
Revenue
Revenue is recognised when the Group is expected to obtain economic benefits and the amount of which
can be reliably determined. Specifically, revenue from the sale of goods is recognised when the risks and
benefits of ownership are transferred to the buyer and the price has been agreed or can be determined and
is expected to be received.
Revenue from services is recognised when the services are rendered and accepted by the customer.
Gross revenue is shown net of discounts, rebates and returns. Revenue adjustments comprise revenue-
based variable costs and estimated returns from customers, both contractual and non-contractual.
Costs
Costs and other operating expenses are recognised when incurred in accordance with the accrual and
matching principles, when they do not produce future economic benefits, or when those benefits do not
qualify for recognition as assets.
Advertising costs are recognised upon receipt of the service.
Cost of sales
The cost of sales is the purchase or production cost of products, goods and/or services for resale. It includes
all materials and workmanship costs.
Changes in inventories consist of the change in the period in the gross carrying amount of period end
inventories.
Royalties paid for the exploitation of international and national licenses are treated as a component of cost
of sales.
If royalty advances are wholly recouped, the calculation method involves determining recoupment by
multiplying the unit royalty by the quantities sold during the period. In the case of partial recoupment, the
degree of recoupment is calculated separately for each contract on the basis of estimated future use.
Dividends received
Dividends received from investee companies are recognised when the right to receive payment is
established, provided they derive from the allocation of profits earned subsequent to the acquisition of the
investee. If they derive from the distribution of reserves generated prior to the acquisition, such dividends
are deducted from the carrying amount of the equity investment.

Digital Bros Group: Annual Report 2016-17
81
Interest income/expense and finance income/costs
Interest income and expense are recognised on an accrual basis and are shown separately in the income
statement without being offset against each other.
Current tax
Income tax includes all taxes computed on the Group companies' taxable income. Income tax is generally
recognised in profit or loss, except when it pertains to items debited or credited directly to equity, in which
case the tax effect is recognised directly in equity.
Other taxes not related to income, such as those on property and capital, are recognised as other operating
costs.
Deferred tax
Deferred tax is calculated under the balance sheet liability method. It is calculated on all temporary
differences between the accounting and tax basis of an asset or liability, with the exception of non-
deductible goodwill and differences deriving from investments in subsidiaries that are not expected to
reverse in the foreseeable future.
Deferred tax assets on tax losses and unused tax credits eligible to be carried forward are recognised to the
extent of the likelihood of earning enough future taxable income for these to be recovered. Deferred tax
assets and liabilities are computed using the tax rates expected to be in force in the respective jurisdictions
in which the Group operates, when the temporary differences are likely to be realised or reversed.
They are classified as non-current assets and liabilities, regardless of the estimated year of use.
Earnings per share
Basic earnings per share is calculated by dividing the profit for the period by the number of shares
outstanding, net of treasury shares. Diluted earnings per share equates to basic earnings per share, since
there were no financial instruments convertible to shares in circulation during the period.
Foreign currency transactions
Transactions in foreign currencies are recognised at the exchange rate in effect on the transaction date.
Monetary assets and liabilities denominated in foreign currencies as of the reporting date are translated at
the exchange rate in force on that date. Exchange gains and losses generated by the closure of monetary
items or by their translation at rates other than those used upon initial recognition during the year or in prior
periods are recognised in profit or loss.
New accounting standards
Accounting standards, amendments and IFRS interpretations applicable as from 1 July 2016

Digital Bros Group: Annual Report 2016-17
82
Given that no accounting standards, amendments or IFRS interpretations were applicable to the Group for
the first time as from 1 July 2016, the Group has prepared its consolidated financial statements using the
same accounting standards adopted for the consolidated financial statements for the year ended 30 June
2016.
Accounting standards, amendments and IFRS and IFRIC interpretations endorsed by the European
Union, but not yet mandatorily applicable and not adopted early by the Group at 30 June 2017:
On 28 May 2014, the IASB issued IFRS 15 – Revenue from Contracts with Customers, which,
in conjunction with additional clarifications issued on 12 April 2016, replaces IAS 18 – Revenue
and IAS 11 – Construction Contracts, as well as the interpretations IFRIC 13 – Customer Loyalty
Programmes, IFRIC 15 – Agreements for the Construction of Real Estate, IFRIC 18 – Transfers
of Assets from Customers and SIC 31 – Revenue - Barter Transactions Involving Advertising
Services. The standard provides a new revenue recognition model to be applied to all contracts
with customers except for those that fall within the scope of application of other IAS/IFRS, such
as leasing, insurance contracts and financial instruments. The fundamental steps for revenue
recognition according to the model are as follows:
o identification of the contract with the customer;
o identification of the performance obligations in the contract;
o determination of the transaction price;
o allocation of the transaction price to the performance obligations in the contracts;
o revenue recognition criteria when the entity satisfies a performance obligation.
The standard is applicable as from 1 January 2018. The amendments to IFRS 15, Clarifications to
IFRS 15 – Revenue from Contracts with Customers, which were published by the IASB in April
2016, have not yet been endorsed by the European Union. The directors believe that the application
of IFRS 15 may have a significant impact on revenue recognition and on related disclosures in the
Group's consolidated financial statements. However, it is not possible to provide a reasonable
estimate of the effects thereof until the Group has completed a detailed analysis of customer
contracts.
On 24 July 2014, the IASB published the final version of IFRS 9 – Financial instruments. The
document contains the results of the IAS 39 replacement project. The new standard is effective for
annual periods beginning on or after 1 January 2018.
It introduces new criteria for the classification and measurement of financial assets and liabilities.
For financial assets, IFRS 9 uses a single approach based on how an entity manages its financial
instruments and the contractual cash flow characteristics of the financial assets themselves to
determine how those assets are measured, replacing the many different rules in IAS 39. Regarding
financial liabilities, the main amendments relate to the accounting treatment of changes in fair
value of a financial liability designated at fair value through profit or loss, in the event that these
changes are due to a change in the credit risk of the issuer of the liability in question. In accordance
with the new standard, these changes are to be presented in other comprehensive income and shall
no longer be presented in the statement of profit or loss.

Digital Bros Group: Annual Report 2016-17
83
With reference to the impairment model, the new standard requires credit losses to be estimated
based on an expected loss model (and not on an incurred loss model used by IAS 39) using
supportable information, which is available without undue cost or effort that includes historical,
current and prospective figures. The standard envisages that the impairment model shall be applied
to all financial instruments, that is, financial assets measured at amortised cost, those measured at
fair value through other comprehensive income, lease receivables and trade receivables.
Finally, the standard introduces a new model of hedge accounting in order to adapt the
requirements of the current IAS 39 that sometimes were considered too stringent and unsuitable
to reflect the risk management policies of the Company. The changes introduced by the document
concern:
o an increase in the types of transactions eligible for hedge accounting, including the risk
components of non-financial assets and liabilities that are eligible for hedge accounting;
o changes in the way forward contracts and options are accounted for when they are in a
hedge accounting relationship, in order to reduce profit or loss volatility;
o replacement of an effectiveness test based on a level of offset of between 80% and 125%
with the principle of an economic relationship between the hedged item and the hedging
instrument; furthermore, there will no longer be a requirement for a retrospective
assessment of the effectiveness of the hedging relationship.
The increased flexibility of the new accounting rules is offset by additional disclosure requirements
concerning a company's risk management activities. The directors do not believe that the
application of IFRS 9 will have a significant impact on the amounts recognised and on the
disclosures provided in the Group's consolidated financial statements.
Accounting standards, amendments and IFRS interpretations not yet endorsed by the European
Union
As of the reporting date, the European Union's delegated bodies had not yet concluded the endorsement
process required for the adoption of the amendments and standards described below:
on 13 January 2016, the IASB issued IFRS 16 – Leases which replaces IAS 17 – Leases, as well
as the interpretations IFRIC 4 Determining Whether an Arrangement Contains a Lease, SIC-15
Operating Leases—Incentives and SIC-27 Evaluating the Substance of Transactions Involving the
Legal Form of a Lease.
The new standard provides a new definition of a lease and introduces a criterion based on control
(right of use) over an asset in order to differentiate lease contracts from service contracts,
identifying the following features: identification of the asset, the right to replacement thereof, the

Digital Bros Group: Annual Report 2016-17
84
right to obtain substantially all of the economic benefits from use of the asset and the right to direct
the use of the underlying asset.
The standard sets out a single model for the recognition and measurement of lease contracts for a
lessee that requires the recognition of assets held under leases, inclusive of operating leases, as
balance sheet assets with an opposite entry to financial liabilities and it also makes it possible not
to recognise as leases contracts for low-value assets and leases with a contractual duration equal
to or less than 12 months. On the other hand, the standard does not include any significant
amendments for lessors.
The standard is applicable as from 1 January 2019, although early application is permitted, but
only for companies that had already adopted IFRS 15 - Revenue from Contracts with Customers.
The directors believe that the application of IFRS 16 may have a significant impact on the
recognition of lease arrangements and on related disclosures in the Group's consolidated financial
statements. However, it is not possible to provide a reasonable estimate of the effects thereof until
the Group has completed a detailed analysis of the related contracts;
on 19 January 2016, the IASB issued Recognition of Deferred Tax Assets for Unrealised
Losses (Amendments to IAS 12). The amendments provide clarifications concerning the
recognition of deferred tax assets computed on unrealised losses under certain circumstances
and the estimate of future taxable income. The amendments, which were published by the IASB
in January 2016 and are applicable as from 1 January 2017, have not yet been endorsed by the
European Union and, accordingly, had not yet been adopted by the Group at 30 June 2017. The
directors do not envisage that the adoption of these amendments will have a significant impact
on the Group's consolidated financial statements;
on 29 January 2016, the IASB issued Disclosure Initiative (Amendments to IAS 7). The
amendments are intended to provide clarifications to improve information concerning liabilities
arising from financing activities. Specifically, the amendments require entities to provide
disclosures that enable users of financial statements to evaluate changes in liabilities arising from
financing activities, including changes arising from monetary movements and changes arising
from non-monetary movements. The amendments do not envisage the use of any specific format
for the disclosures. However, the amendments require entities to provide a reconciliation of the
opening balance of liabilities arising from financing activities to the closing balance thereof. There
is no requirement to present comparative information relating to prior years. The amendments,
which were published by the IASB in January 2016 and are applicable as from 1 January 2017,
have not yet been endorsed by the European Union and, accordingly, had not yet been adopted by
the Group at 30 June 2017. The directors do not envisage that the adoption of these amendments
will have a significant impact on the Group's consolidated financial statements;
on 20 June 2016, the IASB issued Classification and measurement of share-based payment
transactions (Amendments to IFRS 2). The amendments contain clarifications and amendments
in relation to accounting for vesting conditions affecting cash-settled share-based payment
transactions, the classification of share-based payment transactions with net settlement features
and accounting for modifications of share-based payment transactions from cash-settled to equity-

Digital Bros Group: Annual Report 2016-17
85
settled. The amendments are applicable as from 1 January 2018, although early application is
permitted. The directors do not envisage that the adoption of these amendments will have a
significant impact on the Group's consolidated financial statements;
on 8 December 2016, the IASB issued Annual Improvements to IFRSs: 2014-2016 Cycle, a
collection of amendments to standards as part of the annual process of improvements thereto. The
major amendments relate to:
o IFRS 1 First-Time Adoption of International Financial Reporting Standards - Deletion
of short-term exemptions for first-time adopters. The amendment is applicable for annual
periods beginning on or after 1 January 2018, although early application is permitted, and
addresses the deletion of short-term exemptions in paragraphs E3–E7 of Appendix E to
IFRS 1, because they were deemed to have served their intended purpose.
o IAS 28 Investments in Associates and Joint Ventures – Measuring investees at fair value
through profit or loss: an investment-by-investment choice or a consistent policy choice.
The amendment clarifies that the election to measure at fair value through profit or loss
(as opposed to the application of the equity method) an investment in an associate or a
joint venture that is held by an entity that is a venture capital organisation, or other
qualifying entity (such as a mutual fund or a similar entity), is available for each
investment in an associate or joint venture on an investment-by-investment basis, upon
initial recognition. The amendment is applicable as from 1 January 2018.
o IFRS 12 Disclosure of Interests in Other Entities – Clarification of the scope of the
Standard. The amendment clarifies the scope of IFRS 12 by specifying that the disclosure
requirements in the standard, except for those in paragraphs B10–B16, apply to all an
entity’s interests that are classified as held for sale, as held for distribution or as
discontinued operations in accordance with FRS 5. The amendment is applicable as from
1 January 2017, but, since it has not yet been endorsed by the European Union, it had not
been adopted by the Group at 30 June 2017.
The directors do not envisage that the adoption of these amendments will have a
significant impact on the Group's consolidated financial statements;
on 8 December 2016, the IASB issued “Foreign Currency Transactions and Advance
Consideration (IFRIC Interpretation 22)”. The objective of the interpretation is to provide
guidelines for foreign currency transactions when an entity recognises a non-monetary asset or
non-monetary liability arising from the payment or receipt of advance consideration before the
entity recognises the related asset, expense or income. The interpretation provides guidance on
how entities should determine the date of a transaction, and, consequently, the spot exchange rate
to be used when foreign currency transactions take place for which there are payments or receipts
in advance.
The interpretation clarifies that the date of the transaction is the earlier of:
a) the date on which the payment or receipt of advance consideration is recognised in an
entity's financial statements; and

Digital Bros Group: Annual Report 2016-17
86
b) the date on which the asset, expense or income (or part thereof) is recognised in the
financial statements (with the consequent reversal of the payment or receipt of advance
consideration).
If there are numerous payments or receipts of advance consideration, a transaction date should be
established for each thereof. IFRIC 22 is applicable as from 1 January 2018, although early
application is permitted. The directors do not envisage that the adoption of these amendments will
have a significant impact on the Group's consolidated financial statements;
on 8 December 2016, the IASB issued Transfers of Investment Property (Amendments to IAS
40). These amendments provide clarifications concerning transfers to, or from, investment
properties. More specifically, an entity should transfer a property to, or from, investment
properties only when there is evidence of a change in use of the property. The change must be
attributable to a specific event that has occurred and not to a change in management’s intentions
for the use of a property. The amendments are applicable as from 1 January 2018, although early
application is permitted. The directors do not envisage that the adoption of these amendments will
have a significant impact on the Group's consolidated financial statements;
on 7 June 2017, the IASB issued IFRIC 23 – Uncertainty over Income Tax Treatments. The
document addresses the accounting for uncertainties in income taxes.
The document envisages that uncertainties in the determination of tax liabilities or assets should
be reflected in the financial statements only when it is probable that an entity will pay or recover
the amount in question. Moreover, the interpretation does not contain any new disclosure
requirements, but it highlights that an entity should establish whether there will be a need to
provide any disclosures based on management considerations relating to any uncertainty
concerning the accounting for taxation, in accordance with IAS 1.
The new interpretation is applicable as from 1 January 2019, although early application is
permitted. The directors do not envisage that the adoption of this interpretation will have a
significant impact on the Group's consolidated financial statements;
on 11 September 2014, the IASB issued Amendments to IFRS 10 and IAS 28 Sale or
Contribution of Assets between an Investor and its Associate or Joint Venture. The amendments
were proposed due to the conflict between the requirements of IAS 28 and IFRS 10. IAS 28
requires that gains and losses resulting from the sale or contribution of a non-monetary asset to a
joint venture or associate in exchange for an equity interest in the latter is limited to the extent of
the investor's interest in the joint venture or associate. On the contrary, IFRS 10 requires full profit
or loss recognition when a parent loses control of a subsidiary, even if the entity continues to hold
a non-controlling interest therein, inclusive of in the case of a sale or contribution of a subsidiary
to a joint venture or associate. The amendments require that, in the case of a sale or contribution
of an asset or a subsidiary to a joint venture or associate, the extent of the gain or loss to be
recognised in the financial statements of the seller or contributor depends on whether the assets or
the subsidiary sold or contributed consist of a business, as defined by IFRS 3. If the assets or the
subsidiary sold or contributed consist of a business, then the entity should recognise the full profit
or loss in line with the previously held equity interest; otherwise, the portion of the gain or loss

Digital Bros Group: Annual Report 2016-17
87
relating to the equity interest that is still held should be eliminated. For the time being, the IASB
has postponed the application of these amendments. The directors do not envisage that the
adoption of these amendments will have a significant impact on the Group's consolidated financial
statements.

Digital Bros Group: Annual Report 2016-17
88
3. USE OF ESTIMATES
Critical accounting judgements
The preparation of the consolidated financial statements for the year ended 30 June 2017 and the notes
thereto required certain judgements, estimates and assumptions to be made about the carrying amounts of
assets and liabilities recognised in the consolidated financial statements and the disclosures relating to
contingent assets and liabilities as at the reporting date. These judgements are made on the basis of short-
and medium/long-term forecasts that are constantly updated and approved by the Board of Directors prior
to the approval of all financial reports.
Estimates are based on data reflecting current available knowledge, they are periodically reviewed and the
effects are reflected in profit or loss. Actual results may differ even significantly from these estimates due
to changes in the factors considered when formulating them. Estimates are used, in particular, to recognise
provisions for doubtful accounts and for the measurement of inventories, depreciation and amortisation,
equity investments, asset impairment, employee benefits, deferred taxes and other provisions and
allowances.
The main sources of uncertainty in making estimates concerned credit risk, inventory impairment,
employee benefits, revenue adjustments, royalties and deferred tax.
Recoverable amount of intangible assets
In accordance with IAS 36, an impairment loss is recognised whenever events or a change in
circumstances indicate that the carrying amount of an intangible asset is no longer recoverable. Events
that may potentially trigger the recognition of asset impairment would be changes in the strategic plan
and changes in market prices that lead to lower operational performance and a reduced exploitation of
trademarks. The decision to proceed with the recognition of impairment and the quantification thereof
depends on management's assessment of complex and highly uncertain factors, such as the future trend in
prices and demand conditions on a global or regional scale.
Credit risk
As far as the trade receivables of foreign subsidiaries are concerned, the policy is to stay within the
insurance limits for individual customers and, accordingly, there are no particular risk assessment issues.
For the Group’s Italian companies, the risk of credit default is assessed periodically, on the basis of
opinions provided by the external legal advisor in charge of customer disputes. According to the Group's
credit collection procedure, receivables not paid within 45 days of their due date are passed on to the legal
advisor for collection. Frequent updates from the lawyer on the probability of collection make the estimate
of doubtful debts reliable over time.
Measurement of inventories
The Group measures inventories on a quarterly basis, in consideration of the rapid obsolescence of its

Digital Bros Group: Annual Report 2016-17
89
products. Impairment losses may be recognised to reflect individual products’ lower market value with
respect to their historical cost. To arrive at these estimates, the Group uses revenue forecasts for the
subsequent four quarters, periodically produced by the sales department. Any differences found between
the market value of a product held in inventory, taking account of its price category and its historical cost,
are recognised in profit or loss in the period they are revealed.
Premium Games products are easier to measure on account of the smaller number of products distributed
and that need to be valued, as well as the lower unit cost of the products, which consists solely of the cost
of physically producing the games and, accordingly, the unit costs are smaller, thus reducing the need to
recognise impairment losses.
Employee benefits
The Group offers no pension plans and/or other employee benefits, with the exception of employee
termination indemnities (trattamento di fine rapporto, or TFR) required by Italian law. Estimating those
benefits requires an assessment of the future financial outlays that may arise as a result of employees’
voluntary and involuntary departure, in relation to their seniority and the revaluation rates these benefits
enjoy by law.
The TFR system underwent significant changes during the year ended 30 June 2006. Estimating the liability
is still complex, due to a small portion of benefits that have remained with the Group companies. To arrive
at this estimate, the Group is assisted by a registered actuary to help determine the necessary parameters.
Following the approval of the “2016-2026 Stock Option Plan”, an actuarial measurement is performed
thereof in accordance with the guidance contained in IFR2 – Share-based payments. An independent
professional has been appointed to perform the measurement.
Provision for risks
Where necessary, a provision has been recognised to cover the potential negative outcome associated with
tax risks. The amount of any provision recognised in the financial statements pertaining to such risks
represents the directors' best estimate at the reporting date, after having sought the opinion of the Group's
tax advisors. This estimate is based on assumptions that depend on factors that may change over time and
that could, accordingly, impact the estimates made by the directors for the preparation of the consolidated
financial statements.
Revenue adjustments
A significant cost element known as “revenue adjustments” involves analytical computations for which
the Group has adopted suitable procedures.
Revenue adjustments consist of various types of cost. The first, category, which is easier to determine,
consists of discounts granted to customers at the end of the normally annual contractual period (year end
bonuses). The second category is difficult to estimate and consists of potential credit notes that the Group
may have to issue to customers as a result of unsold products. To estimate this amount, management

Digital Bros Group: Annual Report 2016-17
90
prepares analyses by customer and by product that highlight the risks associated with price cuts and
potential returns. The forecast is made quarterly, on a product-by-product basis, comparing volumes sold
to customers with the volumes they have sold to end consumers. The availability of sales figures by country
makes the estimate reliable over time. Many customers submit sales and inventory figures on a weekly
basis, thus facilitating the estimation process.
Royalties and advances to developers for licenses
The method for the determination of royalties varies based on the different types of contract. The number
of contracts that provide for variable royalties with a guaranteed minimum and/or contracts that provide for
a fixed development portion has increased over time. For the foregoing types of contract, there is a need to
estimate the future benefit that a contract will produce in subsequent quarters in order to match costs and
income pertaining thereto and which is based on forecasts of quantities expected to be sold in subsequent
periods. The sales forecasts are based on a medium term (three-year) plan, which is revised twice a year.
For the determination of royalties for digital and/or Free to Play products, the revision of the three-year
plan takes place at least monthly.
Deferred tax assets and liabilities
There are two areas of uncertainty in the calculation of deferred taxes. The first is their recoverability, an
uncertainty the Group mitigates by assessing the deferred tax assets recognised by each company by
reviewing the forecasts prepared therefor. The second is the tax rate to be used that is assumed to be constant
over time and to equate to the rates currently applicable in the various countries in which the Group operates
and/or to amended rates if it is certain that the changes will come into force.
4. BASIS OF CONSOLIDATION

Digital Bros Group: Annual Report 2016-17
91
Subsidiaries
Subsidiaries are investees over which the Group is capable of exercising all of the following three elements:
power over the investee;
exposure, or rights, to variable returns from its involvement with the investee;
ability to use the power over the investee to affect the amount of the variable returns.
Control exists when the Group has the power, directly or indirectly, to influence the financial and operating
policies of a subsidiary in such a way as to obtain benefits from its operations. The financial statements of
subsidiaries are included in the consolidated financial statements for the year ended 30 June 2017 from the
date control is obtained until the date control ceases to exist.
The financial statements of subsidiaries used for the consolidation are prepared as of the same reporting
date and are adjusted from local GAAP to comply with the accounting policies employed by the Group.
Equity investments in associates are stated at cost less any impairment.
Translation of foreign currency financial statements
The Group’s presentation currency is the euro, which is also the functional currency of the parent company.
As at the reporting date, the financial statements of foreign companies with a functional currency other than
the euro were translated into the presentation currency as follows:
assets and liabilities were translated using the exchange rate in force at the reporting date;
income statement components were translated using the average exchange rate for the period;
equity components were translated at historical exchange rates.
Exchange differences arising from this process are recognised directly in other comprehensive income and
are accumulated in the equity reserve, foreign currency translation reserve.
Transactions eliminated in the consolidation process
In preparing the consolidated financial statements for the year ended 30 June 2017, all intragroup assets,
liabilities, income and expenses relating to transactions between Group companies have been eliminated,
as well as unrealised profits and losses on intragroup transactions.
Scope of consolidation
The tables below provide details of companies consolidated on a line-by-line basis and by using the equity
method.
Companies consolidated on a line-by-line basis:

Digital Bros Group: Annual Report 2016-17
92
Name Operational
headquarters Country Capital
% held directly or
indirectly
133 W. Broadway Eugene USA $ 100,000 100%
Digital Bros S.p.A. Milan Italy € 5,644,334.80 Parent company
Digital Bros China (Shenzhen) Ltd. Shenzhen China € 100,000 100%
Digital Bros Game Academy S.r.l. Milan Italy € 50,000 100%
Digital Bros Holdings Ltd. (3) Milton Keynes United Kingdom £ 100,000 100%
DR Studios Ltd. Milton Keynes United Kingdom £ 60,826 100%
Game Entertainment S.r.l. Milan Italy € 100,000 100%
Game Network S.r.l. Milan Italy € 100,000 100%
Game Service S.r.l. Milan Italy € 50,000 100%
Hawken Entertainment Inc. (1) Santa Ana (CA) USA $ 100,000 100%
Kunos Simulazioni S.r.l. (2) Rome Italy € 10,000 100%
Pipeworks Inc. Eugene (OR) USA $ 61,929 100%
505 Games S.p.A. Milan Italy € 100,000 100%
505 Games France S.a.s. Francheville France € 100,000 100%
505 Games Spain Slu Las Rozas de Madrid Spain € 100,000 100%
505 Games Ltd. Milton Keynes United Kingdom £ 100,000 100%
505 Games (US) Inc. Calabasas (CA) USA $ 100,000 100%
505 Games GmbH Burglengenfeld Germany € 50,000 100%
505 Games Interactive Inc. Calabasas (CA) USA $ 100,000 100%
505 Mobile S.r.l. Milan Italy € 100,000 100%
505 Mobile (US) Inc. Calabasas (CA) USA $ 100,000 100%
(1) Hawken Entertainment Inc., which is based in the United States and which was set up on 28 September 2016,
commenced operations in the second quarter of the financial year.
(2) Kunos Simulazioni S.r.l. has been consolidated as of its acquisition date of 15 March 2017.
(3) Digital Bros Holdings Ltd. was dormant in the year.
Associated companies carried at cost:
Name Operational
headquarters Capital % held directly
% held indirectly
Delta DNA Ltd. (1) Edinburgh, UK £3,005 1.12% 0%
Ebooks&Kids S.r.l. Milan € 26,366 16% 0%
Cityglance S.r.l. in liquidation Milan € 10,000 42.5% 0%
Ovosonico S.r.l. Milan € 100,000 49% 0%
Seekhana Ltd. Milton Keynes, UK £ 10,000 33.61% 0%
(1) formerly Games Analytics Ltd.
Digital Bros Group: Annual Report 2016-17
93
5. EQUITY INVESTMENTS IN ASSOCIATES AND OTHER ENTITIES
Equity investments held by Group companies at 30 June 2017 are as follows:
an equity interest of 1.04% in Delta DNA Ltd., acquired on 3 July 2013 and recognised at cost,
equating to Euro 60 thousand (50 thousand pounds);
an equity interest of 16% in Ebooks&Kids S.r.l., which is stated at an amount of Euro 52
thousand. The initially recognised purchase cost amounted to Euro 200 thousand. The investment
was acquired via a first subscription on 7 July 2013 of Euro 70 thousand, of which Euro 68.7
thousand was paid as share premium and a subsequent subscription to a capital increase on 13
February 2014 of Euro 130 thousand, of which Euro 127.1 thousand was paid as share premium.
At 30 June 2017, the carrying amount was adjusted to reflect the share of equity resulting from
the company's latest approved financial statements;
an equity interest of 42.5% in Cityglance S.r.l. in liquidation, which is stated at an amount of
Euro 2 thousand. The initially recognised purchase cost amounted to Euro 46 thousand. This
amount includes Euro 4,250.00 relating to the capital subscribed and approximately Euro 41
thousand relating to costs incurred by Digital Bros S.p.A. to develop the company’s operations
and which was therefore added to the carrying amount of the investment. At 30 June 2017, the
carrying amount was adjusted to reflect the share of equity resulting from the company's latest
approved financial statements;
an equity interest of 49% in Ovosonico S.r.l., the carrying amount of which is Euro 720 thousand,
of which Euro 49,000 thousand equated to the par value and Euro 671 was paid as share premium;
an equity interest of 33.61% in Seekhana Ltd. the carrying amount of which is Euro 511 thousand
(449 thousand pounds) of which Euro 4 thousand equated to the par value and Euro 507 thousand
was paid as share premium.

Digital Bros Group: Annual Report 2016-17
94
6. ANALYSIS OF THE STATEMENT OF FINANCIAL POSITION
The consolidated statement of financial position at 30 June 2017 is set out below together with
comparative figures at 30 June 2016:
Euro thousands 30 June 2017 30 June 2016 Change
Non-current assets
1 Property, plant and equipment 6,619 7,032 (413) -5.9%
2 Investment property 0 0 0 0.0%
3 Intangible assets 18,867 10,458 8,409 80.4%
4 Equity investments 1,345 898 447 49.7%
5 Non-current receivables and other assets 1,052 1,056 (4) -0.4%
6 Deferred tax assets 2,807 2,619 188 7.2%
Total non-current assets 30,690 22,063 8,627 39.1%
Non-current liabilities
7 Employee benefits (545) (529) (16) 2.9%
8 Non-current provisions (79) (36) (43) n.m.
9 Other non-current payables and liabilities 0 (252) 252 n.m.
Total non-current liabilities (624) (817) 193 -23.5%
Net working capital
10 Inventories 12,815 11,933 882 7.4%
11 Trade receivables 36,763 34,840 1,923 5.5%
12 Current tax assets 2,064 2,019 45 2.3%
13 Other current assets 3,263 5,034 (1,771) -35.2%
14 Trade payables (27,680) (21,712) (5,968) 27.5%
15 Current tax liabilities (5,736) (6,211) 475 -7.6%
16 Current provisions (854) 0 (854) n.m.
17 Other current liabilities (3,954) (2,312) (1,642) 71.0%
Total net working capital 16,681 23,591 (6,910) -29.3%
Capital and reserves
18 Share capital (5,704) (5,644) (60) 1.1%
19 Reserves (19,805) (20,804) 999 -4.8%
20 Treasury shares 0 390 (390) n.m.
21 (Retained earnings) accumulated losses (33,265) (22,290) (10,975) 49.2%
Total equity (58,774) (48,348) (10,426) 21.6%
Total net assets (12,027) (3,511) (8,516) n.m.
22 Cash and cash equivalents 12,136 2,785 9,351 n.m.
23 Current bank debt (1,942) (25,929) 23,987 -92.5%
24 Other current financial assets and liabilities 950 28,913 (27,963) -96.7%
Current net cash 11,144 5,769 5,375 93.2%
25 Non-current financial assets 1,306 1,195 111 9.3%
26 Non-current bank debt (383) (1,558) 1,175 -75.4%
27 Other non-current financial liabilities (40) (1,895) 1,855 -97.9%
Non-current net cash/debt 883 (2,258) 3,141 n.m.
Total net cash 12,027 3,511 8,516 n.m.

Digital Bros Group: Annual Report 2016-17
95
1. Property, plant and equipment
The carrying amount of property, plant and machinery has gone from Euro 7,032 thousand to Euro 6,619
thousand. Movements during the year were as follows:
Euro thousands 1 July
2016 Additions Disposals
Foreign
currency
translation
differences
Depr-
eciation
Use of
accum.
deprec.
30
June
2017
Industrial buildings 4,598 0 0 (78) (162) 0 4,358
Land 600 0 0 0 0 0 600
Industrial and commercial
equipment 1,013 289 (7) 0 (374) 6 927
Other assets 821 154 (1) 0 (241) 1 734
Total 7,032 443 (8) (78) (777) 7 6,619
Movements during the prior year were as follows:
Euro thousands 1 July
2015 Additions Disposals
Foreign
currency
translation
differences
Depr-
eciation
Use of
accum.
deprec.
30
June
2016
Industrial buildings 2,375 2,348 0 0 (125) 0 4,598
Land 600 0 0 0 0 0 600
Industrial and commercial
equipment 746 599 (61) 0 (331) 60 1,013
Other assets 1,120 115 (199) 0 (215) 0 821
Total 4,841 3,062 (260) 0 (671) 60 7,032
Property, plant and equipment, with the exception of land, are depreciated over their individual useful lives.
Industrial buildings include the Trezzano sul Naviglio warehouse, the freehold building used as office and
laboratory premises located in Via Labus, Milan, which is used by Digital Bros Game Academy S.r.l. as its
operational headquarters, and the property located in Eugene, Oregon, which is owned by 133 W. Broadway
and which is used by Pipeworks Inc. as its operational headquarters.
The land pertains to the Trezzano sul Naviglio warehouse, the carrying amount of which is Euro 600
thousand.
Additions in the year amounted to Euro 444 thousand, as detailed below:
Euro thousands Year ended
30 June 2017
Year ended
30 June 2016
Office automation equipment 212 551
Equipment and machinery 68 0
Improvements made to building used by 505 Games Ltd. 60 0
Furnishings 60 0
Improvements made to new building used by 505 Games (US) Inc. 19 0
Other capital expenditure 13 230
Property, plant and equipment contributed by Kunos Simulazioni S.r.l. 11 0
Building used by Pipeworks Inc. 0 2,281
Total capital expenditure in the year 443 3,062

Digital Bros Group: Annual Report 2016-17
96
Movements in property, plant and equipment and in accumulated depreciation in the year just ended and in
the previous year, were as follows:
Current year
Gross carrying amount of property, plant and equipment
Euro thousands 1 July 2016 Additions Disposals
Foreign
currency
translation
differences 30 June 2017
Industrial buildings 5,539 0 0 (78) 5,461
Land 600 0 0 0 600
Plant and machinery 24 0 0 0 24
Industrial and commercial
equipment 4,205 289 (7) 0 4,487
Other assets 2,276 154 (1) 0 2,429
Total 12,644 443 (8) (78) 13,001
Accumulated depreciation
Euro thousands 1 July 2016 Depreciation Use 30 June 2017
Industrial buildings (941) (162) 0 (1,103)
Land 0 0 0 0
Plant and machinery (24) 0 0 (24)
Industrial and commercial equipment (3,192) (374) 6 (3,560)
Other assets (1,455) (241) 1 (1,695)
Total (5,612) (777) 7 (6,382)
Previous year
Gross carrying amount of property, plant and equipment
Euro thousands 1 July 2015 Additions Disposals 30 June 2016
Industrial buildings 3,191 2,348 0 5,539
Land 600 0 0 600
Plant and machinery 24 0 0 24
Industrial and commercial equipment 3,667 599 (61) 4,205
Other assets 2,360 115 (199) 2,277
Total 9,842 3,062 (260) 12,644
Accumulated depreciation
Euro thousands 1 July 2015 Additions Disposals 30 June 2016
Industrial buildings (816) (125) 0 (942)
Land 0 0 0 0
Plant and machinery (24) 0 0 (24)
Industrial and commercial equipment (2,921) (331) 60 (3,191)
Other assets (1,240) (215) 0 (1,455)
Total (5,001) (671) 60 (5,613)

Digital Bros Group: Annual Report 2016-17
97
3. Intangible assets
The carrying amount of intangible assets has gone from Euro 10,458 thousand to Euro 18,867 thousand.
All of the intangible assets recognised by the Group have finite useful lives.
The following table shows movements for the year just ended and the previous year:
Euro thousands 1 July 2016 Additions Disposals Amortisation 30 June 2017
Concessions and licences 3,419 14,683 (0) (5,846) 12,256
Trademarks and similar rights 786 3,454 0 (637) 3,603
Other assets 538 5 0 (454) 89
Internally developed assets 5,715 7,458 (10,254) 0 2,919
Total 10,458 25,600 (10,254) (6,937) 18,867
Euro thousands 1 July 2015 Additions Disposals Amortisation 30 June 2016
Concessions and licences 2,750 2,431 0 (1,762) 3,419
Trademarks and similar rights 2,334 6 (694) (860) 786
Other assets 1,033 0 0 (495) 538
Internally developed assets 1,829 4,538 (652) 0 5,715
Total 7,946 6,975 (1,346) (3,117) 10,458
Expenditure on intangible assets during the year was as follows:
Euro thousands Year ended
30 June 2017
Year ended
30 June 2016
Premium Games usage rights 1,993 387
Expenditure on development of ERP systems 183 276
Acquisition of Hawken rights 701 0
Fantasfida 49 801
Free to Play usage rights 5,702 902
Other usage rights 4 64
Reclassification from trade receivables 6,051 0
Total additions to concessions and licences 14,683 2,431
Assetto Corsa brand 3,443 0
Other brands 11 6
Total additions to trademarks 3,454 6
Total additions to other intangible assets 5 0
Internal development contracts in progress 1,657 4,538
Internally developed asset: Premium Games 5,510 0
Internally developed asset: Free to Play 291 0
Total additions to internally developed assets 7,458 4,538
Total additions to intangible assets 25,600 6,975
Internally developed assets consist of costs incurred by the Group for the purchase of intellectual property
as well as costs incurred by DR Studios Ltd., Pipeworks Inc. and Kunos Simulazioni S.r.l. in connection
with video game development contracts for other Group companies and which were not yet completed at
the reporting date.
The carrying amount of the Assetto Corsa brand arises from the difference between the purchase price paid
by Digital Bros S.p.A. and the adjusted equity of the acquired company, Kunos Simulazioni S.r.l., at the

Digital Bros Group: Annual Report 2016-17
98
date of first-time consolidation (15 March 2017) and which has been provisionally allocated to the Assetto
Corsa brand in accordance with IFRS 3.
Part of the additions in the year, amounting to Euro 6,051 thousand, relate to the classification as intangible
assets of certain video games that constitute intellectual property of the Group and, accordingly, they have
been more correctly stated as non-current assets. The video games in question were classified as trade
receivables at 30 June 2016.
Movements in intangible assets and in accumulated amortisation in the year just ended and in the previous
year, were as follows:
Current year
Gross carrying amount of intangible assets
Euro thousands 1 July 2016 Additions Disposals 30 June 2017
Concessions and licences 9,025 14,683 (0) 23,708
Trademarks and similar rights 4,486 3,454 0 7,940
Other 1,678 5 0 1,683
Internally developed assets 5,715 7,458 (10,254) 2,919
Total 20,904 25,600 (10,254) 36,250
Accumulated amortisation
Euro thousands 1 July 2016 Additions Disposals 30 June 2017
Concessions and licences (5,606) (5,846) 0 (11,452)
Trademarks and similar rights (3,700) (637) 0 (4,337)
Other (1,140) (454) 0 (1,594)
Total (10,446) (6,937) 0 (17,383)
Previous year
Gross carrying amount of intangible assets
Euro thousands 1 July 2015 Additions Disposals 30 June 2016
Concessions and licences 6,594 2,431 0 9,025
Trademarks and similar rights 5,175 6 (694) 4,486
Other 1,678 0 0 1,678
Internally developed assets 1,829 4,538 (652) 5,715
Total 15,276 6,975 (1,346) 20,905
Accumulated amortisation
Euro thousands 1 July 2015 Additions Disposals 30 June 2016
Concessions and licences (3,844) (1,762) 0 (5,606)
Trademarks and similar rights (2,841) (860) 0 (3,700)
Other assets (645) (495) 0 (1,139)
Total (7,330) (3,116) 0 (10,446)

Digital Bros Group: Annual Report 2016-17
99
4. Equity investments
Equity investments in associates held by the Group at 30 June 2017 and 2016 were:
Euro thousands 30 June 2017 30 June 2016 Change
Delta Dna Ltd. 60 60 0
Ebooks&Kids S.r.l. 52 200 (148)
Cityglance S.r.l. in liquidation 2 45 (43)
Ovosonico S.r.l. 720 420 300
Seekhana Ltd. 511 173 338
Total equity investments 1,345 898 447
Changes in the year concerning associated companies are detailed in paragraph 6 of the directors' report
entitled “Analysis of the statement of financial position as at 30 June 2017”.
The carrying amount of equity investments at the reporting date along with a comparison to the Group's
share of the investees' equity was as follows:
Name Location
Financial
statements used
Carrying
amount
(a)
Capital
(b)
Pro-
rata
share
of
equity
(c)
Result for
the year
Difference
d=c-a
Delta Dna Ltd. Edinburgh 31 December 2016 60 3 10 (1,222) (50)
Ebooks&Kids S.r.l. Milan 31 December 2016 52 26 52 (77) 0
Cityglance S.r.l. Milan 30 June 2016 2 10 2 (6) 0
Ovosonico S.r.l. Varese 31 December 2016 720 100 359 4 (361)
Seekhana Ltd. Milton Keynes 31 March 2017 511 11 32 (329) (479)
Total 1,345
No impairment has been recognised for the investments in Delta Dna Ltd., Ovosonico S.r.l. and Seekhana
Ltd. given that, based on the companies' future development plans, the losses have not been deemed to be
indicative of impairment.
5. Non-current receivables and other assets
Non-current receivables and other assets at 30 June 2017 amounted to Euro 1,052 thousand.
The components thereof that consist of cautionary deposits pertaining to contractual obligations are as
follows:
Euro thousands 30 June
2017
30 June
2016 Change
Cautionary deposits for the rental of office premises used by Italian
companies 635 635 0
Cautionary deposits for the rental of office premises used by foreign
companies 194 192 2
Cautionary deposits for utilities 3 5 (2)
Cautionary deposits for AAMS concession 220 220 0
Other cautionary deposits 0 4 (4)
Total non-current receivables and other assets 1,052 1,056 (4)
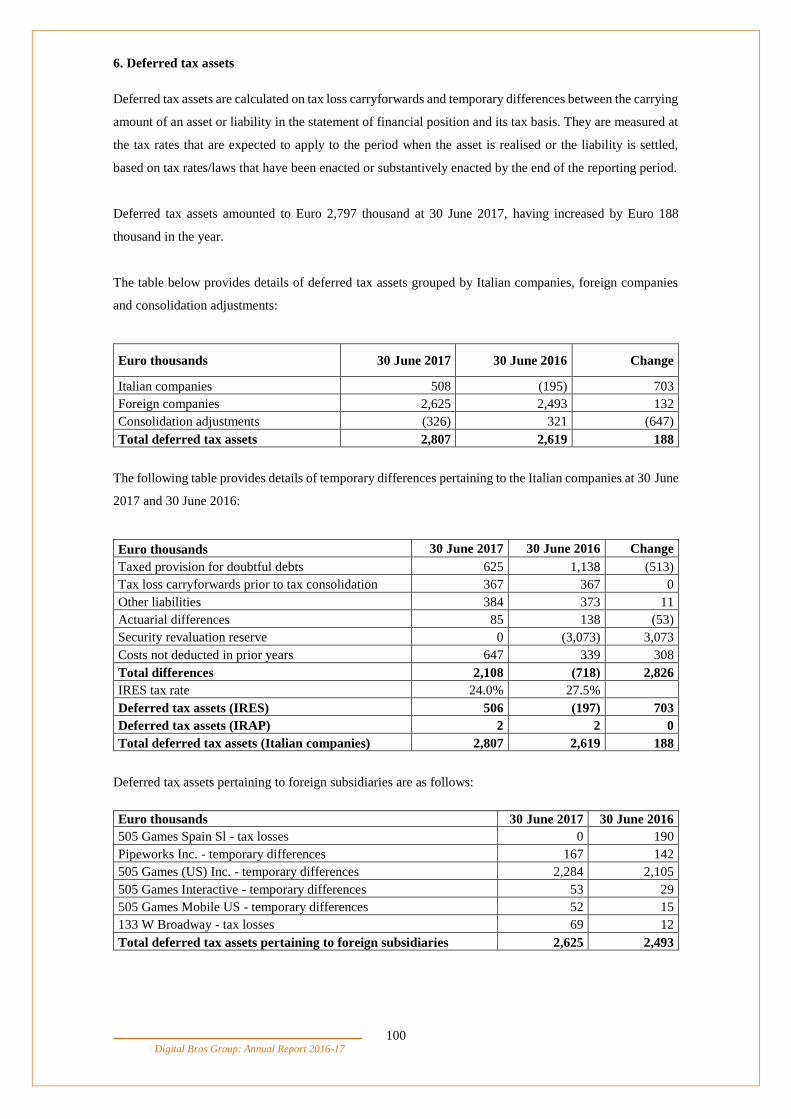
Digital Bros Group: Annual Report 2016-17
100
6. Deferred tax assets
Deferred tax assets are calculated on tax loss carryforwards and temporary differences between the carrying
amount of an asset or liability in the statement of financial position and its tax basis. They are measured at
the tax rates that are expected to apply to the period when the asset is realised or the liability is settled,
based on tax rates/laws that have been enacted or substantively enacted by the end of the reporting period.
Deferred tax assets amounted to Euro 2,797 thousand at 30 June 2017, having increased by Euro 188
thousand in the year.
The table below provides details of deferred tax assets grouped by Italian companies, foreign companies
and consolidation adjustments:
Euro thousands 30 June 2017 30 June 2016 Change
Italian companies 508 (195) 703
Foreign companies 2,625 2,493 132
Consolidation adjustments (326) 321 (647)
Total deferred tax assets 2,807 2,619 188
The following table provides details of temporary differences pertaining to the Italian companies at 30 June
2017 and 30 June 2016:
Euro thousands 30 June 2017 30 June 2016 Change
Taxed provision for doubtful debts 625 1,138 (513)
Tax loss carryforwards prior to tax consolidation 367 367 0
Other liabilities 384 373 11
Actuarial differences 85 138 (53)
Security revaluation reserve 0 (3,073) 3,073
Costs not deducted in prior years 647 339 308
Total differences 2,108 (718) 2,826
IRES tax rate 24.0% 27.5%
Deferred tax assets (IRES) 506 (197) 703
Deferred tax assets (IRAP) 2 2 0
Total deferred tax assets (Italian companies) 2,807 2,619 188
Deferred tax assets pertaining to foreign subsidiaries are as follows:
Euro thousands 30 June 2017 30 June 2016
505 Games Spain Sl - tax losses 0 190
Pipeworks Inc. - temporary differences 167 142
505 Games (US) Inc. - temporary differences 2,284 2,105
505 Games Interactive - temporary differences 53 29
505 Games Mobile US - temporary differences 52 15
133 W Broadway - tax losses 69 12
Total deferred tax assets pertaining to foreign subsidiaries 2,625 2,493

Digital Bros Group: Annual Report 2016-17
101
Deferred tax assets pertaining to foreign subsidiaries relate to temporary differences deemed to be
recoverable, given that, based on approved projections, it is considered probable that each foreign
subsidiary will generate sufficient future taxable profits that will enable the recovery thereof.
NON-CURRENT LIABILITIES
7. Employee benefits
This provision reflects the actuarial measurement of the Group's employee liability, calculated by an
independent actuary in accordance with IAS 19. It increased in the year by Euro 16 thousand.
For the IAS 19 actuarial measurement at 30 June 2017, use was made of a discount rate based on the Iboxx
Corporate A 10y+ index, consistent with the rate used at the prior year end. Use of a discount rate based on
the Iboxx Corporate AA index would not have made a significant difference.
The calculation method can be summarised as follows:
for each employee on the payroll, projection of the termination indemnity already provided for at
31 December 2006 and revalued as of the measurement date;
calculation for each employee of the probable termination indemnity that the Company will have
to pay in the event of the employee's departure due to dismissal, resignation, disability, death or
retirement and in the event of requests for advances;
discounting of each probable payment to present value.
The estimate is based on the Italian companies' year end workforce of 80 employees.
The economic and financial parameters used in the actuarial calculation are as follows:
annual interest rate: 1.74%;
annual rise in real pay: 1%;
annual inflation rate: 1.50%.
The following table shows movements in the provision for employee termination indemnities in the period
just ended and in the corresponding prior year period:
Euro thousands 30 June 2017 30 June 2016
Provision for employee termination indemnities at 1 July 529 486
Benefits paid on termination of service (4) (15)
Allocations to provision in the year 208 180
Measurement of supplementary pension schemes (163) (166)
Actuarial measurement (25) 44
Provision for employee termination indemnities at 30 June 2017 545 529
The Group is not party to any integrated pension plans.
8. Non-current provisions
These consist entirely of the provision for agents’ indemnities. The balance at 30 June 2017 of Euro 79
thousand was Euro 43 thousand higher than the balance at 30 June 2016 of Euro 36 thousand. The change

Digital Bros Group: Annual Report 2016-17
102
was attributable to uses of the provision of Euro 14 thousand and allocations to the provision in the year of
Euro 57 thousand.
9. Other non-current payables and liabilities
Other non-current payables and liabilities had a nil balance at 30 June 2017, whereas the balance at the
2016 year end consisted entirely of variable remuneration linked to the medium/long-term incentive scheme
for directors and key managers that will be paid in September 2017. Accordingly, the payable has been
classified within current payables.

Digital Bros Group: Annual Report 2016-17
103
NET WORKING CAPITAL
10. Inventories
Inventories consist of finished products for resale. Details are provided below of inventories by distribution
channel:
Euro thousands 30 June 2017 30 June 2016 Change
Italian Distribution inventories (A) 5,319 4,804 515
505 Games S.p.A. inventories 786 769 17
Foreign subsidiaries' inventories 6,710 6,360 350
Premium Games inventories (B) 7,496 7,129 367
Total inventories (A+B) 12,815 11,933 882
Inventories went from Euro 11,933 thousand at 30 June 2016 to Euro 12,815 thousand at 30 June 2017,
being an increase of Euro 882 thousand.
11. Trade receivables
Changes in the period in receivables from customers and receivables pertaining to video game user licenses
are summarised as follows:
Euro thousands 30 June 2017 30 June 2016 Change
Receivables from customers - Italy 3,825 4,414 (589)
Receivables from customers - EU 3,629 2,490 1,139
Receivables from customers - rest of the world 11,647 9,207 2,440
Provision for doubtful debts (644) (1,148) 504
Total receivables from customers 18,457 14,963 3,494
Receivables pertaining to video game user licenses 18,306 19,877 (1,571)
Total trade receivables 36,763 34,840 1,923
Total receivables from customers at 30 June 2017 of Euro 18,457 thousand were Euro 3,494 thousand
higher than the balance at 30 June 2016 of Euro 14,963 thousand, in line with the growth in turnover.
Receivables from customers are stated net of an estimate of credit notes to be issued by the Group for price
repositioning or returns.
The provision for doubtful debts decreased in the year by Euro 504 thousand, having gone from Euro 1,148
thousand to Euro 644 thousand at the reporting date. The estimated losses are based on an analytical analysis
of each customer’s degree of solvency. The change was attributable to an allocation to the provision of
Euro 420 thousand to take account of potential losses arising from the bankruptcy of certain customers and
uses thereof of Euro 924 thousand with respect to specifically identified balances.

Digital Bros Group: Annual Report 2016-17
104
The following table provides details of receivables from customers by due date at 30 June 2017 and 2016:
Euro thousands 30 June 2017 % of total 30 June 2016 % of total
Not past due 17,445 95% 13,502 90%
0 > 30 days 174 1% 489 4%
30 > 60 days 258 1% 11 0%
60 > 90 days 111 1% 63 0%
> 90 days 469 3% 898 6%
Total receivables from
customers
18,457 95% 14,963 100%
Receivables pertaining to video game user licenses consist of advances paid for licenses not yet exploited
or completely exploited as at the reporting date. They decreased in the year by Euro 1,571 thousand to Euro
18,306 thousand. Details are provided below:
Euro thousands 30 June
2017
30 June
2016
Change
Advances to developers for licences not yet used 14,360 14,883 (523)
Advances to developers for licences partially used 3,946 4,994 (1,048)
Total receivables pertaining to video game user
licenses 18,306 19,877 (1,571)
12. Current tax assets
Details of current tax assets are provided below:
Euro thousands
30 June
2017
30 June
2016 Change
Receivable under domestic tax group arrangements 1 1 0
VAT receivable 627 613 14
Tax credit for foreign income tax withholdings 986 403 583
IRES refund for IRAP deductibility 119 119 0
Other tax assets 331 883 (552)
Total current tax assets 2,064 2,019 45
Current tax assets went from Euro 2,019 thousand at 30 June 2016 to Euro 2,064 thousand at 30 June 2017,
being an increase of Euro 45 thousand.
The increase of Euro 583 thousand in the tax credit for foreign income tax withholdings is due to
withholding tax suffered by the subsidiary 505 Games S.p.A. on royalty income received.
The decrease in other tax assets of Euro 552 thousand is mainly due to the issue by the parent company of
credit notes provided for at 30 June 2016 and the collection of the receivable for prior year IRAP
deductibility.
13. Other current assets

Digital Bros Group: Annual Report 2016-17
105
Other current assets consist of advances paid to suppliers, employees and agents. They went from Euro
5,034 thousand at 30 June 2016 to Euro 3,263 thousand at 30 June 2017. Details of the balance are provided
below:
Euro thousands 30 June 2017 30 June 2016 Change
Advances to suppliers 3,033 4,826 (1,793)
Advances to employees 115 92 23
Advances to agents 7 13 (6)
Other receivables 108 103 5
Total other current assets 3,263 5,034 (1,771)
Advances to suppliers consist of costs incurred in advance, particularly for services comprising quality
assurance, localisation and video game programming, as well as for the rental of equipment and office
space. Details are provided below:
Euro thousands 30 June 2017 30 June 2016 Change
Advertising 75 32 43
Insurance 100 57 43
Rent 209 167 42
Programming 278 3,029 (2,751)
Other operating costs 2,278 1,436 842
Other prepaid expenses 93 105 (12)
Total other current assets 3,033 4,826 (1,793)
The decrease in the year in programming advances of Euro 2,521 thousand is mainly due to a reduction in
PAYDAY 2 advances of Euro 1,206 thousand and of Family Guy advances of Euro 986 thousand.
Advances classed as other operating costs mainly include costs incurred in advance for quality assurance
services pertaining to 505 Games S.p.A.
14. Trade payables
Trade payables, which amounted to Euro 27,680 thousand at 30 June 2017, increased in the year by Euro
5,968 thousand and were mostly due to publishers for the purchase of finished products and to developers.
Details are provided below:
Euro thousands 30 June 2017 30 June 2016 Change
Trade payables - Italy (2,484) (2,267) (217)
Trade payables - EU (11,644) (7,610) (4,034)
Trade payables - rest of the world (13,552) (11,835) (1,717)
Total trade payables (27,680) (21,712) (5,968)
The increase in total trade payables is attributable to higher royalties payable and the physical production
of video games by 505 Games S.p.A. in line with the rise in sales throughout the year experienced by the
Premium Games operating segment.
15. Current tax liabilities

Digital Bros Group: Annual Report 2016-17
106
Current tax liabilities went from Euro 6,211 thousand at 30 June 2016 to Euro 5,736 thousand at 30 June
2017, a decrease of Euro 475 thousand. Details are provided below:
Euro thousands 30 June 2017 30 June 2016 Change
Income tax (4,127) (5,085) 957
VAT payable (789) (236) (553)
Other tax liabilities (820) (890) 70
Total current tax liabilities (5,736) (6,211) 475
Income tax payable decreased by Euro 957 thousand due to a reduction in tax due by the Italian companies,
partially offset by an increase in tax payable by the subsidiaries 505 Games (US) Inc. and Pipeworks Inc.
The increase in VAT payable is mainly due to sales made by 505 Games Ltd. and 505 Games GmbH in the
last quarter.
16. Current provisions
The amount provided at 30 June 2017 of Euro 854 thousand reflects an assessment made by the directors,
after having sought the opinion of the Group's tax advisors, regarding the liability arising from tax audit
findings notified to the subsidiary 505 Games S.p.A. subsequent to the year end. The directors have assessed
the potential liability arising from the tax audit findings and are of the overall opinion that they are not in a
position to compute a reliable estimate thereof, with the exception of certain findings concerning royalties
payable to developers for which the directors have deemed the risk of a negative outcome to be probable,
in relation to which a provision for risks has been recognised of Euro 854 thousand. As regards the other
disputed findings, the Company has not deemed it appropriate to recognise a provision for risks, despite
the fact that there is a risk of a negative outcome that is typical of a process of this nature.
17. Other current liabilities
Other current liabilities amounted to Euro 3,954 thousand, having increased in the year by Euro 1,642
thousand. Details are provided below:
Euro thousands 30 June 2017 30 June 2016 Change
Amounts due to social security institutions (450) (367) (83)
Amounts due to employees (1,038) (838) (200)
Amounts due to contract staff (43) (52) 9
Other payables (2,423) (1,055) (1,368)
Total other current liabilities (3,954) (2,312) (1,642)
Amounts due to employees include accrued holiday pay and leave of absence not taken by the end of the
year, as well as the future payment of the 14th monthly salary, in addition to accrued variable remuneration
pertaining to the year that will be paid in September 2017.
The increase in other payables is mainly attributable to the residual amount due by the parent company of
Euro 1,384 thousand for the acquisition of Kunos Simulazioni S.r.l.

Digital Bros Group: Annual Report 2016-17
107
EQUITY
Details of changes in equity are reported in the consolidated statement of changes in equity. A summary thereof is provided below:
Euro thousands Share
capital
(A)
Share
premium
Legal
reserve
IAS
transition
reserve
Currency
translation
reserve
Other
reserves
Total
reserves
(B)
Treasury
shares
(C)
Retained
earnings
(accumulated
losses)
Profit
(loss) for
the year
Total
retained
earnings
(D)
Consolidated
equity
attributable
to Group
(A+B+C+D)
As at 1 July 2016 5,644 16,954 1,129 1,367 (813) 2,167 20,804 (390) 5,903 16,387 22,290 48,348
Capital increase 60 1,532 1,532 0 1,592
Allocation of profit for the year 0 16,387 (16,387) 0 0
Payment of dividends 0 (1,834) (1,834) (1,834)
Other changes 315 315 390 1,512 1,512 2,217
Comprehensive income (loss) (634) (2,212) (2,846) 11,297 11,297 8,451
As at 30 June 2016 5,704 18,486 1,129 1,367 (1,447) 270 19,805 0 21,968 11,297 33,265 58,774
Share capital, which has increased in the year by Euro 60 thousand, amounted to Euro 5,704,334.80 at 30 June 2017 and consisted of 14,260,837 ordinary shares with a par value of
Euro 0.4 each. No other shares of any nature are outstanding. There are no rights, liens or restrictions associated with the ordinary shares.
In connection with the acquisition of Kunos Simulazioni S.r.l., an extraordinary general meeting of the shareholders of Digital Bros Group held on 13 March 2017 approved a capital
increase with disapplication of pre-emption rights of Euro 60.000 via the issue of 150,000 shares with a par value of Euro 0.40 each, with the application of a premium of Euro 10.21
per share and, thus, with a total premium of Euro 1,531,500.00.
No specific uses or objectives have been designated for individual equity reserves, other than those laid down by law.

Digital Bros Group: Annual Report 2016-17
108
Changes in the year in other reserves were as follows:
Euro thousands 30 June 2016 Change 30 June 2017
IAS 19 reserve (119) 18 (101)
Share premium 56 (56) 0
Fair value reserve 2,230 (2,230) 0
Stock option reserve 0 371 371
Total 2,167 (1,897) 270
NET CASH/DEBT
Details are provided below of the components of the Group's net cash/debt at 30 June 2017 with
comparative figures at 30 June 2016:
Euro thousands 30 June 2017 30 June 2016 Change
22 Cash and cash equivalents 12,136 2,785 9,351
23 Current bank debt (1,942) (25,929) 23,987
24 Other current financial assets and liabilities 950 28,913 (27,963)
Current net cash 11,144 5,769 5,375
25 Non-current financial assets 1,306 1,195 111
26 Non-current bank debt (383) (1,558) 1,175
27 Other non-current financial liabilities (40) (1,895) 1,855
Non-current net cash/debt 883 (2,258) 3,141
Total net cash 12,027 3,511 8,516
Net cash increased in the year by Euro 8,516 thousand mainly due to an increase in cash and cash
equivalents of Euro 9,351 thousand, a decrease in current bank debt of Euro 23,987 thousand, a decrease
in non-current bank debt of Euro 1,174 thousand and in other non-current financial liabilities of Euro
1,855 thousand, only partially offset by a decrease in other current financial assets and liabilities of Euro
27,963 thousand.
The carrying amount of cash and cash equivalents is a reasonable approximation of fair value since these
are highly liquid forms of investment, while the carrying amount of finance lease obligations (included
in other financial liabilities) is a reasonable approximation of fair value.
The following table provides details of the Group's financial liabilities at 30 June 2017, grouped by
maturity:
Euro thousands Within 1
year
1 - 5
years
Beyond 5
years Total
Bank overdrafts 0 0 0 0
Import and export financing 0 0 0 0
Advances on invoices subject to collection 0 0 0 0
Unsecured bank loans (1,942) (383) 0 (2,325)
Total bank debt (A) (1,942) (383) 0 (2,325)
Other financial liabilities (B) 0 (40) 0 (40)
Total financial liabilities (A) + (B) (1,942) (423) 0 (2,365)

Digital Bros Group: Annual Report 2016-17
109
Current net cash
Current net cash consists of the following:
Euro thousands 30 June 2017 30 June 2016 Change
22 Cash and cash equivalents 12,136 2,785 9,351
23 Current bank debt (1,942) (25,929) 23,987
24 Other current financial assets and liabilities 950 28,913 (27,963)
Current net cash 11,144 5,769 5,375
22. Cash and cash equivalents
Cash and cash equivalents amounted to Euro 12,136 thousand at 30 June 2017, having increased in the
year by Euro 9,351 thousand. They are entirely unrestricted and consist solely of current account sight
deposits.
23. Current bank debt
Current bank debt consists solely of current loan instalments. The decrease in the year of current bank
debt of Euro 23,987 thousand is attributable to a decrease in import and export financing of Euro 21,137
thousand, to a decrease in advances on invoices subject to collection of Euro 1,399 and a decrease in loan
instalments due within 12 months of Euro 1,753 thousand.
Details are provided below:
Euro thousands 30 June 2017 30 June 2016 Change
Bank overdrafts 0 (82) 82
Import and export financing 0 (21,137) 21,137
Advances on invoices subject to collection 0 (1,399) 1,399
Loan instalments due within 12 months (1,942) (3,311) 1,369
Total current bank debt (1,942) (25,929) 23,987
Loan instalments due within 12 months at 30 June 2017 consist of Euro 706 thousand relating to the
entire residual loan granted by Unicredit S.p.A. due to mature in January 2018, Euro 500 thousand
relating to the entire residual loan granted by Monte dei Paschi di Siena S.p.A. due to mature in September
2017, Euro 352 thousand relating to the entire residual loan granted by Banco BPM S.p.A. due to mature
in September 2017 and Euro 384 thousand relating to the current portion of a medium-long-term loans
granted to 505 Games S.p.A. by Unicredit S.p.A.
The Unicredit S.p.A. loan was granted on 1 April 2015 and amounted to Euro 2.5 million; the loan
agreement provides for interest payments and the repayment of the loan principal via quarterly instalments
in arrears commencing 31 July 2015. Interest is charged at a floating rate based on the 3 month Euribor rate
plus a spread of 3.50 percentage points. The agreement contains the following commitment covenants:

Digital Bros Group: Annual Report 2016-17
110
the maintenance of accounting policies in such a manner that, for the entire loan term, the
accounting polices applied for the preparation of the separate financial statements and the
consolidated financial statements (if prepared) are consistent with the criteria followed in prior
years, without prejudice to any changes required by law;
negative pledge not to grant or allow the granting of liens, pledges or mortgage charges over owned
assets (those already owned and those to be purchased) or any pre-emption right and/or preferential
right in connection with receivables, current or future, with the exception of security granted for
the loan or granted in accordance with the provisions of the law, already in place at the date the
loan was granted and except for the sale of trade receivables under factoring arrangements for
working capital financing purposes (including the sale of VAT receivables);
undertaking to provide advance written notice to the bank of the intention to apply for other
medium-long term loans from credit institutions or individuals and, in any event, not to grant to
third parties, subsequent to the date of the agreement, mortgage charges over owned assets and/or
other collateral or unsecured guarantees, for any other loans, unless the security being granted to
third parties is extended to the Bank.
In the event of failure to comply with even one of the foregoing commitments, the Bank may terminate the
loan agreement in accordance with article 1456 of the Italian Civil Code.
The agreement also contains the following financial covenants:
leverage (net debt/equity) lower than or equal to 1.50 to be verified annually with reference to the
Company's consolidated financial statements effective as of those for the year ended 30 June
2016;
debt cover (net debt/EBITDA) lower than or equal to 4.00 to be verified annually with reference
to the Company's consolidated financial statements effective as of those for the year ended 30
June 2016.
In the event of failure to comply with the financial covenants, Digital Bros S.p.A. undertakes to submit a
statement, prepared by its legal representative, with an indication of the reasons and an indication of the
measures adopted, where possible, to restore the original conditions. In such cases, however, the Bank has
the right to terminate the loan agreement in accordance with article 1456 of the Italian Civil Code.
The Monte Paschi di Siena S.p.A. loan was granted to the parent company on 23 November 2015 and
amounted to Euro 1.5 million. The loan has to be repaid within 2 years via the payment of 6 quarterly
instalments inclusive of capital and interest as from 30 September 2016 plus two instalments comprising
interest alone due to mature on 31 March 2016 and 30 June 2016. Interest is charged at a floating rate based
on the 6 month Euribor rate plus a spread of 2 percentage points. The agreement contains a commitment
covenant to present to the Bank, for each reference period, an amount of trade flows equating to Euro 1.350
million that may consist of invoices subject to collection channelled through the Bank in the reference
period, advances on invoices or documents accepted by the Bank and for which advances had been granted
Digital Bros Group: Annual Report 2016-17
111
during the reference period, POS flows through a current account opened with the Bank in the customer's
name in connection with the card acceptance service via POS (point of sale) equipment issued by the Bank,
or the payment of notes and granting of powers for the payment of taxes and dues relating to current account
payments made in the reference period via the Bank. For the purpose of verification of compliance with the
covenants in the reference period, account will be taken of the volumes accumulated by the various types
of eligible trade flows as stipulated above. In the event of failure to comply with the above commitment
covenants, Digital Bros S.p.A. shall pay to the Bank a compensatory amount commensurate with the
difference between the interest rate/spread that would have applied if the Company had not taken on the
foregoing commitment and the amount shall be calculated on a half-yearly basis as 0.500% of the residual
loan existing on the date the failure to comply with the commitment was noted.
The unsecured loan provided by Banco BPM S.p.A. was granted on 22 June 2016 and amounted to Euro
1.75 million. The loan has to be repaid in 15 monthly instalments, the first of which fell due on 31 July
2016 and the last falls due on 30 September 2017. Interest is charged at a floating rate based on the 3 month
Euribor rate plus a spread of 1.2 percentage points. The agreement does not include any commitment or
financial covenants.
The agreement governing the loan granted by Unicredit S.p.A. to 505 Games S.p.A. provides for one or
more partial disbursements up to a maximum amount of Euro 3,900,000 to be used to partially fund the
expenditure plan for Bloodstained software development costs; the loan expires on 30 September 2018 and
505 Games S.p.A. undertakes to repay the amounts granted within six months subsequent to 1 March 2018
via two quarterly instalments in arrears falling due on 1 June 2018 and 1 September 2018. 505 Games
S.p.A. will pay interest quarterly on each disbursement at a quarterly floating rate based on the 3 month
Euribor rate rounded up to the nearest 0.05, plus a spread of 3 percentage points. In the absence of a Euribor
quote determined by the Euribor Steering Committee, reference shall be made to the Euro LIBOR interest
rate; for periods in which the Euribor or the alternative parameter is negative, the interest rate shall equate
solely to the envisaged spread.
The agreement also states that 505 Games S.p.A. has to comply with the following commitments:
to promptly pay any tax, levy, dues or contribution; to pay to Unicredit S.p.A., upon a loan
disbursement being made, where due, substitute tax pursuant to Presidential Decree 601 of 29
September 1973 and subsequent amendments and additions and to reimburse Unicredit S.p.A. any
tax, levy and expense of any kind incurred or paid on behalf of 505 Games S.p.A., including
amounts that Unicredit S.p.A. has paid or has to pay for advice and assistance, in or out of court,
provided thereto, as well as to make full payment of all envisaged costs, such as, by way of
example only, legal costs and those incurred for due diligence in connection with the completion
of the loan agreement;
to communicate to Unicredit S.p.A. without delay the emergence of disputes that may have a
prejudicial impact on 505 Games S.p.A.'s ability to meet the obligations assumed thereby under
the agreement, or the occurrence of any event that may adversely impact its legal status or its

Digital Bros Group: Annual Report 2016-17
112
capital, financial performance or financial position or the integrity and effectiveness of the
warranties, confirming that no dispute of this nature is pending and that no event has occurred at
the time of execution of the agreement;
to notify Unicredit S.p.A. in advance of any change in legal or corporate structure (e.g. form, share
capital, directors, members of board of statutory auditors and shareholders, as well as mergers,
inclusive of by absorption, demergers, spin-offs or contributions), in management structure and
capital and financial structure (e.g. bond issues), as well as in the economic and technical situation
resulting from data, elements and documents submitted during the loan application process, as
well of facts that may potentially change the business's current structure and organisation;
to deliver to Unicredit S.p.A., within 30 days of shareholder approval and, in any event, no later
than 210 days from the financial year end, the separate annual financial statements together with
the Group's consolidated annual financial statements, complete with the minutes documenting the
approval thereof, or within 30 days of having filed the tax returns;
to inform Unicredit S.p.A. in advance of the intention to apply for any other medium-long term
loans from credit institutions or individuals and, in any event, not to grant to third parties,
subsequent to the date of the agreement, mortgage charges over owned assets in connection with
any other loans, unless prior written authorisation has been granted by Unicredit S.p.A.;
to consent to any kind of technical/administrative investigation or audit and to provide all
documents (financial statements, minutes of general meetings etc.) and information that may be
requested by Unicredit S.p.A.;
to use the loan proceeds solely for the purpose stated in the agreement, in compliance with the
laws and regulations in force and, in any event, not to use the loan proceeds to enter into any
transactions involving shares and/or financial instruments of Unicredit S.p.A. that constitute or
may constitute a breach of article 2358 of the Italian Civil Code by Unicredit S.p.A.
In the event of failure to comply with even one of the foregoing commitments, the Bank may terminate the
loan agreement in accordance with article 1456 of the Italian Civil Code.
All financial and commitment covenants had been complied with at 30 June 2017, with the exception of
the Monte dei Paschi di Siena S.p.A. commitment covenant.
24. Other current financial assets and liabilities

Digital Bros Group: Annual Report 2016-17
113
Other current financial assets and liabilities consist of the following:
Euro thousands 30 June 2017 30 June 2016 Change
Starbreeze A shares 0 6,000 (6,000)
Starbreeze B shares 2,972 22,972 (20,000)
Fair value of derivatives expiring within 12 months 0 136 (136)
Advances against trade receivables under non-
recourse factoring arrangements (218) (128) (90)
Current lease obligations (15) (15) 0
Loan for purchase of 133 W. Broadway property (1,789) (52) (1,737)
Total other current financial assets and liabilities 950 28,913 (27,963)
The Starbreeze A shares held by Digital Bros at 30 June 2016 were all sold on 1 July 2016.
The carrying amount of Starbreeze B shares represents the market value at 30 June 2017 of 1,935,588
Starbreeze B shares (listed on Nasdaq Stockholm First North Premier) held by Digital Bros S.p.A. at
the year end.
The 100 million Swedish Krona synthetic agreement for forward exchange that was entered into
between the subsidiary Games S.p.A. and Unicredit S.p.A. on 1 June 2016 to hedge foreign exchange
risk was completely utilised during the year.
Advances against trade receivables under non-recourse factoring arrangements amounted to Euro 218
thousand and have decreased in the year by Euro 90 thousand.
Current lease obligations of Euro 15 thousand relate to two lease agreements entered into in the prior
financial year with Unicredit Leasing. The lease obligations are for a car (Euro 5 thousand) and server
(Euro 10 thousand).
The loan for the purchase of 133 W. Broadway property of Euro 1,789 thousand relates to the entire residual
loan granted by Spring Properties Inc. for the purchase of the Eugene property, which is used by Pipeworks
Inc. The loan, which amounts to 2,125 thousand U.S. dollars, is repayable in 21 monthly instalments of 15
thousand U.S. dollars, inclusive of interest at an annual rate of 6% plus a final instalment of 2,023 thousand
U.S. dollars.
Non-current net cash/debt
Non-current net cash/debt consists of the following:
Euro thousands 30 June 2017 30 June 2016 Change
25 Non-current financial assets 1,306 1,195 111
26 Non-current bank debt (383) (1,558) 1,175
27 Other non-current financial liabilities (40) (1,895) 1,855
Non-current net cash/debt 883 (2,258) 3,141
25. Non-current financial assets

Digital Bros Group: Annual Report 2016-17
114
The balance consists entirely of a loan granted by 505 Games S.p.A. to Shinshuppatsu Junbi Co. Ltd. of
an amount of 150,000,000 Yen. The loan, which bears interest at an annual rate of seven percent, is
repayable on demand, but the Group estimates that the counterparty will benefit therefrom for at least
two more years. The loan was granted to the company as part of a broader commercial agreement
concerning the development of video games. The change in the year is attributable to the recognition of
interest and the impact of the exchange difference on the foreign currency loan receivable.
26. Non-current bank debt
Non-current bank debt consists of the non-current portion of a loan granted to 505 Games S.p.A. by
Unicredit S.p.A., details of which have been provided under current bank debt.
27. Other non-current financial liabilities
The residual amount of Euro 40 thousand relates to lease instalments due beyond twelve months relating
to two finance leases entered into with Unicredit Leasing for the purchase of a server and a car. The amount
financed under the first lease is Euro 54 thousand and the agreement envisages the payment of fifty nine
monthly instalments plus an advance payment of Euro 5 thousand and a purchase option of Euro 1 thousand.
The lease agreement expires on 29 December 2020. Instalments due within twelve months amount to Euro
25 thousand. Interest is charged at a floating rate based on the 3 month Euribor rate plus a spread of 3
percentage points. The amount financed under the car lease is Euro 31 thousand and the agreement
envisages the payment of fifty nine monthly instalments plus an advance payment of Euro 1 thousand and
a purchase option of Euro 1 thousand. The lease agreement expires on 28 April 2021. Instalments due
within twelve months amount to Euro 15 thousand. Interest is payable at a floating rate of 1.41%.
The following table shows finance lease payments by maturity:
Euro thousands 30 June 2017 30 June 2016 Change
Due within 12 months 15 15 0
1-5 years 40 55 (15)
Beyond 5 years 0 0 0
Total 55 70 (15)
COMMITMENTS AND RISKS

Digital Bros Group: Annual Report 2016-17
115
The Group’s commitments almost entirely consist of commitments assumed under executed contracts:
Euro thousands 30 June 2017 30 June 2016 Change
Commitments assumed under executed contracts (26,875) (27,921) 1,046
Commitment to subscribe to Ovosonico S.r.l.'s capital 0 (300) 300
Commitment to subscribe to Seekhana Ltd.'s capital (1,227) (1,621) 394
Total commitments (28,102) (29,842) 1,740
Commitments assumed under executed contracts relate to future outlays by the Group with respect to
licenses and user rights to video games not yet completed or for which production had not yet begun at the
reporting date.
The commitment to subscribe to Ovosonico S.r.l.'s capital relates to an agreement entered into for the
subscription of an amount of Euro 720 thousand that was fulfilled during the year.
The commitment to subscribe to Seekhana Ltd.'s capital relates to an agreement executed on 18 January
2016 for the subscription of an amount of Euro 2 million U.S. dollars, of which 600 thousand U.S. dollars
had been paid as of 30 June 2017.
7. ANALYSIS OF STATEMENT OF PROFIT OR LOSS

Digital Bros Group: Annual Report 2016-17
116
3. Net revenue
Details are provided below of revenue by operating segment, except for the Holding segment, which does
not generate revenue:
Euro thousands
Development
Free to
Play
Premium
Games
Italian
Distribution
Other
Activities Total
1 Gross revenue 9,719 7,736 105,618 18,464 863 142,400
2
Revenue
adjustments 0 0 (4,726) (1,851) (440) (7,017)
3 Net revenue 9,719 7,736 100,892 16,613 423 135,383
The same details for the year ended 30 June 2016 are as follows:
Euro thousands Development
Free to
Play
Premium
Games
Italian
Distribution
Other
Activities Total
1 Gross revenue 1,736 5,275 83,204 19,232 746 110,192
2
Revenue
adjustments 0 0 (1,648) (1,273) (56) (2,977)
3 Net revenue 1,736 5,275 81,556 17,959 690 107,215
For comments on net revenue, reference should be made to paragraph 5 of the directors’ report entitled
"Analysis of results for the year ended 30 June 2017".
8. Cost of sales
Cost of sales is detailed below:
Euro thousands Year ended
30 June 2017
Year ended
30 June 2016 Change %
Purchase of products for resale (31,206) (21,193) (10,013) 47.2%
Purchase of services for resale (9,533) (5,580) (3,953) 70.8%
Royalties (37,102) (23,851) (13,251) 55.6%
Changes in inventories of finished products 882 (948) 1,830 n.m.
Total cost of sales (76,959) (51,572) (25,387) 49.2%
Please refer to the directors’ report for detailed information on the individual components of revenue and
cost of sales.
10. Other income
Other income, which amounted to Euro 1,959 thousand, decreased in the year by Euro 5,714 thousand due
to the fact that, during the year, Pipeworks worked almost exclusively on contracts for non-Group
customers, with services performed for the Group having been limited to quality assurance and live support
for the Prominence Poker video game, as well as development of the new Terraria 1.3. video game.
11. Cost of services
The following table provides details of cost of services:

Digital Bros Group: Annual Report 2016-17
117
Euro thousands Year ended
30 June 2017
Year ended
30 June 2016 Change %
Advertising, marketing, trade fairs and exhibitions (5,791) (7,563) 1,772 -23.4%
Transport and freight (1,394) (530) (864) n.m.
Other sales related costs (751) (818) 67 -8.2%
Subtotal: sales related services (7,936) (8,911) 975 -10.9%
Miscellaneous insurance (332) (394) 62 -15.8%
Consulting fees (3,003) (2,264) (739) 32.6%
Postal and telegraph (263) (251) (12) 4.7%
Travel and subsistence allowances (1,165) (1,162) (3) 0.3%
Utilities (245) (237) (8) 3.5%
Maintenance (90) (98) 8 -8.2%
Statutory auditors’ fees (108) (108) 0 0.0%
Subtotal: general services (5,206) (4,514) (692) 15.3%
Total cost of services (13,142) (13,425) 283 -2.1%
Cost of services decreased by Euro 283 thousand in contrast to the increase in sales, mainly due to the fact
that no advertising expenditure was incurred for Fantasfida, while an amount of Euro 2,291 thousand was
incurred in the year ended 30 June 2016. Transport and freight increased by Euro 864 thousand due to
significant growth in retail revenue, while consulting fees rose by Euro 739 thousand mainly due to costs
incurred for the preparation of the share incentive plan and for the acquisition of Kunos Simulazioni S.r.l.
12. Lease and rental charges
The following table provides details of lease and rental charges, which decreased in the year by Euro 79
thousand:
Euro thousands Year ended
30 June 2017
Year ended
30 June 2016 Change %
Office rental - Italian companies (705) (720) 15 -2.1%
Office rental - 505 Games Ltd. (79) (99) 20 -20.2%
Office rental - DR Studios Ltd. (55) (65) 10 -15.4%
Office rental - Digital Bros France S.a.s. (46) (46) 0 0.0%
Office rental - Digital Bros Spain Slu (20) (20) 0 0.0%
Office rental - 505 Games US Inc. (419) (368) (51) 13.9%
Office rental - Pipeworks Inc. 0 (95) 95 n.m.
Office rental - 505 Games GmbH (3) (3) 0 0.0%
Office rental - Digital Bros China Ltd. (39) (26) (13) 50.0%
Office rental - Kunos S.r.l. (8) 0 (8) n.m.
Office rental - Hawken Entertainment Inc. (7) 0 (7) n.m.
Lease of cars and warehouse equipment (95) (113) 18 -15.9%
Total lease and rental charges (1,476) (1,555) 79 -5.1%
13. Labour costs

Digital Bros Group: Annual Report 2016-17
118
Labour costs, including directors’ fees approved by the shareholders, amounts paid to temporary workers
and contract staff and the cost of cars assigned to employees, came to Euro 22,469 thousand and increased
in the year by Euro 2,608 thousand:
Euro thousands Year ended
30 June 2017
Year ended
30 June 2016 Change %
Wages and salaries (16,686) (14,379) (2,307) 16.0%
Social contributions (3,986) (3,758) (228) 6.1%
Employee termination indemnity (196) (191) (5) 2.4%
Directors’ remuneration (1,196) (1,084) (112) 10.3%
Temporary workers and contract staff (310) (347) 37 -10.7%
Agents’ commission (64) (74) 10 -14.0%
Other labour costs (31) (28) (3) 11.5%
Total labour costs (22,469) (19,861) (2,608) 13.1%
The increase in wages and salaries and related social contributions is attributable to staff hired by foreign
subsidiaries to sustain the international development of the Group's activities, as well as to the acquisition
of Kunos Simulazioni S.r.l. and the set up of Hawken Entertainment Inc. in the course of the year.
Labour costs, in the strict sense of the term, consist of employee wages and salaries, social contributions
and the cost of employee termination indemnities. They increased in the year by Euro 2,539 thousand, while
the average cost per employee increased by 1.2%:
Euro thousands Year ended
30 June 2017
Year ended
30 June 2016 Change %
Wages and salaries (16,686) (14,379) (2,307) 16.0%
Social contributions (3,986) (3,758) (228) 6.1%
Employee termination indemnity (196) (191) (5) 2.4%
Total labour costs (20,868) (18,328) (2,539) 13.9%
Average number of employees 251 223 28 12.6%
Average cost per employee (83.1) (82.2) (0.9) 1.2%
The breakdown of the Group's workforce at 30 June 2017 by category is provided in the directors’ report
under “Other information”.
14. Other operating costs
Details of the nature of operating costs are provided below, together with prior year comparatives:
Euro thousands Year ended
30 June 2017
Year ended
30 June 2016 Change %
Purchase of miscellaneous materials (38) (77) 39 -51.1%
General and administrative costs (1,193) (1,043) (150) 14.4%
Entertainment costs (41) (50) 9 -19.1%
Miscellaneous bank charges (726) (251) (475) n.m.
Total other operating costs (1,998) (1,421) (577) 40.6%

Digital Bros Group: Annual Report 2016-17
119
Operating costs increased in the year by 40.6%, from Euro 1,421 thousand to Euro 1,998 thousand. The
increase is due to fees of Euro 516 thousand incurred by 505 Games S.p.A. in connection with the sale and
purchase of Starbreeze shares during the year.
21. Non-monetary income and operating costs
Non-monetary operating costs consist of the following:
Euro thousands Year ended
30 June 2017
Year ended
30 June 2016 Change %
Depreciation and amortisation (7,714) (3,788) (3,926) n.m.
Allocations to provisions (854) 0 (854) 0.0%
Impairment losses recognised on assets (1,653) (1,080) (573) 53.1%
Reversal of impairment losses 0 588 (588) n.m.
Total non-monetary income and operating costs (10,221) (4,280) (5,941) n.m.
Net non-monetary operating costs increased in the year by Euro 5,941 thousand. The increase is mainly
attributable to a rise in depreciation and amortisation of Euro 3,926 thousand reflecting the use of the
intellectual property held.
The allocations to provisions relate to a risk provision recognised by 505 Games S.p.A. in connection with
a tax audit.
Impairment losses increased by Euro 573 thousand from Euro 1,080 thousand to Euro 1,653 thousand. The
latter amount includes:
the impairment of specific receivable balances of Euro 420 that may not be possible to collect;
the impairment of investments in Cityglance S.r.l. in liquidation and Ebooks&Kids S.r.l. of Euro
44 thousand and Euro 148 thousand, respectively;
the cancellation of certain uncompleted contracts amounting to Euro 1,041 thousand .
25. Net finance income (costs)
This consists of:
Euro thousands
Year ended
30 June 2017
Year ended
30 June 2016 Change %
23 Interest and finance income 8,772 3,093 5,679 n.m.
24 Interest expense and finance costs (3,137) (5,570) 2,433 -43.7%
25 Net finance income (costs) 5,635 (2,477) 8,112 n.m.
Net finance income amounted to Euro 5,635 thousand compared to prior year net finance costs of Euro
2,477 thousand.

Digital Bros Group: Annual Report 2016-17
120
Details of interest and finance income are provided below:
Euro thousands Year ended
30 June 2017
Year ended
30 June 2016 Change %
Exchange gains 1,752 1,429 323 22.6%
Finance income 6,899 1,642 5,257 n.m.
Other 121 22 99 n.m.
Total interest and financial income 8,772 3,093 5,679 n.m.
Interest and finance income increased by Euro 5,679 thousand in the year. This mainly consisted of gains
recognised in the year on the sale and purchase of Starbreeze A and B shares of Euro 6,891 thousand and
exchange gains of Euro 1,752 thousand.
Interest expense and finance costs amounted to Euro 3,137 thousand, representing a decrease in the year of
Euro 2,433 thousand, attributable to a reduction in losses recognised in the year on Starbreeze B shares.
Details are provided below of interest expense:
Euro thousands Year ended
30 June 2017
Year ended
30 June 2016 Change %
Interest charged by banks on current accounts and
trade finance (405) (499) 95 -19.0%
Other interest expense 0 (6) 6 n.m.
Interest on loans and leases (210) (151) (59) 38.7%
Factoring interest (15) (11) (5) 44.6%
Total interest expense payable to lenders (630) (667) 37 -5.6%
Exchange losses (1,508) (1,134) (374) 33.0%
Loss on disposal of securities (999) (3,769) 2,770 -73.5%
Total interest expense (3,137) (5,570) 2,433
-
43.7%
29. Taxation
Details of current and deferred taxes for the year ended 30 June 2017 are provided below:
Euro thousands Year ended
30 June 2017
Year ended
30 June 2016 Change %
Current tax (5,140) (7,016) 1,876 -26.7%
Deferred tax (276) 1,217 (1,492) n.m.
Total income tax expense (5,415) (5,799) 384 -6.6%
Details are provided below of current tax:
Euro thousands Year ended
30 June 2017
Year ended
30 June 2016 Change %
IRES (1,970) (5,134) 3,164 n.m.
IRAP (529) (987) 458 -46.4%
Current tax - foreign companies (2,641) (535) (2,106) 393.6%
Other current tax 0 12 (12) n.m.
Total income tax expense (5,140) (6,644) 1,504 -22.6%
IRES for the year was determined as follows:

Digital Bros Group: Annual Report 2016-17
121
Euro thousands Year ended
30 June 2017
Year ended
30 June 2016
IRES taxable income 8,087 (6,644)
IRES tax rate 27.5% 27.5%
IRES for the year (2,224) (5,103)
Effect of tax consolidation 160 160
Taxes on prior year income 94 (191)
IRES for the year (1,970) (5,134)
Below is a reconciliation of the IRES tax charge for the year to the result reported in the financial
statements:
Euro thousands Year ended
30 June 2017
Year ended
30 June 2016
Pre-tax result of the parent company 3,801 (4,428)
IRES tax rate (27.5%) 27.5% 27.5%
Theoretical tax charge (1,045) -27.5% 1,218 -27.5%
Tax effect of non-deductible costs or non-taxable income 1,444 38% (873) 20%
Tax effect of the use of tax losses not previously used 0 0% 0 0%
Net tax effect of the reversal of deferred tax assets not
included above (57) -1% 188 -4%
Effect of tax consolidation 160 4% 160 -4%
Tax effect of share of results of subsidiaries (2,566) -68% (5,955) 134%
Taxes on prior year income 94 2% 128 -3%
Tax charge for the year and effective tax rate (1,970) -52% (5,134) 116%
IRAP for the year was determined as follows:
Euro thousands Year ended
30 June 2017
Year ended
30 June 2016
IRAP taxable income 11,205 25,384
IRAP tax rate 3.9% 3.9%
IRAP attributable to the year (437) (990)
IRAP attributable to prior year (92) 3
IRAP for the year (529) (987)
Below is a reconciliation of the IRAP tax charge for the year to the result reported in the financial
statements:
Euro thousands Year ended 30 June 2017 Year ended 30 June 2016
Parent company operating margin (3,454) (2,643)
IRAP tax rate 3.9% 3.9%
Theoretical tax charge 0 0.0% 0 0.0%
Tax effect of non-deductible costs 0 0.0% 0 0.0%
Tax effect of share of results of subsidiaries (529) 15.3% (987) 37.3%
Tax charge for the year and effective tax
rate (529) 15.3% (987) 37.3%

Digital Bros Group: Annual Report 2016-17
122
The increase in deferred taxes is mainly attributable to the good performance by the Premium Games
operating segment, which allowed the U.S. and UK subsidiaries to use the deferred tax assets recognised
in prior years.
32. Basic earnings per share
The computation of basic earnings per share was based on the following figures:
Euro thousands Year ended
30 June 2017
Year ended
30 June 2016
Profit (loss) for the year (1) 11,297 12,539
Average number of outstanding shares (2) 14,154,588 14,110,838
Number of treasury shares held in the year (3) (37,989) (171,250)
Total average number of shares (4)=(2)-(3) 14,116,599 13,939,588
Net earnings (loss) per share (1)/(4) (in euros) 0.80 0.90
Basic earnings per share is calculated by dividing the profit for the period by the average number of shares
outstanding, net of treasury shares.
Earnings per share for the year ended 30 June 2017 amounted to Euro 0.80 versus Euro 0.90 per share for
the year ended 30 June 2016.
33. Diluted earnings per share
Diluted earnings per share equates to basic earnings per share, since there were no outstanding financial
instruments convertible to shares in the years ended 30 June 2017 and 2016.

Digital Bros Group: Annual Report 2016-17
123
8. FINANCIAL INSTRUMENTS AND FINANCIAL RISK MANAGEMENT
(IFRS 7)
The main financial instruments that may be used by the Group are as follows:
Bank overdrafts
Sight and short-term bank deposits
Import financing
Export financing
Commercial credit lines (factoring)
Finance leases
Derivative contracts
Financial instruments held for trading.
The purpose of these instruments is to finance the Group’s operating activities. The policy for the use of
financial instruments, including derivative contracts and financial instruments held for trading, are
described in the explanatory notes.
The parent company Digital Bros S.p.A. manages all financial risks on behalf of itself and its subsidiaries,
with the exception of other financial instruments not listed above, namely trade payables and receivables
arising from operating activities for which the financial risk is the responsibility of the individual company.
Since the year ended 30 June 2008, the subsidiary 505 Games S.p.A. has had its own independent credit
facilities to finance international growth, since April 2011, the subsidiary 505 Games Ltd. has had access
to two international factoring facilities and, since November 2012, the subsidiary 505 Games France S.a.s.
has had its own international factoring facility.
The Group tries to maintain a balance between short-term and medium/long-term financial instruments.
The Group’s core business, the marketing of video games, entails investments primarily in net working
capital which are funded through short-term credit lines. Long-term investments are normally financed
through medium/long-term lines of credit often dedicated to the individual investment, including in the
form of finance leases.
Given the above, medium- and long-term financial payables have a well-distributed range of maturities.
The disclosures required by IFRS 7 concerning the significance of financial instruments to the Group's
results and financial position are provided in the following tables for each of the years ended 30 June 2017
and 2016.
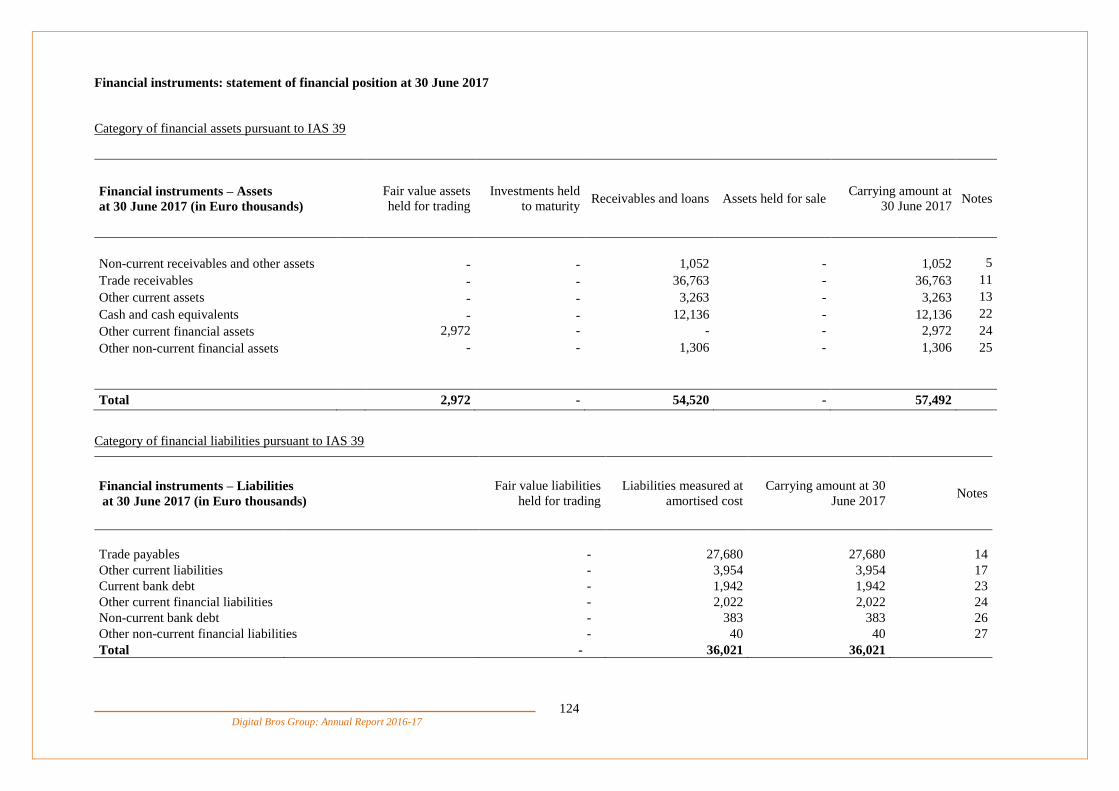
Digital Bros Group: Annual Report 2016-17
124
Financial instruments: statement of financial position at 30 June 2017
Category of financial assets pursuant to IAS 39
Financial instruments – Assets
at 30 June 2017 (in Euro thousands)
Fair value assets
held for trading
Investments held
to maturity Receivables and loans Assets held for sale
Carrying amount at
30 June 2017 Notes
Non-current receivables and other assets - - 1,052 - 1,052 5
Trade receivables - - 36,763 - 36,763 11
Other current assets - - 3,263 - 3,263 13
Cash and cash equivalents - - 12,136 - 12,136 22
Other current financial assets 2,972 - - - 2,972 24
Other non-current financial assets - - 1,306 - 1,306 25
Total 2,972 - 54,520 - 57,492
Category of financial liabilities pursuant to IAS 39
Financial instruments – Liabilities
at 30 June 2017 (in Euro thousands)
Fair value liabilities
held for trading
Liabilities measured at
amortised cost
Carrying amount at 30
June 2017 Notes
Trade payables - 27,680 27,680 14
Other current liabilities - 3,954 3,954 17
Current bank debt - 1,942 1,942 23
Other current financial liabilities - 2,022 2,022 24
Non-current bank debt - 383 383 26
Other non-current financial liabilities - 40 40 27
Total - 36,021 36,021

Digital Bros Group: Annual Report 2016-17
125
Financial instruments: statement of financial position at 30 June 2016
Category of financial assets pursuant to IAS 39
Financial instruments – Assets
at 30 June 2016 (in Euro thousands)
Fair value assets
held for trading
Investments held
to maturity
Receivables and
loans Assets held for sale
Carrying amount at
30 June 2016 Notes
Non-current receivables and other assets - - 1,056 - 1,056 5
Trade receivables - - 34,840 - 34,840 11
Other current assets - - 5,034 - 5,034 13
Cash and cash equivalents - - 2,785 - 2,785 22
Other current financial assets 29,108 - - - 29,108 24
Other non-current financial assets - - 1,195 - 1,195 25
Total 29,108 - 44,910 - 74,018
Category of financial liabilities pursuant to IAS 39
Financial instruments – Liabilities
at 30 June 2016 (in Euro thousands)
Fair value liabilities
held for trading
Liabilities measured at
amortised cost
Carrying amount at 30
June 2016 Notes
Trade payables - 21,712 21,712 14
Other current liabilities - 2,312 2,312 17
Current bank debt - 25,929 25,929 23
Other current financial liabilities - 195 195 24
Non-current bank debt - 1,558 1,558 26
Other non-current financial liabilities - 1,895 1,895 27
Total - 53,601 53,601

Digital Bros Group: Annual Report 2016-17
126
The main risks generated by the Group’s financial instruments are:
interest rate risk
liquidity risk
exchange rate risk
credit risk
Interest rate risk
The Group’s exposure to interest rate fluctuations is marginal with respect to its medium- and long-term
financial instruments, which were originally designated as fixed-rate instruments or have been converted
into fixed rates using appropriate derivative agreements.
For short-term financial instruments, the possibility of rising interest rates is an effective risk, because the
Group cannot immediately transfer the higher rates to its prices. These risks are reduced by:
the availability of an interconnected series of short-term credit lines, allowing it to borrow under
the most favourable conditions;
the level of short-term borrowings, which varies substantially on the basis of seasonal trends in
the video games market and that has shown a constantly falling trend;
the implementation of a short-term cash flow procedure that constantly monitors the trend in short-
term debt and allows preventive action to be taken when interest rates are expected to rise.
Liquidity risk
Liquidity risk arises if it becomes difficult or impossible to obtain, under sustainable conditions, the
financial resources needed to operate the business.
The factors that influence the Group’s financial needs are the resources generated or absorbed by operating
and investing activities, the maturity and renewal terms of debt and the liquidity of investments and current
conditions and available funds in the credit market.
The Group has reduced this risk by setting up the centralised management of treasury procedures and credit
lines, by obtaining adequate credit that allows the creation of a sustainable liability structure through the
use of irrevocable credit lines and continuous monitoring of prospective liquidity conditions.
It is believed that the results of short- and medium/long-term planning and currently available funds, along
with those to be generated by operating activities, should allow the Group to satisfy its requirements as far
as investment, working capital management and debt repayment at natural maturity are concerned and in
any case to determine its financing needs sufficiently ahead of time.
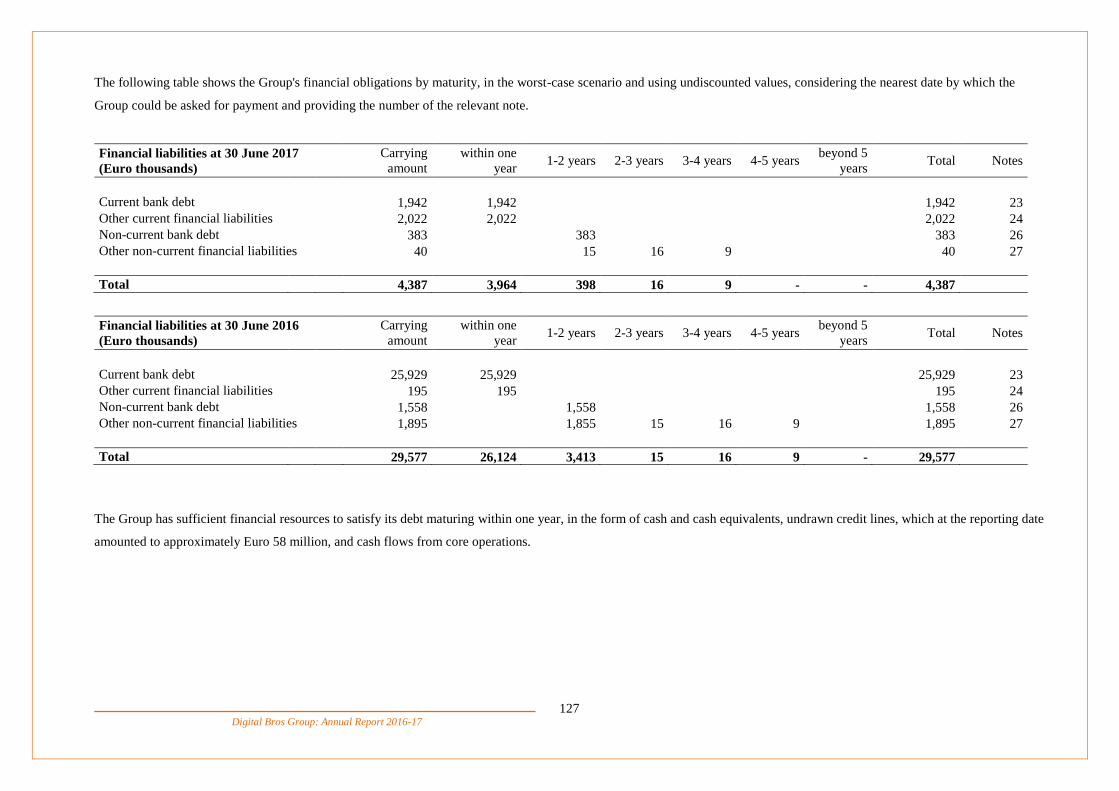
Digital Bros Group: Annual Report 2016-17
127
The following table shows the Group's financial obligations by maturity, in the worst-case scenario and using undiscounted values, considering the nearest date by which the
Group could be asked for payment and providing the number of the relevant note.
Financial liabilities at 30 June 2017
(Euro thousands)
Carrying
amount
within one
year 1-2 years 2-3 years 3-4 years 4-5 years
beyond 5
years Total Notes
Current bank debt 1,942 1,942 1,942 23
Other current financial liabilities 2,022 2,022 2,022 24
Non-current bank debt 383 383 383 26
Other non-current financial liabilities 40 15 16 9 40 27
Total 4,387 3,964 398 16 9 - - 4,387
Financial liabilities at 30 June 2016
(Euro thousands)
Carrying
amount
within one
year 1-2 years 2-3 years 3-4 years 4-5 years
beyond 5
years Total Notes
Current bank debt 25,929 25,929 25,929 23
Other current financial liabilities 195 195 195 24
Non-current bank debt 1,558 1,558 1,558 26
Other non-current financial liabilities 1,895 1,855 15 16 9 1,895 27
Total 29,577 26,124 3,413 15 16 9 - 29,577
The Group has sufficient financial resources to satisfy its debt maturing within one year, in the form of cash and cash equivalents, undrawn credit lines, which at the reporting date
amounted to approximately Euro 58 million, and cash flows from core operations.

Digital Bros Group: Annual Report 2016-17
128
Exchange rate risk
The Group’s exposure in US dollars due to the operations of the U.S. subsidiary is mitigated by the fact
that the Group has many game development contracts in that currency, so any negative changes in the
EUR/USD exchange rate would cause licence costs to go up but would also produce exchange gains on
payments received (the reverse also holds true).
To monitor the risk level of the EUR/USD and EUR/GBP exchange rate, the Group closely monitors
exchange rate forecasts from independent analysts and other sources and may use derivative instruments to
hedge this risk as appropriate (no such instruments are used at present).
In the preparation of its forecasts, the Group runs models that take account of various currencies used by
the companies and forward exchange rates based on reports issued by independent analysts.
Credit risk
As far as Italian customers are concerned, the Group sells exclusively to known buyers. If necessary
information on customers is not available, merchandise is sold with advance payment and/or cash on
delivery to limit credit risk.
The finance department reviews credit facilities and customer balances before any shipments are made.
Despite these precautions, the Group has taken out insurance covering a significant percentage of its
customers.
All foreign subsidiaries have taken out an appropriate credit insurance policy. The credit policy is never to
exceed the limits of coverage for each individual customer, thereby limiting the chance that any difficulties
faced by customers will affect the Group’s performance.
The following table provides details of receivables from customers by due date at 30 June 2017 and 2016:
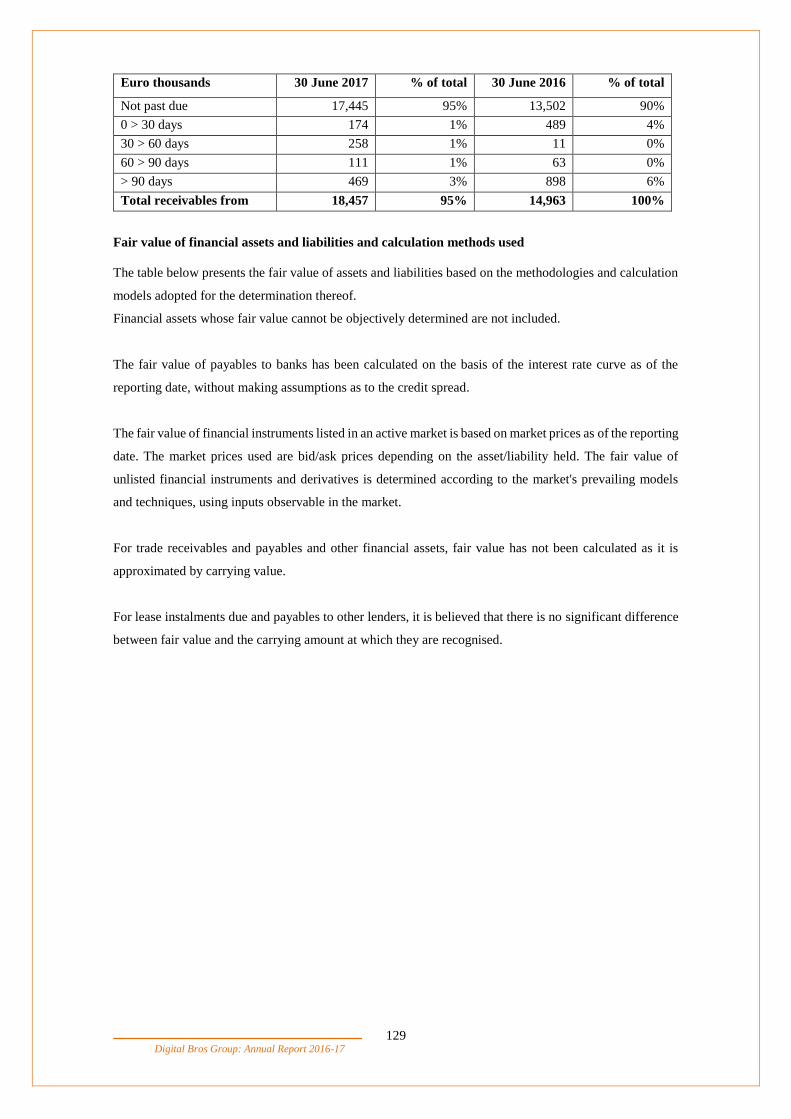
Digital Bros Group: Annual Report 2016-17
129
Euro thousands 30 June 2017 % of total 30 June 2016 % of total
Not past due 17,445 95% 13,502 90%
0 > 30 days 174 1% 489 4%
30 > 60 days 258 1% 11 0%
60 > 90 days 111 1% 63 0%
> 90 days 469 3% 898 6%
Total receivables from
customers
18,457 95% 14,963 100%
Fair value of financial assets and liabilities and calculation methods used
The table below presents the fair value of assets and liabilities based on the methodologies and calculation
models adopted for the determination thereof.
Financial assets whose fair value cannot be objectively determined are not included.
The fair value of payables to banks has been calculated on the basis of the interest rate curve as of the
reporting date, without making assumptions as to the credit spread.
The fair value of financial instruments listed in an active market is based on market prices as of the reporting
date. The market prices used are bid/ask prices depending on the asset/liability held. The fair value of
unlisted financial instruments and derivatives is determined according to the market's prevailing models
and techniques, using inputs observable in the market.
For trade receivables and payables and other financial assets, fair value has not been calculated as it is
approximated by carrying value.
For lease instalments due and payables to other lenders, it is believed that there is no significant difference
between fair value and the carrying amount at which they are recognised.

Digital Bros Group: Annual Report 2016-17
130
Euro thousands Carrying amount at
30 June 2017 Mark to market Mark to model Total fair value Notes
Fair value Fair value
Cash and cash equivalents 12,136 12,136 12,136 22
Current bank debt (1,942) (1,942) (1,942) 23
Other current financial assets and liabilities 950 950 950 24
Other non-current financial assets and liabilities 1,306 1,306 1,306 25
Non-current bank debt (383) (383) (383) 25
Other non-current financial liabilities (40) (40) (40) 27
Total 12,027 12,027 12,027
Euro thousands Carrying amount at
30 June 2016 Mark to market Mark to model Total fair value Notes
Fair value Fair value
Cash and cash equivalents 2,785 2,785 2,785 22
Current bank debt (25,929) (25,929) (25,929) 23
Other current financial assets and liabilities 28,777 28,777 28,777 24
Other non-current financial assets and liabilities 1,195 1,195 1,195 25
Non-current bank debt (1,558) (1,558) (1,558) 25
Interest rate swap 136 136 136 23-26
Other non-current financial liabilities (1,895) (1,895) (1,895) 27
Total 3,511 3,511 3,511

Digital Bros Group: Annual Report 2016-17
131
Exchange rate and interest rate risk: sensitivity analysis
Sensitivity analysis has been performed in accordance with IFRS 7. It applies to all financial instruments
recognised in the financial statements.
The sensitivity analysis measures the estimated impact on profit or loss and on the statement of financial
position of a fluctuation in the exchange rate of +/-10% and in the interest rate of +/-1% with respect to the
rates in effect at 30 June 2017 for each class of financial instrument, with all other variables remaining
constant. The analysis is purely illustrative, as such changes rarely take place in an isolated manner.
At 30 June 2017, the Group was not exposed to additional risks, such as commodity risk.
For the sensitivity analysis of exchange rates, account was taken of the risk that may arise for any financial
instrument denominated in a currency other than the euro. Consequently, translation risk was also taken
into account.
Financial instruments that are subject to gains or losses in value as a result of movements in interest rates
are instruments with floating interest rates and instruments with fixed interest rates, but which are measured
at fair value.
The table below shows the impact on net cash/debt and pre-tax profit of an increase/decrease of 10% in the
EUR/USD exchange rate with respect to the budgeted rate of 1.12:
Type of change Impact on net cash/debt Impact on pre-tax profit
+10% Dollar (443) (100)
-10% Dollar 540 121
Fair value hierarchy
IFRS 7 requires that financial instruments recognised at fair value be classified in a hierarchy reflecting the
significance of the inputs used to measure fair value. The levels are as follows:
− Level 1: quoted prices in active markets for identical assets or liabilities;
− Level 2: inputs other than quoted market prices included within Level 1 that are directly or indirectly
observable in the market;
− Level 3: inputs not based on observable market data.
To calculate the market value of financial instruments, the Group uses various measurement and valuation
models, as summarised below for 2017 and 2016:

Digital Bros Group: Annual Report 2016-17
132
Balances at 30 June
2017 Instrument Level 1 Level 2 Level 3 Total Notes
Other current financial
assets
Listed shares
2,972
2,972 24
Balances at 30 June
2016 Instrument Level 1 Level 2 Level 3 Total Notes
Derivatives for
trading Flexible forward
136
136 23-26
Other current financial
assets
Listed shares
28,777
28,777 24
9. NON-RECURRING INCOME AND EXPENSES
According to Consob Resolution 15519 of 27 July 2006, non-recurring income and expenses have to be
presented separately in the statement of profit or loss. These are generated by transactions or events that by
nature do not occur on a regular basis in the ordinary course of business.
The Group did not recognise any non-recurring income and expenses in the year.
Digital Bros Group: Annual Report 2016-17
133
10. INFORMATION CONCERNING OPERATING SEGMENTS
Digital Bros Group develops, publishes, distributes and markets video games on an international scale.
During the course of the previous financial year, the Group's organisational structure and operating
segments were revised. The previous organisation was structured based on its distribution channels,
International Publishing and Mobile, whereas it has been decided to focus on the type of games, namely
Premium Games and Free to Play. The structure of the Development, Italian Distribution, Other Activities
and Holding operating segments has remained unchanged.
Accordingly, the Group is organised into five operating segments:
Development;
Premium Games;
Free to Play;
Italian Distribution;
Other Activities;
Holding.
The directors monitor the results of each operating segment separately in order to decide how to allocate
resources and verify the results. Finance income and costs (including loan interest and charges) and income
tax are managed at Group level and are not allocated to the operating segments.
The results by operating segment for the years ended 30 June 2017 and 2016 are set out below. Reference
should be made to paragraph 7 of the directors’ report for comments thereon.

Digital Bros Group: Annual Report 2016-17
134
Consolidated statement of profit or loss by operating segment for the year ended 30 June 2017
Amounts in Euro thousands Development Free to Play
Premium
Games Italian Distribution
Other
Activities Holding Total
1 Revenue 9,719 7,736 105,618 18,464 863 0 142,400
2 Revenue adjustments 0 0 (4,726) (1,851) (440) 0 (7,017)
3 Total revenue 9,719 7,736 100,892 16,613 423 0 135,383
4 Purchase of products for resale 0 0 (18,687) (12,519) 0 0 (31,206)
5 Purchase of services for resale (2,526) (2,759) (3,337) (734) (177) 0 (9,533)
6 Royalties 0 (382) (36,648) 0 (72) 0 (37,102)
7 Changes in inventories of finished products 0 0 367 515 (0) 0 882
8 Total cost of sales (2,526) (3,141) (58,305) (12,738) (249) 0 (76,959)
9 Gross profit (3+8) 7,193 4,595 42,587 3,875 174 0 58,424
10 Other income 894 823 200 42 0 0 1,959
11 Cost of services (425) (1,001) (7,528) (1,554) (1,020) (1,614) (13,142)
12 Lease and rental charges (0) (62) (606) (44) (18) (746) (1,476)
13 Labour costs (4,935) (4,127) (7,650) (1,549) (883) (3,325) (22,469)
14 Other operating costs (142) (73) (591) (205) (49) (938) (1,998)
15 Total operating costs (5,502) (5,263) (16,375) (3,352) (1,970) (6,623) (39,085)
16 Gross operating margin (EBITDA) (9+10+15) 2,585 155 26,412 565 (1,796) (6,623) 21,298
17 Depreciation and amortisation (594) (2,584) (3,667) (261) (379) (229) (7,714)
18 Allocations to provisions 0 0 (854) 0 0 0 (854)
19 Impairment losses recognised on assets (0) (158) (882) (420) 0 (193) (1,653)
20 Reversal of impairment losses and non-monetary income 0 0 0 0 0 0 0
21 Total non-monetary income and operating costs (594) (2,742) (5,403) (681) (379) (422) (10,221)
22 Operating margin (EBIT) (16+21) 1,991 (2,587) 21,009 (116) (2,175) (7,045) 11,077

Digital Bros Group: Annual Report 2016-17
135
Information concerning operating segments
Consolidated statement of financial position at 30 June 2017
Amounts in Euro thousands Development Free to Play
Premium
Games
Italian
Distribution
Other
Activities Holding Total
Non-current assets
1 Property, plant and equipment 201 15 922 2,699 189 2,593 6,619
2 Investment property 0 0 0 0 0 0 0
3 Intangible assets 1,230 5,845 10,688 230 507 367 18,867
4 Equity interests 0 0 (0) 0 0 1,345 1,345
5 Non-current receivables and other assets 0 5 185 3 220 639 1,052
6 Deferred tax assets 220 387 1,542 490 100 69 2,807
Total non-current assets 1,651 6,251 13,337 3,422 1,016 5,013 30,690
Non-current liabilities
7 Employee benefits 0 0 (60) (417) (68) 0 (545)
8 Non-current provisions 0 0 0 (79) 0 0 (79)
9 Other non-current payables and liabilities 0 0 0 0 0 0 0
Total non-current liabilities 0 0 (60) (496) (68) 0 (624)
Net working capital
10 Inventories 0 (0) 7,496 5,319 0 0 12,815
11 Trade receivables 2,286 1,071 30,062 3,339 5 0 36,763
12 Current tax assets 0 566 1,131 353 14 0 2,064
13 Other current assets 63 905 1,241 539 164 351 3,263
14 Trade payables (1,094) (978) (22,593) (1,981) (184) (850) (27,680)
15 Current tax liabilities (1,105) (77) (3,869) (167) (45) (473) (5,736)
16 Current provisions 0 0 (854) (0) 0 0 (854)
17 Other current liabilities (640) (57) (320) (896) (651) (1,390) (3,954)
Total net working capital (490) 1,430 12,294 6,506 (697) (2,362) 16,681
Total 1,161 7,681 25,571 9,432 251 2,650 46,746
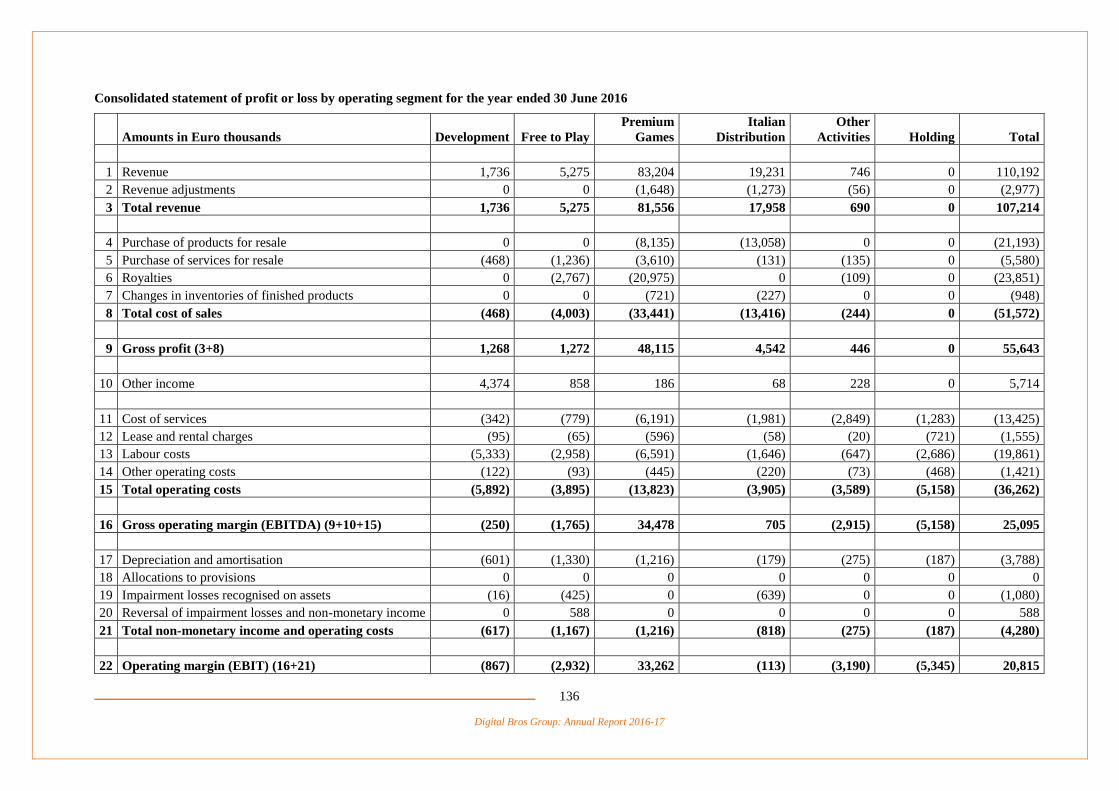
Digital Bros Group: Annual Report 2016-17
136
Consolidated statement of profit or loss by operating segment for the year ended 30 June 2016
Amounts in Euro thousands Development Free to Play
Premium
Games
Italian
Distribution
Other
Activities Holding Total
1 Revenue 1,736 5,275 83,204 19,231 746 0 110,192
2 Revenue adjustments 0 0 (1,648) (1,273) (56) 0 (2,977)
3 Total revenue 1,736 5,275 81,556 17,958 690 0 107,214
4 Purchase of products for resale 0 0 (8,135) (13,058) 0 0 (21,193)
5 Purchase of services for resale (468) (1,236) (3,610) (131) (135) 0 (5,580)
6 Royalties 0 (2,767) (20,975) 0 (109) 0 (23,851)
7 Changes in inventories of finished products 0 0 (721) (227) 0 0 (948)
8 Total cost of sales (468) (4,003) (33,441) (13,416) (244) 0 (51,572)
9 Gross profit (3+8) 1,268 1,272 48,115 4,542 446 0 55,643
10 Other income 4,374 858 186 68 228 0 5,714
11 Cost of services (342) (779) (6,191) (1,981) (2,849) (1,283) (13,425)
12 Lease and rental charges (95) (65) (596) (58) (20) (721) (1,555)
13 Labour costs (5,333) (2,958) (6,591) (1,646) (647) (2,686) (19,861)
14 Other operating costs (122) (93) (445) (220) (73) (468) (1,421)
15 Total operating costs (5,892) (3,895) (13,823) (3,905) (3,589) (5,158) (36,262)
16 Gross operating margin (EBITDA) (9+10+15) (250) (1,765) 34,478 705 (2,915) (5,158) 25,095
17 Depreciation and amortisation (601) (1,330) (1,216) (179) (275) (187) (3,788)
18 Allocations to provisions 0 0 0 0 0 0 0
19 Impairment losses recognised on assets (16) (425) 0 (639) 0 0 (1,080)
20 Reversal of impairment losses and non-monetary income 0 588 0 0 0 0 588
21 Total non-monetary income and operating costs (617) (1,167) (1,216) (818) (275) (187) (4,280)
22 Operating margin (EBIT) (16+21) (867) (2,932) 33,262 (113) (3,190) (5,345) 20,815

Digital Bros Group: Annual Report 2016-17
137
Information concerning operating segments
Consolidated statement of financial position at 30 June 2016
Amounts in Euro thousands Development Free to Play
Premium
Games
Italian
Distribution
Other
Activities Holding Total
Non-current assets
1 Property, plant and equipment 264 30 1,009 2,820 187 2,721 7,032
2 Investment property 0 0 0 0 0 0 0
3 Intangible assets 5,381 2,686 1,223 0 769 399 10,458
4 Equity investments 0 0 (0) 0 0 898 898
5 Non-current receivables and other assets 0 0 192 9 220 635 1,056
6 Deferred tax assets 362 53 1,508 580 104 12 2,619
Total non-current assets 6,007 2,769 3,932 3,409 1,281 4,665 22,063
Non-current liabilities
7 Employee benefits 0 0 0 (495) (34) 0 (529)
8 Non-current provisions 0 0 0 (36) 0 0 (36)
9 Other non-current payables and liabilities 0 0 0 0 0 (252) (252)
Total non-current liabilities 0 0 0 (531) (34) (252) (817)
Net working capital
10 Inventories 0 0 7,129 4,804 0 0 11,933
11 Trade receivables 207 2,252 28,786 3,595 0 0 34,840
12 Current tax assets 0 620 655 741 3 0 2,019
13 Other current assets 49 358 3,949 312 128 238 5,034
14 Trade payables (58) (1,224) (17,933) (1,669) (383) (445) (21,712)
15 Current tax liabilities 0 (28) (2,191) (155) (21) (3,816) (6,211)
16 Current provisions 0 0 0 0 0 0 0
17 Other current liabilities (630) (36) (186) (797) (660) (3) (2,312)
Total net working capital (432) 1,942 20,209 6,831 (933) (4,025) 23,591
Total 5,575 4,711 24,141 9,708 313 388 44,837

Digital Bros Group: Annual Report 2016-17
138
Development: the Development operating segment designs and develops video games and software
applications. Its operations are conducted through a dedicated organisational structure. The operating
segment undertakes development projects on behalf of Group companies and external customers. This work
is performed by the subsidiary Pipeworks Inc.
Premium Games: its operations consist of the acquisition of video game content exploitation rights from
developers and the subsequent distribution of the games through a traditional international sales network
and via digital marketplaces such as Steam, Sony PlayStation Network and Microsoft Xbox Live.
The video games are normally acquired under an exclusive licence and with international exploitation rights
valid for several years. The Group operates globally under the 505 Games brand.
Premium Games' operations were conducted during the period by the subsidiary 505 Games S.p.A., which
coordinates the operating segment, together with 505 Games France S.a.s., 505 Games Ltd., 505 Games
(US) Inc., 505 Games Spain Slu and 505 Games GmbH, which operate in the French, UK, U.S., Spanish
and German markets, respectively. 505 Games Interactive (US) Inc. provides consulting services on behalf
of 505 Games S.p.A. During the course of the period, the liquidation process concerning the Swedish
company 505 Games Nordic AB was completed.
On 15 March 2017, the acquisition was completed of the Italian company, Kunos Simulazioni S.r.l., the
developer and publisher of the Assetto Corsa video game.
Free to Play: its operations consist of the development and publishing of video games available free of
charge on digital marketplaces, but which allow the gamer to make purchases during the various stages of
the game. With respect to Premium video games, Free to Play games are generally simpler and have greater
longevity, since the video game is continuously developed and improved subsequent to its launch, in order
to gain the public's loyalty and to extend the lifespan of the game.
The operating segment is coordinated by the subsidiary 505 Mobile S.r.l. and by the U.S. company 505
Mobile (US) Inc., which provides consulting services to the Group, by the UK company DR Studios Ltd.,
which is a developer of Free to Play games and by the newly formed company Hawken Entertainment Inc.,
which is the developer of the Hawken video game.
The Group operates globally in this segment under the 505 Games Mobile brand.
Italian Distribution: this consists of the distribution in Italy of video games purchased from international
publishers.
Business operations are conducted by the parent, Digital Bros S.p.A., under the Halifax brand, and by the
subsidiary Game Entertainment S.r.l., which handles distribution via the newsstand distribution channel.
The Group also distributes the Yu-Gi-Oh! trading card game in Italy.
Other Activities: this operating segment handles all of the Group's less significant activities, which are thus
grouped within a separate operating segment for a logical presentation of the results. It includes the

Digital Bros Group: Annual Report 2016-17
139
operations of the subsidiary Game Network S.r.l., which manages paid games under concession from
AAMS (Italian State Monopoly Administration) and the operations of the subsidiary Digital Bros Game
Academy S.r.l., which organises specialisation courses and training on video games.
Holding: this includes all the coordinating functions carried out by Digital Bros S.p.A. on behalf of the
various operating segments. The Holding operating segment also handles administration, management
control and business development. The parent company also availed itself of the contribution made by
Digital Bros China Ltd., which operated in the year as a business developer for Asian markets and by 133
W. Broadway Inc., the owner of property located in Eugene, Oregon, USA that has been leased to Group
companies, whereas Digital Bros Holdings Ltd. was dormant in the year.
Information on geographical segments
Details are provided below of gross revenue by geographical segment:
Euro thousands
Year ended
30 June 2017
Year ended
30 June 2016 Change
Europe 35,042 25% 53,959 17% (18,917) -35.1%
The Americas 80,872 57% 33,141 44% 47,731 n.m.
Rest of the world 7,159 5% 3,114 2% 4,045 n.m.
Total foreign revenue 123,073 86% 90,214 82% 32,859 36.4%
Italy 19,327 14% 19,978 18% (651) -3.3%
Total gross consolidated revenue 142,400 100% 110,192 77% 32,208 29.2%
Foreign revenue accounted for 86% of gross consolidated revenue compared to the prior year figure of 82%
and has increased with respect thereto by 36.4%.
Rest of the world revenue relates to sales made by the subsidiary 505 Games Ltd., mainly in Australia, the
Middle East and South Africa.
The most significant portion of foreign revenue is generated by the Premium Games operating segment,
which generated foreign revenue of Euro 105,618 thousand, accounting for 86% of total foreign revenue.
Details are provided below of gross foreign revenue by operating segment:
Euro thousands Year ended 30 June 2017 Year ended 30 June 2016 Change
Free to Play 7,736 6% 5,275 15% 2,461 46.7%
Premium Games 105,618 86% 83,204 83% 22,414 26.9%
Development 9,719 8% 1,736 2% 7,983 n.m.
Total gross foreign revenue 123,073 100% 90,215 100% 32,858 36.4%
The Development operating segment's revenue includes revenue earned by Pipeworks Inc. from
development contracts with non-Group customers.

Digital Bros Group: Annual Report 2016-17
140
11. RELATED PARTY TRANSACTIONS
In accordance with Consob Resolution 17221 of 12 March 2010, it is hereby disclosed that all commercial
and financial transactions between Digital Bros Group companies and between those companies and other
non-subsidiary related parties have been conducted at arm’s length and do not qualify as atypical or unusual
transactions.
Intercompany transactions
Intercompany transactions have been described in section 9 of the directors' report on intercompany and
related party transactions and atypical/unusual transactions, to which reference should be made.
Other related parties
Other related party transactions consist of:
legal counsel provided by the director Dario Treves;
lease of property by Matov Imm. S.r.l. to the parent company and the subsidiary 505 Games France
S.a.s.;
lease of property by Matov LLC to the subsidiary 505 Games (US) Inc.
Both Matov Imm. S.r.l. and Matov LLC are owned by Abramo and Raffaele Galante.
A summary is provided below of year end balances and transactions in the year, together with prior year
comparatives:
Euro thousands Receivables Payables Revenue Costs
comm. finan. comm. finan.
Dario Treves 0 0 (22) 0 0 (262)
Matov Imm. S.r.l. 0 635 0 0 0 (751)
Matov LLC 0 130 0 0 0 (419)
Total as at 30 June 2017 0 765 (22) 0 0 (1,432)
Euro thousands Receivables Payables Revenue Costs
comm. finan. comm. finan.
Dario Treves 0 0 (25) 0 0 (254)
Matov Imm. S.r.l. 0 635 0 0 0 (763)
Matov LLC 0 133 0 0 0 (368)
Total as at 30 June 2016 0 768 (25) 0 0 (1,385)
The financial receivable due to Digital Bros S.p.A. by Matov Imm. S.r.l. relates to a cautionary deposit paid
for the Via Tortona 37 premises in Milan.
Digital Bros Group: Annual Report 2016-17
141
The financial receivable due to 505 Games (US) Inc. by Matov LLC relates to a cautionary deposit paid
against lease obligations concerning the premises that became the U.S. subsidiary’s new offices during the
year.
Lease instalments for the Milan offices paid during the year by Digital Bros S.p.A. to Matov Imm. S.r.l.
amount to Euro 705 thousand and those paid by 505 Games France S.a.s. for the buildings located in
Francheville amount to Euro 46 thousand. Effective December 2015, upon renewal of the lease for a further
six years, the annual lease charge for the Milan offices was reduced by Euro 60 thousand.
In November 2013, a lease agreement was entered into between the subsidiary 505 Games (US) Inc. and
Matov LLC, a related party owned by the Galante family. The transaction was governed by the “Procedure
for related party transactions” adopted by Digital Bros S.p.A. pursuant to Consob Regulation 17221 of 12
March 2010 and envisages an annual lease charge of 419 thousand U.S. dollars.
Tax consolidation
Digital Bros S.p.A., in its capacity as parent company/consolidating company, has opted for tax
consolidation allowed by Italian law, for the period 2015-2017, with the companies 2015 Games Mobile
S.r.l., Game Entertainment S.r.l., Game Service S.r.l., 505 Games S.p.A., Digital Bros Game Academy
S.r.l. and Game Network S.r.l. Membership of a domestic tax group has made it necessary to prepare an
implementing regulation to govern intercompany transactions to ensure there are no grounds for prejudice
against individual participants in the system.
12. ATYPICAL OR UNUSUAL TRANSACTIONS
There were no atypical or unusual transactions in the year just ended or in the corresponding prior year, as
defined by Consob Communication DEM 6064293 of 28 July 2006.
13. INFORMATION ON ASSETS SUBJECT TO REVALUATION IN
ACCORDANCE WITH SPECIAL LAWS
No revaluations have been carried out on the Group's assets pursuant to Art. 10 of Law 72/83.
14. LOANS GRANTED TO MEMBERS OF ADMINISTRATIVE,
MANAGERIAL AND SUPERVISORY BODIES
Pursuant to Art. 43 (1) of the Fourth Council Directive 78/660/EEC, it is hereby disclosed that no loans
have been granted to members of the Company’s administrative, managerial and supervisory bodies.

Digital Bros Group: Annual Report 2016-17
142
15. EXTERNAL AUDIT FEES
Pursuant to Article 149-duodecies of the Listing Rules, the following table provides details of the fees payable for the year just ended to Deloitte & Touche, the external auditors
of Digital Bros S.p.A., and to other auditing firms not pertaining to its network:
Nature of service Fees pertaining to FY 2016-17
Parent company auditor Parent company auditor's
network
Auditors not pertaining to
parent network
Total
to parent
company
to other
companies Total to other companies to other companies
Audit 179,900 63,500 242,400 31,500 99,000 372,900
Attestation services
Tax consultancy services
Other services (to be detailed)
- Fairness opinions 90,000 90,000
- Accounting, tax, legal and
administrative due diligence
- Agreed upon procedures
- Advisory services to the financial
reporting manager (Art. 154-bis CFA)
- Opinions on the application of new
accounting standards
- Consultancy on accounting matters
- Other services
Total 268,900 63,500 242,400 31,500 99,000 462,900

Digital Bros Group: Annual Report 2016-17
143
(this page intentionally left blank)

Digital Bros Group: Annual Report 2016-17
144
STATEMENT PURSUANT TO ART. 154- BIS (5) OF THE CONSOLIDATED
FINANCE ACT
We, the undersigned, Abramo Galante, chairman of the Board of Directors and Stefano Salbe, financial
reporting manager of Digital Bros Group, hereby declare, including in accordance with Art. 154-bis (3) and
(4) of Legislative Decree 58 of 24 February 1998:
- the adequacy in relation to the characteristics of the business; and
- the effective application of the administrative and accounting procedures for the preparation of the
consolidated financial statements for the period 1 July 2016 - 30 June 2016. No significant issues
have arisen.
We also confirm that:
1. the consolidated financial statements of Digital Bros Group for the year ended 30 June 2017:
a) have been prepared in accordance with applicable International Financial Reporting Standards
endorsed by the European Union pursuant to Regulation 1606/2002/EC of the European
Parliament and the Council of 19 July 2002;
b) correspond to the books and accounting records;
c) give a true and fair view of the results and financial position of the issuer and of the entities
included in the consolidation;
2. the directors’ reports accompanying the consolidated and separate financial statements include a
reliable analysis of the results, as well as a description of the main risks and uncertainties to which
Digital Bros S.p.A. and the consolidated entities are exposed.
Milan, 12 September 2017
Signed
Chairman of the Board of Directors Financial Reporting Manager
Abramo Galante Stefano Salbe

Digital Bros Group: Annual Report 2016-17
145
(this page intentionally left blank)