separate financial statements - cibeg.com · the separate and consolidated financial statements of...
TRANSCRIPT

March 2018
SeparateFinancial Statements

.

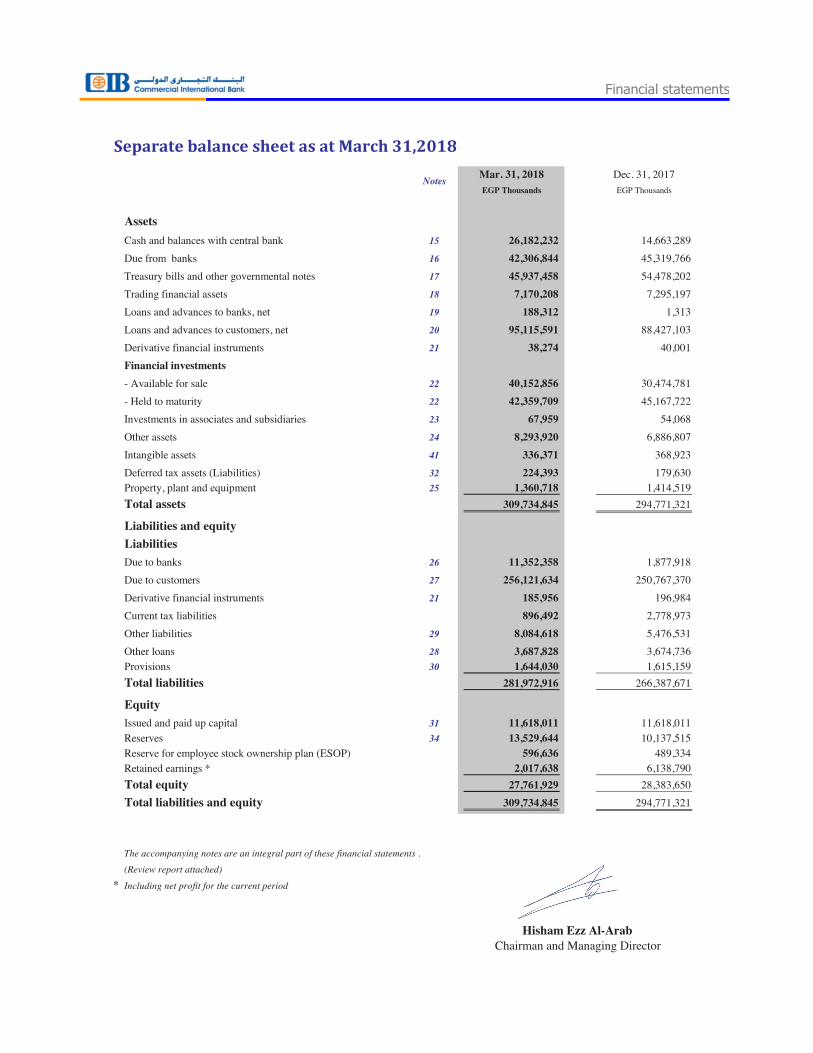
Mar. 31, 2018 Dec. 31, 2017
EGP Thousands EGP Thousands
Assets
Cash and balances with central bank 15 26,182,232 14,663,289
Due from banks 16 42,306,844 45,319,766
Treasury bills and other governmental notes 17 45,937,458 54,478,202
Trading financial assets 18 7,170,208 7,295,197
Loans and advances to banks, net 19 188,312 1,313
Loans and advances to customers, net 20 95,115,591 88,427,103
Derivative financial instruments 21 38,274 40,001
Financial investments
- Available for sale 22 40,152,856 30,474,781
- Held to maturity 22 42,359,709 45,167,722
Investments in associates and subsidiaries 23 67,959 54,068
Other assets 24 8,293,920 6,886,807
Intangible assets 41 336,371 368,923
Deferred tax assets (Liabilities) 32 224,393 179,630
Property, plant and equipment 25 1,360,718 1,414,519
Total assets 309,734,845 294,771,321
Liabilities and equity
Liabilities
Due to banks 26 11,352,358 1,877,918
Due to customers 27 256,121,634 250,767,370
Derivative financial instruments 21 185,956 196,984
Current tax liabilities 896,492 2,778,973
Other liabilities 29 8,084,618 5,476,531
Other loans 28 3,687,828 3,674,736
Provisions 30 1,644,030 1,615,159
Total liabilities 281,972,916 266,387,671
Equity
Issued and paid up capital 31 11,618,011 11,618,011
Reserves 34 13,529,644 10,137,515
Reserve for employee stock ownership plan (ESOP) 596,636 489,334
Retained earnings * 2,017,638 6,138,790
Total equity 27,761,929 28,383,650
Total liabilities and equity 309,734,845 294,771,321
The accompanying notes are an integral part of these financial statements .
(Review report attached)
* Including net profit for the current period
Hisham Ramez Abdel Hafez
Vice Chairman and Managing Director
Notes
Chairman and Managing Director
Hisham Ezz Al-Arab
Financial statements
Last 3 MonthsLast 9 MonthsLast 3 MonthsLast 9 Months
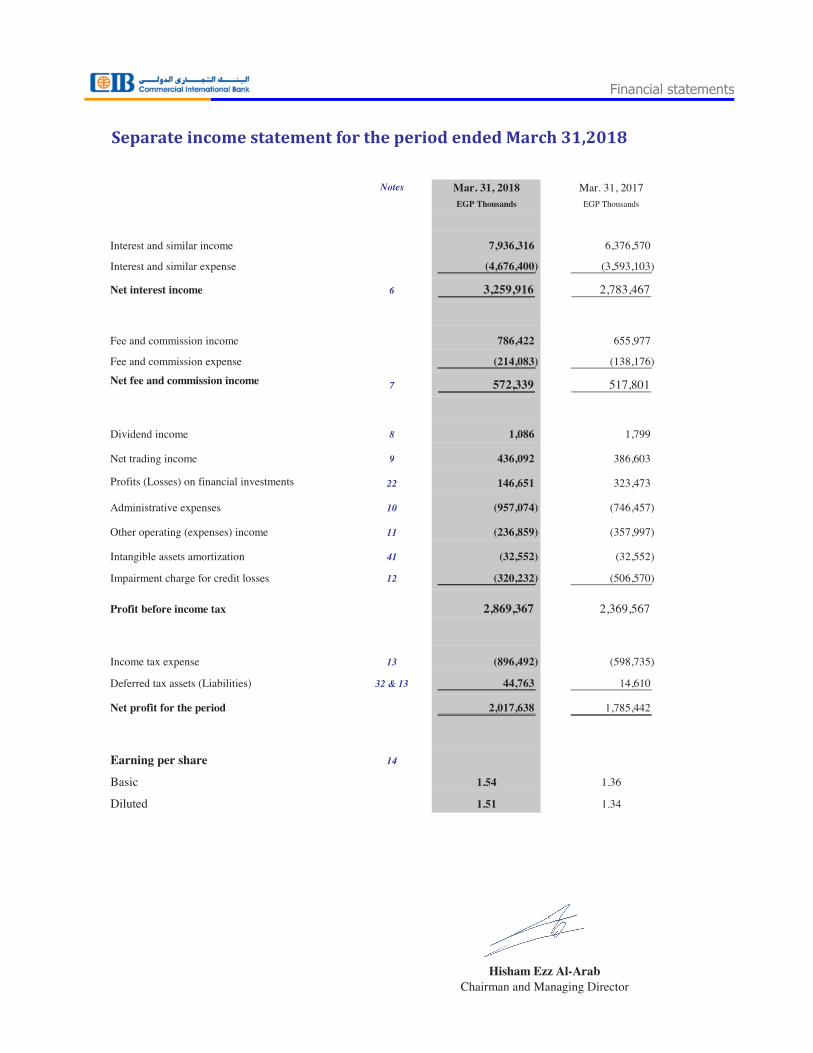
# Mar. 31, 2018 # Mar. 31, 2017
EGP Thousands EGP Thousands EGP Thousands EGP Thousands
Interest and similar income 7,936,316 6,376,570
Interest and similar expense (4,676,400) (3,593,103)
Net interest income 6 3,259,916 2,783,467
Fee and commission income 786,422 655,977
Fee and commission expense (214,083) (138,176)
Net fee and commission income7 572,339 517,801
Dividend income 8 1,086 1,799
Net trading income 9 436,092 386,603
Profits (Losses) on financial investments 22 146,651 323,473
Administrative expenses 10 (957,074) (746,457)
Other operating (expenses) income 11 (236,859) (357,997)
Intangible assets amortization 41 (32,552) (32,552)
Impairment charge for credit losses 12 (320,232) (506,570)
Profit before income tax 2,869,367 2,369,567
Income tax expense 13 (896,492) (598,735)
Deferred tax assets (Liabilities) 32 & 13 44,763 14,610
Net profit for the period 2,017,638 1,785,442
Earning per share 14
Basic # 1.54 # 1.36
Diluted # 1.51 # 1.34
Hisham Ezz Al-Arab
Notes
Chairman and Managing Director
Financial statements

Mar. 31, 2018 Mar. 31, 2017
EGP Thousands EGP Thousands
Cash flow from operating activities
Profit before income tax 2,869,367 2,369,567
Adjustments to reconcile net profit to net cash provided by operating activities
Fixed assets depreciation 94,089 84,592
Impairment charge for credit losses 320,232 506,570
Other provisions charges 26,048 88,440
Available for sale investments exchange revaluation differences 39,053 16,596
Intangible assets amortization 32,552 32,552
Financial investments impairment charge (16) (59,574)
Exchange differences in financial investments in subidiary 209 -
Utilization of other provisions 245 (358)
Other provisions no longer used - (2,470)
Exchange differences of other provisions 2,578 3,523
(Losses) Profits from selling financial investments (146,635) 53,608
Shares based payments 107,302 77,104
Impairment (Released) charges of non current assets held for sale - (312,731)
Operating profits before changes in operating assets and liabilities 3,345,024 2,857,419
Net decrease (increase) in assets and liabilities
Due from banks (29,978,825) (6,369,580)
Treasury bills and other governmental notes 8,624,987 (1,278,538)
Trading financial assets 124,989 235,913
Derivative financial instruments (5,392) 6,832
Loans and advances to banks and customers (7,195,719) (1,095,248)
Other assets (1,232,913) (739,325)
Non current assets held for sale - 188,136
Due to banks 9,474,440 (410,928)
Due to customers 5,354,264 7,765,546
Income tax obligations paid (2,778,973) (2,017,034)
Other liabilities 2,608,087 1,624,858
Net cash (used in) provided from operating activities (11,660,031) 768,051
Cash flow from investing activities
Paymentfor purchases of subsidiary and associates (10,575) -
Payment for purchases of property, plant, equipment and branches constructions (214,488) (204,805)
Proceeds from redemption of held to maturity financial investments 2,808,013 7,111,107
Payment for purchases of held to maturity financial investments - (2,575,231)
Payment for purchases of available for sale financial investments (10,484,844) (153,395)
Proceeds from selling available for sale financial investments 303,449 480,343
Proceeds from selling non current assets held for sale - 500,867
Net cash (used in) provided from investing activities (7,598,445) 5,158,886
Separate cash flow for the period ended March 31,2018
Financial statements
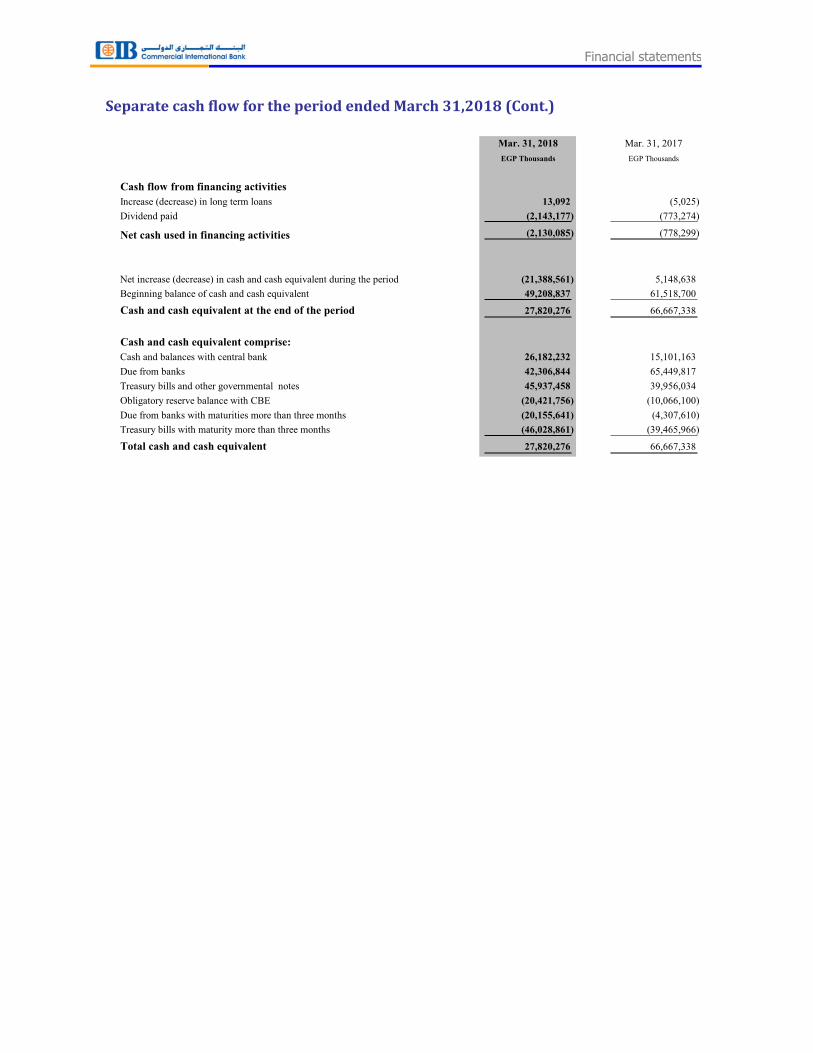
Mar. 31, 2018 Mar. 31, 2017
EGP Thousands EGP Thousands
Cash flow from financing activities
Increase (decrease) in long term loans 13,092 (5,025)
Dividend paid (2,143,177) (773,274)
Net cash used in financing activities (2,130,085) (778,299)
Net increase (decrease) in cash and cash equivalent during the period (21,388,561) 5,148,638
Beginning balance of cash and cash equivalent 49,208,837 61,518,700
Cash and cash equivalent at the end of the period 27,820,276 66,667,338
Cash and cash equivalent comprise:
Cash and balances with central bank 26,182,232 15,101,163
Due from banks 42,306,844 65,449,817
Treasury bills and other governmental notes 45,937,458 39,956,034
Obligatory reserve balance with CBE (20,421,756) (10,066,100)
Due from banks with maturities more than three months (20,155,641) (4,307,610)
Treasury bills with maturity more than three months (46,028,861) (39,465,966)
Total cash and cash equivalent 27,820,276 66,667,338
Separate cash flow for the period ended March 31,2018 (Cont.)
Financial statements
Mar
. 3
1, 2
01
7Is
sued
an
d p
aid
up
capit
al
Leg
al r
eser
ve
Gen
eral
res
erve
Spec
ial
rese
rve
Cap
ital
res
erve
Res
erve
For
A.F
.S
inves
tmen
ts
reval
uat
ion
dif
f.
Ban
kin
g r
isks
rese
rve
IFR
S 9
ris
k
rese
rve
Ret
ain
ed e
arn
ings
Res
erve
for
emplo
yee
sto
ck
ow
ner
ship
pla
n
Tota
l
EG
P T
ho
usa
nd
s
Beg
inn
ing b
alan
ce1
1,5
38
,66
01
,03
5,3
63
4,5
54
,40
32
0,6
45
10
,13
3(2
,18
0,2
44
)3
,01
9-
5,9
50
,55
53
43
,46
02
1,2
75
,99
4
Tra
nsf
erre
d t
o r
eser
ves
-2
97
,44
44
,30
0,6
07
-1
,68
2-
--
(4,5
99
,73
3)
--
Div
iden
d p
aid
--
--
--
--
(1,3
50
,20
7)
-(1
,35
0,2
07
)
Net
pro
fit
for
the
per
iod
--
--
--
--
1,7
85
,44
2-
1,7
85
,44
2
Net
un
real
ised
gai
n/(
loss
)
on
AF
S-
--
--
21
8,2
28
--
--
21
8,2
28
Tra
nsf
erre
d (
from
) to
ban
k r
isk r
eser
ve
--
--
--
61
5-
(61
5)
--
Cost
of
emplo
yee
s st
ock
ow
ner
ship
pla
n (
ES
OP
)-
--
--
--
--
77
,10
47
7,1
04
Bal
ance
at
the
end
of
the
per
iod
11
,53
8,6
60
1,3
32
,80
78
,85
5,0
10
20
,64
51
1,8
15
(1,9
62
,01
6)
3,6
34
-1
,78
5,4
42
42
0,5
64
22
,00
6,5
61
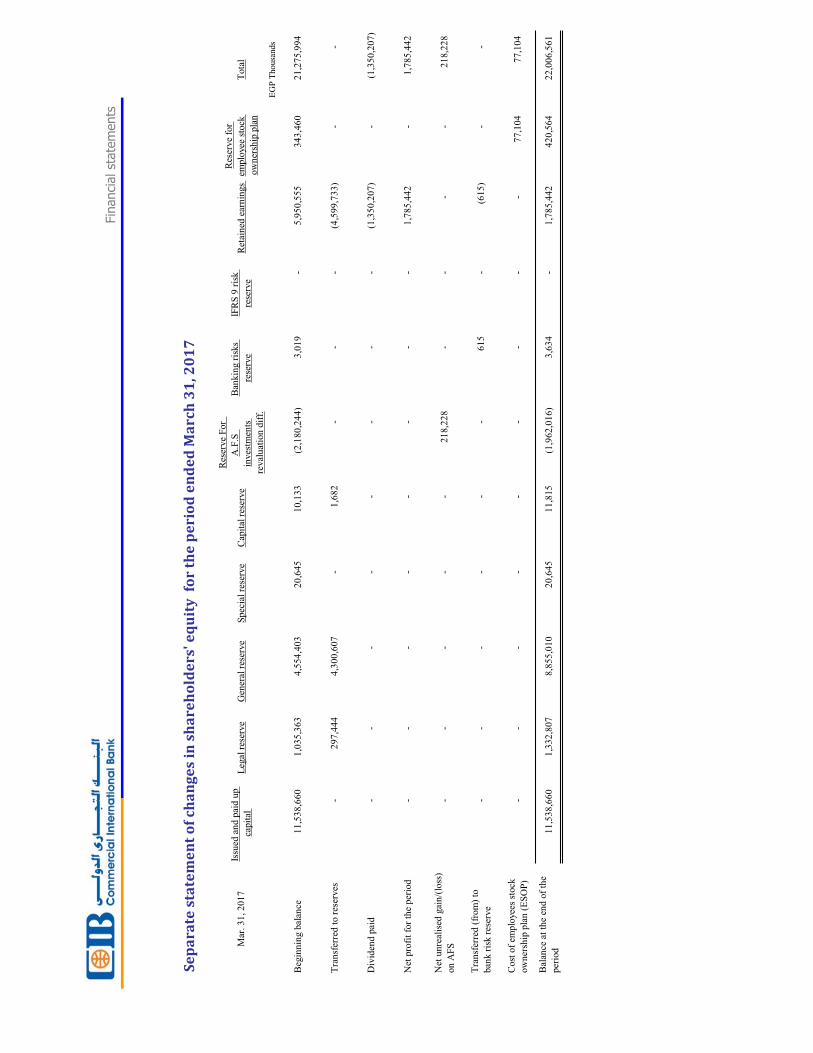
Se
pa
ra
te s
tate
me
nt
of
ch
an
ge
s in
sh
ar
eh
old
er
s' e
qu
ity
fo
r t
he
pe
rio
d e
nd
ed
Ma
rc
h 3
1, 2
01
7
Fin
anci
alst
ate
ments
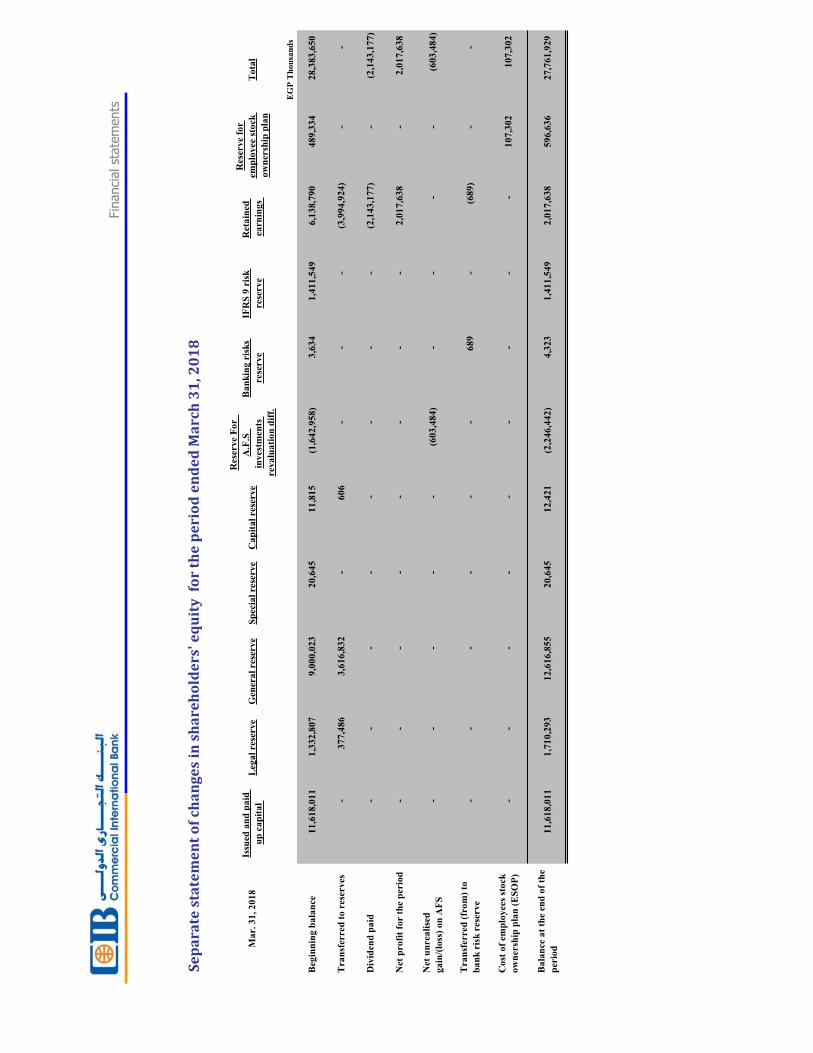
Ma
r. 3
1, 2
01
8Is
sued
an
d p
aid
up
ca
pit
al
Leg
al
rese
rve
Gen
era
l re
serve
Sp
ecia
l re
serve
Ca
pit
al
rese
rve
Res
erve
Fo
r
A.F
.S
inves
tmen
ts
reva
lua
tio
n d
iff.
Ba
nk
ing
ris
ks
rese
rve
IFR
S 9
ris
k
rese
rve
Ret
ain
ed
earn
ing
s
Res
erve
for
emp
loy
ee s
tock
ow
ner
ship
pla
n
To
tal
EG
P T
hou
san
ds
Beg
inn
ing
ba
lan
ce1
1,6
18
,01
11
,33
2,8
07
9,0
00
,02
32
0,6
45
11
,81
5(1
,64
2,9
58
)3
,63
41
,41
1,5
49
6,1
38
,79
04
89
,33
42
8,3
83
,65
0
Tra
nsf
erre
d t
o r
ese
rves
-3
77
,48
63
,61
6,8
32
-6
06
--
-(3
,99
4,9
24
)-
-
Div
iden
d p
aid
--
--
--
--
(2,1
43
,17
7)
-(2
,14
3,1
77
)
Net
pro
fit
for
the
per
iod
--
--
--
--
2,0
17
,63
8-
2,0
17
,63
8
Net
un
rea
lise
d
ga
in/(
loss
) o
n A
FS
--
--
-(6
03
,48
4)
--
--
(60
3,4
84
)
Tra
nsf
erre
d (
fro
m)
to
ba
nk
ris
k r
eser
ve
--
--
--
68
9-
(68
9)
--
Co
st o
f em
plo
yee
s st
ock
ow
ner
ship
pla
n (
ES
OP
)-
--
--
--
--
10
7,3
02
10
7,3
02
Ba
lan
ce a
t th
e en
d o
f th
e
per
iod
11
,61
8,0
11
1,7
10
,29
31
2,6
16
,85
52
0,6
45
12
,42
1(2
,24
6,4
42
)4
,32
31
,41
1,5
49
2,0
17
,63
85
96
,63
62
7,7
61
,92
9
Se
pa
ra
te s
tate
me
nt
of
ch
an
ge
s in
sh
ar
eh
old
er
s' e
qu
ity
fo
r t
he
pe
rio
d e
nd
ed
Ma
rc
h 3
1, 2
01
8
Fin
anci
alst
ate
ments
1
Notes to the separate financial statements for the period ended March
31, 2018
1. General information
Commercial International Bank (Egypt) S.A.E. provides retail, corporate and investment banking services in various parts of Egypt through 176
branches, and 22 units employing 6583 employees on the statement of financial position date.
Commercial International Bank (Egypt) S.A.E. was formed as a commercial bank under the investment law no. 43 of 1974. The address of its
registered head office is as follows: Nile tower, 21/23 Charles de Gaulle Street-Giza. The Bank is listed in the Egyptian stock exchange.
2. Summary of accounting policies
The principal accounting policies applied in the preparation of these financial statements are set out below. These policies have been consistently
applied to all years presented, unless otherwise stated.
2.1. Basis of preparation
The separate financial statements have been prepared in accordance with Egyptian financial reporting standards issued in 2006 and its
amendments and in accordance with the Central Bank of Egypt regulations approved by the Board of Directors on December 16, 2008.
The separate financial statements have been prepared under the historical cost convention, as modified by the revaluation of financial assets and
liabilities classified as trading or held at fair value through profit or loss, available for sale investment and all derivatives contracts.
The separate and consolidated financial statements of the Bank and its subsidiaries have been prepared in accordance with the relevant
domestic laws and the Egyptian financial reporting standards, the affiliated companies are entirely included in the consolidated financial
statements and these companies are the companies that the Bank - directly or indirectly has more than half of the voting rights or has the
ability to control the financial and ope
obtained from the Bank's management. The Bank accounts for investments in subsidiaries and associate companies in the separate financial
statements at cost minus impairment loss.
The separate financial statements of the Bank should be read with its consolidated financial statements, for the year ended on March 31, 2018
ts.
2.2. Subsidiaries and associates
2.2.1. Subsidiaries
Subsidiaries are all entities (including special purpose entities) over which the Bank has owned directly or indirectly the control to govern
the financial and operating policies generally accompanying a shareholding of more than one half of the voting rights. The existence and
effect of potential voting rights that are currently exercisable or convertible are considered when assessing whether the Bank has the ability
to control the entity or not.
2.2.2. Associates
Associates are all entities over which the Bank has significant influence but do not reach to the extent of control, generally accompanying
a shareholding between 20% and 50% of the voting rights.
The acquisition method of accounting is used to account for the purchase of subsidiaries. The cost of an acquisition is measured at the fair
value of the assets given, equity instruments issued and liabilities incurred or assumed, plus any costs directly related to the acquisition.
The excess of the cost of an acquisition over the Bank share of the fair value of the identifiable net assets acquired is recorded as goodwill.
A gain on acquisition is recognized in profit or loss if there is an excess of the Bank
acquired over the cost of the acquisition.
The cost method is applied to account for investments in subsidiaries and associates, whereby, investments are recorded based on the
acquisition cost including any goodwill, deducting any impairment losses, and dividends are recorded in the income statement in the
adoption of the distribution of these profits and evidence of the Bank right to collect them.
2.3. Segment reporting
A business segment is a group of assets and operations engaged in providing products or services that are subject to risks and returns that are
different from those of other business segments. A geographical segment is engaged in providing products or services within a particular
economic environment that are subject to risks and returns different from those of segments operating in other economic environments.
2.4. Foreign currency translation
2.4.1. Functional and presentation currency
The financial statements are presented in Egyptian pound, which is the Bank
2.4.2. Transactions and balances in foreign currencies
The Bank maintains its accounting records in Egyptian pound. Transactions in foreign currencies during the period are translated into the
Egyptian pound using the prevailing exchange rates on the date of the transaction.
Notes to separate financial statements

2
Monetary assets and liabilities denominated in foreign currencies are retranslated at the end of reporting period at the prevailing exchange
rates. Foreign exchange gains and losses resulting from settlement and translation of such transactions and balances are recognized in the
income statement and reported under the following line items:
Net trading income from held-for-trading assets and liabilities.
Other operating revenues (expenses) from the remaining assets and liabilities.
Changes in the fair value of investments in debt instruments; which represent monetary financial instruments, denominated in foreign
currencies and classified as available for sale assets are analyzed into valuation differences resulting from changes in the amortized cost of
the instrument, differences resulting from changes in the applicable exchange rates and differences resulting from changes in the fair value
of the instrument.
come from
umulated in
ve of available-for-
Valuation differences resulting from the non-monetary items include gains and losses of the change in fair value of such equity instruments
held at fair value through profit and loss, as for recognition of the differences of valuation resulting from equity instruments classified as
financial investments available for sale within the fair value reserve in equity.
2.5. Financial assets
The Bank classifies its financial assets in the following categories:
Financial assets designated at fair value through profit or loss.
Loans and receivables.
Held to maturity investments.
Available for sale financial investments.
Management determines the classification of its investments at initial recognition.
2.5.1. Financial assets at fair value through profit or loss
This category has two sub-categories:
Financial assets held for trading.
Financial assets designated at fair value through profit and loss at inception.
A financial asset is classified as held for trading if it is acquired or incurred principally for the purpose of selling or repurchasing in the
short term or if it is part of a portfolio of identified financial instruments that are managed together and for which there is evidence of a
recent actual pattern of short term profit making. Derivatives are also categorized as held for trading unless they are designated as hedging
instruments.
Financial instruments, other than those held for trading, are classified as financial assets designated at fair value through profit and loss if
they meet one or more of the criteria set out below:
When the designation eliminates or significantly reduces measurement and recognition inconsistencies that would arise from
measuring financial assets or financial liabilities, on different bases. Under this criterion, an accounting mismatch would arise if
the debt securities issued were accounted for at amortized cost, because the related derivatives are measured at fair value with
changes in the fair value recognized in the income statement. The main classes of financial instruments designated by the Bank
are loans and advances and long-term debt issues.
Applies to groups of financial assets, financial liabilities or combinations thereof that are managed, and their performance
evaluated, on a fair value basis in accordance with a documented risk management or investment strategy, and where information
about the groups of financial instruments is reported to management on that basis.
Relates to financial instruments containing one or more embedded derivatives that significantly modify the cash flows resulting
from those financial instruments, including certain debt issues and debt securities held.
Any financial derivative initially recognized at fair value can't be reclassified during the holding period. Re-classification is not allowed
for any financial instrument initially recognized at fair value through profit and loss.
2.5.2. Loans and advances
Loans and advances are non-derivative financial assets with fixed or determinable payments that are not quoted in an active market, other
than:
- Those that the Bank intends to sell immediately or in the short term, which is classified as held for trading, or those that the Bank upon
initial recognition designates as at fair value through profit and loss.
Those that the Bank upon initial recognition designates and available for sale; or
Notes to separate financial statements
3
Those for which the holder may not recover substantially all of its initial investment, other than credit deterioration.
2.5.3. Held to maturity financial investments
Held-to-maturity investments are non-derivative financial assets with fixed or determinable payments and fixed maturities that the Bank's
management has the positive intention and ability to hold till maturity. If the Bank has to sell other than an insignificant amount of held-
to-maturity assets, the entire category would be reclassified as available for sale unless in necessary cases subject to regulatory approval.
2.5.4. Available for sale financial investments
Available-for-sale investments are those intended to be held for an indefinite period of time, which may be sold in response to needs for
liquidity or changes in interest rates, exchange rates or equity prices.
The following are applied in respect to all financial assets:
Debt securities and equity shares intended to be held on a continuing basis, other than those designated at fair value, are classified as available-
for-sale or held-to-maturity. Financial investments are recognized on trade date, when the group enters into contractual arrangements with
counterparties to purchase securities.
Financial assets are initially recognized at fair value plus transaction costs for all financial assets not carried at fair value through profit and loss.
Financial assets carried at fair value through profit and loss are initially recognized at fair value, and transaction costs are expensed in the income
statement.
Financial assets are derecognized when the rights to receive cash flows from the financial assets have expired or when the Bank transfers
substantially all risks and rewards of the ownership. Financial liabilities are derecognized when they are extinguished, that is, when the obligation
is discharged, cancelled or expired.
Available-for-sale, held for-trading and financial assets designated at fair value through profit and loss are subsequently measured at fair value.
Loans, receivables and held-to-maturity investments are subsequently measured at amortized cost.
Gains re recognized in
g from changes in the fair value
of available for sale investments are recognized directly in equity, until the financial assets are either sold or become impaired. When available-
for-sale financial assets are sold, the cumulative gain or loss previously recognized in equity is recognized in profit or loss.
Interest income is recognized on available for sale debt securities using the effective interest method, calculated over the life.
Premiums and discounts arising on the purchase are included in the calculation of effective interest rates. Dividends are recognized in the income
statement when the right to receive payment has been established.
The fair values of quoted investments in active markets are based on current bid prices. If there is no active market for a financial asset, or no
current demand prices available, the Bank
discounted cash flow analysis, option pricing models and other valuation models commonly used by market participants. If the Bank has not
been able to estimate the fair value of equity instruments classified as available for sale, the value is measured at cost less impairment.
Available for sale investments that would have met the definition of loans and receivables at initial recognition may be reclassified out to loans
and advances or financial assets held to maturity. In all cases, when the Bank has the intent and ability to hold these financial assets in the
foreseeable future or till maturity. The financial asset is reclassified at its fair value on the date of reclassification, and any profits or losses that
have been recognized previously in equity, are treated based on the following:
If the financial asset has a fixed maturity, gains or losses are amortized over the remaining life of the investment using the effective
interest rate method. In case of subsequent impairment of the financial asset, the previously recognized unrealized gains or losses in
equity are recognized directly in the profits and losses.
In the case of financial asset which has infinite life, any previously recognized profit and loss in equity will remain until the sale of
the asset or its disposal, in the case of impairment of the value of the financial asset after the re-classification, any gain or loss
previously recognized in equity is recycled to the profits and losses.
If the Bank adjusts its estimates of payments or receipts of a financial asset that in return adjusts the carrying amount of the asset (or
group of financial assets) to reflect the actual cash inflows, the carrying value is recalculated based on the present value of estimated
future cash flows at the effective yield of the financial instrument and the differences are recognized in profit and loss.
In all cases, if the Bank re-classifies financial asset in accordance with the above criteria and increases its estimate of the proceeds of
future cash flow, this increase adjusts the effective interest rate of this asset only without affecting the investment book value.
2.6. Offsetting financial instruments
Financial assets and liabilities are offset and the net amount reported in the balance sheet if, and only if, there is a legally enforceable right to
offset the recognized amounts and there is an intention to be settled on a net basis.
Agreements of repos & reverse repos are shown by the net in the financial statement in treasury bills and other governmental notes.
Notes to separate financial statements
4
2.7. Derivative financial instruments and hedge accounting
Derivatives are recognized initially, and subsequently, at fair value. Fair values of exchange traded derivatives are obtained from quoted market
prices. Fair values of over-the-counter derivatives are obtained using valuation techniques, including discounted cash flow models and option
pricing models. Derivatives are classified as assets when their fair value is positive and as liabilities when their fair value is negative.
Embedded derivatives in other financial instruments, such as conversion option in a convertible bond, are treated as separate derivatives when
their economic characteristics and risks are not closely related to those of the host contract, provided that the host contract is not classified as at
fair value through profit and loss. These embedded derivatives are measured at fair value with changes in fair value recognized in income
statement unless the Bank chooses to designate the hybrid contract as at fair value through net trading income through profit and loss.
The timing method of recognition in profit and loss, of any gains or losses arising from changes in the fair value of derivatives, depends on
whether the derivative is designated as a hedging instrument, and the nature of the item being hedged. The Bank designates certain derivatives
as:
Hedging instruments of the risks associated with fair value changes of recognized assets or liabilities or firm commitments (fair value
hedge).
Hedging of risks relating to future cash flows attributable to a recognized asset or liability or a highly probable forecast transaction
(cash flow hedge)
Hedge accounting is used for derivatives designated in a hedging relationship when the following criteria are met.
At the inception of the hedging relationship, the Bank documents the relationship between the hedging instrument and the hedged item, along
with its risk management objectives and its strategy for undertaking various hedge transactions. Furthermore, at the inception of the hedge, and
on ongoing basis, the Bank documents whether the hedging instrument is expected to be highly effective in offsetting changes in fair values of
the hedged item attributable to the hedged risk.
2.7.1. Fair value hedge
Changes in the fair value of derivatives that are designated and qualified as fair value hedges are recognized in profit and loss immediately
together with any changes in the fair value of the hedged asset or liability that is attributable to the hedged risk. The effective portion of
changes in the fair value of the interest rate swaps and the changes in the fair value of the hedged item attributable to the hedged risk are
tement. Any ineffectiveness is recognized in profit and
When the hedging instrument is no longer qualified for hedge accounting, the adjustment to the carrying amount of a hedged item, measured
at amortized cost, arising from the hedged risk is amortized to profit and loss from that date using the effective interest method.
2.7.2. Derivatives that do not qualify for hedge accounting
All gains and losses from changes in the fair values of derivatives that do not qualify for hedge accounting are recognized immediately in
njunction
income from financial instruments
2.8. Interest income and expense
Interest income and expense for all financial instruments except for those classified as held-for-trading or designated at fair value are recognized
The effective interest method is a method of calculating the amortized cost of a financial asset or a financial liability and of allocating the interest
income or interest expense over the relevant period. The effective interest rate is the rate that exactly discounts estimated future cash payments
or receipts through the expected life of the financial instrument or, when appropriate, a shorter period to the net carrying amount of the financial
asset or financial liability. When calculating the effective interest rate, the Bank estimates cash flows considering all contractual terms of the
financial instrument (for example, prepayment options) but does not consider future credit losses. The calculation includes all fees and points
paid or received between parties to the contract that represents an integral part of the effective interest rate, transaction costs and all other
premiums or discounts.
Once loans or debts are classified as nonperforming or impaired, the revenue of interest income will not be recognized and will be recorded off
balance sheet, and are recognized as income subsequently based on a cash basis according to the following:
When all arrears are collected for consumer loans, personnel mortgages and micro-finance loans.
When calculated interest for corporate are capitalized according to the rescheduling agreement conditions until paying 25% from
rescheduled payments for a minimum performing period of one year, if the customer continues to perform, the calculated interest will
be recognized in interest income (interest on the performing rescheduling agreement balance) without the marginalized before the
rescheduling agreement which will be recognized in interest income after the settlement of the outstanding loan balance.
2.9. Fee and commission income
Fees charged for servicing a loan or facility that is measured at amortized cost, are recognized as revenue as the service is provided. Fees and
commissions on non-performing or impaired loans or receivables cease to be recognized as income and are rather recorded off balance sheet.
These are recognized as revenue, on a cash basis, only when interest income on those loans is recognized in profit and loss, at that time, fees
and commissions that represent an integral part of the effective interest rate of a financial asset, are treated as an adjustment to the effective
interest rate of that financial asset.
Notes to separate financial statements

5
Commitment fees and related direct costs for loans and advances where draw down is probable are deferred and recognized as an adjustment to
the effective interest on the loan once drawn. Commitment fees in relation to facilities where draw down is not probable are recognized at the
maturity of the term of the commitment.
Fees are recognized on the debt instruments that are measured at fair value through profit and loss on initial recognition and syndicated loan
fees received by the Bank are recognized when the syndication has been completed and the Bank does not hold any portion of it or holds a part
at the same effective interest rate used for the other participants portions.
Commission and fee arising from negotiating, or participating in the negotiation of a transaction for a third party such as the arrangement of the
acquisition of shares or other securities and the purchase or sale of properties are recognized upon completion of the underlying transaction in
the income statement .
Other management advisory and service fees are recognized based on the applicable service contracts, usually on accrual basis. Financial
planning fees related to investment funds are recognized steadily over the period in which the service is provided. The same principle is applied
for wealth management; financial planning and custody services that are provided on the long term are recognized on the accrual basis also.
2.10.Dividend income
Dividends are recognized in the income statement when the right to collect it is declared.
2.11.Sale and repurchase agreements
Securities may be lent or sold according to a commitment to repurchase (Repos) are reclassified in the financial statements and deducted from
treasury bills balance. Securities borrowed or purchased according to a commitment to resell them (Reverse Repos) are reclassified in the
financial statements and added to treasury bills balance. The difference between sale and repurchase price is treated as interest and accrued over
the life of the agreements using the effective interest rate method.
2.12.Impairment of financial assets
2.12.1. Financial assets carried at amortised cost
The Bank assesses on each balance sheet date whether there is objective evidence that a financial asset or group of financial assets is
impaired. A financial asset or a group of financial assets is impaired only if there is objective evidence of impairment as a result of one or
/ /s has an impact on the estimated
future cash flows of the financial asset or group of financial assets that can be reliably estimated.
The criteria that the Bank uses to determine that there is objective evidence of an impairment loss include:
Cash flow difficulties experienced by the borrower ( e.g, equity ratio, net income percentage of sales).
Violation of the conditions of the loan agreement such as non-payment.
Initiation of bankruptcy proceedings.
The Bank for reasons of economic or legal financial difficulties of the borrower by granting concessions may not agree with the
Bank granted in normal circumstances.
Deterioration in the value of collateral or deterioration of the creditworthiness of the borrower.
The objective evidence of impairment loss for a group of financial assets is observable data indicating that there is a measurable decrease
in the estimated future cash flows from a portfolio of financial assets since the initial recognition of those assets, although the decrease
cannot yet be identified with the individual financial assets in the portfolio, for instance an increase in the default rates for a particular
banking product.
The Bank estimates the period between a losses occurring and its identification for each specific portfolio. In general, the periods used
vary between three months to twelve months.
The Bank first assesses whether objective evidence of impairment exists individually for financial assets that are individually significant,
and individually or collectively for financial assets that are not individually significant and in this field the following are considered:
If the Bank determines that no objective evidence of impairment exists for an individually assessed financial asset, whether
significant or not, it includes the asset in a group of financial assets with similar credit risk characteristics and collectively
assesses them for impairment according to historical default ratios.
If the Bank determines that an objective evidence of financial asset impairment exist that is individually assessed for impairment
and for which an impairment loss is or continues to be recognized are not included in a collective assessment of impairment.
uture cash
flows (excluding future credit losses that have not been incu
carrying amount of the asset is reduced through the use of an allowance account and the amount of the loss is recognized in the income
statement. If a loan or held to maturity investment has a variable interest rate, the discount rate for measuring any impairment loss is the
current effective interest rate determined under the contract when there is objective evidence for asset impairment. As a practical expedient,
the Bank
The calculation of the present value of the estimated future cash flows of a collateralized financial asset reflects the cash flows that may
result from foreclosure less costs for obtaining and selling the collateral, whether or not foreclosure is probable.
Notes to separate financial statements
6
For the purposes of a collective evaluation of impairment, financial assets are grouped on the basis of similar credit risk characteristics
(i.e., on the -due status
and other relevant factors). Those characteristics are relevant to the estimation of future cash flows for groups of such assets by being
ted.
For the purposes of evaluation of impairment for a group of a financial assets according to historical default ratios future cash flows in a
group of financial assets that are collectively evaluated for impairment are estimated on the basis of the contractual cash flows of the assets
in the Bank and historical loss experience for assets with credit risk characteristics similar to those in the Bank. Historical loss experience
is adjusted on the basis of current observable data to reflect the effects of current conditions that did not affect the period on which the
historical loss experience is based and to remove the effects of conditions in the historical period that do not currently exist.
Estimates of changes in future cash flows for groups of assets should be reflected together with changes in related observable data from
period to period (e.g. changes in unemployment rates, property prices, payment status, or other indicative factors of changes in the
probability of losses in the Bank and their magnitude). The methodology and assumptions used for estimating future cash flows are
reviewed regularly by the Bank.
2.12.2. Available for sale investments
The Bank assesses on each balance sheet date whether there is objective evidence that a financial asset or a group of financial assets
classify under available for sale is impaired. In the case of equity investments classified as available for sale, a significant or prolonged
decline in the fair value of the security below its cost is considered in determining whether the assets are impaired. During periods start
from first of January 2009, the decrease consider significant when it became 10% from the book value of the financial instrument and the
decrease consider to be extended if it continues for period more than 9 months, and if the mentioned evidences become available then any
cumulative gains or losses previously recognized in equity are recognized in the income statement , in respect of available for sale equity
securities, impairment losses previously recognized in profit and loss are not reversed through the income statement.
If, in a subsequent period, the fair value of a debt instrument classified as available for sale increases and the increase can be objectively
related to an event occurring after the impairment loss was recognized in the income statement, the impairment loss is reversed through
the income statement to the extent of previously recognized impairment charge from equity to income statement.
2.13.Real estate investments
The real estate investments represent lands and buildings owned by the Bank in order to obtain rental returns or capital gains and therefore do
not include real estate assets which the Bank exercised its work through or those that have owned by the Bank as settlement of debts. The
accounting treatment is the same used with property, plant and equipment.
2.14.Property, plant and equipment
Lands and buildings comprise mainly branches and offices. All property, plant and equipment are stated at historical cost less depreciation and
impairment losses. Historical cost includes expenditure that is directly attributable to the acquisition of the items.
that future economic
benefits will flow to the Bank and the cost of the item can be measured reliably. All other repairs and maintenance are charged to other operating
expenses during the financial period in which they are incurred.
Land is not depreciated. Depreciation of other assets is calculated using the straight-line method to allocate their residual values over estimated
useful lives, as follows:
Buildings 20 years.
Leasehold improvements 3 years, or over the period of the lease if less
Furniture and safes 3/5 years.
Typewriters, calculators and air-conditions 5 years
Vehicles 5 years
Computers and core systems 3/10 years
Fixtures and fittings 3 years
d if appropriate, on each balance sheet date. Depreciable assets are reviewed
carrying amount
is written down immediately to its able amount. The recoverable
Gains and losses on disposals are determined by comparing the selling proceeds with the asset carrying amount and charged to other operating
expenses in the income statement.
Notes to separate financial statements
7
2.15.Impairment of non-financial assets
Assets that have an indefinite useful life are not amortized -except goodwill- and are tested annually for impairment. Assets that are subject to
amortization are reviewed for impairment whenever events or changes in circumstances indicate that the carrying amount may not be recoverable.
An impairment loss is recognized
The recoverable amoun to
the lowest level of cash generating unit(s). A previously recognized impairment loss relating to a fixed asset may be reversed in part or in full
carrying amount
of the fixed asset will only be increased up to the amount that the original impairment not been recognized.
2.15.1 Goodwill
identifiable assets on the date of acquisition. For the purpose of calculating goodwill, the fair values of acquired assets, liabilities and
contingent liabilities are determined by reference to market values or by discounting expected future cash flows. Goodwill is included in
arate financial statements. Goodwill is tested for impairment,
impairment loss is charged to the income statement.
Goodwill is allocated to the cash generating units for the purpose of impairment testing. The cash generating units represented in the Bank
main segments.
2.15.2. Other intangible assets
Is the intangible assets other than goodwill and computer programs (trademarks, licenses, contracts for benefits, the benefits of contracting
with clients).
Other intangible assets that are acquired by the Bank are recognized at cost less accumulated amortization and impairment losses.
Amortization is charged to the income statement on a straight-line basis over the estimated useful lives of the intangible asset with definite
life. Intangible assets with indefinite life are not amortized and tested for impairment.
2.16.Leases
The accounting treatment for the finance lease is complied with law 95/1995, if the contract entitles the lessee to purchase the asset at a specified
date and predefined value, or the current value of the total lease payments representing at least 90% of the value of the asset. The other leases
contracts are considered operating leases contracts.
2.16.1. Being lessee
Finance lease contract recognizes the lease cost, including the cost of maintenance of the leased assets in the income statement for the
period in which they occurred. If the Bank decides to exercise the right to purchase the leased asset the leased assets are capitalized and
p
manner as similar assets.
Operating lease payments leases are accounted for on a straight-line basis over the periods of the leases and are inc
2.16.2. Being lessor
For finance lease, assets are recorded in the property, plant and equipment in the balance sheet and amortized over the expected useful life
of this asset in the same manner as similar assets. Lease income is recognized on the basis of rate of return on the lease in addition to an
amount corresponding to the cost of depreciation for the period. The difference between the recognized rental income and the total finance
lease clients' accounts is transferred to the in the income statement until the expiration of the lease to be reconciled with a net book value
of the leased asset. Maintenance and insurance expenses are charged to the income statement when incurred to the extent that they are not
charged to the tenant.
In case there is objective evidence that the Bank will not be able to collect the of financial lease obligations, the finance lease payments
are reduced to the recoverable amount.
For assets leased under operating lease it appears in the balance sheet under property, plant and equipment, and depreciated over the
expected useful life of the asset in the same way as similar assets, and the lease income recorded less any discounts given to the lessee on
a straight-line method over the contract period.
2.17.Cash and cash equivalents
y from the date
of acquisition, including cash and non-restricted balances with central banks, treasury bills and other eligible bills, loans and advances to banks,
amounts due from other banks and short-term government securities.
2.18.Other provisions
Provisions for restructuring costs and legal claims are recognized when the Bank has present legal or constructive obligations as a result of past
events; where it is more likely than not that a transfer of economic benefit will be necessary to settle the obligation, and it can be reliably
estimated.
Notes to separate financial statements

8
In case of similar obligations, the related cash outflow should be determined in order to settle these obligations as a group. The provision is
recognized even in case of minor probability that cash outflow will occur for an item of these obligations.
When a provision is wholly or partially no longer required, it is reversed through profit or loss under other operating income (expenses).
Provisions for obligations, other than those for credit risk or employee benefits, due within more than 12 months from the balance sheet date
are recognized based on the present value of the best estimate of the consideration required to settle the present obligation on the balance sheet
date. An appropriate pretax discount rate that reflects the time value of money is used to calculate the present value of such provisions. For
obligations due within less than twelve months from the balance sheet date, provisions are calculated based on undiscounted expected cash
outflows unless the time value of money has a significant impact on the amount of provision, then it is measured at the present value.
2.19.Share based payments
The Bank applies an equity-settled, share-based compensation plan. The fair value of equity instruments recognized as an expense over the
vesting period using appropriate valuation models, taking into account the terms and conditions upon which the equity instruments were granted.
The vesting period is the period during which all the specified vesting conditions of a share-based payment arrangement are to be satisfied.
Vesting conditions include service conditions, performance conditions and market performance conditions are taken into account when
estimating the fair value of equity instruments on the date of grant. On each balance sheet date the number of options that are expected to be
exercised are estimated. Recognizes estimate changes, if any, in the income statement, and a corresponding adjustment to equity over the
remaining vesting period.
The proceeds received net of any directly attributable transaction costs are credited to share capital (nominal value) and share premium when
the options are exercised.
2.20.Income tax
Income tax on the profit and loss for the period and deferred tax are recognized in the income statement except for income tax relating to items
of equity that are recognized directly in equity.
Income tax is recognized based on net taxable profit using the tax rates applicable on the date of the balance sheet in addition to tax adjustments
for previous years.
Deferred taxes arising from temporary time differences between the book value of assets and liabilities are recognized in accordance with the
principles of accounting and value according to the foundations of the tax, this is determining the value of deferred tax on the expected manner
to realize or settle the values of assets and liabilities, using tax rates applicable on the date of the balance sheet.
Deferred tax assets of the Bank recognized when there is likely to be possible to achieve profits subject to tax in the future to be possible through
to use that asset, and is reducing the value of deferred tax assets with part of that will come from tax benefit expected during the following years,
that in the case of expected high benefit tax, deferred tax assets will increase within the limits of the above reduced.
2.21.Borrowings
Borrowings are recognized initially at fair value net of transaction costs incurred. Borrowings are subsequently stated at amortized cost also any
difference between proceeds net of transaction costs and the redemption value is recognized in the income statement over the period of the
borrowings using the effective interest method.
2.22.Dividends
Dividends on ordinary shares and profit sharing are recognized as a charge of equity upon the general assembly approval. Profit sharing includes
the Board of Directors the Bank's articles of incorporation and the corporate
law.
2.23.Comparatives
Comparative figures have been adjusted to conform with changes in the presentation of the current period where necessary.
2.24.Non-current assets held for sale
A non-current asset (or disposal group) to be classified as held for sale if its carrying amount will be recovered principally through a sale
transaction rather than through continuing use.
Determining whether (and when) an asset stops being recovered principally through use and becomes recoverable principally through sale.
For an asset (or disposal group) to be classified as held for sale:
(a) It must be available for immediate sale in its present condition, subject only to terms that are usual and customary for sales of such assets
(or disposal groups);
(b) Its sale must be highly probable;
The standard requires that non-current assets (and, in a 'disposal group', related liabilities and current assets,) meeting its criteria to be classified
as held for sale be:
(a) Measured at the lower of carrying amount and fair value less costs to sell, with depreciation on them ceasing; and
(b) Presented separately on the face of the statement of financial position with the results of discontinued operations presented separately in the
income statement.
Notes to separate financial statements
9
2.25.Discontinued operation
Discontinued operation as 'a component of an entity that either has been disposed of, or is classified as held for sale, and
(a) Represents a separate major line of business or geographical area of operations,
(b) Is part of a single coordinated plan to dispose of a separate major line of business or geographical area of operations or
(c) Is a subsidiary acquired exclusively with a view to resale.
When presenting discontinued operations in the income statement, the comparative figures should be adjusted as if the operations had been
discontinued in the comparative period.
3. Financial risk management
The Bank ncial risks and those activities involve the analysis, evaluation, acceptance and management of
some degree of risk or combination of risks. Taking risk is core to the financial business, and the operational risks are an inevitable consequence
of being in business. The Bank minimize potential adverse
effects on the Bank
operating risks. Also market risk includes exchange rate risk, rate of return risk and other prices risks.
The Bank ent policies are designed to identify and analyze these risks, to set appropriate risk limits and controls, and to monitor
the risks and adherence to limits by means of reliable and up-to-date information systems. The Bank regularly reviews its risk management
policies and systems to reflect changes in markets, products and emerging best practice.
Risk management is carried out by risk department under policies approved by the Board of Directors. Bank treasury identifies, evaluates and
hedges financial risks in close co-operation with the Bank
The Board provides written principles for overall risk management, as well as written policies covering specific areas, such as foreign exchange risk,
interest rate risk, credit risk, use of derivative financial instruments and non-derivative financial instruments. In addition, credit risk management is
responsible for the independent review of risk management and the control environment.
3.1. Credit risk
The Bank takes on exposure to credit risk, which is the risk that counterparty will cause a financial loss for the Bank by failing to discharge an
obligation. Management therefore carefully manages its exposure to credit risk. Credit exposures arise principally in loans and advances, debt
securities and other bills. There is also credit risk in off-balance sheet financial arrangements such as loan commitments. The credit risk
management and control are centralized in a credit risk management team in bank treasury and reported to the Board of Directors and head of
each business unit regularly.
3.1.1. Credit risk measurement
3.1.1.1. Loans and advances to banks and customers
In measuring credit risk of loans and facilities to banks and customers at a counterparty level, the Bank reflects three components (i)
erparty and
its likely future development, from which the Bank (iii) the likely recovery ratio on the defaulted
These cr Basel committee on
banking regulations and the supervisory practices (the Basel committee), and are embedded in the Bank
management. The operational measurements can be contrasted with impairment allowances required under EAS 26, which are based
on losses that have been incurred on the balance r than expected losses (note 3.1).
The Bank assesses the probability of default of individual counterparties using internal rating tools tailored to the various categories
of counterparty. They have been developed internally and combine statistical analysis with credit officer judgment and are validated,
where appropriate. Clients of the Bank are segmented into four rating classes. The Bank below, reflects
the range of default probabilities defined for each rating class. This means that, in principle, exposures migrate between classes as
the assessment of their probability of default changes. The rating tools are kept under review and upgraded as necessary. The Bank
regularly validates the performance of the rating and their predictive power with regard to default events.
Description of the grade
1 Performing loans
2 Regular watching
3 Watch list
4 Non-performing loans
Loss given default or loss severity represents the Bank expectation of the extent of loss on a claim should default occur. It is expressed
as percentage loss per unit of exposure and typically varies by type of counterparty, type and seniority of claim and availability of
collateral or other credit mitigation.
3.1.1.2. Debt instruments and treasury and other bills
of the
credit risk exposures, and if this rating is not available, then other ways similar to those used with the credit customers are uses. The
Notes to separate financial statements

10
investments in those securities and bills are viewed as a way to gain a better credit quality mapping and maintain a readily available
source to meet the funding requirement at the same time.
3.1.2. Risk limit control and mitigation policies
The Bank rparties
and banks, and to industries and countries.
The Bank structures the levels of credit risk it undertakes by placing limits on the amount of risk accepted in relation to one borrower, or
groups of borrowers, and to geographical and industry segments. Such risks are monitored on a revolving basis and subject to an annual
or more frequent review, when considered necessary. Limits on the level of credit risk by individual, counterparties, product, and industry
sector and by country are approved quarterly by the Board of Directors.
The exposure to any one borrower including banks and brokers is further restricted by sub-limits covering on- and off-balance sheet
exposures, and daily delivery risk limits in relation to trading items such as forward foreign exchange contracts. Actual exposures against
limits are monitored daily.
Exposure to credit risk is also managed through regular analysis of the ability of borrowers and potential borrowers to meet interest and
capital repayment obligations and by changing these lending limits where appropriate.
Some other specific control and mitigation measures are outlined below:
3.1.2.1. Collateral
The Bank sets a range of policies and practices to mitigate credit risk. The most traditional of these is the taking of security for funds
advances, which is common practice. The Bank implements guidelines on the acceptability of specific classes of collateral or credit
risk mitigation. The principal collateral types for loans and advances are:
Mortgages over residential properties.
Mortgage business assets such as premises, and inventory.
Mortgage financial instruments such as debt securities and equities.
Longer-term finance and lending to corporate entities are generally secured; revolving individual credit facilities are generally
unsecured. In addition, in order to minimize the credit loss the Bank will seek additional collateral from the counterparty as soon as
impairment indicators are noticed for the relevant individual loans and advances.
Collateral held as security for financial assets other than loans and advances is determined by the nature of the instrument. Debt
securities, treasury and other governmental securities are generally unsecured, with the exception of asset-backed securities and
similar instruments, which are secured by portfolios of financial instruments.
3.1.2.2. Derivatives
The Bank maintains strict control limits on net open derivative positions (i.e., the difference between purchase and sale contracts), by
both amount and term. At any one time, the amount subject to credit risk is limited to the current fair value of instruments that are
favorable to the Bank (i.e., assets with positive fair value), which in relation to derivatives is only a small fraction of the contract, or
notional values used to express the volume of instruments outstanding. This credit risk exposure is managed as part of the overall
lending limits with customers, together with potential exposures from market movements. Collateral or other security is not usually
obtained for credit risk exposures on these instruments, except where the Bank requires margin deposits from counterparties.
Settlement risk arises in any situation where a payment in cash, securities or equities is made in the expectation of a corresponding
receipt in cash, securities or equities. Daily settlement limits are established for each counterparty to cover the aggregate of all
settlement risk arising from the Bank market transactions on any single day.
3.1.2.3. Master netting arrangements
The Bank further restricts its exposure to credit losses by entering into master netting arrangements with counterparties with which
it undertakes a significant volume of transactions. Master netting arrangements do not generally result in an offset of balance sheet
assets and liabilities, as transactions are usually settled on a gross basis. However, the credit risk associated with favorable contracts
is reduced by a master netting arrangement to the extent that if a default occurs, all amounts with the counterparty are terminated and
settled on a net basis. The Bank overall exposure to credit risk on derivative instruments subject to master netting arrangements can
change substantially within a short period, as it is affected by each transaction subject to the arrangement.
3.1.2.4. Credit related commitments
The primary purpose of these instruments is to ensure that funds are available to a customer as required. Guarantees and standby
letters of credit carry the same credit risk as loans. Documentary and commercial letters of credit which are written undertakings
by the Bank on behalf of a customer authorizing a third party to draw drafts on the Bank up to a stipulated amount under specific
terms and conditions are collateralized by the underlying shipments of goods to which they relate and therefore carry less risk than
a direct loan.
Commitments to extend credit represent unused portions of authorizations to extend credit in the form of loans, guarantees or letters
of credit. With respect to credit risk on commitments to extend credit, the Bank is potentially exposed to loss in an amount equal to
the total unused commitments. However, the likely amount of loss is less than the total unused commitments, as most commitments
to extend credit are contingent upon customers maintaining specific credit standards. The Bank monitors the term to maturity of credit
commitments because longer-term commitments generally have a greater degree of credit risk than shorter-term commitments.
Notes to separate financial statements
11
3.1.3. Impairment and provisioning policies
The internal rating system described in Note 3.1.1 focus on the credit-quality mapping from the lending and investment activities
perspective. Conversely, for only financial reporting purposes impairment losses are recognized for that has been incurred on the balance
sheet date when there is an objective evidence of impairment. Due to the different methodologies applied, the amount of incurred
impairment losses in balance sheet are usually lower than the amount determined from the expected loss model that is used for internal
operational management and CBE regulation purposes.
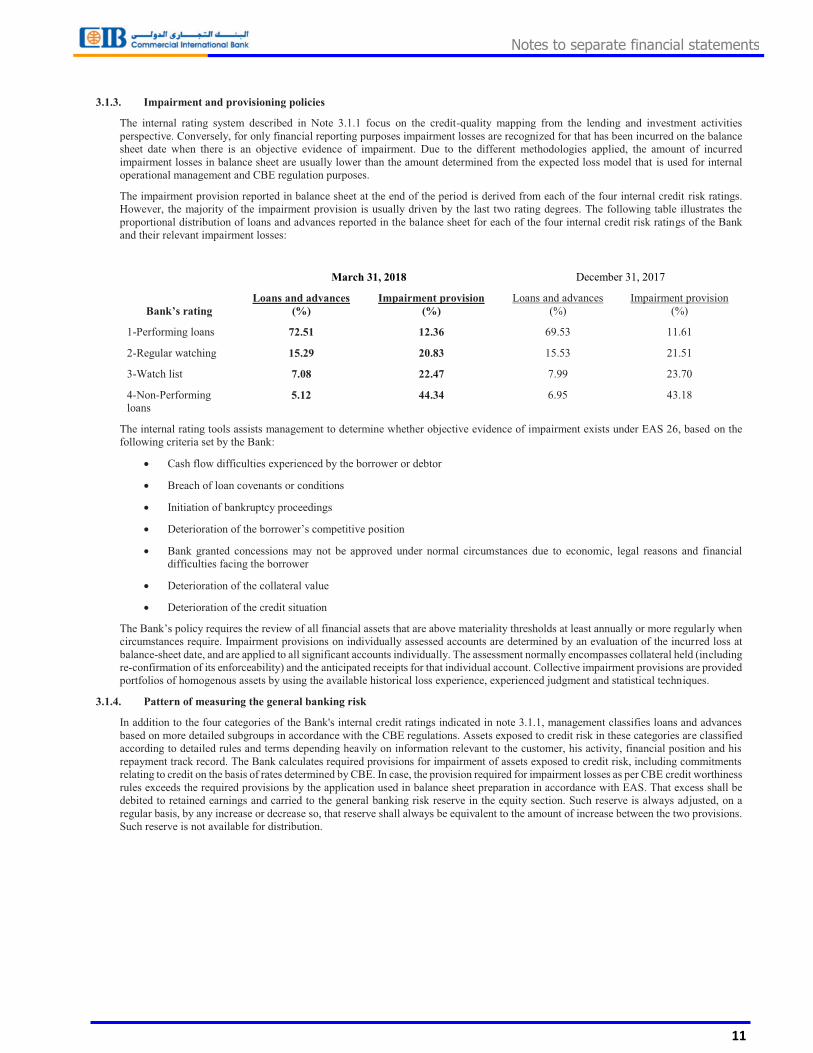
The impairment provision reported in balance sheet at the end of the period is derived from each of the four internal credit risk ratings.
However, the majority of the impairment provision is usually driven by the last two rating degrees. The following table illustrates the
proportional distribution of loans and advances reported in the balance sheet for each of the four internal credit risk ratings of the Bank
and their relevant impairment losses:
March 31, 2018 December 31, 2017
Loans and advances
(%)
Impairment provision
(%)
Loans and advances
(%)
Impairment provision
(%)
1-Performing loans 72.51 12.36 69.53 11.61
2-Regular watching 15.29 20.83 15.53 21.51
3-Watch list 7.08 22.47 7.99 23.70
4-Non-Performing
loans5.12 44.34 6.95 43.18
The internal rating tools assists management to determine whether objective evidence of impairment exists under EAS 26, based on the
following criteria set by the Bank:
Cash flow difficulties experienced by the borrower or debtor
Breach of loan covenants or conditions
Initiation of bankruptcy proceedings
Bank granted concessions may not be approved under normal circumstances due to economic, legal reasons and financial
difficulties facing the borrower
Deterioration of the collateral value
Deterioration of the credit situation
The Bank ly when
circumstances require. Impairment provisions on individually assessed accounts are determined by an evaluation of the incurred loss at
balance-sheet date, and are applied to all significant accounts individually. The assessment normally encompasses collateral held (including
re-confirmation of its enforceability) and the anticipated receipts for that individual account. Collective impairment provisions are provided
portfolios of homogenous assets by using the available historical loss experience, experienced judgment and statistical techniques.
3.1.4. Pattern of measuring the general banking risk
In addition to the four categories of the Bank's internal credit ratings indicated in note 3.1.1, management classifies loans and advances
based on more detailed subgroups in accordance with the CBE regulations. Assets exposed to credit risk in these categories are classified
according to detailed rules and terms depending heavily on information relevant to the customer, his activity, financial position and his
repayment track record. The Bank calculates required provisions for impairment of assets exposed to credit risk, including commitments
relating to credit on the basis of rates determined by CBE. In case, the provision required for impairment losses as per CBE credit worthiness
rules exceeds the required provisions by the application used in balance sheet preparation in accordance with EAS. That excess shall be
debited to retained earnings and carried to the general banking risk reserve in the equity section. Such reserve is always adjusted, on a
regular basis, by any increase or decrease so, that reserve shall always be equivalent to the amount of increase between the two provisions.
Such reserve is not available for distribution.
Notes to separate financial statements

Below is a statement of institutional worthiness according to internal ratings, compared to CBE ratings and rates of provisions
needed for assets impairment related to credit risk:
CBE Rating Categorization Provision
%
Internal
rating
Categorization
1 Low risk 0% 1 Performing loans
2 Average risk 1% 1 Performing loans
3 Satisfactory risk 1% 1 Performing loans
4 Reasonable risk 2% 1 Performing loans
5 Acceptable risk 2% 1 Performing loans
6 Marginally acceptable risk 3% 2 Regular watching
7 Watch list 5% 3 Watch list
8 Substandard 20% 4 Non performing loans
9 Doubtful 50% 4 Non performing loans
10 Bad debts 100% 4 Non performing loans
3.1.5. Maximum exposure to credit risk before collateral held
Mar. 31, 2018 Dec. 31, 2017
In balance sheet items exposed to credit risk EGP Thousands EGP Thousands
Treasury bills and other governmental notes 46,207,625 0 54,653,848
Trading financial assets:
- Debt instruments 6,591,192 0 6,728,843
Gross loans and advances to banks 192,731 0 1,383
Less:Impairment provision (4,419) (70)
Gross loans and advances to customers
Individual:
- Overdraft 1,744,034 0 1,780,416
- Credit cards 2,871,613 0 2,899,930
- Personal loans 15,204,159 0 13,910,837
- Mortgages 548,540 0 416,616
Corporate:
- Overdraft 11,348,294 0 12,450,826
- Direct loans 46,794,359 0 44,200,770
- Syndicated loans 29,231,464 0 26,627,825
- Other loans 126,059 0 112,802
Unamortized bills discount (11,870) (12,476)
Impairment provision (11,142,742) (10,994,446)
Unearned interest (1,598,319) (2,965,997)
Derivative financial instruments 38,274 0 40,001
Financial investments:
-Debt instruments 81,569,522 0 74,767,989
Total 229,710,516 224,619,097
Off balance sheet items exposed to credit risk
Financial guarantees 5,161,515 0 3,605,001
Customers acceptances 1,795,118 0 1,017,690
Letters of credit (import and export) 2,374,089 0 1,700,516
Letter of guarantee 69,770,568 0 69,514,413
Total 79,101,290 75,837,620
The above table represents the Bank's Maximum exposure to credit risk on March 31, 2018, before taking into account any held collateral.
For assets recognized on balance sheet, the exposures set out above are based on net carrying
amounts as reported in the balance sheet.
As shown above, 41.49% of the total maximum exposure is derived from loans and advances to banks and customers while
investments in debt instruments represent 38.38%.
Management is confident in its ability to continue to control and sustain minimal exposure of credit risk resulting from both the bank's loans
and advances portfolio and debt instruments based on the following:
- 87.80% of the loans and advances are concentrated in the top two grades of the internal credit risk rating system.
- 94.89% of loans and advances portfolio are considered to be neither past due nor impaired.
- Loans and advances assessed individualy are valued EGP 5,524,870 thousand.
- The Bank has implemented more prudent processes when granting loans and advances during the financial period
ended on March 31, 2018.
- 97.35% of the investments in debt Instruments are Egyptian sovereign instruments.
12
Notes to separate financial statements

3.1
.6. L
oa
ns
an
d a
dva
nce
s
Loan
s an
d a
dvan
ces
are
sum
mar
ized
as
foll
ow
s:
Lo
an
s a
nd
ad
va
nce
s to
cust
om
ers
Lo
an
s a
nd
ad
va
nce
s to
ba
nk
s
Loan
s an
d
advan
ces
to
cust
om
ers
Loan
s an
d
advan
ces
to b
anks
Nei
ther
pas
t d
ue
nor
impai
red
9
6,0
85
,64
01
92
,73
1 8
9,3
95
,03
6
1
,38
3
Pas
t d
ue
bu
t n
ot
impai
red
6
,25
8,0
12
- 5
,88
4,8
80
-
Ind
ivid
ual
ly i
mpai
red
5
,52
4,8
70
-7
,12
0,1
06
-
Gro
ss1
07
,86
8,5
22
19
2,7
31
10
2,4
00
,02
21
,38
3
Les
s:
Impai
rmen
t pro
vis
ion
11
,14
2,7
42
4,4
19
# 1
0,9
94
,44
6
7
0
Un
amort
ized
bil
ls d
isco
un
t1
1,8
70
-#
1
2,4
76
-
Un
earn
ed i
nte
rest
1,5
98
,31
9-
2,9
65
,99
7-
Net
95
,11
5,5
91
18
8,3
12
88
,42
7,1
03
1,3
13
Impai
rmen
t pro
vis
ion
loss
es f
or
loan
s an
d a
dvan
ces
reac
hed
EG
P 1
1,1
47
,16
1 t
hou
san
d.
In o
rder
to m
inim
ize
the
pro
pab
le e
xposu
re t
o c
red
it r
isk, th
e B
ank f
ocu
ses
more
on
th
e bu
sin
ess
wit
h l
arge
ente
rpri
ses,
ban
ks
or
reta
il c
ust
om
ers
wit
h g
ood
cre
dit
rat
ing o
r su
ffic
ien
t co
llat
eral
.
Net
lo
an
s a
nd
ad
va
nce
s to
cu
sto
mer
s a
nd
ba
nk
s (a
fter
ded
uct
ing
im
pa
irm
ent
pro
vis
ion
):
Ma
r. 3
1, 2
01
8E
GP
Th
ou
san
ds
Gra
des
:
Over
dra
fts
Cre
dit
ca
rds
Per
son
al
loa
ns
Mo
rtg
ag
esO
ver
dra
ftD
irect
lo
an
sS
yn
dic
ate
d l
oa
ns
Oth
er l
oa
ns
To
tal
loa
ns
an
d
ad
va
nce
s to
cust
om
ers
To
tal
loa
ns
an
d
ad
va
nce
s to
ba
nk
s
Per
form
ing
lo
an
s 1
,68
6,9
03
2
,75
7,4
75
1
4,5
52
,80
5
5
33
,91
3
9
,36
2,7
75
2
5,2
14
,87
0
2
2,5
84
,39
1
1
07
,72
9
7
6,8
00
,86
1
1
79
,59
6
Reg
ula
r w
atc
hin
g 1
5,2
12
5
6,4
06
3
73
,70
5
-
8
06
,36
0
9
,60
8,7
09
3
,31
8,3
06
1
5,2
20
1
4,1
93
,91
8
8
,71
6
Wa
tch
lis
t 6
3
2
0,4
89
1
66
,24
0
-
4
37
,43
0
3
,46
7,0
45
1
,05
7,4
31
-
5
,14
8,6
98
-
No
n-p
erfo
rmin
g l
oa
ns
3
8,5
58
1
2,2
40
4
2,2
22
1
,36
0
4
,78
4
4
56
,48
7
2
6,6
52
-
5
82
,30
3
-
To
tal
1
,74
0,7
36
2
,84
6,6
10
1
5,1
34
,97
2
5
35
,27
3
1
0,6
11
,34
9
3
8,7
47
,11
1
2
6,9
86
,78
0
1
22
,94
9
9
6,7
25
,78
0
1
88
,31
2
Dec
. 3
1, 2
01
7E
GP
Th
ou
san
ds
Gra
des
:
Over
dra
fts
Cre
dit
car
ds
Per
son
al l
oan
sM
ort
gag
esO
ver
dra
ftD
irec
t lo
ans
Syn
dic
ated
loan
sO
ther
loan
sT
ota
l lo
ans
and
advan
ces
to
cust
om
ers
Tota
l lo
ans
and
advan
ces
to
ban
ks
Per
form
ing l
oan
s 1
,64
8,2
45
2
,78
1,2
32
1
3,1
01
,74
0
4
05
,93
1 #
8
,82
8,3
36
2
2,5
80
,16
7
2
0,4
75
,96
1
9
4,6
65
6
9,9
16
,27
7
-
Reg
ula
r w
atch
ing
7
6,7
68
5
6,1
14
1
23
,17
3
-
# 8
00
,29
0
9
,61
9,2
51
2
,84
8,4
44
1
5,1
90
1
3,5
39
,23
0
1
,31
3
Wat
ch l
ist
1
2,9
76
2
2,5
37
1
8,1
20
-
# 4
63
,25
7
3
,91
8,5
13
1
,14
1,3
83
-
5
,57
6,7
86
-
Non
-per
form
ing l
oan
s 3
9,1
30
1
4,3
80
4
40
,80
8
1
,18
9 #
6
51
,81
6
9
75
,14
9
2
50
,81
1
-
2
,37
3,2
83
-
Tota
l 1
,77
7,1
19
2
,87
4,2
63
1
3,6
83
,84
1
4
07
,12
0
1
0,7
43
,69
9
3
7,0
93
,08
0
2
4,7
16
,59
9
1
09
,85
5
9
1,4
05
,57
6
1
,31
3
Dec
.31
, 2
01
7
EG
P T
ho
usa
nd
s
Ind
ivid
ual
Corp
ora
te
Ind
ivid
ua
lC
orp
ora
te
Ma
r.3
1, 2
01
8
EG
P T
ho
usa
nd
s
13
Note
sto
separa
tefinanci
alst
ate
ments

Loan
s an
d a
dvan
ces
past
du
e b
ut
not
imp
air
ed:
Loan
s an
d a
dvan
ces
less
than
90 d
ays
pas
t due
are
not
consi
der
ed i
mpai
red, unle
ss t
her
e is
an o
bje
ctiv
e ev
iden
ce o
f im
pai
rmen
t.
EG
P T
ho
usa
nd
s
Mar.
31, 2018
Over
dra
fts
Cre
dit
card
sP
erso
nal
loan
sM
ort
gages
Tota
lO
ver
dra
ftD
irec
t lo
an
sS
yn
dic
ate
d l
oan
sT
ota
l
Past
du
e u
p t
o 3
0 d
ay
s656,6
54
405,3
68
31,2
82
639
1,0
93,9
43
3
09,1
51
3,6
68,2
98
461,9
36
4,4
39,3
85
Past
du
e 30 -
60 d
ay
s15,2
79
60,4
24
18,9
23
207
94,8
33
5
9,2
45
1
27,4
30
13,6
21
2
00,2
96
Past
du
e 60-9
0 d
ay
s102
24,8
35
15,5
72
28
40,5
37
317,4
74
47,3
53
24,1
91
389,0
18
Tota
l672,0
35
490,6
27
65,7
77
874
1,2
29,3
13
685,8
70
3,8
43,0
81
499,7
48
5,0
28,6
99
Dec
.31, 2017
Over
dra
fts
Cre
dit
car
ds
Per
sonal
loan
sM
ort
gag
esT
ota
lO
ver
dra
ftD
irec
t lo
ans
Syndic
ated
loan
sT
ota
l
Pas
t due
up t
o 3
0 d
ays
530,5
93
395,7
09
33,1
55
580
960,0
37
4
45,7
30
3,6
34,1
81
3,0
71
4,0
82,9
82
Pas
t due
30-6
0 d
ays
77,0
71
59,9
27
19,5
47
199
156,7
44
3
0,5
31
5
8,6
88
- 8
9,2
19
Pas
t due
60-9
0 d
ays
13,0
38
27,0
20
10,5
20
69
50,6
47
427,8
11
117,4
40
-545,2
51
Tota
l620,7
02
482,6
56
63,2
22
848
1,1
67,4
28
904,0
72
3,8
10,3
09
3,0
71
4,7
17,4
52
Ind
ivid
uall
y i
mp
air
ed l
oan
s
Loan
s an
d a
dvan
ces
indiv
idual
ly a
sses
sed w
ithout
takin
g i
nto
consi
der
atio
n c
ash f
low
s fr
om
guar
ante
es a
re t
ota
led E
GP
5,5
24,8
70 t
housa
nd.
The
bre
akdow
n o
f th
e gro
ss a
mount
of
indiv
idual
ly i
mpai
red l
oan
s an
d a
dvan
ces
by p
roduct
, al
ong w
ith t
he
fair
val
ue
of
rela
ted c
oll
ater
al h
eld b
y t
he
Ban
k, ar
e as
foll
ow
s:
EG
P T
ho
usa
nd
s
Mar.
31, 2018
Over
dra
fts
Cre
dit
card
sP
erso
nal
loan
sM
ort
gages
Oth
er l
oan
sO
ver
dra
ftD
irec
t lo
an
sS
yn
dic
ate
d l
oan
sT
ota
l
Ind
ivid
uall
y i
mp
air
ed l
oan
s 4
0,2
00
2
1,1
57
6
3,6
81
4
,379
-
1
12,6
49
4,0
38,8
90
1
,243,9
14
5
,524,8
70
Dec
.31, 2017
Over
dra
fts
Cre
dit
car
ds
Per
sonal
loan
sM
ort
gag
esO
ther
loan
sO
ver
dra
ftD
irec
t lo
ans
Syndic
ated
loan
sT
ota
l
Indiv
idual
ly i
mpai
red l
oan
s 4
0,7
92
2
4,0
67
6
21,2
11
3
,960
-
1,7
26,4
40
3,4
45,8
55
1
,257,7
81
7
,120,1
06
Loan
s an
d a
dvan
ces
rest
ruct
ure
d
Res
truct
uri
ng a
ctiv
itie
s in
clude
resc
hed
uli
ng a
rran
gem
ents
, ap
ply
ing o
bli
gat
ory
man
agem
ent
pro
gra
ms,
modif
yin
g a
nd d
efer
ral
of
pay
men
ts. T
he
appli
cati
on o
f r
estr
uct
uri
ng p
oli
cies
are
bas
ed o
n i
ndic
ators
or
crit
eria
of
cred
it p
erfo
rman
ce o
f th
e borr
ow
er t
hat
is
bas
ed o
n t
he
per
sonal
judgm
ent
of
the
man
agem
ent,
whic
h i
ndic
ate
that
pay
men
t w
ill
most
lik
ely c
onti
nue.
Res
truct
uri
ng i
s co
mm
only
appli
ed t
o
term
loan
s, s
pec
iall
y c
ust
om
er l
oan
s. R
eneg
oti
ated
loan
s to
tale
d a
t th
e en
d o
f th
e per
iod:
Mar.
31, 2018
Dec
.31, 2017
Loan
s an
d a
dvan
ces
to c
ust
om
er
Corp
ora
te
- D
irec
t lo
ans
8,3
22,0
40
8,5
77,1
97
Tota
l8,3
22,0
40
8,5
77,1
97
Corp
ora
te
Ind
ivid
ual
C
orp
ora
te
Indiv
idual
Indiv
idual
Ind
ivid
ual
Corp
ora
te
Corp
ora
te
14
Note
sto
separa
tefinanci
alst
ate
ments

3.1.7. Debt instruments, treasury bills and other governmental notes
The table below presents an analysis of debt instruments, treasury bills and other governmental notes by rating
EGP Thousands
Mar.31, 2018
Treasury bills
and other gov.
notes
Trading financial
debt instruments
Non-trading
financial debt
instruments
Total
AAA - - - -
AA- to AA+ - - 367,529 367,529
A- to A+ - - 1,442,371 1,442,371
Lower than A- 45,937,458 6,591,192 79,759,622 132,288,272
Total 45,937,458 6,591,192 81,569,522 134,098,172
3.1.8. Concentration of risks of financial assets with credit risk exposure
3.1.8.1. Geographical sectors
of the period.
The Bank has allocated exposures to regions based on the country of domicile of its counterparties.
EGP Thousands
Mar.31, 2018 Cairo Alex, Delta and
Sinai
Upper Egypt Total
Treasury bills and other governmental notes 46,207,625 - - 46,207,625
Trading financial assets:
- Debt instruments 6,591,192 - - 6,591,192
Gross loans and advances to banks 192,731 - - 192,731
Less:Impairment provision (4,419) - - (4,419)
Gross loans and advances to customers
Individual:
- Overdrafts 992,673 579,295 172,066 1,744,034
- Credit cards 2,292,686 498,460 80,467 2,871,613
- Personal loans 9,234,449 5,055,006 914,704 15,204,159
- Mortgages 471,339 69,497 7,704 548,540
Corporate:
- Overdrafts 9,526,137 1,205,680 616,477 11,348,294
- Direct loans 31,811,768 11,674,386 3,308,205 46,794,359
- Syndicated loans 26,171,054 2,817,705 242,705 29,231,464
- Other loans 84,345 41,714 - 126,059
Unamortized bills discount (11,870) - - (11,870)
Impairment provision (11,142,742) - - (11,142,742)
Unearned interest (1,598,319) - - (1,598,319)
Derivative financial instruments 38,274 - - 38,274
Financial investments:
-Debt instruments 81,569,522 - - 81,569,522
Total 202,426,445 21,941,743 5,342,328 229,710,516
15
Notes to separate financial statements
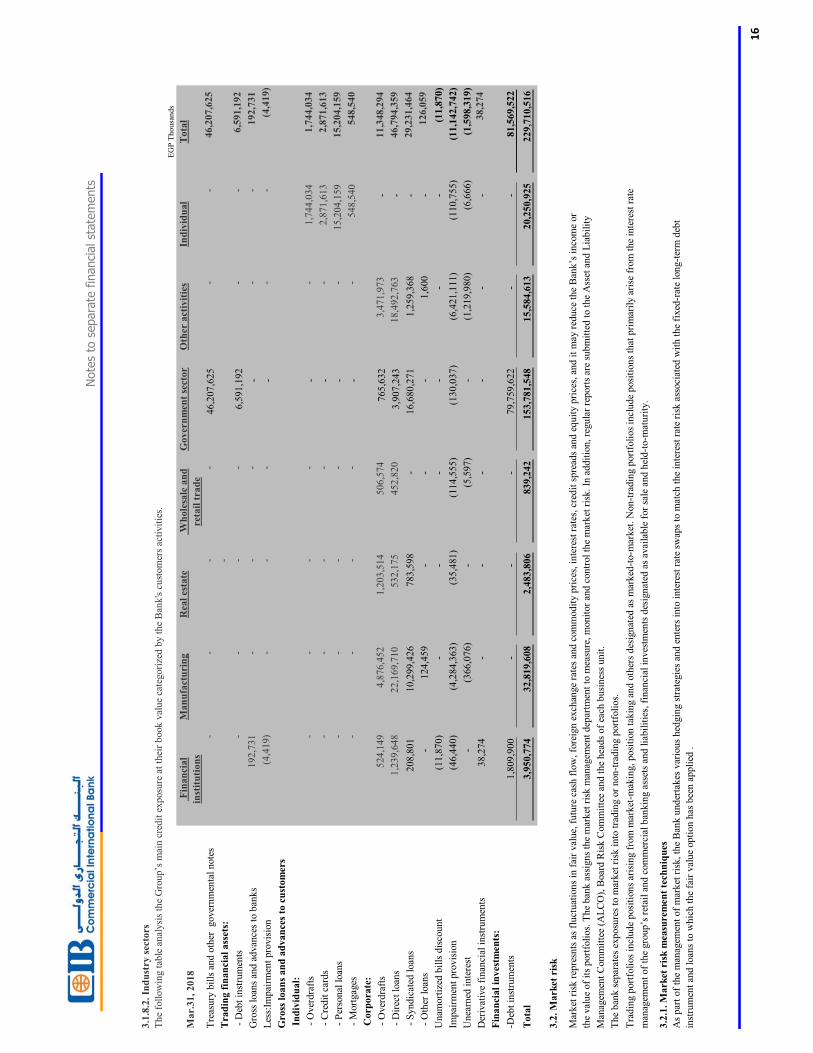
3.1
.8.2
. In
du
stry
sec
tors
EG
P T
ho
usa
nd
s
Mar.
31, 2018
Fin
an
cial
inst
itu
tion
s
Man
ufa
ctu
rin
gR
eal
esta
teW
hole
sale
an
d
reta
il t
rad
e
Gover
nm
ent
sect
or
Oth
er a
ctiv
itie
sIn
div
idu
al
Tota
l
Tre
asury
bil
ls a
nd o
ther
gover
nm
enta
l note
s -
-
-
-
46,2
07,6
25
-
-
4
6,2
07,6
25
Tra
din
g f
inan
cial
ass
ets:
-
- D
ebt
inst
rum
ents
-
-
-
-
6,5
91,1
92
-
-
6
,591,1
92
Gro
ss l
oan
s an
d a
dvan
ces
to b
anks
192,7
31
-
-
-
-
-
-
192,7
31
Les
s:Im
pai
rmen
t pro
vis
ion
(
4,4
19)
-
-
-
-
-
-
(
4,4
19)
Gro
ss l
oan
s an
d a
dvan
ces
to c
ust
om
ers
In
div
idu
al:
- O
ver
dra
fts
-
-
-
-
-
-
1
,744,0
34
1
,744,0
34
- C
redit
car
ds
-
-
-
-
-
-
2
,871,6
13
2
,871,6
13
- P
erso
nal
loan
s -
-
-
-
-
-
1
5,2
04,1
59
1
5,2
04,1
59
- M
ort
gag
es -
-
-
-
-
-
548,5
40
548,5
40
Corp
ora
te:
- O
ver
dra
fts
524,1
49
4,8
76,4
52
1
,203,5
14
506,5
74
765,6
32
3
,471,9
73
- 1
1,3
48,2
94
- D
irec
t lo
ans
1
,239,6
48
22,1
69,7
10
532,1
75
452,8
20
3,9
07,2
43
1
8,4
92,7
63
- 4
6,7
94,3
59
- S
yndic
ated
loan
s208,8
01
10,2
99,4
26
783,5
98
-16,6
80,2
71
1,2
59,3
68
- 2
9,2
31,4
64
- O
ther
loan
s-
124,4
59
--
-1,6
00
- 126,0
59
Unam
ort
ized
bil
ls d
isco
unt
(11,8
70)
--
--
--
(11,8
70)
Impai
rmen
t pro
vis
ion
(46,4
40)
(4,2
84,3
63)
(35,4
81)
(114,5
55)
(130,0
37)
(6,4
21,1
11)
(110,7
55)
(11,1
42,7
42)
Unea
rned
inte
rest
-(3
66,0
76)
-(5
,597)
-(1
,219,9
80)
(6,6
66)
(1,5
98,3
19)
Der
ivat
ive
finan
cial
inst
rum
ents
38,2
74
--
--
--
38,2
74
Fin
an
cial
inves
tmen
ts:
-Deb
t in
stru
men
ts1,8
09,9
00
--
-79,7
59,6
22
--
81,5
69,5
22
Tota
l3,9
50,7
74
32,8
19,6
08
2,4
83,8
06
839,2
42
153,7
81,5
48
15,5
84,6
13
20,2
50,9
25
229,7
10,5
16
3.2
. M
ark
et r
isk
the
val
ue
of
its
port
foli
os.
The
ban
k a
ssig
ns
the
mar
ket
ris
k m
anag
emen
t dep
artm
ent
to m
easu
re, m
onit
or
and c
ontr
ol
the
mar
ket
ris
k. In
addit
ion, re
gula
r re
port
s ar
e su
bm
itte
d t
o t
he
Ass
et a
nd L
iabil
ity
Man
agem
ent
Com
mit
tee
(AL
CO
), B
oar
d R
isk C
om
mit
tee
and t
he
hea
ds
of
each
busi
nes
s unit
.
The
ban
k s
epar
ates
exposu
res
to m
arket
ris
k i
nto
tra
din
g o
r non-t
radin
g p
ort
foli
os.
Tra
din
g p
ort
foli
os
incl
ude
posi
tions
aris
ing f
rom
mar
ket
-mak
ing, posi
tion t
akin
g a
nd o
ther
s des
ignat
ed a
s m
arked
-to-m
arket
. N
on-t
radin
g p
ort
foli
os
incl
ude
posi
tions
that
pri
mar
ily a
rise
fro
m t
he
inte
rest
rat
e
3.2
.1. M
ark
et r
isk
mea
sure
men
t te
chn
iqu
es
As
par
t of
the
man
agem
ent
of
mar
ket
ris
k, th
e B
ank u
nder
takes
var
ious
hed
gin
g s
trat
egie
s an
d e
nte
rs i
nto
inte
rest
rat
e sw
aps
to m
atch
the
inte
rest
rat
e ri
sk a
ssoci
ated
wit
h t
he
fixed
-rat
e lo
ng-t
erm
deb
t
inst
rum
ent
and l
oan
s to
whic
h t
he
fair
val
ue
opti
on h
as b
een a
ppli
ed .
16
Note
sto
separa
tefinanci
alst
ate
ments
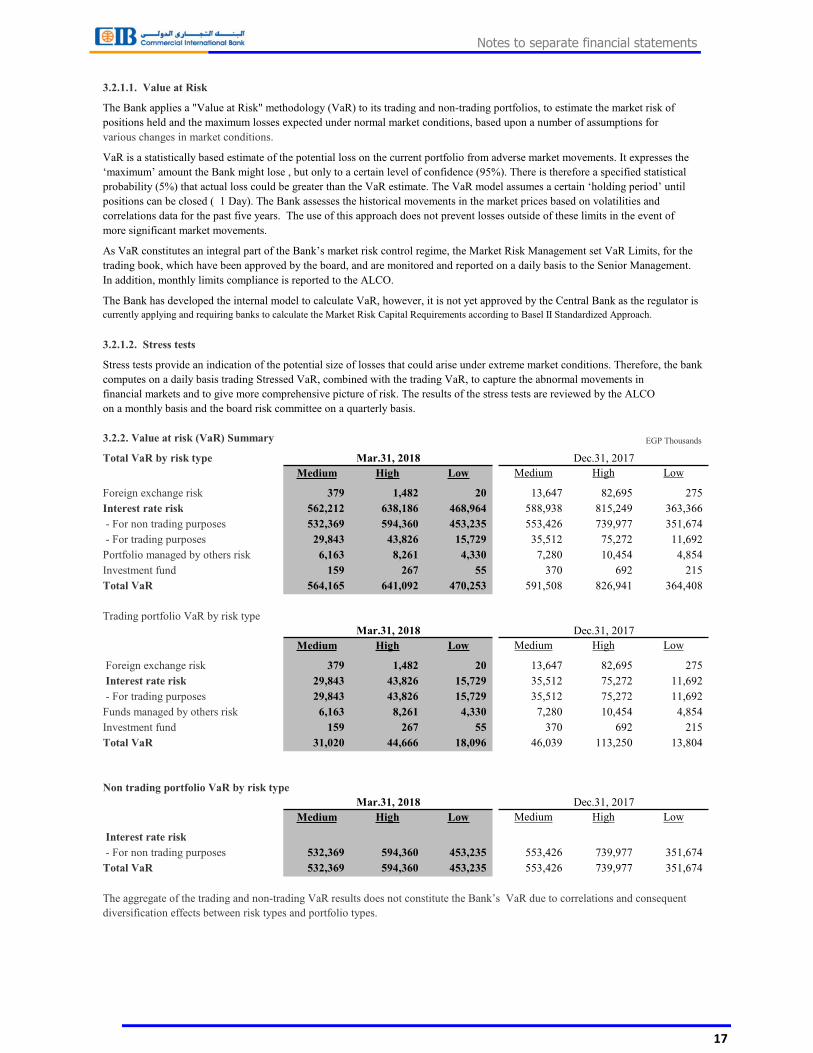
3.2.1.1. Value at Risk
The Bank applies a "Value at Risk" methodology (VaR) to its trading and non-trading portfolios, to estimate the market risk of
positions held and the maximum losses expected under normal market conditions, based upon a number of assumptions for
various changes in market conditions.
VaR is a statistically based estimate of the potential loss on the current portfolio from adverse market movements. It expresses the
‘maximum’ amount the Bank might lose , but only to a certain level of confidence (95%). There is therefore a specified statistical
probability (5%) that actual loss could be greater than the VaR estimate. The VaR model assumes a certain ‘holding period’ until
positions can be closed ( 1 Day). The Bank assesses the historical movements in the market prices based on volatilities and
correlations data for the past five years. The use of this approach does not prevent losses outside of these limits in the event of
more significant market movements.
As VaR constitutes an integral part of the Bank’s market risk control regime, the Market Risk Management set VaR Limits, for the
trading book, which have been approved by the board, and are monitored and reported on a daily basis to the Senior Management.
In addition, monthly limits compliance is reported to the ALCO.
The Bank has developed the internal model to calculate VaR, however, it is not yet approved by the Central Bank as the regulator is
currently applying and requiring banks to calculate the Market Risk Capital Requirements according to Basel II Standardized Approach.
3.2.1.2. Stress tests
Stress tests provide an indication of the potential size of losses that could arise under extreme market conditions. Therefore, the bank
computes on a daily basis trading Stressed VaR, combined with the trading VaR, to capture the abnormal movements in
financial markets and to give more comprehensive picture of risk. The results of the stress tests are reviewed by the ALCO
on a monthly basis and the board risk committee on a quarterly basis.
3.2.2. Value at risk (VaR) Summary EGP Thousands
Total VaR by risk type
Medium High Low Medium High Low
Foreign exchange risk 379 1,482 20 13,647 82,695 275
Interest rate risk 562,212 638,186 468,964 588,938 815,249 363,366
- For non trading purposes 532,369 594,360 453,235 553,426 739,977 351,674
- For trading purposes 29,843 43,826 15,729 35,512 75,272 11,692
Portfolio managed by others risk 6,163 8,261 4,330 7,280 10,454 4,854
Investment fund 159 267 55 370 692 215
Total VaR 564,165 641,092 470,253 591,508 826,941 364,408
Trading portfolio VaR by risk type
Medium High Low Medium High Low
Foreign exchange risk 379 1,482 20 13,647 82,695 275
Interest rate risk 29,843 43,826 15,729 35,512 75,272 11,692
- For trading purposes 29,843 43,826 15,729 35,512 75,272 11,692
Funds managed by others risk 6,163 8,261 4,330 7,280 10,454 4,854
Investment fund 159 267 55 370 692 215
Total VaR 31,020 44,666 18,096 46,039 113,250 13,804
Non trading portfolio VaR by risk type
Medium High Low Medium High Low
Interest rate risk
- For non trading purposes 532,369 594,360 453,235 553,426 739,977 351,674
Total VaR 532,369 594,360 453,235 553,426 739,977 351,674
The aggregate of the trading and non-trading VaR results does not constitute the Bank’s VaR due to correlations and consequent
diversification effects between risk types and portfolio types.
Mar.31, 2018 Dec.31, 2017
Mar.31, 2018 Dec.31, 2017
Mar.31, 2018 Dec.31, 2017
��
Notes to separate financial statements
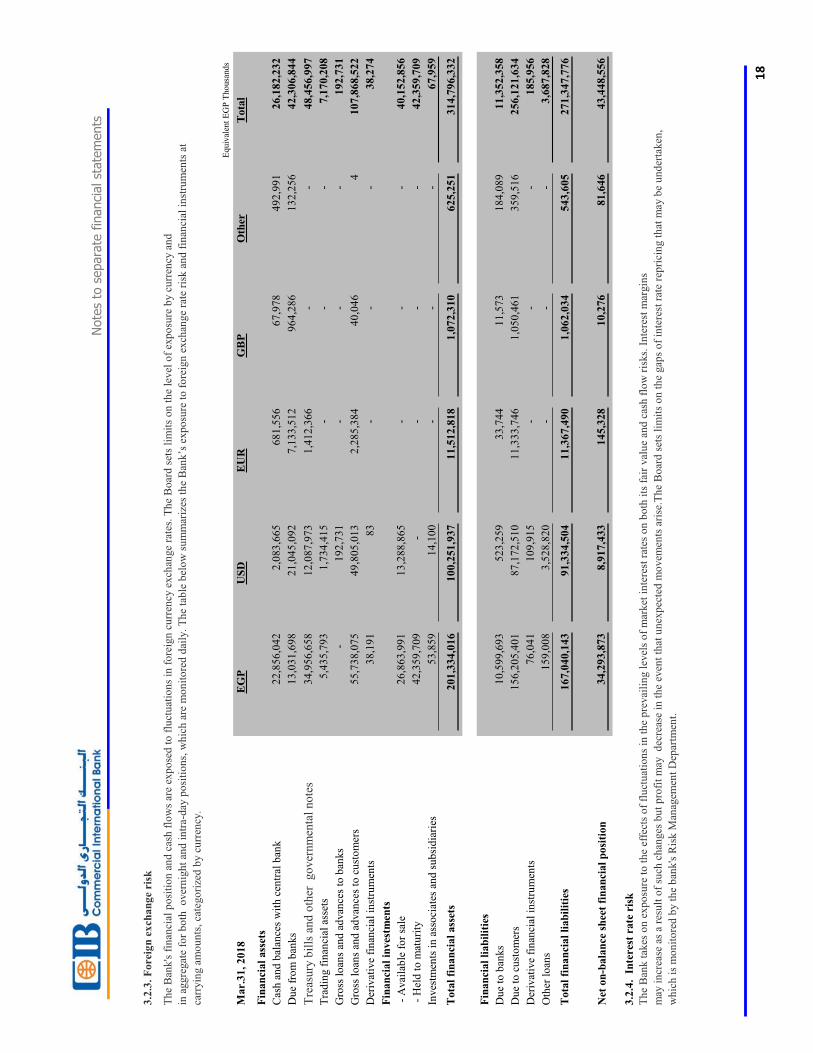
3.2
.3.
Fore
ign
ex
chan
ge
risk
Th
e B
ank's
fin
anci
al p
osi
tio
n a
nd
cas
h f
low
s ar
e ex
po
sed
to
flu
ctu
atio
ns
in f
ore
ign
cu
rren
cy e
xch
ange
rate
s. T
he
Bo
ard
set
s li
mit
s o
n t
he
level
of
exp
osu
re b
y c
urr
ency
an
d
carr
yin
g a
mo
un
ts,
cate
go
rize
d b
y c
urr
ency
.
Eq
uiv
alen
t E
GP
Tho
usa
nd
s
Mar.
31
, 2
01
8E
GP
US
DE
UR
GB
PO
ther
Tota
l
Fin
an
cial
ass
ets
Cas
h a
nd
bal
ance
s w
ith
cen
tral
ban
k2
2,8
56
,04
22
,08
3,6
65
68
1,5
56
67
,97
84
92
,99
12
6,1
82
,23
2
Du
e fr
om
ban
ks
13
,03
1,6
98
21
,04
5,0
92
7,1
33
,51
29
64
,28
61
32
,25
64
2,3
06
,84
4
Tre
asury
bil
ls a
nd
oth
er
go
ver
nm
enta
l no
tes
34
,95
6,6
58
12
,08
7,9
73
1,4
12
,36
6-
-4
8,4
56
,99
7
Tra
din
g f
inan
cial
ass
ets
5,4
35
,79
31
,73
4,4
15
--
-7
,17
0,2
08
Gro
ss l
oan
s an
d a
dvan
ces
to b
anks
-1
92
,73
1-
--
19
2,7
31
Gro
ss l
oan
s an
d a
dvan
ces
to c
ust
om
ers
55
,73
8,0
75
49
,80
5,0
13
2,2
85
,38
44
0,0
46
41
07
,86
8,5
22
Der
ivat
ive
fin
anci
al i
nst
rum
ents
38
,19
18
3-
--
38
,27
4
Fin
an
cial
inves
tmen
ts
- A
vai
lab
le f
or
sale
26
,86
3,9
91
13
,28
8,8
65
--
-4
0,1
52
,85
6
- H
eld
to
mat
uri
ty4
2,3
59
,70
9-
--
-4
2,3
59
,70
9
Inves
tmen
ts i
n a
sso
ciat
es a
nd
su
bsi
dia
ries
53
,85
91
4,1
00
--
-6
7,9
59
Tota
l fi
nan
cial
ass
ets
20
1,3
34
,01
61
00
,25
1,9
37
11
,51
2,8
18
1,0
72
,31
06
25
,25
13
14
,79
6,3
32
Fin
an
cial
liab
ilit
ies
Du
e to
ban
ks
10
,59
9,6
93
52
3,2
59
33
,74
41
1,5
73
18
4,0
89
11
,35
2,3
58
Du
e to
cu
sto
mer
s1
56
,20
5,4
01
87
,17
2,5
10
11
,33
3,7
46
1,0
50
,46
13
59
,51
62
56
,12
1,6
34
Der
ivat
ive
fin
anci
al i
nst
rum
ents
76
,04
11
09
,91
5-
--
18
5,9
56
Oth
er l
oan
s1
59
,00
83
,52
8,8
20
--
-3
,68
7,8
28
Tota
l fi
nan
cial
liab
ilit
ies
16
7,0
40
,14
39
1,3
34
,50
41
1,3
67
,49
01
,06
2,0
34
54
3,6
05
27
1,3
47
,77
6
Net
on
-bala
nce
sh
eet
fin
an
cial
posi
tion
3
4,2
93
,87
38
,91
7,4
33
14
5,3
28
10
,27
68
1,6
46
43
,44
8,5
56
3.2
.4.
In
tere
st r
ate
ris
k
Th
e B
ank t
akes
on
exp
osu
re t
o t
he
effe
cts
of
flu
ctu
atio
ns
in t
he
pre
vai
lin
g l
evel
s o
f m
arket
in
tere
st r
ates
on
bo
th i
ts f
air
val
ue
and
cas
h f
low
ris
ks.
In
tere
st m
argin
s
may
in
crea
se a
s a
resu
lt o
f su
ch c
han
ges
bu
t p
rofi
t m
ay
dec
reas
e in
th
e ev
ent
that
un
exp
ecte
d m
ovem
ents
ari
se.T
he
Bo
ard
set
s li
mit
s o
n t
he
gap
s o
f in
tere
st r
ate
rep
rici
ng t
hat
may
be
un
der
taken
,
wh
ich
is
mo
nit
ore
d b
y t
he
ban
k's
Ris
k M
anag
emen
t D
epar
tmen
t.
18
Note
sto
separa
tefinanci
alst
ate
ments
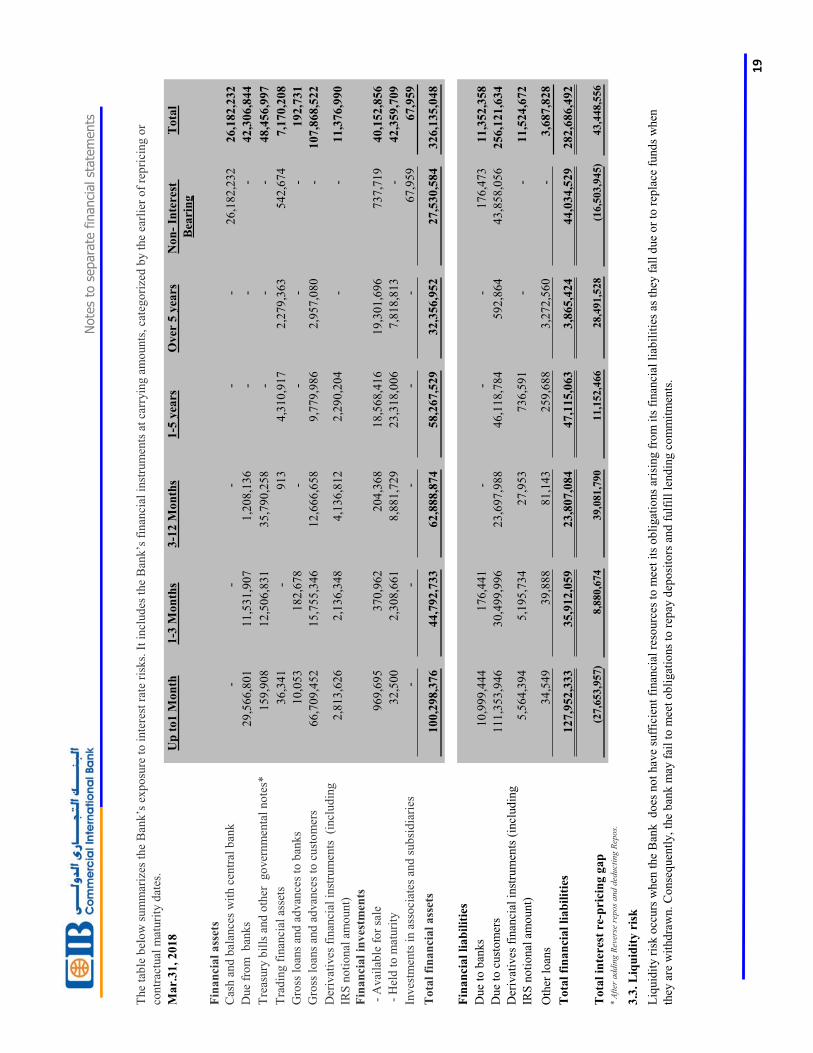
contr
actu
al m
aturi
ty d
ates
.
Ma
r.3
1,
20
18
Up
to
1 M
on
th1
-3 M
on
ths
3-1
2 M
on
ths
1-5
yea
rsO
ver
5 y
ears
No
n-
Inte
rest
Bea
rin
g
To
tal
Fin
an
cia
l a
sset
s
Cas
h a
nd
bal
ance
s w
ith c
entr
al b
ank
--
--
-2
6,1
82
,23
22
6,1
82
,23
2
Due
fro
m
ban
ks
29
,56
6,8
01
11
,53
1,9
07
1,2
08
,13
6-
--
42
,30
6,8
44
Tre
asury
bil
ls a
nd
oth
er
go
ver
nm
enta
l no
tes*
15
9,9
08
12
,50
6,8
31
35
,79
0,2
58
--
-4
8,4
56
,99
7
Tra
din
g f
inan
cial
ass
ets
36
,34
1-
91
34
,31
0,9
17
2,2
79
,36
35
42
,67
47
,17
0,2
08
Gro
ss l
oan
s an
d a
dvan
ces
to b
anks
10
,05
31
82
,67
8-
--
-1
92
,73
1
Gro
ss l
oan
s an
d a
dvan
ces
to c
ust
om
ers
66
,70
9,4
52
15
,75
5,3
46
12
,66
6,6
58
9,7
79
,98
62
,95
7,0
80
-1
07
,86
8,5
22
Der
ivat
ives
fin
anci
al i
nst
rum
ents
(i
ncl
ud
ing
IRS
no
tio
nal
am
ount)
2,8
13
,62
62
,13
6,3
48
4,1
36
,81
22
,29
0,2
04
--
11
,37
6,9
90
Fin
an
cia
l in
ves
tmen
ts
- A
vai
lab
le f
or
sale
96
9,6
95
37
0,9
62
20
4,3
68
18
,56
8,4
16
19
,30
1,6
96
73
7,7
19
40
,15
2,8
56
- H
eld
to
mat
uri
ty3
2,5
00
2,3
08
,66
18
,88
1,7
29
23
,31
8,0
06
7,8
18
,81
3-
42
,35
9,7
09
Inves
tmen
ts i
n a
sso
ciat
es a
nd
sub
sid
iari
es-
--
--
67
,95
96
7,9
59
To
tal
fin
an
cia
l a
sset
s1
00
,29
8,3
76
44
,79
2,7
33
62
,88
8,8
74
58
,26
7,5
29
32
,35
6,9
52
27
,53
0,5
84
32
6,1
35
,04
8
Fin
an
cia
l li
ab
ilit
ies
Due
to b
anks
10
,99
9,4
44
17
6,4
41
--
-1
76
,47
31
1,3
52
,35
8
Due
to c
ust
om
ers
11
1,3
53
,94
63
0,4
99
,99
62
3,6
97
,98
84
6,1
18
,78
45
92
,86
44
3,8
58
,05
62
56
,12
1,6
34
Der
ivat
ives
fin
anci
al i
nst
rum
ents
(in
clud
ing
IRS
no
tio
nal
am
ount)
5,5
64
,39
45
,19
5,7
34
27
,95
37
36
,59
1-
-1
1,5
24
,67
2
Oth
er l
oan
s3
4,5
49
39
,88
88
1,1
43
25
9,6
88
3,2
72
,56
0-
3,6
87
,82
8
To
tal
fin
an
cia
l li
ab
ilit
ies
12
7,9
52
,33
33
5,9
12
,05
92
3,8
07
,08
44
7,1
15
,06
33
,86
5,4
24
44
,03
4,5
29
28
2,6
86
,49
2
To
tal
inte
rest
re-
pri
cin
g g
ap
(27
,65
3,9
57
)8
,88
0,6
74
39
,08
1,7
90
11
,15
2,4
66
28
,49
1,5
28
(16
,50
3,9
45
)4
3,4
48
,55
6
* A
fter
ad
din
g R
ever
se r
epo
s a
nd
ded
uct
ing
Rep
os.
3.3
. L
iqu
idit
y r
isk
Liq
uid
ity r
isk o
ccurs
when
the
Ban
k
do
es n
ot
hav
e su
ffic
ient
finan
cial
res
ourc
es t
o m
eet
its
ob
ligat
ions
aris
ing f
rom
its
fin
anci
al l
iab
ilit
ies
as t
hey
fal
l d
ue
or
to r
epla
ce f
und
s w
hen
they
are
wit
hd
raw
n.
Co
nse
quen
tly,
the
ban
k m
ay f
ail
to m
eet
ob
ligat
ions
to r
epay
dep
osi
tors
and
fulf
ill
lend
ing c
om
mit
men
ts.
19
Note
sto
separa
tefinanci
alst
ate
ments

3.3
.1.
Liq
uid
ity
ris
k m
an
agem
ent
pro
cess
Pro
ject
ing c
ash f
low
s by m
ajor
curr
ency
under
var
ious
stre
ss s
cenar
ios
and c
onsi
der
ing t
he
level
of
liquid
ass
ets
nec
essa
ry i
n r
elat
ion t
her
eto:
- M
ainta
inin
g a
n a
ctiv
e pre
sence
in g
lobal
money
mar
ket
s to
enab
le t
his
to h
appen
.
- M
ainta
inin
g a
div
erse
ran
ge
of
fundin
g s
ourc
es w
ith b
ack-u
p f
acil
itie
s.
- M
onit
ori
ng b
alan
ce s
hee
t li
quid
ity a
nd a
dvan
ces
to c
ore
fundin
g r
atio
s ag
ainst
inte
rnal
and C
BE
reg
ula
tions.
- M
anag
ing t
he
conce
ntr
atio
n a
nd p
rofi
le o
f deb
t m
aturi
ties
.
- M
onit
ori
ng a
nd r
eport
ing t
akes
the
form
of
cash
flo
w m
easu
rem
ent
and p
roje
ctio
ns
for
the
nex
t day
, w
eek a
nd m
onth
res
pec
tivel
y,
as t
hes
e ar
e key
per
iods
for
liquid
ity m
anag
emen
t.
T
he
star
ting p
oin
t fo
r th
ose
ass
ets
pro
ject
ions
is a
n a
nal
ysi
s of
the
contr
actu
al m
aturi
ty o
f th
e fi
nan
cial
lia
bil
itie
s an
d t
he
expec
ted c
oll
ecti
on d
ate
of
the
finan
cial
ass
ets.
B
ank's
Ris
k M
anag
emen
t D
epar
tmen
t al
so m
onit
ors
unm
atch
ed m
ediu
m-t
erm
3.3
.2.
Fu
nd
ing a
pp
roach
Sourc
es o
f li
quid
ity a
re r
egula
rly r
evie
wed
join
tly b
y
the
Ban
k's
Ass
ets
& L
iabil
itie
s M
anag
emen
t D
epar
tmen
t an
d C
onsu
mer
Ban
kin
g t
o m
ainta
in a
wid
e div
ersi
fica
tion w
ithin
curr
enci
es,
geo
gra
phic
al a
rea,
dep
osi
tors
, pro
duct
s an
d t
enors
.
3.3
.3.
Non
-der
ivati
ve
cash
flo
ws
The
table
bel
ow
pre
sents
the
undis
counte
d c
ash f
low
s pay
able
by t
he
Ban
k u
nder
non-d
eriv
ativ
e fi
nan
cial
lia
bil
itie
s, m
easu
red b
y t
he
rem
ainin
g c
ontr
actu
al m
aturi
ties
and t
he
mat
uri
ties
ass
um
pti
on f
or
non
contr
actu
al p
roduct
s ar
e bas
ed o
n t
her
e beh
avio
r st
udie
s.
Mar.
31,
2018
Up
to
On
e to
th
ree
Th
ree
mon
ths
On
e y
ear
toO
ver
fiv
eT
ota
l
1 m
on
thm
on
ths
to o
ne
yea
r f
ive
yea
rs y
ears
EG
P T
ho
usa
nd
s
Fin
an
cia
l li
ab
ilit
ies
Du
e to
ban
ks
11,1
75,9
17
176,4
41
--
-11,3
52,3
58
Du
e to
cu
stom
ers
25,4
93,1
50
33,1
30,0
47
67,2
91,4
71
117,1
70,3
63
13,0
36,6
03
256,1
21,6
34
Oth
er l
oan
s34,5
49
39,8
88
81,1
43
259,6
88
3,2
72,5
60
3,6
87,8
28
Tota
l li
ab
ilit
ies
(con
tract
ual
an
d n
on
con
tract
ual
matu
rity
date
s)36,7
03,6
16
33,3
46,3
76
67,3
72,6
14
117,4
30,0
51
16,3
09,1
63
271,1
61,8
20
Tota
l fi
nan
cial
ass
ets
(con
tract
ual
an
d n
on
con
tract
ual
matu
rity
date
s)36,1
82,7
62
42,9
33,9
93
79,0
91,9
19
108,3
29,8
31
48,2
19,5
53
314,7
58,0
58
Dec
.31,
2017
Up t
oO
ne
to t
hre
eT
hre
e m
onth
s O
ne
yea
r to
Over
fiv
eT
ota
l
1 m
onth
month
sto
one
yea
r f
ive
yea
rs y
ears
EG
P T
ho
usa
nd
s
Fin
anci
al l
iab
ilit
ies
Due
to b
anks
1,8
77,9
18
--
--
1,8
77,9
18
Due
to c
ust
om
ers
31,3
48,1
43
21,7
28,1
94
71,3
35,3
28
109,5
70,3
01
16,7
85,4
04
250,7
67,3
70
Oth
er l
oan
s36,3
93
6,7
43
82,6
31
3,4
29
3,5
45,5
40
3,6
74,7
36
Tota
l li
abil
itie
s (c
ontr
actu
al a
nd n
on c
ontr
actu
al m
aturi
ty d
ates
)33,2
62,4
54
21,7
34,9
37
71,4
17,9
59
109,5
73,7
30
20,3
30,9
44
256,3
20,0
24
Tota
l fi
nan
cial
ass
ets
(contr
actu
al a
nd n
on c
ontr
actu
al m
aturi
ty d
ates
)57,6
44,5
15
33,9
70,6
56
79,9
38,6
43
96,1
74,0
26
36,6
36,5
99
304,3
64,4
39
20
Note
sto
separa
tefinanci
alst
ate
ments
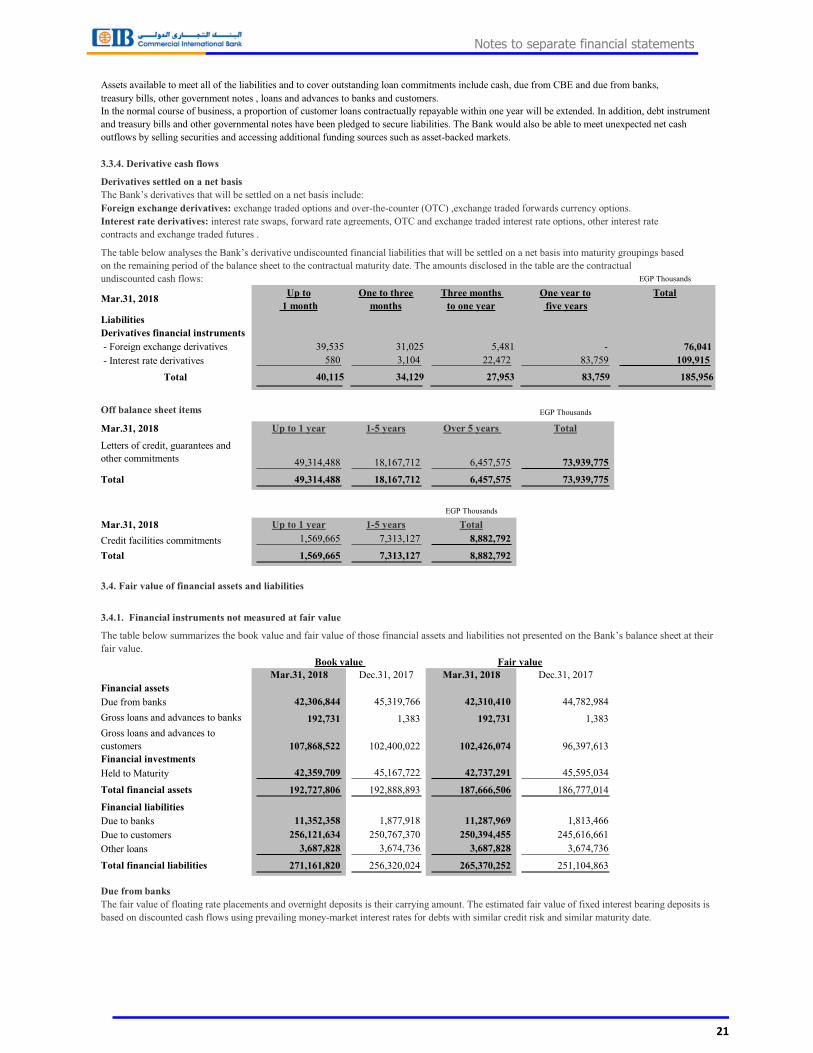
Assets available to meet all of the liabilities and to cover outstanding loan commitments include cash, due from CBE and due from banks,
treasury bills, other government notes , loans and advances to banks and customers.
In the normal course of business, a proportion of customer loans contractually repayable within one year will be extended. In addition, debt instrument
and treasury bills and other governmental notes have been pledged to secure liabilities. The Bank would also be able to meet unexpected net cash
outflows by selling securities and accessing additional funding sources such as asset-backed markets.
3.3.4. Derivative cash flows
Derivatives settled on a net basis
Foreign exchange derivatives: exchange traded options and over-the-counter (OTC) ,exchange traded forwards currency options.
Interest rate derivatives: interest rate swaps, forward rate agreements, OTC and exchange traded interest rate options, other interest rate
contracts and exchange traded futures .
on the remaining period of the balance sheet to the contractual maturity date. The amounts disclosed in the table are the contractual
undiscounted cash flows: EGP Thousands
Up to One to three Three months One year to Total
1 month months to one year five years
Liabilities
Derivatives financial instruments
- Foreign exchange derivatives 39,535 31,025 5,481 - 76,041
- Interest rate derivatives 580 3,104 22,472 83,759 109,915
Total 40,115 34,129 27,953 83,759 185,956
Off balance sheet items EGP Thousands
Mar.31, 2018 Up to 1 year 1-5 years Over 5 years Total
Letters of credit, guarantees and
other commitments 49,314,488 18,167,712 6,457,575 73,939,775
Total 49,314,488 18,167,712 6,457,575 73,939,775
EGP Thousands
Mar.31, 2018 Up to 1 year 1-5 years Total
Credit facilities commitments 1,569,665 7,313,127 8,882,792
Total 1,569,665 7,313,127 8,882,792
3.4. Fair value of financial assets and liabilities
3.4.1. Financial instruments not measured at fair value
fair value.
Mar.31, 2018 Dec.31, 2017 Mar.31, 2018 Dec.31, 2017
Financial assets
Due from banks 42,306,844 45,319,766 42,310,410 44,782,984
Gross loans and advances to banks 192,731 1,383 192,731 1,383
Gross loans and advances to
customers 107,868,522 102,400,022 102,426,074 96,397,613
Financial investments
Held to Maturity 42,359,709 45,167,722 42,737,291 45,595,034
Total financial assets 192,727,806 192,888,893 187,666,506 186,777,014
Financial liabilities
Due to banks 11,352,358 1,877,918 11,287,969 1,813,466
Due to customers 256,121,634 250,767,370 250,394,455 245,616,661
Other loans 3,687,828 3,674,736 3,687,828 3,674,736
Total financial liabilities 271,161,820 256,320,024 265,370,252 251,104,863
Due from banks
The fair value of floating rate placements and overnight deposits is their carrying amount. The estimated fair value of fixed interest bearing deposits is
based on discounted cash flows using prevailing money-market interest rates for debts with similar credit risk and similar maturity date.
Book value Fair value
Mar.31, 2018
21
Notes to separate financial statements
Loans and advances to banks
Loans and advances to banks are represented in loans that do not consider bank placing. The expected fair value of the loans and advances
represents the discounted value of future cash flows expected to be collected. Cash flows are discounted using the current market rate
to determine fair value.
Loans and advances to customers
Loans and advances are net of provisions for impairment. The estimated fair value of loans and advances represents the discounted amount
of estimated future cash flows expected to be received. Expected cash flows are discounted at current market rates to determine fair value.
Financial Investments
Investment securities include only interest-bearing assets, held to maturity assets, and available for sale assets that are measured at fair value.
Fair value for held-to-maturity assets is based on market prices or broker/dealer price quotations. Where this information is not available,
fair value is estimated using quoted market prices for securities with similar credit, maturity and yield characteristics.
Due to other banks and customers
The estimated fair value of deposits with no stated maturity, which includes non-interest-bearing deposits, is the amount repayable on
demand. The estimated fair value of fixed interest-bearing deposits and other borrowings not quoted in an active market is based on
discounted cash flows using interest rates for new debts with similar maturity date.
3.5 Capital management
elements that are managed as capital. The Bank manages its capital to ensure that the following objectives are achieved:
- Complying with the legally imposed capital requirements in Egypt.
with the bank.
on the guidelines developed by the Basel Committee as implemented by the banking supervision unit in the Central Bank of Egypt.
The required data is submitted to the Central Bank of Egypt on a monthly basis.
Central Bank of Egypt requires the following:
- Maintaining EGP 500 million as a minimum requirement for the issued and paid-in capital.
- Maintaining a minimum level of capital adequacy ratio of 11.875%, calculated as the ratio between total value of the capital elements, and
the risk-weighted assets and contingent liabilities of the Bank (credit risk, market risk and opertional risk). While taking into consideration
the conservation buffer.
Tier one:
Tier one comprises of paid-in capital (after deducting the book value of treasury shares), retained earnings and reserves resulting from
the distribution of profits except the banking risk reserve, interim profits and deducting previously recognized goodwill and any retained losse
Tier two:
Tier two represents the gone concern capital which is compposed of general risk provision according to the impairment provision guidelines iss
the Central Bank of Egypt to the maximum of 1.25% risk weighted assets and contingent liabilities ,subordinated loans with more
than five years to maturity (amortizing 20% of its carrying amount in each year of the remaining five years to maturity) and 45% of
the increase in fair value than book value for available for sale , held to maturity , subsidiaries and associates investments.
When calculating the numerator of capital adequacy ratio, the rules set limits of total tier 2 to no more than tier 1 capital and also limits
the subordinated to no more than 50% of tier1.
Assets risk weight scale ranging from zero to 400% is based on the counterparty risk to reflect the related credit risk scheme, taking into
considration the cash collatrals. Similar criteria are used for off balance sheet items after adjustments to reflect the nature of contingency
and the potential loss of those amounts. The Bank has complied with all local capital adequacy requirements for the current year.
22
Notes to separate financial statements
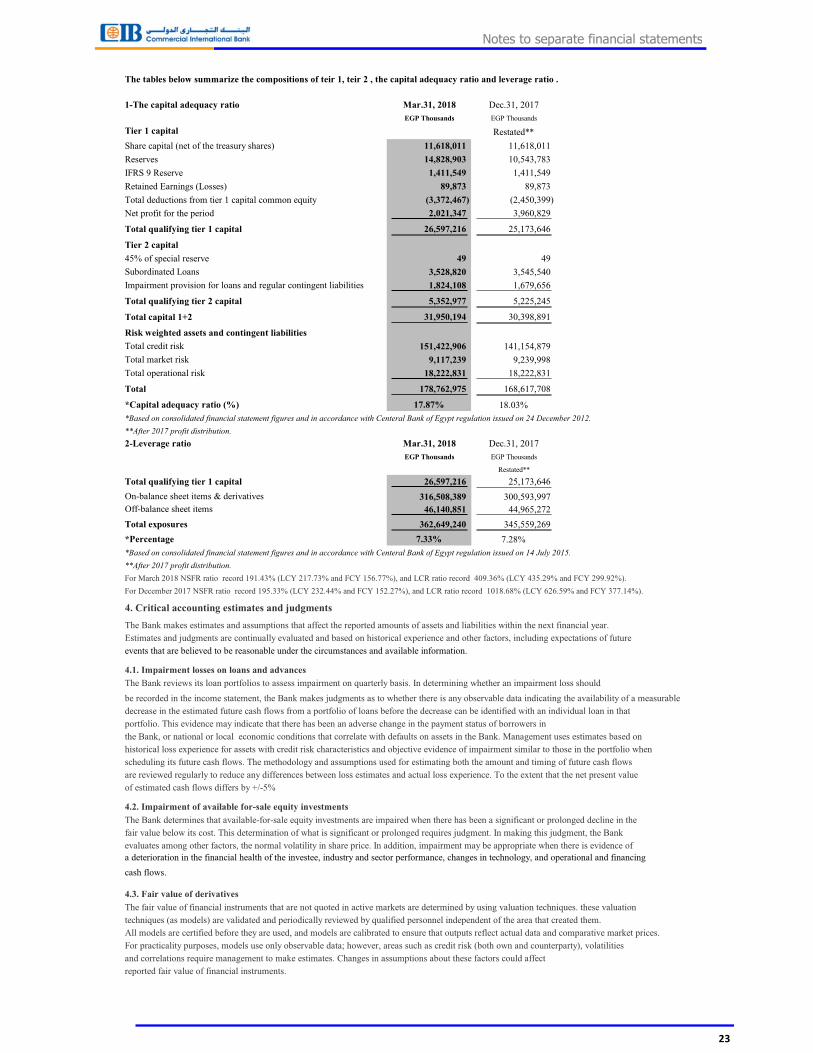
The tables below summarize the compositions of teir 1, teir 2 , the capital adequacy ratio and leverage ratio .
1-The capital adequacy ratio Mar.31, 2018 Dec.31, 2017
EGP Thousands EGP Thousands
Tier 1 capital Restated**
Share capital (net of the treasury shares) 11,618,011 11,618,011
Reserves 14,828,903 10,543,783
IFRS 9 Reserve 1,411,549 1,411,549
Retained Earnings (Losses) 89,873 89,873
Total deductions from tier 1 capital common equity (3,372,467) (2,450,399)
Net profit for the period 2,021,347 3,960,829
Total qualifying tier 1 capital 26,597,216 25,173,646
Tier 2 capital
45% of special reserve 49 49
Subordinated Loans 3,528,820 3,545,540
Impairment provision for loans and regular contingent liabilities 1,824,108 1,679,656
Total qualifying tier 2 capital 5,352,977 5,225,245
Total capital 1+2 31,950,194 30,398,891
Risk weighted assets and contingent liabilities
Total credit risk 151,422,906 141,154,879
Total market risk 9,117,239 9,239,998
Total operational risk 18,222,831 18,222,831
Total 178,762,975 168,617,708
*Capital adequacy ratio (%) 17.87% 18.03%
*Based on consolidated financial statement figures and in accordance with Centeral Bank of Egypt regulation issued on 24 December 2012.
**After 2017 profit distribution.
2-Leverage ratio Mar.31, 2018 Dec.31, 2017
EGP Thousands EGP Thousands
Restated**
Total qualifying tier 1 capital 26,597,216 25,173,646
On-balance sheet items & derivatives 316,508,389 300,593,997
Off-balance sheet items 46,140,851 44,965,272
Total exposures 362,649,240 345,559,269
*Percentage 7.33% 7.28%
*Based on consolidated financial statement figures and in accordance with Centeral Bank of Egypt regulation issued on 14 July 2015.
**After 2017 profit distribution.
For March 2018 NSFR ratio record 191.43% (LCY 217.73% and FCY 156.77%), and LCR ratio record 409.36% (LCY 435.29% and FCY 299.92%).
For December 2017 NSFR ratio record 195.33% (LCY 232.44% and FCY 152.27%), and LCR ratio record 1018.68% (LCY 626.59% and FCY 377.14%).
4. Critical accounting estimates and judgments
The Bank makes estimates and assumptions that affect the reported amounts of assets and liabilities within the next financial year.
Estimates and judgments are continually evaluated and based on historical experience and other factors, including expectations of future
events that are believed to be reasonable under the circumstances and available information.
4.1. Impairment losses on loans and advances
The Bank reviews its loan portfolios to assess impairment on quarterly basis. In determining whether an impairment loss should
be recorded in the income statement, the Bank makes judgments as to whether there is any observable data indicating the availability of a measurable
decrease in the estimated future cash flows from a portfolio of loans before the decrease can be identified with an individual loan in that
portfolio. This evidence may indicate that there has been an adverse change in the payment status of borrowers in
the Bank, or national or local economic conditions that correlate with defaults on assets in the Bank. Management uses estimates based on
historical loss experience for assets with credit risk characteristics and objective evidence of impairment similar to those in the portfolio when
scheduling its future cash flows. The methodology and assumptions used for estimating both the amount and timing of future cash flows
are reviewed regularly to reduce any differences between loss estimates and actual loss experience. To the extent that the net present value
of estimated cash flows differs by +/-5%
4.2. Impairment of available for-sale equity investments
The Bank determines that available-for-sale equity investments are impaired when there has been a significant or prolonged decline in the
fair value below its cost. This determination of what is significant or prolonged requires judgment. In making this judgment, the Bank
evaluates among other factors, the normal volatility in share price. In addition, impairment may be appropriate when there is evidence of
a deterioration in the financial health of the investee, industry and sector performance, changes in technology, and operational and financing
cash flows.
4.3. Fair value of derivatives
The fair value of financial instruments that are not quoted in active markets are determined by using valuation techniques. these valuation
techniques (as models) are validated and periodically reviewed by qualified personnel independent of the area that created them.
All models are certified before they are used, and models are calibrated to ensure that outputs reflect actual data and comparative market prices.
For practicality purposes, models use only observable data; however, areas such as credit risk (both own and counterparty), volatilities
and correlations require management to make estimates. Changes in assumptions about these factors could affect
reported fair value of financial instruments.
23
Notes to separate financial statements

4.4 Held-to-Maturity investments
The non-derivative financial assets with fixed or determinable payments and fixed maturity are being classified as held to maturity. This requires significant judgment, in which the
for example, selling an insignificant amount close to maturity it will be required to reclassify the entire category as available for sale. The investments would therefore be measured
at fair value not amortized cost.
5. Segment analysis
5.1. By business segment
The Bank is divided into four main business segments on a worldwide basis:
currency and derivative products
custody, credit and debit cards, consumer loans and mortgages;
Transactions between the business segments are on normal commercial terms and conditions.
EGP Thousands
Mar.31, 2018
Corporate banking SME's Investment banking Retail banking Asset Liability
Mangement
Total
Revenue according to business segment 1,390,197 606,158 940,395 1,386,839 124,257 4,447,846
Expenses according to business segment (832,407) (144,334) (38,053) (559,161) (4,524) (1,578,479)
Profit before tax 557,790 461,824 902,342 827,678 119,733 2,869,367
Tax (165,571) (137,086) (267,847) (245,684) (35,541) (851,729)
Profit for the period 392,219 324,738 634,495 581,994 84,192 2,017,638
Total assets 101,501,972 2,583,276 135,958,358 19,962,669 49,728,570 309,734,845
Dec.31, 2017Corporate banking SME's Investment banking Retail banking Asset Liability
Mangement
Total
Revenue according to business segment 5,691,435 2,342,539 2,955,690 4,841,757 639,646 16,471,067
Expenses according to business segment (3,550,176) (696,877) (105,293) (1,780,505) (7,226) (6,140,077)
Profit before tax 2,141,259 1,645,662 2,850,397 3,061,252 632,420 10,330,990
Tax (576,762) (442,854) (767,053) (823,795) (170,187) (2,780,651)
Profit for the year 1,564,497 1,202,808 2,083,344 2,237,457 462,233 7,550,339
Total assets 82,138,508 2,352,091 137,645,556 18,444,909 54,190,257 294,771,321
5.2. By geographical segment EGP Thousands
Mar.31, 2018 Cairo Alex, Delta & Sinai Upper Egypt Total
Revenue according to geographical segment 3,667,467 647,395 132,984 4,447,846
Expenses according to geographical segment (1,242,540) (286,351) (49,588) (1,578,479)
Profit before tax 2,424,927 361,044 83,396 2,869,367
Tax (719,803) (107,171) (24,755) (851,729)
Profit for the period 1,705,124 253,873 58,641 2,017,638
Total assets 280,394,038 22,721,974 6,618,833 309,734,845
Dec.31, 2017 Cairo Alex, Delta & Sinai Upper Egypt Total
Revenue according to geographical segment 13,479,965 2,499,912 491,190 16,471,067
Expenses according to geographical segment (5,306,193) (670,176) (163,708) (6,140,077)
Profit before tax 8,173,772 1,829,736 327,482 10,330,990
Tax (2,200,134) (492,390) (88,127) (2,780,651)
Profit for the year 5,973,638 1,337,346 239,355 7,550,339
Total assets 265,654,804 22,598,945 6,517,572 294,771,321
24
Notes to separate financial statements
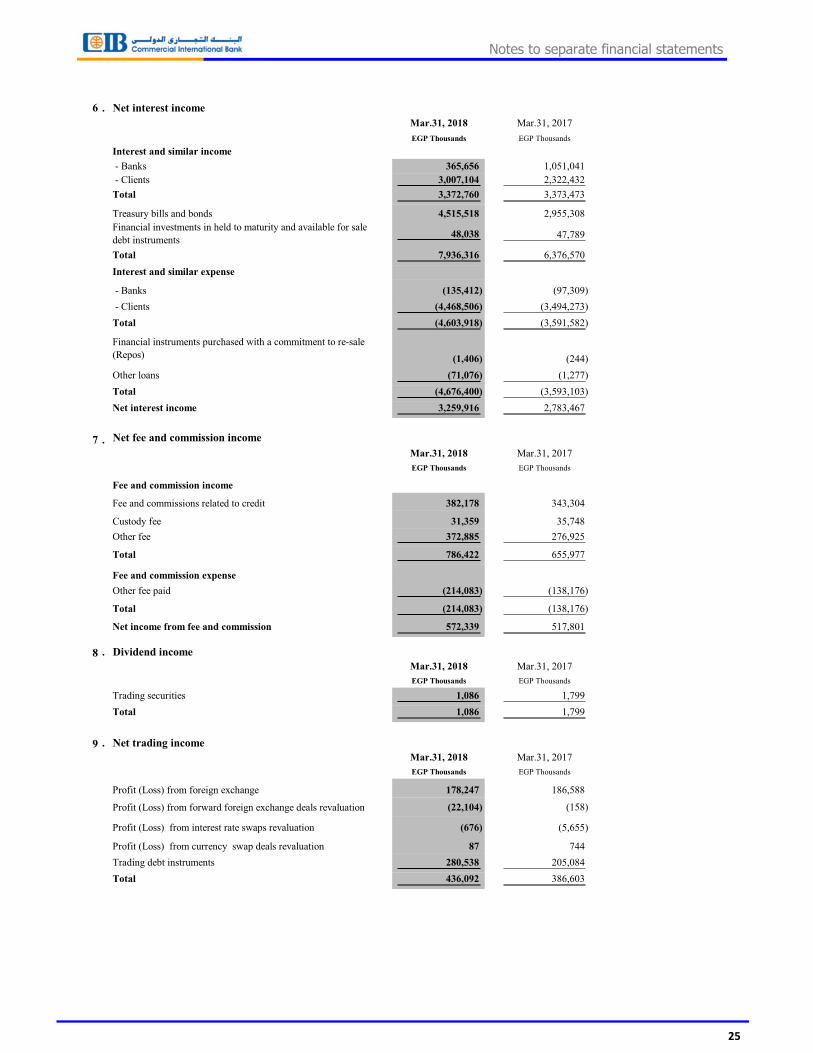
6 . Net interest income 3 M Last 9 Months t 3 Mo Last 9 Months
# Mar.31, 2018 # Mar.31, 2017
EGP ThousandEGP ThousandsEGP Thousand EGP Thousands
Interest and similar income
- Banks 365,656 1,051,041
- Clients 3,007,104 2,322,432
Total 3,372,760 3,373,473
Treasury bills and bonds 4,515,518 2,955,308
Financial investments in held to maturity and available for sale
debt instruments 48,038 47,789
Total 7,936,316 6,376,570
Interest and similar expense
- Banks (135,412) (97,309)
- Clients (4,468,506) (3,494,273)
Total (4,603,918) (3,591,582)
Financial instruments purchased with a commitment to re-sale
(Repos) (1,406) (244)
Other loans (71,076) (1,277)
Total (4,676,400) (3,593,103)
Net interest income 3,259,916 2,783,467
7 . Net fee and commission income 3 M Last 9 Months t 3 Mo Last 9 Months
# Mar.31, 2018 # Mar.31, 2017
EGP ThousandEGP ThousandsEGP Thousand EGP Thousands
Fee and commission income
Fee and commissions related to credit 382,178 343,304
Custody fee 31,359 35,748
Other fee 372,885 276,925
Total 786,422 655,977
Fee and commission expense
Other fee paid (214,083) (138,176)
Total (214,083) (138,176)
Net income from fee and commission 572,339 517,801
8 . Dividend income 3 M Last 9 Months t 3 Mo Last 9 Months
# Mar.31, 2018 # Mar.31, 2017
EGP ThousandEGP ThousandsEGP Thousand EGP Thousands
Trading securities 1,086 1,799
Total 1,086 1,799
9 . Net trading income 3 M Last 9 Months t 3 Mo Last 9 Months
# Mar.31, 2018 # Mar.31, 2017
EGP ThousandEGP ThousandsEGP Thousand EGP Thousands
Profit (Loss) from foreign exchange 178,247 186,588
Profit (Loss) from forward foreign exchange deals revaluation (22,104) (158)
Profit (Loss) from interest rate swaps revaluation (676) (5,655)
Profit (Loss) from currency swap deals revaluation 87 744
Trading debt instruments 280,538 205,084
Total 436,092 386,603
25
Notes to separate financial statements
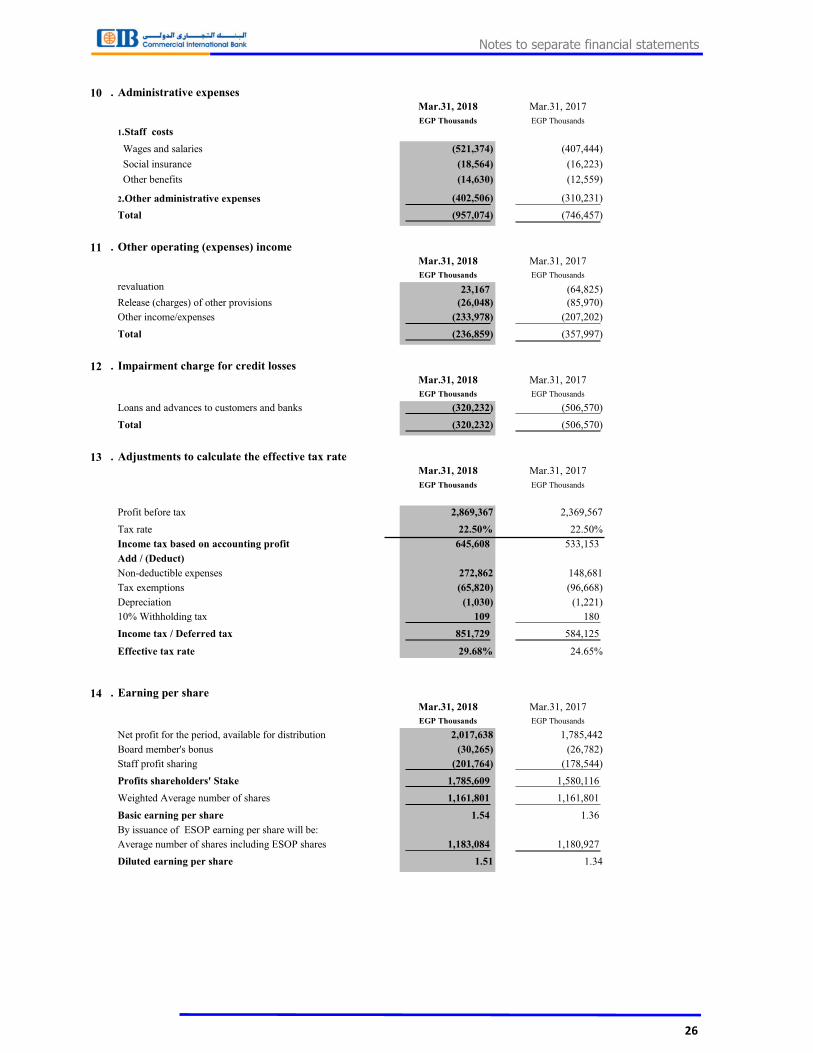
10 . Administrative expenses st 3 Mon Last 9 Months st 3 Mo Last 9 Months
## Mar.31, 2018 ## Mar.31, 2017
EGP ThousandEGP ThousandsEGP Thousand EGP Thousands
1.Staff costs
Wages and salaries # (521,374) # (407,444)
Social insurance # (18,564) # (16,223)
Other benefits # (14,630) # (12,559)
2.Other administrative expenses # (402,506) # (310,231)
Total # (957,074) # (746,457)
11 . Other operating (expenses) income st 3 Mon Last 9 Months st 3 Mo Last 9 Months
## Mar.31, 2018 ## Mar.31, 2017
EGP ThousandEGP ThousandsEGP Thousand EGP Thousands
revaluation # 23,167 # (64,825)
Release (charges) of other provisions # (26,048) # (85,970)
Other income/expenses # (233,978) # (207,202)
Total # (236,859) # (357,997)
12 . Impairment charge for credit losses st 3 Mon Last 9 Months st 3 Mo Last 9 Months
## Mar.31, 2018 ## Mar.31, 2017
EGP ThousandEGP ThousandsEGP Thousand EGP Thousands
Loans and advances to customers and banks # (320,232) # (506,570)
Total # (320,232) # (506,570)
13 . Adjustments to calculate the effective tax rate st 3 Mon Last 9 Months st 3 Mo Last 9 Months
## Mar.31, 2018 ## Mar.31, 2017
EGP ThousandEGP ThousandsEGP Thousand EGP Thousands
Profit before tax ## 2,869,367 ## 2,369,567
Tax rate 22.50% 22.50%
Income tax based on accounting profit # 645,608 # 533,153
Add / (Deduct)
Non-deductible expenses 0 272,862 # 148,681
Tax exemptions # (65,820) # (96,668)
Depreciation # (1,030) # (1,221)
10% Withholding tax # 109 # 180
Income tax / Deferred tax # 851,729 # 584,125
Effective tax rate ## 29.68% ## 24.65%
14 . Earning per share st 3 Mon Last 9 Months st 3 Mo Last 9 Months
## Mar.31, 2018 ## Mar.31, 2017
EGP ThousandEGP ThousandsEGP Thousand EGP Thousands
Net profit for the period, available for distribution ## 2,017,638 ## 1,785,442
Board member's bonus # (30,265) # (26,782)
Staff profit sharing # (201,764) # (178,544)
Profits shareholders' Stake # 1,785,609 # 1,580,116
Weighted Average number of shares # 1,161,801 # 1,161,801
Basic earning per share # 1.54 # 1.36
By issuance of ESOP earning per share will be:
Average number of shares including ESOP shares # 1,183,084 # 1,180,927
Diluted earning per share # 1.51 # 1.34
26
Notes to separate financial statements

15 . Cash and balances with central bank
Mar.31, 2018 Dec.31, 2017
EGP Thousands EGP Thousands
Cash 5,760,476 5,784,303
Obligatory reserve balance with CBE
- Current accounts 20,421,756 8,878,986
Total 26,182,232 14,663,289
Non-interest bearing balances 26,182,232 14,663,289
16 . Due from banks
Mar.31, 2018 Dec.31, 2017
EGP Thousands EGP Thousands
Current accounts 3,986,514 2,679,189
Deposits 38,320,330 42,640,577
Total 42,306,844 45,319,766
Central banks 22,738,132 15,863,399
Local banks 3,737,800 3,894,775
Foreign banks 15,830,912 25,561,592
Total 42,306,844 45,319,766
Fixed interest bearing balances 42,306,844 45,319,766
Total 42,306,844 45,319,766
Current balances 42,306,844 45,319,766
17 . Treasury bills and other governmental notes
Mar.31, 2018 Dec.31, 2017
EGP Thousands EGP Thousands
91 Days maturity 184,000 -
182 Days maturity 588,325 1,289,425
364 Days maturity 47,954,839 57,602,997
Unearned interest (2,519,539) (4,238,574)
Total 1 46,207,625 54,653,848
Repos - treasury bills (270,167) (175,646)
Total 2 (270,167) (175,646)
Net 45,937,458 54,478,202
18 . Trading financial assets
Mar.31, 2018 Dec.31, 2017
EGP Thousands EGP Thousands
Debt instruments
- Governmental bonds 6,591,192 6,728,843
Total 6,591,192 6,728,843
Equity instruments
- Mutual funds 36,342 99,587
Total 36,342 99,587
- Portfolio managed by others 542,674 466,767
Total 7,170,208 7,295,197
27
Notes to separate financial statements
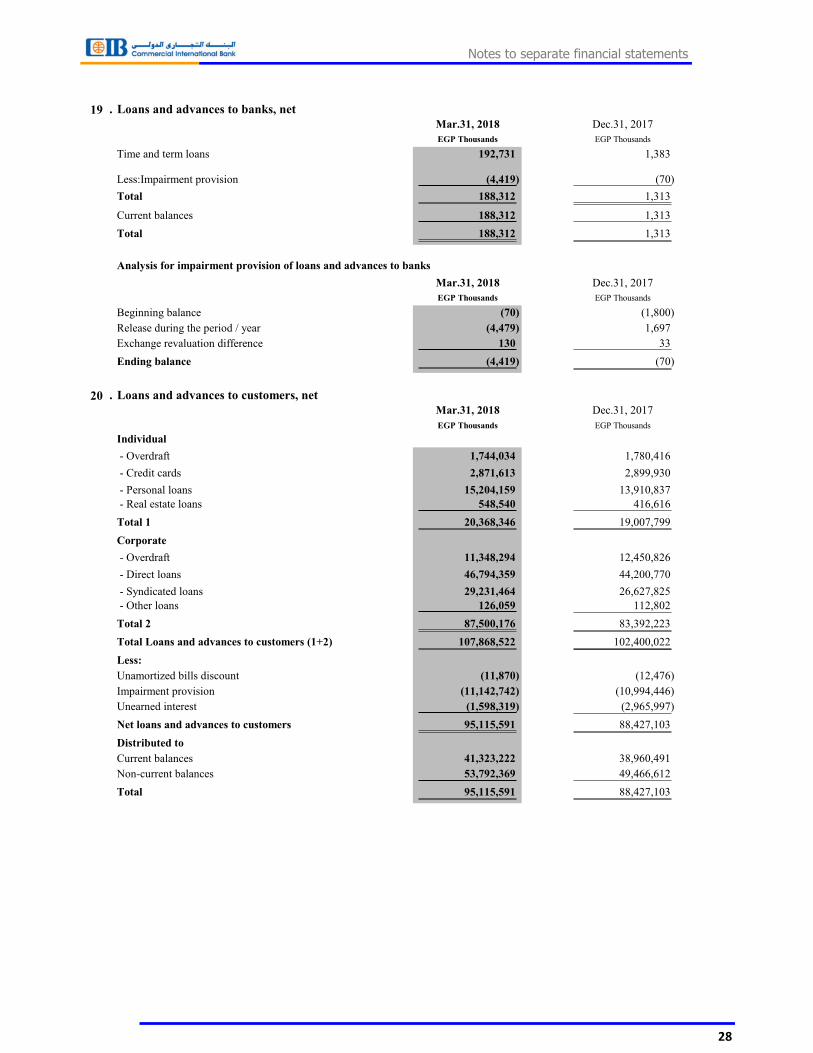
19 . Loans and advances to banks, net
Mar.31, 2018 Dec.31, 2017
EGP Thousands EGP Thousands
Time and term loans 192,731 1,383
Less:Impairment provision (4,419) (70)
Total 188,312 1,313
Current balances 188,312 1,313
Total 188,312 1,313
Analysis for impairment provision of loans and advances to banks
Mar.31, 2018 Dec.31, 2017
EGP Thousands EGP Thousands
Beginning balance (70) (1,800)
Release during the period / year (4,479) 1,697
Exchange revaluation difference 130 33
Ending balance (4,419) (70)
20 . Loans and advances to customers, net
Mar.31, 2018 Dec.31, 2017
EGP Thousands EGP Thousands
Individual
- Overdraft 1,744,034 1,780,416
- Credit cards 2,871,613 2,899,930
- Personal loans 15,204,159 13,910,837
- Real estate loans 548,540 416,616
Total 1 20,368,346 19,007,799
Corporate
- Overdraft 11,348,294 12,450,826
- Direct loans 46,794,359 44,200,770
- Syndicated loans 29,231,464 26,627,825
- Other loans 126,059 112,802
Total 2 87,500,176 83,392,223
Total Loans and advances to customers (1+2) 107,868,522 102,400,022
Less:
Unamortized bills discount (11,870) (12,476)
Impairment provision (11,142,742) (10,994,446)
Unearned interest (1,598,319) (2,965,997)
Net loans and advances to customers 95,115,591 88,427,103
Distributed to
Current balances 41,323,222 38,960,491
Non-current balances 53,792,369 49,466,612
Total 95,115,591 88,427,103
28
Notes to separate financial statements
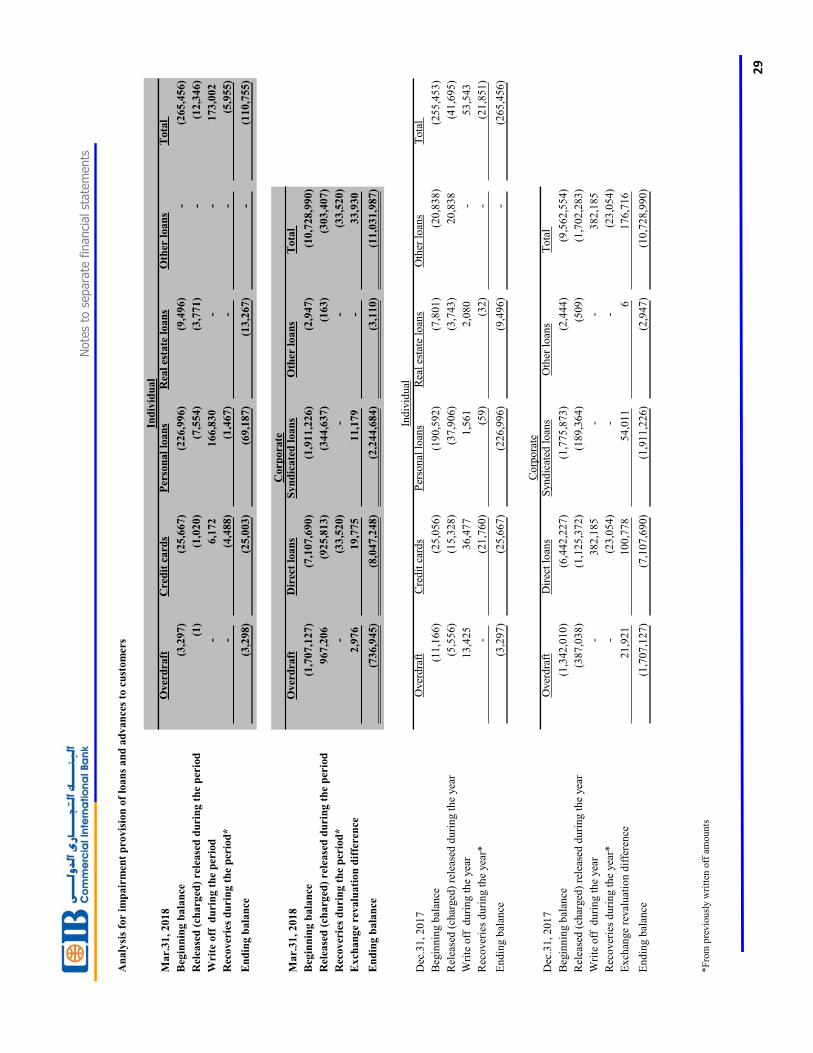
An
aly
sis
for
imp
air
men
t p
rovis
ion
of
loan
s an
d a
dvan
ces
to c
ust
om
ers
Mar.
31
, 2
01
8O
ver
dra
ftC
red
it c
ard
sP
erso
nal
loan
sR
eal
esta
te l
oan
sO
ther
loan
sT
ota
l
Beg
inn
ing
bala
nce
(3,2
97
)(2
5,6
67
)(2
26
,99
6)
(9,4
96
)-
(26
5,4
56
)
Rel
ease
d (
charg
ed)
rele
ase
d d
uri
ng
th
e p
erio
d(1
)(1
,02
0)
(7,5
54
)(3
,77
1)
-(1
2,3
46
)
Wri
te o
ff
du
rin
g t
he
per
iod
-6
,17
21
66
,83
0-
-1
73
,00
2
Rec
over
ies
du
rin
g t
he
per
iod
*-
(4,4
88
)(1
,46
7)
--
(5,9
55
)
En
din
g b
ala
nce
(3,2
98
)(2
5,0
03
)(6
9,1
87
)(1
3,2
67
)-
(11
0,7
55
)
Mar.
31
, 2
01
8O
ver
dra
ftD
irec
t lo
an
sS
yn
dic
ate
d l
oan
sO
ther
loan
sT
ota
l
Beg
inn
ing
bala
nce
(1,7
07
,12
7)
(7,1
07
,69
0)
(1,9
11
,22
6)
(2,9
47
)(1
0,7
28
,99
0)
Rel
ease
d (
charg
ed)
rele
ase
d d
uri
ng
th
e p
erio
d9
67
,20
6(9
25
,81
3)
(34
4,6
37
)(1
63
)(3
03
,40
7)
Rec
over
ies
du
rin
g t
he
per
iod
*-
(33
,52
0)
--
(33
,52
0)
Ex
chan
ge
revalu
ati
on
dif
fere
nce
2,9
76
19
,77
51
1,1
79
-3
3,9
30
En
din
g b
ala
nce
(73
6,9
45
)(8
,04
7,2
48
)(2
,24
4,6
84
)(3
,11
0)
(11
,03
1,9
87
)
Dec
.31
, 2
01
7O
ver
dra
ftC
red
it c
ard
sP
erso
nal
lo
ans
Rea
l es
tate
lo
ans
Oth
er l
oan
sT
ota
l
Beg
inn
ing b
alan
ce(1
1,1
66
)(2
5,0
56
)(1
90
,59
2)
(7,8
01
)(2
0,8
38
)(2
55
,45
3)
Rel
ease
d (
char
ged
) re
leas
ed d
uri
ng t
he
yea
r(5
,55
6)
(15
,32
8)
(37
,90
6)
(3,7
43
)2
0,8
38
(41
,69
5)
Wri
te o
ff
du
rin
g t
he
yea
r1
3,4
25
36
,47
71
,56
12
,08
0-
53
,54
3
Rec
over
ies
du
rin
g t
he
yea
r*-
(21
,76
0)
(59
)(3
2)
-(2
1,8
51
)
En
din
g b
alan
ce(3
,29
7)
(25
,66
7)
(22
6,9
96
)(9
,49
6)
-(2
65
,45
6)
Dec
.31
, 2
01
7O
ver
dra
ftD
irec
t lo
ans
Syn
dic
ated
lo
ans
Oth
er l
oan
sT
ota
l
Beg
inn
ing b
alan
ce(1
,34
2,0
10
)(6
,44
2,2
27
)(1
,77
5,8
73
)(2
,44
4)
(9,5
62
,55
4)
Rel
ease
d (
char
ged
) re
leas
ed d
uri
ng t
he
yea
r(3
87
,03
8)
(1,1
25
,37
2)
(18
9,3
64
)(5
09
)(1
,70
2,2
83
)
Wri
te o
ff
du
rin
g t
he
yea
r-
38
2,1
85
--
38
2,1
85
Rec
over
ies
du
rin
g t
he
yea
r*-
(23
,05
4)
--
(23
,05
4)
Exch
ange
reval
uat
ion
dif
fere
nce
21
,92
11
00
,77
85
4,0
11
61
76
,71
6
En
din
g b
alan
ce(1
,70
7,1
27
)(7
,10
7,6
90
)(1
,91
1,2
26
)(2
,94
7)
(10
,72
8,9
90
)
*F
rom
pre
vio
usl
y w
ritt
en o
ff a
mou
nts
Ind
ivid
ual
Corp
ora
te
Co
rpo
rate
Ind
ivid
ual
29
Note
sto
separa
tefinanci
alst
ate
ments
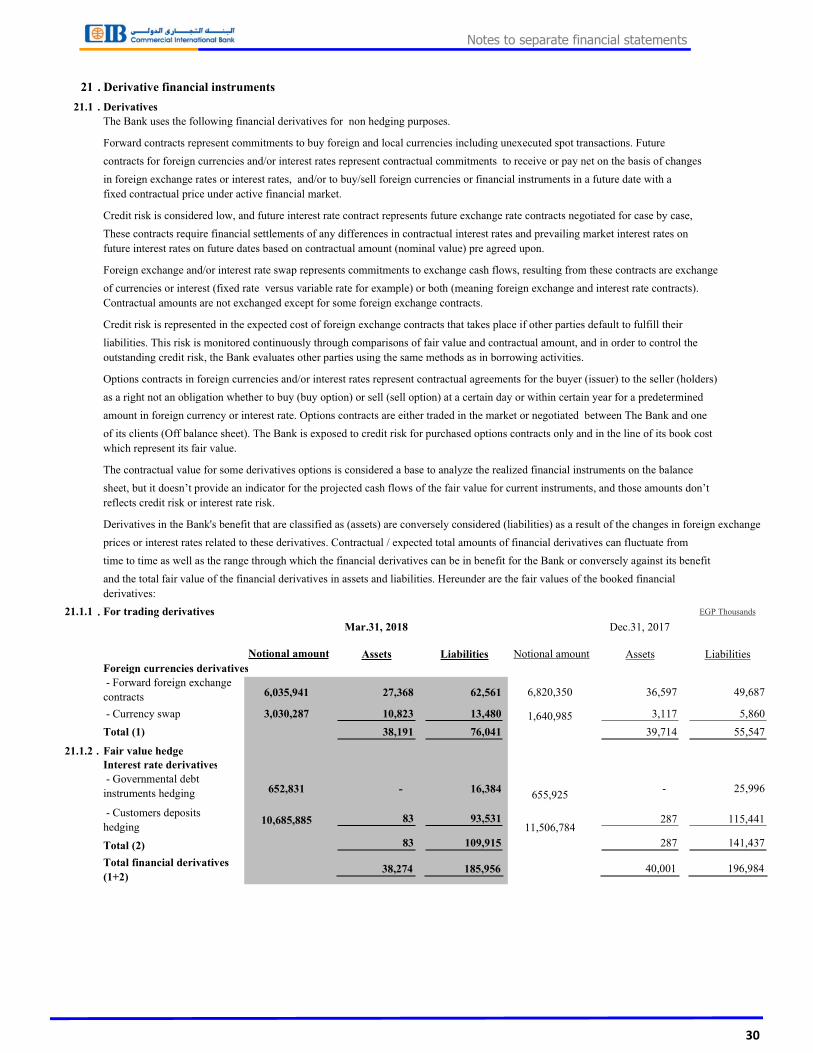
21 . Derivative financial instruments
21.1 . Derivatives
The Bank uses the following financial derivatives for non hedging purposes.
Forward contracts represent commitments to buy foreign and local currencies including unexecuted spot transactions. Future
contracts for foreign currencies and/or interest rates represent contractual commitments to receive or pay net on the basis of changes
in foreign exchange rates or interest rates, and/or to buy/sell foreign currencies or financial instruments in a future date with a
fixed contractual price under active financial market.
Credit risk is considered low, and future interest rate contract represents future exchange rate contracts negotiated for case by case,
These contracts require financial settlements of any differences in contractual interest rates and prevailing market interest rates on
future interest rates on future dates based on contractual amount (nominal value) pre agreed upon.
Foreign exchange and/or interest rate swap represents commitments to exchange cash flows, resulting from these contracts are exchange
of currencies or interest (fixed rate versus variable rate for example) or both (meaning foreign exchange and interest rate contracts).
Contractual amounts are not exchanged except for some foreign exchange contracts.
Credit risk is represented in the expected cost of foreign exchange contracts that takes place if other parties default to fulfill their
liabilities. This risk is monitored continuously through comparisons of fair value and contractual amount, and in order to control the
outstanding credit risk, the Bank evaluates other parties using the same methods as in borrowing activities.
Options contracts in foreign currencies and/or interest rates represent contractual agreements for the buyer (issuer) to the seller (holders)
as a right not an obligation whether to buy (buy option) or sell (sell option) at a certain day or within certain year for a predetermined
amount in foreign currency or interest rate. Options contracts are either traded in the market or negotiated between The Bank and one
of its clients (Off balance sheet). The Bank is exposed to credit risk for purchased options contracts only and in the line of its book cost
which represent its fair value.
The contractual value for some derivatives options is considered a base to analyze the realized financial instruments on the balance
sheet, but it doesn’t provide an indicator for the projected cash flows of the fair value for current instruments, and those amounts don’t
reflects credit risk or interest rate risk.
Derivatives in the Bank's benefit that are classified as (assets) are conversely considered (liabilities) as a result of the changes in foreign exchange
prices or interest rates related to these derivatives. Contractual / expected total amounts of financial derivatives can fluctuate from
time to time as well as the range through which the financial derivatives can be in benefit for the Bank or conversely against its benefit
and the total fair value of the financial derivatives in assets and liabilities. Hereunder are the fair values of the booked financial
derivatives:
21.1.1 . For trading derivatives EGP Thousands
Notional amount Assets Liabilities Notional amount Assets Liabilities
Foreign currencies derivatives
- Forward foreign exchange
contracts 6,035,941 27,368 62,561 6,820,350 36,597 49,687
- Currency swap 3,030,287 10,823 13,480 1,640,985 3,117 5,860
Total (1) 38,191 76,041 39,714 55,547
21.1.2 . Fair value hedge
Interest rate derivatives
- Governmental debt
instruments hedging 652,831 - 16,384655,925
- 25,996
- Customers deposits
hedging 10,685,885 83 93,531
11,506,784287 115,441
Total (2) 83 109,915 287 141,437
Total financial derivatives
(1+2)38,274 185,956 40,001 196,984
Mar.31, 2018 Dec.31, 2017
��
Notes to separate financial statements
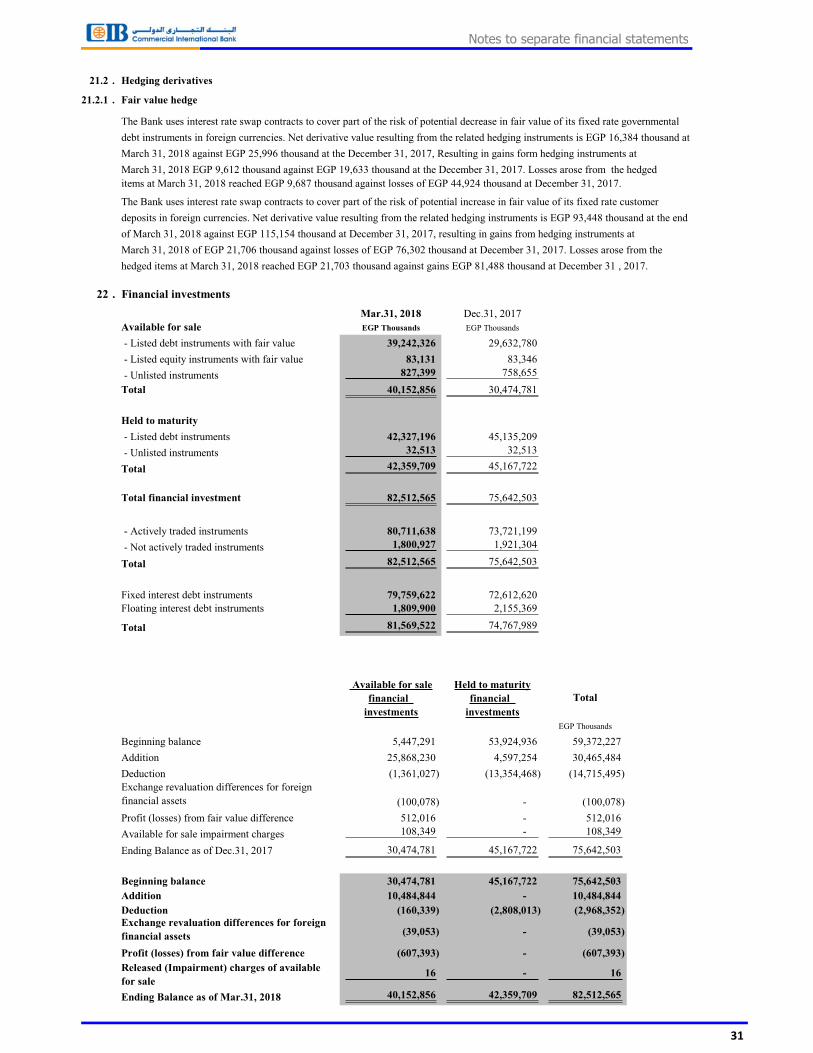
21.2 . Hedging derivatives
21.2.1 . Fair value hedge
The Bank uses interest rate swap contracts to cover part of the risk of potential decrease in fair value of its fixed rate governmental
debt instruments in foreign currencies. Net derivative value resulting from the related hedging instruments is EGP 16,384 thousand at
March 31, 2018 against EGP 25,996 thousand at the December 31, 2017, Resulting in gains form hedging instruments at
March 31, 2018 EGP 9,612 thousand against EGP 19,633 thousand at the December 31, 2017. Losses arose from the hedged
items at March 31, 2018 reached EGP 9,687 thousand against losses of EGP 44,924 thousand at December 31, 2017.
The Bank uses interest rate swap contracts to cover part of the risk of potential increase in fair value of its fixed rate customer
deposits in foreign currencies. Net derivative value resulting from the related hedging instruments is EGP 93,448 thousand at the end
of March 31, 2018 against EGP 115,154 thousand at December 31, 2017, resulting in gains from hedging instruments at
March 31, 2018 of EGP 21,706 thousand against losses of EGP 76,302 thousand at December 31, 2017. Losses arose from the
hedged items at March 31, 2018 reached EGP 21,703 thousand against gains EGP 81,488 thousand at December 31 , 2017.
22 . Financial investments
Mar.31, 2018 Dec.31, 2017
Available for sale EGP Thousands EGP Thousands
- Listed debt instruments with fair value 39,242,326 29,632,780
- Listed equity instruments with fair value 83,131 83,346
- Unlisted instruments 827,399 758,655
Total 40,152,856 30,474,781
Held to maturity
- Listed debt instruments 42,327,196 45,135,209
- Unlisted instruments 32,513 32,513
Total 42,359,709 45,167,722
Total financial investment 82,512,565 75,642,503
- Actively traded instruments 80,711,638 73,721,199
- Not actively traded instruments 1,800,927 1,921,304
Total 82,512,565 75,642,503
Fixed interest debt instruments 79,759,622 72,612,620
Floating interest debt instruments 1,809,900 2,155,369
Total 81,569,522 74,767,989
Available for sale Held to maturity
financial financial
investments investments
EGP Thousands
Beginning balance 5,447,291 53,924,936 59,372,227
Addition 25,868,230 4,597,254 30,465,484
Deduction (1,361,027) (13,354,468) (14,715,495)
Exchange revaluation differences for foreign
financial assets (100,078) - (100,078)
Profit (losses) from fair value difference 512,016 - 512,016
Available for sale impairment charges 108,349 - 108,349
Ending Balance as of Dec.31, 2017 30,474,781 45,167,722 75,642,503
Beginning balance 30,474,781 45,167,722 75,642,503
Addition 10,484,844 - 10,484,844
Deduction (160,339) (2,808,013) (2,968,352)
Exchange revaluation differences for foreign
financial assets (39,053) - (39,053)
Profit (losses) from fair value difference (607,393) - (607,393)
Released (Impairment) charges of available
for sale16 - 16
Ending Balance as of Mar.31, 2018 40,152,856 42,359,709 82,512,565
Total
��
Notes to separate financial statements
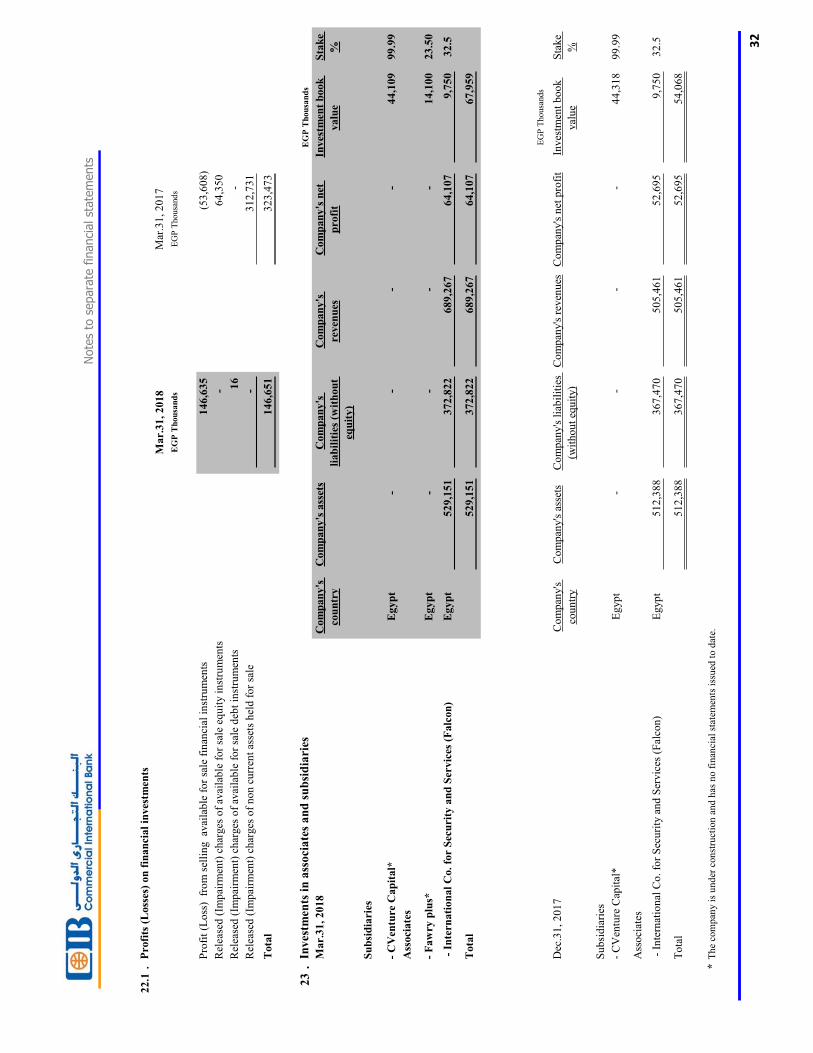
22
.1.
Pro
fits
(L
oss
es)
on
fin
an
cial
inves
tmen
ts
Last
3 M
on
ths
Last
9 M
on
ths
Las
t 3
Mo
nth
sL
ast
9 M
on
ths
Las
t 3
Mo
nth
s
Mar.
31
, 2
01
8M
ar.
31
, 2
01
8M
ar.3
1,
20
17
Mar
.31
, 2
01
7#
##
##
#
EG
P T
hou
san
ds
EG
P T
hou
san
ds
EG
P T
ho
usa
nd
sE
GP
Tho
usa
nd
sE
GP
Th
ou
san
ds
Pro
fit
(Lo
ss)
fro
m s
elli
ng
avai
lab
le f
or
sale
fin
anci
al i
nst
rum
ents
24
8,1
00
14
6,6
35
(69
,85
1)
(53
,60
8)
Rel
ease
d (
Imp
airm
ent)
ch
arges
of
avai
lab
le f
or
sale
eq
uit
y i
nst
rum
ents
(1
12
,44
5)
-1
06
,48
36
4,3
50
Rel
ease
d (
Imp
airm
ent)
ch
arges
of
avai
lab
le f
or
sale
deb
t in
stru
men
ts
16
16
(84
,94
8)
-
Rel
ease
d (
Imp
airm
ent)
ch
arges
of
no
n c
urr
ent
asse
ts h
eld
fo
r sa
le(3
12
,58
4)
-3
12
,73
13
12
,73
1
Tota
l(1
76
,91
3)
14
6,6
51
26
4,4
15
32
3,4
73
23
.In
ves
tmen
ts i
n a
sso
cia
tes
an
d s
ub
sid
iari
esE
GP
Th
ou
san
ds
Mar.
31
, 2
01
8C
om
pan
y's
cou
ntr
y
Com
pan
y's
ass
ets
Com
pan
y's
liab
ilit
ies
(wit
hou
t
equ
ity
)
Com
pan
y's
reven
ues
Com
pan
y's
net
pro
fit
Inves
tmen
t b
ook
valu
e
Sta
ke
%
Su
bsi
dia
ries
- C
Ven
ture
Cap
ital*
Eg
yp
t-
--
-4
4,1
09
99
.99
Ass
oci
ate
s
- F
aw
ry p
lus*
Eg
yp
t-
--
-1
4,1
00
23
.50
- I
nte
rnati
on
al
Co.
for
Sec
uri
ty a
nd
Ser
vic
es (
Falc
on
)E
gy
pt
52
9,1
51
37
2,8
22
68
9,2
67
64
,10
79
,75
03
2.5
Tota
l5
29
,15
13
72
,82
26
89
,26
76
4,1
07
67
,95
9
EG
P T
ho
usa
nd
s
Dec
.31
, 2
01
7C
om
pan
y's
cou
ntr
y
Co
mp
any's
ass
ets
Co
mp
any's
lia
bil
itie
s
(wit
ho
ut
equ
ity)
Co
mp
any's
rev
enu
esC
om
pan
y's
net
pro
fit
Inves
tmen
t b
oo
k
val
ue
Sta
ke
%
Su
bsi
dia
ries
- C
Ven
ture
Cap
ital
*E
gyp
t-
--
-4
4,3
18
99
.99
Ass
oci
ates
- I
nte
rnat
ion
al C
o.
for
Sec
uri
ty a
nd
Ser
vic
es (
Fal
con
)E
gyp
t5
12
,38
83
67
,47
05
05
,46
15
2,6
95
9,7
50
32
.5
To
tal
51
2,3
88
36
7,4
70
50
5,4
61
52
,69
55
4,0
68
*T
he
com
pan
y i
s u
nd
er c
on
stru
ctio
n a
nd
has
no f
inan
cial
sta
tem
ents
iss
ued
to d
ate.
32
Note
sto
separa
tefinanci
alst
ate
ments
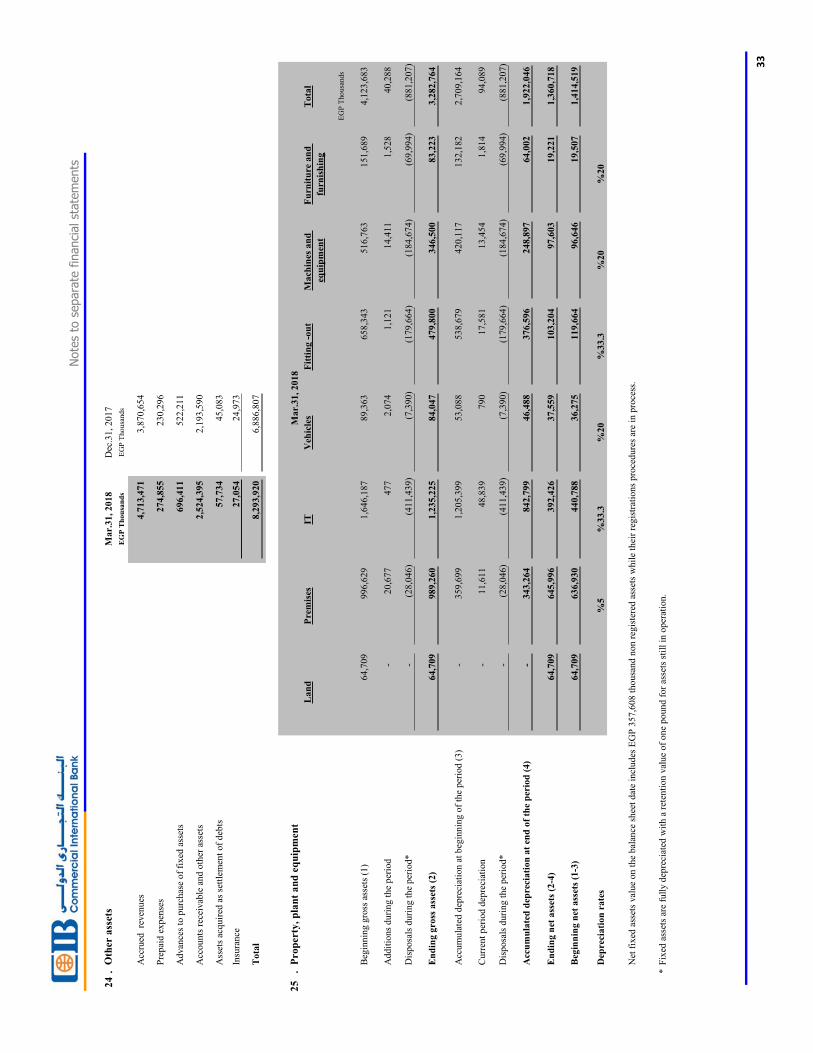
24.Otherassets
Mar.31,2018
Dec.31,2017
EGPThousands
EGPThousands
Accruedrevenues
4,713,471
3,870,654
Prepaidexpenses
274,855
230,296
Advancestopurchaseoffixedassets
696,411
522,211
Accountsreceivableandotherassets
2,524,395
2,193,590
Assetsacquiredassettlementofdebts
57,734
45,083
Insurance
27,054
24,973
Total
8,293,920
6,886,807
25.Property,plantandequipment
EGPThousands
Beginninggrossassets(1)
64,709
996,629
1,646,187
89,363
658,343
516,763
151,689
4,123,683
Additionsduringtheperiod
-20,677
477
2,074
1,121
14,411
1,528
40,288
Disposalsduringtheperiod*
-(28,046)
(411,439)
(7,390)
(179,664)
(184,674)
(69,994)
(881,207)
Endinggrossassets(2)
64,709
989,260
1,235,225
84,047
479,800
346,500
83,223
3,282,764
Accumulateddepreciationatbeginningoftheperiod(3)
-359,699
1,205,399
53,088
538,679
420,117
132,182
2,709,164
Currentperioddepreciation
-11,611
48,839
790
17,581
13,454
1,814
94,089
Disposalsduringtheperiod*
-(28,046)
(411,439)
(7,390)
(179,664)
(184,674)
(69,994)
(881,207)
Accumulateddepreciationatendoftheperiod(4)
-343,264
842,799
46,488
376,596
248,897
64,002
1,922,046
Endingnetassets(2-4)
64,709
645,996
392,426
37,559
103,204
97,603
19,221
1,360,718
Beginningnetassets(1-3)
64,709
636,930
440,788
36,275
119,664
96,646
19,507
1,414,519
Depreciationrates
%5
%33.3
%20
%33.3
%20
%20
NetfixedassetsvalueonthebalancesheetdateincludesEGP357,608thousandnonregisteredassetswhiletheirregistrationsproceduresareinprocess.
*Fixedassetsarefullydepreciatedwitharetentionvalueofonepoundforassetsstillinoperation.
Machinesand
equipment
Mar.31,2018
Fitting-out
Total
Land
Premises
ITVehicles
Furnitureand
furnishing
��
Note
sto
separa
tefinanci
alst
ate
ments

26 . Due to banks
Mar.31, 2018 Dec.31, 2017
EGP Thousands EGP Thousands
Current accounts 498,140 1,067,374
Deposits 10,854,218 810,544
Total 11,352,358 1,877,918
Central banks 106,896 128,527
Local banks 10,654,393 714,294
Foreign banks 591,069 1,035,097
Total 11,352,358 1,877,918
Non-interest bearing balances 176,473 740,158
Fixed interest bearing balances 11,175,885 1,137,760
Total 11,352,358 1,877,918
Current balances 11,352,358 1,877,918
27 . Due to customers
Mar.31, 2018 Dec.31, 2017
EGP Thousands EGP Thousands
Demand deposits 74,488,480 72,487,190
Time deposits 46,674,026 49,952,470
Certificates of deposit 71,550,550 70,486,930
Saving deposits 57,896,522 53,075,098
Other deposits 5,512,056 4,765,682
Total 256,121,634 250,767,370
Corporate deposits 106,099,061 107,798,000
Individual deposits 150,022,573 142,969,370
Total 256,121,634 250,767,370
Non-interest bearing balances 43,858,056 43,317,721
Fixed interest bearing balances 212,263,578 207,449,649
Total 256,121,634 250,767,370
Current balances 183,246,183 178,830,593
Non-current balances 72,875,451 71,936,777
Total 256,121,634 250,767,370
28 . Other loans
Balance on Balance on
Mar.31, 2018 Dec.31, 2017
EGP Thousands EGP Thousands EGP Thousands
Agricultural Research and Development Fund
(ARDF)
3.5 - 5.5 depends on
maturity date3-5 years* 119,886 123,314 87,314
Social Fund for Development (SFD) 3 months T/D or 9%
which is more04/01/2020* 35,694 35,694 41,882
European Bank for Reconstruction and
Development (EBRD) subordinated Loan3 months libor + 6.2% 10 years - 1,764,410 1,772,770
International Finance Corporation (IFC)
subordinated Loan3 months libor + 6.2% 10 years
- 1,764,410 1,772,770
Balance155,580 3,687,828 3,674,736
Interest rates on variable-interest subordinated loans are determined in advance every 3 months/every quarter. Subordinated loans are not repaid before their repayment dates.
* Represents the date of loan repayment to the lending agent.
Maturing through
next year
Maturity dateInterest rate %
��
Notes to separate financial statements
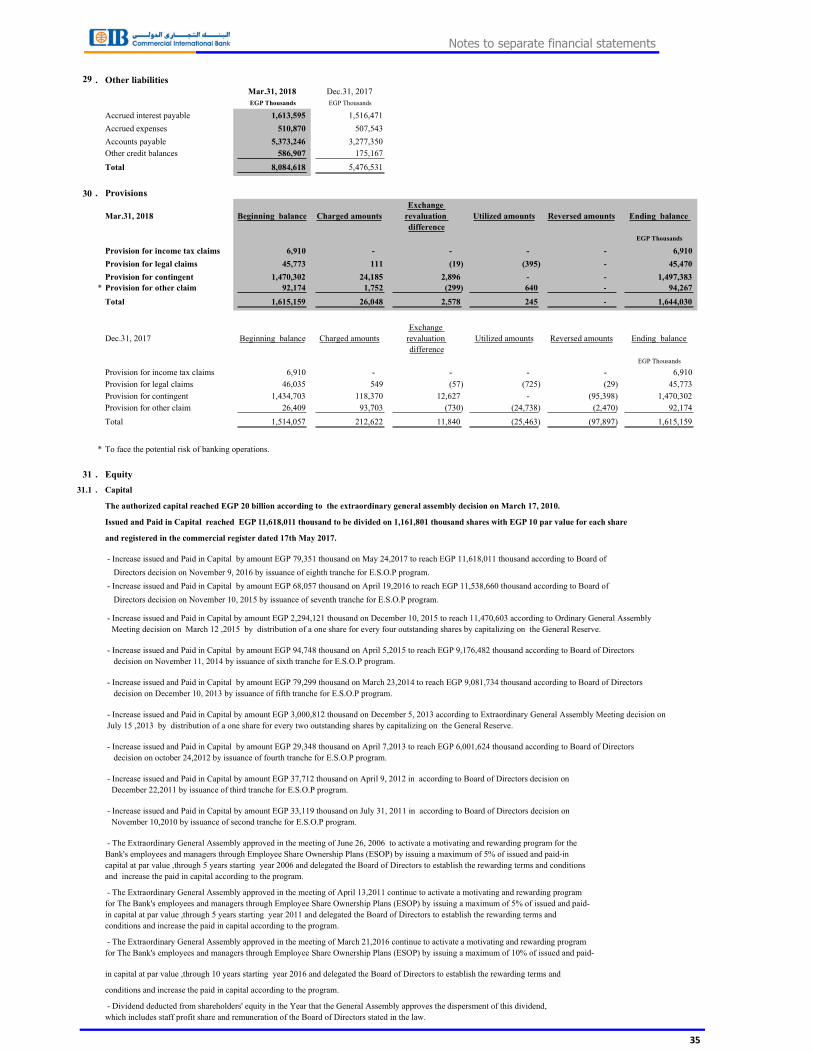
29 . Other liabilities
Mar.31, 2018 Dec.31, 2017
EGP Thousands EGP Thousands
Accrued interest payable 1,613,595 1,516,471
Accrued expenses 510,870 507,543
Accounts payable 5,373,246 3,277,350
Other credit balances 586,907 175,167
Total 8,084,618 5,476,531
30 . Provisions
Mar.31, 2018 Beginning balance Charged amounts
Exchange
revaluation
difference
Utilized amounts Reversed amounts Ending balance
EGP Thousands
Provision for income tax claims 6,910 - - - - 6,910
Provision for legal claims 45,773 111 (19) (395) - 45,470
Provision for contingent 1,470,302 24,185 2,896 - - 1,497,383
* Provision for other claim 92,174 1,752 (299) 640 - 94,267
Total 1,615,159 26,048 2,578 245 - 1,644,030
Dec.31, 2017 Beginning balance Charged amounts
Exchange
revaluation
difference
Utilized amounts Reversed amounts Ending balance
EGP Thousands
Provision for income tax claims 6,910 - - - - 6,910
Provision for legal claims 46,035 549 (57) (725) (29) 45,773
Provision for contingent 1,434,703 118,370 12,627 - (95,398) 1,470,302
Provision for other claim 26,409 93,703 (730) (24,738) (2,470) 92,174
Total 1,514,057 212,622 11,840 (25,463) (97,897) 1,615,159
* To face the potential risk of banking operations.
31 . Equity
31.1 . Capital
The authorized capital reached EGP 20 billion according to the extraordinary general assembly decision on March 17, 2010.
Issued and Paid in Capital reached EGP 11,618,011 thousand to be divided on 1,161,801 thousand shares with EGP 10 par value for each share
and registered in the commercial register dated 17th May 2017.
- Increase issued and Paid in Capital by amount EGP 79,351 thousand on May 24,2017 to reach EGP 11,618,011 thousand according to Board of
Directors decision on November 9, 2016 by issuance of eighth tranche for E.S.O.P program.
- Increase issued and Paid in Capital by amount EGP 68,057 thousand on April 19,2016 to reach EGP 11,538,660 thousand according to Board of
Directors decision on November 10, 2015 by issuance of seventh tranche for E.S.O.P program.
- Increase issued and Paid in Capital by amount EGP 2,294,121 thousand on December 10, 2015 to reach 11,470,603 according to Ordinary General Assembly
Meeting decision on March 12 ,2015 by distribution of a one share for every four outstanding shares by capitalizing on the General Reserve.
- Increase issued and Paid in Capital by amount EGP 94,748 thousand on April 5,2015 to reach EGP 9,176,482 thousand according to Board of Directors
decision on November 11, 2014 by issuance of sixth tranche for E.S.O.P program.
- Increase issued and Paid in Capital by amount EGP 79,299 thousand on March 23,2014 to reach EGP 9,081,734 thousand according to Board of Directors
decision on December 10, 2013 by issuance of fifth tranche for E.S.O.P program.
- Increase issued and Paid in Capital by amount EGP 3,000,812 thousand on December 5, 2013 according to Extraordinary General Assembly Meeting decision on
July 15 ,2013 by distribution of a one share for every two outstanding shares by capitalizing on the General Reserve.
- Increase issued and Paid in Capital by amount EGP 29,348 thousand on April 7,2013 to reach EGP 6,001,624 thousand according to Board of Directors
decision on october 24,2012 by issuance of fourth tranche for E.S.O.P program.
- Increase issued and Paid in Capital by amount EGP 37,712 thousand on April 9, 2012 in according to Board of Directors decision on
December 22,2011 by issuance of third tranche for E.S.O.P program.
- Increase issued and Paid in Capital by amount EGP 33,119 thousand on July 31, 2011 in according to Board of Directors decision on
November 10,2010 by issuance of second tranche for E.S.O.P program.
- The Extraordinary General Assembly approved in the meeting of June 26, 2006 to activate a motivating and rewarding program for the
Bank's employees and managers through Employee Share Ownership Plans (ESOP) by issuing a maximum of 5% of issued and paid-in
capital at par value ,through 5 years starting year 2006 and delegated the Board of Directors to establish the rewarding terms and conditions
and increase the paid in capital according to the program.
- The Extraordinary General Assembly approved in the meeting of April 13,2011 continue to activate a motivating and rewarding program
for The Bank's employees and managers through Employee Share Ownership Plans (ESOP) by issuing a maximum of 5% of issued and paid-
in capital at par value ,through 5 years starting year 2011 and delegated the Board of Directors to establish the rewarding terms and
conditions and increase the paid in capital according to the program.
- The Extraordinary General Assembly approved in the meeting of March 21,2016 continue to activate a motivating and rewarding program
for The Bank's employees and managers through Employee Share Ownership Plans (ESOP) by issuing a maximum of 10% of issued and paid-
in capital at par value ,through 10 years starting year 2016 and delegated the Board of Directors to establish the rewarding terms and
conditions and increase the paid in capital according to the program.
- Dividend deducted from shareholders' equity in the Year that the General Assembly approves the dispersment of this dividend,
which includes staff profit share and remuneration of the Board of Directors stated in the law.
��
Notes to separate financial statements

31.2 . Reserves
According to The Bank status 5% of net profit is used to increase the legal reseve to reaches 50% of The Bank's issued and paid in capital.
Central Bank of Egypt concurrence for usage of special reserve is required.
32 . Deferred tax assets (Liabilities)
Deferred tax assets and liabilities are attributable to the following:
Assets (Liabilities) Assets (Liabilities)
Mar.31, 2018 Dec.31, 2017
EGP Thousands EGP Thousands
Fixed assets (depreciation) (23,552) (31,409)
Other provisions (excluded loan loss, contingent
liabilities and income tax provisions) 31,441 31,038
Intangible Assets 40,949 36,712
Other investments impairment 56,698 56,698
Reserve for employee stock ownership plan (ESOP) 134,243 110,100
Interest rate swaps revaluation 4,157 5,340
Trading investment revaluation (30,981) (37,478)
Forward foreign exchange deals revaluation 11,438 8,629
Balance 224,393 179,630
33 . Share-based payments
According to the extraordinary general assembly meeting on June 26, 2006, the Bank launched new Employees Share Ownership
Plan (ESOP) scheme and issued equity-settled share-based payments. Eligible employees should complete a term of 3 years of
service in The Bank to have the right in ordinary shares at face value (right to share) that will be issued on the vesting date,
otherwise such grants will be forfeited. Equity-settled share-based payments are measured at fair value at the grant date, and
expensed on a straight-line basis over the vesting period (3 years) with corresponding increase in equity based on estimated
number of shares that will eventually vest(True up model). The fair value for such equity instruments is measured using the
Black-Scholes pricing model.
Details of the rights to share outstanding during the period are as follows:
Mar.31, 2018 Dec.31, 2017
No. of shares in
thousand
No. of shares in
thousand
Outstanding at the beginning of the period/year 21,280 22,351
Granted during the period/year 8,100 7,601
Forfeited during the period/year (45) (737)
Exercised during the period/year (5,032) (7,935)
Outstanding at the end of the period/year 24,303 21,280
Details of the outstanding tranches are as follows:
EGP EGP
Maturity date Exercise price Fair value No. of shares
in thousand
2019 10.00 28.43 8,792
2020 10.00 65.55 7,411
2021 10.00 68.13 8,100
Total 24,303
The fair value of granted shares is calculated using Black-Scholes pricing model with the following:
12th tranche 11th tranche
Exercise price 10 10
Current share price 77.35 73.08
Expected life (years) 3 3
Risk free rate % 15.54% 16.77%
Dividend yield% 1.29% 0.68%
Volatility% 26% 30%
Volatility is calculated based on the daily standard deviation of returns for the last three years.
��
Notes to separate financial statements

34 . Reserves
Mar.31, 2018 Dec.31, 2017
EGP Thousands EGP Thousands
Legal reserve 1,710,293 1,332,807
General reserve 12,616,855 9,000,023
Capital reserve 12,421 11,815
Special reserve 20,645 20,645
Reserve for A.F.S investments revaluation difference (2,246,442) (1,642,958)
Banking risks reserve 4,323 3,634
IFRS 9 risk reserve 1,411,549 1,411,549
Ending balance 13,529,644 10,137,515
On 28 January 2018, Central Bank of Egypt issued instructions indicating the following:
Creating IFRS 9 risk reserve (1% of the total weighted credit risk) deducted from 2017 net profit after tax, to be used after
obtaining CBE's approval.
34.1 . Banking risks reserveMar.31, 2018 Dec.31, 2017
EGP Thousands EGP Thousands
Beginning balance 3,634 3,019
Transferred to bank risk reserve 689 615
Ending balance 4,323 3,634
34.2 . Legal reserveMar.31, 2018 Dec.31, 2017
EGP Thousands EGP Thousands
Beginning balance 1,332,807 1,035,363
Transferred from previous year profits 377,486 297,444
Ending balance 1,710,293 1,332,807
34.3 . Reserve for A.F.S investments revaluation differenceMar.31, 2018 Dec.31, 2017
EGP Thousands EGP Thousands
Beginning balance (1,642,958) (2,180,244)
Unrealized gain (loss) from A.F.S investment revaluation (603,484) 537,286
Ending balance (2,246,442) (1,642,958)
35 . Cash and cash equivalent
Mar.31, 2018 Dec.31, 2017
EGP Thousands EGP Thousands
Cash and balances with central bank 26,182,232 14,663,289
Due from banks 42,306,844 45,319,766
Treasury bills and other governmental notes 45,937,458 54,478,202
Obligatory reserve balance with CBE (20,421,756) (8,878,986)
Due from banks with maturities more than three months (20,155,641) (1,719,586)
Treasury bills with maturities more than three months (46,028,861) (54,653,848)
Total 27,820,276 49,208,837
��
Notes to separate financial statements
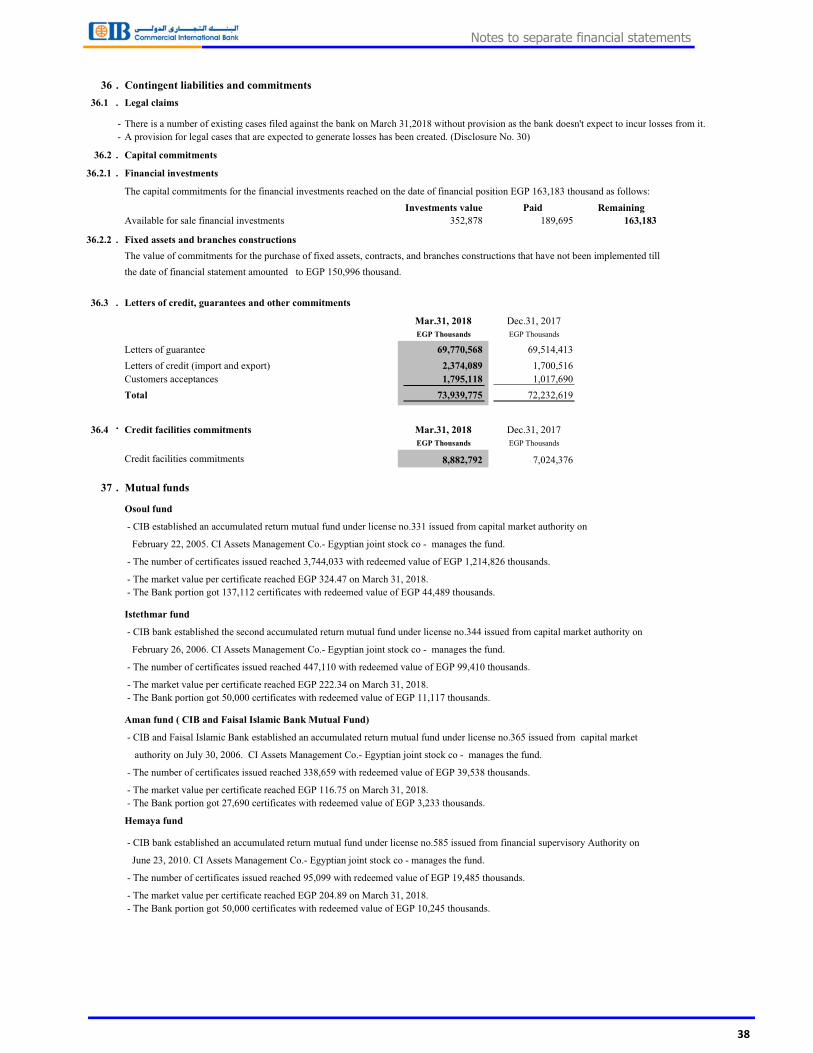
36 . Contingent liabilities and commitments
36.1 . Legal claims
- There is a number of existing cases filed against the bank on March 31,2018 without provision as the bank doesn't expect to incur losses from it.
- A provision for legal cases that are expected to generate losses has been created. (Disclosure No. 30)
36.2 . Capital commitments
36.2.1 . Financial investments
The capital commitments for the financial investments reached on the date of financial position EGP 163,183 thousand as follows:
Investments value Paid Remaining
Available for sale financial investments 352,878 189,695 163,183
36.2.2 . Fixed assets and branches constructions
The value of commitments for the purchase of fixed assets, contracts, and branches constructions that have not been implemented till
the date of financial statement amounted to EGP 150,996 thousand.
36.3 . Letters of credit, guarantees and other commitments
Mar.31, 2018 Dec.31, 2017
EGP Thousands EGP Thousands
Letters of guarantee 69,770,568 69,514,413
Letters of credit (import and export) 2,374,089 1,700,516
Customers acceptances 1,795,118 1,017,690
Total 73,939,775 72,232,619
36.4 . Credit facilities commitments Mar.31, 2018 Dec.31, 2017
EGP Thousands EGP Thousands
Credit facilities commitments 8,882,792 7,024,376
37 . Mutual funds
Osoul fund
- CIB established an accumulated return mutual fund under license no.331 issued from capital market authority on
February 22, 2005. CI Assets Management Co.- Egyptian joint stock co - manages the fund.
- The number of certificates issued reached 3,744,033 with redeemed value of EGP 1,214,826 thousands.
- The market value per certificate reached EGP 324.47 on March 31, 2018.
- The Bank portion got 137,112 certificates with redeemed value of EGP 44,489 thousands.
Istethmar fund
- CIB bank established the second accumulated return mutual fund under license no.344 issued from capital market authority on
February 26, 2006. CI Assets Management Co.- Egyptian joint stock co - manages the fund.
- The number of certificates issued reached 447,110 with redeemed value of EGP 99,410 thousands.
- The market value per certificate reached EGP 222.34 on March 31, 2018.
- The Bank portion got 50,000 certificates with redeemed value of EGP 11,117 thousands.
Aman fund ( CIB and Faisal Islamic Bank Mutual Fund)
- CIB and Faisal Islamic Bank established an accumulated return mutual fund under license no.365 issued from capital market
authority on July 30, 2006. CI Assets Management Co.- Egyptian joint stock co - manages the fund.
- The number of certificates issued reached 338,659 with redeemed value of EGP 39,538 thousands.
- The market value per certificate reached EGP 116.75 on March 31, 2018.
- The Bank portion got 27,690 certificates with redeemed value of EGP 3,233 thousands.
Hemaya fund
- CIB bank established an accumulated return mutual fund under license no.585 issued from financial supervisory Authority on
June 23, 2010. CI Assets Management Co.- Egyptian joint stock co - manages the fund.
- The number of certificates issued reached 95,099 with redeemed value of EGP 19,485 thousands.
- The market value per certificate reached EGP 204.89 on March 31, 2018.
- The Bank portion got 50,000 certificates with redeemed value of EGP 10,245 thousands.
��
Notes to separate financial statements
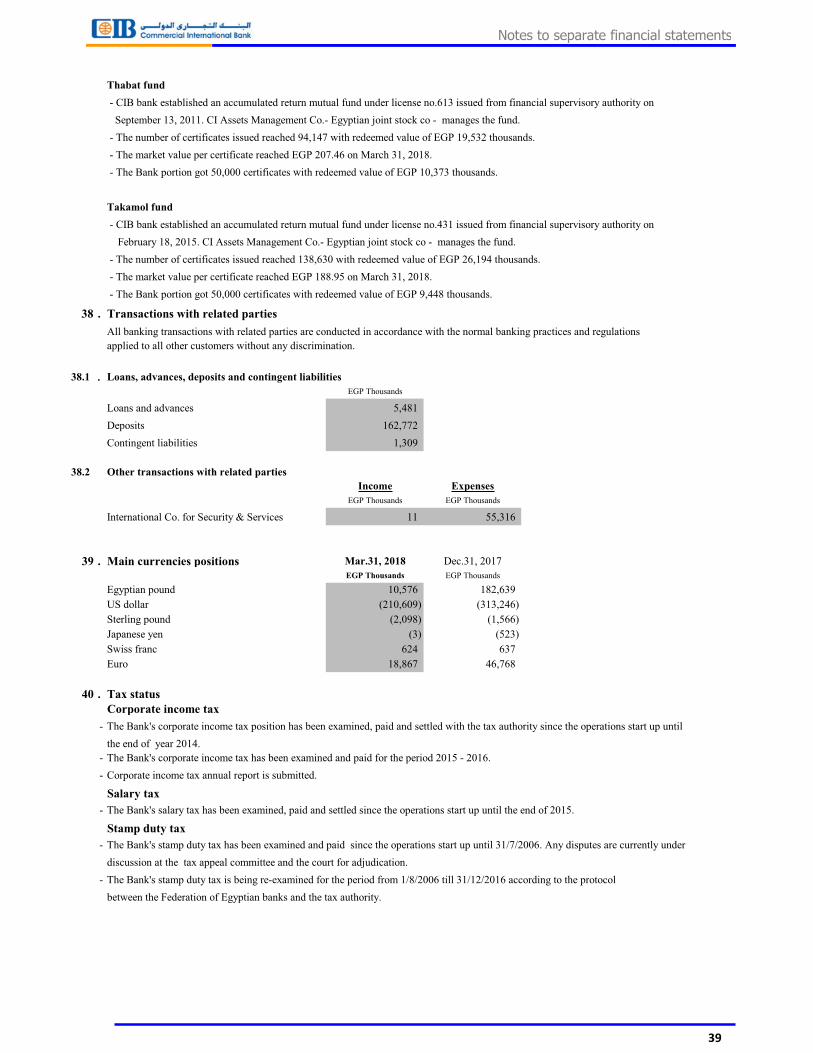
Thabat fund
- CIB bank established an accumulated return mutual fund under license no.613 issued from financial supervisory authority on
September 13, 2011. CI Assets Management Co.- Egyptian joint stock co - manages the fund.
- The number of certificates issued reached 94,147 with redeemed value of EGP 19,532 thousands.
- The market value per certificate reached EGP 207.46 on March 31, 2018.
- The Bank portion got 50,000 certificates with redeemed value of EGP 10,373 thousands.
Takamol fund
- CIB bank established an accumulated return mutual fund under license no.431 issued from financial supervisory authority on
February 18, 2015. CI Assets Management Co.- Egyptian joint stock co - manages the fund.
- The number of certificates issued reached 138,630 with redeemed value of EGP 26,194 thousands.
- The market value per certificate reached EGP 188.95 on March 31, 2018.
- The Bank portion got 50,000 certificates with redeemed value of EGP 9,448 thousands.
38 . Transactions with related parties
All banking transactions with related parties are conducted in accordance with the normal banking practices and regulations
applied to all other customers without any discrimination.
38.1 . Loans, advances, deposits and contingent liabilities
EGP Thousands
Loans and advances 5,481
Deposits 162,772
Contingent liabilities 1,309
38.2 Other transactions with related parties
Income Expenses
EGP Thousands EGP Thousands
International Co. for Security & Services 11 55,316
39 . Main currencies positions Mar.31, 2018 Dec.31, 2017
EGP Thousands EGP Thousands
Egyptian pound 10,576 182,639
US dollar (210,609) (313,246)
Sterling pound (2,098) (1,566)
Japanese yen (3) (523)
Swiss franc 624 637
Euro 18,867 46,768
40 . Tax status
Corporate income tax
- The Bank's corporate income tax position has been examined, paid and settled with the tax authority since the operations start up until
the end of year 2014.
- The Bank's corporate income tax has been examined and paid for the period 2015 - 2016.
- Corporate income tax annual report is submitted.
Salary tax
- The Bank's salary tax has been examined, paid and settled since the operations start up until the end of 2015.
Stamp duty tax
- The Bank's stamp duty tax has been examined and paid since the operations start up until 31/7/2006. Any disputes are currently under
discussion at the tax appeal committee and the court for adjudication.
- The Bank's stamp duty tax is being re-examined for the period from 1/8/2006 till 31/12/2016 according to the protocol
between the Federation of Egyptian banks and the tax authority.
39
Notes to separate financial statements
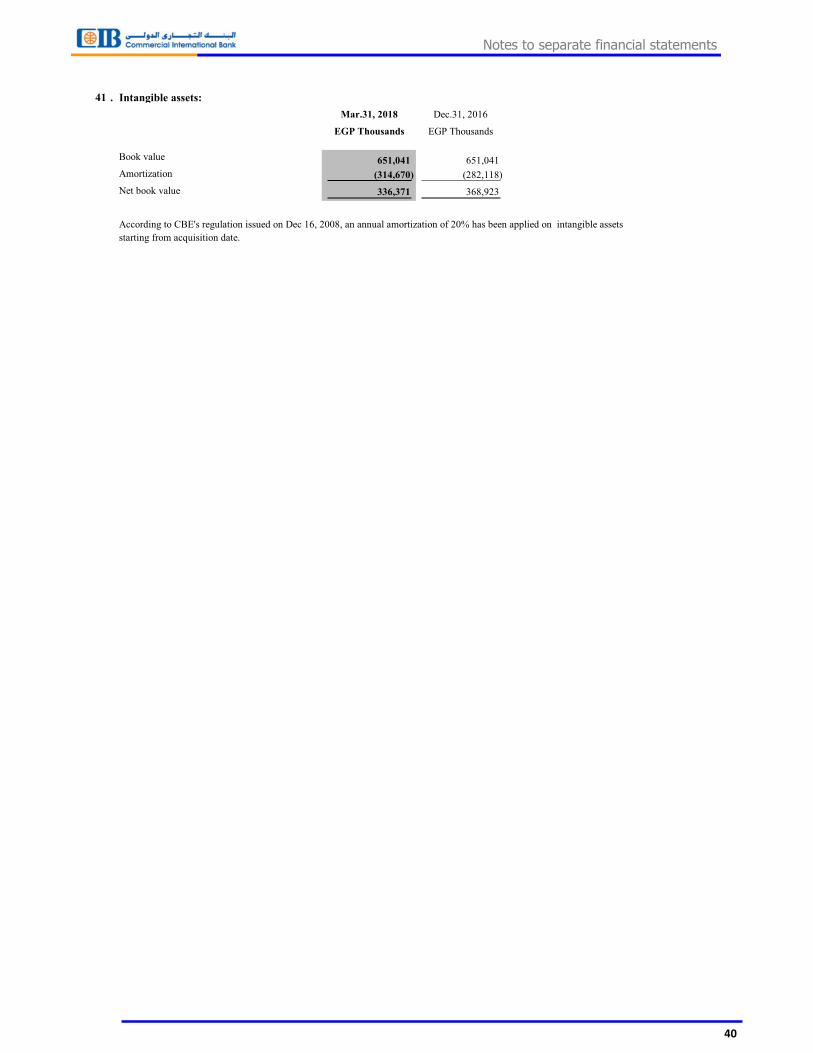
41 . Intangible assets:
Mar.31, 2018 Dec.31, 2016
EGP Thousands EGP Thousands
Book value 651,041 651,041
Amortization (314,670) (282,118)
Net book value 336,371 368,923
According to CBE's regulation issued on Dec 16, 2008, an annual amortization of 20% has been applied on intangible assets
starting from acquisition date.
40
Notes to separate financial statements

.

.